Embed Size (px)
Citation preview
Tijana Jokic, M.Sc.
New pH and CO2 sensitive materials based on
BF2-chelated azadipyrromethenes
DISSERTATION
Zur Erlangung des akademischen Grades
eingereicht an der
Technischen Universität Graz
Betreuer
Univ. Prof. Dipl.-Chem. Dr.rer.nat. Ingo Klimant
Institut für Analytische Chemie und Lebensmittelchemie
Graz, 2015.

EIDESSTATTLICHE ERKLÄRUNG
Ich erkläre an Eides statt, dass ich die vorliegende Arbeit selbstständig verfasst, andere als die
angegebenen Quellen/Hilfsmittel nicht benutzt, und die den benutzten Quellen wörtlich und
inhaltlich entnommenen Stellen als solche kenntlich gemacht habe. Das in TUGRAZonline
hochgeladene Textdokument ist mit der vorliegenden Dissertation identisch.
___________________ ________________________
Datum Unterschrift

Danksagung
Ich möchte an erster Stelle Prof. Ingo Klimant danken, dass er mir eine wunderbare Möglichkeit
gegeben hat auf einem interessanten Thema zu arbeiten und für seine Ünterstutzung und Geduld
während dieser Arbeit.
Dr. Sergey Borisov möchte ich für sein Interesse an meiner Arbeit danken, der immer Zeit für
meine vielen Fragen zur Synthese und optischen Sensorik hatte und mir dabei gern geholfen hat
Lösungen für wissenschaftliche Probleme zu finden.
Ein besonderes Dankeschön geht an Dr. Ruslan Dmitriev, der mir die Grundlagen der Zell-
biologie und Fluoreszenzmikroskopie erklärte und seine Einführung in die wunderbare irische
Kultur.
Weiterhin ich möchte mich bei den Mitgliedern unserer Gruppe für eine schöne gemeinsame Zeit
und die alltägliche Unterstützung bedanken.
Den sehr gute Freunden aus dem CHEBANA-Netzwerk möchte ich für eine schöne Zeit auf
internationalen Meilensteinsitzungen und den wissenschaftlichen und nichtwissenschaftlichen
Diskussionen danken.
Der Europäischen Kommission danke ich für die finanzielle Unterstützung dieser Arbeit.
Schließlich möchte ich meiner Familie danken, dass sie immer an mich geglaubt haben und für
ihre vorbehaltlose Untersützung.
TABLE OF CONTENTS
CHAPTER 1
1.1 Motivation……………………………………………………………………………....…1
1.2 State of the Art – pH Sensors …………………………………………………………..…2
1.3 State of the Art – CO2 Sensors…………………………………………………………….4
1.4 Read-out Schemes……………………………………………………………………....…6
1.5 Near-infrared Fluorescent Dyes…………………………………………………..……….9
1.6 Aza-BODIPY dyes – synthesis and properties…………………………………….…….14
1.7 References……………………………………………………………………………..…22
CHAPTER 2
Highly Photostable Near-Infrared Fluorescent pH Indicators and Sensors based on BF2-
Chelated Tetraarylazadipyrromethene Dyes………………………………………………....27
2.1 Introduction……………………………………………………………………………...28
2.2 Experimental………………………………………………………………………..……29
2.3 Results and Discussion………………………………………………………………..…32
2.4 Conclusion……………………………………………………………………………….43
2.5 References………………………………………………………………………..…..….44
2.6 Supporting Information……………………………………………………………….....47
CHAPTER 3
NIR optical carbon dioxide sensors based on highly photostable dihydroxy-aza-BODIPY
Dyes………………………………………………………………………………………….78
3.1 Introduction………………………………………………………………………….......78
3.2 Experimental……………………………………………………………..…………........80
3.3 Results and Discussion…………………………………………………………….....….87
3.4 Conclusion…………………………………………………………………………….....97
3.5 References…………………………………………………………………………….....98
3.6 Supporting Information……………………………………………………………........101
CHAPTER 4
pH-sensitive aza-BODIPY probe for fluorescence lifetime imaging in MEF cells………..113
4.1 Introduction………………………………………………………………………....…113
4.2 Experimental…………………………………………………………………………...114
4.3 Results and Discussion……………………………………………………………...…116
4.4 Conclusion……………………………………………………………………………..122
4.5 References…………………………………………………………………….……….122
CHAPTER 5
CO2 sensor based on rigid aza-BODIPY probe………………………………………..…..124
5.1 Introduction………………………………………………………………………..…...124
5.2 Experimental………………………………………………………………………..…..124
5.3 Results and Discussion…………………………………………………………………127
5.4 Conclusion……………………………………………………………………..……….135
5.5 References………………………………………………………………………..…….136
5.6 Spectra……………………………………………………………………………..…...137
1
Chapter 1
1.1 Motivation
Optical pH and CO2 sensing has new possibilities in many applications where electrochemical
sensors fail. Optical sensors aren’t prone to electrical interferences, they are noninvasive and
enable remote measurements. They are also capable for continuous measurements and require
low energy consumption. Most optical pH sensors are utilizing colorimetric or fluorescent
indicator dyes. Although many pH indicators are currently available, only a few fulfill the
requirements for use in pH sensors.
Therefore, the focus of this work was to synthesize and characterize new fluorescent probes
suitable for preparation of pH and CO2 sensors for various ranges of pH and pCO2.
Several criteria dictated the choice of the indicator. BF2-chelated-azadipyrromethenes were
chosen due to their near-infrared emission, possibility of tuning the pKa, straightforward
synthesis and high photostability. For optimization of sensor properties different polymer
supports were used onto which the indicators were immobilized. Performance of the sensors was
also evaluated in different sensor formats – planar, nanoparticles formulation and microsensors.
Lifetime-based sensors (FLIM and DLR) are prepared due to particular advantages they have
over intensity-based sensors like negligible signal drift arising from leaching and bleaching, or
fluctuations arising from the light-source intensity and photodetector sensitivity.
Sensors are of interest in biotechnology, marine biology and clinical research.
2
1.2 State of the Art – pH Sensors
There has been an increased interest in the development and application of optical sensors in the
last three decades. They have found application in areas such as process analytical technology,
environmental monitoring, biotechnology and medical diagnostics. Optical chemical sensor is
based on the use of indicator dyes, which are entrapped in a polymer matrix. This material is
then deposited on a planar substrate1 or on the tip of an optical fiber.2 In the 1970s the first type
of a pH sensor became available as a test stripe based on a pH indicator covalently linked to the
cellulose matrix. In 1980 Peterson3 developed the first optical pH sensor. The sensor contained
phenol red as an indicator immobilized into polystyrene microbeads and was applied for
physiological pH measurement. In 19824 first fluorescence-based pH sensor was reported based
on covalently immobilized fluoresceinamin on cellulose.
Most frequently used pH indicators are fluorescein and its derivatives, seminaphthorhodafluor,
8-hydroxypyrene-1,3,6-trisulfonic acid sodium salt, and hydroxycoumarins5-7. The requirements
for an optimal pH indicator are: excitation/emission spectra in the visible/near infrared
wavelength range, high molar absorption coefficients and high fluorescence quantum yields,
large Stokes shifts, pKa value close to the measured pH, high photostability and no-cross-
sensitivity to ionic strength. However, currently available indicators don’t satisfy all of these
requirements; for example, fluoresceins have limited photostability and small Stokes’ shifts, the
pKa value of HPTS is strongly influenced by the ionic strength and most coumarins have low
excitation wavelength.
After designing the pH indicator the next step in sensor development is the immobilization of the
indicator in a polymer support. Indicator can be immobilized in a polymer matrix by different
methods: adsorption, entrapment or covalent binding. Adsorption is the least reliable, due to
possibility of dye leaching. Physical entrapment is straightforward and rapid way of
immobilization. This method can show stability problems due to probe leaching causing reduced
lifetime and sensor reproducibility. However, it is often used for the preparation of sensing
material. Problems can be avoided by introduction of lipophilic alkyl chains or in case of
negatively charged pH indicators by using quaternary ammonium salts. Covalent binding is the
most reliable method, as the effects of aggregation, migration and leaching are eliminated.
3
Indicators can be covalently immobilized either by co-polymerization of functionalized dye-
monomer and the corresponding co-monomer8 or by linking the dyes to the polymer using
suitable functional groups.9 However, optical10 and acid-base properties11,12 can change after
immobilization. Electrostatic immobilization13 is possible onto materials with ion-exchange
properties and with indicators that are charged in both the acid and base form. Hence, the sensors
show fast response and leaching is not observed. However, the shortcoming of this approach is
susceptibility to ionic strength. To minimize the effect of ionic strength on the pKa value of the
indicator Wolfbeis and Offenbacher14 demonstrated a system in which a dual sensor arrangement
can measure ionic strength and pH and simultaneously correct the pH measurement for
variations in ionic strength.
The properties of sensing material depend greatly on the properties of the polymer matrix used
for indicator immobilization. Many different materials are used for this purpose. These are
mostly cellulose derivatives and polyurethane 15,16 or pHEMA hydrogels17 which show good
mechanical properties, temperature stability and high water uptake. Less hydrophilic materials,
such as sol-gels and xerogels are also used, or hydrophobic materials such as poly(vinyl
chloride)18, where proton transport is achieved by use of proton carriers such as
tetraphenylborate and similar lipophilic anions.
4
1.3 State of the Art - CO2 Sensors
The monitoring of CO2 has found application in environmental, health, food and beverage
industries. Analysis of dissolved carbon dioxide has been performed with Severinghaus
electrode, which is a pH electrode in contact with water solution of sodium bicarbonate, behind a
membrane which is permeable to gases, but impermeable to ions. Change in the pH caused by
the dissolved CO2 is measured with the pH electrode. When carbon dioxide dissolves in water, it
is in equilibrium with carbonic acid:
CO2 (g) CO2 (aq) 1.1
CO2 (aq) + H2O H2CO3 1.2
H2CO3 H+ + HCO3
- 1.3
HCO3- H
+ + CO32- 1.4
The Severinghaus electrode is indirectly measuring the partial pressure of CO2 through the pH
change it is inducing. However, it has many drawbacks – expensive production, dimensional
limitations and susceptiblity to electrical and chemical interferences. Therefore, there has been a
consistent effort in the development of CO2 optical sensors in the last two decades.
Wet Sensors
Severinghaus-type sensor has also been used for development of optical sensors for carbon
dioxide with pH indicators instead of pH electrode for determination of pH changes. Sensors for
carbon dioxide used suspended aqueous buffer solution (containing a pH indicator of pKa 7.5-9),
in the form of aqueous droplets, in a hydrophobic polymer which is CO2-permeable and proton-
impermeable in order to avoid interferences by pH and prevent leaching of the indicator when
measurements are done in water. The sensitivity of the sensor dependes on the sensitivity of the
indicator to pH variations (e.g. on the pKa of the indicator).19 Therefore, sensor with optimal
sensitivity in certain range can be designed using indicators with suitable pKa value. This scheme
has certain drawbacks, like changes of osmolarity and ionic strength of the water-buffer system
(due to sensitivity of indicators to IS in terms of pKa values). Additionally, sensor performance
5
can be affected by dehydration or hydration and therefore sensors should be stored under defined
conditions.
Solid Sensors
In 1992 Mills et al.20 made major progress in development of solid optical carbon dioxide
sensors. They used a lipophilic base (instead of an aqueous buffer) which facilitated the
dissolution of the pH indicator in a hydrophobic polymer, such as ethyl cellulose. pH indicator is
forming an ion-pair with quaternary ammonium base, like tetraoctylammonium hydroxide
(TOA+OH˗), (17, 25-27) which acts as an internal buffer. The mechanism is presented by eq. 1.5.
{TOA+D˗ · x H2O} + CO2 → {TOA+HCO3˗ · (x-1) H2O · HD} 1.5
These sensors can be used for measurement of carbon dioxide concentrations in gas phase of
different humidity or in water solutions of different osmotic pressure. They perform well in dry
environment because the water molecules are tightly bound to the ion-pair.
The sensors can be poisoned with acidic gasses because of limited buffer capacity, which can be
improved with addition of quaternary hydroxide21. The excess base acts as a bicarbonate buffer
system and is present in the form of TOA+HCO3˗ ·XH2O. Another problem with solid-state
sensors is to find a suitable polymer matrix. The sensor matrix can be ethyl cellulose, poly (vinyl
alcohol), poly (vinyl chloride), etc. These polymers are proton permeable and therefore
additional gas-permeable and proton-impermeable protection layer made from poly
(tetrafluoroethylene), silicone or polystyrene is necessary. However, during formation of the
protection layer air bubbles can be trapped what causes prolonged response time and problems
with adhesion. This can be avoided by emulsification of the sensing material into a proton-
impermeable, hydrophobic polymer, such as silicone matrix. This polymer has excellent
permeability for gases22.
6
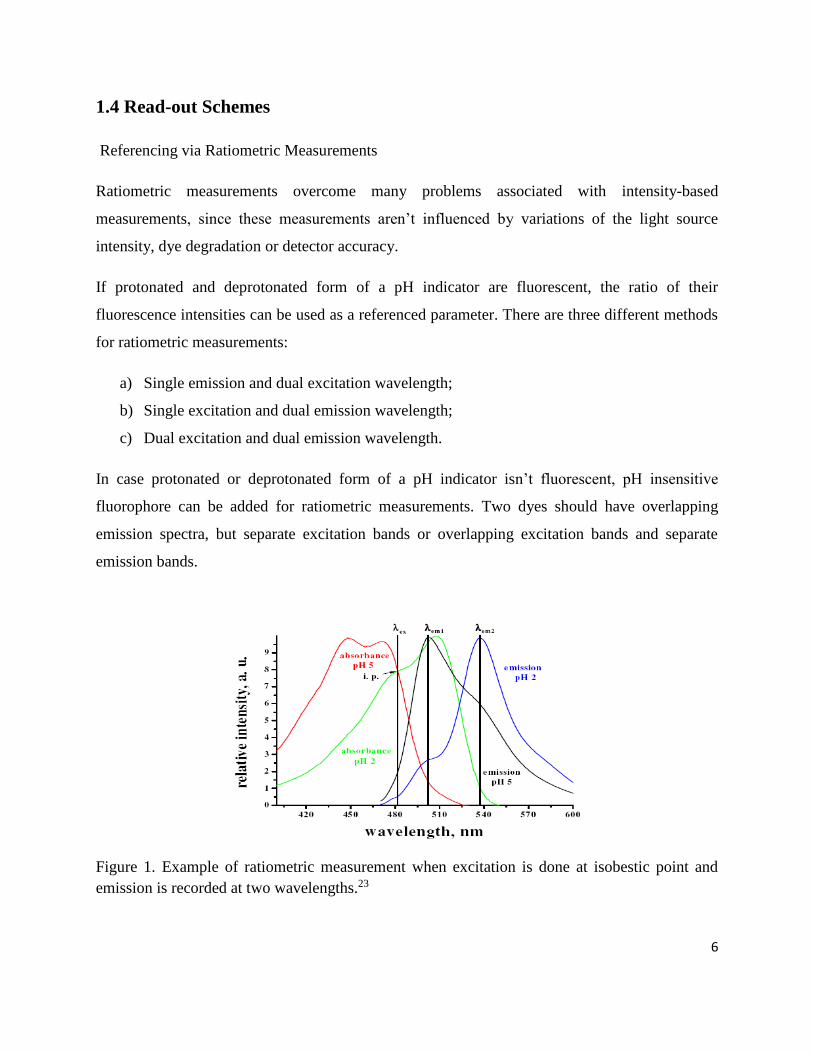
1.4 Read-out Schemes
Referencing via Ratiometric Measurements
Ratiometric measurements overcome many problems associated with intensity-based
measurements, since these measurements aren’t influenced by variations of the light source
intensity, dye degradation or detector accuracy.
If protonated and deprotonated form of a pH indicator are fluorescent, the ratio of their
fluorescence intensities can be used as a referenced parameter. There are three different methods
for ratiometric measurements:
a) Single emission and dual excitation wavelength;
b) Single excitation and dual emission wavelength;
c) Dual excitation and dual emission wavelength.
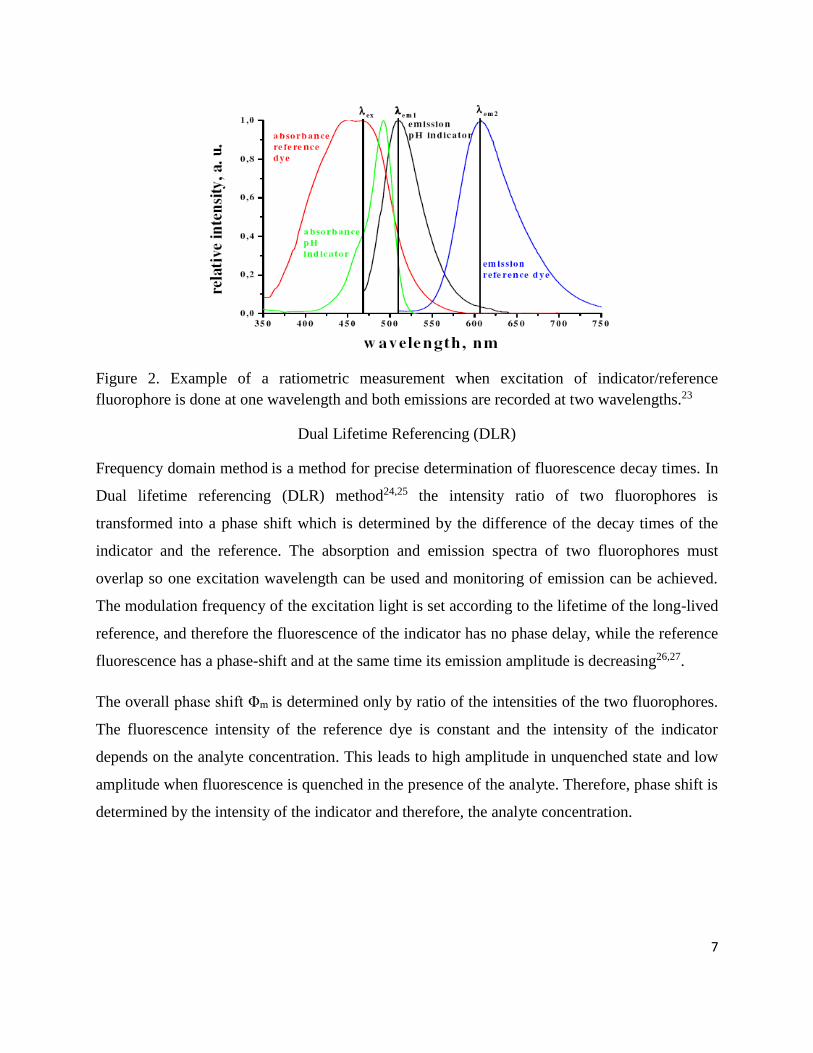
In case protonated or deprotonated form of a pH indicator isn’t fluorescent, pH insensitive
fluorophore can be added for ratiometric measurements. Two dyes should have overlapping
emission spectra, but separate excitation bands or overlapping excitation bands and separate
emission bands.
Figure 1. Example of ratiometric measurement when excitation is done at isobestic point and
emission is recorded at two wavelengths.23
7
Figure 2. Example of a ratiometric measurement when excitation of indicator/reference
fluorophore is done at one wavelength and both emissions are recorded at two wavelengths.23
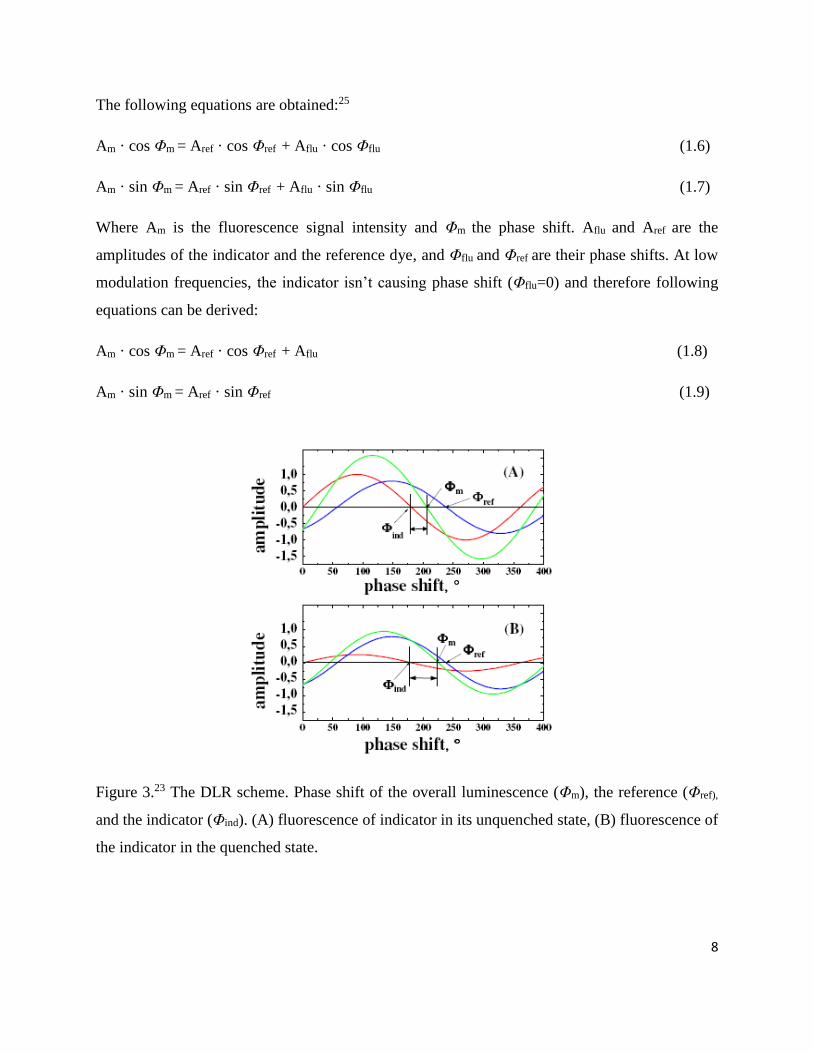
Dual Lifetime Referencing (DLR)
Frequency domain method is a method for precise determination of fluorescence decay times. In
Dual lifetime referencing (DLR) method24,25 the intensity ratio of two fluorophores is
transformed into a phase shift which is determined by the difference of the decay times of the
indicator and the reference. The absorption and emission spectra of two fluorophores must
overlap so one excitation wavelength can be used and monitoring of emission can be achieved.
The modulation frequency of the excitation light is set according to the lifetime of the long-lived
reference, and therefore the fluorescence of the indicator has no phase delay, while the reference
fluorescence has a phase-shift and at the same time its emission amplitude is decreasing26,27.
The overall phase shift Φm is determined only by ratio of the intensities of the two fluorophores.
The fluorescence intensity of the reference dye is constant and the intensity of the indicator
depends on the analyte concentration. This leads to high amplitude in unquenched state and low
amplitude when fluorescence is quenched in the presence of the analyte. Therefore, phase shift is
determined by the intensity of the indicator and therefore, the analyte concentration.
8
The following equations are obtained:25
Am · cos Φm = Aref · cos Φref + Aflu · cos Φflu (1.6)
Am · sin Φm = Aref · sin Φref + Aflu · sin Φflu (1.7)
Where Am is the fluorescence signal intensity and Φm the phase shift. Aflu and Aref are the
amplitudes of the indicator and the reference dye, and Φflu and Φref are their phase shifts. At low
modulation frequencies, the indicator isn’t causing phase shift (Φflu=0) and therefore following
equations can be derived:
Am · cos Φm = Aref · cos Φref + Aflu (1.8)
Am · sin Φm = Aref · sin Φref (1.9)
Figure 3.23 The DLR scheme. Phase shift of the overall luminescence (Φm), the reference (Φref),
and the indicator (Φind). (A) fluorescence of indicator in its unquenched state, (B) fluorescence of
the indicator in the quenched state.
9
By dividing eq.1.8 by 1.9 the following relation is obtained:
(Am · cos Φm) / (Am · sin Φm) = cot Φm = cot Φref + 1 / (sin Φref ) · Aflu / Aref 1.10
Therefore, cot Φm represents the referenced intensity of the indicator.
1.4 Near-infrared Fluorescent Dyes
Near-infrared emission fluorophores found application in optical engineering, analytical
chemistry, biotechnology and medicine as new tools for noninvasive sensing. The advantages of
near-infrared region are minimal background signal from autofluorescence of biomolecules, low-
light scattering, deep light penetration and the use of inexpensive excitation light sources. In
order to be used for real-world applications NIR dyes must fulfill a set of requirements regarding
their optical, chemical and biological properties. They should possess high brightness, large
Stokes shift, high chemo- and photostability and have low photo(toxicity).
Therefore, development of fluorophores for a particular application is not an easy task, as
integration of all required properties in one molecular platform is quite challenging. In order to
design fluorophores it is important to have an insight into structure-property relationship so their
photophysical properties could be optimized. On the other hand, fluorophores often have
limitations in respect to their optical properties, such as low quantum yield and photostability.
For these reasons, intensive research effort has been made to find fluorophores with improved
optical properties and stability.
Thanks to the extensive research that was done on NIR dyes, many have been used as platforms
for the development of fluorescent probes for various analytes based on photo-induced electron
transfer (PET), intramolecular charge transfer (ICT) and Förster resonance energy transfer
(FRET) mechanism.
In PET-based fluorescent probes, fluorophore and receptor are connected with an aliphatic
spacer, which electronically disconnects the π-electron system of the fluorophore and the
receptor.28 The fluorophore can act as an electron donor or acceptor. In the reductive PET, the
fluorophore is reduced while the receptor is oxidized. However, in the oxidative PET, the
fluorophore acts as an electron donor, which is an oxidant in the process.
10
When the fluorophore possesses an electron-donating group, intramolecular charge transfer
(ICT) can take place from a donor to an acceptor (electron-withdrawing group) upon photo-
excitation. Due to electron transfer in excited state, the increase in dipole moment is
considerable, which is inducing the red shift in the fluorescence spectra when increasing solvent
polarity.29 The main difference between PET and ICT probes is in the different fluorescence
response towards analyte detection. PET probes show fluorescence enhancement or quenching
without spectral shifts, what rules out possibility of ratiometric measurements, while ICT probes
show fluorescence band shifts after analyte binding, enabling ratiometric measurements.
FRET is the interaction between two chromophores, of which one is necessary fluorescent. The
energy is transferred from a donor fluorophore which emits at a shorter wavelength to an
acceptor chromophore which emits it at a longer wavelength. In order for FRET to take place,
emission spectra of the donor and the absorption spectra of the acceptor should overlap and the
chromophores should be at a molecular distance in the range of 10-80 Å.30
The need for noninvasive measurement technologies for pH monitoring has driven the
development of pH probes based on NIR fluorescent dyes. pH probes based on NIR dyes that
have been reported are BODIPY and azaBODIPY dyes,31-33 cyanine-based probes,34 diketo-
pyrrolo-pyrrole pigments,35 phenoxiazines and an aminoperylene compound.36
Cyanine-based pH indicators have attracted considerable attention due to their unique NIR
emission. There are two types of cyanine-based pH indicators:
First type are cyanine dyes with a non-N-alkylated indolium moiety37. These type of pH sensitive
cyanine dyes is using the advantage of the pH-dependent optical properties of non-N-alkylated
cyanines. The dye is pH-sensitive when one or both of the indole nitrogen atoms are not
alkylated. Probes aren’t fluorescent when nitrogen atom is deprotonated, but they are highly
fluorescent upon protonation. Synthetic modifications can tune the pKa value of these probes,
therefore probes for various pH ranges have been developed.
The second type of pH - sensitive cyanine dyes is based on PET sensing mechanism.38 These
contain a fluorophore and a nitrogen-containing electron-donor. Supression or enhancement of
PET process is achieved by protonation/deprotonation of the electron donor. The pH changes
11
don’t have the effect on the shift of the fluorescence emission maxima, but the absorption
maximum is red-shifted with the increase of pH.
BODIPY dyes are attractive due to many excellent features like intense absorption, high
fluorescence quantum yield, narrow absorption and emission bands, insensitivity to polarity,
good chemo- and photostability and ease of tuning of their photophysical properties by structural
modifications. Due to their potential for fluorescence sensing applications, many strategies have
been developed to push their absorption and emission to the NIR region (650-900 nm). Many
derivatives such as styryl-substituted BODIPYs, aromatic units-fused BODIPYs,
conformationally constrained BODIPYs and aza-BODIPYs have been synthesized.39
BODIPY pH probes based on the PET mechanism mostly have the proton receptor on the meso-
position to disconnect with the fluorophore since the substituent at this position is usually
orthogonal to the BODIPY core. Daub and coworkers constructed a styryl-substituted BODIPY
probe for pH sensing with a dimethyl-aminophenyl - receptor on the meso-position.40 The
quenching of the fluorescence occurs in polar solvents owing to the PET process. Upon
protonation, 2000- fold fluorescence enhancement was observed due to the supression of the
PET process. With the similar approach Overkleeft and colleagues created a series of fluorescent
pH probes with pKa values ranging from 2.08 to 5.81.41 The emission was shifted to the longer
wavelength by condensation with various aldehydes at the 3,5-positions and the pKa value was
tuned by modifying the dialkylamine moiety at the meso-position.
O’Shea and colleagues developed two aza-BODIPY fluorescent pH probes based on a PET
mechanism.42 The probes contained incorporated diethylamine and morpholine receptors which
enabled pH sensing. The diethylamine receptor analogue showed a significant enhancement of
fluorescence intensity in acidic conditions, but for the morpholine receptor analogue only a
moderate increase was observed. Apparent pKa values of 6.9 and 4.8 were calculated,
respectively. Application of diethylamine analogue for in vitro imaging was demonstrated.
Chen and coworkers investigated similar probes for intracellular pH sensing.43 They synthesized
and characterized the pH-sensitive NIR aza-BODIPY dye, which was highly fluorescent only
under acidic conditions, due to the suppression of PET process. However, after incorporation of
12
the probe with micelles, liposomes and proteins, it was also fluorescent at neutral and basic pH,
indicating that the pH-sensing properties were affected by cellular environment. Live-cell
imaging also showed that the fluorescence was activated by intracellular components rather than
pH. However, probes showed to be a good choice for cell-imaging although not pH indicators.
Instead of alkylated amines, hydroxyphenol can also serve as a pH-sensitive unit. O’Shea and
colleagues44 reported azide conjugatable pH sensitive fluorescence imaging probe. Probes were
conjugated by an alkyne-azide cycloaddition containing amino, carboxy, and carbohydrate
substituents. UV-VIS and fluorescence spectra for all three derivatives were 687/716 nm in
methanol. pH sensing properties of the galactose conjugated derivative was investigated and pKa
of 6.9 was calculated. In vitro pH response was demonstrated by staining MDA-MB-231 cells
with galactose conjugated derivative. Imaging with confocal laser scanning microscopy showed
intense emission localized at the cytosol. After treating the cells with aqueous buffers almost
complete quenching was observed at pH 8.0 and intense emission was restored at pH 6.6. The
increase in fluorescence intensity from off to on-state was 6-fold.
If proton receptors are conjugated to the BODIPY core, the ICT mechanism is operative.
Akkaya and colleagues constructed pH probes with proton receptors at 3,5-positions.31 The probe
with two 4-(dimethylamino)-phenylethynyl groups as proton receptors featured an absorption
maximum at 700 nm and a weak fluorescence at around 750 nm in chloroform. Protonation
caused a blue shift in absorption and emission and an increase in quantum yield due to the
supression of the ICT process. However, probe with p-pyridinestyryl groups as the pH receptors
exhibited a red shift in absorption and emission upon protonation, as the pyridyl substituents
operate as the ICT acceptor instead of donor.
McDonnell and O’Shea also developed ICT-operative aza-BODIPY probe.45 Aza-BODIPY dye
contained two amine substituents as a pH-responsive unit. pH-dependent absorption and
fluorescence response as well as visible color changes were observed for the non-, mono- and di-
protonated form of the indicator. The triple emission sensor is advantageous for ratiometric
sensing applications.
13
Liu et al. reported on NIR pH sensitive benzo[a]phenoxazines.46 Derivatives with an electron-
withdrawing aromatic group attached to nitrogen of the imino group exhibited pH-dependent
absorption and emission properties under near-neutral and subacid conditions. Three water-
soluble probes with different pyridinium structures are designed and synthesized. Their emission
maxima are located at 688, 694 and 697 nm with the full emission ranging from 625 to 850 nm
and the pKa values were 2.7, 5.8 and 7.1, respectively. A composite probe containing the three
benzo[a]phenoxazines showed a linear pH-emission relationship in the range of pH 1.9-8.0.
Schutting et al.35 developed pH sensitive indicators for CO2 sensors based on diketo-pyrrolo-
pyrrole (DPP) pigments Irgazin Ruby and Irgazin Scarlet. After modification with bis(2-
ethylhexyl) sulfonamide groups, the pigments were soluble in organic solvents and polymers and
showed pH sensitivity. Optical carbon dioxide sensors were prepared by dissolving the indicators
with a quaternary ammonium base in ethyl cellulose. Bathochromic shift of the absorption and
emission spectra is observed and therefore the indicator can be used as colorimetric and
fluorescent ratiometric probe.
Aigner et al.36 developed the first NIR emissive pH indicators based on perylene bisimides.
Cyclic secondary amine is introduced into the perylene core by substitution of chlorine what
caused a bathochromic shift of 100-140 nm. The indicator was pH sensitive due to photoinduced
electron transfer from non-protonated amine to the perylene chromophore. pH sensor with
covalently linked indicator was prepared by co-polymerisation of the dye modified with
methacrylate groups and acryloylmorpholine monomer and resulting in a cross-linked polymer
covalently attached to a glass substrate.
14
1.5 Azabodipy dyes - Synthesis and Properties
During the past decade, various studies have been done on aza-BODIPYs owing to their efficient
fluorescence in the far-red and near-IR regions of the spectrum. The nitrogen lone pair at the 8-
position appears to contribute to the orbital levels of the actual cyanine framework, reducing the
HOMO-LUMO energy gap relative to bodipy dyes bearing similar substituents. Electrochemical
measurements and molecular-orbital calculations could confirm this effect, which is responsible
for the red-shifted absorption and emission maxima. Fully conjugated aza-BODIPY core is
suitable for attachment of different substituents and therefore tuning of the fluorescence
properties. Azadipyrromethenes were first discovered by Rogers in the 1940s,47 but the first
borondifluoride azadipyrromethene was then synthesized by Boyer et al.48 in 1993. The
necessary research to obtain symmetric and asymmetric azabodipy dyes was conducted primarily
by the groups of O’Shea and Carreira, motivated by the potential applications as biological
labels, as sensitizers for photodynamic therapy49 and as luminescent proton sensors.50
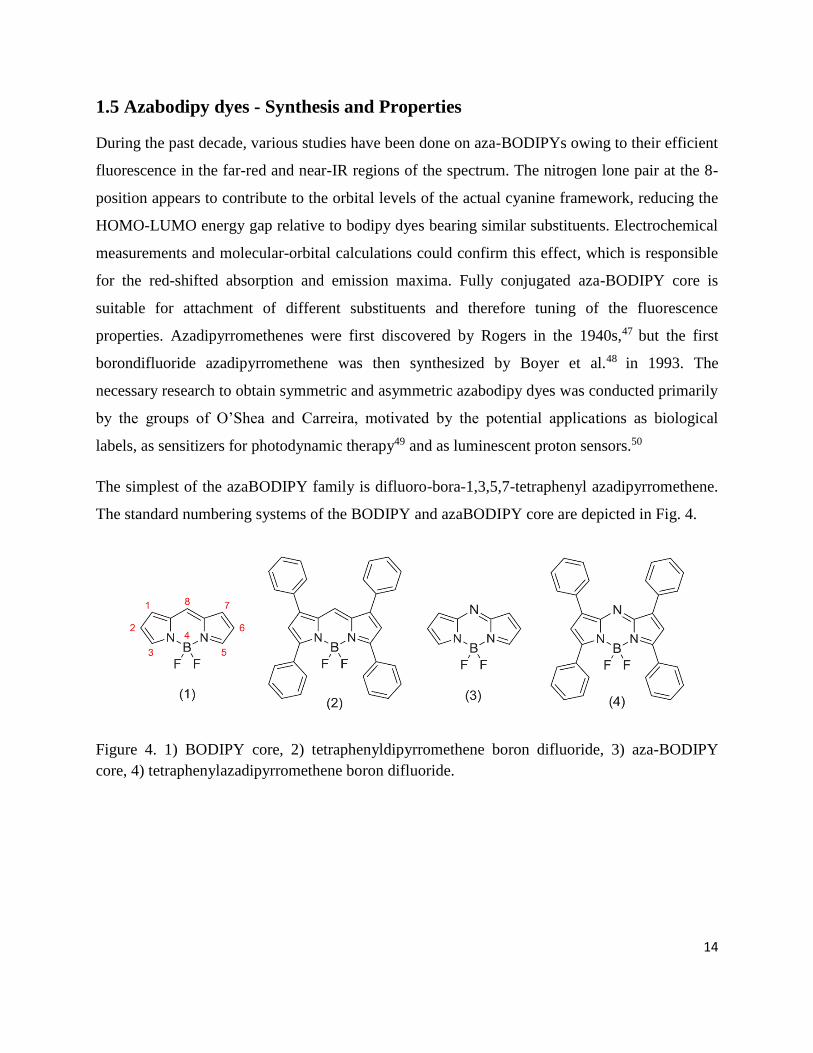
The simplest of the azaBODIPY family is difluoro-bora-1,3,5,7-tetraphenyl azadipyrromethene.
The standard numbering systems of the BODIPY and azaBODIPY core are depicted in Fig. 4.
Figure 4. 1) BODIPY core, 2) tetraphenyldipyrromethene boron difluoride, 3) aza-BODIPY
core, 4) tetraphenylazadipyrromethene boron difluoride.
15
Synthesis of Aza-BODIPYs
Synthesis of azadipyrromethenes
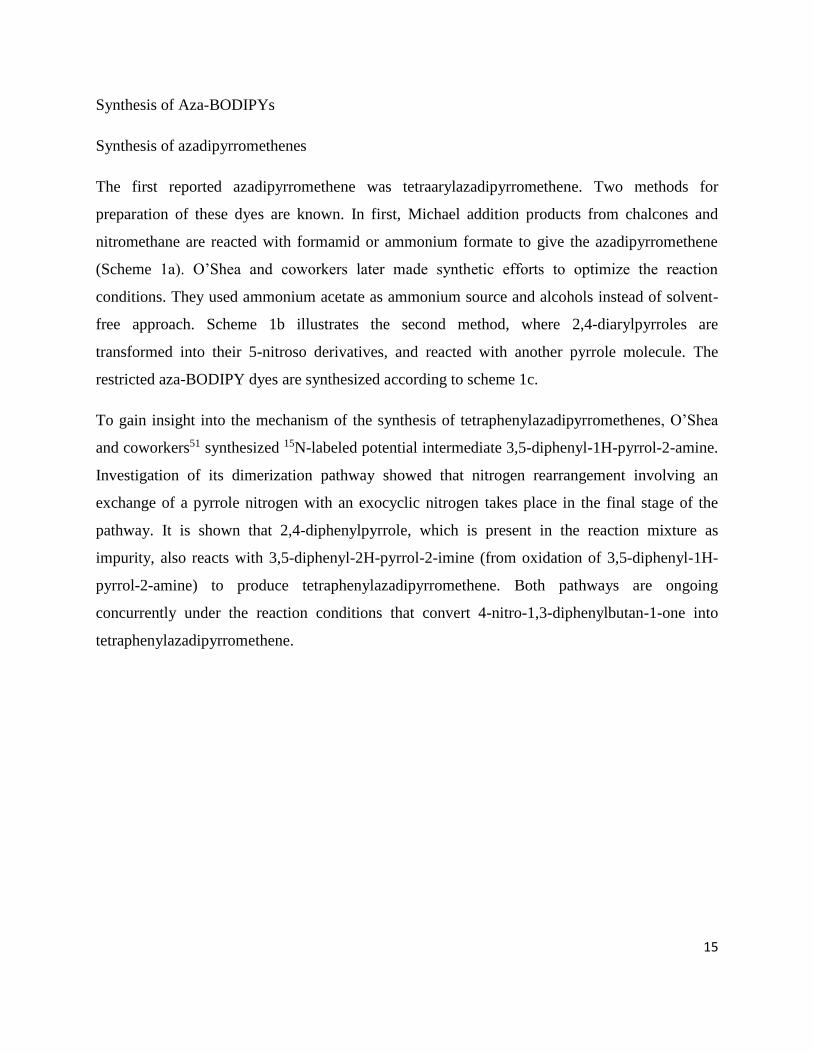
The first reported azadipyrromethene was tetraarylazadipyrromethene. Two methods for
preparation of these dyes are known. In first, Michael addition products from chalcones and
nitromethane are reacted with formamid or ammonium formate to give the azadipyrromethene
(Scheme 1a). O’Shea and coworkers later made synthetic efforts to optimize the reaction
conditions. They used ammonium acetate as ammonium source and alcohols instead of solvent-
free approach. Scheme 1b illustrates the second method, where 2,4-diarylpyrroles are
transformed into their 5-nitroso derivatives, and reacted with another pyrrole molecule. The
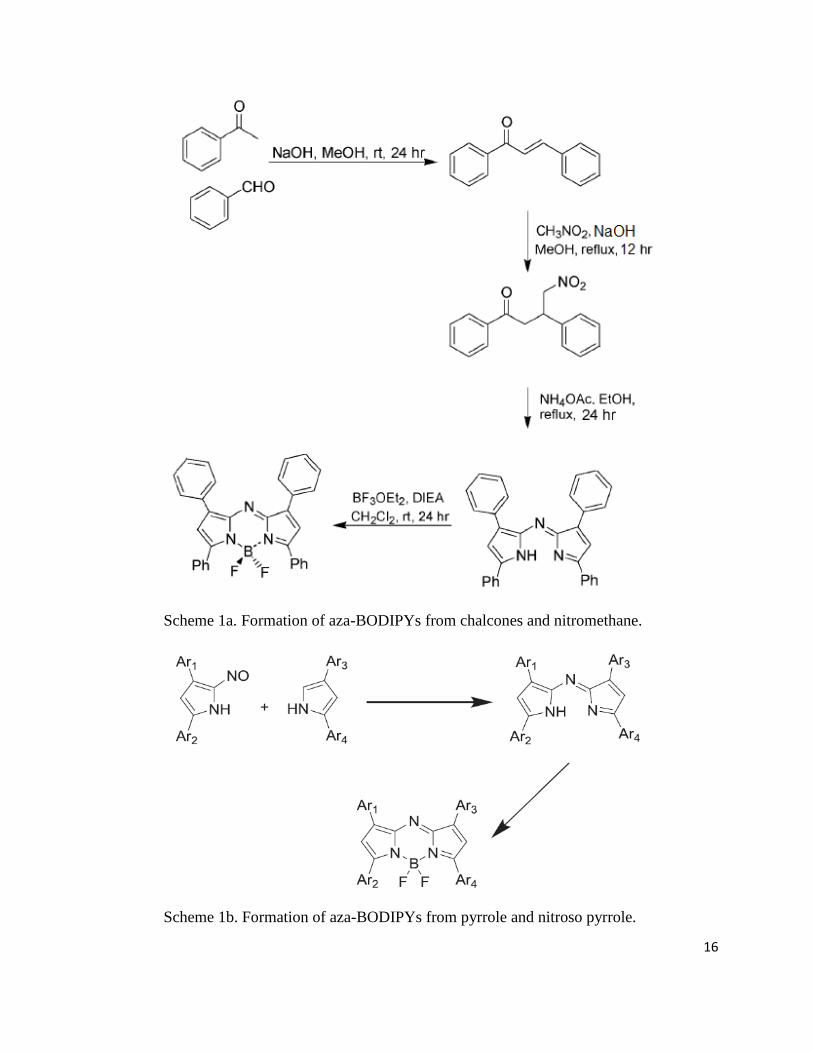
restricted aza-BODIPY dyes are synthesized according to scheme 1c.
To gain insight into the mechanism of the synthesis of tetraphenylazadipyrromethenes, O’Shea
and coworkers51 synthesized 15N-labeled potential intermediate 3,5-diphenyl-1H-pyrrol-2-amine.
Investigation of its dimerization pathway showed that nitrogen rearrangement involving an
exchange of a pyrrole nitrogen with an exocyclic nitrogen takes place in the final stage of the
pathway. It is shown that 2,4-diphenylpyrrole, which is present in the reaction mixture as
impurity, also reacts with 3,5-diphenyl-2H-pyrrol-2-imine (from oxidation of 3,5-diphenyl-1H-
pyrrol-2-amine) to produce tetraphenylazadipyrromethene. Both pathways are ongoing
concurrently under the reaction conditions that convert 4-nitro-1,3-diphenylbutan-1-one into
tetraphenylazadipyrromethene.
16
Scheme 1a. Formation of aza-BODIPYs from chalcones and nitromethane.
Scheme 1b. Formation of aza-BODIPYs from pyrrole and nitroso pyrrole.
17
Scheme 1c. Formation of conformationally restricted aza-BODIPYs.
Absorption and Emission Properties of Aza-BODIPYs
As described in the research of O’Shea and colleagues52 the absorption properties of aza-
BODIPYs are strongly influenced by the substituents of the aryl groups. Introduction of the
electron-donating groups on 5-aryl-substituents causes a red shift in the absorption maxima and
increase in the molar absorption coefficients (5 vs 1). Electron-donating groups at the 3-aryl
position have less effect, but still cause a bathochromic shift (2 vs 3).
The absorption spectral properties of the aza-BODIPY dyes are relatively independent of solvent
polarity; only small blue-shifts are observed (6-9 nm) when changing solvents from toluene to
ethanol. The molar absorption coefficients range from 75000 to 85000 M˗1cm-1 and they also
show large quantum yields.53 Intense absorbance enables efficient production of singlet-oxygen
and therefore these molecules found application in photodynamic therapy.49
Emission spectra of the aza-BODIPYs are also independent of the solvent polarity. Dyes 1 and 2
to 4 show high fluorescence quantum yields. In the case of 4, bromine atoms are introduced on
the 1- and 7-aryl groups, but no significant change in the quantum yield is detected.52 However,
if the bromine atom is attached to the aza-BODIPY core (compounds 6 to 8) quantum yield is
substantially decreased, demonstrating the heavy-atom effect. Most of the literature published on
aza-BODIPY dyes is focused on their application in photodynamic therapy, but chemosensors
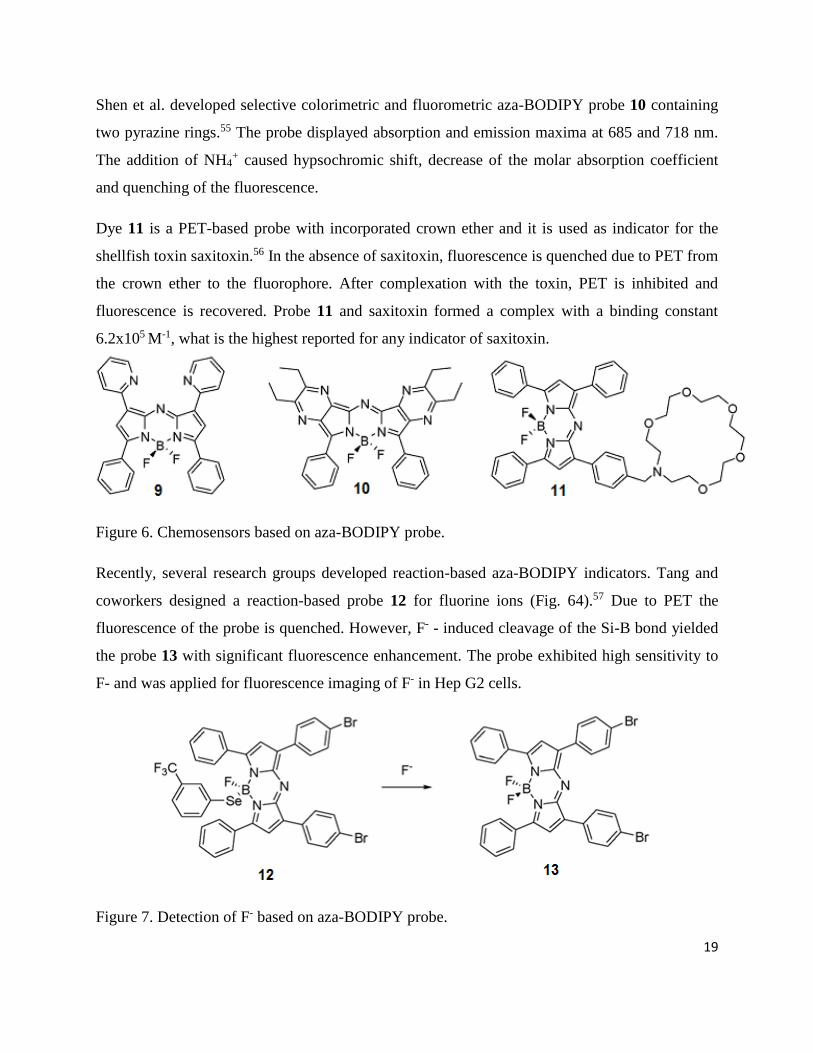
based on these dyes have also been reported. Dye 9 has high selectivity for mercuric ion that is
chelated between two 2-pyridyl groups at the 1 and 7 positions.54 Upon complexation with Hg2+,
bathochromic shift and a 90-fold change in the emission are observed.
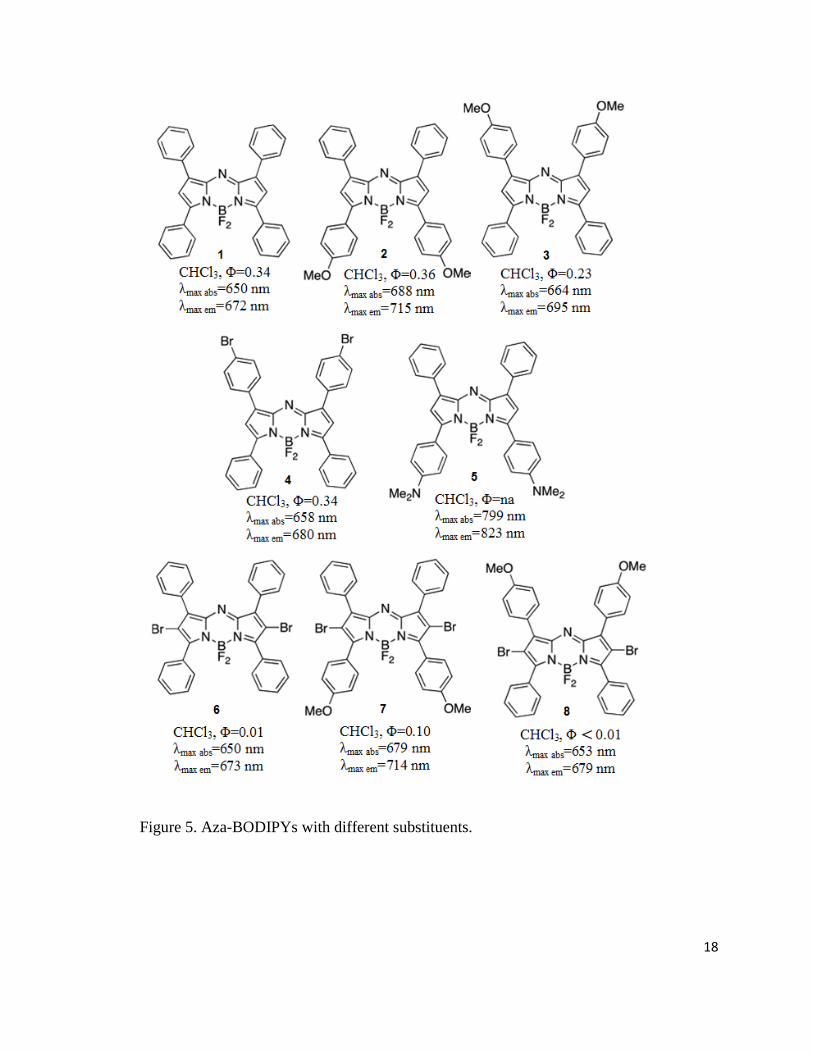
18
Figure 5. Aza-BODIPYs with different substituents.
19
Shen et al. developed selective colorimetric and fluorometric aza-BODIPY probe 10 containing
two pyrazine rings.55 The probe displayed absorption and emission maxima at 685 and 718 nm.
The addition of NH4+ caused hypsochromic shift, decrease of the molar absorption coefficient
and quenching of the fluorescence.
Dye 11 is a PET-based probe with incorporated crown ether and it is used as indicator for the
shellfish toxin saxitoxin.56 In the absence of saxitoxin, fluorescence is quenched due to PET from
the crown ether to the fluorophore. After complexation with the toxin, PET is inhibited and
fluorescence is recovered. Probe 11 and saxitoxin formed a complex with a binding constant
6.2x10⁵ M-1, what is the highest reported for any indicator of saxitoxin.
Figure 6. Chemosensors based on aza-BODIPY probe.
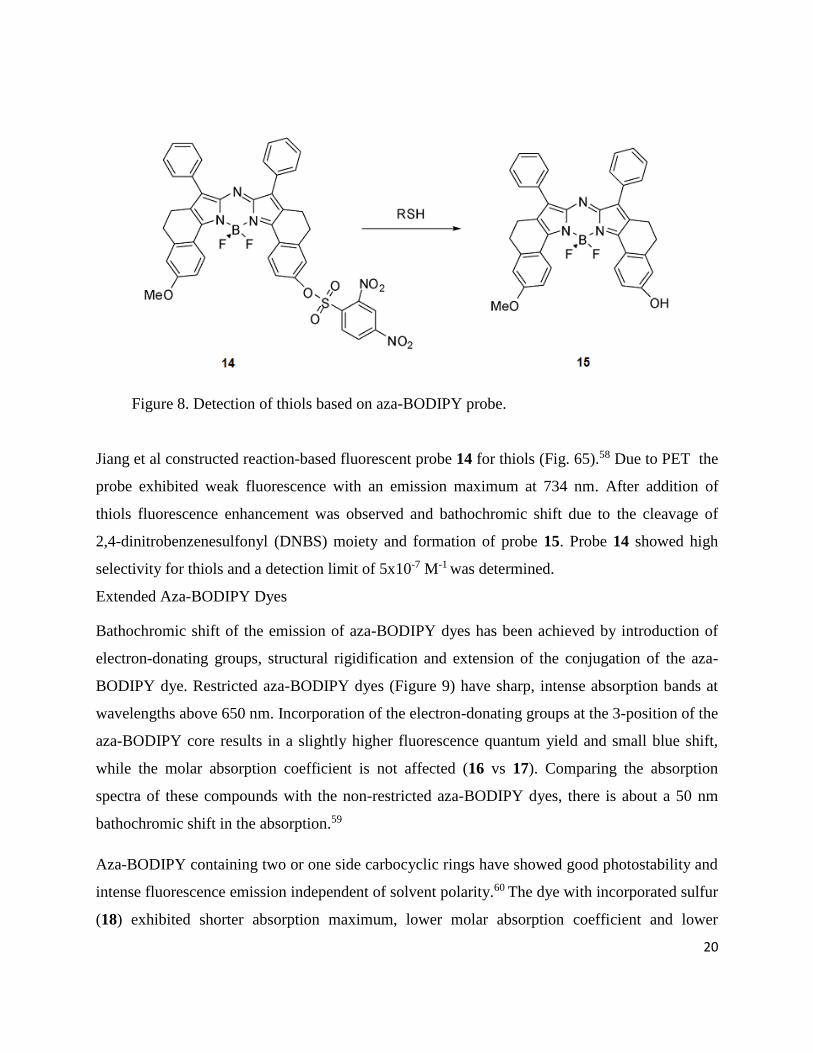
Recently, several research groups developed reaction-based aza-BODIPY indicators. Tang and
coworkers designed a reaction-based probe 12 for fluorine ions (Fig. 64).57 Due to PET the
fluorescence of the probe is quenched. However, F- - induced cleavage of the Si-B bond yielded
the probe 13 with significant fluorescence enhancement. The probe exhibited high sensitivity to
F- and was applied for fluorescence imaging of F- in Hep G2 cells.
Figure 7. Detection of F- based on aza-BODIPY probe.
20
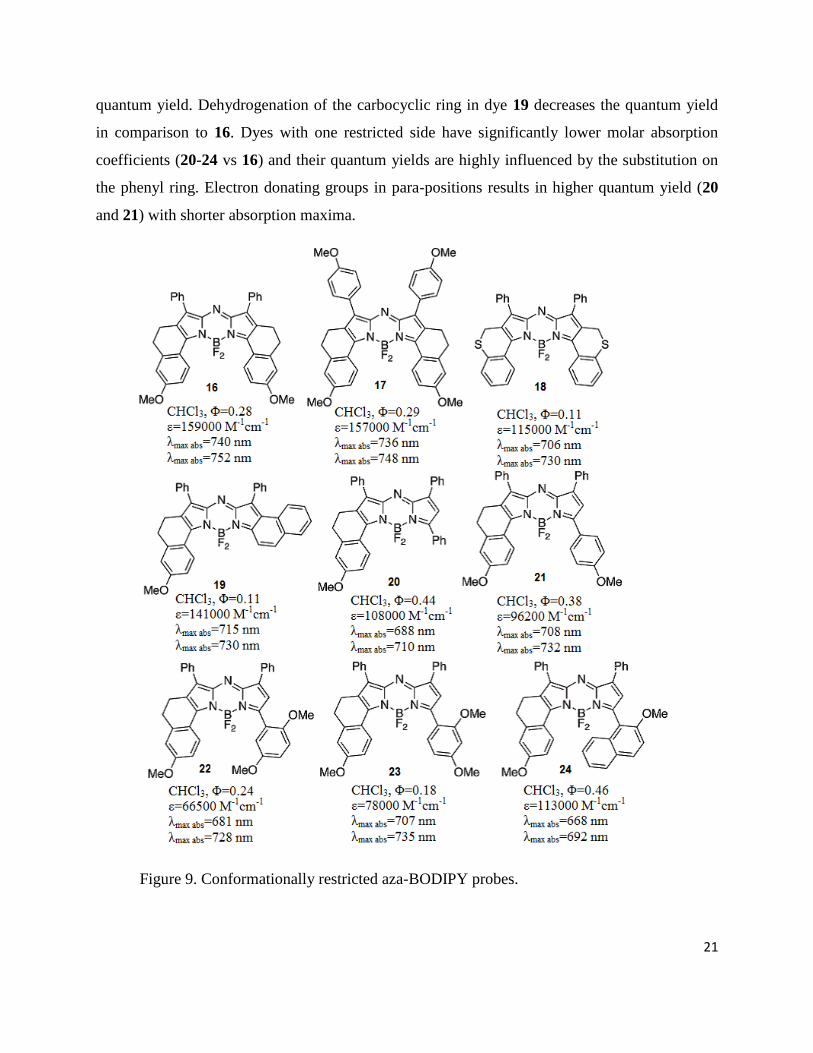
Figure 8. Detection of thiols based on aza-BODIPY probe.
Jiang et al constructed reaction-based fluorescent probe 14 for thiols (Fig. 65).58 Due to PET the
probe exhibited weak fluorescence with an emission maximum at 734 nm. After addition of
thiols fluorescence enhancement was observed and bathochromic shift due to the cleavage of
2,4-dinitrobenzenesulfonyl (DNBS) moiety and formation of probe 15. Probe 14 showed high
selectivity for thiols and a detection limit of 5x10⁻⁷ M-1 was determined.
Extended Aza-BODIPY Dyes
Bathochromic shift of the emission of aza-BODIPY dyes has been achieved by introduction of
electron-donating groups, structural rigidification and extension of the conjugation of the aza-
BODIPY dye. Restricted aza-BODIPY dyes (Figure 9) have sharp, intense absorption bands at
wavelengths above 650 nm. Incorporation of the electron-donating groups at the 3-position of the
aza-BODIPY core results in a slightly higher fluorescence quantum yield and small blue shift,
while the molar absorption coefficient is not affected (16 vs 17). Comparing the absorption
spectra of these compounds with the non-restricted aza-BODIPY dyes, there is about a 50 nm
bathochromic shift in the absorption.59
Aza-BODIPY containing two or one side carbocyclic rings have showed good photostability and
intense fluorescence emission independent of solvent polarity.60 The dye with incorporated sulfur
(18) exhibited shorter absorption maximum, lower molar absorption coefficient and lower
21
quantum yield. Dehydrogenation of the carbocyclic ring in dye 19 decreases the quantum yield
in comparison to 16. Dyes with one restricted side have significantly lower molar absorption
coefficients (20-24 vs 16) and their quantum yields are highly influenced by the substitution on
the phenyl ring. Electron donating groups in para-positions results in higher quantum yield (20
and 21) with shorter absorption maxima.
Figure 9. Conformationally restricted aza-BODIPY probes.
22
Electron donating groups in ortho-positions (22 and 23) cause shorter absorption maximum and
lower molar absorption coefficient. In the case of 24 absorption and high quantum yields are
obtained where 2-methoxy-1-naphthyl is substituent.
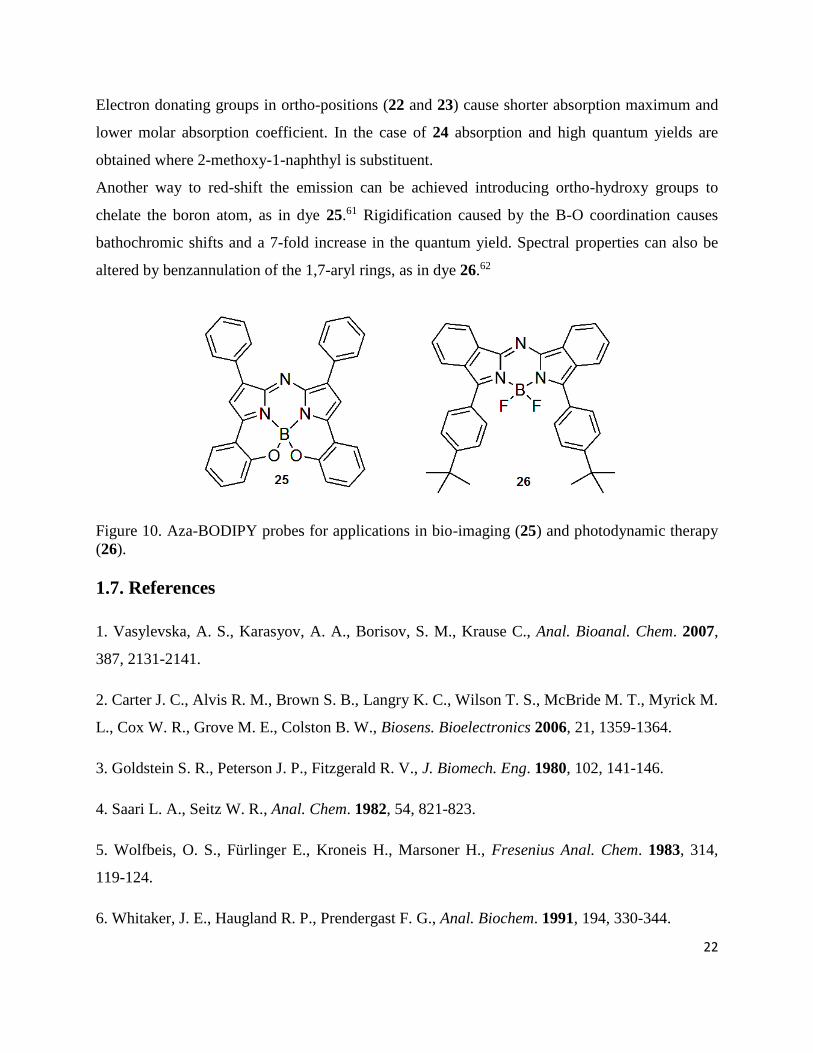
Another way to red-shift the emission can be achieved introducing ortho-hydroxy groups to
chelate the boron atom, as in dye 25.61 Rigidification caused by the B-O coordination causes
bathochromic shifts and a 7-fold increase in the quantum yield. Spectral properties can also be
altered by benzannulation of the 1,7-aryl rings, as in dye 26.62
Figure 10. Aza-BODIPY probes for applications in bio-imaging (25) and photodynamic therapy
(26).
1.7. References
1. Vasylevska, A. S., Karasyov, A. A., Borisov, S. M., Krause C., Anal. Bioanal. Chem. 2007,
387, 2131-2141.
2. Carter J. C., Alvis R. M., Brown S. B., Langry K. C., Wilson T. S., McBride M. T., Myrick M.
L., Cox W. R., Grove M. E., Colston B. W., Biosens. Bioelectronics 2006, 21, 1359-1364.
3. Goldstein S. R., Peterson J. P., Fitzgerald R. V., J. Biomech. Eng. 1980, 102, 141-146.
4. Saari L. A., Seitz W. R., Anal. Chem. 1982, 54, 821-823.
5. Wolfbeis, O. S., Fürlinger E., Kroneis H., Marsoner H., Fresenius Anal. Chem. 1983, 314,
119-124.
6. Whitaker, J. E., Haugland R. P., Prendergast F. G., Anal. Biochem. 1991, 194, 330-344.
23
7. Offenbacher H., Wolfbeis O. S., Fürlinger E., Sens. Actuators B 1986, 9, 73-84.
8. Bojinov, V., Grabchev, I., Dyes and Pigments 2003, 59, 277-283.
9. Dawson, D. J., Otteson, K. M., Wang, P. C., Wingard, R. E., Jr. Macromolecules 1978, 11,
320-324.
10. W. A. Wyatt, G. E. Poirier, F. V. Bright and G. M. Hieftje, Anal. Chem. 1987, 59, 572-576.
11. Z. Zhujun and W.R. Seitz, Anal. Chim. Acta 1984, 160, 47-55.
12. R. Narayanaswamy and F. Sevilla, Anal. Chim. Acta 1986, 189, 3656-3669.
13. Leiner, M. J. P., Hartmann, P., Sensors and Actuators B 1993, 11, 281-289.
14. Wolfbeis O. S., Offenbacher H., Sens. Actuators 1986, 9, 85-91.
15. Werner T., Huber C., Heinl S., Kollmannsberger M., Daub J., Wolfbeis O. S., Fresenius’ J.
Ana. Chem. 1997, 359, 150-154.
16. Draxber S., Lipittsch M. E., Proc. SPIE 1995, 2388, 363-368.
17. Parker J. W., Laksin O., Yu C., Lau M. L., Klima S., Fisher R., Scott I., Atwater B. W., Anal.
Chem. 1993, 65, 2329-2334.
18. Papkovsky D. B., Ponomarev G. V., Wolfbeis O. S., J. Photochem. Photobiol. A 1997, 104,
151-158.
19. Wolfbeis, O. S., E. Fürlinger, E., Kroneis, H., Marsoner, H., Fresenius J. Anal. Chem. 1983,
314, 119-124.
20. Mills, A., Chang, Q., McMurray, N., Anal. Chem. 1992, 64, 1383-1389.
21. Mills, A. Lepre, L. Wild, Sensors Actuat. Part B 1997, B39, 419-425.
22. Wolfbeis, O. S., Weis, L., Leiner, M. J. P., Ziegler, W. E., Anal. Chem. 1988, 60, 2028-2030.
24
23. Vasylevska, A. New pH sensitive sensor materials. Luminescent fiber-optic dual sensors for
non-invasive and simultaneous measurement of pH and pO2 (dissolved oxygen) in biological
systems. PhD thesis, University of Regensburg, Regensburg, 2007, p 9.
24. Klimant, I., Ger. Pat. Appl. 1997, DE 198 29 657.
25. Klimant, I., Huber, C., Liebsch, G., Neurauter, G., Stanglmayer, A., Wolfbeis, O. S., Dual
lifetime referencing (DLR) – a new scheme for converting fluorescence intensity into a
frequency-domain or time-domain information. In New Trends in Fluorescence Spectroscopy,
Springer Series on Fluorescence, 2001, 257-274.
26. Huber, C., Klimant, I., Krause, C., Wolfbeis, O. S., Anal. Chem. 2001, 73, 2097-2103.
27. Lakowitz, J. R., Castellano, F. N., Dattelbaum, J. D., Tolosa, L., Rao, G., Gryczynski, I.,
Anal. Chem. 1998, 70, 5115-5121.
28. R. A. Marcus, Angew. Chem., Int. Ed. 1993, 32, 111-1121.
29. Shao, J., Guo, H., Ji, S., Zhao, J., Biosens. Bioelectron. 2011, 26, 3012-3017.
30. Förster, T., Ann. Phys. 1948, 437, 55-75.
31. Deniz, E., Isbasar, G. C., Bozdemir, O. A., Yildirim, L. T., Siemiarczuk, A., Akkaya, E. U.,
Org. Lett. 2008, 10, 3401-3403.
32. McDonnell, S. O., O’Shea, D. F., Org. Lett. 2006, 8, 3493-3496.
33. Hall, M. J., Allen, L. T., O’Shea, D. F., Org. Biomol. Chem. 2006, 4, 776-780.
34. Fan, L., Fu, Y. J., Liu, Q. L., Lu, D. T., Dong, C., Shuang, S. M., Chem. Commun. 2012, 48,
11202-11204.
35. Schutting, S., Borisov, S. M., Klimant, I. Anal. Chem. 2013, 85, 3271-3279.
36. Aigner, D., Borisov, S. M., Petritsch, P., Klimant, I. Chem. Commun. 2013, 49, 2139-2141.
37. Lee, H., Akers, W., Bhushan, K., Bloch, S., Sudlow, G., Tang, R., Achilefu, S., Bioconjugate
Chem. 2011, 22, 777-784.
25
38. Myochin, T., Hanaoka, K., Kojima, H., Terai, T., Nagano, T., J. Am. Chem. Soc. 2011, 133,
3401-3409.
39. Ni, Y., Wu, J., Org. Biomol. Chem. 2014, 12, 3774-3791.
40. Rurack, K., Kollmannsberger, M., Daub, J., New J. Chem. 2001, 25, 289-292.
41. Hoogendoorn, S., Blom, A. E. M., Willems, L. I., van der Marel, G. A., Overkleeft, H. S.,
Org. Lett., 2011, 13, 5656-5659.
42. Hall, M. J., Allen, L. T., O’Shea, D. F., Org. Biomol. Chem. 2006, 4, 776-780.
43. Zhang, X., Wang, Z., Yue, X., Ma, Y., Kiesewetter, D. O., Chen, X., Mol. Pharmaceutics
2013, 10, 1910-1917.
44. Murtagh, J., Frimannsson, D. O., O’Shea, D. F., Org. Lett. 2009, 11, 5386-5389.
45. McDonnell, S. O., O’Shea, D. F., Org. Lett., 2006, 8, 3493-3496.
46. Liu, W., Sun, R., Ge, J-F., Xu, Y-J., Xu, Y., Lu, J.M., Itoh, I., Ihara, M., Anal. Chem. 2013,
85, 7419-7425.
47. Loudet, A.; Burgess, K. Chem. Rev. 2007, 107, 4891-4932.
48. Sathyamoorthi, G., Soong, M. L., Ross, T. W., Boyer, J. H., Heteroat. Chem. 1993, 4, 603-
608.
49. Gallagher, W.M., Allen, L.T., O’Shea, C., Kenna, T., Hall, M., Gorman, A., Killoran, J.,
O’Shea, D.F., Br. J. Cancer 2005, 92, 1702-1710.
50. Killoran, J., McDonnell, S. O., Gallagher, J. F., O’Shea, F., New J. Chem. 2008, 32, 483-489.
51. Grossi, M., Palma, A., McDonnell, S. O., Hall, M. J., Dilip K. R., Muldoon, J., O’Shea, D.
F., J Org. Chem. 2012, 77, 9304-9312.
52. Gorman, A., Killoran, J., O’Shea, C., Kenna, T., Gallagher, W. M., O’Shea, D. F., J. Am.
Chem. Soc. 2004, 126, 10619-1631.
26
53. Flavin, K., Bartelmess, J., Tasior, M., Navio, C., Bittencourt, C., O’Shea, D. F., Guldi, D. M.,
Giordani, S., ACS Nano 2011, 5, 1198-1206.
54. Coskun, A., Yilmaz, M. D., Akkaya, E. U., Org. Lett. 2007, 9, 607-609.
55. Liu, H., Mack, J., Guo, Q., Lu, H., Kobayashi, N., Shen, Z., Chem. Commun. 2011, 47,
12092-12094.
56. Gawley, R. E., Mao, H., Haque, M. M., Thorne, J. B., Pharr, J. S., J. Org. Chem. 2007, 72,
2187-2191.
57. Gong, W., Su, R. X., Li, L., Xu, K. H., Tang, B., Chin. Sci. Bull. 2011, 56, 3260-3265.
58. Jiang, X.-D., Zhang, J., Shao, X., Zhao, W., Org. Biomol. Chem. 2012, 10, 1966-1968.
59. Zhao, W., Carreira, E. M., Angew. Chem., Int. Ed. 2005, 44, 1677-1679.
60. Loudet, A., Burgess K., Chem. Rev. 2007, 107, 4891-4932.
61. A. Loudet, R. Bandichhor, K. Burgess, A. Palma, S. O. McDonnell, M. J. Hall, D. F. O'Shea,
Org. Lett. 2008, 10, 4771-4774.
62. V. F. Donyagina, S. Shimizu, N. Kobayashi, E. A. Lukyanets, Tetrahedron Lett. 2008, 49,
6152-6154.
27
Chapter 2
Highly Photostable Near-Infrared Fluorescent pH Indicators and Sensors
based on BF2-Chelated Tetraarylazadipyrromethene Dyes
Tijana Jokic,† Sergey M. Borisov,†* Robert Saf,‡ Daniel A. Nielsen,§ Michael Kühl,§⊥∥ and Ingo
Klimant†
†Institute of Analytical Chemistry and Food Chemistry, Graz University of Technology,
Stremayrgasse 9, 8010, Graz, Austria
‡Institute of Chemistry and Technology of Materials, Graz University of Technology,
Stremayrgasse 9, 8010, Graz, Austria
‡Plant Functional Biology and Climate Change Cluster, Department of Environmental Science,
University of Technology, Sydney, PO Box 123, Broadway NSW, Australia
⊥Singapore Centre on Environmental Life Sciences Engineering, School of Biological Sciences,
Nanyang Technological University, Singapore
∥Marine Biology Section, Department of Biology, University of Copenhagen, Strandpromenaden
5, DK-3000 Helsingør, Denmark
Abstract
In this study a series of new BF2-chelated tetraarylazadipyrromethane dyes are synthesized and
are shown to be suitable for the preparation of on/off photoinduced electron transfer modulated
fluorescent sensors. The new indicators are noncovalently entrapped in polyurethane hydrogel
D4 and feature absorption maxima in the range 660-710 nm and fluorescence emission maxima
at 680-740 nm. Indicators have high molar absorption coefficients of ~ 80000 M-1cm-1, good
quantum yields (up to 20%), excellent photostability and low cross-sensitivity to the ionic
strength. pKa values of indicators are determined from absorbance and fluorescence
measurements and range from 7 to 11, depending on the substitution pattern of electron-donating
and -withdrawing functionalities. Therefore, the new indicators are suitable for exploitation and
adaptation in a diverse range of analytical applications. Apparent pKa values in sensor films
28
derived from fluorescence data show 0.5−1 pH units lower values in comparison with those
derived from the absorption data due to Forster resonance energy transfer from protonated to
deprotonated form. A dual-lifetime referenced sensor is prepared, and application for monitoring
of pH in corals is demonstrated.
2.1 Introduction
Design, synthesis, and spectroscopic/photophysical characterization of novel fluorescent
chemosensors remains a central research field in analytical chemistry.1 The measurement of pH
by fluorescence-based techniques is well established for both imaging and sensing
applications2,3 in various fields of experimental science, such as biomedical research,4−10 marine
biology,11,12 and biotechnology.13,14 The most frequently used fluorescent pH indicators are 8-
hydroxypyrene-1,3,6-trisulfonic acid (HPTS), carboxyfluorescein derivatives,
seminaphthorhodafluors (SNARFs), and hydroxycoumarins.15−19 However, these indicators
suffer from several drawbacks. For example, carboxyfluorescein has only moderate
photostability, and the photostability of 2′,7′-dihexylfluorescein (suitable for measurements in
seawater) is very poor;20 the pKa value of HPTS is highly dependent on ionic strength of solution;
and most coumarins are excitable only by high-energy radiation in the range from 350 to 450
nm. In biological applications, it is desirable to use fluorophores with absorption/emission
profiles in the red or near-infrared (NIR) spectral regions because they have many advantages:
significant reduction of the background signal due to the low absorption and autofluorescence of
biomolecules in the NIR region, low light scattering and deep penetration of the NIR light, and
the possibility to use low-cost excitation light sources. Despite the optical benefits, there is a
surprising scarcity of pH indicators that have such desired absorption and emission properties.
Although the water-soluble SNARF indicators and their lipophilic derivatives do absorb at ∼630
nm, they possess only moderate brightness and photostability.21 The same holds for the cyanine
dyes, which are well-known NIR chromophores that have only scarcely been proposed as pH
indicators.22,23
In contrast, BF2-chelated tetraarylazadipyrromethane dyes (aza-BODIPYs) represent an
interesting class of NIR chromophores that are amenable to structural modification and exhibit
excellent photophysical properties.24 Several fluorescent pH indicators based on aza-BODIPY
29
dyes bearing amino- or hydroxy-functionalized substituents were reported by O’Shea and co-
workers.25−27 These on/off pH indicators show photoinduced electron transfer from an amino
group or a twisted phenolate to the aza-BODIPY subunit, causing fluorescence quenching in the
deprotonated state. However, these probes cover only acidic and near-neutral range. A
systematic study of the properties of these pH indicators and possible synthetic modifications
with respect to tuning the pKa values has not previously been reported in the literature.
In the present study, we investigated the synthesis and characterization of aza-BODIPY
fluorophores that can probe pH changes by large associated changes in their emission intensity
around 700 nm and possess pKa values in the physiological and alkaline pH range. Eight 4,4-
difluoro-4-bora-3a,4a-triaza-s-indacene dyes that can detect pH through a photoinduced electron
transfer process were synthesized and characterized. We show that the pKa values of the new
indicators can be tuned over a wide range, and simple prediction rules can be derived. This
enables a variety of potential applications for sensors and imaging. As an example, an
application of the new sensing materials for fiber-optic pH measurements in marine biology is
demonstrated.
2.2 Experimental
Materials
3′-Chloro-4′-hydroxyacetophenone, 1,3-diphenyl-2-propenone, tera-tert-butyl-29H,31H-
phtalocyanine, N,N-diisopropylethylamine, ammonium acetate, benzaldehyde,
seminaphthorhodafluor decyl ester (SNARF-DE, chromoionophore XIII), boron trifluoride
diethyl etherate, MOPS buffer salt, and anhydrous sodium sulfate were purchased from Sigma
Aldrich (www.sigmaaldrich.com). 3′-Hydroxyacetophenone, 4-hydroxychalcone, 4′-
hydroxychalcone, 4′-methoxychalcone, 4,4′-dimethoxychalcone, and nitromethane were obtained
from ABCR (www.abcr.com). 4′-Hydroxy-3′-methylacetophenone was obtained from TCI
Europe (www.tcieurope.de). Deuterated dimethyl sulfoxide was obtained from Euriso-top
(www.eurisotop.com). All other solvents (synthesis grade) as well as sodium chloride and the
buffer salts CHES, MES, and CAPS were supplied by Carl Roth (www.roth.de). Silica-gel
(0.04–0.063 mm) was from Acros (www.fishersci.com). Polyurethane hydrogel (Hydromed D4)
was purchased from AdvanSource biomaterials (www.advbiomaterials.com). Poly(ethylene
30
glycol terephthalate) support (Mylar) was obtained from Goodfellow (www.goodfellow.com).
Microcrystalline powder of phosphor chromium(III)-activated gadolinium aluminum borate
(Gd3Al4.75Cr0.25O12, Cr-GAB) was prepared as described previously.28
Synthesis
The synthetic concept is exemplified by the following synthesis of 1. The other dyes were
obtained in a similar way, and their preparation is described in detail in the Supporting
Information.
BF2 Chelate of [5-(4-Hydroxyphenyl)-3-phenyl-1H-pyrrol-2-yl]-[5-phenyl-3-phenylpyrrol-
2-ylidene]amine (1) 1-(4-Hydroxyphenyl)-4-nitro-3-phenylbutan-1-one (1a). A solution of 1-(4-
hydroxyphenyl)-3-phenylpropenone (1 equiv, 2 g, 8.9 mmol), nitromethane (20 equiv, 9.63 mL,
178 mmol), and KOH (1.2 equiv, 0.6 g, 10.68 mmol) in EtOH (10 mL) was heated at 60 °C
under reflux for 12 h. After cooling to room temperature, the solvent was removed in vacuo, and
the oily residue obtained was acidified with 4 M HCl and partitioned between EtOAc (50 mL)
and H2O (50 mL). The organic layer was separated, dried over sodium sulfate, and evaporated
under reduced pressure. The obtained product was used for further synthesis without purification
(2.06 g, 80%).
1,3-Diphenyl-4-nitro-butan-1-on (1b). A solution of 1,3-diphenyl-2-propenone (1 equiv, 2 g, 9.6
mmol), nitromethane (20 equiv, 10.37 mL, 192 mmol) and KOH (0.2 equiv, 0.106 g, 1.9 mmol)
in EtOH (10 mL) was heated at 60 °C under reflux for 12 h. After cooling to room temperature,
the solvent was removed in vacuo, and the oily residue obtained was partitioned between EtOAc
(50 mL) and H2O (50 mL). The organic layer was separated, dried over sodium sulfate, and
evaporated under reduced pressure. The obtained product was used for further synthesis without
purification (1.52 g, 80%).
[5-(4-Hydroxyphenyl)-3-phenyl-1H-pyrrol-2-yl]-[5-phenyl-3-phenylpyrrol-2-ylidene]amine (1c).
Compound 1a (1 equiv, 1.0 g, 4.4 mmol), compound 1b (1 equiv, 0.93 g, 4.4 mmol), and
ammonium acetate (35 equiv, 8.06 g, 245 mmol) in butanol (50 mL) were heated under reflux
for 24 h. The reaction was cooled to room temperature, and the crude product was purified by
column chromatography on silica-gel eluting with dichloromethane (after eluting symmetric
byproduct with hexane/dichloromethane 3:1 v/v) to yield 1c as a blue-black solid. The product
31
was recrystallized from hexane/tetrahydrofuran mixture to give green metallic crystals (0.42 g,
25%). For the calculation, the theoretical yield of the asymmetrical product is set as 100%).1H
NMR (300 MHz, DMSO-d6) δ: 8.13–8.08 (m, 6H), 7.94 (s, 2H), 7.92 (s, 1 H), 7.80 (s, 1H),
7.63–7.58 (m, 1H), 7.5–7.33 (m, 8H), 7.02 (d, J = 8.8 Hz, 2H). Electron impact direct insertion
time-of-flight (EI-DI-TOF) m/z [MH+] found 465.1822, calc 465.1841.
BF2 chelate of 1c
Compound 1c (0.34 g, 0.73 mmol) was dissolved in dry CH2Cl2 (50 mL), treated with
diisopropylethylamine (10 equiv, 0.54 mL, 3.11 mmol) and BF3 diethyletherate (15 equiv, 0.55
mL, 4.35 mmol),. and stirred under argon for 24 h. Purification by column chromatography on
silica gel eluting with CH2Cl2 and recrystallization from hexane/tetrahydrofurane gave the final
product 1 as a red metallic solid (0.201 g, 43%). 1H NMR (300 MHz, DMSO-d6) δ: 10.72 (s,
1H), 8.23–7.99 (m, 8H), 7.77 (s, 1H), 7.61–7.36 (m, 10H), 6.95 (d, J = 8.8 Hz, 2H). Electron
impact direct insertion time-of-flight (EI-DI-TOF) m/z[MH+] found 512.186, calc 512.186.
Preparation of Sensor Foils and Fiber-Optic Microsensors A “cocktail” containing an
indicator dye (0.25 mg), hydrogel D4 (100 mg) in 700 μL EtOH/H2O (9:1 v/v), and
tetrahydrofurane (300 μL) was knife-coated on a dust-free Mylar support to obtain a ∼2.5 μm
thick sensing layer after solvent evaporation.
The “cocktail” for the dual-lifetime referenced sensor was prepared similarly from 0.1 mg of
indicator dye 1with addition of 200 mg of Cr-GAB particles. Subsequently, it was coated on the
tip of an optical fiber (Ø 400 μm) from Specialty Photonics (www.specialtyphotonics.com). The
sensors were allowed to dry 30 min in the ambient to ensure complete evaporation of the solvent.
Between measurements, the sensors were stored in darkness at room temperature.
Methods
Absorption measurements were performed on a Cary 50 UV–vis spectrophotometer from Varian
(www.varianinc.com). The molar absorption coefficients were determined as an average of three
independent measurements for the concentrations of the dyes 2.5–3.4 × 10⁻⁶ M. Fluorescence
spectra were recorded on a Hitachi F-7000 spectrofluorometer (www.hitachi.com). Relative
fluorescence quantum yields were determined according to Demas and Crosby29 using tera-tert-
butyl-29H,31H-phtalocyanine (Fluka,www.sigmaaldrich.com) as a standard (quantum yield =
0.44).30 Two independent measurements were performed to obtain the average value. The
32
concentration of the indicators was kept below 1.5 × 10⁻⁶ M to avoid dye aggregation and
reabsorption of the fluorescence. NMR spectra were recorded on a 300 MHz instrument (Bruker)
in DMSO-d6 or CDCl3 with TMS as a standard. Electron impact (EI, 70 eV) mass spectra were
recorded on a Waters GCT Premier equipped with direct insertion (DI). The pH of the buffer
solutions (CHES, MES, and CAPS) was controlled by a digital pH meter (InoLab pH/ion, WTW
GmbH & Co. KG, www.wtw.com) calibrated at 25 °C with standard buffers of pH 7.0 and pH
4.0 (WTW GmbH & Co. KG, www.wtw.com). The buffers were adjusted to constant ionic
strength (IS = 0.02 or 0.15 M) using sodium chloride as the background electrolyte. Dual-
lifetime referenced measurements were performed with a fiber-optic Firesting fluorometer from
Pyroscience (www.pyro-science.com) with a modulation frequency of 4 kHz.
Photobleaching experiments in solutions were performed by irradiating the samples with light
from a 642-nm high-power 10 W LED array (www.led-tech.de) focused through a lens
purchased from Edmund optics (www.edmundoptics.de). The photodegradation profiles were
obtained by monitoring the absorption spectra. For the leaching test, sensor foil (D4) was placed
in a flow-through cell, and the absorption of the films was monitored while aqueous buffer (IS =
0.02 M) was passed through it. A detailed description of the pH measurements in the gastric
cavity of a symbiont bearing coral (Goniopora sp.) is contained in the Supporting Information.
2.3 Results and discussion
Synthesis. Two general methods to prepare azadipyrromethene chromophore are known. In the
first method, 2,4-diarylpyrroles act as precursors, and are converted into their 5-nitroso
derivatives, which are then condensed with a second molecule of pyrrole to yield unsymmetric
derivatives.31 In the second method, nitromethane adducts of chalcones are reacted with
ammonium salts at elevated temperatures to give symmetric azadipyrromethenes.32 Conversion
of the diarylnitroketones into pyrroles and 5-nitrosopyrroles and the isolation of these products is
not required in this method.
Unsymmetrical derivatives of the aza-BODIPYs bearing only one pH-sensitive group were
strongly preferable to the symmetrical ones for several reasons: (i) a simple acid–base
equilibrium including only two forms of the indicator; (ii) significantly higher hydrophobic
character of the monosubstituted derivatives compared to the symmetrical ones, which prevents
33
the dye from leaching into an aqueous environment, particularly in case of the deprotonated
form; (iii) a low charge of the deprotonated form (1−), which is expected to minimize the effect
of the ionic strength on the sensing properties.
Keeping practical applications in mind (in which accessibility of the indicators is very important)
we decided to employ the second method for preparation of the unsymmetrical dyes. In this
approach, condensation of two different nitrochalcones results in a mixture of the aimed
unsymmetrical aza-BODIPY and two symmetrical derivatives (Scheme 1), which are easily
separated via chromatography on silica gel. The starting compounds for the synthesis were the
diaryl α,β-unsaturated ketones (chalcones) that are either commercially available (for the
synthesis of 1, 5, 7, and 8) or prepared by Claisen–Schmidt condensation (for the synthesis of 2–
4, 6). These were synthesized from the corresponding aldehyde and acetophenone with KOH as a
base in all cases, except for 6, for which NaH was used. The Michael addition of nitromethane to
the chalcones, with KOH as base,33 yields the 1,3-diaryl-4-nitrobutan-1-ones in essentially
quantitative yields after aqueous workup, which were then used without further purification.
Condensation with ammonium acetate in refluxing butanol gave the azadipyrromethenes via a
cascade of events (in situ formation of the pyrrole and corresponding nitrosopyrrole and
subsequent condensation of those two entities). The obtained mixture was purified by
chromatography with hexane/dichloromethane in the case of 1–6 or toluene/dichloromethane in
case of 7 and 8. Finally, complexation of the azadipyrromethenes with boron trifluoride gave the
aza-BODIPYs in good yields.
Photophysical properties. The new aza-BODIPY compounds were dissolved in an
EtOH/aqueous buffer mixture (1:1), and their spectroscopic properties were investigated (Figure
S1 of the Supporting Information, Table 1). The absorption of the probes bearing a hydroxyl
group in the p-position (R1) of Ar4 is rather similar (668–677 nm). The shortest wavelengths of
the absorption maxima are observed for 5 and 6 (656 and 650 nm, respectively. These data
indicate pronounced conjugation of the Ar3 and Ar4 rings with the aza-BODIPY chromophore
and the absence of such conjugation for the Ar1 and Ar2 rings. This conjugation can be caused by
a hydrogen bond between the fluorine atom and the hydrogen atom located in the o-positon of
Ar3 and Ar4rings. Evidently, the electron-donating substituents (−OH or O–CH3) in the p-
position of the Ar3 and Ar4rings result in the bathochromic shift of the absorption spectrum but
34
have no effect on the spectral properties if located in the Ar1 and Ar2 rings. As expected, the
hydroxyl group in the m-position of the Ar4 has virtually no effect on the spectral properties. The
molar absorption coefficients for all aza-BODIPY derivatives are in the 70 000–90 000 M–1 cm–1
range. It should be mentioned that precision of determination of molar absorptivities as well as
fluorescence quantum yields can be affected by inpurities of the probes. Although all the
indicators were obtained as single crystals, several indicators show solvent impurities in the 1H
NMR spectrum. As revealed by crystallographic study of 8 (Figure S2 of the Supporting
Information), this is explained by incorporation of solvent molecules (tetrahydrofurane and
hexane) into the crystal structure. Evidently, this slightly affects the calculated molar absorption
coefficients. For instance, the crystals of 8 contain one molecule of tetrahydrofurane per each
molecule of the dye, and this results in the reduction of molar absorption coefficients by about
8.8%.
NH N
N
R1 R3
R2
R1
O
R1
ONO2
CH3NO2
KOH/EtOH,12h, 60°C
O ONO2
CH3NO2
KOH/EtOH,12h,60 °C
NH
4 OA
c,Bu
OH
24
h, 1
00°C
BF
3 OE
t2 , DIE
A
CH
2 Cl2 , rt, 2
4 h
R6R6
R4 R4
R2
R3R3
R2
R5 R5
R1
R3
R2
O
+
H
O
KO
H/H
2O
, 24h
,rt
N N
N
BF F
R1 R3
R2
R6 R5
R4
R4
R5R6
Ar1 Ar2
Ar4 Ar3
NH N
N
R4 R4
R5R5
NH N
N
R1 R3
R2
R1
R6R6
R3
R2
+ +
1: R1 = OH; R2 - R6 = H
2: R1 = OH; R2 = Cl; R3 - R6 = H
3: R1 = OH; R2 = CH3; R3 - R6 = H
4: R1 = OH; R2, R3 = CH3; R4 - R6 = H
5: R1 - R5 = H; R6 = OH
6: R2 = OH; R1, R3 - R6 = H
7: R1 = OH; R4 = OCH3; R2, R3, R5, R6 = H
8: R1 = OH; R4, R5 = OCH3; R2, R3, R6 = H
Scheme 1. Synthesis of aza-BODIPY probes.
35
Table 1. Photophysical properties of the aza-BODIPY Probes: Absorbance Maxima for the
acidic (λabs-acid) and the Basic Forms (λabs-base), Emission Maxima for the Acidic Form (λem-acid),
Molar Absorption Coefficients (), and Luminescence Quantum Yields (QY)
dye
λabs-acid/
λabs-base
(EtOH/H2O-1:1)
(nm)
λem-acid
(EtOH/H2O-1:1)
(nm)
λabs-acid/ λabs-base
(hydrogel D4)
(nm)
λem-acid
(hydrogel D4)
(nm)
ε
(M-1cm-1)
(THF)
QY
(THF)
(%)*
QY
(EtOH/buff
er-1:1)
(%)*
1 670/726 702 687/742 718 84000 14.5±1.1 11.1±2.7
2 668/734 699 683/754 730 80600 16.4±3.2 8.2±2.3
3 675/735 709 692/750 720 86200 17.6±4.1 8.4±0.9
4 677/741 714 694/752 722 89700 16.1±4 4.6±1.4
5 656/782,605 691 672/859,615 702 69500 7.3±1.8 2.9±0.8
6 650/656 676 660/663 686 71100 10.1±0.6 1.5±0.1
7 687/743 722 707/760 736 80100 17.4±1 13.5±1.3
8 690/750 721 708/768 736 74000 16.2±1.3 10.9±1.9
*for protonated form
The trend observed in absorption maxima was the same for fluorescence emission maxima
(Table 1). The emission maxima of the probes bearing a hydroxyl group in the p-position (R1) of
Ar4 were located between 699 and 714 nm. The compounds 5 and 6 clearly showed a
hypsochromic shift (676 and 691 nm, respectively), and the emission of 7 and 8 was shifted
bathochromically (721 and 722 nm, respectively) as compared with the parent compound 1. The
trends in the absorption and fluorescence maxima of indicators in hydrogel D4 mirrored those in
solution with an additional bathochromic shift of ∼15 nm (Table 1). The fluorescence quantum
yields (QYs) of most indicators were very similar (0.14–0.17 in tetrahydrofurane, Table 1).
Again, the dyes 5 and 6 represent a notable exception as they exhibited significantly lower
quantum yields. As can be seen, all the values are lower in EtOH/aqueous buffer. Although very
low concentrations of the dyes were used (<1.5 × 10⁻⁶ M), some aggregation of the dyes in
EtOH/water mixture cannot be excluded. On the other hand, lower quantum yields in this media
can be explained by more efficient radiationless deactivation involving O–H vibrations. It should
be mentioned that the QYs of most reported NIR-emitting dyes are generally lower than for
those emitting in the visible part of the spectrum. In summary, the photophysical properties of
36
the new aza-BODIPY derivatives retain most of the advantages of the aza-BODIPY fluorophores
(except for 5 and 6), including narrow bandwidth, high molar absorption coefficient, and
acceptable fluorescence quantum yields.
pH-sensing properties. pKa values of the new probes were determined both in ethanol/aqueous
buffered solution (1:1) and in a hydrogel D4 film from the absorption measurements. As can be
seen, the absorption spectra shift bathochromically upon deprotonation of the hydroxyl group in
all cases except for 6 as a result of the absence of conjugation with the aza-BODIPY core (Figure
1, Table 1). Notably, the absorption spectrum of deprotonated 5 is rather unusual and shows two
peaks (Figure 1b). The pKa values determined at two ionic strengths of the solution (0.02 and
0.15 M) were very similar (Table 2). Such low cross-sensitivity to the ionic strength is explained
by the low charge of the indicator molecule (0 and −1 for the protonated and deprotonated forms,
respectively). The pKa of the aza-BODIPY derivatives can be tuned over a wide range by
introducing electron-withdrawing/donating (remote) neighboring functionalities or changing the
position of the hydroxyl group. If probe 1 (with pKa of 8.38) is substituted at the m-position with
a chlorine atom, the pKa drops to 7.01 (2). When (inductively) electron-donating methyl groups
are introduced in the m-positions, the pKa is 8.47 for one methyl group (3) and 8.05 for two
methyl groups (4). The increased acidity of a dimethyl-substituted derivative is surprising, but
can be explained by the difficulties of formation of the solvent adduct due to steric hindrances. If
a hydroxyl group is introduced in the p-position of the Ar1 aryl ring instead of the Ar4aryl ring,
the pKa increases to 9.68 (5). This is very close to the pKa value of phenol (pKa = 10),34 which
indicates the absence of the conjugation with the aza-BODIPY core. This observation is in good
agreement with the trends obtained from the absorption spectra. A drastically high
pKa of 6 (10.88) compared with the pKa of parent compound 1 (8.38) was attributed to the
formation of an intramolecular hydrogen bond between the hydroxyl group and the neighboring
fluorine atom. Introduction of a remote electron-donating substituent (methoxy group) in the p-
position of the Ar3 ring (7) slightly increases the pKa value (by about 0.3 units), relative to the
parent compound 1. Evidently, the second methoxy group in the p-position on the Ar2 aryl ring
(8) has less effect on the pKa value. Effects observed in this study are in line with the electron-
withdrawing (or -donating) power of the neighboring (remote) substituents. In summary, pH
indicators with tailored pKa values can be realized, and the indicators can be easily adapted to
37
particular applications. The pKa values determined in this study differ significantly from the
reported pKa of 6.9 of a phenolic derivative with a hydroxyl group in the p-position of the
Ar4 ring (similar to the compound 1 in our study),26 possibly because of different media used by
Murtagh et al. for the calibration of the pH indicator (nonionic surfactant) and higher
concentration of the dye in these micelles. As will be demonstrated in the following, the
concentration of the indicators is rather critical for determination of apparent pKa values via
fluorescence measurements.
Figure 1. pH dependence of absorbance for 2 (a – 3.10×10⁻⁶ M), 5 (b – 3.32×10⁻⁶ M) and 6 (c –
3.01×10⁻⁶ M) in ethanol/aqueous buffer solution (1:1, IS 0.02 M).
Table 2. pKa values of fluorescent aza-BODIPY probes
dye
no.
pKabs
(IS=0.02M)
(EtOH/H2O-1:1)
pKem
(IS=0.02M)
(EtOH/H2O-1:1)
pKabs
(IS=0.15M)
(EtOH/H2O-1:1)
pK’em
(IS=0.15M)
(EtOH/H2O-1:1)
pKabs
(IS=0.02M)
(hydrogel D4)
pK’em
(IS=0.02M)
(hydrogel D4)
1 8.35 8.38 8.36 8.41 8.47 8.09
2 7.00 7.01 6.92 6.98 6.73 6.08
3 8.36 8.47 8.42 8.45 8.49 7.82
4 8.06 8.05 8.11 8.15 7.94 7.19
5 9.69 9.68 9.69 10.88 9.84 9.67
6 11.05 10.88 11.02 9.69 12.35 11.4
7 8.71 8.65 8.76 8.74 8.81 8.23
8 8.92 8.89 8.90 8.94 9.11 8.56
38
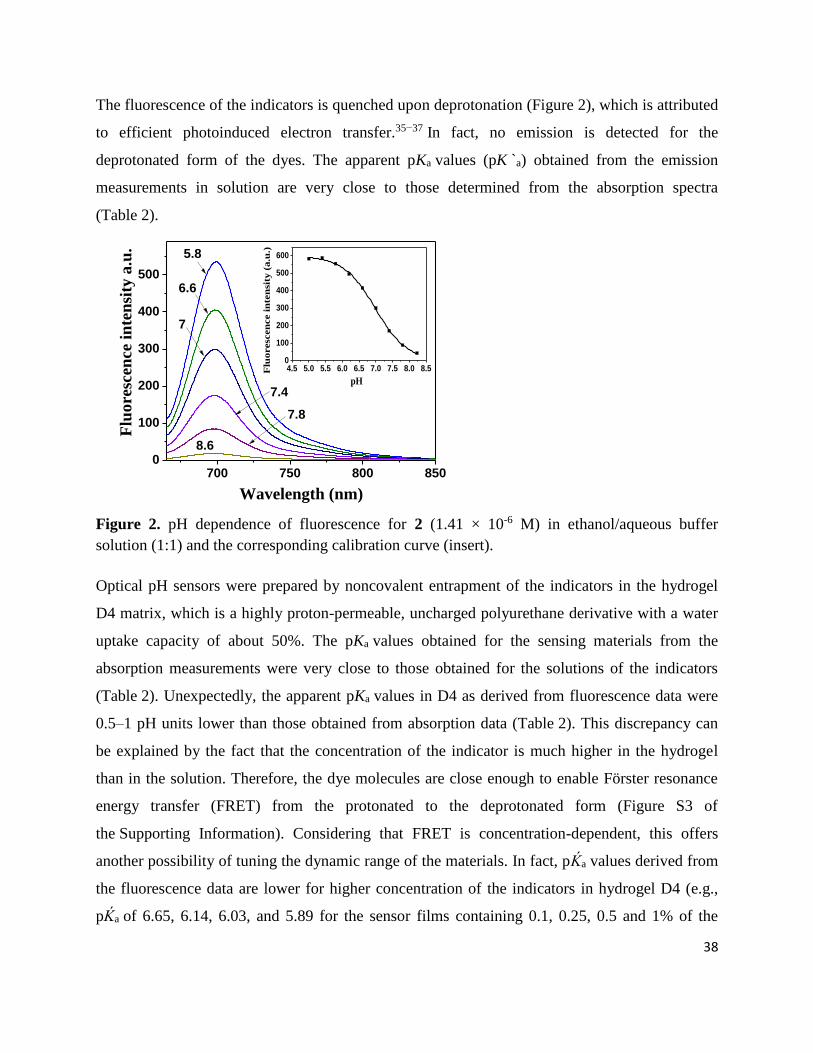
The fluorescence of the indicators is quenched upon deprotonation (Figure 2), which is attributed
to efficient photoinduced electron transfer.35−37 In fact, no emission is detected for the
deprotonated form of the dyes. The apparent pKa values (pK `a) obtained from the emission
measurements in solution are very close to those determined from the absorption spectra
(Table 2).
700 750 800 8500
100
200
300
400
500
7.8
4.5 5.0 5.5 6.0 6.5 7.0 7.5 8.0 8.50
100
200
300
400
500
600
Flu
orescen
ce i
nte
nsit
y (
a.u
.)
pH
Flu
ore
scen
ce i
nte
nsi
ty a
.u.
Wavelength (nm)
5.8
6.6
7
7.4
8.6
Figure 2. pH dependence of fluorescence for 2 (1.41 × 10⁻⁶ M) in ethanol/aqueous buffer
solution (1:1) and the corresponding calibration curve (insert).
Optical pH sensors were prepared by noncovalent entrapment of the indicators in the hydrogel
D4 matrix, which is a highly proton-permeable, uncharged polyurethane derivative with a water
uptake capacity of about 50%. The pKa values obtained for the sensing materials from the
absorption measurements were very close to those obtained for the solutions of the indicators
(Table 2). Unexpectedly, the apparent pKa values in D4 as derived from fluorescence data were
0.5–1 pH units lower than those obtained from absorption data (Table 2). This discrepancy can
be explained by the fact that the concentration of the indicator is much higher in the hydrogel
than in the solution. Therefore, the dye molecules are close enough to enable Förster resonance
energy transfer (FRET) from the protonated to the deprotonated form (Figure S3 of
the Supporting Information). Considering that FRET is concentration-dependent, this offers
another possibility of tuning the dynamic range of the materials. In fact, pḰa values derived from
the fluorescence data are lower for higher concentration of the indicators in hydrogel D4 (e.g.,
pḰa of 6.65, 6.14, 6.03, and 5.89 for the sensor films containing 0.1, 0.25, 0.5 and 1% of the
39
indicator 2), Supporting Information Figure S3c. The pḰa values obtained from the absorption
measurements (Supporting Information Figure S10b) are 6.92, 6.83, 7.04, and 7.32 for the same
concentrations. This increase may be due to different localization patterns of the dye in hydrogel
D4, which is known to be composed of the hydrophilic and hydrophobic regions.
Dye leaching out of the sensing matrix may be a problem in the case of physically entrapped
indicators. It was tested in the case of 1 by monitoring the absorption of the sensing foils. No
evident leaching into the aqueous solution was detectable for the protonated form of the dye. In
the case of the charged deprotonated form, the decrease in the absorption was very low (0.8% per
24 h, Figure S5 of the Supporting Information), which is within the experimental error.
Consequently, leaching is not critical for the investigated sensors due to the pronounced
hydrophobicity of the indicator systems.
We compared the pH-sensing properties of the complexes and the respective ligands. The ligands
were virtually nonfluorescent, possibly due to their nonplanar structure. However, distinct
changes in the absorption spectra were observed (Figure S4a of the Supporting Information). The
pKa values were ∼1 unit higher than for the corresponding complexes (Supporting
Information Figure S4b). For example, the pKa values were 8.35 and 7.00 for 1 and 2, but 9.39
and 7.97 for the corresponding ligands. This effect is likely due in part to the lower degree of the
π-conjugation between the phenolic substituents and the chromophore core (which is reflected by
the smaller shift between the λmax of both forms of the dye compared with the corresponding
complexes). The electron-withdrawing effect of the BF2 group can also contribute here. Despite
the absence of fluorescence, the nonchelated dyes can be promising as absorption-based
indicators.
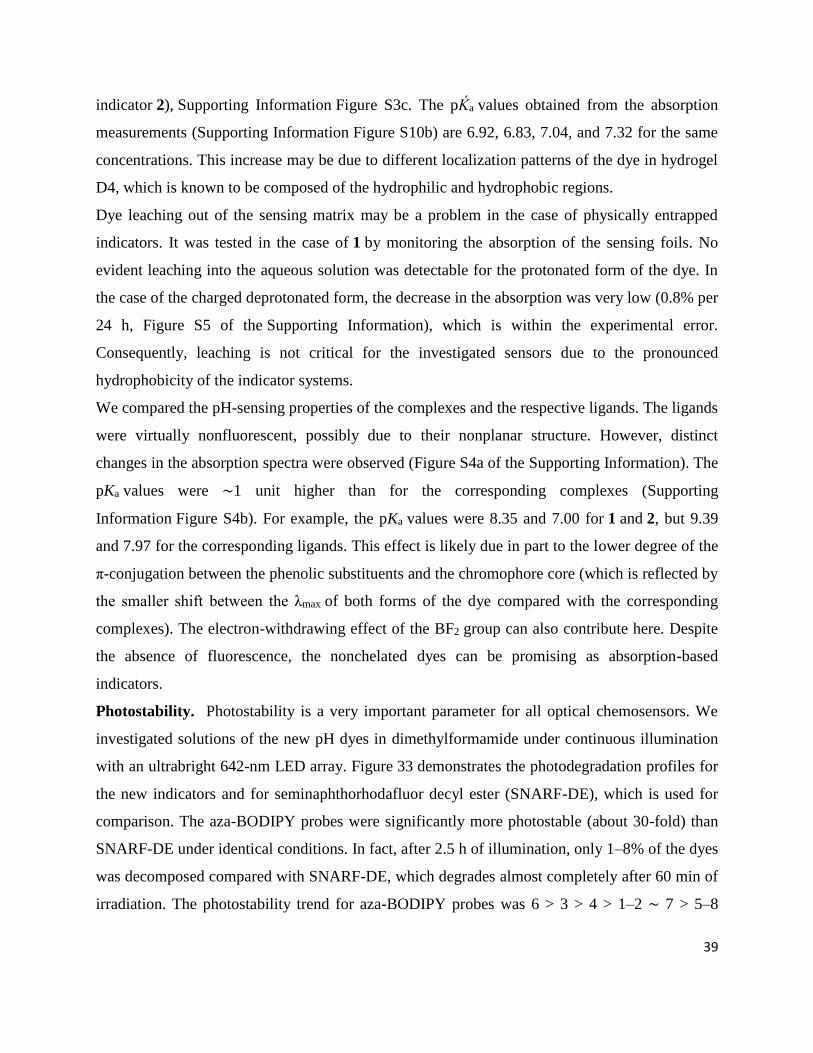
Photostability. Photostability is a very important parameter for all optical chemosensors. We
investigated solutions of the new pH dyes in dimethylformamide under continuous illumination
with an ultrabright 642-nm LED array. Figure 33 demonstrates the photodegradation profiles for
the new indicators and for seminaphthorhodafluor decyl ester (SNARF-DE), which is used for
comparison. The aza-BODIPY probes were significantly more photostable (about 30-fold) than
SNARF-DE under identical conditions. In fact, after 2.5 h of illumination, only 1–8% of the dyes
was decomposed compared with SNARF-DE, which degrades almost completely after 60 min of
irradiation. The photostability trend for aza-BODIPY probes was 6 > 3 > 4 > 1–2 ∼ 7 > 5–8
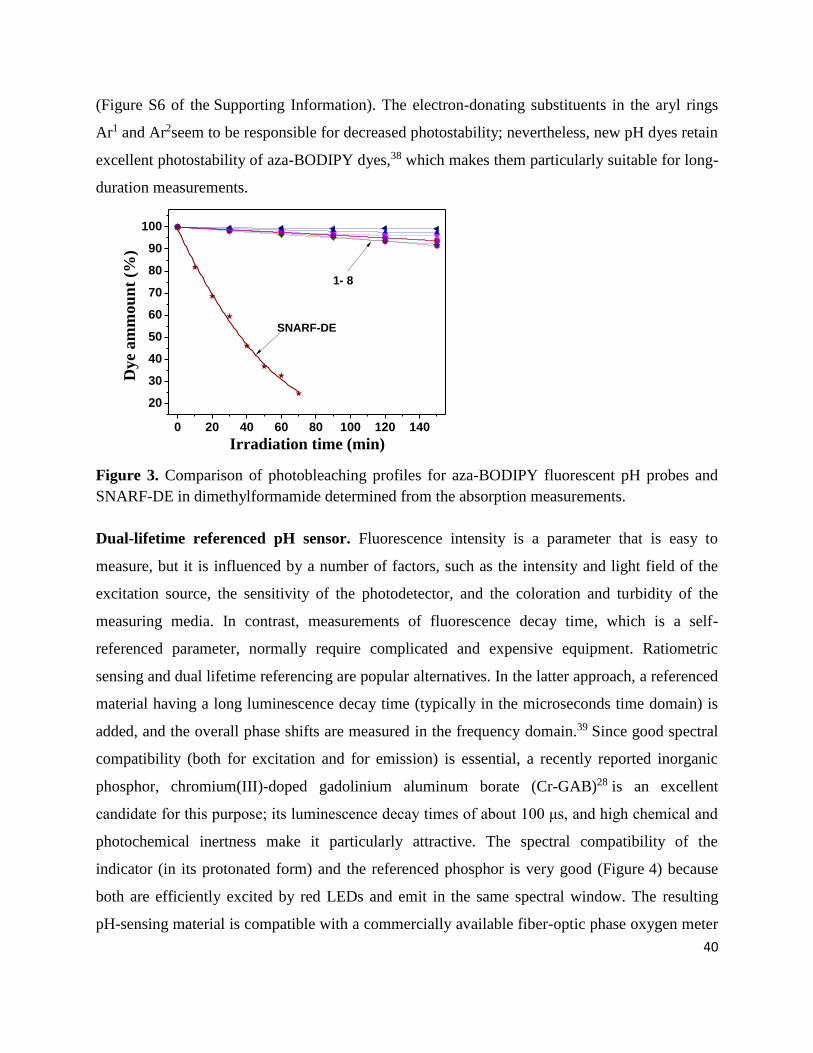
40
(Figure S6 of the Supporting Information). The electron-donating substituents in the aryl rings
Ar1 and Ar2seem to be responsible for decreased photostability; nevertheless, new pH dyes retain
excellent photostability of aza-BODIPY dyes,38 which makes them particularly suitable for long-
duration measurements.
0 20 40 60 80 100 120 140
20
30
40
50
60
70
80
90
100
Dye
am
mou
nt
(%)
Irradiation time (min)
SNARF-DE
1- 8
Figure 3. Comparison of photobleaching profiles for aza-BODIPY fluorescent pH probes and
SNARF-DE in dimethylformamide determined from the absorption measurements.
Dual-lifetime referenced pH sensor. Fluorescence intensity is a parameter that is easy to
measure, but it is influenced by a number of factors, such as the intensity and light field of the
excitation source, the sensitivity of the photodetector, and the coloration and turbidity of the
measuring media. In contrast, measurements of fluorescence decay time, which is a self-
referenced parameter, normally require complicated and expensive equipment. Ratiometric
sensing and dual lifetime referencing are popular alternatives. In the latter approach, a referenced
material having a long luminescence decay time (typically in the microseconds time domain) is
added, and the overall phase shifts are measured in the frequency domain.39 Since good spectral
compatibility (both for excitation and for emission) is essential, a recently reported inorganic
phosphor, chromium(III)-doped gadolinium aluminum borate (Cr-GAB)28 is an excellent
candidate for this purpose; its luminescence decay times of about 100 μs, and high chemical and
photochemical inertness make it particularly attractive. The spectral compatibility of the
indicator (in its protonated form) and the referenced phosphor is very good (Figure 4) because
both are efficiently excited by red LEDs and emit in the same spectral window. The resulting
pH-sensing material is compatible with a commercially available fiber-optic phase oxygen meter
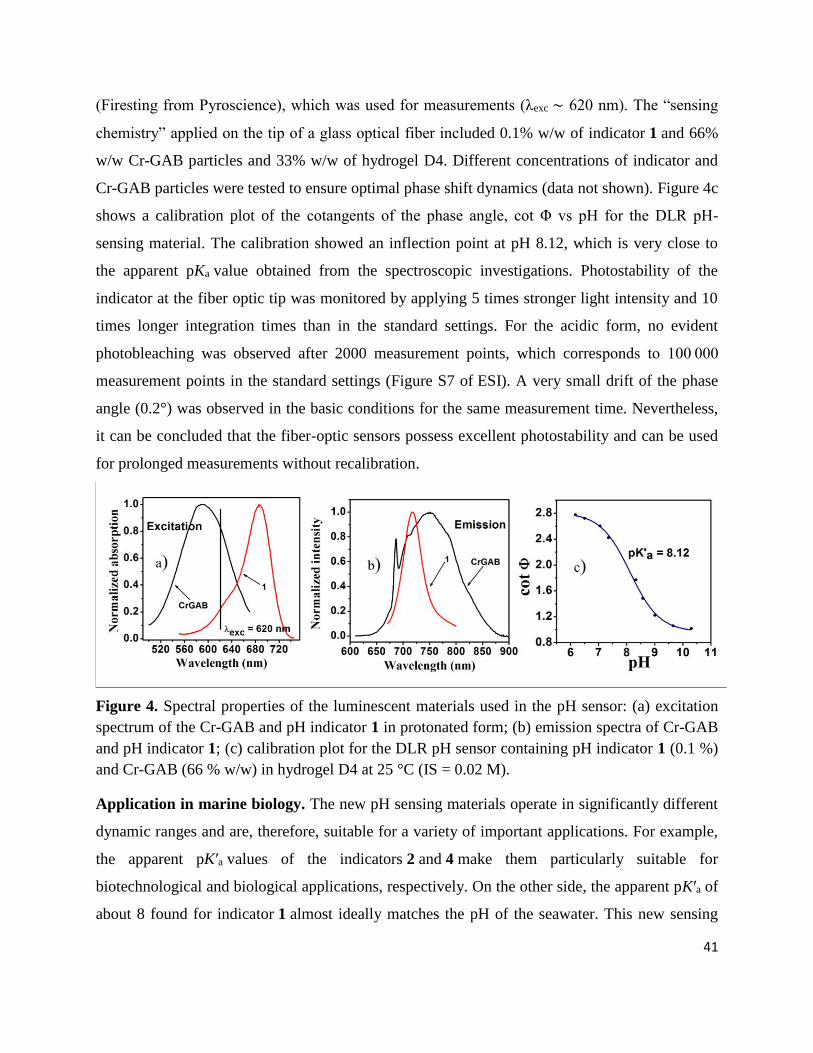
41
(Firesting from Pyroscience), which was used for measurements (λexc ∼ 620 nm). The “sensing
chemistry” applied on the tip of a glass optical fiber included 0.1% w/w of indicator 1 and 66%
w/w Cr-GAB particles and 33% w/w of hydrogel D4. Different concentrations of indicator and
Cr-GAB particles were tested to ensure optimal phase shift dynamics (data not shown). Figure 4c
shows a calibration plot of the cotangents of the phase angle, cot Φ vs pH for the DLR pH-
sensing material. The calibration showed an inflection point at pH 8.12, which is very close to
the apparent pKa value obtained from the spectroscopic investigations. Photostability of the
indicator at the fiber optic tip was monitored by applying 5 times stronger light intensity and 10
times longer integration times than in the standard settings. For the acidic form, no evident
photobleaching was observed after 2000 measurement points, which corresponds to 100 000
measurement points in the standard settings (Figure S7 of ESI). A very small drift of the phase
angle (0.2°) was observed in the basic conditions for the same measurement time. Nevertheless,
it can be concluded that the fiber-optic sensors possess excellent photostability and can be used
for prolonged measurements without recalibration.
Figure 4. Spectral properties of the luminescent materials used in the pH sensor: (a) excitation
spectrum of the Cr-GAB and pH indicator 1 in protonated form; (b) emission spectra of Cr-GAB
and pH indicator 1; (c) calibration plot for the DLR pH sensor containing pH indicator 1 (0.1 %)
and Cr-GAB (66 % w/w) in hydrogel D4 at 25 °C (IS = 0.02 M).
Application in marine biology. The new pH sensing materials operate in significantly different
dynamic ranges and are, therefore, suitable for a variety of important applications. For example,
the apparent pK′a values of the indicators 2 and 4 make them particularly suitable for
biotechnological and biological applications, respectively. On the other side, the apparent pK′a of
about 8 found for indicator 1 almost ideally matches the pH of the seawater. This new sensing
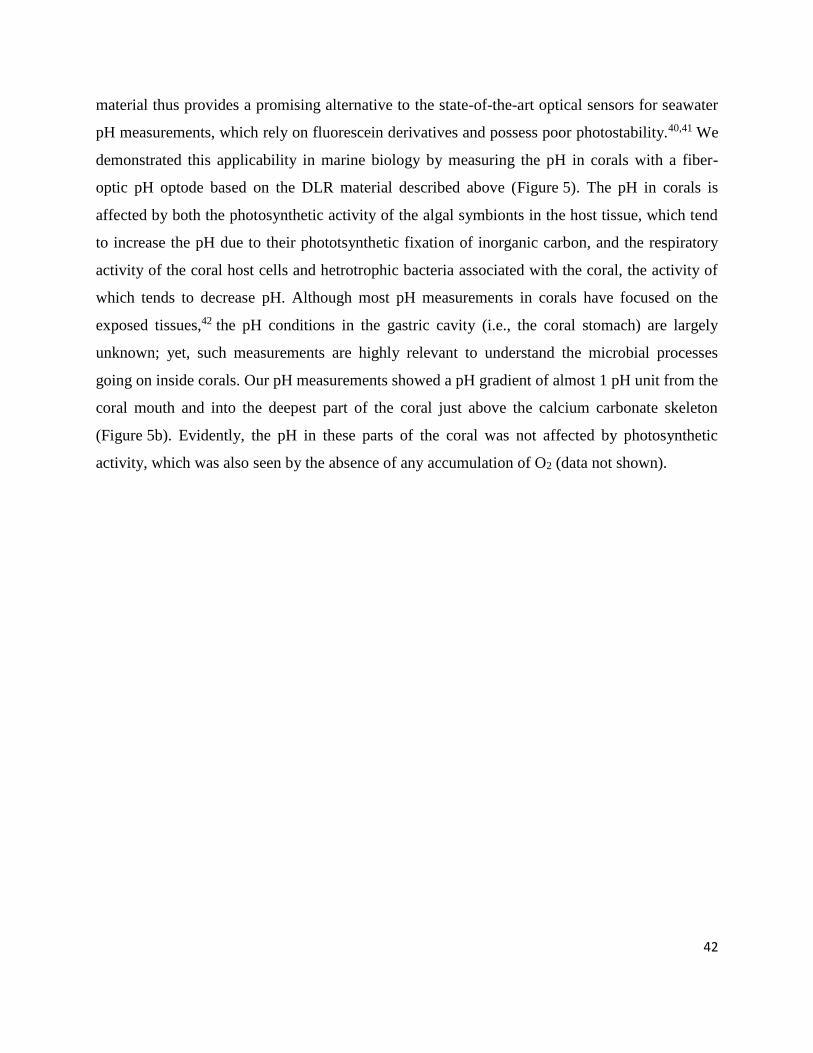
42
material thus provides a promising alternative to the state-of-the-art optical sensors for seawater
pH measurements, which rely on fluorescein derivatives and possess poor photostability.40,41 We
demonstrated this applicability in marine biology by measuring the pH in corals with a fiber-
optic pH optode based on the DLR material described above (Figure 5). The pH in corals is
affected by both the photosynthetic activity of the algal symbionts in the host tissue, which tend
to increase the pH due to their phototsynthetic fixation of inorganic carbon, and the respiratory
activity of the coral host cells and hetrotrophic bacteria associated with the coral, the activity of
which tends to decrease pH. Although most pH measurements in corals have focused on the
exposed tissues,42 the pH conditions in the gastric cavity (i.e., the coral stomach) are largely
unknown; yet, such measurements are highly relevant to understand the microbial processes
going on inside corals. Our pH measurements showed a pH gradient of almost 1 pH unit from the
coral mouth and into the deepest part of the coral just above the calcium carbonate skeleton
(Figure 5b). Evidently, the pH in these parts of the coral was not affected by photosynthetic
activity, which was also seen by the absence of any accumulation of O2 (data not shown).
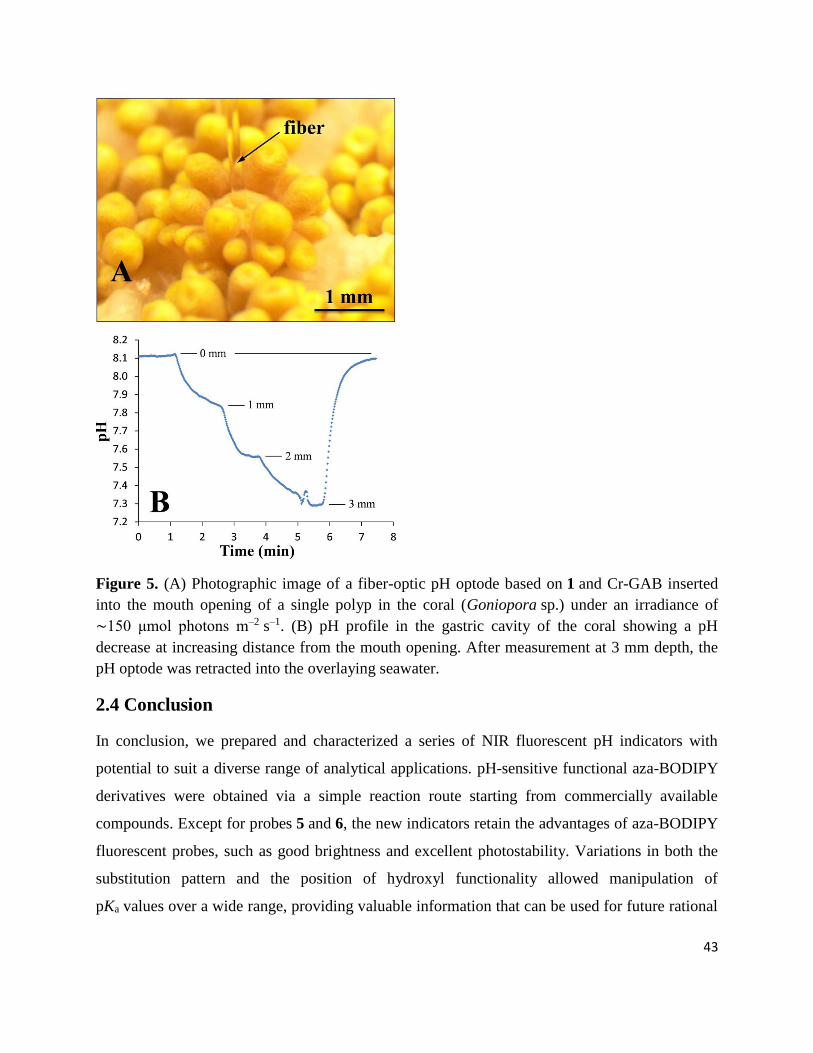
43
Figure 5. (A) Photographic image of a fiber-optic pH optode based on 1 and Cr-GAB inserted
into the mouth opening of a single polyp in the coral (Goniopora sp.) under an irradiance of
∼150 μmol photons m–2 s–1. (B) pH profile in the gastric cavity of the coral showing a pH
decrease at increasing distance from the mouth opening. After measurement at 3 mm depth, the
pH optode was retracted into the overlaying seawater.
2.4 Conclusion
In conclusion, we prepared and characterized a series of NIR fluorescent pH indicators with
potential to suit a diverse range of analytical applications. pH-sensitive functional aza-BODIPY
derivatives were obtained via a simple reaction route starting from commercially available
compounds. Except for probes 5 and 6, the new indicators retain the advantages of aza-BODIPY
fluorescent probes, such as good brightness and excellent photostability. Variations in both the
substitution pattern and the position of hydroxyl functionality allowed manipulation of
pKa values over a wide range, providing valuable information that can be used for future rational
44
design of the indicator systems. The new sensors have high potential for a variety of
biotechnological, biological, environmental, etc. applications. As an example, monitoring of pH
inside coral polyps was demonstrated. Ongoing work concerns the covalent immobilization of
the indicators into the polymeric network, which will completely suppress their leaching,
migration, and aggregation and can lead to even better shelf life stability and operating time of
the optical sensors.
2.5 References
1. B. Valeur, Molecular Fluorescence. Principles and Applications, Wiley-VCH,
Weinheim, Germany, 2002.
2. R. P. Haugland, The Handbook. A Guide to Fluorescent Probes and Labeling
Technologies, 10th ed., Molecular Probes, Eugene, Oregon, 2005, 935.
3. J. Han, K. Burgess, Chem. Rev. 2010, 110, 2709.
4. Zhang W., Tang B., Liu X., Liu Y., Xu K., Ma J., Tong L., Yang G., Analyst, 2009,
134, 367.
5. Tang, B., Yu, F., Li, P. Tong, L., Duan X., Xie T., Wang X., J. Am. Chem. Soc., 2009,
3016.
6. Almutairi, A., Guillaudeu, S. J., Berezin, M. Y., Achilefu, S., Frechet J. M. J., J. Am.
Chem. Soc., 2008, 130 , 444.
7. Lee, H., Berezin, M.Y., Guo, K., Kao, J., Achilefu, S., Org. Lett., 2009, 11, 29.
8. Zhang, Z., Achilefu, S., Chem. Commun., 2005, 47, 5887.
9. Deniz, E., Isbasar, G. C., Bozdemir, O. A. Yildirim, L. T., Siemiarczuk, A., Akkaya E.
U., Org. Lett., 10 2008, 16, 3401.
10. Hilderbrand, S.A., Kelly, K. A., Nieder, M. Weissleder R., Bioconjug. Chem., 2008, 19,
1635.
11. Kühl, M., Meth. Enzymol., 2005, 397, 166.
12. Larsen, M.; Borisov, S. M.; Grunwald, B.; Klimant, I.; Glud, R. N. Limnol. Oceanogr.
Methods 2011, 9, 348.

45
13. Jeevarajan A. S., Vani S., Taylor T. D., Anderson M. M., Biotechnol. Bioeng. 2002, 78,
467.
14. John G. T., Goelling D., Klimant I., Schneider H., Heinzle E., J. Dairy Res. 2003, 70,
327.
15. Wolfbeis OS, Fürlinger E, Kroneis H, Marsoner H, Fresenius Anal. Chem. 1983, 314,
119.
16. Whitaker JE, Haugland R. P., Prendergas F. G. Anal. Biochem. 1991, 194, 330.
17. Offenbacher H, Wolfbeis OS, Fürlinger E, Sens. Act. B 1986, 9, 73.
18. Zhujun Z, Seitz W R, Anal. Chim. Acta 1984, 160, 47.
19. Xu Z, Rollins A, Alcala R, Marchant E, J. Biomed. Mater. Res. 1998, 39, 9.
20. Weidgans, B. M., Krause, C., Klimant, I., Wolfbeis, O. S., Analyst, 2004, 129, 645.
21. Borisov, S. M., Gatterer, K., Klimant, I., Analyst, 2010, 135, 1711.
22. Cooper, M. E., Gregory, S., Adie, E., Kalinka, S. J. Fluoresc. 2002, 12, 425.
23. Briggs, M. S., Burns, D. D., Cooper, M. E., Gregory, S., J. Chem. Commun. 2000, 23,
2323.
24. J. Killoran, L. Allen, J. F. Gallagher, W. M. Gallagher, D. F. O’Shea, Chem. Commun.,
2002, 1862.
25. J. Killoran, Shane O. McDonnell, J. F. Gallagher and D. F. O’Shea, New J. Chem., 2008,
32, 483.
26. J. Murtagh, D. O. Frimannsson and D. F. O’Shea, Org. Lett., 2009, 11, 5386.
27. S. O. McDonnell and D. F. O'Shea, Org. Lett., 2006, 8, 3493.
28. S. M. Borisov, K. Gaterrer, B. Bitschnau and I. Klimant, J. Phys. Chem. C, 2010, 114,
9118.
46
29. W. Freyer, S. Mueller, K. Teuchner, J. Photochem. Photobio. A, 2004, 163, 231.
30. M. J. Hall, S. O. McDonnell, J. Killoran, D. F. O’Shea, J. Org. Chem. 2005, 70, 5571.
31. A. Gorman, J. Killoran, C. O’Shea, T. Kenna, W. M. Gallagher, D. F. O’Shea, J. Am.
Chem. Soc., 2004, 126, 10619.
32. Loudet, A., Rakeshwar, B., Wu, L., Burgess, K., Tetrahedron, 2008, 64, 3642.
33. Demas, J. N., Crosby, G. A., J. Phys. Chem., 1971, 75, 991.
34. Isaacs, N. S., Physical Organic Chemistry, 2nd ed. Ed.; Longman Scientific & Technical:
Harlow, England, 1995, 188.
35. Daffy, L. M., de Silva, A.P., Gunaratne, H.Q.M., Huber, C., Lynch, P.L.M., Werner, T.,
Wolfbeis, O.S., Chem.-Eur. J. 1998, 4, 1810.
36. Werner, T., Huber, C., Heinl, S., Kollmannsberger, M., Daub, J., Wolfbeis, O.S.,
Fresenius J. Anal. Chem. 1997, 359, 150.
37. de Silva, A.P., Vance, T.P., West, M.E.S., Wright, G.D., Org. Biomol. Chem. 2008, 6,
2468.
38. P. Batat, M. Cantuel, G. Jonusauskas, L. Scarpantonio, A. Palma, D. F. O’Shea, N. D.
McClenaghan, J. Phys. Chem. A, 2011, 115, 14034.
39. Huber, C.; Klimant, I.; Krause, C.; Wolfbeis, O. S. Anal. Chem. 2001, 73, 2097.
40. Schröder, C.R., Weidgans, B.M., Klimant, I. Analyst, 2005, 130, 907.
41. Schröder, C. R.; Polerecky, L.; Klimant, I. Anal. Chem. 2007, 79, 60.
42. Kühl, M., Cohen, Y., Dalsgaard, T.,Jørgensen, B. B., Revsbech, N. P. Mar. Ecol. Progr.
Ser., 1995, 117, 159.
47
2.6 Supporting Information
EXPERIMENTAL
Measurements of pH gradients in the gastric cavity of a symbiont bearing coral (Goniopora
sp.)
The coral was sampled from the reef flat off Heron Island, Great Barrier Reef, Australia. After
sampling, the coral was kept at Heron Island Research Station in an outdoor aquarium
continuously flushed with aerated seawater from the reef flat. Prior to pH measurements, coral
specimen was transferred to a flow chamber with aerated seawater (pH ~8.1) at 26 °C and at a
flow rate of approximately 3 cm s-1. The coral was illuminated with an incident irradiance of
~150 µmolphotons m-2s-1 from a fiber-optic halogen lamp Schott kl2500 LCD
(www.schott.com). The pH optode was mounted in a manual micromanipulator MM33
(Märtzhäuser, www.marzhauser.com) that was attached to a heavy stand. The optode tip was
carefully positioned towards and into the mouth opening of a single coral polyp; this was done
by observation under a dissection microscope SM-6TZ-54S, Amscope (www.amscope.com)
equipped with a CCD camera.
Solution preparation for titration curves
Indicators 1 - 8 were dissolved in THF (10 ml). For absorption measurements 200 µl (90 µl for
fluorescence measurements) of this solution was diluted with 25 ml of ethanol. Prior to
absorption (fluorescence) measurements ethanolic solution was diluted with aqueous buffer 1:1.
Final concentration of solutions were for absorption measurements 1 – 3.19 × 10⁻⁶ M, 2 – 3.10 ×
10-6 M, 3 – 3.37 × 10⁻⁶ M, 4 – 3.27 × 10⁻⁶ M, 5 – 3.32 × 10⁻⁶ M, 6 – 3.01 × 10⁻⁶ M, 7- 2.55 × 10⁻⁶
M, 8 – 3.23 × 10⁻⁶ M, and fluorescence measurements 1 – 1.45 × 10⁻⁶ M, 2 – 1.41 × 10⁻⁶ M, 3 –
1.53 × 10⁻⁶ M, 4 – 1.49 × 10⁻⁶ M, 5 – 1.51 × 10⁻⁶ M, 6 – 1.37 × 10⁻⁶ M, 7- 1.16 × 10⁻⁶ M, 8 – 1.47
× 10-6 M.
48
Synthesis
1-(3-chloro-4-hydroxyphenyl)-3-phenylpropenone (2a): 3’-chloro-4’-hydroxyacetophenone (1
eq, 2 g, 11.7 mmol) and benzaldehyde (1 eq, 1.24 g, 11.7 mmol) were dissolved in absolute
ethanol (10 ml). 10 ml of aqueous potassium hydroxide solution (3 eq, 1.96 g, 35.1 mmol) was
added dropwise. Resulting solution was stirred for 8-12 hours, during which the product
precipitated as the potassium salt. The solution/suspension was poured into 1 M HCl (10 ml),
and further concentrated HCl was added until the solution was acidic. Obtained yellow solid was
washed with water and used in further synthesis without purification. (2.7 g, 77%)
1-(3-chloro-4-hydroxyphenyl)-4-nitro-3-phenylbutan-1-one (2b): A solution of 1-(3-chloro-4-
hydroxyphenyl)-3-phenylpropenone (2a) (1eq, 2 g, 7.7 mmol), nitromethane (20 eq, 8,35 ml,
154.7 mmol) and KOH (1.2 eq, 0.52 g, 9.28 mmol) in EtOH (10 ml) was heated at 60 ºC under
reflux for 12 h. After cooling to room temperature, the solvent was removed in vacuo and oily
residue obtained was acidified with 4 M HCl and partitioned between EtOAc (50 ml) and H2O
(50 ml). The organic layer was separated, dried over sodium sulfate and evaporated under
reduced pressure. The obtained product was used for further synthesis without purification. (2.4
g, 73%)
[5-(3-chloro-4-hydroxyphenyl)-3-phenyl-1H-pyrrol-2-yl]-[5-phenyl-3-phenylpyrrol-2-
ylidene]amine (2c): 1-(3-chloro-4-hydroxyphenyl)-4-nitro-3-phenylbutan-1-one (2b) (1 eq, 1 g,
3.7 mmol), 1,3-diphenyl-4-nitro-butan-1-on (1b) (1 eq, 0.99 g, 3.7 mmol) and ammonium acetate
(35 eq, 8.03 g, 129 mmol) in butanol (50 ml) were heated under reflux for 24 h. The reaction was
cooled to room temperature, the crude product was purified by column chromatography on silica
with dichloromethane (after eluting symmetric byproduct with hexane/dichloromethane 3:1 v/v)
to yield to product 2c as a blue-black solid. Product was recrystallized from
hexane/tetrahydrofuran mixture as green metallic crystals (0.26 g, 17%). 1H NMR (300 MHz,
DMSO-d6) δ 8.26-8.27 (d, J = 2 Hz, 1H), 8.06-8.13 (t, J = 6.5 Hz, 4H), 7.99-8.02 (dd, J = 8.7
Hz, 2.1 Hz, 1H), 7.92-7.95 (d, J = 7.4 Hz, 2H), 7.83 (s, 1H), 7.32-7.61 (t, J = 7.5 Hz, 10H), 7.04-
7.06 (d, J = 8.6 Hz, 1H). Electron impact-direct insertion-time of flight (EI-DI-TOF) m/z [MH+]
found 499.1473, calculated 499.1451.
49
BF2 chelate of [5-(3-chloro-4-hydroxyphenyl)-3-phenyl-1H-pyrrol-2-yl]-[5-phenyl-3-
phenylpyrrol-2-ylidene]amine (2): Compound 2c (0.24 g, 0.48 mmol) was dissolved in dry
CH2Cl2 (50 ml), treated with diisopropylethylamine (10 eq, 0.79 ml, 4.8 mmol) and BF3
diethyletherate (15 eq, 0.92 ml, 7.2 mmol) and stirred under argon for 24 h. Purification by
column chromatography on silica eluting with CH2Cl2 and recrystallization from
hexane/tetrahydrofurane gave the product 2 as a red metallic solid ( 0.20 g, 43 %). 1H NMR (300
MHz, DMSO-d6) δ 8.30-8.29 (d, J = 2.1 Hz, 1 H), 8.21 – 8.07 (m, 7 H), 7.76 (s, 1 H), 7.58 –
7.45 (m, 10 H), 7.13- 7.16 (d, J = 8.7 Hz, 1 H). Electron impact-direct insertion-time of flight
(EI-DI-TOF) m/z [MH+] found 546.1490, calculated 546.1470.
1-(3-methyl-4-hydroxyphenyl)-3-phenylpropenone (3a): 3’-methyl-4’-hydroxyacetophenone
(1 eq, 2 g, 14.7 mmol) and benzaldehyde (1 eq, 1.55 g, 11.8 mmol) were dissolved in absolute
ethanol (10 ml). 10 ml of aqueous potassium hydroxide solution (3 eq, 1.98 g, 35.4 mmol) was
added dropwise. Resulting solution was stirred for 8-12 hours, during which the product
precipitated as the potassium salt. The solution/suspension was poured into 1 M HCl (10 ml),
and further concentrated HCl was added until the solution was acidic. Obtained yellow solid was
washed with water and used in further synthesis without purification. (3.5 g, 93%)
1-(3-methyl-4-hydroxyphenyl)-4-nitro-3-phenylbutan-1-one (3b): A solution of 1-(3-methyl-
4-hydroxyphenyl)-3-phenylpropenone (3) (1eq, 2 g, 12.05 mmol), nitromethane (20 eq, 16.6 ml,
240.96 mmol) and KOH (1.2 eq, 0.81 g, 14.46 mmol) in EtOH (10 ml) was heated at 60 ºC under
reflux for 12 h. After cooling to room temperature, the solvent was removed in vacuo and oily
residue obtained was acidified with 4 M HCl and partitioned between EtOAc (50 ml) and H2O
(50 ml). The organic layer was separated, dried over sodium sulfate and evaporated under
reduced pressure. The obtained product was used for further synthesis without purification. (1.33
g, 53%)
[5-(3-methyl-4-hydroxyphenyl)-3-phenyl-1H-pyrrol-2-yl]-[5-phenyl-3-phenylpyrrol-2-
ylidene]amine (3c): 1-(3-methyl-4-hydroxyphenyl)-4-nitro-3-phenylbutan-1-one (3a) (1 eq, 1 g,
3.7 mmol), 1,3-diphenyl-4-nitro-butan-1-on (1b) (1 eq, 0.99 g, 3.7 mmol) and ammonium acetate
(35 eq, 8.03 g, 129 mmol) in butanol (50 ml) were heated under reflux for 24 h. The reaction was
cooled to room temperature, the crude product was purified by column chromatography on silica
50
with dichloromethane (after eluting symmetric byproduct with hexane/dichloromethane 3:1 v/v)
to yield to product 3c as a blue-black solid. Product was recrystalized from
hexane/tetrahydrofuran mixture as green metallic crystals (0.26 g, 10%). 1H NMR (300 MHz,
DMSO-d6) δ 8.05 – 8.13 (m, 5 H), 7.93- 7.95 (d, J = 7.6 Hz, 3 H), 7.80 (s, 1 H), 7.56-7.61 (m, 2
H), 7.32 – 7.51 (m, 8 H), 7.00-7.03 (d, J = 8.4 Hz, 1 H), 2.29 (s, 3 H). Electron impact-direct
insertion-time of flight (EI-DI-TOF) m/z [MH+] found 479.1998, calculated 479.1998.
BF2 chelate of [5-(3-methyl-4-hydroxyphenyl)-3-phenyl-1H-pyrrol-2-yl]-[5-phenyl-3-
phenylpyrrol-2-ylidene]amine (3): Compound 3c (0.19 g, 0.39 mmol) was dissolved in dry
CH2Cl2 (50 ml), treated with diisopropylethylamine (10 eq, 0.65 ml, 3.9 mmol) and BF3
diethyletherate (15 eq, 0.75 ml, 5.85 mmol) and stirred under argon for 24 h. Purification by
column chromatography on silica eluting with CH2Cl2 gave the product 3 as a red metallic solid
(0.22 g, 66 %). 1H NMR (300 MHz, DMSO-d6) δ 10.74 (s, 1 H), 8.04 – 8.22(m, 8 H), 7.82 (s, 1
H), 7.39 – 7.59 (m, 10 H), 6.97 (m, 1 H), 2.21 (s, 3H). Electron impact-direct insertion-time of
flight (EI-DI-TOF) m/z [MH+] found 526.2020, calculated 526.2017.
1-(3,5-dimethyl-4-hydroxyphenyl)-3-phenylpropenone (4a): 3’,5’-dimethyl-4’-
hydroxyacetophenone (1 eq, 2 g, 12.1 mmol) and benzaldehyde (1 eq, 1.29 g, 12.1 mmol ) were
dissolved in absolute ethanol (10 ml). 10 ml of aqueous potassium hydroxide solution (3 eq, 2.04
g, 36.3 mmol) was added dropwise. Resulting solution was stirred for 8-12 hours, during which
the product precipitated as the potassium salt. The solution/suspension was poured into 1 M HCl
(10 ml), and further concentrated HCl was added until the solution was acidic. Obtained yellow
solid was washed with water and used in further synthesis without purification. (3.3 g, 95%)
1-(3,5-dimethyl-4-hydroxyphenyl)-4-nitro-3-phenylbutan-1-one (4b): A solution of 1-(3,5-
dimethyl-4-hydroxyphenyl)-3-phenylpropenone (4a) (1eq, 2 g, 7.93 mmol), nitromethane (20 eq,
16.6 ml, 240.96 mmol) and KOH (1.2 eq, 0.81 g, 14.46 mmol) in EtOH (10 ml) was heated at 60
ºC under reflux for 12 h. After cooling to room temperature, the solvent was removed in vacuo
and oily residue obtained was acidified with 4 M HCl and partitioned between EtOAc (50 ml)
and H2O (50 ml). The organic layer was separated, dried over sodium sulfate and evaporated
under reduced pressure. The obtained product was used for further synthesis without purification.
(1.6 g, 65%)
51
[5-(3,5-dimethyl-4-hydroxyphenyl)-3-phenyl-1H-pyrrol-2-yl]-[5-phenyl-3-phenylpyrrol-2-
ylidene]amine (4c): 1-(3,5-dimethyl-4-hydroxyphenyl)-4-nitro-3-phenylbutan-1-one (4b) (1 eq,
1 g, 3.2 mmol), 1,3-diphenyl-4-nitro-butan-1-on (1b) (1 eq, 1 g, 3.2 mmol) and ammonium
acetate (35 eq, 8.03 g, 112 mmol) in butanol (50 ml) were heated under reflux for 24 h. The
reaction was cooled to room temperature, the crude product was purified by column
chromatography on silica with dichloromethane (after eluting symmetric byproduct with
hexane/dichloromethane 3:1 v/v) to yield to product 5 as a blue-black solid. Product was
recrystallized from hexane/tetrahydrofuran mixture as green metallic crystals (0.43 g, 20%). 1H
NMR (300 MHz, DMSO-d6) δ 8.09-8.15 (m, 4H), 7.93-7.96 (m, 2H), 7.89 (s, 2H), 7.81 (s, 1H),
7.31-7.60 (m, 10H). Electron impact-direct insertion-time of flight (EI-DI-TOF) m/z [MH+]
found 493.2198, calculated 493.2154.
BF2 chelate of [5-(3,5-dimethyl-4-hydroxyphenyl)-3-phenyl-1H-pyrrol-2-yl]-[5-phenyl-3-
phenylpyrrol-2-ylidene]amine (4): Compound 4c (0.19 g, 0.39 mmol) was dissolved in dry
CH2Cl2 (50 ml), treated with diisopropylethylamine (10 eq, 0.65 ml, 3.9 mmol) and BF3
diethyletherate (15 eq, 0.75 ml, 5.85 mmol) and stirred under argon for 24 h. Purification by
column chromatography on silica eluting with CH2Cl2 gave the product 4 as a red metallic solid
(0.28 g, 62 %). 1H NMR (300 MHz, DMSO-d6) δ 9.66 (s, 1H), 8.06 – 8.22 (m, 6H), 8.01 (s, 2H),
7.82 (s, 1H), 7.42 – 7.58 (m, 9 H), 7.40 (s, 1H), 2.26 (s, 6 H). Electron impact-direct insertion-
time of flight (EI-DI-TOF) m/z [MH+] found 540.2192, calculated 540.2173.
1-phenyl-4-nitro-3-(4-hydroxyphenyl)-butan-1-one (5a): A solution of 1-phenyl-3-(4-
hydroxyphenyl)-propenone (1eq, 2 g, 8.9 mmol), nitromethane (20 eq, 10.8 ml, 178.3 mmol)
and KOH (1.2 eq, 0.59 g, 10.68 mmol) in EtOH (10 ml) was heated at 60 ºC under reflux for 12
h. After cooling to room temperature, the solvent was removed in vacuo and oily residue
obtained was acidified with 4 M HCl and partitioned between EtOAc (50 ml) and H2O (50 ml).
The organic layer was separated, dried over sodium sulfate and evaporated under reduced
pressure. The obtained product was used for further synthesis without purification. (1.5 g, 60%)
[5-phenyl-3-(4-hydroxyphenyl)-1H-pyrrol-2-yl]-[5-phenyl-3-phenylpyrrol-2-ylidene]amine
(5b): 1-phenyl-4-nitro-3-(4-hydroxyphenyl)-butan-1-one (5a) (1 eq, 1 g, 3.5 mmol), 1,3-
diphenyl-4-nitro-butan-1-on (1b) (1 eq, 1 g, 3.5 mmol) and ammonium acetate (35 eq, 7.6 g, 122
52
mmol) in butanol (50 ml) were heated under reflux for 24 h. The reaction was cooled to room
temperature, the crude product was purified by column chromatography on silica with
dichloromethane (after eluting symmetric byproduct with hexane/dichloromethane 3:1 v/v) to
yield to product 6b as a blue-black solid. Product was recrystallized from hexane/tetrahydrofuran
mixture as green metallic crystals (0.32 g, 20%). 1H NMR (300 MHz, DMSO-d6) δ 8.14 – 7.99
(m, 8 H), 7.66 – 7.38 (m, 11 H), 6.88- 6.85 (d, J = 8.7 Hz, 2 H). Electron impact-direct insertion-
time of flight (EI-DI-TOF) m/z [MH+] found 465.1876, calculated 465.1841.
BF2 chelate of [5-phenyl-3-(4-hydroxyphenyl)-1H-pyrrol-2-yl]-[5-phenyl-3-phenylpyrrol-2-
ylidene]amine (5): Compound 5b (0.22 g, 0.47 mmol) was dissolved in dry CH2Cl2 (50 ml),
treated with diisopropylethylamine (10 eq, 0.61 ml, 4.7 mmol) and BF3 diethyletherate (15 eq,
0.9 ml, 7.05 mmol) and stirred under argon for 24 h. Purification by column chromatography on
silica eluting with CH2Cl2 and recrystallization from hexane/tetrahydrofurane gave the product 5
as a red metallic solid ( 0.17 g, 36 %). 1H NMR (300 MHz, DMSO-d6) δ 10.22 (s, 1H), 8.08-
8.13 (d, J = 13 Hz, 8 H), 7.45-7.56 (m, 11 H), 6.92-6.95 (d, J = 8.5 Hz, 2 H). Electron impact-
direct insertion-time of flight (EI-DI-TOF) m/z [MH+] found 512.1888, calculated 512.186.
1-(3-hydroxyphenyl)-3-phenylpropenone (6a): 3’-hydroxyacetophenone (1 eq, 2 g, 14.7
mmol) and benzaldehyde (1 eq, 1.56 g, 14.7 mmol) were dissolved in absolute tetrahydrofurane
(10 ml). Sodium hydride (3 eq, 1.06 g, 44.1 mmol) was added dropwise. Resulting solution was
stirred for 8-12 hours, during which the product precipitated as the potassium salt. The
solution/suspension was poured into 1 M HCl (10 ml), and further concentrated HCl was added
until the solution was acidic. Obtained yellow solid was washed with water and used in further
synthesis without purification. (2.98 g, 91%)
1-(3-hydroxyphenyl)-4-nitro-3-phenylbutan-1-one (6b): A solution of 1-(3-hydroxyphenyl)-3-
phenylpropenone (3) (1eq, 2 g, 7 mmol), nitromethane (20 eq, 7.57 ml, 140.2 mmol) and KOH
(1.2 eq, 0.47 g, 8.4 mmol) in EtOH (10 ml) was heated at 60 ºC under reflux for 12 h. After
cooling to room temperature, the solvent was removed in vacuo and oily residue obtained was
acidified with 4 M HCl and partitioned between EtOAc (50 ml) and H2O (50 ml). The organic
layer was separated, dried over sodium sulfate and evaporated under reduced pressure. The
obtained product was used for further synthesis without purification. (0.99 g, 60%)
53
[5-(3-hydroxyphenyl)-3-phenyl-1H-pyrrol-2-yl]-[5-phenyl-3-phenylpyrrol-2-ylidene]amine
(6c): 1-(3-hydroxyphenyl)-4-nitro-3-phenylbutan-1-one (6b) (1 eq, 1 g, 3.5 mmol), 1,3-diphenyl-
4-nitro-butan-1-on (1b) (1 eq, 0.94 g, 3.5 mmol) and ammonium acetate (35 eq, 7.6 g, 122.5
mmol) in butanol (50 ml) were heated under reflux for 24 h. The reaction was cooled to room
temperature, the crude product was purified by column chromatography on silica with
dichloromethane (after eluting symmetric byproduct with hexane/dichloromethane 3:1 v/v) to
yield to product 6c as a blue-black solid. Product was recrystalized from hexane/tetrahydrofuran
mixture as green metallic crystals (0.20 g, 17%). 1H NMR (300 MHz, Chloroform-d) δ 6.97-7.00
(dd, J = 9.7 Hz, 1H), 7.39-7.66 (m, 13H), 7.71 (m, 1H), 8.10-8.12 (d, J = 7.3 Hz, 6H). Electron
impact-direct insertion-time of flight (EI-DI-TOF) m/z [MH+] found 465.1853, calculated
465.1841.
BF2 chelate of [5-(3-hydroxyphenyl)-3-phenyl-1H-pyrrol-2-yl]-[5-phenyl-3-phenylpyrrol-2-
ylidene]amine (6): Compound 6c (0.19 g, 0.4 mmol) was dissolved in dry CH2Cl2 (50 ml),
treated with diisopropylethylamine (10 eq, 0.7 ml, 4 mmol) and BF3 diethyletherate (15 eq, 0.81
ml, 6 mmol) and stirred under argon for 24 h. Purification by column chromatography on silica
eluting with CH2Cl2 and recrystallization from hexane/tetrahydrofurane gave the product 6 as a
red metallic solid ( 0.08 g, 36 %). 1H NMR (300 MHz, Chloroform-d) δ 8.02-8.09 (m, 6H), 7.59-
7.61 (t, J = 2.3 Hz, 1H), 7.44-7.56 (m, 10H), 7.34-7.39 (t, J = 8 Hz, 1H), 6.97-7.01 (m, 3H).
Electron impact-direct insertion-time of flight (EI-DI-TOF) m/z [MH+] found 512.193,
calculated 512.186.
1-phenyl-4-nitro-3-(4-methoxyphenyl)-butan-1-one (7a): A solution of 1-phenyl-3-(4-
methoxyphenyl)-propenone (1 eq, 2 g, 8.4 mmol), nitromethane (20 eq, 10.25 ml, 168 mmol)
and KOH (0.2 eq, 0.09 g, 1.7 mmol) in EtOH (10 ml) was heated at 60 ºC under reflux for 12 h.
After cooling to room temperature, the solvent was removed in vacuo and oily residue obtained
was partitioned between EtOAc (50 ml) and H2O (50 ml). The organic layer was separated, dried
over sodium sulfate and evaporated under reduced pressure. The obtained product was used for
further synthesis without purification. (2.5 g, 82%)
[5-(4-hydroxyphenyl)-3-phenyl-1H-pyrrol-2-yl]-[5-(4-methoxyphenyl)-3-phenylpyrrol-2-
ylidene]amine (7b): Compound 7a (1eq, 1.0 g, 4.4 mmol), compound 1b (1eq, 0.93 g, 4.4 mmol)
54
and ammonium acetate (35 eq, 9.55 g, 154 mmol) in butanol (50 ml) were heated under reflux
for 24 h. The reaction was cooled to room temperature, the crude product was purified by
column chromatography on silica with dichloromethane (after eluting symmetric byproduct with
toluene/dichloromethane 3:1 v/v) to yield to product 7b as a blue-black solid. Product was
recrystallized from hexane/tetrahydrofuran mixture as green metallic crystals (0.13 g, 8%). 1H
NMR (300 MHz, DMSO-d6) δ 8.08-8.10 (d, J = 7.3 Hz, 4 H), 7.97-8.01 (dd, J = 8.7, 3.3 Hz, 4
H), 7.60 (s, 1 H), 7.53 (s, 1 H), 7.34 – 7.49 (m, 2H), 7.18-7.21 (d, J = 8.8 Hz, 2 H), 7.01-7.04 (d,
J = 8.7 Hz, 2 H), 3.89 (s, 3 H). Electron impact-direct insertion-time of flight (EI-DI-TOF) m/z
[MH+] found 495.1984, calculated 495.1947.
BF2 chelate of [5-(4-hydroxyphenyl)-3-phenyl-1H-pyrrol-2-yl]-[5-(4-methoxyphenyl)-3-
phenylpyrrol-2-ylidene]amine (7): Compound 7b (0.1 g, 0.20 mmol) was dissolved in dry
CH2Cl2 (50 ml), treated with diisopropylethylamine (10 eq, 0.39 ml, 2 mmol) and BF3
diethyletherate (15 eq, 0.38 ml, 3 mmol) and stirred under argon for 24 h. Purification by column
chromatography on silica eluting with CH2Cl2 and recrystallization from
hexane/tetrahydrofurane gave the product 7 as a red metallic solid ( 0.079 g, 53 %). 1H NMR
(300 MHz, DMSO-d) δ 8.11-8.19 (m, 8 H), 7.68 (s, 1 H), 7.42-7.57 (m, 7 H), 7.12-7.15 (d, J =
9.0 Hz, 2 H), 6.87-6.90 (d, J = 8.9 Hz, 2 H), 3.88 (s, 3 H). Electron impact-direct insertion-time
of flight (EI-DI-TOF) m/z [MH+] found 542.203, calculated 542.196.
1-(4-methoxyphenyl)-4-nitro-3-(4-methoxyphenyl)-butan-1-one (8a). A solution of 1-(4-
methoxyphenyl)-3-(4-methoxyphenyl)-propenone (1 eq, 2 g, 8.4 mmol), nitromethane (20 eq,
10.25 ml, 168 mmol) and KOH (0.2 eq, 0.09 g, 1.68 mmol) in EtOH (10 ml) was heated at 60
ºC under reflux for 12 h. After cooling to room temperature, the solvent was removed in vacuo
and oily residue obtained was partitioned between EtOAc (50 ml) and H2O (50 ml). The organic
layer was separated, dried over sodium sulfate and evaporated under reduced pressure. The
obtained product was used for further synthesis without purification. (2.2 g, 92%)
[5-(4-hydroxyphenyl)-3-phenyl-1H-pyrrol-2-yl]-[5-(4-methoxyphenyl)-3-(4-methoxy
phenyl)-pyrrol-2-ylidene]amine (8b): Compound 8a (1eq, 1.0 g, 4.4 mmol), compound 1b
(1eq, 0.93 g, 4.4 mmol) and ammonium acetate (35 eq, 9.55 g, 154 mmol) in butanol (50 ml)
were heated under reflux for 24 h. The reaction was cooled to room temperature, the crude
55
product was purified by column chromatography on silica eluting with dichloromethane (after
eluting symmetric byproduct with toluene/dichloromethane 3:1 v/v) to yield to product 8b as a
blue-black solid. Product was recrystallized from hexane/tetrahydrofuran mixture as green
metallic crystals (0.39 g, 20%). 1H NMR (300 MHz, DMSO-d6) δ 8.08-8.13 (m, 4H), 7.92 –
7.95 (m, 2 H), 7.87 (s, 2 H), 7.78 (s, 1 H), 7.54-7.59 (t, 2 H), 7.32-7.50 (m, 8 H), 2.31 (s, 2 H).
Electron impact-direct insertion-time of flight (EI-DI-TOF) m/z [MH+] found 525.2096,
calculated 525.2053.
BF2 chelate of [5-(4-hydroxyphenyl)-3-phenyl-1H-pyrrol-2-yl]-[5-(4-methoxyphenyl)-3-(4-
methoxy phenyl)-pyrrol-2-ylidene]amine (8): Compound 8b (0.22 g, 0.42 mmol) was
dissolved in dry CH2Cl2 (50 ml), treated with diisopropylethylamine (10 eq, 0.71 ml, 4.2 mmol)
and BF3 diethyletherate (15 eq, 0.8 ml, 6.3 mmol) and stirred under argon for 24 h. Purification
by column chromatography on silica eluting with CH2Cl2 and recrystallization from
hexane/tetrahydrofurane gave the product 8 as a red metallic solid ( 0.19 g, 78 %). 1H NMR (300
MHz, DMSO-d6) δ 10.46 (s, 1 H), 8.08 - 8.20 (m, 8 H), 7.46-7.59 (m, 5 H), 7.08-7.11 (dd, J =
12.9, 9.0 Hz, 4 H), 6.92-6.95 (d, J = 8.9 Hz, 2 H), 3.89 (s, 3 H), 3.87 (s, 3 H). Electron impact-
direct insertion-time of flight (EI-DI-TOF) m/z [MH+] found 572.2072, calculated 572.2129.
56
BF2 chelate of [5-(4-hydroxyphenyl)-3-phenyl-1H-pyrrol-2-yl]-[5-phenyl-3-phenylpyrrol-2-
ylidene]amine (1).
57
58
Figure S1. 1H NMR and mass spectra of 1 in DMSO.
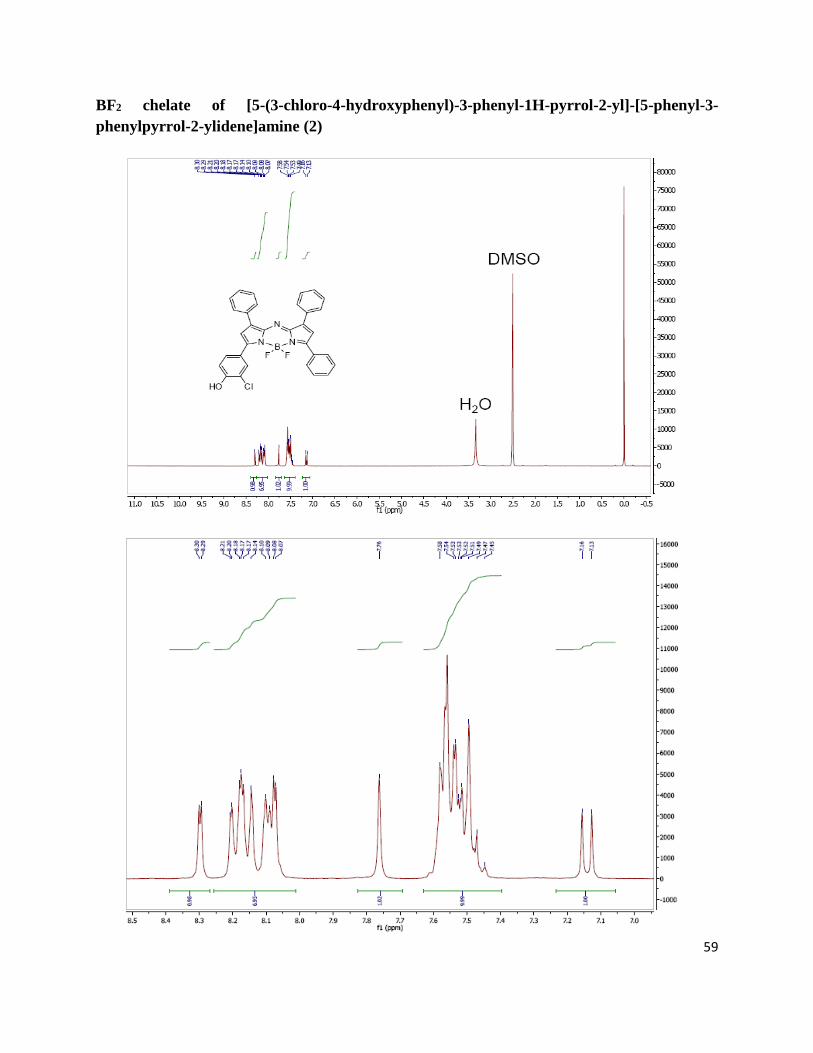
59
BF2 chelate of [5-(3-chloro-4-hydroxyphenyl)-3-phenyl-1H-pyrrol-2-yl]-[5-phenyl-3-
phenylpyrrol-2-ylidene]amine (2)
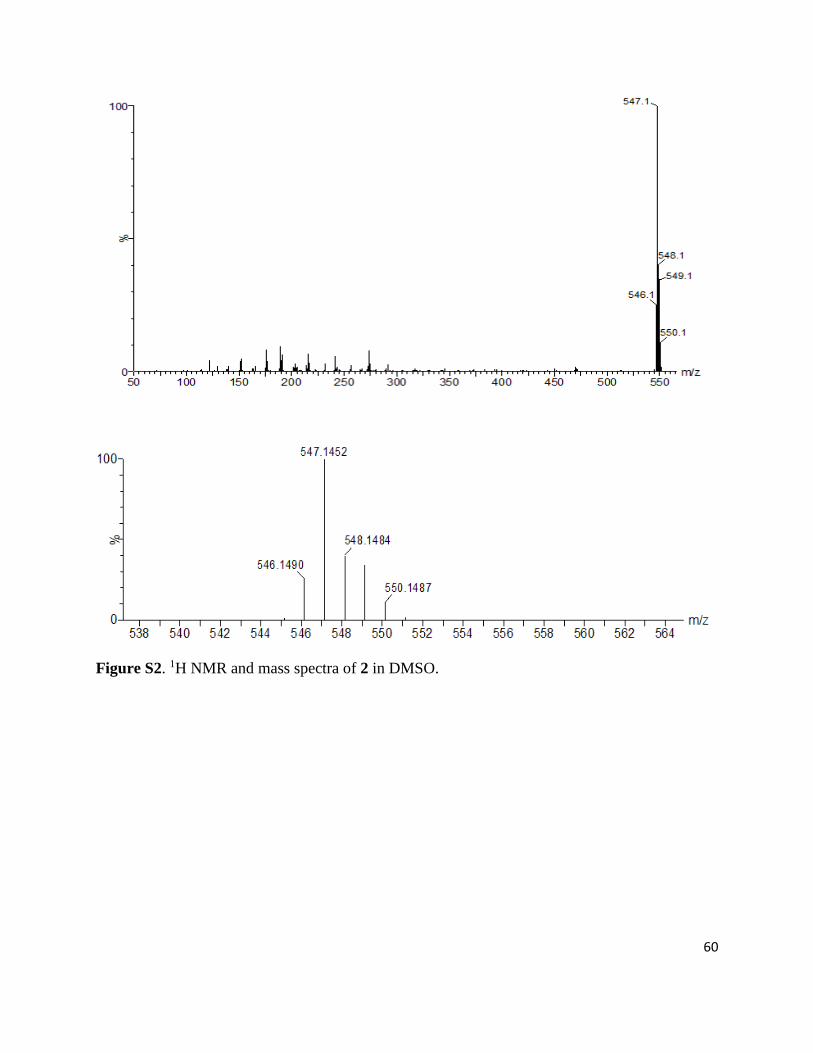
60
Figure S2. 1H NMR and mass spectra of 2 in DMSO.
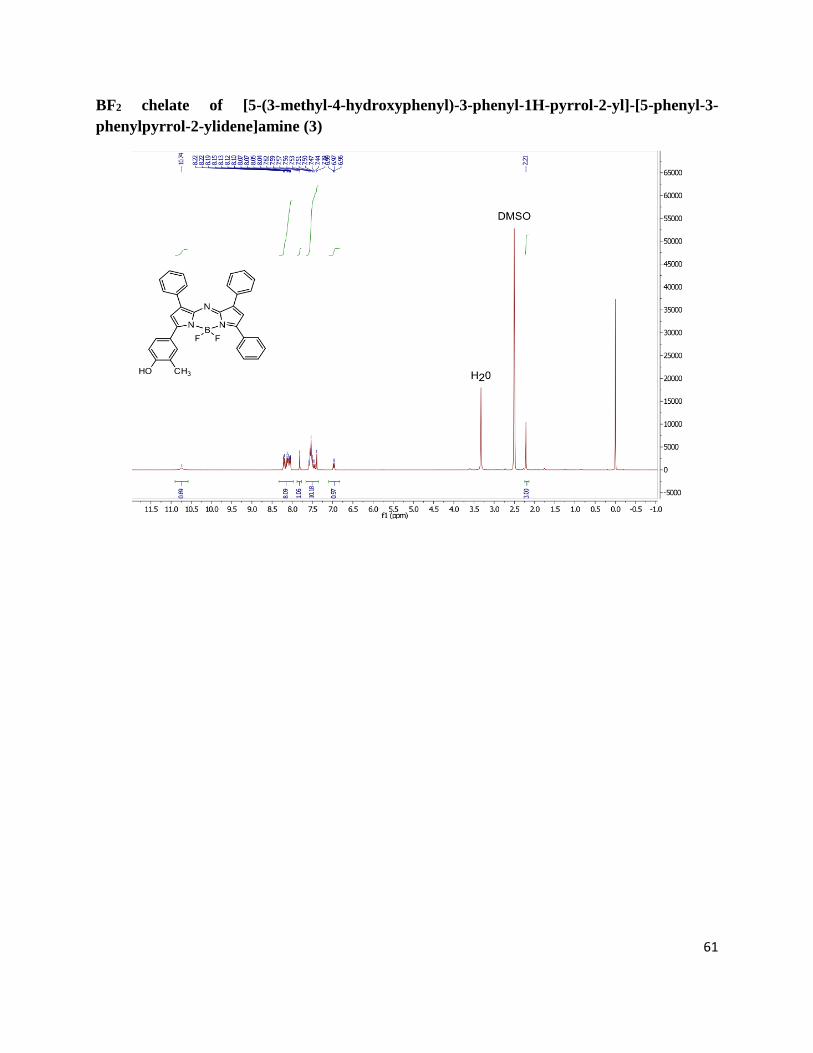
61
BF2 chelate of [5-(3-methyl-4-hydroxyphenyl)-3-phenyl-1H-pyrrol-2-yl]-[5-phenyl-3-
phenylpyrrol-2-ylidene]amine (3)
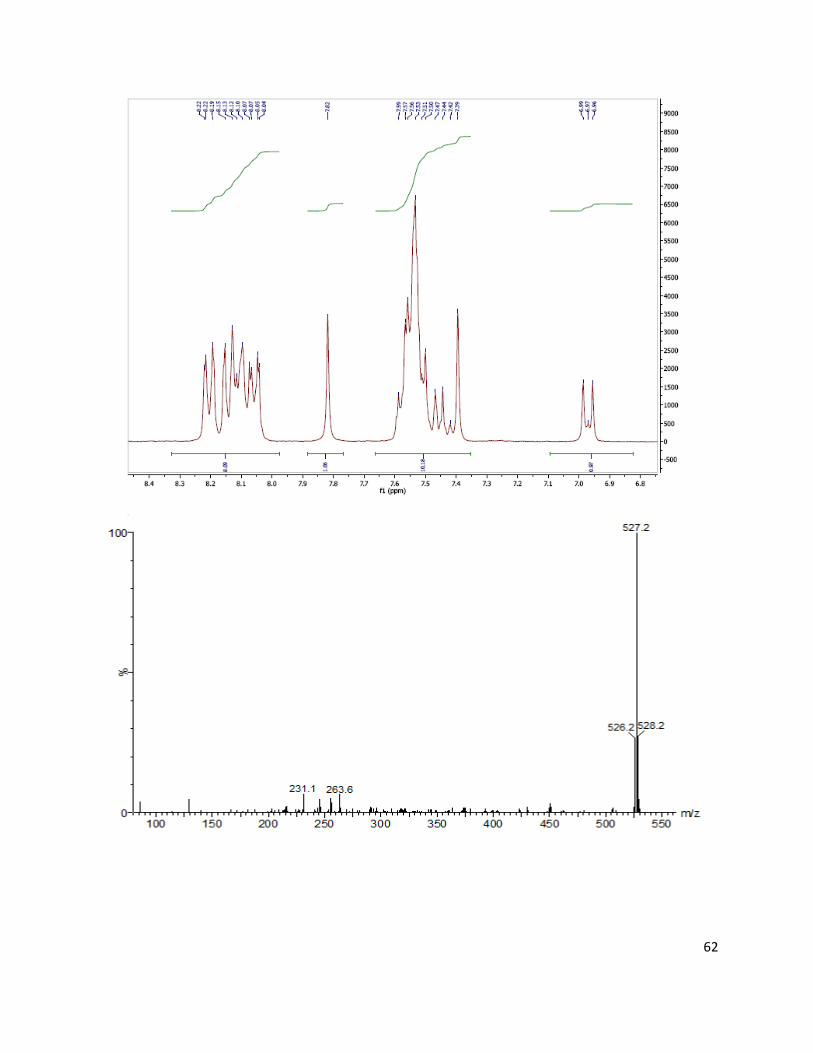
62
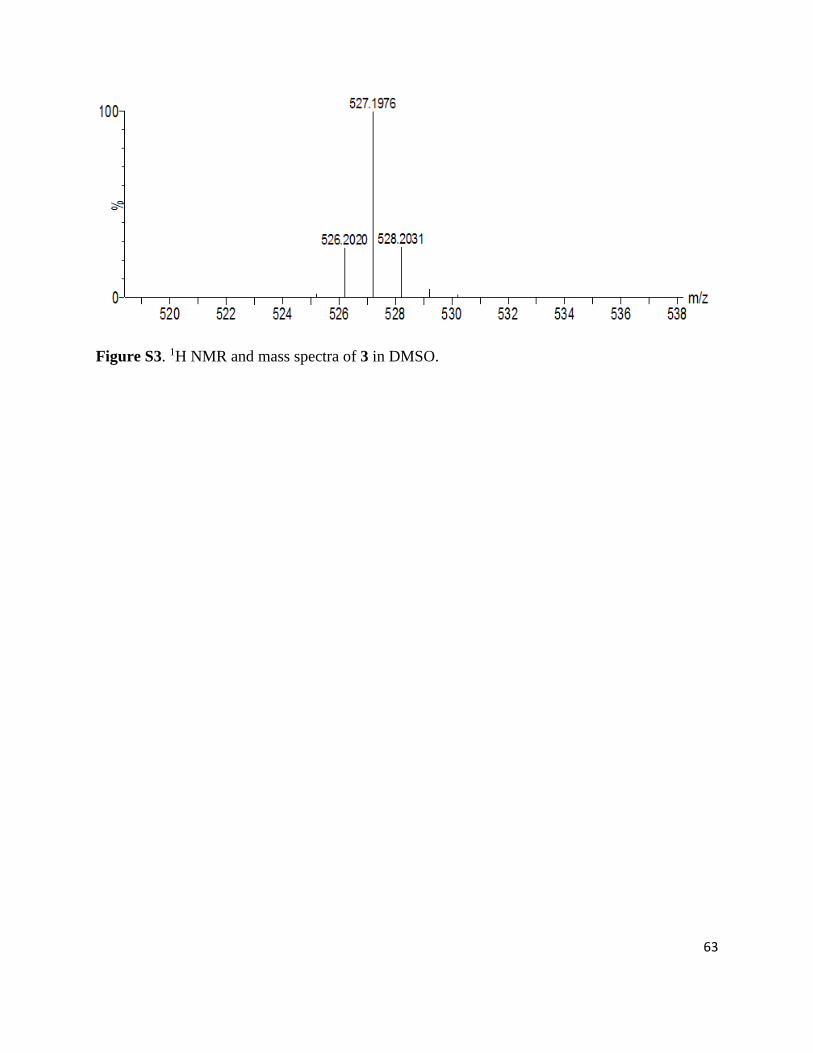
63
Figure S3. 1H NMR and mass spectra of 3 in DMSO.
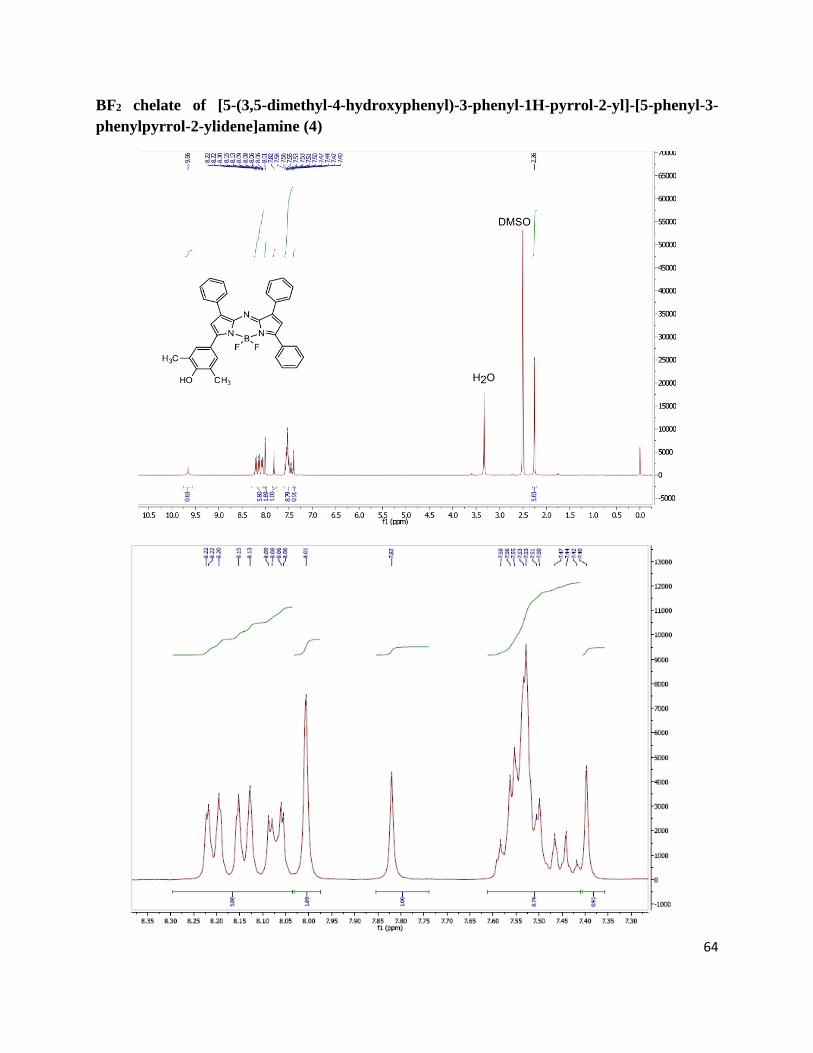
64
BF2 chelate of [5-(3,5-dimethyl-4-hydroxyphenyl)-3-phenyl-1H-pyrrol-2-yl]-[5-phenyl-3-
phenylpyrrol-2-ylidene]amine (4)
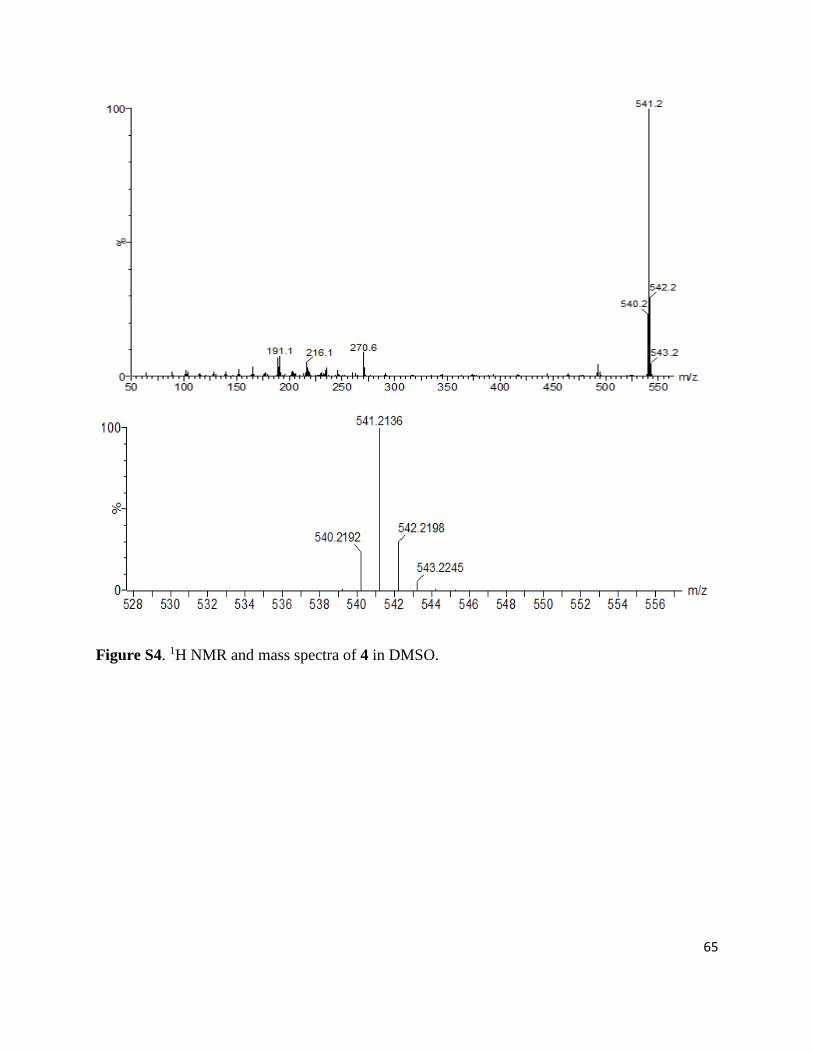
65
Figure S4. 1H NMR and mass spectra of 4 in DMSO.
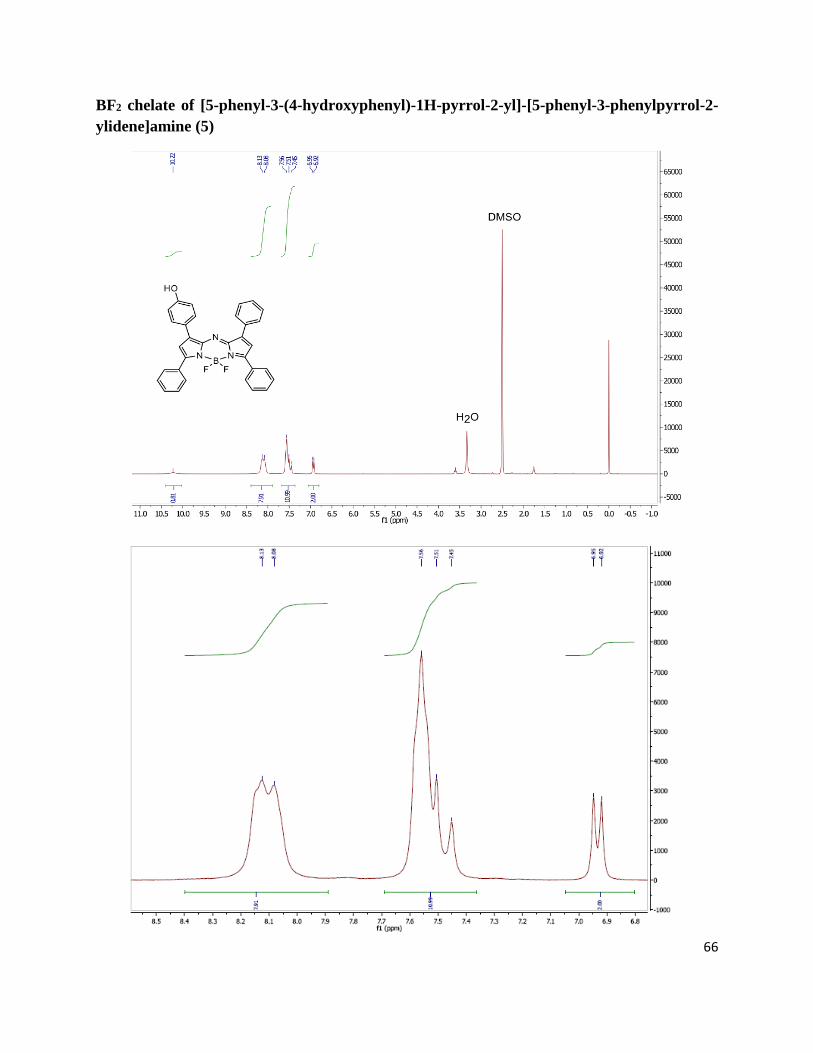
66
BF2 chelate of [5-phenyl-3-(4-hydroxyphenyl)-1H-pyrrol-2-yl]-[5-phenyl-3-phenylpyrrol-2-
ylidene]amine (5)
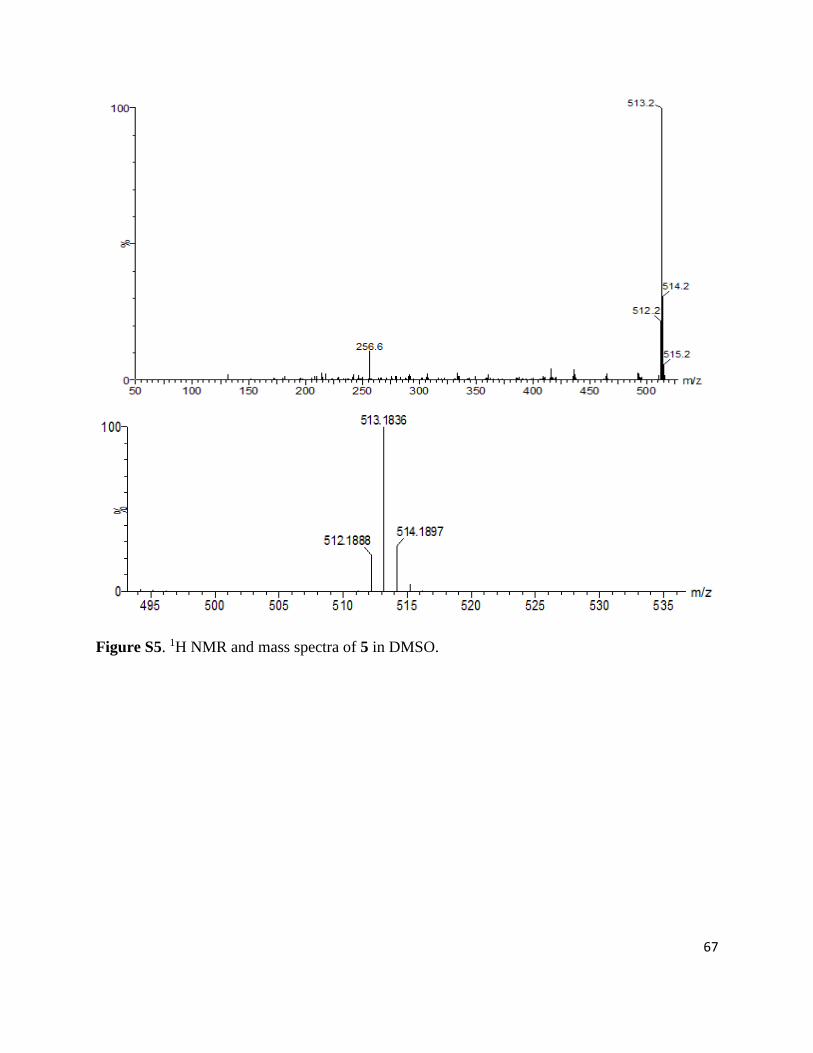
67
Figure S5. 1H NMR and mass spectra of 5 in DMSO.
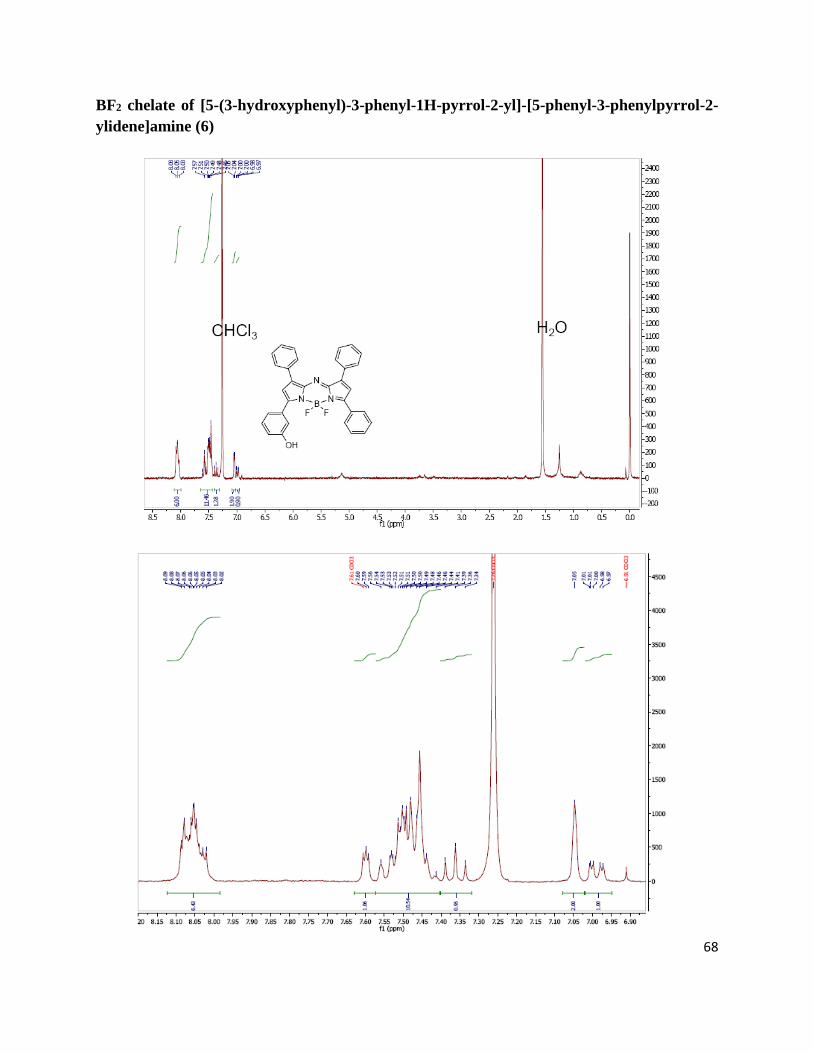
68
BF2 chelate of [5-(3-hydroxyphenyl)-3-phenyl-1H-pyrrol-2-yl]-[5-phenyl-3-phenylpyrrol-2-
ylidene]amine (6)
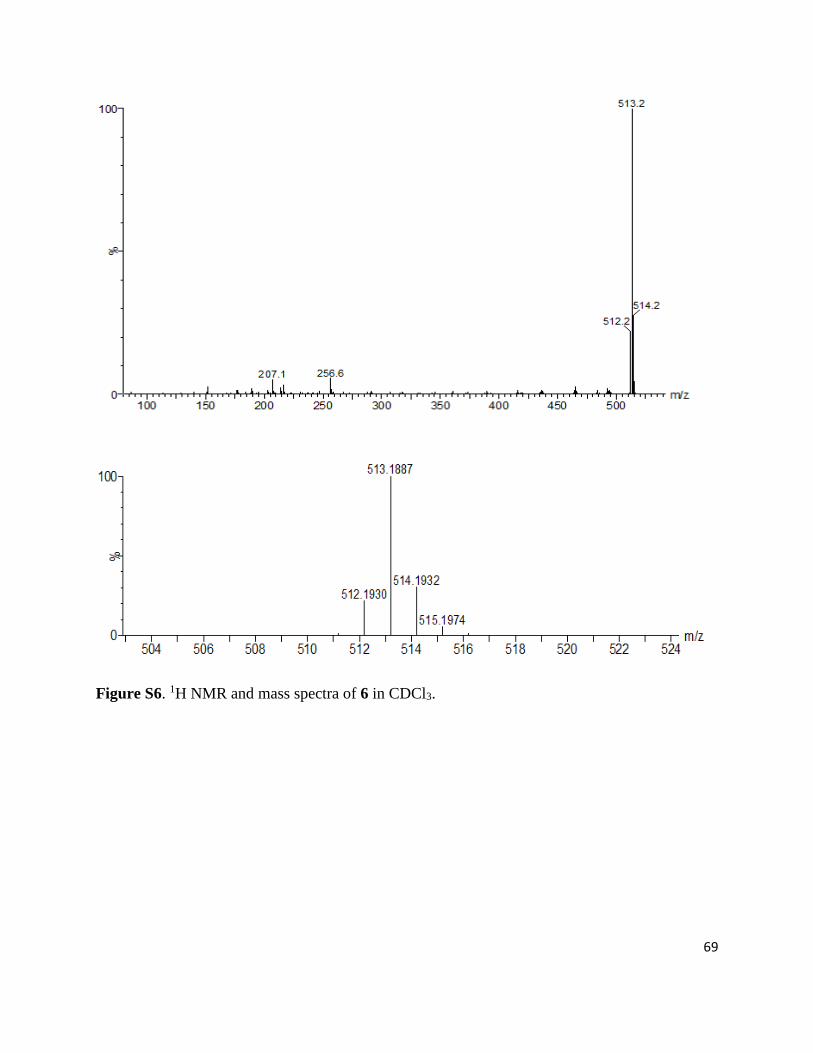
69
Figure S6. 1H NMR and mass spectra of 6 in CDCl3.
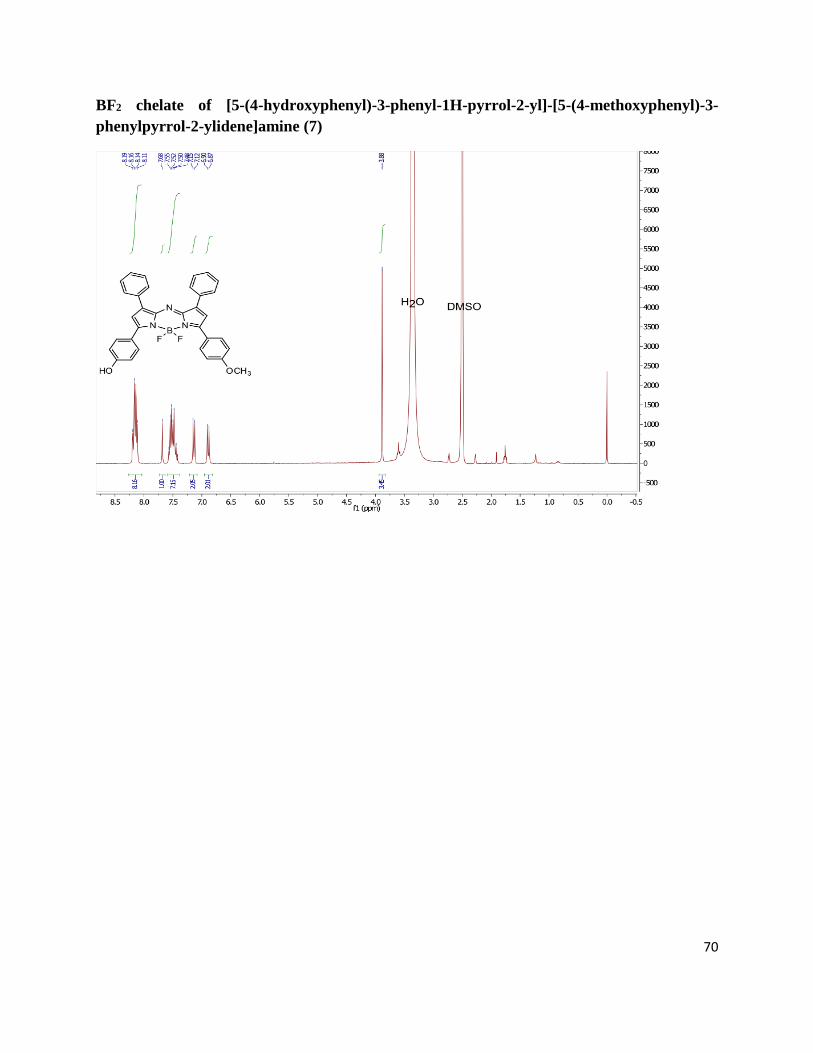
70
BF2 chelate of [5-(4-hydroxyphenyl)-3-phenyl-1H-pyrrol-2-yl]-[5-(4-methoxyphenyl)-3-
phenylpyrrol-2-ylidene]amine (7)
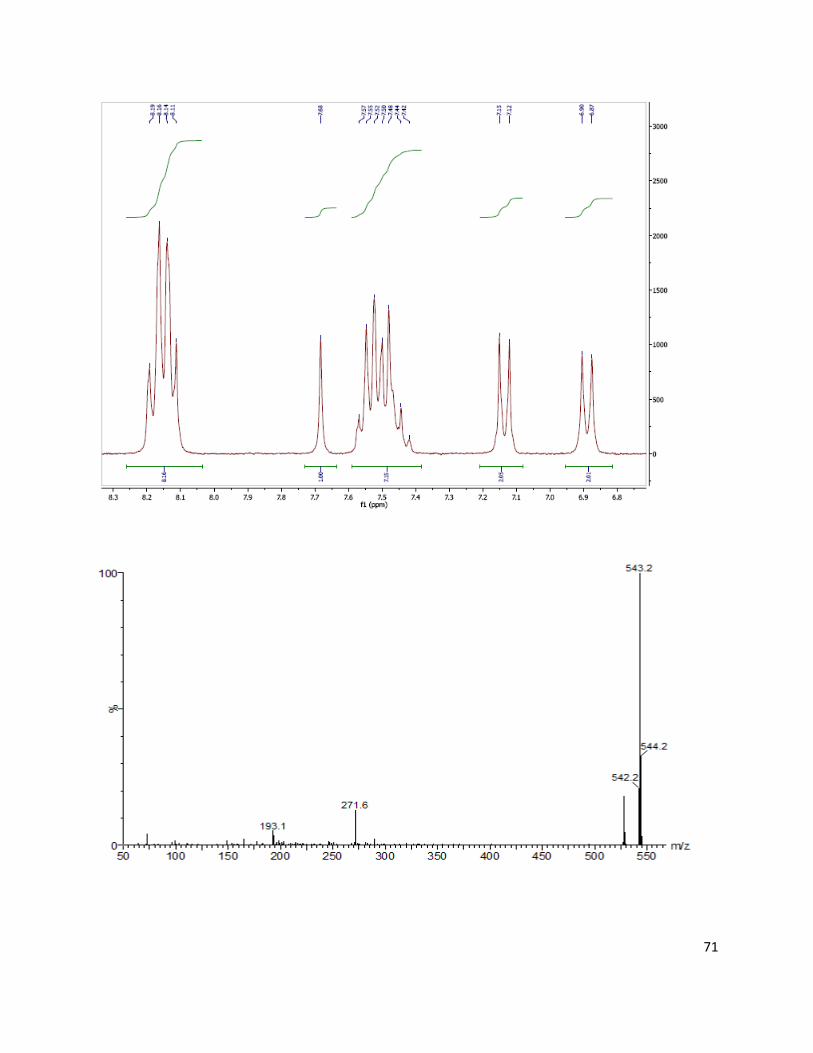
71
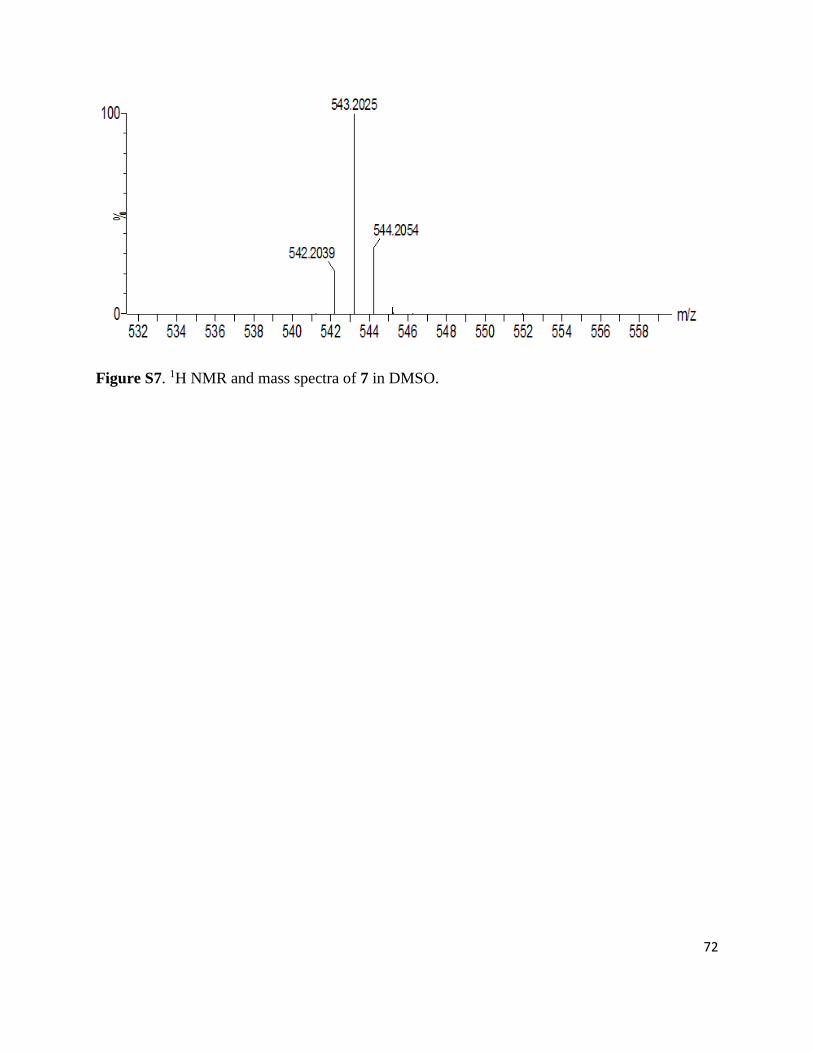
72
Figure S7. 1H NMR and mass spectra of 7 in DMSO.
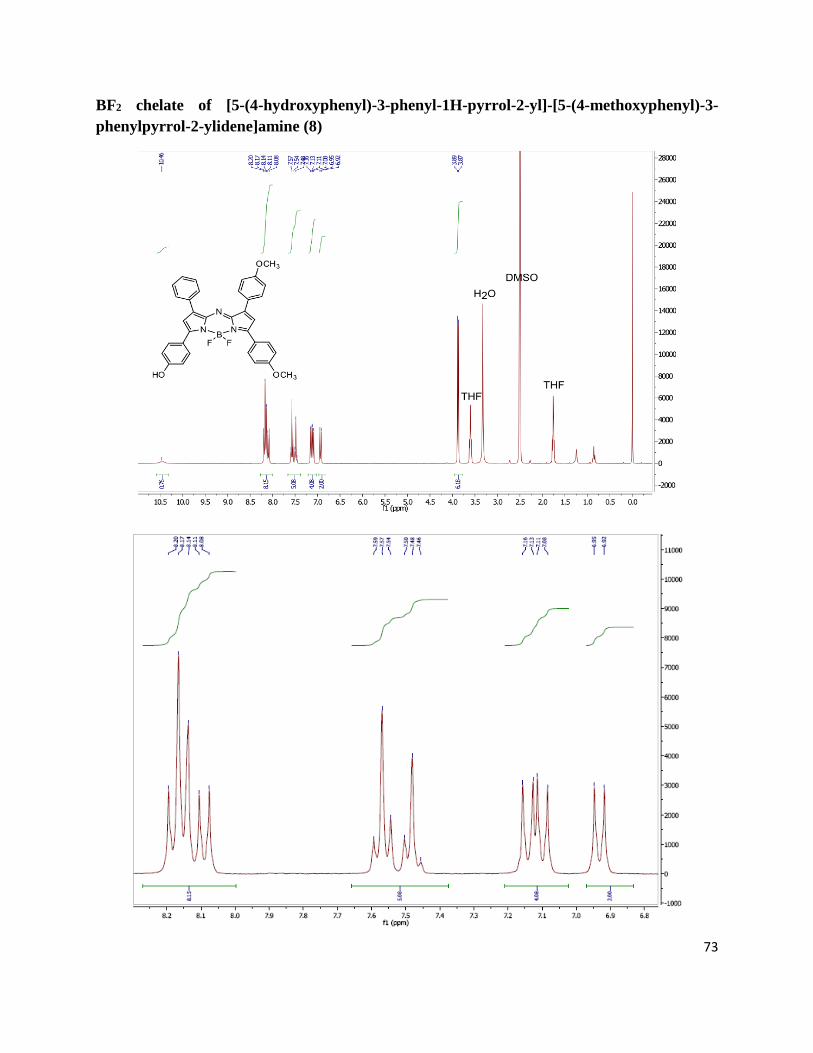
73
BF2 chelate of [5-(4-hydroxyphenyl)-3-phenyl-1H-pyrrol-2-yl]-[5-(4-methoxyphenyl)-3-
phenylpyrrol-2-ylidene]amine (8)
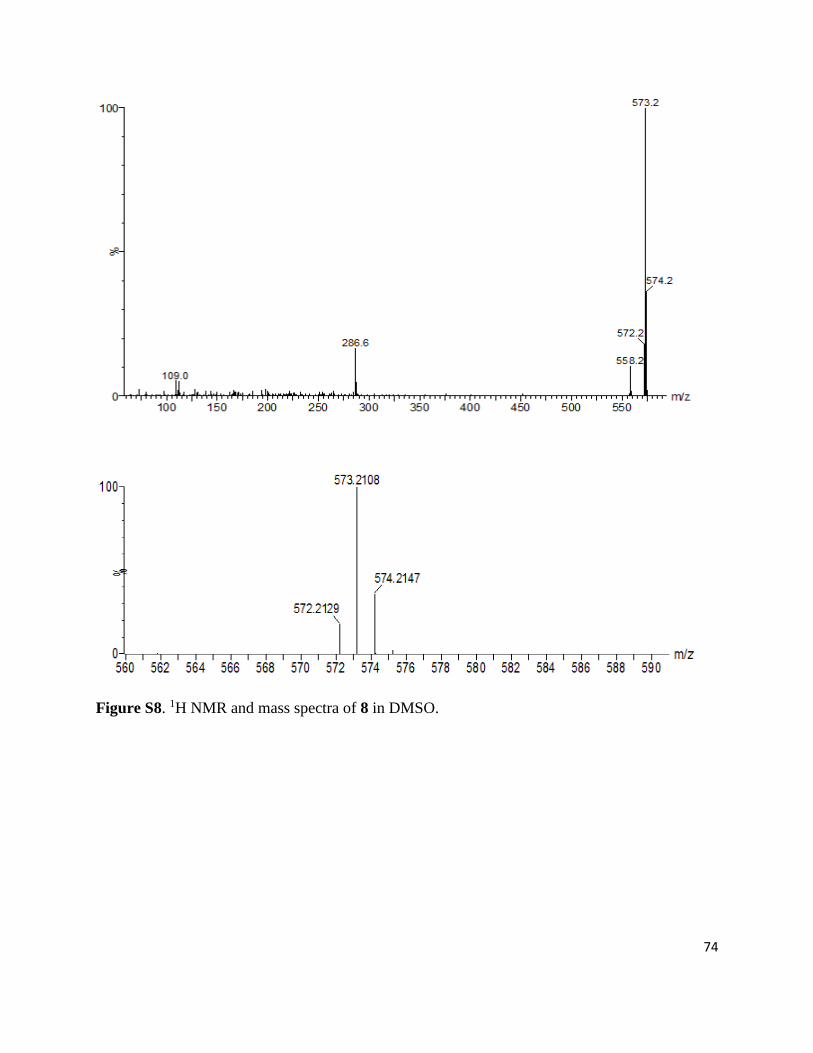
74
Figure S8. 1H NMR and mass spectra of 8 in DMSO.
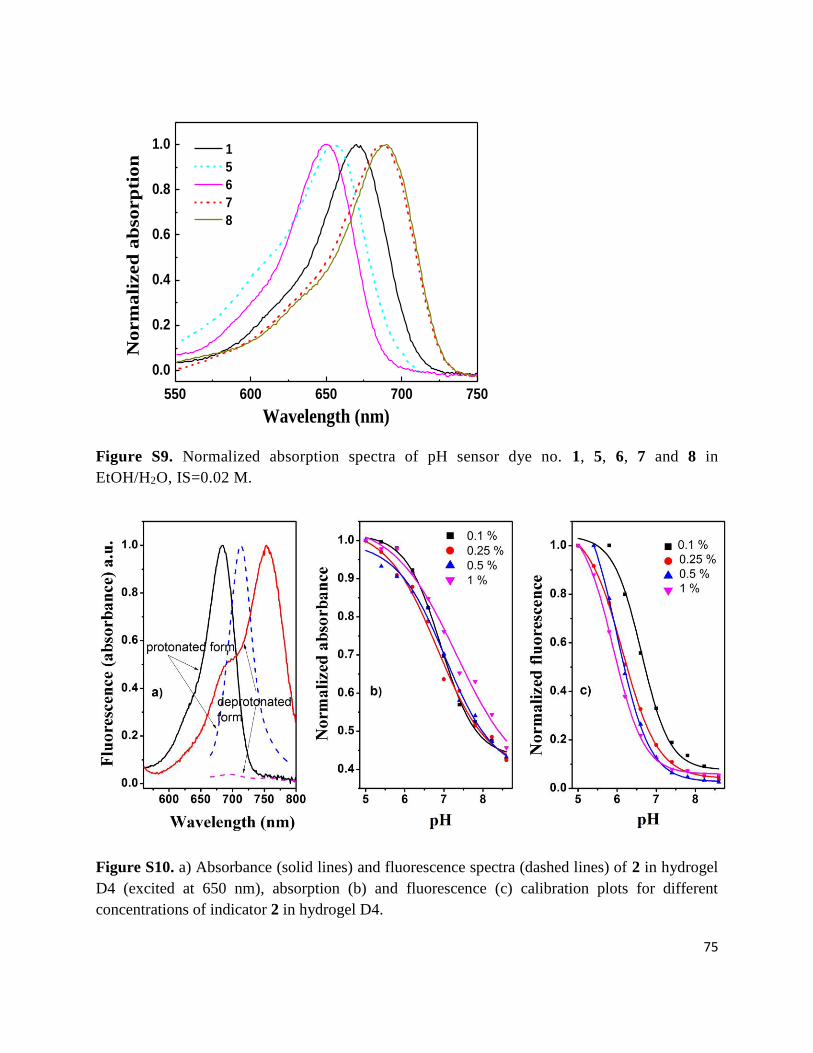
75
550 600 650 700 750
0.0
0.2
0.4
0.6
0.8
1.0 1
5
6
7
8
No
rm
ali
zed
ab
so
rp
tio
n
Wavelength (nm)
Figure S9. Normalized absorption spectra of pH sensor dye no. 1, 5, 6, 7 and 8 in
EtOH/H2O, IS=0.02 M.
Figure S10. a) Absorbance (solid lines) and fluorescence spectra (dashed lines) of 2 in hydrogel
D4 (excited at 650 nm), absorption (b) and fluorescence (c) calibration plots for different
concentrations of indicator 2 in hydrogel D4.
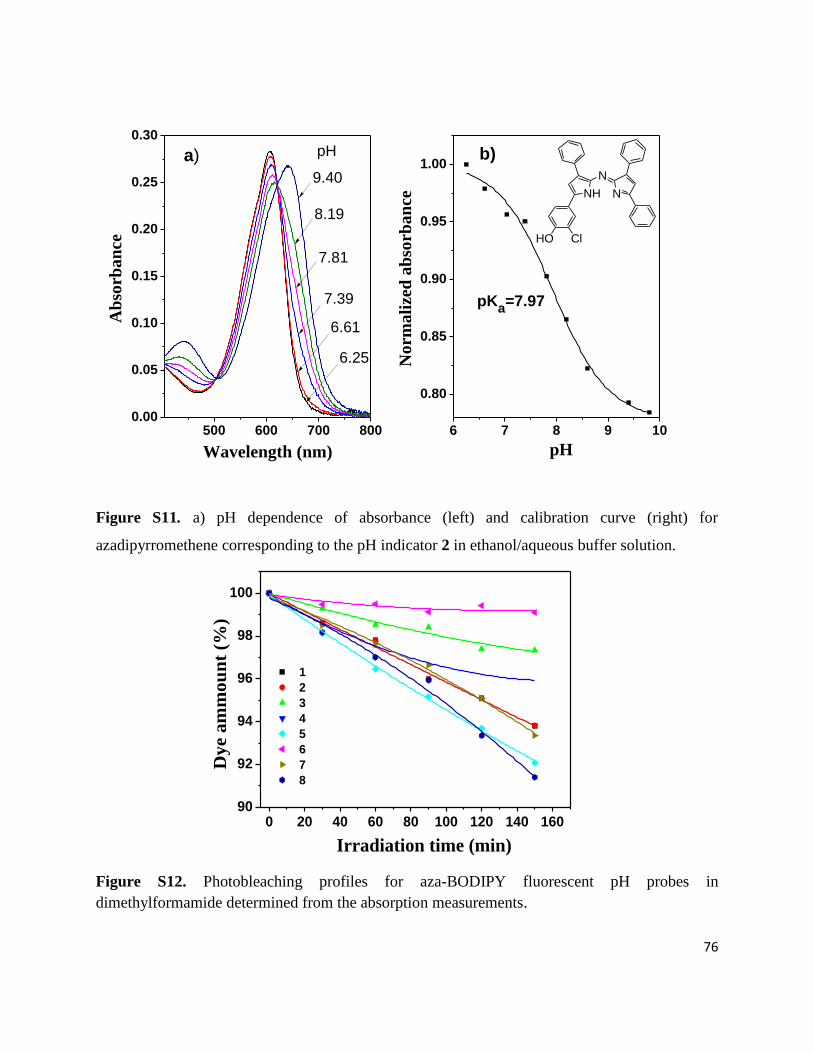
76
500 600 700 8000.00
0.05
0.10
0.15
0.20
0.25
0.30
6 7 8 9 10
0.80
0.85
0.90
0.95
1.009.40
8.19
7.81
7.39
6.61
A
bso
rba
nce
Wavelength (nm)
a)
NH N
N
HO Cl
6.25
pH
No
rm
ali
zed
ab
sorb
an
ce
pH
pKa=7.97
b)
Figure S11. a) pH dependence of absorbance (left) and calibration curve (right) for
azadipyrromethene corresponding to the pH indicator 2 in ethanol/aqueous buffer solution.
0 20 40 60 80 100 120 140 16090
92
94
96
98
100
1
2
3
4
5
6
7
8
Dye a
mm
ou
nt
(%)
Irradiation time (min)
Figure S12. Photobleaching profiles for aza-BODIPY fluorescent pH probes in
dimethylformamide determined from the absorption measurements.
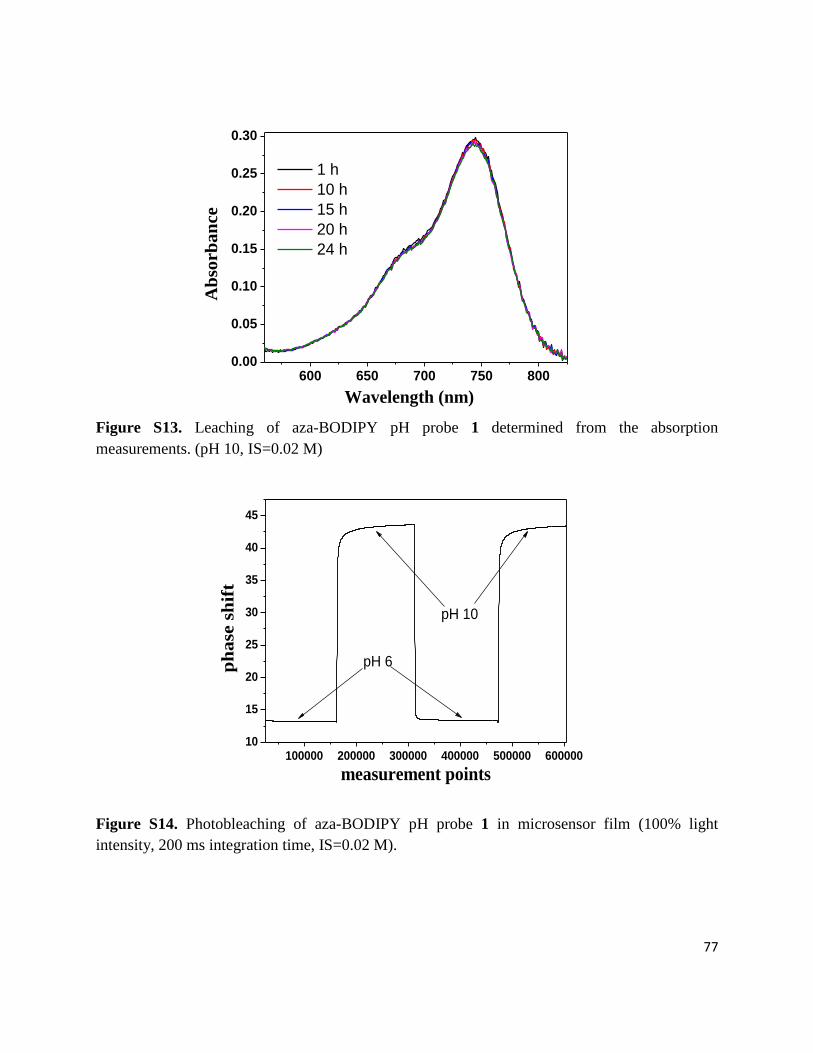
77
600 650 700 750 8000.00
0.05
0.10
0.15
0.20
0.25
0.30
Ab
sorb
an
ce
Wavelength (nm)
1 h
10 h
15 h
20 h
24 h
Figure S13. Leaching of aza-BODIPY pH probe 1 determined from the absorption
measurements. (pH 10, IS=0.02 M)
100000 200000 300000 400000 500000 60000010
15
20
25
30
35
40
45
ph
ase
sh
ift
measurement points
pH 6
pH 10
Figure S14. Photobleaching of aza-BODIPY pH probe 1 in microsensor film (100% light
intensity, 200 ms integration time, IS=0.02 M).
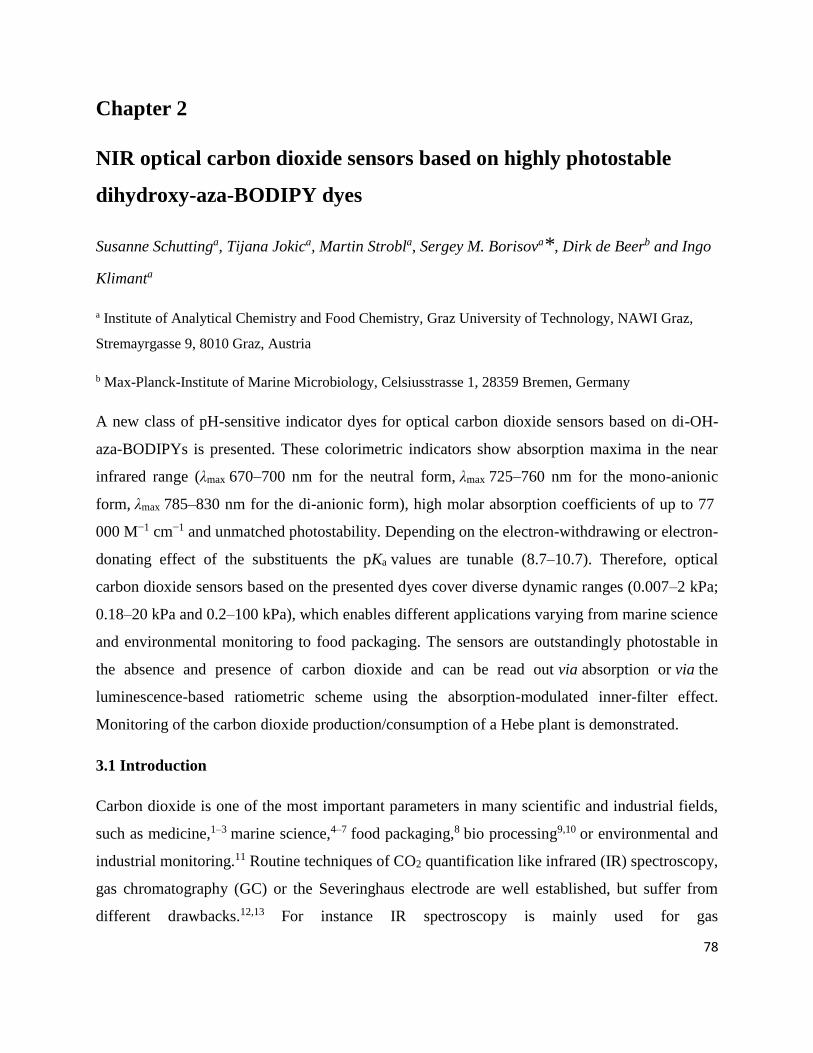
78
Chapter 2
NIR optical carbon dioxide sensors based on highly photostable
dihydroxy-aza-BODIPY dyes
Susanne Schuttinga, Tijana Jokica, Martin Strobla, Sergey M. Borisova*, Dirk de Beerb and Ingo
Klimanta
a Institute of Analytical Chemistry and Food Chemistry, Graz University of Technology, NAWI Graz,
Stremayrgasse 9, 8010 Graz, Austria
b Max-Planck-Institute of Marine Microbiology, Celsiusstrasse 1, 28359 Bremen, Germany
A new class of pH-sensitive indicator dyes for optical carbon dioxide sensors based on di-OH-
aza-BODIPYs is presented. These colorimetric indicators show absorption maxima in the near
infrared range (λmax 670–700 nm for the neutral form, λmax 725–760 nm for the mono-anionic
form, λmax 785–830 nm for the di-anionic form), high molar absorption coefficients of up to 77
000 M−1 cm−1 and unmatched photostability. Depending on the electron-withdrawing or electron-
donating effect of the substituents the pKa values are tunable (8.7–10.7). Therefore, optical
carbon dioxide sensors based on the presented dyes cover diverse dynamic ranges (0.007–2 kPa;
0.18–20 kPa and 0.2–100 kPa), which enables different applications varying from marine science
and environmental monitoring to food packaging. The sensors are outstandingly photostable in
the absence and presence of carbon dioxide and can be read out via absorption or via the
luminescence-based ratiometric scheme using the absorption-modulated inner-filter effect.
Monitoring of the carbon dioxide production/consumption of a Hebe plant is demonstrated.
3.1 Introduction
Carbon dioxide is one of the most important parameters in many scientific and industrial fields,
such as medicine,1–3 marine science,4–7 food packaging,8 bio processing9,10 or environmental and
industrial monitoring.11 Routine techniques of CO2 quantification like infrared (IR) spectroscopy,
gas chromatography (GC) or the Severinghaus electrode are well established, but suffer from
different drawbacks.12,13 For instance IR spectroscopy is mainly used for gas
79
samples,14,15 because of strong interferences of water and the Severinghaus electrode is strongly
affected by osmotic effects. Carbon dioxide chemosensors are a promising alternative,16–
23 among which the so-called “plastic type” sensors are the most common ones.24–31 The core of
this type of sensor is a pH-sensitive indicator dye. It is embedded in a polymer matrix together
with a base (mainly a quaternary ammonium base) and responds to carbon dioxide by changing
its spectral properties according to the degree of protonation. Read-out of these sensors can be
carried out via absorption or luminescence intensity. In the case of a fluorescent indicator dye,
referencing of the fluorescence intensity is necessary to achieve reliable results. This can be
realized by using an analyte-insensitive reference dye with different spectral properties from the
indicator, either a different emission spectrum or a different luminescence decay time. Although
necessary in many cases, the addition of reference materials can cause dramatic ratio changes
when photobleaching of one dye (reference or indicator) or both occurs. Therefore, self-
referencing indicator dyes are highly desired for ratiometric read-out. However, only a few self-
referencing dyes (absorption and fluorescence intensity) have been published so far.32–38 Optical
carbon dioxide sensors are also of great interest in biological applications. Here, indicators with
absorption/fluorescence intensity maxima in the infrared (IR) or near-infrared (NIR) region are
preferred, because of several advantages, e.g. low light scattering, dramatically reduced
autofluorescence and availability of low-cost excitation sources and photodetectors. Recently our
group has presented pH-sensitive BF2-chelated tetraarylazadipyrromethene indicators (aza-
BODIPYs).38 This indicator class represents an interesting alternative to the state-of-the-art dyes
for biological applications as SNARF indicators39 or cyanine dyes.40,41 The aza-BODIPYs
showed absorption/fluorescence intensity spectra in the near-infrared region and were highly
photostable. Although pH-sensitive, these dyes could not be used for optical carbon dioxide
sensors. Here, the formation of the ion pair was irreversible and the indicator could not be
protonated anymore, even at 100% CO2. In this study we present a new class of pH-sensitive
indicator dyes suitable for optical carbon dioxide sensors, the di-OH-aza-BODIPYs containing
two de-/protonatable hydroxyl groups. It will be shown that the pKa values of the di-OH-aza-
BODIPYs can be tuned by using different substituents with either the electron-withdrawing or
the electron-donating effect. Luminescence-based ratiometric read-out can be realized via the
80
absorption-modulated inner-filter effect.42–45 An application example demonstrating the carbon
dioxide production/consumption of a Hebe plant will also be presented.
3.2 Experimental
Materials. Ethyl cellulose (EC49, ethoxyl content 49%), thymol-blue (A.C.S. reagent), m-
cresol-purple (indicator grade), poly(styrene-co-divinylbenzene)microspheres (8 μm mean
particle size; PS-microparticles), 3′-chloro-4′-hydroxyacetophenone, ammonium acetate,
benzaldehyde, N,N-diisopropylethylamine (DIPEA), dry dichloromethane, boron trifluoride
diethyl etherate, MOPS buffer salt, sodium sulfate (anhydrous) and tetraoctylammonium
hydroxide solution (TOAOH, 20% in methanol) were obtained from Sigma-Aldrich
(www.sigmaaldrich.com). Deuterated dimethyl sulfoxide (DMSO-d6) was purchased from
Euriso-top (www.eurisotop.com). Perfluorodecalin (98%; cis and trans), 1-butanol (99%, BuOH)
and nitromethane were received from ABCR (Germany, www.abcr.de), Hyflon AD 60 from
Solvay (www.solvay.com). Nitrogen, 2% oxygen in nitrogen, 5% carbon dioxide in nitrogen,
0.2% carbon dioxide in nitrogen, argon and carbon dioxide (all of 99.999% purity) were obtained
from Air Liquide (Austria, www.airliquide.at). Toluene, ethanol (EtOH), tetrahydrofuran (THF),
hydrochloric acid (37%), dichloromethane (DCM) and hexane were purchased from VWR
(Austria, www.vwr.com). 3′-methyl-4-hydroxyacetophenone, 4′-butoxyacetophenone and 2-
fluoro-4-hydroxyacetophenone were from TCI Europe (www.tcichemicals.com). Poly(ethylene
terephthalate) (PET) support Melinex 505 was obtained from Pütz (Germany, www.puetz-
folien.com). Potassium chloride, potassium carbonate (pro analysi), potassium hydroxide and
silica gel 60 (0.063–0.200 mm) were received from Merck (www.merck.at). Sodium hydroxide,
ethyl acetate, the buffer salts CHES, MES and CAPS were purchased from Roth
(www.carlroth.com). De-ionized water was filtered via a Barnstead NANOpure ultrapure water
system. 1-(4-Hydroxyphenyl)-4-nitro-3-phenylbutan-1-one (compound 1b) was synthesized
according to Jokic et al.38 Silanized Egyptian blue particles were prepared according to the
literature procedure.46
81
Synthesis of 3,7-bis(4-butoxyphenyl)-5,5-difluoro-1,9-diphenyl-5H-4λ4,5λ4-dipyrrolo[1,2-
c:2′,1′-f][1,3,5,2]triazaborinine (di-butoxy-complex).
(E)-1-(4-Butoxyphenyl)-3-phenylprop-2-en-1-one (compound a). 4′-Butoxyacetophenone (1 eq.,
2.00 g, 15.5 mmol) was dissolved in absolute ethanol (15 ml). Benzaldehyde (1 eq., 1580 μl,
15.5 mmol) and potassium hydroxide (3 eq., 2.61 g, 46.4 mmol in 5 ml H2O) were added to the
solution and the reaction was stirred at room temperature for 12 h. Then, the reaction
solution/suspension was acidified with 0.1 M HCl and the resulting precipitate was collected by
filtration and was washed with water three times (3 × 100 ml). The precipitate was dried on a
rotary evaporator and was used for the next step without further purification (3.87 g, 89.2%).
1-(4-Butoxyphenyl)-4-nitro-3-phenylbutan-1-one (compound b). A solution of (E)-1-(4-
butoxyphenyl)-3-phenylprop-2-en-1-one (1 eq., 3.87 g, 13.8 mmol), nitromethane (20 eq., 14.8
ml, 276 mmol) and KOH (0.3 eq., 0.232 g, 4.1 mmol) in 30 ml of absolute ethanol was heated
under reflux for 12 h. After cooling to room temperature the solvent was removed on a rotary
evaporator. The resulting oily residue was acidified with 0.1 M HCl and was partitioned with
ethyl acetate and water in a separating funnel. The organic layer was separated, dried over
sodium sulfate and the solvent was removed under reduced pressure (4.035 g, 85.7%).
(5Z)-5-(4-Butoxyphenyl)-N-(5-(4-butoxyphenyl)-3-phenyl-2H-pyrrol-2-ylidene)-3-phenyl-1H-
pyrrol-2-amine (c). Compound b (1 eq., 2.5 g, 7.33 mmol) and ammonium acetate (35 eq., 19.77
g, 256 mmol) were dissolved in 50 ml of 1-butanol and the reaction solution was heated under
reflux for 24 h. The reaction was cooled to room temperature and the solvent was removed under
reduced pressure. Then, the solid was redissolved in DCM and washed with water three times (3
× 100 ml). The crude solid was purified by column chromatography on silica gel, eluting with
DCM/cyclohexane (1 : 1 v/v). The product was recrystallized from a hexane–THF mixture to
give metallic blue crystals (983 mg, 45.4%). 1H NMR (300 MHz, CDCl3) δ 8.06 (d, J = 7.1 Hz,
4H), 7.88–7.83 (m, 4H), 7.44–7.31 (m, 6H), 7.11 (s, 2H), 7.02 (d, J = 8.8 Hz, 4H), 4.06 (t, J =
6.5 Hz, 4H), 1.91–1.72 (q, J = 8.5 Hz, 4H), 1.6–1.48 (m, 4H), 1.01 (t, J = 7.4 Hz, 6H).
3,7-Bis(4-butoxyphenyl)-5,5-difluoro-1,9-diphenyl-5H-4λ4,5λ4-dipyrrolo[1,2-c:2′,1′-
f][1,3,5,2]triazaborinine. Compound c (1 eq., 300 mg, 0.51 mmol) was dissolved in 200 ml of
dry DCM. N,N-Diisopropylethylamine (DIPEA, 10 eq., 839 μl, 5.06 mmol) and boron trifluoride
diethyl etherate (15 eq., 953 μl, 7.58 mmol) were added and the reaction solution was stirred
82
under nitrogen for 12 h. The green solution was washed with water three times (3 × 200 ml) and
dried over anhydrous sodium sulfate. The crude product was purified by column chromatography
on silica gel, eluting with DCM/cyclohexane (1 : 1 v/v). The product was recrystallized from a
hexane–THF mixture to give metallic red needles (179 mg, 55.2%). 1H NMR (300 MHz,
CDCl3) δ 8.09–8.05 (m, 8H), 7.49–7.38 (m, 6H), 7.04–6.98 (m, 6H), 4.07–4.02 (t, J = 6.4 Hz,
4H), 1.58–1.45 (q, J = 14.4 Hz, 4H), 1.62–1.42 (m, 4H), 1.02–0.97 (t, J = 7.4 Hz, 6H). Electron
impact-direct insertion-time of flight (DI-EI-TOF):m/z of [M]+ was found to be 641.3007, calc.
641.3032.
Synthesis of 4,4′-(5,5-difluoro-1,9-diphenyl-5H-4λ4,5λ4-dipyrrolo[1,2-c:2′,1′-
f][1,3,5,2]triazaborinine-3,7-diyl)bis(2-chlorophenol) (di-Cl-di-OH-complex).
1-(3-Chloro-4-hydroxyphenyl)-3-phenylpropenone (compound 1a). 3′-Chloro-4′-
hydroxyacetophenone (1 eq., 2 g, 11.7 mmol) and benzaldehyde (1 eq., 1.24 g, 11.7 mmol) were
dissolved in 10 ml of ethanol absolute. 10 ml of aqueous potassium hydroxide solution (3 eq.,
1.96 g, 35.1 mmol) were added dropwise. The resulting solution was stirred for 8–12 h, during
which the product precipitated as a potassium salt. The solution/suspension was poured into 10
ml of hydrochloric acid (1 M) and further concentrated hydrochloric acid was added until the
solution became acidic. The obtained yellow solid was washed with water and used for further
synthesis without purification (2.33 g, 77%).
1-(3-Chloro-4-hydroxyphenyl)-4-nitro-3-phenylbutan-1-one (compound 1b). A solution of
compound 1a (1 eq., 2 g, 7.7 mmol), nitromethane (20 eq., 8.35 ml, 154.7 mmol) and potassium
hydroxide (1.2 eq., 0.52 g, 9.28 mmol) in 10 ml of ethanol was heated at 60 °C under reflux for
12 h. After cooling to room temperature, the solvent was removed in vacuo and the oily residue
obtained was acidified with hydrochloric acid (4 M) and partitioned between ethyl acetate (50
ml) and de-ionized water (50 ml). The organic layer was separated, dried over anhydrous sodium
sulfate and evaporated under reduced pressure. The obtained product was used for further
synthesis without purification (2.4 g,97.2%).
[5-(3-Chloro-4-hydroxyphenyl)-3-phenyl-1H-pyrrol-2-yl]-[5-(3-chloro-4-hydroxyphenyl)-3-
phenylpyrrol-2-ylidene]amine (compound 1c). Compound 1b (1 eq., 2.02 g, 8.76 mmol) and
83
ammonium acetate (35 eq., 19.03 g, 307 mmol) in 50 ml of 1-butanol were heated under reflux
for 24 h. The reaction was cooled to room temperature, the salt was removed by extraction with
de-ionized water/DCM and the product was purified by column chromatography on silica gel,
eluting with 5% ethyl acetate/DCM (after eluting impurities with hexane, 20% DCM/hexane, 1%
ethyl acetate/DCM and 2% ethyl acetate/DCM) to yield 1c as a blue-black solid. The product
was recrystallized from a hexane–THF mixture to give metallic green crystals (0.097 g,
5.77%). 1H NMR (300 MHz, DMSO-d6) δ 8.09 (d, J = 7.6 Hz, 6H), 7.90 (d, J = 8.5 Hz, 2H),
7.62 (s, 2H), 7.54–7.32 (m, 6H), 7.19 (d, J = 8.5 Hz, 2H). EI-DI-TOF: m/z [MH]+ found
549.1007, calc. 549.1011.
4,4′-(5,5-Difluoro-1,9-diphenyl-5H-4λ4,5λ4-dipyrrolo[1,2-c:2′,1′-f][1,3,5,2]triazaborinine-3,7-
diyl)bis(2-chlorophenol) (di-Cl-di-OH-complex). Compound 1c (0.017 g, 0.07 mmol) was
dissolved in 50 ml of dry DCM, treated with DIPEA (10 eq., 0.053 ml, 0.32 mmol) and boron
trifluoride diethyletherate (15 eq., 0.061 ml, 0.48 mmol) and stirred under argon for 24 h.
Purification was carried out via column chromatography on silica gel, eluting with 2%
ethanol/DCM (after eluting impurities with DCM). Recrystallization from hexane–THF gave the
final product di-Cl-di-OH-complex as a metallic red solid (0.008 g, 44%). 1H NMR (300 MHz,
DMSO-d6) δ 8.29 (s, 2H), 8.16 (d, J = 7.0 Hz, 4H), 8.03 (d, J = 8.7 Hz, 2H), 7.65 (s, 2H), 7.60–
7.41 (m, 6H), 7.13 (d, J = 8.7 Hz, 2H). EI-DI-TOF: m/z[MH]+ found 597.0968, calc. 597.0999.
Synthesis of 4,4′-(5,5-difluoro-1,9-diphenyl-5H-4λ4,5λ4-dipyrrolo[1,2-c:2′,1′-
f][1,3,5,2]triazaborinine-3,7-diyl)bis(3-fluorophenol) (di-F-di-OH-complex). The
synthesis was performed analogously to that of the di-Cl-di-OH-complex, but starting from 2′-
fluoro-4′-hydroxyacetophenone (728 mg). Steps 1 and 2 yielded 1.033 g (90.2%) and 1.28 g
(99.4%) of the crude product, respectively. After synthesis step 3, the crude product was purified
by column chromatography on silica gel, eluting with 4% THF/DCM to yield [5-(2-fluoro-4-
hydroxyphenyl)-3-phenyl-1H-pyrrol-2-yl]-[5-(2-fluoro-4-hydroxyphenyl)-3-phenylpyrrol-2-
ylidene]amine 2c as a blue-black solid. The product was recrystallized from a hexane–THF
mixture to give metallic green crystals (0.23 g, 20.9%).1H NMR (300 MHz, DMSO-d6) δ 8.04–
8.06 (d, J = 7.0 Hz, 6H), 7.35–7.47 (m, 8H), 6.78–6.86 (m, 4H). DI-EI-TOF: m/z of [M]+ found
517.1626, calc. 517.1602.
84
4,4′-(5,5-Difluoro-1,9-diphenyl-5H-4λ4,5λ4-dipyrrolo[1,2-c:2′,1′-f][1,3,5,2]triazaborinine-3,7-
diyl)bis(3-fluorophenol) (di-F-di-OH-complex). 4,4′-(5,5-Difluoro-1,9-diphenyl-5H-4λ4,5λ4-
dipyrrolo[1,2-c:2′,1′-f][1,3,5,2]triazaborinine-3,7-diyl)bis(3-fluorophenol) (di-F-di-OH-complex)
was synthesized using the same procedure. Purification was carried out via column
chromatography on silica gel, eluting with 4% THF/DCM. Recrystallization from hexane–THF
gave the final product di-F-di-OH-complex as a metallic red solid (0.044 g, 19.6%). 1H NMR
(300 MHz, DMSO-d6) δ 8.12 (d, J = 7.0 Hz, 4H), 7.82 (t, J = 8.7 Hz, 2H), 7.56–7.48 (q, J = 9.4,
7.9 Hz, 6H), 7.31 (d, J = 3.4 Hz, 2H), 6.77 (d, J = 10.7 Hz, 4H). DI-EI-TOF: m/z of [M]+ found
565.1615, calc. 565.1591.
Synthesis of 4,4′-(5,5-difluoro-1,9-diphenyl-5H-4λ4,5λ4-dipyrrolo[1,2-c:2′,1′-
f][1,3,5,2]triazaborinine-3,7-diyl)diphenol (di-OH-complex). Compound 3a 1-(4-
hydroxyphenyl)-3-phenylpropenone was commercially available. Further synthesis steps were
performed analogously to the synthesis steps of the di-Cl-di-OH-complex. The synthesis of
compound 3b gave 2.06 g (80%) of the crude product, starting from 2.02 g of 4′-
hydroxychalcone. The crude 3c was purified by column chromatography on silica gel, eluting
with 4% THF/DCM to yield [5-(4-hydroxyphenyl)-3-phenyl-1H-pyrrol-2-yl]-[5-(4-
hydroxyphenyl)-3-phenylpyrrol-2-ylidene]amine as a blue-black solid. The product was
recrystallized from a hexane–THF mixture to give metallic green crystals (0.41 g, 23.5%). 1H
NMR (300 MHz, DMSO-d6), δ 8.09 (d, J = 7.3 Hz, 4H), 7.93 (d, J = 8.6 Hz, 4H), 7.53 (s, 2H),
7.42 (m, 6H), 7.01 (d, J = 8.6 Hz, 4H). EI-DI-TOF: m/z [MH]+ found 481.1773, calc. 481.179.
Purification of 4,4′-(5,5-difluoro-1,9-diphenyl-5H-4λ4,5λ4-dipyrrolo[1,2-c:2′,1′-
f][1,3,5,2]triazaborinine-3,7-diyl)diphenol. Purification of 4,4′-(5,5-difluoro-1,9-diphenyl-5H-
4λ4,5λ4-dipyrrolo[1,2-c:2′,1′-f][1,3,5,2]triazaborinine-3,7-diyl)diphenol was carried out via
column chromatography on silica gel, eluting with DCM/ethyl acetate (4 : 1). Recrystallization
from hexane–THF gave the final product di-OH-complex as a metallic red solid (0.26 g, 57.8%).
1H NMR (300 MHz, DMSO-d6) δ 8.13 (dd, J = 18.6, 8.0 Hz, 8H), 7.65–7.39 (m, 8H), 6.95 (d, J
= 8.8 Hz, 4H). EI-DI-TOF: m/z [MH]+found 529.1771, calc. 529.1779.
85
Synthesis of 4,4`-(5,5-difluoro-1,9-diphenyl-5H-4λ4,5λ4-dipyrrolo-[1,2-c:2`,1`-
f][1,3,5,2]triazaborinine-3,7-diyl)bis(2-methylphenol) (di-CH3-di-OH-complex).
The synthesis was carried out analogously to that of the di-Cl-di-OH-complex, starting from 3′-
methyl-4′-hydroxyacetophenone (1.88 g). Steps 1 and 2 yielded 2.77 g (93%) and 1.84 g (53%)
of the crude product, respectively. After synthesis step 3, the crude product was purified by
column chromatography on silica gel, eluting with 5% ethyl acetate/DCM (after eluting
impurities with hexane/DCM 1 : 1, DCM) to yield [5-(3-methyl-4-hydroxyphenyl)-3-phenyl-1H-
pyrrol-2-yl]-[5-(3-methyl-4-hydroxyphenyl)-3-phenylpyrrol-2-ylidene]amine 4c as a blue-black
solid. The product was recrystallized from a hexane–THF mixture to give metallic green crystals
(0.091 g, 5.8%). 1H NMR (300 MHz, DMSO-d6) δ 8.10 (d, J = 7.3 Hz, 4H), 7.91–7.75 (m, 4H),
7.57–7.33 (m, 8H), 7.00 (d, J = 8.4 Hz, 2H), 2.29 (s, 6H). EI-DI-TOF: m/z [MH]+ found
509.2086, calc. 509.2103.
Purification of 4,4′-(5,5-difluoro-1,9-diphenyl-5H-4λ4,5λ4-dipyrrolo[1,2-c:2′,1′-
f][1,3,5,2]triazaborinine-3,7-diyl)bis(2-methylphenol). Purification of 4,4′-(5,5-difluoro-1,9-
diphenyl-5H-4λ4,5λ4-dipyrrolo[1,2-c:2′,1′-f][1,3,5,2]triazaborinine-3,7-diyl)bis(2-methylphenol)
was carried out via column chromatography on silica gel, eluting with 5% ethyl acetate/DCM
(after eluting impurities with DCM, 1% ethyl acetate/DCM and 2% ethyl acetate/DCM).
Recrystallization from hexane–THF gave the final product di-CH3-di-OH-complex as a metallic
red solid (0.04 g, 40%). 1H NMR (300 MHz, DMSO-d6) δ 8.16 (d, J = 7.2 Hz, 4H), 8.08–7.90
(m, 4H), 7.52 (m, 8H), 6.95 (d, J = 8.5 Hz, 2H), 2.22 (s, 6H). EI-DI-TOF: m/z [MH]+ found
557.2082, calc. 557.2092.
Staining of PS-microparticles
0.50 g of PS-particles were dispersed in a solution of 5 mg of (1% w/w in respect to the PS-
particles) the di-butoxy-complex in 10 ml of tetrahydrofuran (THF) and stirred for 1.5 h. Then 8
ml of de-ionized water were added dropwise. After 10 min of stirring the dispersion was
transferred rapidly into a beaker with 50 ml of de-ionized water. The dispersion was again stirred
for 10 min. Then the particles were filtered through a cellulose filter and rewashed with 20 ml of
ethanol. Afterwards the particles were transferred into a milling cup and were overlaid with a
86
mixture of ethanol/de-ionized water (1 : 1) to reduce friction and to enhance heat dissipation
during grinding in the planet mill. The particles were washed with ethanol and dried in the oven
at 70 °C.
Sensor preparation
Absorption: a “cocktail” containing 100 mg of ethyl cellulose and 1 mg of dye (1% w/w with
respect to the polymer) dissolved in a toluene : ethanol mixture (6 : 4 v/v, 1.9 g) was purged with
carbon dioxide. Afterwards 100 μl of tetraoctylammonium hydroxide solution (20% w/w
TOAOH in MeOH) were added. The “cocktail” was knife-coated on a dust-free PET support. A
sensing film of ∼7 μm thickness was obtained after evaporation of the solvent. For
luminescence-based measurements a second layer was added to the absorption-based sensing
foils. To prepare the “cocktail” for the second layer, 0.180 g of Hyflon AD 60 were dissolved in
2.820 g of perfluorodecalin, which was washed prior to use with 1 mol l−1 potassium carbonate
solution. Then 0.360 g of Egyptian blue powder (200% w/w with respect to the polymer) and
0.054 g of stained PS-particles (30% w/w with respect to the polymer) were dispersed
homogeneously in the Hyflon solution. The thickness of this layer after evaporation of the
solvent was estimated to be ∼4.5 μm.
Methods
1H NMR spectra were recorded on a 300 MHz instrument (Bruker) in DMSO-d6 with TMS as
standard. Absorption spectra were recorded on a Cary 50 UV-Vis spectrophotometer (Varian).
The determination of the molar absorption coefficients was carried out as an average of three
independent measurements. Fluorescence spectra were recorded on a Fluorolog3 fluorescence
spectrometer (Horiba) equipped with a NIR-sensitive photomultiplier R2658 from Hamamatsu
(300–1050 nm). Photobleaching experiments were performed by irradiating the sensor foils in a
glass cuvette with the light of a high-power 10 W LED array (λmax 458 nm, 3 LEDs, www.LED-
TECH.de) operated at 6 W input power. A lens (Edmund Optics) was used to focus the light of
the LED array on the glass cuvette (photon flux: ∼3900 μmol s−1 m−2 as determined using a Li-
250A light meter from Li-COR). The photodegradation profiles were obtained by monitoring the
absorption spectra of a sensor foil based on the respective dye. The cuvette was flushed with
either carbon dioxide gas for the mono-anionic form, or with nitrogen for the di-anionic form and
87
sealed. Thymol-blue and m-cresol-purple were used for comparison. In the case of the anionic
form of thymol-blue, m-cresol-purple, the di-OH-complex and the di-CH3-di-OH-complex (di-
anionic forms) sodium hydroxide was placed at the bottom of the cuvette to capture carbon
dioxide traces. Gas calibration mixtures were obtained using a gas mixing device from MKS
(www.mksinst.com). The gas mixture was humidified to about 85% relative humidity, using
silica gel soaked with a saturated potassium chloride solution, prior to entering the calibration
chamber. Temperature was controlled by a cryostat ThermoHaake DC50. Dyed particles were
filtered through cellulose filters type 113A from Roth (www.carlroth.com). Particle milling was
carried out using an 80 ml milling cup, zirconia spheres (∅ 5 mm) and a Pulverisette 6 planet
mill from Fritsch (www.fritsch.de). For the determination of the pKa values titration curves in
aqueous buffer/ethanol mixtures (1 : 1) were measured and the average value of the point of
inflection obtained was used. For the production/consumption measurements of carbon dioxide
two Firesting-Mini devices and an oxygen trace sensor from PyroScience (www.pyro-
science.com) were used. Illumination of the sample was performed using 3 commercially
available halogen bulb lamps with an averaged photon flux of ∼217 μmol s−1 m−2 per lamp. The
plant was positioned in a glass desiccator, which was flushed with a gas mixture of 2% oxygen in
nitrogen.
3.3 Results and Discussion
Synthesis
As reported by Jokic et al.38 there are two ways for the preparation of azadipyrromethenes to
obtain either asymmetrical47 or symmetrical48 chromophores. The previously published
asymmetrical dyes bearing one hydroxyl group were proved to be promising pH
indicators.38 Unfortunately, they were found to be unsuitable for optical carbon dioxide sensors.
The ion pair built between the hydroxyl group and the tetraoctylammonium base was
comparatively strong. Even after exposure of the sensors to pure carbon dioxide, the amount of
CO2 was not enough to achieve re-protonation of the indicators and only after exposure to strong
acid vapors (e.g. hydrochloric acid) the indicators were irreversibly re-protonatable. Dissociation
of both hydroxyl groups in symmetrical azadipyrromethenes was expected to be more difficult
compared to the mono-hydroxy derivatives since two ion pairs with bulky cations would be built
88
upon deprotonation. Therefore, this new class of pH indicators potentially suitable for
CO2 sensing was investigated. The starting point of our synthesis was diaryl-α,β-unsaturated
ketones (chalcones) either commercially available or readily made by an aldol condensation of
the corresponding aldehyde and acetophenone (Scheme 1). The Michael addition of
nitromethane to the chalcones, using KOH as a base, yields 1,3-diaryl-4-nitrobutan-1-ones in
essentially quantitative yields. Their condensation with ammonium acetate in refluxing butanol
gave azadipyrromethenes. Finally, the azadipyrromethenes were converted to the corresponding
BF2 chelates via reaction with BF2-etherate using diisopropylethylamine as a base at room
temperature for 24 h, giving yields ranging from 20 to 70%.
89
Scheme 1. 4-step-synthesis scheme for the di-OH-aza-BODIPY-complexes.
R1
OH
OR
2
+
O
OH
R1
OR
2
EtOH/H2O
RT, 12h
3 eq KOH
OH
R1
ONO2
R2
OH
R1
OR2
EtOH/H2O
60°C, 12h
1.2 eq KOH
CH3NO
2 excess
Compound a
Compound b
2 eq
OH
R1
ONO2
R2
NH
N
R1
OH
N
R1
OH
R2
R2
Compound c
BuOH/H2O
100°C, 24h
CH3COONH
4
NH
N
R1
OH
N
R1
OH
R2
R2
dry DCM, Argon
RT, 24h
10 eq DIPEA
BF3 * Et
2O excess
N
N
R1
OH
N
R1
OH
BF
FR
2
R2
BF2 chelate
di-OH-complex: R1 = R2 = H
di-F-di-OH-complex: R1 = H, R2 = F
di-Cl-di-OH-complex: R1 = Cl, R2 = H
di-CH3-di-OH-complex: R1 = CH
3, R2 = H
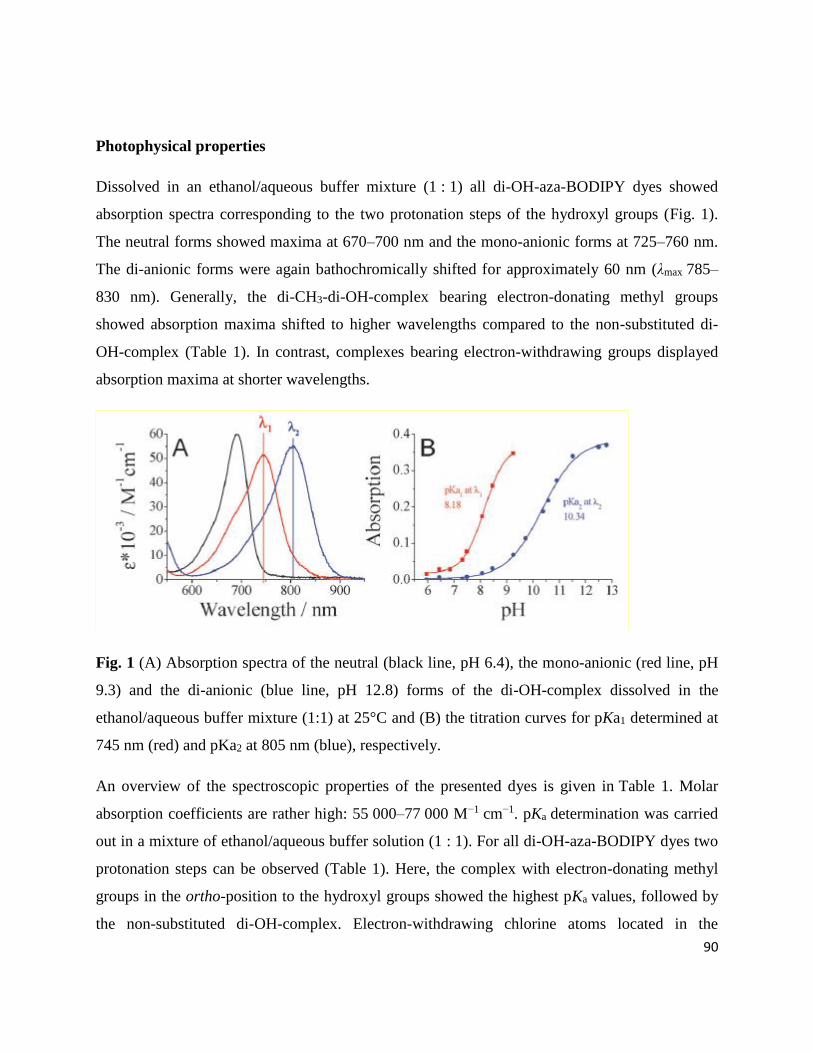
90
Photophysical properties
Dissolved in an ethanol/aqueous buffer mixture (1 : 1) all di-OH-aza-BODIPY dyes showed
absorption spectra corresponding to the two protonation steps of the hydroxyl groups (Fig. 1).
The neutral forms showed maxima at 670–700 nm and the mono-anionic forms at 725–760 nm.
The di-anionic forms were again bathochromically shifted for approximately 60 nm (λmax 785–
830 nm). Generally, the di-CH3-di-OH-complex bearing electron-donating methyl groups
showed absorption maxima shifted to higher wavelengths compared to the non-substituted di-
OH-complex (Table 1). In contrast, complexes bearing electron-withdrawing groups displayed
absorption maxima at shorter wavelengths.
Fig. 1 (A) Absorption spectra of the neutral (black line, pH 6.4), the mono-anionic (red line, pH
9.3) and the di-anionic (blue line, pH 12.8) forms of the di-OH-complex dissolved in the
ethanol/aqueous buffer mixture (1:1) at 25°C and (B) the titration curves for pKa1 determined at
745 nm (red) and pKa2 at 805 nm (blue), respectively.
An overview of the spectroscopic properties of the presented dyes is given in Table 1. Molar
absorption coefficients are rather high: 55 000–77 000 M−1 cm−1. pKa determination was carried
out in a mixture of ethanol/aqueous buffer solution (1 : 1). For all di-OH-aza-BODIPY dyes two
protonation steps can be observed (Table 1). Here, the complex with electron-donating methyl
groups in the ortho-position to the hydroxyl groups showed the highest pKa values, followed by
the non-substituted di-OH-complex. Electron-withdrawing chlorine atoms located in the
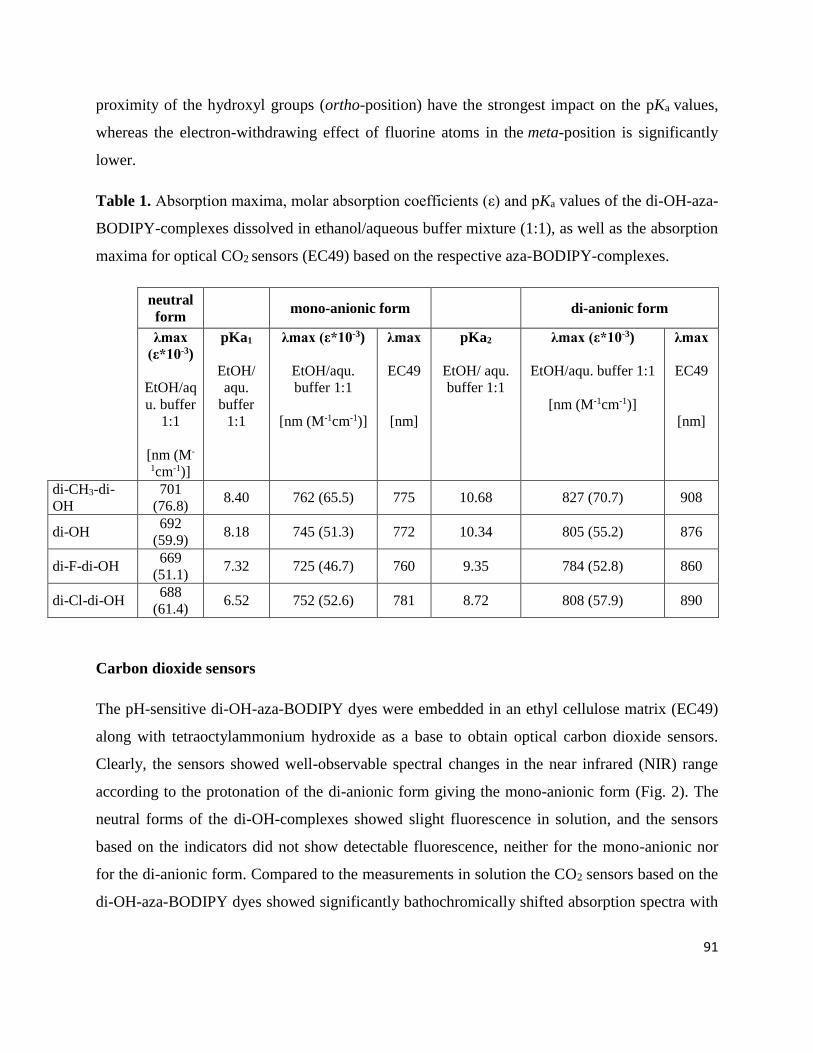
91
proximity of the hydroxyl groups (ortho-position) have the strongest impact on the pKa values,
whereas the electron-withdrawing effect of fluorine atoms in the meta-position is significantly
lower.
Table 1. Absorption maxima, molar absorption coefficients (ε) and pKa values of the di-OH-aza-
BODIPY-complexes dissolved in ethanol/aqueous buffer mixture (1:1), as well as the absorption
maxima for optical CO2 sensors (EC49) based on the respective aza-BODIPY-complexes.
neutral
form
mono-anionic form
di-anionic form
λmax
(ε*10-3)
EtOH/aq
u. buffer
1:1
[nm (M-
1cm-1)]
pKa1
EtOH/
aqu.
buffer
1:1
λmax (ε*10-3)
EtOH/aqu.
buffer 1:1
[nm (M-1cm-1)]
λmax
EC49
[nm]
pKa2
EtOH/ aqu.
buffer 1:1
λmax (ε*10-3)
EtOH/aqu. buffer 1:1
[nm (M-1cm-1)]
λmax
EC49
[nm]
di-CH3-di-
OH
701
(76.8) 8.40 762 (65.5) 775 10.68 827 (70.7) 908
di-OH 692
(59.9) 8.18 745 (51.3) 772 10.34 805 (55.2) 876
di-F-di-OH 669
(51.1) 7.32 725 (46.7) 760 9.35 784 (52.8) 860
di-Cl-di-OH 688
(61.4) 6.52 752 (52.6) 781 8.72 808 (57.9) 890
Carbon dioxide sensors
The pH-sensitive di-OH-aza-BODIPY dyes were embedded in an ethyl cellulose matrix (EC49)
along with tetraoctylammonium hydroxide as a base to obtain optical carbon dioxide sensors.
Clearly, the sensors showed well-observable spectral changes in the near infrared (NIR) range
according to the protonation of the di-anionic form giving the mono-anionic form (Fig. 2). The
neutral forms of the di-OH-complexes showed slight fluorescence in solution, and the sensors
based on the indicators did not show detectable fluorescence, neither for the mono-anionic nor
for the di-anionic form. Compared to the measurements in solution the CO2 sensors based on the
di-OH-aza-BODIPY dyes showed significantly bathochromically shifted absorption spectra with
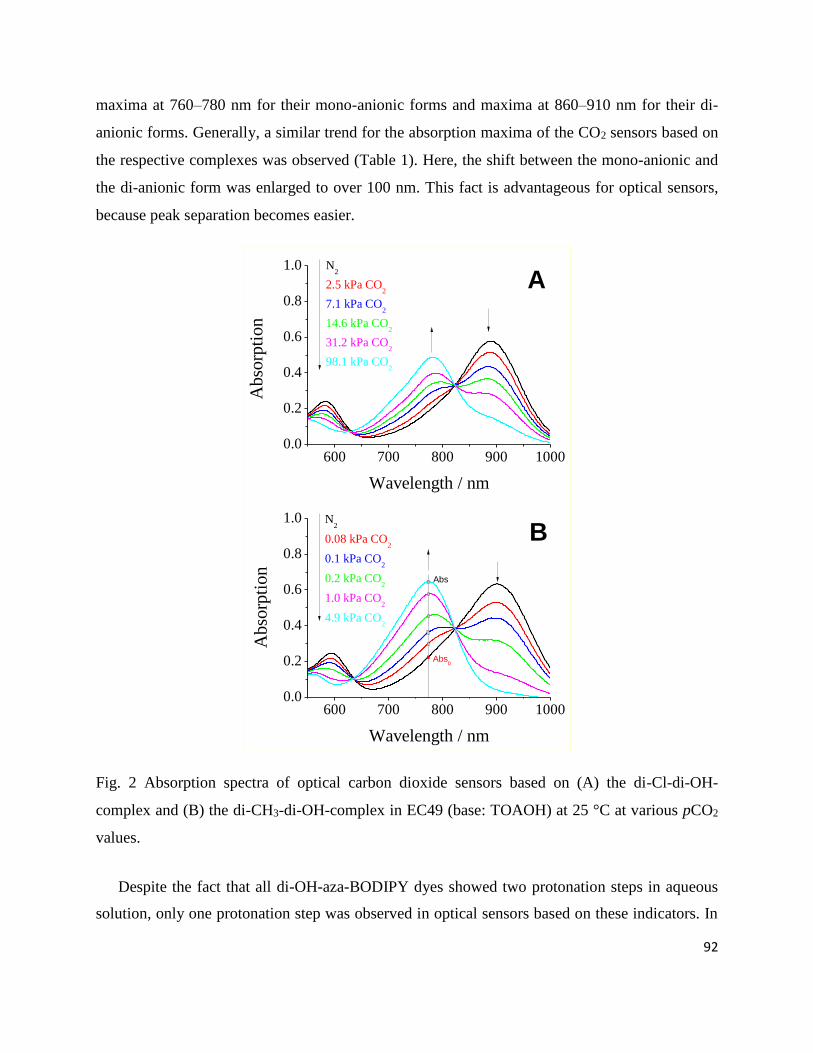
92
maxima at 760–780 nm for their mono-anionic forms and maxima at 860–910 nm for their di-
anionic forms. Generally, a similar trend for the absorption maxima of the CO2 sensors based on
the respective complexes was observed (Table 1). Here, the shift between the mono-anionic and
the di-anionic form was enlarged to over 100 nm. This fact is advantageous for optical sensors,
because peak separation becomes easier.
600 700 800 900 10000.0
0.2
0.4
0.6
0.8
1.0
600 700 800 900 10000.0
0.2
0.4
0.6
0.8
1.0
Abso
rpti
on
Wavelength / nm
N2
2.5 kPa CO2
7.1 kPa CO2
14.6 kPa CO2
31.2 kPa CO2
98.1 kPa CO2
A
B
Abso
rpti
on
Wavelength / nm
N2
0.08 kPa CO2
0.1 kPa CO2
0.2 kPa CO2
1.0 kPa CO2
4.9 kPa CO2
Abs
Abs0
Fig. 2 Absorption spectra of optical carbon dioxide sensors based on (A) the di-Cl-di-OH-
complex and (B) the di-CH3-di-OH-complex in EC49 (base: TOAOH) at 25 °C at various pCO2
values.
Despite the fact that all di-OH-aza-BODIPY dyes showed two protonation steps in aqueous
solution, only one protonation step was observed in optical sensors based on these indicators. In
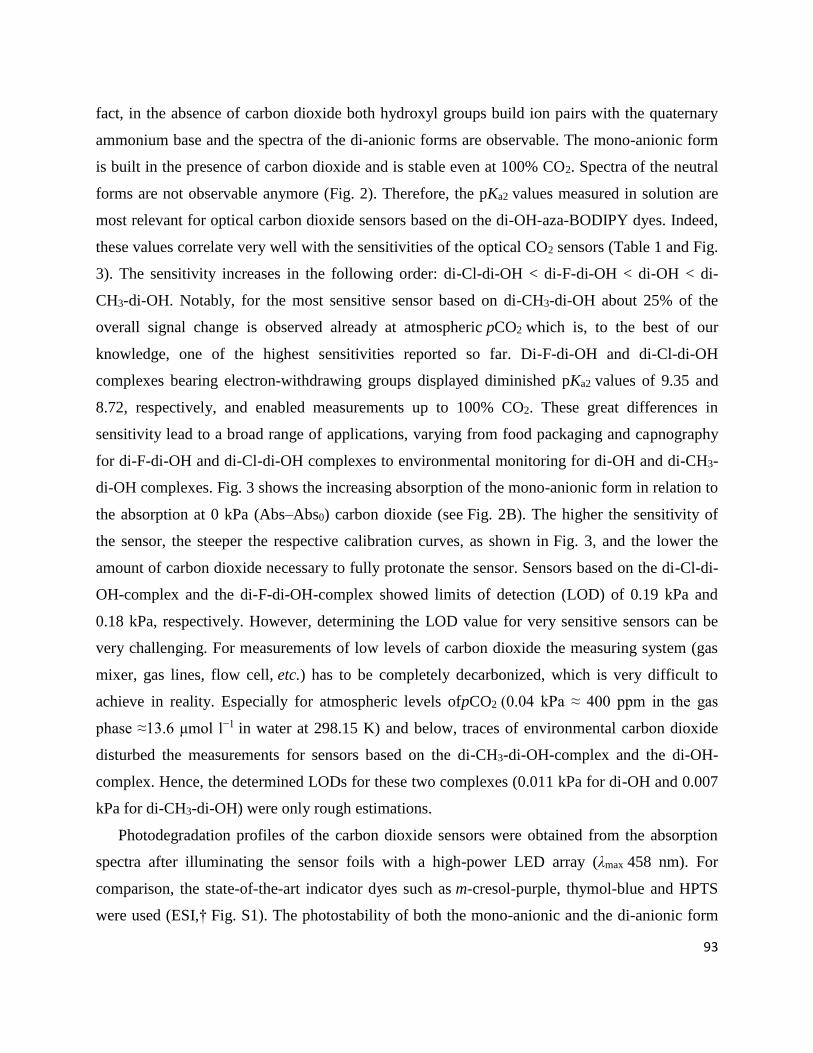
93
fact, in the absence of carbon dioxide both hydroxyl groups build ion pairs with the quaternary
ammonium base and the spectra of the di-anionic forms are observable. The mono-anionic form
is built in the presence of carbon dioxide and is stable even at 100% CO2. Spectra of the neutral
forms are not observable anymore (Fig. 2). Therefore, the pKa2 values measured in solution are
most relevant for optical carbon dioxide sensors based on the di-OH-aza-BODIPY dyes. Indeed,
these values correlate very well with the sensitivities of the optical CO2 sensors (Table 1 and Fig.
3). The sensitivity increases in the following order: di-Cl-di-OH < di-F-di-OH < di-OH < di-
CH3-di-OH. Notably, for the most sensitive sensor based on di-CH3-di-OH about 25% of the
overall signal change is observed already at atmospheric pCO2 which is, to the best of our
knowledge, one of the highest sensitivities reported so far. Di-F-di-OH and di-Cl-di-OH
complexes bearing electron-withdrawing groups displayed diminished pKa2 values of 9.35 and
8.72, respectively, and enabled measurements up to 100% CO2. These great differences in
sensitivity lead to a broad range of applications, varying from food packaging and capnography
for di-F-di-OH and di-Cl-di-OH complexes to environmental monitoring for di-OH and di-CH3-
di-OH complexes. Fig. 3 shows the increasing absorption of the mono-anionic form in relation to
the absorption at 0 kPa (Abs–Abs0) carbon dioxide (see Fig. 2B). The higher the sensitivity of
the sensor, the steeper the respective calibration curves, as shown in Fig. 3, and the lower the
amount of carbon dioxide necessary to fully protonate the sensor. Sensors based on the di-Cl-di-
OH-complex and the di-F-di-OH-complex showed limits of detection (LOD) of 0.19 kPa and
0.18 kPa, respectively. However, determining the LOD value for very sensitive sensors can be
very challenging. For measurements of low levels of carbon dioxide the measuring system (gas
mixer, gas lines, flow cell, etc.) has to be completely decarbonized, which is very difficult to
achieve in reality. Especially for atmospheric levels ofpCO2 (0.04 kPa ≈ 400 ppm in the gas
phase ≈13.6 μmol l−1 in water at 298.15 K) and below, traces of environmental carbon dioxide
disturbed the measurements for sensors based on the di-CH3-di-OH-complex and the di-OH-
complex. Hence, the determined LODs for these two complexes (0.011 kPa for di-OH and 0.007
kPa for di-CH3-di-OH) were only rough estimations.
Photodegradation profiles of the carbon dioxide sensors were obtained from the absorption
spectra after illuminating the sensor foils with a high-power LED array (λmax 458 nm). For
comparison, the state-of-the-art indicator dyes such as m-cresol-purple, thymol-blue and HPTS
were used (ESI,† Fig. S1). The photostability of both the mono-anionic and the di-anionic form
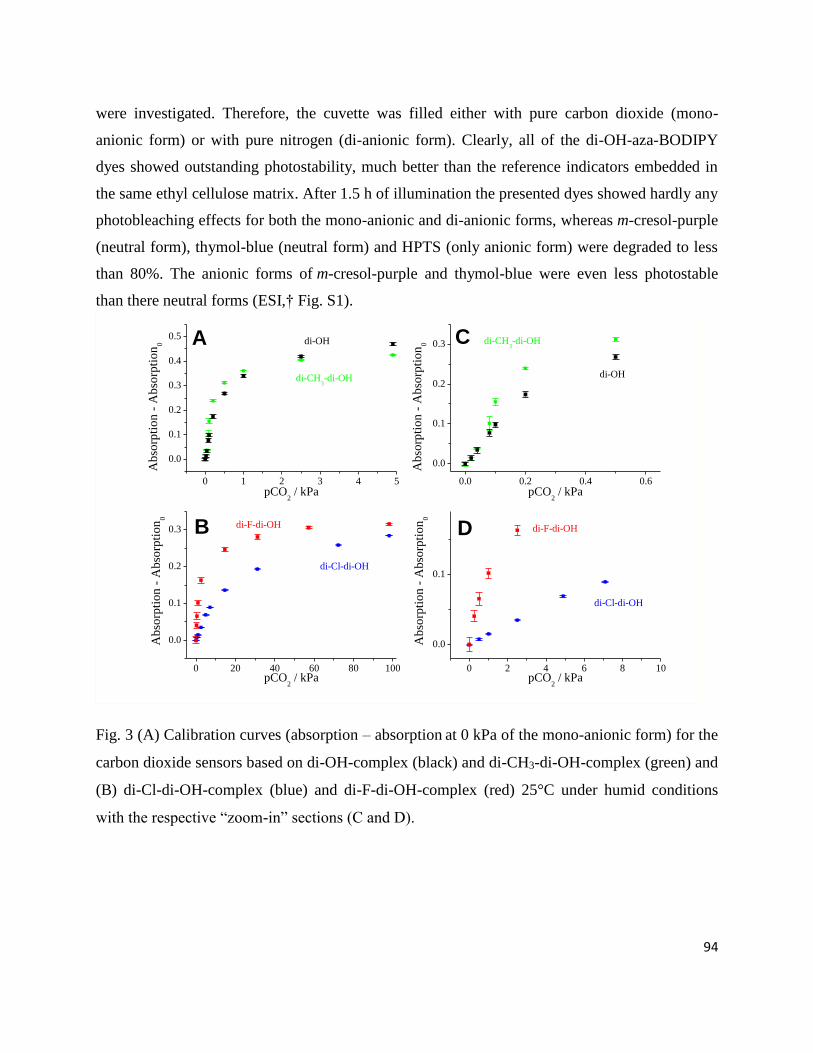
94
were investigated. Therefore, the cuvette was filled either with pure carbon dioxide (mono-
anionic form) or with pure nitrogen (di-anionic form). Clearly, all of the di-OH-aza-BODIPY
dyes showed outstanding photostability, much better than the reference indicators embedded in
the same ethyl cellulose matrix. After 1.5 h of illumination the presented dyes showed hardly any
photobleaching effects for both the mono-anionic and di-anionic forms, whereas m-cresol-purple
(neutral form), thymol-blue (neutral form) and HPTS (only anionic form) were degraded to less
than 80%. The anionic forms of m-cresol-purple and thymol-blue were even less photostable
than there neutral forms (ESI,† Fig. S1).
0 1 2 3 4 5
0.0
0.1
0.2
0.3
0.4
0.5
0.0 0.2 0.4 0.6
0.0
0.1
0.2
0.3
0 20 40 60 80 100
0.0
0.1
0.2
0.3
0 2 4 6 8 10
0.0
0.1
di-OH
Ab
sorp
tio
n -
Ab
sorp
tio
n0
pCO2 / kPa
di-CH3-di-OH
A
di-OH
Ab
sorp
tio
n -
Ab
sorp
tio
n0
pCO2 / kPa
di-CH3-di-OHC
DB di-F-di-OH
Ab
sorp
tio
n -
Ab
sorp
tio
n0
pCO2 / kPa
di-Cl-di-OH
di-F-di-OH
Ab
sorp
tio
n -
Ab
sorp
tio
n0
pCO2 / kPa
di-Cl-di-OH
Fig. 3 (A) Calibration curves (absorption – absorption at 0 kPa of the mono-anionic form) for the
carbon dioxide sensors based on di-OH-complex (black) and di-CH3-di-OH-complex (green) and
(B) di-Cl-di-OH-complex (blue) and di-F-di-OH-complex (red) 25°C under humid conditions
with the respective “zoom-in” sections (C and D).
95
Luminescence-based ratiometric read-out using IFE (inner filter effect) based sensors
Read-out of the planar optodes and fibre-optic sensors based on colorimetric systems is
significantly more challenging than that of the luminescent systems. The inner-filter effect (IFE)
was made use of in order to enable read-out via luminescence. Additionally to the first layer
containing the absorption-based indicator dye along with TOAOH in ethyl cellulose, a second
layer containing the secondary emitters was used.42 It included the pH-insensitive di-butoxy-
complex entrapped in PS-particles as a fluorophore and Egyptian blue (EB) as a phosphor, both
embedded in Hyflon AD 60. The absorption spectra of the di-OH-complex and the emission
spectra of the secondary emitters are shown in Fig. 4A. Here, the broad emission band of the
phosphor (EB) overlaps with the absorption spectrum of the di-anionic form of the indicator and
the emission band of the fluorophore (di-butoxy-aza-BODIPY-complex) overlaps with the
absorption spectrum of the mono-anionic form of the indicator. The isosbestic point of the di-
OH-indicator is located at 610 nm and represents an ideal wavelength for exciting the secondary
emitters matching the maxima of the red LEDs available (605, 617 nm). The fluorescence
spectra of the sensor based on the combination of EB, the di-butoxy-complex and the non-
substituted di-OH indicator are shown in Fig. 4B. Emission peaks in the absence (λmax 913 nm)
and presence (λmax 738 nm) of carbon dioxide were well observable. Hence, luminescence-based
ratiometric read-out becomes possible. This can be realized either by using two emission filters
isolating the respective components or by measuring the luminescence phase shift. In fact, the
phase shift for luminescent Egyptian blue is 55.8° at 2000 Hz and the phase shift of the
fluorophore is 0 at this modulation frequency.
96
600 700 800 900 10000.0
0.2
0.4
0.6
0.8
1.0
1.2
700 800 900 10000.0
0.2
0.4
0.6
0.8
1.0
1.2
Norm
. A
bso
rpti
on
Norm
. L
um
ines
cence
Inte
nsi
ty
Wavelength / nm
Emission
FluorophoreEmission
Phosphor
Absorption
+CO2
Absorption
-CO2
B
Flu
ore
scen
ce I
nte
nsi
ty
Wavelength / nm
98.1 kPa CO2
4.9 kPa CO2
0.5 kPa CO2
0.1 kPa CO2
N2
A
Figure 4. (A) Respective emission spectra (λexc 610 nm) of Egyptian Blue (EB; blue dashed line;
“Emission Phosphor”) and the di-butoxy-complex (dissolved in tetrahydrofuran; magenta dashed
line; “Emission Fluorophore”); absorption spectra of the sensor based on the di-OH-complex in
absence (black line) and in presence (red line) of carbon dioxide at 25°C. (B) Emission spectra
(λexc 610 nm) of a carbon dioxide sensor based on the di-OH-complex and inner-filter-effect
read-out at 25 °C under humidified conditions.
Carbon dioxide production/consumption of a Hebe plant. The applicability of the presented
carbon dioxide sensors is demonstrated by showing the respiration of a Hebe plant. The Hebe
plant in soil, a carbon dioxide sensor based on the di-CH3-di-OH-complex and an oxygen trace
sensor were placed in a desiccator. The desiccator was purged for 15 min with a gas mixture of
2% oxygen in nitrogen (in order to achieve better dynamics when measuring with an optical
oxygen sensor compared to air saturation) and then closed tightly. During the measurement the
97
setup was alternately kept in darkness and illuminated for 30 min using three halogen lamps.
According to these illumination sequences the production/consumption of carbon dioxide was
observed (Fig. 5). In darkness an increase of carbon dioxide occurred due to respiration, whereas
during illumination the concentration of CO2 decreased. Over the whole measurement more
CO2 was produced than consumed which may be due to stress-induced respiration of the Hebe
plant. Corresponding to the applied light sequences also the oxygen concentration was affected.
Note that over the whole experiment the oxygen concentration was increasing which can be
explained by slow diffusion of oxygen into the desiccator. Surprisingly, oxygen concentration
did not increase significantly during the light phase, but it increased abruptly immediately after
the light was switched off, reaching a plateau after about 30 min (Fig. 5). This effect may be
attributed to the storage of generated oxygen in the plant and its release in the beginning of the
dark phase. After this time the equilibrium between oxygen consumption during respiration and
oxygen diffusion from outside is reached. As can be seen, the same phenomenon is observed if
both the light and dark cycles are extended to 60 min (see hours 2 to 4 in Fig. 5). The above plant
behavior is beyond the scope of the paper and calls for more detailed investigation.
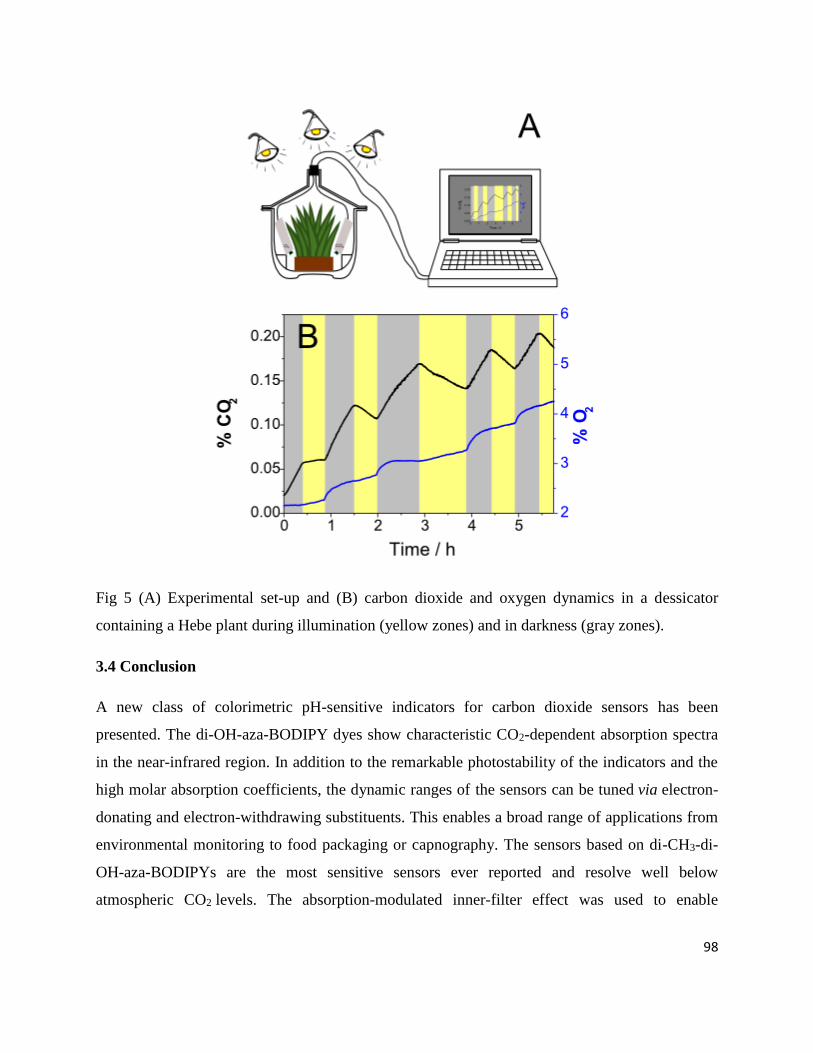
98
Fig 5 (A) Experimental set-up and (B) carbon dioxide and oxygen dynamics in a dessicator
containing a Hebe plant during illumination (yellow zones) and in darkness (gray zones).
3.4 Conclusion
A new class of colorimetric pH-sensitive indicators for carbon dioxide sensors has been
presented. The di-OH-aza-BODIPY dyes show characteristic CO2-dependent absorption spectra
in the near-infrared region. In addition to the remarkable photostability of the indicators and the
high molar absorption coefficients, the dynamic ranges of the sensors can be tuned via electron-
donating and electron-withdrawing substituents. This enables a broad range of applications from
environmental monitoring to food packaging or capnography. The sensors based on di-CH3-di-
OH-aza-BODIPYs are the most sensitive sensors ever reported and resolve well below
atmospheric CO2 levels. The absorption-modulated inner-filter effect was used to enable
99
referenced luminescence-based ratiometric read-out. As an example the production/consumption
of carbon dioxide of a Hebe plant was demonstrated.
3.5 References
1. D. Zhao, D. Miller, X. Xian, F. Tsow, E. S. Forzani, Sens. Actuators B Chem., 2014, 195,
171–176.
2. A. Mills, A. Lepre, L. Wild, Sens. Actuators B-Chem., 1997, 39, 419–425.
3. S. Trivedi, H. Mehta, R. Kashyap, Indian J. Crit. Care Med., 2014, 18, 348.
4. B. Rost, I. Zondervan, D. WolfGladrow, Mar. Ecol. Prog. Ser., 2008, 373, 227–237.
5. S. C. Doney, V. J. Fabry, R. A. Feely, J. A. Kleypas, In Annual Review of Marine Science;
Annual Reviews: Palo Alto, 2009; Vol. 1, pp. 169–192.
6. A. E. Punt, D. Poljak, M. G. Dalton, R. Foy, J. Ecol. Model., 2014, 285, 39–53.
7. K. E. Fabricius, C. Langdon, S. Uthicke, C. Humphrey, S. Noonan, G. De’ath, R. Okazaki, N.
Muehllehner, M. S. Glas, J. M. Lough, Nat. Clim. Change, 2011, 1, 165–169.
8. P. Puligundla, J. Jung, S. Ko, Food Control, 2012, 25, 328–333.
9. B. Weigl, A. Holobar, W. Trettnak, I. Klimant, H. Kraus, P. Oleary, O. Wolfbeis, J.
Biotechnol., 1994, 32, 127–138.
10. T. Beuermann, D. Egly, D. Geoerg, K. I., Klug, W. Storhas, F.-J. Methner, J. Biosci.
Bioeng., 2012, 113, 399–405.
11. A. G. Carroll, R. Przeslawski, L. C. Radke, J. R. Black, K. Picard, J. W. Moreau, R. R.
Haese, S. Nichol, Cont. Shelf Res., 2014, 83, 116–128.
12. A. Mills, S. Hodgen, Adv. Concepts Fluoresc. Spectrosc. Pt Small Mol. Sens., 2005, 9, 119–
161.
13. J. Zosel, W. Oelßner, M. Decker, G. Gerlach, U. Guth, Meas. Sci. Technol., 2011, 22,
072001.
100
14. M. Clegg, C. Sullivan, J. Eastin, J. Plant Physiol., 1978, 62, 924–926.
15. R. Arieli, O. Ertracht, Y. Daskalovic, J. Appl. Physiol. , 1999, 86, 647–650.
16. D. García-Fresnadillo, M. D. Marazuela, M. C. Moreno-Bondi, G. Orellana, .Langmuir ,
1999, 15, 6451–6459.
17. Y. Liu, Y. Tang, N. N. Barashkov, I. S. Irgibaeva, J. W. Y. Lam, R. Hu, D. Birimzhanova,
Y. Yu, B. Z. Tang, J. Am. Chem. Soc., 2010, 132, 13951–13953.
18. R. Ali, T. Lang, S. M. Saleh, R. J. Meier, O. S. Wolfbeis, Anal. Chem., 2011, 83, 2846–2851.
19. S. Pandey, S. N. Baker, S. Pandey, G. A. Baker, Chem. Commun., 2012, 48, 7043–7045.
20. W. Hong, Y. Chen, X. Feng, Y. Yan, X. Hu, B. Zhao, F. Zhang, D. Zhang, Z. Xu, Y. Lai,
Chem. Commun., 2013, 49, 8229–8231.
21. X. Xie, M. Pawlak, M.-L. Tercier-Waeber and E. Bakker, Anal. Chem., 2010, 84, 3163-3169.
22. L. Q. Xu, B. Zhang, M. Sun, L. Hong, K.-G. Neoh, E.-T. Kang and G. D. Fu, J. Mater.
Chem. A, 2013, 1, 1207-1212.
23. Q. Xu, S. Lee, Y. Cho, M. H. Kim, J. Bouffard and J. Yoon, J. Am. Chem. Soc., 2013, 135,
17751-17754.
24. A. Mills, Q. Chang, N. Mcmurray, .Anal. Chem., 1992, 64, 1383–1389.
25. A. Mills, L. Monaf, Analyst, 1996, 121, 535–540.
26. R. N. Dansby-Sparks, J. Jin, S.J. Mechery, U. Sampathkumaran, T. W. Owen, B. D. Yu, K.
Goswami, K. Hong, J. Grant, Z.-L. Xue, Anal. Chem., 2010, 82, 593–600.
27. O. S. Wolfbeis, Kovács, B.; Goswami, K.; Klainer, S. M. Microchim. Acta, 1998, 129, 181–
188.
28. C. Von Bultzingslowen, A. K. McEvoy, C. McDonagh, B. D. MacCraith, I. Klimant, C.
Krause, O. S. Wolfbeis, Analyst, 2002, 127, 1478–1483.
29. O. Oter, K. Ertekin, S. Derinkuyu, Talanta, 2008, 76, 557–563.

101
30. S. M. Borisov, C. Krause, S. Arain, O. S. Wolfbeis, Adv. Mater , 2006, 18, 1511 – 1516.
31. N. B. Borchert, J. P. Kerry and D. B. Papkovsky, Sens. Actuators, B, 2013, 176, 157-165.
32. S. Schutting, S. M. Borisov, I. Klimant, Anal. Chem., 2013, 85, 3271–3279.
33. S. Schutting, I. Klimant, D. de Beer, S. M. Borisov, Methods Appl. Fluoresc. , 2014, 2,
024001.
34. Z. Xu, A. Rollins, R. Alcala, R. E. Marchant, J. Biomed. Mater. Res., 1998, 39, 9–15.
35. R. C. Hunter, T. J. Beveridge, Appl. Environ. Microbiol , 2005, 71, 2501–2510.
36. K. W. Spitzer, R. L. Skolnick, B. E. Peercy, J. P. Keener, R. D. Vaughan-Jones, J. Physiol. ,
2002, 541, 159–167.
37. V.K. Ramshesh, J. J. Lemasters, In Mitochondrial Bioenergetics: Methods and Protocols;
C. M. Palmeira, A. J. Moreno, Eds.; 2012; Vol. 810, pp. 243–248.
38. T. Jokic, S. M. Borisov, R. Saf, D. A. Nielsen, M. Kühl, I. Klimant, Anal. Chem., 2012, 84,
6723–6730.
39. S. M. Borisov, K. Gatterer, I. Klimant, Analyst, 2010, 135, 1711–1717.
40. M. S. Briggs, D. D. Burns, M. E. Cooper, S. J. Gregory, Chem. Commun., 2000, 2323–2324.
41.M. E. Cooper, S. Gregory, E. Adie, S. Kalinka, J. Fluoresc., 2002, 12, 425–429.
42. S. M. Borisov, I. Klimant, Anal. Chim. Acta, 2013, 787, 219–225.
43. N. Nakamura, Y. Amao, Anal. Bioanal. Chem., 2003, 376, 642–646.
44. Y.Amao, N. Nakamura, Sens. Actuators B Chem., 2004, 100, 347–351.
45. I. M. Perez de Vargas-Sansalvador, M. A. Carvajal, O. M. Roldan-Munoz, J. Banqueri, M:
D. Fernandez-Ramos, L. F. Capitan-Vallvey, Anal. Chim. Acta, 2009, 655, 66–74.
46. S. M. Borisov, C. Wuerth, U. Resch-Genger and I. Klimant, Anal. Chem., 2013, 85, 9371-
9377.
102
47. M. J. Hall, S. O. McDonnell, J. Killoran, D. F. O’Shea, J. Org. Chem., 2005, 70, 5571–5578.
48. A. Gorman, J. Killoran, C. O’Shea, T. Kenna, W. M. Gallagher, D. F. O’Shea, J. Am. Chem.
Soc., 2004, 126, 10619–10631.
3.6 Supporting Information
Figure S1. Photodegradation profiles for carbon dioxide sensors (EC49; base: TOAH; T=25 °C)
based on the di-OH-aza-BODIPY dyes (black), m-cresol-purple (red triangles), thymol-blue
(green dots) obtained from the absorption spectra of the respective neutral form and the
absorption spectra of the deprotonated forms of the di-Cl-di-OH-complex (cyan) and
HPTS(TOA)3 (blue stars).
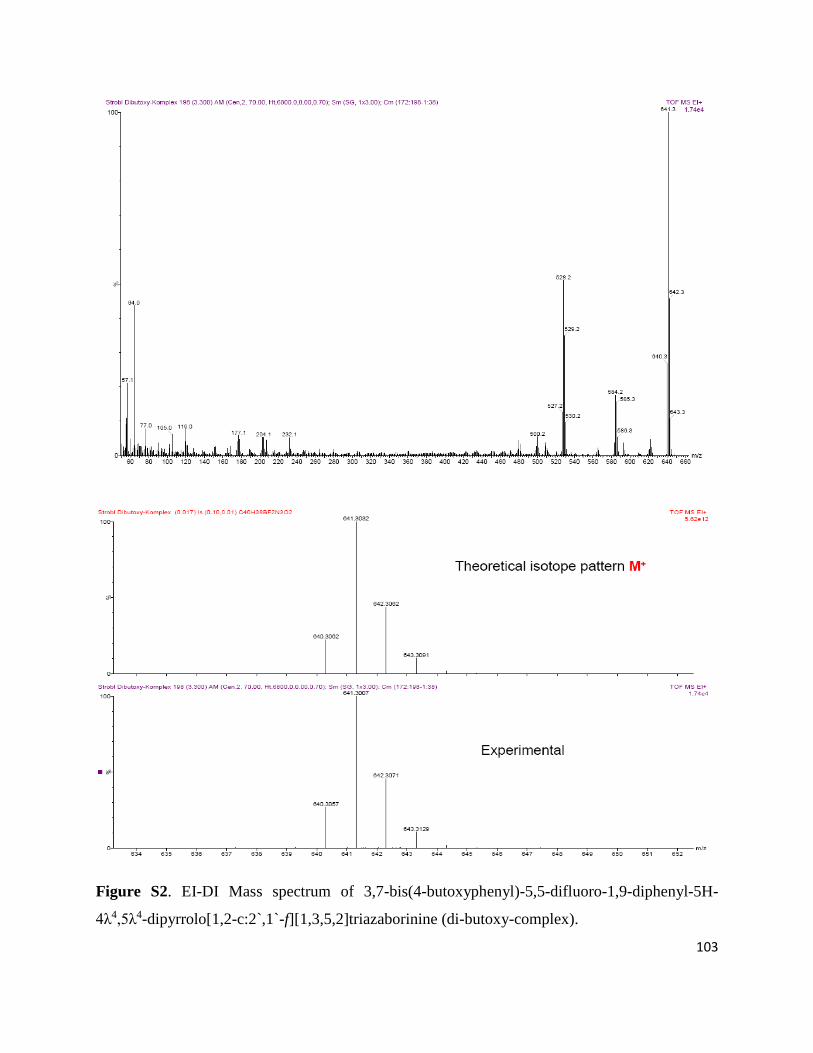
103
Figure S2. EI-DI Mass spectrum of 3,7-bis(4-butoxyphenyl)-5,5-difluoro-1,9-diphenyl-5H-
4λ4,5λ4-dipyrrolo[1,2-c:2`,1`-f][1,3,5,2]triazaborinine (di-butoxy-complex).
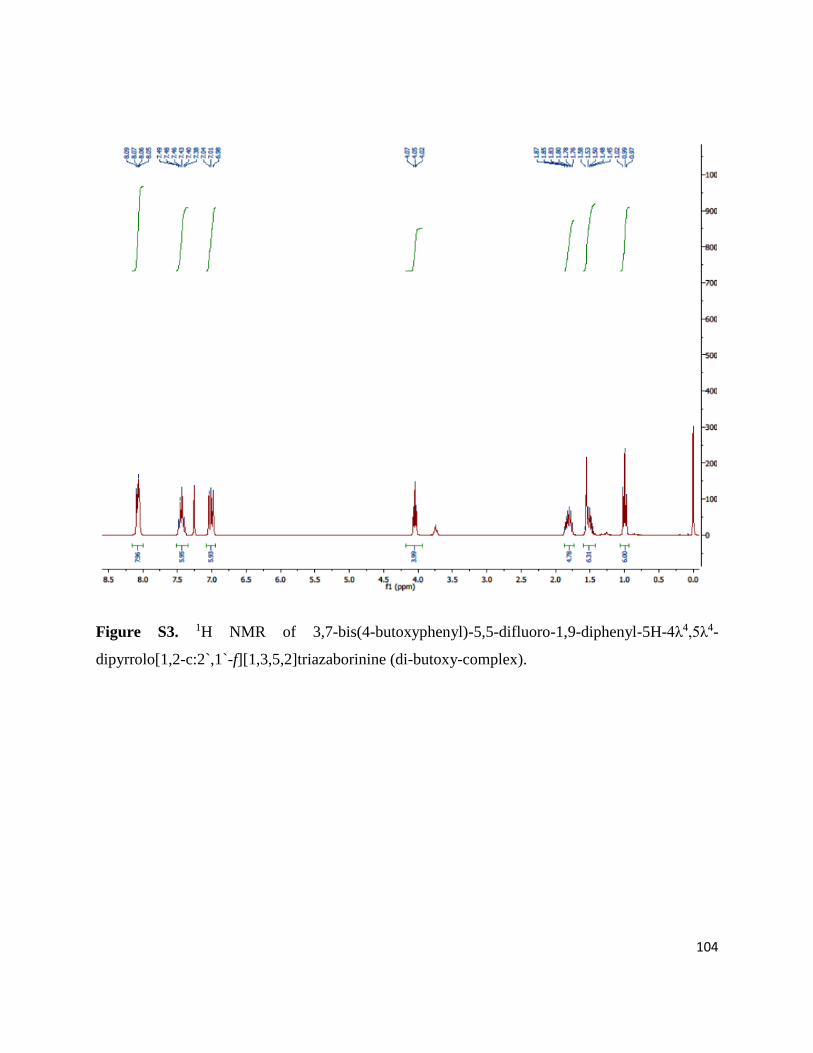
104
Figure S3. 1H NMR of 3,7-bis(4-butoxyphenyl)-5,5-difluoro-1,9-diphenyl-5H-4λ4,5λ4-
dipyrrolo[1,2-c:2`,1`-f][1,3,5,2]triazaborinine (di-butoxy-complex).
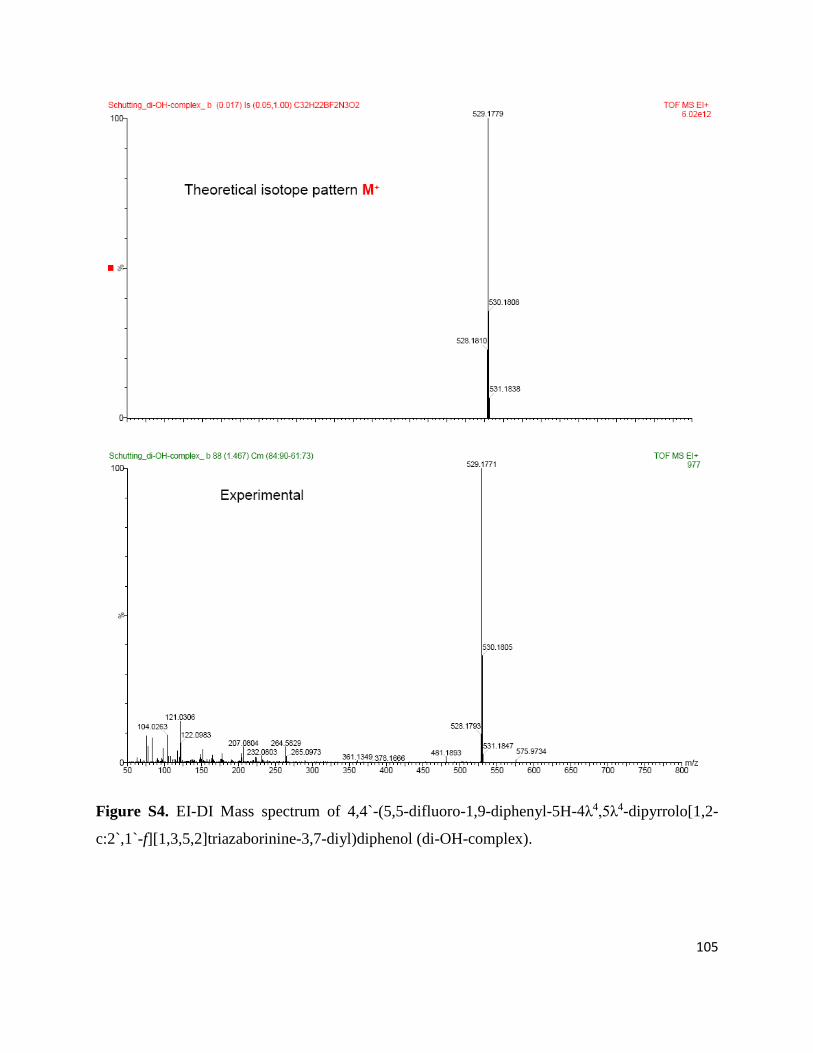
105
Figure S4. EI-DI Mass spectrum of 4,4`-(5,5-difluoro-1,9-diphenyl-5H-4λ4,5λ4-dipyrrolo[1,2-
c:2`,1`-f][1,3,5,2]triazaborinine-3,7-diyl)diphenol (di-OH-complex).
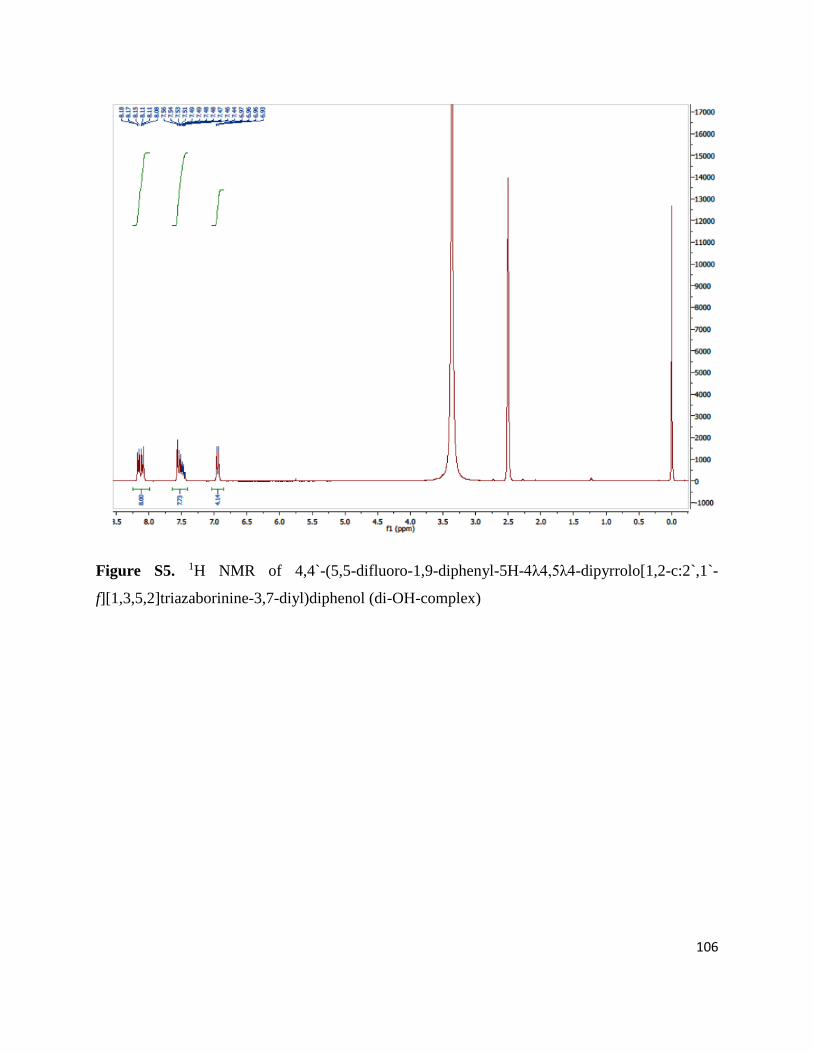
106
Figure S5. 1H NMR of 4,4`-(5,5-difluoro-1,9-diphenyl-5H-4λ4,5λ4-dipyrrolo[1,2-c:2`,1`-
f][1,3,5,2]triazaborinine-3,7-diyl)diphenol (di-OH-complex)
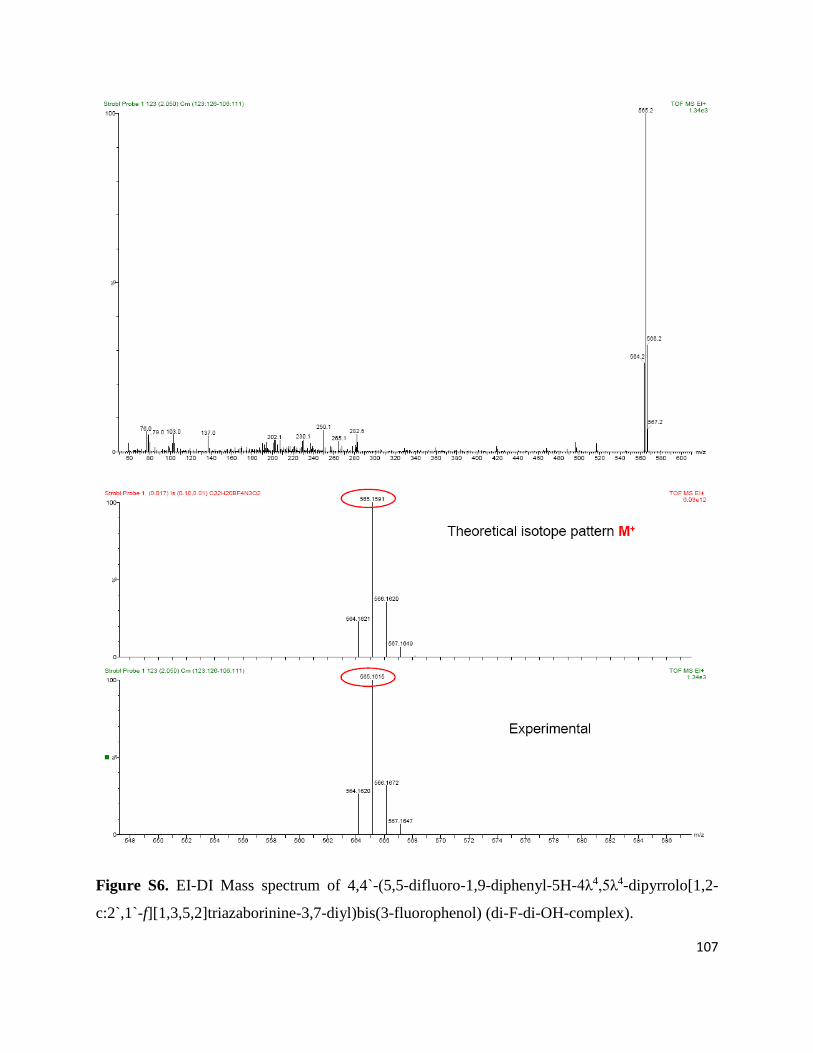
107
Figure S6. EI-DI Mass spectrum of 4,4`-(5,5-difluoro-1,9-diphenyl-5H-4λ4,5λ4-dipyrrolo[1,2-
c:2`,1`-f][1,3,5,2]triazaborinine-3,7-diyl)bis(3-fluorophenol) (di-F-di-OH-complex).
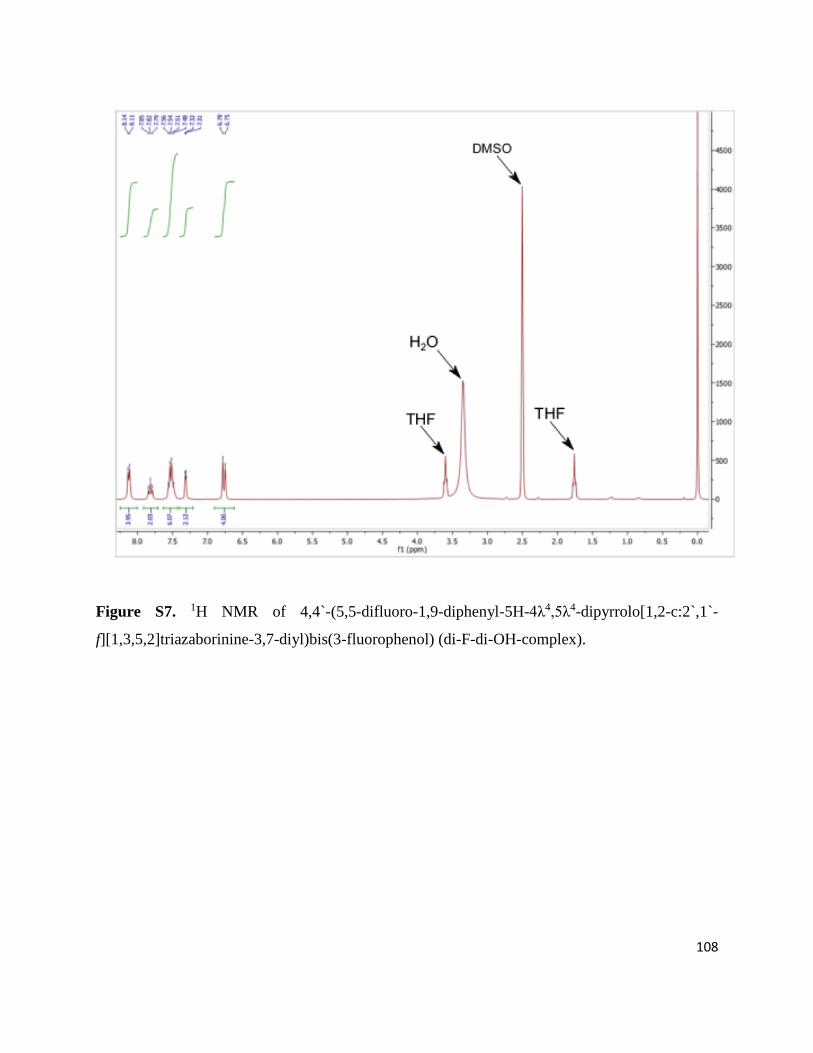
108
Figure S7. 1H NMR of 4,4`-(5,5-difluoro-1,9-diphenyl-5H-4λ4,5λ4-dipyrrolo[1,2-c:2`,1`-
f][1,3,5,2]triazaborinine-3,7-diyl)bis(3-fluorophenol) (di-F-di-OH-complex).
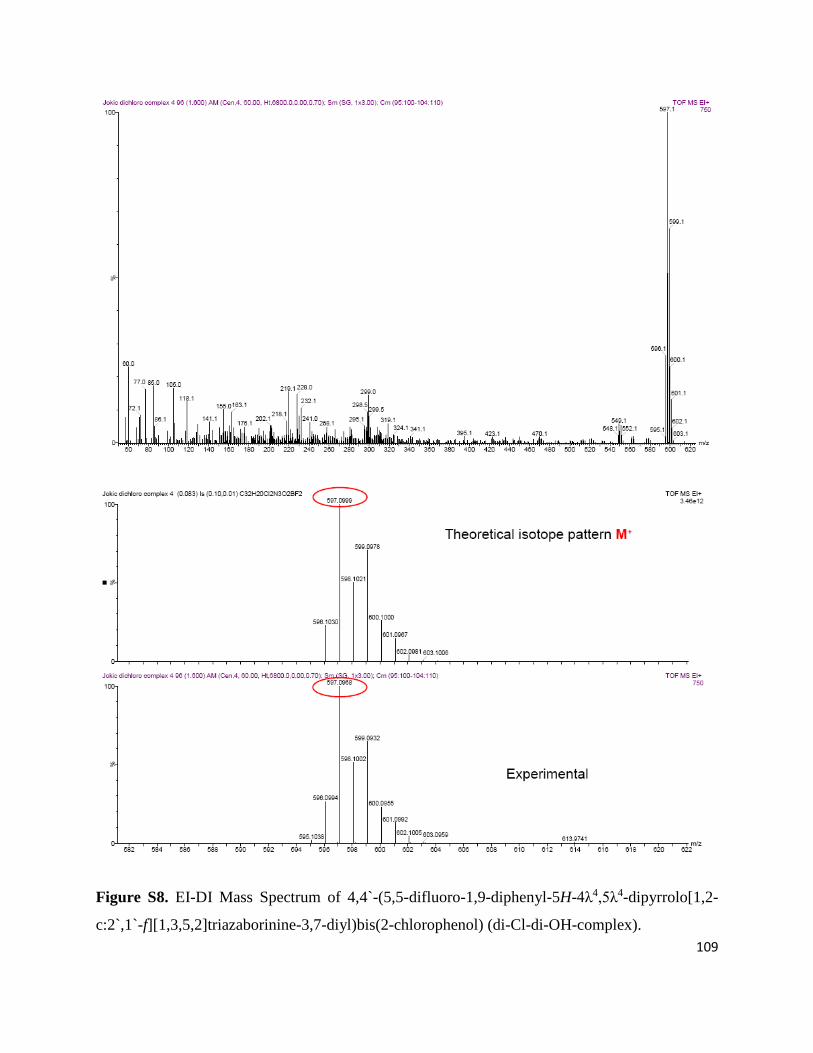
109
Figure S8. EI-DI Mass Spectrum of 4,4`-(5,5-difluoro-1,9-diphenyl-5H-4λ4,5λ4-dipyrrolo[1,2-
c:2`,1`-f][1,3,5,2]triazaborinine-3,7-diyl)bis(2-chlorophenol) (di-Cl-di-OH-complex).
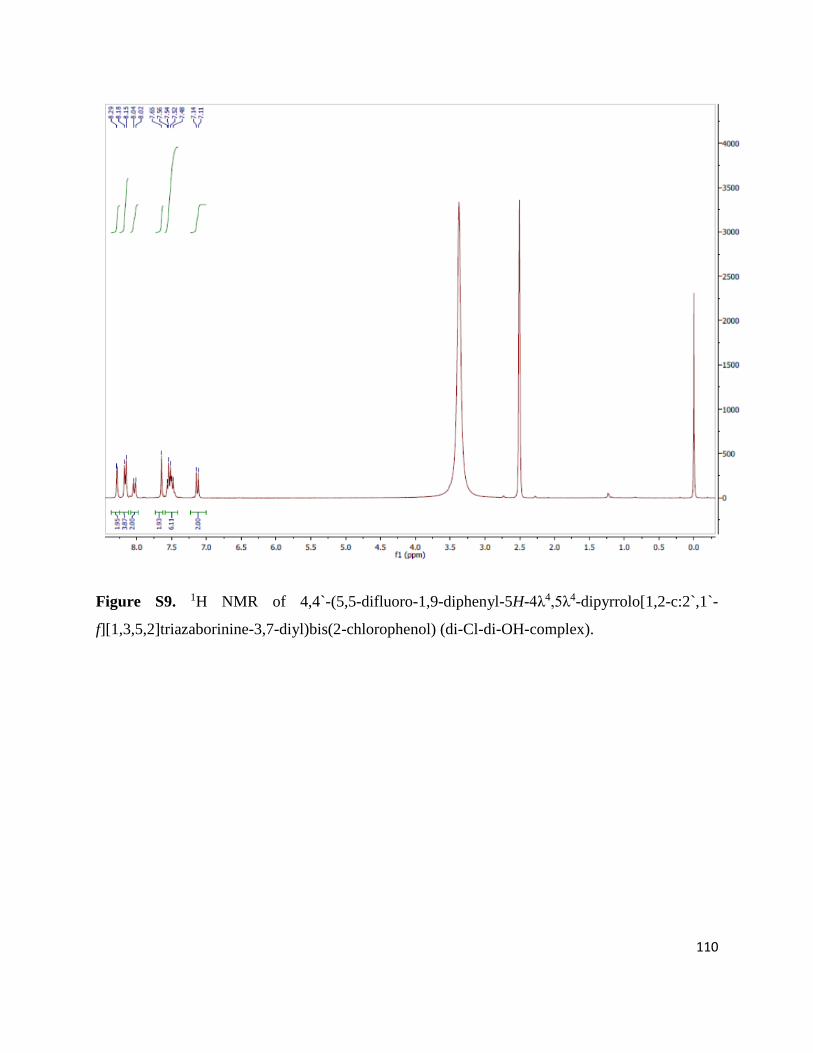
110
Figure S9. 1H NMR of 4,4`-(5,5-difluoro-1,9-diphenyl-5H-4λ4,5λ4-dipyrrolo[1,2-c:2`,1`-
f][1,3,5,2]triazaborinine-3,7-diyl)bis(2-chlorophenol) (di-Cl-di-OH-complex).
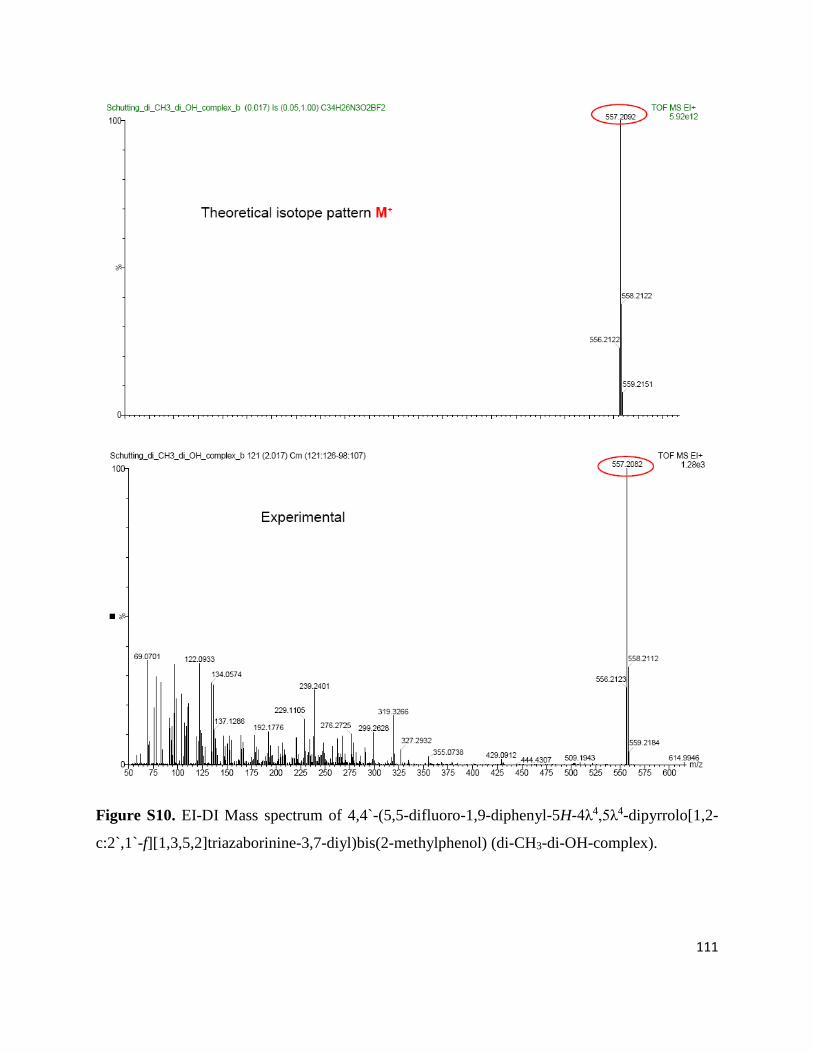
111
Figure S10. EI-DI Mass spectrum of 4,4`-(5,5-difluoro-1,9-diphenyl-5H-4λ4,5λ4-dipyrrolo[1,2-
c:2`,1`-f][1,3,5,2]triazaborinine-3,7-diyl)bis(2-methylphenol) (di-CH3-di-OH-complex).
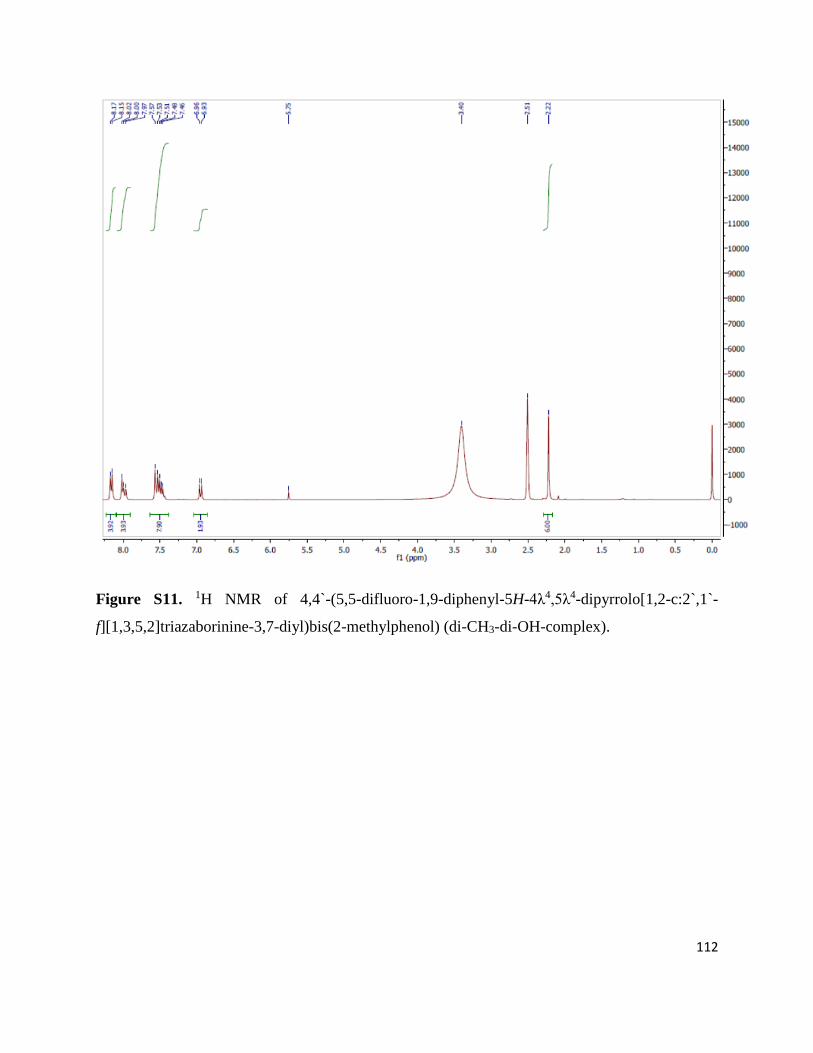
112
Figure S11. 1H NMR of 4,4`-(5,5-difluoro-1,9-diphenyl-5H-4λ4,5λ4-dipyrrolo[1,2-c:2`,1`-
f][1,3,5,2]triazaborinine-3,7-diyl)bis(2-methylphenol) (di-CH3-di-OH-complex).
113
Chapter 4
pH-sensitive aza-BODIPY probe for fluorescence lifetime imaging in MEF
cells
4.1 Introduction
Intracellular pH plays vital role in many metabolic functions of cells. Abnormal pH values are
indicator of improper cell function and are associated with a number of diseases, such as renal
acidosis, metabolic disorders, intoxication, diabetes, cancer1 and Alzheimer’s.2
Monitoring of intracellular pH can give critical information about physiological or pathogenic
processes in living organisms and therefore provide essential information for disease
identification and therapy.
In comparison to other methods used for pH measurements (electrochemical, NMR, absorption
spectroscopy), fluorescence sensing has advantages in respect to dimensional and temporal
monitoring of pH values. Fluorescence methods are more sensitive, more simple to use, and are
nondestructive for in vivo measurements.
Fluorescence probes can detect pH changes by different mechanisms. Most common is using
increase/decrease of fluorescence intensity or shifting of excitation and/or emission wavelength
maximum that has highest response at the pH close to the pKa of the indicator.
However, changes in optical properties of tissues and indicator concentration can influence
measurement data. Fluorescence lifetime imaging microscopy (FLIM) overcomes the limitations
of intensity-based measurements.3,4 Fluorescence lifetime is not influenced by changes of
indicator concentration and light source intensity and therefore the measurement data are more
reliable.
Despite the significance of this topic, extensive research has not yet been done on FLIM pH
imaging, most studies are still focused on ratiometric fluorescence measurements. Due to lack of
probes with desirable lifetime sensitivities there is a growing demand for new probes with
improved properties.
114
In our study of pH sensing properties of aza-BODIPY indicators we observed a decrease of 0.5
to 1 pH units in pKa values in hydrogel D4 determined from fluorescence data in comparison to
those in solution. This phenomenon is due to higher concentration of the indicator in the
hydrogel than in the solution. In hydrogel the distance between indicator molecules is short
enough for Förster resonance energy transfer (FRET) to take place from the protonated to the
deprotonated form. In fact, pKa values obtained from fluorescence data are decreasing with the
increase of the indicator concentration in hydrogel D4.
When the energy is transferred from the donor molecule to the acceptor molecule, the lifetime of
the donor molecule decreases. Therefore, it is expected that at concentration high enough to
enable FRET, it is possible to measure lifetime of aza-BODIPY indicators. To demonstrate the
feasibility of the approach the indicator was incorporated into RL 100 polymer, which was
already used for similar dyes.
Hence, new intracellular probe (MRL) for lifetime imaging is presented based on a nanoparticles
formulation of a RL-1005 polymer and a fluorescent dye, methoxy – substituted azabodipy
derivative6. (Fig.1)
4.2 Experimental
Materials and methods
Lysotracker Green, BCECF and Alexa Fluor 488-dextran 10000 were purchased from Invitrogen
(Biosciences, Dublin, Ireland). PtTPTBPF-RL100 nanoparticles were prepared according to
published procedure.7 A CellTox Green Cytotoxicity assay kit was obtained from Promega
(MyoBio, Ireland). Eudragit®RL100 was supplied by Evonik Industries
(http://corporate.evonik.de). Other used chemicals were from Sigma Aldrich. Standard cell
culture plastic plates were from Sarstedt (Wexford, Ireland) and Corning (VWR, Ireland), glass
bottom culture dishes (diameter 35 mm) were from MatTek (Ashland, USA), and glass bottom 8-
well slides from IBIDI (Martinsried, Germany). Absorption measurements were performed with
Cary 50 UV-VIS spectrophotometer from Varian (www.varianinc.com). Fluorescence spectra
were recorded with Hitachi F-7000 spectrofluorimeter (www.hitachi.com).
115
Preparation of polymer films and nanosensor particles
Particles were prepared according to a known procedure.7 RL100 polymer (200 mg) and the
indicator dye (0.5 mg) were dissolved in acetone (80 ml) and water (500 ml) was added. The
suspension was evaporated under vacuum till concentration of 5 gl˗1 was reached and the
obtained particle solution was kept at 4°C.
Polymer films were prepared by dissolving indicator dye (0.5 mg) in 100 mg of RL100 in 2 ml
of acetone. The “cocktail” was knife-coated on a plastic Mylar support to obtain ~ 7.5 thick
sensing layer.
Cell culture
Mouse embrionic fibroblast (MEF) cells are obtained from ATCC (Manassas, VA, USA) and
were cultured as described in literature.14 For imaging experiments, cells were grown on Cell+
dishes (confocal upright microscope) or glass bottom culture dishes coated with collagen-poly-
D-lysine (inverted microscope). Cell staining was achieved by incubation of cells with pH probe
in medium solution (1-24 h) and consequent washing with medium. Concentration/exposure time
for probes was 2.5 µM/0.5 h (BCECF), 1 µM/0.5 h, 0.01% /10 min (CellTox Green), 25 µg ml-1
/0.5 h (Dextran 10000-Alexa Fluor 488), 1 µM/0.5 h Lysotracker Green and 10 µgml-1 /16 h
(PtTPTBPF in RL100).
Microscopy
Investigation of staining kinetics, toxicity and photostability tests were carried out with a wide-
field fluorescence microscope Axiovert (Zeiss). FLIM images were obtained with upright Axio
Examiner Z1 (Zeiss) microscope with a 20x/1.0 W Apochromat objective, an integrated TCSPC
scanning module DCS-120 (Becker & Hickl, Germany), R10467U-40, 50 photon counting
detectors (Hamamatsu Photonics K.K.) and TCSPS hardwares (Becker & Hickl).14 MRL probe
was excited with a picoseconds super-continuum laser SC400-4 (Fianium, UK) at 632 nm (665
nm longpass filter, emission 750-810 nm), BCECF and Alexa Fluor 488-conjugates at 488 nm
(495 nm longpass filter, emission 512-536 nm). PtTPTBPF in RL100 was excited at 614 nm
(665 nm longpass filter, emission 750- 810 nm).
116
Buffers used for pH calibration contained 10 mM buffer salt (sodium acetate, MES, MOPS and
HEPES), 135 mM KCl, 2mM CaCl2, 1 mM MgCl2 and 20 mM sacharose. Nigericin (10 µM)
was added 15 min before the calibration.
Figure 1. A. Absorption and fluorescence emission (λexc = 680 nm) spectra of MRL in
THF/aqueous buffer. B. Structure of the indicator.
4.3 Results and Discussion
Cell penetration properties
The cell staining with MRL was investigated with mouse embryonic fibroblast (MEF) cells at
concentrations of 20 µgl˗1 (indicator concentration of 0.05 µM). The highest signals for cell
staining were achieved after 24 h with already observed staining after 6 h (Fig. 2).
Figure 2. Staining kinetics in MEF cells (0-24 h).
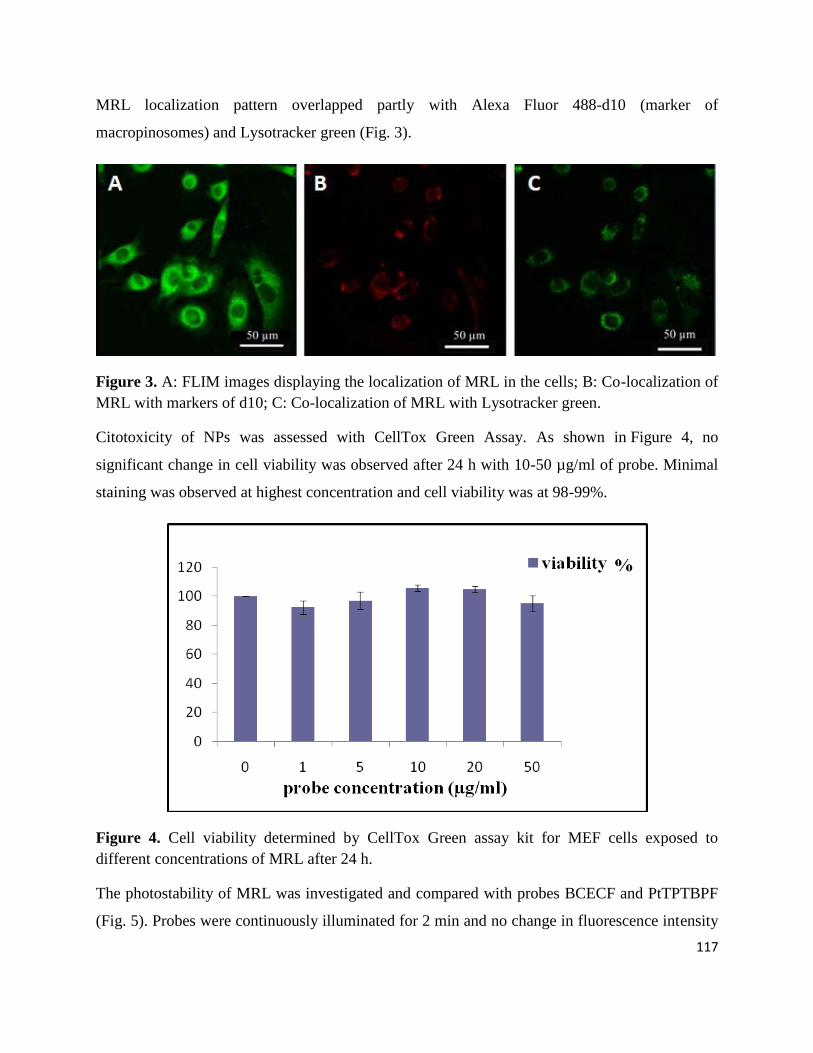
117
MRL localization pattern overlapped partly with Alexa Fluor 488-d10 (marker of
macropinosomes) and Lysotracker green (Fig. 3).
Figure 3. A: FLIM images displaying the localization of MRL in the cells; B: Co-localization of
MRL with markers of d10; C: Co-localization of MRL with Lysotracker green.
Citotoxicity of NPs was assessed with CellTox Green Assay. As shown in Figure 4, no
significant change in cell viability was observed after 24 h with 10-50 µg/ml of probe. Minimal
staining was observed at highest concentration and cell viability was at 98-99%.
Figure 4. Cell viability determined by CellTox Green assay kit for MEF cells exposed to
different concentrations of MRL after 24 h.
The photostability of MRL was investigated and compared with probes BCECF and PtTPTBPF
(Fig. 5). Probes were continuously illuminated for 2 min and no change in fluorescence intensity
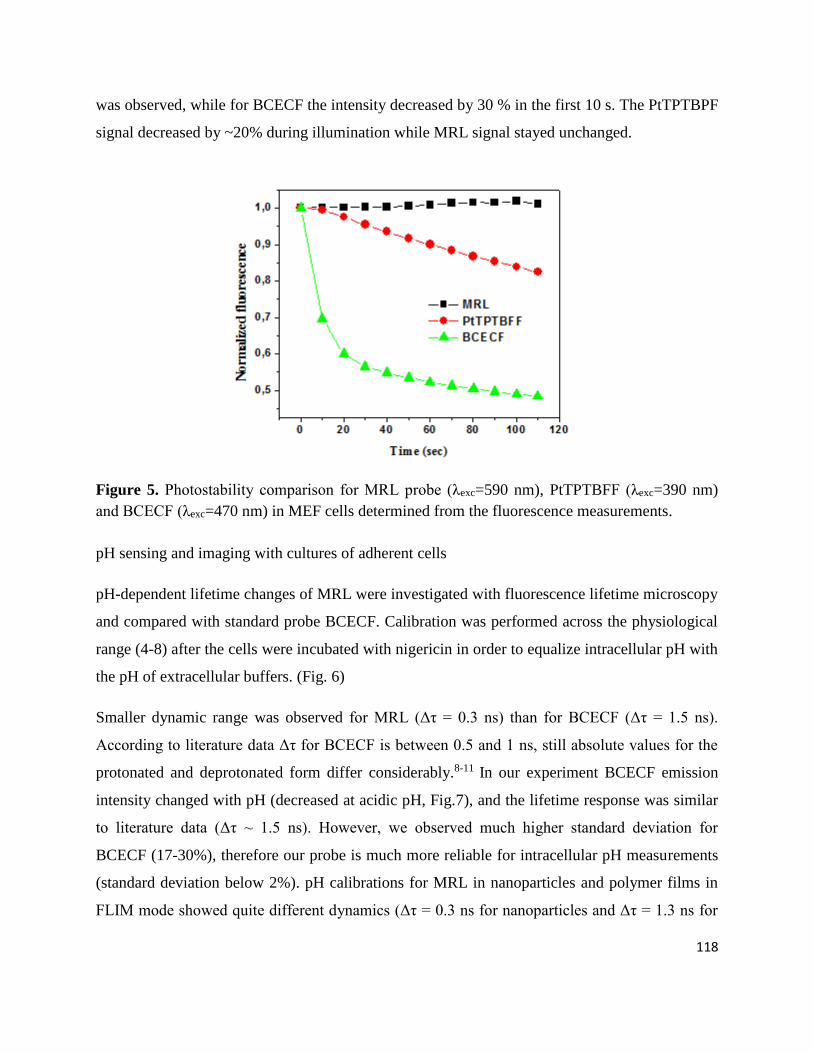
118
was observed, while for BCECF the intensity decreased by 30 % in the first 10 s. The PtTPTBPF
signal decreased by ~20% during illumination while MRL signal stayed unchanged.
Figure 5. Photostability comparison for MRL probe (λexc=590 nm), PtTPTBFF (λexc=390 nm)
and BCECF (λexc=470 nm) in MEF cells determined from the fluorescence measurements.
pH sensing and imaging with cultures of adherent cells
pH-dependent lifetime changes of MRL were investigated with fluorescence lifetime microscopy
and compared with standard probe BCECF. Calibration was performed across the physiological
range (4-8) after the cells were incubated with nigericin in order to equalize intracellular pH with
the pH of extracellular buffers. (Fig. 6)
Smaller dynamic range was observed for MRL (Δτ = 0.3 ns) than for BCECF (Δτ = 1.5 ns).
According to literature data Δτ for BCECF is between 0.5 and 1 ns, still absolute values for the
protonated and deprotonated form differ considerably.8-11 In our experiment BCECF emission
intensity changed with pH (decreased at acidic pH, Fig.7), and the lifetime response was similar
to literature data (Δτ ~ 1.5 ns). However, we observed much higher standard deviation for
BCECF (17-30%), therefore our probe is much more reliable for intracellular pH measurements
(standard deviation below 2%). pH calibrations for MRL in nanoparticles and polymer films in
FLIM mode showed quite different dynamics (Δτ = 0.3 ns for nanoparticles and Δτ = 1.3 ns for
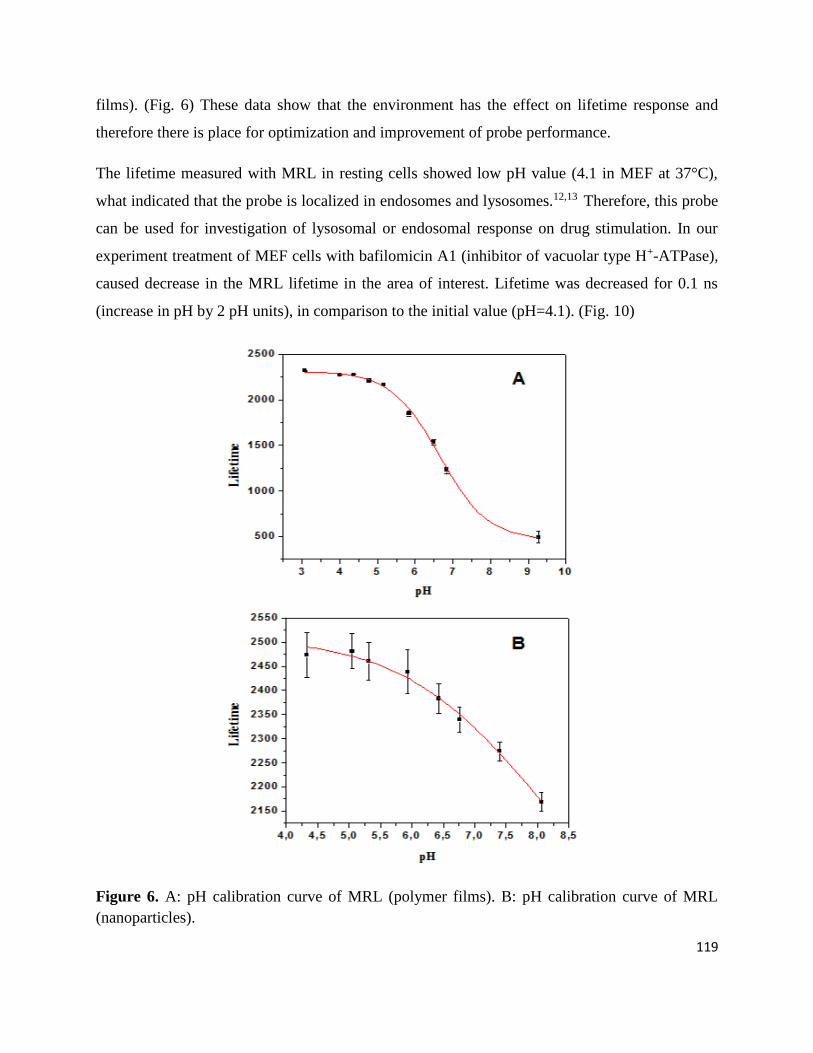
119
films). (Fig. 6) These data show that the environment has the effect on lifetime response and
therefore there is place for optimization and improvement of probe performance.
The lifetime measured with MRL in resting cells showed low pH value (4.1 in MEF at 37°C),
what indicated that the probe is localized in endosomes and lysosomes.12,13 Therefore, this probe
can be used for investigation of lysosomal or endosomal response on drug stimulation. In our
experiment treatment of MEF cells with bafilomicin A1 (inhibitor of vacuolar type H+-ATPase),
caused decrease in the MRL lifetime in the area of interest. Lifetime was decreased for 0.1 ns
(increase in pH by 2 pH units), in comparison to the initial value (pH=4.1). (Fig. 10)
Figure 6. A: pH calibration curve of MRL (polymer films). B: pH calibration curve of MRL
(nanoparticles).
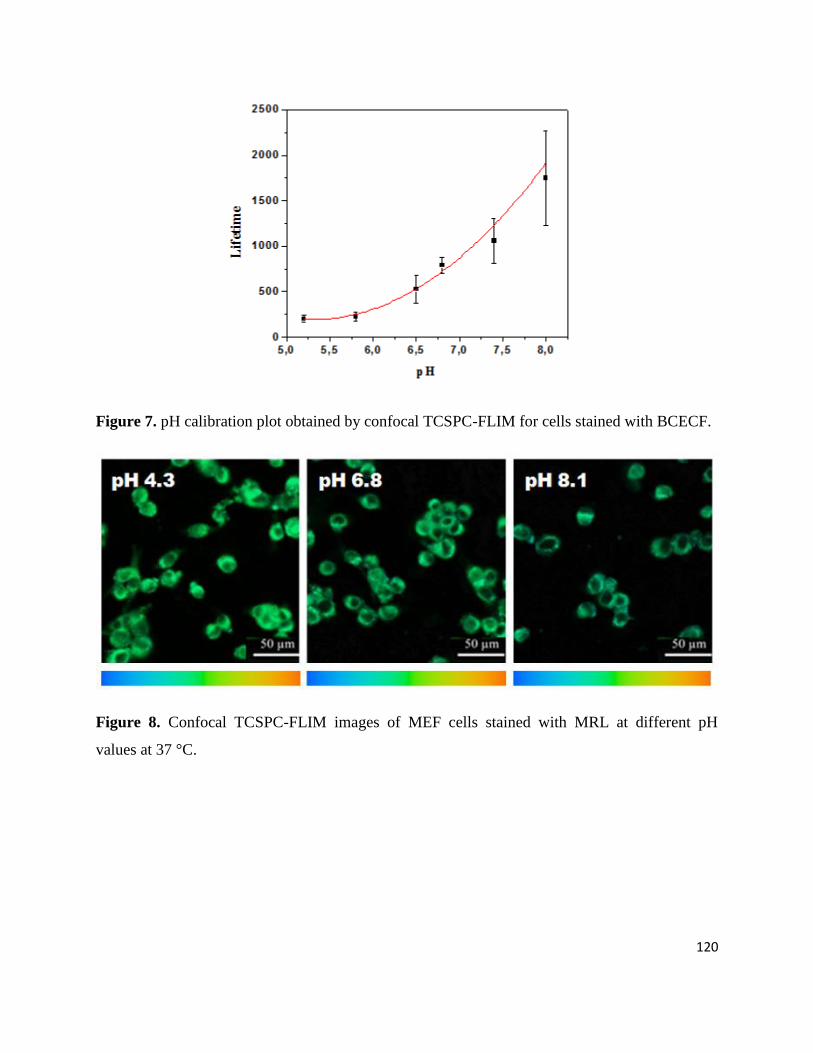
120
Figure 7. pH calibration plot obtained by confocal TCSPC-FLIM for cells stained with BCECF.
Figure 8. Confocal TCSPC-FLIM images of MEF cells stained with MRL at different pH
values at 37 °C.
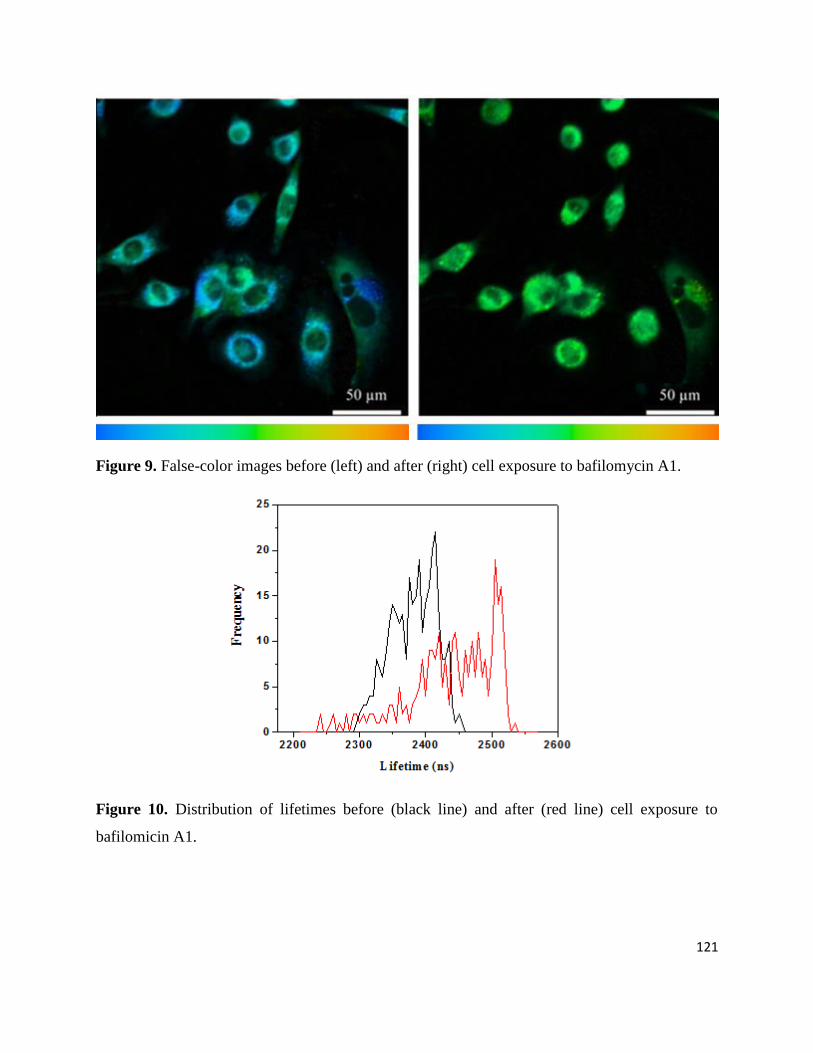
121
Figure 9. False-color images before (left) and after (right) cell exposure to bafilomycin A1.
Figure 10. Distribution of lifetimes before (black line) and after (red line) cell exposure to
bafilomicin A1.
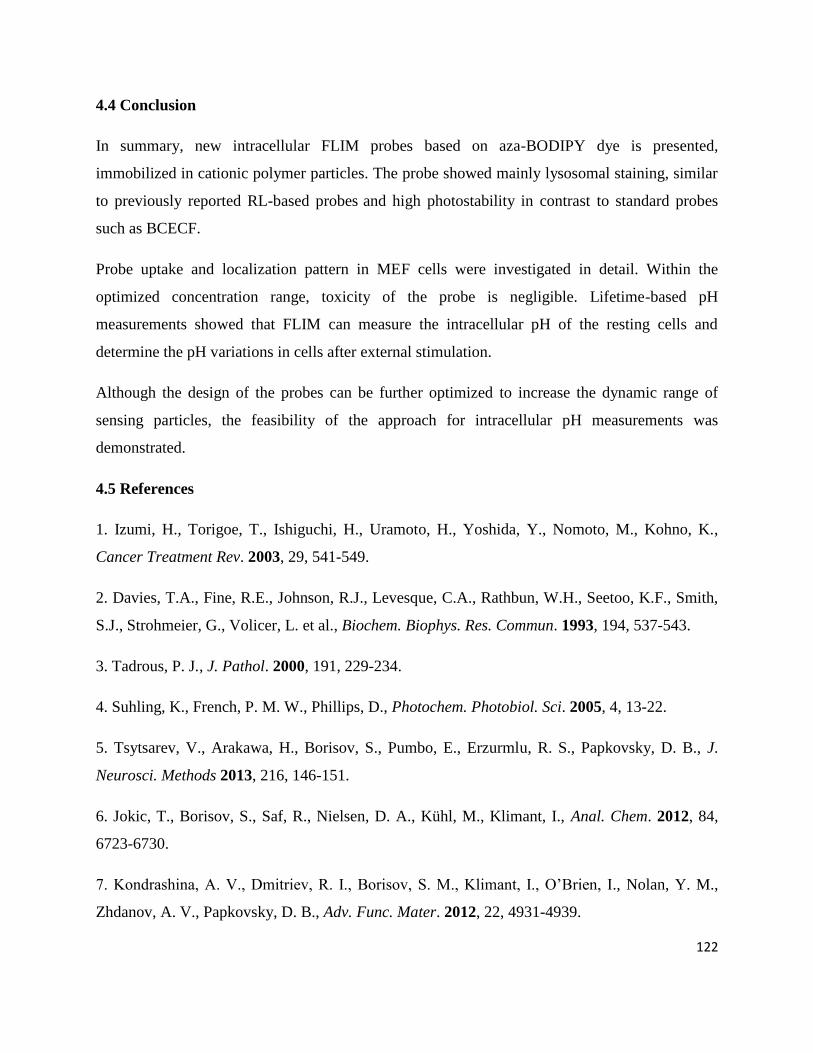
122
4.4 Conclusion
In summary, new intracellular FLIM probes based on aza-BODIPY dye is presented,
immobilized in cationic polymer particles. The probe showed mainly lysosomal staining, similar
to previously reported RL-based probes and high photostability in contrast to standard probes
such as BCECF.
Probe uptake and localization pattern in MEF cells were investigated in detail. Within the
optimized concentration range, toxicity of the probe is negligible. Lifetime-based pH
measurements showed that FLIM can measure the intracellular pH of the resting cells and
determine the pH variations in cells after external stimulation.
Although the design of the probes can be further optimized to increase the dynamic range of
sensing particles, the feasibility of the approach for intracellular pH measurements was
demonstrated.
4.5 References
1. Izumi, H., Torigoe, T., Ishiguchi, H., Uramoto, H., Yoshida, Y., Nomoto, M., Kohno, K.,
Cancer Treatment Rev. 2003, 29, 541-549.
2. Davies, T.A., Fine, R.E., Johnson, R.J., Levesque, C.A., Rathbun, W.H., Seetoo, K.F., Smith,
S.J., Strohmeier, G., Volicer, L. et al., Biochem. Biophys. Res. Commun. 1993, 194, 537-543.
3. Tadrous, P. J., J. Pathol. 2000, 191, 229-234.
4. Suhling, K., French, P. M. W., Phillips, D., Photochem. Photobiol. Sci. 2005, 4, 13-22.
5. Tsytsarev, V., Arakawa, H., Borisov, S., Pumbo, E., Erzurmlu, R. S., Papkovsky, D. B., J.
Neurosci. Methods 2013, 216, 146-151.
6. Jokic, T., Borisov, S., Saf, R., Nielsen, D. A., Kühl, M., Klimant, I., Anal. Chem. 2012, 84,
6723-6730.
7. Kondrashina, A. V., Dmitriev, R. I., Borisov, S. M., Klimant, I., O’Brien, I., Nolan, Y. M.,
Zhdanov, A. V., Papkovsky, D. B., Adv. Func. Mater. 2012, 22, 4931-4939.

123
8. Niesner, B., Peker, B., Schlüsche, P., Gericke, K.-H., Hoffmann, C., Hahne, D., Müller-
Goymann, Pharm. Res. 2005, 22, 1079-1087.
9. Hille, C., Berg, M., Bressel, L., Munzke, D., Primus, P., Löhmannsröben, H.-G., Dosche, C.,
Anal. Bioanal. Chem. 2008, 391, 1871-1879.
10. Wang, H.-P., Nakabayashi, T., Tsujimoto, K., Miyauchi, S., Kamo, N., Ohta, N., Chem.
Phys. Lett. 2007, 442, 441-444.
11. Hanson, K. M., Behne, M. J., Barry, N. P., Mauro, T. M., Gratton, E., Clegg, R. M., Biophys.
J. 2002, 83, 1682-1690.
12. Dmitriev, R. I., Zhdanov, A. V., Jasionek, G., Papkovsky, D. B., Anal. Chem. 2012, 84,
2930-2938.
13. Canton, I., Battaglia, G., Chem. Soc. Rev. 2012, 41, 2718-2739.
14. Dmitriev, R. I., Kondrashina, A. V., Koren, K., Klimant, I., Zhadanov, A. V., Pakan, J. M.,
McDermott, K. W., Papkovsky, D. B., Biomater. Sci. 2014, 2, 853-866.
15. Dmitriev, R. I., Zhadanov, A. V., Nolan, Y. M., Papkovsky, D. B. Biomaterials 2013, 34,
9307-9317.
124
Chapter 5
CO2 sensor based on rigid aza-BODIPY probe
5.1 Introduction
The advantages of fluorescence sensing in the NIR region (700-1100 nm) are many and have
been extensively described. Compared to chromophores absorbing in the visible region,
problems have been encountered in the design and synthesis of the red-shifted NIR counterparts,
such as aggregation, photobleaching, and low fluorescence quantum yields. Therefore, there is a
pressing demand for the development of new, more effective probes that emit in the NIR region.
We have chosen structurally rigidified aza-dipyrromethene dye as our target for synthesis.1,2 We
speculated that the rigidification of the aza-bodipy core would bring many advantages like
simple synthesis and bathochromic shift in the absorption maxima in comparison to the non-rigid
analogue. The probe shows intense, sharp absorption (full width at half maximum height,
fwhm=30.4 nm; ε=145000 M-1cm-1) in the NIR region (λmax=740 nm). Thus, the rigidification of
the azaBODIPY core results in a 52-nm bathochromic shift and 2-fold decrease of the fwhm.
Herein we present detailed characterization of the dye and its application as a carbon dioxide-
sensitive material.
5.2 Experimental
Materials
Vinyldimethylsiloxy terminated polydimethylsiloxane (viscosity 1000 cSt),
methylhydrosiloxane/dimethylsiloxane copolymer (viscosity 25-35 cSt),
tetravinyltetramethylcyclotetrasiloxane, platinum divinyltetramethylsiloxane complex,
imidazole, tert-butyl dimethyl chlorosilane, sodium nitrite and triethylamine were obtained from
ABCR (www.abcr.de). Boron trifluoride diethyl etherate, MOPS buffer salt, sodium sulfate
(anhydrous), acetic acid and acetic anhydride from Sigma Aldrich (www.sigmaaldrich.com),
ethanol, tetrahydrofuran, hydrochloric acid (37%), dichloromethane and cyclohexane from VWR
(www.vwr.com), 6-hydroxy-1-tetralone, 6-methoxy-1-tetralone and LDA (Lithium
Diisopropylamide 20%) from TCI Europe (www.tcichemicals.com), potassium chloride,
potassium carbonate, potassium hydroxide, sodium phosphate and sodium hydrogen phosphate
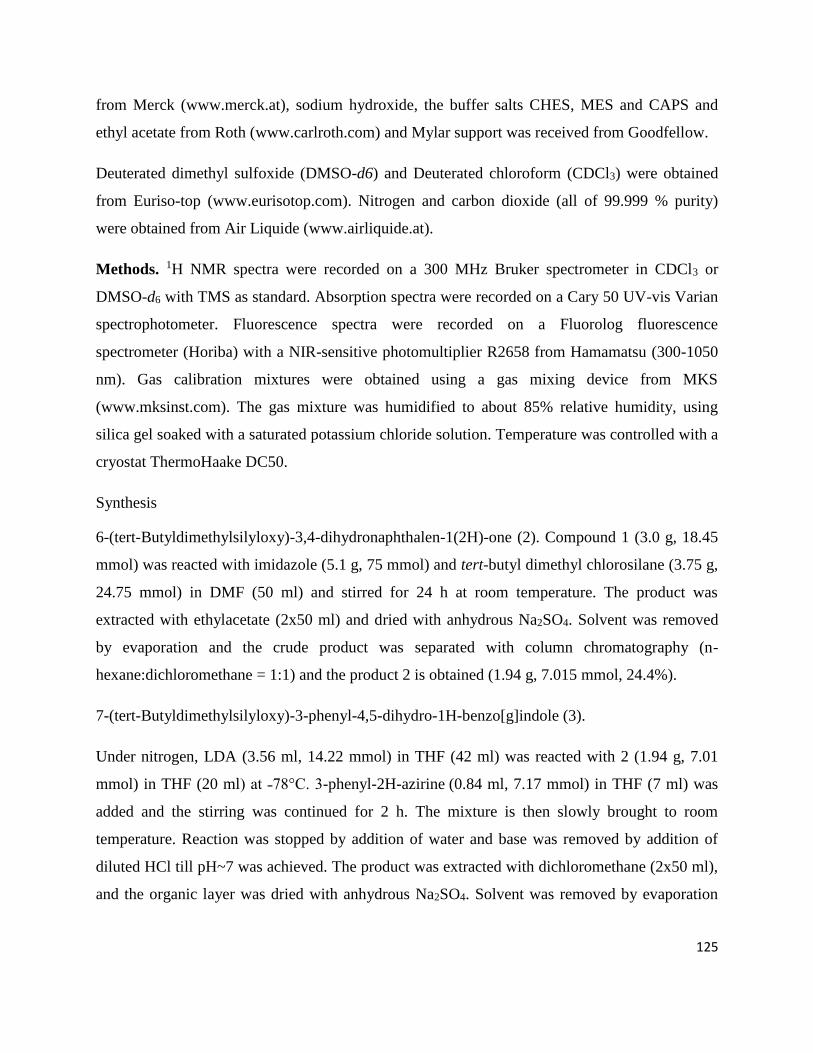
125
from Merck (www.merck.at), sodium hydroxide, the buffer salts CHES, MES and CAPS and
ethyl acetate from Roth (www.carlroth.com) and Mylar support was received from Goodfellow.
Deuterated dimethyl sulfoxide (DMSO-d6) and Deuterated chloroform (CDCl3) were obtained
from Euriso-top (www.eurisotop.com). Nitrogen and carbon dioxide (all of 99.999 % purity)
were obtained from Air Liquide (www.airliquide.at).
Methods. 1H NMR spectra were recorded on a 300 MHz Bruker spectrometer in CDCl3 or
DMSO-d6 with TMS as standard. Absorption spectra were recorded on a Cary 50 UV-vis Varian
spectrophotometer. Fluorescence spectra were recorded on a Fluorolog fluorescence
spectrometer (Horiba) with a NIR-sensitive photomultiplier R2658 from Hamamatsu (300-1050
nm). Gas calibration mixtures were obtained using a gas mixing device from MKS
(www.mksinst.com). The gas mixture was humidified to about 85% relative humidity, using
silica gel soaked with a saturated potassium chloride solution. Temperature was controlled with a
cryostat ThermoHaake DC50.
Synthesis
6-(tert-Butyldimethylsilyloxy)-3,4-dihydronaphthalen-1(2H)-one (2). Compound 1 (3.0 g, 18.45
mmol) was reacted with imidazole (5.1 g, 75 mmol) and tert-butyl dimethyl chlorosilane (3.75 g,
24.75 mmol) in DMF (50 ml) and stirred for 24 h at room temperature. The product was
extracted with ethylacetate (2x50 ml) and dried with anhydrous Na2SO4. Solvent was removed
by evaporation and the crude product was separated with column chromatography (n-
hexane:dichloromethane = 1:1) and the product 2 is obtained (1.94 g, 7.015 mmol, 24.4%).
7-(tert-Butyldimethylsilyloxy)-3-phenyl-4,5-dihydro-1H-benzo[g]indole (3).
Under nitrogen, LDA (3.56 ml, 14.22 mmol) in THF (42 ml) was reacted with 2 (1.94 g, 7.01
mmol) in THF (20 ml) at ˗78°C. 3-phenyl-2H-azirine (0.84 ml, 7.17 mmol) in THF (7 ml) was
added and the stirring was continued for 2 h. The mixture is then slowly brought to room
temperature. Reaction was stopped by addition of water and base was removed by addition of
diluted HCl till pH~7 was achieved. The product was extracted with dichloromethane (2x50 ml),
and the organic layer was dried with anhydrous Na2SO4. Solvent was removed by evaporation
126
and the crude product was separated with column chromatography on silica gel (n-
hexane:dichloromethane=1:1) and product 3 was obtained (1.24 g, 3.3 mmol, 27.4 %).
Under nitrogen, LDA (4.57 ml, 18.26 mmol) in THF (54 ml) was reacted with 2 (5 g, 28.37
mmol) in THF (20 ml) at ˗78°C. 3-phenyl-2H-azirine1 (2.17 ml, 18.53 mmol) in THF (18 ml)
was added and the stirring was continued for 2 h. The mixture is then slowly brought to room
temperature. Reaction was stopped by addition of water and base was removed by addition of
diluted HCl till pH~7 was achieved. The product was extracted with dichloromethane (2x50 ml),
and the organic layer was dried with anhydrous Na2SO4. Solvent was removed by evaporation
and the crude product was separated with column chromatography on silica gel (n-
hexane:dichloromethane=1:1) and product 4 was obtained (1.42 g, 5.16 mmol, 18.2 %).
Aza-BODIPY dye (5). Sodium nitrite (12.5 mg, 0.18 mmol) was reacted with 3 (50 mg, 0.18
mmol) in acetic acid (1.8 ml) at 0 °C for 10 min. The second pyrrole 4 (68 mg, 0.18 mmol) was
added and acetic anhydride (0.72 ml). After 30 min, the mixture was reacted at 80 °C for 30 min.
After that the reaction mixture is brought to room temperature and ice was added to the mixture.
The product was filtered, washed with water and dissolved in dichloromethane. Solvent was
removed by evaporation, the product was dissolved in dry 1,2-dichloromethane, triethylamine
(0.43 ml) was added and BF3·Et2O (0.43 ml). The mixture was stirred for 30 min, then heated at
80 °C for 30 min, and then cooled down. The reaction was stopped with ice, extracted with
dichloromethane, purified by chromatography on silica gel and recrystalized from
dichloromethane/n-hexane to afford 5 (65 mg, 0.102 mmol, 55.6%). 1H NMR (300 MHz,
CDCl3): δ: 8.74-8.77 (d, 1H), 8.79-8.82 (d, 1H), 7.68-7.73 (t, 4H), 7.36-7.47 (m, 6H), 7.15-7.19
(dd, 1H), 7.07 (d, 1H), 7.02-7.06 (dd, 1H), 6.85-6.89 (d, 1H), 3.92 (s, 3H), 2.93 (s, 8H), 2.34 (s,
3H).
Aza-BODIPY dye (6): Compound 5 (32 mg, 0.05 mmol) was stirred overnight with K2CO3 (25.9
mg, 0.18 mmol) in a mixture of dichloromethane (10 ml), methanol (4 ml) and water (0.4 ml) at
room temperature. Solvents are removed by evaporation, the product was dissolved in water (20
ml) and diluted NaH2PO4 was added till pH 5 was achieved. The precipitated product was
filtered, washed and purified by chromatography on silica gel. Recrystallization was done from
dichloromethane/n-hexane to yield 6 (8.7 mg, 0.146 mmol, 29.1%). 1H NMR (300 MHz,
127
CDCl3): δ: 8.56 (d, 1H), 8.49 (d, 1H), 7.71-7.76 (m, 4H), 7.47-7.53 (m, 4H), 7.37-7.44 (m, 2H),
7.09-7.13 (dd, 1H), 7.03-7.04 (d, 1H), 6.87-6.90 (dd, 1H), 6.83-6.84 (d, 1H), 3.89 (s, 3H), 2.87-
2.91 (m, 8H).
Preparation of the CO2 Sensing Material.
100 mg of hydrotane 25 was dissolved in 2 ml of THF and 200 µL of water. 60 µL of 0.2 M
water solution of Na3PO4 was added and the indicator solution (0.5 mg dissolved in 500 µL of
THF). The “cocktail” was knife-coated on a dust-free Mylar support to obtain a ~7.5 µm thick
sensing layer after solvent evaporation.
The cocktail of silicon primers was obtained by mixing tetravinyltetramethylcyclotetrasiloxane
(1.5 µL) with 500 mg of the vinyl-terminated PDMS in 1 ml of cyclohexan followed by addition
of 15 µL of methylhyydrosiloxane-dimethylsiloxane copolymer and 2 µL of the platinum
complex catalyst. The uncured silicone layer was coated onto sensing layer and cured for 10 min
to obtain protection layer with the thickness of ~60 µm.
5.3 Results and Discussion
For the preparation of the pyrrole moieties 6-hydroxy-1-tetralone and 6-methoxy-1-tetralone
were reacted with 3-phenyl-2H-azirine to give 3 in 27.4% yield and 4 in 18.2% yield in the
presence of LDA, respectively2,3 (Scheme 1). Aza-BODIPY 5 was successfully synthesized in
55.6 % yield by condensation of pyrrole with a nitrosopyrrole, which was prepared in a separate
step. The complexation of dipyrromethane was achieved with BF3·Et2O in the presence of
triethylamine in dichloromethane. After hydrolysis of acetate aza-BODIPY 6 was obtained in
29.1 % yield.
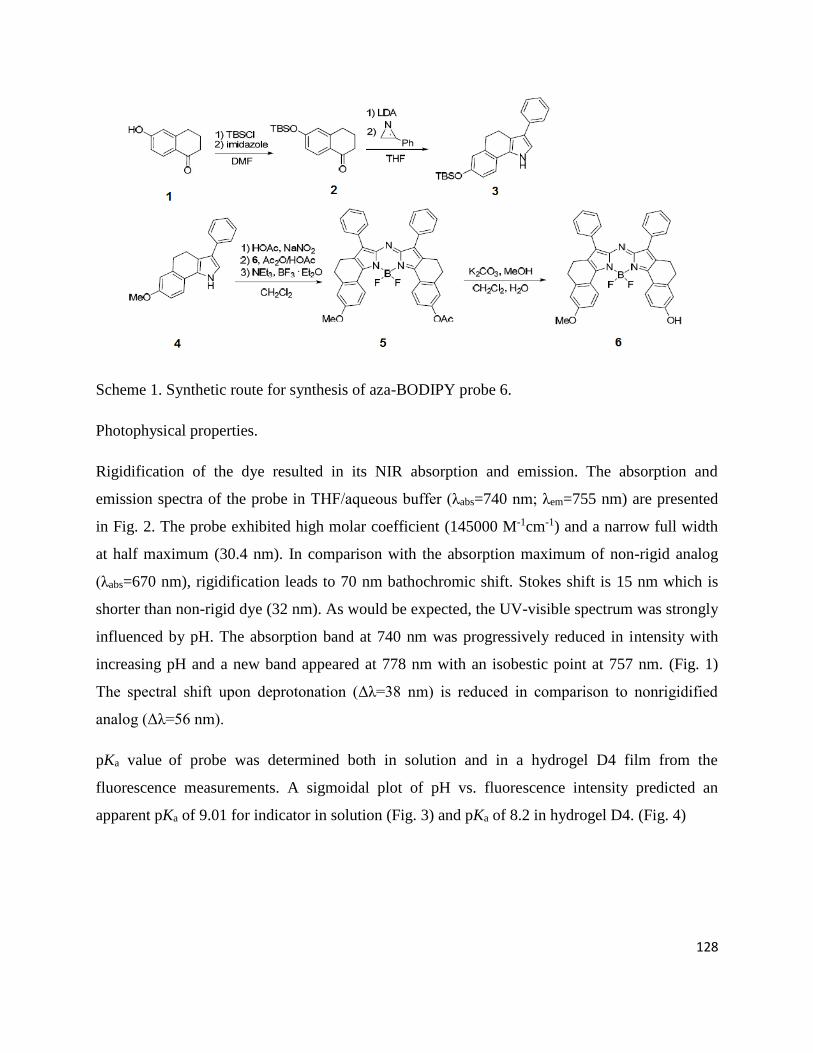
128
Scheme 1. Synthetic route for synthesis of aza-BODIPY probe 6.
Photophysical properties.
Rigidification of the dye resulted in its NIR absorption and emission. The absorption and
emission spectra of the probe in THF/aqueous buffer (λabs=740 nm; λem=755 nm) are presented
in Fig. 2. The probe exhibited high molar coefficient (145000 M-1cm-1) and a narrow full width
at half maximum (30.4 nm). In comparison with the absorption maximum of non-rigid analog
(λabs=670 nm), rigidification leads to 70 nm bathochromic shift. Stokes shift is 15 nm which is
shorter than non-rigid dye (32 nm). As would be expected, the UV-visible spectrum was strongly
influenced by pH. The absorption band at 740 nm was progressively reduced in intensity with
increasing pH and a new band appeared at 778 nm with an isobestic point at 757 nm. (Fig. 1)
The spectral shift upon deprotonation (Δλ=38 nm) is reduced in comparison to nonrigidified
analog (Δλ=56 nm).
pKa value of probe was determined both in solution and in a hydrogel D4 film from the
fluorescence measurements. A sigmoidal plot of pH vs. fluorescence intensity predicted an
apparent pKa of 9.01 for indicator in solution (Fig. 3) and pKa of 8.2 in hydrogel D4. (Fig. 4)
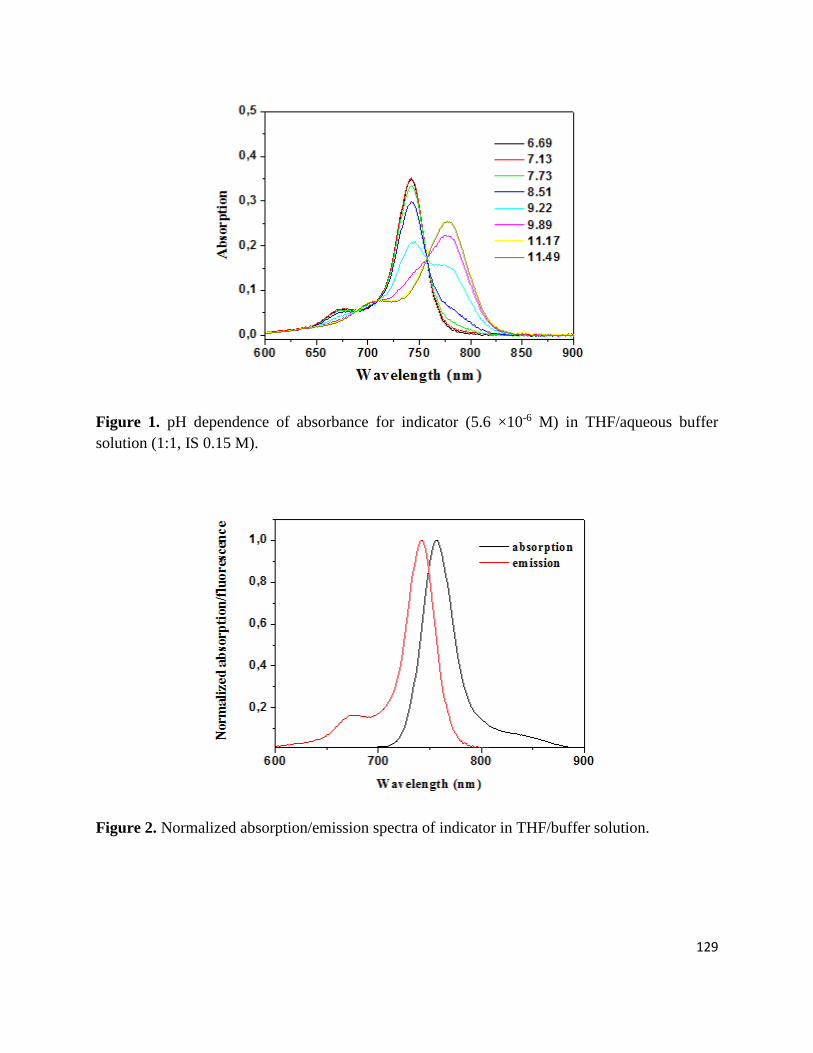
129
Figure 1. pH dependence of absorbance for indicator (5.6 ×10⁻⁶ M) in THF/aqueous buffer
solution (1:1, IS 0.15 M).
Figure 2. Normalized absorption/emission spectra of indicator in THF/buffer solution.
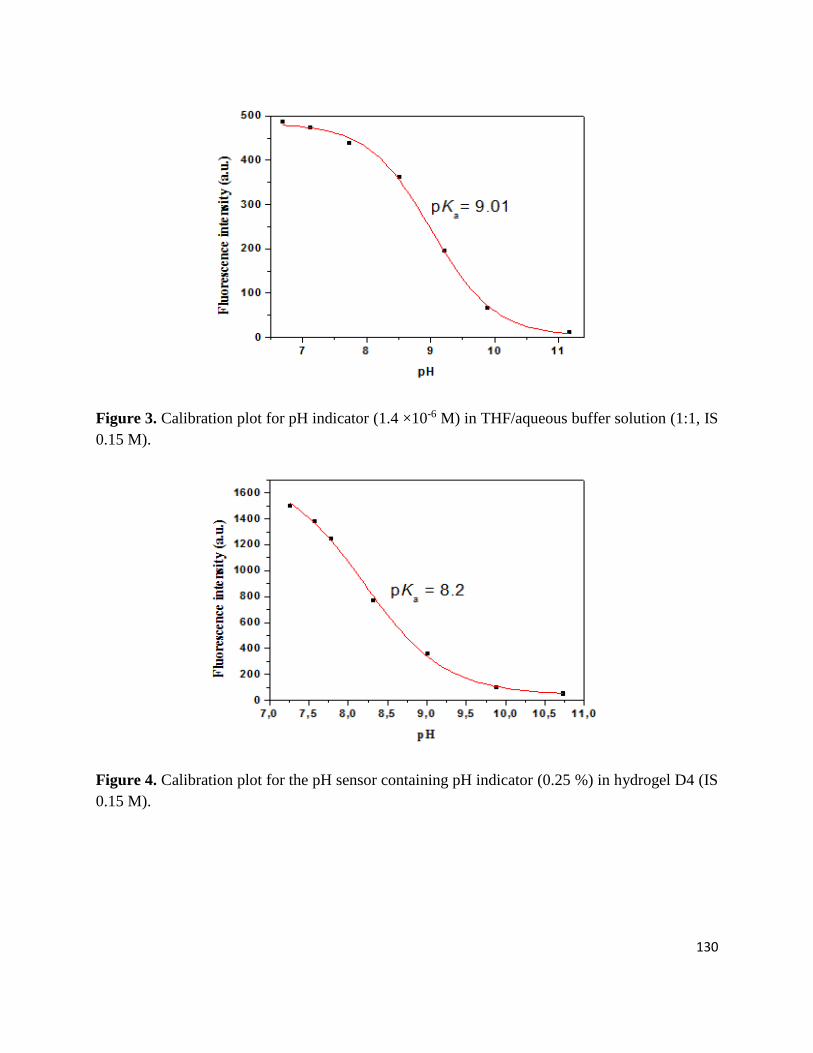
130
Figure 3. Calibration plot for pH indicator (1.4 ×10⁻⁶ M) in THF/aqueous buffer solution (1:1, IS
0.15 M).
Figure 4. Calibration plot for the pH sensor containing pH indicator (0.25 %) in hydrogel D4 (IS
0.15 M).
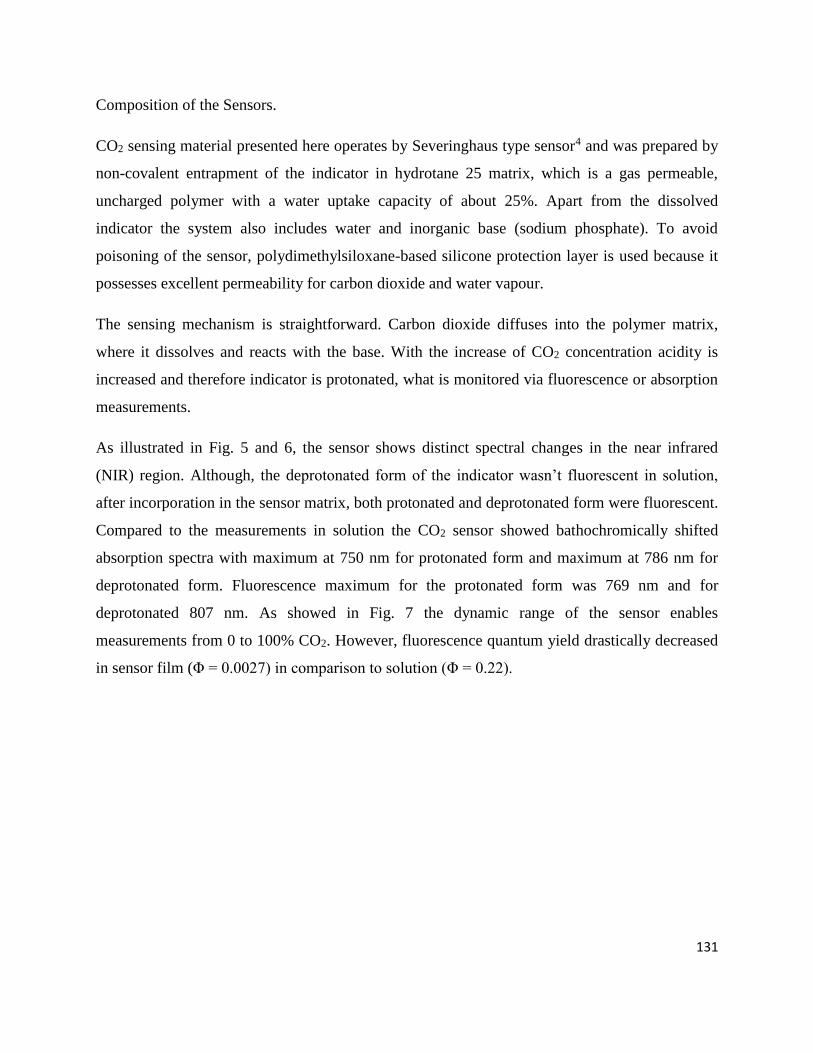
131
Composition of the Sensors.
CO2 sensing material presented here operates by Severinghaus type sensor4 and was prepared by
non-covalent entrapment of the indicator in hydrotane 25 matrix, which is a gas permeable,
uncharged polymer with a water uptake capacity of about 25%. Apart from the dissolved
indicator the system also includes water and inorganic base (sodium phosphate). To avoid
poisoning of the sensor, polydimethylsiloxane-based silicone protection layer is used because it
possesses excellent permeability for carbon dioxide and water vapour.
The sensing mechanism is straightforward. Carbon dioxide diffuses into the polymer matrix,
where it dissolves and reacts with the base. With the increase of CO2 concentration acidity is
increased and therefore indicator is protonated, what is monitored via fluorescence or absorption
measurements.
As illustrated in Fig. 5 and 6, the sensor shows distinct spectral changes in the near infrared
(NIR) region. Although, the deprotonated form of the indicator wasn’t fluorescent in solution,
after incorporation in the sensor matrix, both protonated and deprotonated form were fluorescent.
Compared to the measurements in solution the CO2 sensor showed bathochromically shifted
absorption spectra with maximum at 750 nm for protonated form and maximum at 786 nm for
deprotonated form. Fluorescence maximum for the protonated form was 769 nm and for
deprotonated 807 nm. As showed in Fig. 7 the dynamic range of the sensor enables
measurements from 0 to 100% CO2. However, fluorescence quantum yield drastically decreased
in sensor film (Φ = 0.0027) in comparison to solution (Φ = 0.22).
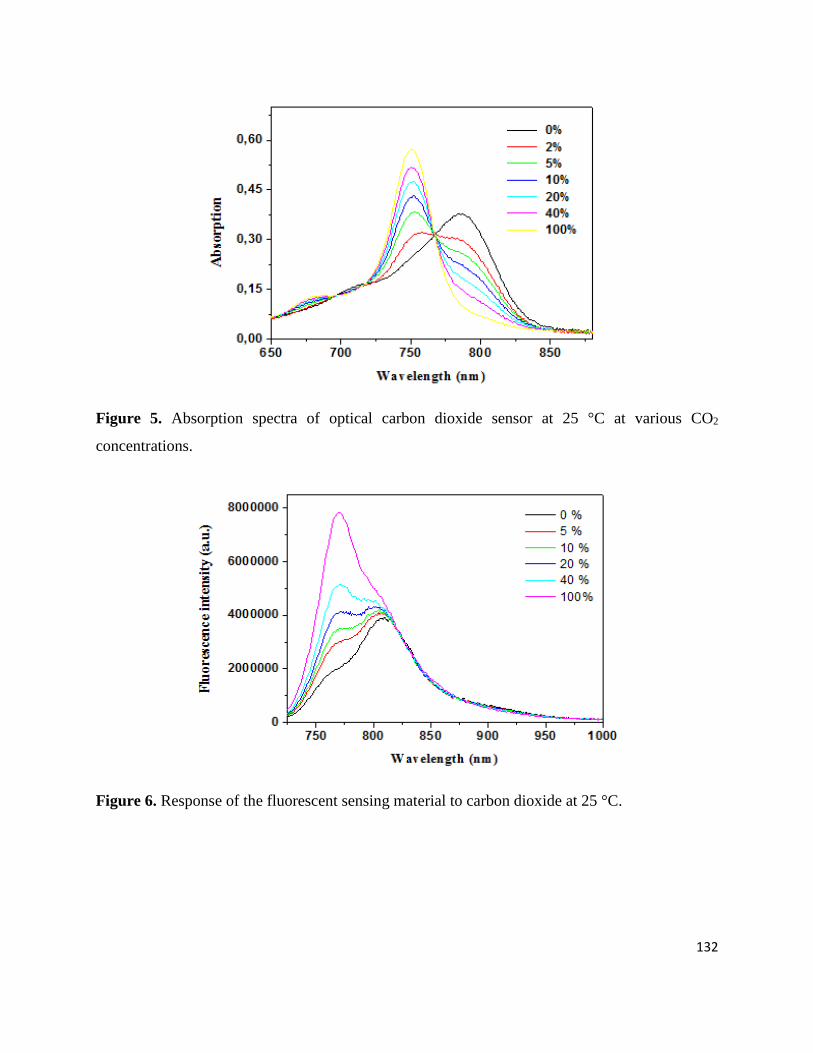
132
Figure 5. Absorption spectra of optical carbon dioxide sensor at 25 °C at various CO2
concentrations.
Figure 6. Response of the fluorescent sensing material to carbon dioxide at 25 °C.
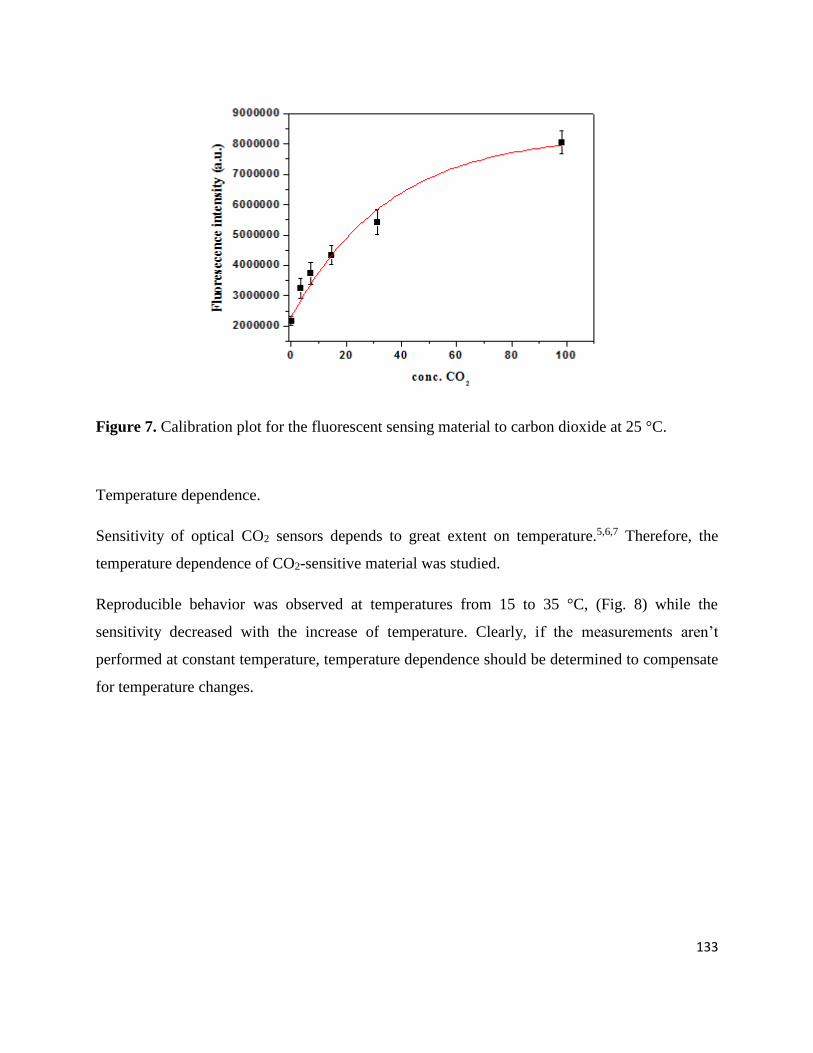
133
Figure 7. Calibration plot for the fluorescent sensing material to carbon dioxide at 25 °C.
Temperature dependence.
Sensitivity of optical CO2 sensors depends to great extent on temperature.5,6,7 Therefore, the
temperature dependence of CO2-sensitive material was studied.
Reproducible behavior was observed at temperatures from 15 to 35 °C, (Fig. 8) while the
sensitivity decreased with the increase of temperature. Clearly, if the measurements aren’t
performed at constant temperature, temperature dependence should be determined to compensate
for temperature changes.
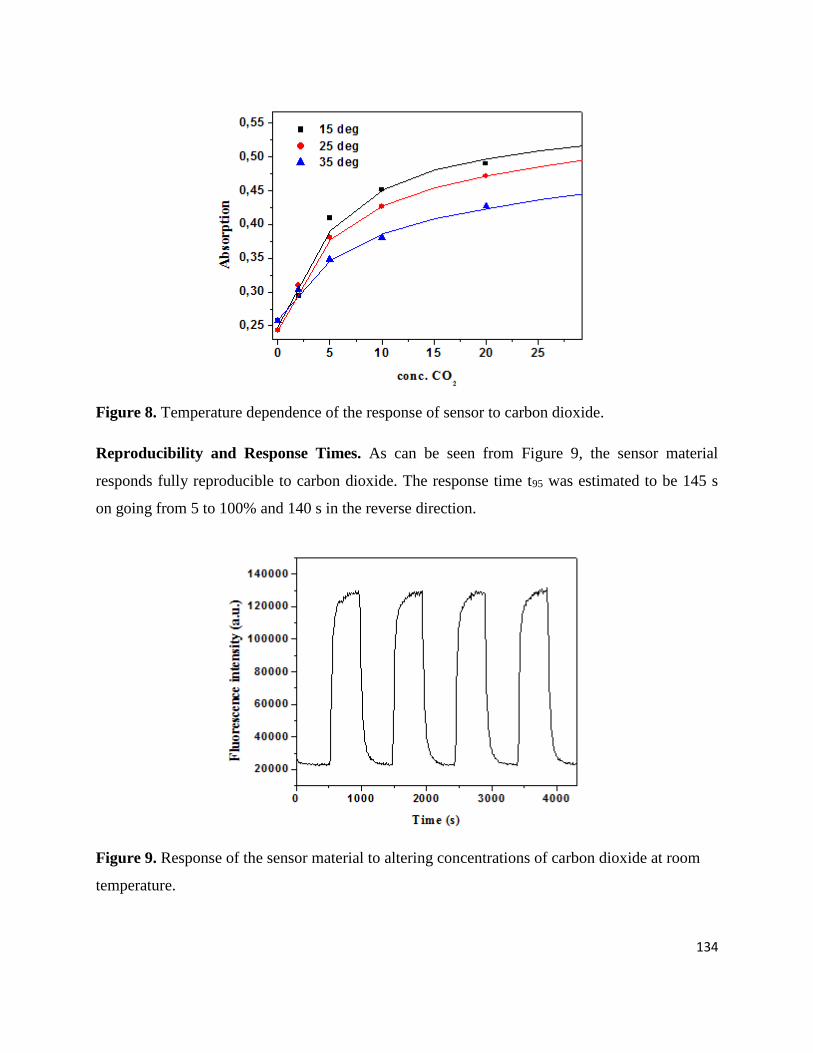
134
Figure 8. Temperature dependence of the response of sensor to carbon dioxide.
Reproducibility and Response Times. As can be seen from Figure 9, the sensor material
responds fully reproducible to carbon dioxide. The response time t95 was estimated to be 145 s
on going from 5 to 100% and 140 s in the reverse direction.
Figure 9. Response of the sensor material to altering concentrations of carbon dioxide at room
temperature.
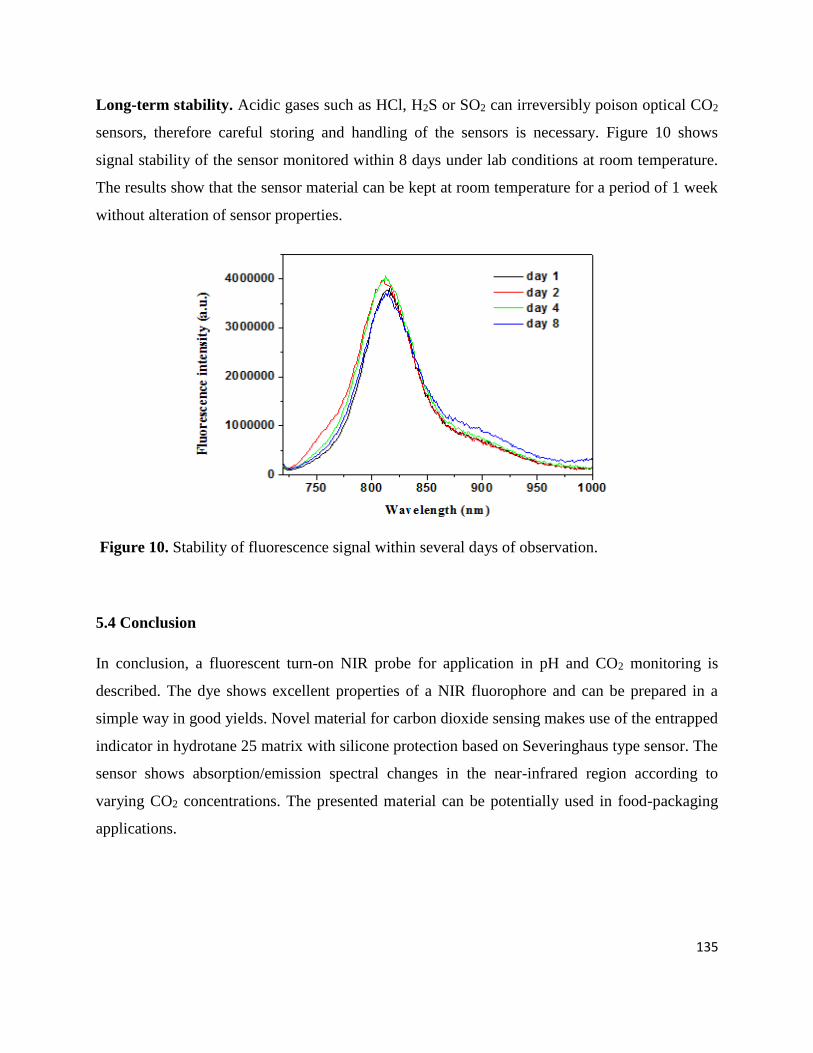
135
Long-term stability. Acidic gases such as HCl, H2S or SO2 can irreversibly poison optical CO2
sensors, therefore careful storing and handling of the sensors is necessary. Figure 10 shows
signal stability of the sensor monitored within 8 days under lab conditions at room temperature.
The results show that the sensor material can be kept at room temperature for a period of 1 week
without alteration of sensor properties.
Figure 10. Stability of fluorescence signal within several days of observation.
5.4 Conclusion
In conclusion, a fluorescent turn-on NIR probe for application in pH and CO2 monitoring is
described. The dye shows excellent properties of a NIR fluorophore and can be prepared in a
simple way in good yields. Novel material for carbon dioxide sensing makes use of the entrapped
indicator in hydrotane 25 matrix with silicone protection based on Severinghaus type sensor. The
sensor shows absorption/emission spectral changes in the near-infrared region according to
varying CO2 concentrations. The presented material can be potentially used in food-packaging
applications.
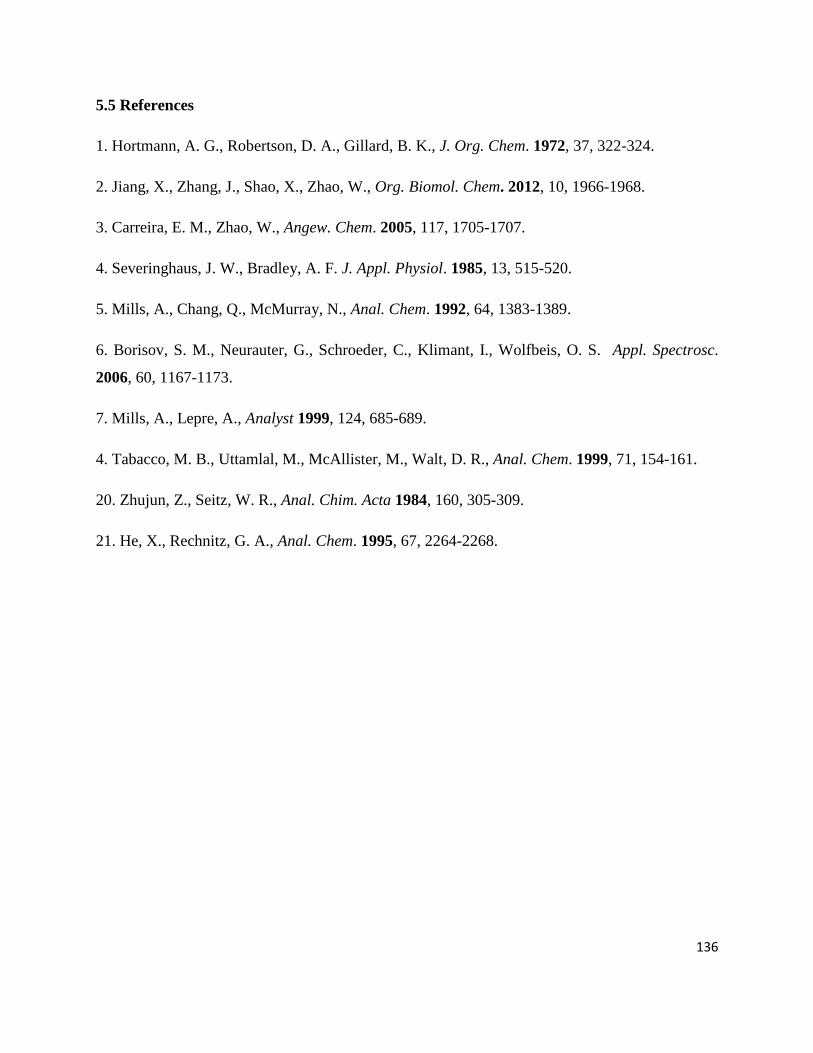
136
5.5 References
1. Hortmann, A. G., Robertson, D. A., Gillard, B. K., J. Org. Chem. 1972, 37, 322-324.
2. Jiang, X., Zhang, J., Shao, X., Zhao, W., Org. Biomol. Chem. 2012, 10, 1966-1968.
3. Carreira, E. M., Zhao, W., Angew. Chem. 2005, 117, 1705-1707.
4. Severinghaus, J. W., Bradley, A. F. J. Appl. Physiol. 1985, 13, 515-520.
5. Mills, A., Chang, Q., McMurray, N., Anal. Chem. 1992, 64, 1383-1389.
6. Borisov, S. M., Neurauter, G., Schroeder, C., Klimant, I., Wolfbeis, O. S. Appl. Spectrosc.
2006, 60, 1167-1173.
7. Mills, A., Lepre, A., Analyst 1999, 124, 685-689.
4. Tabacco, M. B., Uttamlal, M., McAllister, M., Walt, D. R., Anal. Chem. 1999, 71, 154-161.
20. Zhujun, Z., Seitz, W. R., Anal. Chim. Acta 1984, 160, 305-309.
21. He, X., Rechnitz, G. A., Anal. Chem. 1995, 67, 2264-2268.

137
5.6 Spectra
1) Aza-BODIPY dye 5
2) Aza-BODIPY dye 6