Embed Size (px)
Citation preview
FAKULTÄT AGRARWISSENSCHAFTEN
Aus dem Institut für Agrar-und Sozialökonomie in den Tropen und Subtropen
Universität Hohenheim
Fachgebiet: Internationaler Agrarhandel und Welternährungswirtschaft
PROF. DR. MATIN QAIM
OFF-FARM INCOME DIVERSIFICATION AMONG RURAL HOUSEHOLDS IN NIGERIA: IMPACT ON INCOME, FOOD SECURITY AND NUTRITION
Dissertation
zur Erlangung des Grades eines Doktors
der Agrarwissenschaften
vorgelegt
der Fakultät Agrarwissenschaften von
Raphael O. BABATUNDE
aus Oro-Ago, Nigeria
April, 2009
II
This thesis was accepted as a doctoral dissertation in fulfillment of the requirements for the
degree “Doktor der Agrarwissenschaften” by the Faculty of Agricultural Sciences at the
University of Hohenheim on 20 April 2009.
Date of oral examination: 20 April 2009
Examination committee Supervisor and reviewer: Prof. Dr. Matin Qaim
Co-reviewer: Prof. Dr. Volker Hoffmann
Additional examiner: Prof. Dr. Werner Doppler
Vice-Dean and Head of
the Examination committee: Prof. Dr. Werner Bessei

III
ACKNOWLEDGEMENTS
I want to express my sincere appreciation to Prof. Dr. Matin Qaim, my PhD supervisor. I am
particularly grateful for his meticulous and thorough supervision, encouragement and
motivation, and for his guidance and enthusiasm, which help in bringing this PhD work to a
successful completion. Prof. Dr. Qaim is a very optimistic person and he taught me to be
satisfied with nothing less than perfection. His invaluable comments, suggestions and
corrections on the dissertation have helped immensely to improve its quality.
I also thank Prof. Dr. Werner Doppler and Prof. Dr. Volker Hoffmann for agreeing to
evaluate my dissertation.
I would like to express my profound appreciation to the German Academic Exchange
Services (DAAD), for financing this PhD work. The DAAD gave me this unique opportunity
to study in Germany and I am very grateful to DAAD for finding me worthy of the
scholarship award out of the numerous applicants.
I want to extend my gratitude to the University of Ilorin, Nigeria, for granting me the study
leave to pursue this PhD work. Similarly, I want to acknowledge with gratitude the support of
Prof. O.A Omotesho, and other staffs of the Department of Agricultural Economics and Farm
Management, University of Ilorin, Nigeria.
My sincere thanks also go to Mrs Karras, for her kind assistances throughout the period of the
PhD programme. She assisted me in many ways numerous to mention. Mrs Karras is a good
mother to me, God bless you, Mrs Karras.
I would like to thank Marcus Mergenthaler for his kind assistance. He helped to translate my
thesis summary from English to German. Furthermore, I would like to thank my other
colleagues at the Chair of International Agricultural Trade and Food Security, Ira Matuschke,
Arjunan Subramanian, James Rao, Helene Heyd, Carolina Conzales, Angela Hau, and
Alexander Stein.

IV
I want to thank my good friend, Arouna Aminou. He kept my company and assisted me in
uncountable ways. He is like my twin brother at Hohenheim. I would forever be grateful for
your numerous assistances. God bless you and protect your family.
Special thanks to all my other friends, including Oye Ajiboye, Bode Oladimeji, Olabisi
Adeoye, Sunday Ifabiyi, Lawal Olanrewaju, Gbenga Owotoki, Oke Oluwadare, Kayode
Akinola, Cosmas Amuji, Annaliza Miso, Chidi Anagu, Bunmi Aina, and others too numerous
to mention here. I also appreciate Engr. Olaniyan, Dr and Mrs Jide Olaniyan, Mr and Mrs
Amusan, Rev (Dr) and Mrs Adekola, Mr and Mrs Tosho Babalola and Engr. and Mrs Sunday
Balogun.
I also want to specially thank the family of my elder sister, Mr and Mrs Adedire Dada, for
their constant prayers, encouragement and love. God in his mercy will bless your family
abundantly. Similarly, I want to express my gratitude to the Pastors and members of Deeper
Life Bible Church, Esie, Kwara State, Nigeria. They prayed fervently for me all through the
period of the PhD programme. God would bless you all and enlarge your coast. I also
remember with gratitude the prayers and support of the Pastors and members of Deeper Life
Bible Church, Bad-Canstadt, Stuttgart, Germany. I pray God, to enrich and bless his people,
for their kindness. I also thank the pastors and members of International Baptist Church,
Vaihingen, Stuttgart.
I would also like to thank the Pastors and members of ECWA Church, Fate-Tanke, Ilorin,
Kwara State, Nigeria. I am particularly grateful for the prayers and support I received from
the Christian Companion group of the Church. God would bless you all.
Special thanks to my wife, Agnes Babatunde for her love, prayers, encouragement and
support. I also appreciate my daughters; Joy Bukunmi and Peace Eniola for enduring my long
absence during the period of the PhD programme.
Finally, I want to thank and dedicate this PhD work to God Almighty for sparing my life and
for giving me the grace to complete the PhD work.
(Raphael O. BABATUNDE)
Stuttgart, April, 2009
V
CONTENTS PAGE NUMBER
I. Introduction 1 II. ‘The Role of Off-farm Income in Rural Nigeria: Driving Forces and 25 Households Access’
- Raphael O. BABATUNDE and Matin QAIM Submitted to Journal of Development Studies
III. ‘Impact of Off-farm Income on Food Security and Nutrition in Nigeria’ 54
- Raphael O. BABATUNDE and Matin QAIM Submitted to Food Policy
IV. ‘Patterns of Income Diversification in Rural Nigeria: Determinants 81 and Impacts’
- Raphael O. BABATUNDE and Matin QAIM Forthcoming in Quarterly Journal of International Agriculture
V. Conclusions 104 Appendix Summary Zusammenfassung Erklärung Curriculum Vitae
1
CHAPTER I
INTRODUCTION
For the past few decades, finding ways to reduce poverty and food insecurity has been a
major policy challenge in developing countries. More than one billion people in the
developing world live in absolute poverty, and over 900 million are undernourished (FAO,
2008). Three quarters of these poor and undernourished live in rural areas, deriving part, if not
all, of their livelihood from agriculture (World Bank, 2008; IFAD, 2001). The prevalence of
poverty and undernutrition is particularly high in Sub-Saharan Africa (SSA), so that the task
of improving the situation is especially urgent there. For instance, whereas 17% of the
populations in all developing countries are undernourished, the prevalence is 32% in Sub-
Saharan Africa. In more than a dozen African countries, the prevalence of undernourishment
is about 40%, and it exceeds 50% in several countries experiencing or emerging from armed
conflicts (FAO, 2008). This is also associated with widespread problems of child
malnutrition: about 39% and 29% of preschool children in SSA are stunted and underweight,
respectively (Todd, 2004). Undernutrition of various forms is known to be responsible for
more than a quarter of all deaths occurring in Africa every year (Todd, 2004).
In terms of poverty, while 20% of the developing country population is poor, the
prevalence is 42% in SSA. It is particularly high in rural areas (Ehui and Tsigas, 2006).
Whereas the proportion of poor people fell considerably in Asia and Latin America in the past
two decades, it continues to increase in SSA. Because poverty and undernutrition are so
widespread in SSA, there has been a long-standing concern by national governments, non-
governmental organizations and international development agencies on how to reduce these
problems.
2
Among the many policy approaches that have been suggested, two are particularly
prominent. The first is to improve agricultural productivity with the aim of achieving food
security and self sufficiency (Davis et al., 2007). The second is to promote investment in the
non-farm sector, in order to provide alternative income earning opportunities for rural
households (Davis et al., 2007). Since the 1980s, Integrated Rural Development was a popular
approach employed to achieve growth in the agricultural sector by delivering services and
technology to enhance productivity and yield. This approach, however, had only limited
success and turned out to be unsustainable (de Janvry and Sadoulet, 2001). More recently, the
Comprehensive Africa Agriculture Development Program (CAADP), initiated by the New
Partnership for Africa’s Development (NEPAD), also includes investments in infrastructure,
research and development, which could increase agricultural productivity in a more
sustainable way. Similarly, the Alliance for a Green Revolution in Africa was established
with the aim of boosting farm productivity and income from farming (AGRA, 2007).
The failure of Integrated Rural Development and other approaches led to a growing
skepticism in the international development discourse about the relevance of agriculture to
growth and poverty reduction in SSA (Diao et al., 2006). Whereas agriculture-led growth
played an important role in reducing poverty and undernutrition in many Asian and Latin
American countries, the same has not yet occurred in SSA. The Green Revolution that worked
well elsewhere was less successful in SSA, which was partly due to differences in farming
systems, climate and infrastructure (Diao et al., 2006). Specifically, experts have identified
decreasing investment in agriculture both at national and local levels in SSA, as one of the
major constraints to realizing the potentials of agriculture in the region (NEPAD, 2007).
For long, there has been an implicit perception that farm households in developing
countries would rely almost exclusively on farming with little or no off-farm activities. This
perception has led policy makers to neglect the rural off-farm sector. Recently, however, there
has been mounting evidence showing that smallholder farm households rarely rely on farming
3
alone, but often engage in off-farm diversification and maintain a portfolio of income
activities (Barrett, Reardon and Webb, 2001). In addition, off-farm income has been identified
as an important avenue for reducing poverty and undernutrition among farm households
(FAO, 1998; Matshe and Young, 2004). As a result, coupled with increasingly limited
agricultural resources, development experts have proposed a policy strategy that more
explicitly considers the role of the off-farm sector for poverty reduction and rural
development. Hence, the promotion of off-farm income diversification has gained widespread
support among development agencies and rural poverty reduction experts.
I.1 OFF-FARM INCOME DIVERSIFICATION
As a subset of livelihood diversification, Reardon (1997) defined income diversification
as the allocation of household labor to off-farm activities and the construction of diverse
income portfolios. Abdulai and CroleRees (2001) refer to income diversification as the
allocation of production resources among different income generating activities, both on and
off-farm. According to Barrett, Reardon and Webb (2001), very few people collect all their
income from only one source, hold all their wealth in the form of one single asset, or use their
resources in just one activity. The literature on livelihood diversification has recognized
several factors responsible for the widespread income diversification among rural households
in developing countries. These factors have been broadly classified into two groups. The first
are so-called “distress-push” factors, and the second are “demand-pull” factors (e.g., Barrett,
Reardon and Webb, 2001).
In the distress-push category, reasons for income diversification include diminishing
returns to factors in any given use, the need to reduce income risks – by diversifying ex ante
in the context of a missing credit market – the desire to insure against crop failure and market
risks, and the need to cope with income shocks – by diversifying ex post in the face of
insurance market failure (Reardon, 1997; Barrett, Reardon and Webb, 2001; Ellis, 1998). On
4
the other hand, in the demand-pull category, reasons for income diversification include
realization of complementarities and economies of scope between activities, observed market
opportunities, expanding technological innovations and the desire for wealth accumulation
(Barrett, Reardon and Webb, 2001; Davis and Bezemer, 2004).
In summary, rural households can be either pushed or pulled into income diversification,
depending on the particular context. If distress-push diversification dominates, one would
expect that poorer households are more involved in off-farm diversification than richer ones.
On the other hand, in the case of predominantly demand-pull diversification, one would
expect richer households to be more engaged in off-farm activities (Carter and May, 1999). In
reality, both distress-push and demand-pull diversification can occur simultaneously among a
sample of rural households at a given point in time. The available literature suggests that
distress-push diversification is more common in Asian countries. This is often attributed to
high rural population densities and declining per capita land availability, entailing a large
number of landless or near landless households, for whom off-farm activities are the major
way of survival (Adams, 1994; Schwarze and Zeller, 2005; Ellis, 2000). In countries of Sub-
Saharan Africa, it is believed that demand-pull diversification is more common (Abdulai and
CroleRees, 2001; Block and Webb, 2001). For the myriad of reasons mentioned above,
diversification into the off-farm sector is growing among rural households in developing
countries. Income from non-farm sources now accounts for a substantial share of total
income. For instance, in a review of several case studies, Reardon (1997) found that the
average share of non-farm income in total income was 42% in Africa, 40% in Latin America
and 32% in Asia. And, the share still seems to be increasing over time (Haggblade et al.,
2007).
5
I.2 IMPORTANCE AND EFFECTS OF OFF-FARM INCOME DIVERSIFICATION
The importance of income diversification on household income has been widely
documented. For example, Reardon’s (1997) review of several case studies in Africa found a
strong positive relationship between the non-farm income share and total household income
levels in most situations, though there are differences in what exactly constitutes non-farm
income across the different studies. Similarly, Abdulai and Delgado (1999) and Reardon et al.
(1992) have shown that non-farm income diversification is associated with higher overall
household income. Barrett, Bezuneh and Aboud (2001) reported a strong association between
greater income diversification and total income in Kenya and Cote d’Ivoire. In rural Mexico,
de Janvry and Sadoulet (2001) found that participation in off-farm activities helps to reduce
poverty and to increase household incomes.
In terms of agricultural production, Collier and Lar (1986) found a significant
relationship between non-farm income and crop output in rural Kenya, after controlling for
production inputs. In terms of food security, Reardon, et al. (1992) found that income
diversification into the non-farm sector improves daily per adult equivalent calorie
consumption in the Sahelian and Guinean agro ecological zones of Burkina Faso. Tschirley
and Weber (1994) showed that off-farm income has a small but positive effect on calorie
availability among rural households in Angoche district of Northern Zimbabwe. By using the
24-hour consumption recall data, the study found that a 1% increase in off-farm income
would increase calorie availability by 0.04%. Also in Zimbabwe, Ersado (2003) found that
non-farm income diversification is associated with a higher level of consumption expenditure
in rural areas, following the economic policy change and drought of the early 1990s.
Similarly, Ruben and van den Berg (2001) demonstrated that calorie intake adequacy is
strongly enhanced through engagement in non-farm activities among rural households in
Honduras. The study also showed that non-farm income has a positive effect on the use of
6
external farm inputs in agricultural production, directly affecting household food availability
and consumption.
Evidence on the effects of off-farm income diversification on income inequality is
mixed. Studies by van den Berg and Kumbi (2006) in Ethiopia and by Lanjouw (1998) in
Ecuador indicate that off-farm activities reduce rural inequality, while Reardon (1997) found
that off-farm income contributes to increasing inequality in several African countries.
I.3 DETERMINANTS OF OFF-FARM INCOME DIVERSIFICATION
Similar to the importance of off-farm income for total income, analysis of the
determinants of off-farm income diversification has received considerable attention in the
literature. Davis and Bezemer (2004) maintain that the decision to participate in off-farm
activities generally depends on two main factors, namely a) the capacity/ability to participate,
and b) the motivation to participate. Household’s capacity to undertake off-farm activities is
usually a function of factors such as education, age, gender, income, assets, access to credit
etc. In a literature review, Barrett, Reardon and Webb (2001) found a strong positive
relationship between education and non-farm income in almost all of the papers reviewed.
Similarly, studies by de Janvry and Sadoulet (2001) in Mexico and by Ruben and van den
Berg (2001) in Honduras observed that education plays a major role in accessing better
remunerated off-farm employment activities. Some studies have also reported a differential
effect of education on income activities. For instance, a study by Taylor and Yunez-Naude
(2000) in Mexico found high returns to schooling in wage labor, whereas the returns in the
production of staples are low and not significant. In Uganda, secondary school education was
identified as a pre-requisite for wage employment in the government and NGO sectors
(Cannon and Smith, 2002).
Some evidence has also shown that household assets are important for off-farm income
diversification. In the African context Reardon (1997) showed that household wealth has a
7
positive relation with income from non-farm sources. In Burkina Faso, Reardon, Delgado and
Matlon (1992) found that prior wealth is important for income diversification. Similarly,
Kinsey et al (1998) showed a positive and significant relation between household wealth and
non-farm income diversification in rural Zimbabwe. Reardon (1997, p.8) emphasizes the
important of household assets by submitting that, “given the underdeveloped credit markets to
finance non-farm businesses, own-cash sources are important to start non-farm enterprises
and pay for transaction costs to obtain non-farm employment”.
Other than household assets, physical infrastructure such as road, electricity, water,
telecommunication etc. were shown to be important for rural off-farm income diversification.
For example, a study by Corral and Reardon (2001) in Nicaragua found that road access, as
well as access to electricity and water, is important for non-farm incomes. Also, Escobal
(2001) showed that in rural Peru access to public assets such as roads can help rural
households to increase their self employment as well as wage employment in the non-farm
sector. The importance of physical infrastructure emanates from the fact that it facilitates the
starting of an own business as well as taking up non-farm employment by reducing
transportation and transaction costs.
In addition to the correlates of off-farm income diversification discussed so far, the
literature has also identified the importance of access to market, family size and composition,
and gender for participation in the off-farm sector of the rural economy. For instance, studies
by Canagarajah et al. (2001) in Tanzania and Smith et al. (2001) in Uganda showed that better
physical access to markets increases non-farm earnings. Similarly, Lanjouw et al. (2001)
showed that better access to the market is important for participation in the non-farm sector in
the peri-urban areas of Tanzania. Reardon (1997) stated that family size and structure affect
the ability of the household to supply labor to the non-farm sector. Studies by Reardon,
Delgado and Matlon (1992) in Burkina Faso and Clay et al. (1995) in Rwanda found that
larger and polygamous families supplied more labor to the rural non-farm labor market. This
8
allows some wives to assume home maintenance activities and the labor surplus to work off-
farm. In contrast, the relationship between gender and participation in off-farm activities does
not show a clear trend across studies. For example, Newman and Canagarajah (1999) found
that in rural Uganda men participate more in off-farm activities than women. The study
revealed that men show greater propensity to diversify into off-farm traditional occupations
such as carpentry and construction. On the other hand, Berdegue et al. (2001) found that
women in Chile tend to gravitate more towards off-farm employment than their men
counterparts.
I.4 ANALYZING AND MEASURING OFF-FARM INCOME DIVERSIFICATION
Two commonly used methods of analyzing off-farm income diversification can be
identified in the literature (Brown et al., 2006). The first method is the income-based
approach, which looks at household participation and income earned from the different off-
farm activities of the rural economy. For instance, Barrett et al. (2005) analyzed the
relationship between total income and the proportion of income earned in farm and off-farm
activities in three African countries, noting how these proportions changed across income
quartiles and that different income sources became dominant as one moved up the income
distribution. Some studies have also classified the available diversification strategies into
distinct groups and examine the income as well as the factors involved in rural household’s
choice of any particular strategy (Damite and Negatu, 2004; Barrett, Bezuneh and Aboud,
2001). The second method is the asset-based approach, which analyzes the income
diversification behavior of rural households by direct examination of the household’s asset
endowment (Carter and Barrett, 2006; Brown et al., 2006).
Several methods have also been reported in the literature for measuring the degree of
income diversification. The most common and simplest measure is the number of income
sources that a household has. Thus, a household with two income sources would be
9
considered more diversified than another household with just one income source (Ersado,
2003). This method has been criticized for its arbitrariness. In particular, it has been argued
that a household with more economically active adults, other things being equal, will be more
likely to have more income sources. This may reflect household labor supply decisions as
much as a desire for diversification. Second, it may be argued that there is discrepancy when
comparing households receiving different shares of their income from similar activities. For
instance, a household obtaining 99% of its income from farming and 1% from wage labor has
the same number of income sources as a household with 50% from farming and 50% from
wage labor, if appropriate corrections are not made. The advantage of this method, however,
is that it is easy to measure and also allows studying income diversification behavior in urban
areas, thus facilitating an urban-rural comparison.
A second method of measuring income diversification is the share of off-farm income in
total income. The assumption here is that a higher share of off-farm income amounts to higher
diversification from the farm into the off-farm sector and lower vulnerability to weather-
related shocks, which is one of the main risk factors confronting farm households. The major
disadvantage of this method is that it is difficult to measure, because it requires accurate
accounting of incomes from farm and off-farm sources. It also has less relevance in urban
areas, since most of the urban incomes are based on non-farm activities (Ersado, 2005).
A third measure of income diversification is the Herfindahl index (Barrett and Reardon,
2000). This index measures the overall diversity in income and takes into account the
variations in the income shares from different sources. It measures the degree of concentration
of household income. Accordingly, households with most diversified incomes will have the
smallest Herfindahl index, while those with less diversified incomes will have larger values.
For the least diversified households (i.e., those depending on only one single income source),
the Herfindahl index takes on its maximum value of one. It should be noted that there are also
other measures of income diversification, such as the share of income from high-value crops
10
or the share of crop output that is sold commercially. These, however, are not considered in
this particular study.
I.5 THE NIGERIAN CASE STUDY
Decreasing investment in agriculture by international donors and national governments
in SSA over the last two decades has contributed to the inability of the sector to meet the food
needs of the population. Given the shrinking agricultural resource base and the use of often
obsolete farm technologies, off-farm income diversification has become a popular livelihood
strategy among smallholder households in SSA. This has led to a growing interest in
analyzing the role of off-farm income diversification in Africa and the broader implications
for rural development (CroleRees, 2002). Nonetheless, there is still relatively little policy
effort aimed at promoting the off-farm income sector in a pro-poor way and overcome
potential constraints (Lanjouw and Lanjouw, 2001). One reason is probably the dearth of
solid and up-to-date empirical evidence about off-farm income diversification and the role it
plays for food security and poverty reduction in specific contexts. Often, it is unclear whether
and how off-farm activities can contribute to equitable development. This is especially true in
Nigeria. In Nigeria, about three-quarters of the population live and derive their livelihoods
from agriculture (NBS, 2006). However, owing to declining farm incomes and other factors,
households have increasingly diversified their income sources, engaging in multiple activities
both on and off-farm. Although a few studies have mentioned the increasing role of off-farm
income in Nigeria, comprehensive empirical research is lacking or at best outdated.
In his analysis of agricultural production and labor utilization among the ‘Hausa’ in
northern Nigeria, Norman (1973) found that non-farm income contributes 23% to total
household income. Similarly, Matlon (1979) studied income distribution among farmers in
northern Nigeria and found that non-farm income accounts for about 30% of total household
income. A study by Mustapha (1999) on income diversification in south-western Nigeria
11
showed that 53% of all rural employment in the region is from non-farm sources, and
Meagher and Mustapha (1997) found an increasing trend towards non-farm activities in
northern Nigeria. Omonona (2005) analyzed sources of income, determinants and inequality
among rural households in Kogi State, Nigeria, revealing that off-farm income accounts for
69% of total income in that area. This is made up of 7% farm wages, 37% non-farm wages
and 25% self-employed income. Moller (1998) studied four types of livelihood strategies in
rural Nigeria and found that the most economically successful one is that with a high degree
of income diversification, where non-farm activities are strongly integrated with farm work.
The most recent evidence for Nigeria is by Davis et al. (2007). Based on nationwide survey
data, they showed that 35% of rural smallholder households are engaged in off-farm activities
and that income from these activities accounts for about 45% of total income. Davis et al.
(2007) further found that – among the off-farm activities – non-agricultural and self-employed
activities are particularly important and that richer households have a more diversified income
portfolio than poorer households.
One important feature of most of the studies mentioned is that they are silent on the
driving forces of off-farm income diversification, as well as its role for food security and
income inequality. This is considered a gap in knowledge, and filling this gap is one of the
purposes of this dissertation. From a policy perspective, it is important to understand rural off-
farm income diversification and smallholder participation in off-farm activities, especially
among the poor. Such understanding can help to identify potential entry barriers and
constraints for participating in off-farm activities. Research results can then be used as an
input in the design of policies helping to improve the access of the poor to higher-paying off-
farm activities. Similarly, if it is shown that off-farm activities increase rural income
inequality; policies should focus on putting in place measures to promote more equitable
growth of the off-farm sector.
12
Likewise, it is important to quantitatively examine the true nature of the relationship
between off-farm income diversification and household food security. While several studies
have reported a positive relationship in other countries, some have argued that there is also the
possibility that engagement in off-farm activities could impact negatively on household labor
availability for farm work, a situation which could lower food output and reduce household
calorie supply (e.g. Barrett and Reardon, 2000). If off-farm activities impact positively on
food security, what sort of policies would be needed to promote equitable participation? Or, if
off-farm activities impact negatively on food security, what policy measures need to be put in
place to eliminate or reduce this negative effect? All these aspects need to be worked out
clearly within the Nigerian context. Furthermore, a good understanding of the patterns and
driving forces of off-farm income diversification as well as its effects on household’s income
is essential for the design of policies promoting alternative income strategies in rural Nigeria,
where poverty and food insecurity are rampant.
The overall objective of this dissertation is to examine the impact of off-farm income
diversification on income, food security and nutrition among rural households in Nigeria. The
data base for the empirical analysis is a farm household survey that was carried out by the
author in 2006 in Kwara State, north-central Nigeria (see next section for details of data
collection).
Specifically, the following research questions are analyzed:
1. What are the income activities of households in rural Nigeria?
2. What factors determine the participation of households in the different activities?
3. What factors influence the income from the different activities?
4. What are the sources of income inequality in rural Nigeria?
5. What are the effects of off-farm income on household food security and nutrition?
6. What are the patterns, determinants and effects of income diversification in rural
Nigeria?
13
These research questions are addressed within the scope of three research articles. In the
first article, entitled “The role of off-farm income in rural Nigeria: Driving forces and
household access”, research questions 1-4 are dealt with. Research question 5 is addressed in
the second article, entitled “Impact of off-farm income on food security and nutrition in
Nigeria”. The third article, entitled “Patterns of income diversification in rural Nigeria:
Determinants and impacts” addresses research question 6. The dissertation closes with a
conclusion section, in which the main results of the articles are summarized and synthesized.
The policy implications of the results are also highlighted.
I.6 DATA COLLECTION
I.6.1 Selection of the Study Area
As mentioned above, the empirical analysis presented in this dissertation builds on household
survey data collected in Kwara State, north-central Nigeria. Kwara State as a whole has a
population of 2.4 million people, out of which 70% can be classified as peasant farmers
(KWSG, 2006). The state was purposively chosen for this study based on three important
criteria:
1. The availability of important information for the sampling framework, such as
village lists, household lists and details on farm/household systems.
2. The considerable socioeconomic heterogeneity. Kwara State is regarded as the
gateway between the northern and southern regions of Nigeria, and it has a good
mixture of the three major ethnic groups in the country.
3. The poverty status of the state. The nationwide Living Standard Measurement
Survey (LSMS) conducted in 2004 shows that the state is among the six poorest in
Nigeria.
14
I.6.2 Sampling Procedure
A multi-stage random sampling technique was used in selecting the sample households
for this study. In the first stage, eight out of the 16 Local Government Areas (the lowest
administrative unit in Nigeria) within Kwara State were randomly selected. In the second
stage, five villages were randomly selected from each of the 8 Local Government Areas,
making a total of 40 selected villages. In the final stage, six households were randomly
selected in each of the 40 villages, using complete village household lists provided by the
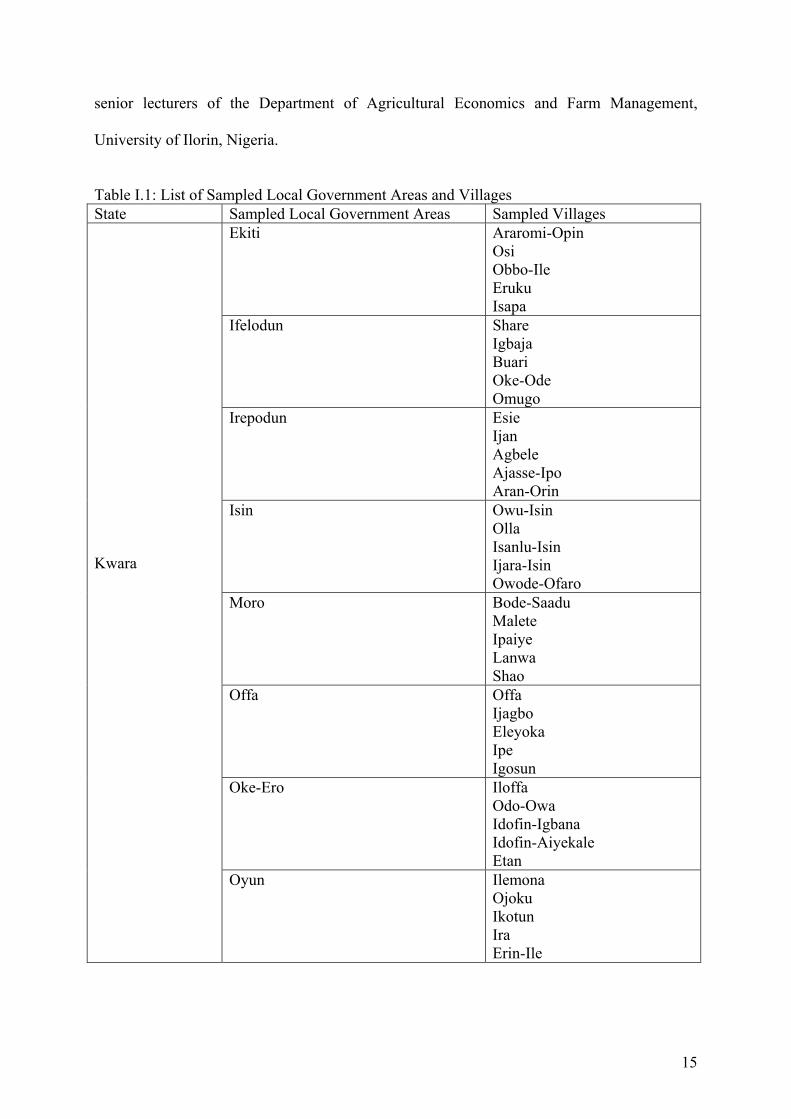
local authorities. The total number of households sampled was 240. The sampled Local
Government Areas and Villages are listed in Table I.1.
I.6.3 Questionnaire Development and Pre-testing
A structured questionnaire was developed for the face to face interviews. The
questionnaire was carefully designed to gather sufficient information about household, farm
and off-farm activities. Questions were simple and precise. Open ended questions were
avoided as far as possible, as the analysis is mostly quantitative in nature. The numbers of
questions was kept to a minimum, in order not to overburden respondents. After the design of
the questionnaire, it was pre-tested with a few selected households from the study area, before
bringing it into its final form. The final questionnaire is shown in the appendix.
I.6.4 Interviewer Selection and Training
Three interviewers were recruited for the purpose of data collection. The interviewers
were selected after a rigorous interview exercise, conducted for the numerous applicants who
applied for the job. The interviewers’ experience and ability to collect the required data were
carefully examined. The successful three candidates were trained intensively by the author.
Interviewer selection and training was also supported by Professor O.A. Omotesho and other
15
senior lecturers of the Department of Agricultural Economics and Farm Management,
University of Ilorin, Nigeria.
Table I.1: List of Sampled Local Government Areas and Villages State Sampled Local Government Areas Sampled Villages
Ekiti Araromi-Opin Osi Obbo-Ile Eruku Isapa
Ifelodun Share Igbaja Buari Oke-Ode Omugo
Irepodun Esie Ijan Agbele Ajasse-Ipo Aran-Orin
Isin Owu-Isin Olla Isanlu-Isin Ijara-Isin Owode-Ofaro
Moro Bode-Saadu Malete Ipaiye Lanwa Shao
Offa Offa Ijagbo Eleyoka Ipe Igosun
Oke-Ero Iloffa Odo-Owa Idofin-Igbana Idofin-Aiyekale Etan
Kwara
Oyun Ilemona Ojoku Ikotun Ira Erin-Ile
16
I.6.5 Type of Data Collected
Primary data were collected from the sampled households through face to face
interviews, using the structured questionnaire developed (see above). Data collected include
household socio-economic characteristics, information on living condition, farm size,
production objectives, agricultural inputs and outputs, level of resource use, costs and returns,
type of off-farm activities, participation in off-farm activities, reasons for seeking off-farm
income, determinants of access to off-farm activities and income, amount of off-farm income,
uses of off-farm income, households’ food consumption and expenditure, food consumption
patterns, nutrition status, anthropometric data (weight, height, age of children and adult
members of households), contribution of off-farm income to food production, infrastructure
and marketing, livelihood patterns and coping strategies of the selected households (see
appendix for the complete questionnaire). Data were collected between April and September
2006. The respondents were usually the household heads. However, other household members
were often also present during interviews, supplying additional information.
Data on off-farm activities and income were collected from all adult members of
the household, including spouses, children and relatives that are presently residing with the
family. For the purpose of our analysis, we disaggregate income sources into seven
categories: i) crop income; ii) livestock income; iii) agricultural wage income; iv) non-
agricultural wage income, including from both formal and informal employment; v) self-
employed income from own businesses; vi) remittance income received from relatives and
friends not presently living with the household; and vii) other income, mostly comprising
capital earnings and pensions. Crop and livestock income together make up farm income,
while the other five categories constitute off-farm income.
Food consumption data were collected through a 7-day food recall technique, covering
105 food items. Quantities consumed per household include food from own production,
market purchases, and out-of-home meals and snacks. Using cross-section data to establish
17
household nutritional status can be problematic because of seasonality effects. Our survey
was carried out in the lean season, during which household food consumption is often below
the annual average. Therefore, the prevalence of malnutrition derived from the data might be
somewhat overestimated. This, however, is not a serious problem in our context, because we
are primarily interested in the nutritional impact of off-farm income rather than establishing
the prevalence of malnutrition on a representative basis. The food consumption data were
supplemented by anthropometric measurements that we took from pre-school children up to
60 months of age. In total, we obtained weight and height data from 127 children.
I.6.6 Measurement of Income Components
Activity income refers to the income from a certain activity measured in Naira (Nigerian
currency). The total household income is measured as the sum of the net income from farm
and off-farm activities. The net income from an activity is obtained by subtracting the cash
expenses incurred in production from the gross income (Taylor and Turner, 1998). Farm
income is the aggregate of crop and livestock income. Crop income is measured as the net
income from cropping activities obtained by subtracting the cash expenses incurred in crop
production from the gross income from the sale of crop output. All data needed to calculate
crop income was collected at the plot level. To make the recall process easier for the
respondents we asked in the case of annual crops, only for the yield and the input
expenditures of the last crop harvested. The gross income from crop production was obtained
as the sum of all crops produced during the recall period valued at the market producer price.
So all the crops produced were valued at the same price regardless whether they were being
sold or consumed at home. If a market producer price for a specific crop was missing at the
household level, the corresponding village level price was used.
The net crop income was obtained by subtracting the sum of the cash expenses for
land preparation, seeds, fertilizer, irrigation, pesticides, transport, and hired labor from the
18
gross income. The labor component consisted of wages paid in cash and in-kind. We did not
consider fixed costs like overhead costs for machinery, as it is not relevant in the study area.
The gross income from livestock production is the value of sales plus the value of home
consumption. The latter was calculated by multiplying the number of animals slaughtered
times the mean value of the animals of this type owned. Other animal products, for example
milk, are not relevant in the area.
Agricultural wage income is the total income received from supplying wage labor on
other people’s farms. This was collected from all household members who engage in
agricultural wage labor. Non-agricultural wage income is the aggregate income of all the
household members from supplying non-agricultural wage labor. This could be in formal or
informal employment. Self-employed income is the total income of the household from self-
employed activities. Dominant self-employed activities in the area include grinding mills,
trading, pot making, soap making, fabric making, hair dressing, gardener, shoe making,
tailoring, plumbing, basket making, local brewing, laundry, catering services, night watching,
barbing, photography, vehicle repair, bricklaying, carpentry, driving, and painting.
Remittance income is the total of all income received by the household from family members
living abroad or in other cities in Nigeria. Other income consists of pension and capital
earnings received by the household.
I.6.7 Data Entry, Cleaning and Processing
The data collected were entered into computer sheets (MS Excel) such that all variables
in the questionnaire were coded and properly arranged according to the various sections.
Missing values in some of the questionnaire led to the rejection of 20 household observations,
so that 220 complete questionnaires were used for analysis. The database was cleaned
thoroughly before the actual statistical analyses were carried out with the software package
STATA.
19
I.6.8 Problems Encountered during Data Collection
As is usual in household surveys, a few problems were encountered during the actual
data collection process. In a few cases, individual households were unwillingness to respond
to certain questions. Depending on the type of missing data, those households had to be
replaced on a random basis with households from the same village. Moreover, it was realized
during the pretest that for cultural reasons, it was completely impossible to measure the
weight of the nursing mothers for anthropometric analysis. But overall, the survey
implementation was smooth and without any major problems. To a great extent, this was
thanks to the support of local village heads. In all sample villages, we tried to gain the
respondents’ trust and confidence by calling a meeting at the village head’s house, where the
intention of the study was explained and some of the problems were raised. Moreover, a
comprehensive introduction and assurance of confidentiality of personal data was given to the
individual respondents before the interviews were started in the sample households. Every
day, the questionnaires completed by the interviewers were carefully cross-checked, so that
ambiguities could be clarified on the spot. As households in rural Nigeria (as elsewhere in the
small farm sector) do not keep written records of their transactions, most of the answers are
based on recalls. We are still confident that the data quality is high, as the questionnaire was
carefully designed and the survey was well prepared and implemented.
20
References
Abdulai, A., and Delgado, C. L. (1999). Determinants of Nonfarm Earnings of Farm-based
Husbands and Wives in Northern Ghana. American Journal of Agricultural
Economics, 81(1), 117 – 130
Abdulai, A., and CroleRees, A. (2001). Determinants of Income Diversification amongst
Rural Households in Southern Mali. Food Policy, 26, 437 – 452
Adams, R. (1999): Nonfarm Income, Inequality and Land in Rural Egypt. Mimeo,
PRMPO/MNSED, Washington DC: World Bank.
AGRA (2007). Alliance for a Green Revolution in Africa. www.agra-alliance.org
Barrett, C. B, Bezuneh, M., and Aboud, A. (2001). Income Diversification, Poverty Traps and
Policy Shocks in Cote d’Ivoire and Kenya. Food Policy, 26, 367 – 384
Barrett, C.B., Reardon, T., and Webb, P. (2001). Nonfarm Income Diversification and
Household Livelihood Strategies in Rural Africa: Concepts, Dynamics, and Policy
Implications. Food Policy, 26(4), 315 – 331
Barrett, C. B. and Reardon, T. (2000). Asset, activity and income diversification among
African Agriculturalists, some practical issues. Project report to the USAID BASIS
CRSP, March 2000
Barrett, C. B, Bezuneh, M., Clay, D. C., and Reardon, T. (2005). Heterogeneous Constraints,
Incentives and Income Diversification Strategies in Rural Africa. Quarterly Journal of
International Agriculture, 44(1), 37 – 60
Berdegue, J.A., Ramirez, E., Reardon, T. and Escobar, G. (2001). Rural Non-farm
Employment and Income in Chile. World Development, 29(3): 411 – 425
Block, S., and Webb, P. (2001). The Dynamics of Livelihood Diversification in Post-famine
Ethiopia. Food Policy, 26(4), 333 – 350
Brown, D. R., Stephens, E. C., Ouma, J. O., Murithi, F. M., and Barrett, C. B. (2006).
Livelihood Strategies in the Rural Kenyan highlands. African Journal of Agricultural
and Resource Economics, 1(1), 21 – 35
Canagarajah, S., Newman, C., and Bhattamishra, R. (2001). Non-farm Income, Gender and
Inequality: Evidence from Rural Ghana and Uganda. Food Policy, 26:405 – 420
Cannon, T., and D. Smith (2002). Rural Non-farm Economy Project: Uganda Fieldwork Case
Study Synthesis Report, NRI Report No. 2701, Chatham: NRI
21
Carter, M. R., and Barrett, C. B. (2006). The Economics of Poverty Traps and Persistent
Poverty: An Asset Based Approach. Journal of Development Studies, 42(2), 178 – 199
Carter, M.R. and J. May. (1999). Poverty, Livelihood and Class in Rural South Africa, World
Development, 27 (1):1 – 20
Clay, D., Byiringiro, F., Kangasniemi, J., Reardon. T., Sibomana, B., Uwamariya, L. and
Tardif-Douglin. D. (1995). Promoting Food Security in Rwanda through Sustainable
Agricultural Productivity: Meeting the Challenges of Population Pressure, Land
Degradation, and Poverty. International Development Paper No. 17. Michigan State
University, East Lansing, MI.
Collier, P. and Lal, D. (1986). Labour and Poverty in Kenya: 1900-1980. Clarendon Press,
Oxford.
Corral, L. and Reardon, T. (2001). Rural Nonfarm Income in Nicaragua. World Development,
29(3): 427 – 442
Crole-Rees, A. (2002). Rural Household Strategies in Southern Mali: Determinants and
Contribution of Income Diversification to Income Level and Distribution. PhD Thesis,
Swiss Federal Institute of Technology (ETHZ), Zurich.
Damite, D., and Negatu, W. (2004). Determinants of Rural Livelihood Diversification:
Evidence from Southern Ethiopia. Quarterly Journal of International Agriculture,
43(3), 267 – 288
Davis, J.R. and Bezemer, D. (2004). The Development of Rural Non-Farm Economy in
Developing Countries and Transition Economies: Key Emerging and Conceptual Issues.
Chatham, UK: Natural Resources Institute.
Davis, B., Winters, P., Carletto, G., Covarrubias, K., Quinones, E., Zezza, A., Stamoulis,
K., Bonomi, G., and DiGiuseppe, S. (2007). Rural Income Generating Activities: A
Cross Country Comparison. ESA Working Paper No. 07-16, Agricultural
Development Economics Division, FAO, Rome, Italy.
de Janvry, A., and Sadoulet, E. (2001). Income Strategies among Rural Households in
Mexico: The Role of Off-farm Activities. World Development, 29(3), 467 – 480
Diao, X., Hazell, P., Resnick, D., and Thurlow, J. (2007). The Role of Agriculture in
Development: Implication for Sub-Saharan Africa. Research Report 153, International
Food Policy Research Institute, Washington, D.C, USA.
22
Ehui, S. and Tsigas, M.E. (2006). Identifying Agricultural Research and Development
Investment Opportunities in Sub-Saharan Africa: A Global Economy-wide Analysis.
African Journal of Agricultural and Resource Economics, 1(1): 1 – 20
Ellis, F. (1998). Household Strategies and Rural Livelihood Diversification. Journal of
Development Studies, 35(1), 1 – 38
Ellis, F. (2000). The Determinants of Rural Livelihood Diversification in Developing
Countries. Journal of Agricultural Economics, 51(2), 289 – 302
Ersado, L. (2003). Income Diversification in Zimbabwe: Welfare Implications from Urban
and Rural Areas. FCND Discussion Paper No. 152, International Food Policy
Research Institute, Washington, DC.
Ersado, L. (2005). Income Diversification Before and After Economic Shocks: Evidence
from Urban and Rural Zimbabwe. Development Southern Africa, 22(1), 27 – 45
Escobal, J. (2001). The Determinants of Non-farm Income Diversification in Peru. World
Development, 29(3): 497 – 508
FAO (1998). Rural Non-Farm Income in Developing Countries, Part III of The State of Food
and Agriculture 1998, Rome: FAO.
FAO (2008). The State of Food Insecurity in the World 2008 – High Food Prices and Food
Security Threats and Opportunities, Rome: FAO.
Development Goals Report, 2006. United Nations, New York.
Haggblade, S., Hazell, P.B.R., and Reardon, T. (2007). Transforming the Rural Non-farm
Economy. John Hopkins University Press, Baltimore, forthcoming.
IFAD (2001). The rural poverty report 2001. International Fund for Agricultural
Development: Rome, Italy. http://www.ifad.org/poverty/index.htm
Kinsey, B., Burger, K., and Gunning, J.W. (1998). Coping with Drought in Zimbabwe:
Survey Evidence on Response of Rural Household to Risk. World Development, 26 (1),
89 – 110
KWSG (2006). Kwara State Government of Nigeria, Planning Studies in Kwara State.
Ministry of Land and Regional Planning, Ilorin.
Lanjouw, P. (1998). Ecuador’s Rural Nonfarm Sector as a Route out of Poverty. World Bank
Policy Research Working Paper 1904. The World Bank, Washington, DC.
Lanjouw, J.O., and Lanjouw, P. (2001). The Rural Non-farm Sector: Issues and Evidence
from Developing Countries. Agricultural Economics, 26 (1), 1 – 23
23
Lanjouw, P., Quizon, J., and Sparrow, R. (2001). Non-agricultural Earnings in Peri-urban
Areas of Tanzania : Evidence from Household Survey Data. Food Policy, 26(4), 385 –
403
Matlon, P. (1979). Income Distribution among Farmers in Northern Nigeria. African Rural
Economy Paper Report No. 18. East Lansing, USA, Michigan State University.
Matshe, I. and Young, T (2004). Off-farm Labour Allocation Decisions in Small-Scale Rural
Households in Zimbabwe. Agricultural Economics, (30): 175 – 186
Meagher, K. and Mustapha, A.R. (1997). Not by Farming Alone: the Role of Non-farm
Income in Rural Hausaland. In Bryceson, D. and V. Jamal, (eds) Farewell to Farms: De-
agrarianisation and Employment in Africa. African Studies Centre Research Series
1997/10, Ashgate, UK
Moller, M. R. (1998). The Changing Role of Rural Non-Agricultural Activities in the
Livelihoods of Nigeria Peasants. CDR Working Paper No. 98 (9): 27
Mustapha, A.R. (1999). Cocoa Farming and Income Diversification in South Eastern
Nigeria. De-agrarianisation and Rural Development Network (DARE), Afrika-
Studiencentrum, ASC Working Paper 42/1999, pp 46
NBS (2006). National Bureau of Statistics, Socio-economic Survey on Nigeria, Abuja
NEPAD (2007). The New Partnership for Africa’s Development: Comprehensive Africa
Agriculture Development Programme, Quarterly Report, April – June, 2007
Newman, C. and Canagarajah, S. (1999). Non-farm Employment, Poverty and Gender
Linkages: Evidence from Ghana and Uganda. Working Draft Paper, Washington DC:
World Bank.
Norman, D. (1973). Economic Analysis of Agricultural Production and Labour Utilization
among the Hausa in the North of Nigeria. African Rural Employment Paper Report No.
4. East Lansing, USA, Michigan State University.
Omonona, B.T. (2005). Source, Income, Determinants and Inequality among Rural
Households in Kogi State Nigeria. Research Report Submitted to Idachaba Foundation
for Research and Scholarship (IFRES), Ibadan, Nigeria.
Reardon, T. (1997). Using Evidence of Household Income Diversification to Inform Study of
the Rural Nonfarm Labour Market in Africa. World Development, 25(5): 735 – 748
Reardon, T., Delgado, C., and Matlon, P. (1992). Determinants and Effects of Income
Diversification amongst Farm households in Burkina Faso. Journal of Development
Studies 28 (1), 264 – 296
24
Ruben, R., and van den Berg, M. (2001). Nonfarm Employment and Poverty Alleviation of
Rural Farm Households in Honduras. World Development, 29(3), 549 – 560
Schwarze, S., and Zeller, M. (2005). Income Diversification of Rural Households in Central
Sulawesi, Indonesia. Quarterly Journal of International Agriculture, 44(1), 61 – 73
Smith, R. D., Gordon, A., Meadows, K., and K. Zwick. (2001): Livelihood Diversification in
Uganda: Patterns and Determinants of Change across Two Rural Districts. Food Policy,
26: 421 – 435
Taylor, J.E. and Yunez-Naude, A. (2000). Selectivity and the Return to Schooling in a
Diversified Economy. American Journal of Agricultural Economics, 287 – 297
Todd, B. (2004). Africa’s Food and Nutrition Security Situation, Where are we and How Did
We Get Here? IFPRI 2020 Discussion Paper 37. New York
Tschirley, D.L., and Weber, M.T. (1994). Food Security Strategies under Extremely Adverse
Conditions: The Determinants of Household Income and Consumption in Rural
Mozambique. World Development, 22 (2), 159 – 173
van den Berg, M., and Kumbi, G.E. (2006). Poverty and the Rural Nonfarm Economy in
Oromia, Ethiopia. Agricultural Economics, 35 (Suppl), 469 – 475
World Bank (2008). World Development Report 2008: Agriculture for Development. The
World Bank, Washington, DC
25
CHAPTER II
The Role of Off-farm Income in Rural Nigeria:
Driving Forces and Household Access
RAPHAEL O. BABATUNDEa,* and MATIN QAIMb
a University of Hohenheim, Department of Agricultural Economics and Social Sciences,
70593 Stuttgart, Germany
b Georg-August-University of Göttingen, Department of Agricultural Economics and Rural
Development, 37073 Göttingen, Germany
* Corresponding author:
Raphael O. Babatunde
Department of Agricultural Economics and Social Sciences (490b),
University of Hohenheim, 70593 Stuttgart, Germany
Tel: +49-711-459-23889
Fax: +49-711-459-23762
Email: [email protected]
26
The Role of Off-farm Income in Rural Nigeria:
Driving Forces and Household Access
ABSTRACT
It is often assumed that shrinking land availability is the main reason for the growing role of
off-farm income among farm households in developing countries. Here, we use survey data
from rural Nigeria to show that this assumption is not always true. The off-farm income share
is 50 per cent, and it increases with total income and farm size, pointing at important
complementarities between farm and off-farm income. Econometric analysis demonstrates
that poor households face entry barriers to higher-paying off-farm activities. Accordingly,
off-farm income tends to increases income inequality. These entry barriers need to be
overcome to promote equitable rural development.
I. INTRODUCTION
Off-farm activities have become an important component of livelihood strategies among
rural households in most developing countries. Several studies have reported a substantial and
increasing share of off-farm income in total household income [de Janvry and Sadoulet,
2001; Ruben and van den Berg, 2001; Haggblade et al., 2007]. Reasons for this observed
income diversification include declining farm incomes and the desire to insure against
agricultural production and market risks [Reardon, 1997; Ellis, 1998; Ellis and Freeman,
2004]. That is, when farming becomes less profitable and more risky as a result of population
growth and crop and market failures, households are pushed into off-farm activities, leading
to “distress-push” diversification. In other cases, however, households are rather pulled into
the off-farm sector, especially when returns to off-farm employment are higher or less risky
than in agriculture, resulting in “demand-pull” diversification.
27
While both effects have been recognized in principle [Reardon et al., 2001], some studies
implicitly assume that distress-push effects dominate: shrinking per capita land availability is
often considered the main reason for increasing off-farm activities [van den Berg and Kumbi,
2006]. Here, we use survey data from Kwara State in Nigeria to show that this assumption is
not always true. Among rural households in the study region, land is not the most limiting
factor for increasing farm production, but off-farm income nevertheless contributes
significantly to total overall income. This suggests that demand-pull effects are more
important in this particular case. Separation between the two effects is not always clear-cut,
and in many situations both effects occur simultaneously. Yet in terms of the policy
implications it can be helpful to disentangle the effects, at least to some extent. So far,
relatively little policy efforts have been made to promote the off-farm sector in a pro-poor
way and overcome potential constraints [Lanjouw and Lanjouw, 2001]. This is especially true
in countries of Sub-Saharan Africa. One reason is probably the dearth of solid and up-to-date
information about the driving forces and impacts of household income diversification in
specific contexts. Often it is unclear whether and how off-farm activities can contribute to
equitable development. While the findings presented in this article are specific to the
particular setting in rural Nigeria, they might also contribute to a better general understanding
of the underlying issues and linkages.
The concrete objectives are threefold. First, we examine the structure of household
incomes across farm sizes and income strata. Evidence on the relationship between total
household income and the share of off-farm income is mixed and sometimes controversial.
Adams [1994], for instance, showed a negative relationship in rural Pakistan, indicating that
off-farm income is more important for poorer than for richer households. In contrast, Reardon
et al. [1992] found a positive association in Burkina Faso. There are also examples where a U-
shaped relationship has been shown, that is, an increase in the relative importance of off-farm
28
income for both the poorest and richest households [Deininger and Olinto, 2001]. These
divergent results are partly due to the interplay of push and pull factors described above.
The second objective is to examine the determinants of household participation in off-
farm employment and the factors influencing the magnitude of incomes from different
sources. This is important to identify potential entry barriers and constraints for certain
household types, which have been shown to exist in other African countries [Woldenhanna
and Oskam, 2001]. If off-farm employment shall increase household income and reduce risk
and inequality, it is important that such constraints are overcome. We use different
econometric techniques and disaggregate off-farm employment into agricultural wage
employment, non-agricultural wage employment, and self employment, hypothesizing that the
results are not uniform for these different segments of the labour market. Such disaggregation
was not always made in previous studies [Abdulai and Delgado, 1999; Canagarajah et al.,
2001].
The third objective is to examine sources of income inequality among households. We
carry out a Gini decomposition analysis, in order to determine how much a particular income
source contributes to overall inequality in rural Nigeria. Also in this respect the literature
offers mixed results [Reardon et al., 2000]. Studies by van den Berg and Kumbi [2006] in
Ethiopia and by Lanjouw [1998] in Ecuador indicate that off-farm activities reduce rural
income inequality, while Reardon [1997] finds that off-farm income contributes to increasing
inequality in a review of case studies from several countries in Africa.
The remaining part of this article is structured as follows. Section II describes the
household survey and presents descriptive statistics, while section III discusses the structure
of incomes across different household types. Subsequently, the determinants of access to off-
farm employment and the main factors influencing household incomes from different sources
are analysed in section IV and V, respectively. Section VI examines the impact of off-farm
income on income inequality, and section VII concludes.
29
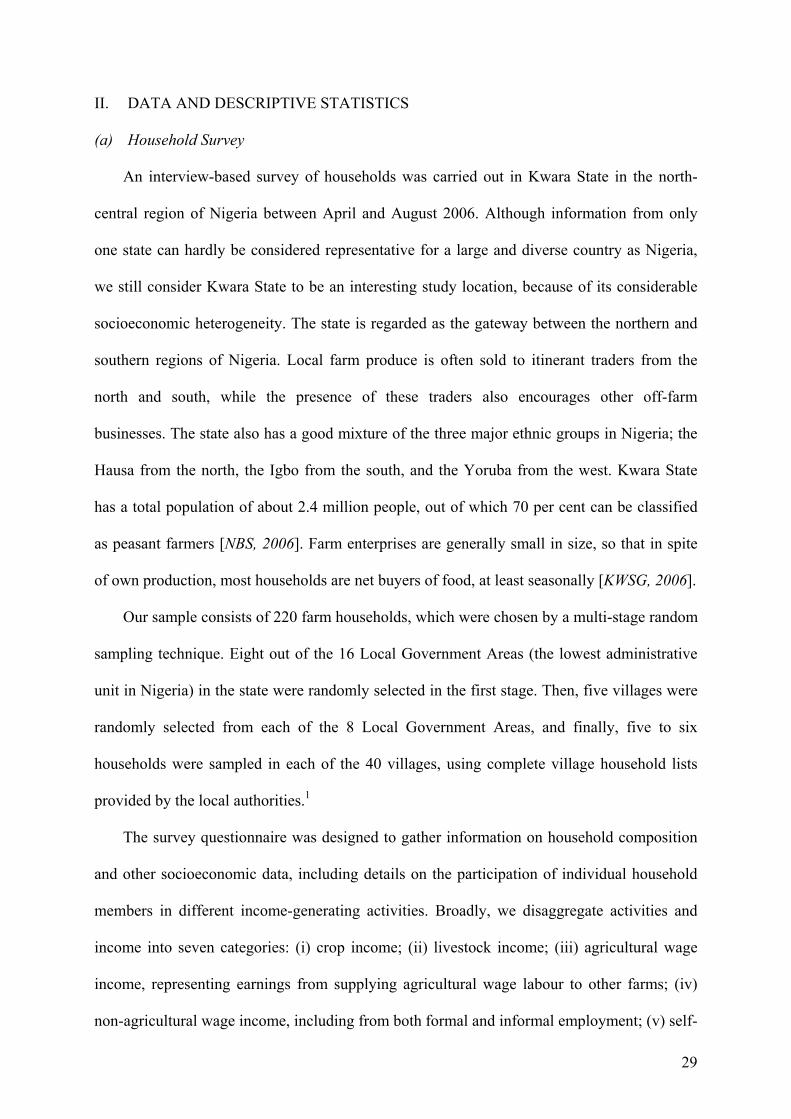
II. DATA AND DESCRIPTIVE STATISTICS
(a) Household Survey
An interview-based survey of households was carried out in Kwara State in the north-
central region of Nigeria between April and August 2006. Although information from only
one state can hardly be considered representative for a large and diverse country as Nigeria,
we still consider Kwara State to be an interesting study location, because of its considerable
socioeconomic heterogeneity. The state is regarded as the gateway between the northern and
southern regions of Nigeria. Local farm produce is often sold to itinerant traders from the
north and south, while the presence of these traders also encourages other off-farm
businesses. The state also has a good mixture of the three major ethnic groups in Nigeria; the
Hausa from the north, the Igbo from the south, and the Yoruba from the west. Kwara State
has a total population of about 2.4 million people, out of which 70 per cent can be classified
as peasant farmers [NBS, 2006]. Farm enterprises are generally small in size, so that in spite
of own production, most households are net buyers of food, at least seasonally [KWSG, 2006].
Our sample consists of 220 farm households, which were chosen by a multi-stage random
sampling technique. Eight out of the 16 Local Government Areas (the lowest administrative
unit in Nigeria) in the state were randomly selected in the first stage. Then, five villages were
randomly selected from each of the 8 Local Government Areas, and finally, five to six
households were sampled in each of the 40 villages, using complete village household lists
provided by the local authorities.1
The survey questionnaire was designed to gather information on household composition
and other socioeconomic data, including details on the participation of individual household
members in different income-generating activities. Broadly, we disaggregate activities and
income into seven categories: (i) crop income; (ii) livestock income; (iii) agricultural wage
income, representing earnings from supplying agricultural wage labour to other farms; (iv)
non-agricultural wage income, including from both formal and informal employment; (v) self-
30
employed income from own businesses; (vi) remittance income received from relatives and
friends not presently living with the household; and (vii) other income, mostly comprising
capital earnings and pensions.
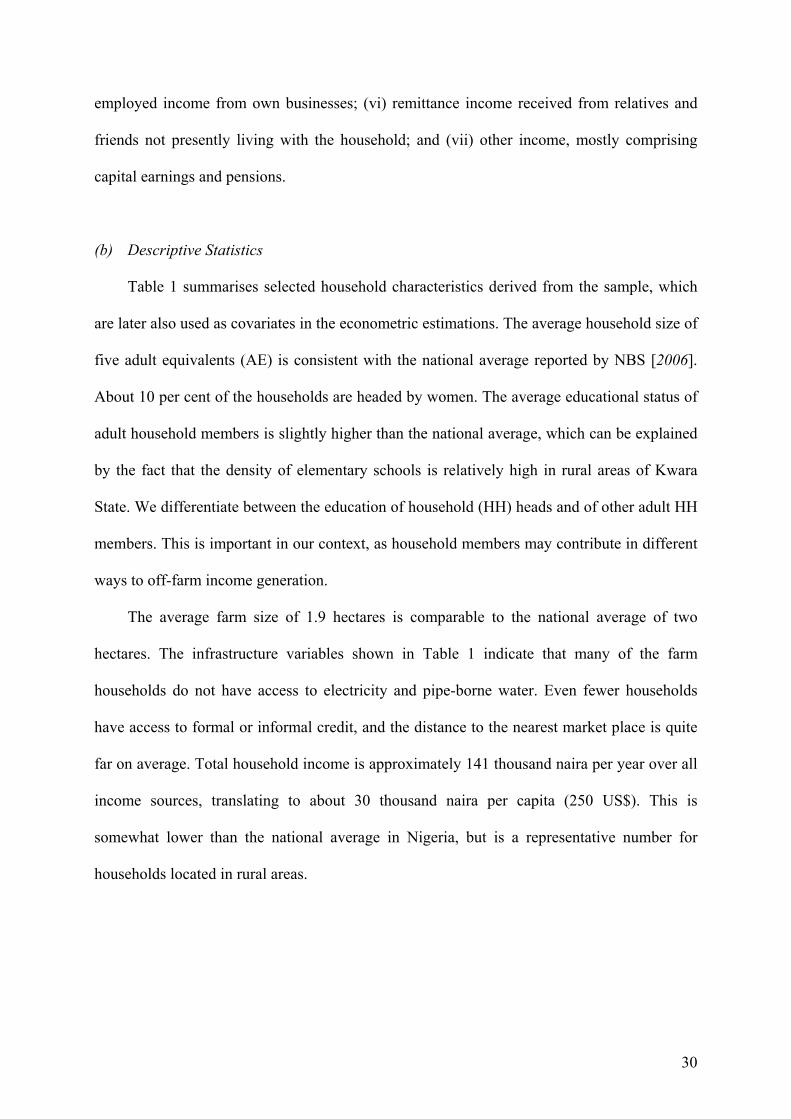
(b) Descriptive Statistics
Table 1 summarises selected household characteristics derived from the sample, which
are later also used as covariates in the econometric estimations. The average household size of
five adult equivalents (AE) is consistent with the national average reported by NBS [2006].
About 10 per cent of the households are headed by women. The average educational status of
adult household members is slightly higher than the national average, which can be explained
by the fact that the density of elementary schools is relatively high in rural areas of Kwara
State. We differentiate between the education of household (HH) heads and of other adult HH
members. This is important in our context, as household members may contribute in different
ways to off-farm income generation.
The average farm size of 1.9 hectares is comparable to the national average of two
hectares. The infrastructure variables shown in Table 1 indicate that many of the farm
households do not have access to electricity and pipe-borne water. Even fewer households
have access to formal or informal credit, and the distance to the nearest market place is quite
far on average. Total household income is approximately 141 thousand naira per year over all
income sources, translating to about 30 thousand naira per capita (250 US$). This is
somewhat lower than the national average in Nigeria, but is a representative number for
households located in rural areas.
31
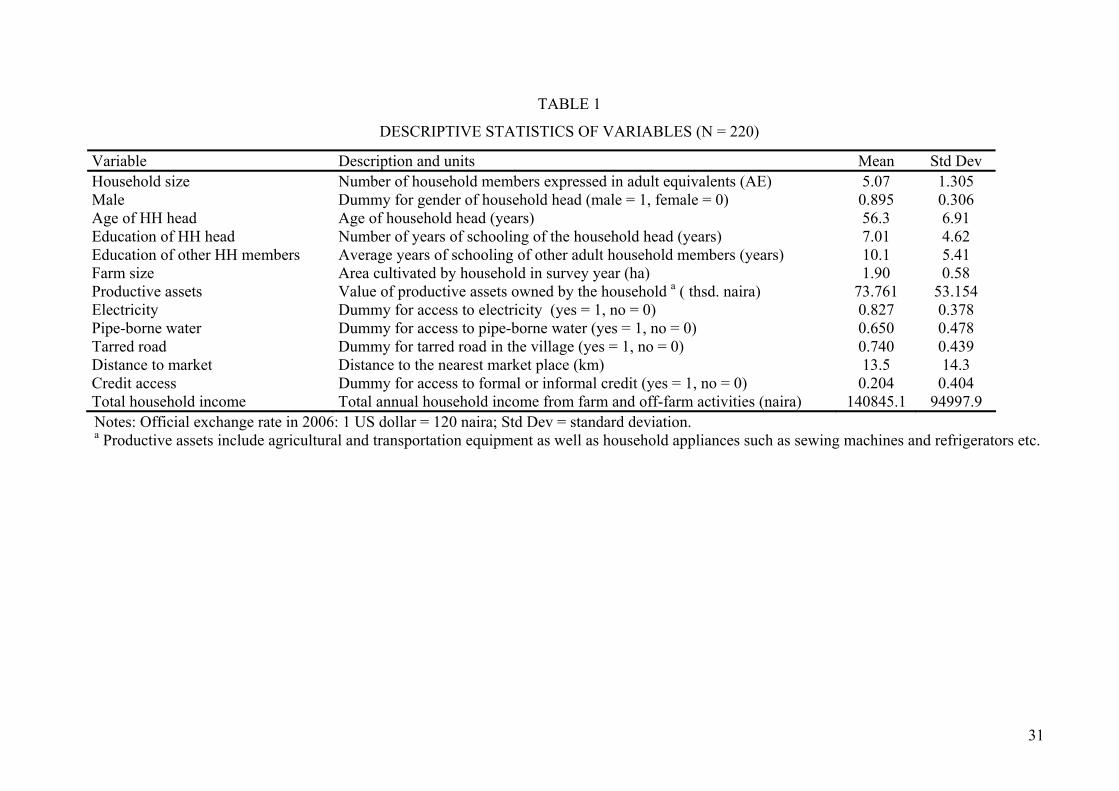
TABLE 1
DESCRIPTIVE STATISTICS OF VARIABLES (N = 220)
Variable Description and units Mean Std Dev Household size Number of household members expressed in adult equivalents (AE) 5.07 1.305 Male Dummy for gender of household head (male = 1, female = 0) 0.895 0.306 Age of HH head Age of household head (years) 56.3 6.91 Education of HH head Number of years of schooling of the household head (years) 7.01 4.62 Education of other HH members Average years of schooling of other adult household members (years) 10.1 5.41 Farm size Area cultivated by household in survey year (ha) 1.90 0.58 Productive assets Value of productive assets owned by the household a ( thsd. naira) 73.761 53.154 Electricity Dummy for access to electricity (yes = 1, no = 0) 0.827 0.378 Pipe-borne water Dummy for access to pipe-borne water (yes = 1, no = 0) 0.650 0.478 Tarred road Dummy for tarred road in the village (yes = 1, no = 0) 0.740 0.439 Distance to market Distance to the nearest market place (km) 13.5 14.3 Credit access Dummy for access to formal or informal credit (yes = 1, no = 0) 0.204 0.404 Total household income Total annual household income from farm and off-farm activities (naira) 140845.1 94997.9 Notes: Official exchange rate in 2006: 1 US dollar = 120 naira; Std Dev = standard deviation. a Productive assets include agricultural and transportation equipment as well as household appliances such as sewing machines and refrigerators etc.
32
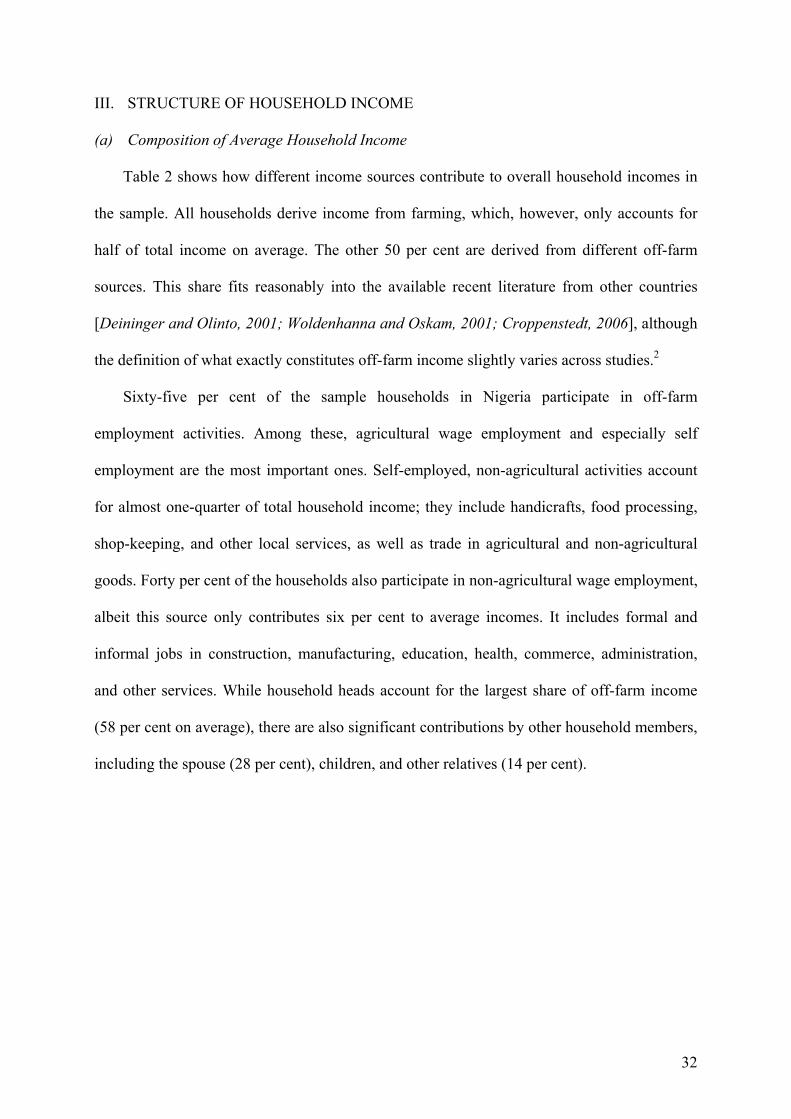
III. STRUCTURE OF HOUSEHOLD INCOME
(a) Composition of Average Household Income
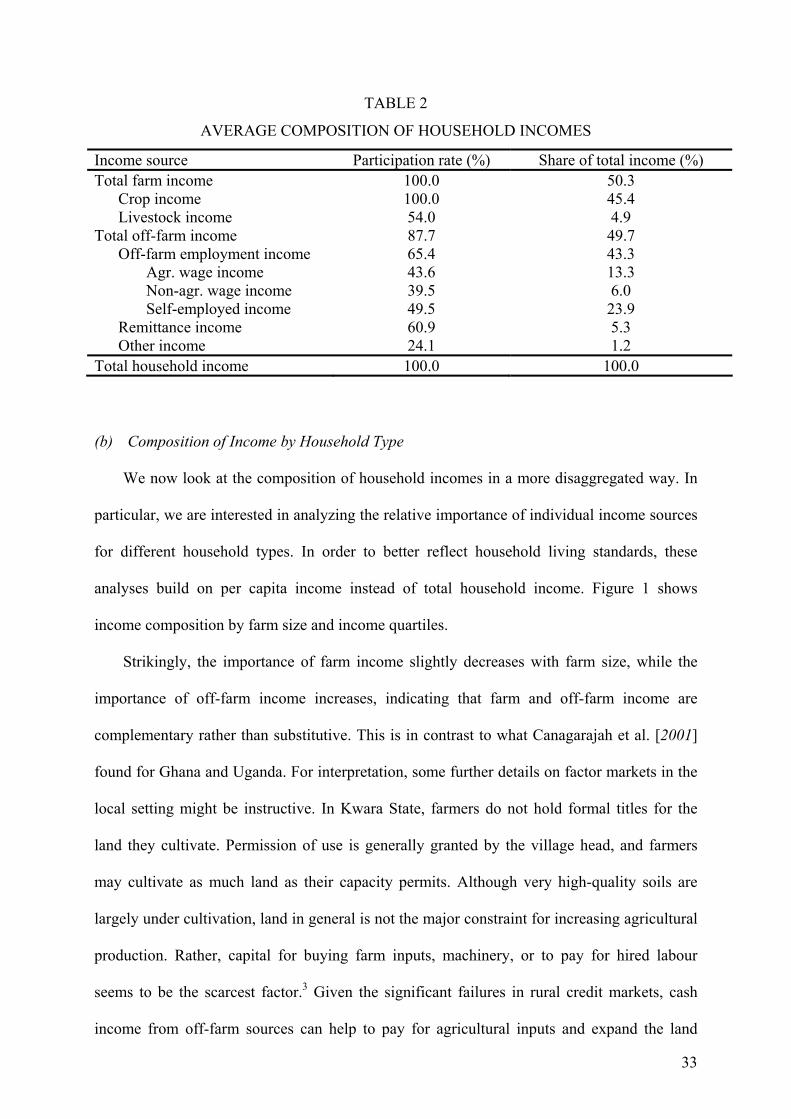
Table 2 shows how different income sources contribute to overall household incomes in
the sample. All households derive income from farming, which, however, only accounts for
half of total income on average. The other 50 per cent are derived from different off-farm
sources. This share fits reasonably into the available recent literature from other countries
[Deininger and Olinto, 2001; Woldenhanna and Oskam, 2001; Croppenstedt, 2006], although
the definition of what exactly constitutes off-farm income slightly varies across studies.2
Sixty-five per cent of the sample households in Nigeria participate in off-farm
employment activities. Among these, agricultural wage employment and especially self
employment are the most important ones. Self-employed, non-agricultural activities account
for almost one-quarter of total household income; they include handicrafts, food processing,
shop-keeping, and other local services, as well as trade in agricultural and non-agricultural
goods. Forty per cent of the households also participate in non-agricultural wage employment,
albeit this source only contributes six per cent to average incomes. It includes formal and
informal jobs in construction, manufacturing, education, health, commerce, administration,
and other services. While household heads account for the largest share of off-farm income
(58 per cent on average), there are also significant contributions by other household members,
including the spouse (28 per cent), children, and other relatives (14 per cent).
33
TABLE 2
AVERAGE COMPOSITION OF HOUSEHOLD INCOMES
Income source Participation rate (%) Share of total income (%) Total farm income 100.0 50.3 Crop income 100.0 45.4 Livestock income 54.0 4.9 Total off-farm income 87.7 49.7 Off-farm employment income 65.4 43.3 Agr. wage income 43.6 13.3 Non-agr. wage income 39.5 6.0 Self-employed income 49.5 23.9 Remittance income 60.9 5.3 Other income 24.1 1.2 Total household income 100.0 100.0
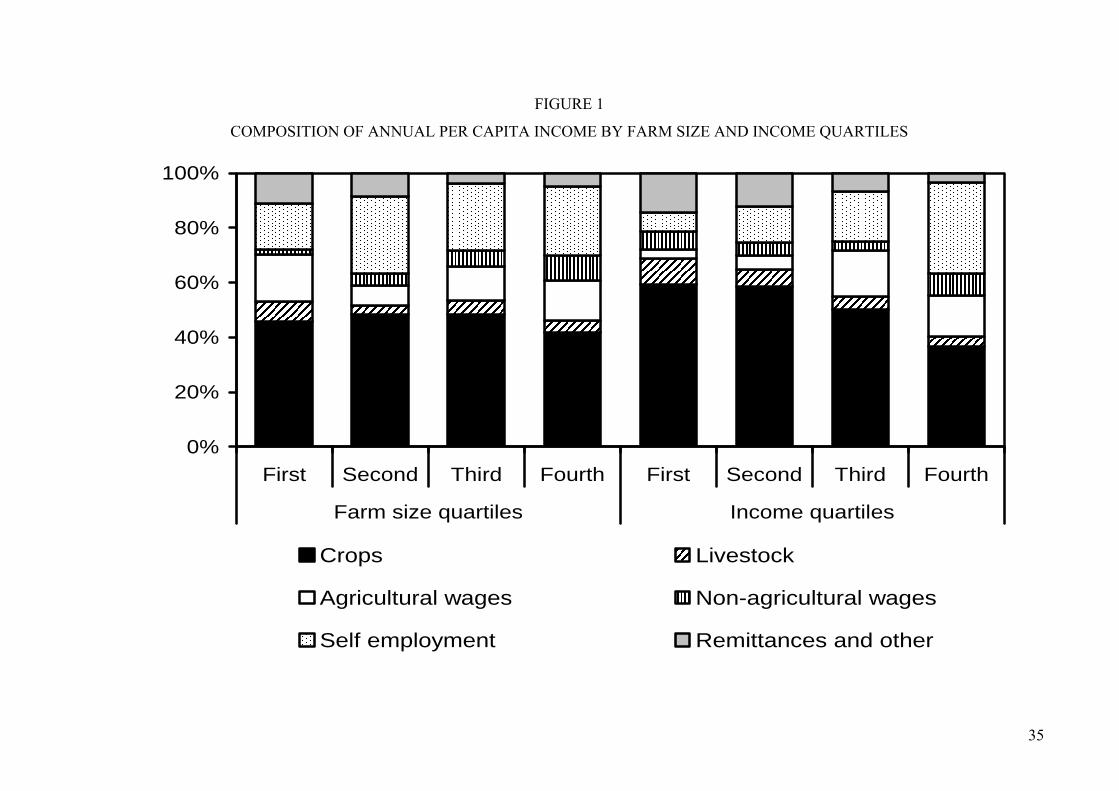
(b) Composition of Income by Household Type
We now look at the composition of household incomes in a more disaggregated way. In
particular, we are interested in analyzing the relative importance of individual income sources
for different household types. In order to better reflect household living standards, these
analyses build on per capita income instead of total household income. Figure 1 shows
income composition by farm size and income quartiles.
Strikingly, the importance of farm income slightly decreases with farm size, while the
importance of off-farm income increases, indicating that farm and off-farm income are
complementary rather than substitutive. This is in contrast to what Canagarajah et al. [2001]
found for Ghana and Uganda. For interpretation, some further details on factor markets in the
local setting might be instructive. In Kwara State, farmers do not hold formal titles for the
land they cultivate. Permission of use is generally granted by the village head, and farmers
may cultivate as much land as their capacity permits. Although very high-quality soils are
largely under cultivation, land in general is not the major constraint for increasing agricultural
production. Rather, capital for buying farm inputs, machinery, or to pay for hired labour
seems to be the scarcest factor.3 Given the significant failures in rural credit markets, cash
income from off-farm sources can help to pay for agricultural inputs and expand the land
34
holding accordingly. Therefore, households with better access to off-farm income also find it
easier to increase their agricultural incomes. Among the off-farm sources, the smallest farms
derive higher shares from agricultural wage employment and remittances than the larger
farmers, for whom non-agricultural wage and self-employed incomes are more important.
Similar patterns also emerge when we look at composition of incomes across income
quartiles (Figure 1). For the poorest households, farming is the most important source,
accounting for over two-thirds of overall income. The richest households, in contrast, derive
the largest income share from off-farm activities. Especially self-employed activities play an
important role for them, which is not surprising, because establishing an own business often
requires seed capital. Without proper functioning financial markets, poorer households face
difficulties to start lucrative self-employed activities. Overall, these results suggest that the
poor might face problems in tapping higher-paying off-farm employment opportunities. This
will be further analysed in the following.
35
FIGURE 1
COMPOSITION OF ANNUAL PER CAPITA INCOME BY FARM SIZE AND INCOME QUARTILES
0%
20%
40%
60%
80%
100%
First Second Third Fourth First Second Third Fourth
Farm size quartiles Income quartiles
Crops Livestock
Agricultural wages Non-agricultural wages
Self employment Remittances and other
36
IV. DETERMINANTS OF PARTICIPATION IN OFF-FARM EMPLOYMENT
We now examine the determinants of participation in off-farm employment. According to
FAO [1998], two major categories of factors determine a household decision to participate in
off-farm activities. The first comprises factors that influence the relative returns to agricultural
production and related risks, while the second includes factors that affect the household’s
capability of participation. These categories coincide with the distress-push and demand-pull
diversification strategies discussed above, and they are certainly interrelated. We consider
participation in off-farm activities as a function of farm and household characteristics, such as
the asset position and human capital endowment, as well as contextual and institutional
variables, such as access to markets and infrastructure conditions. The explanatory variables
used in our context are listed and defined in Table 1. Similar covariates were also used in
previous studies on the determinants of participation in off-farm activities in other countries
[de Janvry and Sadoulet, 2001; Ruben and van den Berg, 2001; Woldenhanna and Oskam,
2001].
As dependent variables, we use dummies for participation in different types of off-farm
activities, such as agricultural wage employment, non-agricultural wage employment, and self
employment, because we expect that the determining factors are not uniform across sectors.
De Janvry and Sadoulet [2001] modeled a similar problem in Mexico, using a multinomial
estimation procedure. This is not appropriate in our context, however, as – unlike Mexico –
households in rural Nigeria often participate in several activities, so that the choices are not
mutually exclusive. Other authors have used separate probit or logit models to explain
household participation in various off-farm activities [Isgut, 2004; Yunez-Naude and Taylor,
2001; Lanjouw, 2001; Ruben and van den Berg, 2001]. Estimating the models independently
may generate biased and inconsistent coefficients, though, as the error terms are likely to be
correlated across activities. We therefore use a multivariate probit model, which estimates the
equations simultaneously, thus allowing for non-zero covariance across the different off-farm
37
activities [Greene, 2003]. The multivariate probit estimator has been used previously in
agricultural technology adoption studies [Marenya and Barrett, 2007; Gillespie et al., 2004],
but we are not aware of its application in explaining household participation in different off-
farm activities.
Given our multi-stage random sampling approach, with household observations clustered
by villages, we use a cluster correction procedure, which takes care of potential intra-cluster
correlation of the error term and produces a consistent variance-covariance matrix [Deaton,
1997]. The estimation results for the multivariate probit are shown in Table 3. The first
column refers to off-farm employment in general, aggregated over the three activities,
agricultural wage employment, non-agricultural wage employment, and self employment.
Education has a significant positive effect. The higher the educational status, the higher is the
probability that the household participates in off-farm employment. This holds true for both
education of the household head and of other adult household members, which makes sense,
since several family members often pursue off-farm activities. These results agree with
previous studies that have highlighted the important role of education for access to off-farm
labour markets [Lanjouw, 2001; Satriawan and Swinton, 2007].
Household productive assets, such as agricultural and non-agricultural machinery, and
access to electricity and water also show positive and significant coefficients, which is
consistent with findings of Matshe and Young [2004] and Escobal [2001] in different
contexts. Likewise, market distance plays a role, with larger distances having a negative effect
on the probability of participation in off-farm activities. These results are as expected, because
market closeness and the availability of physical infrastructure are location advantages for any
economic activity, thus contributing to more vibrant labour markets.
Looking at the demographic variables, households headed by men are more likely to be
engaged in off-farm employment. While there are no cultural restrictions for women to
participate in labour markets, female-headed households are often those where the husband
38
left or passed away, so that women have to spend more time on farm and household duties to
maintain a minimum subsistence level. Somewhat unexpected, the probability of participation
in off-farm employment decreases with increasing family size. This can probably be
explained by time constraints, as larger households are often those with more dependent
family members (small children and old people) that require additional time for care.
The other columns in Table 3 show the results for each individual off-farm activity.
While male-headed households are more likely to participate in agricultural and non-
agricultural wage employment, the result is not significant for self-employed activities. This is
plausible, as own businesses provide more flexibility in timing and can often be performed at
home, which makes it easier for female household heads to participate as well. There are also
interesting differential effects across activities for the education variables. Education of the
household head influences participation in agricultural and non-agricultural employment
positively, whereas education of other adult household members has a large negative effect on
agricultural wage employment. The latter can be explained by the fact that educated people
have better opportunities to find employment in higher-paying activities, which is confirmed
by the positive and significant coefficients in the non-agricultural wage and self employment
equations. Apart from education, participation in self employment is mostly determined by
asset and infrastructure variables. Household assets encourage self-employed activities, as do
access to electricity and pipe-borne water, whereas market distance has a negative effect.
Farm size does not show a significant effect in any of the equations. This finding
confirms that participation in off-farm employment is not primarily a response to household
land constraints.4 Whereas it is likely that poor households pursue a distress-push
diversification to some extent, there also seems to be a significant element of demand-pull
diversification, especially among the better-off. The off-farm sector is quite heterogeneous,
and households appear to have unequal access to different parts of this sector. The
multivariate probit analysis confirms that asset-poor households and those that are
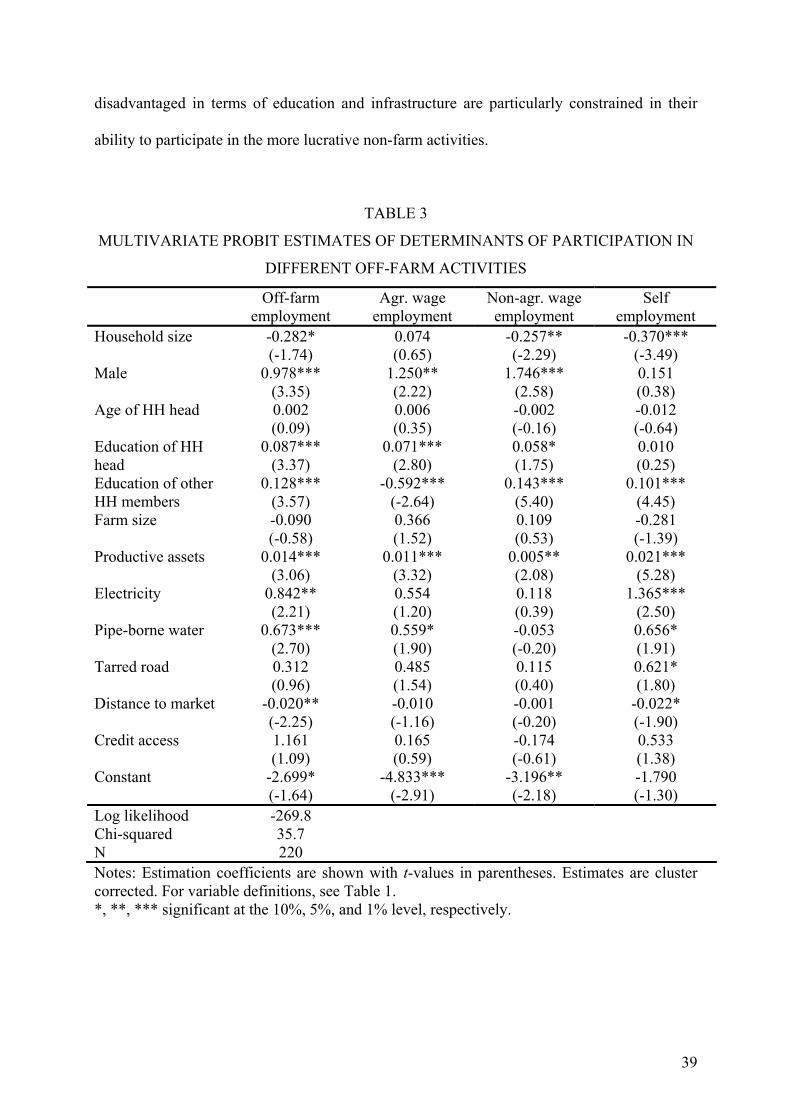
39
disadvantaged in terms of education and infrastructure are particularly constrained in their
ability to participate in the more lucrative non-farm activities.
TABLE 3
MULTIVARIATE PROBIT ESTIMATES OF DETERMINANTS OF PARTICIPATION IN
DIFFERENT OFF-FARM ACTIVITIES
Off-farm employment
Agr. wage employment
Non-agr. wage employment
Self employment
Household size -0.282* (-1.74)
0.074 (0.65)
-0.257** (-2.29)
-0.370*** (-3.49)
Male 0.978*** (3.35)
1.250** (2.22)
1.746*** (2.58)
0.151 (0.38)
Age of HH head 0.002 (0.09)
0.006 (0.35)
-0.002 (-0.16)
-0.012 (-0.64)
Education of HH head
0.087*** (3.37)
0.071*** (2.80)
0.058* (1.75)
0.010 (0.25)
Education of other HH members
0.128*** (3.57)
-0.592*** (-2.64)
0.143*** (5.40)
0.101*** (4.45)
Farm size -0.090 (-0.58)
0.366 (1.52)
0.109 (0.53)
-0.281 (-1.39)
Productive assets 0.014*** (3.06)
0.011*** (3.32)
0.005** (2.08)
0.021*** (5.28)
Electricity 0.842** (2.21)
0.554 (1.20)
0.118 (0.39)
1.365*** (2.50)
Pipe-borne water 0.673*** (2.70)
0.559* (1.90)
-0.053 (-0.20)
0.656* (1.91)
Tarred road 0.312 (0.96)
0.485 (1.54)
0.115 (0.40)
0.621* (1.80)
Distance to market -0.020** (-2.25)
-0.010 (-1.16)
-0.001 (-0.20)
-0.022* (-1.90)
Credit access 1.161 (1.09)
0.165 (0.59)
-0.174 (-0.61)
0.533 (1.38)
Constant -2.699* (-1.64)
-4.833*** (-2.91)
-3.196** (-2.18)
-1.790 (-1.30)
Log likelihood -269.8 Chi-squared 35.7 N 220 Notes: Estimation coefficients are shown with t-values in parentheses. Estimates are cluster corrected. For variable definitions, see Table 1. *, **, *** significant at the 10%, 5%, and 1% level, respectively.
40
V. DETERMINANTS OF HOUSEHOLD INCOME
In this section, we analyse the determinants of total household income and of income by
source. This can help to further understand the potentials and constraints of households to
benefit from certain activities. In different models, we regress annual income on a set of
explanatory variables. We use the same farm, household, and contextual characteristics as
before, as it is likely that factors influencing the probability to participate in certain activities
would also determine the magnitude of incomes from those activities.
For total income and income from cropping, ordinary least squares (OLS) techniques are
employed, since all households reported non-zero income values for these two categories.
However, for the other categories, including income from livestock and the various off-farm
activities, zero observations for the dependent variable occur, as not all households
participate. Hence, there is non-random sample selection, which would lead to biased
estimates when using OLS. A Heckman two-step procedure could be used to avoid this
problem. Yet, since we expect that the sample selection equation is the same as the equation
being estimated, the Tobit model is an appropriate choice, and is even preferable as it build on
maximum likelihood techniques [Kennedy, 2003]. Tobit models have also been used by other
authors in similar contexts [van den Berg and Kumbi, 2006; de Janvry and Sadoulet, 2001].
The income model estimates for our sample are presented in Table 4. As above, we use a
cluster correction procedure to obtain a consistent variance-covariance matrix. Household size
has a positive effect on income in most equations. This is not surprising, as household
incomes are not expressed in per capita terms. Every additional adult equivalent living in the
household increases total household income by approximately 11,000 naira on average.
Exceptions to this positive effect are the self-employed and remittance income models.
Unsurprisingly, farm size contributes positively to total income, and especially to farm
income. Every additional hectare of land cultivated leads to a rise in crop income by
approximately 18,000 naira.
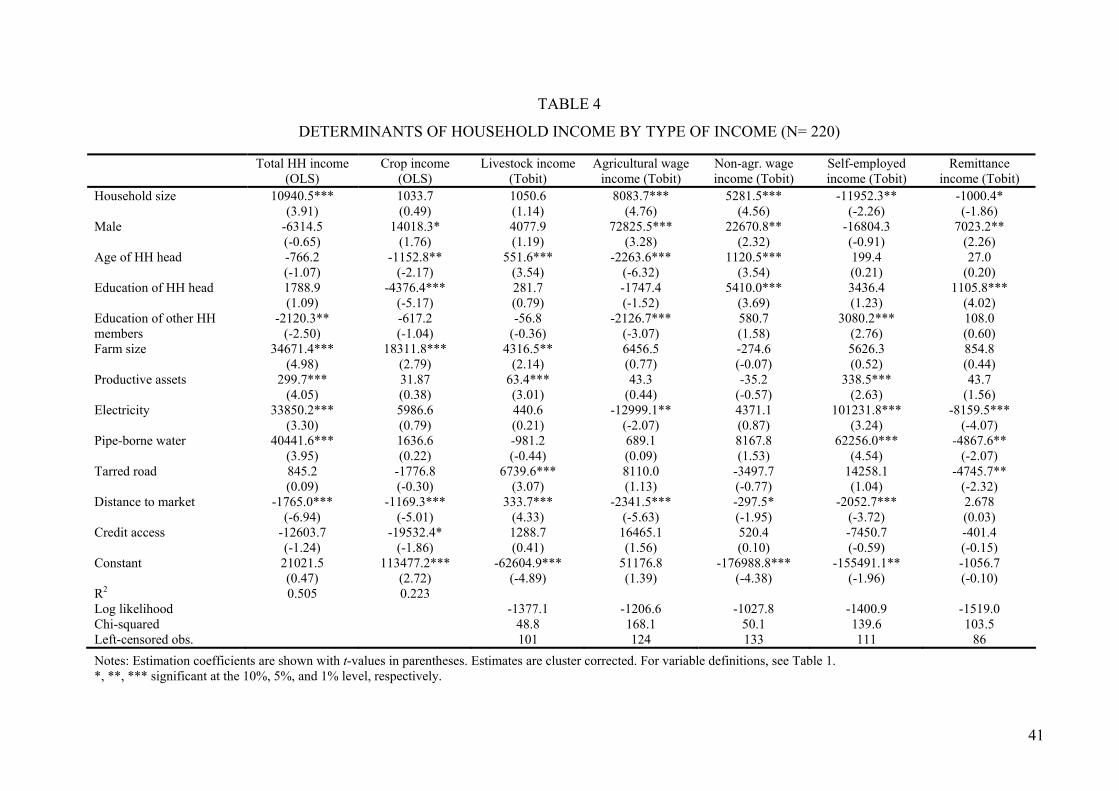
41
TABLE 4
DETERMINANTS OF HOUSEHOLD INCOME BY TYPE OF INCOME (N= 220)
Total HH income (OLS)
Crop income (OLS)
Livestock income (Tobit)
Agricultural wage income (Tobit)
Non-agr. wage income (Tobit)
Self-employed income (Tobit)
Remittance income (Tobit)
Household size 10940.5*** (3.91)
1033.7 (0.49)
1050.6 (1.14)
8083.7*** (4.76)
5281.5*** (4.56)
-11952.3** (-2.26)
-1000.4* (-1.86)
Male -6314.5 (-0.65)
14018.3* (1.76)
4077.9 (1.19)
72825.5*** (3.28)
22670.8** (2.32)
-16804.3 (-0.91)
7023.2** (2.26)
Age of HH head -766.2 (-1.07)
-1152.8** (-2.17)
551.6*** (3.54)
-2263.6*** (-6.32)
1120.5*** (3.54)
199.4 (0.21)
27.0 (0.20)
Education of HH head 1788.9 (1.09)
-4376.4*** (-5.17)
281.7 (0.79)
-1747.4 (-1.52)
5410.0*** (3.69)
3436.4 (1.23)
1105.8*** (4.02)
Education of other HH members
-2120.3** (-2.50)
-617.2 (-1.04)
-56.8 (-0.36)
-2126.7*** (-3.07)
580.7 (1.58)
3080.2*** (2.76)
108.0 (0.60)
Farm size 34671.4*** (4.98)
18311.8*** (2.79)
4316.5** (2.14)
6456.5 (0.77)
-274.6 (-0.07)
5626.3 (0.52)
854.8 (0.44)
Productive assets 299.7*** (4.05)
31.87 (0.38)
63.4*** (3.01)
43.3 (0.44)
-35.2 (-0.57)
338.5*** (2.63)
43.7 (1.56)
Electricity 33850.2*** (3.30)
5986.6 (0.79)
440.6 (0.21)
-12999.1** (-2.07)
4371.1 (0.87)
101231.8*** (3.24)
-8159.5*** (-4.07)
Pipe-borne water 40441.6*** (3.95)
1636.6 (0.22)
-981.2 (-0.44)
689.1 (0.09)
8167.8 (1.53)
62256.0*** (4.54)
-4867.6** (-2.07)
Tarred road 845.2 (0.09)
-1776.8 (-0.30)
6739.6*** (3.07)
8110.0 (1.13)
-3497.7 (-0.77)
14258.1 (1.04)
-4745.7** (-2.32)
Distance to market -1765.0*** (-6.94)
-1169.3*** (-5.01)
333.7*** (4.33)
-2341.5*** (-5.63)
-297.5* (-1.95)
-2052.7*** (-3.72)
2.678 (0.03)
Credit access -12603.7 (-1.24)
-19532.4* (-1.86)
1288.7 (0.41)
16465.1 (1.56)
520.4 (0.10)
-7450.7 (-0.59)
-401.4 (-0.15)
Constant 21021.5 (0.47)
113477.2*** (2.72)
-62604.9*** (-4.89)
51176.8 (1.39)
-176988.8*** (-4.38)
-155491.1** (-1.96)
-1056.7 (-0.10)
R2 0.505 0.223 Log likelihood -1377.1 -1206.6 -1027.8 -1400.9 -1519.0 Chi-squared 48.8 168.1 50.1 139.6 103.5 Left-censored obs. 101 124 133 111 86 Notes: Estimation coefficients are shown with t-values in parentheses. Estimates are cluster corrected. For variable definitions, see Table 1. *, **, *** significant at the 10%, 5%, and 1% level, respectively.
42
Households with older heads benefit less from crop and agricultural wage income, but
slightly more from livestock and non-agricultural employment. Somewhat unexpected is the
significantly negative coefficient for the education of the household head in the crop income
model: each additional year of schooling reduces crop income by nearly 4,500 naira. This
does not imply that better educated persons are worse farmers, but it rather indicates that
education facilitates participation in higher-paying activities, especially non-agricultural wage
employment, as the large and positive education coefficient in that model suggests. Due to
time constraints, such activities are partly pursued at the expense of farming. This supports
our hypothesis that there is an important element of demand-pull diversification for farm
households that have access to more lucrative sectors. For other adult household members, the
education variable indicates that a similar trade-off occurs between agricultural wage
employment and income from self-employed activities. Surprising, however, is the negative
effect of other household members’ education on total household income, which might
potentially be due to other entry barriers to non-agricultural sectors that are not properly
controlled for in our specifications.
Evidently, household assets and access to electricity and pipe-borne water influence total
household income in a positive and significant way. Likewise, market closeness increases
incomes. These effects are particularly pronounced in the self-employed income model.
Hence, good infrastructure does not only facilitate the starting of an own business, as was
found above in the multivariate probit analysis, but it also contributes to higher average
incomes from those businesses. In the remittance income equation, the signs of the
infrastructure coefficients are reversed, that is, better infrastructure leads to lower remittance
incomes. This is plausible, because the magnitude of remittances received is usually
negatively correlated with household living standard and economic opportunities.
Furthermore, remittances are often received from family members who temporarily or
permanently migrated to urban areas. Better infrastructure conditions in village settings and
43
the associated positive impact on rural labour markets are likely to reduce migration to urban
areas and thus also remittance flows.
VI. OFF-FARM INCOME AND INCOME INEQUALITY
We now analyse overall income inequality among rural households in Kwara State and
how individual income sources contribute to the observed inequality. For this purpose, we use
the Gini decomposition method, which allows the decomposition of the overall Gini
coefficient into different components. Using notation similar to that of Shorrocks [1983], we
assume that total income (Y) consists of income from k sources, namely y1, y2, …, yk. Total
income Y is thus given as:
K
Y = ∑ yk . (1) k=1 The Gini coefficient of total income (G) can be expressed as:
K G = ∑ SkGkRk , (2) k=1 where Sk stands for the share of income source k in total income, Gk is the Gini coefficient of
income from source k, and Rk is the correlation coefficient between income from source k and
total income Y. GkRk is known as the pseudo-Gini coefficient of income source k. The
contribution of income source k to total income inequality is given as SkGkRk/G, while the
relative concentration coefficient of income source k in total income inequality is expressed
as:
gk = GkRk/G. (3)
Income sources that have a relative concentration coefficient greater than one contribute
to increasing total inequality, while those with a relative concentration coefficient less than
one contribute to decreasing total inequality. The source elasticity of inequality, indicating the
44
percentage effect of a one per cent change in income from source k on the overall Gini
coefficient, is expressed as (SkGkRk/G) - Sk
Table 5 presents details of the Gini decomposition for our household sample. Overall
income inequality of 0.40 is lower than the Gini coefficient for total Nigeria of 0.48 reported
by NBS [2006]. This is plausible, as rural income inequality is usually lower than urban
inequality. We find that, among the disaggregated income sources, self-employed income is
the most correlated with total household income with a correlation coefficient of 0.72. This is
followed by crop income (0.64) and agricultural wage income (0.56). Apart from other
income, the most unequally distributed income sources are non-agricultural and agricultural
wage incomes with Gini coefficients of 0.84 and 0.74, respectively.
By decomposing the overall Gini coefficient, we find that off-farm income as a whole
accounts for 60.7 per cent, while farm income accounts for 34.6 per cent of total inequality.
This is in contrast to Adams [1999] and van den Berg and Kumbi [2006], who reported that
farm income contributes more than off-farm income to inequality in rural Egypt and Ethiopia.
The second from last column in Table 5, showing the relative concentration coefficients,
confirms that farm income is inequality-decreasing, whereas off-farm income is inequality-
increasing in rural Nigeria. This is entirely driven by off-farm employment income, especially
self employment, as incomes from remittances and other off-farm sources actually decrease
inequality. The source elasticities suggest that a 10 per cent increase in farm income would
reduce the overall Gini coefficient by 1.6 per cent, while a 10 per cent increase in off-farm
income would lead to an increase in the overall Gini coefficient in the same magnitude. This
is not to suggest that the growth of the off-farm sector should be thwarted. On the contrary,
entry barriers for disadvantaged households to participate in higher-paying off-farm activities
need to be overcome, which could contribute significantly to more equitable income
distribution.
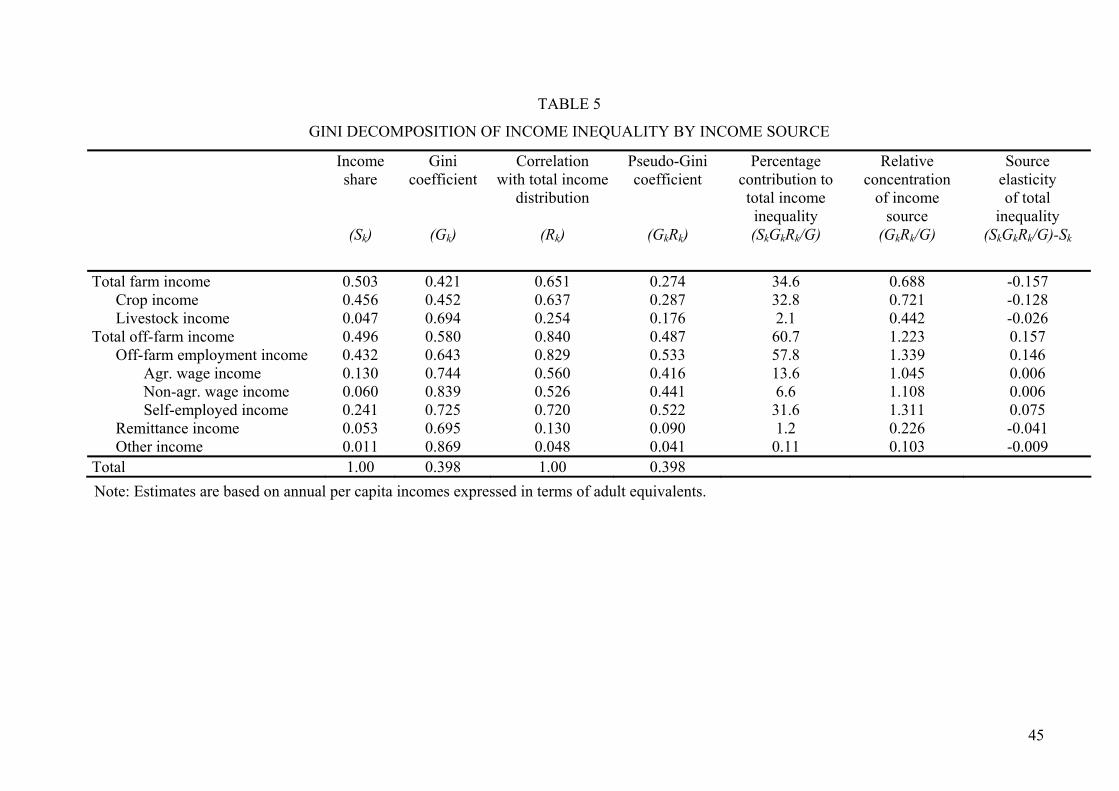
45
TABLE 5
GINI DECOMPOSITION OF INCOME INEQUALITY BY INCOME SOURCE
Income share
(Sk)
Gini coefficient
(Gk)
Correlation with total income
distribution
(Rk)
Pseudo-Gini coefficient
(GkRk)
Percentage contribution to total income inequality (SkGkRk/G)
Relative concentration
of income source
(GkRk/G)
Source elasticity of total
inequality (SkGkRk/G)-Sk
Total farm income 0.503 0.421 0.651 0.274 34.6 0.688 -0.157 Crop income 0.456 0.452 0.637 0.287 32.8 0.721 -0.128 Livestock income 0.047 0.694 0.254 0.176 2.1 0.442 -0.026 Total off-farm income 0.496 0.580 0.840 0.487 60.7 1.223 0.157 Off-farm employment income 0.432 0.643 0.829 0.533 57.8 1.339 0.146 Agr. wage income 0.130 0.744 0.560 0.416 13.6 1.045 0.006 Non-agr. wage income 0.060 0.839 0.526 0.441 6.6 1.108 0.006 Self-employed income 0.241 0.725 0.720 0.522 31.6 1.311 0.075 Remittance income 0.053 0.695 0.130 0.090 1.2 0.226 -0.041 Other income 0.011 0.869 0.048 0.041 0.11 0.103 -0.009 Total 1.00 0.398 1.00 0.398 Note: Estimates are based on annual per capita incomes expressed in terms of adult equivalents.
46
VII. CONCLUSIONS
In this article, we have examined the role of off-farm income in rural Nigeria. In line with
previous research from other countries, we have shown that off-farm income is very important for
the vast majority of households. Almost 90 per cent of the households sampled in Kwara State
have at least some off-farm income; on average, off-farm income accounts for 50 per cent of total
household income. Sixty-five per cent of the households are involved in some type of off-farm
employment, 44 per cent in agricultural wage employment, 40 per cent in non-agricultural wage
employment, and 50 per cent in self-employed, non-farm activities. In fact, self-employed
activities are the dominant source of off-farm income, accounting for almost one-fourth of overall
household income. The share of off-farm income is positively correlated with overall income,
indicating that the relatively richer households benefit much more from the off-farm sector. This
has also been shown in a number of other studies carried out in different countries of Sub-
Saharan Africa.
What is more surprising, however, is that the share of off-farm income also increases with
farm size, suggesting that there are important complementarities between farm and off-farm
income. This result challenges the widespread notion that shrinking per capita land availability is
the main driving force for the growing importance of off-farm activities. Indeed, financial capital
rather than land is the scarcest factor for farm households in the study region, so that cash income
from off-farm activities can also help to expand farm production. This is typical for relatively
land-rich environments in parts of Sub-Saharan Africa, but is quite different from more densely
populated regions in Asia. In land-scarce settings, farm households participate in off-farm
activities as an alternative for shrinking farm incomes, primarily pursuing a distress-push income
diversification. In contrast, in Kwara State of Nigeria, there seems to be a significant element of
demand-pull diversification, especially among the better-off.
47
The off-farm sector is quite heterogeneous, and households appear to have unequal access to
different parts of this sector. The econometric analysis shows that households with little
productive assets and those who are disadvantaged in terms of education and infrastructure are
constrained in their ability to participate in more lucrative off-farm activities. Also, the magnitude
of off-farm income is largely influenced by the same variables. Especially for the successful
establishment and implementation of own small businesses, productive assets, market closeness,
and access to electricity and pipe-borne water are the most important determinants. Against this
background it is not surprising to see that off-farm income increases inequality in the region.
One policy implication is that entry barriers for disadvantaged households to participate in
higher-paying off-farm activities need to be overcome. This holds true in general, regardless of
whether distress-push or demand-pull diversification is pursued. Yet, in demand-pull situations,
in addition to directly increasing household income, improved access to off-farm activities can
also lead to positive indirect effects. Especially when rural financial markets are imperfect, cash
from off-farm income can partly be invested in agriculture, thus also increasing farm production
and income. A related policy implication for this and similar situations is that there is still
significant scope for income increases through the direct promotion of crop and livestock
activities, which are currently the main income sources of the poor. Given the complementarities
between off-farm and farm income and the fact that both sectors actually face similar constraints,
appropriate policy instruments can actually serve both purposes. For instance, accessible credit
schemes can facilitate the establishment of non-farm businesses and promote agricultural
development simultaneously. Likewise, physical infrastructure reduces transportation and
transaction costs in both sectors and increases overall employment opportunities.
These findings suggest that there are a lot of synergies and positive spill-over effects between
agricultural and non-agricultural development. Over time, it is likely that the relative importance
of the off-farm sector will further increase. Broad-based rural income growth requires that also
48
the poor and disadvantaged will be able to benefit from this structural change. Improved
opportunities in rural areas could also help reduce the massive rural-urban migration with its
concomitant development problems.
Clearly, it should be stressed that these results are specific to rural areas of Kwara State,
Nigeria. They should not simply be generalized to other regions of the world. Nonetheless, it is
hypothesized that some of the findings might also hold for other settings with similar conditions.
For instance, complementarities between farm and off-farm income are likely to be found in
regions where land is not yet the scarcest factor, but where access to capital is constrained. This
holds true for some (but certainly not all) regions in Sub-Saharan Africa, but less so in Asia.
Moreover, a positive correlation between off-farm income participation and overall household
income can be expected where markets are thin and market imperfections widespread. Such
relationships are plausible from a theoretic perspective, but certainly additional empirical
research in different situations is necessary before more widely applicable statements and policy
recommendations can be made.
49
NOTES
1. Apart from migrant farm workers, who come from other states on a seasonal basis, all
households living in the villages can be classified as farm households, meaning that they
cultivate at least a small piece of land. There are no landless rural households in the study
area.
2. Off-farm income has been defined differently in many of the available studies. However,
what seems to be a common definition is income from all non-farm activities plus
agricultural wage labour. Following this definition, off-farm income in our context
includes agricultural wages, non-agricultural wages, self-employed income, remittances,
and other income such as capital earnings and pensions.
3. This cannot be generalised to all parts of Nigeria, especially not to the cocoa producing
areas in the south-west. However, with some exceptions, land scarcity in countries of
Sub-Saharan Africa is less pronounced than in Asia.
4. As explained above, households can increase their agricultural area when capital and
labour availability permits. Hence, the variable farm size might potentially be correlated
with the error term. An instrumental variable approach is difficult here, because of the
lack of appropriate instruments. However, when removing farm size from the estimates,
the other coefficients are hardly affected.
50
REFERENCES
Abdulai, A. and C.L. Delgado, 1999, ‘Determinants of Nonfarm Earnings of Farm-based
Husbands and Wives in Northern Ghana’, American Journal of Agricultural Economics, Vol.
81, pp.117–30.
Abdulai, A. and A. CroleRees, 2001, ‘Determinants of Income Diversification amongst Rural
Households in Southern Mali’, Food Policy, Vol. 26, pp.437–452.
Adams, R.H., 1994, ‘Non-farm Income and Inequality in Rural Pakistan: A Decomposition
Analysis’, Journal of Development Studies, Vol.31, No.1, pp.110–33.
Adams, R., 1999, Nonfarm Income, Inequality and Land in Rural Egypt, PRMPO/MNSED, The
World Bank, Washington, DC, mimeo.
Canagarajah, S., C. Newman, and R. Bhattamishra, 2001, ‘Non-farm Income, Gender and
Inequality: Evidence from Rural Ghana and Uganda’, Food Policy, Vol.26, No.4, pp.405–20.
Croppenstedt, A., 2006, Household Income Structure and Determinants in Rural Egypt, ESA
Working Paper No. 06-02. Agriculture and Economic Development Analysis Division, Food
and Agricultural Organization, Rome, Italy.
Deaton, A. 1997, ‘The Analysis of Household Surveys’, Baltimore: The John Hopkins University
Press.
Deininger, K. and P. Olinto, 2001, ‘Rural Nonfarm Employment and Income Diversification in
Colombia’, World Development, Vol.29, No.3, pp.455–65.
de Janvry, A. and E. Sadoulet, 2001, ‘Income Strategies Among Rural Households in Mexico:
The Role of Off-farm Activities’, World Development, Vol.29, No.3, pp.467–80.
Ellis, F., 1998, ‘Household Strategies and Rural Livelihood Diversification’, Journal of
Development Studies, Vol.35, No.1, pp.1–38.
Ellis, F. and H.A. Freeman, 2004, ‘Rural Livelihoods and Poverty Reduction Strategies in Four
African Countries’, Journal of Development Studies, Vol.40, No.4, pp.1–30.
51
Escobal, J., 2001, ‘The determinants of Non-farm Income Diversification in Peru’, World
Development, Vol.29, No.3, pp.497–508.
FAO, 1998, Rural Non-Farm Income in Developing Countries, Part III of The State of Food and
Agriculture 1998, FAO, Rome.
Gillespie, J.M., C.G. Davis and N.C. Rahelizatovo, 2004, ‘Factors Influencing the Adoption of
Breeding Technologies in U.S. Hog Production’, Journal of Agricultural and Applied
Economics, Vol.36, No.1, pp.35–47.
Greene, W.H. 2003, Econometric Analysis. Prentice Hall, New Jersey.
Haggblade, S., P.B.R. Hazell and T. Reardon, 2007, Transforming the Rural Non-farm Economy,
John Hopkins University Press, Baltimore.
Isgut, A.E. 2004, ‘Nonfarm Income and Employment in Rural Honduras: Assessing the Role of
Locational Factors’, Journal of Development Studies, Vol.40, No.3, pp.59–86.
Kennedy, P., 2003, A Guide to Econometrics. MIT Press, Cambridge.
KWSG, 2006, Kwara State Government of Nigeria, Planning Studies in Kwara State, Ministry of
Land and Regional Planning, Ilorin.
Lanjouw, P., 1998, Ecuador’s Rural Nonfarm Sector as a Route out of Poverty, World Bank
Policy Research Working Paper 1904. The World Bank, Washington, DC.
Lanjouw, P., 2001, ‘Nonfarm Employment and Poverty in Rural El Salvador’, World
Development, Vol.29, No.3, pp.529–47.
Lanjouw, J.O. and P. Lanjouw, 2001, ‘The Rural Non-farm Sector: Issues and Evidence from
Developing Countries’, Agricultural Economics, Vol.26, No.1, pp.1–23.
Marenya, P.P. and C.B. Barrett, 2007, ‘Household Level Determinants of Adoption of Improved
Natural Resources Management Practices among Smallholder Farmers in Western Kenya’,
Food Policy, Vol.32, pp.515–536.
52
Matshe, I. and T. Young, 2004, ‘Off-farm Labour Allocation Decisions in Small-scale Rural
Households in Zimbabwe’, Agricultural Economics, Vol.30, No.3, pp.175–86.
NBS, 2006, National Bureau of Statistics, Socio-economic Survey on Nigeria, Abuja, Nigeria.
Reardon, T., 1997, ‘Using Evidence of Household Income Diversification to Inform Study of the
Rural Nonfarm Labour Market in Africa’, World Development, Vol.25, No.5, pp.735–8.
Reardon, T., C. Delgado and P. Matlon, 1992, ‘Determinants and Effects of Income
Diversification amongst Farm Households in Burkina Faso’, Journal of Development
Studies, Vol.28, No.2, pp.264–96.
Reardon, T., J. Berdegué and G. Escobar, 2001, ‘Rural Nonfarm Employment and Incomes in
Latin America: Overview and Policy Implications’, World Development, Vol.29, No.3,
pp.395–409.
Reardon, T., J.E. Taylor, K. Stamoulis, P. Lanjouw and A. Balisacan, 2000, ‘Effects of Non-farm
Employment on Rural Income Inequality in Developing Countries: An Investment
Perspective’, Journal of Agricultural Economics, Vol.51, No.2, pp.266–88.
Ruben, R. and M. van den Berg, 2001, ‘Nonfarm Employment and Poverty Alleviation of Rural
Farm Households in Honduras’, World Development, Vol.29, No.3, pp.549–60.
Satriawan, E. and S.M. Swinton, 2007, ‘Does Human Capital Raise Farm or Nonfarm Earnings
More? New Insight from a Rural Pakistan Household Panel’, Agricultural Economics,
Vol.36, No.3, pp.421–28.
Shorrocks, A., 1983, ‘The Impact of Income Components on the Distribution of Family Income’,
Quarterly Journal of Economics, Vol.98, pp.311–26.
van den Berg, M. and G.E. Kumbi, 2006, ‘Poverty and the Rural Nonfarm Economy in Oromia,
Ethiopia’, Agricultural Economics, Vol. 35 (Suppl), pp.469–75.
Woldenhanna, T. and A. Oskam, 2001, ‘Income Diversification and Entry Barriers: Evidence
from the Tigray Region of Northern Ethiopia’, Food Policy, Vol.26, No.4, pp.351–65.
53
Yunez-Naude, A. and J.E. Taylor, 2001, ‘The Determinants of Nonfarm Activities and Income of
Rural Households in Mexico, with Emphasis on Education’, World Development, Vol.29,
No.3, pp.561–572.
54
CHAPTER III
Impact of off-farm income on food security and nutrition in Nigeria
Raphael O. Babatunde a,*, Matin Qaim b
a University of Hohenheim, Department of Agricultural Economics and Social Sciences, 70593
Stuttgart, Germany
b Georg-August-University of Göttingen, Department of Agricultural Economics and Rural
Development, 37073 Göttingen, Germany
* Corresponding author:
Raphael O. Babatunde
Department of Agricultural Economics and Social Sciences (490b),
University of Hohenheim, 70593 Stuttgart, Germany
Tel: +49-711-459-23889
Fax: +49-711-459-23762
Email: [email protected]
55
Impact of off-farm income on food security and nutrition in Nigeria
Abstract
While the poverty implications of off-farm income have been analyzed in different developing
countries, much less is known about the impact of off-farm income on household food security
and nutrition. Here, this research gap is addressed by using farm survey data from Nigeria.
Econometric analyses are employed to examine the mechanisms by which off-farm income
affects household calorie and micronutrient supply, dietary quality, and child anthropometry. We
find that off-farm income has a positive net effect on food security and nutrition, which is in the
same magnitude as the effect of farm income. We also show that the prevalence of stunting and
underweight is remarkably lower among children in households with off-farm income.
Accordingly, improving poor households’ access to the off-farm sector can contribute to reducing
problems of rural malnutrition.
Keywords: Farm households; Food security; Micronutrients; Child anthropometry; Off-farm
income
Introduction
Reducing food insecurity continues to be a major public policy challenge in developing countries.
Around 854 million people are undernourished worldwide, many more suffer from micronutrient
deficiencies, and the absolute numbers tend to increase further, especially in Sub-Saharan Africa
(FAO, 2006). Recent food price hikes have contributed to greater public awareness of hunger
related problems, also resulting in new international commitments to invest in developing country
agriculture (e.g., Fan and Rosegrant, 2008). Obviously, agricultural development is crucial for
reducing hunger and poverty in rural areas, but non-agricultural growth can be important as well
56
(Diao et al., 2007). Specifically for African countries, with strong population growth and
increasingly limited agricultural resources, the potential role of the rural off-farm sector deserves
particular consideration. Smallholder farm households usually maintain a portfolio of income
sources, with off-farm income being a major component (Barrett et al., 2001). But often a clear
policy strategy to promote the off-farm sector is lacking.
In the available literature, considerable attention has been given to the poverty implications
of off-farm income in developing countries (e.g., Block and Webb, 2001; de Janvry and Sadoulet,
2001; Lanjouw et al., 2001). In contrast, much less is known on food security and nutrition
effects. Nutrition impacts might be positive, because off-farm income contributes to higher
household income and therefore better access to food. But the impacts might also be negative, at
least when controlling for total household income, as working off the farm could potentially
reduce household food availability due to the competition for family labor between farm and off-
farm work (cf. Barrett and Reardon, 2000). A few empirical studies have looked into related
linkages, but all of them are confined to issues of household food expenditure or calorie
availability. For instance, Reardon et al. (1992) found that diversification into the non-farm sector
improves calorie consumption in Burkina Faso. Ruben and van den Berg (2001) obtained similar
results for Honduras, and Ersado (2003) showed that non-farm income diversification is
associated with a higher level of consumption expenditure in rural Zimbabwe. We are not aware
of studies that have analyzed nutritional impacts from a broader perspective, also taking into
account dietary quality, micronutrient consumption, and nutritional outcomes. Here, we address
such issues, building on a detailed survey of farm households in Nigeria.
We hypothesize that off-farm income contributes to better nutrition in terms of calorie and
micronutrient supply and child anthropometry. In the next section, we present the household
survey data. Then, we carry out a descriptive analysis of various nutritional indicators,
differentiating between households with and without off-farm income, before using a set of
57
regression models to test the hypothesis more formally. Issues of endogeneity are taken into
account by using instrumental variable approaches. The last section concludes and discusses
policy implications.
Data and sample characteristics
Household survey
Data used in this article are from a comprehensive survey of farm households in Kwara State,
north-central region of Nigeria, which was conducted between April and August 2006. We chose
Kwara State because of its considerable socioeconomic heterogeneity and location; it is the
gateway between the northern and southern regions, and it has a good mixture of the three major
ethnic groups in Nigeria. These factors tend to encourage the development of off-farm activities.
Moreover, the nationwide living standard measurement survey conducted in 2004 shows that
Kwara State is among the six poorest in Nigeria in terms of prevalence of undernourishment and
income poverty (NBS, 2006). The state has a total population of about 2.4 million people, 70% of
which can be classified as smallholder farmers. The farming system is characterized by low
quality land and predominantly cereal-based cropping patterns. Most farm households are net
buyers of food, at least seasonally (KWSG, 2006).
Our sample consists of 220 farm households which were selected by a multi-stage random
sampling technique. Eight out of the 16 local government areas in Kwara State were randomly
selected in the first stage.1 Then, five villages were randomly chosen from each selected local
government area, and finally, five households were sampled in each of the resulting 40 villages,
using complete village household lists provided by the local authorities. Personal interviews were
carried out with the household head, usually in the presence of other family members. A
1 Local government area is the smallest administrative unit in Nigeria, usually made up of several wards. A ward consists of several villages that are often composed of people of related ethnicity and culture.
58
standardized questionnaire was used that covered information on household expenditure,
consumption, farm and off-farm income, socioeconomic characteristics, and various institutional
and contextual variables. Farm income covers commodity sales and subsistence production, both
valued at local market prices. Off-farm income includes agricultural wages, non-agricultural
wages, self employed income, remittances, and other income such as capital earnings and
pensions.
Food consumption data were elicited through a 7-day recall, covering 105 food items.
Quantities consumed per household include food from own production, market purchases, and
out-of-home meals and snacks. Using cross-section data to establish household nutritional status
can be problematic because of seasonality effects. Our survey was carried out in the lean season,
during which household food consumption is often below the annual average. Therefore, the
prevalence of malnutrition derived from the data might be somewhat overestimated. This,
however, is not a serious problem in our context, because we are primarily interested in the
nutritional impact of off-farm income rather than establishing the prevalence of malnutrition on a
representative basis. The food consumption data are supplemented by anthropometric
measurements that we took from pre-school children up to 60 months of age. In the 220 sample
households, we obtained weight and height data from 127 children.
Sample characteristics
Table 1 shows summary statistics of selected household variables. The average household size of
five adult equivalents (AE) is consistent with the national average in Nigeria reported by NBS
(2006). About 10% of the households are headed by women. The educational status is slightly
higher than the national average, which can probably be explained by the fact that the density of
elementary schools is relatively high in rural areas of Kwara State. The mean farm size of 1.9
59
hectares is comparable to the national average of two hectares. The infrastructure variables
indicate that many of the farm households do not have access to electricity and pipe-borne water.
Even fewer households have access to formal or informal credit, and the mean distance to the
nearest market place is 13.5 kilometers.
Total annual household income is approximately 30 thousand naira (250 US$) per AE over
all income sources. This is somewhat lower than the national average in Nigeria. Farming
accounts for half of this total; the other half consists of different off-farm sources. This average
off-farm income share fits reasonably well into the recent literature from Sub-Sahara Africa (e.g.,
Barrett et al., 2001; Woldenhanna and Oskam, 2001). In our sample, the role of off-farm income
increases with overall household income: while for the poorest quartile, off-farm income accounts
for 31% of total income, it accounts for 60% in the richest quartile. Especially among the better-
off households, self-employed income, that is, income from own non-agricultural businesses,
constitutes the most important off-farm source.
Descriptive analysis
Calorie and micronutrient supply
Food quantities consumed at the household level were converted to calories using the locally
available food composition table (Oguntona and Akinyele, 1995). Only in very few cases where
certain food items were not included in the local table, USDA (2005) data were used. Resulting
calorie values were divided by the number of AE in a household, in order to obtain numbers that
are comparable across households of different size.2 We define a food secure household as one
2 This procedure implicitly assumes that food is distributed equally within each household. More detailed analysis of intra-household distribution is not possible with our 7-day recall data.

60
whose calorie supply per AE is greater than or equal the minimum daily calorie requirement for
adult men of 2500 kcal (FAO/WHO/UNU, 1985). Households with lower calorie intakes are
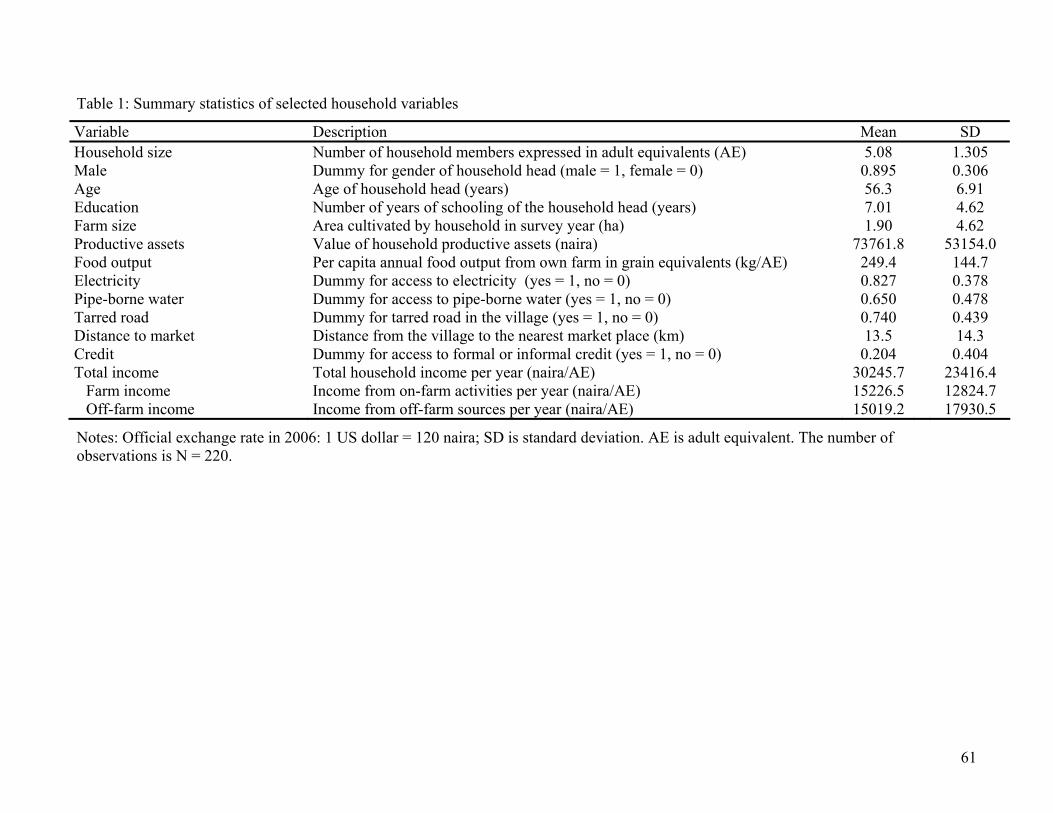
61
Table 1: Summary statistics of selected household variables
Variable Description Mean SD Household size Number of household members expressed in adult equivalents (AE) 5.08 1.305 Male Dummy for gender of household head (male = 1, female = 0) 0.895 0.306 Age Age of household head (years) 56.3 6.91 Education Number of years of schooling of the household head (years) 7.01 4.62 Farm size Area cultivated by household in survey year (ha) 1.90 4.62 Productive assets Value of household productive assets (naira) 73761.8 53154.0 Food output Per capita annual food output from own farm in grain equivalents (kg/AE) 249.4 144.7 Electricity Dummy for access to electricity (yes = 1, no = 0) 0.827 0.378 Pipe-borne water Dummy for access to pipe-borne water (yes = 1, no = 0) 0.650 0.478 Tarred road Dummy for tarred road in the village (yes = 1, no = 0) 0.740 0.439 Distance to market Distance from the village to the nearest market place (km) 13.5 14.3 Credit Dummy for access to formal or informal credit (yes = 1, no = 0) 0.204 0.404 Total income Total household income per year (naira/AE) 30245.7 23416.4 Farm income Income from on-farm activities per year (naira/AE) 15226.5 12824.7 Off-farm income Income from off-farm sources per year (naira/AE) 15019.2 17930.5
Notes: Official exchange rate in 2006: 1 US dollar = 120 naira; SD is standard deviation. AE is adult equivalent. The number of observations is N = 220.
62
considered to be undernourished. In terms of micronutrients, we concentrate on iron and vitamin
A, for which deficiencies are particularly widespread in Sub-Saharan Africa (Mason et al., 2005).
As for calories, levels of iron and vitamin A supply per AE were calculated based on local and
USDA food composition tables. Yet, unlike for calories, we did not compute the prevalence of
micronutrient deficiencies, because this would have required vague assumptions on
bioavailability, especially for iron. For our purpose it suffices to examine factors that influence
gross micronutrient consumption levels.
Table 2 shows calorie and micronutrient consumption levels per AE in our sample. The
average daily calorie supply of 2428 kcal is slightly below the 2500 kcal recommendation, which
is in line with another recent study for rural Nigeria (Aromolaran, 2004). Sixty-one percent of all
sample households are undernourished, falling below the minimum daily calorie supply by 22%
on average. As mentioned above, our survey was carried out in the lean season, so that the
average prevalence of undernourishment might be somewhat overestimated. Nonetheless, our
results fit fairly well into the range of recent estimates for African countries based on
representative household expenditure surveys (Smith et al., 2006). Disaggregating our sample by
income quartiles shows that poorer households consume fewer calories than richer households.
This is unsurprising. Furthermore, dietary quality – measured in terms of calorie supply from
fruits, vegetables, and animal products – and micronutrient supply are positively correlated with
household income. These patterns underscore the importance of income for food and nutrition
security. In the following, we analyze the role of off-farm income in this connection more
explicitly.
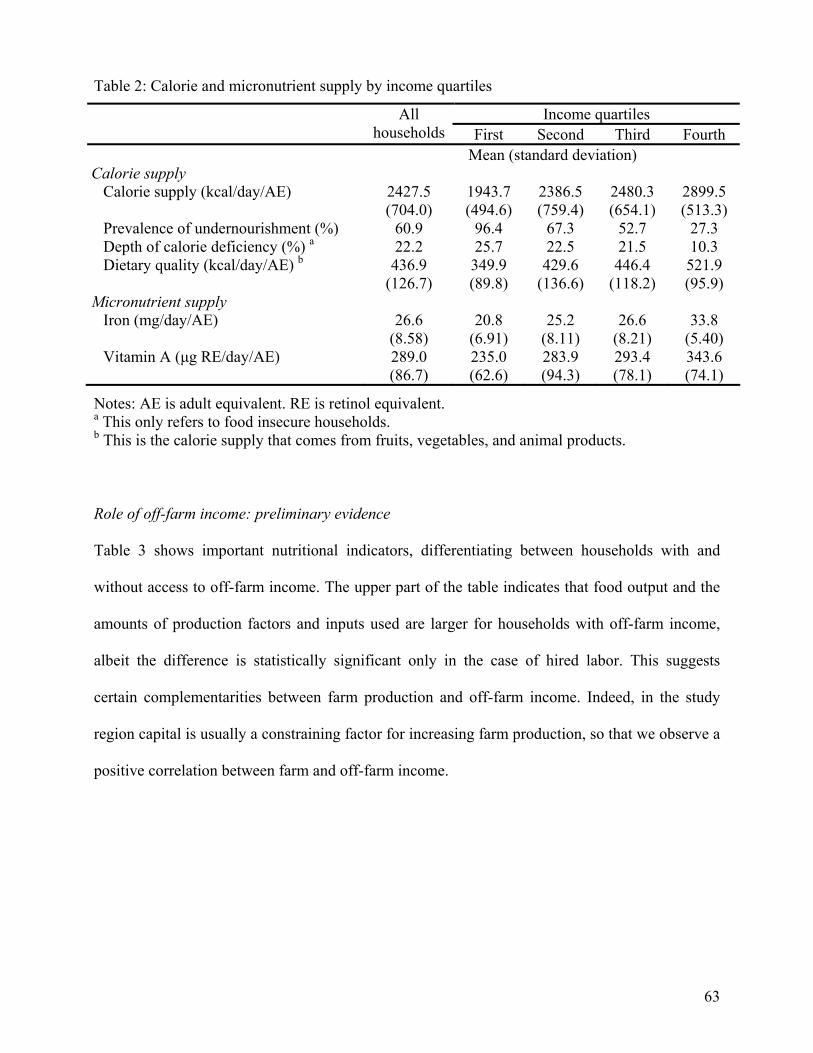
63
Table 2: Calorie and micronutrient supply by income quartiles
Income quartiles All households First Second Third Fourth
Mean (standard deviation) Calorie supply Calorie supply (kcal/day/AE) 2427.5
(704.0) 1943.7 (494.6)
2386.5 (759.4)
2480.3 (654.1)
2899.5 (513.3)
Prevalence of undernourishment (%) 60.9 96.4 67.3 52.7 27.3 Depth of calorie deficiency (%) a 22.2 25.7 22.5 21.5 10.3 Dietary quality (kcal/day/AE) b 436.9
(126.7) 349.9 (89.8)
429.6 (136.6)
446.4 (118.2)
521.9 (95.9)
Micronutrient supply Iron (mg/day/AE) 26.6
(8.58) 20.8
(6.91) 25.2
(8.11) 26.6
(8.21) 33.8
(5.40) Vitamin A (μg RE/day/AE) 289.0
(86.7) 235.0 (62.6)
283.9 (94.3)
293.4 (78.1)
343.6 (74.1)
Notes: AE is adult equivalent. RE is retinol equivalent. a This only refers to food insecure households. b This is the calorie supply that comes from fruits, vegetables, and animal products.
Role of off-farm income: preliminary evidence
Table 3 shows important nutritional indicators, differentiating between households with and
without access to off-farm income. The upper part of the table indicates that food output and the
amounts of production factors and inputs used are larger for households with off-farm income,
albeit the difference is statistically significant only in the case of hired labor. This suggests
certain complementarities between farm production and off-farm income. Indeed, in the study
region capital is usually a constraining factor for increasing farm production, so that we observe a
positive correlation between farm and off-farm income.
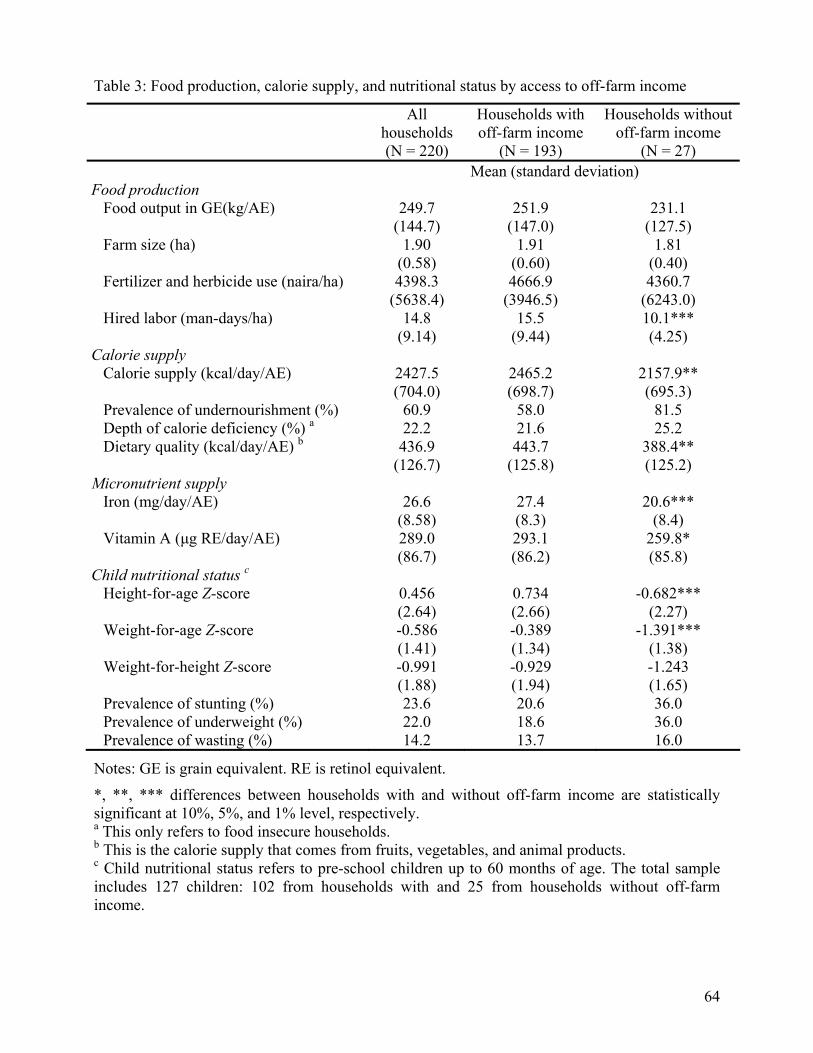
64
Table 3: Food production, calorie supply, and nutritional status by access to off-farm income
All households (N = 220)
Households with off-farm income
(N = 193)
Households without off-farm income
(N = 27) Mean (standard deviation) Food production Food output in GE(kg/AE) 249.7
(144.7) 251.9
(147.0) 231.1
(127.5) Farm size (ha) 1.90
(0.58) 1.91
(0.60) 1.81
(0.40) Fertilizer and herbicide use (naira/ha) 4398.3
(5638.4) 4666.9
(3946.5) 4360.7
(6243.0) Hired labor (man-days/ha) 14.8
(9.14) 15.5
(9.44) 10.1*** (4.25)
Calorie supply Calorie supply (kcal/day/AE) 2427.5
(704.0) 2465.2 (698.7)
2157.9** (695.3)
Prevalence of undernourishment (%) 60.9 58.0 81.5 Depth of calorie deficiency (%) a 22.2 21.6 25.2 Dietary quality (kcal/day/AE) b 436.9
(126.7) 443.7
(125.8) 388.4** (125.2)
Micronutrient supply Iron (mg/day/AE) 26.6
(8.58) 27.4 (8.3)
20.6*** (8.4)
Vitamin A (μg RE/day/AE) 289.0 (86.7)
293.1 (86.2)
259.8* (85.8)
Child nutritional status c Height-for-age Z-score 0.456
(2.64) 0.734 (2.66)
-0.682*** (2.27)
Weight-for-age Z-score -0.586 (1.41)
-0.389 (1.34)
-1.391*** (1.38)
Weight-for-height Z-score -0.991 (1.88)
-0.929 (1.94)
-1.243 (1.65)
Prevalence of stunting (%) 23.6 20.6 36.0 Prevalence of underweight (%) 22.0 18.6 36.0 Prevalence of wasting (%) 14.2 13.7 16.0
Notes: GE is grain equivalent. RE is retinol equivalent.
*, **, *** differences between households with and without off-farm income are statistically significant at 10%, 5%, and 1% level, respectively. a This only refers to food insecure households. b This is the calorie supply that comes from fruits, vegetables, and animal products. c Child nutritional status refers to pre-school children up to 60 months of age. The total sample includes 127 children: 102 from households with and 25 from households without off-farm income.
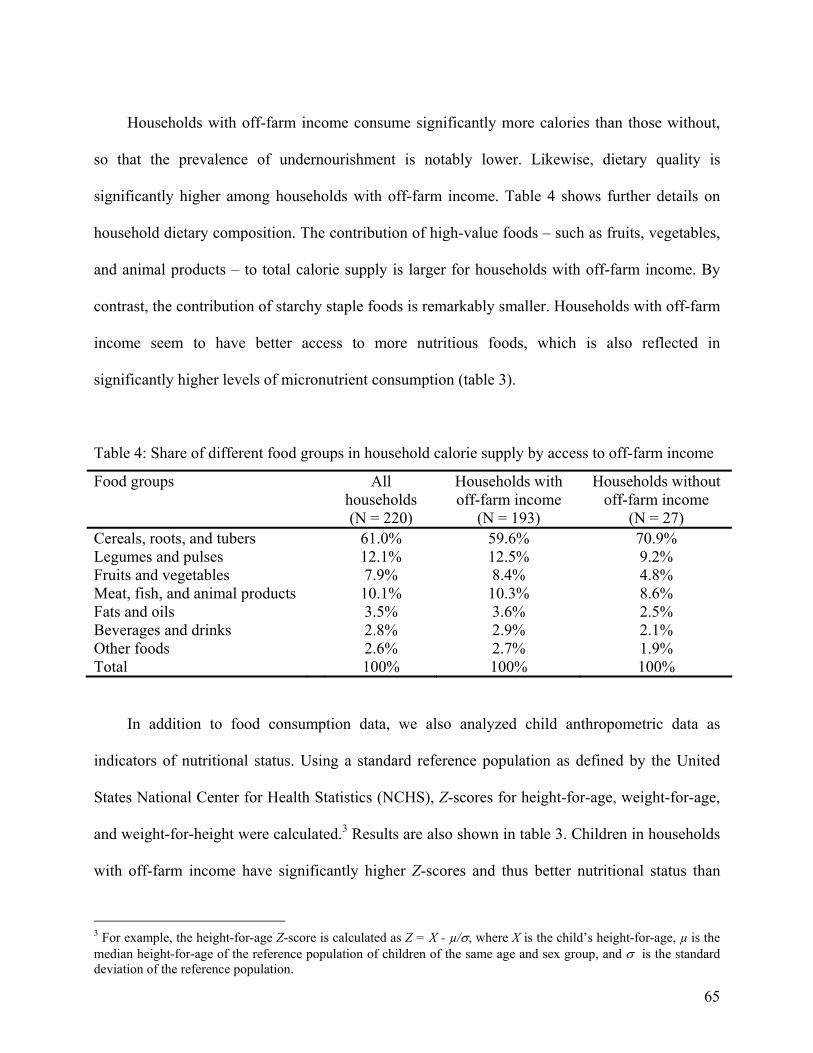
65
Households with off-farm income consume significantly more calories than those without,
so that the prevalence of undernourishment is notably lower. Likewise, dietary quality is
significantly higher among households with off-farm income. Table 4 shows further details on
household dietary composition. The contribution of high-value foods – such as fruits, vegetables,
and animal products – to total calorie supply is larger for households with off-farm income. By
contrast, the contribution of starchy staple foods is remarkably smaller. Households with off-farm
income seem to have better access to more nutritious foods, which is also reflected in
significantly higher levels of micronutrient consumption (table 3).
Table 4: Share of different food groups in household calorie supply by access to off-farm income
Food groups All households (N = 220)
Households with off-farm income
(N = 193)
Households without off-farm income
(N = 27) Cereals, roots, and tubers 61.0% 59.6% 70.9% Legumes and pulses 12.1% 12.5% 9.2% Fruits and vegetables 7.9% 8.4% 4.8% Meat, fish, and animal products 10.1% 10.3% 8.6% Fats and oils 3.5% 3.6% 2.5% Beverages and drinks 2.8% 2.9% 2.1% Other foods 2.6% 2.7% 1.9% Total 100% 100% 100%
In addition to food consumption data, we also analyzed child anthropometric data as
indicators of nutritional status. Using a standard reference population as defined by the United
States National Center for Health Statistics (NCHS), Z-scores for height-for-age, weight-for-age,
and weight-for-height were calculated.3 Results are also shown in table 3. Children in households
with off-farm income have significantly higher Z-scores and thus better nutritional status than
3 For example, the height-for-age Z-score is calculated as Z = X - µ/σ, where X is the child’s height-for-age, µ is the median height-for-age of the reference population of children of the same age and sex group, and σ is the standard deviation of the reference population.
66
children in households without off-farm income. Accordingly, the prevalence of child stunting,
underweight, and wasting is lower in households with off-farm income.4
These results suggest that participation in off-farm activities is associated with better food
access and nutrition, and they challenge the skepticism sometimes expressed towards the impact
of the off-farm sector on food security. The argument that working off-farm would reduce
household food availability due to less own food production (e.g., Barrett and Reardon, 2000) is
not confirmed in Kwara State of Nigeria. The pathway by which off-farm income contributes to
better food security is further analyzed in the next section.
Econometric analysis
Off-farm income and calorie supply
Previous sections have already suggested that off-farm income contributes positively to food
security. Here we analyze this effect more formally by controlling for other factors. At first, we
estimate a food security model with a dummy dependent variable, which is one when the
household is food secure with a daily calorie supply above 2500 kcal, and zero otherwise. The
amount of annual off-farm income, measured in naira per AE, is included as an explanatory
variable. We expect the estimated coefficient for this variable to be positive and significant. This
is confirmed in table 5, where the first column shows results of a logit estimation. That is, off-
farm income increases the probability of households to be food secure.
It should be noted that the level of off-farm income is likely to be endogenous in this model.
First, there might potentially be a reverse causality problem, because the food security status of a
household might also influence its access to off-farm income sources. Second, off-farm income
might be influenced by household unobservables, which can lead to correlation with the error
4 Stunting is defined as height-for-age Z-score less than -2, underweight as weight-for-age Z-score less than -2, and wasting as weight-for-height Z-score less than -2 (WHO, 1995).
67
term. In order to avoid an endogeneity bias, we employed an instrumental variable approach,
using household assets, access to electricity, pipe-borne, and credit, tarred road, and distance to
market as instruments. This is similar to approaches that have been used by Ruel et al. (1999) and
Ruben and van den Berg (2001) in different contexts.
We also included farm income as an explanatory variable in the food security model, again
taking account of endogeneity problems. The coefficient is positive and significant as well. The
results further show that male-headed households are more likely to be food secure. While it is
known that women usually take greater care of family nutrition, female-headed households are
often disadvantaged in terms of social status and economic opportunities. Education and farm
size also contribute positively to food security. By contrast, household size has a negative
coefficient, which might potentially be due to economies of scale in food preparation and
consumption: in larger families there is often less food waste than in smaller ones, so that lower
average calorie supply does not inevitably mean lower calorie intake. Such details are difficult to
disentangle with food expenditure data (e.g., Bouis, 1994).
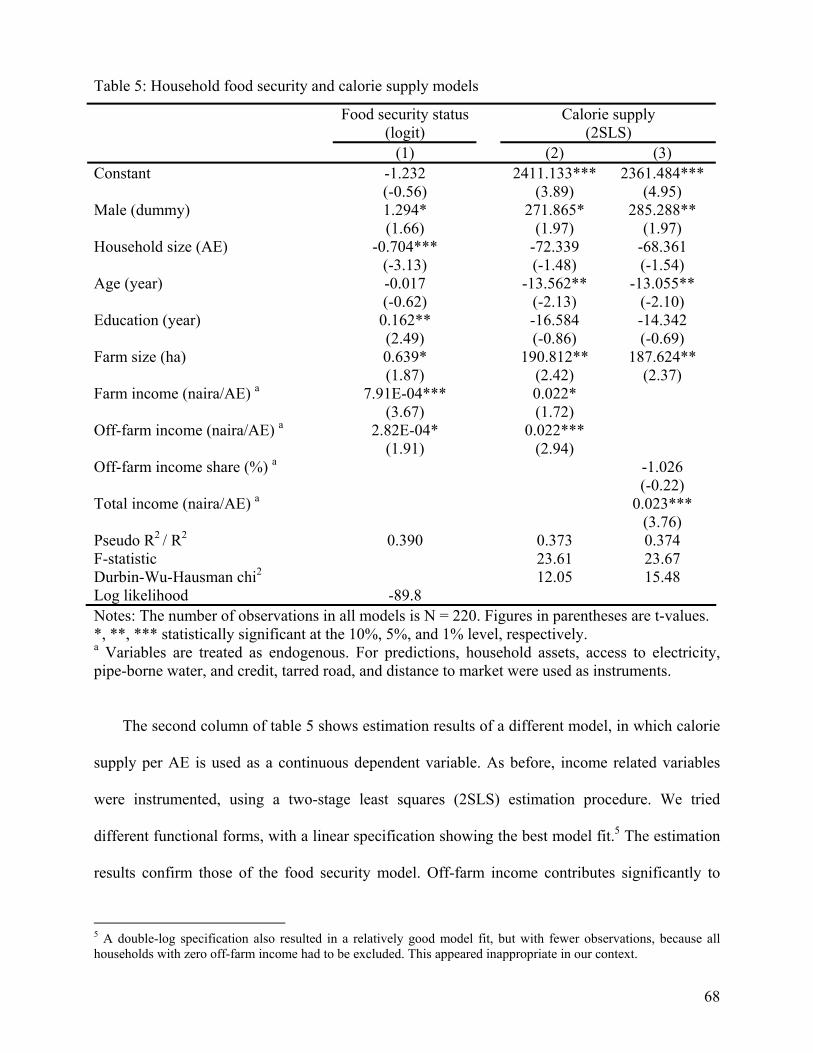
68
Table 5: Household food security and calorie supply models
Food security status Calorie supply (logit) (2SLS) (1)
(2) (3)
Constant -1.232 (-0.56)
2411.133*** (3.89)
2361.484*** (4.95)
Male (dummy) 1.294* (1.66)
271.865* (1.97)
285.288** (1.97)
Household size (AE) -0.704*** (-3.13)
-72.339 (-1.48)
-68.361 (-1.54)
Age (year) -0.017 (-0.62)
-13.562** (-2.13)
-13.055** (-2.10)
Education (year) 0.162** (2.49)
-16.584 (-0.86)
-14.342 (-0.69)
Farm size (ha) 0.639* (1.87)
190.812** (2.42)
187.624** (2.37)
Farm income (naira/AE) a 7.91E-04*** (3.67)
0.022* (1.72)
Off-farm income (naira/AE) a 2.82E-04* (1.91)
0.022*** (2.94)
Off-farm income share (%) a -1.026 (-0.22)
Total income (naira/AE) a 0.023*** (3.76)
Pseudo R2 / R2 0.390 0.373 0.374 F-statistic 23.61 23.67 Durbin-Wu-Hausman chi2 12.05 15.48 Log likelihood -89.8 Notes: The number of observations in all models is N = 220. Figures in parentheses are t-values. *, **, *** statistically significant at the 10%, 5%, and 1% level, respectively. a Variables are treated as endogenous. For predictions, household assets, access to electricity, pipe-borne water, and credit, tarred road, and distance to market were used as instruments.
The second column of table 5 shows estimation results of a different model, in which calorie
supply per AE is used as a continuous dependent variable. As before, income related variables
were instrumented, using a two-stage least squares (2SLS) estimation procedure. We tried
different functional forms, with a linear specification showing the best model fit.5 The estimation
results confirm those of the food security model. Off-farm income contributes significantly to
5 A double-log specification also resulted in a relatively good model fit, but with fewer observations, because all households with zero off-farm income had to be excluded. This appeared inappropriate in our context.
69
higher household calorie supply, which is also consistent with findings by Ruben and van den
Berg (2001) for Honduras and by Reardon et al. (1992) for Burkina Faso. An increase in annual
off-farm income by 1000 naira per AE results in an average consumption improvement by 22
kcal per day. Strikingly, the marginal effect of farm income is identical in magnitude, suggesting
that the level of income is more important than the income source for household calorie supply
and food security. In addition to the variables already discussed above, age of the household head
has a significant and negative effect in the calorie supply model. This might be explained by the
fact that older people are often less aware of nutritional aspects. Moreover, their calorie and
nutritional requirements are usually somewhat lower than those of younger adults.
The third column in table 5 shows results of a model where again calorie supply is the
dependent variable, but with a slightly different specification. Instead of including farm and off-
farm income as separate variables, we include total household income in monetary terms and the
share of off-farm income in percentage terms. Total income has a positive effect, while the off-
farm income share coefficient is insignificant. This is not surprising, given the previous result of
equal marginal effects of farm and off-farm income on household calorie supply. The other
coefficients are not much affected by this changed model specification.
Off-farm income, dietary quality, and micronutrient supply
To examine the impact of off-farm income on dietary quality, we used similar models as
described above, but instead of total calorie supply per AE we took the calorie amount stemming
from fruits, vegetables, and animal products as dependent variable. The results from the 2SLS
estimates are shown in table 6. They indicate that off-farm income has a positive and significant
effect on dietary quality. That is, when off-farm income increases, not only more food in general,
but also more higher-value food is consumed, and again the marginal effect is the same for farm
and off-farm income. This is an interesting result, because a priori one might expect that off-farm
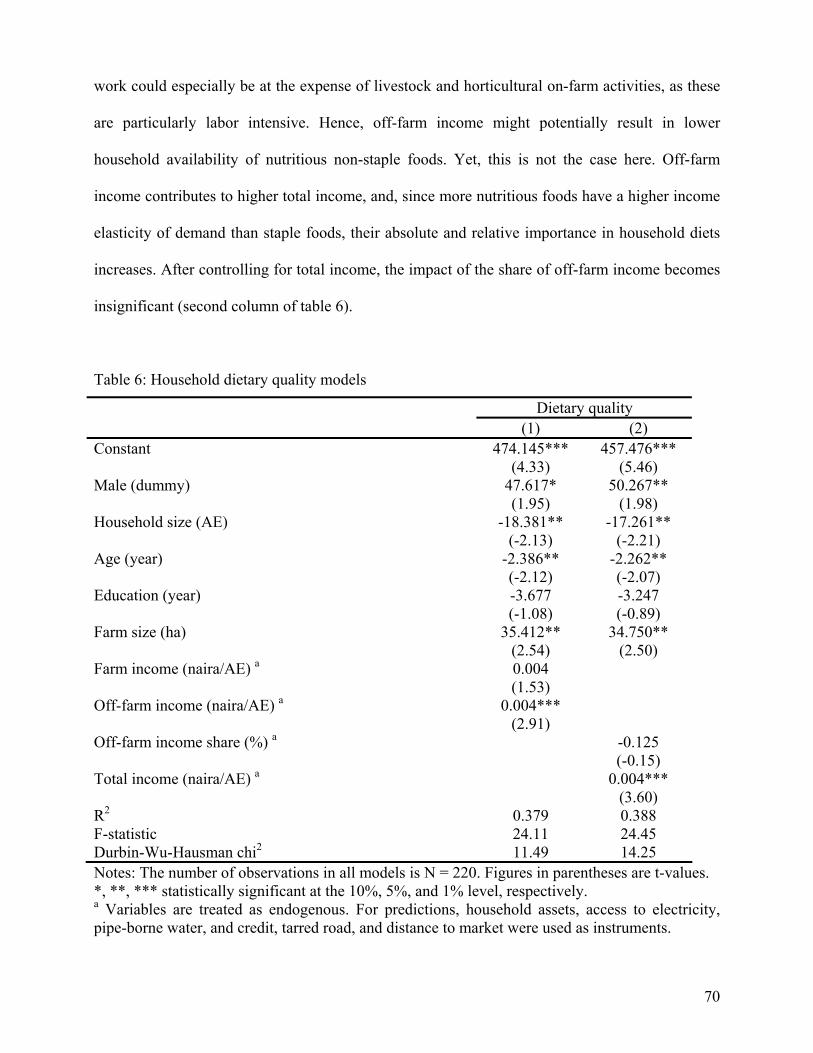
70
work could especially be at the expense of livestock and horticultural on-farm activities, as these
are particularly labor intensive. Hence, off-farm income might potentially result in lower
household availability of nutritious non-staple foods. Yet, this is not the case here. Off-farm
income contributes to higher total income, and, since more nutritious foods have a higher income
elasticity of demand than staple foods, their absolute and relative importance in household diets
increases. After controlling for total income, the impact of the share of off-farm income becomes
insignificant (second column of table 6).
Table 6: Household dietary quality models
Dietary quality (1) (2) Constant 474.145***
(4.33) 457.476***
(5.46) Male (dummy) 47.617*
(1.95) 50.267**
(1.98) Household size (AE) -18.381**
(-2.13) -17.261**
(-2.21) Age (year) -2.386**
(-2.12) -2.262** (-2.07)
Education (year) -3.677 (-1.08)
-3.247 (-0.89)
Farm size (ha) 35.412** (2.54)
34.750** (2.50)
Farm income (naira/AE) a 0.004 (1.53)
Off-farm income (naira/AE) a 0.004*** (2.91)
Off-farm income share (%) a -0.125 (-0.15)
Total income (naira/AE) a 0.004*** (3.60)
R2 0.379 0.388 F-statistic 24.11 24.45 Durbin-Wu-Hausman chi2 11.49 14.25 Notes: The number of observations in all models is N = 220. Figures in parentheses are t-values. *, **, *** statistically significant at the 10%, 5%, and 1% level, respectively. a Variables are treated as endogenous. For predictions, household assets, access to electricity, pipe-borne water, and credit, tarred road, and distance to market were used as instruments.
71
Against this background, it is not surprising that off-farm income also has a positive and
significant effect on household micronutrient consumption (table 7). For every 1000 naira of
additional off-farm income, daily iron supply increases by about 2.8 mg per AE, while vitamin A
supply increases by 2 μg. The effects of farm income are again very similar, but not statistically
significant in these models. The signs and significance levels of the other coefficients in the
micronutrient models are similar to those in the calorie models, suggesting that improving dietary
quantity and quality are two complementary objectives. Education is not significant in most of the
models, which is somewhat unexpected, especially for micronutrients, because better education
should normally lead to higher nutritional awareness. However, the educational variable here
refers to the household head, who, in many cases, is not the person responsible for making
decisions on dietary composition. Hence, the fact that the education variable is insignificant
should not be over-interpreted.
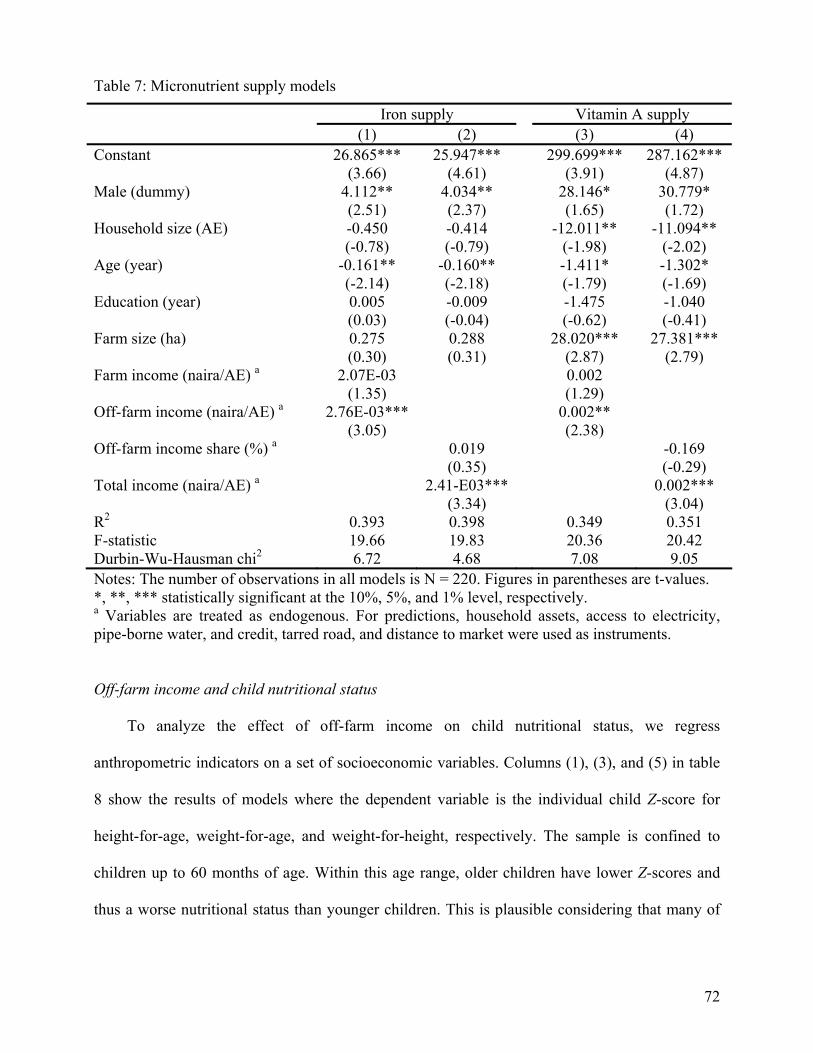
72
Table 7: Micronutrient supply models
Iron supply Vitamin A supply (1) (2) (3) (4) Constant 26.865***
(3.66) 25.947***
(4.61) 299.699***
(3.91) 287.162***
(4.87) Male (dummy) 4.112**
(2.51) 4.034** (2.37)
28.146* (1.65)
30.779* (1.72)
Household size (AE) -0.450 (-0.78)
-0.414 (-0.79)
-12.011** (-1.98)
-11.094** (-2.02)
Age (year) -0.161** (-2.14)
-0.160** (-2.18)
-1.411* (-1.79)
-1.302* (-1.69)
Education (year) 0.005 (0.03)
-0.009 (-0.04)
-1.475 (-0.62)
-1.040 (-0.41)
Farm size (ha) 0.275 (0.30)
0.288 (0.31)
28.020*** (2.87)
27.381*** (2.79)
Farm income (naira/AE) a 2.07E-03 (1.35)
0.002 (1.29)
Off-farm income (naira/AE) a 2.76E-03*** (3.05)
0.002** (2.38)
Off-farm income share (%) a 0.019 (0.35)
-0.169 (-0.29)
Total income (naira/AE) a 2.41-E03*** (3.34)
0.002*** (3.04)
R2 0.393 0.398 0.349 0.351 F-statistic 19.66 19.83 20.36 20.42 Durbin-Wu-Hausman chi2 6.72 4.68 7.08 9.05 Notes: The number of observations in all models is N = 220. Figures in parentheses are t-values. *, **, *** statistically significant at the 10%, 5%, and 1% level, respectively. a Variables are treated as endogenous. For predictions, household assets, access to electricity, pipe-borne water, and credit, tarred road, and distance to market were used as instruments.
Off-farm income and child nutritional status
To analyze the effect of off-farm income on child nutritional status, we regress
anthropometric indicators on a set of socioeconomic variables. Columns (1), (3), and (5) in table
8 show the results of models where the dependent variable is the individual child Z-score for
height-for-age, weight-for-age, and weight-for-height, respectively. The sample is confined to
children up to 60 months of age. Within this age range, older children have lower Z-scores and
thus a worse nutritional status than younger children. This is plausible considering that many of
73
the younger children are breastfed, so that more severe malnutrition sets in only after weaning.6
Having a private toilet in the household has a positive effect on child anthropometry, because this
entails less exposure to unhygienic conditions and a lower risk of infectious diseases. These
results are consistent with the literature (e.g., Strauss and Thomas, 1995; Armar-Klemesu et al,
2000). The effect of off-farm income, however, is insignificant, as is the effect of farm income.
Likewise, the overall model fits are not very good.
We also tried different specifications, where instead of Z-scores we took dummies for
stunting, underweight, and wasting as dependent variables. The results of these logit estimates are
shown in columns (2), (4), and (6) of table 8, respectively. The effects are similar as before, only
with reversed signs, which is due to the way the dependent variables are defined. In addition, the
models show that male children are less likely to be stunted and underweight, which might
potentially indicate unequal intra-household food distribution between boys and girls. Living in a
household with pipe-borne water reduces the probability of being stunted, which makes sense
because of the close interlinkages between health and nutrition outcomes. But again, off-farm
income remains insignificant also in these logit models.7 This is a bit surprising, given that the
descriptive analysis above showed significant differences in child anthropometry between
households with and without access to off-farm income. Also against the background of the
calorie and micronutrient models, we would expect a positive effect of off-farm income on child
nutritional status. One reason why this cannot be established here might be that further child-
specific details – such as birth weight and birth order – as well as health related variables, are not
available from our data set.
6 For breastfed infants, anthropometric measures are usually closely correlated with the mother’s nutritional status, for which we have no data in our sample. 7 Even when including total income instead of separate variables for farm and off-farm income, no significant effects were found in any of the models.

74
Such variables can play an important role (e.g., Strauss and Thomas, 1995), and some of them
might even be correlated with off-farm income. Moreover, our sample size of 127 pre-school
children is relatively small. It is well possible that with more comprehensive data a significant
effect of off-farm income could be shown.
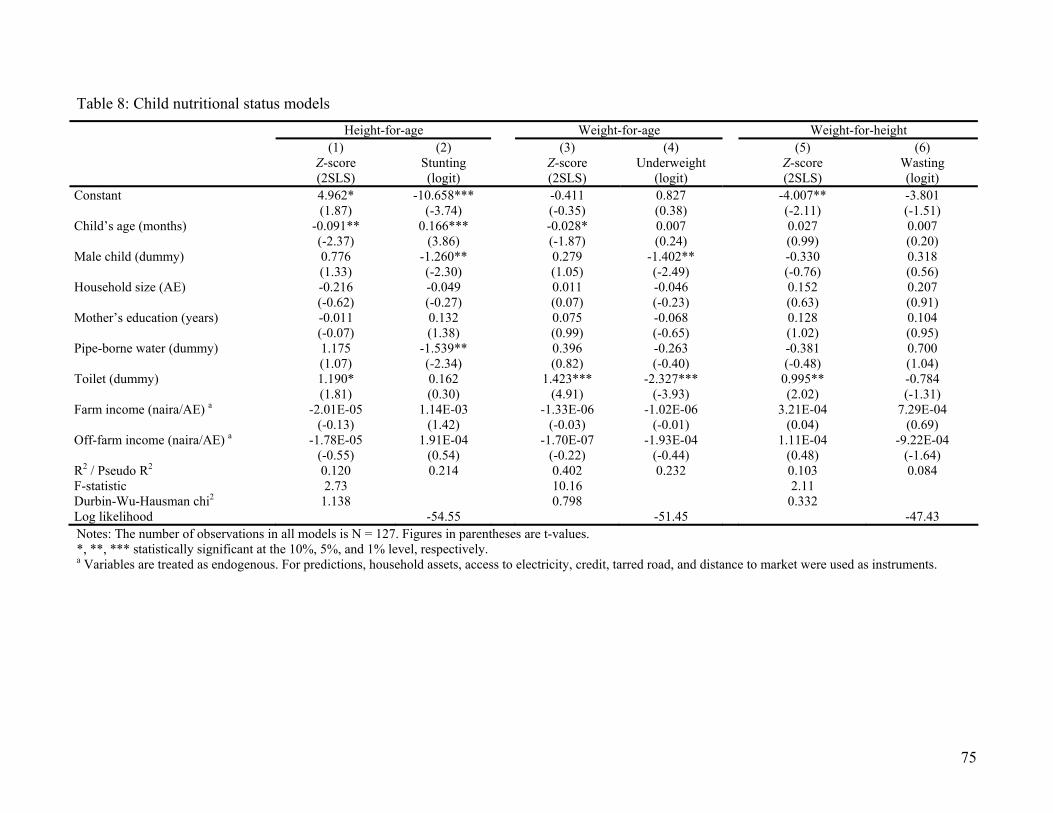
75
Table 8: Child nutritional status models Height-for-age Weight-for-age Weight-for-height (1)
Z-score (2SLS)
(2) Stunting (logit)
(3) Z-score (2SLS)
(4) Underweight
(logit)
(5) Z-score (2SLS)
(6) Wasting (logit)
Constant 4.962* (1.87)
-10.658*** (-3.74)
-0.411 (-0.35)
0.827 (0.38)
-4.007** (-2.11)
-3.801 (-1.51)
Child’s age (months) -0.091** (-2.37)
0.166*** (3.86)
-0.028* (-1.87)
0.007 (0.24)
0.027 (0.99)
0.007 (0.20)
Male child (dummy) 0.776 (1.33)
-1.260** (-2.30)
0.279 (1.05)
-1.402** (-2.49)
-0.330 (-0.76)
0.318 (0.56)
Household size (AE) -0.216 (-0.62)
-0.049 (-0.27)
0.011 (0.07)
-0.046 (-0.23)
0.152 (0.63)
0.207 (0.91)
Mother’s education (years) -0.011 (-0.07)
0.132 (1.38)
0.075 (0.99)
-0.068 (-0.65)
0.128 (1.02)
0.104 (0.95)
Pipe-borne water (dummy) 1.175 (1.07)
-1.539** (-2.34)
0.396 (0.82)
-0.263 (-0.40)
-0.381 (-0.48)
0.700 (1.04)
Toilet (dummy) 1.190* (1.81)
0.162 (0.30)
1.423*** (4.91)
-2.327*** (-3.93)
0.995** (2.02)
-0.784 (-1.31)
Farm income (naira/AE) a -2.01E-05 (-0.13)
1.14E-03 (1.42)
-1.33E-06 (-0.03)
-1.02E-06 (-0.01)
3.21E-04 (0.04)
7.29E-04 (0.69)
Off-farm income (naira/AE) a -1.78E-05 (-0.55)
1.91E-04 (0.54)
-1.70E-07 (-0.22)
-1.93E-04 (-0.44)
1.11E-04 (0.48)
-9.22E-04 (-1.64)
R2 / Pseudo R2 0.120 0.214 0.402 0.232 0.103 0.084 F-statistic 2.73 10.16 2.11 Durbin-Wu-Hausman chi2 1.138 0.798 0.332 Log likelihood -54.55 -51.45 -47.43 Notes: The number of observations in all models is N = 127. Figures in parentheses are t-values. *, **, *** statistically significant at the 10%, 5%, and 1% level, respectively. a Variables are treated as endogenous. For predictions, household assets, access to electricity, credit, tarred road, and distance to market were used as instruments.
76
Conclusions
In this article, we have analyzed the effects of off-farm income on household food security and
nutrition in Kwara State of Nigeria. Both descriptive analyses and econometric approaches have
shown that off-farm income contributes to improved calorie supply at the household level. This is
in line with previous research in other countries. In addition, we could show that off-farm income
has a positive impact on dietary quality and micronutrient supply, aspects which have not been
analyzed previously. Furthermore, child nutritional status is better in households with access to
off-farm income than in households without.
There is a widespread notion that farm income has more favorable nutrition effects than off-
farm income, especially in semi-subsistent production systems. The argumentation is that off-
farm orientation might lead to a decline in own agricultural production, which would cause lower
food availability at the household level. This effect might be especially pronounced for labor-
intensive but highly nutritious foods like vegetables and livestock products. So, even if off-farm
income contributes to better nutrition, the effect might be smaller than for farm income. This
notion is clearly challenged by our results. Off-farm income has the same marginal effect as farm
income, which holds true not only for household calorie consumption, but also for dietary quality
and micronutrient supply. Hence, the source of income does not matter. Obviously, this finding is
specific to the empirical example and should not be generalized. But it shows that widespread
beliefs are not always correct. In the case of Kwara State, where shortage of capital is a major
constraint, off-farm income can even contribute to more intensive farming and higher food
production.
Our results demonstrate that both farm and off-farm activities can equally contribute to
better food security and nutrition. Yet, while investing into agricultural growth is currently
featuring high on the development policy agenda, promoting the rural off-farm sector receives
much less attention. This should be rectified, especially in regions where agricultural resources
77
are becoming increasingly scarce. Off-farm income diversification is already an extensive
phenomenon among rural households in developing countries. But without a clear policy strategy
on how to support this process in a pro-poor way, outcomes might socially undesirable, because
of unequal household access to certain off-farm activities.
References
Aromolaran, A.B., 2004. Household income, women’s income share and food calorie intake in
South Western Nigeria. Food Policy 29 (5), 507 – 530.
Armar-Klemesu, M., M.T. Ruel, D.G. Maxwell, C.E Levin, S.S. Morris, 2000. Poor maternal
schooling is the main constraint to good childcare practices in Accra. Journal of Nutrition
130 (6), 1597 – 1607.
Barrett, C.B., Reardon, T., 2000. Asset, Activity, and Income Diversification among African
Agriculturalists: Some Practical Issues. Project report to USAID BASIS CRSP, Cornell
University, Ithaca, NY.
Barrett, C.B., Reardon, T., Webb, P., 2001. Nonfarm income diversification and household
livelihood strategies in rural Africa: concepts, dynamics, and policy implications. Food
Policy 26 (4), 315 – 331.
78
Block, S., Webb, P., 2001. The dynamics of livelihood diversification in post-famine Ethiopia.
Food Policy 26 (4), 333 – 350.
Bouis, H.E., 1994. The effect of income on demand for food in poor countries: are our food
consumption databases giving us reliable estimates? Journal of Development Economics, 44
(1), 199-226.
Deininger, K., Olinto, P., 2001. Rural nonfarm employment and income diversification in
Colombia. World Development 29 (3), 455 – 465.
de Janvry, A., Sadoulet, E., 2001. Income strategies among rural households in Mexico: the role
of off-farm income. World Development 29 (3), 467 – 480.
Diao, X., Hazell, P., Resnick, D., Thurlow, J., 2007. The Role of Agriculture in Development:
Implications for Sub-Saharan Africa. Research Report 153, International Food Policy
Research Institute, Washington, DC.
Ersado, L., 2003. Income Diversification in Zimbabwe: Welfare Implications from Urban and
Rural Areas. FCND Discussion Paper 152, International Food Policy Research Institute,
Washington, DC.
Fan, S., Rosegrant, M., 2008. Investing in Agriculture to Overcome the World Food Crisis and
Reduce Poverty and Hunger. Policy Brief 3, International Food Policy Research Institute,
Washington, DC.
FAO/WHO/UNU, 1985. Protein and Energy Requirements. Food and Agriculture Organization,
World Health Organization, United Nations University, Rome.
FAO, 2006. The State of Food Insecurity in the World 2006. Food and Agriculture Organization,
Rome.
79
KWSG, 2006. Planning Studies in Kwara State. Kwara State Government of Nigeria, Ministry of
Land and Regional Planning, Ilorin.
Lanjouw, P., Quizon, J., Sparrow, R., 2001. Non-agricultural earnings in peri-urban areas of
Tanzania: evidence from household survey data. Food Policy 26 (4), 385 – 403.
Mason, J., Rivers, J., Helwig, C., 2005. Recent trends in malnutrition in developing regions:
vitamin A deficiency, anemia, iodine deficiency, and child underweight. Food and Nutrition
Bulletin 26(1), 57-162.
NBS, 2006. Socio-Economic Survey of Nigeria. National Bureau of Statistics, Abuja.
Oguntona, E.B., Akinyele, I.O., 1995. Nutrient Composition of Commonly Eaten Foods in
Nigeria – Raw, Processed and Prepared. Food Basket Foundation Series, Ibadan.
Reardon, T., Delgado, C., Matlon, P., 1992. Determinants and effects of income diversification
amongst farm households in Burkina Faso. Journal of Development Studies 28 (1), 264 –
296.
Ruben, R., van den Berg, M., 2001. Nonfarm employment and poverty alleviation of rural farm
households in Honduras. World Development 29 (3), 549 – 560.
Ruel, M.T., Levin, C.E., Armar-Klemesu, M., D. Maxwell, Morris, S.S., 1999. Good care
practices can mitigate the negative effects of poverty and low maternal schooling on
children’s nutritional status: evidence from Accra. World Development 27 (11), 1993 –
2009.
Smith, L.C., Alderman, H., Aduayom, D., 2006. Food Security in Sub-Saharan Africa: New
Estimates from Household Expenditure Surveys. Research Report 146, International Food
Policy Research Institute, Washington, DC.
80
Strauss, J., Thomas, D., 1995. Human resources: Empirical modeling of household and family
decisions. In: Behrman, J., T.N. Srinivasan, (eds.). Handbook of Development Economics,
Vol. 3. Elsevier, Amsterdam.
USDA, 2005. Composition of Foods: Raw, Processed, Prepared; National Nutrient Database for
Standard References, Release 18. United States Department of Agriculture, Washington,
DC.
WHO, 1995. The Use and Interpretation of Anthropometry. Report of a WHO Expert Committee.
Technical Report Series No. 854, World Health Organization, Geneva.
Woldenhanna, T., Oskam, A., 2001. Income diversification and entry barriers: evidence from the
Tigray region of northern Ethiopia. Food Policy 26 (4), 351 – 365.
81
CHAPTER IV
Patterns of Income Diversification in Rural Nigeria:
Determinants and Impacts
Raphael O. Babatunde a,*, Matin Qaim b
a University of Hohenheim, Department of Agricultural Economics and Social Sciences,
70593 Stuttgart, Germany
b Georg-August-University of Göttingen, Department of Agricultural Economics and Rural
Development, 37073 Göttingen, Germany
* Corresponding author:
Raphael O. Babatunde
Department of Agricultural Economics and Social Sciences (490b),
University of Hohenheim, 70593 Stuttgart, Germany
Tel: +49-711-459-23889
Fax: +49-711-459-23762
Email: [email protected]
82
Patterns of Income Diversification in Rural Nigeria: Determinants and Impacts
Abstract
While the determinants of rural income diversification have been analyzed in various
developing countries, the results remain somewhat ambiguous. Likewise, many previous
studies failed to consider the impacts of diversification. Hence, more research is needed to
understand what conditions lead to what outcomes and to identify appropriate policy
responses. Here, we analyze the situation in rural Nigeria based on recent survey data. The
majority of households is fairly diversified; 50% of total income is from off-farm sources.
Strikingly, richer households tend to be more diversified, suggesting that diversification is not
only considered a risk management strategy but also a means to increase overall income.
Econometric analysis confirms that the marginal income effect is positive. Yet, due to market
imperfections, resource-poor households are constrained in diversifying their income sources.
Reducing market failures through infrastructure improvements could enhance their situation,
while, at the same time, promoting specialization among the relatively better off.
Keywords: Farm households, income diversification, Nigeria, off-farm activities
1. Introduction
Income diversification among rural households in developing countries is a research
topic that has received quite a bit of attention in the development economics literature (e.g.,
DAMITE AND NEGATU, 2004; ELLIS, 2000). Income diversification refers to the
allocation of productive resources among different income generating activities, both on-farm
and off-farm (cf. ABDULAI and CROLEREES, 2001). According to BARRETT, REARDON
and WEBB (2001), very few people collect all their income from any one source, hold all
their wealth in the form of any single asset, or use their resources in just one activity.
Researchers have identified several reasons for households to diversify their income sources.
The main driving forces include: first, to increase income when the resources needed for the
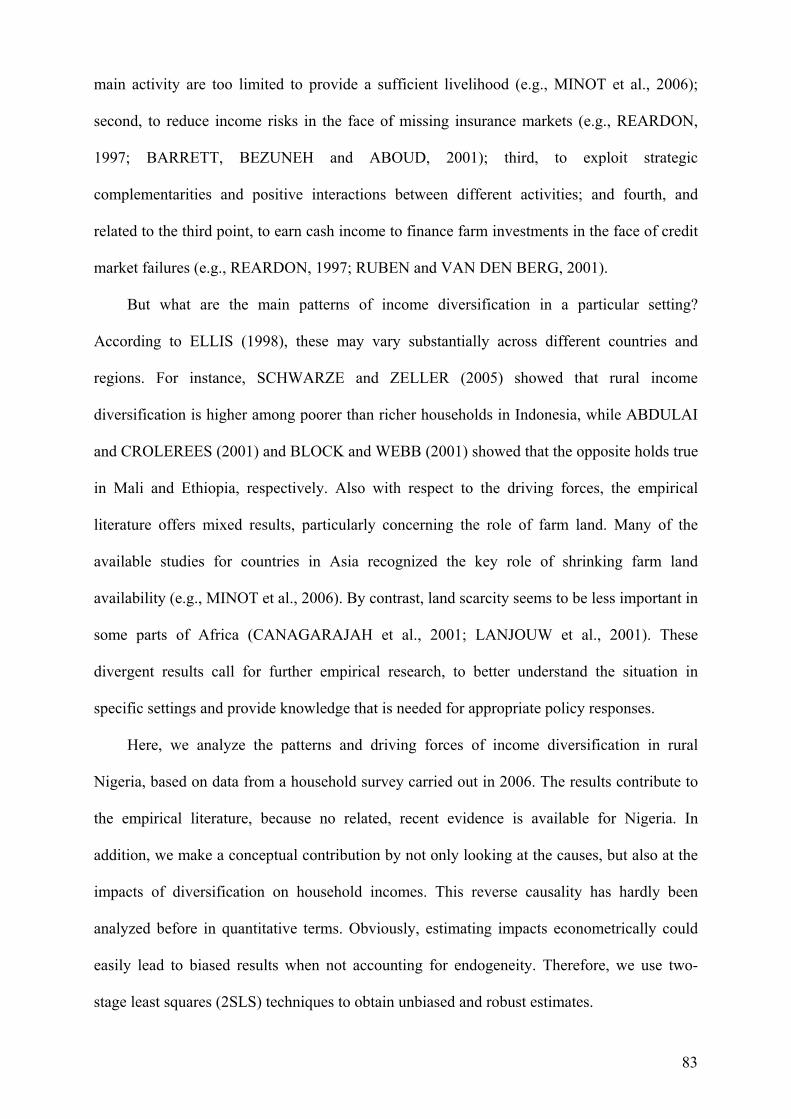
83
main activity are too limited to provide a sufficient livelihood (e.g., MINOT et al., 2006);
second, to reduce income risks in the face of missing insurance markets (e.g., REARDON,
1997; BARRETT, BEZUNEH and ABOUD, 2001); third, to exploit strategic
complementarities and positive interactions between different activities; and fourth, and
related to the third point, to earn cash income to finance farm investments in the face of credit
market failures (e.g., REARDON, 1997; RUBEN and VAN DEN BERG, 2001).
But what are the main patterns of income diversification in a particular setting?
According to ELLIS (1998), these may vary substantially across different countries and
regions. For instance, SCHWARZE and ZELLER (2005) showed that rural income
diversification is higher among poorer than richer households in Indonesia, while ABDULAI
and CROLEREES (2001) and BLOCK and WEBB (2001) showed that the opposite holds true
in Mali and Ethiopia, respectively. Also with respect to the driving forces, the empirical
literature offers mixed results, particularly concerning the role of farm land. Many of the
available studies for countries in Asia recognized the key role of shrinking farm land
availability (e.g., MINOT et al., 2006). By contrast, land scarcity seems to be less important in
some parts of Africa (CANAGARAJAH et al., 2001; LANJOUW et al., 2001). These
divergent results call for further empirical research, to better understand the situation in
specific settings and provide knowledge that is needed for appropriate policy responses.
Here, we analyze the patterns and driving forces of income diversification in rural
Nigeria, based on data from a household survey carried out in 2006. The results contribute to
the empirical literature, because no related, recent evidence is available for Nigeria. In
addition, we make a conceptual contribution by not only looking at the causes, but also at the
impacts of diversification on household incomes. This reverse causality has hardly been
analyzed before in quantitative terms. Obviously, estimating impacts econometrically could
easily lead to biased results when not accounting for endogeneity. Therefore, we use two-
stage least squares (2SLS) techniques to obtain unbiased and robust estimates.
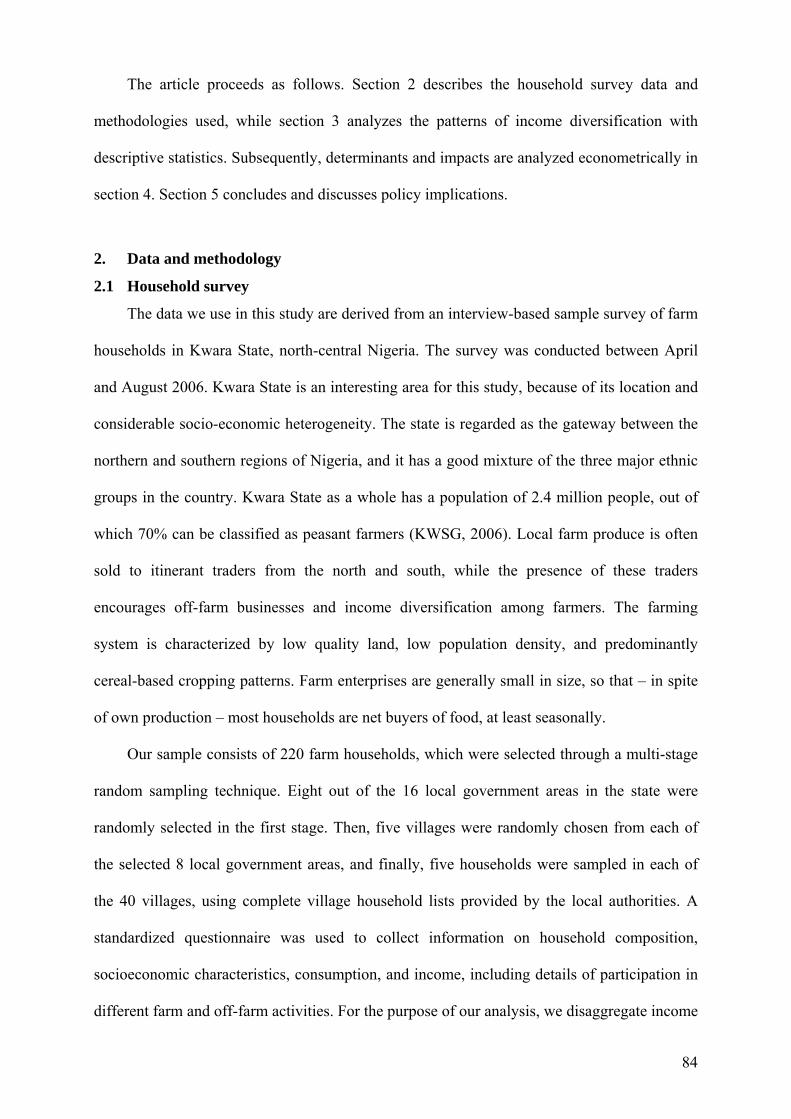
84
The article proceeds as follows. Section 2 describes the household survey data and
methodologies used, while section 3 analyzes the patterns of income diversification with
descriptive statistics. Subsequently, determinants and impacts are analyzed econometrically in
section 4. Section 5 concludes and discusses policy implications.
2. Data and methodology
2.1 Household survey
The data we use in this study are derived from an interview-based sample survey of farm
households in Kwara State, north-central Nigeria. The survey was conducted between April
and August 2006. Kwara State is an interesting area for this study, because of its location and
considerable socio-economic heterogeneity. The state is regarded as the gateway between the
northern and southern regions of Nigeria, and it has a good mixture of the three major ethnic
groups in the country. Kwara State as a whole has a population of 2.4 million people, out of
which 70% can be classified as peasant farmers (KWSG, 2006). Local farm produce is often
sold to itinerant traders from the north and south, while the presence of these traders
encourages off-farm businesses and income diversification among farmers. The farming
system is characterized by low quality land, low population density, and predominantly
cereal-based cropping patterns. Farm enterprises are generally small in size, so that – in spite
of own production – most households are net buyers of food, at least seasonally.
Our sample consists of 220 farm households, which were selected through a multi-stage
random sampling technique. Eight out of the 16 local government areas in the state were
randomly selected in the first stage. Then, five villages were randomly chosen from each of
the selected 8 local government areas, and finally, five households were sampled in each of
the 40 villages, using complete village household lists provided by the local authorities. A
standardized questionnaire was used to collect information on household composition,
socioeconomic characteristics, consumption, and income, including details of participation in
different farm and off-farm activities. For the purpose of our analysis, we disaggregate income
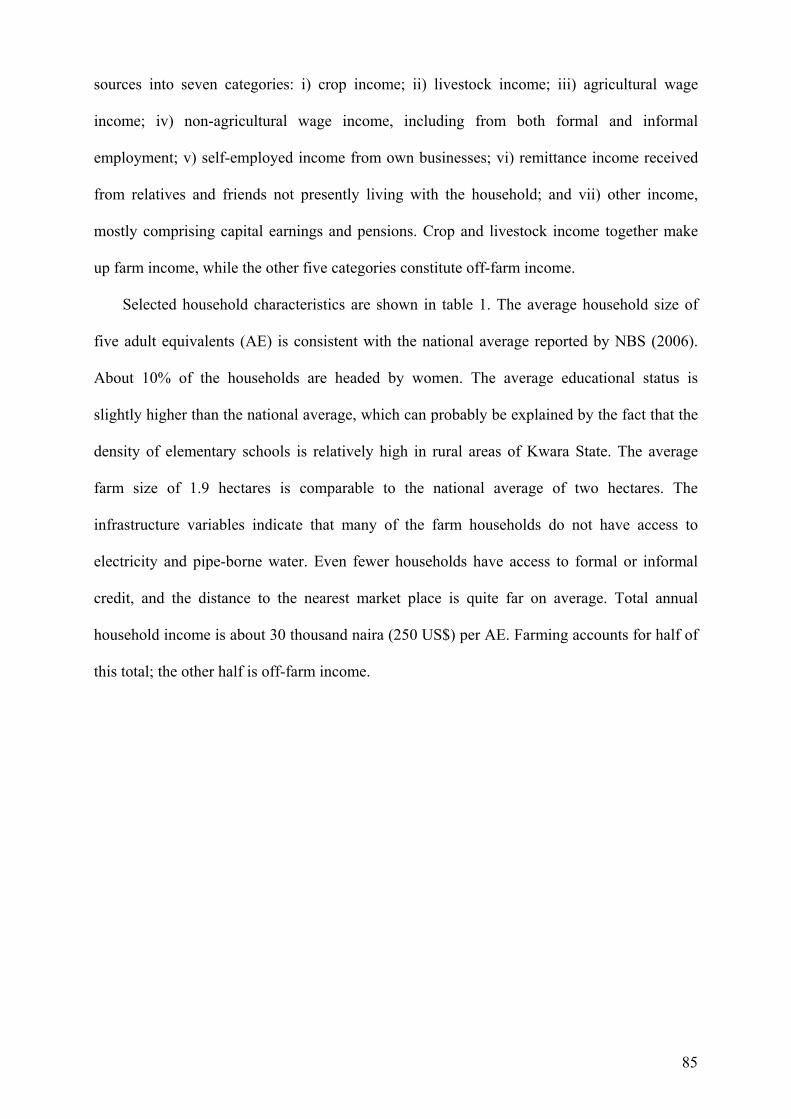
85
sources into seven categories: i) crop income; ii) livestock income; iii) agricultural wage
income; iv) non-agricultural wage income, including from both formal and informal
employment; v) self-employed income from own businesses; vi) remittance income received
from relatives and friends not presently living with the household; and vii) other income,
mostly comprising capital earnings and pensions. Crop and livestock income together make
up farm income, while the other five categories constitute off-farm income.
Selected household characteristics are shown in table 1. The average household size of
five adult equivalents (AE) is consistent with the national average reported by NBS (2006).
About 10% of the households are headed by women. The average educational status is
slightly higher than the national average, which can probably be explained by the fact that the
density of elementary schools is relatively high in rural areas of Kwara State. The average
farm size of 1.9 hectares is comparable to the national average of two hectares. The
infrastructure variables indicate that many of the farm households do not have access to
electricity and pipe-borne water. Even fewer households have access to formal or informal
credit, and the distance to the nearest market place is quite far on average. Total annual
household income is about 30 thousand naira (250 US$) per AE. Farming accounts for half of
this total; the other half is off-farm income.
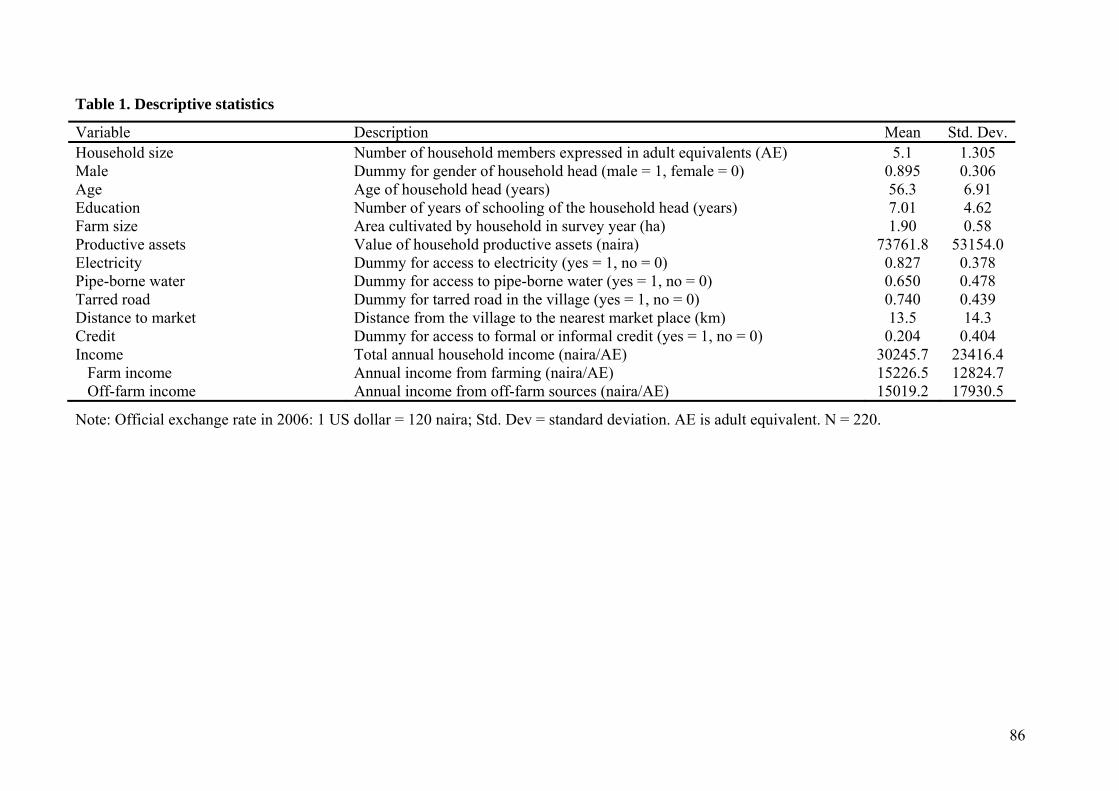
86
Table 1. Descriptive statistics
Variable Description Mean Std. Dev. Household size Number of household members expressed in adult equivalents (AE) 5.1 1.305 Male Dummy for gender of household head (male = 1, female = 0) 0.895 0.306 Age Age of household head (years) 56.3 6.91 Education Number of years of schooling of the household head (years) 7.01 4.62 Farm size Area cultivated by household in survey year (ha) 1.90 0.58 Productive assets Value of household productive assets (naira) 73761.8 53154.0 Electricity Dummy for access to electricity (yes = 1, no = 0) 0.827 0.378 Pipe-borne water Dummy for access to pipe-borne water (yes = 1, no = 0) 0.650 0.478 Tarred road Dummy for tarred road in the village (yes = 1, no = 0) 0.740 0.439 Distance to market Distance from the village to the nearest market place (km) 13.5 14.3 Credit Dummy for access to formal or informal credit (yes = 1, no = 0) 0.204 0.404 Income Total annual household income (naira/AE) 30245.7 23416.4 Farm income Annual income from farming (naira/AE) 15226.5 12824.7 Off-farm income Annual income from off-farm sources (naira/AE) 15019.2 17930.5
Note: Official exchange rate in 2006: 1 US dollar = 120 naira; Std. Dev = standard deviation. AE is adult equivalent. N = 220.
87
This share of off-farm income fits reasonably well into the available recent literature for Sub-
Saharan Africa (e.g., DAVIS et al., 2007; WOLDENHANNA and OSKAM, 2001), although
the definition of what exactly constitutes off-farm income slightly varies across studies.
2.2 Methodology
There are two commonly used methods described in the literature for analyzing
household income diversification strategies. The first method is the income-based approach,
which looks at household participation in different income earning activities of the rural
economy (e.g., BARRETT et al., 2005; DAMITE and NEGATU, 2004; BARRETT,
BEZUNEH and ABOUD, 2001). The second is the asset-based approach, which analyzes
income diversification behavior by direct examination of the household’s asset endowment
(e.g., CARTER and BARRETT, 2006; BROWN et al., 2006). Here, we use the income-based
approach, focusing on three measures of income diversification: i) the number of income
sources (NIS); ii) the share of off-farm income in total income (OFS); and iii) the Herfindahl
diversification index (HDI).
The NIS, which has also been used by MINOT et al. (2006) and ERSADO (2005), is
relatively easy to measure, though it has been criticized for its arbitrariness. For instance, it
has been argued that a household with more economically active adults, other things being
equal, will be more likely to have more income sources. This may reflect household labor
supply decisions as much as the desire for diversification. We recognize this criticism in
general, but since we use the NIS in connection with other measures, we do not consider this
as a major problem in our context. The OFS indicates the importance of off-farm income,
while the HDI is a measure of overall diversification, not only taking into account the number
of income sources, but also the magnitude of income derived from them. The HDI is based on
the Herfindahl index, which originates in the industrial literature where it is used to measure
the degree of industry concentration. It can also be used to measure the degree of
88
concentration of income from various sources at the individual household level. It is then
calculated as the sums of squares of income shares from each income source (cf. ERSADO,
2003). The Herfindahl index as such is increasing in concentration, whereby households with
perfect specialization (i.e., having only one source of income) have a value of one. As we are
interested in diversification, which is the reverse of concentration, we use the HDI, which is
defined as one minus the Herfindahl index. Thus, households with most diversified income
sources have the largest HDI and vice versa (cf. BARRETT and REARDON, 2000).8
In the descriptive part of the analysis in section 3, we use these three measures in order
to portray patterns of income diversification across different types of households. Moreover,
we classify households by livelihood strategies, in order to gain further insights into the
relationship between diversification and household income.9 The livelihood strategy pursued
by a particular household provides indirect evidence as to what it considers the best option,
given individual preferences and constraints. Following BARRETT et al. (2005), we
distinguish between the following four strategies: i) full time farming strategy, including
households that depend exclusively on crop and livestock income; ii) farmer and farm worker
strategy, including households that combine own farming with agricultural wage labor; iii)
farm and skilled non-farm strategy, including households that combine own farming with
supplying skilled labor in the non-farm sector and in self-employed activities; and iv) mixed
strategy, including households that derive income from all these activities. It should be noted
that for this classification by livelihood strategy, remittances and other incomes are not
considered, as these are often sources that cannot be actively chosen by household members.
In the econometric part of the analysis in section 4, we scrutinize determinants and
impacts of income diversification more rigorously. For the analysis of determinants, we
regress the three diversification measures (NIS, OFS, and HDI) on a set of household and
8 Similar measures of income diversification, such as the Simpson index and the Shannon-Weaver index have also been used in empirical analyses (e.g., SCHWARZE and ZELLER, 2005; MINOT et al., 2006).
89
contextual characteristics. For the NIS model, the dependent variable is expressed in the form
of count data, so that we use a Poisson regression. The OFS and HDI measures are censored
between zero and one, so that Tobit models are employed. SCHWARZE and ZELLER
(2005), DE JANVRY and SADOULET (2001), and WOLDENHANNA and OSKAM (2001)
also used Tobit models in similar contexts. In order to analyze the impacts of diversification
on household income, we employ three models where we use total household income as the
dependent variable, whereas the diversification measures are included as explanatory
variables. To avoid an endogeneity bias, we use 2SLS techniques. The choice of instruments
and other explanatory variables is explained further below.
3. Patterns of income diversification
3.1 Household participation in different activities
In this sub-section, we look at the composition of income and the participation of
households in different income generating activities, also disaggregating the sample by
income quartiles. To reflect household living standards appropriately, the income quartiles are
formed based on total household income per AE. The definition of participation used here is
the receipt of any income by any household member from a particular activity. Table 2 shows
that all households derive income from farming, which on average accounts for 50% of total
household income. Crop production, which is mainly subsistence in nature, is by far the most
important single source of income, providing about 45% of total income. More than half of
the households derive income from livestock enterprises, which, however, only accounts for
less than 5% of total income. Most of the livestock activities found in Kwara State are small
scale in nature, predominantly extensive free range backyard type.
9 Livelihood strategy refers to the combination of assets and activities chosen by households to generate income (ELLIS, 1998).
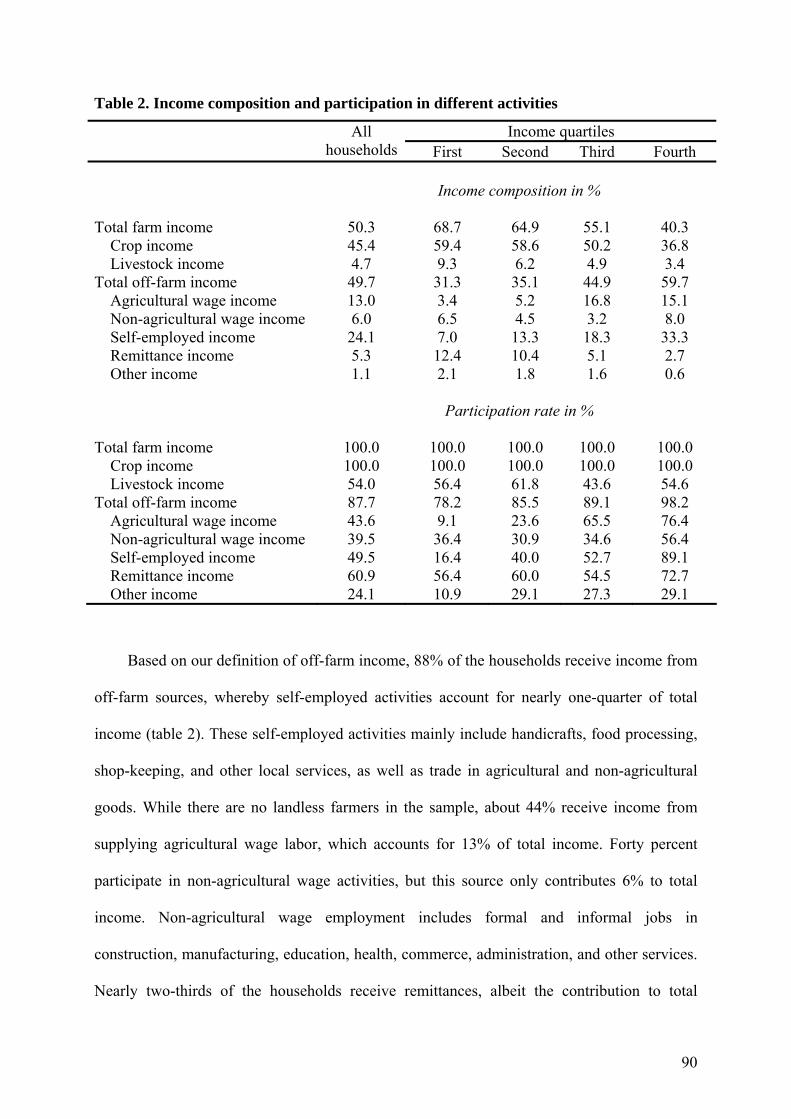
90
Table 2. Income composition and participation in different activities
Income quartiles All households First Second Third Fourth
Income composition in %
Total farm income 50.3 68.7 64.9 55.1 40.3 Crop income 45.4 59.4 58.6 50.2 36.8 Livestock income 4.7 9.3 6.2 4.9 3.4 Total off-farm income 49.7 31.3 35.1 44.9 59.7 Agricultural wage income 13.0 3.4 5.2 16.8 15.1 Non-agricultural wage income 6.0 6.5 4.5 3.2 8.0 Self-employed income 24.1 7.0 13.3 18.3 33.3 Remittance income 5.3 12.4 10.4 5.1 2.7 Other income 1.1 2.1 1.8 1.6 0.6
Participation rate in %
Total farm income 100.0 100.0 100.0 100.0 100.0 Crop income 100.0 100.0 100.0 100.0 100.0 Livestock income 54.0 56.4 61.8 43.6 54.6 Total off-farm income 87.7 78.2 85.5 89.1 98.2 Agricultural wage income 43.6 9.1 23.6 65.5 76.4 Non-agricultural wage income 39.5 36.4 30.9 34.6 56.4 Self-employed income 49.5 16.4 40.0 52.7 89.1 Remittance income 60.9 56.4 60.0 54.5 72.7 Other income 24.1 10.9 29.1 27.3 29.1
Based on our definition of off-farm income, 88% of the households receive income from
off-farm sources, whereby self-employed activities account for nearly one-quarter of total
income (table 2). These self-employed activities mainly include handicrafts, food processing,
shop-keeping, and other local services, as well as trade in agricultural and non-agricultural
goods. While there are no landless farmers in the sample, about 44% receive income from
supplying agricultural wage labor, which accounts for 13% of total income. Forty percent
participate in non-agricultural wage activities, but this source only contributes 6% to total
income. Non-agricultural wage employment includes formal and informal jobs in
construction, manufacturing, education, health, commerce, administration, and other services.
Nearly two-thirds of the households receive remittances, albeit the contribution to total
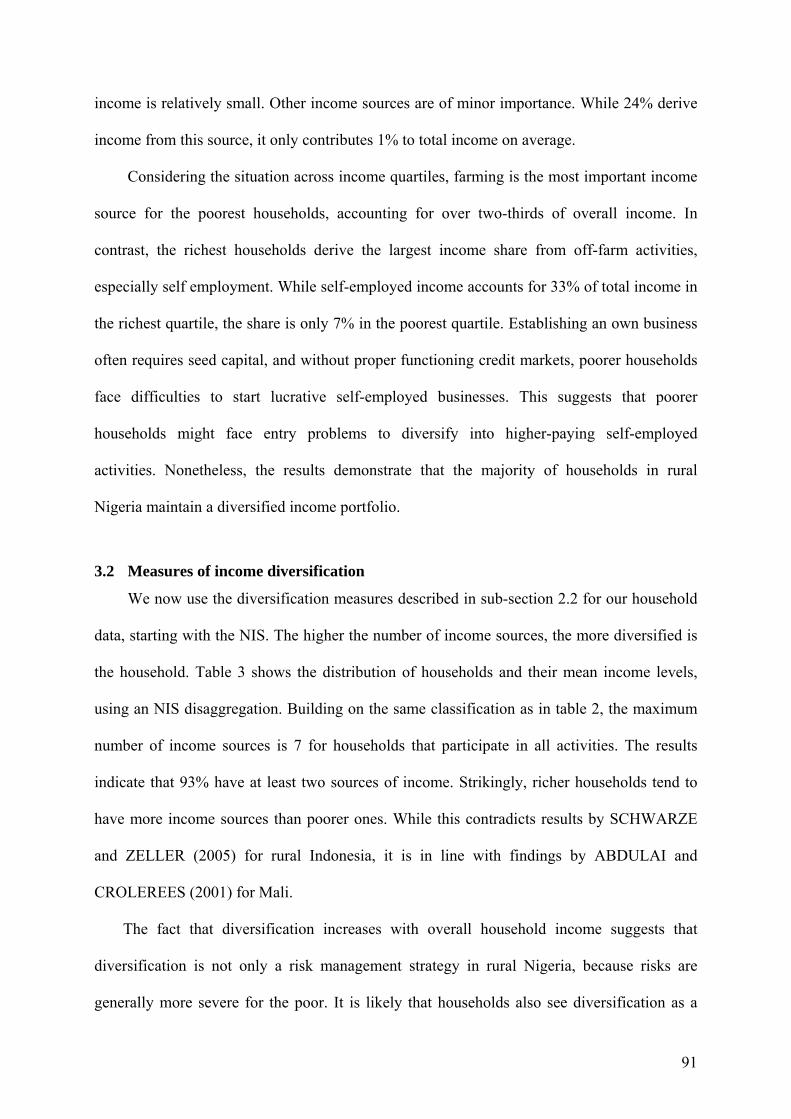
91
income is relatively small. Other income sources are of minor importance. While 24% derive
income from this source, it only contributes 1% to total income on average.
Considering the situation across income quartiles, farming is the most important income
source for the poorest households, accounting for over two-thirds of overall income. In
contrast, the richest households derive the largest income share from off-farm activities,
especially self employment. While self-employed income accounts for 33% of total income in
the richest quartile, the share is only 7% in the poorest quartile. Establishing an own business
often requires seed capital, and without proper functioning credit markets, poorer households
face difficulties to start lucrative self-employed businesses. This suggests that poorer
households might face entry problems to diversify into higher-paying self-employed
activities. Nonetheless, the results demonstrate that the majority of households in rural
Nigeria maintain a diversified income portfolio.
3.2 Measures of income diversification
We now use the diversification measures described in sub-section 2.2 for our household
data, starting with the NIS. The higher the number of income sources, the more diversified is
the household. Table 3 shows the distribution of households and their mean income levels,
using an NIS disaggregation. Building on the same classification as in table 2, the maximum
number of income sources is 7 for households that participate in all activities. The results
indicate that 93% have at least two sources of income. Strikingly, richer households tend to
have more income sources than poorer ones. While this contradicts results by SCHWARZE
and ZELLER (2005) for rural Indonesia, it is in line with findings by ABDULAI and
CROLEREES (2001) for Mali.
The fact that diversification increases with overall household income suggests that
diversification is not only a risk management strategy in rural Nigeria, because risks are
generally more severe for the poor. It is likely that households also see diversification as a
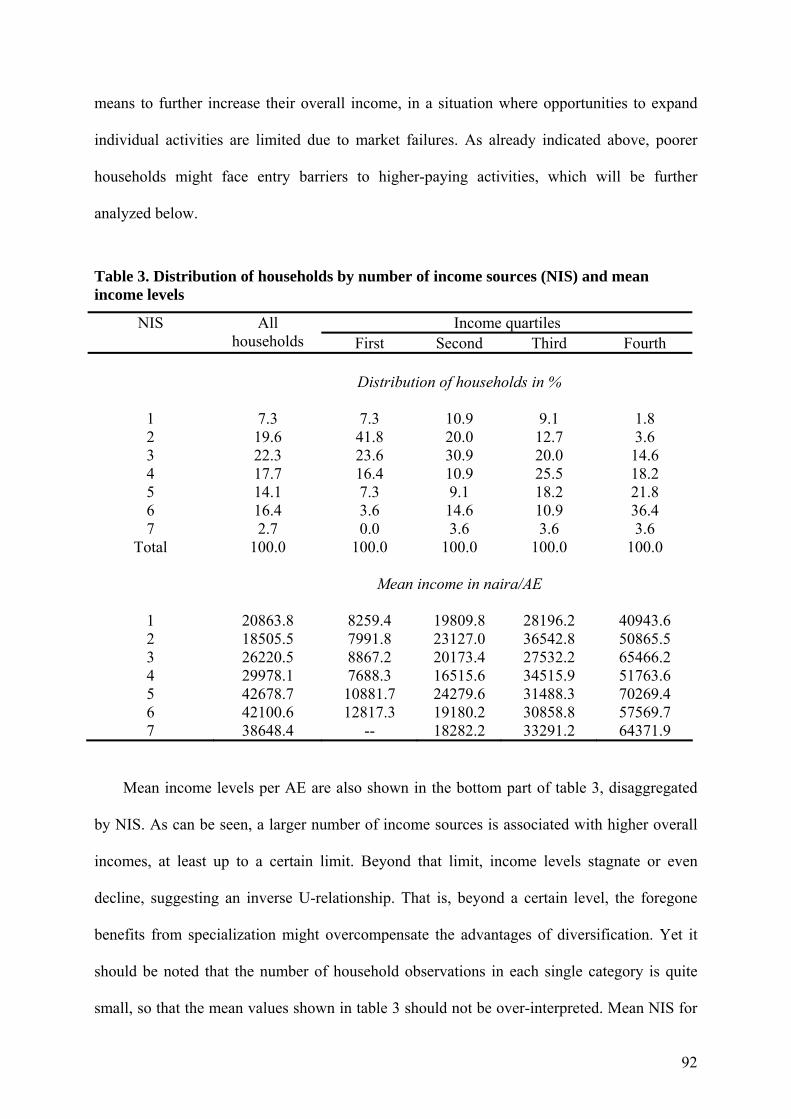
92
means to further increase their overall income, in a situation where opportunities to expand
individual activities are limited due to market failures. As already indicated above, poorer
households might face entry barriers to higher-paying activities, which will be further
analyzed below.
Table 3. Distribution of households by number of income sources (NIS) and mean income levels
Income quartiles NIS All households First Second Third Fourth
Distribution of households in %
1 7.3 7.3 10.9 9.1 1.8 2 19.6 41.8 20.0 12.7 3.6 3 22.3 23.6 30.9 20.0 14.6 4 17.7 16.4 10.9 25.5 18.2 5 14.1 7.3 9.1 18.2 21.8 6 16.4 3.6 14.6 10.9 36.4 7 2.7 0.0 3.6 3.6 3.6
Total 100.0 100.0 100.0 100.0 100.0
Mean income in naira/AE
1 20863.8 8259.4 19809.8 28196.2 40943.6 2 18505.5 7991.8 23127.0 36542.8 50865.5 3 26220.5 8867.2 20173.4 27532.2 65466.2 4 29978.1 7688.3 16515.6 34515.9 51763.6 5 42678.7 10881.7 24279.6 31488.3 70269.4 6 42100.6 12817.3 19180.2 30858.8 57569.7 7 38648.4 -- 18282.2 33291.2 64371.9
Mean income levels per AE are also shown in the bottom part of table 3, disaggregated
by NIS. As can be seen, a larger number of income sources is associated with higher overall
incomes, at least up to a certain limit. Beyond that limit, income levels stagnate or even
decline, suggesting an inverse U-relationship. That is, beyond a certain level, the foregone
benefits from specialization might overcompensate the advantages of diversification. Yet it
should be noted that the number of household observations in each single category is quite
small, so that the mean values shown in table 3 should not be over-interpreted. Mean NIS for
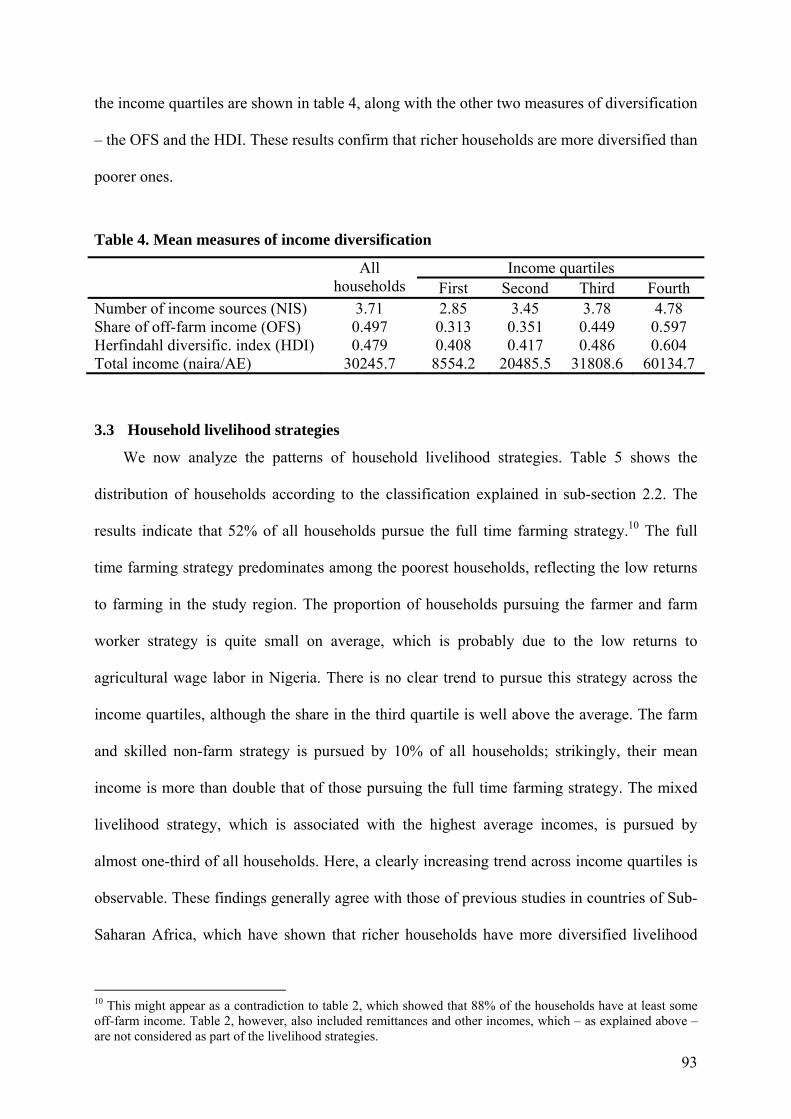
93
the income quartiles are shown in table 4, along with the other two measures of diversification
– the OFS and the HDI. These results confirm that richer households are more diversified than
poorer ones.
Table 4. Mean measures of income diversification
Income quartiles All households First Second Third Fourth
Number of income sources (NIS) 3.71 2.85 3.45 3.78 4.78 Share of off-farm income (OFS) 0.497 0.313 0.351 0.449 0.597 Herfindahl diversific. index (HDI) 0.479 0.408 0.417 0.486 0.604 Total income (naira/AE) 30245.7 8554.2 20485.5 31808.6 60134.7
3.3 Household livelihood strategies
We now analyze the patterns of household livelihood strategies. Table 5 shows the
distribution of households according to the classification explained in sub-section 2.2. The
results indicate that 52% of all households pursue the full time farming strategy.10 The full
time farming strategy predominates among the poorest households, reflecting the low returns
to farming in the study region. The proportion of households pursuing the farmer and farm
worker strategy is quite small on average, which is probably due to the low returns to
agricultural wage labor in Nigeria. There is no clear trend to pursue this strategy across the
income quartiles, although the share in the third quartile is well above the average. The farm
and skilled non-farm strategy is pursued by 10% of all households; strikingly, their mean
income is more than double that of those pursuing the full time farming strategy. The mixed
livelihood strategy, which is associated with the highest average incomes, is pursued by
almost one-third of all households. Here, a clearly increasing trend across income quartiles is
observable. These findings generally agree with those of previous studies in countries of Sub-
Saharan Africa, which have shown that richer households have more diversified livelihood
10 This might appear as a contradiction to table 2, which showed that 88% of the households have at least some off-farm income. Table 2, however, also included remittances and other incomes, which – as explained above – are not considered as part of the livelihood strategies.
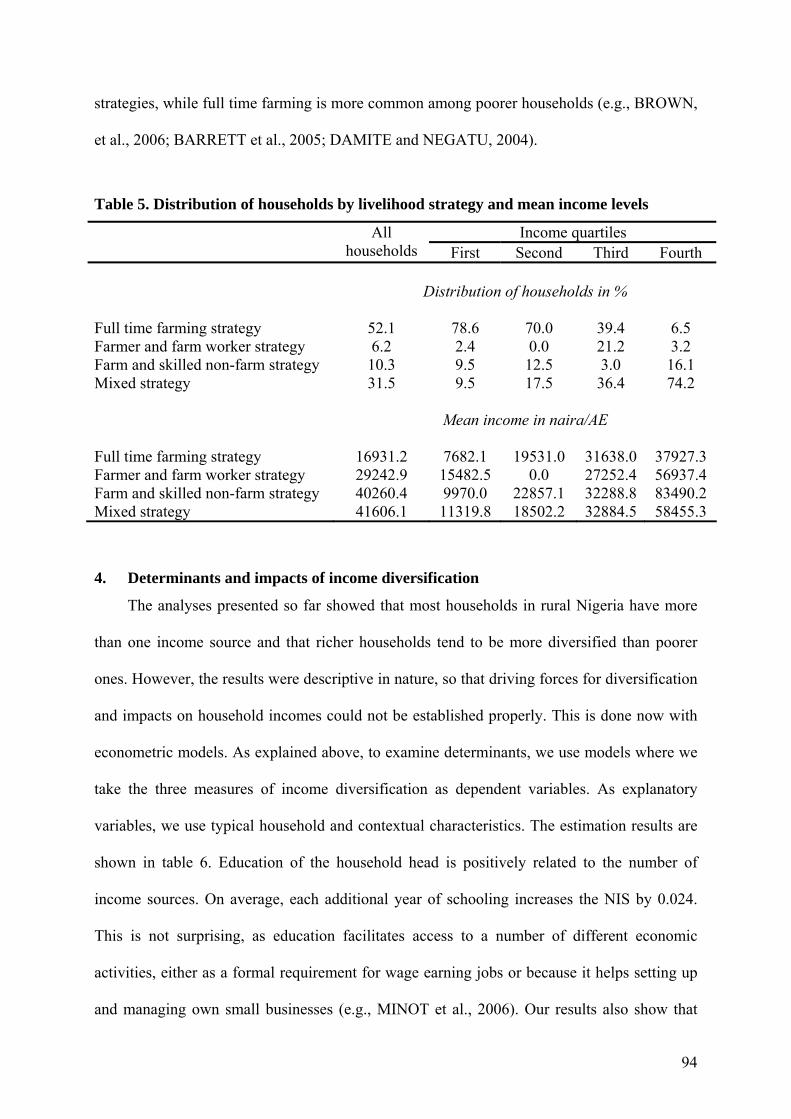
94
strategies, while full time farming is more common among poorer households (e.g., BROWN,
et al., 2006; BARRETT et al., 2005; DAMITE and NEGATU, 2004).
Table 5. Distribution of households by livelihood strategy and mean income levels
Income quartiles All households First Second Third Fourth
Distribution of households in %
Full time farming strategy 52.1 78.6 70.0 39.4 6.5 Farmer and farm worker strategy 6.2 2.4 0.0 21.2 3.2 Farm and skilled non-farm strategy 10.3 9.5 12.5 3.0 16.1 Mixed strategy 31.5 9.5 17.5 36.4 74.2
Mean income in naira/AE
Full time farming strategy 16931.2 7682.1 19531.0 31638.0 37927.3 Farmer and farm worker strategy 29242.9 15482.5 0.0 27252.4 56937.4 Farm and skilled non-farm strategy 40260.4 9970.0 22857.1 32288.8 83490.2 Mixed strategy 41606.1 11319.8 18502.2 32884.5 58455.3
4. Determinants and impacts of income diversification
The analyses presented so far showed that most households in rural Nigeria have more
than one income source and that richer households tend to be more diversified than poorer
ones. However, the results were descriptive in nature, so that driving forces for diversification
and impacts on household incomes could not be established properly. This is done now with
econometric models. As explained above, to examine determinants, we use models where we
take the three measures of income diversification as dependent variables. As explanatory
variables, we use typical household and contextual characteristics. The estimation results are
shown in table 6. Education of the household head is positively related to the number of
income sources. On average, each additional year of schooling increases the NIS by 0.024.
This is not surprising, as education facilitates access to a number of different economic
activities, either as a formal requirement for wage earning jobs or because it helps setting up
and managing own small businesses (e.g., MINOT et al., 2006). Our results also show that
95
there is a positive and significant relationship between household productive assets and the
number of income sources. Likewise, access to electricity and pipe-born water has an
important influence on the NIS, with discrete effects of around 0.2 for both dummy variables.
Assets and infrastructural endowment are particularly important for self-employed activities.
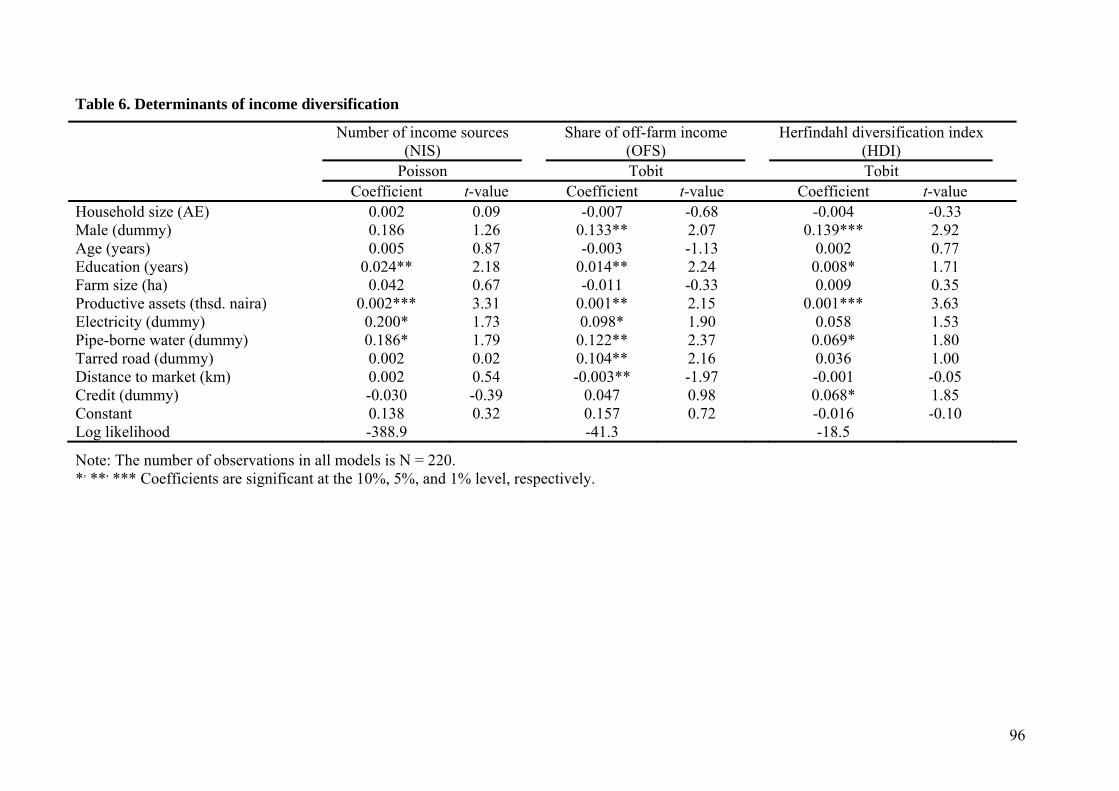
96
Table 6. Determinants of income diversification
Number of income sources (NIS)
Share of off-farm income (OFS)
Herfindahl diversification index (HDI)
Poisson Tobit Tobit Coefficient t-value Coefficient t-value Coefficient t-value Household size (AE) 0.002 0.09 -0.007 -0.68 -0.004 -0.33 Male (dummy) 0.186 1.26 0.133** 2.07 0.139*** 2.92 Age (years) 0.005 0.87 -0.003 -1.13 0.002 0.77 Education (years) 0.024** 2.18 0.014** 2.24 0.008* 1.71 Farm size (ha) 0.042 0.67 -0.011 -0.33 0.009 0.35 Productive assets (thsd. naira) 0.002*** 3.31 0.001** 2.15 0.001*** 3.63 Electricity (dummy) 0.200* 1.73 0.098* 1.90 0.058 1.53 Pipe-borne water (dummy) 0.186* 1.79 0.122** 2.37 0.069* 1.80 Tarred road (dummy) 0.002 0.02 0.104** 2.16 0.036 1.00 Distance to market (km) 0.002 0.54 -0.003** -1.97 -0.001 -0.05 Credit (dummy) -0.030 -0.39 0.047 0.98 0.068* 1.85 Constant 0.138 0.32 0.157 0.72 -0.016 -0.10 Log likelihood -388.9 -41.3 -18.5
Note: The number of observations in all models is N = 220. *, **, *** Coefficients are significant at the 10%, 5%, and 1% level, respectively.
97
Looking at the results of the OFS model, it becomes obvious that the gender of the
household has a significant effect: holding other things equal, the off-farm income share in
male-headed households is 13 percentage points higher than in female-headed households. As
expected, education also influences OFS in a positive and significant way. This is in line with
previous studies that have highlighted the important role of education for off-farm income
diversification (e.g., LANJOUW, 2001). Likewise, household productive assets and the
infrastructure variables increase the OFS. These factors facilitate the establishment of self-
employed businesses. In addition, road infrastructure and market closeness tend to reduce
transportation and transaction costs, which improves rural households’ opportunities to take
up jobs in the non-farm sector.
The HDI model largely confirms the results of the other two models. In addition, access
to credit has a positive influence on income diversification. This is not surprising, as credit
can reduce liquidity constraints and increase the capacity of households to start off-farm
businesses. Interestingly, the variables household size and farm size do not show significant
effects in any of the models in table 6. This contradicts the popular notion that shrinking land
availability and a surplus rural labor force are the main driving forces for income
diversification in rural Africa. While it is likely that poor households pursue a distress-push
diversification in order to minimize risks, there also seems to be a significant element of
demand-pull diversification. Yet, households with little assets and those who are
disadvantaged in terms of education and infrastructure are particularly constrained in their
ability to diversify in the local context.
So better-off households are more diversified in rural Nigeria, but is there also a reverse
causality? In other words, does diversification also lead to higher household incomes? This is
analyzed in the three models in table 7, where total household income is taken as the
dependent variable, and the diversification measures are included as explanatory variables. As
discussed above, these diversification measures are endogenous, so that we employ 2SLS
98
techniques for model estimation, using household productive assets, education, and access to
credit as instruments. The results indicate that – regardless of the diversification measure –
there is a positive and significant impact on total income. For instance, each additional
income source increases annual household income by 27,407 naira (column 1), while an
increase in the off-farm income share by 10 percentage points has an effect of 25,049 naira
(column 2). Obviously, off-farm activities are more lucrative than farming alone, so
diversification is pursued as a strategy to increase household income, whenever the
opportunity arises. Yet, farm size has a positive and significant effect, too, in all three models.
This suggests that, while off-farm activities can increase income, farming still remains
important for household livelihoods in rural Nigeria.
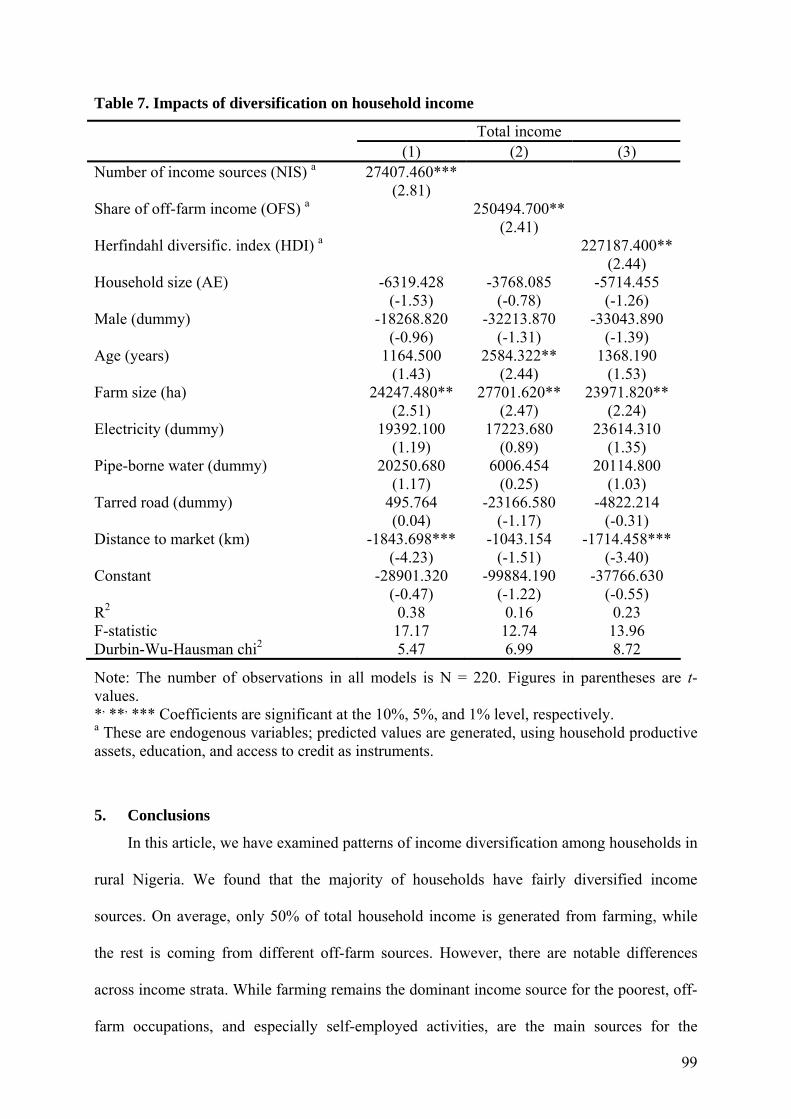
99
Table 7. Impacts of diversification on household income
Total income (1) (2) (3) Number of income sources (NIS) a 27407.460***
(2.81)
Share of off-farm income (OFS) a 250494.700** (2.41)
Herfindahl diversific. index (HDI) a 227187.400** (2.44)
Household size (AE) -6319.428 (-1.53)
-3768.085 (-0.78)
-5714.455 (-1.26)
Male (dummy) -18268.820 (-0.96)
-32213.870 (-1.31)
-33043.890 (-1.39)
Age (years) 1164.500 (1.43)
2584.322** (2.44)
1368.190 (1.53)
Farm size (ha) 24247.480** (2.51)
27701.620** (2.47)
23971.820** (2.24)
Electricity (dummy) 19392.100 (1.19)
17223.680 (0.89)
23614.310 (1.35)
Pipe-borne water (dummy) 20250.680 (1.17)
6006.454 (0.25)
20114.800 (1.03)
Tarred road (dummy) 495.764 (0.04)
-23166.580 (-1.17)
-4822.214 (-0.31)
Distance to market (km) -1843.698*** (-4.23)
-1043.154 (-1.51)
-1714.458*** (-3.40)
Constant -28901.320 (-0.47)
-99884.190 (-1.22)
-37766.630 (-0.55)
R2 0.38 0.16 0.23 F-statistic 17.17 12.74 13.96 Durbin-Wu-Hausman chi2 5.47 6.99 8.72
Note: The number of observations in all models is N = 220. Figures in parentheses are t-values. *, **, *** Coefficients are significant at the 10%, 5%, and 1% level, respectively. a These are endogenous variables; predicted values are generated, using household productive assets, education, and access to credit as instruments.
5. Conclusions
In this article, we have examined patterns of income diversification among households in
rural Nigeria. We found that the majority of households have fairly diversified income
sources. On average, only 50% of total household income is generated from farming, while
the rest is coming from different off-farm sources. However, there are notable differences
across income strata. While farming remains the dominant income source for the poorest, off-
farm occupations, and especially self-employed activities, are the main sources for the
100
relatively richer households. Richer households also tend to be more diversified, which we
showed by using different measures of income diversification.
These patterns suggest that diversification is not only a risk management strategy in rural
Nigeria, as risks are generally more severe for the poor. Nor does diversification seem to be
primarily a response to shrinking farm land availability. Rather, many households see
diversification as a means to increase overall income. This is consistent with previous studies
from Sub-Saharan Africa. And indeed, econometric analysis confirmed that diversification
has a significantly positive impact on total household income. Yet, the regression models also
showed that households have unequal abilities to diversify their income sources. Education,
asset endowment, access to credit, and good infrastructure conditions increase the levels of
household diversification. These factors improve the opportunities to start own businesses and
find employment in the higher-paying non-farm sector. In other words, resource-poor
households in remoter areas are constrained in diversifying their income sources.
What are the policy implications of these findings? Should income diversification be
promoted in rural Nigeria? The answer is yes and no. Enhancing poor households’ access to
off-farm activities is certainly important to support equitable rural development, since farming
alone often cannot sustain a sufficient livelihood. This requires improvements in the physical
infrastructure – including roads, electricity, water, and telecommunication – but also
improvements in rural education and financial markets, as the analysis has shown. But up to
what level is diversification desirable? According to economic theory, specialization allows
the exploitation of comparative advantages and economies of scale, resulting in higher profits
and household incomes. Hence, when markets function properly, diversification is associated
with foregone benefits. When there is risk involved and formal insurance markets fail, these
foregone benefits can be considered as an informal insurance fee that poor households in
particular are willing to pay. But the fact that richer households are more diversified in rural
101
Nigeria and other parts of Sub-Saharan Africa suggests that there are other mechanisms at
work, too.
An important motive for richer households to have highly diversified income sources
instead of specializing more is that there are limited opportunities to expand single economic
activities. This is mainly due to markets that are small and poorly integrated in rural Nigeria,
which again is largely a function of infrastructure weaknesses. Better roads, for instance,
would enable villagers to commute to the next bigger town, where they might find more
stable employment. Better roads and information networks would also improve marketing
opportunities for food and non-food products originating from household self-employed
activities. Therefore, income diversification should not be considered as a policy objective per
se. Rather, it has to be understood as a household response to various market imperfections.
Hence, the policy objective should be to reduce these imperfections and make markets work
better. While this would facilitate income diversification among the poorest, it would
probably promote a higher degree of specialization among the relatively richer households.
References
ABDULAI, A. and A. CROLEREES (2001): Determinants of income diversification
amongst rural households in Southern Mali. In Food Policy 26: 437-452.
BARRETT, C.B., M. BEZUNEH, and A. ABOUD (2001): Income diversification, poverty
traps and policy shocks in Cote d’Ivoire and Kenya. In Food Policy 26: 367-384.
BARRETT, C.B. and T. REARDON (2000): Asset, activity and income diversification
among African Agriculturalists, some practical issues. Project report to the USAID
BASIS CRSP, March 2000.
BARRETT, C.B., T. REARDON and P. WEBB (2001): Nonfarm income diversification and
household livelihood strategies in rural Africa: concepts, dynamics, and policy
implications. In Food Policy 26: 315-331.
102
BARRETT, C.B., M. BEZUNEH, D.C. CLAY and T. REARDON (2005): Heterogeneous
constraints, incentives and income diversification strategies in rural Africa. In: Quarterly
Journal of International Agriculture 44(1): 37-60.
BLOCK, S. and P. WEBB (2001): The dynamics of livelihood diversification in post-famine
Ethiopia. In Food Policy 26(4): 333-350.
BROWN, D.R., E.C. STEPHENS, J.O. OUMA, F.M. MURITHI and C.B. BARRETT (2006):
Livelihood strategies in the rural Kenyan highlands. In: African Journal of Agricultural
and Resource Economics 1(1): 21-35.
CANAGARAJAH, S., C. NEWMAN and R. BHATTAMISHRA (2001): Non-farm income,
gender and inequality: Evidence from rural Ghana and Uganda. In: Food Policy 26:
405-420.
CARTER, M. R. and C.B. BARRETT (2006): The economics of poverty traps and persistent
poverty: An asset based approach. In: Journal of Development Studies 42(2): 178-199.
DAMITE, D. and W. NEGATU (2004): Determinants of rural livelihood diversification:
Evidence from Southern Ethiopia. In: Quarterly Journal of International Agriculture
43(3): 267-288.
DAVIS, B., P. WINTERS, G. CARLETTO, K. COVARRUBIAS, E. QUINONES, A.
ZEZZA, K. STAMOULIS, G. BONOMI and S. DIGIUSEPPE (2007): Rural income
generating activities: A cross country comparison. ESA Working Paper No. 07-16,
Agricultural Development Economics Division, FAO, Rome, Italy.
DE JANVRY, A. and E. SADOULET (2001): Income strategies among rural households in
Mexico: The role of off-farm activities. In: World Development 29(3): 467-480.
ELLIS, F. (1998): Household strategies and rural livelihood diversification. In: Journal of
Development Studies 35(1): 1-38.
ELLIS, F. (2000): The determinants of rural livelihood diversification in developing
countries. In: Journal of Agricultural Economics 51(2): 289-302.
ERSADO, L. (2003): Income diversification in Zimbabwe: Welfare implications from urban
and rural areas. FCND Discussion Paper No. 152, International Food Policy Research
Institute, Washington, DC.
ERSADO, L. (2005): Income diversification before and after economic shocks: Evidence
from urban and rural Zimbabwe. In: Development Southern Africa 22(1): 27-45.
KWSG (2006): Kwara State Government of Nigeria, planning studies in Kwara State.
Ministry of land and regional planning, Ilorin.
103
LANJOUW, P. (2001): Nonfarm employment and poverty in rural El Salvador. In: World
Development 29(3): 529-547.
LANJOUW, P., J. QUIZON and R. SPARROW (2001): Non-agricultural earnings in peri-
urban areas of Tanzania : evidence from household survey data. In: Food Policy 26(4):
385-403.
MINOT, N., M. EPPRECHT, T.T.T. ANH and L.Q. TRUNG (2006): Income diversification
and poverty in the Northern Upland of Vietnam. Research Report No. 145,
International Food Policy Research Institute, Washington, DC.
NBS (2006): National Bureau of Statistics, socio-economic survey on Nigeria, Abuja.
REARDON, T. (1997): Using evidence of household income diversification to inform study
of the rural nonfarm labor market in Africa. In: World Development 25(5): 735-748.
RUBEN, R. and M. VAN DEN BERG (2001): Nonfarm employment and poverty alleviation
of rural farm households in Honduras. In: World Development 29(3): 549-560.
SCHWARZE, S. and M. ZELLER (2005): Income diversification of rural households in
Central Sulawesi, Indonesia. In: Quarterly Journal of International Agriculture 44(1):
61-73.
WOLDENHANNA, T. and A. OSKAM (2001): Income diversification and entry barriers:
Evidence from the Tigray region of northern Ethiopia. In: Food Policy 26: 351-365.
104
CHAPTER V
CONCLUSION
Off-farm activities have become an important component of livelihood strategies among
rural households in most developing countries, and off-farm income diversification has
recently received increased attention in discussions about rural development and poverty
reduction. Studies in various countries have reported a substantial and increasing share of off-
farm income in total household income. There are several reasons why income diversification
is widespread among rural households in developing countries. The main driving forces
include: first, to increase income when the resources needed for the main activity are too
limited to provide a sufficient livelihood; second, to reduce income risks in the face of
missing insurance markets; third, to exploit strategic complementarities and positive
interactions between different activities; and fourth, and related to the third point, to earn cash
income to finance farm investments in the face of credit market failures.
This present study was conducted to analyze the impact of off-farm income
diversification on income, food security and nutrition among rural households in Nigeria.
First, the study examined the income activities of rural households and the driving forces of
household’s participation and income from the different activities. Second, it assessed the
effects of off-farm income on household’s calorie consumption, dietary quality and
micronutrient supply. Third, it analyzed the patterns, determinants and effects of income
diversification in rural Nigeria. Data were collected from a sample of 220 farm households in
40 villages of Kwara State, north-central Nigeria. Different econometric models were
estimated to examine the driving forces of participation and income from different income
activities. The effect of off-farm income on income inequality was examined using the Gini
decomposition method. Instrumental variable approaches were used to analyze the effects of
105
off-farm income on calorie consumption, dietary quality and micronutrient supply, and the
impacts of diversification on total household incomes. This concluding chapter summarizes
and synthesizes the major results related to the research questions presented in chapter I of the
dissertation.
With regards to the income activities of rural households in Nigeria, the results showed
that all households derive income from farming, which, however, only accounts for half of
total income on average. The other half is derived from different off-farm sources. Crop
farming, which is mainly subsistence in nature, is by far the most important single source of
income for the rural households, providing about 45% of total income. Despite the growing
skepticism on the role of agriculture for reducing poverty, this result shows that farming
remains the major source of rural income in the study area. More than half of the sample
households derive income from livestock enterprises, but income from this source is only 5%
of total income on average. The livestock activities in Kwara State are small-scale, mostly
extensive free range backyard type. Eighty-eight percent of the sample households receive
income from off-farm sources, of which self-employed income is the most important one,
accounting for 24% of total income and 49% of off-farm income. Self-employed income is
mainly derived from handicrafts, food processing, shop-keeping and other local services, as
well as trade in agricultural and non-agricultural goods.
Forty percent of the households participate in non-agricultural wage activities, but this
source only contributes 6% to total income. The non-agricultural wage employment includes
formal and informal jobs in construction, manufacturing, education, health, commerce,
administration, and other services. The smaller contribution of non-agricultural wage income
to total income could be because of the little educational and professional qualification of the
rural farmers, which is often a precondition for higher-paying jobs in the formal sector. Even
though all sample households have land, about 44% receive income from supplying
agricultural wage labor, which accounts for about 13% of total income. Nearly two-thirds of
106
the households receive remittances from local and international sources, but this contributes
only 5% to total income.
Households participating in self-employed activities have the largest overall household
income per adult equivalent. This indicates that self-employed activities offer the highest
returns to family labor in the study area. However, because establishing self-employed
businesses requires initial investment, households that are disadvantaged in terms of financial
capital are constrained from reaping these potential benefits. While the household head
accounts for the largest share of household income on average, there are also significant
contributions by other household members, including the spouse, older children, and other
relatives. The contribution of spouses is more through remittances, while other members
contribute more through non-agricultural wage employment.
Disaggregating the income sources by income groups shows that for the poorest
households farming (crop and livestock) is the most important income source, accounting for
over two-thirds of total income. The share of off-farm income increases with total income,
indicating that the richest households derive the largest income share from off-farm activities.
Self-employed activities are exceptionally important for the richest households. This is not
surprising, because establishing an own business often requires seed capital. Surprisingly, the
share of off-farm income in total income increases with farm size, suggesting that there are
important complementarities between farm and off-farm activities.
Concerning the factors determining participation in the different income activities,
household size and male-headship have a positive influence on participation in agricultural
wage employment. In contrast, age of household head, education, access to electricity and
distance to market impact negatively on participation in agricultural wage employment. For
participation in non-agricultural wage employment, household size, male-headship, age and
education have positive effects. Household assets, access to electricity, water, a tarred road
and credit, as well as market closeness, increase the probability of participating in self-
107
employed activities. The results counter the widespread notion that shrinking per capita land
availability is always the main driving force for the growing importance of off-farm activities.
They show that financial capital rather than land is the scarcest factor for farm households in
the study region, so that cash income from off-farm activities can also help to expand farm
production.
Concerning the determinants of income, household size, farm size, household assets and
access to electricity and pipe-borne water influence total household income in a positive and
significant way. Likewise, market closeness increases total income. Crop income is negatively
related to age and education of the household head, but it increases with increasing farm size.
Age of the household head, farm size, household assets, tarred road and closeness to market
increase the income from livestock activities. Household size and male-headship affect
agricultural wage income in a positive way, while age and education have a negative
influence on agricultural wage income. The analysis also shows that household size, age and
education increase the income gained from non-agricultural wage activities. As in the case of
participation, household assets, access to electricity, pipe-borne water and closeness to market
have a significant positive influence on self-employed income. Furthermore, household size,
access to electricity, pipe-borne water and tarred road negatively influence remittance income.
This is reasonable, because the magnitude of remittances received is usually negatively
correlated with household living standard and economic opportunities. Apart from this,
remittances are often received from family members who temporarily or permanently
migrated to urban areas. Better infrastructure conditions in village settings and the associated
positive impact on rural labor markets are likely to reduce migration to urban areas and thus
also remittance flows.
The income inequality analysis with the Gini decomposition method shows that the
overall Gini coefficient of income inequality is 0.40, which is somewhat lower than the all-
Nigeria Gini-coefficient of 0.51. By decomposing overall income inequality between farm
108
and off-farm income, the result shows that off-farm income as a whole accounts for 61%,
while farm income accounts for 35% of total inequality. The analysis suggests that farm
income is inequality-decreasing, while off-farm income is inequality-increasing. Further
disaggregation reveals that, among the off-farm components, agricultural wage, non-
agricultural wage and self-employed income increase inequality, whereas remittances
decrease inequality in rural Nigeria.
On the effects of off-farm income on food security and nutrition, we adopted both
descriptive and econometric approaches. Descriptive analysis indicates that engagement in
off-farm activities is associated with higher calorie consumption and a lower prevalence of
undernourishment among the sample households. Dietary quality – measured by the calorie
supply that comes from fruits, vegetables and animal products – is also higher among
households with off-farm income. Similarly, households with off-farm income enjoy a higher
supply of micronutrients, particularly iron and vitamin A. Child nutritional status, indicated
by the average Z-scores for height-for-age, weight-for-age, and weight-for-height of children
aged 0 to 5 years, is better in households with off-farm income. Econometric analyses
confirms that the net effect of off-farm income on household food security and nutrition is
positive and in the same magnitude as the effect of farm income. This is an interesting result,
because it is often believed that farm income is more important than off-farm income for food
security and dietary quality in rural areas. Accordingly, improving poor households’ access to
the off-farm sector can contribute to reducing problems of rural malnutrition.
The analysis of the patterns, determinants and effects of income diversification also
adopted descriptive and econometric techniques. The descriptive analysis analyzed income
diversification according to income classes and according to alternative livelihood strategies.
The econometric analysis examined the determinants and impacts of income diversification
focusing on three measures of income diversification – the number of income sources, the
share of off-farm income in total income and the Herfindahl diversification index. The results
109
indicate that rural households in the study area have indeed a diversified income base, with
93% having at least two sources of income. Considering the degree of diversification across
income classes, the results indicate that richer households tend to have more income sources,
a higher share of off-farm income and higher overall diversity than poorer households. It was
also shown that a mixed livelihood strategy, which offers higher returns, is more common
among richer households, while full time farming predominates among poorer households.
The econometric analysis suggests that income diversification has a positive net impact on
total household income. The models that examined the factors influencing income
diversification showed that education, household assets and infrastructure significantly
enhance income diversification. Moreover, male-headship, closeness to market and access to
credit are important factors for diversification.
The results have several policy implications for poverty reduction and overall rural
development. First, to promote the off-farm sector of the rural economy and increase the
contribution of this sector to household income, there is need to overcome the entry barriers
for disadvantaged households to participate in higher-paying off-farm activities. The
econometric analysis shows that households with little productive assets and those who are
disadvantaged in terms of education and infrastructure are constrained in their ability to
participate in more lucrative off-farm activities. Also, the magnitude of off-farm income is
largely influenced by the same variables. By removing the entry barriers, all households
would be able to participate and the off-farm sector will have an equalizing effect on the
income distribution, as labor is more equally distributed among households than land.
Removing the barriers will require, among other things, the provision of education programs
and accessible credit schemes that can facilitate the establishment of off-farm businesses.
Likewise, provision of physical infrastructure such as good roads, water and electricity would
increase overall employment opportunities in the off-farm sector, and this could lead to
stronger income growth also among the poorest households. Over time, it is likely that the
110
relative importance of the off-farm sector will further increase in Nigeria and other African
countries. Broad-based rural income growth requires that also the poor and disadvantaged will
be able to benefit from this structural change. Improved opportunities in rural areas could also
help reduce the massive rural-urban migration with its concomitant development problems.
A second policy implication is that there is still significant scope for income increases
through the direct promotion of agricultural activities (crop and livestock), which are
currently the main income sources of the poor households in Kwara State. Policy makers,
therefore, must concentrate on measures to increase agricultural productivity through targeted
efforts such as distribution of improved seed varieties and better extension services. Despite
the growing concern that agricultural growth may not provide the exit way out of poverty, the
results of this dissertation suggest that there is still scope for poverty reduction and food
security through growth in agricultural productivity and income. Given the observed
complementarities between farm and off-farm activities and the fact that both sectors actually
face similar constraints, well-designed policy instruments can help to promote the
development of both sectors simultaneously. For instance, accessible credit schemes can
facilitate the establishment of non-farm businesses and promote agricultural development
simultaneously. The same holds true for education. Likewise, physical infrastructure reduces
transportation and transaction costs in both sectors and increases overall employment
opportunities. These findings suggest that there are a lot of synergies and positive spill-over
effects between agricultural and non-agricultural development.
A third implication is that off-farm income is associated with improved food security
and nutrition among rural households. It is therefore important that promotion of the off-farm
sector is incorporated into policy efforts aimed at reducing malnutrition. Policies that enhance
increased participation and profitability of existing off-farm activities could serve this
purpose. There is a widespread notion that farm income has more favorable nutrition effects
than off-farm income, especially in semi-subsistent production systems. The argumentation is
111
that off-farm orientation might lead to a decline in own agricultural production, which would
cause lower food availability at the household level. This effect might be especially
pronounced for labor-intensive but highly nutritious foods like vegetables and livestock
products. So, even if off-farm income contributes to better nutrition, the effect might be
smaller than for farm income. This notion is clearly challenged here through the empirical
results in Kwara State. In the study area, off-farm income has the same marginal effect as
farm income, which holds true not only for household calorie consumption, but also for
dietary quality and micronutrient supply. Hence, the source of income does not matter.
Obviously, this finding is specific to the empirical example and should not be generalized.
But it shows that widespread beliefs are not always correct.
A final policy implication relates to the finding that income diversification is associated
with higher total income. So, should income diversification be promoted? The answer is yes
and no. Enhancing poor households’ access to off-farm activities is certainly important to
support equitable rural development, as pointed out above. But up to what level is
diversification desirable? According to economic theory, specialization allows exploitation of
comparative advantages and economies of scale, resulting in higher profits and household
incomes. Hence, when markets function properly, diversification is associated with foregone
benefits. When there is risk involved and formal insurance markets fail, these foregone
benefits can be considered as an informal insurance fee that poor households in particular are
willing to pay. But the fact that richer households are more diversified in Kwara State of
Nigeria suggests that there are other mechanisms at work, too. An important motive for richer
households to have highly diversified income sources instead of specializing more is that
there are limited opportunities to expand single economic activities. This is mainly due to
markets that are small and poorly integrated. Therefore, income diversification should not be
considered as a policy objective per se. Rather, it has to be understood as a household
response to various market imperfections. Hence, the policy objective should be to reduce
112
these imperfections and make markets work better. While this would facilitate income
diversification among the poorest, it would probably promote a higher degree of
specialization among the relatively richer households.
Clearly, it should be stressed that these results are specific to rural areas of Kwara State.
They should not simply be generalized to other regions of Nigeria or even other countries of
the world. Nonetheless, it is hypothesized that some of the general findings might also hold
for other settings with similar conditions. For instance, complementarities between farm and
off-farm income are likely to be found in regions where land is not yet the scarcest factor, but
where access to capital is constrained. This holds true for some (but certainly not all) regions
in Sub-Saharan Africa, but less so in Asia. Moreover, a positive correlation between the
degree of income diversification and overall household income can be expected where
markets are thin and market imperfections widespread. Such relationships are plausible from a
theoretic perspective, but certainly additional empirical research in different situations is
necessary before more widely applicable statements and policy recommendations can be
made.
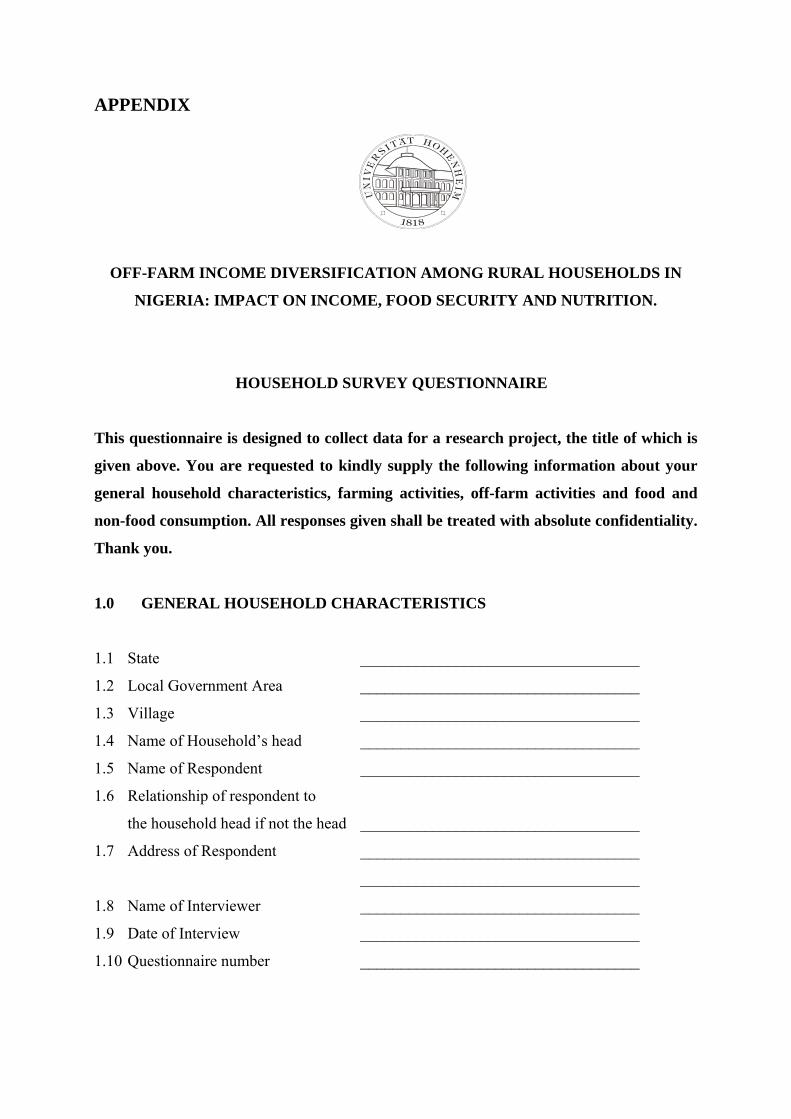
APPENDIX
OFF-FARM INCOME DIVERSIFICATION AMONG RURAL HOUSEHOLDS IN
NIGERIA: IMPACT ON INCOME, FOOD SECURITY AND NUTRITION.
HOUSEHOLD SURVEY QUESTIONNAIRE
This questionnaire is designed to collect data for a research project, the title of which is
given above. You are requested to kindly supply the following information about your
general household characteristics, farming activities, off-farm activities and food and
non-food consumption. All responses given shall be treated with absolute confidentiality.
Thank you.
1.0 GENERAL HOUSEHOLD CHARACTERISTICS
1.1 State ___________________________________
1.2 Local Government Area ___________________________________
1.3 Village ___________________________________
1.4 Name of Household’s head ___________________________________
1.5 Name of Respondent ___________________________________
1.6 Relationship of respondent to
the household head if not the head ___________________________________
1.7 Address of Respondent ___________________________________
___________________________________
1.8 Name of Interviewer ___________________________________
1.9 Date of Interview ___________________________________
1.10 Questionnaire number ___________________________________
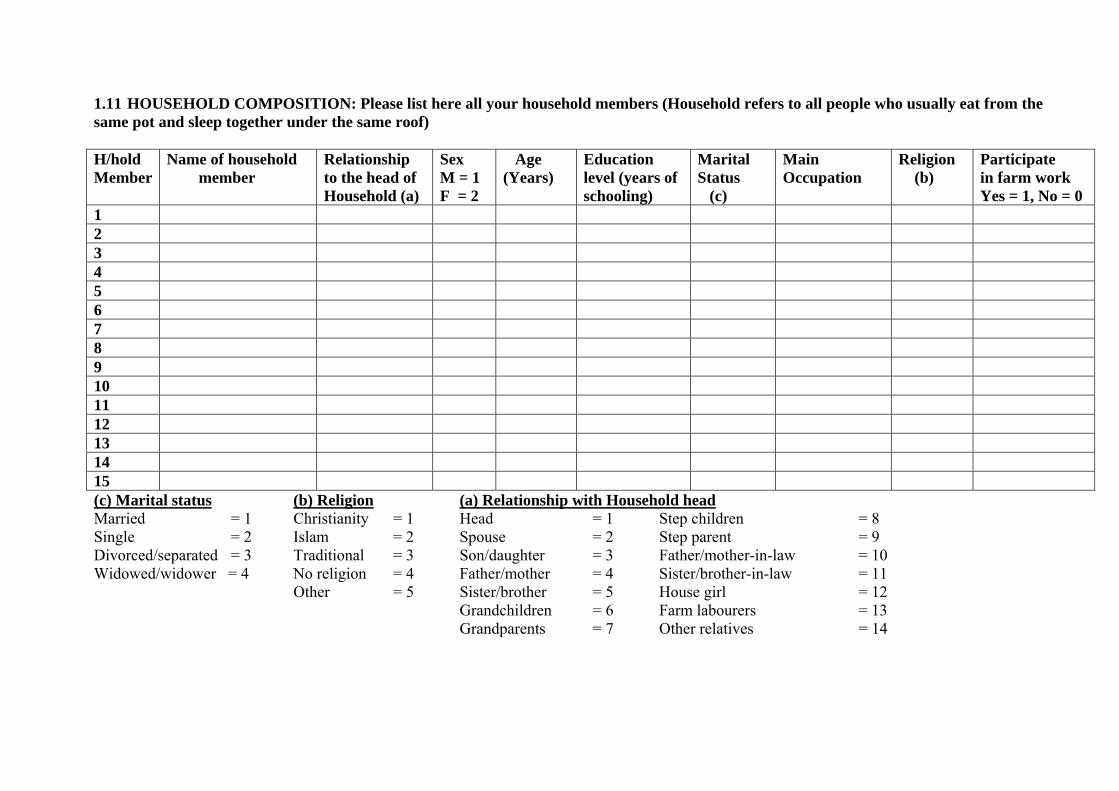
1.11 HOUSEHOLD COMPOSITION: Please list here all your household members (Household refers to all people who usually eat from the same pot and sleep together under the same roof)
H/hold Member
Name of household member
Relationship to the head of Household (a)
Sex M = 1 F = 2
Age (Years)
Education level (years of schooling)
Marital Status (c)
Main Occupation
Religion (b)
Participate in farm work Yes = 1, No = 0
1 2 3 4 5 6 7 8 9 10 11 12 13 14 15 (c) Marital status (b) Religion (a) Relationship with Household head Married = 1 Christianity = 1 Head = 1 Step children = 8 Single = 2 Islam = 2 Spouse = 2 Step parent = 9 Divorced/separated = 3 Traditional = 3 Son/daughter = 3 Father/mother-in-law = 10 Widowed/widower = 4 No religion = 4 Father/mother = 4 Sister/brother-in-law = 11
Other = 5 Sister/brother = 5 House girl = 12 Grandchildren = 6 Farm labourers = 13 Grandparents = 7 Other relatives = 14
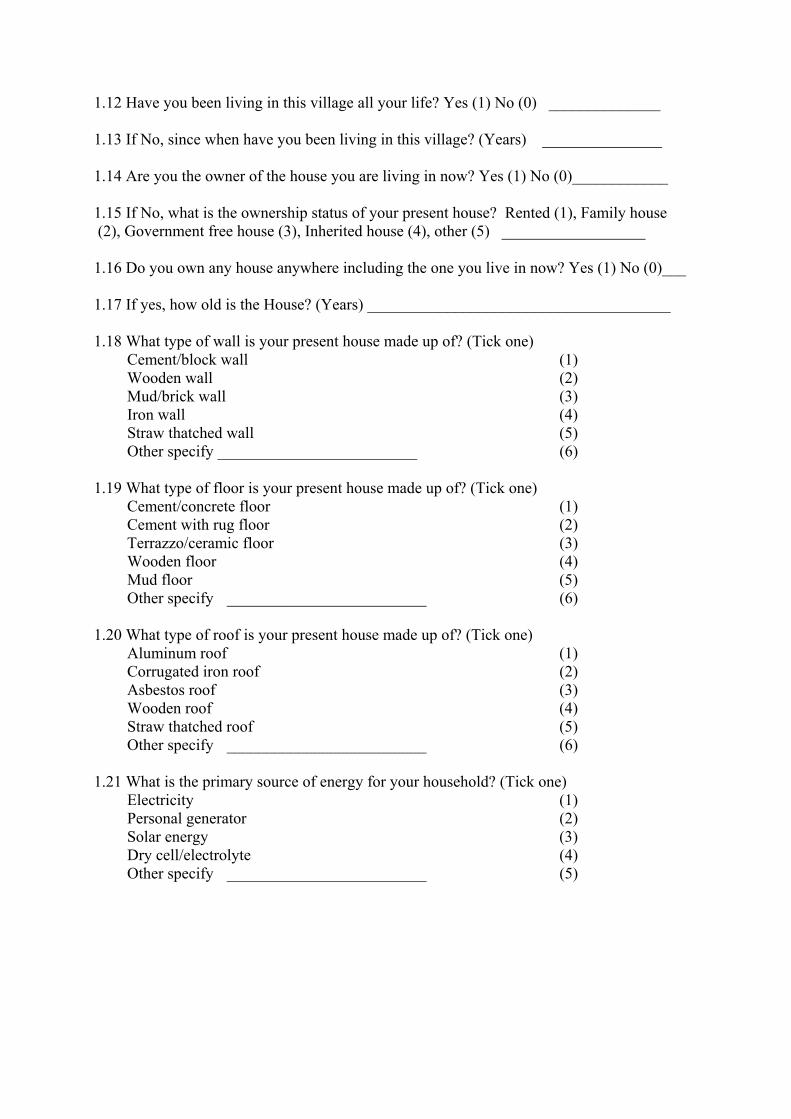
1.12 Have you been living in this village all your life? Yes (1) No (0) ______________ 1.13 If No, since when have you been living in this village? (Years) _______________ 1.14 Are you the owner of the house you are living in now? Yes (1) No (0)____________ 1.15 If No, what is the ownership status of your present house? Rented (1), Family house (2), Government free house (3), Inherited house (4), other (5) __________________ 1.16 Do you own any house anywhere including the one you live in now? Yes (1) No (0)___ 1.17 If yes, how old is the House? (Years) ______________________________________ 1.18 What type of wall is your present house made up of? (Tick one) Cement/block wall (1) Wooden wall (2) Mud/brick wall (3) Iron wall (4)
Straw thatched wall (5) Other specify _________________________ (6) 1.19 What type of floor is your present house made up of? (Tick one) Cement/concrete floor (1) Cement with rug floor (2) Terrazzo/ceramic floor (3) Wooden floor (4)
Mud floor (5) Other specify _________________________ (6) 1.20 What type of roof is your present house made up of? (Tick one) Aluminum roof (1) Corrugated iron roof (2) Asbestos roof (3) Wooden roof (4)
Straw thatched roof (5) Other specify _________________________ (6) 1.21 What is the primary source of energy for your household? (Tick one) Electricity (1) Personal generator (2) Solar energy (3)
Dry cell/electrolyte (4) Other specify _________________________ (5)
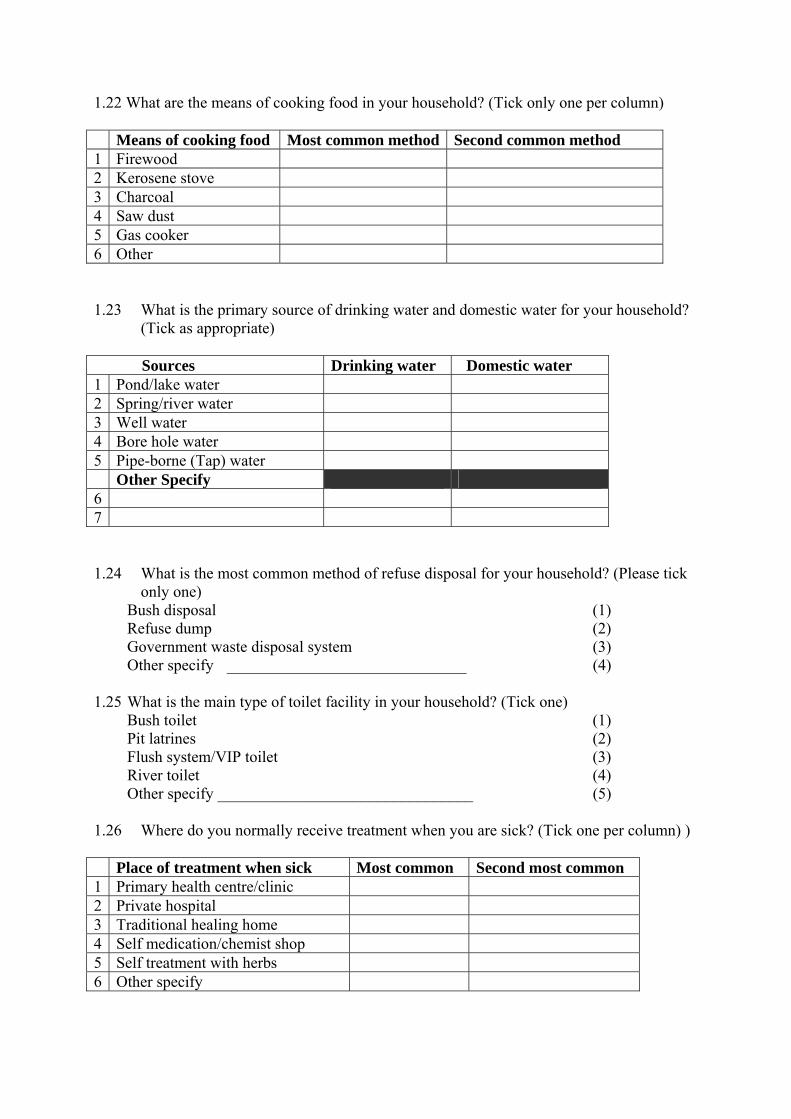
1.22 What are the means of cooking food in your household? (Tick only one per column) Means of cooking food Most common method Second common method 1 Firewood 2 Kerosene stove 3 Charcoal 4 Saw dust 5 Gas cooker 6 Other 1.23 What is the primary source of drinking water and domestic water for your household?
(Tick as appropriate) Sources Drinking water Domestic water 1 Pond/lake water 2 Spring/river water 3 Well water 4 Bore hole water 5 Pipe-borne (Tap) water Other Specify 6 7 1.24 What is the most common method of refuse disposal for your household? (Please tick
only one) Bush disposal (1) Refuse dump (2) Government waste disposal system (3)
Other specify ______________________________ (4) 1.25 What is the main type of toilet facility in your household? (Tick one) Bush toilet (1) Pit latrines (2) Flush system/VIP toilet (3)
River toilet (4) Other specify ________________________________ (5) 1.26 Where do you normally receive treatment when you are sick? (Tick one per column) )
Place of treatment when sick Most common Second most common 1 Primary health centre/clinic 2 Private hospital 3 Traditional healing home 4 Self medication/chemist shop 5 Self treatment with herbs 6 Other specify
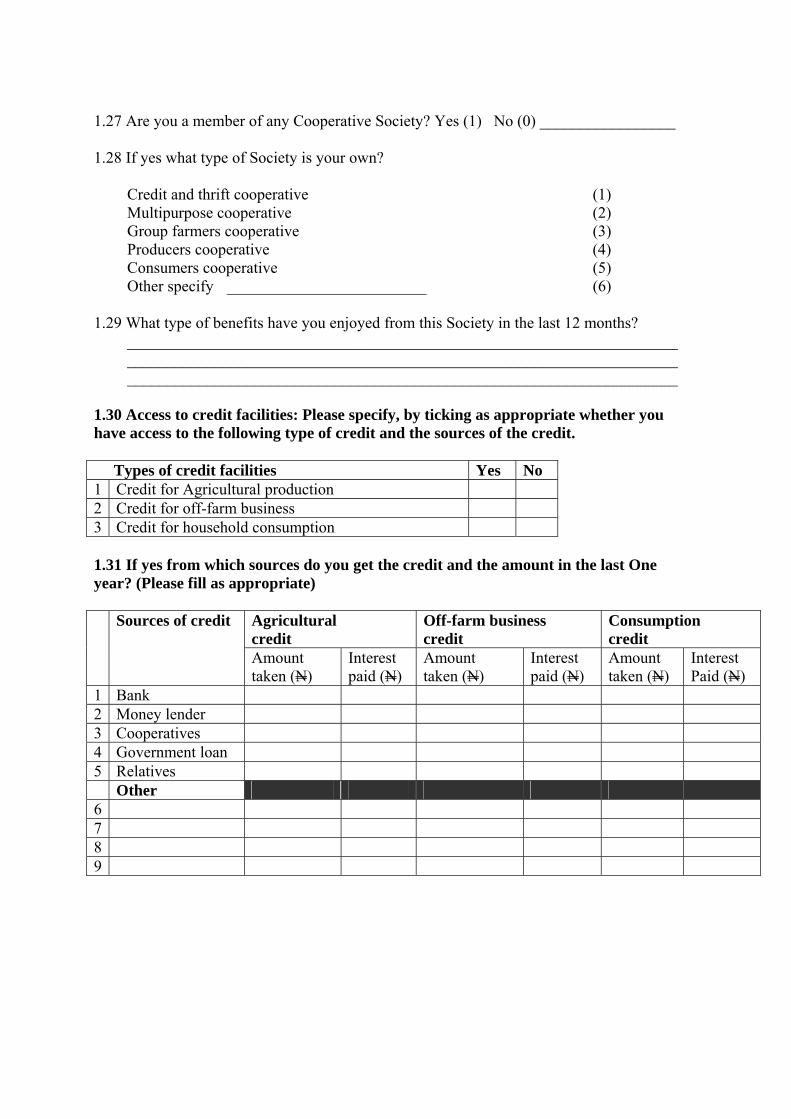
1.27 Are you a member of any Cooperative Society? Yes (1) No (0) _________________ 1.28 If yes what type of Society is your own?
Credit and thrift cooperative (1) Multipurpose cooperative (2) Group farmers cooperative (3) Producers cooperative (4)
Consumers cooperative (5) Other specify _________________________ (6) 1.29 What type of benefits have you enjoyed from this Society in the last 12 months? _____________________________________________________________________ _____________________________________________________________________ _____________________________________________________________________ 1.30 Access to credit facilities: Please specify, by ticking as appropriate whether you have access to the following type of credit and the sources of the credit. Types of credit facilities Yes No 1 Credit for Agricultural production 2 Credit for off-farm business 3 Credit for household consumption 1.31 If yes from which sources do you get the credit and the amount in the last One year? (Please fill as appropriate)
Agricultural credit
Off-farm business credit
Consumption credit
Sources of credit
Amount taken (N)
Interest paid (N)
Amount taken (N)
Interest paid (N)
Amount taken (N)
Interest Paid (N)
1 Bank 2 Money lender 3 Cooperatives 4 Government loan 5 Relatives Other 6 7 8 9
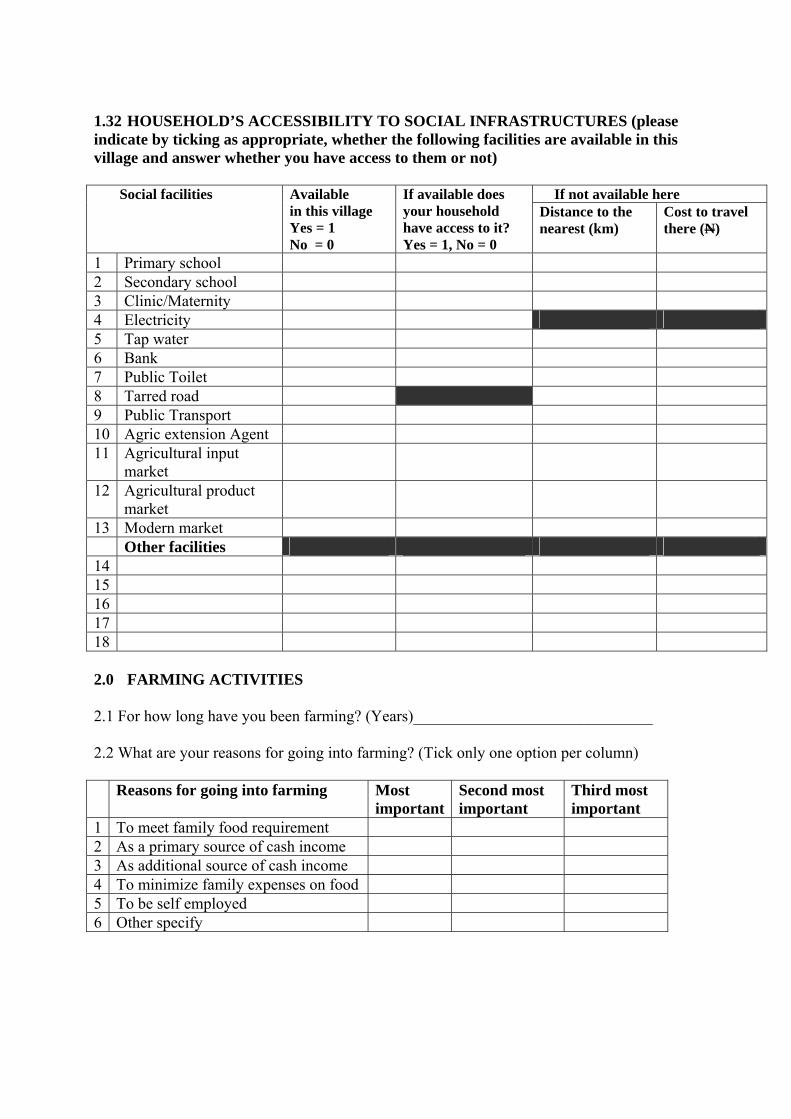
1.32 HOUSEHOLD’S ACCESSIBILITY TO SOCIAL INFRASTRUCTURES (please indicate by ticking as appropriate, whether the following facilities are available in this village and answer whether you have access to them or not)
If not available here Social facilities Available in this village Yes = 1 No = 0
If available does your household have access to it? Yes = 1, No = 0
Distance to the nearest (km)
Cost to travel there (N)
1 Primary school 2 Secondary school 3 Clinic/Maternity 4 Electricity 5 Tap water 6 Bank 7 Public Toilet 8 Tarred road 9 Public Transport 10 Agric extension Agent 11 Agricultural input
market
12 Agricultural product market
13 Modern market Other facilities 14 15 16 17 18 2.0 FARMING ACTIVITIES 2.1 For how long have you been farming? (Years)______________________________ 2.2 What are your reasons for going into farming? (Tick only one option per column) Reasons for going into farming Most
importantSecond most important
Third most important
1 To meet family food requirement 2 As a primary source of cash income 3 As additional source of cash income 4 To minimize family expenses on food 5 To be self employed 6 Other specify
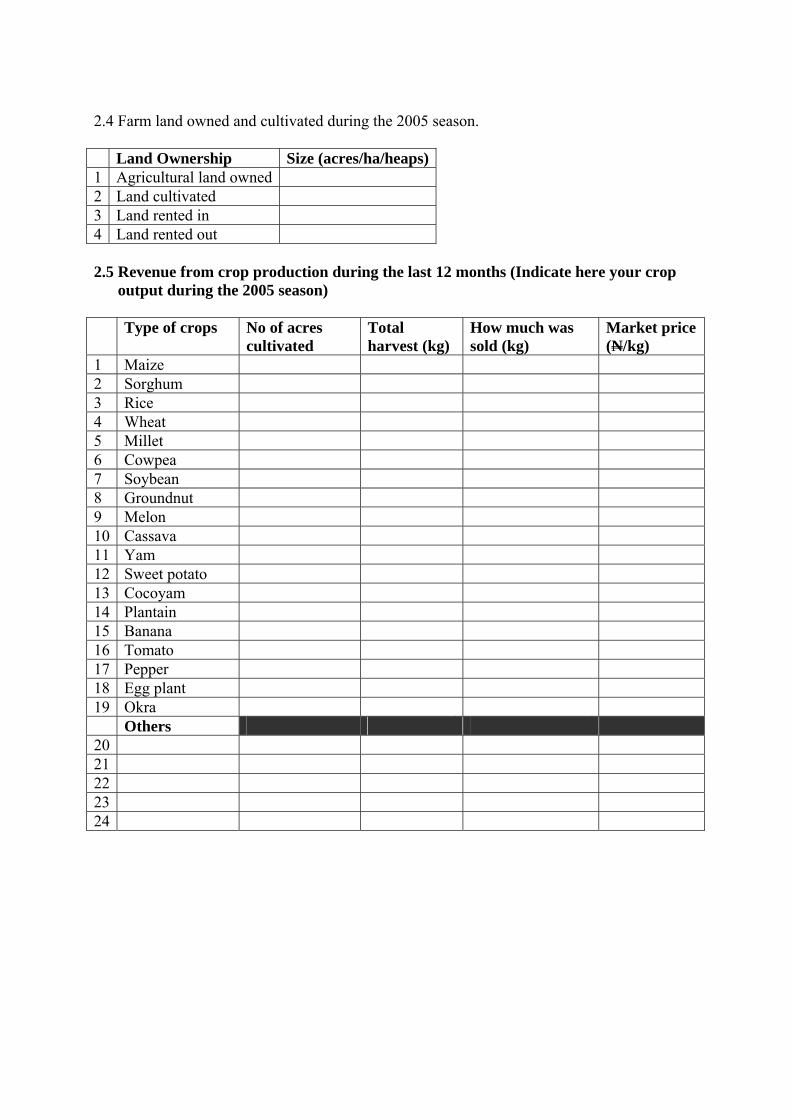
2.4 Farm land owned and cultivated during the 2005 season. Land Ownership Size (acres/ha/heaps)1 Agricultural land owned 2 Land cultivated 3 Land rented in 4 Land rented out 2.5 Revenue from crop production during the last 12 months (Indicate here your crop
output during the 2005 season) Type of crops No of acres
cultivated Total harvest (kg)
How much was sold (kg)
Market price (N/kg)
1 Maize 2 Sorghum 3 Rice 4 Wheat 5 Millet 6 Cowpea 7 Soybean 8 Groundnut 9 Melon 10 Cassava 11 Yam 12 Sweet potato 13 Cocoyam 14 Plantain 15 Banana 16 Tomato 17 Pepper 18 Egg plant 19 Okra Others 20 21 22 23 24
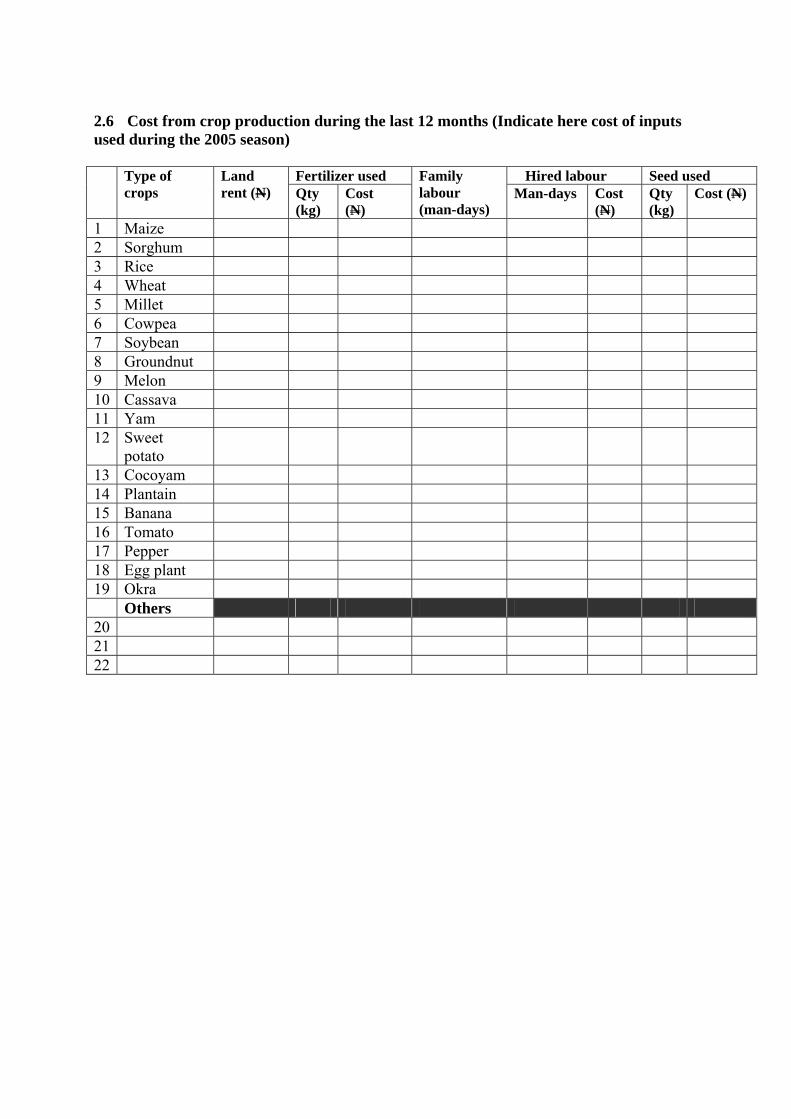
2.6 Cost from crop production during the last 12 months (Indicate here cost of inputs used during the 2005 season)
Fertilizer used Hired labour Seed used Type of crops
Land rent (N) Qty
(kg) Cost (N)
Family labour (man-days)
Man-days Cost (N)
Qty (kg)
Cost (N)
1 Maize 2 Sorghum 3 Rice 4 Wheat 5 Millet 6 Cowpea 7 Soybean 8 Groundnut 9 Melon 10 Cassava 11 Yam 12 Sweet
potato
13 Cocoyam 14 Plantain 15 Banana 16 Tomato 17 Pepper 18 Egg plant 19 Okra Others 20 21 22
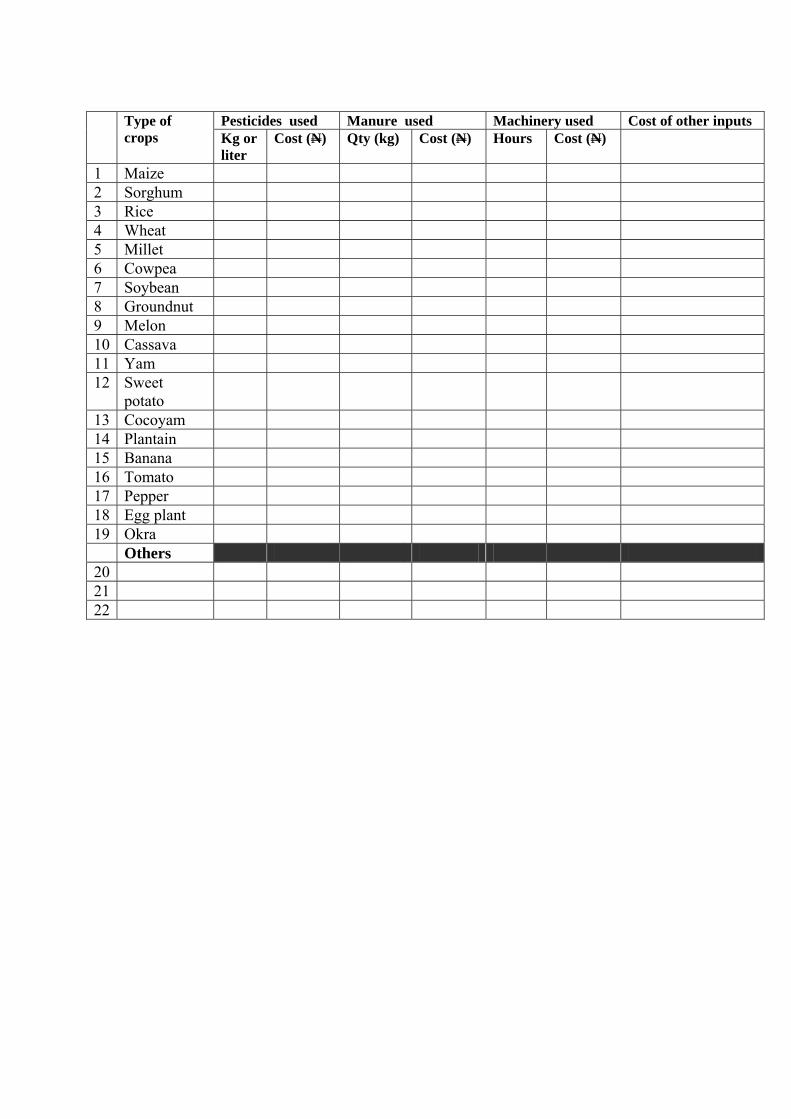
Pesticides used Manure used Machinery used Cost of other inputs Type of
crops Kg or liter
Cost (N) Qty (kg) Cost (N) Hours Cost (N)
1 Maize 2 Sorghum 3 Rice 4 Wheat 5 Millet 6 Cowpea 7 Soybean 8 Groundnut 9 Melon 10 Cassava 11 Yam 12 Sweet
potato
13 Cocoyam 14 Plantain 15 Banana 16 Tomato 17 Pepper 18 Egg plant 19 Okra Others 20 21 22
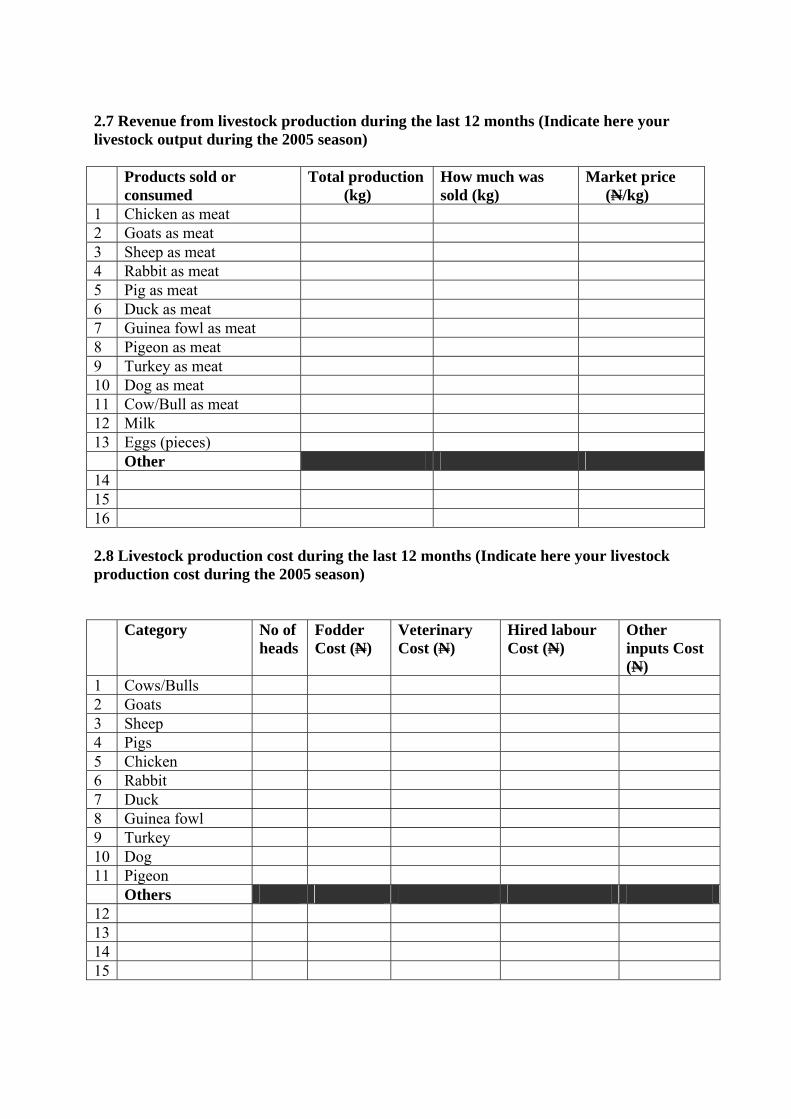
2.7 Revenue from livestock production during the last 12 months (Indicate here your livestock output during the 2005 season) Products sold or
consumed Total production (kg)
How much was sold (kg)
Market price (N/kg)
1 Chicken as meat 2 Goats as meat 3 Sheep as meat 4 Rabbit as meat 5 Pig as meat 6 Duck as meat 7 Guinea fowl as meat 8 Pigeon as meat 9 Turkey as meat 10 Dog as meat 11 Cow/Bull as meat 12 Milk 13 Eggs (pieces) Other 14 15 16 2.8 Livestock production cost during the last 12 months (Indicate here your livestock production cost during the 2005 season) Category No of
heads Fodder Cost (N)
Veterinary Cost (N)
Hired labour Cost (N)
Other inputs Cost (N)
1 Cows/Bulls 2 Goats 3 Sheep 4 Pigs 5 Chicken 6 Rabbit 7 Duck 8 Guinea fowl 9 Turkey 10 Dog 11 Pigeon Others 12 13 14 15
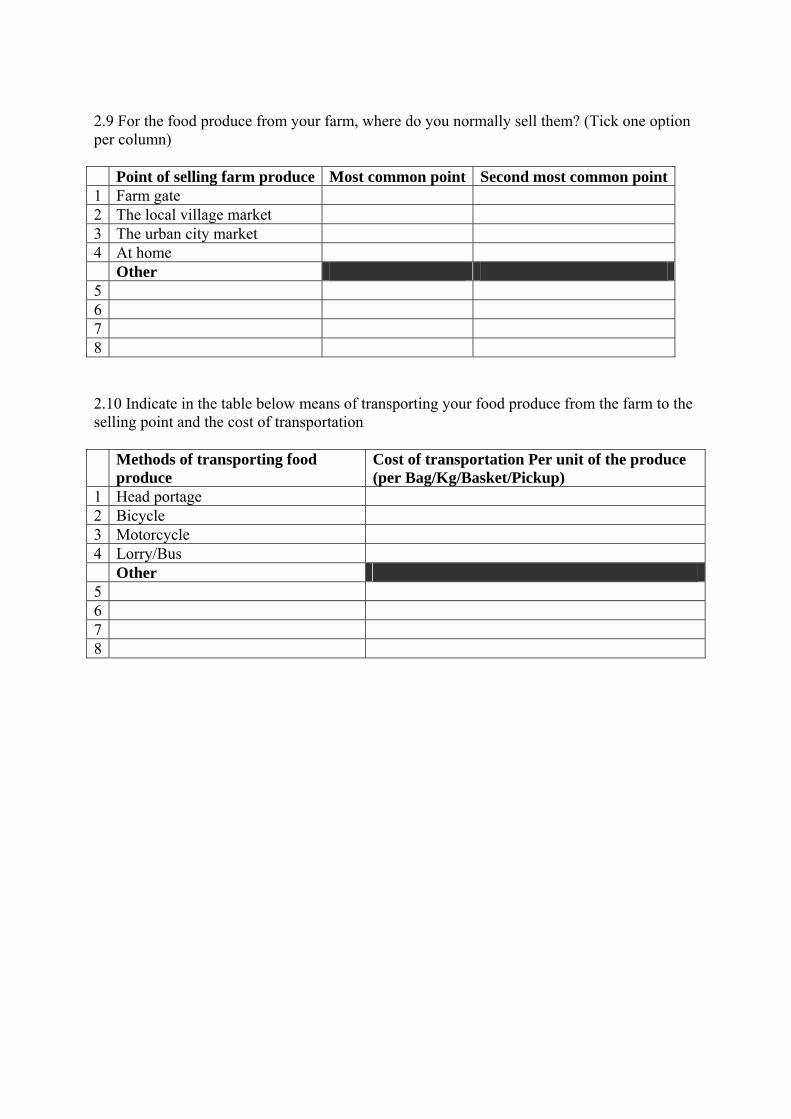
2.9 For the food produce from your farm, where do you normally sell them? (Tick one option per column) Point of selling farm produce Most common point Second most common point1 Farm gate 2 The local village market 3 The urban city market 4 At home Other 5 6 7 8 2.10 Indicate in the table below means of transporting your food produce from the farm to the selling point and the cost of transportation Methods of transporting food
produce Cost of transportation Per unit of the produce (per Bag/Kg/Basket/Pickup)
1 Head portage 2 Bicycle 3 Motorcycle 4 Lorry/Bus Other 5 6 7 8
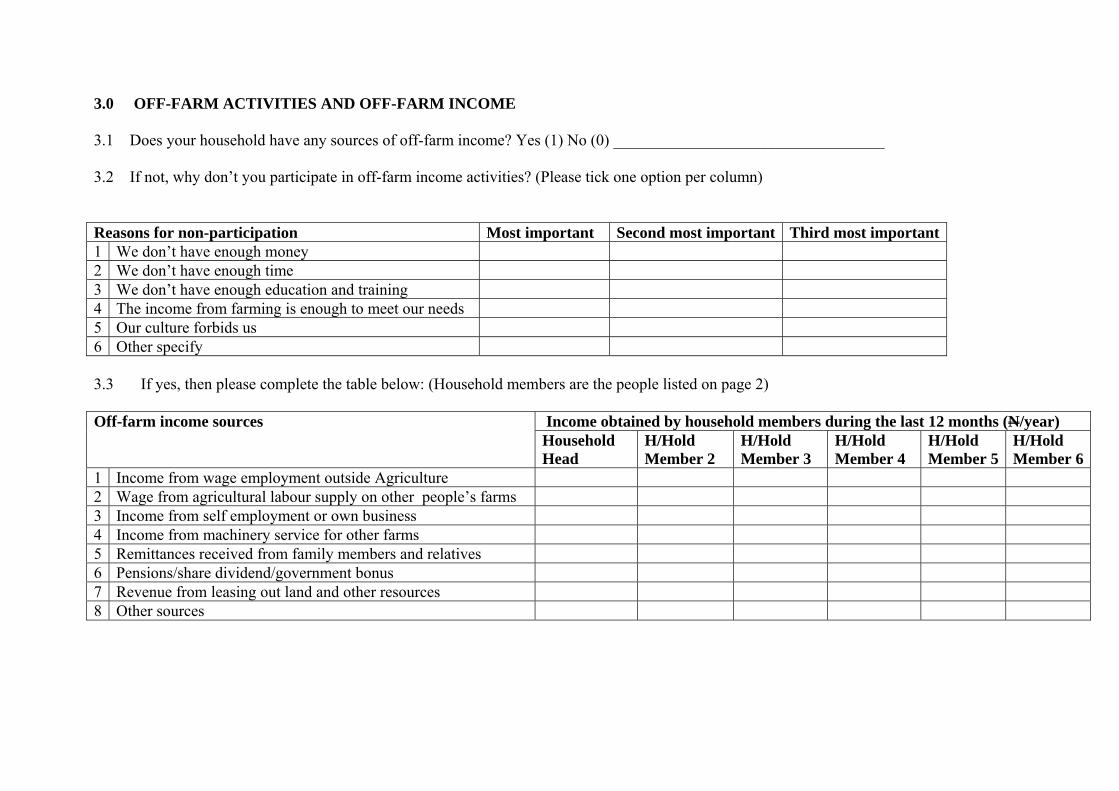
3.0 OFF-FARM ACTIVITIES AND OFF-FARM INCOME 3.1 Does your household have any sources of off-farm income? Yes (1) No (0) __________________________________
3.2 If not, why don’t you participate in off-farm income activities? (Please tick one option per column) Reasons for non-participation Most important Second most important Third most important1 We don’t have enough money 2 We don’t have enough time 3 We don’t have enough education and training 4 The income from farming is enough to meet our needs 5 Our culture forbids us 6 Other specify 3.3 If yes, then please complete the table below: (Household members are the people listed on page 2)
Income obtained by household members during the last 12 months (N/year) Off-farm income sources Household Head
H/Hold Member 2
H/Hold Member 3
H/Hold Member 4
H/Hold Member 5
H/Hold Member 6
1 Income from wage employment outside Agriculture 2 Wage from agricultural labour supply on other people’s farms 3 Income from self employment or own business 4 Income from machinery service for other farms 5 Remittances received from family members and relatives 6 Pensions/share dividend/government bonus 7 Revenue from leasing out land and other resources 8 Other sources
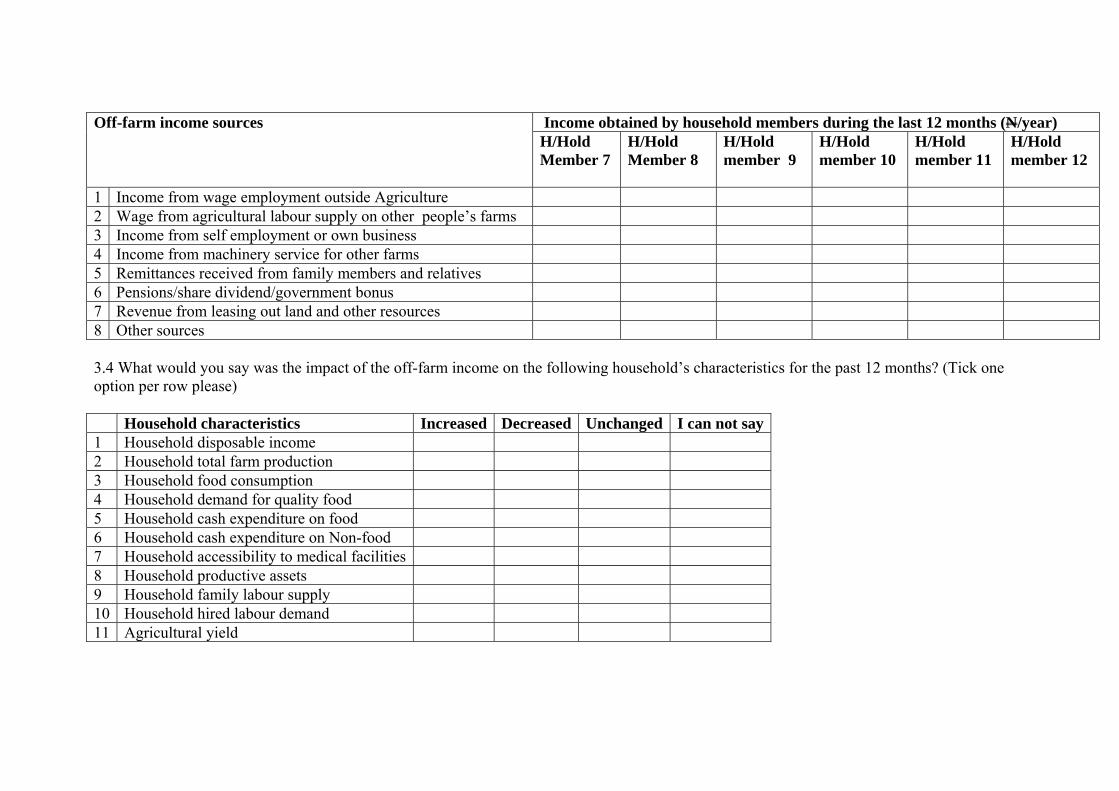
Income obtained by household members during the last 12 months (N/year) Off-farm income sources H/Hold Member 7
H/Hold Member 8
H/Hold member 9
H/Hold member 10
H/Hold member 11
H/Hold member 12
1 Income from wage employment outside Agriculture 2 Wage from agricultural labour supply on other people’s farms 3 Income from self employment or own business 4 Income from machinery service for other farms 5 Remittances received from family members and relatives 6 Pensions/share dividend/government bonus 7 Revenue from leasing out land and other resources 8 Other sources 3.4 What would you say was the impact of the off-farm income on the following household’s characteristics for the past 12 months? (Tick one option per row please) Household characteristics Increased Decreased Unchanged I can not say1 Household disposable income 2 Household total farm production 3 Household food consumption 4 Household demand for quality food 5 Household cash expenditure on food 6 Household cash expenditure on Non-food 7 Household accessibility to medical facilities 8 Household productive assets 9 Household family labour supply 10 Household hired labour demand 11 Agricultural yield
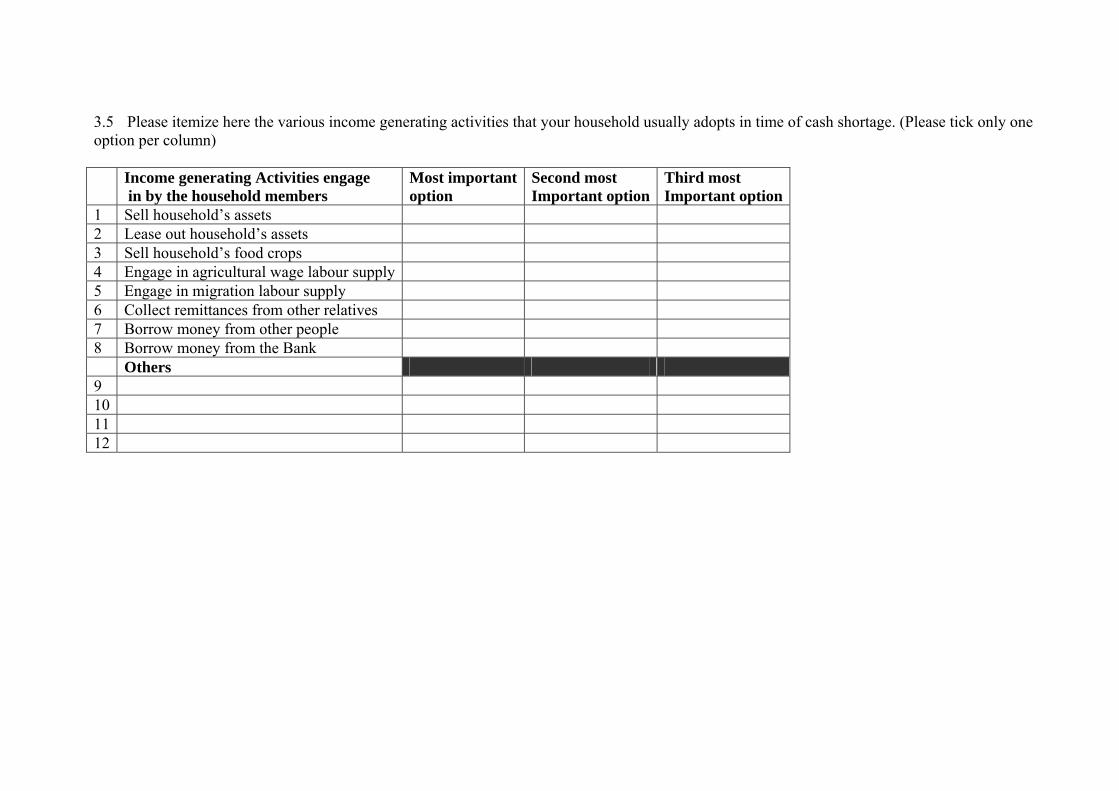
3.5 Please itemize here the various income generating activities that your household usually adopts in time of cash shortage. (Please tick only one option per column) Income generating Activities engage
in by the household members Most importantoption
Second most Important option
Third most Important option
1 Sell household’s assets 2 Lease out household’s assets 3 Sell household’s food crops 4 Engage in agricultural wage labour supply 5 Engage in migration labour supply 6 Collect remittances from other relatives 7 Borrow money from other people 8 Borrow money from the Bank Others 9 10 11 12
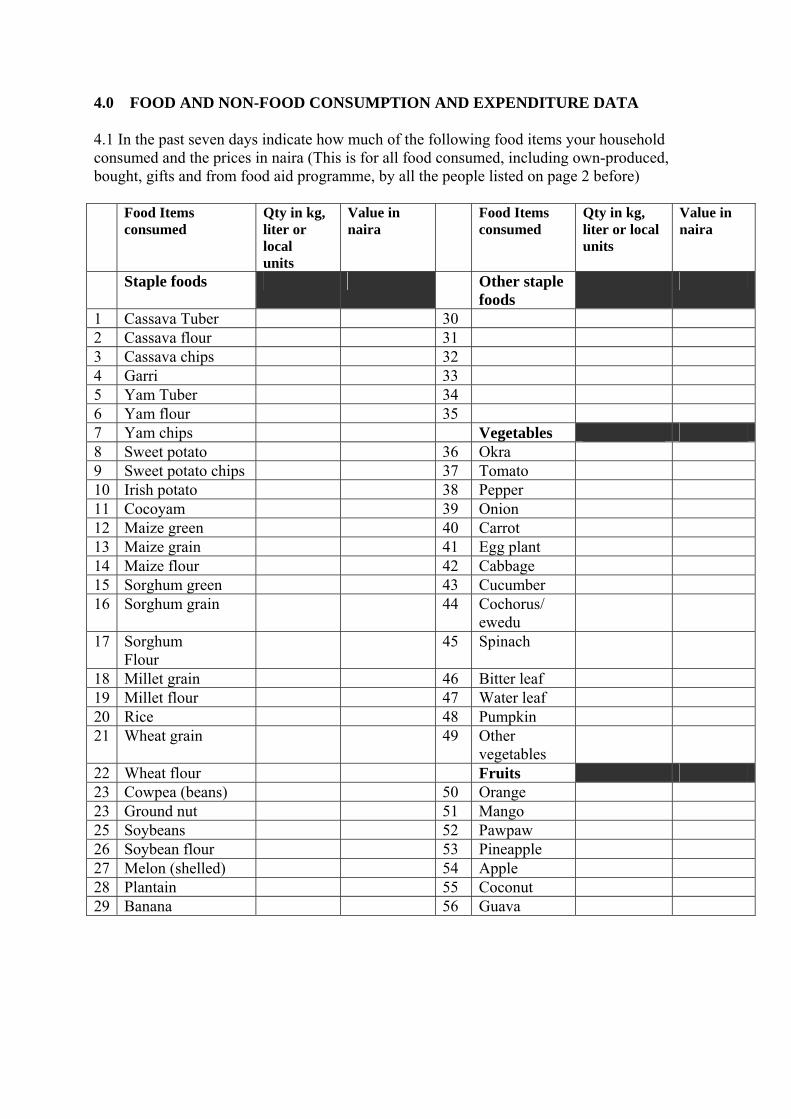
4.0 FOOD AND NON-FOOD CONSUMPTION AND EXPENDITURE DATA 4.1 In the past seven days indicate how much of the following food items your household consumed and the prices in naira (This is for all food consumed, including own-produced, bought, gifts and from food aid programme, by all the people listed on page 2 before) Food Items
consumed Qty in kg, liter or local units
Value in naira
Food Items consumed
Qty in kg, liter or local units
Value in naira
Staple foods Other staple foods
1 Cassava Tuber 30 2 Cassava flour 31 3 Cassava chips 32 4 Garri 33 5 Yam Tuber 34 6 Yam flour 35 7 Yam chips Vegetables 8 Sweet potato 36 Okra 9 Sweet potato chips 37 Tomato 10 Irish potato 38 Pepper 11 Cocoyam 39 Onion 12 Maize green 40 Carrot 13 Maize grain 41 Egg plant 14 Maize flour 42 Cabbage 15 Sorghum green 43 Cucumber 16 Sorghum grain 44 Cochorus/
ewedu
17 Sorghum Flour
45 Spinach
18 Millet grain 46 Bitter leaf 19 Millet flour 47 Water leaf 20 Rice 48 Pumpkin 21 Wheat grain 49 Other
vegetables
22 Wheat flour Fruits 23 Cowpea (beans) 50 Orange 23 Ground nut 51 Mango 25 Soybeans 52 Pawpaw 26 Soybean flour 53 Pineapple 27 Melon (shelled) 54 Apple 28 Plantain 55 Coconut 29 Banana 56 Guava
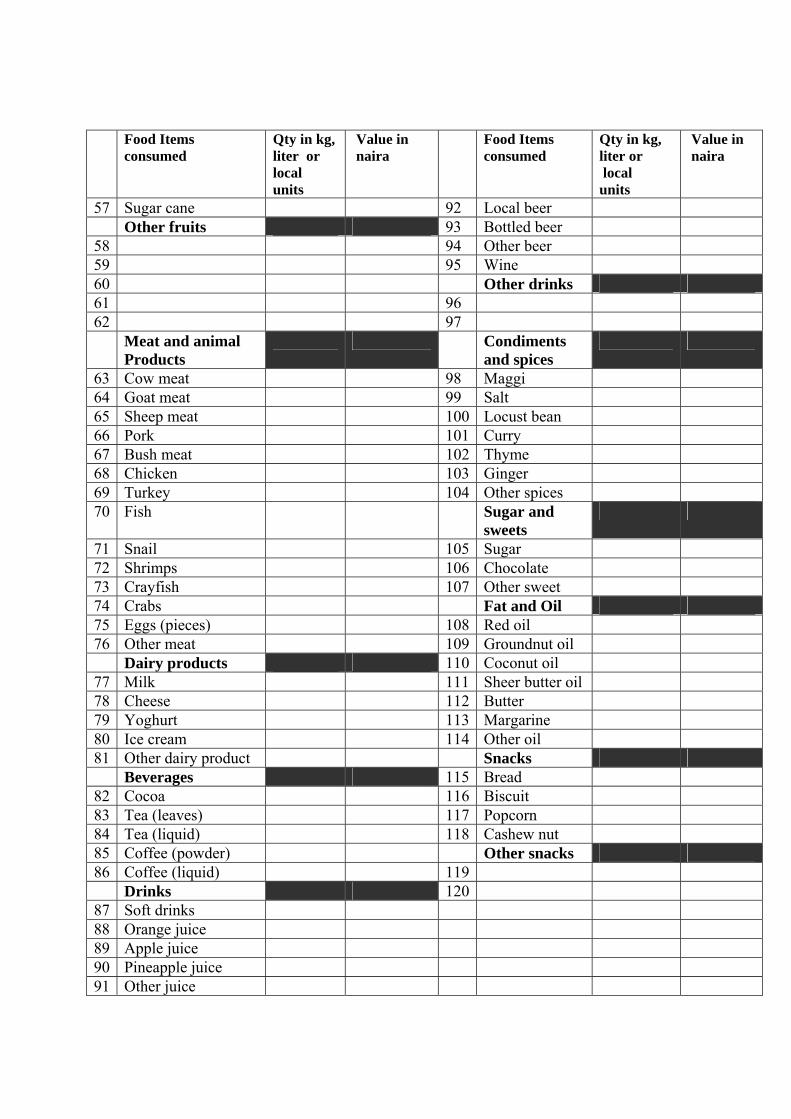
Food Items
consumed Qty in kg, liter or local units
Value in naira
Food Items consumed
Qty in kg, liter or local units
Value in naira
57 Sugar cane 92 Local beer Other fruits 93 Bottled beer 58 94 Other beer 59 95 Wine 60 Other drinks 61 96 62 97 Meat and animal
Products Condiments
and spices
63 Cow meat 98 Maggi 64 Goat meat 99 Salt 65 Sheep meat 100 Locust bean 66 Pork 101 Curry 67 Bush meat 102 Thyme 68 Chicken 103 Ginger 69 Turkey 104 Other spices 70 Fish Sugar and
sweets
71 Snail 105 Sugar 72 Shrimps 106 Chocolate 73 Crayfish 107 Other sweet 74 Crabs Fat and Oil 75 Eggs (pieces) 108 Red oil 76 Other meat 109 Groundnut oil Dairy products 110 Coconut oil 77 Milk 111 Sheer butter oil 78 Cheese 112 Butter 79 Yoghurt 113 Margarine 80 Ice cream 114 Other oil 81 Other dairy product Snacks Beverages 115 Bread 82 Cocoa 116 Biscuit 83 Tea (leaves) 117 Popcorn 84 Tea (liquid) 118 Cashew nut 85 Coffee (powder) Other snacks 86 Coffee (liquid) 119 Drinks 120 87 Soft drinks 88 Orange juice 89 Apple juice 90 Pineapple juice 91 Other juice
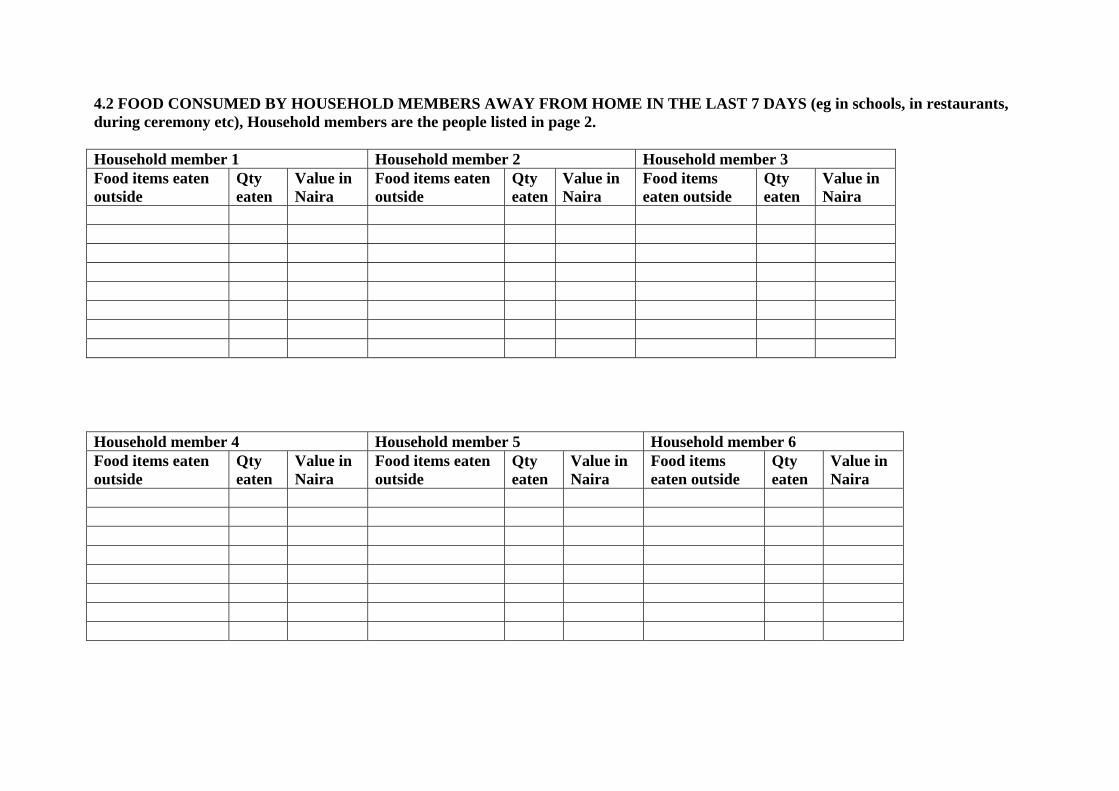
4.2 FOOD CONSUMED BY HOUSEHOLD MEMBERS AWAY FROM HOME IN THE LAST 7 DAYS (eg in schools, in restaurants, during ceremony etc), Household members are the people listed in page 2. Household member 1 Household member 2 Household member 3 Food items eaten outside
Qty eaten
Value in Naira
Food items eaten outside
Qty eaten
Value in Naira
Food items eaten outside
Qty eaten
Value in Naira
Household member 4 Household member 5 Household member 6 Food items eaten outside
Qty eaten
Value in Naira
Food items eaten outside
Qty eaten
Value in Naira
Food items eaten outside
Qty eaten
Value in Naira
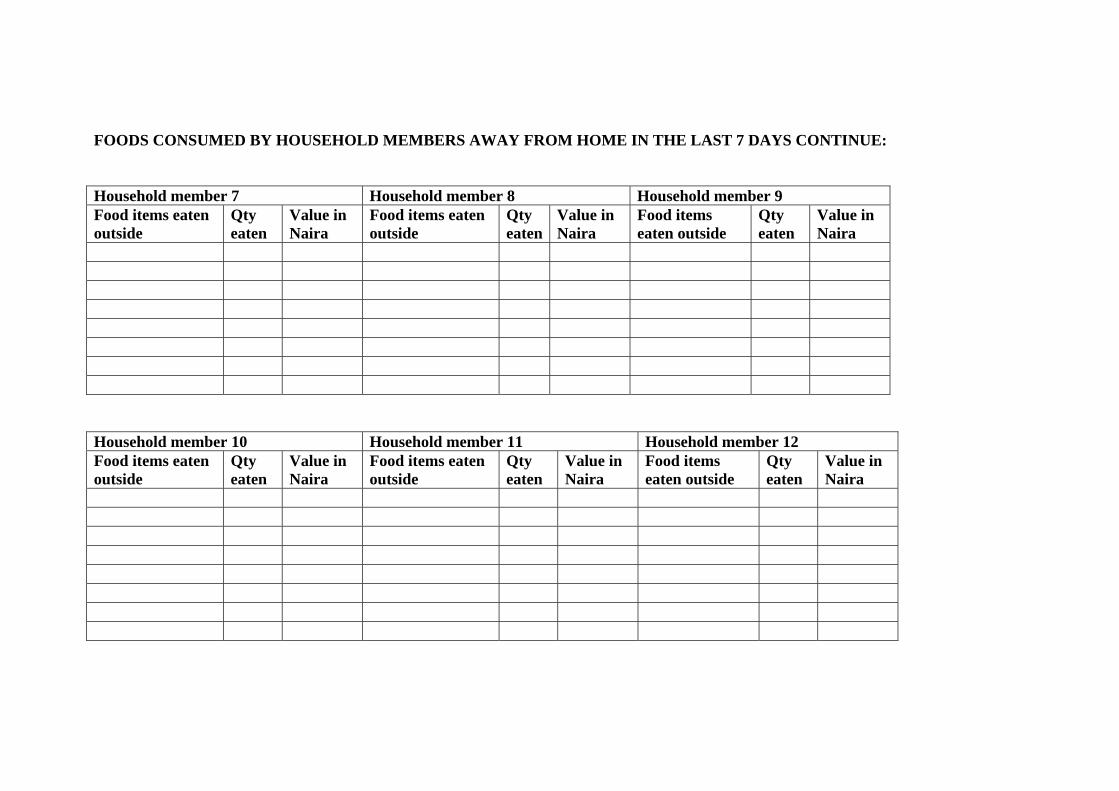
FOODS CONSUMED BY HOUSEHOLD MEMBERS AWAY FROM HOME IN THE LAST 7 DAYS CONTINUE: Household member 7 Household member 8 Household member 9 Food items eaten outside
Qty eaten
Value in Naira
Food items eaten outside
Qty eaten
Value in Naira
Food items eaten outside
Qty eaten
Value in Naira
Household member 10 Household member 11 Household member 12 Food items eaten outside
Qty eaten
Value in Naira
Food items eaten outside
Qty eaten
Value in Naira
Food items eaten outside
Qty eaten
Value in Naira
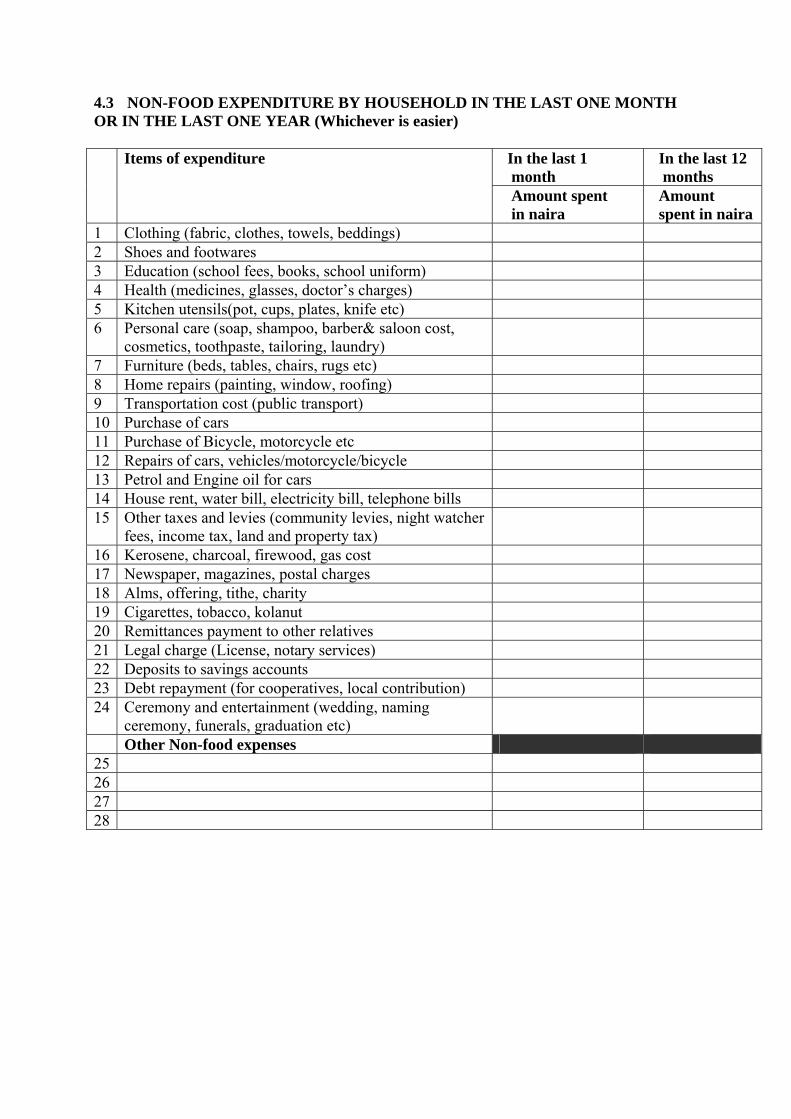
4.3 NON-FOOD EXPENDITURE BY HOUSEHOLD IN THE LAST ONE MONTH OR IN THE LAST ONE YEAR (Whichever is easier)
In the last 1 month
In the last 12 months
Items of expenditure
Amount spent in naira
Amount spent in naira
1 Clothing (fabric, clothes, towels, beddings) 2 Shoes and footwares 3 Education (school fees, books, school uniform) 4 Health (medicines, glasses, doctor’s charges) 5 Kitchen utensils(pot, cups, plates, knife etc) 6 Personal care (soap, shampoo, barber& saloon cost,
cosmetics, toothpaste, tailoring, laundry)
7 Furniture (beds, tables, chairs, rugs etc) 8 Home repairs (painting, window, roofing) 9 Transportation cost (public transport) 10 Purchase of cars 11 Purchase of Bicycle, motorcycle etc 12 Repairs of cars, vehicles/motorcycle/bicycle 13 Petrol and Engine oil for cars 14 House rent, water bill, electricity bill, telephone bills 15 Other taxes and levies (community levies, night watcher
fees, income tax, land and property tax)
16 Kerosene, charcoal, firewood, gas cost 17 Newspaper, magazines, postal charges 18 Alms, offering, tithe, charity 19 Cigarettes, tobacco, kolanut 20 Remittances payment to other relatives 21 Legal charge (License, notary services) 22 Deposits to savings accounts 23 Debt repayment (for cooperatives, local contribution) 24 Ceremony and entertainment (wedding, naming
ceremony, funerals, graduation etc)
Other Non-food expenses 25 26 27 28
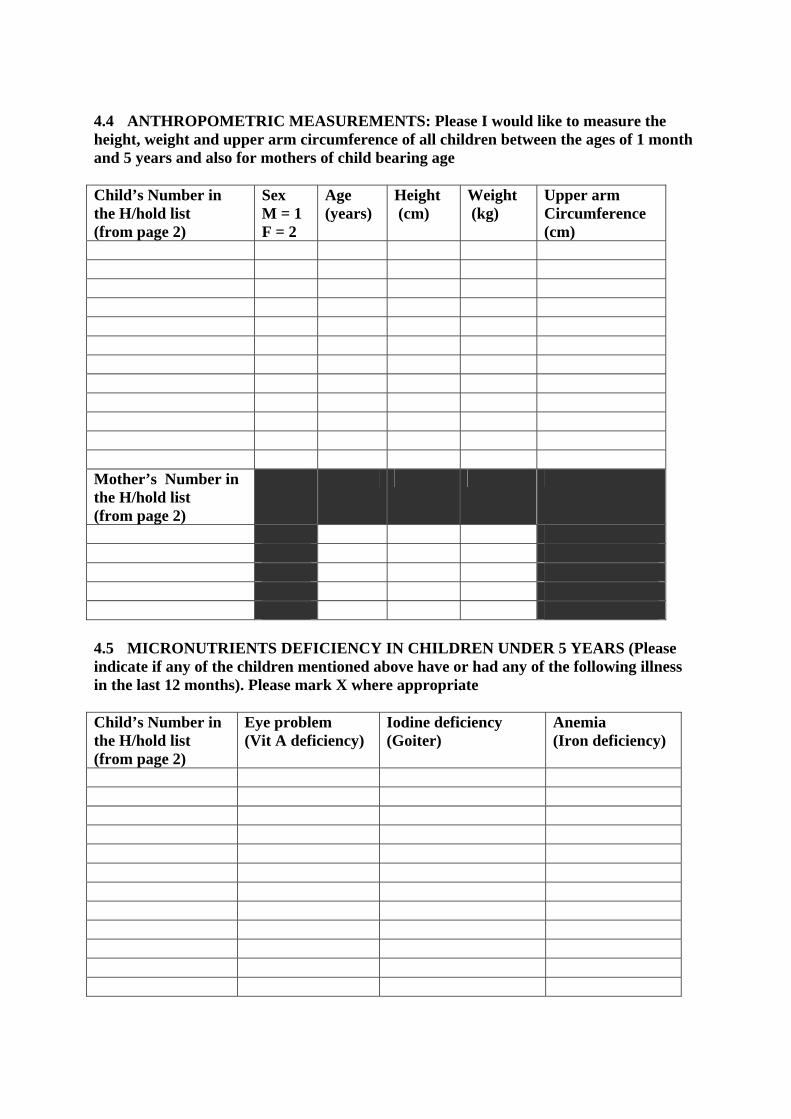
4.4 ANTHROPOMETRIC MEASUREMENTS: Please I would like to measure the height, weight and upper arm circumference of all children between the ages of 1 month and 5 years and also for mothers of child bearing age Child’s Number in the H/hold list (from page 2)
Sex M = 1 F = 2
Age (years)
Height (cm)
Weight (kg)
Upper arm Circumference (cm)
Mother’s Number in the H/hold list (from page 2)
4.5 MICRONUTRIENTS DEFICIENCY IN CHILDREN UNDER 5 YEARS (Please indicate if any of the children mentioned above have or had any of the following illness in the last 12 months). Please mark X where appropriate Child’s Number in the H/hold list (from page 2)
Eye problem (Vit A deficiency)
Iodine deficiency (Goiter)
Anemia (Iron deficiency)
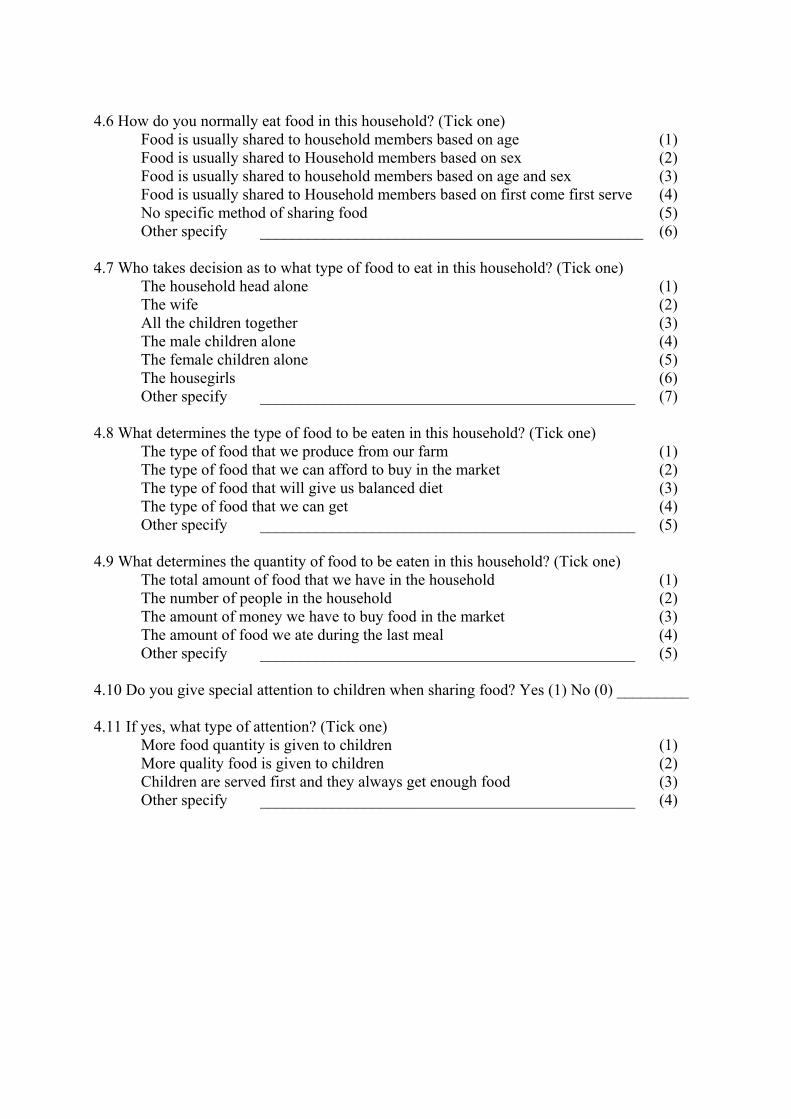
4.6 How do you normally eat food in this household? (Tick one)
Food is usually shared to household members based on age (1) Food is usually shared to Household members based on sex (2) Food is usually shared to household members based on age and sex (3) Food is usually shared to Household members based on first come first serve (4) No specific method of sharing food (5) Other specify ________________________________________________ (6)
4.7 Who takes decision as to what type of food to eat in this household? (Tick one)
The household head alone (1) The wife (2) All the children together (3) The male children alone (4) The female children alone (5) The housegirls (6) Other specify _______________________________________________ (7)
4.8 What determines the type of food to be eaten in this household? (Tick one)
The type of food that we produce from our farm (1) The type of food that we can afford to buy in the market (2) The type of food that will give us balanced diet (3) The type of food that we can get (4) Other specify _______________________________________________ (5)
4.9 What determines the quantity of food to be eaten in this household? (Tick one) The total amount of food that we have in the household (1) The number of people in the household (2) The amount of money we have to buy food in the market (3) The amount of food we ate during the last meal (4) Other specify _______________________________________________ (5)
4.10 Do you give special attention to children when sharing food? Yes (1) No (0) _________ 4.11 If yes, what type of attention? (Tick one)
More food quantity is given to children (1) More quality food is given to children (2) Children are served first and they always get enough food (3) Other specify _______________________________________________ (4)
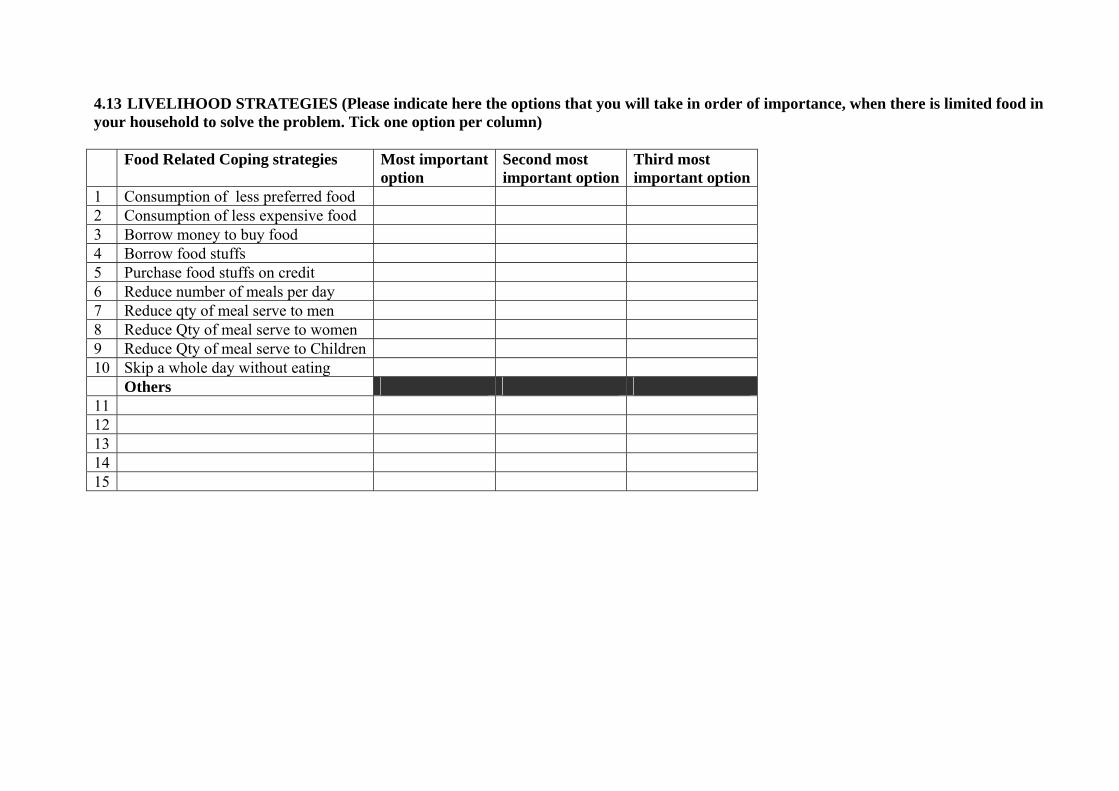
4.13 LIVELIHOOD STRATEGIES (Please indicate here the options that you will take in order of importance, when there is limited food in your household to solve the problem. Tick one option per column) Food Related Coping strategies Most important
option Second most important option
Third most important option
1 Consumption of less preferred food 2 Consumption of less expensive food 3 Borrow money to buy food 4 Borrow food stuffs 5 Purchase food stuffs on credit 6 Reduce number of meals per day 7 Reduce qty of meal serve to men 8 Reduce Qty of meal serve to women 9 Reduce Qty of meal serve to Children 10 Skip a whole day without eating Others 11 12 13 14 15
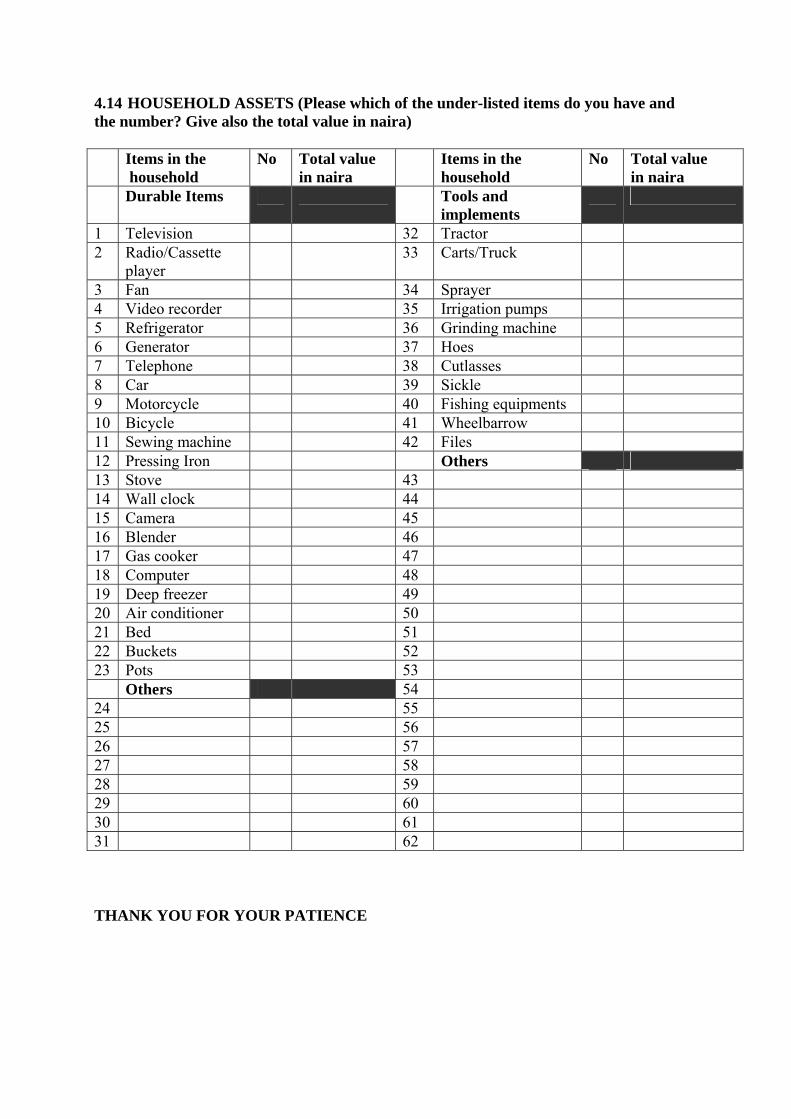
4.14 HOUSEHOLD ASSETS (Please which of the under-listed items do you have and the number? Give also the total value in naira) Items in the
household No Total value
in naira Items in the
household No Total value
in naira Durable Items Tools and
implements
1 Television 32 Tractor 2 Radio/Cassette
player 33 Carts/Truck
3 Fan 34 Sprayer 4 Video recorder 35 Irrigation pumps 5 Refrigerator 36 Grinding machine 6 Generator 37 Hoes 7 Telephone 38 Cutlasses 8 Car 39 Sickle 9 Motorcycle 40 Fishing equipments 10 Bicycle 41 Wheelbarrow 11 Sewing machine 42 Files 12 Pressing Iron Others 13 Stove 43 14 Wall clock 44 15 Camera 45 16 Blender 46 17 Gas cooker 47 18 Computer 48 19 Deep freezer 49 20 Air conditioner 50 21 Bed 51 22 Buckets 52 23 Pots 53 Others 54 24 55 25 56 26 57 27 58 28 59 29 60 30 61 31 62 THANK YOU FOR YOUR PATIENCE
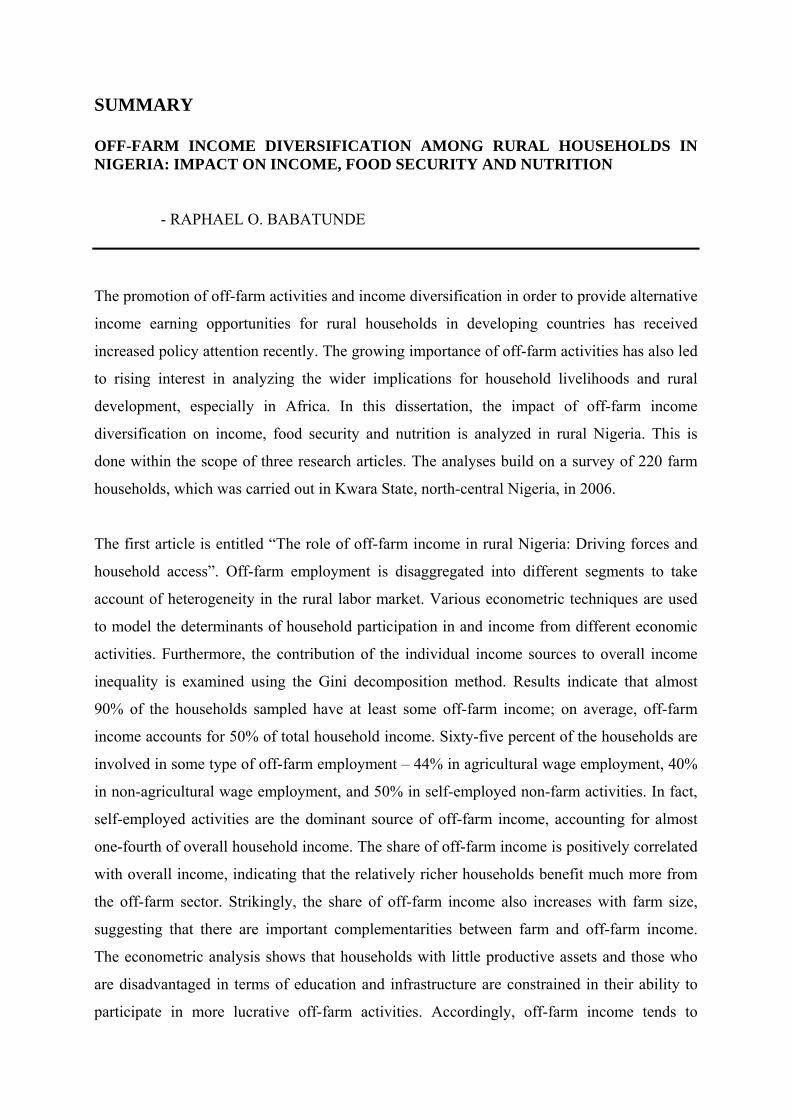
SUMMARY
OFF-FARM INCOME DIVERSIFICATION AMONG RURAL HOUSEHOLDS IN NIGERIA: IMPACT ON INCOME, FOOD SECURITY AND NUTRITION
- RAPHAEL O. BABATUNDE
The promotion of off-farm activities and income diversification in order to provide alternative
income earning opportunities for rural households in developing countries has received
increased policy attention recently. The growing importance of off-farm activities has also led
to rising interest in analyzing the wider implications for household livelihoods and rural
development, especially in Africa. In this dissertation, the impact of off-farm income
diversification on income, food security and nutrition is analyzed in rural Nigeria. This is
done within the scope of three research articles. The analyses build on a survey of 220 farm
households, which was carried out in Kwara State, north-central Nigeria, in 2006.
The first article is entitled “The role of off-farm income in rural Nigeria: Driving forces and
household access”. Off-farm employment is disaggregated into different segments to take
account of heterogeneity in the rural labor market. Various econometric techniques are used
to model the determinants of household participation in and income from different economic
activities. Furthermore, the contribution of the individual income sources to overall income
inequality is examined using the Gini decomposition method. Results indicate that almost
90% of the households sampled have at least some off-farm income; on average, off-farm
income accounts for 50% of total household income. Sixty-five percent of the households are
involved in some type of off-farm employment – 44% in agricultural wage employment, 40%
in non-agricultural wage employment, and 50% in self-employed non-farm activities. In fact,
self-employed activities are the dominant source of off-farm income, accounting for almost
one-fourth of overall household income. The share of off-farm income is positively correlated
with overall income, indicating that the relatively richer households benefit much more from
the off-farm sector. Strikingly, the share of off-farm income also increases with farm size,
suggesting that there are important complementarities between farm and off-farm income.
The econometric analysis shows that households with little productive assets and those who
are disadvantaged in terms of education and infrastructure are constrained in their ability to
participate in more lucrative off-farm activities. Accordingly, off-farm income tends to
increases income inequality. The analysis counters the widespread notion that shrinking per
capita land availability is always the main driving force for the growing importance of off-
farm activities. It shows that financial capital rather than land is the scarcest factor for farm
households in the study region, so that cash income from off-farm activities can also help to
expand farm production. Entry barriers to off-farm activities for poor households need to be
overcome to promote equitable rural development.
In the second article, entitled “Impact of off-farm income on food security and nutrition in
Nigeria”, 7-day food expenditure and anthropometric data are used to analyze the effects of
off-farm income on household calorie consumption, dietary quality, micronutrient supply and
child nutritional status. Descriptive analysis indicates that engagement in off-farm activities is
associated with higher calorie consumption and a reduced prevalence of undernourishment.
Dietary quality, measured by the calorie supply that comes from fruits, vegetables and animal
products, is also higher among households with off-farm income. Similarly, households with
off-farm income enjoy a higher supply of micronutrients, particularly iron and vitamin A.
Child nutritional status, indicated by the average Z-scores for height-for-age, weight-for-age,
and weight-for-height of children aged 0 to 5 years, is also better in households with off-farm
income. Employing instrumental variable approaches, econometric analyses confirms that the
net effect of off-farm income on household food security and nutrition is positive and in the
same magnitude as the effect of farm income. This is an interesting result, because it is often
believed that farm income is more important than off-farm income for food security and
dietary quality in rural areas. Accordingly, improving poor households’ access to the off-farm
sector can contribute to reducing problems of rural malnutrition.
In the third article, entitled “Patterns of income diversification in rural Nigeria: Determinants
and impacts”, descriptive analysis is used to examine income diversification patterns among
households, disaggregated by income classes and livelihood strategies. Econometric models,
focusing on three measures of income diversification – the number of income sources, the
share of off-farm income in total income and the Herfindahl diversification index – are also
estimated. The impact of diversification on total household income is analyzed using an
instrumental variable approach. The results indicate that rural households in Nigeria have
indeed a diversified income base, with 93% having at least two sources of income.
Interestingly, richer households tend to be more diversified than poorer ones, and income
diversification leads to net increases in total household income. Yet, the regression models
also show that households have unequal abilities to diversify their income sources. Education,
asset endowment, access to credit and good infrastructure conditions increase the levels of
household diversification. These factors improve the opportunities to start own businesses and
find employment in the higher-paying non-farm sector. In other words, resource-poor
households in remoter areas are more constrained in diversifying their income sources.
What are the broader policy implications? Enhancing poor households’ access to off-farm
activities is important to support equitable rural development, since farming alone often
cannot sustain a sufficient livelihood. In the Nigerian context – as in many other parts of SSA
– this requires improvements in the physical infrastructure, including roads, electricity, water,
and telecommunication, but also improvements in rural education and financial markets. But
up to what level is income diversification desirable? According to economic theory,
specialization allows exploitation of comparative advantages and economies of scale,
resulting in higher profits and household incomes. Hence, when markets function properly,
diversification is associated with foregone benefits. When there is risk involved and formal
insurance markets fail, these foregone benefits can be considered as an informal insurance fee
that poor households in particular are willing to pay. But the fact that richer households are
more diversified in rural Nigeria suggests that there are other mechanisms at work, too. An
important motive for richer households to have highly diversified income sources instead of
specializing more is that there are limited opportunities to expand single economic activities.
This is mainly due to markets that are small and poorly integrated in rural Nigeria, which
again is largely a function of infrastructure weaknesses. Better roads, for instance, would
enable villagers to commute to the next bigger town, where they might find more stable
employment. Better roads and information networks would also improve marketing
opportunities for food and non-food products originating from household self-employed
activities. Therefore, income diversification should not be considered as a policy objective per
se. Rather, it has to be understood as a household response to various market imperfections.
Hence, the policy objective should be to reduce these imperfections and make markets work
better. While this would facilitate income diversification among the poorest, it would
probably promote a higher degree of specialization among relatively richer households.
ZUSAMMENFASSUNG
OFF-FARM INCOME DIVERSIFICATION AMONG RURAL HOUSEHOLDS IN NIGERIA: IMPACT ON INCOME, FOOD SECURITY AND NUTRITION
- RAPHAEL O. BABATUNDE
Die Förderung von außerlandwirtschaftlichen Tätigkeiten und von
Einkommensdiversifizierung hat in letzter Zeit mehr Beachtung in der Politik gefunden mit
dem Ziel, alternative Einkommensmöglichkeiten für ländliche Haushalte in
Entwicklungsländern zur Verfügung zu stellen. Die zunehmende Bedeutung von
außerlandwirtschaftlichen Tätigkeiten führte zu einem steigenden Interesse, die
weitergehenden Auswirkungen auf den Lebensunterhalt in Haushalten und auf die ländliche
Entwicklung, besonders in Afrika, zu untersuchen. In vorliegenden Dissertation wird der
Einfluss von außerlandwirtschaftlichem Einkommen auf Gesamteinkommen,
Ernährungssicherung und Ernährungsstatus im ländlichen Nigeria untersucht. Dies wird im
Rahmen von drei Forschungsartikeln durchgeführt. Die Analyse baut auf einer Befragung von
220 landwirtschaftlichen Haushalten auf, die 2006 im Bundesstaat Kwara in nord-zentral
Nigeria durchgeführt wurde.
Der erste Artikel trägt den Titel “The role of off-farm income in rural Nigeria: Driving forces
and household access”. Außerlandwirschaftliche Beschäftigung wird in verschiedene
Segmente disaggregiert, um der Heterogeneität in ländlichen Arbeitsmärkten gerecht zu
werden. Verschiedene ökonometrische Techniken werden angewendet, um die Einflussgrößen
der Teilnahme an und das Einkommen aus verschiedenen ökonomischen Tätigkeiten zu
modellieren. Darüber hinaus wird der Beitrag einzelner Einkommensquellen zu
Einkommensungleichheit unter Zuhilfenahme der Gini decomposition Methode untersucht.
Die Ergebnisse zeigen, dass fast 90% der ausgewählten Haushalte zumindest irgendein
außerlandwirtschaftliches Einkommen haben; im Durchschnitt macht
außerlandwirtschaftliches Einkommen 50% des gesamten Haushaltseinkommens aus. 65%
der Haushalte sind in irgendeiner Form in außerlandwirtschaftliche Beschäftigung involviert –
44% in landwirtschaftlicher Lohntätigkeit, 40% in nicht-landwirtschaftlicher Lohntätigkeit
und 50% in selbständigen nicht-landwirtschaftlichen Tätigkeiten. Tatsächlich sind
selbständige Tätigkeiten die dominierende Einkommensquelle, die fast ein Viertel des
gesamten Haushaltseinkommens darstellen. Der Anteil des außerlandwirtschaftlichen
Einkommens ist positiv mit dem Gesamteinkommen korreliert, was anzeigt, dass relativ
reiche Haushalte weit mehr vom außerlandwirtschaftlichen Sektor profitieren.
Überraschenderweise steigt der Anteil des außerlandwirtschaftlichen Einkommens auch mit
der Größe des landwirtschaftlichen Betriebes, was darauf hinweist, dass es wichtige
Komplementaritäten zwischen landwirtschaftlichem und außerlandwirtschaftlichem
Einkommen gibt. Die ökonomtertische Analyse zeigt, dass Haushalte mit geringer
Ausstattung an produktiven Besitzgütern und diejenigen, die in Bezug auf Bildung und
Infrastruktur benachteiligt sind, auch in ihrer Fähigeit begrenzt sind, an lukrativen
außerlandwirtschaftlichen Tätigkeiten teilzunehmen. Die Analyse widerspricht der weit
verbreiteten Annahme, wonach eine sinkende Pro-Kopf-Flächenverfügbarkeit immer die
Haupttriebkraft für die steigende Bedeutung von außerlandwirtschaftlichen Tätigkeiten ist.
Sie zeigt statt dessen, dass finanzielles Kapital in weit größerem Ausmaß als die
Flächenausstattung der knappeste Produktionsfaktor für landwirtschaftliche Haushalte im
Untersuchungsgebiet ist, so dass Bareinkommen aus außerlandwirtschaftlicher Tätigkeit dazu
beitragen kann, die landwirtschaftliche Produktion auszudehnen. Zugangsbarrieren zu
außerlandwirtschaftlichen Tätigkeiten für arme Haushalte müssen beseitigt werden, um eine
gerechte ländliche Entwicklung zu fördern.
Im zweiten Artikel mit dem Titel “Impact of off-farm income on food security and nutrition in
Nigeria”, werden Daten von Nahrungsmittelausgaben aus einem 7-Tage- Zeitraum und
anthropometrische Daten dazu verwendet, um Effekte von außerlandwirtschaftlichem
Einkommen auf den Kalorienverbrauch der Haushalte, auf die Qualität der Diät, auf die
Versorgung mit Mikronährstoffen und auf den Ernährungsstatus von Kindern zu untersuchen.
Die beschreibende Analyse zeigt, dass das Engagement in außerlandwirtschaftliche Tätigkeit
mit einem höheren Kalorienverbrauch und einer geringeren Verbreitung von Unterernährung
verbunden sind. Die Qualität der Diät, gemessen als Versorgung mit Kalorien aus Obst,
Gemüse und tierischen Produkten, ist ebenso unter Haushalten mit außerlandwirtschaftlichem
Einkommen höher. In ähnlicher Weise haben Haushalte mit außerlandwirtschaftlichem
Einkommen eine höhere Versorgung mit Mikronährstoffen, insbesondere mit Eisen und
Vitamin A. Der Ernährungsstatus von Kindern, angezeigt als der durchschnittliche Z-Wert für
Größe-zu-Alter, Gewicht-zu-Alter und Gewicht-zu-Höhe von 0 bis 5-jährigen Kindern, ist
ebenfalls bei außerlandwirtschaftlichem Einkommen besser. Wenn instrumental variable
Ansätze verwendet werden, bestätigen die ökonometrischen Analysen, dass der Netto-Effekt
von außerlandwirtschaftlichem Einkommen auf die Ernährungssicherung und die Qualität der
Ernährung positiv ist und im Ausmaß dem Effekt von landwirtschaftlichem Einkommen
gleich ist. Dies ist ein interessantes Ergebnis, weil oft angenommen wird, dass
landwirtschaftliches Einkommen für die Ernährungssicherung und für die Qualität der Diät in
ländlichen Gebieten wichtiger sind als außerlandwirtschaftliches Einkommen. Entsprechend
kann eine Verbesserung des Zugangs von armen Haushalten zum außerlandwirtschaftlichen
Sektor zur Verringerung der Probleme von ländlicher Mangelernährung beitragen.
Im dritten Artikel mit dem Titel “Patterns of income diversification in rural Nigeria:
Determinants and impacts” wird eine deskriptive Analyse dazu benutzt, um die Muster der
Einkommensdiversifizierung bei Haushalten, disaggregiert nach den Einkommensklassen und
nach Strategien zur Existenzgrundlagensicherung, zu überprüfen. Ökonomterische Modelle,
die sich auf drei Größen der Einkommensdiversifizierung konzentrieren – die Anzahl der
Einkommensquellen, der Anteil des außerlandwirtschaftlichen Einkommens am
Gesamteinkommen und der Herfindahl-Diversifikations-Index – werden geschätzt. Der
Einfluss der Diversifizierung auf das Gesamthaushaltseinkommen wird mit einem
instrumental variable Ansatz analysiert. Die Ergbnisse zeigen, dass ländliche Haushalte in
Nigeria tatsächlich eine diversifizierte Einkommensbasis haben, bei der 93% mindestens zwei
Einkommensquellen haben. Interessanterweise tendieren reichere Haushalte dazu, stärker
diversifiziert zu sein als ärmere, und Einkommensdiversifizierung führt zu einem Netto-
Anstieg des Gesamthaushaltseinkommen. Die Regressionsmodelle zeigen aber auch, dass die
Haushalte ungleiche Leistungsfähigkeiten haben, ihre Einkommensquellen zu diversifizieren.
Bildung, Vermögensausstattung, Zugang zu Kredit und gute Infrastrukturbedingungen
erhöhen das Niveau der Haushaltsdiversifizierung. Diese Faktoren verbessern die
Möglichkeit, sich selbständig zu machen und eine Anstellung im höher bezahlten
außerlandwirtschaftlichen Sektor zu finden. Mit anderen Worten, an Produktionsmittel arme
Haushalte in abgelegeneren Gebieten sind begrenzter, ihr Einkommen zu diversifizieren.
Was sind die allgemeinen Implikationen für die Politik? Den Zugang für arme Haushalte zu
außerlandwirtschaftlichen Tätigkeiten zu verbessern ist wichtig, um eine gleichverteilte
ländliche Entwicklung zu fördern, da eine Tätigkeit in der Landwirtschaft für sich genommen
eine ausreichende Lebensgrundlage nicht sicherstellen kann. Im nigerianischen Kontext –
genauso wie in anderen Teilen Afrikas südlich der Sahara – erfordert dies Verbesserungen in
der physischen Infrastruktur, einschließlich der Straßen, der Elektrizität, des Wassers und der
Telekommunikation, aber auch Verbesserungen in der ländlichen Bildung und auf den
Finanzmärkte. Aber bis zu welchem Niveau ist eine Einkommensdiversifzierung
wünschenswert? Nach der neoklassischen ökonomischen Theorie erlaubt die Spezialisierung
die Ausnutzung komparativer Vorteile und Skaleneffekte, die in höheren Gewinnen und
Haushaltseinkommen resultieren. Wenn Märkte deshalb richtig funktionieren, ist die
Diversifizierung mit einem Verlust an Nutzen verbunden. Wenn es Risiken gibt und formale
Versicherungsmärkte versagen, kann dieser verlorene Nutzen als eine informelle
Versicherungsgebühr betrachtet werden, die besonders arme Haushalte zu bezahlen bereit
sind. Aber die Tatsache, dass reichere Haushalte im ländlichen Nigeria stärker diversifiziert
sind, zeigt, dass andere Mechanismen am Werk sind. Ein wichtiges Motiv für reichere
Haushalte, hoch diversifizierte Einkommensquellen zu haben, anstatt sich mehr zu
spezialisieren ist, dass es nur begrenzte Möglichkeiten gibt, einzelne ökonomische Aktivitäten
auszudehnen. Das liegt vor allem an Märkten, die klein und im ländlichen Nigeria wenig
integriert sind, was wiederum eine Funktion von Infrastrukturschwächen ist. Bessere Straßen
zum Beispiel würden es Dorfbewohnern ermöglichen, in die nächst größere Stadt zu pendeln,
wo sie eine beständigere Anstellung finden könnten. Bessere Straßen und
Informationsnetzwerke würden auch die Vermarktungsmöglichkeiten für Nahrungsmittel und
Nicht-Nahrungs-Produkte aus selbständigen Tätigkeiten von Haushalten verbessern. Deshalb
sollte die Einkommensdiversifizierung nicht als ein Politikziel an sich betrachtet werden.
Vielmehr muss es als eine Antwort auf verschiedene Arten von Marktversagen verstanden
werden. Aus diesem Grund sollte das Ziel der Politik sein, dieses Versagen der Märkte zu
reduzieren und dafür zu sorgen, dass Märkte besser funktionieren. Während dies die
Einkommensdiversifizierung unter den Ärmsten vorantrieben könnte, würde es
wahrscheinlich gleichzeitig ein größeres Maß an Spezialisierung unter den relativ reicheren
Haushalten fördern.
Erklärung
Hiermit versichere ich, daß ich die vorliegende Arbeit selbständig angefertigt, nur angegebenen Quellen und Hilfsmittel benutzut, und wörtlich oder inhaltlich übernommene Stellen als solche gekennzeichnet habe. BABATUNDE, Raphael Olanrewaju Stuttgart, den 20.04.2009
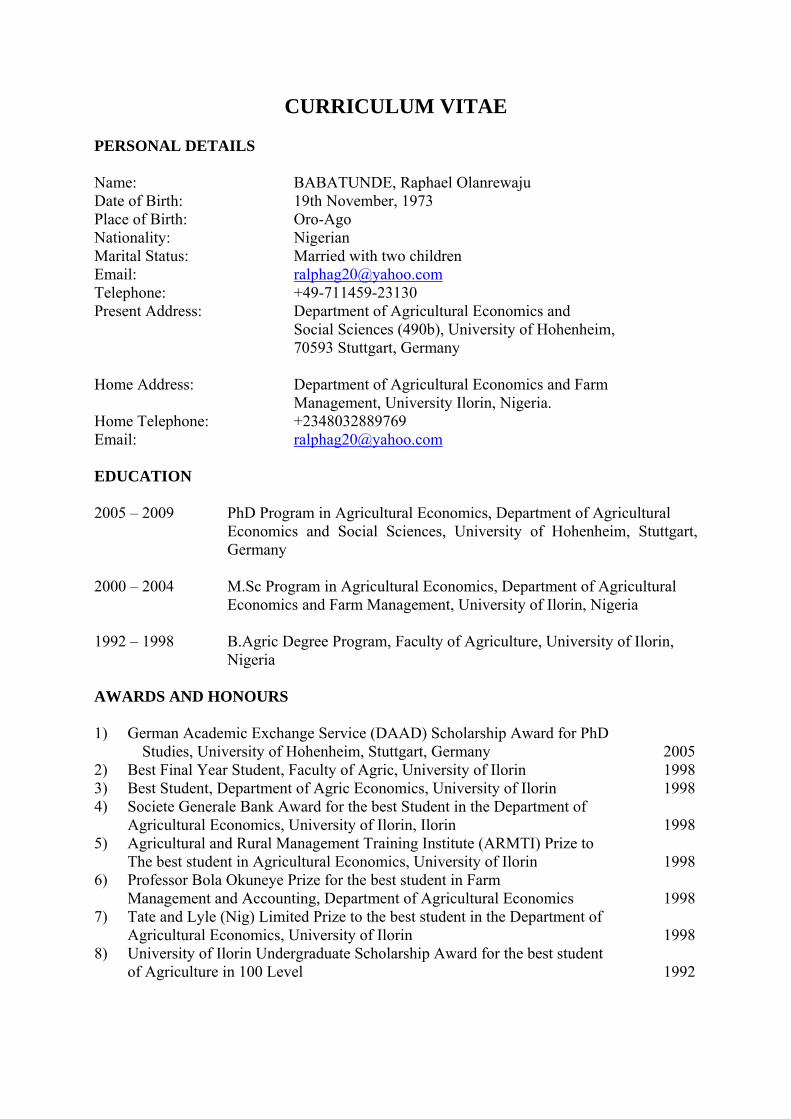
CURRICULUM VITAE PERSONAL DETAILS Name: BABATUNDE, Raphael Olanrewaju Date of Birth: 19th November, 1973 Place of Birth: Oro-Ago Nationality: Nigerian Marital Status: Married with two children Email: [email protected] Telephone: +49-711459-23130 Present Address: Department of Agricultural Economics and Social Sciences (490b), University of Hohenheim, 70593 Stuttgart, Germany Home Address: Department of Agricultural Economics and Farm Management, University Ilorin, Nigeria. Home Telephone: +2348032889769 Email: [email protected] EDUCATION 2005 – 2009 PhD Program in Agricultural Economics, Department of Agricultural
Economics and Social Sciences, University of Hohenheim, Stuttgart, Germany
2000 – 2004 M.Sc Program in Agricultural Economics, Department of Agricultural Economics and Farm Management, University of Ilorin, Nigeria 1992 – 1998 B.Agric Degree Program, Faculty of Agriculture, University of Ilorin, Nigeria AWARDS AND HONOURS 1) German Academic Exchange Service (DAAD) Scholarship Award for PhD
Studies, University of Hohenheim, Stuttgart, Germany 2005 2) Best Final Year Student, Faculty of Agric, University of Ilorin 1998 3) Best Student, Department of Agric Economics, University of Ilorin 1998 4) Societe Generale Bank Award for the best Student in the Department of Agricultural Economics, University of Ilorin, Ilorin 1998 5) Agricultural and Rural Management Training Institute (ARMTI) Prize to The best student in Agricultural Economics, University of Ilorin 1998 6) Professor Bola Okuneye Prize for the best student in Farm Management and Accounting, Department of Agricultural Economics 1998 7) Tate and Lyle (Nig) Limited Prize to the best student in the Department of Agricultural Economics, University of Ilorin 1998 8) University of Ilorin Undergraduate Scholarship Award for the best student of Agriculture in 100 Level 1992
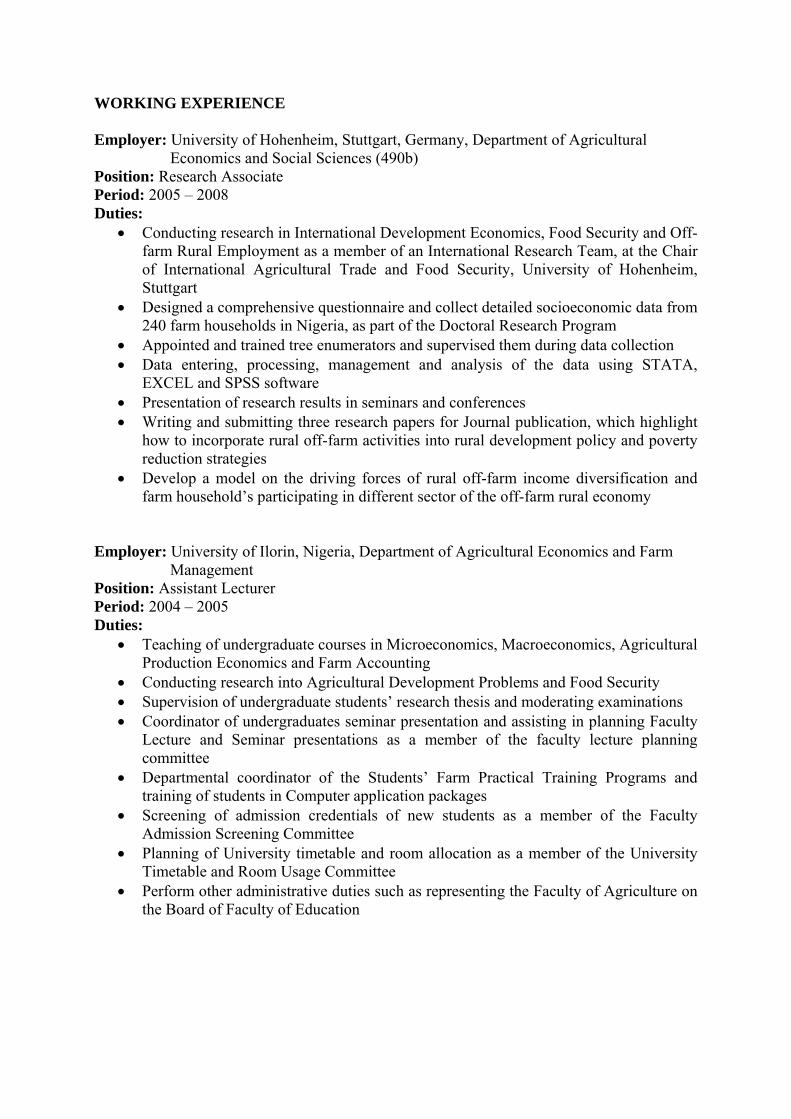
WORKING EXPERIENCE Employer: University of Hohenheim, Stuttgart, Germany, Department of Agricultural Economics and Social Sciences (490b) Position: Research Associate Period: 2005 – 2008 Duties:
• Conducting research in International Development Economics, Food Security and Off-farm Rural Employment as a member of an International Research Team, at the Chair of International Agricultural Trade and Food Security, University of Hohenheim, Stuttgart
• Designed a comprehensive questionnaire and collect detailed socioeconomic data from 240 farm households in Nigeria, as part of the Doctoral Research Program
• Appointed and trained tree enumerators and supervised them during data collection • Data entering, processing, management and analysis of the data using STATA,
EXCEL and SPSS software • Presentation of research results in seminars and conferences • Writing and submitting three research papers for Journal publication, which highlight
how to incorporate rural off-farm activities into rural development policy and poverty reduction strategies
• Develop a model on the driving forces of rural off-farm income diversification and farm household’s participating in different sector of the off-farm rural economy
Employer: University of Ilorin, Nigeria, Department of Agricultural Economics and Farm Management Position: Assistant Lecturer Period: 2004 – 2005 Duties:
• Teaching of undergraduate courses in Microeconomics, Macroeconomics, Agricultural Production Economics and Farm Accounting
• Conducting research into Agricultural Development Problems and Food Security • Supervision of undergraduate students’ research thesis and moderating examinations • Coordinator of undergraduates seminar presentation and assisting in planning Faculty
Lecture and Seminar presentations as a member of the faculty lecture planning committee
• Departmental coordinator of the Students’ Farm Practical Training Programs and training of students in Computer application packages
• Screening of admission credentials of new students as a member of the Faculty Admission Screening Committee
• Planning of University timetable and room allocation as a member of the University Timetable and Room Usage Committee
• Perform other administrative duties such as representing the Faculty of Agriculture on the Board of Faculty of Education

Employer: University of Ilorin, Nigeria, Department of Agricultural Economics and Farm Management Position: Research Assistant Period: 1999 – 2004 Duties:
• Assisting in conducting research into Food Security Problems by collecting primary data from 200 farm households, entering, cleaning and analyzing the data, as part of the University Senate Research Grant Project, 2001
• Assisting in sourcing literature reviews materials and writing of final research reports for submission to the University Senate Research Grant Committee
• Lead Investigator and winner of University Senate Research Grant Project “Farm Size and Resource Productivity Indices of Selected Farms in Kwara State of Nigeria”
• Designed a comprehensive questionnaire and collect detailed socioeconomic data from 180 farm households in Nigeria as part of the research for the degree of master in Agricultural Economics
• Appointed and trained two enumerators and supervised them during data collection for preparation of Master Degree Thesis
• Data entering, processing, management and analysis of the data using MS Excel and SPSS software
• Writing and publishing of three quality research papers from the Master Degree Thesis • Build a model that compares the technical and economic efficiency of large, medium
and small-size farm categories from the M. Sc. Degree Thesis data Employer: National Center for Economic Management and Administration (NCEMA), Ibadan, Nigeria Position: Training Assistant Period: 1998 – 1999 Duties:
• Assisting in organizing training programs/courses for Nigerian public and private sector Administrators and Managers
• Assisting the center’s resource persons in sourcing and preparation of training materials
• Coordinating study tours for course participants as integral part of their training module
CONFERENCES ATTENDED
• Lafia 2004: The 35th Annual Conference of the Agricultural Society of Nigeria (ASN). November 18-21, 2004 at Lafia, Nassarawa state, Nigeria.
• Tropentag 2005: International Conference on Research on Food Security, Natural Resource Management and Rural Development, October 11-13, 2005, University of Hohenheim, Stuttgart, Germany.
• CSAE Conference 2009: Center for the Study of African Economies, Economic Development in Africa, March 22-24, 2009, University of Oxford, United Kingdom.
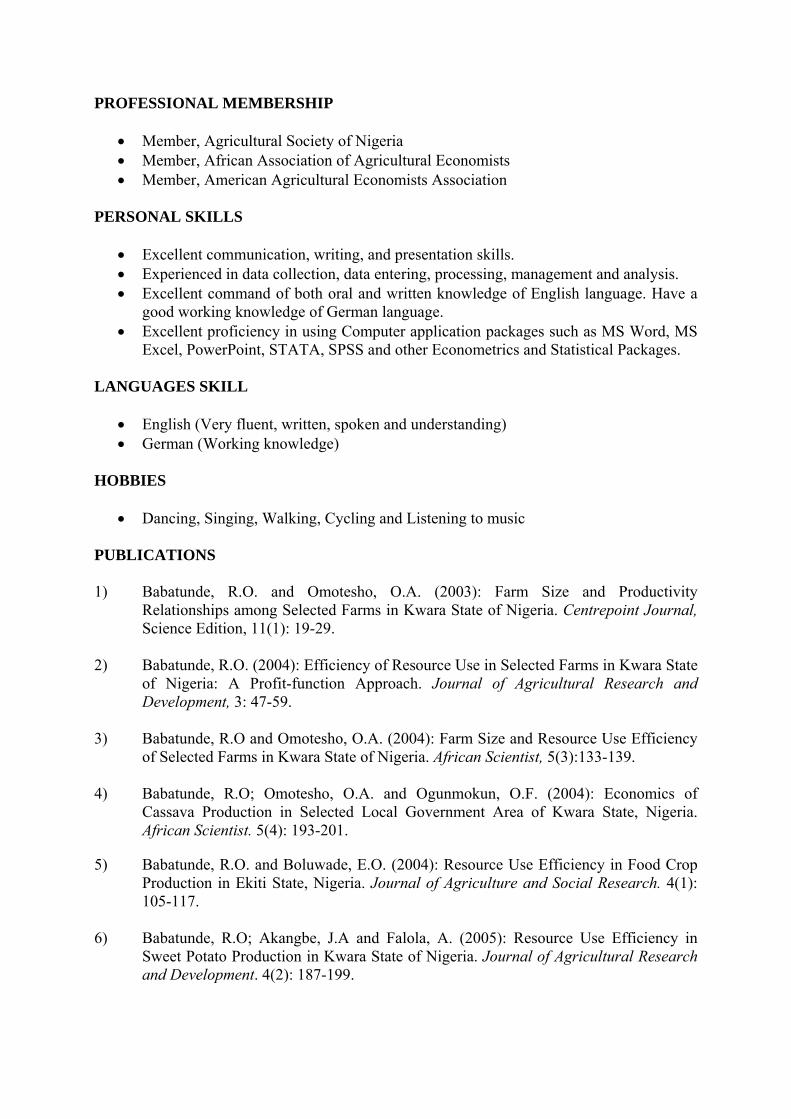
PROFESSIONAL MEMBERSHIP
• Member, Agricultural Society of Nigeria • Member, African Association of Agricultural Economists • Member, American Agricultural Economists Association
PERSONAL SKILLS
• Excellent communication, writing, and presentation skills. • Experienced in data collection, data entering, processing, management and analysis. • Excellent command of both oral and written knowledge of English language. Have a
good working knowledge of German language. • Excellent proficiency in using Computer application packages such as MS Word, MS
Excel, PowerPoint, STATA, SPSS and other Econometrics and Statistical Packages. LANGUAGES SKILL
• English (Very fluent, written, spoken and understanding) • German (Working knowledge)
HOBBIES
• Dancing, Singing, Walking, Cycling and Listening to music PUBLICATIONS 1) Babatunde, R.O. and Omotesho, O.A. (2003): Farm Size and Productivity
Relationships among Selected Farms in Kwara State of Nigeria. Centrepoint Journal, Science Edition, 11(1): 19-29.
2) Babatunde, R.O. (2004): Efficiency of Resource Use in Selected Farms in Kwara State
of Nigeria: A Profit-function Approach. Journal of Agricultural Research and Development, 3: 47-59.
3) Babatunde, R.O and Omotesho, O.A. (2004): Farm Size and Resource Use Efficiency
of Selected Farms in Kwara State of Nigeria. African Scientist, 5(3):133-139. 4) Babatunde, R.O; Omotesho, O.A. and Ogunmokun, O.F. (2004): Economics of
Cassava Production in Selected Local Government Area of Kwara State, Nigeria. African Scientist. 5(4): 193-201.
5) Babatunde, R.O. and Boluwade, E.O. (2004): Resource Use Efficiency in Food Crop Production in Ekiti State, Nigeria. Journal of Agriculture and Social Research. 4(1): 105-117.
6) Babatunde, R.O; Akangbe, J.A and Falola, A. (2005): Resource Use Efficiency in
Sweet Potato Production in Kwara State of Nigeria. Journal of Agricultural Research and Development. 4(2): 187-199.
7) Babatunde, R.O and Oyatoye, E.T.O. (2005): Food Security and Marketing Problems in Nigeria: The Case of Maize Marketing in Kwara State. Paper presented at Tropentag 2005, Conference on International Research on Food Security, Natural Resource Management and Rural Development, October 11-13, University of Hohenheim, Stuttgart, Germany.
8) Orebiyi, J.S; Olorunsanya, E.O; Babatunde, R.O and Fatore, E.O. (2006): Resources
Use Efficiency in Garri Processing in Some Selected Local Government Areas of Ekiti State, Nigeria. International Journal of Agriculture and Rural Development. 7(1): 105-111.
9) Babatunde, R.O; Omotesho, O.A and Sholotan, O. (2007): Socio-Economics Characteristics and Food Security Status of Rural Farming Households in Kwara State, North-Central Nigeria. Pakistan Journal of Nutrition. 6(1): 49-58.
10) Babatunde, R.O; Omotesho, O.A. and Sholotan, O. (2007): Factors Influencing the
Food Security Status of Rural Farming Households in North Central Nigeria. Agricultural Journal. 2(3): 351-357.
11) Babatunde, R.O; Omotesho, A.O; Olorunsanya, E.O and Amadou, A. (2007): Optimal
Crop Combination in Small-size Vegetable Irrigation Farming Scheme: Case Study from Niger Republic. Research Journal of Applied Sciences. 2(5): 617-622.
12) Babatunde, R.O; Olorunsanya, E.O; Orebiyi, J.S and Falola, A. (2007): Optimal Farm
Plan in Sweet Potato Cropping Systems: the Case of Offa and Oyun Local Government Areas of Kwara State, North-Central Nigeria. Agricultural Journal. 2(2): 285-289.
13) Babatunde, R.O; Fakayode, S.B; Olorunsanya, E.O and Gentry, R.A. (2007): Socio-
Economics and Saving Patterns of Cooperative Farmers in South-Western Nigeria.
The Social Sciences. 2(3): 287-292.
14) Babatunde, R.O; Omotesho, O.A; Olorunsanya, E.O and Owotoki, G.M. (2008): Gender Differences in Resources Allocation among Farming Households in Nigeria: Implication for Food Security and Living Standard. European Journal of Social Sciences. 5(4): 161-173.
15) Babatunde, R.O; Omotesho, O. A.; Olorunsanya, E.O; and Owotoki, G.M. (2008):
Determinants of Vulnerability to Food Insecurity: A Gender-based Analysis of Rural Farming Households in Nigeria. Indian Journal of Agricultural Economics. 63(1): 116-125.
_______________________________ Babatunde, Raphael Olanrewaju Hohenheim, 20.04.2009