Embed Size (px)
Citation preview
econstor www.econstor.eu
Der Open-Access-Publikationsserver der ZBW – Leibniz-Informationszentrum WirtschaftThe Open Access Publication Server of the ZBW – Leibniz Information Centre for Economics
Standard-Nutzungsbedingungen:
Die Dokumente auf EconStor dürfen zu eigenen wissenschaftlichenZwecken und zum Privatgebrauch gespeichert und kopiert werden.
Sie dürfen die Dokumente nicht für öffentliche oder kommerzielleZwecke vervielfältigen, öffentlich ausstellen, öffentlich zugänglichmachen, vertreiben oder anderweitig nutzen.
Sofern die Verfasser die Dokumente unter Open-Content-Lizenzen(insbesondere CC-Lizenzen) zur Verfügung gestellt haben sollten,gelten abweichend von diesen Nutzungsbedingungen die in der dortgenannten Lizenz gewährten Nutzungsrechte.
Terms of use:
Documents in EconStor may be saved and copied for yourpersonal and scholarly purposes.
You are not to copy documents for public or commercialpurposes, to exhibit the documents publicly, to make thempublicly available on the internet, or to distribute or otherwiseuse the documents in public.
If the documents have been made available under an OpenContent Licence (especially Creative Commons Licences), youmay exercise further usage rights as specified in the indicatedlicence.
zbw Leibniz-Informationszentrum WirtschaftLeibniz Information Centre for Economics
Danao, Rolando A.
Working Paper
Market power in the Philippine power market
Discussion paper // School of Economics, University of the Philippines, No. 2009,09
Provided in Cooperation with:University of the Philippines School of Economics (UPSE)
Suggested Citation: Danao, Rolando A. (2009) : Market power in the Philippine power market,Discussion paper // School of Economics, University of the Philippines, No. 2009,09
This Version is available at:http://hdl.handle.net/10419/46652
UP School of Economics
Discussion Papers
UPSE Discussion Papers are preliminary versions circulated privately to elicit critical comments. They are protected by Copyright Law (PD No. 49)
and are not for quotation or reprinting without prior approval.
*Professor Emeritus, UP School of Economics
Discussion Paper No. 2009-09 September 2009
Market Power in the Philippine Power Market
by
ROLANDO A. DANAO*
1
MARKET POWER IN THE PHILIPPINE POWER MARKET
by
Rolando A. Danao
Abstract
The Philippine electricity market is in a period of transition as the restructuring provisions of the Electric Power
Industry Reform Act (EPIRA) of 2001 are being implemented. Under current structure, the market is highly
concentrated, indicating the existence of market power. In addition, many plants, including small ones, become
pivotal suppliers during peak hours, creating opportunities for the exercise of market power. Concentration in the
spot market is even more pronounced as a large percentage of uncontracted capacity belongs to the Independent
Power Producers (IPP) with NPC contracts whose energy outputs are under the control of a single company, the
Power Sector Assets and Liabilities Management Corporation. This highlights the urgency of speeding up the
dominance mitigating provision of EPIRA, namely, the appointment of independent IPP administrators who will
trade the IPP outputs in the wholesale market.
2
MARKET POWER IN THE PHILIPPINE POWER MARKET
1. INTRODUCTION
The delivery of electricity has four components: (1) generation at power plants, (2) transmission through
overhead high-voltage wires to stations near population centers, (3) distribution through low-voltage wires to its
users, and (4) retail consisting of metering, billing, and collection of payments1. These components were bundled
and managed as a vertically integrated monopoly because (a) it was argued that integration could lower the costs of
operations and (b) electrical equilibrium2 required by the electrical network could be effectively managed by a
single company. This meant that government regulation was necessary; in fact, the government in many countries
owned the monopoly. Under this setup, the price of electricity was regulated and because electricity was regarded as
a basic commodity which should be accessible to all people, some governments made electricity available with
government subsidy.
This was the model of the electricity industry (with some variations in different countries3) until 1978 when
Chile pioneered the idea of introducing competition in the generation sector. But the first substantial and wide-
ranging reform of the electricity industry took place in 1990 when the United Kingdom split its power stations into
two competing companies, privatized most of the industry, allowed large consumers direct access to the grid,
allowed generators free entry to the industry, opened access to the transmission lines, and established the wholesale
electricity pool. More countries and states soon followed, including, among others, Norway (1990), Argentina
(1992), Singapore (1995), California (1996), Spain (1997), Australia (1998) and the Philippines (2001). Although
reforms varied from country to country in extent and market design, they were all instituted to shift from the
monopolistic to a competitive structure. A common feature of electricity industry restructuring is the establishment
of the wholesale electricity market.
1 It is not unusual to list only three components since retail has traditionally been a part of distribution.
2 Electrical equilibrium means that production and consumption of electricity must be equal at all times.
3 In the Philippines, generation and transmission were operated by the state-controlled National Power Corporation (NPC) while
distribution and retail were operated by privately owned companies such as MERALCO.
3
2. THE WHOLESALE ELECTRICITY MARKET
The wholesale electricity market (or competitive pool) was created to introduce competition in the
generation component of the electricity industry. It is an auction market for the bulk trading of electricity where
generators compete to sell electricity in a centralized pool and distributors and bulk consumers buy from the pool.
The competitive pool may be organized as a gross pool (or mandatory pool), which is to say that all generators are
required to sell all their electricity outputs in the pool and all buyers of electricity buy from the pool (e.g., Argentina
and the Philippines). This market design allows financial bilateral contracts between buyers and sellers as hedges
against the volatility of spot price outcomes but the physical flows of power are all within the pool. In contrast,
buyers and sellers in a net pool (or voluntary pool) can enter into physical bilateral trading of electricity outside the
pool (e.g., Spain and California). But whether the pool is mandatory or voluntary, pool price is determined by
similar auction rules.
2.1. Price Determination in the Wholesale Electricity Market
In a competitive pool, generators compete to supply electricity by submitting price-quantity offers
indicating the amount of electricity they are willing to generate at various prices during a trading period. The Market
Operator (MO) arranges these offers in a supply curve by increasing order of price (called the merit order). The
buyers compete to purchase electricity through price-quantity bids which are arranged by the MO in a demand curve
by decreasing order of price. For each trading period, the MO determines the equilibrium price-quantity pair, being
the intersection of the supply and demand curves. The equilibrium price, also called the market-clearing price, sets
the system market price for the trading period. If the market is designed as a uniform price auction market, as in the
Philippines, then all winning supply offers are paid the system market price.
In some wholesale electricity markets, (e.g., the Philippines) demand side bidding is not developed. In this
case, the Market Operator (MO) forecasts total load 4, say Q0, and uses the vertical line Q = Q0 as the demand curve.
The MO then proceeds to dispatch supply offers in increasing order of price and the last offer dispatched to meet the
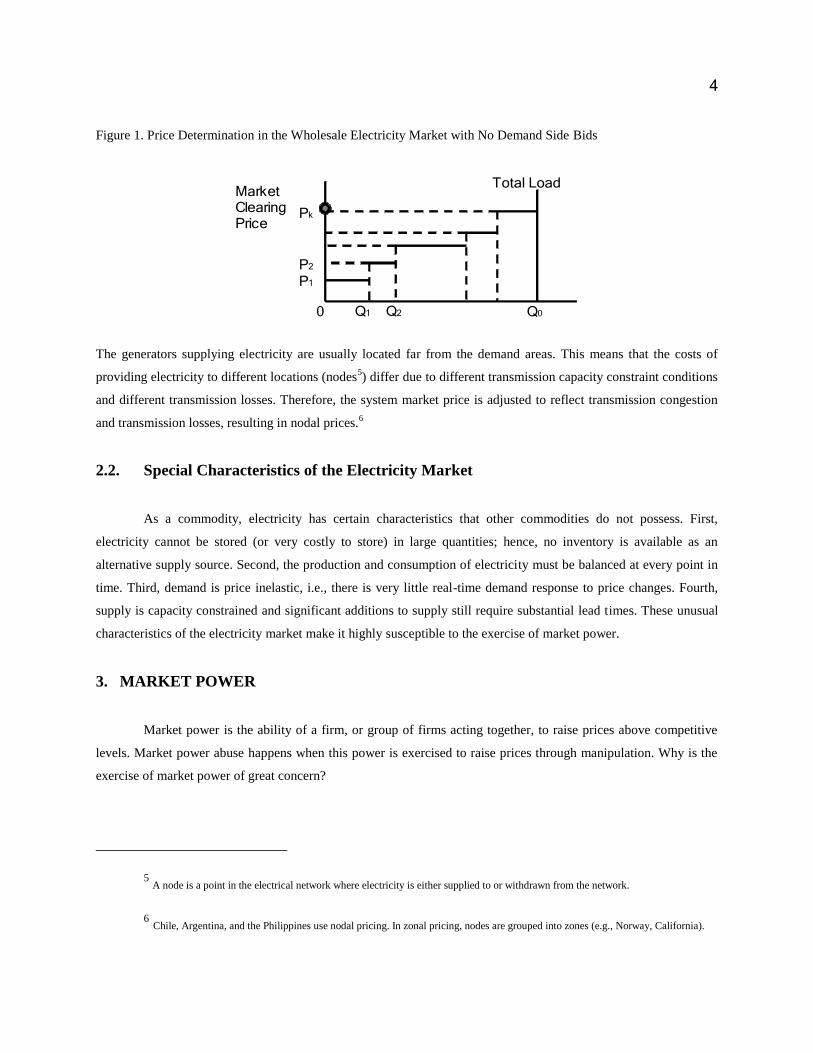
forecasted load sets the system market price. To illustrate (see Figure 1), let the forecasted load be Q0. Starting with
the lowest bid price P1, the MO uses up all quantities offered at price P1. Then he goes to the next lowest price P2
and uses up all quantities offered at P2. He continues in this fashion and ends at the highest price Pk when Q0 is fully
covered. The market-clearing price Pk is the system market price that every seller will receive and every buyer will
pay.
4 “Load” is the electricity industry term for quantity demanded.
4
Figure 1. Price Determination in the Wholesale Electricity Market with No Demand Side Bids
0
MarketClearingPrice
P1
P2
Pk
Q1
Total Load
Q2 Q0
The generators supplying electricity are usually located far from the demand areas. This means that the costs of
providing electricity to different locations (nodes5) differ due to different transmission capacity constraint conditions
and different transmission losses. Therefore, the system market price is adjusted to reflect transmission congestion
and transmission losses, resulting in nodal prices.6
2.2. Special Characteristics of the Electricity Market
As a commodity, electricity has certain characteristics that other commodities do not possess. First,
electricity cannot be stored (or very costly to store) in large quantities; hence, no inventory is available as an
alternative supply source. Second, the production and consumption of electricity must be balanced at every point in
time. Third, demand is price inelastic, i.e., there is very little real-time demand response to price changes. Fourth,
supply is capacity constrained and significant additions to supply still require substantial lead times. These unusual
characteristics of the electricity market make it highly susceptible to the exercise of market power.
3. MARKET POWER
Market power is the ability of a firm, or group of firms acting together, to raise prices above competitive
levels. Market power abuse happens when this power is exercised to raise prices through manipulation. Why is the
exercise of market power of great concern?
5 A node is a point in the electrical network where electricity is either supplied to or withdrawn from the network.
6 Chile, Argentina, and the Philippines use nodal pricing. In zonal pricing, nodes are grouped into zones (e.g., Norway, California).
5
The stakes are enormous as value added in the electricity industry is substantial. For example, in 2005,
value added in the electricity industry in the Philippines was estimated at P148.1 billion which accounted for 2.7%
of the Gross Domestic Product (NSO [2007]; NSCB [2008]). In such a market, any exercise of market power can
result in large wealth transfers from consumers to producers of electricity. Moreover, such transfers can occur within
very short periods of time (see Wolak [2000] for the California example).
3.1. Capacity Withholding: A Strategy for Exercising Market Power
One of the strategies for exercising market power is to reduce the supply of electricity through physical or
economic withholding of capacity. Physical withholding refers to the reduction of the supply of electricity by
declaring an outage or by simply refusing to generate electricity. To prevent physical withholding, some markets
(e.g., the Philippines) prescribe a “must offer” rule which requires every generator to offer its maximum available
capacity. Despite this rule, it is still possible to withhold capacity by economic withholding. This is done by offering
a block of electricity at a price sufficiently high that it will not be dispatched. The effect is, of course, the same as
that of physical withholding.
The following example shows how a generating company can increase its profits by withholding some of
its capacity from the market. Let the total load be 5000 MW. Suppose there are only three generators and their
available capacities and offered prices are as given in Table 1.
Table 1. Generators’ Price-Quantity Offers (Without Capacity Withholding)
Generator Offered Capacity* (MW) Offered Price (Per MWh)
Genco A 3000 P=5000
Genco B 2000 P=6000
Genco C 1000 P=7000
*Without capacity withholding, offered capacity = available capacity.
Assume that it costs Genco A P=4000/MWh to produce electricity and the generators offer all of their available
capacities. The merit order resulting from Table 1 is given by the following dispatch schedule (see Figure 2):
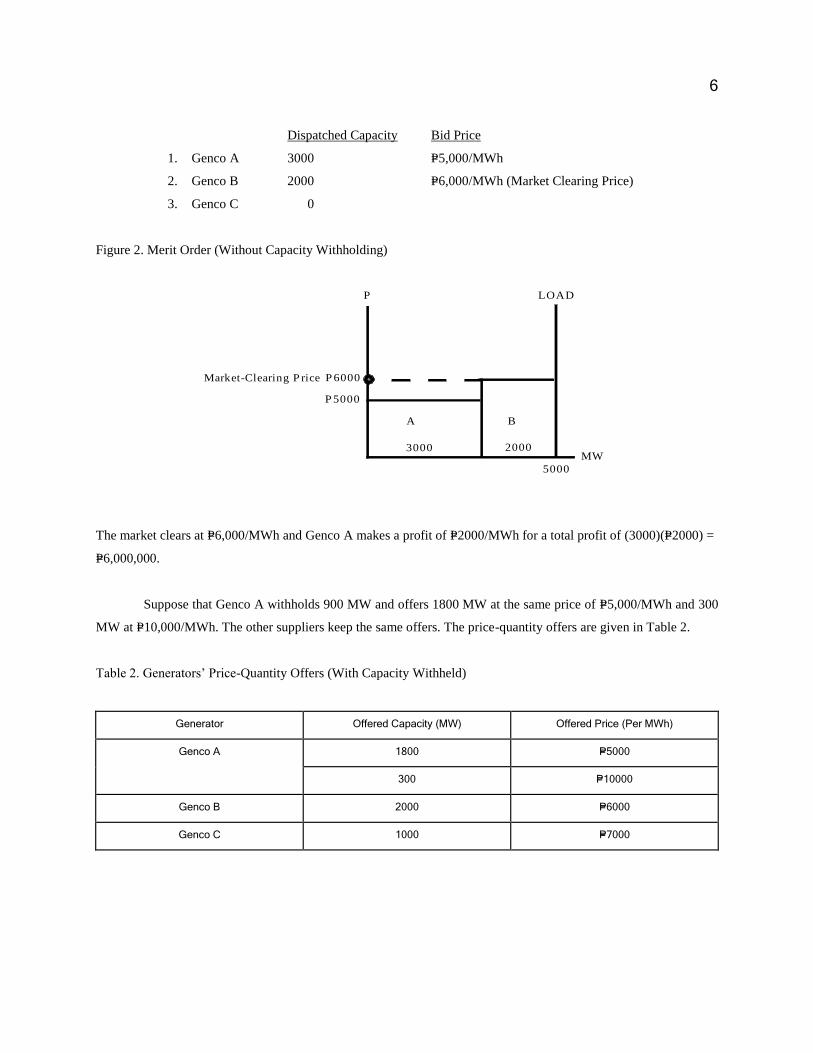
6
Dispatched Capacity Bid Price
1. Genco A 3000 P=5,000/MWh
2. Genco B 2000 P=6,000/MWh (Market Clearing Price)
3. Genco C 0
Figure 2. Merit Order (Without Capacity Withholding)
P 6000
5000
P 5000
P
3000
A
2000
LOAD
MW
B
Market-Clearing P rice
The market clears at P=6,000/MWh and Genco A makes a profit of P=2000/MWh for a total profit of (3000)(P=2000) =
P=6,000,000.
Suppose that Genco A withholds 900 MW and offers 1800 MW at the same price of P=5,000/MWh and 300
MW at P=10,000/MWh. The other suppliers keep the same offers. The price-quantity offers are given in Table 2.
Table 2. Generators’ Price-Quantity Offers (With Capacity Withheld)
Generator Offered Capacity (MW) Offered Price (Per MWh)
Genco A 1800 P=5000
300 P=10000
Genco B 2000 P=6000
Genco C 1000 P=7000
7
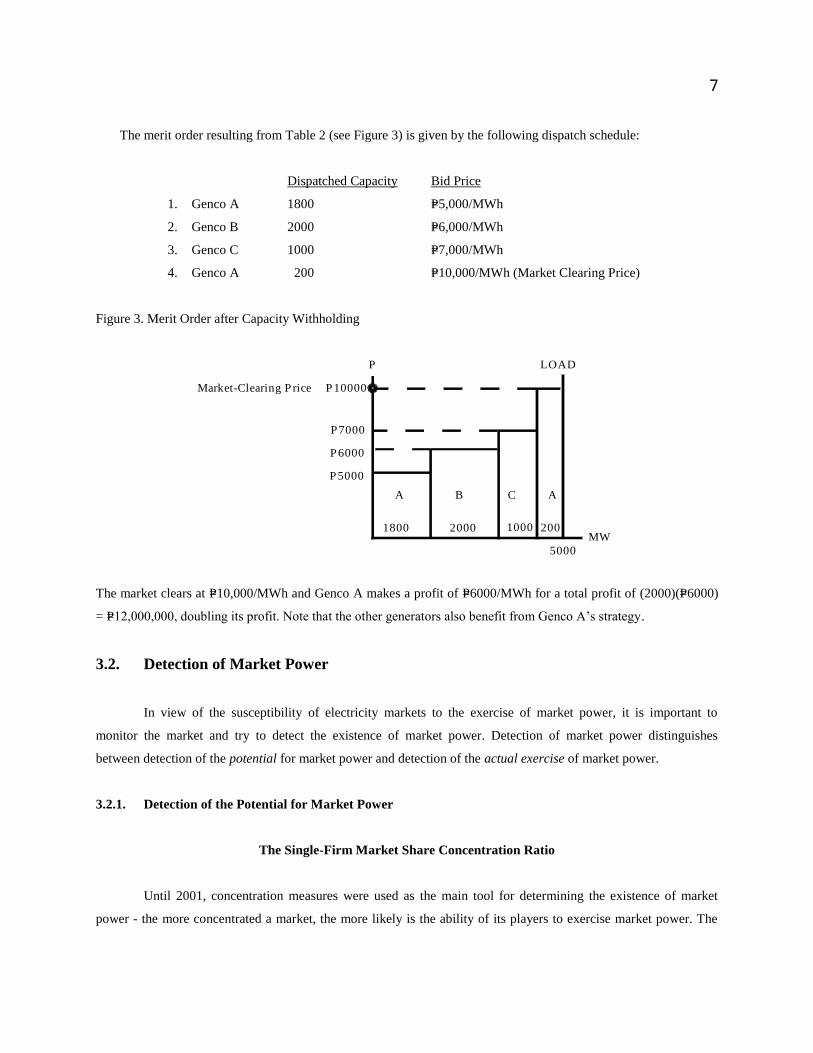
The merit order resulting from Table 2 (see Figure 3) is given by the following dispatch schedule:
Dispatched Capacity Bid Price
1. Genco A 1800 P=5,000/MWh
2. Genco B 2000 P=6,000/MWh
3. Genco C 1000 P=7,000/MWh
4. Genco A 200 P=10,000/MWh (Market Clearing Price)
Figure 3. Merit Order after Capacity Withholding
P 10000
5000
P 5000
P
C
1000
LOAD
MW
P 6000
P 7000
A B A
1800 2002000
Market-Clearing P rice
The market clears at P=10,000/MWh and Genco A makes a profit of P=6000/MWh for a total profit of (2000)(P=6000)
= P=12,000,000, doubling its profit. Note that the other generators also benefit from Genco A’s strategy.
3.2. Detection of Market Power
In view of the susceptibility of electricity markets to the exercise of market power, it is important to
monitor the market and try to detect the existence of market power. Detection of market power distinguishes
between detection of the potential for market power and detection of the actual exercise of market power.
3.2.1. Detection of the Potential for Market Power
The Single-Firm Market Share Concentration Ratio
Until 2001, concentration measures were used as the main tool for determining the existence of market
power - the more concentrated a market, the more likely is the ability of its players to exercise market power. The

8
most concentrated market is, of course, the monopoly which sells 100% of the industry’s output. If the industry has
more than one firm, then the firms’ market shares are used to indicate concentration. The market share of a firm is
called the single-firm market share concentration ratio. The question is: what level of market share should raise
concerns about the existence of market power?
There is no widely accepted critical value for the market share level. The US Federal Energy Regulatory
Commission (FERC), up until 2001, used 20% or less as market shares that indicate lack of market power
(Borenstein [2002]). In 2004, FERC used a market power test based on the market share of uncommitted capacity
and adopted a 20% threshold, i.e., a supplier with less than 20% share of uncommitted capacity passed the test
(FERC [2004]). In the Philippines, the Electric Power Industry Reform Act (EPIRA) provides that “to promote true
market competition and prevent harmful monopoly and market power abuse, the Energy Regulatory Commission
(ERC) shall enforce the following safeguards: (a) No company or related group can own, operate or control more
than 30% of the installed generating capacity of the grid and/or 25% of the national installed generating capacity”.
These benchmarks appear to be large since there is empirical evidence that in electricity markets generation
owners with small market shares (e.g., 6%-8%) have exercised market power (Borenstein [2002]). Later in this
section, we give a hypothetical example of a market where a generator with 10% share of the market has market
power. In fact, data from the Philippine WESM show that during peak hours a small-sized generator can acquire
market power when supply is tight (see Section 5).
The Herfindahl - Hirschman Index
Market concentration does not only depend on the number of firms in the industry but also on the sizes of
the firms. Ten firms with one firm controlling 50% of the market is definitely more concentrated than ten firms of
equal size. Therefore, a good measure of concentration should reflect the number of firms and the distribution of the
sizes of the firms. One such measure is the Herfindahl-Hirschman Index.
Let n be the number of firms in the market and si the percentage share of firm i. Then the Herfindahl -
Hirschman Index (HHI) is defined as
2
1
HHIn
ii
s
For the most concentrated industry, the monopoly, s1 = 100; hence, HHI = 10,000. As the number of firms increases,
HHI decreases. This is easily seen in a market consisting of n firms of equal size. In this case, s1 = s2 = ··· = sn =
100/n and
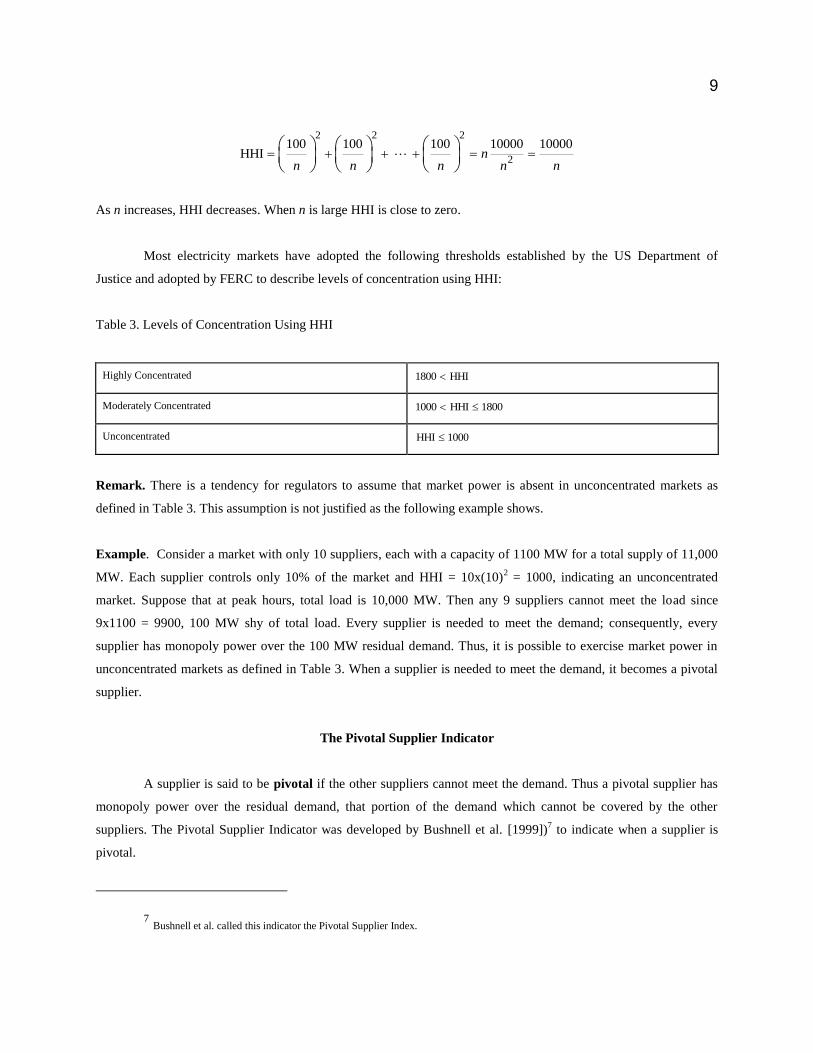
9
2 22
2
100 100 100 10000 10000HHI n
n n n n n
As n increases, HHI decreases. When n is large HHI is close to zero.
Most electricity markets have adopted the following thresholds established by the US Department of
Justice and adopted by FERC to describe levels of concentration using HHI:
Table 3. Levels of Concentration Using HHI
Highly Concentrated 1800 HHI
Moderately Concentrated 1000 HHI 1800
Unconcentrated HHI 1000
Remark. There is a tendency for regulators to assume that market power is absent in unconcentrated markets as
defined in Table 3. This assumption is not justified as the following example shows.
Example. Consider a market with only 10 suppliers, each with a capacity of 1100 MW for a total supply of 11,000
MW. Each supplier controls only 10% of the market and HHI = 10x(10)2 = 1000, indicating an unconcentrated
market. Suppose that at peak hours, total load is 10,000 MW. Then any 9 suppliers cannot meet the load since
9x1100 = 9900, 100 MW shy of total load. Every supplier is needed to meet the demand; consequently, every
supplier has monopoly power over the 100 MW residual demand. Thus, it is possible to exercise market power in
unconcentrated markets as defined in Table 3. When a supplier is needed to meet the demand, it becomes a pivotal
supplier.
The Pivotal Supplier Indicator
A supplier is said to be pivotal if the other suppliers cannot meet the demand. Thus a pivotal supplier has
monopoly power over the residual demand, that portion of the demand which cannot be covered by the other
suppliers. The Pivotal Supplier Indicator was developed by Bushnell et al. [1999])7 to indicate when a supplier is
pivotal.
7 Bushnell et al. called this indicator the Pivotal Supplier Index.
10
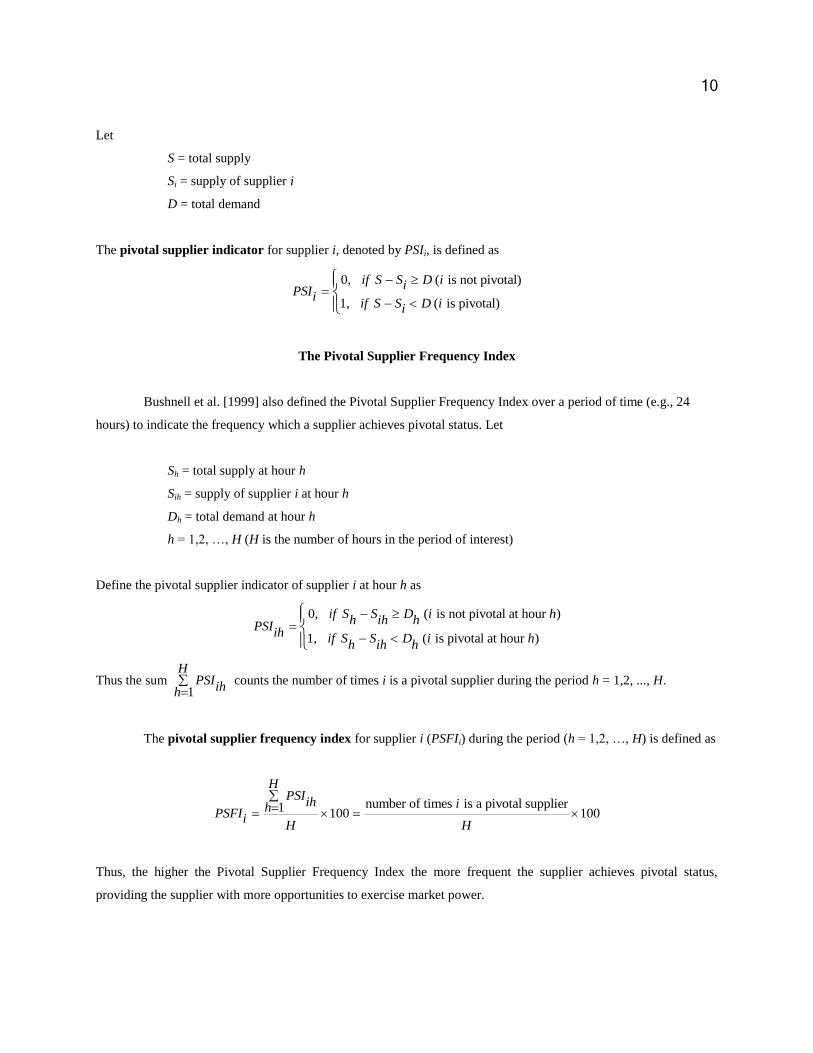
Let
S = total supply
Si = supply of supplier i
D = total demand
The pivotal supplier indicator for supplier i, denoted by PSIi, is defined as
0, ( is not pivotal)
1, ( is pivotal)
if S S D iiPSIi
if S S D ii
The Pivotal Supplier Frequency Index
Bushnell et al. [1999] also defined the Pivotal Supplier Frequency Index over a period of time (e.g., 24
hours) to indicate the frequency which a supplier achieves pivotal status. Let
Sh = total supply at hour h
Sih = supply of supplier i at hour h
Dh = total demand at hour h
h = 1,2, …, H (H is the number of hours in the period of interest)
Define the pivotal supplier indicator of supplier i at hour h as
0, ( is not pivotal at hour )
1, ( is pivotal at hour )
if S S D i hh ih h
PSIih if S S D i h
h ih h
Thus the sum 1
HPSI
ihh
counts the number of times i is a pivotal supplier during the period h = 1,2, ..., H.
The pivotal supplier frequency index for supplier i (PSFIi) during the period (h = 1,2, …, H) is defined as
number of times is a pivotal supplier1 100 100
HPSI
ih ihPSFIiH H
Thus, the higher the Pivotal Supplier Frequency Index the more frequent the supplier achieves pivotal status,
providing the supplier with more opportunities to exercise market power.
11
3.2.2. Detection of the Exercise of Market Power
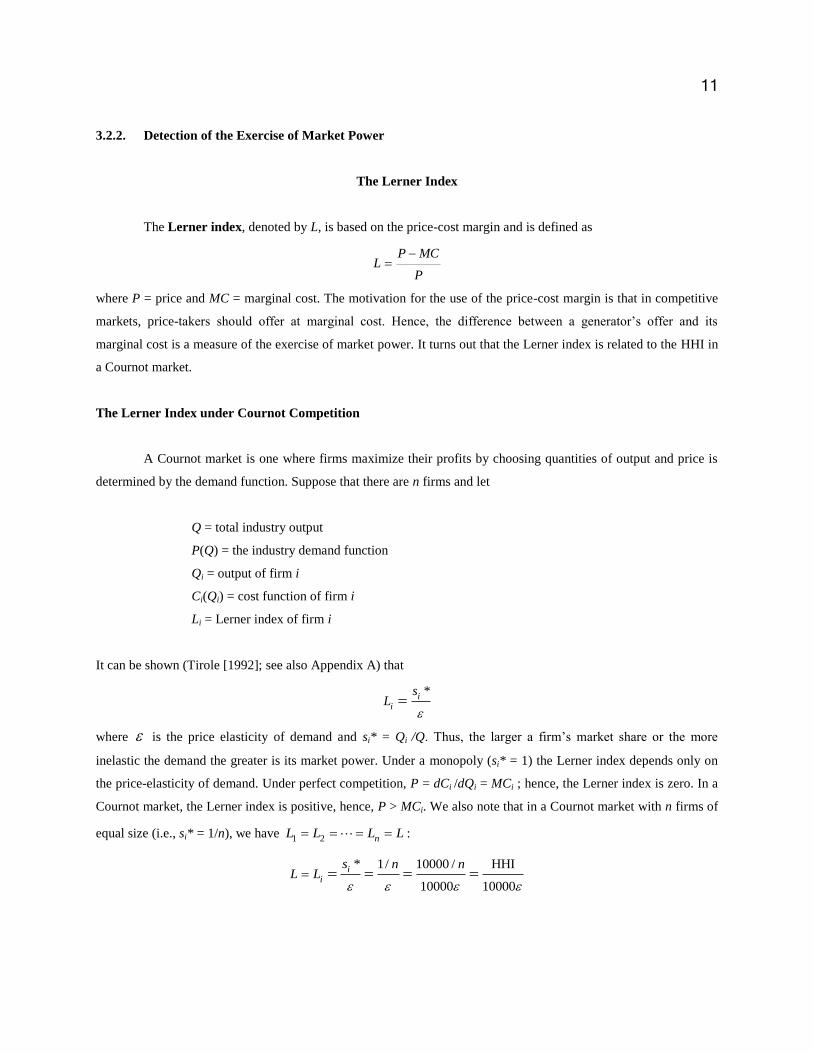
The Lerner Index
The Lerner index, denoted by L, is based on the price-cost margin and is defined as
P MC
LP
where P = price and MC = marginal cost. The motivation for the use of the price-cost margin is that in competitive
markets, price-takers should offer at marginal cost. Hence, the difference between a generator’s offer and its
marginal cost is a measure of the exercise of market power. It turns out that the Lerner index is related to the HHI in
a Cournot market.
The Lerner Index under Cournot Competition
A Cournot market is one where firms maximize their profits by choosing quantities of output and price is
determined by the demand function. Suppose that there are n firms and let
Q = total industry output
P(Q) = the industry demand function
Qi = output of firm i
Ci(Qi) = cost function of firm i
Li = Lerner index of firm i
It can be shown (Tirole [1992]; see also Appendix A) that
*i
i
sL
where is the price elasticity of demand and si* = Qi /Q. Thus, the larger a firm’s market share or the more
inelastic the demand the greater is its market power. Under a monopoly (si* = 1) the Lerner index depends only on
the price-elasticity of demand. Under perfect competition, P = dCi /dQi = MCi ; hence, the Lerner index is zero. In a
Cournot market, the Lerner index is positive, hence, P > MCi. We also note that in a Cournot market with n firms of
equal size (i.e., si* = 1/n), we have 1 2 nL L L L :
* 1/ 10000 / HHI
10000 10000
ii
s n nL L
12
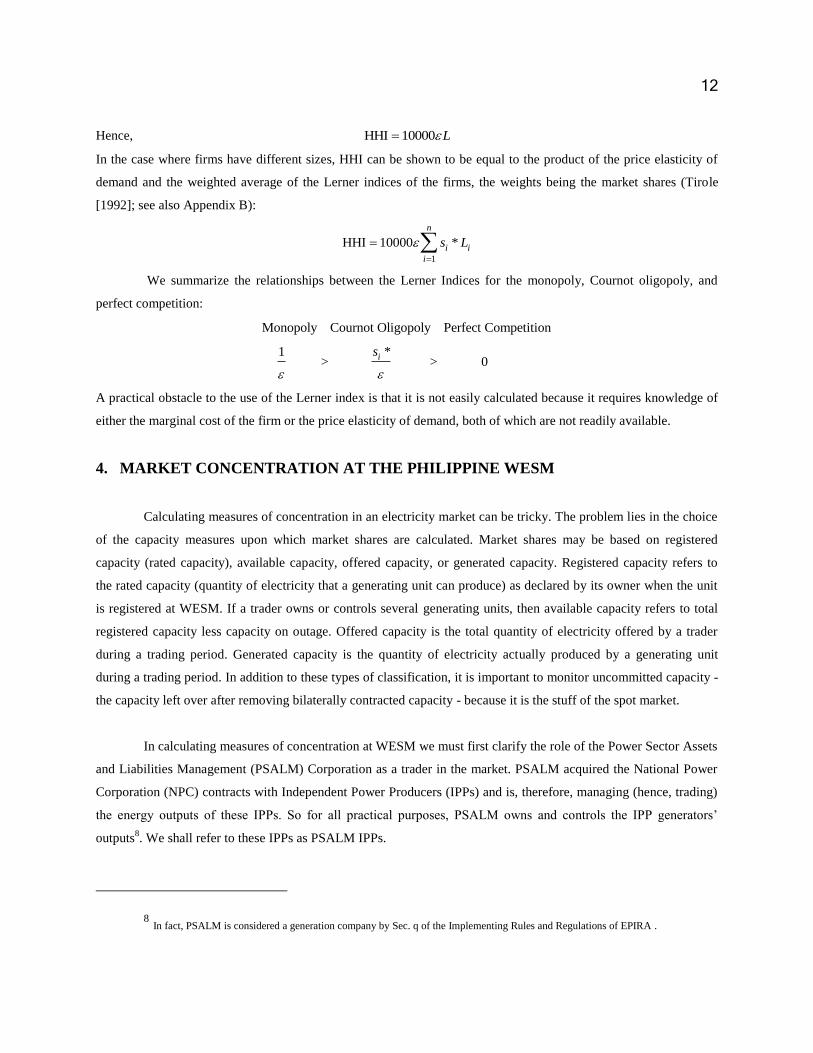
Hence, HHI 10000 L
In the case where firms have different sizes, HHI can be shown to be equal to the product of the price elasticity of
demand and the weighted average of the Lerner indices of the firms, the weights being the market shares (Tirole
[1992]; see also Appendix B):
1
HHI 10000 *
n
i i
i
s L
We summarize the relationships between the Lerner Indices for the monopoly, Cournot oligopoly, and
perfect competition:
Monopoly Cournot Oligopoly Perfect Competition
*1> > 0 is
A practical obstacle to the use of the Lerner index is that it is not easily calculated because it requires knowledge of
either the marginal cost of the firm or the price elasticity of demand, both of which are not readily available.
4. MARKET CONCENTRATION AT THE PHILIPPINE WESM
Calculating measures of concentration in an electricity market can be tricky. The problem lies in the choice
of the capacity measures upon which market shares are calculated. Market shares may be based on registered
capacity (rated capacity), available capacity, offered capacity, or generated capacity. Registered capacity refers to
the rated capacity (quantity of electricity that a generating unit can produce) as declared by its owner when the unit
is registered at WESM. If a trader owns or controls several generating units, then available capacity refers to total
registered capacity less capacity on outage. Offered capacity is the total quantity of electricity offered by a trader
during a trading period. Generated capacity is the quantity of electricity actually produced by a generating unit
during a trading period. In addition to these types of classification, it is important to monitor uncommitted capacity -
the capacity left over after removing bilaterally contracted capacity - because it is the stuff of the spot market.
In calculating measures of concentration at WESM we must first clarify the role of the Power Sector Assets
and Liabilities Management (PSALM) Corporation as a trader in the market. PSALM acquired the National Power
Corporation (NPC) contracts with Independent Power Producers (IPPs) and is, therefore, managing (hence, trading)
the energy outputs of these IPPs. So for all practical purposes, PSALM owns and controls the IPP generators’
outputs8. We shall refer to these IPPs as PSALM IPPs.
8 In fact, PSALM is considered a generation company by Sec. q of the Implementing Rules and Regulations of EPIRA .
13
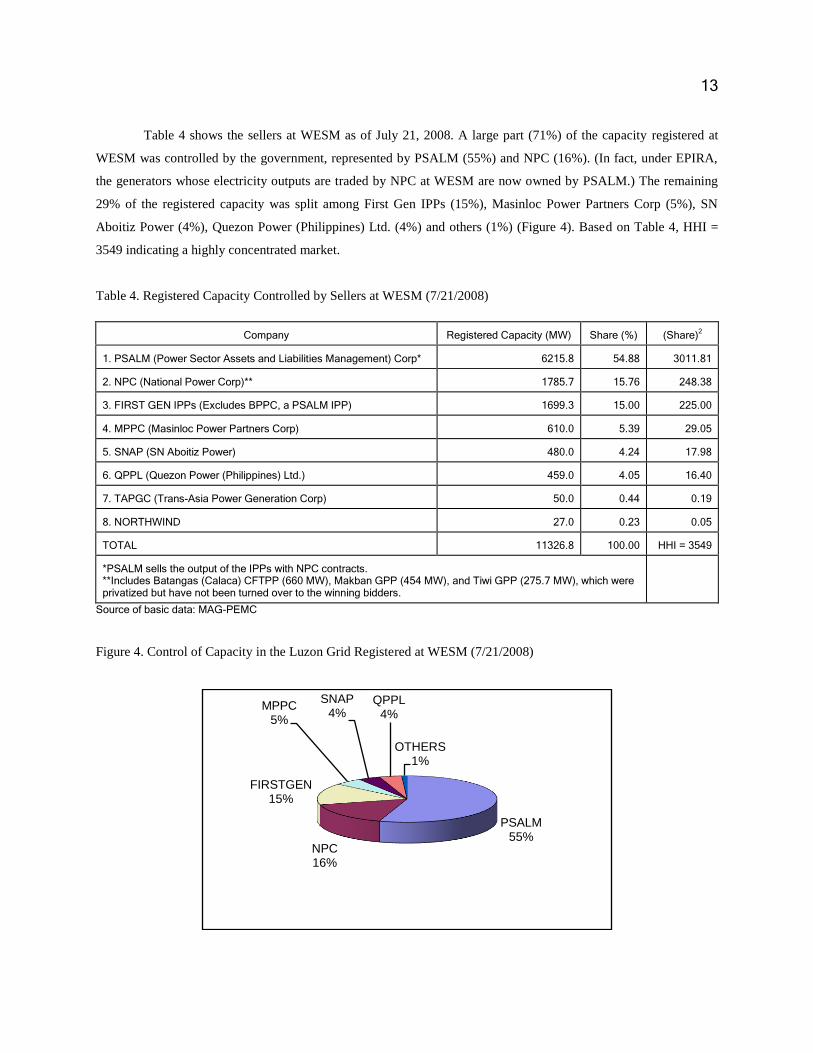
Table 4 shows the sellers at WESM as of July 21, 2008. A large part (71%) of the capacity registered at
WESM was controlled by the government, represented by PSALM (55%) and NPC (16%). (In fact, under EPIRA,
the generators whose electricity outputs are traded by NPC at WESM are now owned by PSALM.) The remaining
29% of the registered capacity was split among First Gen IPPs (15%), Masinloc Power Partners Corp (5%), SN
Aboitiz Power (4%), Quezon Power (Philippines) Ltd. (4%) and others (1%) (Figure 4). Based on Table 4, HHI =
3549 indicating a highly concentrated market.
Table 4. Registered Capacity Controlled by Sellers at WESM (7/21/2008)
Company Registered Capacity (MW) Share (%) (Share)2
1. PSALM (Power Sector Assets and Liabilities Management) Corp* 6215.8 54.88 3011.81
2. NPC (National Power Corp)** 1785.7 15.76 248.38
3. FIRST GEN IPPs (Excludes BPPC, a PSALM IPP) 1699.3 15.00 225.00
4. MPPC (Masinloc Power Partners Corp) 610.0 5.39 29.05
5. SNAP (SN Aboitiz Power) 480.0 4.24 17.98
6. QPPL (Quezon Power (Philippines) Ltd.) 459.0 4.05 16.40
7. TAPGC (Trans-Asia Power Generation Corp) 50.0 0.44 0.19
8. NORTHWIND 27.0 0.23 0.05
TOTAL 11326.8 100.00 HHI = 3549
*PSALM sells the output of the IPPs with NPC contracts. **Includes Batangas (Calaca) CFTPP (660 MW), Makban GPP (454 MW), and Tiwi GPP (275.7 MW), which were privatized but have not been turned over to the winning bidders.
Source of basic data: MAG-PEMC
Figure 4. Control of Capacity in the Luzon Grid Registered at WESM (7/21/2008)
PSALM55%
NPC16%
FIRSTGEN15%
MPPC5%
SNAP4%
QPPL4%
OTHERS1%
14
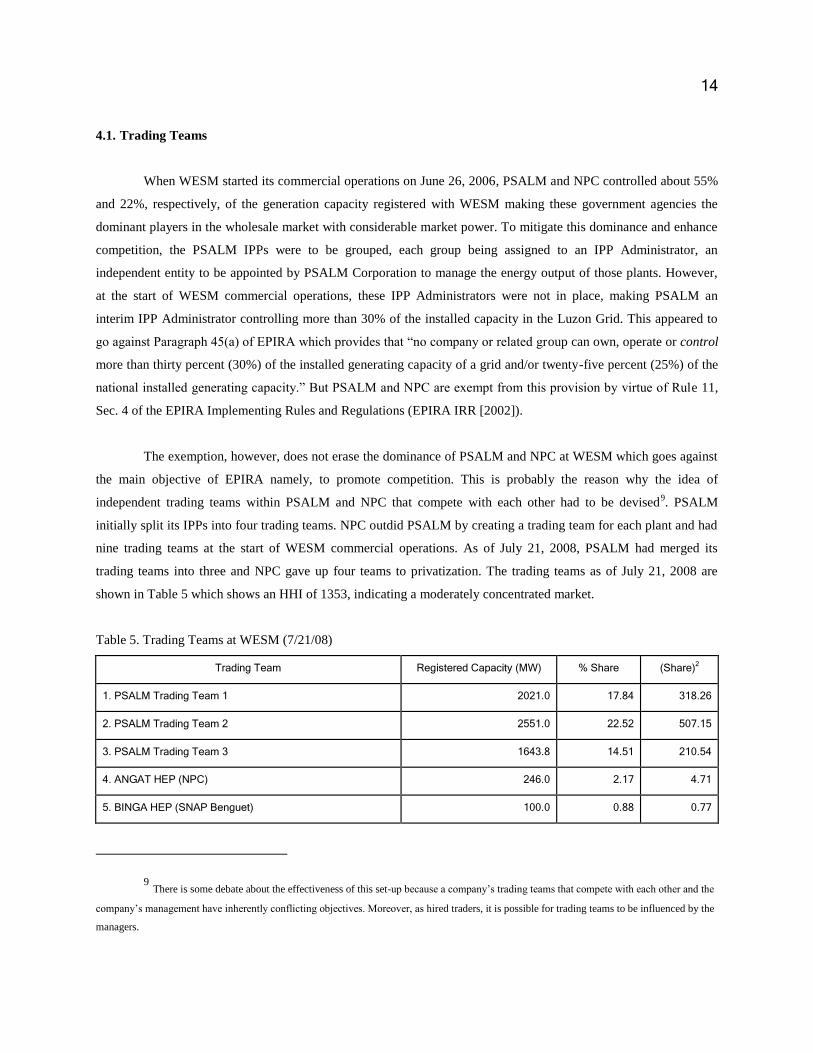
4.1. Trading Teams
When WESM started its commercial operations on June 26, 2006, PSALM and NPC controlled about 55%
and 22%, respectively, of the generation capacity registered with WESM making these government agencies the
dominant players in the wholesale market with considerable market power. To mitigate this dominance and enhance
competition, the PSALM IPPs were to be grouped, each group being assigned to an IPP Administrator, an
independent entity to be appointed by PSALM Corporation to manage the energy output of those plants. However,
at the start of WESM commercial operations, these IPP Administrators were not in place, making PSALM an
interim IPP Administrator controlling more than 30% of the installed capacity in the Luzon Grid. This appeared to
go against Paragraph 45(a) of EPIRA which provides that “no company or related group can own, operate or control
more than thirty percent (30%) of the installed generating capacity of a grid and/or twenty-five percent (25%) of the
national installed generating capacity.” But PSALM and NPC are exempt from this provision by virtue of Rule 11,
Sec. 4 of the EPIRA Implementing Rules and Regulations (EPIRA IRR [2002]).
The exemption, however, does not erase the dominance of PSALM and NPC at WESM which goes against
the main objective of EPIRA namely, to promote competition. This is probably the reason why the idea of
independent trading teams within PSALM and NPC that compete with each other had to be devised9. PSALM
initially split its IPPs into four trading teams. NPC outdid PSALM by creating a trading team for each plant and had
nine trading teams at the start of WESM commercial operations. As of July 21, 2008, PSALM had merged its
trading teams into three and NPC gave up four teams to privatization. The trading teams as of July 21, 2008 are
shown in Table 5 which shows an HHI of 1353, indicating a moderately concentrated market.
Table 5. Trading Teams at WESM (7/21/08)
Trading Team Registered Capacity (MW) % Share (Share)2
1. PSALM Trading Team 1 2021.0 17.84 318.26
2. PSALM Trading Team 2 2551.0 22.52 507.15
3. PSALM Trading Team 3 1643.8 14.51 210.54
4. ANGAT HEP (NPC) 246.0 2.17 4.71
5. BINGA HEP (SNAP Benguet) 100.0 0.88 0.77
9 There is some debate about the effectiveness of this set-up because a company’s trading teams that compete with each other and the
company’s management have inherently conflicting objectives. Moreover, as hired traders, it is possible for trading teams to be influenced by the
managers.
15
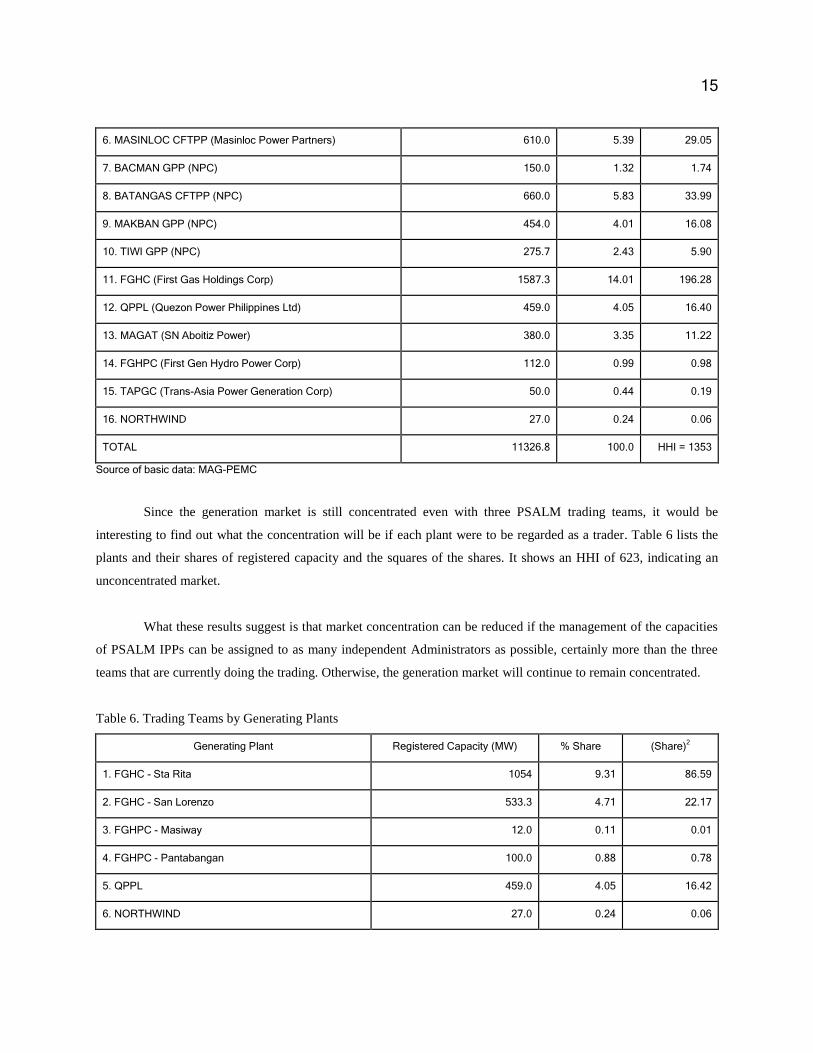
6. MASINLOC CFTPP (Masinloc Power Partners) 610.0 5.39 29.05
7. BACMAN GPP (NPC) 150.0 1.32 1.74
8. BATANGAS CFTPP (NPC) 660.0 5.83 33.99
9. MAKBAN GPP (NPC) 454.0 4.01 16.08
10. TIWI GPP (NPC) 275.7 2.43 5.90
11. FGHC (First Gas Holdings Corp) 1587.3 14.01 196.28
12. QPPL (Quezon Power Philippines Ltd) 459.0 4.05 16.40
13. MAGAT (SN Aboitiz Power) 380.0 3.35 11.22
14. FGHPC (First Gen Hydro Power Corp) 112.0 0.99 0.98
15. TAPGC (Trans-Asia Power Generation Corp) 50.0 0.44 0.19
16. NORTHWIND 27.0 0.24 0.06
TOTAL 11326.8 100.0 HHI = 1353
Source of basic data: MAG-PEMC
Since the generation market is still concentrated even with three PSALM trading teams, it would be
interesting to find out what the concentration will be if each plant were to be regarded as a trader. Table 6 lists the
plants and their shares of registered capacity and the squares of the shares. It shows an HHI of 623, indicating an
unconcentrated market.
What these results suggest is that market concentration can be reduced if the management of the capacities
of PSALM IPPs can be assigned to as many independent Administrators as possible, certainly more than the three
teams that are currently doing the trading. Otherwise, the generation market will continue to remain concentrated.
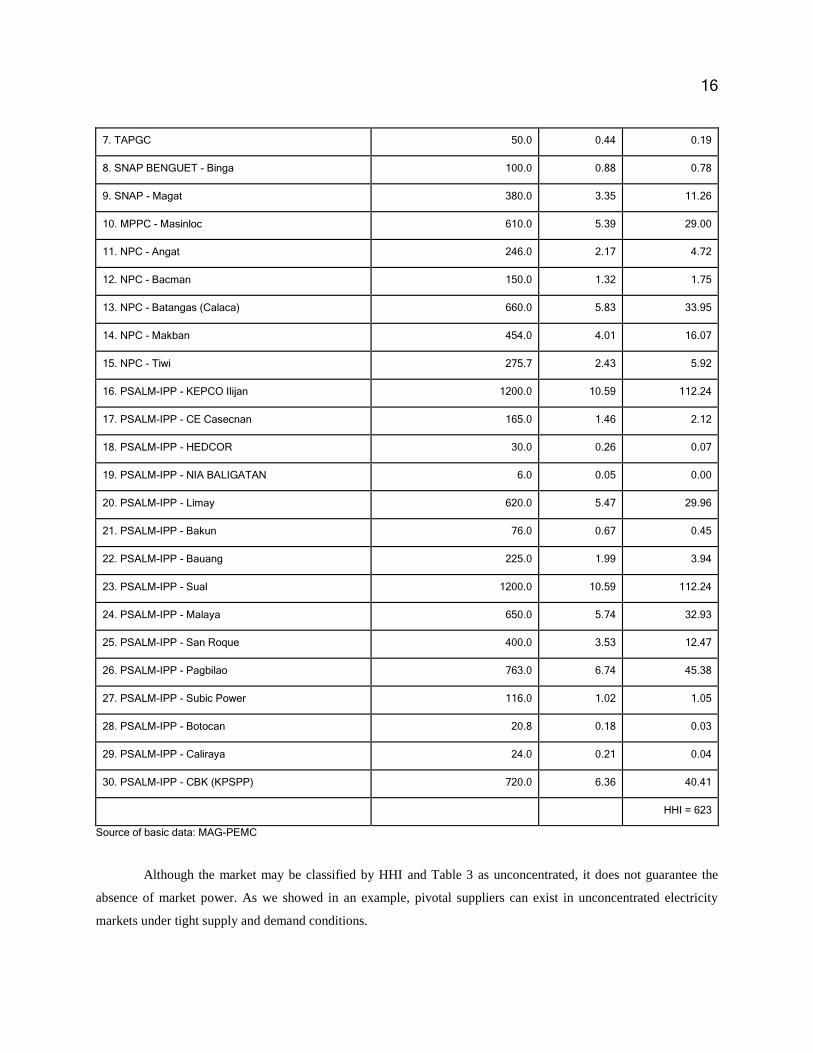
Table 6. Trading Teams by Generating Plants
Generating Plant Registered Capacity (MW) % Share (Share)2
1. FGHC - Sta Rita 1054 9.31 86.59
2. FGHC - San Lorenzo 533.3 4.71 22.17
3. FGHPC - Masiway 12.0 0.11 0.01
4. FGHPC - Pantabangan 100.0 0.88 0.78
5. QPPL 459.0 4.05 16.42
6. NORTHWIND 27.0 0.24 0.06
16
7. TAPGC 50.0 0.44 0.19
8. SNAP BENGUET - Binga 100.0 0.88 0.78
9. SNAP - Magat 380.0 3.35 11.26
10. MPPC - Masinloc 610.0 5.39 29.00
11. NPC - Angat 246.0 2.17 4.72
12. NPC - Bacman 150.0 1.32 1.75
13. NPC - Batangas (Calaca) 660.0 5.83 33.95
14. NPC - Makban 454.0 4.01 16.07
15. NPC - Tiwi 275.7 2.43 5.92
16. PSALM-IPP - KEPCO Ilijan 1200.0 10.59 112.24
17. PSALM-IPP - CE Casecnan 165.0 1.46 2.12
18. PSALM-IPP - HEDCOR 30.0 0.26 0.07
19. PSALM-IPP - NIA BALIGATAN 6.0 0.05 0.00
20. PSALM-IPP - Limay 620.0 5.47 29.96
21. PSALM-IPP - Bakun 76.0 0.67 0.45
22. PSALM-IPP - Bauang 225.0 1.99 3.94
23. PSALM-IPP - Sual 1200.0 10.59 112.24
24. PSALM-IPP - Malaya 650.0 5.74 32.93
25. PSALM-IPP - San Roque 400.0 3.53 12.47
26. PSALM-IPP - Pagbilao 763.0 6.74 45.38
27. PSALM-IPP - Subic Power 116.0 1.02 1.05
28. PSALM-IPP - Botocan 20.8 0.18 0.03
29. PSALM-IPP - Caliraya 24.0 0.21 0.04
30. PSALM-IPP - CBK (KPSPP) 720.0 6.36 40.41
HHI = 623
Source of basic data: MAG-PEMC
Although the market may be classified by HHI and Table 3 as unconcentrated, it does not guarantee the
absence of market power. As we showed in an example, pivotal suppliers can exist in unconcentrated electricity
markets under tight supply and demand conditions.
17
5. PIVOTAL SUPPLIERS
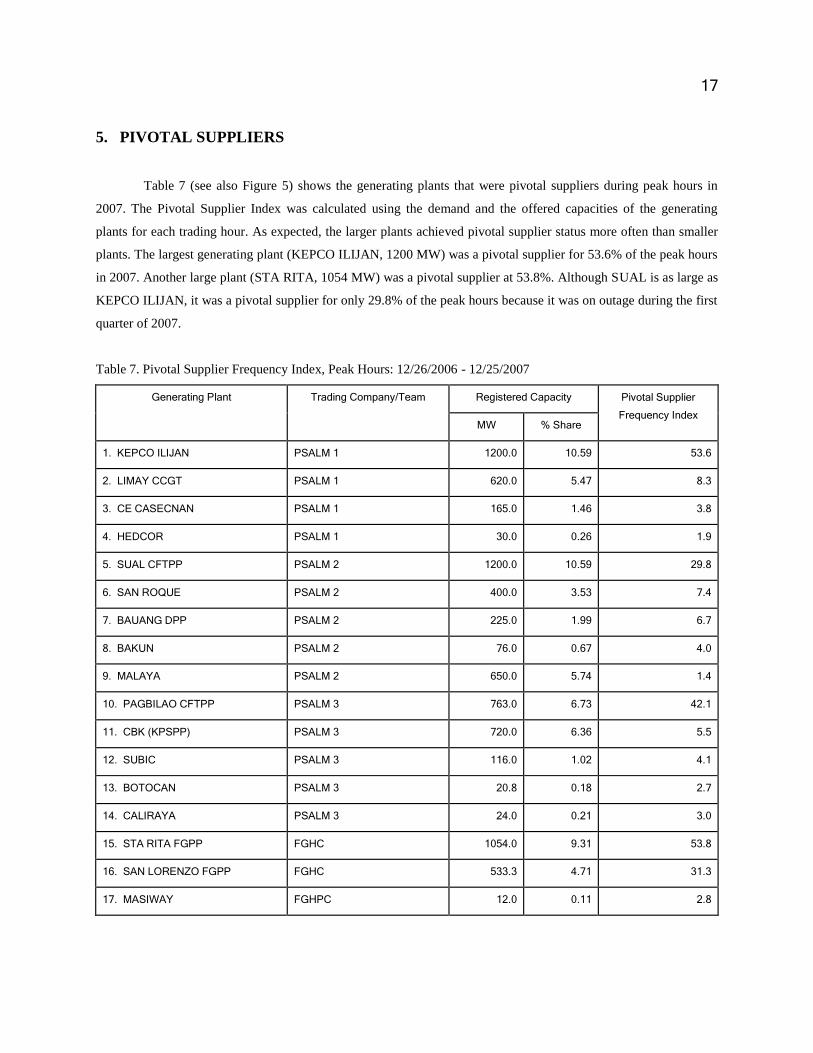
Table 7 (see also Figure 5) shows the generating plants that were pivotal suppliers during peak hours in
2007. The Pivotal Supplier Index was calculated using the demand and the offered capacities of the generating
plants for each trading hour. As expected, the larger plants achieved pivotal supplier status more often than smaller
plants. The largest generating plant (KEPCO ILIJAN, 1200 MW) was a pivotal supplier for 53.6% of the peak hours
in 2007. Another large plant (STA RITA, 1054 MW) was a pivotal supplier at 53.8%. Although SUAL is as large as
KEPCO ILIJAN, it was a pivotal supplier for only 29.8% of the peak hours because it was on outage during the first
quarter of 2007.
Table 7. Pivotal Supplier Frequency Index, Peak Hours: 12/26/2006 - 12/25/2007
Generating Plant Trading Company/Team Registered Capacity Pivotal Supplier
Frequency Index MW % Share
1. KEPCO ILIJAN PSALM 1 1200.0 10.59 53.6
2. LIMAY CCGT PSALM 1 620.0 5.47 8.3
3. CE CASECNAN PSALM 1 165.0 1.46 3.8
4. HEDCOR PSALM 1 30.0 0.26 1.9
5. SUAL CFTPP PSALM 2 1200.0 10.59 29.8
6. SAN ROQUE PSALM 2 400.0 3.53 7.4
7. BAUANG DPP PSALM 2 225.0 1.99 6.7
8. BAKUN PSALM 2 76.0 0.67 4.0
9. MALAYA PSALM 2 650.0 5.74 1.4
10. PAGBILAO CFTPP PSALM 3 763.0 6.73 42.1
11. CBK (KPSPP) PSALM 3 720.0 6.36 5.5
12. SUBIC PSALM 3 116.0 1.02 4.1
13. BOTOCAN PSALM 3 20.8 0.18 2.7
14. CALIRAYA PSALM 3 24.0 0.21 3.0
15. STA RITA FGPP FGHC 1054.0 9.31 53.8
16. SAN LORENZO FGPP FGHC 533.3 4.71 31.3
17. MASIWAY FGHPC 12.0 0.11 2.8
18
18. PANTABANGAN FGHPC 100.0 0.88 4.8
19. QPPL QUEZON POWER 459.0 4.05 28.2
20. MAKBAN GPP NPCA 454.0 4.01 21.1
21. TIWI GPP NPCA 275.7 2.43 7.5
22. BATANGAS CFTPP NPCA 660.0 5.83 18.9
23. MASINLOC NPCB 610.0 5.39 19.3
24. ANGAT NPC 246.0 2.17 4.8
25. BACMAN NPC 150.0 1.32 1.2
26. BINGA NPC/SNAPBENGT 100.0 0.88 3.7
27. MAGAT SNAPC 380.0 3.35 11.5
28. TRANS-ASIA TRANS-ASIA 50.0 0.44 2.8
A Privatized but has not been turned over to the winning bidder as of 8/26/08.
B Turned over to Masinloc Partners on 4/16/08.
C Turned over to SNAP on 4/25/07.
Source of basic data: MAG-PEMC
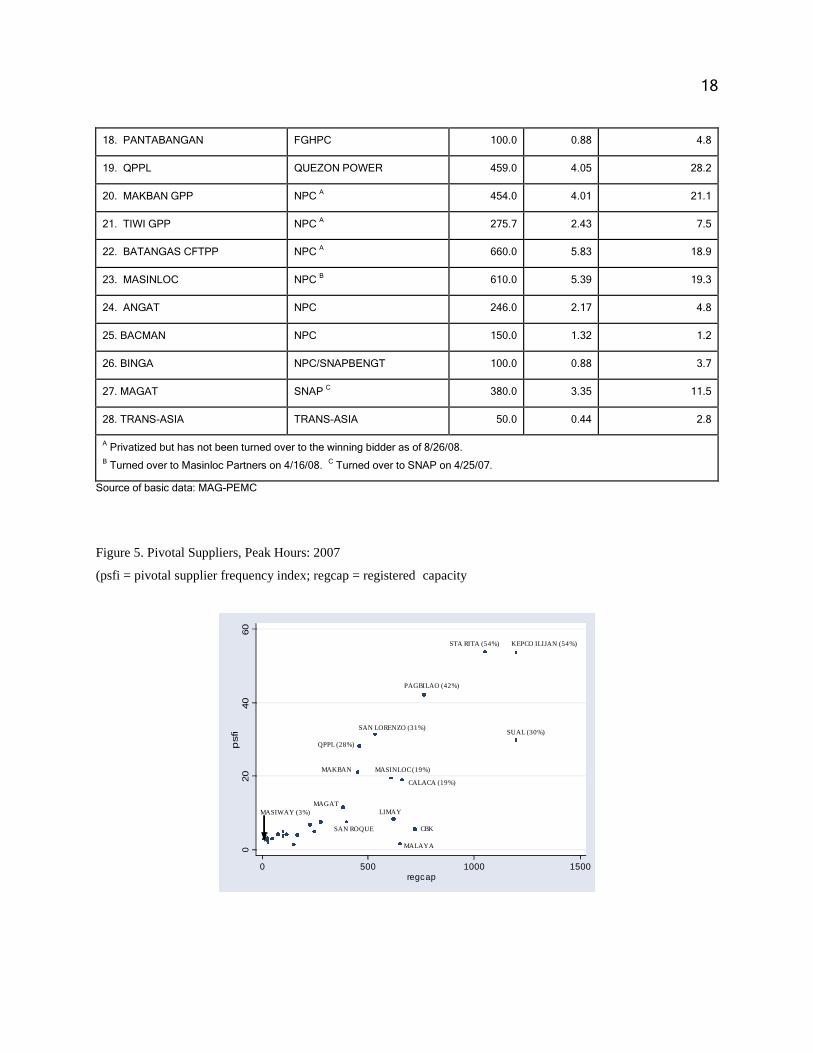
Figure 5. Pivotal Suppliers, Peak Hours: 2007
(psfi = pivotal supplier frequency index; regcap = registered capacity
020
40
60
psfi
0 500 1000 1500regcap
QPPL (28%)
SUAL (30%)
STA RITA (54%) KEPCO ILIJAN (54%)
PAGBILAO (42%)
SAN ROQUE
SAN LORENZO (31%)
CBK
MALAYA
LIMAY
MASINLOC (19%)MAKBAN
MASIWAY (3%)
MAGAT
CALACA (19%)
19
What is worth noting in Figure 5 is that small generators (e.g., MASIWAY, 12 MW) became pivotal
suppliers at certain times during peak hours. This indicates tight demand and supply conditions and confirms the
observation that small suppliers can acquire market power under these conditions (Borenstein [2000]). This raises
the following questions: Why is offered capacity barely enough to meet the demand? Is offered capacity very much
less than available capacity? If so, what is the size of the gap between available capacity and offered capacity?
6. CAPACITY GAPS
We adopt the term “capacity gap” used by WESM to refer to the difference between available capacity and
offered capacity. If a plant has 1000 MW of available capacity and offers only 600 MW to the market, then the
capacity gap is 400 MW. This is an important issue in wholesale electricity markets because capacity withholding,
as shown by the example in Section 3.1, can be used to reduce supply and raise the price of electricity. In fact,
empirical evidence of this behavior exists. For example, Wolak and Patrick [1997] provide evidence that capacity
withholding by the two dominant generators in the England and Wales market resulted in price increases. Joskow
and Kahn [2001] find evidence that withholding of capacity to drive up price occurred in the California market
during Summer 2000.
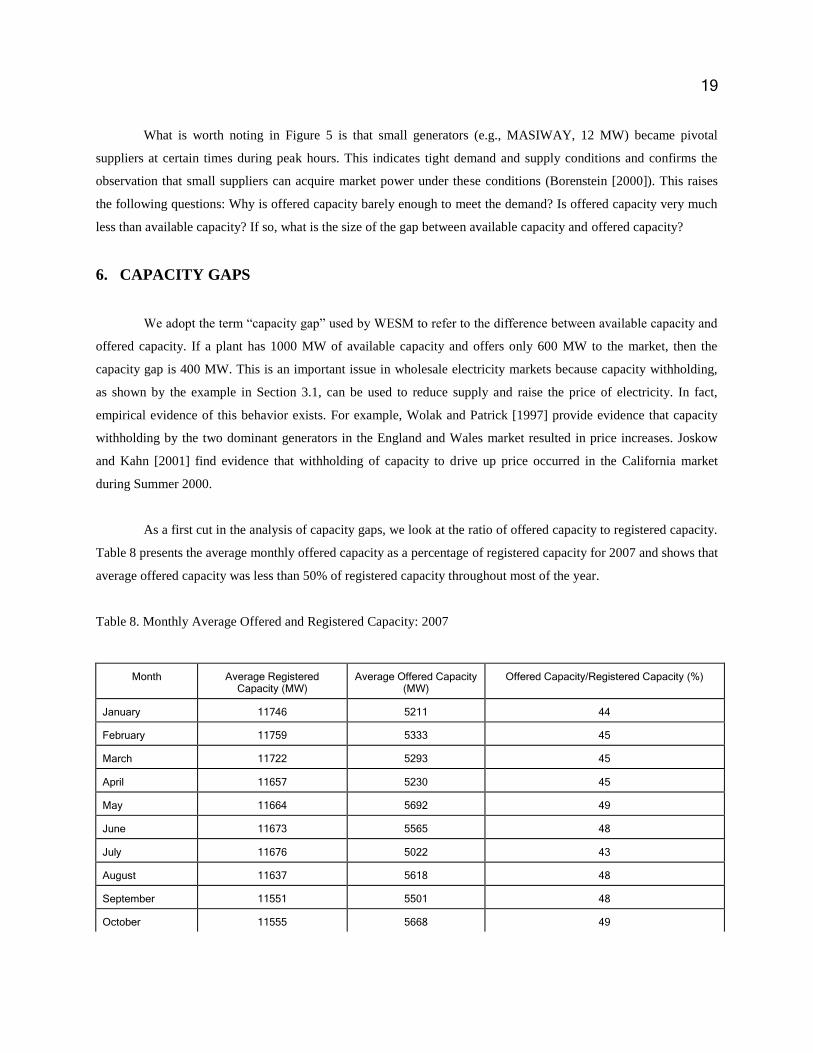
As a first cut in the analysis of capacity gaps, we look at the ratio of offered capacity to registered capacity.
Table 8 presents the average monthly offered capacity as a percentage of registered capacity for 2007 and shows that
average offered capacity was less than 50% of registered capacity throughout most of the year.
Table 8. Monthly Average Offered and Registered Capacity: 2007
Month Average Registered Capacity (MW)
Average Offered Capacity (MW)
Offered Capacity/Registered Capacity (%)
January 11746 5211 44
February 11759 5333 45
March 11722 5293 45
April 11657 5230 45
May 11664 5692 49
June 11673 5565 48
July 11676 5022 43
August 11637 5618 48
September 11551 5501 48
October 11555 5668 49
20
November 11502 5739 50
December 11491 5453 47
Source: MAG-PEMC
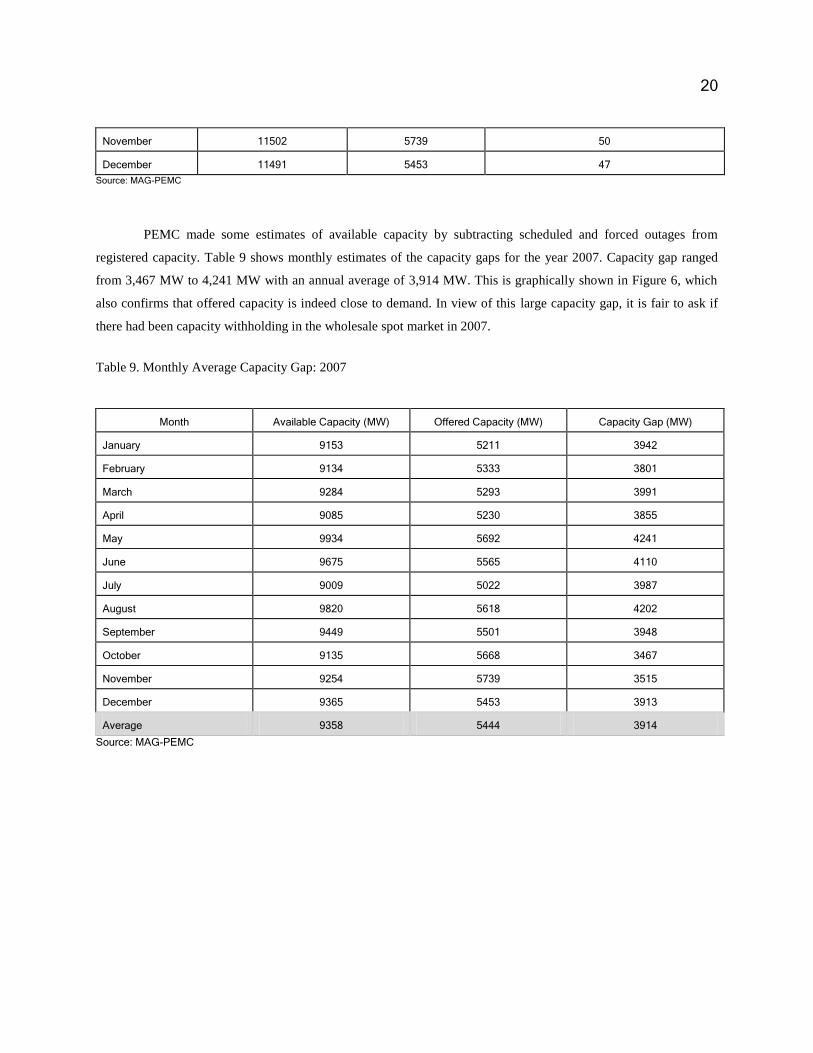
PEMC made some estimates of available capacity by subtracting scheduled and forced outages from
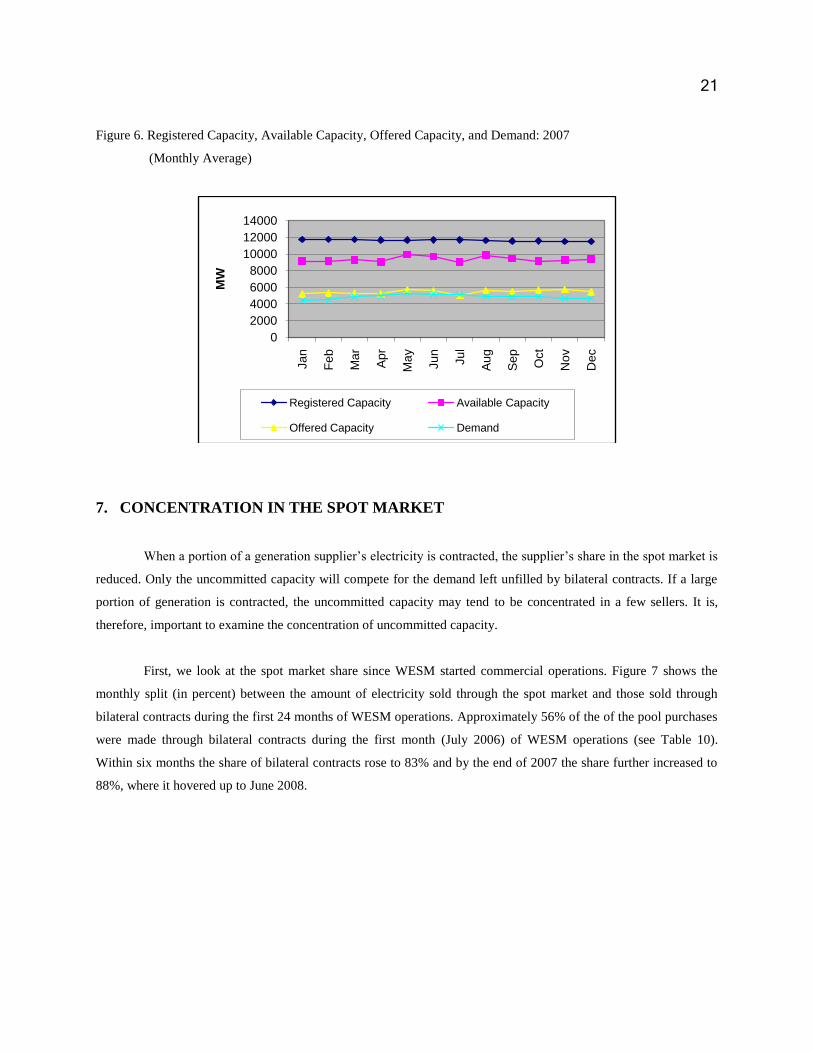
registered capacity. Table 9 shows monthly estimates of the capacity gaps for the year 2007. Capacity gap ranged
from 3,467 MW to 4,241 MW with an annual average of 3,914 MW. This is graphically shown in Figure 6, which
also confirms that offered capacity is indeed close to demand. In view of this large capacity gap, it is fair to ask if
there had been capacity withholding in the wholesale spot market in 2007.
Table 9. Monthly Average Capacity Gap: 2007
Month Available Capacity (MW) Offered Capacity (MW) Capacity Gap (MW)
January 9153 5211 3942
February 9134 5333 3801
March 9284 5293 3991
April 9085 5230 3855
May 9934 5692 4241
June 9675 5565 4110
July 9009 5022 3987
August 9820 5618 4202
September 9449 5501 3948
October 9135 5668 3467
November 9254 5739 3515
December 9365 5453 3913
Average 9358 5444 3914
Source: MAG-PEMC
21
Figure 6. Registered Capacity, Available Capacity, Offered Capacity, and Demand: 2007
(Monthly Average)
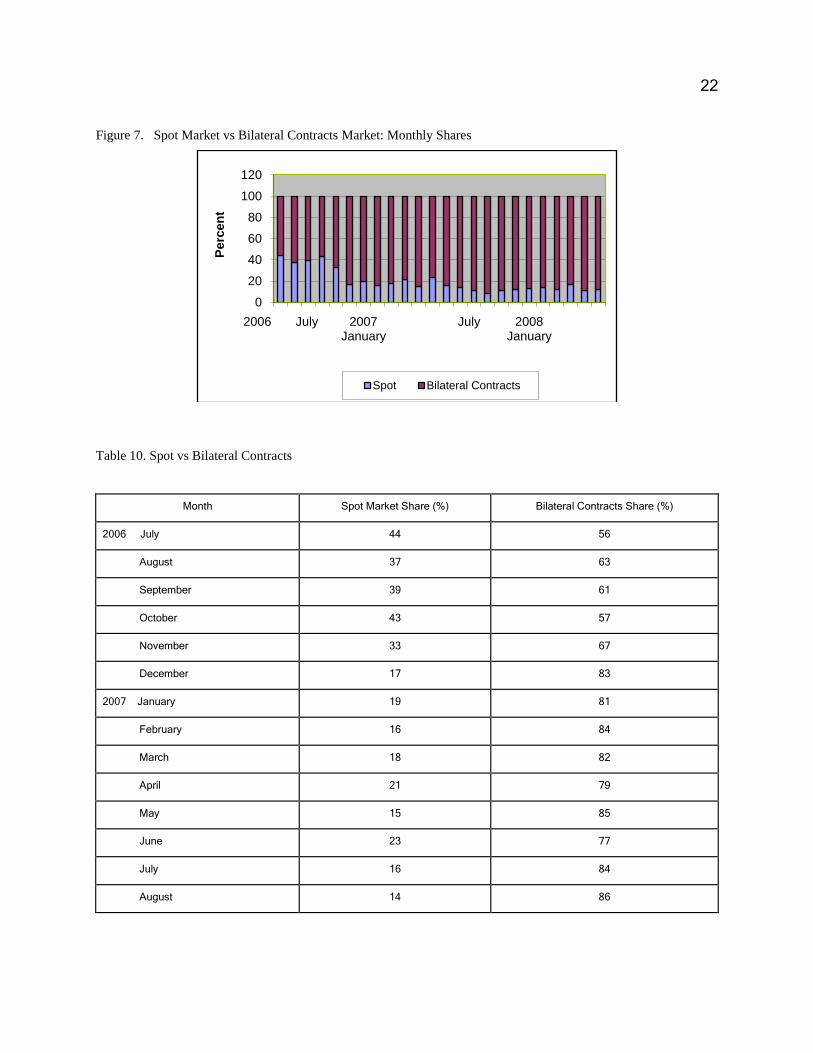
7. CONCENTRATION IN THE SPOT MARKET
When a portion of a generation supplier’s electricity is contracted, the supplier’s share in the spot market is
reduced. Only the uncommitted capacity will compete for the demand left unfilled by bilateral contracts. If a large
portion of generation is contracted, the uncommitted capacity may tend to be concentrated in a few sellers. It is,
therefore, important to examine the concentration of uncommitted capacity.
First, we look at the spot market share since WESM started commercial operations. Figure 7 shows the
monthly split (in percent) between the amount of electricity sold through the spot market and those sold through
bilateral contracts during the first 24 months of WESM operations. Approximately 56% of the of the pool purchases
were made through bilateral contracts during the first month (July 2006) of WESM operations (see Table 10).
Within six months the share of bilateral contracts rose to 83% and by the end of 2007 the share further increased to
88%, where it hovered up to June 2008.
0
2000
4000
6000
8000
10000
12000
14000
Ja
n
Fe
b
Ma
r
Ap
r
Ma
y
Ju
n
Ju
l
Aug
Se
p
Oct
No
v
De
c
MW
Registered Capacity Available Capacity
Offered Capacity Demand
22
Figure 7. Spot Market vs Bilateral Contracts Market: Monthly Shares
Table 10. Spot vs Bilateral Contracts
Month Spot Market Share (%) Bilateral Contracts Share (%)
2006 July 44 56
August 37 63
September 39 61
October 43 57
November 33 67
December 17 83
2007 January 19 81
February 16 84
March 18 82
April 21 79
May 15 85
June 23 77
July 16 84
August 14 86
0
20
40
60
80
100
120
2006 July 2007 January
July 2008 January
Perc
en
t
Spot Bilateral Contracts
23
September 11 89
October 8 92
November 11 89
December 12 88
2008 January 13 87
February 14 86
March 12 88
April 17 83
May 11 89
June* 12* 88*
*Preliminary
Source: MO-PEMC
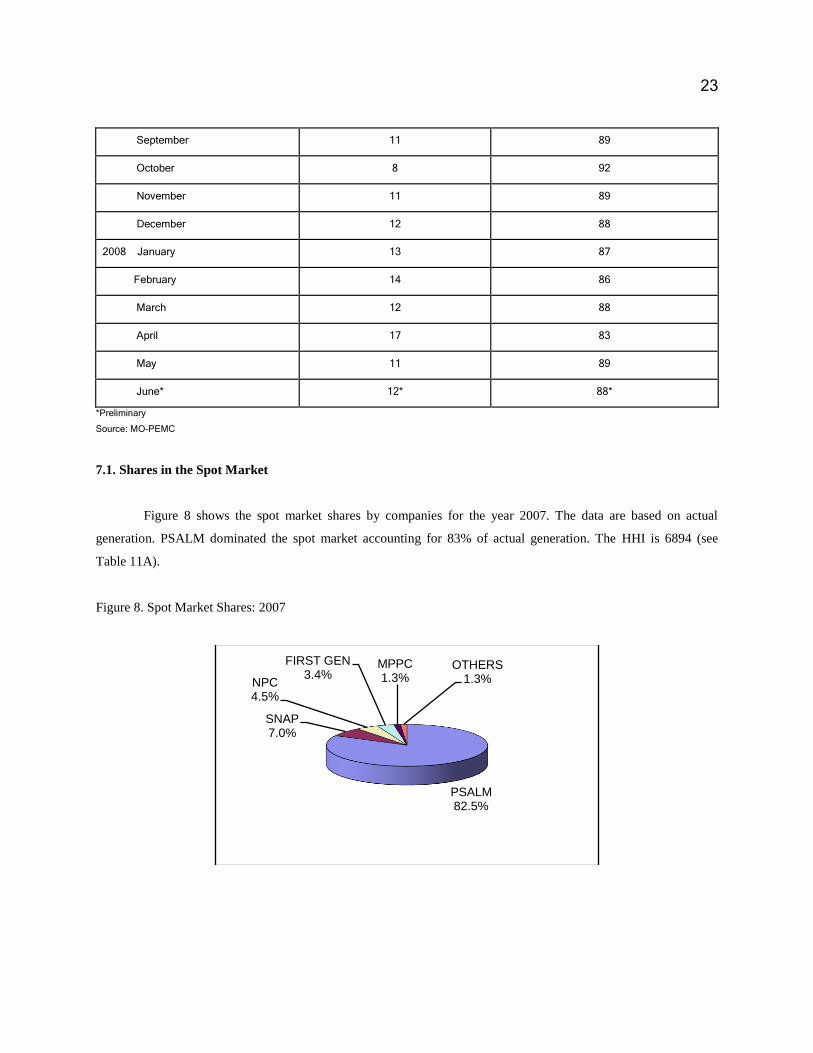
7.1. Shares in the Spot Market
Figure 8 shows the spot market shares by companies for the year 2007. The data are based on actual
generation. PSALM dominated the spot market accounting for 83% of actual generation. The HHI is 6894 (see
Table 11A).
Figure 8. Spot Market Shares: 2007
PSALM82.5%
SNAP7.0%
NPC4.5%
FIRST GEN3.4%
MPPC1.3%
OTHERS1.3%
24
Table 11A. Spot Market Shares: 2007
Company Share (%) (Share)2
PSALM 82.53 6811.20
NPC 4.45 19.80
FIRST GEN IPPs 3.43 11.76
MPPC 1.33 1.77
SNAP 6.99 48.86
QPPL 0.46 0.21
TAPGC 0.59 0.35
NORTHWIND 0.01 0.00
WESMTMP 0.22 0.05
TOTAL 100.00 HHI = 6894
Source of basic data: MAG-PEMC Table 11B shows the spot market shares of the trading teams for the year 2007. One notices at once that the
top three are the PSALM trading teams which account for 83% of the spot market. The spot market is still highly
concentrated with an HHI of 2357.
Table 11B. Spot Market Shares of Trading Teams at WESM: 2007
Trading Team Share (%) (Share)2
1. PSALM Trading Team 1 35.81 1282.36
2. PSALM Trading Team 2 17.92 321.13
3. PSALM Trading Team 3 26.15 683.82
4. PSALM Trading Team 4 2.65 7.02
5. ANGAT HEP (NPC) 0.48 0.23
6. BINGA HEP (SNAP Benguet) 0.37 0.14
7. MASINLOC CFTPP (Masinloc Power Partners) 1.33 1.77
8. BACMAN GPP (NPC) 0.12 0.01
9. BATANGAS CFTPP (NPC) 1.46 2.13
10. MAKBAN GPP (NPC) 1.34 1.80
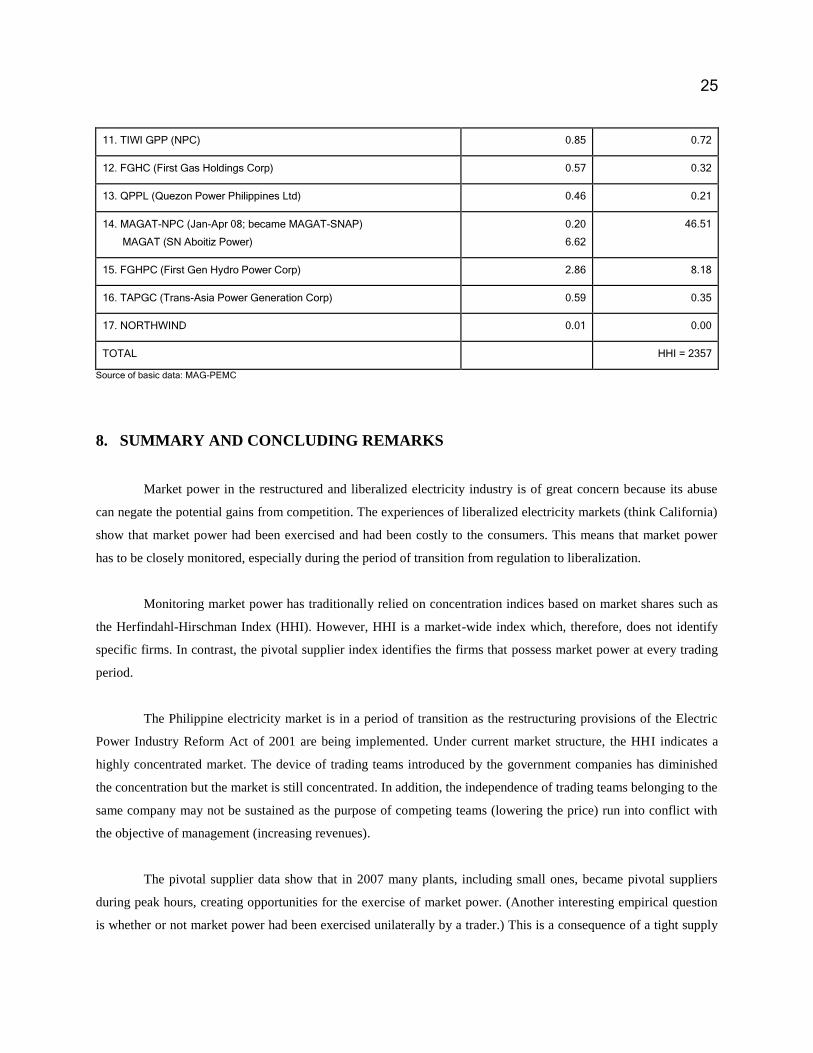
25
11. TIWI GPP (NPC) 0.85 0.72
12. FGHC (First Gas Holdings Corp) 0.57 0.32
13. QPPL (Quezon Power Philippines Ltd) 0.46 0.21
14. MAGAT-NPC (Jan-Apr 08; became MAGAT-SNAP)
MAGAT (SN Aboitiz Power)
0.20
6.62
46.51
15. FGHPC (First Gen Hydro Power Corp) 2.86 8.18
16. TAPGC (Trans-Asia Power Generation Corp) 0.59 0.35
17. NORTHWIND 0.01 0.00
TOTAL HHI = 2357
Source of basic data: MAG-PEMC
8. SUMMARY AND CONCLUDING REMARKS
Market power in the restructured and liberalized electricity industry is of great concern because its abuse
can negate the potential gains from competition. The experiences of liberalized electricity markets (think California)
show that market power had been exercised and had been costly to the consumers. This means that market power
has to be closely monitored, especially during the period of transition from regulation to liberalization.
Monitoring market power has traditionally relied on concentration indices based on market shares such as
the Herfindahl-Hirschman Index (HHI). However, HHI is a market-wide index which, therefore, does not identify
specific firms. In contrast, the pivotal supplier index identifies the firms that possess market power at every trading
period.
The Philippine electricity market is in a period of transition as the restructuring provisions of the Electric
Power Industry Reform Act of 2001 are being implemented. Under current market structure, the HHI indicates a
highly concentrated market. The device of trading teams introduced by the government companies has diminished
the concentration but the market is still concentrated. In addition, the independence of trading teams belonging to the
same company may not be sustained as the purpose of competing teams (lowering the price) run into conflict with
the objective of management (increasing revenues).
The pivotal supplier data show that in 2007 many plants, including small ones, became pivotal suppliers
during peak hours, creating opportunities for the exercise of market power. (Another interesting empirical question
is whether or not market power had been exercised unilaterally by a trader.) This is a consequence of a tight supply
26
(offered capacity) and demand condition. In 2007 average offered capacity was only 47% of average registered
capacity. PEMC estimates of unoffered capacity (available capacity less offered capacity) averaged 3,914 MW for
2007. (Another interesting empirical question is whether or not this large unoffered capacity affected the price
outcomes).
PSALM, through no fault of its own, is the dominant player in the wholesale market. This dominance
became pronounced when more generators shifted to bilateral contracts leaving the PSALM-IPPs with the bulk of
uncommitted capacity that competed in the spot market. In 2007 the generators controlled by PSALM accounted for
83% of actual generation in the spot market, making the spot market highly concentrated. This highlights the
importance and urgency of the dominance mitigation provision of EPIRA: appointing independent IPP
Administrators. The good news is that bidding for IPP Administrators (IPPAs) has started; the first one was held on
June 26, 2009. Although this bidding failed because the bids fell short of the reserve price, PSALM successfully
conducted a second round of bidding on August 28, 2009 for the appointment of IPPAs to manage the contracted
capacities of two coal-fired plants which account for roughly a third of the IPP contracts for Luzon and Visayas.
27
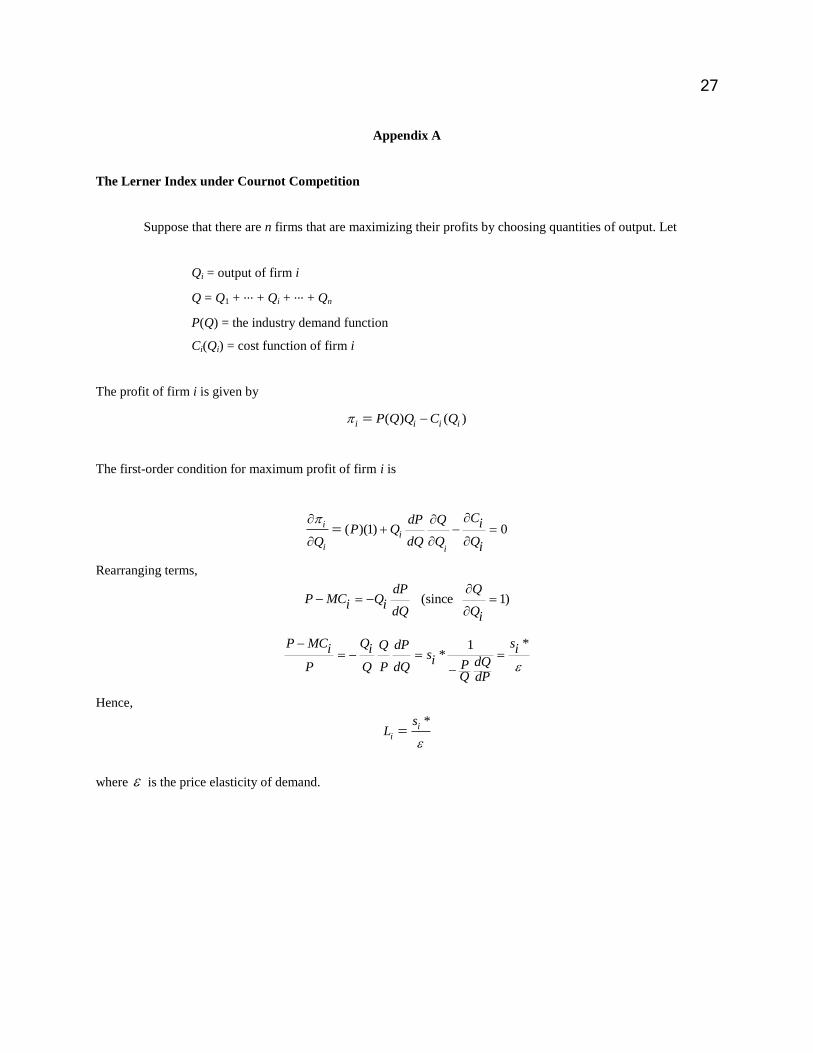
Appendix A
The Lerner Index under Cournot Competition
Suppose that there are n firms that are maximizing their profits by choosing quantities of output. Let
Qi = output of firm i
Q = Q1 + ··· + Qi + ··· + Qn
P(Q) = the industry demand function
Ci(Qi) = cost function of firm i
The profit of firm i is given by
( ) ( )i i i iP Q Q C Q
The first-order condition for maximum profit of firm i is
( )(1) 0i
i
i i
CdP Q iP QdQ Q QQ i
Rearranging terms,
(since 1)dP Q
P MC Qi idQ Qi
*1
*P MC Q sQ dPi i isi dQPP Q P dQ
Q dP
Hence,
*i
i
sL
where is the price elasticity of demand.
28
Appendix B
The Relationship between HHI and the Lerner Index in a Cournot Market
We show that, in a Cournot market, HHI is related to the price elasticity of demand and the Lerner indices
of the firms. We begin with the Lerner index:
*i
i
sL
*i is L
Multiplying both sides of the equation by si*, we get
2
* *( )i i is s L
Taking the sum over i = 1, 2, ..., n, we have
2
1 1
( *) *
n n
i i i
i i
s s L
Note that si = market share in percent, i.e., si = 100si*. Hence,
2
1 1
2
1 1
1
*10000
10000 *
HHI 10000 *
n ni
i i
i i
n n
i i i
i i
n
i i
i
ss L
s s L
s L
Thus HHI depends on the price elasticity of demand and the weighted average of the firms’ Lerner indices, the
weights being the market shares.
29
References
Borentstein, Severin. 2000. Understanding Competitive Pricing and Market Power in the Wholesale Electricity
Markets. Electricity Journal. July 13:6, pp. 49-57
Borenstein, Severin. 2002. The Trouble With Electricity Markets: Understanding California’s Restructuring
Disaster. Journal of Economic Perspectives. 16 (Winter 2002)
Borenstein, Severin, James B. Bushnell, and Christopher R. Knittel. 1999. Market Power in Electricity Markets:
Beyond Concentration Measures, Working Paper PWP-059r, Program on Workable Energy Regulation (POWER),
University of California Energy Institute, Berkeley, California (Feb 1999)
Bushnell, J., Knittel, C., and Wolak, F. (1999) “Estimating the Opportunities for Market Power in a Deregulated
Wisconsin Electricity Market”, The Journal of Industrial Economics, vol. 47, September 1999
EPIRA. 2001. Electric Power Industry Reform Act of 2001
EPIRA IRR. 2002. Electric Power Industry Reform Act of 2001, Implementing Rules and Regulations
FERC. 2004. 107 FERC 61,018. Docket No. ER96-2495-016, et al.
Joskow, P. and Kahn, E. 2001. A Quantitative Analysis of Pricing Behavior in California’s Wholesale Electricity
Market During Summer 2000. NBER Working Paper 8157, http://www.nber.org/papers/w8157
MAG-PEMC, Annual Market Assessment Report for 2007. Market Assessment Group, Philippine Electricity
Market Corporation, Mandaluyong City
NSO. 2007. 2005 Annual Survey of Philippine Business and Industry, National Statistics Office, Manila
NSCB. 2008. Philippine Statistical Yearbook, National Statistical Coordination Board, Makati
Tirole, Jean. 1992. The Theory of Industrial Organization, The MIT Press, Cambridge, Mass.
WESM. 2002. Wholesale Electricity Spot Market Rules, Mandaluyong City
30
Wolak, Frank. 2000. “Lessons from International Experience with Electricity Market Monitoring”, Center for the
Study of Energy Markets (CSEM) WP 134, University of California Energy Institute, 2547 Channing Way,
Berkeley, California 94720-5180, www.ucei.org
Wolak, F. A. and Patrick, R. H. 1997. The Impact of Market Rules and Market Structure on the Price Determination
Process in the England and Wales Electricity Market. POWER Working Paper PWP-047, University of California
Energy Institute, Berkeley, California