Embed Size (px)
Citation preview
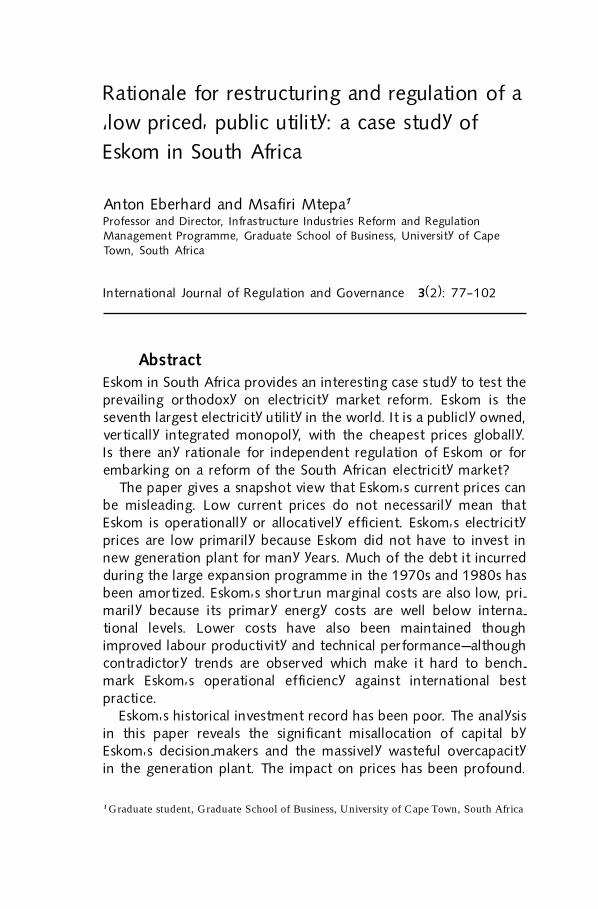
Rationale for restructuring and regulation of a�low priced� public utility: a case study ofEskom in South Africa
Anton Eberhard and Msafiri Mtepa1
Professor and Director, Infrastructure Industries Reform and RegulationManagement Programme, Graduate School of Business, University of CapeTown, South Africa
International Journal of Regulation and Governance 3(2): 77�102
AbstractEskom in South Africa provides an interesting case study to test theprevailing orthodoxy on electricity market reform. Eskom is theseventh largest electricity utility in the world. It is a publicly owned,vertically integrated monopoly, with the cheapest prices globally.Is there any rationale for independent regulation of Eskom or forembarking on a reform of the South African electricity market?
The paper gives a snapshot view that Eskom�s current prices canbe misleading. Low current prices do not necessarily mean thatEskom is operationally or allocatively efficient. Eskom�s electricityprices are low primarily because Eskom did not have to invest innew generation plant for many years. Much of the debt it incurredduring the large expansion programme in the 1970s and 1980s hasbeen amortized. Eskom�s short-run marginal costs are also low, pri-marily because its primary energy costs are well below interna-tional levels. Lower costs have also been maintained thoughimproved labour productivity and technical performance�althoughcontradictory trends are observed which make it hard to bench-mark Eskom�s operational efficiency against international bestpractice.
Eskom�s historical investment record has been poor. The analysisin this paper reveals the significant misallocation of capital byEskom�s decision-makers and the massively wasteful overcapacityin the generation plant. The impact on prices has been profound.
1 Graduate student, Graduate School of Business, University of Cape Town, South Africa
Anton Eberhard and Msafiri Mtepa78
International Journal of Regulation and Governance 3(2): 77�102
Eskom has not always had competitive prices. In real terms, theywere nearly double the current levels in the late 1970s and 1980sand will have to rise in the future as capacity runs out and newinvestments have to be made in generation. Furthermore, the long-term price trend reveals that current electricity prices, in real terms,are no lower than they were in the early 1950s and early 1970s.The question then has to be asked, whether Eskom has been ableto harvest the potential efficiency gains that should have been pos-sible from the application of new technology?
These insights provoke the question of whether Eskom has oper-ated within a governance and regulatory environment that has pro-vided sufficient incentives for improved performance. Low price,publicly owned utilities may not appear to require independentregulation or restructuring. However, this case study of Eskom inSouth Africa demonstrates the importance of a thorough historicalunderstanding of utility performance in order to expose possibleinefficiencies. The test for new and re-regulated electricity marketsis whether they can encourage efficient investment and opera-tional behaviour to secure electricity supply at the lowest possiblecost.
Rationale for restructuring and regulation of a �low priced� public utility 79
International Journal of Regulation and Governance 3(2): 77�102
IntroductionEskom, the publicly owned, vertically integrated electricity util-ity in South Africa, ranks seventh globally in terms of electricitysales. It also generates amongst the lowest priced electricity inthe world. But does the fact that Eskom’s prices and costs arelow mean that it is also among the most efficient of electricityutilities? And, if its prices and costs are low, what is the rationalefor restructuring or re-regulating Eskom?
In this paper, we describe and analyse the electricity industryin South Africa in terms of its historical investment and opera-tional record. We examine the main elements that contribute tothe cost of electricity and how these have changed over time. Weconclude by arguing the case for restructuring and re-regulationin order to maximize efficiency gains in the future.
Eskom�s historical backgroundThe electricity industry in South Africa was spurred by the de-velopment of diamond and gold mining. Kimberly, the site ofthe first large diamond mine, had electric street lights in 1882(before London) and during the 1890s most of South Africa’smajor cities were reticulated. A number of independent powercompanies were established. For example, the VFP (VictoriaFalls Power Company Ltd) was registered in 1906 with the vi-sion of harnessing the hydro-electric potential of the VictoriaFalls to meet the demand for electricity around Johannesburgand Southern Rhodesia (Zimbabwe). Technical and financialconstraints resulted in the company focusing on coal-firedpower stations, which in time became the dominant electricitygenerator in the region.
By the early 1920s, the Government of South Africa was con-cerned about the lack of standardization in the power industryand the need to expand capacity to support the electrification ofthe railways and accelerated industrialization. London-basedconsultants, Merz and McLellan, were commissioned to exam-ine the ‘general question of electricity supply’ in South Africa.They recommended the need to have a central controlling au-thority to oversee and coordinate the development of the elec-tricity industry. The government responded with the ElectricityAct of 1922, which made the provision for the establishment ofthe publicly owned ESCOM (Electricity Supply Commission).ESCOM’s primary goal was to establish new electricity under-takings in cooperation with the existing generators to ensure a
Anton Eberhard and Msafiri Mtepa80
International Journal of Regulation and Governance 3(2): 77�102
cheap and abundant supply of electricity (Steyn 2001). At thesame time the ECB (Electricity Control Board) was formed toissue licences and regulate electricity prices of ESCOM and pri-vate undertakings. Municipalities were not obliged to apply forlicences. However, if municipalities wished to build new gener-ating capacity, they had to seek the permission of the ProvincialAdministrators who, in turn, had to consult ESCOM. The con-sequence was that ESCOM began to build or finance most newpower stations. It took over the VFP and Transvaal Power Com-pany in 1948. Today it accounts for the bulk of the generatingcapacity in South Africa (Steyn 1994 and 2001, Eberhard 2003).
ESCOM sought to reap economies of scale and built largerand larger coal-fired stations as South Africa has only modesthydro-electricity and gas resources. Coal, on the other hand, isabundant and is mined at low cost. Following the oil priceshocks of the 1970s, diesel and oil-fired generators of munici-palities were uncompetitive and they began to rely more andmore on ESCOM. The national high-voltage transmission gridwas also interconnected at this time. Annual growth in peak de-mand between 1972 and 1982 ranged between 6% and 16%.ESCOM engineers and planners were concerned that therewould be power shortages and even ordered more power stationsto be built. Their power forecasting methods relied on extendingpast growth trends into the future and also on the optimisticeconomic growth rate. The consequence was an overestimationof demand, over-building of generation plant, and large priceincreases. Disquiet among stakeholders led to government ap-pointing the De Villiers Commission in 1983. The Commissionwas critical of ESCOM’s governance, management, forecastingmethods, investment decisions, and accounting (Eberhard2003).
ESCOM underwent major organizational and institutionalchanges in 1985 following the implementation of the Commis-sion’s recommendations. New Electricity and Eskom Actswere passed in 1987. ESCOM was renamed as ‘Eskom’ and wasreconfigured with a new two-tier governance structure modelledbroadly on the German corporate governance system. A full-time executive management board now reported to an Electric-ity Council comprising representatives of major electricityconsumers, municipal distributors, and government representa-tives, all appointed by the Minister of Minerals and Energy. Thedrafters of the new Electricity Act, who included members of
Rationale for restructuring and regulation of a �low priced� public utility 81
International Journal of Regulation and Governance 3(2): 77�102
ESCOM’s legal department, inserted a clause that exemptedEskom from the need to have a licence issued by the ElectricityControl Board and thus from having its prices regulated. Effec-tively, the Act relied on the consumer-dominated ElectricityCouncil to control prices subject to government approval. Thenew management also had to re-establish Eskom’s credibilityand reputation with the government and its customers(Eberhard 2003).
In the period following 1987, Eskom’s management and op-erations were increasingly subject to commercial imperatives.The Capital Development Fund was abolished and Eskom’s oldfund accounting system was replaced with standard business ac-counting conventions. The principle of operating at ‘neither aprofit nor loss’ was replaced by the need to ‘provide the systemby which the electricity needs of the consumer may be satisfiedin the most cost-effective manner, subject to resource con-straints and the national interest’ (Eskom 1987). A number ofinitiatives were taken to deal with the excess generation capacity.Eskom postponed the construction of some power plants, in-creased the interval between the service dates of units, andmothballed and decommissioned old and inefficient powerplants. No new power stations have been ordered by Eskomsince 1985, although the plant ordered at that time has beencommissioned later at rescheduled dates.
In the 1990s, further changes were fuelled by the democraticrevolution that marked the end of the apartheid era in SouthAfrica. A massive electrification programme was initiated andthe proportion of the population with access to electricity in-creased from one-third to over two-thirds. A National Electrifi-cation Forum, comprising all interested stakeholders,recommended the rationalization of the distribution sector (toomany local authority utilities are inefficient and cash-strapped).The Forum also recommended the conversion of the ElectricityControl Board into a new NER (National Electricity Regulator)with powers to regulate the entire industry. The Electricity Actwas amended and the NER was established in 1995.
The early redistributive policies of the new South African gov-ernment embodied in its election manifesto (the Reconstructionand Development Programme) were soon accompanied by aself-imposed structural adjustment programme (namedGrowth, Employment and Redistribution Policy). The newemphasis was increasingly on macro-economic stability, fiscal
Anton Eberhard and Msafiri Mtepa82
International Journal of Regulation and Governance 3(2): 77�102
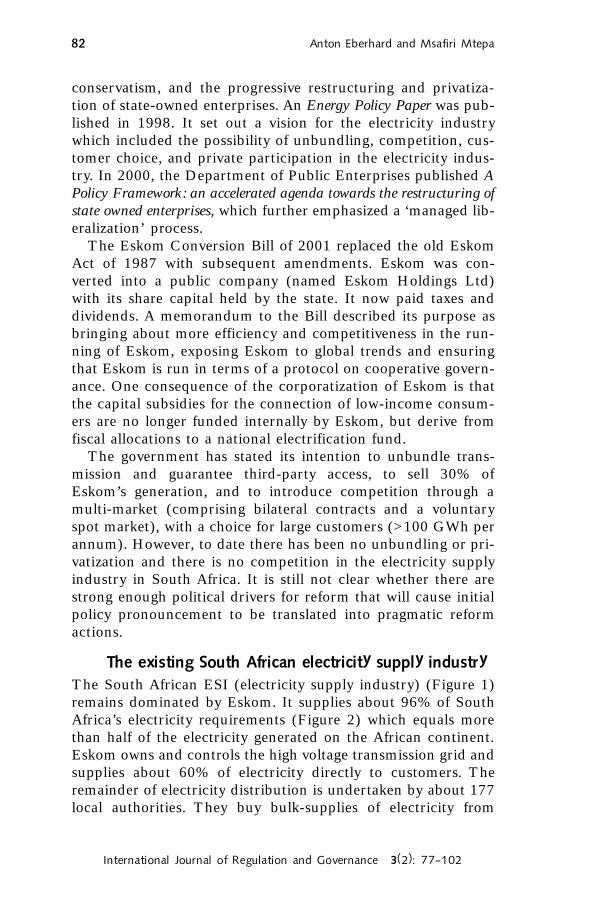
conservatism, and the progressive restructuring and privatiza-tion of state-owned enterprises. An Energy Policy Paper was pub-lished in 1998. It set out a vision for the electricity industrywhich included the possibility of unbundling, competition, cus-tomer choice, and private participation in the electricity indus-try. In 2000, the Department of Public Enterprises published APolicy Framework: an accelerated agenda towards the restructuring ofstate owned enterprises, which further emphasized a ‘managed lib-eralization’ process.
The Eskom Conversion Bill of 2001 replaced the old EskomAct of 1987 with subsequent amendments. Eskom was con-verted into a public company (named Eskom Holdings Ltd)with its share capital held by the state. It now paid taxes anddividends. A memorandum to the Bill described its purpose asbringing about more efficiency and competitiveness in the run-ning of Eskom, exposing Eskom to global trends and ensuringthat Eskom is run in terms of a protocol on cooperative govern-ance. One consequence of the corporatization of Eskom is thatthe capital subsidies for the connection of low-income consum-ers are no longer funded internally by Eskom, but derive fromfiscal allocations to a national electrification fund.
The government has stated its intention to unbundle trans-mission and guarantee third-party access, to sell 30% ofEskom’s generation, and to introduce competition through amulti-market (comprising bilateral contracts and a voluntaryspot market), with a choice for large customers (>100 GWh perannum). However, to date there has been no unbundling or pri-vatization and there is no competition in the electricity supplyindustry in South Africa. It is still not clear whether there arestrong enough political drivers for reform that will cause initialpolicy pronouncement to be translated into pragmatic reformactions.
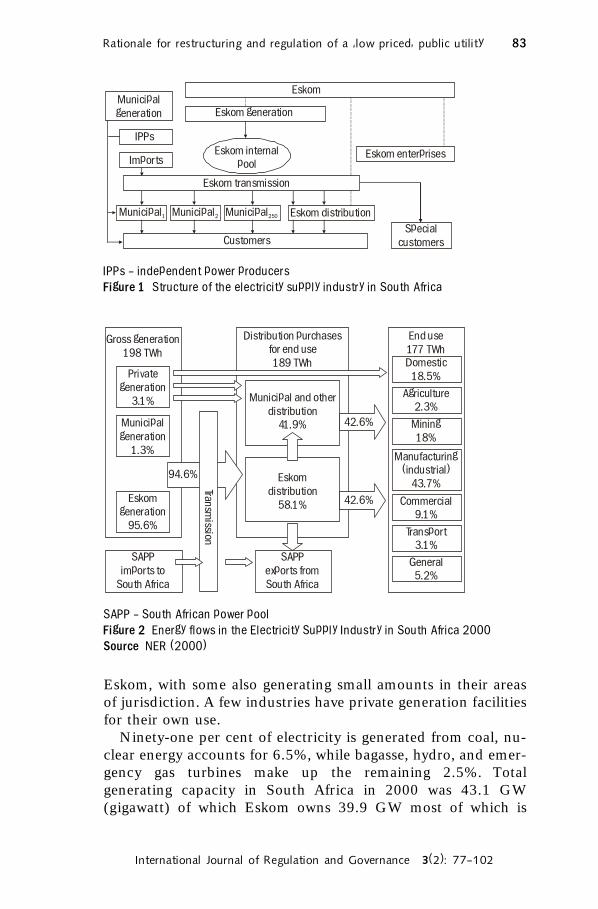
The existing South African electricity supply industryThe South African ESI (electricity supply industry) (Figure 1)remains dominated by Eskom. It supplies about 96% of SouthAfrica’s electricity requirements (Figure 2) which equals morethan half of the electricity generated on the African continent.Eskom owns and controls the high voltage transmission grid andsupplies about 60% of electricity directly to customers. Theremainder of electricity distribution is undertaken by about 177local authorities. They buy bulk-supplies of electricity from
Rationale for restructuring and regulation of a �low priced� public utility 83
International Journal of Regulation and Governance 3(2): 77�102
Eskom, with some also generating small amounts in their areasof jurisdiction. A few industries have private generation facilitiesfor their own use.
Ninety-one per cent of electricity is generated from coal, nu-clear energy accounts for 6.5%, while bagasse, hydro, and emer-gency gas turbines make up the remaining 2.5%. Totalgenerating capacity in South Africa in 2000 was 43.1 GW(gigawatt) of which Eskom owns 39.9 GW most of which is
SAPP � South African power poolFigure 2 Energy flows in the Electricity Supply Industry in South Africa 2000Source NER (2000)
IPPs � independent power producersFigure 1 Structure of the electricity supply industry in South Africa
Municipal
generation Eskom generation
Eskom
Eskom internal
pool
Eskom transmission
Customers
Eskom distribution
Special
customers
Municipal250
Municipal2
Municipal1
Eskom enterprises
IPPs
Imports
Gross generation
198 TWh
End use
177 TWhDomestic
18.5%
Agriculture
2.3%
Mining
18%
Commercial
9.1%
Transport
3.1%
General
5.2%
Manufacturing
(industrial)
43.7%
Distribution purchases
for end use
189 TWh
Municipal and other
distribution
41.9%
Eskom
distribution
58.1%
Private
generation
3.1%
Municipal
generation
1.3%
Eskom
generation
95.6%
SAPP
imports to
South Africa
SAPP
exports from
South Africa
94.6%
42.6%
42.6%
Tran
smissio
n
Anton Eberhard and Msafiri Mtepa84
International Journal of Regulation and Governance 3(2): 77�102
available for generating electricity for sale. Some capacity wasmothballed and the total net operating capacity amounted to35.3 GW. Peak demand on the system was 32 GW in 2003.Eskom has 24 power stations, of which 10 large coal-fired sta-tions dominate—most of them comprise six 600-MW units andare situated on coal mines in the north-east of South Africa.South Africa’s only nuclear station is at Koeberg, 30 kilometresnorth of Cape Town, and is owned and operated by Eskom.There is modest hydro-capacity generation on the Orange River,located on two dams, and there are two pumped storage schemeswhich play a critical role in meeting peak demand, as well as insystem balancing and control (Eskom 2001, NER 2001).
Eskom makes most of its profits from the sale of electricity toits large mining and industrial customers and in bulk sales tomunicipalities. These three customer categories account for82% of its revenue and 89% of its electricity sales. The averageselling price in 2000 to industrial customers was 1.6 cents/kWh2
and for residential customers was 3.7 cents/kWh (Eskom 2000).Tariffs for rural and low-income residential customers are
cross-subsidized from industrial tariffs and surpluses earned onsales to municipalities. The large municipalities, in turn, makean additional profit from reselling Eskom electricity, which en-able them to subsidize property rates and to finance other mu-nicipal services. However, many of the smaller municipalitiesface debt, non-payment by a substantial proportion of their low-income consumers, inefficient operations, and lack of technicaland managerial capacity.
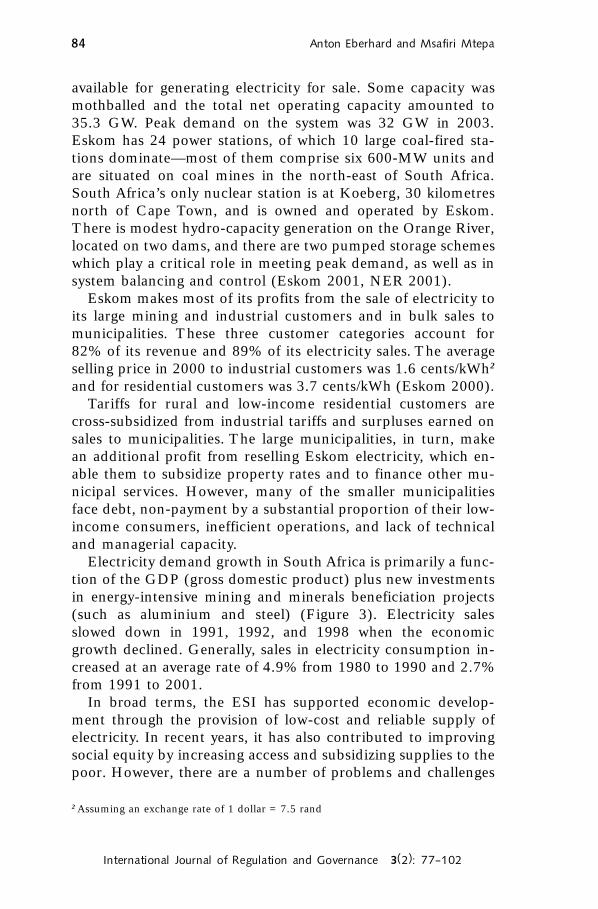
Electricity demand growth in South Africa is primarily a func-tion of the GDP (gross domestic product) plus new investmentsin energy-intensive mining and minerals beneficiation projects(such as aluminium and steel) (Figure 3). Electricity salesslowed down in 1991, 1992, and 1998 when the economicgrowth declined. Generally, sales in electricity consumption in-creased at an average rate of 4.9% from 1980 to 1990 and 2.7%from 1991 to 2001.
In broad terms, the ESI has supported economic develop-ment through the provision of low-cost and reliable supply ofelectricity. In recent years, it has also contributed to improvingsocial equity by increasing access and subsidizing supplies to thepoor. However, there are a number of problems and challenges
2 Assuming an exchange rate of 1 dollar = 7.5 rand
Rationale for restructuring and regulation of a �low priced� public utility 85
International Journal of Regulation and Governance 3(2): 77�102
that are driving changes. These include the need to improve theperformance of the distribution industry; the need to create acompetitive environment for new investment in generationcapacity; and to unlock the economic value in the industry,including widening of economic participation, particularly topreviously disenfranchized South Africans. But whether theseare strong enough political drivers for change remains to be seen.
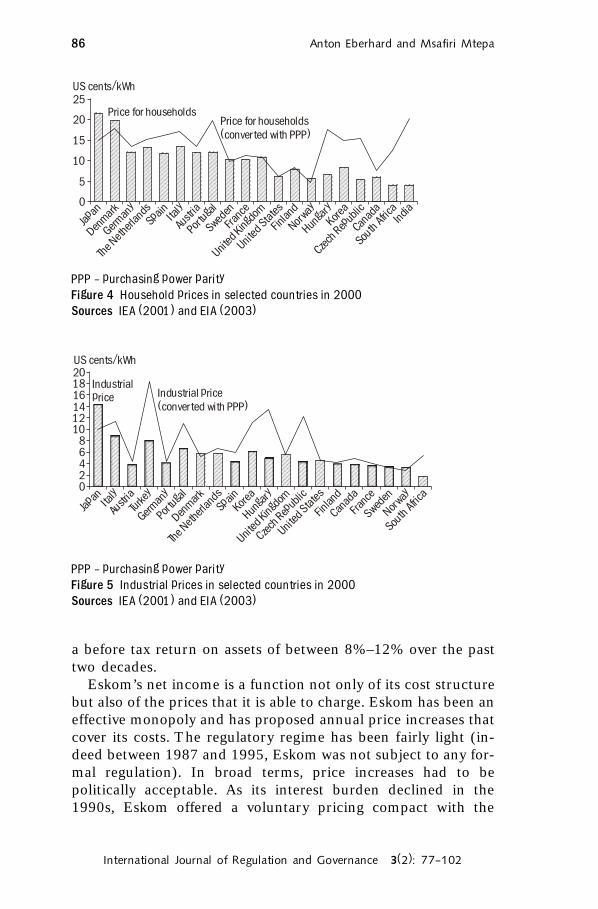
Cost, price, and income trendsInternational comparison of electricity prices
A comparison of Eskom’s electricity prices with available datafrom selected countries shows Eskom’s household and industrialtariffs to be among the cheapest in the world (Figures 4 and 5).
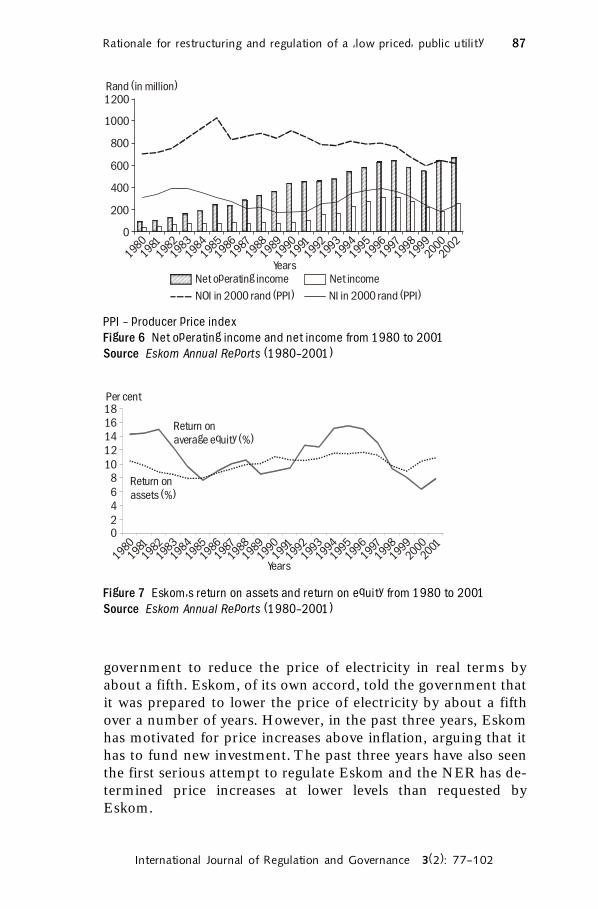
Do Eskom�s prices cover costs?Eskom’s costs have generally been covered by income. Figures 6and 7 show that prices have been set at levels that have providedsufficient income to cover operating expenses, capital charges, aswell as a positive return on capital and equity. Net operating in-come (before interest and tax) increased substantially in theearly 1980s as prices increased to fund new investment. Net in-come (after interest and tax) has cycled in a band between 2 billionrand and 4 billion rand (in real 2000 values). Eskom has earned
GDP � gross domestic productFigure 3 Production and sale of electricity by Eskom and South Africa�s grossdomestic productSources Eskom Annual Reports (1980�2002); Statistical Yearbooks (1985�96)and IMF (2003, pp. 876; 2000, pp. 890)
250000 700000
600000
500000
400000
300000
200000
100000
0
200000
150000
100000
50000
0
GWh produced and sold GDP (millions in rand)
19801982
19841986
19881990
19921994
19961998
20002002
Years
GDP in constant
1995 values
GWh produced
GWh sold
Anton Eberhard and Msafiri Mtepa86
International Journal of Regulation and Governance 3(2): 77�102
a before tax return on assets of between 8%–12% over the pasttwo decades.
Eskom’s net income is a function not only of its cost structurebut also of the prices that it is able to charge. Eskom has been aneffective monopoly and has proposed annual price increases thatcover its costs. The regulatory regime has been fairly light (in-deed between 1987 and 1995, Eskom was not subject to any for-mal regulation). In broad terms, price increases had to bepolitically acceptable. As its interest burden declined in the1990s, Eskom offered a voluntary pricing compact with the
PPP � purchasing power parityFigure 4 Household prices in selected countries in 2000Sources IEA (2001) and EIA (2003)
PPP � purchasing power parityFigure 5 Industrial prices in selected countries in 2000Sources IEA (2001) and EIA (2003)
25
20
15
10
5
0
US cents/kWh
Japan
Denmark
Germany
The N
etherla
nds
SpainIta
ly
Austria
Portuga
l
Sweden
France
United K
ingdom
United S
tate
s
Finla
nd
Norway
Hungary
Korea
Czech
Rep
ublic
Canada
South A
frica
India
Price for householdsPrice for households
(converted with PPP)
US cents/kWh
Japan
Denm
ark
The N
etherla
nds
Germany
Portuga
l
Turk
ey
SpainIta
ly
Austria
Sweden
France
United K
ingd
om
United S
tate
s
Finla
nd
Norway
Hungary
Korea
Czech
Rep
ublic
Canada
South A
frica
201816141210
86420
Industrial
price Industrial price
(converted with PPP)
Rationale for restructuring and regulation of a �low priced� public utility 87
International Journal of Regulation and Governance 3(2): 77�102
PPI � producer price indexFigure 6 Net operating income and net income from 1980 to 2001Source Eskom Annual Reports (1980�2001)
Figure 7 Eskom�s return on assets and return on equity from 1980 to 2001Source Eskom Annual Reports (1980�2001)
government to reduce the price of electricity in real terms byabout a fifth. Eskom, of its own accord, told the government thatit was prepared to lower the price of electricity by about a fifthover a number of years. However, in the past three years, Eskomhas motivated for price increases above inflation, arguing that ithas to fund new investment. The past three years have also seenthe first serious attempt to regulate Eskom and the NER has de-termined price increases at lower levels than requested byEskom.
1200
1000
800
600
400
200
0
19801981
19821983
19841986
19871985
19881989
19901991
19921993
19941995
19961997
19981999
2000
2002
Years
Rand (in million)
Net operating income
NOI in 2000 rand (PPI) NI in 2000 rand (PPI)
Net income
18
16
14
12
10
8
6
4
20
Per cent
19801981
19821983
19841985
19861987
19881989
19901991
19921993
19941995
19961997
19981999
20002001
Years
Return on
assets (%)
Return on
average equity (%)
Anton Eberhard and Msafiri Mtepa88
International Journal of Regulation and Governance 3(2): 77�102
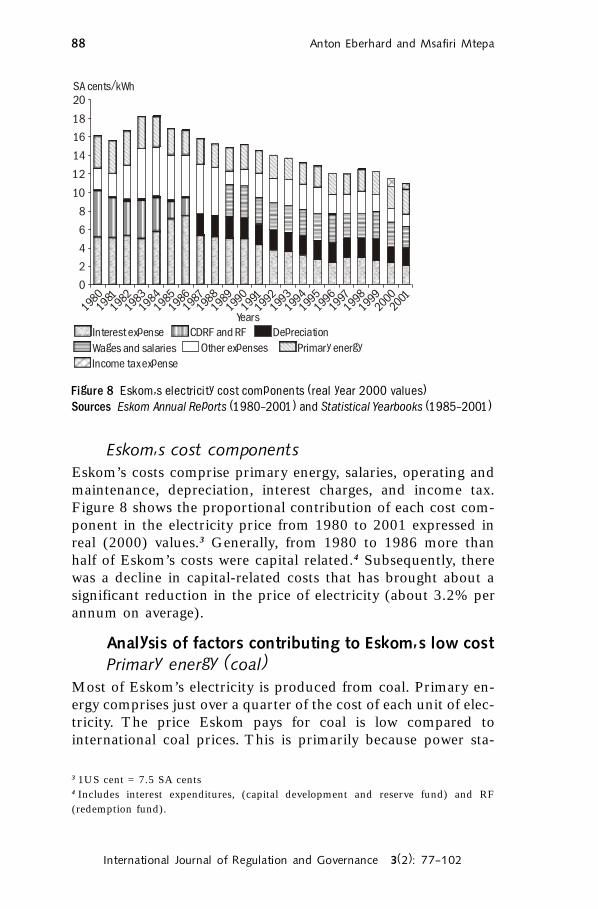
Eskom�s cost componentsEskom’s costs comprise primary energy, salaries, operating andmaintenance, depreciation, interest charges, and income tax.Figure 8 shows the proportional contribution of each cost com-ponent in the electricity price from 1980 to 2001 expressed inreal (2000) values.3 Generally, from 1980 to 1986 more thanhalf of Eskom’s costs were capital related.4 Subsequently, therewas a decline in capital-related costs that has brought about asignificant reduction in the price of electricity (about 3.2% perannum on average).
Analysis of factors contributing to Eskom�s low costPrimary energy (coal)
Most of Eskom’s electricity is produced from coal. Primary en-ergy comprises just over a quarter of the cost of each unit of elec-tricity. The price Eskom pays for coal is low compared tointernational coal prices. This is primarily because power sta-
Figure 8 Eskom�s electricity cost components (real year 2000 values)Sources Eskom Annual Reports (1980�2001) and Statistical Yearbooks (1985�2001)
3 1US cent = 7.5 SA cents4 Includes interest expenditures, (capital development and reserve fund) and RF(redemption fund).
19801981
19821983
19841985
19861987
19881989
19901991
19921993
19941995
19961997
19981999
20002001
Years
Interest expense
Other expenses Primary energy
Income tax expense
CDRF and RF Depreciation
Wages and salaries
20
18
16
14
12
10
8
6
4
2
0
SA cents/kWh
Rationale for restructuring and regulation of a �low priced� public utility 89
International Journal of Regulation and Governance 3(2): 77�102
tions are built adjacent to coal mines producing low cost, lowcalorific-value coal,5 supplied on favourable long-term contracts.
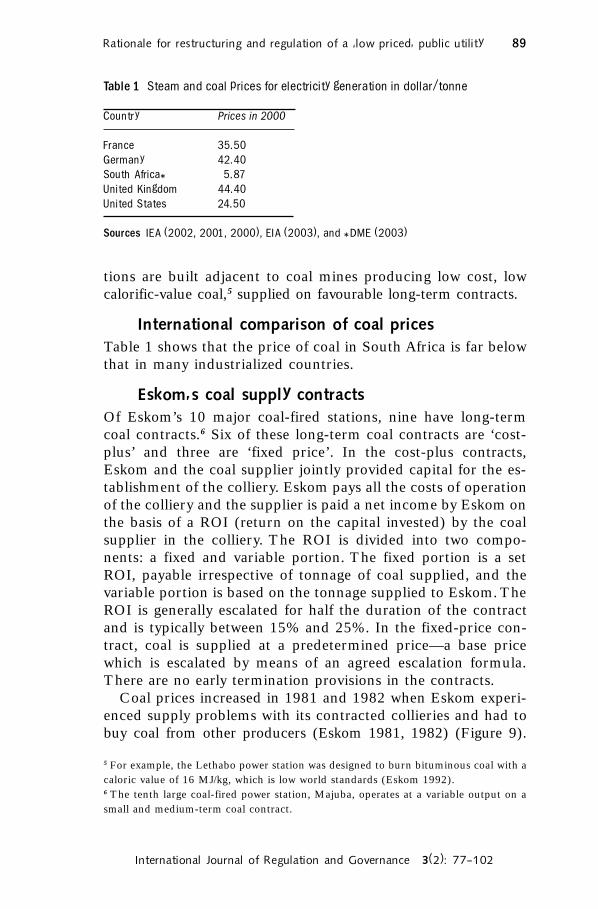
International comparison of coal pricesTable 1 shows that the price of coal in South Africa is far belowthat in many industrialized countries.
Eskom�s coal supply contractsOf Eskom’s 10 major coal-fired stations, nine have long-termcoal contracts.6 Six of these long-term coal contracts are ‘cost-plus’ and three are ‘fixed price’. In the cost-plus contracts,Eskom and the coal supplier jointly provided capital for the es-tablishment of the colliery. Eskom pays all the costs of operationof the colliery and the supplier is paid a net income by Eskom onthe basis of a ROI (return on the capital invested) by the coalsupplier in the colliery. The ROI is divided into two compo-nents: a fixed and variable portion. The fixed portion is a setROI, payable irrespective of tonnage of coal supplied, and thevariable portion is based on the tonnage supplied to Eskom. TheROI is generally escalated for half the duration of the contractand is typically between 15% and 25%. In the fixed-price con-tract, coal is supplied at a predetermined price—a base pricewhich is escalated by means of an agreed escalation formula.There are no early termination provisions in the contracts.
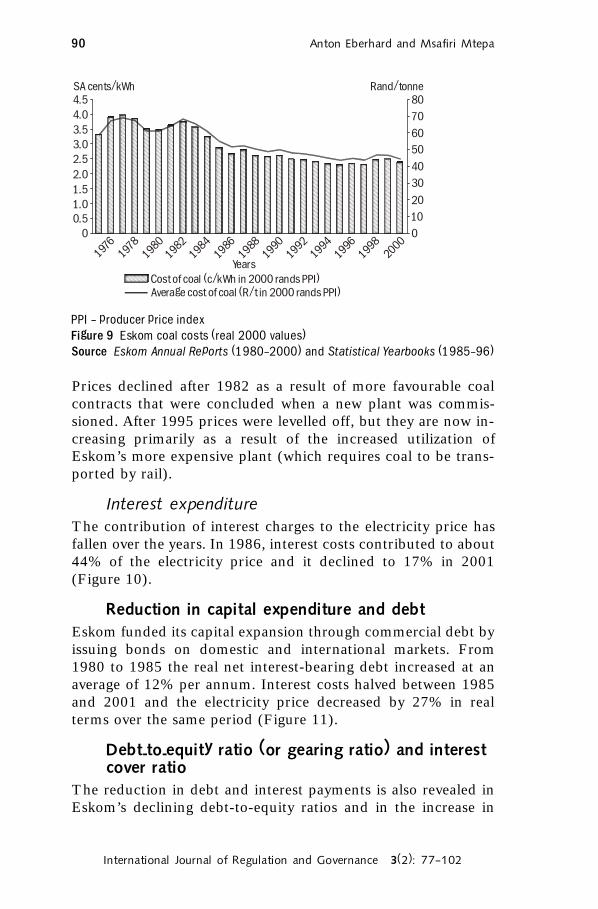
Coal prices increased in 1981 and 1982 when Eskom experi-enced supply problems with its contracted collieries and had tobuy coal from other producers (Eskom 1981, 1982) (Figure 9).
5 For example, the Lethabo power station was designed to burn bituminous coal with acaloric value of 16 MJ/kg, which is low world standards (Eskom 1992).6 The tenth large coal-fired power station, Majuba, operates at a variable output on asmall and medium-term coal contract.
Table 1 Steam and coal prices for electricity generation in dollar/tonne
Country Prices in 2000
France 35.50Germany 42.40South Africa* 5.87United Kingdom 44.40United States 24.50
Sources IEA (2002, 2001, 2000), EIA (2003), and *DME (2003)
Anton Eberhard and Msafiri Mtepa90
International Journal of Regulation and Governance 3(2): 77�102
PPI � producer price indexFigure 9 Eskom coal costs (real 2000 values)Source Eskom Annual Reports (1980�2000) and Statistical Yearbooks (1985�96)
19801978
19761982
19841986
19881990
19921994
19961998
2000
Years
4.5
4.0
3.5
3.0
2.5
2.0
1.5
1.0
0.5
0
80
70
60
50
40
30
20
10
0
SA cents/kWh Rand/tonne
Cost of coal (c/kWh in 2000 rands PPI)
Average cost of coal (R/t in 2000 rands PPI)
Prices declined after 1982 as a result of more favourable coalcontracts that were concluded when a new plant was commis-sioned. After 1995 prices were levelled off, but they are now in-creasing primarily as a result of the increased utilization ofEskom’s more expensive plant (which requires coal to be trans-ported by rail).
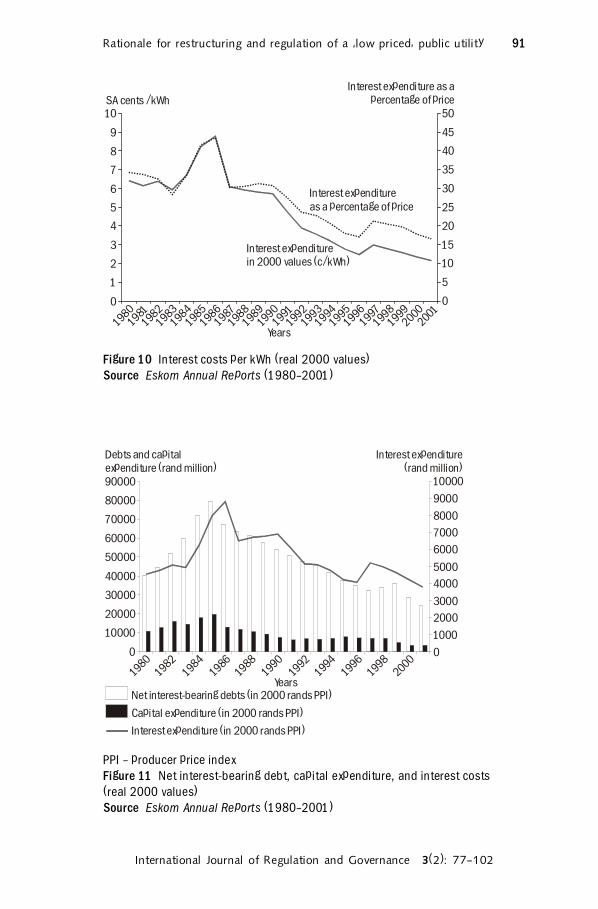
Interest expenditureThe contribution of interest charges to the electricity price hasfallen over the years. In 1986, interest costs contributed to about44% of the electricity price and it declined to 17% in 2001(Figure 10).
Reduction in capital expenditure and debtEskom funded its capital expansion through commercial debt byissuing bonds on domestic and international markets. From1980 to 1985 the real net interest-bearing debt increased at anaverage of 12% per annum. Interest costs halved between 1985and 2001 and the electricity price decreased by 27% in realterms over the same period (Figure 11).
Debt-to-equity ratio (or gearing ratio) and interestcover ratio
The reduction in debt and interest payments is also revealed inEskom’s declining debt-to-equity ratios and in the increase in
Rationale for restructuring and regulation of a �low priced� public utility 91
International Journal of Regulation and Governance 3(2): 77�102
Figure 10 Interest costs per kWh (real 2000 values)Source Eskom Annual Reports (1980�2001)
PPI � producer price indexFigure 11 Net interest-bearing debt, capital expenditure, and interest costs(real 2000 values)Source Eskom Annual Reports (1980�2001)
10
9
8
7
6
5
4
3
2
1
0
50
45
40
35
30
25
20
15
10
5
0
19801981
19821983
19841985
19861987
19881989
19901991
19921993
19941995
19961997
19981999
20002001
Years
Interest expenditure
in 2000 values (c/kWh)
Interest expenditure
as a percentage of price
SA cents /kWh
Interest expenditure as a
percentage of price
19801982
19841986
19881990
19921994
19961998
2000
Years
90000
80000
70000
60000
50000
40000
30000
20000
10000
0
10000
9000
8000
7000
6000
5000
4000
3000
2000
1000
0
Debts and capital
(rand million)expenditure
Interest expenditure
(rand million)
Net interest-bearing debts (in 2000 rands PPI)
Capital expenditure (in 2000 rands PPI)
Interest expenditure (in 2000 rands PPI)
Anton Eberhard and Msafiri Mtepa92
International Journal of Regulation and Governance 3(2): 77�102
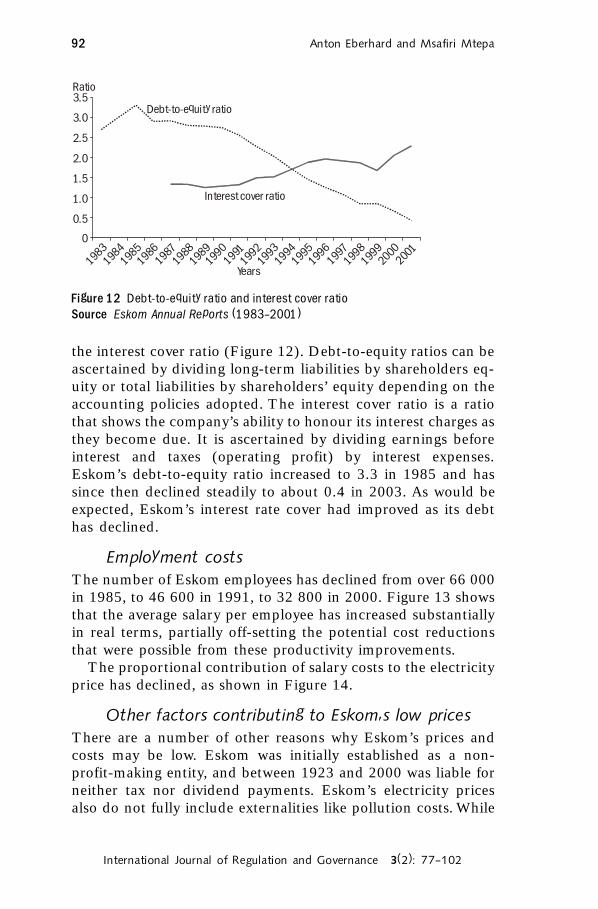
the interest cover ratio (Figure 12). Debt-to-equity ratios can beascertained by dividing long-term liabilities by shareholders eq-uity or total liabilities by shareholders’ equity depending on theaccounting policies adopted. The interest cover ratio is a ratiothat shows the company’s ability to honour its interest charges asthey become due. It is ascertained by dividing earnings beforeinterest and taxes (operating profit) by interest expenses.Eskom’s debt-to-equity ratio increased to 3.3 in 1985 and hassince then declined steadily to about 0.4 in 2003. As would beexpected, Eskom’s interest rate cover had improved as its debthas declined.
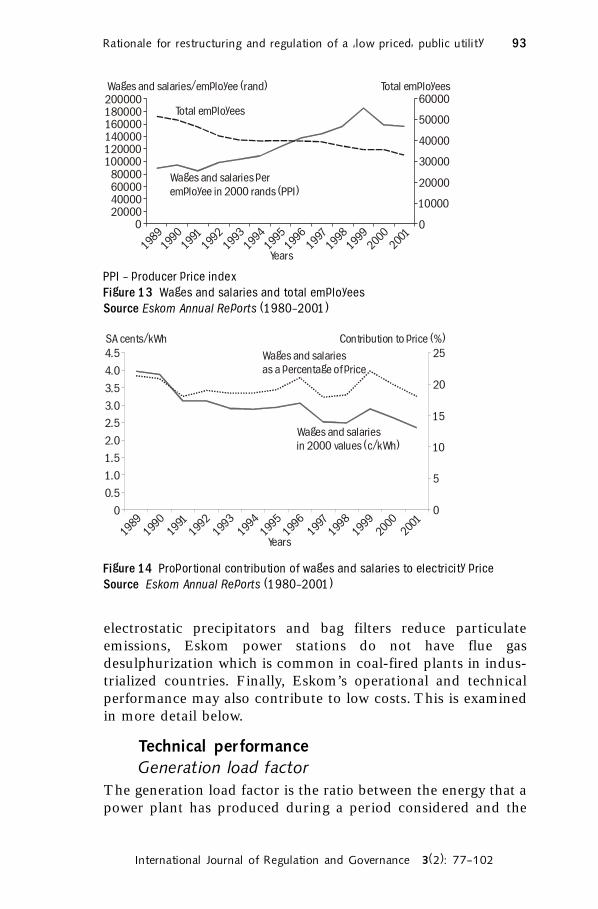
Employment costsThe number of Eskom employees has declined from over 66 000in 1985, to 46 600 in 1991, to 32 800 in 2000. Figure 13 showsthat the average salary per employee has increased substantiallyin real terms, partially off-setting the potential cost reductionsthat were possible from these productivity improvements.
The proportional contribution of salary costs to the electricityprice has declined, as shown in Figure 14.
Other factors contributing to Eskom�s low pricesThere are a number of other reasons why Eskom’s prices andcosts may be low. Eskom was initially established as a non-profit-making entity, and between 1923 and 2000 was liable forneither tax nor dividend payments. Eskom’s electricity pricesalso do not fully include externalities like pollution costs. While
Figure 12 Debt-to-equity ratio and interest cover ratioSource Eskom Annual Reports (1983�2001)
19831984
19851986
19871988
19891990
19911992
19931994
19951996
19971998
19992000
2001
Years
Debt-to-equity ratio
Interest cover ratio
3.5
3.0
2.5
2.0
1.5
1.0
0.5
0
Ratio
Rationale for restructuring and regulation of a �low priced� public utility 93
International Journal of Regulation and Governance 3(2): 77�102
PPI � producer price indexFigure 13 Wages and salaries and total employeesSource Eskom Annual Reports (1980�2001)
Figure 14 Proportional contribution of wages and salaries to electricity priceSource Eskom Annual Reports (1980�2001)
200000180000160000140000120000100000
80000600004000020000
0
60000
50000
40000
30000
20000
10000
0
Total employees
Total employeesWages and salaries/employee (rand)
Wages and salaries per
employee in 2000 rands (PPI)
19891990
19911992
19931994
19951996
19971998
19992000
2001
Years
19891990
19911992
19931994
19951996
19971998
19992000
2001
Years
4.5
4.0
3.5
3.0
2.5
2.0
1.5
1.0
0.5
0
25
20
15
10
5
0
Wages and salaries
as a percentage of price
Wages and salaries
in 2000 values (c/kWh)
SA cents/kWh Contribution to price (%)
electrostatic precipitators and bag filters reduce particulateemissions, Eskom power stations do not have flue gasdesulphurization which is common in coal-fired plants in indus-trialized countries. Finally, Eskom’s operational and technicalperformance may also contribute to low costs. This is examinedin more detail below.
Technical performanceGeneration load factor
The generation load factor is the ratio between the energy that apower plant has produced during a period considered and the
Anton Eberhard and Msafiri Mtepa94
International Journal of Regulation and Governance 3(2): 77�102
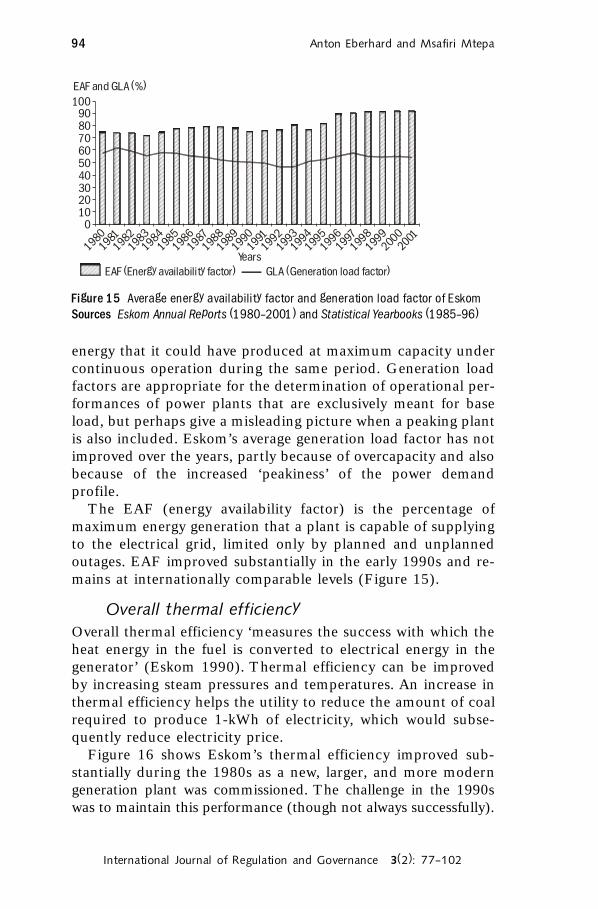
energy that it could have produced at maximum capacity undercontinuous operation during the same period. Generation loadfactors are appropriate for the determination of operational per-formances of power plants that are exclusively meant for baseload, but perhaps give a misleading picture when a peaking plantis also included. Eskom’s average generation load factor has notimproved over the years, partly because of overcapacity and alsobecause of the increased ‘peakiness’ of the power demandprofile.
The EAF (energy availability factor) is the percentage ofmaximum energy generation that a plant is capable of supplyingto the electrical grid, limited only by planned and unplannedoutages. EAF improved substantially in the early 1990s and re-mains at internationally comparable levels (Figure 15).
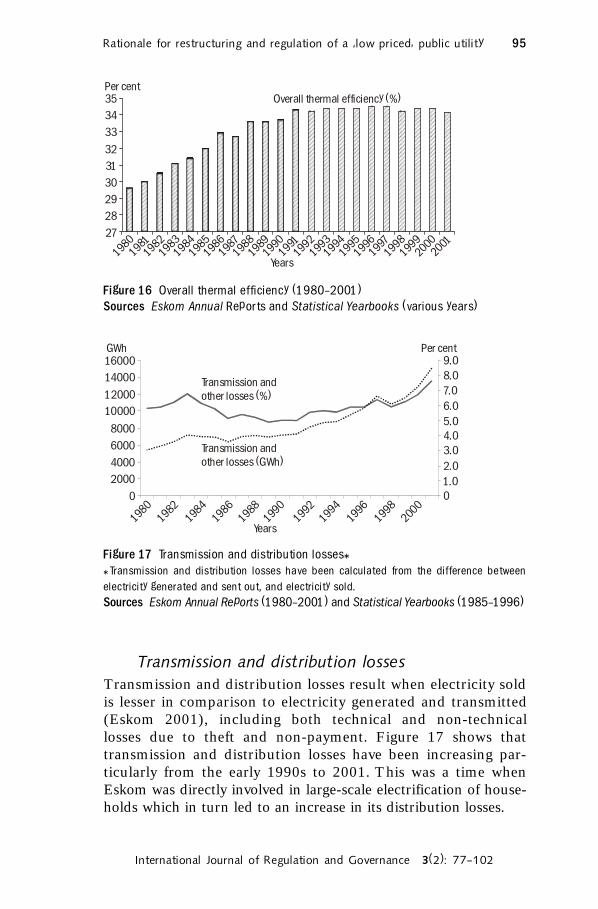
Overall thermal efficiencyOverall thermal efficiency ‘measures the success with which theheat energy in the fuel is converted to electrical energy in thegenerator’ (Eskom 1990). Thermal efficiency can be improvedby increasing steam pressures and temperatures. An increase inthermal efficiency helps the utility to reduce the amount of coalrequired to produce 1-kWh of electricity, which would subse-quently reduce electricity price.
Figure 16 shows Eskom’s thermal efficiency improved sub-stantially during the 1980s as a new, larger, and more moderngeneration plant was commissioned. The challenge in the 1990swas to maintain this performance (though not always successfully).
Figure 15 Average energy availability factor and generation load factor of EskomSources Eskom Annual Reports (1980�2001) and Statistical Yearbooks (1985�96)
100908070605040302010
0
EAF and GLA (%)
19831982
19811980
19841985
19861987
19881989
19901991
19921993
19941995
19961997
19981999
20002001
Years
EAF (Energy availability factor) GLA (Generation load factor)
Rationale for restructuring and regulation of a �low priced� public utility 95
International Journal of Regulation and Governance 3(2): 77�102
Transmission and distribution lossesTransmission and distribution losses result when electricity soldis lesser in comparison to electricity generated and transmitted(Eskom 2001), including both technical and non-technicallosses due to theft and non-payment. Figure 17 shows thattransmission and distribution losses have been increasing par-ticularly from the early 1990s to 2001. This was a time whenEskom was directly involved in large-scale electrification of house-holds which in turn led to an increase in its distribution losses.
Figure 16 Overall thermal efficiency (1980�2001)Sources Eskom Annual Reports and Statistical Yearbooks (various years)
35
34
33
32
31
30
29
28
27
Overall thermal efficiency (%)
19801981
19821983
19841985
19861987
19881989
19901991
19921993
19941995
19961997
19981999
20002001
Years
Per cent
16000
14000
12000
10000
8000
6000
4000
2000
0
9.0
8.0
7.0
6.0
5.0
4.0
3.0
2.0
1.0
0
Transmission and
other losses (%)
Transmission and
other losses (GWh)
GWh Per cent
19801982
19841986
19881990
19921994
19961998
2000
Years
Figure 17 Transmission and distribution losses**Transmission and distribution losses have been calculated from the difference betweenelectricity generated and sent out, and electricity sold.Sources Eskom Annual Reports (1980�2001) and Statistical Yearbooks (1985�1996)
Anton Eberhard and Msafiri Mtepa96
International Journal of Regulation and Governance 3(2): 77�102
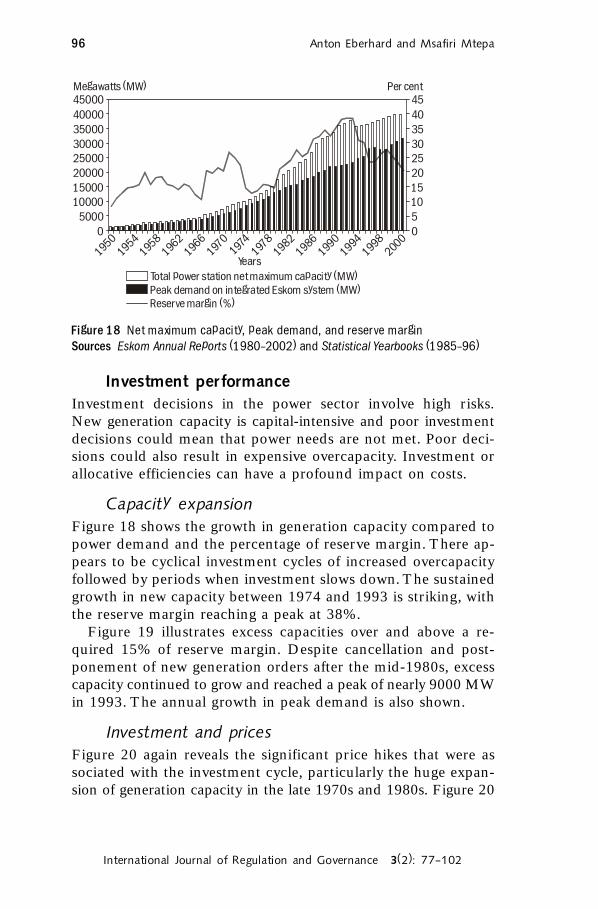
Investment performanceInvestment decisions in the power sector involve high risks.New generation capacity is capital-intensive and poor investmentdecisions could mean that power needs are not met. Poor deci-sions could also result in expensive overcapacity. Investment orallocative efficiencies can have a profound impact on costs.
Capacity expansionFigure 18 shows the growth in generation capacity compared topower demand and the percentage of reserve margin. There ap-pears to be cyclical investment cycles of increased overcapacityfollowed by periods when investment slows down. The sustainedgrowth in new capacity between 1974 and 1993 is striking, withthe reserve margin reaching a peak at 38%.
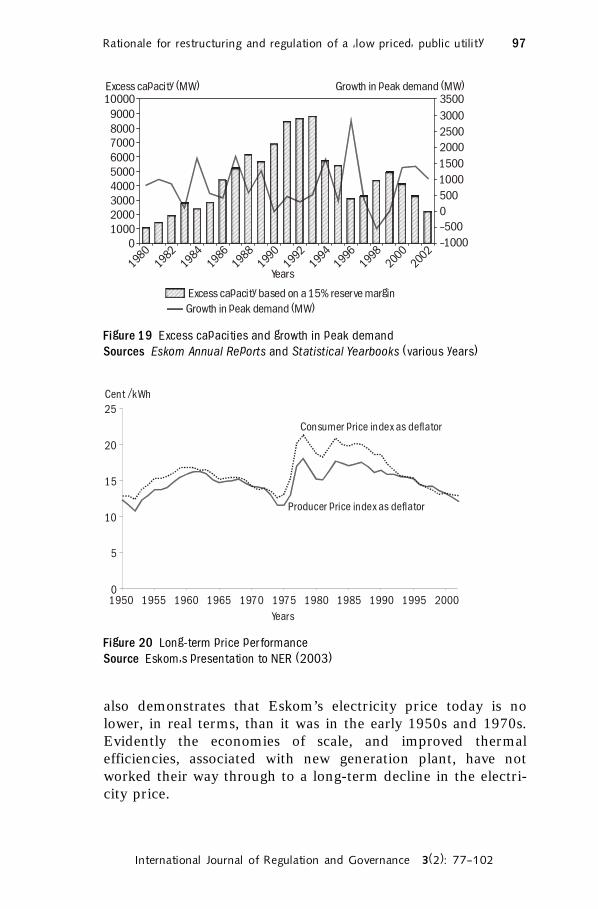
Figure 19 illustrates excess capacities over and above a re-quired 15% of reserve margin. Despite cancellation and post-ponement of new generation orders after the mid-1980s, excesscapacity continued to grow and reached a peak of nearly 9000 MWin 1993. The annual growth in peak demand is also shown.
Investment and pricesFigure 20 again reveals the significant price hikes that were associated with the investment cycle, particularly the huge expan-sion of generation capacity in the late 1970s and 1980s. Figure 20
Figure 18 Net maximum capacity, peak demand, and reserve marginSources Eskom Annual Reports (1980�2002) and Statistical Yearbooks (1985�96)
45000 45
40000 40
35000 35
30000 30
25000 25
20000 20
15000 15
10000 10
5000 5
0 0
Megawatts (MW) Per cent
19501954
19581962
19661970
19741978
19821986
19901994
19982000
Years
Total power station net maximum capacity (MW)
Peak demand on integrated Eskom system (MW)
Reserve margin (%)
Rationale for restructuring and regulation of a �low priced� public utility 97
International Journal of Regulation and Governance 3(2): 77�102
Figure 19 Excess capacities and growth in peak demandSources Eskom Annual Reports and Statistical Yearbooks (various years)
10000
9000
8000
7000
6000
5000
4000
3000
2000
1000
0
3500
3000
2500
2000
1500
1000
500
0
�500
�1000
Excess capacity (MW) Growth in peak demand (MW)
19801982
19841986
19881990
19921994
19961998
20002002
Years
Excess capacity based on a 15% reserve margin
Growth in peak demand (MW)
Consumer price index as deflator
Producer price index as deflator
25
20
15
10
5
0
Cent /kWh
1950 1955 1960 1965 1970 1975 1980 1985 1990 1995 2000
Years
Figure 20 Long-term price performanceSource Eskom�s presentation to NER (2003)
also demonstrates that Eskom’s electricity price today is nolower, in real terms, than it was in the early 1950s and 1970s.Evidently the economies of scale, and improved thermalefficiencies, associated with new generation plant, have notworked their way through to a long-term decline in the electri-city price.
Anton Eberhard and Msafiri Mtepa98
International Journal of Regulation and Governance 3(2): 77�102
ConclusionEskom’s electricity prices are clearly low by international stand-ards. The above analysis has shown that prices are low primarilybecause Eskom has not had to invest in new generation plant formany years. Much of the debt it incurred during the large expan-sion programme in the 1970s and 1980s has been amortized. Itsdebt-to-equity ratio has been reduced substantially. Accord-ingly, the contribution of finance and interest charges to the costof producing electricity are very low.
Eskom’s short-run marginal costs are also low, primarily be-cause its primary energy costs are well below international lev-els. Eskom power stations are situated adjacent to low-cost coalmines. Further reasons for Eskom’s low costs are the absence offlue gas desulphurization and the fact that, in previous years,Eskom was not liable to pay tax or dividends.
Labour productivity (number of employees per electricityoutput) has substantially improved since the mid-1980s, al-though higher salary levels have largely cancelled out thesegains. Technical performance has improved in a number of ar-eas. New generation plant enabled improved thermalefficiencies—that is less coal is required to produce a unit ofelectricity. Plant availability improved in the early 1990s, but hasdeclined in recent years. Technical and non-technical losses onthe distribution system have worsened through the 1990s.
Eskom’s historical investment record has been poor and theabove analysis indicates the extent of misallocation of capital re-sources that resulted in massively wasteful overcapacity in gen-eration plants. The impact on prices has been profound as aresult of this. Eskom has not always had competitive prices. Inreal terms, they were nearly double the current levels in the1970s and 1980s, and will have to rise in the future as capacityruns out and new investments have to be made in generation.
The long-term price trend reveals that current electricityprices, in real terms, are at the same level as the early 1950s andearly 1970s. The question then has to be asked whether Eskomhas been able to harvest the potential efficiency gains that shouldhave been possible from the application of new technology?
The implication of the above analysis is that a snapshot viewof Eskom’s current low prices does not provide any real indica-tion of its efficiency. However, an examination of historicaltrends reveals important insights. It is clear that there have beenmajor investment inefficiencies. It is also clear that over the long
Rationale for restructuring and regulation of a �low priced� public utility 99
International Journal of Regulation and Governance 3(2): 77�102
term, we have not seen consistent downward pressure on opera-tional costs that would have been expected from the employ-ment of new technology and improved productive efficiencies.
These insights provoke the question whether Eskom has oper-ated within a governance and regulatory environment that hasprovided sufficient incentives for improved performance. Whenthese questions are raised within policy debates regarding thepossible restructuring of Eskom, the rejoinder is often: ‘if it ain’tbroke don’t fix it!’ However our analysis has shown that there areserious shortcomings in the way investment risks have beenmanaged, with profound long-term cost and price implications.In a monopolistic model, risks and costs of poorinvestment decision are simply passed on to consumers. Steyn(2001) has demonstrated that there are a number of inherentcharacteristics of monopoly institutions that make this quitelikely. There is a sound basis for serious consideration of a newinstitutional model for the electricity industry in South Africa:one that will provide a more appropriate apportioning of invest-ment risk. Indeed, work has begun on designing a competitiveelectricity market for South Africa (Eberhard 2001).
The effectiveness of regulation also has to be questioned. Al-though Eskom’s marginal costs are low by international stand-ards, we have shown that low coal costs are one of the primaryreasons. There is little hard evidence on how Eskom’s productiveefficiencies compare internationally. Regulation of Eskom hashistorically been quite light. However, in recent years the NERhas been instituting a more rigorous and transparent regulatorymethodology and there is some indication that there is room forfurther efficiency improvements.
Low price, publicly owned utilities may not appear to requireindependent regulation or restructuring. This case study ofEskom in South Africa demonstrates the importance of a thor-ough historical understanding of utility performance in order toexpose possible inefficiencies. The test for new, re-regulatedelectricity markets is whether they can encourage efficient in-vestment behaviour and operational performance to secure elec-tricity supply at the lowest possible cost.
BibliographyDe Villiers W J. 1984Report of the Commission of Inquiry into the supply of electricity inthe Republic of South AfricaPretoria: Government Printer
Anton Eberhard and Msafiri Mtepa100
International Journal of Regulation and Governance 3(2): 77�102
DME (Department of Minerals and Energy). 1998White Paper on Energy Policy for Republic of South AfricaPretoria: Department of Minerals and Energy
DME (Department of Minerals and Energy). 2003Production and sale of coal, Table 19[Available at www.dme.gov.za/publications/pdf/stats/minerals/tables tbl19.pdf(accessed on 24 July 2003)]
Eberhard A. 2000Competition and Regulation in the Electricity Supply Industry inSouth Africa. A paper for the Competition Commission South AfricaCape Town: University of Cape Town
Eberhard A. 2001Competition and Regulation in the Electricity Supply Industry inSouth Africa[A paper presented to the Trade and Industrial Policy Strategies Annual Fo-rum, Pretoria]Cape Town: Graduate School of Business, University of Cape Town.
Eberhard A. 2003The Political, Economic, Institutional and Legal Dimensions ofElectricity Supply Industry Reform in South Africa[Working Paper Series]Stanford, USA: Centre for Environmental Science and Policy, StanfordUniversity
EIA (Energy Information Administration). 2003Monthly review, July 2003[Available at www.eia.doe.gov/emeu/international/stmforelec.html. (accessedon 11 September 2003)]
Eskom. 1981Eskom Annual ReportJohannesburg: Eskom
Eskom. 1982Eskom Annual ReportJohannesburg: Eskom
Eskom. 1987Eskom Annual ReportJohannesburg: Eskom
Eskom. 1989Koeberg nuclear power station: General information brochureCape Town: Eskom
Eskom. 1990Eskom Annual Report, pp.19Johannesburg: Eskom
Rationale for restructuring and regulation of a �low priced� public utility 101
International Journal of Regulation and Governance 3(2): 77�102
Eskom. 1992Eskom Annual Report, pp.24Johannesburg: Eskom
Eskom. 2000Eskom Annual ReportJohannesburg: Eskom
Eskom. 2001Eskom Annual Report, pp.124Johannesburg: Eskom
Eskom. 2002Eskom tariffs and charges for January to June 2002[Available at www.eskom.co.za/tariffs (accessed on 20 September 2002)]
Heap J. 1992Productivity Management: a fresh approachLondon: Cassell Educational Limited
IEA (International Energy Agency). 2000Electricity Information 2000 with 1999 dataParis: IEA
IEA (International Energy Agency). 2001Quarterly statistics (Third quarter 2000)Paris: IEA
IEA (International Energy Agency). 2002Retail prices in selected countries in US Dollars/Unit.[Available at www.iea.org/statist/keyworld2002/key2002 p_0505.htm(accessed on 18 June 2003)]
IMF (International Monetary Fund). 2000International Financial Statistics, LIIIWashington, DC: IMF
IMF (International Monetary Fund). 2003International Financial Statistics, LVIWashington, DC: IMF
Khatib H. 2001Environmental performance of generation plant: electricity genera-tion and global environmental protocolsIn Performance of Generating Plant (Section 5) [A report by the World EnergyCouncil, October 2001]London: World Energy Council
Mahona B, Hoppe-Kilpper M, Vigoti R, Hughes E, Bertani R. 2001Renewable energy plantIn Performance of Generating Plant (Section 2) [A report by the World EnergyCouncil, October 2001]London: World Energy Council
Anton Eberhard and Msafiri Mtepa102
International Journal of Regulation and Governance 3(2): 77�102
NER (National Electricity Regulator). 1998Lighting up South AfricaPretoria: NER
NER (National Electricity Regulator). 2000Electricity Supply Statistics for South Africa 2000Pretoria: NER
NER (National Electricity Regulator). 2001Electricity Supply Statistics for South Africa 2001Pretoria: NER
Spiegelberg R, Kaupang B, Glorian D, Blin P. 2001Thermal generating plant (100 MW +) availability and unavailabilityfactors: 2001In Performance of Generating Plant (Section 1); [A report by the World EnergyCouncil, October 2001]London: World Energy Council
Statistics South Africa. 2003aConsumer Price Index[Available at www.statssa.gov.za/Products/Releases/CPI_Historical/CPIHistoricalCurrent.pdf(accessed on 10 March 2003)]
Statistics South Africa. 2003bProduction Price Index[Available at www.statssa.gov.za/Products/Releases/PPIHistorical/PPI_HistoricalCurrent.pdf(accessed on 11 December2002)]
Steyn G. 1994Restructuring the South African Electricity Supply IndustryCape Town: Energy for Development Research Centre, University ofCape Town
Steyn G. 2001Governance, Finance, and Investment: decision making and risk inthe electric power sector [DPhil]Brighton: University of Sussex
World Bank. 2003The International Comparison Programme and Purchasing PowerParities[Available at www.worldbank.org/data/icp/pppdata.htm.(accessed on 20 June 2003)]