Embed Size (px)
Citation preview
CROSSHOLE SONIC LOGGING OF SECANT PILE WALLS
A FEASIBILTY STUDY
Ernst Niederleithinger, BAM Federal Institute for Materials Research and Testing, Berlin, Germany
Joram M. Amir, Piletest Ltd., London, United Kingdom
Markus Hübner, GGU Gesellschaft für Geophysikalische Untersuchungen mbH, Karlsruhe, Germany
Abstract
Secant pile walls are used as permanent or temporary elements in foundations, excavations, slope
stabilization, retaining walls or hydraulic barriers. In contrast to single piles, reliable non-destructive
testing methods are not available so far. The reinforced secondary piles can be checked by standard
crosshole sonic logging, but there is no access to the unreinforced primary piles. Experiments at
construction sites using ray paths across several piles have shown encouraging results, but there have
been several open questions. To evaluate the potential of cross-pile sonic logging, a real scale test model
with built in flaws on two primary piles was constructed at the BAM test site. Measurements with two
different instruments have been performed. In one primary pile relevant flaws could be detected. At the
other one the signals showed anomalous damping, probably due to unintended delamination. The results
can be used to interpret real site data.
Introduction
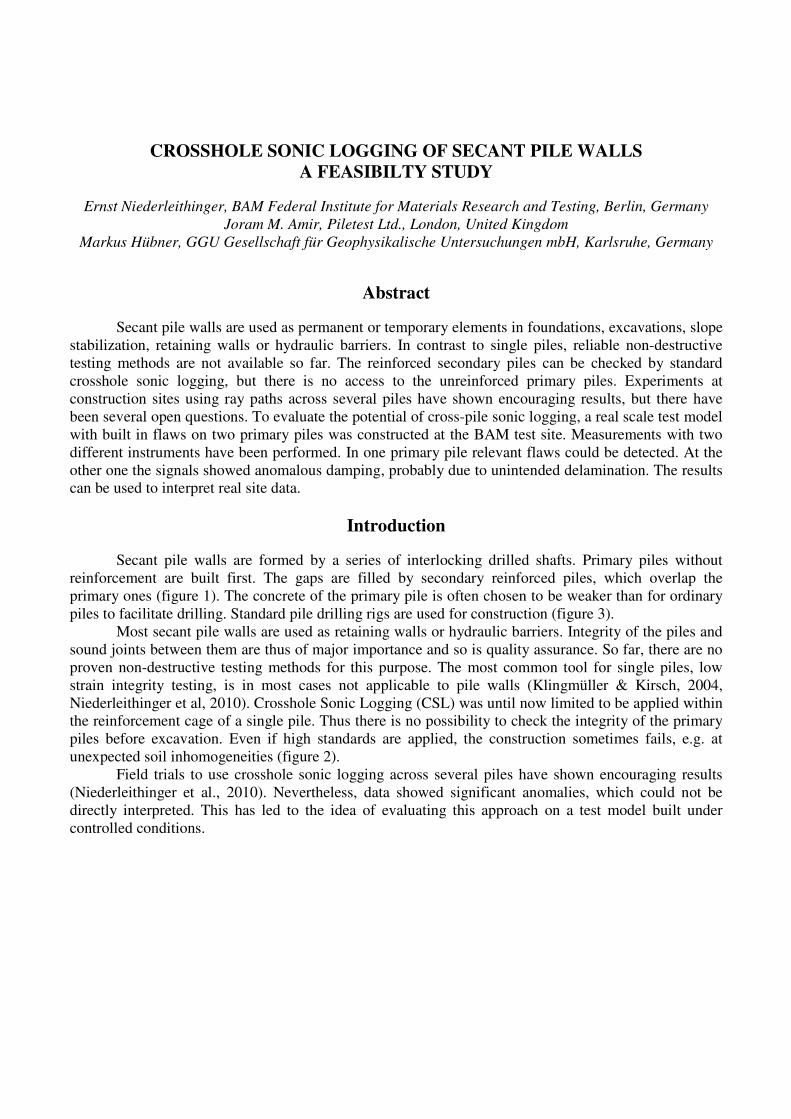
Secant pile walls are formed by a series of interlocking drilled shafts. Primary piles without
reinforcement are built first. The gaps are filled by secondary reinforced piles, which overlap the
primary ones (figure 1). The concrete of the primary pile is often chosen to be weaker than for ordinary
piles to facilitate drilling. Standard pile drilling rigs are used for construction (figure 3).
Most secant pile walls are used as retaining walls or hydraulic barriers. Integrity of the piles and
sound joints between them are thus of major importance and so is quality assurance. So far, there are no
proven non-destructive testing methods for this purpose. The most common tool for single piles, low
strain integrity testing, is in most cases not applicable to pile walls (Klingmüller & Kirsch, 2004,
Niederleithinger et al, 2010). Crosshole Sonic Logging (CSL) was until now limited to be applied within
the reinforcement cage of a single pile. Thus there is no possibility to check the integrity of the primary
piles before excavation. Even if high standards are applied, the construction sometimes fails, e.g. at
unexpected soil inhomogeneities (figure 2).
Field trials to use crosshole sonic logging across several piles have shown encouraging results
(Niederleithinger et al., 2010). Nevertheless, data showed significant anomalies, which could not be
directly interpreted. This has led to the idea of evaluating this approach on a test model built under
controlled conditions.
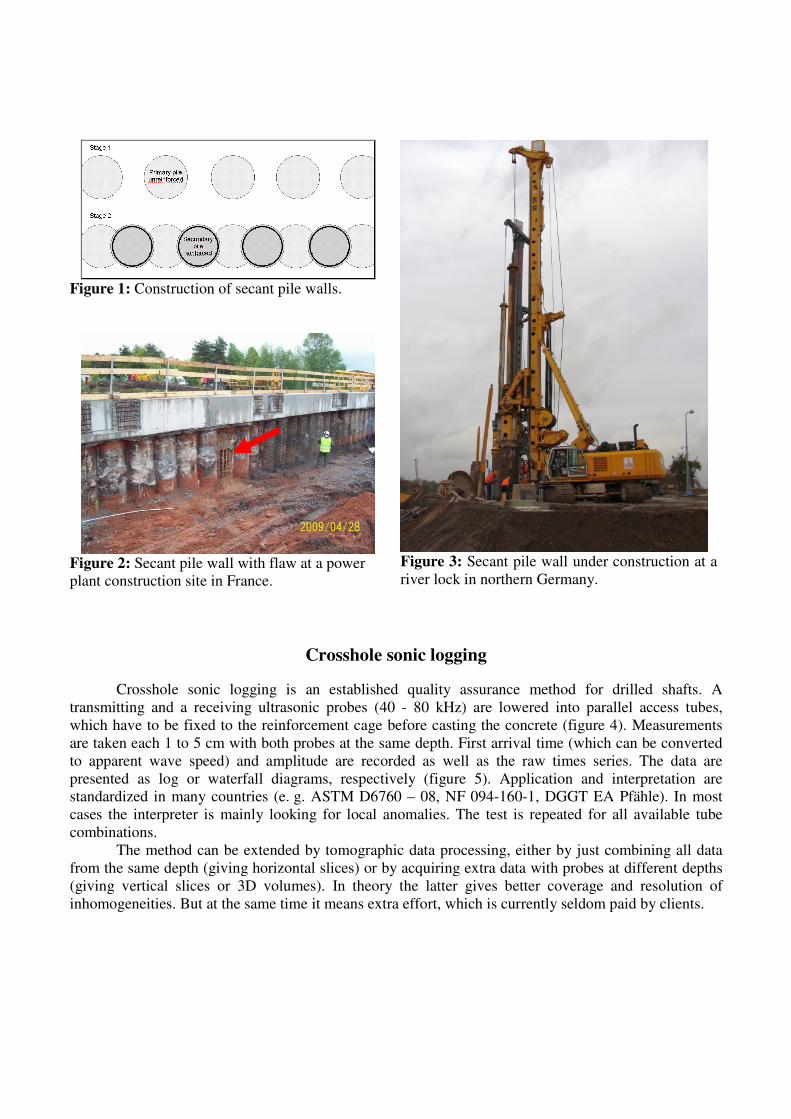
Figure 1: Construction of secant pile walls.
Figure 2: Secant pile wall with flaw at a power
plant construction site in France.
Figure 3: Secant pile wall under construction at a
river lock in northern Germany.
Crosshole sonic logging
Crosshole sonic logging is an established quality assurance method for drilled shafts. A
transmitting and a receiving ultrasonic probes (40 - 80 kHz) are lowered into parallel access tubes,
which have to be fixed to the reinforcement cage before casting the concrete (figure 4). Measurements
are taken each 1 to 5 cm with both probes at the same depth. First arrival time (which can be converted
to apparent wave speed) and amplitude are recorded as well as the raw times series. The data are
presented as log or waterfall diagrams, respectively (figure 5). Application and interpretation are
standardized in many countries (e. g. ASTM D6760 – 08, NF 094-160-1, DGGT EA Pfähle). In most
cases the interpreter is mainly looking for local anomalies. The test is repeated for all available tube
combinations.
The method can be extended by tomographic data processing, either by just combining all data
from the same depth (giving horizontal slices) or by acquiring extra data with probes at different depths
(giving vertical slices or 3D volumes). In theory the latter gives better coverage and resolution of
inhomogeneities. But at the same time it means extra effort, which is currently seldom paid by clients.
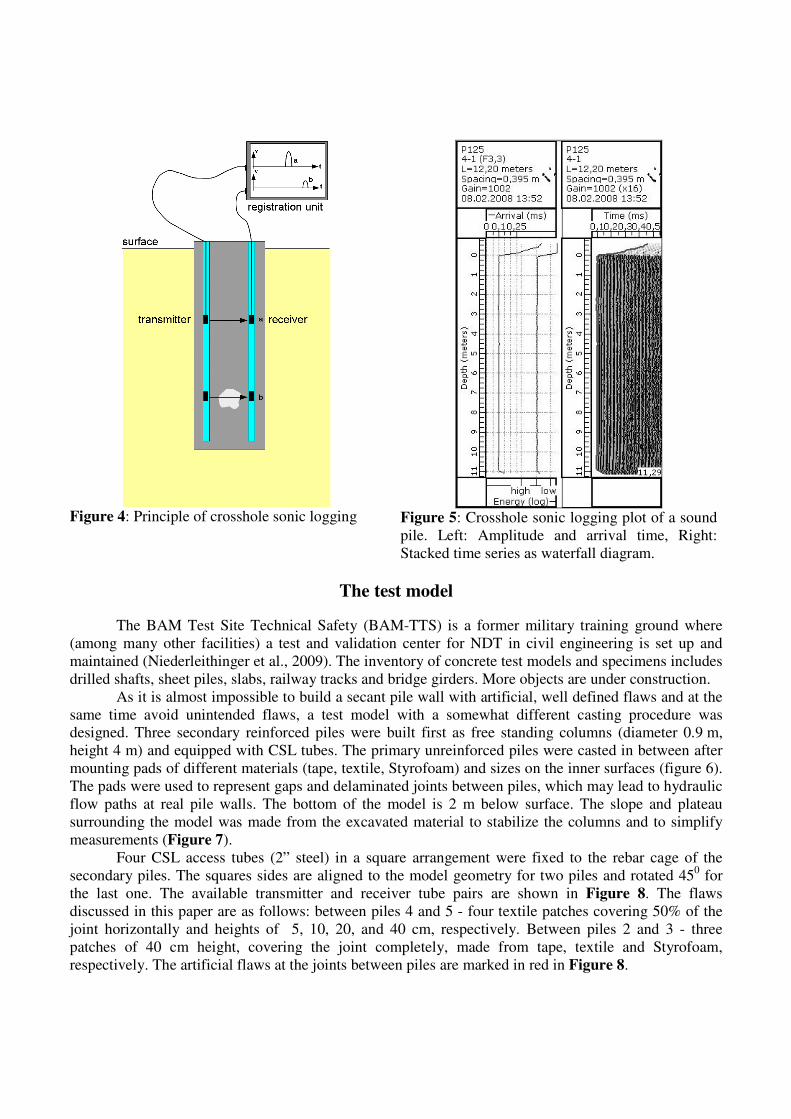
Figure 4: Principle of crosshole sonic logging
Figure 5: Crosshole sonic logging plot of a sound
pile. Left: Amplitude and arrival time, Right:
Stacked time series as waterfall diagram.
The test model
The BAM Test Site Technical Safety (BAM-TTS) is a former military training ground where
(among many other facilities) a test and validation center for NDT in civil engineering is set up and
maintained (Niederleithinger et al., 2009). The inventory of concrete test models and specimens includes
drilled shafts, sheet piles, slabs, railway tracks and bridge girders. More objects are under construction.
As it is almost impossible to build a secant pile wall with artificial, well defined flaws and at the
same time avoid unintended flaws, a test model with a somewhat different casting procedure was
designed. Three secondary reinforced piles were built first as free standing columns (diameter 0.9 m,
height 4 m) and equipped with CSL tubes. The primary unreinforced piles were casted in between after
mounting pads of different materials (tape, textile, Styrofoam) and sizes on the inner surfaces (figure 6).
The pads were used to represent gaps and delaminated joints between piles, which may lead to hydraulic
flow paths at real pile walls. The bottom of the model is 2 m below surface. The slope and plateau
surrounding the model was made from the excavated material to stabilize the columns and to simplify
measurements (Figure 7).
Four CSL access tubes (2” steel) in a square arrangement were fixed to the rebar cage of the
secondary piles. The squares sides are aligned to the model geometry for two piles and rotated 450 for
the last one. The available transmitter and receiver tube pairs are shown in Figure 8. The flaws
discussed in this paper are as follows: between piles 4 and 5 - four textile patches covering 50% of the
joint horizontally and heights of 5, 10, 20, and 40 cm, respectively. Between piles 2 and 3 - three
patches of 40 cm height, covering the joint completely, made from tape, textile and Styrofoam,
respectively. The artificial flaws at the joints between piles are marked in red in Figure 8.
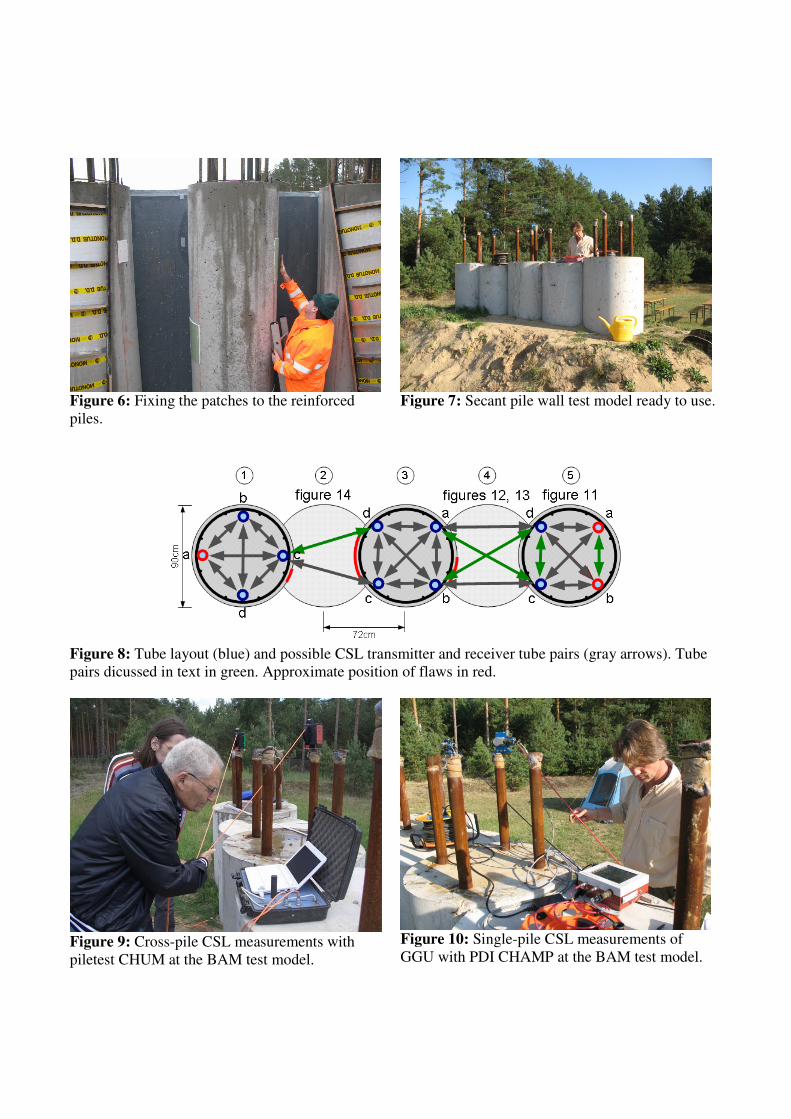
Figure 6: Fixing the patches to the reinforced
piles.
Figure 7: Secant pile wall test model ready to use.
Figure 8: Tube layout (blue) and possible CSL transmitter and receiver tube pairs (gray arrows). Tube
pairs dicussed in text in green. Approximate position of flaws in red.
Figure 9: Cross-pile CSL measurements with
piletest CHUM at the BAM test model.
Figure 10: Single-pile CSL measurements of
GGU with PDI CHAMP at the BAM test model.
Measurements and results
Two sets of CSL measurements at the test model were carried out in June and September 2009
by independent operators with different instruments (figures 9, 10). Data processing and display were
done using the software supplied by the manufacturers according to manuals and standards.
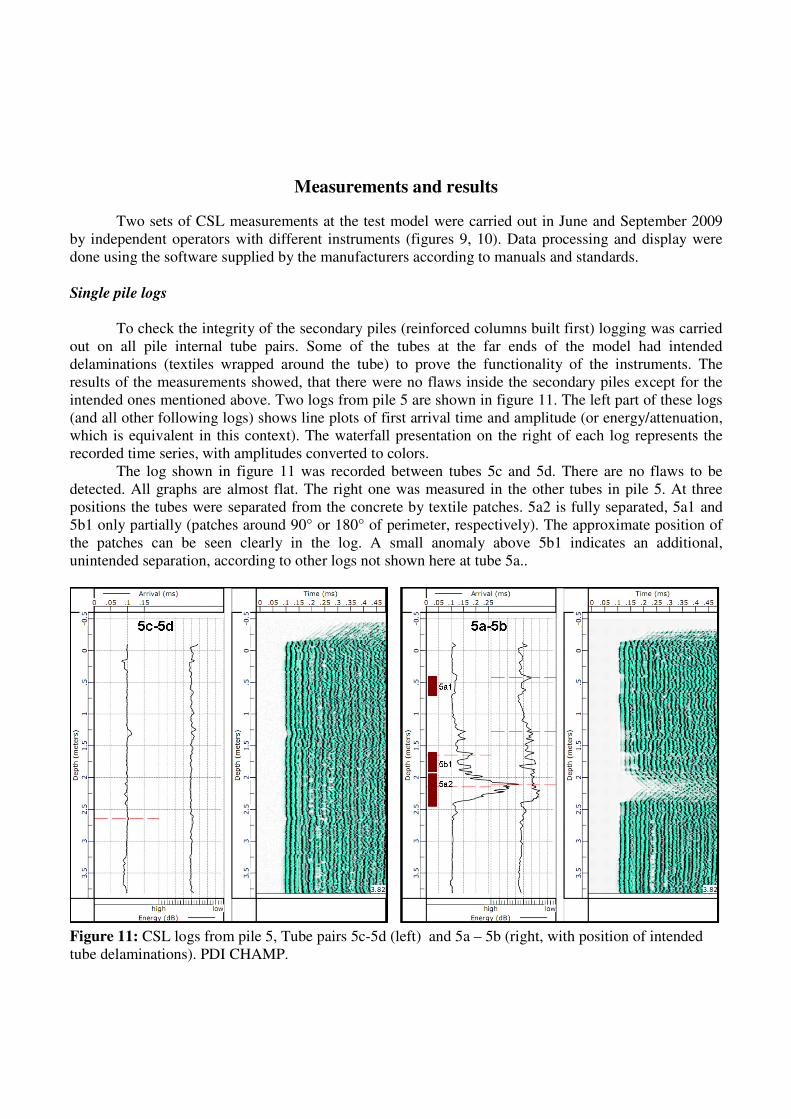
Single pile logs
To check the integrity of the secondary piles (reinforced columns built first) logging was carried
out on all pile internal tube pairs. Some of the tubes at the far ends of the model had intended
delaminations (textiles wrapped around the tube) to prove the functionality of the instruments. The
results of the measurements showed, that there were no flaws inside the secondary piles except for the
intended ones mentioned above. Two logs from pile 5 are shown in figure 11. The left part of these logs
(and all other following logs) shows line plots of first arrival time and amplitude (or energy/attenuation,
which is equivalent in this context). The waterfall presentation on the right of each log represents the
recorded time series, with amplitudes converted to colors.
The log shown in figure 11 was recorded between tubes 5c and 5d. There are no flaws to be
detected. All graphs are almost flat. The right one was measured in the other tubes in pile 5. At three
positions the tubes were separated from the concrete by textile patches. 5a2 is fully separated, 5a1 and
5b1 only partially (patches around 90° or 180° of perimeter, respectively). The approximate position of
the patches can be seen clearly in the log. A small anomaly above 5b1 indicates an additional,
unintended separation, according to other logs not shown here at tube 5a..
Figure 11: CSL logs from pile 5, Tube pairs 5c-5d (left) and 5a – 5b (right, with position of intended
tube delaminations). PDI CHAMP.

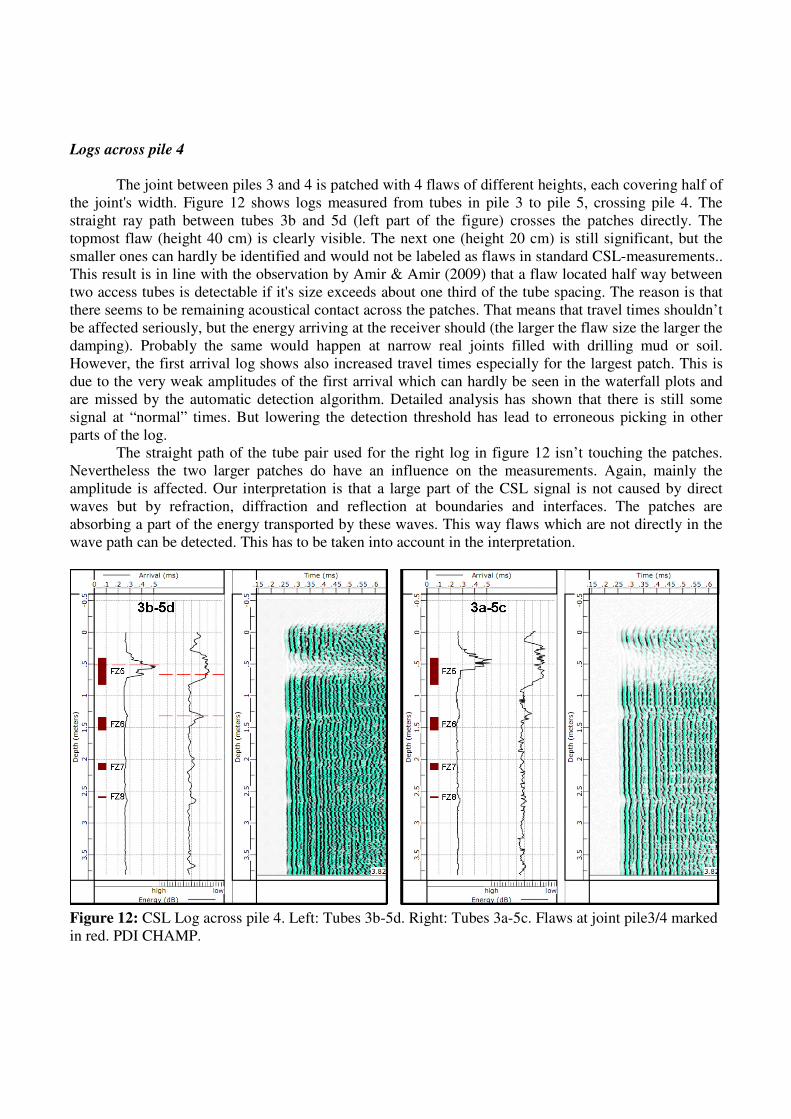
Logs across pile 4
The joint between piles 3 and 4 is patched with 4 flaws of different heights, each covering half of
the joint's width. Figure 12 shows logs measured from tubes in pile 3 to pile 5, crossing pile 4. The
straight ray path between tubes 3b and 5d (left part of the figure) crosses the patches directly. The
topmost flaw (height 40 cm) is clearly visible. The next one (height 20 cm) is still significant, but the
smaller ones can hardly be identified and would not be labeled as flaws in standard CSL-measurements..
This result is in line with the observation by Amir & Amir (2009) that a flaw located half way between
two access tubes is detectable if it's size exceeds about one third of the tube spacing. The reason is that
there seems to be remaining acoustical contact across the patches. That means that travel times shouldn’t
be affected seriously, but the energy arriving at the receiver should (the larger the flaw size the larger the
damping). Probably the same would happen at narrow real joints filled with drilling mud or soil.
However, the first arrival log shows also increased travel times especially for the largest patch. This is
due to the very weak amplitudes of the first arrival which can hardly be seen in the waterfall plots and
are missed by the automatic detection algorithm. Detailed analysis has shown that there is still some
signal at “normal” times. But lowering the detection threshold has lead to erroneous picking in other
parts of the log.
The straight path of the tube pair used for the right log in figure 12 isn’t touching the patches.
Nevertheless the two larger patches do have an influence on the measurements. Again, mainly the
amplitude is affected. Our interpretation is that a large part of the CSL signal is not caused by direct
waves but by refraction, diffraction and reflection at boundaries and interfaces. The patches are
absorbing a part of the energy transported by these waves. This way flaws which are not directly in the
wave path can be detected. This has to be taken into account in the interpretation.
Figure 12: CSL Log across pile 4. Left: Tubes 3b-5d. Right: Tubes 3a-5c. Flaws at joint pile3/4 marked
in red. PDI CHAMP.
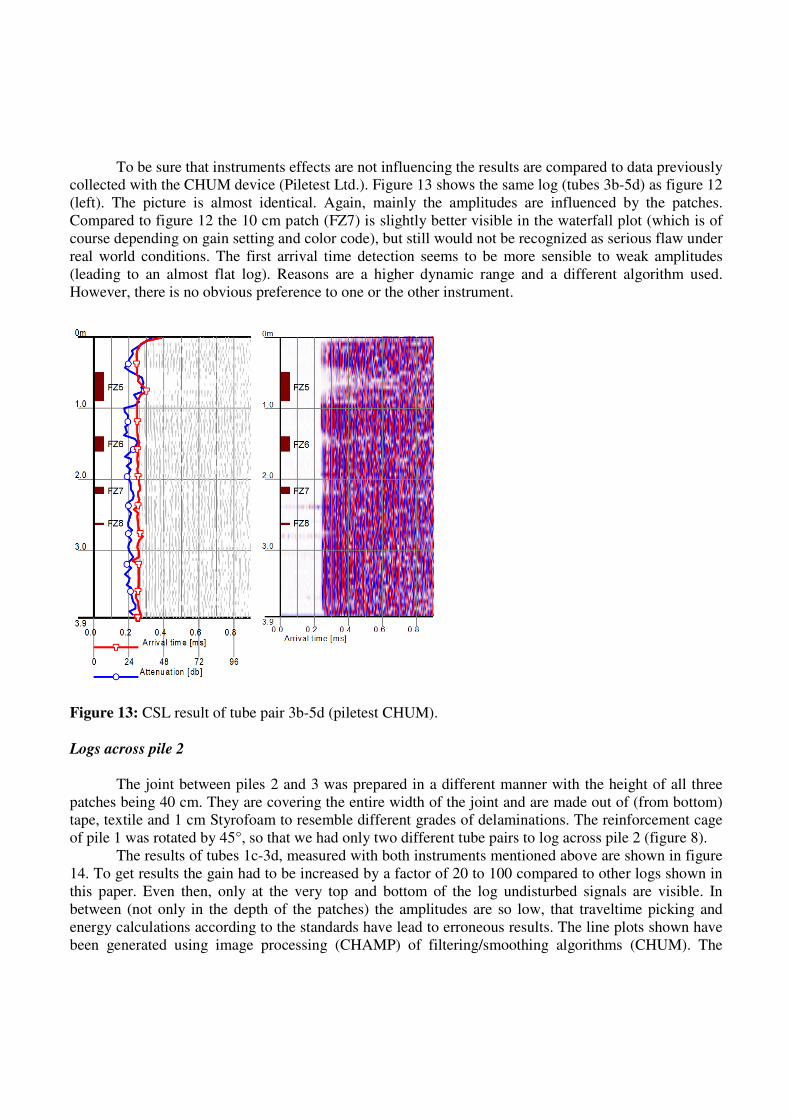
To be sure that instruments effects are not influencing the results are compared to data previously
collected with the CHUM device (Piletest Ltd.). Figure 13 shows the same log (tubes 3b-5d) as figure 12
(left). The picture is almost identical. Again, mainly the amplitudes are influenced by the patches.
Compared to figure 12 the 10 cm patch (FZ7) is slightly better visible in the waterfall plot (which is of
course depending on gain setting and color code), but still would not be recognized as serious flaw under
real world conditions. The first arrival time detection seems to be more sensible to weak amplitudes
(leading to an almost flat log). Reasons are a higher dynamic range and a different algorithm used.
However, there is no obvious preference to one or the other instrument.
Figure 13: CSL result of tube pair 3b-5d (piletest CHUM).
Logs across pile 2
The joint between piles 2 and 3 was prepared in a different manner with the height of all three
patches being 40 cm. They are covering the entire width of the joint and are made out of (from bottom)
tape, textile and 1 cm Styrofoam to resemble different grades of delaminations. The reinforcement cage
of pile 1 was rotated by 45°, so that we had only two different tube pairs to log across pile 2 (figure 8).
The results of tubes 1c-3d, measured with both instruments mentioned above are shown in figure
14. To get results the gain had to be increased by a factor of 20 to 100 compared to other logs shown in
this paper. Even then, only at the very top and bottom of the log undisturbed signals are visible. In
between (not only in the depth of the patches) the amplitudes are so low, that traveltime picking and
energy calculations according to the standards have lead to erroneous results. The line plots shown have
been generated using image processing (CHAMP) of filtering/smoothing algorithms (CHUM). The
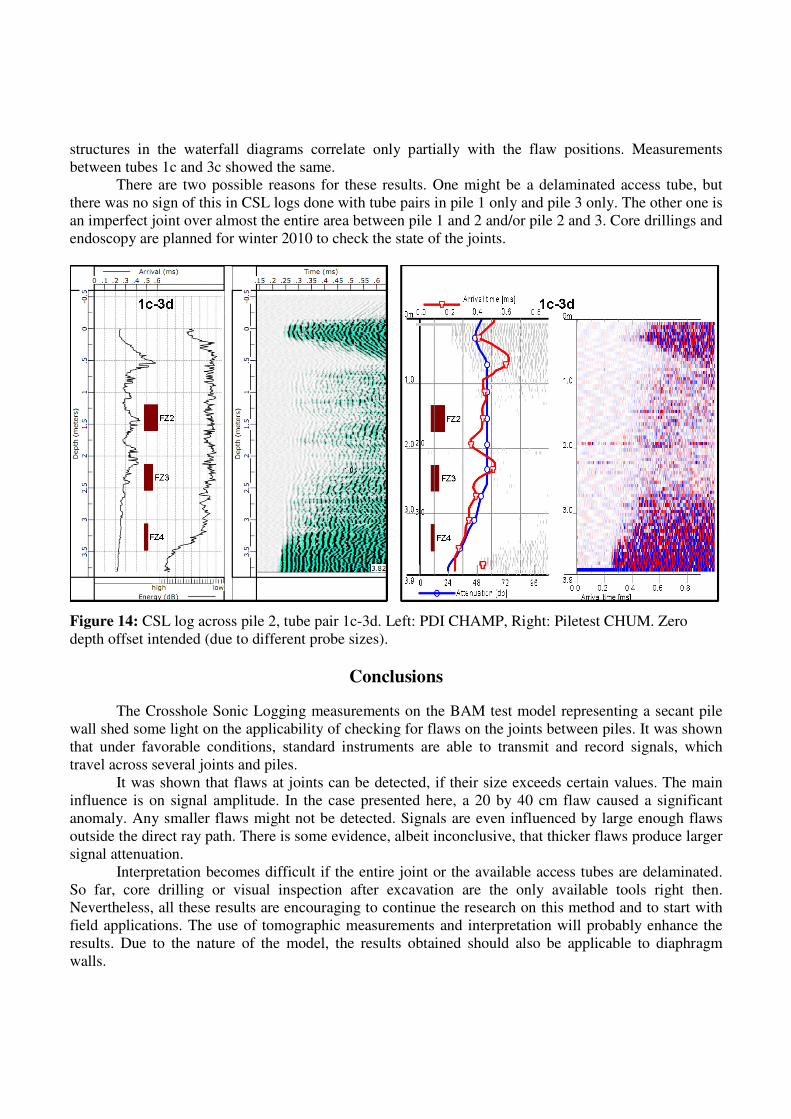
structures in the waterfall diagrams correlate only partially with the flaw positions. Measurements
between tubes 1c and 3c showed the same.
There are two possible reasons for these results. One might be a delaminated access tube, but
there was no sign of this in CSL logs done with tube pairs in pile 1 only and pile 3 only. The other one is
an imperfect joint over almost the entire area between pile 1 and 2 and/or pile 2 and 3. Core drillings and
endoscopy are planned for winter 2010 to check the state of the joints.
Figure 14: CSL log across pile 2, tube pair 1c-3d. Left: PDI CHAMP, Right: Piletest CHUM. Zero
depth offset intended (due to different probe sizes).
Conclusions
The Crosshole Sonic Logging measurements on the BAM test model representing a secant pile
wall shed some light on the applicability of checking for flaws on the joints between piles. It was shown
that under favorable conditions, standard instruments are able to transmit and record signals, which
travel across several joints and piles.
It was shown that flaws at joints can be detected, if their size exceeds certain values. The main
influence is on signal amplitude. In the case presented here, a 20 by 40 cm flaw caused a significant
anomaly. Any smaller flaws might not be detected. Signals are even influenced by large enough flaws
outside the direct ray path. There is some evidence, albeit inconclusive, that thicker flaws produce larger
signal attenuation.
Interpretation becomes difficult if the entire joint or the available access tubes are delaminated.
So far, core drilling or visual inspection after excavation are the only available tools right then.
Nevertheless, all these results are encouraging to continue the research on this method and to start with
field applications. The use of tomographic measurements and interpretation will probably enhance the
results. Due to the nature of the model, the results obtained should also be applicable to diaphragm
walls.

Acknowledgements
The test model was built by at the BAM-TTS by Marco Lange, Sean Smith and Christoph
Richter. A part of the measurements was funded by the BAW (German Federal Waterways Engineering
and Research Institute). Tony Ballhause assisted during measurements.
References
Amir, J.M. & Amir, E.I., 2009: Capabilities and Limitations of Cross Hole Ultrasonic Testing of Piles,
Proc. Conf. Contemporary Topics in Deep Foundation, ASCE GSP 185, Orlando.
ASTM D6760 - 08 Standard Test Method for Integrity Testing of Concrete Deep Foundations by
Ultrasonic Crosshole Testing
DGGT AK 2.1: Empfehlungen des Arbeitskreises „Pfähle“ (EA Pfähle). Ernst& Sohn, Berlin, 2007.
Klingmüller, O., & Kirsch, F., 2004: A quality and safety issue for cast-in-place piles 25 years of
experience with low-strain integrity testing in Germany: From scientific peculiarity to day-to-day
practice. Current Practice and Future Trends in Deep Foundations, American Society of Civil
Engineers, Geotechnical Special Publication No. 125, 2004, S. 202-221
Niederleithinger, E., Wiggenhauser, H., & Taffe, A., 2009: The NDT-CE test and validation center in
Horstwalde. Proceedings of NDTCE’09, Nantes, France.
(http://www.ndt.net/article/ndtce2009/papers/127.pdf)
Niederleithinger, E., Schallert, M., Klingmüller, O., & Bobbe, A., 2010: Quality assurance of a secant
pile wall using three different non-destructive test methods. Accepted for proceedings of
ISSMGE “Geotechnical Challenges in Megacities”, Moskau.
NF P94-160-1 Octobre 2000: Sols : reconnaissance et essais - Auscultation d'un élément de fondation -
Partie 1 : méthode par transparence (French CSL standard).


![Baustoffdesign Einführung.ppt [Kompatibilitätsmodus] · containing cement, sand and chemical admixtures etc. Machine foundation Earthquake retrofit Pile top. Baustoffdesign Composition](https://img.pdfslide.org/doc/110x75/5dd13028d6be591ccb64a4e7/baustoffdesign-einfhrungppt-kompatibilittsmodus-containing-cement-sand-and.jpg)


![KI meets Training [3]: Lernbot im Eigenbau – Mit Jix und ... fileBriefing Konzept Treatment, Storyboard Produktion / Skripten Testbetrieb, Logging, Optimierung Live-Betrieb, Logging,](https://img.pdfslide.org/doc/110x75/5d554bc788c993f2088b7d5d/ki-meets-training-3-lernbot-im-eigenbau-mit-jix-und-konzept-treatment.jpg)