Embed Size (px)
Citation preview
DDeeggrraaddaattiioonn ooff aaccrryylloonniittrriillee bbuuttaaddiieennee rruubbbbeerr aanndd fflluuoorrooeellaassttoommeerrss iinn rraappeesseeeedd bbiiooddiieesseell aanndd hhyyddrrooggeennaatteedd vveeggeettaabbllee ooiill
Shahin Akhlaghi
Doctoral Thesis Stockholm, Sweden 2017 KTH Royal Institute of Technology Department of Fibre and Polymer Technology School of Chemical Science and Engineering 100 44 Stockholm, Sweden
II
Supervisor Professor Ulf W. Gedde Copyright © 2017 Shahin Akhlaghi All rights reserved Paper I © 2015 Elsevier Ltd. Paper II © 2015 Elsevier Ltd. Paper III © 2016 Elsevier Ltd. Paper IV © 2017 Elsevier Ltd. Paper V © 2017 Elsevier Ltd. TRITA-CHE Report 2017:9 ISSN 1654-1081 ISBN 978-91-7729-274-6 Tryck: US-AB, Stockholm 2017 Scanning electron micrographs in the cover illustration show the biodiesel-driven degradation of the rubber layer adsorbed on the carbon black surfaces.
AKADEMISK AVHANDLING Som med tillstånd av Kungliga Tekniska Högskolan i Stockholm framlägges till offentlig granskning för avläggande av teknisk doktorsexamen den 31 mars 2017, kl. 10:00, i sal F3, Lindstedtsvägen 26, KTH campus, Stockholm. Avhandlingen försvaras på engelska. Fakultetsopponent: Professor Jean-Luc Gardette, Institut de Chimie de Clermont-Ferrand, Equipe Photochimie, Université Blaise Pascal, Aubière, France

III
To my mother and father
IV
ABSTRACT
Biodiesel and hydrotreated vegetable oil (HVO) are currently viewed by the transportation sector as the most viable alternative fuels to replace petroleum-based fuels. The use of biodiesel has, however, been limited by the deteriorative effect of biodiesel on rubber parts in automobile fuel systems. This work therefore aimed at investigating the degradation of acrylonitrile butadiene rubber (NBR) and fluoroelastomers (FKM) on exposure to biodiesel and HVO at different temperatures and oxygen concentrations in an automated ageing equipment and a high-pressure autoclave. The oxidation of biodiesel at 80 °C was promoted by an increase in the oxygen partial pressure, resulting in the formation of larger amounts of hydroperoxides and acids in the fuel. The fatty acid methyl esters of the biodiesel oxidized less at 150 °C on autoclave aging, because the termination reactions between alkyl and alkylperoxyl radicals dominated over the initiation reactions. HVO consists of saturated hydrocarbons, and remained intact during the exposure. The NBR absorbed a large amount of biodiesel due to fuel-driven internal cavitation in the rubber, and the uptake increased with increasing oxygen partial pressure due to the increase in concentration of oxidation products of the biodiesel. The absence of a tan δ peak (dynamical mechanical measurements) of the bound rubber and the appearance of carbon black particles devoid of rubber suggested that the cavitation was caused by the detachment of bound rubber from particle surfaces. A significant decrease in the strain-at-break and in the Payne-effect amplitude of NBR exposed to biodiesel was explained as being due to the damage caused by biodiesel to the rubber-carbon-black network. During the high-temperature autoclave ageing, the NBR swelled less in biodiesel, and showed a small decrease in the strain-at-break due to the cleavage of rubber chains. The degradation of NBR in the absence of carbon black was due only to biodiesel-promoted oxidative crosslinking. The zinc cations released by the dissolution of zinc oxide particles in biodiesel promoted reduction reactions in the acrylonitrile part of the NBR. Heat-treated star-shaped ZnO particles dissolved more slowly in biodiesel than the commercial ZnO nanoparticles due to the elimination of inter-particle porosity by heat treatment. The fuel sorption was hindered in HVO-exposed NBR by the steric constraints of the bulky HVO molecules. The extensibility of NBR decreased only slightly after exposure to HVO, due to the migration of plasticizer from the rubber. The bisphenol-cured FKM co- and terpolymer swelled more than the peroxide-cured GFLT-type FKM in biodiesel due to the chain cleavage caused by the attack of biodiesel on the double bonds formed during the bisphenol curing. The FKM rubbers absorbed biodiesel faster, and to a greater extent, with increasing oxygen concentration. It is suggested that the extensive biodiesel uptake and the decrease in the strain-at-break and Young’s modulus of the FKM terpolymer was due to dehydrofluorination of the rubber by the coordination complexes of biodiesel and magnesium oxide and calcium hydroxide particles. An increase in the CH2-concentration of the extracted FKM rubbers suggested that biodiesel was grafted onto the FKM at the unsaturated sites resulting from dehydrofluorination.
Keywords: Degradation; Acrylonitrile butadiene rubber; Fluoroelastomers; Biodiesel; Hydrotreated vegetable oil; Cavitation; Bound rubber; Dehydrofluorination.
V
SAMMANFATTNING
Biodiesel och hydrogenererad vegetabilisk olja (HVO) ses av transportsektorn som tillgängliga alternativa bränslen för att minska beroendet av petroleumbaserade bränslen. Biodiesels användning har emellertid begränsats genom dess negativa effekter på gummidelar i bilars bränslesystem. Syftet med detta arbete har således varit att öka förståelsen av nedbrytning av två vanliga gummin i bilar (akrylnitrilbutadiengummi (NBR) och fluorelastomerer (FKM)) under exponering i biodiesel och HVO. Detta har utförts vid olika temperaturer och syrehalter i en automatiserad åldrings-utrustning och i en högtrycksautoklav. Biodiesels oxidationen vid 80 °C främjades av en ökning av syrekoncentationen, vilket resulterade i bildning av stora mängder av hydroperoxider och syror i bränslet. De fettsyrametylestrar som finns i biodiesel oxiderade i mindre omfattning vid 150 °C i autoklav-åldring, eftersom de terminala reaktionerna mellan alkyl- och alkylperoxyl-radikaler dominerade över initieringsreaktionerna. HVO består av mättade kolväten, och förblev intakt under exponeringen. NBR absorberade en stor mängd biodiesel på grund av bränsleorsakad inre kavitation i gummit, vilket ökade genom att öka syrepartialtryck till följd av ökningen i koncentrationen av oxidationsprodukter av biodiesel. Frånvaron av tan δ toppen (dynamisk-mekanisk analys) från bundet gummi och närvaron av kimrökspartiklar som saknade gummi på ytan tydde på att kavitationen orsakades av avskiljandet av bundet gummi från partikelytorna. Den stora minskningen av extensibiliteten och Payne-effekten hos NBR gummit som exponerats för biodiesel orsakades av biodieselns nedbrytning av gummi-kimröks-nätverket. Under autoklav-åldrandet vid hög temperatur, svällde NBR mindre i biodiesel, och visade endast en mindre nedgång i extensibiliteten, då orsakad av klyvningen av polymerkedjor. Nedbrytningen av NBR, i frånvaro av kimrök, berodde endast på biodieselns främjande av oxidativ tvärbindning. De av bränslets utlösta zinkkatjoner från zinkoxid-tillsatsen genererade reduktionsreaktioner i akrylnitrildelen av NBR-gummit. Detta kunde motverkas till viss del genom att använda värmebehandlade stjärnformade ZnO partiklar (utan inter-partikel porositet), vilka löstes mycket långsammare i biodiesel än de kommersiella ZnO nanopartiklarna. Upptag av HVO bränslet i NBR var lägre än i fallet biodisesel till följd av steriska begränsningar av skrymmande HVO molekyler. Extensibiliteten hos NBR minskade en aning efter exponering i HVO på grund av migrering av mjukgörare från gummit. De bisfenol-härdade FKM sam- och terpolymererna svällde mer än det peroxid-härdade FKM materialet (GFLT-typ) i biodiesel till följd av kedjeklyvning som orsakades av angrepp av biodiesel på dubbelbindningar som bildades under bisfenol härdningen. FKM-gummimaterialen absorberade biodiesel snabbare och i större mängder med en ökande syrekoncentration. Det stora biodiesel-upptaget och en minskande extensibilitet och styvhet hos FKM-terpolymeren orsakades av dehydrofluorering av gummit genom bildandet av koordinationskomplex av biodiesel och partiklar av magnesiumoxid och kalciumhydroxid. En ökning i CH2-koncentrationen hos de extraherade FKM materialen antydde att biodiesel-komponenter ympades på de omättade platserna på molekylkedjan till följd av dehydrofluorering.
Nyckelord: Nedbrytning; Akrylnitril-butadiengummi; fluorelastomerer; biodiesel; Vätebehandlad vegetabilisk olja; kavitation; Bundet gummi; Dehydrofluorering.
VI
LIST OF PAPERS
This thesis is a summary of the following papers:
[I] Akhlaghi S, Gedde UW, Hedenqvist MS, Conde Braña MT, Bellander M. Deterioration of automotive rubbers in liquid biofuels: A review. Renew. Sustain. Energy. Rev. 2015, 43, 1238–1248.
[II] Akhlaghi S, Gedde UW, Hedenqvist MS, Conde Braña MT, Bellander M. Deterioration of acrylonitrile butadiene rubber in rapeseed biodiesel. Polym. Degrad. Stab. 2015, 111, 211–222.
[III] Akhlaghi S, Pourrahimi AM, Hedenqvist MS, Sjöstedt C, Bellander M, Gedde UW. Degradation of carbon-black-filled acrylonitrile butadiene rubber in alternative fuels: Transesterified and hydrotreated vegetable oils. Polym. Degrad. Stab. 2016, 123, 69–79.
[IV] Akhlaghi S, Pourrahimi AM, Hedenqvist MS, Sjöstedt C, Bellander M, Gedde UW. Degradation of fluoroelastomers in rapeseed biodiesel at different oxygen concentrations. Polym. Degrad. Stab. 2017, 136, 10–19.
[V] Akhlaghi S, Pourrahimi AM, Hedenqvist MS, Sjöstedt C, Bellander M, Gedde UW. Effects of ageing conditions on degradation of acrylonitrile butadiene rubber filled with heat-treated ZnO star-shaped particles in rapeseed biodiesel. Polym. Degrad. Stab. 2017, DOI:10.1016/j.polymdegradstab.2017.02.011.
The author’s contribution to each of the papers was:
Paper I: performed literature review, data collection and manuscript writing. Paper II: performed all the experimental work, data analysis and manuscript writing. Paper III: performed all the experimental work, data analysis and manuscript writing. Paper IV: performed all the experimental work, data analysis and manuscript writing. Paper V: performed all the experimental work (except particle synthesis), data analysis and
manuscript writing.
Other publications not included in the thesis:
[VI] Wei X, Akhlaghi S, Kallio KJ, Bruder S, Bellander M, Gedde UW, Hedenqvist MS. Long-term properties of polyamide-based multilayer (bio)diesel fuel lines aged under “in-car” conditions. Manuscript.
[VII] Akhlaghi S, Hedenqvist MS, Sjöstedt C, Bellander M, Gedde UW. Degradation of fluoroelastomers in ethanol-ED95 under accelerated ageing. Manuscript.
VII
[VIII] Ghorbani FM, Kaffashi B, Shokrollahi P, Akhlaghi S, Hedenqvist MS. Effect of hydroxyapatite nano-particles on morphology, rheology and thermal behavior of poly (caprolactone)/chitosan blends. Mater. Sci. Eng. C, 2016, 59, 980–989.
[IX] R Arasteh, A Naderi, N Kaptan, L Maleknia, S Akhlaghi, H Nazockdast. Effects of fiber spinning on the morphology, rheology, thermal, and mechanical properties of poly (trimethylene terephthalate)/poly (ethylene terephthalate) blends. Adv. Polym. Tech. 2014, 33, 21443(E1–E7).
[X] Kaptan N, Jafari SH, Mazinani S, Akhlaghi S, Fazilat H, Gedde UW, Hedenqvist MS. Thermal behavior and degradation kinetics of compatibilized metallocene-linear low density polyethylene/nanoclay nanocomposites. Polym. Plast. Technol. Eng. 2014, 53, 890–902.
[XI] Amanizadeh F, Akhlaghi S, Mobarakeh HS, Gedde UW, Hedenqvist MS. Starve fed emulsion copolymerization of vinyl acetate and 1-hexene at ambient pressure. Polym. Int. 2014, 63, 1850–1855.
[XII] Arabasadi Z, Khorasani M, Akhlaghi S, Fazilat H, Gedde UW, Hedenqvist MS. Prediction and optimization of fireproofing properties of intumescent flame retardant coatings using artificial intelligence techniques. Fire Saf. J. 2013, 61, 193–199.
VIII
TABLE OF CONTENTS
1. PURPOSE OF THE STUDY ....................................................................................................... 1
2. INTRODUCTION ........................................................................................................................ 2
2.1. Biodiesel and HVO: alternative fuels to compensate for the demand for fossil fuels ............. 2 2.2. Transesterification of vegetable oils and animal fats: biodiesel chemistry ............................. 3 2.3. Hydrotreatment of vegetable oils: the HVO production process ............................................. 5 2.4. Rubber materials in automobile fuel systems .......................................................................... 6
2.4.1. Acrylonitrile butadiene rubber (NBR) .............................................................................. 6 2.4.2. Fluoroelastomers (FKM) .................................................................................................. 6
2.5. Compatibility of biodiesel and HVO with rubber parts in automobile fuel systems ............... 7
3. EXPERIMENTAL ........................................................................................................................ 9
3.1. Material .................................................................................................................................... 9 3.1.1. Sulphur-cured NBR filled with carbon black ................................................................... 9 3.1.2. NBR containing ZnO nanoparticles and star-shaped ZnO submicron particles ............... 9 3.1.3. Copolymer- and terpolymer-FKM and GFLT-type FKM .............................................. 10 3.1.4. Fuels: biodiesel and hydrogenated vegetable oil (HVO) ................................................ 11
3.2. Ageing devices ....................................................................................................................... 11 3.2.1. Automated ageing equipment ......................................................................................... 11 3.2.2. High-pressure autoclaves ................................................................................................ 13
3.3. Aging of NBR and FKM samples in biodiesel and HVO ...................................................... 13 3.3.1. Ageing of NBR in biodiesel and HVO in the automated ageing equipment .................. 13 3.3.2. Ageing of NBR in biodiesel in the high-pressure autoclave at 150 °C .......................... 14 3.3.3. Ageing of FKMs in the automated ageing equipment at 100 °C .................................... 14
3.4. Swelling experiments ............................................................................................................. 14 3.5. Thermal analyses ................................................................................................................... 15 3.6. Tensile testing ........................................................................................................................ 16 3.7. Crosslink density measurement ............................................................................................. 16 3.8. Infrared spectroscopy (IR) ..................................................................................................... 17 3.9. Dynamical mechanical analysis (DMA) ................................................................................ 17 3.10. Determination of bound rubber content ............................................................................... 17 3.11. Scanning electron microscopy (SEM) ................................................................................. 17 3.12. Wide-angle X-ray diffraction (XRD) ................................................................................... 18 3.13. Brunauer-Emmett-Teller (BET) determination ................................................................... 18 3.14. High-performance liquid chromatography (HPLC) ............................................................. 18 3.15. 1H NMR spectroscopy ......................................................................................................... 18 3.16. Determinations of acid value, hydroperoxide value and water content in biodiesel ........... 19
4. RESULTS AND DISCUSSION ................................................................................................. 20
4.1. Oxidation of biodiesel ............................................................................................................ 20 4.1.1. Determination of composition of the FAMEs in biodiesel ............................................. 20 4.1.2. Oxidation pathways of fatty acid methyl esters of biodiesel .......................................... 21 4.1.3. Oxidation of biodiesel alone and in contact with NBR at 90 °C .................................... 23 4.1.4. Oxidation of biodiesel at different oxygen partial pressures and temperatures .............. 25
4.2. Degradation of NBR in HVO and biodiesel .......................................................................... 27 4.2.1. Sorption of biodiesel in NBR at different oxygen partial pressures and temperatures ... 27 4.2.2. Degradation of bound rubber in NBR exposed to biodiesel ........................................... 29 4.2.3. Swelling of NBR in HVO at 75 °C ................................................................................. 31
IX
4.2.4. Mechanical performance of NBR exposed to HVO and to biodiesel at different oxygen partial pressures and temperatures ............................................................................................ 33 4.2.5. Oxidative crosslinking in the NBR exposed to HVO and to biodiesel at different oxygen partial pressures and temperatures ............................................................................................ 35 4.2.6. Biodiesel-driven degradation of NBR in the absence of carbon black ........................... 39 4.2.7. Dissolution of zinc oxide particles in acidic components of biodiesel .......................... 42 4.2.8. Performance of NBR containing heat-treated star-shaped ZnO particles and commercial ZnO nanoparticles in biodiesel ................................................................................................. 43
4.3. Degradation of fluoroelastomers in biodiesel ........................................................................ 46 4.3.1. Sorption kinetics of biodiesel in FKM at different oxygen partial pressures ................. 46 4.3.2. The mechanism of degradation of fluoroelastomers in biodiesel ................................... 48
4.3.2.1. Dehydrofluorination of fluoroelastomers on exposure to biodiesel ........................ 48 4.3.2.2. Water-assisted complexation of biodiesel on magnesium oxide and calcium hydroxide particles ................................................................................................................ 50
4.3.3. Mechanical performance of fluoroelastomers on exposure to biodiesel at different oxygen concentrations .............................................................................................................. 53
5. CONCLUSION ........................................................................................................................... 55
6. FUTURE OUTLOOK ................................................................................................................ 56
ACKNOWLEDGMENTS .............................................................................................................. 57
REFERENCES ................................................................................................................................ 58

1
1. PURPOSE OF THE STUDY
Concerns over the rapid depletion of fossil fuels and the environmental issues associated with petroleum-based fuels have led to the global advocacy of a paradigm shift to alternative fuels. Biodiesel and hydrotreated vegetable oil (HVO) appear to hold the key for renewable energy sources that offer a more sustainable development and less pollutant emissions. However, the use of biodiesel and HVO in conventional fuel systems shortens the life-time of rubber parts in the fuel pump, engine, fuel injector and fuel filter. The damage caused by biodiesel to rubber seals, O-rings and grommets results in serious running problems such as engine chocking, fuel filter plugging and fuel pump failure. This project has therefore aimed at achieving an understanding of the degradation mechanisms of acrylonitrile butadiene rubber (NBR) and fluoroelastomers (FKM), the most common sealing materials in automobile fuel systems, in biodiesel and HVO. In the first phase of the project, an automated ageing equipment was designed that permitted on-site monitoring of the temperature and oxygen concentration in the headspace and in the fuel, and of the water content and pH of the fuel during the exposures. Specially designed autoclaves were also manufactured by Scania CV AB, Sweden for fuel exposure at elevated temperatures. Different types of NBR and FKM rubbers were exposed to biodiesel and HVO under different conditions to study: (i) the effects of oxygen partial pressure and temperature on the degradation of NBR and FKM rubbers in biodiesel, (ii) the oxidation of biodiesel at different temperatures and different oxygen concentrations, (iii) the biodiesel-driven degradation of FKMs with different types of monomers, additives and curing systems, and of NBRs with different acrylonitrile contents, (iv) the attack of biodiesel on bound rubber and the rubber-carbon black network, (v) the degradation of NBR in the absence of carbon black, (vi) the sorption kinetics and structural changes of NBR exposed to HVO, (vii) the migration of plasticizer and stabilizer from the rubber to the fuel, (viii) the dissolution of different types of zinc oxide particles in biodiesel and (ix) the complexation of biodiesel on magnesium oxide and calcium hydroxide particles in the rubber.
2
2. INTRODUCTION
2.1. Biodiesel and HVO: alternative fuels to compensate for the demand for fossil fuels
The transportation sector is currently facing a rapid increase in the demand for energy due to overwhelming population growth and industrialization. A large proportion of the energy consumed in this sector is supplied by fossil fuels which has been extensively consumed during the past centuries. The remaining oil resources will be depleted in the near future at the current consumption rate [1–3]. The environmental impacts of fossil fuels have also caused governments to pass stringent regulations limiting the use of petroleum-based fuels [4–7]. These circumstances, together with concerns over supply security and economic factors [8], have led to a global effort to reduce reliance on fossil fuels by developing alternative fuels that offer more sustainable development and less pollutant emissions. Since the European transport sector has lost faith in ethanol, biodiesel is currently in focus as the most ready-to-use biofuel to compensate for shrinking reserves of fossil fuels, and to contribute to the economic development of agricultural areas. Biodiesel is produced from a broad range of renewable resources such as vegetable oils, animal fats and algae and low-cost feedstock such as frying oils [9,10]. Biodiesel fulfils automotive standards in terms of cetane number, lubricity, viscosity and cold flow properties, and is suitable for regular diesel engines. The combustion of biodiesel in compression-ignition engines may release less carbon monoxide, less unburned hydrocarbons and less aromatic emissions than petroleum-based diesel [12–15]. Steps to develop the use of biodiesel have been achieved by government funding to expand the biodiesel infrastructure. The global market for biodiesel is rapidly growing. About 33.2 billion litres of biodiesel were produced in 2015, and the production is expected to increase by 14 % in 2020 [11]. Another viable alternative fuel, hydrogenated vegetable oil (HVO), is produced by the hydrotreatment of vegetable oils. HVO is a mixture of paraffinic hydrocarbons with no or less unsaturation than biodiesel [16,17]. HVO can be produced in petroleum refineries, distributed through the existing infrastructure, and combusted in conventional compression-ignition engines while releasing
3
less nitrous oxide (N2O) than biodiesel [18,19]. The global installed capacity of HVO plants was about 3.8 billion litres per year in 2014. Neste Oil has the largest share in the HVO production, with four facilities in Finland, Singapore and Rotterdam [20,21]. The production of HVO by Preem AB, Sweden, increased from 45 million litres in 2011 to about 440 million litres in 2014. HVO and biodiesel can be blended with petroleum diesel in different ratios. In 2011, 82 % of the total amount of diesel sold in Sweden contained biodiesel [20,21].
2.2. Transesterification of vegetable oils and animal fats: biodiesel chemistry
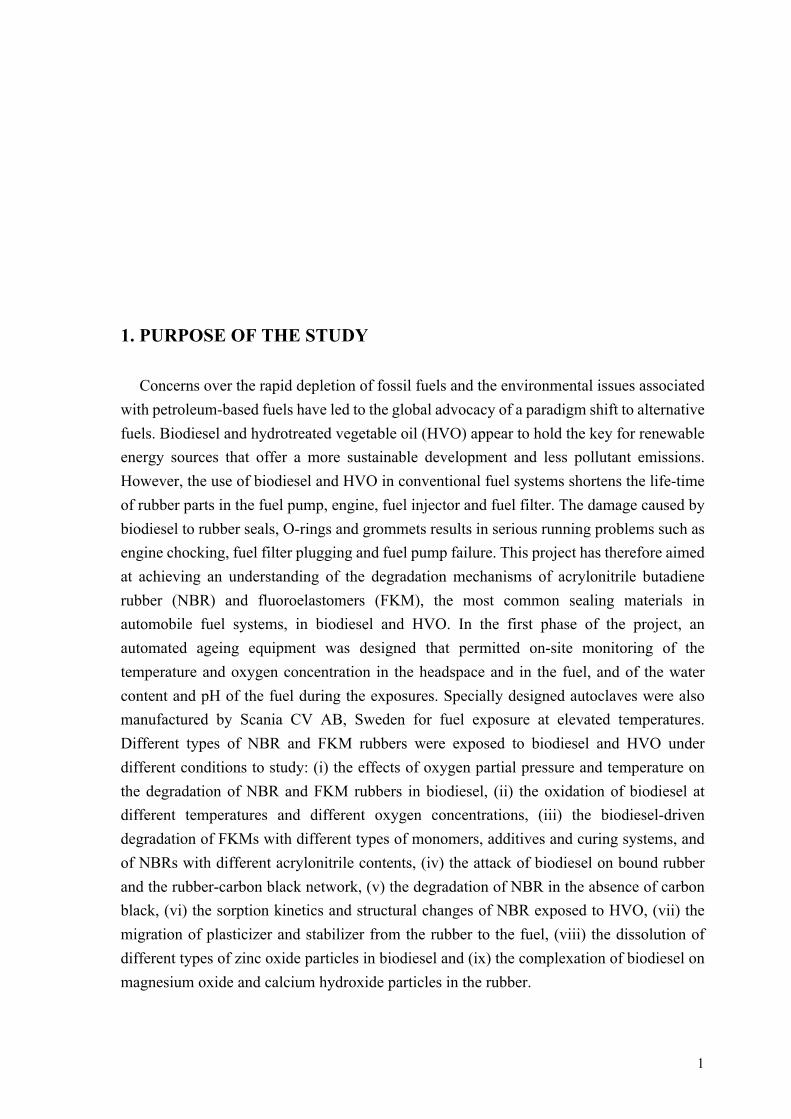
Biodiesel contains fatty acid methyl esters (FAME) derived from the transesterification of vegetable oils. In practice, fatty acids and triglycerides of the oil react with an alcohol in the presence of a catalyst such as alkali (sodium hydroxide or potassium hydroxide), acid (sulfuric acid or hydrochloric acid) or enzymes (lipases hydrochloric acid), to form glycerol and biodiesel [23–26]. Fig. 1 shows the transesterification reaction of triglycerides and methanol.
Figure 1. Transesterification of (a) triglycerides of vegetable oils by (b) methanol, to form (c) glycerol and (d) a mixture of fatty acid methyl esters (biodiesel). R1, R2 and R3 are long-chain hydrocarbons containing carbon and hydrogen atoms.
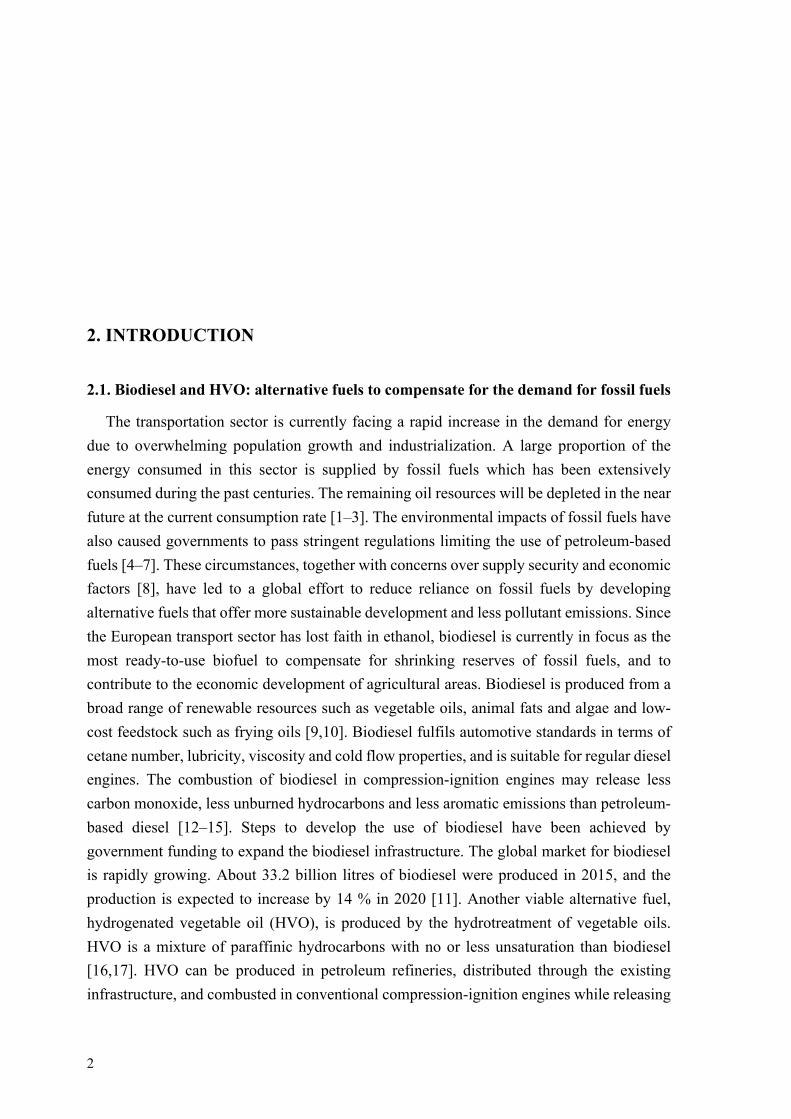
The alkali-catalysed transesterification of vegetable oils is the most common technique used to produce biodiesel [27]. Fig. 2 illustrates different steps of the alkali-catalysed process. Vegetable oils containing less than 2.5 wt.% free fatty acids are directly fed into the alkali-catalysed system. If the free fatty acid content of the oil is greater than 2.5 wt.%, a pre-treatment step such as steam distillation, extraction by alcohol or esterification by acid-catalysis is necessary (step 1 in Fig. 2) [28–30]. Neutralization reactions begin immediately after the addition of a mixture of alcohol and catalyst to the oil (step 2 in Fig. 3) [28–30]. Methanol, ethanol, propanol, butanol and amyl alcohol are commonly used for transesterification of triglycerides [31,32]. The reaction time and temperature of the transesterification process and the concentrations of catalyst and alcohol are the most important factors affecting the yield of biodiesel [33–35]. When the transesterification is completed (step 3 in Fig. 2), the glycerol is separated from the biodiesel (step 4 in Fig. 2). The biodiesel phase is less dense than the glycerol phase, and rises to the surface of the reaction vessel. Glycerol may also be separated from the biodiesel by centrifugation. In the
4
next step, the crude biodiesel is purified by removing residual catalysts, water, unreacted alcohols, free glycerols, and soaps through water washing, dry washing and membrane extraction (step 5 in Fig. 2) [32–35]. The resultant biodiesel is a mixture of different saturated and unsaturated-FAMEs. The type and concentration of FAMEs in the biodiesel depend essentially on the biological source of the feedstock [36].
Figure 2. Alkali-catalysed transesterification process for producing biodiesel from vegetable oils. This technique may include additional steps such as re-neutralization, alcohol recovery and crude glycerol refining, which are not shown here.
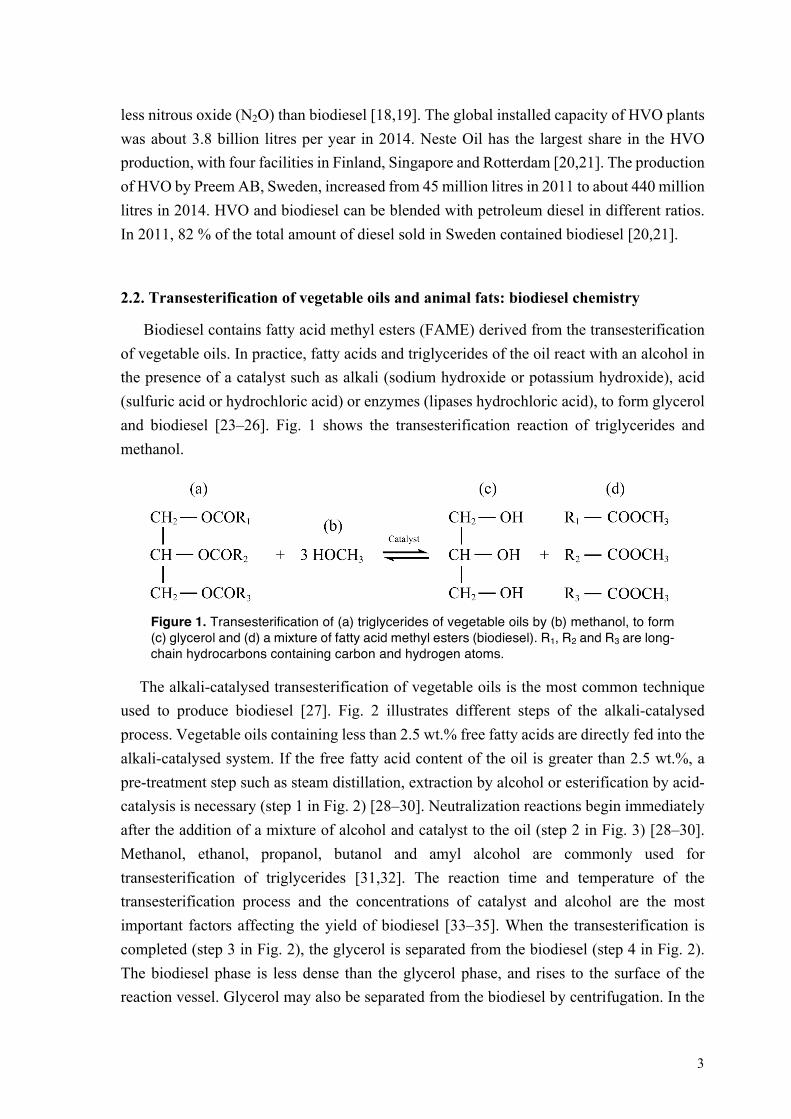
Figure 3. Chemical structures of linolenic acid methyl ester (C18:3), linoleic acid methyl ester (C18:2), oleic acid methyl ester (C18:1), cis-9-eicosenoic acid methyl ester (C20:1) and erucic acid methyl ester (C22:1).
5
Fig. 3 shows the main unsaturated-FAMEs of rapeseed biodiesel, which are: linolenic acid methyl ester, C18:3 (where the notation Cn:m shows the numbers of carbon atoms (n) and double bonds (m) in the backbone of the FAME); linoleic acid methyl ester (C18:2); oleic acid methyl ester (C18:1); cis-9-eicosenoic acid methyl ester (C20:1); and erucic acid methyl ester (C22:1). The saturated-FAMEs of rapeseed biodiesel are stearic acid methyl ester (C18:0) and palmitic acid methyl ester (C16:0). The composition of FAMEs in the biodiesel affects the oxidative stability index (the time that elapses before the fuel reaches its maximum rate of oxidation), nitrogen oxides exhaust emissions, cetane number (indicating the ignition properties of the fuel), heat of combustion, cloud point, boiling temperature, lubricity and viscosity of the fuel [37–40].
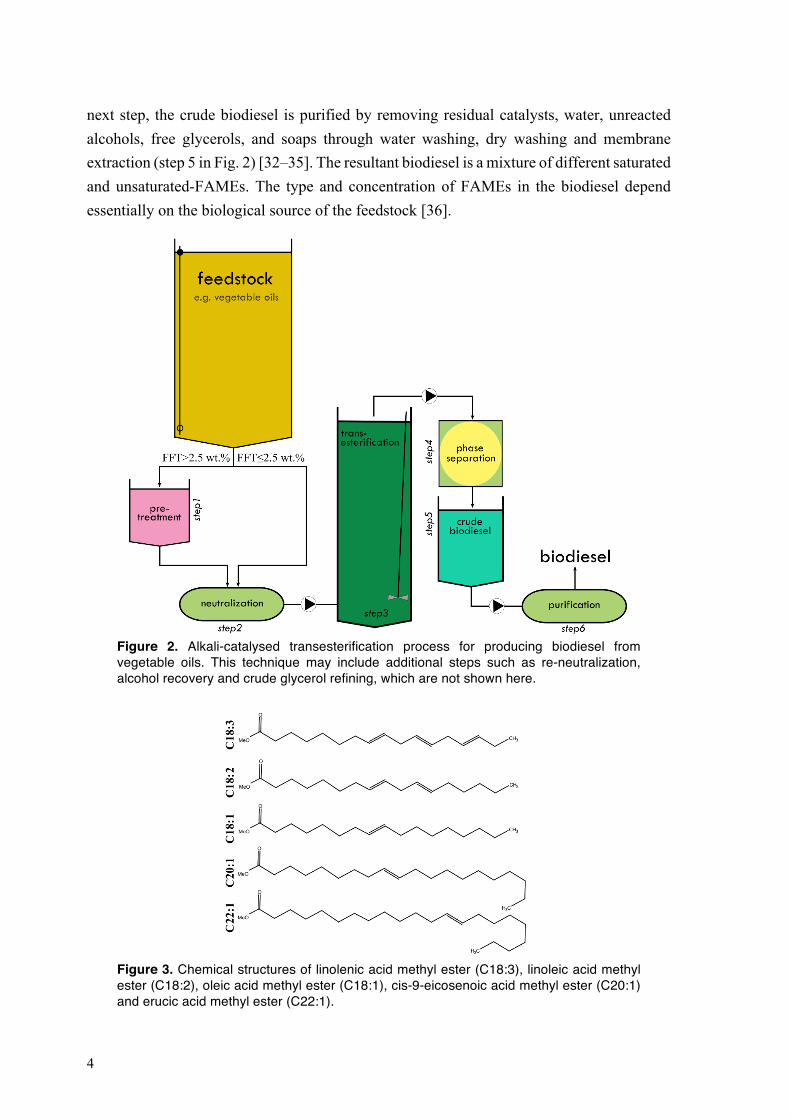
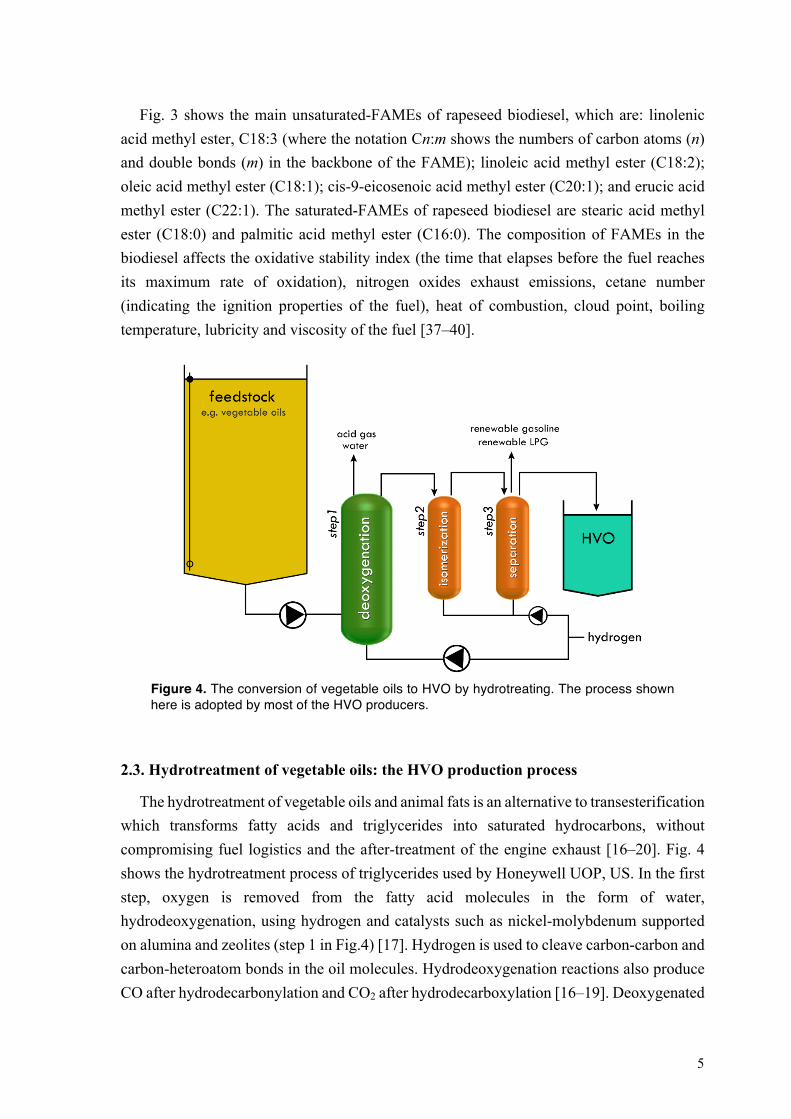
Figure 4. The conversion of vegetable oils to HVO by hydrotreating. The process shown here is adopted by most of the HVO producers.
2.3. Hydrotreatment of vegetable oils: the HVO production process
The hydrotreatment of vegetable oils and animal fats is an alternative to transesterification which transforms fatty acids and triglycerides into saturated hydrocarbons, without compromising fuel logistics and the after-treatment of the engine exhaust [16–20]. Fig. 4 shows the hydrotreatment process of triglycerides used by Honeywell UOP, US. In the first step, oxygen is removed from the fatty acid molecules in the form of water, hydrodeoxygenation, using hydrogen and catalysts such as nickel-molybdenum supported on alumina and zeolites (step 1 in Fig.4) [17]. Hydrogen is used to cleave carbon-carbon and carbon-heteroatom bonds in the oil molecules. Hydrodeoxygenation reactions also produce CO after hydrodecarbonylation and CO2 after hydrodecarboxylation [16–19]. Deoxygenated
6
oil is then isomerized to form branched paraffin molecules in order to adjust the cold flow properties of the fuel (step 2 in Fig. 4). After isomerization, the mixture of n- and iso-paraffins is separated (step 3 in Fig. 4) to yield HVO together with a small amount of renewable gasoline and liquefied petroleum gas (LPG). HVO is totally free from sulphur and aromatics, and can be stored and transported like petroleum-based diesel [21]. Unlike biodiesel, no precaution against auto-oxidation is needed for HVO storage. The ignition, combustion and emission properties of HVO have been widely reported [20,21].
2.4. Rubber materials in automobile fuel systems
2.4.1. Acrylonitrile butadiene rubber (NBR)
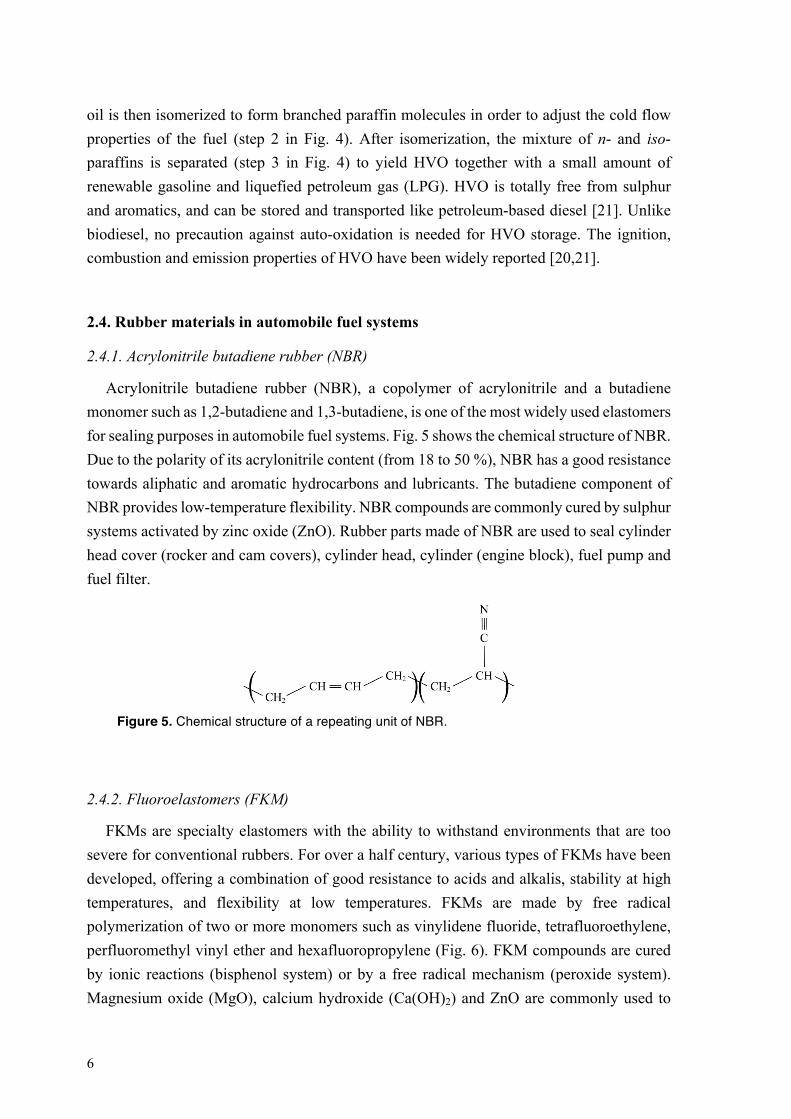
Acrylonitrile butadiene rubber (NBR), a copolymer of acrylonitrile and a butadiene monomer such as 1,2-butadiene and 1,3-butadiene, is one of the most widely used elastomers for sealing purposes in automobile fuel systems. Fig. 5 shows the chemical structure of NBR. Due to the polarity of its acrylonitrile content (from 18 to 50 %), NBR has a good resistance towards aliphatic and aromatic hydrocarbons and lubricants. The butadiene component of NBR provides low-temperature flexibility. NBR compounds are commonly cured by sulphur systems activated by zinc oxide (ZnO). Rubber parts made of NBR are used to seal cylinder head cover (rocker and cam covers), cylinder head, cylinder (engine block), fuel pump and fuel filter.
Figure 5. Chemical structure of a repeating unit of NBR.
2.4.2. Fluoroelastomers (FKM)
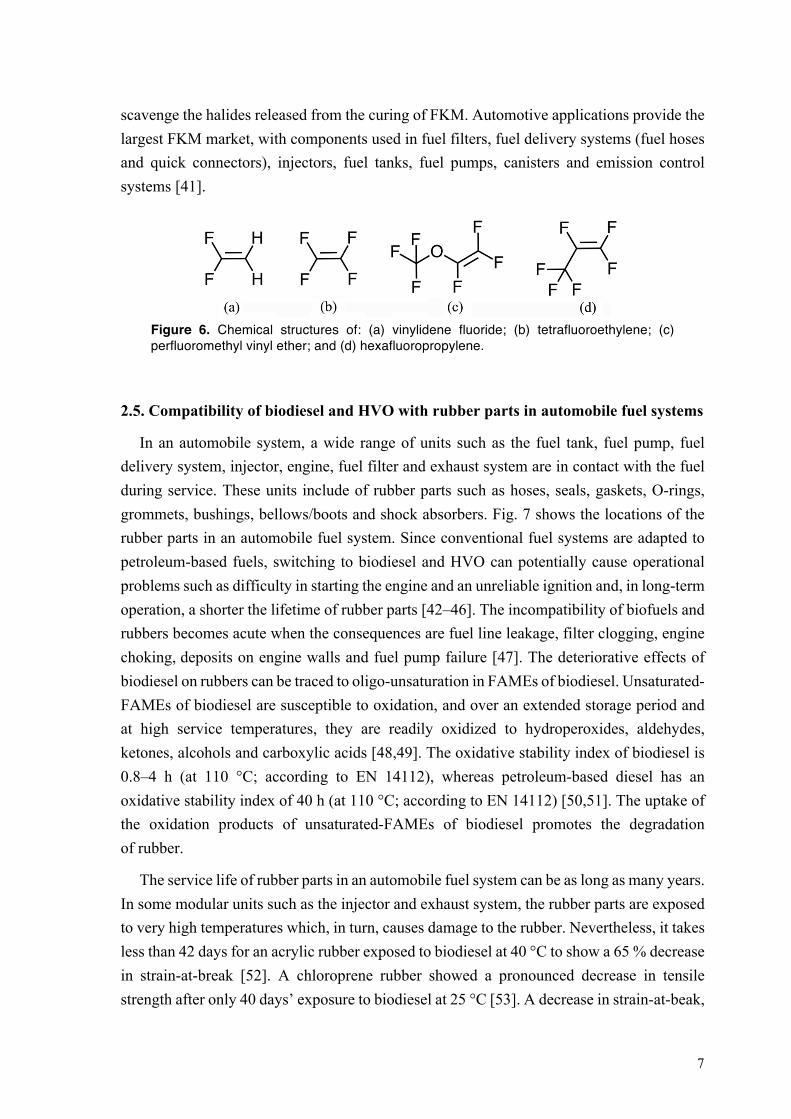
FKMs are specialty elastomers with the ability to withstand environments that are too severe for conventional rubbers. For over a half century, various types of FKMs have been developed, offering a combination of good resistance to acids and alkalis, stability at high temperatures, and flexibility at low temperatures. FKMs are made by free radical polymerization of two or more monomers such as vinylidene fluoride, tetrafluoroethylene, perfluoromethyl vinyl ether and hexafluoropropylene (Fig. 6). FKM compounds are cured by ionic reactions (bisphenol system) or by a free radical mechanism (peroxide system). Magnesium oxide (MgO), calcium hydroxide (Ca(OH)2) and ZnO are commonly used to
7
scavenge the halides released from the curing of FKM. Automotive applications provide the largest FKM market, with components used in fuel filters, fuel delivery systems (fuel hoses and quick connectors), injectors, fuel tanks, fuel pumps, canisters and emission control systems [41].
Figure 6. Chemical structures of: (a) vinylidene fluoride; (b) tetrafluoroethylene; (c) perfluoromethyl vinyl ether; and (d) hexafluoropropylene.
2.5. Compatibility of biodiesel and HVO with rubber parts in automobile fuel systems
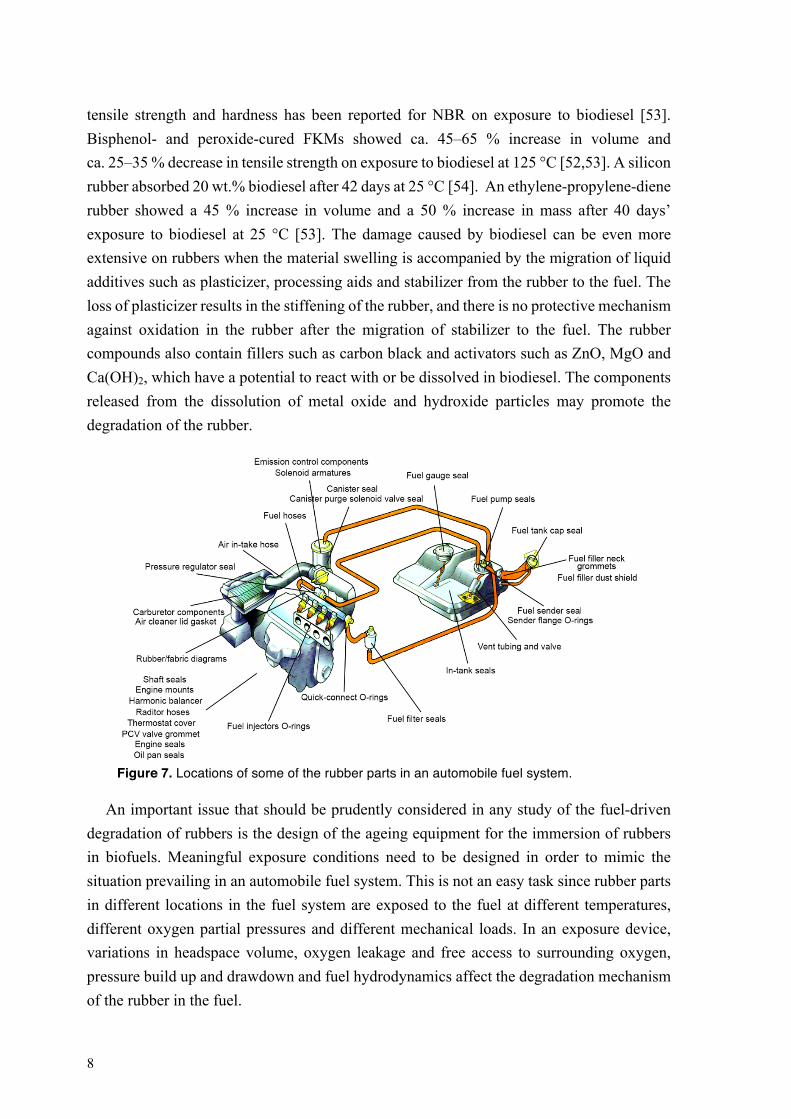
In an automobile system, a wide range of units such as the fuel tank, fuel pump, fuel delivery system, injector, engine, fuel filter and exhaust system are in contact with the fuel during service. These units include of rubber parts such as hoses, seals, gaskets, O-rings, grommets, bushings, bellows/boots and shock absorbers. Fig. 7 shows the locations of the rubber parts in an automobile fuel system. Since conventional fuel systems are adapted to petroleum-based fuels, switching to biodiesel and HVO can potentially cause operational problems such as difficulty in starting the engine and an unreliable ignition and, in long-term operation, a shorter the lifetime of rubber parts [42–46]. The incompatibility of biofuels and rubbers becomes acute when the consequences are fuel line leakage, filter clogging, engine choking,deposits on engine walls and fuel pump failure [47]. The deteriorative effects of biodiesel on rubbers can be traced to oligo-unsaturation in FAMEs of biodiesel. Unsaturated-FAMEs of biodiesel are susceptible to oxidation, and over an extended storage period and at high service temperatures, they are readily oxidized to hydroperoxides, aldehydes, ketones, alcohols and carboxylic acids [48,49]. The oxidative stability index of biodiesel is 0.8–4 h (at 110 °C; according to EN 14112), whereas petroleum-based diesel has an oxidative stability index of 40 h (at 110 °C; according to EN 14112) [50,51]. The uptake of the oxidation products of unsaturated-FAMEs of biodiesel promotes the degradation of rubber.
The service life of rubber parts in an automobile fuel system can be as long as many years. In some modular units such as the injector and exhaust system, the rubber parts are exposed to very high temperatures which, in turn, causes damage to the rubber. Nevertheless, it takes less than 42 days for an acrylic rubber exposed to biodiesel at 40 °C to show a 65 % decrease in strain-at-break [52]. A chloroprene rubber showed a pronounced decrease in tensile strength after only 40 days’ exposure to biodiesel at 25 °C [53]. A decrease in strain-at-beak,
8
tensile strength and hardness has been reported for NBR on exposure to biodiesel [53]. Bisphenol- and peroxide-cured FKMs showed ca. 45–65 % increase in volume and ca. 25–35 % decrease in tensile strength on exposure to biodiesel at 125 °C [52,53]. A silicon rubber absorbed 20 wt.% biodiesel after 42 days at 25 °C [54]. An ethylene-propylene-diene rubber showed a 45 % increase in volume and a 50 % increase in mass after 40 days’ exposure to biodiesel at 25 °C [53]. The damage caused by biodiesel can be even more extensive on rubbers when the material swelling is accompanied by the migration of liquid additives such as plasticizer, processing aids and stabilizer from the rubber to the fuel. The loss of plasticizer results in the stiffening of the rubber, and there is no protective mechanism against oxidation in the rubber after the migration of stabilizer to the fuel. The rubber compounds also contain fillers such as carbon black and activators such as ZnO, MgO and Ca(OH)2, which have a potential to react with or be dissolved in biodiesel. The components released from the dissolution of metal oxide and hydroxide particles may promote the degradation of the rubber.
Figure 7. Locations of some of the rubber parts in an automobile fuel system.
An important issue that should be prudently considered in any study of the fuel-driven degradation of rubbers is the design of the ageing equipment for the immersion of rubbers in biofuels. Meaningful exposure conditions need to be designed in order to mimic the situation prevailing in an automobile fuel system. This is not an easy task since rubber parts in different locations in the fuel system are exposed to the fuel at different temperatures, different oxygen partial pressures and different mechanical loads. In an exposure device, variations in headspace volume, oxygen leakage and free access to surrounding oxygen, pressure build up and drawdown and fuel hydrodynamics affect the degradation mechanism of the rubber in the fuel.
9
3. EXPERIMENTAL
3.1. Material
3.1.1. Sulphur-cured NBR filled with carbon black
Sulphur-cured NBR sheets (28.5 wt.% acrylonitrile and 71.5 wt.% butadiene) with a Tg of −31 °C were manufactured by Trelleborg AB, Sweden. According to thermogravimetry, the rubbers contained 47 ± 1 wt.% polymer, 10 ± 1 wt.% low-molecular weight additives (including 9 ± 1 wt.% oligomeric ether-thioether plasticizer, as revealed by infrared spectroscopy, and a small amount of unreacted sulphur), 37 ± 1 wt.% carbon black (black N990 and black N550, as revealed by scanning electron microscopy) and 6 ± 1 wt.% residual ash including zinc oxide, as revealed by energy-dispersive X-ray spectroscopy. Some of the rubber samples were extracted before ageing: rubber strips (2 × 15 × 60 (mm)3) were extracted at 40 ± 1 °C under ultrasonication (Bandelin Sonorex RK 100H, volume = 3 L, ultrasonic peak output = 320 W, frequency = 35 kHz) for 30 min in tetrahydrofuran (THF; ≥ 99.7 wt.%; VWR International, Sweden). The ultrasonication time was optimized by examining the concentration of the extracted plasticizer in the solvent with high performance liquid chromatography (HPLC) and by calculating the plasticizer mass from the TG curve of the extracted NBR. The extracted specimens were finally dried at 75 ± 1 °C for 24 h in a vacuum oven (pressure = 20 kPa), and stored at 23 ± 2 °C for at least a week.
3.1.2. NBR containing ZnO nanoparticles and star-shaped ZnO submicron particles
Zinc nitrate hexahydrate (Zn(NO3)2•6H2O; ≥ 98 wt.%, Sigma Aldrich) and sodium hydroxide (≥ 98 wt.%; Sigma Aldrich) were used as received. High resistivity Milli-Q water (18.2 MΩ cm at 25 °C) was used in the aqueous reaction. The ZnO star-shaped particles were prepared by an aqueous precipitation method described by Pourrahimi et al. [55]: (i) 1 L NaOH aqueous solution (0.5 M) was added to 1 L zinc nitrate hexahydrate aqueous solution (0.2 M) at 60 °C under vigorous stirring for 1h; (ii) the ZnO particles were purified
10
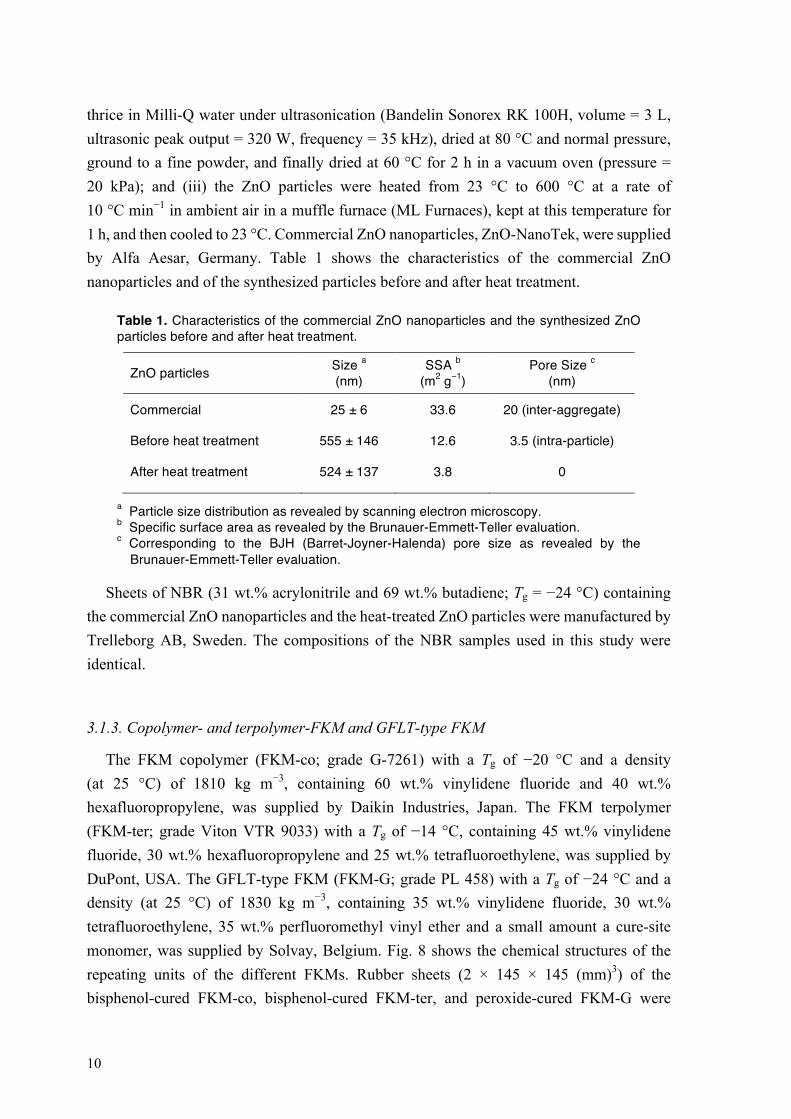
thrice in Milli-Q water under ultrasonication (Bandelin Sonorex RK 100H, volume = 3 L, ultrasonic peak output = 320 W, frequency = 35 kHz), dried at 80 °C and normal pressure, ground to a fine powder, and finally dried at 60 °C for 2 h in a vacuum oven (pressure = 20 kPa); and (iii) the ZnO particles were heated from 23 °C to 600 °C at a rate of 10 °C min−1 in ambient air in a muffle furnace (ML Furnaces), kept at this temperature for 1 h, and then cooled to 23 °C. Commercial ZnO nanoparticles, ZnO-NanoTek, were supplied by Alfa Aesar, Germany. Table 1 shows the characteristics of the commercial ZnO nanoparticles and of the synthesized particles before and after heat treatment.
Table 1. Characteristics of the commercial ZnO nanoparticles and the synthesized ZnO particles before and after heat treatment.
ZnO particles Size a (nm)
SSA b (m2 g−1)
Pore Size c
(nm)
Commercial 25 ± 6 33.6 20 (inter-aggregate)
Before heat treatment 555 ± 146 12.6 3.5 (intra-particle)
After heat treatment 524 ± 137 3.8 0
a Particle size distribution as revealed by scanning electron microscopy. b Specific surface area as revealed by the Brunauer-Emmett-Teller evaluation. c Corresponding to the BJH (Barret-Joyner-Halenda) pore size as revealed by the
Brunauer-Emmett-Teller evaluation.
Sheets of NBR (31 wt.% acrylonitrile and 69 wt.% butadiene; Tg = −24 °C) containing the commercial ZnO nanoparticles and the heat-treated ZnO particles were manufactured by Trelleborg AB, Sweden. The compositions of the NBR samples used in this study were identical.
3.1.3. Copolymer- and terpolymer-FKM and GFLT-type FKM
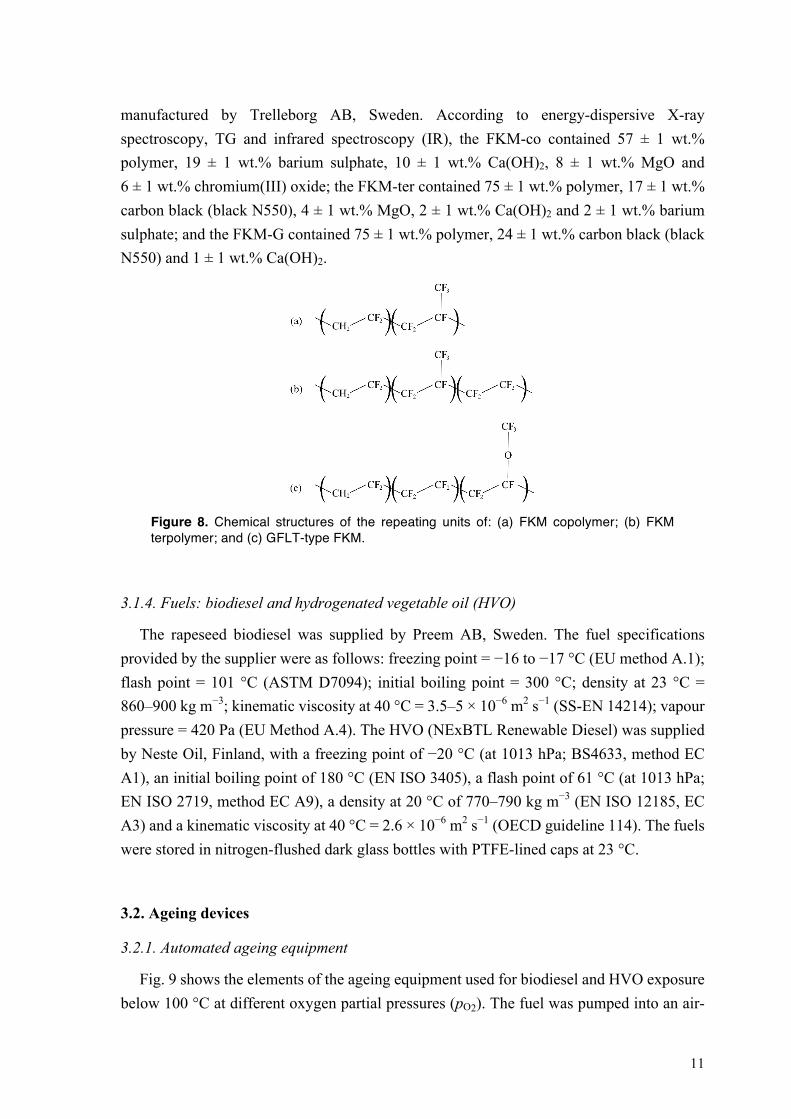
The FKM copolymer (FKM-co; grade G-7261) with a Tg of −20 °C and a density (at 25 °C) of 1810 kg m−3, containing 60 wt.% vinylidene fluoride and 40 wt.% hexafluoropropylene, was supplied by Daikin Industries, Japan. The FKM terpolymer (FKM-ter; grade Viton VTR 9033) with a Tg of −14 °C, containing 45 wt.% vinylidene fluoride, 30 wt.% hexafluoropropylene and 25 wt.% tetrafluoroethylene, was supplied by DuPont, USA. The GFLT-type FKM (FKM-G; grade PL 458) with a Tg of −24 °C and a density (at 25 °C) of 1830 kg m−3, containing 35 wt.% vinylidene fluoride, 30 wt.% tetrafluoroethylene, 35 wt.% perfluoromethyl vinyl ether and a small amount a cure-site monomer, was supplied by Solvay, Belgium. Fig. 8 shows the chemical structures of the repeating units of the different FKMs. Rubber sheets (2 × 145 × 145 (mm)3) of the bisphenol-cured FKM-co, bisphenol-cured FKM-ter, and peroxide-cured FKM-G were
11
manufactured by Trelleborg AB, Sweden. According to energy-dispersive X-ray spectroscopy, TG and infrared spectroscopy (IR), the FKM-co contained 57 ± 1 wt.% polymer, 19 ± 1 wt.% barium sulphate, 10 ± 1 wt.% Ca(OH)2, 8 ± 1 wt.% MgO and 6 ± 1 wt.% chromium(III) oxide; the FKM-ter contained 75 ± 1 wt.% polymer, 17 ± 1 wt.% carbon black (black N550), 4 ± 1 wt.% MgO, 2 ± 1 wt.% Ca(OH)2 and 2 ± 1 wt.% barium sulphate; and the FKM-G contained 75 ± 1 wt.% polymer, 24 ± 1 wt.% carbon black (black N550) and 1 ± 1 wt.% Ca(OH)2.
Figure 8. Chemical structures of the repeating units of: (a) FKM copolymer; (b) FKM terpolymer; and (c) GFLT-type FKM.
3.1.4. Fuels: biodiesel and hydrogenated vegetable oil (HVO)
The rapeseed biodiesel was supplied by Preem AB, Sweden. The fuel specifications provided by the supplier were as follows: freezing point = −16 to −17 °C (EU method A.1); flash point = 101 °C (ASTM D7094); initial boiling point = 300 °C; density at 23 °C = 860–900 kg m−3; kinematic viscosity at 40 °C = 3.5–5 × 10⁻⁶ m2 s−1 (SS-EN 14214); vapour pressure = 420 Pa (EU Method A.4). The HVO (NExBTL Renewable Diesel) was supplied by Neste Oil, Finland, with a freezing point of −20 °C (at 1013 hPa; BS4633, method EC A1), an initial boiling point of 180 °C (EN ISO 3405), a flash point of 61 °C (at 1013 hPa; EN ISO 2719, method EC A9), a density at 20 °C of 770–790 kg m−3 (EN ISO 12185, EC A3) and a kinematic viscosity at 40 °C = 2.6 × 10⁻⁶ m2 s−1 (OECD guideline 114). The fuels were stored in nitrogen-flushed dark glass bottles with PTFE-lined caps at 23 °C.
3.2. Ageing devices
3.2.1. Automated ageing equipment
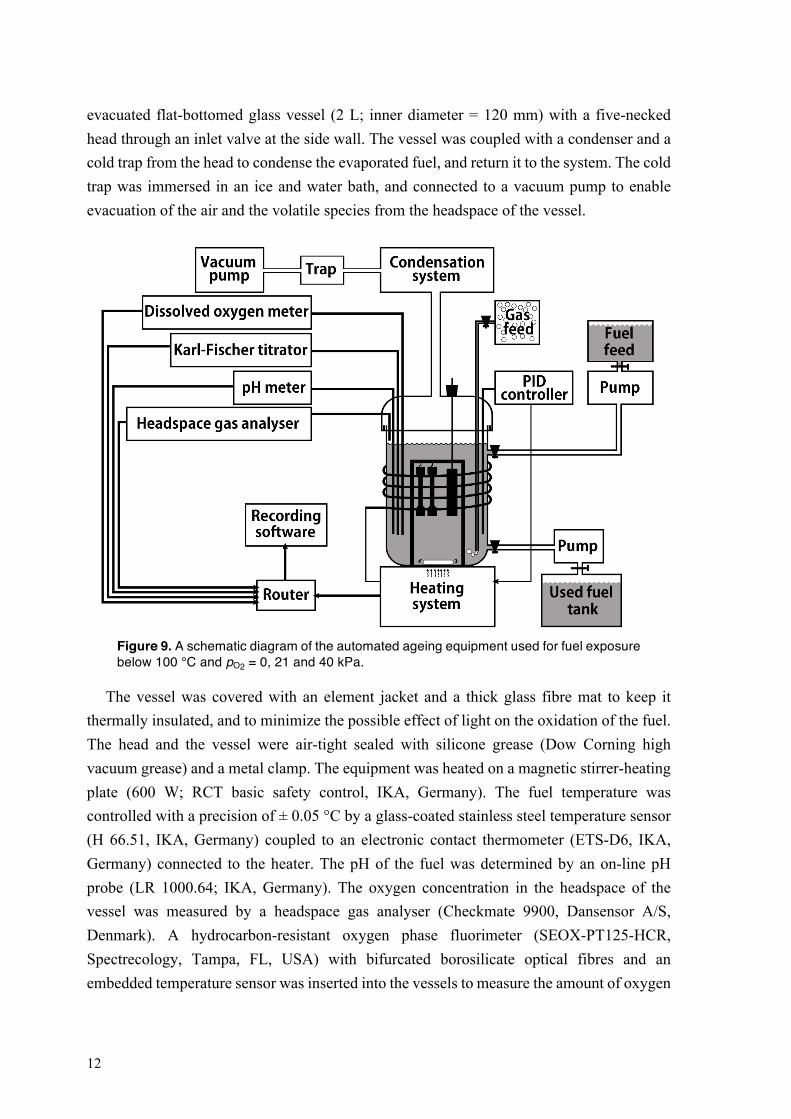
Fig. 9 shows the elements of the ageing equipment used for biodiesel and HVO exposure below 100 °C at different oxygen partial pressures (pO2). The fuel was pumped into an air-
12
evacuated flat-bottomed glass vessel (2 L; inner diameter = 120 mm) with a five-necked head through an inlet valve at the side wall. The vessel was coupled with a condenser and a cold trap from the head to condense the evaporated fuel, and return it to the system. The cold trap was immersed in an ice and water bath, and connected to a vacuum pump to enable evacuation of the air and the volatile species from the headspace of the vessel.
Figure 9. A schematic diagram of the automated ageing equipment used for fuel exposure below 100 °C and pO2 = 0, 21 and 40 kPa.
The vessel was covered with an element jacket and a thick glass fibre mat to keep it thermally insulated, and to minimize the possible effect of light on the oxidation of the fuel. The head and the vessel were air-tight sealed with silicone grease (Dow Corning high vacuum grease) and a metal clamp. The equipment was heated on a magnetic stirrer-heating plate (600 W; RCT basic safety control, IKA, Germany). The fuel temperature was controlled with a precision of ± 0.05 °C by a glass-coated stainless steel temperature sensor (H 66.51, IKA, Germany) coupled to an electronic contact thermometer (ETS-D6, IKA, Germany) connected to the heater. The pH of the fuel was determined by an on-line pH probe (LR 1000.64; IKA, Germany). The oxygen concentration in the headspace of the vessel was measured by a headspace gas analyser (Checkmate 9900, Dansensor A/S, Denmark). A hydrocarbon-resistant oxygen phase fluorimeter (SEOX-PT125-HCR, Spectrecology, Tampa, FL, USA) with bifurcated borosilicate optical fibres and an embedded temperature sensor was inserted into the vessels to measure the amount of oxygen
13
dissolved in the fuel during the exposure. The data obtained from the sensor was recorded by OceanView software (Ocean Optics, Dunedin, FL, USA) through the sensor's transmitter (NEOFOX-GT, Spectrecology, Tampa, FL, USA). The temperature, pH and pO2 were recorded by Labworldsoft software (V. 5.0; IKA, Germany) through a plug-in card (PCI 8.2, IKA, Germany) connected to the heater and the sensors. The highest operating temperature allowed for the equipment was 100 °C for biodiesel and 75 °C for HVO (limited by the flash points of biodiesel and HVO).
3.2.2. High-pressure autoclaves
Flat-bottomed autoclaves (inner diameter = 100 mm, height = 145 mm, volume = 900 mL) were used for the exposures above 100 °C and at pO2 = 0 kPa. The autoclaves were designed by Scania CV AB, Sweden for gaseous fuel pressures up to 2000 kPa. The autoclaves were coupled with a head equipped with right-angled spring-loaded relief valves (type 10.2; Niezgodka GmbH, Germany). The pressure vessel and the head were made of stainless steel (grade EN 1.4436), and sealed by a locking ring and an O-ring (a GFLT-type FKM, Trelleborg AB, Sweden) on the side wall of the head. The autoclave was placed in a forced-air-circulation oven (Model UFE 700; Memmert, Germany), and coupled with the ventilation tubes through the relief valve on the head by steel wire braided PTFE hoses.
3.3. Aging of NBR and FKM samples in biodiesel and HVO
3.3.1. Ageing of NBR in biodiesel and HVO in the automated ageing equipment
NBR strips (2 × 15 × 60 (mm)3) and dumb-bells (type c; ASTM D412-06a) were exposed to biodiesel at 80 ± 0.05, 90 ± 0.05 and 100 ± 0.05 °C and at pO2 = 0, 21 and 40 kPa and to HVO at 75 ± 0.05 °C and pO2 = 0 kPa in the automated ageing equipment. The specimens used for the swelling measurements were cut from the NBR sheets, attached to a 20 mm long stainless steel wire, and immersed in the fuel (initial volume = 2 L) through the vessel neck. The neck was then plugged with a rubber stopper and sealed with laboratory tape. The dumb-bells (75 mm long) were hung from a stainless steel (grade EN 1.4436) stand (four-legged; 165 × 60 × 60 (mm)3), and placed inside the vessel. The fuel was stirred during the exposure at a rate of 1200 rpm by a glass-coated magnetic bar (diameter = 8 mm; IKAFLON glass, IKA, Germany). For exposures at 80 ± 0.05 and 90 ± 0.05 °C with a pO2 of 0 kPa in biodiesel and at 75 ± 0.05 °C and pO2 = 0 kPa in HVO, the headspace gas was regularly evacuated from the vessel by a vacuum pump. Nitrogen/oxygen gas mixtures were continuously purged into the biodiesel at a rate of 50 mL min–1 through a PTFE tube to study the degradation of NBR at pO2 = 21 and 40 kPa and 80 ± 0.05 °C. Unfilled-NBR samples (no carbon black in
14
the compound) were aged in biodiesel at 80 ± 0.05 °C and pO2 = 0 kPa. The carbon-black-filled rubbers containing the ZnO nanoparticles and synthesized heat-treated ZnO particles were exposed to biodiesel at 100 ± 1 °C, pO2 = 21 kPa (gas flow rate = 100 mL min–1); a higher temperature and vigorous gas flushing being used to accelerate the fuel oxidation and rubber degradation. Biodiesel alone (without physical contact with the rubber) was also aged at 80 ± 0.05 °C and pO2 = 0 kPa. Rubber samples and fuel aliquots were taken from the vessel during the exposure, immediately cooled in liquid nitrogen, and stored in plastic zip bags at –25 °C in the dark prior to further analysis.
3.3.2. Ageing of NBR in biodiesel in the high-pressure autoclave at 150 °C
The NBR strips and dumb-bells were exposed to biodiesel in the autoclave at 150 ± 1 °C. No oxygen was purged into the fuel during the exposures. The fuel in the autoclave was then oxidized solely by oxygen dissolved in the biodiesel and in the headspace air. The specimens were hung from stainless steel wires, and placed in the autoclave (initial volume of the fuel = 1.5 L). The fuel was not stirred during the exposures in the autoclave. The exposures were performed in nine identical autoclaves. The autoclaves were taken from the oven during the ageing, and the rubber and fuel samples were then collected and stored in plastic zip bags at –25 °C in the dark prior to further analysis.
3.3.3. Ageing of FKMs in the automated ageing equipment at 100 °C
The FKM-co, FKM-ter and FKM-G samples were exposed to biodiesel at 100 ± 0.05 °C and pO2 = 0 and 21 kPa in the automated ageing equipment. The exposure was stopped when swelling equilibrium was reached. In the case of FKM-ter, the exposure was stopped after 82 days’ exposure. The Dimension of the samples and the ageing method were those described in Section 3.3.1. The state of biodiesel and HVO at the latter stages of the exposure does not represent a useful fuel. However, ageing of the fuel in contact with the rubber is necessary for mechanistic studies and for understanding the degradation process of the rubbers.
3.4. Swelling experiments
The change in mass and volume of the rubber samples on exposure to the fuel was determined at 23 ± 1 °C using a Mettler-Toledo balance equipped with a density kit (precision = 0.01 mg; MS-DNY-54). The specimens were quickly washed with acetone, and then blotted lightly with a medical wipe before being weighed. The relative change in volume (ΔV/V0) was calculated according to:
15
)()()(
20
2031
0 mmmmmm
VV
----
=D
(1)
where m0 and m1 are the masses of the sample in air before and after immersion in the fuel, and m2 and m3 are the masses of the sample in water before and after exposure to the fuel. The relative mass change (∆m/m0) was calculated according to:
0
01
0
)(mmm
mm -=
D
(2)
3.5. Thermal analyses
The composition of the virgin rubbers was determined by thermogravimetry (TGA/ DSC 1, Mettler-Toledo, Switzerland). The sample (mass = 8–10 mg) was placed in a 70 µL aluminium oxide crucible and purged with nitrogen for 1 min at 25 °C before starting the heating/cooling cycles. The degradation of the polymer was distinguished from the combustion of the carbon black by dividing the experiments into three sections: the samples were first heated from 25 °C to 510 °C in nitrogen, cooled to 300 °C maintaining the nitrogen gas flow and then reheated in oxygen to 800 °C to oxidize the carbon black and any polymer residue. The scanning rate and the gas flow rate were 10 °C min–1 and 50 mL min–1, respectively. The decomposition of insoluble biodiesel in the aged FKM samples was studied by heating the 10 ± 0.5 mg sample from 25 °C to 1000 °C in oxygen. The scanning rate and the gas flow rate were 10 °C min−1 and 50 mL min−1, respectively. The soluble components of biodiesel were first extracted from the samples at 40 ± 1 °C under ultrasonication (Bandelin Sonorex RK 100H, volume = 3 L, ultrasonic peak output = 320 W, frequency = 35 kHz) for 30 min in THF, 30 min in n-hexane (≥99 wt%; AnalaR NORMAPUR, VWR International, Sweden) and 30 min in acetone (≥99.8 wt%; AnalaR NORMAPUR, VWR International, Sweden). The sample remaining after the extractions was finally dried at 70 ± 1 °C for 72 h in a vacuum oven (pressure = 20 kPa), and stored at 25 °C for a week prior to the TG analysis.
A Mettler-Toledo DSC 1 (Mettler-Toledo, Switzerland) was used to determine the Tg of the virgin and aged samples. The 7 ± 0.5 mg samples were placed in crimp-sealed 40 µL aluminium pans with a hole in the cover, cooled to –80 °C, kept at this temperature for 5 min, and then heated to 150 °C in nitrogen. The scanning rate and the gas flow rate were 5 °C min–1 and 50 mL min–1, respectively. Before the measurements, the soluble species were extracted from the samples. The extracted samples were dried for 72 h at 70 ± 1 °C under reduced pressure (20 kPa). DSC measurements were also performed on the fresh fuel and extracted biodiesel-exposed FKM samples to trace the insoluble biodiesel in the aged
16
rubbers. The sample (mass = 7 ± 0.5 mg), was placed in a crimp-sealed 100 µL aluminium pan, cooled to −30 °C, kept at this temperature for 5 min, and then heated to 550 °C. The scanning rate and the nitrogen flow rate were respectively 10 °C min−1 and 50 mL min−1.
3.6. Tensile testing
The dumb-bell specimens (length = 75 mm long and thickness = 2 mm) were cut from the rubber sheets by an Elastocon pneumatic cutting press (EP 02; Sweden). Tensile tests were performed at 25 ± 1 °C and 50 ± 5 % RH in an Instron 5944 Universal Tensile Testing Machine, USA, using a 500 N load cell according to ASTM D412-06a. The crosshead speed and gauge length were 500 mm min–1 and 30 mm, respectively. The average strain-at-break and Young’s modulus (secant modulus at 5 % strain) were determined for three to five specimens of each sample.
3.7. Crosslink density measurement
The crosslink densities of the NBR samples were determined using the Flory-Rehner equation according to ASTM D6814-02. The samples were first extracted according to the method described in Section 3.5, and then dried for 24 h at 70 ± 1 °C under reduced pressure (20 KPa). The dried samples were immersed in benzene (EMSURE® ACS, Merck Millipore, Germany) for 72 h at 23 ± 1 °C, the solvent being refreshed every 12 h. The samples were weighed before and after drying at 70 ± 1 °C for 19 h. The effective number of chains in a real network per unit volume (νe), was calculated according to [56]:
[ ]
úúû
ù
êêë
é -
++--=
2)(
)1ln(3
2
rrs
rrre
VVVVVV c
n (3)
where χ and Vs are respectively the polymer-solvent interaction parameter (χ = 0.486 [56]) and the molecular volume of solvent, and Vr is volume fraction of the polymer in the swollen network, calculated according to [56]:
s
s
r
r
r
r
r WW
W
V
rr
r
+= (4)
where Wr, Ws, ρr and ρs are respectively the mass of dried rubber, the mass of solvent absorbed by the sample, the density of dried rubber and the density of solvent.
17
3.8. Infrared spectroscopy (IR)
The IR spectra of the NBR and FKM samples obtained using a Perkin-Elmer FT-IR Spectrometer 2000 equipped with an attenuated total reflectance accessory (Graseby Specac Ltd, UK). In the case of the NBR samples, the spectra were normalized with respect to the absorbance at 2944 cm−1 assigned to the C–H stretching mode of the methylene units. The IR spectra of the FKM samples were normalized with respect to the absorbance at 886 cm−1 assigned to the C–F stretching mode of the CF3 groups. The samples were extracted in THF, acetone and n-hexane before IR measurements according to Section 3.5.
3.9. Dynamical mechanical analysis (DMA)
The storage and loss moduli of the virgin and aged NBR and FKM samples were recorded by a Q800 DMA analyzer (TA Instruments, USA) in the tensile mode. Long strips of specimens (2 × 10 ± 1 × 50 ± 1 (mm)3) were fixed between the clamps with an initial gauge length of 20 mm. For the temperature sweep tests, the samples were cooled to −120 °C, kept at −120 °C for 5 min, and then heated to 150 °C with a temperature ramp of 10 °C min–1, a constant frequency of 1 Hz, a static force of 0.01 N and an amplitude of 10 µm. The linear viscoelastic region was determined by strain sweep tests carried out at 80 °C with a frequency of 1 Hz, over strains ranging from 0.1 to 20%. Isothermal strain sweep tests were performed at 90 °C with a static force of 0.01 N over strains ranging between 0.01 and 10%.
3.10. Determination of bound rubber content
The bound rubber content of the uncured NBR sample (1.5 g) was determined after extraction for 7 days in toluene (≥ 99.8 %, anhydrous; Sigma-Aldrich, Sweden; solvent was refreshed after every 24 h) and for 2 days in n-hexane (300 mL; solvent was refreshed after every 24 h) at 23 ± 2 °C. The remaining rubber was dried for 4 days at 45 ± 2 °C under reduced pressure (20 kPa). The samples were weighed before extraction and after drying.
3.11. Scanning electron microscopy (SEM)
Cross-sections of the fresh and aged NBR and FKM samples (fractured in liquid nitrogen) and the morphology of the extracted uncured NBR compound and ZnO particles were studied using a field emission scanning electron microscope (Hitachi S-4800). The rubber and powder samples were coated for 20–30 s with a thin conductive layer of Pt/Pd (60/40) using a current of 80 mA in a Cressington sputter coater, model 208 HR. The micrographs were taken at an acceleration voltage of 5 kV and a current of 10 µA.
18
3.12. Wide-angle X-ray diffraction (XRD)
X-ray diffractograms of the virgin and aged NBR samples were taken at 23 ± 0.1 °C using a PANalytical X'pert Pro MPD diffractometer with Cu-Kα radiation (wavelength = 1.54 Å) at a generator voltage of 45 kV and current of 45 mA. The data were collected between 5 and 40° (2θ) at a step size of 0.004° (2θ) and scanning step time of 10.16 s.
3.13. Brunauer-Emmett-Teller (BET) determination
The specific surface area and pore size distribution of the ZnO particles were determined by the Brunauer-Emmett-Teller (BET) method based on nitrogen adsorption/desorption with a Micromeritics ASAP 2000 at 77 K. Before the measurements, the samples were degassed at 200 °C until the pressure reached 0.3 hPa.
3.14. High-performance liquid chromatography (HPLC)
The fresh and aged biodiesel samples as well as the extracts from the fresh and aged NBR samples were assessed using a Hewlett-Packard 1100-series HPLC equipped with a C18-column (particle size = 3 µm; length = 150 mm; inner diameter = 3.2 mm; Agilent Technologies, Germany) and an ultraviolet diode array detector (G1315A, Agilent Technologies, Germany). The HPLC measurements were performed at 25 °C, a wavelength of 220 nm and a flow rate 0.5 mL min−1 of methanol (≥ 99.8 wt.%; HiPerSolv CHROMANORM; VWR International, Sweden) as the carrier solvent. The soluble fraction of the NBR samples was extracted with acetone. The peaks were identified by comparing the retention times for the samples with those for a series of FAME standard solutions (ME14-1 KT Supelco; Sigma-Aldrich, Sweden). HPLC experiments were also performed on the FAME standard solutions oxidized in air at 60 °C for 12 h in an oven using the same procedure.
3.15. 1H NMR spectroscopy
The concentration of FAMEs in the biodiesel samples was assessed in an NMR spectrometer (Bruker Avance 400 MHz, Billerica, MA, USA) at 25 °C. Each fuel sample (50 ± 1 µL) was mixed with 500 ± 1 µL chloroform-d (99.96% atom D containing 0.03 vol.% trimethylsilane; Sigma-Aldrich, Sweden), and then transferred to a 1H NMR tube (diameter = 5 mm). The 1H spectra were acquired at a spectral width of 10 kHz, a pulse length (90° pulse) of 8.55 µs, a relaxation delay of 3 s and a chemical shift (δ) of 0–12 ppm. The acquired
19
spectra were plotted at a fixed value of absolute intensity, corrected for baseline distortion, and referenced to trimethylsilane using MestReNova software.
3.16. Determinations of acid value, hydroperoxide value and water content in biodiesel
The concentration of acidic components in biodiesel aliquots were determined according to ASTM D974-12, and expressed as mg KOH per g of biodiesel required to titrate 3 ± 0.01 g of the sample in 100 mL toluene, water and isopropyl alcohol (≥ 99.5 %; anhydrous; Sigma-Aldrich, Sweden), in the ratio 100:1:99, containing 1 g p-naphtholbenzein (70480; Fluka, Sweden) as an indicator, to a specified endpoint. The hydroperoxide value of the biodiesel samples was measured according to ASTM D3703-13. A standard 0.005 N solution of sodium thiosulphate pentahydrate (≥ 99.5 %; ACS reagent, Sigma-Aldrich, Sweden) was used to titrate the biodiesel samples (mass per sample = 5 ± 0.01 g) dissolved in 25 mL 2,2,4-trimethylpentane (≥ 99 %; ACS reagent; Sigma-Aldrich, Sweden), 20 mL acetic acid (≥ 96 %; EMSURE, VWR International, Sweden), 2 mL potassium iodide (≥ 99 %; ACS reagent; Sigma-Aldrich, Sweden), 100 mL water and 5 mL starch solution (soluble potato starch; analytical reagent; Sigma-Aldrich, Sweden). The water content in the biodiesel samples was determined in a Karl-Fischer titrator (831 KF coulometer, Metrohm, Switzerland) according to ISO 12937.
20
4. RESULTS AND DISCUSSION
4.1. Oxidation of biodiesel
4.1.1. Determination of composition of the FAMEs in biodiesel
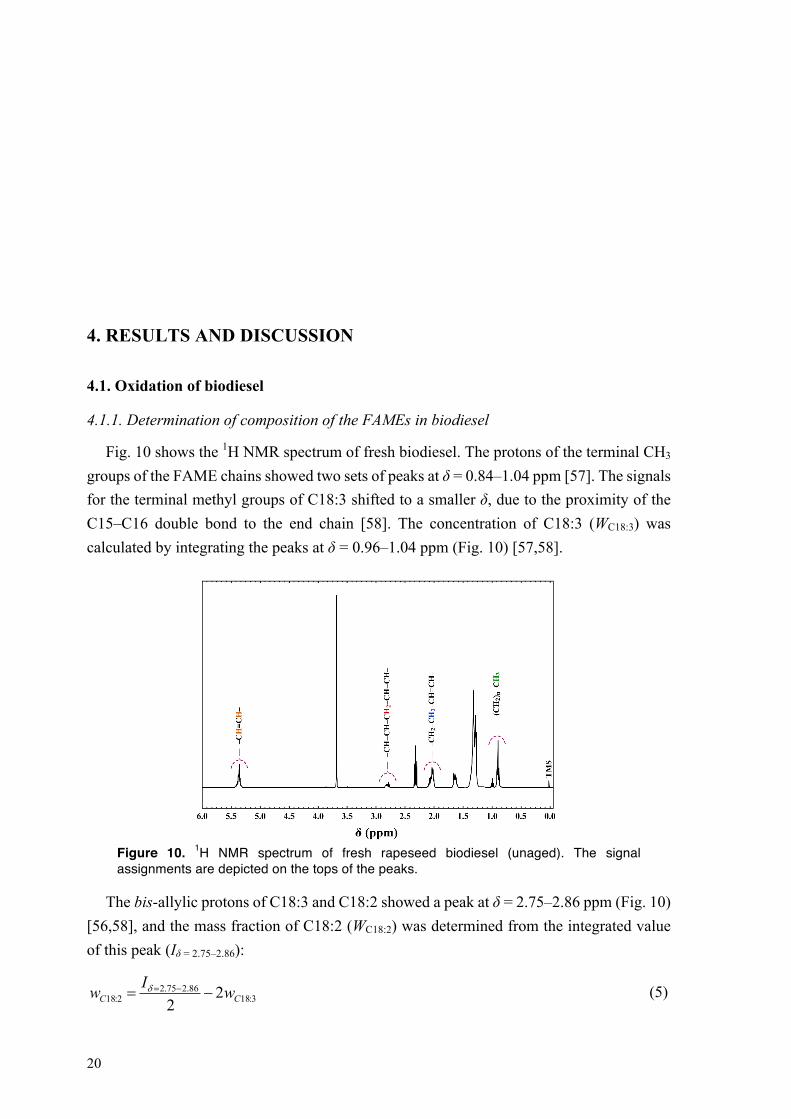
Fig. 10 shows the 1H NMR spectrum of fresh biodiesel. The protons of the terminal CH3 groups of the FAME chains showed two sets of peaks at δ = 0.84–1.04 ppm [57]. The signals for the terminal methyl groups of C18:3 shifted to a smaller δ, due to the proximity of the C15–C16 double bond to the end chain [58]. The concentration of C18:3 (WC18:3) was calculated by integrating the peaks at δ = 0.96–1.04 ppm (Fig. 10) [57,58].
Figure 10. 1H NMR spectrum of fresh rapeseed biodiesel (unaged). The signal assignments are depicted on the tops of the peaks.
The bis-allylic protons of C18:3 and C18:2 showed a peak at δ = 2.75–2.86 ppm (Fig. 10) [56,58], and the mass fraction of C18:2 (WC18:2) was determined from the integrated value of this peak (Iδ = 2.75–2.86):
3:1886.275.2
2:18 22 CC wIw -= -=d
(5)
21
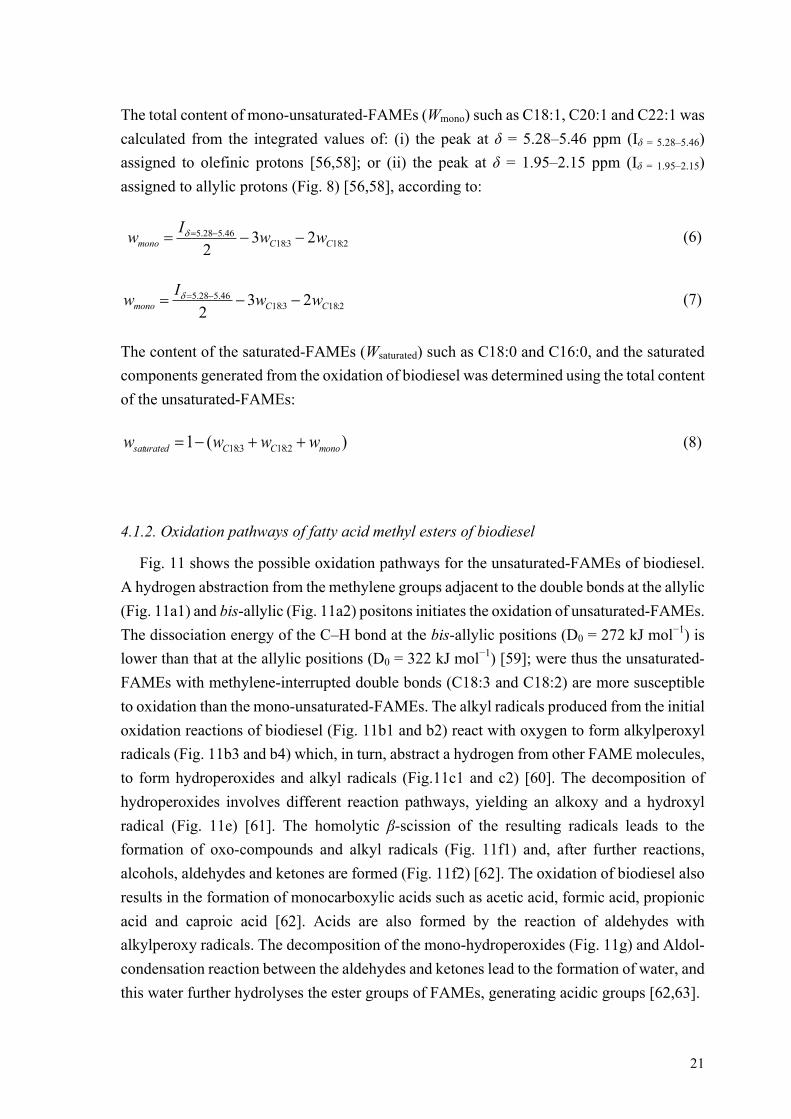
The total content of mono-unsaturated-FAMEs (Wmono) such as C18:1, C20:1 and C22:1 was calculated from the integrated values of: (i) the peak at δ = 5.28–5.46 ppm (Iδ = 5.28–5.46) assigned to olefinic protons [56,58]; or (ii) the peak at δ = 1.95–2.15 ppm (Iδ = 1.95–2.15) assigned to allylic protons (Fig. 8) [56,58], according to:
2:183:1846.528.5 23
2 CCmono wwIw --= -=d
(6)
2:183:1846.528.5 23
2 CCmono wwIw --= -=d (7)
The content of the saturated-FAMEs (Wsaturated) such as C18:0 and C16:0, and the saturated components generated from the oxidation of biodiesel was determined using the total content of the unsaturated-FAMEs:
)(1 2:183:18 monoCCsaturated wwww ++-= (8)
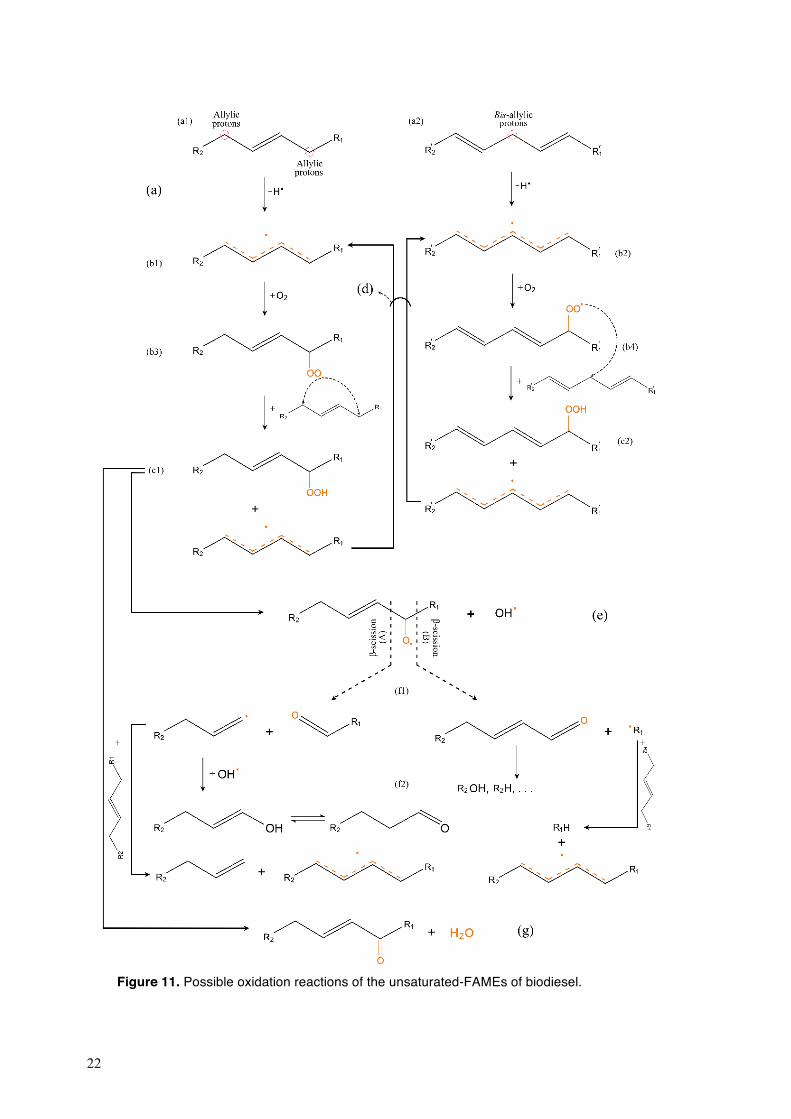
4.1.2. Oxidation pathways of fatty acid methyl esters of biodiesel
Fig. 11 shows the possible oxidation pathways for the unsaturated-FAMEs of biodiesel. A hydrogen abstraction from the methylene groups adjacent to the double bonds at the allylic (Fig. 11a1) and bis-allylic (Fig. 11a2) positons initiates the oxidation of unsaturated-FAMEs. The dissociation energy of the C–H bond at the bis-allylic positions (D0 = 272 kJ mol−1) is lower than that at the allylic positions (D0 = 322 kJ mol−1) [59]; were thus the unsaturated-FAMEs with methylene-interrupted double bonds (C18:3 and C18:2) are more susceptible to oxidation than the mono-unsaturated-FAMEs. The alkyl radicals produced from the initial oxidation reactions of biodiesel (Fig. 11b1 and b2) react with oxygen to form alkylperoxyl radicals (Fig. 11b3 and b4) which, in turn, abstract a hydrogen from other FAME molecules, to form hydroperoxides and alkyl radicals (Fig.11c1 and c2) [60]. The decomposition of hydroperoxides involves different reaction pathways, yielding an alkoxy and a hydroxyl radical (Fig. 11e) [61]. The homolytic β-scission of the resulting radicals leads to the formation of oxo-compounds and alkyl radicals (Fig. 11f1) and, after further reactions, alcohols, aldehydes and ketones are formed (Fig. 11f2) [62]. The oxidation of biodiesel also results in the formation of monocarboxylic acids such as acetic acid, formic acid, propionic acid and caproic acid [62]. Acids are also formed by the reaction of aldehydes with alkylperoxy radicals. The decomposition of the mono-hydroperoxides (Fig. 11g) and Aldol-condensation reaction between the aldehydes and ketones lead to the formation of water, and this water further hydrolyses the ester groups of FAMEs, generating acidic groups [62,63].
22
Figure 11. Possible oxidation reactions of the unsaturated-FAMEs of biodiesel.
23
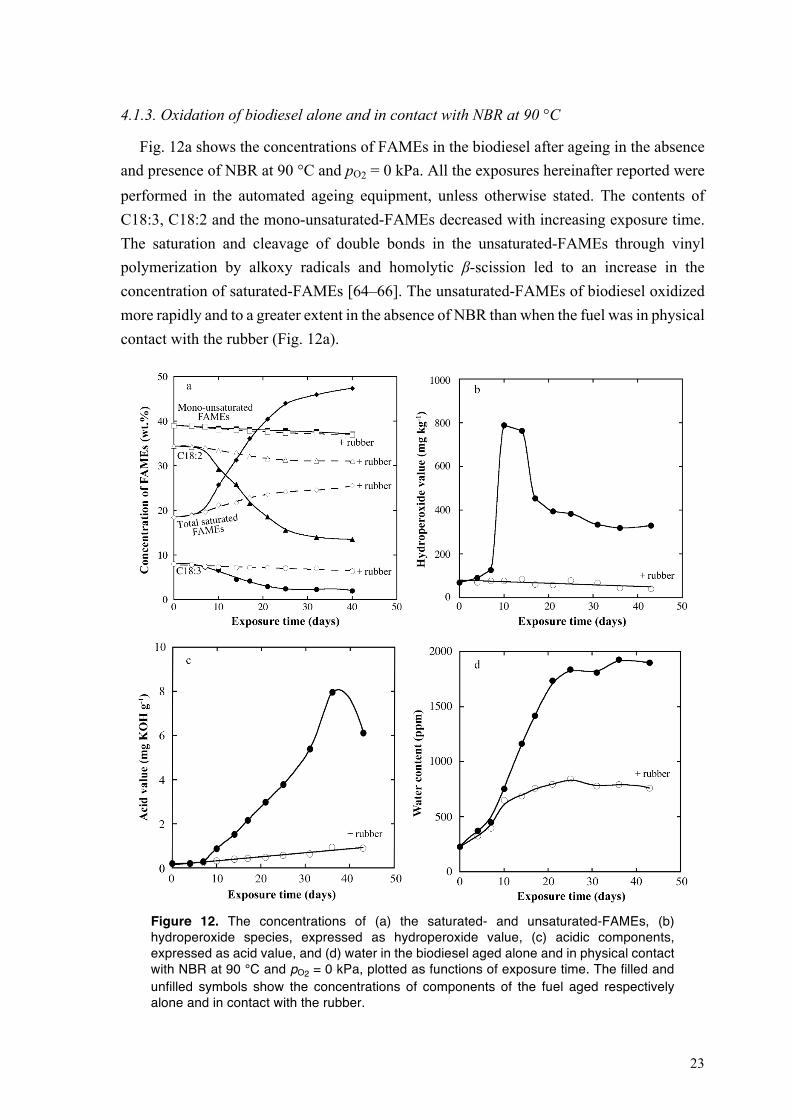
4.1.3. Oxidation of biodiesel alone and in contact with NBR at 90 °C
Fig. 12a shows the concentrations of FAMEs in the biodiesel after ageing in the absence and presence of NBR at 90 °C and pO2 = 0 kPa. All the exposures hereinafter reported were performed in the automated ageing equipment, unless otherwise stated. The contents of C18:3, C18:2 and the mono-unsaturated-FAMEs decreased with increasing exposure time. The saturation and cleavage of double bonds in the unsaturated-FAMEs through vinyl polymerization by alkoxy radicals and homolytic β-scission led to an increase in the concentration of saturated-FAMEs [64–66]. The unsaturated-FAMEs of biodiesel oxidized more rapidly and to a greater extent in the absence of NBR than when the fuel was in physical contact with the rubber (Fig. 12a).
Figure 12. The concentrations of (a) the saturated- and unsaturated-FAMEs, (b) hydroperoxide species, expressed as hydroperoxide value, (c) acidic components, expressed as acid value, and (d) water in the biodiesel aged alone and in physical contact with NBR at 90 °C and pO2 = 0 kPa, plotted as functions of exposure time. The filled and unfilled symbols show the concentrations of components of the fuel aged respectively alone and in contact with the rubber.
24
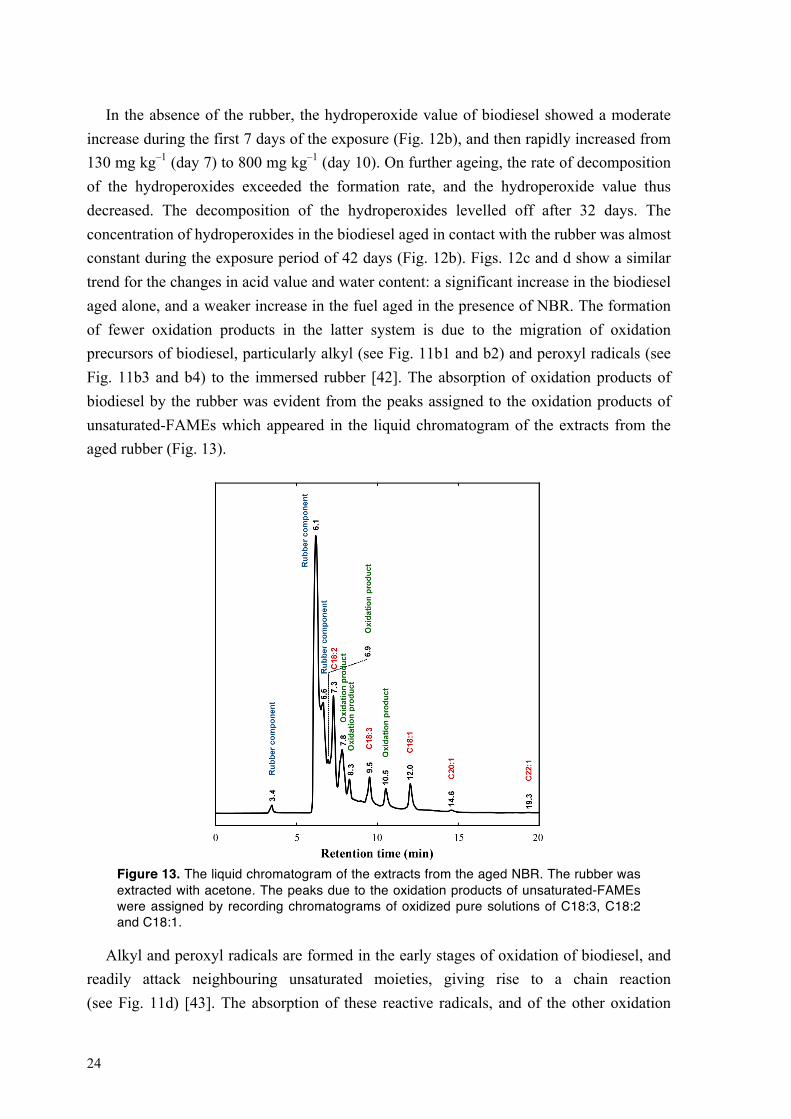
In the absence of the rubber, the hydroperoxide value of biodiesel showed a moderate increase during the first 7 days of the exposure (Fig. 12b), and then rapidly increased from 130 mg kg–1 (day 7) to 800 mg kg–1 (day 10). On further ageing, the rate of decomposition of the hydroperoxides exceeded the formation rate, and the hydroperoxide value thus decreased. The decomposition of the hydroperoxides levelled off after 32 days. The concentration of hydroperoxides in the biodiesel aged in contact with the rubber was almost constant during the exposure period of 42 days (Fig. 12b). Figs. 12c and d show a similar trend for the changes in acid value and water content: a significant increase in the biodiesel aged alone, and a weaker increase in the fuel aged in the presence of NBR. The formation of fewer oxidation products in the latter system is due to the migration of oxidation precursors of biodiesel, particularly alkyl (see Fig. 11b1 and b2) and peroxyl radicals (see Fig. 11b3 and b4) to the immersed rubber [42]. The absorption of oxidation products of biodiesel by the rubber was evident from the peaks assigned to the oxidation products of unsaturated-FAMEs which appeared in the liquid chromatogram of the extracts from the aged rubber (Fig. 13).
Figure 13. The liquid chromatogram of the extracts from the aged NBR. The rubber was extracted with acetone. The peaks due to the oxidation products of unsaturated-FAMEs were assigned by recording chromatograms of oxidized pure solutions of C18:3, C18:2 and C18:1.
Alkyl and peroxyl radicals are formed in the early stages of oxidation of biodiesel, and readily attack neighbouring unsaturated moieties, giving rise to a chain reaction (see Fig. 11d) [43]. The absorption of these reactive radicals, and of the other oxidation
25
products by the rubber hindered further oxidation of the unsaturated-FAMEs, and thus smaller amounts of hydroperoxides and acids were formed [43–46]. The migration of stabilizer from the rubber to the fuel may also impede the oxidation of biodiesel.
4.1.4. Oxidation of biodiesel at different oxygen partial pressures and temperatures
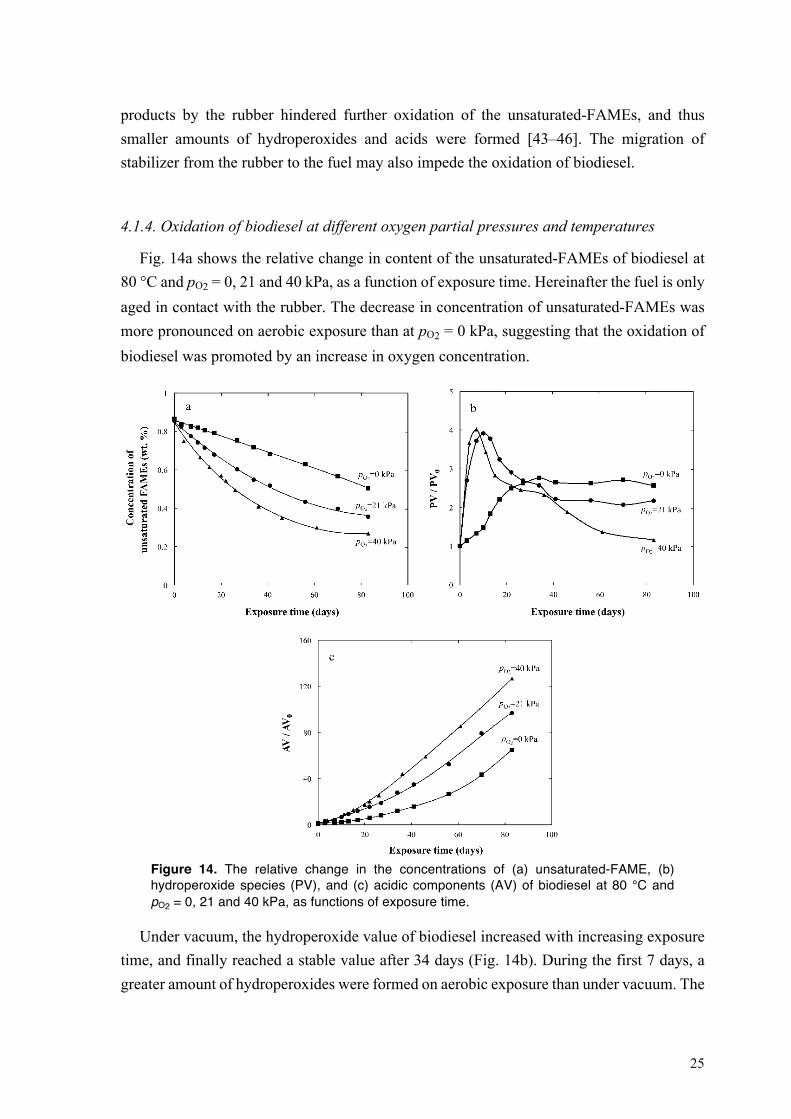
Fig. 14a shows the relative change in content of the unsaturated-FAMEs of biodiesel at 80 °C and pO2 = 0, 21 and 40 kPa, as a function of exposure time. Hereinafter the fuel is only aged in contact with the rubber. The decrease in concentration of unsaturated-FAMEs was more pronounced on aerobic exposure than at pO2 = 0 kPa, suggesting that the oxidation of biodiesel was promoted by an increase in oxygen concentration.
Figure 14. The relative change in the concentrations of (a) unsaturated-FAME, (b) hydroperoxide species (PV), and (c) acidic components (AV) of biodiesel at 80 °C and pO2 = 0, 21 and 40 kPa, as functions of exposure time.
Under vacuum, the hydroperoxide value of biodiesel increased with increasing exposure time, and finally reached a stable value after 34 days (Fig. 14b). During the first 7 days, a greater amount of hydroperoxides were formed on aerobic exposure than under vacuum. The
26
concentration of hydroperoxides decreased with a further increase in the exposure time at pO2 = 21 and 40 kPa, due to the faster decomposition of hydroperoxides than their formation (Fig. 14b). The hydroperoxide value remained constant after 41 days at pO2 = 21 kPa, whereas the hydroperoxide value further decreased at pO2 = 40 kPa until all the hydroperoxides formed during the initial stages of the exposure were consumed after 83 days (Fig. 14b). At any of the selected oxygen activities, the acid value increased remarkably with increasing exposure time (Fig. 14c). A larger amount of acids was formed with increasing pO2, the acid value of biodiesel after 83 days at pO2 = 40 kPa being 3 times greater than that after the same period of time at pO2 = 0 kPa (Fig. 14c).
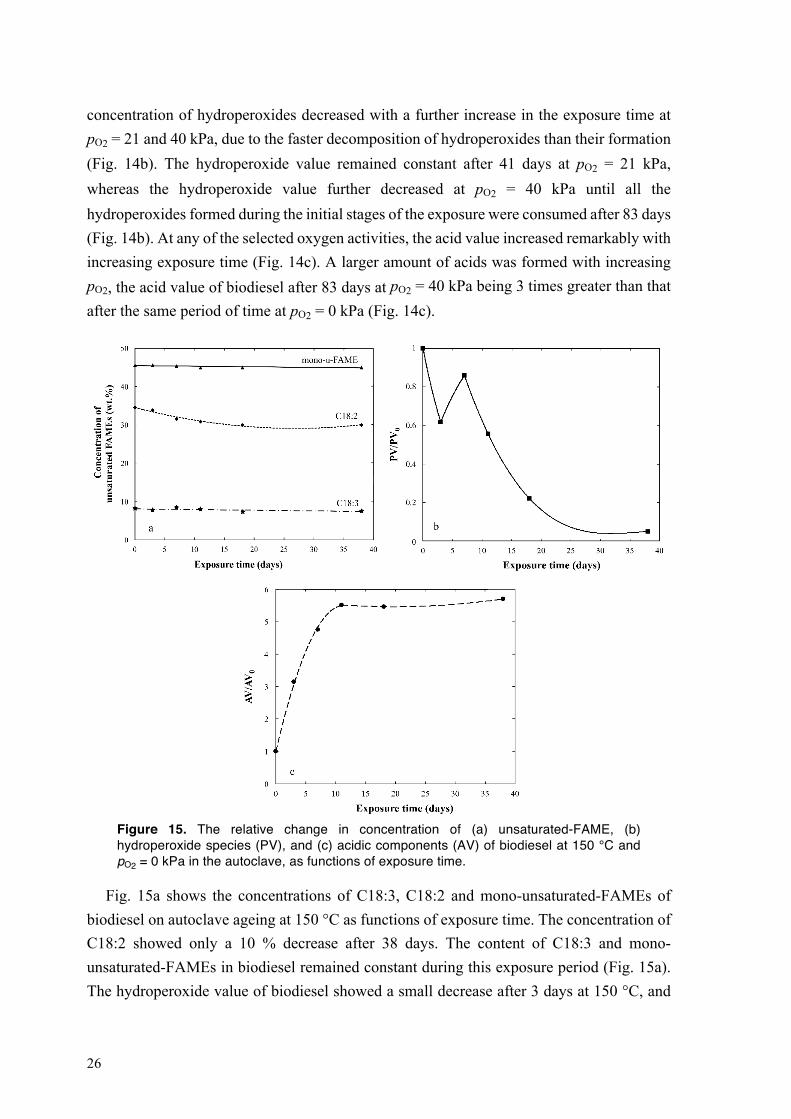
Figure 15. The relative change in concentration of (a) unsaturated-FAME, (b) hydroperoxide species (PV), and (c) acidic components (AV) of biodiesel at 150 °C and pO2 = 0 kPa in the autoclave, as functions of exposure time.
Fig. 15a shows the concentrations of C18:3, C18:2 and mono-unsaturated-FAMEs of biodiesel on autoclave ageing at 150 °C as functions of exposure time. The concentration of C18:2 showed only a 10 % decrease after 38 days. The content of C18:3 and mono-unsaturated-FAMEs in biodiesel remained constant during this exposure period (Fig. 15a). The hydroperoxide value of biodiesel showed a small decrease after 3 days at 150 °C, and
27
then increased slightly with increasing exposure time up to 7 days (Fig. 15b). On further ageing, all hydroperoxides decomposed, the hydroperoxide value being almost zero after 38 days. The acid value of biodiesel increased at 150 °C after 11 days (Fig. 15c), and reached a stable value much lower than that at 80 °C and pO2 = 0 kPa (cf. Fig. 14c and Fig.15c). When the oxygen partial pressure was decreased at 150 °C on autoclave ageing, the polymerization and cyclization of alkyl and alkylperoxyl radicals (termination reactions) dominated over the reaction of alkyl radicals and oxygen (initiation reactions) [46,67–69]. As a consequence, the oxidation of unsaturated-FAMEs of biodiesel was hindered, and a smaller amount of hydroperoxides and acids was thus formed in the fuel during autoclave ageing than in the automated ageing equipment. The hydroperoxides also decomposed more rapidly than they were formed with increasing temperature [46]. The exposures in the autoclave were static, and the oxygen in the headspace entered the fuel only by diffusion. In the automated ageing equipment, however, the fuel was stirred during the exposure, allowing the transfer of oxygen in the headspace air to the fuel by both diffusion and convection [46]. In the automated equipment, a higher concentration of oxygen in the fuel promoted the reaction of alkyl radicals with oxygen, whereas, in the autoclave ageing, the stabilizers present in the biodiesel were more likely to react with the alkyl radicals, and thus contributed more to inhibiting the oxidation of biodiesel [46].
4.2. Degradation of NBR in HVO and biodiesel
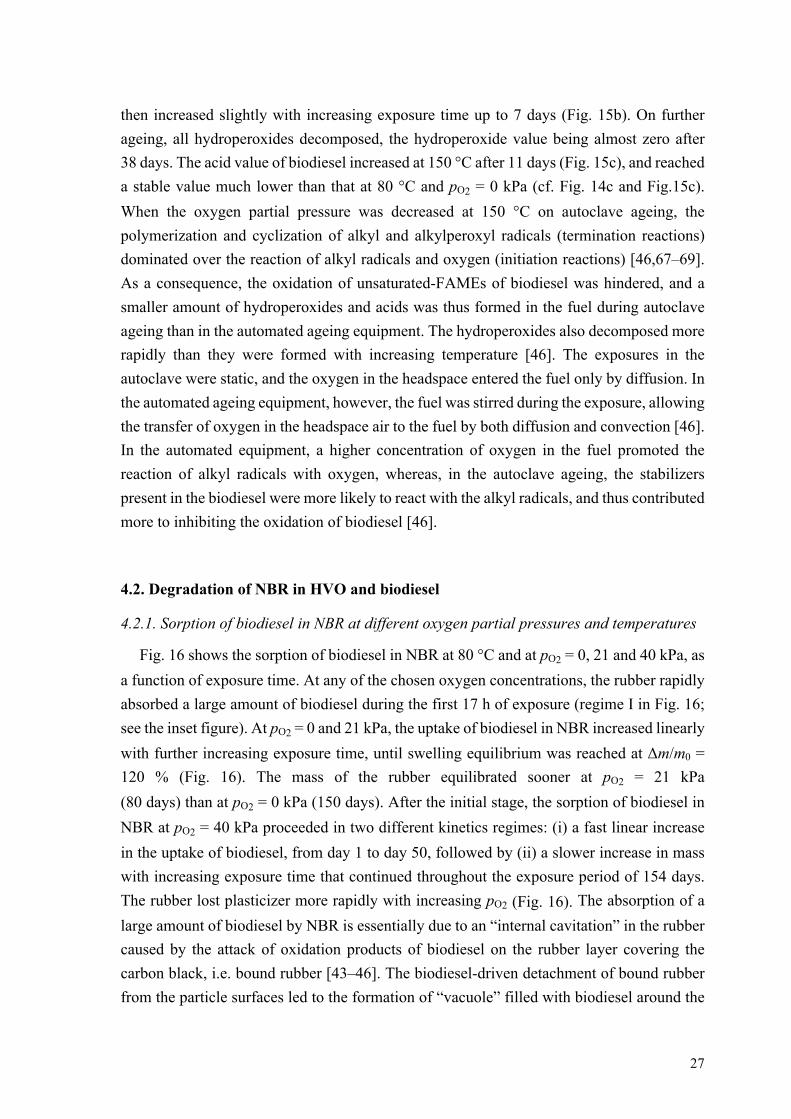
4.2.1. Sorption of biodiesel in NBR at different oxygen partial pressures and temperatures
Fig. 16 shows the sorption of biodiesel in NBR at 80 °C and at pO2 = 0, 21 and 40 kPa, as a function of exposure time. At any of the chosen oxygen concentrations, the rubber rapidly absorbed a large amount of biodiesel during the first 17 h of exposure (regime I in Fig. 16; see the inset figure). At pO2 = 0 and 21 kPa, the uptake of biodiesel in NBR increased linearly with further increasing exposure time, until swelling equilibrium was reached at Δm/m0 = 120 % (Fig. 16). The mass of the rubber equilibrated sooner at pO2 = 21 kPa (80 days) than at pO2 = 0 kPa (150 days). After the initial stage, the sorption of biodiesel in NBR at pO2 = 40 kPa proceeded in two different kinetics regimes: (i) a fast linear increase in the uptake of biodiesel, from day 1 to day 50, followed by (ii) a slower increase in mass with increasing exposure time that continued throughout the exposure period of 154 days. The rubber lost plasticizer more rapidly with increasing pO2 (Fig. 16). The absorption of a large amount of biodiesel by NBR is essentially due to an “internal cavitation” in the rubber caused by the attack of oxidation products of biodiesel on the rubber layer covering the carbon black, i.e. bound rubber [43–46]. The biodiesel-driven detachment of bound rubber from the particle surfaces led to the formation of “vacuole” filled with biodiesel around the
28
particles, resulting in an extensive uptake of the fuel in the rubber [44,46]. The mechanism of degradation of bound rubber in NBR exposed to biodiesel is further discussed in Section 4.2.2. On exposure to biodiesel, the oxidation products were absorbed by the rubber; see Fig. 13. A higher concentration of oxygen promoted the formation of hydroperoxides and acids in the biodiesel, and this led to more severe damage to the rubber, leading to a greater and more rapid uptake of biodiesel [45,46].
Figure 16. The biodiesel uptake and plasticizer loss of NBR on exposure to biodiesel at 80 °C and at pO2 = 0, 21 and 40 kPa, as a function of exposure time. The sorption curves of NBR during the first three days’ exposure to biodiesel are shown in the inset graph.
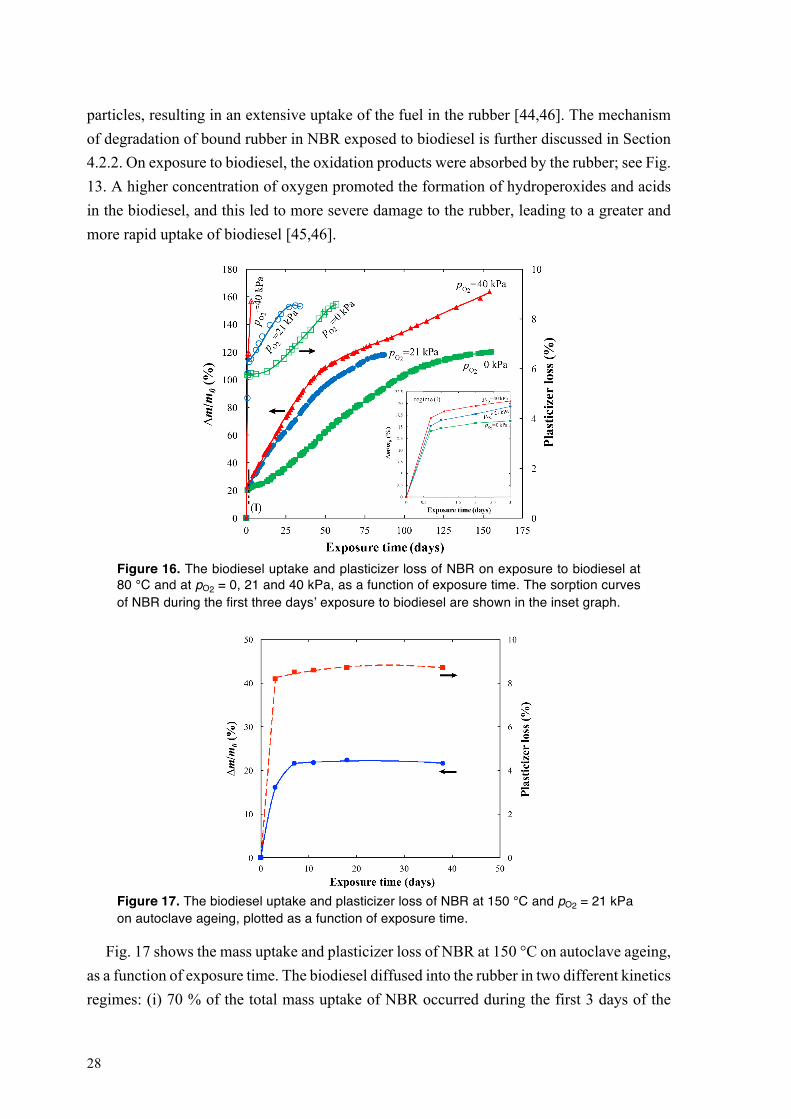
Figure 17. The biodiesel uptake and plasticizer loss of NBR at 150 °C and pO2 = 21 kPa on autoclave ageing, plotted as a function of exposure time.
Fig. 17 shows the mass uptake and plasticizer loss of NBR at 150 °C on autoclave ageing, as a function of exposure time. The biodiesel diffused into the rubber in two different kinetics regimes: (i) 70 % of the total mass uptake of NBR occurred during the first 3 days of the
29
exposure (Δm/m0 = 4 % at day 3), followed by (ii) a slow approach towards swelling equilibrium, which was completed after 7 days (Fig. 17). The plasticizer loss curve showed a similar trend: (i) 90 % of the total amount of plasticizer included in the rubber was extracted by biodiesel after 7 days, and (ii) the remaining plasticizer migrated from NBR to the fuel after 38 days (Fig. 17). A smaller amount of oxidation products was generated from biodiesel at 150 °C on autoclave ageing than on exposure in the automated ageing equipment (cf. Figs. 14a-c and Figs. 15a-c). This suggests that the biodiesel-driven degradation of NBR was less pronounced in the former case, so that the fuel uptake in the rubber was smaller.
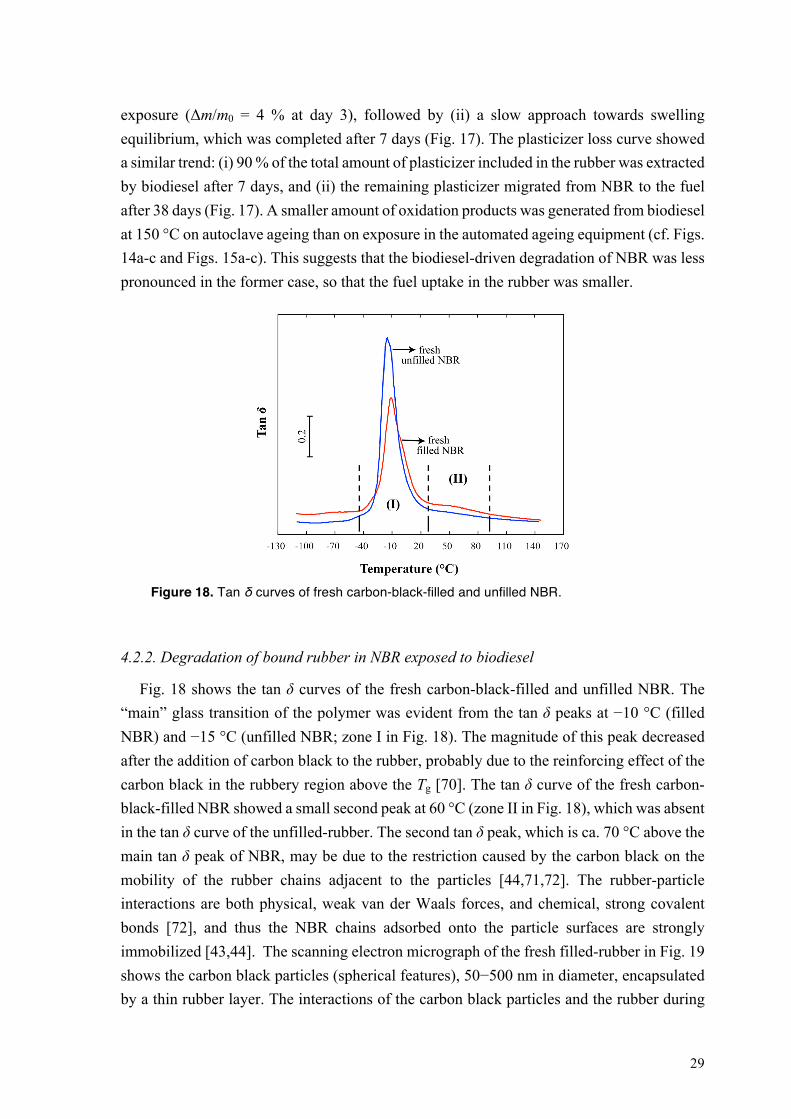
Figure 18. Tan δ curves of fresh carbon-black-filled and unfilled NBR.
4.2.2. Degradation of bound rubber in NBR exposed to biodiesel
Fig. 18 shows the tan δ curves of the fresh carbon-black-filled and unfilled NBR. The “main” glass transition of the polymer was evident from the tan δ peaks at −10 °C (filled NBR) and −15 °C (unfilled NBR; zone I in Fig. 18). The magnitude of this peak decreased after the addition of carbon black to the rubber, probably due to the reinforcing effect of the carbon black in the rubbery region above the Tg [70]. The tan δ curve of the fresh carbon-black-filled NBR showed a small second peak at 60 °C (zone II in Fig. 18), which was absent in the tan δ curve of the unfilled-rubber. The second tan δ peak, which is ca. 70 °C above the main tan δ peak of NBR, may be due to the restriction caused by the carbon black on the mobility of the rubber chains adjacent to the particles [44,71,72]. The rubber-particle interactions are both physical, weak van der Waals forces, and chemical, strong covalent bonds [72], and thus the NBR chains adsorbed onto the particle surfaces are strongly immobilized [43,44]. The scanning electron micrograph of the fresh filled-rubber in Fig. 19 shows the carbon black particles (spherical features), 50−500 nm in diameter, encapsulated by a thin rubber layer. The interactions of the carbon black particles and the rubber during
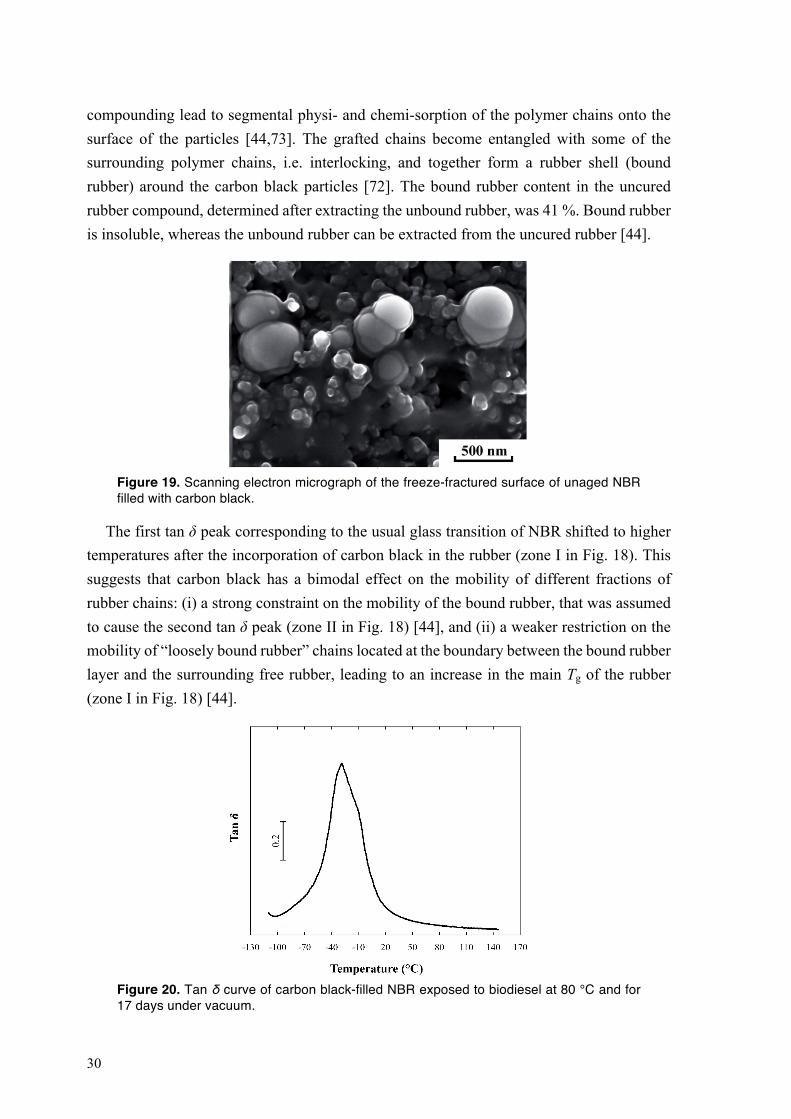
30
compounding lead to segmental physi- and chemi-sorption of the polymer chains onto the surface of the particles [44,73]. The grafted chains become entangled with some of the surrounding polymer chains, i.e. interlocking, and together form a rubber shell (bound rubber) around the carbon black particles [72]. The bound rubber content in the uncured rubber compound, determined after extracting the unbound rubber, was 41 %. Bound rubber is insoluble, whereas the unbound rubber can be extracted from the uncured rubber [44].
Figure 19. Scanning electron micrograph of the freeze-fractured surface of unaged NBR filled with carbon black.
The first tan δ peak corresponding to the usual glass transition of NBR shifted to higher temperatures after the incorporation of carbon black in the rubber (zone I in Fig. 18). This suggests that carbon black has a bimodal effect on the mobility of different fractions of rubber chains: (i) a strong constraint on the mobility of the bound rubber, that was assumed to cause the second tan δ peak (zone II in Fig. 18) [44], and (ii) a weaker restriction on the mobility of “loosely bound rubber” chains located at the boundary between the bound rubber layer and the surrounding free rubber, leading to an increase in the main Tg of the rubber (zone I in Fig. 18) [44].
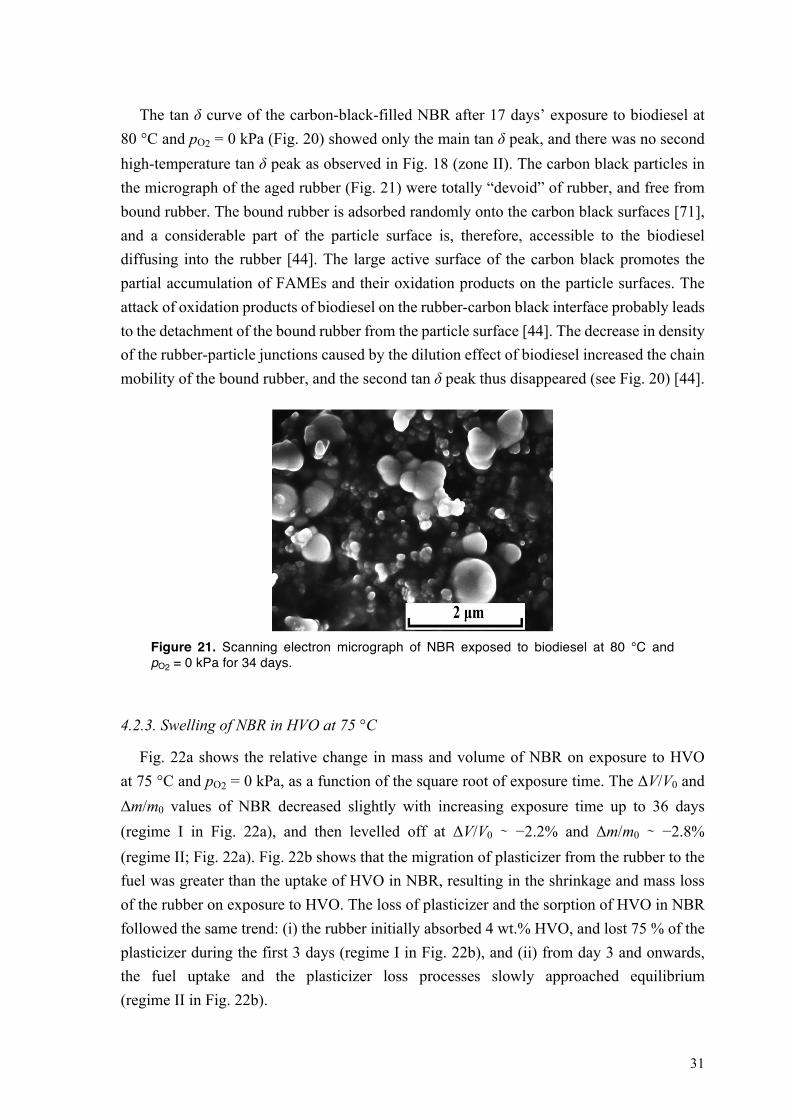
Figure 20. Tan δ curve of carbon black-filled NBR exposed to biodiesel at 80 °C and for 17 days under vacuum.
31
The tan δ curve of the carbon-black-filled NBR after 17 days’ exposure to biodiesel at 80 °C and pO2 = 0 kPa (Fig. 20) showed only the main tan δ peak, and there was no second high-temperature tan δ peak as observed in Fig. 18 (zone II). The carbon black particles in the micrograph of the aged rubber (Fig. 21) were totally “devoid” of rubber, and free from bound rubber. The bound rubber is adsorbed randomly onto the carbon black surfaces [71], and a considerable part of the particle surface is, therefore, accessible to the biodiesel diffusing into the rubber [44]. The large active surface of the carbon black promotes the partial accumulation of FAMEs and their oxidation products on the particle surfaces. The attack of oxidation products of biodiesel on the rubber-carbon black interface probably leads to the detachment of the bound rubber from the particle surface [44]. The decrease in density of the rubber-particle junctions caused by the dilution effect of biodiesel increased the chain mobility of the bound rubber, and the second tan δ peak thus disappeared (see Fig. 20) [44].
Figure 21. Scanning electron micrograph of NBR exposed to biodiesel at 80 °C and pO2 = 0 kPa for 34 days.
4.2.3. Swelling of NBR in HVO at 75 °C
Fig. 22a shows the relative change in mass and volume of NBR on exposure to HVO at 75 °C and pO2 = 0 kPa, as a function of the square root of exposure time. The ΔV/V0 and Δm/m0 values of NBR decreased slightly with increasing exposure time up to 36 days (regime I in Fig. 22a), and then levelled off at ΔV/V0 ∼ −2.2% and Δm/m0 ∼ −2.8% (regime II; Fig. 22a). Fig. 22b shows that the migration of plasticizer from the rubber to the fuel was greater than the uptake of HVO in NBR, resulting in the shrinkage and mass loss of the rubber on exposure to HVO. The loss of plasticizer and the sorption of HVO in NBR followed the same trend: (i) the rubber initially absorbed 4 wt.% HVO, and lost 75 % of the plasticizer during the first 3 days (regime I in Fig. 22b), and (ii) from day 3 and onwards, the fuel uptake and the plasticizer loss processes slowly approached equilibrium (regime II in Fig. 22b).
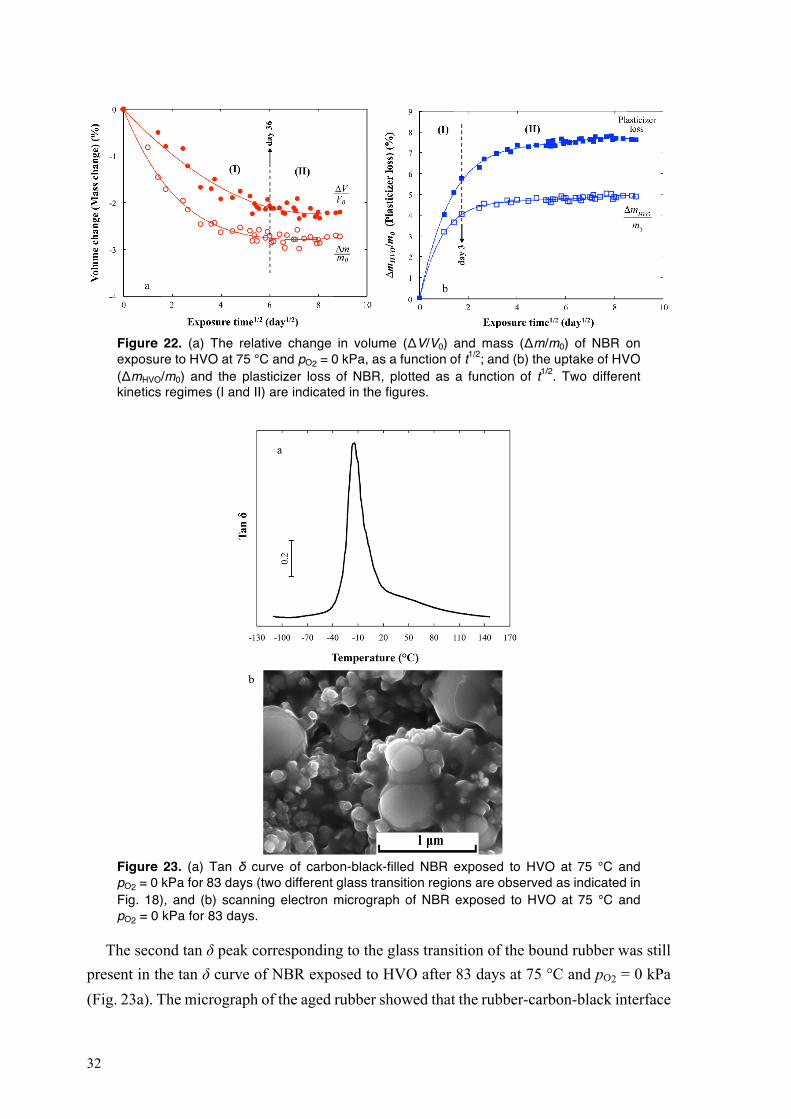
32
Figure 22. (a) The relative change in volume (ΔV/V0) and mass (Δm/m0) of NBR on exposure to HVO at 75 °C and pO2 = 0 kPa, as a function of t1/2; and (b) the uptake of HVO (ΔmHVO/m0) and the plasticizer loss of NBR, plotted as a function of t1/2. Two different kinetics regimes (I and II) are indicated in the figures.
Figure 23. (a) Tan δ curve of carbon-black-filled NBR exposed to HVO at 75 °C and pO2 = 0 kPa for 83 days (two different glass transition regions are observed as indicated in Fig. 18), and (b) scanning electron micrograph of NBR exposed to HVO at 75 °C and pO2 = 0 kPa for 83 days.
The second tan δ peak corresponding to the glass transition of the bound rubber was still present in the tan δ curve of NBR exposed to HVO after 83 days at 75 °C and pO2 = 0 kPa (Fig. 23a). The micrograph of the aged rubber showed that the rubber-carbon-black interface
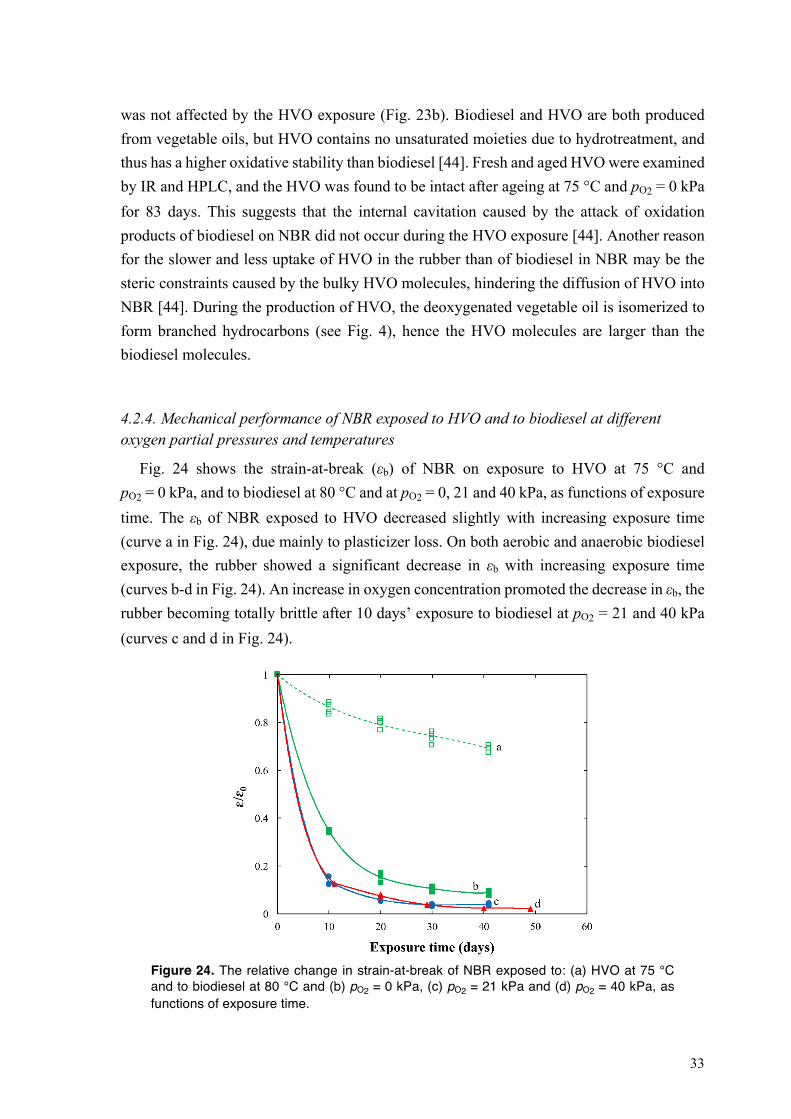
33
was not affected by the HVO exposure (Fig. 23b). Biodiesel and HVO are both produced from vegetable oils, but HVO contains no unsaturated moieties due to hydrotreatment, and thus has a higher oxidative stability than biodiesel [44]. Fresh and aged HVO were examined by IR and HPLC, and the HVO was found to be intact after ageing at 75 °C and pO2 = 0 kPa for 83 days. This suggests that the internal cavitation caused by the attack of oxidation products of biodiesel on NBR did not occur during the HVO exposure [44]. Another reason for the slower and less uptake of HVO in the rubber than of biodiesel in NBR may be the steric constraints caused by the bulky HVO molecules, hindering the diffusion of HVO into NBR [44]. During the production of HVO, the deoxygenated vegetable oil is isomerized to form branched hydrocarbons (see Fig. 4), hence the HVO molecules are larger than the biodiesel molecules.
4.2.4. Mechanical performance of NBR exposed to HVO and to biodiesel at different oxygen partial pressures and temperatures
Fig. 24 shows the strain-at-break (εb) of NBR on exposure to HVO at 75 °C and pO2 = 0 kPa, and to biodiesel at 80 °C and at pO2 = 0, 21 and 40 kPa, as functions of exposure time. The εb of NBR exposed to HVO decreased slightly with increasing exposure time (curve a in Fig. 24), due mainly to plasticizer loss. On both aerobic and anaerobic biodiesel exposure, the rubber showed a significant decrease in εb with increasing exposure time (curves b-d in Fig. 24). An increase in oxygen concentration promoted the decrease in εb, the rubber becoming totally brittle after 10 days’ exposure to biodiesel at pO2 = 21 and 40 kPa (curves c and d in Fig. 24).
Figure 24. The relative change in strain-at-break of NBR exposed to: (a) HVO at 75 °C and to biodiesel at 80 °C and (b) pO2 = 0 kPa, (c) pO2 = 21 kPa and (d) pO2 = 40 kPa, as functions of exposure time.
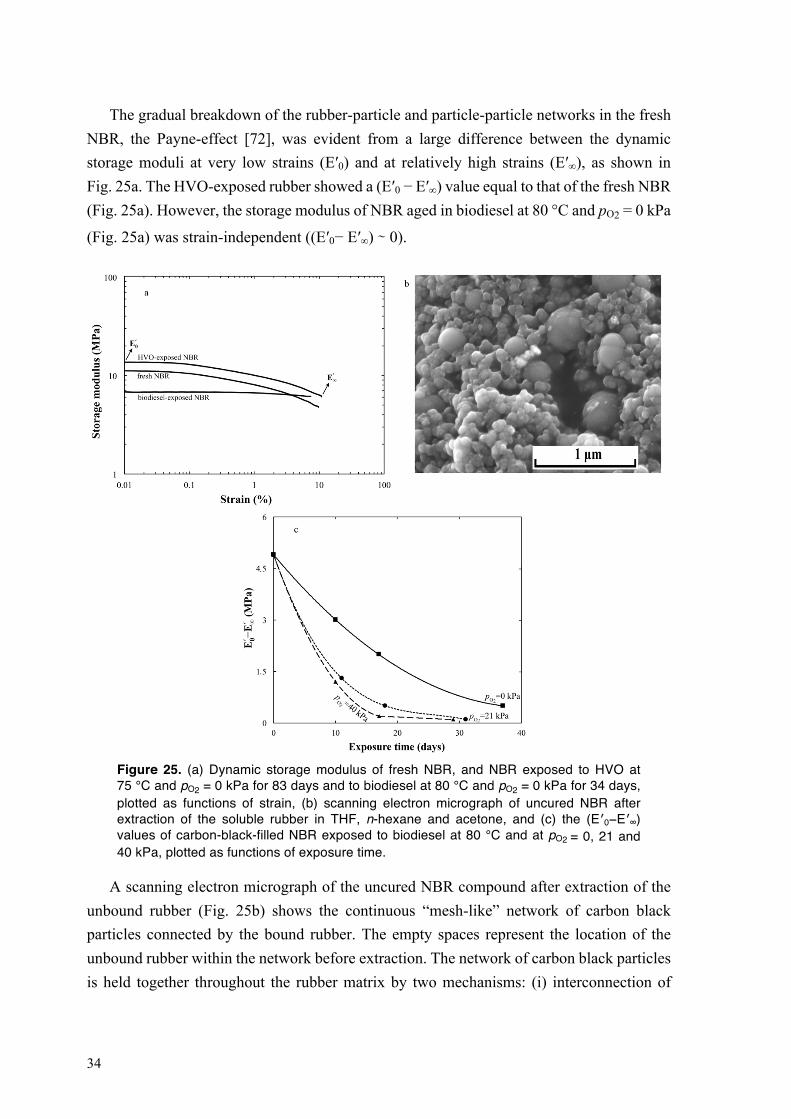
34
The gradual breakdown of the rubber-particle and particle-particle networks in the fresh NBR, the Payne-effect [72], was evident from a large difference between the dynamic storage moduli at very low strains (E′0) and at relatively high strains (E′∞), as shown in Fig. 25a. The HVO-exposed rubber showed a (E′0 − E′∞) value equal to that of the fresh NBR (Fig. 25a). However, the storage modulus of NBR aged in biodiesel at 80 °C and pO2 = 0 kPa
(Fig. 25a) was strain-independent ((E′0− E′∞) ∼ 0).
Figure 25. (a) Dynamic storage modulus of fresh NBR, and NBR exposed to HVO at 75 °C and pO2 = 0 kPa for 83 days and to biodiesel at 80 °C and pO2 = 0 kPa for 34 days, plotted as functions of strain, (b) scanning electron micrograph of uncured NBR after extraction of the soluble rubber in THF, n-hexane and acetone, and (c) the (E′0−E′∞) values of carbon-black-filled NBR exposed to biodiesel at 80 °C and at pO2 = 0, 21 and 40 kPa, plotted as functions of exposure time.
A scanning electron micrograph of the uncured NBR compound after extraction of the unbound rubber (Fig. 25b) shows the continuous “mesh-like” network of carbon black particles connected by the bound rubber. The empty spaces represent the location of the unbound rubber within the network before extraction. The network of carbon black particles is held together throughout the rubber matrix by two mechanisms: (i) interconnection of
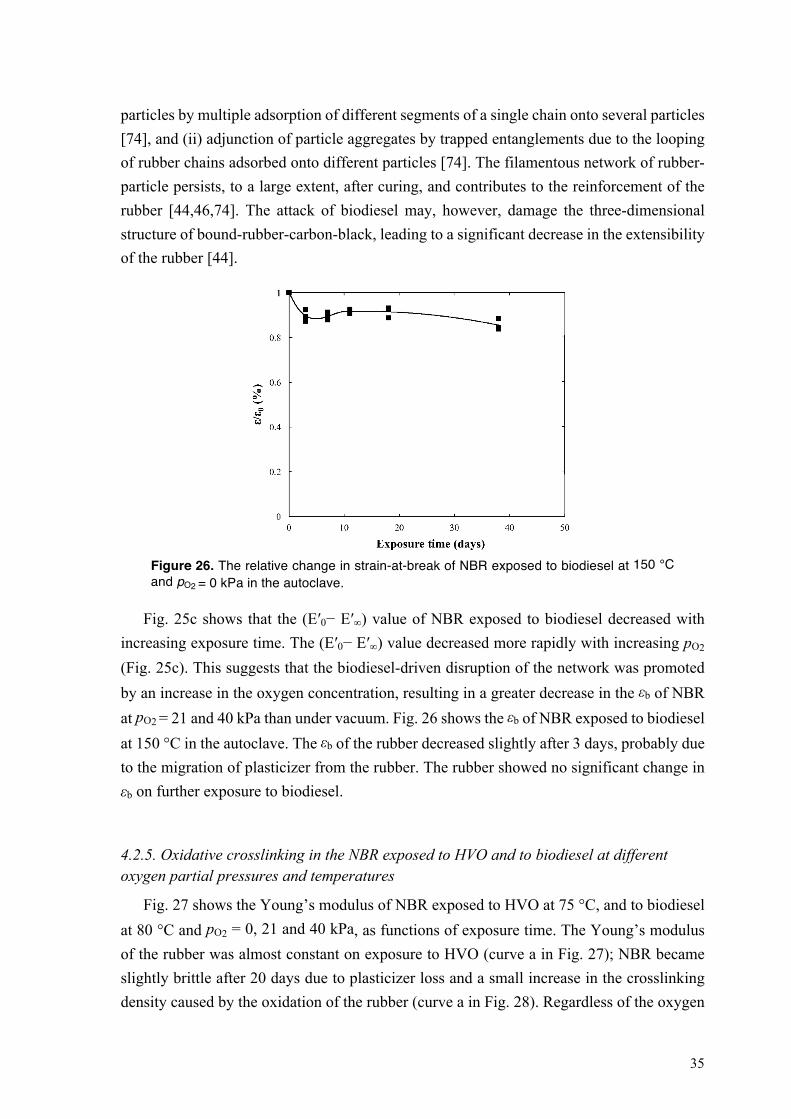
35
particles by multiple adsorption of different segments of a single chain onto several particles [74], and (ii) adjunction of particle aggregates by trapped entanglements due to the looping of rubber chains adsorbed onto different particles [74]. The filamentous network of rubber-particle persists, to a large extent, after curing, and contributes to the reinforcement of the rubber [44,46,74]. The attack of biodiesel may, however, damage the three-dimensional structure of bound-rubber-carbon-black, leading to a significant decrease in the extensibility of the rubber [44].
Figure 26. The relative change in strain-at-break of NBR exposed to biodiesel at 150 °C and pO2 = 0 kPa in the autoclave.
Fig. 25c shows that the (E′0− E′∞) value of NBR exposed to biodiesel decreased with increasing exposure time. The (E′0− E′∞) value decreased more rapidly with increasing pO2 (Fig. 25c). This suggests that the biodiesel-driven disruption of the network was promoted by an increase in the oxygen concentration, resulting in a greater decrease in the εb of NBR at pO2 = 21 and 40 kPa than under vacuum. Fig. 26 shows the εb of NBR exposed to biodiesel at 150 °C in the autoclave. The εb of the rubber decreased slightly after 3 days, probably due to the migration of plasticizer from the rubber. The rubber showed no significant change in εb on further exposure to biodiesel.
4.2.5. Oxidative crosslinking in the NBR exposed to HVO and to biodiesel at different oxygen partial pressures and temperatures
Fig. 27 shows the Young’s modulus of NBR exposed to HVO at 75 °C, and to biodiesel at 80 °C and pO2 = 0, 21 and 40 kPa, as functions of exposure time. The Young’s modulus of the rubber was almost constant on exposure to HVO (curve a in Fig. 27); NBR became slightly brittle after 20 days due to plasticizer loss and a small increase in the crosslinking density caused by the oxidation of the rubber (curve a in Fig. 28). Regardless of the oxygen
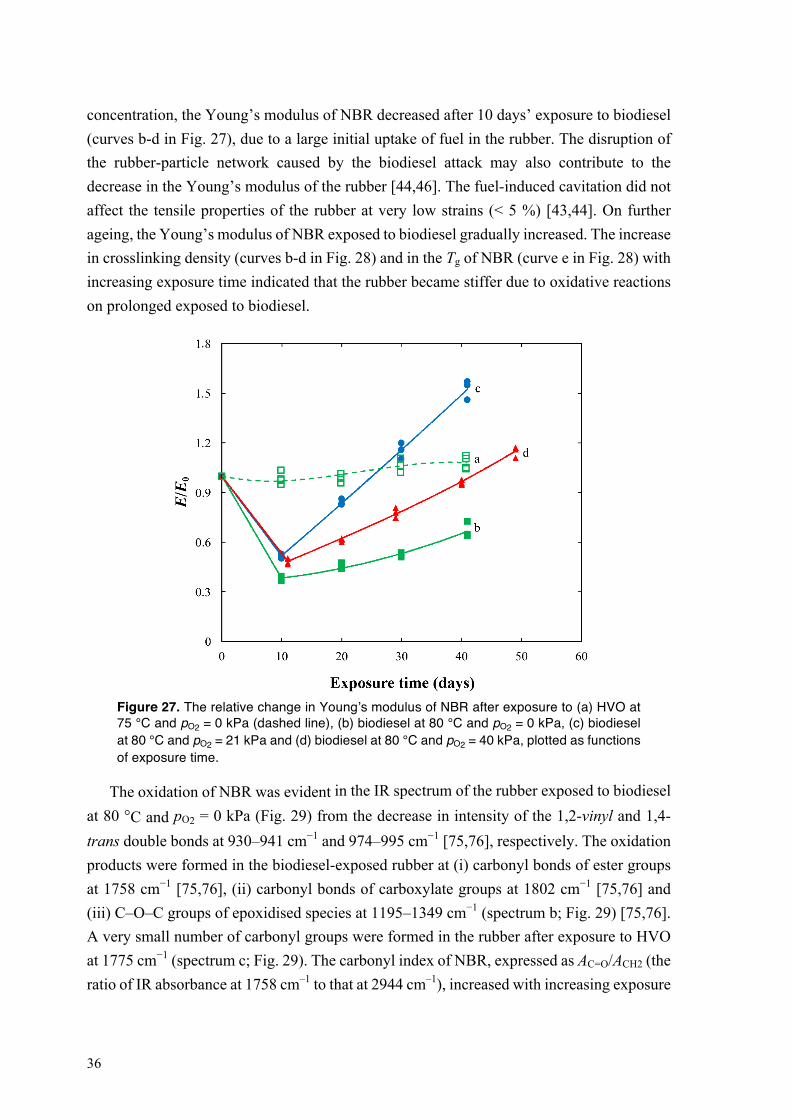
36
concentration, the Young’s modulus of NBR decreased after 10 days’ exposure to biodiesel (curves b-d in Fig. 27), due to a large initial uptake of fuel in the rubber. The disruption of the rubber-particle network caused by the biodiesel attack may also contribute to the decrease in the Young’s modulus of the rubber [44,46]. The fuel-induced cavitation did not affect the tensile properties of the rubber at very low strains (< 5 %) [43,44]. On further ageing, the Young’s modulus of NBR exposed to biodiesel gradually increased. The increase in crosslinking density (curves b-d in Fig. 28) and in the Tg of NBR (curve e in Fig. 28) with increasing exposure time indicated that the rubber became stiffer due to oxidative reactions on prolonged exposed to biodiesel.
Figure 27. The relative change in Young’s modulus of NBR after exposure to (a) HVO at 75 °C and pO2 = 0 kPa (dashed line), (b) biodiesel at 80 °C and pO2 = 0 kPa, (c) biodiesel at 80 °C and pO2 = 21 kPa and (d) biodiesel at 80 °C and pO2 = 40 kPa, plotted as functions of exposure time.
The oxidation of NBR was evident in the IR spectrum of the rubber exposed to biodiesel at 80 °C and pO2 = 0 kPa (Fig. 29) from the decrease in intensity of the 1,2-vinyl and 1,4-trans double bonds at 930–941 cm−1 and 974–995 cm−1 [75,76], respectively. The oxidation products were formed in the biodiesel-exposed rubber at (i) carbonyl bonds of ester groups at 1758 cm−1 [75,76], (ii) carbonyl bonds of carboxylate groups at 1802 cm−1 [75,76] and (iii) C–O–C groups of epoxidised species at 1195–1349 cm−1 (spectrum b; Fig. 29) [75,76]. A very small number of carbonyl groups were formed in the rubber after exposure to HVO at 1775 cm−1 (spectrum c; Fig. 29). The carbonyl index of NBR, expressed as AC=O/ACH2 (the ratio of IR absorbance at 1758 cm–1 to that at 2944 cm–1), increased with increasing exposure
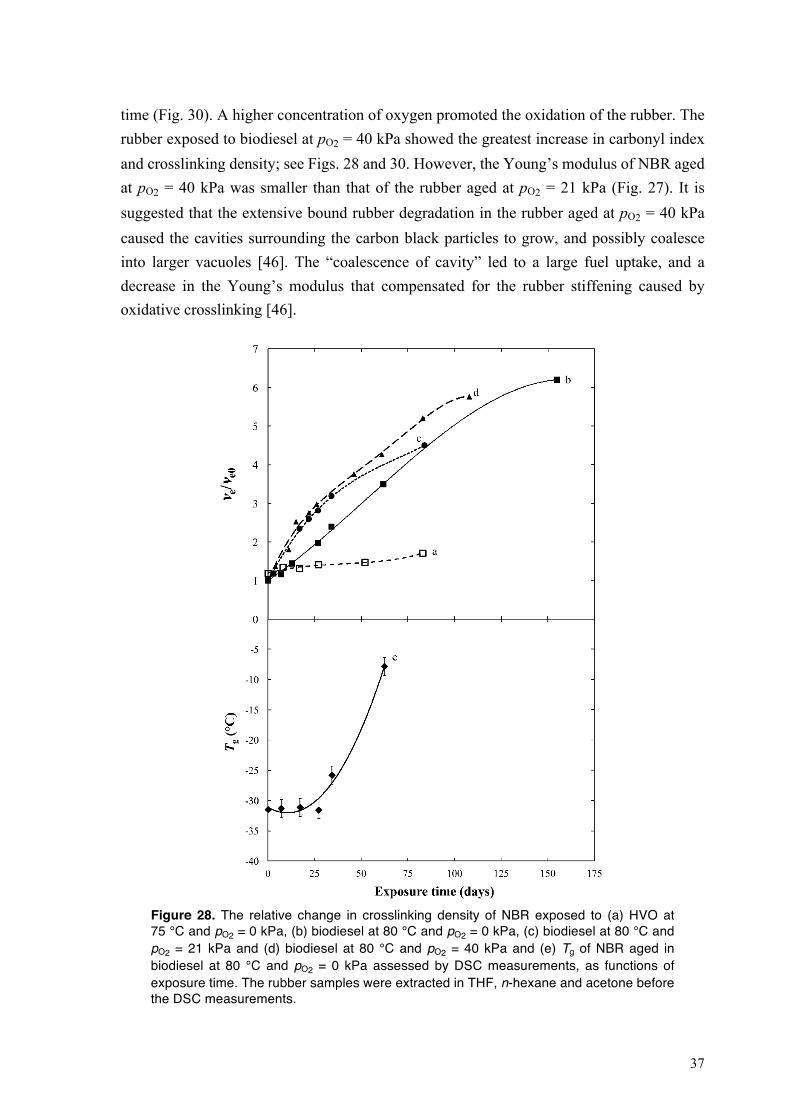
37
time (Fig. 30). A higher concentration of oxygen promoted the oxidation of the rubber. The rubber exposed to biodiesel at pO2 = 40 kPa showed the greatest increase in carbonyl index and crosslinking density; see Figs. 28 and 30. However, the Young’s modulus of NBR aged at pO2 = 40 kPa was smaller than that of the rubber aged at pO2 = 21 kPa (Fig. 27). It is suggested that the extensive bound rubber degradation in the rubber aged at pO2 = 40 kPa caused the cavities surrounding the carbon black particles to grow, and possibly coalesce into larger vacuoles [46]. The “coalescence of cavity” led to a large fuel uptake, and a decrease in the Young’s modulus that compensated for the rubber stiffening caused by oxidative crosslinking [46].
Figure 28. The relative change in crosslinking density of NBR exposed to (a) HVO at 75 °C and pO2 = 0 kPa, (b) biodiesel at 80 °C and pO2 = 0 kPa, (c) biodiesel at 80 °C and pO2 = 21 kPa and (d) biodiesel at 80 °C and pO2 = 40 kPa and (e) Tg of NBR aged in biodiesel at 80 °C and pO2 = 0 kPa assessed by DSC measurements, as functions of exposure time. The rubber samples were extracted in THF, n-hexane and acetone before the DSC measurements.
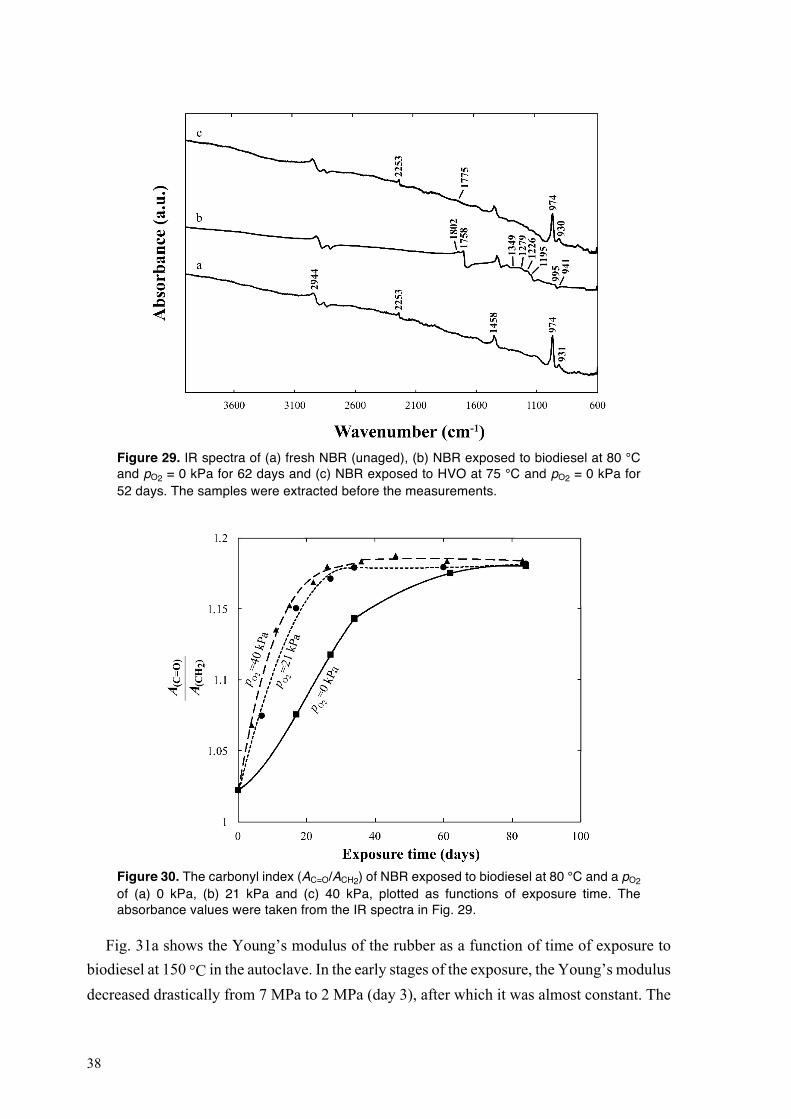
38
Figure 29. IR spectra of (a) fresh NBR (unaged), (b) NBR exposed to biodiesel at 80 °C and pO2 = 0 kPa for 62 days and (c) NBR exposed to HVO at 75 °C and pO2 = 0 kPa for 52 days. The samples were extracted before the measurements.
Figure 30. The carbonyl index (AC=O/ACH2) of NBR exposed to biodiesel at 80 °C and a pO2 of (a) 0 kPa, (b) 21 kPa and (c) 40 kPa, plotted as functions of exposure time. The absorbance values were taken from the IR spectra in Fig. 29.
Fig. 31a shows the Young’s modulus of the rubber as a function of time of exposure to biodiesel at 150 °C in the autoclave. In the early stages of the exposure, the Young’s modulus decreased drastically from 7 MPa to 2 MPa (day 3), after which it was almost constant. The
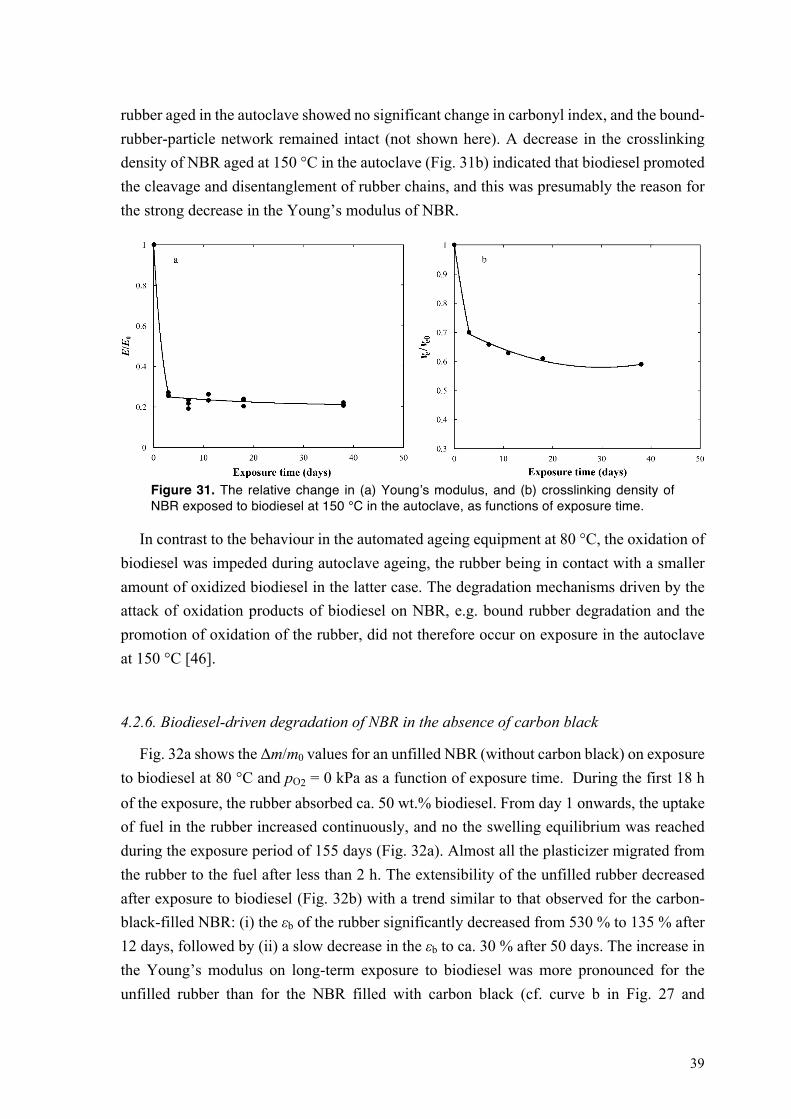
39
rubber aged in the autoclave showed no significant change in carbonyl index, and the bound-rubber-particle network remained intact (not shown here). A decrease in the crosslinking density of NBR aged at 150 °C in the autoclave (Fig. 31b) indicated that biodiesel promoted the cleavage and disentanglement of rubber chains, and this was presumably the reason for the strong decrease in the Young’s modulus of NBR.
Figure 31. The relative change in (a) Young’s modulus, and (b) crosslinking density of NBR exposed to biodiesel at 150 °C in the autoclave, as functions of exposure time.
In contrast to the behaviour in the automated ageing equipment at 80 °C, the oxidation of biodiesel was impeded during autoclave ageing, the rubber being in contact with a smaller amount of oxidized biodiesel in the latter case. The degradation mechanisms driven by the attack of oxidation products of biodiesel on NBR, e.g. bound rubber degradation and the promotion of oxidation of the rubber, did not therefore occur on exposure in the autoclave at 150 °C [46].
4.2.6. Biodiesel-driven degradation of NBR in the absence of carbon black
Fig. 32a shows the Δm/m0 values for an unfilled NBR (without carbon black) on exposure to biodiesel at 80 °C and pO2 = 0 kPa as a function of exposure time. During the first 18 h of the exposure, the rubber absorbed ca. 50 wt.% biodiesel. From day 1 onwards, the uptake of fuel in the rubber increased continuously, and no the swelling equilibrium was reached during the exposure period of 155 days (Fig. 32a). Almost all the plasticizer migrated from the rubber to the fuel after less than 2 h. The extensibility of the unfilled rubber decreased after exposure to biodiesel (Fig. 32b) with a trend similar to that observed for the carbon-black-filled NBR: (i) the εb of the rubber significantly decreased from 530 % to 135 % after 12 days, followed by (ii) a slow decrease in the εb to ca. 30 % after 50 days. The increase in the Young’s modulus on long-term exposure to biodiesel was more pronounced for the unfilled rubber than for the NBR filled with carbon black (cf. curve b in Fig. 27 and
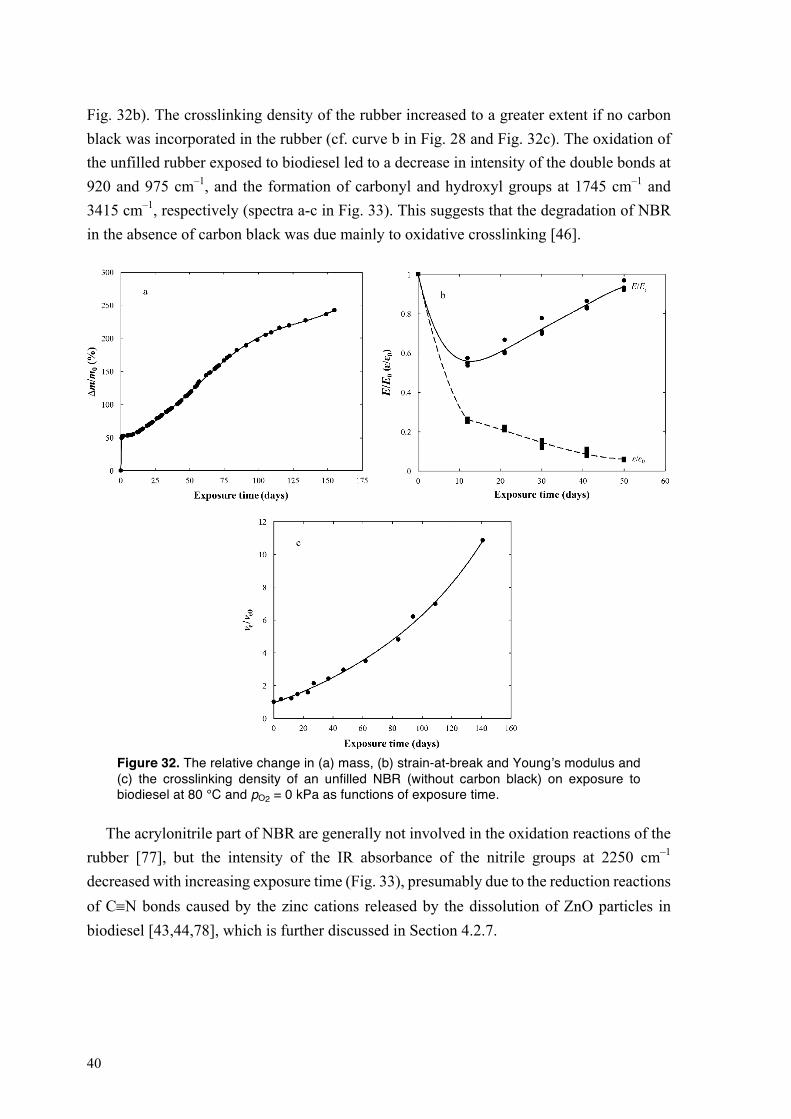
40
Fig. 32b). The crosslinking density of the rubber increased to a greater extent if no carbon black was incorporated in the rubber (cf. curve b in Fig. 28 and Fig. 32c). The oxidation of the unfilled rubber exposed to biodiesel led to a decrease in intensity of the double bonds at 920 and 975 cm–1, and the formation of carbonyl and hydroxyl groups at 1745 cm–1 and 3415 cm–1, respectively (spectra a-c in Fig. 33). This suggests that the degradation of NBR in the absence of carbon black was due mainly to oxidative crosslinking [46].
Figure 32. The relative change in (a) mass, (b) strain-at-break and Young’s modulus and (c) the crosslinking density of an unfilled NBR (without carbon black) on exposure to biodiesel at 80 °C and pO2 = 0 kPa as functions of exposure time.
The acrylonitrile part of NBR are generally not involved in the oxidation reactions of the rubber [77], but the intensity of the IR absorbance of the nitrile groups at 2250 cm–1
decreased with increasing exposure time (Fig. 33), presumably due to the reduction reactions of CºN bonds caused by the zinc cations released by the dissolution of ZnO particles in biodiesel [43,44,78], which is further discussed in Section 4.2.7.
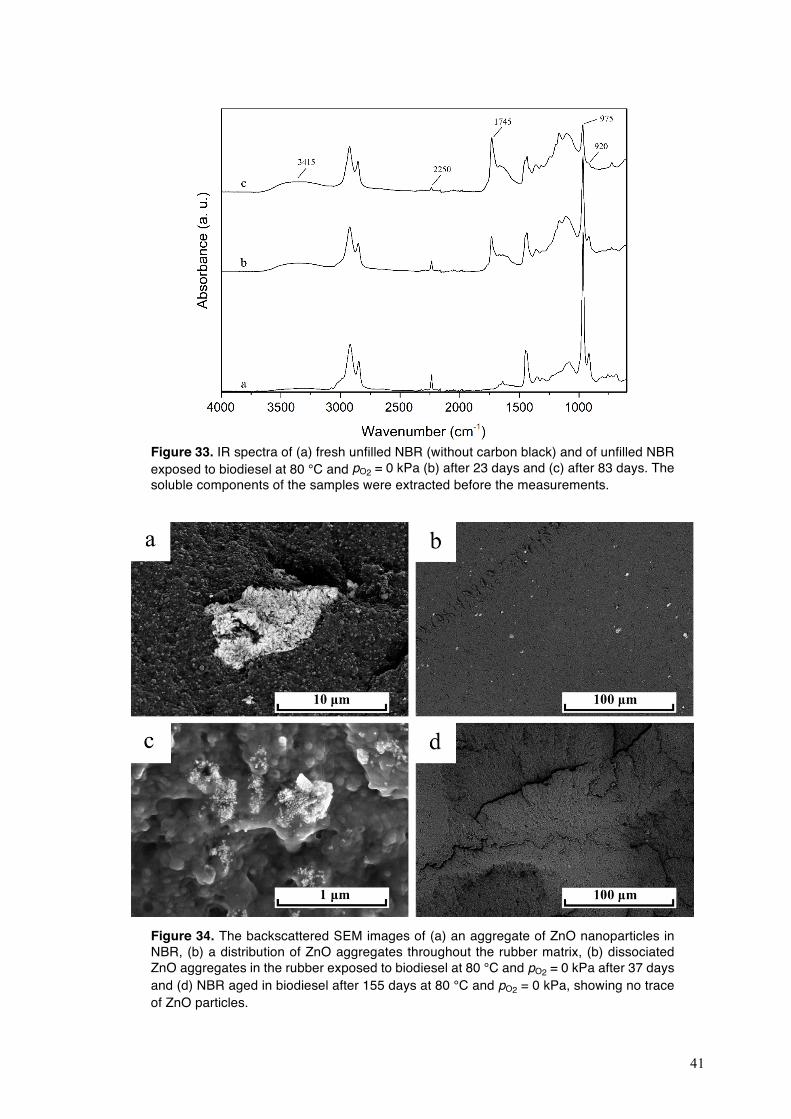
41
Figure 33. IR spectra of (a) fresh unfilled NBR (without carbon black) and of unfilled NBR exposed to biodiesel at 80 °C and pO2 = 0 kPa (b) after 23 days and (c) after 83 days. The soluble components of the samples were extracted before the measurements.
Figure 34. The backscattered SEM images of (a) an aggregate of ZnO nanoparticles in NBR, (b) a distribution of ZnO aggregates throughout the rubber matrix, (b) dissociated ZnO aggregates in the rubber exposed to biodiesel at 80 °C and pO2 = 0 kPa after 37 days and (d) NBR aged in biodiesel after 155 days at 80 °C and pO2 = 0 kPa, showing no trace of ZnO particles.
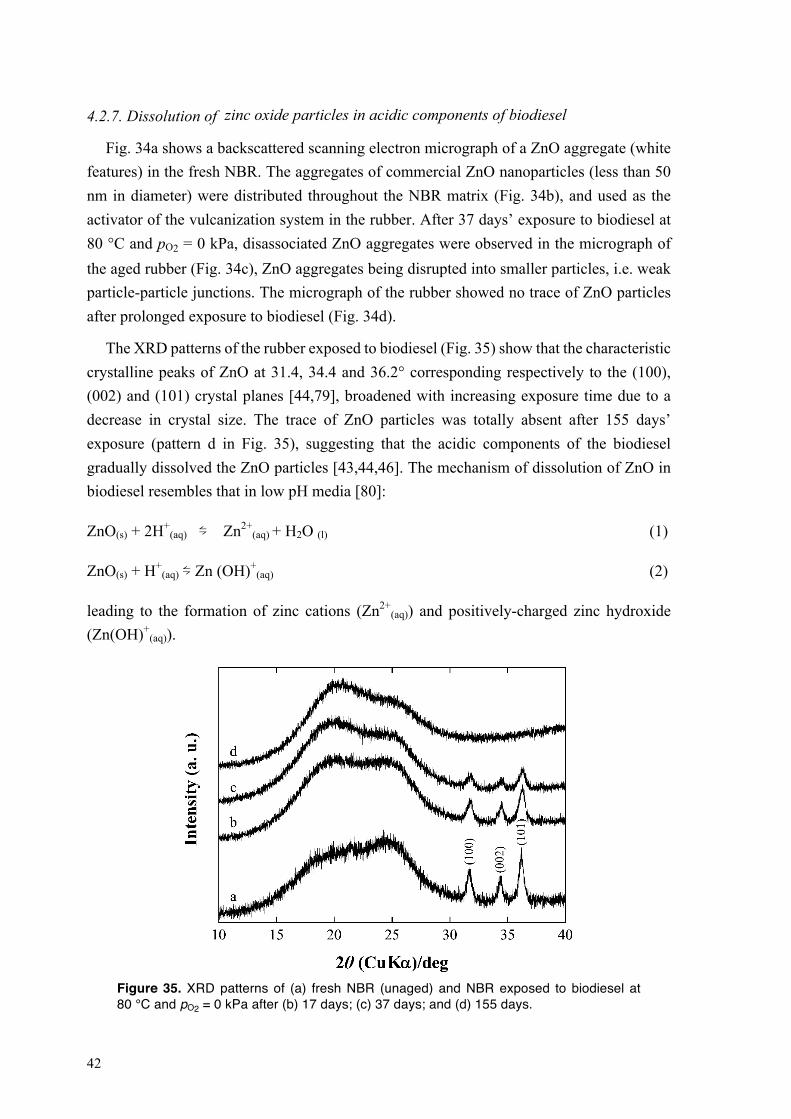
42
4.2.7. Dissolution of zinc oxide particles in acidic components of biodiesel
Fig. 34a shows a backscattered scanning electron micrograph of a ZnO aggregate (white features) in the fresh NBR. The aggregates of commercial ZnO nanoparticles (less than 50 nm in diameter) were distributed throughout the NBR matrix (Fig. 34b), and used as the activator of the vulcanization system in the rubber. After 37 days’ exposure to biodiesel at 80 °C and pO2 = 0 kPa, disassociated ZnO aggregates were observed in the micrograph of the aged rubber (Fig. 34c), ZnO aggregates being disrupted into smaller particles, i.e. weak particle-particle junctions. The micrograph of the rubber showed no trace of ZnO particles after prolonged exposure to biodiesel (Fig. 34d).
The XRD patterns of the rubber exposed to biodiesel (Fig. 35) show that the characteristic crystalline peaks of ZnO at 31.4, 34.4 and 36.2° corresponding respectively to the (100), (002) and (101) crystal planes [44,79], broadened with increasing exposure time due to a decrease in crystal size. The trace of ZnO particles was totally absent after 155 days’ exposure (pattern d in Fig. 35), suggesting that the acidic components of the biodiesel gradually dissolved the ZnO particles [43,44,46]. The mechanism of dissolution of ZnO in biodiesel resembles that in low pH media [80]:
ZnO(s) + 2H+(aq) ⇋ Zn2+
(aq) + H2O (l) (1)
ZnO(s) + H+(aq) ⇋ Zn (OH)+
(aq) (2)
leading to the formation of zinc cations (Zn2+(aq)) and positively-charged zinc hydroxide
(Zn(OH)+(aq)).
Figure 35. XRD patterns of (a) fresh NBR (unaged) and NBR exposed to biodiesel at 80 °C and pO2 = 0 kPa after (b) 17 days; (c) 37 days; and (d) 155 days.
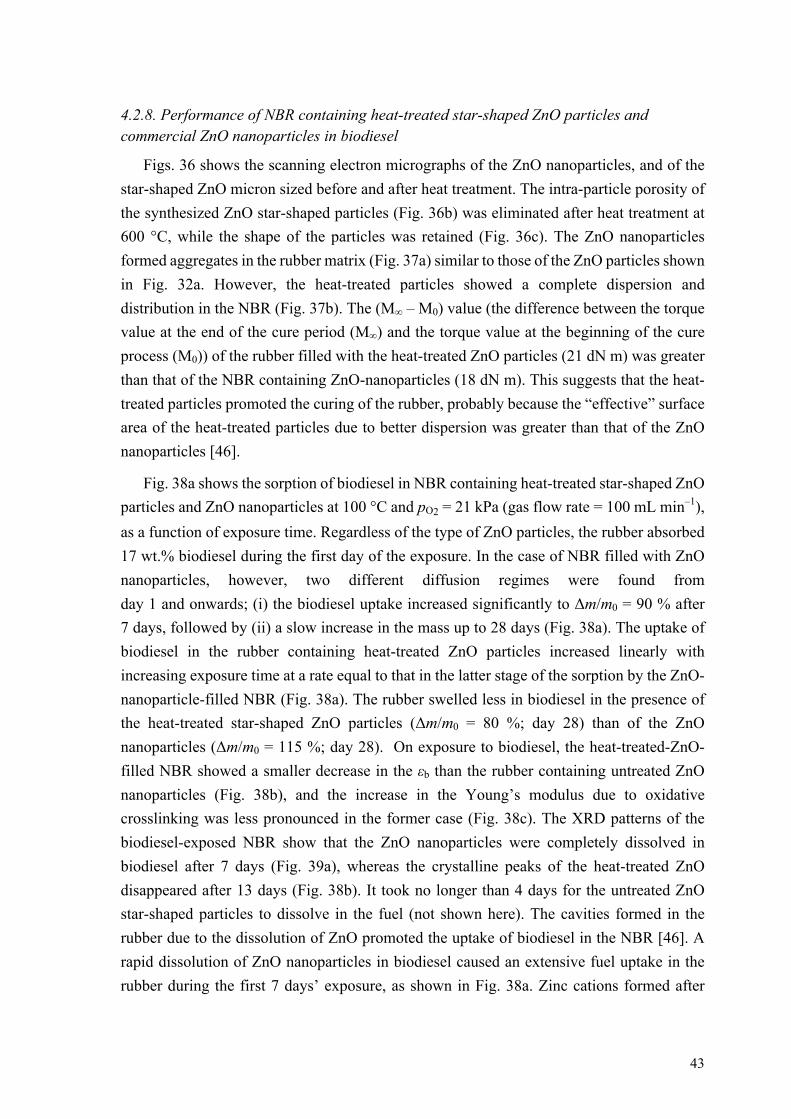
43
4.2.8. Performance of NBR containing heat-treated star-shaped ZnO particles and commercial ZnO nanoparticles in biodiesel
Figs. 36 shows the scanning electron micrographs of the ZnO nanoparticles, and of the star-shaped ZnO micron sized before and after heat treatment. The intra-particle porosity of the synthesized ZnO star-shaped particles (Fig. 36b) was eliminated after heat treatment at 600 °C, while the shape of the particles was retained (Fig. 36c). The ZnO nanoparticles formed aggregates in the rubber matrix (Fig. 37a) similar to those of the ZnO particles shown in Fig. 32a. However, the heat-treated particles showed a complete dispersion and distribution in the NBR (Fig. 37b). The (M∞ – M0) value (the difference between the torque value at the end of the cure period (M∞) and the torque value at the beginning of the cure process (M0)) of the rubber filled with the heat-treated ZnO particles (21 dN m) was greater than that of the NBR containing ZnO-nanoparticles (18 dN m). This suggests that the heat-treated particles promoted the curing of the rubber, probably because the “effective” surface area of the heat-treated particles due to better dispersion was greater than that of the ZnO nanoparticles [46].
Fig. 38a shows the sorption of biodiesel in NBR containing heat-treated star-shaped ZnO particles and ZnO nanoparticles at 100 °C and pO2 = 21 kPa (gas flow rate = 100 mL min–1), as a function of exposure time. Regardless of the type of ZnO particles, the rubber absorbed 17 wt.% biodiesel during the first day of the exposure. In the case of NBR filled with ZnO nanoparticles, however, two different diffusion regimes were found from day 1 and onwards; (i) the biodiesel uptake increased significantly to Δm/m0 = 90 % after 7 days, followed by (ii) a slow increase in the mass up to 28 days (Fig. 38a). The uptake of biodiesel in the rubber containing heat-treated ZnO particles increased linearly with increasing exposure time at a rate equal to that in the latter stage of the sorption by the ZnO-nanoparticle-filled NBR (Fig. 38a). The rubber swelled less in biodiesel in the presence of the heat-treated star-shaped ZnO particles (Δm/m0 = 80 %; day 28) than of the ZnO nanoparticles (Δm/m0 = 115 %; day 28). On exposure to biodiesel, the heat-treated-ZnO-filled NBR showed a smaller decrease in the εb than the rubber containing untreated ZnO nanoparticles (Fig. 38b), and the increase in the Young’s modulus due to oxidative crosslinking was less pronounced in the former case (Fig. 38c). The XRD patterns of the biodiesel-exposed NBR show that the ZnO nanoparticles were completely dissolved in biodiesel after 7 days (Fig. 39a), whereas the crystalline peaks of the heat-treated ZnO disappeared after 13 days (Fig. 38b). It took no longer than 4 days for the untreated ZnO star-shaped particles to dissolve in the fuel (not shown here). The cavities formed in the rubber due to the dissolution of ZnO promoted the uptake of biodiesel in the NBR [46]. A rapid dissolution of ZnO nanoparticles in biodiesel caused an extensive fuel uptake in the rubber during the first 7 days’ exposure, as shown in Fig. 38a. Zinc cations formed after
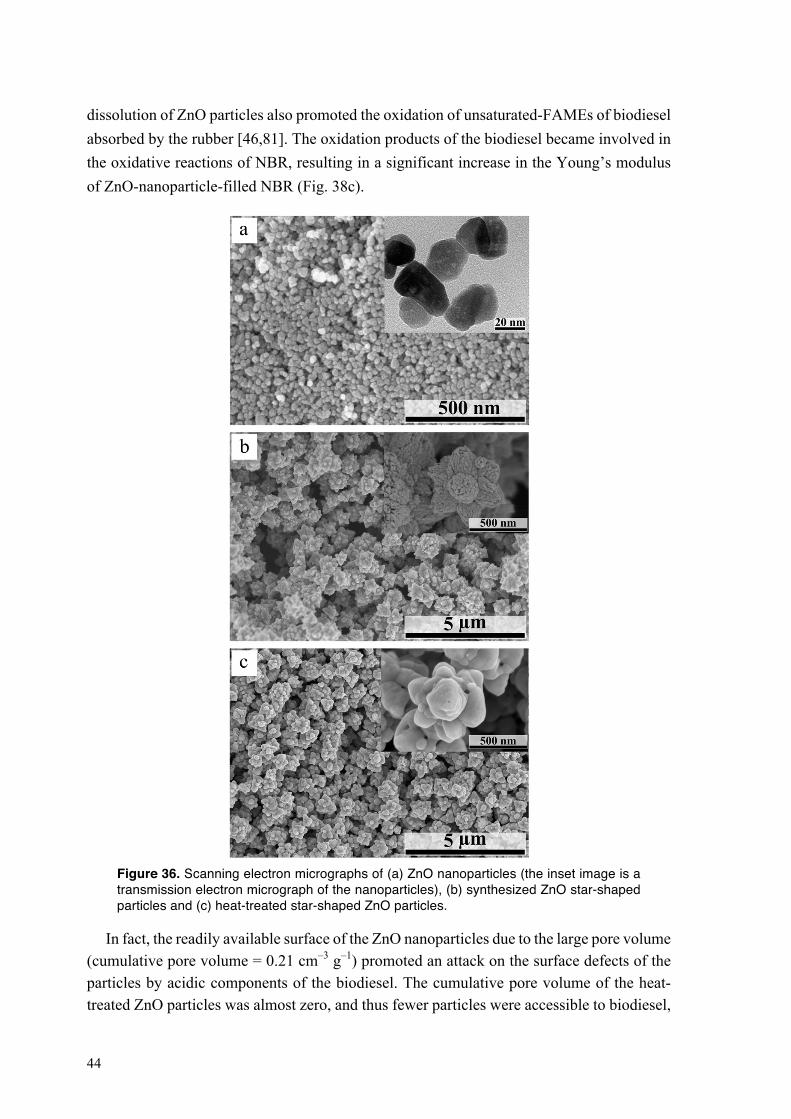
44
dissolution of ZnO particles also promoted the oxidation of unsaturated-FAMEs of biodiesel absorbed by the rubber [46,81]. The oxidation products of the biodiesel became involved in the oxidative reactions of NBR, resulting in a significant increase in the Young’s modulus of ZnO-nanoparticle-filled NBR (Fig. 38c).
Figure 36. Scanning electron micrographs of (a) ZnO nanoparticles (the inset image is a transmission electron micrograph of the nanoparticles), (b) synthesized ZnO star-shaped particles and (c) heat-treated star-shaped ZnO particles.
In fact, the readily available surface of the ZnO nanoparticles due to the large pore volume (cumulative pore volume = 0.21 cm–3 g–1) promoted an attack on the surface defects of the particles by acidic components of the biodiesel. The cumulative pore volume of the heat-treated ZnO particles was almost zero, and thus fewer particles were accessible to biodiesel,
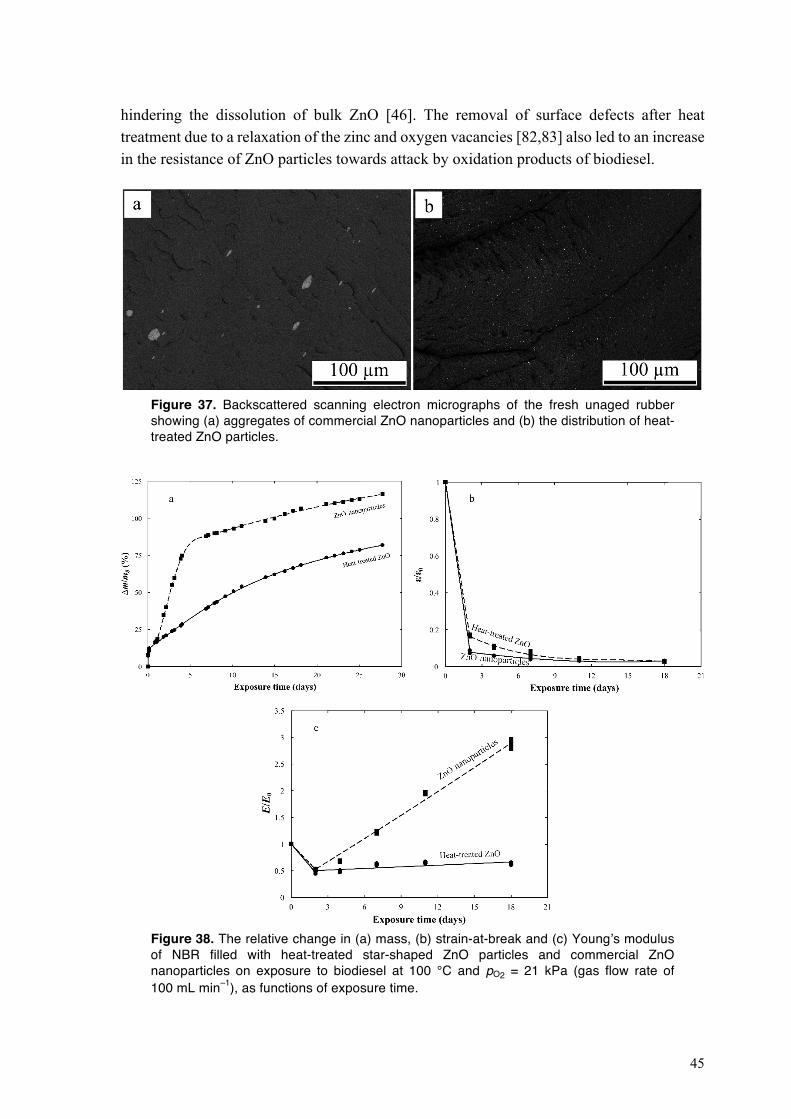
45
hindering the dissolution of bulk ZnO [46]. The removal of surface defects after heat treatment due to a relaxation of the zinc and oxygen vacancies [82,83] also led to an increase in the resistance of ZnO particles towards attack by oxidation products of biodiesel.
Figure 37. Backscattered scanning electron micrographs of the fresh unaged rubber showing (a) aggregates of commercial ZnO nanoparticles and (b) the distribution of heat-treated ZnO particles.
Figure 38. The relative change in (a) mass, (b) strain-at-break and (c) Young’s modulus of NBR filled with heat-treated star-shaped ZnO particles and commercial ZnO nanoparticles on exposure to biodiesel at 100 °C and pO2 = 21 kPa (gas flow rate of 100 mL min–1), as functions of exposure time.
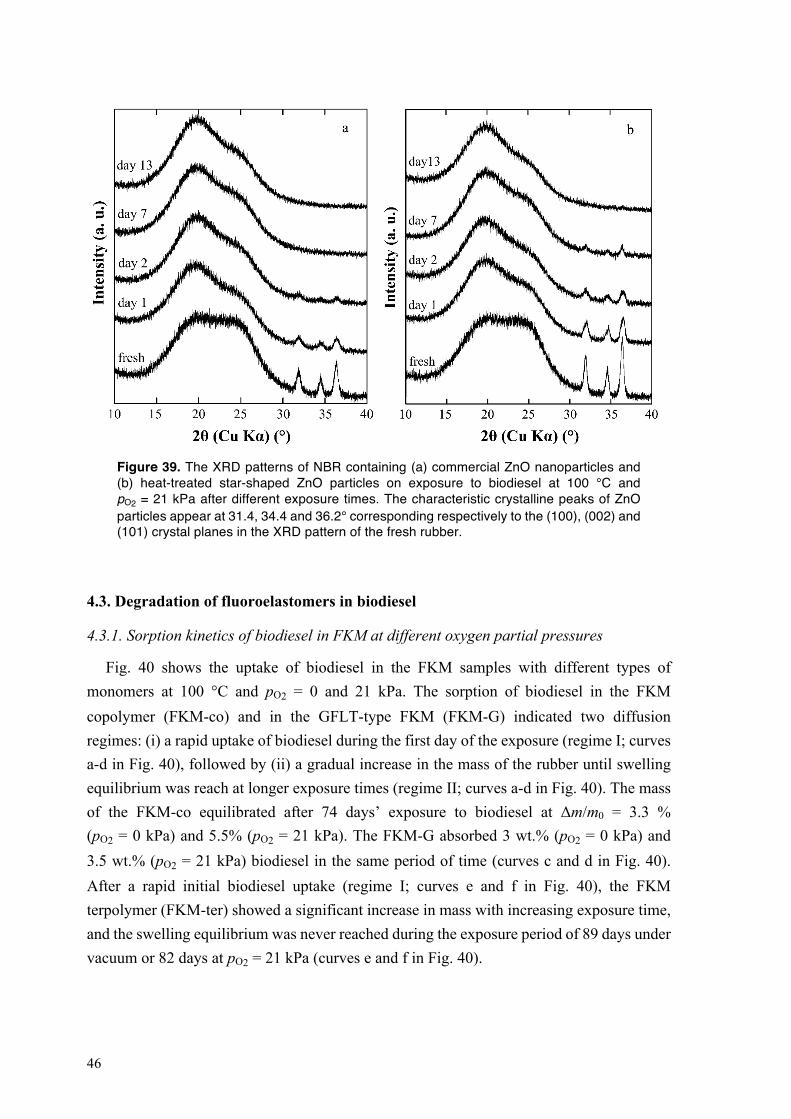
46
Figure 39. The XRD patterns of NBR containing (a) commercial ZnO nanoparticles and (b) heat-treated star-shaped ZnO particles on exposure to biodiesel at 100 °C and pO2 = 21 kPa after different exposure times. The characteristic crystalline peaks of ZnO particles appear at 31.4, 34.4 and 36.2° corresponding respectively to the (100), (002) and (101) crystal planes in the XRD pattern of the fresh rubber.
4.3. Degradation of fluoroelastomers in biodiesel
4.3.1. Sorption kinetics of biodiesel in FKM at different oxygen partial pressures
Fig. 40 shows the uptake of biodiesel in the FKM samples with different types of monomers at 100 °C and pO2 = 0 and 21 kPa. The sorption of biodiesel in the FKM copolymer (FKM-co) and in the GFLT-type FKM (FKM-G) indicated two diffusion regimes: (i) a rapid uptake of biodiesel during the first day of the exposure (regime I; curves a-d in Fig. 40), followed by (ii) a gradual increase in the mass of the rubber until swelling equilibrium was reach at longer exposure times (regime II; curves a-d in Fig. 40). The mass of the FKM-co equilibrated after 74 days’ exposure to biodiesel at Δm/m0 = 3.3 % (pO2 = 0 kPa) and 5.5% (pO2 = 21 kPa). The FKM-G absorbed 3 wt.% (pO2 = 0 kPa) and 3.5 wt.% (pO2 = 21 kPa) biodiesel in the same period of time (curves c and d in Fig. 40). After a rapid initial biodiesel uptake (regime I; curves e and f in Fig. 40), the FKM terpolymer (FKM-ter) showed a significant increase in mass with increasing exposure time, and the swelling equilibrium was never reached during the exposure period of 89 days under vacuum or 82 days at pO2 = 21 kPa (curves e and f in Fig. 40).
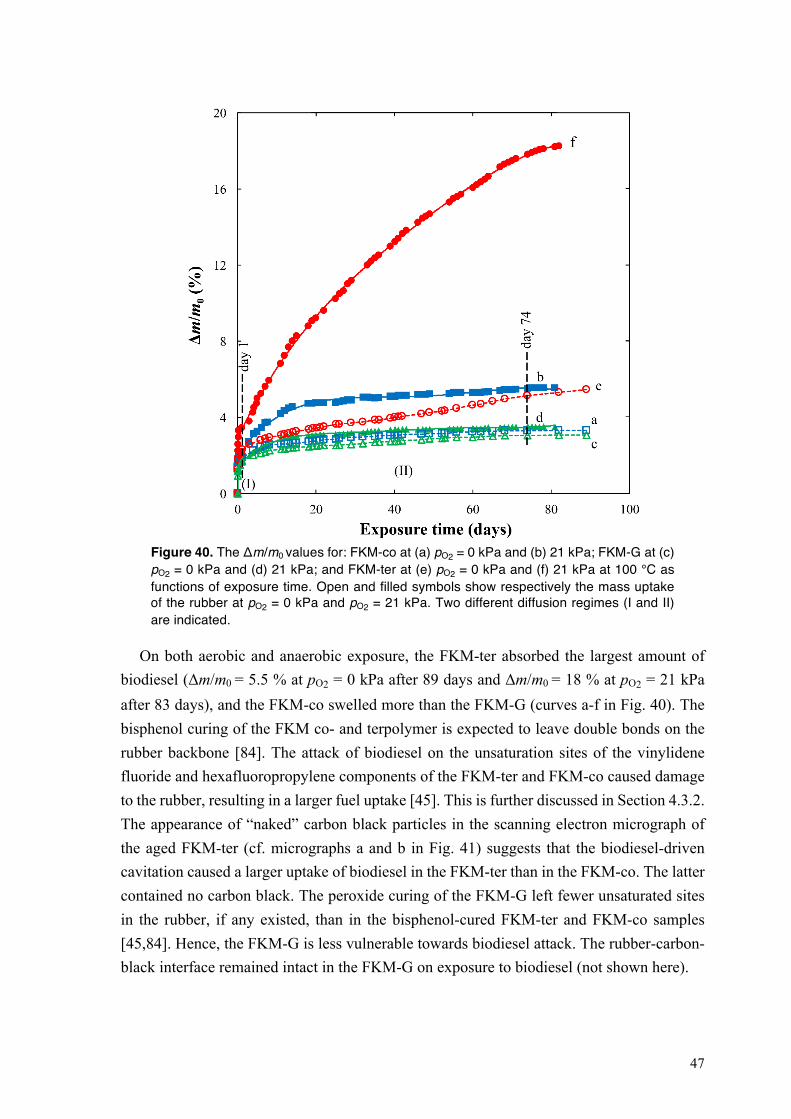
47
Figure 40. The Δm/m0 values for: FKM-co at (a) pO2 = 0 kPa and (b) 21 kPa; FKM-G at (c) pO2 = 0 kPa and (d) 21 kPa; and FKM-ter at (e) pO2 = 0 kPa and (f) 21 kPa at 100 °C as functions of exposure time. Open and filled symbols show respectively the mass uptake of the rubber at pO2 = 0 kPa and pO2 = 21 kPa. Two different diffusion regimes (I and II) are indicated.
On both aerobic and anaerobic exposure, the FKM-ter absorbed the largest amount of biodiesel (Δm/m0 = 5.5 % at pO2 = 0 kPa after 89 days and Δm/m0 = 18 % at pO2 = 21 kPa after 83 days), and the FKM-co swelled more than the FKM-G (curves a-f in Fig. 40). The bisphenol curing of the FKM co- and terpolymer is expected to leave double bonds on the rubber backbone [84]. The attack of biodiesel on the unsaturation sites of the vinylidene fluoride and hexafluoropropylene components of the FKM-ter and FKM-co caused damage to the rubber, resulting in a larger fuel uptake [45]. This is further discussed in Section 4.3.2. The appearance of “naked” carbon black particles in the scanning electron micrograph of the aged FKM-ter (cf. micrographs a and b in Fig. 41) suggests that the biodiesel-driven cavitation caused a larger uptake of biodiesel in the FKM-ter than in the FKM-co. The latter contained no carbon black. The peroxide curing of the FKM-G left fewer unsaturated sites in the rubber, if any existed, than in the bisphenol-cured FKM-ter and FKM-co samples [45,84]. Hence, the FKM-G is less vulnerable towards biodiesel attack. The rubber-carbon-black interface remained intact in the FKM-G on exposure to biodiesel (not shown here).
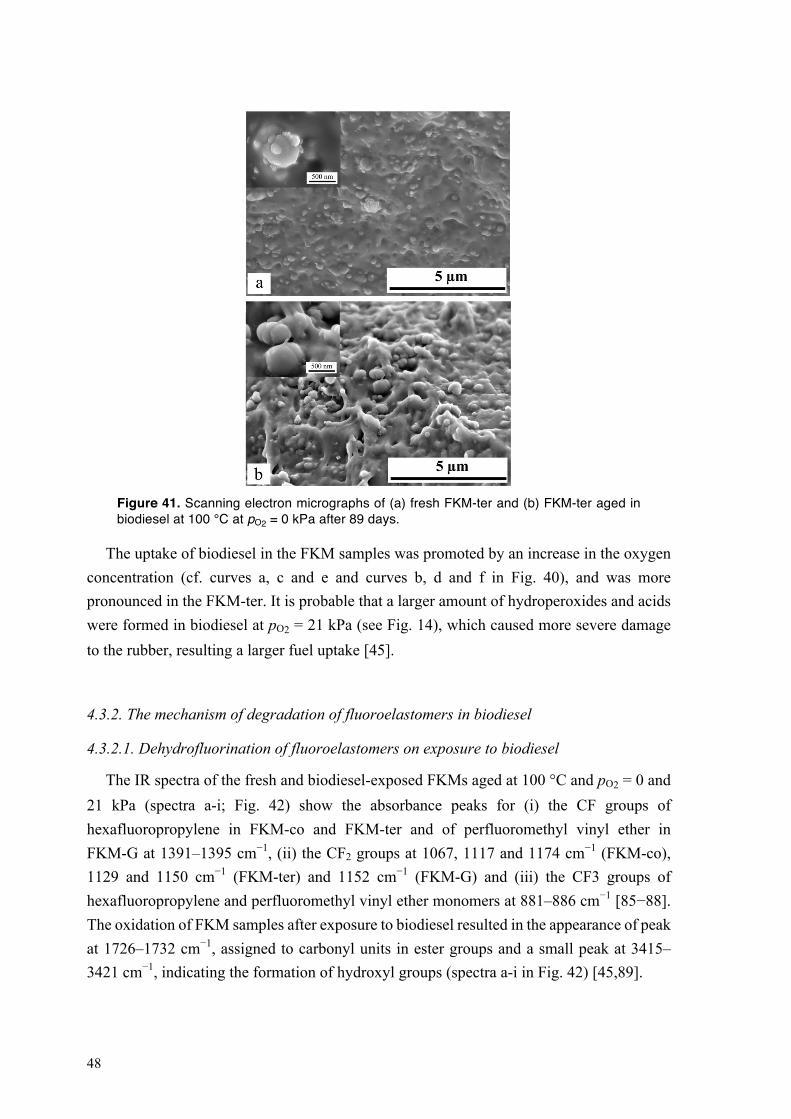
48
Figure 41. Scanning electron micrographs of (a) fresh FKM-ter and (b) FKM-ter aged in biodiesel at 100 °C at pO2 = 0 kPa after 89 days.
The uptake of biodiesel in the FKM samples was promoted by an increase in the oxygen concentration (cf. curves a, c and e and curves b, d and f in Fig. 40), and was more pronounced in the FKM-ter. It is probable that a larger amount of hydroperoxides and acids were formed in biodiesel at pO2 = 21 kPa (see Fig. 14), which caused more severe damage to the rubber, resulting a larger fuel uptake [45].
4.3.2. The mechanism of degradation of fluoroelastomers in biodiesel
4.3.2.1. Dehydrofluorination of fluoroelastomers on exposure to biodiesel
The IR spectra of the fresh and biodiesel-exposed FKMs aged at 100 °C and pO2 = 0 and 21 kPa (spectra a-i; Fig. 42) show the absorbance peaks for (i) the CF groups of hexafluoropropylene in FKM-co and FKM-ter and of perfluoromethyl vinyl ether in FKM-G at 1391–1395 cm−1, (ii) the CF2 groups at 1067, 1117 and 1174 cm−1 (FKM-co), 1129 and 1150 cm−1 (FKM-ter) and 1152 cm−1 (FKM-G) and (iii) the CF3 groups of hexafluoropropylene and perfluoromethyl vinyl ether monomers at 881–886 cm−1 [85−88]. The oxidation of FKM samples after exposure to biodiesel resulted in the appearance of peak at 1726–1732 cm−1, assigned to carbonyl units in ester groups and a small peak at 3415–3421 cm−1, indicating the formation of hydroxyl groups (spectra a-i in Fig. 42) [45,89].
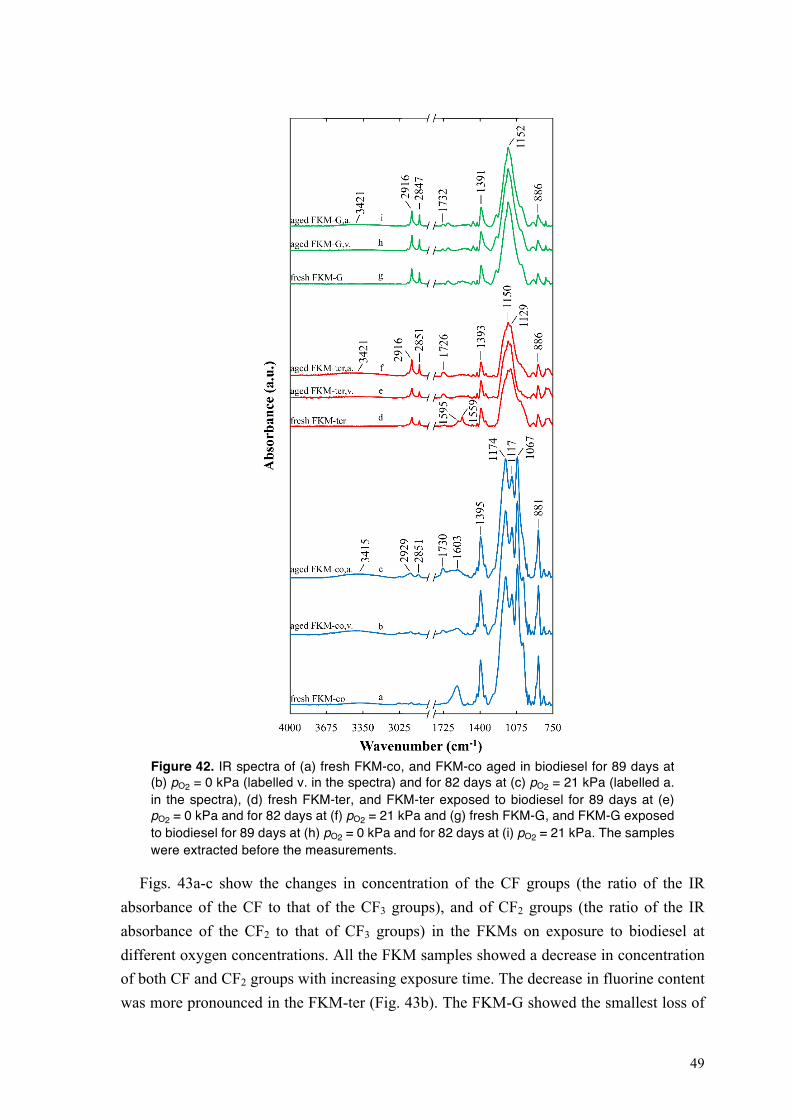
49
Figure 42. IR spectra of (a) fresh FKM-co, and FKM-co aged in biodiesel for 89 days at (b) pO2 = 0 kPa (labelled v. in the spectra) and for 82 days at (c) pO2 = 21 kPa (labelled a. in the spectra), (d) fresh FKM-ter, and FKM-ter exposed to biodiesel for 89 days at (e) pO2 = 0 kPa and for 82 days at (f) pO2 = 21 kPa and (g) fresh FKM-G, and FKM-G exposed to biodiesel for 89 days at (h) pO2 = 0 kPa and for 82 days at (i) pO2 = 21 kPa. The samples were extracted before the measurements.
Figs. 43a-c show the changes in concentration of the CF groups (the ratio of the IR absorbance of the CF to that of the CF3 groups), and of CF2 groups (the ratio of the IR absorbance of the CF2 to that of CF3 groups) in the FKMs on exposure to biodiesel at different oxygen concentrations. All the FKM samples showed a decrease in concentration of both CF and CF2 groups with increasing exposure time. The decrease in fluorine content was more pronounced in the FKM-ter (Fig. 43b). The FKM-G showed the smallest loss of
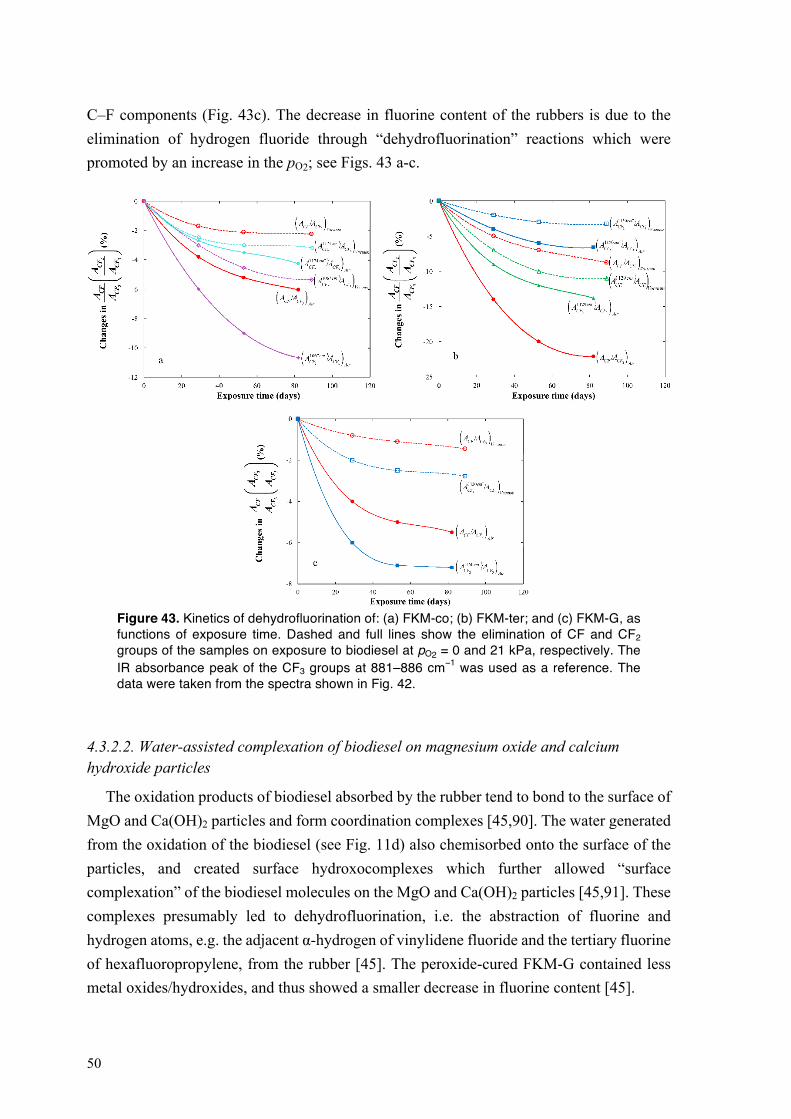
50
C–F components (Fig. 43c). The decrease in fluorine content of the rubbers is due to the elimination of hydrogen fluoride through “dehydrofluorination” reactions which were promoted by an increase in the pO2; see Figs. 43 a-c.
Figure 43. Kinetics of dehydrofluorination of: (a) FKM-co; (b) FKM-ter; and (c) FKM-G, as functions of exposure time. Dashed and full lines show the elimination of CF and CF2 groups of the samples on exposure to biodiesel at pO2 = 0 and 21 kPa, respectively. The IR absorbance peak of the CF3 groups at 881–886 cm−1 was used as a reference. The data were taken from the spectra shown in Fig. 42.
4.3.2.2. Water-assisted complexation of biodiesel on magnesium oxide and calcium hydroxide particles
The oxidation products of biodiesel absorbed by the rubber tend to bond to the surface of MgO and Ca(OH)2 particles and form coordination complexes [45,90]. The water generated from the oxidation of the biodiesel (see Fig. 11d) also chemisorbed onto the surface of the particles, and created surface hydroxocomplexes which further allowed “surface complexation” of the biodiesel molecules on the MgO and Ca(OH)2 particles [45,91]. These complexes presumably led to dehydrofluorination, i.e. the abstraction of fluorine and hydrogen atoms, e.g. the adjacent α-hydrogen of vinylidene fluoride and the tertiary fluorine of hexafluoropropylene, from the rubber [45]. The peroxide-cured FKM-G contained less metal oxides/hydroxides, and thus showed a smaller decrease in fluorine content [45].
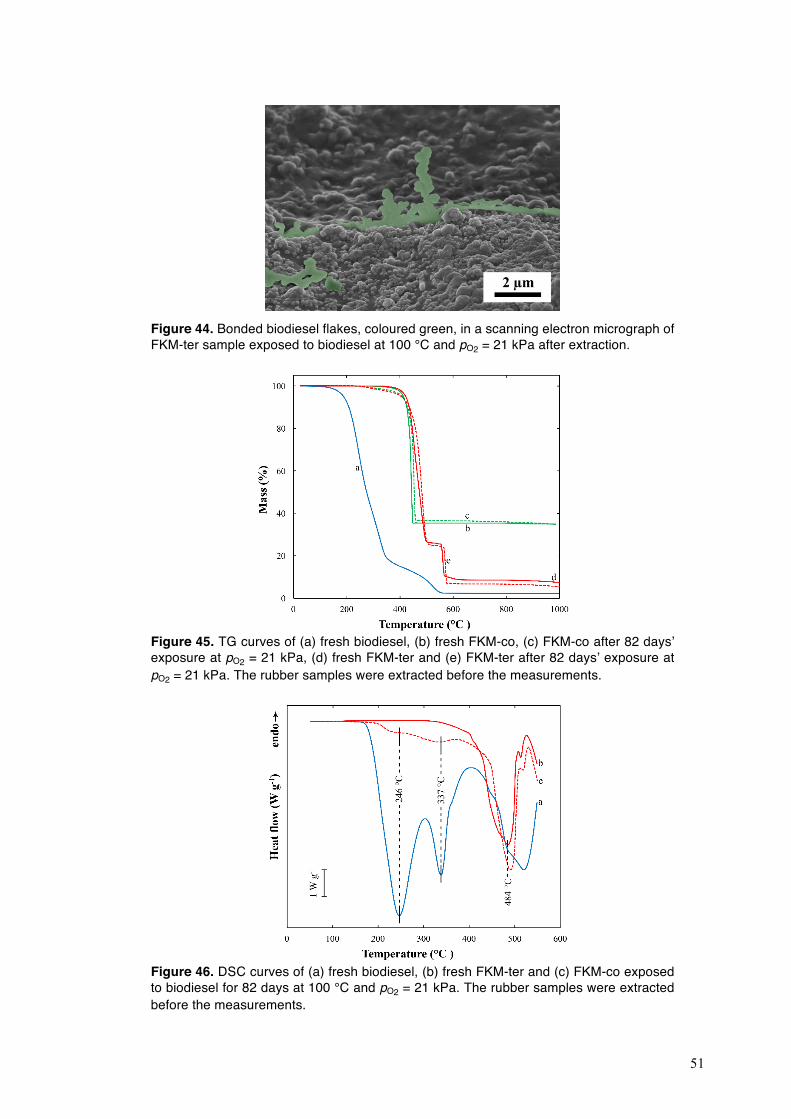
51
Figure 44. Bonded biodiesel flakes, coloured green, in a scanning electron micrograph of FKM-ter sample exposed to biodiesel at 100 °C and pO2 = 21 kPa after extraction.
Figure 45. TG curves of (a) fresh biodiesel, (b) fresh FKM-co, (c) FKM-co after 82 days’ exposure at pO2 = 21 kPa, (d) fresh FKM-ter and (e) FKM-ter after 82 days’ exposure at pO2 = 21 kPa. The rubber samples were extracted before the measurements.
Figure 46. DSC curves of (a) fresh biodiesel, (b) fresh FKM-ter and (c) FKM-co exposed to biodiesel for 82 days at 100 °C and pO2 = 21 kPa. The rubber samples were extracted before the measurements.
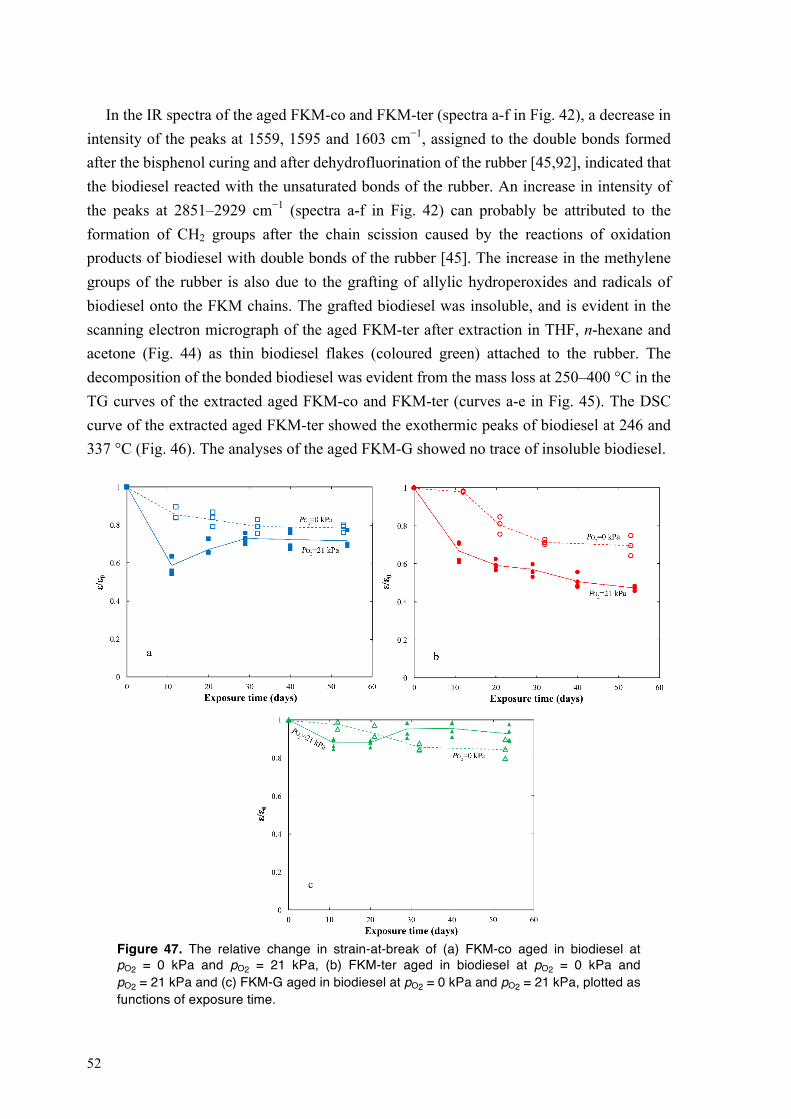
52
In the IR spectra of the aged FKM-co and FKM-ter (spectra a-f in Fig. 42), a decrease in intensity of the peaks at 1559, 1595 and 1603 cm−1, assigned to the double bonds formed after the bisphenol curing and after dehydrofluorination of the rubber [45,92], indicated that the biodiesel reacted with the unsaturated bonds of the rubber. An increase in intensity of the peaks at 2851–2929 cm−1 (spectra a-f in Fig. 42) can probably be attributed to the formation of CH2 groups after the chain scission caused by the reactions of oxidation products of biodiesel with double bonds of the rubber [45]. The increase in the methylene groups of the rubber is also due to the grafting of allylic hydroperoxides and radicals of biodiesel onto the FKM chains. The grafted biodiesel was insoluble, and is evident in the scanning electron micrograph of the aged FKM-ter after extraction in THF, n-hexane and acetone (Fig. 44) as thin biodiesel flakes (coloured green) attached to the rubber. The decomposition of the bonded biodiesel was evident from the mass loss at 250–400 °C in the TG curves of the extracted aged FKM-co and FKM-ter (curves a-e in Fig. 45). The DSC curve of the extracted aged FKM-ter showed the exothermic peaks of biodiesel at 246 and 337 °C (Fig. 46). The analyses of the aged FKM-G showed no trace of insoluble biodiesel.
Figure 47. The relative change in strain-at-break of (a) FKM-co aged in biodiesel at pO2 = 0 kPa and pO2 = 21 kPa, (b) FKM-ter aged in biodiesel at pO2 = 0 kPa and pO2 = 21 kPa and (c) FKM-G aged in biodiesel at pO2 = 0 kPa and pO2 = 21 kPa, plotted as functions of exposure time.
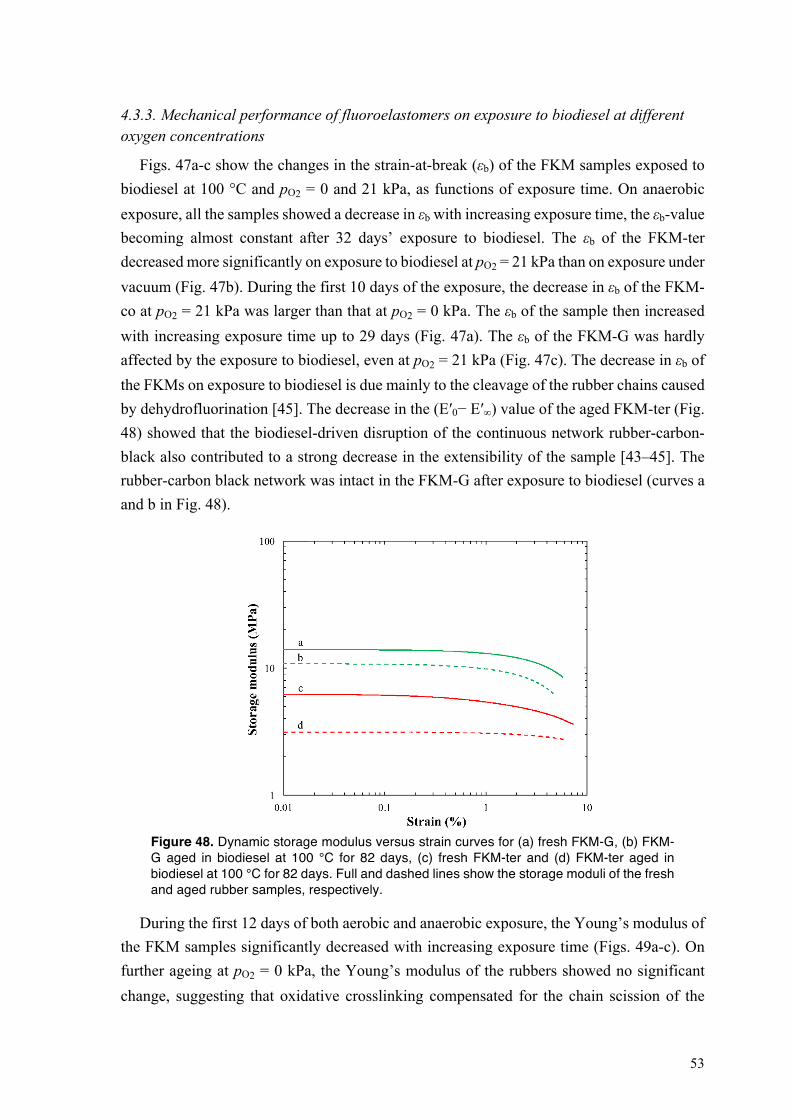
53
4.3.3. Mechanical performance of fluoroelastomers on exposure to biodiesel at different oxygen concentrations
Figs. 47a-c show the changes in the strain-at-break (εb) of the FKM samples exposed to biodiesel at 100 °C and pO2 = 0 and 21 kPa, as functions of exposure time. On anaerobic exposure, all the samples showed a decrease in εb with increasing exposure time, the εb-value becoming almost constant after 32 days’ exposure to biodiesel. The εb of the FKM-ter decreased more significantly on exposure to biodiesel at pO2 = 21 kPa than on exposure under vacuum (Fig. 47b). During the first 10 days of the exposure, the decrease in εb of the FKM-co at pO2 = 21 kPa was larger than that at pO2 = 0 kPa. The εb of the sample then increased with increasing exposure time up to 29 days (Fig. 47a). The εb of the FKM-G was hardly affected by the exposure to biodiesel, even at pO2 = 21 kPa (Fig. 47c). The decrease in εb of the FKMs on exposure to biodiesel is due mainly to the cleavage of the rubber chains caused by dehydrofluorination [45]. The decrease in the (E′0− E′∞) value of the aged FKM-ter (Fig. 48) showed that the biodiesel-driven disruption of the continuous network rubber-carbon-black also contributed to a strong decrease in the extensibility of the sample [43–45]. The rubber-carbon black network was intact in the FKM-G after exposure to biodiesel (curves a and b in Fig. 48).
Figure 48. Dynamic storage modulus versus strain curves for (a) fresh FKM-G, (b) FKM-G aged in biodiesel at 100 °C for 82 days, (c) fresh FKM-ter and (d) FKM-ter aged in biodiesel at 100 °C for 82 days. Full and dashed lines show the storage moduli of the fresh and aged rubber samples, respectively.
During the first 12 days of both aerobic and anaerobic exposure, the Young’s modulus of the FKM samples significantly decreased with increasing exposure time (Figs. 49a-c). On further ageing at pO2 = 0 kPa, the Young’s modulus of the rubbers showed no significant change, suggesting that oxidative crosslinking compensated for the chain scission of the
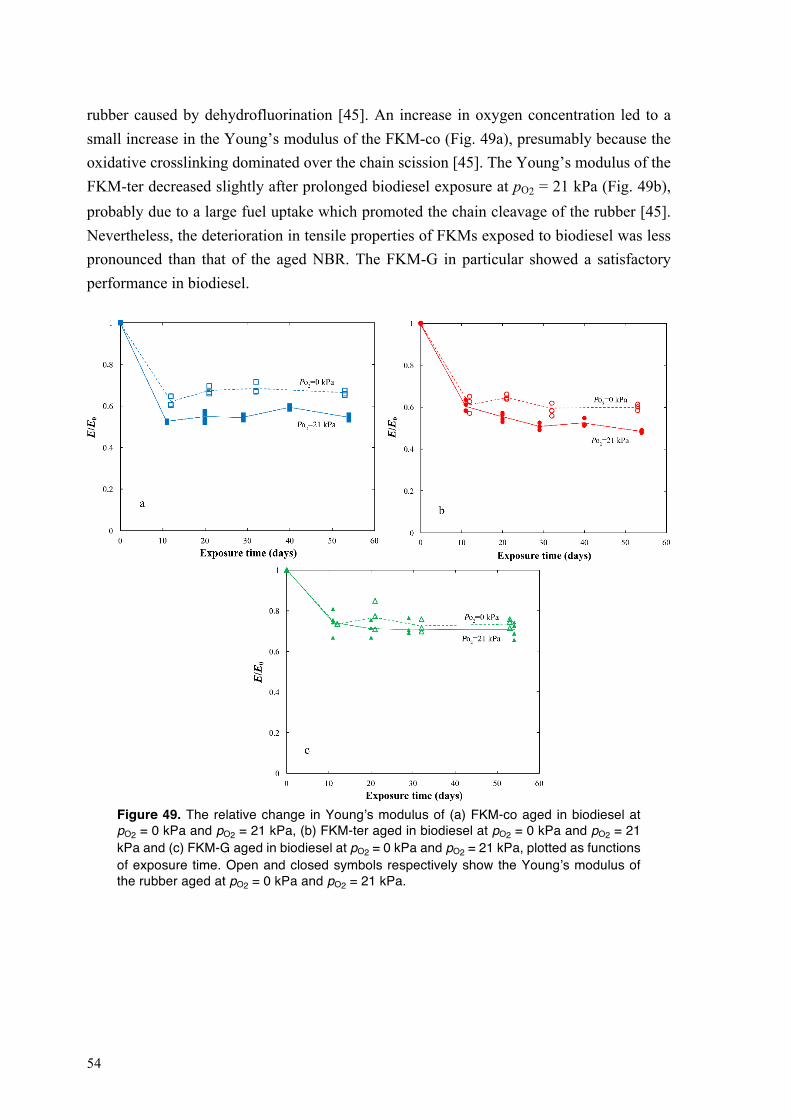
54
rubber caused by dehydrofluorination [45]. An increase in oxygen concentration led to a small increase in the Young’s modulus of the FKM-co (Fig. 49a), presumably because the oxidative crosslinking dominated over the chain scission [45]. The Young’s modulus of the FKM-ter decreased slightly after prolonged biodiesel exposure at pO2 = 21 kPa (Fig. 49b), probably due to a large fuel uptake which promoted the chain cleavage of the rubber [45]. Nevertheless, the deterioration in tensile properties of FKMs exposed to biodiesel was less pronounced than that of the aged NBR. The FKM-G in particular showed a satisfactory performance in biodiesel.
Figure 49. The relative change in Young’s modulus of (a) FKM-co aged in biodiesel at pO2 = 0 kPa and pO2 = 21 kPa, (b) FKM-ter aged in biodiesel at pO2 = 0 kPa and pO2 = 21 kPa and (c) FKM-G aged in biodiesel at pO2 = 0 kPa and pO2 = 21 kPa, plotted as functions of exposure time. Open and closed symbols respectively show the Young’s modulus of the rubber aged at pO2 = 0 kPa and pO2 = 21 kPa.
55
5. CONCLUSION
The degradation of acrylonitrile butadiene rubber (NBR) in the presence and absence of carbon black and of fluoroelastomers (FKM) based on different monomers, additives and curing systems in hydrotreated vegetable oil (HVO) and biodiesel at different temperatures and oxygen partial pressures has been studied. The formation of the primary and secondary oxidation products of the biodiesel was impeded in the presence of rubber, probably due to the migration of oxidation precursors of biodiesel into the rubber. A higher concentration of oxygen promoted the formation of oxidation products of biodiesel. During high-temperature autoclave ageing, smaller amounts of hydroperoxides and acids were formed in the biodiesel. The NBR swelled extensively in biodiesel due to the formation of vacuoles around the carbon black particles caused by the detachment of bound rubber from the particle surfaces. The NBR exposed to biodiesel became significantly brittle with increasing oxygen partial pressure due to coalescence of the cavities and the rupture of the continuous rubber-carbon-black network. The tensile properties of the NBR were less affected by the biodiesel attack on autoclave ageing at 150 °C, due to retardation of the oxidation of the biodiesel. The Young’s modulus of the unfilled-NBR increased significantly due to biodiesel-promoted oxidative crosslinking. The NBR containing heat-treated ZnO particles showed a smaller decrease in the strain-at-break and less oxidative crosslinking than a NBR filled with commercial ZnO nanoparticles. The NBR showed a small decrease in the strain-at-break and a small increase in the Young's modulus after exposure to HVO due to the migration of the plasticizer. The FKM terpolymer absorbed the largest amount of biodiesel due to chain scission caused by dehydrofluorination. Dehydrofluorination of FKM by the complexes of biodiesel and MgO and Ca(OH)2 led to a decrease in the strain-at-break of the rubbers. The attack of oxidation products of biodiesel on the double bonds of the bisphenol-cured FKM led to chain scission of the rubber. An increase in the concentration of the methylene group and the appearance of insoluble biodiesel flakes in the scanning electron micrograph of the aged rubber suggested that the biodiesel was grafted onto the FKM. The FKM performed better in biodiesel if a peroxide curing system was used, and if the rubber compound contained a smaller content of metal oxide/hydroxide particles.
56
6. FUTURE OUTLOOK
The increasing interest in the use of alternative fuels instead of the fossil fuels has led to the development of a broad range of biofuels. However, the investigations of rubber-biofuel compatibility have been concerned only with the degradation of rubbers in biodiesel and ethanol. Further studies are therefore needed to study the performance of rubbers in contact with new biofuels such as biomethanol, bioethers, dimethyl ether and Fischer–Tropsch diesel. Even in the case of biodiesel, the degradation of plastics such as polyamides, commonly used for manufacturing fuel lines and quick connectors, has been insufficiently studied. A project has been recently started at KTH, the Royal Institute of Technology, in collaboration with Volvo Car, Sweden and Scania CV AB, Sweden to study the degradation of polyamide-based multi-layer fuel lines in biodiesel/diesel blends. In order to function in a conventional automobile fuel system, different types of additives are added to the biofuels and biofuel/petroleum-based fuel blends to improve their lubricity, thermal stability, cold flow and combustion efficiency. These additives often contain metal-organic and oxygenated compounds, which may cause damage to rubber. The impact of the fuel additives on the properties of rubbers is currently unknown. The results obtained from this project provide an input for the future design of NBR and FKM rubbers with an improved resistance towards biodiesel. Modified compounds of NBR and FKM were prepared in collaboration with Trelleborg AB, Sweden, and the initial exposures to biodiesel and ethanol have shown that the modified rubbers performed better in these fuels. The O-rings made of the modified rubbers will be mounted in a truck engine for field trials. The ageing program and equipment used for the fuel exposures in the present project can be further modified. Since vehicles are regularly refuelled, the rubber parts are always in contact with fresh fuel. The ageing conditions may better represent the real service condition in the vehicle if the fuel is frequently refreshed during the exposure. The rubber seals operate under both static and dynamic stresses in the fuel systems, and this probably promotes the degradation of rubbers in biodiesel. A mechanical load needs to be imposed on the rubber samples during the ageing.
58
REFERENCES
[1] Atta M, Idris A, Bukhari A, Wahidin S. Intensity of blue LED light: A potential stimulus for biomass and lipid content in fresh water microalgae Chlorella vulgaris. Bioresour. Technol. 2013;148:373–378.
[2] Feng P, Deng Z, Hu Z, Fan L. Lipid accumulation and growth of Chlorella zofingiensis in flat plate photobioreactors outdoors. Bioresour. Technol. 2011;102; 10577–10584.
[3] Megahed MM. Feasibility of nuclear power and desalination on El-Dabaa site. Desalination 2009;246:238–256.
[4] Diez LI, Cortés C, Pallarés J. Numerical investigation of NOx emissions from a tangentially-fired utility boiler under conventional and overfire air operation. Fuel 2008;87:1259–1269.
[5] Mezher N, Rathbun WE, Wang H, Ahmad F. Chemical composition and screening-level environmental contamination risk of bioderived synthetic paraffinic kerosene (Bio-SPK) jet fuels. Energy Fuels 2013;27:3830–3837.
[6] Anuar MR, Abdullah AZ. Challenges in biodiesel industry with regards to feedstock, environmental, social and sustainability issues: A critical review. Renew. Sustain. Energy Rev. 2016;58:208–223.
[7] Ramírez-Verduzco LF, Rodríguez-Rodríguez JE, Jaramillo-Jacob AR. Predicting cetane number, kinematic viscosity, density and higher heating value of biodiesel from its fatty acid methyl ester composition. Fuel 2012;91:102–111.
[8] Man XJ, Cheung CS, Ning Z, Wei L, Huang ZH. Influence of engine load and speed on regulated and unregulated emissions of a diesel engine fueled with diesel fuel blended with waste cooking oil biodiesel. Fuel 2016;180:41–49.
[9] Naika SN, Goud VV, Rout PK, Dalai AK. Production of first and second generation biofuels: A comprehensive review. Renew. Sustain. Energy Rev. 2010;14:578–597.
[10] Jayed MH, Masjuki HH, Saidur R, Kalam MA, Jahirul MI. Environmental aspects and challenges of oilseed produced biodiesel in Southeast Asia. Renew. Sustain. Energy Rev. 2009;13:2452–2462.
[11] Verma P, Sharma MP. Review of process parameters for biodiesel production from different feedstocks. Renew. Sustain. Energy Rev. 2016;62:1063–1071.
[12] Rounce P, Tsolakis A, Leung P, York APE. A comparison of diesel and biodiesel emissions using dimethyl carbonate as an oxygenated additive. Energy Fuels 2010;24:4812–4819.
59
[13] Basha SA, Gopal KR, Jebaraj S. A review on biodiesel production, combustion, emissions and performance. 2009;13:1628–1634.
[14] Xue J, Grift TE, Hansen AC. Effect of biodiesel on engine performances and emissions. Renew. Sustain. Energy Rev. 2011;15:1098–1116.
[15] Armas O, Gómez A, Cárdenas MD. Biodiesel emissions from a baseline engine operated with different injection systems and exhaust gas recirculation (EGR) strategies during transient sequences. Energy Fuels 2009;23:6168–6180.
[16] Arun N, Sharma RV, Dalai AK. Green diesel synthesis by hydrodeoxygenation of bio-based feedstocks: Strategies for catalyst design and development. Renew. Sustain. Energy Rev. 2015;48:240–255.
[17] Jęczmionek Ł, Porzycka-Semczuk K. Hydrodeoxygenation, decarboxylation and decarbonylation reactions while co-processing vegetable oils over NiMo hydrotreatment catalyst. Part II: Thermal effects – Experimental results. Fuels 2014;128:296–301.
[18] Jęczmionek Ł, Krasodomski W. Biocomponents via Zeoforming and Hydroconversion of vegetable oil: 1H NMR analysis of glycerides conversion. Energy Fuels 2015;29:2372–2379.
[19] Aatola H, Larmi M, Sarjovaara T, Mikkonen S. Hydrotreated vegetable oil (HVO) as a renewable diesel fuel: trade-off between NOx, particulate emission, and fuel consumption of a heavy duty engine. SAE Technical paper No. 2008–01–2500.
[20] Erkkilä K, Nylund N, Hulkkonen T, Tilli A. Emission performance of paraffinic HVO diesel fuel in heavy duty vehicles. SAE Technical paper No. 2011–01–1966.
[21] Singh D, Subramanian KA, Singal SK. Emissions and fuel consumption characteristics of a heavy duty diesel engine fueled with hydroprocessed renewable diesel and biodiesel. Appl. Energy 2015;155:440–446.
[22] Verziu M, Florea M, Simon S, Simon V, Filip P, Parvulescu VI, Hardacre C. Transesterification of vegetable oils on basic large mesoporous alumina supported alkaline fluorides—Evidences of the nature of the active site and catalytic performances. J. Catalysis 2009;263:56–66.
[23] Verziu M, Coman SM, Richards R, Parvulescu VI. Transesterification of vegetable oils over CaO catalysts. Catalysis Today 2011;167:64–70.
[24] Kouzu M, Hidaka J. Transesterification of vegetable oil into biodiesel catalyzed by CaO: A review. Fuel 2012;93:1–12.
[25] Ganesan D, Rajendran A, Thangavelu V. An overview on the recent advances in the transesterification of vegetable oils for biodiesel production using chemical and biocatalysts. Rev. Environ. Sci. Bio/Technol. 2009;8:367–394.
[26] Guan G, Kusakabe K, Sakurai N, Moriyama K. Transesterification of vegetable oil to biodiesel fuel using acid catalysts in the presence of dimethyl ether. Fuel 2009;88:81–86.
[27] Sharma YC, Singh B. Development of biodiesel: Current scenario. Renew. Sustain. Energy Rev. 2009;13:1646–1651.
60
[28] MY Koh, Ghazi TIM. A review of biodiesel production from Jatropha curcas L. oil. Renew. Sustain. Energy Rev. 2011;15:2240–2251.
[29] Gana S, Ng HK, Ooi CW, Motala NO, Ismail MAF. Ferric sulphate catalysed esterification of free fatty acids in waste cooking oil. Bioresource Technol. 2010;101:7338–7343.
[30] Bautist LF, Vicente G, Rodríguez R, Pacheco M. Optimisation of FAME production from waste cooking oil for biodiesel use. Biomass and Bioenergy 2009;33:862–872.
[31] Jain S, Sharma MP, Rajvanshi S. Acid base catalyzed transesterification kinetics of waste cooking oil. Fuel Processing Technol. 2011;92:32–38.
[32] Murugesan A, Umarani C, Chinnusamy TR, Krishnan M, Subramanian R, Neduzchezhain N. Production and analysis of bio-diesel from non-edible oils-A review. Renew. Sustain. Energy Rev. 2009;13:825–834.
[33] Karmakar A, Karmakar S, Mukherjee S. Properties of various plants and animals feedstocks for biodiesel production. Bioresource Technol. 2010;101:7201–7210.
[34] Parawira W. Biodiesel production from Jatropha curcas: A review. Scientific Res. Essays 2010;5:1796–1808.
[35] Tan HW, Aziz ARA, Aroua MK. Glycerol production and its applications as a raw material: A review. Renew. Sustain. Energy Rev. 2013;27:118–127.
[36] Boz N, Degirmenbasi N, Kalyon DM. Transesterification of canola oil to biodiesel using calcium bentonite functionalized with K compounds. Appl. Catal. B: Environ. 2013;138:236–242.
[37] Knothe G. Biodiesel and renewable diesel: A comparison. Prog. Energy Combustion Sci. 2010;36:364–373.
[38] Bhale PV, Deshpande NV, Thombre SB. Improving the low temperature properties of biodiesel fuel. Renew. Energy 2009;34:794–800.
[39] Berman P, Nizri S, Wiesman Z. Castor oil biodiesel and its blends as alternative fuel. Biomass and Bioenergy 2011;35:2861–2866.
[40] Demirbas A. Progress and recent trends in biodiesel fuels. Energy Convers. Manage. 2009;50:14–34.
[41] Gardiner J. Fluoropolymers: origin, production, and industrial and commercial applications. Australian J. Chem. 2014;68:13–22.
[42] Akhlaghi S, Gedde UW, Hedenqvist MS, Conde Braña MT, Bellander M. Deterioration of automotive rubbers in liquid biofuels: A review. Renew. Sustain. Energy Rev. 2015;43:1238–1248.
[43] Akhlaghi S, Gedde UW, Hedenqvist MS, Conde Braña MT, Bellander M. Deterioration of acrylonitrile butadiene rubber in rapeseed biodiesel. Polym. Degrad. Stab. 2015;111:211–222.
[44] Akhlaghi S, Pourrahimi AM, Hedenqvist MS, Sjöstedt C, Bellander M, Gedde UW. Degradation of carbon-black-filled acrylonitrile butadiene rubber in alternative fuels: Transesterified and hydrotreated vegetable oils. Polym. Degrad. Stab. 2016;123:69–79.
61
[45] Akhlaghi S, Pourrahimi AM, Hedenqvist MS, Sjöstedt C, Bellander M, Gedde UW. Degradation of fluoroelastomers in rapeseed biodiesel at different oxygen concentrations. Polym. Degrad. Stab. 2017;136:10–19.
[46] Akhlaghi S, Pourrahimi AM, Hedenqvist MS, Sjöstedt C, Bellander M, Gedde UW. Degradation of fluoroelastomers in rapeseed biodiesel at different oxygen concentrations. Polym. Degrad. Stab. Manuscript.
[47] Karavalakis G, Stournas S, Karonis D. Evaluation of the oxidation stability of diesel/biodiesel blends. Fuel 2010;89:2483–2489.
[48] Fazal MA, Haseeb ASMA, Masjuki HH. Biodiesel feasibility study: An evaluation of material compatibility; performance; emission and engine durability. Renew. Sustain. Energy Rev. 2011;15:1314–1324.
[49] Haseeb ASMA, Fazal MA, Jahirul MI, Masjuki HH. Compatibility of automotive materials in biodiesel: A review. Fuel 2011;90: 922–931.
[50] Chandran D, Ng HK, Lau HLN, Gan S, Choo YM. Investigation of the effects of palm biodiesel dissolved oxygen and conductivity on metal corrosion and elastomer degradation under novel immersion method. Appl. Thermal Eng. 2016;104:294–308.
[51] Díaz-Ballote L, Castillo-Atoche A, Maldonado L, Ruiz-Gómez MA, Hernández E. Effect of commercial metals (Al, Cu, carbon steel, and Zn) on the oxidation of soy-biodiesel. J. Phys. D: Appl. Phys. 2016;49:1–7.
[52] Walker FJ. Effects of bio-fuels on common static sealing elastomers. Rubber Chem. Technol. 2009;82:369–378.
[53] Haseeb ASMA, Jun TS, Fazal MA, Masjuki HH. Degradation of physical properties of different elastomers upon exposure to palm biodiesel. Energy 2011;36:1814–1819.
[54] Hu E, Hu X, Xu Y, Yu H, Zhu X. On the compatibility between biomass fuel and elastomer. Corrosion 2012;68:1108–1118.
[55] Pourrahimi AM, Liu D, Ström V, Hedenqvist MS, Olsson RT, Gedde UW. Heat treatment of ZnO nanoparticles: new methods to achieve high-purity nanoparticles for high-voltage applications. J. Mater. Chem. A 2015;3:17190–17200.
[56] Mitchell BS. An introduction to materials engineering and science for chemical and materials engineers. Hoboken, New Jersey: John Wiley & Sons, Inc., 2004. p. 194.
[57] Satyarthi JK, Srinivas D, Ratnasamy P. Estimation of free fatty acid content in oils, fats, and biodiesel by 1H NMR Spectroscopy. Energy Fuels 2009;23:2273–2277.
[58] Knothe G. Analysis of oxidized biodiesel by 1H-NMR and effect of contact area with air. Eur. J. Lipid Sci. Technol. 2006;108:493–500.
[59] Kerr JA. Bond dissociation energies by kinetic methods. Chem. Rev. 1966;66:465–500.
[60] Xin J, Saka S. Test methods for the determination of biodiesel stability. Biofuels 2010;1:275–289.
[61] Zuleta EC, Baena L, Rios LA, Calderón JA. The oxidative stability of biodiesel and its impact on the deterioration of metallic and polymeric materials: a review. J. Braz. Chem. Soc. 2012;23:2159–2175.
62
[62] Choe E, Min DB. Mechanisms and factors for edible oil oxidation. Compr. Rev. Food Sci. Food Saf. 2006;5:169–186.
[63] Jain S, Sharma MP. Stability of biodiesel and its blends: A review. Renew. Sustain. Energy Rev. 2010;2:667–678.
[64] Balaji G, Cheralathan M. The effect of antioxidant additives with methyl ester of neem oil on the oxidation stability. Energy Sources A 2016;38:2454–2461.
[65] Kang H, Song H, Ha J, Na BK. Effects of oxidized biodiesel on formation of particulate matter and NOx. Korean J. Chem. Eng. 2016;33:2084–2089.
[66] VS Gurau, MS Agarwal, A Sarin, Sandhu SS. Experimental study on storage and oxidation stability of bitter apricot kernel oil biodiesel. Energy Fuels 2016;30:8377–8385.
[67] Min DB, Wen JYE. Effects of dissolved free oxygen on the volatile compounds of oil. J. Food Sci. 1983;48:1429–1430.
[68] Velasco J, Dobarganes C. Oxidative stability of virgin olive oil. Eur. J. Lipid Sci. Technol. 2002;104:661–76.
[69] Le XT, Mai TVT, Ratkiewicz A, Huynh LK. Mechanism and kinetics of low-temperature oxidation of a biodiesel surrogate: methyl propanoate radicals with oxygen molecule. J. Phys. Chem. A 2015;119:3689–3703.
[70] Robertson CG, Lin CJ, Rackaitis M, Roland CM. Influence of Particle Size and Polymer-Filler Coupling on Viscoelastic Glass Transition of Particle-Reinforced Polymers. Macromolecules 2008;41:2727–2731.
[71] Litvinov VM, Steeman PAM. EPDM−Carbon Black Interactions and the Reinforcement Mechanisms, As Studied by Low-Resolution 1H NMR. Macromolecules 1999;32:8476–8490.
[72] Fröhlich J, Niedermeier W, Luginsland HD. The effect of filler–filler and filler elastomer interaction on rubber reinforcement. Composites Part A: Appl. Sci. Manufact. 2005;36:449–460.
[73] Gabriel D, Karbach A, Drechsler D, Gutmann J, Graf K, Kheirandish S. Bound rubber morphology and loss tangent properties of carbon-black-filled rubber compounds. Colloid Polym. Sci. 2016;294:501–511.
[74] Wolff S, Wang M, Tan E. Filler-Elastomer Interactions. Part VII. Study on Bound Rubber. Rubber Chem. Technol. 1993;66:163–177.
[75] Skowronski TA. Photo-oxidation of copolymers of butadiene and acrylonitrile. Polym. Degrad. Stab. 1983;5:173–188.
[76] Adam C, Lacoste J, Lemaire J. Photo-oxidation of elastomeric materials: part 3-photo-oxidation of acrylonitrile-butadiene copolymer. Polym. Degrad. Stab. 1990;27:85–97.
[77] Li GY, Koenig JL. A review of rubber oxidation. Rubb. Chem. Technol. 2005;78: 355–390.
[78] Vega-Cantu Y, Hauge R, Norman L, Billups WE. ZnBr2-catalyzed chemical effects in poly(acrylonitrile- co-butadiene). J. Appl. Polym. Sci. 2003;89:1250–1257.
[79] Pourrahimi AM, Liu D, Pallon LKH, Andersson RL, Martínez Abad A, Lagarón JM, Hedenqvist MS, Ström V, Gedde UW, Olsson RT. Water-based synthesis and cleaning
63
methods for high purity ZnO nanoparticles – comparing acetate, chloride, sulphate and nitrate zinc salt precursors. RSC Adv. 2014;4:35568–35577.
[80] Degen A, Kosec M. Effect of pH and impurities on the surface charge of zinc oxide in aqueous solution. J. Eur. Ceramic Soc. 2000;20:667–673.
[81] Díaz-Ballote L, Castillo-Atoche A, Maldonado L, Ruiz-Gómez MA, Hernández E. Effect of commercial metals (Al, Cu, carbon steel, and Zn) on the oxidation of soy-biodiesel. J. Phys. D: Appl. Phys. 2016;49:355602–355609.
[82] Pourrahimi AM, Liu D, Andersson RL, Ström V, Gedde UW, Olsson RT. Aqueous synthesis of (21 ̅0) oxygen-terminated defect-free hierarchical ZnO particles and their heat treatment for enhanced reactivity. Langmuir 2016;32:11002–11013.
[83] Pourrahimi AM, Hoang TA, Liu D, Pallon LKH, Gubanski S, Olsson RT, Gedde UW, Hedenqvist MS. Highly efficient interfaces in nanocomposites based on polyethylene and ZnO nano/hierarchical particles: a novel approach toward ultralow electrical conductivity insulations. Adv. Mater. 2016;28:8651–8657.
[84] Améduri B, Boutevin B, Kostov G. Fluoroelastomers: synthesis, properties and applications. Prog. Polym. Sci. 2001;26:105–187.
[85] Wang Y, Liu L, Luo Y, Jia D. Aging behavior and thermal degradation of fluoroelastomer reactive blends with poly-phenol hydroxy EPDM. Polym. Degrad. Stab. 2009;94:443–449.
[86] Banik I, Bhowmick AK, Raghavan SV, Majali AB, Tikku VK. Thermal degradation studies of electron beam cured terpolymeric FKM. Polym. Degrad. Stab. 1999;63:413–421.
[87] Sugama T. Surface analyses of fluoroelastomer bearings exposed to geothermal environments. Mater. Lett. 2001;50:66–72.
[88] Banik I, Dutta SK, Chaki TK, Bhowmick AK. Electron beam induced structural modification of a fluorocarbon elastomer in the presence of polyfunctional monomers. Polymer 1999;40:447–458.
[89] L Xia, M Wang, H Wu, S Guo. Effects of cure system and filler on chemical aging behavior of fluoroelastomer in simulated proton exchange membrane fuel cell environment. Int. J. Hydrogen Energy 2016;41:2887–2895.
[90] Thomas EW, Fuller RE, Terauchi K. Fluoroelastomer compatibility with biodiesel fuels. SAE Technical paper No. 2007-01-40061.
[91] Blesa MA, Weisz AD, Morando PJ, Salfity JA, Magaz GE, Regazzoni AE. The interaction of metal oxide surfaces with complexing agents dissolved in water. Coord. Chem. Rev. 2000;196:31–63.
[92] Taguet A, Ameduri B, Boutevin B. Crosslinking of Vinylidene Fluoride-Containing Fluoropolymers. Adv. Polym. Sci. 2005;184:127–211.


![POTENTIALINDUZIERTE DEGRADATION (PID ... - tuv.com · 1200 Rp [:] Time [min] PIDcon Test - Encapsulant 1 PIDcon Test ... Modultests haben SEMI Task-Force “PV Material Degradation”](https://img.pdfslide.org/doc/110x75/5b145c627f8b9a397c8cb2e5/potentialinduzierte-degradation-pid-tuvcom-1200-rp-time-min-pidcon.jpg)