Embed Size (px)
Citation preview
Industrie- und Handelskammernin Bayern
Der Außenhandel
Bayerns 2016Bavaria‘s Foreign Trade 2016
2 | IMPORTE UND EXPORTE BAYERNS | BAVARIA’S IMPORTS AND EXPORTS
0
50
100
150
200
1998 1999 2000 2001 2002 2003 2004 2005 2006 2007 2008 2009 2010 2011 2012 2013 2014 2015 2016
183179
169168165160
144
122
154152
140
127117
107102
9893
8177
166161
150146147146
129
107
129124
116
9994
878690
85
6966
Importe / Imports Exporte / Exports
in Mrd. EUR /in bn. EUR
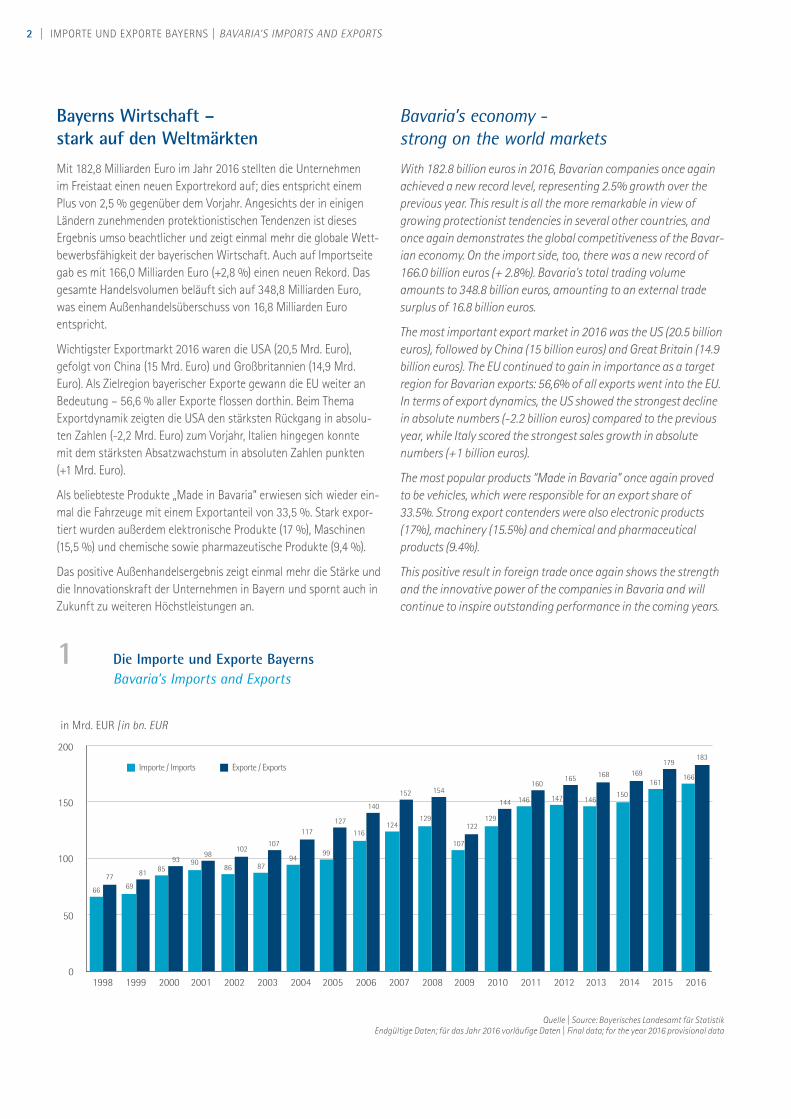
1 Die Importe und Exporte Bayerns Bavaria’s Imports and Exports
Quelle | Source: Bayerisches Landesamt für StatistikEndgültige Daten; für das Jahr 2016 vorläufige Daten | Final data; for the year 2016 provisional data
Bayerns Wirtschaft – stark auf den Weltmärkten
Mit 182,8 Milliarden Euro im Jahr 2016 stellten die Unternehmen im Freistaat einen neuen Exportrekord auf; dies entspricht einem Plus von 2,5 % gegenüber dem Vorjahr. Angesichts der in einigen Ländern zunehmenden protektionistischen Tendenzen ist dieses Ergebnis umso beachtlicher und zeigt einmal mehr die globale Wett-bewerbsfähigkeit der bayerischen Wirtschaft. Auch auf Importseite gab es mit 166,0 Milliarden Euro (+2,8 %) einen neuen Rekord. Das gesamte Handelsvolumen beläuft sich auf 348,8 Milliarden Euro, was einem Außenhandelsüberschuss von 16,8 Milliarden Euro entspricht.
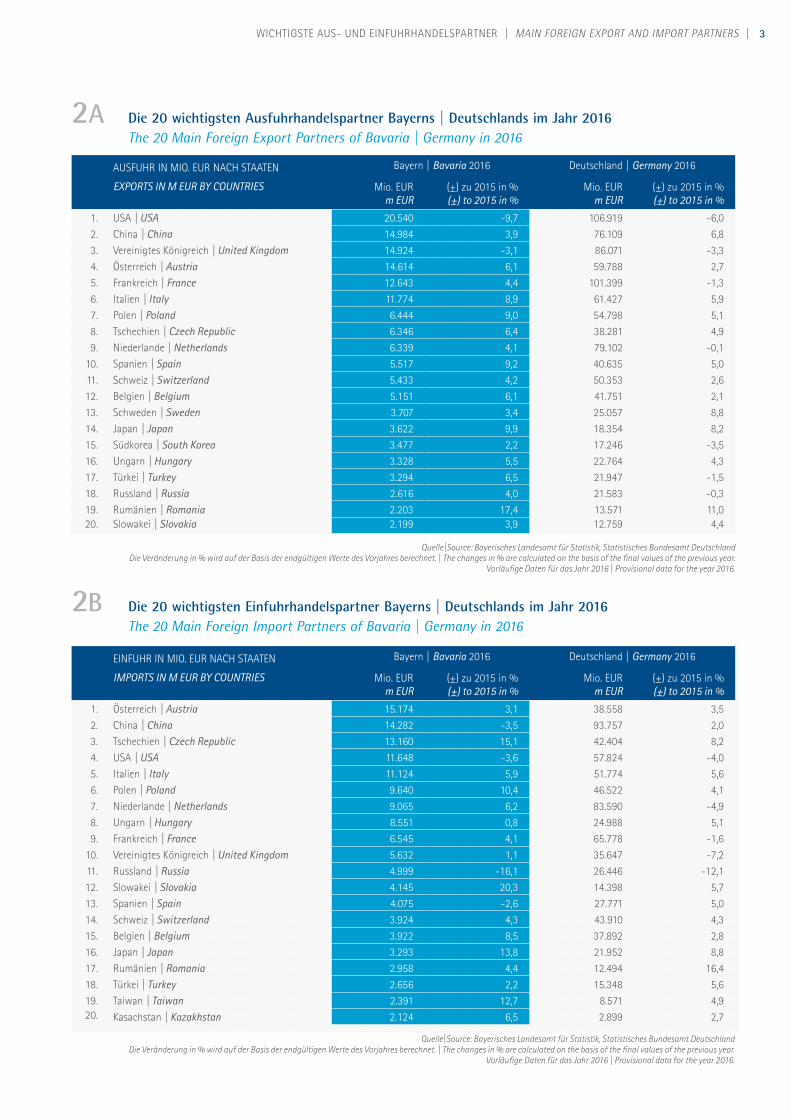
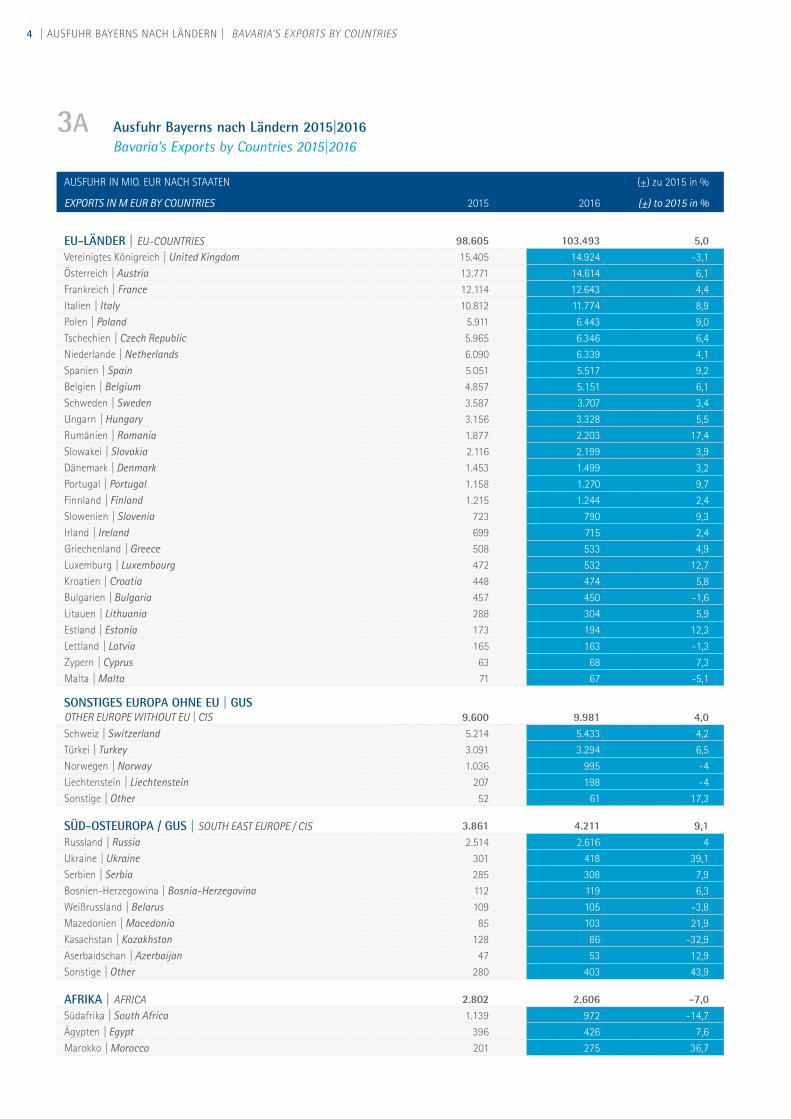
Wichtigster Exportmarkt 2016 waren die USA (20,5 Mrd. Euro), gefolgt von China (15 Mrd. Euro) und Großbritannien (14,9 Mrd. Euro). Als Zielregion bayerischer Exporte gewann die EU weiter an Bedeutung – 56,6 % aller Exporte flossen dorthin. Beim Thema Exportdynamik zeigten die USA den stärksten Rückgang in absolu-ten Zahlen (-2,2 Mrd. Euro) zum Vorjahr, Italien hingegen konnte mit dem stärksten Absatzwachstum in absoluten Zahlen punkten (+1 Mrd. Euro).
Als beliebteste Produkte „Made in Bavaria“ erwiesen sich wieder ein-mal die Fahrzeuge mit einem Exportanteil von 33,5 %. Stark expor-tiert wurden außerdem elektronische Produkte (17 %), Maschinen (15,5 %) und chemische sowie pharmazeutische Produkte (9,4 %).
Das positive Außenhandelsergebnis zeigt einmal mehr die Stärke und die Innovationskraft der Unternehmen in Bayern und spornt auch in Zukunft zu weiteren Höchstleistungen an.
Bavaria’s economy - strong on the world markets
With 182.8 billion euros in 2016, Bavarian companies once again achieved a new record level, representing 2.5% growth over the previous year. This result is all the more remarkable in view of growing protectionist tendencies in several other countries, and once again demonstrates the global competitiveness of the Bavar-ian economy. On the import side, too, there was a new record of 166.0 billion euros (+ 2.8%). Bavaria’s total trading volume amounts to 348.8 billion euros, amounting to an external trade surplus of 16.8 billion euros.
The most important export market in 2016 was the US (20.5 billion euros), followed by China (15 billion euros) and Great Britain (14.9 billion euros). The EU continued to gain in importance as a target region for Bavarian exports: 56,6% of all exports went into the EU. In terms of export dynamics, the US showed the strongest decline in absolute numbers (-2.2 billion euros) compared to the previous year, while Italy scored the strongest sales growth in absolute numbers (+1 billion euros).
The most popular products “Made in Bavaria” once again proved to be vehicles, which were responsible for an export share of 33.5%. Strong export contenders were also electronic products (17%), machinery (15.5%) and chemical and pharmaceutical products (9.4%).
This positive result in foreign trade once again shows the strength and the innovative power of the companies in Bavaria and will continue to inspire outstanding performance in the coming years.
3WICHTIGSTE AUS- UND EINFUHRHANDELSPARTNER | MAIN FOREIGN EXPORT AND IMPORT PARTNERS |
2A Die 20 wichtigsten Ausfuhrhandelspartner Bayerns | Deutschlands im Jahr 2016 The 20 Main Foreign Export Partners of Bavaria | Germany in 2016
2B Die 20 wichtigsten Einfuhrhandelspartner Bayerns | Deutschlands im Jahr 2016 The 20 Main Foreign Import Partners of Bavaria | Germany in 2016
AUSFUHR IN MIO. EUR NACH STAATEN Bayern | Bavaria 2016 Deutschland | Germany 2016
EXPORTS IN M EUR BY COUNTRIES Mio. EURm EUR
(±) zu 2015 in %(±) to 2015 in %
Mio. EURm EUR
(±) zu 2015 in %(±) to 2015 in %
1. USA | USA 20.540 -9,7 106.919 -6,02. China | China 14.984 3,9 76.109 6,83. Vereinigtes Königreich | United Kingdom 14.924 -3,1 86.071 -3,34. Österreich | Austria 14.614 6,1 59.788 2,75. Frankreich | France 12.643 4,4 101.399 -1,36. Italien | Italy 11.774 8,9 61.427 5,97. Polen | Poland 6.444 9,0 54.798 5,18. Tschechien | Czech Republic 6.346 6,4 38.281 4,99. Niederlande | Netherlands 6.339 4,1 79.102 -0,1
10. Spanien | Spain 5.517 9,2 40.635 5,011. Schweiz | Switzerland 5.433 4,2 50.353 2,612. Belgien | Belgium 5.151 6,1 41.751 2,113. Schweden | Sweden 3.707 3,4 25.057 8,814. Japan | Japan 3.622 9,9 18.354 8,215. Südkorea | South Korea 3.477 2,2 17.246 -3,516. Ungarn | Hungary 3.328 5,5 22.764 4,317. Türkei | Turkey 3.294 6,5 21.947 -1,518. Russland | Russia 2.616 4,0 21.583 -0,319. Rumänien | Romania 2.203 17,4 13.571 11,020. Slowakei | Slovakia 2.199 3,9 12.759 4,4
EINFUHR IN MIO. EUR NACH STAATEN Bayern | Bavaria 2016 Deutschland | Germany 2016
IMPORTS IN M EUR BY COUNTRIES Mio. EURm EUR
(±) zu 2015 in %(±) to 2015 in %
Mio. EURm EUR
(±) zu 2015 in %(±) to 2015 in %
1. Österreich | Austria 15.174 3,1 38.558 3,52. China | China 14.282 -3,5 93.757 2,03. Tschechien | Czech Republic 13.160 15,1 42.404 8,24. USA | USA 11.648 -3,6 57.824 -4,05. Italien | Italy 11.124 5,9 51.774 5,66. Polen | Poland 9.640 10,4 46.522 4,17. Niederlande | Netherlands 9.065 6,2 83.590 -4,98. Ungarn | Hungary 8.551 0,8 24.988 5,19. Frankreich | France 6.545 4,1 65.778 -1,6
10. Vereinigtes Königreich | United Kingdom 5.632 1,1 35.647 -7,211. Russland | Russia 4.999 -16,1 26.446 -12,112. Slowakei | Slovakia 4.145 20,3 14.398 5,713. Spanien | Spain 4.075 -2,6 27.771 5,014. Schweiz | Switzerland 3.924 4,3 43.910 4,315. Belgien | Belgium 3.922 8,5 37.892 2,816. Japan | Japan 3.293 13,8 21.952 8,817. Rumänien | Romania 2.958 4,4 12.494 16,418. Türkei | Turkey 2.656 2,2 15.348 5,619. Taiwan | Taiwan 2.391 12,7 8.571 4,920. Kasachstan | Kazakhstan 2.124 6,5 2.899 2,7
Quelle|Source: Bayerisches Landesamt für Statistik, Statistisches Bundesamt DeutschlandDie Veränderung in % wird auf der Basis der endgültigen Werte des Vorjahres berechnet. | The changes in % are calculated on the basis of the final values of the previous year.
Vorläufige Daten für das Jahr 2016 | Provisional data for the year 2016.
4 | AUSFUHR BAYERNS NACH LÄNDERN | BAVARIA’S EXPORTS BY COUNTRIES
AUSFUHR IN MIO. EUR NACH STAATEN
2015 2016
(±) zu 2015 in %
EXPORTS IN M EUR BY COUNTRIES (±) to 2015 in %
EU-LÄNDER | EU-COUNTRIES 98.605 103.493 5,0Vereinigtes Königreich | United Kingdom 15.405 14.924 -3,1Österreich | Austria 13.771 14.614 6,1Frankreich | France 12.114 12.643 4,4Italien | Italy 10.812 11.774 8,9Polen | Poland 5.911 6.443 9,0Tschechien | Czech Republic 5.965 6.346 6,4Niederlande | Netherlands 6.090 6.339 4,1Spanien | Spain 5.051 5.517 9,2Belgien | Belgium 4.857 5.151 6,1Schweden | Sweden 3.587 3.707 3,4Ungarn | Hungary 3.156 3.328 5,5Rumänien | Romania 1.877 2.203 17,4Slowakei | Slovakia 2.116 2.199 3,9Dänemark | Denmark 1.453 1.499 3,2Portugal | Portugal 1.158 1.270 9,7Finnland | Finland 1.215 1.244 2,4Slowenien | Slovenia 723 790 9,3Irland | Ireland 699 715 2,4Griechenland | Greece 508 533 4,9Luxemburg | Luxembourg 472 532 12,7Kroatien | Croatia 448 474 5,8Bulgarien | Bulgaria 457 450 -1,6Litauen | Lithuania 288 304 5,9Estland | Estonia 173 194 12,3Lettland | Latvia 165 163 -1,3Zypern | Cyprus 63 68 7,3Malta | Malta 71 67 -5,1
SONSTIGES EUROPA OHNE EU | GUSOTHER EUROPE WITHOUT EU | CIS 9.600 9.981 4,0Schweiz | Switzerland 5.214 5.433 4,2Türkei | Turkey 3.091 3.294 6,5Norwegen | Norway 1.036 995 -4Liechtenstein | Liechtenstein 207 198 -4Sonstige | Other 52 61 17,3
SÜD-OSTEUROPA / GUS | SOUTH EAST EUROPE / CIS 3.861 4.211 9,1Russland | Russia 2.514 2.616 4Ukraine | Ukraine 301 418 39,1Serbien | Serbia 285 308 7,9Bosnien-Herzegowina | Bosnia-Herzegovina 112 119 6,3Weißrussland | Belarus 109 105 -3,8Mazedonien | Macedonia 85 103 21,9Kasachstan | Kazakhstan 128 86 -32,9Aserbaidschan | Azerbaijan 47 53 12,9Sonstige | Other 280 403 43,9
AFRIKA | AFRICA 2.802 2.606 -7,0Südafrika | South Africa 1.139 972 -14,7Ägypten | Egypt 396 426 7,6Marokko | Morocco 201 275 36,7
3A Ausfuhr Bayerns nach Ländern 2015|2016 Bavaria’s Exports by Countries 2015|2016
5AUSFUHR BAYERNS NACH LÄNDERN | BAVARIA’S EXPORTS BY COUNTRIES |
Quelle|Source: Bayerisches Landesamt für StatistikDie Veränderung in % wird auf der Basis der endgültigen Werte des Vorjahres berechnet. | The changes in % are calculated on the basis of the final values of the previous year.
Endgültige Daten; vorläufige Daten für das Jahr 2016 | Final data; provisional data for the year 2016.
AUSFUHR IN MIO. EUR NACH STAATEN
2015 2016
(±) zu 2015 in %
EXPORTS IN M EUR BY COUNTRIES (±) to 2015 in %
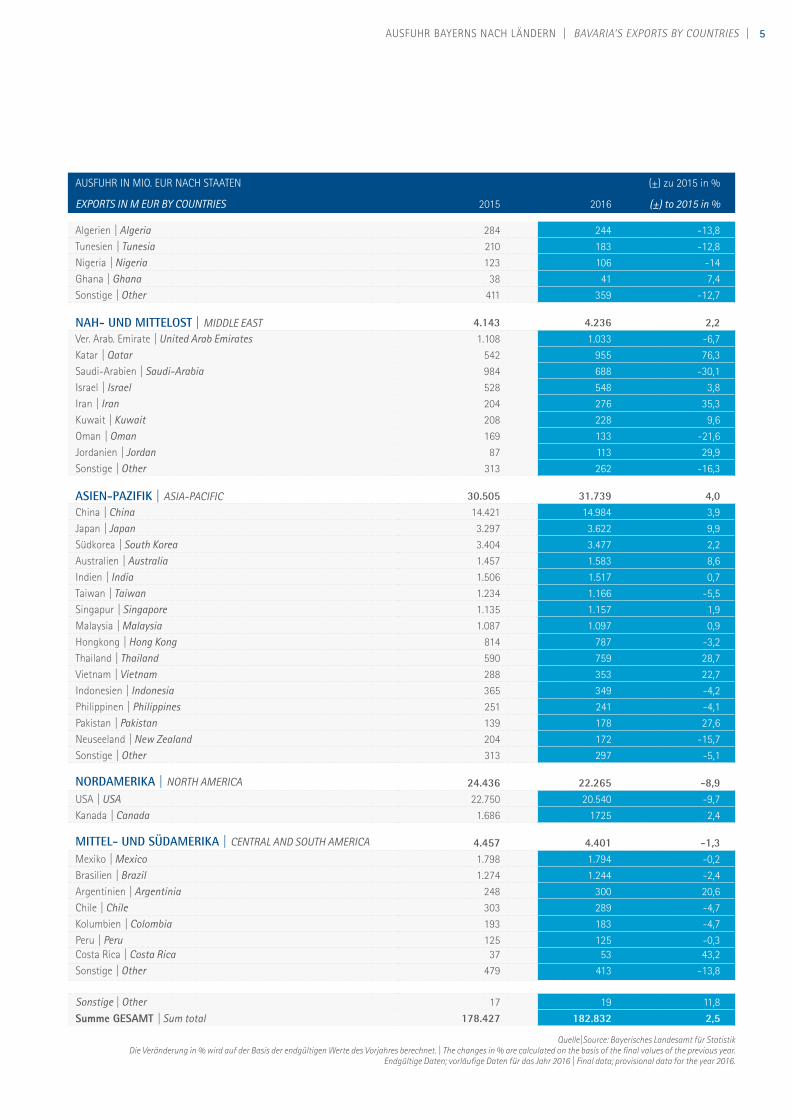
Algerien | Algeria 284 244 -13,8Tunesien | Tunesia 210 183 -12,8Nigeria | Nigeria 123 106 -14Ghana | Ghana 38 41 7,4Sonstige | Other 411 359 -12,7
NAH- UND MITTELOST | MIDDLE EAST 4.143 4.236 2,2Ver. Arab. Emirate | United Arab Emirates 1.108 1.033 -6,7Katar | Qatar 542 955 76,3Saudi-Arabien | Saudi-Arabia 984 688 -30,1Israel | Israel 528 548 3,8Iran | Iran 204 276 35,3Kuwait | Kuwait 208 228 9,6Oman | Oman 169 133 -21,6Jordanien | Jordan 87 113 29,9Sonstige | Other 313 262 -16,3
ASIEN-PAZIFIK | ASIA-PACIFIC 30.505 31.739 4,0China | China 14.421 14.984 3,9Japan | Japan 3.297 3.622 9,9Südkorea | South Korea 3.404 3.477 2,2Australien | Australia 1.457 1.583 8,6Indien | India 1.506 1.517 0,7Taiwan | Taiwan 1.234 1.166 -5,5Singapur | Singapore 1.135 1.157 1,9Malaysia | Malaysia 1.087 1.097 0,9Hongkong | Hong Kong 814 787 -3,2Thailand | Thailand 590 759 28,7Vietnam | Vietnam 288 353 22,7Indonesien | Indonesia 365 349 -4,2Philippinen | Philippines 251 241 -4,1Pakistan | Pakistan 139 178 27,6Neuseeland | New Zealand 204 172 -15,7Sonstige | Other 313 297 -5,1
NORDAMERIKA | NORTH AMERICA 24.436 22.265 -8,9USA | USA 22.750 20.540 -9,7Kanada | Canada 1.686 1725 2,4
MITTEL- UND SÜDAMERIKA | CENTRAL AND SOUTH AMERICA 4.457 4.401 -1,3Mexiko | Mexico 1.798 1.794 -0,2Brasilien | Brazil 1.274 1.244 -2,4Argentinien | Argentinia 248 300 20,6Chile | Chile 303 289 -4,7Kolumbien | Colombia 193 183 -4,7Peru | Peru 125 125 -0,3Costa Rica | Costa Rica 37 53 43,2Sonstige | Other 479 413 -13,8
Sonstige | Other 17 19 11,8
Summe GESAMT | Sum total 178.427 182.832 2,5
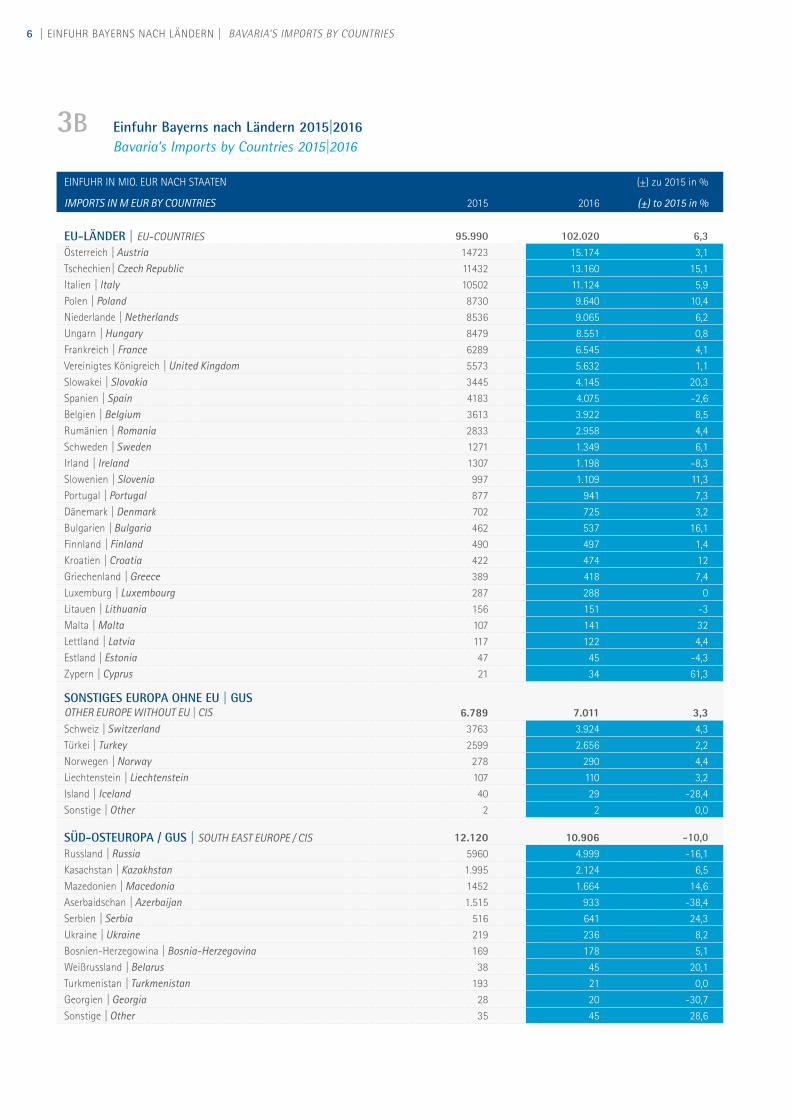
6 | EINFUHR BAYERNS NACH LÄNDERN | BAVARIA’S IMPORTS BY COUNTRIES
EINFUHR IN MIO. EUR NACH STAATEN
2015 2016
(±) zu 2015 in %
IMPORTS IN M EUR BY COUNTRIES (±) to 2015 in %
EU-LÄNDER | EU-COUNTRIES 95.990 102.020 6,3Österreich | Austria 14723 15.174 3,1Tschechien| Czech Republic 11432 13.160 15,1Italien | Italy 10502 11.124 5,9Polen | Poland 8730 9.640 10,4Niederlande | Netherlands 8536 9.065 6,2Ungarn | Hungary 8479 8.551 0,8Frankreich | France 6289 6.545 4,1Vereinigtes Königreich | United Kingdom 5573 5.632 1,1Slowakei | Slovakia 3445 4.145 20,3Spanien | Spain 4183 4.075 -2,6Belgien | Belgium 3613 3.922 8,5Rumänien | Romania 2833 2.958 4,4Schweden | Sweden 1271 1.349 6,1Irland | Ireland 1307 1.198 -8,3Slowenien | Slovenia 997 1.109 11,3Portugal | Portugal 877 941 7,3Dänemark | Denmark 702 725 3,2Bulgarien | Bulgaria 462 537 16,1Finnland | Finland 490 497 1,4Kroatien | Croatia 422 474 12Griechenland | Greece 389 418 7,4Luxemburg | Luxembourg 287 288 0Litauen | Lithuania 156 151 -3Malta | Malta 107 141 32Lettland | Latvia 117 122 4,4Estland | Estonia 47 45 -4,3Zypern | Cyprus 21 34 61,3
SONSTIGES EUROPA OHNE EU | GUSOTHER EUROPE WITHOUT EU | CIS 6.789 7.011 3,3Schweiz | Switzerland 3763 3.924 4,3Türkei | Turkey 2599 2.656 2,2Norwegen | Norway 278 290 4,4Liechtenstein | Liechtenstein 107 110 3,2Island | Iceland 40 29 -28,4Sonstige | Other 2 2 0,0
SÜD-OSTEUROPA / GUS | SOUTH EAST EUROPE / CIS 12.120 10.906 -10,0Russland | Russia 5960 4.999 -16,1Kasachstan | Kazakhstan 1.995 2.124 6,5Mazedonien | Macedonia 1452 1.664 14,6Aserbaidschan | Azerbaijan 1.515 933 -38,4Serbien | Serbia 516 641 24,3Ukraine | Ukraine 219 236 8,2Bosnien-Herzegowina | Bosnia-Herzegovina 169 178 5,1Weißrussland | Belarus 38 45 20,1Turkmenistan | Turkmenistan 193 21 0,0Georgien | Georgia 28 20 -30,7Sonstige | Other 35 45 28,6
3B Einfuhr Bayerns nach Ländern 2015|2016 Bavaria’s Imports by Countries 2015|2016
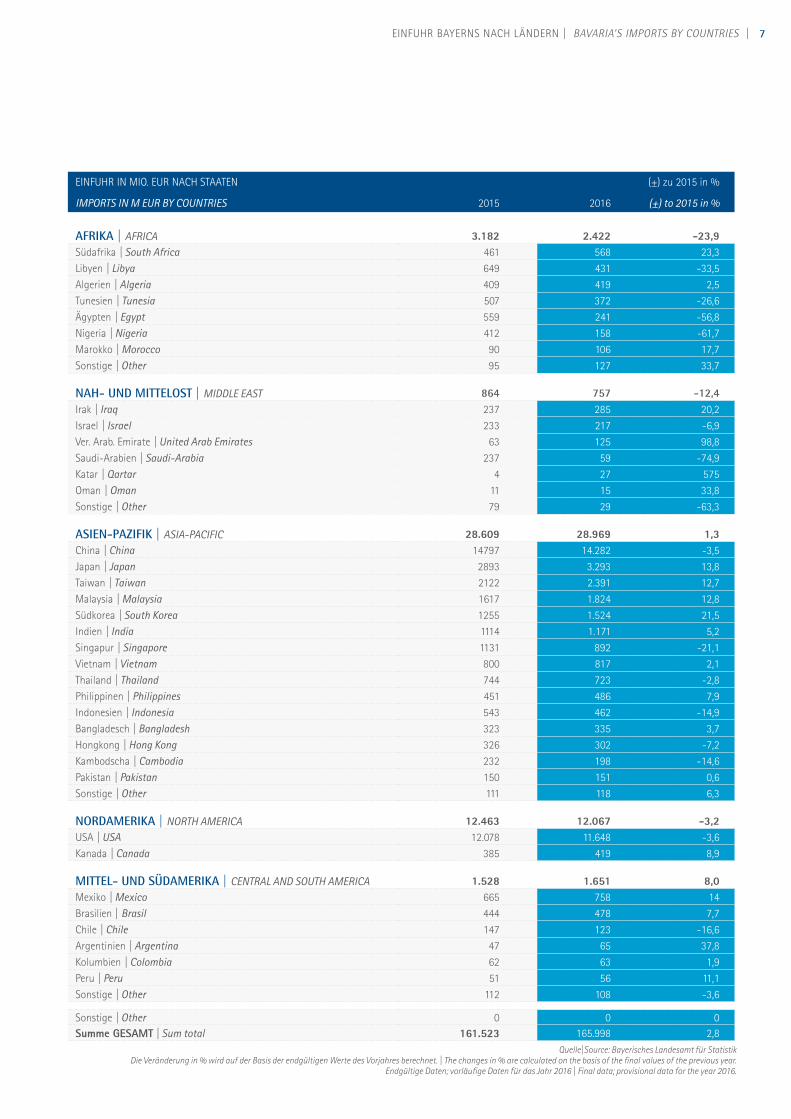
7EINFUHR BAYERNS NACH LÄNDERN | BAVARIA’S IMPORTS BY COUNTRIES |
EINFUHR IN MIO. EUR NACH STAATEN
2015 2016
(±) zu 2015 in %
IMPORTS IN M EUR BY COUNTRIES (±) to 2015 in %
AFRIKA | AFRICA 3.182 2.422 -23,9Südafrika | South Africa 461 568 23,3Libyen | Libya 649 431 -33,5Algerien | Algeria 409 419 2,5Tunesien | Tunesia 507 372 -26,6Ägypten | Egypt 559 241 -56,8Nigeria | Nigeria 412 158 -61,7Marokko | Morocco 90 106 17,7Sonstige | Other 95 127 33,7
NAH- UND MITTELOST | MIDDLE EAST 864 757 -12,4Irak | Iraq 237 285 20,2Israel | Israel 233 217 -6,9Ver. Arab. Emirate | United Arab Emirates 63 125 98,8Saudi-Arabien | Saudi-Arabia 237 59 -74,9Katar | Qartar 4 27 575Oman | Oman 11 15 33,8Sonstige | Other 79 29 -63,3
ASIEN-PAZIFIK | ASIA-PACIFIC 28.609 28.969 1,3China | China 14797 14.282 -3,5Japan | Japan 2893 3.293 13,8Taiwan | Taiwan 2122 2.391 12,7Malaysia | Malaysia 1617 1.824 12,8Südkorea | South Korea 1255 1.524 21,5Indien | India 1114 1.171 5,2Singapur | Singapore 1131 892 -21,1Vietnam | Vietnam 800 817 2,1Thailand | Thailand 744 723 -2,8Philippinen | Philippines 451 486 7,9Indonesien | Indonesia 543 462 -14,9Bangladesch | Bangladesh 323 335 3,7Hongkong | Hong Kong 326 302 -7,2Kambodscha | Cambodia 232 198 -14,6Pakistan | Pakistan 150 151 0,6Sonstige | Other 111 118 6,3
NORDAMERIKA | NORTH AMERICA 12.463 12.067 -3,2USA | USA 12.078 11.648 -3,6Kanada | Canada 385 419 8,9
MITTEL- UND SÜDAMERIKA | CENTRAL AND SOUTH AMERICA 1.528 1.651 8,0Mexiko | Mexico 665 758 14Brasilien | Brasil 444 478 7,7Chile | Chile 147 123 -16,6Argentinien | Argentina 47 65 37,8Kolumbien | Colombia 62 63 1,9Peru | Peru 51 56 11,1Sonstige | Other 112 108 -3,6
Sonstige | Other 0 0 0Summe GESAMT | Sum total 161.523 165.998 2,8
Quelle|Source: Bayerisches Landesamt für StatistikDie Veränderung in % wird auf der Basis der endgültigen Werte des Vorjahres berechnet. | The changes in % are calculated on the basis of the final values of the previous year.
Endgültige Daten; vorläufige Daten für das Jahr 2016 | Final data; provisional data for the year 2016.
8 | EIN- UND AUSFUHR BAYERNS NACH REGIONEN | BAVARIA’S IMPORTS AND EXPORTS BY REGIONS
Nah- und Mittelost Middle East
Sonstiges Europa Other Europe
Central and SouthamericaMittel- und Südamerika
Nordamerika North America
Asien-Pazifik Asia-Pacific
Afrika Africa
Süd-Osteuropa/ GUS South East Europe/ CIS
EU-Länder EU Countries 56,6 %
2,4 %
12,2 %17,4%
1,4 %
2,3 %
2,3 %
5,5 %
61,5 %
1,0 %
7,3 %17,5 %
1,5 %
0,5 %
Nah- und Mittelost Middle East
6,6 %
4,2 %
Sonstiges Europa Other Europe
Central and SouthamericaMittel- und Südamerika
Nordamerika North America
Asien-Pazifik Asia-Pacific
Afrika Africa
Süd-Osteuropa/ GUS South East Europe/ CIS
EU-Länder EU Countries
Quelle|Source: Bayerisches Landesamt für StatistikVorläufige Daten für das Jahr 2016 | Provisional data for the year 2016.
Quelle|Source: Bayerisches Landesamt für StatistikVorläufige Daten für das Jahr 2016 | Provisional data for the year 2016.
4A Ausfuhr Bayerns nach Regionen 2016 Bavaria’s Exports by Regions 2016
4B Einfuhr Bayerns nach Regionen 2016 Bavaria’s Imports by Regions 2016
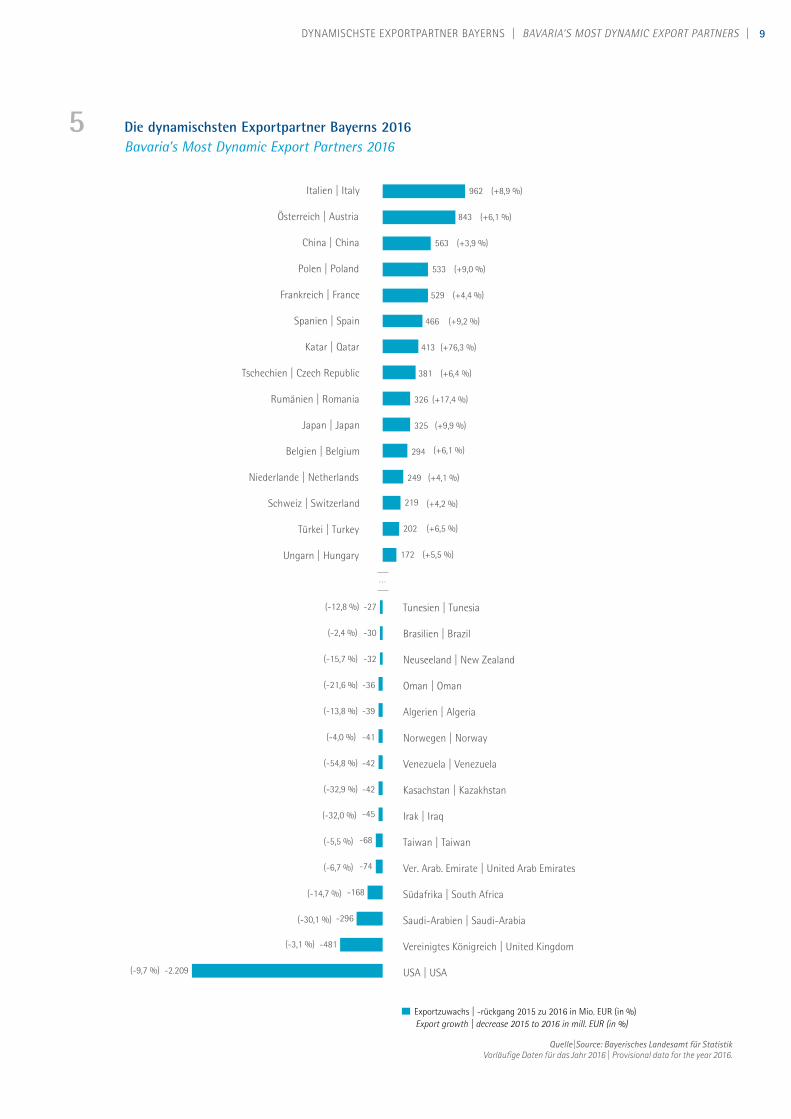
9DYNAMISCHSTE EXPORTPARTNER BAYERNS | BAVARIA’S MOST DYNAMIC EXPORT PARTNERS |
Italien | Italy
Österreich | Austria
China | China
Polen | Poland
Frankreich | France
Spanien | Spain
Katar | Qatar
Tschechien | Czech Republic
Rumänien | Romania
Japan | Japan
Belgien | Belgium
Niederlande | Netherlands
Schweiz | Switzerland
Türkei | Turkey
Ungarn | Hungary
Tunesien | Tunesia
Brasilien | Brazil
Neuseeland | New Zealand
Oman | Oman
Algerien | Algeria
Norwegen | Norway
Venezuela | Venezuela
Kasachstan | Kazakhstan
Irak | Iraq
Taiwan | Taiwan
Ver. Arab. Emirate | United Arab Emirates
Südafrika | South Africa
Saudi-Arabien | Saudi-Arabia
Vereinigtes Königreich | United Kingdom
USA | USA-2.209
-481
-296
-168
-74
-68
-45
-42
-42
-41
-39
-36
-32
-30
-27
172
202
219
249
294
325
326
381
413
466
529
533
563
843
962
Exportzuwachs | -rückgang 2015 zu 2016 in Mio. EUR (in %)
(+8,9 %)
Export growth | decrease 2015 to 2016 in mill. EUR (in %)
(+6,1 %)
(+3,9 %)
(+9,0 %)
(+4,4 %)
(+9,2 %)
(+76,3 %)
(+6,4 %)
(+17,4 %)
(+9,9 %)
(+6,1 %)
(+4,1 %)
(+4,2 %)
(+6,5 %)
(+5,5 %)
(-12,8 %)
(-2,4 %)
(-15,7 %)
(-21,6 %)
(-13,8 %)
(-4,0 %)
(-54,8 %)
(-32,9 %)
(-32,0 %)
(-5,5 %)
(-6,7 %)
(-14,7 %)
(-30,1 %)
(-3,1 %)
(-9,7 %)
…
5 Die dynamischsten Exportpartner Bayerns 2016 Bavaria’s Most Dynamic Export Partners 2016
Quelle|Source: Bayerisches Landesamt für Statistik Vorläufige Daten für das Jahr 2016 | Provisional data for the year 2016.
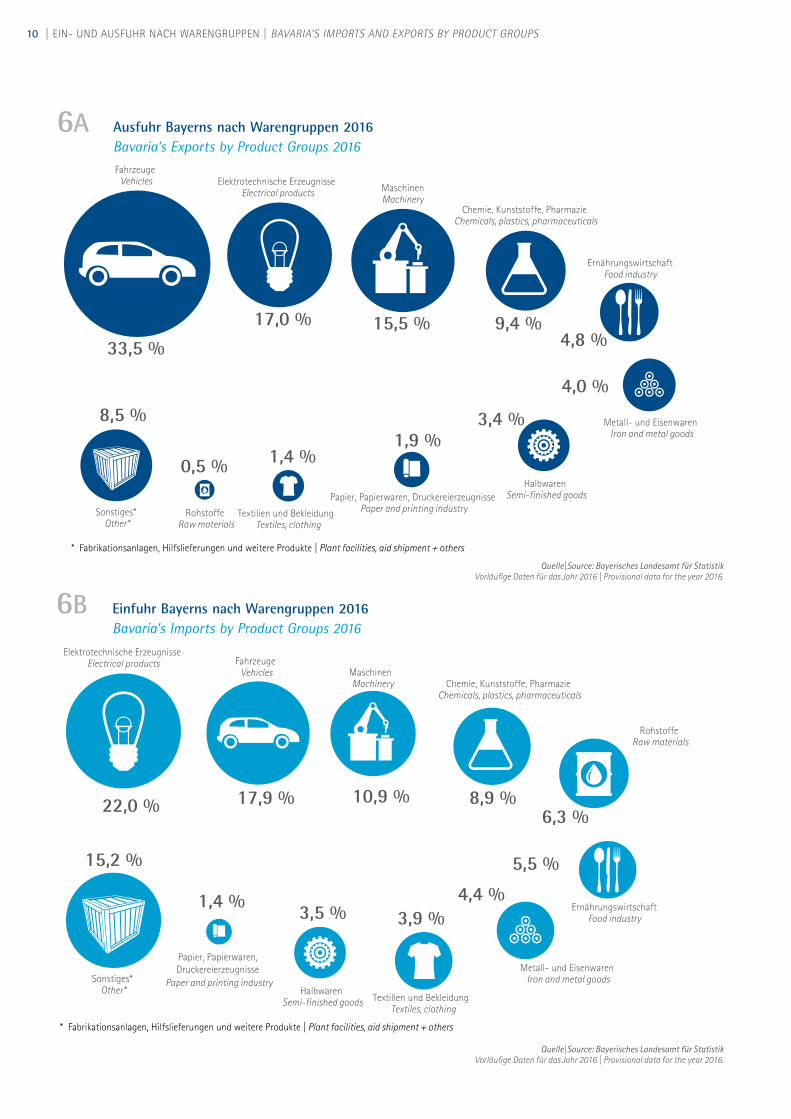
10 | EIN- UND AUSFUHR NACH WARENGRUPPEN | BAVARIA’S IMPORTS AND EXPORTS BY PRODUCT GROUPS
33,5 %9,4 %
3,4 %1,9 %
1,4 %
8,5 %
4,8 %
0,5 %
15,5 %
4,0 %
Fahrzeuge Vehicles Elektrotechnische Erzeugnisse
Electrical products Maschinen Machinery
Chemie, Kunststoffe, Pharmazie Chemicals, plastics, pharmaceuticals
Metall- und Eisenwaren Iron and metal goods
Ernährungswirtschaft Food industry
Halbwaren Semi-finished goodsPapier, Papierwaren, Druckereierzeugnisse
Paper and printing industryTextilien und Bekleidung Textiles, clothing
Rohstoffe Raw materials
Sonstiges* Other*
17,0 %
* Fabrikationsanlagen, Hilfslieferungen und weitere Produkte | Plant facilities, aid shipment + others
17,9 %6,3 %
3,5 %1,4 %3,9 %
15,2 % 5,5 %
8,9 %10,9 %
4,4 %
Fahrzeuge Vehicles
Elektrotechnische Erzeugnisse Electrical products
Maschinen Machinery Chemie, Kunststoffe, Pharmazie
Chemicals, plastics, pharmaceuticals
Metall- und Eisenwaren Iron and metal goods
Ernährungswirtschaft Food industry
Halbwaren Semi-finished goods
Papier, Papierwaren, Druckereierzeugnisse
Paper and printing industryTextilien und Bekleidung
Textiles, clothing
Rohstoffe Raw materials
Sonstiges* Other*
22,0 %
* Fabrikationsanlagen, Hilfslieferungen und weitere Produkte | Plant facilities, aid shipment + others
6A Ausfuhr Bayerns nach Warengruppen 2016 Bavaria’s Exports by Product Groups 2016
6B Einfuhr Bayerns nach Warengruppen 2016 Bavaria’s Imports by Product Groups 2016
Quelle|Source: Bayerisches Landesamt für Statistik Vorläufige Daten für das Jahr 2016 | Provisional data for the year 2016.
Quelle|Source: Bayerisches Landesamt für StatistikVorläufige Daten für das Jahr 2016 | Provisional data for the year 2016.
11KONTAKT ZUR AUSSENWIRTSCHAFT | CONTACT FOR FOREIGN TRADE |
Bayerische Industrie- und Handelskammern Bavarian Chambers of Commerce and Industry
IHK Aschaffenburg | CCI Aschaffenburg
Ursula Müller +49 (0) 6021 880-113 | [email protected] aschaffenburg.ihk.de
IHK zu Coburg | CCI Coburg
Elisabeth Löhr +49 (0) 9561 7426-14 | [email protected] coburg.ihk.de
IHK für München und Oberbayern | CCI for Munich and Upper Bavaria
Frank Dollendorf +49 (0) 89 5116-1368 | [email protected] ihk-muenchen.de
IHK Nürnberg für Mittelfranken | CCI for Nuremberg and Central Franconia
Armin Siegert | +49 (0) 911 1335-397| [email protected] ihk-nuernberg.de
IHK für Niederbayern in Passau | CCI for Lower Bavaria in Passau
Peter Sonnleitner +49 (0) 851 507-245 [email protected] ihk-niederbayern.de
IHK für Oberfranken Bayreuth | CCI for Upper Franconia Bayreuth
Dr. Hans Kolb +49 (0) 921 886-158 | [email protected] bayreuth.ihk.de
IHK Regensburg für Oberpfalz/Kelheim | CCI Regensburg for Upper Palatinate/Kelheim
Dr. Alfred Brunnbauer +49 (0) 941 5694-231 | [email protected] ihk-regensburg.de
IHK Schwaben | CCI Swabia
Axel Sir +49 (0) 821 3162-251 | [email protected] schwaben.ihk.de
IHK Würzburg-Schweinfurt | CCI Wuerzburg-Schweinfurt
Kurt Treumann +49 (0) 931 4194-353 | [email protected] wuerzburg.ihk.de
Bayerisches Staatsministerium für Wirtschaft und Medien, Energie und TechnologieBavarian Ministry of Economic Affairs and Media, Energy and Technology
Abteilung 6 - Internationalisierung und Industrie | Department 6 - Internationalisation and Industry Prinzregentenstraße 28 | 80538 München, Germany
+49 (0) 89 2162-2559 | [email protected]
aussenwirtschaft-in-bayern.de
Bayerische Repräsentanten im Ausland Bavarian Representatives Abroad
bavariaworldwide.de
BAYERN INTERNATIONAL – Bayerische Gesellschaft für Internationale Wirtschaftsbeziehungen mbH
+49 (0) 89 660566-0 [email protected] bayern-international.de
Industrie- und Handelskammernin Bayern
Über uns:Der Bayerische Industrie- und Handelskammertag e.V. (BIHK) ist die Dachorganisation der neun IHKs in Bayern. Alle bayerischen Unternehmen – ausge-nommen Handwerksbetriebe, freie Berufe und landwirtschaftliche Betriebe – sind per Gesetz Mitglied einer IHK. Folglich spricht der BIHK für über 973.000 Unternehmen aller Größen und Branchen: vom global operierenden Konzern bis zum inhabergeführten mittelständischen Unternehmen. Der BIHK ist nicht abhängig von einer bestimmten Gruppe von Unternehmern, sondern repräsentiert das Gesamtinteresse der gewerblichen Wirtschaft in Bayern. Seit seiner Gründung im Jahr 1909 ist er die größte Wirtschaftsorganisation im Freistaat Bayern.
About us:The Association of Bavarian Chambers of Commerce and Industry (Bayerische Industrie- und Handelskammertag – BIHK) is the central organisation for the nine Bavarian CCI (Chamber of Commerce and Industry). All Bavarian companies - with the exception of handicraft businesses, the free professions and agricultural businesses- are required by law to join a CCI. Thus, the BIHK speaks on behalf of more than 973.000 companies of all sizes and trades. This ranges from global corporations to small and medium sized family run businesses. The BIHK is not dependent upon any one specific company or corporate group, but rather represents the overall concerns of the economy in Bavaria. Ever since its foundation in 1909 the BIHK has been the largest economic organisation in the Free State of Bavaria.
Impressum | Publishing Information
Bayerischer Industrie- und Handelskammertag e. V. Association of Bavarian Chambers of Commerce and Industry Peter Driessen und Dr. Eberhard Sasse
Balanstraße 55-59, 81541 München +49 (0) 89 - 5116 - 0 [email protected] bihk.de
Ansprechpartner | Contact person: Ilga Koners, IHK für München und Oberbayern
Gestaltung | Creation: Word Wide KG, München
Druck | Printed by: Satz & Druck Peter Molnar, Blumenstraße 26, 82407 Wielenbach
Foto | Picture Credit: iStock.com/donvictorio
17. Auflage, Stand Juni 2017