Embed Size (px)
Citation preview
Politikberatung kompakt
Energy, Climate, and Policy towards 2055: An Interdisciplinary Energy Outlook (DIW-REM Outlook)
139
Dawud Ansari, Franziska Holz, Hashem al-Kuhlani
Deutsches Institut für Wirtschaftsforschung 2019
IMPRESSUM © DIW Berlin, 2019 DIW Berlin Deutsches Institut für Wirtschaftsforschung Mohrenstraße 58 10117 Berlin Tel. +49 (30) 897 89-0 Fax +49 (30) 897 89-200 www.diw.de ISBN 978-3-946417-31-6 ISSN 1614-6921 Alle Rechte vorbehalten. Abdruck oder vergleichbare Verwendung von Arbeiten des DIW Berlin ist auch in Auszügen nur mit vorheriger schriftlicher Genehmigung gestattet.
DIW Berlin: Politikberatung kompakt 139
Dawud Ansari 1, 2, * Franziska Holz 1, 3, + Hashem al-Kuhlani 1, 2, # Energy, climate, and policy towards 2055: An interdisciplinary energy outlook (DIW-REM Outlook)
This report contains results from research projects for the European Commission and the German Federal Ministry of Education and Research (‘SET-Nav’, H2020 grant agreement no. 691843; ‘FoReSee’, BMBF Economics of Climate Change grant agreement no 01LA1811B). Berlin, August 2019 1 DIW Berlin, Department Energy, Transportation, Environment 2 Energy Access and Development Program (EADP) 3 Norwegian University of Science and Technology (NTNU) * [email protected] / [email protected] + [email protected] # [email protected]
DIW Berlin: Politikberatung kompakt 139 Content
Content Content ........................................................................................................................... III
List of Figures ................................................................................................................... IV
List of Tables ..................................................................................................................... V
Executive Summary and policy recommendations ............................................................. 6
1 Introduction: The history and theory of scenarios ......................................................... 8
2 Overview.................................................................................................................... 11
3 The four narratives ..................................................................................................... 16
3.1 Business as Usual ......................................................................................................... 16
3.1.1 The Paris promise: between targets and ambitions in the 2020s ..................... 16
3.1.2 Catching up after 2030? .................................................................................... 18
3.2 Survival of the Fittest ................................................................................................... 20
3.2.1 A world apart ..................................................................................................... 20
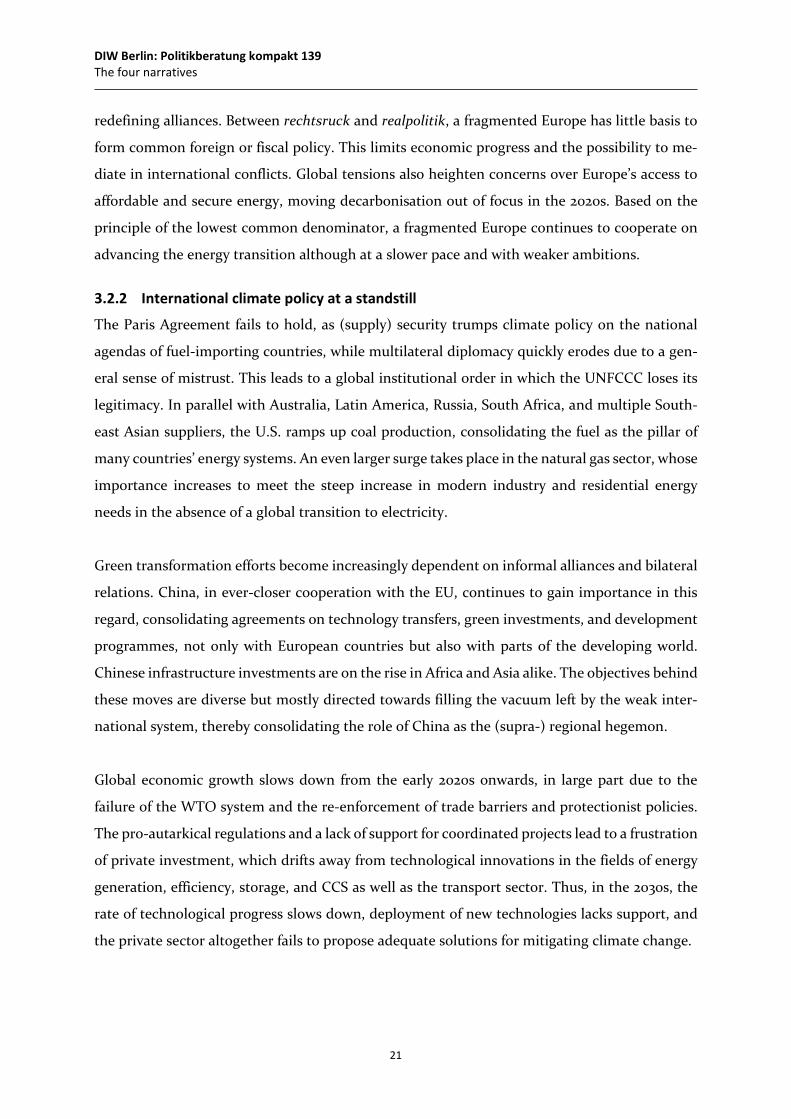
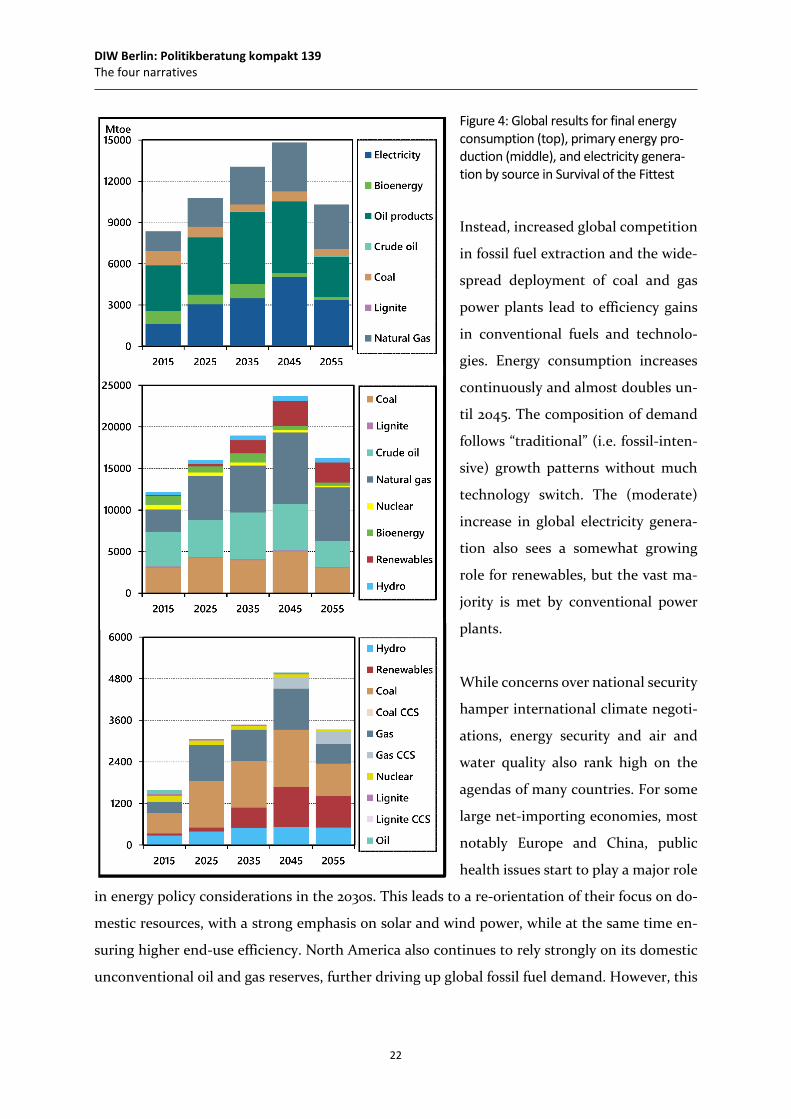
3.2.2 International climate policy at a standstill ........................................................ 21
3.3 Green Cooperation ...................................................................................................... 24
3.3.1 Clean Peace ........................................................................................................ 24
3.3.2 The future of green synergies ........................................................................... 26
3.4 ClimateTech ................................................................................................................. 28
3.4.1 Time is on my side ............................................................................................. 28
3.4.2 A tale of sulphates and nucléocrates ................................................................ 29
4 Analysis of the global level ......................................................................................... 33
5 Regional analyses ....................................................................................................... 36
5.1 Europe .......................................................................................................................... 36
5.2 Middle East .................................................................................................................. 37
5.3 South America .............................................................................................................. 39
5.4 Asia-Pacific ................................................................................................................... 40
5.5 North America .............................................................................................................. 42
6 Indicators ................................................................................................................... 44
7 Outlooks compared .................................................................................................... 48
8 Stranded assets in the Global South ............................................................................ 56
8.1 Introduction ................................................................................................................. 56
8.2 Assessing stranded assets ............................................................................................ 57
9 Conclusions and lessons learnt ................................................................................... 59
DIW Berlin: Politikberatung kompakt 139 List of Figures
Acknowledgements ........................................................................................................ 62
Methodological appendix ............................................................................................... 63
A1 Generating scenarios ...................................................................................................... 63
A2 Stranded assets index..................................................................................................... 67
A3 Data structure and sources ............................................................................................ 68
References ...................................................................................................................... 72
List of Figures Figure 1: Illustration of the scenario cone ............................................................................... 10
Figure 2: Illustration of the main developments over time in the four scenarios ................... 12
Figure 3: Global results for final energy consumption (top), primary energy production (middle), and electricity generation by source in Business as Usual ......................... 17
Figure 4: Global results for final energy consumption (top), primary energy production (middle), and electricity generation by source in Survival of the Fittest................... 22
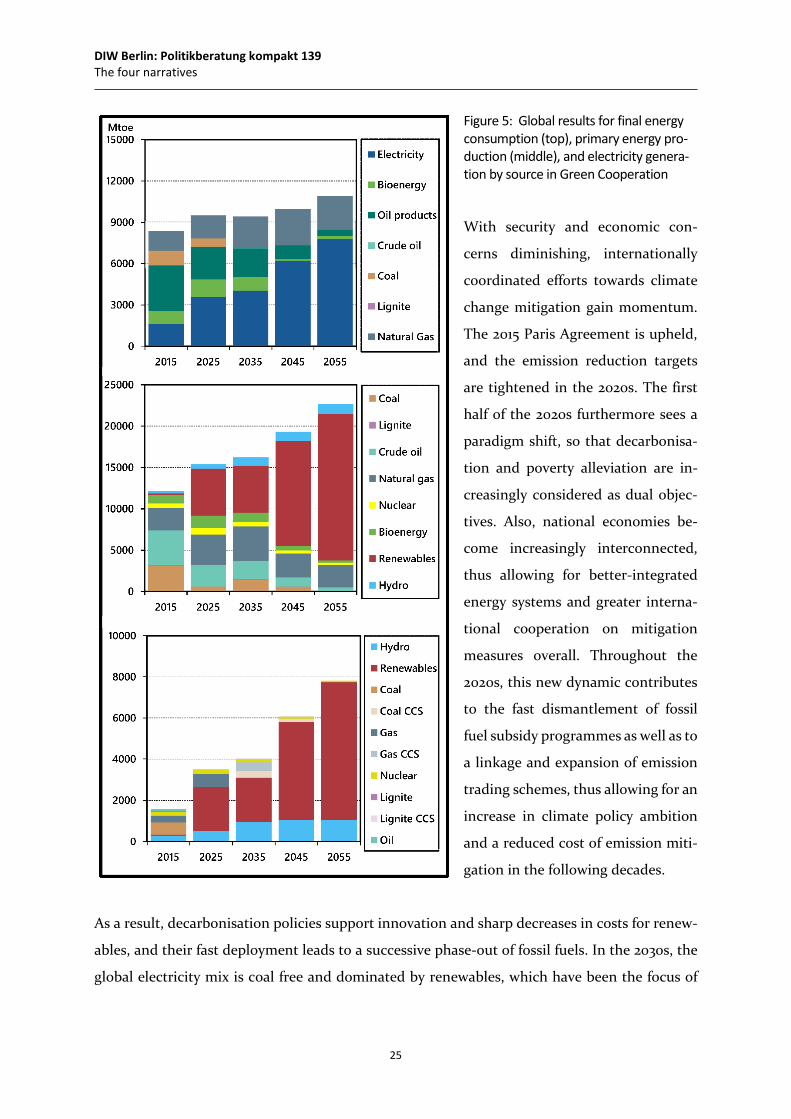
Figure 5: Global results for final energy consumption (top), primary energy production (middle), and electricity generation by source in Green Cooperation ...................... 25
Figure 6: Global results for final energy consumption (top), primary energy production (middle), and electricity generation by source in ClimateTech ................................. 30
Figure 7: Final energy consumption (left), electricity consumption (middle), and CO2 net emissions (right) as percentage changes from 2015 values compared between the scenarios ............................................................................................... 34
Figure 8: Fossil fuel production (left, as percent of 2015 values) and renewable electricity generation (right, as percent of total electricity) compared between the scenarios .............................................................................................................. 35
Figure 9: Final energy consumption (top) and primary energy production (bottom) for the European Union ................................................................................................... 36
Figure 10: Electricity mix for the European Union in the four scenarios ................................. 37
Figure 11: Final energy consumption (top) and primary energy production (bottom) for the Middle East region ............................................................................................. 38
Figure 12: Electricity mix for the Middle East Region in the four scenarios ............................ 38
Figure 13: Final energy consumption (top) and primary energy production (bottom) for Latin America in the four scenarios ......................................................................... 40
Figure 14: Electricity mix for Latin America in the four scenarios ........................................... 40
Figure 15: Final energy consumption (top) and primary energy production (bottom) for Asia-Pacific ............................................................................................................... 41
DIW Berlin: Politikberatung kompakt 139 List of Tables
Figure 16: Electricity mix for Latin America in the four scenarios ........................................... 41
Figure 17: Final energy consumption (top) and primary energy production (bottom) for North America ......................................................................................................... 43
Figure 18: Electricity mix for North America in the four scenarios .......................................... 43
Figure 19: Quantitative indicators for all four dimensions ...................................................... 47
Figure 20: Global total primary energy demand, coal demand, and electricity generation compared .............................................................................................. 50
Figure 21: Total primary energy demand, coal demand, and electricity generation in the European Union compared ............................................................................... 52
Figure 22: Total primary energy demand, coal demand, and electricity generation in Asia-Pacific compared .............................................................................................. 53
Figure 23: Global total primary energy demand, coal demand, and electricity in North America compared .................................................................................................. 55
Figure 24: Illustration of the methods ..................................................................................... 63
Figure 25: Overview of the regional disaggregation ................................................................ 66
Figure 26: Illustration of the modelled value chains ................................................................ 66
List of Tables Table 1: Qualitative indicators for all four scenarios by dimension ........................................ 44
Table 2: Values for the stranded asset index ........................................................................... 57
Table 3: Megatrends and key assumptions ............................................................................. 64
Table 4: Drivers in each scenario ............................................................................................. 65
Table 5: Main sources for sectoral input data ......................................................................... 69
Table 6: Main sources and assumptions for the narratives p.d.: per decade.......................... 70
DIW Berlin: Politikberatung kompakt 139 Executive Summary and policy recommendations
6
Executive Summary and policy recommendations
• The energy system is subject to substantial uncertainty over the coming decades. Energy
outlooks inform analysts and decision-makers about potential developments. Scenarios
do not typically aim at predicting the future, but at giving bounds to the range of plau-
sible developments. In other words, energy outlooks provide readers with information
on how current drivers will manifest in specific futures.
• In a three-year study, we have composed an independent energy outlook, which focusses
equally on “conventional” factors (i.e. technology development, climate policies) as well
as more unconventional factors, such as (geo-)politics, the state of global governance,
and the role of society. These factors were integrated in a multi-step process that fea-
tured expert-led qualitative analyses and quantitative energy sector modelling.
• The outlook contains four scenarios (base case ‘Business as Usual’, worst case ‘Survival
of the Fittest’, best case ‘Green Cooperation’, and surprise case ‘Climate Tech’) that
depict plausible alternative futures of global energy, climate, and policy. Each scenario
contains a detailed storyline of the events between today and 2055, including figures for
global energy production and consumption as well as the electricity mix. Moreover, this
report presents energy system metrics for selected regions in more detail and includes a
comparison with other prominent outlooks. We also discuss stranded assets in the fossil
resource sector and the related risks that become apparent in our outlook.
The following conclusions and recommendations are found:
o A return to political isolationism is a critical risk for the energy transition: First, effective
climate policies require international collaboration. Second, the energy transition de-
pends on channelling investments into the ‘right’ directions, whereas lacking global co-
ordination leads to ambiguous (technological) developments and competing technolo-
gies. Substantial increases in the global temperature risk to create massive refugee waves,
further fuelling inter-regional tensions.
o Public opinion and societal transitions are an integral component of decarbonisation ef-
forts. It is highly unlikely that technological progress alone will be sufficient to outweigh
missing efforts to phase-out fossil fuel consumption. Deep decarbonisation necessitates
a holistic transition that includes society.
DIW Berlin: Politikberatung kompakt 139 Executive Summary and policy recommendations
7
o The integration of economic and energy-related objectives and incentives (e.g. poverty
alleviation, infrastructure modernisation, and private investment) is crucial. Technology
transfer, the creation of incentives, and geopolitical reconciliation are necessary for a
successful global transition.
o Energy importers need to consider the exporters’ perspectives. Asset stranding, that is
the depreciation of assets due to sudden policies or market disruptions, is a risk for fossil-
fuel dependent economies with limited diversification of exports and of fiscal budgets.
There is a high risk for market rebounds and increasing political tensions that can dam-
age decarbonisation efforts and fragile security environments alike.
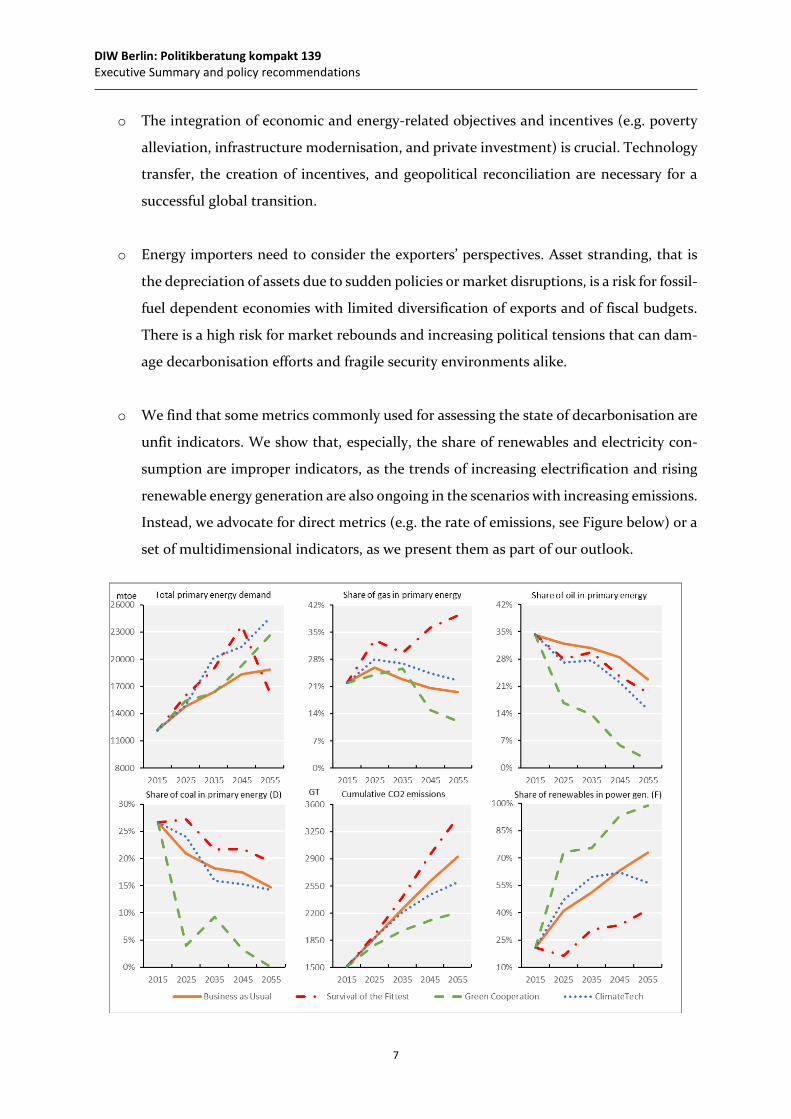
o We find that some metrics commonly used for assessing the state of decarbonisation are
unfit indicators. We show that, especially, the share of renewables and electricity con-
sumption are improper indicators, as the trends of increasing electrification and rising
renewable energy generation are also ongoing in the scenarios with increasing emissions.
Instead, we advocate for direct metrics (e.g. the rate of emissions, see Figure below) or a
set of multidimensional indicators, as we present them as part of our outlook.
DIW Berlin: Politikberatung kompakt 139 Introduction: The history and theory of scenarios
8
1 Introduction: The history and theory of scenarios
Van Notten (2005, p. 7) defines scenarios as “consistent and coherent descriptions of alternative
hypothetical futures that reflect different perspectives on past, present, and future develop-
ments, which can serve as a basis for action”. They differ from other methods, mainly in the type
of questions. While contingency planning focuses on ‘what if?’ questions by presenting a base
case and an exception (or contingency), “scenarios explore the joint impact of various uncertain-
ties which stand side by side as equals” (Schoemaker, 1995, p. 26). Scenario building also differs
from sensitivity analysis with regards to how uncertainty is approached. While the former gen-
erally considers simultaneous modifications of several variables, sensitivity analysis only focuses
on the effect of modifying one variable while keeping everything else unchanged.
Although some suggest that scenarios date back to the 19th century and military strategists such
as von Clausewitz (Bradfield et al., 2005), the use of modern scenario techniques started after
the Second World War. Rand Corporation was among the first organisations to provide scenario-
based services for the Pentagon. Herman Kahn, a top strategist for Rand in the 1950s, was the
one to begin developing scenarios that altered the US military’s approach to thermonuclear war,
most notably in consideration to ‘thinking the unthinkable’, which allowed for alternative strat-
egies to annihilation or surrender (ibid., p. 798). Methods used at the time ranged from Delphi
techniques to cross-impact matrices.
In the 1960s and 70s, scenario development finally emerged as a tool not only for public policy
but also for strategic corporate purposes. Wack (1985, p. 73) explains the emergence of so-called
‘scenario planning’:
‘Beginning in the late 1960s and early 1970s, Shell developed a technique known as “scenario plan-
ning.” By listening to planners’ analysis of the global business environment, Shell’s management
was prepared for the eventuality—if not the timing—of the 1973 oil crisis. And again in 1981,
when other oil companies stockpiled reserves in the aftermath of the outbreak of the Iran-Iraq
war, Shell sold off its excess before the glut became a reality and prices collapsed.’
Hence, scenario planning allowed Shell to respond quickly to the oil crises of 1973 and 1981. It
contributed to the company becoming one of the stronger “Seven Sisters”. The original raison
d’être of scenario planning was, therefore, to help (corporate) decision-makers open their minds
to improbable future developments contingent on previously ‘inconceivable or imperceptible’
change (Wilkinson and Kupers, 2013, p. 118).
DIW Berlin: Politikberatung kompakt 139 Introduction: The history and theory of scenarios
9
Scenarios, in this sense, need to be distinguished from other future-oriented methods, most im-
portantly from forecasting methods and other prediction-oriented techniques. The latter seek
to predict the future with the utmost accuracy and answer the question ‘What will happen?’.
Given the highly complex nature of a system such as that of global energy, which sits on the
interplay of dozens if not hundreds of parameters, that quest is most likely bound to fail.
Instead, scenario analysis considers the questions ‘What can happen?’ and, in certain applica-
tions, ‘What should happen?’. Scenarios, as Wilkinson and Kupers (2013, p. 121) describe it, “are
intended to set the stage for a future world in which readers imagine themselves as actors and
are invited to pay attention to deeply held assumptions about how that world works. What hap-
pens at a scenario’s horizon date is not as important as the storyline’s clarity of logic and how it
helps open the mind to new dynamics”. Therefore, the “strength of scenarios is that they do not
describe just one future, but that several realisable or desirable futures are placed side by side.”
(Mietzner and Reger, 2005, p. 235). In this context, and opposed to forecasting, the term “plau-
sibility” is more central than “probability” (Derbyshire, 2017). Scenarios, hence, explore the range
of plausible futures rather than necessarily aiming at finding the most probable one of them.
Forecasting, in contrast, is based on computer simulations and tends to reason from continuous
developments and linear processes, which does not allow the outlook to reflect discontinuity,
whether in the form of sudden technological breakthroughs, economic booms and busts, or a
geopolitical shift (Söderholm et al., 2011; Van Notten, 2005). Scenario studies are intrinsically
better suited, if not for anticipating sudden changes, at least for facilitating early response sys-
tems to them. Therefore, scenarios are often equipped with diagnostic indicators, which help
observers monitor the situation and reveal which scenario eventually unfolds (e.g. Heuer and
Pherson, 2015).
Moreover, there is a seemingly small yet important distinction between scenario building and
scenario planning. As summarised by Mietzner and Reger (2005, p. 223), “building scenarios
means speculating about the uncertainty surrounding the future”, whereas scenario planning is
“a management technology used by managers to articulate their mental models about the future
and thereby make better decisions” and thereby relies on the former as its foundation.
Ultimately, scenario building exercises rely on a smart balance between qualitative and quanti-
tative information inputs that can tell “a story of how various elements might interact under
uncertain conditions” (Schoemaker, 1995, p. 26). Nevertheless, the actual way of handling both
inputs varies considerably and may range from thorough methods for including a multitude of
DIW Berlin: Politikberatung kompakt 139 Introduction: The history and theory of scenarios
10
drivers to the use of numerical models to combinations of them. Often, several scenarios are
developed by the same institution at the same time, with the desire to englobe the largest plau-
sible range of potential future realization.
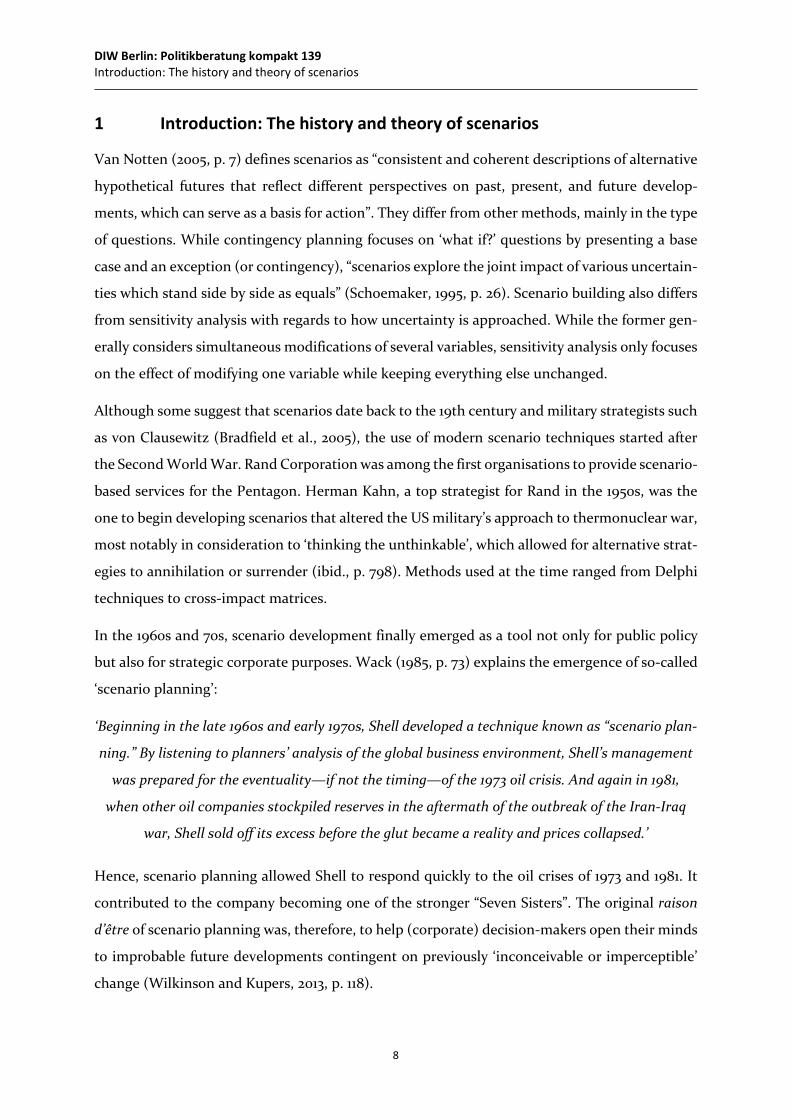
This range of potential futures is often referred to as the ‘scenario cone’ or the ‘cone of plausi-
bility’ (Figure 1), as the uncertainty (and, hence, the spread between the scenarios) increases
over time (e.g. Amer et al., 2013). Scenarios are specific futures that typically lie in the area of
plausible developments, which is to be distinguished from the probable developments. The lat-
ter are the futures that seem most likely based on a projection of the present. Either of these
areas can or cannot overlap with the space of preferable scenarios, i.e. the developments and
outcomes that are normatively desirable. Beyond the borders of plausible developments are the
implausible but possible developments, which can be envisioned but do not seem reasonable
from today’s point of few. Even further outside the circle of plausible developments, we find the
space of developments that are labelled as impossible to occur.
Still, an important dimension frequently side-lined in energy scenarios is social transition. Sce-
narios "barely take lifestyle sufficiency into account”, although “sufficiency and changes in life-
style should rather be embedded, discussed and quantified independently of technology deci-
sions” (Samadi et al., 2017, p. 132). In the following outlook, we will see that this dimension is, at
best, part of those scenarios that include a detailed analysis of their vision and drivers.
Figure 1: Illustration of the scenario cone
DIW Berlin: Politikberatung kompakt 139 Overview
11
2 Overview
This report presents a novel and independent energy outlook1 towards 2055. Similar to other
prominent outlooks, such as the IEA’s World Energy Outlook or the Royal Dutch Shell scenarios,
our outlook illustrates possible global futures and provides readers with several insights on en-
ergy, climate, and interrelating fields.
The outlook is the result of a three-year study by the research group Resource and Environmen-
tal Markets at the German Institute for Economic Research (DIW-REM). Its development has
been part of research projects for the European Commission and the German Federal Ministry
of Education and Research. The scenarios (to which we refer as ‘narratives’) depict the broad
range of plausible developments in the years to come (cf. Figure 1). Each narrative starts in 2015
and describes a plausible (but not necessarily probable) path of the world towards 2055. Pre-
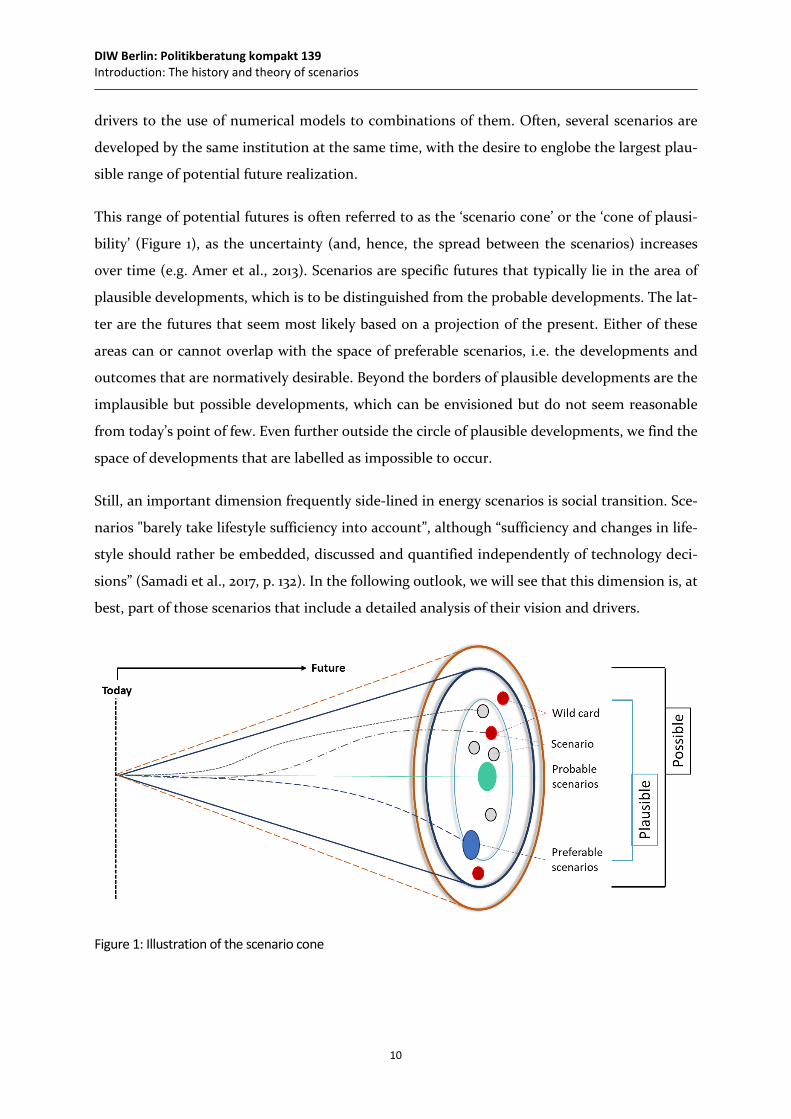
cisely, the outlook comprises the following four scenarios:
• Business as Usual: A vision of the developments to happen if current trends are set to
continue, i.e. the conflicting interests of various state and market actors in a tense
(geo-)political environment lead to a diverse and ambiguous future energy system
(which fails to curb emissions).
• Survival of the Fittest: A worst-case vision of a world that disaggregates into various
competing (regional) actors, who show only little regard to decarbonisation efforts and
instead ramp up previous commitments in fossil fuels, eventually leading to a consolida-
tion of power before large-scale climate catastrophes disrupt the world entirely.
• Green Cooperation: A best-case vision of the revival of global cooperation and collab-
oration between different states and within them, which enables markets to allocate in-
vestments in the various technologies required to turn civilisation, society, and growth
green.
• ClimateTech: A surprise-case vision (wild card) of a technology-centred world in the
aftermath of sudden advancements in various energy and climate technologies, which
ultimately succeed in curbing emissions but fail to address the underlying social and
economic structures preventing deep decarbonisation.
1 To avoid confusion, we shall use ‘outlook’ to describe a set of scenarios that are generate by one source; and we shall use ‘scenario’ to describe a particular future.
DIW Berlin: Politikberatung kompakt 139 Overview
12
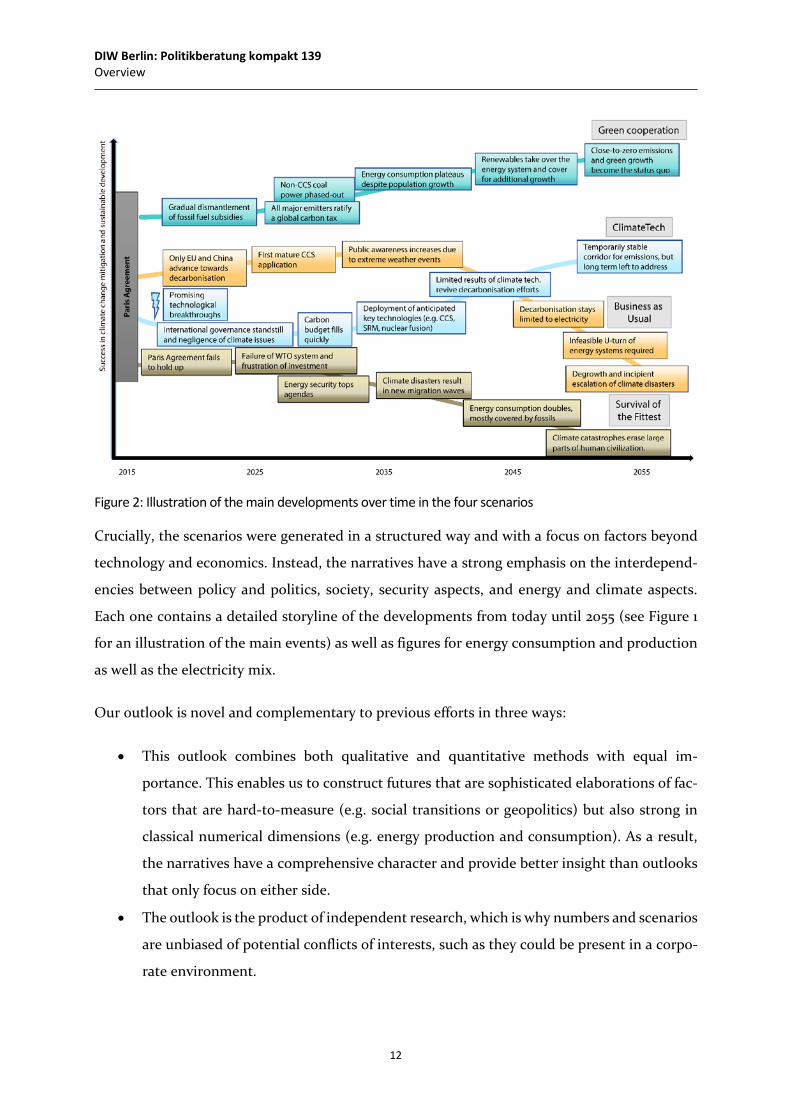
Figure 2: Illustration of the main developments over time in the four scenarios
Crucially, the scenarios were generated in a structured way and with a focus on factors beyond
technology and economics. Instead, the narratives have a strong emphasis on the interdepend-
encies between policy and politics, society, security aspects, and energy and climate aspects.
Each one contains a detailed storyline of the developments from today until 2055 (see Figure 1
for an illustration of the main events) as well as figures for energy consumption and production
as well as the electricity mix.
Our outlook is novel and complementary to previous efforts in three ways:
• This outlook combines both qualitative and quantitative methods with equal im-
portance. This enables us to construct futures that are sophisticated elaborations of fac-
tors that are hard-to-measure (e.g. social transitions or geopolitics) but also strong in
classical numerical dimensions (e.g. energy production and consumption). As a result,
the narratives have a comprehensive character and provide better insight than outlooks
that only focus on either side.
• The outlook is the product of independent research, which is why numbers and scenarios
are unbiased of potential conflicts of interests, such as they could be present in a corpo-
rate environment.
DIW Berlin: Politikberatung kompakt 139 Overview
13
• While most outlooks rely on simulations or linear optimisations, this outlook makes
(rare) use of a complementarity model. Therefore, our quantitative analysis is better
suited to give insights into actual (energy) market dynamics than other outlooks.
The remainder of this report proceeds as follows:
Section 3 covers the core of the outlook, i.e. the four narratives. After a brief overview, we pre-
sent their qualitative storylines along with figures for global final energy consumption, global
primary energy production, and the global electricity generation mix.
Section 4 summarises the figures for the global level and analyses them in the context of decar-
bonisation and the energy transition.
Section 5 continues the outlook by presenting and describing the regional figures for final en-
ergy consumption, primary energy production, and power generation mix in the European Un-
ion, the Middle East, South America, Asia-Pacific, and North America.
Section 7 proceeds with a comparison of our outlook to other prominent outlooks. The section
elaborates on differences and similarities for the global numerical figures as well as regional
metrics for Europe, Asia-Pacific, and North America.
Section 8 is a side-note dedicated to stranded assets, a topic of rising importance in the energy
industry. The section introduces the issue and provides an index that indicates the risk for asset
stranding in the Middle East, China, and South America, based on the outlook’s numbers.
Section 6 provides qualitative and quantitative indicators for the scenarios, i.e. a set of diagnos-
tic observables that enable readers to monitor the situation and track which scenario eventually
unfolds.
A Acknowledgements
We thank Oliver Gnad, Nathan Appleman, Hasan Basri Tosun, Ezaldeen Aref, Ruud Egging,
Daniel Huppmann, Sauleh Siddiqui, Christian von Hirschhausen, Claudia Kemfert, Anna Pegels,
DIW Berlin: Politikberatung kompakt 139 Overview
14
Ambria Fareed, Christian Hauenstein, Jimi Oke, Pao-Yu Oei, Konstantin Löffler, Thorsten Bu-
randt, Katherine Croll-Knight, Isabell Braunger, and Gustav Resch for their helpful comments
on earlier versions of the manuscript.
We are indebted to the participants in the DIW Berlin Scenario Foresight Workshop in Novem-
ber 2016 and the TU Berlin Scenario Workshop in April 2018. We are also grateful for comments
at the Berlin Conference on Energy and Electricity Economics 2017 and 2018 (Berlin, Germany),
the IHS and ÖGOR workshop Mathematical Economics and Optimisation in Energy Economics
2018 (Vienna, Austria), the Transatlantic Infraday 2018 (Washington DC, USA), and the 41st IAEE
International Conference 2018 (Groningen, Netherlands), the “Green transformation and com-
petitive advantage” conference in July 2018 at GDI in Bonn, and the HU Berlin FoReSee Work-
shop in March 2019.
This project received funding from the European Union’s Horizon 2020 research and innovation
programme under grant agreement no. 691843 (SET-Nav) and the German Federal Ministry of
Education and Research’s research program Economics of Climate Change II, grant agreement
no. 01LA1811B (FoReSee). The authors declare that there is no conflict of interest.

DIW Berlin: Politikberatung kompakt 139 Overview
15
Methodological appendix provides further information on the methods that were used for gen-
erating this outlook.
DIW Berlin: Politikberatung kompakt 139 The four narratives
16
3 The four narratives
3.1 Business as Usual
3.1.1 The Paris promise: between targets and ambitions in the 2020s
In the Business as Usual scenario, geopolitical tensions and localised conflict continue in the
late 2010s and early 2020s, not only in the Middle East and Africa but also in OECD countries.
While this geopolitical situation does not directly impact the accomplishment of climate targets
set by countries in their NDCs, political priorities are diverted away from climate and energy
issues.
The 2015 Paris Agreement was only a first step and poses several additional challenges: While
ambitions on mitigation objectives are converging, much still needs to be done with regards to
actual measures. The climate targets that were announced in the NDCs following the Paris
Agreement are mostly met in the Business as Usual scenario. However, the re-evaluation of those
targets and associated measures, agreed to take place every five years, brings only modest
changes to the original ambitions of the signatory countries. Between 2019 and 2025, among the
top 10 GHG emitters that signed the Paris Agreement, only the EU and China effectively scale
up their efforts. Further questions relating to financing schemes to support developing coun-
tries’ plans as well as frameworks that could foster technology transfers have yet to be addressed.
Schemes such as the Green Climate Fund and the Global Environment Facility are present on
paper but fail to kickstart effectively. This limited progress is connected to a general increase in
struggles to find a global common stance: Many United Nations initiatives (including the UN-
FCCC) hold firm but face a cooling of international relations, a growing divergence in national
interests, and thus, a weakening of their legitimacy and influence.
By the mid-2020s, carbon pricing is not enforced globally but instead relies on regional, national,
and local implementation. EU policies for a green transition become more stringent although
political differences and national interests mean a decarbonised Europe is still far from a reality.
The United States does not witness major changes with regards to the pace of clean energy de-
ployment. Country-wide carbon pricing remains absent, and the regional extent of decarboni-
sation efforts is heterogeneous. Some states rely on cap-and-trade initiatives, but others refuse
to introduce new bills, often due to pressure from large upstream (fossil fuel) and downstream
(conventional) energy companies, which continue to be crucial to many local economies.
DIW Berlin: Politikberatung kompakt 139 The four narratives
17
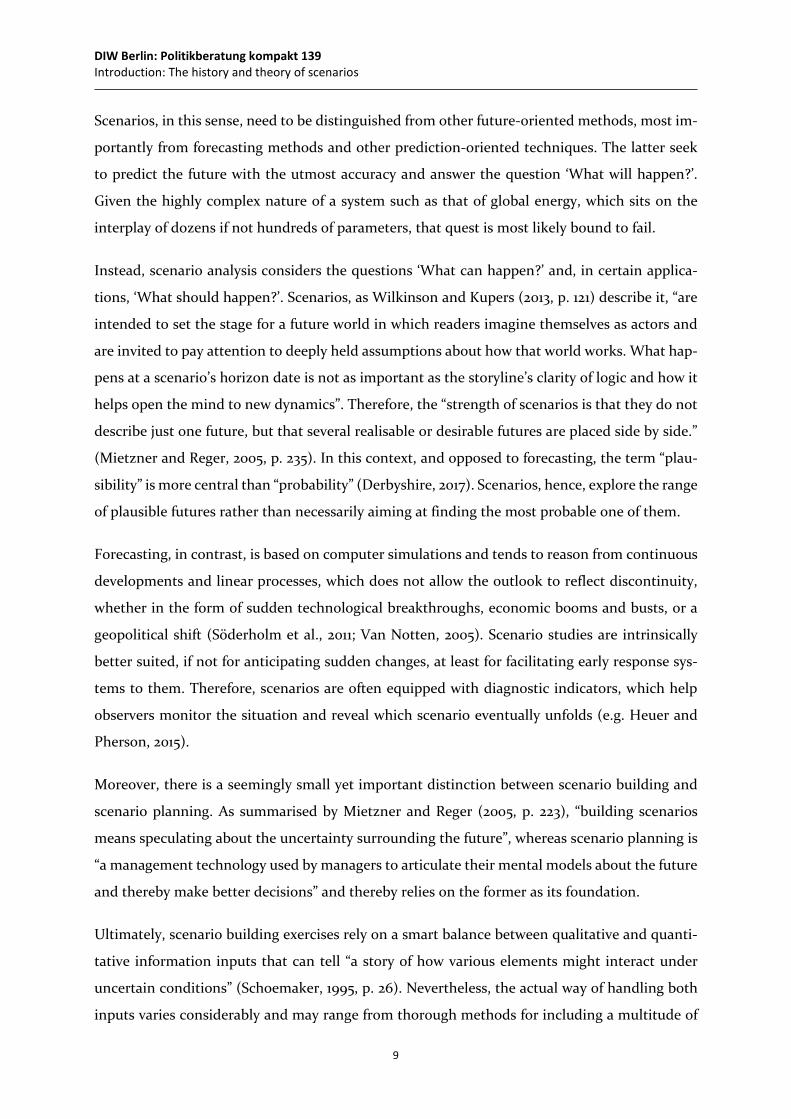
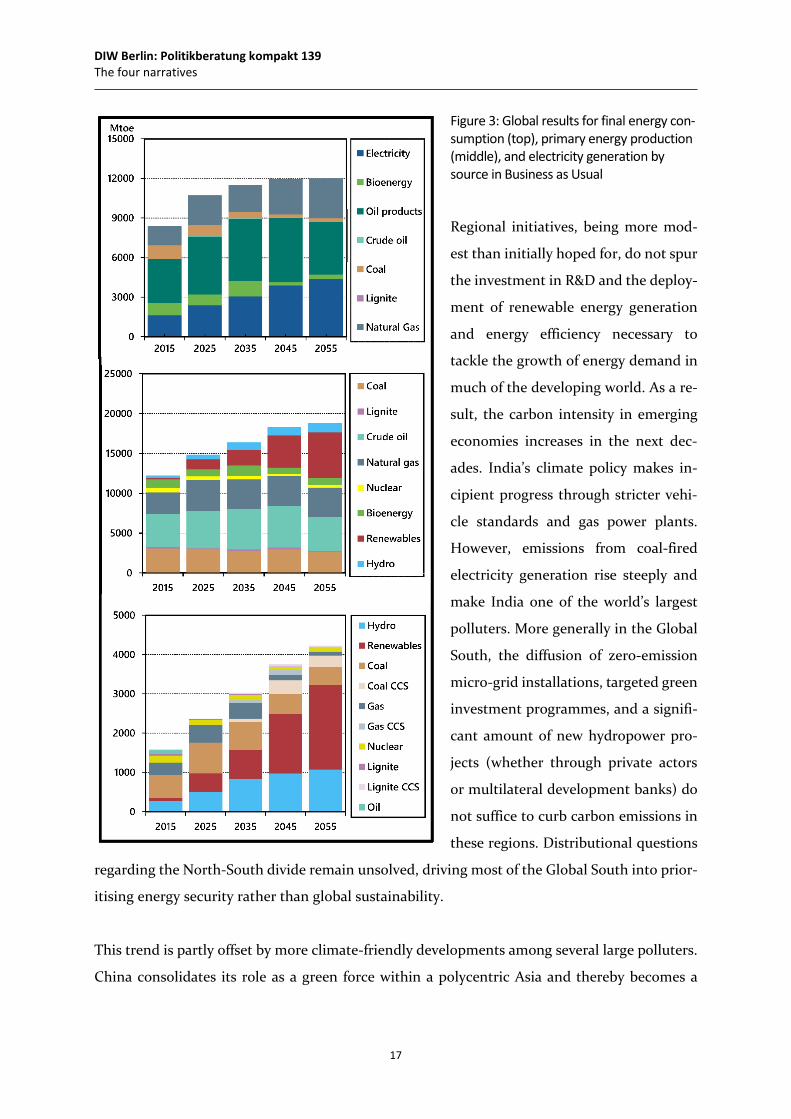
Figure 3: Global results for final energy con-sumption (top), primary energy production (middle), and electricity generation by source in Business as Usual
Regional initiatives, being more mod-
est than initially hoped for, do not spur
the investment in R&D and the deploy-
ment of renewable energy generation
and energy efficiency necessary to
tackle the growth of energy demand in
much of the developing world. As a re-
sult, the carbon intensity in emerging
economies increases in the next dec-
ades. India’s climate policy makes in-
cipient progress through stricter vehi-
cle standards and gas power plants.
However, emissions from coal-fired
electricity generation rise steeply and
make India one of the world’s largest
polluters. More generally in the Global
South, the diffusion of zero-emission
micro-grid installations, targeted green
investment programmes, and a signifi-
cant amount of new hydropower pro-
jects (whether through private actors
or multilateral development banks) do
not suffice to curb carbon emissions in
these regions. Distributional questions
regarding the North-South divide remain unsolved, driving most of the Global South into prior-
itising energy security rather than global sustainability.
This trend is partly offset by more climate-friendly developments among several large polluters.
China consolidates its role as a green force within a polycentric Asia and thereby becomes a
DIW Berlin: Politikberatung kompakt 139 The four narratives
18
pillar for future international climate cooperation. However, despite large investments in renew-
able energy generation and stagnating coal demand, fossil fuels remain an integral part of the
Chinese energy system.
The MENA region takes a more pro-active stance towards decarbonisation with an increased
number of initiatives towards clean energy, especially for net importers of fuel. For exporters,
these initiatives remain mostly symbolic, and an effective move towards deep economic and
energy sector reforms is constrained by conflicting interests with the regional fossil fuel sector,
which becomes ever more dependent on domestic consumption.
Despite the absence of a global carbon pricing mechanism, and heterogeneous, largely insuffi-
cient schemes for supporting investments in renewable energies in the first decade of the sce-
nario, some developments favour a future reduction in global GHG emissions. For example,
while global demand will not yet have switched away from coal by the 2020s, new solutions start
to emerge at the turn of the 2030s, for instance in the form of the first mature carbon capture
and storage (CCS) applications and efficiency increases for renewable technologies.
Altogether, the 2020s see renewable energy and fossil fuels co-exist. Transport, especially in the
Global South, depends on fossil fuels, whereas the diffusion of electric vehicles accelerates slowly
in many industrialised economies. Despite significant advances towards decarbonisation in
China and Europe, disruptive changes in conventional energy systems are virtually absent. Fos-
sils still dominate in the rest of the world, supported by the absence of joint political action or
technological advances.
3.1.2 Catching up after 2030?
The pace of the global energy transition accelerates somewhat in the 2030s and 2040s as a con-
sequence of stronger climate change effects and technological advances. The number and mag-
nitude of extreme weather events such as droughts, wildfires, storms, and excessive precipitation
grows. North America is among the regions that are increasingly hit. This leads to a gradual
change in public perception and eventually redirects the U.S. federal leadership towards a
stronger stance on climate policy. These fresh ambitions enable a new and significant multilat-
eral push towards decarbonisation, in which all large emitting countries take part. This effort
comprises coordinated action to decrease carbon leakage, stricter national climate policies, and
financing schemes for supporting climate adaptation. However, the agreements continue to lag
DIW Berlin: Politikberatung kompakt 139 The four narratives
19
behind initial expectations in a world order that has never fully moved on from political tensions
between major powers. They merely lead to a stagnation of fossil fuel consumption rather than
a shift in the global energy system, among other reasons due to the continued absence of a global
CO2 price.
Concerning technological advances, the transport sector is subject to substantial changes, with
electric vehicles experiencing significant cost decreases by the late 2020s, although wide-scale
deployment only takes place in the following decade. Traditional combustion-engine cars persist
in many parts of the globe. Freight and air travel do not undergo any significant changes. Re-
newable electricity generation becomes increasingly cheaper relative to electricity generation
from coal and gas. CCS enters power generation on a larger scale, yet the technology stays ex-
pensive and its efficiency remains below expectations. Over time, renewables and, to a lesser
degree, CCS dominate the global fuel mix and cover the steep increase in electricity demand
from all sectors towards 2050. Other technologies, such as nuclear fusion, are far from commer-
cially available, although research into those technologies nevertheless continues. Global sub-
stitution of fossils by renewables only takes place in power generation and in the 2040s. Exam-
ples of deep decarbonisation in industry and transport are rare, which is why fossil fuels are still
essential, partly due to the availability of CCS technology. Nevertheless, efforts finally lead to
stagnation of fossil fuel production and consumption despite global population growth.
Global collective action for climate change mitigation still operates within a UNFCCC-type
framework. However, the associated emission reduction is too low and comes too late: by this
point, not only a smooth transition but a U-turn in the energy system and disruptive shift to
negative net emissions would be necessary to have a chance at keeping cumulative emissions
below the 2 °C limit.
The growing impact and quantity of extreme weather events crucially raises awareness among
the public and decision makers. However, fears of too harsh and expensive reactions by fossil
fuel owners – threatened by asset stranding – and a lack of common ground in dealing with
distributional questions on a global scale lead to a reluctance to enact a profound transition in
the energy system and fuel-dependent economies. The late re-invigoration of mitigation efforts
is too little, too late to prevent the intensification and surge in – still localised – climate change-
induced catastrophes towards 2050 and beyond. As a result, multiple regions of the world are
about to enter a period of de-growth, as adaptation costs escalate globally.
DIW Berlin: Politikberatung kompakt 139 The four narratives
20
3.2 Survival of the Fittest
3.2.1 A world apart
In the Survival of the Fittest scenario, policy making in Europe and North America becomes
increasingly influenced by protectionist and nationalist interests. Hence, their relevance in the
international economic governance system declines in the 2020s, making any multilateral pro-
cess much less likely to bring efficient results. Agreements on trade and economic cooperation
are instead determined within regions, thus accelerating the transition to a polycentric world
order dominated by regional powers.
Influenced by a rationale rooted in isolationism, the United States drastically reduces its efforts
in the Middle East and Eastern Europe around 2020. Its reduced military presence in the Middle
East especially leads to a disaggregation of alliances into competing local factions. These devel-
opments have a direct effect on the economic and political stability of oil exporters, including
the Gulf States, which become ever more vulnerable to global economic conditions. Political
struggles eventually lead to the disaggregation of the Gulf Cooperation Council, and a climate
of tension and hostility characterises a gulf apart. This even leads to localised instances of mili-
tary confrontation, and the conflict expands to the wider Middle East and North Africa. Fuelled
by mounting tensions on domestic fronts, exporters fail to achieve a common stance on oil pol-
icy. Without the leadership of Saudi Arabia, OPEC continues to exist on paper, but it fails to
establish a common output policy.
Therefore, and despite conflict and insecurity, global oil and gas output is only subject to mild
disruption. Instead, each country engages in a self-preserving and short-term oriented approach,
and the absence of coordination leads to a surge in production and a drop in oil prices.
At the same time, conflicts erupt elsewhere. Among them, in the South China Sea, isolated yet
violent confrontations take place between China and a coalition of smaller countries backed by
the United States. Although both powers avoid the escalation to open conflict, the continued
struggle severely damages relations between China and the US, reducing their diplomatic ties to
a minimum.
Conflicts in the South Caucasus also put a strain on European solidarity. The continent is divided
into “hawks and doves” over how to best deal with Russia. Weakened transatlantic relations
leave Europe and the U.S. alienated, and European decision makers are torn when it comes to
DIW Berlin: Politikberatung kompakt 139 The four narratives
21
redefining alliances. Between rechtsruck and realpolitik, a fragmented Europe has little basis to
form common foreign or fiscal policy. This limits economic progress and the possibility to me-
diate in international conflicts. Global tensions also heighten concerns over Europe’s access to
affordable and secure energy, moving decarbonisation out of focus in the 2020s. Based on the
principle of the lowest common denominator, a fragmented Europe continues to cooperate on
advancing the energy transition although at a slower pace and with weaker ambitions.
3.2.2 International climate policy at a standstill
The Paris Agreement fails to hold, as (supply) security trumps climate policy on the national
agendas of fuel-importing countries, while multilateral diplomacy quickly erodes due to a gen-
eral sense of mistrust. This leads to a global institutional order in which the UNFCCC loses its
legitimacy. In parallel with Australia, Latin America, Russia, South Africa, and multiple South-
east Asian suppliers, the U.S. ramps up coal production, consolidating the fuel as the pillar of
many countries’ energy systems. An even larger surge takes place in the natural gas sector, whose
importance increases to meet the steep increase in modern industry and residential energy
needs in the absence of a global transition to electricity.
Green transformation efforts become increasingly dependent on informal alliances and bilateral
relations. China, in ever-closer cooperation with the EU, continues to gain importance in this
regard, consolidating agreements on technology transfers, green investments, and development
programmes, not only with European countries but also with parts of the developing world.
Chinese infrastructure investments are on the rise in Africa and Asia alike. The objectives behind
these moves are diverse but mostly directed towards filling the vacuum left by the weak inter-
national system, thereby consolidating the role of China as the (supra-) regional hegemon.
Global economic growth slows down from the early 2020s onwards, in large part due to the
failure of the WTO system and the re-enforcement of trade barriers and protectionist policies.
The pro-autarkical regulations and a lack of support for coordinated projects lead to a frustration
of private investment, which drifts away from technological innovations in the fields of energy
generation, efficiency, storage, and CCS as well as the transport sector. Thus, in the 2030s, the
rate of technological progress slows down, deployment of new technologies lacks support, and
the private sector altogether fails to propose adequate solutions for mitigating climate change.
DIW Berlin: Politikberatung kompakt 139 The four narratives
22
Figure 4: Global results for final energy consumption (top), primary energy pro-duction (middle), and electricity genera-tion by source in Survival of the Fittest
Instead, increased global competition
in fossil fuel extraction and the wide-
spread deployment of coal and gas
power plants lead to efficiency gains
in conventional fuels and technolo-
gies. Energy consumption increases
continuously and almost doubles un-
til 2045. The composition of demand
follows “traditional” (i.e. fossil-inten-
sive) growth patterns without much
technology switch. The (moderate)
increase in global electricity genera-
tion also sees a somewhat growing
role for renewables, but the vast ma-
jority is met by conventional power
plants.
While concerns over national security
hamper international climate negoti-
ations, energy security and air and
water quality also rank high on the
agendas of many countries. For some
large net-importing economies, most
notably Europe and China, public
health issues start to play a major role
in energy policy considerations in the 2030s. This leads to a re-orientation of their focus on do-
mestic resources, with a strong emphasis on solar and wind power, while at the same time en-
suring higher end-use efficiency. North America also continues to rely strongly on its domestic
unconventional oil and gas reserves, further driving up global fossil fuel demand. However, this
DIW Berlin: Politikberatung kompakt 139 The four narratives
23
trend is partially offset by some cities and state-level actors which push for a green transfor-
mation. This Quixotic approach creates an atmosphere of clean enclaves, which further cement
heterogeneity and divergence within the continent.
Without strong international organisations to coordinate policies tackling energy consumption
or end-use efficiency, the 2 °C carbon budget is met early in the 2030s. Therefore, in the following
decades, climate change-related catastrophes become frequent. The persistent absence of inter-
national cooperation between states and the diversion of public spending away from potential
mitigation or adaptation measures further hinder financial and technological transfers to the
countries most affected. The developments fail to create the necessary global common sense of
solidarity since estranged governments oppose free-rider gains and focus on local adaptation
measures.
As a result, climate change becomes an influential factor for international migration in the late
2030s and leads to a multiplication of security threats. Not unlike the refugee crisis in the mid-
2010s in Europe, albeit on a larger scale, a new wave of mass migration overwhelms international
assistance and further fuels state-on-state as well as domestic conflicts. This new migratory crisis
and the resulting tensions further hinder government responsiveness in many host countries,
thereby delaying any concerted climate change measures even further, and increasing adapta-
tion costs drastically.
In the endgame, towards 2050, global warming is out of control and results in large-scale natural
catastrophes globally. Whereas the richest nations are forced to afford the exploding costs of
adapting to this world and pay significant shares of their GDPs to survive, vulnerable regions
that cannot afford these measures become uninhabitable. Regional wars over remaining re-
sources add to an extraordinary high number of human casualties that results from the unprec-
edented floods, droughts, and storms. With the death of roughly one third of humanity and the
massive destruction of productive factors, the world will see veritable global de-growth, de-in-
dustrialisation, and, therefore, a slump in energy production and consumption. Survival of the
Fittest sees the world as we know it cease to exist.
DIW Berlin: Politikberatung kompakt 139 The four narratives
24
3.3 Green Cooperation
3.3.1 Clean Peace
In the early years of the Green Cooperation scenario, decades of conflict in the Global South
push northwards, transported by migration and market turbulence. Societies in the Global
North are increasingly tense and see a quick rise in nationalist and reactionary forces, which
begin to gain the upper hand throughout Europe and North America. However, this eventually
causes a strong push-back by a revived liberal civil society which elects a new generation of
progressive leaders into office. Aiming to rebuild their societies and end conflicts, this young
class of leaders values the potential losses from non-cooperation in an interdependent world
more highly than the prospective gains through confrontation.
Therefore, this scenario sees a quick return to peace where conflicts soon de-escalate in key
geopolitical regions such as the Middle East, South Caucasus and the South China Sea. The in-
ternational order is characterised by a strong stance against sedition and discord, which moves
rather fiery regional players to set conflicts aside. Some internal power disputes remain, e.g. in
the Greater Middle East, but the frequency and scope of armed conflict diminish and do not
resurge throughout the 2050s, in large part due to a continued common policy of conciliation
among the world’s major powers.
The effects on international relations and fossil fuel prices are mixed. On the one hand, the
phase-out of armed conflicts in the Middle East is accompanied by renewed dialogue between
the major players in OPEC. As relations between Saudi Arabia and Iran normalise, oil-producing
countries are finally able to reach an effective and long-lasting agreement on withholding pro-
duction. This has nevertheless only limited influence on oil and gas prices because consumption
in many net-importing countries decreases due to technological advances and a shift to alterna-
tive energy sources from the 2020s onwards. While North America becomes increasingly energy
self-sufficient, Europe, India, and China benefit from the détente, which allows them to consol-
idate their security of supply, for example through the diversification of gas imports. Growing
fossil fuel demand in Sub-Saharan Africa is the main counterbalancing force against this trend
in the first decade of the outlook period, driven by fast economic growth as well as rising demand
for transport fuels.
DIW Berlin: Politikberatung kompakt 139 The four narratives
25
Figure 5: Global results for final energy consumption (top), primary energy pro-duction (middle), and electricity genera-tion by source in Green Cooperation
With security and economic con-
cerns diminishing, internationally
coordinated efforts towards climate
change mitigation gain momentum.
The 2015 Paris Agreement is upheld,
and the emission reduction targets
are tightened in the 2020s. The first
half of the 2020s furthermore sees a
paradigm shift, so that decarbonisa-
tion and poverty alleviation are in-
creasingly considered as dual objec-
tives. Also, national economies be-
come increasingly interconnected,
thus allowing for better-integrated
energy systems and greater interna-
tional cooperation on mitigation
measures overall. Throughout the
2020s, this new dynamic contributes
to the fast dismantlement of fossil
fuel subsidy programmes as well as to
a linkage and expansion of emission
trading schemes, thus allowing for an
increase in climate policy ambition
and a reduced cost of emission miti-
gation in the following decades.
As a result, decarbonisation policies support innovation and sharp decreases in costs for renew-
ables, and their fast deployment leads to a successive phase-out of fossil fuels. In the 2030s, the
global electricity mix is coal free and dominated by renewables, which have been the focus of
DIW Berlin: Politikberatung kompakt 139 The four narratives
26
public and private investment as opposed to CCS technology. However, CCS only plays a tem-
porary role by extending the phase-out of fossil fuels into the 2040s. The use of oil products is
substantially decreased as well, in particular due to strong policies that push towards an early
transition of the transit sector.
3.3.2 The future of green synergies
While the role of central governments remains crucial for the global energy transition in the
next decades, more and more solutions are being put forward through other channels, involving
not only the private sector but also transnational bodies, cities, and consumers. The global tran-
sition, therefore, lives off synergies that are reached by combining top-down approaches, mostly
in the form of strict carbon taxation and green subsidies, and bottom-up action from all actors.
For transition economies, the scenario foresees an increased role for multilateral development
banks and micro-finance programmes. Ensuring near-universal energy access under clean stand-
ards becomes a focus of these initiatives for much of rural Africa and South-East Asia, where,
despite a reduction in conflicts, state capacity remains limited. Distributed generation and de-
centralised renewable energy solutions leapfrog the slow-moving deployment of centralised
power and rapidly accelerate energy access. As a result, infrastructure, private sector investment,
and productivity improve quickly from the mid-2020s onwards in the Global South. Generally,
there is less need for energy infrastructure (expansions) in this scenario due to the substantial
success of energy efficiency efforts in all energy consumption sectors compared to the Business
as Usual scenario. Therefore, despite rapid population growth, final energy consumption first
plateaus in the 2030s. Subsequent increases are of only a modest nature and covered almost
entirely by growth in clean electricity, which largely dominates the global energy mix in the
2040s.
Prosumers gain importance and consolidate the image of responsible citizens, thanks to ma-
tured decentralised system designs, the availability of microfinance in developing countries, and
policy support schemes, as well as harmonised legal frameworks. Hence, in the 2020s and 2030s,
prosumers become a key driver of the Asian energy transition and contribute to the switch away
from dirty electricity sources in other fossil fuel-dependent regions.
Finally, the interconnectedness of economies and the political support for a global energy tran-
sition lead to an acceleration of the integration of national energy agendas. Early progress to-
wards a global carbon tax is made in the early 2020s and initially only ratified by a handful of
nations. However, the group widens quickly and includes all major emitters by the 2030s.
DIW Berlin: Politikberatung kompakt 139 The four narratives
27
The scenario period witnesses an intense urbanisation process, both in the Global South and in
OECD countries. However, energy efficiency efforts are sizeable, and much of the energy de-
mand in the urban buildings and transport sectors is met by clean solutions, thus avoiding a
lock-in of carbon-intensive infrastructure in developing regions. In many growing cities, urban
density enables the integration of district heating and cooling networks fuelled by low-carbon
energy sources or waste heat from industrial plants. New building materials, which are the result
of the large-scale support for R&D, allow for the construction of new megacities without a large
carbon footprint.
As low-carbon urban mobility becomes a top priority, electric vehicles take over the streets in
the 2020s, but large investments in new and innovative modes of mass public transit prove the
only way to manage the quick growth of cities sustainably. Major cities, therefore, push towards
bans or strong restrictions on private car traffic, which are welcomed by their inhabitants.
This is part of an overall shift in individual behaviour which results from a symbiosis of policy,
culture, and technology. Progressive cities welcome the international climate efforts and vie in
the creation of green urban ecosystems whose leitmotif is the urban oasis: a modern and efficient
yet green utopia. The rapid improvement in living conditions, especially in areas that observed
high rates of air pollution, seizes citizens’ imaginations and improves public awareness of envi-
ronmental issues drastically. With the change in generations, a close-to-zero-emission environ-
ment becomes the status quo in most developed countries. Some latecomers still exhibit higher
emission levels but pledge improvements beyond 2050. Increased specialisation, lower risk, and
large public programmes lead to a culture of investment and research which allows progress in
numerous key technologies that enable an affordable transition to this clean, modern vision,
such as 3D and 4D printing, novel materials, and quantum computing.
Thanks to early, widespread, and deep emission mitigation, climate change only has localised
impacts in the medium run, to which the international community reacts promptly with finan-
cial and technological transfers and adaptation measures. By 2050, all these factors combined
will have led to the achievement of an inclusive renewable energy transition, which prevents
extensive global warming. In combination with further advances in negative emission technol-
ogies beyond 2050, green growth has become a reality.
DIW Berlin: Politikberatung kompakt 139 The four narratives
28
3.4 ClimateTech
3.4.1 Time is on my side
Similarly to the Business as Usual scenario, diplomatic relations between the large regional pow-
ers remain steady over the outlook period of this scenario. Geopolitical tensions and localised
conflict in the late 2010s and 2020s worsen human and economic conditions across the globe.
The international governance system comes to a standstill at the turn of the 2020s at the expense
of climate and energy issues, in part due to the failure of any major actors to take the lead in
multilateral, rule-based (international) institutions.
However, and at the same time, research into climate intervention shows promising results, so
technologies such as carbon capture and storage (CCS) and solar radiation management see
their performances increasing while costs are cut. Although these technologies are still at an
early stage of development in the 2020s, their perceived benefits alone significantly affect cli-
mate policy in the following years. News of the forthcoming technical revolution generates an
atmosphere of public euphoria that is fortified with the widespread perception that climate
questions are already solved.
Although not seconded by scientists, politicians rejoice in the diminished pressure to decarbon-
ise their respective economies and divert political effort to other topics such as economic
growth. Therefore, the global economy remains strong over the entire outlook period, accom-
panied by significant worldwide population growth in Africa and South-East Asia. However, eco-
nomic development remains unequal, due to an international order that continues to be tense
and does not provide a vital setting for balanced free trade and technology transfer. Despite the
loss of focus on climate policy, environmental policy becomes important as public health is an-
other topic rejuvenated by a public that expects a transition to a clean lifestyle.
The loss of momentum in decarbonisation policy making combined with the frustration of dip-
lomatic relations between the large global powers affects international climate negotiations.
While the Paris Agreement leads to a deceleration in fossil fuel consumption growth until 2035,
progress soon slows down, as the initially formulated NDCs are not followed by more ambitious
pledges. This failure in emissions reduction is also due to rapidly rising energy demand driven
by population growth and urbanisation. Some isolated attempts at climate change mitigation in
the first half of the outlook are, however, noteworthy: Europe scales up its ambitions, and China
exploits the tech dawn to finally move beyond the production of cheap tradeables. On this
DIW Berlin: Politikberatung kompakt 139 The four narratives
29
course, China redefines its comparative advantage and is determined to take the global lead as
an R&D powerhouse.
A Business-as-Usual world with the (absent) climate policy of Survival of the Fittest and techno-
logical ambitions beyond Green Cooperation establishes an energy system that exhibits a steep
growth in demand, rapid technological change, and uneven developments. Throughout the first
half of the outlook, strong gains in fossil fuel demand nearly double final energy consumption,
and medium-paced growth in the electricity sector comes with new renewables and conven-
tional plants alike. As a result, GHG emissions increase dramatically and exceed the Business as
Usual case dramatically. With internationally concerted efforts to tackle CO2 emissions facing a
dead end, the 2°C carbon budget is nearly spent by the early 2030s, thus inducing more frequent
extreme weather events.
3.4.2 A tale of sulphates and nucléocrates
Final breakthroughs in key climate and energy engineering technologies in addition to various
forms of geo-engineering are seen in the 2030s. However, these adolescent technologies still
teeter into the wider energy system on their quest for an ultimate role.
First, direct air capture witnesses sharp cost cuts due to the development of modular units that
enable quick deployment. Although initially the efficiency and applicability of the technology is
still limited, direct air capture soon becomes the symbol of omnipresent action to tackle emis-
sions, as the (now smaller) devices are installed virtually everywhere. Air capture is furthermore
favoured by decision-makers for its ability to capture not only emission flows but also stocks.
The social acceptance of underground CO2 storage comes hand in hand with the air capture
technology development, as the rapid development of commercial CO2 use, in particular in the
chemical industry takes place.
A second key technology, solar radiation management (SRM) receives a spike in attention during
the 2030s. In the public eye, the technology is celebrated as the liberator of humanity from cli-
mate change due to its potential to have a large and lasting effect on emissions. Nevertheless,
after a multitude of tests during the first years of its availability, scientists begin to warn that
SRM, and more specifically aerosol sulphate, may deplete ozone and bring significant changes
to the hydrological cycle. While these warnings are initially unheeded by politicians, the effects
become discernible and measurable, affecting nearly all kind of maritime value creation. Also,
DIW Berlin: Politikberatung kompakt 139 The four narratives
30
specific SRM techniques threaten to be developed into weapons, thereby violating the 1976 En-
vironmental Modification Convention. As a result, the unilateral use of SRM is eventually pro-
hibited and only scaled up slowly within multilaterally concerted initiatives.
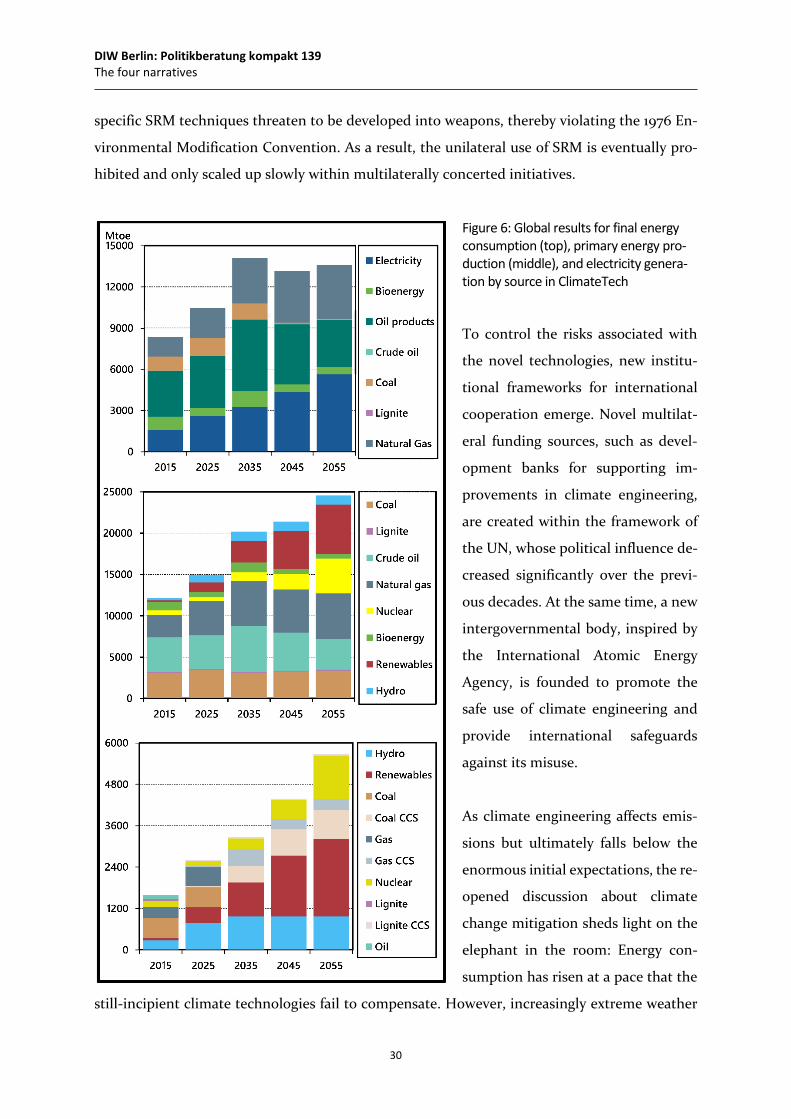
Figure 6: Global results for final energy consumption (top), primary energy pro-duction (middle), and electricity genera-tion by source in ClimateTech
To control the risks associated with
the novel technologies, new institu-
tional frameworks for international
cooperation emerge. Novel multilat-
eral funding sources, such as devel-
opment banks for supporting im-
provements in climate engineering,
are created within the framework of
the UN, whose political influence de-
creased significantly over the previ-
ous decades. At the same time, a new
intergovernmental body, inspired by
the International Atomic Energy
Agency, is founded to promote the
safe use of climate engineering and
provide international safeguards
against its misuse.
As climate engineering affects emis-
sions but ultimately falls below the
enormous initial expectations, the re-
opened discussion about climate
change mitigation sheds light on the
elephant in the room: Energy con-
sumption has risen at a pace that the
still-incipient climate technologies fail to compensate. However, increasingly extreme weather
DIW Berlin: Politikberatung kompakt 139 The four narratives
31
events and widespread coverage of the rise and fall of hopes for adaptation-based solutions have
created a broad awareness of climate change. Therefore, the re-empowered international com-
munity manages to commit to a global CO2 cap. However, numerous exemptions are given and
remain a common practice because of fears for national industries and the presence of emission
reduction technologies. Nevertheless, the energy system in the 2040s experiences a reduction in
fossil-fuel consumption and witnesses the death blow for direct coal usage, though natural gas
and crude oil remain crucial in the final energy mix. Priority is given to completing the decar-
bonisation of electricity.
One of the technologies that sees sudden advances is nuclear fusion. Although, particularly dur-
ing the 2030s, the technology’s value is questioned due to high costs, its promise to break the
energy trilemma by providing affordable, secure, and clean energy in the long run is a tempting
vision. Especially China, which is responsible for much of the research during the 2020s that
finally leads to a breakthrough, is set to supply the majority of its exponentially growing elec-
tricity demand with nuclear fusion. The decision to go all-in on this technology is, in the early
stages, mostly aimed at turning it into the greatest Chinese export. Its mesmerising effect on
politicians creates a new generation of nuclear advocates who seek to pressure the “new saviour”
of energy and climate into global power grids at any cost. However, the 2030s see virtually no
application of the technology outside of China. Finally, towards 2050, more mature reactors are
installed in other energy systems, despite continued controversies regarding their actual poten-
tial. However, outside of China, whose nuclear elite refuses to question the technology, applica-
tions remain limited.
Elsewhere, cost cuts and novel technologies turn renewables into the major source of electricity
with a global share of roughly 50%. The other half of electricity demand is met by nuclear energy
and highly efficient CCS coal and natural gas power plants, which profit from strong R&D in-
vestments even after their mature emergence around 2030. As a result, over all five decades of
the outlook, there are only minor changes in global fossil fuel production except for a surge in
the production of natural gas.
Altogether, the numerous breakthroughs – a consequence of both fortune and significant in-
vestments – buy time and lessen the burden of the energy transition, but eventually both decar-
bonisation and adaptation measures are necessary. The resulting system succeeds in curtailing

DIW Berlin: Politikberatung kompakt 139 The four narratives
32
emissions and in preventing large scale climate catastrophes. Nevertheless, the negative emis-
sion technologies fail to provide a robust counterweight to the lagging decarbonisation and lack
of behavioural shifts. Hence, the emission trajectory is inherently fragile concerning population
and economic growth beyond the outlook period. This world can only be sustainable if techno-
logical progress continues to outrun growth.
DIW Berlin: Politikberatung kompakt 139 Analysis of the global level
33
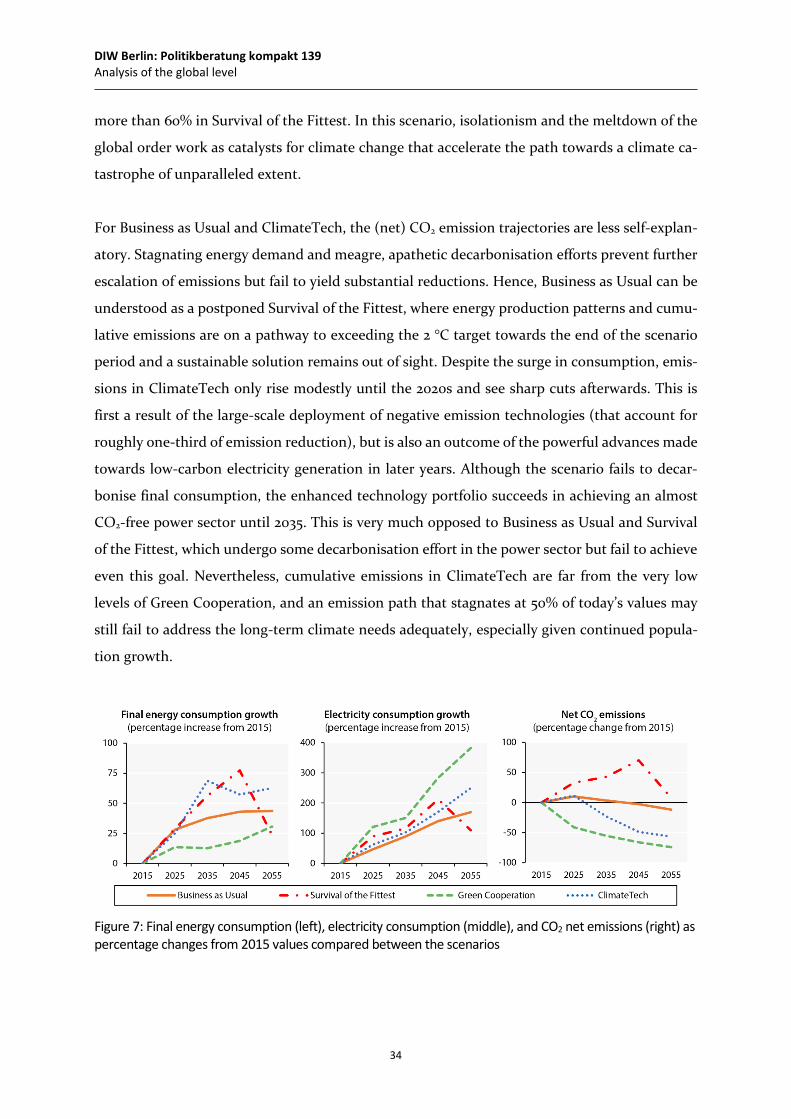
4 Analysis of the global level
The comparative assessment of emissions, energy service consumption, and electricity genera-
tion (Figure 7) shows discrepancies but also similarities between the four scenarios.
The four trajectories of final energy consumption show a substantial divergence, with only mod-
est increases in Green Cooperation, a stagnation of demand starting in 2025 in Business as Usual,
and strong increases in ClimateTech and Survival of the Fittest. The two latter scenarios outgrow
Business as Usual in terms of energy consumption by twofold in 2035 and 2045, respectively.
Energy demand in ClimateTech is then disrupted by the shift towards stricter climate policies.
In contrast, energy consumption growth in Survival of the Fittest is only brought to an end by
the global collapse induced by the climate catastrophe.
More homogenous development occurs for in electricity sector, albeit with some variation. All
scenarios witness a large increase in power demand by 2035 that exceeds a 50% increase com-
pared to 2015 and even reaches a fourfold increase by 2045 in Green Cooperation. In the 2020s,
all four scenarios still lie in a similar range and experience a – more or less pronounced – first
wave of electrification of the economy. Then, however, the gap between the scenarios widens.
In Green Cooperation, the green transition moves beyond energy and merges with a holistic
change in technology and society into a smart world. Survival of the Fittest sees the second-
largest increase in power demand (before its eventual collapse) which, however, is the outcome
of absent energy efficiency measures and unlimited growth. This suggests that the electrification
of the economy – sometimes understood as an indicator of how well energy transition and cli-
mate change mitigation succeed – may be misleading in this regard. Business as Usual and Cli-
mateTech show somewhat lower electricity growth at first, although slow system decarbonisa-
tion and new technologies lead to higher growth rates towards the end of the scenario period
for the latter.
CO2 emission trajectories reveal deeper insights. The quick global shift towards (green) cooper-
ation in the corresponding narrative results in a U-turn for CO2 emissions, which have their
largest drop during the 2020s. Despite later increases in energy demand, emissions fall continu-
ously and reach approximately 20% of today’s levels by 2050. Negative emission technologies do
not play a major role in this scenario. On the other end of the scenario spectrum, the rampant
growth of (non-clean) consumption leads to emission peaks that outsize current emissions by
DIW Berlin: Politikberatung kompakt 139 Analysis of the global level
34
more than 60% in Survival of the Fittest. In this scenario, isolationism and the meltdown of the
global order work as catalysts for climate change that accelerate the path towards a climate ca-
tastrophe of unparalleled extent.
For Business as Usual and ClimateTech, the (net) CO2 emission trajectories are less self-explan-
atory. Stagnating energy demand and meagre, apathetic decarbonisation efforts prevent further
escalation of emissions but fail to yield substantial reductions. Hence, Business as Usual can be
understood as a postponed Survival of the Fittest, where energy production patterns and cumu-
lative emissions are on a pathway to exceeding the 2 °C target towards the end of the scenario
period and a sustainable solution remains out of sight. Despite the surge in consumption, emis-
sions in ClimateTech only rise modestly until the 2020s and see sharp cuts afterwards. This is
first a result of the large-scale deployment of negative emission technologies (that account for
roughly one-third of emission reduction), but is also an outcome of the powerful advances made
towards low-carbon electricity generation in later years. Although the scenario fails to decar-
bonise final consumption, the enhanced technology portfolio succeeds in achieving an almost
CO2-free power sector until 2035. This is very much opposed to Business as Usual and Survival
of the Fittest, which undergo some decarbonisation effort in the power sector but fail to achieve
even this goal. Nevertheless, cumulative emissions in ClimateTech are far from the very low
levels of Green Cooperation, and an emission path that stagnates at 50% of today’s values may
still fail to address the long-term climate needs adequately, especially given continued popula-
tion growth.
Figure 7: Final energy consumption (left), electricity consumption (middle), and CO2 net emissions (right) as percentage changes from 2015 values compared between the scenarios
DIW Berlin: Politikberatung kompakt 139 Analysis of the global level
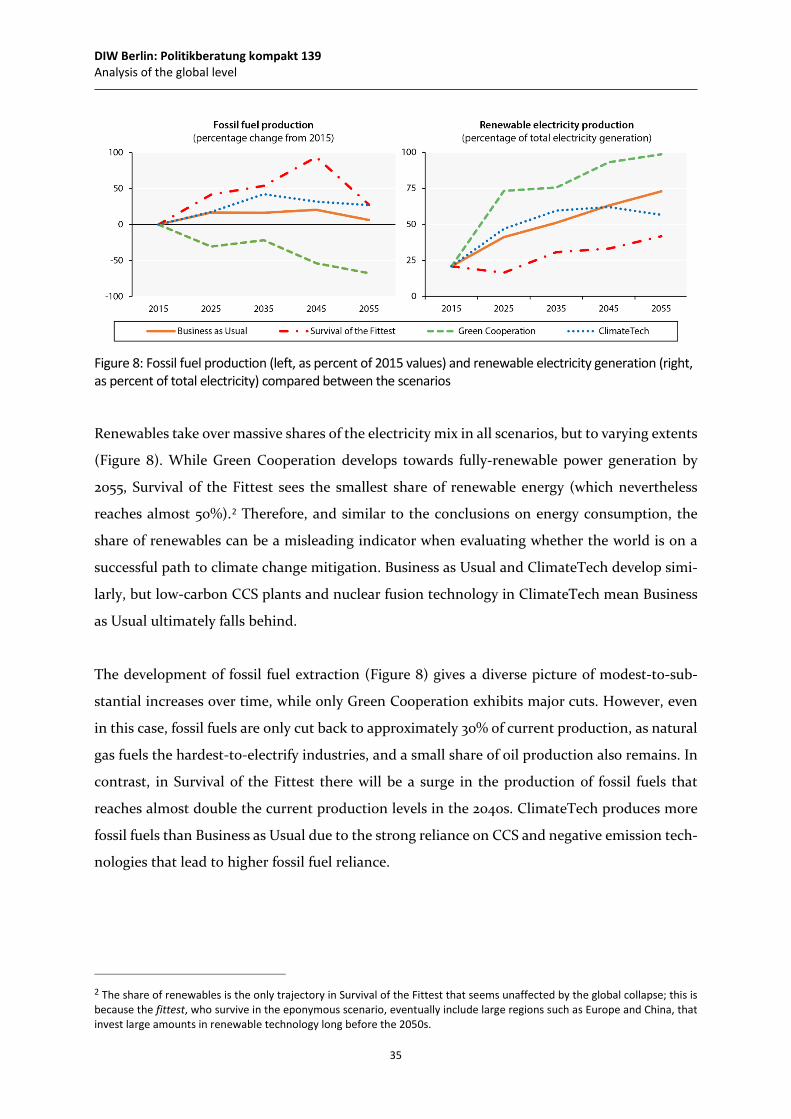
35
Figure 8: Fossil fuel production (left, as percent of 2015 values) and renewable electricity generation (right, as percent of total electricity) compared between the scenarios
Renewables take over massive shares of the electricity mix in all scenarios, but to varying extents
(Figure 8). While Green Cooperation develops towards fully-renewable power generation by
2055, Survival of the Fittest sees the smallest share of renewable energy (which nevertheless
reaches almost 50%).2 Therefore, and similar to the conclusions on energy consumption, the
share of renewables can be a misleading indicator when evaluating whether the world is on a
successful path to climate change mitigation. Business as Usual and ClimateTech develop simi-
larly, but low-carbon CCS plants and nuclear fusion technology in ClimateTech mean Business
as Usual ultimately falls behind.
The development of fossil fuel extraction (Figure 8) gives a diverse picture of modest-to-sub-
stantial increases over time, while only Green Cooperation exhibits major cuts. However, even
in this case, fossil fuels are only cut back to approximately 30% of current production, as natural
gas fuels the hardest-to-electrify industries, and a small share of oil production also remains. In
contrast, in Survival of the Fittest there will be a surge in the production of fossil fuels that
reaches almost double the current production levels in the 2040s. ClimateTech produces more
fossil fuels than Business as Usual due to the strong reliance on CCS and negative emission tech-
nologies that lead to higher fossil fuel reliance.
2 The share of renewables is the only trajectory in Survival of the Fittest that seems unaffected by the global collapse; this is because the fittest, who survive in the eponymous scenario, eventually include large regions such as Europe and China, that invest large amounts in renewable technology long before the 2050s.
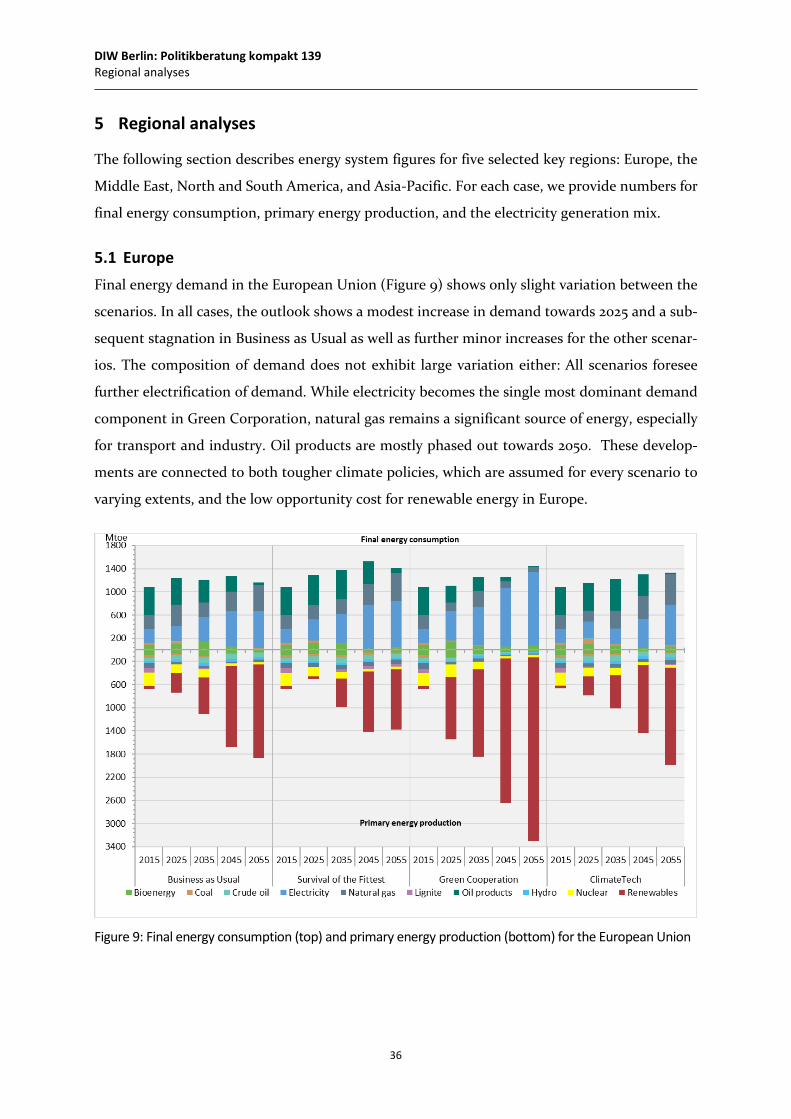
DIW Berlin: Politikberatung kompakt 139 Regional analyses
36
5 Regional analyses
The following section describes energy system figures for five selected key regions: Europe, the
Middle East, North and South America, and Asia-Pacific. For each case, we provide numbers for
final energy consumption, primary energy production, and the electricity generation mix.
5.1 Europe Final energy demand in the European Union (Figure 9) shows only slight variation between the
scenarios. In all cases, the outlook shows a modest increase in demand towards 2025 and a sub-
sequent stagnation in Business as Usual as well as further minor increases for the other scenar-
ios. The composition of demand does not exhibit large variation either: All scenarios foresee
further electrification of demand. While electricity becomes the single most dominant demand
component in Green Corporation, natural gas remains a significant source of energy, especially
for transport and industry. Oil products are mostly phased out towards 2050. These develop-
ments are connected to both tougher climate policies, which are assumed for every scenario to
varying extents, and the low opportunity cost for renewable energy in Europe.
Figure 9: Final energy consumption (top) and primary energy production (bottom) for the European Union
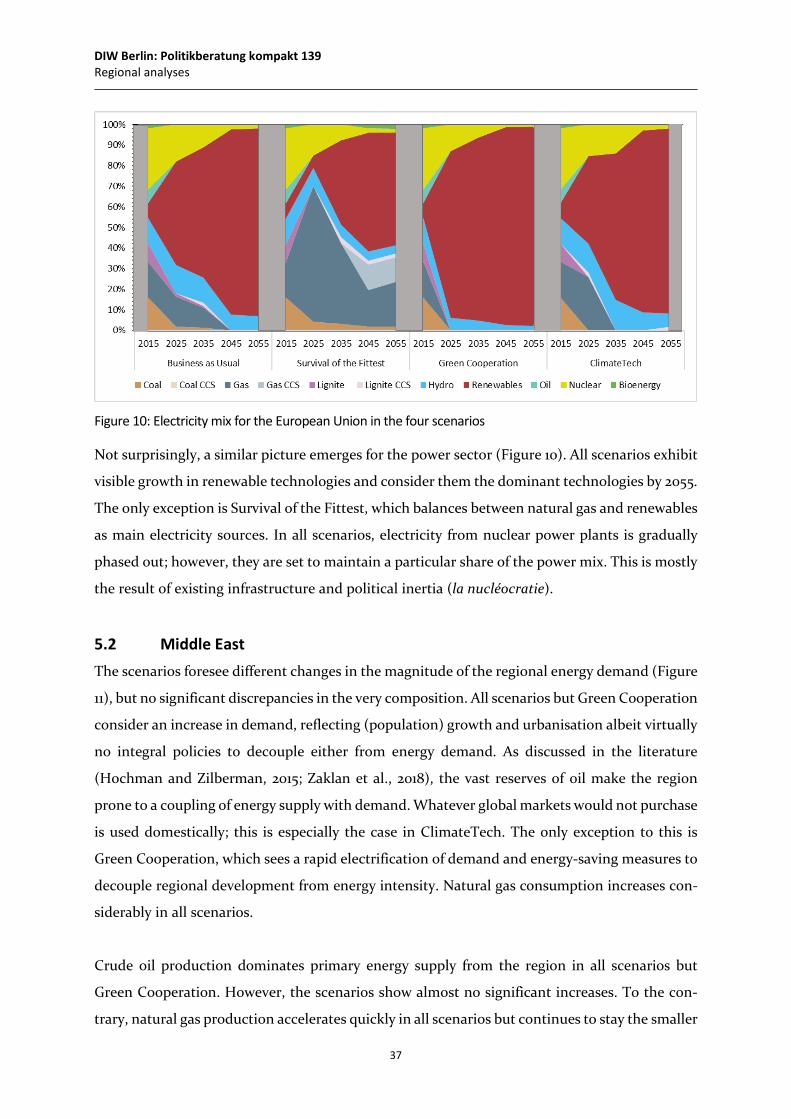
DIW Berlin: Politikberatung kompakt 139 Regional analyses
37
Figure 10: Electricity mix for the European Union in the four scenarios
Not surprisingly, a similar picture emerges for the power sector (Figure 10). All scenarios exhibit
visible growth in renewable technologies and consider them the dominant technologies by 2055.
The only exception is Survival of the Fittest, which balances between natural gas and renewables
as main electricity sources. In all scenarios, electricity from nuclear power plants is gradually
phased out; however, they are set to maintain a particular share of the power mix. This is mostly
the result of existing infrastructure and political inertia (la nucléocratie).
5.2 Middle East The scenarios foresee different changes in the magnitude of the regional energy demand (Figure
11), but no significant discrepancies in the very composition. All scenarios but Green Cooperation
consider an increase in demand, reflecting (population) growth and urbanisation albeit virtually
no integral policies to decouple either from energy demand. As discussed in the literature
(Hochman and Zilberman, 2015; Zaklan et al., 2018), the vast reserves of oil make the region
prone to a coupling of energy supply with demand. Whatever global markets would not purchase
is used domestically; this is especially the case in ClimateTech. The only exception to this is
Green Cooperation, which sees a rapid electrification of demand and energy-saving measures to
decouple regional development from energy intensity. Natural gas consumption increases con-
siderably in all scenarios.
Crude oil production dominates primary energy supply from the region in all scenarios but
Green Cooperation. However, the scenarios show almost no significant increases. To the con-
trary, natural gas production accelerates quickly in all scenarios but continues to stay the smaller
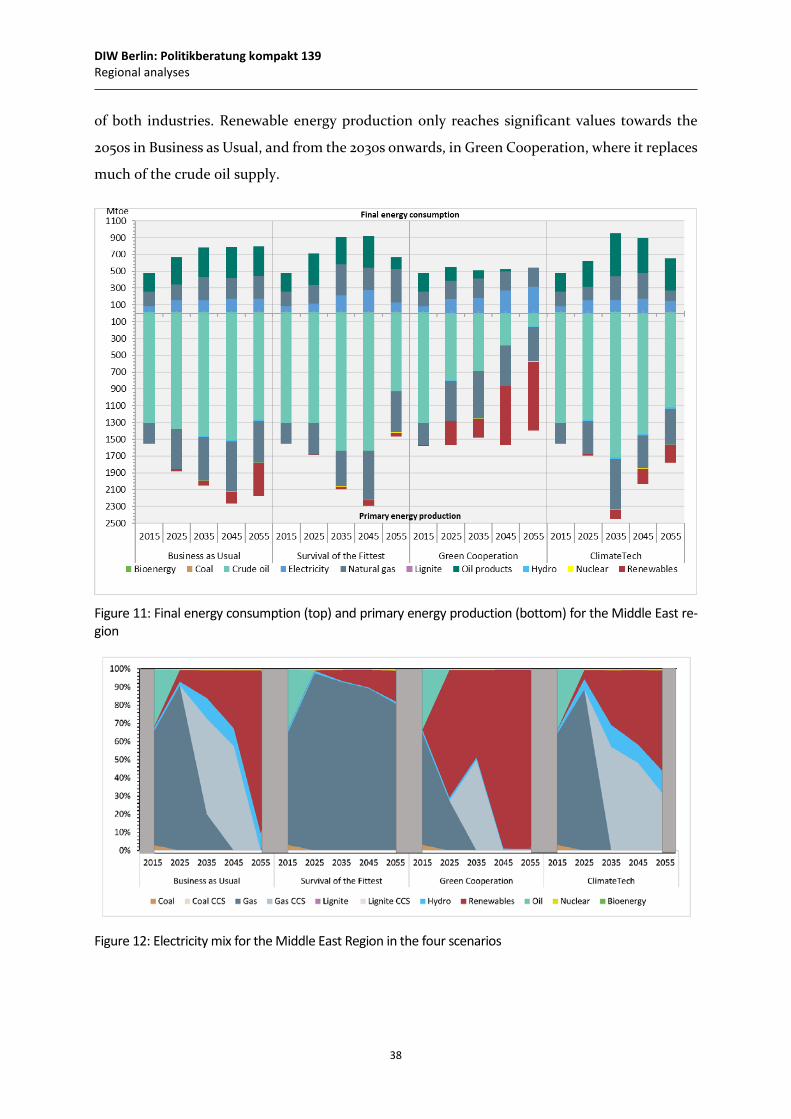
DIW Berlin: Politikberatung kompakt 139 Regional analyses
38
of both industries. Renewable energy production only reaches significant values towards the
2050s in Business as Usual, and from the 2030s onwards, in Green Cooperation, where it replaces
much of the crude oil supply.
Figure 11: Final energy consumption (top) and primary energy production (bottom) for the Middle East re-gion
Figure 12: Electricity mix for the Middle East Region in the four scenarios
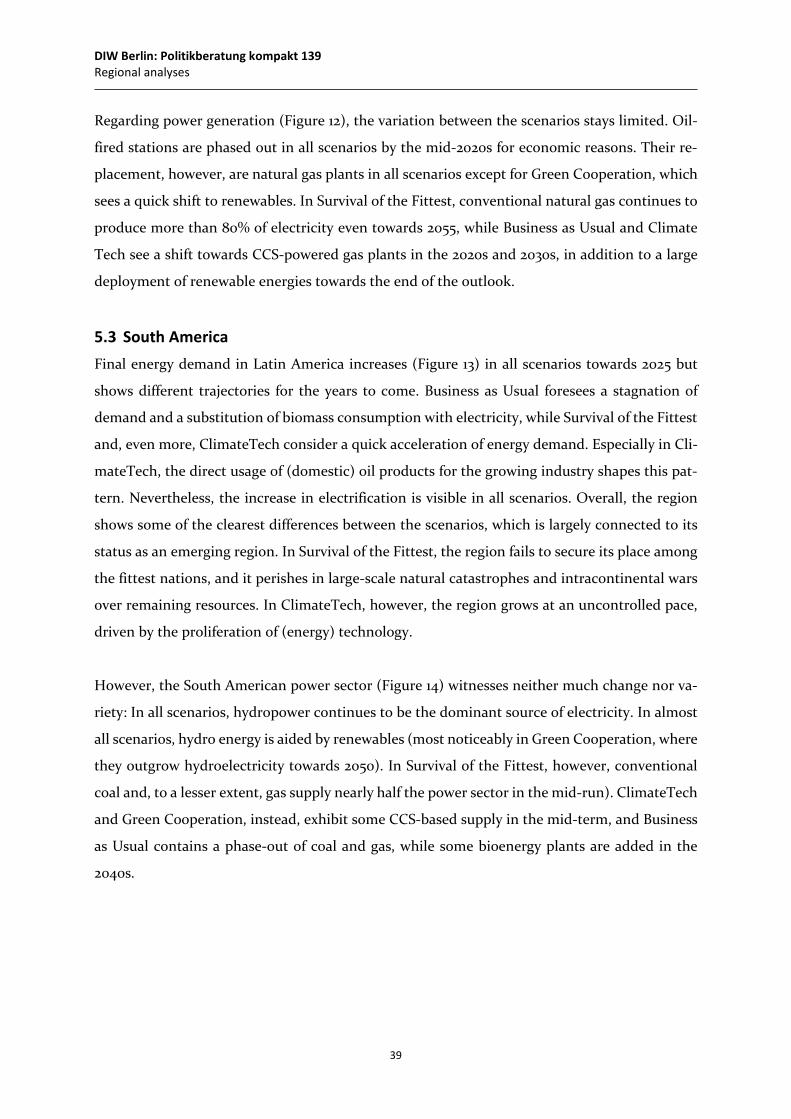
DIW Berlin: Politikberatung kompakt 139 Regional analyses
39
Regarding power generation (Figure 12), the variation between the scenarios stays limited. Oil-
fired stations are phased out in all scenarios by the mid-2020s for economic reasons. Their re-
placement, however, are natural gas plants in all scenarios except for Green Cooperation, which
sees a quick shift to renewables. In Survival of the Fittest, conventional natural gas continues to
produce more than 80% of electricity even towards 2055, while Business as Usual and Climate
Tech see a shift towards CCS-powered gas plants in the 2020s and 2030s, in addition to a large
deployment of renewable energies towards the end of the outlook.
5.3 South America Final energy demand in Latin America increases (Figure 13) in all scenarios towards 2025 but
shows different trajectories for the years to come. Business as Usual foresees a stagnation of
demand and a substitution of biomass consumption with electricity, while Survival of the Fittest
and, even more, ClimateTech consider a quick acceleration of energy demand. Especially in Cli-
mateTech, the direct usage of (domestic) oil products for the growing industry shapes this pat-
tern. Nevertheless, the increase in electrification is visible in all scenarios. Overall, the region
shows some of the clearest differences between the scenarios, which is largely connected to its
status as an emerging region. In Survival of the Fittest, the region fails to secure its place among
the fittest nations, and it perishes in large-scale natural catastrophes and intracontinental wars
over remaining resources. In ClimateTech, however, the region grows at an uncontrolled pace,
driven by the proliferation of (energy) technology.
However, the South American power sector (Figure 14) witnesses neither much change nor va-
riety: In all scenarios, hydropower continues to be the dominant source of electricity. In almost
all scenarios, hydro energy is aided by renewables (most noticeably in Green Cooperation, where
they outgrow hydroelectricity towards 2050). In Survival of the Fittest, however, conventional
coal and, to a lesser extent, gas supply nearly half the power sector in the mid-run). ClimateTech
and Green Cooperation, instead, exhibit some CCS-based supply in the mid-term, and Business
as Usual contains a phase-out of coal and gas, while some bioenergy plants are added in the
2040s.
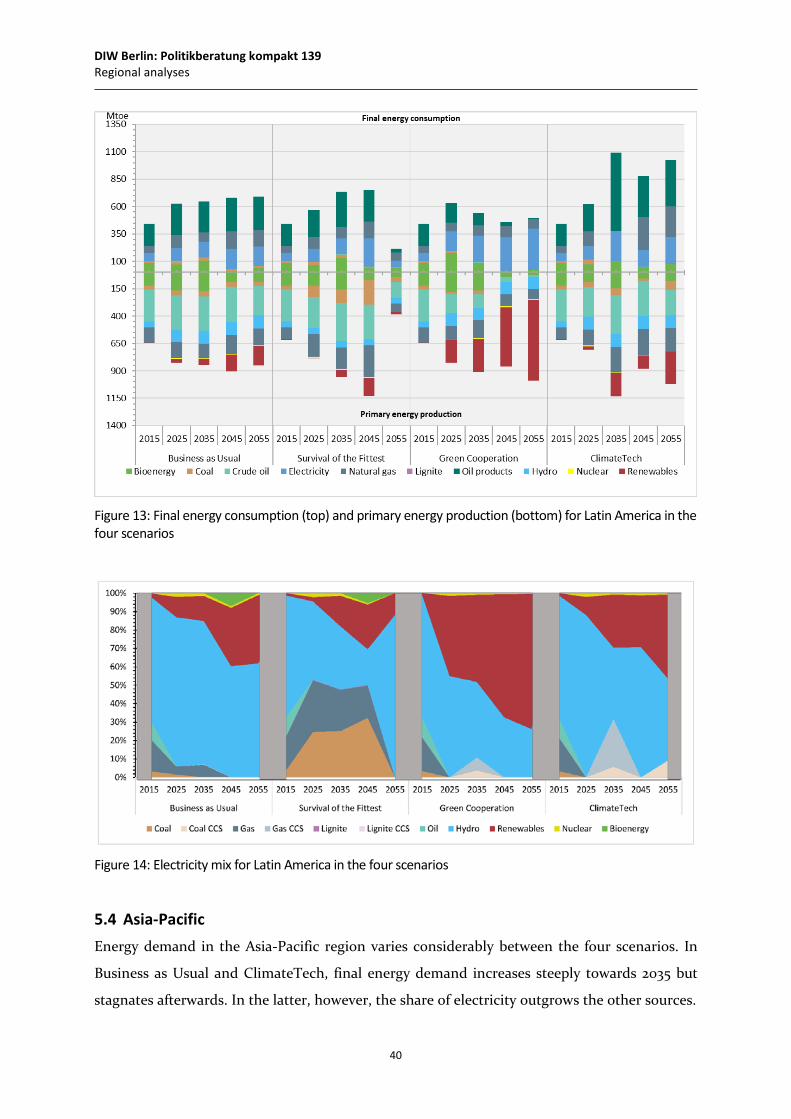
DIW Berlin: Politikberatung kompakt 139 Regional analyses
40
Figure 13: Final energy consumption (top) and primary energy production (bottom) for Latin America in the four scenarios
Figure 14: Electricity mix for Latin America in the four scenarios
5.4 Asia-Pacific Energy demand in the Asia-Pacific region varies considerably between the four scenarios. In
Business as Usual and ClimateTech, final energy demand increases steeply towards 2035 but
stagnates afterwards. In the latter, however, the share of electricity outgrows the other sources.
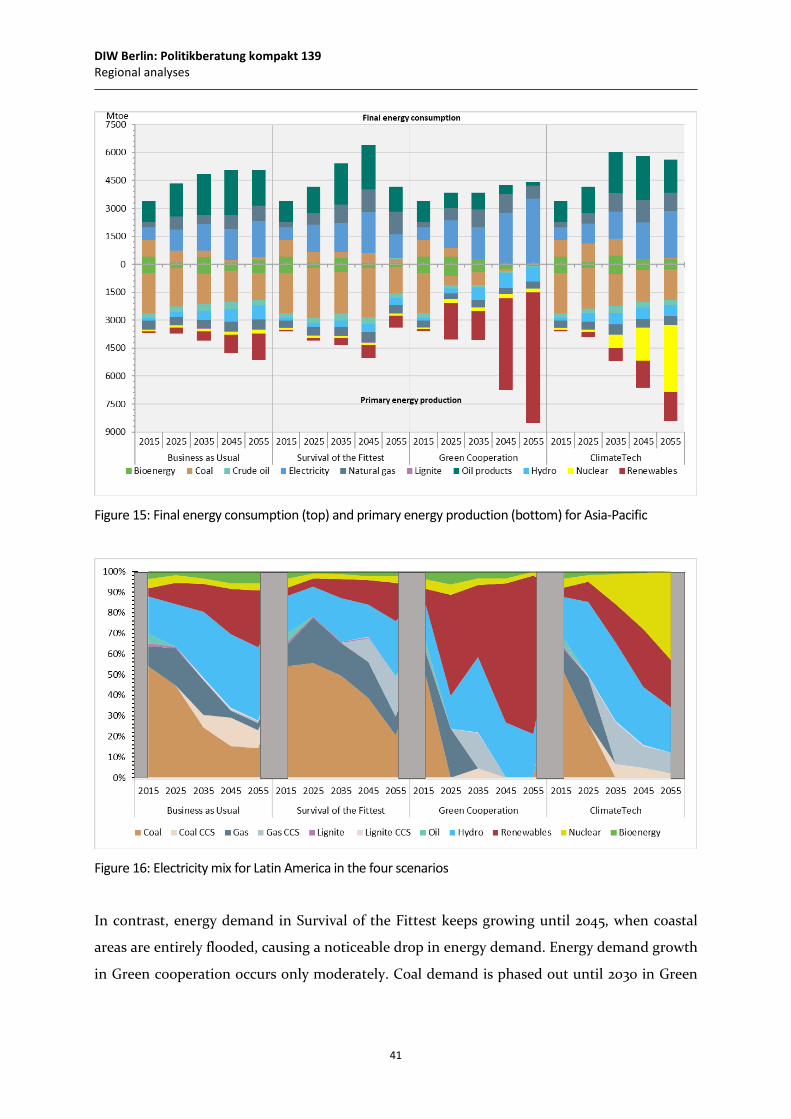
DIW Berlin: Politikberatung kompakt 139 Regional analyses
41
Figure 15: Final energy consumption (top) and primary energy production (bottom) for Asia-Pacific
Figure 16: Electricity mix for Latin America in the four scenarios
In contrast, energy demand in Survival of the Fittest keeps growing until 2045, when coastal
areas are entirely flooded, causing a noticeable drop in energy demand. Energy demand growth
in Green cooperation occurs only moderately. Coal demand is phased out until 2030 in Green
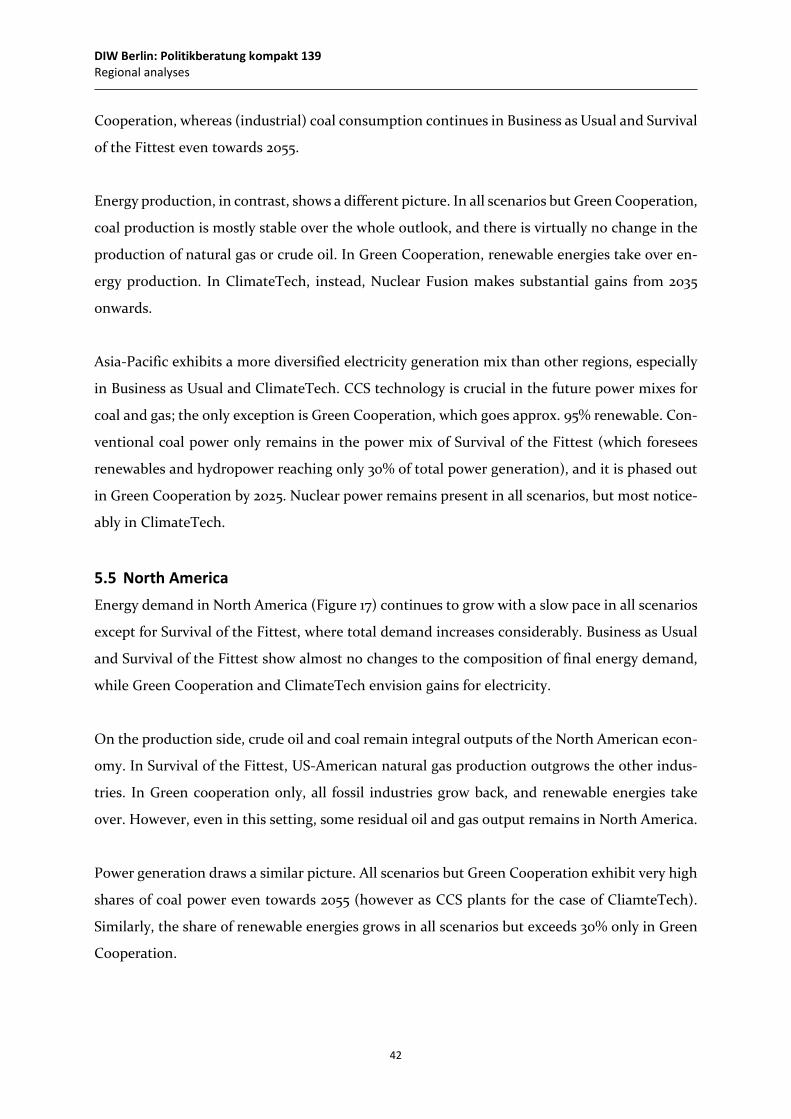
DIW Berlin: Politikberatung kompakt 139 Regional analyses
42
Cooperation, whereas (industrial) coal consumption continues in Business as Usual and Survival
of the Fittest even towards 2055.
Energy production, in contrast, shows a different picture. In all scenarios but Green Cooperation,
coal production is mostly stable over the whole outlook, and there is virtually no change in the
production of natural gas or crude oil. In Green Cooperation, renewable energies take over en-
ergy production. In ClimateTech, instead, Nuclear Fusion makes substantial gains from 2035
onwards.
Asia-Pacific exhibits a more diversified electricity generation mix than other regions, especially
in Business as Usual and ClimateTech. CCS technology is crucial in the future power mixes for
coal and gas; the only exception is Green Cooperation, which goes approx. 95% renewable. Con-
ventional coal power only remains in the power mix of Survival of the Fittest (which foresees
renewables and hydropower reaching only 30% of total power generation), and it is phased out
in Green Cooperation by 2025. Nuclear power remains present in all scenarios, but most notice-
ably in ClimateTech.
5.5 North America Energy demand in North America (Figure 17) continues to grow with a slow pace in all scenarios
except for Survival of the Fittest, where total demand increases considerably. Business as Usual
and Survival of the Fittest show almost no changes to the composition of final energy demand,
while Green Cooperation and ClimateTech envision gains for electricity.
On the production side, crude oil and coal remain integral outputs of the North American econ-
omy. In Survival of the Fittest, US-American natural gas production outgrows the other indus-
tries. In Green cooperation only, all fossil industries grow back, and renewable energies take
over. However, even in this setting, some residual oil and gas output remains in North America.
Power generation draws a similar picture. All scenarios but Green Cooperation exhibit very high
shares of coal power even towards 2055 (however as CCS plants for the case of CliamteTech).
Similarly, the share of renewable energies grows in all scenarios but exceeds 30% only in Green
Cooperation.
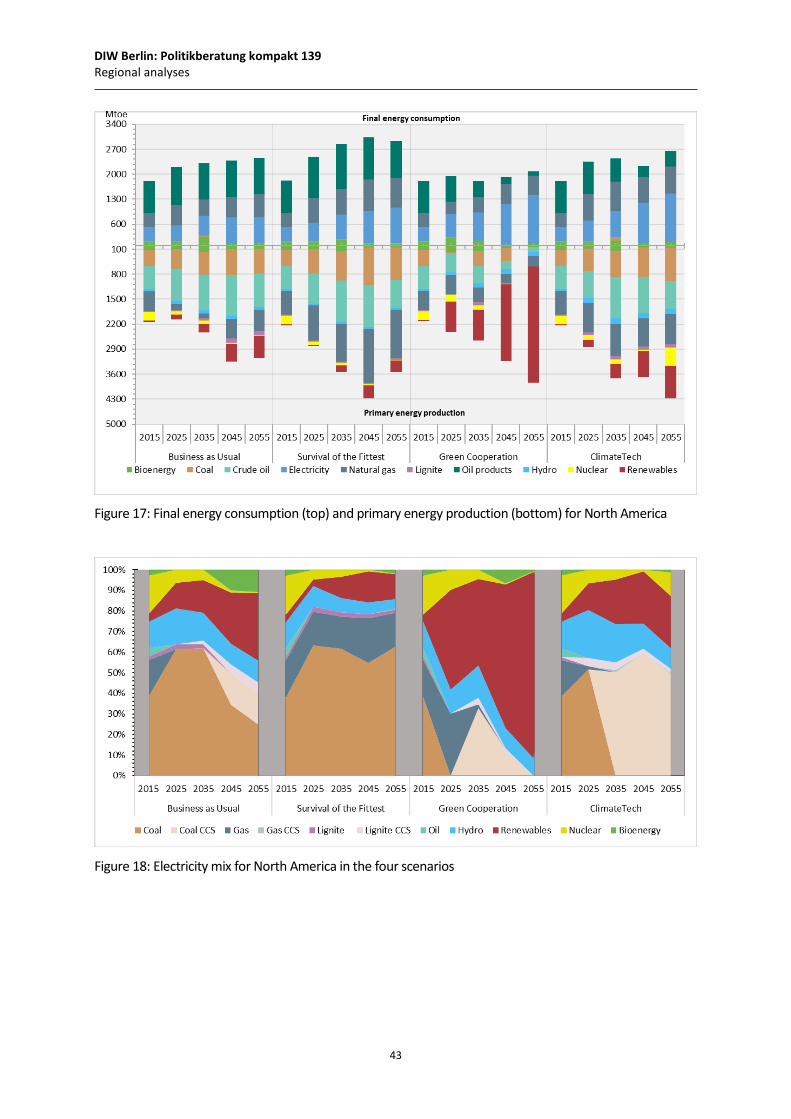
DIW Berlin: Politikberatung kompakt 139 Regional analyses
43
Figure 17: Final energy consumption (top) and primary energy production (bottom) for North America
Figure 18: Electricity mix for North America in the four scenarios
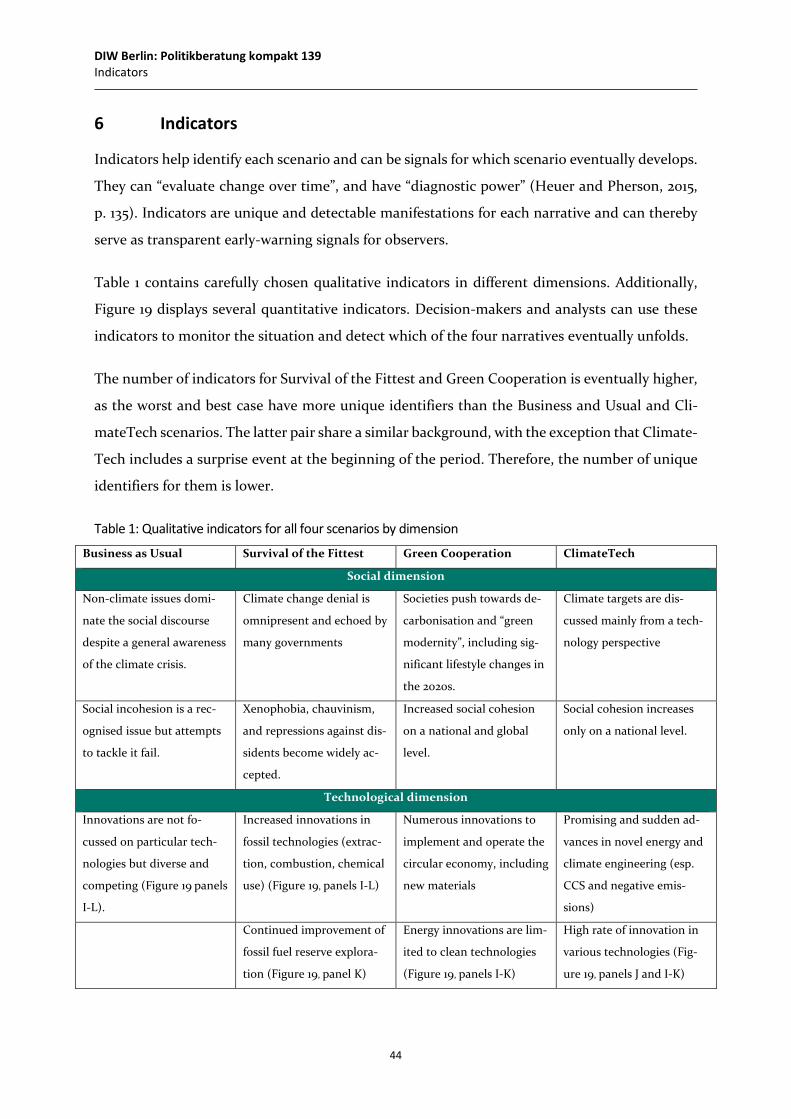
DIW Berlin: Politikberatung kompakt 139 Indicators
44
6 Indicators
Indicators help identify each scenario and can be signals for which scenario eventually develops.
They can “evaluate change over time”, and have “diagnostic power” (Heuer and Pherson, 2015,
p. 135). Indicators are unique and detectable manifestations for each narrative and can thereby
serve as transparent early-warning signals for observers.
Table 1 contains carefully chosen qualitative indicators in different dimensions. Additionally,
Figure 19 displays several quantitative indicators. Decision-makers and analysts can use these
indicators to monitor the situation and detect which of the four narratives eventually unfolds.
The number of indicators for Survival of the Fittest and Green Cooperation is eventually higher,
as the worst and best case have more unique identifiers than the Business and Usual and Cli-
mateTech scenarios. The latter pair share a similar background, with the exception that Climate-
Tech includes a surprise event at the beginning of the period. Therefore, the number of unique
identifiers for them is lower.
Table 1: Qualitative indicators for all four scenarios by dimension
Business as Usual Survival of the Fittest Green Cooperation ClimateTech
Social dimension
Non-climate issues domi-
nate the social discourse
despite a general awareness
of the climate crisis.
Climate change denial is
omnipresent and echoed by
many governments
Societies push towards de-
carbonisation and “green
modernity”, including sig-
nificant lifestyle changes in
the 2020s.
Climate targets are dis-
cussed mainly from a tech-
nology perspective
Social incohesion is a rec-
ognised issue but attempts
to tackle it fail.
Xenophobia, chauvinism,
and repressions against dis-
sidents become widely ac-
cepted.
Increased social cohesion
on a national and global
level.
Social cohesion increases
only on a national level.
Technological dimension
Innovations are not fo-
cussed on particular tech-
nologies but diverse and
competing (Figure 19 panels
I-L).
Increased innovations in
fossil technologies (extrac-
tion, combustion, chemical
use) (Figure 19, panels I-L)
Numerous innovations to
implement and operate the
circular economy, including
new materials
Promising and sudden ad-
vances in novel energy and
climate engineering (esp.
CCS and negative emis-
sions)
Continued improvement of
fossil fuel reserve explora-
tion (Figure 19, panel K)
Energy innovations are lim-
ited to clean technologies
(Figure 19, panels I-K)
High rate of innovation in
various technologies (Fig-
ure 19, panels J and I-K)
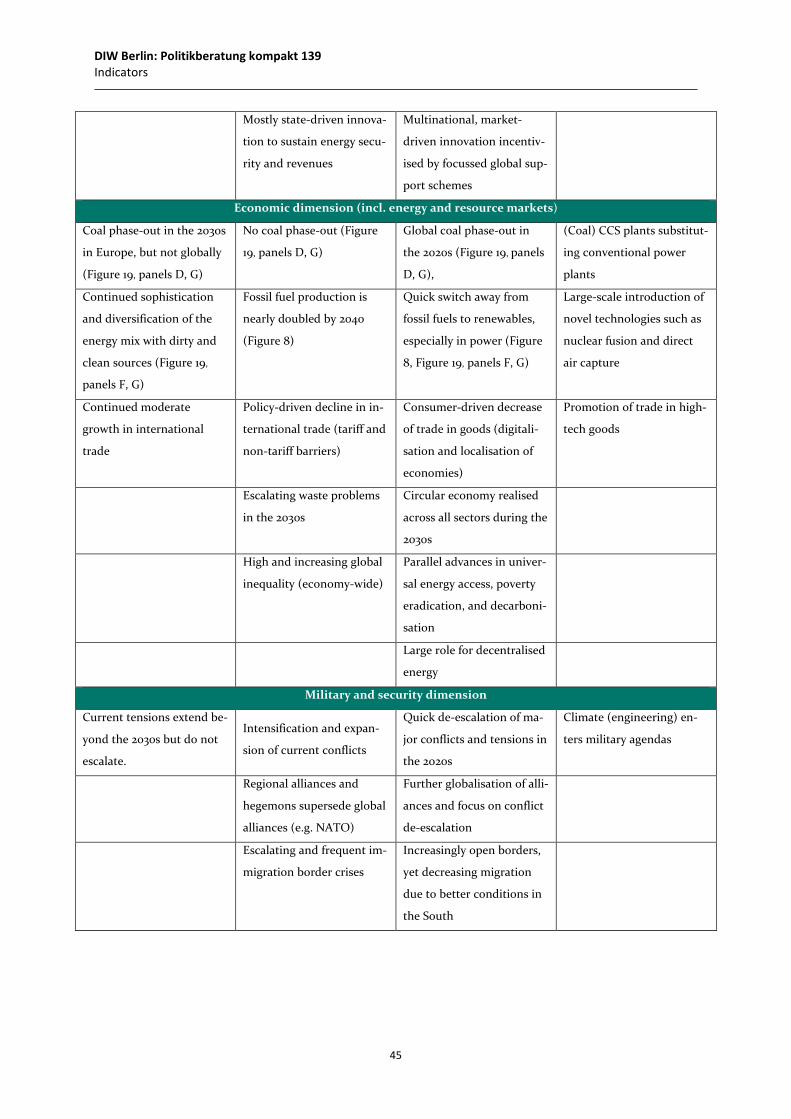
DIW Berlin: Politikberatung kompakt 139 Indicators
45
Mostly state-driven innova-
tion to sustain energy secu-
rity and revenues
Multinational, market-
driven innovation incentiv-
ised by focussed global sup-
port schemes
Economic dimension (incl. energy and resource markets)
Coal phase-out in the 2030s
in Europe, but not globally
(Figure 19, panels D, G)
No coal phase-out (Figure
19, panels D, G)
Global coal phase-out in
the 2020s (Figure 19, panels
D, G),
(Coal) CCS plants substitut-
ing conventional power
plants
Continued sophistication
and diversification of the
energy mix with dirty and
clean sources (Figure 19,
panels F, G)
Fossil fuel production is
nearly doubled by 2040
(Figure 8)
Quick switch away from
fossil fuels to renewables,
especially in power (Figure
8, Figure 19, panels F, G)
Large-scale introduction of
novel technologies such as
nuclear fusion and direct
air capture
Continued moderate
growth in international
trade
Policy-driven decline in in-
ternational trade (tariff and
non-tariff barriers)
Consumer-driven decrease
of trade in goods (digitali-
sation and localisation of
economies)
Promotion of trade in high-
tech goods
Escalating waste problems
in the 2030s
Circular economy realised
across all sectors during the
2030s
High and increasing global
inequality (economy-wide)
Parallel advances in univer-
sal energy access, poverty
eradication, and decarboni-
sation
Large role for decentralised
energy
Military and security dimension
Current tensions extend be-
yond the 2030s but do not
escalate.
Intensification and expan-
sion of current conflicts
Quick de-escalation of ma-
jor conflicts and tensions in
the 2020s
Climate (engineering) en-
ters military agendas
Regional alliances and
hegemons supersede global
alliances (e.g. NATO)
Further globalisation of alli-
ances and focus on conflict
de-escalation
Escalating and frequent im-
migration border crises
Increasingly open borders,
yet decreasing migration
due to better conditions in
the South
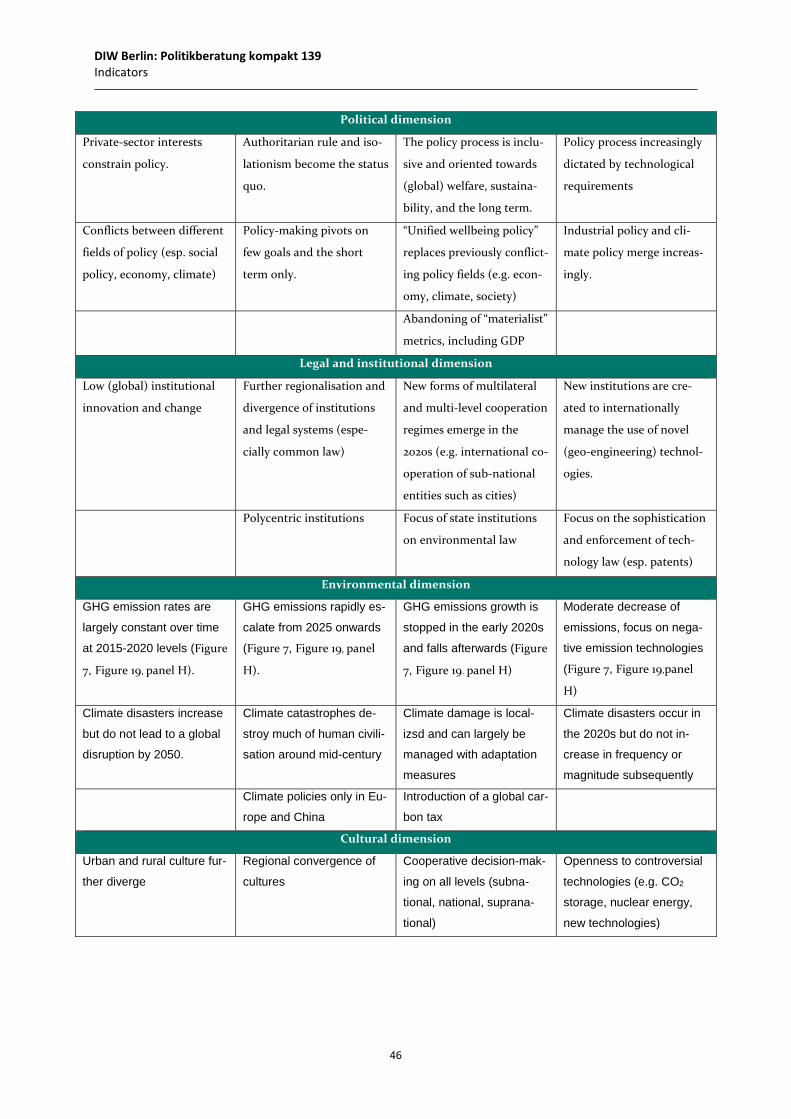
DIW Berlin: Politikberatung kompakt 139 Indicators
46
Political dimension
Private-sector interests
constrain policy.
Authoritarian rule and iso-
lationism become the status
quo.
The policy process is inclu-
sive and oriented towards
(global) welfare, sustaina-
bility, and the long term.
Policy process increasingly
dictated by technological
requirements
Conflicts between different
fields of policy (esp. social
policy, economy, climate)
Policy-making pivots on
few goals and the short
term only.
“Unified wellbeing policy”
replaces previously conflict-
ing policy fields (e.g. econ-
omy, climate, society)
Industrial policy and cli-
mate policy merge increas-
ingly.
Abandoning of “materialist”
metrics, including GDP
Legal and institutional dimension
Low (global) institutional
innovation and change
Further regionalisation and
divergence of institutions
and legal systems (espe-
cially common law)
New forms of multilateral
and multi-level cooperation
regimes emerge in the
2020s (e.g. international co-
operation of sub-national
entities such as cities)
New institutions are cre-
ated to internationally
manage the use of novel
(geo-engineering) technol-
ogies.
Polycentric institutions Focus of state institutions
on environmental law
Focus on the sophistication
and enforcement of tech-
nology law (esp. patents)
Environmental dimension
GHG emission rates are
largely constant over time
at 2015-2020 levels (Figure
7, Figure 19, panel H).
GHG emissions rapidly es-
calate from 2025 onwards
(Figure 7, Figure 19, panel
H).
GHG emissions growth is
stopped in the early 2020s
and falls afterwards (Figure
7, Figure 19. panel H)
Moderate decrease of
emissions, focus on nega-
tive emission technologies
(Figure 7, Figure 19,panel
H)
Climate disasters increase
but do not lead to a global
disruption by 2050.
Climate catastrophes de-
stroy much of human civili-
sation around mid-century
Climate damage is local-
izsd and can largely be
managed with adaptation
measures
Climate disasters occur in
the 2020s but do not in-
crease in frequency or
magnitude subsequently
Climate policies only in Eu-
rope and China
Introduction of a global car-
bon tax
Cultural dimension
Urban and rural culture fur-
ther diverge
Regional convergence of
cultures
Cooperative decision-mak-
ing on all levels (subna-
tional, national, suprana-
tional)
Openness to controversial
technologies (e.g. CO2
storage, nuclear energy,
new technologies)
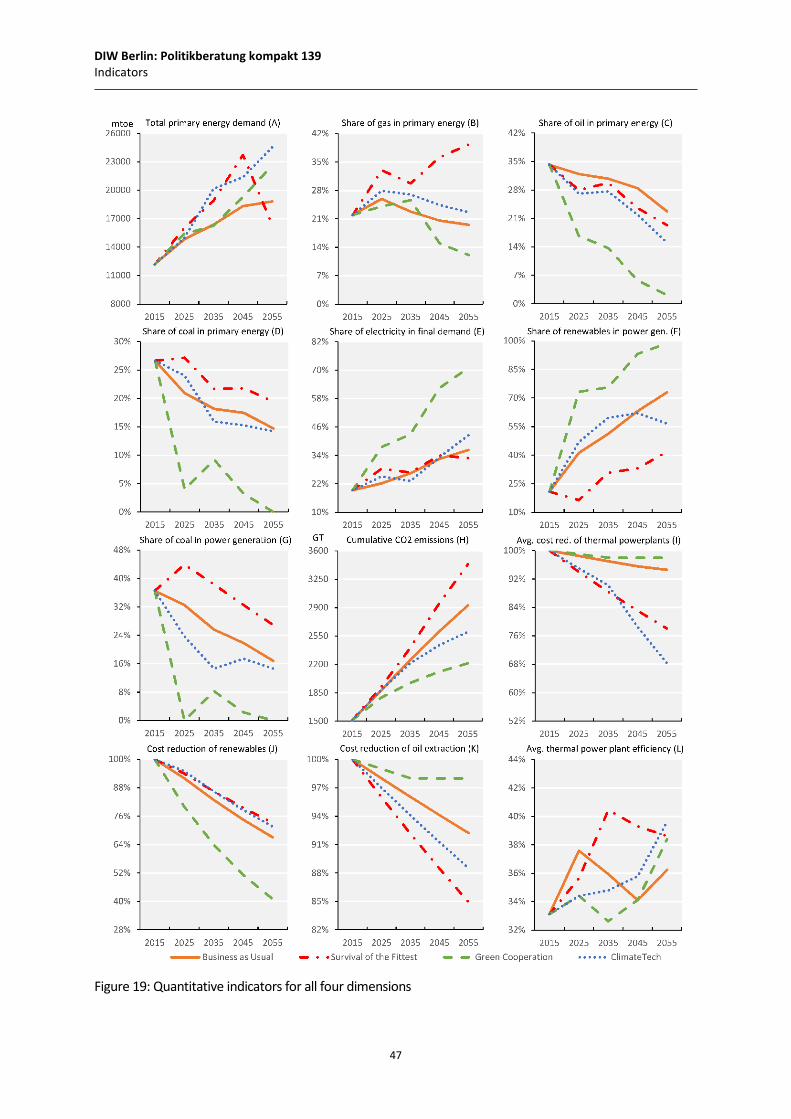
DIW Berlin: Politikberatung kompakt 139 Indicators
47
Figure 19: Quantitative indicators for all four dimensions
DIW Berlin: Politikberatung kompakt 139 Outlooks compared
48
7 Outlooks compared
Energy scenarios have come a long way from their introduction in the 1960s, fighting their way
into the very core of mainstream energy analysis. Several institutions, among them suprana-
tional bodies but also civil society organisations and private companies, prepare energy out-
looks, which provide the basis for business and policy decisions. In recent years, scenarios also
gained additional prominence in outlining possible paths to low-carbon futures and for moni-
toring the status of decarbonisation and climate change (Söderholm et al., 2011).
We use this section to provide a brief comparison of various prominent outlooks and to put our
outlook into context. First, we consider the World Energy Outlook (WEO), which is published
by the International Energy Agency (IEA) – an intergovernmental, public body established in
the framework of the OECD – and arguably the most prominent energy outlook. We also con-
sider the energy outlooks published by the World Energy Council (WEC), a global energy body
with UN accreditation; the international oil companies Royal Dutch Shell, BP, Equinor, and Exx-
onMobil; as well as the research institution MIT; and the scientist-led civil society organisation
Energy Watch Group.
• The IEA (2018) World Energy Outlook contains three scenarios: “Current Policies” and “New
Policies”, which assume a world with current and recently announced energy and climate
policies, respectively, and “Sustainable Development”, which assesses the pathway to uni-
versal energy access and climate change mitigation.
• Shell’s scenarios – Shell (2013)’s “Ocean” and “Mountain” and Shell (2018)’s “Sky” – have
dedicated storylines that feature detailed events and timelines on both global and regional
levels. While Sky is a normative assessment designed to meet climate goals, Ocean and
Mountain are positive assessments of the energy system.
• The WEC (2016) outlook contains three scenarios, which can arguably be understood as best
(“Unfinished Symphony”), base (“Modern Jazz”), and worst case (“Hard Rock”). They are
positive assessments of the energy system and mostly focussed on carrying forward current
policy trends.
• The Equinor (2019) outlook has a very similar setup (best case “Renewal”, base case “Re-
form”, and worst case “Rivalry”) and considers three worlds of global (non-)cooperation re-
flected in the energy system.
• The latest BP (2019) outlook features a base case projection (“Evolving Transition”), similar
to the definition of the IEA WEO’s Current Policies Scenario, and a number of scenarios
DIW Berlin: Politikberatung kompakt 139 Outlooks compared
49
that consider slight variations: stricter climate policies (“Rapid Transition”), a positive shock
on energy demand (“More Energy”), and the case of decreasing global trade and GDP (“Less
Globalization”).
The remaining three examples are no outlooks in the previous sense of a line-up of futures, but
each one contains one scenario only.
• The MIT scenario “Food, Water, Energy & Climate Outlook” (Chen et al., 2016) and the Exx-
onMobil (2018) outlook consider a continuation of current trends.
• The EWG scenario (Ram et al., 2019), on the contrary, is a normative scenario that assesses
the pathway to a 100% renewable energy system
Figure 20 visualises global trajectories of the different scenarios. The three graphs show total
primary energy demand, total coal demand, and electricity generation for the different outlooks,
categorised into baseline projections (solid lines), best case projections (dotted lines), worst case
projections (dashed line), and others (dash-dotted line).
Global total primary energy demand shows considerable variation between the scenarios but
also some common characteristics. All scenarios witness major energy demand increases in the
2030s except for the best cases by Equinor and IEA’s WEO. Other than that, there is no apparent
pattern towards 2050: Energy demand projections cover a wide range of possible developments,
regardless of the scenario nature (except for the two scenarios mentioned before). Noticeably,
all Shell scenarios project a steep growth in demand that is only seconded by our Green Coop-
eration and ClimateTech scenarios. A special and distinct case is the EWG projection, which
operates in another order of magnitude and starts off approximately one-third below the other
scenarios in 2015.
Global total coal demand projections diverge even more but along the lines of scenario natures.
All best-case scenarios include significant drops in global coal demand, starting as early as 2020
and approaching zero towards 2050. The latecomer in this category is Shell’s Sky, which only
begins to drop by 2040. Most base-case scenarios (ExxonMobil, MIT, Equinor, BP, DIW-REM)
consider stagnating or slowly decreasing coal demand, and the worst-case scenarios move be-
tween a stagnation of coal demand and (for some even drastic) increases. There are, however,
two major exceptions to this categorisation: First, Shell’s Oceans and Mountains scenarios pre-
sent severe increases in coal demand. Second, WEC’s Unfinished Symphony mimics the trajec-
tories of the best cases rather than other base cases.
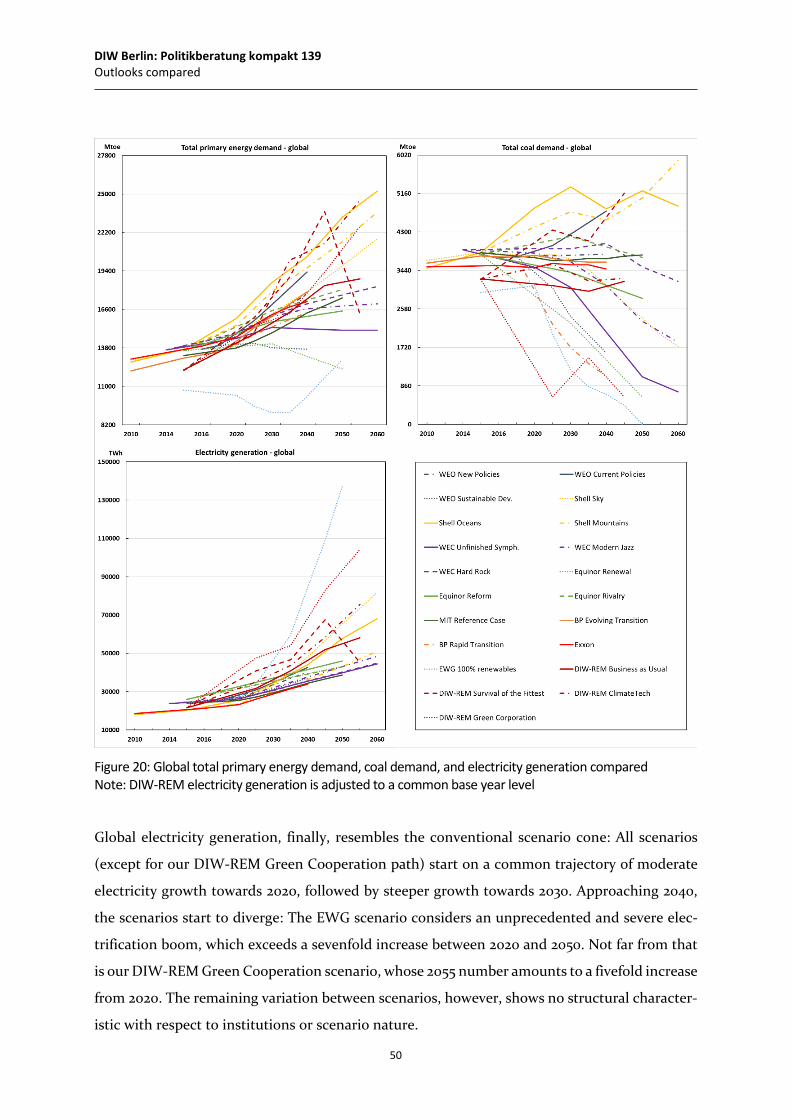
DIW Berlin: Politikberatung kompakt 139 Outlooks compared
50
Figure 20: Global total primary energy demand, coal demand, and electricity generation compared Note: DIW-REM electricity generation is adjusted to a common base year level
Global electricity generation, finally, resembles the conventional scenario cone: All scenarios
(except for our DIW-REM Green Cooperation path) start on a common trajectory of moderate
electricity growth towards 2020, followed by steeper growth towards 2030. Approaching 2040,
the scenarios start to diverge: The EWG scenario considers an unprecedented and severe elec-
trification boom, which exceeds a sevenfold increase between 2020 and 2050. Not far from that
is our DIW-REM Green Cooperation scenario, whose 2055 number amounts to a fivefold increase
from 2020. The remaining variation between scenarios, however, shows no structural character-
istic with respect to institutions or scenario nature.
DIW Berlin: Politikberatung kompakt 139 Outlooks compared
51
Furthermore, we compare the (available) outlooks for the key regions Europe (EU28, Figure 21)
and Asia-Pacific (Figure 22).
The development of total primary energy demand in Europe is more driven by outlooks than by
scenarios. For example, our DIW-REM scenarios all project significant growth in demand. Espe-
cially Green Cooperation projects a steep increase that exceeds today’s levels by twofold, reflect-
ing its concept of green growth. In contrast, the Shell scenarios follow a stagnating to increasing
energy demand path, where Mountains comes closest to our scenario results. The EWG trajec-
tory mimics its global counterpart and considers a late increase, and so does the MIT outlook.
All other scenarios consider modest to substantial decreases in energy demand; reflecting strong
efforts in energy efficiency; the most articulate example for this is Equinor’s best case Renewal.
All outlooks show a common trend in European coal consumption, namely the decrease of coal
use throughout the next decades. The most ambitious outlook is, again, DIW-REM, with all sce-
narios witnessing steep decreases in the 2020s. Green Cooperation eventually phases out coal by
2035, shortly before BP’s Rapid Transition. After that, a cloud of best-case scenarios and Equi-
nor’s base case approach arrive at a complete coal phase-out before 2050. On the upper end of
the range, worst-case scenarios only project a drop in coal production by approximately one half.
Electricity production offers the largest variety in European energy developments: EWG’s re-
newable outlook and DIW-REM’s Green Cooperation project a more-than-fivefold increase in
power generation, while the entire IEA outlook considers a stagnation of European electricity
generation. The remaining few scenarios that present disaggregated electricity generation are in
between these two extremes.
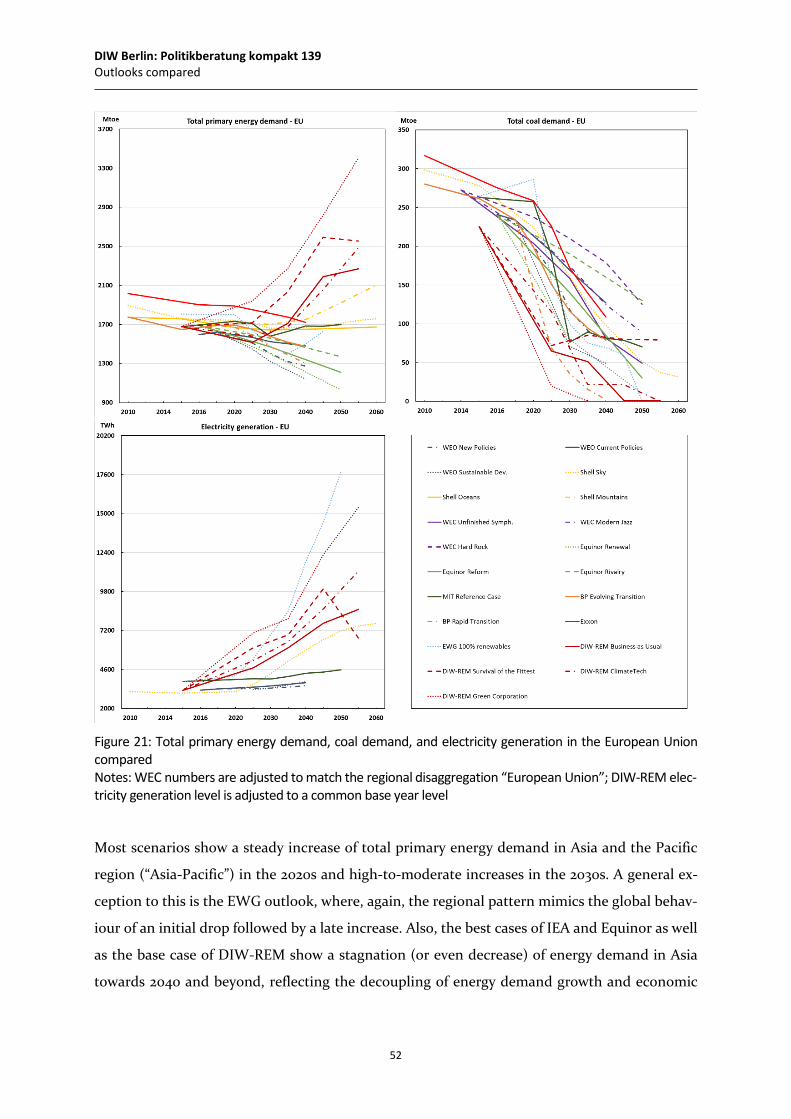
DIW Berlin: Politikberatung kompakt 139 Outlooks compared
52
Figure 21: Total primary energy demand, coal demand, and electricity generation in the European Union compared Notes: WEC numbers are adjusted to match the regional disaggregation “European Union”; DIW-REM elec-tricity generation level is adjusted to a common base year level
Most scenarios show a steady increase of total primary energy demand in Asia and the Pacific
region (“Asia-Pacific”) in the 2020s and high-to-moderate increases in the 2030s. A general ex-
ception to this is the EWG outlook, where, again, the regional pattern mimics the global behav-
iour of an initial drop followed by a late increase. Also, the best cases of IEA and Equinor as well
as the base case of DIW-REM show a stagnation (or even decrease) of energy demand in Asia
towards 2040 and beyond, reflecting the decoupling of energy demand growth and economic
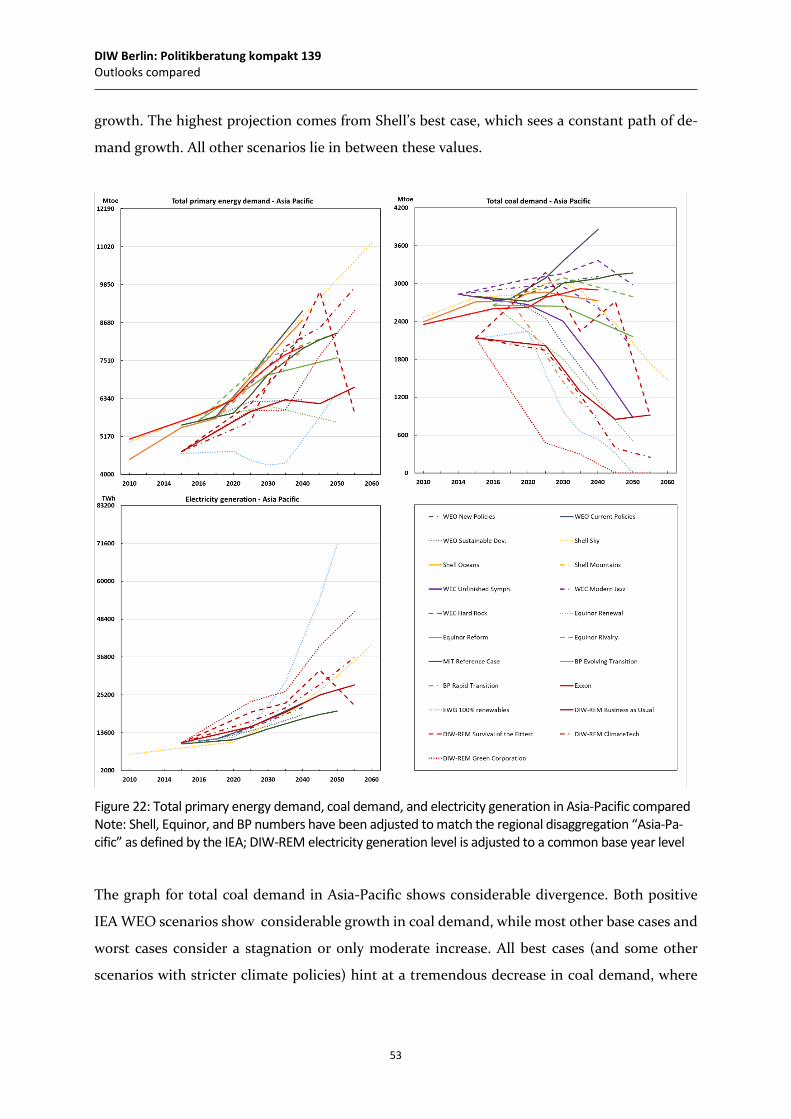
DIW Berlin: Politikberatung kompakt 139 Outlooks compared
53
growth. The highest projection comes from Shell’s best case, which sees a constant path of de-
mand growth. All other scenarios lie in between these values.
Figure 22: Total primary energy demand, coal demand, and electricity generation in Asia-Pacific compared Note: Shell, Equinor, and BP numbers have been adjusted to match the regional disaggregation “Asia-Pa-cific” as defined by the IEA; DIW-REM electricity generation level is adjusted to a common base year level
The graph for total coal demand in Asia-Pacific shows considerable divergence. Both positive
IEA WEO scenarios show considerable growth in coal demand, while most other base cases and
worst cases consider a stagnation or only moderate increase. All best cases (and some other
scenarios with stricter climate policies) hint at a tremendous decrease in coal demand, where
DIW Berlin: Politikberatung kompakt 139 Outlooks compared
54
DIW-REM and EWG have the fastest phase-out and Shell’s Sky initiates the path towards a
phase-out only around 2050.
Asian-Pacific electricity generation, finally, shows a homogenous trend of a moderate increase
in the 2020s and a more rapid ascent in the 2030s. Towards 2050, however, the spread between
scenarios becomes broader again, with EWG and DIW-REM’s Green Cooperation on the upper
scale and the MIT outlook on the lower end.
Total North American primary energy demand (Figure 17) resembles again the conic shape dis-
cussed before: The divergence of scenarios increases over time and almost symmetrically in both
directions. The lower end is filled by a cloud of best-case scenarios (EWG, Equinor, Shell, IEA),
and our DIW-REM outlook takes the upper end of the range. The medium range is filled with
all other scenarios and varies between slight decreases and slight increases in energy demand.
ExxonMobil’s outlook considers the highest demand growth among them, and Shell’s Ocean and
Mountains in addition to MIT and Equinor’s base case come closer to the best-case scenarios.
Total North American coal demand presents our DIW-REM outlook as an outlier: All DIW-REM
scenarios foresee an increase in demand, at least for the mid-term. This is connected to the
strong role that the CCS technology plays in Green Cooperation and ClimateTech and to the
dominant force of US energy independence for the other two. All other outlooks foresee modest
to strong reductions in coal demand: Worst-case scenarios consider stagnating coal demand
with some reduction (but small) towards 2050, while best-case scenarios and Shell’s Mountains
consider quicker decreases. Remarkably, towards 2060, Shell’s Sky converges to a small, yet pos-
itive coal demand level, similar to the numbers of the WEC outlook that reaches Paris-compat-
ible cumulative global emissions by then. This is an indicator that these scenarios also include
negative emissions technologies, albeit without transparently mentioning it.
Electricity generation in North America shows more initial variation than its European and Asian
counterparts. The DIW-REM scenarios, again, foresee large increases in the 2020s, while the
outlooks of MIT and IEA as well as Shell’s Sky project no changes at first. Towards 2030, however,
the outlooks part again with different growth rates. IEA and MIT continue to stay close to today’s
values, while Sky eventually witnesses firm increases. The EWG outlook starts with slow in-
creases but finally catches up with our outlook.
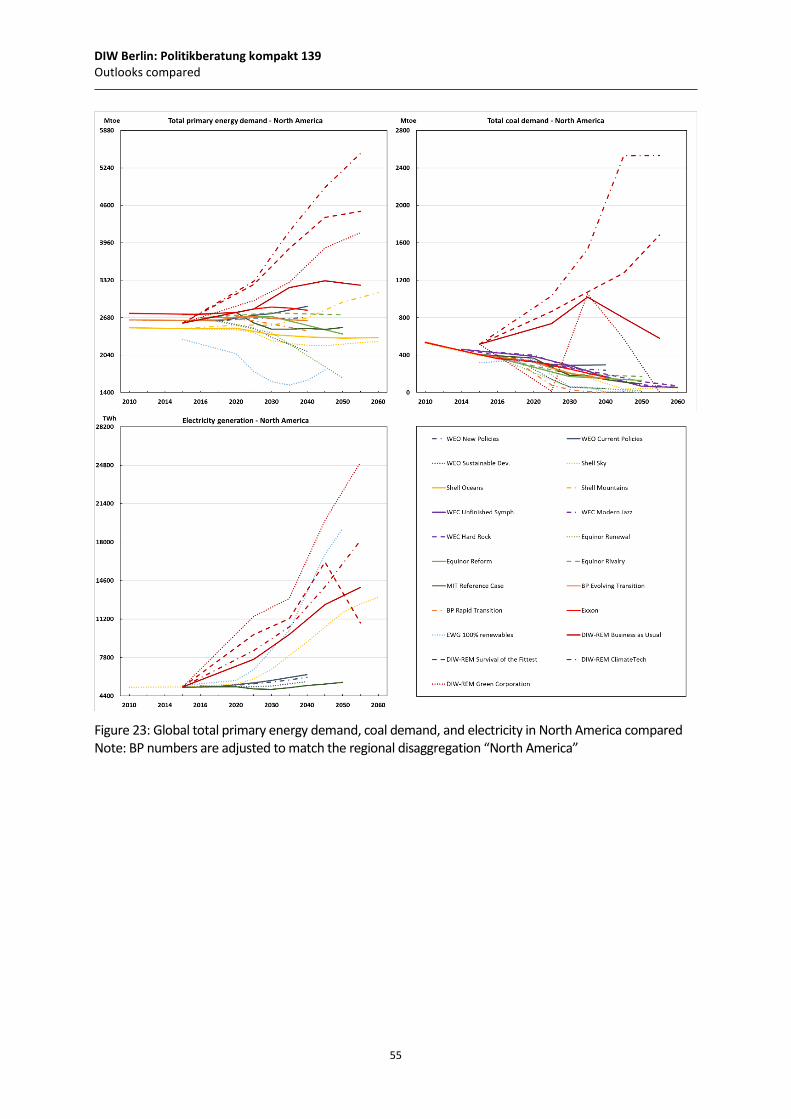
DIW Berlin: Politikberatung kompakt 139 Outlooks compared
55
Figure 23: Global total primary energy demand, coal demand, and electricity in North America compared Note: BP numbers are adjusted to match the regional disaggregation “North America”
DIW Berlin: Politikberatung kompakt 139 Stranded assets in the Global South
56
8 Stranded assets in the Global South
8.1 Introduction
Asset stranding is an increasing concern for the energy sector. In its broadest form, the term
describes "assets [that] suffer from unanticipated or premature write-offs, downward revalua-
tions or are converted to liabilities” (Caldecott et al., 2013, p. 7). It can be the result of disruptive
innovation (Green and Newman, 2017) or policies, particularly of environmental nature
(Harnett, 2018). Stranded assets are connected to sunk costs and include all of their key charac-
teristics (recoverability, transferability, longevity, and financing needs), but they describe a nar-
rower phenomenon (ibid.).
Researching (potential) stranded assets and their effects has received attention in several aca-
demic fields over the past decade. Among them are, of course, energy and climate (e.g. Ansar et
al., 2013), electricity (e.g. Saygin et al., 2019; Simshauser, 2017), resources (e.g. McGlade and
Ekins, 2015; Muttitt, 2016), agriculture (e.g. Caldecott et al., 2013), as well as environmental and
public economics (e.g. Baldwin et al., 2019; Rozenberg et al., 2018; Sen and von Schickfus, 2017;
van der Ploeg and Rezai, 2018). Many contributions were made in finance and investment, but
with a strong emphasis on the effects for and in developed economies (e.g. Andersson et al.,
2016; Byrd and Cooperman, 2015; Byrd and Cooperman, 2018; Silver, 2017).
However, stranded assets have only received very limited attention by development researchers.
Rare examples include Kalin et al. (2019) for the water sector, Comello et al. (2017) and Hoffmann
and Ansari (2019) for mini-grids. This is very surprising given the potential effect that asset
stranding has on the developing world. Low-income countries might eventually be hit hardest
by conventional climate policy instruments (Dorband et al., 2019), and resource endowments
prone to stranding are often located in the developing world (McGlade and Ekins, 2015). In this
vein, Mercure et al. (2018) estimate a future global wealth loss in the range of US$ 1 to 4 trillion
with tremendous distributional impacts (an excess burden for net exporters and benefits for net
importers). Non-producing economies could also be hit: Asset stranding can produce a cascad-
ing effect, hitting downstream sectors and affiliated industries, such as the power sector and
energy-intensive industries (Campiglio et al., 2017). On the other hand, successful transitions to
greener economy models could eventually benefit developing economies. Carbon pricing, for
instance, could finance infrastructure development (Jakob et al., 2016). As examples from the
19th and 20th century show, chances for the developing world do not depend solely on ‘hard’
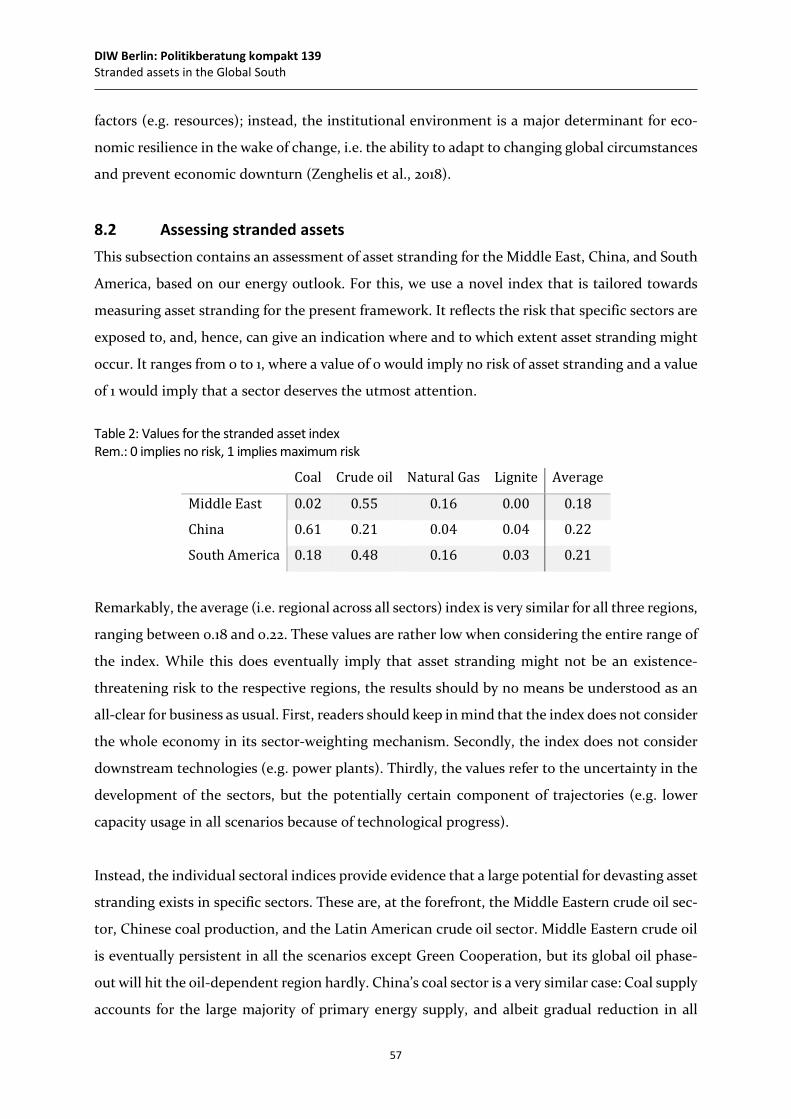
DIW Berlin: Politikberatung kompakt 139 Stranded assets in the Global South
57
factors (e.g. resources); instead, the institutional environment is a major determinant for eco-
nomic resilience in the wake of change, i.e. the ability to adapt to changing global circumstances
and prevent economic downturn (Zenghelis et al., 2018).
8.2 Assessing stranded assets This subsection contains an assessment of asset stranding for the Middle East, China, and South
America, based on our energy outlook. For this, we use a novel index that is tailored towards
measuring asset stranding for the present framework. It reflects the risk that specific sectors are
exposed to, and, hence, can give an indication where and to which extent asset stranding might
occur. It ranges from 0 to 1, where a value of 0 would imply no risk of asset stranding and a value
of 1 would imply that a sector deserves the utmost attention.
Table 2: Values for the stranded asset index Rem.: 0 implies no risk, 1 implies maximum risk
Coal Crude oil Natural Gas Lignite Average
Middle East 0.02 0.55 0.16 0.00 0.18
China 0.61 0.21 0.04 0.04 0.22
South America 0.18 0.48 0.16 0.03 0.21
Remarkably, the average (i.e. regional across all sectors) index is very similar for all three regions,
ranging between 0.18 and 0.22. These values are rather low when considering the entire range of
the index. While this does eventually imply that asset stranding might not be an existence-
threatening risk to the respective regions, the results should by no means be understood as an
all-clear for business as usual. First, readers should keep in mind that the index does not consider
the whole economy in its sector-weighting mechanism. Secondly, the index does not consider
downstream technologies (e.g. power plants). Thirdly, the values refer to the uncertainty in the
development of the sectors, but the potentially certain component of trajectories (e.g. lower
capacity usage in all scenarios because of technological progress).
Instead, the individual sectoral indices provide evidence that a large potential for devasting asset
stranding exists in specific sectors. These are, at the forefront, the Middle Eastern crude oil sec-
tor, Chinese coal production, and the Latin American crude oil sector. Middle Eastern crude oil
is eventually persistent in all the scenarios except Green Cooperation, but its global oil phase-
out will hit the oil-dependent region hardly. China’s coal sector is a very similar case: Coal supply
accounts for the large majority of primary energy supply, and albeit gradual reduction in all
DIW Berlin: Politikberatung kompakt 139
58
scenarios, Green Cooperation eventually sees a phase-out by 2040. The case of Latin American
crude is slightly different from the Middle East: The spread between the scenarios is even larger,
as Latin American production virtually disappears in Green Cooperation, but the relative im-
portance of oil is lower than that in the Middle East.
Indices for the natural gas sector are only small to modest for all regions. This results from two
central factors: First, natural gas consumption continues in each scenario, which is why the sec-
tor’s prospects are less uncertain. Second, none of the three regions is all-dependent on natural
gas-supply: China’s production is anyhow limited, and the other two regions produce large
amounts of either crude oil or renewables, depending on the scenario. Clearly, this does not
need to be the case for individual nations (e.g. Qatar). This remark is also central for the Latin
American coal sector: Continent-wise, the index is low. However, (current and prospective) coal
production is distributed unevenly across Latin American countries, which is why some (e.g.
Colombia) will be hit significantly in Green Cooperation. Values for lignite are only barely above
0, as the sector’s production is neither large in any of the regions, nor does any scenario foresee
significant lignite supply in the future.
Nevertheless, in the presence of uncertainty, fossil-fuel exporters will always be in an adverse
position, as a unilateral transformation away from fuel exports is likely to be economically harm-
ful in the short-run. The institutional framework plays a dominant role in enabling or hindering
a green transition. Middle Eastern economies are in adverse condition with rigid social contracts
and are mostly unsuccessful in the factors that determine economic resilience and, thus, the
prospects of and likeliness to engage in a green transition. China, on the contrary, offers many
of the required factors to be able to adapt to a climate constrained world and is likely to engage
a green transition, whose extent yet to determine and potentially to be influenced by policy-
making. Latin American economies stand between both models and do not provide the same
rigid institutional framework of the Middle East. However, human capital formation, innova-
tion, and credibility in policy-making remain crucial issues that will determine whether the con-
tinent moves rather towards a green transition or if it will endure the risk of stranded assets.
Stranded assets in the Global South
DIW Berlin: Politikberatung kompakt 139 Conclusions and lessons learnt
59
9 Conclusions and lessons learnt
In this report, we have presented the DIW-REM outlook for developments of the global energy
system and climate towards 2055. Moreover, we gave a brief comparison to other outlooks and
discussion of the effects of the diverse developments in the fossil fuel sectors on asset stranding
in resource-dependent countries.
The following conclusions and recommendations apply:
o A return to political isolationism is a critical risk for the energy transition: First, effective
climate policies require international collaboration. Indeed, recent theoretical and em-
pirical research shows that an at least partial transition is bound to happen due to market
developments (especially cost reductions), and some climate action will happen even
unilaterally. However, finding economic solutions to the global carbons problem re-
quires multilateral, global efforts, since actors will often have unilateral incentives to de-
ter costly transitions. Moreover, and second, the energy transition depends on channel-
ling investments into the ‘right’ directions. Despite the importance of state actors, who
set aims and policies, it will be non-state actors that implement a transition eventually.
The availability and cost of certain (cleaner) technologies is the most important variable
for private actors. Therefore, targeted research and development, supported by multilat-
eral state initiatives (e.g. under the UN framework), are a crucial tool to direct market
actors in the right direction. Otherwise, lacking global coordination will lead to ambig-
uous (technological) developments and competing technologies. An unsuccessful tran-
sition, stranded assets, and wasteful research expenses may be the consequence. Lastly,
substantial increases in the global temperature risks to create massive refugee waves.
These waves would further fuel inter-regional tensions, potentially leading to even more
isolationism and cementing existing carbon lock-ins.
o Public opinion and societal transitions are an integral component of decarbonization
efforts. First, the outlook shows that a solely technical transition may succeed in pre-
venting an immediate escalation of the climate crisis, but it will typically not manage to
provide a stable corridor for the long run. Second, conflicting interests on all levels of
society as well as incohesion provide strong barriers to transition. An inclusive society
that shifts its opinion towards transition is necessary to create the holistic change that is
required to overcome the inertia of the current system.
DIW Berlin: Politikberatung kompakt 139 Conclusions and lessons learnt
60
o The integration of economic and energy-related objectives and incentives (e.g. poverty
alleviation, infrastructure modernisation, and private investment) is crucial. On a global
level, energy access and economic development in the Global South remain urgent needs
that are bound to put additional pressure on the carbon budget. Historical questions of
distributive justice between Global North and South risk to create a kicking-away-the-
ladder narrative in energy-related issues. Therefore, for a successful transition, nations
of the Global North will not only have to decarbonise within their borders, but they will
be required to take an active role in green growth in the Global South. This push for
inclusive, sustainable development includes but is not limited to technology transfer, the
incentive design, and geopolitical reconciliation. Moreover, fossil-fuel sectors in re-
source-rich regions will require special emphasis by the international community, since
economies and social contracts may depend on them. Asset stranding, which is the de-
preciation of assets due to sudden policies or market disruptions, is a risk for fossil-fuel
dependent economies with limited diversification of exports and fiscal budgets. There is
a high risk for market rebounds and increasing political tensions that can damage decar-
bonisation efforts and fragile security environments alike. Also, industrialised countries
will need to make sure that the transition does not create an excessive burden for lower-
income groups.
o We find that some metrics commonly used for assessing the state of decarbonisation are
unfit indicators. We show that, especially, the share of renewables and electricity con-
sumption are improper indicators, as the trends of increasing electrification and rising
renewable energy generation are also ongoing in the scenarios with increasing emissions.
Monitoring the transition and designing policies solely based on these indicators risks
wrong assessments and biased action. Instead, we advocate for direct metrics (e.g. the
rate of emissions, see Figure below) or a set of multidimensional indicators, as we present
them as part of our outlook.
Concerning the methods of foresight analysis and complementarity modelling of the global en-
ergy system, the following lessons learnt can be drawn:
o Scenario planning is a useful tool. However, foresight analysis is rather short-term ori-
ented (usually 5-6 years ahead) and needs to be adapted for long-term analyses. The
DIW Berlin: Politikberatung kompakt 139 Conclusions and lessons learnt
61
adaptation then is similar, if not equal, to the scenario planning method which is em-
ployed by Shell, and to a weaker extend by the World Energy Council and the IEA.
o Taking into account a large variety of sectors, factors, as well as societal and political
dimensions allows detecting interlinkages and feedback loops beyond the energy sector.
For the question of global decarbonization of the energy system, it is particularly neces-
sary to account for geopolitics and societal developments.
o Equilibrium (complementarity modelling) of energy systems allows for including market
features such as imperfect competition. However, the mathematical complexity of the
method requires to reduce the data complexity (e.g. the number of energy consumption
technologies). Moreover, in the multi-period setting, this modelling setup tends to rep-
licate existing systems with similar structures over time, as opposed to (linear) optimi-
sation methods which may also include substantial structural breaks (extreme solutions,
such as the complete abandoning of a particular technology or fuel).
DIW Berlin: Politikberatung kompakt 139 Acknowledgements
62
Acknowledgements
We thank Oliver Gnad, Nathan Appleman, Hasan Basri Tosun, Ezaldeen Aref, Ruud Egging,
Daniel Huppmann, Sauleh Siddiqui, Christian von Hirschhausen, Claudia Kemfert, Anna Pegels,
Ambria Fareed, Christian Hauenstein, Jimi Oke, Pao-Yu Oei, Konstantin Löffler, Thorsten Bu-
randt, Katherine Croll-Knight, Isabell Braunger, and Gustav Resch for their helpful comments
on earlier versions of the manuscript.
We are indebted to the participants in the DIW Berlin Scenario Foresight Workshop in Novem-
ber 2016 and the TU Berlin Scenario Workshop in April 2018. We are also grateful for comments
at the Berlin Conference on Energy and Electricity Economics 2017 and 2018 (Berlin, Germany),
the IHS and ÖGOR workshop Mathematical Economics and Optimisation in Energy Economics
2018 (Vienna, Austria), the Transatlantic Infraday 2018 (Washington DC, USA), and the 41st IAEE
International Conference 2018 (Groningen, Netherlands), the “Green transformation and com-
petitive advantage” conference in July 2018 at GDI in Bonn, and the HU Berlin FoReSee Work-
shop in March 2019.
This project received funding from the European Union’s Horizon 2020 research and innovation
programme under grant agreement no. 691843 (SET-Nav) and the German Federal Ministry of
Education and Research’s research program Economics of Climate Change II, grant agreement
no. 01LA1811B (FoReSee). The authors declare that there is no conflict of interest.
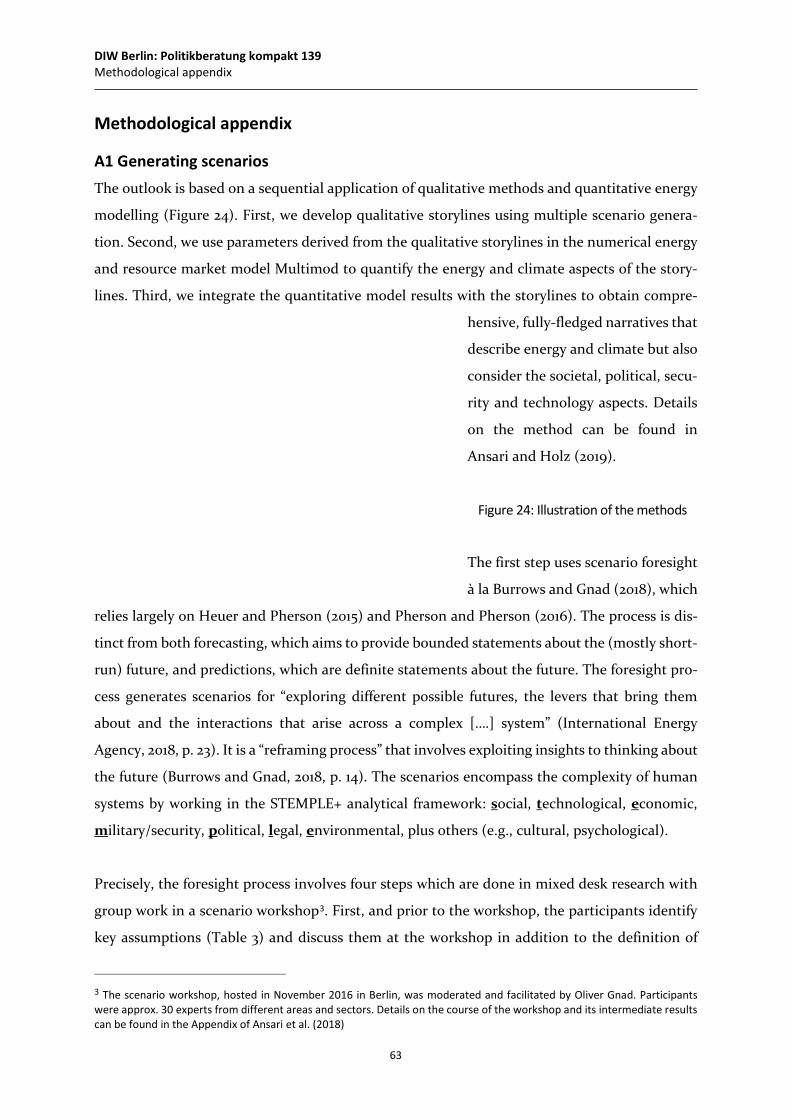
DIW Berlin: Politikberatung kompakt 139 Methodological appendix
63
Methodological appendix
A1 Generating scenarios The outlook is based on a sequential application of qualitative methods and quantitative energy
modelling (Figure 24). First, we develop qualitative storylines using multiple scenario genera-
tion. Second, we use parameters derived from the qualitative storylines in the numerical energy
and resource market model Multimod to quantify the energy and climate aspects of the story-
lines. Third, we integrate the quantitative model results with the storylines to obtain compre-
hensive, fully-fledged narratives that
describe energy and climate but also
consider the societal, political, secu-
rity and technology aspects. Details
on the method can be found in
Ansari and Holz (2019).
Figure 24: Illustration of the methods
The first step uses scenario foresight
à la Burrows and Gnad (2018), which
relies largely on Heuer and Pherson (2015) and Pherson and Pherson (2016). The process is dis-
tinct from both forecasting, which aims to provide bounded statements about the (mostly short-
run) future, and predictions, which are definite statements about the future. The foresight pro-
cess generates scenarios for “exploring different possible futures, the levers that bring them
about and the interactions that arise across a complex [….] system” (International Energy
Agency, 2018, p. 23). It is a “reframing process” that involves exploiting insights to thinking about
the future (Burrows and Gnad, 2018, p. 14). The scenarios encompass the complexity of human
systems by working in the STEMPLE+ analytical framework: social, technological, economic,
military/security, political, legal, environmental, plus others (e.g., cultural, psychological).
Precisely, the foresight process involves four steps which are done in mixed desk research with
group work in a scenario workshop3. First, and prior to the workshop, the participants identify
key assumptions (Table 3) and discuss them at the workshop in addition to the definition of
3 The scenario workshop, hosted in November 2016 in Berlin, was moderated and facilitated by Oliver Gnad. Participants were approx. 30 experts from different areas and sectors. Details on the course of the workshop and its intermediate results can be found in the Appendix of Ansari et al. (2018)
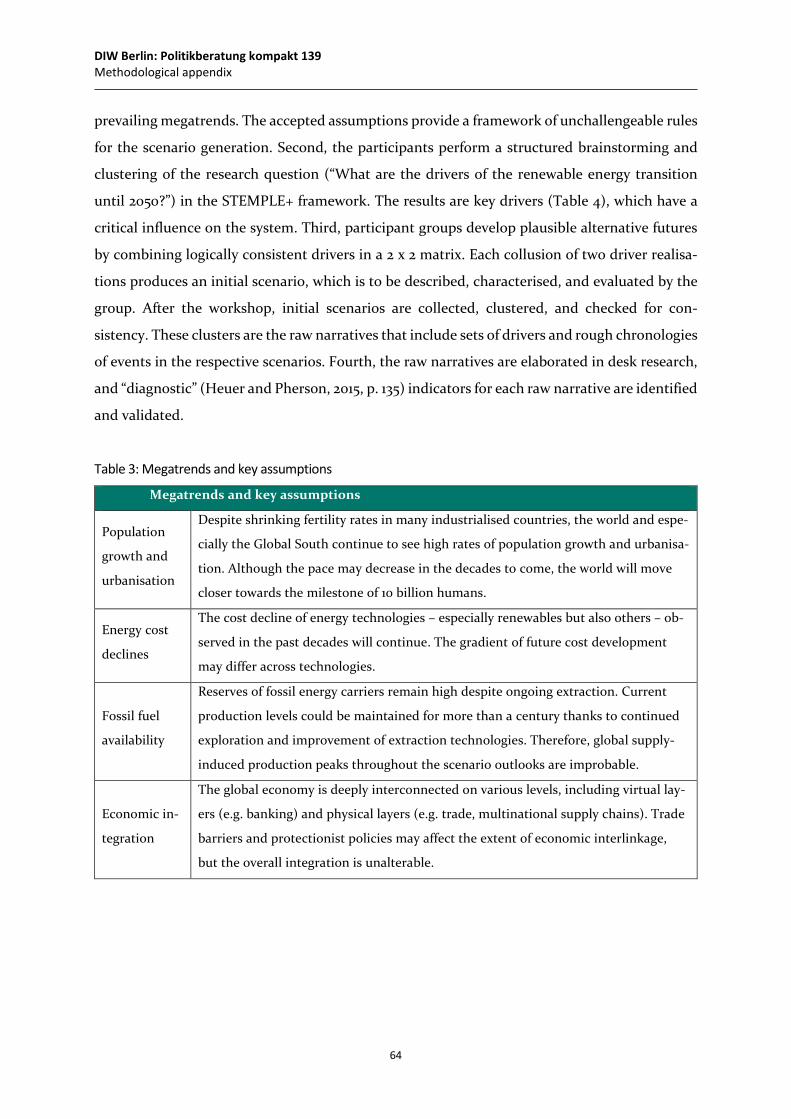
DIW Berlin: Politikberatung kompakt 139 Methodological appendix
64
prevailing megatrends. The accepted assumptions provide a framework of unchallengeable rules
for the scenario generation. Second, the participants perform a structured brainstorming and
clustering of the research question (“What are the drivers of the renewable energy transition
until 2050?”) in the STEMPLE+ framework. The results are key drivers (Table 4), which have a
critical influence on the system. Third, participant groups develop plausible alternative futures
by combining logically consistent drivers in a 2 x 2 matrix. Each collusion of two driver realisa-
tions produces an initial scenario, which is to be described, characterised, and evaluated by the
group. After the workshop, initial scenarios are collected, clustered, and checked for con-
sistency. These clusters are the raw narratives that include sets of drivers and rough chronologies
of events in the respective scenarios. Fourth, the raw narratives are elaborated in desk research,
and “diagnostic” (Heuer and Pherson, 2015, p. 135) indicators for each raw narrative are identified
and validated.
Table 3: Megatrends and key assumptions
Megatrends and key assumptions
Population
growth and
urbanisation
Despite shrinking fertility rates in many industrialised countries, the world and espe-
cially the Global South continue to see high rates of population growth and urbanisa-
tion. Although the pace may decrease in the decades to come, the world will move
closer towards the milestone of 10 billion humans.
Energy cost
declines
The cost decline of energy technologies – especially renewables but also others – ob-
served in the past decades will continue. The gradient of future cost development
may differ across technologies.
Fossil fuel
availability
Reserves of fossil energy carriers remain high despite ongoing extraction. Current
production levels could be maintained for more than a century thanks to continued
exploration and improvement of extraction technologies. Therefore, global supply-
induced production peaks throughout the scenario outlooks are improbable.
Economic in-
tegration
The global economy is deeply interconnected on various levels, including virtual lay-
ers (e.g. banking) and physical layers (e.g. trade, multinational supply chains). Trade
barriers and protectionist policies may affect the extent of economic interlinkage,
but the overall integration is unalterable.
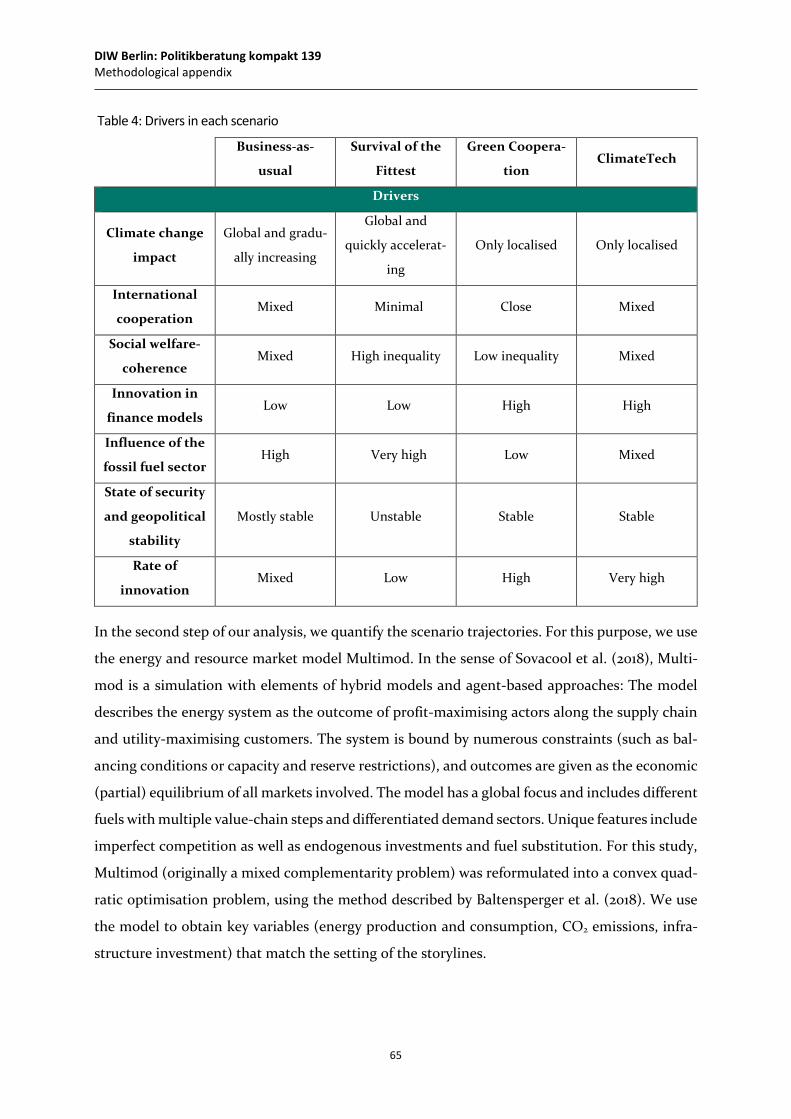
DIW Berlin: Politikberatung kompakt 139 Methodological appendix
65
Table 4: Drivers in each scenario
Business-as-
usual
Survival of the
Fittest
Green Coopera-
tion ClimateTech
Drivers
Climate change
impact
Global and gradu-
ally increasing
Global and
quickly accelerat-
ing
Only localised Only localised
International
cooperation Mixed Minimal Close Mixed
Social welfare-
coherence Mixed High inequality Low inequality Mixed
Innovation in
finance models Low Low High High
Influence of the
fossil fuel sector High Very high Low Mixed
State of security
and geopolitical
stability
Mostly stable Unstable Stable Stable
Rate of
innovation Mixed Low High Very high
In the second step of our analysis, we quantify the scenario trajectories. For this purpose, we use
the energy and resource market model Multimod. In the sense of Sovacool et al. (2018), Multi-
mod is a simulation with elements of hybrid models and agent-based approaches: The model
describes the energy system as the outcome of profit-maximising actors along the supply chain
and utility-maximising customers. The system is bound by numerous constraints (such as bal-
ancing conditions or capacity and reserve restrictions), and outcomes are given as the economic
(partial) equilibrium of all markets involved. The model has a global focus and includes different
fuels with multiple value-chain steps and differentiated demand sectors. Unique features include
imperfect competition as well as endogenous investments and fuel substitution. For this study,
Multimod (originally a mixed complementarity problem) was reformulated into a convex quad-
ratic optimisation problem, using the method described by Baltensperger et al. (2018). We use
the model to obtain key variables (energy production and consumption, CO2 emissions, infra-
structure investment) that match the setting of the storylines.
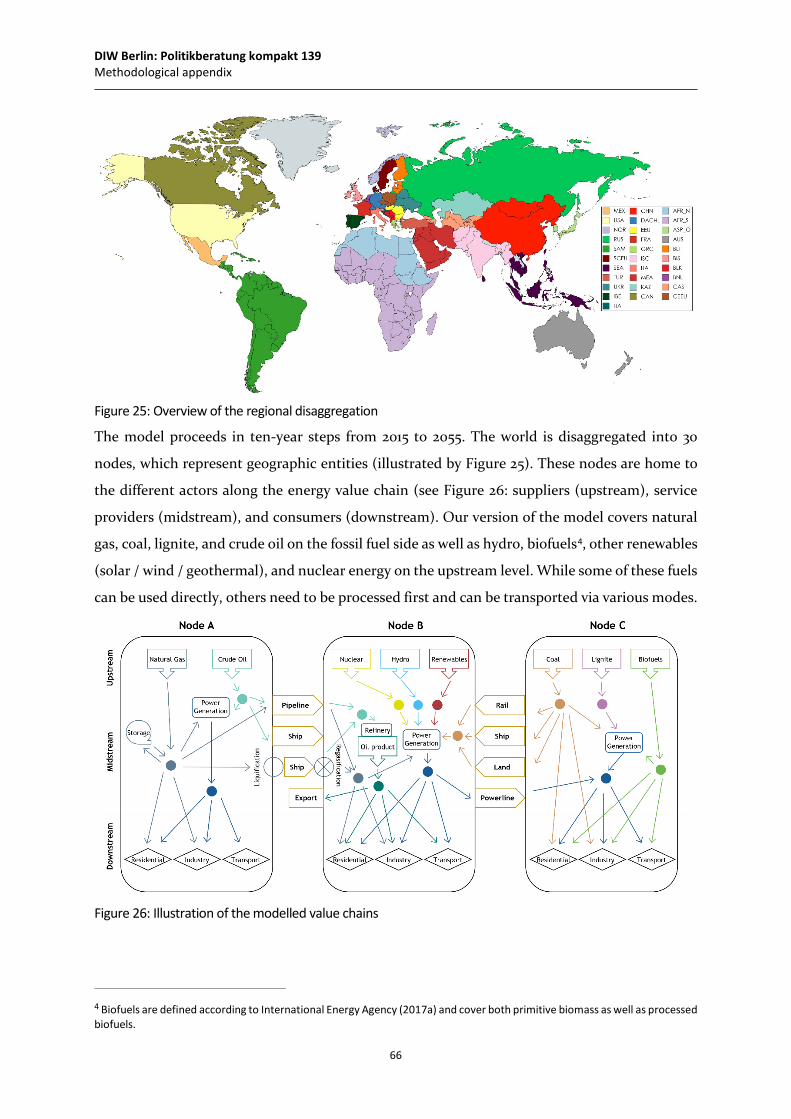
DIW Berlin: Politikberatung kompakt 139 Methodological appendix
66
Figure 25: Overview of the regional disaggregation
The model proceeds in ten-year steps from 2015 to 2055. The world is disaggregated into 30
nodes, which represent geographic entities (illustrated by Figure 25). These nodes are home to
the different actors along the energy value chain (see Figure 26: suppliers (upstream), service
providers (midstream), and consumers (downstream). Our version of the model covers natural
gas, coal, lignite, and crude oil on the fossil fuel side as well as hydro, biofuels4, other renewables
(solar / wind / geothermal), and nuclear energy on the upstream level. While some of these fuels
can be used directly, others need to be processed first and can be transported via various modes.
Figure 26: Illustration of the modelled value chains
4 Biofuels are defined according to International Energy Agency (2017a) and cover both primitive biomass as well as processed biofuels.
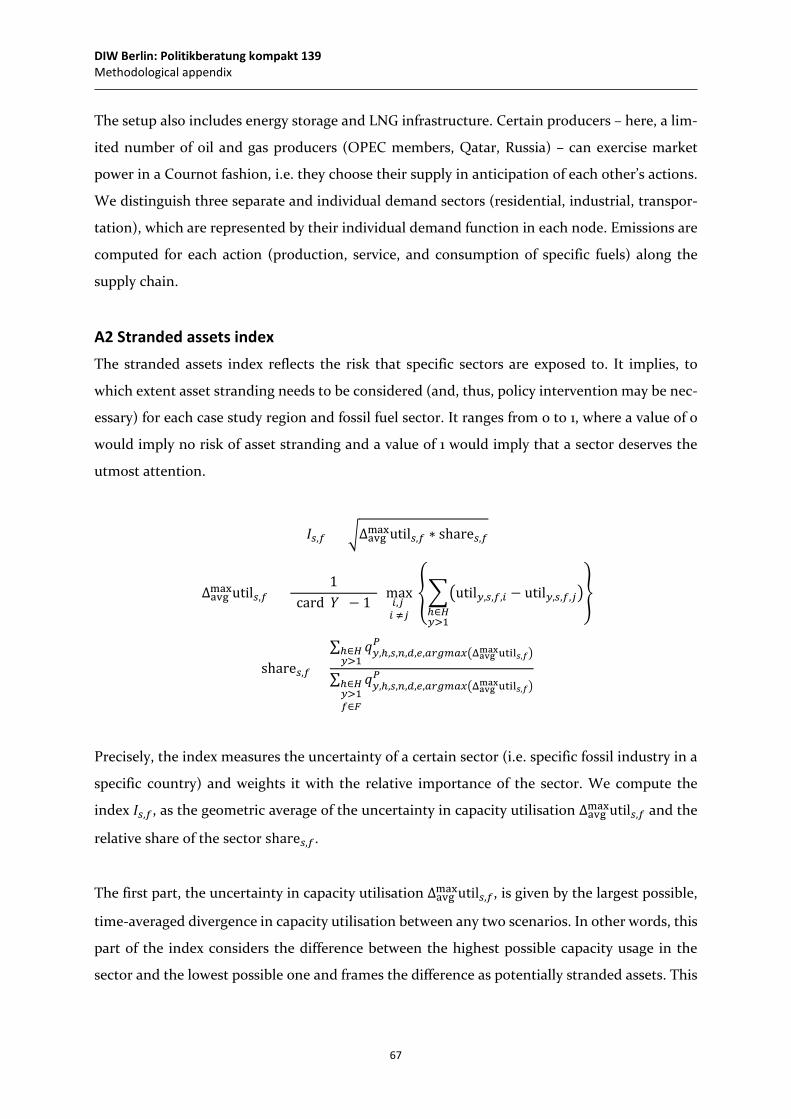
DIW Berlin: Politikberatung kompakt 139 Methodological appendix
67
The setup also includes energy storage and LNG infrastructure. Certain producers – here, a lim-
ited number of oil and gas producers (OPEC members, Qatar, Russia) – can exercise market
power in a Cournot fashion, i.e. they choose their supply in anticipation of each other’s actions.
We distinguish three separate and individual demand sectors (residential, industrial, transpor-
tation), which are represented by their individual demand function in each node. Emissions are
computed for each action (production, service, and consumption of specific fuels) along the
supply chain.
A2 Stranded assets index The stranded assets index reflects the risk that specific sectors are exposed to. It implies, to
which extent asset stranding needs to be considered (and, thus, policy intervention may be nec-
essary) for each case study region and fossil fuel sector. It ranges from 0 to 1, where a value of 0
would imply no risk of asset stranding and a value of 1 would imply that a sector deserves the
utmost attention.
𝐼𝐼𝑠𝑠,𝑓𝑓 = �Δavgmaxutil𝑠𝑠,𝑓𝑓 ∗ share𝑠𝑠,𝑓𝑓
Δavgmaxutil𝑠𝑠,𝑓𝑓 = 1
(card(𝑌𝑌) − 1) max𝑖𝑖,𝑗𝑗 𝑖𝑖 ≠𝑗𝑗
���util𝑦𝑦,𝑠𝑠,𝑓𝑓,𝑖𝑖 − util𝑦𝑦,𝑠𝑠,𝑓𝑓,𝑗𝑗�
ℎ∈𝐻𝐻𝑦𝑦>1
�
share𝑠𝑠,𝑓𝑓 =∑ 𝑞𝑞𝑦𝑦,ℎ,𝑠𝑠,𝑛𝑛,𝑑𝑑,𝑒𝑒,𝑎𝑎𝑎𝑎𝑎𝑎𝑎𝑎𝑎𝑎𝑎𝑎�Δavgmaxutil𝑠𝑠,𝑓𝑓�
𝑃𝑃 ℎ∈𝐻𝐻𝑦𝑦>1
∑ 𝑞𝑞𝑦𝑦,ℎ,𝑠𝑠,𝑛𝑛,𝑑𝑑,𝑒𝑒,𝑎𝑎𝑎𝑎𝑎𝑎𝑎𝑎𝑎𝑎𝑎𝑎�Δavgmaxutil𝑠𝑠,𝑓𝑓�𝑃𝑃
ℎ∈𝐻𝐻𝑦𝑦>1𝑓𝑓∈𝐹𝐹
Precisely, the index measures the uncertainty of a certain sector (i.e. specific fossil industry in a
specific country) and weights it with the relative importance of the sector. We compute the
index 𝐼𝐼𝑠𝑠,𝑓𝑓, as the geometric average of the uncertainty in capacity utilisation Δavgmaxutil𝑠𝑠,𝑓𝑓 and the
relative share of the sector share𝑠𝑠,𝑓𝑓.
The first part, the uncertainty in capacity utilisation Δavgmaxutil𝑠𝑠,𝑓𝑓, is given by the largest possible,
time-averaged divergence in capacity utilisation between any two scenarios. In other words, this
part of the index considers the difference between the highest possible capacity usage in the
sector and the lowest possible one and frames the difference as potentially stranded assets. This
DIW Berlin: Politikberatung kompakt 139 Methodological appendix
68
mimics the idea that stranded assets are unanticipated write-offs to (productive) as-
sets: Δavgmaxutil𝑠𝑠,𝑓𝑓 takes the scenarios as given and measures the range of uncertainty in the usage
of productive capacities util𝑦𝑦,𝑠𝑠,𝑓𝑓,𝑖𝑖.5. However, and not downplaying localised effects, this will only
be of minor interest, if the corresponding sector shows no importance in the overall (energy)
economy. Therefore, share𝑠𝑠,𝑓𝑓, the second factor in the index, measures the relative share that
the sector has in overall national energy production accumulated over the outlook period.
Hence, the index increases in a larger share of the sector, as asset stranding becomes most dan-
gerous if an essential part of the economy were hit.
A3 Data structure and sources
We use a dataset named 30 nodes plus, which is an extended and updated version of Huppmann
and Egging (2014)’s dataset, to which we refer for a general and more comprehensive overview.
An overview of the most important sources for input data is given in Table 5. The dataset makes
extensive use of the DIW Berlin sector-level models and databases.
In a nutshell, the model translates detailed information for a base year, reference points for the
future, and techno-economic specifications of the supply chain into energy system and market
outcomes as the result of the objective-oriented interaction of all market actors. In detail, the
model requires disaggregated energy balances for a base year, operational costs for production
(i.e. a quadratic function in our version) and (linear) costs for all energy services, investment
costs for the expansion of production and energy service capacities as well as their limits (e.g.
possibilities for new transport routes or power plants), resource reserves, efficiency values, (sea-
sonal) reference demand6 values, depreciation rates, and greenhouse gas emission values for
each action. The model then computes a single equilibrium solution for all periods, nodes, and
actors. This solution contains quantities and flows for production, consumption, conversion,
storage, and transport as well as investments in all infrastructures. Additionally, the model de-
termines end-use costs, prices, emissions, and welfare.
5 In case all scenarios are considerably similar (at least in terms of capacity utilisation), the sector does not face much uncer-tainty. Instead, no matter the future, the sector faces a similar trajectory, which is why there would not be a major risk of asset stranding. However, in the case of at least two scenarios diverging significantly (e.g. Green Cooperation foresees almost no utilisation of present capacities and Survival of the Fittest foresees a high capacity utilisation), that sector’s future would be highly uncertain, increasing the risk of stranded assets. 6 There is a central difference between having an eventual demand level and a reference demand point as input. Models that use final demand levels as input fix the final quantities exogenously. Hence, such a model is not economic in the sense that the model does not replicate a market action with price and quantity as endogenous variables. In contrast to that, a reference demand point (including a reference price) refers to a single and specific point on the demand curve, which is used to extrap-olate the remainder of the curve. Hence, while choosing and varying the reference demand point influences the eventual demand, it does not determine it. This is done endogenously in the interplay of supply and demand.
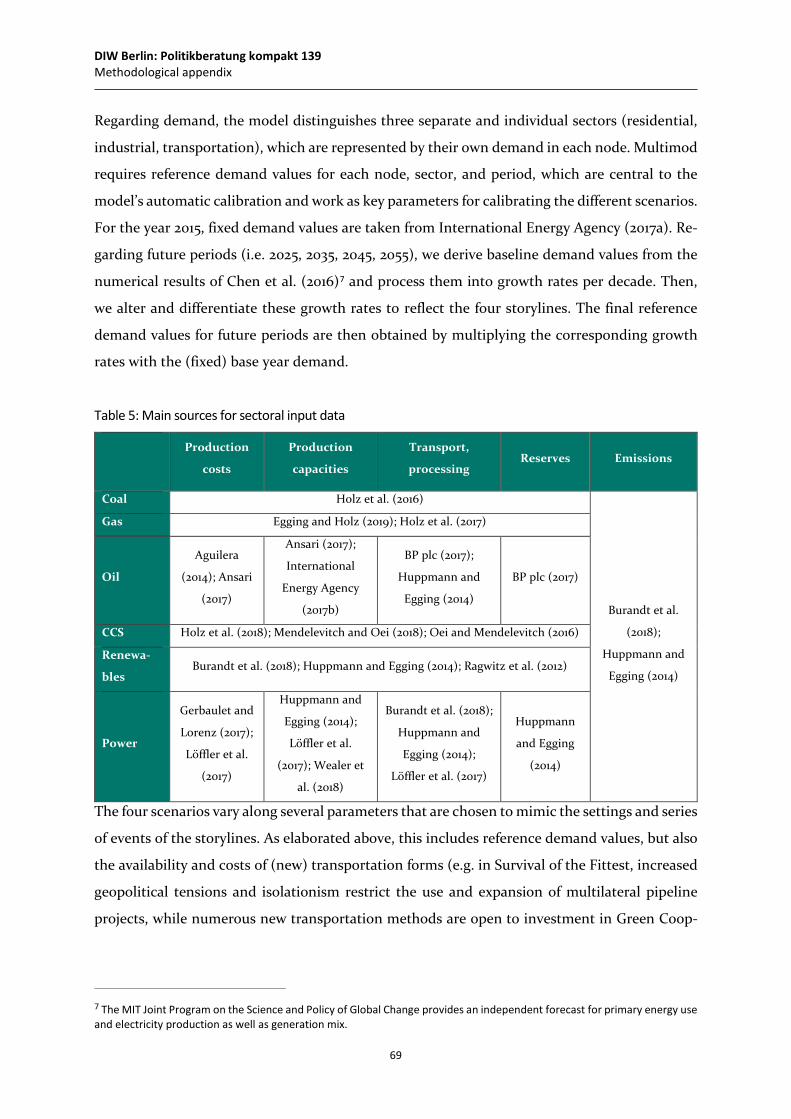
DIW Berlin: Politikberatung kompakt 139 Methodological appendix
69
Regarding demand, the model distinguishes three separate and individual sectors (residential,
industrial, transportation), which are represented by their own demand in each node. Multimod
requires reference demand values for each node, sector, and period, which are central to the
model’s automatic calibration and work as key parameters for calibrating the different scenarios.
For the year 2015, fixed demand values are taken from International Energy Agency (2017a). Re-
garding future periods (i.e. 2025, 2035, 2045, 2055), we derive baseline demand values from the
numerical results of Chen et al. (2016)7 and process them into growth rates per decade. Then,
we alter and differentiate these growth rates to reflect the four storylines. The final reference
demand values for future periods are then obtained by multiplying the corresponding growth
rates with the (fixed) base year demand.
Table 5: Main sources for sectoral input data
Production
costs
Production
capacities
Transport,
processing Reserves Emissions
Coal Holz et al. (2016)
Burandt et al.
(2018);
Huppmann and
Egging (2014)
Gas Egging and Holz (2019); Holz et al. (2017)
Oil
Aguilera
(2014); Ansari
(2017)
Ansari (2017);
International
Energy Agency
(2017b)
BP plc (2017);
Huppmann and
Egging (2014)
BP plc (2017)
CCS Holz et al. (2018); Mendelevitch and Oei (2018); Oei and Mendelevitch (2016)
Renewa-
bles Burandt et al. (2018); Huppmann and Egging (2014); Ragwitz et al. (2012)
Power
Gerbaulet and
Lorenz (2017);
Löffler et al.
(2017)
Huppmann and
Egging (2014);
Löffler et al.
(2017); Wealer et
al. (2018)
Burandt et al. (2018);
Huppmann and
Egging (2014);
Löffler et al. (2017)
Huppmann
and Egging
(2014)
The four scenarios vary along several parameters that are chosen to mimic the settings and series
of events of the storylines. As elaborated above, this includes reference demand values, but also
the availability and costs of (new) transportation forms (e.g. in Survival of the Fittest, increased
geopolitical tensions and isolationism restrict the use and expansion of multilateral pipeline
projects, while numerous new transportation methods are open to investment in Green Coop-
7 The MIT Joint Program on the Science and Policy of Global Change provides an independent forecast for primary energy use and electricity production as well as generation mix.
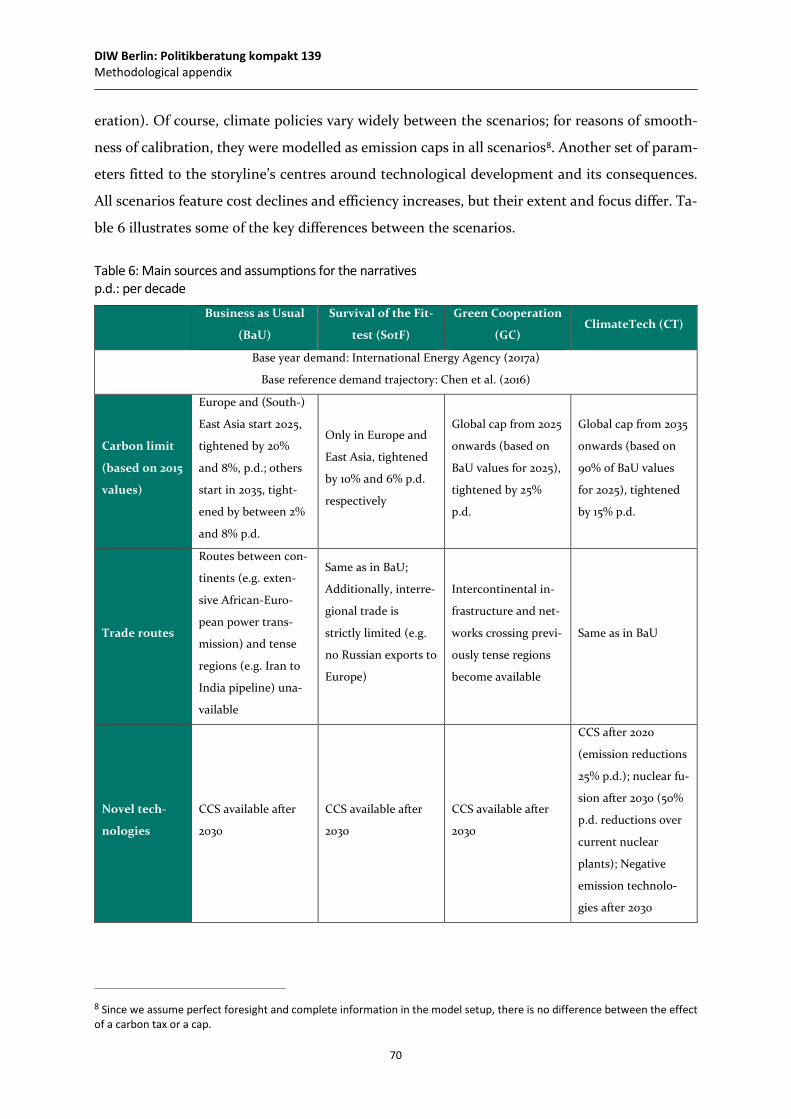
DIW Berlin: Politikberatung kompakt 139 Methodological appendix
70
eration). Of course, climate policies vary widely between the scenarios; for reasons of smooth-
ness of calibration, they were modelled as emission caps in all scenarios8. Another set of param-
eters fitted to the storyline’s centres around technological development and its consequences.
All scenarios feature cost declines and efficiency increases, but their extent and focus differ. Ta-
ble 6 illustrates some of the key differences between the scenarios.
Table 6: Main sources and assumptions for the narratives p.d.: per decade
Business as Usual
(BaU)
Survival of the Fit-
test (SotF)
Green Cooperation
(GC) ClimateTech (CT)
Base year demand: International Energy Agency (2017a)
Base reference demand trajectory: Chen et al. (2016)
Carbon limit
(based on 2015
values)
Europe and (South-)
East Asia start 2025,
tightened by 20%
and 8%, p.d.; others
start in 2035, tight-
ened by between 2%
and 8% p.d.
Only in Europe and
East Asia, tightened
by 10% and 6% p.d.
respectively
Global cap from 2025
onwards (based on
BaU values for 2025),
tightened by 25%
p.d.
Global cap from 2035
onwards (based on
90% of BaU values
for 2025), tightened
by 15% p.d.
Trade routes
Routes between con-
tinents (e.g. exten-
sive African-Euro-
pean power trans-
mission) and tense
regions (e.g. Iran to
India pipeline) una-
vailable
Same as in BaU;
Additionally, interre-
gional trade is
strictly limited (e.g.
no Russian exports to
Europe)
Intercontinental in-
frastructure and net-
works crossing previ-
ously tense regions
become available
Same as in BaU
Novel tech-
nologies
CCS available after
2030
CCS available after
2030
CCS available after
2030
CCS after 2020
(emission reductions
25% p.d.); nuclear fu-
sion after 2030 (50%
p.d. reductions over
current nuclear
plants); Negative
emission technolo-
gies after 2030
8 Since we assume perfect foresight and complete information in the model setup, there is no difference between the effect of a carbon tax or a cap.
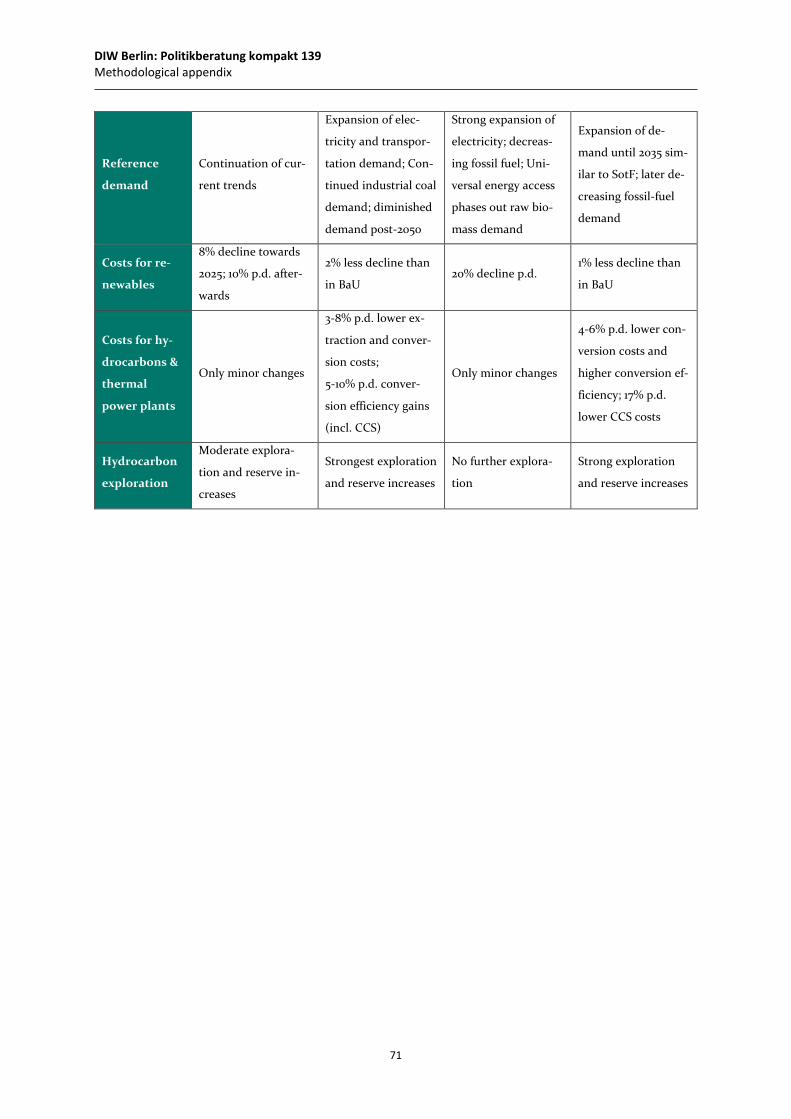
DIW Berlin: Politikberatung kompakt 139 Methodological appendix
71
Reference
demand
Continuation of cur-
rent trends
Expansion of elec-
tricity and transpor-
tation demand; Con-
tinued industrial coal
demand; diminished
demand post-2050
Strong expansion of
electricity; decreas-
ing fossil fuel; Uni-
versal energy access
phases out raw bio-
mass demand
Expansion of de-
mand until 2035 sim-
ilar to SotF; later de-
creasing fossil-fuel
demand
Costs for re-
newables
8% decline towards
2025; 10% p.d. after-
wards
2% less decline than
in BaU 20% decline p.d.
1% less decline than
in BaU
Costs for hy-
drocarbons &
thermal
power plants
Only minor changes
3-8% p.d. lower ex-
traction and conver-
sion costs;
5-10% p.d. conver-
sion efficiency gains
(incl. CCS)
Only minor changes
4-6% p.d. lower con-
version costs and
higher conversion ef-
ficiency; 17% p.d.
lower CCS costs
Hydrocarbon
exploration
Moderate explora-
tion and reserve in-
creases
Strongest exploration
and reserve increases
No further explora-
tion
Strong exploration
and reserve increases
DIW Berlin: Politikberatung kompakt 139 References
72
References
Aguilera, R.F., 2014. Production costs of global conventional and unconventional petroleum. Energy Policy 64, 134-140.
Amer, M., Daim, T.U., Jetter, A., 2013. A review of scenario planning. Futures 46, 23-40.
Andersson, M., Bolton, P., Samama, F., 2016. Hedging climate risk. Financial Analysts Journal 72, 13-32.
Ansar, A., Caldecott, B., Tilbury, J., 2013. Stranded assets and the fossil fuel divestment campaign: what does divestment mean for the valuation of fossil fuel assets?
Ansari, D., 2017. OPEC, Saudi Arabia, and the shale revolution: Insights from equilibrium modelling and oil politics. Energy Policy 111, 166-178.
Ansari, D., Holz, F., 2019. Anticipating global energy, climate and policy in 2055: Constructing qualitative and quantitative narratives. Energy Research & Social Science 58, 101250.
Ansari, D., Holz, F., Appleman, N., 2018. Scenarios of the global fossil fuel markets. SET-Nav Case Study Report D 4.3.
Baldwin, E., Cai, Y., Kuralbayeva, K., 2019. To build or not to build? Capital stocks and climate policy. Journal of Environmental Economics and Management in press.
Baltensperger, T., Egging, R., Tomasgard , A., 2018. Solving imperfect market equilibrium problems with convex optimization. CenSES working paper.
BP, 2019. BP Energy Outlook. https://www.bp.com/content/dam/bp/business-sites/en/global/corporate/pdfs/energy-economics/energy-outlook/bp-energy-outlook-2019.pdf.
BP plc, 2017. BP Statistical Review of World Energy June 2017. http://www.bp.com/en/global/corporate/energy-economics/statistical-review-of-world-energy.html.
Bradfield, R., Wright, G., Burt, G., Cairns, G., Van Der Heijden, K., 2005. The origins and evolution of scenario techniques in long range business planning. Futures 37, 795-812.
Burandt, T., Löffler, K., Hainsch, K., 2018. GENeSYS-MOD v2. 0-Enhancing the Global Energy System Model: Model improvements, framework changes, and European data set. DIW Data Documentation 94. DIW Berlin, Berlin.
Burrows, M.J., Gnad, O.J.F., 2018. Between ‘muddling through’and ‘grand design’: Regaining political initiative–The role of strategic foresight. Futures 97, 6-17.
Byrd, J., Cooperman, E., 2015. Carbon bubble & divestment trouble: Investor reactions, an analysis. Journal of Environmental Investing 6, 75-88.
Byrd, J., Cooperman, E.S., 2018. Investors and stranded asset risk: evidence from shareholder responses to carbon capture and sequestration (CCS) events. Journal of Sustainable Finance & Investment 8, 185-202.
DIW Berlin: Politikberatung kompakt 139 References
73
Caldecott, B., Howarth, N., McSharry, P., 2013. Stranded assets in agriculture: Protecting value from environment-related risks.
Campiglio, E., Godin, A., Kemp-Benedict, E., 2017. Networks of stranded assets: A case for a balance sheet approach. AFD Research Papers 54.
Chen, Y., Ejaz, Q., Gao, X., Huang, J., Morris, J., Monier, E., Patsev, S., Reilly, J., Schlosser, A., Scott, J., 2016. Food, water, energy and climate outlook: Perspectives from 2016. MIT Joint Program on the Science and Policy of Global Change. (http://globalchange.mit.edu/Outlook2016).
Comello, S.D., Reichelstein, S.J., Sahoo, A., Schmidt, T.S., 2017. Enabling Mini-Grid Development in Rural India. World Development 93, 94-107.
Derbyshire, J., 2017. Potential surprise theory as a theoretical foundation for scenario planning. Technological Forecasting and Social Change 124, 77-87.
Dorband, I.I., Jakob, M., Kalkuhl, M., Steckel, J.C., 2019. Poverty and distributional effects of carbon pricing in low-and middle-income countries–A global comparative analysis. World Development 115, 246-257.
Egging, R., Holz, F., 2019. Global gas model: Model and data documentation v3.0. DIW Data Documentation 100. DIW Berlin, Berlin.
Equinor, 2019. Energy Prespectives 2019 long-term macro and market outlook. https://www.equinor.com/content/dam/statoil/documents/energy-perspectives/Energy%20Perspectives%202019%20report.pdf.
ExxonMobil, 2018. Outlook for Energy: a view to 2040. https://corporate.exxonmobil.com/-/media/Global/Files/outlook-for-energy/2018-Outlook-for-Energy.pdf.
Gerbaulet, C., Lorenz, C., 2017. dynELMOD: A dynamic investment and dispatch model for the future european electricity market. DIW Data Documentation 88. DIW Berlin, Berlin.
Green, J., Newman, P., 2017. Disruptive innovation, stranded assets and forecasting: the rise and rise of renewable energy. Journal of Sustainable Finance & Investment 7, 169-187.
Harnett, E., 2018. Stranded assets: an environmentally driven framework of sunk costs, Stranded Assets and the Environment. Routledge, pp. 109-132.
Heuer, R.J., Pherson, R.H., 2015. Structured Analytic Techniques for Intelligence Analysis, Second edition ed. SAGE Publications, London, United Kingdom.
Hochman, G., Zilberman, D., 2015. The political economy of OPEC. Energy Economics 48, 203-216.
Hoffmann, M.M., Ansari, D., 2019. Simulating the potential of swarm grids for pre-electrified communities – A case study from Yemen. Renewable and Sustainable Energy Reviews 108, 289-302.
Holz, F., Brauers, H., Richter, P.M., Roobeek, T., 2017. Shaking Dutch grounds won’t shatter the European gas market. Energy Economics 64, 520-529.
DIW Berlin: Politikberatung kompakt 139 References
74
Holz, F., Haftendorn, C., Mendelevitch, R., von Hirschhausen, C., 2016. DIW Berlin: a model of the international Steam Coal Market (COALMOD-World). DIW Data Documentation 85. DIW Berlin, Berlin.
Holz, F., Scherwath, T., Kafemann, I.V., Skar, C., Maranon-Ledesma, H., Crespo del Granado, P., Ramos, A., Olmos, L., Ploussard, Q., Lumbreras, S., Herbst, A., Fleiter, T., 2018. The Role for Carbon Capture, Transport and Storage in Electricity and Industry in the Future. Which Role for Infrastructure? SET-Nav Case Study Report D 6.8.
Huppmann, D., Egging, R., 2014. Market power, fuel substitution and infrastructure–A large-scale equilibrium model of global energy markets. Energy 75, 483-500.
IEA, 2018. World Energy Outlock. https://webstore.iea.org/world-energy-outlook-2018.
International Energy Agency, 2017a. Extended world energy balances
International Energy Agency, 2017b. Oil market report.
International Energy Agency, 2018. World Energy Outlook 2018.
Jakob, M., Chen, C., Fuss, S., Marxen, A., Rao, N.D., Edenhofer, O., 2016. Carbon pricing revenues could close infrastructure access gaps. World Development 84, 254-265.
Kalin, R.M., Mwanamveka, J., Coulson, A.B., Robertson, D.J., Clark, H., Rathjen, J., Rivett, M.O., 2019. Stranded assets as a key concept to guide investment strategies for sustainable development goal 6. Water 11, 702.
Löffler, K., Hainsch, K., Burandt, T., Oei, P.-Y., Kemfert, C., von Hirschhausen, C.J.E., 2017. Designing a Model for the Glogbal Energy System—GENeSYS-MOD: An Application of the Open-Source Energy Modeling System (OSeMOSYS). Energies 10, 1468.
McGlade, C., Ekins, P., 2015. The geographical distribution of fossil fuels unused when limiting global warming to 2 [deg] C. Nature 517, 187-190.
Mendelevitch, R., Oei, P.-Y., 2018. The impact of policy measures on future power generation portfolio and infrastructure: a combined electricity and CCTS investment and dispatch model (ELCO). Energy Systems 9, 1025-1054.
Mercure, J.F., Pollitt, H., Viñuales, J.E., Edwards, N.R., Holden, P.B., Chewpreecha, U., Salas, P., Sognnaes, I., Lam, A., Knobloch, F., 2018. Macroeconomic impact of stranded fossil fuel assets. Nature Climate Change 8, 588-593.
Mietzner, D., Reger, G., 2005. Advantages and disadvantages of scenario approaches for strategic foresight. International Journal Technology Intelligence and Planning 1, 220-239.
Muttitt, G., 2016. The Sky's Limit: why the Paris Climate Goals Require a Managed Decline of Fossil Fuel Production. Oil Change International.
Oei, P.-Y., Mendelevitch, R., 2016. European scenarios of CO2 infrastructure investment until 2050. The Energy Journal 37.
Pherson, K.H., Pherson, R.H., 2016. Critical thinking for strategic intelligence. SAGE Publications, Washington, United States.
DIW Berlin: Politikberatung kompakt 139 References
75
Ragwitz, M., Steinhilber, S., Breitschopf, B., Resch, G., Panzer, C., Ortner, A., Busch, S., Rathmann, W., Klessmann, C., Nabe, C., 2012. D23 Final Report: RE-Shaping: Shaping an effective and efficient European renewable energy market. Copernicus Institute, Department IMEW, Energy & Resources.
Ram, M., Bogdanov, D., Aghahosseini, A., Gulagi, A., Oyewo, A.S., Child, M., Caldera, U., Sadovskaia, K., Farfan, J., Barbosa, L., Fasihi, M., Khalili, S., Dalheimer, B., Gruber, G., Traber, T., De Caluwe, F., Fell, H.-J., Breyer, C., 2019. Global Energy System based on 100% Renewable Energy – Power, Heat, Transport and Desalination Sectors. Study by Lappeenranta University of Technology and Energy Watch Group, Lappeenranta, Berlin, March 2019.
Rozenberg, J., Vogt-Schilb, A., Hallegatte, S., 2018. Instrument choice and stranded assets in the transition to clean capital. Journal of Environmental Economics and Management.
Samadi, S., Gröne, M.-C., Schneidewind, U., Luhmann, H.-J., Venjakob, J., Best, B., 2017. Sufficiency in energy scenario studies: Taking the potential benefits of lifestyle changes into account. Technological Forecasting and Social Change 124, 126-134.
Saygin, D., Rigter, J., Caldecott, B., Wagner, N., Gielen, D., 2019. Power sector asset stranding effects of climate policies. Energy Sources, Part B: Economics, Planning, and Policy, 1-26.
Schoemaker, P.J., 1995. Scenario planning: a tool for strategic thinking. Sloan management review 36, 25.
Sen, S., von Schickfus, M.-T., 2017. Will Assets be Stranded or Bailed Out? Expectations of Investors in the Face of Climate Policy. ifo Institute-Leibniz Institute for Economic Research at the University of ….
Shell, 2013. New Lens Scenarios a Shift in Perspective for a World in Transition. https://www.shell.com/content/dam/royaldutchshell/documents/corporate/scenarios-newdoc.pdf.
Shell, 2018. Shell Scenarios SKY meeting the goals of the paris Agreement. https://www.shell.com/promos/business-customers-promos/download-latest-scenario-sky/_jcr_content.stream/1530643931055/eca19f7fc0d20adbe830d3b0b27bcc9ef72198f5/shell-scenario-sky.pdf.
Silver, N., 2017. Blindness to risk: why institutional investors ignore the risk of stranded assets. Journal of Sustainable Finance & Investment 7, 99-113.
Simshauser, P., 2017. Monopoly regulation, discontinuity & stranded assets. Energy Economics 66, 384-398.
Söderholm, P., Hildingsson, R., Johansson, B., Khan, J., Wilhelmsson, F., 2011. Governing the transition to low-carbon futures: A critical survey of energy scenarios for 2050. Futures 43, 1105-1116.
Sovacool, B.K., Axsen, J., Sorrell, S., 2018. Promoting novelty, rigor, and style in energy social science: Towards codes of practice for appropriate methods and research design. Energy Research & Social Science 45, 12-42.
DIW Berlin: Politikberatung kompakt 139 References
76
van der Ploeg, F., Rezai, A., 2018. The simple arithmetic of carbon pricing and stranded assets. Energy Efficiency 11, 627-639.
Van Notten, P., 2005. Writing on the wall: Scenario development in times of discontinuity. Universal-Publishers.
Wack, P., 1985. Scenarios: uncharted waters ahead. Harvard Business Review September–October.
Wealer, B., Bauer, S., Landry, N., Seiß, H., von Hirschhausen, C.R., 2018. Nuclear power reactors worldwide: Technology developments, diffusion patterns, and country-by-country analysis of implementation (1951-2017). DIW Data Documentation 93. DIW Berlin, Berlin.
WEC, 2016. World Energy Scenarios the grand transition. https://www.worldenergy.org/wp-content/uploads/2016/10/World-Energy-Scenarios-2016_Full-Report.pdf.
Wilkinson, A., Kupers, R., 2013. Living in the futures. Harvard business review 91, 118-127.
Zaklan, A., Ansari, D., Kemfert, C., 2018. Rohölmarkt: Iran-Sanktionen dürften zu moderatem Preisanstieg führen. DIW-Wochenbericht 85, 1053-1059.
Zenghelis, D., Fouquet, R., Hippe, R., 2018. Stranded assets: then and now, Stranded Assets and the Environment. Routledge, pp. 45-76.