Embed Size (px)
Citation preview
Eric Strutz CFO Frankfurt August 6th, 2009
Die neue Commerzbank Analyst conference – Q2 2009 results
1Eric Strutz CFO Frankfurt August 6th, 2009
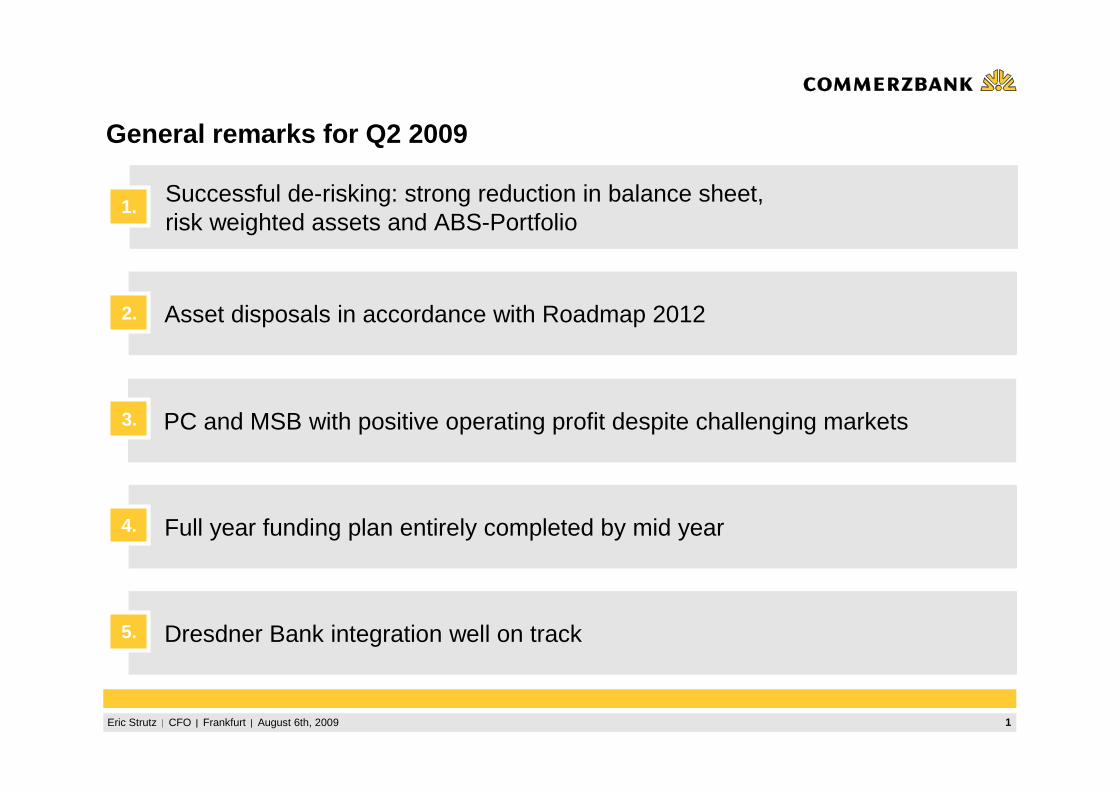
General remarks for Q2 2009
Dresdner Bank integration well on track
Successful de-risking: strong reduction in balance sheet, risk weighted assets and ABS-Portfolio
1.
Asset disposals in accordance with Roadmap 20122.
Full year funding plan entirely completed by mid year4.
5.
PC and MSB with positive operating profit despite challenging markets3.
2Eric Strutz CFO Frankfurt August 6th, 2009
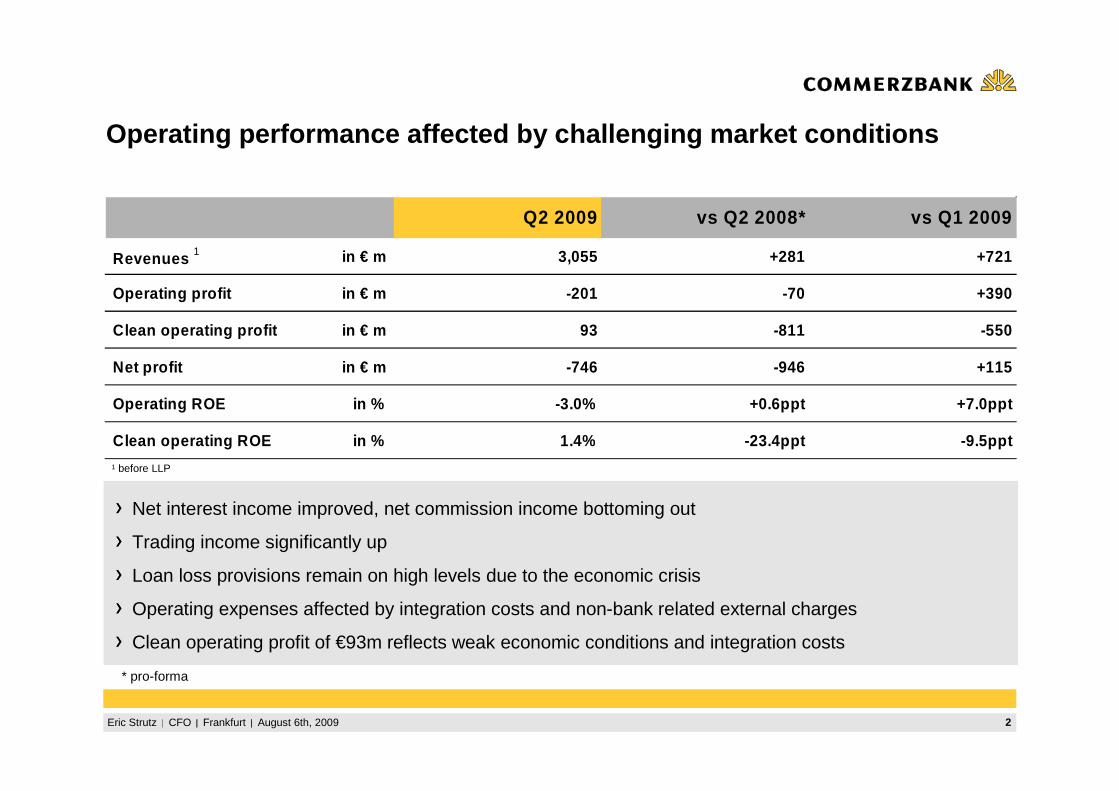
Operating performance affected by challenging market c onditions
Net interest income improved, net commission income bottoming out
Trading income significantly up
Loan loss provisions remain on high levels due to the economic crisis
Operating expenses affected by integration costs and non-bank related external charges
Clean operating profit of €93m reflects weak economic conditions and integration costs
1 before LLP
* pro-forma
Q2 2009 vs Q2 2008* vs Q1 2009
Revenues 1 in € m 3,055 +281 +721
Operating profit in € m -201 -70 +390
Clean operating profit in € m 93 -811 -550
Net profit in € m -746 -946 +115
Operating ROE in % -3.0% +0.6ppt +7.0ppt
Clean operating ROE in % 1.4% -23.4ppt -9.5ppt
3Eric Strutz CFO Frankfurt August 6th, 2009
-159
-50
-116
-129
-98
328
-70
-294
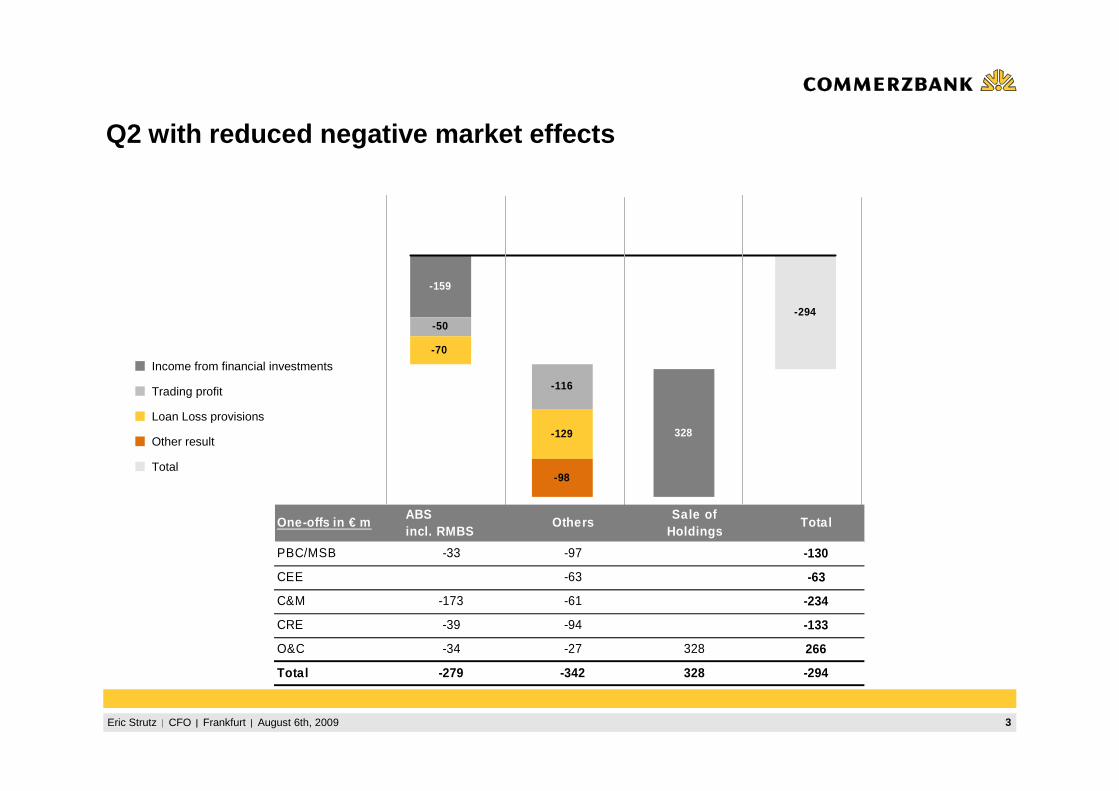
Q2 with reduced negative market effects
Income from financial investments
Trading profit
Loan Loss provisions
Other result
One-offs in € mABS incl. RMBS
OthersSale of
HoldingsTotal
PBC/MSB -33 -97 -130
CEE -63 -63
C&M -173 -61 -234
CRE -39 -94 -133
O&C -34 -27 328 266
Total -279 -342 328 -294
Total
4Eric Strutz CFO Frankfurt August 6th, 2009
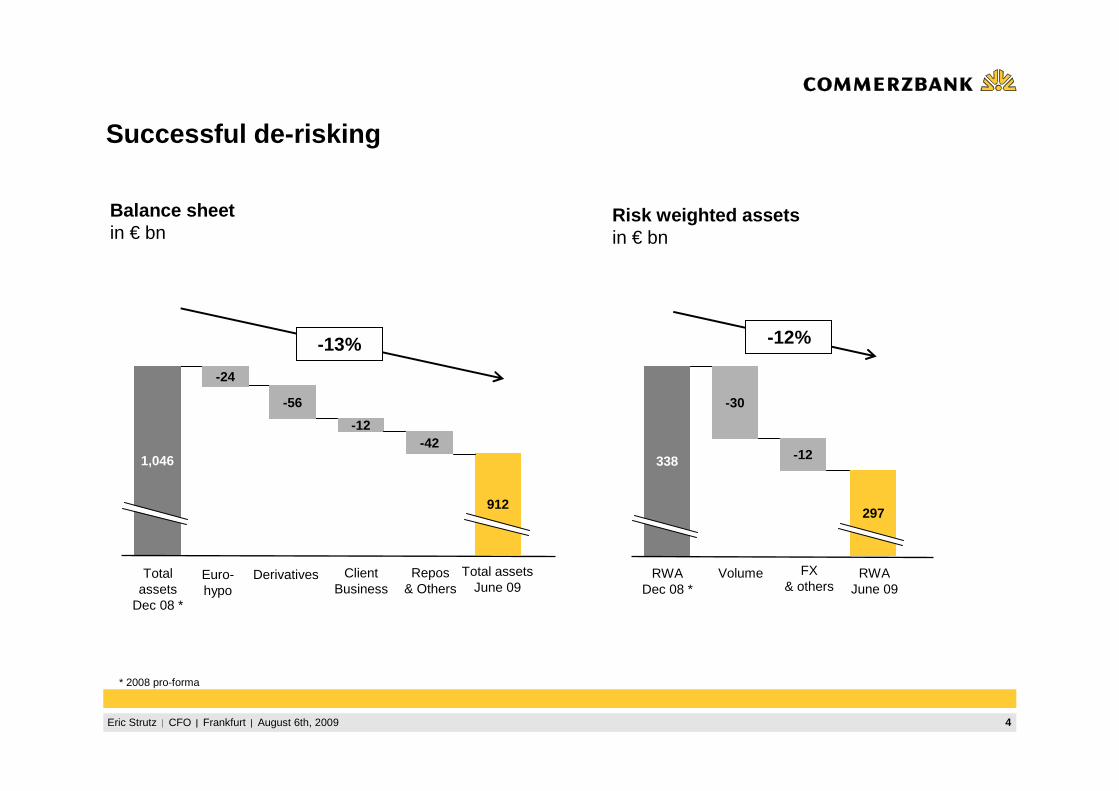
Successful de-risking
RWADec 08 *
338
-30
297
Volume
-12
FX& others
RWAJune 09
Total assets
Dec 08 *
1,046
-24
912
Derivatives
-56
-12
Euro-hypo
ClientBusiness
Total assetsJune 09
Balance sheetin € bn
Risk weighted assetsin € bn
-42
Repos & Others
-13% -12%
* 2008 pro-forma
5Eric Strutz CFO Frankfurt August 6th, 2009
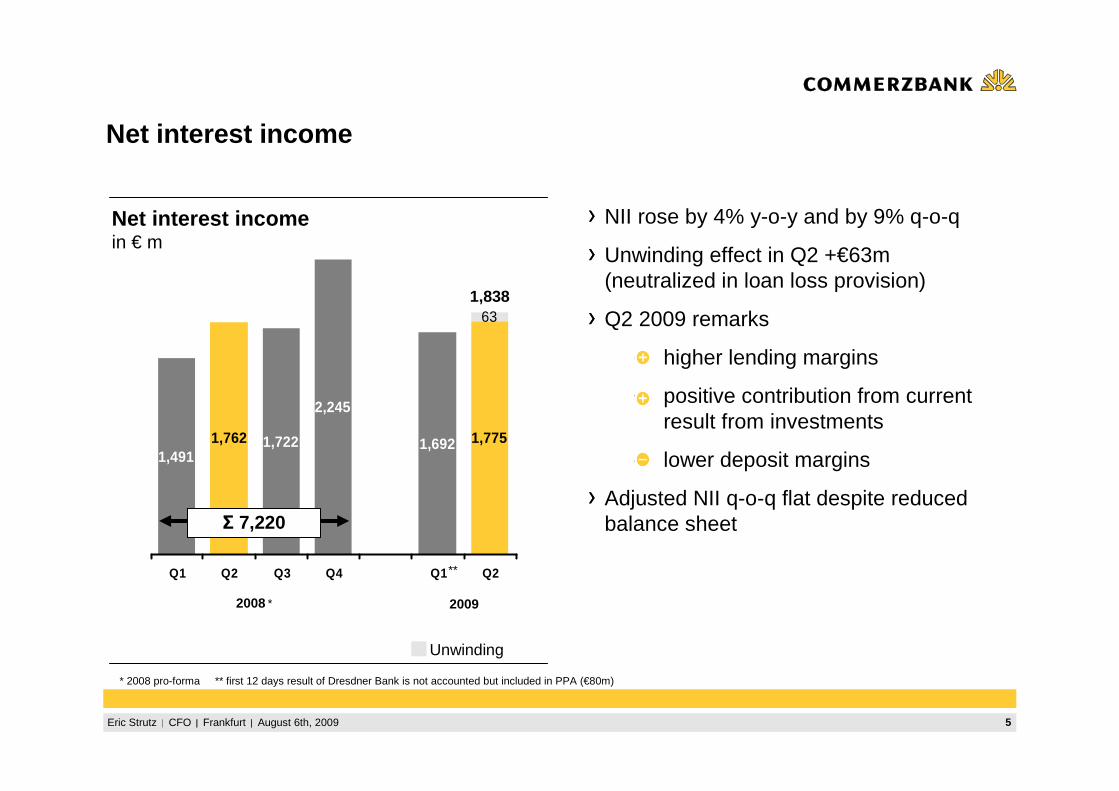
1,762 1,7751,491
1,722
2,245
1,692
63
Q1 Q2 Q3 Q4 Q1 Q2
Net interest income
Net interest incomein € m
NII rose by 4% y-o-y and by 9% q-o-q
Unwinding effect in Q2 +€63m (neutralized in loan loss provision)
Q2 2009 remarks
+ higher lending margins
+ positive contribution from current result from investments
- lower deposit margins
Adjusted NII q-o-q flat despite reduced balance sheet
2008 2009
* 2008 pro-forma ** first 12 days result of Dresdner Bank is not accounted but included in PPA (€80m)
Σ 7,220
**
Unwinding
1,838
*
6Eric Strutz CFO Frankfurt August 6th, 2009
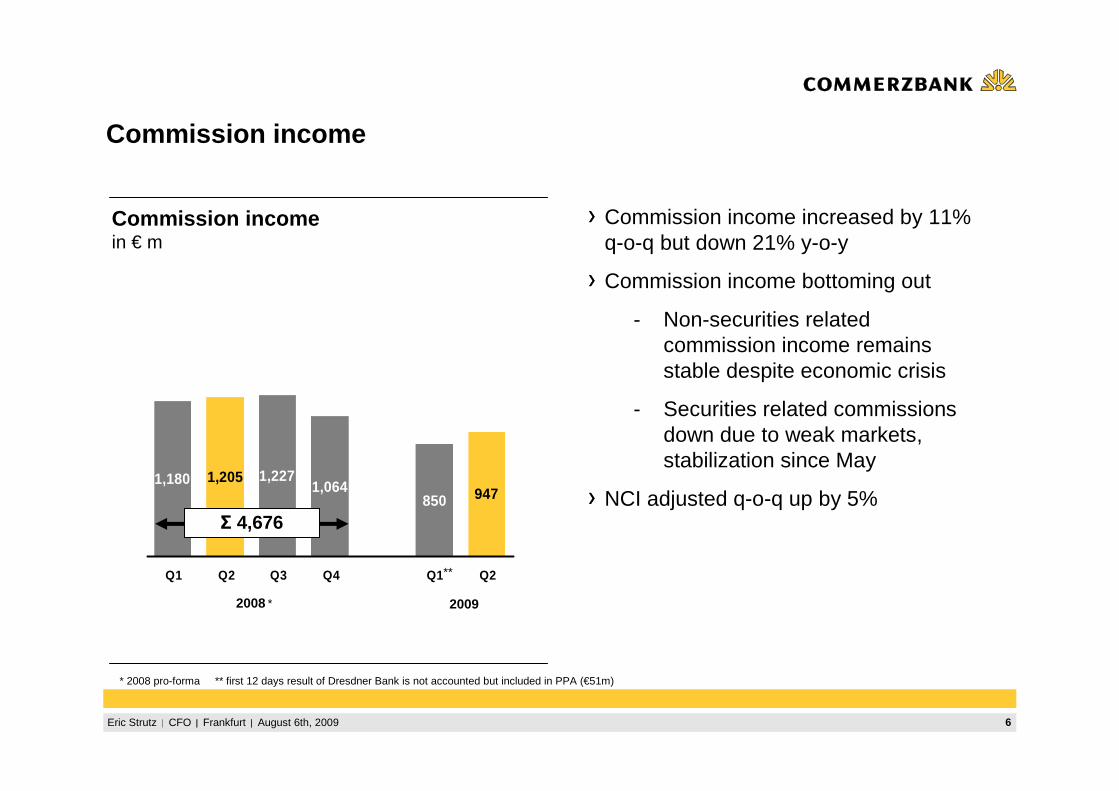
1,205947850
1,0641,2271,180
Q1 Q2 Q3 Q4 Q1 Q2
Commission income
Commission incomein € m
Commission income increased by 11% q-o-q but down 21% y-o-y
Commission income bottoming out
- Non-securities related commission income remains stable despite economic crisis
- Securities related commissions down due to weak markets, stabilization since May
NCI adjusted q-o-q up by 5%
2008 2009
Σ 4,676
**
* 2008 pro-forma ** first 12 days result of Dresdner Bank is not accounted but included in PPA (€51m)
*
7Eric Strutz CFO Frankfurt August 6th, 2009
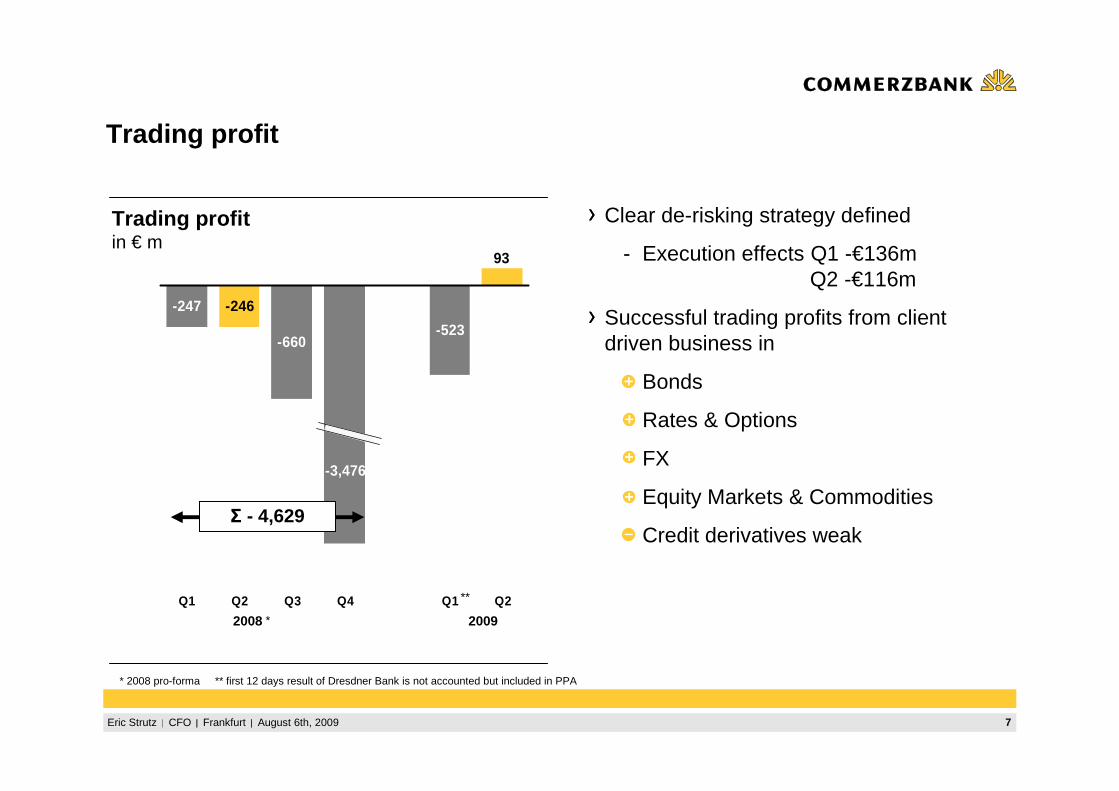
Trading profit
Trading profitin € m
Clear de-risking strategy defined
- Execution effects Q1 -€136mQ2 -€116m
Successful trading profits from client driven business in
+ Bonds
+ Rates & Options
+ FX
+ Equity Markets & Commodities
- Credit derivatives weak
2008 2009
* 2008 pro-forma ** first 12 days result of Dresdner Bank is not accounted but included in PPA
-246
93
-523
-3,476
-660
-247
Q1 Q2 Q3 Q4 Q1 Q2
Σ - 4,629
*
**
8Eric Strutz CFO Frankfurt August 6th, 2009
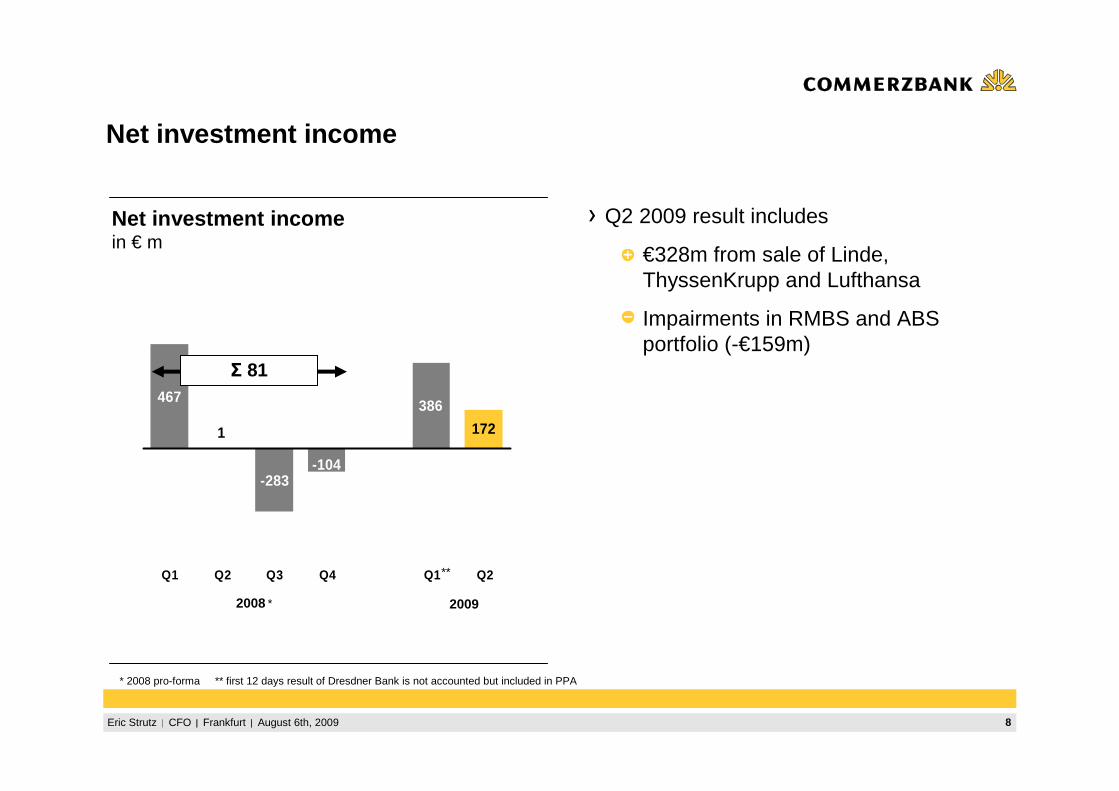
1 172
386
-104-283
467
Q1 Q2 Q3 Q4 Q1 Q2
Net investment income
Q2 2009 result includes
+ €328m from sale of Linde, ThyssenKrupp and Lufthansa
- Impairments in RMBS and ABS portfolio (-€159m)
Net investment incomein € m
2008 2009
Σ 81
**
* 2008 pro-forma ** first 12 days result of Dresdner Bank is not accounted but included in PPA
*
9Eric Strutz CFO Frankfurt August 6th, 2009
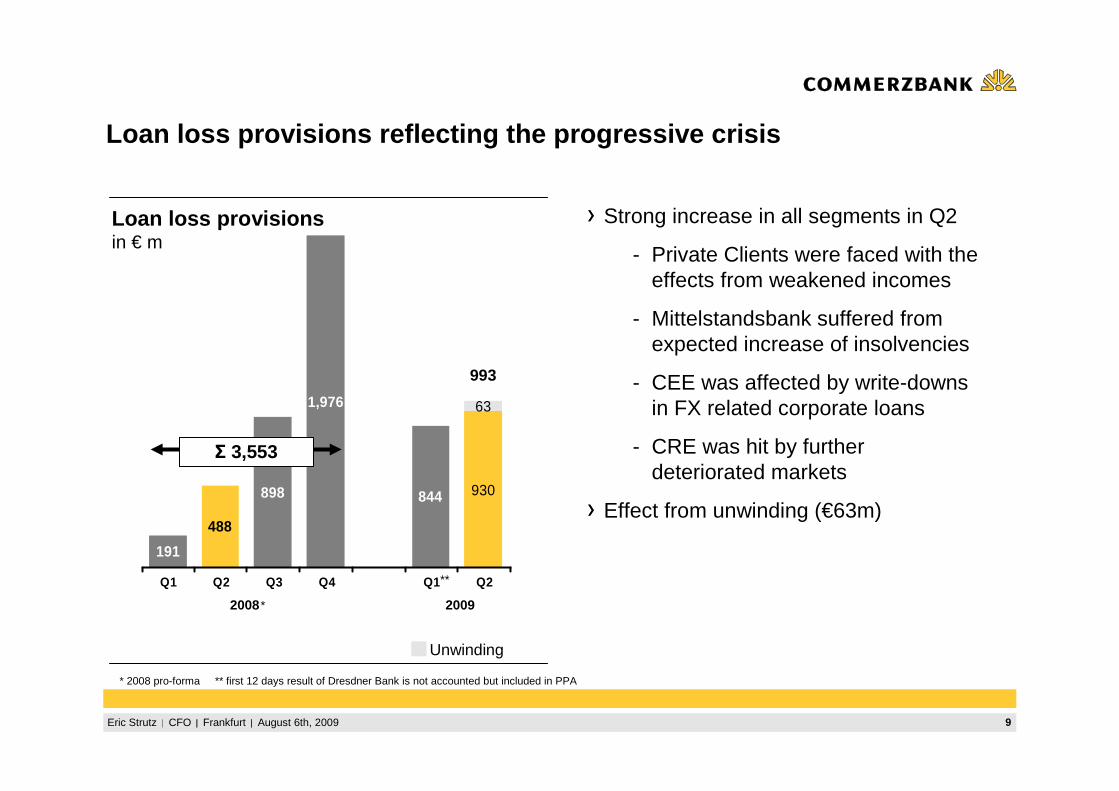
488
930844
1,976
898
191
63
Q1 Q2 Q3 Q4 Q1 Q2
Loan loss provisions reflecting the progressive crisi s
Strong increase in all segments in Q2
- Private Clients were faced with the effects from weakened incomes
- Mittelstandsbank suffered from expected increase of insolvencies
- CEE was affected by write-downs in FX related corporate loans
- CRE was hit by further deteriorated markets
Effect from unwinding (€63m)
Loan loss provisionsin € m
2008 2009
Σ 3,553
**
* 2008 pro-forma ** first 12 days result of Dresdner Bank is not accounted but included in PPA
*
Unwinding
993
10Eric Strutz CFO Frankfurt August 6th, 2009
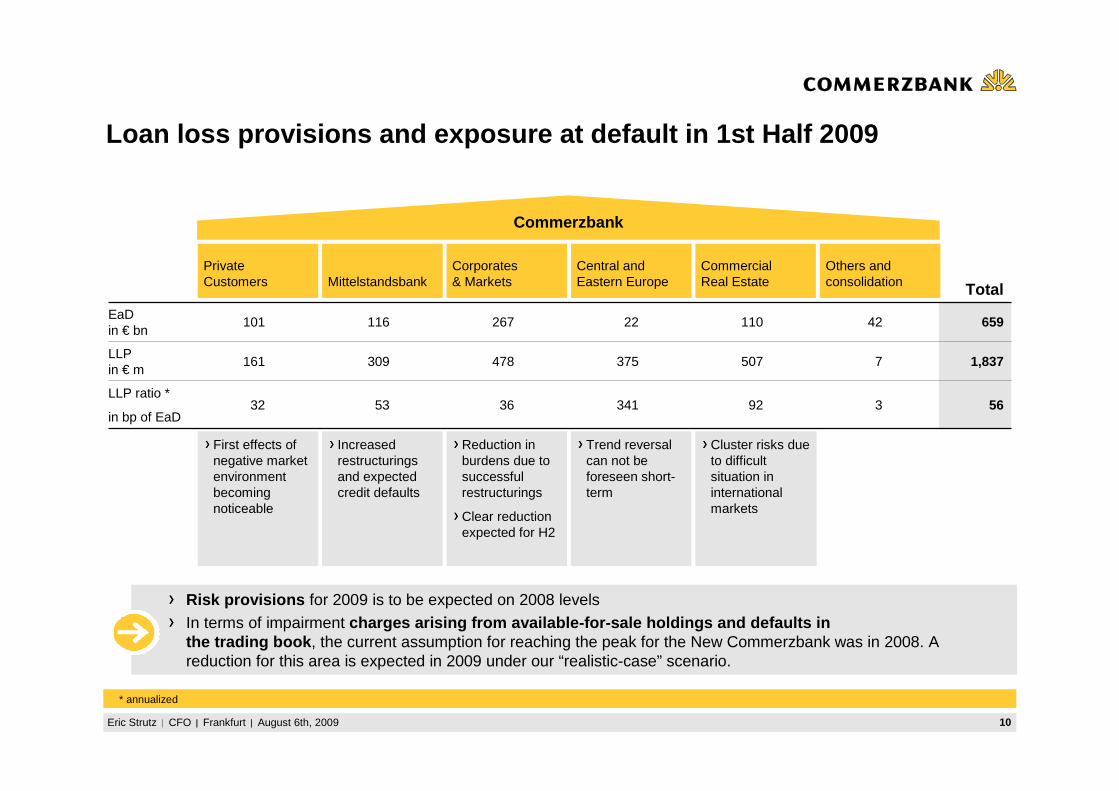
Loan loss provisions and exposure at default in 1st Half 2009
MittelstandsbankCorporates& Markets
Commercial Real Estate
Others and consolidation
Commerzbank
Total
EaDin € bn
101 116 267 22 110 42 659
LLPin € m
161 309 478 375 507 7 1,837
LLP ratio *
in bp of EaD32 53 36 341 92 3 56
Central and Eastern Europe
Reduction in burdens due to successfulrestructurings
Clear reduction expected for H2
Trend reversalcan not beforeseen short-term
Cluster risks dueto difficultsituation in international markets
Increasedrestructuringsand expectedcredit defaults
First effects of negative marketenvironmentbecomingnoticeable
Private Customers
* annualized
Risk provisions for 2009 is to be expected on 2008 levels In terms of impairment charges arising from available-for-sale holdings an d defaults inthe trading book , the current assumption for reaching the peak for the New Commerzbank was in 2008. A reduction for this area is expected in 2009 under our “realistic-case” scenario.
11Eric Strutz CFO Frankfurt August 6th, 2009
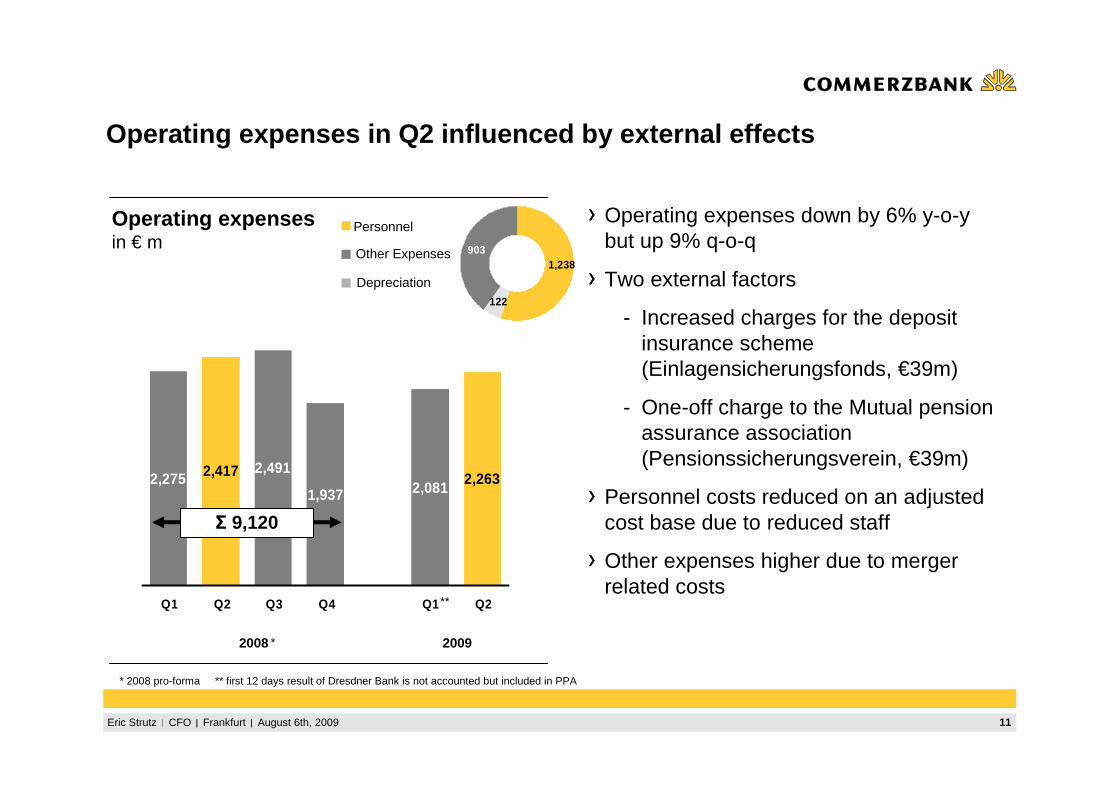
2,417 2,2632,0811,937
2,4912,275
Q1 Q2 Q3 Q4 Q1 Q2
Operating expenses in Q2 influenced by external effec ts
Operating expensesin € m
Operating expenses down by 6% y-o-ybut up 9% q-o-q
Two external factors
- Increased charges for the deposit insurance scheme (Einlagensicherungsfonds, €39m)
- One-off charge to the Mutual pension assurance association (Pensionssicherungsverein, €39m)
Personnel costs reduced on an adjusted cost base due to reduced staff
Other expenses higher due to merger related costs
2008 2009
Σ 9,120
Personnel
Depreciation
Other Expenses
122
9031,238
* 2008 pro-forma ** first 12 days result of Dresdner Bank is not accounted but included in PPA
*
**
12Eric Strutz CFO Frankfurt August 6th, 2009
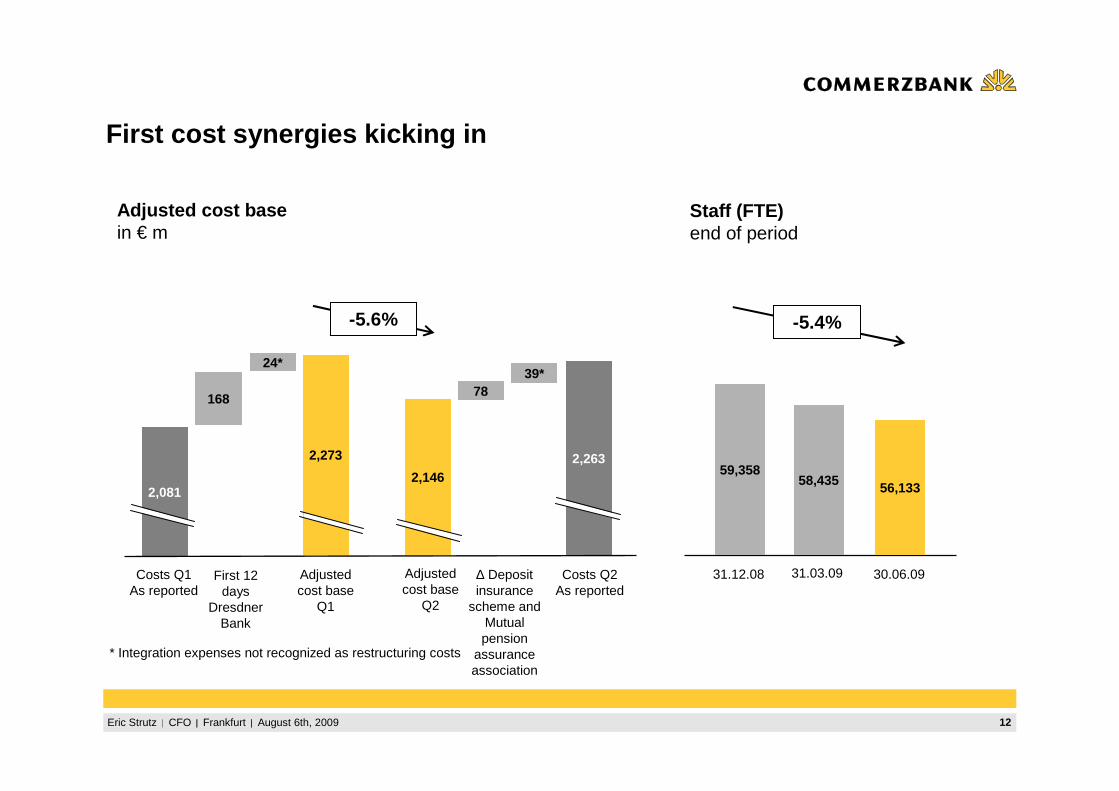
First cost synergies kicking in
Adjusted cost basein € m
* Integration expenses not recognized as restructuring costs
Adjusted cost base
Q1
2,081
168
2,263
First 12 days
Dresdner Bank
78
∆ Deposit insurance
scheme and Mutual pension
assurance association
Adjusted cost base
Q2
24*39*
2,273
2,146
Costs Q1As reported
Costs Q2As reported
Staff (FTE)end of period
-5.4%
59,35858,435 56,133
31.12.08 31.03.09 30.06.09
-5.6%
13Eric Strutz CFO Frankfurt August 6th, 2009
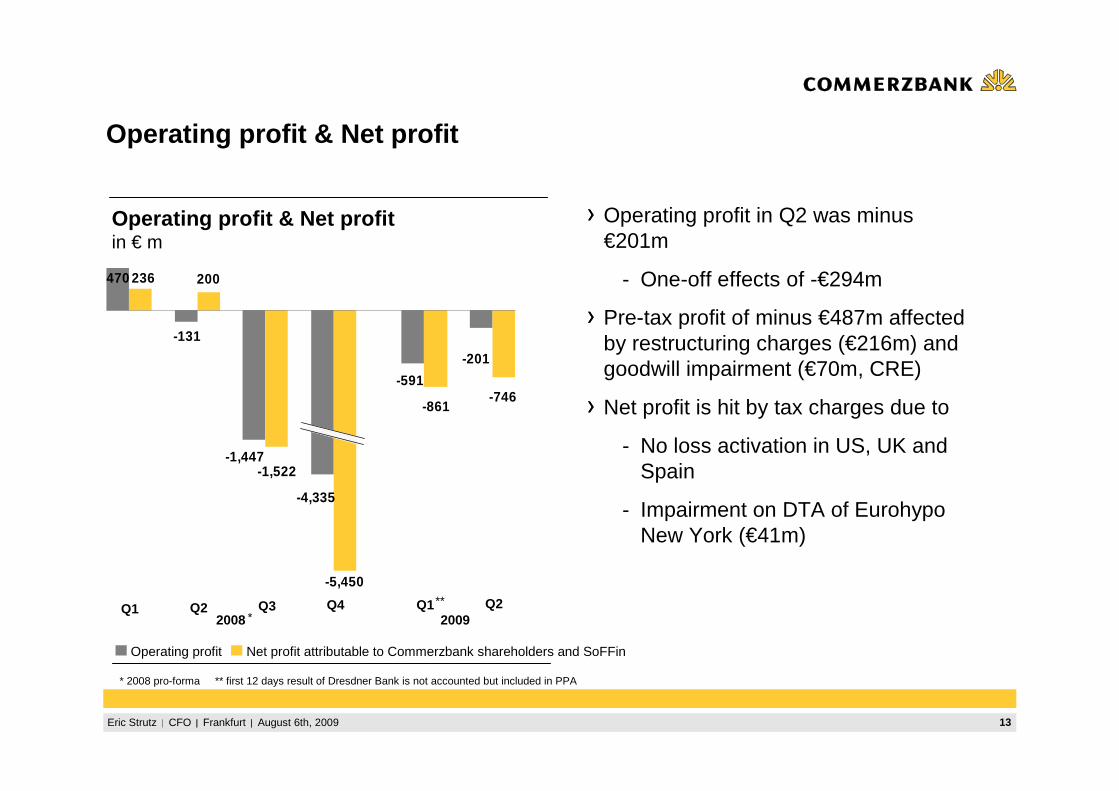
-746
-201
236
-861
-591
-5,450
-4,335
-1,522-1,447
-131
470 200
Operating profit & Net profit
Operating profit & Net profitin € m
Net profit attributable to Commerzbank shareholders and SoFFinOperating profit
Operating profit in Q2 was minus €201m
- One-off effects of -€294m
Pre-tax profit of minus €487m affected by restructuring charges (€216m) and goodwill impairment (€70m, CRE)
Net profit is hit by tax charges due to
- No loss activation in US, UK and Spain
- Impairment on DTA of Eurohypo New York (€41m)
Q1 Q2 Q3 Q42008 2009
Q1 Q2**
* 2008 pro-forma ** first 12 days result of Dresdner Bank is not accounted but included in PPA
*
14Eric Strutz CFO Frankfurt August 6th, 2009
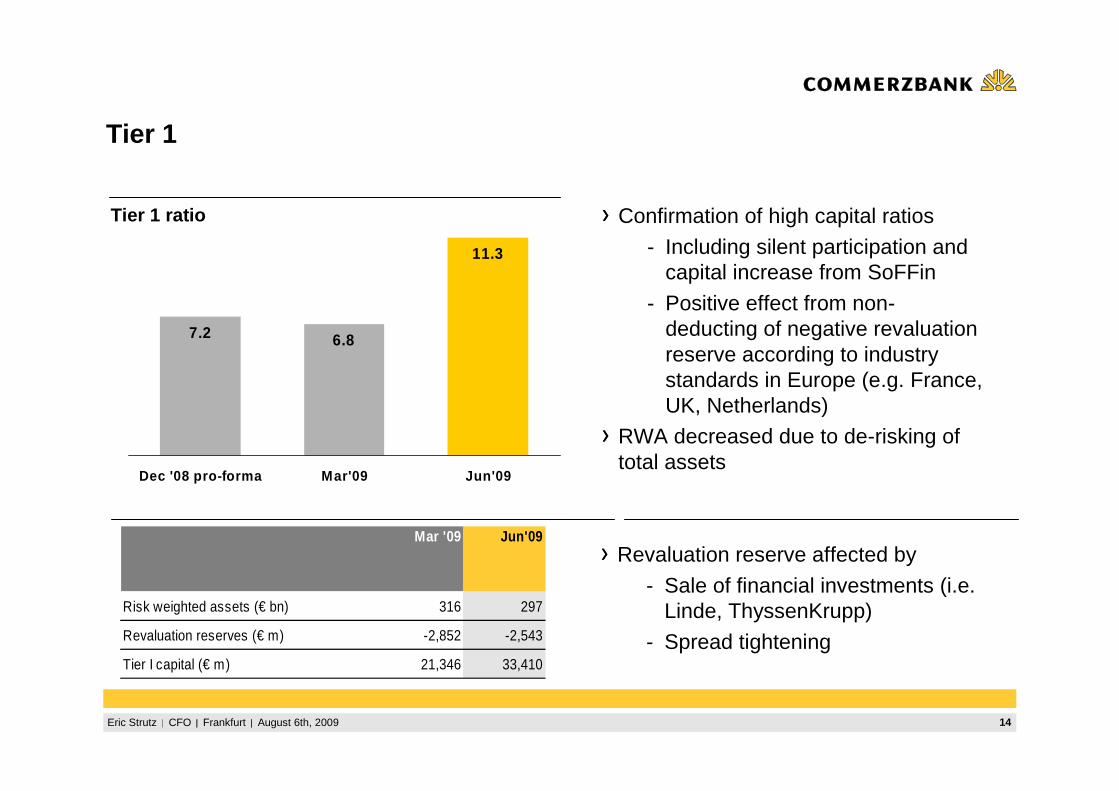
Tier 1 ratio
Tier 1
Confirmation of high capital ratios
- Including silent participation and capital increase from SoFFin
- Positive effect from non-deducting of negative revaluation reserve according to industry standards in Europe (e.g. France, UK, Netherlands)
RWA decreased due to de-risking of total assets
Revaluation reserve affected by
- Sale of financial investments (i.e. Linde, ThyssenKrupp)
- Spread tightening
7.2 6.8
11.3
Dec '08 pro-forma Mar'09 Jun'09
Mar '09 Jun'09
Risk weighted assets (€ bn) 316 297
Revaluation reserves (€ m) -2,852 -2,543
Tier I capital (€ m) 21,346 33,410
15Eric Strutz CFO Frankfurt August 6th, 2009
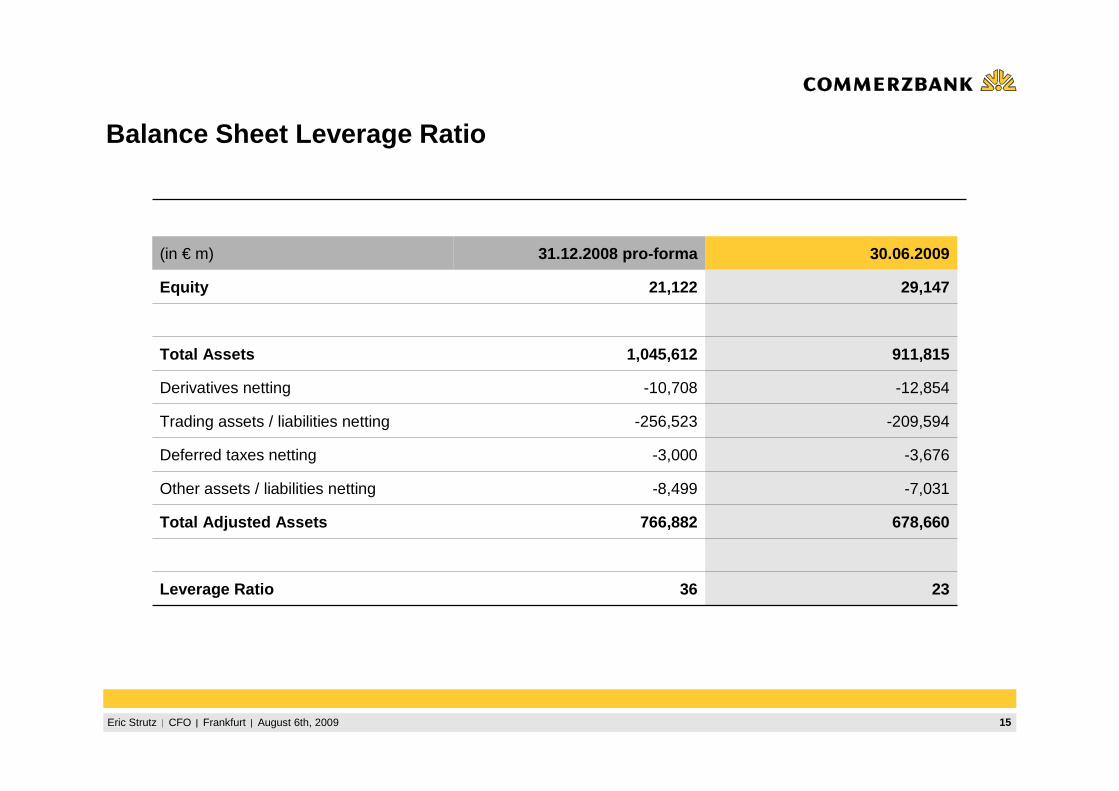
Balance Sheet Leverage Ratio
(in € m) 31.12.2008 pro-forma 30.06.2009
Equity 21,122 29,147
Total Assets 1,045,612 911,815
Derivatives netting -10,708 -12,854
Trading assets / liabilities netting -256,523 -209,594
Deferred taxes netting -3,000 -3,676
Other assets / liabilities netting -8,499 -7,031
Total Adjusted Assets 766,882 678,660
Leverage Ratio 36 23
16Eric Strutz CFO Frankfurt August 6th, 2009
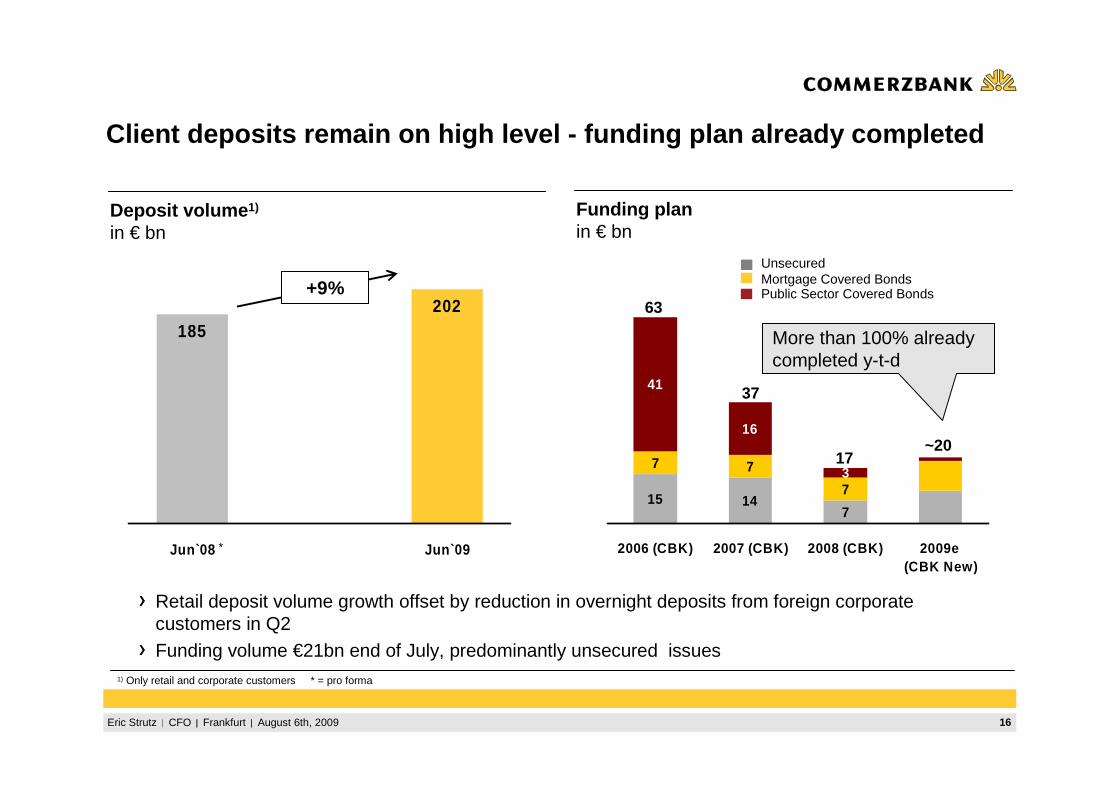
Client deposits remain on high level - funding plan al ready completed
Deposit volume 1)
in € bnFunding planin € bn
UnsecuredMortgage Covered BondsPublic Sector Covered Bonds
Retail deposit volume growth offset by reduction in overnight deposits from foreign corporate customers in Q2Funding volume €21bn end of July, predominantly unsecured issues
7
41
16
14157
7
73
2006 (CBK) 2007 (CBK) 2008 (CBK) 2009e (CBK New)
63
37
17~20
1) Only retail and corporate customers * = pro forma
More than 100% alreadycompleted y-t-d
185202
Jun`08 Jun`09
+9%
*
17Eric Strutz CFO Frankfurt August 6th, 2009
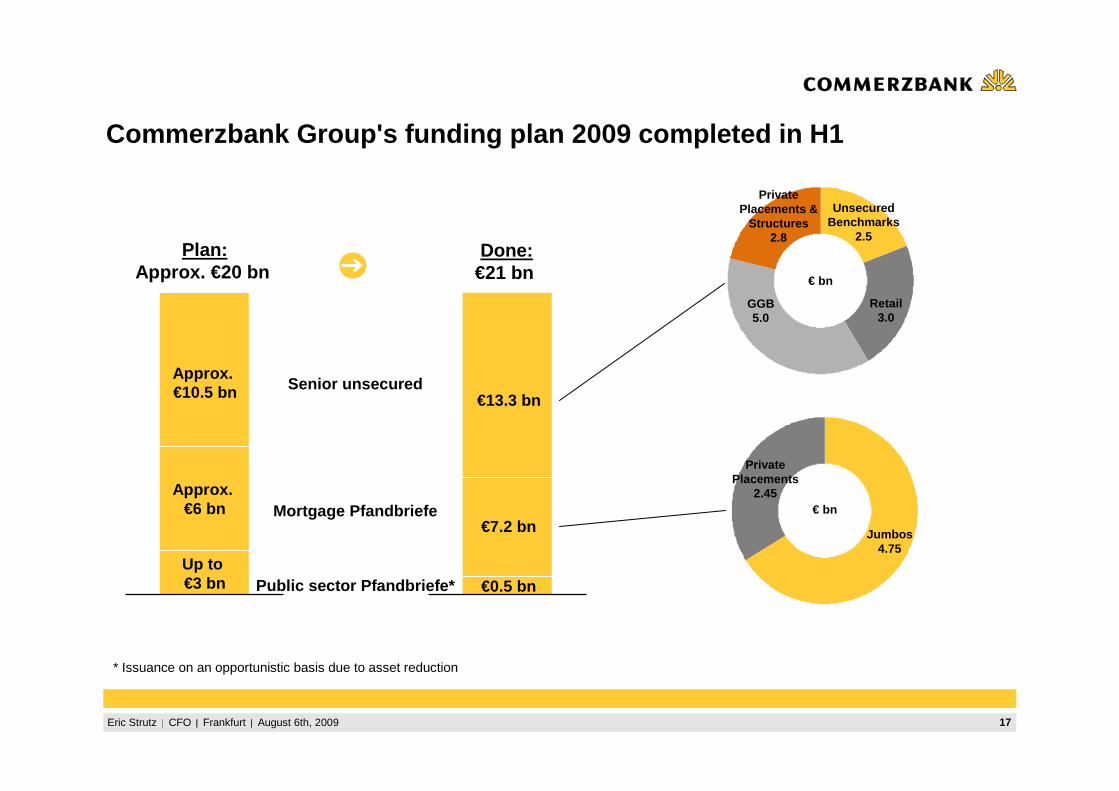
Commerzbank Group's funding plan 2009 completed in H 1
Senior unsecured
Mortgage Pfandbriefe
Plan:Approx. €20 bn
Public sector Pfandbriefe*
* Issuance on an opportunistic basis due to asset reduction
Approx. €10.5 bn
Approx. €6 bn
Up to €3 bn
€13.3 bn
€7.2 bn
€0.5 bn
Done:€21 bn
Private Placements
2.45
Jumbos4.75
GGB5.0
Retail3.0
UnsecuredBenchmarks
2.5
Private Placements &
Structures2.8
€ bn
€ bn
18Eric Strutz CFO Frankfurt August 6th, 2009
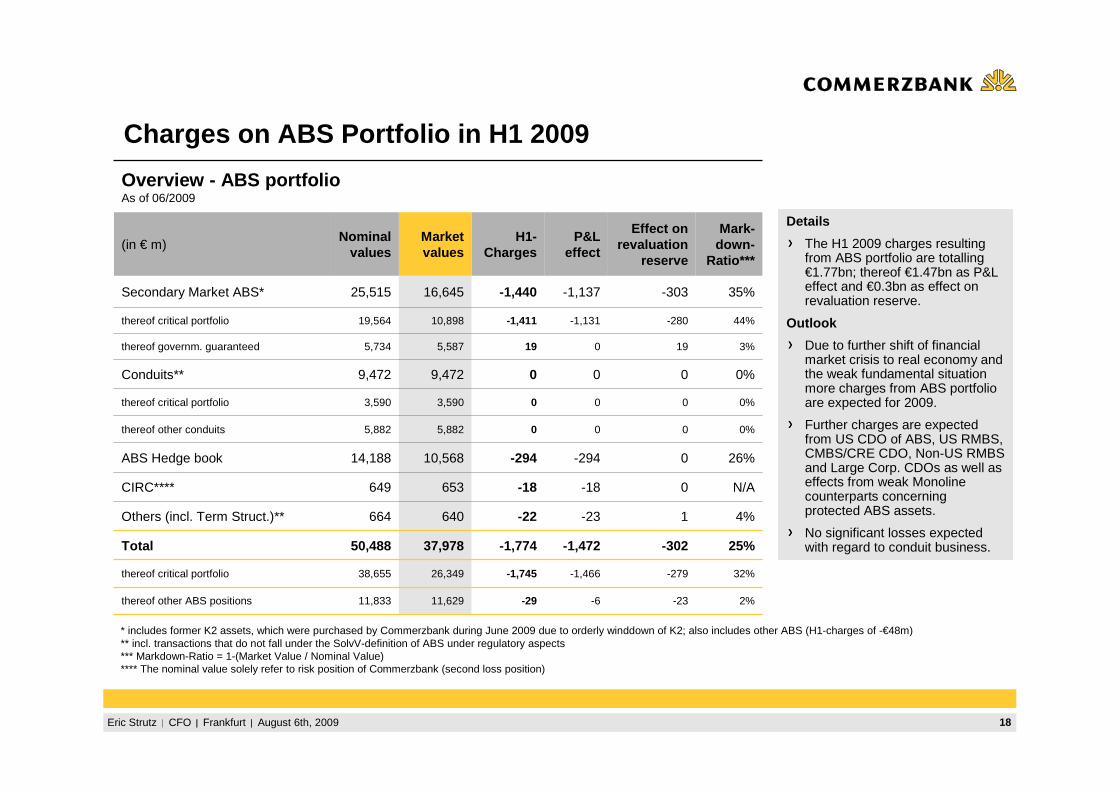
Charges on ABS Portfolio in H1 2009
* includes former K2 assets, which were purchased by Commerzbank during June 2009 due to orderly winddown of K2; also includes other ABS (H1-charges of -€48m)** incl. transactions that do not fall under the SolvV-definition of ABS under regulatory aspects*** Markdown-Ratio = 1-(Market Value / Nominal Value)**** The nominal value solely refer to risk position of Commerzbank (second loss position)
Details
The H1 2009 charges resulting from ABS portfolio are totalling €1.77bn; thereof €1.47bn as P&L effect and €0.3bn as effect on revaluation reserve.
Outlook
Due to further shift of financial market crisis to real economy and the weak fundamental situation more charges from ABS portfolio are expected for 2009.
Further charges are expected from US CDO of ABS, US RMBS, CMBS/CRE CDO, Non-US RMBS and Large Corp. CDOs as well as effects from weak Monolinecounterparts concerning protected ABS assets.
No significant losses expected with regard to conduit business.
32%-279-1,466-1,74526,34938,655thereof critical portfolio
0%0003,5903,590thereof critical portfolio
25%-302-1,472-1,77437,97850,488Total
2%-23-6-2911,62911,833thereof other ABS positions
0%0005,8825,882thereof other conduits
44%-280-1,131-1,41110,89819,564thereof critical portfolio
3%190195,5875,734thereof governm. guaranteed
0%0009,4729,472Conduits**
N/A0-18-18653649CIRC****
4%1-23-22640664Others (incl. Term Struct.)**
0
-303
Effect on revaluation
reserve
-294
-1,137
P&L effect
Overview - ABS portfolioAs of 06/2009
35%-1,44016,64525,515Secondary Market ABS*
26%-29410,56814,188ABS Hedge book
H1-Charges
Market values
Mark-down-
Ratio***
Nominal values
(in € m)
19Eric Strutz CFO Frankfurt August 6th, 2009
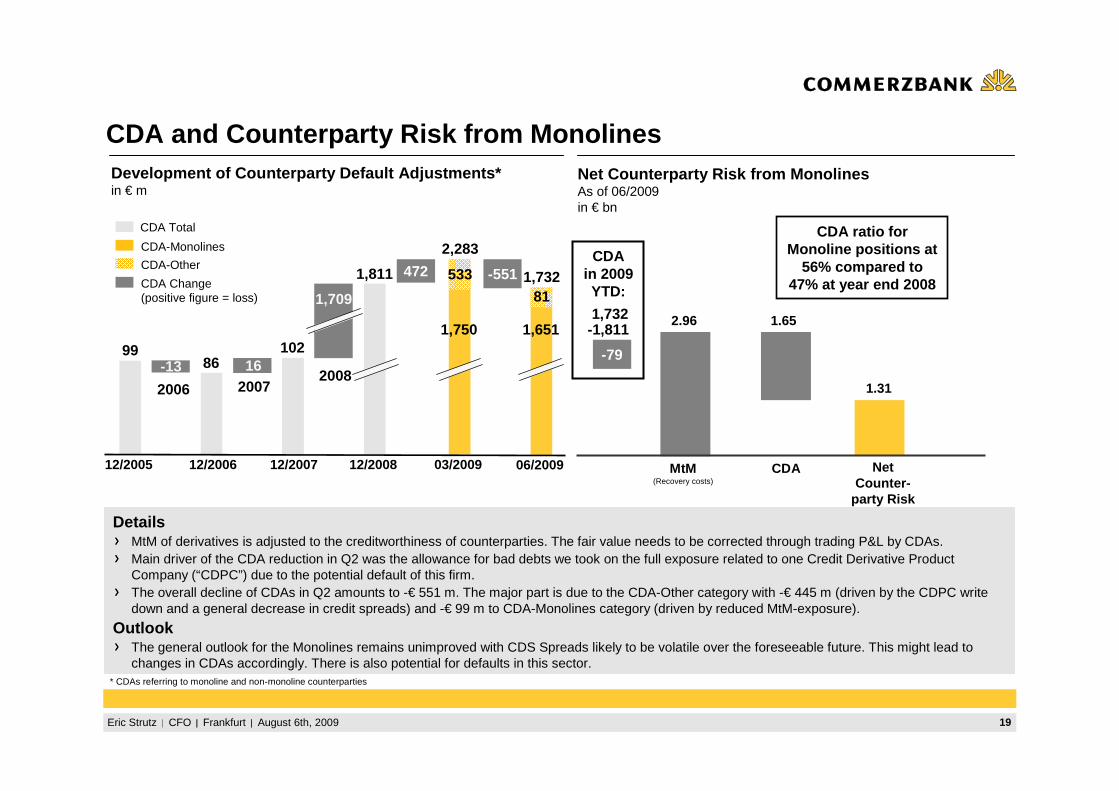
CDA and Counterparty Risk from MonolinesNet Counterparty Risk from MonolinesAs of 06/2009in € bn
MtM(Recovery costs)
2.96
CDA
1.65
Development of Counterparty Default Adjustments*in € m
1.31
NetCounter-
party Risk
* CDAs referring to monoline and non-monoline counterparties
9986
102
1,811
12/2005 12/2006 12/2007 12/2008
-13 16
1,709
2006 20072008
2,283
03/2009
472CDA
in 2009YTD:
1,750
533CDA Change(positive figure = loss)
CDA-Monolines
CDA-Other
CDA Total
DetailsMtM of derivatives is adjusted to the creditworthiness of counterparties. The fair value needs to be corrected through trading P&L by CDAs.Main driver of the CDA reduction in Q2 was the allowance for bad debts we took on the full exposure related to one Credit Derivative Product Company (“CDPC”) due to the potential default of this firm.The overall decline of CDAs in Q2 amounts to -€ 551 m. The major part is due to the CDA-Other category with -€ 445 m (driven by the CDPC write down and a general decrease in credit spreads) and -€ 99 m to CDA-Monolines category (driven by reduced MtM-exposure).
OutlookThe general outlook for the Monolines remains unimproved with CDS Spreads likely to be volatile over the foreseeable future. This might lead to changes in CDAs accordingly. There is also potential for defaults in this sector.
1,732
06/2009
1,651
81
-551
1,732-1,811
-79
CDA ratio forMonoline positions at
56% compared to 47% at year end 2008
20Eric Strutz CFO Frankfurt August 6th, 2009
156
325
52
329364 361
Q1 Q2 Q3 Q4 Q1 Q2
-231
-1,144
-4,790-1,837
-683-780
Q1 Q2 Q3 Q4 Q1 Q2
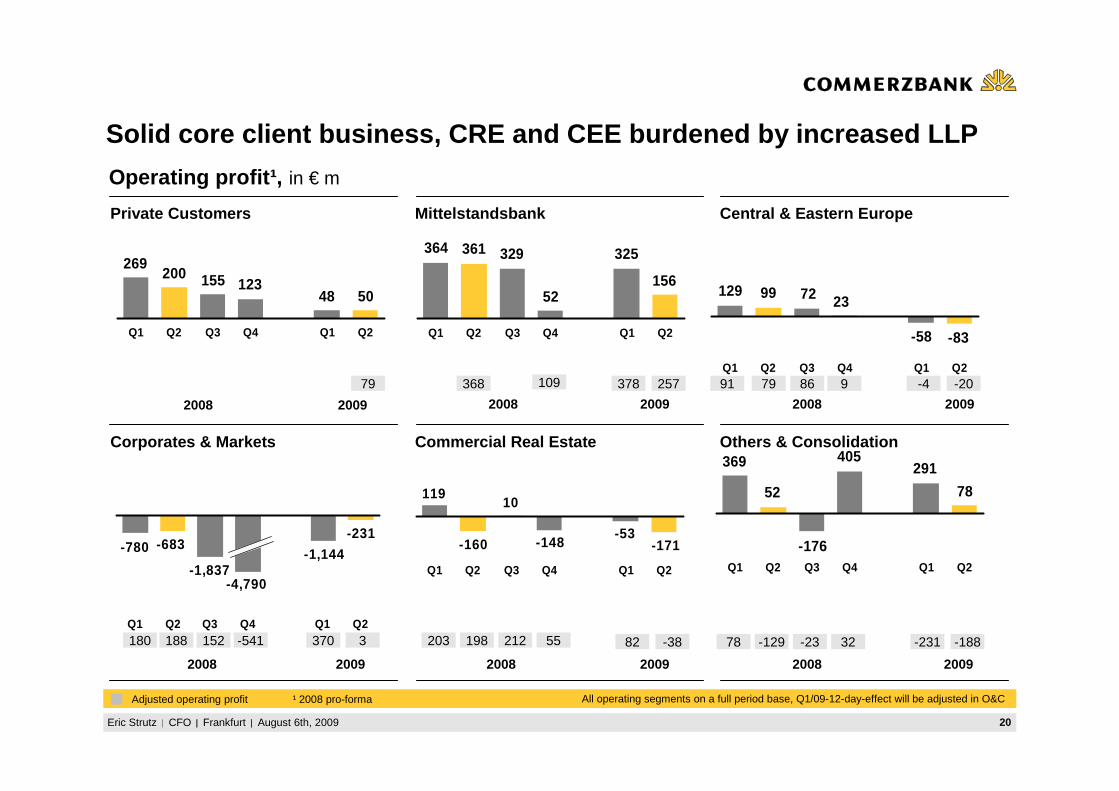
Solid core client business, CRE and CEE burdened by i ncreased LLP
Mittelstandsbank Central & Eastern EuropePrivate Customers
Commercial Real EstateCorporates & Markets
2008 2009 2008 2009 2008 2009
Operating profit¹, in € m
2008 2009 2008 2009
Adjusted operating profit ¹ 2008 pro-forma
Others & Consolidation
2008 2009
All operating segments on a full period base, Q1/09-12-day-effect will be adjusted in O&C
5048123155200
269
Q1 Q2 Q3 Q4 Q1 Q2 -83
72 23
-58
99129
Q1 Q2 Q3 Q4 Q1 Q2
-171-53
-148
10
-160
119
Q1 Q2 Q3 Q4 Q1 Q2
78
291
-176
405
52
369
Q1 Q2 Q3 Q4 Q1 Q2
79 368 109 378 257 79 9 -4 -208691
3 198 55 82 -38 -129 32 -231 -188-2378-541152 370 203 212188180
21Eric Strutz CFO Frankfurt August 6th, 2009
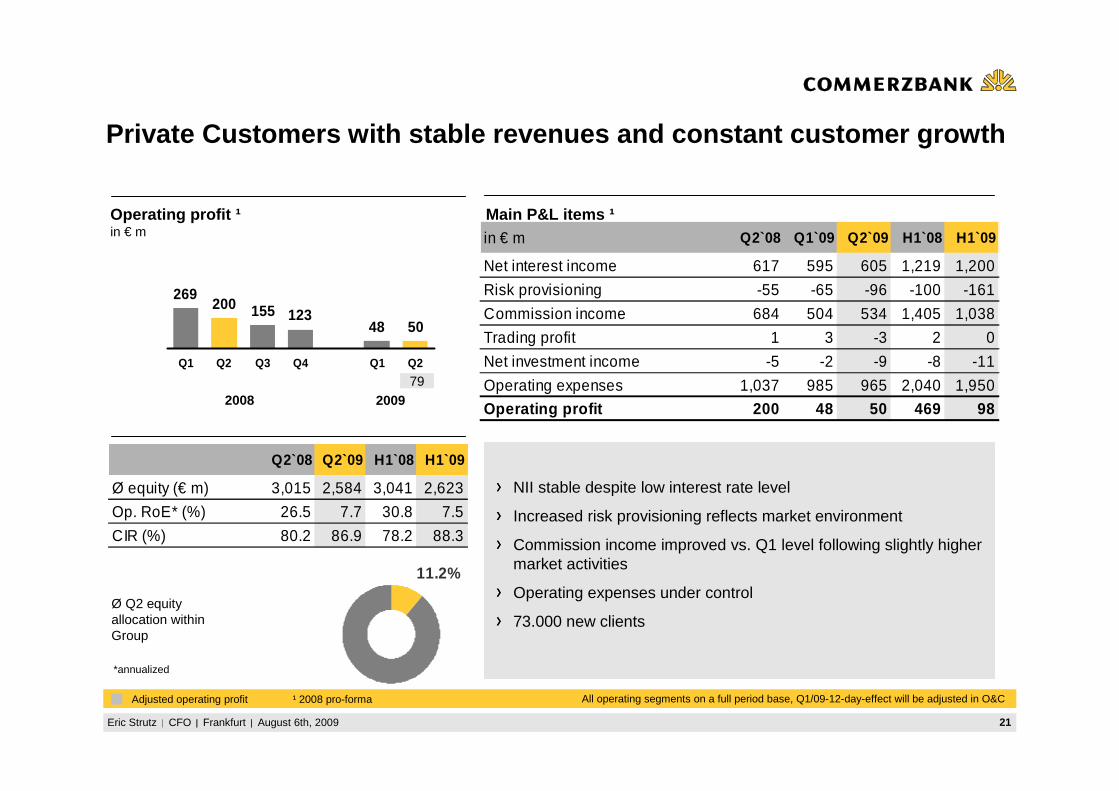
Private Customers with stable revenues and constant cu stomer growth
Ø Q2 equityallocation withinGroup
*annualized
NII stable despite low interest rate level
Increased risk provisioning reflects market environment
Commission income improved vs. Q1 level following slightly higher market activities
Operating expenses under control
73.000 new clients
2008 2009
Main P&L items ¹Operating profit ¹in € m
11.2%
in € m Q2`08 Q1`09 Q2`09 H1`08 H1`09
Net interest income 617 595 605 1,219 1,200
Risk provisioning -55 -65 -96 -100 -161
Commission income 684 504 534 1,405 1,038
Trading profit 1 3 -3 2 0
Net investment income -5 -2 -9 -8 -11
Operating expenses 1,037 985 965 2,040 1,950
Operating profit 200 48 50 469 98
Q2`08 Q2`09 H1`08 H1`09
Ø equity (€ m) 3,015 2,584 3,041 2,623
Op. RoE* (%) 26.5 7.7 30.8 7.5
CIR (%) 80.2 86.9 78.2 88.3
All operating segments on a full period base, Q1/09-12-day-effect will be adjusted in O&C
5048123155200
269
Q1 Q2 Q3 Q4 Q1 Q2
79
Adjusted operating profit ¹ 2008 pro-forma
22Eric Strutz CFO Frankfurt August 6th, 2009
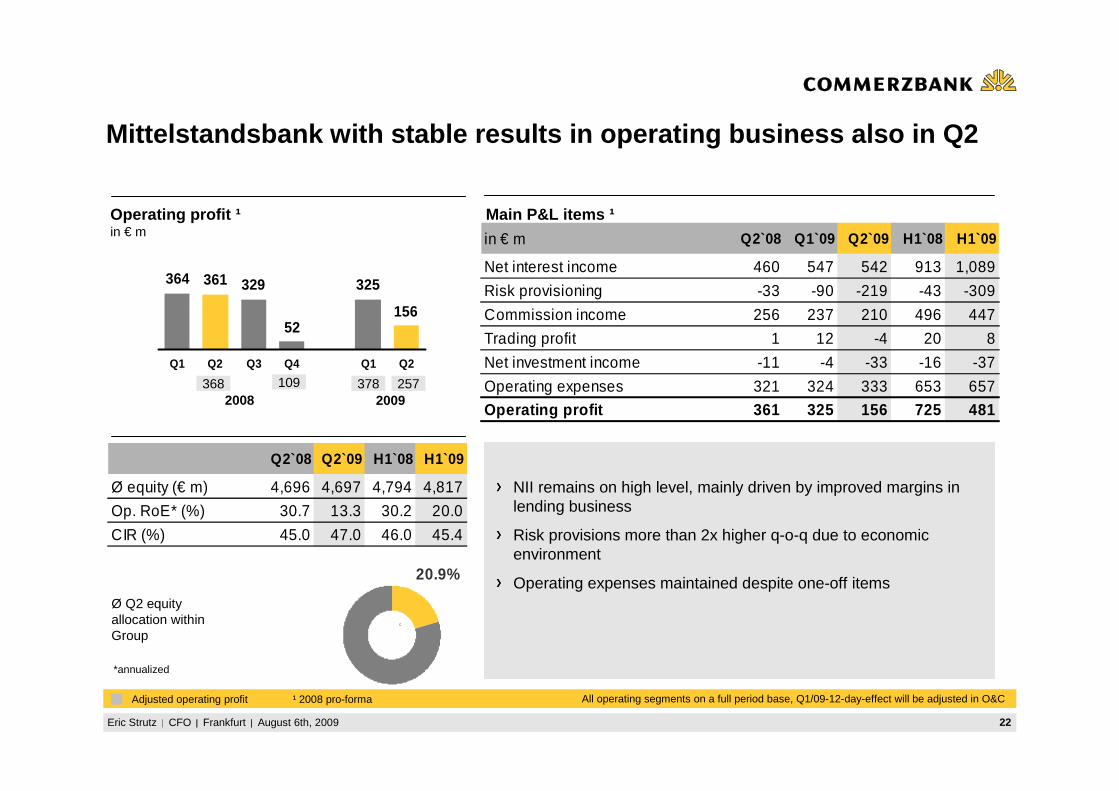
*annualized
Operating profit ¹in € m
Main P&L items ¹
Mittelstandsbank with stable results in operating bus iness also in Q2
NII remains on high level, mainly driven by improved margins in lending business
Risk provisions more than 2x higher q-o-q due to economic environment
Operating expenses maintained despite one-off itemsØ Q2 equityallocation withinGroup
2008 2009
Q2`08 Q2`09 H1`08 H1`09
Ø equity (€ m) 4,696 4,697 4,794 4,817
Op. RoE* (%) 30.7 13.3 30.2 20.0
CIR (%) 45.0 47.0 46.0 45.4
20.9%
in € m Q2`08 Q1`09 Q2`09 H1`08 H1`09
Net interest income 460 547 542 913 1,089
Risk provisioning -33 -90 -219 -43 -309
Commission income 256 237 210 496 447
Trading profit 1 12 -4 20 8
Net investment income -11 -4 -33 -16 -37
Operating expenses 321 324 333 653 657
Operating profit 361 325 156 725 481
All operating segments on a full period base, Q1/09-12-day-effect will be adjusted in O&C
C
156
325
52
329364 361
Q1 Q2 Q3 Q4 Q1 Q2
368 109 378 257
Adjusted operating profit ¹ 2008 pro-forma
23Eric Strutz CFO Frankfurt August 6th, 2009
*annualized
Operating profit ¹in € m
Main P&L items ¹
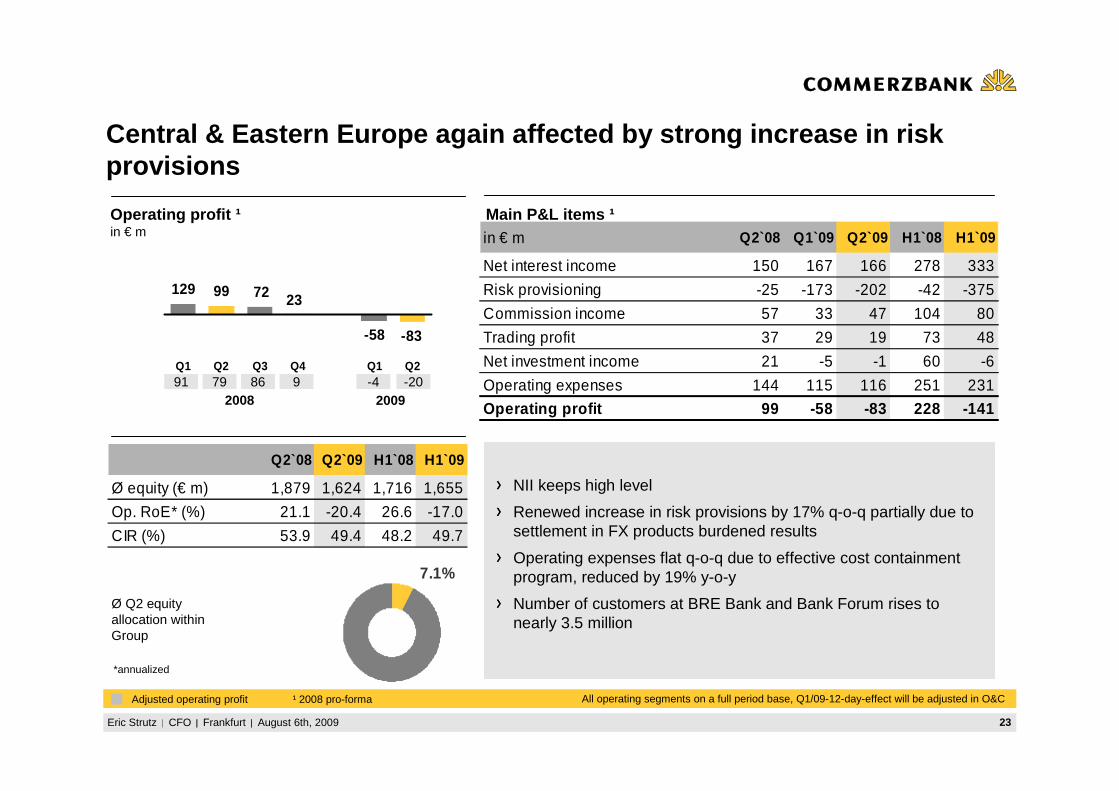
Central & Eastern Europe again affected by strong increa se in risk provisions
NII keeps high level
Renewed increase in risk provisions by 17% q-o-q partially due to settlement in FX products burdened results
Operating expenses flat q-o-q due to effective cost containment program, reduced by 19% y-o-y
Number of customers at BRE Bank and Bank Forum rises to nearly 3.5 million
Ø Q2 equityallocation withinGroup
2008 2009
Q2`08 Q2`09 H1`08 H1`09
Ø equity (€ m) 1,879 1,624 1,716 1,655
Op. RoE* (%) 21.1 -20.4 26.6 -17.0
CIR (%) 53.9 49.4 48.2 49.7
7.1%
in € m Q2`08 Q1`09 Q2`09 H1`08 H1`09
Net interest income 150 167 166 278 333
Risk provisioning -25 -173 -202 -42 -375
Commission income 57 33 47 104 80
Trading profit 37 29 19 73 48
Net investment income 21 -5 -1 60 -6
Operating expenses 144 115 116 251 231
Operating profit 99 -58 -83 228 -141
All operating segments on a full period base, Q1/09-12-day-effect will be adjusted in O&C
-83
72 23
-58
99129
Q1 Q2 Q3 Q4 Q1 Q279 9 -4 -208691
Adjusted operating profit ¹ 2008 pro-forma
24Eric Strutz CFO Frankfurt August 6th, 2009
*annualized
Operating profit ¹in € m
Main P&L items ¹
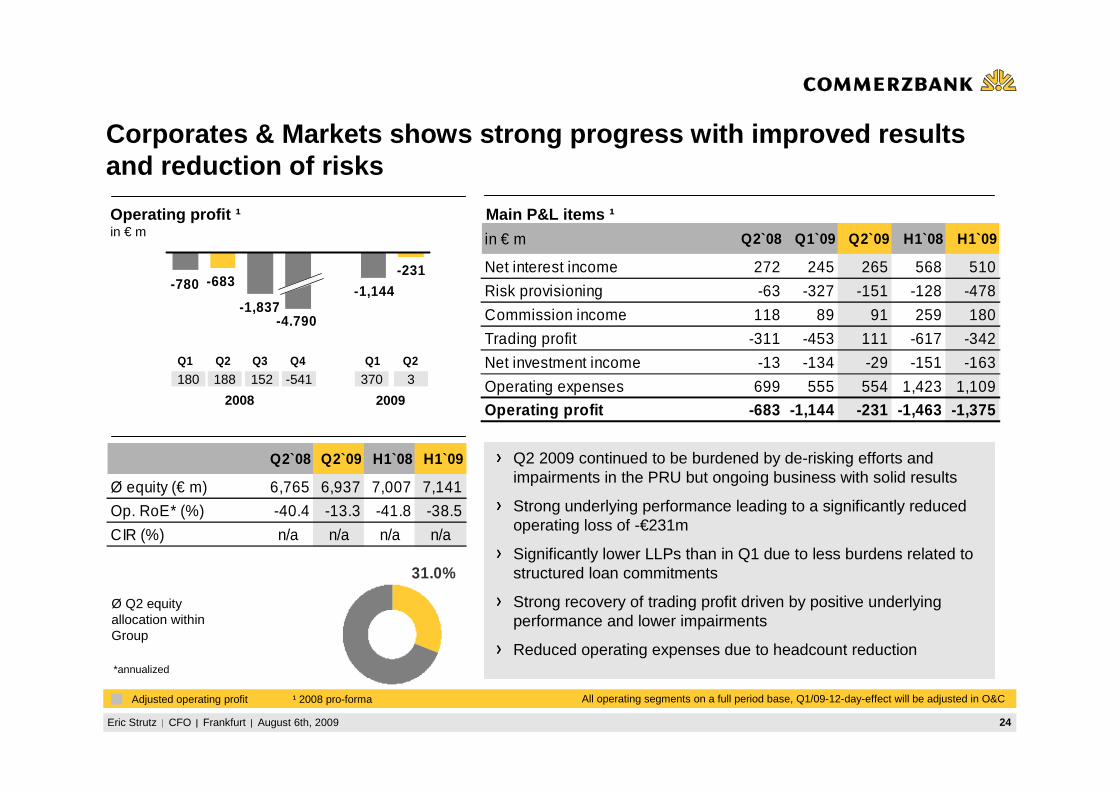
Corporates & Markets shows strong progress with improved re sultsand reduction of risks
Ø Q2 equityallocation withinGroup
2008 2009
31.0%
in € m Q2`08 Q1`09 Q2`09 H1`08 H1`09
Net interest income 272 245 265 568 510
Risk provisioning -63 -327 -151 -128 -478
Commission income 118 89 91 259 180
Trading profit -311 -453 111 -617 -342
Net investment income -13 -134 -29 -151 -163
Operating expenses 699 555 554 1,423 1,109
Operating profit -683 -1,144 -231 -1,463 -1,375
Q2`08 Q2`09 H1`08 H1`09
Ø equity (€ m) 6,765 6,937 7,007 7,141
Op. RoE* (%) -40.4 -13.3 -41.8 -38.5
CIR (%) n/a n/a n/a n/a
All operating segments on a full period base, Q1/09-12-day-effect will be adjusted in O&C
Q2 2009 continued to be burdened by de-risking efforts and impairments in the PRU but ongoing business with solid results
Strong underlying performance leading to a significantly reducedoperating loss of -€231m
Significantly lower LLPs than in Q1 due to less burdens related to structured loan commitments
Strong recovery of trading profit driven by positive underlying performance and lower impairments
Reduced operating expenses due to headcount reduction
-231
-1,144
-4.790-1,837
-683-780
Q1 Q2 Q3 Q4 Q1 Q2
3-541152 370188180
Adjusted operating profit ¹ 2008 pro-forma
25Eric Strutz CFO Frankfurt August 6th, 2009
PF
Operating Result in € m
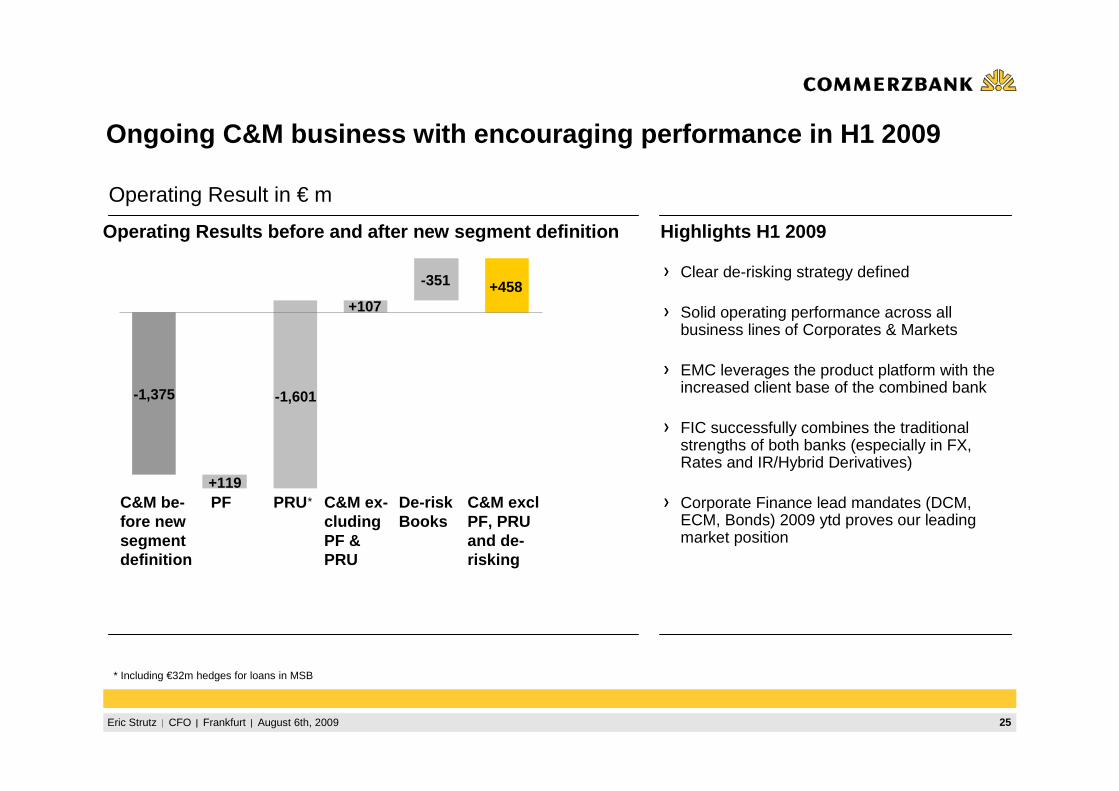
Ongoing C&M business with encouraging performance in H1 2009
Operating Results before and after new segment defi nition
-1,375
+119
-1,601
+107
-351 +458
C&M be-fore new segment definition
PRU C&M ex-cludingPF & PRU
De-riskBooks
C&M excl PF, PRU and de-risking
Highlights H1 2009
Clear de-risking strategy defined
Solid operating performance across all business lines of Corporates & Markets
EMC leverages the product platform with the increased client base of the combined bank
FIC successfully combines the traditional strengths of both banks (especially in FX, Rates and IR/Hybrid Derivatives)
Corporate Finance lead mandates (DCM, ECM, Bonds) 2009 ytd proves our leading market position
*
* Including €32m hedges for loans in MSB
26Eric Strutz CFO Frankfurt August 6th, 2009
*annualized
Operating profit ¹in € m
Main P&L items ¹
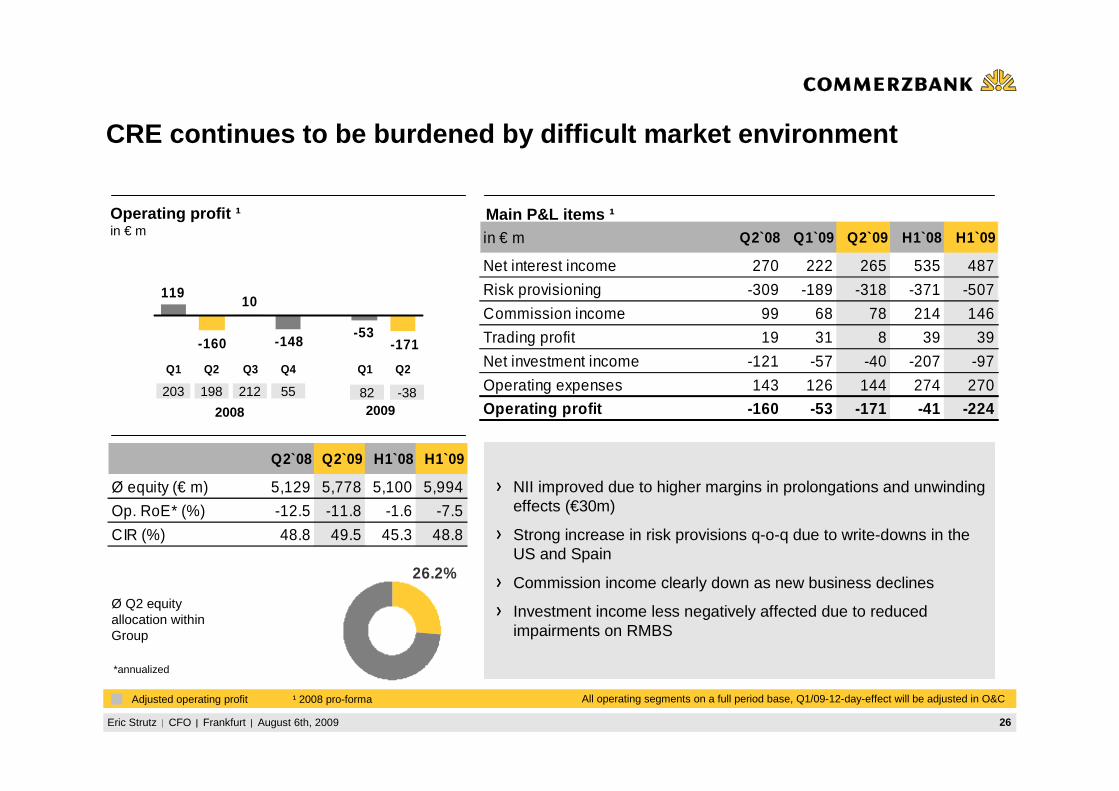
CRE continues to be burdened by difficult market environmen t
Ø Q2 equityallocation withinGroup
NII improved due to higher margins in prolongations and unwinding effects (€30m)
Strong increase in risk provisions q-o-q due to write-downs in the US and Spain
Commission income clearly down as new business declines
Investment income less negatively affected due to reduced impairments on RMBS
2008 2009
in € m Q2`08 Q1`09 Q2`09 H1`08 H1`09
Net interest income 270 222 265 535 487
Risk provisioning -309 -189 -318 -371 -507
Commission income 99 68 78 214 146
Trading profit 19 31 8 39 39
Net investment income -121 -57 -40 -207 -97
Operating expenses 143 126 144 274 270
Operating profit -160 -53 -171 -41 -224
Q2`08 Q2`09 H1`08 H1`09
Ø equity (€ m) 5,129 5,778 5,100 5,994
Op. RoE* (%) -12.5 -11.8 -1.6 -7.5
CIR (%) 48.8 49.5 45.3 48.8
26.2%
All operating segments on a full period base, Q1/09-12-day-effect will be adjusted in O&C
-171-53
-148
10
-160
119
Q1 Q2 Q3 Q4 Q1 Q2
198 55 82 -38203 212
Adjusted operating profit ¹ 2008 pro-forma
27Eric Strutz CFO Frankfurt August 6th, 2009
Operating profit ¹in € m
Main P&L items ¹
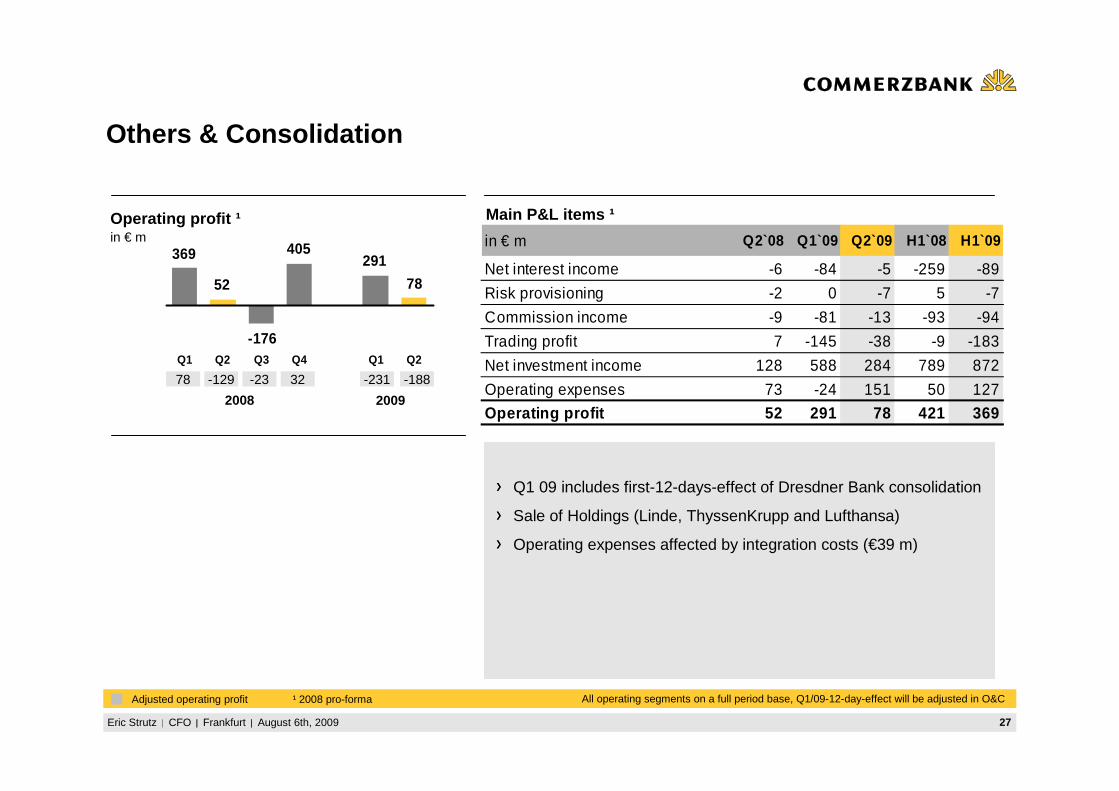
Others & Consolidation
Q1 09 includes first-12-days-effect of Dresdner Bank consolidation
Sale of Holdings (Linde, ThyssenKrupp and Lufthansa)
Operating expenses affected by integration costs (€39 m)
2008 2009
in € m Q2`08 Q1`09 Q2`09 H1`08 H1`09
Net interest income -6 -84 -5 -259 -89
Risk provisioning -2 0 -7 5 -7
Commission income -9 -81 -13 -93 -94
Trading profit 7 -145 -38 -9 -183
Net investment income 128 588 284 789 872
Operating expenses 73 -24 151 50 127
Operating profit 52 291 78 421 369
All operating segments on a full period base, Q1/09-12-day-effect will be adjusted in O&C
78
291
-176
405
52
369
Q1 Q2 Q3 Q4 Q1 Q2
-129 32 -231 -188-2378
Adjusted operating profit ¹ 2008 pro-forma
28Eric Strutz CFO Frankfurt August 6th, 2009
Outlook
New segment reporting starting July 1st, restated figures will be delivered ahead Q3 disclosure
Sentiment improved, but both institutional and private clients are still transacting less securities
1.
PRU with the right set up, shareholder-minded approach in reducing assets -De-risking continues
2.
Cautious outlook due to the fragile market environment4.
5.
Integration of Dresdner Bank continues to be on high priority3.
29Eric Strutz CFO Frankfurt August 6th, 2009
Appendix 1: Segmental reporting
30Eric Strutz CFO Frankfurt August 6th, 2009
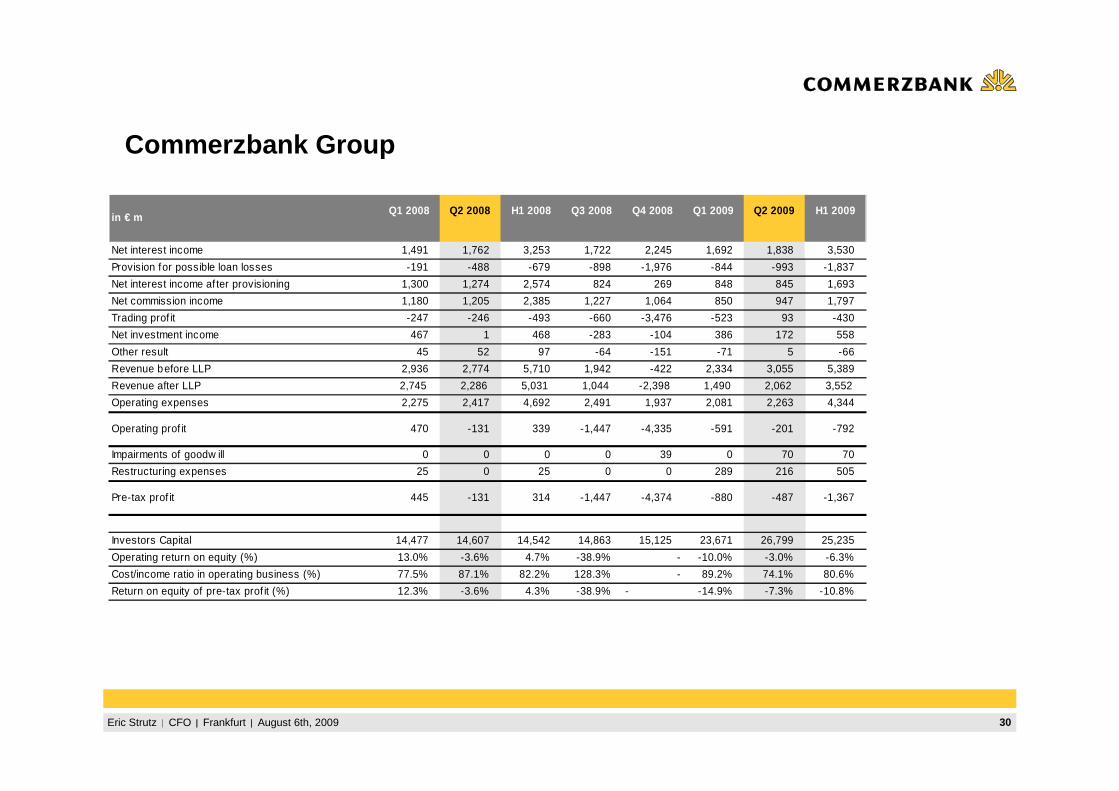
Commerzbank Group
in € mQ1 2008 Q2 2008 H1 2008 Q3 2008 Q4 2008 Q1 2009 Q2 2009 H1 2009
Net interest income 1,491 1,762 3,253 1,722 2,245 1,692 1,838 3,530
Provision for possible loan losses -191 -488 -679 -898 -1,976 -844 -993 -1,837
Net interest income af ter provisioning 1,300 1,274 2,574 824 269 848 845 1,693
Net commission income 1,180 1,205 2,385 1,227 1,064 850 947 1,797
Trading prof it -247 -246 -493 -660 -3,476 -523 93 -430
Net investment income 467 1 468 -283 -104 386 172 558
Other result 45 52 97 -64 -151 -71 5 -66
Revenue before LLP 2,936 2,774 5,710 1,942 -422 2,334 3,055 5,389
Revenue after LLP 2,745 2,286 5,031 1,044 -2,398 1,490 2,062 3,552
Operating expenses 2,275 2,417 4,692 2,491 1,937 2,081 2,263 4,344
Operating prof it 470 -131 339 -1,447 -4,335 -591 -201 -792
Impairments of goodw ill 0 0 0 0 39 0 70 70
Restructuring expenses 25 0 25 0 0 289 216 505
Pre-tax prof it 445 -131 314 -1,447 -4,374 -880 -487 -1,367
Investors Capital 14,477 14,607 14,542 14,863 15,125 23,671 26,799 25,235
Operating return on equity (%) 13.0% -3.6% 4.7% -38.9% - -10.0% -3.0% -6.3%
Cost/income ratio in operating business (%) 77.5% 87.1% 82.2% 128.3% - 89.2% 74.1% 80.6%
Return on equity of pre-tax prof it (%) 12.3% -3.6% 4.3% -38.9% - -14.9% -7.3% -10.8%

31Eric Strutz CFO Frankfurt August 6th, 2009
Private Customers
in € mQ1 2008 Q2 2008 H1 2008 Q3 2008 Q4 2008 Q1 2009 Q2 2009 H1 2009
Net interest income 602 617 1,219 622 639 595 605 1,200
Provision for possible loan losses -45 -55 -100 -57 -55 -65 -96 -161
Net interest income af ter provisioning 557 562 1,119 565 584 530 509 1,039
Net commission income 721 684 1,405 623 516 504 534 1,038
Trading prof it 1 1 2 -4 34 3 -3 0
Net investment income -3 -5 -8 -15 -15 -2 -9 -11
Other result -4 -4 -8 -15 -53 -2 -16 -18
Revenue before LLP 1,317 1,293 2,610 1,211 1,121 1,098 1,111 2,209
Revenue after LLP 1,272 1,238 2,510 1,154 1,066 1,033 1,015 2,048
Operating expenses 1,003 1,037 2,040 1,000 942 985 965 1,950
Operating prof it 269 200 469 155 123 48 50 98
Impairments of goodw ill 0 0 0 0 0 0 0 0
Restructuring expenses -6 1 -5 -3 -14 51 43 94
Pre-tax prof it 275 199 474 158 137 -3 7 4
Average equity tied up 3,068 3,015 3,041 2,975 2,807 2,661 2,584 2,623
Operating return on equity (%) 35.1% 26.5% 30.8% 20.8% 17.5% 7.2% 7.7% 7.5%
Cost/income ratio in operating business (%) 76.2% 80.2% 78.2% 82.6% 84.0% 89.7% 86.9% 88.3%
Return on equity of pre-tax prof it (%) 35.9% 26.4% 31.2% 21.2% 19.5% -0.5% 1.1% 0.3%
32Eric Strutz CFO Frankfurt August 6th, 2009
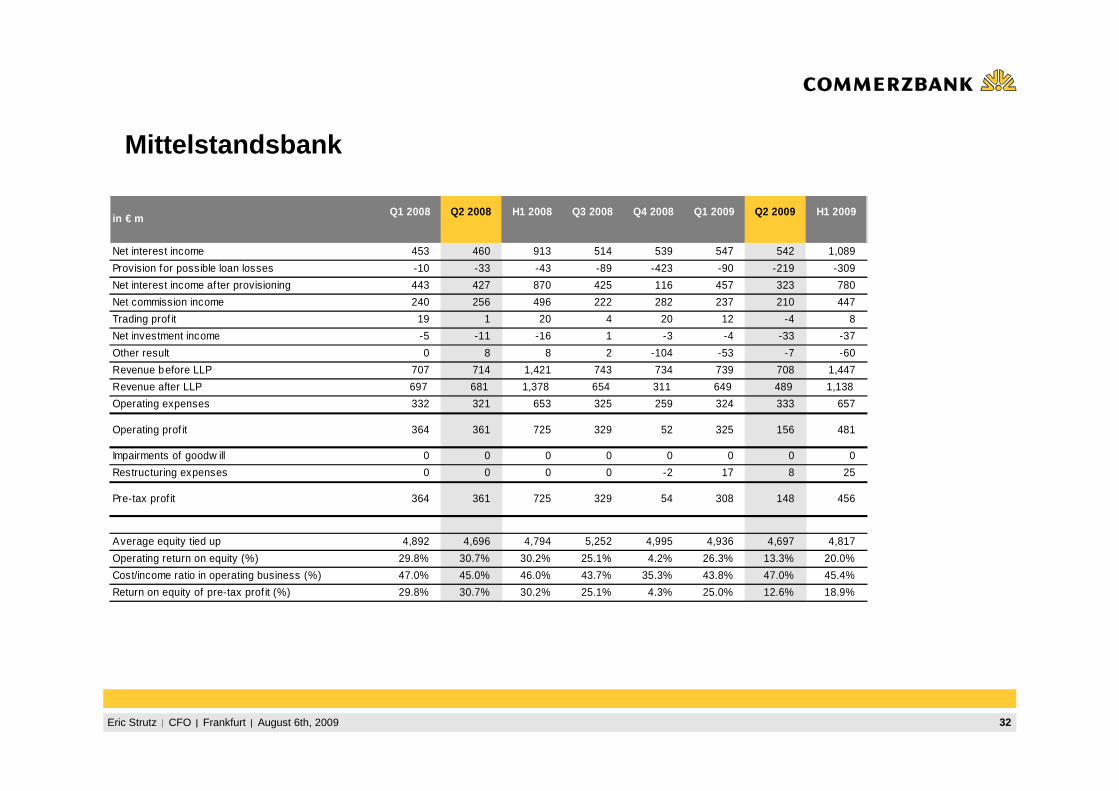
Mittelstandsbank
in € mQ1 2008 Q2 2008 H1 2008 Q3 2008 Q4 2008 Q1 2009 Q2 2009 H1 2009
Net interest income 453 460 913 514 539 547 542 1,089
Provision for possible loan losses -10 -33 -43 -89 -423 -90 -219 -309
Net interest income af ter provisioning 443 427 870 425 116 457 323 780
Net commission income 240 256 496 222 282 237 210 447
Trading prof it 19 1 20 4 20 12 -4 8
Net investment income -5 -11 -16 1 -3 -4 -33 -37
Other result 0 8 8 2 -104 -53 -7 -60
Revenue before LLP 707 714 1,421 743 734 739 708 1,447
Revenue after LLP 697 681 1,378 654 311 649 489 1,138
Operating expenses 332 321 653 325 259 324 333 657
Operating prof it 364 361 725 329 52 325 156 481
Impairments of goodw ill 0 0 0 0 0 0 0 0
Restructuring expenses 0 0 0 0 -2 17 8 25
Pre-tax prof it 364 361 725 329 54 308 148 456
Average equity tied up 4,892 4,696 4,794 5,252 4,995 4,936 4,697 4,817
Operating return on equity (%) 29.8% 30.7% 30.2% 25.1% 4.2% 26.3% 13.3% 20.0%
Cost/income ratio in operating business (%) 47.0% 45.0% 46.0% 43.7% 35.3% 43.8% 47.0% 45.4%
Return on equity of pre-tax prof it (%) 29.8% 30.7% 30.2% 25.1% 4.3% 25.0% 12.6% 18.9%

33Eric Strutz CFO Frankfurt August 6th, 2009
Central and Eastern Europe
in € mQ1 2008 Q2 2008 H1 2008 Q3 2008 Q4 2008 Q1 2009 Q2 2009 H1 2009
Net interest income 128 150 278 210 189 167 166 333
Provision for possible loan losses -17 -25 -42 -71 -76 -173 -202 -375
Net interest income af ter provisioning 111 125 236 139 113 -6 -36 -42
Net commission income 47 57 104 50 46 33 47 80
Trading prof it 36 37 73 31 -6 29 19 48
Net investment income 39 21 60 1 8 -5 -1 -6
Other result 4 2 6 -1 24 6 4 10
Revenue before LLP 254 267 521 291 261 230 235 465
Revenue after LLP 237 242 479 220 185 57 33 90
Operating expenses 107 144 251 147 163 115 116 231
Operating prof it 129 99 228 72 23 -58 -83 -141
Impairments of goodw ill 0 0 0 0 0 0 0 0
Restructuring expenses 0 0 0 0 0 0 0 0
Pre-tax prof it 129 99 228 72 23 -58 -83 -141
Average equity tied up 1,553 1,879 1,716 1,998 1,894 1,686 1,624 1,655
Operating return on equity (%) 33.2% 21.1% 26.6% 14.4% 4.9% -13.8% -20.4% -17.0%
Cost/income ratio in operating business (%) 42.1% 53.9% 48.2% 50.5% 62.5% 50.0% 49.4% 49.7%
Return on equity of pre-tax prof it (%) 33.2% 21.1% 26.6% 14.4% 4.9% -13.8% -20.4% -17.0%
34Eric Strutz CFO Frankfurt August 6th, 2009
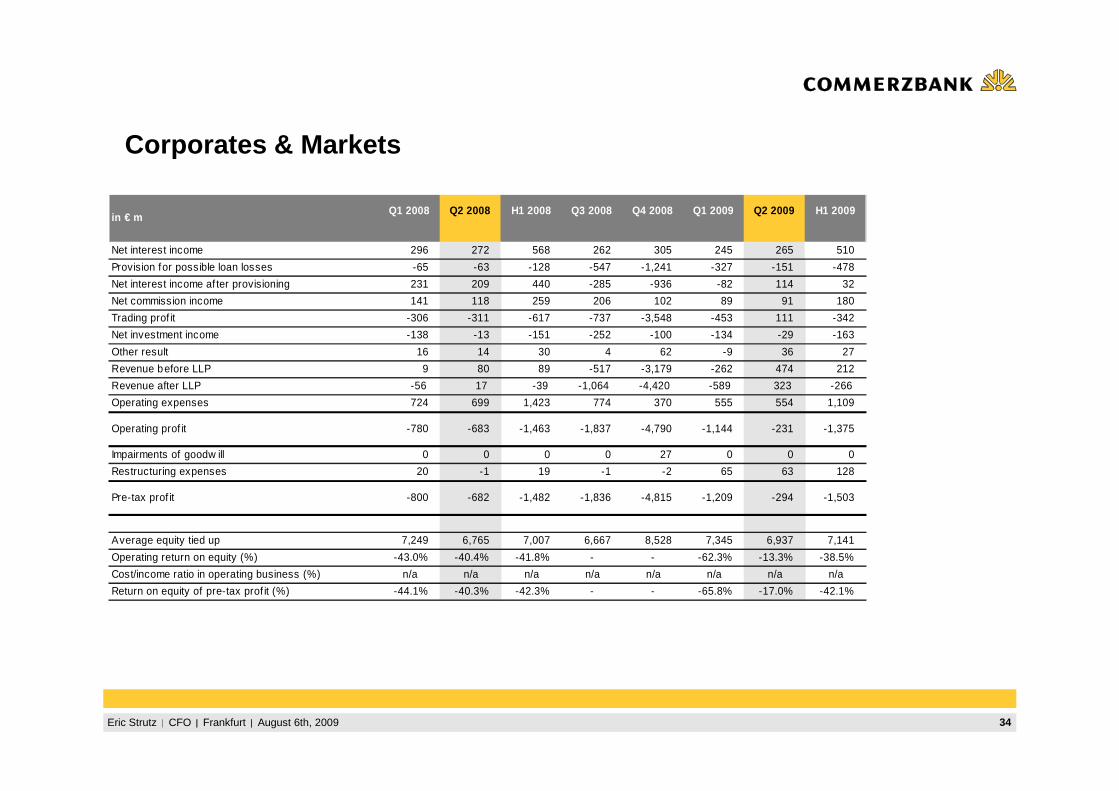
Corporates & Markets
in € mQ1 2008 Q2 2008 H1 2008 Q3 2008 Q4 2008 Q1 2009 Q2 2009 H1 2009
Net interest income 296 272 568 262 305 245 265 510
Provision for possible loan losses -65 -63 -128 -547 -1,241 -327 -151 -478
Net interest income af ter provisioning 231 209 440 -285 -936 -82 114 32
Net commission income 141 118 259 206 102 89 91 180
Trading prof it -306 -311 -617 -737 -3,548 -453 111 -342
Net investment income -138 -13 -151 -252 -100 -134 -29 -163
Other result 16 14 30 4 62 -9 36 27
Revenue before LLP 9 80 89 -517 -3,179 -262 474 212
Revenue after LLP -56 17 -39 -1,064 -4,420 -589 323 -266
Operating expenses 724 699 1,423 774 370 555 554 1,109
Operating prof it -780 -683 -1,463 -1,837 -4,790 -1,144 -231 -1,375
Impairments of goodw ill 0 0 0 0 27 0 0 0
Restructuring expenses 20 -1 19 -1 -2 65 63 128
Pre-tax prof it -800 -682 -1,482 -1,836 -4,815 -1,209 -294 -1,503
Average equity tied up 7,249 6,765 7,007 6,667 8,528 7,345 6,937 7,141
Operating return on equity (%) -43.0% -40.4% -41.8% - - -62.3% -13.3% -38.5%
Cost/income ratio in operating business (%) n/a n/a n/a n/a n/a n/a n/a n/a
Return on equity of pre-tax prof it (%) -44.1% -40.3% -42.3% - - -65.8% -17.0% -42.1%
35Eric Strutz CFO Frankfurt August 6th, 2009
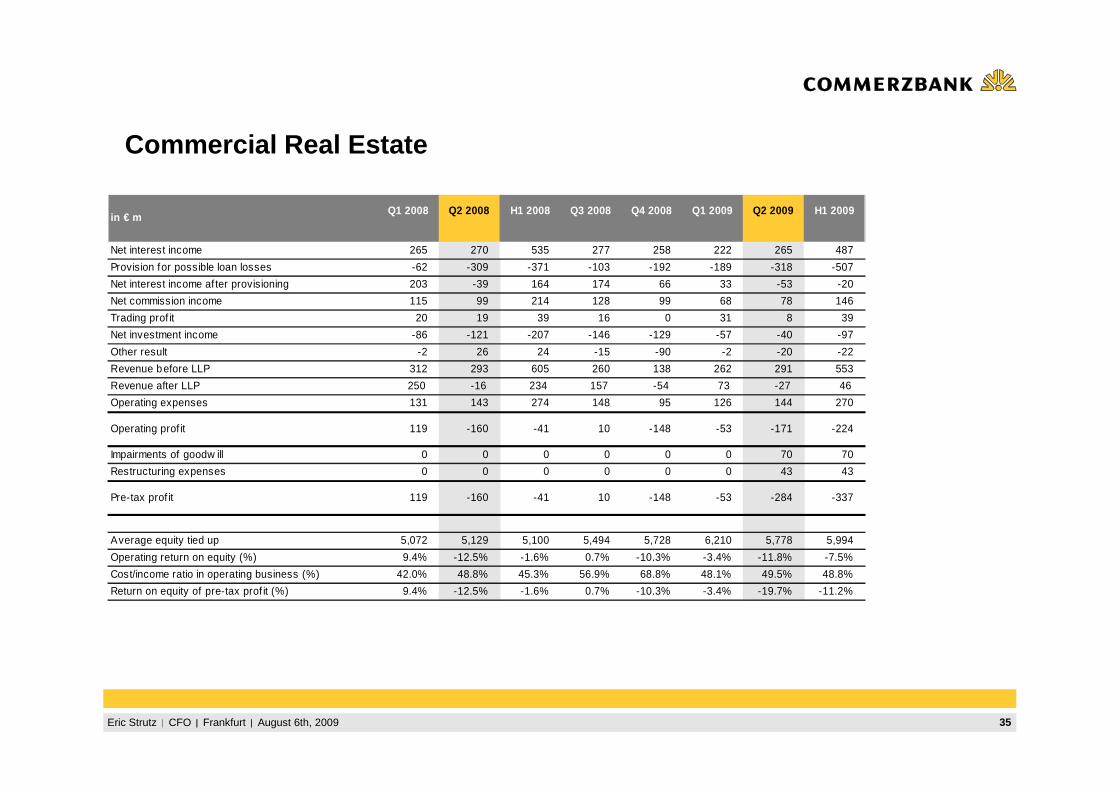
Commercial Real Estate
in € mQ1 2008 Q2 2008 H1 2008 Q3 2008 Q4 2008 Q1 2009 Q2 2009 H1 2009
Net interest income 265 270 535 277 258 222 265 487
Provision for possible loan losses -62 -309 -371 -103 -192 -189 -318 -507
Net interest income af ter provisioning 203 -39 164 174 66 33 -53 -20
Net commission income 115 99 214 128 99 68 78 146
Trading prof it 20 19 39 16 0 31 8 39
Net investment income -86 -121 -207 -146 -129 -57 -40 -97
Other result -2 26 24 -15 -90 -2 -20 -22
Revenue before LLP 312 293 605 260 138 262 291 553
Revenue after LLP 250 -16 234 157 -54 73 -27 46
Operating expenses 131 143 274 148 95 126 144 270
Operating prof it 119 -160 -41 10 -148 -53 -171 -224
Impairments of goodw ill 0 0 0 0 0 0 70 70
Restructuring expenses 0 0 0 0 0 0 43 43
Pre-tax prof it 119 -160 -41 10 -148 -53 -284 -337
Average equity tied up 5,072 5,129 5,100 5,494 5,728 6,210 5,778 5,994
Operating return on equity (%) 9.4% -12.5% -1.6% 0.7% -10.3% -3.4% -11.8% -7.5%
Cost/income ratio in operating business (%) 42.0% 48.8% 45.3% 56.9% 68.8% 48.1% 49.5% 48.8%
Return on equity of pre-tax prof it (%) 9.4% -12.5% -1.6% 0.7% -10.3% -3.4% -19.7% -11.2%
36Eric Strutz CFO Frankfurt August 6th, 2009
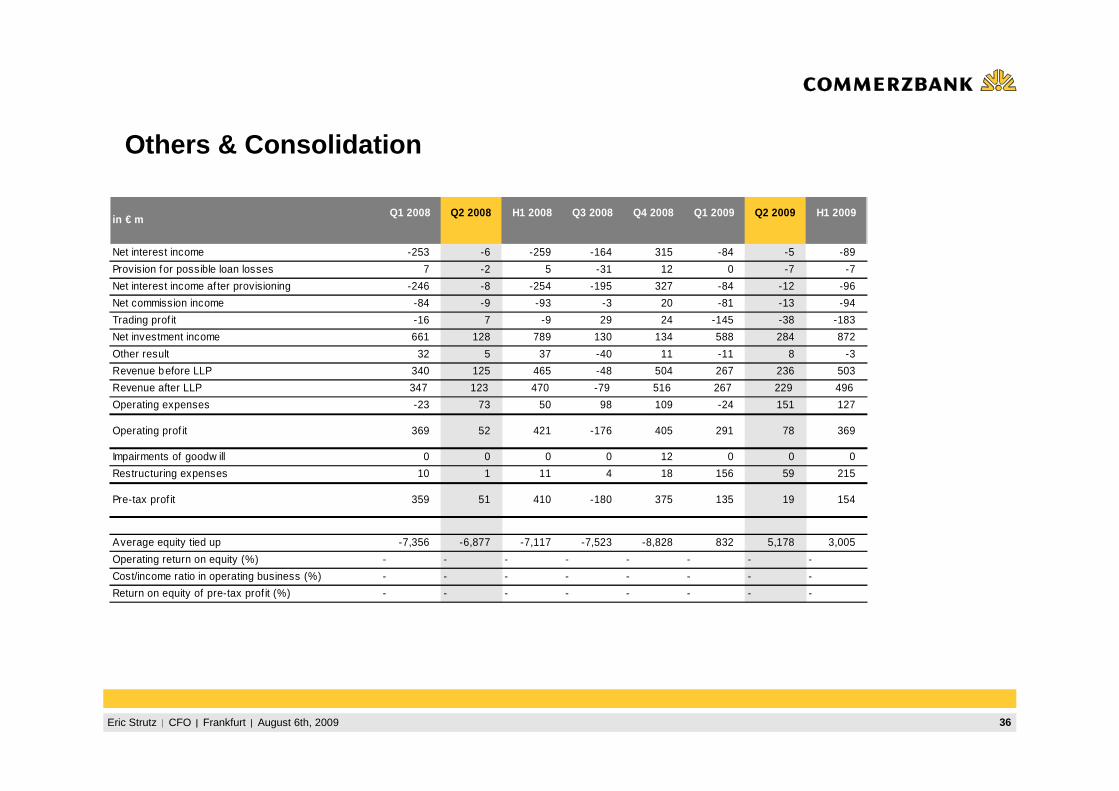
Others & Consolidation
in € mQ1 2008 Q2 2008 H1 2008 Q3 2008 Q4 2008 Q1 2009 Q2 2009 H1 2009
Net interest income -253 -6 -259 -164 315 -84 -5 -89
Provision for possible loan losses 7 -2 5 -31 12 0 -7 -7
Net interest income af ter provisioning -246 -8 -254 -195 327 -84 -12 -96
Net commission income -84 -9 -93 -3 20 -81 -13 -94
Trading prof it -16 7 -9 29 24 -145 -38 -183
Net investment income 661 128 789 130 134 588 284 872
Other result 32 5 37 -40 11 -11 8 -3
Revenue before LLP 340 125 465 -48 504 267 236 503
Revenue after LLP 347 123 470 -79 516 267 229 496
Operating expenses -23 73 50 98 109 -24 151 127
Operating prof it 369 52 421 -176 405 291 78 369
Impairments of goodw ill 0 0 0 0 12 0 0 0
Restructuring expenses 10 1 11 4 18 156 59 215
Pre-tax prof it 359 51 410 -180 375 135 19 154
Average equity tied up -7,356 -6,877 -7,117 -7,523 -8,828 832 5,178 3,005
Operating return on equity (%) - - - - - - - -
Cost/income ratio in operating business (%) - - - - - - - -
Return on equity of pre-tax prof it (%) - - - - - - - -
37Eric Strutz CFO Frankfurt August 6th, 2009
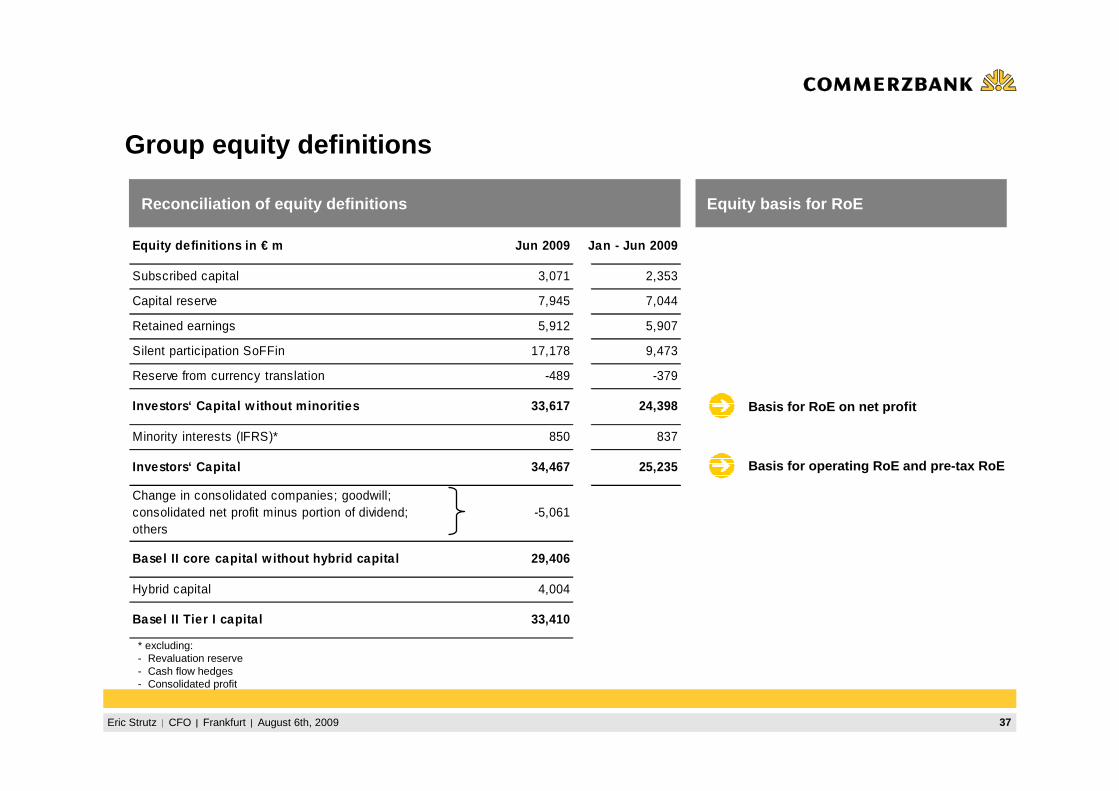
Equity definitions in € m Jun 2009 Jan - Jun 2009
Subscribed capital 3,071 2,353
Capital reserve 7,945 7,044
Retained earnings 5,912 5,907
Silent participation SoFFin 17,178 9,473
Reserve from currency translation -489 -379
Investors‘ Capita l w ithout minorities 33,617 24,398
Minority interests (IFRS)* 850 837
Investors‘ Capita l 34,467 25,235
Change in consolidated companies; goodwill; consolidated net profit minus portion of dividend; others
-5,061
Basel II core capita l w ithout hybrid capita l 29,406
Hybrid capital 4,004
Basel II Tier I capita l 33,410
Group equity definitions
Reconciliation of equity definitions
Basis for RoE on net profit
Equity basis for RoE
Basis for operating RoE and pre-tax RoE
* excluding:- Revaluation reserve- Cash flow hedges- Consolidated profit
38Eric Strutz CFO Frankfurt August 6th, 2009
Appendix 2: ABS-Portfolio & Leveraged Acquisition Fin ance (LAF)
39Eric Strutz CFO Frankfurt August 6th, 2009
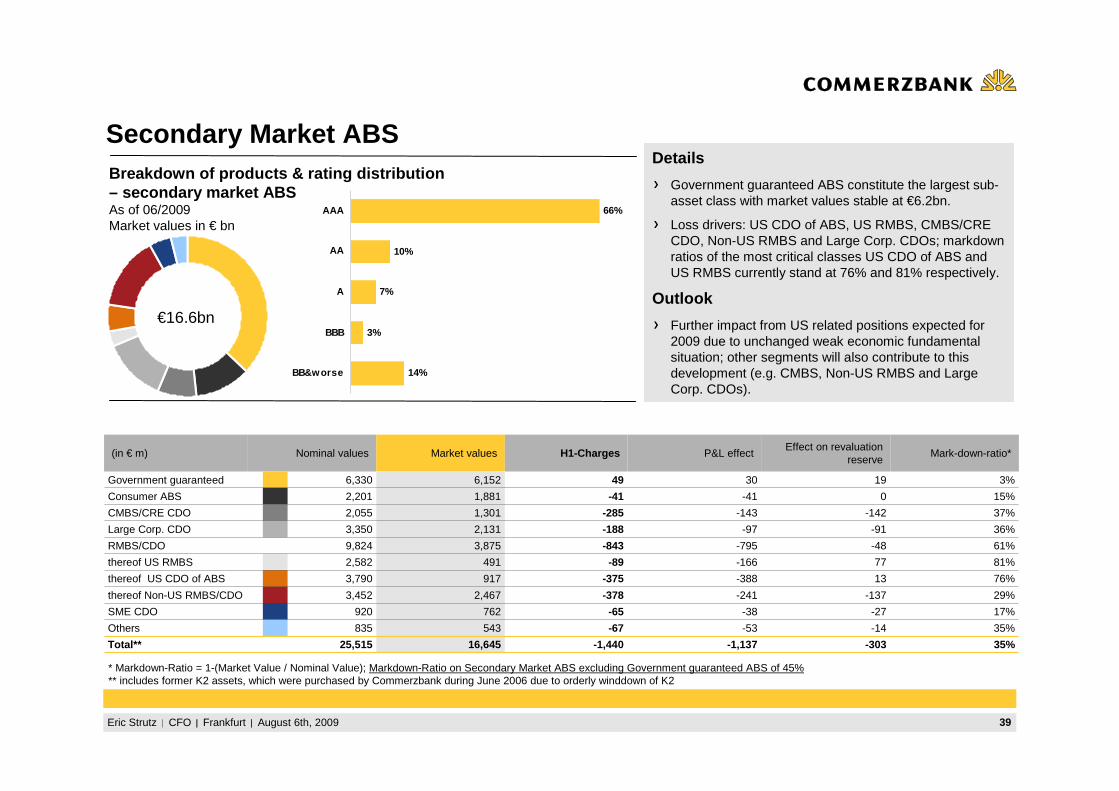
Secondary Market ABSDetails
Government guaranteed ABS constitute the largest sub-asset class with market values stable at €6.2bn.
Loss drivers: US CDO of ABS, US RMBS, CMBS/CRE CDO, Non-US RMBS and Large Corp. CDOs; markdown ratios of the most critical classes US CDO of ABS and US RMBS currently stand at 76% and 81% respectively.
Outlook
Further impact from US related positions expected for 2009 due to unchanged weak economic fundamental situation; other segments will also contribute to this development (e.g. CMBS, Non-US RMBS and Large Corp. CDOs).
(in € m) Nominal values Market values H1-Charges P&L effectEffect on revaluation
reserveMark-down-ratio*
Government guaranteed 6,330 6,152 49 30 19 3%
Consumer ABS 2,201 1,881 -41 -41 0 15%
CMBS/CRE CDO 2,055 1,301 -285 -143 -142 37%
Large Corp. CDO 3,350 2,131 -188 -97 -91 36%
RMBS/CDO 9,824 3,875 -843 -795 -48 61%
thereof US RMBS 2,582 491 -89 -166 77 81%
thereof US CDO of ABS 3,790 917 -375 -388 13 76%
thereof Non-US RMBS/CDO 3,452 2,467 -378 -241 -137 29%
SME CDO 920 762 -65 -38 -27 17%
Others 835 543 -67 -53 -14 35%
Total** 25,515 16,645 -1,440 -1,137 -303 35%
* Markdown-Ratio = 1-(Market Value / Nominal Value); Markdown-Ratio on Secondary Market ABS excluding Government guaranteed ABS of 45%** includes former K2 assets, which were purchased by Commerzbank during June 2006 due to orderly winddown of K2
Breakdown of products & rating distribution – secondary market ABSAs of 06/2009Market values in € bn
€16.6bn
14%
3%
10%
66%
7%
BB&worse
BBB
A
AA
AAA
40Eric Strutz CFO Frankfurt August 6th, 2009
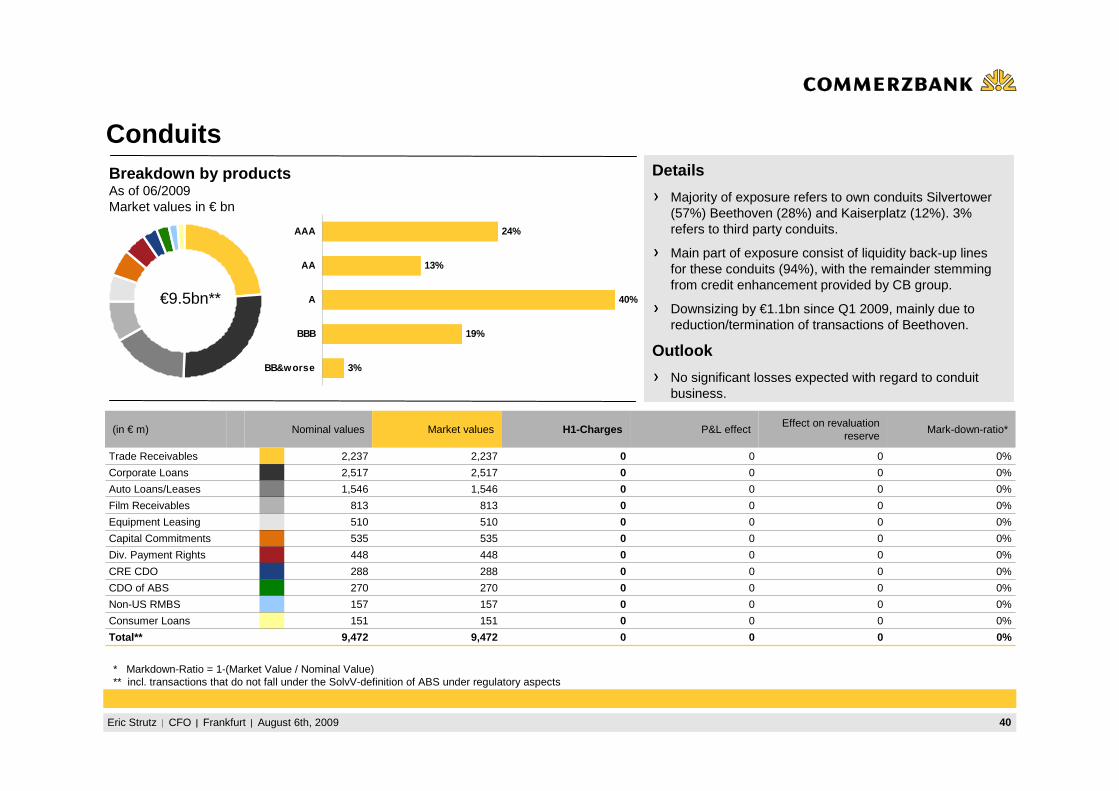
ConduitsDetails
Majority of exposure refers to own conduits Silvertower(57%) Beethoven (28%) and Kaiserplatz (12%). 3% refers to third party conduits.
Main part of exposure consist of liquidity back-up lines for these conduits (94%), with the remainder stemming from credit enhancement provided by CB group.
Downsizing by €1.1bn since Q1 2009, mainly due to reduction/termination of transactions of Beethoven.
Outlook
No significant losses expected with regard to conduit business.
(in € m) Nominal values Market values H1-Charges P&L effectEffect on revaluation
reserveMark-down-ratio*
Trade Receivables 2,237 2,237 0 0 0 0%
Corporate Loans 2,517 2,517 0 0 0 0%
Auto Loans/Leases 1,546 1,546 0 0 0 0%
Film Receivables 813 813 0 0 0 0%
Equipment Leasing 510 510 0 0 0 0%
Capital Commitments 535 535 0 0 0 0%
Div. Payment Rights 448 448 0 0 0 0%
CRE CDO 288 288 0 0 0 0%
CDO of ABS 270 270 0 0 0 0%
Non-US RMBS 157 157 0 0 0 0%
Consumer Loans 151 151 0 0 0 0%
Total** 9,472 9,472 0 0 0 0%
* Markdown-Ratio = 1-(Market Value / Nominal Value)** incl. transactions that do not fall under the SolvV-definition of ABS under regulatory aspects
Breakdown by productsAs of 06/2009Market values in € bn
€9.5bn**
3%
19%
13%
24%
40%
BB&worse
BBB
A
AA
AAA
41Eric Strutz CFO Frankfurt August 6th, 2009
7
0
1
14
77
1
≤ BB
BB
BBB
A
AA
AAA
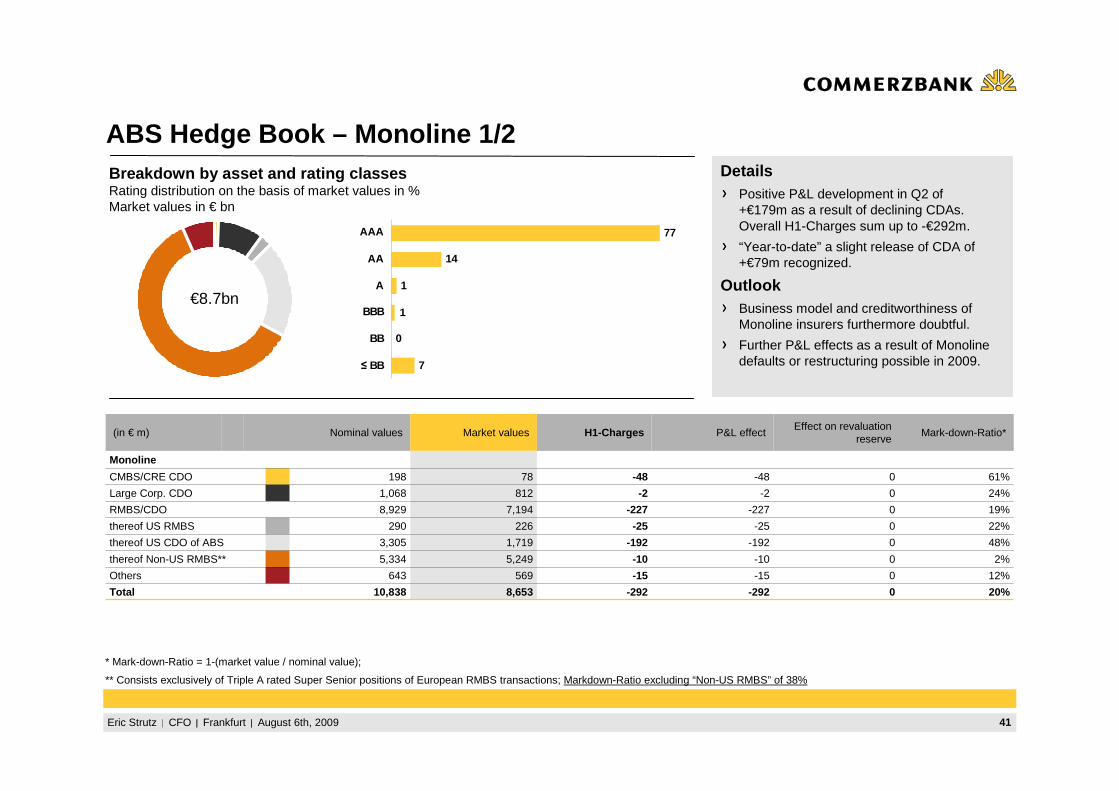
ABS Hedge Book – Monoline 1/2Breakdown by asset and rating classes Rating distribution on the basis of market values in %Market values in € bn
DetailsPositive P&L development in Q2 of +€179m as a result of declining CDAs. Overall H1-Charges sum up to -€292m.
“Year-to-date” a slight release of CDA of +€79m recognized.
OutlookBusiness model and creditworthiness of Monoline insurers furthermore doubtful.
Further P&L effects as a result of Monolinedefaults or restructuring possible in 2009.
€8.7bn
(in € m) Nominal values Market values H1-Charges P&L effectEffect on revaluation
reserveMark-down-Ratio*
Monoline
CMBS/CRE CDO 198 78 -48 -48 0 61%
Large Corp. CDO 1,068 812 -2 -2 0 24%
RMBS/CDO 8,929 7,194 -227 -227 0 19%
thereof US RMBS 290 226 -25 -25 0 22%
thereof US CDO of ABS 3,305 1,719 -192 -192 0 48%
thereof Non-US RMBS** 5,334 5,249 -10 -10 0 2%
Others 643 569 -15 -15 0 12%
Total 10,838 8,653 -292 -292 0 20%
* Mark-down-Ratio = 1-(market value / nominal value);
** Consists exclusively of Triple A rated Super Senior positions of European RMBS transactions; Markdown-Ratio excluding “Non-US RMBS” of 38%
42Eric Strutz CFO Frankfurt August 6th, 2009
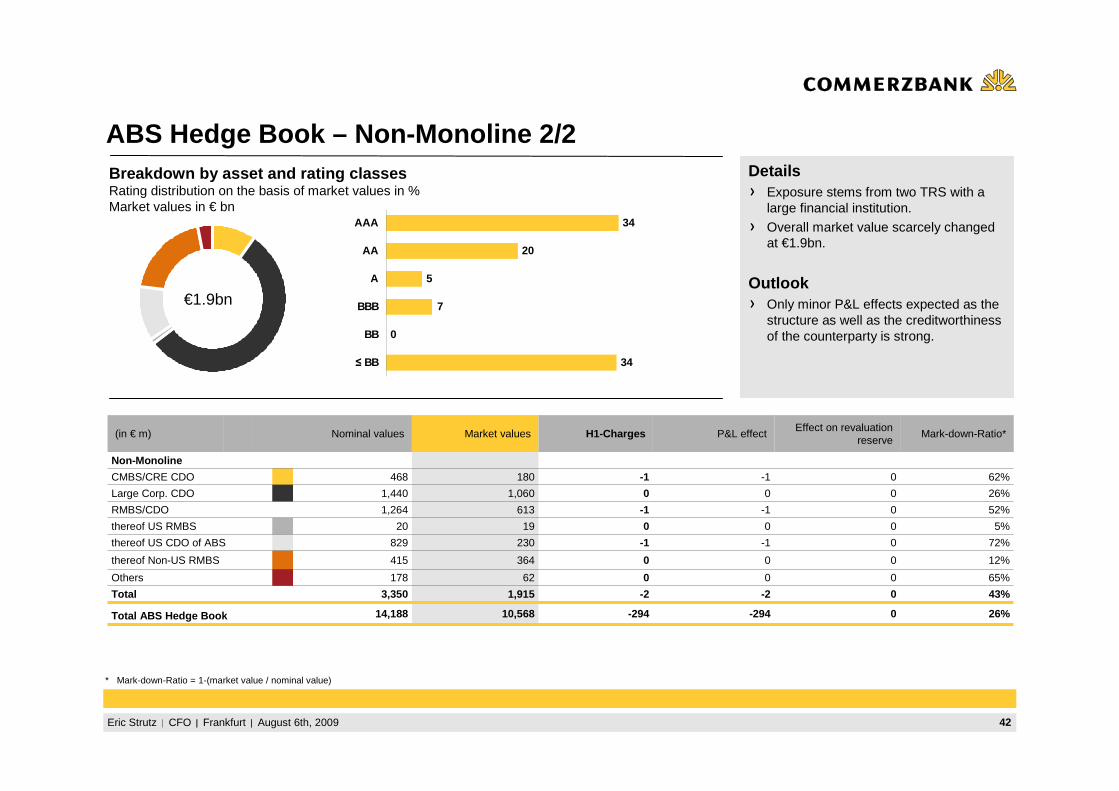
ABS Hedge Book – Non-Monoline 2/2Breakdown by asset and rating classes Rating distribution on the basis of market values in %Market values in € bn
DetailsExposure stems from two TRS with a large financial institution.
Overall market value scarcely changed at €1.9bn.
OutlookOnly minor P&L effects expected as the structure as well as the creditworthiness of the counterparty is strong.
€1.9bn
34
0
5
20
34
7
≤ BB
BB
BBB
A
AA
AAA
(in € m) Nominal values Market values H1-Charges P&L effectEffect on revaluation
reserveMark-down-Ratio*
Non-Monoline
CMBS/CRE CDO 468 180 -1 -1 0 62%
Large Corp. CDO 1,440 1,060 0 0 0 26%
RMBS/CDO 1,264 613 -1 -1 0 52%
thereof US RMBS 20 19 0 0 0 5%
thereof US CDO of ABS 829 230 -1 -1 0 72%
thereof Non-US RMBS 415 364 0 0 0 12%
Others 178 62 0 0 0 65%
Total 3,350 1,915 -2 -2 0 43%
Total ABS Hedge Book 14,188 10,568 -294 -294 0 26%
* Mark-down-Ratio = 1-(market value / nominal value)
43Eric Strutz CFO Frankfurt August 6th, 2009
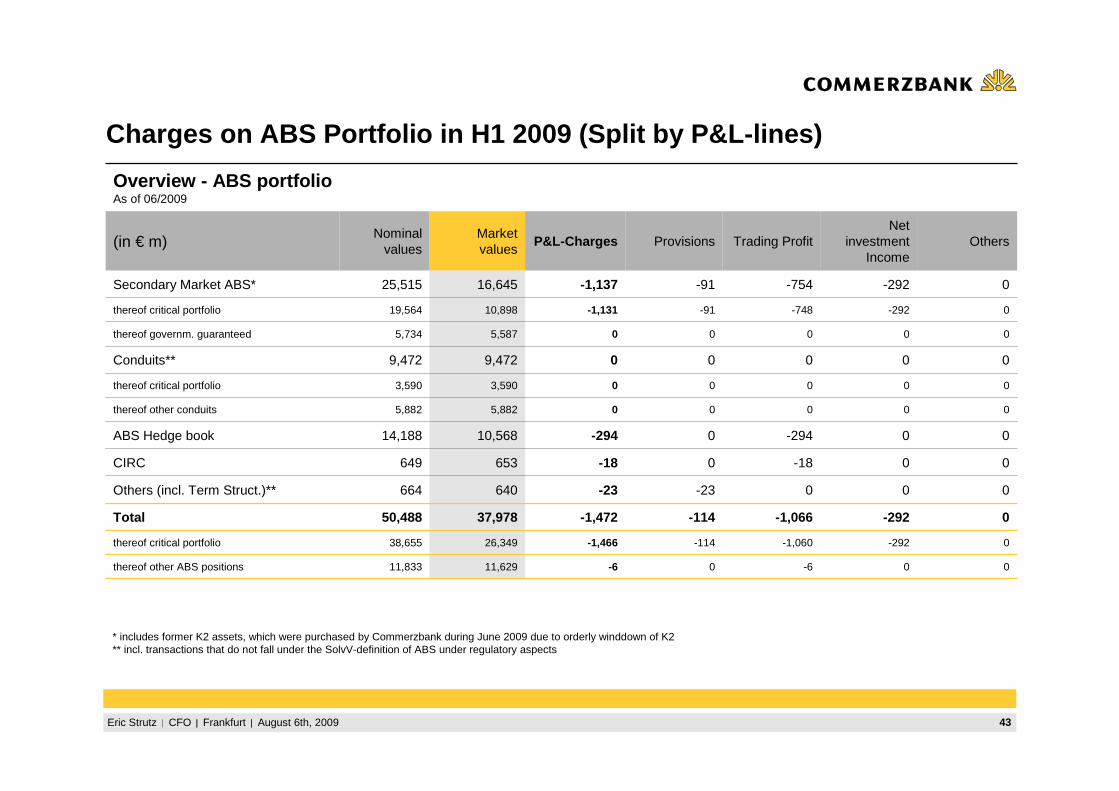
Charges on ABS Portfolio in H1 2009 (Split by P&L-lin es)
* includes former K2 assets, which were purchased by Commerzbank during June 2009 due to orderly winddown of K2** incl. transactions that do not fall under the SolvV-definition of ABS under regulatory aspects
0-292-1,060-114-1,46626,34938,655thereof critical portfolio
000003,5903,590thereof critical portfolio
0-292-1,066-114-1,47237,97850,488Total
00-60-611,62911,833thereof other ABS positions
000005,8825,882thereof other conduits
0-292-748-91-1,13110,89819,564thereof critical portfolio
000005,5875,734thereof governm. guaranteed
00-180-18653649CIRC
0
0
0
-292
Net investment
Income
00-23-23640664Others (incl. Term Struct.)**
-294
0
-754
Trading Profit
0
0
-91
Provisions
Overview - ABS portfolioAs of 06/2009
0-1,13716,64525,515Secondary Market ABS*
009,4729,472Conduits**
-294
P&L-Charges
10,568
Market values
014,188ABS Hedge book
OthersNominal
values(in € m)
44Eric Strutz CFO Frankfurt August 6th, 2009
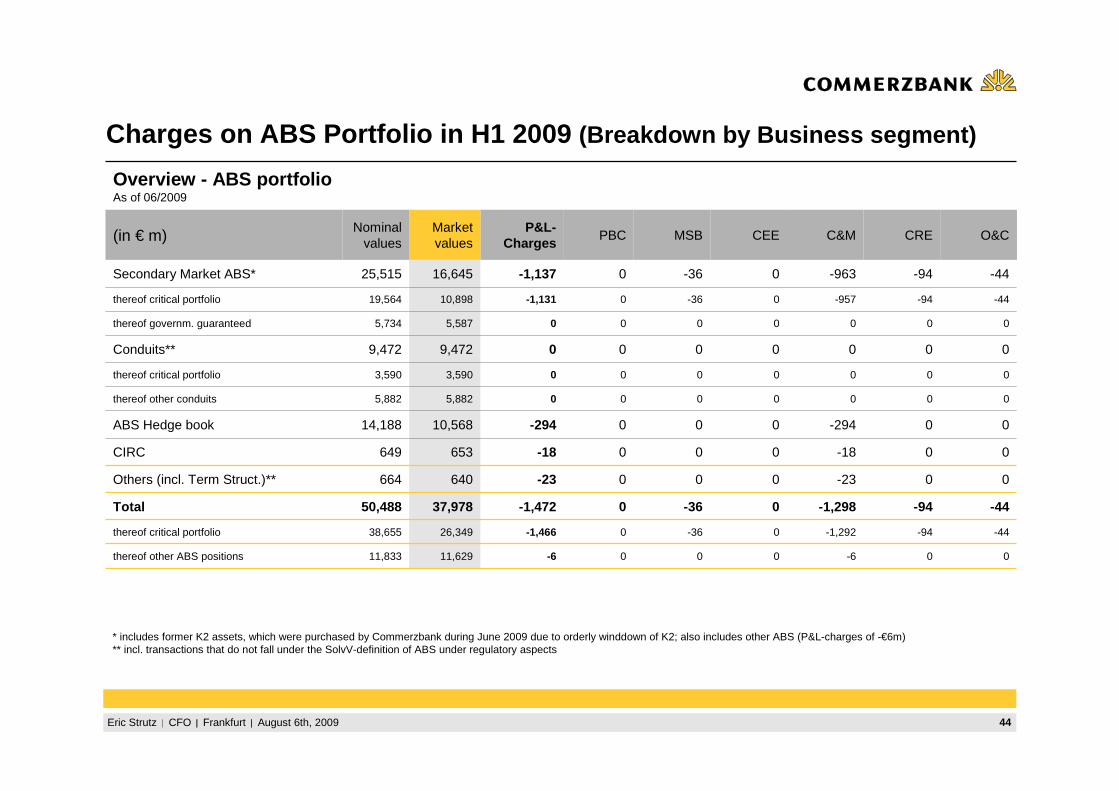
Charges on ABS Portfolio in H1 2009 (Breakdown by Business segment)
-44-94-1,2980-360-1,47237,97850,488Total
-44-94-1,2920-360-1,46626,34938,655thereof critical portfolio
00-23000-23640664Others (incl. Term Struct.)**
00-6000-611,62911,833thereof other ABS positions
00000003,5903,590thereof critical portfolio
-44-94-9570-360-1,13110,89819,564thereof critical portfolio
00000005,5875,734thereof governm. guaranteed
0
0
0
0
-94
CRE
-18
-294
0
0
-963
C&M
0000-29410,56814,188ABS Hedge book
0
0
0
0
CEE
000-18653649CIRC
0
0
-36
MSB
0
0
0
PBC
Overview - ABS portfolioAs of 06/2009
-44-1,13716,64525,515Secondary Market ABS*
009,4729,472Conduits**
0
P&L-Charges
5,882
Market values
05,882thereof other conduits
O&CNominal
values(in € m)
* includes former K2 assets, which were purchased by Commerzbank during June 2009 due to orderly winddown of K2; also includes other ABS (P&L-charges of -€6m) ** incl. transactions that do not fall under the SolvV-definition of ABS under regulatory aspects
45Eric Strutz CFO Frankfurt August 6th, 2009
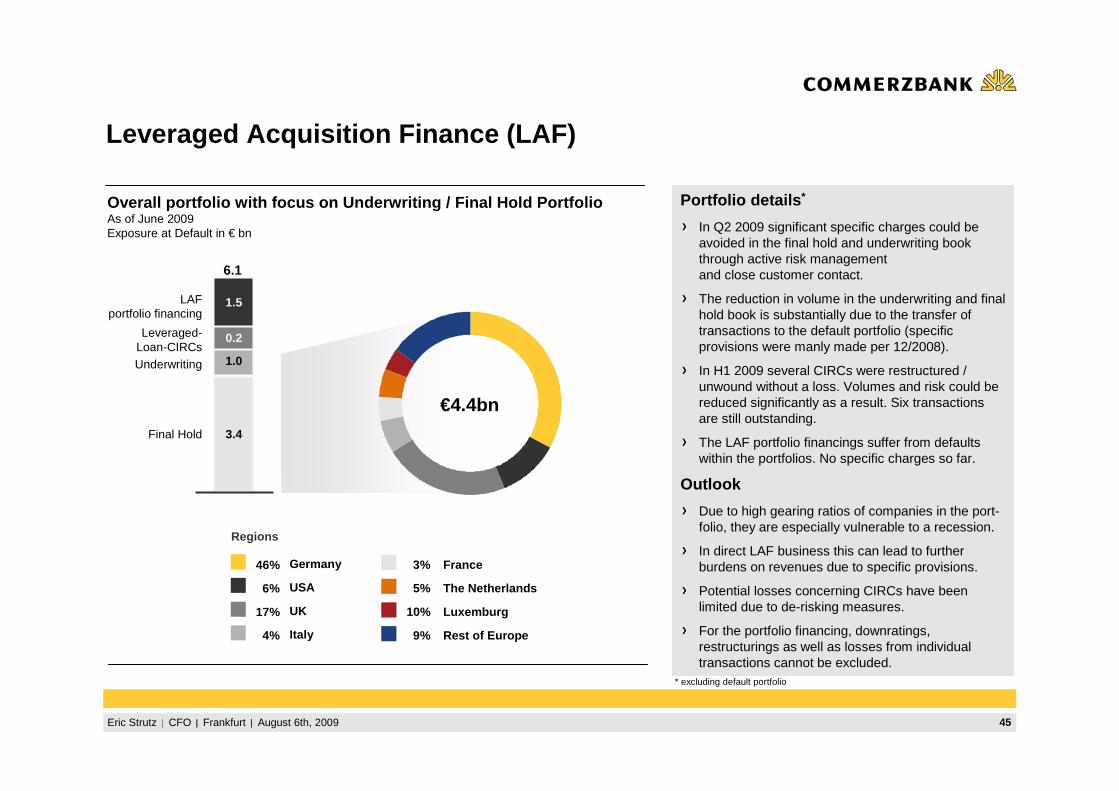
€4.4bn
LAFportfolio financing
Leveraged-Loan-CIRCsUnderwriting
Final Hold
6.1
3.4
1.0
0.2
1.5
Italy4%
France3%
The Netherlands5%
UK17% Luxemburg10%
Rest of Europe9%
Germany 46%
USA6%
Regions
Overall portfolio with focus on Underwriting / Fina l Hold PortfolioAs of June 2009Exposure at Default in € bn
Portfolio details *
In Q2 2009 significant specific charges could beavoided in the final hold and underwriting bookthrough active risk managementand close customer contact.
The reduction in volume in the underwriting and final hold book is substantially due to the transfer of transactions to the default portfolio (specificprovisions were manly made per 12/2008).
In H1 2009 several CIRCs were restructured / unwound without a loss. Volumes and risk could bereduced significantly as a result. Six transactionsare still outstanding.
The LAF portfolio financings suffer from defaultswithin the portfolios. No specific charges so far.
Outlook
Due to high gearing ratios of companies in the port-folio, they are especially vulnerable to a recession.
In direct LAF business this can lead to furtherburdens on revenues due to specific provisions.
Potential losses concerning CIRCs have beenlimited due to de-risking measures.
For the portfolio financing, downratings, restructurings as well as losses from individualtransactions cannot be excluded.
Leveraged Acquisition Finance (LAF)
* excluding default portfolio
46Eric Strutz CFO Frankfurt August 6th, 2009
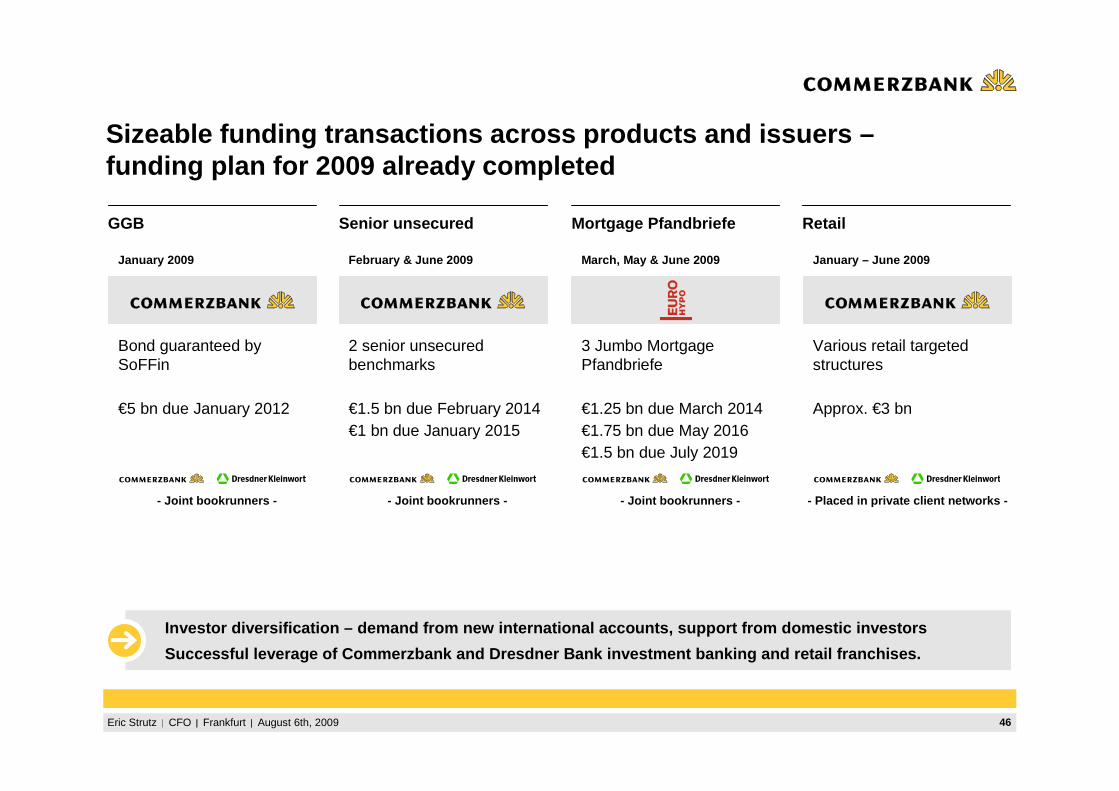
Sizeable funding transactions across products and iss uers –funding plan for 2009 already completed
Investor diversification – demand from new internati onal accounts, support from domestic investors
Successful leverage of Commerzbank and Dresdner Ban k investment banking and retail franchises.
GGB Senior unsecured Mortgage Pfandbriefe Retail
January 2009
Bond guaranteed by SoFFin
€5 bn due January 2012
- Joint bookrunners -
February & June 2009
2 senior unsecured benchmarks
€1.5 bn due February 2014€1 bn due January 2015
- Joint bookrunners -
January – June 2009
Various retail targeted structures
Approx. €3 bn
- Placed in private client networks -
March, May & June 2009
3 Jumbo Mortgage Pfandbriefe
€1.25 bn due March 2014€1.75 bn due May 2016€1.5 bn due July 2019
- Joint bookrunners -
47Eric Strutz CFO Frankfurt August 6th, 2009
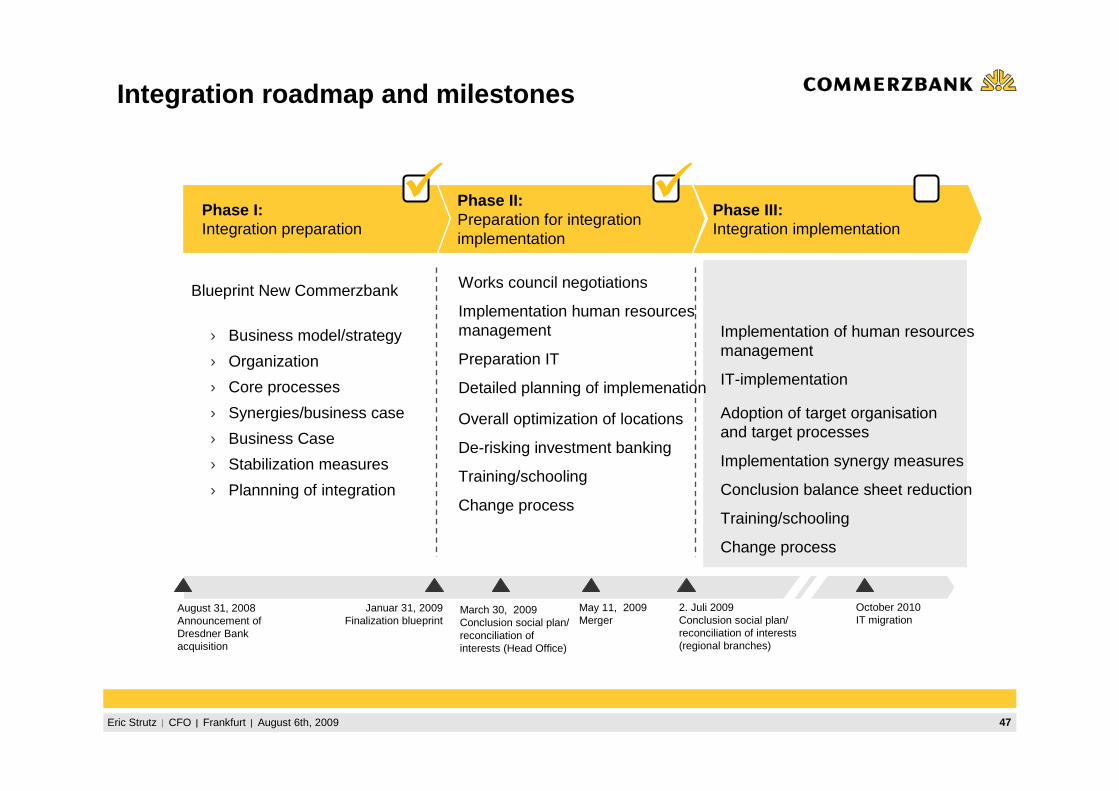
Integration roadmap and milestones
Phase I:Integration preparation
Phase II:Preparation for integrationimplementation
Phase III:Integration implementation
Blueprint New Commerzbank
› Business model/strategy
› Organization
› Core processes
› Synergies/business case
› Business Case
› Stabilization measures
› Plannning of integration
Works council negotiations
Implementation human resourcesmanagement
Preparation IT
Detailed planning of implemenation
Overall optimization of locations
De-risking investment banking
Training/schooling
Change process
Implementation of human resourcesmanagement
IT-implementation
Adoption of target organisationand target processes
Implementation synergy measures
Conclusion balance sheet reduction
Training/schooling
Change process
Januar 31, 2009 Finalization blueprint
2. Juli 2009 Conclusion social plan/ reconciliation of interests(regional branches)
����
May 11, 2009Merger
August 31, 2008Announcement of Dresdner Bank acquisition
October 2010 IT migration
����
March 30, 2009 Conclusion social plan/ reconciliation of interests (Head Office)
48Eric Strutz CFO Frankfurt August 6th, 2009
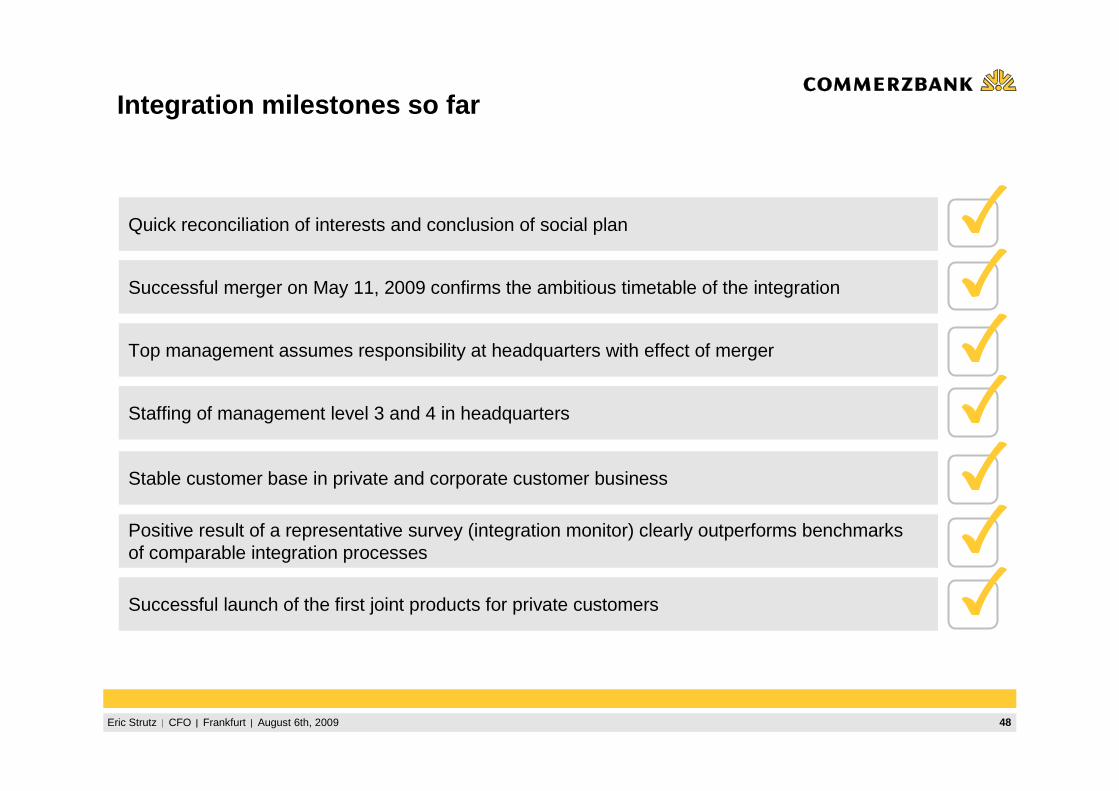
Integration milestones so far
Top management assumes responsibility at headquarters with effect of merger
Quick reconciliation of interests and conclusion of social plan
Successful merger on May 11, 2009 confirms the ambitious timetable of the integration
Positive result of a representative survey (integration monitor) clearly outperforms benchmarksof comparable integration processes
Successful launch of the first joint products for private customers
Stable customer base in private and corporate customer business
Staffing of management level 3 and 4 in headquarters
Eric Strutz CFO Frankfurt August 6th, 2009
Jürgen Ackermann (Head of IR)P: +49 69 136 22338M: [email protected]
Sandra Büschken (Deputy Head of IR)P: +49 69 136 23617M: [email protected]
Michael H. KleinP: +49 69 136 24522M: [email protected]
Wennemar von BodelschwinghP: +49 69 136 43611M: [email protected]
Ute Heiserer-JäckelP: +49 69 136 41874M: [email protected]
Simone NuxollP: +49 69 136 45660M: [email protected]
For more information, please contact Commerzbank´s I R team:Stefan PhilippiP: +49 69 136 45231M: [email protected]
Karsten SwobodaP: +49 69 136 22339M: [email protected]
www.ir.commerzbank.com
50Eric Strutz CFO Frankfurt August 6th, 2009
Disclaimer
investor relations
This presentation has been prepared and issued by Commerzbank AG. This publication is intended for professional and institutional customers.
Any information in this presentation is based on data obtained from sources considered to be reliable, but no representations or guarantees are made by Commerzbank Group with regard to the accuracy of the data. The opinions and estimates contained herein constitute our best judgement at this date and time, and are subject to change without notice. This presentation is for information purposes, it is not intended to be and should not be construed as an offer or solicitation to acquire, or dispose of any of the securities or issues mentioned in this presentation.
Commerzbank AG and/or its subsidiaries and/or affiliates (herein described as Commerzbank Group) may use the information in this presentation prior to its publication to its customers. Commerzbank Group or its employees may also own or build positions or trade in any such securities, issues, and derivatives thereon and may also sell them whenever considered appropriate. Commerzbank Group may also provide banking or other advisory services to interested parties.
Commerzbank Group accepts no responsibility or liability whatsoever for any expense, loss or damages arising out of, or in any way connected with, the use of all or any part of this presentation.
Copies of this document are available upon request or can be downloaded from www.commerzbank.com/aktionaere/index.htm