Embed Size (px)
Citation preview
Aus dem Med. Zentrum für Nervenheilkunde der Philipps-Universität Marburg
Geschäftsführender Direktor: Prof. Dr. Jürgen-Christian Krieg Klinik für Neurologie
Direktor: Prof. Dr. Wolfgang H. Oertel
Evaluierung neurographischer Parameter bei diabetischer Neuropathie
Inaugural-Dissertation zur Erlangung des Doktorgrades der gesamten Medizin dem Fachbereich Humanmedizin der
Philipps-Universität Marburg vorgelegt
von Markus Hahn
aus Hünfeld
Marburg 2004
Page 2
Angenommen vom Fachbereich Humanmedizin der Philipps-Universität
Marburg am 30.09.2004 gedruckt mit Genehmigung des Fachbereichs
Dekan: Prof. Dr. med. Bernhard Maisch
Referent: Prof. Dr. med. Hans-Joachim Braune
Coreferent: Prof. Dr. med. R. Göke
Page 3
1. INTRODUCTION 7
2. PATHOGENESIS OF DIABETIC NEUROPATHY 8
3. CLASSIFICATION OF DIABETIC NEUROPATHIES 9
3.1 Clinical presentation 10
3.1.1 Focal neuropathies 10
3.1.2 Diffuse neuropathies 11
3.1.3 Autonomic neuropathies 12
4. DIAGNOSIS OF DIABETIC NEUROPATHIES 12
5. THERAPY OF DIABETIC NEUROPATHY 15
6. AIM OF THE STUDY 16
7. STATISTICAL ISSUES 18
8. PATIENTS AND METHODS 19
8.1 Patients 19
8.2 Neurophysiological examinations 24
Page 4
9. RESULTS 34
9.1 N. medianus 34
9.1.1 Distal and proximal intervals, amplitudes and areas 34
9.1.2 Nerve conduction velocities 36
9.1.3 Interval, amplitude and area quotients 37
9.1.4 Summary 39
9.2 N. tibialis 39
9.2.1 Distal and proximal intervals, amplitudes and areas 39
9.2.2 Nerve conduction velocities 42
9.2.3 Interval, amplitude and area quotients 43
9.2.4 Summary 44
9.3 N. peronaeus 45
9.3.1 Distal and proximal intervals, amplitudes and areas 45
9.3.2 Nerve conduction velocities 47
9.3.3 Interval, amplitude and area quotients 48
9.3.4 Summary 49
10. DISCUSSION 49
11. CONCLUSION 55
Page 5
12. SUMMARY 57
13. ATTACHMENT 58
13.1 Listing of tables/boxplots 58
13.1.1 N. medianus 58
13.1.1.1 Distal parameter 58
13.1.1.2 Proximal parameter 63
13.1.1.3 Nerve conduction velocities 68
13.1.1.4 Quotient parameter 71
13.1.2 N. tibialis 76
13.1.2.1 Distal parameter 76
13.1.2.2 Proximal parameter 81
13.1.2.3 Nerve conduction velocities 86
13.1.2.4 Quotient parameter 89
13.1.3 N. peronaeus 94
13.1.3.1 Distal parameter 94
13.1.3.2 Proximal parameter 99
13.1.3.3 Nerve conduction velocities 104
13.1.3.4 Quotient parameter 107
13.2 Ethical issues 113
13.3 Abbreviations 114

Page 6
13.4 Literature 116
14. DANKSAGUNG 120
15. VERZEICHNIS DER AKADEMISCHEN LEHRER 121
16. POSTANSCHRIFT 122
Page 7
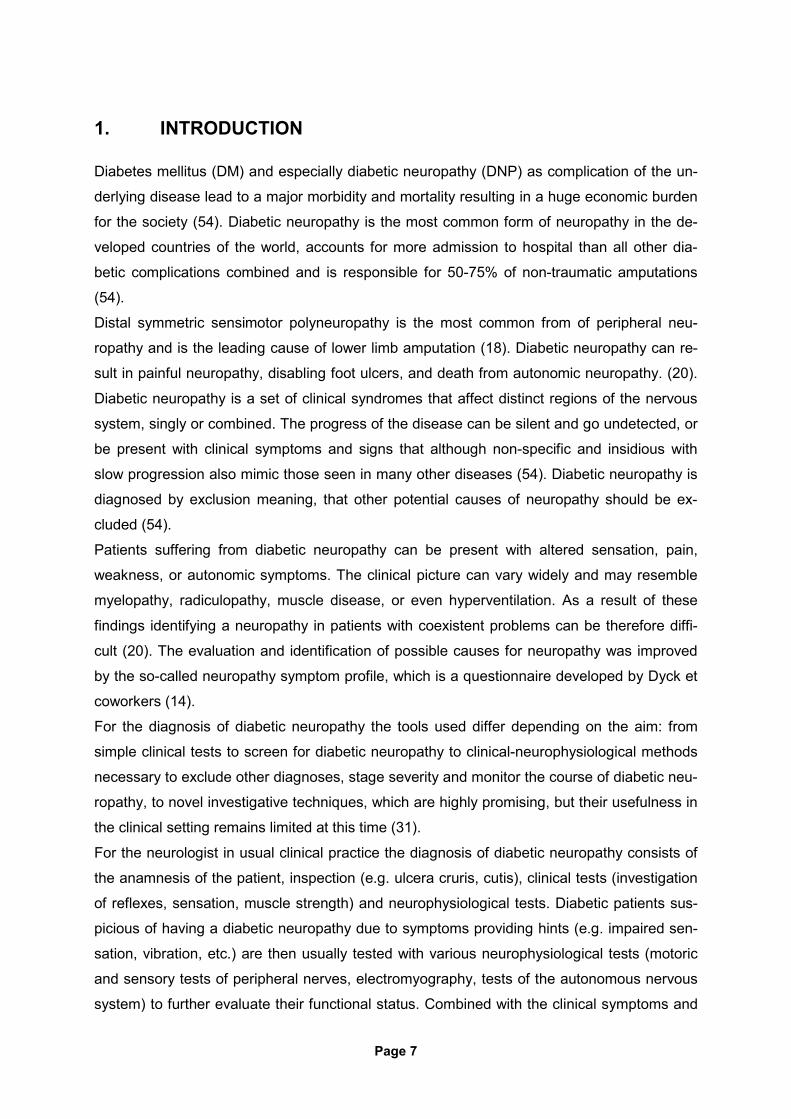
1. INTRODUCTION
Diabetes mellitus (DM) and especially diabetic neuropathy (DNP) as complication of the un-
derlying disease lead to a major morbidity and mortality resulting in a huge economic burden
for the society (54). Diabetic neuropathy is the most common form of neuropathy in the de-
veloped countries of the world, accounts for more admission to hospital than all other dia-
betic complications combined and is responsible for 50-75% of non-traumatic amputations
(54).
Distal symmetric sensimotor polyneuropathy is the most common from of peripheral neu-
ropathy and is the leading cause of lower limb amputation (18). Diabetic neuropathy can re-
sult in painful neuropathy, disabling foot ulcers, and death from autonomic neuropathy. (20).
Diabetic neuropathy is a set of clinical syndromes that affect distinct regions of the nervous
system, singly or combined. The progress of the disease can be silent and go undetected, or
be present with clinical symptoms and signs that although non-specific and insidious with
slow progression also mimic those seen in many other diseases (54). Diabetic neuropathy is
diagnosed by exclusion meaning, that other potential causes of neuropathy should be ex-
cluded (54).
Patients suffering from diabetic neuropathy can be present with altered sensation, pain,
weakness, or autonomic symptoms. The clinical picture can vary widely and may resemble
myelopathy, radiculopathy, muscle disease, or even hyperventilation. As a result of these
findings identifying a neuropathy in patients with coexistent problems can be therefore diffi-
cult (20). The evaluation and identification of possible causes for neuropathy was improved
by the so-called neuropathy symptom profile, which is a questionnaire developed by Dyck et
coworkers (14).
For the diagnosis of diabetic neuropathy the tools used differ depending on the aim: from
simple clinical tests to screen for diabetic neuropathy to clinical-neurophysiological methods
necessary to exclude other diagnoses, stage severity and monitor the course of diabetic neu-
ropathy, to novel investigative techniques, which are highly promising, but their usefulness in
the clinical setting remains limited at this time (31).
For the neurologist in usual clinical practice the diagnosis of diabetic neuropathy consists of
the anamnesis of the patient, inspection (e.g. ulcera cruris, cutis), clinical tests (investigation
of reflexes, sensation, muscle strength) and neurophysiological tests. Diabetic patients sus-
picious of having a diabetic neuropathy due to symptoms providing hints (e.g. impaired sen-
sation, vibration, etc.) are then usually tested with various neurophysiological tests (motoric
and sensory tests of peripheral nerves, electromyography, tests of the autonomous nervous system) to further evaluate their functional status. Combined with the clinical symptoms and
Page 8
the anamnesis of the patient and by excluding other common causes of neuropathy (e.g. al-
cohol misuse, drugs, paraneoplasia, etc.) (20) the patient will be analyzed and diagnosed.
Due to the fact, that the measurement of motoric nerve function of peripheral nerves is one of
the most valid methods (51) that can be applied in the electrophysiological evaluation of pe-
ripheral nerves, this study was designed to measure the motoric function of three peripheral
nerves (N. medianus, N. tibialis, N. peronaeus). Combined with the anamnesis of the patient
and the results of the neurological examination this neurophysiological test shall help to iden-
tify those patients with diabetes mellitus, who are at an early stage of diabetic neuropathy.
Those patients should be engaged to have an optimal control of their glucose metabolism
with low glycosylated hemoglobin levels, which was proved to keep their disease status or
slow down the progression of their diabetic neuropathy (35, 45, 49).
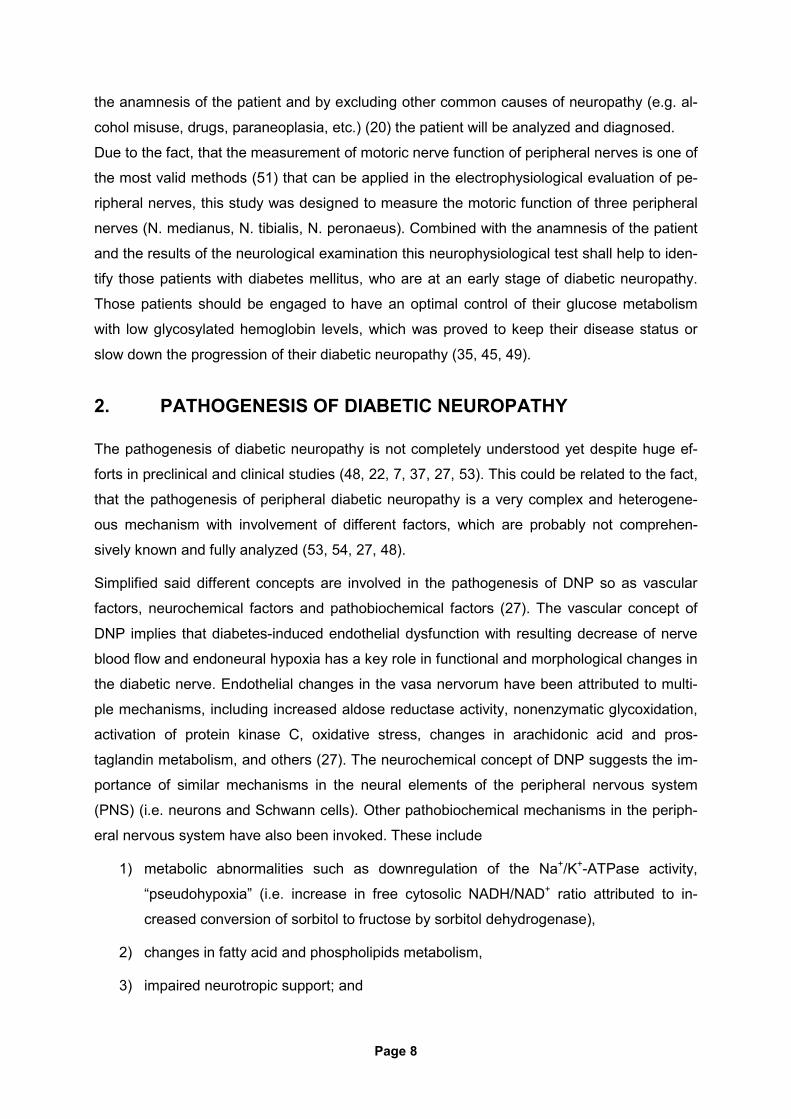
2. PATHOGENESIS OF DIABETIC NEUROPATHY
The pathogenesis of diabetic neuropathy is not completely understood yet despite huge ef-
forts in preclinical and clinical studies (48, 22, 7, 37, 27, 53). This could be related to the fact,
that the pathogenesis of peripheral diabetic neuropathy is a very complex and heterogene-
ous mechanism with involvement of different factors, which are probably not comprehen-
sively known and fully analyzed (53, 54, 27, 48).
Simplified said different concepts are involved in the pathogenesis of DNP so as vascular
factors, neurochemical factors and pathobiochemical factors (27). The vascular concept of
DNP implies that diabetes-induced endothelial dysfunction with resulting decrease of nerve
blood flow and endoneural hypoxia has a key role in functional and morphological changes in
the diabetic nerve. Endothelial changes in the vasa nervorum have been attributed to multi-
ple mechanisms, including increased aldose reductase activity, nonenzymatic glycoxidation,
activation of protein kinase C, oxidative stress, changes in arachidonic acid and pros-
taglandin metabolism, and others (27). The neurochemical concept of DNP suggests the im-
portance of similar mechanisms in the neural elements of the peripheral nervous system
(PNS) (i.e. neurons and Schwann cells). Other pathobiochemical mechanisms in the periph-
eral nervous system have also been invoked. These include
1) metabolic abnormalities such as downregulation of the Na+/K+-ATPase activity,
“pseudohypoxia” (i.e. increase in free cytosolic NADH/NAD+ ratio attributed to in-
creased conversion of sorbitol to fructose by sorbitol dehydrogenase),
2) changes in fatty acid and phospholipids metabolism,
3) impaired neurotropic support; and
Page 9
4) dorsal root ganglion and Schwann cell mitochondrial dysfunction and premature
apoptosis.
The vascular concept of DNP was also supported by results of pathological tests carried out
in autopsy cases in diabetic patients, which revealed focal fascicular lesions likely due to
diabetic microangiopathy (22).
The structural changes within the peripheral nervous system in patients suffering from DNP
can be classified as
1) nodal structural changes leading to axo-glial dysfunction and paranodal demyelina-
tion and
2) axonal structural changes leading to axonal atrophy and fiber loss (37).
The functional changes related to the former mentioned structural changes are for
1) a reduction of the nerve conduction velocity (NCV) and for
2) a reduction of the amplitude of the compound muscle action potential.
The predominant pathological factor in this context seems to be rather the axonal atrophy as
main structural abnormality of DNP, as demonstrated in various studies involving both hu-
mans and experimental animals (37).
3. CLASSIFICATION OF DIABETIC NEUROPATHIES
The natural course of DNP separates them into two very distinctive entities, namely those
which progresses gradually with increasing duration of diabetes and those which remit usu-
ally completely. Sensory and autonomic neuropathies usually generally progress, whereas
mononeuropathies, radiculopathies and acute painful neuropathies, although symptoms are
severe, tend to be short-lived and often recover (54). Acute painful diabetic sensory neuropa-
thies is therefore a separate entity with a favorable prognosis (47) and will be not further ad-
dressed in this study.
The progression of DNP is related to the glycemic control in both type I and type II diabetes
(54). It seems that the most rapid deterioration of nerve function occurs soon after the onset
of type I diabetes and within 2-3 years there is a slowing of the progress with a shallower
slope to the curve of dysfunction. In contrast in type II diabetes slowing of nerve conduction
velocities can be one of the earliest neuropathic abnormalities and often is present even at
diagnosis (57). After diagnosis, slowing of nerve conduction velocity generally progresses at
a steady state of approximately 1 m/s per year and the level of impairment is positively corre-
lated with the duration of diabetes. Although most studies have documented that sympto-
Page 10
matic patients are more likely to have slower nerve conduction velocities than patients with-
out symptoms, these do not relate to the severity of symptoms.
In a long-term follow-up study of type II diabetes patients (29) the percentage of patients with
electrophysiological abnormalities in the lower limb increase from 8% at baseline to 42% af-
ter 10 years: a decrease in sensory and motor potential amplitudes, indicating axonal de-
struction was more pronounced than slowing of the nerve conduction velocities.
The form of neuropathy found in patients with impaired glucose tolerance (IGT) at early stage
of diabetes mellitus is predominantly a small-fiber neuropathy, compared to patients with
diabetes mellitus, who had a more involvement of large nerve fibers (42).
3.1 Clinical presentation
The spectrum of clinical neuropathic syndromes described in patients with diabetes includes
dysfunction of almost every segment of the somatic peripheral and autonomic nervous sys-
tem (54). Each syndrome can be distinguished by its pathophysiological, therapeutic and
prognostic features. Usually the clinical syndromes be can differentiated into the following
items:
• Focal neuropathies
• Diffuse neuropathies
o Proximal motor neuropathies (diabetic amyotrophy)
o Distal symmetric polyneuropathy
o Small-fiber neuropathy
o Large-fiber neuropathies
• Autonomic neuropathies
3.1.1 Focal neuropathies
Monoreuropathies are rare in comparison with distal symmetric neuropathies. They usually
occur primarily in older populations, their onset is often rapid, associated with pain and their
course is self-limiting, resolving within 6-8 weeks. One example of this clinical entity would be
the carpal tunnel syndrome, which occurs twice as frequently in people with diabetes com-
pared with normal healthy population and its increased prevalence in diabetes can be related
to repeated undetected trauma, metabolic changes, or accumulation of fluid or edema with
the confined space of the carpal tunnel (55).
Page 11
3.1.2 Diffuse neuropathies
Proximal motor neuropathies (diabetic amyotrophy) has been for many years considered as
a variant of diabetic neuropathy. It can be clinically identified based on recognition of these
common features (54):
1) primarily affects the elderly,
2) gradual or abrupt onset,
3) begins with pain in the tighs and hips or buttocks
4) followed by weakness of the proximal muscles of the lower limbs with the inability to
rise from the sitting position,
5) begins unilaterally and spreads bilaterally,
6) coexists with distal symmetric polyneuropathy and
7) spontaneous muscle fasciculation, or provoked by percussion.
The condition is now recognized as being secondary to a variety of causes unrelated to dia-
betes but which have a greater frequency in patients with diabetes than the general popula-
tion. It includes patients with chronic inflammatory demyelinating polyneuropathy (CIPD),
monoclonal gammopathy, circulating GM1-antibodies and antibodies to neuronal cells and
inflammatory vasculitis (40). It was formerly thought to resolve spontaneously in 1.5 to 2
years but now, if found to be immune-mediated, can resolve within days with immunotherapy
(54).
Distal symmetric polyneuropathy (DSP) is the most common and widely recognized form of
diabetic neuropathy. The onset is usually creeping but occasionally rapid, following stress or
initiation of therapy for diabetes. It can be either sensory or motor and involve small fibers,
large fibers or both (54). There is now evidence that distal symmetric polyneuropathy can be
accompanied by loss of cutaneous nerve fibers that stain positive for the neuronal antigen
PGP9.5 as well as impaired neurovascular blood flow (39). There are however a variety of
ways in which small fiber neuropathies can be present.
Small fiber neuropathy can be differentiated between acute and chronic painful form. For
acute painful neuropathy some patients develop a predominantly small-fiber neuropathy,
which is manifested by pain and paresthesia early in the course of diabetes. It can be asso-
ciated with the onset of insulin therapy and has been termed “insulin neuritis” (43). By defini-
tion it has been there for less than 6 months. Symptoms are often exacerbated at night and
are manifested in the feet more than the hands. Spontaneous episodes of pain can be se-
verely disabling. The pain varies in intensity and character. Chronic painful neuropathy per-
sist by definition longer than 6 months and becomes disabling. This condition can result in
Page 12
tolerance to narcotics and analgetics and finally to addiction. It is extremely resistant to all
forms of intervention, and more frustrating for both patient and physician.
Large-fiber neuropathies can involve sensory or motor nerves or both. These tend to be neu-
ropathies of signs rather than symptoms. Large fibers subserve motor function, vibration per-
ception, position sense and cold thermal function. Unlike the small fibers these are myeli-
nated, rapidly conducting fibers that begin in the toes and have their first synapse in the me-
dulla oblongata. They tend to be affected first because of their length and tendency in diabe-
tes for nerves to “die back”. Because they are myelinated, they are the fibers represented in
the electroneurograph and subclinical abnormalities in nerve function are readily detected.
The symptoms can be minimal; sensation of walking on cotton, floors feeling “strange”, in-
ability to turn the pages of a book or inability to discriminate among coins.
Most patients with DSP have, however, a “mixed” variety of neuropathy with both large and
small fiber damage. In the case of distal symmetric polyneuropathy, a “glove and stocking”
distribution of sensory loss is almost universal (55). Early in the course of the neuropathic
process, multifocal sensory loss also might be found. In some patients, severe distal muscle
weakness can accompany the sensory loss resulting in an inability to stand on the toes or
heels. Some grading systems use this as a definition of severity.
3.1.3 Autonomic neuropathies
Diabetic autonomic neuropathy can involve any system in the body. Involvement of the
autonomous system can occur as early as the first year after diagnosis and major manifesta-
tions are cardiovascular, gastrointestinal, and genitourinary system dysfunction (55). Re-
duced exercise tolerance, edema, paradoxic supine or nocturnal hypertension and intoler-
ance to heat due to defective thermoregulation are a consequence of autonomic neuropathy.
Silent myocardial infarction, respiratory failure, amputations and sudden deaths are hazards
for the diabetic patients with cardiac autonomic neuropathy (50). Therefore, it is vitally impor-
tant to make this diagnosis early so that appropriate intervention can be instituted.
4. DIAGNOSIS OF DIABETIC NEUROPATHIES
The diagnosis of diabetic neuropathy in clinical practice requires the neurological history and
physical examination in combination with neurophysiological testing as a criterion standard
for diagnosis and measurement of severity (31).
The assessment of neuropathy can be carried out using different tools: one example would
be the Michigan Neuropathy Screening Instrument, which is an eight-point assessment that
relies on clinical examination of the feet, the presence or absence of foot ulcerations, the as-
sessment of vibratory sensation in the great toes, and grading of ankle reflexes (38).
Page 13
A more sophisticated and detailed tool would be the neurological symptom score and neu-
ropathy impairment score by Dyck et al (13), which was also used in the Diabetes Control
and Complication Trial (DCCT) (44). These classifications are however time-consuming and
therefore inconvenient in daily practice (41).
The 1988 San Antonio conference on diabetic neuropathy and the 1992 conference of the
American Academy of Neurology (2, 3) recommended that at least one variable from each of
the following five categories are measured to classify diabetic neuropathy: symptom profiles,
neurologic examination, quantitative sensory test (QST), nerve conduction study and quanti-
tative autonomic function testing (QAFT) (54). The least reliable measure is the neurologic
symptom score. The quantitative sensory test and quantitative autonomic function test are
objective indices of neurologic functional status. Combined, these tests cover vibratory, pro-
prioceptive, tactile, pain, thermal and autonomic function (54). Nevertheless these tests are
also quite time-consuming and therefore for daily practice maybe not useful.
The validity respectively reproducibility of different diagnostic measures in diabetic patients
was evaluated by Dyck et coworkers (15), the results showed that the neurologic disability
score (NDS), vibratory and cooling thresholds, compound muscle action potential, sensory
nerve action potentials, and motor nerve conduction velocities achieved the most reliable re-
sults.
Perkins (31) stated in his review, that screening for diabetic neuropathy is justified as it offers
the patient with diabetes a crucial opportunity to actively alter the course of suboptimal gly-
cemic control prior to significant morbidity associated with the natural history of neuropathy.
For screening purposes three fundamental issues need to be addressed (31):
1) Specificity,
2) confirmatory diagnosis and
3) appropriateness of screening.
The first issue specificity need be addressed, since distal symmetrical sensimotor deficits
may arise from such conditions as uremic, toxic, alcoholic, familial, paraneoplastic, and/or
nutritional neuropathy (17). The second issue is still in discussion, the criterion standard to
diagnose diabetic neuropathy (DNP) is not finalized yet. The most objective test in the
evaluation of DNP are the physical examination, quantitative sensory testing and nerve con-
duction studies (NCS). It is generally agreed, that at least two objective tests are required for
a diagnosis for research purposes (6). Nerve conduction studies are the least subjective of
these tests since they are independent of patient psychophysical interpretation and they pro-
vide reliable, quantitative measures of nerve function. The lack of sensitivity for isolated small
fiber neuropathy is however a criticism of the use of nerve conduction studies alone, al-
though the clinical importance of this form of neuropathy is likely insignificant in the context of
DNP, in which the progressive loss of all nerve fibers is observed.(16). The third issue ad-
Page 14
dresses the common prerequisites to justify the necessity for the screening for certain sub-
jects so as the relevance of the disease, the consequences of the natural course of the dis-
ease, the possibility to positively influence the course of the disease and the availability of a
simple and accurate test suitable for diabetes or primary care.
Another proposal for the screening of large numbers of diabetic patients from Simmons et al
(38) proposes the use of inexpensive, rapid methods e.g. the use of monofilaments to meas-
ure touch sensitivity and the use of tactile circumference discrimination.
Meijer et coworkers (25) tested the possibility to differentiate between three patient groups
(group 1: diabetic patients with diabetic foot ulcers; group 2: 24 diabetic patients without
clinical neuropathy; and group 3: 21 control subjects without diabetes) with the diabetic neu-
ropathy score (DNS), the diabetic neuropathy examination score (DNE), and their relation-
ship with cardiovascular autonomic function testing (CAFT) and electrodiagnostic studies
(EDS). Both scores were able to discriminate between group 1 and group 2 significantly
(p<0.001). The diabetic neuropathy examination score discriminated also between group 2
and group 3 (p<0.05). Spearman’s correlation coefficients between both scores and cardio-
vascular autonomic function testing and electrodiagnostic studies were high.
Perkins et coworkers (32) investigated the diagnostic value of four different simple sensory
tests (the 10-g Semmes-Weinstein monofilament examination [SWME], superficial pain sen-
sation, vibration testing by the on-off method, and vibration testing by the timed method) as
screening tests for peripheral neuropathy in the diabetes clinic. Therefore these tests were
carried out in 478 subjects with independent blinded evaluations compared against the crite-
rion standard of nerve conduction studies. The results gained were convincing for superficial
pain sensation testing, Semmes-Weinstein monofilament examination, or vibration testing by
the on-off method.
The value of nerve fiber conduction velocity distributions as additional diagnostic criteria for
diabetic neuropathy was evaluated by Cummins et coworkers (10). He found a shift of to-
wards slower conduction velocities in diabetic patients with minimal or no clinical neuropathy,
but these findings were obtained in the elbow-to-axilla segment of the N. medianus.
The conduction slowing observed in diabetic patients was also evaluated by Herrmann et
coworker (19) in comparison to patients suffering from amyotrophic lateral sclerosis (ALS),
where a form of neuropathy with a loss of large axons is observed. The findings suggested
that the nerve conduction velocity slowing was due to an amplitude-dependent mechanism in
both diabetic patients and ALS patients in the upper and lower extremities, consistent with a
loss of large myelinated fibers. In addition in diabetic patients also a significant amplitude-
independent slowing in intermedia but not in distal nerve segments was found, supporting
that an additional demyelinative component could be observed.
The influence of aging to changes of the compound muscle action potential (CMAP) in pa-
Page 15
tients without clinical neuropathy was investigated by Kurokawa (24). He found, that the am-
plitude of the compound muscle action potential was lower in older patients, however the
compound muscle action potential ratio (proximal CMAP/distal CMAP) did not change with
age. The compound muscle action potential duration or interval and the corresponding ratio
was not different in groups of patients with different age, but the compound muscle action po-
tential area was smaller in older patients, the area ratio nevertheless remained almost con-
stant.
To summarize: Nerve conduction studies remain the most reliable, accurate, and sensitive
measure of peripheral nerve function (1). These have long been a gold standard for the di-
agnosis of all neuropathies (11) and are, most simply considered, an extension of the clinical
neurological examination. The nerve conduction study findings correlate with the clinical
endpoints (32), and the nerve potential amplitudes reflect the degree of nerve fiber loss (34).
Standardized methods improve the reliability of testing such that nerve conduction studies
have the lowest degree of variance of all tests in diabetic neuropathy (51). The prevalence of
abnormal nerve conduction velocities increases with duration of diabetes (1), and disease
severity correlates with glycemic control (21). Only small changes in parameters are ob-
served In intervals as long as 5 years, particularly in the setting of acceptable glycemic con-
trol (45). The small changes in conduction velocity are readily demonstrable, but amplitude
changes are more difficult to show due to higher variability of this measures (9). Two poten-
tial disadvantages must be considered for the use of nerve conduction studies: the limit of
availability of nerve conduction testing for routine diagnostic evaluation and the insensitivity
for the identification of small fiber neuropathy (16).
All these findings are interesting for further diagnostic measures for early detection of dia-
betic neuropathy in patients suspicious of having diabetic neuropathy and need to be re-
evaluated in this patient population in a comparison to a “normal” population without diabetes
and clinical signs for any form of neuropathy.
5. THERAPY OF DIABETIC NEUROPATHY
This section describes the treatment of diabetic neuropathy without considering the treatment
of symptomatic diabetic neuropathy.
Despite huge efforts for clinical research in treatment of DNP the value of intensive glycemic
control remains as the most important issue in this context (30).
The Diabetes Control and Complications Trial showed that maintenance of an intensive ther-
apy intervention, resulting in a mean hemoglobin A1 concentration of 7.2%, as compared
Page 16
with conventional therapy, resulting in a mean of 9.1%, reduced the risk of neuropathy by
60% (95% CI: 38% to 74%) (44). A weakness of this and other studies of the effect of glyce-
mic control is that they used surrogate measures for the improvement (or slowing of progres-
sion) of neurologic function (28). Most used sensory or motor nerve conduction studies and
some used vibration perception thresholds. Whether such measures correlate reliably with
neuropathy symptom scores, neurologic examination, quality-of-life, neuropathic complica-
tions (foot ulcers and amputation), and mortality remains controversial. Nevertheless: as a
result of these studies patients should be treated with a goal of glycated hemoglobin less
than 7% (30).
Measures other than improved glycemic control and symptomatic control of painful symp-
toms can improve the prognosis for patients with DNP. Beside glycemic control other ap-
proaches to treat DNP so as aldose reductase inhibitors (ARI), which aims to protect nerves
from the effects of overactivity of the polyol pathway caused by chronic hyperglycemia (8).
Several substances were clinically tested with negative results for various reasons (negative
clinical results, side effects, poor study data quality).
Neurotropins such as nerve growth factors used to stimulate the growth of nerves, which
demonstrated encouraging results in preclinical and early clinical studies (4), failed also in
phase III clinical trials, due to poor efficacy results or side effects observed (8).
Anti-oxidant therapy (e.g. alpha-lipoic acid) which shall improve the blood flow is still in clini-
cal investigations and need to be reconsidered.
Summarizing it can be stated, that beside optimal glycemic control no other convincing ther-
apy option consists for the treatment of DNP. Beside this specific approaches more common
measures as preventing of known toxic substances (e.g. alcohol, prevention of vitamin defi-
ciencies, certain drugs), reduction of known risk factors (e.g. hypertension, hypercholes-
terolemia, smoking) and prevention of complications (podiatry, hygiene, appropriate stock-
ings and shoes, weight reduction) need to be considered also (26).
6. AIM OF THE STUDY
Due to the high risk for foot ulceration in patients with distal symmetric polyneuropathy, which
may lead to lower limb amputation and high financial burden for the society it is mandatory to
optimize the early diagnosis of these disease (46). The early identification of the neuropathic
process in diabetic patients is justified as it offers the patient a crucial opportunity to actively
alter the course of suboptimal glycemic control prior to significant morbidity associated with
the natural course of neuropathy in these patients (31). It is likely that effective intervention
will be possible only during the subclinical or early phase of dysfunction in diabetic patients
Page 17
(5).
The impact and diagnostic value of determination of motor nerve conduction velocities
(mNCV) as early diagnostic tool for diabetic neuropathy is well accepted. (41, 23). This non-
invasive and easy-to-generate method is frequently used in neurophysiological examinations.
In general the assessment of this diagnostic tool in terms of reproducibility and validity as a
prerequisite for comparing analyzes demonstrates, that this tool used professional is able to
be utilized for diagnosis and staging of diabetic neuropathy (33, 51). A comparative study in-
vestigating whether it is sufficient to test only one side of peripheral nerves for nerve conduc-
tion velocity analyses revealed, that in patients with diabetic neuropathy interside symmetry
can be considered (33). Therefore it is acceptable for studies in this field to rely on data col-
lected in patients from one side. Parameters usually applied for the testing of peripheral mo-
tor nerves are the determination of the maximum nerve conduction velocity, amplitude of the
compound muscle action potential (CMAP), latency and F-wave latency (12). It can be as-
sumed, that these parameters could become pathological not in the early course of disease
but in later stages.
Therefore the aim of this study was to determine, whether there are additional ways in ana-
lyzing the neurophysiological status of the peripheral nerve system in the case suspected
diabetic neuropathy in an early stage of disease. The determination of the maximum motor
nerve conduction identifies only demyelination of the fastest nerve fibers, which represent
only a minority of the profile of the complete nerve (41). Up to now it is still in discussion,
whether DNP is based on a loss of nerve fibers or a process of demyelinisation or on both,
and if both processes are involved, which of both are involved in the beginning of the process
(52, 23).
Therefore a study was carried out comparing two groups of patients to test additional pa-
rameters for the evaluation of peripheral motor nerve function beside the parameters already
mentioned above. In the group 1 inpatients of the Neurologische Universitätsklinik Marburg
were included, who
1) had no diabetes mellitus,
2) had no clinical signs of any neuropathy,
3) were not suspected to have any alcohol abuse,
4) gave their informed consent for the tests carried out.
In group 2 patients
1) having impaired glucose tolerance or manifest diabetes mellitus,
2) clinical signs of distal symmetric DNP and
3) with informed consent
were included and investigated. The parameters tested additionally beside the parameters
Page 18
already mentioned are described and defined in the section 8.2 Neurophysiological investiga-
tion (8.2). Summarized following characteristics of the compound muscle action potential
shall be analyzed:
1) Since the usual nerve conduction velocity determination analyzes only the fastest
nerve fibers, additionally the nerve conduction velocities of the other characteristic
CMAP markers shall be analyzed in order to further characterize not only the fastest
nerve fibers, but also slower-conducting nerve fibers.
2) The changes of the characteristics of the CMAP (amplitudes, intervals, areas) from
distal to proximal stimulation due to dispersion of the CMAP (24, 56) will be evaluated
by calculation of the quotient of the corresponding proximal and distal values (e.g.
proximal maximum amplitude divided by distal maximum amplitude).
3) The area under the curves (distal and proximal) of the CMAP provide further informa-
tion about the quantity of nerve fibers tested and shall be therefore analyzed.
4) Intervals of the CMAP (distal and proximal) further characterize the function of pe-
ripheral nerves and shall be therefore analyzed.
5) In addition to the maximum amplitude of the compound muscle action potential also
parts of the amplitude (positive/negative amplitude) shall be analyzed.
The Zero-Hypothesis for this study will be therefore defined as following:
For the support of the diagnosis of diabetic neuropathy other parameters (as de-scribed above) than maximum nerve conduction velocity and compound muscle ac-tion potential amplitude do not differentiate with statistical significant results between healthy persons and patients suspicious of having diabetic neuropathy.
7. STATISTICAL ISSUES
All relevant data collected for the neurophysiological investigations were transferred into a
data table (Excel 2000) and analyzed by a statistician program (SPSS 11.5). A non-
parametric test (Mann-Whitney test) was applied to compare the parameters for both patient
groups. In addition descriptive statistical parameters (mean, standard deviation [SD], median,
minimum, maximum, percentile 25/50/75) were provided for both patient groups. Relevant
results of the analysis were transferred into boxplots.
Page 19
8. PATIENTS AND METHODS
8.1 Patients
All patients included in this study were inpatients of the Neurologische Universitätsklinik Mar-
burg. In order to comply with ethical standards to study was evaluated and accepted by the
ethical committee of the Universitätsklinik Marburg before initiation. All patients gave their in-
formed consent prior recruitment. The further details of the ethical background of the study
are summarized in section Ethical issues (13.2).
All patients who have participated in this study were examined after following scheme:
1) Common anamnesis
2) Anamnesis for diabetes mellitus
3) Anamnesis for neuropathic symptoms (NS)
4) Neurological examination for neuropathic deficits (ND)
For group 1 following items were checked before recruitment:
1) Patients with diabetes mellitus were excluded
2) Patients with clinical symptoms for any neuropathy were excluded
3) Patients with suspicion of having any alcohol abuse were excluded
4) Patients have to give their written informed consent
In group 1 32 female and 35 male patients were included. The average age (±SD) was 49
years( ±28 years).
For patients of group 2 following items were checked prior recruitment:
1) Patients need to have at least impaired glucose tolerance test results or manifest
diabetes mellitus
2) Patients with clinical signs of neuropathy
3) Patients with written informed consent.
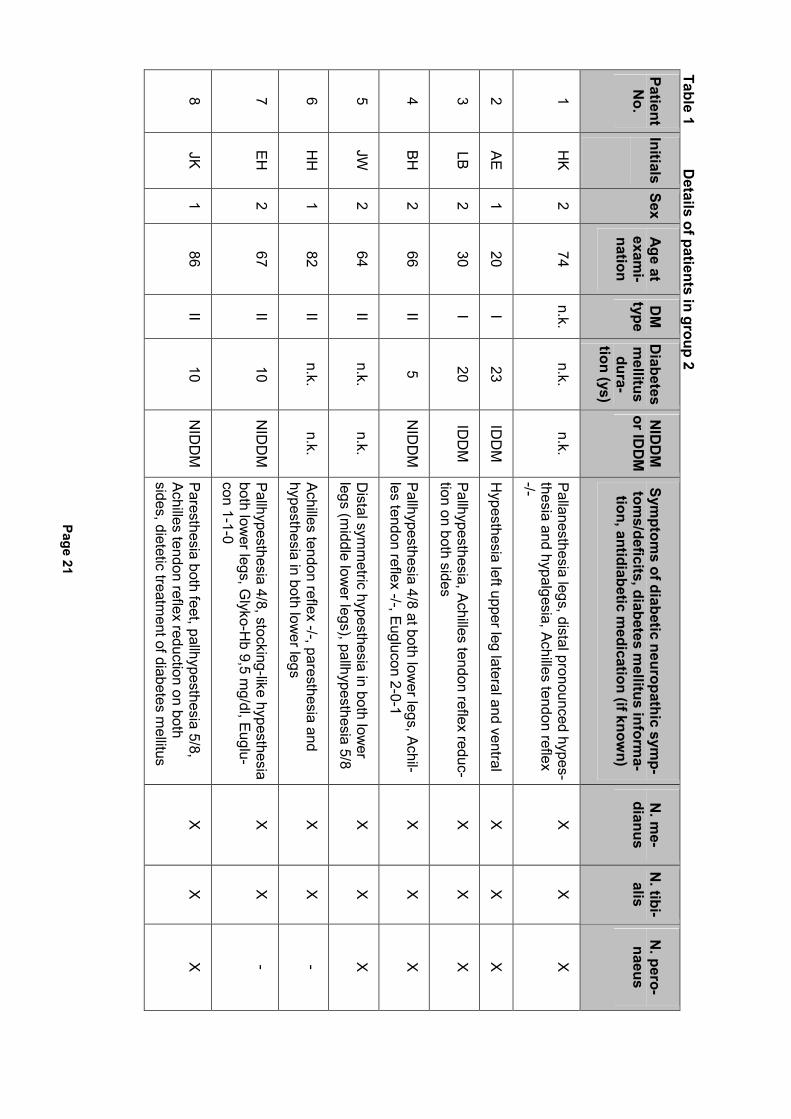
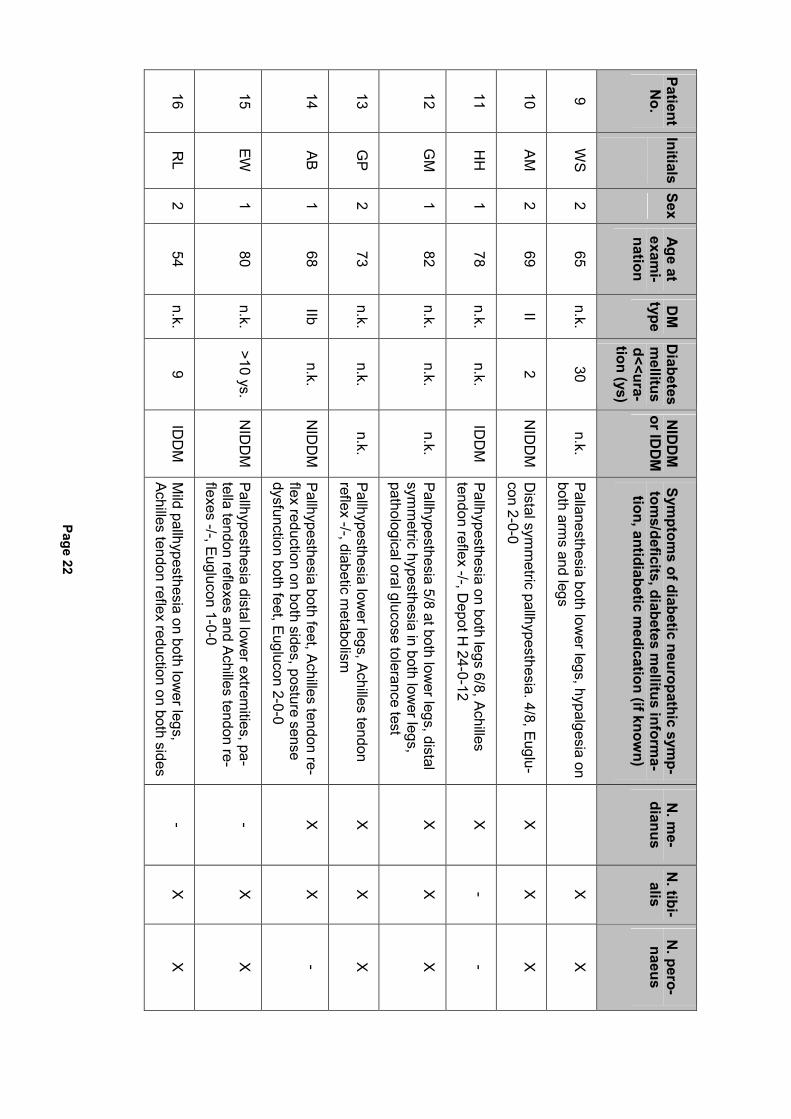
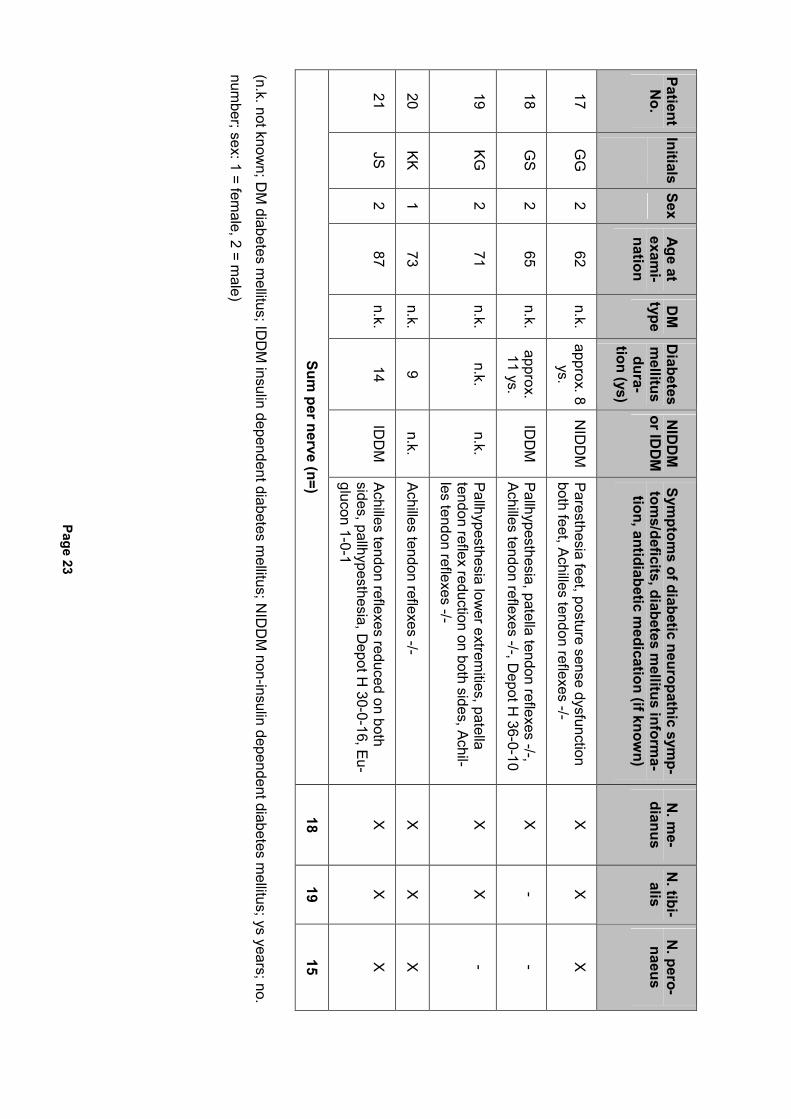
In group 2 9 female and 12 male patients were included, the average age (±SD) was 68
years (±17 years). The average time elapsed (±SD) since diagnosis of diabetes mellitus or
impaired glucose tolerance (IGT) was 12.1 years ( ±7.3 ys). In 2 of 21 cases type I diabetes
mellitus was diagnosed, in 7 cases type II diabetes mellitus, in 12 cases unknown. 6 Patients
suffered from insulin-dependent diabetes mellitus (IDDM), 6 from non-insulin-dependent dia-
betes mellitus (NIDDM), 9 cases unknown. The results of nerves investigated were available
in 18, 19 respectively 15 cases (N. medianus, N. tibialis, N. peronaeus). In 19 out of 21 pa-
Page 20
tients symptoms of diminished or altered sensation could be observed, in 2 patients the re-
duction or absence of reflexes was the only symptom of DNP.
The difference with regard to the average age between group 1 and group 2 could have
some impact on the results, since it is known that age of patients could influence the nerve
conduction (36) or CMAP amplitude (24). This issue will be considered later in the section
Discussion (10).
The definition of the gender of the patients is as following: 1 means female, 2 means male.
The detailed information about patients in group 2 is provided in the following table 1:
Page 21
Table 1 D
etails of patients in group 2
Patient N
o. Initials
Sex A
ge at exam
i-nation
DM
type
Diabetes
mellitus dura-
tion (ys)
NID
DM
or ID
DM
Symptom
s of diabetic neuropathic symp-
toms/deficits, diabetes m
ellitus informa-
tion, antidiabetic medication (if know
n)
N. m
e-dianus
N. tibi-alis
N. pero-naeus
1 H
K 2
74 n.k.
n.k. n.k.
Pallanesthesia legs, distal pronounced hypes-thesia and hypalgesia, Achilles tendon reflex -/-
X
X
X
2 AE
1 20
I 23
IDD
M
Hypesthesia left upper leg lateral and ventral
X
X
X
3 LB
2 30
I 20
IDD
M
Pallhypesthesia, Achilles tendon reflex reduc-tion on both sides
X
X
X
4 BH
2
66 II
5 N
IDD
M
Pallhypesthesia 4/8 at both lower legs, Achil-
les tendon reflex -/-, Euglucon 2-0-1 X
X
X
5 JW
2
64 II
n.k. n.k.
Distal sym
metric hypesthesia in both low
er legs (m
iddle lower legs), pallhypesthesia 5/8
X
X
X
6 H
H
1 82
II n.k.
n.k. Achilles tendon reflex -/-, paresthesia and hypesthesia in both low
er legs X
X
-
7 EH
2
67 II
10 N
IDD
M
Pallhypesthesia 4/8, stocking-like hypesthesia both low
er legs, Glyko-H
b 9,5 mg/dl, Euglu-
con 1-1-0
X
X
-
8 JK
1 86
II 10
NID
DM
Paresthesia both feet, pallhypesthesia 5/8, Achilles tendon reflex reduction on both sides, dietetic treatm
ent of diabetes mellitus
X
X
X
Page 22
Patient N
o. Initials
Sex A
ge at exam
i-nation
DM
type
Diabetes
mellitus
d<<ura-tion (ys)
NID
DM
or ID
DM
Symptom
s of diabetic neuropathic symp-
toms/deficits, diabetes m
ellitus informa-
tion, antidiabetic medication (if know
n)
N. m
e-dianus
N. tibi-alis
N. pero-naeus
9 W
S 2
65 n.k.
30 n.k.
Pallanesthesia both lower legs, hypalgesia on
both arms and legs
X
X
10 A
M
2 69
II 2
NID
DM
D
istal symm
etric pallhypesthesia. 4/8, Euglu-con 2-0-0
X
X
X
11 H
H
1 78
n.k. n.k.
IDD
M
Pallhypesthesia on both legs 6/8, Achilles tendon reflex -/-, D
epot H 24-0-12
X
- -
12 G
M
1 82
n.k. n.k.
n.k. Pallhypesthesia 5/8 at both low
er legs, distal sym
metric hypesthesia in both low
er legs, pathological oral glucose tolerance test
X
X
X
13 G
P 2
73 n.k.
n.k. n.k.
Pallhypesthesia lower legs, Achilles tendon
reflex -/-, diabetic metabolism
X
X
X
14 AB
1 68
IIb n.k.
NID
DM
Pallhypesthesia both feet, Achilles tendon re-flex reduction on both sides, posture sense dysfunction both feet, Euglucon 2-0-0
X
X
-
15 EW
1
80 n.k.
>10 ys. N
IDD
M
Pallhypesthesia distal lower extrem
ities, pa-tella tendon reflexes and Achilles tendon re-flexes -/-, Euglucon 1-0-0
- X
X
16 R
L 2
54 n.k.
9 ID
DM
M
ild pallhypesthesia on both lower legs,
Achilles tendon reflex reduction on both sides-
X
X
Page 23
Patient N
o. Initials
Sex A
ge at exam
i-nation
DM
type
Diabetes
mellitus dura-
tion (ys)
NID
DM
or ID
DM
Symptom
s of diabetic neuropathic symp-
toms/deficits, diabetes m
ellitus informa-
tion, antidiabetic medication (if know
n)
N. m
e-dianus
N. tibi-alis
N. pero-naeus
17 G
G
2 62
n.k. approx. 8
ys. N
IDD
M
Paresthesia feet, posture sense dysfunction both feet, Achilles tendon reflexes -/-
X
X
X
18 G
S 2
65 n.k.
approx. 11 ys.
IDD
M
Pallhypesthesia, patella tendon reflexes -/-, Achilles tendon reflexes -/-, D
epot H 36-0-10
X
- -
19 KG
2
71 n.k.
n.k. n.k.
Pallhypesthesia lower extrem
ities, patella tendon reflex reduction on both sides, Achil-les tendon reflexes -/-
X
X
-
20 KK
1 73
n.k. 9
n.k. Achilles tendon reflexes -/-
X
X
X
21 JS
2 87
n.k. 14
IDD
M
Achilles tendon reflexes reduced on both sides, pallhypesthesia, D
epot H 30-0-16, Eu-
glucon 1-0-1
X
X
X
Sum per nerve (n=)
18 19
15
(n.k. not known; D
M diabetes m
ellitus; IDD
M insulin dependent diabetes m
ellitus; NID
DM
non-insulin dependent diabetes mellitus; ys years; no.
number; sex: 1 = fem
ale, 2 = male)
Page 24
8.2 Neurophysiological examinations
The measurements were carried out with an usual device for neurophysiological examina-
tions (Neuropack 4 by Nihon Kohden/Japan).
Following parameters of the device were kept up during all measurements:
• Sensitivity of the amplifier 5 mV
• Upper filter frequency 3 kHz
• Lower filter frequency 20 kHz
• Delay time 0 ms
• Stimulation frequency 1 Hz
• Stimulation duration 0.2 ms
• Stimulation type: single
Following parameters were changed during the measurements:
• Analysis time (X axis) from 20-50 ms depending on the length of the CMAP.
• Analysis amplitude (Y axis) 1-5 mV/DIV depending on the amplitude of the CMAP.
• Stimulation intensity: beginning with 20 mA increased in steps of 5 mA until no
change of the CMAP could be observed (maximum 99mA).
The parameters were determined on the Nn. medianus, tibialis and peronaeus on one side of
the patients. Before carrying out the measurements the temperature of the skin was deter-
mined by a sensor and eventually corrected with the help of a red light lamp (if surface tem-
perature was < 32 oC). During testing the patients were lying on a stretcher.
The skin of the patients was cleaned with an alcoholic pad and the surface electrodes
(Ag/AgCl 13mmx7mmx1,5mm) were fixed after application of electrode gel.
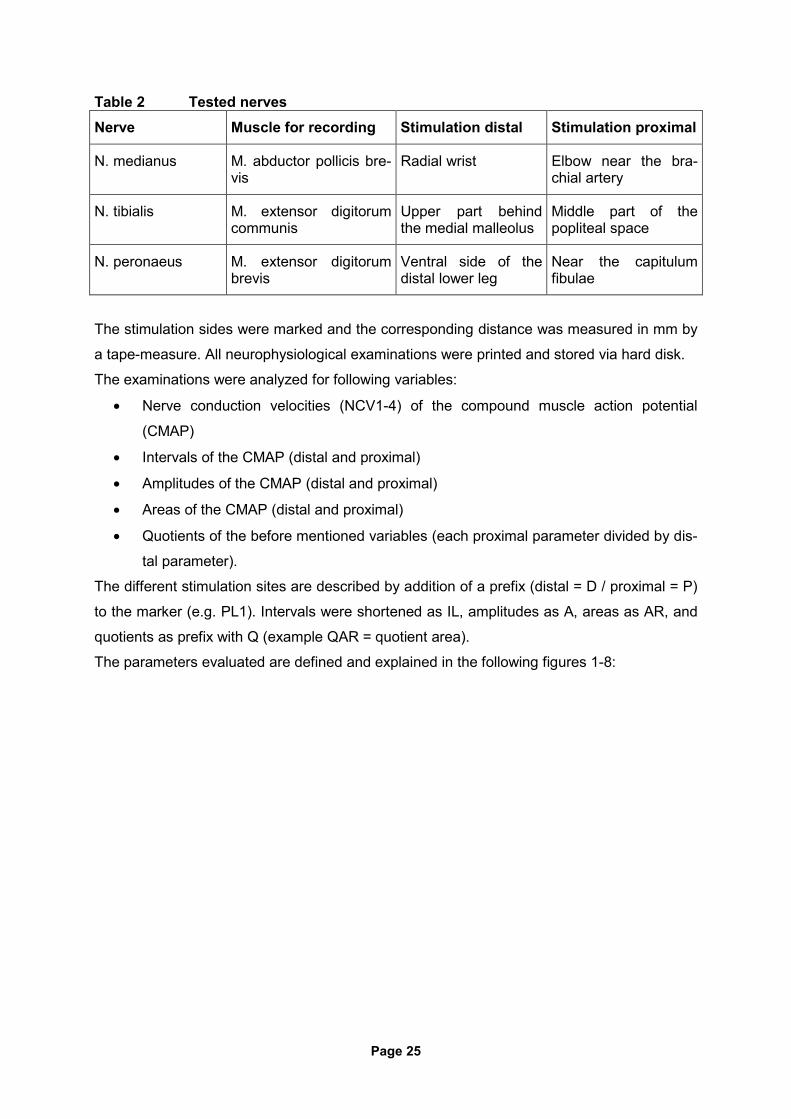
The different electrode was fixed above the muscle belly, the indifferent electrode was fixed
above the tendon of the muscle (see figure 1). To get an optimal compound muscle action
potential the position of the different electrode was corrected if necessary. The grounding
electrode was moistened and connected to the wrist (N. medianus) or the ankle (N. tibialis,
N. peronaeus). Following nerves were tested:
Page 25
Table 2 Tested nerves Nerve Muscle for recording Stimulation distal Stimulation proximal
N. medianus M. abductor pollicis bre-vis
Radial wrist Elbow near the bra-chial artery
N. tibialis M. extensor digitorum communis
Upper part behind the medial malleolus
Middle part of the popliteal space
N. peronaeus M. extensor digitorum brevis
Ventral side of the distal lower leg
Near the capitulum fibulae
The stimulation sides were marked and the corresponding distance was measured in mm by
a tape-measure. All neurophysiological examinations were printed and stored via hard disk.
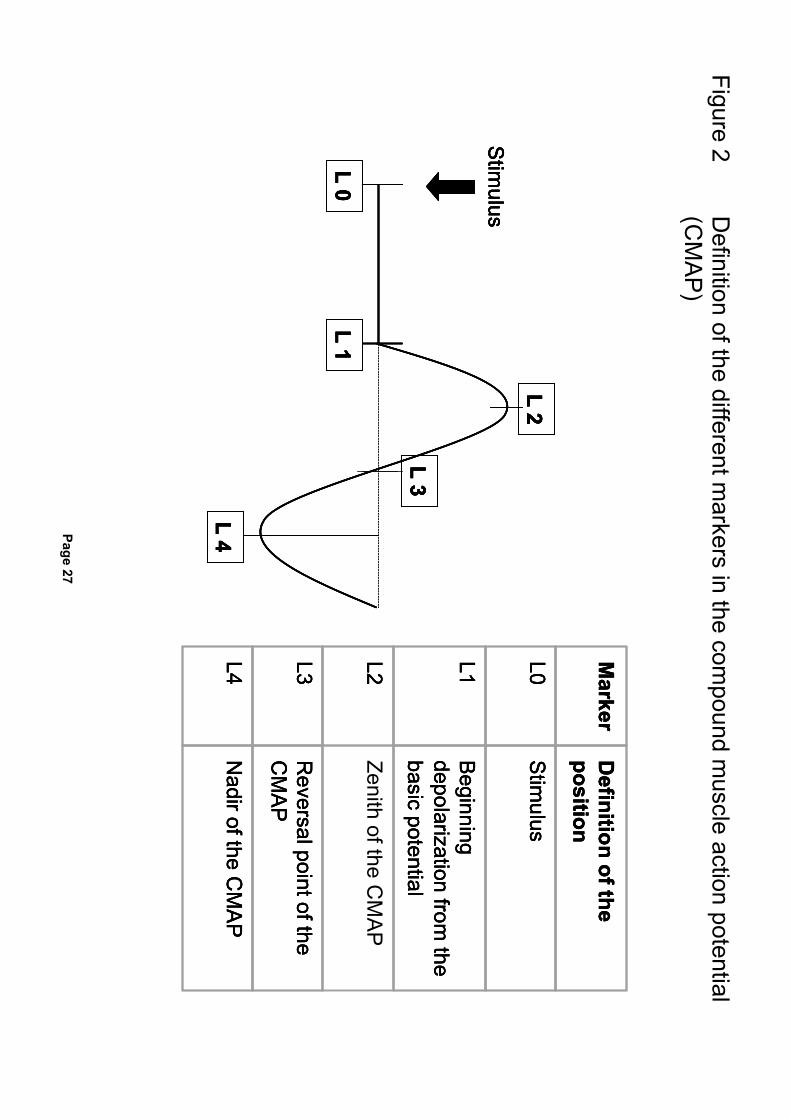
The examinations were analyzed for following variables:
• Nerve conduction velocities (NCV1-4) of the compound muscle action potential
(CMAP)
• Intervals of the CMAP (distal and proximal)
• Amplitudes of the CMAP (distal and proximal)
• Areas of the CMAP (distal and proximal)
• Quotients of the before mentioned variables (each proximal parameter divided by dis-
tal parameter).
The different stimulation sites are described by addition of a prefix (distal = D / proximal = P)
to the marker (e.g. PL1). Intervals were shortened as IL, amplitudes as A, areas as AR, and
quotients as prefix with Q (example QAR = quotient area).
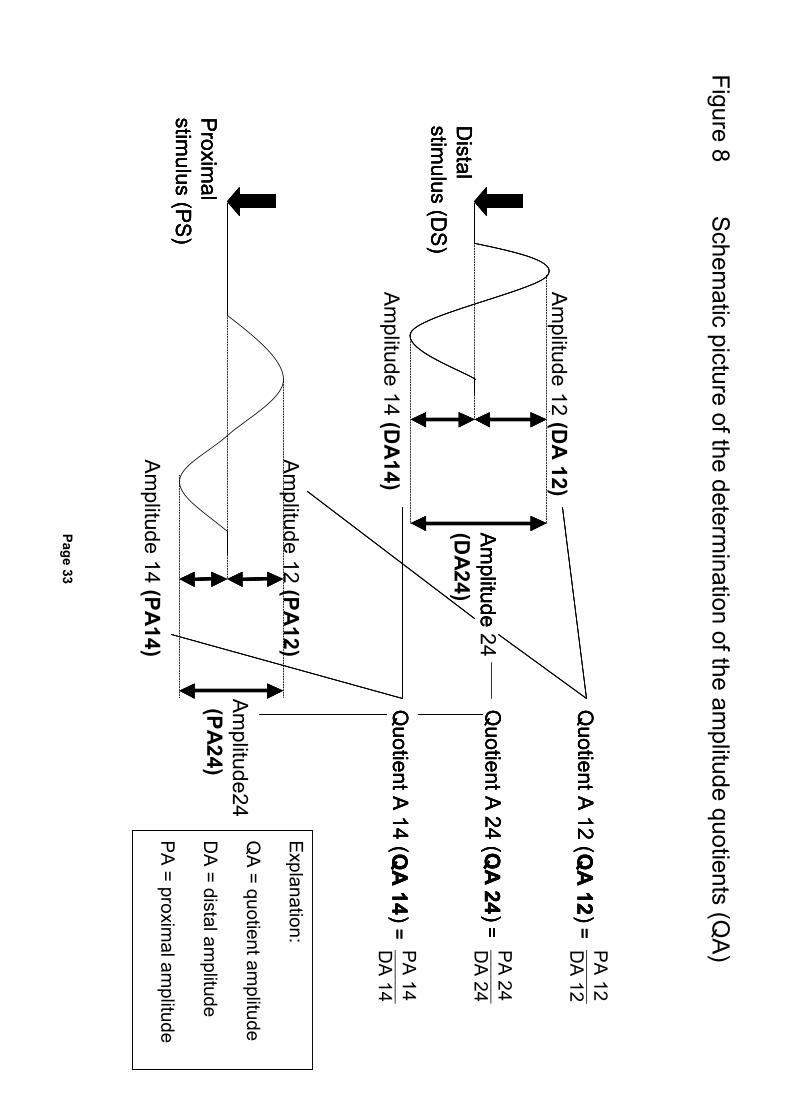
The parameters evaluated are defined and explained in the following figures 1-8:
Page 26
Figure 1 Schem
atic picture of the neurophysiological examination of the N
. medianus
Distal
stimulus
Proxim
al stim
ulus
Direct derivation
electrode
Indirect derivation
electrode
Grounding
wire
Distal
stimulus
Proxim
al stim
ulus
Direct derivation
electrode
Indirect derivation
electrode
Grounding
wire
Distal
stimulus
stim
ulus
Direct derivation
electrode
Indirect derivation
electrode
Grounding
wire
Page 27
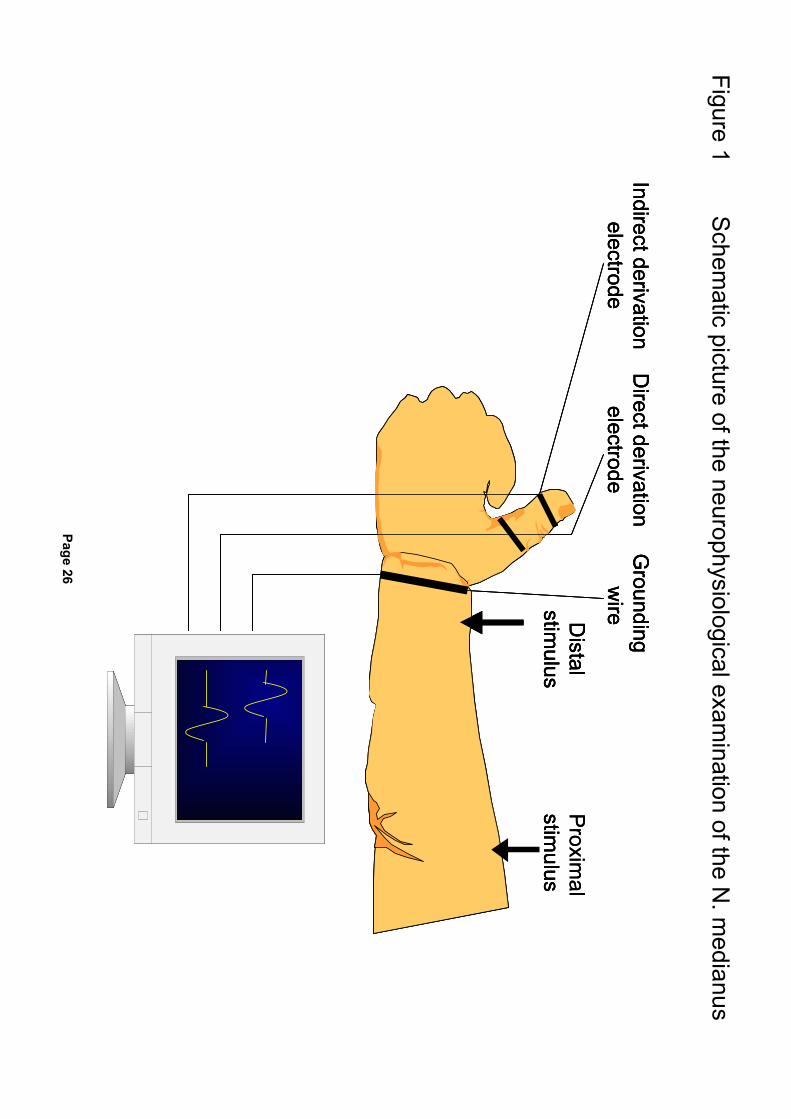
Figure 2 D
efinition of the different markers in the com
pound muscle action potential
(CM
AP
)
L 1
L 2
L 3
L 4
L 0
Stim
ulus
L 1
L 2
L 3
L 4
L 0
Stim
ulus
Marker
Definition of the
position
L0
Stim
ulus
L1
Beginning
depolarization from the
basic potential
L2
Zenith of the CM
AP
L3
Reversal point of the
CM
AP
L4
Nadir of the C
MA
P
Marker
Marker
Definition of the
position
Definition of the
position
L0
L0
Stim
ulus
Stim
ulus
L1
L1
Beginning
depolarization from the
basic potential
Beginning
depolarization from the
basic potential
L2
L2
L3
L3
Reversal point of the
CM
AP
Reversal point of the
CM
AP
L4
L4
Nadir of the C
MA
P
Nadir of the C
MA
P
L 1
L 2
L 3
L 4
L 0
Stim
ulus
L 1
L 2
L 3
L 4
L 0
Stim
ulus
Page 28
Figure 3 D
efinition of the different parameters of the com
pound muscle action potential
(CM
AP
)
L 1
L 2
L 3
L 4
L 0
Interval L1 - 4 ( IL 14
)
Interval L1 - 3 ( IL 13
)
Am
plitude L1 - 2 ( A
12 )
Am
plitude L1 - 4 ( A
14 )
Ar13
Ar14
Area from
L1-3 (AR
13) A
rea from L1-3 + A
rea from L3-4 (A
R14)
Stim
ulus
Marker
L 1
L 2
L 3
L 4
L 0
Interval L1 - 4 ( IL 14
)
Interval L1 - 3 ( IL 13
)
Am
plitude L1 - 2 ( A
12 )
Am
plitude L1 - 4 ( A
14 )
Ar13
Ar14
Stim
ulus
L 1
L 2
L 3
L 4
L 0
Interval L1 - 4 ( IL 14
)
Interval L1 - 3 ( IL 13
)
Am
plitude L1 - 2 ( A
12 )
Am
plitude L1 - 4 ( A
14 )
Am
plitude L2 - 4 ( A
24 )
Am
plitude L2 - 4 ( A
24 )
Am
plitude L2 - 4 ( A
24 )
Ar13
Ar14
Stim
ulus
Page 29
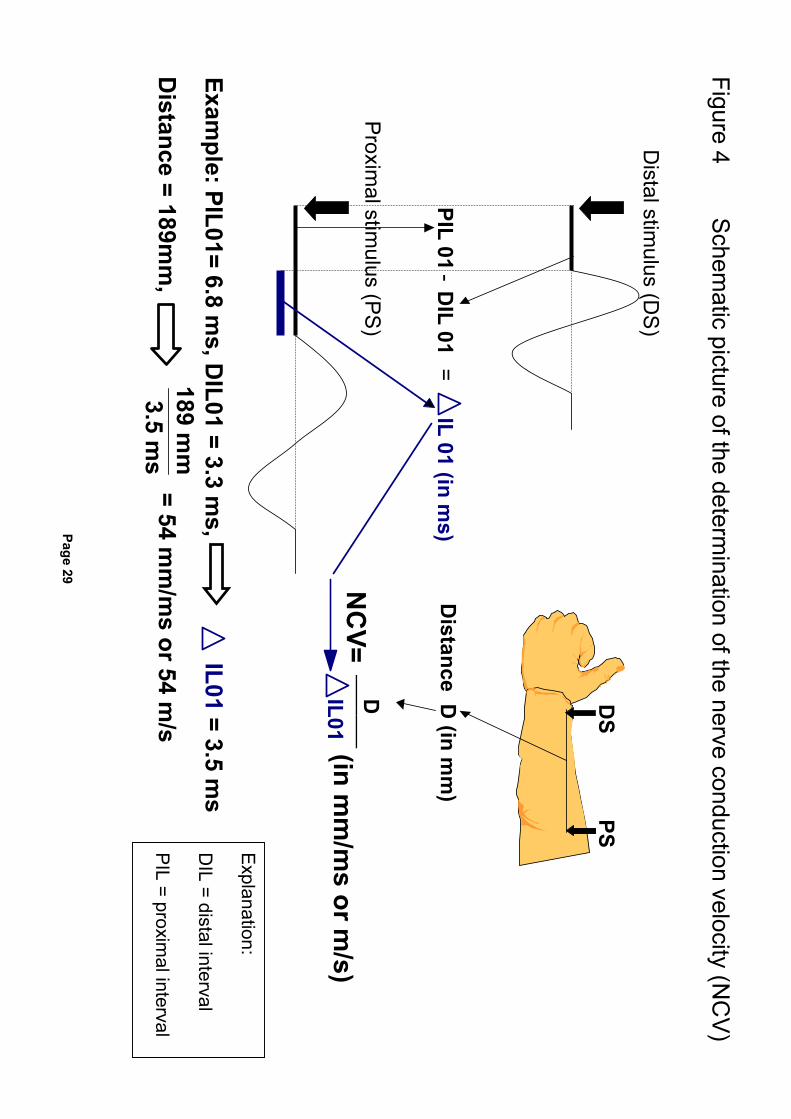
Figure 4 S
chematic picture of the determ
ination of the nerve conduction velocity (NC
V)
PIL 01 - D
IL 01 = IL 01 (in ms)
Distance D
(in mm
)
D
NC
V= _________(in m
m/m
s or m/s)
IL01
DS
PS
Distal stim
ulus (DS
)
Proxim
al stimulus (P
S)
Example: PIL01= 6.8 m
s, DIL01 = 3.3 m
s, IL01 = 3.5 ms
189 mm
3.5 m
sD
istance = 189mm
, = 54 mm
/ms or 54 m
/s
Explanation:
DIL = distal interval
PIL = proxim
al interval
Page 30
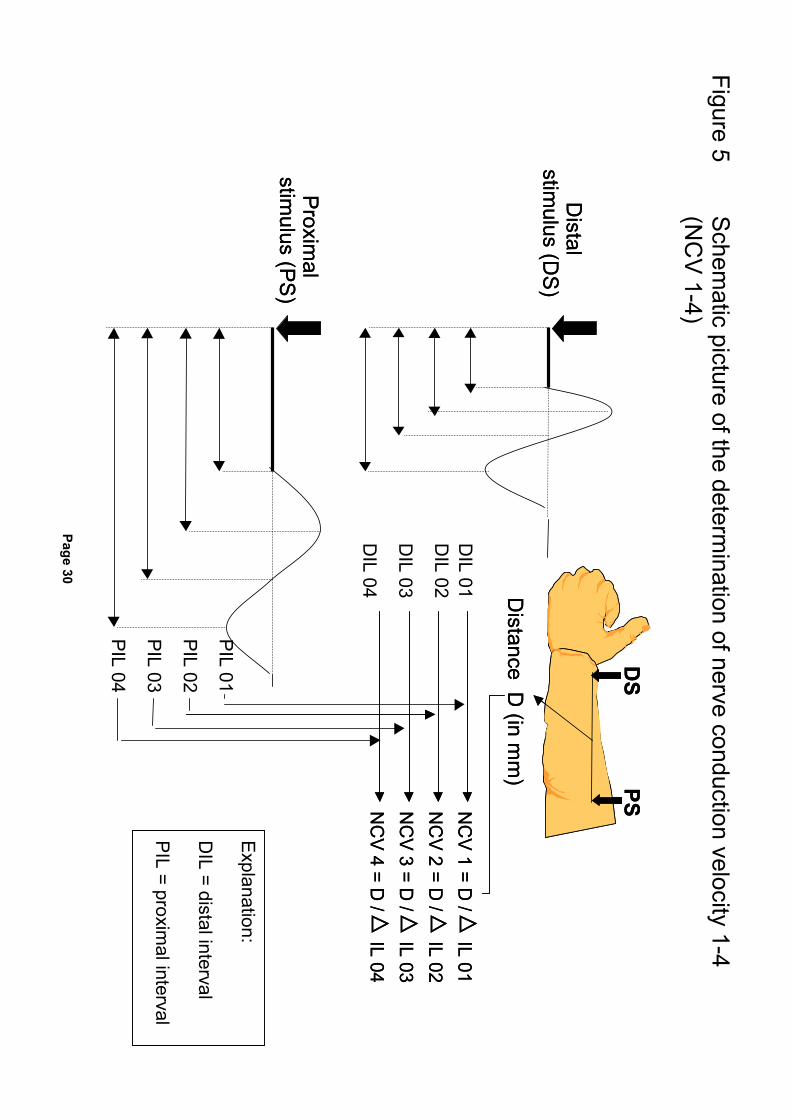
Figure 5 S
chematic picture of the determ
ination of nerve conduction velocity 1-4 (N
CV
1-4)
DIL 04
DIL 03
DIL 02
DIL 01
NC
V 1 = D / IL 01
Distance D
(in mm
)
NC
V 2 = D / IL 02
NC
V 3 = D /
IL 03
NC
V 4 = D /
IL 04
DS
PS
Distal
stimulus (D
S)
Proxim
al stim
ulus (PS
)
NC
V 1 = D / IL 01
Distance D
(in mm
)
NC
V 2 = D / IL 02
NC
V 3 = D /
IL 03
NC
V 4 = D /
IL 04
PIL 04
PIL 03
PIL 02
PIL 01
DS
PS
Distal
stimulus (D
S)
Proxim
al stim
ulus (PS
)
Explanation:
DIL = distal interval
PIL = proxim
al interval
Page 31
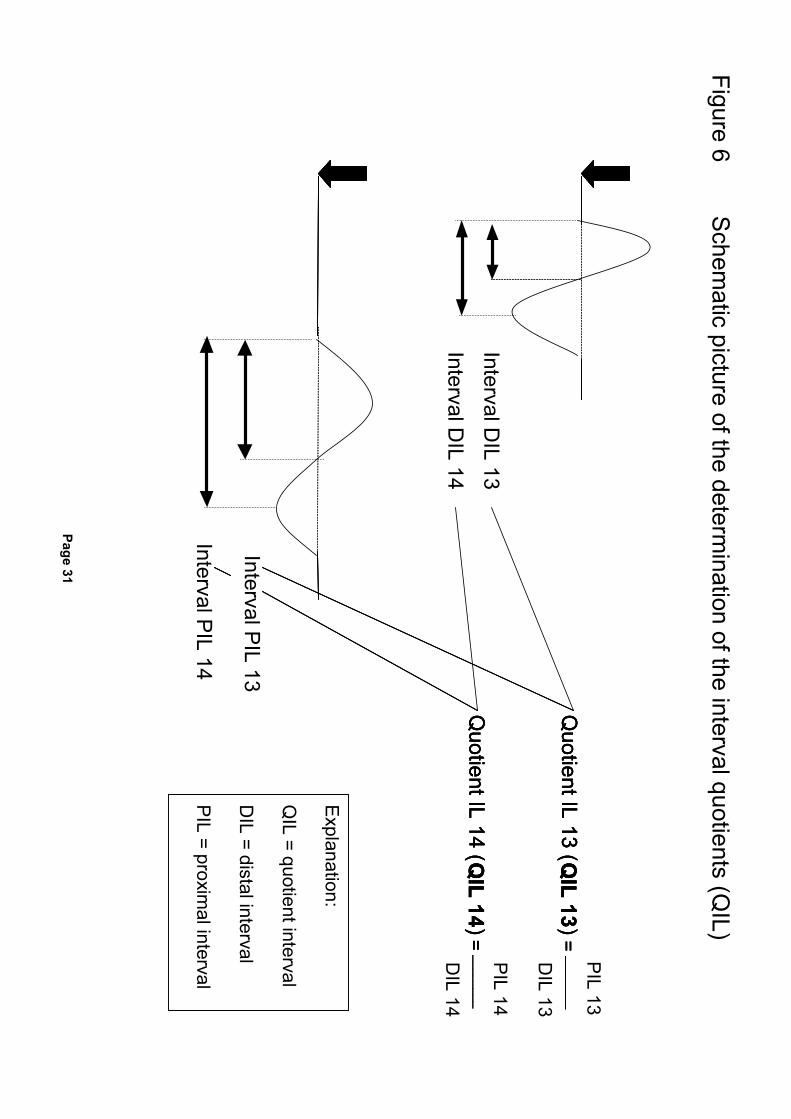
Figure 6 S
chematic picture of the determ
ination of the interval quotients (QIL)
Interval DIL 13
Interval PIL 13
Interval PIL 14
PIL 13
Quotient IL 13 ( Q
IL 13 ) = ________
DIL 13
PIL 14
Quotient IL 14 ( Q
IL 14 ) = ________
DIL 14
Quotient IL 13 ( Q
IL 13 ) = ________
Quotient IL 14 ( Q
IL 14 ) = ________
Interval DIL 14
Quotient IL 13 ( Q
IL 13 ) = ________
Quotient IL 14 ( Q
IL 14 ) = ________
Explanation:
QIL = quotient interval
DIL = distal interval
PIL = proxim
al interval
Page 32
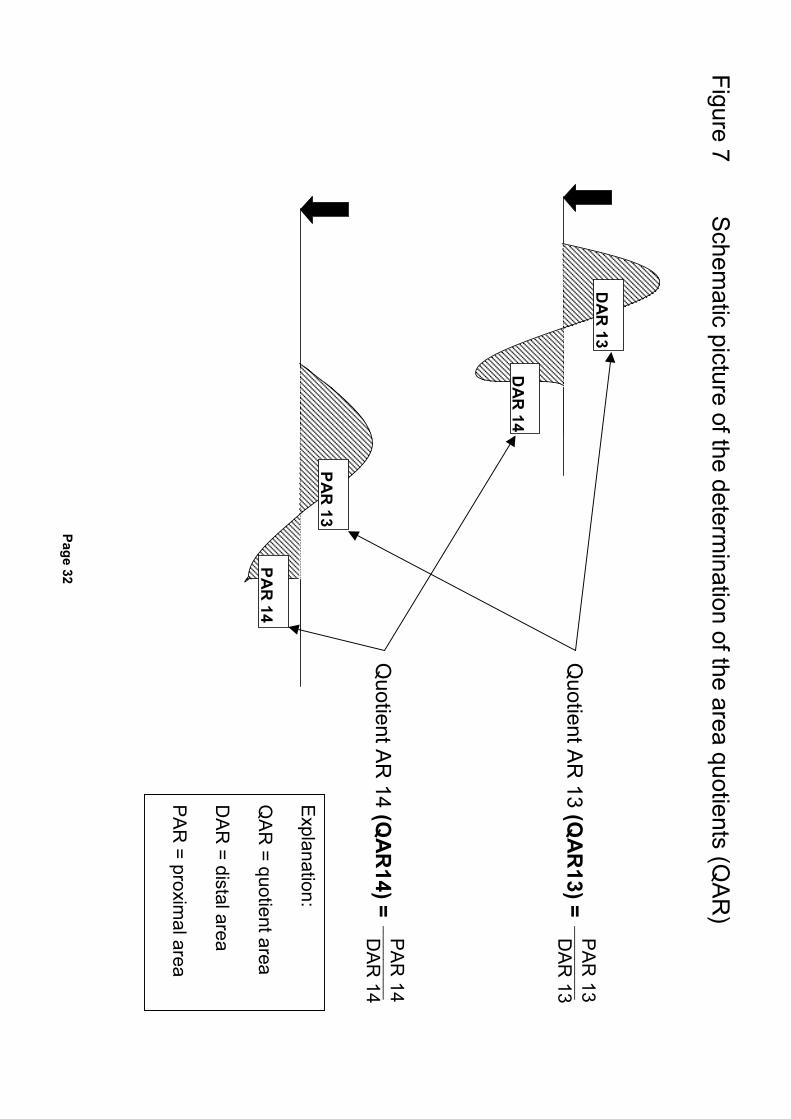
Figure 7 S
chematic picture of the determ
ination of the area quotients (QA
R)
DA
R 13
DA
R 14
PAR
13
PAR
14
PA
R 13
___________
DAR
13
Quotient A
R 13 (Q
AR
13) =
PA
R 14
___________
DAR
14
Quotient A
R 14 (Q
AR
14) =
Explanation:
QA
R = quotient area
DA
R = distal area
PA
R = proxim
al area
Page 33
Figure 8 S
chematic picture of the determ
ination of the amplitude quotients (Q
A)
Am
plitude (D
A24)
Am
plitude 12 (PA12)
Am
plitude 14 (PA14)
Am
plitude24
(PA24)
PA
12 Q
uotient A 12 ( Q
A 12
) =D
A 12
PA
24
Quotient A
24 ( Q
A 24
) =________ D
A 24
PA
14
Quotient A
14 ( QA
14 ) =
________ D
A 14
Am
plitude 12 (DA
12)
Am
plitude 14 (DA
14)
Distal
stimulus (D
S)
Proxim
al stim
ulus (PS
)
Am
plitude
Quotient A
12 ( QA
12 ) =
________
Quotient A
24 ( Q
A 24
) =
Quotient A
14 ( QA
14 ) =
Distal
stimulus (D
S)
Proxim
al stim
ulus (PS
)
Am
plitude 24
Quotient A
12 ( QA
12 ) =
Quotient A
24 ( Q
A 24
) =
Quotient A
14 ( QA
14 ) =
Distal
stimulus (D
S)
Proxim
al stim
ulus (PS
)
Explanation:
QA
= quotient amplitude
DA
= distal amplitude
PA
= proximal am
plitude
Page 34
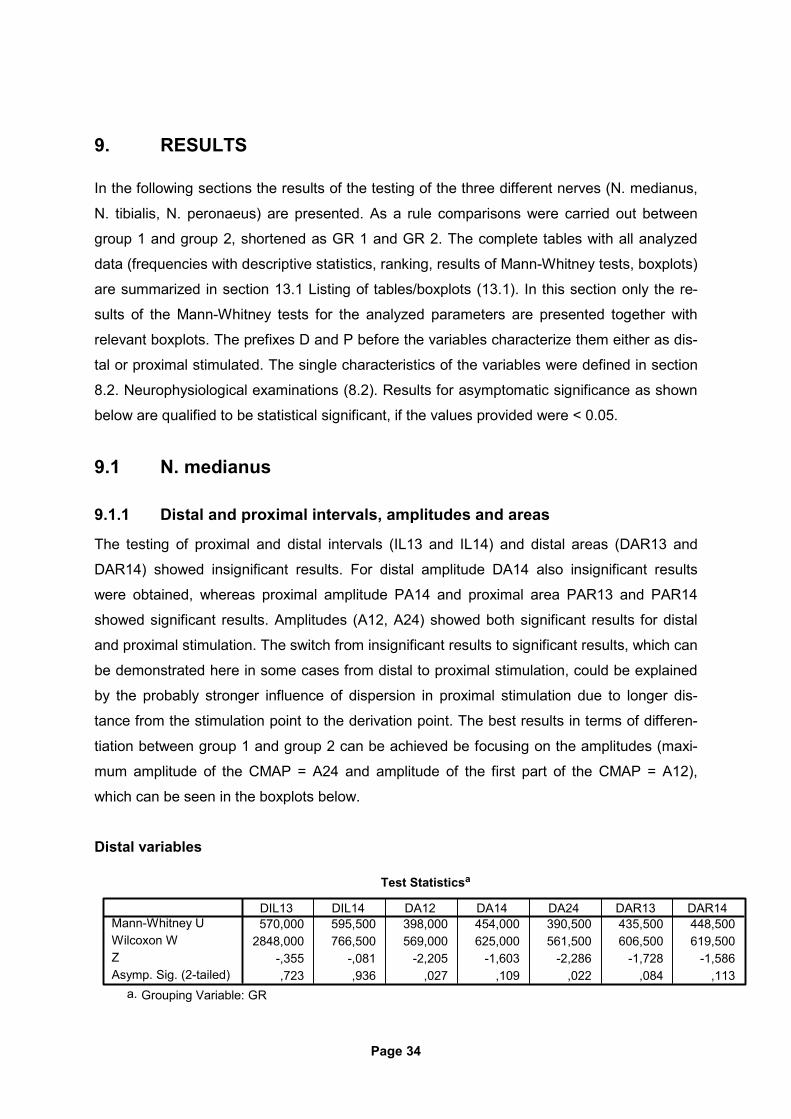
9. RESULTS
In the following sections the results of the testing of the three different nerves (N. medianus,
N. tibialis, N. peronaeus) are presented. As a rule comparisons were carried out between
group 1 and group 2, shortened as GR 1 and GR 2. The complete tables with all analyzed
data (frequencies with descriptive statistics, ranking, results of Mann-Whitney tests, boxplots)
are summarized in section 13.1 Listing of tables/boxplots (13.1). In this section only the re-
sults of the Mann-Whitney tests for the analyzed parameters are presented together with
relevant boxplots. The prefixes D and P before the variables characterize them either as dis-
tal or proximal stimulated. The single characteristics of the variables were defined in section
8.2. Neurophysiological examinations (8.2). Results for asymptomatic significance as shown
below are qualified to be statistical significant, if the values provided were < 0.05.
9.1 N. medianus
9.1.1 Distal and proximal intervals, amplitudes and areas
The testing of proximal and distal intervals (IL13 and IL14) and distal areas (DAR13 and
DAR14) showed insignificant results. For distal amplitude DA14 also insignificant results
were obtained, whereas proximal amplitude PA14 and proximal area PAR13 and PAR14
showed significant results. Amplitudes (A12, A24) showed both significant results for distal
and proximal stimulation. The switch from insignificant results to significant results, which can
be demonstrated here in some cases from distal to proximal stimulation, could be explained
by the probably stronger influence of dispersion in proximal stimulation due to longer dis-
tance from the stimulation point to the derivation point. The best results in terms of differen-
tiation between group 1 and group 2 can be achieved be focusing on the amplitudes (maxi-
mum amplitude of the CMAP = A24 and amplitude of the first part of the CMAP = A12),
which can be seen in the boxplots below.
Distal variables
Test Statisticsa
570,000 595,500 398,000 454,000 390,500 435,500 448,5002848,000 766,500 569,000 625,000 561,500 606,500 619,500
-,355 -,081 -2,205 -1,603 -2,286 -1,728 -1,586,723 ,936 ,027 ,109 ,022 ,084 ,113
Mann-Whitney UWilcoxon WZAsymp. Sig. (2-tailed)
DIL13 DIL14 DA12 DA14 DA24 DAR13 DAR14
Grouping Variable: GRa.
Page 35
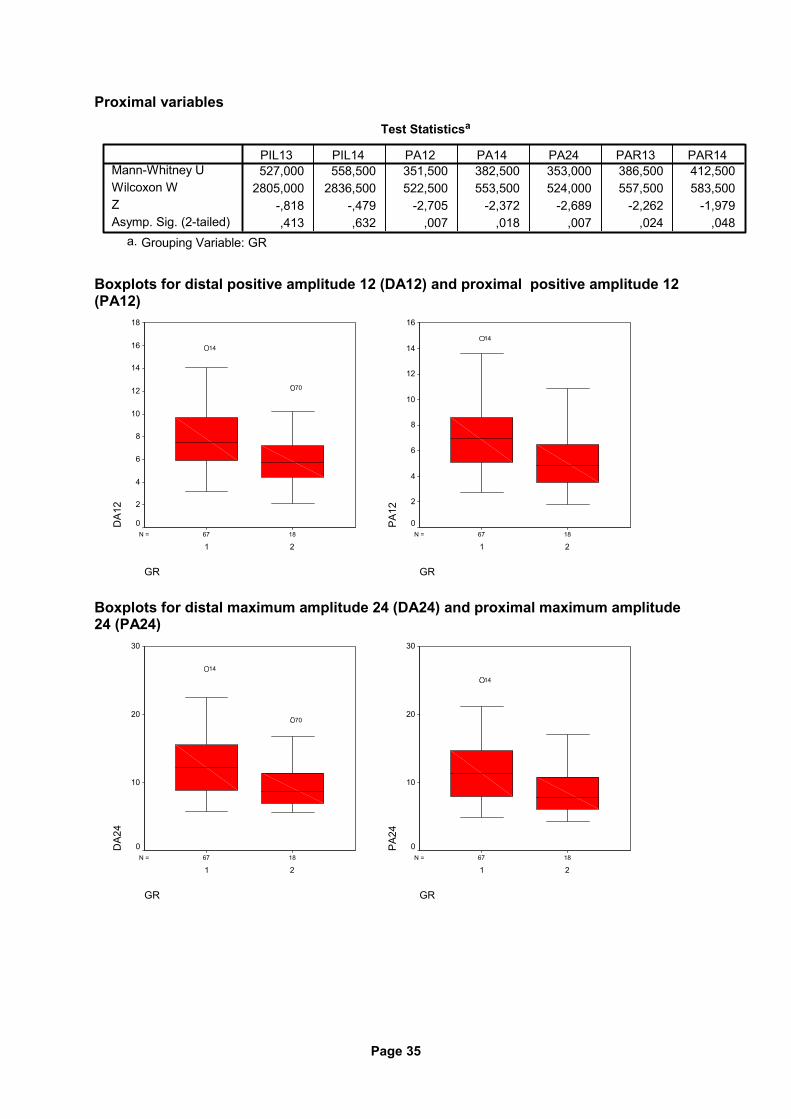
Proximal variables
Test Statisticsa
527,000 558,500 351,500 382,500 353,000 386,500 412,5002805,000 2836,500 522,500 553,500 524,000 557,500 583,500
-,818 -,479 -2,705 -2,372 -2,689 -2,262 -1,979,413 ,632 ,007 ,018 ,007 ,024 ,048
Mann-Whitney UWilcoxon WZAsymp. Sig. (2-tailed)
PIL13 PIL14 PA12 PA14 PA24 PAR13 PAR14
Grouping Variable: GRa.
Boxplots for distal positive amplitude 12 (DA12) and proximal positive amplitude 12 (PA12)
1867N =
GR
21
DA1
2
18
16
14
12
10
8
6
4
2
0
70
14
1867N =
GR
21
PA
12
16
14
12
10
8
6
4
2
0
14
Boxplots for distal maximum amplitude 24 (DA24) and proximal maximum amplitude 24 (PA24)
1867N =
GR
21
DA2
4
30
20
10
0
70
14
1867N =
GR
21
PA
24
30
20
10
0
14
Page 36
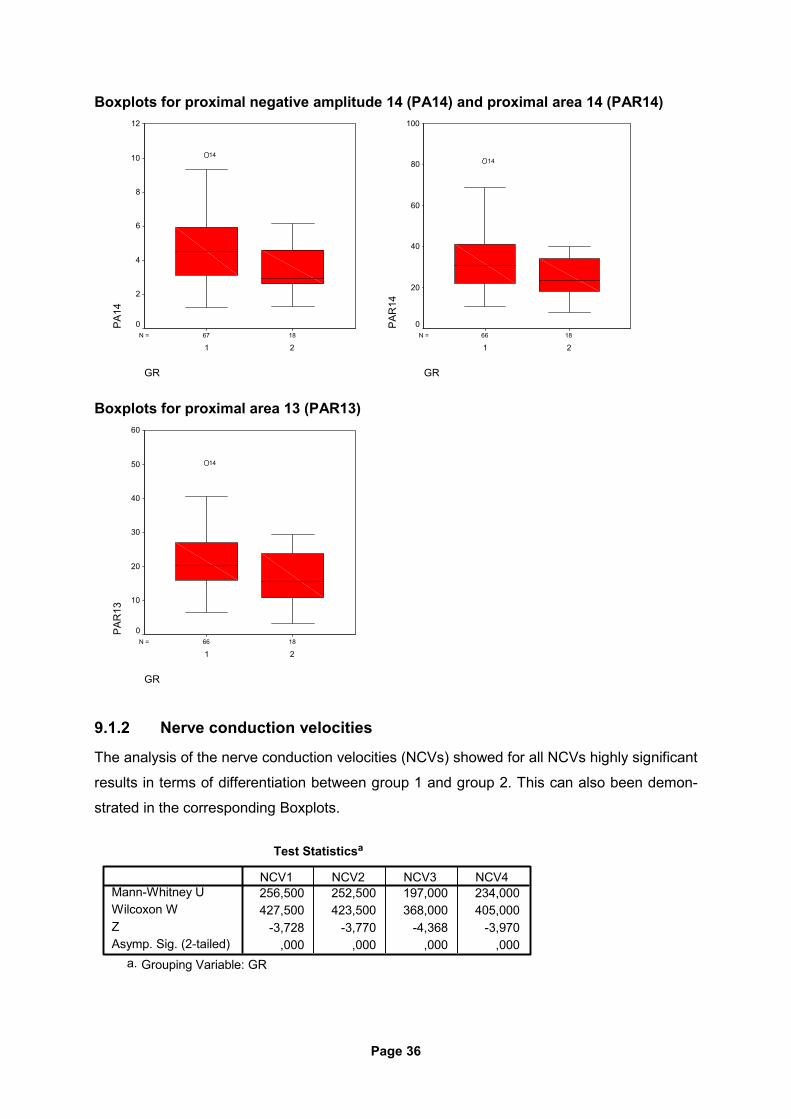
Boxplots for proximal negative amplitude 14 (PA14) and proximal area 14 (PAR14)
1867N =
GR
21
PA
1412
10
8
6
4
2
0
14
1866N =
GR
21
PA
R14
100
80
60
40
20
0
14
Boxplots for proximal area 13 (PAR13)
1866N =
GR
21
PA
R13
60
50
40
30
20
10
0
14
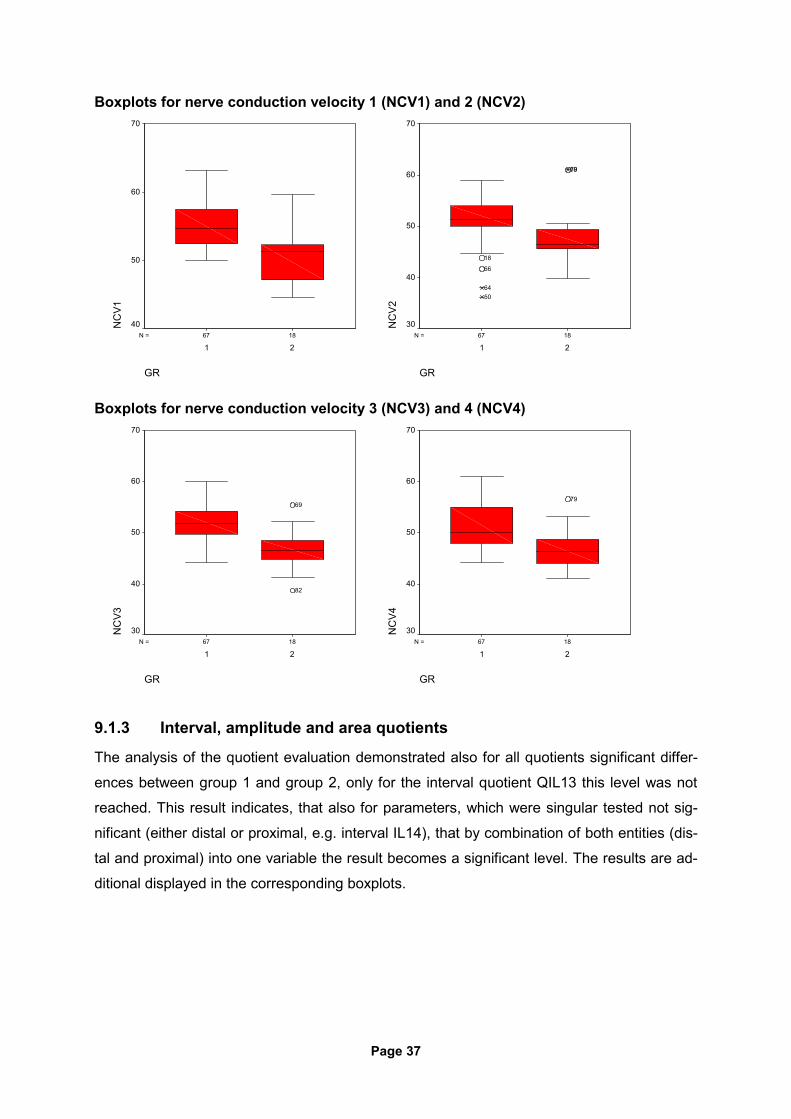
9.1.2 Nerve conduction velocities
The analysis of the nerve conduction velocities (NCVs) showed for all NCVs highly significant
results in terms of differentiation between group 1 and group 2. This can also been demon-
strated in the corresponding Boxplots.
Test Statisticsa
256,500 252,500 197,000 234,000427,500 423,500 368,000 405,000
-3,728 -3,770 -4,368 -3,970,000 ,000 ,000 ,000
Mann-Whitney UWilcoxon WZAsymp. Sig. (2-tailed)
NCV1 NCV2 NCV3 NCV4
Grouping Variable: GRa.
Page 37
Boxplots for nerve conduction velocity 1 (NCV1) and 2 (NCV2)
1867N =
GR
21
NC
V170
60
50
401867N =
GR
21
NC
V2
70
60
50
40
30
7969
18
66
6450
Boxplots for nerve conduction velocity 3 (NCV3) and 4 (NCV4)
1867N =
GR
21
NC
V3
70
60
50
40
30
82
69
1867N =
GR
21
NC
V4
70
60
50
40
30
79
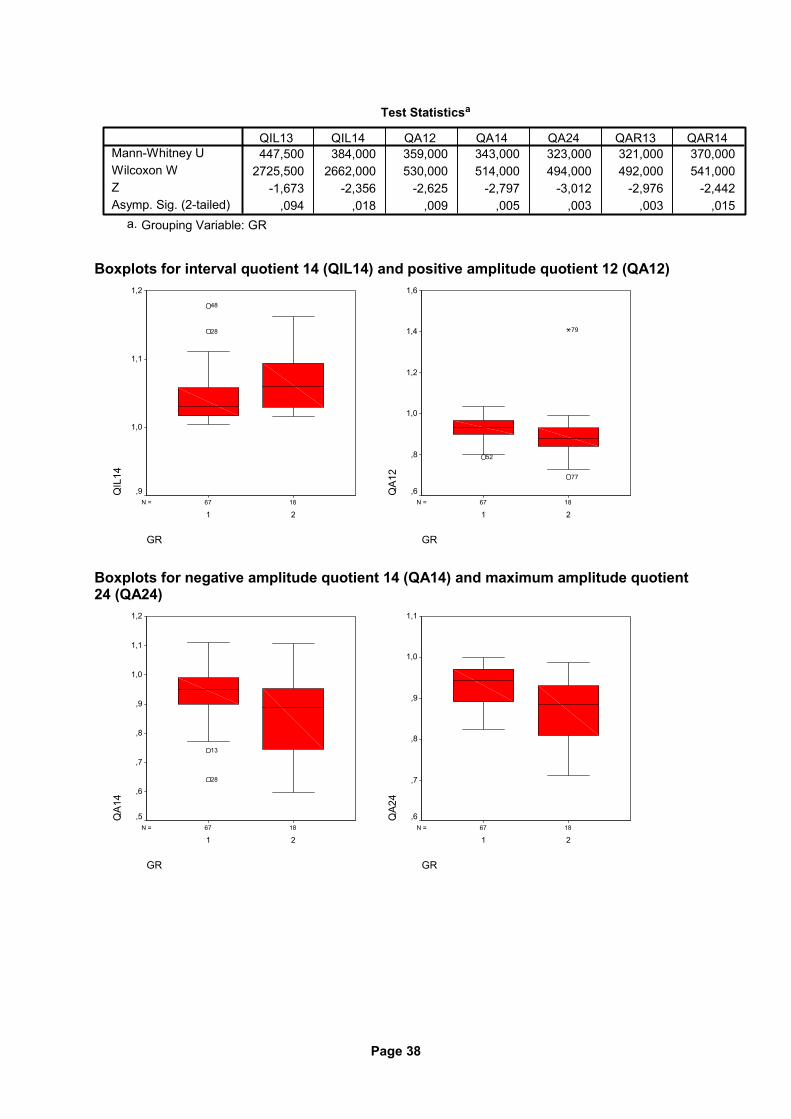
9.1.3 Interval, amplitude and area quotients
The analysis of the quotient evaluation demonstrated also for all quotients significant differ-
ences between group 1 and group 2, only for the interval quotient QIL13 this level was not
reached. This result indicates, that also for parameters, which were singular tested not sig-
nificant (either distal or proximal, e.g. interval IL14), that by combination of both entities (dis-
tal and proximal) into one variable the result becomes a significant level. The results are ad-
ditional displayed in the corresponding boxplots.
Page 38
Test Statisticsa
447,500 384,000 359,000 343,000 323,000 321,000 370,0002725,500 2662,000 530,000 514,000 494,000 492,000 541,000
-1,673 -2,356 -2,625 -2,797 -3,012 -2,976 -2,442,094 ,018 ,009 ,005 ,003 ,003 ,015
Mann-Whitney UWilcoxon WZAsymp. Sig. (2-tailed)
QIL13 QIL14 QA12 QA14 QA24 QAR13 QAR14
Grouping Variable: GRa.
Boxplots for interval quotient 14 (QIL14) and positive amplitude quotient 12 (QA12)
1867N =
GR
21
QIL
14
1,2
1,1
1,0
,9
28
48
1867N =
GR
21
QA1
2
1,6
1,4
1,2
1,0
,8
,6
77
79
52
Boxplots for negative amplitude quotient 14 (QA14) and maximum amplitude quotient 24 (QA24)
1867N =
GR
21
QA1
4
1,2
1,1
1,0
,9
,8
,7
,6
,5
13
28
1867N =
GR
21
QA2
4
1,1
1,0
,9
,8
,7
,6
Page 39
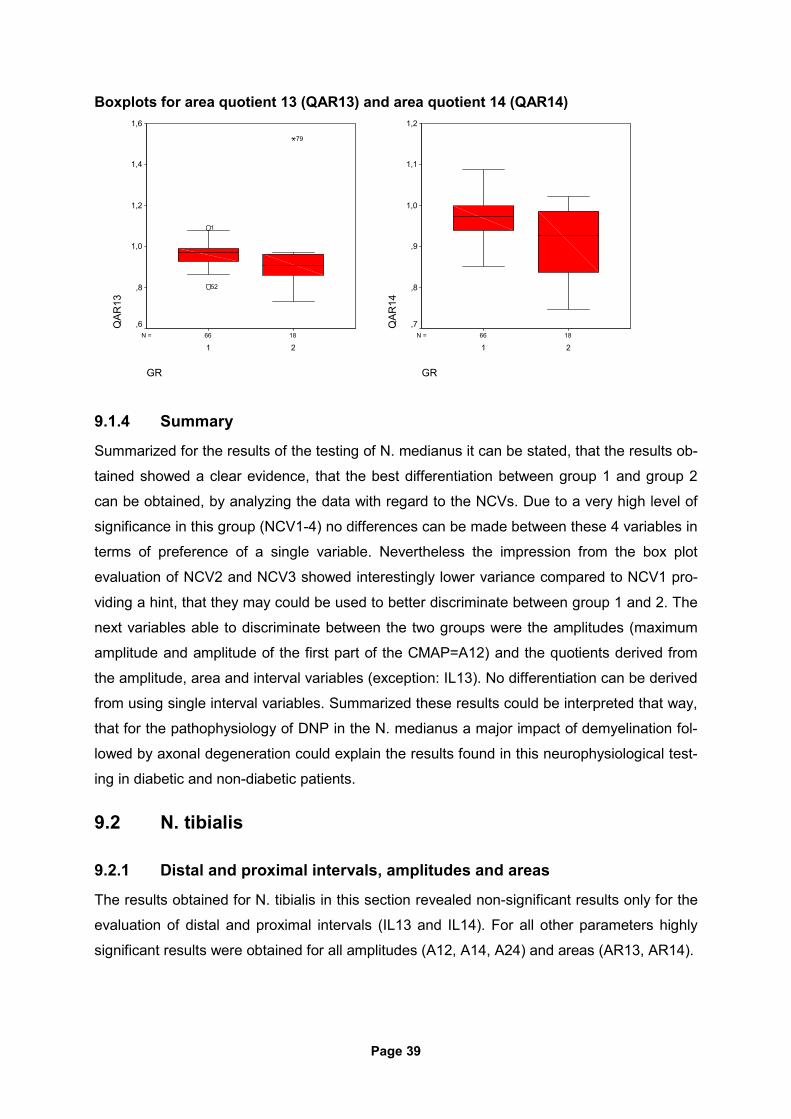
Boxplots for area quotient 13 (QAR13) and area quotient 14 (QAR14)
1866N =
GR
21
QAR
131,6
1,4
1,2
1,0
,8
,6
79
52
1
1866N =
GR
21
QAR
14
1,2
1,1
1,0
,9
,8
,7
9.1.4 Summary
Summarized for the results of the testing of N. medianus it can be stated, that the results ob-
tained showed a clear evidence, that the best differentiation between group 1 and group 2
can be obtained, by analyzing the data with regard to the NCVs. Due to a very high level of
significance in this group (NCV1-4) no differences can be made between these 4 variables in
terms of preference of a single variable. Nevertheless the impression from the box plot
evaluation of NCV2 and NCV3 showed interestingly lower variance compared to NCV1 pro-
viding a hint, that they may could be used to better discriminate between group 1 and 2. The
next variables able to discriminate between the two groups were the amplitudes (maximum
amplitude and amplitude of the first part of the CMAP=A12) and the quotients derived from
the amplitude, area and interval variables (exception: IL13). No differentiation can be derived
from using single interval variables. Summarized these results could be interpreted that way,
that for the pathophysiology of DNP in the N. medianus a major impact of demyelination fol-
lowed by axonal degeneration could explain the results found in this neurophysiological test-
ing in diabetic and non-diabetic patients.
9.2 N. tibialis
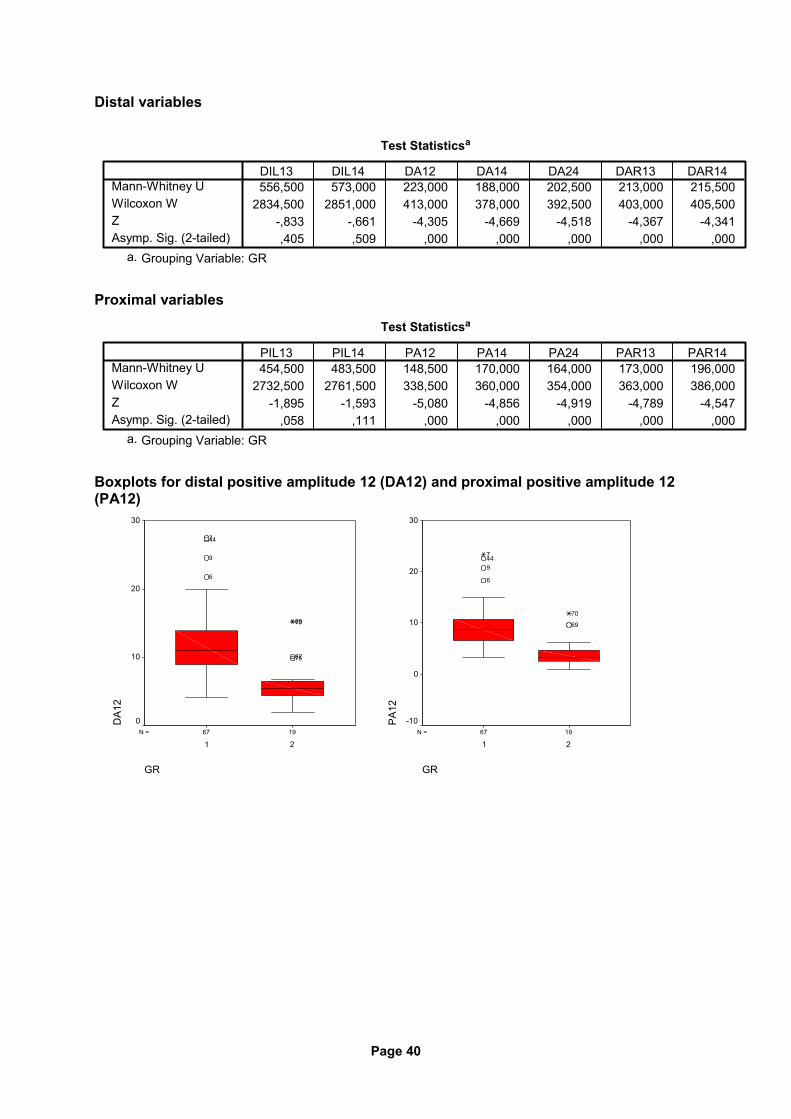
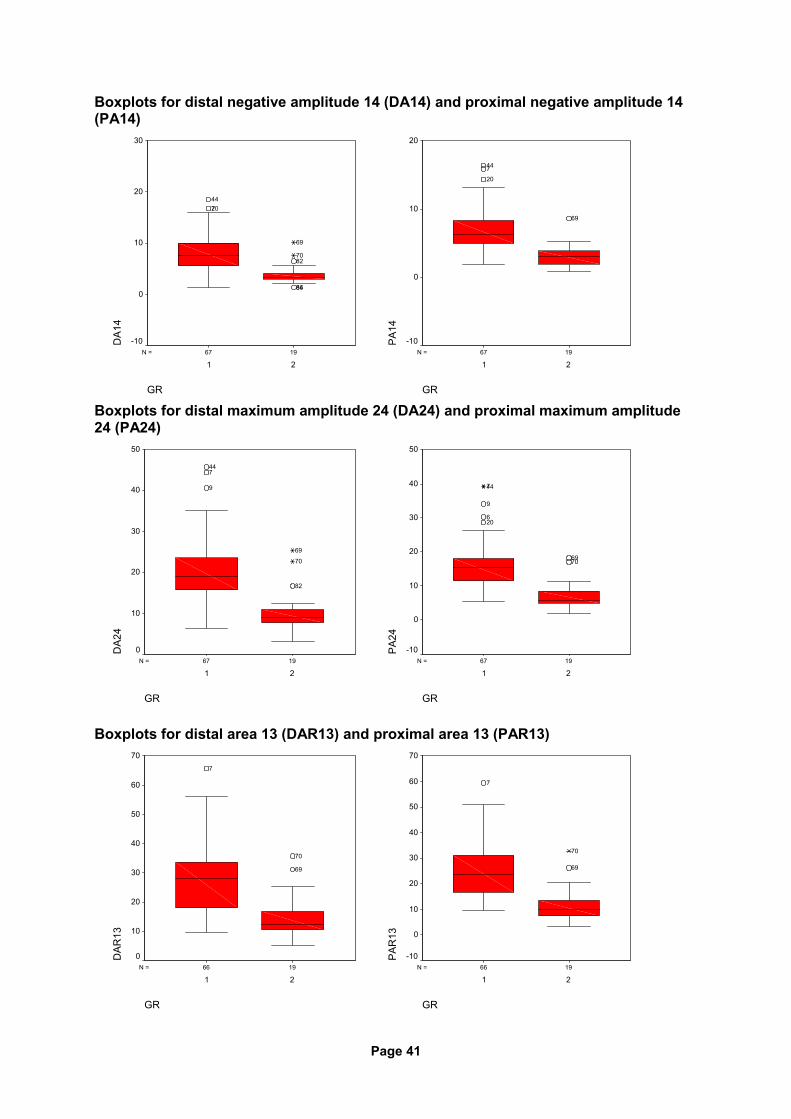
9.2.1 Distal and proximal intervals, amplitudes and areas
The results obtained for N. tibialis in this section revealed non-significant results only for the
evaluation of distal and proximal intervals (IL13 and IL14). For all other parameters highly
significant results were obtained for all amplitudes (A12, A14, A24) and areas (AR13, AR14).
Page 40
Distal variables
Test Statisticsa
556,500 573,000 223,000 188,000 202,500 213,000 215,5002834,500 2851,000 413,000 378,000 392,500 403,000 405,500
-,833 -,661 -4,305 -4,669 -4,518 -4,367 -4,341,405 ,509 ,000 ,000 ,000 ,000 ,000
Mann-Whitney UWilcoxon WZAsymp. Sig. (2-tailed)
DIL13 DIL14 DA12 DA14 DA24 DAR13 DAR14
Grouping Variable: GRa.
Proximal variables
Test Statisticsa
454,500 483,500 148,500 170,000 164,000 173,000 196,0002732,500 2761,500 338,500 360,000 354,000 363,000 386,000
-1,895 -1,593 -5,080 -4,856 -4,919 -4,789 -4,547,058 ,111 ,000 ,000 ,000 ,000 ,000
Mann-Whitney UWilcoxon WZAsymp. Sig. (2-tailed)
PIL13 PIL14 PA12 PA14 PA24 PAR13 PAR14
Grouping Variable: GRa.
Boxplots for distal positive amplitude 12 (DA12) and proximal positive amplitude 12 (PA12)
1967N =
GR
21
DA1
2
30
20
10
0
7582
7069
6
9
447
1967N =
GR
21
PA
12
30
20
10
0
-10
69
70
6
9447
Page 41
Boxplots for distal negative amplitude 14 (DA14) and proximal negative amplitude 14 (PA14)
1967N =
GR
21
DA1
4
30
20
10
0
-10
8486
8270
69
20744
1967N =
GR
21
PA
14
20
10
0
-10
69
20744
Boxplots for distal maximum amplitude 24 (DA24) and proximal maximum amplitude 24 (PA24)
1967N =
GR
21
DA2
4
50
40
30
20
10
0
82
70
69
9
744
1967N =
GR
21
PA
24
50
40
30
20
10
0
-10
7069
206
9
447
Boxplots for distal area 13 (DAR13) and proximal area 13 (PAR13)
1966N =
GR
21
DAR
13
70
60
50
40
30
20
10
0
69
70
7
1966N =
GR
21
PA
R13
70
60
50
40
30
20
10
0
-10
69
70
7
Page 42
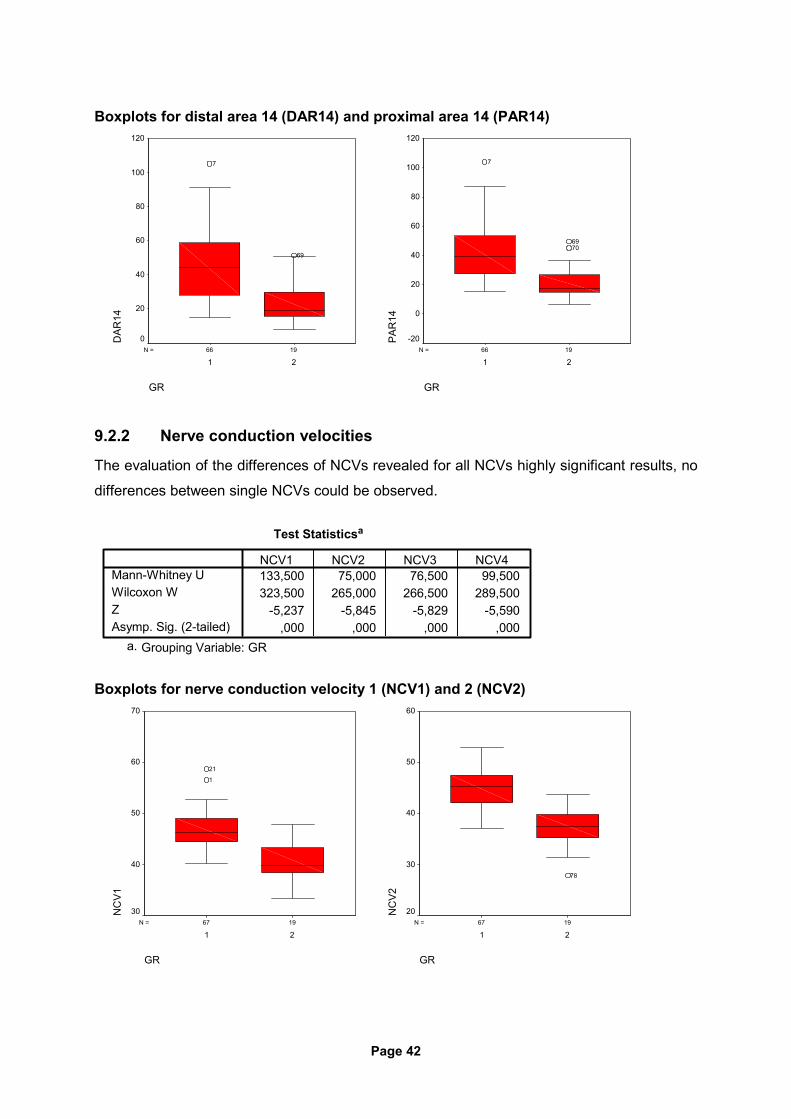
Boxplots for distal area 14 (DAR14) and proximal area 14 (PAR14)
1966N =
GR
21
DAR
14
120
100
80
60
40
20
0
69
7
1966N =
GR
21
PA
R14
120
100
80
60
40
20
0
-20
7069
7
9.2.2 Nerve conduction velocities
The evaluation of the differences of NCVs revealed for all NCVs highly significant results, no
differences between single NCVs could be observed.
Test Statisticsa
133,500 75,000 76,500 99,500323,500 265,000 266,500 289,500
-5,237 -5,845 -5,829 -5,590,000 ,000 ,000 ,000
Mann-Whitney UWilcoxon WZAsymp. Sig. (2-tailed)
NCV1 NCV2 NCV3 NCV4
Grouping Variable: GRa.
Boxplots for nerve conduction velocity 1 (NCV1) and 2 (NCV2)
1967N =
GR
21
NC
V1
70
60
50
40
30
1
21
1967N =
GR
21
NC
V2
60
50
40
30
20
78
Page 43
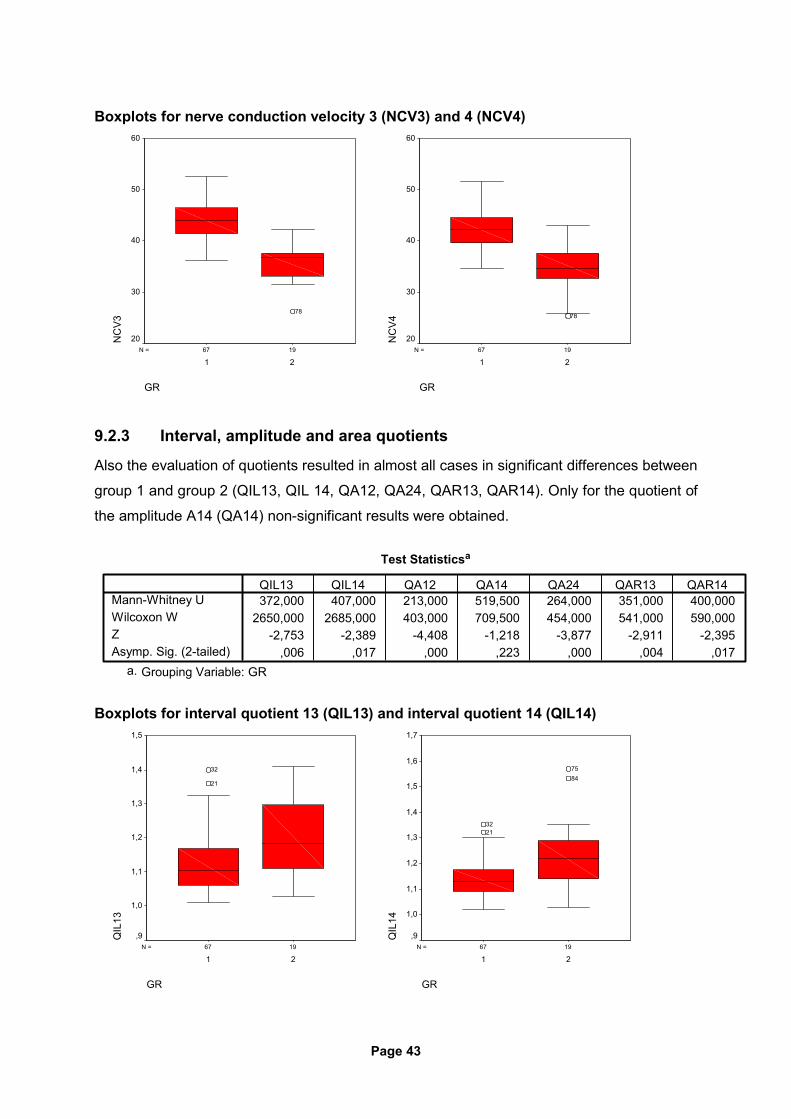
Boxplots for nerve conduction velocity 3 (NCV3) and 4 (NCV4)
1967N =
GR
21
NC
V3
60
50
40
30
20
78
1967N =
GR
21
NC
V4
60
50
40
30
20
78
9.2.3 Interval, amplitude and area quotients
Also the evaluation of quotients resulted in almost all cases in significant differences between
group 1 and group 2 (QIL13, QIL 14, QA12, QA24, QAR13, QAR14). Only for the quotient of
the amplitude A14 (QA14) non-significant results were obtained.
Test Statisticsa
372,000 407,000 213,000 519,500 264,000 351,000 400,0002650,000 2685,000 403,000 709,500 454,000 541,000 590,000
-2,753 -2,389 -4,408 -1,218 -3,877 -2,911 -2,395,006 ,017 ,000 ,223 ,000 ,004 ,017
Mann-Whitney UWilcoxon WZAsymp. Sig. (2-tailed)
QIL13 QIL14 QA12 QA14 QA24 QAR13 QAR14
Grouping Variable: GRa.
Boxplots for interval quotient 13 (QIL13) and interval quotient 14 (QIL14)
1967N =
GR
21
QIL
13
1,5
1,4
1,3
1,2
1,1
1,0
,9
21
32
1967N =
GR
21
QIL
14
1,7
1,6
1,5
1,4
1,3
1,2
1,1
1,0
,9
8475
2132
Page 44
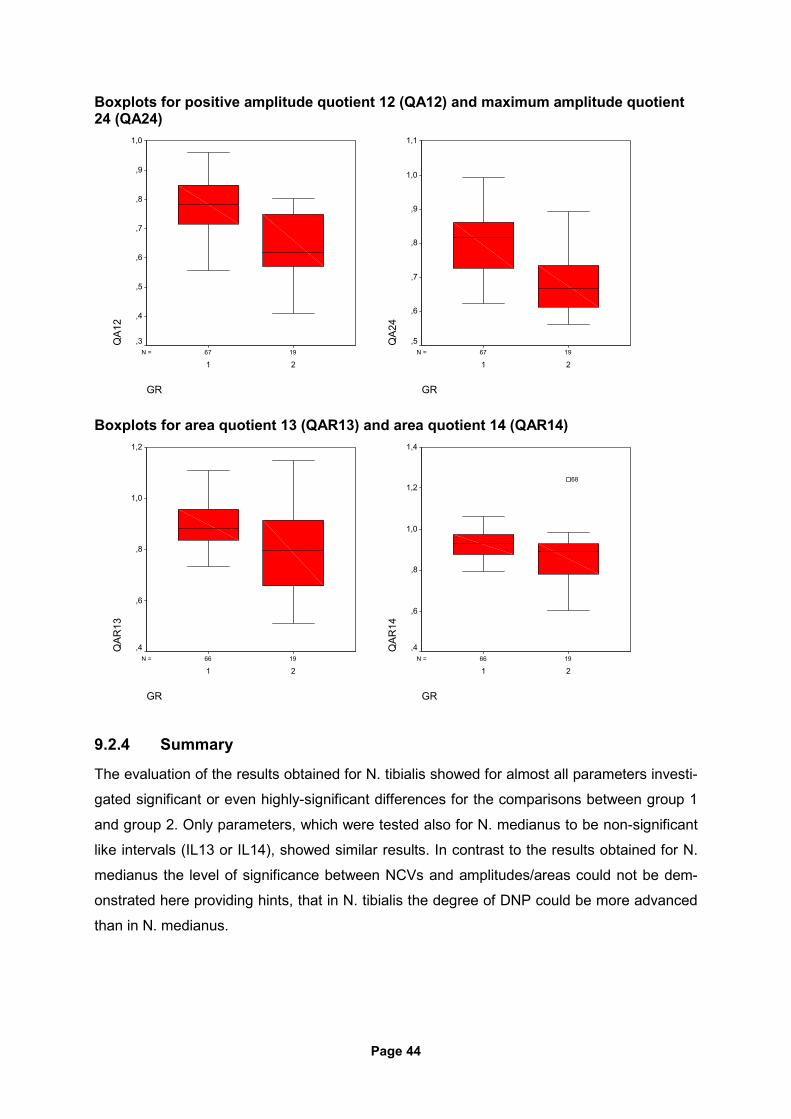
Boxplots for positive amplitude quotient 12 (QA12) and maximum amplitude quotient 24 (QA24)
1967N =
GR
21
QA1
2
1,0
,9
,8
,7
,6
,5
,4
,31967N =
GR
21
QA2
4
1,1
1,0
,9
,8
,7
,6
,5
Boxplots for area quotient 13 (QAR13) and area quotient 14 (QAR14)
1966N =
GR
21
QAR
13
1,2
1,0
,8
,6
,41966N =
GR
21
QAR
14
1,4
1,2
1,0
,8
,6
,4
68
9.2.4 Summary
The evaluation of the results obtained for N. tibialis showed for almost all parameters investi-
gated significant or even highly-significant differences for the comparisons between group 1
and group 2. Only parameters, which were tested also for N. medianus to be non-significant
like intervals (IL13 or IL14), showed similar results. In contrast to the results obtained for N.
medianus the level of significance between NCVs and amplitudes/areas could not be dem-
onstrated here providing hints, that in N. tibialis the degree of DNP could be more advanced
than in N. medianus.
Page 45
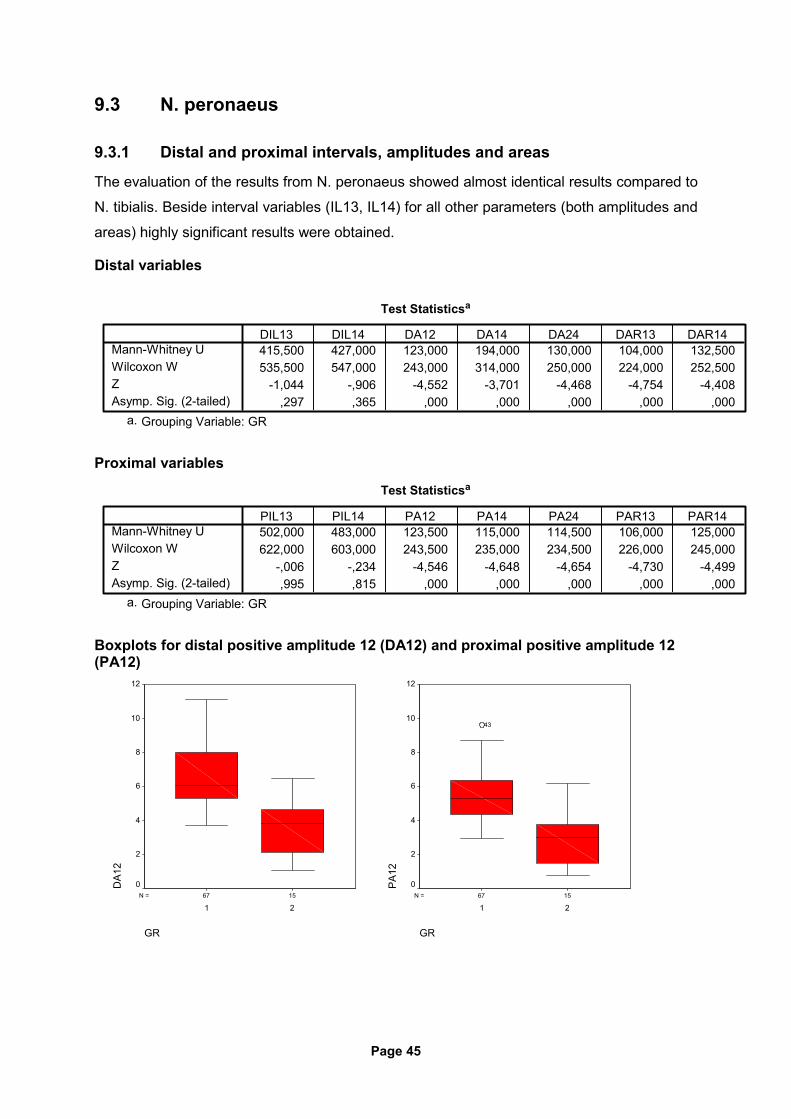
9.3 N. peronaeus
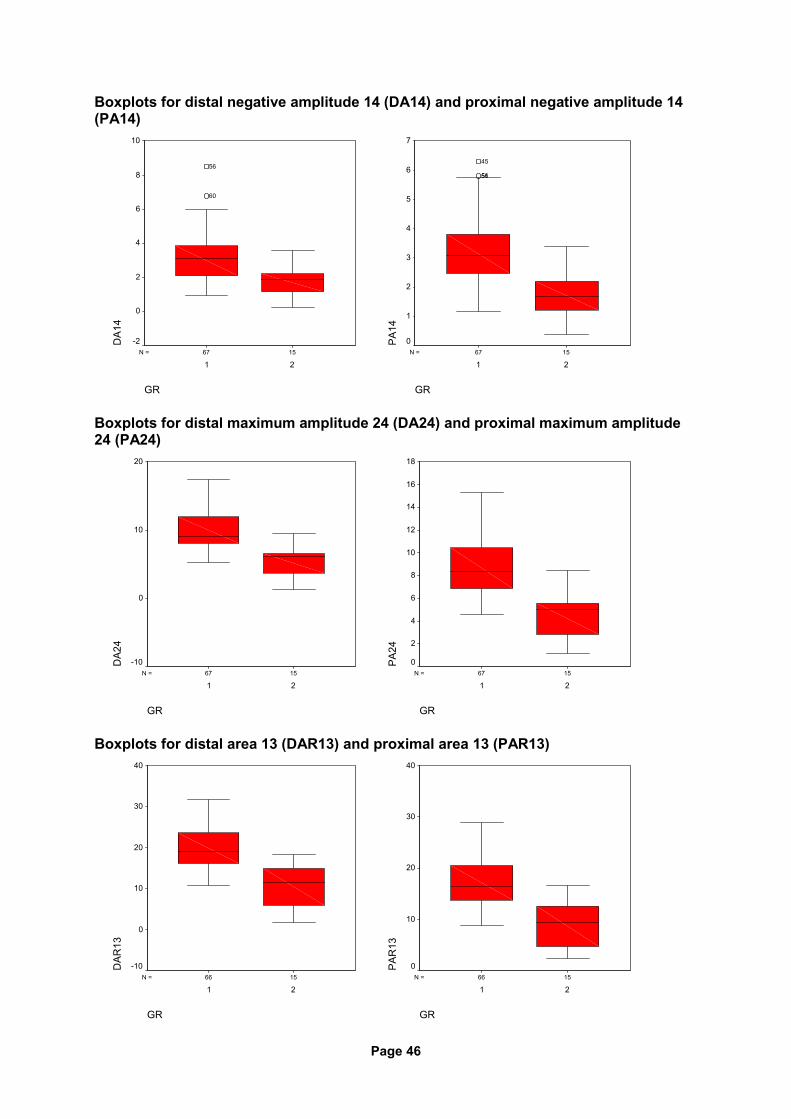
9.3.1 Distal and proximal intervals, amplitudes and areas
The evaluation of the results from N. peronaeus showed almost identical results compared to
N. tibialis. Beside interval variables (IL13, IL14) for all other parameters (both amplitudes and
areas) highly significant results were obtained.
Distal variables
Test Statisticsa
415,500 427,000 123,000 194,000 130,000 104,000 132,500535,500 547,000 243,000 314,000 250,000 224,000 252,500
-1,044 -,906 -4,552 -3,701 -4,468 -4,754 -4,408,297 ,365 ,000 ,000 ,000 ,000 ,000
Mann-Whitney UWilcoxon WZAsymp. Sig. (2-tailed)
DIL13 DIL14 DA12 DA14 DA24 DAR13 DAR14
Grouping Variable: GRa.
Proximal variables
Test Statisticsa
502,000 483,000 123,500 115,000 114,500 106,000 125,000622,000 603,000 243,500 235,000 234,500 226,000 245,000
-,006 -,234 -4,546 -4,648 -4,654 -4,730 -4,499,995 ,815 ,000 ,000 ,000 ,000 ,000
Mann-Whitney UWilcoxon WZAsymp. Sig. (2-tailed)
PIL13 PIL14 PA12 PA14 PA24 PAR13 PAR14
Grouping Variable: GRa.
Boxplots for distal positive amplitude 12 (DA12) and proximal positive amplitude 12 (PA12)
1567N =
GR
21
DA1
2
12
10
8
6
4
2
01567N =
GR
21
PA
12
12
10
8
6
4
2
0
43
Page 46
Boxplots for distal negative amplitude 14 (DA14) and proximal negative amplitude 14 (PA14)
1567N =
GR
21
DA1
4
10
8
6
4
2
0
-2
60
56
1567N =
GR
21
PA
14
7
6
5
4
3
2
1
0
5651
45
Boxplots for distal maximum amplitude 24 (DA24) and proximal maximum amplitude 24 (PA24)
1567N =
GR
21
DA2
4
20
10
0
-101567N =
GR
21
PA
24
18
16
14
12
10
8
6
4
2
0
Boxplots for distal area 13 (DAR13) and proximal area 13 (PAR13)
1566N =
GR
21
DAR
13
40
30
20
10
0
-101566N =
GR
21
PA
R13
40
30
20
10
0
Page 47
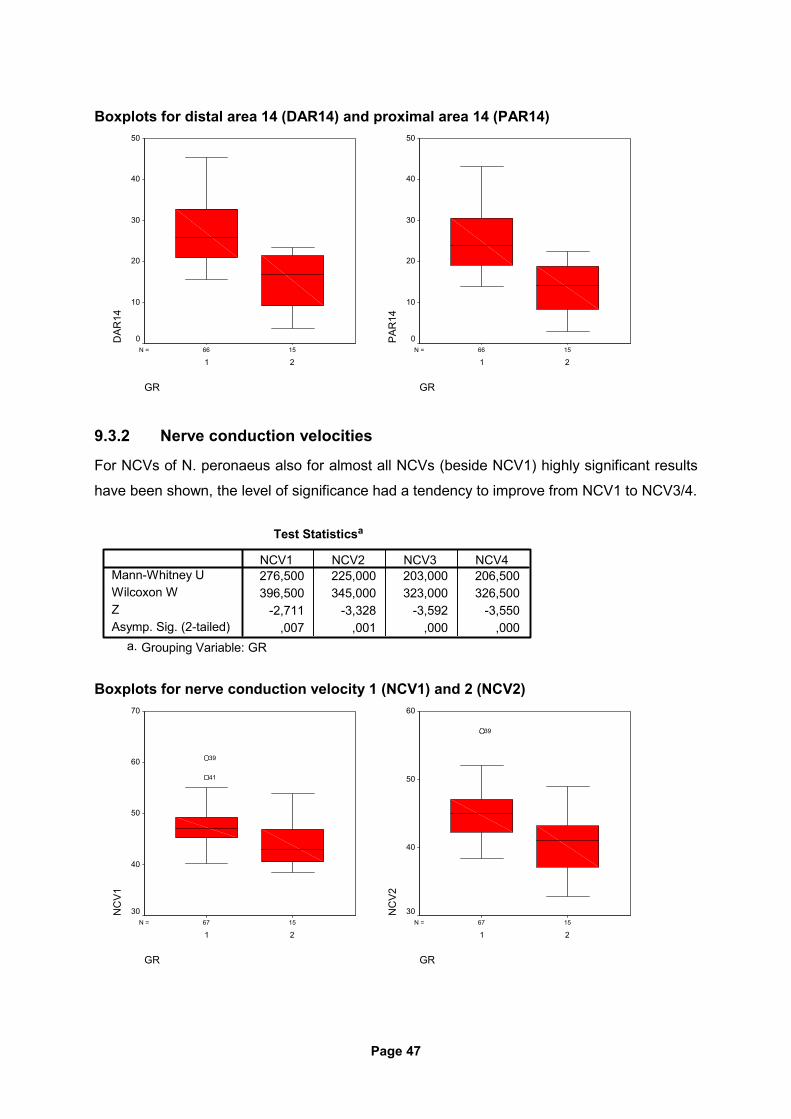
Boxplots for distal area 14 (DAR14) and proximal area 14 (PAR14)
1566N =
GR
21
DAR
14
50
40
30
20
10
01566N =
GR
21
PA
R14
50
40
30
20
10
0
9.3.2 Nerve conduction velocities
For NCVs of N. peronaeus also for almost all NCVs (beside NCV1) highly significant results
have been shown, the level of significance had a tendency to improve from NCV1 to NCV3/4.
Test Statisticsa
276,500 225,000 203,000 206,500396,500 345,000 323,000 326,500
-2,711 -3,328 -3,592 -3,550,007 ,001 ,000 ,000
Mann-Whitney UWilcoxon WZAsymp. Sig. (2-tailed)
NCV1 NCV2 NCV3 NCV4
Grouping Variable: GRa.
Boxplots for nerve conduction velocity 1 (NCV1) and 2 (NCV2)
1567N =
GR
21
NC
V1
70
60
50
40
30
41
39
1567N =
GR
21
NC
V2
60
50
40
30
39
Page 48
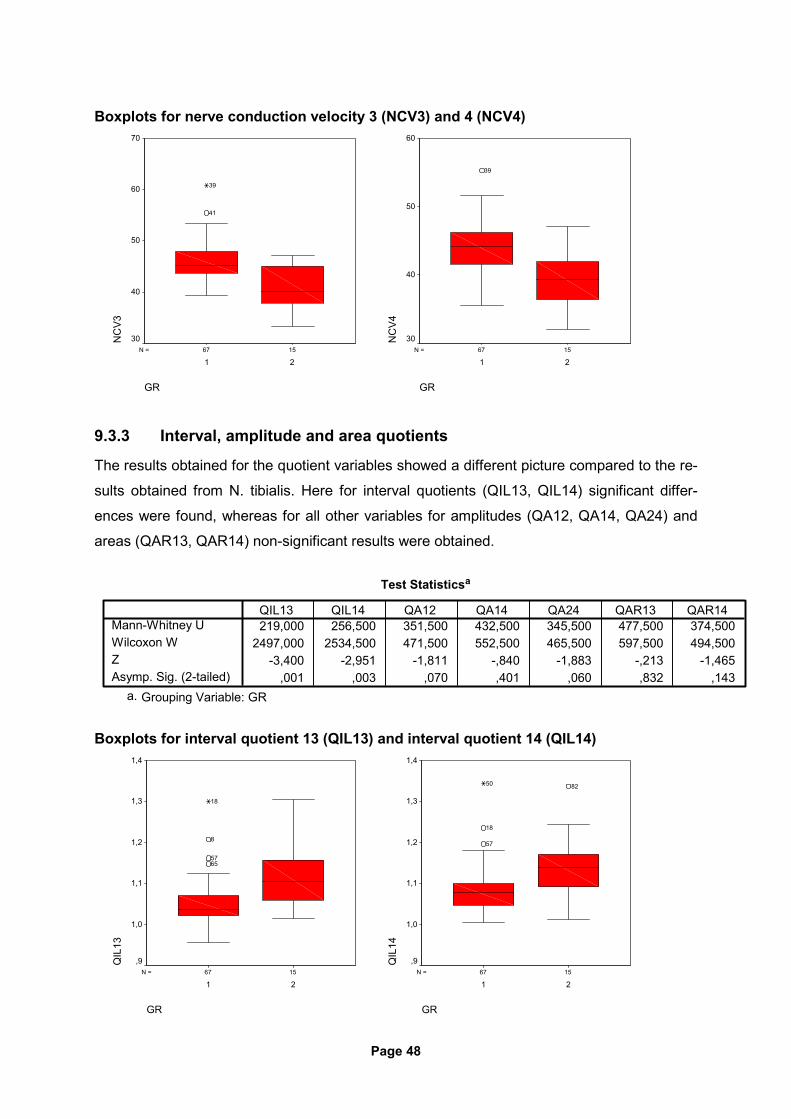
Boxplots for nerve conduction velocity 3 (NCV3) and 4 (NCV4)
1567N =
GR
21
NC
V3
70
60
50
40
30
41
39
1567N =
GR
21
NC
V4
60
50
40
30
39
9.3.3 Interval, amplitude and area quotients
The results obtained for the quotient variables showed a different picture compared to the re-
sults obtained from N. tibialis. Here for interval quotients (QIL13, QIL14) significant differ-
ences were found, whereas for all other variables for amplitudes (QA12, QA14, QA24) and
areas (QAR13, QAR14) non-significant results were obtained.
Test Statisticsa
219,000 256,500 351,500 432,500 345,500 477,500 374,5002497,000 2534,500 471,500 552,500 465,500 597,500 494,500
-3,400 -2,951 -1,811 -,840 -1,883 -,213 -1,465,001 ,003 ,070 ,401 ,060 ,832 ,143
Mann-Whitney UWilcoxon WZAsymp. Sig. (2-tailed)
QIL13 QIL14 QA12 QA14 QA24 QAR13 QAR14
Grouping Variable: GRa.
Boxplots for interval quotient 13 (QIL13) and interval quotient 14 (QIL14)
1567N =
GR
21
QIL
13
1,4
1,3
1,2
1,1
1,0
,9
6557
8
18
1567N =
GR
21
QIL
14
1,4
1,3
1,2
1,1
1,0
,9
82
57
18
50
Page 49
9.3.4 Summary
The analysis of the results for N. peronaeus showed similar results compared to N. tibialis.
The results obtained with the highest level of significance were found for amplitude and area
variables, for NCV variables this could be confirmed with a negligible exception for NCV1/2.
The quotient evaluation showed in contrast to the results of N. tibialis significant results only
for interval quotients (QIL13, QIL14), all other parameters remained with non-significant re-
sults. The observed shift from non-significant results for single interval variables to significant
results in quotient intervals has been demonstrated also in the results of N. medianus and N.
tibialis. These results indicate, that the for N. peronaeus variable quotients are not useful fro
the differentiation between patient group 1 and 2 (exception: interval quotients).
10. DISCUSSION
As already discussed in the section 4. (Diagnosis of diabetic neuropathies [4]) the measure-
ments used to diagnose DNP vary widely and are still in discussion. In clinical routine the
items tested for diagnosis of DNP may be different from the items tested e.g. in clinical re-
search projects. For daily practice of diagnostic tools tests applied shall ideally fulfill the fol-
lowing standards:
1) Easy to apply with low effort in time,
2) low inter-observer variation,
3) good correlation with clinical progress of the disease, and
4) non-invasive to the patient with a low risk profile.
The application of peripheral motor nerve conduction testing was proven to serve these
standards and is used widely by neurologists, where patients with suspicion of DNP are
commonly diagnosed and treated. The advantages of this diagnostic tool has led to the fur-
ther developments for the purpose of diagnosis of different peripheral nerve disorders (23).
Nevertheless the evaluations carried out in this study comparing this two patient groups con-
sisting of either normal subjects or patients suspicious of having DNP were not conducted
yet. The advantages described above for nerve conduction studies qualify this method to be
used for the diagnosis of DNP. Due to the fact, that in DNP nerve fibers of all diameters are
affected (16) and a correlation exists between duration of diabetes mellitus and the progress
of nerve conduction slowing in diabetic patients (1) this method should be also applicable to
detect early changes of the peripheral nervous system in diabetic patients. It is well known,
that the evaluation of nerve conduction velocity in peripheral nerves characterizes only the
Page 50
nerve fibers with the fastest conduction velocities, this test has only limited evidence for the
testing and evaluation of peripheral nerves (41). Indeed the underlying pathogenesis of DNP
is still in discussion, both axonal degeneration and demyelinisation are probably involved in
different stages of the disease (37). Therefore this study aims to characterize the function of
motoric peripheral nerves to probably identify a demyelinisation process or axonal degenera-
tion or both in diabetic patients. To further evaluate the nerve function in terms of conduction
velocity the characteristics of the compound muscle action potential shall be analyzed mean-
ing, that beyond the maximum nerve conduction velocity also the derived nerve conduction
velocities of the characteristic biphasic compound muscle action potential shall be analyzed,
which were defined to be NCV 2 to 4 (see 8.2). With this measure also nerve fibers repre-
senting slower conduction velocities shall be analyzed. Possible axonal degeneration shall
be evaluated by testing the different amplitudes of the CMAP (maximum, positive amplitude,
negative amplitude) for distal and proximal stimulation. Usually the area under the curve,
which represents the quantity of nerve fibers stimulated, is almost comparable for distal and
proximal stimulation in normal subjects (24). If a process like axonal degeneration occurs in
DNP, then usually nerve fibers “die back” meaning that beginning with the distal end of the
nerve fibers the degenerative process starts moving forward to proximal segments. This
process should therefore not influence the quantity of nerve fibers stimulated, so that that for
supramaximum stimulation the area under the curve is almost comparable both for distal and
proximal stimulation. This issue could be identified by calculation of quotients derived from
distal and proximal areas. In general the calculation of quotients for the variables amplitudes
and intervals could serve to characterize the dispersion of the CMAP from distal to proximal
stimulation, which could be explained by the diverse conduction of different nerve fibers
within the peripheral nerve, which is naturally more pronounced for longer distances meaning
proximal stimulation compared to distal stimulation. This dispersion mechanism will be ana-
lyzed by calculation of the quotients of amplitudes and intervals from distal to proximal stimu-
lation.
All parameters tested are summarized in the following section. Results were categorized as
following:
1. distal parameters (intervals, amplitudes areas)
2. proximal parameters (Intervals, amplitudes, areas)
3. nerve conduction velocities (maximum nerve conduction velocity = NCV1 and follow-
ing nerve conduction velocities = NCV 2-4)
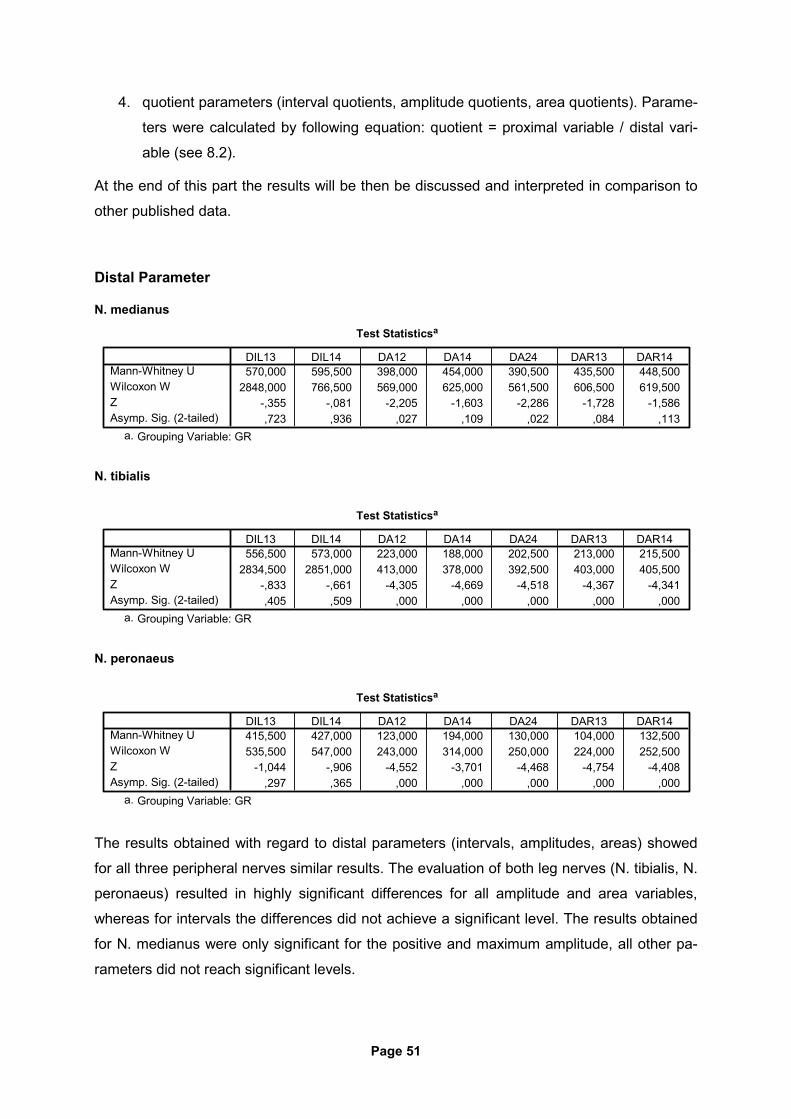
Page 51
4. quotient parameters (interval quotients, amplitude quotients, area quotients). Parame-
ters were calculated by following equation: quotient = proximal variable / distal vari-
able (see 8.2).
At the end of this part the results will be then be discussed and interpreted in comparison to
other published data.
Distal Parameter
N. medianus
Test Statisticsa
570,000 595,500 398,000 454,000 390,500 435,500 448,5002848,000 766,500 569,000 625,000 561,500 606,500 619,500
-,355 -,081 -2,205 -1,603 -2,286 -1,728 -1,586,723 ,936 ,027 ,109 ,022 ,084 ,113
Mann-Whitney UWilcoxon WZAsymp. Sig. (2-tailed)
DIL13 DIL14 DA12 DA14 DA24 DAR13 DAR14
Grouping Variable: GRa.
N. tibialis
Test Statisticsa
556,500 573,000 223,000 188,000 202,500 213,000 215,5002834,500 2851,000 413,000 378,000 392,500 403,000 405,500
-,833 -,661 -4,305 -4,669 -4,518 -4,367 -4,341,405 ,509 ,000 ,000 ,000 ,000 ,000
Mann-Whitney UWilcoxon WZAsymp. Sig. (2-tailed)
DIL13 DIL14 DA12 DA14 DA24 DAR13 DAR14
Grouping Variable: GRa.
N. peronaeus
Test Statisticsa
415,500 427,000 123,000 194,000 130,000 104,000 132,500535,500 547,000 243,000 314,000 250,000 224,000 252,500
-1,044 -,906 -4,552 -3,701 -4,468 -4,754 -4,408,297 ,365 ,000 ,000 ,000 ,000 ,000
Mann-Whitney UWilcoxon WZAsymp. Sig. (2-tailed)
DIL13 DIL14 DA12 DA14 DA24 DAR13 DAR14
Grouping Variable: GRa.
The results obtained with regard to distal parameters (intervals, amplitudes, areas) showed
for all three peripheral nerves similar results. The evaluation of both leg nerves (N. tibialis, N.
peronaeus) resulted in highly significant differences for all amplitude and area variables,
whereas for intervals the differences did not achieve a significant level. The results obtained
for N. medianus were only significant for the positive and maximum amplitude, all other pa-
rameters did not reach significant levels.
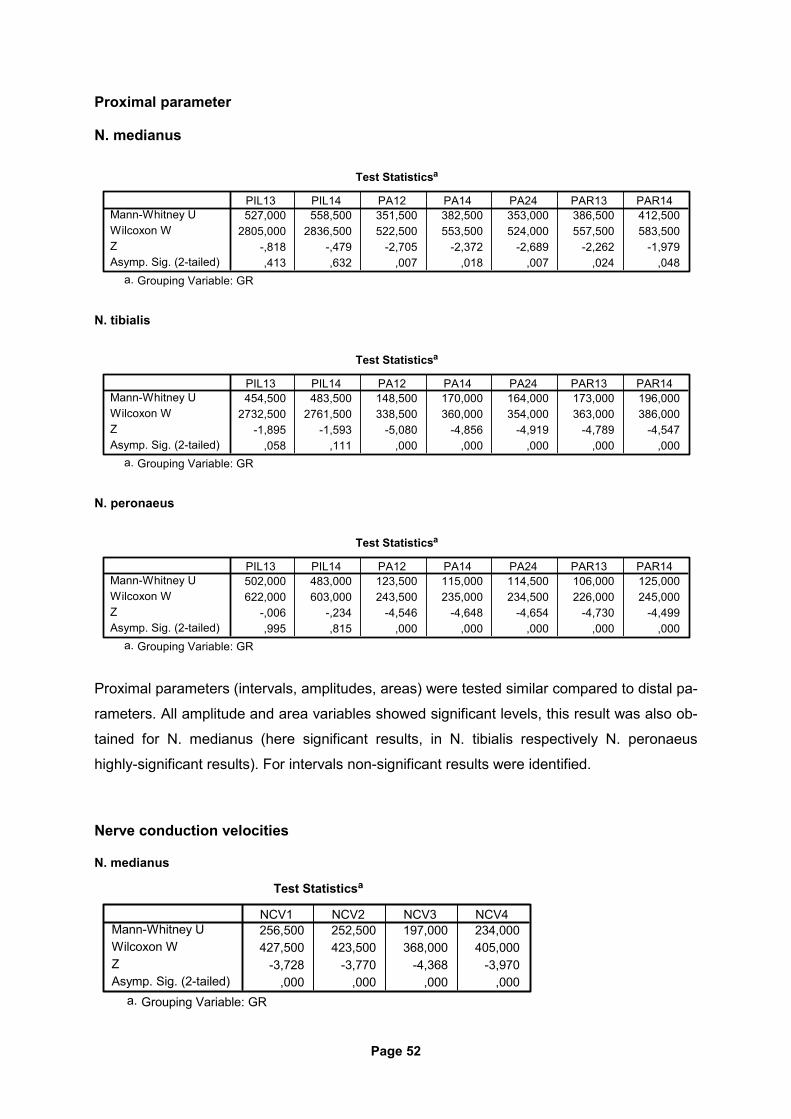
Page 52
Proximal parameter
N. medianus
Test Statisticsa
527,000 558,500 351,500 382,500 353,000 386,500 412,5002805,000 2836,500 522,500 553,500 524,000 557,500 583,500
-,818 -,479 -2,705 -2,372 -2,689 -2,262 -1,979,413 ,632 ,007 ,018 ,007 ,024 ,048
Mann-Whitney UWilcoxon WZAsymp. Sig. (2-tailed)
PIL13 PIL14 PA12 PA14 PA24 PAR13 PAR14
Grouping Variable: GRa.
N. tibialis
Test Statisticsa
454,500 483,500 148,500 170,000 164,000 173,000 196,0002732,500 2761,500 338,500 360,000 354,000 363,000 386,000
-1,895 -1,593 -5,080 -4,856 -4,919 -4,789 -4,547,058 ,111 ,000 ,000 ,000 ,000 ,000
Mann-Whitney UWilcoxon WZAsymp. Sig. (2-tailed)
PIL13 PIL14 PA12 PA14 PA24 PAR13 PAR14
Grouping Variable: GRa.
N. peronaeus
Test Statisticsa
502,000 483,000 123,500 115,000 114,500 106,000 125,000622,000 603,000 243,500 235,000 234,500 226,000 245,000
-,006 -,234 -4,546 -4,648 -4,654 -4,730 -4,499,995 ,815 ,000 ,000 ,000 ,000 ,000
Mann-Whitney UWilcoxon WZAsymp. Sig. (2-tailed)
PIL13 PIL14 PA12 PA14 PA24 PAR13 PAR14
Grouping Variable: GRa.
Proximal parameters (intervals, amplitudes, areas) were tested similar compared to distal pa-
rameters. All amplitude and area variables showed significant levels, this result was also ob-
tained for N. medianus (here significant results, in N. tibialis respectively N. peronaeus
highly-significant results). For intervals non-significant results were identified.
Nerve conduction velocities
N. medianus
Test Statisticsa
256,500 252,500 197,000 234,000427,500 423,500 368,000 405,000
-3,728 -3,770 -4,368 -3,970,000 ,000 ,000 ,000
Mann-Whitney UWilcoxon WZAsymp. Sig. (2-tailed)
NCV1 NCV2 NCV3 NCV4
Grouping Variable: GRa.
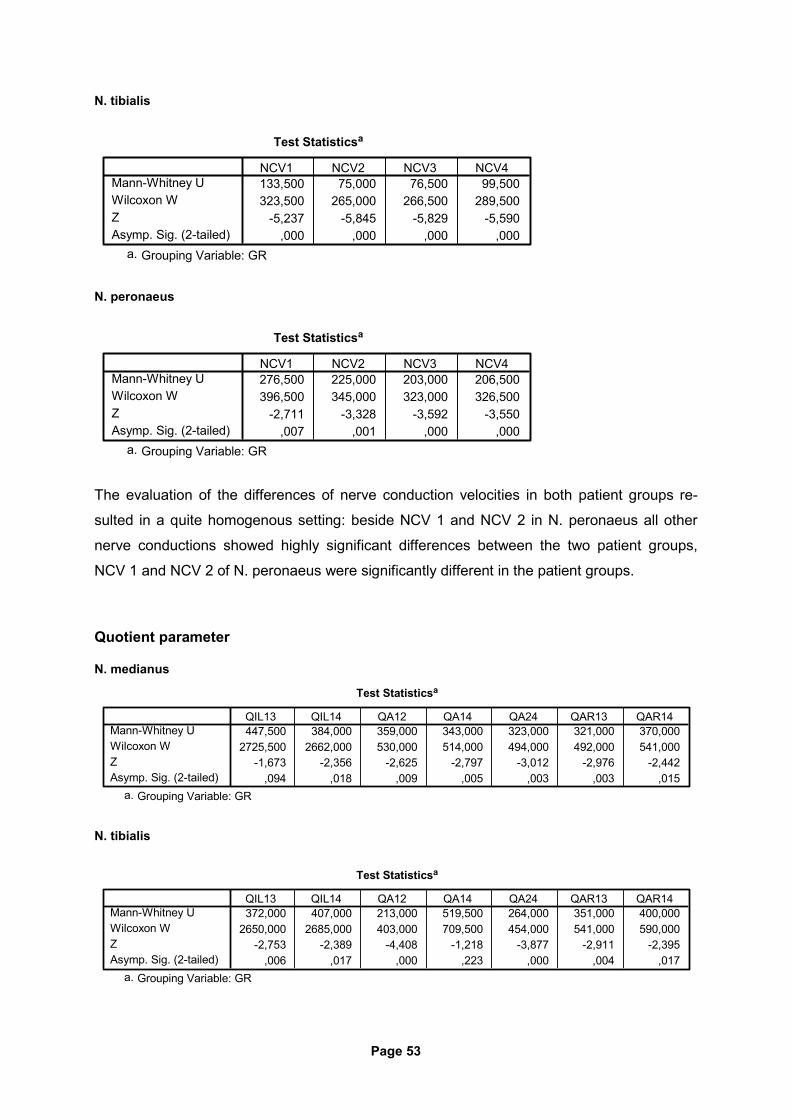
Page 53
N. tibialis
Test Statisticsa
133,500 75,000 76,500 99,500323,500 265,000 266,500 289,500
-5,237 -5,845 -5,829 -5,590,000 ,000 ,000 ,000
Mann-Whitney UWilcoxon WZAsymp. Sig. (2-tailed)
NCV1 NCV2 NCV3 NCV4
Grouping Variable: GRa.
N. peronaeus
Test Statisticsa
276,500 225,000 203,000 206,500396,500 345,000 323,000 326,500
-2,711 -3,328 -3,592 -3,550,007 ,001 ,000 ,000
Mann-Whitney UWilcoxon WZAsymp. Sig. (2-tailed)
NCV1 NCV2 NCV3 NCV4
Grouping Variable: GRa.
The evaluation of the differences of nerve conduction velocities in both patient groups re-
sulted in a quite homogenous setting: beside NCV 1 and NCV 2 in N. peronaeus all other
nerve conductions showed highly significant differences between the two patient groups,
NCV 1 and NCV 2 of N. peronaeus were significantly different in the patient groups.
Quotient parameter
N. medianus
Test Statisticsa
447,500 384,000 359,000 343,000 323,000 321,000 370,0002725,500 2662,000 530,000 514,000 494,000 492,000 541,000
-1,673 -2,356 -2,625 -2,797 -3,012 -2,976 -2,442,094 ,018 ,009 ,005 ,003 ,003 ,015
Mann-Whitney UWilcoxon WZAsymp. Sig. (2-tailed)
QIL13 QIL14 QA12 QA14 QA24 QAR13 QAR14
Grouping Variable: GRa.
N. tibialis
Test Statisticsa
372,000 407,000 213,000 519,500 264,000 351,000 400,0002650,000 2685,000 403,000 709,500 454,000 541,000 590,000
-2,753 -2,389 -4,408 -1,218 -3,877 -2,911 -2,395,006 ,017 ,000 ,223 ,000 ,004 ,017
Mann-Whitney UWilcoxon WZAsymp. Sig. (2-tailed)
QIL13 QIL14 QA12 QA14 QA24 QAR13 QAR14
Grouping Variable: GRa.
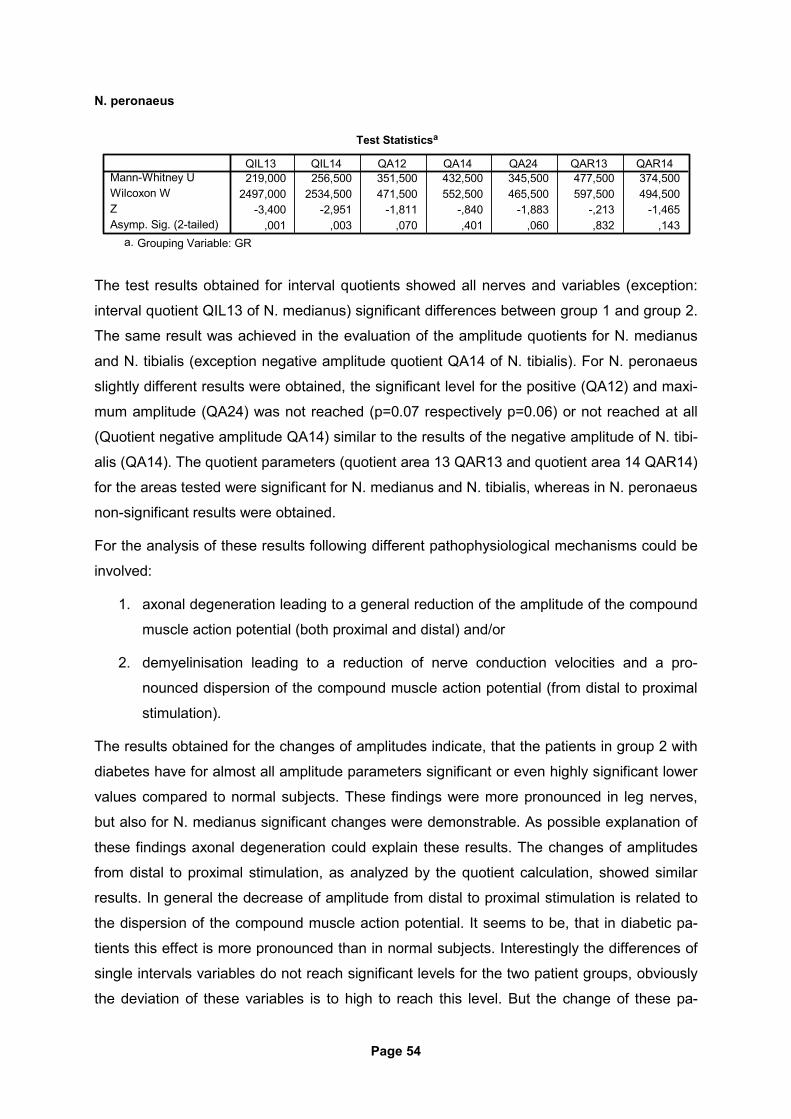
Page 54
N. peronaeus
Test Statisticsa
219,000 256,500 351,500 432,500 345,500 477,500 374,5002497,000 2534,500 471,500 552,500 465,500 597,500 494,500
-3,400 -2,951 -1,811 -,840 -1,883 -,213 -1,465,001 ,003 ,070 ,401 ,060 ,832 ,143
Mann-Whitney UWilcoxon WZAsymp. Sig. (2-tailed)
QIL13 QIL14 QA12 QA14 QA24 QAR13 QAR14
Grouping Variable: GRa.
The test results obtained for interval quotients showed all nerves and variables (exception:
interval quotient QIL13 of N. medianus) significant differences between group 1 and group 2.
The same result was achieved in the evaluation of the amplitude quotients for N. medianus
and N. tibialis (exception negative amplitude quotient QA14 of N. tibialis). For N. peronaeus
slightly different results were obtained, the significant level for the positive (QA12) and maxi-
mum amplitude (QA24) was not reached (p=0.07 respectively p=0.06) or not reached at all
(Quotient negative amplitude QA14) similar to the results of the negative amplitude of N. tibi-
alis (QA14). The quotient parameters (quotient area 13 QAR13 and quotient area 14 QAR14)
for the areas tested were significant for N. medianus and N. tibialis, whereas in N. peronaeus
non-significant results were obtained.
For the analysis of these results following different pathophysiological mechanisms could be
involved:
1. axonal degeneration leading to a general reduction of the amplitude of the compound
muscle action potential (both proximal and distal) and/or
2. demyelinisation leading to a reduction of nerve conduction velocities and a pro-
nounced dispersion of the compound muscle action potential (from distal to proximal
stimulation).
The results obtained for the changes of amplitudes indicate, that the patients in group 2 with
diabetes have for almost all amplitude parameters significant or even highly significant lower
values compared to normal subjects. These findings were more pronounced in leg nerves,
but also for N. medianus significant changes were demonstrable. As possible explanation of
these findings axonal degeneration could explain these results. The changes of amplitudes
from distal to proximal stimulation, as analyzed by the quotient calculation, showed similar
results. In general the decrease of amplitude from distal to proximal stimulation is related to
the dispersion of the compound muscle action potential. It seems to be, that in diabetic pa-
tients this effect is more pronounced than in normal subjects. Interestingly the differences of
single intervals variables do not reach significant levels for the two patient groups, obviously
the deviation of these variables is to high to reach this level. But the change of these pa-
Page 55
rameters from distal to proximal stimulation, as tested by the quotient calculation, reaches
significant levels (exception: quotient QIL13 of N. medianus). This indicates, that also for this
parameter of dispersion differences exist between the two patient groups. The evaluation of
changes of areas from distal to proximal stimulation provide similar results, nevertheless the
results obtained for N. peronaeus did not reach significant levels. The changes of nerve con-
duction velocities provide in most cases (exception: NCV1/NCV2 of N. peronaeus) highly
significant results between the patient groups. These changes indicate, that in diabetic pa-
tients obviously a demyelinisation process is involved.
11. CONCLUSION
As defined in the section 6. Aim of the study (6) the zero-hypothesis of this study was that
parameters beside the standard parameters are not able to differentiate with significant re-
sults between the two patient groups in order to proof, whether other as standard variables
can differentiate between these two patient groups.
The standard parameters usually applied for the neurophysiological testing in patients suspi-
cious of having diabetic neuropathy are maximum nerve conduction velocity (NCV1) and the
amplitude of the compound muscle action potential (A24). In addition to these parameters in
this study further variables so as
1) nerve conduction velocities (NCV 2, 3, 4),
2) different parts of the amplitude (positive part=amplitude A12, negative ampli-
tude=A14),
3) intervals (interval 13=IL13 and 14=IL14),
4) areas (area 13=AR13 and 14=AR14), and
5) quotients of these variables (quotient of intervals 13=QIL13 and 14=QIL14; quo-
tients of amplitudes A12=QA12, A14=QA14, A24=QA24; quotients of areas
13=QAR13 and 14=QAR14) (see also 8.2)
were analyzed and evaluated.
The results obtained for nerve conduction velocities were all statistical significant different for
the patient groups tested. This finding was demonstrated both for the conventional meaning
maximum nerve conduction velocity (NCV1) as well as for the other nerve conduction veloci-
ties (NCV2, 3, 4).
Page 56
The evaluation for amplitude parameters showed statistical significant differences for almost
all tested variable (both maximum amplitudes as well as positive/negatives amplitudes), only
the negative amplitude of N. medianus showed non-significant results.
The changes of intervals were tested with non-significant results for all variables.
Almost all area variables were tested to be statistical significant different (exception: distal
area 13 DAR13 and 14 DAR14 of N. medianus) between the two patient groups.
Quotient variables were mostly tested with significant differences (exception: quotient interval
13 [QIL13] N. medianus; quotient negative amplitude A14 [QA14] N. tibialis; quotient positive
amplitude A12 [QA12] N. peronaeus; quotient negative amplitude A14 [QA14] N. peronaeus;
quotient maximum amplitude A24 [QA24] N. peronaeus; quotient area 13 [QAR13] and 14
[QAR14] N. peronaeus).
These findings summarized can be interpreted that way, that in this study beside the stan-
dard variables, which achieved significant levels of differences in all tested peripheral nerves
and items, also most of other parameters achieved this level of difference with the exception
of interval variables and some others. In general the findings correlate well with the results of
other publications (23). In addition the findings for N. medianus provide some hints, that for
this peripheral nerve, which is usually affected in later stages of DNP, the progression of de-
myelinisation was more advanced than the axonal degeneration. The findings in both leg
nerves did not demonstrate this difference, here both axonal degeneration and demyelinisa-
tion were similar advanced.
The limitation of the testing carried out in this study is related to different items:
1) the average age of the two groups tested differed, in group 2 the average age
was 68 (±17 years), whereas in group 1 the average age was 49 years (±28
years). In general it is known, that age influences nerve conduction velocities (36)
and the amplitude of the compound muscle action potential (24). Both parameters
have a tendency to decrease with increasing age.
2) the number of patients investigated was different (group 1: n=67, group 2: n=21).
3) the average time (±SD) elapsed since diagnosis of impaired glucose tolerance or
manifest diabetes mellitus in group 2 was 12,1 years ( ±7.3 ys), therefore in some
patients the metabolic disorder and related diseases could be more advanced.
4) patients with either impaired glucose tolerance or manifest diabetes mellitus were
included, as a consequence different stages of severity of the underlying disease
will influence the analysis of the data.
Page 57
All together it seems to be, that the parameters tested could be helpful to be further investi-
gated in studies, which aim to solve the problems as mentioned above in order to improve
the differentiation of normal subjects and patients in early stages of diabetes mellitus or im-
paired glucose tolerance.
12. SUMMARY
Diabetic neuropathy is a frequent complication of patients suffering from diabetes mellitus
(either type I or type II diabetes). The clinical picture of this disease varies widely from non-
symptomatic courses to severe disabling and potential life-threatening cases, mostly due to
autonomic neuropathy. The treatment of diabetic neuropathy is despite huge investments in
clinical research mostly related to an effective control of blood glucose levels. Beside acute
courses of diabetic neuropathy, which tend to remit, most patients suffer from chronic
courses of diabetic neuropathy, where distal symmetric neuropathy is the most common
course of disease. These cases are usually chronic progressive, therefore early diagnosis
and intervention is mandatory. The advantages of neurographic testing as diagnostic tool in
terms of reliability, validity, relevance, and patient’s safety is well accepted. Used by medical
professionals this method provides information about the functional status of the peripheral
nervous system. This study was conducted comparing normal subjects and patients with
diabetes mellitus or impaired glucose tolerance, who with suspicion of diabetic neuropathy.
The aim of this study was to identify additional neurographic markers who can differentiate
between the two patient groups in order to possibly provide a diagnostic tool for the early di-
agnosis of diabetic neuropathy. These markers should supplement the markers already es-
tablished so as maximum nerve conduction velocity or amplitude of the compound muscle
action potential. The evaluation of further markers so as further conduction velocities, posi-
tive/negative amplitudes, quotients of intervals/amplitudes/areas revealed significant differ-
ences between the two patient groups, nevertheless also the standard markers demon-
strated significant differences. These findings could be related to the fact, that the average
age in group 2 with diabetic patients was substantially higher than in group 1 with normal
subjects. In addition the progression of diabetic neuropathy could be more advanced, so that
an additional study with patients in an earlier stage of disease and comparable age could im-
prove the diagnosis of early diabetic neuropathy.
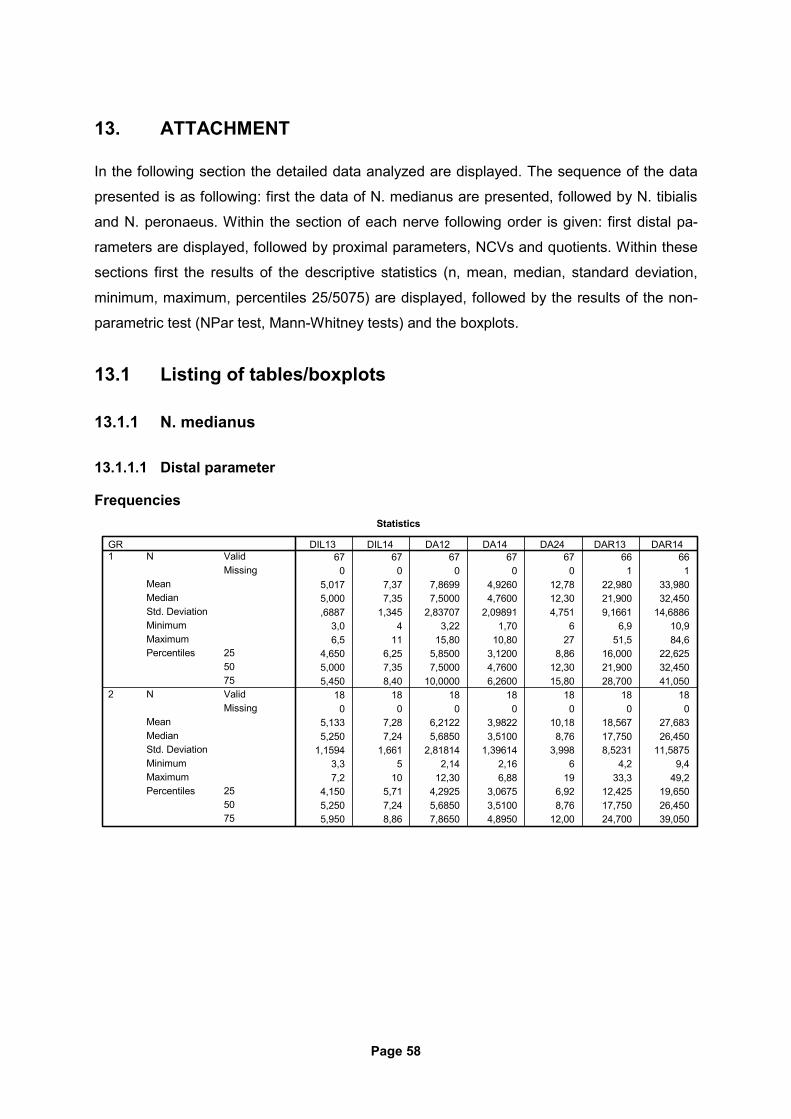
Page 58
13. ATTACHMENT
In the following section the detailed data analyzed are displayed. The sequence of the data
presented is as following: first the data of N. medianus are presented, followed by N. tibialis
and N. peronaeus. Within the section of each nerve following order is given: first distal pa-
rameters are displayed, followed by proximal parameters, NCVs and quotients. Within these
sections first the results of the descriptive statistics (n, mean, median, standard deviation,
minimum, maximum, percentiles 25/5075) are displayed, followed by the results of the non-
parametric test (NPar test, Mann-Whitney tests) and the boxplots.
13.1 Listing of tables/boxplots
13.1.1 N. medianus
13.1.1.1 Distal parameter
Frequencies Statistics
67 67 67 67 67 66 660 0 0 0 0 1 1
5,017 7,37 7,8699 4,9260 12,78 22,980 33,9805,000 7,35 7,5000 4,7600 12,30 21,900 32,450,6887 1,345 2,83707 2,09891 4,751 9,1661 14,6886
3,0 4 3,22 1,70 6 6,9 10,96,5 11 15,80 10,80 27 51,5 84,6
4,650 6,25 5,8500 3,1200 8,86 16,000 22,6255,000 7,35 7,5000 4,7600 12,30 21,900 32,4505,450 8,40 10,0000 6,2600 15,80 28,700 41,050
18 18 18 18 18 18 180 0 0 0 0 0 0
5,133 7,28 6,2122 3,9822 10,18 18,567 27,6835,250 7,24 5,6850 3,5100 8,76 17,750 26,450
1,1594 1,661 2,81814 1,39614 3,998 8,5231 11,58753,3 5 2,14 2,16 6 4,2 9,47,2 10 12,30 6,88 19 33,3 49,2
4,150 5,71 4,2925 3,0675 6,92 12,425 19,6505,250 7,24 5,6850 3,5100 8,76 17,750 26,4505,950 8,86 7,8650 4,8950 12,00 24,700 39,050
ValidMissing
N
MeanMedianStd. DeviationMinimumMaximum
255075
Percentiles
ValidMissing
N
MeanMedianStd. DeviationMinimumMaximum
255075
Percentiles
GR1
2
DIL13 DIL14 DA12 DA14 DA24 DAR13 DAR14
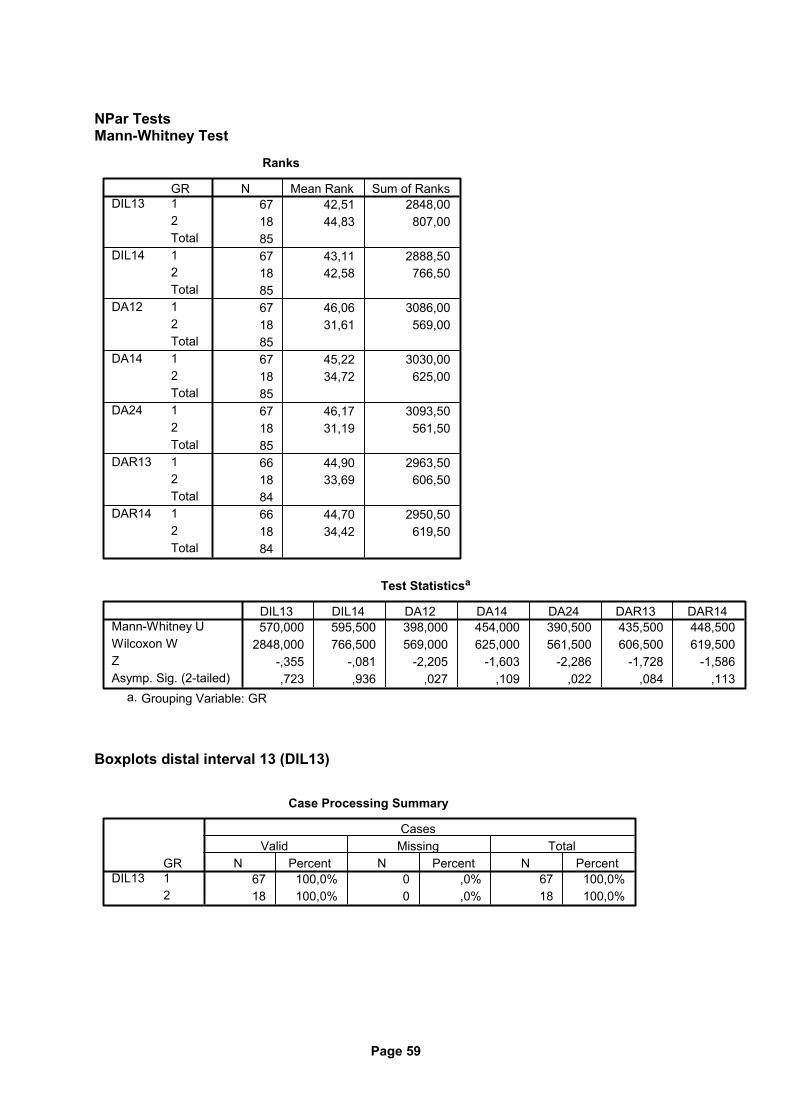
Page 59
NPar Tests Mann-Whitney Test
Ranks
67 42,51 2848,0018 44,83 807,008567 43,11 2888,5018 42,58 766,508567 46,06 3086,0018 31,61 569,008567 45,22 3030,0018 34,72 625,008567 46,17 3093,5018 31,19 561,508566 44,90 2963,5018 33,69 606,508466 44,70 2950,5018 34,42 619,5084
GR12Total12Total12Total12Total12Total12Total12Total
DIL13
DIL14
DA12
DA14
DA24
DAR13
DAR14
N Mean Rank Sum of Ranks
Test Statisticsa
570,000 595,500 398,000 454,000 390,500 435,500 448,5002848,000 766,500 569,000 625,000 561,500 606,500 619,500
-,355 -,081 -2,205 -1,603 -2,286 -1,728 -1,586,723 ,936 ,027 ,109 ,022 ,084 ,113
Mann-Whitney UWilcoxon WZAsymp. Sig. (2-tailed)
DIL13 DIL14 DA12 DA14 DA24 DAR13 DAR14
Grouping Variable: GRa.
Boxplots distal interval 13 (DIL13)
Case Processing Summary
67 100,0% 0 ,0% 67 100,0%18 100,0% 0 ,0% 18 100,0%
GR12
DIL13N Percent N Percent N Percent
Valid Missing TotalCases
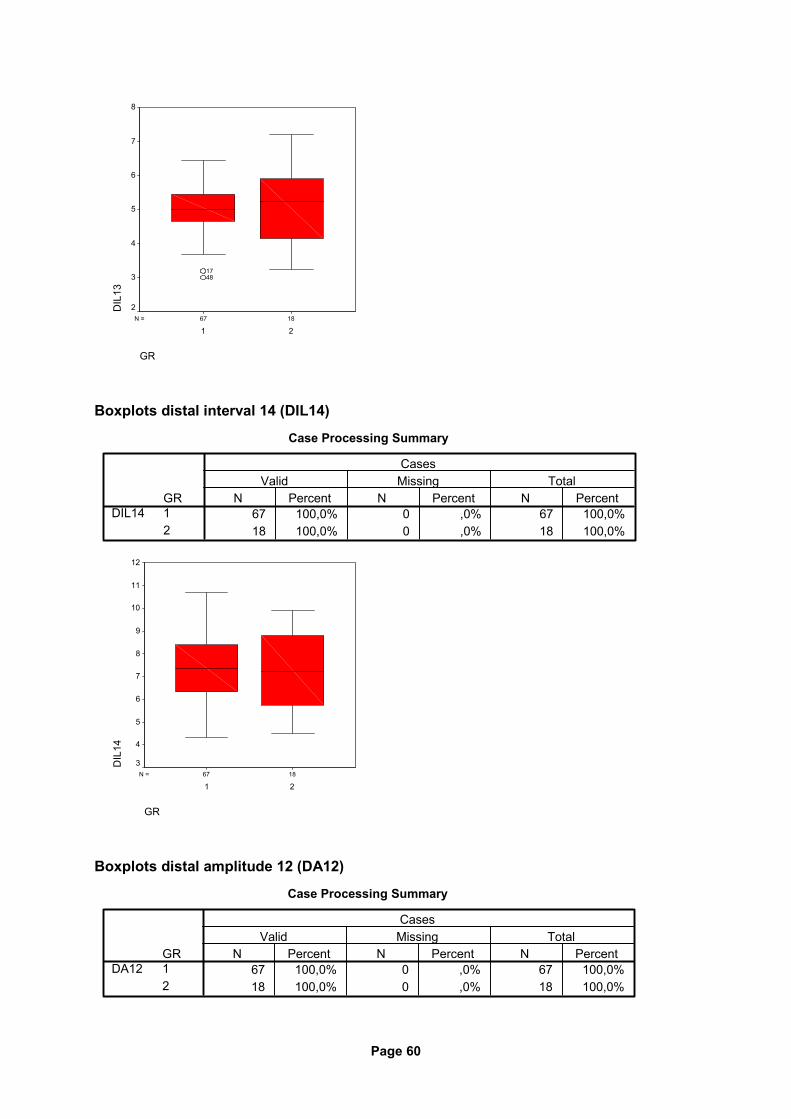
Page 60
1867N =
GR
21
DIL
138
7
6
5
4
3
2
1748
Boxplots distal interval 14 (DIL14)
Case Processing Summary
67 100,0% 0 ,0% 67 100,0%18 100,0% 0 ,0% 18 100,0%
GR12
DIL14N Percent N Percent N Percent
Valid Missing TotalCases
1867N =
GR
21
DIL
14
12
11
10
9
8
7
6
5
4
3
Boxplots distal amplitude 12 (DA12)
Case Processing Summary
67 100,0% 0 ,0% 67 100,0%18 100,0% 0 ,0% 18 100,0%
GR12
DA12N Percent N Percent N Percent
Valid Missing TotalCases
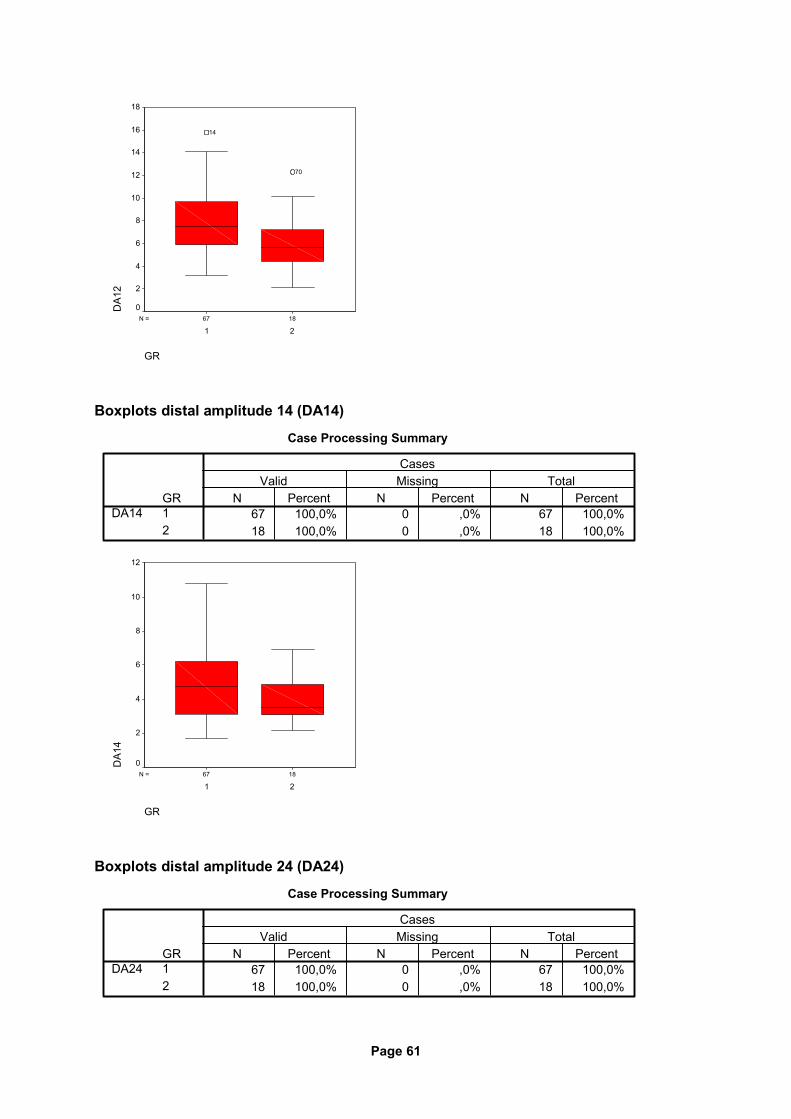
Page 61
1867N =
GR
21
DA1
218
16
14
12
10
8
6
4
2
0
70
14
Boxplots distal amplitude 14 (DA14)
Case Processing Summary
67 100,0% 0 ,0% 67 100,0%18 100,0% 0 ,0% 18 100,0%
GR12
DA14N Percent N Percent N Percent
Valid Missing TotalCases
1867N =
GR
21
DA1
4
12
10
8
6
4
2
0
Boxplots distal amplitude 24 (DA24)
Case Processing Summary
67 100,0% 0 ,0% 67 100,0%18 100,0% 0 ,0% 18 100,0%
GR12
DA24N Percent N Percent N Percent
Valid Missing TotalCases
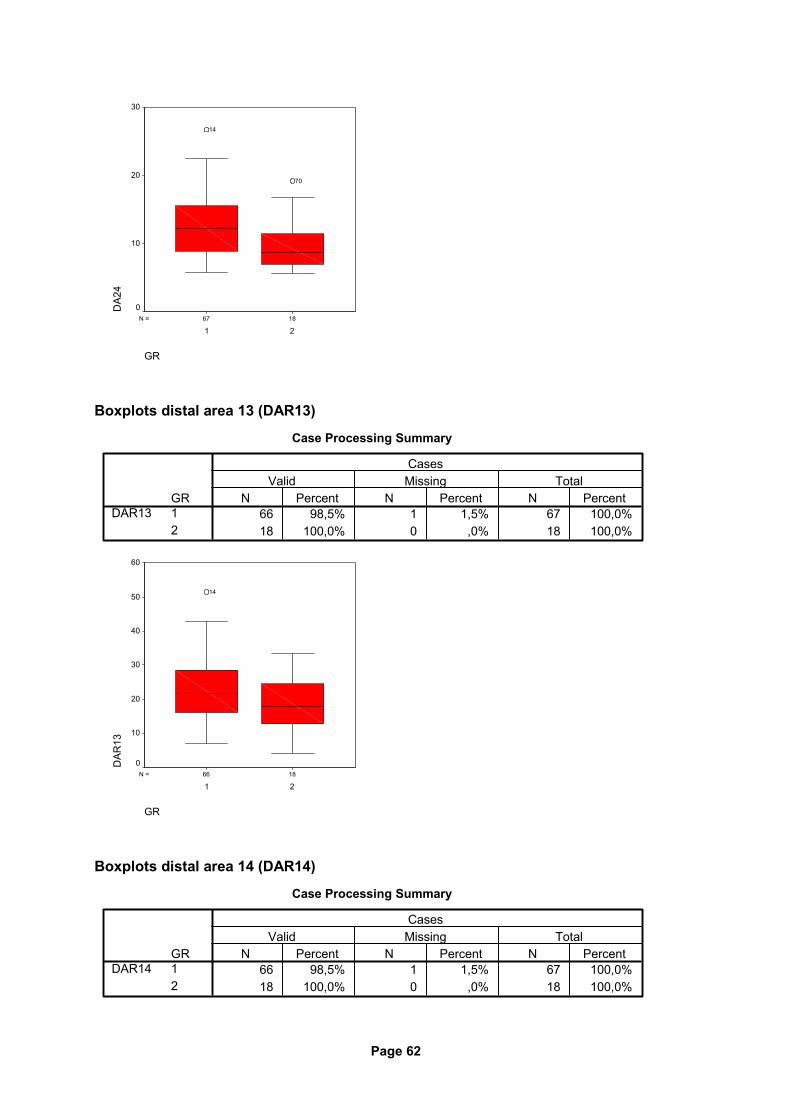
Page 62
1867N =
GR
21
DA2
430
20
10
0
70
14
Boxplots distal area 13 (DAR13)
Case Processing Summary
66 98,5% 1 1,5% 67 100,0%18 100,0% 0 ,0% 18 100,0%
GR12
DAR13N Percent N Percent N Percent
Valid Missing TotalCases
1866N =
GR
21
DAR
13
60
50
40
30
20
10
0
14
Boxplots distal area 14 (DAR14)
Case Processing Summary
66 98,5% 1 1,5% 67 100,0%18 100,0% 0 ,0% 18 100,0%
GR12
DAR14N Percent N Percent N Percent
Valid Missing TotalCases
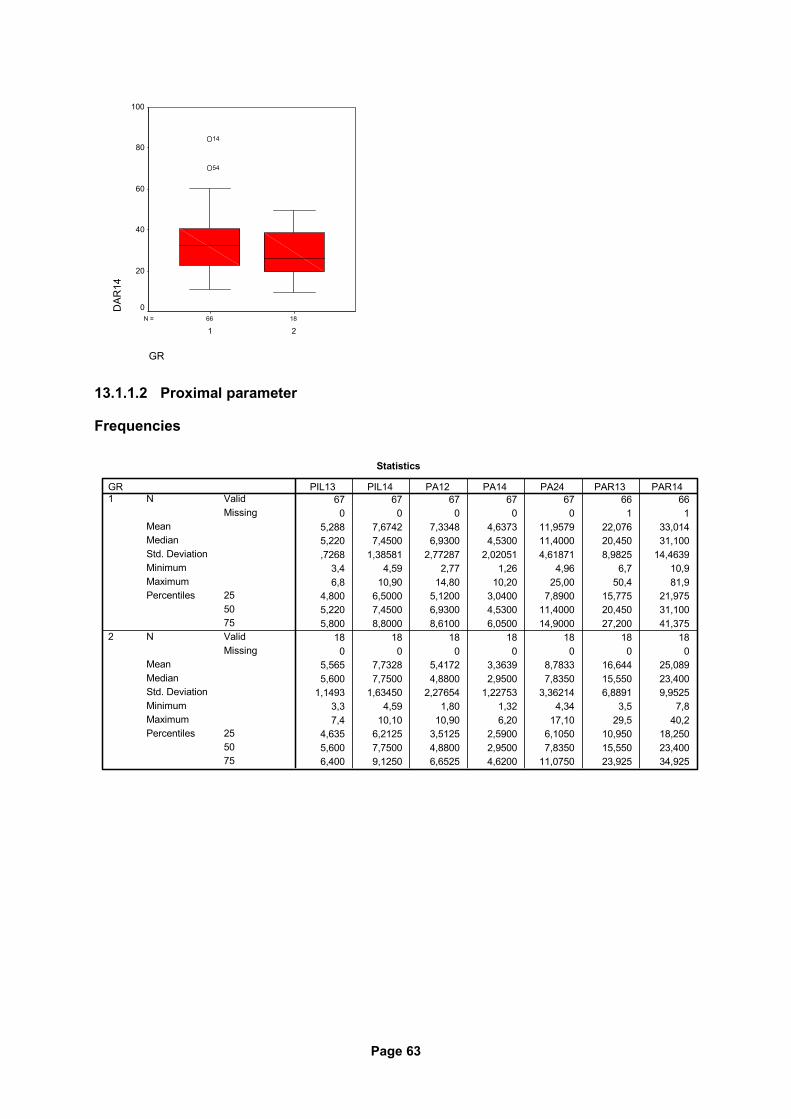
Page 63
1866N =
GR
21
DAR
14100
80
60
40
20
0
54
14
13.1.1.2 Proximal parameter
Frequencies
Statistics
67 67 67 67 67 66 660 0 0 0 0 1 1
5,288 7,6742 7,3348 4,6373 11,9579 22,076 33,0145,220 7,4500 6,9300 4,5300 11,4000 20,450 31,100,7268 1,38581 2,77287 2,02051 4,61871 8,9825 14,4639
3,4 4,59 2,77 1,26 4,96 6,7 10,96,8 10,90 14,80 10,20 25,00 50,4 81,9
4,800 6,5000 5,1200 3,0400 7,8900 15,775 21,9755,220 7,4500 6,9300 4,5300 11,4000 20,450 31,1005,800 8,8000 8,6100 6,0500 14,9000 27,200 41,375
18 18 18 18 18 18 180 0 0 0 0 0 0
5,565 7,7328 5,4172 3,3639 8,7833 16,644 25,0895,600 7,7500 4,8800 2,9500 7,8350 15,550 23,400
1,1493 1,63450 2,27654 1,22753 3,36214 6,8891 9,95253,3 4,59 1,80 1,32 4,34 3,5 7,87,4 10,10 10,90 6,20 17,10 29,5 40,2
4,635 6,2125 3,5125 2,5900 6,1050 10,950 18,2505,600 7,7500 4,8800 2,9500 7,8350 15,550 23,4006,400 9,1250 6,6525 4,6200 11,0750 23,925 34,925
ValidMissing
N
MeanMedianStd. DeviationMinimumMaximum
255075
Percentiles
ValidMissing
N
MeanMedianStd. DeviationMinimumMaximum
255075
Percentiles
GR1
2
PIL13 PIL14 PA12 PA14 PA24 PAR13 PAR14
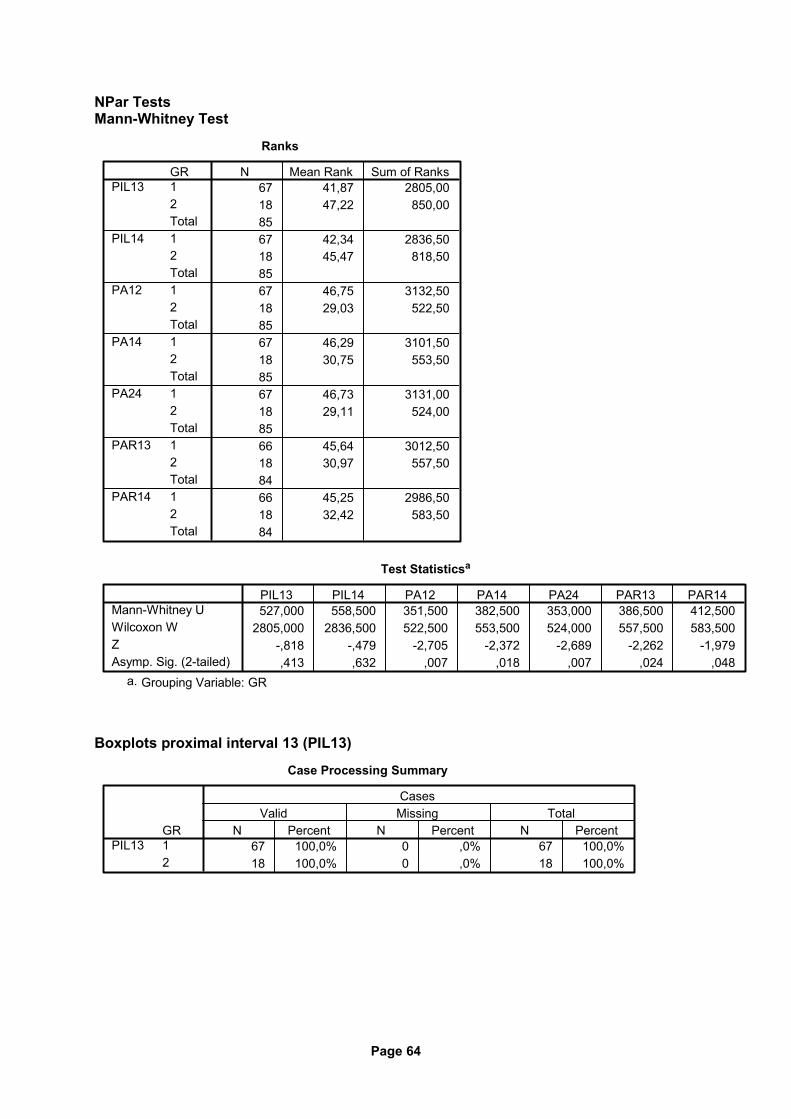
Page 64
NPar Tests Mann-Whitney Test
Ranks
67 41,87 2805,0018 47,22 850,008567 42,34 2836,5018 45,47 818,508567 46,75 3132,5018 29,03 522,508567 46,29 3101,5018 30,75 553,508567 46,73 3131,0018 29,11 524,008566 45,64 3012,5018 30,97 557,508466 45,25 2986,5018 32,42 583,5084
GR12Total12Total12Total12Total12Total12Total12Total
PIL13
PIL14
PA12
PA14
PA24
PAR13
PAR14
N Mean Rank Sum of Ranks
Test Statisticsa
527,000 558,500 351,500 382,500 353,000 386,500 412,5002805,000 2836,500 522,500 553,500 524,000 557,500 583,500
-,818 -,479 -2,705 -2,372 -2,689 -2,262 -1,979,413 ,632 ,007 ,018 ,007 ,024 ,048
Mann-Whitney UWilcoxon WZAsymp. Sig. (2-tailed)
PIL13 PIL14 PA12 PA14 PA24 PAR13 PAR14
Grouping Variable: GRa.
Boxplots proximal interval 13 (PIL13)
Case Processing Summary
67 100,0% 0 ,0% 67 100,0%18 100,0% 0 ,0% 18 100,0%
GR12
PIL13N Percent N Percent N Percent
Valid Missing TotalCases
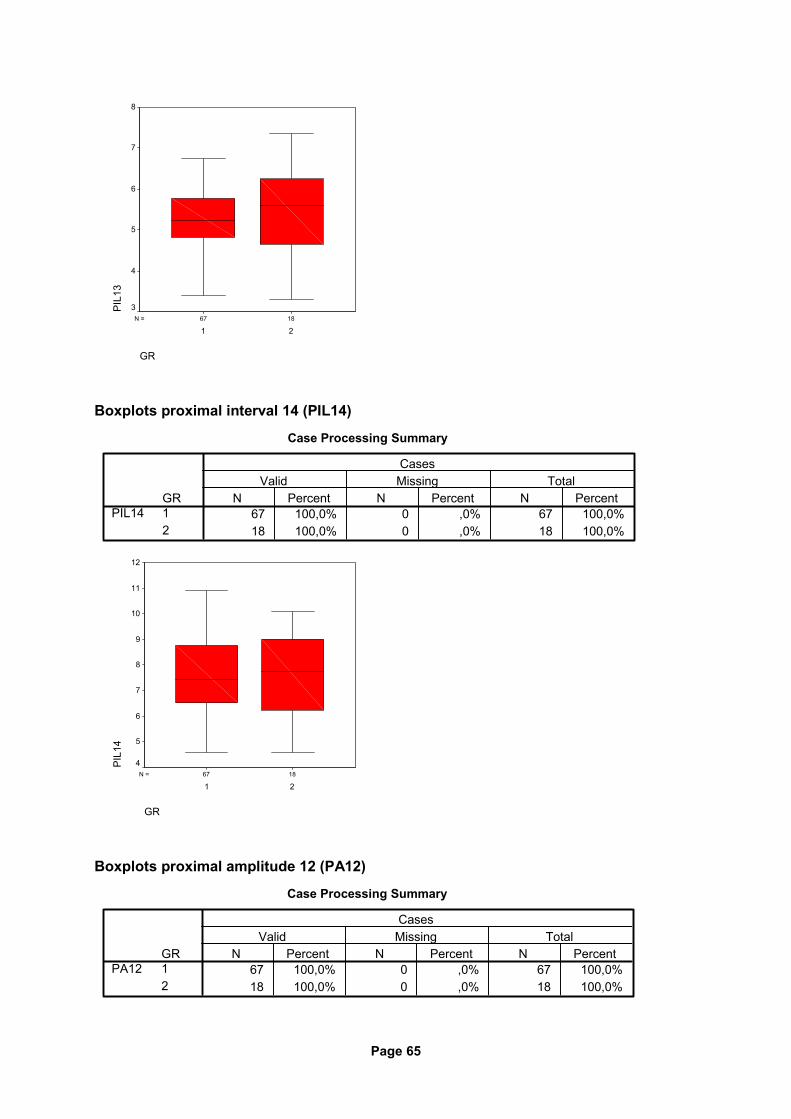
Page 65
1867N =
GR
21
PIL
138
7
6
5
4
3
Boxplots proximal interval 14 (PIL14)
Case Processing Summary
67 100,0% 0 ,0% 67 100,0%18 100,0% 0 ,0% 18 100,0%
GR12
PIL14N Percent N Percent N Percent
Valid Missing TotalCases
1867N =
GR
21
PIL
14
12
11
10
9
8
7
6
5
4
Boxplots proximal amplitude 12 (PA12)
Case Processing Summary
67 100,0% 0 ,0% 67 100,0%18 100,0% 0 ,0% 18 100,0%
GR12
PA12N Percent N Percent N Percent
Valid Missing TotalCases
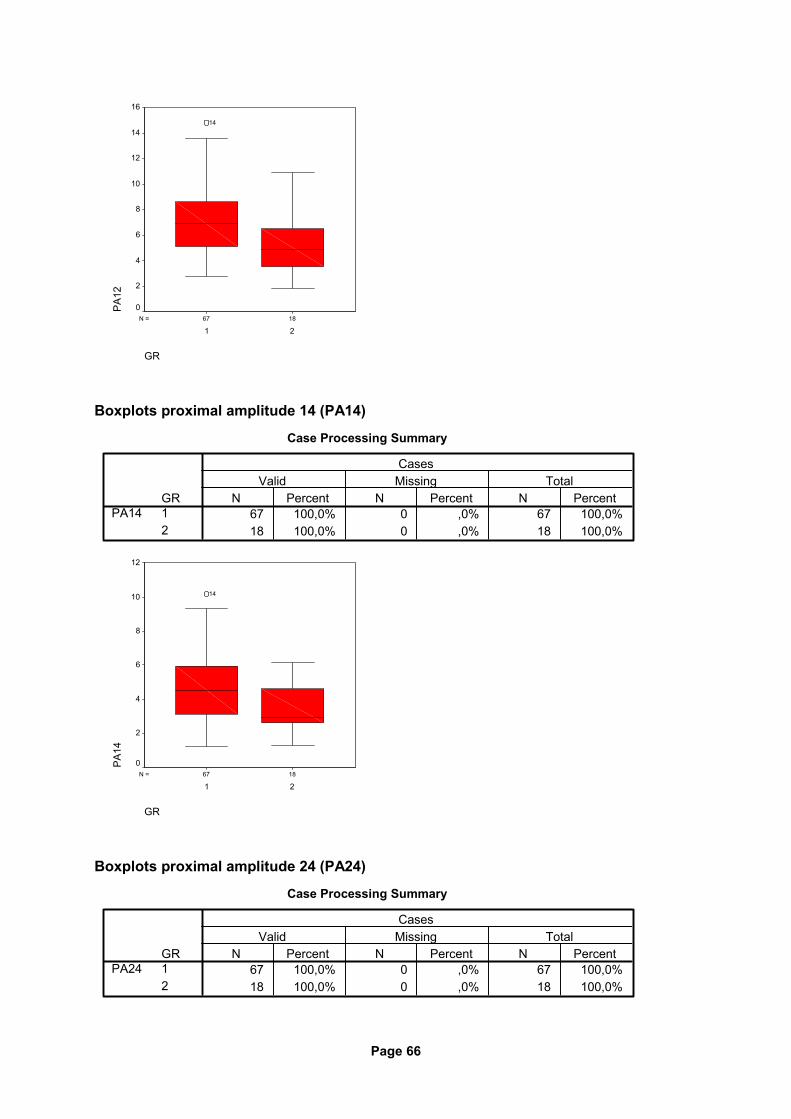
Page 66
1867N =
GR
21
PA
1216
14
12
10
8
6
4
2
0
14
Boxplots proximal amplitude 14 (PA14)
Case Processing Summary
67 100,0% 0 ,0% 67 100,0%18 100,0% 0 ,0% 18 100,0%
GR12
PA14N Percent N Percent N Percent
Valid Missing TotalCases
1867N =
GR
21
PA
14
12
10
8
6
4
2
0
14
Boxplots proximal amplitude 24 (PA24)
Case Processing Summary
67 100,0% 0 ,0% 67 100,0%18 100,0% 0 ,0% 18 100,0%
GR12
PA24N Percent N Percent N Percent
Valid Missing TotalCases
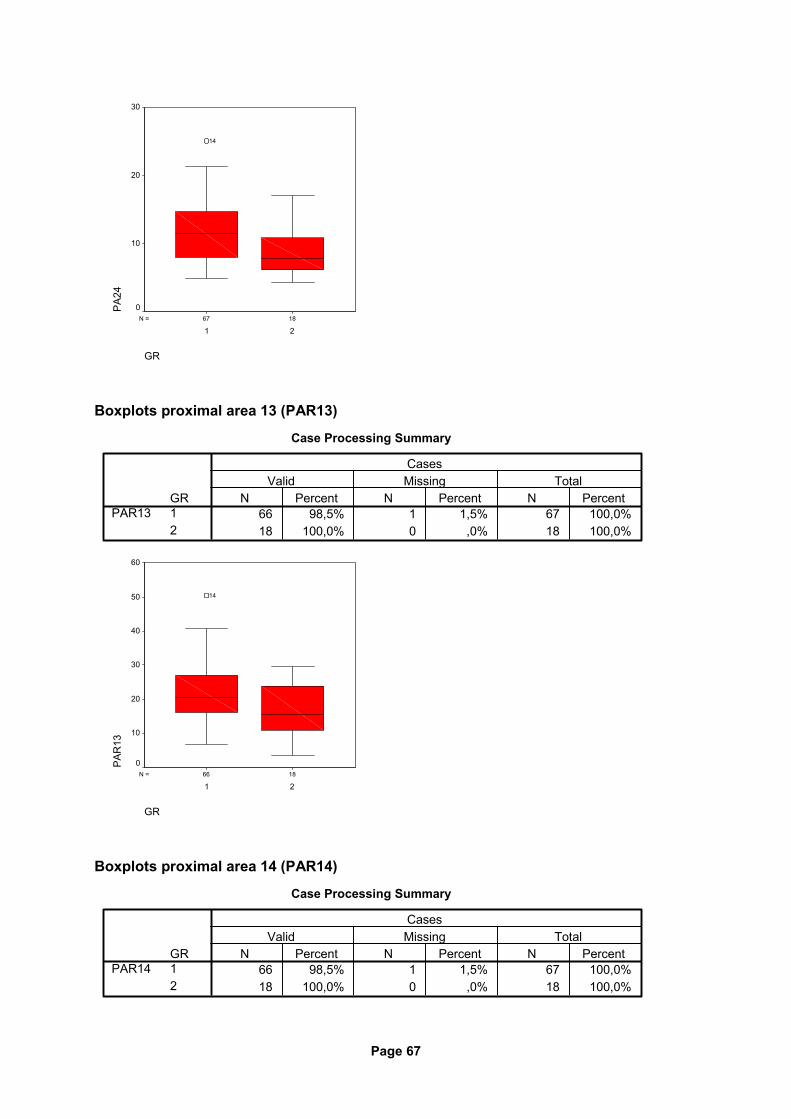
Page 67
1867N =
GR
21
PA
2430
20
10
0
14
Boxplots proximal area 13 (PAR13)
Case Processing Summary
66 98,5% 1 1,5% 67 100,0%18 100,0% 0 ,0% 18 100,0%
GR12
PAR13N Percent N Percent N Percent
Valid Missing TotalCases
1866N =
GR
21
PA
R13
60
50
40
30
20
10
0
14
Boxplots proximal area 14 (PAR14)
Case Processing Summary
66 98,5% 1 1,5% 67 100,0%18 100,0% 0 ,0% 18 100,0%
GR12
PAR14N Percent N Percent N Percent
Valid Missing TotalCases
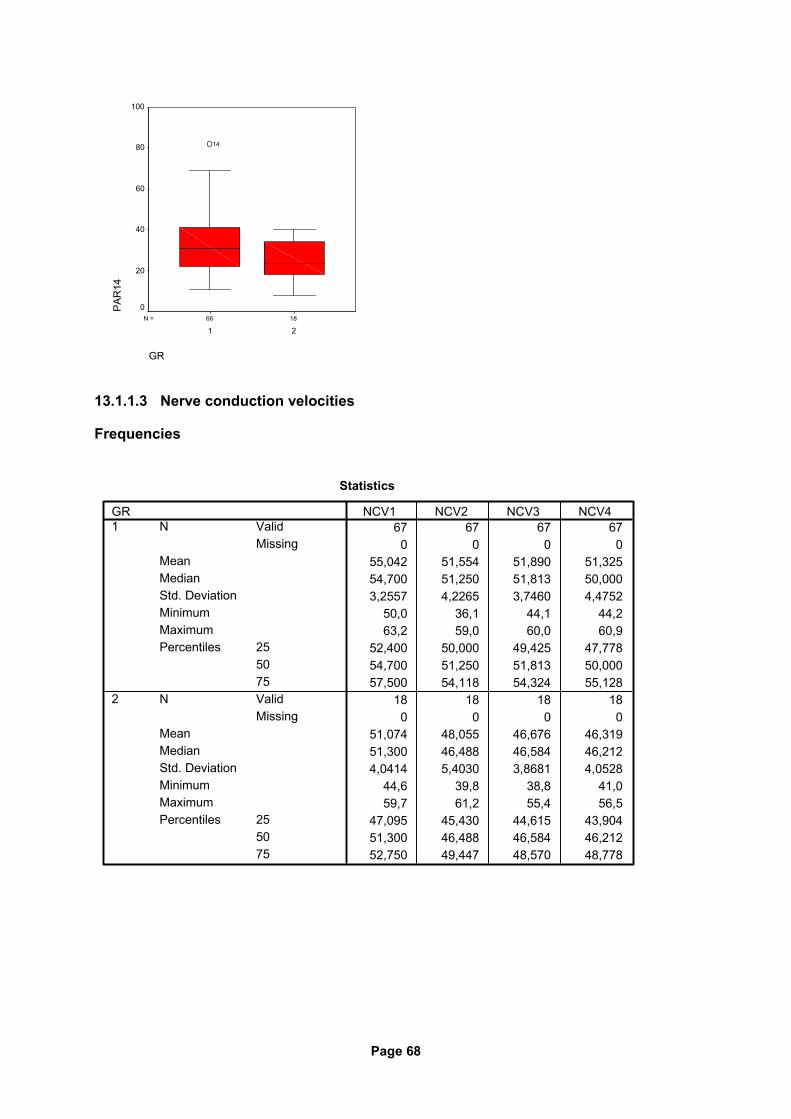
Page 68
1866N =
GR
21
PA
R14
100
80
60
40
20
0
14
13.1.1.3 Nerve conduction velocities
Frequencies
Statistics
67 67 67 670 0 0 0
55,042 51,554 51,890 51,32554,700 51,250 51,813 50,0003,2557 4,2265 3,7460 4,4752
50,0 36,1 44,1 44,263,2 59,0 60,0 60,9
52,400 50,000 49,425 47,77854,700 51,250 51,813 50,00057,500 54,118 54,324 55,128
18 18 18 180 0 0 0
51,074 48,055 46,676 46,31951,300 46,488 46,584 46,2124,0414 5,4030 3,8681 4,0528
44,6 39,8 38,8 41,059,7 61,2 55,4 56,5
47,095 45,430 44,615 43,90451,300 46,488 46,584 46,21252,750 49,447 48,570 48,778
ValidMissing
N
MeanMedianStd. DeviationMinimumMaximum
255075
Percentiles
ValidMissing
N
MeanMedianStd. DeviationMinimumMaximum
255075
Percentiles
GR1
2
NCV1 NCV2 NCV3 NCV4
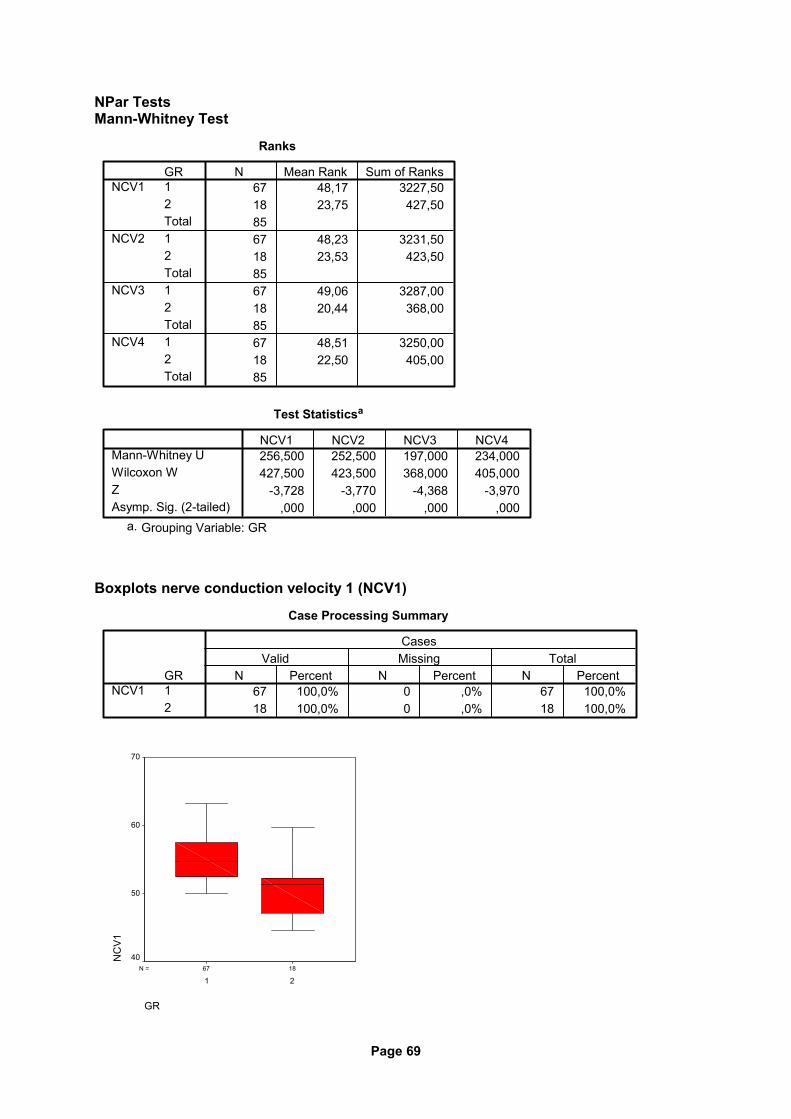
Page 69
NPar Tests Mann-Whitney Test
Ranks
67 48,17 3227,5018 23,75 427,508567 48,23 3231,5018 23,53 423,508567 49,06 3287,0018 20,44 368,008567 48,51 3250,0018 22,50 405,0085
GR12Total12Total12Total12Total
NCV1
NCV2
NCV3
NCV4
N Mean Rank Sum of Ranks
Test Statisticsa
256,500 252,500 197,000 234,000427,500 423,500 368,000 405,000
-3,728 -3,770 -4,368 -3,970,000 ,000 ,000 ,000
Mann-Whitney UWilcoxon WZAsymp. Sig. (2-tailed)
NCV1 NCV2 NCV3 NCV4
Grouping Variable: GRa.
Boxplots nerve conduction velocity 1 (NCV1)
Case Processing Summary
67 100,0% 0 ,0% 67 100,0%18 100,0% 0 ,0% 18 100,0%
GR12
NCV1N Percent N Percent N Percent
Valid Missing TotalCases
1867N =
GR
21
NC
V1
70
60
50
40
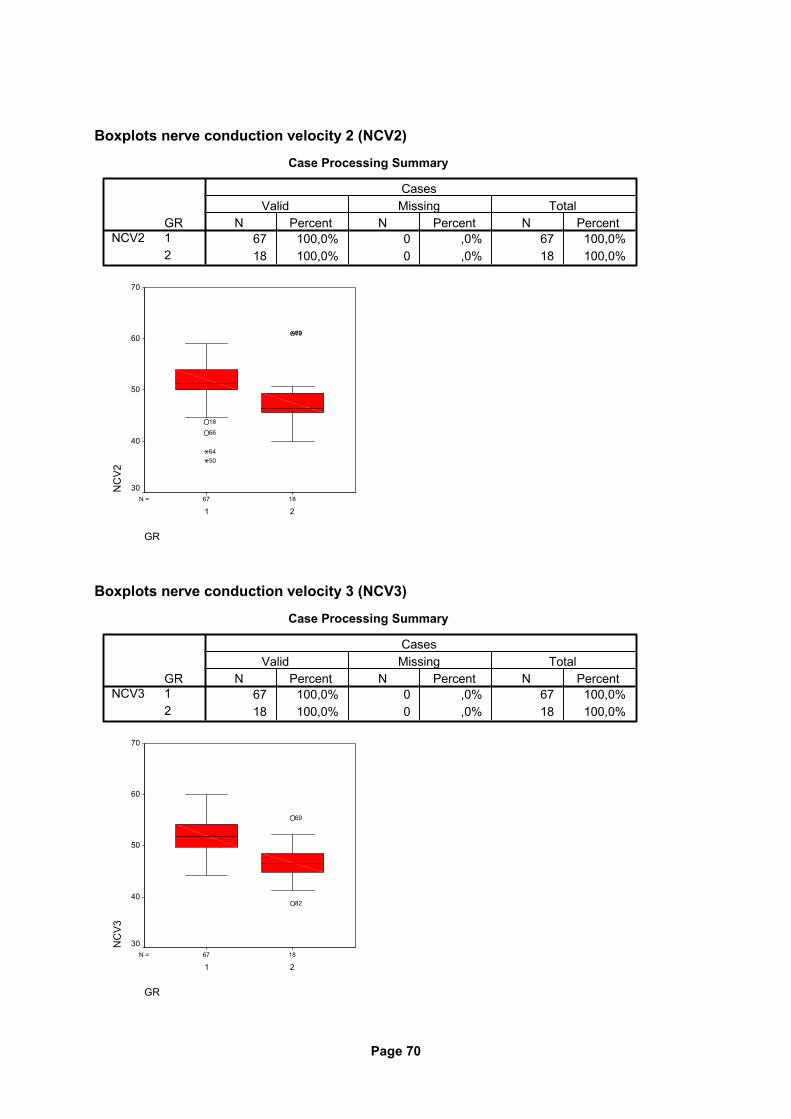
Page 70
Boxplots nerve conduction velocity 2 (NCV2)
Case Processing Summary
67 100,0% 0 ,0% 67 100,0%18 100,0% 0 ,0% 18 100,0%
GR12
NCV2N Percent N Percent N Percent
Valid Missing TotalCases
1867N =
GR
21
NC
V2
70
60
50
40
30
7969
18
66
6450
Boxplots nerve conduction velocity 3 (NCV3)
Case Processing Summary
67 100,0% 0 ,0% 67 100,0%18 100,0% 0 ,0% 18 100,0%
GR12
NCV3N Percent N Percent N Percent
Valid Missing TotalCases
1867N =
GR
21
NC
V3
70
60
50
40
30
82
69
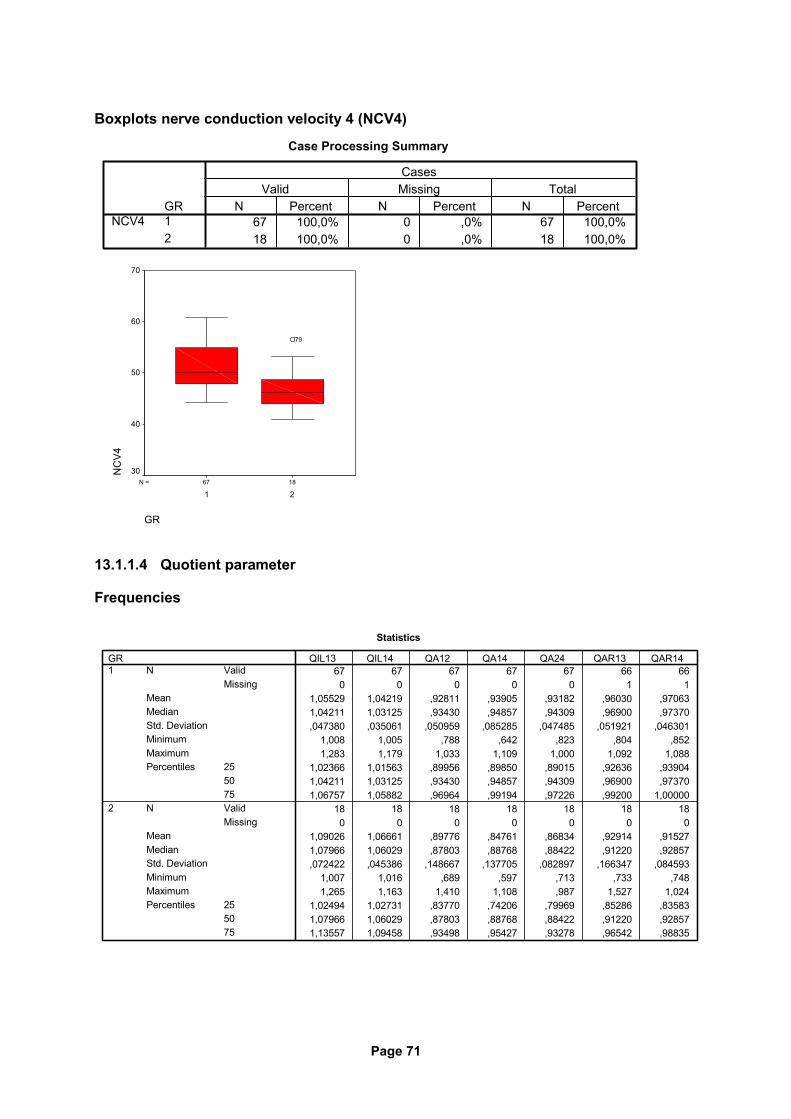
Page 71
Boxplots nerve conduction velocity 4 (NCV4)
Case Processing Summary
67 100,0% 0 ,0% 67 100,0%18 100,0% 0 ,0% 18 100,0%
GR12
NCV4N Percent N Percent N Percent
Valid Missing TotalCases
1867N =
GR
21
NC
V4
70
60
50
40
30
79
13.1.1.4 Quotient parameter
Frequencies
Statistics
67 67 67 67 67 66 660 0 0 0 0 1 1
1,05529 1,04219 ,92811 ,93905 ,93182 ,96030 ,970631,04211 1,03125 ,93430 ,94857 ,94309 ,96900 ,97370,047380 ,035061 ,050959 ,085285 ,047485 ,051921 ,046301
1,008 1,005 ,788 ,642 ,823 ,804 ,8521,283 1,179 1,033 1,109 1,000 1,092 1,088
1,02366 1,01563 ,89956 ,89850 ,89015 ,92636 ,939041,04211 1,03125 ,93430 ,94857 ,94309 ,96900 ,973701,06757 1,05882 ,96964 ,99194 ,97226 ,99200 1,00000
18 18 18 18 18 18 180 0 0 0 0 0 0
1,09026 1,06661 ,89776 ,84761 ,86834 ,92914 ,915271,07966 1,06029 ,87803 ,88768 ,88422 ,91220 ,92857,072422 ,045386 ,148667 ,137705 ,082897 ,166347 ,084593
1,007 1,016 ,689 ,597 ,713 ,733 ,7481,265 1,163 1,410 1,108 ,987 1,527 1,024
1,02494 1,02731 ,83770 ,74206 ,79969 ,85286 ,835831,07966 1,06029 ,87803 ,88768 ,88422 ,91220 ,928571,13557 1,09458 ,93498 ,95427 ,93278 ,96542 ,98835
ValidMissing
N
MeanMedianStd. DeviationMinimumMaximum
255075
Percentiles
ValidMissing
N
MeanMedianStd. DeviationMinimumMaximum
255075
Percentiles
GR1
2
QIL13 QIL14 QA12 QA14 QA24 QAR13 QAR14
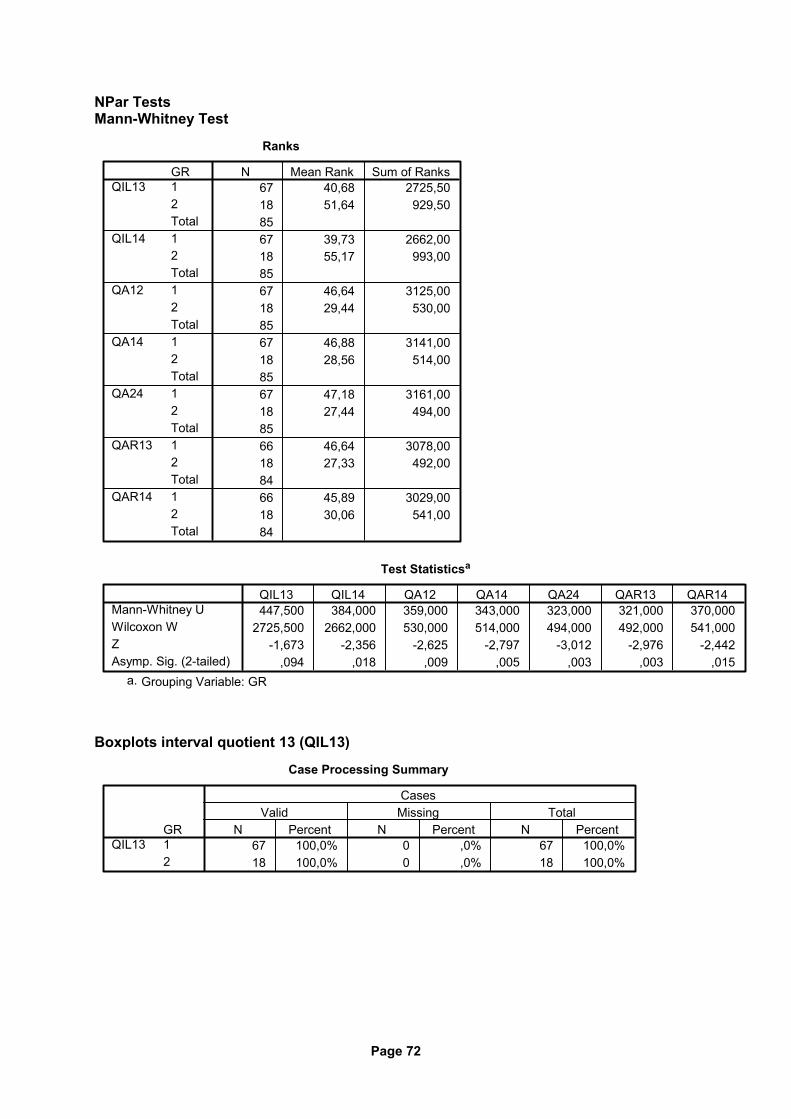
Page 72
NPar Tests Mann-Whitney Test
Ranks
67 40,68 2725,5018 51,64 929,508567 39,73 2662,0018 55,17 993,008567 46,64 3125,0018 29,44 530,008567 46,88 3141,0018 28,56 514,008567 47,18 3161,0018 27,44 494,008566 46,64 3078,0018 27,33 492,008466 45,89 3029,0018 30,06 541,0084
GR12Total12Total12Total12Total12Total12Total12Total
QIL13
QIL14
QA12
QA14
QA24
QAR13
QAR14
N Mean Rank Sum of Ranks
Test Statisticsa
447,500 384,000 359,000 343,000 323,000 321,000 370,0002725,500 2662,000 530,000 514,000 494,000 492,000 541,000
-1,673 -2,356 -2,625 -2,797 -3,012 -2,976 -2,442,094 ,018 ,009 ,005 ,003 ,003 ,015
Mann-Whitney UWilcoxon WZAsymp. Sig. (2-tailed)
QIL13 QIL14 QA12 QA14 QA24 QAR13 QAR14
Grouping Variable: GRa.
Boxplots interval quotient 13 (QIL13)
Case Processing Summary
67 100,0% 0 ,0% 67 100,0%18 100,0% 0 ,0% 18 100,0%
GR12
QIL13N Percent N Percent N Percent
Valid Missing TotalCases
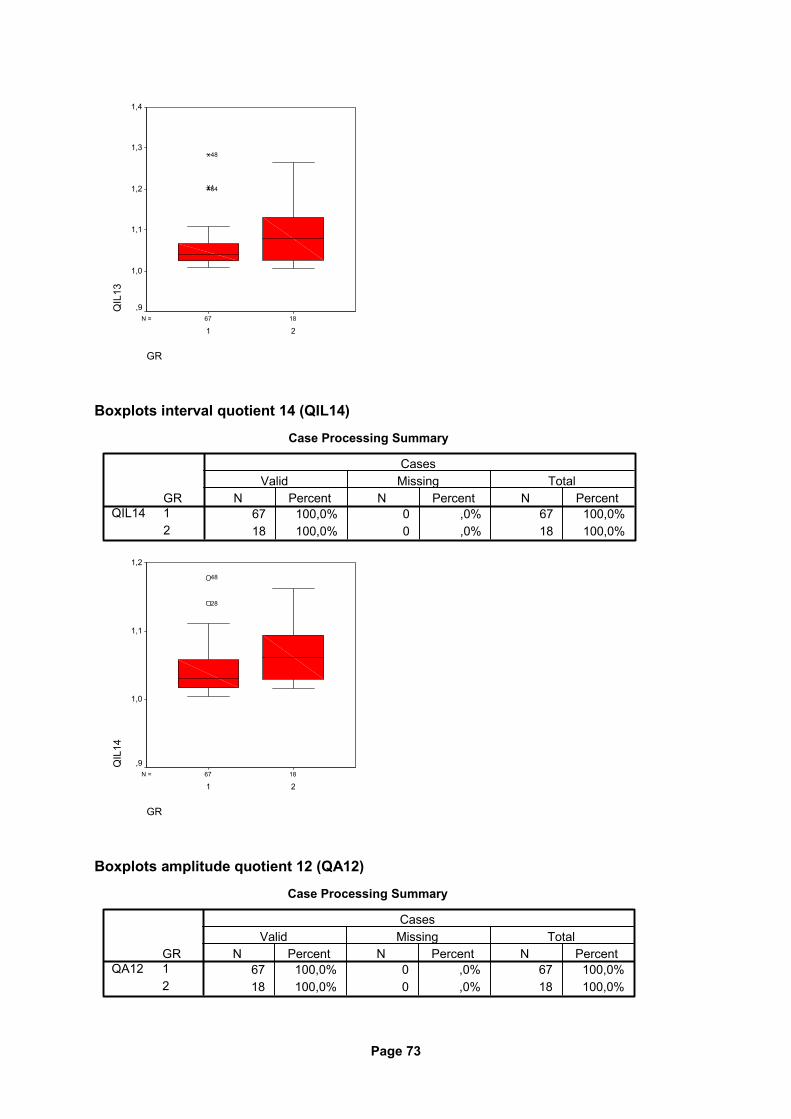
Page 73
1867N =
GR
21
QIL
131,4
1,3
1,2
1,1
1,0
,9
641
48
Boxplots interval quotient 14 (QIL14)
Case Processing Summary
67 100,0% 0 ,0% 67 100,0%18 100,0% 0 ,0% 18 100,0%
GR12
QIL14N Percent N Percent N Percent
Valid Missing TotalCases
1867N =
GR
21
QIL
14
1,2
1,1
1,0
,9
28
48
Boxplots amplitude quotient 12 (QA12)
Case Processing Summary
67 100,0% 0 ,0% 67 100,0%18 100,0% 0 ,0% 18 100,0%
GR12
QA12N Percent N Percent N Percent
Valid Missing TotalCases
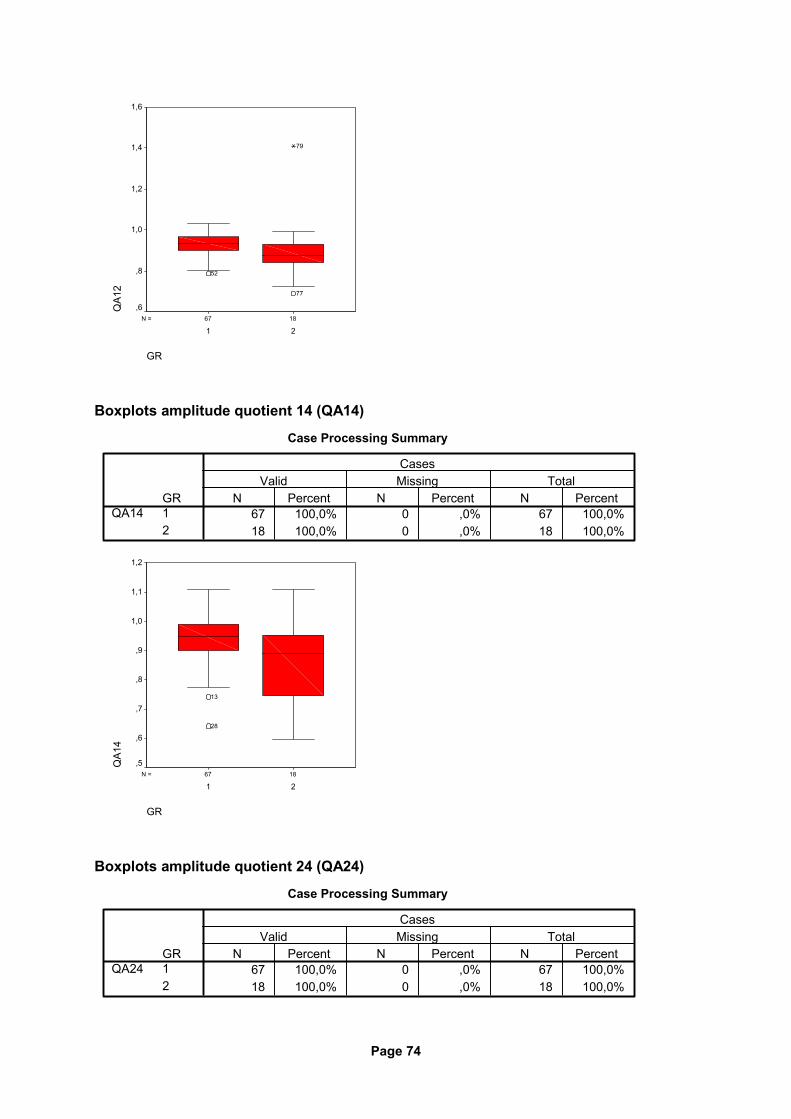
Page 74
1867N =
GR
21
QA1
21,6
1,4
1,2
1,0
,8
,6
77
79
52
Boxplots amplitude quotient 14 (QA14)
Case Processing Summary
67 100,0% 0 ,0% 67 100,0%18 100,0% 0 ,0% 18 100,0%
GR12
QA14N Percent N Percent N Percent
Valid Missing TotalCases
1867N =
GR
21
QA1
4
1,2
1,1
1,0
,9
,8
,7
,6
,5
13
28
Boxplots amplitude quotient 24 (QA24)
Case Processing Summary
67 100,0% 0 ,0% 67 100,0%18 100,0% 0 ,0% 18 100,0%
GR12
QA24N Percent N Percent N Percent
Valid Missing TotalCases
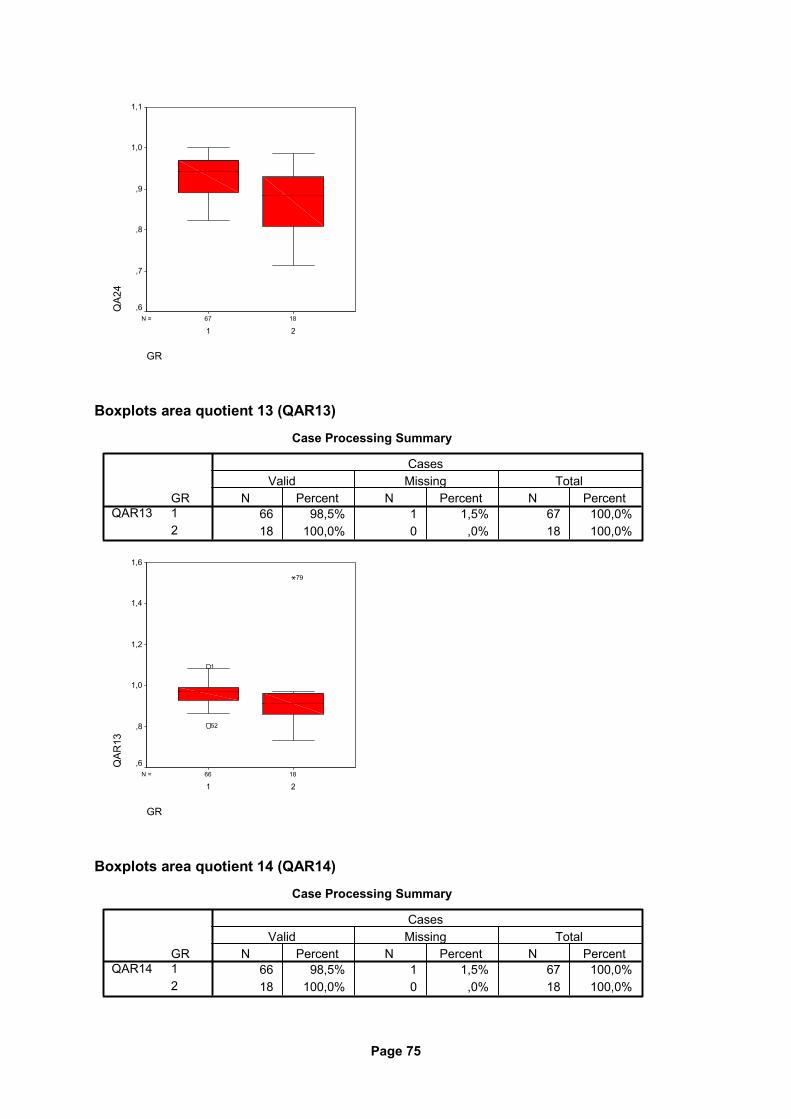
Page 75
1867N =
GR
21
QA2
41,1
1,0
,9
,8
,7
,6
Boxplots area quotient 13 (QAR13)
Case Processing Summary
66 98,5% 1 1,5% 67 100,0%18 100,0% 0 ,0% 18 100,0%
GR12
QAR13N Percent N Percent N Percent
Valid Missing TotalCases
1866N =
GR
21
QAR
13
1,6
1,4
1,2
1,0
,8
,6
79
52
1
Boxplots area quotient 14 (QAR14)
Case Processing Summary
66 98,5% 1 1,5% 67 100,0%18 100,0% 0 ,0% 18 100,0%
GR12
QAR14N Percent N Percent N Percent
Valid Missing TotalCases
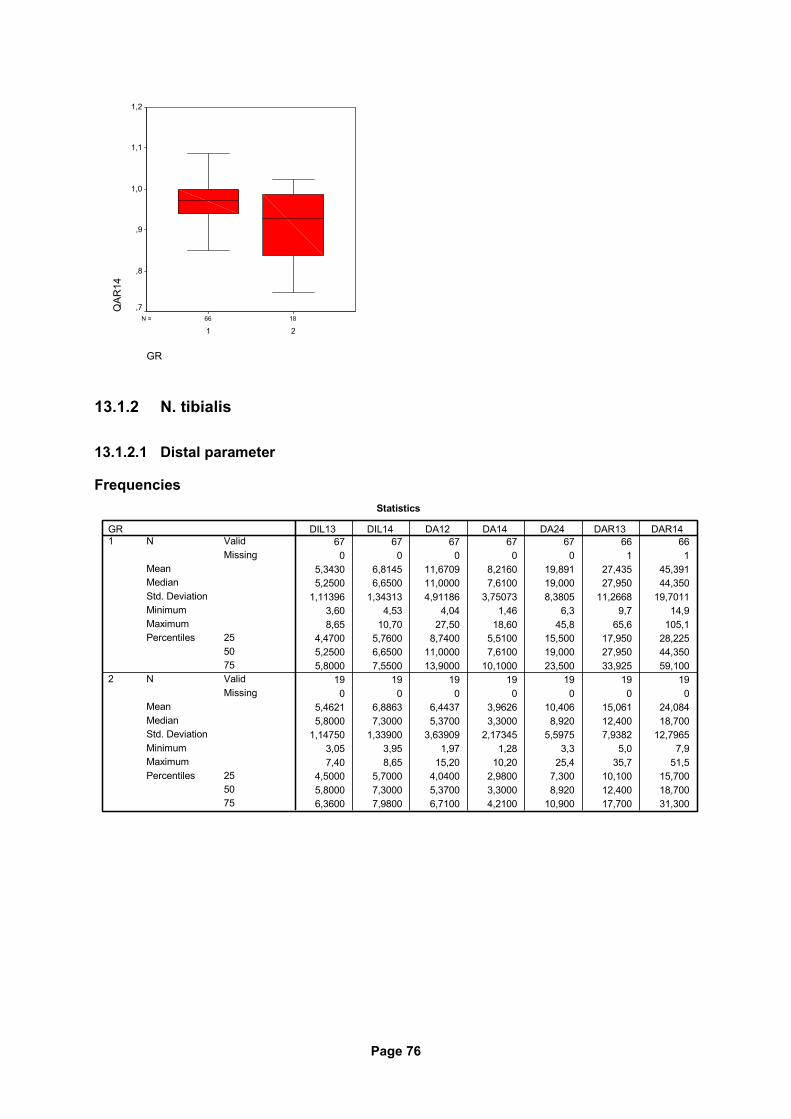
Page 76
1866N =
GR
21
QAR
141,2
1,1
1,0
,9
,8
,7
13.1.2 N. tibialis
13.1.2.1 Distal parameter
Frequencies Statistics
67 67 67 67 67 66 660 0 0 0 0 1 1
5,3430 6,8145 11,6709 8,2160 19,891 27,435 45,3915,2500 6,6500 11,0000 7,6100 19,000 27,950 44,350
1,11396 1,34313 4,91186 3,75073 8,3805 11,2668 19,70113,60 4,53 4,04 1,46 6,3 9,7 14,98,65 10,70 27,50 18,60 45,8 65,6 105,1
4,4700 5,7600 8,7400 5,5100 15,500 17,950 28,2255,2500 6,6500 11,0000 7,6100 19,000 27,950 44,3505,8000 7,5500 13,9000 10,1000 23,500 33,925 59,100
19 19 19 19 19 19 190 0 0 0 0 0 0
5,4621 6,8863 6,4437 3,9626 10,406 15,061 24,0845,8000 7,3000 5,3700 3,3000 8,920 12,400 18,700
1,14750 1,33900 3,63909 2,17345 5,5975 7,9382 12,79653,05 3,95 1,97 1,28 3,3 5,0 7,97,40 8,65 15,20 10,20 25,4 35,7 51,5
4,5000 5,7000 4,0400 2,9800 7,300 10,100 15,7005,8000 7,3000 5,3700 3,3000 8,920 12,400 18,7006,3600 7,9800 6,7100 4,2100 10,900 17,700 31,300
ValidMissing
N
MeanMedianStd. DeviationMinimumMaximum
255075
Percentiles
ValidMissing
N
MeanMedianStd. DeviationMinimumMaximum
255075
Percentiles
GR1
2
DIL13 DIL14 DA12 DA14 DA24 DAR13 DAR14
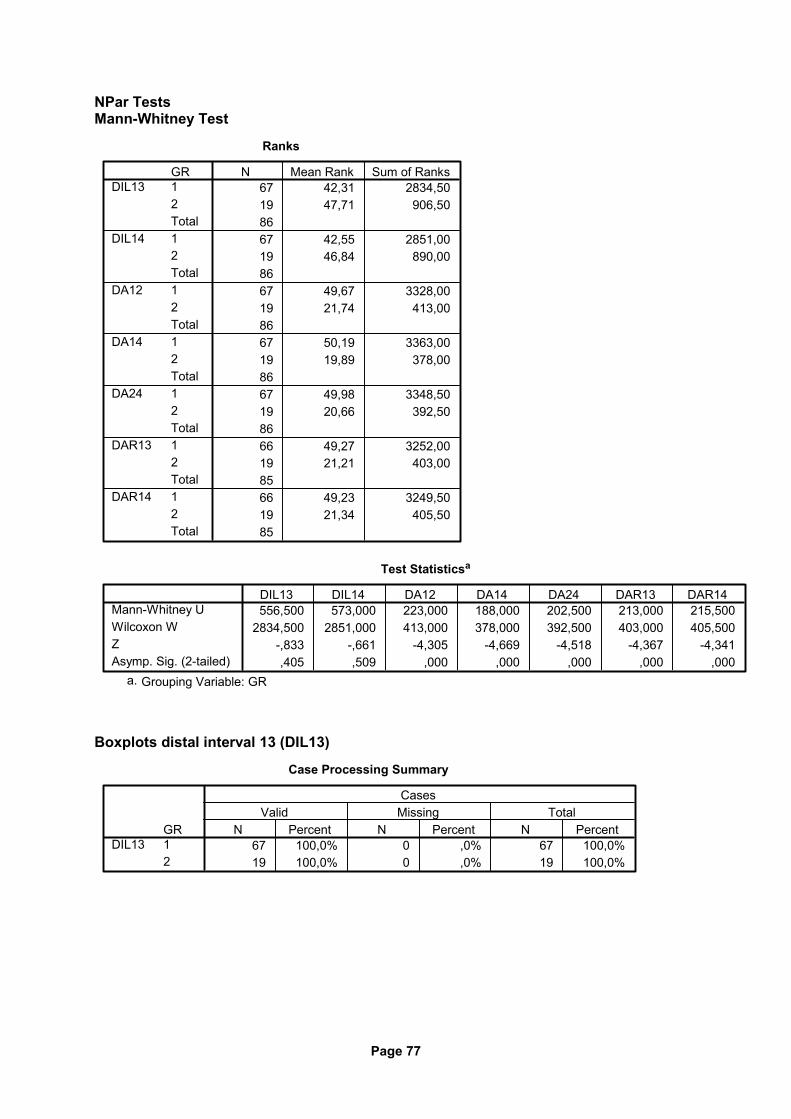
Page 77
NPar Tests Mann-Whitney Test
Ranks
67 42,31 2834,5019 47,71 906,508667 42,55 2851,0019 46,84 890,008667 49,67 3328,0019 21,74 413,008667 50,19 3363,0019 19,89 378,008667 49,98 3348,5019 20,66 392,508666 49,27 3252,0019 21,21 403,008566 49,23 3249,5019 21,34 405,5085
GR12Total12Total12Total12Total12Total12Total12Total
DIL13
DIL14
DA12
DA14
DA24
DAR13
DAR14
N Mean Rank Sum of Ranks
Test Statisticsa
556,500 573,000 223,000 188,000 202,500 213,000 215,5002834,500 2851,000 413,000 378,000 392,500 403,000 405,500
-,833 -,661 -4,305 -4,669 -4,518 -4,367 -4,341,405 ,509 ,000 ,000 ,000 ,000 ,000
Mann-Whitney UWilcoxon WZAsymp. Sig. (2-tailed)
DIL13 DIL14 DA12 DA14 DA24 DAR13 DAR14
Grouping Variable: GRa.
Boxplots distal interval 13 (DIL13)
Case Processing Summary
67 100,0% 0 ,0% 67 100,0%19 100,0% 0 ,0% 19 100,0%
GR12
DIL13N Percent N Percent N Percent
Valid Missing TotalCases
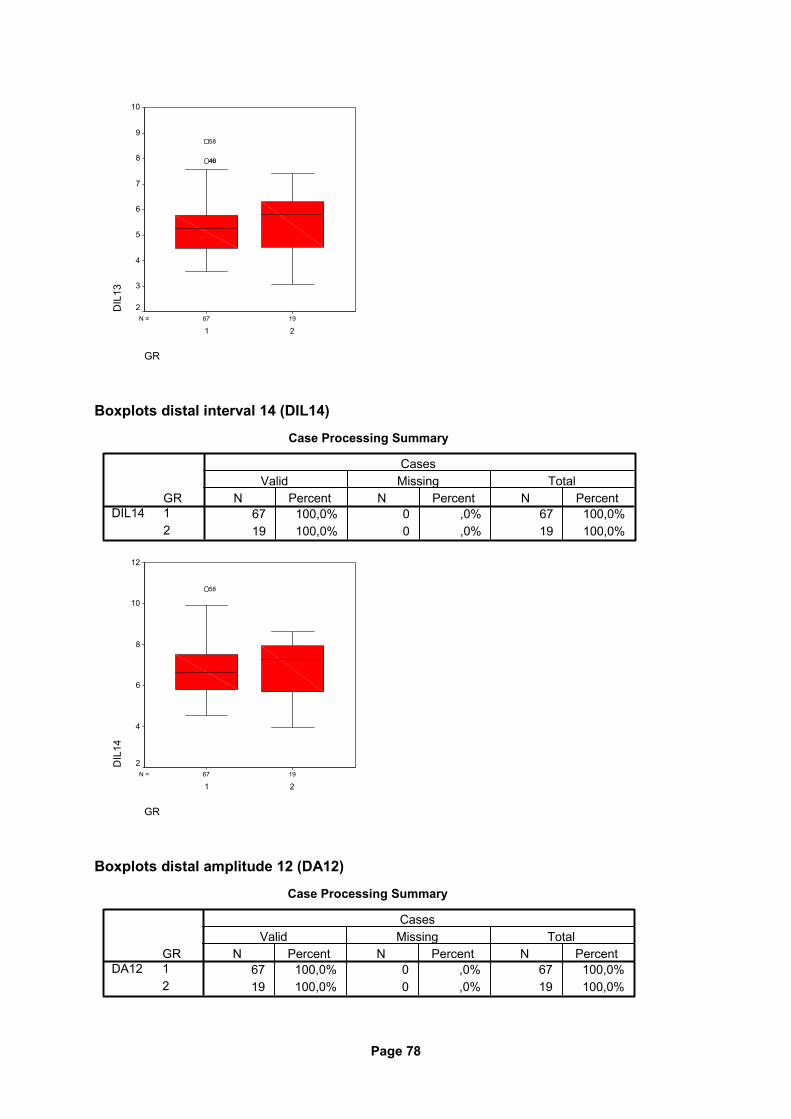
Page 78
1967N =
GR
21
DIL
1310
9
8
7
6
5
4
3
2
4640
58
Boxplots distal interval 14 (DIL14)
Case Processing Summary
67 100,0% 0 ,0% 67 100,0%19 100,0% 0 ,0% 19 100,0%
GR12
DIL14N Percent N Percent N Percent
Valid Missing TotalCases
1967N =
GR
21
DIL
14
12
10
8
6
4
2
58
Boxplots distal amplitude 12 (DA12)
Case Processing Summary
67 100,0% 0 ,0% 67 100,0%19 100,0% 0 ,0% 19 100,0%
GR12
DA12N Percent N Percent N Percent
Valid Missing TotalCases
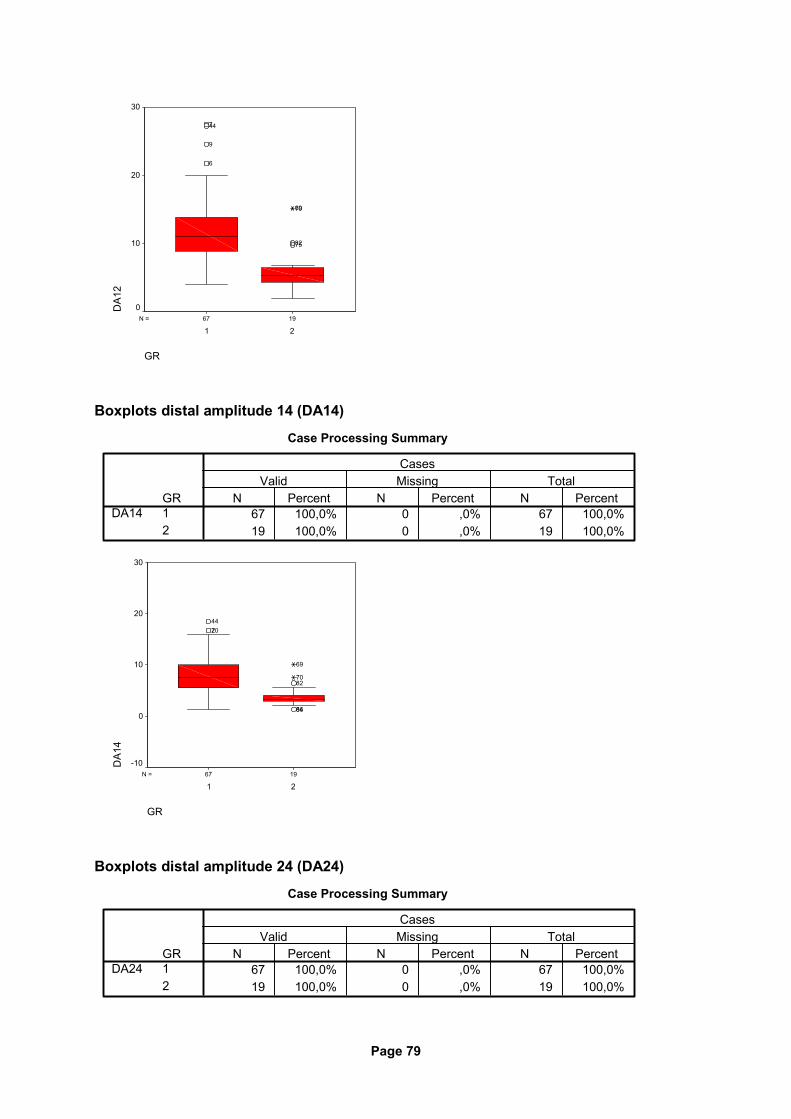
Page 79
1967N =
GR
21
DA1
230
20
10
0
7582
7069
6
9
447
Boxplots distal amplitude 14 (DA14)
Case Processing Summary
67 100,0% 0 ,0% 67 100,0%19 100,0% 0 ,0% 19 100,0%
GR12
DA14N Percent N Percent N Percent
Valid Missing TotalCases
1967N =
GR
21
DA1
4
30
20
10
0
-10
8486
8270
69
20744
Boxplots distal amplitude 24 (DA24)
Case Processing Summary
67 100,0% 0 ,0% 67 100,0%19 100,0% 0 ,0% 19 100,0%
GR12
DA24N Percent N Percent N Percent
Valid Missing TotalCases
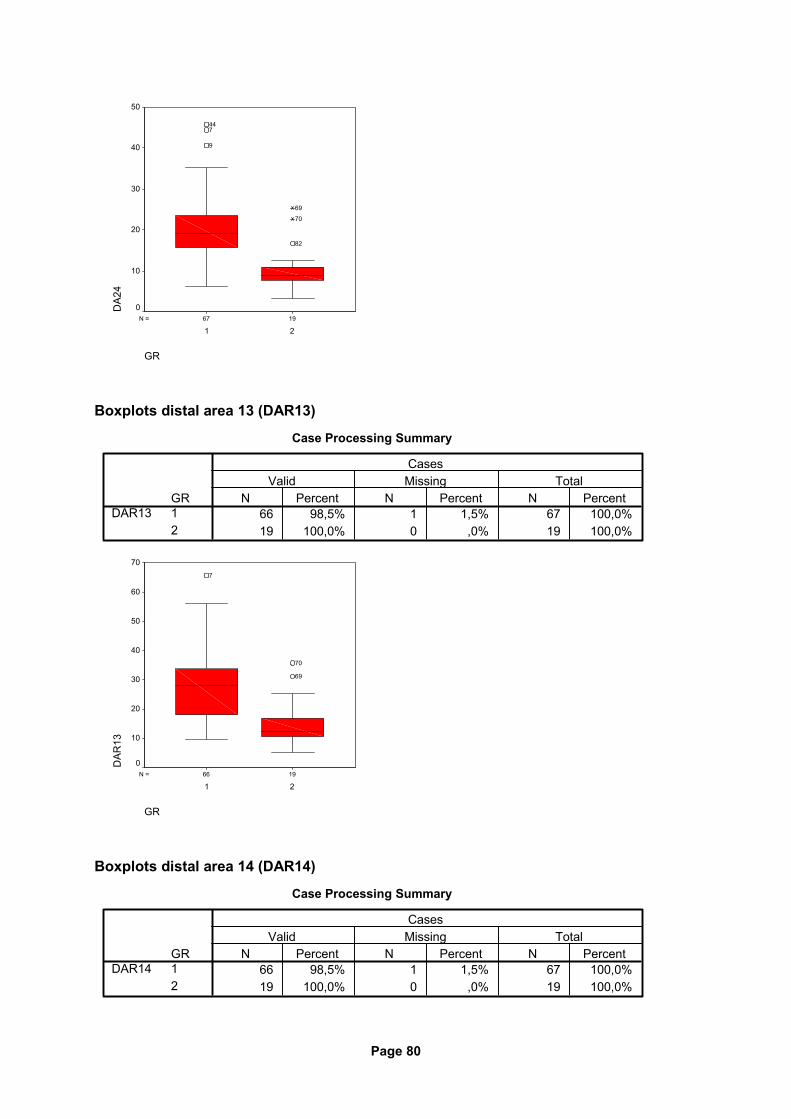
Page 80
1967N =
GR
21
DA2
450
40
30
20
10
0
82
70
69
9
744
Boxplots distal area 13 (DAR13)
Case Processing Summary
66 98,5% 1 1,5% 67 100,0%19 100,0% 0 ,0% 19 100,0%
GR12
DAR13N Percent N Percent N Percent
Valid Missing TotalCases
1966N =
GR
21
DAR
13
70
60
50
40
30
20
10
0
69
70
7
Boxplots distal area 14 (DAR14)
Case Processing Summary
66 98,5% 1 1,5% 67 100,0%19 100,0% 0 ,0% 19 100,0%
GR12
DAR14N Percent N Percent N Percent
Valid Missing TotalCases
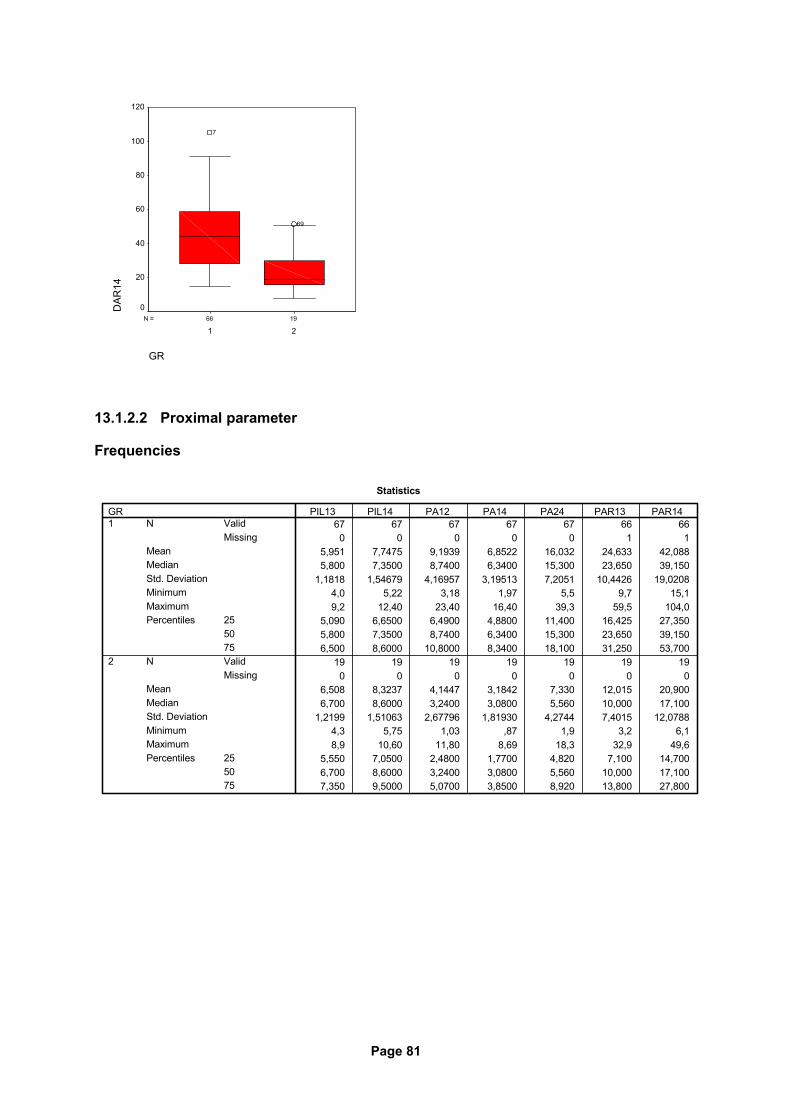
Page 81
1966N =
GR
21
DAR
14120
100
80
60
40
20
0
69
7
13.1.2.2 Proximal parameter
Frequencies
Statistics
67 67 67 67 67 66 660 0 0 0 0 1 1
5,951 7,7475 9,1939 6,8522 16,032 24,633 42,0885,800 7,3500 8,7400 6,3400 15,300 23,650 39,150
1,1818 1,54679 4,16957 3,19513 7,2051 10,4426 19,02084,0 5,22 3,18 1,97 5,5 9,7 15,19,2 12,40 23,40 16,40 39,3 59,5 104,0
5,090 6,6500 6,4900 4,8800 11,400 16,425 27,3505,800 7,3500 8,7400 6,3400 15,300 23,650 39,1506,500 8,6000 10,8000 8,3400 18,100 31,250 53,700
19 19 19 19 19 19 190 0 0 0 0 0 0
6,508 8,3237 4,1447 3,1842 7,330 12,015 20,9006,700 8,6000 3,2400 3,0800 5,560 10,000 17,100
1,2199 1,51063 2,67796 1,81930 4,2744 7,4015 12,07884,3 5,75 1,03 ,87 1,9 3,2 6,18,9 10,60 11,80 8,69 18,3 32,9 49,6
5,550 7,0500 2,4800 1,7700 4,820 7,100 14,7006,700 8,6000 3,2400 3,0800 5,560 10,000 17,1007,350 9,5000 5,0700 3,8500 8,920 13,800 27,800
ValidMissing
N
MeanMedianStd. DeviationMinimumMaximum
255075
Percentiles
ValidMissing
N
MeanMedianStd. DeviationMinimumMaximum
255075
Percentiles
GR1
2
PIL13 PIL14 PA12 PA14 PA24 PAR13 PAR14
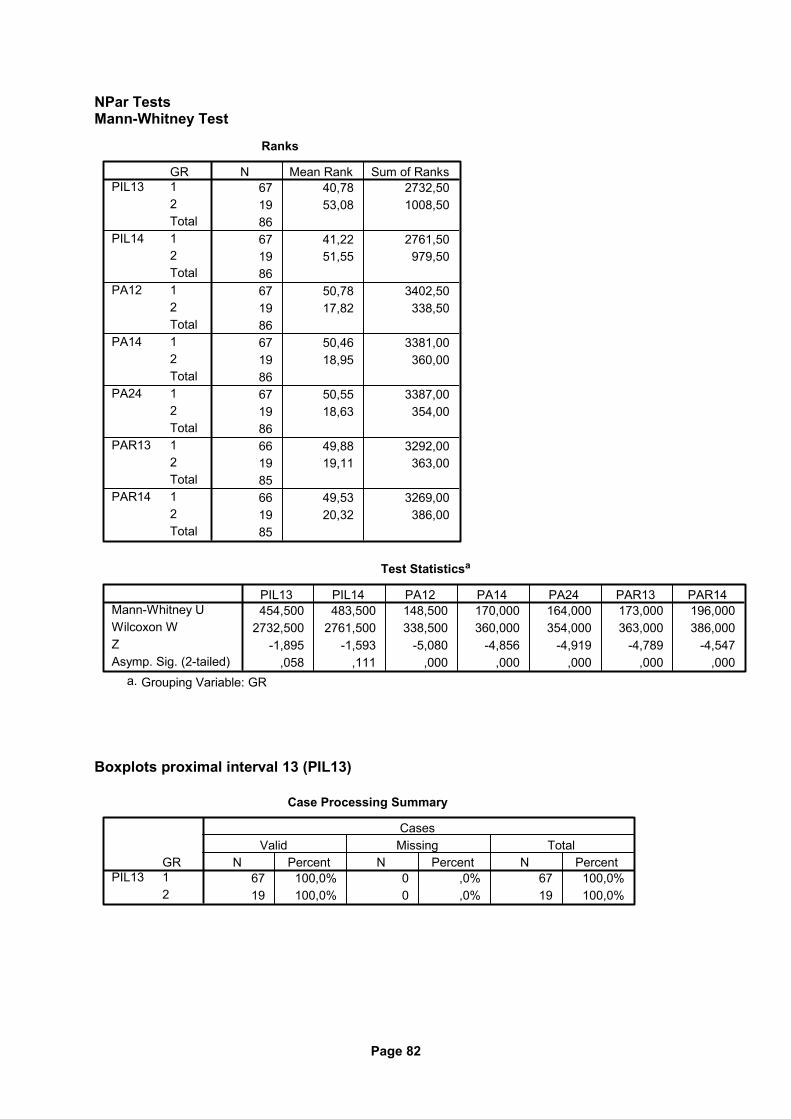
Page 82
NPar Tests Mann-Whitney Test
Ranks
67 40,78 2732,5019 53,08 1008,508667 41,22 2761,5019 51,55 979,508667 50,78 3402,5019 17,82 338,508667 50,46 3381,0019 18,95 360,008667 50,55 3387,0019 18,63 354,008666 49,88 3292,0019 19,11 363,008566 49,53 3269,0019 20,32 386,0085
GR12Total12Total12Total12Total12Total12Total12Total
PIL13
PIL14
PA12
PA14
PA24
PAR13
PAR14
N Mean Rank Sum of Ranks
Test Statisticsa
454,500 483,500 148,500 170,000 164,000 173,000 196,0002732,500 2761,500 338,500 360,000 354,000 363,000 386,000
-1,895 -1,593 -5,080 -4,856 -4,919 -4,789 -4,547,058 ,111 ,000 ,000 ,000 ,000 ,000
Mann-Whitney UWilcoxon WZAsymp. Sig. (2-tailed)
PIL13 PIL14 PA12 PA14 PA24 PAR13 PAR14
Grouping Variable: GRa.
Boxplots proximal interval 13 (PIL13)
Case Processing Summary
67 100,0% 0 ,0% 67 100,0%19 100,0% 0 ,0% 19 100,0%
GR12
PIL13N Percent N Percent N Percent
Valid Missing TotalCases
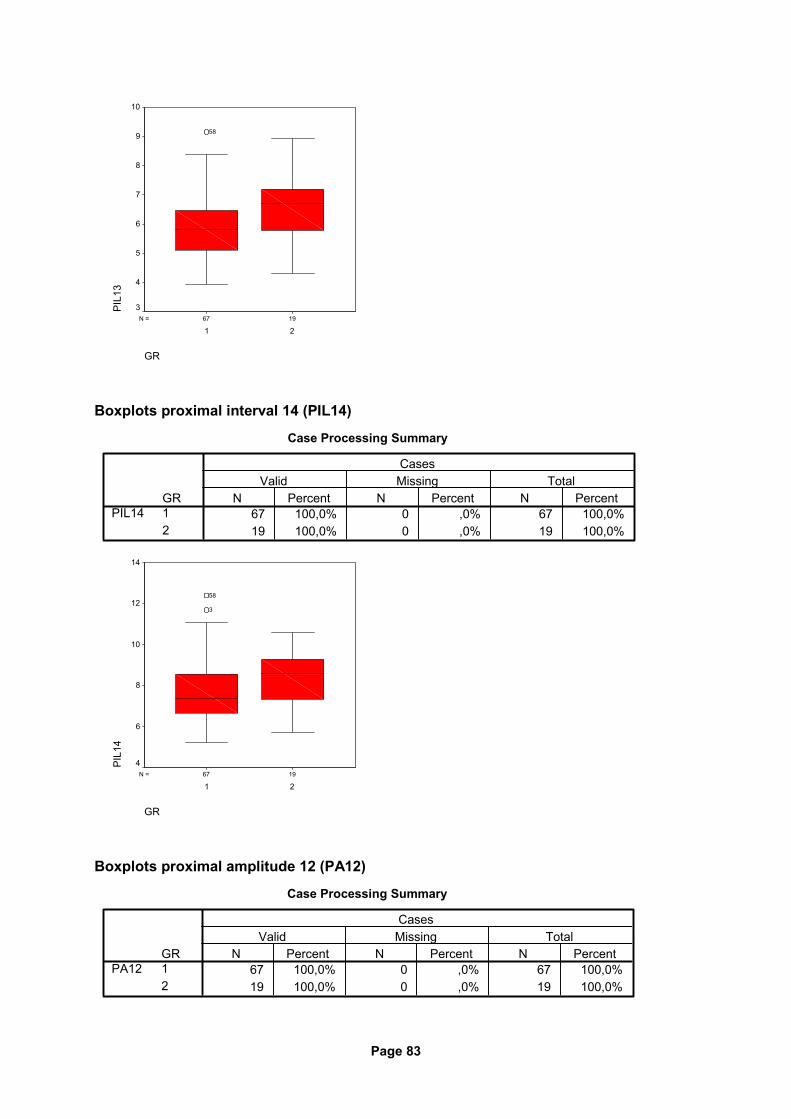
Page 83
1967N =
GR
21
PIL
1310
9
8
7
6
5
4
3
58
Boxplots proximal interval 14 (PIL14)
Case Processing Summary
67 100,0% 0 ,0% 67 100,0%19 100,0% 0 ,0% 19 100,0%
GR12
PIL14N Percent N Percent N Percent
Valid Missing TotalCases
1967N =
GR
21
PIL
14
14
12
10
8
6
4
3
58
Boxplots proximal amplitude 12 (PA12)
Case Processing Summary
67 100,0% 0 ,0% 67 100,0%19 100,0% 0 ,0% 19 100,0%
GR12
PA12N Percent N Percent N Percent
Valid Missing TotalCases
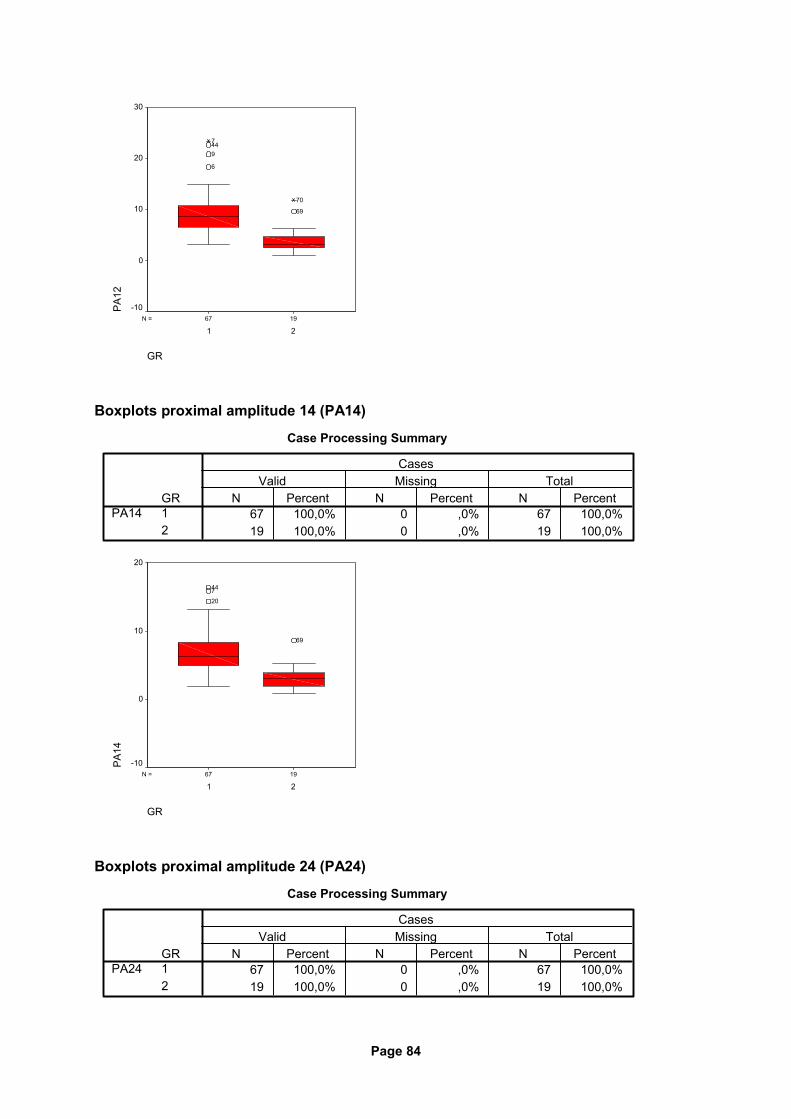
Page 84
1967N =
GR
21
PA
1230
20
10
0
-10
69
70
6
9447
Boxplots proximal amplitude 14 (PA14)
Case Processing Summary
67 100,0% 0 ,0% 67 100,0%19 100,0% 0 ,0% 19 100,0%
GR12
PA14N Percent N Percent N Percent
Valid Missing TotalCases
1967N =
GR
21
PA
14
20
10
0
-10
69
20744
Boxplots proximal amplitude 24 (PA24)
Case Processing Summary
67 100,0% 0 ,0% 67 100,0%19 100,0% 0 ,0% 19 100,0%
GR12
PA24N Percent N Percent N Percent
Valid Missing TotalCases
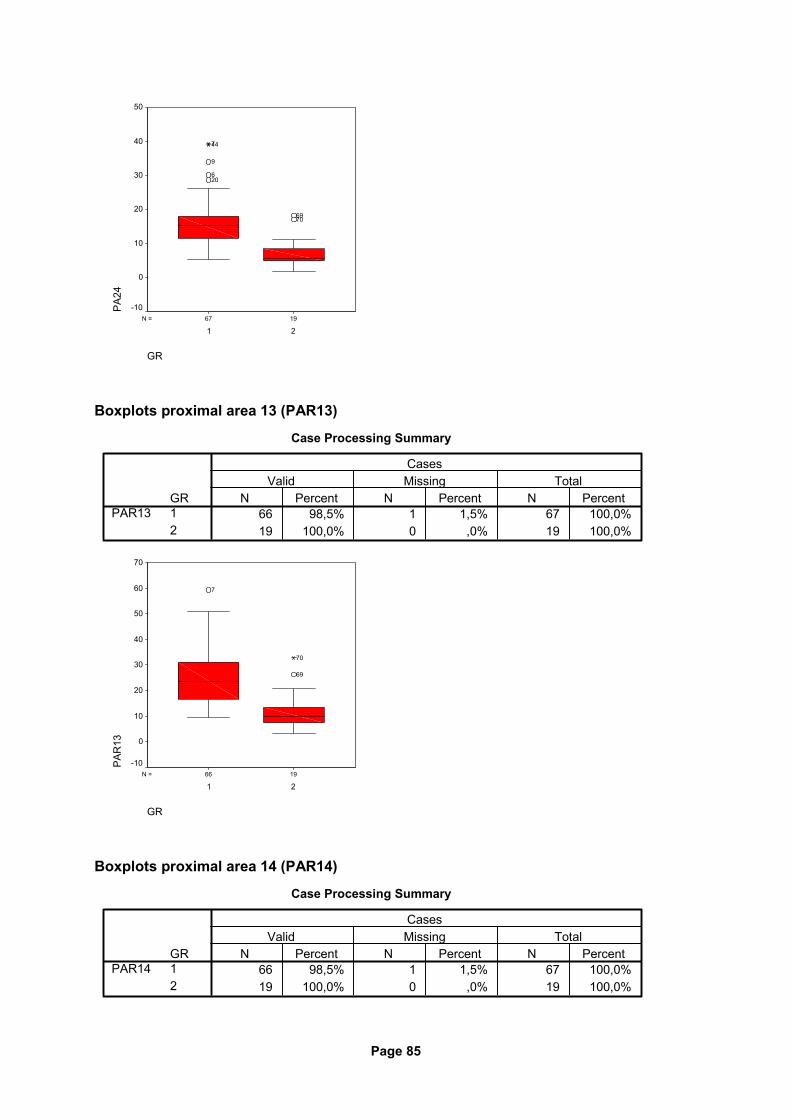
Page 85
1967N =
GR
21
PA
2450
40
30
20
10
0
-10
7069
206
9
447
Boxplots proximal area 13 (PAR13)
Case Processing Summary
66 98,5% 1 1,5% 67 100,0%19 100,0% 0 ,0% 19 100,0%
GR12
PAR13N Percent N Percent N Percent
Valid Missing TotalCases
1966N =
GR
21
PA
R13
70
60
50
40
30
20
10
0
-10
69
70
7
Boxplots proximal area 14 (PAR14)
Case Processing Summary
66 98,5% 1 1,5% 67 100,0%19 100,0% 0 ,0% 19 100,0%
GR12
PAR14N Percent N Percent N Percent
Valid Missing TotalCases
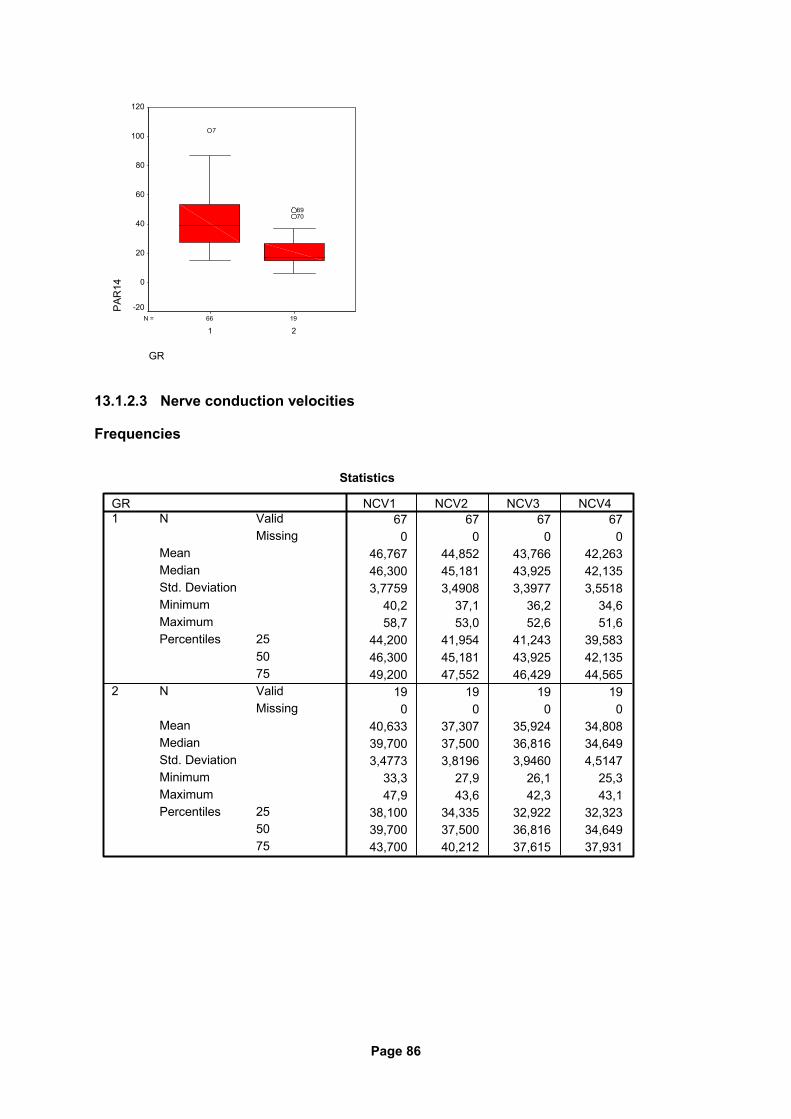
Page 86
1966N =
GR
21
PA
R14
120
100
80
60
40
20
0
-20
7069
7
13.1.2.3 Nerve conduction velocities
Frequencies
Statistics
67 67 67 670 0 0 0
46,767 44,852 43,766 42,26346,300 45,181 43,925 42,1353,7759 3,4908 3,3977 3,5518
40,2 37,1 36,2 34,658,7 53,0 52,6 51,6
44,200 41,954 41,243 39,58346,300 45,181 43,925 42,13549,200 47,552 46,429 44,565
19 19 19 190 0 0 0
40,633 37,307 35,924 34,80839,700 37,500 36,816 34,6493,4773 3,8196 3,9460 4,5147
33,3 27,9 26,1 25,347,9 43,6 42,3 43,1
38,100 34,335 32,922 32,32339,700 37,500 36,816 34,64943,700 40,212 37,615 37,931
ValidMissing
N
MeanMedianStd. DeviationMinimumMaximum
255075
Percentiles
ValidMissing
N
MeanMedianStd. DeviationMinimumMaximum
255075
Percentiles
GR1
2
NCV1 NCV2 NCV3 NCV4
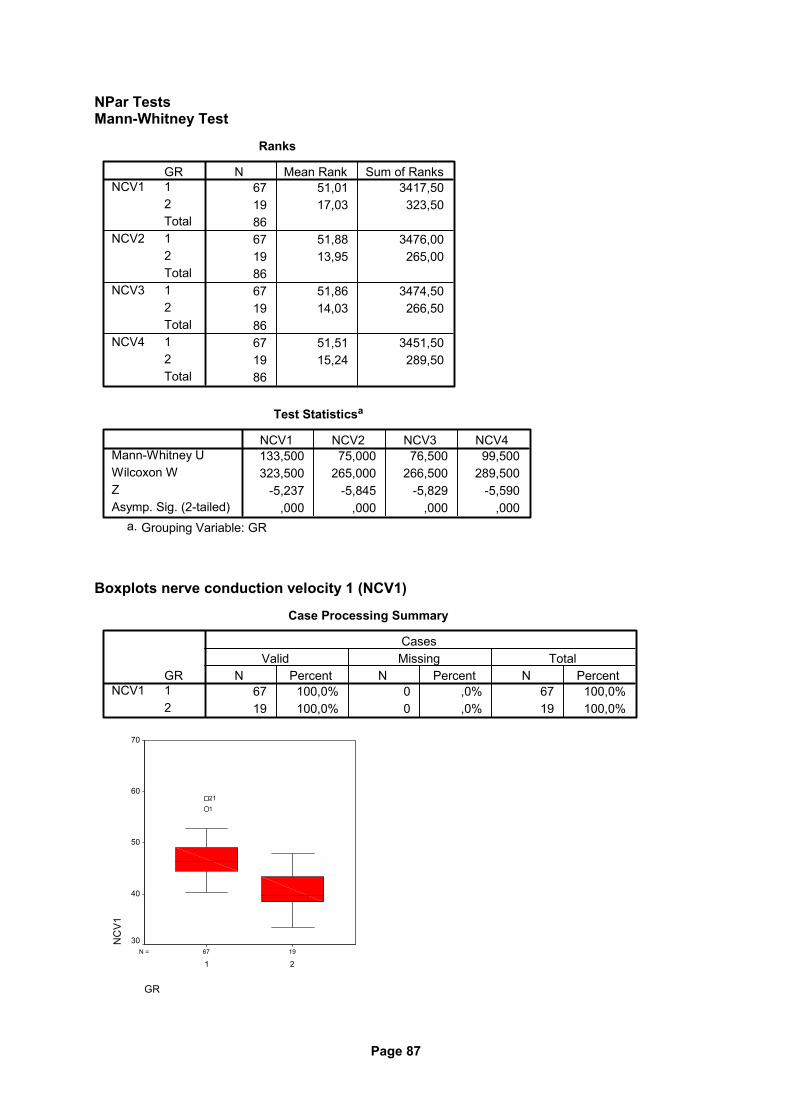
Page 87
NPar Tests Mann-Whitney Test
Ranks
67 51,01 3417,5019 17,03 323,508667 51,88 3476,0019 13,95 265,008667 51,86 3474,5019 14,03 266,508667 51,51 3451,5019 15,24 289,5086
GR12Total12Total12Total12Total
NCV1
NCV2
NCV3
NCV4
N Mean Rank Sum of Ranks
Test Statisticsa
133,500 75,000 76,500 99,500323,500 265,000 266,500 289,500
-5,237 -5,845 -5,829 -5,590,000 ,000 ,000 ,000
Mann-Whitney UWilcoxon WZAsymp. Sig. (2-tailed)
NCV1 NCV2 NCV3 NCV4
Grouping Variable: GRa.
Boxplots nerve conduction velocity 1 (NCV1)
Case Processing Summary
67 100,0% 0 ,0% 67 100,0%19 100,0% 0 ,0% 19 100,0%
GR12
NCV1N Percent N Percent N Percent
Valid Missing TotalCases
1967N =
GR
21
NC
V1
70
60
50
40
30
1
21
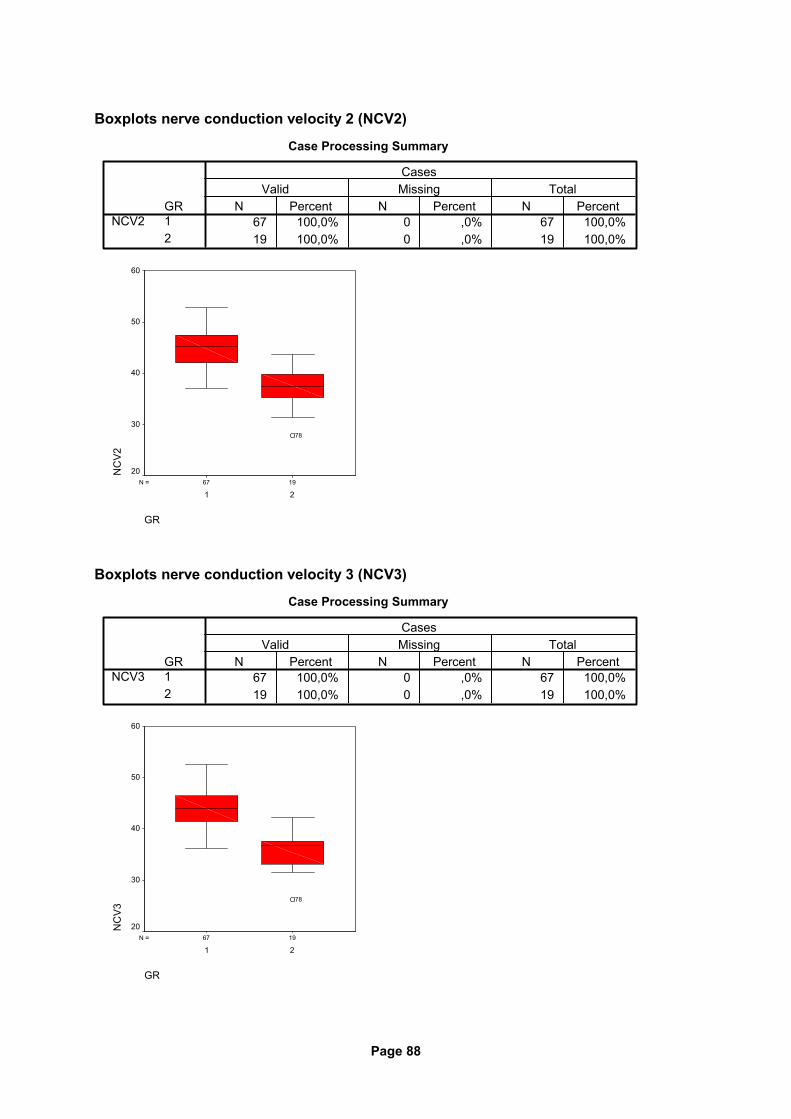
Page 88
Boxplots nerve conduction velocity 2 (NCV2)
Case Processing Summary
67 100,0% 0 ,0% 67 100,0%19 100,0% 0 ,0% 19 100,0%
GR12
NCV2N Percent N Percent N Percent
Valid Missing TotalCases
1967N =
GR
21
NC
V2
60
50
40
30
20
78
Boxplots nerve conduction velocity 3 (NCV3)
Case Processing Summary
67 100,0% 0 ,0% 67 100,0%19 100,0% 0 ,0% 19 100,0%
GR12
NCV3N Percent N Percent N Percent
Valid Missing TotalCases
1967N =
GR
21
NC
V3
60
50
40
30
20
78
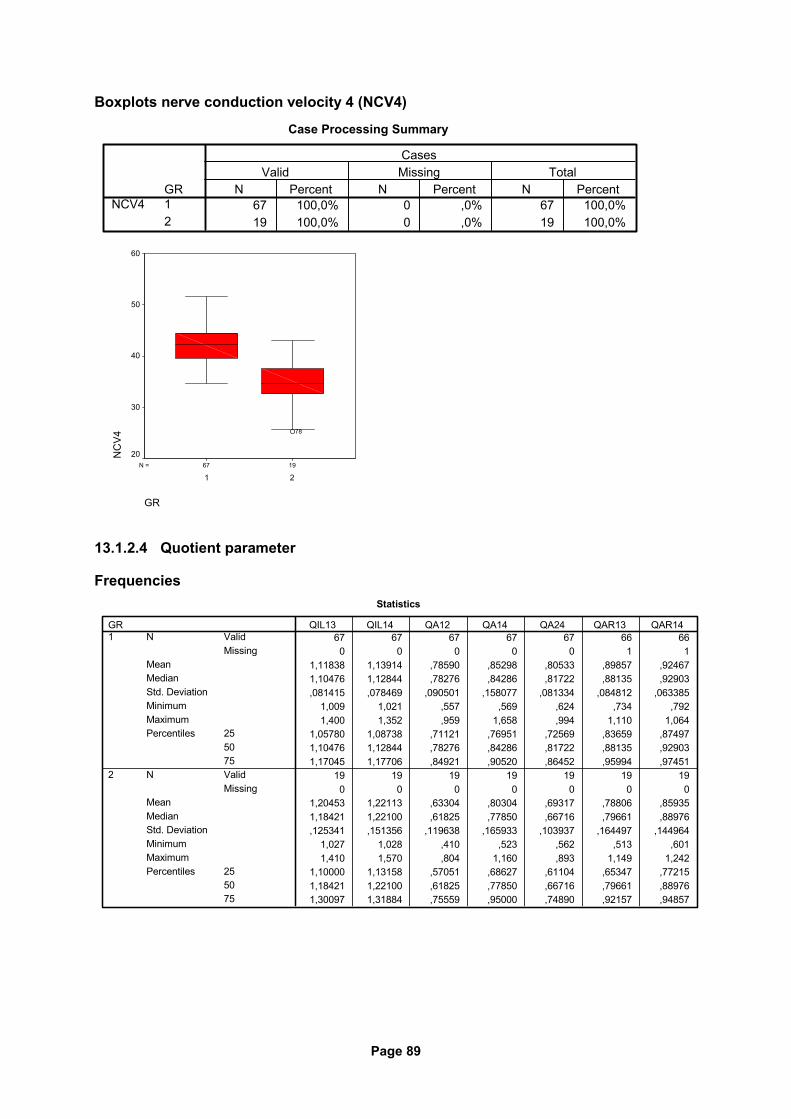
Page 89
Boxplots nerve conduction velocity 4 (NCV4)
Case Processing Summary
67 100,0% 0 ,0% 67 100,0%19 100,0% 0 ,0% 19 100,0%
GR12
NCV4N Percent N Percent N Percent
Valid Missing TotalCases
1967N =
GR
21
NC
V4
60
50
40
30
20
78
13.1.2.4 Quotient parameter
Frequencies Statistics
67 67 67 67 67 66 660 0 0 0 0 1 1
1,11838 1,13914 ,78590 ,85298 ,80533 ,89857 ,924671,10476 1,12844 ,78276 ,84286 ,81722 ,88135 ,92903,081415 ,078469 ,090501 ,158077 ,081334 ,084812 ,063385
1,009 1,021 ,557 ,569 ,624 ,734 ,7921,400 1,352 ,959 1,658 ,994 1,110 1,064
1,05780 1,08738 ,71121 ,76951 ,72569 ,83659 ,874971,10476 1,12844 ,78276 ,84286 ,81722 ,88135 ,929031,17045 1,17706 ,84921 ,90520 ,86452 ,95994 ,97451
19 19 19 19 19 19 190 0 0 0 0 0 0
1,20453 1,22113 ,63304 ,80304 ,69317 ,78806 ,859351,18421 1,22100 ,61825 ,77850 ,66716 ,79661 ,88976,125341 ,151356 ,119638 ,165933 ,103937 ,164497 ,144964
1,027 1,028 ,410 ,523 ,562 ,513 ,6011,410 1,570 ,804 1,160 ,893 1,149 1,242
1,10000 1,13158 ,57051 ,68627 ,61104 ,65347 ,772151,18421 1,22100 ,61825 ,77850 ,66716 ,79661 ,889761,30097 1,31884 ,75559 ,95000 ,74890 ,92157 ,94857
ValidMissing
N
MeanMedianStd. DeviationMinimumMaximum
255075
Percentiles
ValidMissing
N
MeanMedianStd. DeviationMinimumMaximum
255075
Percentiles
GR1
2
QIL13 QIL14 QA12 QA14 QA24 QAR13 QAR14
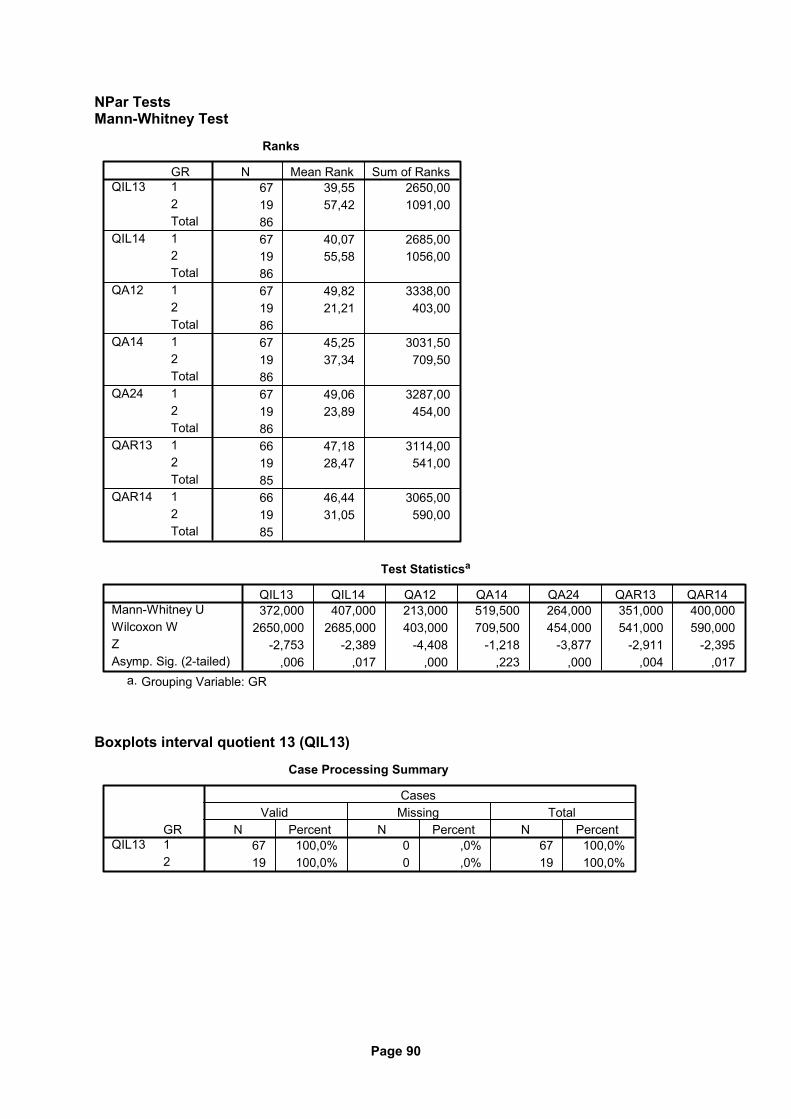
Page 90
NPar Tests Mann-Whitney Test
Ranks
67 39,55 2650,0019 57,42 1091,008667 40,07 2685,0019 55,58 1056,008667 49,82 3338,0019 21,21 403,008667 45,25 3031,5019 37,34 709,508667 49,06 3287,0019 23,89 454,008666 47,18 3114,0019 28,47 541,008566 46,44 3065,0019 31,05 590,0085
GR12Total12Total12Total12Total12Total12Total12Total
QIL13
QIL14
QA12
QA14
QA24
QAR13
QAR14
N Mean Rank Sum of Ranks
Test Statisticsa
372,000 407,000 213,000 519,500 264,000 351,000 400,0002650,000 2685,000 403,000 709,500 454,000 541,000 590,000
-2,753 -2,389 -4,408 -1,218 -3,877 -2,911 -2,395,006 ,017 ,000 ,223 ,000 ,004 ,017
Mann-Whitney UWilcoxon WZAsymp. Sig. (2-tailed)
QIL13 QIL14 QA12 QA14 QA24 QAR13 QAR14
Grouping Variable: GRa.
Boxplots interval quotient 13 (QIL13)
Case Processing Summary
67 100,0% 0 ,0% 67 100,0%19 100,0% 0 ,0% 19 100,0%
GR12
QIL13N Percent N Percent N Percent
Valid Missing TotalCases
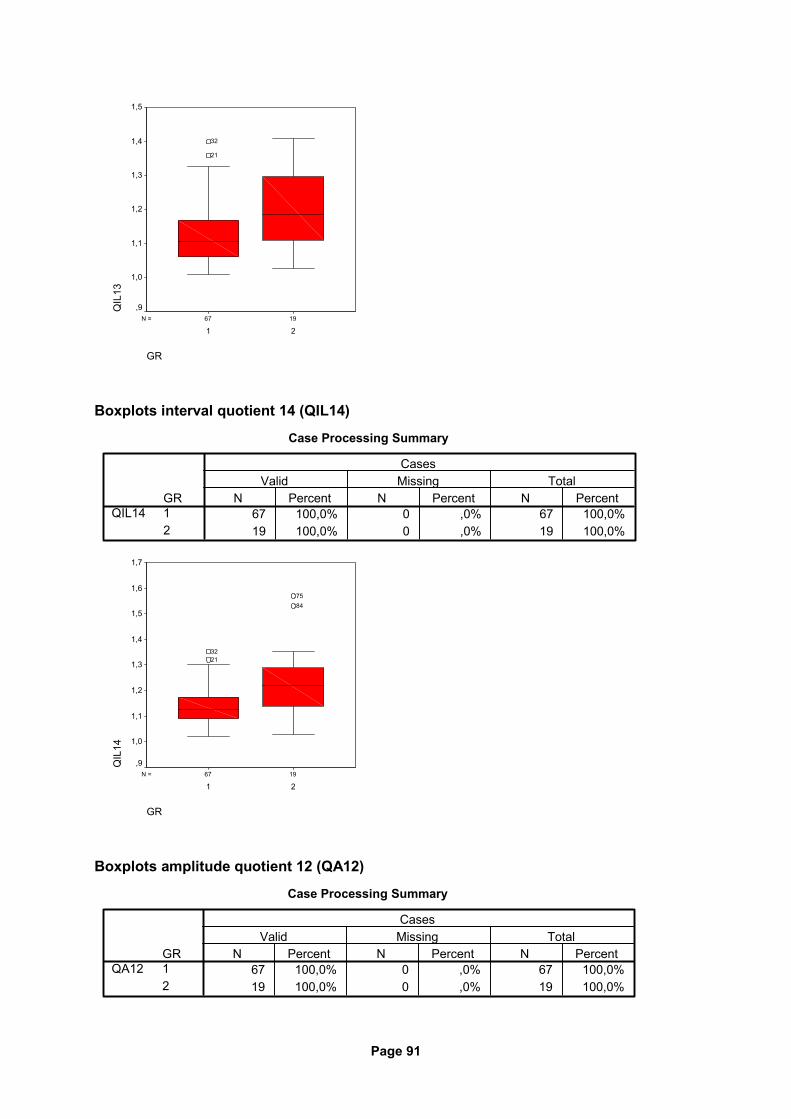
Page 91
1967N =
GR
21
QIL
131,5
1,4
1,3
1,2
1,1
1,0
,9
21
32
Boxplots interval quotient 14 (QIL14)
Case Processing Summary
67 100,0% 0 ,0% 67 100,0%19 100,0% 0 ,0% 19 100,0%
GR12
QIL14N Percent N Percent N Percent
Valid Missing TotalCases
1967N =
GR
21
QIL
14
1,7
1,6
1,5
1,4
1,3
1,2
1,1
1,0
,9
8475
2132
Boxplots amplitude quotient 12 (QA12)
Case Processing Summary
67 100,0% 0 ,0% 67 100,0%19 100,0% 0 ,0% 19 100,0%
GR12
QA12N Percent N Percent N Percent
Valid Missing TotalCases
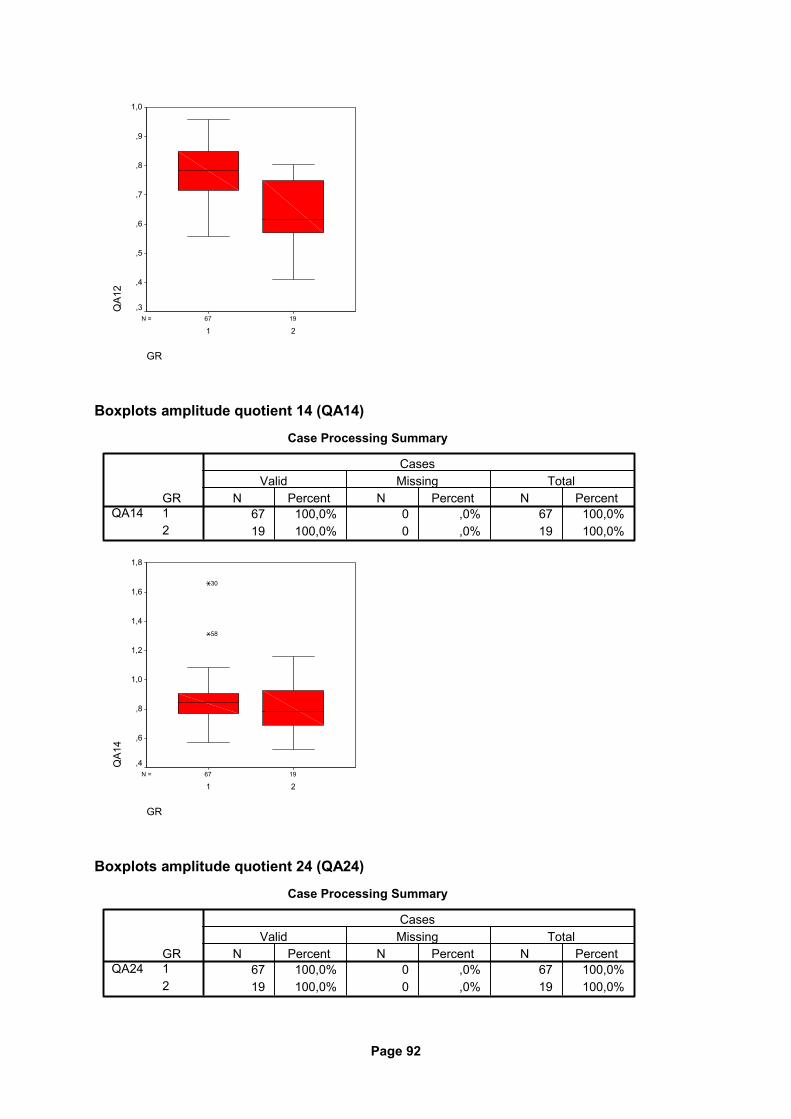
Page 92
1967N =
GR
21
QA1
21,0
,9
,8
,7
,6
,5
,4
,3
Boxplots amplitude quotient 14 (QA14)
Case Processing Summary
67 100,0% 0 ,0% 67 100,0%19 100,0% 0 ,0% 19 100,0%
GR12
QA14N Percent N Percent N Percent
Valid Missing TotalCases
1967N =
GR
21
QA1
4
1,8
1,6
1,4
1,2
1,0
,8
,6
,4
58
30
Boxplots amplitude quotient 24 (QA24)
Case Processing Summary
67 100,0% 0 ,0% 67 100,0%19 100,0% 0 ,0% 19 100,0%
GR12
QA24N Percent N Percent N Percent
Valid Missing TotalCases
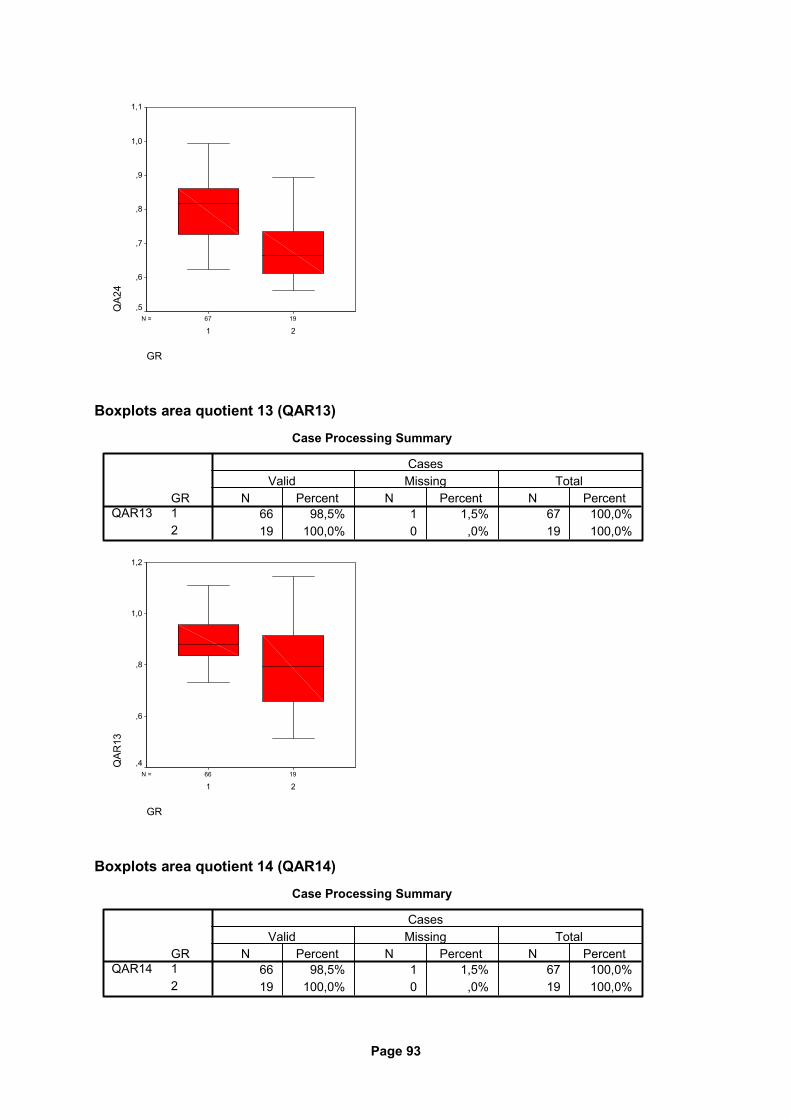
Page 93
1967N =
GR
21
QA2
41,1
1,0
,9
,8
,7
,6
,5
Boxplots area quotient 13 (QAR13)
Case Processing Summary
66 98,5% 1 1,5% 67 100,0%19 100,0% 0 ,0% 19 100,0%
GR12
QAR13N Percent N Percent N Percent
Valid Missing TotalCases
1966N =
GR
21
QAR
13
1,2
1,0
,8
,6
,4
Boxplots area quotient 14 (QAR14)
Case Processing Summary
66 98,5% 1 1,5% 67 100,0%19 100,0% 0 ,0% 19 100,0%
GR12
QAR14N Percent N Percent N Percent
Valid Missing TotalCases
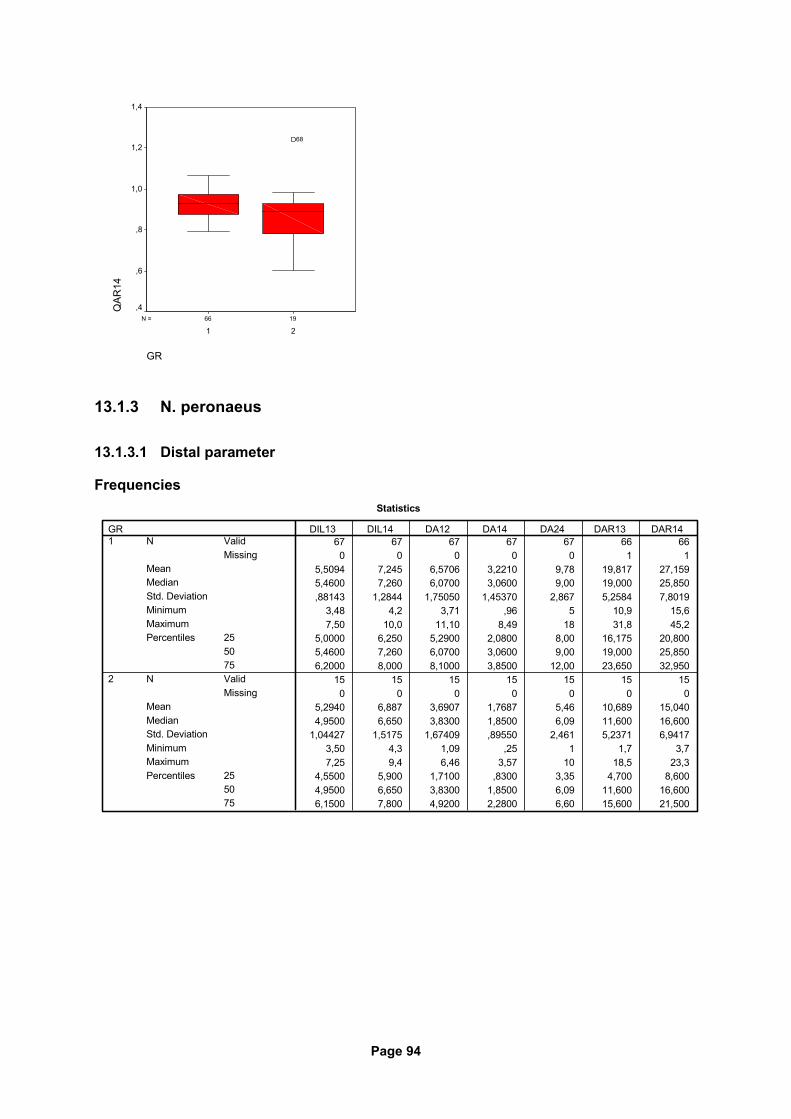
Page 94
1966N =
GR
21
QAR
141,4
1,2
1,0
,8
,6
,4
68
13.1.3 N. peronaeus
13.1.3.1 Distal parameter
Frequencies Statistics
67 67 67 67 67 66 660 0 0 0 0 1 1
5,5094 7,245 6,5706 3,2210 9,78 19,817 27,1595,4600 7,260 6,0700 3,0600 9,00 19,000 25,850,88143 1,2844 1,75050 1,45370 2,867 5,2584 7,8019
3,48 4,2 3,71 ,96 5 10,9 15,67,50 10,0 11,10 8,49 18 31,8 45,2
5,0000 6,250 5,2900 2,0800 8,00 16,175 20,8005,4600 7,260 6,0700 3,0600 9,00 19,000 25,8506,2000 8,000 8,1000 3,8500 12,00 23,650 32,950
15 15 15 15 15 15 150 0 0 0 0 0 0
5,2940 6,887 3,6907 1,7687 5,46 10,689 15,0404,9500 6,650 3,8300 1,8500 6,09 11,600 16,600
1,04427 1,5175 1,67409 ,89550 2,461 5,2371 6,94173,50 4,3 1,09 ,25 1 1,7 3,77,25 9,4 6,46 3,57 10 18,5 23,3
4,5500 5,900 1,7100 ,8300 3,35 4,700 8,6004,9500 6,650 3,8300 1,8500 6,09 11,600 16,6006,1500 7,800 4,9200 2,2800 6,60 15,600 21,500
ValidMissing
N
MeanMedianStd. DeviationMinimumMaximum
255075
Percentiles
ValidMissing
N
MeanMedianStd. DeviationMinimumMaximum
255075
Percentiles
GR1
2
DIL13 DIL14 DA12 DA14 DA24 DAR13 DAR14
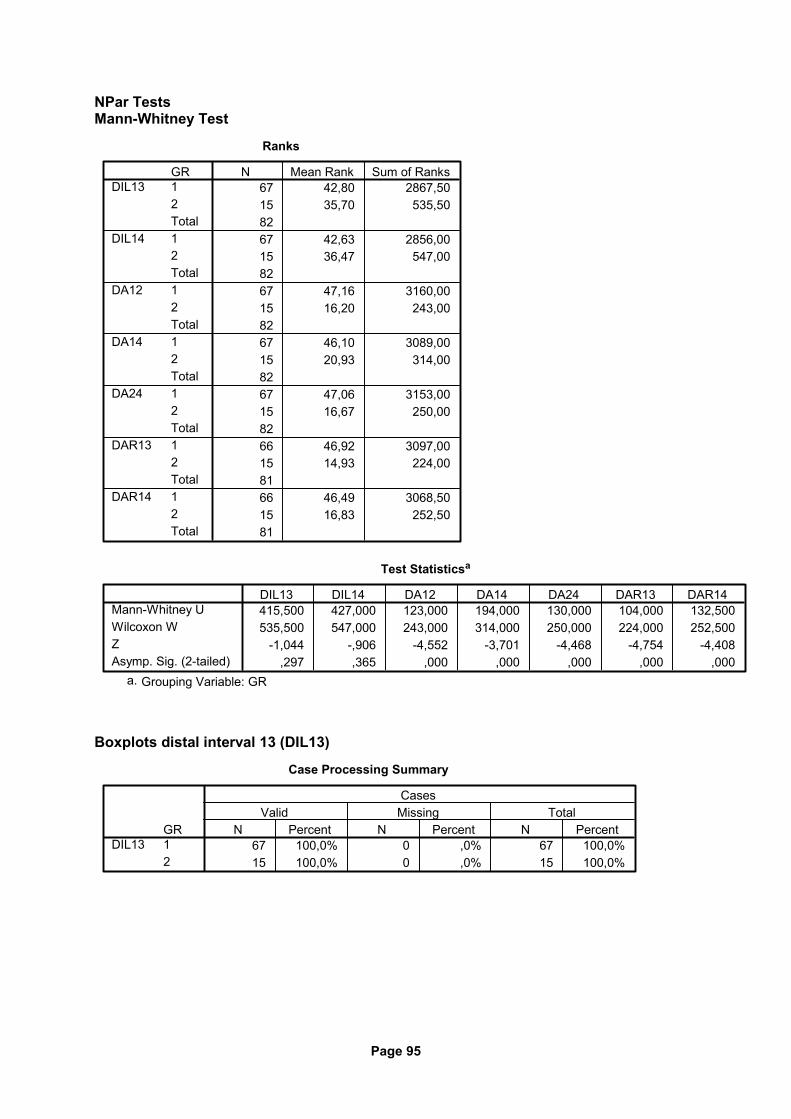
Page 95
NPar Tests Mann-Whitney Test
Ranks
67 42,80 2867,5015 35,70 535,508267 42,63 2856,0015 36,47 547,008267 47,16 3160,0015 16,20 243,008267 46,10 3089,0015 20,93 314,008267 47,06 3153,0015 16,67 250,008266 46,92 3097,0015 14,93 224,008166 46,49 3068,5015 16,83 252,5081
GR12Total12Total12Total12Total12Total12Total12Total
DIL13
DIL14
DA12
DA14
DA24
DAR13
DAR14
N Mean Rank Sum of Ranks
Test Statisticsa
415,500 427,000 123,000 194,000 130,000 104,000 132,500535,500 547,000 243,000 314,000 250,000 224,000 252,500
-1,044 -,906 -4,552 -3,701 -4,468 -4,754 -4,408,297 ,365 ,000 ,000 ,000 ,000 ,000
Mann-Whitney UWilcoxon WZAsymp. Sig. (2-tailed)
DIL13 DIL14 DA12 DA14 DA24 DAR13 DAR14
Grouping Variable: GRa.
Boxplots distal interval 13 (DIL13)
Case Processing Summary
67 100,0% 0 ,0% 67 100,0%15 100,0% 0 ,0% 15 100,0%
GR12
DIL13N Percent N Percent N Percent
Valid Missing TotalCases
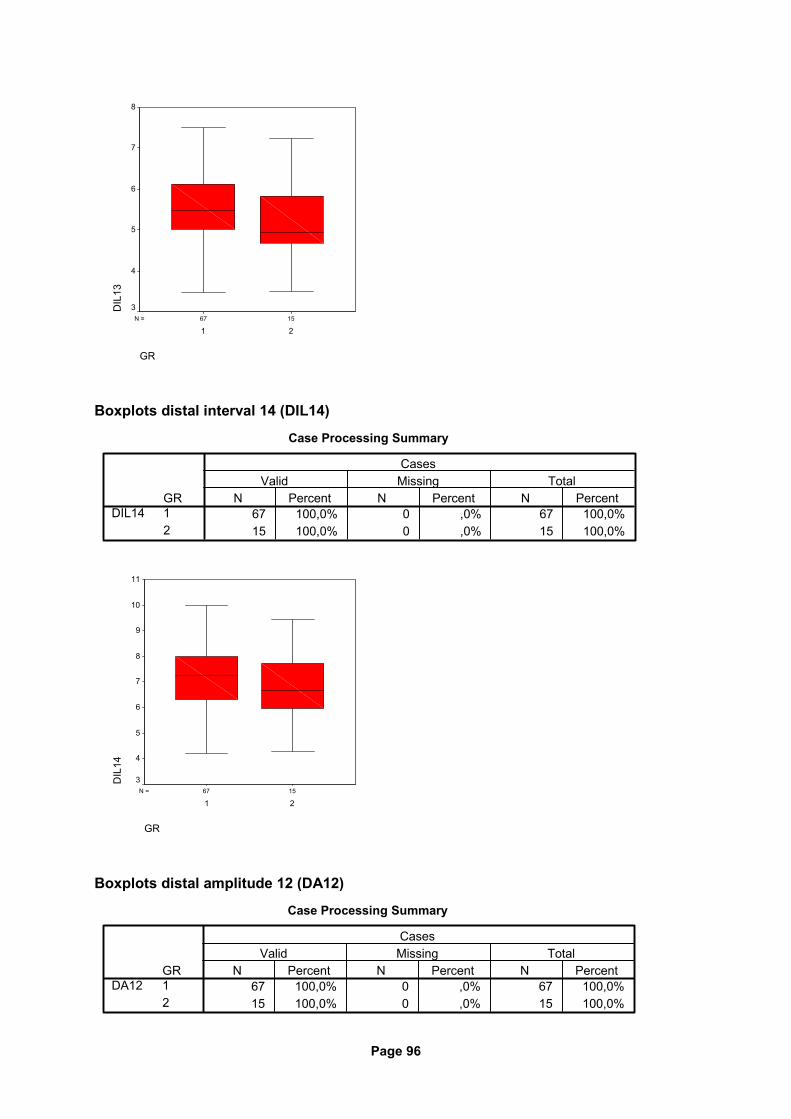
Page 96
1567N =
GR
21
DIL
138
7
6
5
4
3
Boxplots distal interval 14 (DIL14)
Case Processing Summary
67 100,0% 0 ,0% 67 100,0%15 100,0% 0 ,0% 15 100,0%
GR12
DIL14N Percent N Percent N Percent
Valid Missing TotalCases
1567N =
GR
21
DIL
14
11
10
9
8
7
6
5
4
3
Boxplots distal amplitude 12 (DA12)
Case Processing Summary
67 100,0% 0 ,0% 67 100,0%15 100,0% 0 ,0% 15 100,0%
GR12
DA12N Percent N Percent N Percent
Valid Missing TotalCases
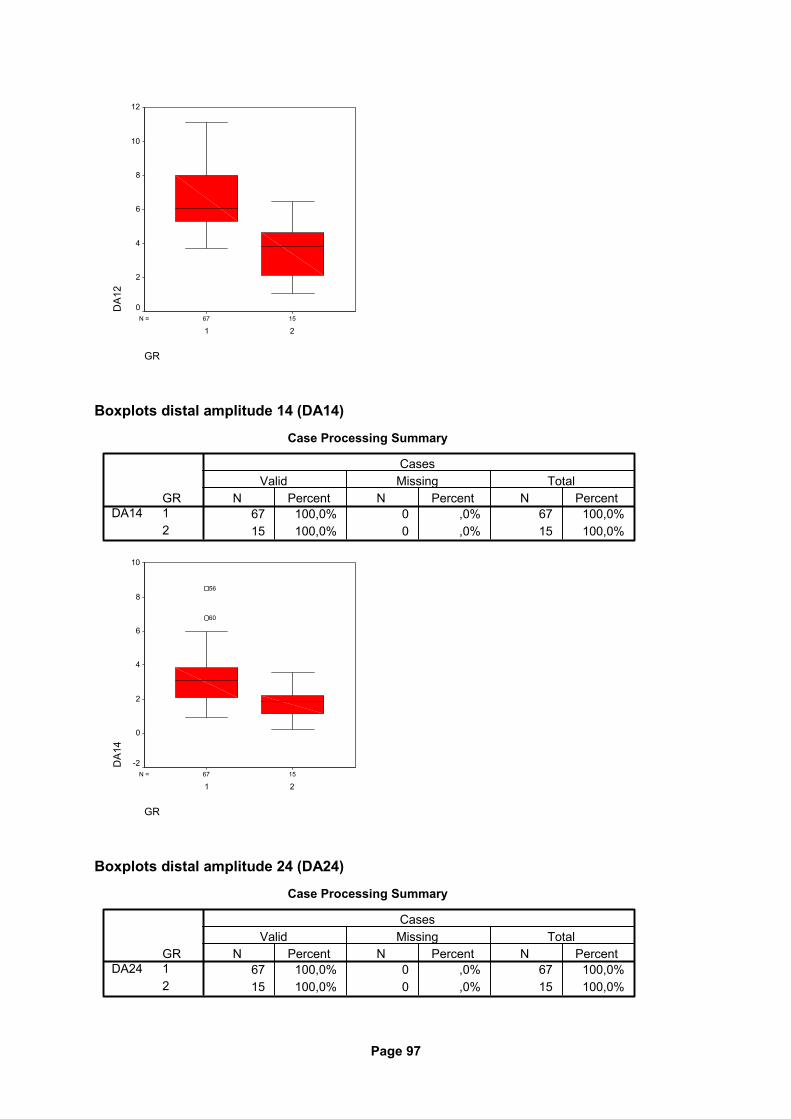
Page 97
1567N =
GR
21
DA1
212
10
8
6
4
2
0
Boxplots distal amplitude 14 (DA14)
Case Processing Summary
67 100,0% 0 ,0% 67 100,0%15 100,0% 0 ,0% 15 100,0%
GR12
DA14N Percent N Percent N Percent
Valid Missing TotalCases
1567N =
GR
21
DA1
4
10
8
6
4
2
0
-2
60
56
Boxplots distal amplitude 24 (DA24)
Case Processing Summary
67 100,0% 0 ,0% 67 100,0%15 100,0% 0 ,0% 15 100,0%
GR12
DA24N Percent N Percent N Percent
Valid Missing TotalCases
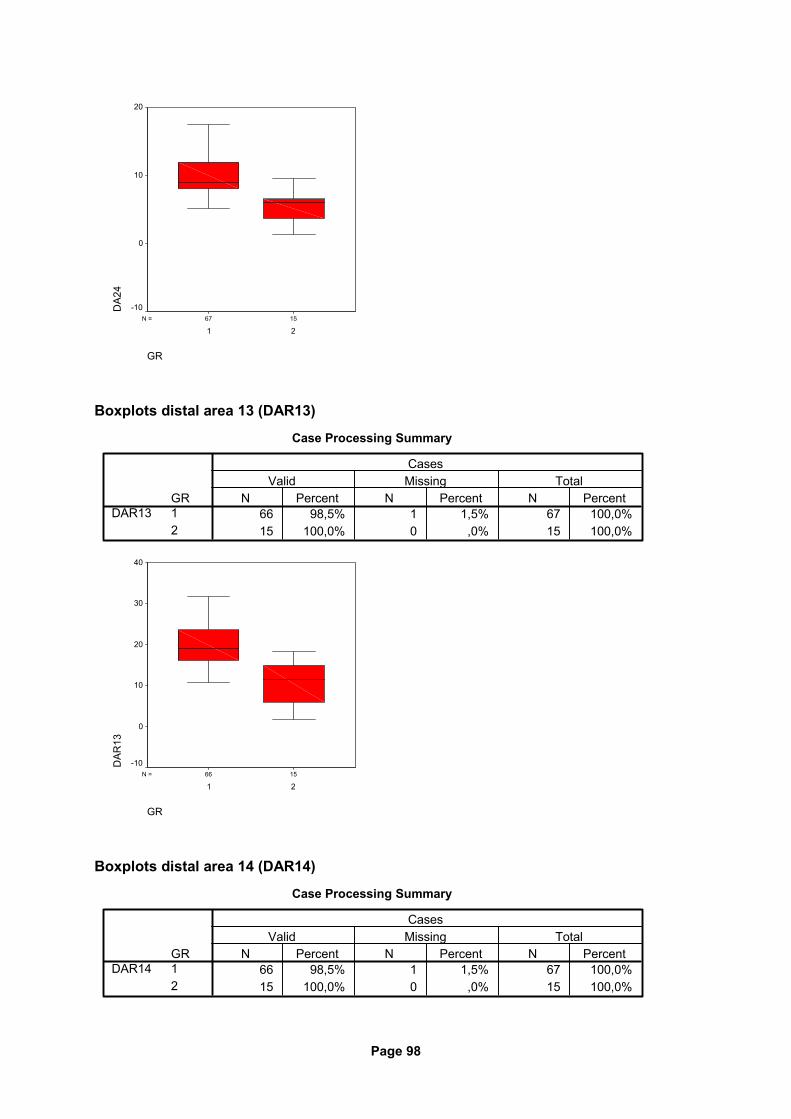
Page 98
1567N =
GR
21
DA2
420
10
0
-10
Boxplots distal area 13 (DAR13)
Case Processing Summary
66 98,5% 1 1,5% 67 100,0%15 100,0% 0 ,0% 15 100,0%
GR12
DAR13N Percent N Percent N Percent
Valid Missing TotalCases
1566N =
GR
21
DAR
13
40
30
20
10
0
-10
Boxplots distal area 14 (DAR14)
Case Processing Summary
66 98,5% 1 1,5% 67 100,0%15 100,0% 0 ,0% 15 100,0%
GR12
DAR14N Percent N Percent N Percent
Valid Missing TotalCases
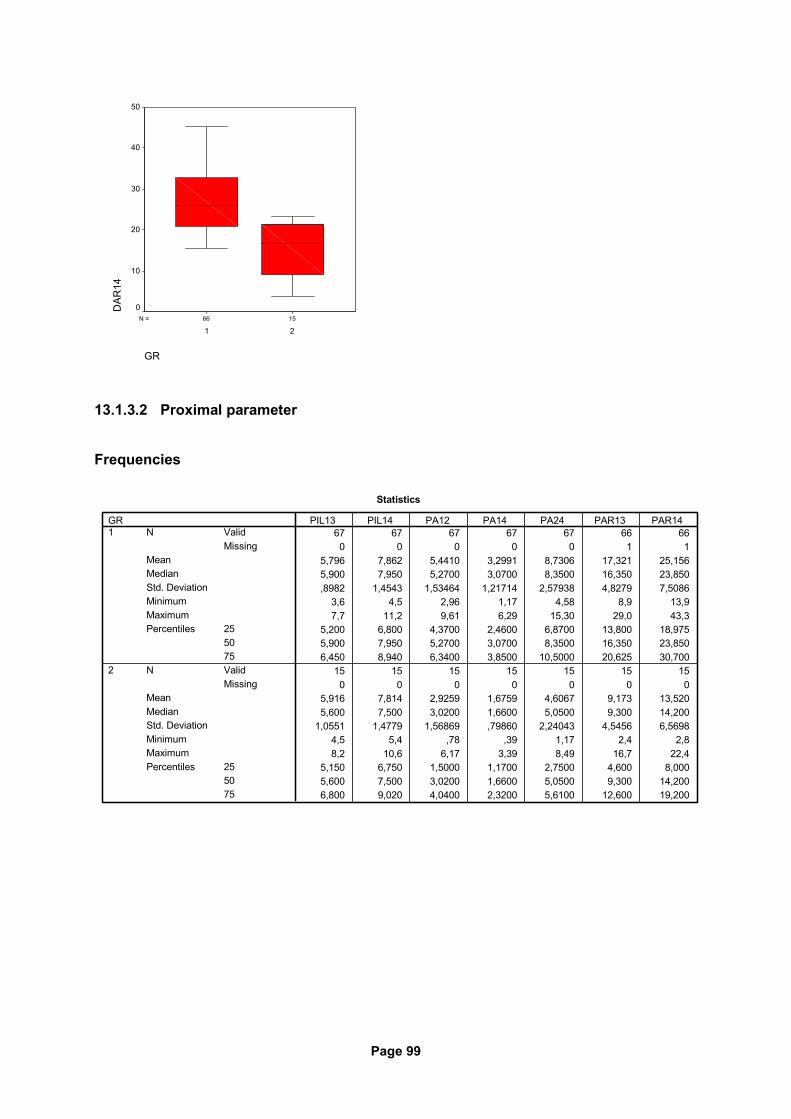
Page 99
1566N =
GR
21
DAR
1450
40
30
20
10
0
13.1.3.2 Proximal parameter
Frequencies
Statistics
67 67 67 67 67 66 660 0 0 0 0 1 1
5,796 7,862 5,4410 3,2991 8,7306 17,321 25,1565,900 7,950 5,2700 3,0700 8,3500 16,350 23,850,8982 1,4543 1,53464 1,21714 2,57938 4,8279 7,5086
3,6 4,5 2,96 1,17 4,58 8,9 13,97,7 11,2 9,61 6,29 15,30 29,0 43,3
5,200 6,800 4,3700 2,4600 6,8700 13,800 18,9755,900 7,950 5,2700 3,0700 8,3500 16,350 23,8506,450 8,940 6,3400 3,8500 10,5000 20,625 30,700
15 15 15 15 15 15 150 0 0 0 0 0 0
5,916 7,814 2,9259 1,6759 4,6067 9,173 13,5205,600 7,500 3,0200 1,6600 5,0500 9,300 14,200
1,0551 1,4779 1,56869 ,79860 2,24043 4,5456 6,56984,5 5,4 ,78 ,39 1,17 2,4 2,88,2 10,6 6,17 3,39 8,49 16,7 22,4
5,150 6,750 1,5000 1,1700 2,7500 4,600 8,0005,600 7,500 3,0200 1,6600 5,0500 9,300 14,2006,800 9,020 4,0400 2,3200 5,6100 12,600 19,200
ValidMissing
N
MeanMedianStd. DeviationMinimumMaximum
255075
Percentiles
ValidMissing
N
MeanMedianStd. DeviationMinimumMaximum
255075
Percentiles
GR1
2
PIL13 PIL14 PA12 PA14 PA24 PAR13 PAR14
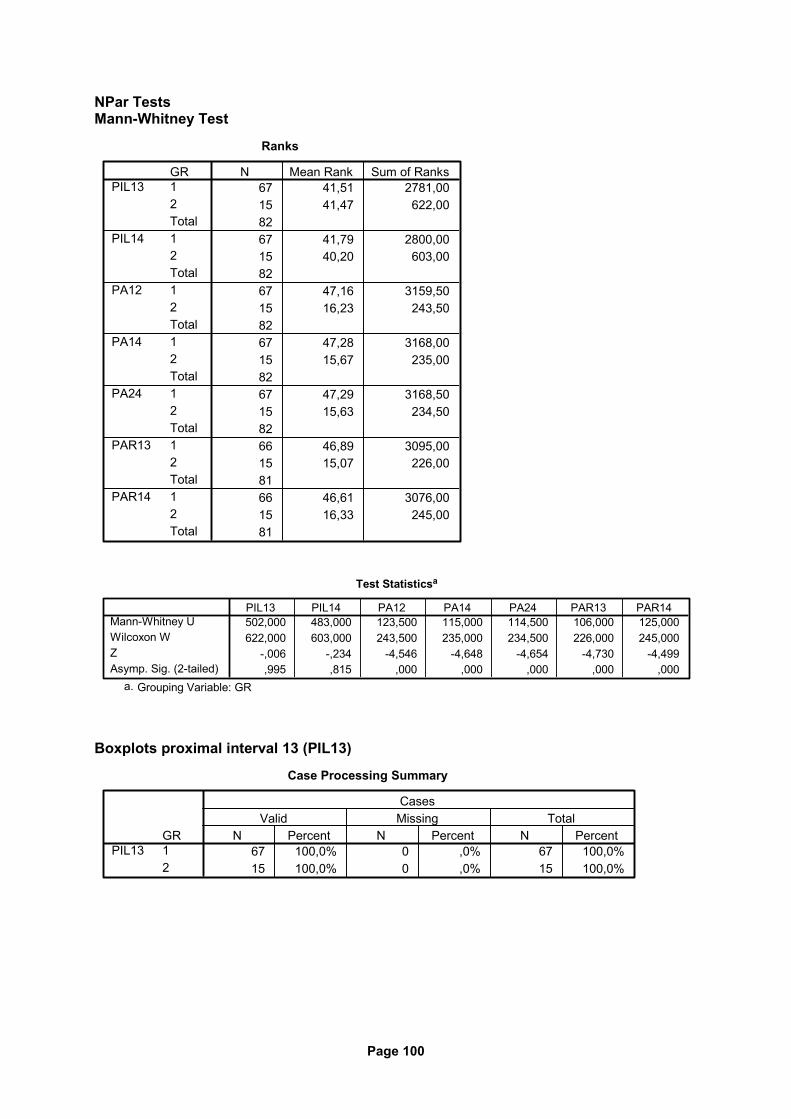
Page 100
NPar Tests Mann-Whitney Test
Ranks
67 41,51 2781,0015 41,47 622,008267 41,79 2800,0015 40,20 603,008267 47,16 3159,5015 16,23 243,508267 47,28 3168,0015 15,67 235,008267 47,29 3168,5015 15,63 234,508266 46,89 3095,0015 15,07 226,008166 46,61 3076,0015 16,33 245,0081
GR12Total12Total12Total12Total12Total12Total12Total
PIL13
PIL14
PA12
PA14
PA24
PAR13
PAR14
N Mean Rank Sum of Ranks
Test Statisticsa
502,000 483,000 123,500 115,000 114,500 106,000 125,000622,000 603,000 243,500 235,000 234,500 226,000 245,000
-,006 -,234 -4,546 -4,648 -4,654 -4,730 -4,499,995 ,815 ,000 ,000 ,000 ,000 ,000
Mann-Whitney UWilcoxon WZAsymp. Sig. (2-tailed)
PIL13 PIL14 PA12 PA14 PA24 PAR13 PAR14
Grouping Variable: GRa.
Boxplots proximal interval 13 (PIL13)
Case Processing Summary
67 100,0% 0 ,0% 67 100,0%15 100,0% 0 ,0% 15 100,0%
GR12
PIL13N Percent N Percent N Percent
Valid Missing TotalCases
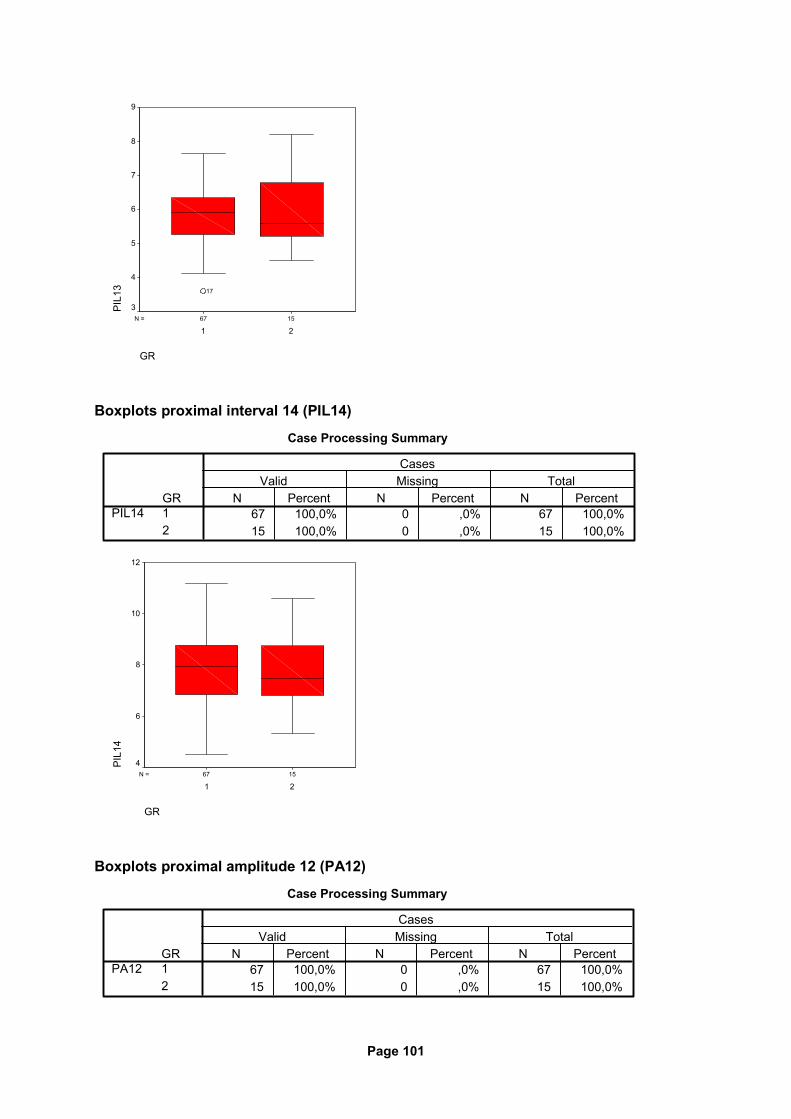
Page 101
1567N =
GR
21
PIL
139
8
7
6
5
4
3
17
Boxplots proximal interval 14 (PIL14)
Case Processing Summary
67 100,0% 0 ,0% 67 100,0%15 100,0% 0 ,0% 15 100,0%
GR12
PIL14N Percent N Percent N Percent
Valid Missing TotalCases
1567N =
GR
21
PIL
14
12
10
8
6
4
Boxplots proximal amplitude 12 (PA12)
Case Processing Summary
67 100,0% 0 ,0% 67 100,0%15 100,0% 0 ,0% 15 100,0%
GR12
PA12N Percent N Percent N Percent
Valid Missing TotalCases
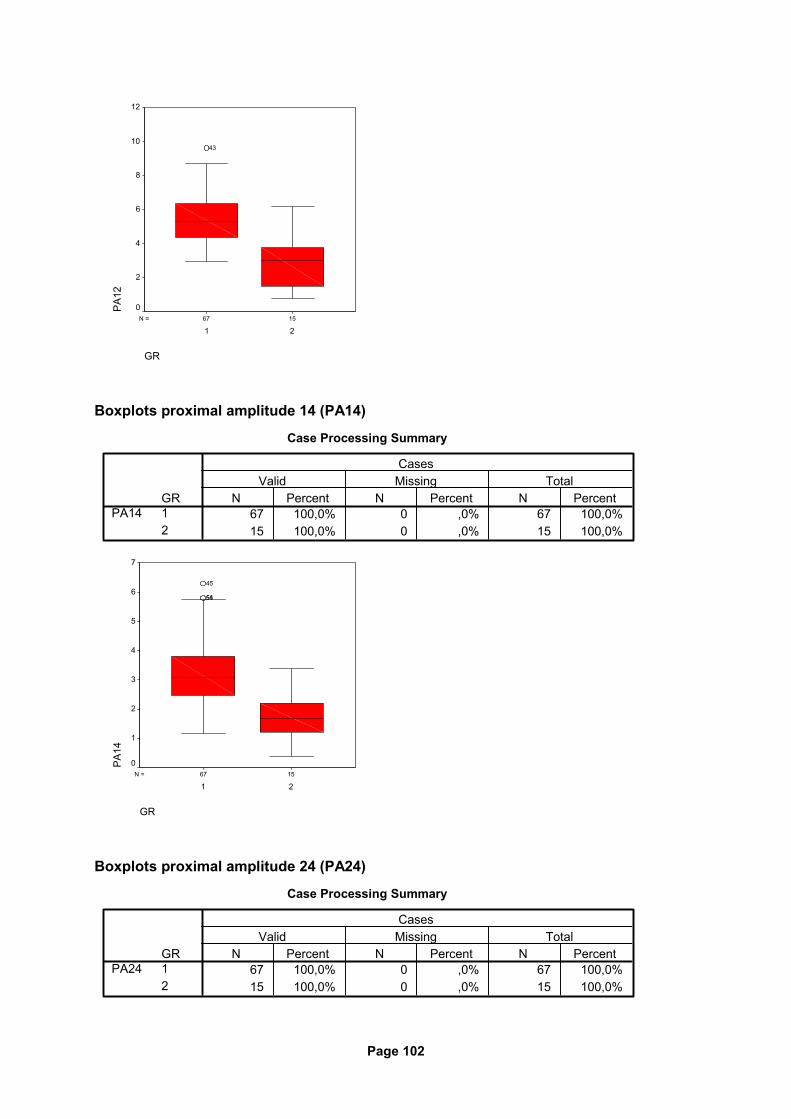
Page 102
1567N =
GR
21
PA
1212
10
8
6
4
2
0
43
Boxplots proximal amplitude 14 (PA14)
Case Processing Summary
67 100,0% 0 ,0% 67 100,0%15 100,0% 0 ,0% 15 100,0%
GR12
PA14N Percent N Percent N Percent
Valid Missing TotalCases
1567N =
GR
21
PA
14
7
6
5
4
3
2
1
0
5651
45
Boxplots proximal amplitude 24 (PA24)
Case Processing Summary
67 100,0% 0 ,0% 67 100,0%15 100,0% 0 ,0% 15 100,0%
GR12
PA24N Percent N Percent N Percent
Valid Missing TotalCases
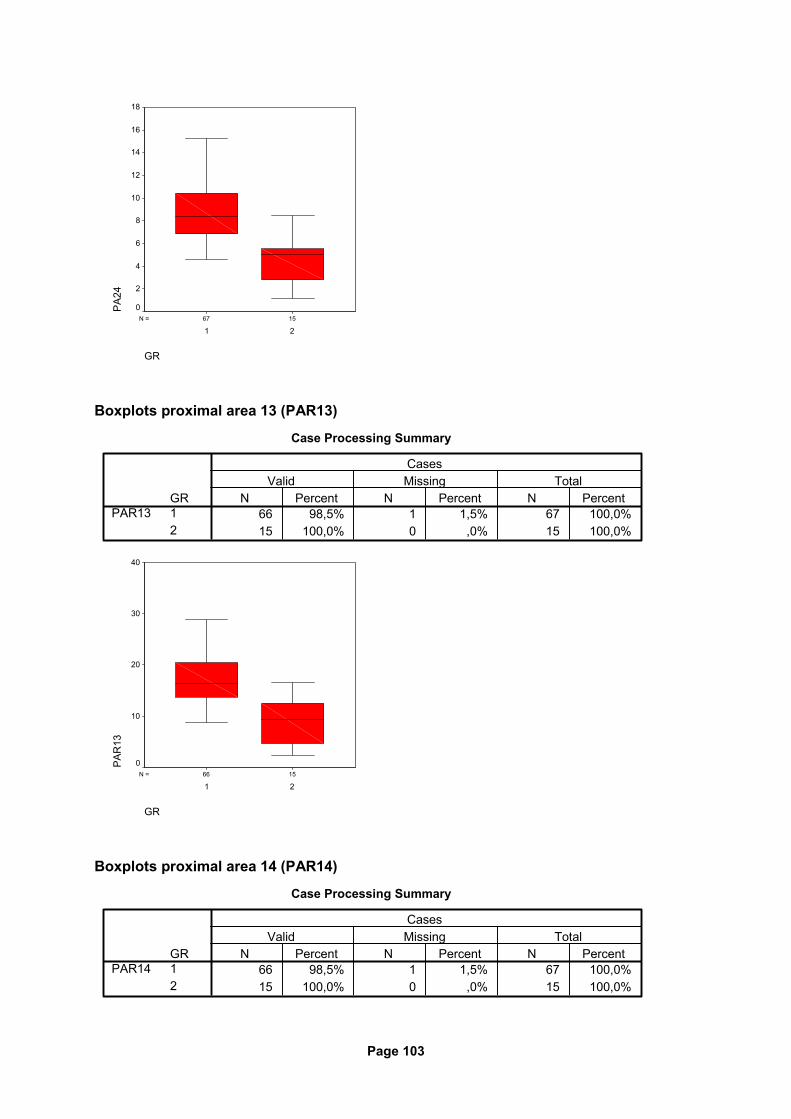
Page 103
1567N =
GR
21
PA
2418
16
14
12
10
8
6
4
2
0
Boxplots proximal area 13 (PAR13)
Case Processing Summary
66 98,5% 1 1,5% 67 100,0%15 100,0% 0 ,0% 15 100,0%
GR12
PAR13N Percent N Percent N Percent
Valid Missing TotalCases
1566N =
GR
21
PA
R13
40
30
20
10
0
Boxplots proximal area 14 (PAR14)
Case Processing Summary
66 98,5% 1 1,5% 67 100,0%15 100,0% 0 ,0% 15 100,0%
GR12
PAR14N Percent N Percent N Percent
Valid Missing TotalCases
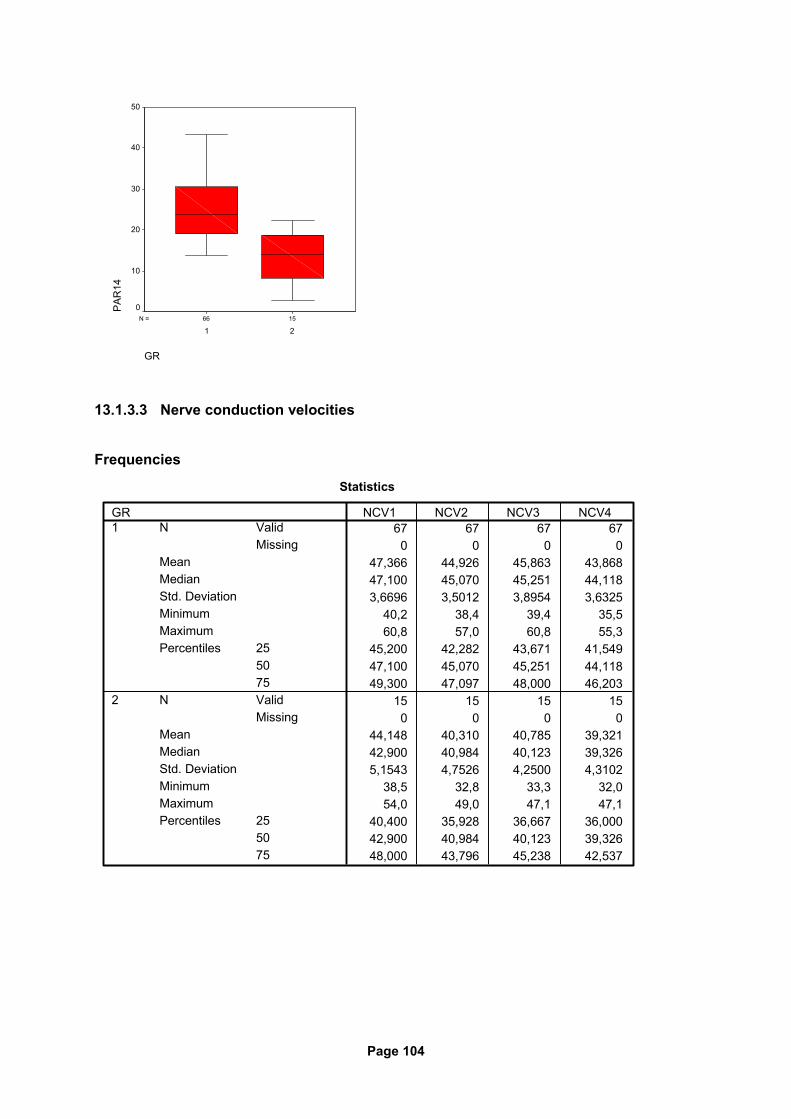
Page 104
1566N =
GR
21
PA
R14
50
40
30
20
10
0
13.1.3.3 Nerve conduction velocities
Frequencies
Statistics
67 67 67 670 0 0 0
47,366 44,926 45,863 43,86847,100 45,070 45,251 44,1183,6696 3,5012 3,8954 3,6325
40,2 38,4 39,4 35,560,8 57,0 60,8 55,3
45,200 42,282 43,671 41,54947,100 45,070 45,251 44,11849,300 47,097 48,000 46,203
15 15 15 150 0 0 0
44,148 40,310 40,785 39,32142,900 40,984 40,123 39,3265,1543 4,7526 4,2500 4,3102
38,5 32,8 33,3 32,054,0 49,0 47,1 47,1
40,400 35,928 36,667 36,00042,900 40,984 40,123 39,32648,000 43,796 45,238 42,537
ValidMissing
N
MeanMedianStd. DeviationMinimumMaximum
255075
Percentiles
ValidMissing
N
MeanMedianStd. DeviationMinimumMaximum
255075
Percentiles
GR1
2
NCV1 NCV2 NCV3 NCV4
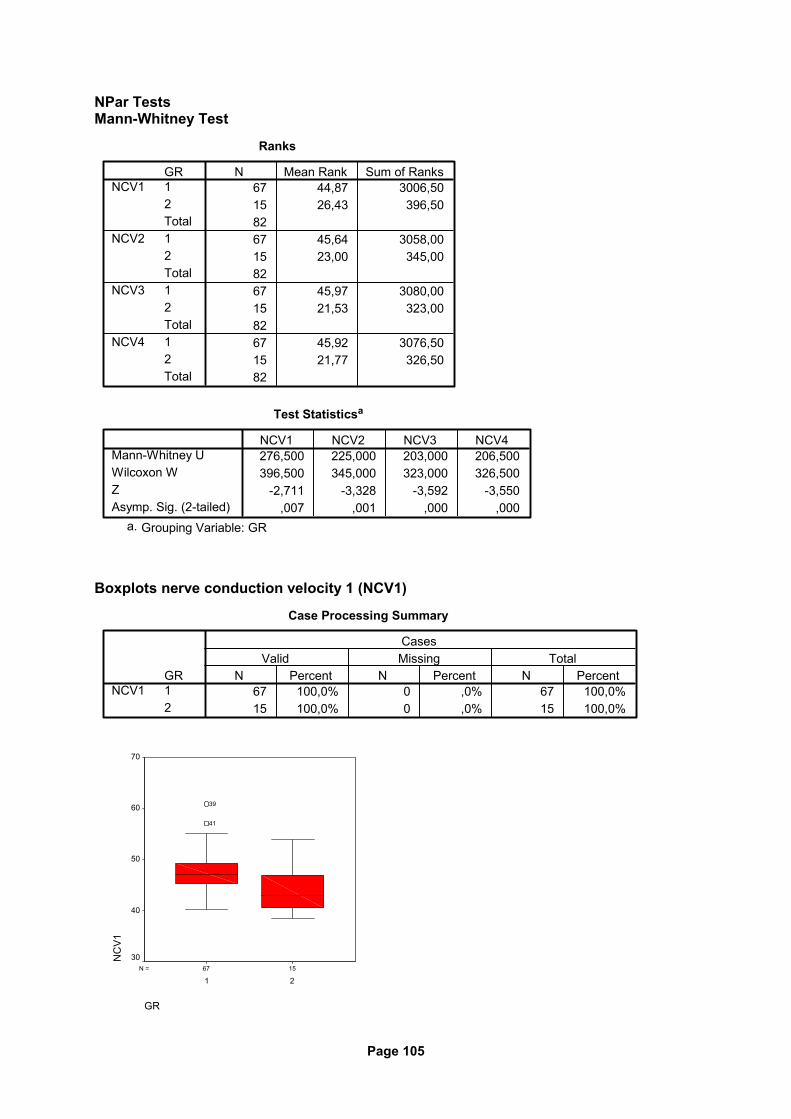
Page 105
NPar Tests Mann-Whitney Test
Ranks
67 44,87 3006,5015 26,43 396,508267 45,64 3058,0015 23,00 345,008267 45,97 3080,0015 21,53 323,008267 45,92 3076,5015 21,77 326,5082
GR12Total12Total12Total12Total
NCV1
NCV2
NCV3
NCV4
N Mean Rank Sum of Ranks
Test Statisticsa
276,500 225,000 203,000 206,500396,500 345,000 323,000 326,500
-2,711 -3,328 -3,592 -3,550,007 ,001 ,000 ,000
Mann-Whitney UWilcoxon WZAsymp. Sig. (2-tailed)
NCV1 NCV2 NCV3 NCV4
Grouping Variable: GRa.
Boxplots nerve conduction velocity 1 (NCV1)
Case Processing Summary
67 100,0% 0 ,0% 67 100,0%15 100,0% 0 ,0% 15 100,0%
GR12
NCV1N Percent N Percent N Percent
Valid Missing TotalCases
1567N =
GR
21
NC
V1
70
60
50
40
30
41
39
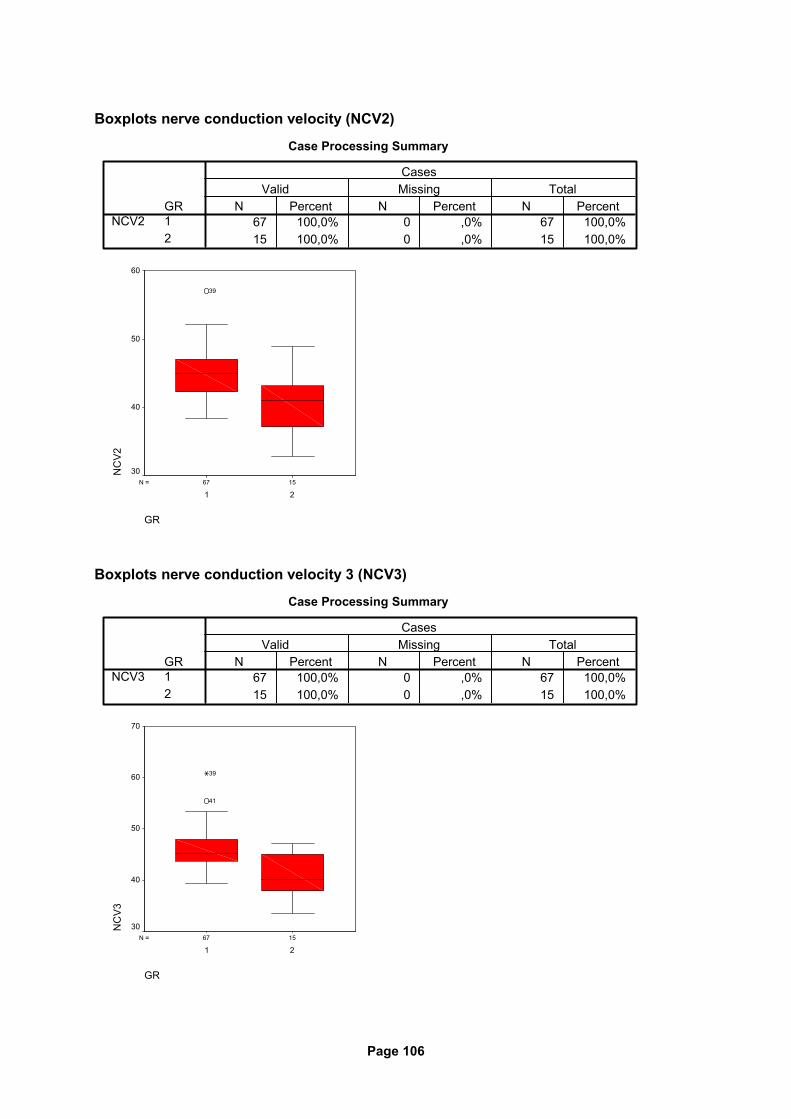
Page 106
Boxplots nerve conduction velocity (NCV2)
Case Processing Summary
67 100,0% 0 ,0% 67 100,0%15 100,0% 0 ,0% 15 100,0%
GR12
NCV2N Percent N Percent N Percent
Valid Missing TotalCases
1567N =
GR
21
NC
V2
60
50
40
30
39
Boxplots nerve conduction velocity 3 (NCV3)
Case Processing Summary
67 100,0% 0 ,0% 67 100,0%15 100,0% 0 ,0% 15 100,0%
GR12
NCV3N Percent N Percent N Percent
Valid Missing TotalCases
1567N =
GR
21
NC
V3
70
60
50
40
30
41
39
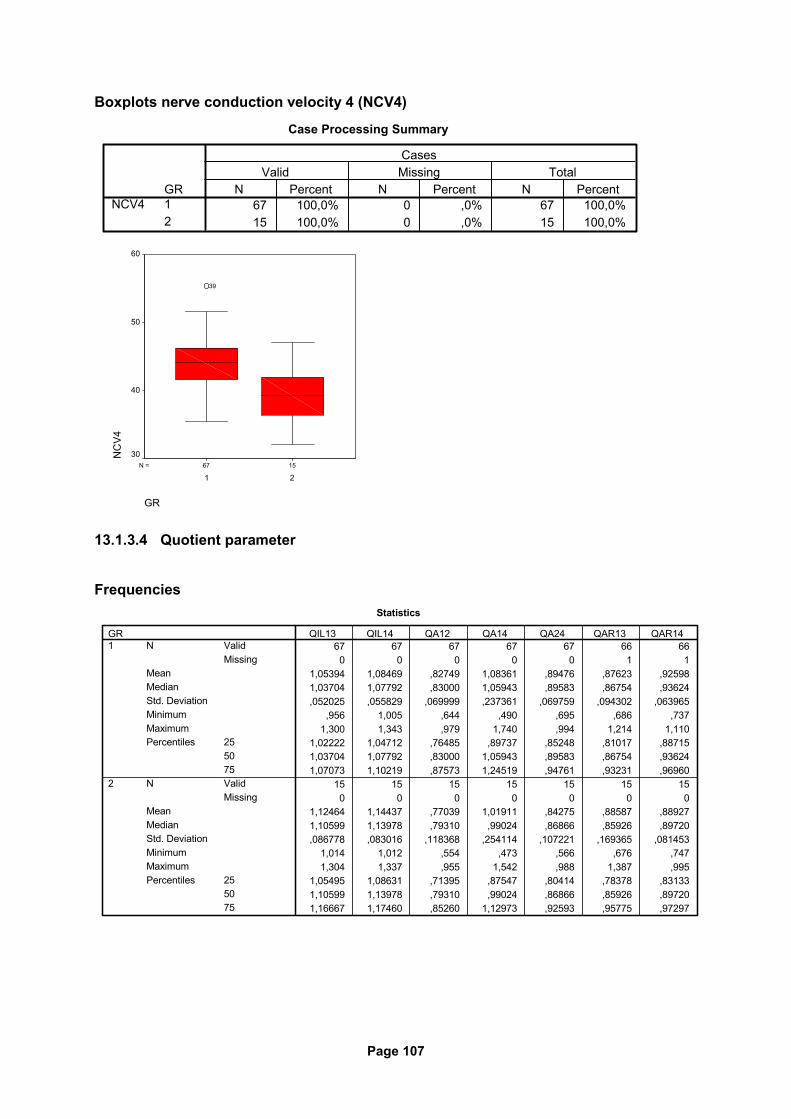
Page 107
Boxplots nerve conduction velocity 4 (NCV4)
Case Processing Summary
67 100,0% 0 ,0% 67 100,0%15 100,0% 0 ,0% 15 100,0%
GR12
NCV4N Percent N Percent N Percent
Valid Missing TotalCases
1567N =
GR
21
NC
V4
60
50
40
30
39
13.1.3.4 Quotient parameter
Frequencies
Statistics
67 67 67 67 67 66 660 0 0 0 0 1 1
1,05394 1,08469 ,82749 1,08361 ,89476 ,87623 ,925981,03704 1,07792 ,83000 1,05943 ,89583 ,86754 ,93624,052025 ,055829 ,069999 ,237361 ,069759 ,094302 ,063965
,956 1,005 ,644 ,490 ,695 ,686 ,7371,300 1,343 ,979 1,740 ,994 1,214 1,110
1,02222 1,04712 ,76485 ,89737 ,85248 ,81017 ,887151,03704 1,07792 ,83000 1,05943 ,89583 ,86754 ,936241,07073 1,10219 ,87573 1,24519 ,94761 ,93231 ,96960
15 15 15 15 15 15 150 0 0 0 0 0 0
1,12464 1,14437 ,77039 1,01911 ,84275 ,88587 ,889271,10599 1,13978 ,79310 ,99024 ,86866 ,85926 ,89720,086778 ,083016 ,118368 ,254114 ,107221 ,169365 ,081453
1,014 1,012 ,554 ,473 ,566 ,676 ,7471,304 1,337 ,955 1,542 ,988 1,387 ,995
1,05495 1,08631 ,71395 ,87547 ,80414 ,78378 ,831331,10599 1,13978 ,79310 ,99024 ,86866 ,85926 ,897201,16667 1,17460 ,85260 1,12973 ,92593 ,95775 ,97297
ValidMissing
N
MeanMedianStd. DeviationMinimumMaximum
255075
Percentiles
ValidMissing
N
MeanMedianStd. DeviationMinimumMaximum
255075
Percentiles
GR1
2
QIL13 QIL14 QA12 QA14 QA24 QAR13 QAR14
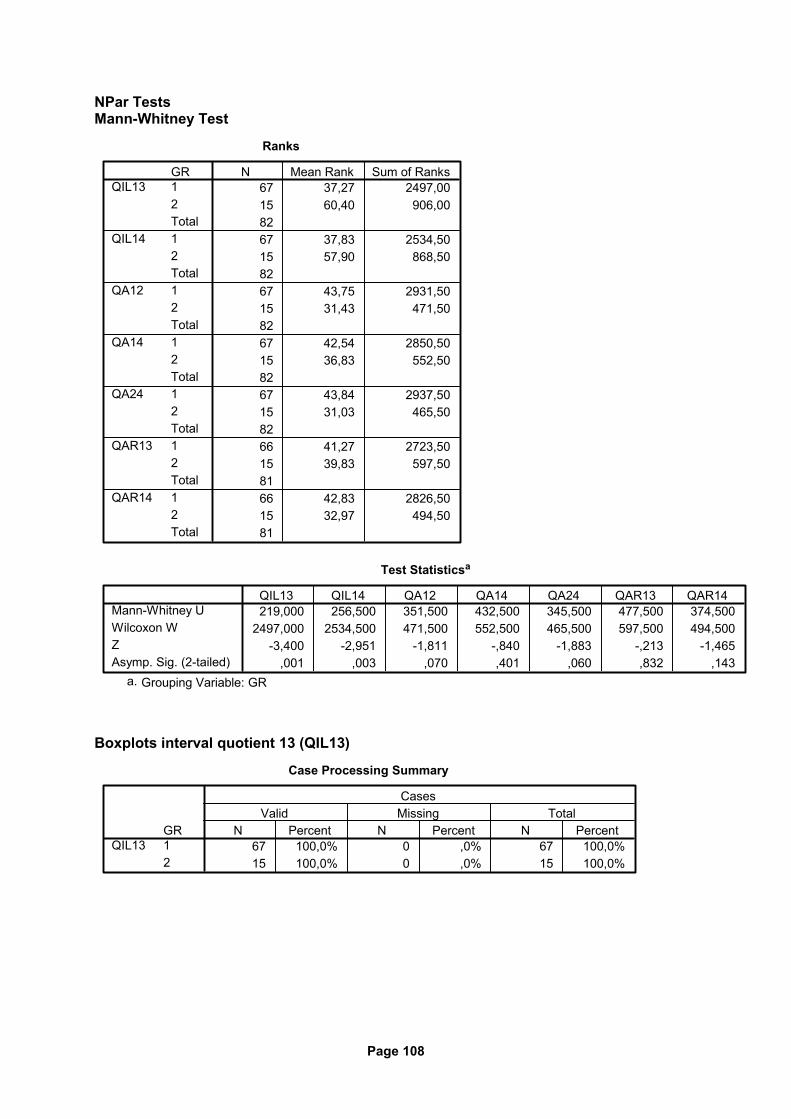
Page 108
NPar Tests Mann-Whitney Test
Ranks
67 37,27 2497,0015 60,40 906,008267 37,83 2534,5015 57,90 868,508267 43,75 2931,5015 31,43 471,508267 42,54 2850,5015 36,83 552,508267 43,84 2937,5015 31,03 465,508266 41,27 2723,5015 39,83 597,508166 42,83 2826,5015 32,97 494,5081
GR12Total12Total12Total12Total12Total12Total12Total
QIL13
QIL14
QA12
QA14
QA24
QAR13
QAR14
N Mean Rank Sum of Ranks
Test Statisticsa
219,000 256,500 351,500 432,500 345,500 477,500 374,5002497,000 2534,500 471,500 552,500 465,500 597,500 494,500
-3,400 -2,951 -1,811 -,840 -1,883 -,213 -1,465,001 ,003 ,070 ,401 ,060 ,832 ,143
Mann-Whitney UWilcoxon WZAsymp. Sig. (2-tailed)
QIL13 QIL14 QA12 QA14 QA24 QAR13 QAR14
Grouping Variable: GRa.
Boxplots interval quotient 13 (QIL13)
Case Processing Summary
67 100,0% 0 ,0% 67 100,0%15 100,0% 0 ,0% 15 100,0%
GR12
QIL13N Percent N Percent N Percent
Valid Missing TotalCases
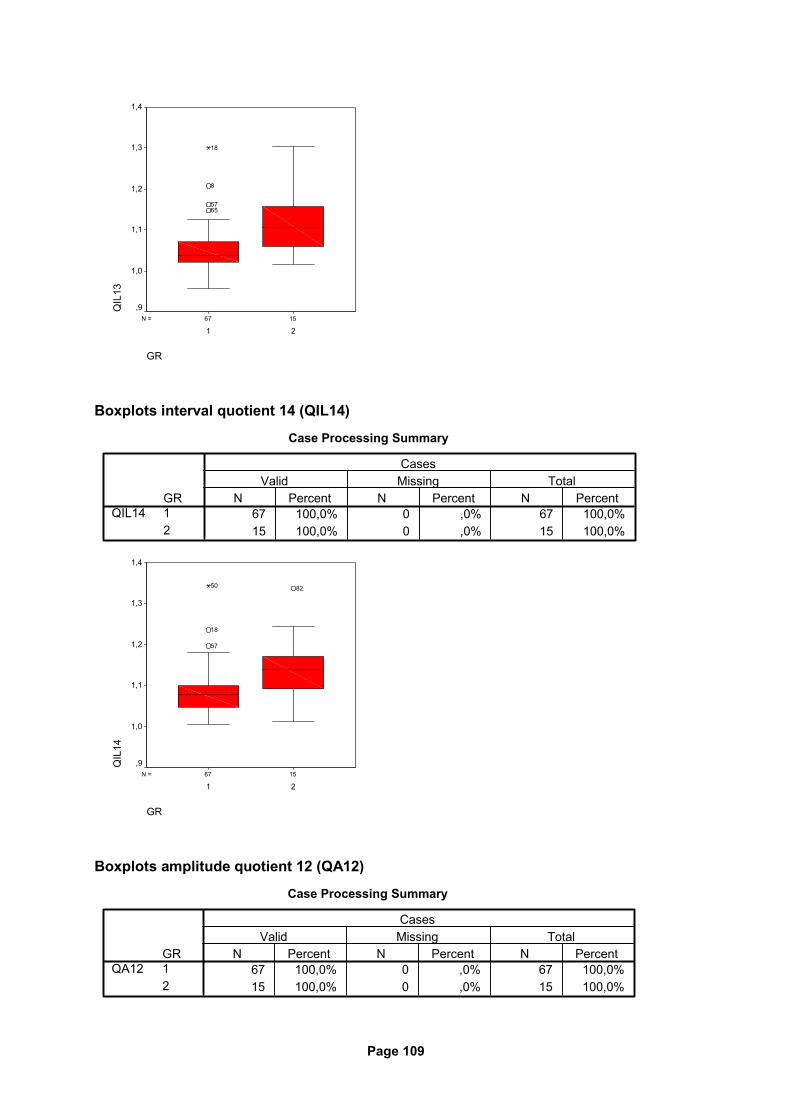
Page 109
1567N =
GR
21
QIL
131,4
1,3
1,2
1,1
1,0
,9
6557
8
18
Boxplots interval quotient 14 (QIL14)
Case Processing Summary
67 100,0% 0 ,0% 67 100,0%15 100,0% 0 ,0% 15 100,0%
GR12
QIL14N Percent N Percent N Percent
Valid Missing TotalCases
1567N =
GR
21
QIL
14
1,4
1,3
1,2
1,1
1,0
,9
82
57
18
50
Boxplots amplitude quotient 12 (QA12)
Case Processing Summary
67 100,0% 0 ,0% 67 100,0%15 100,0% 0 ,0% 15 100,0%
GR12
QA12N Percent N Percent N Percent
Valid Missing TotalCases
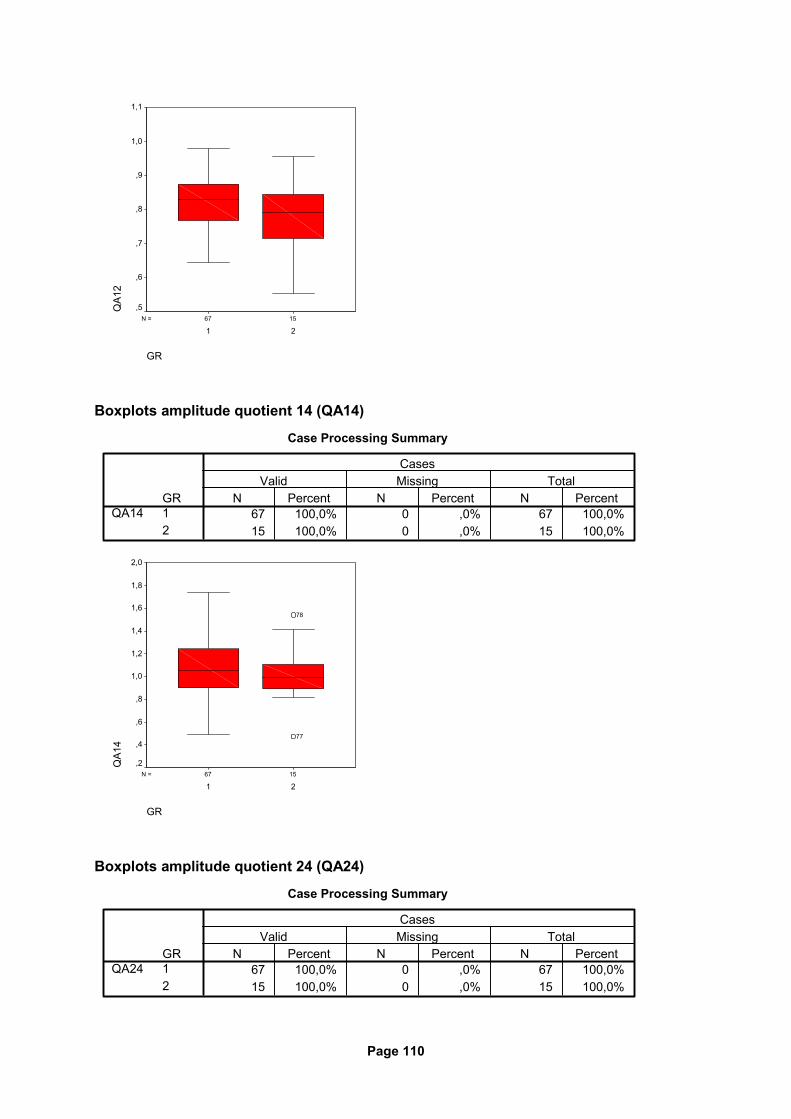
Page 110
1567N =
GR
21
QA1
21,1
1,0
,9
,8
,7
,6
,5
Boxplots amplitude quotient 14 (QA14)
Case Processing Summary
67 100,0% 0 ,0% 67 100,0%15 100,0% 0 ,0% 15 100,0%
GR12
QA14N Percent N Percent N Percent
Valid Missing TotalCases
1567N =
GR
21
QA1
4
2,0
1,8
1,6
1,4
1,2
1,0
,8
,6
,4
,2
77
78
Boxplots amplitude quotient 24 (QA24)
Case Processing Summary
67 100,0% 0 ,0% 67 100,0%15 100,0% 0 ,0% 15 100,0%
GR12
QA24N Percent N Percent N Percent
Valid Missing TotalCases
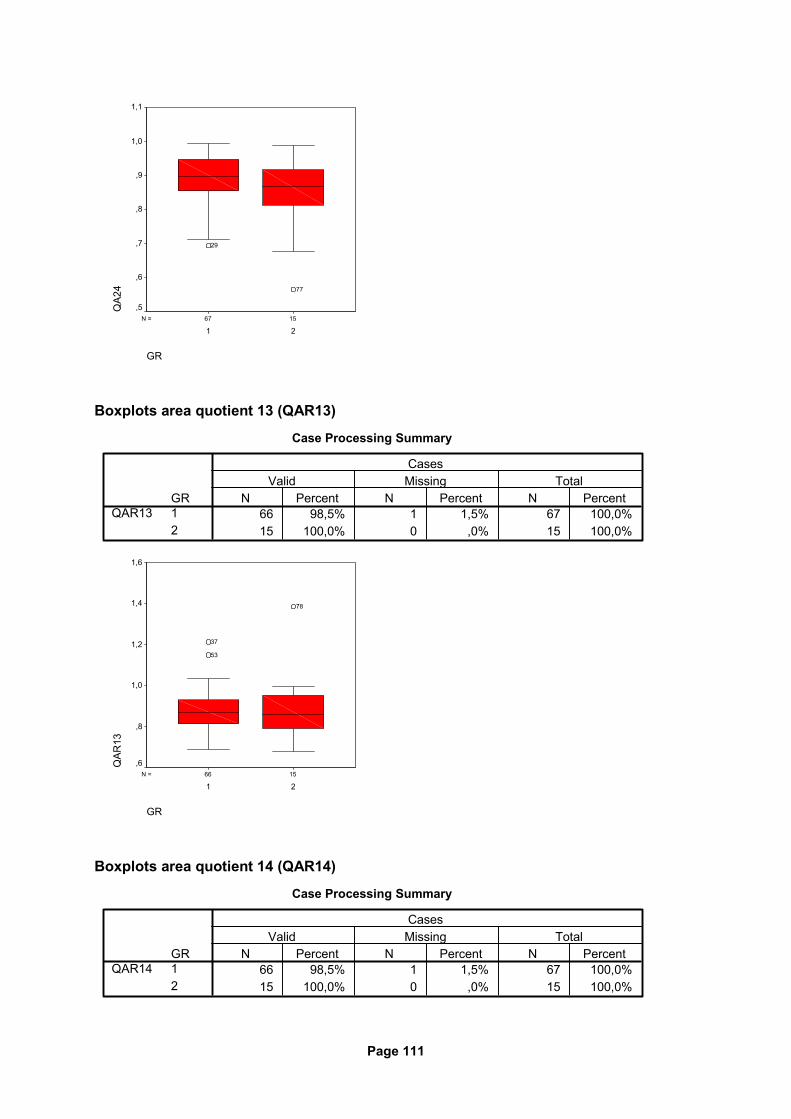
Page 111
1567N =
GR
21
QA2
41,1
1,0
,9
,8
,7
,6
,5
77
29
Boxplots area quotient 13 (QAR13)
Case Processing Summary
66 98,5% 1 1,5% 67 100,0%15 100,0% 0 ,0% 15 100,0%
GR12
QAR13N Percent N Percent N Percent
Valid Missing TotalCases
1566N =
GR
21
QAR
13
1,6
1,4
1,2
1,0
,8
,6
78
53
37
Boxplots area quotient 14 (QAR14)
Case Processing Summary
66 98,5% 1 1,5% 67 100,0%15 100,0% 0 ,0% 15 100,0%
GR12
QAR14N Percent N Percent N Percent
Valid Missing TotalCases
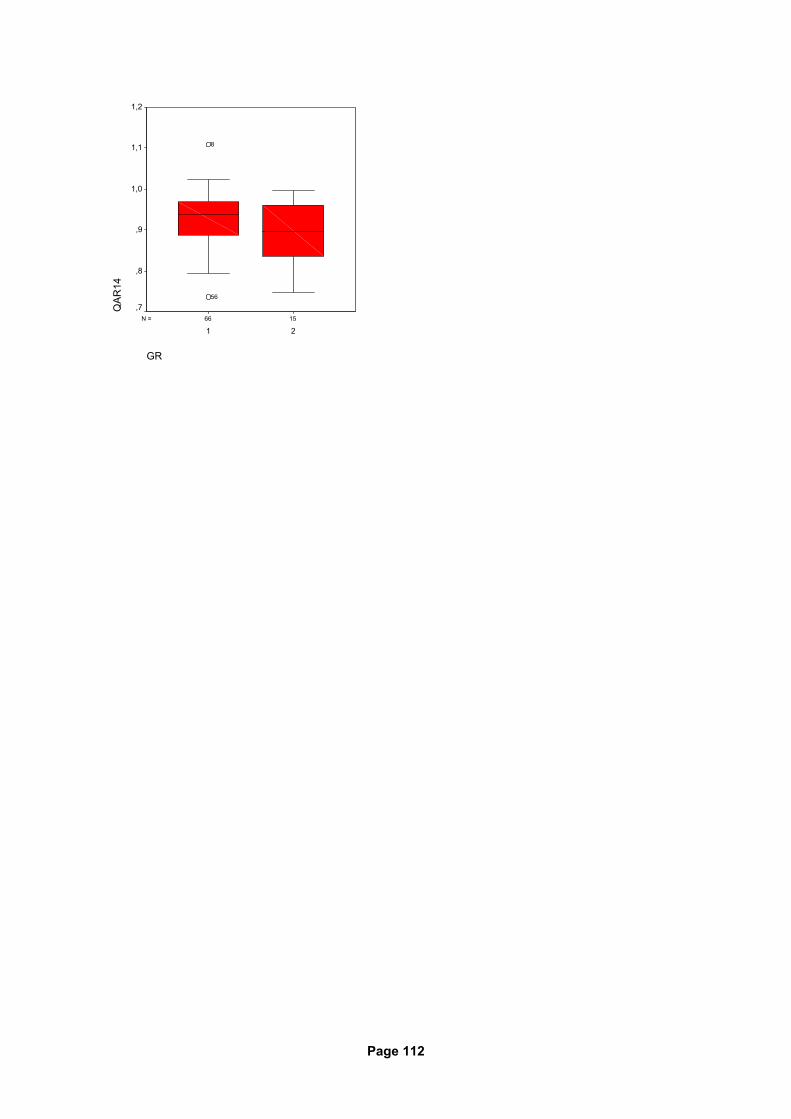
Page 112
1566N =
GR
21
QAR
141,2
1,1
1,0
,9
,8
,756
8

Page 113
13.2 Ethical issues
Acrobat-Dokumen
Page 114
13.3 Abbreviations
A amplitude
ALS amyotrophic lateral sclerosis
AR area
ARI aldose reductase inhibitor
ATR achilles tendon reflex
CAFT cardiovascular autonomic function testing
CI confidence interval
CIPD chronic inflammatory demyelinating polyneuropathy
CMAP compound muscle action potential
d distal (as prefix)
DCCT diabetes control and complication trial
DM diabetes mellitus
DNES diabetic neuropathy examination score
DNP diabetic neuropathy
DNS diabetic neuropathy score
DS distal stimulus
DSP distal symmetric polyneuropathy
EDS electro-diagnostic study
GR group
IDDM insulin-dependent diabetes mellitus
IGT impaired glucose tolerance
IL interval
mA milliampere
mm millimeter
mNCV motor nerve conduction velocity
ms milliseconds
mV millivolt
N. nervus
NCS nerve conduction study
NCV nerve conduction velocity
ND neuropathic deficit
n.k. not known
NIDDM non-insulin-dependent diabetes mellitus
No. number
Page 115
NPar Tests non-parametric tests
NS neuropathic symptoms
p proximal (as prefix)
PNS peripheral nervous system
PS proximal stimulus
PTR patella tendon reflex
Q quotient
QAFT quantitative autonomic function test
QST quantitative sensory test
SD standard deviation
SWME 10-g Semmes-Weinstein monofilament examination
ys years
Page 116
13.4 Literature
1. Albers JW, Brown MB, Sima AAF, Greene DA: Nerve conduction measures in mild dia-betic neuropathy: the effect of age, sex, type of diabetes, disease duration, and anthro-pometric factors. Neurology 45 (suppl.) (1995) 190-191.
2. American diabetes association/American academy of neurology: Report and recommen-
dations of the San Antonio conference on diabetic neuropathy. Diabetes Care 11 (1988) 592-597.
3. American diabetes association: Proceedings of a consensus development conference on
standardized measures in diabetic neuropathy. Muscle Nerve (1992) 1143-1146. 4. Apfel SC: Neurotropic factors in the therapy of diabetic neuropathy. Am. J. Med. 107 (2B)
(1999) 34S-42S. 5. Arezzo JC: New developments in the diagnosis of diabetic neuropathy. Am. J. Med. 107,
2B (1999) 9S-16S. 6. Asbury AK, Porte DP: Report and recommendations of the San Antonio Conference on
diabetic neuropathy. Ann. Neurol. 24 (1988)99-104. 7. Asbury AK, Brown MJ: Clinical and pathological studies of diabetic neuropathies. In: Goto
Y et al. (eds.): Diabetic Neuropathy, Excerpta medica, Amsterdam (1982) 50-57. 8. Bril V: Status of current clinical trials in diabetic polyneuropathy
Can. J. Neurol. Sci. 28 (2001) 191-198.
9. Bril V, Ellison R, Ngo M, Bergstrom B, Raynard D, Gin H, Roche Neuropathy Study Group: Electrophysiological monitoring in clinical trials. Muscle Nerve 21 (1998) 1368-1373.
10. Cummins KL, Dorfman LJ: Nerve fiber conduction velocity distributions studies of normal
and diabetic human nerves. Ann. Neurol. 9 (1981) 67-74. 11. Donofrio PD, Albers JW: AAEM minimograph #34: polyneuropathy: classification by
nerve conduction studies and electromyography. Muscle Nerve 13, 889-903 (1990) 12. Dyck PJ, Karnes JL, Daube J, O’Brien PO, Service FJ: Clinical and neuropathological cri-
teria for the diagnosis and staging of diabetic polyneuropathy. Brain 108 (1985) 861-880 13. Dyck PJ: Detection, characterization, and staging of polyneuropathy: assessed in diabet-
ics. Muscle Nerve 11 (1988) 21-32 14. Dyck PJ, Karnes J, O’Brien PC, Swanson CJ: Neuropathy symptom profile in health, mo-
tor neuron disease, diabetic neuropathy, and amyloidosis. Neurology 36 (1988) 1300-1308
15. Dyck PJ, Kratz KM, Lehman KA, Karnes JL, Melton LJ, O’Brien PO, Litchy WJ, Winde-
bank AJ, Smith BE, Low PA, Service FJ, Rizza RA, Zimmermann BR: The Rochester diabetic neuropathy study: design, criteria for types of neuropathy, selection bias, and re-producibility of neuropathic tests. Neurology 41 (1991) 799-807
Page 117
16. Giannini C, Dyck PJ: Pathological alterations in human diabetic polyneuropathy In: Dyck PJ, Thomas PK, editors. Diabetic neuropathy, 2nd ed. Philadelphia, PA: WB Saunders, 1999, p. 279-295
17. Grant IA, Dyck PJ: Differential diagnosis of diabetic neuropathies
In: Dyck PJ, Thomas PK, editors. Diabetic neuropathy, 2nd ed. Philadelphia, PA: WB Saunders, 1999, p. 415-444
18. Greene AG , Stevens MJ, Feldman EN: Diabetic neuropathy: scope of the syndrome
Am. J. Med. 107(2B) (1999) 2S-8S 19. Herrmann DN, Ferguson ML, Logigian EL: Conduction slowing in diabetic distal polyneu-
ropathy. Muscle Nerve 26 (2002) 232-237 20. Hughes R: Peripheral neuropathy. B.M.J. 324 (2003) 466-469 21. Hyllienmark L, Golster H, Samuelsson U, Ludvigsson J: Nerve conduction defects are re-
tarded by tight metabolic control in type 1 diabetes. Muscle Nerve 24 (2001) 240-246 22. Johnson PC, Doll SC, Cromey DW: Pathogenesis of diabetic neuropathy. Ann. Neurol.
19 (1986) 450-457 23. Krarup C: An update on electrophysiological studies in neuropathy. Curr. Opin. Neurol 16
(2003) 603-612 24. Kurokawa K, Mimori Y, Tanaka E, Kohriyama T, Nakamura S: Age-related change in pe-
ripheral nerve conduction: compound muscle action potential duration an dispersion Gerontology 45 (1999) 168-173
25. Meijer JWG, Bosma E, Lefrandt JD, Links TP, Smit AJ, Stewart RE, Van Der Hoeven JH,
Hoogenberg K: Clinical diagnosis of diabetic polyneuropathy with the diabetic neuropathy symptom and diabetic neuropathy examination scores. Diabetes Care 26 (2003) 697-701
26. Neundörfer B: Therapie der Polyneuropathien. Dtsch. Med. Wschr. 123 (1998) 1553-
1555 27. Obrosova IG: Update on the pathogenesis of diabetic neuropathy. Curr. Diab. Rep. 3
(2003) 439-445 28. Parry GJ: Management of diabetic neuropathy. Am. J. Med. 107(2B) (1999) 27S-33S 29. Partanen J, Niskanen L, Lehtinen J, Mervaala E, Siitonen O, Usuitupa M: Natural history
of peripheral neuropathy in patients with non-insulin-dependent diabetes mellitus. N. Engl. J. Med. 333 (1995) 89-94
30. Perkins BA, Bril V: Diagnosis and management of diabetic neuropathy. Curr. Diab. Rep.
2 (2002) 495-500 31. Perkins BA, Bril V: Diabetic neuropathy: a review emphasizing diagnostic methods
Clin. Neurophysiol. 114 (2003) 1167-1175 32. Perkins BA, Olaleye D, Zinman B, Bril V: Simple screening tests for peripheral neuropa-
thy in the diabetes clinic. Diabetes Care 24 (2001) 250-256
Page 118
33. Perkins BA, Mylan NGO, Bril V: Symmetry of nerve conduction studies in different stages of diabetic polyneuropathy. Muscle Nerve 25 (2002) 212-217
34. Perkins BA, Greene DA, Bril V: Glycemic control is related to the morphological severity
of diabetic peripheral sensimotor polyneuropathy. Diabetes Care 24 (2001) 748-752 35. Pietri A, Ehle AL, Raskin P: Changes in nerve conduction velocity after six weeks of glu-
coregulation with portable insulin infusion pumps. Diabetes 29 (1980) 668-671 36. Rivner MH, Swift TR, Malik K: Influence of age and height on nerve conduction
Muscle Nerve 24 (2001) 1134-1141 37. Sima AAF: Pathological definition and evaluation of diabetic neuropathy and clinical cor-
relations. Can. J. Neurol. Sci. 21 (1994) 13-17 38. Simmons Z, Feldman EL: Update on diabetic neuropathy.
Curr. Opin. Neurol. 15 (2002) 595-603 39. Stansberry KB, Hill MA, Shapiro SA, McNitt PM, Bhatt BA, Vinik AI: Impairment of pe-
ripheral blood flow responses in diabetes resembles an enhanced aging effect Diabetes Care 20 (1997) 1711-1716
40. Steck AJ, Kappos L: Gangliosides and autoimmune neuropathies: classification and clini-
cal aspects of autoimmune neuropathies. J. Neurol. Neurosurg. Psychiat: 57 (suppl.) (1994) 26-28
41. Sugimoto K, Murakawa Y, Sima AA: Diabetic neuropathy - a continuing enigma
Diabetes Metab. Res. Rev. 16 (2000) 408-433 42. Sumner CJ, Sheth S, Griffin JW, Cornblath DR, Polydefkis M: The spectrum of neuropa-
thy in diabetes and impaired glucose tolerance. Neurology 60 (2003) 108-111 43. Tesfaye S, Malik R, Harris N, Jakubowski JJ, Mody C, Rennie IG, Ward JD: Arterio-
venous shunting and proliferating new vessels in acute painful neuropathy of rapid gly-cemic control (insulin neuritis). Diabetologia 39 (1996) 329-335
44. The diabetes control and complications trial research group: The effect of intensive
treatment of diabetes on the development and progression of long-term complications in insulin-dependent diabetes mellitus. N. Engl. J. Med. 329 (1993) 977-86
45. The diabetes control and complications trial research group: The effect of intensive dia-
betes therapy on the development and progression of neuropathy. Ann. Intern. Med. 122 (1995) 561-568
46. Thomas PK: Diabetic peripheral neuropathies: their cost to patient and society and the
value of knowledge of risk factors for development of interventions Eur. Neurol. 41 (suppl 1) (1999) 35-43
47. Thomas PK: Clinical features and investigation of diabetic somatic peripheral neuropathy
Neuroscience 4 (1997) 341-345 48. Thomas PK: Diabetic neuropathy: models, mechanisms and mayhem.
Can. J. Neurol. Sci. 19 (1992) 1-7
Page 119
49. UKPDS Group: Intensive blood glucose control with sulfonylureas or insulin compared with conventional treatment and risk of complications in patients with type 2 diabetes (UKPDS32). Lancet 352 (1998) 837-853
50. Valensi P: Diabetic autonomic neuropathy: what are the risks? Diab. Metab. 24 (1998)
66-72 51. Valk GD, Grootenhuis PA, van Eijk JTM, Bouter LM, Bertelsmann FW: Methods of as-
sessing diabetic polyneuropathy: validity and reproducibility of the measurement of sen-sory symptom severity and nerve function tests Diab. Res. Clin. Pract. 47 (2000) 87-95
52. Valls-Canals J, Povedano M, Montero J, Pradas J: Diabetic polyneuropathy. Axonal or
demyelinating? Electromyogr. Clin. Neurophysiol. 42 (2002) 3-6 53. Vinik AI: Diabetic neuropathy: pathogenesis and therapy
Am. J. Med. 107(2B) (1999) 17S-26S 54. Vinik AI, Park TS, Stansberry KB, Pittenger GL: Diabetic neuropathies
Diabetologia 43 (2000) 957-973 55. Vinik AI, Holland MT, LeBeau JM, Liuzzi FJ, Stansberry KB, Colen LB: Diabetic neuropa-
thies. Diabetes Care 15 (1992) 1926-1975 56. Weber F: Conduction block and abnormal temporal dispersion – diagnostic criteria
Electromyogr Clin. Neurophysiol. 37(5) (1997) 305-309 57. Ziegler D, Cicmir I, Mayer P, Wiefels K, Gries FA: Somatic and autonomic nerve function
during the first year after diagnosis of type 1 (insulin-dependent) diabetes Diab. Res. 7 (1988) 123-127
Page 120
14. DANKSAGUNG
Mein besonderer Dank für die Überlassung des Themas sowie die exzellente Beratung und
Unterstützung gilt Herrn Prof. Dr. med. Hans-Joachim Braune.
Des weiteren möchte ich danken Herrn Prof. Dr. G. Huffmann sowie Herrn Prof. Dr. W. H.
Oertel für die Möglichkeit, die Patienten an der Neurologischen Universitätsklinik der Phil-
ipps-Universität Marburg zu untersuchen.
Zu guter letzt möchte ich meiner Frau Dr. Stefanie Schwarz-Hahn danken für die anhaltende
und geduldige Unterstützung bei der Abfassung meiner Dissertation sowie meinen Eltern
Erwin und Renate Hahn für die Begleitung und mentale Unterstützung.
Page 121
15. VERZEICHNIS DER AKADEMISCHEN LEHRER
Meine akademischen Lehrer waren die Damen und Herren,
Arnold, Aumüller, Basler, Bauer, Baum, Berger, Engel, Eschenbach, Fruhstorfer, Ganz,
Gemsa, Geus, Gotzen, Grzeschik, Gressner, Griss, Habermehl, Happle, Havemann, Hilger-
mann, Huffmann, Joseph, Kern, Kleine, Kleinsasser, Klenk, Klose, Krause, Kretschmer,
Krieg, Kroll, Küster, Kuni, Lang, Lange, Lennartz, Maisch, Mannheim, Mennel, Mueller, Net-
ter, Pohlen, Prinz, Remschmidt, Riedmiller, Rothmund, Schachtschabel, Schäfer, Schmitz-
Moormann, Schüffel, Schulz, Seyberth, Strempel, Sturm, Thomas, Tuohimaa, Unsicker, Voh-
land, Voigt, von Wichert, Wesemann, Zelder.

Page 122
16. POSTANSCHRIFT
Markus Hahn
Königstor 32
34117 Kassel