Embed Size (px)
Citation preview
Evolution of eukaryotic intronsfollowing endosymbiotic
gene transfer
Inaugural-Dissertation
zur Erlangung des Doktorgrades derMathematisch-Naturwissenschaftlichen Fakultätder Heinrich-Heine-Universität Düsseldorf
vorgelegt von
Nahal Ahmadinejadaus Neuss
Düsseldorf, Dezember 2008
aus dem Institut für Botanik IIIder Heinrich-Heine Universität Düsseldorf
Gedruckt mit der Genehmigung derMathematisch-Naturwissenschaftlichen Fakultät derHeinrich-Heine-Universität Düsseldorf
Referent: Prof. Dr. W. MartinKorreferent: Prof. Dr. M. Lercher
Tag der mündlichen Prüfung: 15.01.2009
Für meine Familie

Contents
List of Figures vii
List of Tables ix
1 Abstract 1
2 Zusammenfassung 3
3 Introduction 53.1 Introns . . . . . . . . . . . . . . . . . . . . . . . . . . . . . . . . . . . 5
3.1.1 Types of Introns . . . . . . . . . . . . . . . . . . . . . . . . . . 53.1.2 Introns in protein coding genes . . . . . . . . . . . . . . . . . 73.1.3 Intron characteristics . . . . . . . . . . . . . . . . . . . . . . . 83.1.4 Distribution of introns among eukaryotes . . . . . . . . . . . 103.1.5 Evolutionary origin of introns . . . . . . . . . . . . . . . . . 12
3.1.5.1 Early views on intron evolution . . . . . . . . . . . 123.1.5.2 Origin of spliceosomal introns . . . . . . . . . . . . 12
3.2 Evolutionary origin of mitochondria . . . . . . . . . . . . . . . . . . 143.2.1 Endosymbiotic gene transfer . . . . . . . . . . . . . . . . . . 15
3.2.1.1 Oxidative phosphorylation pathway . . . . . . . . 173.2.1.2 Mitochondrial ribosomal proteins . . . . . . . . . . 18
3.3 Goals of this study . . . . . . . . . . . . . . . . . . . . . . . . . . . . 19
4 Material and Methods 214.1 Sequence data . . . . . . . . . . . . . . . . . . . . . . . . . . . . . . . 21
4.1.1 Identifying the α-proteobacterial origin of genes . . . . . . 224.1.2 Homology search and multiple alignments . . . . . . . . . . 29
4.2 Identifying intron positions . . . . . . . . . . . . . . . . . . . . . . . 304.2.1 Exon-intron databases . . . . . . . . . . . . . . . . . . . . . . 304.2.2 A database independent method to identify intron positions 314.2.3 Comparison of intron positions . . . . . . . . . . . . . . . . . 364.2.4 Intron density and intron phases . . . . . . . . . . . . . . . . 38
4.3 Timing of endosymbiotic gene transfer . . . . . . . . . . . . . . . . 384.4 Phylogenetic analyses and data visualization . . . . . . . . . . . . . 40
4.4.1 Multiple alignments with intron positions . . . . . . . . . . 404.4.2 Phylogenetic trees and median networks . . . . . . . . . . . 404.4.3 Comprehensive phylogeny of the nad7 gene . . . . . . . . . 40
v
Contents
4.5 Survey . . . . . . . . . . . . . . . . . . . . . . . . . . . . . . . . . . . 42
5 Results 435.1 Database and annotation independent method to identify intron
positions . . . . . . . . . . . . . . . . . . . . . . . . . . . . . . . . . . 435.2 Proteins of the oxidative phosphorylation pathway . . . . . . . . . 45
5.2.1 Intron densities and phase distributions . . . . . . . . . . . 505.2.2 Shared intron positions . . . . . . . . . . . . . . . . . . . . . 555.2.3 Parallel intron gain in the nad7 gene . . . . . . . . . . . . . . 56
5.3 Ribosomal mitochondrial proteins . . . . . . . . . . . . . . . . . . . 615.3.1 Intron densities and phase distributions . . . . . . . . . . . 665.3.2 Shared intron positions . . . . . . . . . . . . . . . . . . . . . 69
5.4 Intron positions in gene duplications . . . . . . . . . . . . . . . . . . 71
6 Discussion 756.1 Database and annotation independent method to identify intron
positions . . . . . . . . . . . . . . . . . . . . . . . . . . . . . . . . . . 756.2 Endosymbiotic gene transfer, gene loss and sequence information 766.3 Shared intron positions are not always ancient . . . . . . . . . . . . 776.4 Dynamic intron evolution in proto-mitochondrial genes . . . . . . 786.5 Can we solve the question about the origin of spliceosomal introns? 81
References 83
vi
List of Figures
3.1 Types of introns . . . . . . . . . . . . . . . . . . . . . . . . . . . . . . 63.2 Illustration of a protein coding gene in eukaryotes . . . . . . . . . . 83.3 The intron phases . . . . . . . . . . . . . . . . . . . . . . . . . . . . . 93.4 The symmetry of exons . . . . . . . . . . . . . . . . . . . . . . . . . 103.5 Intron density among eukaryotes . . . . . . . . . . . . . . . . . . . . 113.6 Endosymbiotic gene transfer . . . . . . . . . . . . . . . . . . . . . . 163.7 Oxidative phosphorylation pathway . . . . . . . . . . . . . . . . . . 17
4.1 Identification of the proteins of α-proteobacterial origin . . . . . . 234.2 blat result for an intronless gene . . . . . . . . . . . . . . . . . . . . 314.3 blat result on two locations of the genome . . . . . . . . . . . . . . 324.4 First two steps of dentifying intron positions . . . . . . . . . . . . . 334.5 Identifying a phase 0 intron . . . . . . . . . . . . . . . . . . . . . . . 344.6 Identifying a phase 1 intron . . . . . . . . . . . . . . . . . . . . . . . 354.7 General workflow . . . . . . . . . . . . . . . . . . . . . . . . . . . . . 364.8 Presence/absence matrix and group profiles . . . . . . . . . . . . . 374.9 Survey of the workflow framework . . . . . . . . . . . . . . . . . . . 42
5.1 Timing the endosymbiotic gene transfer of genes in the oxidativephosphorylation pathway . . . . . . . . . . . . . . . . . . . . . . . . 50
5.2 Intron densities and phase distributions in genes of the oxidativephosphorylation pathway . . . . . . . . . . . . . . . . . . . . . . . . 51
5.3 Exon symmetry distribution in genes of the oxidative phosphory-lation pathway . . . . . . . . . . . . . . . . . . . . . . . . . . . . . . . 53
5.4 Intron density in genes transferred at different evolutionary stages 545.5 Shared intron position in the protein alignment of the gene nad7 . 585.6 Phylogeny and identical intron position of the nad7 gene . . . . . . 605.7 Timing the endosymbiotic gene transfer of mitochondrial riboso-
mal proteins . . . . . . . . . . . . . . . . . . . . . . . . . . . . . . . . 665.8 Intron densities and phase distributions in genes for mitochon-
drial ribosomal proteins . . . . . . . . . . . . . . . . . . . . . . . . . 675.9 Exon symmetry distribution in genes for mitochondrial ribosomal
proteins . . . . . . . . . . . . . . . . . . . . . . . . . . . . . . . . . . . 685.10 Intron density in genes transferred at different evolutionary stages 695.11 Multiple sequence alignment of the gene nad9 . . . . . . . . . . . . 735.12 Phylogenetic maximum likelihood tree of the gene nad9 . . . . . . 745.13 Median network of the intron profiles of the gene nad9 . . . . . . . 74
vii
List of Figures
6.1 Influences on dynamics of intron evolution in genes that origi-nated by endosymbiotic gene transfer . . . . . . . . . . . . . . . . . 81
viii
List of Tables
3.1 Different composition of prokaryotic, eukaryotic and mitochon-drial ribosomes . . . . . . . . . . . . . . . . . . . . . . . . . . . . . . 18
4.1 Source of genome and protein sequences . . . . . . . . . . . . . . . 224.2 Proteins of the oxidative phosphorylation pathway, in Homo sa-
piens, Complex I . . . . . . . . . . . . . . . . . . . . . . . . . . . . . . 244.3 Proteins of the oxidative phosphorylation pathway in Homo sa-
piens, Complex II . . . . . . . . . . . . . . . . . . . . . . . . . . . . . 254.4 Proteins of the oxidative phosphorylation pathway in Homo sa-
piens, Complex III . . . . . . . . . . . . . . . . . . . . . . . . . . . . . 254.5 Proteins of the oxidative phosphorylation pathway in Homo sa-
piens, Complex VI . . . . . . . . . . . . . . . . . . . . . . . . . . . . . 264.6 Proteins of the oxidative phosphorylation pathway in Homo sa-
piens, Complex V . . . . . . . . . . . . . . . . . . . . . . . . . . . . . 274.7 Proteins of the mitochondrial ribosome in Homo sapiens, large sub-
unit . . . . . . . . . . . . . . . . . . . . . . . . . . . . . . . . . . . . . 284.8 Proteins of the mitochondrial ribosome in Homo sapiens, small
subunit . . . . . . . . . . . . . . . . . . . . . . . . . . . . . . . . . . . 294.9 RefSeq accession numbers of the mitochondrial genomes . . . . . . 39
5.1 Number of identified intron positions and proteins . . . . . . . . . 435.2 Number of excluded intron positions . . . . . . . . . . . . . . . . . 445.3 Proto-mitochondrial genes of the oxidative phosphorylation path-
way . . . . . . . . . . . . . . . . . . . . . . . . . . . . . . . . . . . . . 455.4 Genomic location of genes of the oxidative phosphorylation path-
way . . . . . . . . . . . . . . . . . . . . . . . . . . . . . . . . . . . . . 465.5 Genes of the oxidative phosphorylation pathway encoded in the
mitochondrion and the nuclear genome . . . . . . . . . . . . . . . . 485.6 Shared intron positions in genes of the oxidative phosphorylation
pathway . . . . . . . . . . . . . . . . . . . . . . . . . . . . . . . . . . 555.7 Phase distribution of shared intron positions in proteins of the
oxidative phosphorylation pathway . . . . . . . . . . . . . . . . . . 565.8 Preferred codon usage . . . . . . . . . . . . . . . . . . . . . . . . . . 615.9 Proto-mitochondrial ribosomal genes . . . . . . . . . . . . . . . . . 625.10 Genomic location of mitochondrial ribosomal genes . . . . . . . . . 645.11 Mitochondrial ribosomal genes encoded in the mitochondrion and
the nuclear genome . . . . . . . . . . . . . . . . . . . . . . . . . . . . 65
ix

List of Tables
5.12 Shared intron positions in genes of mitochondrial ribosomal pro-teins . . . . . . . . . . . . . . . . . . . . . . . . . . . . . . . . . . . . . 70
5.13 Phase distribution of shared intron positions of mitochondrial ri-bosomal proteins . . . . . . . . . . . . . . . . . . . . . . . . . . . . . 71
x
1 Abstract
Spliceosomal introns are segments of non-coding sequences in eukaryotic genes.
After transcription of a gene, introns are excised from the pre-mRNA by the
spliceosome before translation into a functional protein. Spliceosomal introns
and the spliceosomal machinery have been identified in all eukaryotic genomes
and are absent from all prokaryotic genomes sequenced to date. The origin of
spliceosomal introns is mainly discussed in the context of two different hypothe-
ses. The introns-early hypothesis states that spliceosomal introns were present
in the last common ancestor of prokaryotes and eukaryotes but were subse-
quently lost in all prokaryotes. In contrast, the introns-late hypothesis links the
origin of spliceosomal introns to the emergence of eukaryotes.
Similarities between splicing mechanisms of spliceosomal introns and those
of group II introns support the opinion that they might have had a common an-
cestor. The fact that group II introns are present in bacterial and mitochondrial
genomes, leads to a possible evolutionary connection between spliceosomal in-
trons and mitochondria. These cell organelles originated from endosymbiosis
with an α-proteobacterial ancestor in a host cell. During evolution, the mito-
chondrial genome was reduced and many genes were lost or transferred to the
host genome, a process known as endosymbiotic gene transfer. This process
might have spread group II introns into the host genome, and subsequently
might have initiated the evolution of spliceosomal introns and the spliceosome.
These influences could also have created a selective force towards the evolution
of the nucleus which separated splicing from translation.
Nuclear genes that originated in endosymbiotic gene transfer did not con-
tain spliceosomal introns when they were transferred to the host genome, so
that introns in these genes were all gained after integration into the genome. To
gain insight into the evolution of spliceosomal introns, the intron/exon structure
of nuclear encoded proto-mitochondrial genes of the oxidative phosphorylation
pathway and genes of mitochondrial ribosomal proteins were examined. Ho-
mologs of 64 human proto-mitochondrial proteins were identified in 18 eukary-
1
1 Abstract
otic species. The timing of gene transfer events within the species phylogeny
revealed endosymbiotic gene transfer as a very dynamic evolutionary process
in general.
A database annotation independent method was developed to identify intron
positions using the sequence information. The analyzed characteristic features
of spliceosomal introns in the genes under consideration revealed a highly dy-
namic and species specific intron evolution. Intron densities and phase distribu-
tions as well as a predominance of shared intron positions between animals and
plants are in accordance to other results found in eukaryotic genes or genomes.
No correlation was detected between the time of the transfer and the intron den-
sity, which suggests a high rate of intron gain after the integration of the genes
in the host genome.
A clear case of parallel intron gain in animals and a green alga was found in
the gene nad7 which was transferred independently in these species. This rare
example supports the opinion that shared intron positions are not implicitly
conserved.
2
2 Zusammenfassung
Spleißosomale Introns sind nicht-kodierende Sequenzabschnitte in Genen von
Eukaryoten. Nach der Transkription eines Gens werden die Introns mit Hilfe
des Spleißosoms aus der prä-mRNA herausgeschnitten, bevor das Gen in ein
funktionelles Protein translatiert wird. Spleißosomale Introns und der Spleißo-
somenkomplex wurden in allen bisher sequenzierten eukaryotischen Genomen
identifiziert, in prokaryotischen Genomen sind sie jedoch nicht vorhanden. Der
Ursprung spleißosomaler Introns wird hauptsächlich im Kontext von zwei un-
terschiedlichen Hypothesen diskutiert. Die "introns-early" Hypothese gibt an,
daß spleißosomale Introns in dem frühesten gemeinsamen Vorfahren der Pro-
karyoten und Eukaryoten vorhanden waren, die anschließend in allen Proka-
ryoten verloren gingen. Die "introns-late" Hypothese hingegen verbindet den
Ursprung der spleißosomalen Introns mit der Entstehung der Eukaryoten.
Ähnlichkeiten zwischen den Spleiß-Mechanismen von spleißosomalen In-
trons und denen der selbstspleißenden Gruppe-II Introns unterstützen die An-
nahme, das sie einen gemeinsamen Vorfahren besitzen. Die Tatsache, daß die
Gruppe-II Introns in den Genomen von Bakterien und Mitochondrien vorkom-
men, führt zu einer möglichen evolutionären Verbindung zwischen spleißoso-
malen Introns und Mitochondrien. Diese Zellorganellen entstammen einer En-
dosymbiose eines α-proteobakteriellen Vorfahren in einer Wirtszelle. Im Laufe
der Evolution wurde das mitochondriale Genom reduziert indem viele Gene
verloren gingen oder zu demWirtsgenom transferiert, der Prozess des endosym-
biontischen Gentransfers. Dieser Prozess könnte die Verbreitung der Gruppe-II
Introns im Wirtsgenom verursacht haben und anschließend die Evolution der
spleißosomalen Introns und des Spleißosoms eingeleitet haben. Diese Einflüsse
könnten auch eine selektive Kraft zur Begünstigung der Bildung eines Zellkerns
hervorgerufen haben, welcher das Spleißen von der Translation trennt.
Zellkernkodierte Gene die dem endosymbiontischen Gentransfer entstam-
men, enthielten keine spleißosomalen Introns als sie in das Wirtsgenom trans-
feriert wurden, so daß diese Introns erst nach der Integration im Wirtsgenom
3
2 Zusammenfassung
eingefügt wurden. Um Einsicht in die Evolution von spleißosomalen Introns
zu gewinnen, wurden die Intron/Exon Stukturen von zellkernkodierten proto-
mitochondrialen Genen des Oxidativen Phosphorylierungsstoffwechselwegs und
von Genen mitochondrialer ribosomaler Proteine untersucht. Ausgehend von
64 proto-mitochondrialen Proteinen des Menschen wurden Homologe in 18 eu-
karyotischen Spezies identifiziert. Die zeitliche Einordnung der Gentransfer-
ereignisse innerhalb der Phylogenie der Spezies zeigte den endosymbiontischen
Gentransfer als einen generell dynamischen evolutionären Prozess.
Eine Methode unabhängig von Annotationen in Datenbanken wurde für die
Identifizierung der Intronpositionen entwickelt. Die analysierten charakteristi-
schen Eigenschaften der spleißosomalen Introns in den hier untersuchten Genen
zeigte eine sehr dynamische, Spezies spezifische Evolution von Introns. Die In-
trondichte und die Verteilung der Intronphasen, sowie eine überwiegende An-
zahl von gemeinsamen Intronpositionen in Tieren und Pflanzen sind in Einklang
mit Ergebnissen die aus Untersuchungen eukaryotischer Gene und Genome
stammen. Es wurde keine Korrelation zwischen dem Zeitpunkt des Gentrans-
fers und der Introndichte festgestellt, was auf eine hohe Rate neu eingefügter
Introns nach der Integration eines Gens in das Wirtsgenom schließen lässt.
Ein eindeutiger Fall eines parallelen Introngewinns in Tieren und einer Grü-
nalge wurde in dem Gen nad7 identifiziert, welches unabhängig in diese Organ-
ismen transferiert wurde. Dieses Beispiel unterstützt die Meinung, daß gemein-
same Intronpositionen nicht unbedingt konserviert sind.
4
3 Introduction
3.1 Introns
DNA builds the genetic information of all living organisms except for some
RNA viruses. Eukaryotic DNA contains a high fraction of regions which are
not translated into protein sequences. Introns account for a large fraction of
these non-coding regions and are usually composed of random sequences. If
introns interrupt protein-coding genes in eukaryotes, the coding regions are
called exons (Gilbert, 1978). The pre-mRNA (precurser messenger RNA) as the
first product of transcription contains both, exons and introns. Before translation
into a functional protein takes place, introns are excised from the transcript and
the exonic regions are ligated. This process is called splicing and is one of the
pre-mRNA processing mechanisms in eukaryotic cells.
Since their discovery in 1977 (Berget et al., 1977; Klessig, 1977; Chow et al.,
1977) (Section 3.1.5.1), introns were the subject of many studies in which many
of their characteristics were described (Section 3.1.1). Mechanistically differ-
ent splicing processes define the two major groups of self-splicing introns and
spliceosomal introns (Figure 3.1). The latter exist only in eukaryotic genomes
and need a RNA-protein complex, the spliceosome (Grabowski et al., 1985;
Brody and Abelson, 1985; Frendewey and Keller, 1985), to catalyze the splicing
reaction, in contrast to the autocatalytic capabilities of the self-splicing introns.
Questions about the possible function of introns in the genome or about the
origin and evolution of spliceosomal introns are still under discussion.
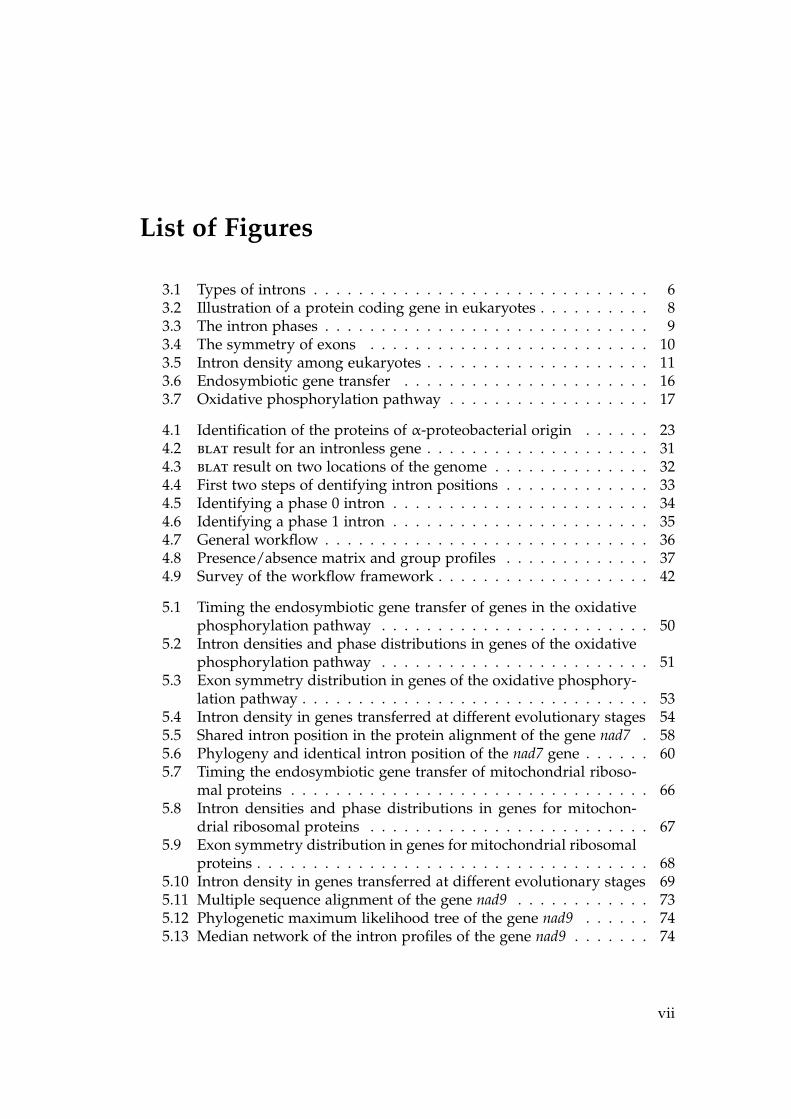
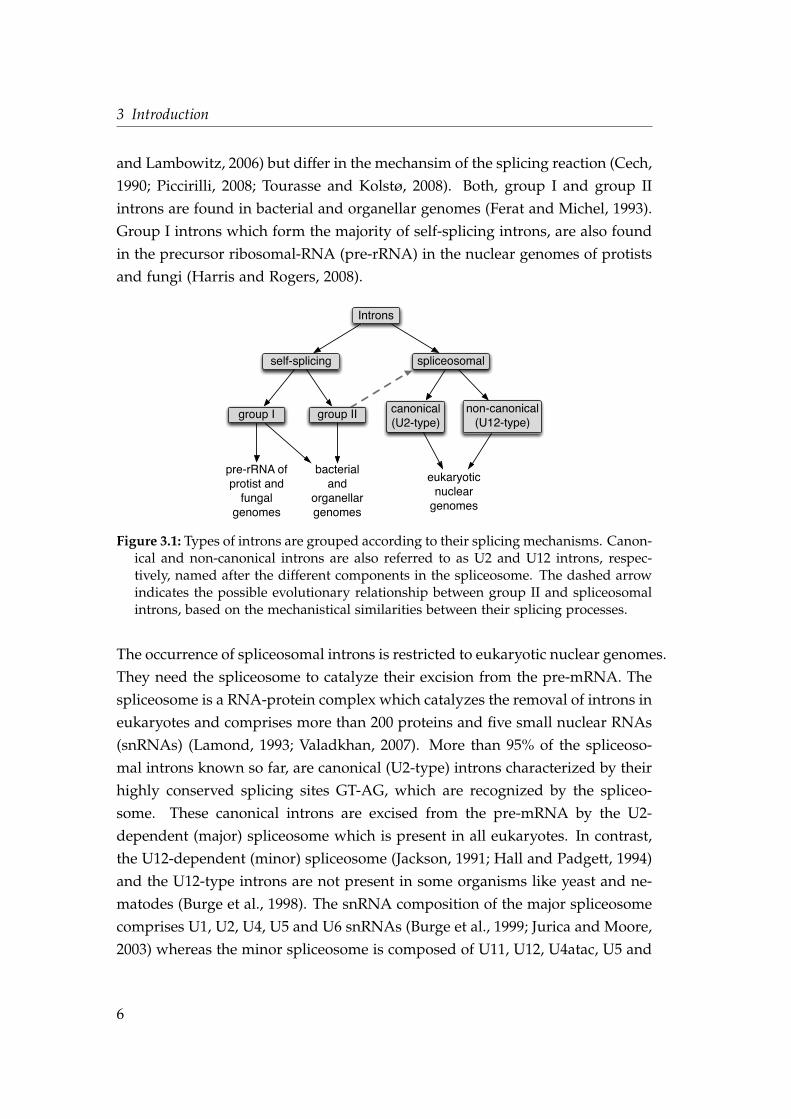
3.1.1 Types of Introns
The different types of introns shown in Figure 3.1 grouped by their splicing
mechanism into self-splicing and spliceosomal introns (Roy and Gilbert, 2006;
Rodríguez-Trelles et al., 2006). Self-splicing introns contain group I and group II
introns which both have ribozymic activity to catalyze their own excision (Pyle
5
3 Introduction
and Lambowitz, 2006) but differ in the mechansim of the splicing reaction (Cech,
1990; Piccirilli, 2008; Tourasse and Kolstø, 2008). Both, group I and group II
introns are found in bacterial and organellar genomes (Ferat and Michel, 1993).
Group I introns which form the majority of self-splicing introns, are also found
in the precursor ribosomal-RNA (pre-rRNA) in the nuclear genomes of protists
and fungi (Harris and Rogers, 2008).
canonical(U2-type)
group II
Introns
self-splicing spliceosomal
group I non-canonical(U12-type)
pre-rRNA ofprotist and
fungalgenomes
bacterial and
organellargenomes
eukaryoticnuclear
genomes
Figure 3.1: Types of introns are grouped according to their splicing mechanisms. Canon-ical and non-canonical introns are also referred to as U2 and U12 introns, respec-tively, named after the different components in the spliceosome. The dashed arrowindicates the possible evolutionary relationship between group II and spliceosomalintrons, based on the mechanistical similarities between their splicing processes.
The occurrence of spliceosomal introns is restricted to eukaryotic nuclear genomes.
They need the spliceosome to catalyze their excision from the pre-mRNA. The
spliceosome is a RNA-protein complex which catalyzes the removal of introns in
eukaryotes and comprises more than 200 proteins and five small nuclear RNAs
(snRNAs) (Lamond, 1993; Valadkhan, 2007). More than 95% of the spliceoso-
mal introns known so far, are canonical (U2-type) introns characterized by their
highly conserved splicing sites GT-AG, which are recognized by the spliceo-
some. These canonical introns are excised from the pre-mRNA by the U2-
dependent (major) spliceosome which is present in all eukaryotes. In contrast,
the U12-dependent (minor) spliceosome (Jackson, 1991; Hall and Padgett, 1994)
and the U12-type introns are not present in some organisms like yeast and ne-
matodes (Burge et al., 1998). The snRNA composition of the major spliceosome
comprises U1, U2, U4, U5 and U6 snRNAs (Burge et al., 1999; Jurica and Moore,
2003) whereas the minor spliceosome is composed of U11, U12, U4atac, U5 and
6
3.1 Introns
U6atac snRNAs (Tarn and Steitz, 1996; Will and Luhrmann, 2005). The splice
sites of the U12-type introns have the consensus nucloetide pattern [A/G]T-
A[C/G] and are not as strictly conserved as the GT-AG splice sites of the U2
introns. Because of similarities between the splicing procedures of self-splicing
group II introns and spliceosomal introns, it is suggested that spliceosomal in-
trons or components of the spliceosome, the snRNAs, might have originated
from group II introns (Valadkhan, 2007; Toro et al., 2007; Toor et al., 2008). This
probable evolutionary relationship between the different intron types is indi-
cated in Figure 3.1.
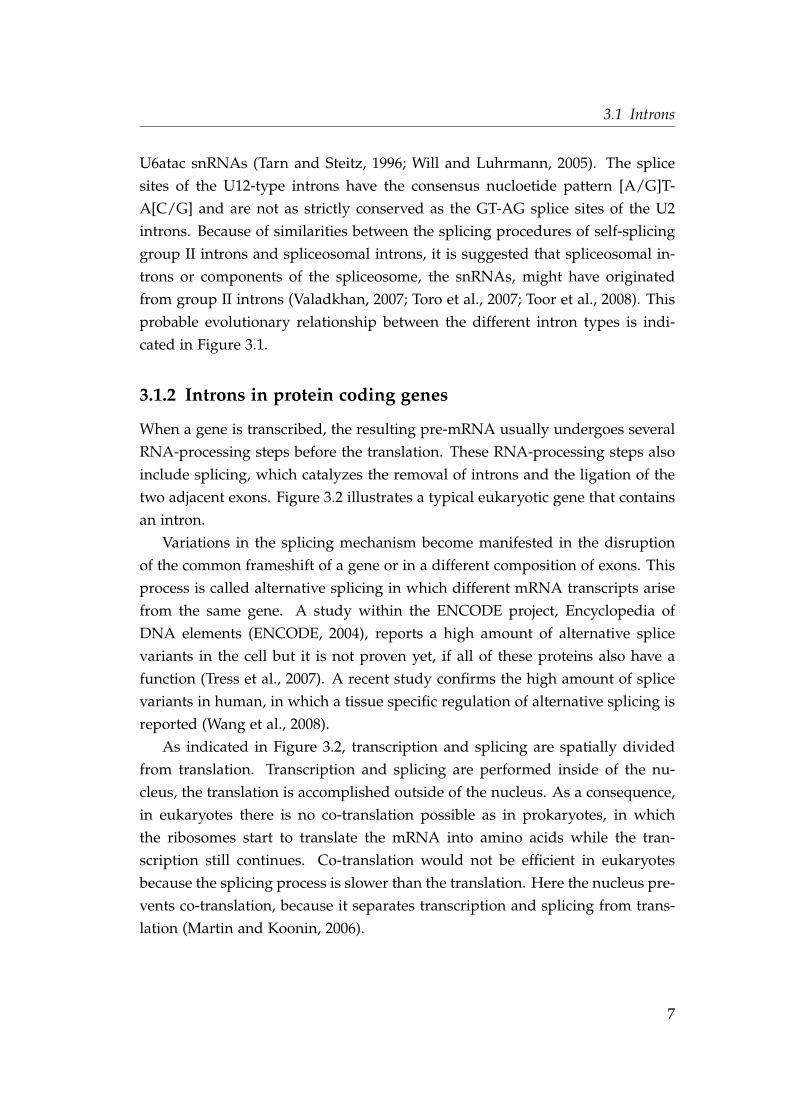
3.1.2 Introns in protein coding genes
When a gene is transcribed, the resulting pre-mRNA usually undergoes several
RNA-processing steps before the translation. These RNA-processing steps also
include splicing, which catalyzes the removal of introns and the ligation of the
two adjacent exons. Figure 3.2 illustrates a typical eukaryotic gene that contains
an intron.
Variations in the splicing mechanism become manifested in the disruption
of the common frameshift of a gene or in a different composition of exons. This
process is called alternative splicing in which different mRNA transcripts arise
from the same gene. A study within the ENCODE project, Encyclopedia of
DNA elements (ENCODE, 2004), reports a high amount of alternative splice
variants in the cell but it is not proven yet, if all of these proteins also have a
function (Tress et al., 2007). A recent study confirms the high amount of splice
variants in human, in which a tissue specific regulation of alternative splicing is
reported (Wang et al., 2008).
As indicated in Figure 3.2, transcription and splicing are spatially divided
from translation. Transcription and splicing are performed inside of the nu-
cleus, the translation is accomplished outside of the nucleus. As a consequence,
in eukaryotes there is no co-translation possible as in prokaryotes, in which
the ribosomes start to translate the mRNA into amino acids while the tran-
scription still continues. Co-translation would not be efficient in eukaryotes
because the splicing process is slower than the translation. Here the nucleus pre-
vents co-translation, because it separates transcription and splicing from trans-
lation (Martin and Koonin, 2006).
7
3 Introduction
AGGTExon 1 Exon 2
Spliceosome
Intron
Translation
Protein
Exon
Exon
Intron
Gene
Exon 2Exon 1
Nucleus
Cytoplasm
pre-mRNA
mRNA
Transcription
Figure 3.2: Illustration of a protein coding gene in eukaryotes. After transcription insidethe nucleus, the pre-mRNA contains the two exons and the intron. The intron isspliced out of the pre-mRNA at the canonical splicing sites GT-AG and the two exonsare rejoined, catalyzed by the spliceosome. The mRNA transcript is transported fromthe nucleus into the cytosol, where it is translated into a protein sequence.
In eukaryotes, introns can also be found in non-coding regions of a gene, be-
tween the transcription initiation site and the translation initiation codon (Graur
and Li, 2000), but in this work the focus is on spliceosomal introns in protein
coding regions.
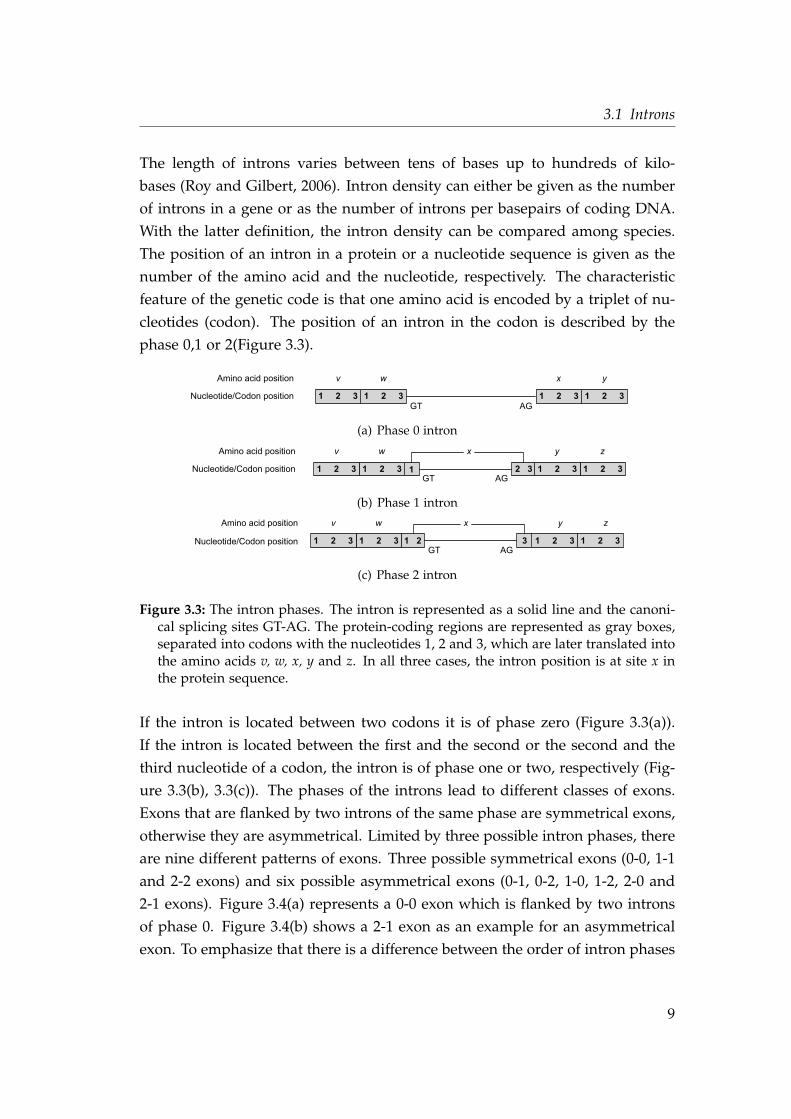
3.1.3 Intron characteristics
Spliceosomal introns within genes can be characterized and described by differ-
ent features:
• number of introns per gene (intron density)• intron position in the protein or nucleotide sequence (intron position)• position of the intron in the codon (intron phase)• length of the intron (intron length)
8
3.1 Introns
The length of introns varies between tens of bases up to hundreds of kilo-
bases (Roy and Gilbert, 2006). Intron density can either be given as the number
of introns in a gene or as the number of introns per basepairs of coding DNA.
With the latter definition, the intron density can be compared among species.
The position of an intron in a protein or a nucleotide sequence is given as the
number of the amino acid and the nucleotide, respectively. The characteristic
feature of the genetic code is that one amino acid is encoded by a triplet of nu-
cleotides (codon). The position of an intron in the codon is described by the
phase 0,1 or 2(Figure 3.3).
1 2 31 2 3 1 2 31 2 3
GT AG
v w x yAmino acid position
Nucleotide/Codon position
(a) Phase 0 intron
1 2 31 2 3 1 2 31 2 3
GT AG
v w x y
2 31
zAmino acid position
Nucleotide/Codon position
(b) Phase 1 intron
1 2 31 2 3 1 2 31 2 3
GT AG
v w x y
1 2 3
zAmino acid position
Nucleotide/Codon position
(c) Phase 2 intron
Figure 3.3: The intron phases. The intron is represented as a solid line and the canoni-cal splicing sites GT-AG. The protein-coding regions are represented as gray boxes,separated into codons with the nucleotides 1, 2 and 3, which are later translated intothe amino acids v, w, x, y and z. In all three cases, the intron position is at site x inthe protein sequence.
If the intron is located between two codons it is of phase zero (Figure 3.3(a)).
If the intron is located between the first and the second or the second and the
third nucleotide of a codon, the intron is of phase one or two, respectively (Fig-
ure 3.3(b), 3.3(c)). The phases of the introns lead to different classes of exons.
Exons that are flanked by two introns of the same phase are symmetrical exons,
otherwise they are asymmetrical. Limited by three possible intron phases, there
are nine different patterns of exons. Three possible symmetrical exons (0-0, 1-1
and 2-2 exons) and six possible asymmetrical exons (0-1, 0-2, 1-0, 1-2, 2-0 and
2-1 exons). Figure 3.4(a) represents a 0-0 exon which is flanked by two introns
of phase 0. Figure 3.4(b) shows a 2-1 exon as an example for an asymmetrical
exon. To emphasize that there is a difference between the order of intron phases
9
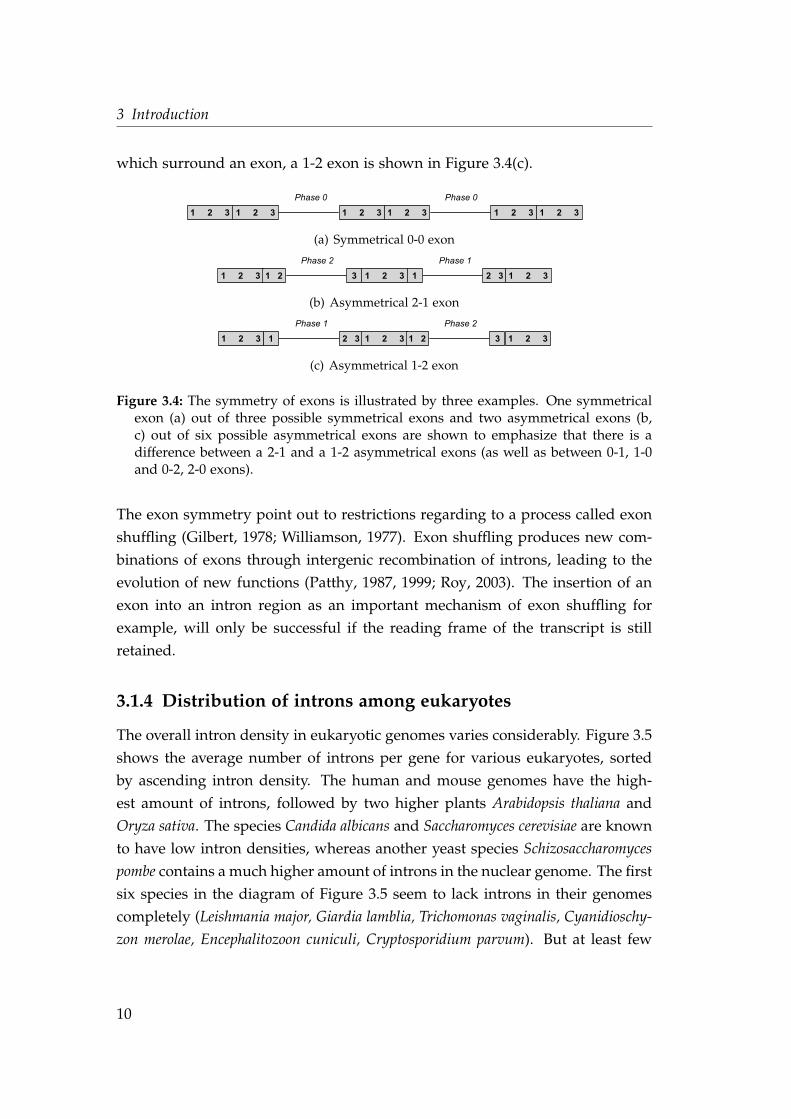
3 Introduction
which surround an exon, a 1-2 exon is shown in Figure 3.4(c).
1 2 3 1 2 31 2 3 1 2 3 1 2 3
Phase 0 Phase 0
1 2 3
(a) Symmetrical 0-0 exon
1 2 3 1 2 1 2 33
Phase 2 Phase 1
1 1 2 32 3
(b) Asymmetrical 2-1 exon
1 2 3
Phase 1
1 1 2 32 3 1 2 1 2 33
Phase 2
(c) Asymmetrical 1-2 exon
Figure 3.4: The symmetry of exons is illustrated by three examples. One symmetricalexon (a) out of three possible symmetrical exons and two asymmetrical exons (b,c) out of six possible asymmetrical exons are shown to emphasize that there is adifference between a 2-1 and a 1-2 asymmetrical exons (as well as between 0-1, 1-0and 0-2, 2-0 exons).
The exon symmetry point out to restrictions regarding to a process called exon
shuffling (Gilbert, 1978; Williamson, 1977). Exon shuffling produces new com-
binations of exons through intergenic recombination of introns, leading to the
evolution of new functions (Patthy, 1987, 1999; Roy, 2003). The insertion of an
exon into an intron region as an important mechanism of exon shuffling for
example, will only be successful if the reading frame of the transcript is still
retained.
3.1.4 Distribution of introns among eukaryotes
The overall intron density in eukaryotic genomes varies considerably. Figure 3.5
shows the average number of introns per gene for various eukaryotes, sorted
by ascending intron density. The human and mouse genomes have the high-
est amount of introns, followed by two higher plants Arabidopsis thaliana and
Oryza sativa. The species Candida albicans and Saccharomyces cerevisiae are known
to have low intron densities, whereas another yeast species Schizosaccharomyces
pombe contains a much higher amount of introns in the nuclear genome. The first
six species in the diagram of Figure 3.5 seem to lack introns in their genomes
completely (Leishmania major, Giardia lamblia, Trichomonas vaginalis, Cyanidioschy-
zon merolae, Encephalitozoon cuniculi, Cryptosporidium parvum). But at least few
10
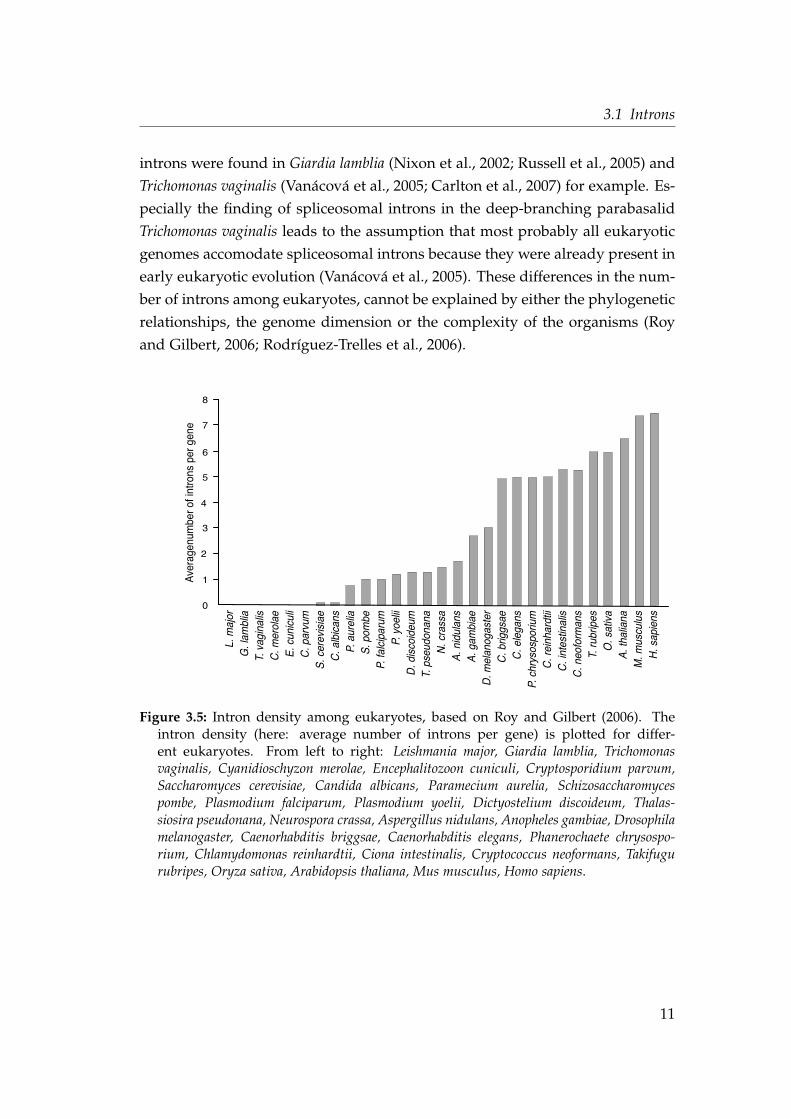
3.1 Introns
introns were found in Giardia lamblia (Nixon et al., 2002; Russell et al., 2005) and
Trichomonas vaginalis (Vanácová et al., 2005; Carlton et al., 2007) for example. Es-
pecially the finding of spliceosomal introns in the deep-branching parabasalid
Trichomonas vaginalis leads to the assumption that most probably all eukaryotic
genomes accomodate spliceosomal introns because they were already present in
early eukaryotic evolution (Vanácová et al., 2005). These differences in the num-
ber of introns among eukaryotes, cannot be explained by either the phylogenetic
relationships, the genome dimension or the complexity of the organisms (Roy
and Gilbert, 2006; Rodríguez-Trelles et al., 2006).
L. m
ajor
G. l
ambl
iaT.
vag
inal
isC
. mer
olae
E. c
unic
uli
C. p
arvu
mS
. cer
evis
iae
C. a
lbic
ans
P. a
urel
iaS
. pom
beP.
falc
ipar
umP.
yoe
liiD
. dis
coid
eum
T. p
seud
onan
aN
. cra
ssa
A. n
idul
ans
A. g
ambi
aeD
. mel
anog
aste
rC
. brig
gsae
C. e
lega
nsP.
chr
ysos
poriu
mC
. rei
nhar
dtii
C. i
ntes
tinal
isC
. neo
form
ans
T. ru
brip
esO
. sat
iva
A. t
halia
naM
. mus
culu
sH
. sap
iens
7
6
5
4
3
2
1Ave
rage
num
ber o
f int
rons
per
gen
e
8
0
Figure 3.5: Intron density among eukaryotes, based on Roy and Gilbert (2006). Theintron density (here: average number of introns per gene) is plotted for differ-ent eukaryotes. From left to right: Leishmania major, Giardia lamblia, Trichomonasvaginalis, Cyanidioschyzon merolae, Encephalitozoon cuniculi, Cryptosporidium parvum,Saccharomyces cerevisiae, Candida albicans, Paramecium aurelia, Schizosaccharomycespombe, Plasmodium falciparum, Plasmodium yoelii, Dictyostelium discoideum, Thalas-siosira pseudonana, Neurospora crassa, Aspergillus nidulans, Anopheles gambiae, Drosophilamelanogaster, Caenorhabditis briggsae, Caenorhabditis elegans, Phanerochaete chrysospo-rium, Chlamydomonas reinhardtii, Ciona intestinalis, Cryptococcus neoformans, Takifugurubripes, Oryza sativa, Arabidopsis thaliana, Mus musculus, Homo sapiens.
11
3 Introduction
3.1.5 Evolutionary origin of introns
3.1.5.1 Early views on intron evolution
Introns were first observed and described in the literature in several different
studies in 1977 where they were discovered in the mRNA of the human aden-
ovirus 2 (Berget et al., 1977; Klessig, 1977; Chow et al., 1977; Sambrook, 1977;
Aloni et al., 1977) and in ovalbumin, β-globin and immunoglobulin genes of an-
imals (Breathnach et al., 1977; Doel et al., 1977; Jeffreys and Flavell, 1977; Brack
and Tonegawa, 1977; Williamson, 1977). The conception of a monocistronic gene
structure was disproved with these findings. Gilbert proposed the name introns
(= intragenic regions) for the sequences which split the genes, in contrast to ex-
ons (= expressed regions) (Gilbert, 1978). He also predicted introns as a large
source of new genetic functions through exon shuffling (Section 3.1.1). Because
of the non-coding regions between exons, the duplication, insertion or deletion
of exons could result in new proteins.
Spliceosomal introns and the spliceosomal machinery have been identified
in all eukaryotic genomes but they are absent from all prokaryotic genomes se-
quenced to date (Collins and Penny, 2005). Aside from similarities between the
group II self-splicing introns and the spliceosome (Valadkhan, 2007; Toro et al.,
2007; Toor et al., 2008) (Section 3.1.1), no transitional form between self-splicing
introns and spliceosomal introns could be identified. The influences of introns
on the evolution of eukaryotic genes, selective forces and new evolving protein
functions by alternative splicing still take influence on our understanding and
the definition of what exactly a gene is (Pesole, 2008).
3.1.5.2 Origin of spliceosomal introns
There are many open questions about the origin of spliceosomal introns. Es-
pecially the questions "when" and "where" they originated lead to different
hypotheses and scenarios about their evolution and their contribution to the
genome structure we see today. The origin of spliceosomal introns is mainly
discussed in the context of two different hypotheses.
The introns-early hypothesis states that spliceosomal introns arose early in
evolution of the genome, so introns were present in the last common ancestor of
prokaryotes and eukaryotes (Darnell, 1978; Doolittle, 1978; Gilbert, 1978). In this
hypothesis, spliceosomal introns were subsequently lost in all prokaryotes to
12
3.1 Introns
explain their absence in these genomes. In contrast, the introns-late hypothesis
states that spliceosomal introns originated after the divergence of prokaryotes
and eukaryotes (Cavalier-Smith, 1985; Palmer and Logsdon, 1991). Furthermore
the introns-late hypothesis links the origin of spliceosomal introns to the ori-
gin of mitochondria in eukaryotes (Cavalier-Smith, 1991; Martin and Koonin,
2006). The introns-early and introns-late hypotheses are still debated in the lit-
erature (Rogozin et al., 2005; Belshaw and Bensasson, 2006; Roy and Gilbert,
2006). With every newly sequenced genome more information is added to our
understanding of intron evolution throughout eukaryotic lineages. The different
hypotheses are both supported until now, because the observations and results
of exon/intron structure in the light of the general knowledge of genomic evo-
lution do not unambigously reject one of them. Combining different theoretical
scenarios based on logical assumptions with results of comparative genomic
or experimental analyses, the different hypotheses try to explain the origin of
spliceosomal introns, while each hypothesis builds a framework which includes
the observations and makes predictions which can be tested. Differences in
intron density among different species for example, are mostly explained as a
loss of introns rather than a species specific development. The ancient origin of
introns is supported by the observation of shared intron positions among eu-
karyotes, especially if they are found within divergent lineages. These introns
should reflect a conservation of the position at which the ancient gain of the
intron happend before speciation events (Gilbert and Glynias, 1993).
Dynamics of intron gain and loss are used as a resource to deduce informa-
tion about the evolution of introns (Roy and Gilbert, 2005; Irimia and Roy, 2008).
Intron gain and loss is a very controversial subject in which no clear trend or
general evolutionary mechanism can be defined for all eukaryotes yet (Sharpton
et al., 2008). For example, there is a general low intron gain and loss rate ob-
served in Plasmodium falciparum (Roy and Hartl, 2006) but a high rate of intron
gain and loss events identified in Arabidopsis thaliana (Knowles and McLysaght,
2006). There exist five different models of how an intron can be gained (Roy and
Gilbert, 2006; Rogers, 1989):
• Intron transposition• Transposon insertion• Tandem genomic duplication
• Intron transfer
13
3 Introduction
• Self-splicing group II intronsIntron loss can be explained with two possible mechanisms (Roy and Gilbert,
2006; Mourier, 2005; Lewin, 1983):
• reverse transcribed copy of a spliced mRNA transcript recombines with
the genomic copy
• genomic deletionAccording to the introns-late theory, there is evidence to suggest a connection
between the evolution of spliceosomal introns and self-splicing group II introns
as indicated in Figure 3.1. Because of the ability of group II introns to function
as mobile retroelements they were suggested to invade DNA through reverse
splicing reactions, but they themselves bear an indistinct evolutionary history
as well (Zimmerly et al., 1995; Zimmerly and Hausner, 2001). The possibility of
a common origin of spliceosomal introns and group II introns is becoming more
significant with new observations and insights into the complex mechanisms
and molecular structures of self-splicing and the spliceosome (Lambowitz and
Zimmerly, 2004; Robart et al., 2007; Valadkhan, 2007; Toro et al., 2007; Toor et al.,
2008).
3.2 Evolutionary origin of mitochondria
Mitochondria are the main energy suppplier of eukaryotic cells. The cell or-
ganelles were once free living prokaryotes and originated by endosymbiosis (Gray
et al., 1999). This endosymbiosis started with the engulfment of a faculta-
tive anaerobic α-proteobacterium by a host cell. Through this endosymbiotic
event, the prokaryotic endosymbionts developed into cell organelles in their
host cells (Martin et al., 2001).
The hypothesis of endosymbiosis for the origin of plastids was first devel-
oped in the literature in 1905 by Mereschkowsky (Mereschkowsky, 1905). The
first time that mitochondria were described to have a bacterial origin was in
1927 (Wallin, 1927) but the hypothesis was not accepted as an explanation for
the origin of these organelles at that time. Later, the endosymbiotic theory and
the bacterial origin of mitochondria appeared in the literature again (Sagan,
1967; Goksøyr, 1967) and finally got serious acceptation in the scientific commu-
nity.
α-proteobacteria were revealed as the prokaryotic group most closely re-
14
3.2 Evolutionary origin of mitochondria
lated to mitochondria and the ancestors of these organelles (Gray et al., 2001;
Wu et al., 2004). The α-proteobacteria Rickettsia prowazekii was suggested to
represent the mitochondrial ancestor (Andersson et al., 1998; Emelyanov, 2003),
but problems in this result are reported in other studies, regarding to insuffi-
ciency of phylogenetic methods and the constitution of recent α-proteobacterial
genomes, which do not exactly represent the ancestral mitochondrion (Esser
et al., 2004, 2007). Another way to approach the state of the ancestral mitochon-
drion without defining the most closely related species of α-proteobacteria was
for example, to reconstruct the proto-mitochondrial metabolism (Gabaldón and
Huynen, 2003).
Comparably to the question about the ancestor of mitochondria, the en-
dosymbiotic theory opened the question about the nature of the host cell. Var-
ious hypotheses exist with the main difference that either the host cell already
was a primitive eukaryote (Moreira and Lopez-Garcia, 1998; Cavalier-Smith,
2002, 2004; Margulis et al., 2005), or it was an archaebacterial-like prokaryote, in
which the endosymbiotic event initiated the evolution of eukaryotes (Martin and
Müller, 1998; Vellai et al., 1998; Martin et al., 2003; Embley and Martin, 2006). All
present known eukaryotes possess mitochondria or variations of them, the mito-
somes and hydrogenosomes, which have the same origin as mitochondria. The
organisms Giardia and Trichomonas for example, were thought to be amitochon-
drial eukaryotes, before it became clear that Giardia possesses mitosomes (Tovar
et al., 1999, 2003) and Trichomonas hydrogenosomes (Lindmark and Müller, 1973;
Martin and Müller, 1998).
3.2.1 Endosymbiotic gene transfer
Some of the influences of the mitochondrion on the eukaryotic evolution may
be evident, as the production of energy for the cell for example (Section 3.2.1.1).
Comparative sequence analyses allowed to trace the origin of mitochondria to α-
proteobacteria (Section 3.2), and also led to the discovery of endosymbiotic gene
transfer (Martin et al., 1998; Martin and Herrmann, 1998; Timmis et al., 2004).
This process defines the transfer of genes from the endosymbiont to the host
genome. Integration of genes into the host nucleus and loss of those genes in
the organellar genomes are the main reason for the reduced organellar genome.
Some genes were also lost completely during the evolution of eukaryotes (Fig-
15
3 Introduction
ure 3.6).
Gene transfer
Gene loss
Mitochondrion
Chloroplast
Nucleus
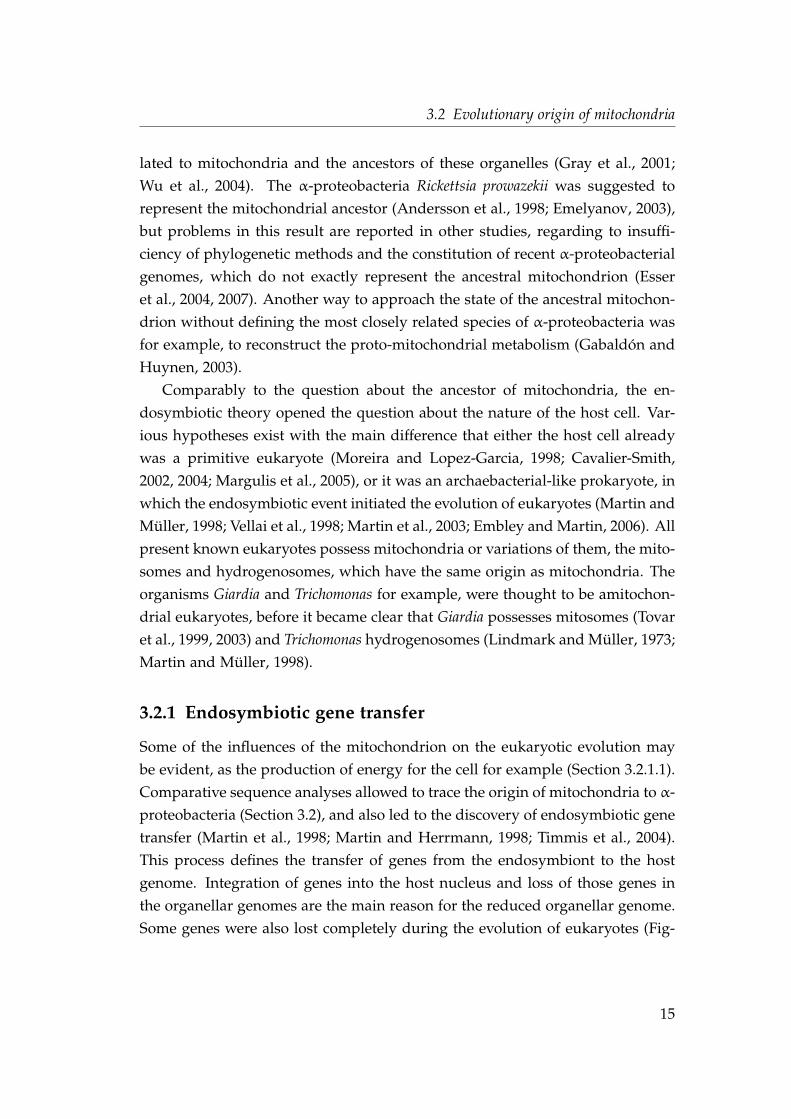
Figure 3.6: Endosymbiotic gene transfer of organellar genes to the nuclear genome.Genes of mitochondria (red) and chloroplasts (green) can be transferred into thenucleus of the host (solid arrows), but genes can also be lost from the organellargenome (dashed arrow) during the evolution of eukaryotic cells.
Figure 3.6 shows the endosymbiotic gene transfer of mitochondria and chloro-
plasts and indicates gene loss. The photosynthetic chloroplasts, found in plants
and algae, originated by endosymbiosis, like mitochondria. The ancestry of
chloroplast lies within the cyanobacteria (Goksøyr, 1967), but a specific lin-
eage of cyanobacteria that gave rise to chloroplasts could first not be identi-
fied (Douglas, 1998; Delwiche, 1999). With growing number of available plant
and cyanobacterial genomes the amount of genes that were transferred from
the chloroplast to the nuclear genome of Arabidopsis thaliana was inferred to be
between 2-9% with Synechocystis as the most representative ancestor of chloro-
plasts (Rujan and Martin, 2001). Including more genome sequences to the analy-
ses gave a rise up to 18% of chloroplast genes in Arabidopsis (Martin et al., 2002)
and 14% among four different plant genomes, indicating heterocyst-forming
species as the cyanobacteria which seem to be most similar to the ancestor of
chloroplasts (Deusch et al., 2008).
Different evolutionary scenarios have to be considered for the identification
of genes originated by endosymbiotic gene transfer. Genes that were transferred
to the host genome and evolved to have a new function might only expose their
origin in phylogenetic analyses (Gabaldón and Huynen, 2003), while genes that
have a function in the organelle did not necessarily originate from the bacterial
ancestor of the organelle (Section 3.2.1.1).
16
3.2 Evolutionary origin of mitochondria
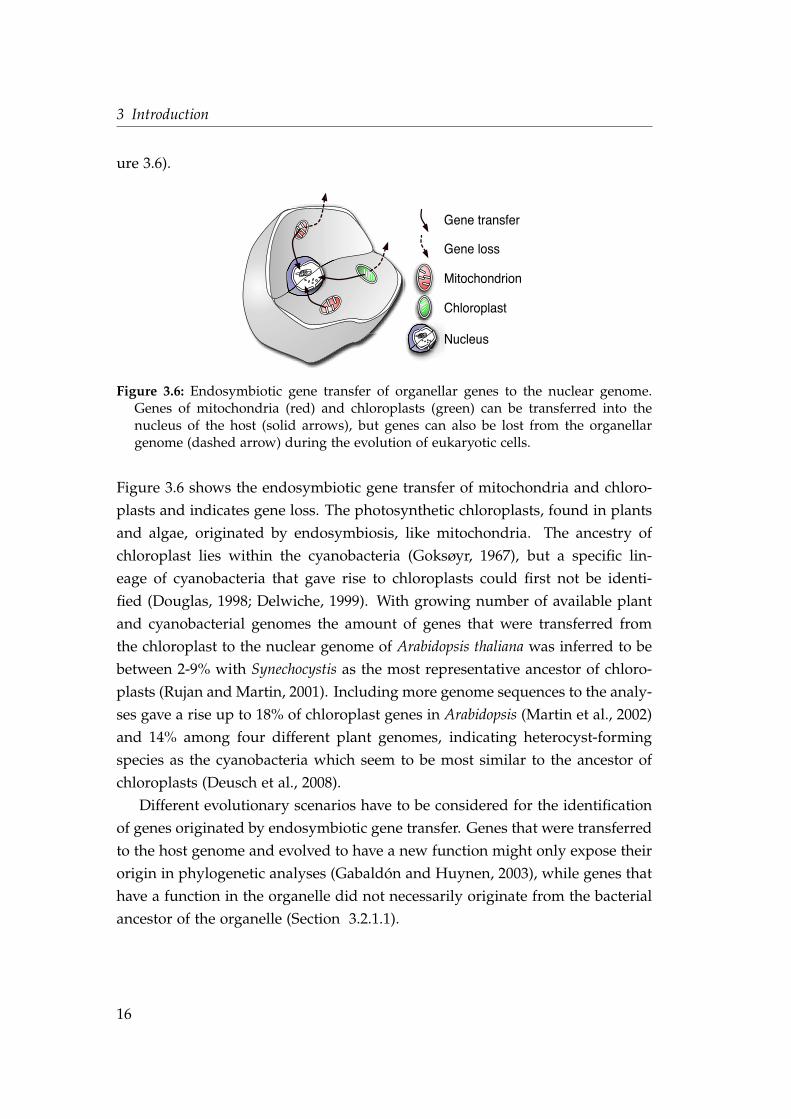
3.2.1.1 Oxidative phosphorylation pathway
The oxidative phosphorylation pathway is a key process of mitochondria in
which ATP is produced, the major energy source in the cell (Figure 3.7).
Complex I Complex II Complex III Complex IV Complex V
Mitochondrialmatrix
Intermembranespace
Q
NADHNAD+
SuccinateFumarate
H+
2OH O 2
H+ H+
H+
iPADP +
ATP
Cyt c
Figure 3.7: Oxidative phosphorylation pathway. The five protein complexes are em-bedded into the mitochondrial inner membrane. The pathway consists of the elec-tron transport chain which includes four protein complexes (Complex I – NADH-ubiquinone oxidoreductase; Complex II – Succinate-ubiquinone oxidoreductase;Complex III – Ubiquinol-cytochrome c oxidoreductase; Complex IV – Cytochrome coxidase) and the ATP Synthase (Complex V). The flow of electrons is shown by thedotted arrows, with two possible electron sources NADH or succinate and is sup-ported by the electron shuttle molecules Coenzyme Q (Q) and cytochrome c (Cyt c).Oxygen serves as the final electron acceptor. Protons (H+) are released into the inter-membrane space. The resulting proton gradient is used by the Complex V to produceATP. (based on http://www.genome.ad.jp/kegg/pathway/map/map00190.html)
Oxidative phosphorylation consists of the electron transport chain (Complex I-
IV) including two electron shuttle molecules (Coenzyme Q and Cytochrome c)
and the ATP-synthase (Complex V) which are all located in the mitochondrial
inner membrane. The genes for these proteins are encoded either in the mi-
tochondrial or in the nuclear genome. The proteins are organized within five
multiprotein complexes (Saraste, 1999), up to approximately 113 proteins in hu-
man mitochondria (van Waveren and Moraes, 2008). Electrons are transferred
via the redox groups of the complexes to the final acceptor oxygen (Complex IV).
The resulting free energy is used to pump protons out of the mitochondrial ma-
trix into the intermembrane space, which generates an electrochemical gradient
across the mitochondrial inner membrane. Proton flux back into the mitochon-
drial matrix is going through Complex V and is coupled with ATP synthesis.
17
3 Introduction
The first proposed principle of this mechanism was first described by Mitchell
(1961, 1979) who explained with the chemiosmotic theory the linkage between
respiration and ATP synthesis in the mitochondrion.
A high similarity is found between mitochondrial proteins of the electron
transport chain and those of α-proteobacteria, specifically Rickettsia prowazekii.
The main difference of the bacterial electron transport chain is that bacteria can
use many different electron donors and electron acceptors, allowing prokaryotes
to grow under various environmental conditions. The most studied prokaryotic
oxidative phosphorylation pathway is that of the bacterium Escherichia coli (In-
gledew and Poole, 1984).
3.2.1.2 Mitochondrial ribosomal proteins
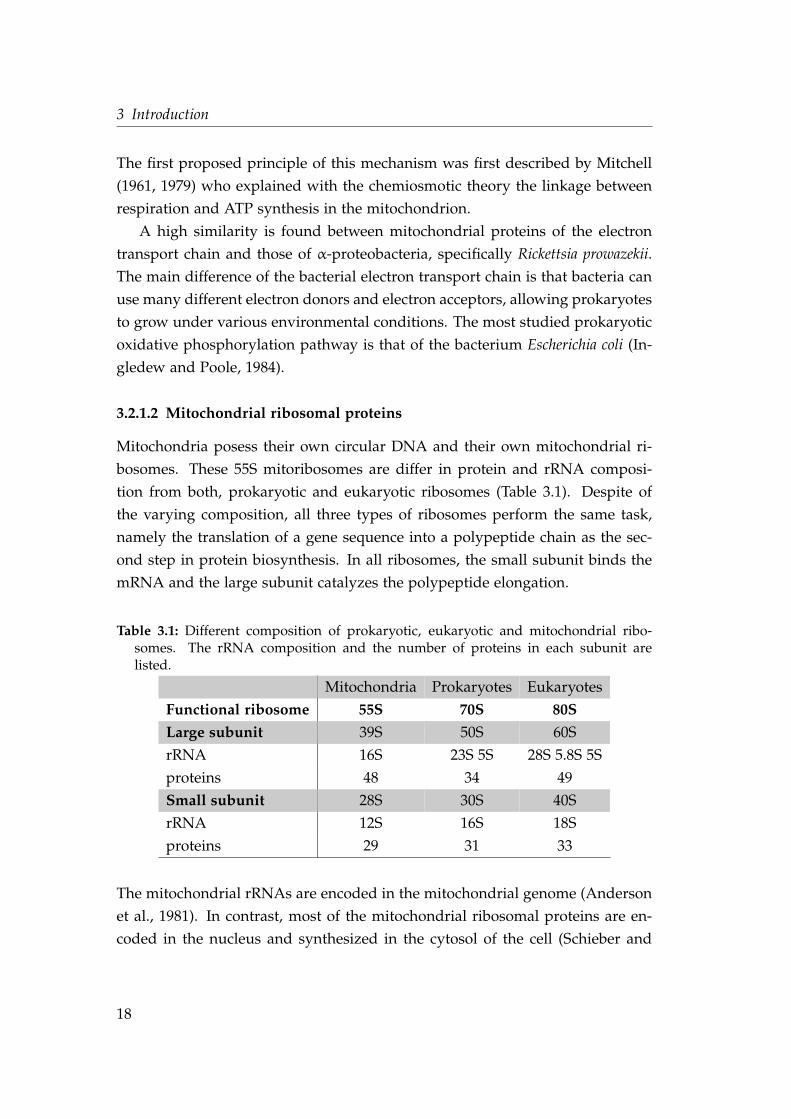
Mitochondria posess their own circular DNA and their own mitochondrial ri-
bosomes. These 55S mitoribosomes are differ in protein and rRNA composi-
tion from both, prokaryotic and eukaryotic ribosomes (Table 3.1). Despite of
the varying composition, all three types of ribosomes perform the same task,
namely the translation of a gene sequence into a polypeptide chain as the sec-
ond step in protein biosynthesis. In all ribosomes, the small subunit binds the
mRNA and the large subunit catalyzes the polypeptide elongation.
Table 3.1: Different composition of prokaryotic, eukaryotic and mitochondrial ribo-somes. The rRNA composition and the number of proteins in each subunit arelisted.
Mitochondria Prokaryotes Eukaryotes
Functional ribosome 55S 70S 80SLarge subunit 39S 50S 60S
rRNA 16S 23S 5S 28S 5.8S 5S
proteins 48 34 49
Small subunit 28S 30S 40S
rRNA 12S 16S 18S
proteins 29 31 33
The mitochondrial rRNAs are encoded in the mitochondrial genome (Anderson
et al., 1981). In contrast, most of the mitochondrial ribosomal proteins are en-
coded in the nucleus and synthesized in the cytosol of the cell (Schieber and
18
3.3 Goals of this study
O Brien, 1985). Assembly of the mitochondrial ribosomes take place after the
transfer of the proteins into the mitchondrion.
3.3 Goals of this study
The goal of this study was to gain insight into the evolution of spliceosomal
introns within nuclear genes that originated by endosymbiotic gene transfer
from the mitochondrion. In accordance with the introns-late hypothesis, spliceo-
somal introns were supposed to originate during the evolution of eukaryotes,
with a common ancestry of self-splicing group II introns (Cavalier-Smith, 1985;
Cech, 1986), which is supported by similarities between splicing mechanisms
of spliceosomal introns and those of group II introns (Valadkhan, 2007; Toor
et al., 2008). The fact that group II introns are found in bacterial and mitochon-
drial genomes, suggests an evolutionary connection between spliceosomal in-
trons and the origin of mitochondria (Cavalier-Smith, 1991; Martin and Koonin,
2006), and leads to study the dynamics of intron evolution in eukaryotic genes
that originated from endosymbiotic gene transfer from mitochondria.
Genes that originated by endosymbiotic gene transfer did not contain spliceo-
somal introns when they were transferred to the host genome. Nuclear encoded
genes with mitochondrial origin can be identified with sequence similarity to
their α-proteobacterial homologs (Martin et al., 2001; Esser et al., 2004). In-
tron characteristics, like intron density, phase distribution and shared intron
positions in these genes should provide insights into the dynamics of intron
evolution in eukaryotes.
19

3 Introduction
20
4 Material and Methods
4.1 Sequence data
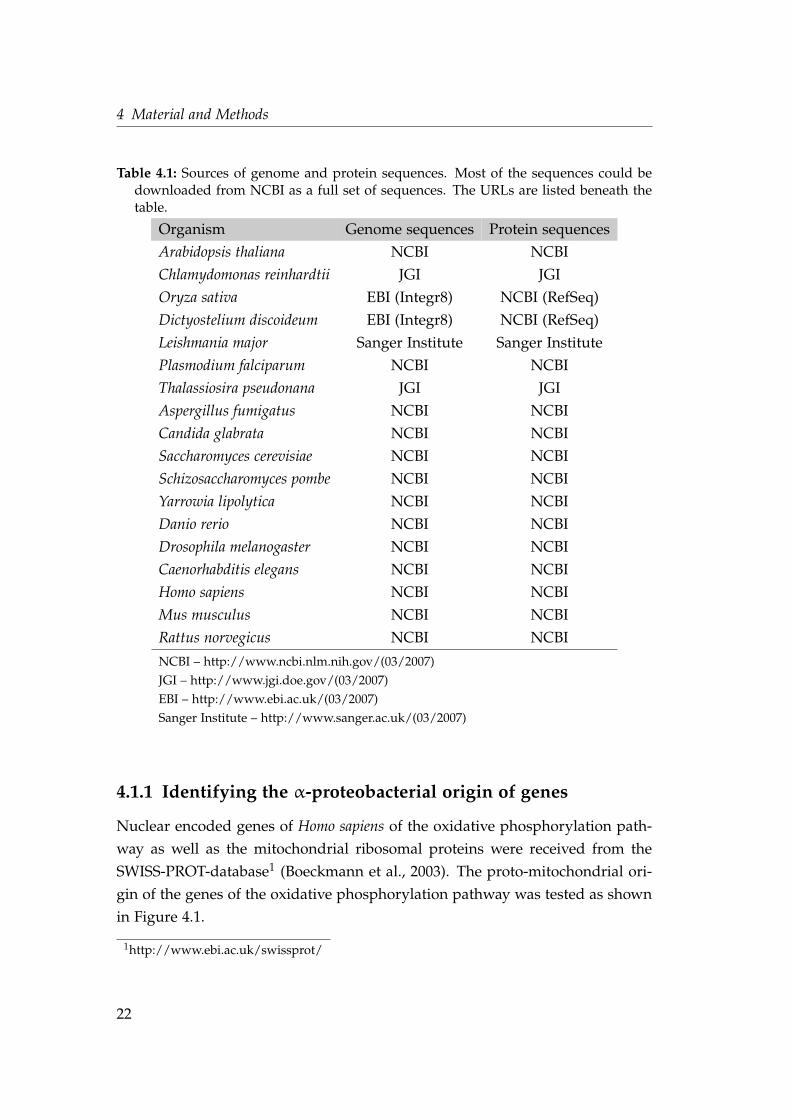
Completely sequenced genomes of various eukaryotes were downloaded from
public databases, including genomes of plants and green algae (Arabidopsis
thaliana, Oryza sativa, Chlamydomonas reinhardtii) a diatom (Thalassiosira pseudo-
nana), two parasitic protists (Plasmodium falciparum, Leishmania major), a myceto-
zoa (Dictyostelium discoideum), five fungi (Aspergillus fumigatus, Candida glabrata,
Saccharomyces cerevisiae, Schizosaccharomyces pombe, Yarrowia lipolytica) and six an-
imals (Danio rerio, Drosophila melanogaster, Caenorhabditis elegans, Homo sapiens,
Mus musculus, Rattus norvegicus). These 18 organisms were chosen to provide
a representative set of genomes across eukaryotes, including the most diverse
multicellular eukaryotes plants, fungi and animals. For each genome, the cor-
responding set of proteins was downloaded, too. The database sources of the
sequences are listed in Table 4.1. Either the sequences were received in a single
file, if the whole chromosome or protein set could be downloaded all at once,
or the sequences of the single chromosomes were downloaded via ftp using a
shell-script and later assembled into one dataset for the corresponding species.
The sequences were stored as local nucleotide and protein databases.
21
4 Material and Methods
Table 4.1: Sources of genome and protein sequences. Most of the sequences could bedownloaded from NCBI as a full set of sequences. The URLs are listed beneath thetable.
Organism Genome sequences Protein sequences
Arabidopsis thaliana NCBI NCBI
Chlamydomonas reinhardtii JGI JGI
Oryza sativa EBI (Integr8) NCBI (RefSeq)
Dictyostelium discoideum EBI (Integr8) NCBI (RefSeq)
Leishmania major Sanger Institute Sanger Institute
Plasmodium falciparum NCBI NCBI
Thalassiosira pseudonana JGI JGI
Aspergillus fumigatus NCBI NCBI
Candida glabrata NCBI NCBI
Saccharomyces cerevisiae NCBI NCBI
Schizosaccharomyces pombe NCBI NCBI
Yarrowia lipolytica NCBI NCBI
Danio rerio NCBI NCBI
Drosophila melanogaster NCBI NCBI
Caenorhabditis elegans NCBI NCBI
Homo sapiens NCBI NCBI
Mus musculus NCBI NCBI
Rattus norvegicus NCBI NCBI
NCBI – http://www.ncbi.nlm.nih.gov/(03/2007)
JGI – http://www.jgi.doe.gov/(03/2007)
EBI – http://www.ebi.ac.uk/(03/2007)
Sanger Institute – http://www.sanger.ac.uk/(03/2007)
4.1.1 Identifying the α-proteobacterial origin of genes
Nuclear encoded genes of Homo sapiens of the oxidative phosphorylation path-
way as well as the mitochondrial ribosomal proteins were received from the
SWISS-PROT-database1 (Boeckmann et al., 2003). The proto-mitochondrial ori-
gin of the genes of the oxidative phosphorylation pathway was tested as shown
in Figure 4.1.
1http://www.ebi.ac.uk/swissprot/
22
4.1 Sequence data
No Yes
No
Yes
Humansequence
Hit
Annotation as ETC
No alpha-proteobacterial
origin
BLASTRickettsia prowazekii
Mitochondrial origin with gene name
No Yes
Very early transfer
Mitochondrial gene name
BLASTReclinmonas americana
Alpha-proteobacterial
origin
No alpha-proteobacterial
origin
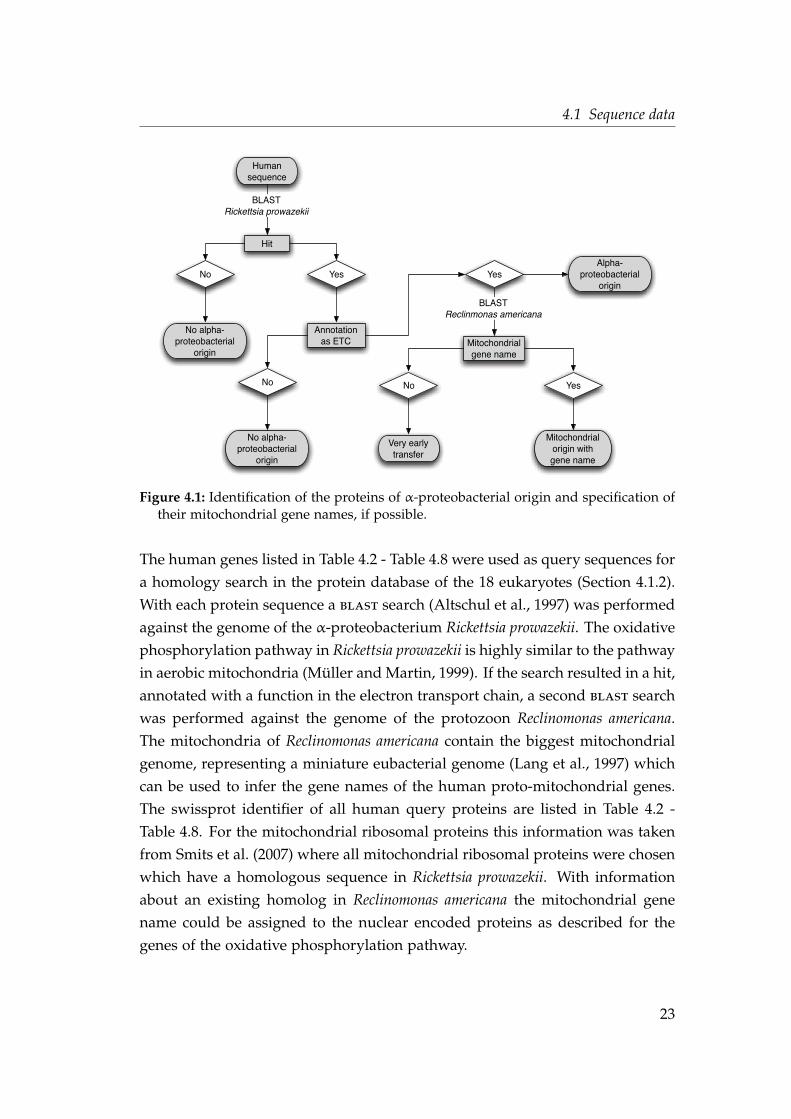
Figure 4.1: Identification of the proteins of α-proteobacterial origin and specification oftheir mitochondrial gene names, if possible.
The human genes listed in Table 4.2 - Table 4.8 were used as query sequences for
a homology search in the protein database of the 18 eukaryotes (Section 4.1.2).
With each protein sequence a blast search (Altschul et al., 1997) was performedagainst the genome of the α-proteobacterium Rickettsia prowazekii. The oxidative
phosphorylation pathway in Rickettsia prowazekii is highly similar to the pathway
in aerobic mitochondria (Müller and Martin, 1999). If the search resulted in a hit,
annotated with a function in the electron transport chain, a second blast searchwas performed against the genome of the protozoon Reclinomonas americana.
The mitochondria of Reclinomonas americana contain the biggest mitochondrial
genome, representing a miniature eubacterial genome (Lang et al., 1997) which
can be used to infer the gene names of the human proto-mitochondrial genes.
The swissprot identifier of all human query proteins are listed in Table 4.2 -
Table 4.8. For the mitochondrial ribosomal proteins this information was taken
from Smits et al. (2007) where all mitochondrial ribosomal proteins were chosen
which have a homologous sequence in Rickettsia prowazekii. With information
about an existing homolog in Reclinomonas americana the mitochondrial gene
name could be assigned to the nuclear encoded proteins as described for the
genes of the oxidative phosphorylation pathway.
23
4 Material and Methods
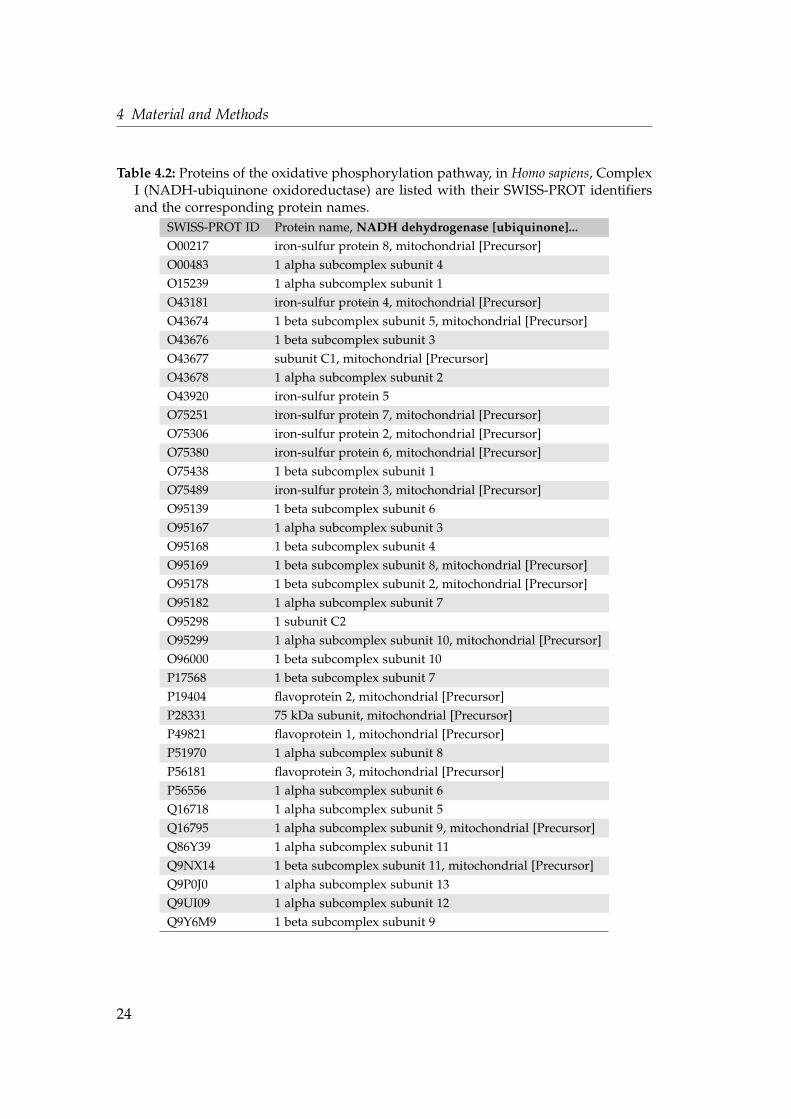
Table 4.2: Proteins of the oxidative phosphorylation pathway, in Homo sapiens, ComplexI (NADH-ubiquinone oxidoreductase) are listed with their SWISS-PROT identifiersand the corresponding protein names.
SWISS-PROT ID Protein name, NADH dehydrogenase [ubiquinone]...O00217 iron-sulfur protein 8, mitochondrial [Precursor]
O00483 1 alpha subcomplex subunit 4
O15239 1 alpha subcomplex subunit 1
O43181 iron-sulfur protein 4, mitochondrial [Precursor]
O43674 1 beta subcomplex subunit 5, mitochondrial [Precursor]
O43676 1 beta subcomplex subunit 3
O43677 subunit C1, mitochondrial [Precursor]
O43678 1 alpha subcomplex subunit 2
O43920 iron-sulfur protein 5
O75251 iron-sulfur protein 7, mitochondrial [Precursor]
O75306 iron-sulfur protein 2, mitochondrial [Precursor]
O75380 iron-sulfur protein 6, mitochondrial [Precursor]
O75438 1 beta subcomplex subunit 1
O75489 iron-sulfur protein 3, mitochondrial [Precursor]
O95139 1 beta subcomplex subunit 6
O95167 1 alpha subcomplex subunit 3
O95168 1 beta subcomplex subunit 4
O95169 1 beta subcomplex subunit 8, mitochondrial [Precursor]
O95178 1 beta subcomplex subunit 2, mitochondrial [Precursor]
O95182 1 alpha subcomplex subunit 7
O95298 1 subunit C2
O95299 1 alpha subcomplex subunit 10, mitochondrial [Precursor]
O96000 1 beta subcomplex subunit 10
P17568 1 beta subcomplex subunit 7
P19404 flavoprotein 2, mitochondrial [Precursor]
P28331 75 kDa subunit, mitochondrial [Precursor]
P49821 flavoprotein 1, mitochondrial [Precursor]
P51970 1 alpha subcomplex subunit 8
P56181 flavoprotein 3, mitochondrial [Precursor]
P56556 1 alpha subcomplex subunit 6
Q16718 1 alpha subcomplex subunit 5
Q16795 1 alpha subcomplex subunit 9, mitochondrial [Precursor]
Q86Y39 1 alpha subcomplex subunit 11
Q9NX14 1 beta subcomplex subunit 11, mitochondrial [Precursor]
Q9P0J0 1 alpha subcomplex subunit 13
Q9UI09 1 alpha subcomplex subunit 12
Q9Y6M9 1 beta subcomplex subunit 9
24
4.1 Sequence data
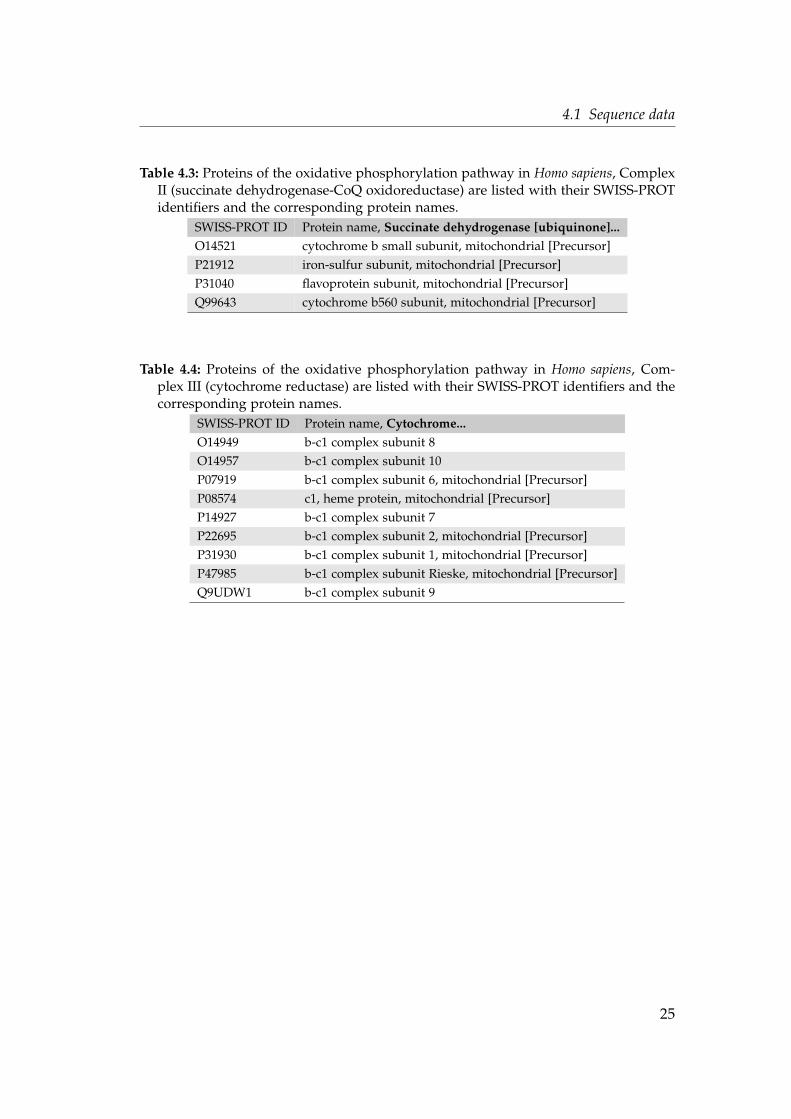
Table 4.3: Proteins of the oxidative phosphorylation pathway in Homo sapiens, ComplexII (succinate dehydrogenase-CoQ oxidoreductase) are listed with their SWISS-PROTidentifiers and the corresponding protein names.
SWISS-PROT ID Protein name, Succinate dehydrogenase [ubiquinone]...O14521 cytochrome b small subunit, mitochondrial [Precursor]
P21912 iron-sulfur subunit, mitochondrial [Precursor]
P31040 flavoprotein subunit, mitochondrial [Precursor]
Q99643 cytochrome b560 subunit, mitochondrial [Precursor]
Table 4.4: Proteins of the oxidative phosphorylation pathway in Homo sapiens, Com-plex III (cytochrome reductase) are listed with their SWISS-PROT identifiers and thecorresponding protein names.
SWISS-PROT ID Protein name, Cytochrome...O14949 b-c1 complex subunit 8
O14957 b-c1 complex subunit 10
P07919 b-c1 complex subunit 6, mitochondrial [Precursor]
P08574 c1, heme protein, mitochondrial [Precursor]
P14927 b-c1 complex subunit 7
P22695 b-c1 complex subunit 2, mitochondrial [Precursor]
P31930 b-c1 complex subunit 1, mitochondrial [Precursor]
P47985 b-c1 complex subunit Rieske, mitochondrial [Precursor]
Q9UDW1 b-c1 complex subunit 9
25
4 Material and Methods
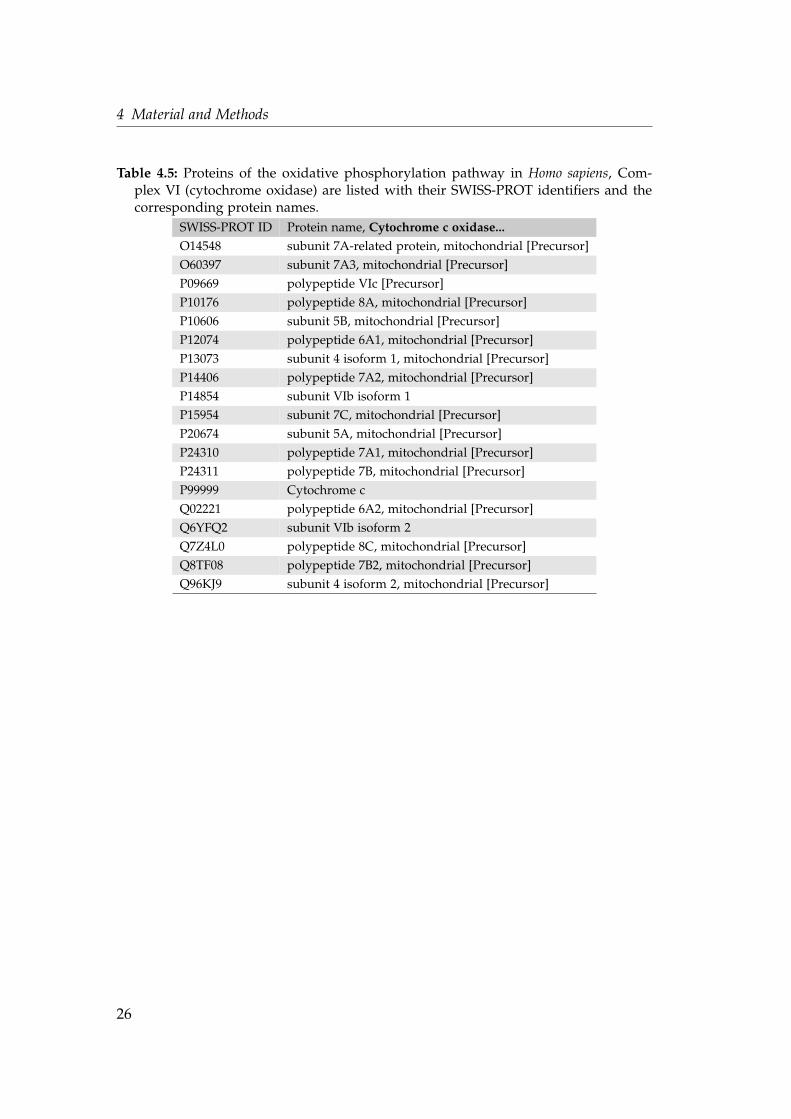
Table 4.5: Proteins of the oxidative phosphorylation pathway in Homo sapiens, Com-plex VI (cytochrome oxidase) are listed with their SWISS-PROT identifiers and thecorresponding protein names.
SWISS-PROT ID Protein name, Cytochrome c oxidase...O14548 subunit 7A-related protein, mitochondrial [Precursor]
O60397 subunit 7A3, mitochondrial [Precursor]
P09669 polypeptide VIc [Precursor]
P10176 polypeptide 8A, mitochondrial [Precursor]
P10606 subunit 5B, mitochondrial [Precursor]
P12074 polypeptide 6A1, mitochondrial [Precursor]
P13073 subunit 4 isoform 1, mitochondrial [Precursor]
P14406 polypeptide 7A2, mitochondrial [Precursor]
P14854 subunit VIb isoform 1
P15954 subunit 7C, mitochondrial [Precursor]
P20674 subunit 5A, mitochondrial [Precursor]
P24310 polypeptide 7A1, mitochondrial [Precursor]
P24311 polypeptide 7B, mitochondrial [Precursor]
P99999 Cytochrome c
Q02221 polypeptide 6A2, mitochondrial [Precursor]
Q6YFQ2 subunit VIb isoform 2
Q7Z4L0 polypeptide 8C, mitochondrial [Precursor]
Q8TF08 polypeptide 7B2, mitochondrial [Precursor]
Q96KJ9 subunit 4 isoform 2, mitochondrial [Precursor]
26
4.1 Sequence data
Table 4.6: Proteins of the oxidative phosphorylation pathway in Homo sapiens, ComplexV (ATP synthase) are listed with their SWISS-PROT identifiers and the correspondingprotein names.
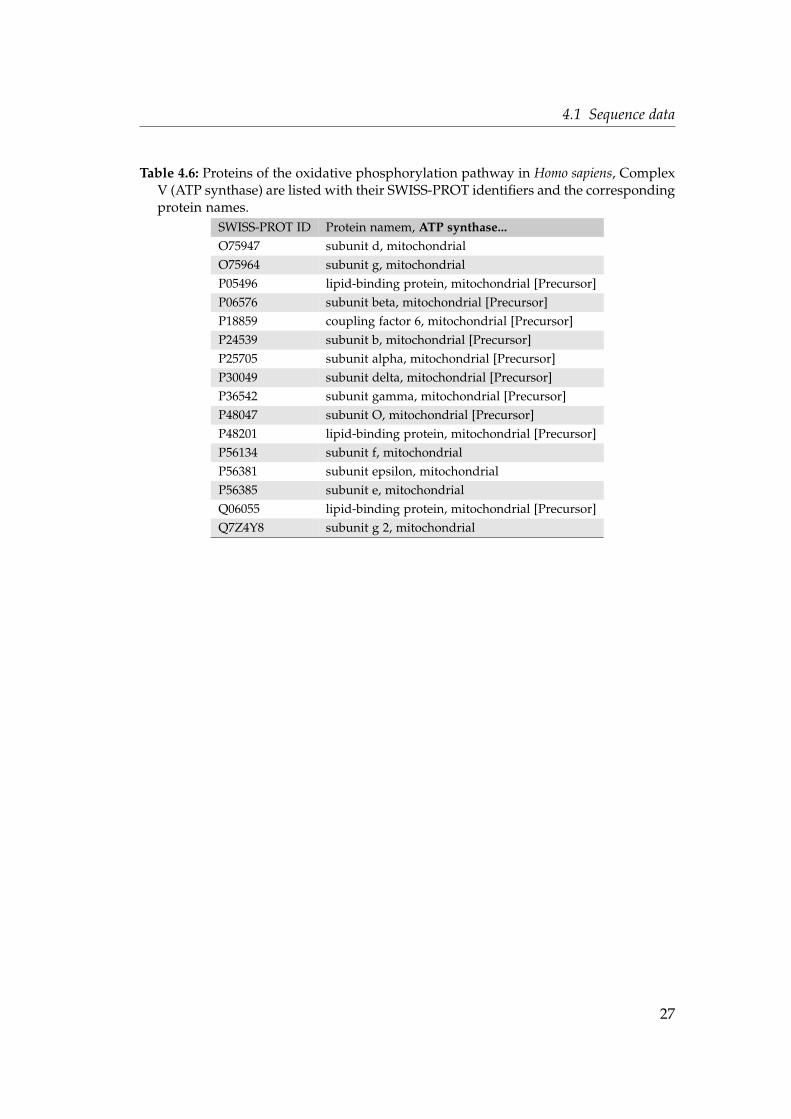
SWISS-PROT ID Protein namem, ATP synthase...O75947 subunit d, mitochondrial
O75964 subunit g, mitochondrial
P05496 lipid-binding protein, mitochondrial [Precursor]
P06576 subunit beta, mitochondrial [Precursor]
P18859 coupling factor 6, mitochondrial [Precursor]
P24539 subunit b, mitochondrial [Precursor]
P25705 subunit alpha, mitochondrial [Precursor]
P30049 subunit delta, mitochondrial [Precursor]
P36542 subunit gamma, mitochondrial [Precursor]
P48047 subunit O, mitochondrial [Precursor]
P48201 lipid-binding protein, mitochondrial [Precursor]
P56134 subunit f, mitochondrial
P56381 subunit epsilon, mitochondrial
P56385 subunit e, mitochondrial
Q06055 lipid-binding protein, mitochondrial [Precursor]
Q7Z4Y8 subunit g 2, mitochondrial
27
4 Material and Methods
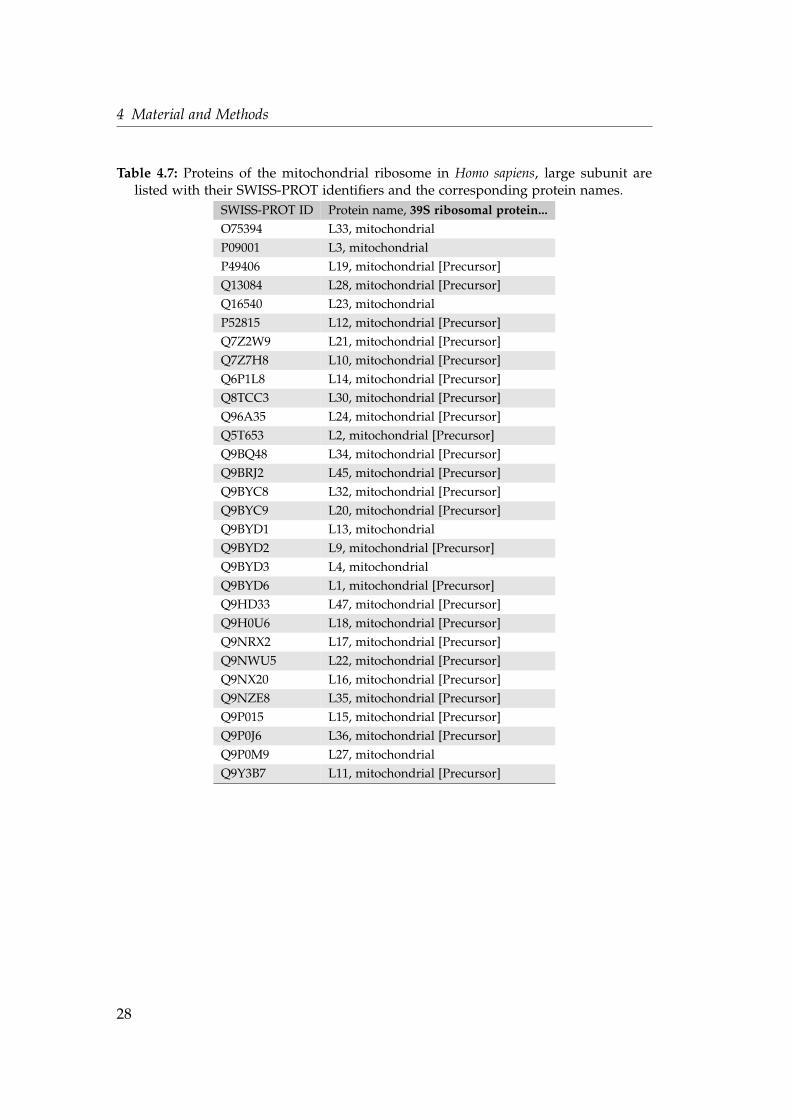
Table 4.7: Proteins of the mitochondrial ribosome in Homo sapiens, large subunit arelisted with their SWISS-PROT identifiers and the corresponding protein names.
SWISS-PROT ID Protein name, 39S ribosomal protein...O75394 L33, mitochondrial
P09001 L3, mitochondrial
P49406 L19, mitochondrial [Precursor]
Q13084 L28, mitochondrial [Precursor]
Q16540 L23, mitochondrial
P52815 L12, mitochondrial [Precursor]
Q7Z2W9 L21, mitochondrial [Precursor]
Q7Z7H8 L10, mitochondrial [Precursor]
Q6P1L8 L14, mitochondrial [Precursor]
Q8TCC3 L30, mitochondrial [Precursor]
Q96A35 L24, mitochondrial [Precursor]
Q5T653 L2, mitochondrial [Precursor]
Q9BQ48 L34, mitochondrial [Precursor]
Q9BRJ2 L45, mitochondrial [Precursor]
Q9BYC8 L32, mitochondrial [Precursor]
Q9BYC9 L20, mitochondrial [Precursor]
Q9BYD1 L13, mitochondrial
Q9BYD2 L9, mitochondrial [Precursor]
Q9BYD3 L4, mitochondrial
Q9BYD6 L1, mitochondrial [Precursor]
Q9HD33 L47, mitochondrial [Precursor]
Q9H0U6 L18, mitochondrial [Precursor]
Q9NRX2 L17, mitochondrial [Precursor]
Q9NWU5 L22, mitochondrial [Precursor]
Q9NX20 L16, mitochondrial [Precursor]
Q9NZE8 L35, mitochondrial [Precursor]
Q9P015 L15, mitochondrial [Precursor]
Q9P0J6 L36, mitochondrial [Precursor]
Q9P0M9 L27, mitochondrial
Q9Y3B7 L11, mitochondrial [Precursor]
28
4.1 Sequence data
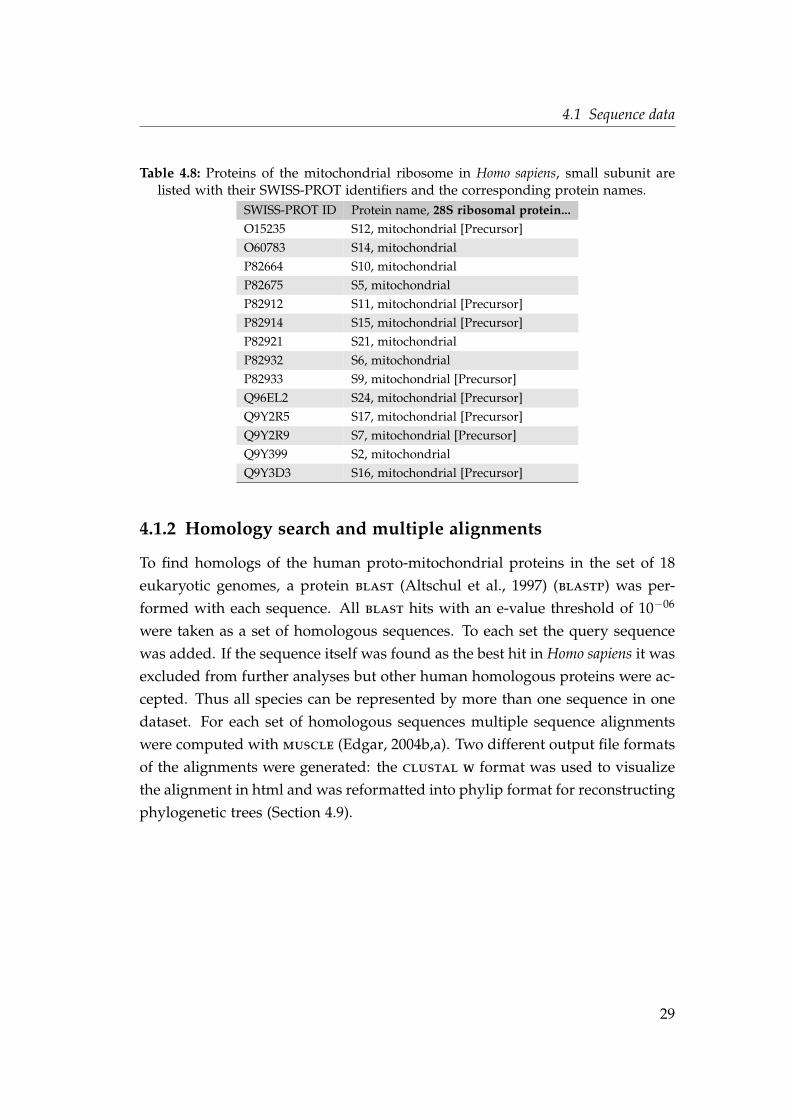
Table 4.8: Proteins of the mitochondrial ribosome in Homo sapiens, small subunit arelisted with their SWISS-PROT identifiers and the corresponding protein names.
SWISS-PROT ID Protein name, 28S ribosomal protein...O15235 S12, mitochondrial [Precursor]
O60783 S14, mitochondrial
P82664 S10, mitochondrial
P82675 S5, mitochondrial
P82912 S11, mitochondrial [Precursor]
P82914 S15, mitochondrial [Precursor]
P82921 S21, mitochondrial
P82932 S6, mitochondrial
P82933 S9, mitochondrial [Precursor]
Q96EL2 S24, mitochondrial [Precursor]
Q9Y2R5 S17, mitochondrial [Precursor]
Q9Y2R9 S7, mitochondrial [Precursor]
Q9Y399 S2, mitochondrial
Q9Y3D3 S16, mitochondrial [Precursor]
4.1.2 Homology search and multiple alignments
To find homologs of the human proto-mitochondrial proteins in the set of 18
eukaryotic genomes, a protein blast (Altschul et al., 1997) (blastp) was per-formed with each sequence. All blast hits with an e-value threshold of 10−06
were taken as a set of homologous sequences. To each set the query sequence
was added. If the sequence itself was found as the best hit in Homo sapiens it was
excluded from further analyses but other human homologous proteins were ac-
cepted. Thus all species can be represented by more than one sequence in one
dataset. For each set of homologous sequences multiple sequence alignments
were computed with muscle (Edgar, 2004b,a). Two different output file formatsof the alignments were generated: the clustal w format was used to visualize
the alignment in html and was reformatted into phylip format for reconstructing
phylogenetic trees (Section 4.9).
29
4 Material and Methods
4.2 Identifying intron positions
4.2.1 Exon-intron databases
In the first approach, information about intron positions was obtained from
pre-existing exon-intron databases. The exon-intron databases described in this
section are secondary databases, meaning that they based on the data of pri-
mary databases. The Xpro database (Gopalan et al., 2004) for example processes
the data of one of the most comprehensive public databases, GenBank (Benson
et al., 2008). It takes the information on annotated exon/intron gene struc-
tures in GenBank and stores additional data like the splicing sites and intron
phases. In the Xpro database, intron positions are validated by aligning the
genomic sequence with EST sequences found in EST-databases using the pro-
gram blat (Kent, 2002). With this validation alternative splicing variants areidentified.
The ExInt database (Sakharkar et al., 2000, 2002) stores the information in a
relational database (MySQL) in addition to a file in text-format. It is also based
on annotated sequences in GenBank. In consideration of redundancy found
in GenBank, the authors created a non-redundant dataset avoiding a bias in
their database statistics. The IDB (Intron DataBase) and IEDB (Intron Evolution
DataBase) (Schisler and Palmer, 2000)) contain additional data from the SWISS-
PROT database. Exon/intron structures are also stored in this database. More-
over the IEDB provides statistical information about the sequences included in
IDB, for example intron density and distribution of introns in the species.
In the first approach, the EID (Exon-Intron Database (Saxonov et al., 2000;
Shepelev and Fedorov, 2006)) was used to receive the intron positions. At
this time it offered the most up-to-date database, with available information
about single species in separate datasets. Because some completely sequenced
genomes were not included (for example Oryza sativa), the authors kindly pro-
vided their programs to generate a database of any genome sequence which is
available in GenBank format. But using the EID raised some problems. Several
human query sequences received from SWISS-PROT (Section 4.1) were not in-
cluded in the database. So the analysis could not be performed without loosing
a lot of information. Because of these problems a method was developed to ob-
tain intron positions independently from annotations or database information,
by taking only the sequence information into account.
30
4.2 Identifying intron positions
4.2.2 A database independent method to identify intron
positions
The database independent method to identify intron positions was implemented
in several perl scripts. Using blat (Kent, 2002), each query protein was alignedto its translated genomic region. Originally, blat was developed to align ESTsequences to a complete reference genome in order to assemble and annotate a
large amount of EST sequences in a moderate time frame. In contrast to blastthe program blat aligns exons to the genome without overlapping ends of twoconsecutive hits. This is important and very useful for identifying the correct
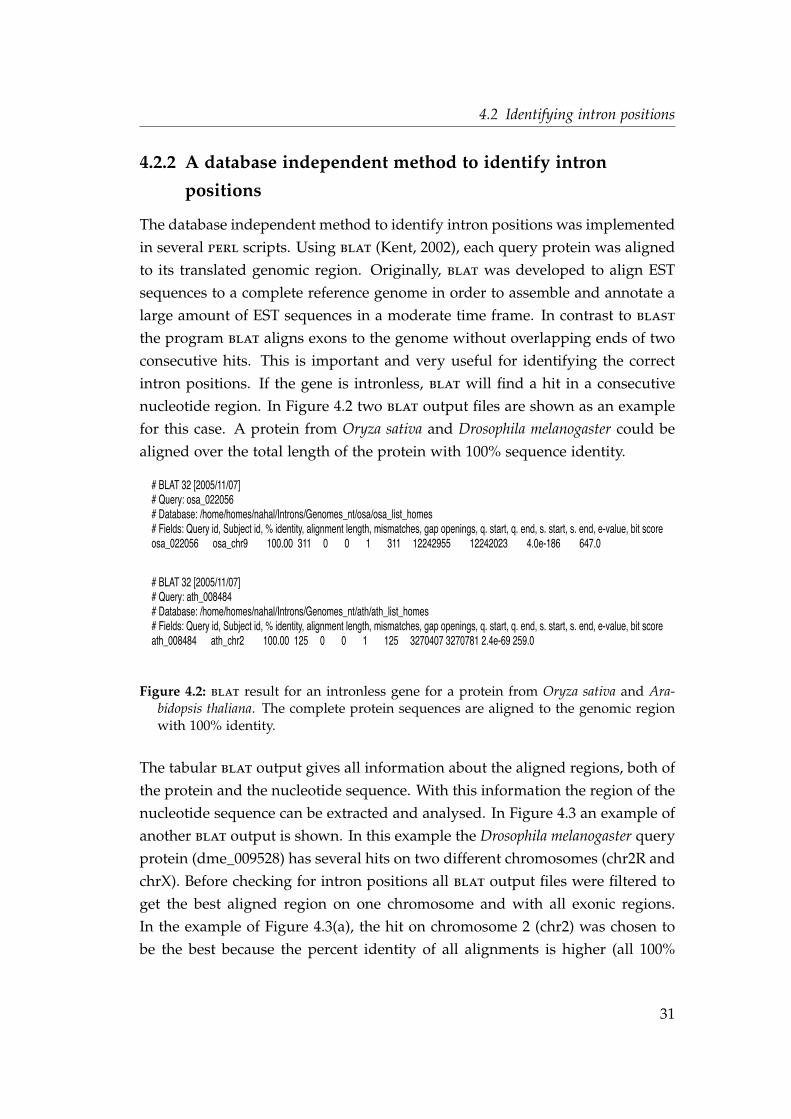
intron positions. If the gene is intronless, blat will find a hit in a consecutivenucleotide region. In Figure 4.2 two blat output files are shown as an examplefor this case. A protein from Oryza sativa and Drosophila melanogaster could be
aligned over the total length of the protein with 100% sequence identity.
# BLAT 32 [2005/11/07]# Query: osa_022056# Database: /home/homes/nahal/Introns/Genomes_nt/osa/osa_list_homes# Fields: Query id, Subject id, % identity, alignment length, mismatches, gap openings, q. start, q. end, s. start, s. end, e-value, bit scoreosa_022056 osa_chr9 100.00 311 0 0 1 311 12242955 12242023 4.0e-186 647.0
# BLAT 32 [2005/11/07]# Query: ath_008484# Database: /home/homes/nahal/Introns/Genomes_nt/ath/ath_list_homes# Fields: Query id, Subject id, % identity, alignment length, mismatches, gap openings, q. start, q. end, s. start, s. end, e-value, bit scoreath_008484 ath_chr2 100.00 125 0 0 1 125 3270407 3270781 2.4e-69 259.0
Figure 4.2: blat result for an intronless gene for a protein from Oryza sativa and Ara-bidopsis thaliana. The complete protein sequences are aligned to the genomic regionwith 100% identity.
The tabular blat output gives all information about the aligned regions, both ofthe protein and the nucleotide sequence. With this information the region of the
nucleotide sequence can be extracted and analysed. In Figure 4.3 an example of
another blat output is shown. In this example the Drosophila melanogaster query
protein (dme_009528) has several hits on two different chromosomes (chr2R and
chrX). Before checking for intron positions all blat output files were filtered toget the best aligned region on one chromosome and with all exonic regions.
In the example of Figure 4.3(a), the hit on chromosome 2 (chr2) was chosen to
be the best because the percent identity of all alignments is higher (all 100%
31
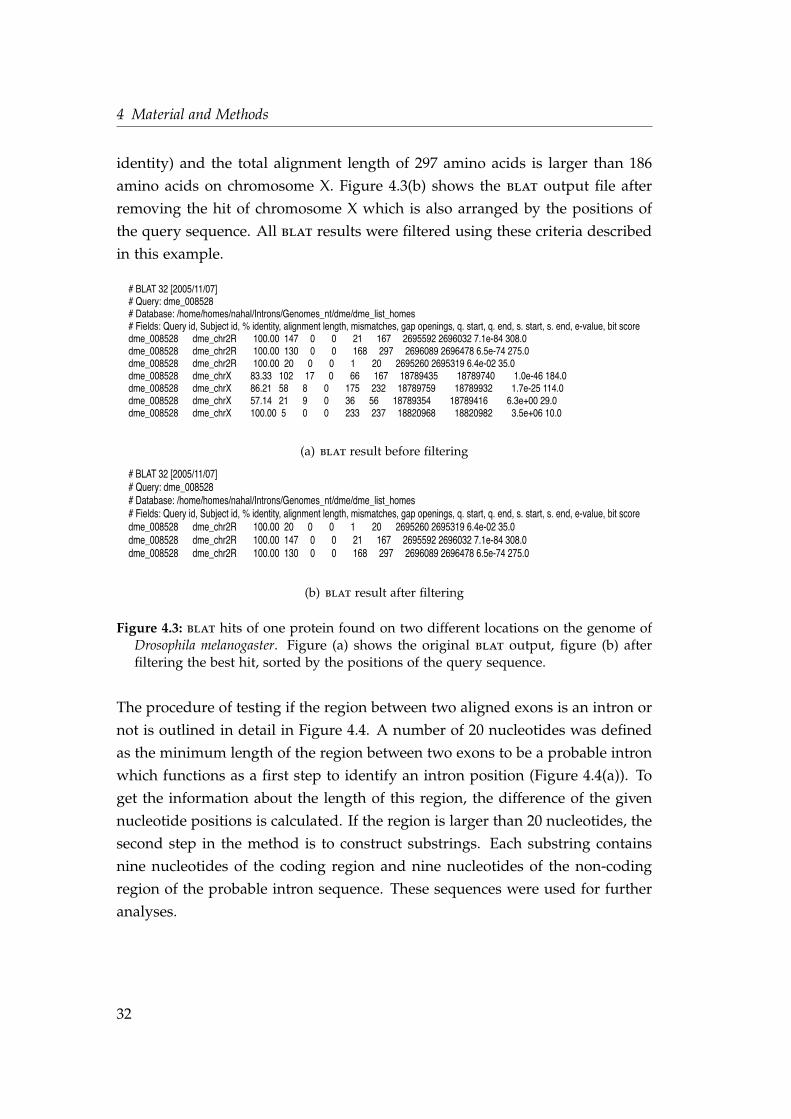
4 Material and Methods
identity) and the total alignment length of 297 amino acids is larger than 186
amino acids on chromosome X. Figure 4.3(b) shows the blat output file afterremoving the hit of chromosome X which is also arranged by the positions of
the query sequence. All blat results were filtered using these criteria describedin this example.
# BLAT 32 [2005/11/07]# Query: dme_008528# Database: /home/homes/nahal/Introns/Genomes_nt/dme/dme_list_homes# Fields: Query id, Subject id, % identity, alignment length, mismatches, gap openings, q. start, q. end, s. start, s. end, e-value, bit scoredme_008528 dme_chr2R 100.00 147 0 0 21 167 2695592 2696032 7.1e-84 308.0dme_008528 dme_chr2R 100.00 130 0 0 168 297 2696089 2696478 6.5e-74 275.0dme_008528 dme_chr2R 100.00 20 0 0 1 20 2695260 2695319 6.4e-02 35.0dme_008528 dme_chrX 83.33 102 17 0 66 167 18789435 18789740 1.0e-46 184.0dme_008528 dme_chrX 86.21 58 8 0 175 232 18789759 18789932 1.7e-25 114.0dme_008528 dme_chrX 57.14 21 9 0 36 56 18789354 18789416 6.3e+00 29.0dme_008528 dme_chrX 100.00 5 0 0 233 237 18820968 18820982 3.5e+06 10.0
(a) blat result before filtering
# BLAT 32 [2005/11/07]# Query: dme_008528# Database: /home/homes/nahal/Introns/Genomes_nt/dme/dme_list_homes# Fields: Query id, Subject id, % identity, alignment length, mismatches, gap openings, q. start, q. end, s. start, s. end, e-value, bit scoredme_008528 dme_chr2R 100.00 20 0 0 1 20 2695260 2695319 6.4e-02 35.0dme_008528 dme_chr2R 100.00 147 0 0 21 167 2695592 2696032 7.1e-84 308.0dme_008528 dme_chr2R 100.00 130 0 0 168 297 2696089 2696478 6.5e-74 275.0
(b) blat result after filtering
Figure 4.3: blat hits of one protein found on two different locations on the genome ofDrosophila melanogaster. Figure (a) shows the original blat output, figure (b) afterfiltering the best hit, sorted by the positions of the query sequence.
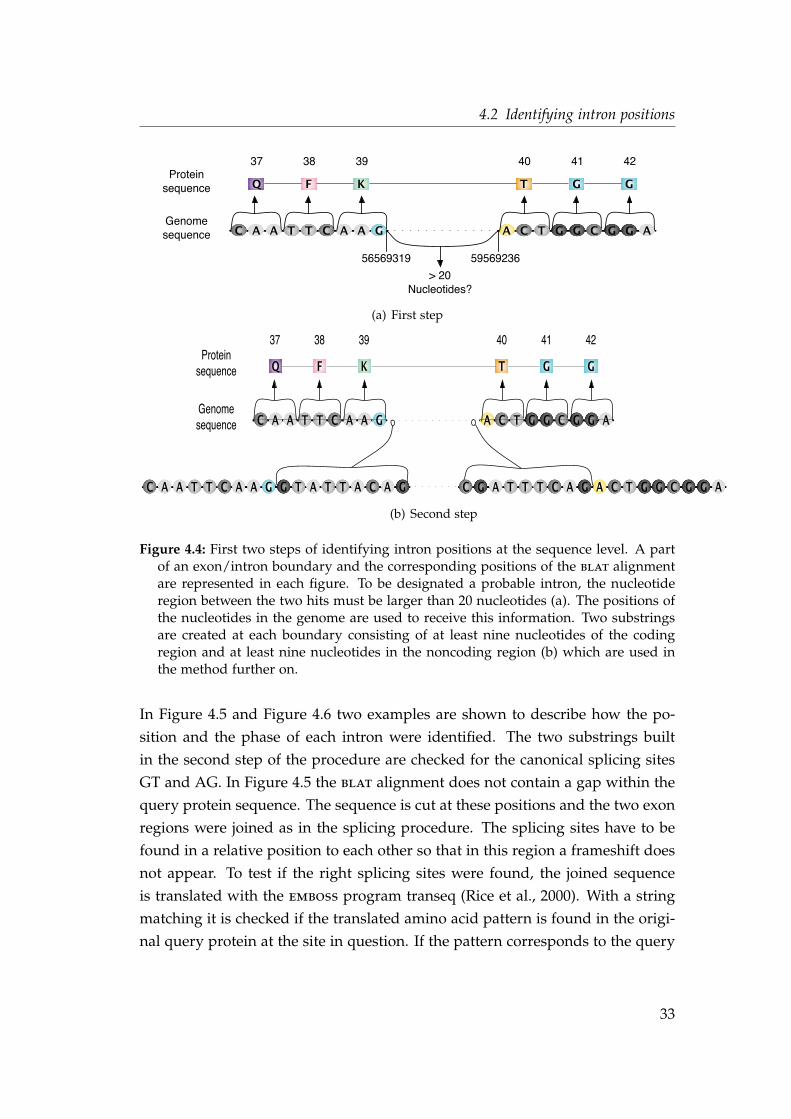
The procedure of testing if the region between two aligned exons is an intron or
not is outlined in detail in Figure 4.4. A number of 20 nucleotides was defined
as the minimum length of the region between two exons to be a probable intron
which functions as a first step to identify an intron position (Figure 4.4(a)). To
get the information about the length of this region, the difference of the given
nucleotide positions is calculated. If the region is larger than 20 nucleotides, the
second step in the method is to construct substrings. Each substring contains
nine nucleotides of the coding region and nine nucleotides of the non-coding
region of the probable intron sequence. These sequences were used for further
analyses.
32
4.2 Identifying intron positions
AC A T T C A A G A GC T G C G G A
Proteinsequence
Genomesequence
Q F K T G G
37 38 39 40 41 42
5956923656569319
> 20 Nucleotides?
(a) First step
AC A T T C A A G A GC T G C G G A
Proteinsequence
Genomesequence
Q F K T G G
37 38 39 40 41 42
AC A T T C A A G A GC T G C G G AG CT A T T A A G C G A T T T C A G
(b) Second step
Figure 4.4: First two steps of identifying intron positions at the sequence level. A partof an exon/intron boundary and the corresponding positions of the blat alignmentare represented in each figure. To be designated a probable intron, the nucleotideregion between the two hits must be larger than 20 nucleotides (a). The positions ofthe nucleotides in the genome are used to receive this information. Two substringsare created at each boundary consisting of at least nine nucleotides of the codingregion and at least nine nucleotides in the noncoding region (b) which are used inthe method further on.
In Figure 4.5 and Figure 4.6 two examples are shown to describe how the po-
sition and the phase of each intron were identified. The two substrings built
in the second step of the procedure are checked for the canonical splicing sites
GT and AG. In Figure 4.5 the blat alignment does not contain a gap within thequery protein sequence. The sequence is cut at these positions and the two exon
regions were joined as in the splicing procedure. The splicing sites have to be
found in a relative position to each other so that in this region a frameshift does
not appear. To test if the right splicing sites were found, the joined sequence
is translated with the emboss program transeq (Rice et al., 2000). With a string
matching it is checked if the translated amino acid pattern is found in the origi-
nal query protein at the site in question. If the pattern corresponds to the query
33
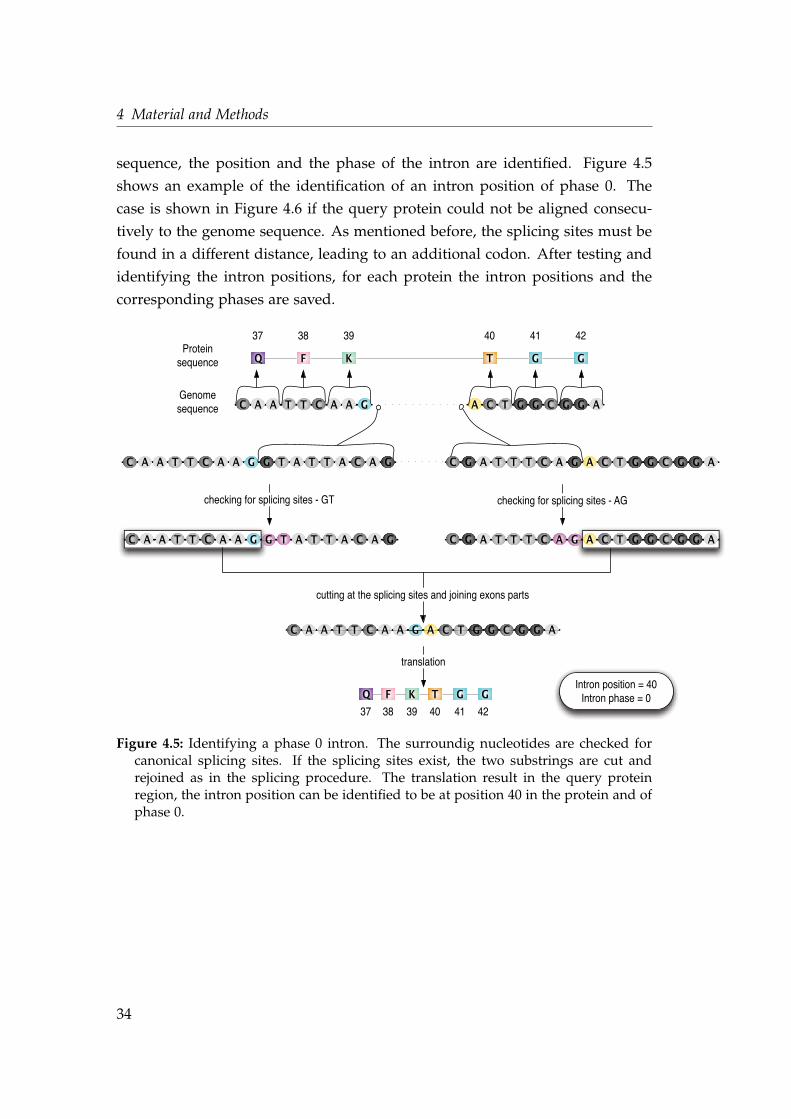
4 Material and Methods
sequence, the position and the phase of the intron are identified. Figure 4.5
shows an example of the identification of an intron position of phase 0. The
case is shown in Figure 4.6 if the query protein could not be aligned consecu-
tively to the genome sequence. As mentioned before, the splicing sites must be
found in a different distance, leading to an additional codon. After testing and
identifying the intron positions, for each protein the intron positions and the
corresponding phases are saved.
AC A T T C A A G A GC T G C G G A
Proteinsequence
Genomesequence
Q F K T G G
37 38 39 40 41 42
AC A T T C A A G A GC T G C G G AG CT A T T A A G C G A T T T C A G
checking for splicing sites - GT checking for splicing sites - AG
AC A T T C A A G G CT A T T A A G A GC T G C G G AC G A T T T C A G
cutting at the splicing sites and joining exons parts
AC A T T C A A G A GC T G C G G A
translation
Q F K T G GIntron position = 40
Intron phase = 037 38 39 40 41 42
Figure 4.5: Identifying a phase 0 intron. The surroundig nucleotides are checked forcanonical splicing sites. If the splicing sites exist, the two substrings are cut andrejoined as in the splicing procedure. The translation result in the query proteinregion, the intron position can be identified to be at position 40 in the protein and ofphase 0.
34
4.2 Identifying intron positions
C TT T C G G C
Proteinsequence
Genomesequence
Y I R L F G
180 181 182 184 185 186
A AT T C A AT G T
checking for splicing sites - GT
A AT T C A AT G G AT TCG GA A C TT T C G G CTTT T T C A G T T
A AT T C A AT G G AT TCG GA A
checking for splicing sites - AG
C TT T C G G CTTT T T C A G T T
cutting at the splicing sites and joining exons parts
translation
Intron position = 183Intron phase = 1Y I R L F GI
183
A AT T C A AT G A C TT T C G G CTT T
180 181 182 184 185 186
183
I
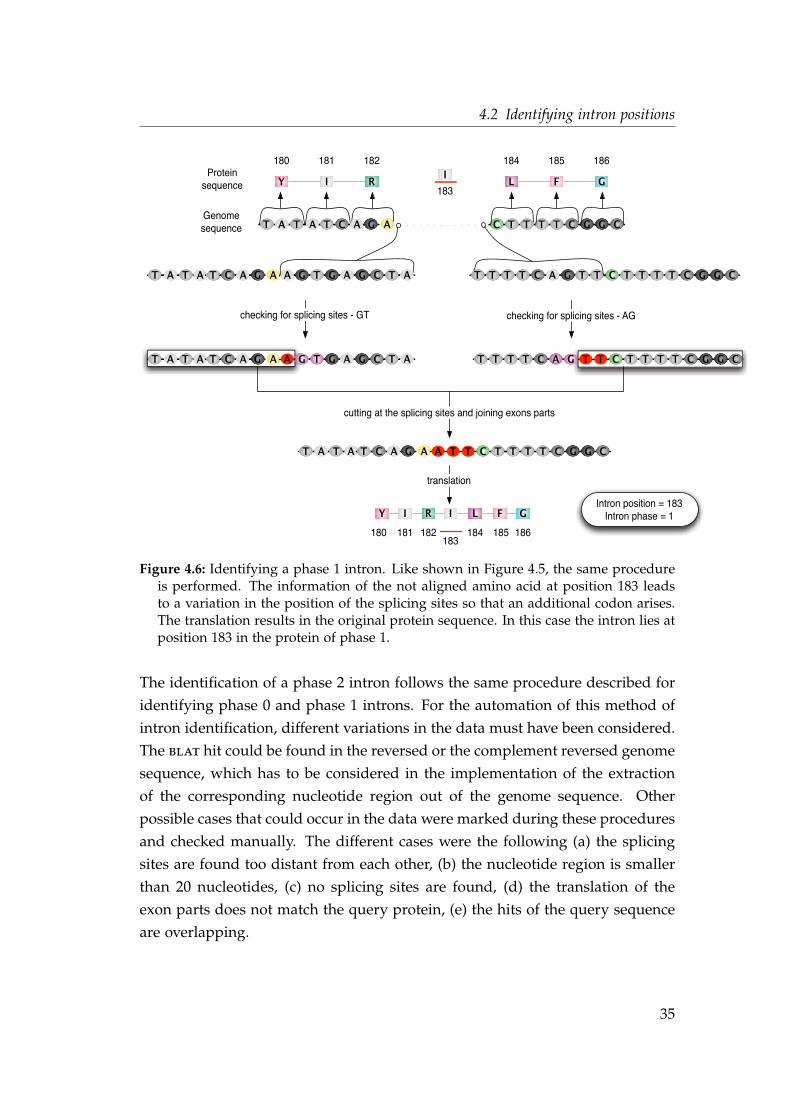
Figure 4.6: Identifying a phase 1 intron. Like shown in Figure 4.5, the same procedureis performed. The information of the not aligned amino acid at position 183 leadsto a variation in the position of the splicing sites so that an additional codon arises.The translation results in the original protein sequence. In this case the intron lies atposition 183 in the protein of phase 1.
The identification of a phase 2 intron follows the same procedure described for
identifying phase 0 and phase 1 introns. For the automation of this method of
intron identification, different variations in the data must have been considered.
The blat hit could be found in the reversed or the complement reversed genomesequence, which has to be considered in the implementation of the extraction
of the corresponding nucleotide region out of the genome sequence. Other
possible cases that could occur in the data were marked during these procedures
and checked manually. The different cases were the following (a) the splicing
sites are found too distant from each other, (b) the nucleotide region is smaller
than 20 nucleotides, (c) no splicing sites are found, (d) the translation of the
exon parts does not match the query protein, (e) the hits of the query sequence
are overlapping.
35
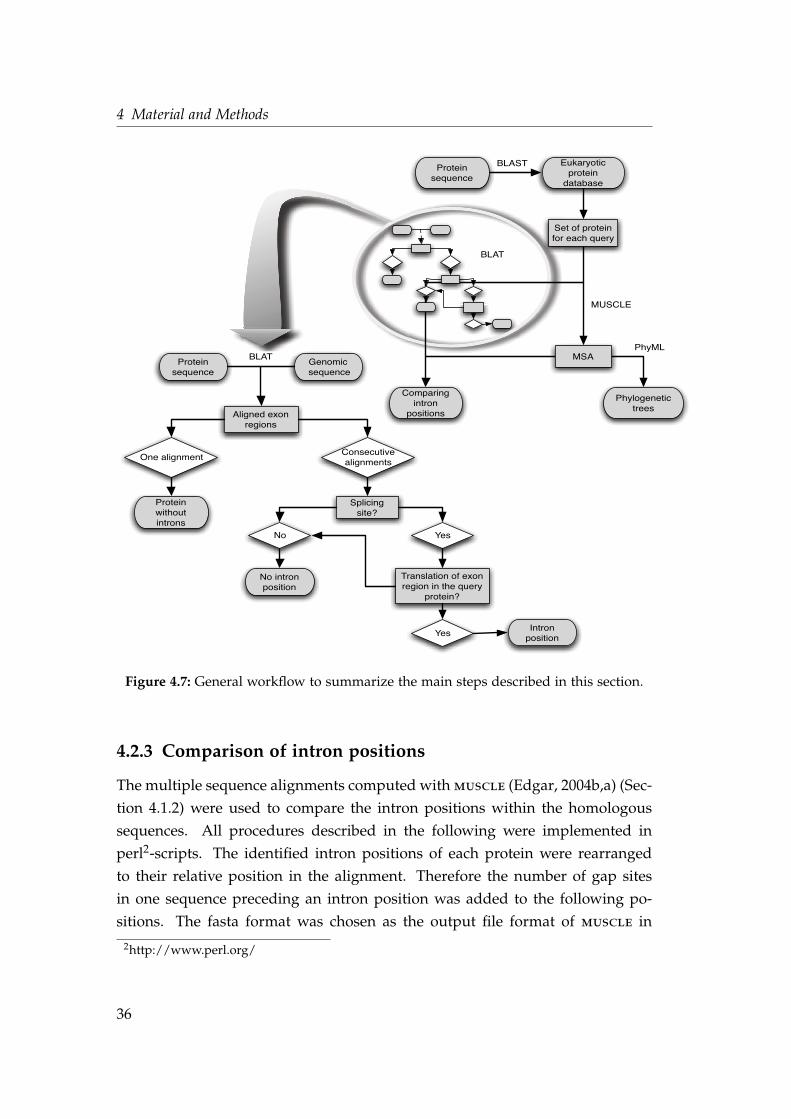
4 Material and Methods
Phylogenetic trees
Comparing intron
positions
BLAST
BLAT
MUSCLE
PhyML
Proteinsequence
Set of protein for each query
Eukaryoticprotein
database
MSA
Consecutive alignments
Aligned exon regions
One alignment
Splicingsite?
No Yes
Translation of exon region in the query
protein?
Protein without introns
YesIntron
position
No intron position
Protein sequence
Genomic sequence
BLAT
Figure 4.7: General workflow to summarize the main steps described in this section.
4.2.3 Comparison of intron positions
The multiple sequence alignments computed withmuscle (Edgar, 2004b,a) (Sec-tion 4.1.2) were used to compare the intron positions within the homologous
sequences. All procedures described in the following were implemented in
perl2-scripts. The identified intron positions of each protein were rearranged
to their relative position in the alignment. Therefore the number of gap sites
in one sequence preceding an intron position was added to the following po-
sitions. The fasta format was chosen as the output file format of muscle in
2http://www.perl.org/
36
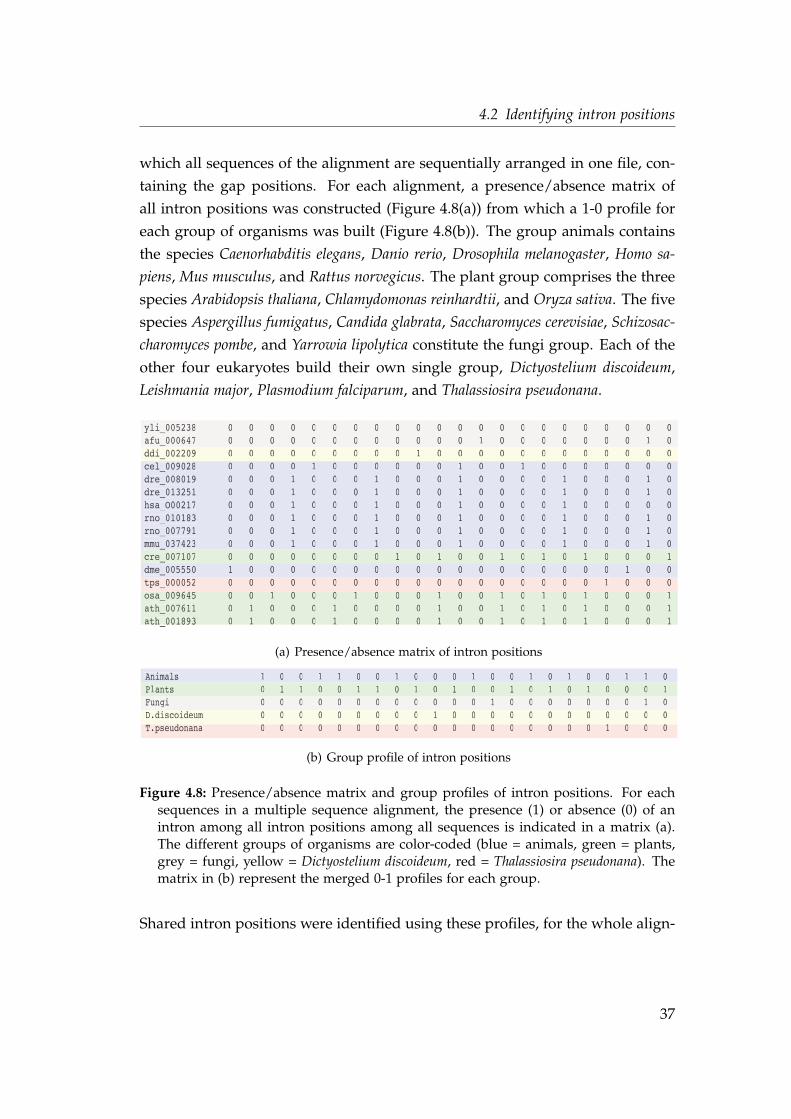
4.2 Identifying intron positions
which all sequences of the alignment are sequentially arranged in one file, con-
taining the gap positions. For each alignment, a presence/absence matrix of
all intron positions was constructed (Figure 4.8(a)) from which a 1-0 profile for
each group of organisms was built (Figure 4.8(b)). The group animals contains
the species Caenorhabditis elegans, Danio rerio, Drosophila melanogaster, Homo sa-
piens, Mus musculus, and Rattus norvegicus. The plant group comprises the three
species Arabidopsis thaliana, Chlamydomonas reinhardtii, and Oryza sativa. The five
species Aspergillus fumigatus, Candida glabrata, Saccharomyces cerevisiae, Schizosac-
charomyces pombe, and Yarrowia lipolytica constitute the fungi group. Each of the
other four eukaryotes build their own single group, Dictyostelium discoideum,
Leishmania major, Plasmodium falciparum, and Thalassiosira pseudonana.
yli_005238� � 0� 0� 0� 0� 0� 0� 0� 0� 0� 0� 0� 0� 0� 0� 0� 0� 0� 0� 0� 0� 0� 0afu_000647� � 0� 0� 0� 0� 0� 0� 0� 0� 0� 0� 0� 0� 1� 0� 0� 0� 0� 0� 0� 0� 1� 0ddi_002209� � 0� 0� 0� 0� 0� 0� 0� 0� 0� 1� 0� 0� 0� 0� 0� 0� 0� 0� 0� 0� 0� 0cel_009028� � 0� 0� 0� 0� 1� 0� 0� 0� 0� 0� 0� 1� 0� 0� 1� 0� 0� 0� 0� 0� 0� 0dre_008019� � 0� 0� 0� 1� 0� 0� 0� 1� 0� 0� 0� 1� 0� 0� 0� 0� 1� 0� 0� 0� 1� 0dre_013251� � 0� 0� 0� 1� 0� 0� 0� 1� 0� 0� 0� 1� 0� 0� 0� 0� 1� 0� 0� 0� 1� 0hsa_O00217� � 0� 0� 0� 1� 0� 0� 0� 1� 0� 0� 0� 1� 0� 0� 0� 0� 1� 0� 0� 0� 0� 0rno_010183� � 0� 0� 0� 1� 0� 0� 0� 1� 0� 0� 0� 1� 0� 0� 0� 0� 1� 0� 0� 0� 1� 0rno_007791� � 0� 0� 0� 1� 0� 0� 0� 1� 0� 0� 0� 1� 0� 0� 0� 0� 1� 0� 0� 0� 1� 0mmu_037423� � 0� 0� 0� 1� 0� 0� 0� 1� 0� 0� 0� 1� 0� 0� 0� 0� 1� 0� 0� 0� 1� 0cre_007107� � 0� 0� 0� 0� 0� 0� 0� 0� 1� 0� 1� 0� 0� 1� 0� 1� 0� 1� 0� 0� 0� 1dme_005550� � 1� 0� 0� 0� 0� 0� 0� 0� 0� 0� 0� 0� 0� 0� 0� 0� 0� 0� 0� 1� 0� 0tps_000052� � 0� 0� 0� 0� 0� 0� 0� 0� 0� 0� 0� 0� 0� 0� 0� 0� 0� 0� 1� 0� 0� 0osa_009645� � 0� 0� 1� 0� 0� 0� 1� 0� 0� 0� 1� 0� 0� 1� 0� 1� 0� 1� 0� 0� 0� 1ath_007611� � 0� 1� 0� 0� 0� 1� 0� 0� 0� 0� 1� 0� 0� 1� 0� 1� 0� 1� 0� 0� 0� 1ath_001893� � 0� 1� 0� 0� 0� 1� 0� 0� 0� 0� 1� 0� 0� 1� 0� 1� 0� 1� 0� 0� 0� 1
cel_009028 0 0 0 0 1 0 0 0 0 0 0 1 0 0 1 0 0 0 0 0 0 0dre_008019 0 0 0 1 0 0 0 1 0 0 0 1 0 0 0 0 1 0 0 0 1 0dre_013251 0 0 0 1 0 0 0 1 0 0 0 1 0 0 0 0 1 0 0 0 1 0hsa_O00217 0 0 0 1 0 0 0 1 0 0 0 1 0 0 0 0 1 0 0 0 0 0rno_010183 0 0 0 1 0 0 0 1 0 0 0 1 0 0 0 0 1 0 0 0 1 0rno_007791 0 0 0 1 0 0 0 1 0 0 0 1 0 0 0 0 1 0 0 0 1 0mmu_037423 0 0 0 1 0 0 0 1 0 0 0 1 0 0 0 0 1 0 0 0 1 0cre_007107 0 0 0 0 0 0 0 0 1 0 1 0 0 1 0 1 0 1 0 0 0 1dme_005550 1 0 0 0 0 0 0 0 0 0 0 0 0 0 0 0 0 0 0 1 0 0tps_000052 0 0 0 0 0 0 0 0 0 0 0 0 0 0 0 0 0 0 1 0 0 0
ddi_002209� � 0 0 0 0 0 0 0 0 0 1 0 0 0 0 0 0 0 0 0 0 0 0
yli_005238 0 0 0 0 0 0 0 0 0 0 0 0 0 0 0 0 0 0 0 0 0 0afu_000647 0 0 0 0 0 0 0 0 0 0 0 0 1 0 0 0 0 0 0 0 1 0
osa_009645 0 0 1 0 0 0 1 0 0 0 1 0 0 1 0 1 0 1 0 0 0 1ath_007611 0 1 0 0 0 1 0 0 0 0 1 0 0 1 0 1 0 1 0 0 0 1ath 001893� � 0 1 0 0 0 1 0 0 0 0 1 0 0 1 0 1 0 1 0 0 0 1
(a) Presence/absence matrix of intron positions
Animals�� � � � 1� 0� 0� 1� 1� 0� 0� 1� 0� 0� 0� 1� 0� 0� 1� 0� 1� 0� 0� 1� 1� 0Plants� � � � � 0� 1� 1� 0� 0� 1� 1� 0� 1� 0� 1� 0� 0� 1� 0� 1� 0� 1� 0� 0� 0� 1Fungi� � � � � 0� 0� 0� 0� 0� 0� 0� 0� 0� 0� 0� 0� 1� 0� 0� 0� 0� 0� 0� 0� 1� 0D.discoideum� � � 0� 0� 0� 0� 0� 0� 0� 0� 0� 1� 0� 0� 0� 0� 0� 0� 0� 0� 0� 0� 0� 0T.pseudonana� � � 0� 0� 0� 0� 0� 0� 0� 0� 0� 0� 0� 0� 0� 0� 0� 0� 0� 0� 1� 0� 0� 0T.pseudonana 0 0 0 0 0 0 0 0 0 0 0 0 0 0 0 0 0 0 1 0 0 0
Fungi 0 0 0 0 0 0 0 0 0 0 0 0 1 0 0 0 0 0 0 0 1 0
Animals 1 0 0 1 1 0 0 1 0 0 0 1 0 0 1 0 1 0 0 1 1 0
D.discoideumm 0 0 0 0 0 0 0 0 0 1 0 0 0 0 0 0 0 0 0 0 0 0
Plants 0 1 1 0 0 1 1 0 1 0 1 0 0 1 0 1 0 1 0 0 0 1
(b) Group profile of intron positions
Figure 4.8: Presence/absence matrix and group profiles of intron positions. For eachsequences in a multiple sequence alignment, the presence (1) or absence (0) of anintron among all intron positions among all sequences is indicated in a matrix (a).The different groups of organisms are color-coded (blue = animals, green = plants,grey = fungi, yellow = Dictyostelium discoideum, red = Thalassiosira pseudonana). Thematrix in (b) represent the merged 0-1 profiles for each group.
Shared intron positions were identified using these profiles, for the whole align-
37
4 Material and Methods
ment and only for conserved alignment regions, determined with Blockmaker3
(Henikoff et al., 1995), a feature at the Blocks database (Henikoff and Henikoff,
1991).
4.2.4 Intron density and intron phases
For a single gene, the intron density was calculated as the number of introns per
kilo basepairs of the coding sequence. This number is independent of the gene-
length. The intron density for one species, encompassing more than one gene is
represented by the mean intron density for the genes under consideration. The
intron phases are given as percentages so that the distributions of intron phases
represent the fractions of introns in each phase of the total number of introns in
the corresponding genes.
4.3 Timing of endosymbiotic gene transfer
Using the information of presence/absence of the mitochondrial and proto-
mitochondrial genes in the genomes of the different species, the relative time
of endosymbiotic gene transfer events could be defined.
A table was constructed, containing the information about the presence in
the mitochondrial genome. The information was taken from the protein tables
of the mitochondrial genomes of NCBI. In Table 4.9 the RefSeq accession num-
bers are listed of the mitochondrial genomes of each species. This information
was not available for Leishmania major and Aspergillus fumigatus, which were re-
placed by the species Leishmania tarentolae and Aspergillus niger, respectively. The
number of protein coding genes in the mitochondrial genomes is also listed in
Table 4.9.
3http://blocks.fhcrc.org/blocks/
38
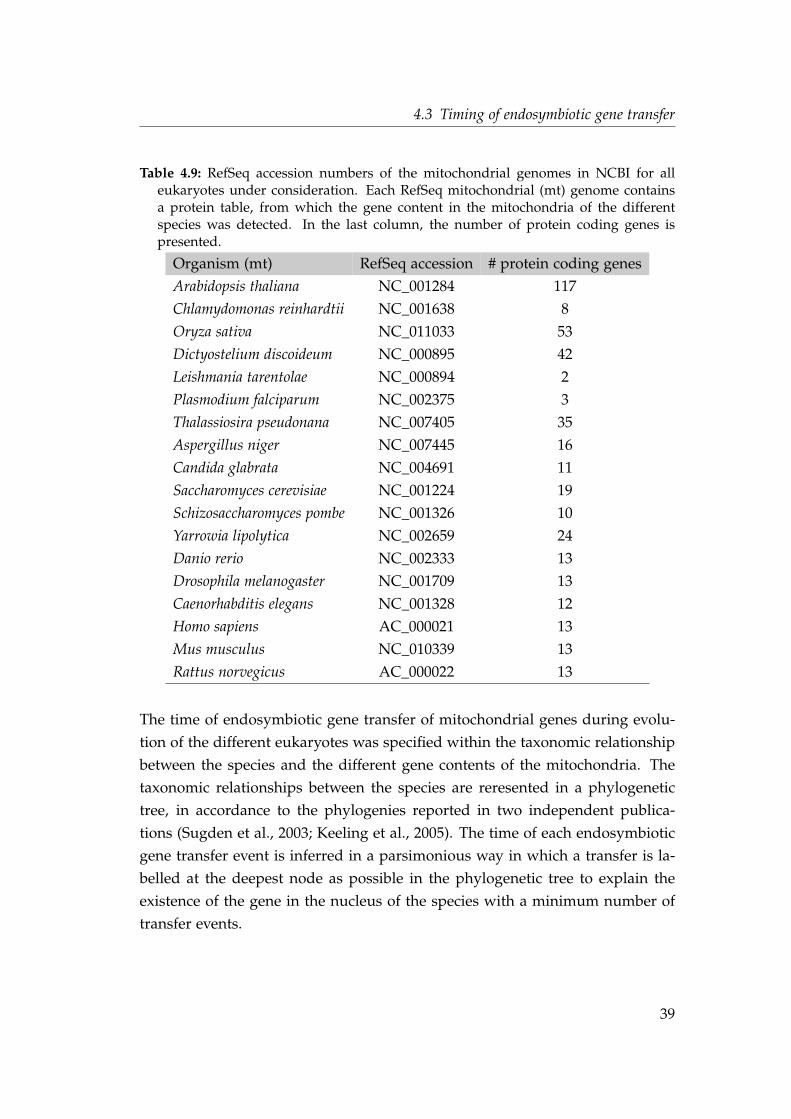
4.3 Timing of endosymbiotic gene transfer
Table 4.9: RefSeq accession numbers of the mitochondrial genomes in NCBI for alleukaryotes under consideration. Each RefSeq mitochondrial (mt) genome containsa protein table, from which the gene content in the mitochondria of the differentspecies was detected. In the last column, the number of protein coding genes ispresented.
Organism (mt) RefSeq accession # protein coding genes
Arabidopsis thaliana NC_001284 117
Chlamydomonas reinhardtii NC_001638 8
Oryza sativa NC_011033 53
Dictyostelium discoideum NC_000895 42
Leishmania tarentolae NC_000894 2
Plasmodium falciparum NC_002375 3
Thalassiosira pseudonana NC_007405 35
Aspergillus niger NC_007445 16
Candida glabrata NC_004691 11
Saccharomyces cerevisiae NC_001224 19
Schizosaccharomyces pombe NC_001326 10
Yarrowia lipolytica NC_002659 24
Danio rerio NC_002333 13
Drosophila melanogaster NC_001709 13
Caenorhabditis elegans NC_001328 12
Homo sapiens AC_000021 13
Mus musculus NC_010339 13
Rattus norvegicus AC_000022 13
The time of endosymbiotic gene transfer of mitochondrial genes during evolu-
tion of the different eukaryotes was specified within the taxonomic relationship
between the species and the different gene contents of the mitochondria. The
taxonomic relationships between the species are reresented in a phylogenetic
tree, in accordance to the phylogenies reported in two independent publica-
tions (Sugden et al., 2003; Keeling et al., 2005). The time of each endosymbiotic
gene transfer event is inferred in a parsimonious way in which a transfer is la-
belled at the deepest node as possible in the phylogenetic tree to explain the
existence of the gene in the nucleus of the species with a minimum number of
transfer events.
39
4 Material and Methods
4.4 Phylogenetic analyses and data visualization
4.4.1 Multiple alignments with intron positions
As described in Section 4.2.3, intron positions were rearranged in the multiple
sequence alignments to compare the positions of the introns. For counting the
number of species specific and shared intron positions, the presence/absence
matrix of intron positions is useful for an automated process but for a closer
examination of individual cases, a graphical representation is much more com-
fortable. For this reason, the intron positions were graphically mapped onto the
alignments. Using HTML (Hypertext Markup Language), the intron positions
and the group of species were color-coded in the alignment files which could
than be opened reviewed in a web browser. Additionally, the species were sorted
and the conserved alignment regions inferred with Blockmaker (Section 4.2.3)
were highlighted.
4.4.2 Phylogenetic trees and median networks
Maximum likelihood trees were computed with the program phyml (Guindon
and Gascuel, 2003) for all homologous sets of the human query sequences.
Therefore the alignments were reformatted from the clustal format into the
phylip format, which is a required input file format. Before reconstructing
the phylogenetic trees, all gap positions in the alignments were removed. The
graphical display of the trees was done with the program FigTree4. This pro-
gram can read the output files of the program phyml in newick format.
The binary information of the presence/absence patterns of intron positions
in the alignments were used to reconstruct median networks (Bandelt et al.,
1995, 2000). The computation and visualization was performed with the pro-
gram SplitsTree (Huson, 1998).
4.4.3 Comprehensive phylogeny of the nad7 gene
To resolve the phylogeny of the gene nad7 in more detail, the mitochondrial
encoded nad7 genes were added from the two plants Arabidopsis thaliana and
4http://tree.bio.ed.ac.uk/software/figtree/
40
4.4 Phylogenetic analyses and data visualization
Oryza sativa, the moss Physcomitrella patens, the two green algae Pseudendoclo-
nium akinetum and Ostreococcus tauri, the diatom Thalassiosira pseudonana, and
the slime mold Dictyostelium discoideum. The nuclear encoded nad7 gene in the
green alga Volvox carteri was added, too. All these nad7 protein sequences were
aligned with muscle (Edgar, 2004b,a), and the gapped sites were removed. Be-cause the nad7 data sample includes eukaryotic nuclear sequence, mitochondrial
sequences, and prokaryotic sequences, the phylogenetic reconstruction method
has to take different evolutionary rates into account (Bruno and Halpern, 1999;
Singer and Hickey, 2000). Therefore the program ProtTest (Abascal et al., 2005)
was used to estimate which substitution model fits the data best. ProtTest com-
putes maximum likelihood trees using phyml (Guindon and Gascuel, 2003) un-
der different substitution models and outputs the most likely tree according to
different criteria. The maximum likelihood values for the trees are then used
to perform a goodness of fit test. The AICc (Akaike Information Criterion with
a second order correction for small sample sizes) (Akaike, 1973) and the BIC
(Bayesian Information Criterion) were used. In all cases the WAG (Whelan and
Goldman, 2001) substitution model with an estimated proportion of invariable
sites and a Γ-distribution (WAG+I+G) was chosen to explain the evolution ofnad7 best. Bootstrap values were calculated using this model with 100 bootstrap
replicates. The phylogenetic tree is rooted by a clade of α-proteobacterial nad7
genes.
The codon usage of the amino acid Glutamine (Q) was compared between
the mitochondrial and the nuclear genomes which were included in this tree.
The percentage of used codons was received from the codon usage database5 (Naka-
mura et al., 2000) for each single species and averaged for the mitochondrial and
the nuclear genomes, respectively.
5http://www.kazusa.or.jp/codon/
41
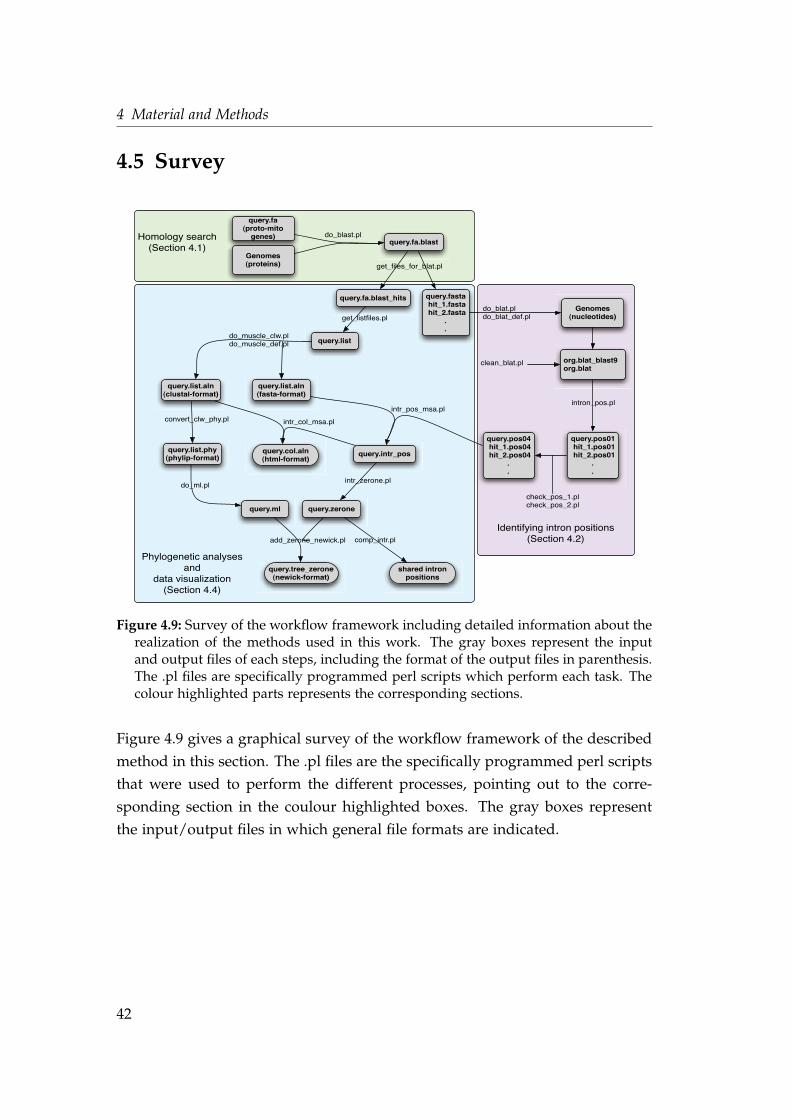
4 Material and Methods
4.5 Survey
query.intr_pos
query.fa(proto-mito
genes)
Genomes(proteins)
query.fa.blast
query.list
query.fa.blast_hits query.fastahit_1.fastahit_2.fasta
.
.
query.list.aln(clustal-format)
query.list.aln(fasta-format)
query.list.phy(phylip-format)
query.ml
Genomes(nucleotides)
org.blat_blast9org.blat
query.pos01hit_1.pos01hit_2.pos01
.
.
query.pos04hit_1.pos04hit_2.pos04
.
.
query.zerone
get_files_for_blat.pl
get_listfiles.pldo_blat.pldo_blat_def.pl
do_muscle_clw.pldo_muscle_def.pl
convert_clw_phy.pl
do_ml.pl
add_zerone_newick.pl
intr_zerone.pl
clean_blat.pl
intron_pos.pl
check_pos_1.plcheck_pos_2.pl
query.col.aln(html-format)
query.tree_zerone(newick-format)
shared intronpositions
comp_intr.pl
Identifying intron positions(Section 4.2)
do_blast.plHomology search(Section 4.1)
intr_pos_msa.pl
intr_col_msa.pl
Phylogenetic analysesand
data visualization(Section 4.4)
Figure 4.9: Survey of the workflow framework including detailed information about therealization of the methods used in this work. The gray boxes represent the inputand output files of each steps, including the format of the output files in parenthesis.The .pl files are specifically programmed perl scripts which perform each task. Thecolour highlighted parts represents the corresponding sections.
Figure 4.9 gives a graphical survey of the workflow framework of the described
method in this section. The .pl files are the specifically programmed perl scripts
that were used to perform the different processes, pointing out to the corre-
sponding section in the coulour highlighted boxes. The gray boxes represent
the input/output files in which general file formats are indicated.
42
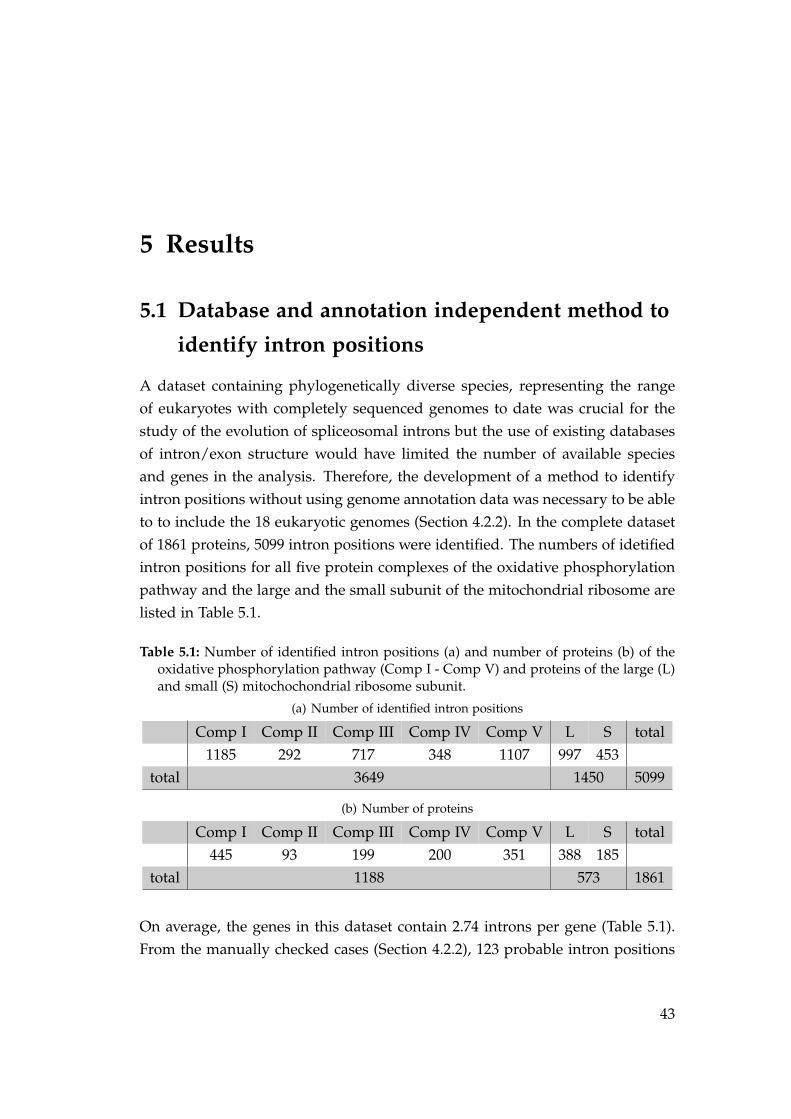
5 Results
5.1 Database and annotation independent method to
identify intron positions
A dataset containing phylogenetically diverse species, representing the range
of eukaryotes with completely sequenced genomes to date was crucial for the
study of the evolution of spliceosomal introns but the use of existing databases
of intron/exon structure would have limited the number of available species
and genes in the analysis. Therefore, the development of a method to identify
intron positions without using genome annotation data was necessary to be able
to to include the 18 eukaryotic genomes (Section 4.2.2). In the complete dataset
of 1861 proteins, 5099 intron positions were identified. The numbers of idetified
intron positions for all five protein complexes of the oxidative phosphorylation
pathway and the large and the small subunit of the mitochondrial ribosome are
listed in Table 5.1.
Table 5.1: Number of identified intron positions (a) and number of proteins (b) of theoxidative phosphorylation pathway (Comp I - Comp V) and proteins of the large (L)and small (S) mitochochondrial ribosome subunit.
(a) Number of identified intron positions
Comp I Comp II Comp III Comp IV Comp V L S total
1185 292 717 348 1107 997 453
total 3649 1450 5099
(b) Number of proteins
Comp I Comp II Comp III Comp IV Comp V L S total
445 93 199 200 351 388 185
total 1188 573 1861
On average, the genes in this dataset contain 2.74 introns per gene (Table 5.1).
From the manually checked cases (Section 4.2.2), 123 probable intron positions
43
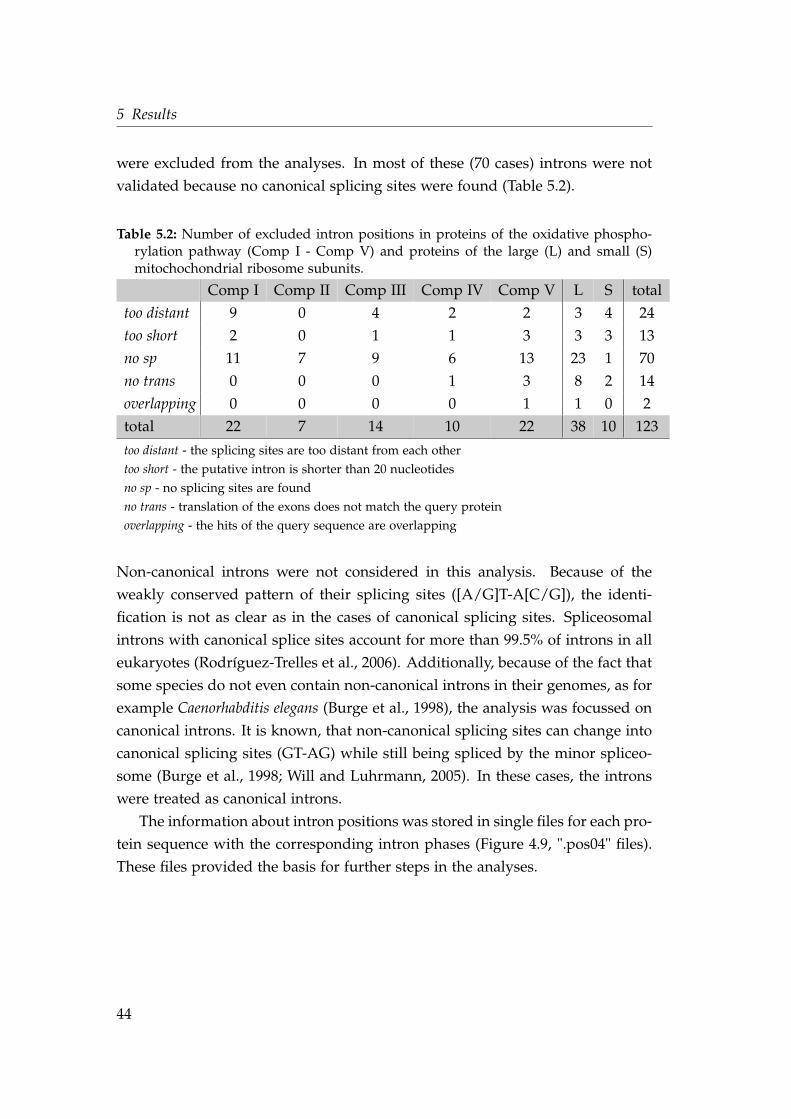
5 Results
were excluded from the analyses. In most of these (70 cases) introns were not
validated because no canonical splicing sites were found (Table 5.2).
Table 5.2: Number of excluded intron positions in proteins of the oxidative phospho-rylation pathway (Comp I - Comp V) and proteins of the large (L) and small (S)mitochochondrial ribosome subunits.
Comp I Comp II Comp III Comp IV Comp V L S total
too distant 9 0 4 2 2 3 4 24
too short 2 0 1 1 3 3 3 13
no sp 11 7 9 6 13 23 1 70
no trans 0 0 0 1 3 8 2 14
overlapping 0 0 0 0 1 1 0 2
total 22 7 14 10 22 38 10 123
too distant - the splicing sites are too distant from each other
too short - the putative intron is shorter than 20 nucleotides
no sp - no splicing sites are found
no trans - translation of the exons does not match the query protein
overlapping - the hits of the query sequence are overlapping
Non-canonical introns were not considered in this analysis. Because of the
weakly conserved pattern of their splicing sites ([A/G]T-A[C/G]), the identi-
fication is not as clear as in the cases of canonical splicing sites. Spliceosomal
introns with canonical splice sites account for more than 99.5% of introns in all
eukaryotes (Rodríguez-Trelles et al., 2006). Additionally, because of the fact that
some species do not even contain non-canonical introns in their genomes, as for
example Caenorhabditis elegans (Burge et al., 1998), the analysis was focussed on
canonical introns. It is known, that non-canonical splicing sites can change into
canonical splicing sites (GT-AG) while still being spliced by the minor spliceo-
some (Burge et al., 1998; Will and Luhrmann, 2005). In these cases, the introns
were treated as canonical introns.
The information about intron positions was stored in single files for each pro-
tein sequence with the corresponding intron phases (Figure 4.9, ".pos04" files).
These files provided the basis for further steps in the analyses.
44
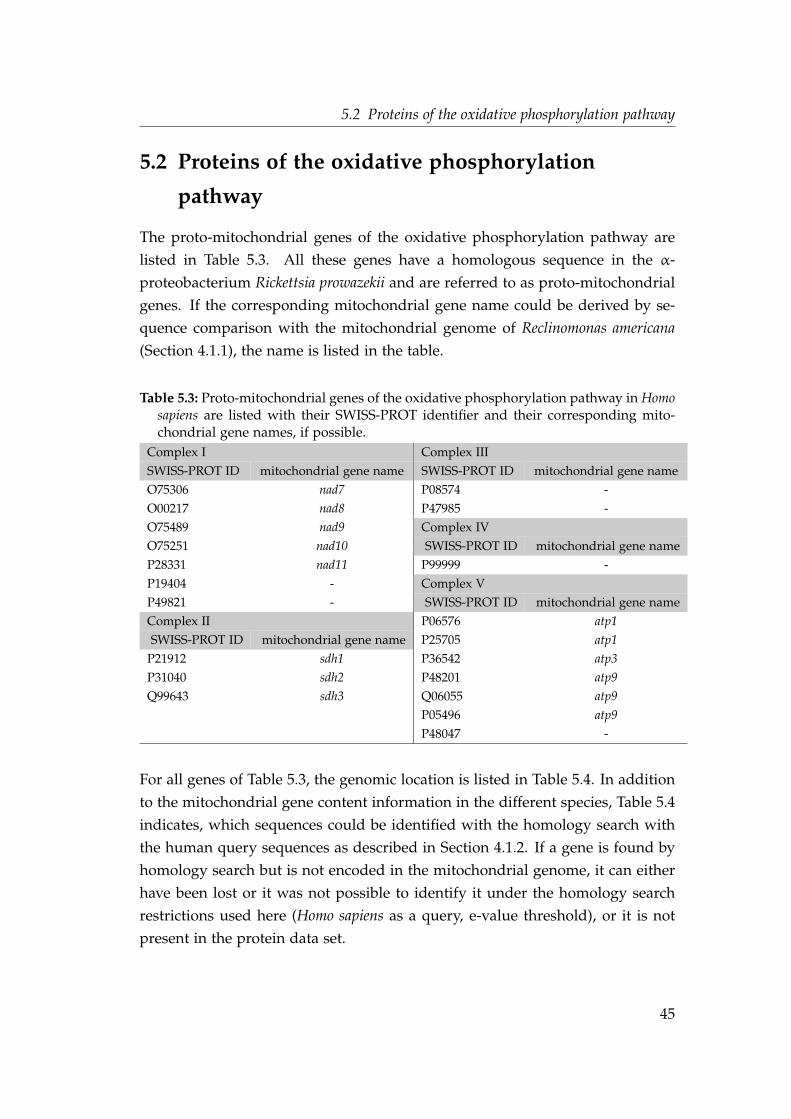
5.2 Proteins of the oxidative phosphorylation pathway
5.2 Proteins of the oxidative phosphorylation
pathway
The proto-mitochondrial genes of the oxidative phosphorylation pathway are
listed in Table 5.3. All these genes have a homologous sequence in the α-
proteobacterium Rickettsia prowazekii and are referred to as proto-mitochondrial
genes. If the corresponding mitochondrial gene name could be derived by se-
quence comparison with the mitochondrial genome of Reclinomonas americana
(Section 4.1.1), the name is listed in the table.
Table 5.3: Proto-mitochondrial genes of the oxidative phosphorylation pathway in Homosapiens are listed with their SWISS-PROT identifier and their corresponding mito-chondrial gene names, if possible.
Complex I Complex III
SWISS-PROT ID mitochondrial gene name SWISS-PROT ID mitochondrial gene name
O75306 nad7 P08574 -
O00217 nad8 P47985 -
O75489 nad9 Complex IV
O75251 nad10 SWISS-PROT ID mitochondrial gene name
P28331 nad11 P99999 -
P19404 - Complex V
P49821 - SWISS-PROT ID mitochondrial gene name
Complex II P06576 atp1
SWISS-PROT ID mitochondrial gene name P25705 atp1
P21912 sdh1 P36542 atp3
P31040 sdh2 P48201 atp9
Q99643 sdh3 Q06055 atp9
P05496 atp9
P48047 -
For all genes of Table 5.3, the genomic location is listed in Table 5.4. In addition
to the mitochondrial gene content information in the different species, Table 5.4
indicates, which sequences could be identified with the homology search with
the human query sequences as described in Section 4.1.2. If a gene is found by
homology search but is not encoded in the mitochondrial genome, it can either
have been lost or it was not possible to identify it under the homology search
restrictions used here (Homo sapiens as a query, e-value threshold), or it is not
present in the protein data set.
45
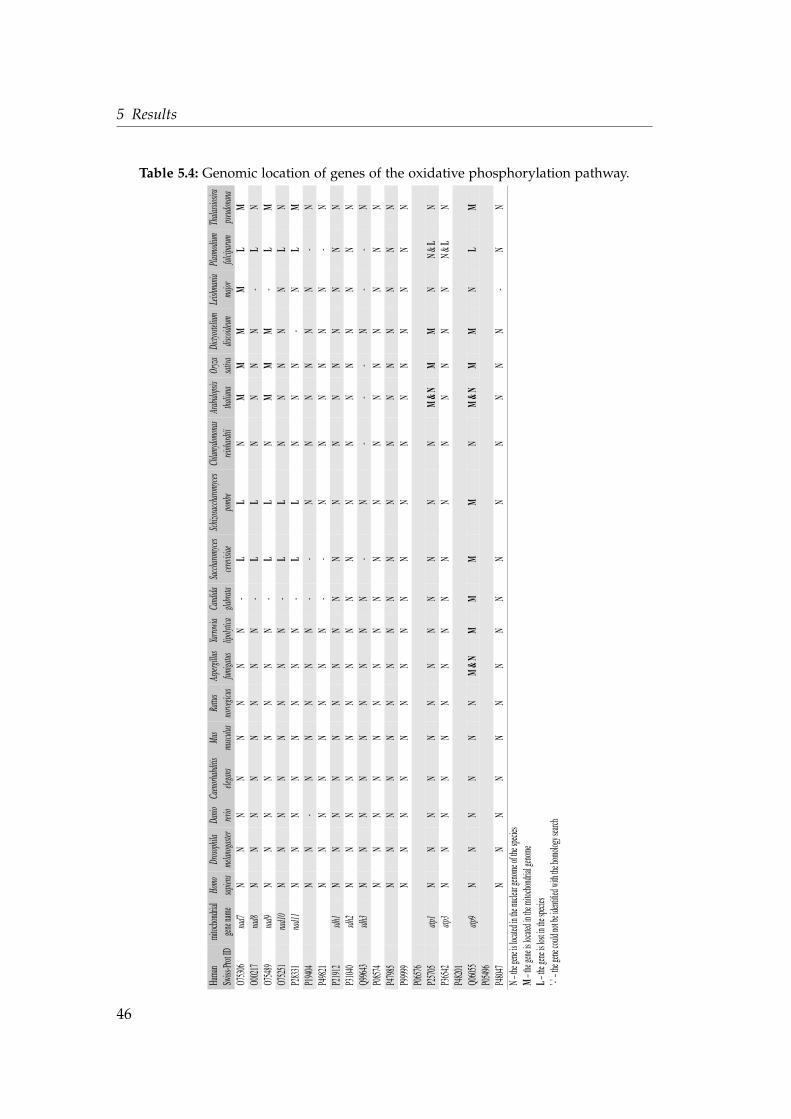
5 Results
Table 5.4: Genomic location of genes of the oxidative phosphorylation pathway.
Huma
nmi
tochon
drial
Homo
Dros
ophil
aDa
nioCa
enor
habd
itis
Mus
Rattu
sAs
perg
illus
Yarro
wia
Cand
idaSa
ccha
romy
ces
Schiz
osac
char
omyc
esCh
lamyd
omon
asAr
abido
psis
Oryz
aDi
ctyos
telium
Leish
mania
Plas
modiu
mTh
alassi
osira
Swiss
-ProtI
Dgen
enam
esa
piens
melan
ogas
terrer
ioele
gans
musc
ulus
norv
egicu
sfum
igatus
lipoly
tica
glabr
atace
revisi
aepo
mbe
reinh
ardti
itha
liana
sativ
adis
coide
umma
jorfal
cipar
umps
eudo
nana
O7530
6na
d7N
NN
NN
NN
N-
LL
NM
MM
ML
MO0
0217
nad8
NN
NN
NN
NN
-L
LN
NN
N-
LN
O7548
9na
d9N
NN
NN
NN
N-
LL
NM
MM
-L
MO7
5251
nad1
0N
NN
NN
NN
N-
LL
NN
NN
NL
NP2
8331
nad1
1N
NN
NN
NN
N-
LL
NN
N-
NL
MP1
9404
NN
-N
NN
NN
--
NN
NN
NN
-N
P4982
1N
NN
NN
NN
N-
-N
NN
NN
N-
NP2
1912
sdh1
NN
NN
NN
NN
NN
NN
NN
NN
NN
P3104
0sd
h2N
NN
NN
NN
NN
NN
NN
NN
NN
NQ9
9643
sdh3
NN
NN
NN
NN
N-
N-
--
N-
-N
P0857
4N
NN
NN
NN
NN
NN
NN
NN
NN
NP4
7985
NN
NN
NN
NN
NN
NN
NN
NN
NN
P9999
9N
NN
NN
NN
NN
NN
NN
NN
NN
NP0
6576
P2570
5atp
1N
NN
NN
NN
NN
NN
NM
&NM
MN
N&L
NP3
6542
atp3
NN
NN
NN
NN
NN
NN
NN
NN
N&L
NP4
8201
Q0605
5atp
9N
NN
NN
NM
&NM
MM
MN
M&N
MM
NL
MP0
5496
P4804
7N
NN
NN
NN
NN
NN
NN
NN
-N
NN–
thegen
eisloc
atedin
thenuc
learg
enome
ofthe
specie
sM
–theg
eneisl
ocated
inthe
mitoc
hondri
algeno
meL–
thegen
eislos
tinthe
specie
s’-’
–theg
enecou
ldnotb
eident
ifiedw
iththe
homolo
gysea
rch
46
5.2 Proteins of the oxidative phosphorylation pathway
Most of the mitochondrial encoded genes are found in the four species Ara-
bidopsis thaliana, Oryza sativa, Dictyostelium discoideum and Thalassiosira pseudo-
nana. Only proven cases of gene loss are indicated in the table ("L", Table 5.4).
The complete loss of Complex I, and thus the loss of the corresponding genes,
is reported for the two yeasts Saccharomyces cerevisiae and Schizosaccharomyces
pombe (Gabaldón et al., 2005) and in Plasmodium falciparum which also lacks
the ATPase genes (Gardner et al., 2002). Surprisingly, the two genes atp1 and
atp3 were identified in the genome of Plasmodium falciparum (NP_701707 and
NP_705013, respectively). A recent reevaluation revealed that the entries of
these two nuclear encoded genes were removed from the actual version of the
database NCBI and therefore subsequently excluded from this analysis. The
gene atp1 in Arabidopsis thaliana and the gene atp9 in Arabidopsis thaliana and
Aspergillus fumigatus appear to be encoded in both, the mitochondrial and the
nuclear genome. These cases were studied in detail with the results summarized
in Table 5.5
47
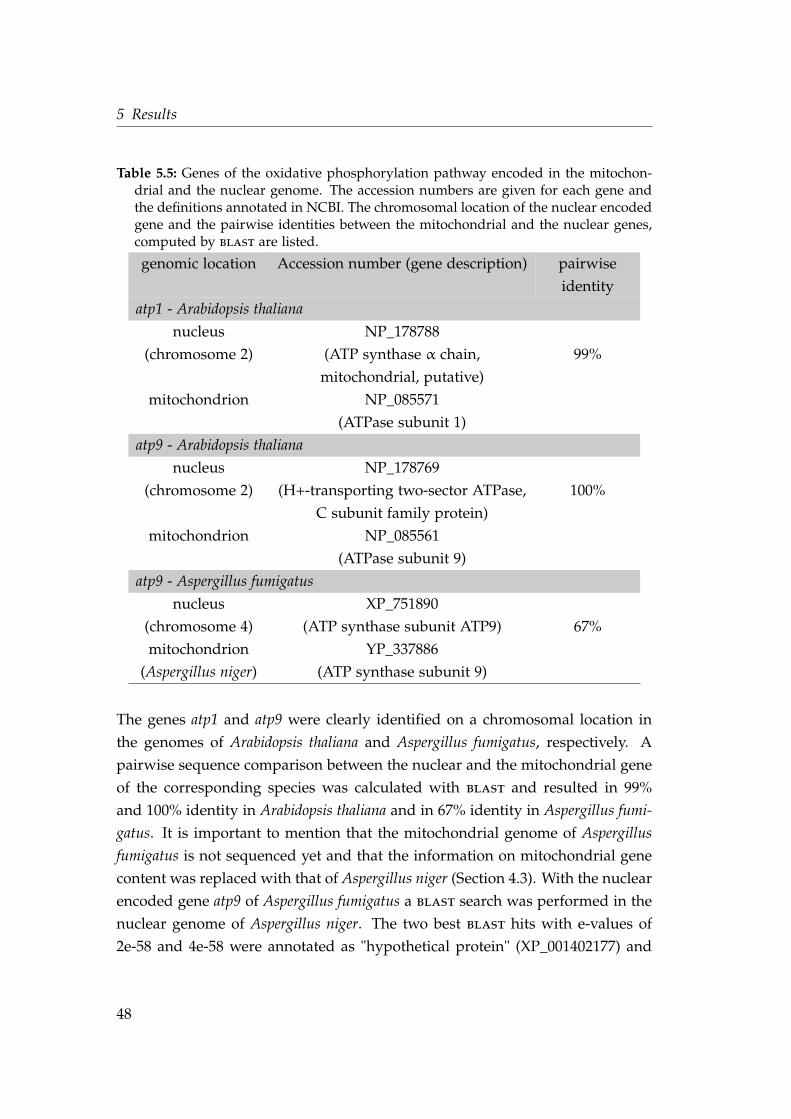
5 Results
Table 5.5: Genes of the oxidative phosphorylation pathway encoded in the mitochon-drial and the nuclear genome. The accession numbers are given for each gene andthe definitions annotated in NCBI. The chromosomal location of the nuclear encodedgene and the pairwise identities between the mitochondrial and the nuclear genes,computed by blast are listed.
genomic location Accession number (gene description) pairwise
identity
atp1 - Arabidopsis thaliana
nucleus NP_178788
(chromosome 2) (ATP synthase α chain,
mitochondrial, putative)
99%
mitochondrion NP_085571
(ATPase subunit 1)
atp9 - Arabidopsis thaliana
nucleus NP_178769
(chromosome 2) (H+-transporting two-sector ATPase,
C subunit family protein)
100%
mitochondrion NP_085561
(ATPase subunit 9)
atp9 - Aspergillus fumigatus
nucleus XP_751890
(chromosome 4) (ATP synthase subunit ATP9) 67%
mitochondrion YP_337886
(Aspergillus niger) (ATP synthase subunit 9)
The genes atp1 and atp9 were clearly identified on a chromosomal location in
the genomes of Arabidopsis thaliana and Aspergillus fumigatus, respectively. A
pairwise sequence comparison between the nuclear and the mitochondrial gene
of the corresponding species was calculated with blast and resulted in 99%and 100% identity in Arabidopsis thaliana and in 67% identity in Aspergillus fumi-
gatus. It is important to mention that the mitochondrial genome of Aspergillus
fumigatus is not sequenced yet and that the information on mitochondrial gene
content was replaced with that of Aspergillus niger (Section 4.3). With the nuclear
encoded gene atp9 of Aspergillus fumigatus a blast search was performed in thenuclear genome of Aspergillus niger. The two best blast hits with e-values of2e-58 and 4e-58 were annotated as "hypothetical protein" (XP_001402177) and
48
5.2 Proteins of the oxidative phosphorylation pathway
"ATP synthase 9" (1510195A), respectively. That would suggest the existence
of atp9 in the nuclear genomes of the two fungi. A third significant hit of this
blast search with an e-value of 3e-21 was the mitochondrial encoded gene ofAspergillus niger (YP_337886).
The endosymbiotic gene transfer events of genes of the oxidative phospho-
rylation pathway were mapped onto the branches of a tree which represents
the taxonomic relationships between the species (Figure 5.1). Depending on
the presence or absence of a gene in the mitochondrial genomes, the parsimo-
nious inference of gene transfer events result in this picture of endosymbiotic
gene transfer among the evolution of these species. Each transfer is labelled at
the earliest possible speciation event. For example, the genes nad8, nad10, atp3,
and sdh2,3,4 are transferred at an early stage of eukaryotic evolution because
they are nuclear encoded in all species in this tree. In the group of plants and
green algae, there are nine genes which were only transferred to the nuclear
genome in Chlamydomonas reinhardtii. The timing of transfer events does not
exclude occurrences of gene losses, but the labelled genes are not present in the
mitochondrial genomes of the corresponding species. There are no indepen-
dent transfer events within the groups of vertebrates and fungi which are both
represented in the tree in Figure 5.1 as a single clade each.
49
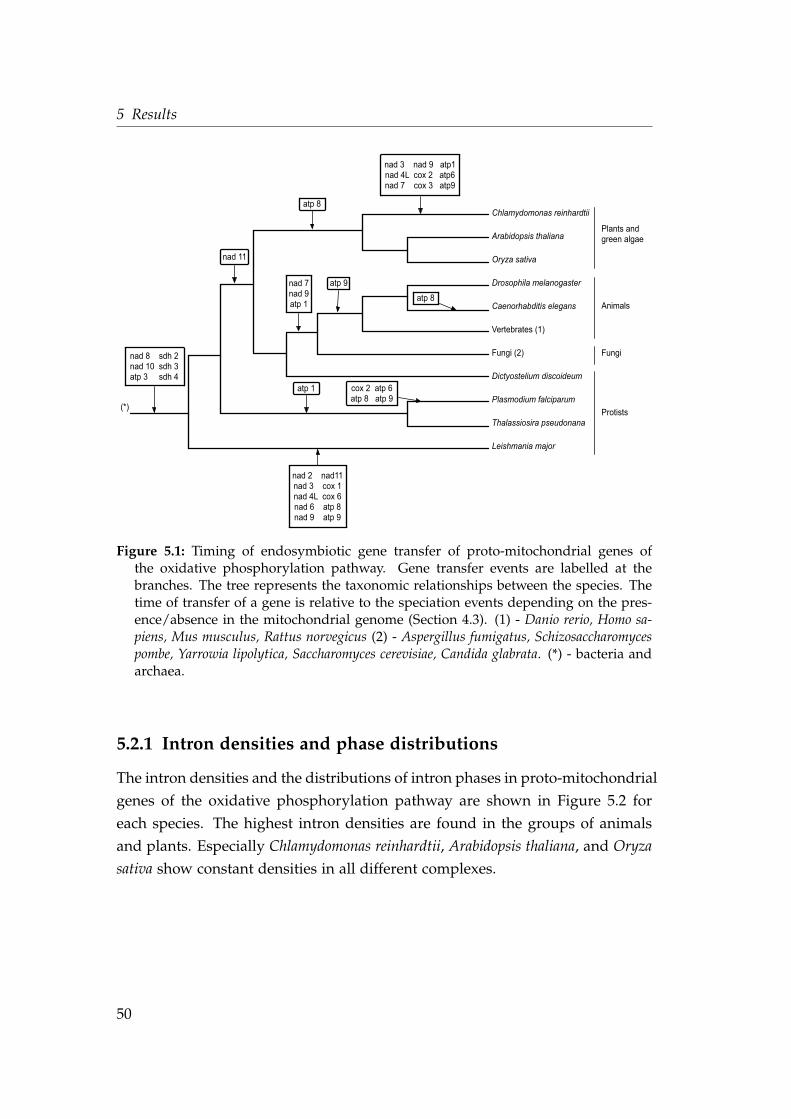
5 Results
Chlamydomonas reinhardtii
Arabidopsis thaliana
Leishmania major
Fungi (2)
Drosophila melanogaster
Caenorhabditis elegans
Vertebrates (1)
Dictyostelium discoideum
Plasmodium falciparum
Thalassiosira pseudonana
atp 8
atp 9
atp 8
nad 11
atp 1
nad 7nad 9atp 1
nad 8 sdh 2nad 10 sdh 3atp 3 sdh 4
cox 2 atp 6atp 8 atp 9
Oryza sativa
Plants and green algae
Animals
Protists(*)
Fungi
nad 2 nad11nad 3 cox 1nad 4L cox 6nad 6 atp 8nad 9 atp 9
nad 3 nad 9 atp1nad 4L cox 2 atp6nad 7 cox 3 atp9
Figure 5.1: Timing of endosymbiotic gene transfer of proto-mitochondrial genes ofthe oxidative phosphorylation pathway. Gene transfer events are labelled at thebranches. The tree represents the taxonomic relationships between the species. Thetime of transfer of a gene is relative to the speciation events depending on the pres-ence/absence in the mitochondrial genome (Section 4.3). (1) - Danio rerio, Homo sa-piens, Mus musculus, Rattus norvegicus (2) - Aspergillus fumigatus, Schizosaccharomycespombe, Yarrowia lipolytica, Saccharomyces cerevisiae, Candida glabrata. (*) - bacteria andarchaea.
5.2.1 Intron densities and phase distributions
The intron densities and the distributions of intron phases in proto-mitochondrial
genes of the oxidative phosphorylation pathway are shown in Figure 5.2 for
each species. The highest intron densities are found in the groups of animals
and plants. Especially Chlamydomonas reinhardtii, Arabidopsis thaliana, and Oryza
sativa show constant densities in all different complexes.
50
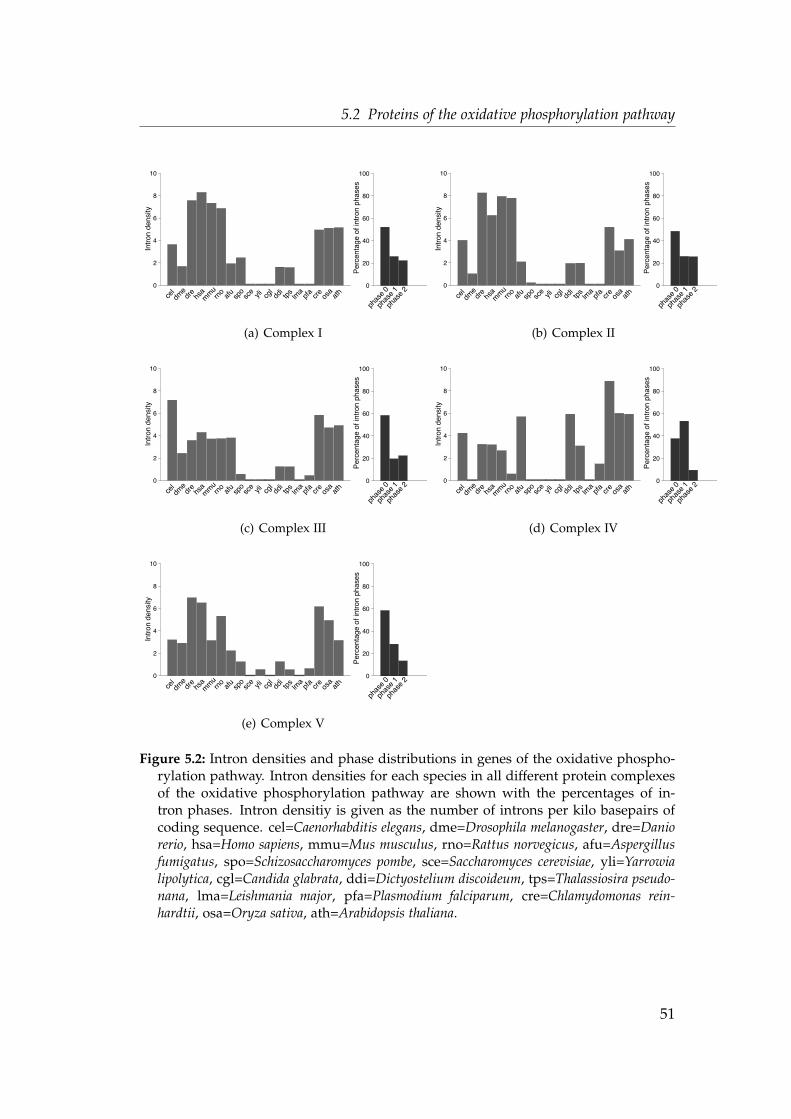
5.2 Proteins of the oxidative phosphorylation pathway
0
2
4
6
8
10ce
ldm
edr
ehs
am
mu
rno
afu
spo
sce yli cgl
ddi
tps
lma
pfa
cre
osa
ath
Intr
on d
ensi
ty
0
20
40
60
80
100
phas
e 2
phas
e 1
phas
e 0
Per
cent
age
of in
tron
pha
ses
(a) Complex I
0
2
4
6
8
10
cel
dme
dre
hsa
mm
urn
oaf
usp
osc
e yli cgl
ddi
tps
lma
pfa
cre
osa
ath
Intr
on d
ensi
ty
0
20
40
60
80
100
phas
e 2
phas
e 1
phas
e 0
Per
cent
age
of in
tron
pha
ses
(b) Complex II
0
2
4
6
8
10
cel
dme
dre
hsa
mm
urn
oaf
usp
osc
e yli cgl
ddi
tps
lma
pfa
cre
osa
ath
Intr
on d
ensi
ty
0
20
40
60
80
100
phas
e 2
phas
e 1
phas
e 0
Per
cent
age
of in
tron
pha
ses
(c) Complex III
0
2
4
6
8
10
cel
dme
dre
hsa
mm
urn
oaf
usp
osc
e yli cgl
ddi
tps
lma
pfa
cre
osa
ath
Intr
on d
ensi
ty
0
20
40
60
80
100
phas
e 2
phas
e 1
phas
e 0
Per
cent
age
of in
tron
pha
ses
(d) Complex IV
0
2
4
6
8
10
cel
dme
dre
hsa
mm
urn
oaf
usp
osc
e yli cgl
ddi
tps
lma
pfa
cre
osa
ath
Intr
on d
ensi
ty
0
20
40
60
80
100
phas
e 2
phas
e 1
phas
e 0
Per
cent
age
of in
tron
pha
ses
(e) Complex V
Figure 5.2: Intron densities and phase distributions in genes of the oxidative phospho-rylation pathway. Intron densities for each species in all different protein complexesof the oxidative phosphorylation pathway are shown with the percentages of in-tron phases. Intron densitiy is given as the number of introns per kilo basepairs ofcoding sequence. cel=Caenorhabditis elegans, dme=Drosophila melanogaster, dre=Daniorerio, hsa=Homo sapiens, mmu=Mus musculus, rno=Rattus norvegicus, afu=Aspergillusfumigatus, spo=Schizosaccharomyces pombe, sce=Saccharomyces cerevisiae, yli=Yarrowialipolytica, cgl=Candida glabrata, ddi=Dictyostelium discoideum, tps=Thalassiosira pseudo-nana, lma=Leishmania major, pfa=Plasmodium falciparum, cre=Chlamydomonas rein-hardtii, osa=Oryza sativa, ath=Arabidopsis thaliana.
51
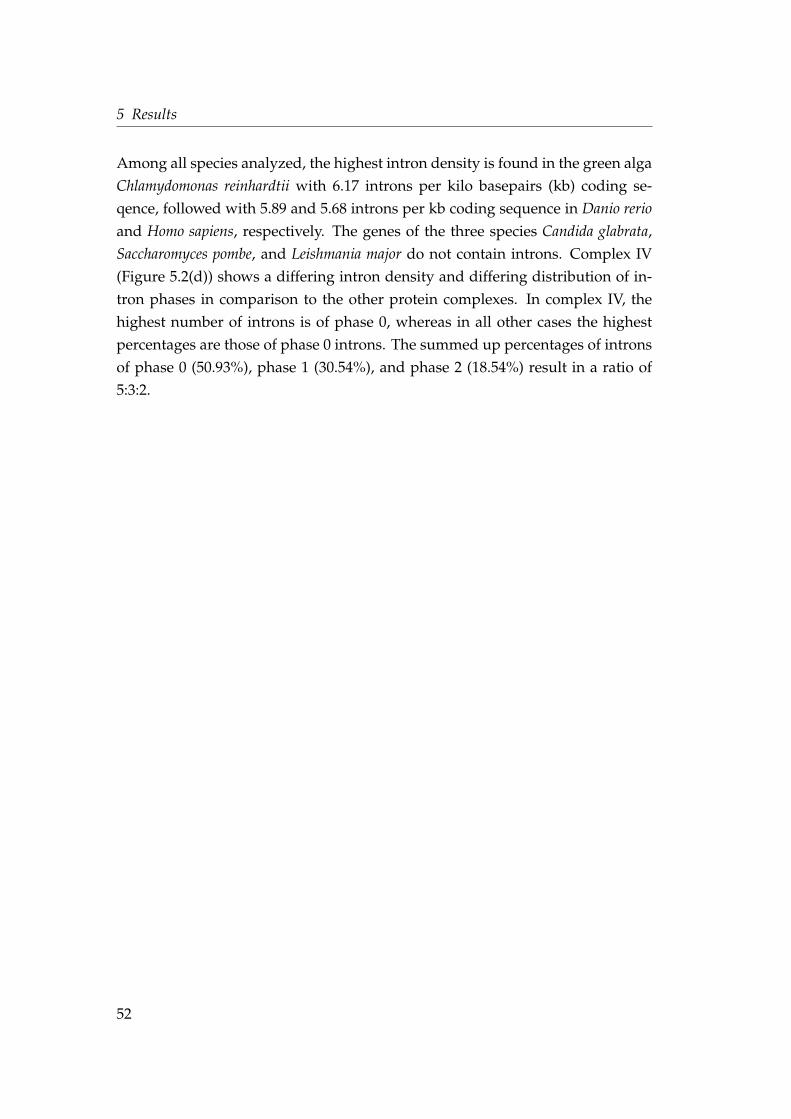
5 Results
Among all species analyzed, the highest intron density is found in the green alga
Chlamydomonas reinhardtii with 6.17 introns per kilo basepairs (kb) coding se-
qence, followed with 5.89 and 5.68 introns per kb coding sequence in Danio rerio
and Homo sapiens, respectively. The genes of the three species Candida glabrata,
Saccharomyces pombe, and Leishmania major do not contain introns. Complex IV
(Figure 5.2(d)) shows a differing intron density and differing distribution of in-
tron phases in comparison to the other protein complexes. In complex IV, the
highest number of introns is of phase 0, whereas in all other cases the highest
percentages are those of phase 0 introns. The summed up percentages of introns
of phase 0 (50.93%), phase 1 (30.54%), and phase 2 (18.54%) result in a ratio of
5:3:2.
52
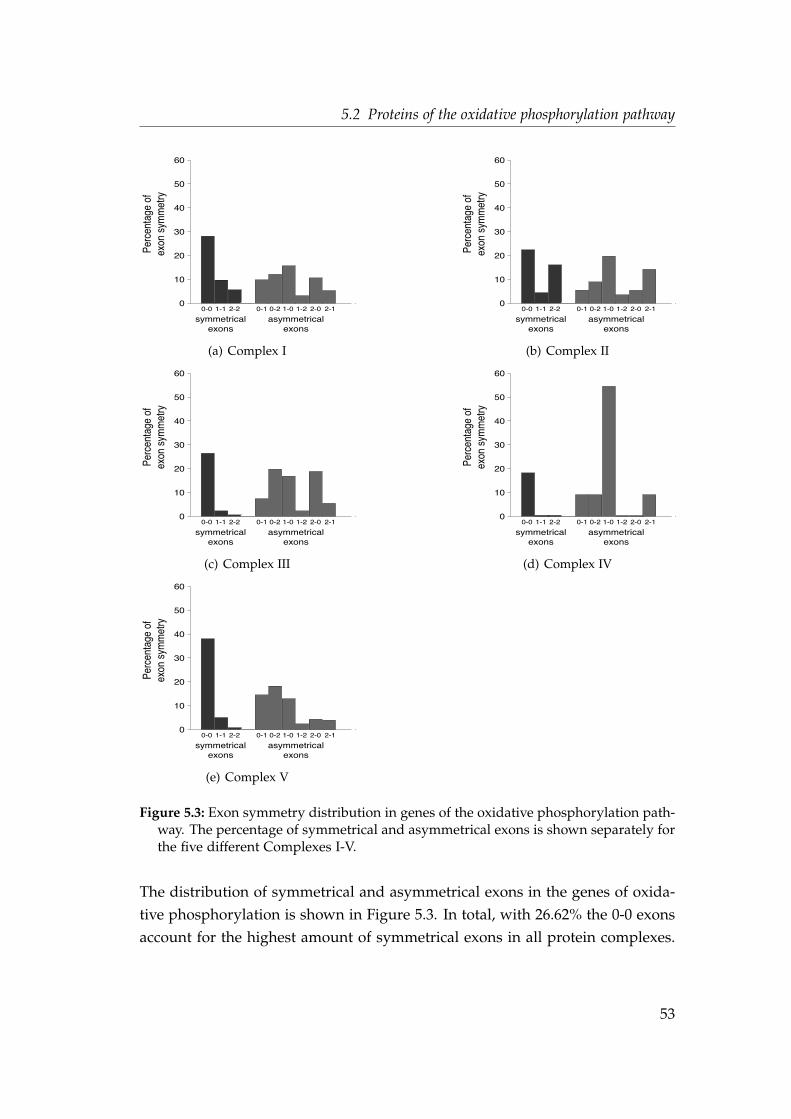
5.2 Proteins of the oxidative phosphorylation pathway
0
10
20
30
40
50
60
Perc
enta
ge o
f ex
on s
ymm
etry
0-0 1-1 2-2 0-1 0-2 2-01-21-0 2-1
symmetricalexons
asymmetricalexons
(a) Complex I
0
10
20
30
40
50
60
Perc
enta
ge o
f ex
on s
ymm
etry
0-0 1-1 2-2 0-1 0-2 2-01-21-0 2-1
symmetricalexons
asymmetricalexons
(b) Complex II
0
10
20
30
40
50
60
Perc
enta
ge o
f ex
on s
ymm
etry
0-0 1-1 2-2 0-1 0-2 2-01-21-0 2-1
symmetricalexons
asymmetricalexons
(c) Complex III
0
10
20
30
40
50
60
Perc
enta
ge o
f ex
on s
ymm
etry
0-0 1-1 2-2 0-1 0-2 2-01-21-0 2-1
symmetricalexons
asymmetricalexons
(d) Complex IV
0
10
20
30
40
50
60
Perc
enta
ge o
f ex
on s
ymm
etry
0-0 1-1 2-2 0-1 0-2 2-01-21-0 2-1
symmetricalexons
asymmetricalexons
(e) Complex V
Figure 5.3: Exon symmetry distribution in genes of the oxidative phosphorylation path-way. The percentage of symmetrical and asymmetrical exons is shown separately forthe five different Complexes I-V.
The distribution of symmetrical and asymmetrical exons in the genes of oxida-
tive phosphorylation is shown in Figure 5.3. In total, with 26.62% the 0-0 exons
account for the highest amount of symmetrical exons in all protein complexes.
53
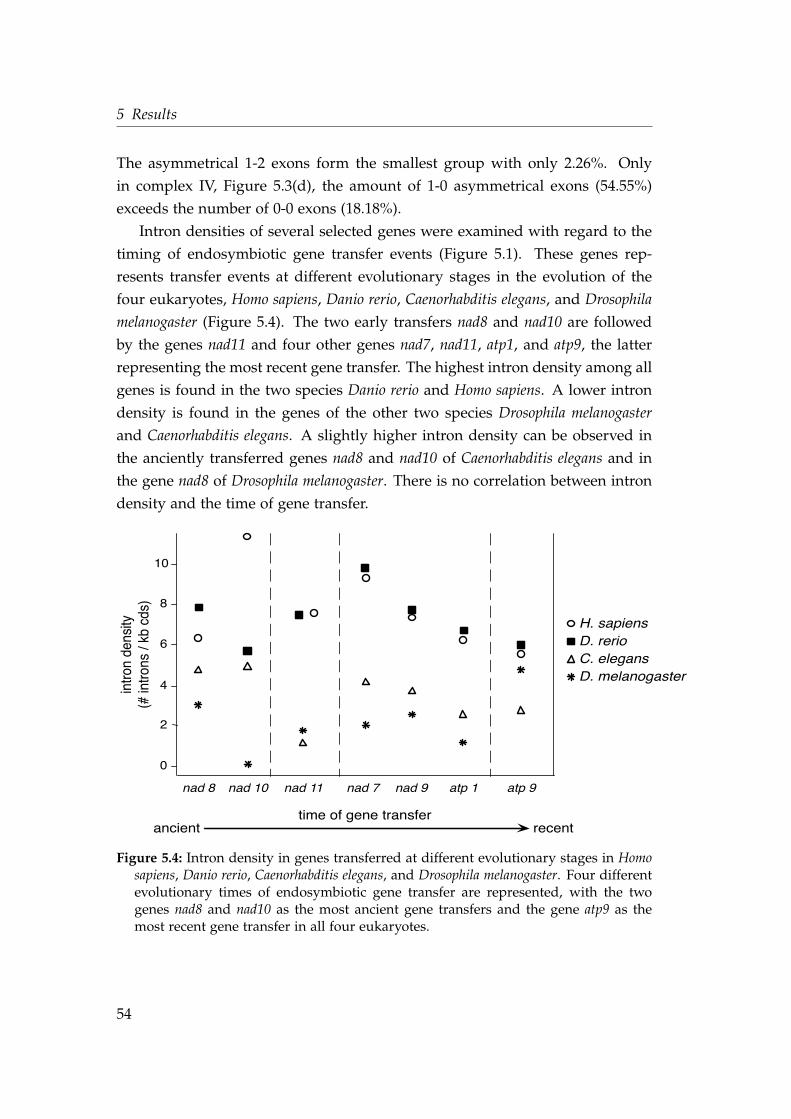
5 Results
The asymmetrical 1-2 exons form the smallest group with only 2.26%. Only
in complex IV, Figure 5.3(d), the amount of 1-0 asymmetrical exons (54.55%)
exceeds the number of 0-0 exons (18.18%).
Intron densities of several selected genes were examined with regard to the
timing of endosymbiotic gene transfer events (Figure 5.1). These genes rep-
resents transfer events at different evolutionary stages in the evolution of the
four eukaryotes, Homo sapiens, Danio rerio, Caenorhabditis elegans, and Drosophila
melanogaster (Figure 5.4). The two early transfers nad8 and nad10 are followed
by the genes nad11 and four other genes nad7, nad11, atp1, and atp9, the latter
representing the most recent gene transfer. The highest intron density among all
genes is found in the two species Danio rerio and Homo sapiens. A lower intron
density is found in the genes of the other two species Drosophila melanogaster
and Caenorhabditis elegans. A slightly higher intron density can be observed in
the anciently transferred genes nad8 and nad10 of Caenorhabditis elegans and in
the gene nad8 of Drosophila melanogaster. There is no correlation between intron
density and the time of gene transfer.
time of gene transfer
nad 11 atp 9
10
8
6
4
2
0
ancient recent
nad 8 nad 10 atp 1nad 9nad 7
intro
n de
nsity
(# in
trons
/ kb
cds
)
H. sapiens
D. melanogasterC. elegansD. rerio
Figure 5.4: Intron density in genes transferred at different evolutionary stages in Homosapiens, Danio rerio, Caenorhabditis elegans, and Drosophila melanogaster. Four differentevolutionary times of endosymbiotic gene transfer are represented, with the twogenes nad8 and nad10 as the most ancient gene transfers and the gene atp9 as themost recent gene transfer in all four eukaryotes.
54
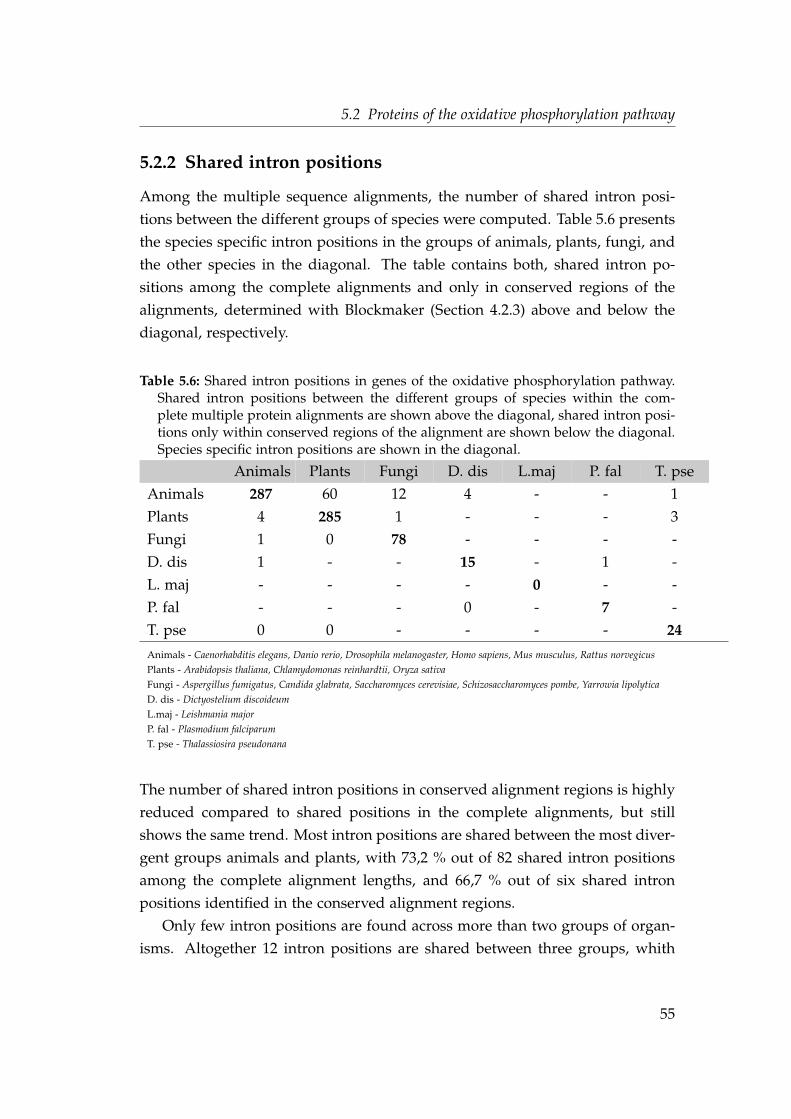
5.2 Proteins of the oxidative phosphorylation pathway
5.2.2 Shared intron positions
Among the multiple sequence alignments, the number of shared intron posi-
tions between the different groups of species were computed. Table 5.6 presents
the species specific intron positions in the groups of animals, plants, fungi, and
the other species in the diagonal. The table contains both, shared intron po-
sitions among the complete alignments and only in conserved regions of the
alignments, determined with Blockmaker (Section 4.2.3) above and below the
diagonal, respectively.
Table 5.6: Shared intron positions in genes of the oxidative phosphorylation pathway.Shared intron positions between the different groups of species within the com-plete multiple protein alignments are shown above the diagonal, shared intron posi-tions only within conserved regions of the alignment are shown below the diagonal.Species specific intron positions are shown in the diagonal.
Animals Plants Fungi D. dis L.maj P. fal T. pse
Animals 287 60 12 4 - - 1
Plants 4 285 1 - - - 3
Fungi 1 0 78 - - - -
D. dis 1 - - 15 - 1 -
L. maj - - - - 0 - -
P. fal - - - 0 - 7 -
T. pse 0 0 - - - - 24Animals - Caenorhabditis elegans, Danio rerio, Drosophila melanogaster, Homo sapiens, Mus musculus, Rattus norvegicus
Plants - Arabidopsis thaliana, Chlamydomonas reinhardtii, Oryza sativa
Fungi - Aspergillus fumigatus, Candida glabrata, Saccharomyces cerevisiae, Schizosaccharomyces pombe, Yarrowia lipolytica
D. dis - Dictyostelium discoideum
L.maj - Leishmania major
P. fal - Plasmodium falciparum
T. pse - Thalassiosira pseudonana
The number of shared intron positions in conserved alignment regions is highly
reduced compared to shared positions in the complete alignments, but still
shows the same trend. Most intron positions are shared between the most diver-
gent groups animals and plants, with 73,2 % out of 82 shared intron positions
among the complete alignment lengths, and 66,7 % out of six shared intron
positions identified in the conserved alignment regions.
Only few intron positions are found across more than two groups of organ-
isms. Altogether 12 intron positions are shared between three groups, whith
55
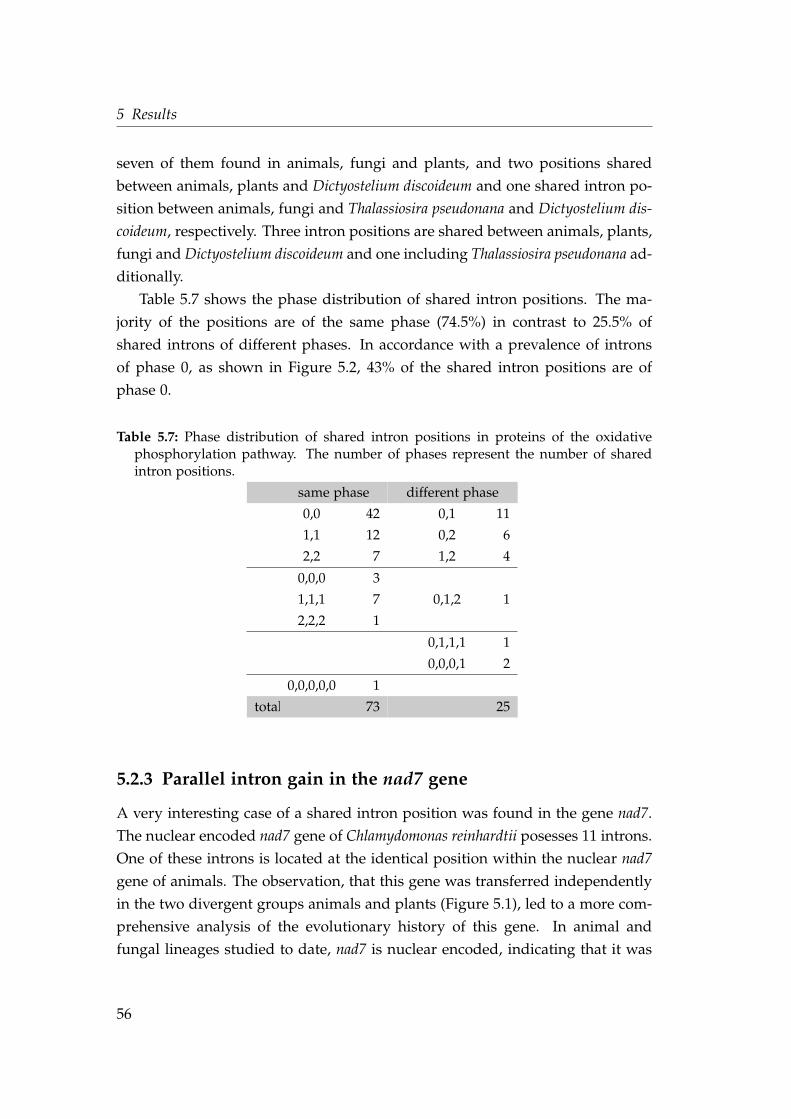
5 Results
seven of them found in animals, fungi and plants, and two positions shared
between animals, plants and Dictyostelium discoideum and one shared intron po-
sition between animals, fungi and Thalassiosira pseudonana and Dictyostelium dis-
coideum, respectively. Three intron positions are shared between animals, plants,
fungi andDictyostelium discoideum and one including Thalassiosira pseudonana ad-
ditionally.
Table 5.7 shows the phase distribution of shared intron positions. The ma-
jority of the positions are of the same phase (74.5%) in contrast to 25.5% of
shared introns of different phases. In accordance with a prevalence of introns
of phase 0, as shown in Figure 5.2, 43% of the shared intron positions are of
phase 0.
Table 5.7: Phase distribution of shared intron positions in proteins of the oxidativephosphorylation pathway. The number of phases represent the number of sharedintron positions.
same phase different phase
0,0 42 0,1 11
1,1 12 0,2 6
2,2 7 1,2 4
0,0,0 3
1,1,1 7 0,1,2 1
2,2,2 1
0,1,1,1 1
0,0,0,1 2
0,0,0,0,0 1
total 73 25
5.2.3 Parallel intron gain in the nad7 gene
A very interesting case of a shared intron position was found in the gene nad7.
The nuclear encoded nad7 gene of Chlamydomonas reinhardtii posesses 11 introns.
One of these introns is located at the identical position within the nuclear nad7
gene of animals. The observation, that this gene was transferred independently
in the two divergent groups animals and plants (Figure 5.1), led to a more com-
prehensive analysis of the evolutionary history of this gene. In animal and
fungal lineages studied to date, nad7 is nuclear encoded, indicating that it was
56
5.2 Proteins of the oxidative phosphorylation pathway
transferred to the nucleus in the opisthokont common ancestor (Gray et al.,
1999). Among higher plants, algae and protists, the gene is often still encoded
in the mitochondrial genome, like in those of the green algae Pseudendoclonium
akinetum (Pombert et al., 2004) and Ostreococcus tauri (Robbens et al., 2007). In
contrast, nad7 is absent from the mitochondrial genomes of the green algae
Chlamydomonas reinhardtii and Volvox carteri, where it is nuclear encoded instead.
The region of the shared intron position in the multiple sequence alignment is
shown in Figure 5.5. The shared intron position is found in a very conserved
region of the alignment, to which seven mitochondrial encoded nad7 genes were
added.
57
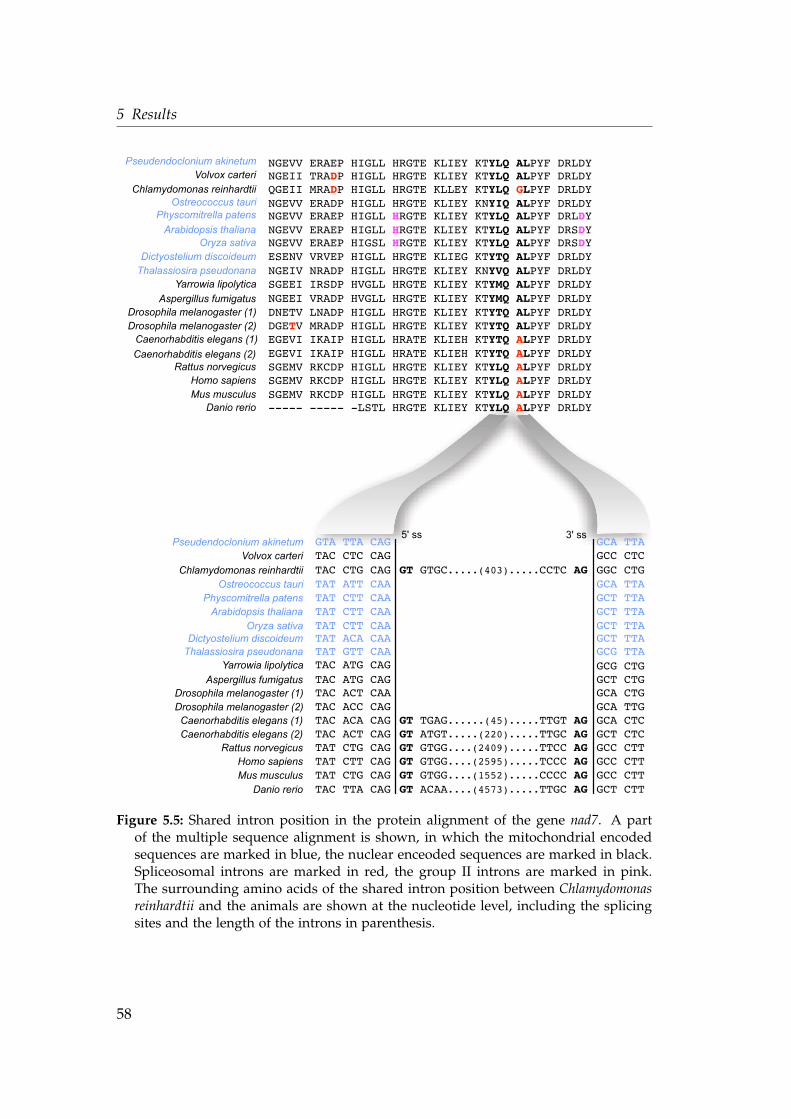
5 Results
GT ACAA....(4573).....TTGC AG
GTA TTA CAGTAC CTC CAGTAC CTG CAGTAT ATT CAATAT CTT CAATAT CTT CAATAT CTT CAA
TAC ATG CAGTAC ATG CAGTAC ACT CAATAC ACC CAGTAC ACA CAGTAC ACT CAGTAT CTG CAG
TAC TTA CAG
TAT GTT CAA
TAT CTT CAG
GT GTGC.....(403).....CCTC AG
GT TGAG......(45).....TTGT AGGT ATGT.....(220).....TTGC AGGT GTGG....(2409).....TTCC AGGT GTGG....(2595).....TCCC AGGT GTGG....(1552).....CCCC AG
GCA TTAGCC CTCGGC CTGGCA TTAGCT TTAGCT TTAGCT TTA
GCG CTGGCT CTGGCA CTGGCA TTGGCA CTCGCT CTCGCC CTT
GCC CTTGCT CTT
GCG TTA
GCC CTT
5' ss 3' ssPseudendoclonium akinetum
Ostreococcus tauri
Physcomitrella patens
Arabidopsis thaliana
Oryza sativa
Thalassiosira pseudonana
Volvox carteri
Chlamydomonas reinhardtii
Drosophila melanogaster (1)
Drosophila melanogaster (2)
Caenorhabditis elegans (1)
Caenorhabditis elegans (2)
Homo sapiens
Mus musculus
Danio rerio
Rattus norvegicus
Yarrowia lipolytica
Aspergillus fumigatus
NGEVV ERAEP HIGLL HRGTE KLIEY KTYLQ ALPYF DRLDY NGEII TRADP HIGLL HRGTE KLIEY KTYLQ ALPYF DRLDYQGEII MRADP HIGLL HRGTE KLLEY KTYLQ GLPYF DRLDYNGEVV ERADP HIGLL HRGTE KLIEY KNYIQ ALPYF DRLDYNGEVV ERAEP HIGLL HRGTE KLIEY KTYLQ ALPYF DRLDYNGEVV ERAEP HIGLL HRGTE KLIEY KTYLQ ALPYF DRSDYNGEVV ERAEP HIGSL HRGTE KLIEY KTYLQ ALPYF DRSDY
NGEIV NRADP HIGLL HRGTE KLIEY KNYVQ ALPYF DRLDYSGEEI IRSDP HVGLL HRGTE KLIEY KTYMQ ALPYF DRLDYNGEEI VRADP HVGLL HRGTE KLIEY KTYMQ ALPYF DRLDYDNETV LNADP HIGLL HRGTE KLIEY KTYTQ ALPYF DRLDYDGETV MRADP HIGLL HRGTE KLIEY KTYTQ ALPYF DRLDYEGEVI IKAIP HIGLL HRATE KLIEH KTYTQ ALPYF DRLDYEGEVI IKAIP HIGLL HRATE KLIEH KTYTQ ALPYF DRLDYSGEMV RKCDP HIGLL HRGTE KLIEY KTYLQ ALPYF DRLDYSGEMV RKCDP HIGLL HRGTE KLIEY KTYLQ ALPYF DRLDYSGEMV RKCDP HIGLL HRGTE KLIEY KTYLQ ALPYF DRLDY----- ----- -LSTL HRGTE KLIEY KTYLQ ALPYF DRLDY
Pseudendoclonium akinetum
Ostreococcus tauri
Physcomitrella patens
Arabidopsis thaliana
Oryza sativa
Thalassiosira pseudonana
Volvox carteri
Chlamydomonas reinhardtii
Drosophila melanogaster (1)
Drosophila melanogaster (2)
Caenorhabditis elegans (1)
Caenorhabditis elegans (2)
Homo sapiens
Mus musculus
Danio rerio
Rattus norvegicus
Yarrowia lipolytica
Aspergillus fumigatus
TAT CTG CAG
ESENV VRVEP HIGLL HRGTE KLIEG KTYTQ ALPYF DRLDYDictyostelium discoideum
TAT ACA CAA GCT TTADictyostelium discoideum
Figure 5.5: Shared intron position in the protein alignment of the gene nad7. A partof the multiple sequence alignment is shown, in which the mitochondrial encodedsequences are marked in blue, the nuclear enceoded sequences are marked in black.Spliceosomal introns are marked in red, the group II introns are marked in pink.The surrounding amino acids of the shared intron position between Chlamydomonasreinhardtii and the animals are shown at the nucleotide level, including the splicingsites and the length of the introns in parenthesis.
58
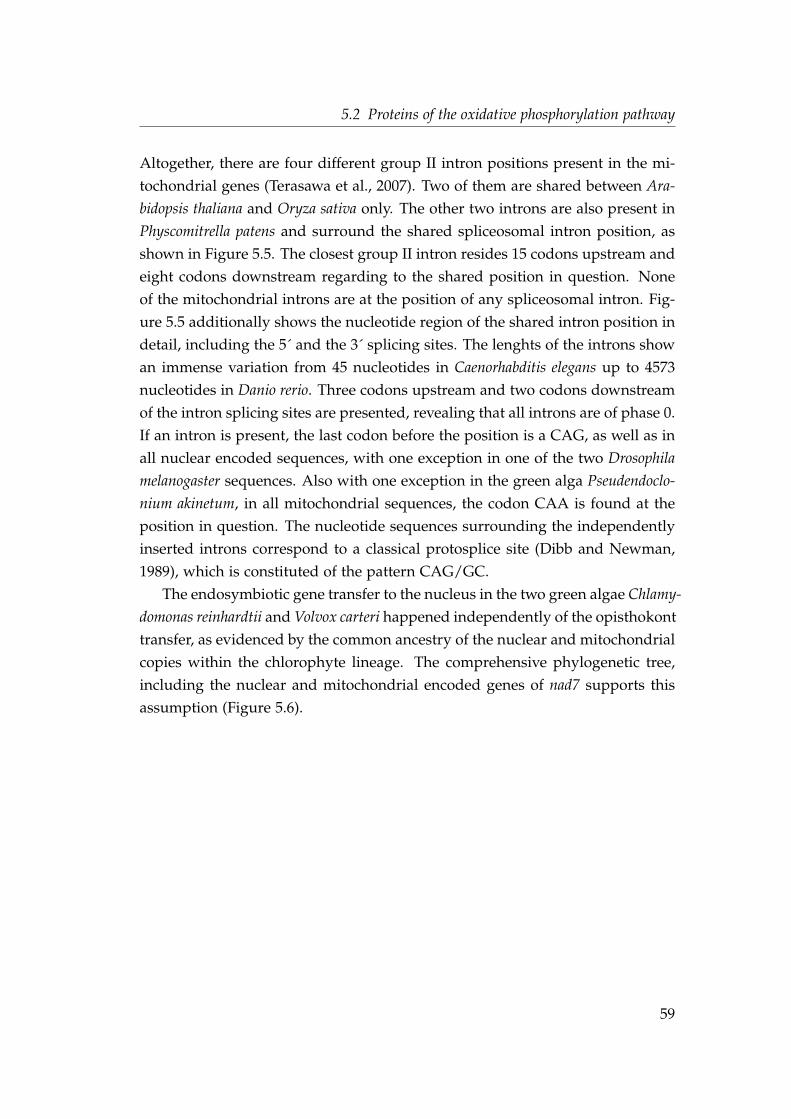
5.2 Proteins of the oxidative phosphorylation pathway
Altogether, there are four different group II intron positions present in the mi-
tochondrial genes (Terasawa et al., 2007). Two of them are shared between Ara-
bidopsis thaliana and Oryza sativa only. The other two introns are also present in
Physcomitrella patens and surround the shared spliceosomal intron position, as
shown in Figure 5.5. The closest group II intron resides 15 codons upstream and
eight codons downstream regarding to the shared position in question. None
of the mitochondrial introns are at the position of any spliceosomal intron. Fig-
ure 5.5 additionally shows the nucleotide region of the shared intron position in
detail, including the 5´ and the 3´ splicing sites. The lenghts of the introns show
an immense variation from 45 nucleotides in Caenorhabditis elegans up to 4573
nucleotides in Danio rerio. Three codons upstream and two codons downstream
of the intron splicing sites are presented, revealing that all introns are of phase 0.
If an intron is present, the last codon before the position is a CAG, as well as in
all nuclear encoded sequences, with one exception in one of the two Drosophila
melanogaster sequences. Also with one exception in the green alga Pseudendoclo-
nium akinetum, in all mitochondrial sequences, the codon CAA is found at the
position in question. The nucleotide sequences surrounding the independently
inserted introns correspond to a classical protosplice site (Dibb and Newman,
1989), which is constituted of the pattern CAG/GC.
The endosymbiotic gene transfer to the nucleus in the two green algae Chlamy-
domonas reinhardtii and Volvox carteri happened independently of the opisthokont
transfer, as evidenced by the common ancestry of the nuclear and mitochondrial
copies within the chlorophyte lineage. The comprehensive phylogenetic tree,
including the nuclear and mitochondrial encoded genes of nad7 supports this
assumption (Figure 5.6).
59
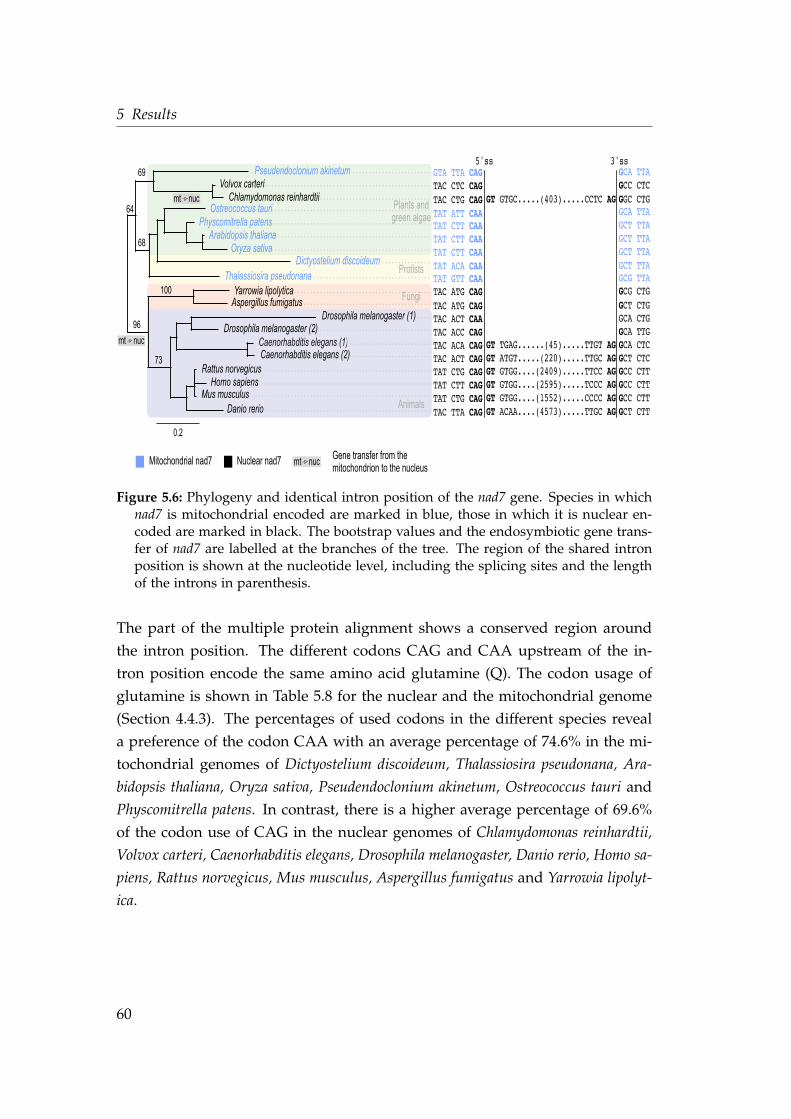
5 Results
Caenorhabditis elegans (1)Caenorhabditis elegans (1)
........................
Mitochondrial nad7
Pseudendoclonium akinetum
Dictyostelium discoideum
Ostreococcus tauri
Physcomitrella patens
Arabidopsis thaliana
Oryza sativa
Thalassiosira pseudonana
Volvox carteri
Chlamydomonas reinhardtii
Drosophila melanogaster (1)
Drosophila melanogaster (2)
Caenorhabditis elegans (2)
Homo sapiens
Mus musculus
Danio rerio
Rattus norvegicus
Yarrowia lipolytica
69
64
68
100
96
73
0.2
mt nuc
mt nuc
Nuclear nad7 Gene transfer from themitochondrion to the nucleus
mt nuc
Animals
Fungi
Protists
Plants andgreen algae
...................................
.........................
.......................................................
...................................................
....
.....................................................
.....................................................
.........................
.......................................
...................................................
..................................
.................................................
.................................................
................................................
.................................................
...............
....................................
..........................................
Aspergillus fumigatus
GTA TTA CAGTAC CTC CAGTAC CTG CAGTAT ATT CAATAT CTT CAATAT CTT CAATAT CTT CAATAT ACA CAA
TAC ATG CAGTAC ATG CAGTAC ACT CAATAC ACC CAGTAC ACA CAGTAC ACT CAGTAT CTG CAG
TAT CTG CAGTAC TTA CAG
TAT GTT CAA
TAT CTT CAG
GT GTGC.....(403).....CCTC AG
GT TGAG......(45).....TTGT AGGT ATGT.....(220).....TTGC AGGT GTGG....(2409).....TTCC AGGT GTGG....(2595).....TCCC AGGT GTGG....(1552).....CCCC AGGT ACAA....(4573).....TTGC AG
GCA TTAGCC CTCGGC CTGGCA TTAGCT TTAGCT TTAGCT TTAGCT TTA
GCG CTGGCT CTGGCA CTGGCA TTGGCA CTCGCT CTCGCC CTT
GCC CTTGCT CTT
GCG TTA
GCC CTT
5'ss 3'ss
Figure 5.6: Phylogeny and identical intron position of the nad7 gene. Species in whichnad7 is mitochondrial encoded are marked in blue, those in which it is nuclear en-coded are marked in black. The bootstrap values and the endosymbiotic gene trans-fer of nad7 are labelled at the branches of the tree. The region of the shared intronposition is shown at the nucleotide level, including the splicing sites and the lengthof the introns in parenthesis.
The part of the multiple protein alignment shows a conserved region around
the intron position. The different codons CAG and CAA upstream of the in-
tron position encode the same amino acid glutamine (Q). The codon usage of
glutamine is shown in Table 5.8 for the nuclear and the mitochondrial genome
(Section 4.4.3). The percentages of used codons in the different species reveal
a preference of the codon CAA with an average percentage of 74.6% in the mi-
tochondrial genomes of Dictyostelium discoideum, Thalassiosira pseudonana, Ara-
bidopsis thaliana, Oryza sativa, Pseudendoclonium akinetum, Ostreococcus tauri and
Physcomitrella patens. In contrast, there is a higher average percentage of 69.6%
of the codon use of CAG in the nuclear genomes of Chlamydomonas reinhardtii,
Volvox carteri, Caenorhabditis elegans, Drosophila melanogaster, Danio rerio, Homo sa-
piens, Rattus norvegicus, Mus musculus, Aspergillus fumigatus and Yarrowia lipolyt-
ica.
60
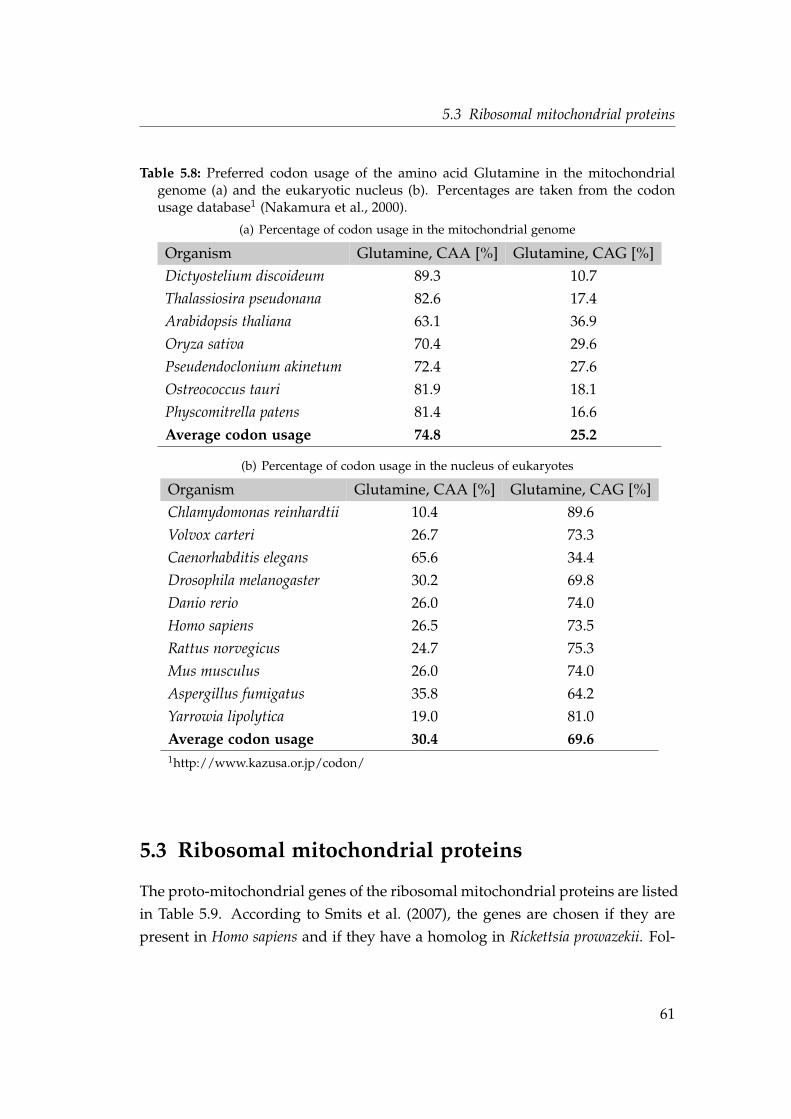
5.3 Ribosomal mitochondrial proteins
Table 5.8: Preferred codon usage of the amino acid Glutamine in the mitochondrialgenome (a) and the eukaryotic nucleus (b). Percentages are taken from the codonusage database1 (Nakamura et al., 2000).
(a) Percentage of codon usage in the mitochondrial genome
Organism Glutamine, CAA [%] Glutamine, CAG [%]
Dictyostelium discoideum 89.3 10.7
Thalassiosira pseudonana 82.6 17.4
Arabidopsis thaliana 63.1 36.9
Oryza sativa 70.4 29.6
Pseudendoclonium akinetum 72.4 27.6
Ostreococcus tauri 81.9 18.1
Physcomitrella patens 81.4 16.6
Average codon usage 74.8 25.2
(b) Percentage of codon usage in the nucleus of eukaryotes
Organism Glutamine, CAA [%] Glutamine, CAG [%]
Chlamydomonas reinhardtii 10.4 89.6
Volvox carteri 26.7 73.3
Caenorhabditis elegans 65.6 34.4
Drosophila melanogaster 30.2 69.8
Danio rerio 26.0 74.0
Homo sapiens 26.5 73.5
Rattus norvegicus 24.7 75.3
Mus musculus 26.0 74.0
Aspergillus fumigatus 35.8 64.2
Yarrowia lipolytica 19.0 81.0
Average codon usage 30.4 69.61http://www.kazusa.or.jp/codon/
5.3 Ribosomal mitochondrial proteins
The proto-mitochondrial genes of the ribosomal mitochondrial proteins are listed
in Table 5.9. According to Smits et al. (2007), the genes are chosen if they are
present in Homo sapiens and if they have a homolog in Rickettsia prowazekii. Fol-
61
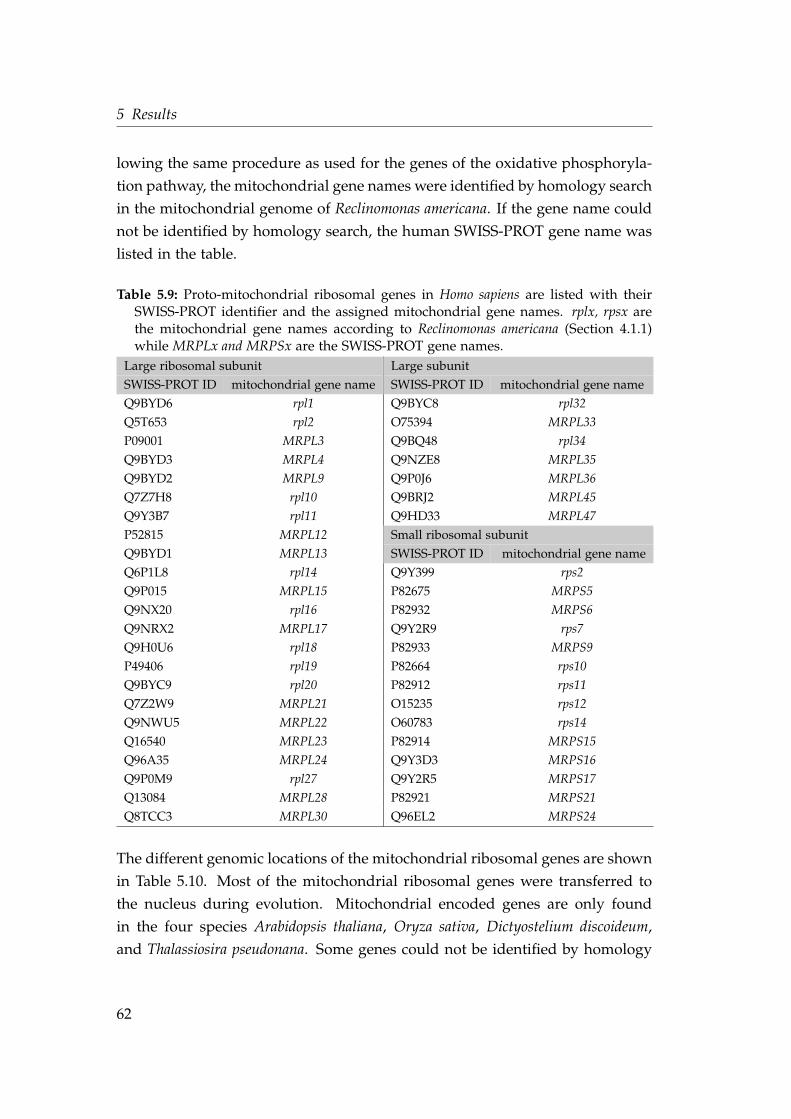
5 Results
lowing the same procedure as used for the genes of the oxidative phosphoryla-
tion pathway, the mitochondrial gene names were identified by homology search
in the mitochondrial genome of Reclinomonas americana. If the gene name could
not be identified by homology search, the human SWISS-PROT gene name was
listed in the table.
Table 5.9: Proto-mitochondrial ribosomal genes in Homo sapiens are listed with theirSWISS-PROT identifier and the assigned mitochondrial gene names. rplx, rpsx arethe mitochondrial gene names according to Reclinomonas americana (Section 4.1.1)while MRPLx and MRPSx are the SWISS-PROT gene names.
Large ribosomal subunit Large subunit
SWISS-PROT ID mitochondrial gene name SWISS-PROT ID mitochondrial gene name
Q9BYD6 rpl1 Q9BYC8 rpl32
Q5T653 rpl2 O75394 MRPL33
P09001 MRPL3 Q9BQ48 rpl34
Q9BYD3 MRPL4 Q9NZE8 MRPL35
Q9BYD2 MRPL9 Q9P0J6 MRPL36
Q7Z7H8 rpl10 Q9BRJ2 MRPL45
Q9Y3B7 rpl11 Q9HD33 MRPL47
P52815 MRPL12 Small ribosomal subunit
Q9BYD1 MRPL13 SWISS-PROT ID mitochondrial gene name
Q6P1L8 rpl14 Q9Y399 rps2
Q9P015 MRPL15 P82675 MRPS5
Q9NX20 rpl16 P82932 MRPS6
Q9NRX2 MRPL17 Q9Y2R9 rps7
Q9H0U6 rpl18 P82933 MRPS9
P49406 rpl19 P82664 rps10
Q9BYC9 rpl20 P82912 rps11
Q7Z2W9 MRPL21 O15235 rps12
Q9NWU5 MRPL22 O60783 rps14
Q16540 MRPL23 P82914 MRPS15
Q96A35 MRPL24 Q9Y3D3 MRPS16
Q9P0M9 rpl27 Q9Y2R5 MRPS17
Q13084 MRPL28 P82921 MRPS21
Q8TCC3 MRPL30 Q96EL2 MRPS24
The different genomic locations of the mitochondrial ribosomal genes are shown
in Table 5.10. Most of the mitochondrial ribosomal genes were transferred to
the nucleus during evolution. Mitochondrial encoded genes are only found
in the four species Arabidopsis thaliana, Oryza sativa, Dictyostelium discoideum,
and Thalassiosira pseudonana. Some genes could not be identified by homology
62
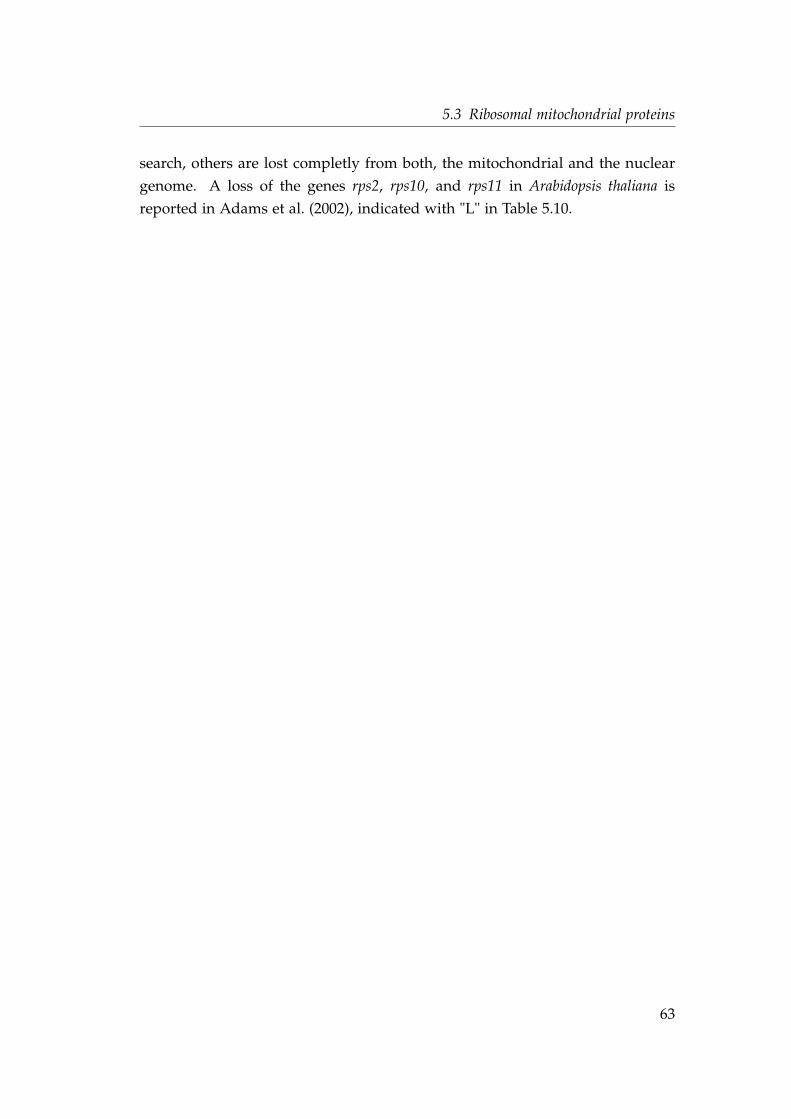
5.3 Ribosomal mitochondrial proteins
search, others are lost completly from both, the mitochondrial and the nuclear
genome. A loss of the genes rps2, rps10, and rps11 in Arabidopsis thaliana is
reported in Adams et al. (2002), indicated with "L" in Table 5.10.
63
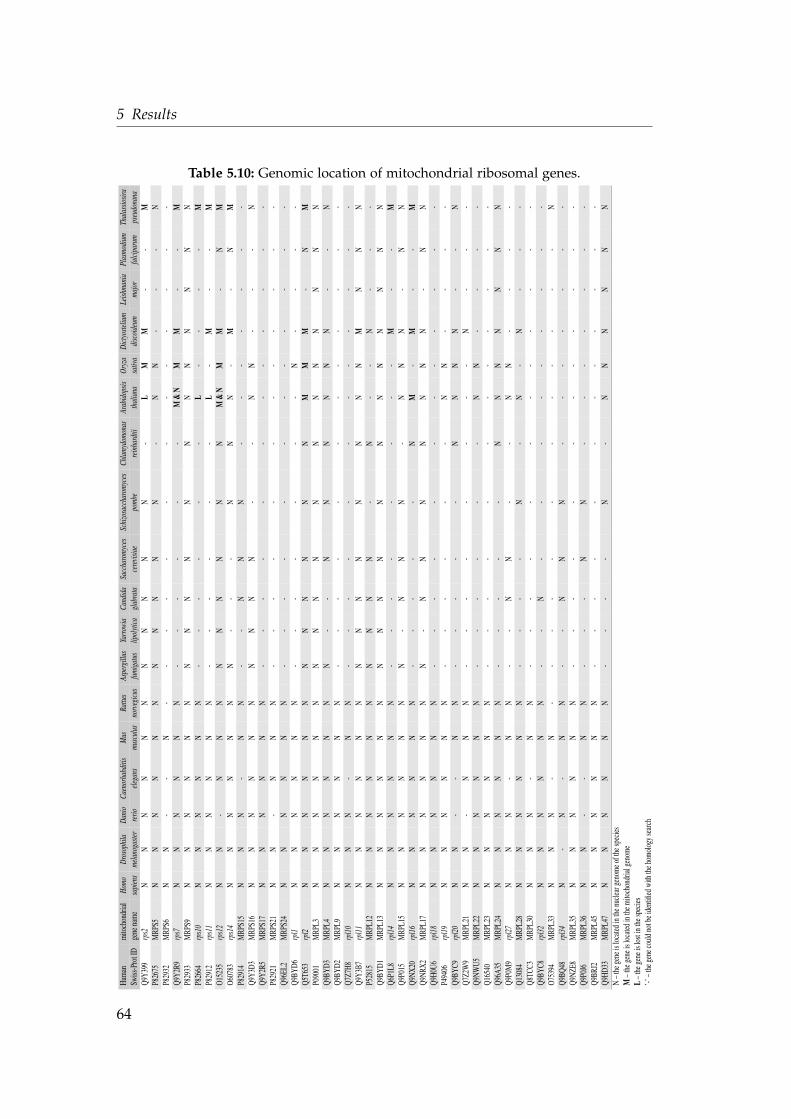
5 Results
Table 5.10: Genomic location of mitochondrial ribosomal genes.
Huma
nmi
tocho
ndria
lH
omo
Dro
soph
ilaD
anio
Cae
norh
abdi
tisM
usRa
ttus
Aspe
rgill
usYa
rrow
iaC
andi
daSa
ccha
rom
yces
Schi
zosa
ccha
rom
yces
Chl
amyd
omon
asAr
abid
opsi
sO
ryza
Dic
tyos
teliu
mLe
ishm
ania
Plas
mod
ium
Thal
assi
osir
a
Swiss
-Pro
tID
gene
name
sapi
ens
mel
anog
aste
rre
rio
eleg
ans
mus
culu
sno
rveg
icus
fum
igat
uslip
olyt
ica
glab
rata
cere
visi
aepo
mbe
rein
hard
tiith
alia
nasa
tiva
disc
oide
umm
ajor
falc
ipar
umps
eudo
nana
Q9Y3
99rp
s2N
NN
NN
NN
NN
NN
-L
MM
--
MP8
2675
MRP
S5N
NN
NN
NN
NN
NN
-N
N-
--
NP8
2932
MRP
S6N
N-
-N
--
--
--
--
--
--
-Q9
Y2R9
rps7
NN
NN
NN
--
--
--
M&
NM
M-
-M
P829
33M
RPS9
NN
NN
NN
NN
NN
NN
NN
NN
NN
P826
64rp
s10
NN
NN
NN
--
--
--
L-
--
-M
P829
12rp
s11
NN
NN
NN
--
--
--
L-
M-
-M
O152
35rp
s12
NN
-N
NN
NN
NN
NN
M&
NM
M-
NM
O607
83rp
s14
NN
NN
NN
N-
--
NN
N-
M-
NM
P829
14M
RPS1
5N
NN
-N
N-
-N
NN
--
--
--
-Q9
Y3D3
MRP
S16
NN
NN
NN
NN
NN
--
NN
--
-N
Q9Y2
R5M
RPS1
7N
NN
NN
N-
--
--
--
--
--
-P8
2921
MRP
S21
NN
-N
NN
--
--
--
--
--
--
Q96E
L2M
RPS2
4N
NN
NN
N-
--
--
--
--
--
-Q9
BYD6
rpl1
NN
NN
NN
--
--
--
-N
--
--
Q5T6
53rp
l2N
NN
NN
NN
NN
NN
NM
MM
-N
MP0
9001
MRP
L3N
NN
NN
NN
NN
NN
NN
NN
NN
NQ9
BYD3
MRP
L4N
NN
NN
NN
--
NN
NN
NN
--
NQ9
BYD2
MRP
L9N
NN
NN
N-
--
--
--
--
--
-Q7
Z7H8
rpl1
0N
NN
-N
N-
--
--
--
--
--
-Q9
Y3B7
rpl1
1N
NN
NN
NN
NN
NN
NN
NM
NN
NP5
2815
MRP
L12
NN
NN
NN
NN
NN
-N
--
N-
--
Q9BY
D1M
RPL1
3N
NN
NN
NN
NN
NN
NN
NN
NN
NQ6
P1L8
rpl1
4N
NN
NN
N-
--
--
--
-M
--
MQ9
P015
MRP
L15
NN
NN
NN
N-
NN
N-
NN
N-
NN
Q9NX
20rp
l16
NN
NN
NN
--
--
-N
M-
M-
-M
Q9NR
X2M
RPL1
7N
NN
NN
NN
-N
NN
NN
NN
-N
NQ9
H0U6
rpl1
8N
NN
NN
N-
--
--
--
--
--
-P4
9406
rpl1
9N
NN
NN
N-
--
--
-N
N-
--
-Q9
BYC9
rpl2
0N
N-
-N
N-
--
--
NN
NN
--
NQ7
Z2W
9M
RPL2
1N
N-
NN
N-
--
--
--
-N
--
-Q9
NWU5
MRP
L22
NN
NN
NN
--
--
--
NN
--
--
Q165
40M
RPL2
3N
NN
NN
N-
--
--
--
--
--
-Q9
6A35
MRP
L24
NN
NN
NN
--
--
-N
NN
NN
NN
Q9P0
M9
rpl2
7N
NN
-N
N-
-N
N-
-N
N-
--
-Q1
3084
MRP
L28
NN
NN
NN
--
--
N-
N-
N-
--
Q8TC
C3M
RPL3
0N
NN
-N
N-
--
--
--
--
--
-Q9
BYC8
rpl3
2N
NN
NN
N-
-N
--
--
--
--
-O7
5394
MRP
L33
NN
N-
N-
--
--
--
--
--
-N
Q9BQ
48rp
l34
N-
N-
NN
--
NN
N-
--
--
--
Q9NZ
E8M
RPL3
5N
NN
NN
N-
--
--
--
--
--
-Q9
P0J6
MRP
L36
NN
--
NN
--
-N
N-
--
--
--
Q9BR
J2M
RPL4
5N
NN
NN
N-
--
--
--
--
--
-Q9
HD33
MRP
L47
NN
NN
NN
--
--
N-
NN
NN
NN
N–t
hege
neis
locate
dint
henu
clear
geno
meof
thesp
ecies
M–t
hege
neis
locate
dint
hemi
tocho
ndria
lgen
ome
L–t
hege
neis
lostin
thesp
ecies
’-’–t
hege
neco
uldno
tbei
denti
fiedw
iththe
homo
logys
earch
64
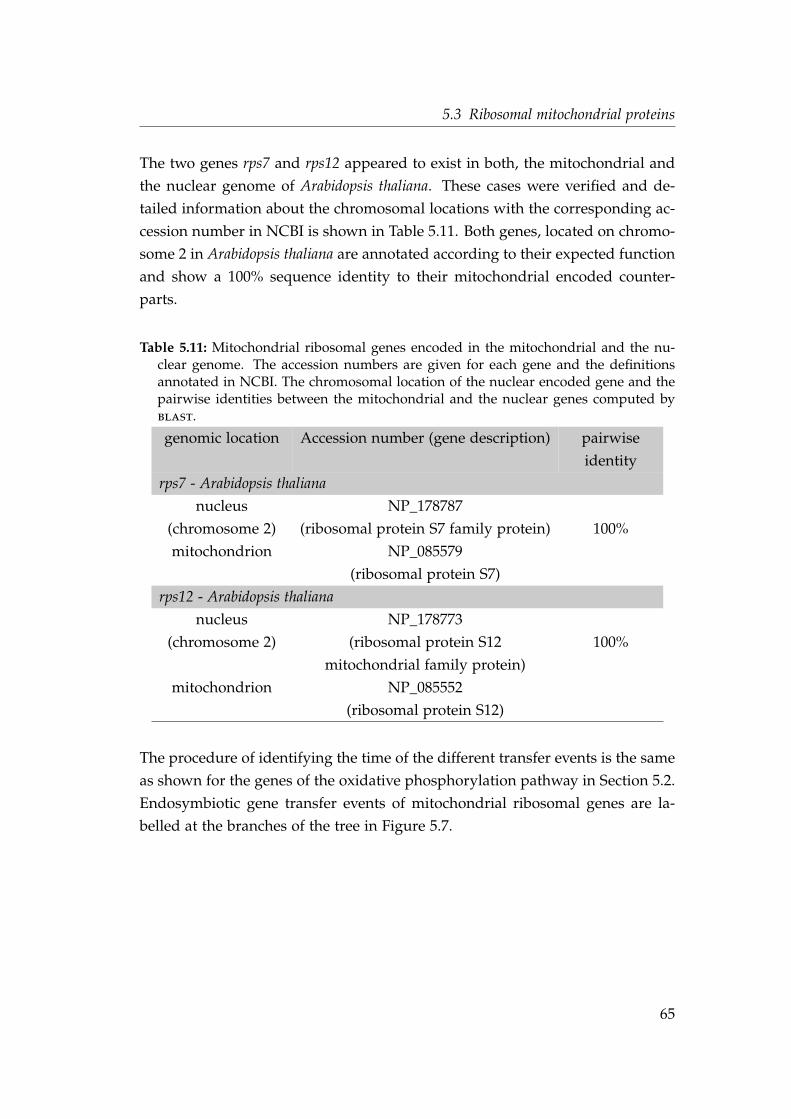
5.3 Ribosomal mitochondrial proteins
The two genes rps7 and rps12 appeared to exist in both, the mitochondrial and
the nuclear genome of Arabidopsis thaliana. These cases were verified and de-
tailed information about the chromosomal locations with the corresponding ac-
cession number in NCBI is shown in Table 5.11. Both genes, located on chromo-
some 2 in Arabidopsis thaliana are annotated according to their expected function
and show a 100% sequence identity to their mitochondrial encoded counter-
parts.
Table 5.11: Mitochondrial ribosomal genes encoded in the mitochondrial and the nu-clear genome. The accession numbers are given for each gene and the definitionsannotated in NCBI. The chromosomal location of the nuclear encoded gene and thepairwise identities between the mitochondrial and the nuclear genes computed byblast.
genomic location Accession number (gene description) pairwise
identity
rps7 - Arabidopsis thaliana
nucleus NP_178787
(chromosome 2) (ribosomal protein S7 family protein) 100%
mitochondrion NP_085579
(ribosomal protein S7)
rps12 - Arabidopsis thaliana
nucleus NP_178773
(chromosome 2) (ribosomal protein S12
mitochondrial family protein)
100%
mitochondrion NP_085552
(ribosomal protein S12)
The procedure of identifying the time of the different transfer events is the same
as shown for the genes of the oxidative phosphorylation pathway in Section 5.2.
Endosymbiotic gene transfer events of mitochondrial ribosomal genes are la-
belled at the branches of the tree in Figure 5.7.
65
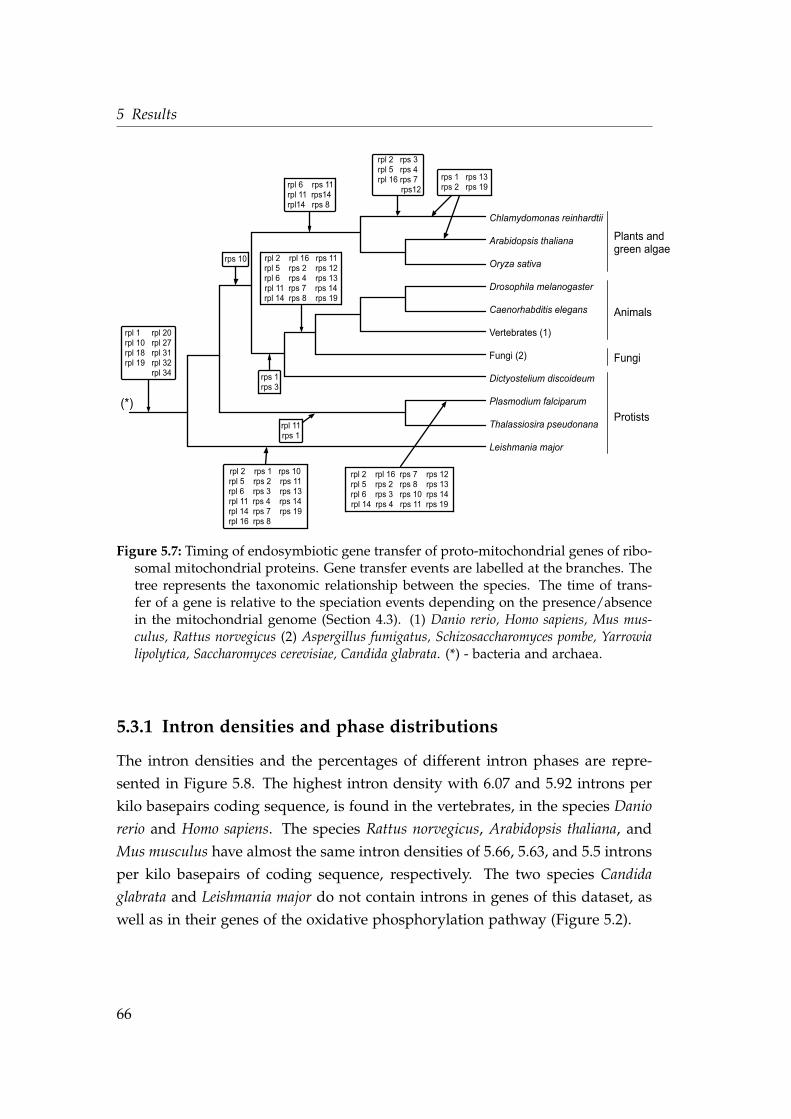
5 Results
Chlamydomonas reinhardtii
Arabidopsis thaliana
Leishmania major
Dictyostelium discoideum
Fungi (2)
Drosophila melanogaster
Caenorhabditis elegans
Vertebrates (1)
Plasmodium falciparum
Thalassiosira pseudonana
Oryza sativa
Plants and green algae
Animals
Protists
rpl 1 rpl 20rpl 10 rpl 27rpl 18 rpl 31rpl 19 rpl 32 rpl 34
rps 10
(*)
rpl 6 rps 11rpl 11 rps14rpl14 rps 8
rps 1 rps 13rps 2 rps 19
rps 1rps 3
rpl 2 rpl 16 rps 11rpl 5 rps 2 rps 12rpl 6 rps 4 rps 13rpl 11 rps 7 rps 14rpl 14 rps 8 rps 19
rpl 2 rpl 16 rps 7 rps 12rpl 5 rps 2 rps 8 rps 13rpl 6 rps 3 rps 10 rps 14rpl 14 rps 4 rps 11 rps 19
Fungi
rpl 11rps 1
rpl 2 rps 1 rps 10rpl 5 rps 2 rps 11rpl 6 rps 3 rps 13rpl 11 rps 4 rps 14rpl 14 rps 7 rps 19 rpl 16 rps 8
rpl 2 rps 3rpl 5 rps 4rpl 16 rps 7
rps12
Figure 5.7: Timing of endosymbiotic gene transfer of proto-mitochondrial genes of ribo-somal mitochondrial proteins. Gene transfer events are labelled at the branches. Thetree represents the taxonomic relationship between the species. The time of trans-fer of a gene is relative to the speciation events depending on the presence/absencein the mitochondrial genome (Section 4.3). (1) Danio rerio, Homo sapiens, Mus mus-culus, Rattus norvegicus (2) Aspergillus fumigatus, Schizosaccharomyces pombe, Yarrowialipolytica, Saccharomyces cerevisiae, Candida glabrata. (*) - bacteria and archaea.
5.3.1 Intron densities and phase distributions
The intron densities and the percentages of different intron phases are repre-
sented in Figure 5.8. The highest intron density with 6.07 and 5.92 introns per
kilo basepairs coding sequence, is found in the vertebrates, in the species Danio
rerio and Homo sapiens. The species Rattus norvegicus, Arabidopsis thaliana, and
Mus musculus have almost the same intron densities of 5.66, 5.63, and 5.5 introns
per kilo basepairs of coding sequence, respectively. The two species Candida
glabrata and Leishmania major do not contain introns in genes of this dataset, as
well as in their genes of the oxidative phosphorylation pathway (Figure 5.2).
66
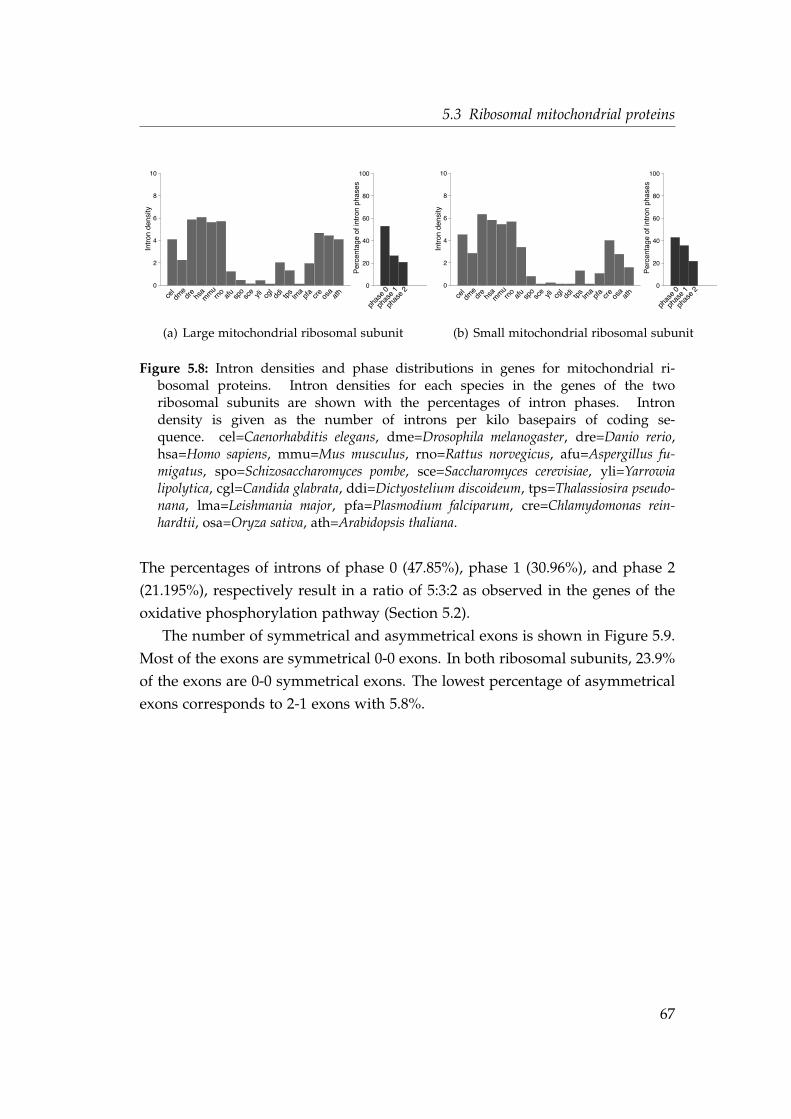
5.3 Ribosomal mitochondrial proteins
0
2
4
6
8
10ce
ldm
edr
ehs
am
mu
rno
afu
spo
sce yli cgl
ddi
tps
lma
pfa
cre
osa
ath
Intr
on d
ensi
ty
0
20
40
60
80
100
phas
e 2
phas
e 1
phas
e 0
Per
cent
age
of in
tron
pha
ses
(a) Large mitochondrial ribosomal subunit
0
2
4
6
8
10
cel
dme
dre
hsa
mm
urn
oaf
usp
osc
e yli cgl
ddi
tps
lma
pfa
cre
osa
ath
Intr
on d
ensi
ty
0
20
40
60
80
100
phas
e 2
phas
e 1
phas
e 0
Per
cent
age
of in
tron
pha
ses
(b) Small mitochondrial ribosomal subunit
Figure 5.8: Intron densities and phase distributions in genes for mitochondrial ri-bosomal proteins. Intron densities for each species in the genes of the tworibosomal subunits are shown with the percentages of intron phases. Introndensity is given as the number of introns per kilo basepairs of coding se-quence. cel=Caenorhabditis elegans, dme=Drosophila melanogaster, dre=Danio rerio,hsa=Homo sapiens, mmu=Mus musculus, rno=Rattus norvegicus, afu=Aspergillus fu-migatus, spo=Schizosaccharomyces pombe, sce=Saccharomyces cerevisiae, yli=Yarrowialipolytica, cgl=Candida glabrata, ddi=Dictyostelium discoideum, tps=Thalassiosira pseudo-nana, lma=Leishmania major, pfa=Plasmodium falciparum, cre=Chlamydomonas rein-hardtii, osa=Oryza sativa, ath=Arabidopsis thaliana.
The percentages of introns of phase 0 (47.85%), phase 1 (30.96%), and phase 2
(21.195%), respectively result in a ratio of 5:3:2 as observed in the genes of the
oxidative phosphorylation pathway (Section 5.2).
The number of symmetrical and asymmetrical exons is shown in Figure 5.9.
Most of the exons are symmetrical 0-0 exons. In both ribosomal subunits, 23.9%
of the exons are 0-0 symmetrical exons. The lowest percentage of asymmetrical
exons corresponds to 2-1 exons with 5.8%.
67
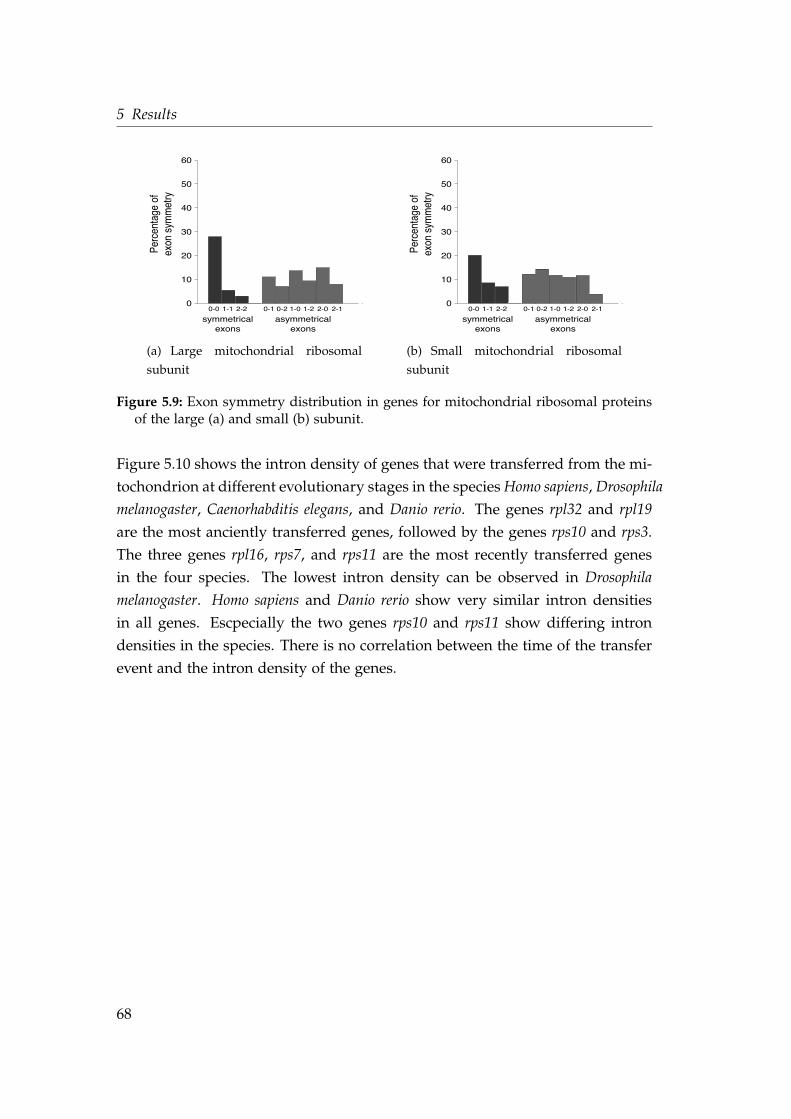
5 Results
0
10
20
30
40
50
60Pe
rcen
tage
of
exon
sym
met
ry
0-0 1-1 2-2 0-1 0-2 2-01-21-0 2-1
symmetricalexons
asymmetricalexons
(a) Large mitochondrial ribosomal
subunit
0
10
20
30
40
50
60
Perc
enta
ge o
f ex
on s
ymm
etry
0-0 1-1 2-2 0-1 0-2 2-01-21-0 2-1
symmetricalexons
asymmetricalexons
(b) Small mitochondrial ribosomal
subunit
Figure 5.9: Exon symmetry distribution in genes for mitochondrial ribosomal proteinsof the large (a) and small (b) subunit.
Figure 5.10 shows the intron density of genes that were transferred from the mi-
tochondrion at different evolutionary stages in the speciesHomo sapiens, Drosophila
melanogaster, Caenorhabditis elegans, and Danio rerio. The genes rpl32 and rpl19
are the most anciently transferred genes, followed by the genes rps10 and rps3.
The three genes rpl16, rps7, and rps11 are the most recently transferred genes
in the four species. The lowest intron density can be observed in Drosophila
melanogaster. Homo sapiens and Danio rerio show very similar intron densities
in all genes. Escpecially the two genes rps10 and rps11 show differing intron
densities in the species. There is no correlation between the time of the transfer
event and the intron density of the genes.
68
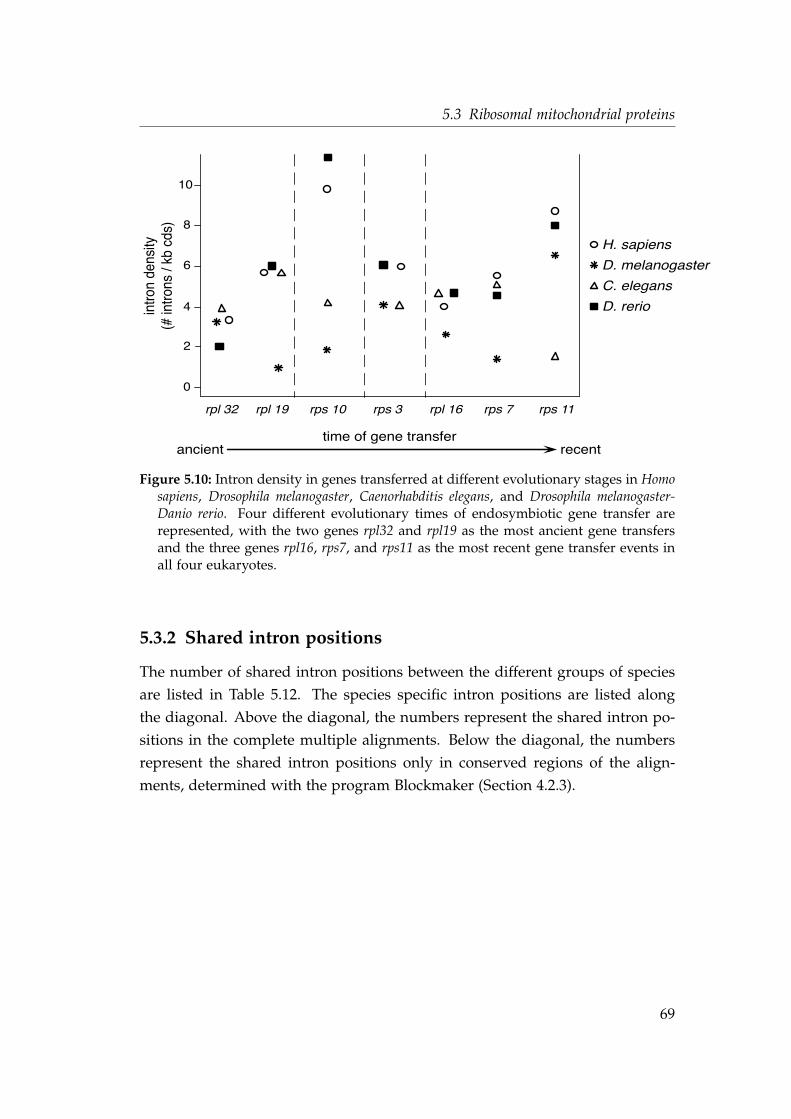
5.3 Ribosomal mitochondrial proteins
time of gene transfer
rps 10 rps 11
10
8
6
4
2
0
ancient recent
H. sapiens
D. melanogaster
C. elegans
rpl 32 rpl 19 rps 7rpl 16rps 3
intro
n de
nsity
(# in
trons
/ kb
cds
)
D. rerio
Figure 5.10: Intron density in genes transferred at different evolutionary stages in Homosapiens, Drosophila melanogaster, Caenorhabditis elegans, and Drosophila melanogaster-Danio rerio. Four different evolutionary times of endosymbiotic gene transfer arerepresented, with the two genes rpl32 and rpl19 as the most ancient gene transfersand the three genes rpl16, rps7, and rps11 as the most recent gene transfer events inall four eukaryotes.
5.3.2 Shared intron positions
The number of shared intron positions between the different groups of species
are listed in Table 5.12. The species specific intron positions are listed along
the diagonal. Above the diagonal, the numbers represent the shared intron po-
sitions in the complete multiple alignments. Below the diagonal, the numbers
represent the shared intron positions only in conserved regions of the align-
ments, determined with the program Blockmaker (Section 4.2.3).
69
5 Results
Table 5.12: Shared intron positions in genes of mitochondrial ribosomal proteins.Shared intron positions between the different groups of species within the com-plete multiple protein alignments are shown above the diagonal, shared intron posi-tions only within conserved regions of the alignment are shown below the diagonal.Species specific intron positions are shown in the diagonal.
Animals Plants Fungi D. dis L. maj P. fal T. pse
Animals 318 12 4 3 - - 2
Plants 6 105 1 - - - -
Fungi 1 1 17 - - - -
D. dis 1 - - 6 - - -
L. maj - - - - 0 - -
P. fal - - - - - 11 -
T. pse 1 - - - - - 3Animals - Caenorhabditis elegans, Danio rerio, Drosophila melanogaster, Homo sapiens, Mus musculus, Rattus norvegicus
Plants - Arabidopsis thaliana, Chlamydomonas reinhardtii, Oryza sativa
Fungi - Aspergillus fumigatus, Candida glabrata, Saccharomyces cerevisiae, Schizosaccharomyces pombe, Yarrowia lipolytica
D. dis - Dictyostelium discoideum
L.maj - Leishmania major
P. fal - Plasmodium falciparum
T. pse - Thalassiosira pseudonana
Excluding shared intron positions in non-conserved alignment regions, reduces
the numbers approximately by half. Most of the intron positions are shared
between animals and plants, which is 54.55% in the complete alignment and
60% in the conserved regions. Five intron positions are shared between more
than two species. Two of them are shared between the group of animals, plants
and Dictyostelium discoideum. One of these intron positions is shared between
animals, fungi, Dictyostelium discoideum and the other one is found in the group
of animals, fungi and plants. The numbers of shared intron positions of the
same or different phase were computed (Table 5.13).
70
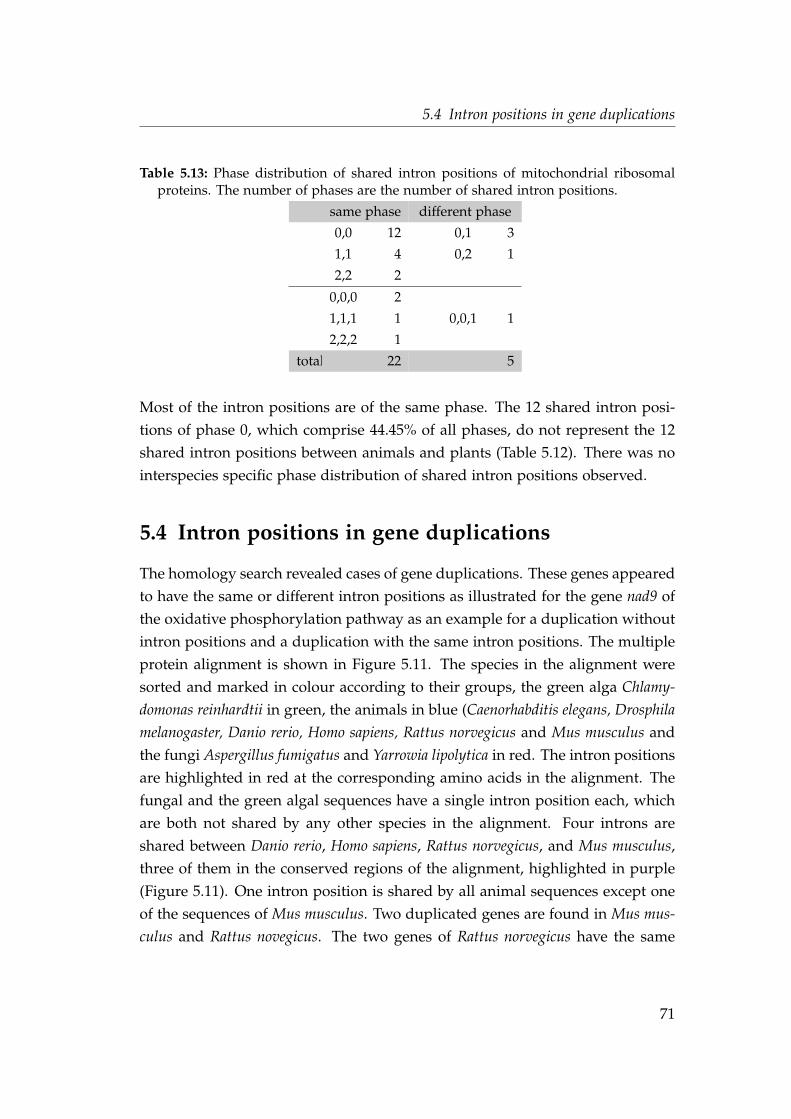
5.4 Intron positions in gene duplications
Table 5.13: Phase distribution of shared intron positions of mitochondrial ribosomalproteins. The number of phases are the number of shared intron positions.
same phase different phase
0,0 12 0,1 3
1,1 4 0,2 1
2,2 2
0,0,0 2
1,1,1 1 0,0,1 1
2,2,2 1
total 22 5
Most of the intron positions are of the same phase. The 12 shared intron posi-
tions of phase 0, which comprise 44.45% of all phases, do not represent the 12
shared intron positions between animals and plants (Table 5.12). There was no
interspecies specific phase distribution of shared intron positions observed.
5.4 Intron positions in gene duplications
The homology search revealed cases of gene duplications. These genes appeared
to have the same or different intron positions as illustrated for the gene nad9 of
the oxidative phosphorylation pathway as an example for a duplication without
intron positions and a duplication with the same intron positions. The multiple
protein alignment is shown in Figure 5.11. The species in the alignment were
sorted and marked in colour according to their groups, the green alga Chlamy-
domonas reinhardtii in green, the animals in blue (Caenorhabditis elegans, Drosphila
melanogaster, Danio rerio, Homo sapiens, Rattus norvegicus and Mus musculus and
the fungi Aspergillus fumigatus and Yarrowia lipolytica in red. The intron positions
are highlighted in red at the corresponding amino acids in the alignment. The
fungal and the green algal sequences have a single intron position each, which
are both not shared by any other species in the alignment. Four introns are
shared between Danio rerio, Homo sapiens, Rattus norvegicus, and Mus musculus,
three of them in the conserved regions of the alignment, highlighted in purple
(Figure 5.11). One intron position is shared by all animal sequences except one
of the sequences of Mus musculus. Two duplicated genes are found in Mus mus-
culus and Rattus novegicus. The two genes of Rattus norvegicus have the same
71
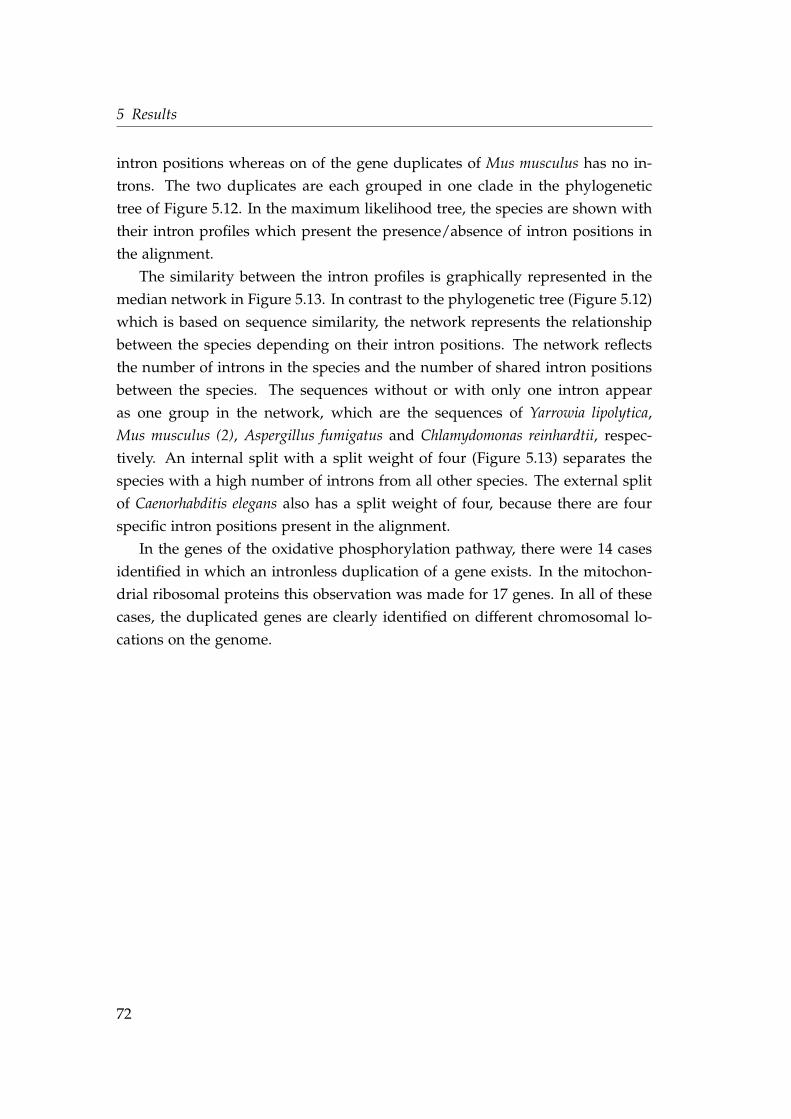
5 Results
intron positions whereas on of the gene duplicates of Mus musculus has no in-
trons. The two duplicates are each grouped in one clade in the phylogenetic
tree of Figure 5.12. In the maximum likelihood tree, the species are shown with
their intron profiles which present the presence/absence of intron positions in
the alignment.
The similarity between the intron profiles is graphically represented in the
median network in Figure 5.13. In contrast to the phylogenetic tree (Figure 5.12)
which is based on sequence similarity, the network represents the relationship
between the species depending on their intron positions. The network reflects
the number of introns in the species and the number of shared intron positions
between the species. The sequences without or with only one intron appear
as one group in the network, which are the sequences of Yarrowia lipolytica,
Mus musculus (2), Aspergillus fumigatus and Chlamydomonas reinhardtii, respec-
tively. An internal split with a split weight of four (Figure 5.13) separates the
species with a high number of introns from all other species. The external split
of Caenorhabditis elegans also has a split weight of four, because there are four
specific intron positions present in the alignment.
In the genes of the oxidative phosphorylation pathway, there were 14 cases
identified in which an intronless duplication of a gene exists. In the mitochon-
drial ribosomal proteins this observation was made for 17 genes. In all of these
cases, the duplicated genes are clearly identified on different chromosomal lo-
cations on the genome.
72
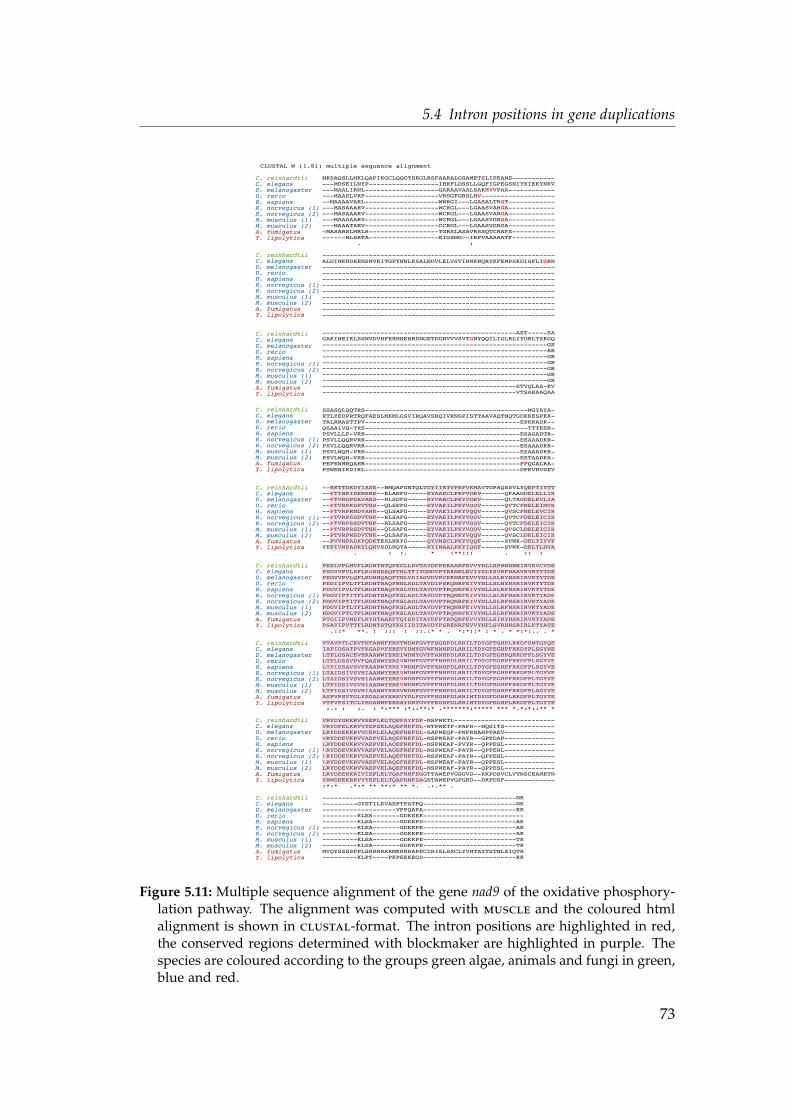
5.4 Intron positions in gene duplications
CLUSTAL W (1.81) multiple sequence alignment
cre_011289 MKSAQSLLMKLQAPIKGCLQQGTSEGLRSFAARALGSAMETSLIPEANS-----------cel_001378 ---MDSEILNYP------------------IHRFLDSSLLGQFIGPEGSNIYKIEKYNKVdme_016537 ---MAALIRNL-------------------GARAAVAALSAKHVVPAA------------dre_021297 ---MAASLVRF-------------------VRSGFGRSLNV-------------------hsa_O75489 --MAAAAVARL-------------------WWRGI---LGASALTRGT------------rno_016499 ---MASAAARV-------------------WCRGL---LGAASVARGA------------rno_004217 ---MASAAARV-------------------WCRGL---LGAASVARGA------------mmu_015071 ---MAAAAARV-------------------WCRGL---LGAASVGRGA------------mmu_010177 ---MAAATARV-------------------CCRGL---LGAASVGRGA------------afu_008079 -MASARSLMRLS------------------TGRSLASAVRSSQTCRAFS-----------yli_005288 ------MLSRFA------------------RIGSMG--IRPVAAARATF----------- . :
cre_011289 ------------------------------------------------------------cel_001378 ALDIWKNDEENSNVRITGPYWNLKSALNDVLELVSTIRNKNQRYKFEMPSKDIGFLIGKNdme_016537 ------------------------------------------------------------dre_021297 ------------------------------------------------------------hsa_O75489 ------------------------------------------------------------rno_016499 ------------------------------------------------------------rno_004217 ------------------------------------------------------------mmu_015071 ------------------------------------------------------------mmu_010177 ------------------------------------------------------------afu_008079 ------------------------------------------------------------yli_005288 ------------------------------------------------------------
cre_011289 --------------------------------------------------AST-----SAcel_001378 GAKINEIKLSSNVDVHFERNNENRDNGETDGRVVVSVTGNYQQILIGLRLIYDRLTSKGQdme_016537 ----------------------------------------------------------GSdre_021297 ----------------------------------------------------------ARhsa_O75489 ----------------------------------------------------------GRrno_016499 ----------------------------------------------------------GRrno_004217 ----------------------------------------------------------GRmmu_015071 ----------------------------------------------------------GRmmu_010177 ----------------------------------------------------------GRafu_008079 --------------------------------------------------STVQLAS-KVyli_005288 --------------------------------------------------VTSARAAQAA
cre_011289 SSASQLQQTRS------------------------------------------MGYAYA-cel_001378 KTLYEDPRTRQFAESLMKMLGSVIRQAVSRQIVRNSPISTTAAVAQTNQTGDKKESPKK-dme_016537 TALRMASTTPV----------------------------------------EPKKADK--dre_021297 QSAAIVQ-TRS------------------------------------------TTTESR-hsa_O75489 PSVLLLP-VRR----------------------------------------ESAGADTR-rno_016499 PSVLLQQRVRR----------------------------------------ESAAADKR-rno_004217 PSVLLQQRVRR----------------------------------------ESAAADKR-mmu_015071 PSVLWQH-VRR----------------------------------------ESAAADKR-mmu_010177 PSVLWQH-VRR----------------------------------------ESTAADKR-afu_008079 PEPENMRQAHR----------------------------------------PPQGALRA-yli_005288 PSWENIKDIRL----------------------------------------DPKVHVDEV
cre_011289 --RKTTDKDYIASE--HMQAFGNTQLTDYIIKTVPKFVKMAVTGPAQSSVLYQEPTIYTTcel_001378 --PTIWKIDEHKRE--RLANFG-----KYAAECLPKFVQKV------QFAAGDELELLIHdme_016537 --PTVRQPDAVARS--HLSDFG-----RYVAECLPKYVQKV------QLTAGDELEVLIAdre_021297 --PTVRPKDPVTHS--QLSEFG-----EYVAEILPKYVQQV------QVTCFNELEIMVHhsa_O75489 --PTVRPRNDVAHK--QLSAFG-----EYVAEILPKYVQQV------QVSCFNELEVCIHrno_016499 --PTVRPSSDVTHK--RLSAFG-----EYVAEILPKYVQQV------QVTCFDELEICIHrno_004217 --PTVRPSSDVTHK--RLSAFG-----EYVAEILPKYVQQV------QVTCFDELEICIHmmu_015071 --PTVRPRSDVTHK--QLSAFG-----EYVAEILPKYVQQV------QVSCLDELEICIHmmu_010177 --PTVRPWSDVTHK--QLSAFA-----EYVAEILPKYVQQV------QVSCLDKLEICIHafu_008079 --PVVNPADKYQDKTESLHKYG-----QYVMSCLPKYVQQF------SVWK-DELTIYVPyli_005288 YEPIVNPADRYLQHVSDLHQYA-----KYIMAALPKYIQGF------SVWK-DELTLHVA . : :. * :**::: . :: :
cre_011289 PESLVPLMVFLRDHTNTQFKCLLDVTAVDFPERAARFEVVYHLLSPRWNNRIRVKVCVDEcel_001378 PSGVVPVLSFLKGNHSAQFTNLTFITGMDVPTRKNRLEVIYSLYSVRFNARVRVRTYTDEdme_016537 PEGVVPVLQFLKDHHQAQFTNLVDIAGVDVPCRKNRFEVVYNLLSLRYNSRIRVKTYTDEdre_021297 PEGIIPVLTFLKDHTNAQFRNLADLTAVDIPSKQNRFEIVYNLLSLHYNSRIRVKTYTDEhsa_O75489 PDGVIPVLTFLRDHTNAQFKSLVDLTAVDVPTRQNRFEIVYNLLSLRFNSRIRVKTYTDErno_016499 PDGVIPTITFLKDHTNAQFKSLADLTAVDVPTRQNRFEIVYNLLSLRFNSRIRVKTYADErno_004217 PDGVIPTITFLKDHTNAQFKSLADLTAVDVPTRQNRFEIVYNLLSLRFNSRIRVKTYADEmmu_015071 PDGVIPTLTFLRDHTNAQFKSLADLTAVDVPTRQNRFEIVYNLLSLRFNSRIRVKTYADEmmu_010177 HDGVIPTLTFLRDHTNAQFKSLADLTAVDVPTRQNRFEIVYNLLSLRFNSRIRVKTYADEafu_008079 PTGIIPVMSFLKYHTAAEFTQISDITAVDFPTRDQRFEVVYNLLSIRYNSRIRVKTYADEyli_005288 PSAVIPVTTFLRDNTSTQYKSIIDITAVDYPSRENRFEVVYNFLSVRHNSRIRLKTYATE .::* **. : ::: : ::.:* * . *:*::* : * . * *:*:.. . *
cre_011289 VTAVPTLCKVFNTANWFERETWDMFGVFFSGHPDLRRILTDYGFTGHPLRKDFPMTGYQEcel_001378 IAPIDSATPVFKGADWFEREVYDMYGVWFNNHPDLRRILTDYGFEGHPFRKDYPLSGYNEdme_016537 LTPLDSACEVHKAANWYEREIWDMYGVFFANHPDLRRILTDYGFEGHPQRRDFPLSGYVEdre_021297 LTPLDSSVPVFQASNWYEREVWDMFGVFFTNHPDLRRILTDYGFEGHPFRKDFPLSGYVEhsa_O75489 LTPIESAVSVFKAANWYEREIWDMFGVFFANHPDLRRILTDYGFEGHPFRKDFPLSGYVErno_016499 LTAIDSIVSVHIAANWYEREVWDMFGVFFFNHPDLRRILTDYGFEGHPFRKDFPLTGYVErno_004217 LTAIDSIVSVHIAANWYEREVWDMFGVFFFNHPDLRRILTDYGFEGHPFRKDFPLTGYVEmmu_015071 LTPIDSIVSVHIAANWYEREVWDMFGVFFFNHPDLRRILTDYGFEGHPFRKDFPLTGYVEmmu_010177 LTPIDSIVSVHIAANWYEREVWDMFGVFFFNHPDLRRILTDYGFEGHPFRKDFPLAGYVEafu_008079 ASPVPSVTGLYEGALWYEREVYDLFGVFFSGHPDLRRIMTDYGFDGHPLRKDFPLTGYTEyli_005288 VTPVPSITCLYEGANWFEREAYDMYGVFFEGHPDLRRIMTDYGFEGHPLRKDFPLTGYTE :.: : :. : *:*** :*::**:* .*******:***** *** *.*:*::** *
cre_011289 VRYDYGKKRVVSEPLELTQEFRYFDF-NSPWETL--------------------------cel_001378 VRYDPELKRVVYEPSELAQEFRKFDL-NTPWETF-PAFR--NQSITS-------------dme_016537 LRYDDEKKRVVCEPLELAQEFRKFDL-SAPWEQF-PNFRNANPPAEV-------------dre_021297 VRYDDEVKRVVAEPVELAQEFRKFDL-NSPWEAF-PAYR--GPKDAP-------------hsa_O75489 LRYDDEVKRVVAEPVELAQEFRKFDL-NSPWEAF-PVYR--QPPESL-------------rno_016499 LRYDDEVKRVVAEPVELAQEFRKFDL-NSPWEAF-PAYR--QPPEHL-------------rno_004217 LRYDDEVKRVVAEPVELAQEFRKFDL-NSPWEAF-PAYR--QPPEHL-------------mmu_015071 LRYDDEVKRVVAEPVELAQEFRKFDL-NSPWEAF-PAYR--QPPESL-------------mmu_010177 LRYDDEVKRVVAEPVELAQEFRKFDL-NSPWEAF-PAYR--QPPESL-------------afu_008079 LRYDEEKKRIVIEPLELTQAFRNFEGGTTAWEPVGSGVD--RKPDSVCLVTNSCEAMETNyli_005288 VRWDEEKRRVVYEPLELTQAFRNFSAGSTAWEPVGPGRD--DRPDSF------------- :*:* .*:* ** **:* ** *. .:.** .
cre_011289 --------------------------------------------------NRcel_001378 ---------GYETILEVAEPTPATPQ------------------------NKdme_016537 -------------------VPPQAPA------------------------KKdre_021297 ---------KLES-------GDKSEK--------------------------hsa_O75489 ---------KLEA-------GDKKPD------------------------AKrno_016499 ---------KLEA-------GDKKPE------------------------AKrno_004217 ---------KLEA-------GDKKPE------------------------AKmmu_015071 ---------KLEA-------GDKKPE------------------------TKmmu_010177 ---------KLEA-------GDKKPE------------------------TKafu_008079 MVQYSSSSPPLSRRRRRRMKRNRAPECIRISLSRCLYVHTAYTSTNLSIQTRyli_005288 ---------KLPT----PKPEEKEGD------------------------KK
RKTTDKDYIASE-PTIWKIDEHKRE-PTVRQPDAVARS-PTVRPKDPVTHS-PTVRPRNDVAHK-PTVRPSSDVTHK-PTVRPSSDVTHK-PTVRPRSDVTHK-PTVRPWSDVTHK-PVVNPADKYQDKTPIVNPADRYLQHV
C. reinhardtiiC. elegans
M. musculus (1)M. musculus (2)
D. melanogasterD. rerioH. sapiensR. norvegicus (1)R. norvegicus (2)
A. fumigatusY. lipolytica
C. reinhardtiiC. elegans
M. musculus (1)M. musculus (2)
D. melanogasterD. rerioH. sapiensR. norvegicus (1)R. norvegicus (2)
A. fumigatusY. lipolytica
C. reinhardtiiC. elegans
M. musculus (1)M. musculus (2)
D. melanogasterD. rerioH. sapiensR. norvegicus (1)R. norvegicus (2)
A. fumigatusY. lipolytica
C. reinhardtiiC. elegans
M. musculus (1)M. musculus (2)
D. melanogasterD. rerioH. sapiensR. norvegicus (1)R. norvegicus (2)
A. fumigatusY. lipolytica
C. reinhardtiiC. elegans
M. musculus (1)M. musculus (2)
D. melanogasterD. rerioH. sapiensR. norvegicus (1)R. norvegicus (2)
A. fumigatusY. lipolytica
C. reinhardtiiC. elegans
M. musculus (1)M. musculus (2)
D. melanogasterD. rerioH. sapiensR. norvegicus (1)R. norvegicus (2)
A. fumigatusY. lipolytica
C. reinhardtiiC. elegans
M. musculus (1)M. musculus (2)
D. melanogasterD. rerioH. sapiensR. norvegicus (1)R. norvegicus (2)
A. fumigatusY. lipolytica
C. reinhardtiiC. elegans
M. musculus (1)M. musculus (2)
D. melanogasterD. rerioH. sapiensR. norvegicus (1)R. norvegicus (2)
A. fumigatusY. lipolytica
C. reinhardtiiC. elegans
M. musculus (1)M. musculus (2)
D. melanogasterD. rerioH. sapiensR. norvegicus (1)R. norvegicus (2)
A. fumigatusY. lipolytica
DYIIKTVPKFVKMAVKYAAECLPKFVQKVRYVAECLPKYVQKVEYVAEILPKYVQQVEYVAEILPKYVQQVEYVAEILPKYVQQVEYVAEILPKYVQQVEYVAEILPKYVQQVEYVAEILPKYVQQVQYVMSCLPKYVQQFKYIMAALPKYIQGF* **
YQEPTIYTTGDELELLIHGDELEVLIAFNELEIMVHFNELEVCIHFDELEICIHFDELEICIHLDELEICIHLDKLEICIH-DELTIYVP-DELTLHVA
PESLVPLMVFLRDHTNTQFKCLLDVTAVDFPERAARFEVVYHLLSPRWNNRIRVKVCVDEPSGVVPVLSFLKGNHSAQFTNLTFITGMDVPTRKNRLEVIYSLYSVRFNARVRVRTYTDEPEGVVPVLQFLKDHHQAQFTNLVDIAGVDVPCRKNRFEVVYNLLSLRYNSRIRVKTYTDEPEGIIPVLTFLKDHTNAQFRNLADLTAVDIPSKQNRFEIVYNLLSLHYNSRIRVKTYTDEPDGVIPVLTFLRDHTNAQFKSLVDLTAVDVPTRQNRFEIVYNLLSLRFNSRIRVKTYTDEPDGVIPTITFLKDHTNAQFKSLADLTAVDVPTRQNRFEIVYNLLSLRFNSRIRVKTYADEPDGVIPTITFLKDHTNAQFKSLADLTAVDVPTRQNRFEIVYNLLSLRFNSRIRVKTYADEPDGVIPTLTFLRDHTNAQFKSLADLTAVDVPTRQNRFEIVYNLLSLRFNSRIRVKTYADEHDGVIPTLTFLRDHTNAQFKSLADLTAVDVPTRQNRFEIVYNLLSLRFNSRIRVKTYADEPTGIIPVMSFLKYHTAAEFTQISDITAVDFPTRDQRFEVVYNLLSIRYNSRIRVKTYADEPSAVIPVTTFLRDNTSTQYKSIIDITAVDYPSRENRFEVVYNFLSVRHNSRIRLKTYATE
VTAVPTLCKVFNTANWFERETWDMFGVFFSGHPDLRRILTDYGFTGHPLRKDFPMTGYQEIAPIDSATPVFKGADWFEREVYDMYGVWFNNHPDLRRILTDYGFEGHPFRKDYPLSGYNELTPLDSACEVHKAANWYEREIWDMYGVFFANHPDLRRILTDYGFEGHPQRRDFPLSGYVELTPLDSSVPVFQASNWYEREVWDMFGVFFTNHPDLRRILTDYGFEGHPFRKDFPLSGYVEVVLTPIESAVSVFKAANWYEREIWDMFGVFFANHPDLRRILTDYGFEGHPFRKDFPLSGYVELTAIDSIVSVHIAANWYEREVWDMFGVFFFNHPDLRRILTDYGFEGHPFRKDFPLTGYVEVVLTAIDSIVSVHIAANWYEREVWDMFGVFFFNHPDLRRILTDYGFEGHPFRKDFPLTGYVEVVLTPIDSIVSVHIAANWYEREVWDMFGVFFFNHPDLRRILTDYGFEGHPFRKDFPLTGYVEVVLTPIDSIVSVHIAANWYEREVWDMFGVFFFNHPDLRRILTDYGFEGHPFRKDFPLAGYVEASPVPSVTGLYEGALWYEREVYDLFGVFFSGHPDLRRIMTDYGFDGHPLRKDFPLTGYTEVTPVPSITCLYEGANWFEREAYDMYGVFFEGHPDLRRIMTDYGFEGHPLRKDFPLTGYTE
VRYDYGKKRVVSEPLELTQEFRYFDFVRYDPELKRVVYEPSELAQEFRKFDLLRYDDEKKRVVCEPLELAQEFRKFDLVRYDDEVKRVVAEPVELAQEFRKFDLLRYDDEVKRVVAEPVELAQEFRKFDLLRYDDEVKRVVAEPVELAQEFRKFDLLRYDDEVKRVVAEPVELAQEFRKFDLLRYDDEVKRVVAEPVELAQEFRKFDLLRYDDEVKRVVAEPVELAQEFRKFDLLRYDEEKKRIVIEPLELTQAFRNFEGGVRWDEEKRRVVYEPLELTQAFRNFSAG
Figure 5.11: Multiple sequence alignment of the gene nad9 of the oxidative phosphory-lation pathway. The alignment was computed with muscle and the coloured htmlalignment is shown in clustal-format. The intron positions are highlighted in red,the conserved regions determined with blockmaker are highlighted in purple. Thespecies are coloured according to the groups green algae, animals and fungi in green,blue and red.
73
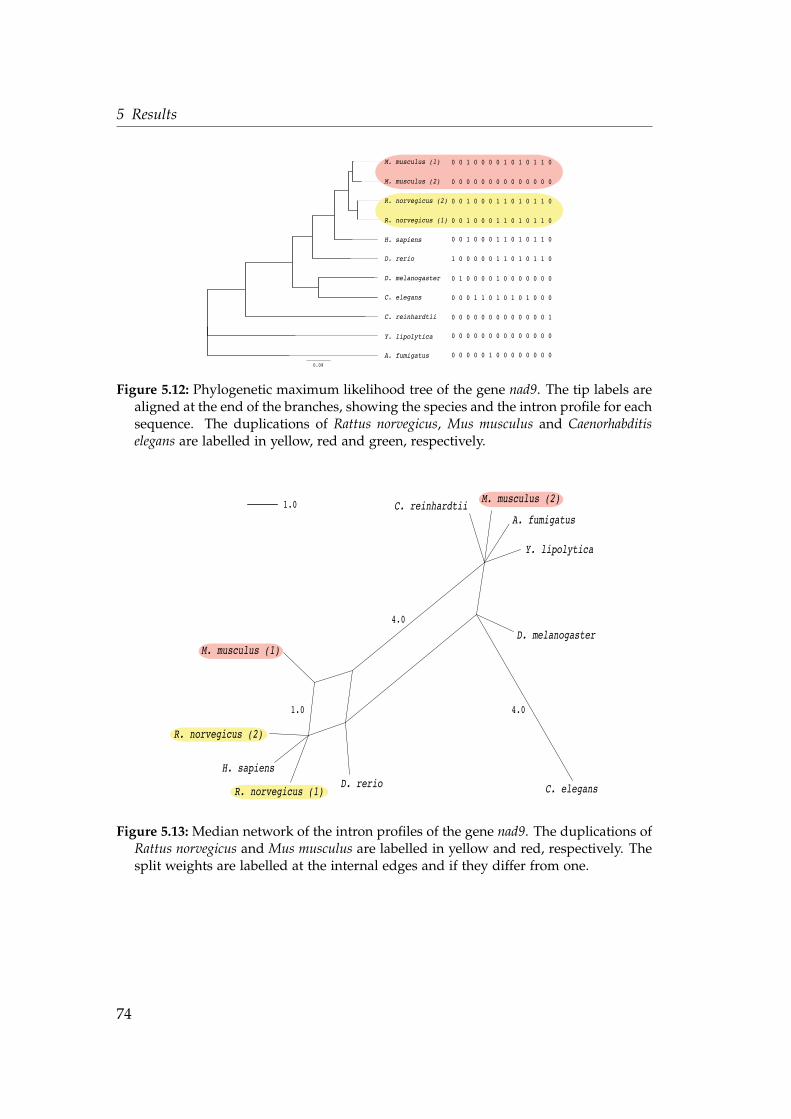
5 Results
0.09
afu_008079
hsa_O75489
yli_005288
rno_004217
dre_021297
cre_011289
mmu_010177
cel_001378
dme_016537
mmu_015071
rno_016499
R. norvegicus (2) 0 0 1 0 0 0 1 1 0 1 0 1 1 0
R. norvegicus (1) 0 0 1 0 0 0 1 1 0 1 0 1 1 0
M. musculus (2)
M. musculus (1)
0 0 0 0 0 0 0 0 0 0 0 0 0 0
0 0 1 0 0 0 0 1 0 1 0 1 1 0
C. reinhardtii
D. rerio
D. melanogaster
0 0 0 0 0 0 0 0 0 0 0 0 0 1
0 0 1 0 0 0 1 1 0 1 0 1 1 0
1 0 0 0 0 0 1 1 0 1 0 1 1 0
0 1 0 0 0 0 1 0 0 0 0 0 0 0
H. sapiens
C. elegans 0 0 0 1 1 0 1 0 1 0 1 0 0 0
0 0 0 0 0 1 0 0 0 0 0 0 0 0A. fumigatus
0 0 0 0 0 0 0 0 0 0 0 0 0 0Y. lipolytica
0.09
Figure 5.12: Phylogenetic maximum likelihood tree of the gene nad9. The tip labels arealigned at the end of the branches, showing the species and the intron profile for eachsequence. The duplications of Rattus norvegicus, Mus musculus and Caenorhabditiselegans are labelled in yellow, red and green, respectively.
1.0
R. norvegicus (1)
H. sapiensD. rerio
C. reinhardtiiA. fumigatus
Y. lipolytica
D. melanogaster
C. elegans
4.0
4.01.0
M. musculus (1)
M. musculus (2)
R. norvegicus (2)
Figure 5.13: Median network of the intron profiles of the gene nad9. The duplications ofRattus norvegicus and Mus musculus are labelled in yellow and red, respectively. Thesplit weights are labelled at the internal edges and if they differ from one.
74
6 Discussion
6.1 Database and annotation independent method to
identify intron positions
The method presented in this work was developed to identify intron positions
independently from gene annotations (Section 4.2.2). Genome and sequence an-
notations are not always reliable and complete. Using a secondary exon/intron
database will limit the set of data that is included in primary databases. If a pro-
tein occurs to be intronless in a database, it is possible that this is due to miss-
ing annotation. Furthermore, the quality of annotations differ among genomes,
depending on importance and time a species is studied. While investigations
of the evolution of spliceosomal introns which include well annotated species
and based on large scale analysis might not be significantly effected, a lim-
ited set of data under consideration may substantially reduce the reliability of
exon/intron structure information and should therefore be treated carefully. Of
course, exon/intron databases test the annotations as described in Section 4.2.1
for the EID (Exon-Intron Database) (Saxonov et al., 2000; Shepelev and Fedorov,
2006), but missing intron positions are not added.
The method developed here depends only on the quality of the sequences
in the databases which are used. With a sufficient sequence quality a reliable
identification of intron positions can be performed. Despite of being indepen-
dent of annotation errors, the method developed in this work allows to identify
intron positions in species or genes which are not included in exon/intron data-
bases. Very recently, a similar method (Scipio) was published (Keller et al., 2008)
in which also the program blat is used to align the protein sequences to theirgenomic counterparts. This publication supports the need for an annotation
independent method to obtain information about the exon/intron structure of
genes.
75
6 Discussion
6.2 Endosymbiotic gene transfer, gene loss and
sequence information
The timing of endosymbiotic gene transfer as described in Section 5.2 and Sec-
tion 5.3 reveals a very dynamic evolutionary process with species specific gene
transfer events at different evolutionary stages. The timing of the transfer events
depends on the species phylogeny, the parsimonious method and on the avail-
able database information. This approach is similar to that, shown in Bonen and
Calixte (2006), in which the timing of transfer events is inferred for the liverwort
Marchantia polymorpha, and the plants Arabidopsis thaliana and Oryza sativawhich
leads to the same mitochondrial gene content of the two plants as identified in
this work. But the separation of ancient and recent gene transfers becomes
more differentiated with a growing number of species used here. The phyloge-
netic relationship of the 18 eukaryotes resolves in more detail independent gene
transfers as in the case of the gene nad7 which was transferred independently
in the group of animals and the green alga Chlamydomonas reinhardtii. Obser-
vations of present ongoing gene transfer events are mainly reported for plant
genomes (Adams et al., 2002; Bonen and Calixte, 2006), which is reflected in the
results of this work. Most of the mitochondrial encoded genes are present in the
two plants Arabidopsis thaliana and Oryza sativa, which provide the possibility
of being transferred prospectively. The genes atp1, atp9, rps7 and rps12 are en-
coded in both, the mitochondrial and the nuclear genome of Arabidopsis thaliana
which most probably represent recent endosymbiotic gene transfers. The pres-
ence of the gene atp9 in Aspergillus fumigatus in both genomic locations cannot be
clearly verified, because the presence of the gene in the mitochondrial genome
is only proved for Aspergillus niger. But the presence of a nuclear encoded atp9
gene in Aspergillus niger (Section 5.2) supports the existence of this gene in the
mitochondrial and the nuclear genome in both lineages.
To have an equivalent basis of sequence similarity for the reconstruction of
multiple sequence alignments, the human sequences were used as query se-
quences. In some cases, it was not possible to detect a homologous protein in
a species where it should be present, given by the sources of Gabaldón et al.
(2005) and Smits et al. (2007). Reasons for not detected genes by homology
search (Table 5.4, Table 5.10) could be the restrictions of the blast search, miss-ing sequence information in the database or an eventual gene loss. Allowing to
76
6.3 Shared intron positions are not always ancient
include missing sequences with a low sequence similarity would lead to prob-
lems in alignment reconstruction and consequently to problems in the identifi-
cation of shared intron positions. So it was decided to keep the human proteins
as query sequences and the e-value threshold of 10−6 for the filtering of theblast results.Cases of gene loss cannot clearly be evidenced in this study. The experi-
mentally verified cases of gene loss are reflected in the survey of endosymbiotic
gene transfer (Table 5.4, Table 5.10). The main reason for mitochondrial gene
loss, next to functional substitution, is the gene transfer to the nucleus (Adams
et al., 2002; Adams and Palmer, 2003). Lost genes are included to represent a
gene transfer as well as the other genes (Figure 5.1, Figure 5.7), because most
probably they were transferred to the nuclear genome and subsequently lost
from both, the mitochondrial and the nuclear genome.
6.3 Shared intron positions are not always ancient
The number of shared intron positions in homologous genes are mainly dis-
cussed under the terms of the introns-early and the introns-late hypothesis
where shared positions are either conserved or they can be gained indepen-
dently at the same site in the gene, respectively. Most shared intron positions
are found between the most divergent groups animals and plants (Fedorov et al.,
2002; Rogozin et al., 2003) giving rise to the assumption that these positions were
achieved in the common ancestor of these species.
Taking into account the shared intron positions only in conserved regions of
the alignments, lead to 62.5% of shared intron positions between animals and
plants. This number is twice of the percentage, reported in other studies, where
25-30% of intron positions are shared between animals and plants (Sverdlov
et al., 2005).
A clear case of a parallel intron gain was identified in the gene nad7 of the
oxidative phosphorylation pathway (Section 5.2.3). Although the mitochondrial
encoded nad7 genes of higher plants contain four group II introns (Terasawa
et al., 2007), the molecular ancestors of spliceosomal introns (Martin and Koonin,
2006; Toro et al., 2007), none are present at the same position as the spliceoso-
mal introns (Figure 5.5). Given the absence of spliceosomes in mitochondria, the
present data indicate that the nuclear nad7 intron shared by animals and Chlamy-
77
6 Discussion
domonas reinhardtii has been acquired by independent insertions at indentical po-
sitions in those lineages. The nuclear codon usage might have facilitated intron
insertion and efficient splicing at this site (Schwartz et al., 2008). Arguments in
favor of intron antiquity at identical intron positions are traditionally founded in
weighting the relative probabilities of massive intron loss versus a few parallel
intron gains (Sverdlov et al., 2005; Roy and Gilbert, 2006), with clear evidence
for the existence of the latter lacking so far. The independent intron insertions
in nad7 following its independent transfers from the mitochondrion to the nu-
cleus show that independent intron insertions do occur. While there can be no
doubt that the last common ancestor of present eukaryotes had spliceosomes
and introns (Jeffares et al., 2006; Martin and Koonin, 2006; Toro et al., 2007), the
nad7 gene of Chlamydomonas reinhardtii offers a straightforward counterexample
to the view that identical intron positions reflect ancient conservation of intron
positions.
Different contributions of parallel gained introns in contrast to the conser-
vation of shared intron positions are reported. In Qiu et al. (2004) most shared
intron positions should be inserted at the same sites independently. A percent-
age of 5-10% of shared intron positions as a result of parallel intron gains is
reported in Sverdlov et al. (2005). A similar number of 8% is reported as paral-
lel intron gain using a probabilistic model (Carmel et al., 2007). 18% of shared
intron positions are identified as parallel gains, computed with a maximum
likelihood method (Nguyen et al., 2005). In this work, the parallel intron gain
in the gene nad7, leads to 6.25% of parallel intron gain in the proteins under
consideration. Clear examples of parallel intron gains as presented in this work
are not easy to identify because the evolutionary history of most genes is not as
clear as for the gene nad7.
6.4 Dynamic intron evolution in proto-mitochondrial
genes
The intron characteristics in this study reveal a highly dynamic evolution of
spliceosomal introns in genes that originated from endosymbiotic gene transfer
from mitochondria. This conclusion is based on the observation that the intron
characteristics in these genes are not significantly different from characteristics
78
6.4 Dynamic intron evolution in proto-mitochondrial genes
of introns in ancestral eukaryotic genes. The distribution of intron densitiy
among species (Figure 5.2, Figure 5.8) is in accordance with the intron density
reported in the literature (Figure 3.5). Based on the number of identified introns
in this dataset, the average number of introns per gene is 2.74 which represents
the mean number of introns in the species of Figure 3.5.
A bias of phase 0 introns is a frequent observartion and often linked with
the preference of newly gained introns (Long and Deutsch, 1999; Lynch, 2002).
A ratio of 5:3:2 of phase 0, phase 1 and phase 2 introns as found in the genes of
the oxidative phosphorylation pathway, as well as in the genes of mitochondrial
ribosomal proteins (Section 5.2.1, Section 5.3.1) is in accordance with results
reported for genes that did not originate by endosymbiotic gene transfer (Qiu
et al., 2004; Ruvinsky and Ward, 2006). The 0-0 exons account for the majority
of symmetrical exons (Figure 5.3, Figure 5.9). This observation is also reported
among eukaryotic genomes (Ruvinsky and Ward, 2006).
The timing of endosymbiotic gene transfer events among the 18 eukaryotes
enabled to test if the time of the gene origin takes influence on the intron den-
sity. It is possible, that more recently transferred genes have a lower intron
density than genes that were transferred earlier in the eukaryotic evolution be-
cause of the higher possibility of intron accumulation over time. However, the
genes of the oxidative phosphorylation pathway as well as the ribosomal mi-
tochondrial genes, do not display correlation between the time of the transfer
and the intron density. In Basu et al. (2008) there was a slightly but signifi-
cantly lower intron density observed in nuclear encoded genes that originated
by endosymbiotic gene transfer from the chloroplast than in ancestral eukary-
otic genes what could be the result of the more recent endosymbiotic event that
gave rise to chloroplasts around 1.5 billion years ago, in contrast to the pre-
ceding origin of mitochondria, around 2 billion years ago (Martin et al., 2003).
Very recent transfer events in this analysis are most probably the genes atp1,
atp9, rps7, and rps12 because they are present in the mitochondrial and the nu-
clear genomes of Arabidopsis thaliana. Only the nuclear encoded gene atp1 in
Arabidopsis thaliana contains one intron, whereas the other genes are intronless
which is in accordance with the observation in Basu et al. (2008), because these
recently transferred genes reflect the low intron density. But a general lower
intron desity cannot be identified in this data.
The recent transfers as well as the cases of intronless gene duplications
79
6 Discussion
within species, count for preferred molecular mechanisms which do not re-
tain introns in the transferred or duplicated genes. The genes which have
an intronless copy in the genome, most probably arose by retrotransposition,
one of the two main mechanisms of gene duplication as described in Zhang
(2003), in which the processed/mature mRNA is reverse transcribed into DNA
and subsequently inserted into the genome. The absence of introns in a proto-
mitochondrial gene in the nucleus might not be an adequate evidence for deter-
minig the mechanism of the transfer. The mechanism does not have to involve
processed mRNA, because self-splicing introns which have been present at the
time of the transfer could also be spliced out of the transcript after the integra-
tion into the nucleus (Henze and Martin, 2001).
A possibility to describe the different influences on the evolution of spliceo-
somal introns we can observe in this study is shown in Figure 6.1. Similar to
the diagram in Jeffares et al. (2006), Figure 6.1 shows that mostly species spe-
cific factors determine the dynamics of intron evolution in genes that originated
by endosymbiotic gene transfer from the mitochondrion. This is indicated by
the intron density which is specific according to the overall intron density in
each species. The time of the origin of the genes in the nuclear genome set the
starting point at which spliceosomal introns can be gained, but as there is no
correlation found between the time of the transfer and the intron density, the
structure of genes seems to play a more prominent role.
80
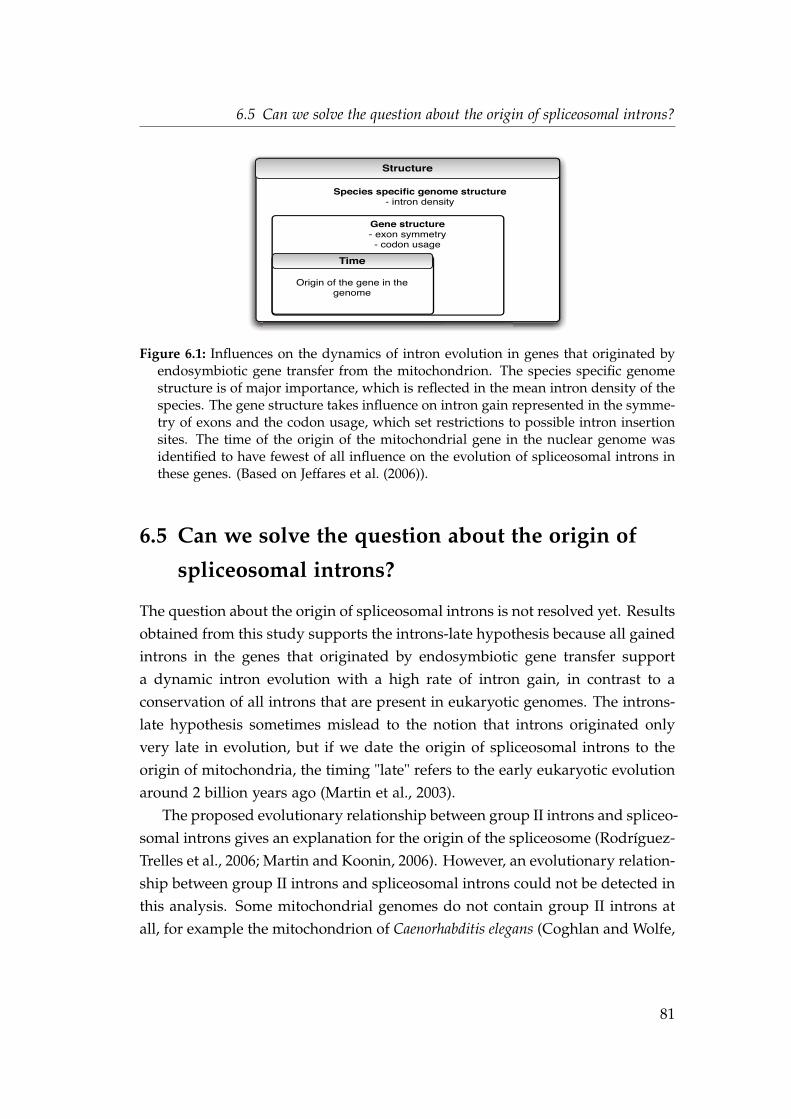
6.5 Can we solve the question about the origin of spliceosomal introns?
Structure
Time
Gene structure- exon symmetry- codon usage
Species specific genome structure- intron density
Origin of the gene in the genome
Figure 6.1: Influences on the dynamics of intron evolution in genes that originated byendosymbiotic gene transfer from the mitochondrion. The species specific genomestructure is of major importance, which is reflected in the mean intron density of thespecies. The gene structure takes influence on intron gain represented in the symme-try of exons and the codon usage, which set restrictions to possible intron insertionsites. The time of the origin of the mitochondrial gene in the nuclear genome wasidentified to have fewest of all influence on the evolution of spliceosomal introns inthese genes. (Based on Jeffares et al. (2006)).
6.5 Can we solve the question about the origin of
spliceosomal introns?
The question about the origin of spliceosomal introns is not resolved yet. Results
obtained from this study supports the introns-late hypothesis because all gained
introns in the genes that originated by endosymbiotic gene transfer support
a dynamic intron evolution with a high rate of intron gain, in contrast to a
conservation of all introns that are present in eukaryotic genomes. The introns-
late hypothesis sometimes mislead to the notion that introns originated only
very late in evolution, but if we date the origin of spliceosomal introns to the
origin of mitochondria, the timing "late" refers to the early eukaryotic evolution
around 2 billion years ago (Martin et al., 2003).
The proposed evolutionary relationship between group II introns and spliceo-
somal introns gives an explanation for the origin of the spliceosome (Rodríguez-
Trelles et al., 2006; Martin and Koonin, 2006). However, an evolutionary relation-
ship between group II introns and spliceosomal introns could not be detected in
this analysis. Some mitochondrial genomes do not contain group II introns at
all, for example the mitochondrion of Caenorhabditis elegans (Coghlan and Wolfe,
81
6 Discussion
2004), so that they cannot be responsible for recent intron gain we observe in
genes that originated from endosymbiotic gene transfer. The observation that
the group II introns of the mitochondrial encoded nad7 gene are not at the same
position as the spliceosomal introns in the nuclear encoded gene (Section 5.2.3)
does not disprove their possible evolutionary relationship, especially since sim-
ilarities between group II introns and the spliceosome are reported in recent
studies (Valadkhan, 2007; Toro et al., 2007; Toor et al., 2008).
Inferred rates of intron gain today are too slow to explain the proliferation
of introns with the current mechanisms (Roy and Gilbert, 2005, 2006), and con-
sequentially, these rates are too slow to explain the intron density in genes that
originated by endosymbiotic gene transfer, which gained introns in a relatively
short period of time. The existing scenarios of intron evolution which are in-
ferred under different assumptions and evolutionary models are too static to
explain the dynamics of intron evlolution in all eukaryotic genes with different
evolutionary histories. Also single case studies of parallel intron insertions do
not lead to general trends or patterns in eukaryotic intron evolution. The results
obtained in this work, support a continuously intron gain and loss during eu-
karyotic evolution including both, conservation of intron positions and parallel
intron gains. According to Martin and Koonin (2006), the results would speak
for a time in eukaryotic evolution in which the cell had adapt to the invading
genes from the mitochondrion and the proliferation of introns in the genome,
in which the development of a nucleus played an important role. Testing that
hypothesis is, however, complicated by the overriding effects of lineage-specific
gain and loss, the dynamics of which were uncovered in the work presented
here.
82
References
Abascal, F., Zardoya, R., and Posada, D. (2005) ProtTest: selection of best-fit
models of protein evolution. Bioinformatics, 21, 2104–2105.
Adams, K.L. and Palmer, J.D. (2003) Evolution of mitochondrial gene content:
gene loss and transfer to the nucleus. Mol Phylogenet Evol, 29, 380–395.
Adams, K.L., Qiu, Y.L., Stoutemyer, M., and Palmer, J.D. (2002) Punctuated evo-
lution of mitochondrial gene content: high and variable rates of mitochondrial
gene loss and transfer to the nucleus during angiosperm evolution. Proc Natl
Acad Sci USA, 99, 9905–9912.
Akaike, H. (1973) Information theory and an extension of the maximum like-
lihood principle. In Proceedings of 2nd International Symposium on Information
Theory Budapest Hungary, 17, 267–281.
Aloni, Y., Dhar, R., Laub, O., Horowitz, M., and Khoury, G. (1977) Novel mech-
anism for RNA maturation: the leader sequences of simian virus 40 mRNA
are not transcribed adjacent to the coding sequences. Proc Natl Acad Sci USA,
74, 3686–3690.
Altschul, S., Madden, T., Schaffer, A., Zhang, J., Zhang, Z., Miller, W., and Lip-
man, D. (1997) Gapped BLAST and PSI-BLAST: a new generation of protein
database search programs. Nuleic Acids Res, 25, 3389–3402.
Anderson, S., Bankier, A., Barrell, B., Debruijn, M., Coulson, A., Drouin, J.,
Eperon, I., Nierlich, D., Roe, B., Sanger, F., Schreier, P., Smith, A., Staden, R.,
and Young, I. (1981) Sequence and organization of the human mitochondrial
genome. Nature, 290, 457–465.
Andersson, S.G., Zomorodipour, A., Andersson, J.O., Sicheritz-Ponten, T., Als-
mark, U.C., Podowski, R.M., Naslund, A.K., Eriksson, A.S., Winkler, H.H.,
and Kurland, C.G. (1998) The genome sequence of Rickettsia prowazekii and
the origin of mitochondria. Nature, 396, 133–140.
83
References
Bandelt, H.J., Forster, P., Sykes, B.C., and Richards, M.B. (1995) Mitochondrial
portraits of human populations using median networks. Genetics, 141, 743–753.
Bandelt, H.J., Macaulay, V., and Richards, M. (2000) Median networks: speedy
construction and greedy reduction, one simulation, and two case studies from
human mtDNA. Mol Phylogenet Evol, 16, 8–28.
Basu, M.K., Rogozin, I.B., Deusch, O., Dagan, T., Martin, W., and Koonin, E.V.
(2008) Evolutionary dynamics of introns in plastid-derived genes in plants:
saturation nearly reached but slow intron gain continues. Mol Biol Evol, 25,111–119.
Belshaw, R. and Bensasson, D. (2006) The rise and falls of introns. Heredity, 96,208–213.
Benson, D.A., Karsch-Mizrachi, I., Lipman, D.J., Ostell, J., and Wheeler, D.L.
(2008) GenBank. Nuleic Acids Res, 36, D25–D30.
Berget, S., Moore, C., and Sharp, P. (1977) Spliced segments at the 5 terminus
of adenovirus 2 late mRNA. Proc Natl Acad Sci USA, 74, 3171–3175.
Boeckmann, B., Bairoch, A., Apweiler, R., Blatter, M.C., Estreicher, A., Gasteiger,
E., Martin, M.J., Michoud, K., O Donovan, C., Phan, I., Pilbout, S., and Schnei-
der, M. (2003) The SWISS-PROT protein knowledgebase and its supplement
TrEMBL in 2003. Nucleic Acids Res, 31, 365–370.
Bonen, L. and Calixte, S. (2006) Comparative analysis of bacterial-origin genes
for plant mitochondrial ribosomal proteins. Mol Biol Evol, 23, 701–712.
Brack, C. and Tonegawa, S. (1977) Variable and constant parts of the im-
munoglobulin light chain gene of a mouse myeloma cell are 1250 nontrans-
lated bases apart. Proc Natl Acad Sci USA, 74, 5652–5656.
Breathnach, R., Mandel, J., and Chambon, P. (1977) Ovalbumin gene is split in
chicken DNA. Nature, 270, 314–319.
Brody, E. and Abelson, J. (1985) The "spliceosome": yeast pre-messenger RNA
associates with a 40S complex in a splicing-dependent reaction. Science, 228,963–967.
84
References
Bruno, W.J. and Halpern, A.L. (1999) Topological bias and inconsistency of max-
imum likelihood using wrong models. Mol Biol Evol, 16, 564–566.
Burge, C.B., Padgett, R.A., and Sharp, P.A. (1998) Evolutionary fates and origins
of U12-type introns. Mol Cell, 2, 773–785.
Burge, C.B., T, T., and Sharp, P.A. (1999) Splicing of precursors to mRNAs by the
spliceosomes. In The RNAWorld, Cold Spring Harbor, NY: Cold Spring Harbor
Laboratory Press.
Carlton, J.M., Hirt, R.P., Silva, J.C., Delcher, A.L., Schatz, M., Zhao, Q., Wort-
man, J.R., Bidwell, S.L., Alsmark, U.C.M., Besteiro, S., Sicheritz-Ponten, T.,
Noel, C.J., Dacks, J.B., Foster, P.G., Simillion, C., Van de Peer, Y., Miranda-
Saavedra, D., Barton, G.J., Westrop, G.D., Muller, S., Dessi, D., Fiori, P.L., Ren,
Q., Paulsen, I., Zhang, H., Bastida-Corcuera, F.D., Simoes-Barbosa, A., Brown,
M.T., Hayes, R.D., Mukherjee, M., Okumura, C.Y., Schneider, R., Smith, A.J.,
Vanacova, S., Villalvazo, M., Haas, B.J., Pertea, M., Feldblyum, T.V., Utterback,
T.R., Shu, C.L., Osoegawa, K., de Jong, P.J., Hrdy, I., Horvathova, L., Zubacova,
Z., Dolezal, P., Malik, S.B., Logsdon, J.M.J., Henze, K., Gupta, A., Wang, C.C.,
Dunne, R.L., Upcroft, J.A., Upcroft, P., White, O., Salzberg, S.L., Tang, P., Chiu,
C.H., Lee, Y.S., Embley, T.M., Coombs, G.H., Mottram, J.C., Tachezy, J., Fraser-
Liggett, C.M., and Johnson, P.J. (2007) Draft genome sequence of the sexually
transmitted pathogen Trichomonas vaginalis. Science, 315, 207–212.
Carmel, L., Rogozin, I.B., Wolf, Y.I., and Koonin, E.V. (2007) Patterns of intron
gain and conservation in eukaryotic genes. BMC Evol Biol, 7, 192.
Cavalier-Smith, T. (1985) Selfish DNA and the origin of introns. Nature, 315,283–284.
Cavalier-Smith, T. (1991) Intron phylogeny: a new hypothesis. Trends Genet, 7,145–148.
Cavalier-Smith, T. (2002) The phagotrophic origin of eukaryotes and phyloge-
netic classification of Protozoa. Int J Syst Evol Microbiol, 52, 297–354.
Cavalier-Smith, T. (2004) Only six kingdoms of life. Proc R Soc Lond B, 271,1251–1262.
85
References
Cech, T.R. (1986) The generality of self-splicing RNA: relationship to nuclear
mRNA splicing. Cell, 44, 207–210.
Cech, T.R. (1990) Self-splicing of group I introns. Annu Rev Biochem, 59, 543–568.
Chow, L.T., Gelinas, R.E., Broker, T.R., and Roberts, R.J. (1977) An amazing
sequence arrangement at the 5 ends of adenovirus 2 messenger RNA. Cell,
12, 1–8.
Coghlan, A. and Wolfe, K.H. (2004) Origins of recently gained introns in
Caenorhabditis. Proc Natl Acad Sci USA, 101, 11362–11367.
Collins, L. and Penny, D. (2005) Complex spliceosomal organization ancestral to
extant eukaryotes. Mol Biol Evol, 22, 1053–1066.
Darnell, J.E.J. (1978) Implications of RNA-RNA splicing in evolution of eukary-
otic cells. Science, 202, 1257–1260.
Delwiche, C. (1999) Tracing the thread of plastid diversity through the tapestry
of life. Am Nat, 154, S164–S177.
Deusch, O., Landan, G., Roettger, M., Gruenheit, N., Kowallik, K.V., Allen, J.F.,
Martin, W., and Dagan, T. (2008) Genes of cyanobacterial origin in plant nu-
clear genomes point to a heterocyst-forming plastid ancestor. Mol Biol Evol,
25, 748–761.
Dibb, N.J. and Newman, A.J. (1989) Evidence that introns arose at proto-splice
sites. EMBO J, 8, 2015–2021.
Doel, M.T., Houghton, M., Cook, E.A., and Carey, N.H. (1977) The presence
of ovalbumin mRNA coding sequences in multiple restriction fragments of
chicken DNA. Nucleic Acids Res, 4, 3701–3713.
Doolittle, W.F. (1978) Genes in pieces: were they ever together? Nature, 272,581–582.
Douglas, S.E. (1998) Plastid evolution: origins, diversity, trends. Curr Opin Genet
Dev, 8, 655–661.
Edgar, R.C. (2004a) MUSCLE: a multiple sequence alignment method with re-
duced time and space complexity. BMC Bioinformatics, 5, 113.
86
References
Edgar, R.C. (2004b) MUSCLE: multiple sequence alignment with high accuracy
and high throughput. Nucleic Acids Res, 32, 1792–1797.
Embley, T.M. and Martin, W. (2006) Eukaryotic evolution, changes and chal-
lenges. Nature, 440, 623–630.
Emelyanov, V.V. (2003) Common evolutionary origin of mitochondrial and rick-
ettsial respiratory chains. Arch Biochem Biophys, 420, 130–141.
ENCODE (2004) The ENCODE (ENCyclopedia Of DNA Elements) Project. Sci-
ence, 306, 636–640.
Esser, C., Ahmadinejad, N., Wiegand, C., Rotte, C., Sebastiani, F., Gelius-
Dietrich, G., Henze, K., Kretschmann, E., Richly, E., Leister, D., Bryant, D.,
Steel, M.A., Lockhart, P.J., Penny, D., and Martin, W. (2004) A genome phy-
logeny for mitochondria among α-proteobacteria and a predominantly eubac-
terial ancestry of yeast nuclear genes. Mol Biol Evol, 21, 1643–1660.
Esser, C., Martin, W., and Dagan, T. (2007) The origin of mitochondria in light
of a fluid prokaryotic chromosome model. Biol Lett, 3, 180–184.
Fedorov, A., Merican, A.F., and Gilbert, W. (2002) Large-scale comparison of
intron positions among animal, plant, and fungal genes. Proc Natl Acad Sci
USA, 99, 16128–16133.
Ferat, J.L. and Michel, F. (1993) Group II self-splicing introns in bacteria. Nature,
364, 358–361.
Frendewey, D. and Keller, W. (1985) Stepwise assembly of a pre-mRNA splicing
complex requires U-snRNPs and specific intron sequences. Cell, 42, 355–367.
Gabaldón, T. and Huynen, M.A. (2003) Reconstruction of the proto-
mitochondrial metabolism. Science, 301, 609.
Gabaldón, T., Rainey, D., and Huynen, M.A. (2005) Tracing the evolution of a
large protein complex in the eukaryotes, NADH:ubiquinone oxidoreductase
(Complex I). J Mol Biol, 348, 857–870.
Gardner, M.J., Hall, N., Fung, E., White, O., Berriman, M., Hyman, R.W., Carl-
ton, J.M., Pain, A., Nelson, K.E., Bowman, S., Paulsen, I.T., James, K., Eisen,
87
References
J.A., Rutherford, K., Salzberg, S.L., Craig, A., Kyes, S., Chan, M.S., Nene,
V., Shallom, S.J., Suh, B., Peterson, J., Angiuoli, S., Pertea, M., Allen, J., Se-
lengut, J., Haft, D., Mather, M.W., Vaidya, A.B., Martin, D.M.A., Fairlamb,
A.H., Fraunholz, M.J., Roos, D.S., Ralph, S.A., McFadden, G.I., Cummings,
L.M., Subramanian, G.M., Mungall, C., Venter, J.C., Carucci, D.J., Hoffman,
S.L., Newbold, C., Davis, R.W., Fraser, C.M., and Barrell, B. (2002) Genome
sequence of the human malaria parasite Plasmodium falciparum. Nature, 419,498–511.
Gilbert, W. (1978) Why genes in pieces? Nature, 271, 501.
Gilbert, W. and Glynias, M. (1993) On the ancient nature of introns. Gene, 135,137–144.
Goksøyr, J. (1967) Evolution of eucaryotic cells. Nature, 214, 1161.
Gopalan, V., Tan, T., Lee, B., and Ranganathan, S. (2004) Xpro: database of
eukaryotic protein-encoding genes. Nuleic Acids Res, 32, D59–D63.
Grabowski, P.J., Seiler, S.R., and Sharp, P.A. (1985) A multicomponent complex
is involved in the splicing of messenger RNA precursors. Cell, 42, 345–353.
Graur, D. and Li, W.H. (2000) Fundamentals of molecular evolution. Sinauer
Associates, Inc.
Gray, M.W., Burger, G., and Lang, B.F. (1999) Mitochondrial evolution. Science,
283, 1476–1481.
Gray, M.W., Burger, G., and Lang, B.F. (2001) The origin and early evolution of
mitochondria. Genome Biol, 2, reviews1018.
Guindon, S. and Gascuel, O. (2003) A simple, fast, and accurate algorithm to
estimate large phylogenies by maximum likelihood. Syst Biol, 52, 696–704.
Hall, S.L. and Padgett, R.A. (1994) Conserved sequences in a class of rare eu-
karyotic nuclear introns with non-consensus splice sites. J Mol Biol, 239, 357–365.
Harris, L. and Rogers, S.O. (2008) Splicing and evolution of an unusually small
group I intron. Curr Genet, 54, 213–222.
88
References
Henikoff, S. and Henikoff, J.G. (1991) Automated assembly of protein blocks for
database searching. Nucleic Acids Res, 19, 6565–6572.
Henikoff, S., Henikoff, J.G., Alford, W.J., and Pietrokovski, S. (1995) Automated
construction and graphical presentation of protein blocks from unaligned se-
quences. Gene, 163, GC17–GC26.
Henze, K. and Martin, W. (2001) How do mitochondrial genes get into the nu-
cleus? Trends Genet, 17, 383–387.
Huson, D.H. (1998) SplitsTree: analyzing and visualizing evolutionary data.
Bioinformatics, 14, 68–73.
Ingledew, W.J. and Poole, R.K. (1984) The respiratory chains of Escherichia coli.
Microbiol Rev, 48, 222–271.
Irimia, M. and Roy, S.W. (2008) Spliceosomal introns as tools for genomic and
evolutionary analysis. Nucleic Acids Res, 36, 1703–1712.
Jackson, I.J. (1991) A reappraisal of non-consensus mRNA splice sites. Nucleic
Acids Res, 19, 3795–3798.
Jeffares, D.C., Mourier, T., and Penny, D. (2006) The biology of intron gain and
loss. Trends Genet, 22, 16–22.
Jeffreys, A.J. and Flavell, R.A. (1977) The rabbit β-globin gene contains a large
insert in the coding sequence. Cell, 12, 1097–1108.
Jurica, M.S. and Moore, M.J. (2003) Pre-mRNA splicing: awash in a sea of pro-
teins. Mol Cell, 12, 5–14.
Keeling, P.J., Burger, G., Durnford, D.G., Lang, B.F., Lee, R.W., Pearlman, R.E.,
Roger, A.J., and Gray, M.W. (2005) The tree of eukaryotes. Trends Ecol Evol, 20,670–676.
Keller, O., Odronitz, F., Stanke, M., Kollmar, M., and Waack, S. (2008) Scipio:
using protein sequences to determine the precise exon/intron structures of
genes and their orthologs in closely related species. BMC Bioinformatics, 9,278.
Kent, W.J. (2002) BLAT–the BLAST-like alignment tool. Genome Res, 12, 656–664.
89
References
Klessig, D.F. (1977) Two adenovirus mRNAs have a common 5üterminal leader
sequence encoded at least 10 kb upstream from their main coding regions.
Cell, 12, 9–21.
Knowles, D.G. and McLysaght, A. (2006) High rate of recent intron gain and loss
in simultaneously duplicated Arabidopsis genes. Mol Biol Evol, 23, 1548–1557.
Lambowitz, A.M. and Zimmerly, S. (2004) Mobile group II introns. Annu Rev
Genet, 38, 1–35.
Lamond, A.I. (1993) The spliceosome. Bioessays, 15, 595–603.
Lang, B.F., Burger, G., OüKelly, C.J., Cedergren, R., Golding, G.B., Lemieux, C.,
Sankoff, D., Turmel, M., and Gray, M.W. (1997) An ancestral mitochondrial
DNA resembling a eubacterial genome in miniature. Nature, 387, 493–497.
Lewin, R. (1983) How mammalian RNA returns to its genome. Science, 219,1052–1054.
Lindmark, D.G. and Müller, M. (1973) Hydrogenosome, a cytoplasmic or-
ganelle of the anaerobic flagellate Tritrichomonas foetus, and its role in pyruvate
metabolism. J Biol Chem, 248, 7724–7728.
Long, M. and Deutsch, M. (1999) Association of intron phases with conservation
at splice site sequences and evolution of spliceosomal introns. Mol Biol Evol,
16, 1528–1534.
Lynch, M. (2002) Intron evolution as a population-genetic process. Proc Natl
Acad Sci USA, 99, 6118–6123.
Margulis, L., Dolan, M.E., and Whiteside, J.H. (2005) “Imperfections and oddi-
ties” in the origin of the nucleus. Paleobiology, 31, 175–191.
Martin, W. and Herrmann, R. (1998) Gene transfer from organelles to the nu-
cleus: How much, what happens, and why? Plant Physiology, 118, 9–17.
Martin, W., Hoffmeister, M., Rotte, C., and Henze, K. (2001) An overview of
endosymbiotic models for the origins of eukaryotes, their ATP-producing
organelles (mitochondria and hydrogenosomes), and their heterotrophic
lifestyle. Biol Chem, 382, 1521–1539.
90
References
Martin, W. and Müller, M. (1998) The hydrogen hypothesis for the first eukary-
ote. Nature, 392, 37–41.
Martin, W., Stoebe, B., Goremykin, V., Hapsmann, S., Hasegawa, M., and Kowal-
lik, K.V. (1998) Gene transfer to the nucleus and the evolution of chloroplasts.
Nature, 393, 162–165.
Martin, W. and Koonin, E.V. (2006) Introns and the origin of nucleus-cytosol
compartmentalization. Nature, 440, 41–45.
Martin, W., Rotte, C., Hoffmeister, M., Theissen, U., Gelius-Dietrich, G., Ahr, S.,
and Henze, K. (2003) Early cell evolution, eukaryotes, anoxia, sulfide, oxygen,
fungi first (?), and a tree of genomes revisited. IUBMB Life, 55, 193–204.
Martin, W., Rujan, T., Richly, E., Hansen, A., Cornelsen, S., Lins, T., Leister, D.,
Stoebe, B., Hasegawa, M., and Penny, D. (2002) Evolutionary analysis of Ara-
bidopsis, cyanobacterial, and chloroplast genomes reveals plastid phylogeny
and thousands of cyanobacterial genes in the nucleus. Proc Natl Acad Sci USA,
99, 12246–12251.
Mereschkowsky, K. (1905) Über Natur und Ursprung der Chromatophoren im
Pflanzenreiche. Biol Centralbl, 25, 593–604. (English translation in Martin, W.,and Kowallik, K.V. (1999) Annotated English translation of Mereschkowskyüs
1905 paper üÜber Natur und Ursprung der Chromatophoren im Pflanzenre-
iche.üEur J Phycol, 34, 287–295.).
Mitchell, P. (1961) Coupling of phosphorylation to electron and hydrogen trans-
fer by a chemi-osmotic type of mechanism. Nature, 191, 144–148.
Mitchell, P. (1979) Keilinüs respiratory chain concept and its chemiosmotic con-
sequences. Science, 206, 1148–1159.
Moreira, D. and Lopez-Garcia, P. (1998) Symbiosis between methanogenic ar-
chaea and δ-proteobacteria as the origin of eukaryotes: the syntrophic hy-
pothesis. J Mol Evol, 47, 517–530.
Mourier, T. (2005) Reverse transcription in genome evolution. Cytogenet Genome
Res, 110, 56–62.
91
References
Müller, M. and Martin, W. (1999) The genome of Rickettsia prowazekii and some
thoughts on the origin of mitochondria and hydrogenosomes. Bioessays, 21,377–381.
Nakamura, Y., Gojobori, T., and Ikemura, T. (2000) Codon usage tabulated from
international DNA sequence databases: status for the year 2000. Nucleic Acids
Res, 28, 292.
Nguyen, H.D., Yoshihama, M., and Kenmochi, N. (2005) New maximum likeli-
hood estimators for eukaryotic intron evolution. PLoS Comput Biol, 1, e79.
Nixon, J.E.J., Wang, A., Morrison, H.G., McArthur, A.G., Sogin, M.L., Loftus,
B.J., and Samuelson, J. (2002) A spliceosomal intron in Giardia lamblia. Proc
Natl Acad Sci USA, 99, 3701–3705.
Palmer, J.D. and Logsdon, J.M.J. (1991) The recent origins of introns. Curr Opin
Genet Dev, 1, 470–477.
Patthy, L. (1987) Intron-dependent evolution: preferred types of exons and in-
trons. FEBS Lett, 214, 1–7.
Patthy, L. (1999) Genome evolution and the evolution of exon-shuffling – a re-
view. Gene, 238, 103–114.
Pesole, G. (2008) What is a gene? An updated operational definition. Gene, 417,1–4.
Piccirilli, J.A. (2008) Toward understanding self-splicing. Science, 320, 56–57.
Pombert, J.F., Otis, C., Lemieux, C., and Turmel, M. (2004) The complete mi-
tochondrial DNA sequence of the green alga Pseudendoclonium akinetum (Ul-
vophyceae) highlights distinctive evolutionary trends in the chlorophyta and
suggests a sister-group relationship between the Ulvophyceae and Chloro-
phyceae. Mol Biol Evol, 21, 922–935.
Pyle, A.M. and Lambowitz, A.M. (2006) The RNA World. Cold Spring Harbor,
NY ed 3.
Qiu, W.G., Schisler, N., and Stoltzfus, A. (2004) The evolutionary gain of spliceo-
somal introns: sequence and phase preferences. Mol Biol Evol, 21, 1252–1263.
92
References
Rice, P., Longden, I., and Bleasby, A. (2000) EMBOSS: the European Molecular
Biology Open Software Suite. Trends Genet, 16, 276–277.
Robart, A.R., Seo, W., and Zimmerly, S. (2007) Insertion of group II intron
retroelements after intrinsic transcriptional terminators. Proc Natl Acad Sci
USA, 104, 6620–6625.
Robbens, S., Derelle, E., Ferraz, C., Wuyts, J., Moreau, H., and Van de Peer, Y.
(2007) The complete chloroplast and mitochondrial DNA sequence of Ostre-
ococcus tauri: organelle genomes of the smallest eukaryote are examples of
compaction. Mol Biol Evol, 24, 956–968.
Rodríguez-Trelles, F., Tarrío, R., and Ayala, F.J. (2006) Origins and evolution of
spliceosomal introns. Annu Rev Genet, 40, 47–76.
Rogers, J.H. (1989) How were introns inserted into nuclear genes? Trends Genet,
5, 213–216.
Rogozin, I.B., Sverdlov, A.V., Babenko, V.N., and Koonin, E.V. (2005) Analysis
of evolution of exon-intron structure of eukaryotic genes. Brief Bioinform, 6,118–134.
Rogozin, I.B., Wolf, Y.I., Sorokin, A.V., Mirkin, B.G., and Koonin, E.V. (2003) Re-
markable interkingdom conservation of intron positions and massive, lineage-
specific intron loss and gain in eukaryotic evolution. Curr Biol, 13, 1512–1517.
Roy, S.W. (2003) Recent evidence for the exon theory of genes. Genetica, 118,251–266.
Roy, S.W. and Gilbert, W. (2005) Rates of intron loss and gain: implications for
early eukaryotic evolution. Proc Natl Acad Sci USA, 102, 5773–5778.
Roy, S.W. and Gilbert, W. (2006) The evolution of spliceosomal introns: patterns,
puzzles and progress. Nat Rev Genet, 7, 211–221.
Roy, S.W. and Hartl, D.L. (2006) Very little intron loss/gain in Plasmodium: intron
loss/gain mutation rates and intron number. Genome Res, 16, 750–756.
Rujan, T. and Martin, W. (2001) How many genes in Arabidopsis come from
cyanobacteria? An estimate from 386 protein phylogenies. Trends Genet, 17,113–120.
93
References
Russell, A.G., Shutt, T.E., Watkins, R.F., and Gray, M.W. (2005) An ancient
spliceosomal intron in the ribosomal protein L7a gene (Rpl7a) of Giardia lam-
blia. BMC Evol Biol, 5, 45.
Ruvinsky, A. and Ward, W. (2006) A gradient in the distribution of introns in
eukaryotic genes. J Mol Evol, 63, 136–141.
Sagan, L. (1967) On the origin of mitosing cells. J Theor Biol, 14, 255–274.
Sakharkar, M., Long, M., Tan, T., and de Souza, S. (2000) ExInt: an Exon/Intron
database. Nuleic Acids Res, 28, 191–192.
Sakharkar, M., Passetti, F., de Souza, J., Long, M., and de Souza, S. (2002) ExInt:
an Exon Intron Database. Nuleic Acids Res, 30, 191–194.
Sambrook, J. (1977) Adenovirus amazes at Cold Spring Harbor. Nature, 268,101–104.
Saraste, M. (1999) Oxidative phosphorylation at the fin de siecle. Science, 283,1488–1493.
Saxonov, S., Daizadeh, I., Fedorov, A., and Gilbert, W. (2000) EID: the Exon-
Intron Database-an exhaustive database of protein-coding intron-containing
genes. Nucleic Acids Res, 28, 185–190.
Schieber, G.L. and OüBrien, T.W. (1985) Site of synthesis of the proteins of mam-
malian mitochondrial ribosomes. Evidence from cultured bovine cells. J Biol
Chem, 260, 6367–6372.
Schisler, N. and Palmer, J. (2000) The IDB and IEDB: intron sequence and evo-
lution databases. Nuleic Acids Res, 28, 181–184.
Schwartz, S.H., Silva, J., Burstein, D., Pupko, T., Eyras, E., and Ast, G. (2008)
Large-scale comparative analysis of splicing signals and their corresponding
splicing factors in eukaryotes. Genome Res, 18, 88–103.
Sharpton, T., Neafsey, D., Galagan, J., and Taylor, J. (2008) Mechanisms of intron
gain and loss in Cryptococcus. Genome Biol, 9, R24.
Shepelev, V. and Fedorov, A. (2006) Advances in the Exon-Intron Database (EID).
Brief Bioinform, 7, 178–185.
94
References
Singer, G.A. and Hickey, D.A. (2000) Nucleotide bias causes a genomewide bias
in the amino acid composition of proteins. Mol Biol Evol, 17, 1581–1588.
Smits, P., Smeitink, J.A.M., van den Heuvel, L.P., Huynen, M.A., and Ettema,
T.J.G. (2007) Reconstructing the evolution of the mitochondrial ribosomal pro-
teome. Nuleic Acids Res, 35, 4686–4703.
Sugden, A., Jasny, B., Culotta, E., and Pennisi, E. (2003) Charting the evolution-
ary history of life. Science, 300, 1691.
Sverdlov, A.V., Rogozin, I.B., Babenko, V.N., and Koonin, E.V. (2005) Conserva-
tion versus parallel gains in intron evolution. Nucleic Acids Res, 33, 1741–1748.
Tarn, W.Y. and Steitz, J.A. (1996) A novel spliceosome containing U11, U12, and
U5 snRNPs excises a minor class (AT-AC) intron in vitro. Cell, 84, 801–811.
Terasawa, K., Odahara, M., Kabeya, Y., Kikugawa, T., Sekine, Y., Fujiwara, M.,
and Sato, N. (2007) The mitochondrial genome of the moss Physcomitrella
patens sheds new light on mitochondrial evolution in land plants. Mol Biol
Evol, 24, 699–709.
Timmis, J.N., Ayliffe, M.A., Huang, C.Y., and Martin, W. (2004) Endosymbiotic
gene transfer: organelle genomes forge eukaryotic chromosomes. Nat Rev
Genet, 5, 123–135.
Toor, N., Keating, K.S., Taylor, S.D., and Pyle, A.M. (2008) Crystal structure of a
self-spliced group II intron. Science, 320, 77–82.
Toro, N., Jiménez-Zurdo, J.I., and García-Rodríguez, F.M. (2007) Bacterial group
II introns: not just splicing. FEMS Microbiol Rev, 31, 342–358.
Tourasse, N.J. and Kolstø, A.B. (2008) Survey of group I and group II introns in
29 sequenced genomes of the Bacillus cereus group: insights into their spread
and evolution. Nucleic Acids Res, 36, 4529–4548.
Tovar, J., Fischer, A., and Clark, C.G. (1999) The mitosome, a novel organelle
related to mitochondria in the amitochondrial parasite Entamoeba histolytica.
Mol Microbiol, 32, 1013–1021.
95
References
Tovar, J., León-Avila, G., Sánchez, L.B., Sutak, R., Tachezy, J., van der Giezen, M.,
Hernández, M., Muller, M., and Lucocq, J.M. (2003) Mitochondrial remnant
organelles of Giardia function in iron-sulphur protein maturation. Nature, 426,172–176.
Tress, M.L., Martelli, P.L., Frankish, A., Reeves, G.A., Wesselink, J.J., Yeats, C.,
Ólason, P.Í., Albrecht, M., Hegyi, H., Giorgetti, A., Raimondo, D., Lagarde, J.,
Laskowski, R.A., López, G., Sadowski, M.I., Watson, J.D., Fariselli, P., Rossi,
I., Nagy, A., Kai, W., Størling, Z., Orsini, M., Assenov, Y., Blankenburg, H.,
Huthmacher, C., Ramírez, F., Schlicker, A., Denoeud, F., Jones, P., Kerrien, S.,
Orchard, S., Antonarakis, S.E., Reymond, A., Birney, E., Brunak, S., Casadio,
R., Guigo, R., Harrow, J., Hermjakob, H., Jones, D.T., Lengauer, T., Orengo,
C.A., Patthy, L., Thornton, J.M., Tramontano, A., and Valencia, A. (2007) The
implications of alternative splicing in the ENCODE protein complement. Proc
Natl Acad Sci USA, 104, 5495–5500.
Valadkhan, S. (2007) The spliceosome: a ribozyme at heart? Biol Chem, 388,693–697.
van Waveren, C. and Moraes, C.T. (2008) Transcriptional co-expression and co-
regulation of genes coding for components of the oxidative phosphorylation
system. BMC Genomics, 9, 18.
Vaünáücová, Š., Yan, W., Carlton, J.M., and Johnson, P.J. (2005) Spliceosomal in-
trons in the deep-branching eukaryote Trichomonas vaginalis. Proc Natl Acad
Sci USA, 102, 4430–4435.
Vellai, T., Takács, K., and Vida, G. (1998) A new aspect to the origin and evolu-
tion of eukaryotes. J Mol Evol, 46, 499–507.
Wallin, I.E. (1927) Symbionticism and the Origin of Species. Baltimore, Williams
& Wilkins company.
Wang, E., Sandberg, R., Luo, S., Khrebtukova, I., Zhang, L., Mayr, C., Kingsmore,
S., Schroth, G., and Burge, C. (2008) Alternative isoform regulation in human
tissue transcriptomes. Nature, 456, 470–476.
Whelan, S. and Goldman, N. (2001) A general empirical model of protein evo-
lution derived from multiple protein families using a maximum-likelihood
approach. Mol Biol Evol, 18, 691–699.
96
References
Will, C.L. and Luhrmann, R. (2005) Splicing of a rare class of introns by the
U12-dependent spliceosome. Biol Chem, 386, 713–724.
Williamson, B. (1977) DNA insertions and gene structure. Nature, 270, 295–297.
Wu, M., Sun, L.V., Vamathevan, J., Riegler, M., Deboy, R., Brownlie, J.C., Mc-
Graw, E.A., Martin, W., Esser, C., Ahmadinejad, N., Wiegand, C., Madupu, R.,
Beanan, M.J., Brinkac, L.M., Daugherty, S.C., Durkin, A.S., Kolonay, J.F., Nel-
son, W.C., Mohamoud, Y., Lee, P., Berry, K., Young, M.B., Utterback, T., Weid-
man, J., Nierman, W.C., Paulsen, I.T., Nelson, K.E., Tettelin, H., OüNeill, S.L.,
and Eisen, J.A. (2004) Phylogenomics of the reproductive parasite Wolbachia
pipientis wMel: a streamlined genome overrun by mobile genetic elements.
PLoS Biol, 2, E69.
Zhang, J. (2003) Evolution by gene duplication: an update. Trends Ecol Evol, 18,292–298.
Zimmerly, S., Guo, H., Perlman, P.S., and Lambowitz, A.M. (1995) Group II
intron mobility occurs by target DNA-primed reverse transcription. Cell, 82,545–554.
Zimmerly, S. and Hausner, G. (2001) Phylogenetic relationships among group II
intron ORFs. Nucleic Acids Res, 29, 1238–1250.
97

Vielen Dank
Mein besonderer Dank gilt Herrn Prof. Dr. William Martin für die Überlassung
des interessanten Themas, seine stete Bereitschaft für konstruktive sowie kriti-
sche Diskussionen, die mich während der Arbeit motivierend begleitet haben.
Für die großzügige Ermöglichung meines Auslandsaufenthaltes und den Teil-
nahmen an internationalen Konferenzen bin ich sehr dankbar.
Herrn Prof. Dr. Martin Lercher danke ich sehr für das entgegengebrachte Inte-
resse und die Übernahme des Korreferats.
Sehr herzlich danke ich Frau Dr. Tal Dagan für ihre freundliche und geduldige
Betreuung, die mich immer wieder mit wertvollen Anregungen für meine Ar-
beit motiviert hat.
Frau PD Dr. Katrin Henze danke ich sehr herzlich für ihre grossartige Un-
terstützung bei der Fertigstellung dieser Arbeit.
Herrn Dr. Toni Gabaldón und der Arbeitsgruppe des CIPFs in Valencia danke
ich sehr herzlich für die warmherzige Gastfreundschaft und der tollen Arbeits-
atmosphäre in der ich einen Großteil dieser Arbeit anfertigen durfte.
Der gesamten Botanik III Arbeitsgruppe danke ich für die schönen Jahre im
Institut. Insbesondere dem zickenfreien Mädelsbüro und dem harten Kern, mit
dem ich viele Konferenzerinnerungen teile: Verena, Nicole, Christian, Gabriel,
Oliver, Britta, Mayo, Silke, Sara.
Meiner lieben Familie und meinen Freunden danke ich dafür, daß sie da sind;
meine Eltern, mein Bruder, die Mainzer, Indra, Deniz, Timo, Paola, Nicki, Julia,
Sandra, Ilija, Tatjana, Ingo und die JKD-Familie ...
Danke Dominic.

Jedes Ding hat drei Seiten.
Eine, die du siehst,
Eine, die ich sehe,
Und eine, die wir beide nicht sehen.
(Chinesisches Sprichwort)


![Research Paper The First Mitochondrial Genome for ... · Mitochondria are important functional orga-nelles in eukaryotic cells [18], and the mt genome is being widely used for studies](https://img.pdfslide.org/doc/110x75/607232f2b1c1c830045d9845/research-paper-the-first-mitochondrial-genome-for-mitochondria-are-important.jpg)