Embed Size (px)
Citation preview
RESEARCH Open Access
Examination of the profitability of technicalanalysis based on moving averagestrategies in BRICSMatheus José Silva de Souza1, Danilo Guimarães Franco Ramos2, Marina Garcia Pena2,Vinicius Amorim Sobreiro2* and Herbert Kimura2
* Correspondence: [email protected] of Management,University of Brasília, Federal District,BrazilFull list of author information isavailable at the end of the article
Abstract
In this paper, we investigated the profitability of technical analysis as applied to thestock markets of the BRICS member nations. In addition, we searched for evidencethat technical analysis and fundamental analysis can complement each other inthese markets. To implement this research, we created a comprehensive portfoliocontaining the assets traded in the markets of each BRICS member. We developedan automated trading system that simulated transactions in this portfolio usingtechnical analysis techniques. Our assessment updated the findings of previousresearch by including more recent data and adding South Africa, the latest memberincluded in BRICS. Our results showed that the returns obtained by the automatedsystem, on average, exceeded the value invested. There were groups of assets fromeach country that performed well above the portfolio average, surpassing the returnsobtained using a buy and hold strategy. The returns from the sample portfolio werevery strong in Russia and India. We also found that technical analysis can helpfundamental analysis identify the most dynamic companies in the stock market.
Keywords: Technical analysis, Moving average strategies, Automated tradingsystems, Portfolio analysis, BRICS
IntroductionThe basic principle of technical analysis (TA) is that patterns related to past prices
of instruments traded in the asset markets can be used to predict the direction of
future prices. The objective is to enhance the return of an investment portfolio by
understanding the interaction of price indicators for the portfolio’s holdings over
an identified time period. According to Stanković et al. (2015), TA is a way of
detecting trends in asset prices based on the premise that the price series moves
according to investors’ perceived standards. Their study demonstrated that the
duration of these standards is sufficient for the investor to make above-average
profits, even if the investments incur transaction costs.
The goal of our research was to investigate the profitability of trading strategies
based on TA in the stock markets of BRICS countries. To this end, we developed
an automated trading system based on the moving averages of past prices. We
demonstrated that this trading system, using technical analysis techniques, could
Financial Innovation
© The Author(s). 2018 Open Access This article is distributed under the terms of the Creative Commons Attribution 4.0 InternationalLicense (http://creativecommons.org/licenses/by/4.0/), which permits unrestricted use, distribution, and reproduction in any medium,provided you give appropriate credit to the original author(s) and the source, provide a link to the Creative Commons license, andindicate if changes were made.
de Souza et al. Financial Innovation (2018) 4:3 https://doi.org/10.1186/s40854-018-0087-z
surpass the profitability of a buy and hold strategy for a portion of the traded as-
sets, calculated by country. The work presented in this paper updated the findings
of previous research, and found that technical analysis can help fundamental
analysis identify the most dynamic companies in the stock market.
TA uses a systematic, graphical approach to identify patterns of historical trading
prices and market movements, and then formulate predictions that may generate
abnormally strong returns. According to Murphy (1999, pp. 1–2), graphs are the
primary instruments of TA. The graphs reflect indicators, such as moving averages
and oscillators, that allow analysts to detect trends, identify points of inflection in
the price movement, and track capital inflows and outflows.
The tools used by TA can provide an index of resistance and support as well.
Indicators include the Relative Strength Index (RSI), the Moving Average Conver-
gence Divergence (MACD), and the Average Directional Index (ADX), among
others. These indicators seek to estimate patterns of future behavior and predict
buy and sell opportunities solely from the previously verified pricing of assets.
More specifically, Vandewalle et al. (1999, pp. 170–172) defined moving averages as
transformations of a price series that allow us to identify trends from data
smoothing.
According to Gerritsen (2016), the success of technical analysis trading rules
would conflict with the weak form of the Efficient Market Hypothesis (EMH)
(Fama 1970), which holds that current asset prices reflect all relevant past data. In
its weak form, EMH states that it is not possible to obtain above-average returns
from the study of past prices (Malkiel and Fama 1970, p. 383), implying that a
price series has a unit root. Therefore, belief in the validity of TA means rejecting
EMH. Expressed in economic terms, Jensen (1978, p. 97) considered a market to
be efficient if the economic profit is null, i.e., if the market meets the optimal
condition that marginal benefit equals the marginal cost of acting based on the
publicly available information.
Technical analysis is not compatible with the idea that stock prices can change
at random (the random walk hypothesis), as pointed out by Lo and MacKinlay
(1987, pp. 87–88). A series of prices presents a unit root, or follows a random
walk, if the observations at an instant t can be expressed as the price in t − 1
added to a random shock. In other words, random factors persist in determining
the observations of the variable, since the shock is little dissipated over time. More
formally, let pt. be the price of an asset at the instant t, and let εt be a term de-
noting a random shock. If the data generation process is in the following form:
pt ¼ α � pt−1 þ εt ; ð1Þ
, then the series of prices is said to be a unit root if α is not statistically different from
1, which means that the random shock is completely absorbed in the process.
In comparison to TA, fundamental analysis (FA) is focused on the economic
and financial aspects of stocks and the markets. According to Lui and Mole
(1998), FA turns to the microeconomic aspects of companies and to the macro-
economic fundamentals of sectors and countries — known as market fundamen-
tals (Allen and Taylor 1990) — to justify past movements and to predict
de Souza et al. Financial Innovation (2018) 4:3 Page 2 of 18
fluctuations. Through the review of previous research, we also made clear that
FA and TA are not mutually exclusive tools for analyzing market data, but rather
explore different drivers of price behavior. TA could be an auxiliary tool to FA.
In fact, some studies explored a hybrid approach using both TA and FA, e.g., Lui
and Mole (1998), Lam (2004), and António Silva and Neves (2015). In this paper,
however, we focused primarily on TA. For our research, we assumed that prices
are determined by the equilibrium between the supply and demand of the asset
to which they refer. Therefore, prices captures any considerations that may be
brought by fundamental analysis (Nison 1991, pp. 8–11).
The remainder of this paper is structured as follows: In Section 2, we give a brief
summary of related research regarding both the development of TA and the results of
experiments with data from emerging countries. Section 3 provides the conceptual
foundation of TA, while section 4 explains our method and the algorithm applied to
generate buy and sell signals. Section 5 discusses the main results obtained, demon-
strates the importance of using TA and FA as complementary tools for obtaining
profits in the open market, and draws attention to the importance of these results for
the literature. Section 6 provides our conclusion.
Related research
Scholars have tested the efficiency of the tools of technical analysis frequently, for
example, in the studies of Allen and Taylor (1990), Jegadeesh (2000), and Kuang et
al. (2014). The main reasons for this continued research, as discussed in Zhu and
Zhou (2009), were that previous studies of the profitability of technical analysis ob-
tained inconclusive results and lacked a scientific basis. Consequently, more con-
sistent hypotheses to justify TA were needed. For example, Allen and Taylor
(1990), Frankel and Froot (1986), Shiller (1989), and others pointed out the
irrationality of TA. According to Allen and Taylor (1990), the subjectivity of this
approach prevents it from acquiring a scientific character. Frankel and Froot
(1986) and Shiller (1989) held that the use of technical indicators leads to over-
valuation of asset prices, thereby heating up the demand for some assets without
good reason.
There have been few experimental tests of the profitability of the TA indicators
across the typical market structures of emerging countries. In particular, further
work is needed regarding the BRICS member nations, a special subgroup
composed of Brazil, Russia, India, China, and South Africa. Recently, studies were
carried out on isolated emerging markets that are not similar to each other, includ-
ing contributions by Chang et al. (2004), Kuang et al. (2014), Mitra (2011), and
Mobarek et al. (2008). However, none of these studies proposed a comparison of
the results for groups of similar countries, so they failed to answer whether TA is
profitable for emerging markets as a whole.
Interest in these countries has been stimulated by the typical characteristics of
their macroeconomic environments, such as instability, uncertainty, and inflation
resulting from their adopted economic growth strategies. According to Chang et al.
(2004), emerging countries became attractive markets to investors looking for port-
folio diversification and financial returns above the average attainable from the
de Souza et al. Financial Innovation (2018) 4:3 Page 3 of 18
consolidated markets of developed countries. Emerging markets differ from markets
in developing countries insofar as they are closer to the markets of developed
countries, making them more dynamic and attractive to foreign investors. On this
topic, Mukherjee and Roy (2016) emphasized the relationship between instrument
price fluctuations and macroeconomic particularities.
The good predictability of TA and the high returns in emerging markets are not
unanimously accepted in the literature. Chang et al. (2004) and Harvey (1995) empha-
sized that there is a strong autocorrelation in the price series of emerging markets,
which means that the random walk hypothesis is rejected. Therefore, there is a good
predictive capacity in these markets. However, Costa et al. (2015) and Ratner and Leal
(1999), who considered transaction costs, identified that the predictive capacity of TA
does not lead to abnormally strong returns.
In this context, Urrutia (1995) identified positive results of TA for Latin
American countries. Noakes and Rajaratnam (2014) signaled mixed results for
South Africa because the profitability of TA for low capitalization assets sustains it-
self, which is the opposite of more commonly traded assets. Sharma and Kennedy
(1977) showed negative results for India. Almujamed et al. (2013); Errunza and
Losq (1985) suggested there is a lower degree of efficiency in emerging markets,
compared to the consolidated markets of developed countries. Sobreiro et al.
(2016, p. 99) found that a strategy based on the crossover of moving averages
generated greater profits than a static strategy for Russia, Brazil, and Argentina,
but not for the markets of Jamaica and China.
Table 1 summarizes the results of the main studies of the profitability of TA in both
emerging and developed countries. Surveys were considered to provide mixed evidence
if their results demonstrated that the good performance of technical analysis was not
sustained after considering transaction costs.
Table 1 Summary of the profitability of TA around the world according to researchers from 1961to 2016
Positive Results Negative Results
– USA - Alexander (1961), Fama and Blume (1966)and Brock et al. (1992).
– India - Sharma and Kennedy (1977).
Malaysia, Thailand and Taiwan – Bessembinder andChan (1995).
Japan and Hong Kong - Bessembinder andChan (1995).
Taiwan - Ratner and Leal (1999). –
Mexico - Ratner and Leal (1999). –
Thailand - Ratner and Leal (1999). –
Bangladesh, India, Pakistan and Sri Lanka - Gunasekarageand Power (2001).
–
Bangladesh - Mobarek et al. (2008). –
– India - Mitra (2011).
– South Africa - Noakes and Rajaratnam (2014).
USA, Germany and United Kingdom - Cervelló-Royo et al.(2015).
Singapore, Indonesia and Malaysia - Tharavanijet al. (2015).
Russia - Sobreiro et al. (2016). –
Brazil - Sobreiro et al. (2016). –
Argentina - Sobreiro et al. (2016). –
de Souza et al. Financial Innovation (2018) 4:3 Page 4 of 18
Based on this context, the objective of this paper was to investigate the profitability
of moving average trading strategies in the stock markets of BRICS countries. We
sought to analyze the performance of TA in environments that are different from those
of developed countries and other emerging nations in terms of their stock markets, the
behavior of investors, and national economic policies (Mozumder et al. 2015; Naresha
et al. 2017).
For this research, we used an automated trading system (ATS) that simulated the
transactions based on patterns verified by the data and related to the signals of the
moving averages over the prices of the assets. We prepared a comprehensive port-
folio for each country, containing all the assets traded in the markets of each
BRICS member. For South Africa, China, and India, we included the asset prices
from 2000 to 2016. For Brazil and Russia, we used price data from 2007 to 2016.
Initial capital transactions were carried out as the model issued buy and sell signals
from the interaction of the series of moving averages over prices.
In this work, we sought to complement the approach of Costa et al. (2015) and
Sobreiro et al. (2016) in some respects. First, we studied the performance of technical
analysis for the instruments traded in Brazil as verified in Costa et al. (2015), and also
for the BRICS members, to check the profitability of indicators for a more general class
of countries. In contrast to Sobreiro et al. (2016), we included transaction costs, aiming
to establish more realistic assumptions.
Our study aimed to update results from Chong et al. (2010) by using more
recent data and adding South Africa to the analysis, the latest member to be in-
cluded in the BRICS countries. In this context, we investigated all BRICS
countries, instead of only the BRIC nations, using data through 2016. It is im-
portant to highlight that both Sobreiro et al. (2016) and Chong et al. (2010) did
not analyze the results of trading strategies that took into account transaction
costs. Therefore, our automated trading system, by operating with and without
brokerage fees, allowed us to assess the impact of transaction costs on the overall
profitability of the strategies.
A brief overview of the conceptual foundation of technical analysis
Nison (1991, pp. 8–11) added the psychological and emotional components of the
rational agents to the study of asset prices in the financial market. This approach
was capable of capturing the animal spirits spoken about by Keynes (1936), a con-
cept that is not incorporated in fundamental analysis. Nison (1991) suggested that
the study of technical analysis is important because it provides an understanding of
why the market moves. The author emphasized that great negotiators make their
decisions based on technical indicators. Both the previous price and the influence
exercised by leaders over the decisions of other investors are factors that determine
the price movement itself.
Ellis and Parbery (2005) highlighted the use of moving averages for the gener-
ation of buy and sell signals as a mechanism to identify price trends. While the
short-term moving average is more sensitive to price changes, longer term
moving averages capture medium- and long-term trends. Investors in the stock
exchanges utilize technical analysis extensively, and moving averages are the most
de Souza et al. Financial Innovation (2018) 4:3 Page 5 of 18
commonly used indicators because they are simple to understand and relatively
easy to use.
Regarding the calculation of the moving averages, let h be the length of the moving
average, i.e., the number of observations from which the average of the values will be
extracted, and let N ≥ h be the position of a given observation from which the previous
h values will be included in the calculation of the N-th moving average. If SMAN is the
N-th simple moving average, and EMAN is the Nth exponential moving average, they
can be calculated as follows:
SMAN ¼PN
t¼N−hþ1pth
; ð2Þ
and
EMAN ¼ 2hþ 1
� �
� pt−1 þ 1þ 2hþ 1
� �� �
� EMAN−1; ð3Þ
For a deeper explanation of the simple moving average, please see Vandewalle et
al. (1999). According to Appel (2005), the exponential moving average is better
than the simple moving average for identifying trends in a price series. Park and
Irwin (2007, p. 67) summarized the evidence for the profitability of technical
analysis in futures contracts, foreign currency markets, and in the capital markets.
According to the authors, from 1988 to 2004, 26 studies obtained positive results
for the use of technical indicators in the capital markets, and 12 found negative
results. However, Park and Irwin (2007, pp. 29–30) concluded that the positive
results of technical analysis were more consistent and significant for the futures
and foreign currency markets, compared to results for the stock markets. Also, the
authors concluded that TA’s positive results for asset markets were subject to data
manipulation problems and the creation of ex-post strategies.
In previous research, findings about the profitability of technical analysis were quite
inconsistent when applied to the stock markets of emerging countries. In general, the
simple moving average (SMA) or exponential moving average (EMA) strategies assured
a positive return, but the return was not sustained when transaction costs were consid-
ered, such as fees paid to the broker (Brock et al. 1992).
Similar results were presented by Mitra (2011), and Ratner and Leal (1999) when they
compared the returns obtained from the generation of buy or sell signals with the
returns of a static strategy such as buy and hold. The former study focused on financial
assets traded in India, and found that when the short-term moving average crossed
above the long-term moving average, the prices generated positive net results. However,
when transaction costs were considered, this profitability did not sustain itself. Ratner
and Leal’s study (Ratner and Leal 1999), which was broader and considered countries
in Latin America and Asia, reached the same conclusion. The exceptions were the Tai-
wanese, Mexican, and Thai markets, whose profitability was maintained even after
transaction costs were included.
For data regarding the United States of America (USA), Alexander (1961), Brock et
al. (1992), and Fama and Blume (1966) found that if the transaction costs were not
de Souza et al. Financial Innovation (2018) 4:3 Page 6 of 18
zero, the profitability gained by applying technical analysis was not significant. In com-
parison, Kuang et al. (2014) achieved an average annual return of approximately 30%
for emerging countries’ stock markets. However, they considered that this profitability
was not accurate, since it was the result of problems arising from prior manipulation of
the data to discover ex-ante patterns.
In a study using data from Bangladesh, Mobarek et al. (2008) proposed that the
accelerated growth of the capitalization level in that country was an investment
opportunity. The research emphasized that Bangladesh was an emerging country
that had undergone extreme structural economic changes in which the focus on
agriculture was abandoned in favor of a strategy involving industrialization and the
formation of new companies. The null hypothesis that the market is weakly
efficient was rejected after verification.
These results showed the weakness of moving average techniques in predicting price
behavior. They also suggested that if transaction costs are negligible, technical analysis
becomes a viable alternative, indicating that under certain conditions the markets are
not efficient. Treynor and Ferguson (1985) emphasized the importance of historical
prices in forecasting price behavior as a complement to the role played by the informa-
tion available to suppliers and claimants who are, above all, responsible for creating
profit opportunities.
Shynkevich (2012) concluded that the profitability of technical analysis for portfolios
holding small cap assets with less liquidity was greater than for portfolios holding large
cap companies from the technology area. For this reason, it is especially relevant to
analyze the returns of classic technical indicators for emerging markets where more
small caps are expected, possibly because of policies used to stimulate industrial
activity.
Recent empirical evidence for South Africa verified by Noakes and Rajaratnam (2014)
suggested that the level of capitalization of traded assets in that country was inversely
related to market inefficiency. Moreover, the authors suggested that the degree of mar-
ket efficiency falls during periods of crisis, as during the financial crisis of 2008.
The research of Costa et al. (2015) analyzed the power of technical analysis indi-
cators for the Brazilian asset market. The authors concluded that technical analysis
has weak predictive power whether or not brokerage fees are considered. However,
the use of crossing moving averages, simple or exponential, and Moving Average
Convergence Divergence (MACD) provided a high probability of guaranteeing a
return greater than the amount invested. In general, research indicated that it is
natural for markets to become efficient, because they do not obtain significant
returns from past price behavior. Thus, evidence for technical analysis in emerging
markets suggested less efficiency in these countries, which might set up an attract-
ive investment option for the foreign investor.
Sobreiro et al. (2016) obtained positive and above-average returns generated by the
static buy and hold strategy for the short-term SMA crossing over the long-term SMA.
However, although some combinations of short- and long-term SMAs were profitable
for some countries, they did not provide sustained profitability for other emerging
countries. Consequently, a more general conclusion could not be reached from the
study. In general, buy and hold is a more profitable and risk-free alternative to an auto-
mated strategy for most emerging markets.
de Souza et al. Financial Innovation (2018) 4:3 Page 7 of 18
It is worth mentioning that the approach of Sobreiro et al. (2016) does not ex-
plore the impact of transaction cost on a portfolio’s return, which has a significant
cooling effect on the performance of the trades, and is subject to currency rate
volatility. With regard to this last aspect, it is worth noting that the authors’ use
of 10,000.00 local currency units as the initial value of the portfolio left the invest-
ments open to the effects of exchange rate fluctuations and inflation that often
impact the currencies of emerging countries.
Concerning the influence of technical analysis on fundamental analysis,
Almujamed et al. (2013, pp. 57–58) studied data for Kuwait. They concluded that
investors check a firm’s profitability before looking at the stock chart movements
and stock price trends of the company. Furthermore, they asserted that fundamen-
tal analysis that uses a more recent series of prices, usually within five years, is
employed more commonly by investors in developed markets, while emerging
markets are considered inefficient.
According to Bettman et al. (2009, pp. 21–22), TA and FA are complementary, since
models that combine the assumptions and elements of both analyses achieve higher profit-
ability than models based on a single approach only. For their analysis of TA and FA, the
authors ran linear regression models with explanatory variables from TA, e.g., trend and
momentum indicators based on past prices. They also ran models using variables from FA,
e.g., book value and earnings per share, and models using variables from both. Bettman’s
findings indicated that a model with independent variables from both approaches provided
better performance based on statistics such as the Akaike information criterion (AIC) and
likelihood ratio tests. The work of Wang et al. (2014, pp. 33) supported a similar conclusion,
showing that the joint application of FA and TA reduced the risk of the investment.
Chong et al. (2010, pp. 237–238) set out to compare the performance of the
traditional technical analysis indicators for the BRIC1. They concluded that the
average profit in Russia surpassed the returns obtained in the other countries,
and the evidence indicated that the Brazilian open market was the most efficient.
The authors attributed these findings to the fact that the age of the market was
directly related to efficiency. Therefore, they supported the view that markets be-
come efficient over time. However, the costs associated with open market buy
and sell transactions were not considered. Lo et al. (2000, pp. 1753–1764)
demonstrated that technical analysis benefits from the automation provided by
computerized trading systems, with emphasis on the identification of visual
patterns in the asset price series.
Tharavanij et al. (2015, pp. 39–40) analyzed the performance of a wide variety of
technical indicators for similar Asian emerging markets, such as Malaysia, Indonesia,
Singapore, and Thailand. The analysis was conducted on a risk-adjusted basis, and
accounted for brokerage fees. The authors found several levels of efficiency in the mar-
kets, but overall, TA strategies could not beat the buy and hold benchmark, and prices
could not foster excess returns above the market average. These results indicated that
similar characteristics did not lead to a single winning strategy.
MethodTo meet the objectives of this paper, we developed a transaction model, called the
automated trading system (ATS), that worked automatically based on classic technical
de Souza et al. Financial Innovation (2018) 4:3 Page 8 of 18
analysis, especially the use of moving averages, to soften price series and identify trends.
As described by Booth et al. (2014, p. 3651), automated trading systems perform trades
autonomously, identifying investment opportunities based on artificial intelligence
methods. The procedures that define the strategy used to generate trading signals can
vary substantially. Technical indicators have found wide spread use for this purpose as
a result of their extensive application by market practitioners.
Whatever the method used in a trading system, the base assumption is still the same:
price predictions are based on past price data. According to Cervelló-Royo et al. (2015,
p. 5963), this principle imposes an important challenge for individual investors and
companies, because forecasts of future prices are subject to occasional unexpected fluc-
tuations that do not depend on the historical behavior of the markets. Chen and Chen
(2016, pp. 261–262) indicated that the stock market is subject to many changes in the
underlying environment, such as variations in economic, political, and industrial condi-
tions. According to the authors, finding the proper means for analysis is paramount for
defining better or worse strategies for generating profits in the market.
Concerning the psychological aspects of the investors, Pring (2016, pp. 2–5)
emphasized that TA reflects the concept that price trends depend on the attitudes of
individuals, i.e., the mass psychology of the crowd. In this context, technical analysis
relies on the assumption that herd behavior fluctuates between periods of fear or
pessimism and times of confidence or optimism.
We chose to use the crossover of moving averages for the generation of buy and
sell signals because this technique is employed extensively by financial market ana-
lysts, is based on graphical patterns of historical market prices (Alexander 1961;
Reitz 2006), and allows for a comparatively simple approach to computational im-
plementation. The algorithm for the generation of buy signals is based on the
crossing of two series generated from the available quotations for the assets: the
short-term moving average and the long-term moving average. For the analysis of
the technical indicators, based on Ellis and Parbery (2005), we agreed that a buy
signal would be issued when the short-term MA becomes bigger than the long-
term MA, and a sales signal would be issued when the short-term MA becomes
smaller than the long-term MA.
The study’s data came from the daily closing quotations for 1454 assets traded on the
BRICS stock exchanges: 236 assets from South Africa, 198 assets from Brazil, 65 assets
from Russia, 755 assets from India, and 300 assets from China, as shown in Table 2.
The data were taken from Bloomberg© and included historical prices for 2569 assets.
For computing purposes, we opted to choose the 300 most dynamic assets in the Chin-
ese market.
Table 2 Information of countries
Countries Number of Stocks Period Exchange at 6/24/2016 Initial Capital at LocalCurrency
Brazil. 198 2007–2016 33,728 BRL/USD 33,728 BRL
Russia. 65 2007–2016 65,676 RUB/USD 656,760 RUB
India. 755 2000–2016 67,858 INR/USD 678,580 INR
China. 300 2000–2016 66,155 CNY/USD 661,550 CNY
South Africa. 236 2000–2016 150,876 ZAR/USD 150,876 ZAR
de Souza et al. Financial Innovation (2018) 4:3 Page 9 of 18
Of the total assets of the database, some did not allow the generation of buy/sell sig-
nals, and therefore were excluded from the portfolio. Data for South Africa, China, and
India corresponded to the period from 2000 to 2016. For Brazil and Russia, the period
considered was from 2007 to 2016. For the transaction simulations, we used the closing
prices per day.
Also, the simulations were carried out considering an application of US$10,000.00 in
local currency quoted on June 24, 2016 to normalize the investment from the perspec-
tive of an external investor. Returns obtained were compared with and without the in-
clusion of costs. Neither of these aspects were considered in Sobreiro et al. (2016),
whose simulations were made with the initial application of 10,000.00 local currency
units and without considering transaction costs. Similarly, costs were not considered in
Chong et al. (2010).
For our research, we constructed a portfolio composed of a wide number of holdings.
This approach allowed us to verify the average profitability gained through technical
analysis for all assets traded in the stock market for each BRICS member country.
Given these conditions, we considered an investor who was investing US$10,000.00 in
each asset of the country, converted at the exchange rate on June 24, 2016.
In the moving average system, a buy signal is generated when the short-term MA be-
comes greater than the long-term MA, indicating the start of an uptrend and the end
of a downtrend. On the other hand, if the long-term MA becomes greater than the
short-term MA, a sell signal is generated. This is one of the very basic principles agreed
upon among chartists.
It is worth noting that three types of moving average crossovers were analyzed in our
trading system: SMA-SMA, SMA-EMA, and EMA-EMA. In each class, we used groups
of MA combinations, with the short-term MA ranging from 5 to 40 periods, and the
long-term MA varying from 80 to 120 periods. Although the periods were arbitrary,
the short-term MA reflected a time horizon of approximately 2 months, and the long-
term MA a time horizon between 4 to 6 months. To perform the computational
experiment, the algorithm was implemented in the software’s programming language.
Since the short-term MA varied between 5 and 40 periods, and the long-term MA
varied between 80 and 120 periods, we had 1.476 strategies for a single class of cross-
over. Thus, we had 4.428 strategies, and for each one, three simulations were made:
without transaction costs, with brokerage costs of 2%, and with brokerage costs of 5%.
Since the purpose of the study was to formulate an automated model to investigate
the profitability and efficiency of technical analysis in emerging markets, the return
obtained in local currency was converted into dollars according to the exchange rate of
the investment’s initial date. This procedure eliminated the impact of any nominal
exchange rate and inflation fluctuations on transactions.
We elaborated and compiled the algorithm in the R software, which allowed handling a
large mass of data in an uncomplicated way. In general, the execution flow of the auto-
mated trading system can be summarized by the pseudo–code presented in Algorithm 1.
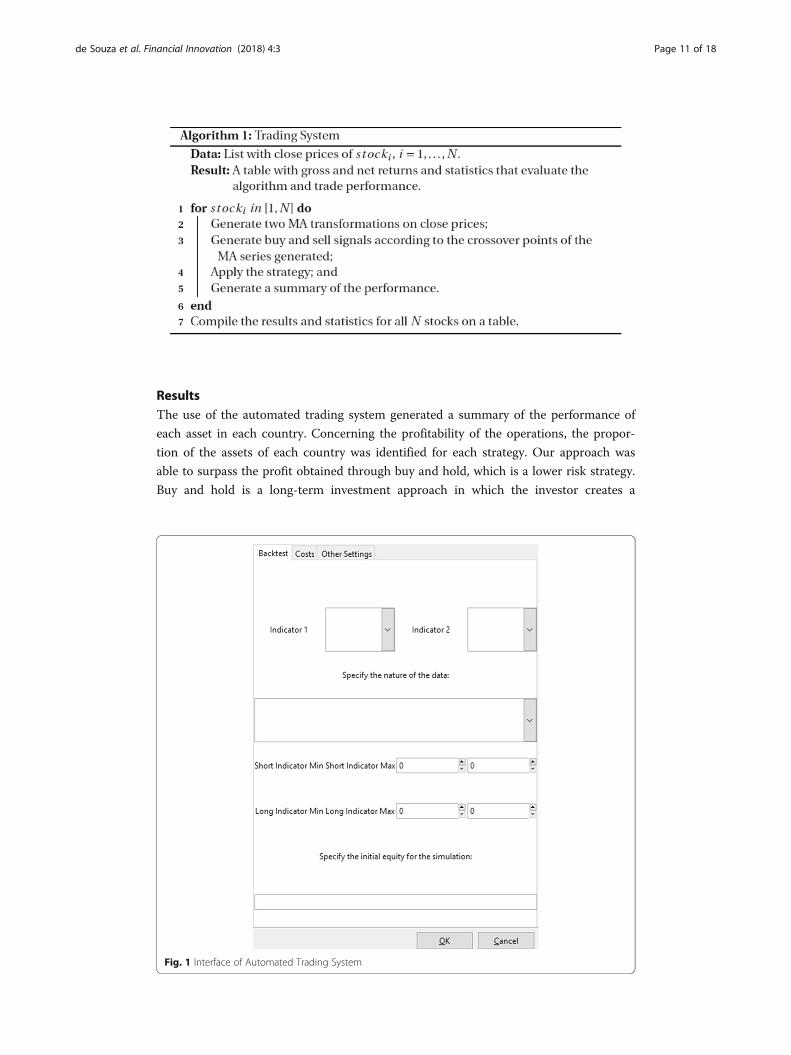
The automated trading system had a graphical user interface (shown in Fig. 1), also
elaborated in R to facilitate the collection of input data that came from tables containing
the closing price history of traded assets and the set of parameters. The latter included
the specification of the moving average type, the range of each MA, and the initial capital
to be applied.
de Souza et al. Financial Innovation (2018) 4:3 Page 10 of 18
ResultsThe use of the automated trading system generated a summary of the performance of
each asset in each country. Concerning the profitability of the operations, the propor-
tion of the assets of each country was identified for each strategy. Our approach was
able to surpass the profit obtained through buy and hold, which is a lower risk strategy.
Buy and hold is a long-term investment approach in which the investor creates a
Fig. 1 Interface of Automated Trading System
de Souza et al. Financial Innovation (2018) 4:3 Page 11 of 18
portfolio of assets, and sells only when the valuation of the assets is considered satisfac-
tory, providing above-market average returns.
Table 3 shows the average returns per country when buy and hold was imple-
mented. In short, we applied the buy and hold strategy for each asset of the same
country, and we extracted the average profitability of the operations for each
country.
The data available in Table 2 supports Table 4, which shows the proportion of assets in
each country that surpassed the average buy and hold return for the same country. We
chose to compare the returns of each asset obtained by the automated trading system
with the average market return of the risk-free strategy to identify groups of assets that of-
fered good, consistent performance and were issued by dynamic companies in the market.
In general, dynamic strategies for the purchase and sale of assets are studied to
determine whether it is possible to obtain above-market average returns in the
short term. According to Table 4, a tiny group of assets surpassed the buy and
hold returns using the automated trading system. However, the main conclusion
here is that there was a group of assets in each country that could outperform the
passive buying strategy.
As shown in Fig. 2, the average return was very high in India and Russia. Because
their stock markets are younger, efficiency may be related to market maturity, indicat-
ing that technical analysis performs well and sustains the results of Chong et al. (2010).
However, this argument could be a topic for further study. Moreover, in these same
markets, the increase in transaction costs shifted significantly the range of the short-
term MAs that were better, as presented by Tables 5, 6, and 7.
Results for India and Russia indicated higher returns, but our study did not focus on
potential explanations for the different results among the countries. TA explores infor-
mation from past data only, without consideration of macro or micro elements that
could explain the future price behavior of specific stocks. Consequently, the results of
the analysis indicated potential violations of the weak form of market efficiency, but
could not be used to explain potential fundamental rationales for the profitability of
trading strategies.
For the South African market, one of the most consolidated of the samples, the
most attractive returns were stable. For the three categories of MA crossovers,
and for all simulated types of cost, the short-term MA crossover at the interval
[37; 40] with the long-term MA of the range [116; 120] proved to be profitable
in all simulations. Thus, more efficient markets showed more conservative, but
more stable, returns.
Table 3 Buy and hold results
Countries Initial Capital atLocal Currency
Average Buy and Hold Result(Local Currency)
Average Buy and HoldResult (Dollars)
Brazil. 33,728 BRL 153,936.90 BRL 45,640.48 USD
Russia. 656,760 RUB 4,066,074 RUB 61,911.11 USD
India. 678,580 INR 23,877,054 INR 351,867.93 USD
China. 661,550 CNY 3,999,462 CNY 60,455.93 USD
South Africa. 150,876 ZAR 1,559,474 ZAR 103,361.30 USD
de Souza et al. Financial Innovation (2018) 4:3 Page 12 of 18
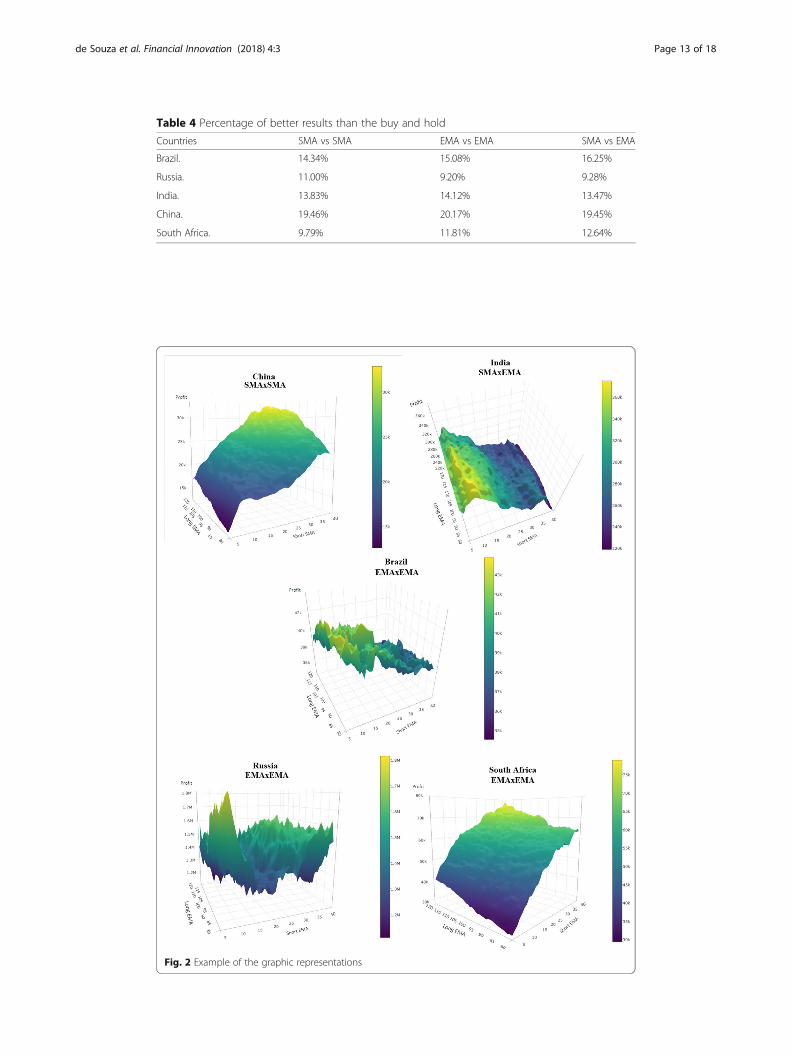
Table 4 Percentage of better results than the buy and hold
Countries SMA vs SMA EMA vs EMA SMA vs EMA
Brazil. 14.34% 15.08% 16.25%
Russia. 11.00% 9.20% 9.28%
India. 13.83% 14.12% 13.47%
China. 19.46% 20.17% 19.45%
South Africa. 9.79% 11.81% 12.64%
Fig. 2 Example of the graphic representations
de Souza et al. Financial Innovation (2018) 4:3 Page 13 of 18
ConclusionThis paper investigated the efficiency and profitability of applying technical analysis to
the stock markets of BRICS member countries. We analyzed whether investors could
obtain above-average returns, as suggested by the recent research of Stanković et al.
(2015) and others. For this research, we assembled a comprehensive portfolio of stocks
from the BRICS countries that contained all the assets traded in the markets of each
BRICS member. We developed an automated trading system that simulated transac-
tions in this portfolio using technical analysis techniques.
While this system was developed carefully, the study had some limitations. For
example, we assumed that the stocks had high liquidity, and that transactions
could be traded at specific market prices. Nonetheless, the results indicated that
our automated trading system, using technical analysis, could surpass the profitabil-
ity of a buy and hold strategy for a small portion of the traded assets, calculated
by country. Although small, this portion presented returns well above the amount
invested, because the gains were from assets related to dynamic companies in the
stock market.
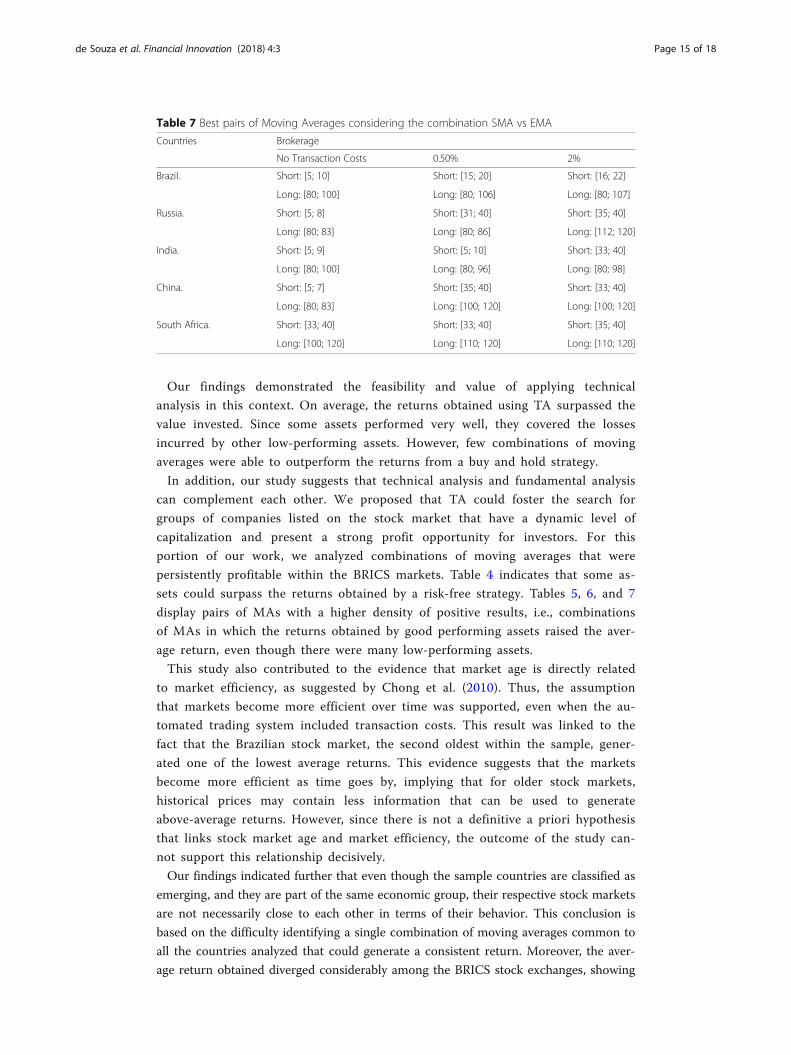
Table 5 Best pairs of Moving Averages considering the combination SMA vs SMA
Countries Brokerage
No Transaction Costs 0.50% 2%
Brazil. Short: [5; 15] Short: [10; 16] Short: [10; 24]
Long: [80; 117] Long: [80; 115] Long: [90; 110]
Russia. Short: [5; 8] Short: [5; 8] Short: [20; 28]
Long: [80; 85] Long: [80; 85] Long: [90; 98]
India. Short: [5; 10] Short: [5; 15] Short: [30; 37]
Long: [80; 105] Long: [80; 115] Long: [110; 120]
China. Short: [32; 40] Short: [31; 40] Short: [31; 40]
Long: [90; 112] Long: [99; 115] Long: [102; 120]
South Africa. Short: [15; 17], [37; 40] Short: [36; 40] Short: [37; 40]
Long: [115; 120] Long: [116; 120] Long: [116; 120]
Table 6 Best pairs of Moving Averages considering the combination EMA vs EMA
Countries Brokerage
No Transaction Costs 0.50% 2%
Brazil. Short: [5; 20] Short: [11; 24] Short: [20; 32]
Long: [80; 105] Long: [80; 110] Long: [80; 112]
Russia. Short: [5; 8], [11; 14] Short: [19;20] Short: [26; 28]
Short: [5; 8], [11; 14] Long: [80; 82] Long: [91; 92]
India. Short: [5; 13] Short: [5; 16] Short: [15; 20], [30; 34]
Long: [80; 120] Long: [80; 96] Long: [80; 120]
China. Short: [5; 7], [32; 34] Short: [33; 38] Short: [33; 40]
Long: [80; 85] Long: [80; 120] Long: [90; 120]
South Africa. Short: [36; 40] Short: [36; 40] Short: [35; 40]
Long: [96; 120] Long: [96; 120] Long: [97; 120]
de Souza et al. Financial Innovation (2018) 4:3 Page 14 of 18
Our findings demonstrated the feasibility and value of applying technical
analysis in this context. On average, the returns obtained using TA surpassed the
value invested. Since some assets performed very well, they covered the losses
incurred by other low-performing assets. However, few combinations of moving
averages were able to outperform the returns from a buy and hold strategy.
In addition, our study suggests that technical analysis and fundamental analysis
can complement each other. We proposed that TA could foster the search for
groups of companies listed on the stock market that have a dynamic level of
capitalization and present a strong profit opportunity for investors. For this
portion of our work, we analyzed combinations of moving averages that were
persistently profitable within the BRICS markets. Table 4 indicates that some as-
sets could surpass the returns obtained by a risk-free strategy. Tables 5, 6, and 7
display pairs of MAs with a higher density of positive results, i.e., combinations
of MAs in which the returns obtained by good performing assets raised the aver-
age return, even though there were many low-performing assets.
This study also contributed to the evidence that market age is directly related
to market efficiency, as suggested by Chong et al. (2010). Thus, the assumption
that markets become more efficient over time was supported, even when the au-
tomated trading system included transaction costs. This result was linked to the
fact that the Brazilian stock market, the second oldest within the sample, gener-
ated one of the lowest average returns. This evidence suggests that the markets
become more efficient as time goes by, implying that for older stock markets,
historical prices may contain less information that can be used to generate
above-average returns. However, since there is not a definitive a priori hypothesis
that links stock market age and market efficiency, the outcome of the study can-
not support this relationship decisively.
Our findings indicated further that even though the sample countries are classified as
emerging, and they are part of the same economic group, their respective stock markets
are not necessarily close to each other in terms of their behavior. This conclusion is
based on the difficulty identifying a single combination of moving averages common to
all the countries analyzed that could generate a consistent return. Moreover, the aver-
age return obtained diverged considerably among the BRICS stock exchanges, showing
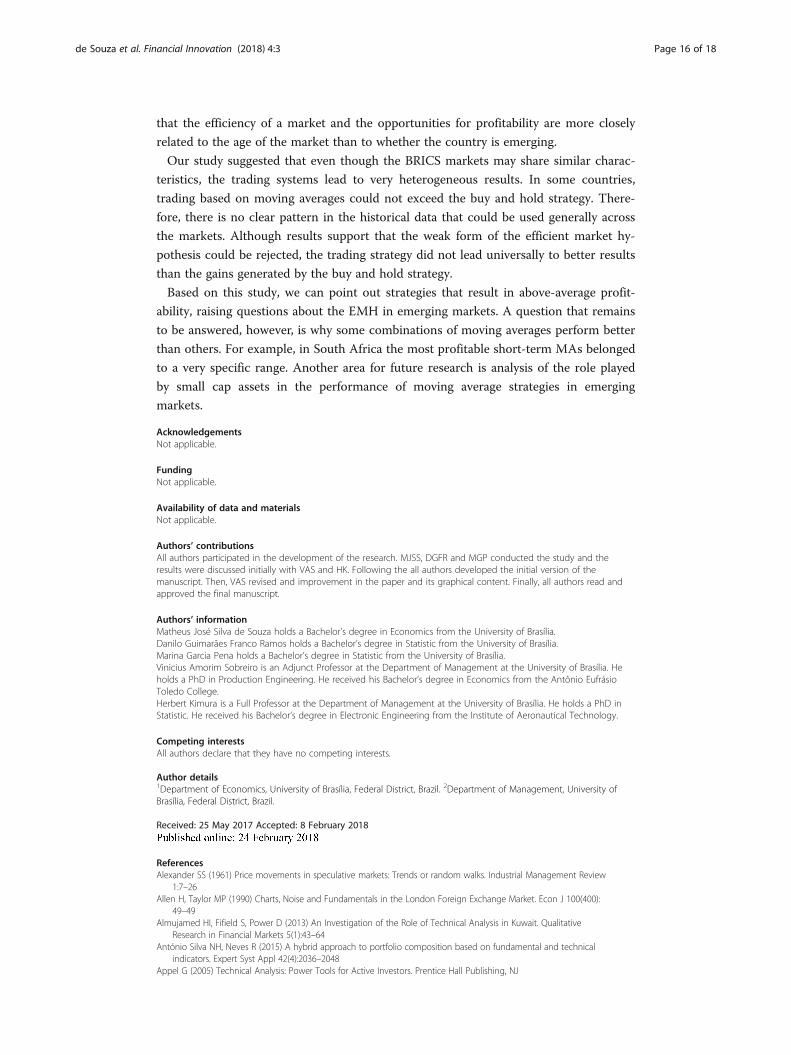
Table 7 Best pairs of Moving Averages considering the combination SMA vs EMA
Countries Brokerage
No Transaction Costs 0.50% 2%
Brazil. Short: [5; 10] Short: [15; 20] Short: [16; 22]
Long: [80; 100] Long: [80; 106] Long: [80; 107]
Russia. Short: [5; 8] Short: [31; 40] Short: [35; 40]
Long: [80; 83] Long: [80; 86] Long: [112; 120]
India. Short: [5; 9] Short: [5; 10] Short: [33; 40]
Long: [80; 100] Long: [80; 96] Long: [80; 98]
China. Short: [5; 7] Short: [35; 40] Short: [33; 40]
Long: [80; 83] Long: [100; 120] Long: [100; 120]
South Africa. Short: [33; 40] Short: [33; 40] Short: [35; 40]
Long: [100; 120] Long: [110; 120] Long: [110; 120]
de Souza et al. Financial Innovation (2018) 4:3 Page 15 of 18
that the efficiency of a market and the opportunities for profitability are more closely
related to the age of the market than to whether the country is emerging.
Our study suggested that even though the BRICS markets may share similar charac-
teristics, the trading systems lead to very heterogeneous results. In some countries,
trading based on moving averages could not exceed the buy and hold strategy. There-
fore, there is no clear pattern in the historical data that could be used generally across
the markets. Although results support that the weak form of the efficient market hy-
pothesis could be rejected, the trading strategy did not lead universally to better results
than the gains generated by the buy and hold strategy.
Based on this study, we can point out strategies that result in above-average profit-
ability, raising questions about the EMH in emerging markets. A question that remains
to be answered, however, is why some combinations of moving averages perform better
than others. For example, in South Africa the most profitable short-term MAs belonged
to a very specific range. Another area for future research is analysis of the role played
by small cap assets in the performance of moving average strategies in emerging
markets.
AcknowledgementsNot applicable.
FundingNot applicable.
Availability of data and materialsNot applicable.
Authors’ contributionsAll authors participated in the development of the research. MJSS, DGFR and MGP conducted the study and theresults were discussed initially with VAS and HK. Following the all authors developed the initial version of themanuscript. Then, VAS revised and improvement in the paper and its graphical content. Finally, all authors read andapproved the final manuscript.
Authors’ informationMatheus José Silva de Souza holds a Bachelor’s degree in Economics from the University of Brasília.Danilo Guimarães Franco Ramos holds a Bachelor’s degree in Statistic from the University of Brasília.Marina Garcia Pena holds a Bachelor’s degree in Statistic from the University of Brasília.Vinicius Amorim Sobreiro is an Adjunct Professor at the Department of Management at the University of Brasília. Heholds a PhD in Production Engineering. He received his Bachelor’s degree in Economics from the Antônio EufrásioToledo College.Herbert Kimura is a Full Professor at the Department of Management at the University of Brasília. He holds a PhD inStatistic. He received his Bachelor’s degree in Electronic Engineering from the Institute of Aeronautical Technology.
Competing interestsAll authors declare that they have no competing interests.
Author details1Department of Economics, University of Brasília, Federal District, Brazil. 2Department of Management, University ofBrasília, Federal District, Brazil.
Received: 25 May 2017 Accepted: 8 February 2018
ReferencesAlexander SS (1961) Price movements in speculative markets: Trends or random walks. Industrial Management Review
1:7–26Allen H, Taylor MP (1990) Charts, Noise and Fundamentals in the London Foreign Exchange Market. Econ J 100(400):
49–49Almujamed HI, Fifield S, Power D (2013) An Investigation of the Role of Technical Analysis in Kuwait. Qualitative
Research in Financial Markets 5(1):43–64António Silva NH, Neves R (2015) A hybrid approach to portfolio composition based on fundamental and technical
indicators. Expert Syst Appl 42(4):2036–2048Appel G (2005) Technical Analysis: Power Tools for Active Investors. Prentice Hall Publishing, NJ
de Souza et al. Financial Innovation (2018) 4:3 Page 16 of 18
Bessembinder H, Chan K (1995) The profitability of technical trading rules in the Asian stock markets. Pac Basin Financ J3(2-3):257–284
Bettman JL, Sault SJ, Schultz EL (2009) Fundamental and technical analysis: Substitutes or complements? AccountFinance 49(1):21–36
Booth A, Gerding E, McGroarty F (2014) Automated trading with performance weighted random forests andseasonality. Expert Syst Appl 41(8):3651–3661
Brock W, Lakonishok J, Lebaron B (1992) Simple Technical Trading Rules and the Stochastic Properties of Stock Returns.J Financ 47(5):1731–1764
Cervelló-Royo R, Guijarro F, Michniuk K (2015) Stock market trading rule based on pattern recognition and technicalanalysis: Forecasting the DJIA index with intraday data. Expert Syst Appl 42(14):5963–5975
Chang EJ, Lima EJA, Tabak BM (2004) Testing for Predictability in Emerging Equity Markets. Emerg Mark Rev 5(3):295–316
Chen TL, Chen FY (2016) An intelligent pattern recognition model for supporting investment decisions in stock market.Inf Sci 346-347(1):261–274
Chong TTL, Cheng SHS, Wong ENY (2010) A Comparison of Stock Market Efficiency of the BRIC Countries. TechnolInvest 01(04):235–238
Costa TRCC, Nazário RT, GSZ B, Sobreiro VA, Kimura H (2015) Trading System Based on the Use of Technical Analysis: AComputational Experiment. Journal of Behavioral and Experimental Finance 6(1):42–55
Ellis CA, Parbery SA (2005) Is Smarter Better? A Comparison of Adaptive, and Simple Moving Average TradingStrategies. Res Int Bus Financ 19(3):399–411
Errunza VR, Losq E (1985) The Behavior of Stock Prices on LDC Markets. J Bank Financ 9(4):561–575Fama EF (1970) Efficient capital markets: A review of theory and empirical work. J Financ 25(2):383–417Fama EF, Blume ME (1966) Filter Rules and Stock-Market Trading. J Bus 39(S1):226–226Frankel JA, Froot KA (1986) Understanding the US Dollar in the Eighties: The Expectations of Chartists and
Fundamentalists. Econ Rec 62(1):24–38Gerritsen DF (2016) Are chartists artists? The determinants and profitability of recommendations based on technical
analysis. Int Rev Financ Anal 47:179–196Gunasekarage A, Power DM (2001) The profitability of moving average trading rules in South Asian stock markets.
Emerg Mark Rev 2(1):17–33Harvey CR (1995) Predictable Risk and Returns in Emerging Markets. Rev Financ Stud 8(3):773–816Jegadeesh N (2000) Discussion. J Financ 55(4):1765–1770Jensen MC (1978) Some Anomalous Evidence Regarding Market Efficiency. J Financ Econ 6(2-3):95–101Keynes JM (1936) The General Theory of Employment, Interest and Money, Chapter 12: The State of Long-Term
Expectation. Macmillan, LondonKuang P, Schröder M, Wang Q (2014) Illusory Profitability of Technical Analysis in Emerging Foreign Exchange Markets.
Int J Forecast 30(2):192–205Lam M (2004) Neural network techniques for financial performance prediction: integrating fundamental and technical
analysis. Decis Support Syst 37(4):567–581Lo AW, MacKinlay AC (1987) Stock Market Prices Do Not Follow Random Walks: Evidence From A Simple Specification
Test. Tech. rep.Lo AW, Mamaysky H, Wang J (2000) Foundations of Technical Analysis: Computational Algorithms, Statistical Inference,
and Empirical Implementation. J Financ 55(4):1705–1765Lui YH, Mole D (1998) The Use of Fundamental and Technical Analyses by Foreign Exchange Dealers: Hong Kong
Evidence. J Int Money Financ 17(3):535–545Malkiel BG, Fama EF (1970) Efficient Capital Markets: A Review of Theory and Empirical Work Ast. J Financ
25(2):383–417Mitra SK (2011) How Rewarding is Technical Analysis in the Indian Stock Market? Quantitative Finance 11(2):287–297Mobarek A, Mollah AS, Bhuyan R (2008) Market Efficiency in Emerging Stock Market: Evidence From Bangladesh.
Journal of Emerging Market Finance 7(1):17–41Mozumder N, Vita GD, Kyaw SK, Larkin C (2015) Volatility spillover between stock prices and exchange rates: New
evidence across the recent financial crisis period. Economic Issues 20(1):43–64Mukherjee P, Roy M (2016) What Drives the Stock Market Return in India? An Exploration with Dynamic Factor Model.
Journal of Emerging Market Finance 15(1):119–145Murphy JJ (1999) Technical Analysis of the Financial Markets. New York Institute of Finance, ParamusNaresha G, Vasudevan G, Mahalakshmi S, Thiyagarajan S (2017) Spillover effect of US dollar on the stock indices of
BRICS. Res Int Bus Financ Article in pressNison S (1991) Japanese Candlestick Charting Techniques. New York Institute of FinanceNoakes MA, Rajaratnam K (2014) Testing Market Efficiency on the Johannesburg Stock Exchange Using the Overlapping
Serial Test. Ann Oper Res 243(1-2):273–300Park CH, Irwin SH (2007) What do We Know About the Profitability of Technical Analysis? J Econ Surv 21(4):786–826Pring MJ (2016) Technical Analysis Explained Fifth Edition The Successful Investor’s Guide to Spotting Investment
Trends and Turning Points, vol 1, 5th edn. McGraw-HillRatner M, Leal RP (1999) Tests of Technical Trading Strategies in the Emerging Equity Markets of Latin America and
Asia. J Bank Financ 23(12):1887–1905Reitz S (2006) On the Predictive Content of Technical Analysis. The North American Journal of Economics and Finance
17(2):121–137Sharma JL, Kennedy RE (1977) A Comparative Analysis of Stock Price Behavior on the Bombay, London, and New York
Stock Exchanges. The Journal of Financial and Quantitative Analysis 12(3):391–391Shiller RJ (1989) Market Volatility. The M.I.T. Press, CambridgeShynkevich A (2012) Performance of Technical Analysis in Growth and Small Cap Segments of the US Equity Market. J
Bank Financ 36(1):193–208
de Souza et al. Financial Innovation (2018) 4:3 Page 17 of 18
Sobreiro VA, Costa TRCC, Nazário RTF, e Silva JL, Moreira EA, MCL F, Kimura H, JCA Z (2016) The Profitability of MovingAverage Trading Rules in BRICS and Emerging Stock Markets. The North American Journal of Economics andFinance 38(1):86–101
Stanković J, Marković I, Stojanović M (2015) Investment Strategy Optimization Using Technical Analysis and PredictiveModeling in Emerging Markets. Procedia Economics and Finance 19(1):51–62
Tharavanij P, Siraprapasiri V, Rajchamaha K (2015) Performance of technical trading rules: Evidence from SoutheastAsian stock markets. SpringerPlus 4(1):1–40
Treynor JL, Ferguson R (1985) In Defense of Technical Analysis. J Financ 40(3):757–773Urrutia JL (1995) Tests of Random Walk and Market Efficiency for Latin American Emerging Equity Markets. J Financ Res
18(3):299–309Vandewalle N, Ausloos M, Boveroux P (1999) The Moving Averages Demystified. Physica A: Statistical Mechanics and Its
Applications 269(1):170–176Wang YC, Yu J, Wen SY (2014) Does Fundamental and Technical Analysis Reduce Investment Risk for Growth Stock? An
Analysis of Taiwan Stock Market. International Business Research 7(11):1–11Zhu Y, Zhou G (2009) Technical Analysis: An Asset Allocation Perspective on the Use of Moving Averages. J Financ
Econ 92(3):519–544
de Souza et al. Financial Innovation (2018) 4:3 Page 18 of 18