Embed Size (px)
Citation preview
TECHNISCHE UNIVERSITÄT MÜNCHEN
Wissenschaftszentrum Weihenstephan für Ernährung, Landnutzung und Umwelt
Lehrstuhl für Pflanzenzüchtung
Exploring new alleles for frost tolerance in winter rye
using genetic resources
Wiltrud Renate Erath
Vollständiger Abdruck der von der Fakultät Wissenschaftszentrum Weihenstephan für
Ernährung, Landnutzung und Umwelt der Technischen Universität München zur
Erlangung des akademischen Grades eines
Doktors der Naturwissenschaften (Dr. rer. nat.)
genehmigten Dissertation.
Vorsitzender: Prof. Dr. Ralph Hückelhoven
Prüfer der Dissertation: 1. Prof. Dr. Chris-Carolin Schön
2. apl. Prof. Dr. Thomas Miedaner
Die Dissertation wurde am 04.12.2017 bei der Technischen Universität München
eingereicht und durch die Fakultät Wissenschaftszentrum Weihenstephan für Ernährung,
Landnutzung und Umwelt am 11.04.2018 angenommen.
Table of contents
II
Table of contents
Summary .............................................................................................................................. V
Zusammenfassung ............................................................................................................. VII
List of abbreviations ............................................................................................................ X
List of figures ..................................................................................................................... XI
List of tables ...................................................................................................................... XII
Publications out of this thesis .......................................................................................... XIII
1. INTRODUCTION ............................................................................................................ 1
1.1 Origin, utilization and breeding of rye ........................................................................ 1
1.2 The use of plant genetic resources .............................................................................. 2
1.3 Frost tolerance in cereals ............................................................................................ 4
1.3.1 Phenotyping for frost tolerance ............................................................................ 4
1.3.2 Genetic basis of frost tolerance ............................................................................ 5
1.4 Marker-based selection methods for quantitative traits .............................................. 8
1.4.1 QTL-based selection ............................................................................................ 8
1.4.2 Genomic selection .............................................................................................. 10
1.5 Objectives of this study ............................................................................................. 12
2. MATERIALS AND METHODS .................................................................................... 13
2.1 Plant material ............................................................................................................ 13
2.1.1 Lo157 × Puma-SK mapping population ............................................................ 13
2.1.2 Inbred lines for analyses of SNP effects ............................................................ 13
2.1.3 Diversity panel ................................................................................................... 14
2.2 Analysis of frost tolerance in the Lo157 × Puma-SK population ............................. 14
2.2.1 Phenotypic trait assessment ............................................................................... 14
2.2.2 Phenotypic data analysis .................................................................................... 16
2.2.3 Genotypic data analysis and genetic linkage mapping ...................................... 18
2.2.4 QTL analysis ...................................................................................................... 20
2.2.5 Genomic prediction ............................................................................................ 21
2.3 Phylogenetic analysis of the Cbf gene family in rye ................................................. 23
2.3.1 Identification of Cbf sequences in twelve rye accessions .................................. 23
2.3.2 Investigation of phylogenetic relationships with wheat and barley ................... 24
2.4 Analysis of the Fr-R2 and Vrn-R1 loci in rye ........................................................... 25
Table of contents
III
2.4.1 Population genetic analysis of the Fr-R2 and Vrn-R1 loci ................................ 25
2.4.1.1 Population structure .................................................................................... 25
2.4.1.2 Diversity analyses ....................................................................................... 25
2.4.2 Characterization of the Fr-R2 locus in rye ........................................................ 26
2.4.3 Analysis of SNP effects in candidate genes ....................................................... 27
2.5 Analysis of population structure in European elite lines and genetic resources ....... 27
3. RESULTS ....................................................................................................................... 28
3.1 Phenotypic variation for frost tolerance in breeding pools and genetic resources.... 28
3.2 Analysis of frost tolerance in the Lo157 × Puma-SK population ............................. 29
3.2.1 Analysis of frost response .................................................................................. 29
3.2.2 Genetic linkage maps and mapping of candidate genes .................................... 31
3.2.3 QTL analysis ...................................................................................................... 32
3.2.4 Evaluation of prediction models for frost tolerance .......................................... 36
3.3 The Cbf gene family in rye ....................................................................................... 38
3.4 The Fr-R2 and Vrn-R1 loci in rye ............................................................................. 42
3.4.1 Population genetic analysis of the Fr-R2 and Vrn-R1 loci ................................ 42
3.4.2 Insights into the Fr-R2 locus in rye and its collinearity with other cereals ....... 45
3.4.3 Effects of SNPs in Cbf genes from the Fr-R2 locus on frost tolerance ............. 48
3.5 Population structure in European elite lines and genetic resources .......................... 49
4. DISCUSSION ................................................................................................................. 52
4.1 Phenotyping for frost tolerance ................................................................................. 52
4.2 Genomic regions controlling frost tolerance in winter rye ....................................... 53
4.2.1 QTL for frost tolerance in the Lo157 Puma-SK population ........................... 53
4.2.2 SNP effects in candidate genes .......................................................................... 56
4.3 Selection strategies for frost tolerance ...................................................................... 57
4.3.1 Marker-based selection methods ........................................................................ 57
4.3.2 Dominance, epistatic effects and inbreeding depression ................................... 58
4.4 The Fr-R2 locus and the Cbf gene family in rye ...................................................... 60
4.4.1 Structural organization of the Fr-R2 locus ........................................................ 60
4.4.2 The Cbf gene family in rye ................................................................................ 62
4.5 Prospects for using genetic resources in rye breeding .............................................. 63
4.6 Conclusions ............................................................................................................... 66
5. REFERENCES ............................................................................................................... 67
Table of contents
IV
6. APPENDIX ..................................................................................................................... 82
6.1 Supporting figures ..................................................................................................... 82
6.2 Supporting tables ...................................................................................................... 85
6.3 Supporting documentation ........................................................................................ 98
7. ACKNOWLEDGEMENTS .......................................................................................... 100
8. CURRICULUM VITAE ............................................................................................... 102
Summary
V
Summary
Frost tolerance is a must-have trait for winter cereal production in northern and
continental cropping areas. Winter rye (Secale cereale L.) is the most freezing tolerant
small grain cereal and is well suited for production areas where severe winters occur.
Genetic resources originating from these geographic regions should harbor promising
alleles for the improvement of frost tolerance of winter rye elite lines. Frost tolerance is a
quantitative trait which is affected by environmental factors. The identification of
quantitative trait loci (QTL) and the choice of optimum genome-based selection methods
are therefore essential for the improvement of frost tolerance.
The main objective of this study was to identify genomic regions involved in frost
tolerance of winter rye by QTL mapping in a biparental population derived from a cross of
the highly frost tolerant Canadian cultivar Puma-SK and the European elite line Lo157.
Lines from the F3, F4 and F5 generations of the mapping population were genotyped with
single nucleotide polymorphism (SNP) arrays. Lines per se and their testcrosses were
phenotyped in a controlled freeze test and in multi-location field trials in Russia and
Canada. Phenotypes were obtained on the trait recovery after frost treatment (REC) in the
freeze test and on the traits development after winter (DAW) and survival after winter
(SAW) in the field trials. Three QTL on chromosomes 4R, 5R and 7R were consistently
detected across environments. The QTL on 5R is congruent with the genomic region
harboring the Frost resistance locus 2 (Fr-2) in Triticeae. The Puma-SK allele at the
Fr-R2 locus was found to significantly increase frost tolerance. A comparison of
predictive ability obtained from the QTL-based model with different whole-genome
prediction models revealed that besides a few large, also small QTL effects contribute to
the genomic variance of frost tolerance in rye. Genomic prediction (GP) methods
assigning a high weight to the Fr-R2 locus allow increasing the selection intensity for frost
tolerance by genome-based preselection of promising candidates.
The Fr-2 locus in Triticeae includes a cluster of C-repeat binding factor (Cbf) genes and
members of the Cbf gene family were frequently associated with frost tolerance. Using
F4 lines developed from plant material previously used for a candidate gene-based
association study, the effect of SNPs in three Cbf genes from the Fr-R2 locus on frost
tolerance was analyzed. SNPs in ScCbf12, ScCbf14 and ScCbf15 were significantly
associated with frost tolerance in the field. Particularly the SNPs in ScCbf12 and ScCbf15
Summary
VI
are promising markers for selection on frost tolerance. The structure of the Fr-R2 locus in
rye was further investigated using nucleotide sequences from bacterial artificial
chromosome (BAC) clones and sequence contigs anchored to a recently published high-
density linkage map. The order of Cbf genes in the analyzed regions of the Fr-R2 locus
was in large part syntenic to barley and einkorn wheat. Two Cbf genes in the Fr-R2 locus
of rye were previously not reported in the Fr-2 locus of the Triticeae. In silico analyses of
whole-genome contigs from eleven rye inbred lines and the wild relative S. vavilovii
revealed that the Cbf gene family comprises at least 35 putative full-length Cbf genes and
is enlarged compared to barley and wheat.
In addition, molecular diversity was analyzed at the Fr-R2 locus and the Vernalization
locus 1 (Vrn-R1) which is known as an additional important genetic determinant of frost
tolerance in Triticeae. Genetic diversity was analyzed in inbred lines from two European
rye breeding pools - the seed and the pollen parent pool - and in genetic resources. In a
principal coordinate analysis, (PCoA) no differentiation of the three groups was observed
at the Fr-R2 and/or the Vrn-1 locus. However, high nucleotide diversity in all three groups
and a high differentiation index between genetic resources and the seed or the pollen
parent pool was assessed at individual map positions in the genomic region encompassing
Fr-R2 and Vrn-R1. The genetic distance between the three genetic groups was also
investigated on the whole-genome level and on individual chromosomes using PCoA. On
the whole-genome level, the seed and pollen parent pool formed separate clusters whereas
the genetic resources were located between both breeding pools. By chromosome
partitioning, three genomic regions on chromosomes 1RS, 3RL and 4R were identified at
which clustering of the seed and pollen parent pool was similar to that observed on the
whole genome level. Markers from these genomic regions could assist with maintaining
the heterotic pattern between seed and pollen parent pool when frost tolerance alleles are
introduced from genetic resources to European breeding pools.
In conclusion, rye genetic resources provide a valuable source of new alleles for the
improvement of frost tolerance in rye breeding programs. New sources of genetic
variation were identified which could be valuable for improving frost tolerance in rye.
Genome based prediction methods assigning a high weight to the Fr-R2 locus are best
suited for selection on frost tolerance in rye.
Zusammenfassung
VII
Zusammenfassung
Frosttoleranz ist ein Must-have-Merkmal für die Wintergetreideproduktion in nördlichen
und kontinentalen Anbaugebieten. Winterroggen (Secale cereale L.) ist die
frosttoleranteste Getreideart und gut für Anbaugebiete mit harten Wintern geeignet.
Genetische Ressourcen aus diesen Gebieten sollten vielversprechende Allele für die
Verbesserung der Frosttoleranz von Winterroggen-Elitelinien tragen. Frosttoleranz ist ein
quantitatives und umweltabhängiges Merkmal. Die Identifikation von „Quantitative Trait
Loci“ (QTL) und die Wahl optimaler genombasierter Selektionsmethoden sind deswegen
von grundlegender Bedeutung für die züchterische Verbesserung der Frosttoleranz.
Das Hauptziel dieser Arbeit war die Identifikation von Genomregionen, die mit
Frosttoleranz in Winterroggen assoziiert werden. Dafür wurde eine biparentale Population
verwendet, die aus einer Kreuzung der hoch frosttoleranten kanadischen Sorte Puma-SK
mit der europäischen Elitelinie Lo157 erstellt wurde. Linien der F3-, F4- and F5-
Generationen der Kartierungspopulation wurden mit „Single Nucleotide Polymorphism“
(SNP) Markerarrays genotypisiert. Linien per se und deren Testkreuzungen wurden in
einer kontrollierten Umwelt und in mehreren Feldversuchen in Russland und Kanada
phänotypisiert. In der kontrollierten Umwelt wurde das Merkmal Regenerierung nach
Froststress (REC) erfasst und in den Feldversuchen die Merkmale Entwicklung nach
Winter (DAW) und Überlebensrate nach Winter (SAW). Drei QTL auf den Chromosomen
4R, 5R und 7R wurden durchgehend über Umwelten hinweg identifiziert. Der QTL auf
5R entspricht der Genomregion des Frost resistance locus 2 (Fr-2) der Triticeae. Das
Puma-SK-Allel am Fr-R2 Locus führt zu einer signifikanten Erhöhung der Frosttoleranz.
Ein Vergleich der Vorhersagefähigkeit des QTL-basierten mit verschiedenen
genomweiten Vorhersagemodellen zeigte, dass neben wenigen großen, auch kleinere
QTL-Effekte zur genomischen Varianz für Frosttoleranz in Roggen beitragen.
Genomische Vorhersagemethoden, die den Fr-R2 Locus stark gewichten, ermöglichen die
Erhöhung der Selektionsintensität für Frosttoleranz durch genombasierte Vorauswahl
vielversprechender Selektionskandidaten.
Der Fr-R2 Locus der Triticeae enthält ein Cluster von C-repeat binding factor (Cbf)
Genen und Mitglieder der Cbf-Genfamilie wurden häufig mit Frosttoleranz in Verbindung
gebracht. Unter Verwendung von F4 Linien, die aus dem Pflanzenmaterial einer früheren
kandidatengenbasierten Assoziationsstudie entwickelt wurden, wurde der Effekt von
Zusammenfassung
VIII
SNPs in drei Cbf-Genen des Fr-R2 Locus auf Frosttoleranz analysiert. SNPs in ScCbf12,
ScCbf14 und ScCbf15 konnten signifikant mit Frosttoleranz im Freiland assoziiert werden.
Besonders die SNPs in ScCbf12 und ScCbf15 sind vielversprechende Marker für die
Selektion auf Frosttoleranz. Um die Struktur des Fr-R2 Locus in Roggen genauer zu
untersuchen, wurden Nukleotidsequenzen zweier „Bacterial Artificial Chromosome“
(BAC) Klone und Sequenzcontigs, die in einer kürzlich veröffentlichten hochdichten
genetischen Karte verankert sind, analysiert. Die Abfolge der Cbf-Gene in den
analysierten Regionen des Fr-R2 Locus war größtenteils synten zu Gerste oder Einkorn.
Zwei Cbf-Gene im Fr-R2 Locus des Roggens sind bisher nicht vom Fr-R2 Locus der
Triticeae bekannt gewesen. In silico-Analysen genomweiter Contigs von elf
Roggeninzuchtlinien und dem wilden Verwandten S. vavilovii zeigten, dass die Cbf-
Genfamilie in Roggen mindestens 35 mutmaßlich vollständige Cbf-Gene enthält und
damit größer als die von Gerste und Weizen ist.
Die molekulare Diversität am Fr-R2 Locus und dem Vernalization locus 1 (Vrn-R1),
einem weiteren wichtigen Einflussfaktor für Frosttoleranz in den Triticeae, wurde
ebenfalls analysiert. Dazu wurden Inzuchtlinien der beiden europäischen genetischen
Zuchtpools, dem Saatelter- und dem Pollenelterpool, und genetische Ressourcen
verwendet. In einer Principal coordinate Analyse (PCoA) konnte keine Differenzierung
zwischen den drei Gruppen am Fr-R2 und/oder dem Vrn-1 Locus beobachtet werden. An
einzelnen Kartenpositionen im Chromosomenintervall, das die Fr-R2 und Vrn-R1 Loci
enthält, wurde aber eine hohe Nukleotiddiversität in allen drei Gruppen und ein hoher
Differenzierungsindex zwischen genetischen Ressourcen und dem Saat- oder
Pollenelterpool festgestellt. Die genetische Distanz zwischen den drei Gruppen wurde
außerdem auf genomweiter Ebene und für einzelne Chromosomen mittels PCoA
untersucht. Auf genomweiter Ebene bildeten Saat- und Pollenelterpool getrennte Cluster
während die genetischen Ressourcen einen Platz zwischen beiden Pools einnahmen.
Durch Unterteilung der Chromosomen konnten drei Genomregionen auf 1RS, 3RL und
4R identifiziert werden, an denen die Aufteilung von Seed- und Pollenelterpool der auf
genomweiter Ebene stark ähnelte. Marker aus diesen Genomregionen können eingesetzt
werden, um die Heterosis zwischen Saat- und Pollenelterpool zu wahren, wenn
Frosttoleranzallele von genetischen Ressourcen in europäisches Zuchtmaterial übertragen
werden.

Zusammenfassung
IX
Zusammenfassend wurde hier gezeigt, dass genetische Ressourcen in Roggen über
wertvolle neue Allele verfügen, die für die Verbesserung der Frosttoleranz in
Roggenzuchtprogrammen genutzt werden können. Bisher ungenutzte Quellen genetischer
Variation wurden identifiziert, die für die züchterische Verbesserung von Frosttoleranz
interessant sein könnten. Für die Selektion auf Frosttoleranz in Roggen sind
genombasierte Vorhersagemethoden mit einem hohen Gewicht auf dem Fr-R2 Locus am
besten geeignet.
List of abbreviations
X
List of abbreviations
AP2 APETALA2 DNA motif
BAC Bacterial artificial chromosome
BLAST Basic Local Alignment Search Tool
bp DNA base pair
Cbf C-repeat binding factor
cM CentiMorgan
CMS Cytoplasmic male sterility
Cor Cold-responsive
CRT C-repeat
CV Cross-validation
cv. Cultivar
DAW Development after winter
DNA Deoxyribonucleic acid
dNTP Deoxynucleoside triphosphate
Fr-2 Frost resistance locus 2
FST Fixation index
Gb DNA giga base pair
GBLUP Genomic best linear unbiased prediction
GP Genomic prediction
iid Independent and identically distributed
KASP Kompetitive allele specific PCR
kbp DNA kilo base pair
LASSO Least absolute shrinkage and selection operator
LD Linkage disequilibrium
LOD Logarithm of the odds
MAS Marker-assisted selection
MVN Multivariate normal
NCBI National Center for Biotechnology Information
PCoA Principal coordinate analysis
PCR Polymerase chain reaction
QTL Quantitative trait locus / loci
R2 Coefficient of determination
RAPT Related to AP2 Triticeae gene
REC Recovery after freezing
SAW Survival after winter
SNP Single nucleotide polymorphism
Vrn-1 Vernalization locus 1
List of figures
XI
List of figures
Figure 1 Structure of Cbf genes. .......................................................................................... 7
Figure 2 Adjusted means for recovery after freezing (REC, score 1-9) for six inbred
lines from the seed and pollen parent pool, respectively, and Puma-SK. ........... 28
Figure 3 Phenotypic correlations between freeze test and field in the
Lo157 Puma-SK population based on adjusted means across
environments ....................................................................................................... 31
Figure 4 QTL analysis in the F4 generation of the Lo157 Puma-SK population ............ 34
Figure 5 Additive additive epistatic interactions detected in the QTL analysis on
the F4 linkage map .............................................................................................. 35
Figure 6 Phylogenetic relationships of 157 Cbf sequences from rye (Secale cereale,
Sc), barley (Hordeum vulgare, Hv), einkorn (Triticum monococcum, Tm)
and bread wheat (Triticum aestivum, Ta) ........................................................... 39
Figure 7 Principal coordinate analysis of 38 inbred lines from the seed parent pool
(red), 46 inbred lines from the pollen parent pool (blue) and 38 genetic
resources (orange) ............................................................................................... 43
Figure 8 Genetic diversity of 122 rye accessions at the Fr-R2/Vrn-R1 genomic region ... 44
Figure 9 Physical maps of the Fr-2 locus in rye, barley and einkorn wheat aligned
with the genetic map of the Fr-R2 locus ............................................................. 47
Figure 10 Genomic regions with high genetic distance between seed and pollen
parent pool identified by chromosome partitioning ............................................ 51
Figure 11 Number of days below 5°C and below -15°C air temperature in different
field environments. ............................................................................................. 54
List of tables
XII
List of tables
Table 1 Means, variance components and heritability for frost tolerance in the
Lo157 Puma-SK population ............................................................................ 30
Table 2 Summary of main QTL detected in the Lo157 Puma-SK mapping
population ........................................................................................................... 33
Table 3 Mean predictive abilities of QTL-based and genomic prediction models in
the Lo157 × Puma-SK mapping population ....................................................... 37
Table 4 Putative Cbf genes identified in whole-genome sequence contigs of 12 rye
accessions. ........................................................................................................... 40
Table 5 Number of F4 lines derived from crosses of Lo152 with a Middle European
(Petkus Lo152) and two Eastern European (PR2733 Lo152 and
ROM Lo152) populations. ............................................................................... 48
Table 6 Effects of SNPs in the candidate genes ScCbf12, ScCbf14 and ScCbf15 on
frost tolerance assessed in 65 F4 lines ................................................................. 49
Publications out of this thesis
XIII
Publications out of this thesis
Parts of this thesis were published in advance:
Journal article
Erath W, Bauer E, Fowler DB, Gordillo A, Korzun V, Ponomareva M, Schmidt M,
Schmiedchen B, Wilde P, Schön C-C (2017) Exploring new alleles for frost
tolerance in winter rye. Theor Appl Genet 130:2151-2164
The publication is available at:
https://link.springer.com/article/10.1007/s00122-017-2948-7
Candidate`s contribution: statistical data analysis, interpretation and discussion of results,
composition of graphs and tables, writing and revisions of the manuscript and contribution
to the laboratory work for genotyping of candidate genes.
Oral presentations
Erath W, Bauer E, Fowler B, Gordillo A, Haseneyer G, Korzun V, Ponomareva M,
Schmidt M, Schmiedchen B, Wilde P, Schön C-C (2014) Identification of genomic
regions involved in frost tolerance in winter rye. EUCARPIA Cereals Section –
ITMI Joint Conference, Wernigerode, Germany, 29.06.2014 - 04.07.2014
Erath W, Bauer E, Gordillo A, Korzun V, Schmidt M, Schmiedchen B, Wilde P, Schön
C-C (2014) Identification of genomic regions involved in frost tolerance in winter
rye. GPZ 2014: Genetic Variation in Plant Breeding, Kiel, Germany, 23.09.2014 -
25.09.2014
Erath W, Bauer E, Fowler B, Gordillo A, Korzun V, Ponomareva M, Schmidt M,
Schmiedchen B, Wilde P, Schön C-C (2016) Identification of genomic regions
involved in frost tolerance in winter rye. GPZ 2016: Statistical genetics /
genomics, Bonn, Germany, 08.03.2016 - 10.03.2016
Poster presentation
Erath W, Bauer E, Fowler B, Gordillo A, Korzun V, Ponomareva M, Schmidt M,
Schmiedchen B, Wilde P, Schön C-C (2015) RYE SELECT: Identification of
genomic regions involved in frost tolerance in winter rye. Statusseminar Potsdam,
Germany
1. INTRODUCTION
1
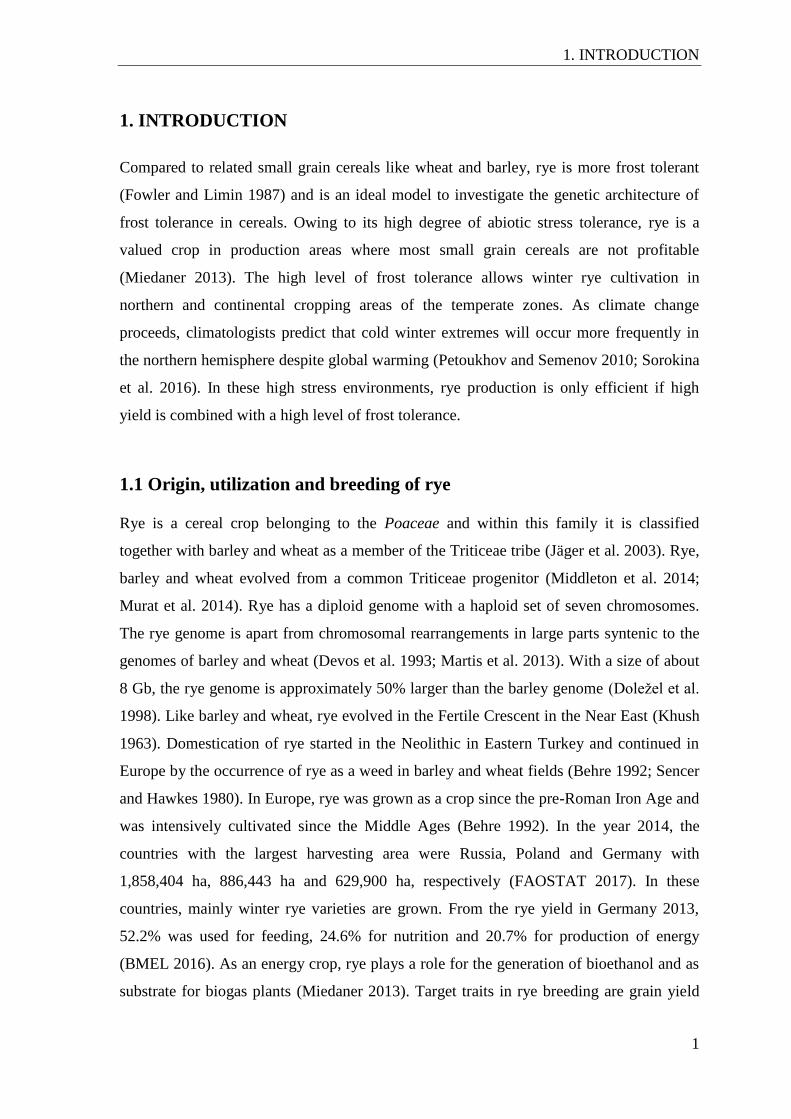
1. INTRODUCTION
Compared to related small grain cereals like wheat and barley, rye is more frost tolerant
(Fowler and Limin 1987) and is an ideal model to investigate the genetic architecture of
frost tolerance in cereals. Owing to its high degree of abiotic stress tolerance, rye is a
valued crop in production areas where most small grain cereals are not profitable
(Miedaner 2013). The high level of frost tolerance allows winter rye cultivation in
northern and continental cropping areas of the temperate zones. As climate change
proceeds, climatologists predict that cold winter extremes will occur more frequently in
the northern hemisphere despite global warming (Petoukhov and Semenov 2010; Sorokina
et al. 2016). In these high stress environments, rye production is only efficient if high
yield is combined with a high level of frost tolerance.
1.1 Origin, utilization and breeding of rye
Rye is a cereal crop belonging to the Poaceae and within this family it is classified
together with barley and wheat as a member of the Triticeae tribe (Jäger et al. 2003). Rye,
barley and wheat evolved from a common Triticeae progenitor (Middleton et al. 2014;
Murat et al. 2014). Rye has a diploid genome with a haploid set of seven chromosomes.
The rye genome is apart from chromosomal rearrangements in large parts syntenic to the
genomes of barley and wheat (Devos et al. 1993; Martis et al. 2013). With a size of about
8 Gb, the rye genome is approximately 50% larger than the barley genome (Doležel et al.
1998). Like barley and wheat, rye evolved in the Fertile Crescent in the Near East (Khush
1963). Domestication of rye started in the Neolithic in Eastern Turkey and continued in
Europe by the occurrence of rye as a weed in barley and wheat fields (Behre 1992; Sencer
and Hawkes 1980). In Europe, rye was grown as a crop since the pre-Roman Iron Age and
was intensively cultivated since the Middle Ages (Behre 1992). In the year 2014, the
countries with the largest harvesting area were Russia, Poland and Germany with
1,858,404 ha, 886,443 ha and 629,900 ha, respectively (FAOSTAT 2017). In these
countries, mainly winter rye varieties are grown. From the rye yield in Germany 2013,
52.2% was used for feeding, 24.6% for nutrition and 20.7% for production of energy
(BMEL 2016). As an energy crop, rye plays a role for the generation of bioethanol and as
substrate for biogas plants (Miedaner 2013). Target traits in rye breeding are grain yield
1. INTRODUCTION
2
and high kernel weight, short straw, lodging resistance and tolerance to pre-harvest
sprouting (Geiger and Miedaner 2009). Breeding in rye also focuses on resistance against
ergot, Fusarium, leaf and stem rust (Geiger and Miedaner 2009). Since rye is more
tolerant than most other cereals to abiotic stresses, like frost, salt or aluminum pollution
(Bishnoi and Pancholy 1980; Fowler and Limin 1987; Mugwira et al. 1976), rye is a
preferred crop in areas with unfavorable climatic or soil conditions. Therefore rye
breeding also involves the development of varieties exhibiting an enhanced tolerance to
abiotic stresses. By contrast to barley and wheat, rye is allogamous and self-incompatible
(Lundqvist 1956). Thus a long time, open-pollinated and synthetic population varieties
were grown. Most established population varieties belonged to two genetically distant
gene pools, the Petkus pool and the Carsten pool. The discovery of cytoplasmic male
sterility in an Argentinian ‘Pampa’ rye in 1970 (Geiger and Schnell 1970) and of self-
fertility genes paved the way for the development of hybrid varieties (Geiger and
Miedaner 2009; Wricke 1969). For hybrid breeding, crosses between inbred lines from the
Petkus pool used as seed parents and inbred lines from the Carsten pool used as pollen
parents enable exploitation of heterosis effects for traits of agronomic interest (Geiger and
Miedaner 2009). In 2014 and 2015, the hybrid winter rye varieties Brasetto (KWS
Lochow), Palazzo (KWS Lochow) and SU Mephisto (Hybro Saatzucht/Saaten Union)
together contributed about 50% of the annual rye yield in Germany (BMEL 2016).
Broadening each gene pool in order to develop new rye varieties for a large range of traits
and geographic regions without losing the heterotic pattern between both pools is one of
the current challenges in rye breeding.
1.2 The use of plant genetic resources
Genetic variation for a target trait is a prerequisite for its improvement by breeding.
Domestication of crops and subsequent continued breeding led to the elimination of
unfavorable alleles from established breeding material but was often accompanied with
unintended loss of beneficial alleles. Continued reduction of genetic variation for traits of
agronomic interest in contemporary breeding pools may be the consequence (Tanksley
and McCouch 1997). Similarly, when gene pools are kept isolated to maintain heterotic
patterns, like in European rye breeding programs, genetic variation among inbred lines
tends to decrease by constant breeding within gene pools (Fischer et al. 2010; Targońska
et al. 2016). All plant material useful for the improvement of cultivated plants can be
1. INTRODUCTION
3
defined as genetic resources (Becker 2011). While plant material may be an inherent
component in breeding programs in one geographic region, it can serve to introduce new
alleles to established breeding pools in another geographic region. In this study, plant
material which is not integrated in current European breeding programs is considered as
genetic resources. Accordingly, genetic resources are often not adapted to the farming
system, the breeding practices and climatic and soil conditions of the geographic target
region where they are to be introduced. In allogamous species like rye, self-
incompatibility may hamper inbreeding steps for research and selection purposes, when
the progeny suffers from inbreeding depression (Haussmann et al. 2004). Signs of
inbreeding depression can also mask true performance for traits of interest. Moreover,
beneficial alleles of interest can be linked to unfavorable alleles in the genetic resource
and the number of necessary backcrossing steps can retard the breeding process severely
(Hawkes 1977; Stam and Zeven 1981). In crosses involving genetically distant breeding
material, beneficial allele combinations evolved by natural or artificial selection in either
of the crossing partners may be decomposed. This can hamper selection for quantitative
traits involving also epistatic interactions (Haussmann et al. 2004). Detailed
characterization of the genetic basis underlying agronomic traits of interest and identifying
closely linked markers therefore help to introduce beneficial alleles and allele
combinations into established breeding material by marker-assisted selection or genomic
prediction (GP). In rye, genetic resources were used to analyze the genetic architecture of
agronomic, quality and resistance traits (Erath et al. 2016; Falke et al. 2009; Miedaner et
al. 2000). Turkish barley accessions exceeding the frost tolerance levels of European
accessions were identified and are supposed to improve frost tolerance in European barley
germplasm (Akar et al. 2009). Apart from direct introgression of favorable alleles, genetic
resources can be used to increase overall genetic diversity of established gene pools.
Eastern European open-pollinated rye varieties were reported as a valuable source of yet
unexploited alleles for broadening the genetic base of the Central European seed and
pollen breeding pools (Fischer et al. 2010). For the introduction of tolerance to abiotic
stresses or disease resistance, landraces adapted to environments in which the respective
abiotic stresses and pests occur are of particular value (Kovach and McCouch 2008).
Accordingly, genetic resources adapted to continental or northern geographic regions are
expected to exhibit strong overwintering capabilities that could be used in breeding for
frost tolerance in the European breeding programs. The advantage of landraces is that they
have experienced long-term selection and exhibit acceptable performance for many
1. INTRODUCTION
4
agronomic traits (Kovach and McCouch 2008). However, genetic resources harboring
desired alleles cannot always be identified in the first gene pool (Harlan and de Wet
1971). Then favorable alleles for traits of interest may be found in the genetically more
distant plant material from the second or third gene pool but their use is surpassingly more
laborious and time-consuming. Only 1.45% of all rye accessions are stored in gene banks
(Hammer 2003). Identification of genetic resources from diverse geographic regions and
their phenotypic and genotypic evaluation for research and breeding purposes is most
important for maintaining a rich tool box for crop improvement.
1.3 Frost tolerance in cereals
1.3.1 Phenotyping for frost tolerance
Frost tolerance includes the survival of sub-zero temperatures and even heavy frost for a
long period of time depending on the geographic region. Plants also have to tolerate early
onset of frost after sawing in autumn as well as late spring frost and fluctuating
temperatures in the middle of winter. Frost tolerant plants are able to prepare to these
conditions by cold acclimation. This process includes the up-regulation of a multitude of
genes upon perception of low but non-freezing temperatures which leads to biochemical,
morphological and physiological changes conferring enhanced frost tolerance
(Thomashow 1999). Due to the strong environmental effect on frost tolerance gene
expression (Fowler and Limin 2004; Gray et al. 1997), reliable phenotyping in field trials
requires extensive testing at multiple sites. Conditions for frost field tests can be
unfavorable or technically demanding due to variable snow coverage, damage by snow
mold or occurrence of mild temperatures. The influence of snow can be reduced by semi-
controlled freeze tests, in which a glass lid keeps snow away and prohibits its isolating
effect. Whereas high differentiation and a significant correlation of 0.71 between a semi-
controlled platform and field trials was reported for frost tolerance in durum wheat
(Longin et al. 2013; Sieber et al. 2014), a low correlation of 0.19 was obtained between
both platforms in rye (Li 2012). Various types of freeze tests under controlled conditions
have been developed to facilitate frost tolerance phenotyping and to increase the
repeatability of results (Fowler et al. 1973; Pomeroy and Fowler 1973; Skinner and
Mackey 2009). A range of different temperatures can be applied in a freeze test in order to
identify the minimum temperature at which 50% of the plants of a genotype survive
1. INTRODUCTION
5
(LT50). This method allows for low experimental errors (Pomeroy and Fowler 1973) and
was reported to correlate significantly (r = 0.56) with field survival (Gusta et al. 2001).
The LT50 value is also used to draw conclusions on the ability of plants to cold acclimate.
It has been shown that highly frost tolerant genotypes start cold acclimation at warmer
temperatures than frost susceptible genotypes (Fowler 2008; Vágújfalvi et al. 2000).
Freeze tests can also be performed with a given temperature profile using one single
minimum temperature. These freeze tests are suitable for pre-screenings (Fowler et al.
1973) since they are straightforward and time-saving, which is particularly attractive to
practical breeders. Controlled environments offer the possibility to assess frost tolerance
also based on indirect traits like osmotic potential, water content or endogenic levels of
abscisic acid (ABA) but low correlations were reported for these traits with field survival
in barley (Prášil et al. 2007). Generally, freeze tests do not give conclusions on the plants`
response to prolonged exposure to freezing temperatures (Gusta et al. 1997) and cannot
fully replace field testing. Phenotyping must be quick, cost-saving and repeatable. A
controlled freeze test providing phenotypes which are highly correlated with frost
tolerance assessed in the field could reduce expensive field testing and thereby accelerate
the selection progress in breeding programs.
1.3.2 Genetic basis of frost tolerance
The genetic basis underlying frost tolerance has been investigated in the Triticeae species
barley, einkorn and bread wheat. Two major determinants of frost tolerance have been
identified on the Triticeae homoeologous group 5. Frost tolerance is mediated by the
vernalization locus Vrn-1 and a QTL at this position explained up to 36.6% of the
phenotypic variance for frost tolerance in a winter spring cross in barley (Francia et al.
2004). The Fr-2 locus maps about 30 cM proximal to the Vrn-1 locus in wheat and
harbors a cluster of transcription factor genes belonging to the Cbf gene family (Båga et
al. 2007; Pasquariello et al. 2014). In bread wheat and barley, a QTL at Fr-2 explained
about 30 to 40% of the phenotypic variance for frost tolerance assessed in controlled
freeze tests (Båga et al. 2007; Francia et al. 2004). The structure of the Fr-2 locus is
collinear in members of the Poaceae (Tondelli et al. 2011) and spans a genetic map
distance of about 0.8 cM in einkorn, wheat and barley (Miller et al. 2006; Pasquariello et
al. 2014). A physical map of the Fr-H2 locus was constructed in barley. It encompasses
1.47 Mbp and includes 13 full-length Cbf genes (Pasquariello et al. 2014). According to
the conserved order of Cbf genes between Poaceae species, the locus was subdivided into
1. INTRODUCTION
6
a proximal, central and distal cluster. A significant influence on frost tolerance was most
frequently observed for polymorphisms in Cbf12, Cbf14 and Cbf15 from the central
cluster in barley, wheat and rye (Fricano et al. 2009; Knox et al. 2008; Li et al. 2011a).
For all three genes also copy number variation (CNV) was reported and CNV in Cbf12
and Cbf14 was significantly associated with frost tolerance in durum and bread wheat
(Sieber et al. 2016; Zhu et al. 2014).
Compared to the dicotyledonous and not exceptionally frost tolerant species Arabidopsis
thaliana which contains six Cbf genes (Sakuma et al. 2002), the Cbf gene family in the
Pooideae is expanded and includes ten Cbf subgroups from which six (subgroups IIIc/d,
IVa/b/c/d) only occur in the Pooideae (Badawi et al. 2007; Miller et al. 2006; Mohseni et
al. 2012; Skinner et al. 2005). The expansion of the Cbf gene family occurred during a
period of global cooling in the Eocene-Oligocene transition (Sandve and Fjellheim 2010),
indicating a relation between Cbf genes and frost tolerance in cereals. Individual Cbf
genes were frequently associated with frost tolerance in barley, wheat and rye (Fricano et
al. 2009; Knox et al. 2008; Sieber et al. 2016). The Cbf gene family belongs to the
AP2/ERF superfamily of DNA binding proteins (Riechmann and Meyerowitz 1998). A
common feature of Cbf genes is the lack of introns and the DNA binding APETALA2
(AP2) domain which can bind to the C-repeat/dehydration-responsive (CRT/DRE)
element in the promoter of many cold-responsive (Cor) genes (Gilmour et al. 1998; Jaglo
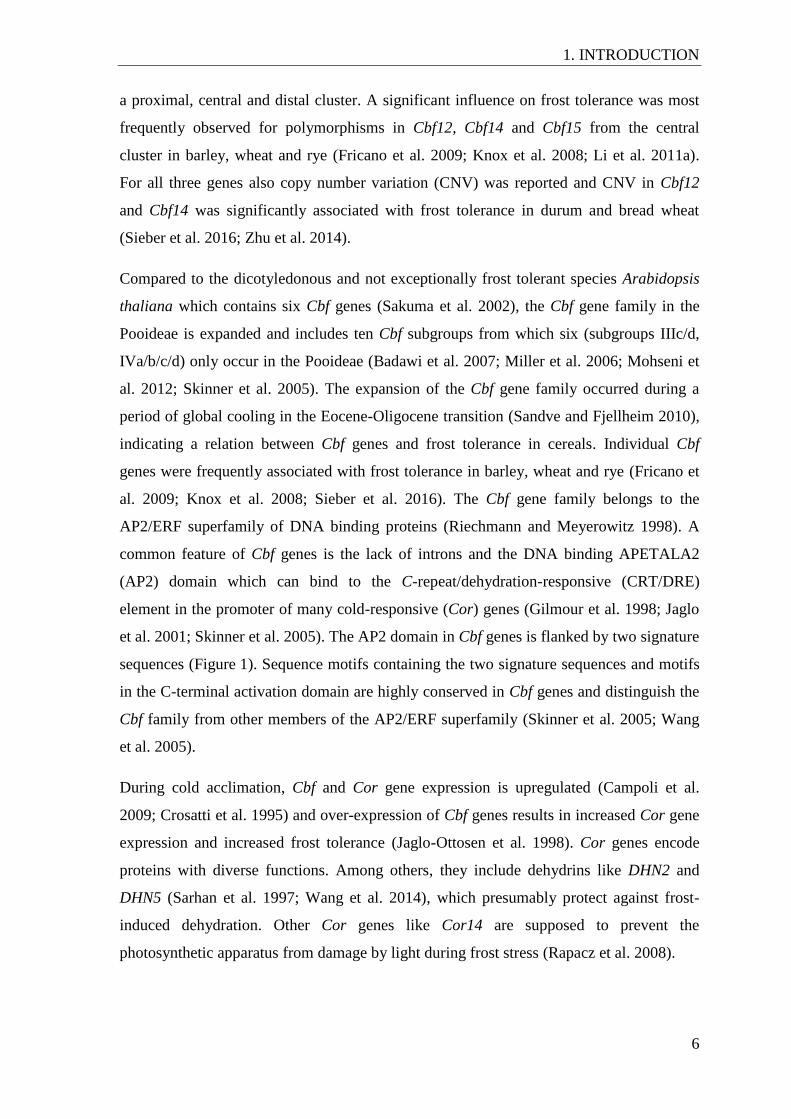
et al. 2001; Skinner et al. 2005). The AP2 domain in Cbf genes is flanked by two signature
sequences (Figure 1). Sequence motifs containing the two signature sequences and motifs
in the C-terminal activation domain are highly conserved in Cbf genes and distinguish the
Cbf family from other members of the AP2/ERF superfamily (Skinner et al. 2005; Wang
et al. 2005).
During cold acclimation, Cbf and Cor gene expression is upregulated (Campoli et al.
2009; Crosatti et al. 1995) and over-expression of Cbf genes results in increased Cor gene
expression and increased frost tolerance (Jaglo-Ottosen et al. 1998). Cor genes encode
proteins with diverse functions. Among others, they include dehydrins like DHN2 and
DHN5 (Sarhan et al. 1997; Wang et al. 2014), which presumably protect against frost-
induced dehydration. Other Cor genes like Cor14 are supposed to prevent the
photosynthetic apparatus from damage by light during frost stress (Rapacz et al. 2008).
1. INTRODUCTION
7
Figure 1 Structure of Cbf genes. The amino acid sequences of the first and second signature
motifs (underlined) and flanking positions as described by Jaglo et al. (2001) and Skinner et al.
(2005) are given for two Cbf genes from barley (Hordeum vulgare, Hv, accession numbers
AAX23686 and AAX28952) and two Cbf genes from einkorn wheat (Triticum monococcum, Tm,
accession numbers ABW87013 and ABW87012) as representatives for four different Cbf
subgroups.
Besides the interaction with Cor genes, Cbf genes also interact with vernalization genes
like Vrn-1. Barley and wheat genotypes carrying the dominant allele of Vrn-1 conferring
spring growth habit accumulate less Cbf and Cor gene transcripts than genotypes carrying
the recessive winter growth habit vrn-1 allele (Badawi et al. 2007; Kobayashi et al. 2005;
Stockinger et al. 2007). In spring barley varieties, long day length also resulted in lower
transcript levels of Cbf genes compared to short day length (Stockinger et al. 2007). The
fact that wheat lines carrying the vrn-1 winter habit allele tolerate lower temperatures than
wheat lines carrying the Vrn-1 spring allele finally suggests a pleiotropic effect of Vrn-1
on vernalization and on frost tolerance (Limin and Fowler 2006). Besides Cbf genes, also
other transcription factors influence the freezing tolerance in plants. Myb transcription
factors were identified as negative regulators of the Cbf dependent cold signaling
pathway. Phosphorylation of the transcription factor MYB15 prevented repression of the
Cbf pathway and increased frost tolerance in Arabidopsis (Kim et al. 2017). In rice, the
Mybs3 transcription factor suppressed the Cbf dependent cold signaling pathway and
overexpression of Mybs3 increased cold tolerance. It was suggested that Mybs3 is
involved in an alternative pathway which acts complementary to the Cbf pathway (Su et
al. 2010). The frost responsive network also interacts with phytohormones. In
Arabidopsis, brassinosteroids increased the expression of Cor genes via the Cbf pathway
and also in a Cbf-independent way (Eremina et al. 2016). Cold-responsive genes were also
reported to be induced by ABA in a Cbf-independent pathway since some Cor genes
1. INTRODUCTION
8
include an ABA-responsive element/complex (ABRE) in their promoter (Ishitani et al.
1997). However, ABA was also reported to mediate Cor gene expression by the induction
of Cbf expression (Knight et al. 2004). In barley, ABA levels increased in the course of
cold acclimation and exogenous application of ABA increased the soluble sugar content in
barley leaves (Bravo et al. 1998). Many organisms including barley, oat and rye produce
antifreeze proteins during cold acclimation (Ding et al. 2015; Marentes et al. 1993; Zhang
et al. 2016). But the molecular pathway leading to the expression of antifreeze proteins
and several other cold-induced proteins, carbohydrates and lipids involved in the
biochemical and physiological changes during cold acclimation were not yet identified in
cereals. This shows that variation which was not explained by the Fr-2 and Vrn-1 loci is
most likely determined by a large number of minor effect genes, potentially with epistatic
interactions and encourages further investigation of the genetic basis of frost tolerance.
1.4 Marker-based selection methods for quantitative traits
Decisions based on phenotypic selection on quantitative traits like frost tolerance can be
misguided by unfavorable environmental conditions such as mild winters or flooding of
trial sites. Compared to phenotypic selection, marker-based selection enabled strong
improvement of selection accuracy, especially for low to moderate heritable traits when
markers tightly linked with QTL were available (Francia et al. 2005). Marker-based
selection has the advantage that selection can be performed fast and independent from
growth cycle or environmental effects like climatic conditions (Francia et al. 2005). By
the early identification of high performing genotypes, the number of individuals which
have to be phenotyped can be reduced, selection intensity can be increased and the
breeding process is thereby accelerated (Heffner et al. 2010; Yousef and Juvik 2001).
1.4.1 QTL-based selection
QTL for frost tolerance were detected by association mapping in barley, winter wheat and
rye (Li et al. 2011a; Visioni et al. 2013; Zhao et al. 2013) and by QTL mapping in
biparental populations segregating for frost tolerance in barley and wheat (Båga et al.
2007; Fisk et al. 2013; Francia et al. 2004). By contrast to association analyses, QTL
analysis can be performed in a single bibarental population segregating for frost tolerance
and exploit recombination events between closely related individuals (Haley and Knott
1992; Lander and Botstein 1989; Liu and Zeng 2000). QTL analyses are therefore suitable
1. INTRODUCTION
9
to identify favorable alleles from genetic resources like wild relatives for subsequent
introgression in established breeding material (Semagn et al. 2010). Successful selection
based on markers flanking identified QTL requires that marker and QTL are as closely
linked that no recombination occurs between them (Collard and Mackill 2008). Simple
approaches to identify QTL involve regression of the phenotype on the genotypes of
single markers, by analyses of variance for the genotypes at a single marker locus, or by
pair-wise t-tests between the different marker classes (Edwards et al. 1987; Soller et al.
1976; Tanksley et al. 1982). These methods allow for the identification of markers close to
a QTL position but do not provide an estimation of the QTL position itself. Interval
mapping was an advanced approach, which enabled a more precise estimation of the QTL
positions relative to both flanking markers. In order to avoid that QTL effects are
confounded with the effects of additional QTL in the genome, this method was refined by
including markers in other genomic regions, preferably markers flanking other QTL, as
cofactors in the model which is denoted as composite interval mapping (Utz and
Melchinger 1996; Zeng 1993). The likelihood of a QTL at a given genomic position is set
into relation with the likelihood of no QTL at this position. The magnitude of the
logarithm of this relationship, the logarithm of the odds (LOD), is used to judge the
probability of a QTL at the given position (Hackett 2002). Only QTL significantly
influencing the trait of interest are supposed to be informative in the marker-assisted
selection model. An important step in QTL mapping is therefore the determination of
thresholds to decide which QTL are significant. Since the significance threshold depends
amongst others on the sample size, the number of markers or the number and distribution
of missing values, empirical determination of threshold values by permutation tests is
recommended (Churchill and Doerge 1994).
The large effects of the QTL at the Vrn-H1 and Fr-H2 loci have already been exploited by
marker-based selection for the improvement of frost tolerance in barley (Akar et al. 2009;
Tóth et al. 2004). Only moderate correlation between markers from the Fr-H2 locus and
frost tolerance levels measured in field and freeze tests was observed for a diverse panel
of barley genotypes (Akar et al. 2009). This underlines the complex trait architecture of
frost tolerance and indicates that selection only based on main effect QTL insufficiently
captures phenotypic variance for frost tolerance.
1. INTRODUCTION
10
1.4.2 Genomic selection
Alternative selection methods for quantitative traits were developed in animal breeding,
where breeding values are predicted for individual animals based on pedigree data. The
pedigree is used to calculate a kinship matrix which is integrated into a best linear
unbiased prediction (BLUP) model. BLUP models are then solved by mixed-model
equations using least squares (Henderson 1985). Decreasing costs of marker technologies
in the recent past enabled to cover genomes with increasing marker density. This was a
prerequisite to predict highly quantitative traits involving a large number of small effects
using marker data (Meuwissen et al. 2001). Compared to the use of pedigree data, a higher
accuracy was obtained from prediction based on marker data (Albrecht et al. 2011;
Auinger et al. 2016; VanRaden 2008), which is referred to as genomic BLUP (GBLUP).
Thereby, relationships between individuals are represented by a genomic relationship
matrix constructed from the genotypes at all available markers (VanRaden 2008) and
included in the GBLUP model. Alternatively, the GBLUP model can be transformed into
a ridge regression (RR-BLUP) model which directly includes marker data instead of a
kinship matrix (Meuwissen et al. 2001). Since the number of markers largely exceeds the
number of phenotypes, these models are solved by penalized least squares where a penalty
function is used to shrink marker effects. Estimates of marker effects are obtained by
minimizing the residual error variance by including a penalization term.
The large benefits of GBLUP and RR-BLUP were discovered also for plant breeding. In
rye, GBLUP models applied on plant height, grain yield and thousand kernel weight
yielded an accuracy of 0.70 suggesting that genomic prediction could reduce selection
cycle length in hybrid breeding (Auinger et al. 2016). Promising results of GBLUP
models were also reported for the prediction of resistance and tolerance traits. The
predictive ability of resistance to the European corn borer exceeded that of a QTL-based
model for all measured traits (Foiada et al. 2015) and in sunflower, high predictive ability
was obtained for resistance to the fungal pathogen Sclerotinia (Livaja et al. 2015). Abiotic
stress tolerance was only rarely predicted by genome-wide approaches. In maize, selection
for drought tolerance using GP was more effective than phenotypic selection under stress
conditions (Vivek et al. 2017) and moderate to high accuracies were obtained for frost
tolerance using RR-BLUP in winter wheat (Würschum et al. 2017; Zhao et al. 2013).
1. INTRODUCTION
11
Compared to traits involving a large number of small effects, GP models like GBLUP or
RR-BLUP revealed lower predictive ability for traits involving few QTL with large
effects, since the assumption of normally distributed marker effects with equal variance
made by these models is violated (Daetwyler et al. 2010; Wimmer et al. 2013). This
constraint can be overcome when markers flanking large effect QTL are known and are
individually weighted or included as fixed effects into RR-BLUP models. Compared to
the standard RR-BLUP model, including informative markers from the Fr-A2 locus as
fixed effects in the RR-BLUP model improved the predictive ability for winter hardiness
in winter wheat (Würschum et al. 2017). Variable selection methods like the least absolute
shrinkage and selection operator (LASSO), elastic net or Bayes B provide additional
possibilities to account for heterogeneous SNP effects in prediction of quantitative traits
(Daetwyler et al. 2010; Wimmer et al. 2013). For Bayes B, a prior distribution is used
which assumes a high density of markers having no effect (Meuwissen et al. 2001).
Similarly, LASSO and elastic net allow strong shrinkage of marker effects up to zero
while large effects may be attributed to individual markers. Whereas squared marker
effects are used to obtain the penalization parameter λ in RR-BLUP to shrink marker
effects by penalized regression, the absolute value of marker effects is used by LASSO to
derive the penalization parameter λ for the penalty function (Tibshirani 1996). Elastic net
uses both absolute and squared marker effects resulting in an attenuated shrinkage of
marker effects compared to LASSO (Zou and Hastie 2005). Despite the multitude of
genomic prediction methods, high prediction accuracies are hardly obtained for low
heritable traits which are difficult or expensive to measure. However, if such traits are
correlated to a highly heritable trait which can be easily assessed, selection can be
facilitated by multivariate prediction (Guo et al. 2014; Jia and Jannink 2012). Bivariate
prediction of protein content and grain yield increased predictive accuracy for the lower
heritable trait protein content in rye, particularly when data were missing for protein
content but were complete for grain yield (Schulthess et al. 2016). GP for frost tolerance
was already applied in wheat. However, the genetic architecture of frost tolerance and the
potential to improve this trait by genomic selection in the most frost tolerant cereal rye are
to be elucidated.
1. INTRODUCTION
12
1.5 Objectives of this study
In rye, genome analysis and detailed investigation of genomic regions involved in frost
tolerance has been constrained by the large and highly repetitive genome (Doležel et al.
1998). The recent development of genome-wide molecular tools and the availability of
sequence resources open new avenues for genomic research in rye (Bauer et al. 2017;
Haseneyer et al. 2011). The main goal of this study was to identify genomic regions
involved in frost tolerance in winter rye. The detailed objectives of this study were to
1) identify the number, location and the effects of genomic regions involved in frost
tolerance in a biparental winter rye population by QTL analysis,
2) determine the optimum selection strategy with regard to the phenotyping platform,
the plant material and the selection method given the genetic architecture of frost
tolerance,
3) investigate the Cbf gene family in rye using sequence resources,
4) assess the population structure and molecular diversity of European breeding pools
and genetic resources at the Fr-R2 and Vrn-R1 loci in order to evaluate their
potential for frost tolerance breeding,
5) gain insights into the structure of the Fr-R2 locus in rye,
6) evaluate effects of SNPs in three Cbf genes from the Fr-R2 locus on frost
tolerance, and
7) identify genomic regions causing population structure which could help to
maintain the heterotic pattern between seed and pollen parent pool when frost
tolerance alleles are introduced from genetic resources to European breeding pools
2. MATERIALS AND METHODS
13
2. MATERIALS AND METHODS
2.1 Plant material
2.1.1 Lo157 × Puma-SK mapping population
A biparental mapping population was developed from a cross between the European elite
inbred line Lo157 and a Canadian genetic resource. In rye breeding, hybrids are generally
produced by crossing a male sterile mother from the so-called seed parent heterotic pool
and a fertile father from the pollen parent pool (Geiger and Miedaner 2009). The self-
fertile inbred line Lo157 belongs to the seed parent pool. The genetic resource was
represented by one plant from a re-selected fraction of the frost tolerant Canadian open-
pollinated cv. Puma (Shebeski et al. 1973). This fraction resulted from a recurrent
selection program, has been designated Puma-SK (A. E. Limin and D. B. Fowler,
University of Saskatchewan, Canada; unpublished) and exhibits enhanced frost tolerance.
For the mapping population, one F1 plant resulting from the Lo157 Puma-SK cross was
selfed to obtain 273 F2 individuals (Figure A1). These were advanced by single-seed
descent up to the F4 generation. In higher selfing generations, some lines exhibited strong
inbreeding depression leading to seed shortage. In order to provide sufficient seed for the
F5 generation, instead of one single plant, three plants per F4 line were randomly chosen
and selfed separately to produce F5 lines. F3 and F4 testcross seed was obtained by
crossing F3 and F4 single plants, respectively, to a male-sterile single-cross tester of the
seed parent pool (Lo115-P Lo133-N). Apart from the Puma-SK population, all plant
material is proprietary to KWS Lochow GmbH, Bergen, Germany.
2.1.2 Inbred lines for analyses of SNP effects
For the analysis of SNP effects in the candidate genes ScCbf12, ScCbf14 and ScCbf15,
F4 lines were developed from plant material previously used for a candidate gene-based
association study by Li et al. (2011a). The available F3 lines were initially derived from
crosses of Middle and Eastern European self-incompatible winter rye breeding
populations with the self-fertile elite inbred line Lo152, as described in Li et al. (2011a).
F3 lines were selected which were heterozygous for the SNP of interest but homozygous at
the remaining SNPs. By selfing the selected F3 lines, F4 lines were obtained which
segregated for the SNP of interest. Finally, 65 F4 lines with contrasting homozygous
2. MATERIALS AND METHODS
14
genotypes at the SNP of interest as well as the inbred line Lo152 were used for analyses of
the SNP effects. The 65 F4 lines included 40 and 5 representatives from crosses with two
Eastern European populations (PR2733 Lo152 and ROM Lo152, respectively). The
remaining 20 F4 lines were derived from crosses with a Middle European population
(Petkus Lo152).
2.1.3 Diversity panel
A diverse panel of 122 accessions composed of 38 and 46 elite inbred breeding lines from
the seed and the pollen parent pool from a commercial rye breeding program and 38
genetic resources was used for molecular analyses. Lines from the seed parent pool were
developed by selfing to the F5 or F6 generation. Lines from the pollen parent pool were
developed by selfing until the F3 generation and maintained as F3:4 bulks. The genetic
resources comprised accessions from Germany, Canada, USA and from Eastern European
open-pollinated populations (Table A1).
2.2 Analysis of frost tolerance in the Lo157 × Puma-SK population
2.2.1 Phenotypic trait assessment
Frost tolerance of the Lo157 Puma-SK population was assessed using two phenotyping
platforms: a controlled freeze test and field trials. In the winter 2011/2012, F4 lines per se
and F3 testcrosses and in 2012/2013 and 2013/2014 F5 lines per se and F4 testcrosses were
phenotyped in both controlled freeze tests and the field (Table A2). All phenotypic data
were assessed and provided by KWS Lochow GmbH, Bergen, Germany.
A typical temperature profile in the controlled platform is shown in Figure A2. In
preparation for the freeze test, plants were vernalized for seven weeks at 2 to 3°C and 8 h
light per day. At the three leaf stage, plants were transferred to the freezer at 0°C.
Subsequently, the temperature was decreased to -9°C in ~2°C steps per day. At the fourth
or fifth day, temperature was further decreased by 2°C per hour to a minimum of -20 to
-23°C depending on the trial. This temperature was held for one to two hours and then
increased to -5°C. In the following two days, the temperature was increased to 1 and 5°C,
respectively. Throughout the freezing cycle, plants were kept in the dark. Afterwards,
plants were allowed to recover at 8 to 10°C for two weeks until they were scored for the
trait recovery after freezing (REC). A score of 1 corresponded to plants with fully necrotic
2. MATERIALS AND METHODS
15
leaves which did not recover from frost stress. A score of 9 corresponded to healthy and
vital plants with fully green leaves which recovered completely. In 2012/2013, lines and
testcrosses were evaluated at two minimum temperatures, -21°C and -23°C. In 2011/2012
and 2012/2013, the freeze test was carried out in two freezers in several series. Since not
all lines and testcrosses of the mapping population could be placed in the two freezers
simultaneously, the freeze test in 2011/2012 and 2012/2013 was performed in several
series. Series were connected by common entries (Lo157, experimental lines, commercial
checks). The freeze test in 2013/2014 was performed in a single climate chamber and
plants were arranged in a 14 × 15 alpha-lattice design. All freeze tests comprised two
replications. In an additional experiment, six inbred lines from the seed (Lo7, Lo90,
Lo115, Lo117, Lo176, Lo191) and the pollen (Lo225, Lo282, Lo298, Lo310, Lo348,
Lo351) parent pool, respectively, and Puma-SK were assessed for REC in the freeze test
in a single climate chamber with four replications. Each test unit in the freeze test
contained 5 plants per line and testcross entry.
Field trials were carried out at one Russian location, Lipezk (52° 37′ N, 39° 36′ E,
160 m a. s. l.) and three Canadian locations, Minto (49° 24′ N, 100° 01′ W, 487 m a. s. l.),
Portage la Prairie (49° 58′ N, 98° 17′ W, 262 m a. s. l.) and Saskatoon (52° 8′ N,
106° 40′ W, 481 m a. s. l.). Daily minimum temperatures from trial sites in the winter
seasons are shown in Figure A3. Lines per se and testcrosses were evaluated in alpha-
lattice designs (13 × 13, 14 × 15 or 15 × 15) with two replications in each year, except for
Lipezk in 2012/2013 where testcrosses were evaluated in three replications. One plot
comprised 50-70 plants in Russia and 80-100 plants in Canada. Phenotypic data were
assessed two weeks after snow melt in April or May on survival after winter (SAW) and
development after winter (DAW). SAW was measured as the percentage of plants per plot
that survived the winter. DAW was assessed as a score with a range from 1 to 9 where 1
represents a plot with severely damaged plants and 9 a plot with completely healthy and
vital plants as described for the scoring of REC.
For the analysis of SNP effects in the candidate genes ScCbf12, ScCbf14 and ScCbf15,
phenotyping of 65 F4 lines was carried out in the winters 2012/2013 and 2013/2014 in the
same locations in Russia and Canada as the mapping population in lattice designs (9 × 8,
10 × 10) with four replications per location and including checks (Lo152 and other
commercial lines). Phenotypes on REC in the controlled platform were assessed at two
2. MATERIALS AND METHODS
16
different temperatures, -21°C and -23°C, each in a lattice design (9 × 8, 5 × 15) with two
or four replications and including checks (Lo152 and other commercial lines).
2.2.2 Phenotypic data analysis
Lines per se and testcrosses were analyzed separately. All phenotypic data analyses were
performed using the ASReml-R package (Butler et al. 2009). In the controlled platform,
the tests in 2011/2012 and in 2013/2014 and both tests at different minimum temperatures
in 2012/2013 were treated as individual environments. In the field trials, an environment
is defined as a location-year combination. Phenotypic data analyses for controlled
experiments and field trials were performed for individual environments and across
environments. Distribution of residuals was inspected by means of residual diagnostic
plots and observations were identified as outliers and removed from the dataset when their
standardized residuals exceeded the threefold standard deviation.
In the freeze test in 2013/2014 and in the field trials, lattice analyses were carried out for
each individual environment according to the following model:
yikm = µ + gi + rk + bkm + ϵikm (1)
yikm trait observation
µ overall mean
gi effect of genotype i
rk effect of replication k
bkm effect of incomplete block m nested in replication k
ϵikm residual error;
In the freeze test an incomplete block was represented by a multipot plate. As the freeze
tests in 2011/2012 and 2012/2013 were carried out in two freezers and several series
during the winter, freezer and series were included as factors in the model. Consequently,
models were adapted to the respective experimental design in individual environments
(Appendix Documentation A1) in the controlled platform and analysis across
environments was performed in a two-stage approach. In the first stage, adjusted means
for individual environments were obtained for each genotype by assuming genotype as
fixed effect. In the second stage, adjusted means were calculated across environments
based on adjusted means obtained from the first stage by including genotype as fixed
2. MATERIALS AND METHODS
17
effect and environment and genotype environment as random effects. Adjusted means
from the first stage were weighted according to method 1 of Möhring and Piepho (2009).
The combined analysis across environments was performed across all environments that
exhibited significant genotypic variance and a repeatability > 0.10. The repeatability was
calculated as the ratio between the genotypic variance component and the sum of the
genotypic and the residual error variance component. The combined analysis in the freeze
test was performed according to the following model:
yij = µ + gi + lj + glij + ϵij (2)
yij trait observation
µ overall mean
gi effect of genotype i
lj effect of environment j
glij interaction effect of genotype i with environment j
ϵij residual error;
The combined analysis in the field trials was performed based on the following model:
yijkm = µ + gi + lj + glij+ rjk + bjkm + ϵijkm (3)
yijkm trait observation
µ overall mean
gi effect of genotype i
lj effect of environment j
glij interaction effect of genotype i with environment j
rjk effect of replication k nested in environment j
bjkm effect of incomplete block m nested in replication k nested in environment j
ϵijkm residual error;
Adjusted means across environments were obtained by fitting genotype as fixed effect.
For the estimation of variance components all effects were assumed to be random. To
estimate genotypic variance components only for mapping individuals, a grouping
variable and a dummy variable were used in all models as described in Ould Estaghvirou
et al. (2013). The grouping variable differentiating between checks and lines/testcrosses
was introduced as fixed effect. The factor variable denoting individual lines/testcrosses
2. MATERIALS AND METHODS
18
was combined with the numerical dummy variable (0 for checks and 1 for
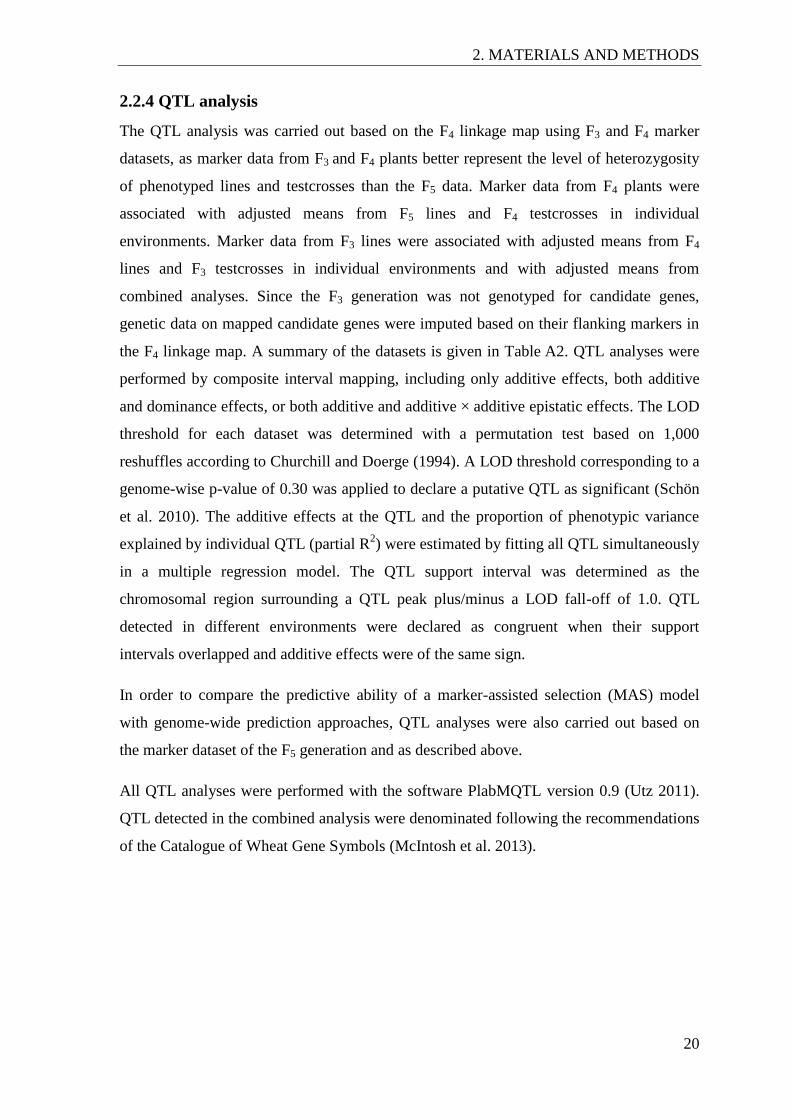
lines/testcrosses) for estimation of the genotypic variance component. Broad-sense
heritabilities ( ) were estimated according to Holland et al. (2003):
(4)
estimate for the genotypic variance component
estimate for the genotype × environment interaction variance component
estimate for the residual error variance component
L number of environments
R number of replications per environment
Since the number of phenotyped lines and testcrosses was different in individual
environments and since the number of replications varied across environments for
testcrosses, the harmonic mean was calculated and used for the number of replications and
the number of environments.
Phenotypic correlations between lines per se and testcrosses and between phenotyping
platforms were calculated based on adjusted entry means across environments using
Pearson`s correlation coefficient. Genotypic correlations between lines per se and
testcrosses were obtained from a bivariate model using adjusted entry means from
common individual environments and fitting genotype and environment as random terms.
2.2.3 Genotypic data analysis and genetic linkage mapping
For QTL analyses, DNA was extracted from the leaves of 263 F3 and 775 F4 single plants
representing 263 F3 and 260 F4 lines from the Lo157 × Puma-SK population. F3 and F4
generations were analyzed with a subset of 384 SNPs from the Illumina iSelect Rye5k
SNP array (Haseneyer et al. 2011). SNPs with more than 20% missing values and
monomorphic markers were excluded from the analyses. Due to discrepancies in
relationships across generations, 49 F4 lines were removed. After quality checks,
genotypic data on 180 SNPs were available from 211 F3 single plants representing 211
F3 lines and 594 F4 single plants representing 211 F4 lines for further analyses. Genetic
analysis of polymorphisms in four candidate genes from the frost-responsive network
2. MATERIALS AND METHODS
19
(ScCbf9, ScCbf12, Vrn-R1, ScMybs3) was carried out by cleaved amplified polymorphic
site (CAPS) marker assays or by sequencing. Primers for ScCbf9, ScCbf12, and Vrn-R1
were adopted from Li et al. (2011b). Primers for ScMybs3 were designed based on
information from the homoeologous gene in rice (Lu et al. 2002). In addition, two
putatively novel ScCbf genes were discovered. According to their closest homologs in
Triticum aestivum and Triticum monococcum to which they were 95% and 93% identical
based on their nucleotide sequences, these Cbf genes were designated as ScCbf1 and
ScCbf18. Their sequences were submitted to GenBank under accession numbers
KY780081 and KY780082. Based on sequence contigs of Lo7 and 11 other sequenced rye
lines (Bauer et al. 2017), SNPs were identified for genotyping. PCR was carried out in
20 µl reaction volumes containing 30 ng DNA, 150 nM of each primer, 0.2 nM of each
dNTP, 1 × Paq DNA polymerase reaction buffer, and 1.0 U Paq DNA Polymerase
(Stratagene, Europe). The primer sequences and details on PCR conditions for the
mapping of candidate genes in the F4 generation are listed in Table A3. For the
construction of the F4 linkage map, genotypic data from 211 randomly chosen single
plants representing the 211 F4 lines were used. One SNP in each of the five candidate
genes was used to integrate ScCbf9, ScCbf12, ScCbf18, Vrn-R1 and ScMybs3 in the
genetic linkage map of the F4 generation.
From the F5 generation, 266 single plants representing 200 F5 lines were analyzed with a
16k custom Illumina Infinium SNP array (Illumina Inc., San Diego California, USA).
Monomorphic SNPs and SNPs with more than 10% missing or 10% heterozygous
genotype calls were excluded from the analyses. After quality checks and SNP filtering,
258 single plants representing 192 F5 lines and 2,950 SNPs were available for further
analyses. For mapping of SNPs in seven candidate genes, ScCbf1, ScCbf9, ScCbf11,
ScCbf12, ScCbf18, ScDhn3, ScMybs3, KASP (Kompetitive Allele Specific PCR) marker
assays were applied (LGC Genomics, Hoddesdon, UK) (Table A4).
The genetic maps of the F4 and F5 generations were established with the software JoinMap
4.1 (Van Ooijen 2006) using the maximum likelihood algorithm and Haldane´s mapping
function (Haldane 1919).
2. MATERIALS AND METHODS
20
2.2.4 QTL analysis
The QTL analysis was carried out based on the F4 linkage map using F3 and F4 marker
datasets, as marker data from F3 and F4 plants better represent the level of heterozygosity
of phenotyped lines and testcrosses than the F5 data. Marker data from F4 plants were
associated with adjusted means from F5 lines and F4 testcrosses in individual
environments. Marker data from F3 lines were associated with adjusted means from F4
lines and F3 testcrosses in individual environments and with adjusted means from
combined analyses. Since the F3 generation was not genotyped for candidate genes,
genetic data on mapped candidate genes were imputed based on their flanking markers in
the F4 linkage map. A summary of the datasets is given in Table A2. QTL analyses were
performed by composite interval mapping, including only additive effects, both additive
and dominance effects, or both additive and additive × additive epistatic effects. The LOD
threshold for each dataset was determined with a permutation test based on 1,000
reshuffles according to Churchill and Doerge (1994). A LOD threshold corresponding to a
genome-wise p-value of 0.30 was applied to declare a putative QTL as significant (Schön
et al. 2010). The additive effects at the QTL and the proportion of phenotypic variance
explained by individual QTL (partial R2) were estimated by fitting all QTL simultaneously
in a multiple regression model. The QTL support interval was determined as the
chromosomal region surrounding a QTL peak plus/minus a LOD fall-off of 1.0. QTL
detected in different environments were declared as congruent when their support
intervals overlapped and additive effects were of the same sign.
In order to compare the predictive ability of a marker-assisted selection (MAS) model
with genome-wide prediction approaches, QTL analyses were also carried out based on
the marker dataset of the F5 generation and as described above.
All QTL analyses were performed with the software PlabMQTL version 0.9 (Utz 2011).
QTL detected in the combined analysis were denominated following the recommendations
of the Catalogue of Wheat Gene Symbols (McIntosh et al. 2013).
2. MATERIALS AND METHODS
21
2.2.5 Genomic prediction
Based on the dataset of the F5 generation comprising 1,050 markers, the predictive ability
of a QTL-based model was compared with genome-wide prediction approaches. Adjusted
means from the combined analysis across environments from 165 individuals were used as
input data for all models. Marker genotypes were coded according to the number of minor
alleles with 0 and 2 for the homozygous and 1 for the heterozygous genotypes. Imputation
of missing marker data by flanking markers in the linkage map was carried out using the
software package BEAGLE 3.3 (Browning and Browning 2009). For GBLUP models, a
realized relationship matrix was constructed according to Habier et al. (2007). GBLUP
was performed using the R package synbreed (Wimmer et al. 2012) according to the
model:
, (5)
n-dimensional vector of phenotypic values
1 n-dimensional vector of ones
overall mean
n × n matrix assigning genotypes to phenotypes
n-dimensional vector of genotypic effects ( ); = realized relationship
matrix
n-dimensional vector of residuals,
n × n identity matrix
residual variance
An additional GBLUP model was calculated which was extended by a vector of fixed
marker effects in order to include flanking SNPs of one or multiple QTL as fixed effect:
, (6)
n × 2k-dimensional design matrix assigning marker scores to fixed effects (k =
number of markers included as fixed effects)
2k-dimensional vector of fixed marker effects
2. MATERIALS AND METHODS
22
In addition, a GBLUP model considering epistatic effects was applied. It included an
epistatic relationship matrix which was the Hadamard product (H) of the realized
relationship matrix as proposed by Henderson (1985):
, (7)
n-dimensional vector of genotypic effects ( ))
n-dimensional vector of additive × additive epistatic effects ( ))
The described regression methods assume marker effects to be sampled from a normal
distribution thereby resulting in rather low and homogeneous marker effects. Since frost
tolerance was reported to be controlled by genomic regions of small and large effects, the
variable selection method LASSO (Tibshirani 1996) was applied using the R package
glmnet (Friedman et al. 2010). This method allows more accurate estimation of traits
influenced by heterogeneous marker effects.
In order to exploit also information on correlated traits for the prediction of frost
tolerance, a multivariate prediction model was fitted using the MTM function
(https://github.com/QuantGen/MTM) described in Lehermeier et al. (2015). A Gibbs
sampler implemented in the MTM function was used to obtain 20,000 samples from the
posterior distribution from which the first 10,000 iterations were discarded as burn-in.
Posterior mean estimates were obtained using the remaining 10,000 samples. Genotypic
effects are assumed to be multivariate normal (MVN) distributed with the variance being
the Kronecker product ( ) of the genetic covariance matrix T between traits with the
realized relationship matrix U. Residuals were assumed to be correlated and MVN
distributed with the variance being the Kronecker product of the residual covariance
matrix R between traits with the identity matrix In × n. The applied multivariate GP model
is shown here with two exemplary traits, trait 1 and trait 2, as response variables:
2. MATERIALS AND METHODS
23
(8)
n-dimensional vector of genotypic effects of trait 1 / 2
g = (g´1, g´2)´ ~ MVN2n x 2n (0, T U)
T = (
)
residuals specific for trait 1 / 2
= ( ´1, ´2)´ ~ MVN2n x 2n (0, R )
R = (
)
For the QTL-based and all GP models, the mean predictive ability and its standard
deviation were calculated based on the 100 cross-validation (CV) runs from a fivefold
random sampling with 20 replications (Albrecht et al. 2011). The predictive ability of GP
models was estimated by the Pearson’s correlation coefficient of observed versus
predicted phenotypes for each test set. The predictive ability of the QTL model was
calculated as the square root of the adjusted phenotypic variance (R2
adj.) explained in the
test set using PlabMQTL version 0.9 (Utz 2011). For a fair comparison of predictive
abilities from different models, the same partitioning of individuals into estimation set and
test set was applied in QTL and GP models.
2.3 Phylogenetic analysis of the Cbf gene family in rye
2.3.1 Identification of Cbf sequences in twelve rye accessions
A screening of Cbf gene sequences was performed on whole genome sequence contigs of
the rye reference line Lo7, ten rye inbred lines (Lo90, Lo115, Lo117, Lo176, Lo191,
Lo282, Lo298, Lo310, Lo348, Lo351) and the wild relative Secale vavilovii (Bauer et al.
2017). The coverage of the sequence resources was highest for Lo7 with 72.4x and ranged
between 11.2x (Lo117) and 13.2x (S. vavilovii) for the other eleven accessions. The N50
statistic was 1708 bp for Lo7 and ranged from 1225 (Lo117) to 1394 bp (S. vavilovii) for
the eleven other accessions. Further details on the sequence resources of the twelve
accessions were described in Bauer et al. (2017). The three frames of the forward and the
2. MATERIALS AND METHODS
24
reverse complement strand of each contig were translated into amino acid sequences using
the R package seqinr (Charif and Lobry 2007). Putative Cbf sequences were identified by
filtering for strings of highly conserved amino acids in the first signature motif (AGR or
ETRH) or the flanking AP2 domain (YRGV) in combination with the occurrence of a
highly conserved arginine (R) at the sixth and eighth position of the AP2 domain.
Resulting amino acid sequences were sorted for the composition of the first signature
sequence and assigned provisory Cbf names. Remaining non-Cbf sequences were
manually removed.
2.3.2 Investigation of phylogenetic relationships with wheat and barley
An extensive selection of 111 Cbf encoding nucleotide sequences from barley, einkorn
wheat, bread wheat and rye was compiled from NCBI. The AP2 domain and the
conserved flanking first and second signature sequences as defined by Jaglo et al. (2001)
were extracted from known and new putative Cbf genes and a multiple sequence
alignment was generated with ClustalW (Higgins et al. 1994) using MEGA software
version 7.0.26 (Kumar et al. 2016). A maximum likelihood phylogenetic tree was
generated based on the Tamura 3-parameter model (Tamura 1992) with 500 bootstrap
replications implemented in MEGA. For the phylogenetic tree, names of all known Cbf
genes were adapted to the nomenclature of Badawi et al. (2007).
The affiliation of newly identified Cbf genes to established cereal Cbf subgroups in wheat
and barley (Badawi et al. 2007; Skinner et al. 2005) was confirmed and conclusive rye Cbf
designations were assigned by nucleotide alignments with putative Triticeae orthologs.
The nucleotide sequence of the coding frame of putative rye Cbf genes was aligned with
that from barley, einkorn wheat, bread wheat and rye which were located in the same
monophyletic group in the phylogenetic tree using ClustalW (Higgins et al. 1994)
implemented in the software Bioedit (Hall 1999). Since there are no unique rules for the
assignment of Cbf genes to orthologs in cereals, a Cbf gene from rye which was highly
identical to a Cbf gene from barley or (einkorn) wheat was declared as a putative ortholog.
If more than one rye Cbf gene exhibited high identity to the same putative ortholog from
barley or (einkorn) wheat, no designation was assigned to the respective rye Cbf genes. An
exception was made only for rye Cbf genes with the highest identity to the putative
Triticeae ortholog if homology was supported by synteny in genetic or physical maps.
2. MATERIALS AND METHODS
25
2.4 Analysis of the Fr-R2 and Vrn-R1 loci in rye
2.4.1 Population genetic analysis of the Fr-R2 and Vrn-R1 loci
2.4.1.1 Population structure
Population structure was investigated in the diversity panel of 122 accessions described in
section 2.1.3. Principle coordinate analyses (PCoA) were performed on SNPs from the
Rye600k array which were mapped in the high-density linkage map of the Lo7 Lo225
population (Bauer et al. 2017). The PCoA was carried out for the whole genome (66,561
SNPs), for the Fr-R2 (179 SNPs) and the Vrn-R1 (212 SNPs) loci, and for both loci
together (391 SNPs). The analyses were based on modified Rogers’ distance and using the
R package ape (Paradis et al. 2004). In order to avoid bias arising from the higher degree
of heterozygosity in genetic resources compared to the inbred lines from the seed and
pollen parent pools, pseudo-S0 genotypes were used instead of original inbred line
genotypes. Haplotype phasing was performed with BEAGLE 4.0 (Browning and
Browning 2007). Pseudo-S0 genotypes were obtained separately for each pool by
combining pairs of haplotypes from two randomly sampled individuals of the same pool
as described in Meyer et al. (2016).
2.4.1.2 Diversity analyses
For the Fr-R2/Vrn-R1 genomic region, nucleotide diversity per site was calculated for 142
SNPs according to Tajima (1983) in R (R Development Core Team 2013). The
differentiation index FST weighted for sample size was calculated according to Weir and
Cockerham (1984) using PLINK version 1.9 (Chang et al. 2015) with default parameter
settings. For the visualization of haplotypes, missing values were imputed using BEAGLE
(Browning and Browning 2009) implemented in the R package synbreed (Wimmer et al.
2012). Among all contigs anchored in the Fr-R2/Vrn-R1 genomic region, one contig was
selected per map position and selected contigs were ordered according to their
centiMorgan position in the Lo7 Lo225 high-density linkage map. Contigs containing
candidate genes from the Fr-R2 or Vrn-R1 loci which were not genetically mapped or
exhibited identical map positions, were arranged according to their relative positions in
the Fr-2 or Vrn-1 loci in wheat and barley (Miller et al. 2006; Pasquariello et al. 2014;
Yan et al. 2003). The 142 SNPs were ordered according to their physical position within
each contig but the orientation of contigs along the interval is unknown. Haplotypes were
then constructed by concatenating the unphased sequence of SNP genotypes.
2. MATERIALS AND METHODS
26
2.4.2 Characterization of the Fr-R2 locus in rye
The Fr-2 locus in cereals harbors a cluster of Cbf genes (Båga et al. 2007; Pasquariello et
al. 2014). In order to identify genomic sequences of the Fr-R2 locus, PCR primers for Cbf
genes were applied for the screening of two bacterial artificial chromosome (BAC)
libraries. A public BAC library of the spring rye variety Blanco (Sce-B-FRG) and a BAC
library of the winter rye inbred line Lo298 (Sce-B-RoS104) proprietary to KWS Saat SE
were used for the PCR screening at the Plant Genomic Center INRA CNRGV in France
(https://cnrgv.toulouse.inra.fr/ ).
For the screening of the Blanco BAC library, PCR products obtained from primers of
ScCbf2, ScCbf9, ScCbf12, ScCbf14, and ScCbf20 were used (Table A5). BACs displaying
positive hybridization signals were sequenced using Roche/454 GS FLX pyrosequencing
and assembled using the Newbler v2.6 software package (Margulies et al. 2005). The
assembled BACs (IDs: P2A9, P3C7, P4B2, P4D2) were aligned and integrated into one
contiguous sequence (Dr. G. Schwertfirm, unpublished results).
For the PCR-based screening of the Lo298 BAC library primers were designed for the
AP2 domain and the flanking signature sequences which are highly conserved in Cbf
genes. By this, each primer pair allowed the amplification of a pool of one to nine
different Cbf gene fragments (Table A6) and thus the identification of BACs harboring
one or more Cbf genes. BAC sequencing using the PacBio RS sequencer (Pacific
Biosciences, CA, USA) and assembly of sequence reads using the SMRT® analysis
software (Pacific Biosciences, CA, USA) was performed at INRA.
Coding sequences on the resulting BAC sequences were identified using the AUGUSTUS
web interface (Stanke and Morgenstern 2005, http://bioinf.uni-
greifswald.de/augustus/submission). For gene annotation, the predicted coding sequences
were blasted against the NCBI nucleotide database. For comparisons with the Fr-2 locus
in other cereals, Cbf coding sequences of the physical map of the Fr-H2 locus in barley
(Pasquariello et al. 2014) and the BAC clones 60J11 and 21C6 from Triticum
monococcum (Miller et al. 2006) were downloaded from the NCBI nucleotide database.
Coding sequences on the Triticum monococcum BAC clones were identified using the
AUGUSTUS web interface and annotations were re-evaluated by alignments with the
corresponding sequences of Triticeae Cbf genes which were downloaded from the NCBI
nucleotide database. Alignments and calculation of the percent identity between Cbf
2. MATERIALS AND METHODS
27
sequences were performed using ClustalW (Higgins et al. 1994) implemented in Bioedit
(Hall 1999).
2.4.3 Analysis of SNP effects in candidate genes
For the analysis of SNP effects in candidate genes, genotyping was carried out on three
SNPs from the Fr-R2 locus which were significantly associated with frost tolerance in
cereals (Fricano et al. 2009; Knox et al. 2008; Li et al. 2011a) and which were previously
identified in Li et al. (2011a): SNP6 in ScCbf12 (Genbank accession
HQ730767:g.[84G>C]), SNP5 in ScCbf14 (Genbank accession HQ730768:g.[425A>C])
and SNP2 in ScCbf15 (Genbank accession HQ730769:g.[313A>G]). Genotypic data on
the SNPs in ScCbf12 and ScCbf14 were assessed by KASP marker assays. The SNP in
ScCbf15 was analyzed by pyrosequencing. SNP genotyping was performed by KWS
Lochow GmbH.
Adjusted means from individual environments and from the combined analysis across
environments from the 65 F4 lines and the inbred line Lo152 were used as input data. A
linear model was applied including the SNP of interest and the population as fixed effects.
Significance of SNP effects was determined by a two-sided t-test. The analysis was
carried out using the software R (R Development Core Team 2013).
2.5 Analysis of population structure in European elite lines and genetic
resources
PCoA was performed for the seven rye chromosomes based on SNPs mapped in the
Lo7 × Lo225 genetic map (Bauer et al. 2017) and using the 38 and 46 elite lines from the
seed and pollen parent pool and the 38 genetic resources which were described above.
Chromosomes which showed a clear structure in the PCoA plots were subdivided into
eight parts of similar length (cM). PCoA was repeated based on the SNPs mapped in each
of the eight parts. From the eight parts, the part in which the population structure observed
on the whole-chromosome level was preserved was selected for further analysis.
Subdivision of the selected genomic region and PCoA were repeated as long as the
observed population structure on the chromosome-level was preserved in one of the
selected parts. For individual chromosomes of interest, FST was calculated using all
mapped SNPs and the same marker datasets as for PCoA with the software PLINK
version 1.9 (Chang et al. 2015).
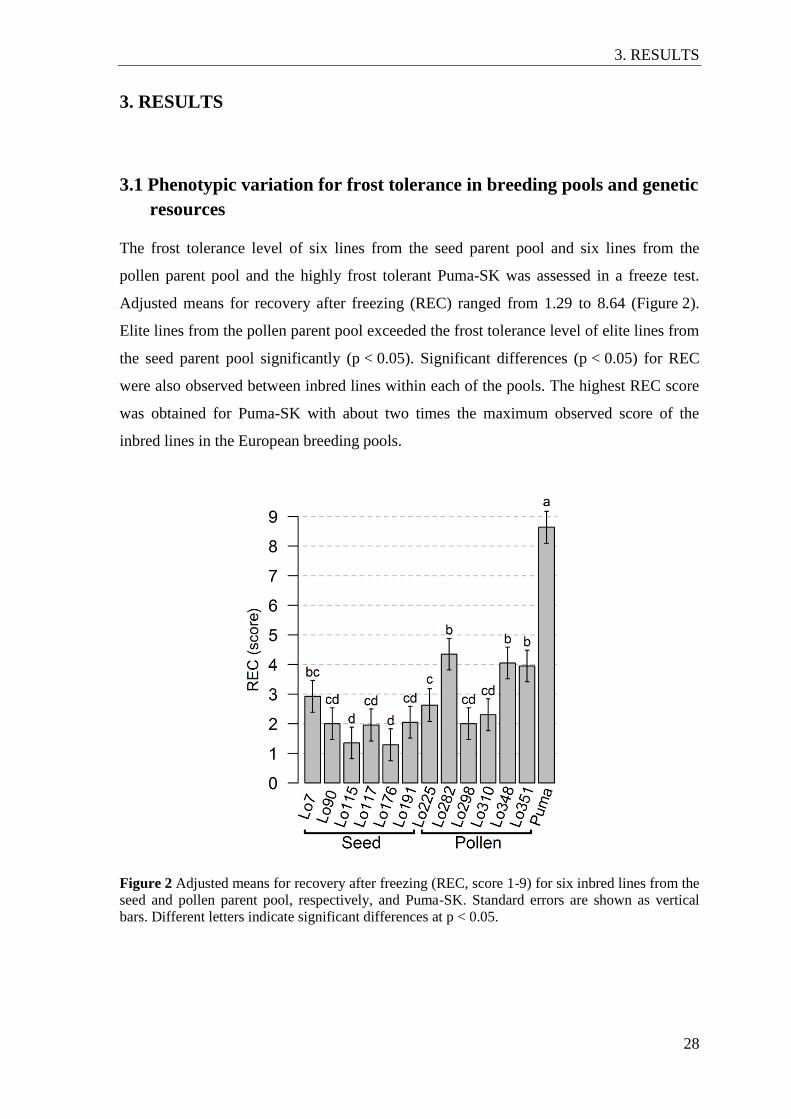
3. RESULTS
28
3. RESULTS
3.1 Phenotypic variation for frost tolerance in breeding pools and genetic
resources
The frost tolerance level of six lines from the seed parent pool and six lines from the
pollen parent pool and the highly frost tolerant Puma-SK was assessed in a freeze test.
Adjusted means for recovery after freezing (REC) ranged from 1.29 to 8.64 (Figure 2).
Elite lines from the pollen parent pool exceeded the frost tolerance level of elite lines from
the seed parent pool significantly (p < 0.05). Significant differences (p < 0.05) for REC
were also observed between inbred lines within each of the pools. The highest REC score
was obtained for Puma-SK with about two times the maximum observed score of the
inbred lines in the European breeding pools.
Figure 2 Adjusted means for recovery after freezing (REC, score 1-9) for six inbred lines from the
seed and pollen parent pool, respectively, and Puma-SK. Standard errors are shown as vertical
bars. Different letters indicate significant differences at p < 0.05.
3. RESULTS
29
3.2 Analysis of frost tolerance in the Lo157 × Puma-SK population
3.2.1 Analysis of frost response
F4 and F5 generations of the Lo157 Puma-SK mapping population were phenotyped for
frost tolerance during three years in two phenotyping platforms, a controlled freeze test
and field trials in Russia and Canada (Table A2). In the freeze test, the REC progeny mean
of lines per se was not significantly different from the parental mean (Table 1). Testcross
performance for REC significantly (p < 0.05) exceeded line per se performance in
combined analyses across environments (Table 1) and in individual environments
(Table A7). The only exception was in the winter 2011/2012 where testcrosses were tested
at 2°C lower temperatures than lines per se. The genotypic variance component for REC
was highly significant (p < 0.01) for lines per se and testcrosses in the combined analysis
across environments and in single environments. The heritability for REC of the lines per
se and testcrosses was 0.79 and 0.87, respectively. Phenotypic and genotypic correlations
between line per se and testcross performance for REC were strong and highly significant
(p < 0.01) with 0.86 and 0.98, respectively.
In the field trials, long frost periods occurred in all environments with minimum air
temperatures of -10 to -38°C (Figure A3). Testcross performance for DAW and SAW
significantly (p < 0.05) exceeded line per se performance in combined analyses across
environments (Table 1) and in single environments, except in Lipezk in 2011/2012
(Table A7). In the combined analysis across environments, the genotypic variance
components for DAW and SAW were significant (p < 0.05) except for DAW in the
testcrosses (Table 1). For DAW and SAW, the variance components for genotype
environment interaction greatly exceeded the magnitude of the genotypic variance
components in lines per se and testcrosses. Heritability estimates for DAW and SAW
were 0.38 and 0.49 for lines per se and 0.15 and 0.26 for testcrosses, respectively
(Table 1). The phenotypic correlation between line per se and testcross performance was
significant (p < 0.01) for DAW (rp = 0.26) but not for SAW (rp = 0.03). Genotypic
correlations were not significant. Phenotypic correlations between the traits DAW and
SAW assessed in the field trials and REC assessed in the freeze tests were highly
significant (p < 0.01) and ranged between 0.31 and 0.50 for lines per se and testcrosses
(Figure 3).
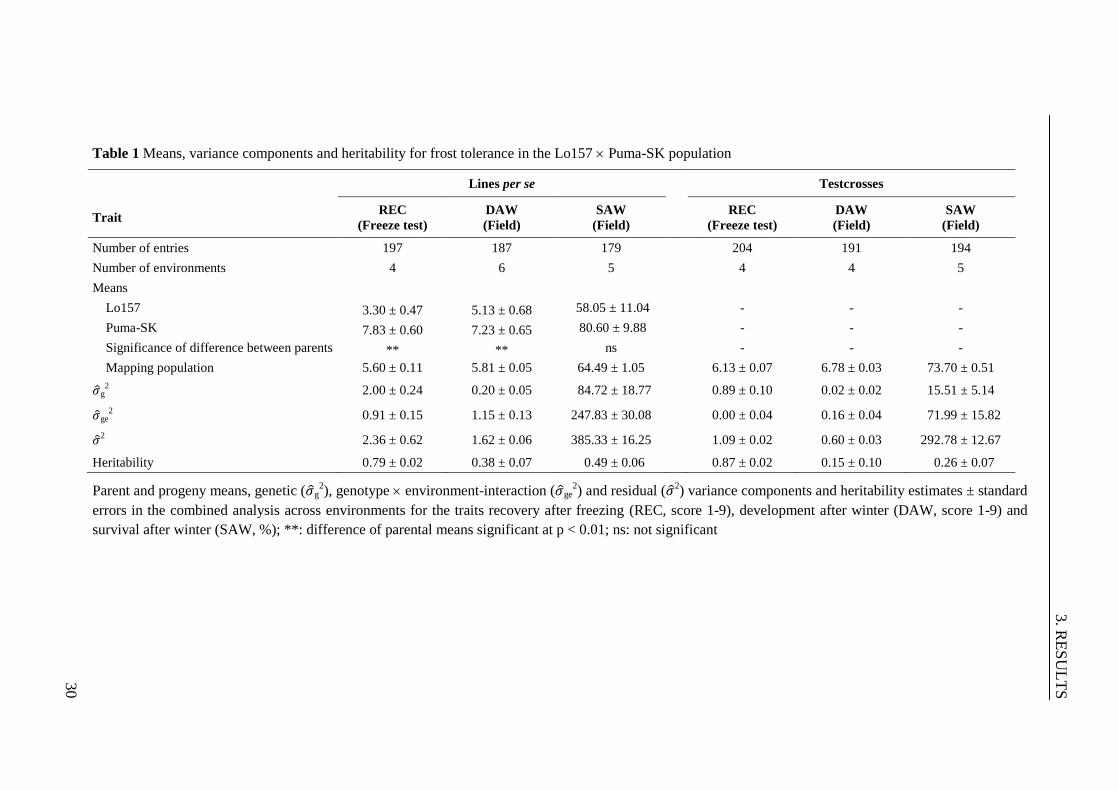
3. R
ES
UL
TS
30
Table 1 Means, variance components and heritability for frost tolerance in the Lo157 Puma-SK population
Lines per se Testcrosses
Trait REC
(Freeze test)
DAW
(Field)
SAW
(Field)
REC
(Freeze test)
DAW
(Field)
SAW
(Field)
Number of entries 197 187 179
204 191 194
Number of environments 4 6 5
4 4 5
Means
Lo157 3.30 ± 0.47 5.13 ± 0.68 58.05 ± 11.04
- - -
Puma-SK 7.83 ± 0.60 7.23 ± 0.65 80.60 ± 9.88
- - -
Significance of difference between parents ** ** ns
- - -
Mapping population 5.60 ± 0.11 5.81 ± 0.05 64.49 ± 1.05
6.13 ± 0.07 6.78 ± 0.03 73.70 ± 0.51
g2 2.00 ± 0.24 0.20 ± 0.05 84.72 ± 18.77
0.89 ± 0.10 0.02 ± 0.02 15.51 ± 5.14
ge2 0.91 ± 0.15 1.15 ± 0.13 247.83 ± 30.08 0.00 ± 0.04 0.16 ± 0.04 71.99 ± 15.82
2 2.36 ± 0.62 1.62 ± 0.06 385.33 ± 16.25 1.09 ± 0.02 0.60 ± 0.03 292.78 ± 12.67
Heritability 0.79 ± 0.02 0.38 ± 0.07 0.49 ± 0.06
0.87 ± 0.02 0.15 ± 0.10 0.26 ± 0.07
Parent and progeny means, genetic ( g2), genotype environment-interaction ( ge
2) and residual ( 2
) variance components and heritability estimates ± standard
errors in the combined analysis across environments for the traits recovery after freezing (REC, score 1-9), development after winter (DAW, score 1-9) and
survival after winter (SAW, %); **: difference of parental means significant at p < 0.01; ns: not significant
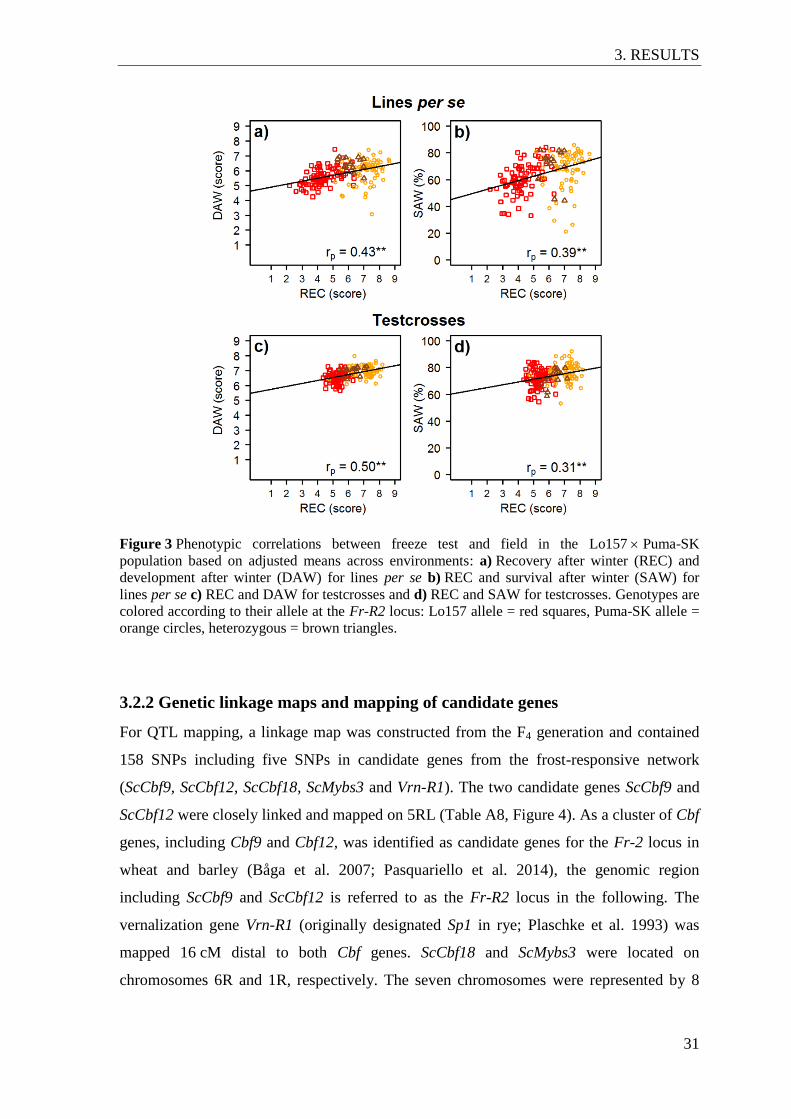
3. RESULTS
31
Figure 3 Phenotypic correlations between freeze test and field in the Lo157 Puma-SK
population based on adjusted means across environments: a) Recovery after winter (REC) and
development after winter (DAW) for lines per se b) REC and survival after winter (SAW) for
lines per se c) REC and DAW for testcrosses and d) REC and SAW for testcrosses. Genotypes are
colored according to their allele at the Fr-R2 locus: Lo157 allele = red squares, Puma-SK allele =
orange circles, heterozygous = brown triangles.
3.2.2 Genetic linkage maps and mapping of candidate genes
For QTL mapping, a linkage map was constructed from the F4 generation and contained
158 SNPs including five SNPs in candidate genes from the frost-responsive network
(ScCbf9, ScCbf12, ScCbf18, ScMybs3 and Vrn-R1). The two candidate genes ScCbf9 and
ScCbf12 were closely linked and mapped on 5RL (Table A8, Figure 4). As a cluster of Cbf
genes, including Cbf9 and Cbf12, was identified as candidate genes for the Fr-2 locus in
wheat and barley (Båga et al. 2007; Pasquariello et al. 2014), the genomic region
including ScCbf9 and ScCbf12 is referred to as the Fr-R2 locus in the following. The
vernalization gene Vrn-R1 (originally designated Sp1 in rye; Plaschke et al. 1993) was
mapped 16 cM distal to both Cbf genes. ScCbf18 and ScMybs3 were located on
chromosomes 6R and 1R, respectively. The seven chromosomes were represented by 8
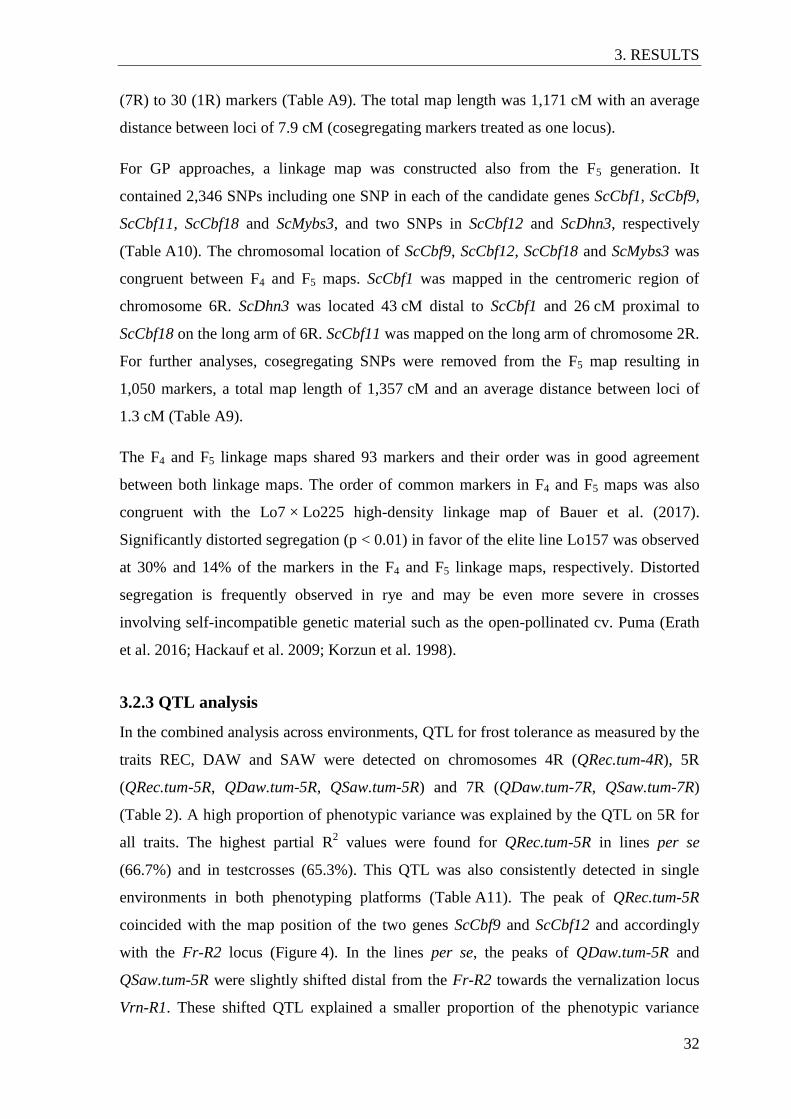
3. RESULTS
32
(7R) to 30 (1R) markers (Table A9). The total map length was 1,171 cM with an average
distance between loci of 7.9 cM (cosegregating markers treated as one locus).
For GP approaches, a linkage map was constructed also from the F5 generation. It
contained 2,346 SNPs including one SNP in each of the candidate genes ScCbf1, ScCbf9,
ScCbf11, ScCbf18 and ScMybs3, and two SNPs in ScCbf12 and ScDhn3, respectively
(Table A10). The chromosomal location of ScCbf9, ScCbf12, ScCbf18 and ScMybs3 was
congruent between F4 and F5 maps. ScCbf1 was mapped in the centromeric region of
chromosome 6R. ScDhn3 was located 43 cM distal to ScCbf1 and 26 cM proximal to
ScCbf18 on the long arm of 6R. ScCbf11 was mapped on the long arm of chromosome 2R.
For further analyses, cosegregating SNPs were removed from the F5 map resulting in
1,050 markers, a total map length of 1,357 cM and an average distance between loci of
1.3 cM (Table A9).
The F4 and F5 linkage maps shared 93 markers and their order was in good agreement
between both linkage maps. The order of common markers in F4 and F5 maps was also
congruent with the Lo7 × Lo225 high-density linkage map of Bauer et al. (2017).
Significantly distorted segregation (p < 0.01) in favor of the elite line Lo157 was observed
at 30% and 14% of the markers in the F4 and F5 linkage maps, respectively. Distorted
segregation is frequently observed in rye and may be even more severe in crosses
involving self-incompatible genetic material such as the open-pollinated cv. Puma (Erath
et al. 2016; Hackauf et al. 2009; Korzun et al. 1998).
3.2.3 QTL analysis
In the combined analysis across environments, QTL for frost tolerance as measured by the
traits REC, DAW and SAW were detected on chromosomes 4R (QRec.tum-4R), 5R
(QRec.tum-5R, QDaw.tum-5R, QSaw.tum-5R) and 7R (QDaw.tum-7R, QSaw.tum-7R)
(Table 2). A high proportion of phenotypic variance was explained by the QTL on 5R for
all traits. The highest partial R2 values were found for QRec.tum-5R in lines per se
(66.7%) and in testcrosses (65.3%). This QTL was also consistently detected in single
environments in both phenotyping platforms (Table A11). The peak of QRec.tum-5R
coincided with the map position of the two genes ScCbf9 and ScCbf12 and accordingly
with the Fr-R2 locus (Figure 4). In the lines per se, the peaks of QDaw.tum-5R and
QSaw.tum-5R were slightly shifted distal from the Fr-R2 towards the vernalization locus
Vrn-R1. These shifted QTL explained a smaller proportion of the phenotypic variance
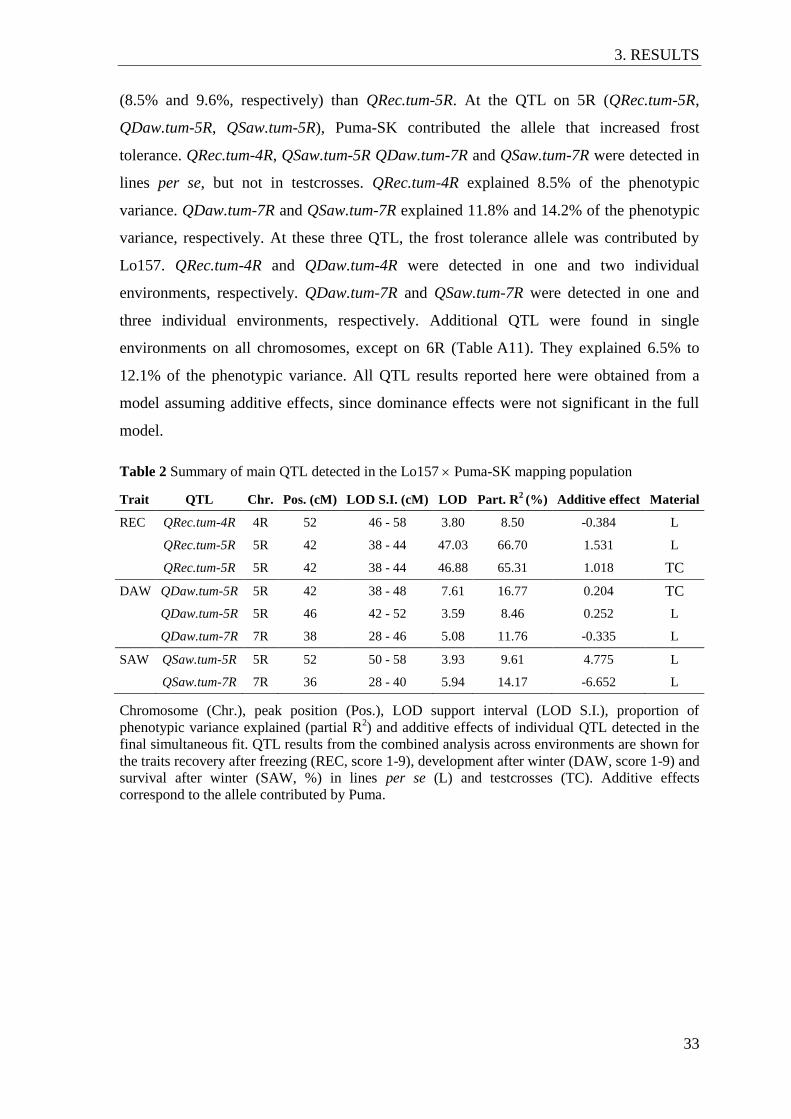
3. RESULTS
33
(8.5% and 9.6%, respectively) than QRec.tum-5R. At the QTL on 5R (QRec.tum-5R,
QDaw.tum-5R, QSaw.tum-5R), Puma-SK contributed the allele that increased frost
tolerance. QRec.tum-4R, QSaw.tum-5R QDaw.tum-7R and QSaw.tum-7R were detected in
lines per se, but not in testcrosses. QRec.tum-4R explained 8.5% of the phenotypic
variance. QDaw.tum-7R and QSaw.tum-7R explained 11.8% and 14.2% of the phenotypic
variance, respectively. At these three QTL, the frost tolerance allele was contributed by
Lo157. QRec.tum-4R and QDaw.tum-4R were detected in one and two individual
environments, respectively. QDaw.tum-7R and QSaw.tum-7R were detected in one and
three individual environments, respectively. Additional QTL were found in single
environments on all chromosomes, except on 6R (Table A11). They explained 6.5% to
12.1% of the phenotypic variance. All QTL results reported here were obtained from a
model assuming additive effects, since dominance effects were not significant in the full
model.
Table 2 Summary of main QTL detected in the Lo157 Puma-SK mapping population
Trait QTL Chr. Pos. (cM) LOD S.I. (cM) LOD Part. R2 (%) Additive effect Material
REC QRec.tum-4R 4R 52 46 - 58 3.80 8.50 -0.384 L
QRec.tum-5R 5R 42 38 - 44 47.03 66.70 1.531 L
QRec.tum-5R 5R 42 38 - 44 46.88 65.31 1.018 TC
DAW QDaw.tum-5R 5R 42 38 - 48 7.61 16.77 0.204 TC
QDaw.tum-5R 5R 46 42 - 52 3.59 8.46 0.252 L
QDaw.tum-7R 7R 38 28 - 46 5.08 11.76 -0.335 L
SAW QSaw.tum-5R 5R 52 50 - 58 3.93 9.61 4.775 L
QSaw.tum-7R 7R 36 28 - 40 5.94 14.17 -6.652 L
Chromosome (Chr.), peak position (Pos.), LOD support interval (LOD S.I.), proportion of
phenotypic variance explained (partial R2) and additive effects of individual QTL detected in the
final simultaneous fit. QTL results from the combined analysis across environments are shown for
the traits recovery after freezing (REC, score 1-9), development after winter (DAW, score 1-9) and
survival after winter (SAW, %) in lines per se (L) and testcrosses (TC). Additive effects
correspond to the allele contributed by Puma.
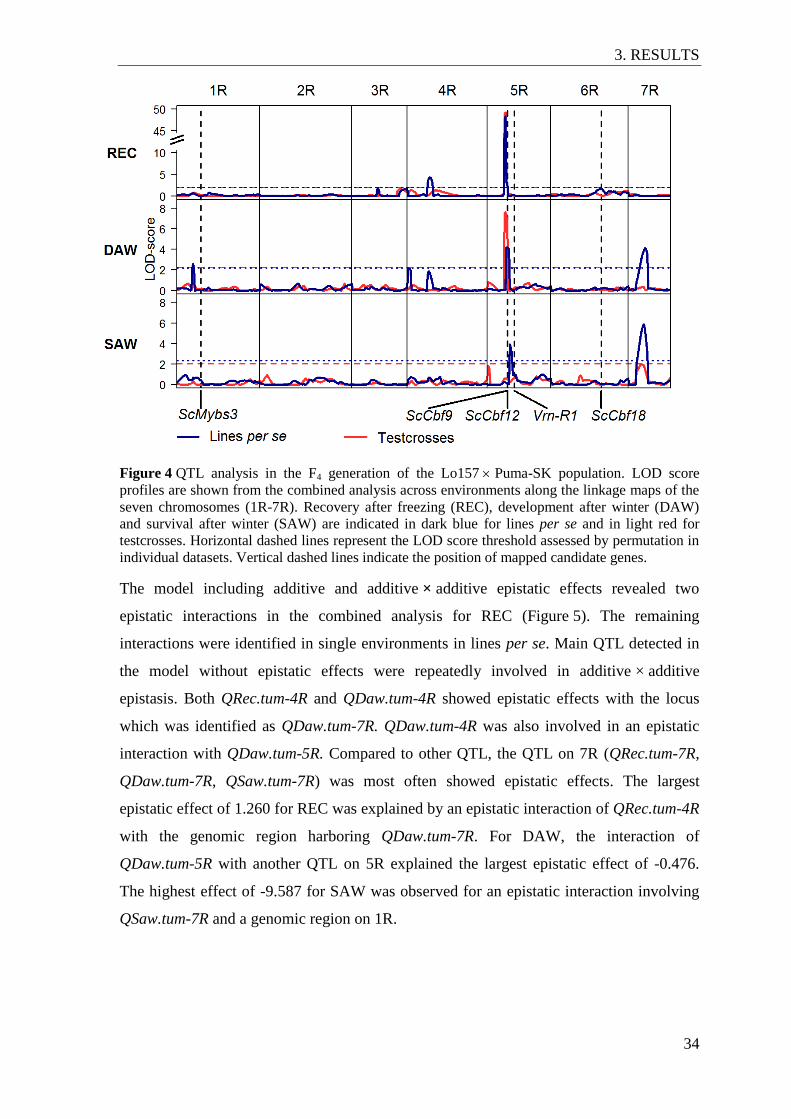
3. RESULTS
34
Figure 4 QTL analysis in the F4 generation of the Lo157 Puma-SK population. LOD score
profiles are shown from the combined analysis across environments along the linkage maps of the
seven chromosomes (1R-7R). Recovery after freezing (REC), development after winter (DAW)
and survival after winter (SAW) are indicated in dark blue for lines per se and in light red for
testcrosses. Horizontal dashed lines represent the LOD score threshold assessed by permutation in
individual datasets. Vertical dashed lines indicate the position of mapped candidate genes.
The model including additive and additive × additive epistatic effects revealed two
epistatic interactions in the combined analysis for REC (Figure 5). The remaining
interactions were identified in single environments in lines per se. Main QTL detected in
the model without epistatic effects were repeatedly involved in additive × additive
epistasis. Both QRec.tum-4R and QDaw.tum-4R showed epistatic effects with the locus
which was identified as QDaw.tum-7R. QDaw.tum-4R was also involved in an epistatic
interaction with QDaw.tum-5R. Compared to other QTL, the QTL on 7R (QRec.tum-7R,
QDaw.tum-7R, QSaw.tum-7R) was most often showed epistatic effects. The largest
epistatic effect of 1.260 for REC was explained by an epistatic interaction of QRec.tum-4R
with the genomic region harboring QDaw.tum-7R. For DAW, the interaction of
QDaw.tum-5R with another QTL on 5R explained the largest epistatic effect of -0.476.
The highest effect of -9.587 for SAW was observed for an epistatic interaction involving
QSaw.tum-7R and a genomic region on 1R.
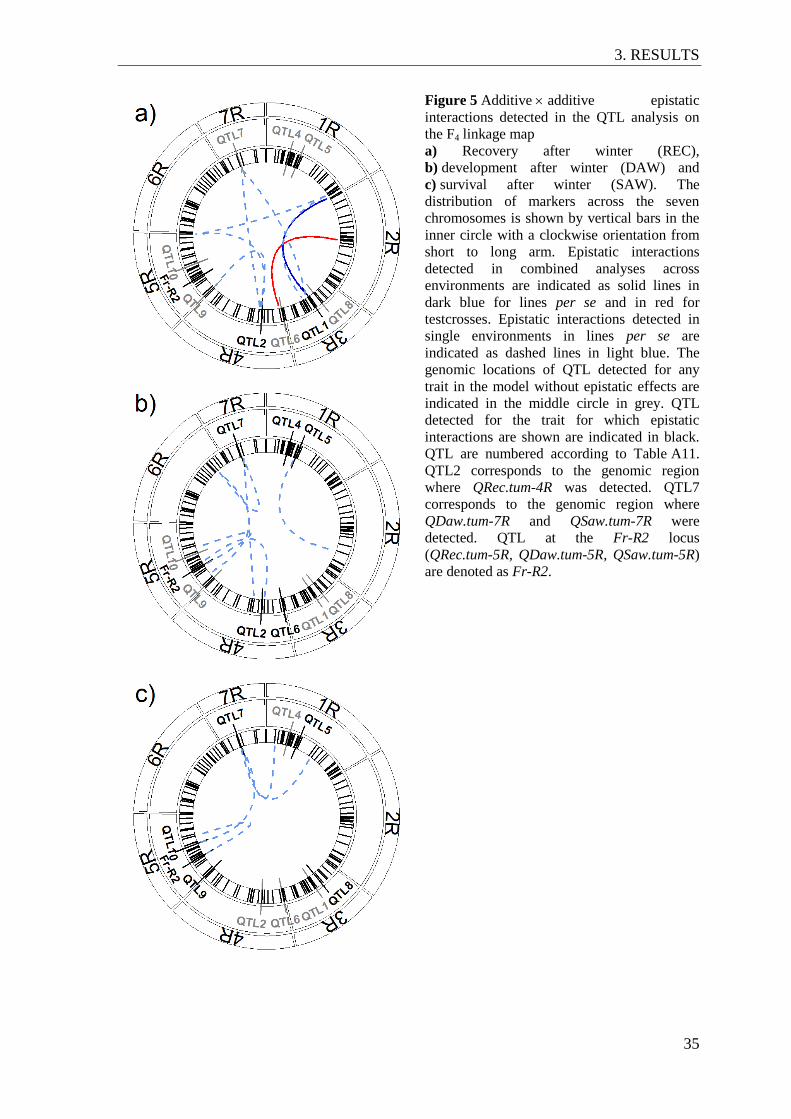
3. RESULTS
35
Figure 5 Additive additive epistatic
interactions detected in the QTL analysis on
the F4 linkage map
a) Recovery after winter (REC),
b) development after winter (DAW) and
c) survival after winter (SAW). The
distribution of markers across the seven
chromosomes is shown by vertical bars in the
inner circle with a clockwise orientation from
short to long arm. Epistatic interactions
detected in combined analyses across
environments are indicated as solid lines in
dark blue for lines per se and in red for
testcrosses. Epistatic interactions detected in
single environments in lines per se are
indicated as dashed lines in light blue. The
genomic locations of QTL detected for any
trait in the model without epistatic effects are
indicated in the middle circle in grey. QTL
detected for the trait for which epistatic
interactions are shown are indicated in black.
QTL are numbered according to Table A11.
QTL2 corresponds to the genomic region
where QRec.tum-4R was detected. QTL7
corresponds to the genomic region where
QDaw.tum-7R and QSaw.tum-7R were
detected. QTL at the Fr-R2 locus
(QRec.tum-5R, QDaw.tum-5R, QSaw.tum-5R)
are denoted as Fr-R2.
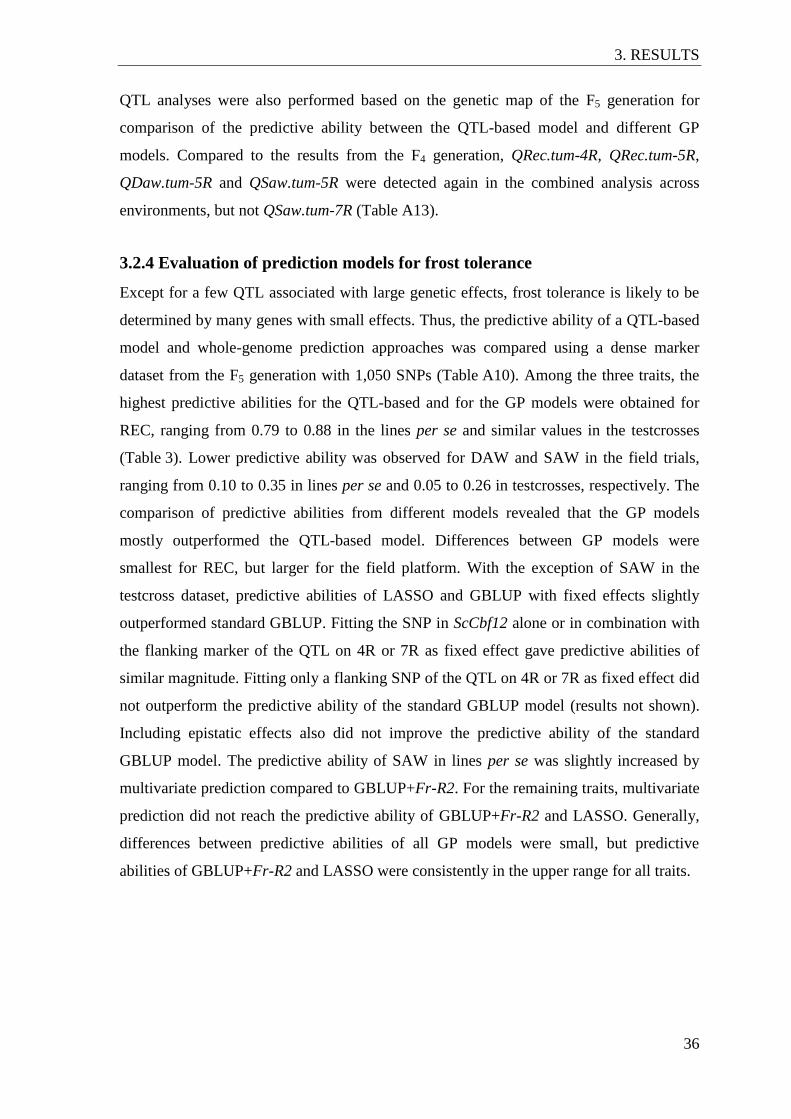
3. RESULTS
36
QTL analyses were also performed based on the genetic map of the F5 generation for
comparison of the predictive ability between the QTL-based model and different GP
models. Compared to the results from the F4 generation, QRec.tum-4R, QRec.tum-5R,
QDaw.tum-5R and QSaw.tum-5R were detected again in the combined analysis across
environments, but not QSaw.tum-7R (Table A13).
3.2.4 Evaluation of prediction models for frost tolerance
Except for a few QTL associated with large genetic effects, frost tolerance is likely to be
determined by many genes with small effects. Thus, the predictive ability of a QTL-based
model and whole-genome prediction approaches was compared using a dense marker
dataset from the F5 generation with 1,050 SNPs (Table A10). Among the three traits, the
highest predictive abilities for the QTL-based and for the GP models were obtained for
REC, ranging from 0.79 to 0.88 in the lines per se and similar values in the testcrosses
(Table 3). Lower predictive ability was observed for DAW and SAW in the field trials,
ranging from 0.10 to 0.35 in lines per se and 0.05 to 0.26 in testcrosses, respectively. The
comparison of predictive abilities from different models revealed that the GP models
mostly outperformed the QTL-based model. Differences between GP models were
smallest for REC, but larger for the field platform. With the exception of SAW in the
testcross dataset, predictive abilities of LASSO and GBLUP with fixed effects slightly
outperformed standard GBLUP. Fitting the SNP in ScCbf12 alone or in combination with
the flanking marker of the QTL on 4R or 7R as fixed effect gave predictive abilities of
similar magnitude. Fitting only a flanking SNP of the QTL on 4R or 7R as fixed effect did
not outperform the predictive ability of the standard GBLUP model (results not shown).
Including epistatic effects also did not improve the predictive ability of the standard
GBLUP model. The predictive ability of SAW in lines per se was slightly increased by
multivariate prediction compared to GBLUP+Fr-R2. For the remaining traits, multivariate
prediction did not reach the predictive ability of GBLUP+Fr-R2 and LASSO. Generally,
differences between predictive abilities of all GP models were small, but predictive
abilities of GBLUP+Fr-R2 and LASSO were consistently in the upper range for all traits.
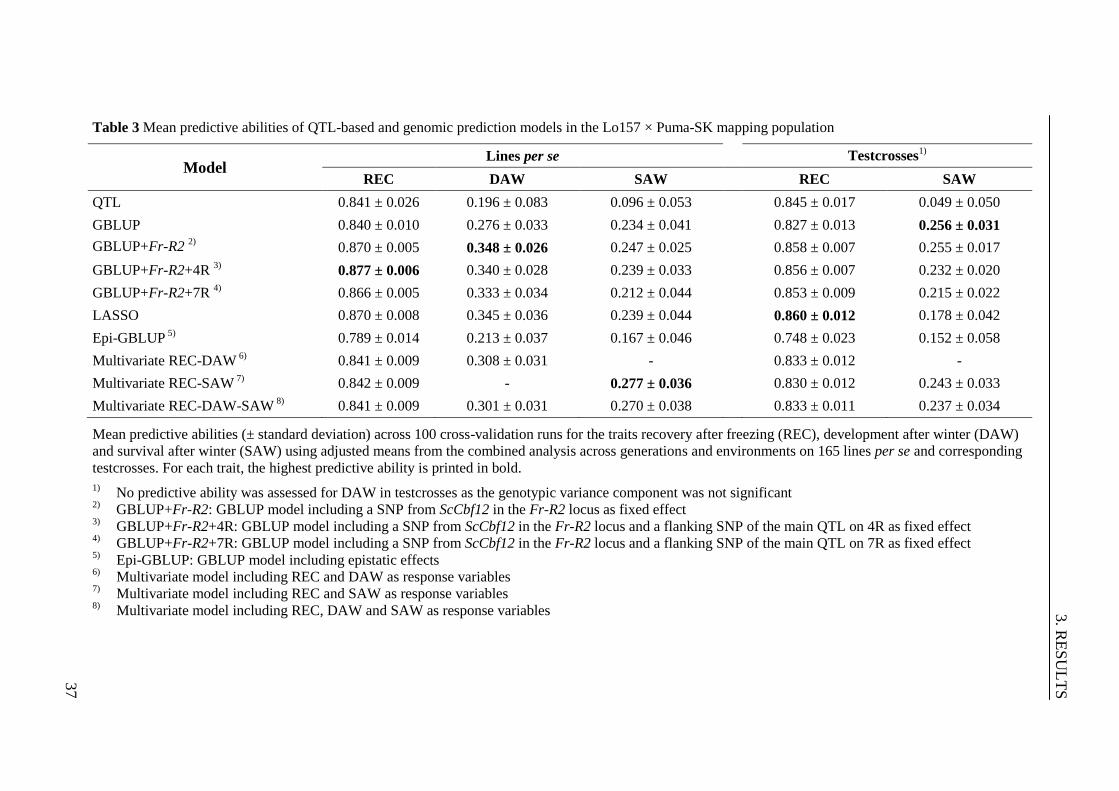
3. R
ES
UL
TS
37
Table 3 Mean predictive abilities of QTL-based and genomic prediction models in the Lo157 × Puma-SK mapping population
Model Lines per se
Testcrosses
1)
REC DAW SAW
REC SAW
QTL 0.841 ± 0.026 0.196 ± 0.083 0.096 ± 0.053
0.845 ± 0.017 0.049 ± 0.050
GBLUP 0.840 ± 0.010 0.276 ± 0.033 0.234 ± 0.041 0.827 ± 0.013 0.256 ± 0.031
GBLUP+Fr-R2 2)
0.870 ± 0.005 0.348 ± 0.026 0.247 ± 0.025
0.858 ± 0.007 0.255 ± 0.017
GBLUP+Fr-R2+4R 3) 0.877 ± 0.006 0.340 ± 0.028 0.239 ± 0.033 0.856 ± 0.007 0.232 ± 0.020
GBLUP+Fr-R2+7R 4) 0.866 ± 0.005 0.333 ± 0.034 0.212 ± 0.044 0.853 ± 0.009 0.215 ± 0.022
LASSO 0.870 ± 0.008 0.345 ± 0.036 0.239 ± 0.044 0.860 ± 0.012 0.178 ± 0.042
Epi-GBLUP 5) 0.789 ± 0.014 0.213 ± 0.037 0.167 ± 0.046 0.748 ± 0.023 0.152 ± 0.058
Multivariate REC-DAW 6) 0.841 ± 0.009 0.308 ± 0.031 - 0.833 ± 0.012 -
Multivariate REC-SAW 7) 0.842 ± 0.009 - 0.277 ± 0.036 0.830 ± 0.012 0.243 ± 0.033
Multivariate REC-DAW-SAW 8) 0.841 ± 0.009 0.301 ± 0.031 0.270 ± 0.038 0.833 ± 0.011 0.237 ± 0.034
Mean predictive abilities (± standard deviation) across 100 cross-validation runs for the traits recovery after freezing (REC), development after winter (DAW)
and survival after winter (SAW) using adjusted means from the combined analysis across generations and environments on 165 lines per se and corresponding
testcrosses. For each trait, the highest predictive ability is printed in bold.
1) No predictive ability was assessed for DAW in testcrosses as the genotypic variance component was not significant 2) GBLUP+Fr-R2: GBLUP model including a SNP from ScCbf12 in the Fr-R2 locus as fixed effect 3) GBLUP+Fr-R2+4R: GBLUP model including a SNP from ScCbf12 in the Fr-R2 locus and a flanking SNP of the main QTL on 4R as fixed effect
4) GBLUP+Fr-R2+7R: GBLUP model including a SNP from ScCbf12 in the Fr-R2 locus and a flanking SNP of the main QTL on 7R as fixed effect
5) Epi-GBLUP: GBLUP model including epistatic effects
6) Multivariate model including REC and DAW as response variables
7) Multivariate model including REC and SAW as response variables
8) Multivariate model including REC, DAW and SAW as response variables
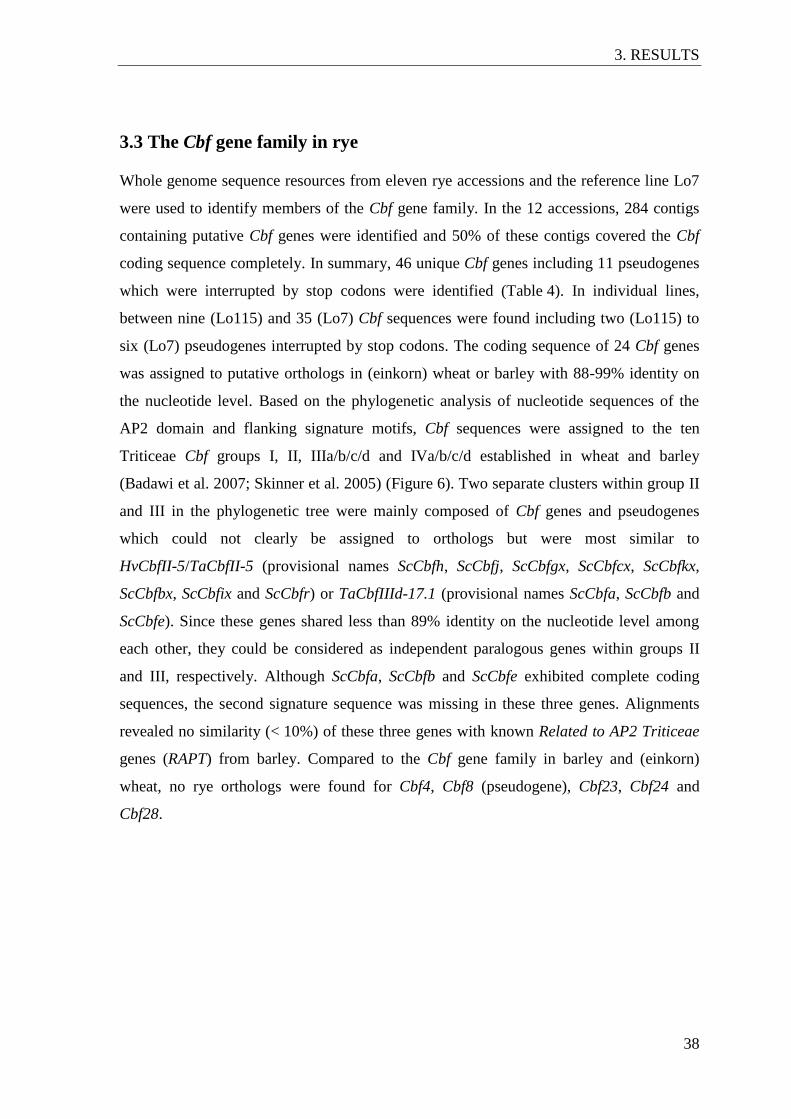
3. RESULTS
38
3.3 The Cbf gene family in rye
Whole genome sequence resources from eleven rye accessions and the reference line Lo7
were used to identify members of the Cbf gene family. In the 12 accessions, 284 contigs
containing putative Cbf genes were identified and 50% of these contigs covered the Cbf
coding sequence completely. In summary, 46 unique Cbf genes including 11 pseudogenes
which were interrupted by stop codons were identified (Table 4). In individual lines,
between nine (Lo115) and 35 (Lo7) Cbf sequences were found including two (Lo115) to
six (Lo7) pseudogenes interrupted by stop codons. The coding sequence of 24 Cbf genes
was assigned to putative orthologs in (einkorn) wheat or barley with 88-99% identity on
the nucleotide level. Based on the phylogenetic analysis of nucleotide sequences of the
AP2 domain and flanking signature motifs, Cbf sequences were assigned to the ten
Triticeae Cbf groups I, II, IIIa/b/c/d and IVa/b/c/d established in wheat and barley
(Badawi et al. 2007; Skinner et al. 2005) (Figure 6). Two separate clusters within group II
and III in the phylogenetic tree were mainly composed of Cbf genes and pseudogenes
which could not clearly be assigned to orthologs but were most similar to
HvCbfII-5/TaCbfII-5 (provisional names ScCbfh, ScCbfj, ScCbfgx, ScCbfcx, ScCbfkx,
ScCbfbx, ScCbfix and ScCbfr) or TaCbfIIId-17.1 (provisional names ScCbfa, ScCbfb and
ScCbfe). Since these genes shared less than 89% identity on the nucleotide level among
each other, they could be considered as independent paralogous genes within groups II
and III, respectively. Although ScCbfa, ScCbfb and ScCbfe exhibited complete coding
sequences, the second signature sequence was missing in these three genes. Alignments
revealed no similarity (< 10%) of these three genes with known Related to AP2 Triticeae
genes (RAPT) from barley. Compared to the Cbf gene family in barley and (einkorn)
wheat, no rye orthologs were found for Cbf4, Cbf8 (pseudogene), Cbf23, Cbf24 and
Cbf28.
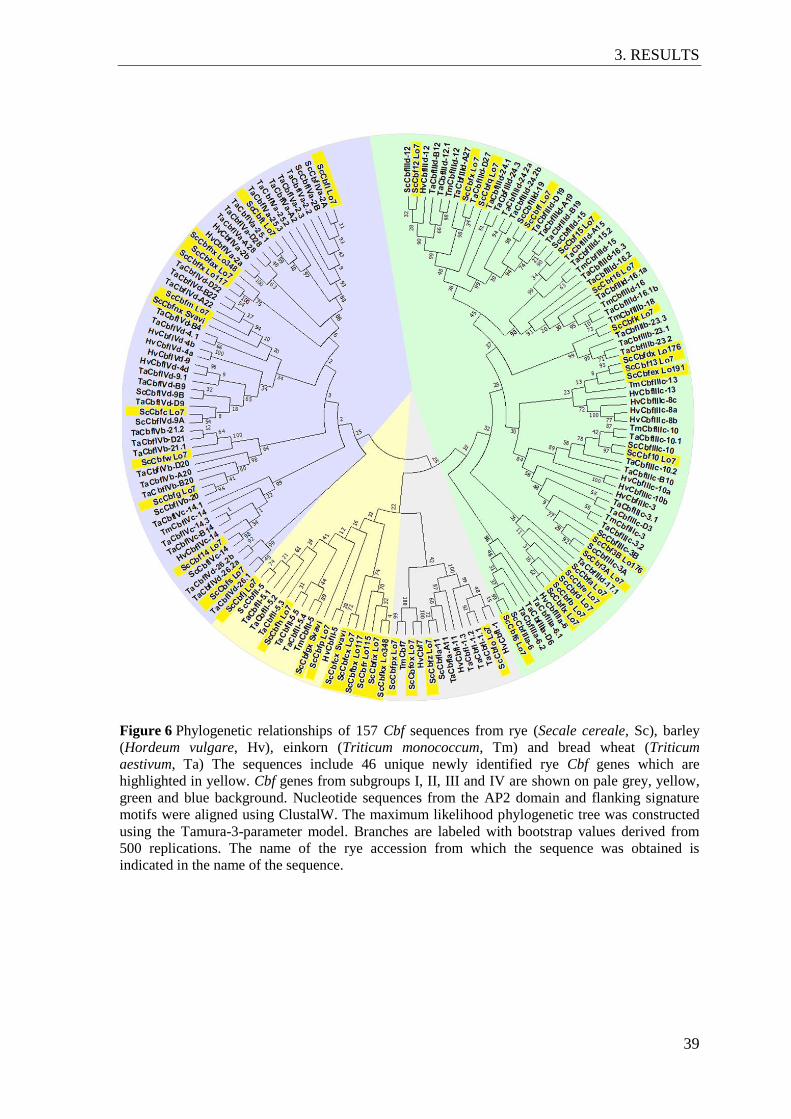
3. RESULTS
39
Figure 6 Phylogenetic relationships of 157 Cbf sequences from rye (Secale cereale, Sc), barley
(Hordeum vulgare, Hv), einkorn (Triticum monococcum, Tm) and bread wheat (Triticum
aestivum, Ta) The sequences include 46 unique newly identified rye Cbf genes which are
highlighted in yellow. Cbf genes from subgroups I, II, III and IV are shown on pale grey, yellow,
green and blue background. Nucleotide sequences from the AP2 domain and flanking signature
motifs were aligned using ClustalW. The maximum likelihood phylogenetic tree was constructed
using the Tamura-3-parameter model. Branches are labeled with bootstrap values derived from
500 replications. The name of the rye accession from which the sequence was obtained is
indicated in the name of the sequence.
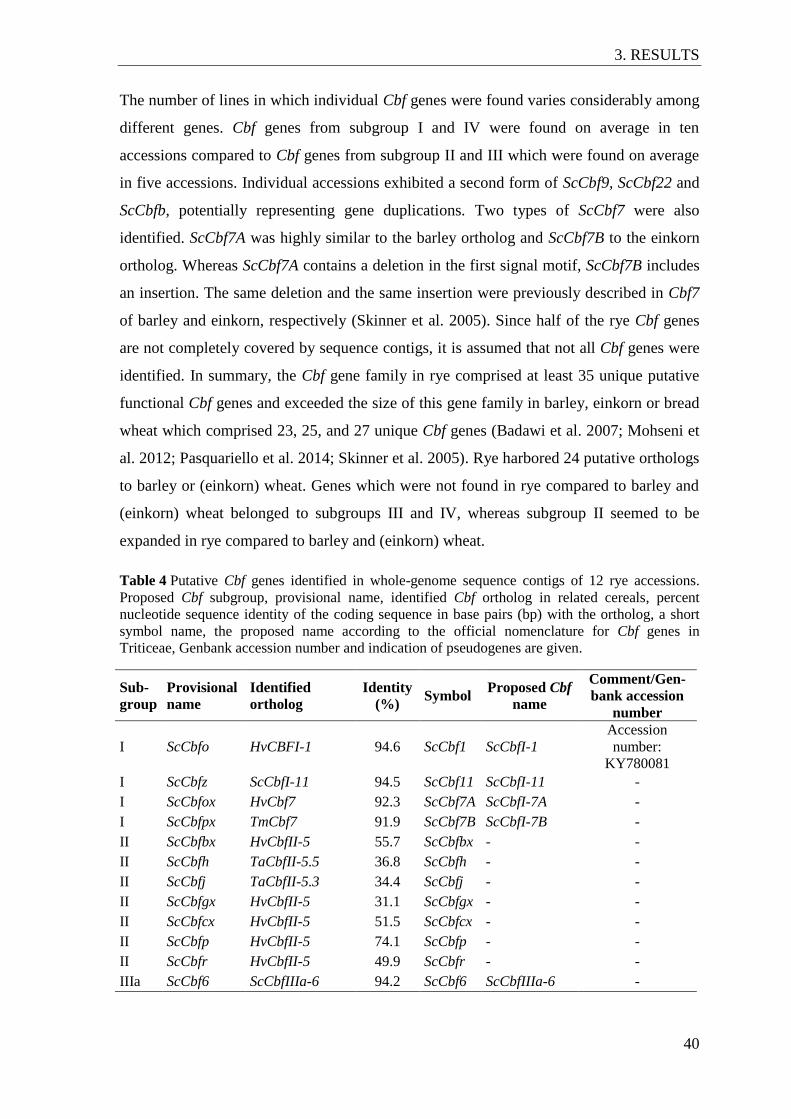
3. RESULTS
40
The number of lines in which individual Cbf genes were found varies considerably among
different genes. Cbf genes from subgroup I and IV were found on average in ten
accessions compared to Cbf genes from subgroup II and III which were found on average
in five accessions. Individual accessions exhibited a second form of ScCbf9, ScCbf22 and
ScCbfb, potentially representing gene duplications. Two types of ScCbf7 were also
identified. ScCbf7A was highly similar to the barley ortholog and ScCbf7B to the einkorn
ortholog. Whereas ScCbf7A contains a deletion in the first signal motif, ScCbf7B includes
an insertion. The same deletion and the same insertion were previously described in Cbf7
of barley and einkorn, respectively (Skinner et al. 2005). Since half of the rye Cbf genes
are not completely covered by sequence contigs, it is assumed that not all Cbf genes were
identified. In summary, the Cbf gene family in rye comprised at least 35 unique putative
functional Cbf genes and exceeded the size of this gene family in barley, einkorn or bread
wheat which comprised 23, 25, and 27 unique Cbf genes (Badawi et al. 2007; Mohseni et
al. 2012; Pasquariello et al. 2014; Skinner et al. 2005). Rye harbored 24 putative orthologs
to barley or (einkorn) wheat. Genes which were not found in rye compared to barley and
(einkorn) wheat belonged to subgroups III and IV, whereas subgroup II seemed to be
expanded in rye compared to barley and (einkorn) wheat.
Table 4 Putative Cbf genes identified in whole-genome sequence contigs of 12 rye accessions. Proposed Cbf subgroup, provisional name, identified Cbf ortholog in related cereals, percent
nucleotide sequence identity of the coding sequence in base pairs (bp) with the ortholog, a short
symbol name, the proposed name according to the official nomenclature for Cbf genes in
Triticeae, Genbank accession number and indication of pseudogenes are given.
Sub-
group Provisional
name Identified
ortholog Identity
(%) Symbol
Proposed Cbf
name
Comment/Gen-
bank accession
number
I ScCbfo HvCBFI-1 94.6 ScCbf1 ScCbfI-1 Accession
number:
KY780081
I ScCbfz ScCbfI-11 94.5 ScCbf11 ScCbfI-11 -
I ScCbfox HvCbf7 92.3 ScCbf7A ScCbfI-7A -
I ScCbfpx TmCbf7 91.9 ScCbf7B ScCbfI-7B -
II ScCbfbx HvCbfII-5 55.7 ScCbfbx - -
II ScCbfh TaCbfII-5.5 36.8 ScCbfh - -
II ScCbfj TaCbfII-5.3 34.4 ScCbfj - -
II ScCbfgx HvCbfII-5 31.1 ScCbfgx - -
II ScCbfcx HvCbfII-5 51.5 ScCbfcx - -
II ScCbfp HvCbfII-5 74.1 ScCbfp - -
II ScCbfr HvCbfII-5 49.9 ScCbfr - -
IIIa ScCbf6 ScCbfIIIa-6 94.2 ScCbf6 ScCbfIIIa-6 -
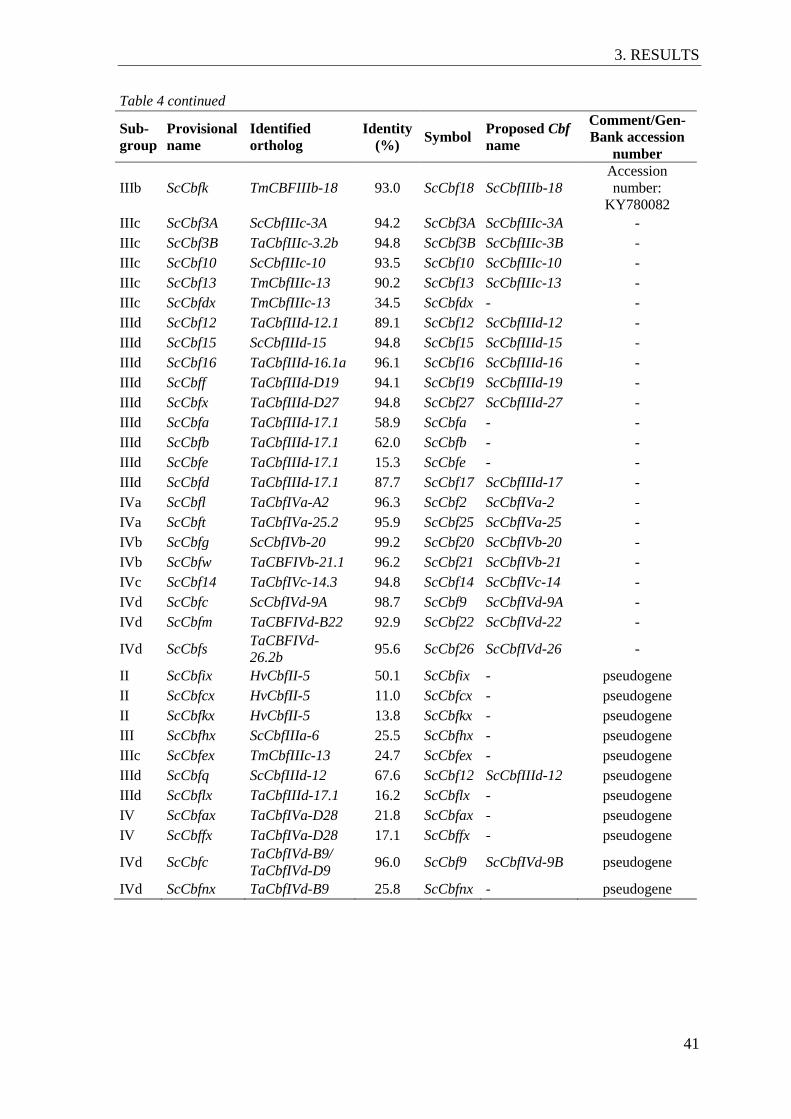
3. RESULTS
41
Table 4 continued
Sub-
group Provisional
name Identified
ortholog Identity
(%) Symbol
Proposed Cbf
name
Comment/Gen-
Bank accession
number
IIIb ScCbfk TmCBFIIIb-18 93.0 ScCbf18 ScCbfIIIb-18 Accession
number:
KY780082
IIIc ScCbf3A ScCbfIIIc-3A 94.2 ScCbf3A ScCbfIIIc-3A -
IIIc ScCbf3B TaCbfIIIc-3.2b 94.8 ScCbf3B ScCbfIIIc-3B -
IIIc ScCbf10 ScCbfIIIc-10 93.5 ScCbf10 ScCbfIIIc-10 -
IIIc ScCbf13 TmCbfIIIc-13 90.2 ScCbf13 ScCbfIIIc-13 -
IIIc ScCbfdx TmCbfIIIc-13 34.5 ScCbfdx - -
IIId ScCbf12 TaCbfIIId-12.1 89.1 ScCbf12 ScCbfIIId-12 -
IIId ScCbf15 ScCbfIIId-15 94.8 ScCbf15 ScCbfIIId-15 -
IIId ScCbf16 TaCbfIIId-16.1a 96.1 ScCbf16 ScCbfIIId-16 -
IIId ScCbff TaCbfIIId-D19 94.1 ScCbf19 ScCbfIIId-19 -
IIId ScCbfx TaCbfIIId-D27 94.8 ScCbf27 ScCbfIIId-27 -
IIId ScCbfa TaCbfIIId-17.1 58.9 ScCbfa - -
IIId ScCbfb TaCbfIIId-17.1 62.0 ScCbfb - -
IIId ScCbfe TaCbfIIId-17.1 15.3 ScCbfe - -
IIId ScCbfd TaCbfIIId-17.1 87.7 ScCbf17 ScCbfIIId-17 -
IVa ScCbfl TaCbfIVa-A2 96.3 ScCbf2 ScCbfIVa-2 -
IVa ScCbft TaCbfIVa-25.2 95.9 ScCbf25 ScCbfIVa-25 -
IVb ScCbfg ScCbfIVb-20 99.2 ScCbf20 ScCbfIVb-20 -
IVb ScCbfw TaCBFIVb-21.1 96.2 ScCbf21 ScCbfIVb-21 -
IVc ScCbf14 TaCbfIVc-14.3 94.8 ScCbf14 ScCbfIVc-14 -
IVd ScCbfc ScCbfIVd-9A 98.7 ScCbf9 ScCbfIVd-9A -
IVd ScCbfm TaCBFIVd-B22 92.9 ScCbf22 ScCbfIVd-22 -
IVd ScCbfs TaCBFIVd-
26.2b 95.6 ScCbf26 ScCbfIVd-26 -
II ScCbfix HvCbfII-5 50.1 ScCbfix - pseudogene
II ScCbfcx HvCbfII-5 11.0 ScCbfcx - pseudogene
II ScCbfkx HvCbfII-5 13.8 ScCbfkx - pseudogene
III ScCbfhx ScCbfIIIa-6 25.5 ScCbfhx - pseudogene
IIIc ScCbfex TmCbfIIIc-13 24.7 ScCbfex - pseudogene
IIId ScCbfq ScCbfIIId-12 67.6 ScCbf12 ScCbfIIId-12 pseudogene
IIId ScCbflx TaCbfIIId-17.1 16.2 ScCbflx - pseudogene
IV ScCbfax TaCbfIVa-D28 21.8 ScCbfax - pseudogene
IV ScCbffx TaCbfIVa-D28 17.1 ScCbffx - pseudogene
IVd ScCbfc TaCbfIVd-B9/
TaCbfIVd-D9 96.0 ScCbf9 ScCbfIVd-9B pseudogene
IVd ScCbfnx TaCbfIVd-B9 25.8 ScCbfnx - pseudogene
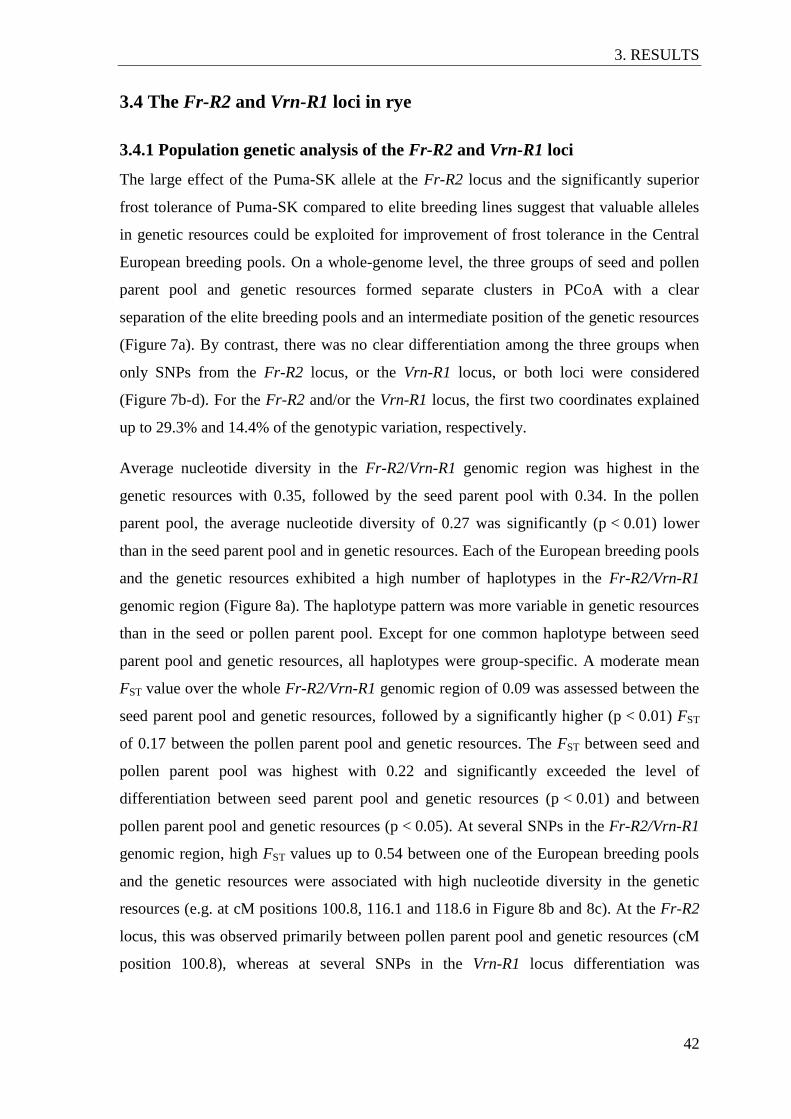
3. RESULTS
42
3.4 The Fr-R2 and Vrn-R1 loci in rye
3.4.1 Population genetic analysis of the Fr-R2 and Vrn-R1 loci
The large effect of the Puma-SK allele at the Fr-R2 locus and the significantly superior
frost tolerance of Puma-SK compared to elite breeding lines suggest that valuable alleles
in genetic resources could be exploited for improvement of frost tolerance in the Central
European breeding pools. On a whole-genome level, the three groups of seed and pollen
parent pool and genetic resources formed separate clusters in PCoA with a clear
separation of the elite breeding pools and an intermediate position of the genetic resources
(Figure 7a). By contrast, there was no clear differentiation among the three groups when
only SNPs from the Fr-R2 locus, or the Vrn-R1 locus, or both loci were considered
(Figure 7b-d). For the Fr-R2 and/or the Vrn-R1 locus, the first two coordinates explained
up to 29.3% and 14.4% of the genotypic variation, respectively.
Average nucleotide diversity in the Fr-R2/Vrn-R1 genomic region was highest in the
genetic resources with 0.35, followed by the seed parent pool with 0.34. In the pollen
parent pool, the average nucleotide diversity of 0.27 was significantly (p < 0.01) lower
than in the seed parent pool and in genetic resources. Each of the European breeding pools
and the genetic resources exhibited a high number of haplotypes in the Fr-R2/Vrn-R1
genomic region (Figure 8a). The haplotype pattern was more variable in genetic resources
than in the seed or pollen parent pool. Except for one common haplotype between seed
parent pool and genetic resources, all haplotypes were group-specific. A moderate mean
FST value over the whole Fr-R2/Vrn-R1 genomic region of 0.09 was assessed between the
seed parent pool and genetic resources, followed by a significantly higher (p < 0.01) FST
of 0.17 between the pollen parent pool and genetic resources. The FST between seed and
pollen parent pool was highest with 0.22 and significantly exceeded the level of
differentiation between seed parent pool and genetic resources (p < 0.01) and between
pollen parent pool and genetic resources (p < 0.05). At several SNPs in the Fr-R2/Vrn-R1
genomic region, high FST values up to 0.54 between one of the European breeding pools
and the genetic resources were associated with high nucleotide diversity in the genetic
resources (e.g. at cM positions 100.8, 116.1 and 118.6 in Figure 8b and 8c). At the Fr-R2
locus, this was observed primarily between pollen parent pool and genetic resources (cM
position 100.8), whereas at several SNPs in the Vrn-R1 locus differentiation was
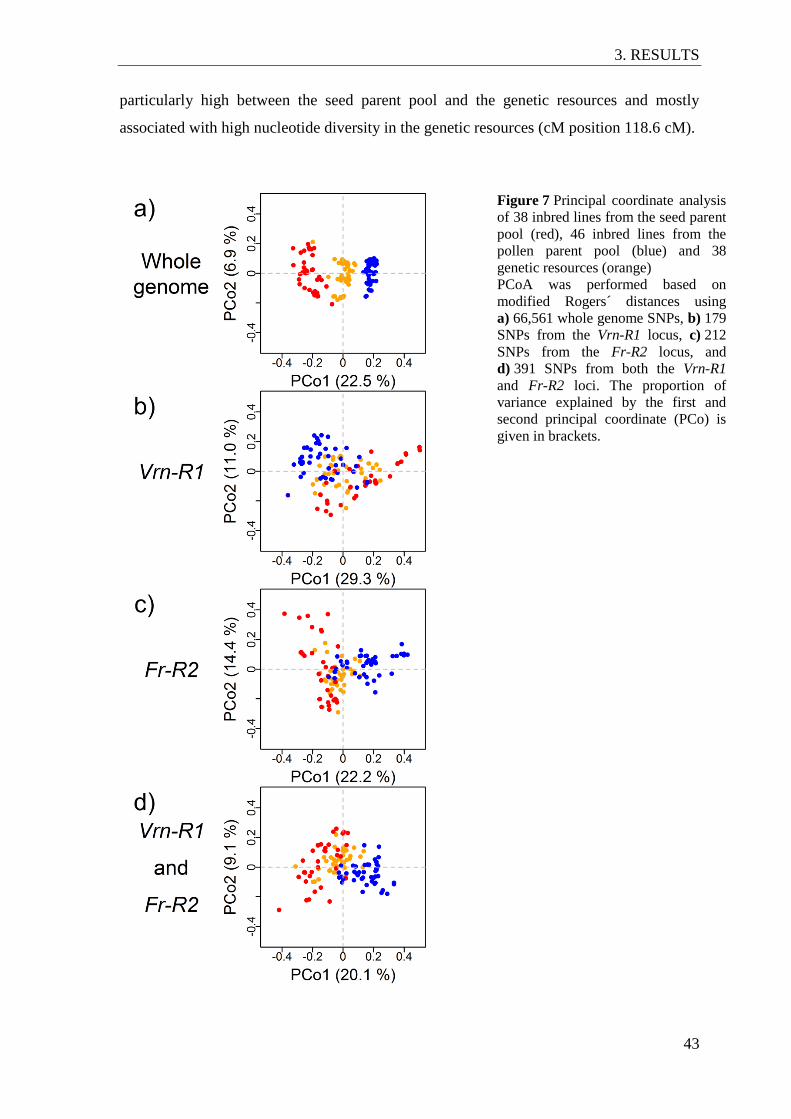
3. RESULTS
43
particularly high between the seed parent pool and the genetic resources and mostly
associated with high nucleotide diversity in the genetic resources (cM position 118.6 cM).
Figure 7 Principal coordinate analysis
of 38 inbred lines from the seed parent
pool (red), 46 inbred lines from the
pollen parent pool (blue) and 38
genetic resources (orange)
PCoA was performed based on
modified Rogers´ distances using
a) 66,561 whole genome SNPs, b) 179
SNPs from the Vrn-R1 locus, c) 212
SNPs from the Fr-R2 locus, and
d) 391 SNPs from both the Vrn-R1
and Fr-R2 loci. The proportion of
variance explained by the first and
second principal coordinate (PCo) is
given in brackets.
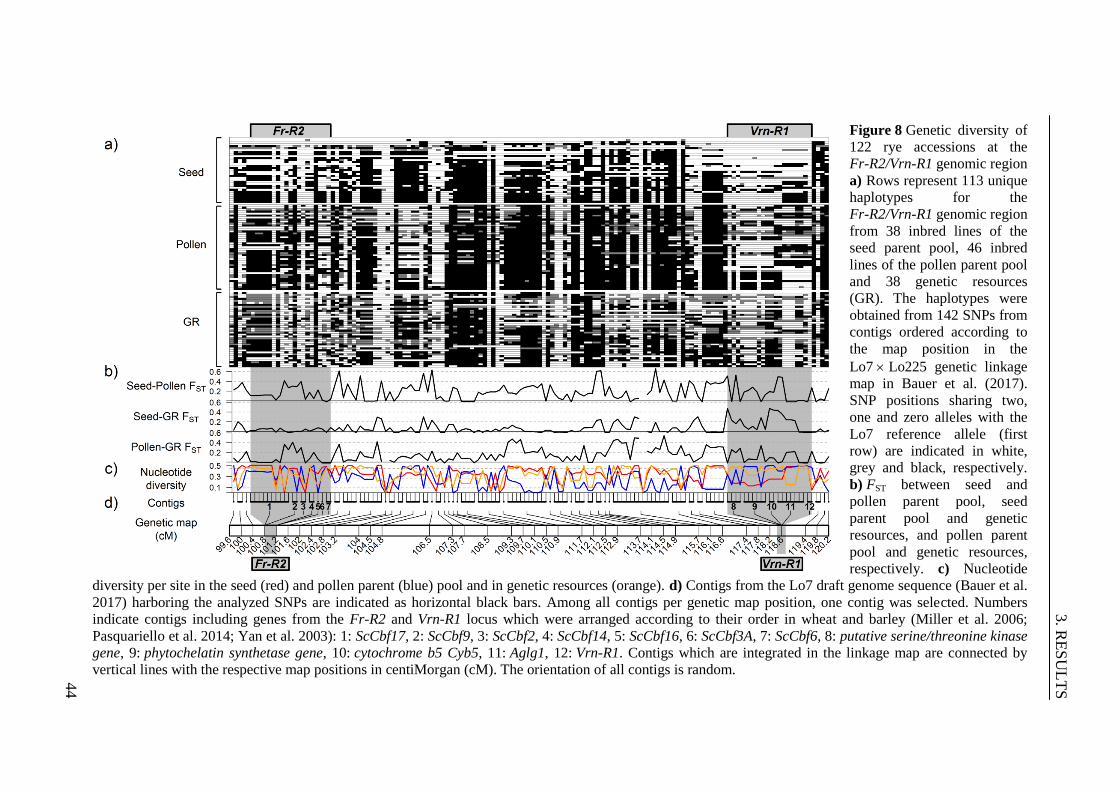
3. R
ES
UL
TS
44
Figure 8 Genetic diversity of
122 rye accessions at the
Fr-R2/Vrn-R1 genomic region
a) Rows represent 113 unique
haplotypes for the
Fr-R2/Vrn-R1 genomic region
from 38 inbred lines of the
seed parent pool, 46 inbred
lines of the pollen parent pool
and 38 genetic resources
(GR). The haplotypes were
obtained from 142 SNPs from
contigs ordered according to
the map position in the
Lo7 Lo225 genetic linkage
map in Bauer et al. (2017).
SNP positions sharing two,
one and zero alleles with the
Lo7 reference allele (first
row) are indicated in white,
grey and black, respectively.
b) FST between seed and
pollen parent pool, seed
parent pool and genetic
resources, and pollen parent
pool and genetic resources,
respectively. c) Nucleotide
diversity per site in the seed (red) and pollen parent (blue) pool and in genetic resources (orange). d) Contigs from the Lo7 draft genome sequence (Bauer et al.
2017) harboring the analyzed SNPs are indicated as horizontal black bars. Among all contigs per genetic map position, one contig was selected. Numbers
indicate contigs including genes from the Fr-R2 and Vrn-R1 locus which were arranged according to their order in wheat and barley (Miller et al. 2006;
Pasquariello et al. 2014; Yan et al. 2003): 1: ScCbf17, 2: ScCbf9, 3: ScCbf2, 4: ScCbf14, 5: ScCbf16, 6: ScCbf3A, 7: ScCbf6, 8: putative serine/threonine kinase
gene, 9: phytochelatin synthetase gene, 10: cytochrome b5 Cyb5, 11: Aglg1, 12: Vrn-R1. Contigs which are integrated in the linkage map are connected by
vertical lines with the respective map positions in centiMorgan (cM). The orientation of all contigs is random.
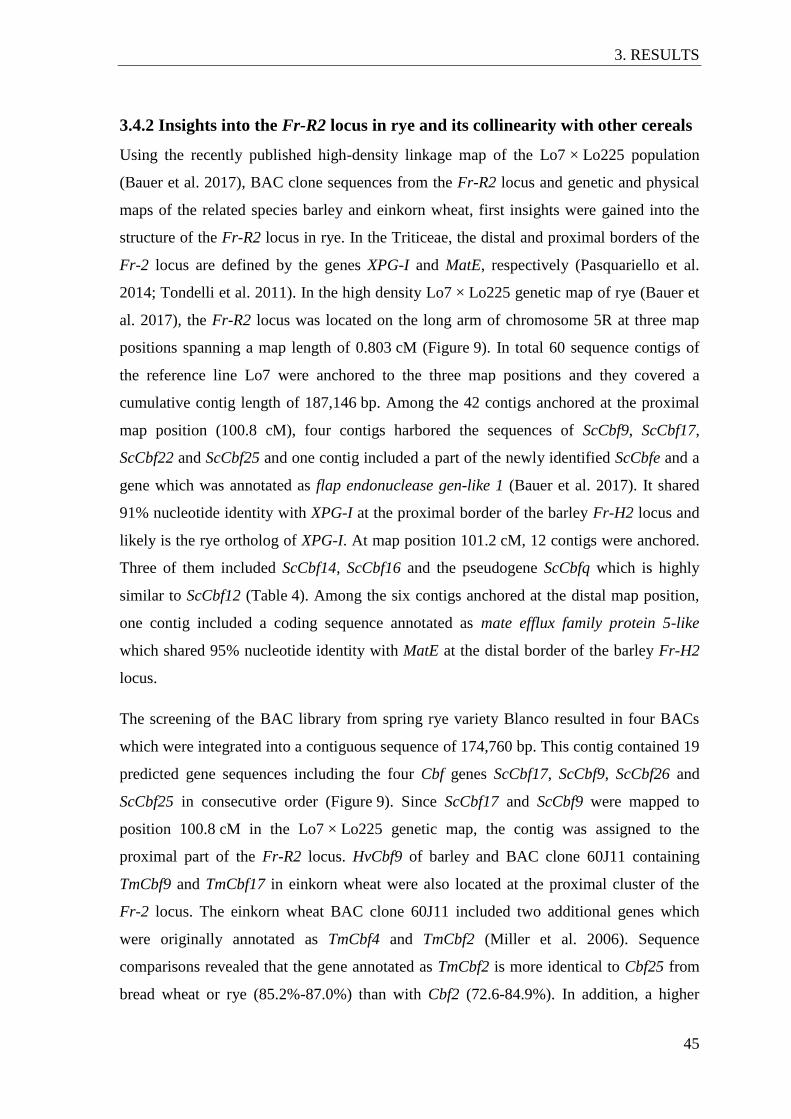
3. RESULTS
45
3.4.2 Insights into the Fr-R2 locus in rye and its collinearity with other cereals
Using the recently published high-density linkage map of the Lo7 × Lo225 population
(Bauer et al. 2017), BAC clone sequences from the Fr-R2 locus and genetic and physical
maps of the related species barley and einkorn wheat, first insights were gained into the
structure of the Fr-R2 locus in rye. In the Triticeae, the distal and proximal borders of the
Fr-2 locus are defined by the genes XPG-I and MatE, respectively (Pasquariello et al.
2014; Tondelli et al. 2011). In the high density Lo7 × Lo225 genetic map of rye (Bauer et
al. 2017), the Fr-R2 locus was located on the long arm of chromosome 5R at three map
positions spanning a map length of 0.803 cM (Figure 9). In total 60 sequence contigs of
the reference line Lo7 were anchored to the three map positions and they covered a
cumulative contig length of 187,146 bp. Among the 42 contigs anchored at the proximal
map position (100.8 cM), four contigs harbored the sequences of ScCbf9, ScCbf17,
ScCbf22 and ScCbf25 and one contig included a part of the newly identified ScCbfe and a
gene which was annotated as flap endonuclease gen-like 1 (Bauer et al. 2017). It shared
91% nucleotide identity with XPG-I at the proximal border of the barley Fr-H2 locus and
likely is the rye ortholog of XPG-I. At map position 101.2 cM, 12 contigs were anchored.
Three of them included ScCbf14, ScCbf16 and the pseudogene ScCbfq which is highly
similar to ScCbf12 (Table 4). Among the six contigs anchored at the distal map position,
one contig included a coding sequence annotated as mate efflux family protein 5-like
which shared 95% nucleotide identity with MatE at the distal border of the barley Fr-H2
locus.
The screening of the BAC library from spring rye variety Blanco resulted in four BACs
which were integrated into a contiguous sequence of 174,760 bp. This contig contained 19
predicted gene sequences including the four Cbf genes ScCbf17, ScCbf9, ScCbf26 and
ScCbf25 in consecutive order (Figure 9). Since ScCbf17 and ScCbf9 were mapped to
position 100.8 cM in the Lo7 × Lo225 genetic map, the contig was assigned to the
proximal part of the Fr-R2 locus. HvCbf9 of barley and BAC clone 60J11 containing
TmCbf9 and TmCbf17 in einkorn wheat were also located at the proximal cluster of the
Fr-2 locus. The einkorn wheat BAC clone 60J11 included two additional genes which
were originally annotated as TmCbf4 and TmCbf2 (Miller et al. 2006). Sequence
comparisons revealed that the gene annotated as TmCbf2 is more identical to Cbf25 from
bread wheat or rye (85.2%-87.0%) than with Cbf2 (72.6-84.9%). In addition, a higher
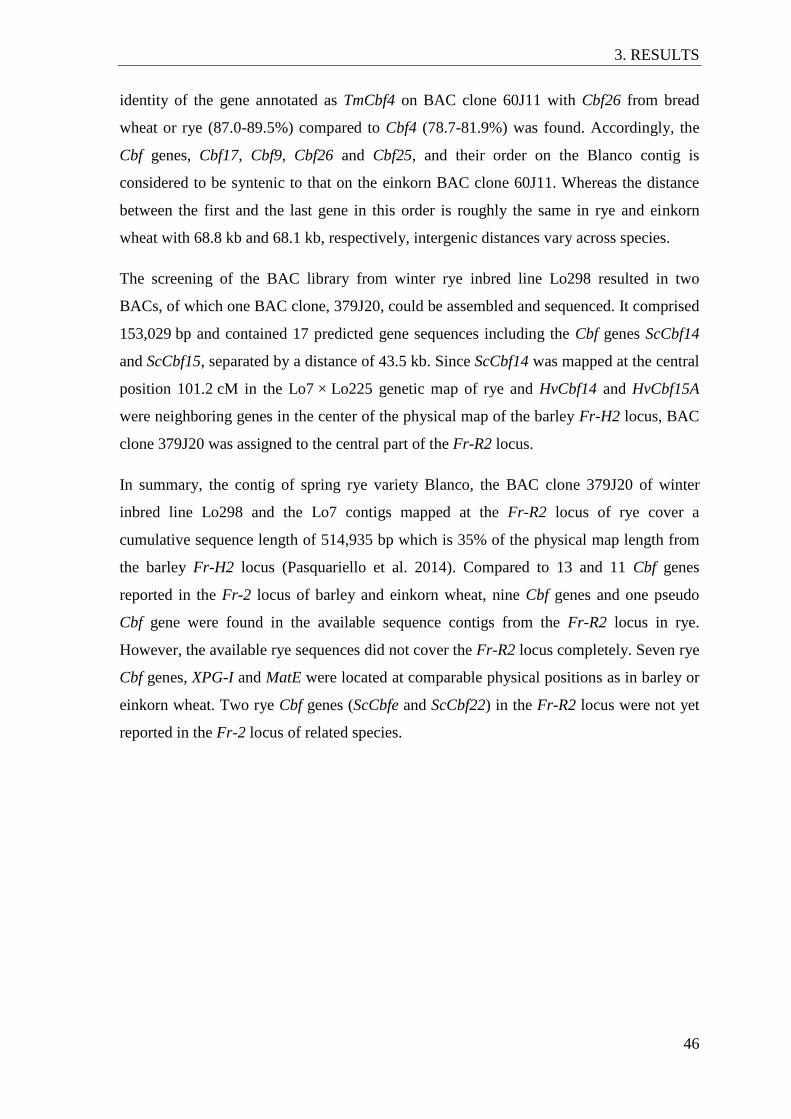
3. RESULTS
46
identity of the gene annotated as TmCbf4 on BAC clone 60J11 with Cbf26 from bread
wheat or rye (87.0-89.5%) compared to Cbf4 (78.7-81.9%) was found. Accordingly, the
Cbf genes, Cbf17, Cbf9, Cbf26 and Cbf25, and their order on the Blanco contig is
considered to be syntenic to that on the einkorn BAC clone 60J11. Whereas the distance
between the first and the last gene in this order is roughly the same in rye and einkorn
wheat with 68.8 kb and 68.1 kb, respectively, intergenic distances vary across species.
The screening of the BAC library from winter rye inbred line Lo298 resulted in two
BACs, of which one BAC clone, 379J20, could be assembled and sequenced. It comprised
153,029 bp and contained 17 predicted gene sequences including the Cbf genes ScCbf14
and ScCbf15, separated by a distance of 43.5 kb. Since ScCbf14 was mapped at the central
position 101.2 cM in the Lo7 × Lo225 genetic map of rye and HvCbf14 and HvCbf15A
were neighboring genes in the center of the physical map of the barley Fr-H2 locus, BAC
clone 379J20 was assigned to the central part of the Fr-R2 locus.
In summary, the contig of spring rye variety Blanco, the BAC clone 379J20 of winter
inbred line Lo298 and the Lo7 contigs mapped at the Fr-R2 locus of rye cover a
cumulative sequence length of 514,935 bp which is 35% of the physical map length from
the barley Fr-H2 locus (Pasquariello et al. 2014). Compared to 13 and 11 Cbf genes
reported in the Fr-2 locus of barley and einkorn wheat, nine Cbf genes and one pseudo
Cbf gene were found in the available sequence contigs from the Fr-R2 locus in rye.
However, the available rye sequences did not cover the Fr-R2 locus completely. Seven rye
Cbf genes, XPG-I and MatE were located at comparable physical positions as in barley or
einkorn wheat. Two rye Cbf genes (ScCbfe and ScCbf22) in the Fr-R2 locus were not yet
reported in the Fr-2 locus of related species.
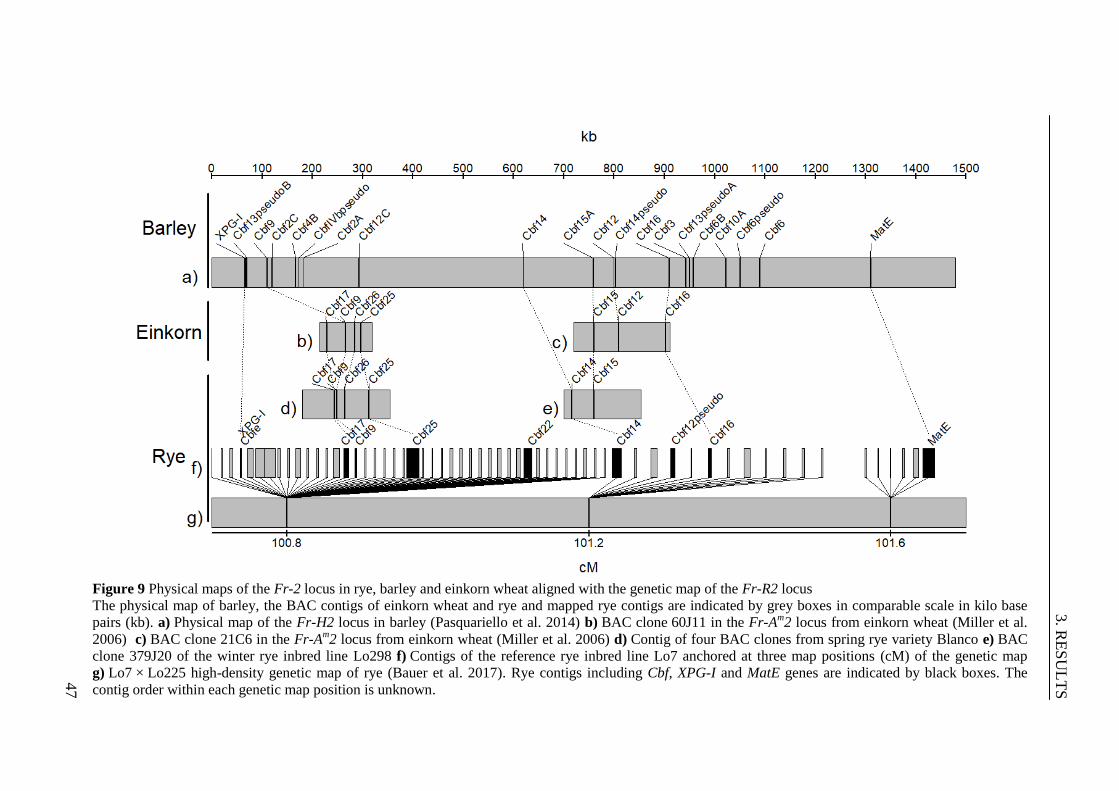
3. R
ES
UL
TS
47
Figure 9 Physical maps of the Fr-2 locus in rye, barley and einkorn wheat aligned with the genetic map of the Fr-R2 locus
The physical map of barley, the BAC contigs of einkorn wheat and rye and mapped rye contigs are indicated by grey boxes in comparable scale in kilo base
pairs (kb). a) Physical map of the Fr-H2 locus in barley (Pasquariello et al. 2014) b) BAC clone 60J11 in the Fr-Am2 locus from einkorn wheat (Miller et al.
2006) c) BAC clone 21C6 in the Fr-Am2 locus from einkorn wheat (Miller et al. 2006) d) Contig of four BAC clones from spring rye variety Blanco e) BAC
clone 379J20 of the winter rye inbred line Lo298 f) Contigs of the reference rye inbred line Lo7 anchored at three map positions (cM) of the genetic map
g) Lo7 × Lo225 high-density genetic map of rye (Bauer et al. 2017). Rye contigs including Cbf, XPG-I and MatE genes are indicated by black boxes. The
contig order within each genetic map position is unknown.
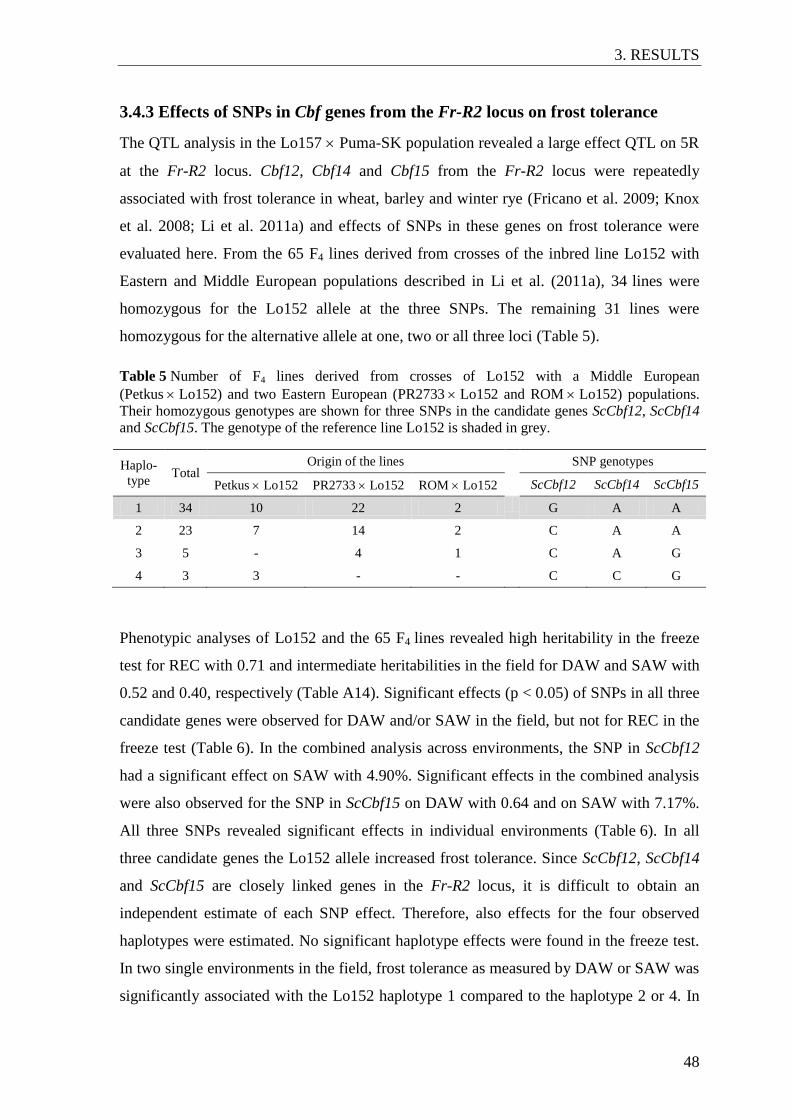
3. RESULTS
48
3.4.3 Effects of SNPs in Cbf genes from the Fr-R2 locus on frost tolerance
The QTL analysis in the Lo157 Puma-SK population revealed a large effect QTL on 5R
at the Fr-R2 locus. Cbf12, Cbf14 and Cbf15 from the Fr-R2 locus were repeatedly
associated with frost tolerance in wheat, barley and winter rye (Fricano et al. 2009; Knox
et al. 2008; Li et al. 2011a) and effects of SNPs in these genes on frost tolerance were
evaluated here. From the 65 F4 lines derived from crosses of the inbred line Lo152 with
Eastern and Middle European populations described in Li et al. (2011a), 34 lines were
homozygous for the Lo152 allele at the three SNPs. The remaining 31 lines were
homozygous for the alternative allele at one, two or all three loci (Table 5).
Table 5 Number of F4 lines derived from crosses of Lo152 with a Middle European
(Petkus Lo152) and two Eastern European (PR2733 Lo152 and ROM Lo152) populations. Their homozygous genotypes are shown for three SNPs in the candidate genes ScCbf12, ScCbf14
and ScCbf15. The genotype of the reference line Lo152 is shaded in grey.
Haplo-
type Total
Origin of the lines SNP genotypes
Petkus Lo152 PR2733 Lo152 ROM Lo152 ScCbf12 ScCbf14 ScCbf15
1 34 10 22 2 G A A
2 23 7 14 2 C A A
3 5 - 4 1 C A G
4 3 3 - - C C G
Phenotypic analyses of Lo152 and the 65 F4 lines revealed high heritability in the freeze
test for REC with 0.71 and intermediate heritabilities in the field for DAW and SAW with
0.52 and 0.40, respectively (Table A14). Significant effects (p < 0.05) of SNPs in all three
candidate genes were observed for DAW and/or SAW in the field, but not for REC in the
freeze test (Table 6). In the combined analysis across environments, the SNP in ScCbf12
had a significant effect on SAW with 4.90%. Significant effects in the combined analysis
were also observed for the SNP in ScCbf15 on DAW with 0.64 and on SAW with 7.17%.
All three SNPs revealed significant effects in individual environments (Table 6). In all
three candidate genes the Lo152 allele increased frost tolerance. Since ScCbf12, ScCbf14
and ScCbf15 are closely linked genes in the Fr-R2 locus, it is difficult to obtain an
independent estimate of each SNP effect. Therefore, also effects for the four observed
haplotypes were estimated. No significant haplotype effects were found in the freeze test.
In two single environments in the field, frost tolerance as measured by DAW or SAW was
significantly associated with the Lo152 haplotype 1 compared to the haplotype 2 or 4. In
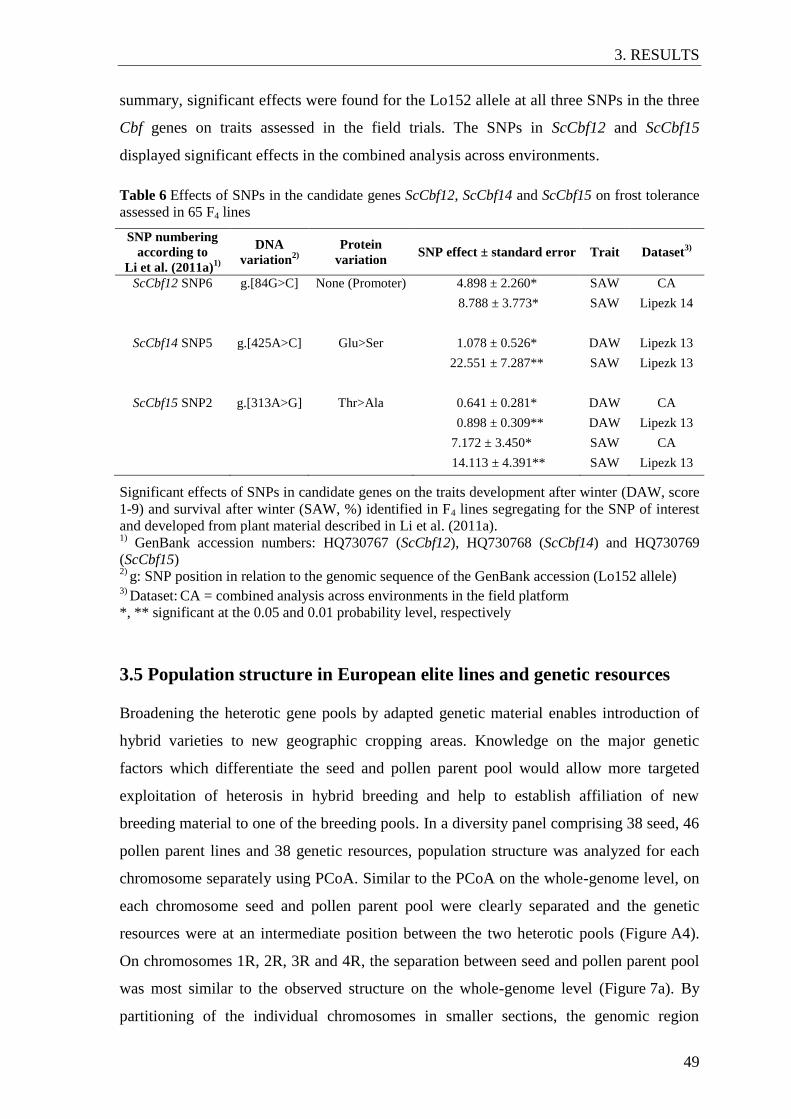
3. RESULTS
49
summary, significant effects were found for the Lo152 allele at all three SNPs in the three
Cbf genes on traits assessed in the field trials. The SNPs in ScCbf12 and ScCbf15
displayed significant effects in the combined analysis across environments.
Table 6 Effects of SNPs in the candidate genes ScCbf12, ScCbf14 and ScCbf15 on frost tolerance
assessed in 65 F4 lines
SNP numbering
according to
Li et al. (2011a)1)
DNA
variation2)
Protein
variation SNP effect ± standard error Trait Dataset
3)
ScCbf12 SNP6 g.[84G>C] None (Promoter) 4.898 ± 2.260* SAW CA
8.788 ± 3.773* SAW Lipezk 14
ScCbf14 SNP5 g.[425A>C] Glu>Ser 1.078 ± 0.526* DAW Lipezk 13
22.551 ± 7.287** SAW Lipezk 13
ScCbf15 SNP2 g.[313A>G] Thr>Ala 0.641 ± 0.281* DAW CA
0.898 ± 0.309** DAW Lipezk 13
7.172 ± 3.450* SAW CA
14.113 ± 4.391** SAW Lipezk 13
Significant effects of SNPs in candidate genes on the traits development after winter (DAW, score
1-9) and survival after winter (SAW, %) identified in F4 lines segregating for the SNP of interest
and developed from plant material described in Li et al. (2011a). 1)
GenBank accession numbers: HQ730767 (ScCbf12), HQ730768 (ScCbf14) and HQ730769
(ScCbf15) 2)
g: SNP position in relation to the genomic sequence of the GenBank accession (Lo152 allele) 3)
Dataset: CA = combined analysis across environments in the field platform
*, ** significant at the 0.05 and 0.01 probability level, respectively
3.5 Population structure in European elite lines and genetic resources
Broadening the heterotic gene pools by adapted genetic material enables introduction of
hybrid varieties to new geographic cropping areas. Knowledge on the major genetic
factors which differentiate the seed and pollen parent pool would allow more targeted
exploitation of heterosis in hybrid breeding and help to establish affiliation of new
breeding material to one of the breeding pools. In a diversity panel comprising 38 seed, 46
pollen parent lines and 38 genetic resources, population structure was analyzed for each
chromosome separately using PCoA. Similar to the PCoA on the whole-genome level, on
each chromosome seed and pollen parent pool were clearly separated and the genetic
resources were at an intermediate position between the two heterotic pools (Figure A4).
On chromosomes 1R, 2R, 3R and 4R, the separation between seed and pollen parent pool
was most similar to the observed structure on the whole-genome level (Figure 7a). By
partitioning of the individual chromosomes in smaller sections, the genomic region
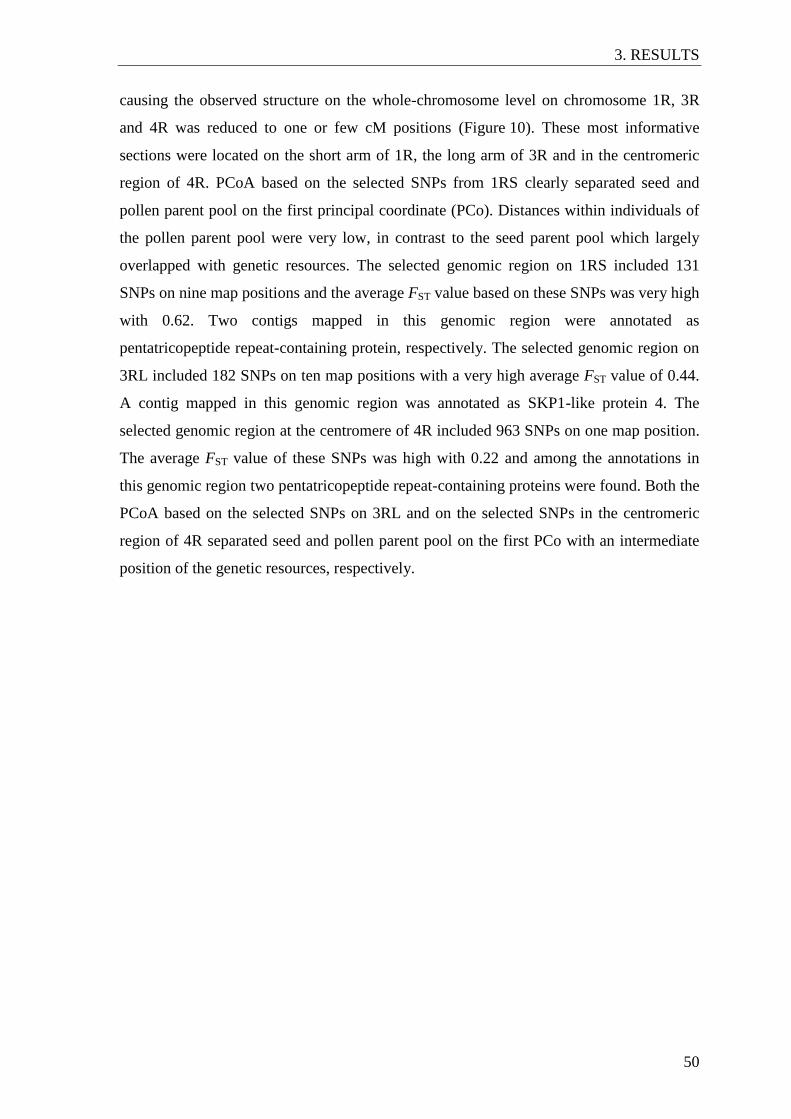
3. RESULTS
50
causing the observed structure on the whole-chromosome level on chromosome 1R, 3R
and 4R was reduced to one or few cM positions (Figure 10). These most informative
sections were located on the short arm of 1R, the long arm of 3R and in the centromeric
region of 4R. PCoA based on the selected SNPs from 1RS clearly separated seed and
pollen parent pool on the first principal coordinate (PCo). Distances within individuals of
the pollen parent pool were very low, in contrast to the seed parent pool which largely
overlapped with genetic resources. The selected genomic region on 1RS included 131
SNPs on nine map positions and the average FST value based on these SNPs was very high
with 0.62. Two contigs mapped in this genomic region were annotated as
pentatricopeptide repeat-containing protein, respectively. The selected genomic region on
3RL included 182 SNPs on ten map positions with a very high average FST value of 0.44.
A contig mapped in this genomic region was annotated as SKP1-like protein 4. The
selected genomic region at the centromere of 4R included 963 SNPs on one map position.
The average FST value of these SNPs was high with 0.22 and among the annotations in
this genomic region two pentatricopeptide repeat-containing proteins were found. Both the
PCoA based on the selected SNPs on 3RL and on the selected SNPs in the centromeric
region of 4R separated seed and pollen parent pool on the first PCo with an intermediate
position of the genetic resources, respectively.
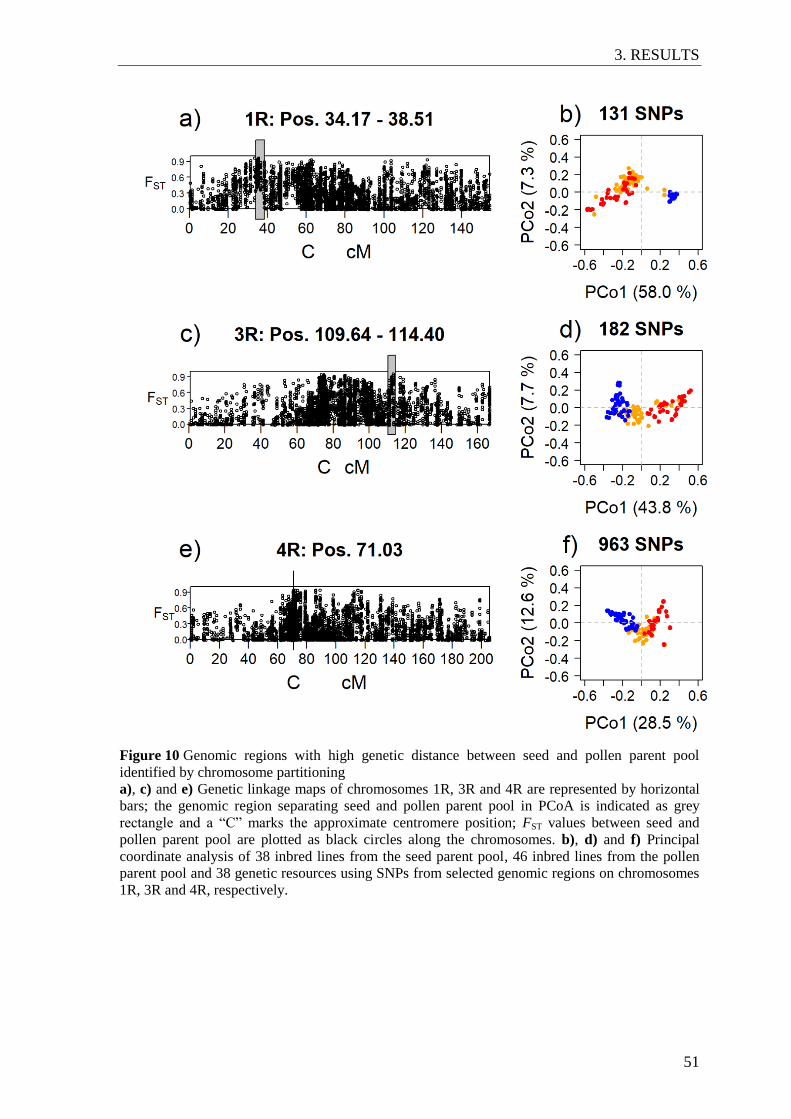
3. RESULTS
51
Figure 10 Genomic regions with high genetic distance between seed and pollen parent pool
identified by chromosome partitioning
a), c) and e) Genetic linkage maps of chromosomes 1R, 3R and 4R are represented by horizontal
bars; the genomic region separating seed and pollen parent pool in PCoA is indicated as grey
rectangle and a “C” marks the approximate centromere position; FST values between seed and
pollen parent pool are plotted as black circles along the chromosomes. b), d) and f) Principal
coordinate analysis of 38 inbred lines from the seed parent pool, 46 inbred lines from the pollen
parent pool and 38 genetic resources using SNPs from selected genomic regions on chromosomes
1R, 3R and 4R, respectively.
4. DISCUSSION
52
4. DISCUSSION
Frost tolerance is an important trait in geographic regions which are affected by severe
and long periods at sub-zero winter temperatures. In these regions, the cultivation of
winter rye is often preferred over other cereals due to its high level of frost tolerance. This
study lays the foundation for the development of genome-based breeding strategies by
investigating the genetic architecture of frost tolerance in rye.
4.1 Phenotyping for frost tolerance
Breeding for improved frost tolerance in cereals is challenging given that the observed
genetic variability is highly affected by environmental conditions and the complex nature
of this trait (Gray et al. 1997). Three different traits were assessed as indicators for frost
tolerance. Whereas SAW measures the survival rate, DAW is a visual score that integrates
both the survival rate as well as the development after winter. As DAW likely captures
small effects which are involved in cold adaptation, in the fine-tuning of response to frost
and in the recovery after frost periods, it might be the more informative trait for selection
purposes. On the other hand, SAW can be counted and has a higher heritability compared
to DAW. The correlation with REC in the controlled platform was higher for DAW than
for SAW, since REC, similar to DAW, integrates survival and development after frost
stress. The highest correlation between both phenotypic platforms was observed for DAW
in testcrosses. Despite low heritability, a large proportion of phenotypic variance for
DAW was explained by QDaw.tum-5R. Both findings suggest that the majority of
phenotypic variance for DAW resulted from allelic variation at the Fr-R2 locus. Moderate
correlations between the two phenotyping platforms also showed that freeze tests cannot
fully substitute phenotyping in field trials. In an artificial freeze test, plants are exposed to
freezing temperatures for relatively short periods and experience optimal cold acclimation
conditions which rarely occur in the field (Gusta et al. 1997). Since this can result in an
overestimation of the frost tolerance level (Gusta et al. 2001), phenotyping in field trials
remains indispensable. Nevertheless, a pre-screening for frost tolerance in the freeze test
may enable a better utilization of capacities in the field trials by phenotyping only
preselected candidates in frost stress environments.
4. DISCUSSION
53
4.2 Genomic regions controlling frost tolerance in winter rye
4.2.1 QTL for frost tolerance in the Lo157 Puma-SK population
In the Lo157 Puma-SK population, consistent QTL were detected on chromosomes 4R,
5R and 7R. A QTL on 5R coinciding with the Fr-R2 locus explained the largest
proportion of phenotypic variance for REC and DAW. It was detected in extreme frost
stress environments and in the controlled freeze test. The one common feature of those
winter environments and the freeze test was a rather fast drop of temperatures until
freezing (Figures 11, A1, A2). Both the variation in the threshold induction temperature at
which a plant starts to cold acclimate and the initial rate of cold acclimation have been
associated with the Fr-2 locus in cereals (Båga et al. 2007; Campoli et al. 2009; Fowler
2008; Knox et al. 2008). In preparation for the freeze tests, plants were allowed to
acclimate for seven weeks, representing optimal conditions for the acquisition of a high
level of frost tolerance. Thus, the large variation explained by QRec.tum-5R likely
represents variation in the initial rate of cold acclimation rather than variation in threshold
induction temperatures. By contrast, in the field it could not be determined to what extent
variation in threshold induction temperatures or in the rate of cold acclimation led to the
detection of QDaw.tum-5R and QSaw.tum-5R. Interestingly, the QTL peaks of
QDaw.tum-5R and QSaw.tum-5R in lines per se in the combined analysis were slightly
shifted towards Vrn-R1. Highly significant marker effects on frost tolerance were also
detected on chromosomes 5A and 5B in winter wheat, which could not be clearly assigned
to the Vrn-1 nor the Fr-2 locus (Case et al. 2014; Snape et al. 2001; Zhao et al. 2013). It
cannot be concluded whether the peaks of QDaw.tum-5R and QSaw.tum-5R were shifted
distal to the Fr-R2 locus due to joint effects on frost tolerance of the Fr-R2 locus and
Vrn-R1 or due to the lower heritabilities in the field trials resulting in lower mapping
precision. Fine-mapping of the Fr-R2 locus and the adjacent distal genomic region should
reveal the mode of action of individual genes in the Fr-R2 locus and determine if there are
additional genetic determinants of frost tolerance in the Fr-R2/Vrn-R1 genomic interval.
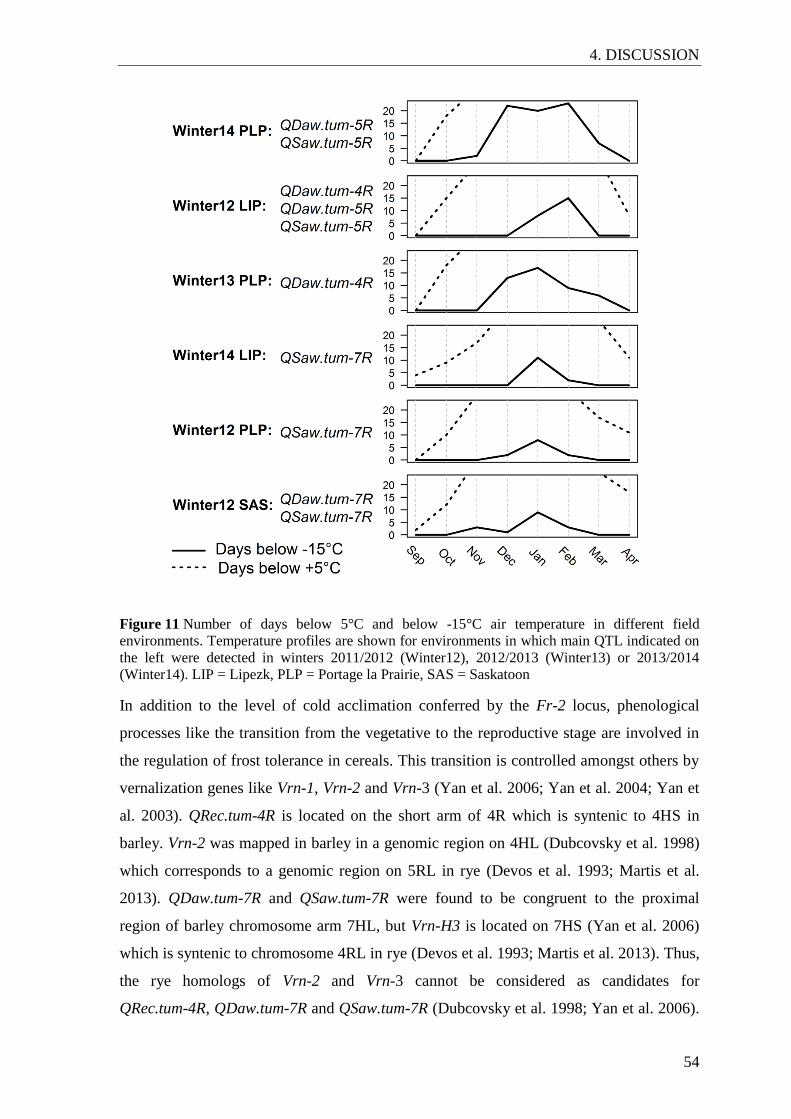
4. DISCUSSION
54
Figure 11 Number of days below 5°C and below -15°C air temperature in different field
environments. Temperature profiles are shown for environments in which main QTL indicated on
the left were detected in winters 2011/2012 (Winter12), 2012/2013 (Winter13) or 2013/2014
(Winter14). LIP = Lipezk, PLP = Portage la Prairie, SAS = Saskatoon
In addition to the level of cold acclimation conferred by the Fr-2 locus, phenological
processes like the transition from the vegetative to the reproductive stage are involved in
the regulation of frost tolerance in cereals. This transition is controlled amongst others by
vernalization genes like Vrn-1, Vrn-2 and Vrn-3 (Yan et al. 2006; Yan et al. 2004; Yan et
al. 2003). QRec.tum-4R is located on the short arm of 4R which is syntenic to 4HS in
barley. Vrn-2 was mapped in barley in a genomic region on 4HL (Dubcovsky et al. 1998)
which corresponds to a genomic region on 5RL in rye (Devos et al. 1993; Martis et al.
2013). QDaw.tum-7R and QSaw.tum-7R were found to be congruent to the proximal
region of barley chromosome arm 7HL, but Vrn-H3 is located on 7HS (Yan et al. 2006)
which is syntenic to chromosome 4RL in rye (Devos et al. 1993; Martis et al. 2013). Thus,
the rye homologs of Vrn-2 and Vrn-3 cannot be considered as candidates for
QRec.tum-4R, QDaw.tum-7R and QSaw.tum-7R (Dubcovsky et al. 1998; Yan et al. 2006).
4. DISCUSSION
55
A contig from the whole genome sequence resource of rye (Bauer et al. 2017) located in
the genomic region of QDaw.tum-7R and QSaw.tum-7R was annotated as early heading
date 3 (ehd3). This gene might be a potential candidate for QDaw.tum-7R and
QSaw.tum-7R since flowering genes are known to influence the regulation of response to
frost in plants (Dhillon et al. 2010; Seo et al. 2009). The QTL region on 7R was involved
in epistatic interactions more often than any other QTL in this study. It also showed
epistatic effects with QRec.tum-4R and QDaw.tum-4R. Thus, fine-mapping of the QTL on
7R would allow conclusions not only on the gene underlying QDaw.tum-7R and
QSaw.tum-7R, but could also help to identify candidate genes for QRec.tum-4R and
QDaw.tum-4R.
In contrast to QDaw.tum-5R and QSaw.tum-5R, QDaw.tum-7R and QSaw.tum-7R were
only detected in environments with a slow decrease of temperatures in autumn resulting in
a longer adaptation phase and with milder frost periods (Figure 11). The Lo157 allele
conferring frost tolerance at QDaw.tum-7R and QSaw.tum-7R was obviously sufficient
and the Puma-SK allele at QDaw.tum-5R and QSaw.tum-5R was not essential for survival
and the development after winter in these lower stress environments. The fact that the
tolerance to frost is influenced by additional factors like drought or light stress (Gray et al.
1997; Thomashow 1999) may explain the observed sensitivity of QTL effects on
environmental conditions in this study. Assessing phenotypes in more environments and
classifying frost stress environments according to climatic factors like temperature profile
or the presence of a snow cover during the winter could reveale the importance of
individual QTL for specific target environments. A multi-environment multi-locus model
enabled the assignment of QTL effects to specific heat and drought scenarios in maize
(Millet et al. 2016). Similar approaches could facilitate the identification of candidate
genes also for tolerance to frost. Moreover, a cross-talk of light and temperature signaling
was investigated in Arabidopsis (Franklin and Whitelam 2007) and in few studies in
cereals (Crosatti et al. 1999; Vashegyi et al. 2013). The expression of Cbf genes was
induced not only by cold temperatures (Campoli et al. 2009) but also by the circadian
clock (Fowler et al. 2005), day length (Lee and Thomashow 2012) and light quality
(Novák et al. 2015; Novák et al. 2017). Monitoring the expression of candidate genes for
frost tolerance at a defined set of time points after cold acclimation, different time points
during the day and at different light qualities would help to gain insights into the mode of
4. DISCUSSION
56
action of candidate genes in the frost responsive network and enable selection of frost
tolerance alleles for specific target environments.
Compared to barley, wheat and triticale, a main effect QTL was detected at the Fr-2 locus
together with smaller effects also in this study in winter rye. Although candidate genes for
frost tolerance were already mapped in other Triticeae, like the Cor genes Dhn1 or
Cor14b (Cattivelli et al. 2002), candidate genes underlying QTL for frost tolerance were
merely identified. Besides the Fr-2 and Vrn-1 locus, the QTL detected in nine and 20 QTL
studies in barley and wheat, respectively, were mostly located on homologous
chromosomes 1, 2 and 4 (Jha et al. 2017). QTL studies using additional rye populations
segregating for frost tolerance and mapping more candidate genes would permit to
evaluate the relative importance of the QTL detected in this study in rye and enable the
detection of QTL which did not segregate in the Lo157 × Puma-SK population.
4.2.2 SNP effects in candidate genes
In barley, wheat and in this study in rye, QTL at the Fr-2 locus explained a large
proportion of phenotypic variance for frost tolerance (Båga et al. 2007; Francia et al.
2004; Miller et al. 2006). Identifying polymorphisms or haplotypes in the Fr-2 locus
which explain most variance for frost tolerance should help to establish effective selection
strategies for frost tolerance. Cbf12, Cbf14 and Cbf15 are in the central Cbf cluster of the
Fr-2 locus and each of them was significantly associated with frost tolerance in cereals
(Fricano et al. 2009; Knox et al. 2008; Sieber et al. 2016). A significant effect of ScCbf12
and ScCbf15 on frost tolerance in rye was previously established in a candidate gene based
association study (Li et al. 2011a) and could be confirmed here. No significant effect was
found for the SNP in ScCbf14 in the combined analysis across environments which may
be explained by the fact that only three of the 65 F4 lines exhibited the alternative allele.
Conclusions cannot be drawn from allele frequencies at the three candidate genes since
the applied F4 lines were selected also for another candidate gene on another chromosome.
The fact that the frost tolerance allele at the analyzed SNPs in all three candidate genes
originated from the elite line Lo152 but not from the Eastern European populations was
unexpected but shows that effective frost tolerance alleles are also available in European
inbred lines. In barley and wheat, differences in frost tolerant and susceptible cultivars
were associated with haplotypes involving multiple Cbf genes at the Fr-2 locus and with
copy number variation of Cbf genes (Knox et al. 2010; Pearce et al. 2013; Zhu et al.
4. DISCUSSION
57
2014). The effect of haplotypes from the SNPs in ScCbf12, ScCbf14 and ScCbf15 was not
significant in the combined analysis in the present study. However, the low inter-genic
linkage disequilibrium (LD) between seven Cbf genes from which six belonged to the
Fr-R2 locus (Li et al. 2011b) and the significant effects of individual SNPs in ScCbf12,
ScCbf14 and ScCbf15 on frost tolerance in the present study suggest that selection on
promising polymorphisms in individual candidate genes of the Fr-R2 locus could be
successful for frost tolerance breeding in rye. A more detailed characterization of the
Fr-R2 locus in rye and comparisons of the Cbf cluster between frost tolerant and
susceptible rye accessions would allow the identification of more polymorphisms and
haplotypes which could be used for selection on frost tolerance in rye.
4.3 Selection strategies for frost tolerance
4.3.1 Marker-based selection methods
In this study, the predictive ability of a QTL-based model and different GP models was
evaluated using CV for three frost tolerance traits assessed in the field and a freeze test.
For REC, GP models only marginally outperformed the QTL-based model. Together with
the high variance explained in QTL analyses, this suggests that REC is strongly affected
by the QTL at the Fr-R2 (QRec.tum-5R) locus as opposed to traits assessed in the field.
Nevertheless, GP models had higher predictive ability than the QTL-based model for all
traits indicating that frost tolerance in cereals also involves genes with small effects that
are not detected in QTL analyses. The superiority of the variable selection method LASSO
over the QTL-based model and the standard GBLUP model in most datasets underline
heterogeneous contributions of SNPs to the estimated genomic variance for frost tolerance
(Wimmer et al. 2013). Large and small marker effects were also captured through
GBLUP+Fr-R2 by fitting the QTL at the Fr-R2 locus as fixed effect, which yielded
predictive abilities similar to LASSO. Similarly, integrating markers from the Fr-A2 locus
in wheat as fixed effects into a GP model improved predictive ability for frost tolerance
(Würschum et al. 2017). The high heritability of REC suggested that the prediction of
DAW and SAW could be supported by REC using multivariate prediction. Surprisingly,
SAW in lines per se was the only dataset in which multivariate prediction increased
predictive ability. Potentially, the correlation of DAW and SAW with REC was not high
enough to profit consistently from multivariate prediction. In addition, the datasets used
4. DISCUSSION
58
for the evaluation of GP methods included only lines/testcrosses with complete
phenotypic records. In studies using simulated or experimental data from cereals,
multivariate prediction including a high heritable and sufficiently phenotyped trait
particularly improved predictive ability of low heritable traits with insufficient phenotypic
data if both traits were correlated (Jia and Jannink 2012; Schulthess et al. 2016).
Phenotypic data on frost tolerance are often incomplete or biased by environmental effects
like mild winters in field trials but can be easily assessed in freeze tests. When phenotypes
are available only from few lines in field trials or only from previous years, multivariate
prediction including the highly heritable and correlated trait REC is assumed to improve
predictive ability of frost tolerance in the field and would allow for more selection cycles
per unit of time. Therefore, multivariate prediction is a promising method for selection on
frost tolerance in rye and should be further investigated in additional datasets.
This study showed that pre-selection for frost tolerance can be performed using markers
from Cbf genes in the Fr-R2 locus like ScCbf9 or ScCbf12. The SNP in ScCbf12 also
displayed a highly significant effect on frost tolerance in the controlled platform and in
field trials in a previous candidate-gene based association study in rye (Li et al. 2011a)
and therefore represents a promising marker for selection on frost tolerance. Refined
selection in lines per se and selection in testcrosses should be performed in field trials for
DAW and SAW. The use of GP methods, like GBLUP+Fr-R2 or LASSO, can increase
selection intensity and speed up the breeding progress when expensive field trials in frost
stress environments are performed with preselected candidates.
4.3.2 Dominance, epistatic effects and inbreeding depression
Frost tolerance in wheat was proposed to be controlled by both additive and dominance
effects whereas additive effects prevailed over dominance effects (Sutka 1994; Zhao et al.
2013). Due to the high degree of homozygosity in the F4 and F5 generation used for QTL
analysis in the present study, the power for detecting dominance effects was low in the
Lo157 × Puma-SK population. However, testcrosses from these generations were
significantly more frost tolerant than the according lines per se. Significantly higher REC
scores were also observed in the F4 generation compared to the F5 generation whereas
differences between the two minimum temperatures within the F5 generation were not
significant. Similarly, the six lines from the pollen parent pool exhibited significantly
higher REC values than the six lines from the seed parent pool. All these findings may be
4. DISCUSSION
59
explained by differences in heterozygosity. However, it cannot be stated whether the
higher performance of testcrosses and earlier generations resulted from dominance effects
of frost tolerance alleles or from overall higher fitness due to lower or missing inbreeding
depression. Testcrosses in this study were developed using a single-cross tester from the
seed parent pool. More conclusions on potential dominance effects on frost tolerance and
on the combining ability of Puma-SK could be obtained in further studies by analyzing
earlier generations for dominance effects on frost tolerance and by evaluating also crosses
to the pollen parent pool. In addition, more extensive testing of elite lines with comparable
levels of heterozygosity should clarify if pool-specific differences in frost tolerance
already exist. If dominance effects play an important role, dominant frost tolerance alleles
could be introduced into only one of the two heterotic breeding pools in hybrid breeding.
In the Lo157 × Puma-SK population, genotypic correlations between lines per se and
testcrosses were not significant in the field platform for DAW and SAW. This suggests
that frost tolerance in the field trials could be controlled by different QTL in lines per se
and their testcrosses (Smith 1986). Low genotypic correlations between line per se and
testcross performance observed in studies on complex agronomic traits could also occur
due to a significantly large proportion of non-additive variance caused by dominance or
epistasis (Mihaljevic et al. 2005; Schwegler et al. 2014). The relevance of epistasis for
frost tolerance in the Lo157 × Puma-SK population was also analyzed. The QTL model
including additive and additive × additive epistatic effects explained less genetic variance
in the test set after cross-validation than the model including only additive effects.
Incorporating epistatic effects into the GBLUP model also did not improve the predictive
ability compared to standard GBLUP, although they were frequently reported to influence
frost tolerance (Galiba et al. 2009; Li et al. 2011a; Wooten et al. 2008). The effect of
epistasis on trait variation strongly depends on genetic material and sample size (Carlborg
and Haley 2004; Jiang and Reif 2015). Potentially the size of the Lo157 × Puma-SK
population was too small to estimate epistatic effects and the QTL and GP models
including epistasis were overfitted. Therefore, investigating epistasis using different
genetic material and larger population sizes should provide further insights into the
relevance of epistasis for frost tolerance in rye and enable the identification of additional
key players in the frost-responsive network. Since the epistatic interaction involving
QRec.tum-4R and the genomic region harboring QDAW.tum-7R and QSAW.tum-7R
explained the largest epistatic effect for REC, it would be interesting to investigate this
4. DISCUSSION
60
epistatic effect in more detail for instance in near-isogenic lines with homogenous genetic
background (Kim et al. 2015; Mackay 2014).
4.4 The Fr-R2 locus and the Cbf gene family in rye
4.4.1 Structural organization of the Fr-R2 locus
The Fr-2 locus was described as a cluster of Cbf genes in several Poaceae species. In the
Fr-Am2 locus of einkorn wheat, eleven Cbf genes were identified (Miller et al. 2006) and a
physical map of the Fr-H2 locus in barley included 13 full-length and five pseudo Cbf
genes (Pasquariello et al. 2014). The Fr-2 locus in both species covered a map length of
0.8 cM. This study provides first insights into the structure of the Fr-R2 locus in rye. In
the available sequences from a part of the Fr-R2 locus, nine putative full-length Cbf genes
and one pseudo Cbf gene were found. Like in several Poaceae species (Tondelli et al.
2011), the borders of the Fr-R2 locus in rye were also defined by the XPG-I and MatE
genes. Further synteny was established between rye and einkorn wheat based on a BAC
clones in the proximal and central region of the Fr-2 locus. On the BAC clone 60J11 in
the proximal Fr-Am2 locus of einkorn wheat, four Cbf genes were identified and
previously annotated as TmCbf17, TmCbf9, TmCbf4 and TmCbf2 (Miller et al. 2006). Six
years later, the Cbf gene family was newly investigated in bread wheat and new Cbf genes
were described, such as TaCbf25 and TaCbf26 (Mohseni et al. 2012). Despite a high
similarity of TaCbf25 and TaCbf26 with the already known TaCbf2 and TaCbf4,
respectively, TaCbf25 and TaCbf26 exhibited clear differences in the structure of the AP2
domain with respect to TaCbf2 and TaCbf4. For this reason the annotations on the
proximal BAC clone of einkorn wheat were re-evaluated in the present study. The coding
sequences previously annotated as TmCbf2 and TmCbf4 exhibited highest sequence
identity with TaCbf25 and TaCbf26. This finding revealed that the type and order of Cbf
genes on the proximal BAC clone of einkorn wheat in the Fr-2 locus is completely
syntenic to the BAC clone of spring rye variety Blanco which includes the four Cbf genes
ScCbf17, ScCbf9, ScCbf26 and ScCbf25. Whereas no orthologs of Cbf25 and Cbf26 were
identified in the Fr-H2 locus of barley, no ortholog of Cbf4 was identified in the whole-
genome sequence resources of rye. The high similarity between Cbf2 and Cbf25 and
between Cbf4 and Cbf26 indicates that Cbf25 and Cbf26 could have evolved by
duplication from Cbf2 and Cbf4, respectively. Whereas barley diverged from the common
4. DISCUSSION
61
Triticeae ancestor about eight million years ago, rye diverged from the genus Triticum
about four million years ago (Middleton et al. 2014). Accordingly, the duplication events
creating Cbf25 and Cbf26 in wheat and rye likely occurred after the divergence of barley
from the common Triticeae ancestor. It remains to be shown if gene duplications have an
impact on cultivar differences in rye and on the high frost tolerance level of rye compared
to barley or wheat. In barley, winter habit genotypes harboring the vrn-1 allele were found
to exhibit a tandem segmental duplication of the genomic region encompassing HvCbf2
and HvCbf4 in the Fr-H2 locus, including two different paralogs of HvCbf2. By contrast
spring habit genotypes harboring the Vrn-1 allele had only one HvCbf2-HvCbf4 segment
(Knox et al. 2010). CNV at both the Fr-R2 and Vrn-R1 locus was also associated with
enhanced frost tolerance in bread wheat (Zhu et al. 2014) and CNV of Cbf genes
explained up to 24.3% of genotypic variance for frost tolerance in winter wheat
(Würschum et al. 2017). Preliminary read depth analyses using the sequence resources in
Bauer et al. (2017) indicated CNV of Cbf genes in the Fr-R2 locus also in rye. Additional
research is required to experimentally validate these results by qPCR or by hybridization
of sequence fragments not conserved among Cbf genes against restriction digested
genomes of susceptible and tolerant rye accessions.
Five Cbf genes mapped at the proximal and central map position of the Lo7 × Lo225
genetic map and the Cbf genes found on the sequence contig from spring variety Blanco
and the BAC of winter rye inbred line Lo298 were syntenic to genomic regions of the
proximal and central Cbf cluster at the Fr-2 locus in Triticeae. Only one Cbf gene,
ScCbf16, from the distal Cbf cluster could not be identified in the Fr-R2 locus in this
study. In a previous study including rye, ScCbf19 and ScCbf20 were mapped to 5RL
(Campoli et al. 2009). This suggests that besides ScCbf22 and ScCbfe which were not
reported in the Fr-2 locus of other Triticeae, more Cbf genes could occur only in the
Fr-R2 locus of rye. The structure of large parts of the Fr-R2 locus has to be further
investigated in order to assess the extent of genetic variation at the Fr-R2 locus which
could be used for frost tolerance breeding in rye. Compared to BAC library screening
approaches in barley (Pasquariello et al. 2014), the number of BAC clones obtained from
the screening of the BAC library from spring rye variety Blanco and winter rye inbred line
Lo298 was low. By constructing a high density genetic map with an increased population
size and using SNPs from the rye 600k array (Bauer et al. 2017), the number of rye
sequence contigs anchored to map positions could be increased. Designing primers based
4. DISCUSSION
62
on the anchored sequence contigs for the screening of BAC libraries could be more
efficient than using only primers or PCR products from Cbf genes. Recently published and
exhaustive reference sequence resources from barley (Mascher et al. 2017) and emmer
(Avni et al. 2017) will help to exploit the synteny between Triticeae to further investigate
the structural organization of the Fr-R2 locus in rye.
4.4.2 The Cbf gene family in rye
Members of the Cbf gene family play a key role in the induction of cold acclimation in
plants (Jaglo et al. 2001; Stockinger et al. 2007). Analyses of the Cbf gene family in rye
should reveal the role of individual members in the regulation of frost tolerance. The Cbf
gene family of rye included at least 35 Cbf genes in this study, besides pseudo Cbf genes,
and exceeded the size of the Cbf gene family in other Triticeae. The rye Cbf genes
reported in this study were determined in silico using established sequence resources
(Bauer et al. 2017). Thus, Cbf genes containing strongly modified signature sequences
potentially remained undiscovered and about half of the Cbf sequences were not
completely covered by the contigs. However, using these sequence resources allowed an
extensive overview on the Cbf gene family in eleven rye inbred lines and S. vavilovii.
Despite low bootstrap values at some branches of the phylogenetic tree, the known cereal
Cbf genes clustered into the established Poaceae Cbf subgroups (Badawi et al. 2007;
Mohseni et al. 2012; Skinner et al. 2005) without exception. Most of the rye Cbf genes for
which no Triticeae ortholog was found were clustered in two groups, the CbfII subgroup
and a fraction of the CbfIIId subgroup. The CbfII cluster was also enlarged in bread wheat
and the included Cbf genes were considered as homeologs or copies within the same
wheat genome (Mohseni et al. 2012). By contrast in rye, subgroup II included seven
putative full-length Cbf genes which were less than 82 % identical on the nucleotide level
to each other. The newly identified rye Cbf genes in subgroup II and the separate cluster
of subgroup IIId possibly evolved by gene duplications. The high number of putative full-
length Cbf genes in subgroup II and IIId is surprising, since duplicated genes accumulate
mutations and degenerate to pseudogenes in the course of evolution or disappear, when
not exposed to selective pressure (Zhang 2003). However, the majority of studies
including barley, bread wheat and rye Cbf genes from subgroup II reported no important
function of subgroup II in frost tolerance (Badawi et al. 2007; Campoli et al. 2009;
Skinner et al. 2005). By contrast, Cbf genes from subgroups III and IV were frequently
associated with frost tolerance (Knox et al. 2008; Skinner et al. 2005) and all Cbf genes
4. DISCUSSION
63
identified in the Fr-2 locus from barley, einkorn wheat and rye belonged to these two
subgroups (Miller et al. 2006; Pasquariello et al. 2014). In this study in rye, the enlarged
fraction of subgroup IIId includes Cbf17 which is located in the Fr-2 locus of einkorn
wheat and rye. To date, no important role in cold acclimation was described for Cbf17.
Hydrophobic clusters which are evolutionarily conserved in CBF proteins provide
indications on similar or divergent functions of different Cbf subgroups (Badawi et al.
2007; Wang et al. 2005). Thus, comparisons of hydrophobic clusters in individual CBF
amino acid sequences between rye and other Triticeae species could point to differences in
their functional activity. Evaluating the potential of the first signature motifs to bind to the
CRT element in cold responsive genes by bioinformatics and by gel shift assays could
reveal insights into the potential interaction of newly identified Cbf genes with Cor genes
in rye (Knox et al. 2008). In addition, expression analysis at different time points of
acclimation could show whether the strong frost tolerance of rye relies mainly on Cbf
expression profiles which differ from other Triticeae or also on the expression of rye
specific Cbf genes.
4.5 Prospects for using genetic resources in rye breeding
Genetic resources are appreciated as a rich source of valuable alleles or haplotypes that
can improve traits of interest in elite material (McCouch et al. 2013). The freeze test on
lines from the European seed and pollen parent pool and Puma-SK and the large effect of
the Puma-SK allele at the Fr-R2 locus in the Lo157 Puma-SK population revealed a
superiority of individual genetic resource for frost tolerance. These results encourage the
use of genetic resources for the improvement of frost tolerance in European breeding
pools. The frost resistance loci Fr-R2 and Vrn-R1 are known major determinants of frost
tolerance (Båga et al. 2007; Francia et al. 2004). Whereas the seed and pollen parent pools
and genetic resources were clearly separated by PCoA on a whole-genome level, no
differentiation between the groups was observed when only the Fr-R2 and/or the Vrn-R1
region were considered. This suggests that no strong differential selection has occurred in
these genomic regions in winter rye. The high nucleotide diversity and the high number of
haplotypes observed in this study and the fast decline of LD in candidate genes from the
Fr-R2 locus identified in a previous study on rye (Li et al. 2011b) indicate high genetic
variability within each genetic group. In combination with the moderate to high
differentiation index between genetic resources and each European breeding pool this
4. DISCUSSION
64
suggests that a high level of genetic variation in the Fr-R2/Vrn-R1 genomic region can be
exploited from genetic resources and within the European breeding pools to improve frost
tolerance.
When new alleles are introduced from genetic resources into the seed and pollen parent
pool, the heterotic pattern of the two breeding pools must be preserved (Fischer et al.
2010). Identifying genes or genomic regions in which both pools differ strongly could
help to broaden the established gene pools without losing the heterotic pattern. The largest
genetic distances between the seed and pollen parent pool as revealed in PCoA were
observed on 1RS, 3RL and in the centromeric region of 4R. Strong molecular
differentiation between seed and pollen parent pool is expected to be caused by genes
which are differentially selected in the seed parent pool compared to the pollen parent
pool. For instance for hybrid breeding, seed parent lines are needed which are male-sterile
in the cytoplasmic male sterility (CMS) cytoplasm, whereas fertility restoration is an
obligatory breeding goal in the pollen parent pool (Geiger and Miedaner 2009). The
restoration of fertility in cytoplasmic male sterile lines is required for hybrid seed
production and known restorer genes were found to encode members of the
pentatricopeptide-repeat (PPR) protein family (Bentolila et al. 2002; Wise and Pring
2002). In the genomic region on 1RS, differentiating seed and pollen parent pool in the
PCoA, two annotations as PPR genes were discovered. Genetic markers on 1RS in rye
were previously suggested to be linked to a major gene for fertility restoration since they
explained 54 to 78.0 % of the phenotypic variance for fertility restoration (Miedaner et al.
2000; Wolf 2002; Wricke et al. 1993). The fact that almost no genetic variation was found
in the pollen parent pool suggests that pollen lines exhibit restorer alleles in this genomic
region on which selection occurred. In contrast to PCoA based on SNPs from the whole
genome or from the selected genomic regions on 3RL and 4R, only few genetic resources
were placed at an intermediated position between the seed and the pollen parent pool but
most genetic resources had an affiliation to the seed parent pool. It is therefore essential to
preserve the selected genomic region on 1RS from the pollen parent pool in crosses
between the pollen parent pool and genetic resources. By contrast, crosses between seed
parent pool and most genetic resources should be uncomplicated with respect to this
genomic region.
Another genomic region differentiating seed and pollen parent pool in the PCoA was
found on 3RL and a sequence contig in this region was annotated as SKP1-like protein 4.
4. DISCUSSION
65
SKP1 negatively regulates the expression of class-B genes which are required for the
development of petals and anthers (Chase 2007). In alloplasmic CMS-plants which have
the nuclear genome of Brassica napus and the mitochondrial genome of Arabidopsis
thaliana, the abundance of SKP1 proteins was suggested to be influenced by CMS
determining genes (Teixeira et al. 2005). The phenotype of aberrant carpelloid stamens
observed in CMS lines could therefore also be generated by mutations in SKP1 (Chase
2007; Teixeira et al. 2005). On chromosome 3RL in rye, a QTL was also detected for
fertility restoration and explained 10.2 to 17.0% of phenotypic variance for this trait
(Miedaner et al. 2000; Wolf 2002). It was supposed to be a minor restorer locus and
showed a strong epistatic effect with the major restorer locus on 1RS (Wolf 2002). These
findings suggest that the strong differentiation between seed and pollen parent lines on
3RL could result from epistatic effects with other genomic regions affecting fertility in
rye.
The genomic region differentiating seed and pollen parent pool in PCoA on 4R could be
limited to only one map position at the centromere and included two annotations as
pentatricopeptide repeat-containing protein. Multiple loci, designated Rfc4, Rfg1, Rfp1,
Rfp2 and Rfp3 were associated with fertility restoration for different sterility cytoplasms,
but all were mapped to the distal region of 4RL (Börner et al. 1998; Curtis and
Lukaszewski 1993; Hackauf et al. 2017; Miedaner et al. 2000; Stracke et al. 2003).
However, in a previous study in rye, high selection signals between seed and pollen parent
pool as measured by FST and Bayenv2.0 XtX values were also assessed for SNPs at the
centromere of 4R (Bauer et al. 2017). Contigs harboring these SNPs were suggested to
encode genes for ear morphology and plant height and the findings were associated with
the generally more compact ears, larger seed size and increased plant height of seed parent
lines compared to pollen parent lines. Since no QTL or marker at or near the centromeric
region of 4R was previously associated with fertility restoration, it is more likely that the
observed differentiation between seed and pollen parent pool in PCoA results from other
genes than by the two putative annotated candidate genes for fertility restoration.
With regard to frost tolerance, high genetic diversity at the Fr-R2 and Vrn-R1 loci was
found in genetic resources although no differentiation was observed in PCoA based on
SNPs at these genomic regions between genetic resources and the seed and pollen parent
pool. To further investigate whether frost tolerance of elite breeding pools can be
improved by alleles from genetic resources, phenotypic data on frost tolerance should be
4. DISCUSSION
66
assessed on genotyped genetic resources, particularly from northern and continental
geographic regions. The high frost tolerance level of Puma-SK suggested that the frost
tolerance in European elite lines can be improved beyond the existing level in the seed and
pollen parent pool. Markers from the genomic regions on 1RS, 3RL and the centromeric
region on 4R identified in this study could be used to preserve the high genetic distance
between elite breeding pools when frost tolerance alleles are introduced into lines from the
seed or pollen parent pool.
4.6 Conclusions
A large effect on frost tolerance was explained by a QTL at the Fr-R2 locus at which the
Puma-SK allele increased frost tolerance significantly. Pre-selection of breeding lines can
be performed by MAS based on markers from the Fr-R2 locus. Further selection steps on
DAW and SAW should be performed in field trials. Genomic selection models like
GBLUP+Fr-R2 or LASSO can help to increase selection intensity. The Fr-R2 locus of rye
revealed Cbf genes which were not reported up to date in the Fr-2 locus of barley or
einkorn wheat and the Cbf gene family in rye seemed to be expanded compared to barley
and wheat. These findings indicate new sources of genetic variation, potentially impacting
frost tolerance which could be used for breeding purposes in rye. The high genetic
variation at the Fr-R2 and Vrn-R1 loci in a diverse panel of rye accessions suggests a large
potential for the improvement of frost tolerance within the European seed and pollen
parent breeding pools or by exploiting genetic resources. The high frost tolerance level of
Puma compared to lines from the seed and pollen parent pool and the large effect
contributed by the Puma allele at the Fr-R2 locus encourage the use of genetic resources
for the improvement of frost tolerance in European elite material. Markers from genomic
regions explaining a high genetic distance between the seed and pollen parent pool were
identified on 1RS, 3RL and 4R and should help to preserve the heterotic pattern when
frost tolerance alleles are introduced from genetic resources to European breeding pools.
5. REFERENCES
67
5. REFERENCES
Akar T, Francia E, Tondelli A, Rizza F, Stanca AM, Pecchioni N (2009) Marker-assisted
characterization of frost tolerance in barley (Hordeum vulgare L.). Plant Breeding
128:381-386
Albrecht T, Wimmer V, Auinger HJ, Erbe M, Knaak C, Ouzunova M, Simianer H, Schön C-C
(2011) Genome-based prediction of testcross values in maize. Theor Appl Genet 123:339-
350
Auinger H-J, Schönleben M, Lehermeier C, Schmidt M, Korzun V, Geiger HH, Piepho H-P,
Gordillo A, Wilde P, Bauer E, Schön C-C (2016) Model training across multiple breeding
cycles significantly improves genomic prediction accuracy in rye (Secale cereale L.).
Theor Appl Genet 129:1-11
Avni R, Nave M, Barad O, Baruch K, Twardziok SO, Gundlach H, Hale I, Mascher M, Spannagl
M, Wiebe K, Jordan KW, Golan G, Deek J, Ben-Zvi B, Ben-Zvi G, Himmelbach A,
MacLachlan RP, Sharpe AG, Fritz A, Ben-David R, Budak H, Fahima T, Korol A, Faris
JD, Hernandez A, Mikel MA, Levy AA, Steffenson B, Maccaferri M, Tuberosa R,
Cattivelli L, Faccioli P, Ceriotti A, Kashkush K, Pourkheirandish M, Komatsuda T, Eilam
T, Sela H, Sharon A, Ohad N, Chamovitz DA, Mayer KFX, Stein N, Ronen G, Peleg Z,
Pozniak CJ, Akhunov ED, Distelfeld A (2017) Wild emmer genome architecture and
diversity elucidate wheat evolution and domestication. Science 357:93-97
Badawi M, Danyluk J, Boucho B, Houde M, Sarhan F (2007) The Cbf gene family in hexaploid
wheat and its relationship to the phylogenetic complexity of cereal Cbfs. Mol Genet
Genomics 277:533-554
Båga M, Chodaparambil SV, Limin AE, Pecar M, Fowler DB, Chibbar RN (2007) Identification
of quantitative trait loci and associated candidate genes for low-temperature tolerance in
cold-hardy winter wheat. Funct Integr Genomics 7:53-68
Bauer E, Schmutzer T, Barilar I, Mascher M, Gundlach H, Martis MM, Twardziok SO, Hackauf
B, Gordillo A, Wilde P, Schmidt M, Korzun V, Mayer KFX, Schmid K, Schön C-C,
Scholz U (2017) Towards a whole-genome sequence for rye (Secale cereale L.). Plant J
89:853-869
Becker H (2011) Pflanzenzüchtung, 2. Auflage. Eugen Ulmer Verlag, Stuttgart
Behre K-E (1992) The history of rye cultivation in Europe. Veg Hist Archeobot 1:141-156
Bentolila S, Alfonso AA, Hanson MR (2002) A pentatricopeptide repeat-containing gene restores
fertility to cytoplasmic male-sterile plants. Proc Natl Acad Sci USA 99:10887-10892
Bishnoi UR, Pancholy DK (1980) Comparative salt tolerance in triticale, wheat and rye during
germination. Plant Soil 55:491-493
BMEL (2016) Statistisches Jahrbuch über Ernährung, Landwirtschaft und Forsten der
Bundesrepublik Deutschland 2015. Bundesministerium für Ernährung und
Landwirtschaft, Landwirtschaftsverlag Münster-Hiltrup
5. REFERENCES
68
Börner A, Korzun V, Polley A, Malyshev S, Melz G (1998) Genetics and molecular mapping of a
male fertility restoration locus (Rfg1) in rye (Secale cereale L.). Theor Appl Genet 97:99-
102
Bravo LA, Zúñiga GE, Alberdi M, Corcuera LJ (1998) The role of ABA in freezing tolerance and
cold acclimation in barley. Physiol Plant 103:17-23
Browning BL, Browning SR (2009) A unified approach to genotype imputation and haplotype-
phase inference for large data sets of trios and unrelated individuals. Am J Hum Genet
84:210-223
Browning SR, Browning BL (2007) Rapid and accurate haplotype phasing and missing-data
inference for whole-genome association studies by use of localized haplotype clustering.
Am J Hum Genet 81:1084-1097
Butler D, Cullis B, Gilmour A, Gogel B (2009) ASReml-R reference manual. Queensland
Department of Primary Industries and Fisheries, Toowoomba, Australia
Campoli C, Matus-Cadiz MA, Pozniak CJ, Cattivelli L, Fowler DB (2009) Comparative
expression of Cbf genes in the Triticeae under different acclimation induction
temperatures. Mol Genet Genomics 282:141-152
Carlborg O, Haley CS (2004) Epistasis: too often neglected in complex trait studies? Nat Rev
Genet 5:618-625
Case AJ, Skinner DZ, Garland-Campbell KA, Carter AH (2014) Freezing tolerance-associated
quantitative trait loci in the Brundage × Coda wheat recombinant inbred line population.
Crop Sci 54:982-992
Cattivelli L, Baldi P, Crosatti C, Di Fonzo N, Faccioli P, Grossi M, Mastrangelo A, Pecchioni N,
Stanca AM (2002) Chromosome regions and stress-related sequences involved in
resistance to abiotic stress in Triticeae. Plant Mol Biol 48:649-665
Chang CC, Chow CC, Tellier LC, Vattikuti S, Purcell SM, Lee JJ (2015) Second-generation
PLINK: rising to the challenge of larger and richer datasets. GigaScience 4:1-16
Charif D, Lobry JR (2007) SeqinR 1.0-2: A contributed package to the R project for statistical
computing devoted to biological sequences retrieval and analysis. In: Bastolla U, Porto M,
Roman HE, Vendruscolo M (eds) Structural approaches to sequence evolution: Molecules,
networks, populations. Springer Berlin Heidelberg, pp 207-232
Chase CD (2007) Cytoplasmic male sterility: a window to the world of plant mitochondrial–
nuclear interactions. Trends Genet 23:81-90
Churchill G, Doerge R (1994) Empirical threshold values for quantitative trait mapping. Genetics
138:963 - 971
Collard BCY, Mackill DJ (2008) Marker-assisted selection: an approach for precision plant
breeding in the twenty-first century. Philos T Roy Soc B 363:557-572
5. REFERENCES
69
Crosatti C, Polverino de Laureto P, Bassi R, Cattivelli L (1999) The interaction between cold and
light controls the expression of the cold-regulated barley gene cor14b and the
accumulation of the corresponding protein. Plant Physiol 119:671-680
Crosatti C, Soncini C, Stanca AM, Cattivelli L (1995) The accumulation of a cold-regulated
chloroplastic protein is light-dependent. Planta 196:458-463
Curtis CA, Lukaszewski AJ (1993) Localization of genes in rye that restore male fertility to
hexaploid wheat with timopheevi cytoplasm. Plant Breeding 111:106-112
Daetwyler HD, Pong-Wong R, Villanueva B, Woolliams JA (2010) The impact of genetic
architecture on genome-wide evaluation methods. Genetics 185:1021-1031
Devos KM, Atkinson MD, Chinoy CN, Francis HA, Harcourt RL, Koebner RMD, Liu CJ,
Masojc P, Xie DX, Gale MD (1993) Chromosomal rearrangements in the rye genome
relative to that of wheat. Theor Appl Genet 85:673-680
Dhillon T, Pearce SP, Stockinger EJ, Distelfeld A, Li C, Knox AK, Vashegyi I, Vágújfalvi A,
Galiba G, Dubcovsky J (2010) Regulation of freezing tolerance and flowering in
temperate cereals: the VRN-1 connection. Plant Physiol 153:1846-1858
Ding X, Zhang H, Chen H, Wang L, Qian H, Qi X (2015) Extraction, purification and
identification of antifreeze proteins from cold acclimated malting barley (Hordeum
vulgare L.). Food Chem 175:74-81
Doležel J, Greilhuber J, Lucretti S, Meister A, Lysák MA, Nardi L, Obermayer R (1998) Plant
genome size estimation by flow cytometry: Inter-laboratory comparison. Ann Bot 82,
Supplement A:17-26
Dubcovsky J, Lijavetzky D, Appendino L, Tranquilli G (1998) Comparative RFLP mapping of
Triticum monococcum genes controlling vernalization requirement. Theor Appl Genet
97:968-975
Edwards MD, Stuber CW, Wendel JF (1987) Molecular-marker-facilitated investigations of
quantitative-trait loci in maize. I. Numbers, genomic distribution and types of gene action.
Genetics 116:113-125
Erath W, Bauer E, Fowler DB, Gordillo A, Korzun V, Ponomareva M, Schmidt M, Schmiedchen
B, Wilde P, Schön C-C (2017) Exploring new alleles for frost tolerance in winter rye.
Theor Appl Genet 130:2151-2164
Erath W, Bauer E, Kastirr U, Schmidt M, Korzun V, Schmiedchen B, Wilde P, Schön C-C (2016)
Oligogenic control of resistance to soil-borne viruses SBCMV and WSSMV in rye (Secale
cereale L.). Plant Breeding 135:552-559
Eremina M, Unterholzner SJ, Rathnayake AI, Castellanos M, Khan M, Kugler KG, May ST,
Mayer KFX, Rozhon W, Poppenberger B (2016) Brassinosteroids participate in the
control of basal and acquired freezing tolerance of plants. Proc Natl Acad Sci USA
113:5982-5991
5. REFERENCES
70
Falke K, Wilde P, Wortmann H, Geiger H, Miedaner T (2009) Identification of genomic regions
carrying QTL for agronomic and quality traits in rye (Secale cereale) introgression
libraries. Plant Breeding 128:615 - 623
FAOSTAT (2017) Data from 2014. Statistics database of the Food and Agriculture Organisation
of the United Nations (FAO), Production, Crops, URL:
http://faostatfaoorg/site/567/DesktopDefaultaspx?PageID=567#ancor
Fischer S, Melchinger AE, Korzun V, Wilde P, Schmiedchen B, Möhring J, Piepho H-P, Dhillon
BS, Würschum T, Reif JC (2010) Molecular marker assisted broadening of the Central
European heterotic groups in rye with Eastern European germplasm. Theor Appl Genet
120:291-299
Fisk SP, Cuesta-Marcos A, Cistue L, Russell J, Smith KP, Baenziger S, Bedo Z, Corey A,
Filichkin T, Karsai I, Waugh R, Hayes PM (2013) FR-H3: a new QTL to assist in the
development of fall-sown barley with superior low temperature tolerance. Theor Appl
Genet 126:335-347
Foiada F, Westermeier P, Kessel B, Ouzunova M, Wimmer V, Mayerhofer W, Presterl T, Dilger
M, Kreps R, Eder J, Schön C-C (2015) Improving resistance to the European corn borer: a
comprehensive study in elite maize using QTL mapping and genome-wide prediction.
Theor Appl Genet 128:875-891
Fowler DB (2008) Cold acclimation threshold induction temperatures in cereals. Crop Sci
48:1147-1154
Fowler DB, Limin AE (1987) Exploitable genetic-variability for cold tolerance in commercially
grown cereals. Can J Plant Sci 67:278-278
Fowler DB, Limin AE (2004) Interactions among factors regulating phenological development
and acclimation rate determine low-temperature tolerance in wheat. Ann Bot 94:717-724
Fowler DB, Siminovitch D, Pomeroy MK (1973) Evaluation of an artificial test for frost
hardiness in wheat. Can J Plant Sci 53:53-59
Fowler SG, Cook D, Thomashow MF (2005) Low temperature induction of Arabidopsis Cbf1, 2,
and 3 is gated by the circadian clock. Plant Physiol 137:961-968
Francia E, Rizza F, Cattivelli L, Stanca AM, Galiba G, Tóth B, Hayes PM, Skinner JS, Pecchioni
N (2004) Two loci on chromosome 5H determine low-temperature tolerance in a ‘Nure’
(winter) × ‘Tremois’ (spring) barley map. Theor Appl Genet 108:670-680
Francia E, Tacconi G, Crosatti C, Barabaschi D, Bulgarelli D, Dall’Aglio E, Valè G (2005)
Marker assisted selection in crop plants. Plant Cell Tiss Org Cult 82:317-342
Franklin KA, Whitelam GC (2007) Light-quality regulation of freezing tolerance in Arabidopsis
thaliana. Nat Genet 39:1410-1413
Fricano A, Rizza F, Faccioli P, Pagani D, Pavan P, Stella A, Rossini L, Piffanelli P, Cattivelli L
(2009) Genetic variants of HvCbf14 are statistically associated with frost tolerance in a
European germplasm collection of Hordeum vulgare. Theor Appl Genet 119:1335-1348
5. REFERENCES
71
Friedman J, Hastie T, Tibshirani R (2010) Regularization paths for generalized linear models via
coordinate descent. J Stat Softw 33:1-22
Galiba G, Vágújfalvi A, Li C, Soltész A, Dubcovsky J (2009) Regulatory genes involved in the
determination of frost tolerance in temperate cereals. Plant Sci 176:12-19
Geiger HH, Miedaner T (2009) Rye breeding. In: Cereals (Carena MJ, ed) New York, USA:
Springer:157-181
Geiger HH, Schnell FW (1970) Cytoplasmic male sterility in rye (Secale cereale L.). Crop Sci
10:590-593
Gilmour SJ, Zarka DG, Stockinger EJ, Salazar MP, Houghton JM, Thomashow MF (1998) Low
temperature regulation of the Arabidopsis CBF family of AP2 transcriptional activators as
an early step in cold-induced Cor gene expression. Plant J 16:433-442
Gray GR, Chauvin LP, Sarhan F, Huner N (1997) Cold acclimation and freezing tolerance (A
complex interaction of light and temperature). Plant Physiol 114:467-474
Guo G, Zhao F, Wang Y, Zhang Y, Du L, Su G (2014) Comparison of single-trait and multiple-
trait genomic prediction models. BMC Genet 15:30
Gusta LV, O'Connor BJ, MacHutcheon MG (1997) The selection of superior winter-hardy
genotypes using a prolonged freeze test. Can J Plant Sci 77:15-21
Gusta LV, O’Connor BJ, Gao YP, Jana S (2001) A re-evaluation of controlled freeze-tests and
controlled environment hardening conditions to estimate the winter survival potential of
hardy winter wheats. Can J Plant Sci 81:241-246
Habier D, Fernando RL, Dekkers JCM (2007) The impact of genetic relationship information on
genome-assisted breeding values. Genetics 177:2389-2397
Hackauf B, Bauer E, Korzun V, Miedaner T (2017) Fine mapping of the restorer gene Rfp3 from
an Iranian primitive rye (Secale cereale L.). Theor Appl Genet 130:1179-1189
Hackauf B, Rudd S, Van der Voort J, Miedaner T, Wehling P (2009) Comparative mapping of
DNA sequences in rye (Secale cereale L.) in relation to the rice genome. Theor Appl
Genet 118:371-384
Hackett CA (2002) Statistical methods for QTL mapping in cereals. Plant Mol Biol 48:585-599
Haldane J (1919) The combination of linkage values and the calculation of distances between the
loci of linked factors. J Genet 8:299-309
Haley CS, Knott SA (1992) A simple regression method for mapping quantitative trait loci in line
crosses using flanking markers. Heredity 69:315-324
Hall TA (1999) BioEdit: a user-friendly biological sequence alignment editor and analysis
program for Windows 95/98/NT. Nucl Acid S 41:95-98
Hammer K (2003) A paradigm shift in the discipline of plant genetic resources. Genet Resour
Crop Evol 50:3-10
5. REFERENCES
72
Harlan JR, de Wet JMJ (1971) Toward a rational classification of cultivated plants. Taxon
20:509-517
Haseneyer G, Schmutzer T, Seidel M, Zhou RN, Mascher M, Schön C-C, Taudien S, Scholz U,
Stein N, Mayer KFX, Bauer E (2011) From RNA-seq to large-scale genotyping -
genomics resources for rye (Secale cereale L.). BMC Plant Biol 11:131
Haussmann B, Parzies H, Presterl T, Susic Z, Miedaner T (2004) Plant genetic resources in crop
improvement. Plant Genetic Resources 2:3-21
Hawkes JG (1977) The importance of wild germplasm in plant breeding. Euphytica 26:615-621
Heffner EL, Lorenz AJ, Jannink J-L, Sorrells ME (2010) Plant breeding with genomic selection:
Gain per unit time and cost. Crop Sci 50:1681-1690
Henderson CR (1985) Best linear unbiased prediction of nonadditive genetic merits in noninbred
populations. J Anim Sci 60:111-117
Higgins D, Thompson J, Gibson T, Thompson JD, Higgins DG, Gibson TJ (1994) CLUSTAL W:
Improving the sensitivity of progressive multiple sequence alignment through sequence
weighting, position-specific gap penalties and weight matrix choice. Nucleic Acids Res
22:4673-4680
Holland JB, Nyquist WE, Cervantes-Martinez CT (2003) Estimating and interpreting heritability
for plant breeding: an update. Plant Breed Rev 22:9-112
Ishitani M, Xiong L, Stevenson B, Zhu JK (1997) Genetic analysis of osmotic and cold stress
signal transduction in Arabidopsis: interactions and convergence of abscisic acid-
dependent and abscisic acid-independent pathways. Plant Cell 9:1935-1949
Jäger E, J., Neumann S, Ohmann E (2003) Botanik. Spektrum Akademischer Verlag, Heidelberg
Jaglo-Ottosen KR, Gilmour SJ, Zarka DG, Schabenberger O, Thomashow MF (1998)
Arabidopsis Cbf1 overexpression induces Cor genes and enhances freezing tolerance.
Science 280:104-106
Jaglo KR, Kleff S, Amundsen KL, Zhang X, Haake V, Zhang JZ, Deits T, Thomashow MF
(2001) Components of the Arabidopsis C-repeat/dehydration-responsive element binding
factor cold-response pathway are conserved in Brassica napus and other plant species.
Plant Physiol 127:910-917
Jha UC, Bohra A, Jha R (2017) Breeding approaches and genomics technologies to increase crop
yield under low-temperature stress. Plant Cell Rep 36:1-35
Jia Y, Jannink J-L (2012) Multiple-trait genomic selection methods increase genetic value
prediction accuracy. Genetics 192:1513-1522
Jiang Y, Reif JC (2015) Modelling epistasis in genomic selection. Genetics 201:759-768
Khush GS (1963) Cytogenetic and evolutionary studies in Secale III. Cytogenetics of weedy ryes
and origin of cultivated rye. Econ Bot 17:60-71
5. REFERENCES
73
Kim H-h, Kim D-m, Kang J-w, Lee H-S, Kang Y-j, Ahn S-n (2015) Analysis of QTL interaction
for grain weight using near isogenic lines in rice. Plant Breed Biotech 3:30-38
Kim SH, Kim HS, Bahk S, An J, Yoo Y, Kim J-Y, Chung WS (2017) Phosphorylation of the
transcriptional repressor MYB15 by mitogen-activated protein kinase 6 is required for
freezing tolerance in Arabidopsis. Nucleic Acids Res 45:6613-6627
Knight H, Zarka DG, Okamoto H, Thomashow MF, Knight MR (2004) Abscisic acid induces Cbf
gene transcription and subsequent induction of cold-regulated genes via the CRT promoter
element. Plant Physiol 135:1710-1717
Knox AK, Dhillon T, Cheng HM, Tondelli A, Pecchioni N, Stockinger EJ (2010) Cbf gene copy
number variation at Frost resistance-2 is associated with levels of freezing tolerance in
temperate-climate cereals. Theor Appl Genet 121:21-35
Knox AK, Li CX, Vágújfalvi A, Galilba G, Stockinger EJ, Dubcovsky J (2008) Identification of
candidate Cbf genes for the frost tolerance locus Fr-Am2 in Triticum monococcum. Plant
Mol Biol 67:257-270
Kobayashi F, Takumi S, Kume S, Ishibashi M, Ohno R, Murai K, Nakamura C (2005) Regulation
by Vrn-1/Fr-1 chromosomal intervals of Cbf-mediated Cor/Lea gene expression and
freezing tolerance in common wheat. J Exp Bot 56:887-895
Korzun V, Malyshev S, Kartel N, Westermann T, Weber WE, Börner A (1998) A genetic linkage
map of rye (Secale cereale L.). Theor Appl Genet 96:203-208
Kovach MJ, McCouch SR (2008) Leveraging natural diversity: back through the bottleneck. Curr
Opin Plant Biol 11:193-200
Kumar S, Stecher G, Tamura K (2016) MEGA7: Molecular evolutionary genetics analysis
version 7.0 for bigger datasets. Mol Biol Evol 33:1870-1874
Lander ES, Botstein D (1989) Mapping mendelian factors underlying quantitative traits using
RFLP linkage maps. Genetics 121:185-199
Lee CM, Thomashow MF (2012) Photoperiodic regulation of the C-repeat binding factor (CBF)
cold acclimation pathway and freezing tolerance in Arabidopsis thaliana. Proc Natl Acad
Sci USA 109:15054-15059
Lehermeier C, Schön C-C, de los Campos G (2015) Assessment of genetic heterogeneity in
structured plant populations using multivariate whole-genome regression models.
Genetics 201:323-337
Li Y (2012) Association analysis of frost tolerance in rye (Secale cereale L.) using candidate
gene polymorphisms and phenotypic data from controlled, semi-controlled, and field
phenotyping platforms. München, Technische Universität München, Diss., 2012
Li Y, Böck A, Haseneyer G, Korzun V, Wilde P, Schön C-C, Ankerst D, Bauer E (2011a)
Association analysis of frost tolerance in rye using candidate genes and phenotypic data
from controlled, semi-controlled, and field phenotyping platforms. BMC Plant Biol
11:146
5. REFERENCES
74
Li Y, Haseneyer G, Schön C-C, Ankerst D, Korzun V, Wilde P, Bauer E (2011b) High levels of
nucleotide diversity and fast decline of linkage disequilibrium in rye (Secale cereale L.)
genes involved in frost response. BMC Plant Biol 11:6
Limin AE, Fowler DB (2006) Low-temperature tolerance and genetic potential in wheat
(Triticum aestivum L.): response to photoperiod, vernalization, and plant development.
Planta 224:360-366
Liu Y, Zeng Z-B (2000) A general mixture model approach for mapping quantitative trait loci
from diverse cross designs involving multiple inbred lines. Genet Res 75:345-355
Livaja M, Unterseer S, Erath W, Lehermeier C, Wieseke R, Plieske J, Polley A, Luerßen H,
Wieckhorst S, Mascher M, Hahn V, Ouzunova M, Schön C-C, Ganal MW (2015)
Diversity analysis and genomic prediction of Sclerotinia resistance in sunflower using a
new 25 K SNP genotyping array. Theor Appl Genet 129:317-329
Longin CFH, Sieber A-N, Reif JC (2013) Combining frost tolerance, high grain yield and good
pasta quality in durum wheat. Plant Breeding 132:353-358
Lu C, Ho TD, Ho S, Yu S (2002) Three novel MYB proteins with one DNA binding repeat
mediate sugar and hormone regulation of α-amylase gene expression. Plant Cell 14:1963-
1980
Lundqvist A (1956) Self‒incompatibility in rye. Hereditas 42:293-348
Mackay TFC (2014) Epistasis and quantitative traits: using model organisms to study gene-gene
interactions. Nat Rev Genet 15:22-33
Marentes E, Griffith M, Mlynarz A, Brush RA (1993) Proteins accumulate in the apoplast of
winter rye leaves during cold acclimation. Physiol Plant 87:499-507
Margulies M, Egholm M, Altman WE, Attiya S, Bader JS, Bemben LA, Berka J, Braverman MS,
Chen Y-J, Chen Z (2005) Genome sequencing in microfabricated high-density picolitre
reactors. Nature 437:376-380
Martis MM, Zhou R, Haseneyer G, Schmutzer T, Vrána J, Kubaláková M, König S, Kugler KG,
Scholz U, Hackauf B, Korzun V, Schön C-C, Doležel J, Bauer E, Mayer KFX, Stein N
(2013) Reticulate evolution of the rye genome. Plant Cell 25:3685-3698
Mascher M, Gundlach H, Himmelbach A, Beier S, Twardziok SO, Wicker T, Radchuk V,
Dockter C, Hedley PE, Russell J, Bayer M, Ramsay L, Liu H, Haberer G, Zhang X-Q,
Zhang Q, Barrero RA, Li L, Taudien S, Groth M, Felder M, Hastie A, Šimková H,
Staňková H, Vrána J, Chan S, Muñoz-Amatriaín M, Ounit R, Wanamaker S, Bolser D,
Colmsee C, Schmutzer T, Aliyeva-Schnorr L, Grasso S, Tanskanen J, Chailyan A,
Sampath D, Heavens D, Clissold L, Cao S, Chapman B, Dai F, Han Y, Li H, Li X, Lin C,
McCooke JK, Tan C, Wang P, Wang S, Yin S, Zhou G, Poland JA, Bellgard MI, Borisjuk
L, Houben A, Doležel J, Ayling S, Lonardi S, Kersey P, Langridge P, Muehlbauer GJ,
Clark MD, Caccamo M, Schulman AH, Mayer KFX, Platzer M, Close TJ, Scholz U,
Hansson M, Zhang G, Braumann I, Spannagl M, Li C, Waugh R, Stein N (2017) A
chromosome conformation capture ordered sequence of the barley genome. Nature
544:427-433
5. REFERENCES
75
McCouch S, Baute GJ, Bradeen J, Bramel P, Bretting PK, Buckler E, Burke JM, Charest D,
Cloutier S, Cole G, Dempewolf H, Dingkuhn M, Feuillet C, Gepts P, Grattapaglia D,
Guarino L, Jackson S, Knapp S, Langridge P, Lawton-Rauh A, Lijua Q, Lusty C, Michael
T, Myles S, Naito K, Nelson RL, Pontarollo R, Richards CM, Rieseberg L, Ross-Ibarra J,
Rounsley S, Hamilton RS, Schurr U, Stein N, Tomooka N, van der Knaap E, van Tassel
D, Toll J, Valls J, Varshney RK, Ward J, Waugh R, Wenzl P, Zamir D (2013) Agriculture:
Feeding the future. Nature 499:23-24
McIntosh R, Yamazaki Y, Dubcovsky J, Rogers W, Morris C, Appels R, Xia X (2013) Catalogue
of Gene Symbols for Wheat. 12th International Wheat Genetic Symposium. Yokohama,
Japan, September, 8-13, 2013
Meuwissen THE, Hayes BJ, Goddard ME (2001) Prediction of total genetic value using genome-
wide dense marker maps. Genetics 157:1819-1829
Meyer RS, Choi JY, Sanches M, Plessis A, Flowers JM, Amas J, Dorph K, Barretto A, Gross B,
Fuller DQ, Bimpong IK, Ndjiondjop M-N, Hazzouri KM, Gregorio GB, Purugganan MD
(2016) Domestication history and geographical adaptation inferred from a SNP map of
African rice. Nat Genet 48:1083-1088
Middleton CP, Senerchia N, Stein N, Akhunov ED, Keller B, Wicker T, Kilian B (2014)
Sequencing of chloroplast genomes from wheat, barley, rye and their relatives provides a
detailed insight into the evolution of the Triticeae tribe. PLoS ONE 9:e85761
Miedaner T (2013) Roggenanbau: Eine erfolgreiche Alternative, AgrarPraxis kompakt. DLG-
Verlag, Frankfurt am Main
Miedaner T, Glass C, Dreyer F, Wilde P, Wortmann H, Geiger HH (2000) Mapping of genes for
male-fertility restoration in ’Pampa’ CMS winter rye (Secale cereale L.). Theor Appl
Genet 101:1226-1233
Mihaljevic R, Schön C-C, Utz HF, Melchinger AE (2005) Correlations and QTL correspondence
between line per se and testcross performance for agronomic traits in four populations of
European maize. Crop Sci 45:114-122
Miller AK, Galiba G, Dubcovsky J (2006) A cluster of 11 Cbf transcription factors is located at
the frost tolerance locus Fr-A(m)2 in Triticum monococcum. Mol Genet Genomics
275:193-203
Millet EJ, Welcker C, Kruijer W, Negro S, Coupel-Ledru A, Nicolas SD, Laborde J, Bauland C,
Praud S, Ranc N, Presterl T, Tuberosa R, Bedő Z, Draye X, Usadel B, Charcosset A, Van
Eeuwijk F, Tardieu F (2016) Genome-wide analysis of yield in Europe: allelic effects vary
with drought and heat scenarios. Plant Physiol 172:749-764
Möhring J, Piepho H-P (2009) Comparison of weighting in two-stage analysis of plant breeding
trials. Crop Sci 49:1977-1988
Mohseni S, Che H, Djillali Z, Dumont E, Nankeu J, Danyluk J (2012) Wheat Cbf gene family:
identification of polymorphisms in the Cbf coding sequence. Genome 55:865-881
Mugwira LM, Elgawhary SM, Patel KI (1976) Differential tolerances of triticale, wheat, rye, and
barley to aluminum in nutrient solution. Agron J 68:782-787
5. REFERENCES
76
Murat F, Pont C, Salse J (2014) Paleogenomics in Triticeae for translational research. Curr Plant
Biol 1:34-39
Novák A, Boldizsár Á, Ádám É, Kozma-Bognár L, Majláth I, Båga M, Tóth B, Chibbar R, Galiba
G (2015) Light-quality and temperature-dependent Cbf14 gene expression modulates
freezing tolerance in cereals. J Exp Bot 67:1285–1295
Novák A, Boldizsár Á, Gierczik K, Vágújfalvi A, Ádám É, Kozma-Bognár L, Galiba G (2017)
Light and temperature signalling at the level of Cbf14 gene expression in wheat and
barley. Plant Mol Biol Rep 35:399-408
Ould Estaghvirou SB, Ogutu JO, Schulz-Streeck T, Knaak C, Ouzunova M, Gordillo A, Piepho
H-P (2013) Evaluation of approaches for estimating the accuracy of genomic prediction in
plant breeding. BMC Genomics 14:860
Paradis E, Claude J, Strimmer K (2004) APE: Analyses of phylogenetics and evolution in R
language. Bioinformatics 20:289-290
Pasquariello M, Barabaschi D, Himmelbach A, Steuernagel B, Ariyadasa R, Stein N, Gandolfi F,
Tenedini E, Bernardis I, Tagliafico E, Pecchioni N, Francia E (2014) The barley Frost
resistance-H2 locus. Funct Integr Genomics 14:85-100
Pearce S, Zhu J, Boldizsár Á, Vágújfalvi A, Burke A, Garland-Campbell K, Galiba G,
Dubcovsky J (2013) Large deletions in the Cbf gene cluster at the Fr-B2 locus are
associated with reduced frost tolerance in wheat. Theor Appl Genet 126:2683-2697
Petoukhov V, Semenov VA (2010) A link between reduced Barents-Kara sea ice and cold winter
extremes over northern continents. J Geophys Res (Atmos) 115:D21111
Plaschke J, Börner A, Xie DX, Koebner RMD, Schlegel R, Gale MD (1993) RFLP mapping of
genes affecting plant height and growth habit in rye. Theor Appl Genet 85:1049-1054
Pomeroy MK, Fowler DB (1973) Use of lethal dose temperature estimates as indices of frost
tolerance for wheat cold acclimated under natural and controlled environments. Can J
Plant Sci 53:489-494
Prášil IT, Prášilová P, Mařík P (2007) Comparative study of direct and indirect evaluations of
frost tolerance in barley. Field Crops Res 102:1-8
R Development Core Team (2013) R: A language and environment for statistical computing. R
Foundation for Statistical Computing, Vienna
Rapacz M, Wolanin B, Hura K, Tyrka M (2008) The effects of cold acclimation on
photosynthetic apparatus and the expression of Cor14b in four genotypes of barley
(Hordeum vulgare) contrasting in their tolerance to freezing and high-light treatment in
cold conditions. Ann Bot 101:689-699
Riechmann JL, Meyerowitz EM (1998) The AP2/EREBP family of plant transcription factors.
Biol Chem 379:633-646
Sakuma Y, Liu Q, Dubouzet JG, Abe H, Shinozaki K, Yamaguchi-Shinozaki K (2002) DNA-
binding specificity of the ERF/AP2 domain of Arabidopsis DREBs, transcription factors
5. REFERENCES
77
involved in dehydration- and cold-inducible gene expression. Biochem Biophys Res
Commun 290:998-1009
Sandve SR, Fjellheim S (2010) Did gene family expansions during the Eocene–Oligocene
boundary climate cooling play a role in Pooideae adaptation to cool climates? Mol Ecol
19:2075-2088
Sarhan F, Ouellet F, Vazquez-Tello A (1997) The wheat wcs120 gene family. A useful model to
understand the molecular genetics of freezing tolerance in cereals. Physiol Plant 101:439-
445
Schön C-C, Dhillon BS, Utz HF, Melchinger AE (2010) High congruency of QTL positions for
heterosis of grain yield in three crosses of maize. Theor Appl Genet 120:321-332
Schulthess AW, Wang Y, Miedaner T, Wilde P, Reif JC, Zhao Y (2016) Multiple-trait- and
selection indices-genomic predictions for grain yield and protein content in rye for feeding
purposes. Theor Appl Genet 129:273-287
Schwegler DD, Gowda M, Schulz B, Miedaner T, Liu W, Reif JC (2014) Genotypic correlations
and QTL correspondence between line per se and testcross performance in sugar beet
(Beta vulgaris L.) for the three agronomic traits beet yield, potassium content, and sodium
content. Mol Breed 34:205-215
Semagn K, Björnstad Å, Xu Y (2010) The genetic dissection of quantitative traits in crops.
Electron J Biotechnol 13
Sencer HA, Hawkes JG (1980) On the origin of cultivated rye. Biol J Linn Soc 13:299-313
Seo E, Lee H, Jeon J, Park H, Kim J, Noh Y-S, Lee I (2009) Crosstalk between cold response and
flowering in Arabidopsis is mediated through the flowering-time gene SOC1 and its
upstream negative regulator FLC. Plant Cell 21:3185-3197
Shebeski L, McGinnis R, Evans L, Zuzens D (1973) Puma, a new cultivar of winter rye. Can J
Plant Sci 53:67-67
Sieber A-N, Longin CFH, Leiser WL, Würschum T (2016) Copy number variation of Cbf-A14 at
the Fr-A2 locus determines frost tolerance in winter durum wheat. Theor Appl Genet
129:1087-1097
Sieber A-N, Würschum T, Longin CFH (2014) Evaluation of a semi-controlled test as a selection
tool for frost tolerance in durum wheat (Triticum durum). Plant Breeding 133:465-469
Skinner DZ, Mackey B (2009) Freezing tolerance of winter wheat plants frozen in saturated soil.
Field Crops Res 113:335-341
Skinner J, Zitzewitz J, Szűcs P, Marquez-Cedillo L, Filichkin T, Amundsen K, Stockinger E,
Thomashow M, Chen TH, Hayes P (2005) Structural, functional, and phylogenetic
characterization of a large Cbf gene family in barley. Plant Mol Biol 59:533-551
Smith OS (1986) Covariance between line per se and testcross performance. Crop Sci 26:540-543
5. REFERENCES
78
Snape JW, Sarma R, Quarrie SA, Fish L, Galiba G, Sutka J (2001) Mapping genes for flowering
time and frost tolerance in cereals using precise genetic stocks. Euphytica 120:309-315
Soller M, Brody T, Genizi A (1976) On the power of experimental designs for the detection of
linkage between marker loci and quantitative loci in crosses between inbred lines. Theor
Appl Genet 47:35-39
Sorokina SA, Li C, Wettstein JJ, Kvamstø NG (2016) Observed atmospheric coupling between
Barents Sea ice and the warm-Arctic cold-Siberian anomaly pattern. J Clim 29:495-511
Stam P, Zeven AC (1981) The theoretical proportion of the donor genome in near-isogenic lines
of self-fertilizers bred by backcrossing. Euphytica 30:227-238
Stanke M, Morgenstern B (2005) AUGUSTUS: a web server for gene prediction in eukaryotes
that allows user-defined constraints. Nucleic Acids Res 33:W465-W467
Stockinger EJ, Skinner JS, Gardner KG, Francia E, Pecchioni N (2007) Expression levels of
barley Cbf genes at the Frost resistance-H2 locus are dependent upon alleles at Fr-H1 and
Fr-H2. Plant J 51:308-321
Stracke S, Schilling AG, Förster J, Weiss C, Glass C, Miedaner T, Geiger HH (2003)
Development of PCR-based markers linked to dominant genes for male-fertility
restoration in Pampa CMS of rye (Secale cereale L.). Theor Appl Genet 106:1184-1190
Su C-F, Wang Y-C, Hsieh T-H, Lu C-A, Tseng T-H, Yu S-M (2010) A novel MYBS3-dependent
pathway confers cold tolerance in rice. Plant Physiol 153:145-158
Sutka J (1994) Genetic control of frost tolerance in wheat (Triticum aestivum L.). Euphytica
77:277-282
Tajima F (1983) Evolutionary relationship of DNA sequences in finite populations. Genetics
105:437-460
Tamura K (1992) Estimation of the number of nucleotide substitutions when there are strong
transition-transversion and G+C-content biases. Mol Biol Evol 9:678-687
Tanksley SD, McCouch SR (1997) Seed banks and molecular maps: Unlocking genetic potential
from the wild. Science 277:1063-1066
Tanksley SD, Medina-Filho H, Rick CM (1982) Use of naturally-occurring enzyme variation to
detect and map genes controlling quantitative traits in an interspecific backcross of
tomato. Heredity 49:11-25
Targońska M, Bolibok-Brągoszewska H, Rakoczy-Trojanowska M (2016) Assessment of genetic
diversity in Secale cereale based on SSR markers. Plant Mol Biol Rep 34:37-51
Teixeira RT, Farbos I, Glimelius K (2005) Expression levels of meristem identity and homeotic
genes are modified by nuclear–mitochondrial interactions in alloplasmic male-sterile lines
of Brassica napus. Plant J 42:731-742
Thomashow MF (1999) Plant cold acclimation: Freezing tolerance genes and regulatory
mechanisms. Annu Rev Plant Physiol Plant Mol Biol 50:571-599
5. REFERENCES
79
Tibshirani R (1996) Regression shrinkage and selection via the LASSO. J Roy Stat Soc B Met
58:267-288
Tondelli A, Francia E, Barabaschi D, Pasquariello M, Pecchioni N (2011) Inside the Cbf locus in
Poaceae. Plant Sci 180:39-45
Tóth B, Francia E, Rizza F, Stanca AM, Galiba G, Pecchioni N (2004) Development of PCR-
based markers on chromosome 5H for assisted selection of frost-tolerant genotypes in
barley. Mol Breed 14:265-273
Utz HF (2011) PlabMQTL - Software for meta-QTL analysis with composite interval mapping.
Version 0.9. Institute of Plant Breeding, Seed Science, and Population Genetics,
University of Hohenheim
Utz HF, Melchinger AE (1996) PLABQTL: a program for composite interval mapping of QTL. J
Quant Trait Loci 2:1-5
Vágújfalvi A, Galiba G, Dubcovsky J, Cattivelli L (2000) Two loci on wheat chromosome 5A
regulate the differential cold-dependent expression of the Cor14b gene in frost-tolerant
and frost-sensitive genotypes. Mol Gen Genet 263:194-200
Van Ooijen JW (2006) JoinMap 4, software for the calculation of genetic linkage maps in
experimental populations. Kyazma B V, Wageningen, Netherlands
VanRaden PM (2008) Efficient methods to compute genomic predictions. J Dairy Sci 91:4414-
4423
Vashegyi I, Marozsán-Tóth Z, Galiba G, Dobrev PI, Vankova R, Tóth B (2013) Cold response of
dedifferentiated barley cells at the gene expression, hormone composition, and freezing
tolerance levels: studies on callus cultures. Mol Biotechnol 54:337-349
Visioni A, Tondelli A, Francia E, Pswarayi A, Malosetti M, Russell J, Thomas W, Waugh R,
Pecchioni N, Romagosa I, Comadran J (2013) Genome-wide association mapping of frost
tolerance in barley (Hordeum vulgare L.). BMC Genomics 14:424
Vivek BS, Krishna GK, Vengadessan V, Babu R, Zaidi PH, Kha LQ, Mandal SS, Grudloyma P,
Takalkar S, Krothapalli K, Singh IS, Ocampo ETM, Xingming F, Burgueño J, Azrai M,
Singh RP, Crossa J (2017) Use of genomic estimated breeding values results in rapid
genetic gains for drought tolerance in maize. Plant Genome 10
Wang Y, Xu H, Zhu H, Tao Y, Zhang G, Zhang L, Zhang C, Zhang Z, Ma Z (2014)
Classification and expression diversification of wheat dehydrin genes. Plant Sci 214:113-
120
Wang Z, Triezenberg SJ, Thomashow MF, Stockinger EJ (2005) Multiple hydrophobic motifs in
Arabidopsis CBF1 COOH-terminus provide functional redundancy in trans-activation.
Plant Mol Biol 58:543-559
Weir BS, Cockerham CC (1984) Estimating F-statistics for the analysis of population structure.
Evolution 38:1358-1370
5. REFERENCES
80
Wimmer V, Albrecht T, Auinger H-J, Schön C-C (2012) synbreed: a framework for the analysis
of genomic prediction data using R. Bioinformatics 28:2086-2087
Wimmer V, Lehermeier C, Albrecht T, Auinger H-J, Wang Y, Schön C-C (2013) Genome-wide
prediction of traits with different genetic architecture through efficient variable selection.
Genetics 195:573-587
Wise RP, Pring DR (2002) Nuclear-mediated mitochondrial gene regulation and male fertility in
higher plants: Light at the end of the tunnel? Proc Natl Acad Sci USA 99:10240-10242
Wolf M (2002) Markergestützte Vererbungsanalyse der Pollenfertilitätsrestauration bei
Winterroggen (Secale cereale L.). Pflanzenproduktion und Landschaftsökologie,
Universität Hohenheim, Dissertation
Wooten DR, Livingston DP, Holland JB, Marshall DS, Murphy JP (2008) Quantitative trait loci
and epistasis for crown freezing tolerance in the ‘Kanota’ × ‘Ogle’ hexaploid oat mapping
population. Crop Sci 48:149-157
Wricke G (1969) Untersuchungen zur Vererbung der Selbstfertilität beim Roggen (Secale
cereale). Theor Appl Genet 39:371-378
Wricke G, Wilde P, Wehling P, Gieselmann C (1993) An isozyme marker for pollen fertility
restoration in the Pampa CMS system of rye (Secale cereale L.). Plant Breeding 111:290-
294
Würschum T, Longin CFH, Hahn V, Tucker MR, Leiser WL (2017) Copy number variations of
Cbf genes at the Fr-A2 locus are essential components of winter hardiness in wheat. Plant
J 89:764-773
Yan L, Fu D, Li C, Blechl A, Tranquilli G, Bonafede M, Sanchez A, Valarik M, Yasuda S,
Dubcovsky J (2006) The wheat and barley vernalization gene Vrn3 is an orthologue of FT.
Proc Natl Acad Sci USA 103:19581-19586
Yan L, Loukoianov A, Blechl A, Tranquilli G, Ramakrishna W, SanMiguel P, Bennetzen JL,
Echenique V, Dubcovsky J (2004) The wheat Vrn2 gene is a flowering repressor down-
regulated by vernalization. Science 303:1640-1644
Yan L, Loukoianov A, Tranquilli G, Helguera M, Fahima T, Dubcovsky J (2003) Positional
cloning of the wheat vernalization gene Vrn1. Proc Natl Acad Sci USA 100:6263-6268
Yousef GG, Juvik JA (2001) Comparison of phenotypic and marker-assisted selection for
quantitative traits in sweet corn. Crop Sci 41:645-655
Zeng ZB (1993) Theoretical basis for separation of multiple linked gene effects in mapping
quantitative trait loci. Proc Natl Acad Sci USA 90:10972-10976
Zhang J (2003) Evolution by gene duplication: an update. Trends Ecol Evol 18:292-298
Zhang Y, Zhang H, Ding X, Cheng L, Wang L, Qian H, Qi X, Song C (2016) Purification and
identification of antifreeze protein from cold-acclimated oat (Avena sativa L.) and the
cryoprotective activities in ice cream. Food Bioprocess Tech 9:1746-1755

5. REFERENCES
81
Zhao Y, Gowda M, Würschum T, Longin CFH, Korzun V, Kollers S, Schachschneider R, Zeng J,
Fernando R, Dubcovsky J, Reif JC (2013) Dissecting the genetic architecture of frost
tolerance in Central European winter wheat. J Exp Bot 64:4453-4460
Zhu J, Pearce S, Burke A, See D, Skinner D, Dubcovsky J, Garland-Campbell K (2014) Copy
number and haplotype variation at the Vrn-A1 and central Fr-A2 loci are associated with
frost tolerance in hexaploid wheat. Theor Appl Genet 127:1183-1197
Zou H, Hastie T (2005) Regularization and variable selection via the elastic net. J R Statist Soc B
67:301-320
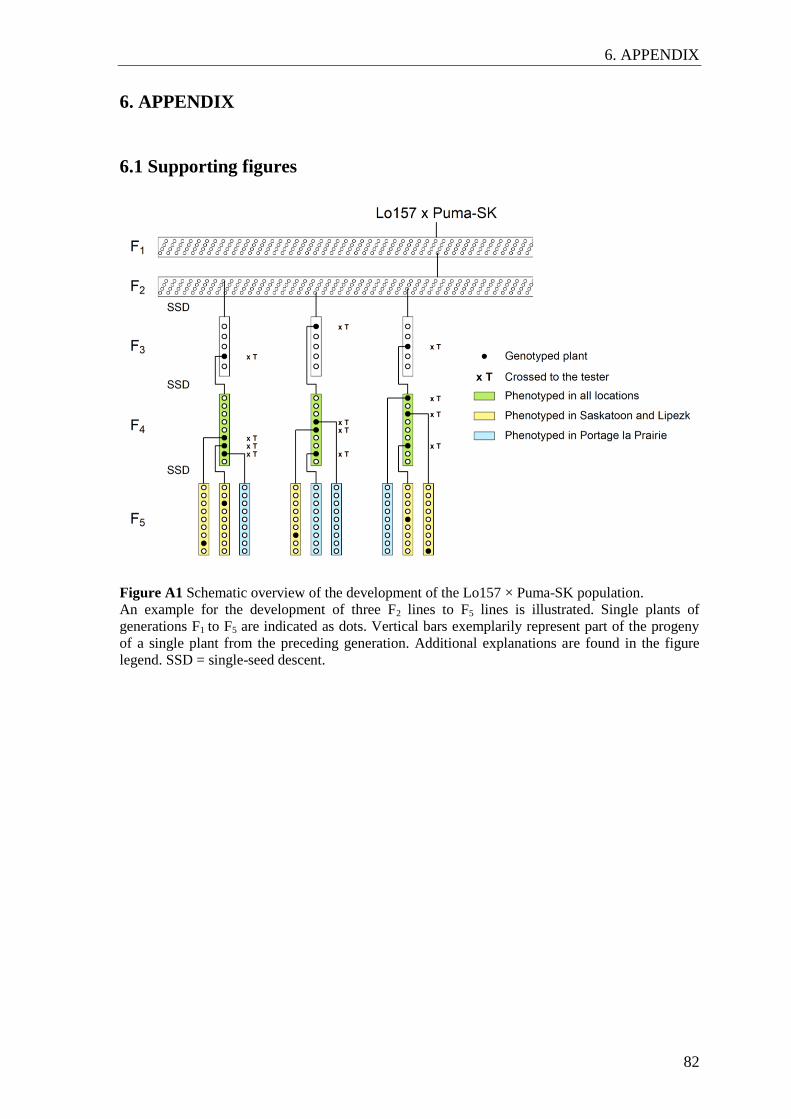
6. APPENDIX
82
6. APPENDIX
6.1 Supporting figures
Figure A1 Schematic overview of the development of the Lo157 × Puma-SK population.
An example for the development of three F2 lines to F5 lines is illustrated. Single plants of
generations F1 to F5 are indicated as dots. Vertical bars exemplarily represent part of the progeny
of a single plant from the preceding generation. Additional explanations are found in the figure
legend. SSD = single-seed descent.
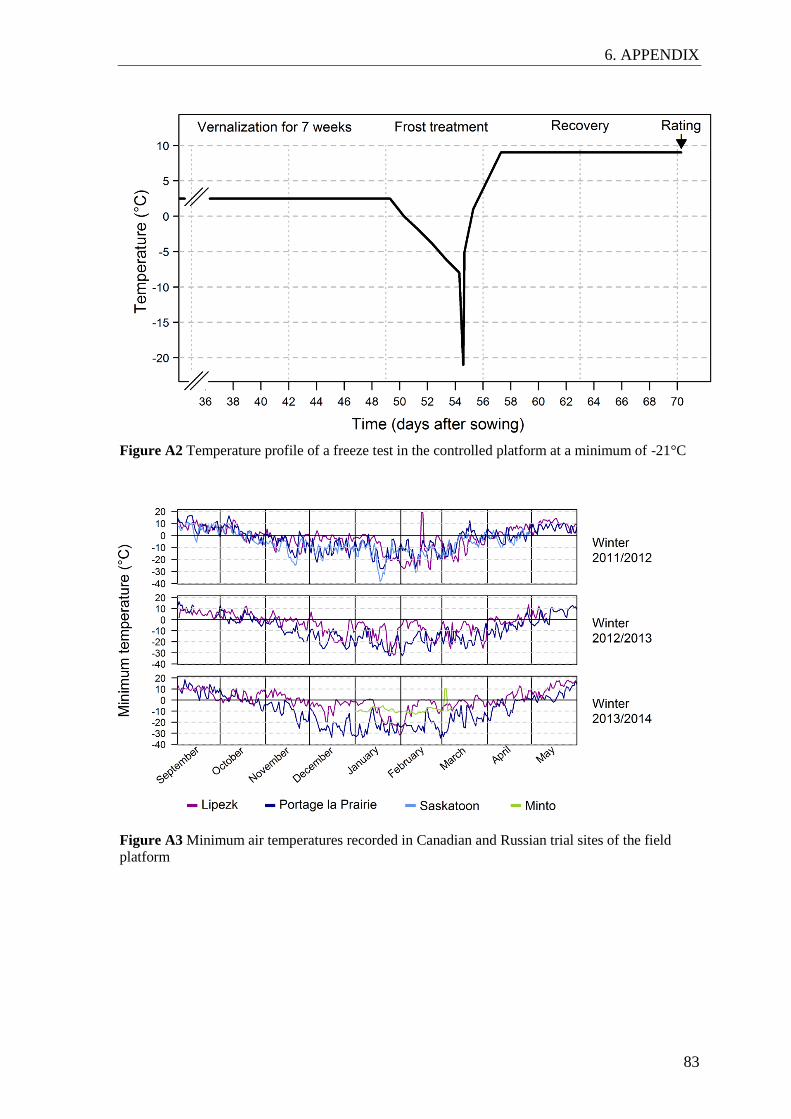
6. APPENDIX
83
Figure A2 Temperature profile of a freeze test in the controlled platform at a minimum of -21°C
Figure A3 Minimum air temperatures recorded in Canadian and Russian trial sites of the field
platform
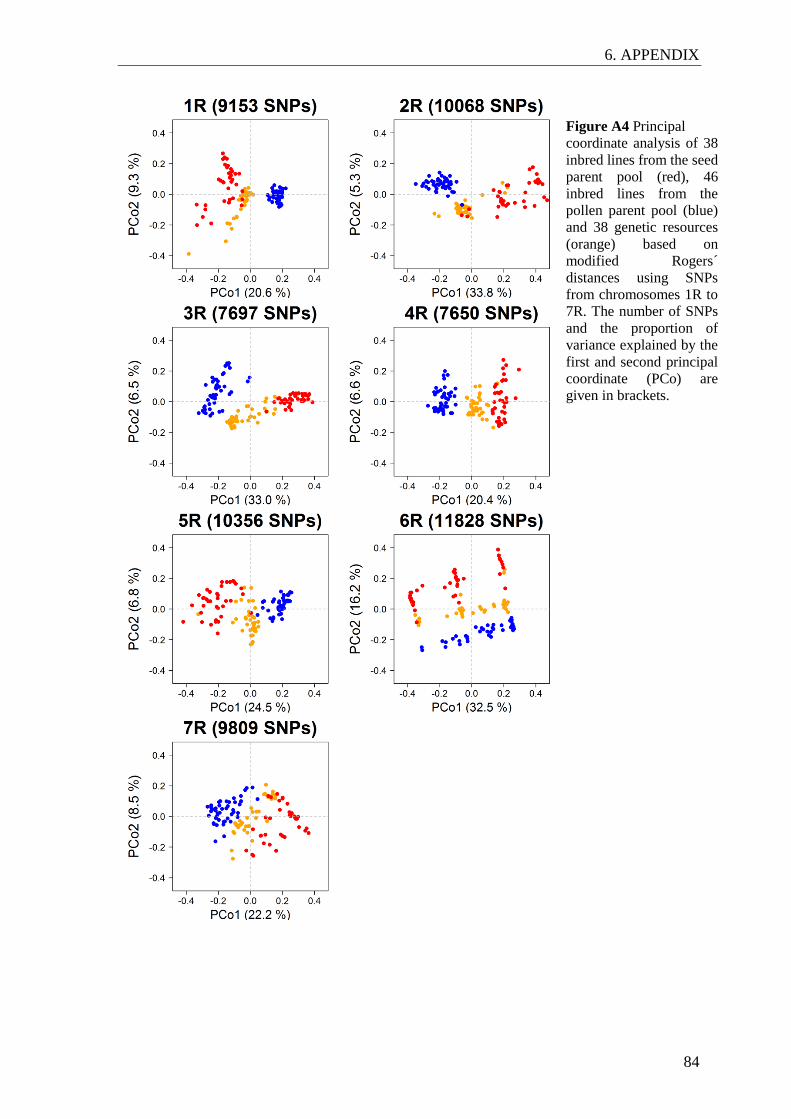
6. APPENDIX
84
Figure A4 Principal
coordinate analysis of 38
inbred lines from the seed
parent pool (red), 46
inbred lines from the
pollen parent pool (blue)
and 38 genetic resources
(orange) based on
modified Rogers´
distances using SNPs
from chromosomes 1R to
7R. The number of SNPs
and the proportion of
variance explained by the
first and second principal
coordinate (PCo) are
given in brackets.
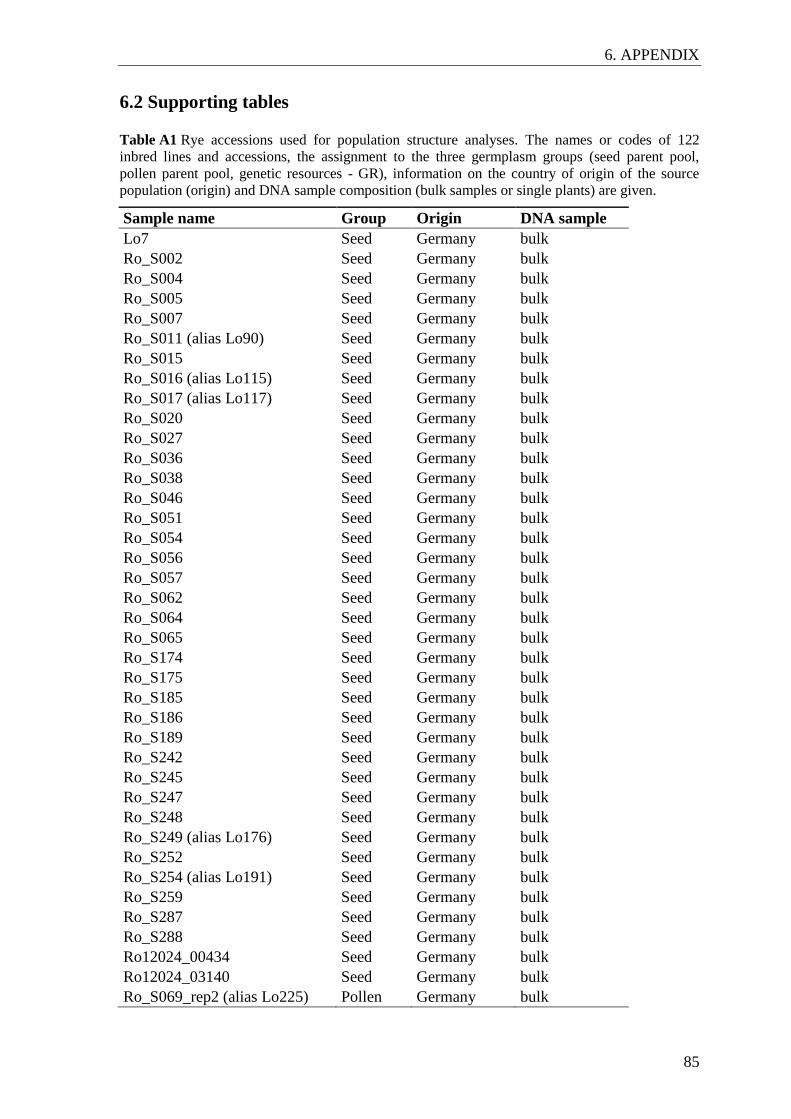
6. APPENDIX
85
6.2 Supporting tables
Table A1 Rye accessions used for population structure analyses. The names or codes of 122
inbred lines and accessions, the assignment to the three germplasm groups (seed parent pool,
pollen parent pool, genetic resources - GR), information on the country of origin of the source
population (origin) and DNA sample composition (bulk samples or single plants) are given.
Sample name Group Origin DNA sample
Lo7 Seed Germany bulk
Ro_S002 Seed Germany bulk
Ro_S004 Seed Germany bulk
Ro_S005 Seed Germany bulk
Ro_S007 Seed Germany bulk
Ro_S011 (alias Lo90) Seed Germany bulk
Ro_S015 Seed Germany bulk
Ro_S016 (alias Lo115) Seed Germany bulk
Ro_S017 (alias Lo117) Seed Germany bulk
Ro_S020 Seed Germany bulk
Ro_S027 Seed Germany bulk
Ro_S036 Seed Germany bulk
Ro_S038 Seed Germany bulk
Ro_S046 Seed Germany bulk
Ro_S051 Seed Germany bulk
Ro_S054 Seed Germany bulk
Ro_S056 Seed Germany bulk
Ro_S057 Seed Germany bulk
Ro_S062 Seed Germany bulk
Ro_S064 Seed Germany bulk
Ro_S065 Seed Germany bulk
Ro_S174 Seed Germany bulk
Ro_S175 Seed Germany bulk
Ro_S185 Seed Germany bulk
Ro_S186 Seed Germany bulk
Ro_S189 Seed Germany bulk
Ro_S242 Seed Germany bulk
Ro_S245 Seed Germany bulk
Ro_S247 Seed Germany bulk
Ro_S248 Seed Germany bulk
Ro_S249 (alias Lo176) Seed Germany bulk
Ro_S252 Seed Germany bulk
Ro_S254 (alias Lo191) Seed Germany bulk
Ro_S259 Seed Germany bulk
Ro_S287 Seed Germany bulk
Ro_S288 Seed Germany bulk
Ro12024_00434 Seed Germany bulk
Ro12024_03140 Seed Germany bulk
Ro_S069_rep2 (alias Lo225) Pollen Germany bulk
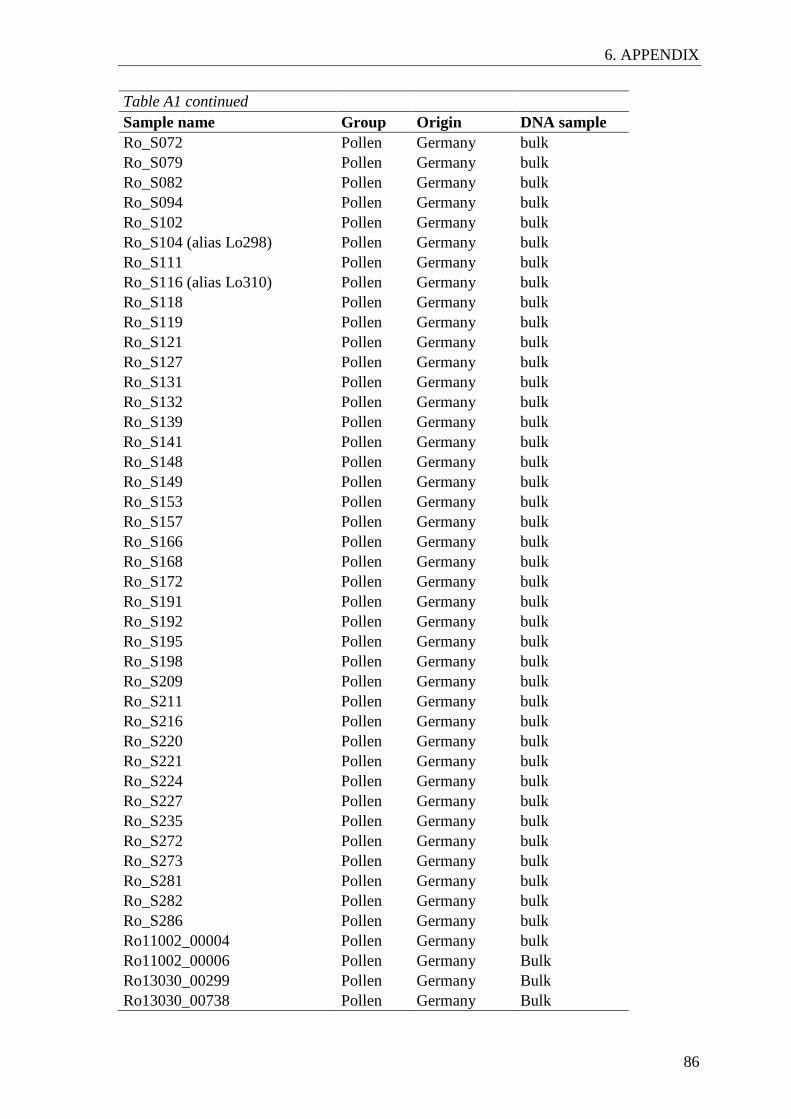
6. APPENDIX
86
Table A1 continued
Sample name Group Origin DNA sample
Ro_S072 Pollen Germany bulk
Ro_S079 Pollen Germany bulk
Ro_S082 Pollen Germany bulk
Ro_S094 Pollen Germany bulk
Ro_S102 Pollen Germany bulk
Ro_S104 (alias Lo298) Pollen Germany bulk
Ro_S111 Pollen Germany bulk
Ro_S116 (alias Lo310) Pollen Germany bulk
Ro_S118 Pollen Germany bulk
Ro_S119 Pollen Germany bulk
Ro_S121 Pollen Germany bulk
Ro_S127 Pollen Germany bulk
Ro_S131 Pollen Germany bulk
Ro_S132 Pollen Germany bulk
Ro_S139 Pollen Germany bulk
Ro_S141 Pollen Germany bulk
Ro_S148 Pollen Germany bulk
Ro_S149 Pollen Germany bulk
Ro_S153 Pollen Germany bulk
Ro_S157 Pollen Germany bulk
Ro_S166 Pollen Germany bulk
Ro_S168 Pollen Germany bulk
Ro_S172 Pollen Germany bulk
Ro_S191 Pollen Germany bulk
Ro_S192 Pollen Germany bulk
Ro_S195 Pollen Germany bulk
Ro_S198 Pollen Germany bulk
Ro_S209 Pollen Germany bulk
Ro_S211 Pollen Germany bulk
Ro_S216 Pollen Germany bulk
Ro_S220 Pollen Germany bulk
Ro_S221 Pollen Germany bulk
Ro_S224 Pollen Germany bulk
Ro_S227 Pollen Germany bulk
Ro_S235 Pollen Germany bulk
Ro_S272 Pollen Germany bulk
Ro_S273 Pollen Germany bulk
Ro_S281 Pollen Germany bulk
Ro_S282 Pollen Germany bulk
Ro_S286 Pollen Germany bulk
Ro11002_00004 Pollen Germany bulk
Ro11002_00006 Pollen Germany Bulk
Ro13030_00299 Pollen Germany Bulk
Ro13030_00738 Pollen Germany Bulk
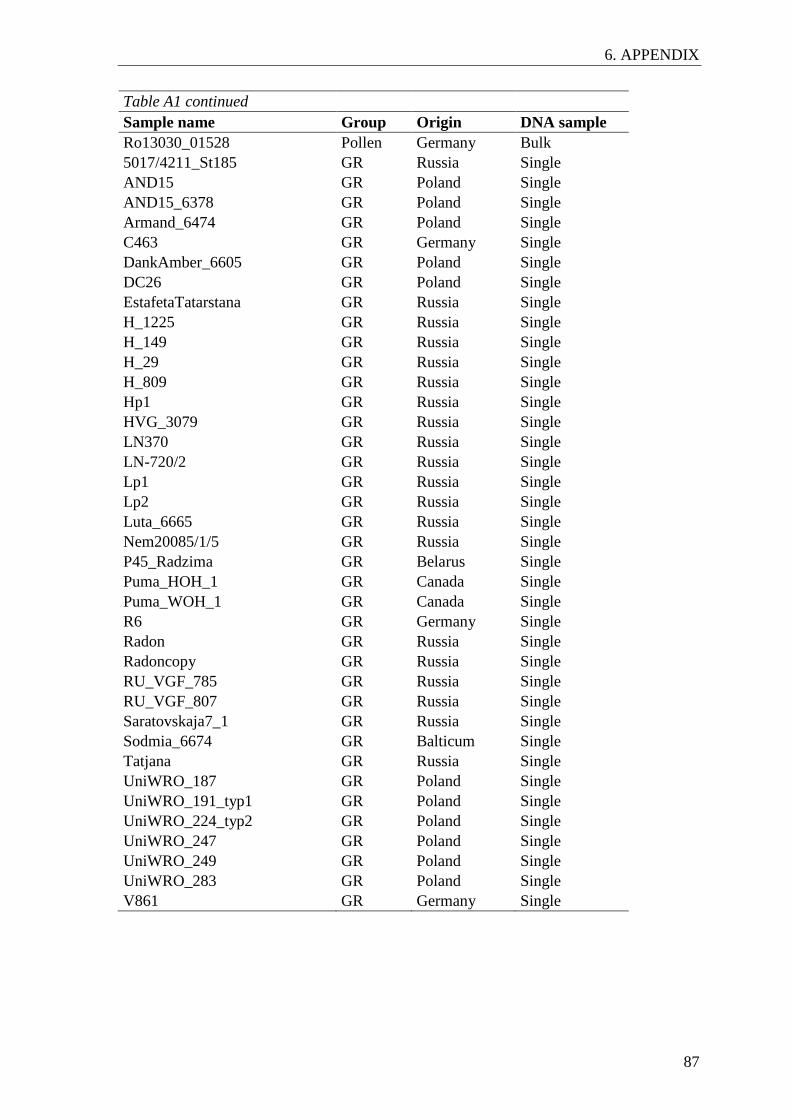
6. APPENDIX
87
Table A1 continued
Sample name Group Origin DNA sample
Ro13030_01528 Pollen Germany Bulk
5017/4211_St185 GR Russia Single
AND15 GR Poland Single
AND15_6378 GR Poland Single
Armand_6474 GR Poland Single
C463 GR Germany Single
DankAmber_6605 GR Poland Single
DC26 GR Poland Single
EstafetaTatarstana GR Russia Single
H_1225 GR Russia Single
H_149 GR Russia Single
H_29 GR Russia Single
H_809 GR Russia Single
Hp1 GR Russia Single
HVG_3079 GR Russia Single
LN370 GR Russia Single
LN-720/2 GR Russia Single
Lp1 GR Russia Single
Lp2 GR Russia Single
Luta_6665 GR Russia Single
Nem20085/1/5 GR Russia Single
P45_Radzima GR Belarus Single
Puma_HOH_1 GR Canada Single
Puma_WOH_1 GR Canada Single
R6 GR Germany Single
Radon GR Russia Single
Radoncopy GR Russia Single
RU_VGF_785 GR Russia Single
RU_VGF_807 GR Russia Single
Saratovskaja7_1 GR Russia Single
Sodmia_6674 GR Balticum Single
Tatjana GR Russia Single
UniWRO_187 GR Poland Single
UniWRO_191_typ1 GR Poland Single
UniWRO_224_typ2 GR Poland Single
UniWRO_247 GR Poland Single
UniWRO_249 GR Poland Single
UniWRO_283 GR Poland Single
V861 GR Germany Single
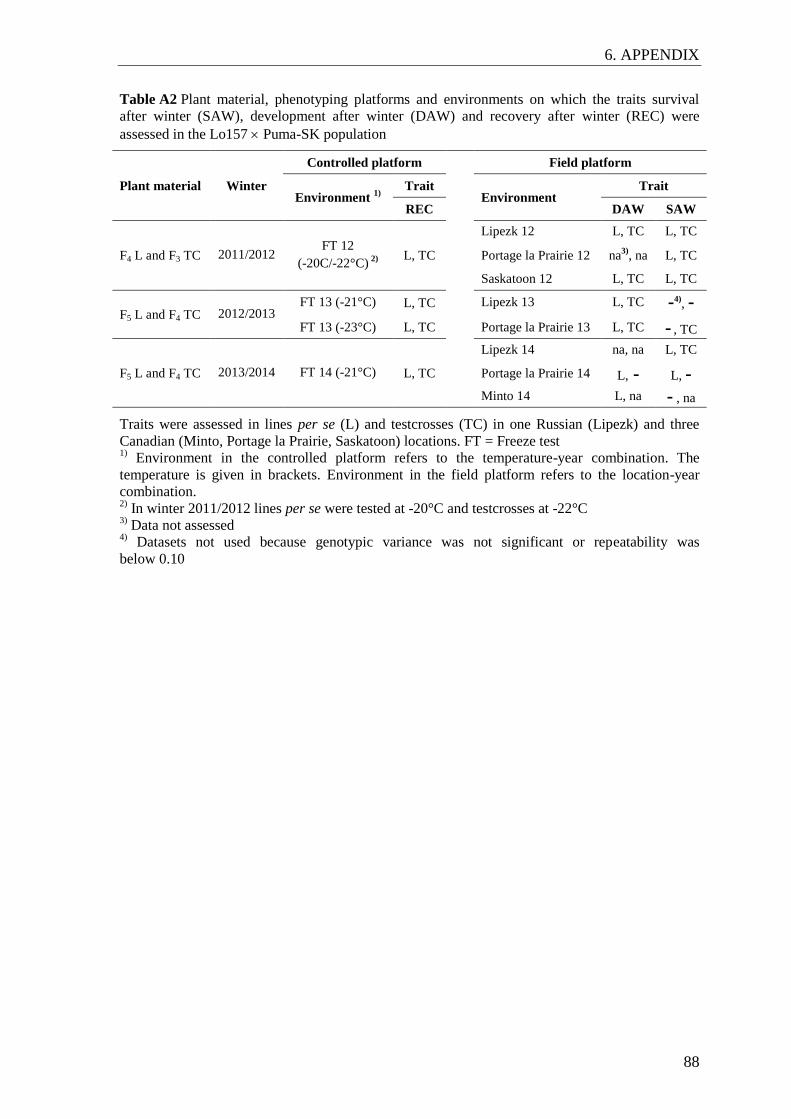
6. APPENDIX
88
Table A2 Plant material, phenotyping platforms and environments on which the traits survival
after winter (SAW), development after winter (DAW) and recovery after winter (REC) were
assessed in the Lo157 Puma-SK population
Plant material Winter
Controlled platform Field platform
Environment 1)
Trait
Environment Trait
REC DAW SAW
F4 L and F3 TC 2011/2012 FT 12
(-20C/-22°C) 2)
L, TC
Lipezk 12 L, TC L, TC
Portage la Prairie 12 na3)
, na L, TC
Saskatoon 12 L, TC L, TC
F5 L and F4 TC 2012/2013 FT 13 (-21°C) L, TC Lipezk 13 L, TC -4)
, -
FT 13 (-23°C) L, TC Portage la Prairie 13 L, TC - , TC
F5 L and F4 TC 2013/2014 FT 14 (-21°C) L, TC
Lipezk 14 na, na L, TC
Portage la Prairie 14 L, - L, -
Minto 14 L, na - , na
Traits were assessed in lines per se (L) and testcrosses (TC) in one Russian (Lipezk) and three
Canadian (Minto, Portage la Prairie, Saskatoon) locations. FT = Freeze test 1)
Environment in the controlled platform refers to the temperature-year combination. The
temperature is given in brackets. Environment in the field platform refers to the location-year
combination.
2) In winter 2011/2012 lines per se were tested at -20°C and testcrosses at -22°C
3) Data not assessed
4) Datasets not used because genotypic variance was not significant or repeatability was
below 0.10
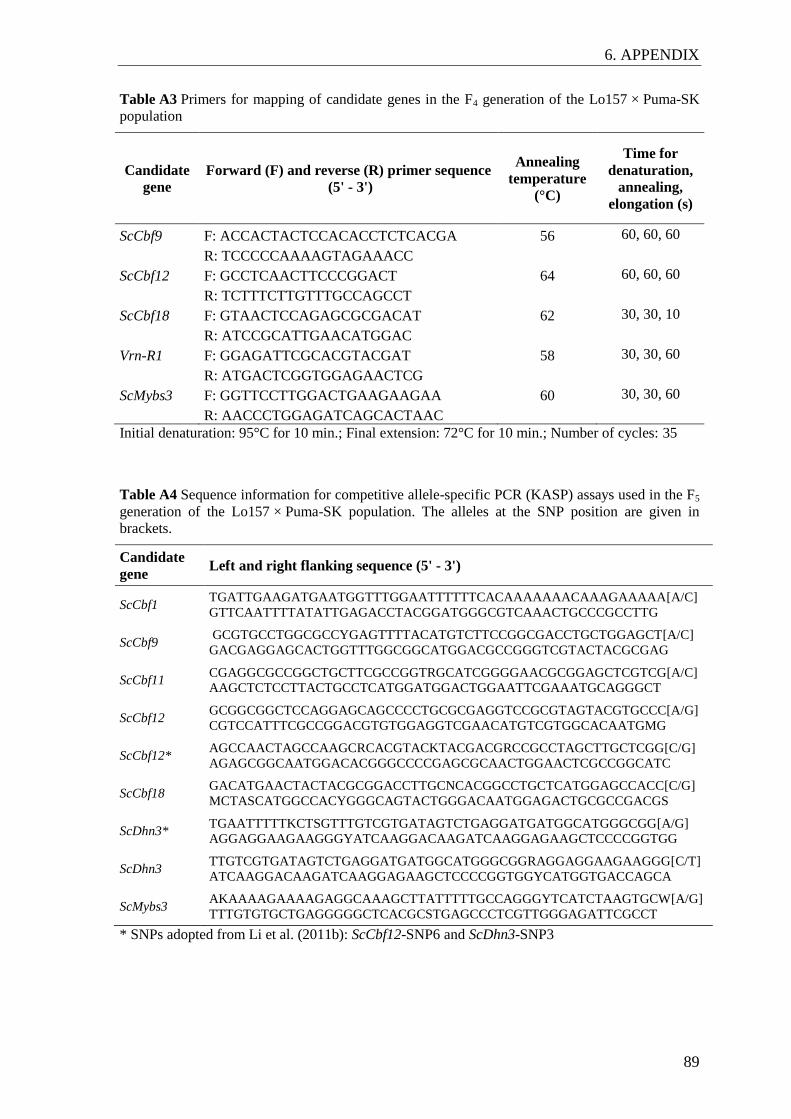
6. APPENDIX
89
Table A3 Primers for mapping of candidate genes in the F4 generation of the Lo157 × Puma-SK
population
Candidate
gene Forward (F) and reverse (R) primer sequence
(5' - 3')
Annealing
temperature
(°C)
Time for
denaturation,
annealing,
elongation (s)
ScCbf9 F: ACCACTACTCCACACCTCTCACGA 56 60, 60, 60
R: TCCCCCAAAAGTAGAAACC
ScCbf12 F: GCCTCAACTTCCCGGACT 64 60, 60, 60
R: TCTTTCTTGTTTGCCAGCCT
ScCbf18 F: GTAACTCCAGAGCGCGACAT 62 30, 30, 10
R: ATCCGCATTGAACATGGAC
Vrn-R1 F: GGAGATTCGCACGTACGAT 58 30, 30, 60
R: ATGACTCGGTGGAGAACTCG
ScMybs3 F: GGTTCCTTGGACTGAAGAAGAA 60 30, 30, 60
R: AACCCTGGAGATCAGCACTAAC
Initial denaturation: 95°C for 10 min.; Final extension: 72°C for 10 min.; Number of cycles: 35
Table A4 Sequence information for competitive allele-specific PCR (KASP) assays used in the F5
generation of the Lo157 × Puma-SK population. The alleles at the SNP position are given in
brackets.
Candidate
gene Left and right flanking sequence (5' - 3')
ScCbf1 TGATTGAAGATGAATGGTTTGGAATTTTTTCACAAAAAAACAAAGAAAAA[A/C]
GTTCAATTTTATATTGAGACCTACGGATGGGCGTCAAACTGCCCGCCTTG
ScCbf9 GCGTGCCTGGCGCCYGAGTTTTACATGTCTTCCGGCGACCTGCTGGAGCT[A/C]
GACGAGGAGCACTGGTTTGGCGGCATGGACGCCGGGTCGTACTACGCGAG
ScCbf11 CGAGGCGCCGGCTGCTTCGCCGGTRGCATCGGGGAACGCGGAGCTCGTCG[A/C]
AAGCTCTCCTTACTGCCTCATGGATGGACTGGAATTCGAAATGCAGGGCT
ScCbf12 GCGGCGGCTCCAGGAGCAGCCCCTGCGCGAGGTCCGCGTAGTACGTGCCC[A/G]
CGTCCATTTCGCCGGACGTGTGGAGGTCGAACATGTCGTGGCACAATGMG
ScCbf12* AGCCAACTAGCCAAGCRCACGTACKTACGACGRCCGCCTAGCTTGCTCGG[C/G]
AGAGCGGCAATGGACACGGGCCCCGAGCGCAACTGGAACTCGCCGGCATC
ScCbf18 GACATGAACTACTACGCGGACCTTGCNCACGGCCTGCTCATGGAGCCACC[C/G]
MCTASCATGGCCACYGGGCAGTACTGGGACAATGGAGACTGCGCCGACGS
ScDhn3* TGAATTTTTKCTSGTTTGTCGTGATAGTCTGAGGATGATGGCATGGGCGG[A/G]
AGGAGGAAGAAGGGYATCAAGGACAAGATCAAGGAGAAGCTCCCCGGTGG
ScDhn3 TTGTCGTGATAGTCTGAGGATGATGGCATGGGCGGRAGGAGGAAGAAGGG[C/T]
ATCAAGGACAAGATCAAGGAGAAGCTCCCCGGTGGYCATGGTGACCAGCA
ScMybs3 AKAAAAGAAAAGAGGCAAAGCTTATTTTTGCCAGGGYTCATCTAAGTGCW[A/G]
TTTGTGTGCTGAGGGGGCTCACGCSTGAGCCCTCGTTGGGAGATTCGCCT
* SNPs adopted from Li et al. (2011b): ScCbf12-SNP6 and ScDhn3-SNP3
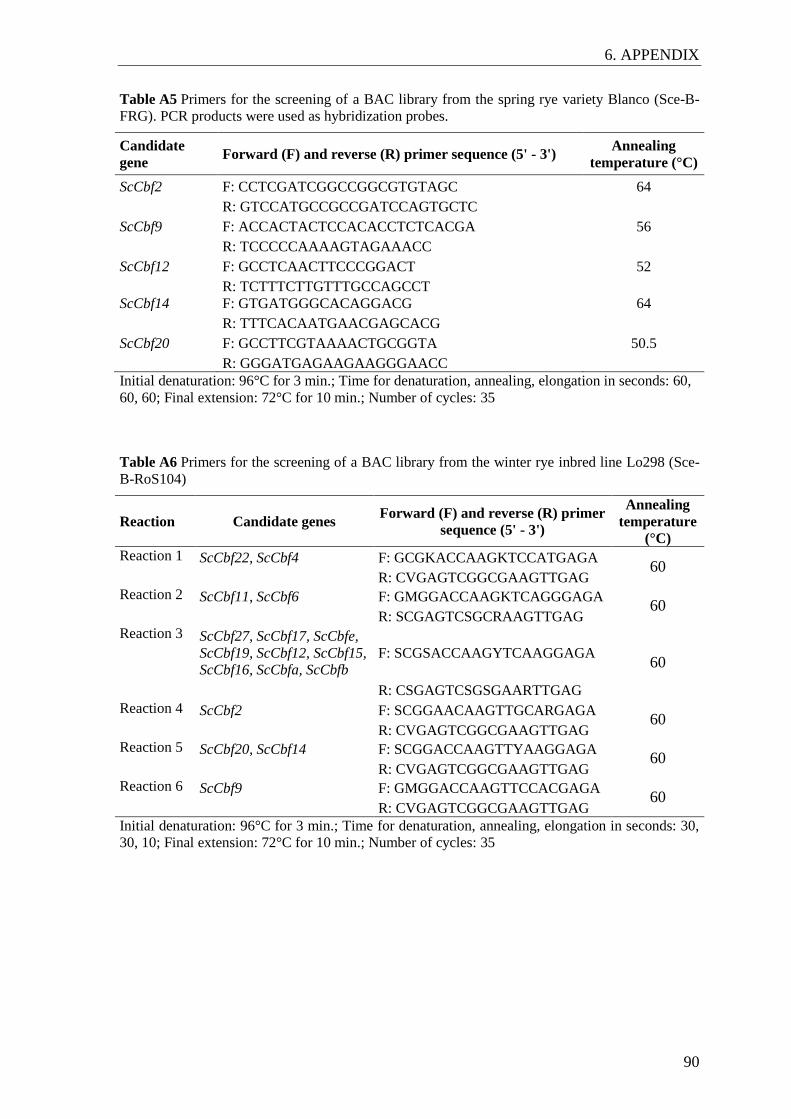
6. APPENDIX
90
Table A5 Primers for the screening of a BAC library from the spring rye variety Blanco (Sce-B-
FRG). PCR products were used as hybridization probes.
Candidate
gene Forward (F) and reverse (R) primer sequence (5' - 3')
Annealing
temperature (°C)
ScCbf2 F: CCTCGATCGGCCGGCGTGTAGC 64
R: GTCCATGCCGCCGATCCAGTGCTC
ScCbf9 F: ACCACTACTCCACACCTCTCACGA 56
R: TCCCCCAAAAGTAGAAACC
ScCbf12 F: GCCTCAACTTCCCGGACT 52
R: TCTTTCTTGTTTGCCAGCCT
ScCbf14 F: GTGATGGGCACAGGACG 64
R: TTTCACAATGAACGAGCACG
ScCbf20 F: GCCTTCGTAAAACTGCGGTA 50.5
R: GGGATGAGAAGAAGGGAACC Initial denaturation: 96°C for 3 min.; Time for denaturation, annealing, elongation in seconds: 60,
60, 60; Final extension: 72°C for 10 min.; Number of cycles: 35
Table A6 Primers for the screening of a BAC library from the winter rye inbred line Lo298 (Sce-
B-RoS104)
Reaction Candidate genes Forward (F) and reverse (R) primer
sequence (5' - 3')
Annealing
temperature
(°C) Reaction 1 ScCbf22, ScCbf4 F: GCGKACCAAGKTCCATGAGA
60 R: CVGAGTCGGCGAAGTTGAG Reaction 2 ScCbf11, ScCbf6 F: GMGGACCAAGKTCAGGGAGA
60 R: SCGAGTCSGCRAAGTTGAG Reaction 3 ScCbf27, ScCbf17, ScCbfe,
ScCbf19, ScCbf12, ScCbf15,
ScCbf16, ScCbfa, ScCbfb F: SCGSACCAAGYTCAAGGAGA
60
R: CSGAGTCSGSGAARTTGAG Reaction 4 ScCbf2 F: SCGGAACAAGTTGCARGAGA
60 R: CVGAGTCGGCGAAGTTGAG Reaction 5 ScCbf20, ScCbf14 F: SCGGACCAAGTTYAAGGAGA
60 R: CVGAGTCGGCGAAGTTGAG Reaction 6 ScCbf9 F: GMGGACCAAGTTCCACGAGA
60 R: CVGAGTCGGCGAAGTTGAG Initial denaturation: 96°C for 3 min.; Time for denaturation, annealing, elongation in seconds: 30,
30, 10; Final extension: 72°C for 10 min.; Number of cycles: 35
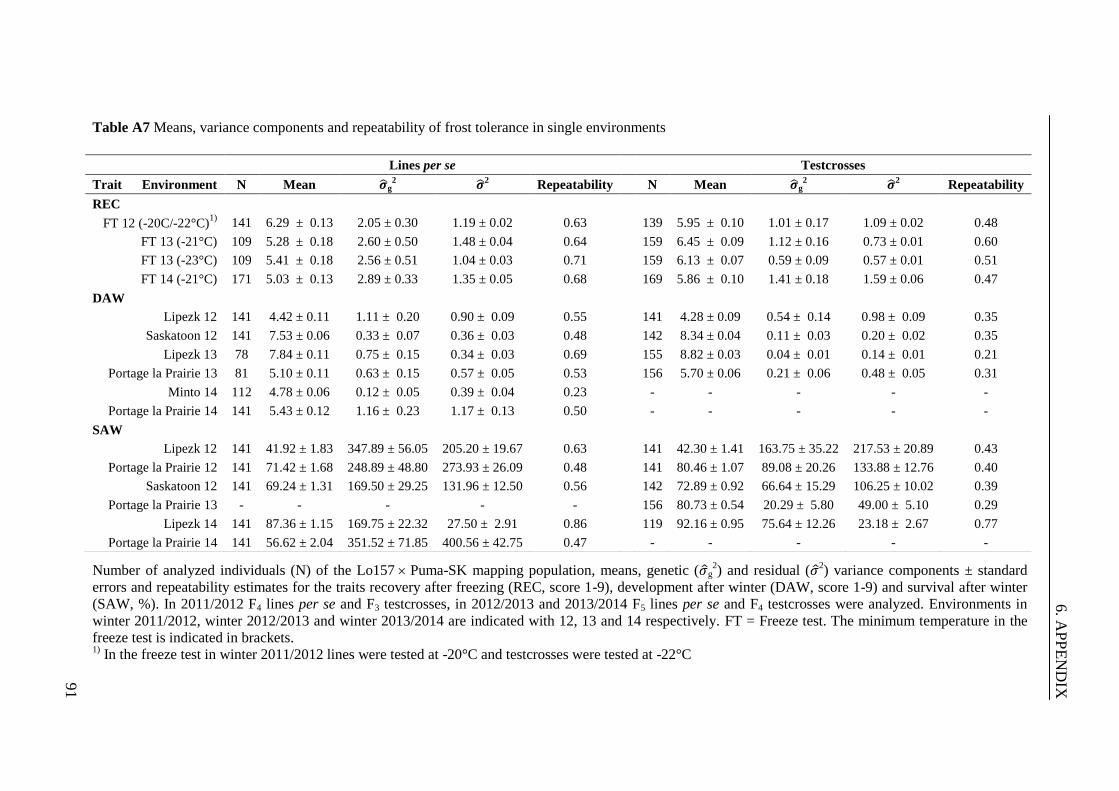
6. A
PP
EN
DIX
91
Table A7 Means, variance components and repeatability of frost tolerance in single environments
Number of analyzed individuals (N) of the Lo157 Puma-SK mapping population, means, genetic ( g2) and residual ( 2
) variance components ± standard
errors and repeatability estimates for the traits recovery after freezing (REC, score 1-9), development after winter (DAW, score 1-9) and survival after winter
(SAW, %). In 2011/2012 F4 lines per se and F3 testcrosses, in 2012/2013 and 2013/2014 F5 lines per se and F4 testcrosses were analyzed. Environments in
winter 2011/2012, winter 2012/2013 and winter 2013/2014 are indicated with 12, 13 and 14 respectively. FT = Freeze test. The minimum temperature in the
freeze test is indicated in brackets. 1)
In the freeze test in winter 2011/2012 lines were tested at -20°C and testcrosses were tested at -22°C
Lines per se Testcrosses
Trait Environment N Mean g2 2
Repeatability N Mean g2 2
Repeatability
REC
FT 12 (-20C/-22°C)1)
141 6.29 ± 0.13 2.05 ± 0.30 1.19 ± 0.02 0.63 139 5.95 ± 0.10 1.01 ± 0.17 1.09 ± 0.02 0.48
FT 13 (-21°C) 109 5.28 ± 0.18 2.60 ± 0.50 1.48 ± 0.04 0.64 159 6.45 ± 0.09 1.12 ± 0.16 0.73 ± 0.01 0.60
FT 13 (-23°C) 109 5.41 ± 0.18 2.56 ± 0.51 1.04 ± 0.03 0.71 159 6.13 ± 0.07 0.59 ± 0.09 0.57 ± 0.01 0.51
FT 14 (-21°C) 171 5.03 ± 0.13 2.89 ± 0.33 1.35 ± 0.05 0.68 169 5.86 ± 0.10 1.41 ± 0.18 1.59 ± 0.06 0.47
DAW
Lipezk 12 141 4.42 ± 0.11 1.11 ± 0.20 0.90 ± 0.09 0.55 141 4.28 ± 0.09 0.54 ± 0.14 0.98 ± 0.09 0.35
Saskatoon 12 141 7.53 ± 0.06 0.33 ± 0.07 0.36 ± 0.03 0.48 142 8.34 ± 0.04 0.11 ± 0.03 0.20 ± 0.02 0.35
Lipezk 13 78 7.84 ± 0.11 0.75 ± 0.15 0.34 ± 0.03 0.69 155 8.82 ± 0.03 0.04 ± 0.01 0.14 ± 0.01 0.21
Portage la Prairie 13 81 5.10 ± 0.11 0.63 ± 0.15 0.57 ± 0.05 0.53 156 5.70 ± 0.06 0.21 ± 0.06 0.48 ± 0.05 0.31
Minto 14 112 4.78 ± 0.06 0.12 ± 0.05 0.39 ± 0.04 0.23 - - - - -
Portage la Prairie 14 141 5.43 ± 0.12 1.16 ± 0.23 1.17 ± 0.13 0.50 - - - - -
SAW
Lipezk 12 141 41.92 ± 1.83 347.89 ± 56.05 205.20 ± 19.67 0.63 141 42.30 ± 1.41 163.75 ± 35.22 217.53 ± 20.89 0.43
Portage la Prairie 12 141 71.42 ± 1.68 248.89 ± 48.80 273.93 ± 26.09 0.48 141 80.46 ± 1.07 89.08 ± 20.26 133.88 ± 12.76 0.40
Saskatoon 12 141 69.24 ± 1.31 169.50 ± 29.25 131.96 ± 12.50 0.56 142 72.89 ± 0.92 66.64 ± 15.29 106.25 ± 10.02 0.39
Portage la Prairie 13 - - - - - 156 80.73 ± 0.54 20.29 ± 5.80 49.00 ± 5.10 0.29
Lipezk 14 141 87.36 ± 1.15 169.75 ± 22.32 27.50 ± 2.91 0.86 119 92.16 ± 0.95 75.64 ± 12.26 23.18 ± 2.67 0.77
Portage la Prairie 14 141 56.62 ± 2.04 351.52 ± 71.85 400.56 ± 42.75 0.47 - - - - -
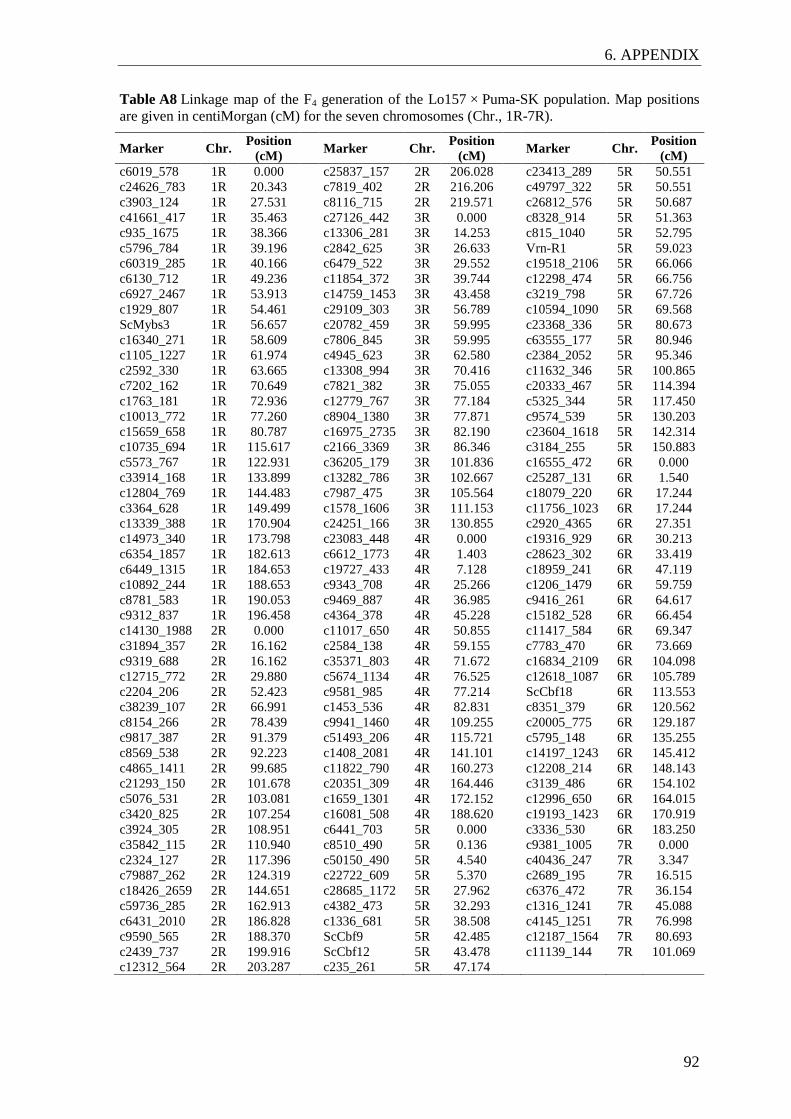
6. APPENDIX
92
Table A8 Linkage map of the F4 generation of the Lo157 × Puma-SK population. Map positions
are given in centiMorgan (cM) for the seven chromosomes (Chr., 1R-7R).
Marker Chr. Position
(cM) Marker Chr.
Position
(cM) Marker Chr.
Position
(cM)
c6019_578 1R 0.000 c25837_157 2R 206.028 c23413_289 5R 50.551
c24626_783 1R 20.343 c7819_402 2R 216.206 c49797_322 5R 50.551
c3903_124 1R 27.531 c8116_715 2R 219.571 c26812_576 5R 50.687
c41661_417 1R 35.463 c27126_442 3R 0.000 c8328_914 5R 51.363
c935_1675 1R 38.366 c13306_281 3R 14.253 c815_1040 5R 52.795
c5796_784 1R 39.196 c2842_625 3R 26.633 Vrn-R1 5R 59.023
c60319_285 1R 40.166 c6479_522 3R 29.552 c19518_2106 5R 66.066
c6130_712 1R 49.236 c11854_372 3R 39.744 c12298_474 5R 66.756
c6927_2467 1R 53.913 c14759_1453 3R 43.458 c3219_798 5R 67.726
c1929_807 1R 54.461 c29109_303 3R 56.789 c10594_1090 5R 69.568
ScMybs3 1R 56.657 c20782_459 3R 59.995 c23368_336 5R 80.673
c16340_271 1R 58.609 c7806_845 3R 59.995 c63555_177 5R 80.946
c1105_1227 1R 61.974 c4945_623 3R 62.580 c2384_2052 5R 95.346
c2592_330 1R 63.665 c13308_994 3R 70.416 c11632_346 5R 100.865
c7202_162 1R 70.649 c7821_382 3R 75.055 c20333_467 5R 114.394
c1763_181 1R 72.936 c12779_767 3R 77.184 c5325_344 5R 117.450
c10013_772 1R 77.260 c8904_1380 3R 77.871 c9574_539 5R 130.203
c15659_658 1R 80.787 c16975_2735 3R 82.190 c23604_1618 5R 142.314
c10735_694 1R 115.617 c2166_3369 3R 86.346 c3184_255 5R 150.883
c5573_767 1R 122.931 c36205_179 3R 101.836 c16555_472 6R 0.000
c33914_168 1R 133.899 c13282_786 3R 102.667 c25287_131 6R 1.540
c12804_769 1R 144.483 c7987_475 3R 105.564 c18079_220 6R 17.244
c3364_628 1R 149.499 c1578_1606 3R 111.153 c11756_1023 6R 17.244
c13339_388 1R 170.904 c24251_166 3R 130.855 c2920_4365 6R 27.351
c14973_340 1R 173.798 c23083_448 4R 0.000 c19316_929 6R 30.213
c6354_1857 1R 182.613 c6612_1773 4R 1.403 c28623_302 6R 33.419
c6449_1315 1R 184.653 c19727_433 4R 7.128 c18959_241 6R 47.119
c10892_244 1R 188.653 c9343_708 4R 25.266 c1206_1479 6R 59.759
c8781_583 1R 190.053 c9469_887 4R 36.985 c9416_261 6R 64.617
c9312_837 1R 196.458 c4364_378 4R 45.228 c15182_528 6R 66.454
c14130_1988 2R 0.000 c11017_650 4R 50.855 c11417_584 6R 69.347
c31894_357 2R 16.162 c2584_138 4R 59.155 c7783_470 6R 73.669
c9319_688 2R 16.162 c35371_803 4R 71.672 c16834_2109 6R 104.098
c12715_772 2R 29.880 c5674_1134 4R 76.525 c12618_1087 6R 105.789
c2204_206 2R 52.423 c9581_985 4R 77.214 ScCbf18 6R 113.553
c38239_107 2R 66.991 c1453_536 4R 82.831 c8351_379 6R 120.562
c8154_266 2R 78.439 c9941_1460 4R 109.255 c20005_775 6R 129.187
c9817_387 2R 91.379 c51493_206 4R 115.721 c5795_148 6R 135.255
c8569_538 2R 92.223 c1408_2081 4R 141.101 c14197_1243 6R 145.412
c4865_1411 2R 99.685 c11822_790 4R 160.273 c12208_214 6R 148.143
c21293_150 2R 101.678 c20351_309 4R 164.446 c3139_486 6R 154.102
c5076_531 2R 103.081 c1659_1301 4R 172.152 c12996_650 6R 164.015
c3420_825 2R 107.254 c16081_508 4R 188.620 c19193_1423 6R 170.919
c3924_305 2R 108.951 c6441_703 5R 0.000 c3336_530 6R 183.250
c35842_115 2R 110.940 c8510_490 5R 0.136 c9381_1005 7R 0.000
c2324_127 2R 117.396 c50150_490 5R 4.540 c40436_247 7R 3.347
c79887_262 2R 124.319 c22722_609 5R 5.370 c2689_195 7R 16.515
c18426_2659 2R 144.651 c28685_1172 5R 27.962 c6376_472 7R 36.154
c59736_285 2R 162.913 c4382_473 5R 32.293 c1316_1241 7R 45.088
c6431_2010 2R 186.828 c1336_681 5R 38.508 c4145_1251 7R 76.998
c9590_565 2R 188.370 ScCbf9 5R 42.485 c12187_1564 7R 80.693
c2439_737 2R 199.916 ScCbf12 5R 43.478 c11139_144 7R 101.069
c12312_564 2R 203.287 c235_261 5R 47.174
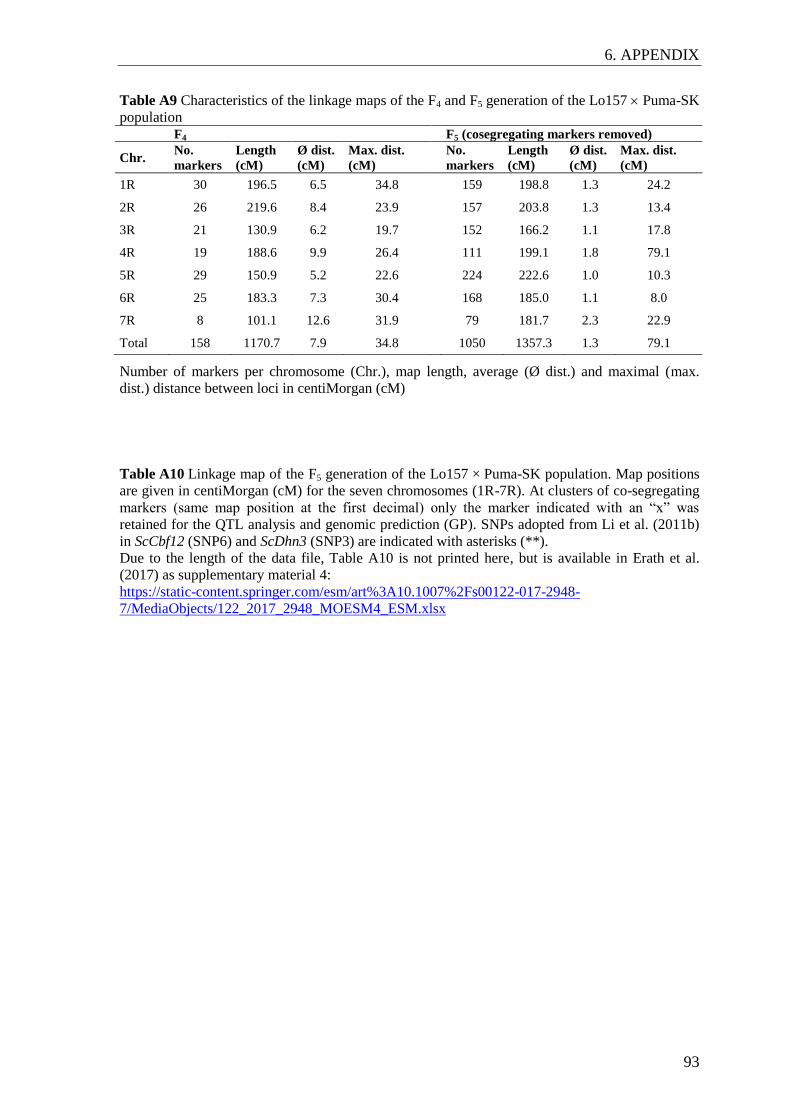
6. APPENDIX
93
Table A9 Characteristics of the linkage maps of the F4 and F5 generation of the Lo157 Puma-SK
population F4 F5 (cosegregating markers removed)
Chr. No.
markers
Length
(cM)
Ø dist.
(cM)
Max. dist.
(cM)
No.
markers
Length
(cM)
Ø dist.
(cM)
Max. dist.
(cM)
1R 30 196.5 6.5 34.8 159 198.8 1.3 24.2
2R 26 219.6 8.4 23.9 157 203.8 1.3 13.4
3R 21 130.9 6.2 19.7 152 166.2 1.1 17.8
4R 19 188.6 9.9 26.4 111 199.1 1.8 79.1
5R 29 150.9 5.2 22.6 224 222.6 1.0 10.3
6R 25 183.3 7.3 30.4 168 185.0 1.1 8.0
7R 8 101.1 12.6 31.9 79 181.7 2.3 22.9
Total 158 1170.7 7.9 34.8 1050 1357.3 1.3 79.1
Number of markers per chromosome (Chr.), map length, average (Ø dist.) and maximal (max.
dist.) distance between loci in centiMorgan (cM)
Table A10 Linkage map of the F5 generation of the Lo157 × Puma-SK population. Map positions
are given in centiMorgan (cM) for the seven chromosomes (1R-7R). At clusters of co-segregating
markers (same map position at the first decimal) only the marker indicated with an “x” was
retained for the QTL analysis and genomic prediction (GP). SNPs adopted from Li et al. (2011b)
in ScCbf12 (SNP6) and ScDhn3 (SNP3) are indicated with asterisks (**).
Due to the length of the data file, Table A10 is not printed here, but is available in Erath et al.
(2017) as supplementary material 4:
https://static-content.springer.com/esm/art%3A10.1007%2Fs00122-017-2948-
7/MediaObjects/122_2017_2948_MOESM4_ESM.xlsx
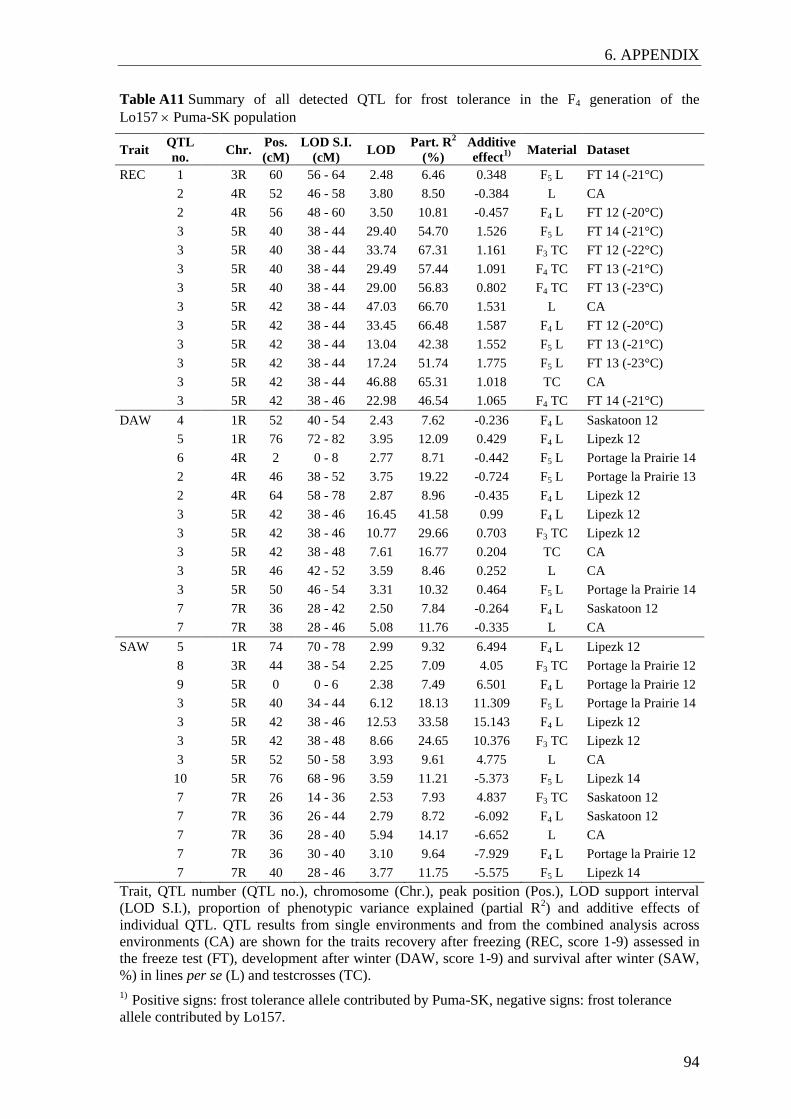
6. APPENDIX
94
Table A11 Summary of all detected QTL for frost tolerance in the F4 generation of the
Lo157 Puma-SK population
Trait QTL
no. Chr.
Pos.
(cM)
LOD S.I.
(cM) LOD
Part. R2
(%)
Additive
effect1)
Material Dataset
REC 1 3R 60 56 - 64 2.48 6.46 0.348 F5 L FT 14 (-21°C)
2 4R 52 46 - 58 3.80 8.50 -0.384 L CA
2 4R 56 48 - 60 3.50 10.81 -0.457 F4 L FT 12 (-20°C)
3 5R 40 38 - 44 29.40 54.70 1.526 F5 L FT 14 (-21°C)
3 5R 40 38 - 44 33.74 67.31 1.161 F3 TC FT 12 (-22°C)
3 5R 40 38 - 44 29.49 57.44 1.091 F4 TC FT 13 (-21°C)
3 5R 40 38 - 44 29.00 56.83 0.802 F4 TC FT 13 (-23°C)
3 5R 42 38 - 44 47.03 66.70 1.531 L CA
3 5R 42 38 - 44 33.45 66.48 1.587 F4 L FT 12 (-20°C)
3 5R 42 38 - 44 13.04 42.38 1.552 F5 L FT 13 (-21°C)
3 5R 42 38 - 44 17.24 51.74 1.775 F5 L FT 13 (-23°C)
3 5R 42 38 - 44 46.88 65.31 1.018 TC CA
3 5R 42 38 - 46 22.98 46.54 1.065 F4 TC FT 14 (-21°C)
DAW 4 1R 52 40 - 54 2.43 7.62 -0.236 F4 L Saskatoon 12
5 1R 76 72 - 82 3.95 12.09 0.429 F4 L Lipezk 12
6 4R 2 0 - 8 2.77 8.71 -0.442 F5 L Portage la Prairie 14
2 4R 46 38 - 52 3.75 19.22 -0.724 F5 L Portage la Prairie 13
2 4R 64 58 - 78 2.87 8.96 -0.435 F4 L Lipezk 12
3 5R 42 38 - 46 16.45 41.58 0.99 F4 L Lipezk 12
3 5R 42 38 - 46 10.77 29.66 0.703 F3 TC Lipezk 12
3 5R 42 38 - 48 7.61 16.77 0.204 TC CA
3 5R 46 42 - 52 3.59 8.46 0.252 L CA
3 5R 50 46 - 54 3.31 10.32 0.464 F5 L Portage la Prairie 14
7 7R 36 28 - 42 2.50 7.84 -0.264 F4 L Saskatoon 12
7 7R 38 28 - 46 5.08 11.76 -0.335 L CA
SAW 5 1R 74 70 - 78 2.99 9.32 6.494 F4 L Lipezk 12
8 3R 44 38 - 54 2.25 7.09 4.05 F3 TC Portage la Prairie 12
9 5R 0 0 - 6 2.38 7.49 6.501 F4 L Portage la Prairie 12
3 5R 40 34 - 44 6.12 18.13 11.309 F5 L Portage la Prairie 14
3 5R 42 38 - 46 12.53 33.58 15.143 F4 L Lipezk 12
3 5R 42 38 - 48 8.66 24.65 10.376 F3 TC Lipezk 12
3 5R 52 50 - 58 3.93 9.61 4.775 L CA
10 5R 76 68 - 96 3.59 11.21 -5.373 F5 L Lipezk 14
7 7R 26 14 - 36 2.53 7.93 4.837 F3 TC Saskatoon 12
7 7R 36 26 - 44 2.79 8.72 -6.092 F4 L Saskatoon 12
7 7R 36 28 - 40 5.94 14.17 -6.652 L CA
7 7R 36 30 - 40 3.10 9.64 -7.929 F4 L Portage la Prairie 12
7 7R 40 28 - 46 3.77 11.75 -5.575 F5 L Lipezk 14
Trait, QTL number (QTL no.), chromosome (Chr.), peak position (Pos.), LOD support interval
(LOD S.I.), proportion of phenotypic variance explained (partial R2) and additive effects of
individual QTL. QTL results from single environments and from the combined analysis across
environments (CA) are shown for the traits recovery after freezing (REC, score 1-9) assessed in
the freeze test (FT), development after winter (DAW, score 1-9) and survival after winter (SAW,
%) in lines per se (L) and testcrosses (TC).
1) Positive signs: frost tolerance allele contributed by Puma-SK, negative signs: frost tolerance
allele contributed by Lo157.
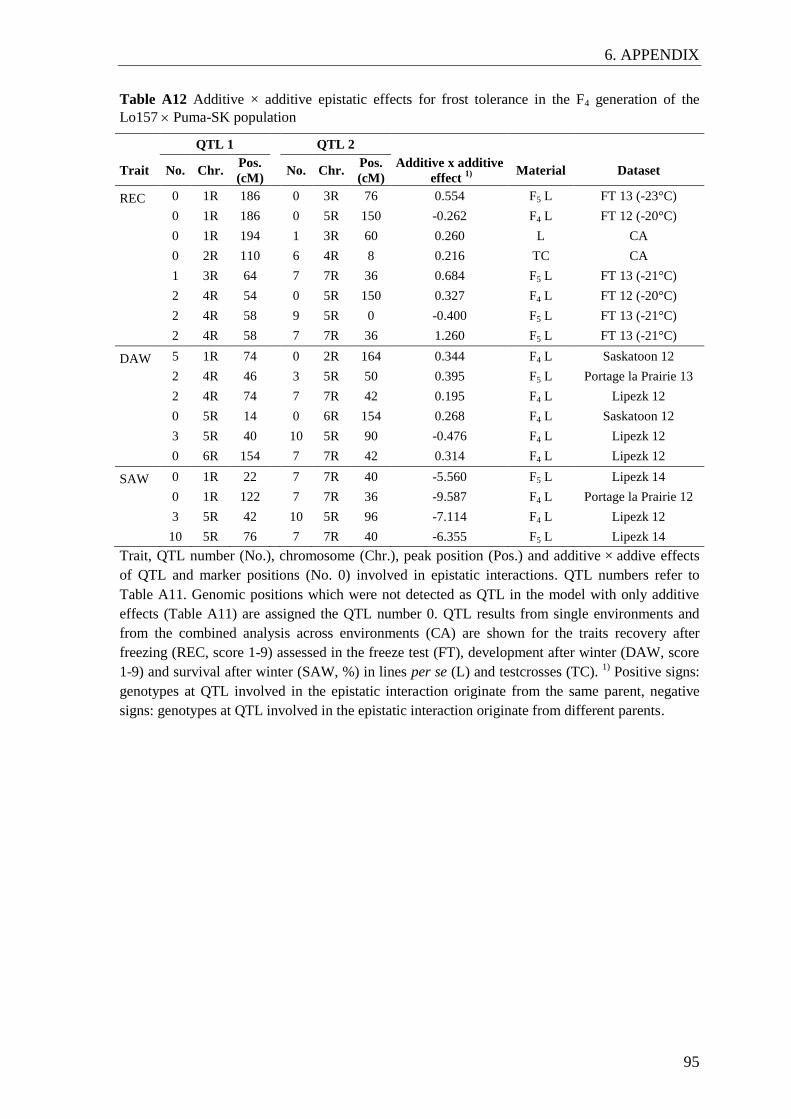
6. APPENDIX
95
Table A12 Additive × additive epistatic effects for frost tolerance in the F4 generation of the
Lo157 Puma-SK population
QTL 1 QTL 2
Trait No. Chr. Pos.
(cM)
No. Chr.
Pos.
(cM)
Additive x additive
effect 1)
Material Dataset
REC 0 1R 186 0 3R 76 0.554 F5 L FT 13 (-23°C)
0 1R 186 0 5R 150 -0.262 F4 L FT 12 (-20°C)
0 1R 194 1 3R 60 0.260 L CA
0 2R 110 6 4R 8 0.216 TC CA
1 3R 64 7 7R 36 0.684 F5 L FT 13 (-21°C)
2 4R 54 0 5R 150 0.327 F4 L FT 12 (-20°C)
2 4R 58 9 5R 0 -0.400 F5 L FT 13 (-21°C)
2 4R 58 7 7R 36 1.260 F5 L FT 13 (-21°C)
DAW 5 1R 74 0 2R 164 0.344 F4 L Saskatoon 12
2 4R 46 3 5R 50 0.395 F5 L Portage la Prairie 13
2 4R 74 7 7R 42 0.195 F4 L Lipezk 12
0 5R 14 0 6R 154 0.268 F4 L Saskatoon 12
3 5R 40 10 5R 90 -0.476 F4 L Lipezk 12
0 6R 154 7 7R 42 0.314 F4 L Lipezk 12
SAW 0 1R 22 7 7R 40 -5.560 F5 L Lipezk 14
0 1R 122 7 7R 36 -9.587 F4 L Portage la Prairie 12
3 5R 42 10 5R 96 -7.114 F4 L Lipezk 12
10 5R 76 7 7R 40 -6.355 F5 L Lipezk 14
Trait, QTL number (No.), chromosome (Chr.), peak position (Pos.) and additive × addive effects
of QTL and marker positions (No. 0) involved in epistatic interactions. QTL numbers refer to
Table A11. Genomic positions which were not detected as QTL in the model with only additive
effects (Table A11) are assigned the QTL number 0. QTL results from single environments and
from the combined analysis across environments (CA) are shown for the traits recovery after
freezing (REC, score 1-9) assessed in the freeze test (FT), development after winter (DAW, score
1-9) and survival after winter (SAW, %) in lines per se (L) and testcrosses (TC). 1)
Positive signs:
genotypes at QTL involved in the epistatic interaction originate from the same parent, negative
signs: genotypes at QTL involved in the epistatic interaction originate from different parents.
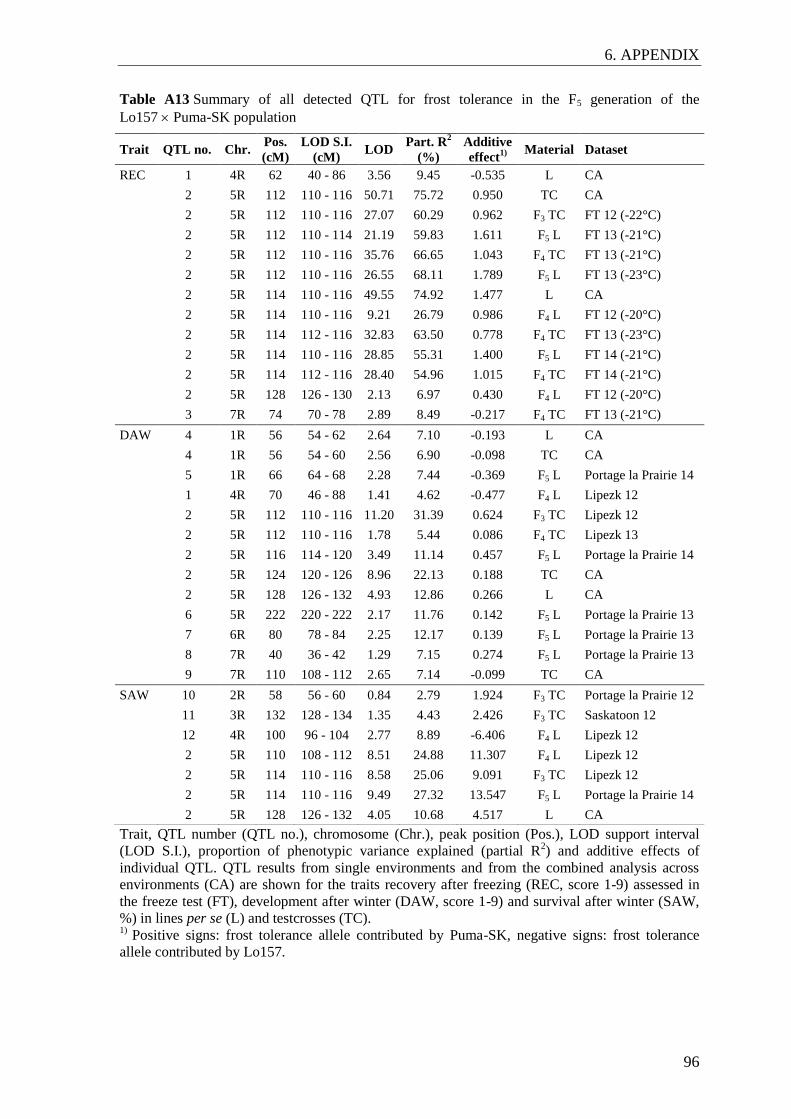
6. APPENDIX
96
Table A13 Summary of all detected QTL for frost tolerance in the F5 generation of the
Lo157 Puma-SK population
Trait, QTL number (QTL no.), chromosome (Chr.), peak position (Pos.), LOD support interval
(LOD S.I.), proportion of phenotypic variance explained (partial R2) and additive effects of
individual QTL. QTL results from single environments and from the combined analysis across
environments (CA) are shown for the traits recovery after freezing (REC, score 1-9) assessed in
the freeze test (FT), development after winter (DAW, score 1-9) and survival after winter (SAW,
%) in lines per se (L) and testcrosses (TC). 1)
Positive signs: frost tolerance allele contributed by Puma-SK, negative signs: frost tolerance
allele contributed by Lo157.
Trait QTL no. Chr. Pos.
(cM)
LOD S.I.
(cM) LOD
Part. R2
(%)
Additive
effect1)
Material Dataset
REC 1 4R 62 40 - 86 3.56 9.45 -0.535 L CA
2 5R 112 110 - 116 50.71 75.72 0.950 TC CA
2 5R 112 110 - 116 27.07 60.29 0.962 F3 TC FT 12 (-22°C)
2 5R 112 110 - 114 21.19 59.83 1.611 F5 L FT 13 (-21°C)
2 5R 112 110 - 116 35.76 66.65 1.043 F4 TC FT 13 (-21°C)
2 5R 112 110 - 116 26.55 68.11 1.789 F5 L FT 13 (-23°C)
2 5R 114 110 - 116 49.55 74.92 1.477 L CA
2 5R 114 110 - 116 9.21 26.79 0.986 F4 L FT 12 (-20°C)
2 5R 114 112 - 116 32.83 63.50 0.778 F4 TC FT 13 (-23°C)
2 5R 114 110 - 116 28.85 55.31 1.400 F5 L FT 14 (-21°C)
2 5R 114 112 - 116 28.40 54.96 1.015 F4 TC FT 14 (-21°C)
2 5R 128 126 - 130 2.13 6.97 0.430 F4 L FT 12 (-20°C)
3 7R 74 70 - 78 2.89 8.49 -0.217 F4 TC FT 13 (-21°C)
DAW 4 1R 56 54 - 62 2.64 7.10 -0.193 L CA
4 1R 56 54 - 60 2.56 6.90 -0.098 TC CA
5 1R 66 64 - 68 2.28 7.44 -0.369 F5 L Portage la Prairie 14
1 4R 70 46 - 88 1.41 4.62 -0.477 F4 L Lipezk 12
2 5R 112 110 - 116 11.20 31.39 0.624 F3 TC Lipezk 12
2 5R 112 110 - 116 1.78 5.44 0.086 F4 TC Lipezk 13
2 5R 116 114 - 120 3.49 11.14 0.457 F5 L Portage la Prairie 14
2 5R 124 120 - 126 8.96 22.13 0.188 TC CA
2 5R 128 126 - 132 4.93 12.86 0.266 L CA
6 5R 222 220 - 222 2.17 11.76 0.142 F5 L Portage la Prairie 13
7 6R 80 78 - 84 2.25 12.17 0.139 F5 L Portage la Prairie 13
8 7R 40 36 - 42 1.29 7.15 0.274 F5 L Portage la Prairie 13
9 7R 110 108 - 112 2.65 7.14 -0.099 TC CA
SAW 10 2R 58 56 - 60 0.84 2.79 1.924 F3 TC Portage la Prairie 12
11 3R 132 128 - 134 1.35 4.43 2.426 F3 TC Saskatoon 12
12 4R 100 96 - 104 2.77 8.89 -6.406 F4 L Lipezk 12
2 5R 110 108 - 112 8.51 24.88 11.307 F4 L Lipezk 12
2 5R 114 110 - 116 8.58 25.06 9.091 F3 TC Lipezk 12
2 5R 114 110 - 116 9.49 27.32 13.547 F5 L Portage la Prairie 14
2 5R 128 126 - 132 4.05 10.68 4.517 L CA
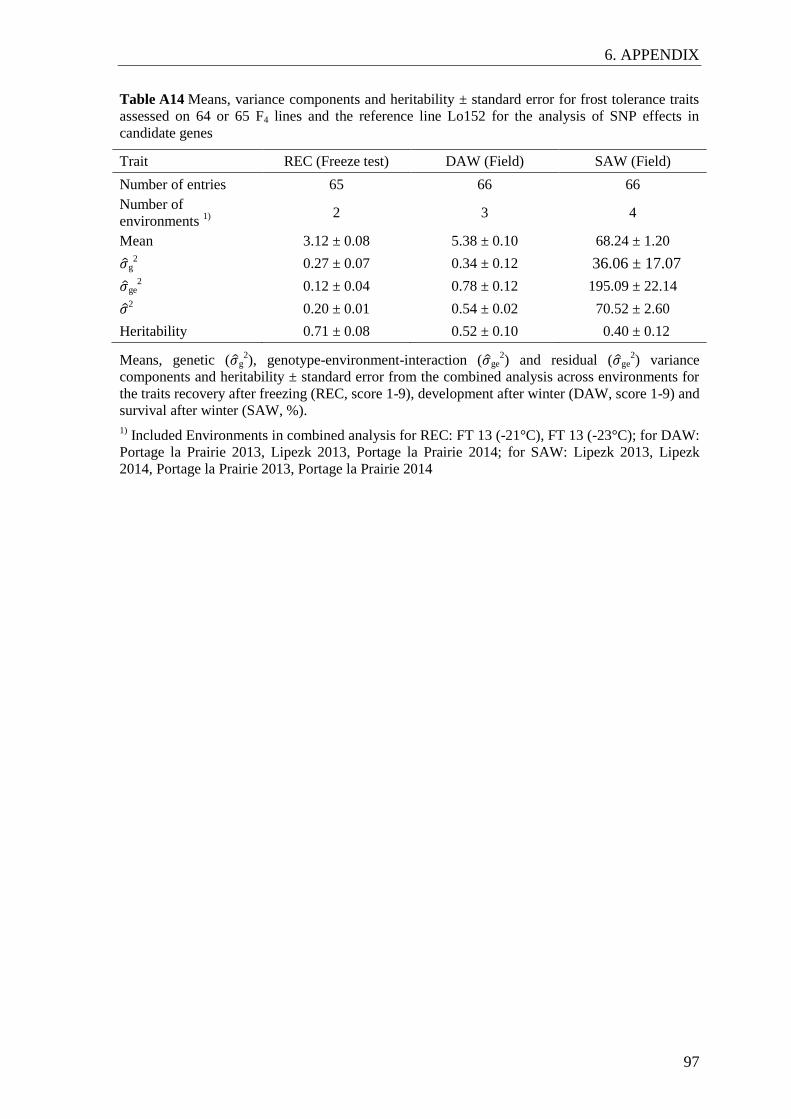
6. APPENDIX
97
Table A14 Means, variance components and heritability ± standard error for frost tolerance traits
assessed on 64 or 65 F4 lines and the reference line Lo152 for the analysis of SNP effects in
candidate genes
Trait REC (Freeze test) DAW (Field) SAW (Field)
Number of entries 65 66 66
Number of
environments 1)
2 3 4
Mean 3.12 ± 0.08 5.38 ± 0.10 68.24 ± 1.20
g2 0.27 ± 0.07 0.34 ± 0.12 36.06 ± 17.07
ge2 0.12 ± 0.04 0.78 ± 0.12 195.09 ± 22.14
2 0.20 ± 0.01 0.54 ± 0.02 70.52 ± 2.60
Heritability 0.71 ± 0.08 0.52 ± 0.10 0.40 ± 0.12
Means, genetic ( g2), genotype-environment-interaction ( ge
2) and residual ( ge
2) variance
components and heritability ± standard error from the combined analysis across environments for
the traits recovery after freezing (REC, score 1-9), development after winter (DAW, score 1-9) and
survival after winter (SAW, %).
1) Included Environments in combined analysis for REC: FT 13 (-21°C), FT 13 (-23°C); for DAW:
Portage la Prairie 2013, Lipezk 2013, Portage la Prairie 2014; for SAW: Lipezk 2013, Lipezk
2014, Portage la Prairie 2013, Portage la Prairie 2014
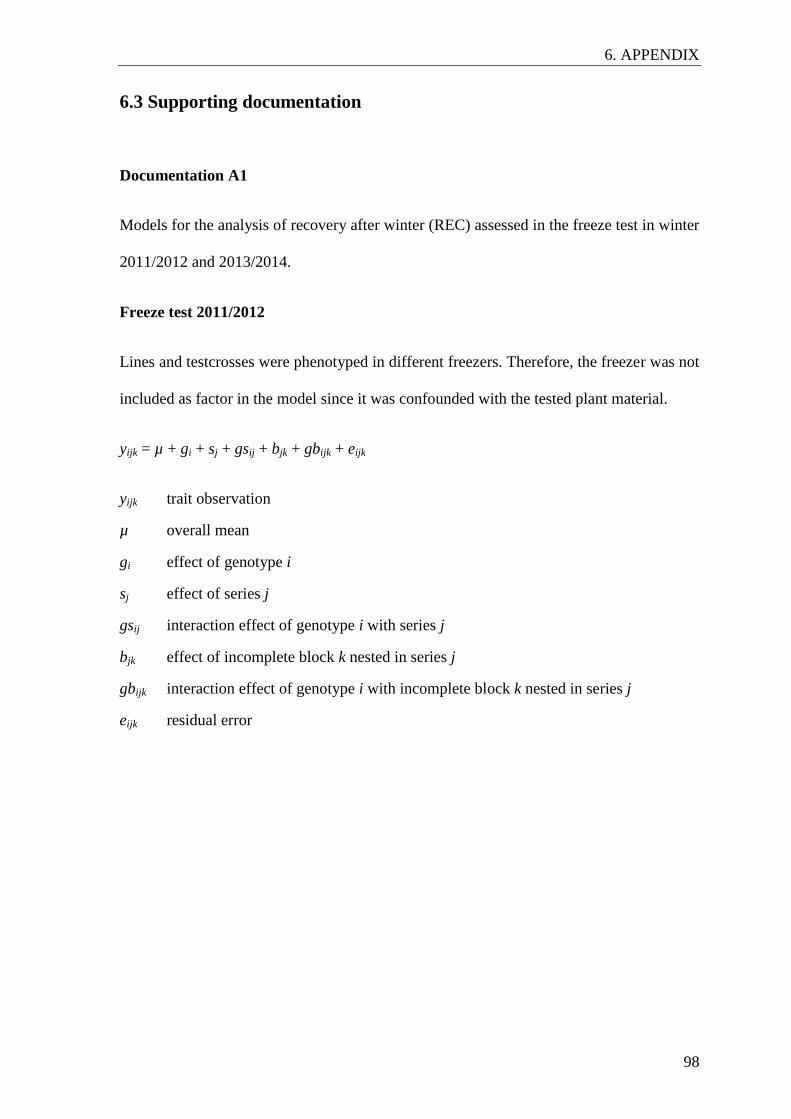
6. APPENDIX
98
6.3 Supporting documentation
Documentation A1
Models for the analysis of recovery after winter (REC) assessed in the freeze test in winter
2011/2012 and 2013/2014.
Freeze test 2011/2012
Lines and testcrosses were phenotyped in different freezers. Therefore, the freezer was not
included as factor in the model since it was confounded with the tested plant material.
yijk = µ + gi + sj + gsij + bjk + gbijk + eijk
yijk trait observation
µ overall mean
gi effect of genotype i
sj effect of series j
gsij interaction effect of genotype i with series j
bjk effect of incomplete block k nested in series j
gbijk interaction effect of genotype i with incomplete block k nested in series j
eijk residual error

6. APPENDIX
99
Freeze test 2012/2013
Interactions with the freezer were not included as factor in the model, since no variance
was explained by those interactions.
yifjk = µ + gi + ff + sj + gsij + bjk + gbijk + eifjk
yifjk trait observation
µ overall mean
gi effect of genotype i
ff effect of freezer f
sj effect of series j
gsij interaction effect of genotype i with series j
bjk effect of incomplete block k nested in series j
gbijk interaction effect of genotype i with incomplete block k nested in series j
eifjk residual error
7. ACKNOWLEDGEMENTS
100
7. ACKNOWLEDGEMENTS
First of all, I would like to express my great gratitude to Prof. Dr. Chris-Carolin Schön for
giving me the opportunity to do a PhD on this interesting topic and for her valuable advice
and support. Thanks to her encouragement I could gain and extend knowledge in
quantitative genetics, statistics, population genetics, scientific writing and presentation
skills.
Thanks a lot to my mentor Prof. Dr. Thomas Miedaner for his input and the interesting
discussions about rye breeding and quantitative genetics. I am also grateful to him and to
Prof. Dr. Ralph Hückelhoven for their engagement in the frame of my PhD thesis
committee.
My special appreciation and gratitude goes to my supervisor Dr. Eva Bauer for her
constant support throughout all phases of this thesis. I am grateful for her interest in this
work, her constructive feedback and for the many helpful discussions.
Many thanks go to Dr. Peer Wilde, Dr. Andres Gordillo, Dr. Viktor Korzun, Brigitta
Schmiedchen and Malthe Schmidt from KWS for providing phenotypic and genotypic
data and for supplying a lot of information on the trials in the freeze test and field sites and
on plant materials.
I gratefully acknowledge Dr. Christina Lehermeier for introducing me to statistical
methods and her valuable and constant support in this field. My thanks also go to
Dr. Theresa Albrecht, Dr. Valentin Wimmer, Katrin Töpner, Hans-Jürgen Auinger and
Manfred Schönleben for their many helpful pieces of advice on data analysis.
I am very grateful for the support by Dr. Sandra Unterseer and Manfred Mayer in
population genetic analyses and the helpful discussions.
I wish to express my gratitude to Dr. Grit Schwertfirm for the supervision in the initial
phase of my PhD and for introducing me to the bioinformatics aspects of this work.
Many thanks go to Stefan Schwertfirm, Amalie Fiedler and Sylwia Schepella for their
expert advices and their help in the laboratory.
I wish to gratefully acknowledge Dr. Sebastian Steinemann, Dr. Michaela Matthes,
Dr. Maren Livaja and Dr. Bernd Hackauf for the helpful discussions and their counseling
in molecular genetics and bioinformatics. A lot of thanks also go to Dr. Flavio Foiada for
introducing me to genomic prediction.
I would like to cordially acknowledge all former and current members of the Plant
Breeding Chair for their scientific and spiritual input by professional assistance and plenty
of encouraging and inspiring discussions.
A lot of thanks go to all co-authors and all RYE SELECT project partners for their
encouraged collaboration and for the fruitful discussions. Special thanks to Dr. Thomas

7. ACKNOWLEDGEMENTS
101
Schmutzer for providing information on rye sequence resources. I also thank
Prof. Dr. Hans Friedrich Utz for providing an extension of PlabMQTL.
I want to express my special thanks to the TUM graduate school for the financial support.
This research was made possible through the financial support from the German Federal
Ministry of Education and Research (BMBF) within the project RYE SELECT (Grant ID
0315946).
Finally, I want to express my deepest gratitude to my family who always supported me in
the last years.
8. CURRICULUM VITAE
102
8. CURRICULUM VITAE
Personal information
Wiltrud Renate Erath
Date of birth: 31st January 1985
Place of birth: Dachau, Germany
Nationality: German
Education
08 / 2012 – current PhD thesis in plant breeding, Chair of Plant Breeding,
Technical University of Munich, Freising, Germany
Thesis: Exploring new alleles for frost tolerance in winter
rye using genetic resources
Supervisor: Prof. Dr. Chris-Carolin Schön
04 / 2010 – 07 / 2012 Master of Science in Agricultural Sciences, Chair of Plant
Breeding, Technical University of Munich, Freising,
Germany
Thesis: Mapping of QTL for resistance against the soil-borne
viruses SBCMV and WSSMV in rye
Supervisor: Prof. Dr. Chris-Carolin Schön
10 / 2005 – 03 / 2010 Diplom in Horticulture, University of Applied Sciences
Weihenstephan-Triesdorf, Freising
Thesis: Pflanzliche Abwehrmechanismen
Supervisor: Prof. Dr. Wolfgang W. P. Gerlach
09 / 2004 – 08 / 2005 Voluntary ecological year, Franziskuswerk Schönbrunn,
Germany
09 / 1995 – 06 / 2004 Abitur, Josef-Effner-Gymnasium Dachau