Embed Size (px)
Citation preview
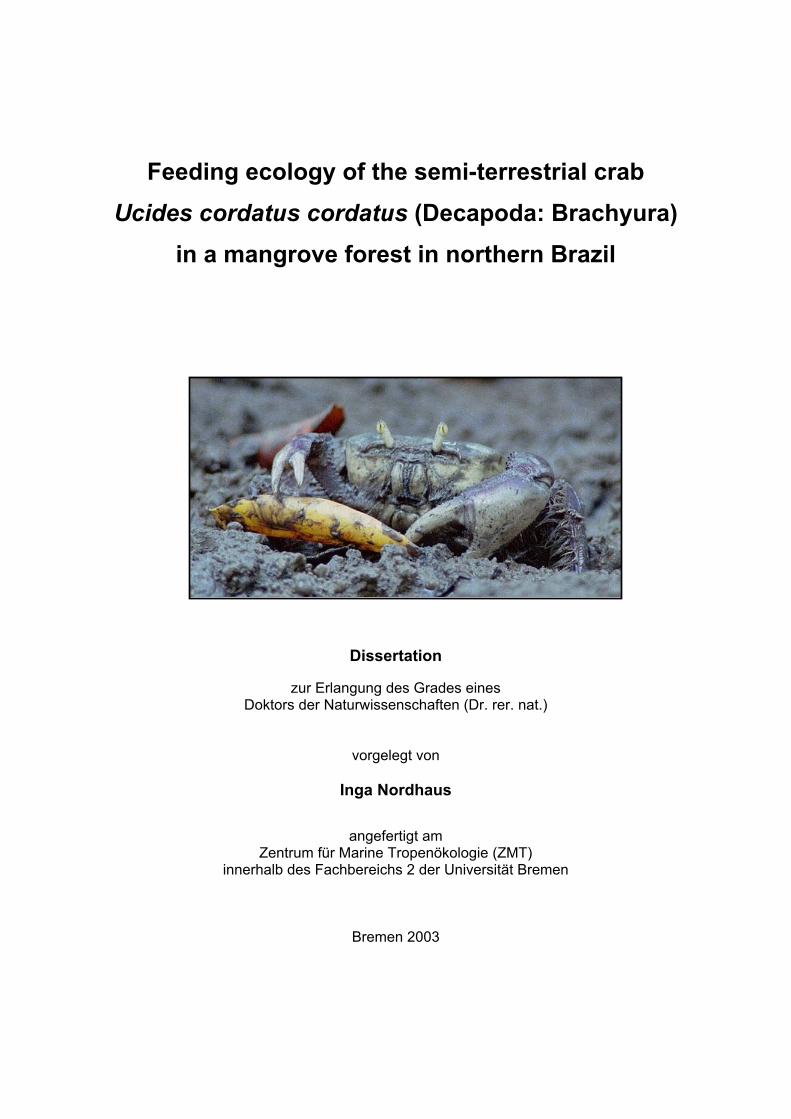
Feeding ecology of the semi-terrestrial crab
Ucides cordatus cordatus (Decapoda: Brachyura) in a mangrove forest in northern Brazil
Dissertation
zur Erlangung des Grades eines Doktors der Naturwissenschaften (Dr. rer. nat.)
vorgelegt von
Inga Nordhaus
angefertigt am Zentrum für Marine Tropenökologie (ZMT)
innerhalb des Fachbereichs 2 der Universität Bremen
Bremen 2003
Principal supervisor: Prof. Dr. Matthias Wolff, ZMT at the University of Bremen Co-supervisor: Prof. Dr. Wolf Arntz, Alfred-Wegener-Institut für Polar- und
Meeresforschung, Bremerhaven; University of Bremen
I
CONTENTS ABBREVIATION LIST………………………………………………………………………………..III SUMMARY……………………………………………………………………………………...……. V RESUMO……………………………………………………………………………………………..VII ZUSAMMENFASSUNG……………………………………………………………………………...X 1 GENERAL INTRODUCTION ........................................................................................... 1 2 STUDY AREA.................................................................................................................. 6 3 DIET AND CONSUMPTION .......................................................................................... 13
3.1 Introduction .............................................................................................................13
3.2 Material and methods .............................................................................................16 3.2.1 Stomach content analyses................................................................................. 16 3.2.2 Food preferences............................................................................................... 17 3.2.3 Food availability ................................................................................................. 19
3.2.3.1 Litter material in burrows and litter standing stock ..................................... 19 3.2.3.2 Litter fall...................................................................................................... 19
3.2.4 Evacuation ......................................................................................................... 21 3.2.5 Daily food intake ................................................................................................ 22 3.2.6 Statistical analyses ............................................................................................ 23
3.3 Results....................................................................................................................24
3.3.1 Stomach content analyses................................................................................. 24 3.3.2 Food preferences............................................................................................... 26 3.3.3 Food availability ................................................................................................. 29
3.3.3.1 Litter material in burrows and litter standing stock ..................................... 29 3.3.3.2 Litter fall...................................................................................................... 31
3.3.4 Evacuation ......................................................................................................... 33 3.3.5 Daily food intake ................................................................................................ 35
3.4 Discussion ..............................................................................................................39
3.4.1 Stomach content analyses................................................................................. 39 3.4.2 Food preferences............................................................................................... 40 3.4.3 Food availability ................................................................................................. 46 3.4.4 Evacuation ......................................................................................................... 49 3.4.5 Daily food intake ................................................................................................ 50
4 FEEDING PERIODICITY AND BEHAVIOUR ................................................................ 59
4.1 Introduction .............................................................................................................59
4.2 Material and methods .............................................................................................61 4.2.1 Analysis of gastrointestinal contents .................................................................. 61 4.2.2 Binocular observation ........................................................................................ 62 4.2.3 Camera observation........................................................................................... 63
4.3 Results....................................................................................................................64
4.3.1 Analysis of gastrointestinal contents .................................................................. 64 4.3.2 Binocular observation ........................................................................................ 64 4.3.3 Camera observation........................................................................................... 67
4.4 Discussion ..............................................................................................................75
II
5 ASSIMILATION AND MICROBIOLOGICAL INVESTIGATIONS ................................... 83
5.1 Introduction .............................................................................................................83
5.2 Material and methods .............................................................................................86 5.2.1 Assimilation........................................................................................................ 89
5.2.1.1 Sampling .................................................................................................... 89 5.2.1.2 Sample processing..................................................................................... 91
5.2.2 Microbiological investigations............................................................................. 93 5.2.2.1 Sampling .................................................................................................... 93 5.2.2.2 Sample processing..................................................................................... 96
5.3 Results....................................................................................................................99
5.3.1 Assimilation........................................................................................................ 99 5.3.1.1 Food characteristics ................................................................................... 99 5.3.1.2 Assimilation efficiency .............................................................................. 109
5.3.2 Microbiological investigations........................................................................... 111 5.3.2.1 Microbial abundance ................................................................................ 111 5.3.2.2 Microbial community structure ................................................................. 114 5.3.2.3 Bacterial biomass..................................................................................... 116
5.4 Discussion ............................................................................................................118
5.4.1 Assimilation...................................................................................................... 118 5.4.1.1 Food characteristics ................................................................................. 118 5.4.1.2 Assimilation efficiency .............................................................................. 122 5.4.1.3 Energy and nutrient budget...................................................................... 123
5.4.2 Microbiological investigations........................................................................... 128 5.4.2.1 Microbial abundance and community structure........................................ 128 5.4.2.2 The role of microorganisms for the nutrition of U. cordatus ..................... 131
6 CONCLUSIONS AND PERSPECTIVES ..................................................................... 137 7 ACKNOWLEDGEMENTS............................................................................................ 143 8 REFERENCES ............................................................................................................ 145 9 LIST OF FIGURES ...................................................................................................... 157 10 LIST OF TABLES ........................................................................................................ 159 11 APPENDICES.............................................................................................................. 164
11.1 Appendix I: Diet and consumption – Statistical analysis.......................................164 11.2 Appendix II: Feeding periodicity and behaviour – Statistical analysis...................172 11.3 Appendix III: Assimilation and microbiological investigations-Statistical analysis.176
III
Abbreviation list SI untits are not included
Av Avicennia germinans
AF Avicennia forest
BDW body dry weight
CL carapace length
CW carapace width
DW dry weight
f female
FC Furo do Chato
FG Furo Grande
GIC gastrointestinal contents
La Laguncularia racemosa
Lab Laboratory
m male
MF mixed forest
Rh Rhizophora mangle
SDW stomach dry weight
SC stomach contents
WW wet weight

IV
Summary V
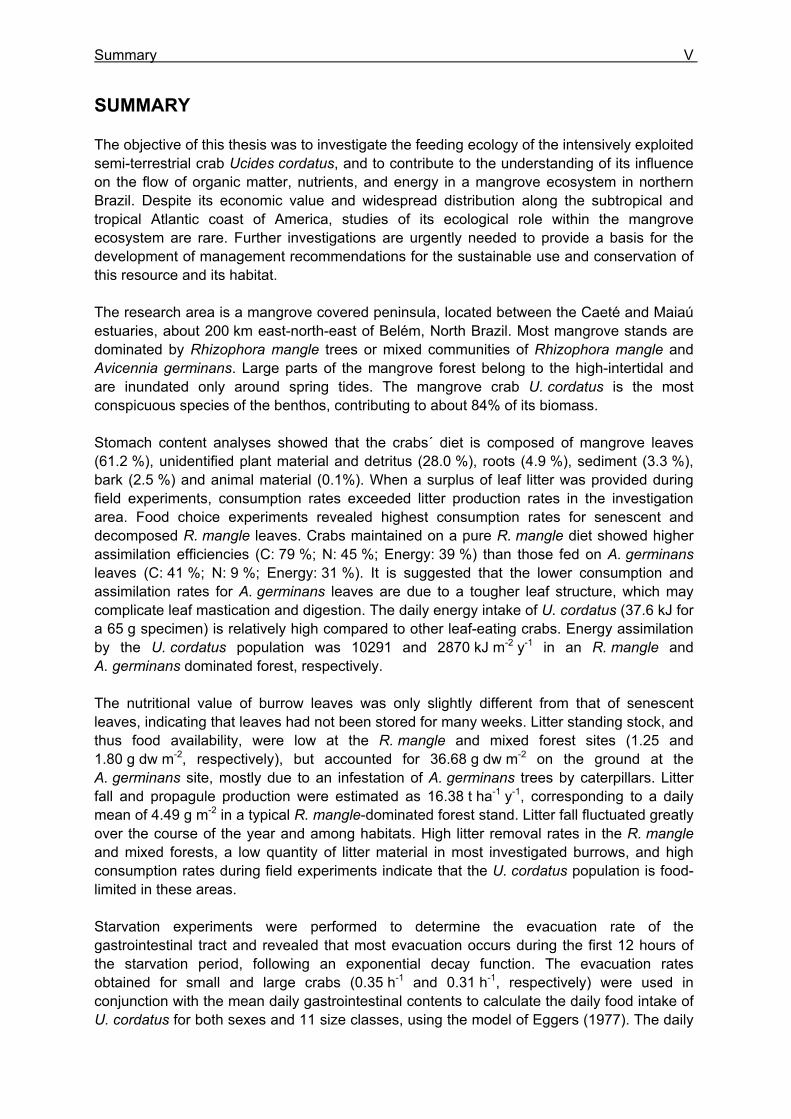
SUMMARY The objective of this thesis was to investigate the feeding ecology of the intensively exploited semi-terrestrial crab Ucides cordatus, and to contribute to the understanding of its influence on the flow of organic matter, nutrients, and energy in a mangrove ecosystem in northern Brazil. Despite its economic value and widespread distribution along the subtropical and tropical Atlantic coast of America, studies of its ecological role within the mangrove ecosystem are rare. Further investigations are urgently needed to provide a basis for the development of management recommendations for the sustainable use and conservation of this resource and its habitat. The research area is a mangrove covered peninsula, located between the Caeté and Maiaú estuaries, about 200 km east-north-east of Belém, North Brazil. Most mangrove stands are dominated by Rhizophora mangle trees or mixed communities of Rhizophora mangle and Avicennia germinans. Large parts of the mangrove forest belong to the high-intertidal and are inundated only around spring tides. The mangrove crab U. cordatus is the most conspicuous species of the benthos, contributing to about 84% of its biomass. Stomach content analyses showed that the crabs´ diet is composed of mangrove leaves (61.2 %), unidentified plant material and detritus (28.0 %), roots (4.9 %), sediment (3.3 %), bark (2.5 %) and animal material (0.1%). When a surplus of leaf litter was provided during field experiments, consumption rates exceeded litter production rates in the investigation area. Food choice experiments revealed highest consumption rates for senescent and decomposed R. mangle leaves. Crabs maintained on a pure R. mangle diet showed higher assimilation efficiencies (C: 79 %; N: 45 %; Energy: 39 %) than those fed on A. germinans leaves (C: 41 %; N: 9 %; Energy: 31 %). It is suggested that the lower consumption and assimilation rates for A. germinans leaves are due to a tougher leaf structure, which may complicate leaf mastication and digestion. The daily energy intake of U. cordatus (37.6 kJ for a 65 g specimen) is relatively high compared to other leaf-eating crabs. Energy assimilation by the U. cordatus population was 10291 and 2870 kJ m-2 y-1 in an R. mangle and A. germinans dominated forest, respectively. The nutritional value of burrow leaves was only slightly different from that of senescent leaves, indicating that leaves had not been stored for many weeks. Litter standing stock, and thus food availability, were low at the R. mangle and mixed forest sites (1.25 and 1.80 g dw m-2, respectively), but accounted for 36.68 g dw m-2 on the ground at the A. germinans site, mostly due to an infestation of A. germinans trees by caterpillars. Litter fall and propagule production were estimated as 16.38 t ha-1 y-1, corresponding to a daily mean of 4.49 g m-2 in a typical R. mangle-dominated forest stand. Litter fall fluctuated greatly over the course of the year and among habitats. High litter removal rates in the R. mangle and mixed forests, a low quantity of litter material in most investigated burrows, and high consumption rates during field experiments indicate that the U. cordatus population is food-limited in these areas. Starvation experiments were performed to determine the evacuation rate of the gastrointestinal tract and revealed that most evacuation occurs during the first 12 hours of the starvation period, following an exponential decay function. The evacuation rates obtained for small and large crabs (0.35 h-1 and 0.31 h-1, respectively) were used in conjunction with the mean daily gastrointestinal contents to calculate the daily food intake of U. cordatus for both sexes and 11 size classes, using the model of Eggers (1977). The daily
VI Summary
food intake was 1.0 g dw in small males (CW 3.0-3.5 cm), corresponding to 19.8 % of the crabs´ body dry weight. Large males (CW 7.0-7.5 cm) consumed 3.3 g dw daily, corresponding to 6.0 % of their body dry weight. The overall daily food intake of the U. cordatus population at a R. mangle dominated forest stand was estimated as 4.1 g dw m-2, corresponding to 81.3 % of the daily litter production. This indicates that litter processing by U. cordatus highly influences the flux of organic matter, leading to the retention of nutrients and energy inside the mangrove forest. Video in situ observations over 24 h revealed that feeding activities outside burrows were clearly light-dependent, decreasing significantly after dusk and increasing at dawn. Crabs stayed inside their burrows 79 % and 92 % of the time during the day and at night, respectively. Higher activities during the day were most likely attributable to the visual localisation of food and the absence of crab racoons. Crabs collected mangrove leaves, flowers and stipules but rarely fed on these components outside burrows. Gastrointestinal contents measured over a day´s cycle do not indicate a daily feeding periodicity, suggesting that crabs feed inside burrows both day and night. Competition for food occurred rarely, since the crabs have a small foraging radius. Almost all available litter was collected around neap tides when the forest floor was not inundated. These observations thus confirm that the U. cordatus population is most likely food-limited in most parts of the peninsula. The role of microorganisms for the nutrition of U. cordatus was investigated by using fluorescence in situ hybridization (FISH) with rRNA-targeted oligonucleotide probes. Microbial abundances increased continuously as food (R. mangle leaves: 3.7 x 10⁸ cells g dw-1) passed through the stomach (5.0 x 10⁹ cells g dw-1) and intestine (1.7 x 10¹⁰ cells g dw-1), reaching highest values in the faecal material (3.2 x 10¹⁰ cells g dw-1). A low quantity of bacterial carbon and nitrogen on leaf surfaces and in the sediment suggests a minor importance of ingested bacterial biomass for the nutrition of U. cordatus. Bacterial community composition was significantly different between leaf surfaces and the gastrointestinal contents, suggesting that several species are residents in the digestive tract where they maintain more or less stable populations. The Bacteroidetes group accounted for the largest proportion of bacteria in the stomach contents (85 %), intestine contents (52 %), and faeces (32 %). High proliferation rates of this group in the digestive tract point to degradation of cellulose and possibly other natural polymers by bacteria. The following feeding strategy for U. cordatus emerges: The crabs feed almost exclusively on plant material, in particular on mangrove litter, a food source which is constantly available, although temporal and spatial fluctuations were recorded. The daily food intake is relatively high due to more or less continuous feeding, a moderate gut passage time, and a large stomach size. High ingestion rates and relatively high assimilation rates on an R. mangle diet lead to a comparatively high intake of carbon, nitrogen and energy, and partly compensate for the poor food quality. The C:N ratio, a measure of the nutritional value of a diet, was most favourable in green and brown algae. Since crabs have frequently been observed to feed on algae, it is suggested that algae are an important food component, partly compensating for the unfavourable C:N ratio of mangrove leaves. Bacteria in the digestive tract most likely assist in the digestion of litter material. The data suggest that the gut bacteria are of some nitrogen-related nutritive advantage to the crab. Perhaps nitrogen-fixing bacteria, or their metabolic products, serve as a nitrogen source for the crabs, as they do for wood-consuming termites. Although the nitrogen intake of U. cordatus is relatively high compared to other leaf-consuming crabs, nitrogen limitation can not be excluded, due to the very slow growth rate estimated for the crabs in a previous study.
Resumo VII
The results of the thesis show that U. cordatus is a keystone species at the investigation area. Through litter burial and consumption, the bulk of litter production, and thus nutrients and energy, are retained in the mangrove forest. The impact of U. cordatus on the litter turnover rate is similar to or even higher than that of sesarmine crabs in the Indo-West Pacific region. The U. cordatus population produces large amounts of finely fragmented faeces which is rich in carbon, nitrogen and bacterial biomass compared to the sediment. The decomposition of mangrove litter, and thus nutrient remineralisation and energy transfer into the sediment, is greatly accelerated due to litter processing by U. cordatus. Microbial density increased 210-fold and that of the Bacteroidetes group 673-fold between freshly shed R. mangle leaves and faeces. Faecal material and finely shredded leaf particles enrich the detritus pool and thus most likely promote the production of detritivorous organisms, in particular fiddler crabs. It could be shown that burrowing activities of U. cordatus improve the oxygenation of deeper sediment layers which coincided with an enhanced microbial abundance and biomass. RESUMO O objetivo desta tese foi investigar a ecologia alimentar do caranguejo de mangue Ucides cordatus (nome comum: caranguejo Uçá), espécie amplamente explorada comercialmente, assim como contribuir na compreensão do fluxo de matéria orgânica, nutrientes e energia em um ecosistema de manguezal do Norte do Brasil. Apesar do valor econômico dessa espécie, estudos sobre sua ecologia em manguezais são raros e urgentes, diante da necessidade de promover subsídios para o desenvolvimento das recomendações de manejo para o uso sustentável e conservação deste recurso e seu habitat. A área da pesquisa é uma península coberta por mangue, localizada entre os estuários de Caeté e Maiaú, aproximadamente 200 km nordeste de Belém, região Norte do Brasil. Estes manguezais são dominados por árvores de Rhizophora mangle ou comunidades misturadas de Rhizophora mangle e Avicennia germinans. Grande parte das florestas de manguezais pertencem ao alto-interdital e são inundadas somente nas marés vivas. A especie U. cordatus é a mais distinta espécie do bentos, contribuindo com cerca de 84 % da biomassa do bentos. As análises de conteúdo estomacal mostraram que a dieta dos caranguejos é composta por folhas de mangue (61.2 %), material vegetal nao identificado e detritos (28.0 %), raízes (4.9 %), sedimento (3.3 %), casca de árvores (2.5 %) e material animal (0.1 %). Quando um excesso de folhas foi fornecido durante experimentos de campo, as taxas de consumo excederam as taxas de produção na área investigada. Os experimentos em seletividade de alimento revelaram altas taxas de consumo das folhas senescentes e decompostas de R. mangle. A manutenção da dieta com folhas de R. mangle mostrou maior eficiência de assimilação (C: 79 %; N: 45 %; energia: 39%) que os caranguejos que se alimentaram com A. germinans (C: 41 %; N: 9 %; energia: 31 %). Isto sugere que as baixas taxas de consumo e assimilação para folhas de A. germinans se deve a uma estrutura de folha mais dura, que complica a mastigação e digestão. A entrada diária de energia para U. cordatus (37.6 kJ para um espécime de 65 g é relativamente alta comparada a outros caranguejos com dieta de folhas. A assimilação de energia pela população de U. cordatus foi 10291 e 2870 kJ m 2 y-1 em uma floresta dominada por R. mangle e A. germinans, respectivamente.
VIII Resumo
O valor nutricional das folhas decompostas foi ligeiramente diferente do que o das senescentes, indicando que as folhas não foram estocadas durante algumas semanas. O standing stock de folhas acumuladas, assim como a disponibilidade de alimento, foram baixos nos locais de florestas de R. mangle e A. germinans (1.25 e 1.80 g peso seco m-2, respectivamente), mas considerado para 36.68 g m-2 no solo da região de A. germinans, principalmente pela infestação de lagartas. A serrapilheira e a produção dos propágulos foram estimados em 16.38 t ha-1 y-1, corespondendo a uma média diária de 4.49 g m-2 em uma região dominada por R. mangle. A serrapilheira variou amplamente durante um ciclo anual e ao longo dos habitats. As altas taxas de remoção da serrapilheira pelos caranguejos nas regiões de R. mangle e comunidades misturadas, a baixa quantidade de folhas em buracos e as altas taxas de consumo durante os experimentos de campo indicam que a população de U. cordatus é limitada pelo alimento nessas áreas. Experimentos em carência alimentar foram realizados para determinar a taxa de evacuação gastro-intestinal e revelaram que a evacuação ocorre durante as primeiras 12 horas do período de carência alimentar, seguindo uma função exponencial decrescente. As taxas de evacuação obtidas para pequenos e grandes caranguejos (0.35 h-1 e 0.31 h-1, respectivamente), foram utilizadas em conjunto com os conteúdos gastro-intestinais médios diários para calcular a entrada diária de alimento para U. cordatus de ambos os sexos e 11 classes de tamanho, usando o modelo de Eggers (1977). A entrada diária de alimento foi 1.0 g dw em pequenos caranguejos machos (largura 3.0-3.5 cm), corespondendo á 19.8% do peso seco corpóreo dos caranguejos. Machos maiores (largura 7.0-7.5 cm) consumiram 3.3 g dw diariamente, correspondendo a 6.0 % do peso seco de seus corpos. A entrada global de alimento para a população de U. cordatus na região dominada por R. mangle foi estimada em 4.1 g dw m-2, correspondendo a 81.3 % da produção diária de serrapilheira. Isto indica que o processamento das folhas por U. cordatus influência amplamente o fluxo de matéria orgânica, promovendo a retenção dos nutrientes e da energia dentro da floresta de mangue. As observações in situ através de vídeo durante 24 horas revelaram que as atividades alimentares fora dos buracos foram claramente dependentes da luminosidade, decrescendo significantemente após anoitecer e crescendo ao amanhecer. Os caranguejos permaneceram dentro de seus buracos 79 % e 92 % do tempo durante o dia e noite, respectivamente. A maior atividade durante o dia é mais atribuída à localização visual do alimento e a ausência dos guaxinims. Os caranguejos coletaram folhas de mangue, flores e estípulas, mas raramente se alimentaram destes componentes fora dos buracos. Os conteúdos gastro-intestinais medidos ao longo de um ciclo diário não indicam uma periodicidade diária, sugerindo que os caranguejos se alimentam dentro dos buracos de dia e de noite. A competição por alimento ocorreu raramente, considerando-se que os caranguejos apresentam um pequeno raio de ação. Quase todas as folhas disponíveis foram coletadas ao longo das marés de quadratura, quando o solo da floresta não é inundado. Essas observações confirmam que a população de U. cordatus é alimentarmente limitada na maior parte da península. O papel dos micro-organismos na nutrição de U. cordatus foi investigado pelo uso de fluorescência in situ hibridação (FISH) com amostras oligonucleotídeas rRNA. As abundâncias microbiais aumentam continuamente como alimento (folhas de R. mangle: 3.7 x 10⁸ células g dw-1) que passaram através do estomago (5.0 x 10⁹ células g dw-1) e intestino (1.7 x 10¹⁰ células g dw-1), atingindo altos valores no material fecal (3.2 x 10¹⁰
células g dw -1). Uma baixa quantidade de carbono e nitrogênio bacterial na superfície das
Resumo IX
folhas e sedimento sugere uma menor importância de biomassa bacterial ingerida para a nutrição de U. cordatus. A composição da comunidade bacterial foi significantemente diferente entre a superfície das folhas e o conteúdo gastro-intestinal, sugerindo que várias espécies são residentes no tracto digestivo, onde mantêm populações mais ou menos estáveis. O grupo Bacteroidetes foi contado com a maior proporção das bacterias nos conteúdos estomacais (85 %), conteúdos intestinais (52 %) e fezes (32 %). As altas taxas de proliferação do grupo Bacteroidetes no tracto digestivo apontam á degradação da celulose e possivelmente outros polímeros naturais por bactérias. A seguinte estratégia de alimentação para U. cordatus emerge: Os caranguejos se alimentam quase que exclusivamente de material vegetal, em particular de origem mangal, uma fonte alimentar constantemente disponível, embora flutuações espaço-temporais tenham sido registradas. A entrada diária de alimento é relativamente alta, devido a alimentação mais ou menos continua, um moderado tempo de passagem pelo intestino e um grande tamanho estomacal. As altas taxas de ingestão e relativa alta assimilação em uma dieta de R. mangle leva a uma comparativa alta entrada de carbono, nitrogênio e energia, e em parte compensado pela pobre qualidade alimentar. A taxa C:N, uma medida do valor nutricional da dieta, foi mais favorável em algas verdes e marrons. Caranguejos são frequentemente observados alimentando-se de algas, sugerindo que algas são um componente importante da alimentação, compensando a desfavorável taxa C:N das folhas de mangue. Bactérias no tracto digestivo ajudam na digestão do material das folhas. Os dados sugerem que as bactérias no intestino são associadas as vantagens nutricionais relacionadas ao nitrogênio para o caranguejo. Talvez a fixação de nitrogênio bacterial ou seus produtos metabólicos sirvam como uma fonte de nitrogênio, como elas fazem para os consumidores de madeira térmitas. Embora a entrada de nitrogênio do U. cordatus seja relativamente alta comparada com outros caranguejos consumidores de folhas, as limitações de nitrogênio não podem ser excluídas, devido á baixa taxa de crescimento estimada para caranguejos em estudo prévio. Os resultados apresentados mostram que o U. cordatus é uma espécie chave na península Bragança. Através do armazenamento em buracos e consumo de folhas, a maior parte da serrapilheira, assim como a energia e os nutrientes são retidos na floresta de mangue. O impacto do U. cordatus na taxa de renovação da serrapilheira é similar ou maior que a dos caranguejos Sesarminae na região Indo-pacífica Oeste. As populações de U. cordatus produzem largas porções de fezes finamente particuladas ricas em carbono, nitrogênio e biomassa bacterial comparada com o sedimento. A decomposição das folhas de mangue, assim como a remineralização dos nutrientes e transferência destes para o sedimento, é amplamente acelerada devido ao processamento de folhas pelo U. cordatus. As densidades microbiais cresceram 210 vezes, e o grupo Bacteroidetes 673 vezes, entre folhas recém senescentes de R. mangle e fezes. O material fecal e partículas de folhas finamente rasgadas enriquecem os detritos, promovendo assim a produção de organismos detritívoros, em particular caranguejos Uca spp. Pode ser notado que as atividades de perfurações do U. cordatus promovem a oxigenação das camadas mais profundas de sedimento, coincidindo com o incremento das abundâncias e biomassas microbiais.
X Zusammenfassung
ZUSAMMENFASSUNG Das Ziel dieser Arbeit war es, die Ernährungsökologie der kommerziell stark genutzten semi-terrestrischen Krabbe Ucides cordatus zu untersuchen und zum Verständnis ihrer Bedeutung für den Fluss von organischem Material, Nährstoffen und Energie innerhalb eines Mangrovenökosystems in Nordbrasilien beizutragen. Trotz des ökonomischen Wertes und der ausgedehnten Verbreitung dieser Krabbe entlang der subtropischen und tropischen Atlantikküste von Amerika wurde ihre ökologische Rolle innerhalb des Mangrovenökosystems kaum untersucht. Weitere Studien sind dringend notwendig, um eine Basis für die Entwicklung von Managementempfehlungen zur nachhaltigen Nutzung und den Schutz dieser Ressource und ihres Habitats bereit zu stellen. Das Untersuchungsgebiet ist eine mit Mangrovenbäumen bestandene Halbinsel und liegt zwischen dem Caeté und dem Maiaú Ästuar in Nordbrasilien, ca. 200 km ost-nordöstlich von Belém. Die Mangrovenbestände werden zum großen Teil von Rhizophora mangle Bäumen oder einer Mischung aus Rhizophora mangle und Avicennia germinans Bäumen dominiert. Große Teile des Mangrovenwaldes befinden sich im oberen Gezeitenbereich und werden nur bei Springtiden überflutet. U. cordatus ist die auffälligste Art des Benthos und beträgt 84 % seiner Biomasse. Magenanalysen zeigten, dass die Nahrung der Krabben aus Mangrovenblättern (61.2 %), nicht identifiziertem Pflanzenmaterial und Detritus (28.0 %), Baumwurzeln (4.9 %), Sediment (3.3 %), Baumrinde (2.5 %) und tierischem Material (0.1 %) besteht. Bei einem Überangebot an Blattstreu in Feldexperimenten überstiegen die Konsumptionsraten der Krabben die Streufallraten im Untersuchungsgebiet. In Nahrungswahlexperimenten wurden höchste Konsumptionsraten für frisch abgefallene und verrottende R. mangle Blätter erzielt. Krabben die nur mit R. mangle Blättern gefüttert wurden, zeigten höhere Assimilationseffizienzen (C: 79 %; N: 45 %; Energie: 39%) als solche, die sich von A. germinans Blättern ernährten (C: 41 %; N: 9 %; Energie: 31 %). Die geringeren Konsumptions- und Assimilationsraten für A. germinans Blätter werden auf eine härtere Blattstruktur zurückgeführt, die eine Zerkleinerung und Verdauung erschwert. Die tägliche Energieaufnahme von U. cordauts (37.6 kJ bei einem 65 g schweren Tier) ist im Vergleich zu anderen Blatt fressenden Krabben relativ hoch. Die Energieassimilation der U. cordatus Population betrug 10291 und 2870 kJ m-2 y-1 in einem von R. mangle bzw. A. germinans dominierten Waldbestand. Der Nährwert von Blättern aus Krabbenhöhlen variierte nur geringfügig von dem frisch abgefallener Blätter, was deutlich macht, dass Blätter nicht für viele Wochen in den Höhlen gelagert werden. Die Streufallmenge am Waldboden und damit die Futterverfügbarkeit war in einem R. mangle Waldbestand und in einem Mischwald gering (1.25 bzw. 1.80 g dw m-2). Dagegen betrug der Streufall 36.68 g dw m-2 am Boden eines A. germinans Bestandes, was vor allem auf einen Raupenbefall der Bäume zurück zu führen war. Der Streufall und die Produktion von Keimlingen betrugen in einem typischen von R. mangle Bäumen dominierten Waldbestand 16.38 t ha-1 y-1 oder 4.49 g m-2 d-1. Es wurden hohe Schwankungen des Streufalls im Jahresverlauf und zwischen den Habitaten registriert. Hohe Blattsammelraten der Krabben im R. mangle- und Mischwald, eine geringe Menge an Streumaterial in der Mehrzahl der untersuchten Höhlen und hohe Konsumptionsraten bei den Feldexperimenten weisen auf eine Futterlimitierung der U. cordatus Population in diesen Gebieten hin. Die Evakuationsrate des Verdauungstraktes wurde in Hungerexperimenten bestimmt. Die Evakuation erfolgte hauptsächlich in den ersten 12 Stunden nach Beginn des Experimentes
Zusammenfassung XI
und zeigte einen negativ exponentiellen Verlauf. Auf Grundlage der Evakuationsrate kleiner und großer Krabben (0.35 h-1 bzw. 0.31 h-1) und des durchschnittlichen Magen- und Darminhaltes wurde die tägliche Nahrungsaufnahme von U. cordatus für beide Geschlechter und 11 Größenklassen unter Verwendung des Modells von Eggers (1977) bestimmt. Die tägliche Nahrungsaufnahme kleiner Männchen betrug 1.0 g dw (CW 3.0-3.5 cm), was 19.8 % des Trockengewichtes der Krabben entspricht. Große Männchen (CW 7.0-7.5 cm) konsumierten 3.3 g dw täglich, entsprechend 6.0 % ihres Körpertrockengewichtes. Die Nahrungsaufnahme der gesamten U. cordatus Population in einem von R. mangle Bäumen dominierten Waldbestand wurde auf 4.1 g dw m-2 geschätzt, was 81.3 % der täglichen Streufallmenge entspricht. Dieses zeigt, dass die Nutzung des Streufalls durch U. cordatus den Fluss von organischem Material stark beeinflusst, wodurch Nährstoffe und Energie im Mangrovenwald zurückgehalten werden. Videobeobachtungen über 24 h zeigten, dass die Aktivitäten der Nahrungsaufnahme und Nahrungssuche außerhalb der Baue deutlich lichtabhängig sind. Die Aktivitäten wurden nach Ende der Abenddämmerung signifikant weniger und nahmen bei Beginn der Morgendämmerung stark zu. Die Krabben blieben am Tag zu 79 % und in der Nacht zu 92 % der Zeit in ihren Höhlen. Höhere Aktivitäten während des Tages sind höchstwahrscheinlich auf das visuelle Suchen des Futters und das Fehlen von Krabbenwaschbären zurück zu führen. Die Krabben sammelten Mangrovenblätter, Blüten und Stipel, aber fraßen diese Komponenten selten außerhalb der Höhlen. Der über einen Tagesverlauf untersuchte Füllungsgrad des Verdauungstraktes ließ keine Fraßperiodizität erkennen, was darauf schließen lässt, dass die Krabben tags und nachts in ihren Höhlen fressen. Futterkonkurrenz trat selten auf, da der Aktionsradius der Krabben sehr klein ist. Fast das gesamte Streumaterial wurde bei Nipptiden gesammelt, wenn der Waldboden nicht überschwemmt war. Diese Beobachtungen bekräftigen, dass die U. cordatus Population sehr wahrscheinlich in weiten Teilen der Halbinsel Futter limitiert ist. Die Bedeutung von Mikroorganismen für die Ernährung von U. cordatus wurde mit der Methode der Fluoreszenz in situ Hybridisierung (FISH) mit rRNA-bindenden Oligonucleotid-Sonden untersucht. Die Abundanzen der Mikroorganismen stiegen kontinuierlich an, während das Futter (R. mangle Blätter: 3.7 x 10⁸ Zellen g dw-1) den Magen (5.0 x 10⁹ Zellen g dw-1) und Darm (1.7 x 10¹⁰ Zellen g dw-1) passierte, und erreichten höchste Werte in den Fezes (3.2 x 10¹⁰ Zellen g dw-1). Die geringen Mengen an Bakterienkohlenstoff und -stickstoff auf den Blattoberflächen und im Sediment weisen auf eine geringe Bedeutung von aufgenommener Bakterienbiomasse für die Ernährung von U. cordatus hin. Die Zusammensetzung der Bakteriengemeinschaft auf den Blattoberflächen unterschied sich signifikant von der im Verdauungstrakt. Daraus wurde geschlossen, dass residente Bakterienarten im Verdauungstrakt vorkommen und dort mehr oder weniger stabile Populationen bilden. Die Bacteroidetes Gruppe stellte den größten Anteil der Bakterien im Magen (85 %), im Darm (52 %) und in den Fezes (32 %). Hohe Vermehrungsraten dieser Gruppe im Verdauungstrakt weisen auf den Abbau von Cellulose und wahrscheinlich anderen Naturstoffen hin. Die folgende Ernährungsstrategie von U. cordatus wurde deutlich: Die Krabben ernähren sich fast ausschließlich von Pflanzenmaterial, vor allem vom Streufall der Mangrovenbäume, der trotz zeitlicher und räumlicher Schwankungen eine konstante Futterquelle darstellt. Aufgrund einer mehr oder weniger kontinuierlichen Nahrungsaufnahme, einer moderaten Verdauungszeit und eines großen Magens, ist die täglich aufgenommene Nahrungsmenge vergleichsweise groß. Hohe Nahrungsaufnahmeraten und relativ hohe Assimilationsraten bei Fütterung mit R. mangle Blättern führen zu einer vergleichsweise hohen Aufnahme von
XII Zusammenfassung
Kohlenstoff, Stickstoff und Energie, wodurch die schlechte Futterqualität teilweise kompensiert wird. Das C:N Verhältnis, ein Maß für den Nährstoffgehalt des Futters, war in Grün- und Braunalgen am günstigsten. Dies weist darauf hin, dass Algenmaterial eine wichtige Futterkomponente darstellt, die das ungünstige C:N Verhältnis der Mangrovenblätter teilweise ausgleicht. Die Verdauung des Streumaterials wird höchstwahrscheinlich von Bakterien im Magen und Darm unterstützt. Die Ergebnisse lassen vermuten, dass die Darmbakterien für den Stickstoffhaushalt von Vorteil sind. Stickstoff fixierende Bakterien oder ihre Metabolite dienen den Krabben vielleicht als Stickstoffquelle, wie es bei Holz fressenden Termiten vorkommt. Obwohl die Stickstoffaufnahme verglichen mit anderen Blatt fressenden Krabben relativ hoch ist, kann aufgrund der sehr geringen Wachstumsraten der Krabben eine Stickstofflimitierung nicht ausgeschlossen werden. Die Ergebnisse dieser Arbeit zeigen, dass U. cordatus eine Schlüsselart im Untersuchungs-gebiet darstellt. Durch das Vergraben und die Konsumption des Streumaterials werden der Großteil der produzierten Streu und damit Nährstoffe und Energie im Mangrovenwald zurückgehalten. Der Einfluss von U. cordatus auf den Streuumsatz ist gleichartig oder sogar höher als der von Krabben der Familie Sesarminae im Indo-West Pazifik. Die U. cordatus Population produziert eine beträchtliche Menge an fein fragmentierten Fezes, die im Vergleich zum Sediment reich an Kohlenstoff, Stickstoff und Bakterienbiomasse sind. Der Abbau des Streumaterials und damit die Remineralisierung der Nährstoffe und der Energietransfer ins Sediment wird durch die Nutzung des Streumaterials durch U. cordatus stark beschleunigt. Zwischen frisch abgefallenen R. mangle Blättern und den Fezes stieg die Dichte der Mikroorganismen um das 210-fache und die der Bacteroidetes Gruppe um das 673-fache an. Fezes und fein zerkleinerte Blattstücke reichern den Detritus an und fördern damit höchstwahrscheinlich die Produktion von detritivoren Organismen, vor allem die der Winkerkrabben. Es konnte gezeigt werden, dass die Grabaktivitäten von U. cordatus die Oxygenierung von tieferen Sedimentschichten verbessern, welches mit einer gesteigerten mikrobiellen Abundanz und Biomasse einherging.
1 General introduction 1
1 GENERAL INTRODUCTION
Intertidal mangrove forests fringe about 60-75 % of tropical and subtropical coasts where they cover approximately 17.1 million hectares globally (Spalding et al. 1997, Lacerda et al. 2002). Brazilian mangroves extend along a coastline of 6800 km (Spalding et al. 1997), covering more than one million hectares (Por 1994). Mangrove areas have considerable environmental and ecological value, as they prevent erosion of coastlines, protect adjacent coral reefs and sea grass beds from the input of terrestrial sediments and serve as nursery sites, feeding grounds and protection areas for many fish species, invertebrates, mammals and birds (Odum and Heald 1972, Lugo and Snedaker 1974, Jones 1984, Robertson and Duke 1987, Little et al. 1988, Robertson and Duke 1990, Robertson and Alongi 1992, Sasekumar et al. 1992, Krumme 2003). Species diversity and/or biomass of brachyuran crabs is particularly high in mangrove forests, and the important impact of this group on the flow of nutrients and energy within the ecosystem has been documented by several studies (Jones 1984, Robertson 1986, Lee 1989a, Robertson and Daniel 1989, Emmerson and Mc Gwynne 1992, Steinke et al. 1993, Lee 1998, Hogarth 1999, Koch 1999, Wolff et al. 2000, Koch and Wolff 2002, Schories et al. 2003). The semi-terrestrial crab Ucides cordatus cordatus (Ocypodidae, L. 1763), the subject of this dissertation, occurs in mangrove forests along the subtropical and tropical Atlantic coast of America from Florida to Uruguay, and on the Caribbean islands (Burggren and McMahon 1988). It is an important fishery resource along the Brazilian coastline (Nascimento et al. 1982, Nascimento 1993, Nordi 1994a, b, Gondim and Araújo 1996, Corrêa Ivo et al. 1999, Corrêa Ivo and Vasconcelos Gesteira 1999). The second subspecies of the genus Ucides is U. cordatus occidentalis which occurs on the Pacific coast of America. Transitional forms were reported from northern Peru and Columbia. Subspecies can be distinguished by the varying degree of chelae thornation (Türkay 1970). U. cordatus cordatus (referred to as U. cordatus from now on) is a true mangrove crab, found exclusively in mangrove forests (Türkay 1970), where it lives intertidally and supratidally on soft substrates. It constructs burrows with a maximum depth of about 2 m (Rademaker 1998). The crabs remain within the burrows when the forest is covered by the tide. The burrows offer protection against predators (mostly crab racoons, capuchin monkeys, crab hawks, and fish), and because they reach down to the groundwater, also protect against desiccation. U. cordatus mainly feeds upon mangrove leaf litter, which is collected and either consumed directly or stored in the burrows (Nascimento 1993, Rademaker 1998). Removal of mangrove leaves by crabs through consumption or burial considerably reduces the direct export of particulate organic matter into the estuary by the tide (Wolff et al. 2000, Koch and Wolff 2002, Schories et al. 2003). This ensures preservation of nutrients in the mangrove habitat. Despite the widespread occurrence of Ucides in America and on the Caribbean
2 1 General introduction
islands, studies investigating the importance of litter processing by crabs are very rare (Twilley et al. 1997, Koch and Wolff 2002, Schories et al. 2003). This topic has been investigated more intensively in mangrove forests of the Indo-West-Pacific region. There, particularly crabs of the sub-family Sesarminae consume a large proportion of the annual litter fall (Robertson 1986, Lee 1989a, Robertson and Daniel 1989, Emmerson and Mc Gwynne 1992, Steinke et al. 1993). In addition, leaf-eating crabs play an important role in leaf degradation (Camilleri 1992, Koch and Wolff 2002). Through the process of digestion, mangrove leaves are returned to the environment as finely shredded, partially digested faecal material (Camilleri 1989, Robertson and Daniel 1989), which is more readily consumed by detritivores and provides more surface area for colonization by microorganisms than the undigested leaves. Detrital material formed from mangrove leaf litter is considered to be the basis of food webs within mangrove ecosystems (Odum and Heald 1975). The rapid conversion of leaf litter into finer detritus greatly accelerates the cycling of nutrients within the mangrove system (Robertson and Daniel 1989). Food quality may limit the populations or growth rates of herbivorous crabs even where the quantity of food is ample (Wolcott and Wolcott 1987, Burggren and McMahon 1988). Physical and chemical characteristics of plants can lead to difficulties in harvesting and ingestion, to low digestibility, unpalatability and toxicity, and to deficiencies in specific nutrients, especially nitrogen, vitamins and fatty acids (Wolcott and O´Connor 1992). It is not yet known whether food components besides mangrove tree leaves are important sources of nutrients, especially nitrogen, to U. cordatus. This study aims to obtain insight into the utilization of nutrients by U. cordatus. Previous studies have focussed on the assimilation of sesarmid and small ocypodid crabs (Dye and Lasiak 1987, Emmerson and Mc Gwynne 1992, Micheli 1993, Lee 1997). This is the first study to provide an assessment of the assimilation efficiency of U. cordatus. Since plant material is usually difficult to digest and contains little nitrogen (Mattson 1980) this study also investigates whether bacterial biomass is important for the nutrition of U. cordatus. In terrestrial ruminants, termites and isopods, symbiotic microorganisms are essential in extracting nutrients from plant material and making them available to the host. The presence of bacteria has been reported from the digestive tract of some brachyuran crabs (Harris 1993a, Harris 1993b), including U. cordatus (Nascimento 1993), but information on the abundance, biomass, community structure and functional role of these bacteria is very limited. The study presented here forms part of the MADAM project (MAngrove Dynamics And Management), a bilateral co-operation between the Centre for Tropical Marine Ecology (ZMT) in Bremen, Germany and the Federal University of the State Pará (UFPa) in Belém, Brazil. The ten-year research project started in 1995 and is being carried out at the Caeté
1 General introduction 3
estuary in northern Brazil, about 200 km east-north-east of Belém, Pará (Figures 1 and 2), where relatively extensive mangrove forests can still be found (Berger et al. 1999). The aim of this multidisciplinary research project is to understand the links and interactions between biotic, abiotic and socioeconomic factors in the mangrove ecosystem. The information acquired will be used to model the current and predicted future response of the Caeté estuary to changing environmental conditions and different utilization scenarios (Berger et al. 1999). Furthermore, management recommendations and strategies for the sustainable use of the Caeté mangrove estuary and its resources shall be developed. U. cordatus is intensively harvested by local crab-fishing communities in the investigation area (Glaser 1999, 2003). According to calculations by Koch (1999) and Wolff et al. (2000), the crab contributes to about 76% of the total faunal biomass of the Caeté mangrove estuary. Due to its high abundance, large size and high nutritional value (Nascimento 1993), it is the most important income source for over half of the rural households (Glaser 1999, 2003). Mean annual extraction is estimated to be 1700 tons for the investigation area (180 km2) (Araújo and Diele, in preparation). Increasing exploitation rates have led to a growing concern about the future development of the U. cordatus population and to the interest in protecting and managing this resource. Within the MADAM project, data on population structure, reproduction, growth and commercial exploitation of U. cordatus (Diele 2000), as well as its production and respiration (Koch 1999, Koch and Wolff 2002), habitat ecology and some aspects of feeding ecology (Rademaker 1998), spatial distribution (Wessels 1999) and utilization by man (Glaser 1999) were collected. Information on leaf-removal by U. cordatus (Schories et al. 2003) was acquired indirectly. This information was included in a trophic steady state model of the ecosystem that integrated data on biomass, catches, food spectrum and dynamics of the main species of the Caeté estuary (Wolff et al. 2000). The socio-economic importance of the resource U. cordatus and the need to develop management recommendations for its sustainable use at the Caeté estuary calls for in-depth knowledge of its biology and ecological role. Despite the economical value and widespread distribution of U. cordatus along the Atlantic coast of America, studies of its ecological role and value for the mangrove ecosystem are still very limited. Objectives The general objective of this study is to investigate the feeding ecology of the mangrove crab U. cordatus in order to gain a better understanding of its functional role and its influence on the flow of organic matter, nutrients and energy within the mangrove ecosystem. An outline about the investigated topics of this dissertation is given in Figure 1.
4 1 General introduction
The specific objectives are: (1) to provide knowledge about the food spectrum, food preferences, consumption rates and
gastric evacuation rate of U. cordatus and to assess whether the crabs are food limited at the study area (chapter 3). Field and laboratory experiments were conducted to determine the diet diversity, food preferences, and consumption rates of U. cordatus. It was aimed to investigate whether algae or animal material are significant components of the crab´s diet. The gastric evacuation rate for U. cordatus was determined for the first time. Together with data about abundance and biomass of U. cordatus (Diele 2000), as well as litter production, these experiments provided the basis for quantifying the daily consumption of mangrove litter by the U. cordatus population per square metre and in relation to litter fall. In order to determine food availability to the crabs, litter fall, litter standing stock and litter quantity in crab burrows were determined.
(2) to investigate the feeding behaviour and periodicity of U. cordatus (chapter 4).
It was aimed to determine whether the crabs show a feeding periodicity depending on the time of day, the tidal cycle or both. Therefore, investigation of the gastrointestinal contents and behavioural observations were conducted over 24 h periods. In addition, field observations focussed on activity patterns, the foraging radius, the exploitation of the litter standing stock, food preferences, and intraspecific competition for food and burrows.
(3) to study the assimilation efficiency for available nutrients and the role of microorganisms
for the nutrition of U. cordatus (chapter 5). It was aimed to determine the assimilation of organic matter, carbon, nitrogen and energy by U. cordatus. Direct measurements of assimilation efficiencies for different food items were evaluated by monodietary experiments. Faeces production and the nutritive value of faeces were quantified for specifying the flow of organic matter and nutrients through this species. By comparing the nutritive value and the bacterial abundance of mangrove leaves taken from crab burrows and from the sediment surface, it was intended to gain information on the duration of leaf storage in burrows. Microbial abundance, biomass and community structure were compared among the surface of mangrove leaves, the sediment, the gastrointestinal contents and faecal material of U. cordatus. It was aimed to reveal whether bacterial biomass constitutes a supplementary food source for the crabs and/or whether bacteria are involved in the degradation of plant material in the digestive tract.
The thesis is organized into three chapters, corresponding to these three objectives. Subsequently, a conclusion is given, including the main findings of this thesis.
1 General introduction 5
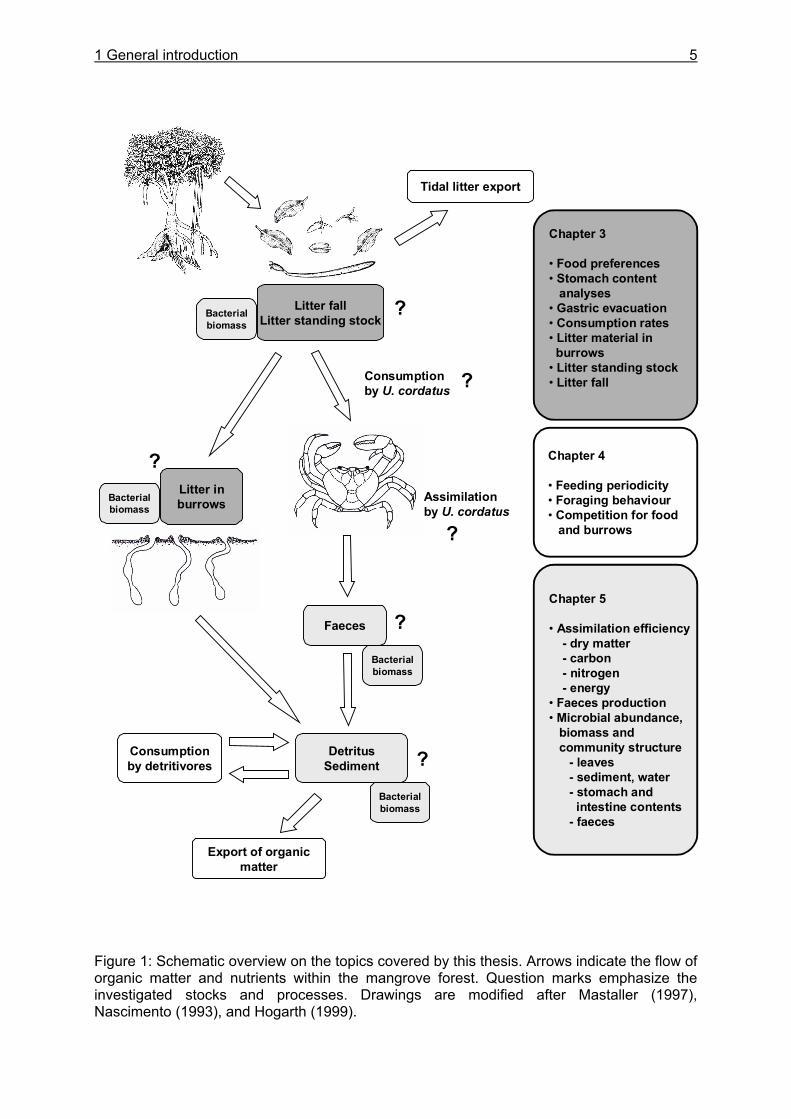
Figure 1: Schematic overview on the topics covered by this thesis. Arrows indicate the flow of organic matter and nutrients within the mangrove forest. Question marks emphasize the investigated stocks and processes. Drawings are modified after Mastaller (1997), Nascimento (1993), and Hogarth (1999).
Chapter 3
• Food preferences• Stomach content
analyses• Gastric evacuation• Consumption rates• Litter material in burrows
• Litter standing stock• Litter fall
Litter fallLitter standing stock
Faeces
Bacterialbiomass
Export of organicmatter
Consumptionby detritivores
?
?
?
?
DetritusSediment
?
Tidal litter export
Chapter 4
• Feeding periodicity• Foraging behaviour• Competition for food
and burrows
Chapter 5
• Assimilation efficiency- dry matter- carbon- nitrogen- energy
• Faeces production• Microbial abundance,
biomass andcommunity structure
- leaves- sediment, water- stomach andintestine contents
- faeces
Consumptionby U. cordatus
Assimilationby U. cordatus
Bacterialbiomass
Bacterialbiomass
Bacterialbiomass
Litter inburrows
?
6 2 Study area
2 STUDY AREA
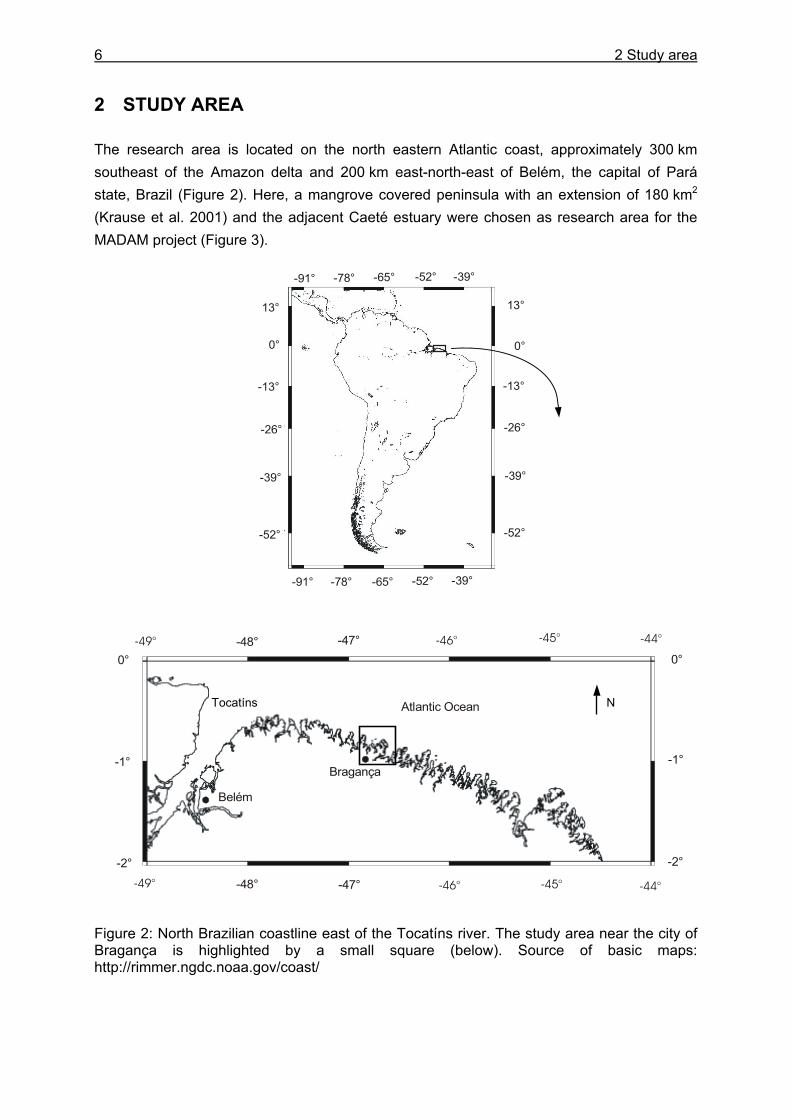
The research area is located on the north eastern Atlantic coast, approximately 300 km southeast of the Amazon delta and 200 km east-north-east of Belém, the capital of Pará state, Brazil (Figure 2). Here, a mangrove covered peninsula with an extension of 180 km2 (Krause et al. 2001) and the adjacent Caeté estuary were chosen as research area for the MADAM project (Figure 3).
Figure 2: North Brazilian coastline east of the Tocatíns river. The study area near the city of Bragança is highlighted by a small square (below). Source of basic maps: http://rimmer.ngdc.noaa.gov/coast/
-91° -78° -65° -52° -39°
-91° -78° -65° -52° -39°
13°
0°
-13°
-26°
-39°
-52°
13°
0°
-13°
-26°
-39°
-52°
Belém
Bragança
Atlantic Ocean
-49° -48° -47° -46° -45° -44°
-49° -48° -47° -46° -45° -44°
0°
-1°
-2°
0°
-1°
-2°
Tocatíns N
2 Study area 7
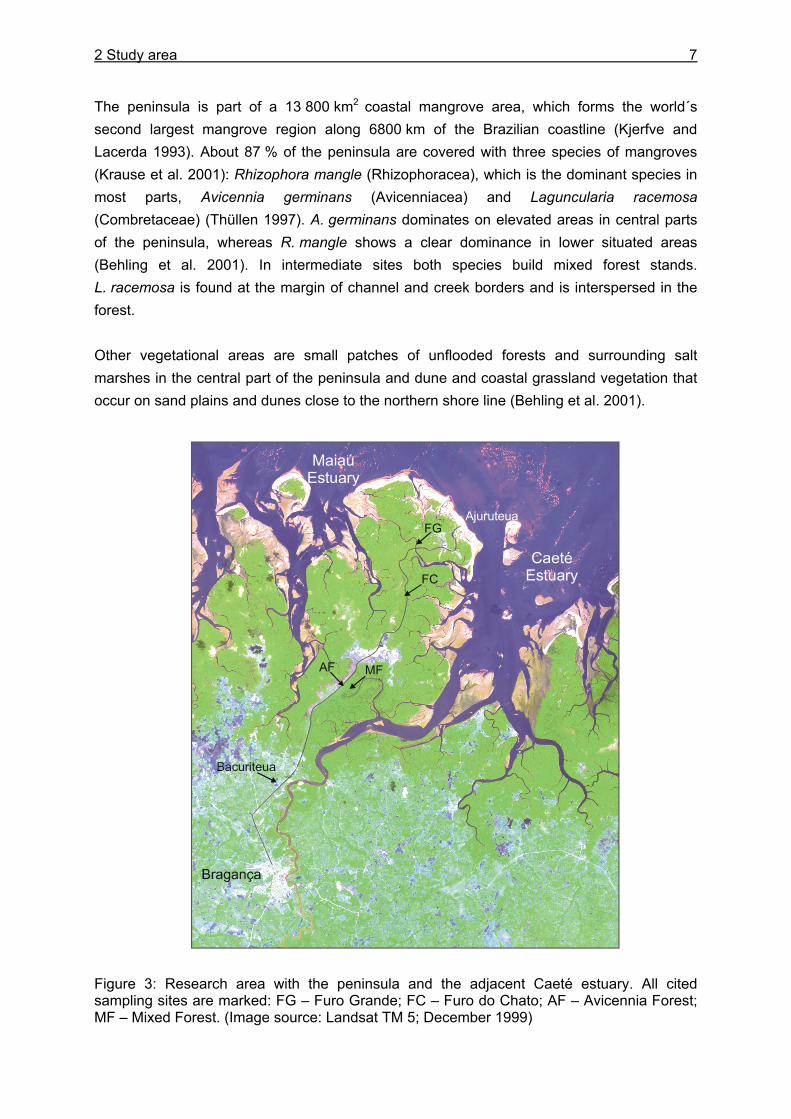
The peninsula is part of a 13 800 km2 coastal mangrove area, which forms the world´s second largest mangrove region along 6800 km of the Brazilian coastline (Kjerfve and Lacerda 1993). About 87 % of the peninsula are covered with three species of mangroves (Krause et al. 2001): Rhizophora mangle (Rhizophoracea), which is the dominant species in most parts, Avicennia germinans (Avicenniacea) and Laguncularia racemosa (Combretaceae) (Thüllen 1997). A. germinans dominates on elevated areas in central parts of the peninsula, whereas R. mangle shows a clear dominance in lower situated areas (Behling et al. 2001). In intermediate sites both species build mixed forest stands. L. racemosa is found at the margin of channel and creek borders and is interspersed in the forest. Other vegetational areas are small patches of unflooded forests and surrounding salt marshes in the central part of the peninsula and dune and coastal grassland vegetation that occur on sand plains and dunes close to the northern shore line (Behling et al. 2001). Figure 3: Research area with the peninsula and the adjacent Caeté estuary. All cited sampling sites are marked: FG – Furo Grande; FC – Furo do Chato; AF – Avicennia Forest; MF – Mixed Forest. (Image source: Landsat TM 5; December 1999)
CaetéEstuary
FG
FC
AF MF
Ajuruteua
Bacuriteua
MaiaúEstuary
8 2 Study area
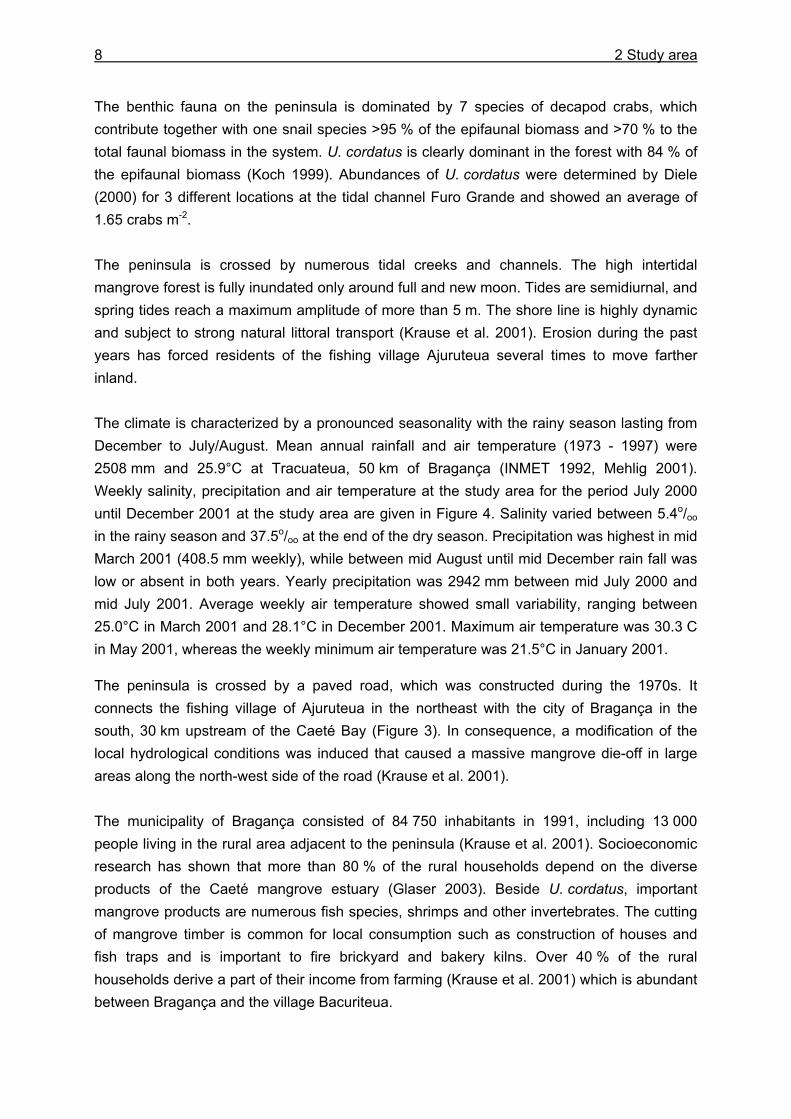
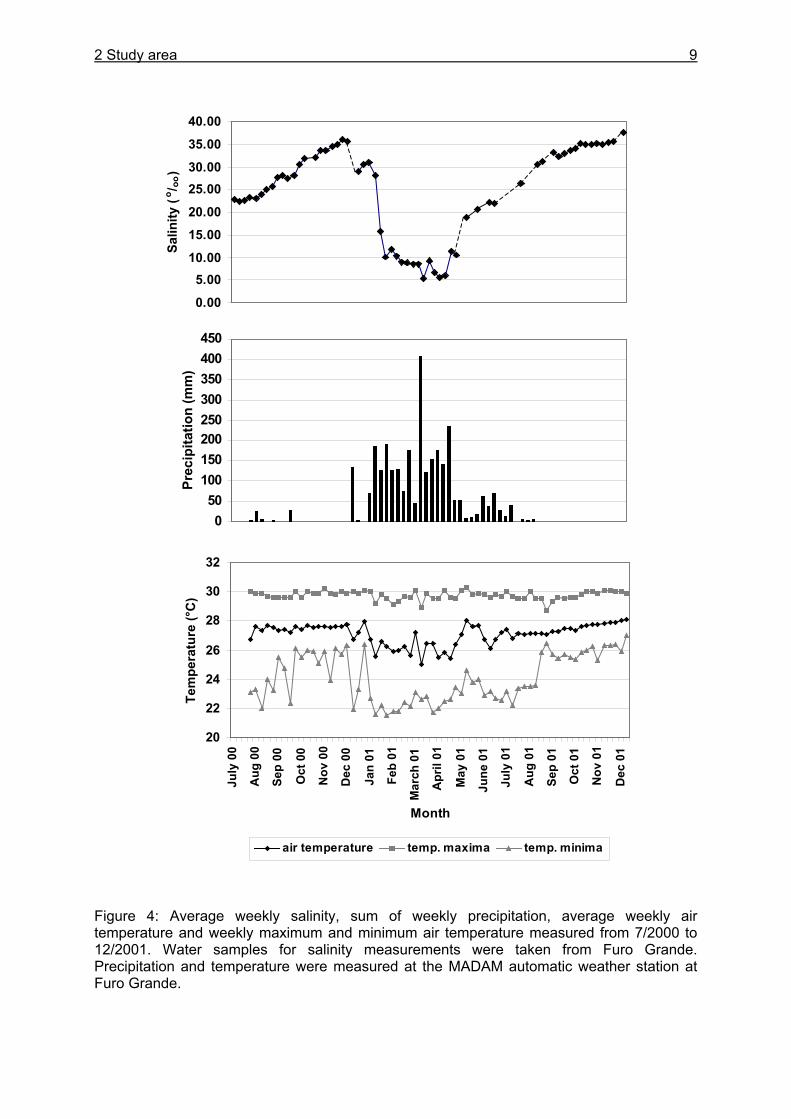
The benthic fauna on the peninsula is dominated by 7 species of decapod crabs, which contribute together with one snail species >95 % of the epifaunal biomass and >70 % to the total faunal biomass in the system. U. cordatus is clearly dominant in the forest with 84 % of the epifaunal biomass (Koch 1999). Abundances of U. cordatus were determined by Diele (2000) for 3 different locations at the tidal channel Furo Grande and showed an average of 1.65 crabs m-2. The peninsula is crossed by numerous tidal creeks and channels. The high intertidal mangrove forest is fully inundated only around full and new moon. Tides are semidiurnal, and spring tides reach a maximum amplitude of more than 5 m. The shore line is highly dynamic and subject to strong natural littoral transport (Krause et al. 2001). Erosion during the past years has forced residents of the fishing village Ajuruteua several times to move farther inland. The climate is characterized by a pronounced seasonality with the rainy season lasting from December to July/August. Mean annual rainfall and air temperature (1973 - 1997) were 2508 mm and 25.9°C at Tracuateua, 50 km of Bragança (INMET 1992, Mehlig 2001). Weekly salinity, precipitation and air temperature at the study area for the period July 2000 until December 2001 at the study area are given in Figure 4. Salinity varied between 5.4o/oo in the rainy season and 37.5o/oo at the end of the dry season. Precipitation was highest in mid March 2001 (408.5 mm weekly), while between mid August until mid December rain fall was low or absent in both years. Yearly precipitation was 2942 mm between mid July 2000 and mid July 2001. Average weekly air temperature showed small variability, ranging between 25.0°C in March 2001 and 28.1°C in December 2001. Maximum air temperature was 30.3 C in May 2001, whereas the weekly minimum air temperature was 21.5°C in January 2001.
The peninsula is crossed by a paved road, which was constructed during the 1970s. It connects the fishing village of Ajuruteua in the northeast with the city of Bragança in the south, 30 km upstream of the Caeté Bay (Figure 3). In consequence, a modification of the local hydrological conditions was induced that caused a massive mangrove die-off in large areas along the north-west side of the road (Krause et al. 2001). The municipality of Bragança consisted of 84 750 inhabitants in 1991, including 13 000 people living in the rural area adjacent to the peninsula (Krause et al. 2001). Socioeconomic research has shown that more than 80 % of the rural households depend on the diverse products of the Caeté mangrove estuary (Glaser 2003). Beside U. cordatus, important mangrove products are numerous fish species, shrimps and other invertebrates. The cutting of mangrove timber is common for local consumption such as construction of houses and fish traps and is important to fire brickyard and bakery kilns. Over 40 % of the rural households derive a part of their income from farming (Krause et al. 2001) which is abundant between Bragança and the village Bacuriteua.
2 Study area 9
Figure 4: Average weekly salinity, sum of weekly precipitation, average weekly air temperature and weekly maximum and minimum air temperature measured from 7/2000 to 12/2001. Water samples for salinity measurements were taken from Furo Grande. Precipitation and temperature were measured at the MADAM automatic weather station at Furo Grande.
20
22
24
26
28
30
32
July
00
Aug
00
Sep
00
Oct
00
Nov
00
Dec
00
Jan
01
Feb
01
Mar
ch 0
1
Apr
il 01
May
01
June
01
July
01
Aug
01
Sep
01
Oct
01
Nov
01
Dec
01
Month
Tem
pera
ture
(°C
)
air temperature temp. maxima temp. minima
050
100150200250300350400450
Prec
ipita
tion
(mm
)
0.005.00
10.0015.0020.0025.0030.0035.0040.00
Salin
ity (
o / oo)
10 2 Study area
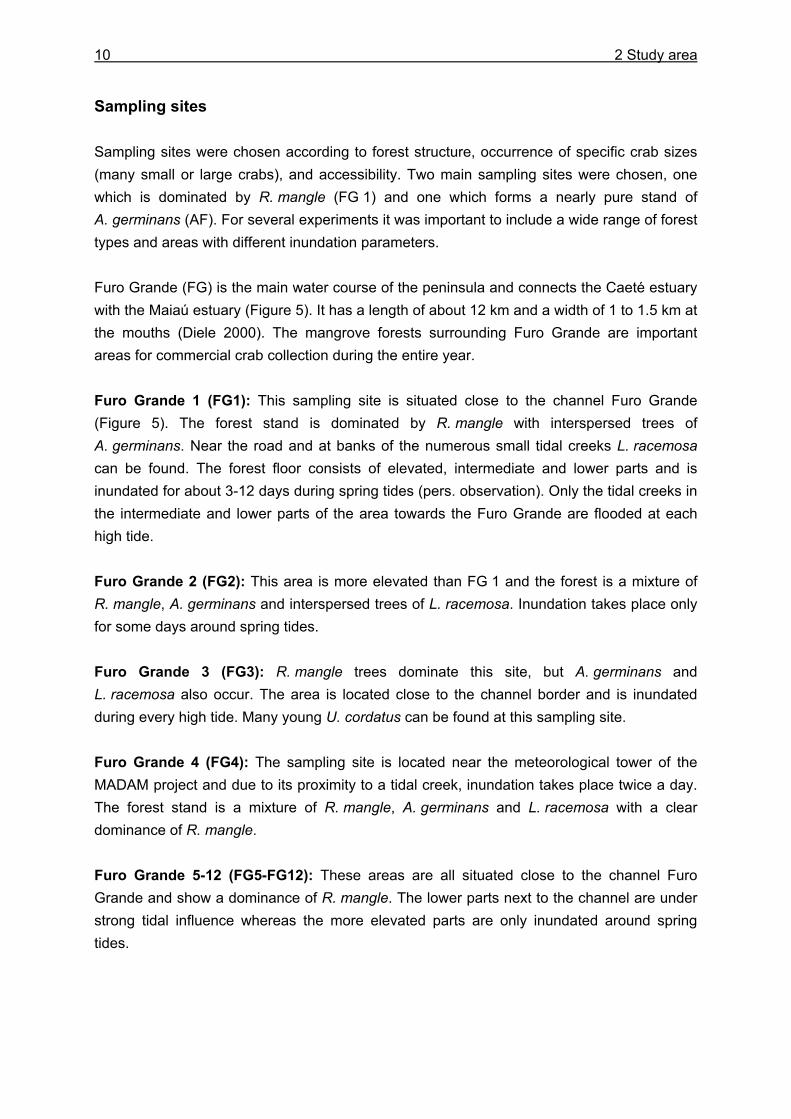
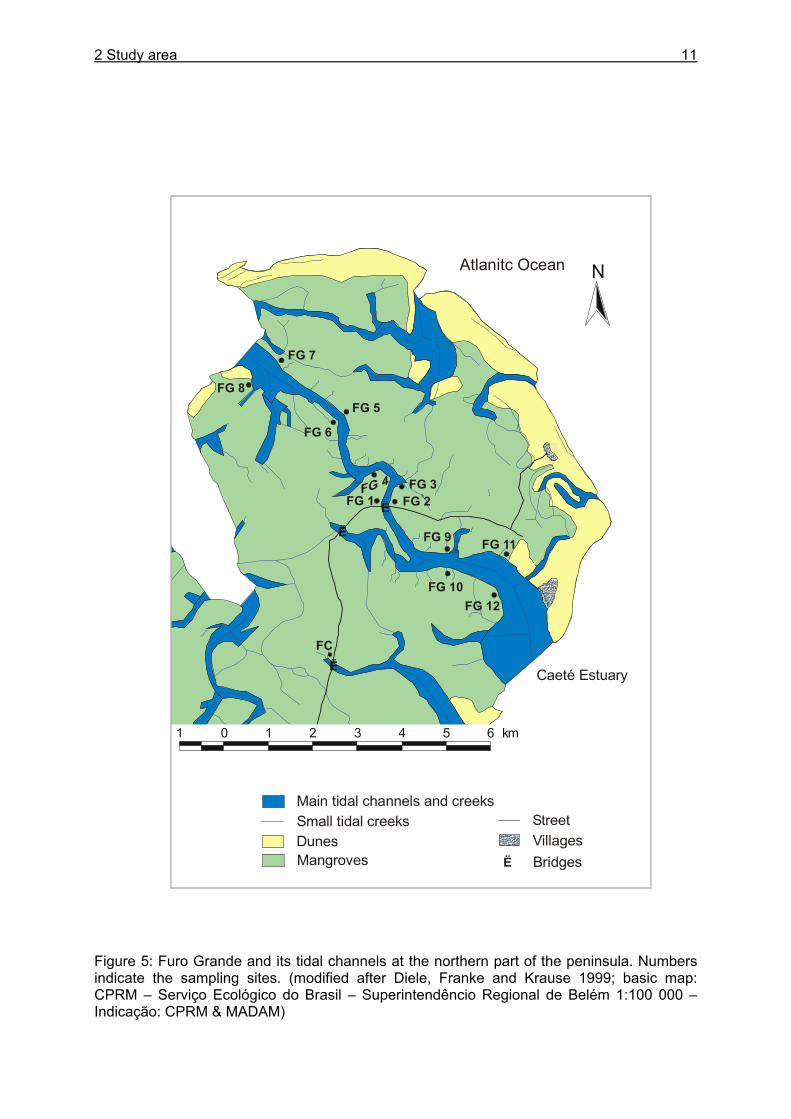
Sampling sites Sampling sites were chosen according to forest structure, occurrence of specific crab sizes (many small or large crabs), and accessibility. Two main sampling sites were chosen, one which is dominated by R. mangle (FG 1) and one which forms a nearly pure stand of A. germinans (AF). For several experiments it was important to include a wide range of forest types and areas with different inundation parameters. Furo Grande (FG) is the main water course of the peninsula and connects the Caeté estuary with the Maiaú estuary (Figure 5). It has a length of about 12 km and a width of 1 to 1.5 km at the mouths (Diele 2000). The mangrove forests surrounding Furo Grande are important areas for commercial crab collection during the entire year. Furo Grande 1 (FG1): This sampling site is situated close to the channel Furo Grande (Figure 5). The forest stand is dominated by R. mangle with interspersed trees of A. germinans. Near the road and at banks of the numerous small tidal creeks L. racemosa can be found. The forest floor consists of elevated, intermediate and lower parts and is inundated for about 3-12 days during spring tides (pers. observation). Only the tidal creeks in the intermediate and lower parts of the area towards the Furo Grande are flooded at each high tide. Furo Grande 2 (FG2): This area is more elevated than FG 1 and the forest is a mixture of R. mangle, A. germinans and interspersed trees of L. racemosa. Inundation takes place only for some days around spring tides. Furo Grande 3 (FG3): R. mangle trees dominate this site, but A. germinans and L. racemosa also occur. The area is located close to the channel border and is inundated during every high tide. Many young U. cordatus can be found at this sampling site. Furo Grande 4 (FG4): The sampling site is located near the meteorological tower of the MADAM project and due to its proximity to a tidal creek, inundation takes place twice a day. The forest stand is a mixture of R. mangle, A. germinans and L. racemosa with a clear dominance of R. mangle. Furo Grande 5-12 (FG5-FG12): These areas are all situated close to the channel Furo Grande and show a dominance of R. mangle. The lower parts next to the channel are under strong tidal influence whereas the more elevated parts are only inundated around spring tides.
2 Study area 11
Figure 5: Furo Grande and its tidal channels at the northern part of the peninsula. Numbers indicate the sampling sites. (modified after Diele, Franke and Krause 1999; basic map: CPRM – Serviço Ecológico do Brasil – Superintendêncio Regional de Belém 1:100 000 – Indicação: CPRM & MADAM)
Ë
Ë
#
#
#
#
#
#
#
#
#
#
#
#
#
#
#
#
#
##
# #
#
#
#
#
##
#
#
#
#
#
#
#
#
#
#
#
#
#
#
#
#
#
#
#
#
#
#
#
#
ro
l
I
i
Áreas de captura do caranguejo-Uçá(Ucides cordatus) no Furo Grande
N
Legenda
DunasFurosIgarapés
VilasEstrada
Manguezal
PoNtesLimites das áreas
1 0 1 2 3 4 5 6 km
Mapa: K. Diele, K. Franke, G. Krause, ZMT / 1999Mapa básica: CPRM - Serviçio Ecologico do BrasilSuperintendência Regional de Bélem (1:100.000)Indicaçao: CPRM & MADAM
Atlanitc Ocean
Caeté Estuary
Bridges
Main tidal channels and creeks
ËDunesMangroves
Villages
FC
FG 1 FG 2FG 3
FG 5
FG 6
FG 7
FG 8
FG 9
FG 10
FG 11
FG 12
Ë
Ë
Small tidal creeks
12 2 Study area
Furo do Chato (FC): Furo do Chato is a blind ending large tidal creek (Figure 5). The sampling site is located northwards from the Furo do Chato between a branch of the Furo do Chato and the road. This area is characterized by a mixed forest with dominance of R. mangle, followed by A. germinans. L. racemosa is found mainly near the road and along the creek borders. The forest is cut by numerous small creeks that are flooded during every high tide. A study of Cohen et al. (2001) revealed an inundation frequency of 275 days in 1999 close to the tidal channel. At the sampling site, which is located more elevated, an inundation frequency around 4-5 days at spring tides, corresponding to approximately 120 days could be observed. The density of U. cordatus at this sampling site is 1.38 m-2 (Rademaker 1998). Avicennia forest (AF): In the relatively high central part of the peninsula A. germinans forms a nearly pure stand (Figure 3). This forest consists of 98 % A. germinans and 2 % R. mangle and the mean density of trees is 0.9 m-2 (Reise 1999). During the whole period of this study a relatively high number of dead trees was found. A strong defoliation of large parts of this forest caused by moth larvae of Hyblae puera was observed in 2001. The sampling site is less influenced by tidal inundations. Even at spring tides this area is not always inundated. In 1999 the frequency of inundation at this sampling site was 47 days (Cohen et al. 2001). The tidal creek Furo do Pará is about 1 km away from this area. Therefore, the sediment dries out and shows cracks during the dry season. This sampling site is not regularly visited by crab collectors due to the relatively hard sediment surface and a smaller average crab size. Wessels (1999) reported an average number of U. cordatus burrows of 0.6 m-2. Mixed forest (MF): This forest is located seawards of the Avicennia forest (Figure 3). It is less elevated and about 600 m away from the Furo do Pará. Consequently, inundation occurs for some days at every spring tide. The frequency of inundation was 128 days in 1999 (Cohen et al. 2001). The forest consists of 68 % A. germinans, 24% R. mangle and 8 % L. racemosa and is sparse with an average tree density of 0.23 m-2 (Reise 1999). The number of U. cordatus burrows was 2.5 m-2 during the study of Wessels (1999).
3 Diet and consumption: Introduction 13
3 DIET AND CONSUMPTION
3.1 Introduction
Knowledge about the food spectrum and preferences of an organism is fundamental for the understanding of its feeding ecology and functional role within the food web. Food preferences of litter-consuming brachyuran crabs have been investigated in studies on sesarmine crabs (Giddens et al. 1986, Neilson et al. 1986, Smith III 1987, Camilleri 1989, Micheli et al. 1991, Kyomo 1992, Micheli 1993, Steinke et al. 1993, Dahdouh-Guebas et al. 1997, Ashton 2002) and gecarcinid crabs (Micheli et al. 1991, Greenaway and Raghaven 1998). The nutritional value, which is often expressed as the carbon to nitrogen ratio, and the tannin content of different mangrove leaf types have been found to affect the crabs´ choice (Giddens et al. 1986, Neilson et al. 1986, Camilleri 1989, Lee 1989a, O´Dowd and Lake 1990). In contrast, other studies reported that these leaf properties do not influence food preferences (Micheli et al. 1991, Micheli 1993). Although U. cordatus is abundant in various mangrove areas in Central and South America (Alcantara-Filho 1978, Nascimento et al. 1982, Nascimento and Santos 1982, Branco 1993, McKee 1995, Wiedemeyer 1997, Corrêa Ivo and Vasconcelos Gesteira 1999), knowledge of its diet diversity, food preferences and consumption rates is limited. Some researchers have mentioned a preference for R. mangle leaves (De Castro 1986, Rademaker 1998), decomposing organic material (De Castro 1986) and a decomposed mangrove fruit mix (Wiedemeyer 1997). According to Costa (1979) (cit in Corrêa Ivo and Vasconcelos Gesteira 1999), U. cordatus is an omnivore, feeding mainly on taxonomically higher plants, algae and sponges, as well as on sediment. Data on the stomach contents of U. cordatus have only been reported by Branco (1993) who found plant components, sediment and animal remains in the stomachs of specimens in Santa Catarina, southern Brazil. However, information about the proportional composition of ingested food components is still lacking. In order to gain detailed knowledge on the food spectrum and preferences of U. cordatus and to determine consumption rates, food choice experiments using mangrove leaves of different tree species and decomposition stages were carried out in the laboratory and in the field. Some experiments were conducted with tethered leaves to reveal whether crabs select among food components at the sediment surface or inside their burrows. These experiments also served to determine the consumption rate in the field. Since mangrove litter has a low nitrogen content (Cundell et al. 1979, Mattson 1980, de Lacerda et al. 1986, Camilleri 1989, Steinke et al. 1993, Rao et al. 1994, Wafar et al. 1997, Woitchik et al. 1997, Mfilinge et al. 2002, Skov and Hartnoll 2002) it was investigated whether U. cordatus is restricted to the intake of litter material or prefer a diet rich in protein. Food preference experiments were therefore carried out offering soybeans and dead fish in addition to leaf litter. Furthermore, stomach content analyses were conducted to obtain more information on the food spectrum
14 3 Diet and consumption: Introduction
of U. cordatus. In particular, it was investigated whether algal material, sediment or animal material are significant components of the crabs´ diet. Litter processing by crabs occurs by direct consumption or burial of litter material (Giddens et al. 1986, Camilleri 1989, Micheli et al. 1991, Micheli 1993, Steinke et al. 1993, Dahdouh-Guebas et al. 1997). Analyses of litter from crab burrows may help reveal preferences regarding leaf litter type and decomposition stage. Litter material was therefore dug out of the burrows of U. cordatus at three different study sites and investigated for its proportional composition and decomposition stage. These analyses were completed by the determination of the carbon, nitrogen and energy content of leaves and the colonization by microorganisms (chapter 5). In order to provide knowledge upon the availability of plant material to the crabs, litter from crab burrows was quantified and litter was collected from the sediment surface around the investigated burrows, thus estimating the litter standing stock at the sampling sites. In addition, litter fall was analysed by disposing litter traps in the forest. As data on litter production had already been reported for several of the study sites (Rademaker 1998, Mehlig 2001, Reise 2002), additional litter fall experiments were needed only at site FG 1, where numerous investigations of this study took place. Another purpose of this study was to estimate the daily food consumption of U. cordatus based on data about gut evacuation rates and average gastrointestinal contents. Gut evacuation time determines the amount of food that can be processed within a day. Long gut passage times may limit the food intake even if the quantity of food is high. Investigations on gastric evacuation were first conducted for fish. Several researchers have fit a linear model to fish gastric evacuation data (Daan 1973, Jones 1974), assuming that the amount of food evacuated per unit time remains constant. Other studies have suggested an exponential model, which predicts that, as the stomach contents volume declines, the amount of food evacuated per unit time will decrease (Eggers 1977, Thorpe 1977, Elliott and Persson 1978, Kiørboe 1978, for review see Jobling 1981). In recent years, gastric evacuation rates have also been determined for brachyuran crabs (Hill 1976, Wolff and Cerda 1992, Wiedemeyer 1997, Koch 1999, Jesse 2001, Reigada and Negreiros-Fransozo 2001) and shrimps (Wassenberg and Hill 1993, Nunes and Parsons 2000, Schwamborn and Criales 2000) applying the models originally developed for fish. Instead of evacuation rate, gut clearance time was determined for a few terrestrial crabs (Wolcott and Wolcott 1984, Wolcott and Wolcott 1987). Gut evacuation rates of U. cordatus were determined for the first time. Starving experiments were conducted in the laboratory. Then, the daily food consumption of U. cordatus was calculated based on evacuation data. Few studies so far have calculated food consumption based on evacuation rates in crustaceans (Wolff and Cerda 1992, del Norte-Campos and Temming 1994, Maynou and Cartes 1998, Koch 1999). In order to improve the estimation of
3 Diet and consumption: Introduction 15
the daily food consumption of U. cordatus, evacuation rates were determined for large and small crabs, considering a possible size dependency of the evacuation process. Lower gut clearance times for small and juvenile individuals have been reported for several decapods (Wolcott and Wolcott 1987, Jesse 2001, Gurney et al. 2002). The observation that there are only small amounts of litter on the forest floor in large parts of mangrove areas along the tidal channel Furo Grande even in periods without tidal flushing at spring tides led to the question whether U. cordatus act as a keystone species in the high intertidal forest by processing the bulk of litter shed at these areas. The daily food consumption of the U. cordatus population was therefore expressed in relation to litter and propagule production using data on litter production and information on the size-frequency distribution of U. cordatus (Diele 2000). Despite the occurrence of U. cordatus in various mangrove areas along the Brazilian coastline, data about litter consumption in relation to litter production are lacking. Schories et al. (2003) who worked on the same peninsula estimated the litter removal rate of U. cordatus indirectly and suggested that the main part of litter removal can be attributed to this crab. A high influence on litter dynamics was also suggested for Ucides occidentalis in an Ecuadorian mangrove (Twilley et al. 1997) but quantitative data was not provided. In contrast to the American mangroves, the influence of litter processing by crabs has been investigated more intensively in tropical mangrove forests of the Indo-West-Pacific region. There, particularly crabs of the sub-family Sesarminae consume a large proportion of the annual litter fall (Robertson 1986, Lee 1989a, Robertson and Daniel 1989, Emmerson and Mc Gwynne 1992, Steinke et al. 1993). Data provided by the present study should determine whether litter processing by U. cordatus in the high intertidal forest on the Brangança peninsula displays a similar important route of litter turnover than that reported for sesarmine crabs in the Indo-West-Pacific. Furthermore, results should reveal whether the U. cordatus population is food limited in the investigation area. The following questions were addressed: (1) Does U. cordatus choose among different plant components? Does it prefer leaves of a
specific tree species or decomposition stage? (2) Is the diet of U. cordatus restricted to plant material? Or is animal material a significant
component of the crabs´ diet? Does the diet depend on the size or sex of the crabs? (3) Do the crabs store food in their burrows? Does the proportional composition of food
components in burrows differ from that on the sediment surface? (4) What is the litter standing stock at the sediment surface and the litter fall at the study
area? (5) What is the evacuation rate of U. cordatus? (6) What is the daily food intake of different sized individuals? What proportion of the annual
litter production is consumed by the U. cordatus population? Is the crabs´ food limited at the study sites?
16 3 Diet and consumption: Material and methods
3.2 Material and methods
MATERIAL Equipment used for the stomach content analysis and litter fall experiment: Balance: SARTORIUS AG Göttingen; LC 4200S – 00V1; d = 0.01 g
Analytical balance: SARTORIUS AG Göttingen; BP211D; d = 0.01 mg
Oven: MEMMERT; Modell 600
Litter traps: with 1x1m opening and 3-mm-plastic mesh bag
Microscopes: ZEISS; Axiovert 100; ocular: 10 x /20
ZEISS; Axioskop 2; ocular: 10x /23
Stereo microscope: ZEISS; Stemi 2000
Binoculars
Bengal rose: MERCK
METHODS 3.2.1 Stomach content analyses
Sampling. Six males and six females of two size classes (CW 3.0 - 3.5 cm and 6.0 - 6.5 cm) were caught by a crab collector at FG 1 (11.06.2001) and AF (13.06.2001). The crabs were kept on ice for several minutes, then a solution of 4 % formaldehyde was injected through the mouth into the stomach with a plastic syringe in order to quickly stop the digestion. The crabs were transferred to the laboratory on ice and were frozen (-20°C) until further analyses. A few smaller individuals (app. 1.5 - 2.0 cm CW) which were collected by chance during the course of the study were also investigated. Analysis. Each crab was sexed, the length and width of the carapace was measured with a calliper rule to the nearest 0.1 mm and the fresh weight was determined to the nearest 0.01 g. The carapace was opened, the stomach was extracted and the contents were transferred to a PVC bottle (50 ml), using a squirt bottle with distilled water to rinse the stomach carefully. The animal material was stained with bengal rose for at least 1 day.
3 Diet and consumption: Material and Methods 17
All particles present in the stomach were classified into distinguishable categories, using a stereo microscope and a microscope. The following parameters were determined: (1) Degree of fullness of the stomach (Dahdouh-Guebas et al. 1997) with the following graduation: D0 (empty), D1 (1-25 %), D2 (26-50 %), D3 (51-75 %) and D4 (75-100 %) (a subjective estimation). (2) Frequency of occurrence of the different food categories (Dahdouh-Guebas et al. 1992; Hyslop 1980). The occurrence of different food items belonging to a certain category was counted, divided by the total number of individuals with a non-empty stomach and multiplied by 100. (3) Percentage of the total volume visible contributed by each of the categories (Giddens et al. 1986; Hyslop 1980). Of each stomach contents 15 subsamples of 1 ml were analysed. The following graduation was applied: < 1 %; 1-5 %; 6-10 %; 11-20 %, 21-30 %, etc. 3.2.2 Food preferences
Food preferences in the laboratory. During laboratory experiments, crabs were kept separately in glass aquaria (30x40x30 cm) that were covered with black plastic film and contained open-ended plastic tubes (20 cm length, 10 cm diameter) for shelter. The aquaria were filled with estuarine water from the sampling site (2 - 3 cm depth) and the water was changed every other day. A brick was placed in one corner so that crabs could sit outside the water. The animals were captured by a crab collector at FG 1 and AF. Table 1 summarizes the dates of the experiment, study sites, food components and replicates of the laboratory and field experiments. During qualitative experiments, food items were placed on the brick over one week. Four times a day the food was examined for feeding marks and strongly decayed food was replaced by fresh food. For the quantitative and qualitative experiments, leaf litter was collected from the sediment surface at FG 1 and AF. Fruits and fish were purchased at the local market. All food items were weighed to the nearest 0.01 g in advance, offered to the crabs for 8 hours and then weighed again. In order to look for correlations between leaf characteristics and leaf preferences, the following food characteristics were measured or obtained from previous studies within the MADAM project or from the literature: wet and dry weight, organic matter content, energy content, nitrogen and carbon content (chapter 5.3.1.1), tannin content, thickness. Food preferences in the field. Field experiments for testing food preferences were performed at 3 study sites during April and May 2000 (Table 1). Different food items were tied to prop roots with a thin nylon thread and placed around the burrows (Figure 6). The crabs were observed with binoculars for a period of four hours in order to determine whether they choose among available litter components. Then the plant material was carefully pulled out of the burrows and examined for feeding marks.
18 3 Diet and consumption: Material and methods
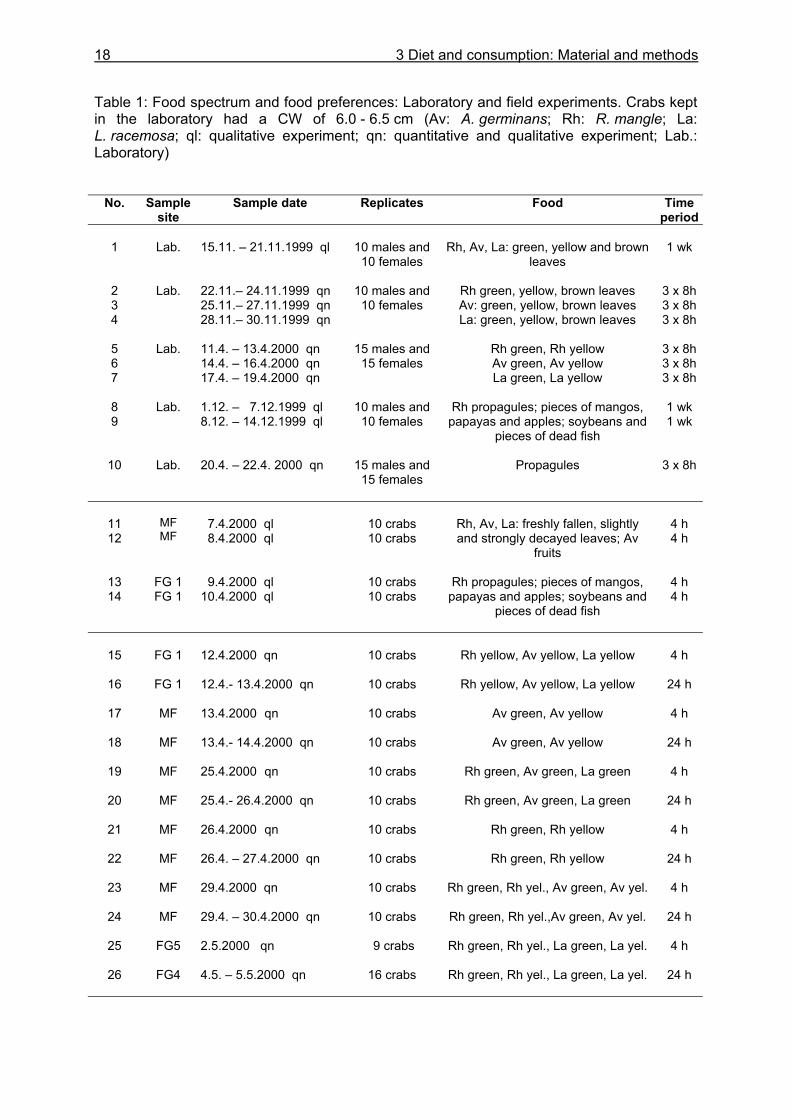
Table 1: Food spectrum and food preferences: Laboratory and field experiments. Crabs kept in the laboratory had a CW of 6.0 - 6.5 cm (Av: A. germinans; Rh: R. mangle; La: L. racemosa; ql: qualitative experiment; qn: quantitative and qualitative experiment; Lab.: Laboratory)
No. Sample site
Sample date Replicates Food Time period
1
Lab.
15.11. – 21.11.1999 ql
10 males and
10 females
Rh, Av, La: green, yellow and brown
leaves
1 wk
2 3 4
Lab. 22.11.– 24.11.1999 qn 25.11.– 27.11.1999 qn 28.11.– 30.11.1999 qn
10 males and 10 females
Rh green, yellow, brown leaves Av: green, yellow, brown leaves La: green, yellow, brown leaves
3 x 8h 3 x 8h 3 x 8h
5 6 7
Lab. 11.4. – 13.4.2000 qn 14.4. – 16.4.2000 qn 17.4. – 19.4.2000 qn
15 males and 15 females
Rh green, Rh yellow Av green, Av yellow La green, La yellow
3 x 8h 3 x 8h 3 x 8h
8 9
Lab. 1.12. – 7.12.1999 ql 8.12. – 14.12.1999 ql
10 males and 10 females
Rh propagules; pieces of mangos, papayas and apples; soybeans and
pieces of dead fish
1 wk 1 wk
10 Lab. 20.4. – 22.4. 2000 qn 15 males and 15 females
Propagules 3 x 8h
11 12
MF MF
7.4.2000 ql 8.4.2000 ql
10 crabs 10 crabs
Rh, Av, La: freshly fallen, slightly and strongly decayed leaves; Av
fruits
4 h 4 h
13 14
FG 1 FG 1
9.4.2000 ql 10.4.2000 ql
10 crabs 10 crabs
Rh propagules; pieces of mangos, papayas and apples; soybeans and
pieces of dead fish
4 h 4 h
15
FG 1
12.4.2000 qn
10 crabs
Rh yellow, Av yellow, La yellow
4 h
16 FG 1 12.4.- 13.4.2000 qn
10 crabs Rh yellow, Av yellow, La yellow 24 h
17 MF 13.4.2000 qn
10 crabs Av green, Av yellow 4 h
18 MF 13.4.- 14.4.2000 qn
10 crabs Av green, Av yellow 24 h
19
MF 25.4.2000 qn
10 crabs
Rh green, Av green, La green 4 h
20 MF 25.4.- 26.4.2000 qn
10 crabs Rh green, Av green, La green 24 h
21
MF 26.4.2000 qn
10 crabs
Rh green, Rh yellow 4 h
22 MF 26.4. – 27.4.2000 qn
10 crabs Rh green, Rh yellow 24 h
23 MF 29.4.2000 qn 10 crabs
Rh green, Rh yel., Av green, Av yel. 4 h
24 MF 29.4. – 30.4.2000 qn 10 crabs
Rh green, Rh yel.,Av green, Av yel. 24 h
25 FG5 2.5.2000 qn
9 crabs Rh green, Rh yel., La green, La yel. 4 h
26 FG4 4.5. – 5.5.2000 qn 16 crabs
Rh green, Rh yel., La green, La yel. 24 h
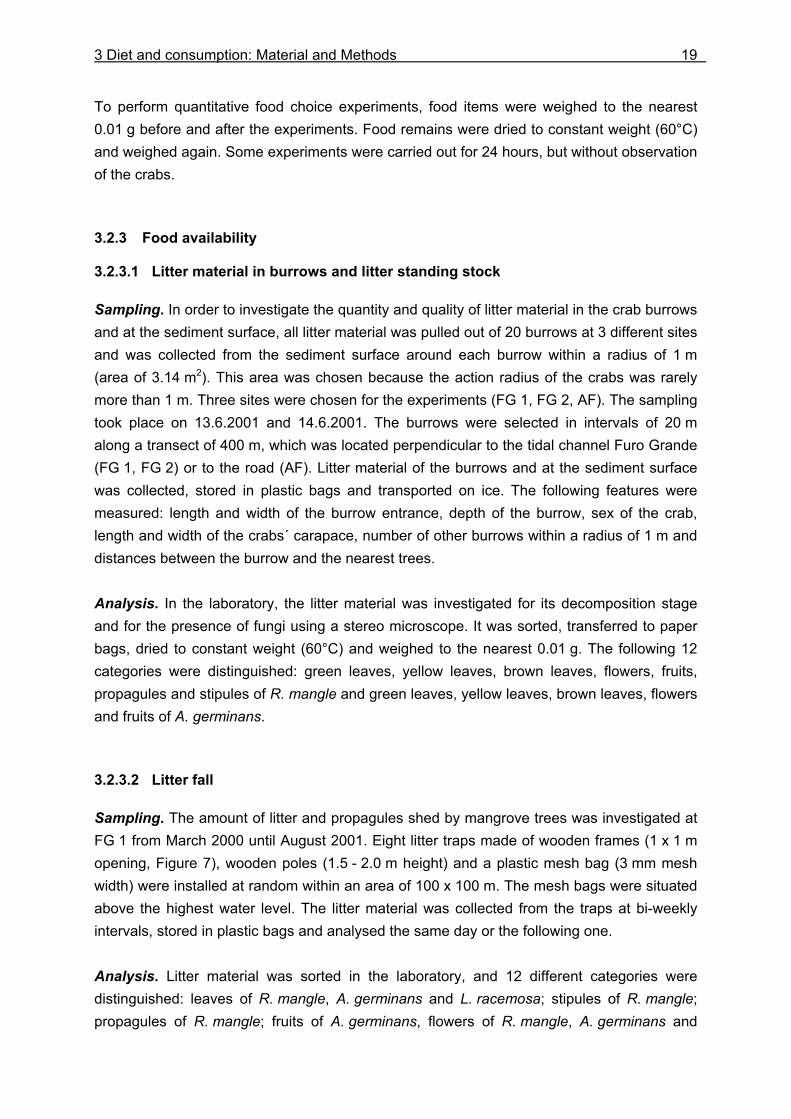
3 Diet and consumption: Material and Methods 19
To perform quantitative food choice experiments, food items were weighed to the nearest 0.01 g before and after the experiments. Food remains were dried to constant weight (60°C) and weighed again. Some experiments were carried out for 24 hours, but without observation of the crabs. 3.2.3 Food availability
3.2.3.1 Litter material in burrows and litter standing stock
Sampling. In order to investigate the quantity and quality of litter material in the crab burrows and at the sediment surface, all litter material was pulled out of 20 burrows at 3 different sites and was collected from the sediment surface around each burrow within a radius of 1 m (area of 3.14 m2). This area was chosen because the action radius of the crabs was rarely more than 1 m. Three sites were chosen for the experiments (FG 1, FG 2, AF). The sampling took place on 13.6.2001 and 14.6.2001. The burrows were selected in intervals of 20 m along a transect of 400 m, which was located perpendicular to the tidal channel Furo Grande (FG 1, FG 2) or to the road (AF). Litter material of the burrows and at the sediment surface was collected, stored in plastic bags and transported on ice. The following features were measured: length and width of the burrow entrance, depth of the burrow, sex of the crab, length and width of the crabs´ carapace, number of other burrows within a radius of 1 m and distances between the burrow and the nearest trees. Analysis. In the laboratory, the litter material was investigated for its decomposition stage and for the presence of fungi using a stereo microscope. It was sorted, transferred to paper bags, dried to constant weight (60°C) and weighed to the nearest 0.01 g. The following 12 categories were distinguished: green leaves, yellow leaves, brown leaves, flowers, fruits, propagules and stipules of R. mangle and green leaves, yellow leaves, brown leaves, flowers and fruits of A. germinans. 3.2.3.2 Litter fall
Sampling. The amount of litter and propagules shed by mangrove trees was investigated at FG 1 from March 2000 until August 2001. Eight litter traps made of wooden frames (1 x 1 m opening, Figure 7), wooden poles (1.5 - 2.0 m height) and a plastic mesh bag (3 mm mesh width) were installed at random within an area of 100 x 100 m. The mesh bags were situated above the highest water level. The litter material was collected from the traps at bi-weekly intervals, stored in plastic bags and analysed the same day or the following one. Analysis. Litter material was sorted in the laboratory, and 12 different categories were distinguished: leaves of R. mangle, A. germinans and L. racemosa; stipules of R. mangle; propagules of R. mangle; fruits of A. germinans, flowers of R. mangle, A. germinans and
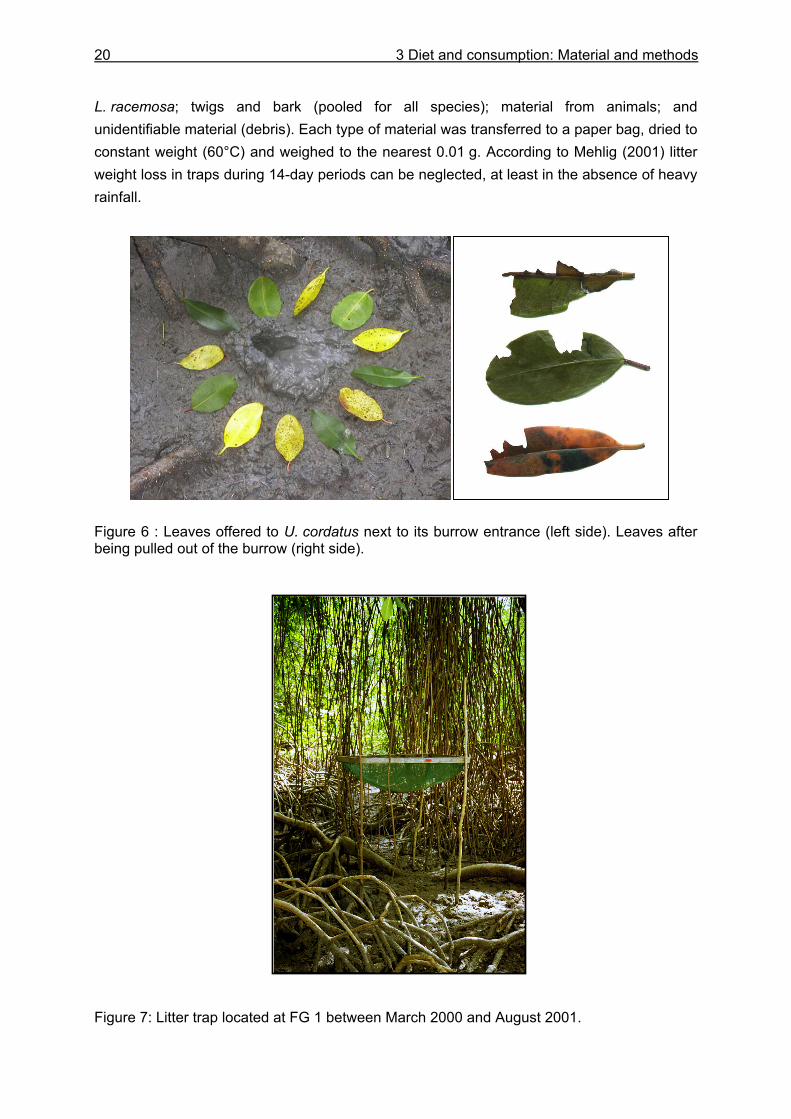
20 3 Diet and consumption: Material and methods
L. racemosa; twigs and bark (pooled for all species); material from animals; and unidentifiable material (debris). Each type of material was transferred to a paper bag, dried to constant weight (60°C) and weighed to the nearest 0.01 g. According to Mehlig (2001) litter weight loss in traps during 14-day periods can be neglected, at least in the absence of heavy rainfall. Figure 6 : Leaves offered to U. cordatus next to its burrow entrance (left side). Leaves after being pulled out of the burrow (right side). Figure 7: Litter trap located at FG 1 between March 2000 and August 2001.
3 Diet and consumption: Material and Methods 21
3.2.4 Evacuation
Since it was found that U. cordatus is not a periodic feeder, the evacuation rate could not be calculated from the steepest part of the descending portion of the feeding curves according to Wolff and Cerda (1992). Instead, additional laboratory starvation experiments were conducted to determine the evacuation rate. Starvation experiments. Preliminary experiments showed that the ER is similar in both sexes, but may depend on crab size, so only males were used. Two experiments were carried out in the rainy season 2001, one with males of a carapace width between 6.5 and 7.5 cm (5.3.2001, waxing moon) and one with males of a carapace width between 2.5 and 3.5 cm (3.4.2001, waxing moon). For both samplings the site FG 3 was chosen, because it was possible to find sufficient crabs of both size classes in a comparatively short period there. Crab sampling started at low tide to ensure that the crabs could feed prior to their capture. First, 15 crabs were captured and immediately killed on ice. A further 135 crabs were then collected and kept in plastic boxes filled with about 5 cm of estuarine water. Every 2 hours, 15 crabs were put on ice (2, 4, 6, 8, 10 and 12 hours after capture). Subsequently, the time interval was increased, so that 15 crabs were killed on ice 24, 48 and 72 hours after capture. All crabs were kept in the freezer (–20°C) until further processing. The analyses of the gastrointestinal contents were conducted as described earlier (chapter 3.2.1). The stomach and intestinal contents were calculated as percent dry bodyweight, averaged for each time interval and plotted against starvation time. Calculation. Assuming an exponential decay function for the evacuation rate (ER h-1) of U. cordatus, the model of Elliott (1972) was first fit to the data. (1) Elliott (1972) GICt = GICo · e –ER·t where GICt and GICo refer to the gastrointestinal contents at time t and at the beginning of evacuation, respectively. While the model describes the rapid decline during the first hours of starvation very well, it could not explain the evacuation process later in the experiment. Although faeces production had ceased after 24 to 36 hours, stomach and intestine never emptied completely. A constant factor c was therefore added to the model of Elliott (1972), resulting in the following equation: GICt = c + GICo · e –ER·t This model was fit to the data, and the resulting regression showed a much better fit. The estimation of the equation parameters revealed that each of the assumed parameters (ER, GCI0, c) is significantly different from zero (Appendix I, Table 34). Thus, the constant c is
22 3 Diet and consumption: Material and methods
appropriate to enhance the consistency of the model and experimental data. Using the original model of Elliot (1972), the calculated values for ER were slightly higher and are likely overestimates. 3.2.5 Daily food intake
The daily food intake (DFI) of U. cordatus was estimated from the gastrointestinal contents data (chapter 4.3.1) and the evacuation rate (ER). The model of Eggers (1977) was applied to the data. (2) Eggers (1977) DFI = 24 · GICa · ER where GICa is the average gastrointestinal contents. The aim is to convert the calculated food intake per time interval into food intake per day and crab. This value will be combined with the available data on abundance and biomass of U. cordatus from previous studies within the MADAM project to determine the mangrove litter consumption by U. cordatus per square metre and day. Data on litter fall for the different sampling sites serve as a basis for estimating litter consumption by U. cordatus as a percentage of total litter fall. Since GIC and thus DFI may depend on crab body weight, the model was applied separately for different size classes: CW < 3.5 cm, 3.5-4.0 cm, 4.0-4.5 cm, etc. up to 7.5-8.0 cm. A regression analysis was carried out to calculate the correlation of GIC and dry bodyweight, separately for both sexes. The calculated functions were applied to determine DFI separately for each size class. ER calculated for small crabs was applied to all sizes ≤ 3.5 cm carapace width whereas ER determined for large crabs was applied to all sizes ≥ 6.5 cm. An average value was assigned to sizes between 3.5 - 6.5 cm. To obtain an average dry bodyweight for each size class, the size-weight relationship of U. cordatus was calculated from the data acquired in the experiments on feeding periodicity and evacuation rate.
3 Diet and consumption: Material and Methods 23
3.2.6 Statistical analyses
Statistical analyses were performed with the programme STATISTICA© for Windows, release 6. Homogeneity of variance was examined for all data using Levene´s test. The Shapiro-Wilk W-test was applied to test for normality. Both tests were used with a α-value of 0.05. Homogeneous and normally distributed data were tested for significant differences with the independent t-test or with 2- or 3-factorial analysis of variances (ANOVA). Post hoc analyses were performed with the Tukey´s HSD test and the modified Tukey´s HSD test for unequal N. Data that failed the tests of homogeneity and normality were transformed (logarithmic, square root or power transformation). Where transformed data did not meet the specified criteria, non-parametric statistics were applied. For comparisons between two independent groups, the Mann-Whitney U-test and the Kolmogorov-Smirnov two-sample test (K-S-test) were used. Since the former requires equal distribution shapes in the two samples, the latter was used in cases of unequal distributions. Kruskal-Wallis ANOVAs by ranks were performed testing multiple independent groups. Nonparametric post hoc comparisons were conducted with the Mann-Whitney U-test (equal distribution shapes of samples) or the Nemenyi test as described in Zar (1996). For post hoc comparisons, several U-tests have to be conducted. Since the probability for incorrectly rejecting H0 increases with every test, a Bonferroni correction was used to decrease α appropriately: αnew = α / (number of U-tests applied) The non-parametric Spearman Rank correlation analysis was used to explore the relationship between two variables. Correlations were only assumed to be considerable in the case of ρ > 0.5. Regression analyses were conducted with the linear regression programme of STATISTICA using least squares estimation except for the calculation of the evacuation curve, where the non-linear regression programme was applied using the Gauss-Newton algorithm. All tests were considered statistically significant at p-level < 0.05. Complete results and tables of all statistical analyses are listed in the Appendices I-III.
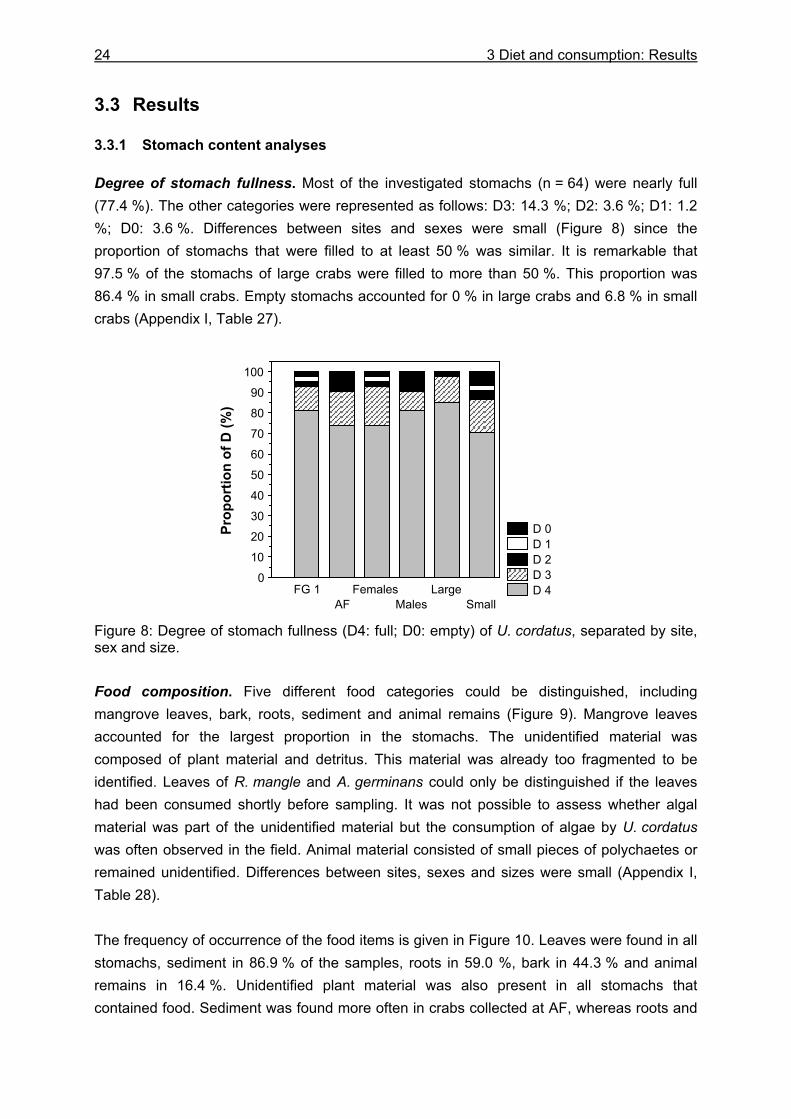
24 3 Diet and consumption: Results
3.3 Results
3.3.1 Stomach content analyses
Degree of stomach fullness. Most of the investigated stomachs (n = 64) were nearly full (77.4 %). The other categories were represented as follows: D3: 14.3 %; D2: 3.6 %; D1: 1.2 %; D0: 3.6 %. Differences between sites and sexes were small (Figure 8) since the proportion of stomachs that were filled to at least 50 % was similar. It is remarkable that 97.5 % of the stomachs of large crabs were filled to more than 50 %. This proportion was 86.4 % in small crabs. Empty stomachs accounted for 0 % in large crabs and 6.8 % in small crabs (Appendix I, Table 27). Figure 8: Degree of stomach fullness (D4: full; D0: empty) of U. cordatus, separated by site, sex and size. Food composition. Five different food categories could be distinguished, including mangrove leaves, bark, roots, sediment and animal remains (Figure 9). Mangrove leaves accounted for the largest proportion in the stomachs. The unidentified material was composed of plant material and detritus. This material was already too fragmented to be identified. Leaves of R. mangle and A. germinans could only be distinguished if the leaves had been consumed shortly before sampling. It was not possible to assess whether algal material was part of the unidentified material but the consumption of algae by U. cordatus was often observed in the field. Animal material consisted of small pieces of polychaetes or remained unidentified. Differences between sites, sexes and sizes were small (Appendix I, Table 28). The frequency of occurrence of the food items is given in Figure 10. Leaves were found in all stomachs, sediment in 86.9 % of the samples, roots in 59.0 %, bark in 44.3 % and animal remains in 16.4 %. Unidentified plant material was also present in all stomachs that contained food. Sediment was found more often in crabs collected at AF, whereas roots and
D 0 D 1 D 2 D 3 D 4FG 1
AFFemales
MalesLarge
Small
0
10
20
30
40
50
60
70
80
90
100
Prop
ortio
n of
D (%
)
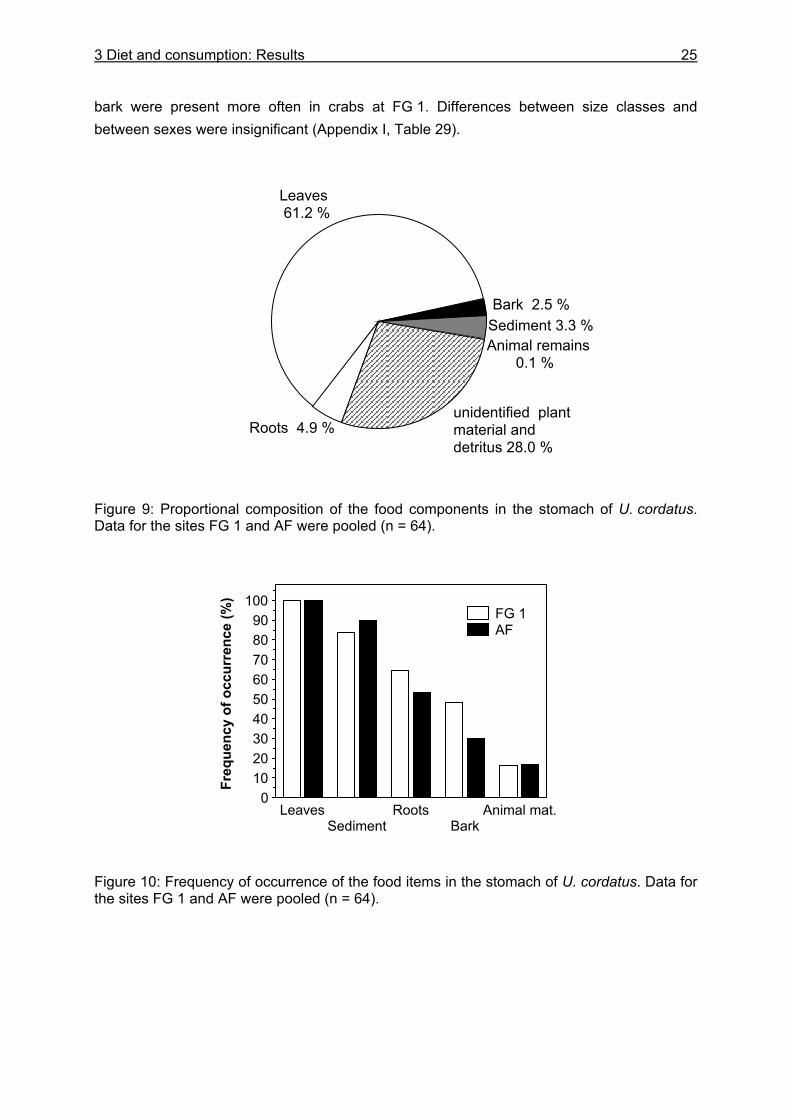
3 Diet and consumption: Results
25
bark were present more often in crabs at FG 1. Differences between size classes and between sexes were insignificant (Appendix I, Table 29). Figure 9: Proportional composition of the food components in the stomach of U. cordatus. Data for the sites FG 1 and AF were pooled (n = 64). Figure 10: Frequency of occurrence of the food items in the stomach of U. cordatus. Data for the sites FG 1 and AF were pooled (n = 64).
LeavesSediment
RootsBark
Animal mat.0
102030405060708090
100
Freq
uenc
y of
occ
urre
nce
(%)
FG 1 AF
Roots 4.9 %
Leaves 61.2 %
Bark 2.5 %
unidentified plant material and detritus 28.0 %
Sediment 3.3 %Animal remains 0.1 %
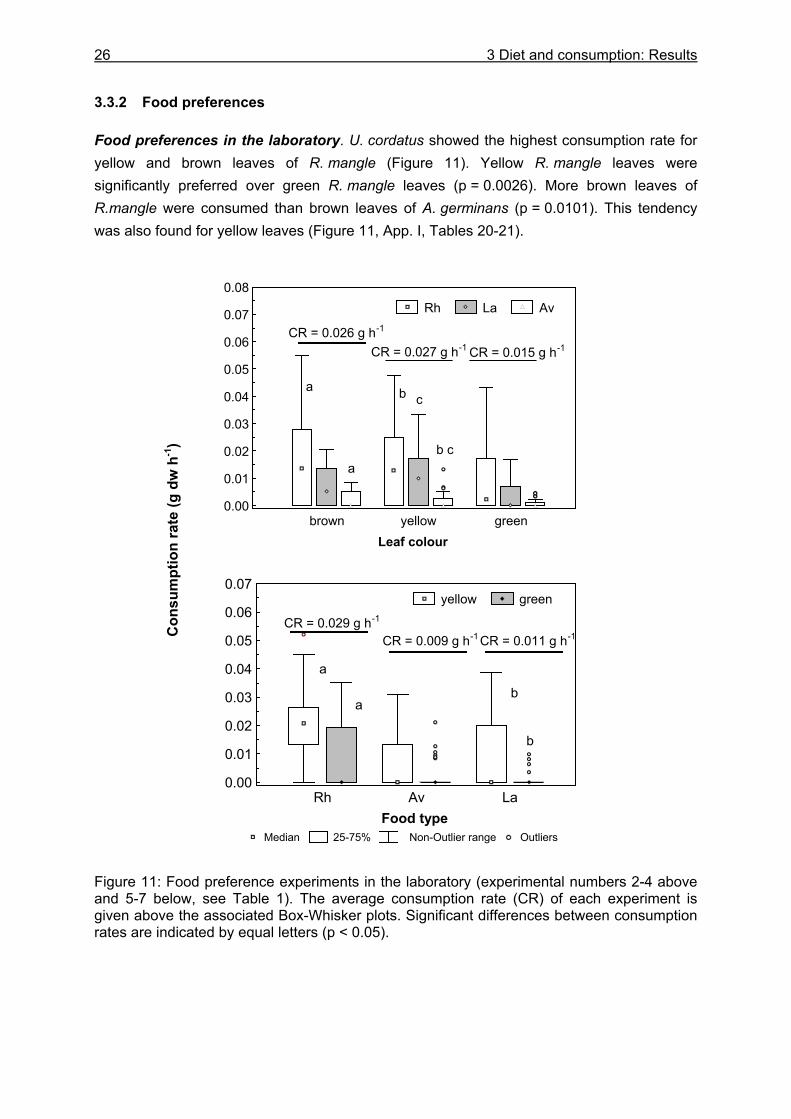
26 3 Diet and consumption: Results
3.3.2 Food preferences
Food preferences in the laboratory. U. cordatus showed the highest consumption rate for yellow and brown leaves of R. mangle (Figure 11). Yellow R. mangle leaves were significantly preferred over green R. mangle leaves (p = 0.0026). More brown leaves of R.mangle were consumed than brown leaves of A. germinans (p = 0.0101). This tendency was also found for yellow leaves (Figure 11, App. I, Tables 20-21). Figure 11: Food preference experiments in the laboratory (experimental numbers 2-4 above and 5-7 below, see Table 1). The average consumption rate (CR) of each experiment is given above the associated Box-Whisker plots. Significant differences between consumption rates are indicated by equal letters (p < 0.05).
brown yellow greenLeaf colour
0.00
0.01
0.02
0.03
0.04
0.05
0.06
0.07
0.08 Rh La Av
CR = 0.026 g h-1
CR = 0.027 g h-1 CR = 0.015 g h-1
a
a
b
b c
c
Median 25-75% Non-Outlier range Outliers
Rh Av LaFood type
0.00
0.01
0.02
0.03
0.04
0.05
0.06
0.07 yellow green
CR = 0.011 g h-1CR = 0.029 g h-1
CR = 0.009 g h-1Con
sum
ptio
n ra
te (g
dw
h-1
)
a
a b
b
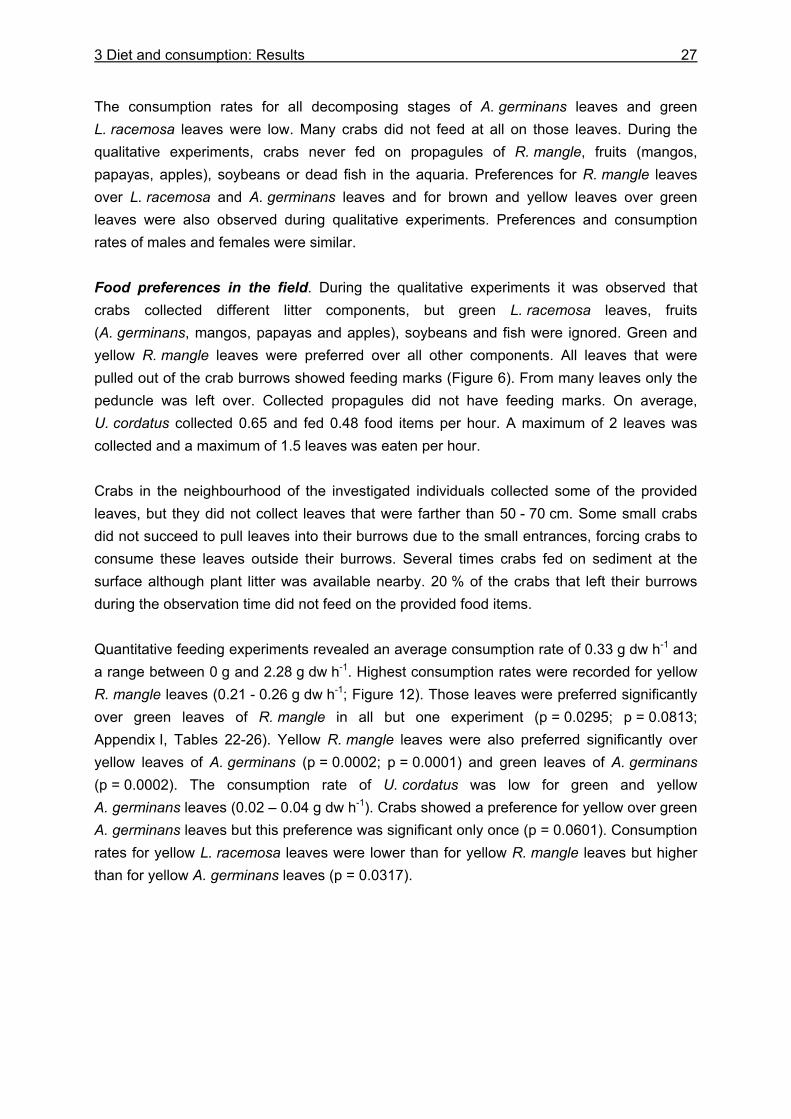
3 Diet and consumption: Results
27
The consumption rates for all decomposing stages of A. germinans leaves and green L. racemosa leaves were low. Many crabs did not feed at all on those leaves. During the qualitative experiments, crabs never fed on propagules of R. mangle, fruits (mangos, papayas, apples), soybeans or dead fish in the aquaria. Preferences for R. mangle leaves over L. racemosa and A. germinans leaves and for brown and yellow leaves over green leaves were also observed during qualitative experiments. Preferences and consumption rates of males and females were similar. Food preferences in the field. During the qualitative experiments it was observed that crabs collected different litter components, but green L. racemosa leaves, fruits (A. germinans, mangos, papayas and apples), soybeans and fish were ignored. Green and yellow R. mangle leaves were preferred over all other components. All leaves that were pulled out of the crab burrows showed feeding marks (Figure 6). From many leaves only the peduncle was left over. Collected propagules did not have feeding marks. On average, U. cordatus collected 0.65 and fed 0.48 food items per hour. A maximum of 2 leaves was collected and a maximum of 1.5 leaves was eaten per hour. Crabs in the neighbourhood of the investigated individuals collected some of the provided leaves, but they did not collect leaves that were farther than 50 - 70 cm. Some small crabs did not succeed to pull leaves into their burrows due to the small entrances, forcing crabs to consume these leaves outside their burrows. Several times crabs fed on sediment at the surface although plant litter was available nearby. 20 % of the crabs that left their burrows during the observation time did not feed on the provided food items. Quantitative feeding experiments revealed an average consumption rate of 0.33 g dw h-1 and a range between 0 g and 2.28 g dw h-1. Highest consumption rates were recorded for yellow R. mangle leaves (0.21 - 0.26 g dw h-1; Figure 12). Those leaves were preferred significantly over green leaves of R. mangle in all but one experiment (p = 0.0295; p = 0.0813; Appendix I, Tables 22-26). Yellow R. mangle leaves were also preferred significantly over yellow leaves of A. germinans (p = 0.0002; p = 0.0001) and green leaves of A. germinans (p = 0.0002). The consumption rate of U. cordatus was low for green and yellow A. germinans leaves (0.02 – 0.04 g dw h-1). Crabs showed a preference for yellow over green A. germinans leaves but this preference was significant only once (p = 0.0601). Consumption rates for yellow L. racemosa leaves were lower than for yellow R. mangle leaves but higher than for yellow A. germinans leaves (p = 0.0317).
28 3 Diet and consumption: Results
Figure 12: Food preference experiments with tethered leaves (experimental numbers 15-26, see Table 1). Data obtained from 4 h and 24 h experiments were pooled. The average consumption rate (CR) of each experiment is given in the plots. Significant differences between consumption rates are indicated by equal letters (letter c: p < 0.1; others: p < 0.05).
Con
sum
ptio
n ra
te (g
dw
h-1
)
Leaf type
Rh yellow Rh green0.0
0.1
0.2
0.3
0.4
0.5
0.6
0.7 Median 25%-75% Min-Max
CR = 0.35 g h-1
a
a
Av yellow Av green0.00
0.05
0.10
0.15
0.20 Median 25%-75% Min-Max
CR = 0.06 g h-1
a
a
Rh yellow Av yellow La yellow0.0
0.1
0.2
0.3
0.4
0.5
0.6
0.7 Median 25%-75% Min-Max
CR = 0.32 g h-1
a
a
a
Rh green Av green La green0.0
0.1
0.2
0.3
0.4
0.5
0.6
0.7 Median 25%-75% Min-Max Outliers
CR = 0.28 g h-1
a
a b
b
Rh yelRh green
Av yelAv green
0.0
0.1
0.2
0.3
0.4
0.5
0.6
0.7 Median 25%-75% Min-Max Outliers
CR = 0.37 g h-1
a b c
a d
c d e
b e
Rh yelRh green
La yelLa green
0.0
0.2
0.4
0.6
0.8
1.0
1.2
1.4 Median 25%-75% Min-Max Outliers
CR = 0.56 g h-1
3 Diet and consumption: Results
29
3.3.3 Food availability
3.3.3.1 Litter material in burrows and litter standing stock
Crab burrows contained more litter material at AF than at FG 1 and FG 2 but differences were not significant (Table 2). Litter amount in burrows was low compared to the litter standing stock (1 m radius) at all 3 sites. The situation was conspicuous at AF, where litter accounted for 115.23 g dw around burrows (1 m radius). Variances were high at all 3 sites. The amount of litter at the surface was significantly higher at AF than at FG 1 and FG 2 (p < 0.000001). Litter standing stock per square metre is given in Appendix I (Table 30). At AF, the quantities of litter in crab burrows and on the sediment surface were positively correlated (ρ = 0.5540; p < 0.05; App. I, Tables 31-32). In contrast, significant correlations could not be found at the other sites. The amount of litter material in crab burrows did not correlate significantly with crab size, crab sex or burrow depth. Table 2: Litter material (g dw) taken from crab burrows and from the sediment surface (3.14 m2) at the sites FG 1, FG 2 and AF.
Site n Average ± SD (g) Maximum (g ) Minimum (g) FG 1 Surface 22 3.77 ± 6.16 21.20 0.23 FG 1 Burrow 22 0.40 ± 0.40 1.43 0.00
FG 2 Sediment 20 5.67 ± 8.16 35.90 0.26 FG 2 Burrow 20 0.74 ± 0.68 2.45 0.00
AF Sediment 20 115.23 ± 82.26 258.68 6.34 AF Burrow 20 3.44 ± 4.68 15.05 0.00
The composition of litter components at the sediment surface and in crab burrows was different among the 3 sites (Figure 13). The food diversity was lowest at AF with 6 different litter components and one predominated (Figure 13). At FG 1 and FG 2, 7 and 8 types of litter components were found, respectively. Dominances of litter components were lowest at FG 2, thus this sampling site had the highest diet diversity. Yellow leaves of R. mangle dominated at the surface (58.3 %) and in burrows (77.6 %) at FG 1. The proportion of stipules, propagules and brown leaves of R. mangle was lower in the burrows compared to the surface. At FG 2, the mixed forest, brown R. mangle leaves accounted for 44.6 % at the sediment surface but for only 15.2 % in burrows. The crabs preferred yellow leaves of R. mangle which were less abundant at the surface (14.4 %) but predominant in burrows (43.5 %). In contrast to both sites at FG, mostly brown leaves of A. germinans were available to U. cordatus at AF. Even so, crabs showed a preference for brown leaves of R. mangle which were rare on the sediment surface. At this site, the
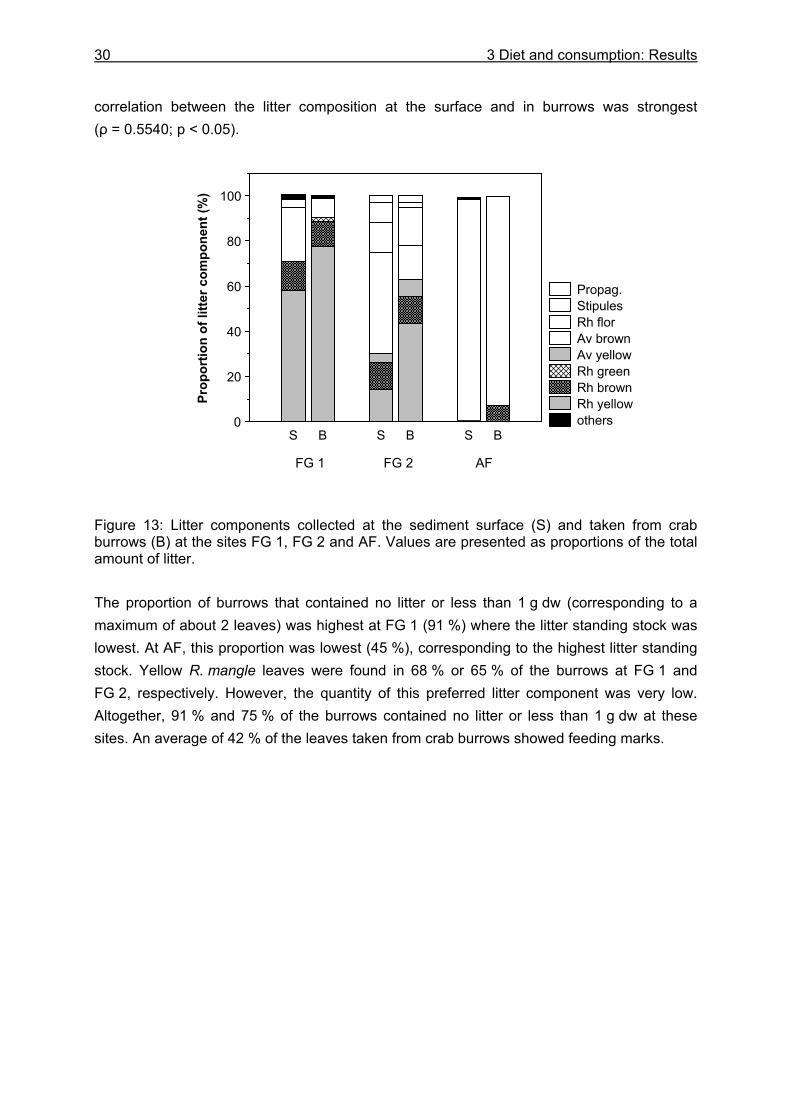
30 3 Diet and consumption: Results
correlation between the litter composition at the surface and in burrows was strongest (ρ = 0.5540; p < 0.05).
Figure 13: Litter components collected at the sediment surface (S) and taken from crab burrows (B) at the sites FG 1, FG 2 and AF. Values are presented as proportions of the total amount of litter. The proportion of burrows that contained no litter or less than 1 g dw (corresponding to a maximum of about 2 leaves) was highest at FG 1 (91 %) where the litter standing stock was lowest. At AF, this proportion was lowest (45 %), corresponding to the highest litter standing stock. Yellow R. mangle leaves were found in 68 % or 65 % of the burrows at FG 1 and FG 2, respectively. However, the quantity of this preferred litter component was very low. Altogether, 91 % and 75 % of the burrows contained no litter or less than 1 g dw at these sites. An average of 42 % of the leaves taken from crab burrows showed feeding marks.
Propag. Stipules Rh flor Av brown Av yellow Rh green Rh brown Rh yellow others
S B S B S B0
20
40
60
80
100Pr
opor
tion
of li
tter c
ompo
nent
(%)
FG 1 FG 2 AF
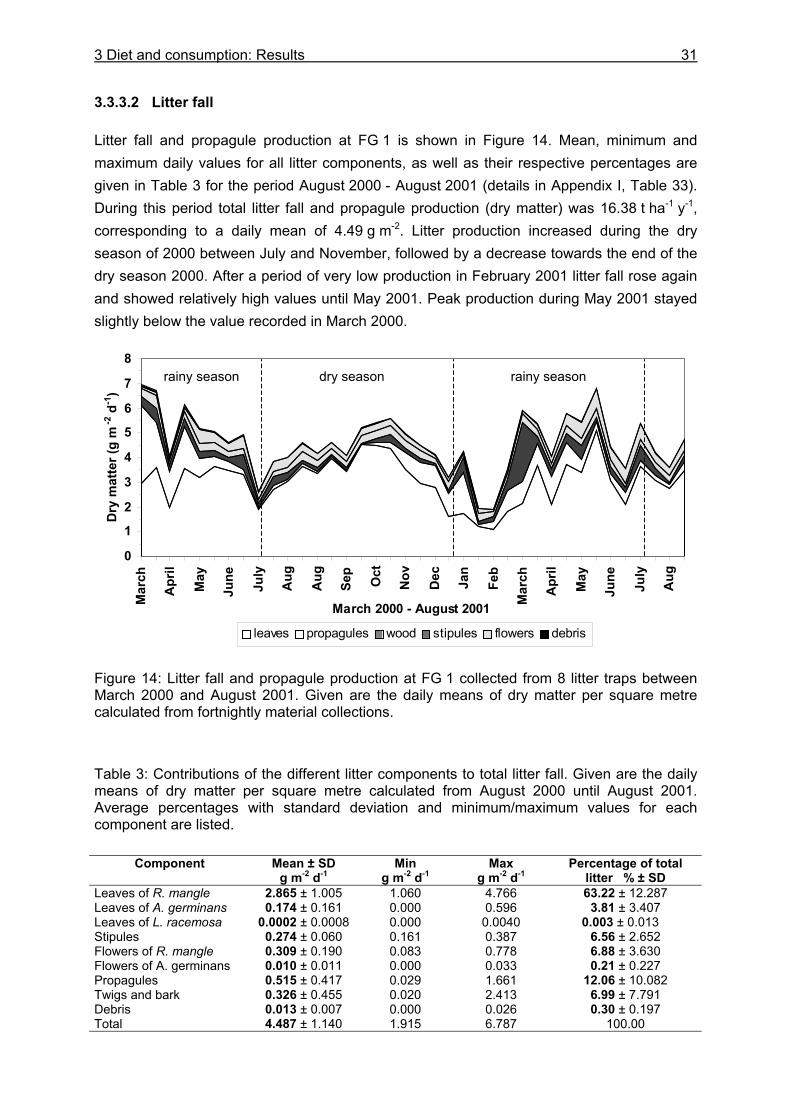
3 Diet and consumption: Results
31
3.3.3.2 Litter fall
Litter fall and propagule production at FG 1 is shown in Figure 14. Mean, minimum and maximum daily values for all litter components, as well as their respective percentages are given in Table 3 for the period August 2000 - August 2001 (details in Appendix I, Table 33). During this period total litter fall and propagule production (dry matter) was 16.38 t ha-1 y-1, corresponding to a daily mean of 4.49 g m-2. Litter production increased during the dry season of 2000 between July and November, followed by a decrease towards the end of the dry season 2000. After a period of very low production in February 2001 litter fall rose again and showed relatively high values until May 2001. Peak production during May 2001 stayed slightly below the value recorded in March 2000.
Figure 14: Litter fall and propagule production at FG 1 collected from 8 litter traps between March 2000 and August 2001. Given are the daily means of dry matter per square metre calculated from fortnightly material collections. Table 3: Contributions of the different litter components to total litter fall. Given are the daily means of dry matter per square metre calculated from August 2000 until August 2001. Average percentages with standard deviation and minimum/maximum values for each component are listed.
Component Mean ± SD g m-2 d-1
Min g m-2 d-1
Max g m-2 d-1
Percentage of total litter % ± SD
Leaves of R. mangle 2.865 ± 1.005 1.060 4.766 63.22 ± 12.287 Leaves of A. germinans 0.174 ± 0.161 0.000 0.596 3.81 ± 3.407 Leaves of L. racemosa 0.0002 ± 0.0008 0.000 0.0040 0.003 ± 0.013 Stipules 0.274 ± 0.060 0.161 0.387 6.56 ± 2.652 Flowers of R. mangle 0.309 ± 0.190 0.083 0.778 6.88 ± 3.630 Flowers of A. germinans 0.010 ± 0.011 0.000 0.033 0.21 ± 0.227 Propagules 0.515 ± 0.417 0.029 1.661 12.06 ± 10.082 Twigs and bark 0.326 ± 0.455 0.020 2.413 6.99 ± 7.791 Debris 0.013 ± 0.007 0.000 0.026 0.30 ± 0.197 Total 4.487 ± 1.140 1.915 6.787 100.00
0
1
2
3
4
5
6
7
8
Mar
ch
Apr
il
May
June
July
Aug
Aug
Sep
Oct
Nov
Dec Jan
Feb
Mar
ch
Apr
il
May
June
July
Aug
March 2000 - August 2001
Dry
mat
ter (
g m
-2 d
-1)
leaves propagules wood stipules flowers debris
dry season rainy season rainy season
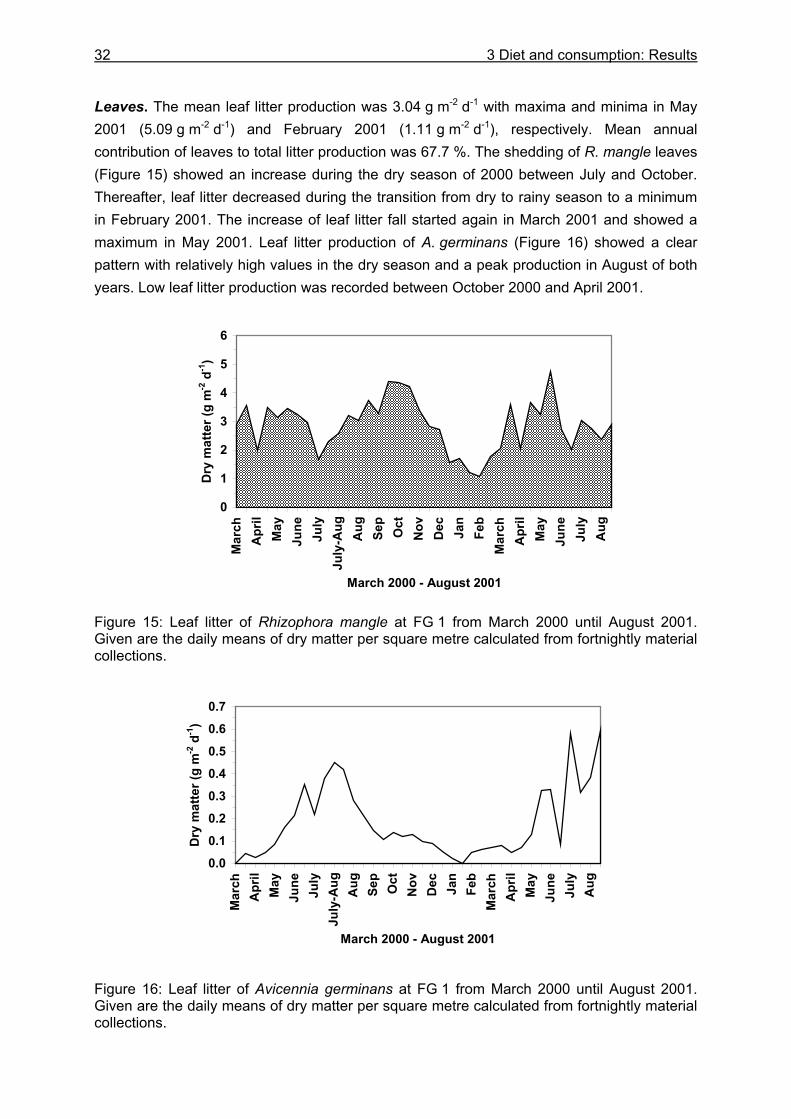
32 3 Diet and consumption: Results
Leaves. The mean leaf litter production was 3.04 g m-2 d-1 with maxima and minima in May 2001 (5.09 g m-2 d-1) and February 2001 (1.11 g m-2 d-1), respectively. Mean annual contribution of leaves to total litter production was 67.7 %. The shedding of R. mangle leaves (Figure 15) showed an increase during the dry season of 2000 between July and October. Thereafter, leaf litter decreased during the transition from dry to rainy season to a minimum in February 2001. The increase of leaf litter fall started again in March 2001 and showed a maximum in May 2001. Leaf litter production of A. germinans (Figure 16) showed a clear pattern with relatively high values in the dry season and a peak production in August of both years. Low leaf litter production was recorded between October 2000 and April 2001. Figure 15: Leaf litter of Rhizophora mangle at FG 1 from March 2000 until August 2001. Given are the daily means of dry matter per square metre calculated from fortnightly material collections. Figure 16: Leaf litter of Avicennia germinans at FG 1 from March 2000 until August 2001. Given are the daily means of dry matter per square metre calculated from fortnightly material collections.
0
1
2
3
4
5
6
Mar
chA
pril
May
June
July
July
-Aug
Aug Se
pO
ctN
ov Dec Jan
Feb
Mar
chA
pril
May
June
July
Aug
March 2000 - August 2001
Dry
mat
ter (
g m
-2 d
-1)
0.00.10.20.30.40.50.60.7
Mar
chA
pril
May
June
July
July
-Aug
Aug Se
pO
ctN
ov Dec Jan
Feb
Mar
chA
pril
May
June
July
Aug
March 2000 - August 2001
Dry
mat
ter (
g m
-2 d
-1)
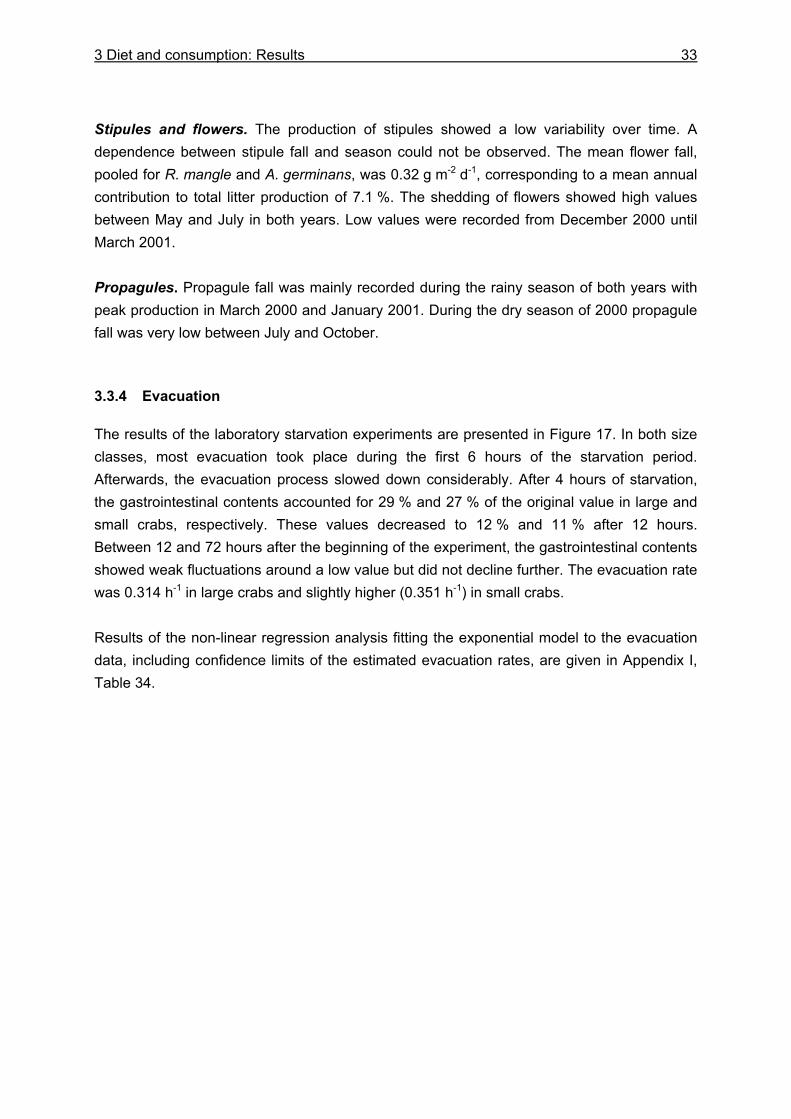
3 Diet and consumption: Results
33
Stipules and flowers. The production of stipules showed a low variability over time. A dependence between stipule fall and season could not be observed. The mean flower fall, pooled for R. mangle and A. germinans, was 0.32 g m-2 d-1, corresponding to a mean annual contribution to total litter production of 7.1 %. The shedding of flowers showed high values between May and July in both years. Low values were recorded from December 2000 until March 2001. Propagules. Propagule fall was mainly recorded during the rainy season of both years with peak production in March 2000 and January 2001. During the dry season of 2000 propagule fall was very low between July and October. 3.3.4 Evacuation
The results of the laboratory starvation experiments are presented in Figure 17. In both size classes, most evacuation took place during the first 6 hours of the starvation period. Afterwards, the evacuation process slowed down considerably. After 4 hours of starvation, the gastrointestinal contents accounted for 29 % and 27 % of the original value in large and small crabs, respectively. These values decreased to 12 % and 11 % after 12 hours. Between 12 and 72 hours after the beginning of the experiment, the gastrointestinal contents showed weak fluctuations around a low value but did not decline further. The evacuation rate was 0.314 h-1 in large crabs and slightly higher (0.351 h-1) in small crabs. Results of the non-linear regression analysis fitting the exponential model to the evacuation data, including confidence limits of the estimated evacuation rates, are given in Appendix I, Table 34.
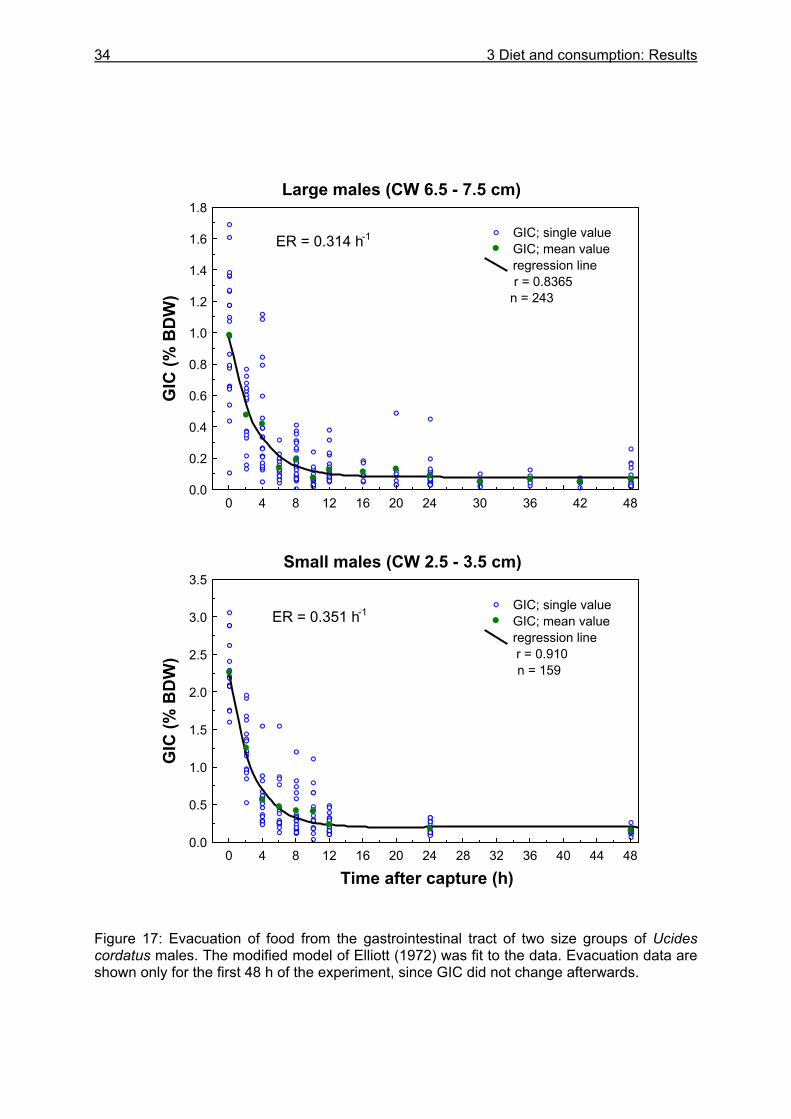
34 3 Diet and consumption: Results
Figure 17: Evacuation of food from the gastrointestinal tract of two size groups of Ucides cordatus males. The modified model of Elliott (1972) was fit to the data. Evacuation data are shown only for the first 48 h of the experiment, since GIC did not change afterwards.
Small males (CW 2.5 - 3.5 cm)
0 4 8 12 16 20 24 28 32 36 40 44 48
Time after capture (h)
0.0
0.5
1.0
1.5
2.0
2.5
3.0
3.5
GIC
(% B
DW
)
GIC; single value GIC; mean value regression line r = 0.910 n = 159
ER = 0.351 h-1
Large males (CW 6.5 - 7.5 cm)
0 4 8 12 16 20 24 30 36 42 48
.
0.0
0.2
0.4
0.6
0.8
1.0
1.2
1.4
1.6
1.8
GIC
(% B
DW
)
GIC; single value GIC; mean value regression line r = 0.8365 n = 243
ER = 0.314 h-1
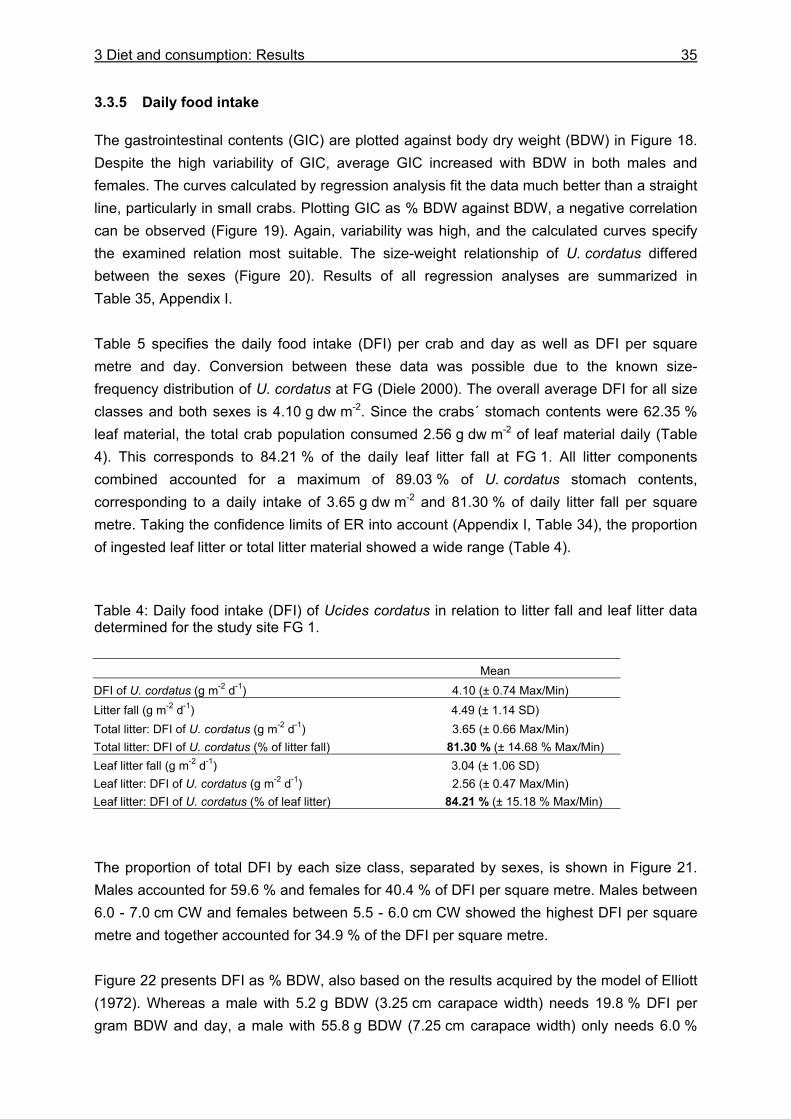
3 Diet and consumption: Results
35
3.3.5 Daily food intake
The gastrointestinal contents (GIC) are plotted against body dry weight (BDW) in Figure 18. Despite the high variability of GIC, average GIC increased with BDW in both males and females. The curves calculated by regression analysis fit the data much better than a straight line, particularly in small crabs. Plotting GIC as % BDW against BDW, a negative correlation can be observed (Figure 19). Again, variability was high, and the calculated curves specify the examined relation most suitable. The size-weight relationship of U. cordatus differed between the sexes (Figure 20). Results of all regression analyses are summarized in Table 35, Appendix I. Table 5 specifies the daily food intake (DFI) per crab and day as well as DFI per square metre and day. Conversion between these data was possible due to the known size-frequency distribution of U. cordatus at FG (Diele 2000). The overall average DFI for all size classes and both sexes is 4.10 g dw m-2. Since the crabs´ stomach contents were 62.35 % leaf material, the total crab population consumed 2.56 g dw m-2 of leaf material daily (Table 4). This corresponds to 84.21 % of the daily leaf litter fall at FG 1. All litter components combined accounted for a maximum of 89.03 % of U. cordatus stomach contents, corresponding to a daily intake of 3.65 g dw m-2 and 81.30 % of daily litter fall per square metre. Taking the confidence limits of ER into account (Appendix I, Table 34), the proportion of ingested leaf litter or total litter material showed a wide range (Table 4). Table 4: Daily food intake (DFI) of Ucides cordatus in relation to litter fall and leaf litter data determined for the study site FG 1. Mean DFI of U. cordatus (g m-2 d-1) 4.10 (± 0.74 Max/Min) Litter fall (g m-2 d-1) 4.49 (± 1.14 SD) Total litter: DFI of U. cordatus (g m-2 d-1) 3.65 (± 0.66 Max/Min) Total litter: DFI of U. cordatus (% of litter fall) 81.30 % (± 14.68 % Max/Min) Leaf litter fall (g m-2 d-1) 3.04 (± 1.06 SD) Leaf litter: DFI of U. cordatus (g m-2 d-1) 2.56 (± 0.47 Max/Min) Leaf litter: DFI of U. cordatus (% of leaf litter) 84.21 % (± 15.18 % Max/Min)
The proportion of total DFI by each size class, separated by sexes, is shown in Figure 21. Males accounted for 59.6 % and females for 40.4 % of DFI per square metre. Males between 6.0 - 7.0 cm CW and females between 5.5 - 6.0 cm CW showed the highest DFI per square metre and together accounted for 34.9 % of the DFI per square metre. Figure 22 presents DFI as % BDW, also based on the results acquired by the model of Elliott (1972). Whereas a male with 5.2 g BDW (3.25 cm carapace width) needs 19.8 % DFI per gram BDW and day, a male with 55.8 g BDW (7.25 cm carapace width) only needs 6.0 %
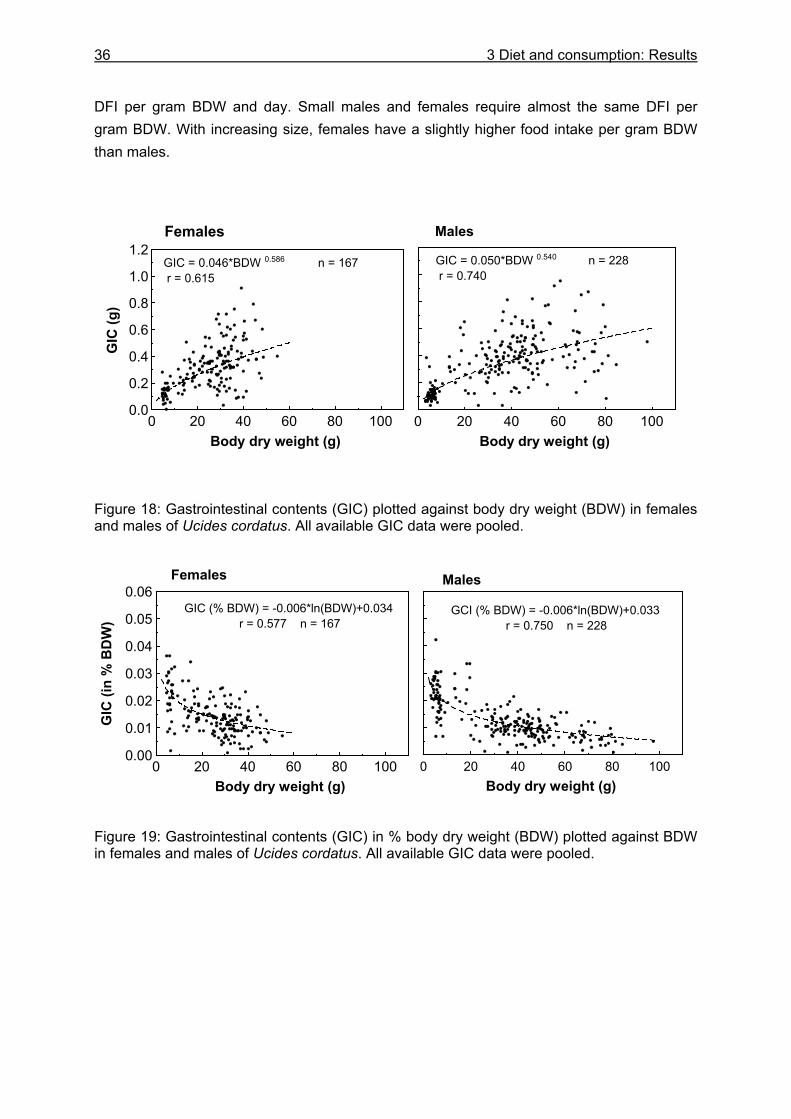
36 3 Diet and consumption: Results
DFI per gram BDW and day. Small males and females require almost the same DFI per gram BDW. With increasing size, females have a slightly higher food intake per gram BDW than males.
Figure 18: Gastrointestinal contents (GIC) plotted against body dry weight (BDW) in females and males of Ucides cordatus. All available GIC data were pooled.
Figure 19: Gastrointestinal contents (GIC) in % body dry weight (BDW) plotted against BDW in females and males of Ucides cordatus. All available GIC data were pooled.
Females
0 20 40 60 80 100Body dry weight (g)
0.00
0.01
0.02
0.03
0.04
0.05
0.06
GIC
(in
% B
DW
)
GIC (% BDW) = -0.006*ln(BDW)+0.034r = 0.577 n = 167
Males
0 20 40 60 80 100Body dry weight (g)
GCI (% BDW) = -0.006*ln(BDW)+0.033r = 0.750 n = 228
Males
0 20 40 60 80 100Body dry weight (g)
GIC = 0.050*BDW 0.540 n = 228 r = 0.740
Females
0 20 40 60 80 100Body dry weight (g)
0.0
0.2
0.4
0.6
0.8
1.0
1.2
GIC
(g)
GIC = 0.046*BDW 0.586 n = 167 r = 0.615
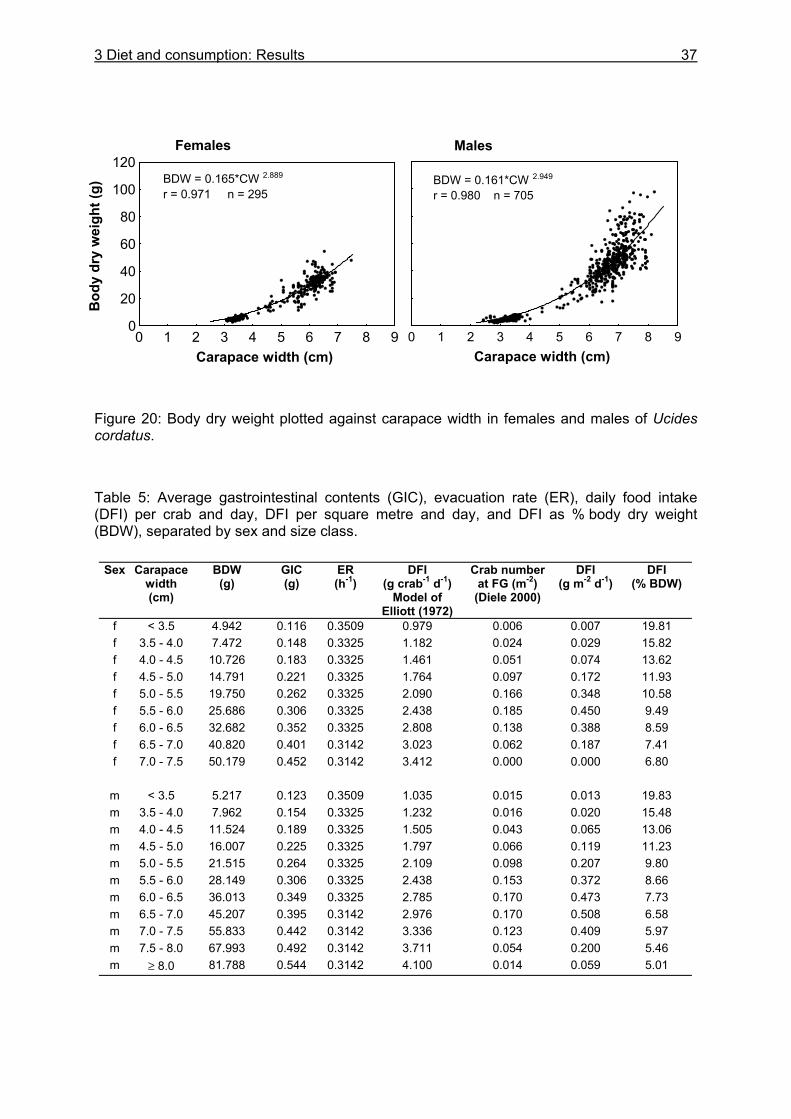
3 Diet and consumption: Results
37
Figure 20: Body dry weight plotted against carapace width in females and males of Ucides cordatus. Table 5: Average gastrointestinal contents (GIC), evacuation rate (ER), daily food intake (DFI) per crab and day, DFI per square metre and day, and DFI as % body dry weight (BDW), separated by sex and size class.
Sex
Carapace width (cm)
BDW (g)
GIC (g)
ER (h-1)
DFI (g crab-1 d-1)
Model of Elliott (1972)
Crab numberat FG (m-2)
(Diele 2000)
DFI (g m-2 d-1)
DFI (% BDW)
f < 3.5 4.942 0.116 0.3509 0.979 0.006 0.007 19.81 f 3.5 - 4.0 7.472 0.148 0.3325 1.182 0.024 0.029 15.82 f 4.0 - 4.5 10.726 0.183 0.3325 1.461 0.051 0.074 13.62 f 4.5 - 5.0 14.791 0.221 0.3325 1.764 0.097 0.172 11.93 f 5.0 - 5.5 19.750 0.262 0.3325 2.090 0.166 0.348 10.58 f 5.5 - 6.0 25.686 0.306 0.3325 2.438 0.185 0.450 9.49 f 6.0 - 6.5 32.682 0.352 0.3325 2.808 0.138 0.388 8.59 f 6.5 - 7.0 40.820 0.401 0.3142 3.023 0.062 0.187 7.41 f 7.0 - 7.5 50.179 0.452 0.3142 3.412 0.000 0.000 6.80
m < 3.5 5.217 0.123 0.3509 1.035 0.015 0.013 19.83 m 3.5 - 4.0 7.962 0.154 0.3325 1.232 0.016 0.020 15.48 m 4.0 - 4.5 11.524 0.189 0.3325 1.505 0.043 0.065 13.06 m 4.5 - 5.0 16.007 0.225 0.3325 1.797 0.066 0.119 11.23 m 5.0 - 5.5 21.515 0.264 0.3325 2.109 0.098 0.207 9.80 m 5.5 - 6.0 28.149 0.306 0.3325 2.438 0.153 0.372 8.66 m 6.0 - 6.5 36.013 0.349 0.3325 2.785 0.170 0.473 7.73 m 6.5 - 7.0 45.207 0.395 0.3142 2.976 0.170 0.508 6.58 m 7.0 - 7.5 55.833 0.442 0.3142 3.336 0.123 0.409 5.97 m 7.5 - 8.0 67.993 0.492 0.3142 3.711 0.054 0.200 5.46 m ≥ 8.0 81.788 0.544 0.3142 4.100 0.014 0.059 5.01
Females
0 1 2 3 4 5 6 7 8 9Carapace width (cm)
0
20
40
60
80
100
120
Bod
y dr
y w
eigh
t (g)
BDW = 0.165*CW 2.889
r = 0.971 n = 295
Males
0 1 2 3 4 5 6 7 8 9Carapace width (cm)
BDW = 0.161*CW 2.949
r = 0.980 n = 705
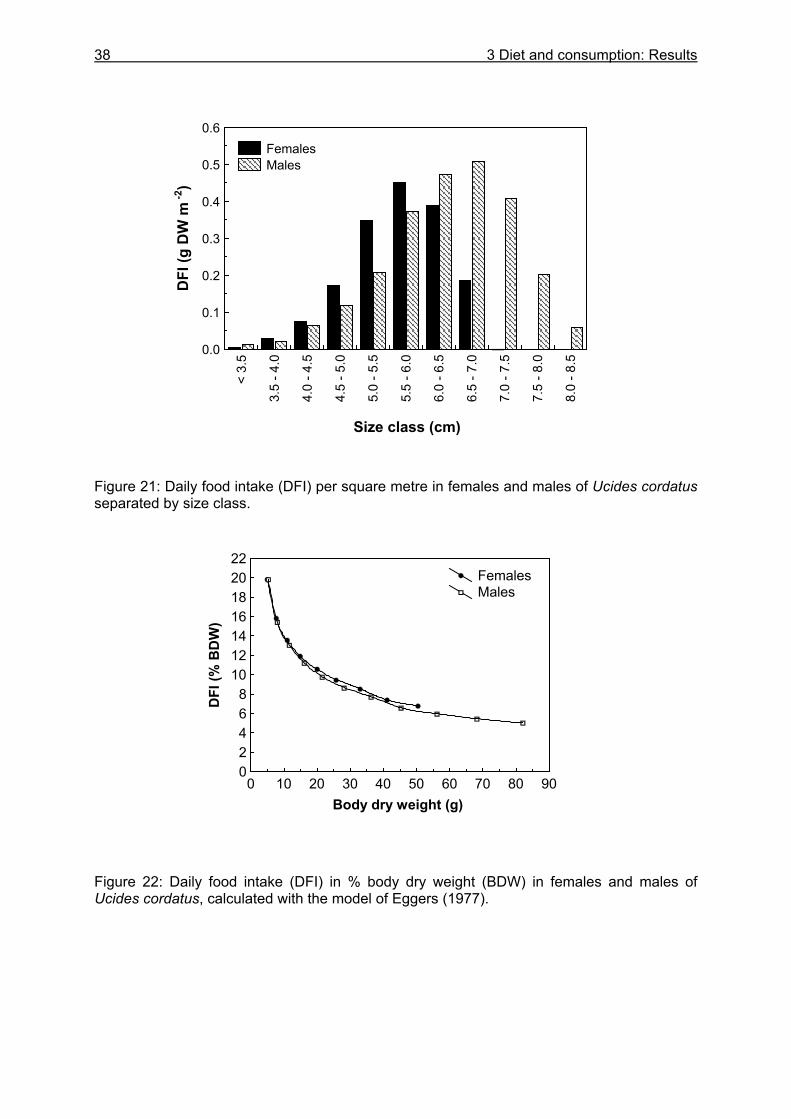
38 3 Diet and consumption: Results
Figure 21: Daily food intake (DFI) per square metre in females and males of Ucides cordatus separated by size class. Figure 22: Daily food intake (DFI) in % body dry weight (BDW) in females and males of Ucides cordatus, calculated with the model of Eggers (1977).
0 10 20 30 40 50 60 70 80 90Body dry weight (g)
02468
10121416182022
DFI
(% B
DW
)
Females Males
< 3.
5
3.5
- 4.0
4.0
- 4.5
4.5
- 5.0
5.0
- 5.5
5.5
- 6.0
6.0
- 6.5
6.5
- 7.0
7.0
- 7.5
7.5
- 8.0
8.0
- 8.5
Size class (cm)
0.0
0.1
0.2
0.3
0.4
0.5
0.6
DFI
(g D
W m
-2)
Females Males
3 Diet and consumption: Discussion
39
3.4 Discussion
3.4.1 Stomach content analyses
Stomach content analyses revealed that the diet of U. cordatus consists mainly of plant material. The most important food component of U. cordatus are mangrove leaves that were found in all stomachs. Mangrove leaves are also the major food source of various sesarmid crabs in Malaysia (Malley 1978), Australia (Giddens et al. 1986, Camilleri 1992), South Africa (Emmerson and Mc Gwynne 1992, Dahdouh-Guebas et al. 1997, Dahdouh-Guebas et al. 1999) and Brazil (Brogim and Lana 1997). Besides the leaf-eating mangrove crabs, gecarcinid land crabs are predominantly herbivorous and feed on litter from trees, on shrubs and on other herbaceous plants (Kellman and Delfosse 1993, Greenaway and Linton 1995, Greenaway and Raghaven 1998). It is assumed that a part of the unidentified plant material in the stomachs of U. cordatus also originated from leaf litter. Since crabs were observed collecting stipules, flowers and propagules of R. mangle, and feeding on algae, it is likely that these components were also part of the unidentified material. The proportion of roots and bark in the diet was slightly higher at FG 1, probably due to greater availability of roots at FG 1. The fine root biomass in the sediment was much higher at FG than at MF (adjacent to AF) during the rainy season 2000 (Reise 2002), but was not measured in 2001. Crabs were observed feeding on algae growing on prop roots of R. mangle, and probably ingested bark along with the algae. Benthic fauna accounted for only a small part of the diet of U. cordatus, and were most likely ingested during the consumption of sediment. The proportion of animal remains in the stomach of U. cordatus was too low to be considered nutritionally significant. Observations of the feeding behaviour also confirm that the crabs do not prey on the epibenthos and infauna although both groups are abundant on the peninsula (Koch 1999, Dittmann, pers. comm.). The stomach contents of the smallest investigated crabs (about 1.5 cm CW) consisted also mainly of plant material. In contrast, crabs do not consume leaf particles during the first 4 months of life, feeding rather on infauna such as polychaetes (Diele 2000). The conversion from that diet to a diet of primarily plant litter occurs sometime between the ages of 4 months and approximately 12 - 15 months in males (corresponding to 1.5 cm CW in males, Diele 2000). Other studies on U. cordatus confirm the predominance of plant material in the stomach of U. cordatus. Nascimento (1993) reported that the crabs´ stomachs contained exclusively vegetable fibres . In Florianópolis, South Brazil, plant material was found in 95 % of the stomachs, followed by sediment (73 %) (Branco 1993). Of the plant material, roots, bark, twigs, mangrove leaves, algae and seeds were found. Leaves occurred in 32 % of the stomachs in Florianópolis but in 100 % of the stomachs on the Bragança peninsula. In addition, Branco (1993) recorded 22 % of empty stomachs. Since litter fall data are not
40 3 Diet and consumption: Discussion
reported for the investigated area, litter was possibly less abundant than on the Bragança peninsula. In contrast to the results presented here, animal material was ingested more frequently (53 %) by the Florianopolis crabs (Branco 1993). Here crabs were described as omnivorous with a preference for plants. However, since the different food components in the stomachs were not quantified by Branco (1993), the significance of fauna to the crabs´ nutrition in Florianópolis remains questionable. The diet diversity of U. cordatus is low. Sediment is the only significant food source other than plant material. Sediment intake is probably very important to the crabs, since it occurred in 87 % of the individuals and accounted for 3.3 % by volume of the diet. Crabs were often observed feeding on the sediment outside their burrows. Thus, sediment is ingested purposely, and not only swallowed together with plant material. Bacterial analyses suggest that sediment consumption is important to the nutrition of U. cordatus in order to ingest cellulose digesting bacteria (chapter 5.4.2.2). Feeding on mud was also common for S. meinerti in southern Africa and it was suggested that nitrogen needed by crabs probably comes from microbial populations in the mud (Steinke et al. 1993). Sediment was found in 91 % and 66 % of the stomachs of Chasmagnathus granulata and S. rectum, respectively, but accounted for less than 5 % by volume in both species (Brogim and Lana 1997), a finding similar to that for U. cordatus. In contrast to the study presented here, the authors concluded that sediment was ingested only due to its adherence to the food items. Silt and clay was also of minor importance for Chiromanthes onychophorum (Malley 1978) and Sesarma erythrodactyla (Camilleri 1992). The fact that 92 % of the investigated stomachs were more than 50 % full signifies that enough plant material was available to most of the crabs before capture. None of the large crabs had an empty stomach, but 7 % of the small crabs did, which suggests that some of the small crabs had restricted access to plant material. Small crabs were more abundant at the border of tidal creeks, in forest gaps and near the road than in the forest (Diele 2000, pers. observation). These habitats are sub-optimal for the crabs, as the canopy coverage and thus the availability of leaf litter is lower. 3.4.2 Food preferences
Food preference studies in the field and in the laboratory revealed that U. cordatus preferred R. mangle leaves over L. racemosa and A. germinans leaves, which is the opposite of what might be predicted from leaf characteristics. In addition, brown and yellow leaves were preferred over green leaves for each tree species. Measurements of the carbon and nitrogen concentration showed that A. germinans leaves have more nitrogen and a lower C:N ratio than R. mangle and L. racemosa leaves, and that senescent and decomposed leaves have less nitrogen and a lower C:N ratio than green leaves (chapter 5.3.1.1). Beside the nitrogen content and the C:N ratio, flavolans, or condensed tannins are known to affect the crabs´
3 Diet and consumption: Discussion
41
choice. They are present in relatively high concentrations in mangrove leaves, and they are thought to deter herbivore grazing (Giddens et al. 1986, Neilson et al. 1986, Steinke et al. 1993, Hogarth 1999). The tannin content is much higher in Rhizophora than in Avicennia leaves (Micheli 1993, Hogarth 1999). Food preferences of U. cordauts probably depend on other food characteristics and on the ability to digest and assimilate the different food components (chapter 5.3.1.2). Other leaf characteristics include water content, thickness and hardness. Since the water content differed only slightly between both green and decomposing R. mangle and A. germinans leaves, it could not have been responsible for the crabs´ choice. Rhizophora spp. leaves are thicker and wider than Avicennia spp. leaves and thus provide more dry matter per leaf, which may partly explain the crabs´ preference for this species. L. racemosa leaves, which are also thicker and have a higher water content than A. germinans leaves, were also preferred by the crabs. Camilleri (1989) reported that Sesarma erythrodactyla preferred thick over thin leaves of R. stylosa. During this study, it was recorded that A. germinans leaves are tougher and have strong veins. Microscopic investigations revealed remains of middle ribs and veins of A. germinans leaves in faeces, with a coarser structure than leaf remains from R. mangle. Thus, A. germinans leaves were more difficult to digest, and a greater proportion of plant dry matter was excreted by crabs feeding on A. germinans leaves. Data on assimilation efficiency for dry matter, carbon, nitrogen and energy confirm these observations (chapter 5.3.1.1). A. germinans leaves were digested less efficiently, counteracting the potential advantages of their higher nitrogen and lower tannin content. Several researchers have mentioned food preferences of U. cordatus (Table 6). Most data on preferences revealed in this study are in agreement with those of Rademaker (1998). The preference for mangrove leaves over other food items, as found in this study, was also reported for individuals in a mangrove forest in São Luís, northeastern Brazil (De Castro 1986) and in the Dominican Republic (De Geraldes and De Calventi 1983). In contrast, tank experiments with specimens from a mangrove area in Pernambuco, northeastern Brazil, indicated a preference for a slightly or strongly decomposed mangrove fruit mix (Wiedemeyer 1997). Chlorophytes, phaeophytes, rhodophytes and benthic microalgae were also preferred over mangrove leaves. The consumption of algae by U. cordatus was often observed on the Bragança peninsular. Because of their low C:N ratio relative to mangrove leaves, it is suggested that they are nutritionally significant (chapter 5.3.1.1). Beside mangrove leaves and algae, U. cordatus fed on sponges and sediment (Costa 1979, cited in Corrêa Ivo and Vasconcelos Gesteira 1999), decomposing organic material (De Castro 1986), water lilies, coconuts, banana leaves and corn (De Geraldes and De Calventi 1983). Naturally, the diet range varies with the study site and the availability of food components. None of the studies reported that U. cordatus fed on epifauna or infauna in the field. During food choice experiments in this thesis, crabs did not feed on fish. Only Wiedemeyer (1997) reported that U. cordatus fed on decayed meat of decapod crabs and
42 3 Diet and consumption: Discussion
fish during tank experiments, but this food was less accepted than all other food items. These findings together with field observations and stomach content analyses, allow the conclusion that the diet of U. cordatus in the field is restricted to mangrove litter, algae, bark, roots and sediment and, if available, fruits or leaves of other plants. Thus, the crabs can be described as predominantly herbivorous. Food preferences of other litter-consuming brachyuran crabs have been investigated in studies on sesarmid and gecarcinid crabs (Table 6). Avicennia leaves have been found to be the preferred food item of Sesarma erythrodactyla (Camilleri 1989). This was related to their low tannin content and C:N ratio. However, food choice experiments for other species confirm the findings of this study, reporting a preference for Rhizophora or Bruguiera leaves over Avicennia leaves (Micheli et al. 1991, Micheli 1993). Other sesarmid crabs, including S. meinerti (Micheli et al. 1991, Emmerson and Mc Gwynne 1992) and S. messa (Micheli 1993), showed no preference as to mangrove species. Several sesarmids have been reported feeding on fresh mangrove litter, but experiments have shown that when given a choice, crabs prefer decayed leaves to senescent or fresh leaves (Giddens et al. 1986, Camilleri 1989, Lee 1989a, Micheli 1993). Some studies demonstrated that tannins may gradually leach out of leaves into seawater during the ageing process (Cundell et al. 1979, Camilleri and Ribi 1986, Neilson et al. 1986, Robertson 1988), probably making them more palatable to crabs. The leaching of flavolans from mangrove leaves correlated with increasing relative consumption rates of Neosarmatium smithi (Giddens et al. 1986) and S. meinerti (Steinke et al. 1993). Concerning the interaction of food preferences and leaf characteristics, a general pattern for leaf-consuming crabs can not be found. The crabs´ choice obviously depends not only on potential nutritional value (low tannin content, high nitrogen concentration, low C:N ratio or high water content) or other food characteristics (size, thickness), but also on the food digestibility (chapter 5.3.1.2).
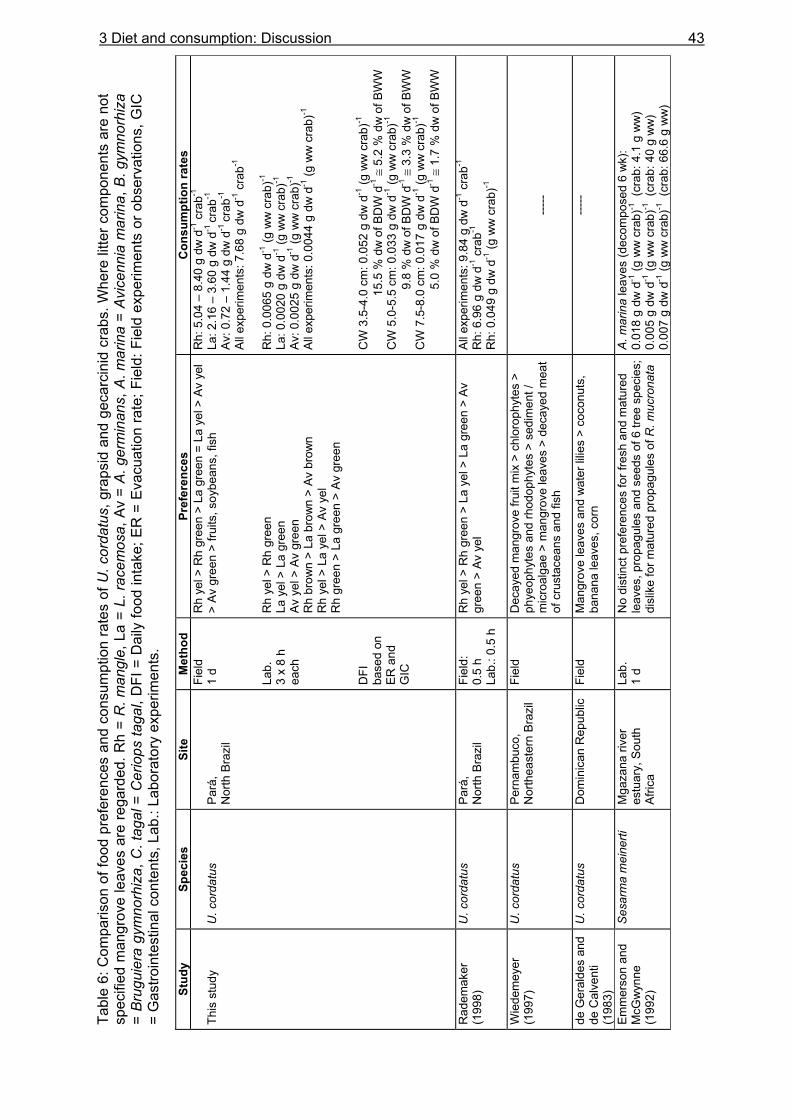
Tabl
e 6:
Com
paris
on o
f foo
d pr
efer
ence
s an
d co
nsum
ptio
n ra
tes
of U
. cor
datu
s, g
raps
id a
nd g
ecar
cini
d cr
abs.
Whe
re li
tter c
ompo
nent
s ar
e no
t sp
ecifi
ed m
angr
ove
leav
es a
re re
gard
ed. R
h =
R. m
angl
e, L
a =
L. ra
cem
osa,
Av
= A.
ger
min
ans,
A. m
arin
a =
Avic
enni
a m
arin
a, B
. gym
norh
iza
= Br
ugui
era
gym
norh
iza,
C. t
agal
= C
erio
ps ta
gal,
DFI
= D
aily
food
inta
ke; E
R =
Eva
cuat
ion
rate
; Fie
ld: F
ield
exp
erim
ents
or o
bser
vatio
ns, G
IC
= G
astro
inte
stin
al c
onte
nts,
Lab
.: La
bora
tory
exp
erim
ents
.
Stud
y Sp
ecie
s Si
te
Met
hod
Pref
eren
ces
Con
sum
ptio
n ra
tes
This
stu
dy
U. c
orda
tus
Pará
, N
orth
Bra
zil
Fiel
d 1
d La
b.
3 x
8 h
each
D
FI
base
d on
ER
and
G
IC
Rh
yel >
Rh
gree
n >
La g
reen
= L
a ye
l > A
v ye
l >
Av g
reen
> fr
uits
, soy
bean
s, fi
sh
Rh
yel >
Rh
gree
n La
yel
> L
a gr
een
Av y
el >
Av
gree
n R
h br
own
> La
bro
wn
> Av
bro
wn
Rh
yel >
La
yel >
Av
yel
Rh
gree
n >
La g
reen
> A
v gr
een
Rh:
5.0
4 –
8.40
g d
w d
-1 c
rab-1
La
: 2.1
6 –
3.60
g d
w d
-1 cr
ab-1
Av
: 0.7
2 –
1.44
g d
w d
-1 cr
ab-1
Al
l exp
erim
ents
: 7.6
8 g
dw d
-1 c
rab-1
R
h: 0
.006
5 g
dw d
-1 (g
ww
cra
b)-1
La
: 0.0
020
g dw
d-1
(g w
w c
rab)
-1
Av: 0
.002
5 g
dw d
-1 (g
ww
cra
b)-1
Al
l exp
erim
ents
: 0.0
044
g dw
d-1
(g w
w c
rab)
-1
CW
3.5
-4.0
cm
: 0.0
52 g
dw
d-1
(g w
w c
rab)
-1
1
5.5
% d
w o
f BD
W d
-1 ≅
5.2
% d
w o
f BW
W
CW
5.0
-5.5
cm
: 0.0
33 g
dw
d-1
(g w
w c
rab)
-1
9.8
% d
w o
f BD
W d
-1 ≅
3.3
% d
w o
f BW
W
CW
7.5
-8.0
cm
: 0.0
17 g
dw
d-1
(g w
w c
rab)
-1
5.0
% d
w o
f BD
W d
-1 ≅
1.7
% d
w o
f BW
W
R
adem
aker
(1
998)
U
. cor
datu
s Pa
rá,
Nor
th B
razi
l Fi
eld:
0.
5 h
Lab.
: 0.5
h
Rh
yel >
Rh
gree
n >
La y
el >
La
gree
n >
Av
gree
n >
Av y
el
All e
xper
imen
ts: 9
.84
g dw
d-1
cra
b-1
Rh:
6.9
6 g
dw d
-1 c
rab-1
R
h: 0
.049
g d
w d
-1 (g
ww
cra
b)-1
Wie
dem
eyer
(1
997)
U
. cor
datu
s Pe
rnam
buco
, N
orth
east
ern
Braz
il Fi
eld
Dec
ayed
man
grov
e fru
it m
ix >
chl
orop
hyte
s >
phye
ophy
tes
and
rhod
ophy
tes
> se
dim
ent /
m
icro
alga
e >
man
grov
e le
aves
> d
ecay
ed m
eat
of c
rust
acea
ns a
nd fi
sh
---
--
de G
eral
des
and
de C
alve
nti
(198
3)
U. c
orda
tus
Dom
inic
an R
epub
lic
Fiel
d M
angr
ove
leav
es a
nd w
ater
lilie
s >
coco
nuts
, ba
nana
leav
es, c
orn
-----
Emm
erso
n an
d M
cGw
ynne
(1
992)
Sesa
rma
mei
nerti
M
gaza
na ri
ver
estu
ary,
Sou
th
Afric
a
Lab.
1
d N
o di
stin
ct p
refe
renc
es fo
r fre
sh a
nd m
atur
ed
leav
es, p
ropa
gule
s an
d se
eds
of 6
tree
spe
cies
;di
slik
e fo
r mat
ured
pro
pagu
les
of R
. muc
rona
ta
A. m
arin
a le
aves
(dec
ompo
sed
6 w
k):
0.01
8 g
dw d
-1 (g
ww
cra
b)-1
(cr
ab: 4
.1 g
ww
) 0.
005
g dw
d-1
(g w
w c
rab)
-1 (
crab
: 40
g w
w)
0.00
7 g
dw d
-1 (g
ww
cra
b)-1
(cr
ab: 6
6.6
g w
w)
3 Diet and consumption: Discussion 43
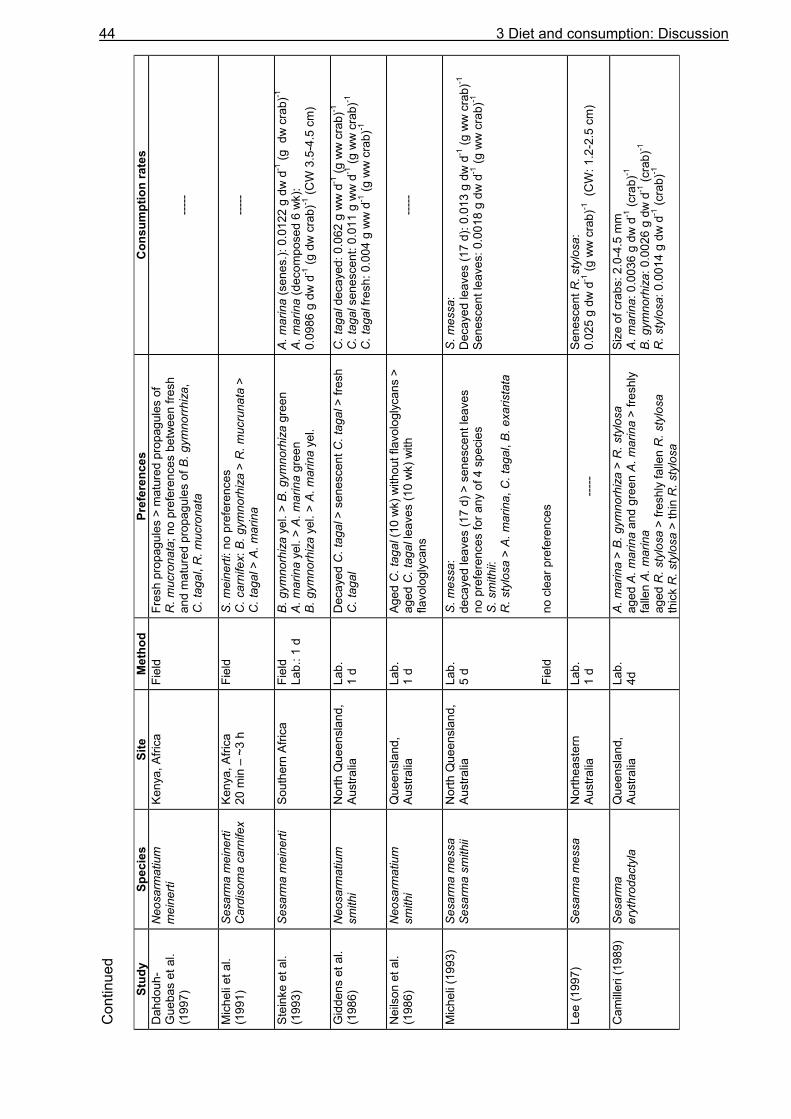
Con
tinue
d
Stud
y Sp
ecie
s Si
te
Met
hod
Pref
eren
ces
Con
sum
ptio
n ra
tes
Dah
douh
-G
ueba
s et
al.
(199
7)
Neo
sarm
atiu
m
mei
nerti
Ke
nya,
Afri
ca
Fiel
d Fr
esh
prop
agul
es >
mat
ured
pro
pagu
les
of
R. m
ucro
nata
; no
pref
eren
ces
betw
een
fresh
an
d m
atur
ed p
ropa
gule
s of
B. g
ymno
rrhiz
a,
C. t
agal
, R. m
ucro
nata
---
--
Mic
heli
et a
l. (1
991)
Se
sarm
a m
eine
rti
Car
diso
ma
carn
ifex
Keny
a, A
frica
20
min
– ~
3 h
Fiel
d S.
mei
nerti
: no
pref
eren
ces
C. c
arni
fex:
B. g
ymno
rhiz
a >
R. m
ucru
nata
>
C. t
agal
> A
. mar
ina
---
--
Stei
nke
et a
l. (1
993)
Se
sarm
a m
eine
rti
Sout
hern
Afri
ca
Fiel
d La
b.: 1
d
B. g
ymno
rhiz
a ye
l. >
B. g
ymno
rhiz
a gr
een
A. m
arin
a ye
l. >
A. m
arin
a gr
een
B. g
ymno
rhiz
a ye
l. >
A. m
arin
a ye
l.
A. m
arin
a (s
enes
.): 0
.012
2 g
dw d
-1 (g
dw
cra
b)-1
A.
mar
ina
(dec
ompo
sed
6 w
k):
0.09
86 g
dw
d-1
(g d
w c
rab)
-1 (C
W 3
.5-4
.5 c
m)
G
idde
ns e
t al.
(198
6)
Neo
sarm
atiu
m
smith
i N
orth
Que
ensl
and,
Au
stra
lia
Lab.
1
d D
ecay
ed C
. tag
al >
sen
esce
nt C
. tag
al >
fres
h C
. tag
al
C. t
agal
dec
ayed
: 0.0
62 g
ww
d-1
(g w
w c
rab)
-1
C. t
agal
sen
esce
nt: 0
.011
g w
w d
-1 (g
ww
cra
b)-1
C. t
agal
fres
h: 0
.004
g w
w d
-1 (g
ww
cra
b)-1
N
eils
on e
t al.
(198
6)
Neo
sarm
atiu
m
smith
i Q
ueen
slan
d,
Aust
ralia
Lab.
1
d Ag
ed C
. tag
al (1
0 w
k) w
ithou
t fla
volo
glyc
ans
> ag
ed C
. tag
al le
aves
(10
wk)
with
fla
volo
glyc
ans
---
--
Mic
heli
(199
3)
Sesa
rma
mes
sa
Sesa
rma
smith
ii N
orth
Que
ensl
and,
Au
stra
lia
Lab.
5
d Fi
eld
S. m
essa
: de
caye
d le
aves
(17
d) >
sen
esce
nt le
aves
no
pre
fere
nces
for a
ny o
f 4 s
peci
es
S. s
mith
ii:
R. s
tylo
sa >
A. m
arin
a, C
. tag
al, B
. exa
rista
ta
no c
lear
pre
fere
nces
S. m
essa
: D
ecay
ed le
aves
(17
d): 0
.013
g d
w d
-1 (g
ww
cra
b)-1
Sene
scen
t lea
ves:
0.0
018
g dw
d-1
(g w
w c
rab)
-1
Lee
(199
7)
Sesa
rma
mes
sa
Nor
thea
ster
n Au
stra
lia
Lab.
1
d
-----
Sene
scen
t R. s
tylo
sa:
0.02
5 g
dw d
-1 (g
ww
cra
b)-1
(C
W: 1
.2-2
.5 c
m)
C
amille
ri (1
989)
Se
sarm
a er
ythr
odac
tyla
Q
ueen
slan
d,
Aust
ralia
La
b.
4d
A. m
arin
a >
B. g
ymno
rhiz
a >
R. s
tylo
sa
aged
A. m
arin
a an
d gr
een
A. m
arin
a >
fresh
ly
falle
n A.
mar
ina
aged
R. s
tylo
sa >
fres
hly
falle
n R
. sty
losa
th
ick
R. s
tylo
sa >
thin
R. s
tylo
sa
Size
of c
rabs
: 2.0
-4.5
mm
A.
mar
ina:
0.0
036
g dw
d-1
(cra
b)-1
B.
gym
norh
iza:
0.0
026
g dw
d-1
(cra
b)-1
R
. sty
losa
: 0.0
014
g dw
d-1
(cra
b)-1
44 3 Diet and consumption: Discussion
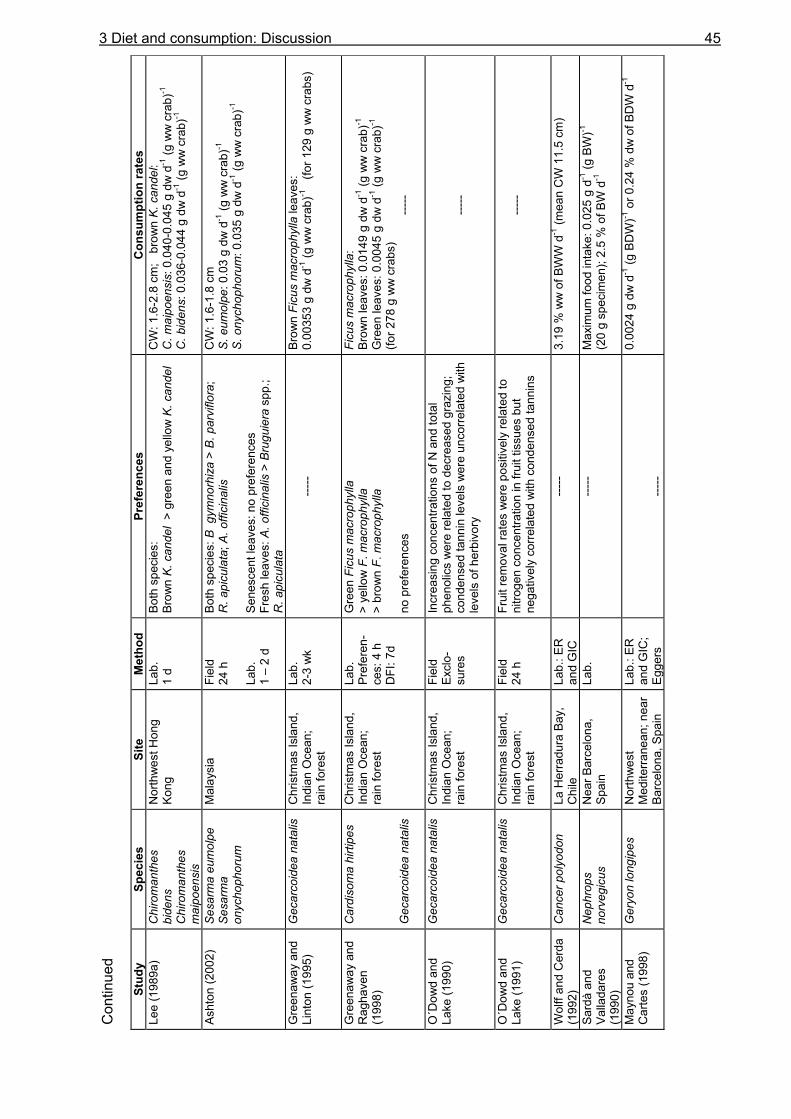
Con
tinue
d
Stud
y Sp
ecie
s Si
te
Met
hod
Pref
eren
ces
Con
sum
ptio
n ra
tes
Lee
(198
9a)
Chi
rom
anth
es
bide
ns
Chi
rom
anth
es
mai
poen
sis
Nor
thw
est H
ong
Kong
La
b.
1 d
Both
spe
cies
: Br
own
K. c
ande
l >
gree
n an
d ye
llow
K. c
ande
l C
W: 1
.6-2
.8 c
m;
bro
wn
K. c
ande
l: C
. mai
poen
sis:
0.0
40-0
.045
g d
w d
-1 (g
ww
cra
b)-1
C. b
iden
s: 0
.036
-0.0
44 g
dw
d-1
(g w
w c
rab)
-1
As
hton
(200
2)
Sesa
rma
eum
olpe
Se
sarm
a on
ycho
phor
um
Mal
aysi
a Fi
eld
24 h
La
b.
1 –
2 d
Both
spe
cies
: B g
ymno
rhiz
a >
B. p
arvi
flora
; R
. api
cula
ta; A
. offi
cina
lis
Sene
scen
t lea
ves:
no
pref
eren
ces
Fres
h le
aves
: A. o
ffici
nalis
> B
rugu
iera
spp
.; R
. api
cula
ta
CW
: 1.6
-1.8
cm
S.
eum
olpe
: 0.0
3 g
dw d
-1 (g
ww
cra
b)-1
S. o
nych
opho
rum
: 0.0
35 g
dw
d-1
(g w
w c
rab)
-1
Gre
enaw
ay a
nd
Lint
on (1
995)
G
ecar
coid
ea n
atal
is
Chr
istm
as Is
land
, In
dian
Oce
an;
rain
fore
st
Lab.
2-
3 w
k
-----
Brow
n Fi
cus
mac
roph
ylla
leav
es:
0.00
353
g dw
d-1
(g w
w c
rab)
-1
(for 1
29 g
ww
cra
bs)
Gre
enaw
ay a
nd
Rag
have
n (1
998)
Car
diso
ma
hirti
pes
Gec
arco
idea
nat
alis
Chr
istm
as Is
land
, In
dian
Oce
an;
rain
fore
st
Lab.
Pr
efer
en-
ces:
4 h
D
FI: 7
d
Gre
en F
icus
mac
roph
ylla
>
yello
w F
. mac
roph
ylla
>
brow
n F.
mac
roph
ylla
no
pre
fere
nces
Ficu
s m
acro
phyl
la:
Brow
n le
aves
: 0.0
149
g dw
d-1
(g w
w c
rab)
-1
Gre
en le
aves
: 0.0
045
g dw
d-1
(g w
w c
rab)
-1
(for 2
78 g
ww
cra
bs)
-----
O´D
owd
and
Lake
(199
0)
Gec
arco
idea
nat
alis
C
hris
tmas
Isla
nd,
Indi
an O
cean
; ra
in fo
rest
Fiel
d Ex
clo-
sure
s
Incr
easi
ng c
once
ntra
tions
of N
and
tota
l ph
enol
ics
wer
e re
late
d to
dec
reas
ed g
razi
ng;
cond
ense
d ta
nnin
leve
ls w
ere
unco
rrela
ted
with
le
vels
of h
erbi
vory
---
--
O´D
owd
and
Lake
(199
1)
Gec
arco
idea
nat
alis
C
hris
tmas
Isla
nd,
Indi
an O
cean
; ra
in fo
rest
Fiel
d 24
h
Frui
t rem
oval
rate
s w
ere
posi
tivel
y re
late
d to
ni
troge
n co
ncen
tratio
n in
frui
t tis
sues
but
ne
gativ
ely
corre
late
d w
ith c
onde
nsed
tann
ins
---
--
Wol
ff an
d C
erda
(1
992)
C
ance
r pol
yodo
n La
Her
radu
ra B
ay,
Chi
le
Lab.
: ER
an
d G
IC
-----
3.19
% w
w o
f BW
W d
-1 (m
ean
CW
11.
5 cm
)
Sard
à an
d Va
llada
res
(199
0)
Nep
hrop
s no
rveg
icus
N
ear B
arce
lona
, Sp
ain
Lab.
---
-- M
axim
um fo
od in
take
: 0.0
25 g
d-1
(g B
W)-1
(2
0 g
spec
imen
); 2.
5 %
of B
W d
-1
May
nou
and
Car
tes
(199
8)
Ger
yon
long
ipes
Nor
thw
est
Med
iterra
nean
; nea
r Ba
rcel
ona,
Spa
in
Lab.
: ER
an
d G
IC;
Egge
rs
---
--
0.00
24 g
dw
d-1
(g B
DW
)-1 o
r 0.2
4 %
dw
of B
DW
d-1
3 Diet and consumption: Discussion 45
46 Diet and consumption: Discussion
3.4.3 Food availability
Litter material in burrows and litter standing stock. Almost all litter components that were available to the crabs were also found in the burrows at all 3 sites. Although crabs showed preferences for several litter components, they still gathered at least a small number of each litter type. It is therefore assumed that the overall availability of litter is too low to allow a strong preference for one or two components. Yellow R. mangle leaves were preferred over all other litter components and found in 68 % and 65 % of the burrows at FG 1 and FG 2, respectively, confirming the results of the food choice experiments. At AF, where crabs had almost only access to brown A. germinans leaves some crabs gathered a lot of these leaves despite their dislike. Nevertheless, the preference for R. mangle leaves was also evident at AF. In contrast to R. mangle leaves, the proportion of R. mangle stipules was much lower in burrows than on the surface at both sites. Stipules have the lowest nitrogen content and the highest C:N ratio of all investigated litter components (chapter 5.3.1.1), suggesting that they are of low nutritional significance to the crabs. In addition, stipules are very small and provide less plant matter than leaves which makes stipules probably less attractive. Propagules of R. mangle were only found in one burrow at FG 2 which reflected the low availability on the sediment surface. Crabs were observed to gather propagules but particularly small crabs occasionally did not manage to pull them into their burrows. All sample areas (1 m radius) contained litter material, suggesting that most crabs had access to at least a part of this material. Since the litter quantity varied highly between sample areas and the radius of activity of U. cordatus is small (< 1 m) crabs cannot avoid temporary deficiencies of food. The availability of food varies on a short and long term scale. The patchy distribution of litter material changes during the course of the day (pers. observation) and is affected by wind, rain and tide. Around spring tides crabs have to adapt to the absence of litter on the surface for several hours. Small quantities of leaves in burrows thus may bypass these periods. Although litter fall was slightly below the annual average at FG 1 during the experiment, the litter standing stock was not fully exploited by the crabs. The observation that large parts of the forest floor were without any leaf litter (Rademaker, pers. comm.) was not confirmed by this study. This was only observed directly after forest inundation. Occasionally, smaller patches without leaf litter were observed, especially where crab abundances were high. A low litter standing stock was often observed at the mixed forest stand (MF). These observations were confirmed by Wessels (1999) who reported that the litter standing stock with 14.5 g dw m-2 at AF close to the road decreased gradually to 0.39 g dw m-2 at MF during the dry season of 1998. An average litter standing stock of 4.51 g dw m-2 at AF was determined by Reise (1999) at the same time. The much higher litter standing stock at AF in
3 Diet and consumption: Discussion
47
2001 was due to the infestation by Hyblae puera caterpillars which spread out over the whole study site within a few weeks. The quantity of litter was low in most burrows and many leaves taken from crab burrows showed feeding marks, suggesting that U. cordatus does not store leaves for long periods. Even at AF, where the litter standing stock was very high, the quantity of burrow litter was relatively low. Only three burrows at AF contained a quantity corresponding to about 8 - 10 A. germinans leaves. Nutrient analysis of burrow leaves indicates that leaf storage does not exceed 2 – 3 weeks (chapter 5.4.1.1). The findings of this study are in agreement with the study of Rademaker (1998) who also found more R. mangle leaves in crab burrows at FC although leaves of all three tree species were available to the crabs. There, the average amount of litter in burrows accounted for 8.43 g ww (Rademaker 1998). This was only slightly more than the litter quantity in burrows at AF, but about 10 times that at FG1. Since the litter standing stock at FC was not measured in the study of Rademaker (1998), it can only be assumed that it was higher compared to that at FG 1. Similar to AF, the variability of the litter quantity in burrows was high at FC. Other studies on U. cordatus did not investigate the quantity of burrow litter. Few studies have examined the occurrence of leaves in crab burrows of sesarmid crabs. Skov and Hartnoll (2002) found leaves in 45 % of burrows of Neosarmatium meinerti within high-shore A. marina mangroves in Africa. The majority of leaves were more than three-quarters eaten. Steinke et al. (1993) found also only small quantities of leaf litter in burrows of N. meinerti in South Africa. Similar to U. cordatus, storing of leaves by N. meinerti was therefore not common. In contrast, O´Dowd and Lake (1989) reported that the land crab Gecarcoidea natalis most likely sequester litter for food in the rain forest on Christmas Island. Leaves lined chambers of 64 % of excavated burrows and litter biomass around the entrances was significantly greater than that on off-burrow locations. Litter fall. Average litter and propagule fall was 16.3 t ha-1 y-1 at FG 1, being slightly higher than the annual total of 13.1 t ha-1 in a mixed mangrove stand at FC on the same peninsula between July 1996 and August 1998 (Mehlig 2001). Litter production was slightly lower (15.4 t ha-1 y-1) in a neighbouring mixed mangrove forest stand at FG between August 2000 and August 2001 (Reise 2002). Since in that study litter traps were placed directly below tree canopies, litter fall data is only suitable to estimate the litter production below canopies. Although litter traps during this study were placed randomly in the mangrove forest it was noted that all but one of the traps were located below tree canopies, probably leading to a slightly overestimation of litter production. Compared with mangrove forests worldwide, litter fall values found for the peninsula are at the higher end of the range. Annual litter production in Rhizophora forests were 15.4 t ha-1 in Malaysia (Sasekumar and Loi 1983), 9.6 -12.2 t ha-1 in Australia (Duke et al. 1981,
48 Diet and consumption: Discussion
Woodroffe et al. 1988) and 5.5 t ha-1 in the United States (Lugo and Snedaker 1974). A similar range was found for A. germinans forests with an annual yield of 14.0 t ha-1 in Malaysia and Australia (Sasekumar and Loi 1983, Woodroffe et al. 1988) and 7.2 t ha-1 in South Africa (Steinke and Charles 1984). Litter production in a mixed mangrove stand and in a Laguncularia forest in Mexico was up to 12.5 t ha-1 and 11.0 t ha-1, respectively (Day Jr. et al. 1987, Flores-Verdugo et al. 1987). Values found for the peninsula fit well into the yield reported for equatorial mangroves (Saenger and Snedaker 1993). Comparisons of litter fall studies worldwide are given in detail by Saenger and Snedaker (1993) and Mehlig (2001). The temporal variability (1.92 –6.93 g m-2 d-1) was high at FG 1, and a similar or even higher variability was found at FC during July 1996 and July 1998 (2.3 -6.5 g m-2 d-1 and 2.0 -11.4 g m-2 d-1 in the first and second year, respectively) (Mehlig 2001). Litter production at FG 1 showed seasonal patterns. Leaf litter fall of R. mangle was low at the beginning of the wet season, confirming results found for FC (Mehlig 2001) and the neighbouring mangrove forest at FG (Reise 2002). Leaf shedding in A. germinans at FG 1 was more synchronised than that of R. mangle, showing high yields in the transition from rainy to dry season with a peak production end of July and low values between mid September and April. This unimodal pattern was also recognised by Mehlig (2001) and Reise (2002). R. mangle propagules were mainly shed during the wet season, a finding which also coincided with the other study areas on the peninsula (Mehlig 2001, Reise 2002). Phenology of litter production on the Bragança peninsula is most likely affected by rainfall along with the concomitant changes in water salinity and air humidity (Mehlig 2001). Thus, leaf fall augmented during the dry season, resulting in a reduced leaf number and therefore transpiring area while salinity stress increased (Mehlig 2001). By contrast, several scientists found that maxima in litter fall were related to wet, rainy season, suggesting that the increased nutrient supply with freshwater enhances litter production (Leach and Burgin 1985, Woodroffe et al. 1988, Lee 1989b). Environmental factors like wind (Sasekumar and Loi 1983), storm (Goulter and Allaway 1979, Woodroffe 1982) and incident radiation (Steinke and Charles 1984) were also reported to partly cause seasonality of litter fall. An influence of temperature changes and day length on litter production has been discussed in detail by Mehlig (2001) without finding significant interactions for the Bragança peninsula. The high seasonal variability of the litter fall on the Bragança peninsula indicates that crabs have to adapt to this highly variable food source. During the rainy season 2000/2001 litter fall was below the average for about 3 months (mid November – mid/end of February). This period of low litter fall overlapped with the reproduction period which takes place between December and April (Diele 2000). It is assumed that U. cordatus needs a higher energy intake during the reproduction period in order to produce the high amount of eggs and spermatophores. Probably crabs could ingest enough food before this period, since litter fall was high between mid September and mid November. R. mangle propagules accounted for a high proportion of the litter during the rainy season and thus during the reproduction period
3 Diet and consumption: Discussion
49
of U. cordatus, providing more carbon and nitrogen than do senescent and decomposing R. mangle leaves (chapter 5.3.1.1). Litter production varies also spatially. Food supply is higher below tree canopies than in forest gaps or near the street. Crabs which burrow below the canopy of A. germinans trees are exposed to a higher seasonal litter fluctuation than crabs below the canopy of R. mangle trees. This results in a pattern of optimal and suboptimal habitats not only among forest types but also on a small scale within a forest stand. 3.4.4 Evacuation
The evacuation rate was slightly higher in small than in large crabs of U. cordatus. Thus, relatively more food can be ingested by small crabs during the same time period. A higher evacuation rate partly enables crabs to meet the demands of a relatively higher daily food intake (DFI as % body dry weight) compared to larger crabs. Stomach size is of no importance in this context, as stomach weight in relation to body weight is similar in small and large crabs. The findings for U. cordatus are in agreement with those of the omnivorous land crab Cardisoma guanhumi (Wolcott and Wolcott 1987, Table 7), the carnivorous crab Cancer coronatus (Jesse 2001) and the krills Euphausia vallentini and E. superba (Pakhomov and Perissinotto 1996, Gurney et al. 2002), where lower gut clearance times were reported for small and juvenile individuals. The evacuation rate of U. cordatus is moderate compared to other Brachyura (0.13 – 1.18 h-1, Table 7). This study is the first to estimate gut evacuation rate of U. cordatus, but few studies have examined gut evacuation for other large litter-consuming crabs. Gut clearance time of U. cordatus is high (> 72 h) and similar to that of the land crabs Cardisoma hirtipes and Gecarcoidea natalis, both feeding on plant litter on Christmas Island (Greenaway and Linton 1995, Greenaway and Raghaven 1998). Conversely, Cardisoma guanhumi and Gecarcinus lateralis had much lower gut clearance times (Wolcott and Wolcott 1984, Wolcott and Wolcott 1987). The gut evacuation in U. cordatus was high during the first hours of starvation, resulting in a decrease of the gastrointestinal contents to 50 % after 2 hours (large crabs), enabling crabs to continue feeding a short time after the last meal. Ocypodid crabs of the genus Uca are reported to have either similar evacuation rates (Wiedemeyer 1997) or up to 2- fold higher rates than U. cordatus (Koch 1999). Differences are most likely attributed to the different food sources and the huge difference in size. In contrast to the slow-growing and long-living U. cordatus, fiddler crabs have small life spans and higher growth rates, resulting in a daily food intake between 22 and 32 % of their body dry weight (Koch 1999). Based on the applied model, small specimens of U. cordatus (< 3.0 cm CW) have at least a daily food intake of 20 % of their body dry weight. It is suggested that this value increases further with decreasing body size. Similar sized specimens of Uca spp. and U. cordatus may therefore have a similar food demand. Since
50 Diet and consumption: Discussion
plant material is generally more difficult to digest and has a lower nutritional value than bacteria and algae – the food sources of Uca spp. – an even higher daily food intake is conceivable for similar sized specimens of U. cordatus. Comparisons show that the evacuation rate of U. cordatus is similar (Wiedemeyer 1997, Koch 1999) or up to 3.3-fold higher in carnivorous crabs (Jesse 2001). In contrast, according to McNeill and Southwood (1978), rapid gut passage is adaptive for herbivores whose food is difficult to digest and has a low nitrogen content. However, comparisons show that the evacuation rate of U. cordatus is at the lower end of the range of evacuation rates reported for carnivorous crabs (0.33 – 1.18 h-1). McNeill and Southwood (1978) also reported that herbivores possess an increased gut volume compared to carnivores, allowing for a higher food intake. A large digestive tract and high evacuation rates may allow relatively high ingestion rates and thus compensate for the low nitrogen content in plant material. For instance, the anterior foregut of the litter-consuming crab Gecarcinus lateralis is four times as large as that of the carnivorous crab Scylla serrata (Wolcott and Wolcott 1984). Even though the evacuation rate of U. cordatus is moderate compared to other Brachyura, the daily food intake is comparatively high (see below) due to a large stomach and a more or less continuous feeding (chapter 4.3.1). 3.4.5 Daily food intake
Daily consumption rates of U. cordatus were determined during laboratory and field experiments as well as on the basis of evacuation data and gastrointestinal contents (chapter 3.3). Since many crabs did not feed at all in the laboratory, the much higher consumption rates obtained during field experiments are most likely more realistic. On the other hand, consumption rates determined in the field probably overestimated the average consumption rate per crab and day since crabs were provided with a surplus supply of leaves during the experiments. A single crab consumed 7.7 g dw (this study) or 9.8 g dw (Rademaker 1998) per day, which exceeded the daily litter fall by far (4.5 g dw m-2 at FG 1). Results have therefore to be regarded as maximal daily ingestion rates. However, crabs did not ingest all litter provided during the experiments, probably because of the limited amount of food that can be processed due to stomach size and evacuation rate.
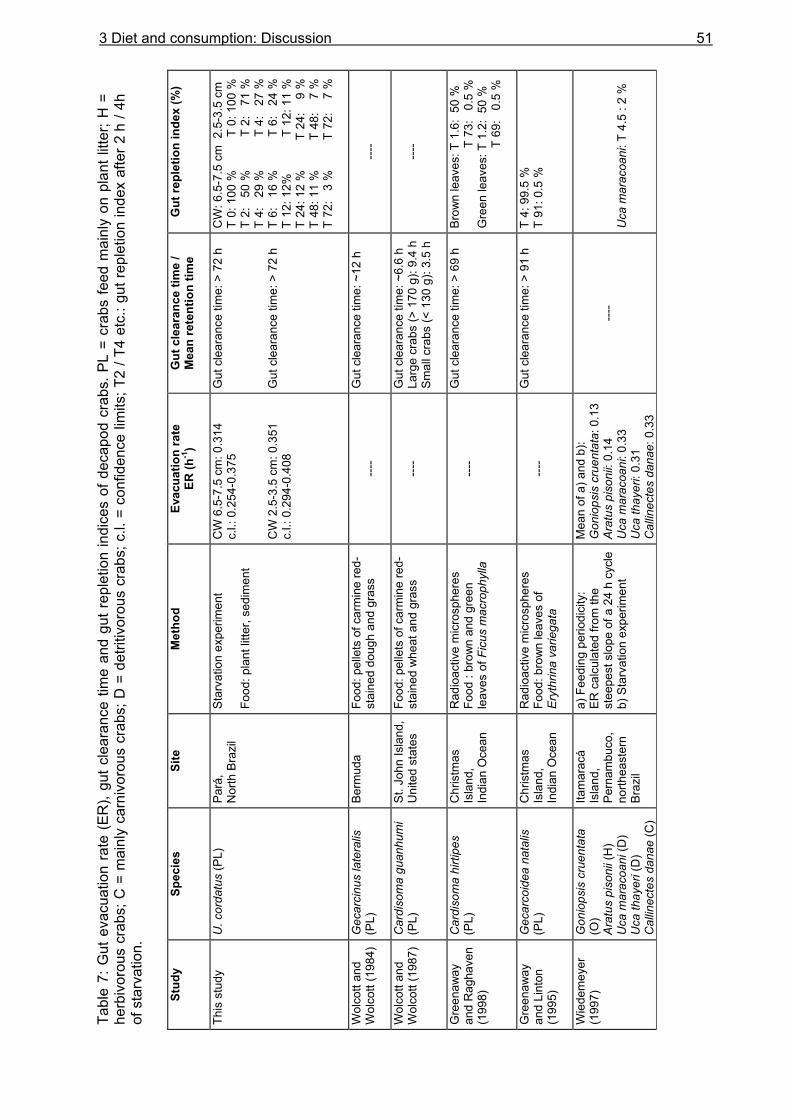
Tabl
e 7:
Gut
eva
cuat
ion
rate
(ER
), gu
t cle
aran
ce ti
me
and
gut r
eple
tion
indi
ces
of d
ecap
od c
rabs
. PL
= cr
abs
feed
mai
nly
on p
lant
litte
r; H
=
herb
ivor
ous
crab
s; C
= m
ainl
y ca
rniv
orou
s cr
abs;
D =
det
ritiv
orou
s cr
abs;
c.l.
= c
onfid
ence
lim
its; T
2 / T
4 et
c.: g
ut re
plet
ion
inde
x af
ter 2
h /
4h
of s
tarv
atio
n.
St
udy
Spec
ies
Site
M
etho
d Ev
acua
tion
rate
ER
(h-1
)
Gut
cle
aran
ce ti
me
/ M
ean
rete
ntio
n tim
e G
ut re
plet
ion
inde
x (%
)
This
stu
dy
U. c
orda
tus
(PL)
Pará
, N
orth
Bra
zil
Star
vatio
n ex
perim
ent
Food
: pla
nt li
tter,
sedi
men
t
CW
6.5
-7.5
cm
: 0.3
14
c.l.:
0.2
54-0
.375
C
W 2
.5-3
.5 c
m: 0
.351
c.l.:
0.2
94-0
.408
Gut
cle
aran
ce ti
me:
> 7
2 h
Gut
cle
aran
ce ti
me:
> 7
2 h
CW
: 6.5
-7.5
cm
2.5
-3.5
cm
T
0: 1
00 %
T
0: 1
00 %
T
2:
50 %
T
2:
71
%
T 4:
29
%
T 4
: 2
7 %
T
6:
16 %
T
6:
24
%
T 12
: 12%
T
12:
11
%
T 24
: 12
%
T 24
: 9
%
T 48
: 11
%
T 48
: 7
%
T 72
: 3
%
T 72
: 7
%
W
olco
tt an
d W
olco
tt (1
984)
G
ecar
cinu
s la
tera
lis
(PL)
Be
rmud
a Fo
od: p
elle
ts o
f car
min
e re
d-st
aine
d do
ugh
and
gras
s
----
Gut
cle
aran
ce ti
me:
~12
h
---
-
Wol
cott
and
Wol
cott
(198
7)
Car
diso
ma
guan
hum
i (P
L)
St. J
ohn
Isla
nd,
Uni
ted
stat
es
Food
: pel
lets
of c
arm
ine
red-
stai
ned
whe
at a
nd g
rass
----
Gut
cle
aran
ce ti
me:
~6.
6 h
Larg
e cr
abs
(> 1
70 g
): 9.
4 h
Smal
l cra
bs (<
130
g):
3.5
h
---
-
Gre
enaw
ay
and
Rag
have
n (1
998)
Car
diso
ma
hirti
pes
(PL)
Chr
istm
as
Isla
nd,
Indi
an O
cean
Rad
ioac
tive
mic
rosp
here
s Fo
od :
brow
n an
d gr
een
leav
es o
f Fic
us m
acro
phyl
la
---
- G
ut c
lear
ance
tim
e: >
69
h Br
own
leav
es: T
1.6
: 50
%
T 73
: 0
.5 %
G
reen
leav
es: T
1.2
: 50
%
T 69
: 0
.5 %
Gre
enaw
ay
and
Lint
on
(199
5)
Gec
arco
idea
nat
alis
(P
L)
Chr
istm
as
Isla
nd,
Indi
an O
cean
Rad
ioac
tive
mic
rosp
here
s Fo
od: b
row
n le
aves
of
Eryt
hrin
a va
riega
ta
---
- G
ut c
lear
ance
tim
e: >
91
h T
4: 9
9.5
%
T 91
: 0.5
%
Wie
dem
eyer
(1
997)
G
onio
psis
cru
enta
ta
(O)
Arat
us p
ison
ii (H
) U
ca m
arac
oani
(D)
Uca
thay
eri (
D)
Cal
linec
tes
dana
e (C
)
Itam
arac
á Is
land
, Pe
rnam
buco
, no
rthea
ster
n Br
azil
a) F
eedi
ng p
erio
dici
ty:
ER c
alcu
late
d fro
m th
e st
eepe
st s
lope
of a
24
h cy
cle
b) S
tarv
atio
n ex
perim
ent
Mea
n of
a) a
nd b
): G
onio
psis
cru
enta
ta: 0
.13
Arat
us p
ison
ii: 0
.14
Uca
mar
acoa
ni: 0
.33
Uca
thay
eri:
0.31
C
allin
ecte
s da
nae:
0.3
3
---
-
Uca
mar
acoa
ni: T
4.5
: 2
%
3 Diet and consumption: Discussion 51
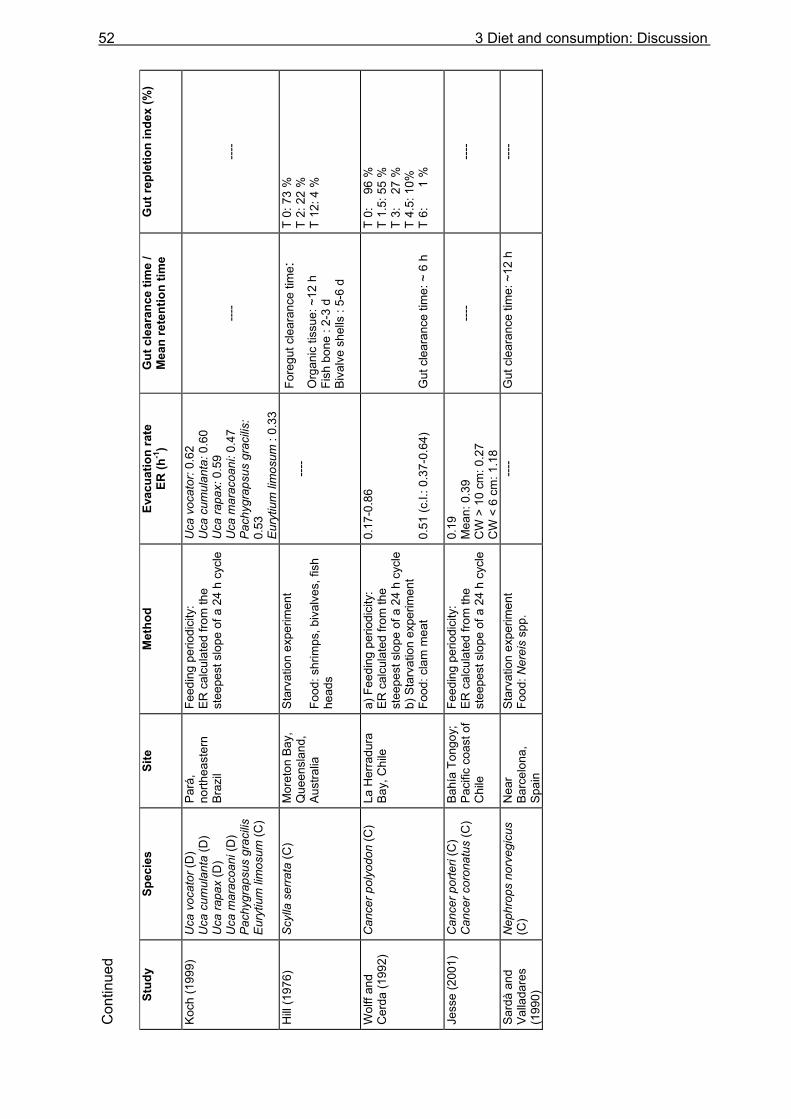
Con
tinue
d
Stud
y Sp
ecie
s Si
te
Met
hod
Evac
uatio
n ra
te
ER (h
-1)
Gut
cle
aran
ce ti
me
/ M
ean
rete
ntio
n tim
e G
ut re
plet
ion
inde
x (%
)
Koch
(199
9)
Uca
voc
ator
(D)
Uca
cum
ulan
ta (D
) U
ca ra
pax
(D)
Uca
mar
acoa
ni (D
) Pa
chyg
raps
us g
raci
lis
Eury
tium
lim
osum
(C)
Pará
, no
rthea
ster
n Br
azil
Feed
ing
perio
dici
ty:
ER c
alcu
late
d fro
m th
e st
eepe
st s
lope
of a
24
h cy
cle
Uca
voc
ator
: 0.6
2 U
ca c
umul
anta
: 0.6
0 U
ca ra
pax:
0.5
9 U
ca m
arac
oani
: 0.4
7 Pa
chyg
raps
us g
raci
lis:
0.53
Eu
rytiu
m li
mos
um :
0.33
---
-
---
-
Hill
(197
6)
Scyl
la s
erra
ta (C
) M
oret
on B
ay,
Que
ensl
and,
Au
stra
lia
Star
vatio
n ex
perim
ent
Food
: shr
imps
, biv
alve
s, fi
sh
head
s
---
- Fo
regu
t cle
aran
ce ti
me :
O
rgan
ic ti
ssue
: ~12
h
Fish
bon
e : 2
-3 d
Bi
valv
e sh
ells
: 5-
6 d
T 0:
73
%
T 2:
22
%
T 12
: 4 %
Wol
ff an
d C
erda
(199
2)
Can
cer p
olyo
don
(C)
La H
erra
dura
Ba
y, C
hile
a)
Fee
ding
per
iodi
city
: ER
cal
cula
ted
from
the
stee
pest
slo
pe o
f a 2
4 h
cycl
e b)
Sta
rvat
ion
expe
rimen
t Fo
od: c
lam
mea
t
0.17
-0.8
6 0.
51 (c
.l.: 0
.37-
0.64
)
Gut
cle
aran
ce ti
me:
~ 6
h
T 0:
9
6 %
T
1.5:
55
%
T 3:
2
7 %
T
4.5:
10%
T
6:
1
%
Jess
e (2
001)
C
ance
r por
teri
(C)
Can
cer c
oron
atus
(C)
Bahí
a To
ngoy
; Pa
cific
coa
st o
f C
hile
Feed
ing
perio
dici
ty:
ER c
alcu
late
d fro
m th
e st
eepe
st s
lope
of a
24
h cy
cle
0.19
M
ean:
0.3
9 C
W >
10
cm: 0
.27
CW
< 6
cm
: 1.1
8
---
- ----
Sard
à an
d Va
llada
res
(199
0)
Nep
hrop
s no
rveg
icus
(C
) N
ear
Barc
elon
a,
Spai
n
Star
vatio
n ex
perim
ent
Food
: Ner
eis
spp.
---
- G
ut c
lear
ance
tim
e: ~
12 h
---
-
52 3 Diet and consumption: Discussion
3 Diet and consumption: Discussion 53
Consumption rates based on the determination of evacuation rate and gastrointestinal contents most likely provide a more exact value than feeding experiments. The gastrointestinal contents of many crabs were examined which were collected at different sampling occasions over a days´ cycle and at different times of the year. Periods with lower and higher litter availability and fluctuations of ingestion rates during the day were therefore included. Most studies determining litter consumption of crabs do not consider fluctuations of the ingestion rate during the year. Lee (1989b) reported that sesarmids in a Hong Kong tidal shrimp pond are able to consume > 57 % of the daily leaf litter production but that the average consumption is probably only half that amount since crabs are inactive around half the year due to the ambient temperature. The possible variation in feeding activities by crabs in the course of the day and year still awaits further investigation. Based on evacuation rate and average gastrointestinal contents, the estimated daily consumption accounted for 19.8 % and 5.5 % of the crabs´ body dry weight in small (3.0 - 3.5 cm CW) and large (7.5 - 8.0 cm CW) males, respectively. Therefore, the daily food intake per gram body weight depends highly on the crabs´ weight, which is also a typical pattern in other decapods (Wolcott and Wolcott 1984, Emmerson and Mc Gwynne 1992, Nunes and Parsons 2000). Due to a slightly higher average gastrointestinal contents in females compared to males of the same weight, females have a higher average daily food intake. The difference between the gastrointestinal contents of females and males was relatively high in December but marginal in June. This suggests that females had an increased food intake before the start of the reproduction period, probably in order to ensure egg production. Since leaf litter was comparatively low in December, it is assumed that crabs fed relatively more on propagules of R. mangle which were abundant during this period and have a higher nutritive value than leaf litter. Comparisons of consumption rates among litter-consuming crabs are complicated due to the inconsistency of applied methods (Table 6). Most studies did not investigate the dependency of the daily food intake on crab body weight and several studies estimated consumption rates only in the laboratory which could have caused biased data. Comparing ingestion rates determined in the laboratory, results gained for U. cordatus (0.0044 g dw d-1 per g ww crab) are within the range (0.0018 – 0.0450 g dw d-1 per g ww crab) found for litter-consuming grapsid and gecarcinid crabs (Lee 1989a, Emmerson and Mc Gwynne 1992, Micheli 1993, Greenaway and Linton 1995, Lee 1997, Greenaway and Raghaven 1998, Ashton 2002). Regarding the consumption rate of U. cordatus obtained by determination of evacuation rate and gastrointestinal contents (0.017 – 0.052 g dw d-1 per g ww crab, depending on size), values are at the higher end of the range. Comparing similar sized crabs, the ingestion rate of U. cordatus exceeded that of the terrestrial crab Gecarcoidea natalis 6.5-fold (Greenaway and Linton 1995). The daily food intake of G. natalis was only 0.35 % of its body wet weight (Greenaway and Linton 1995) which seems very low for a species feeding on plant litter being usually low in nutrients. In contrast, the other terrestrial land crab on Christmas Island,
54 3 Diet and consumption: Discussion
Cardisoma hirtipes, has a similar daily food intake than U. cordatus (Greenaway and Raghaven 1998). Consumption rates of the carnivorous brachyuran crabs Cancer polyodon and Geryon longipes were also obtained from data on gastrointestinal contents and evacuation rates (Wolff and Cerda 1992, Maynou and Cartes 1998). C. polyodon showed a slightly lower and G. longipes a much lower food intake per day than U. cordatus. This is probably due to the ingestion of animal material which is of high nutritional value compared to plant litter (chapter 5.4.1.1) and allows for a lower daily food intake. Daily food intake in relation to litter production. Litter consumption rate of U. cordatus in relation to litter production is high (81.3 %). Determined consumption rates, observations, and experiments with tethered leaves strongly indicate that most of the litter material is buried and of this the bulk is consumed by the crabs. Therefore, U. cordatus is a keystone species on the Bragança peninsula. The results suggest that the crab population is food limited in many areas of the peninsula even though litter availability is comparatively high. High litter burial rates are mainly caused by the fact that most parts of the peninsula belong to the high intertidal and are flooded only around spring tides. Considerably more litter material is therefore available to the crabs in the high intertidal compared to the rims of tidal channels that are flooded with every high tide. Litter which is shed during forest inundation around spring tides can not be buried or consumed by U. cordatus. According to Schories et al. (2003) the quantity of leaf litter and propagules washed out with spring tides is 10 and 17 times greater than during neap tides at the study site Furo do Chato (FC). Beside the topography of the peninsula, another reason for the high litter processing rate of U. cordatus is the lack of effective competitors. Koch (1999) found five brachyuran species of the family Grapsidae in the forest at FC. Even though they may partly feed on mangrove litter, their biomass is negligible compared to U. cordatus. Schories et al. (2003) who worked on the same peninsula estimated leaf removal rates of U. cordatus indirectly by subtracting leaf lost through tidal export and decomposition of leaves on the forest floor from leaf fall data. Since tidal export and decomposition together were responsible for less than 39 % of the litter fall, the remaining 61 % were attributed to removal by U. cordatus. Consumption rates determined in this study reveal that the value of Schories et al. (2003) is most likely underestimated. However, taking the confidence limits of the calculated evacuation rate into account, daily consumption of leaf litter ranged between 69 % and 99 % of leaf litter production, demonstrating that the lower limit is close to the estimated value of Schories et al. (2003). The impact of U. cordatus on litter dynamics in other mangrove forests along the South American Atlantic coast must be considered high in areas with a high crab density and a low inundation frequency. The reported abundances in mangrove areas along the Brazilian
3 Diet and consumption: Discussion 55
coastline (3-5 crabs m-2, Alcantara-Filho 1978, Nascimento et al. 1982, Nascimento and Santos 1982, Corrêa Ivo and Vasconcelos Gesteira 1999) seem to be high compared to the investigation area (1.65 and 1.38 crabs m-2 at FG and FC, respectively; Diele 2000, Rademaker 1998). Nevertheless, U. cordatus is widespread over the Bragança peninsula and the biomass of the population is very high (142 and 148 g ww m-2 at FG and FC, respectively; Diele 2000, Rademaker 1998). The mean densities have therefore to be regarded as high. On the Bragança peninsula, abundances were determined along transects at different sites, including large areas and the whole range of habitats in the forest (Rademaker 1998, Diele 2000). It was shown during in situ video observations that densities in favourable habitats reach high values (11 crabs m-2 near stilt roots of R. mangle). In contrast, densities are relatively low in forest gaps, dwarf forest stands and very dry areas. Since many other studies determined crab abundances on the basis of small areas and did not mention whether habitats with different forest structures were included, it is likely that the whole range of crab densities was not included and that mean densities were overestimated. Comparisons of crab densities are therefore difficult. By contrast, a very low biomass of U. cordatus was reported from the Canal Sta. Cruz mangrove ecosystem, northeastern Brazil (Wiedemeyer 1997). Due to the low crab abundance and a regularly inundation of the mangrove area twice a day (Porto, pers. comm.), litter processing by the U. cordatus population is therefore most likely negligible in the Canal Sta. Cruz mangrove ecosystem. High litter removal rates by U. cordatus on the Bragança peninsula are in agreement with the findings for U. occidentalis in Ecuador (Twilley et al. 1997). There, litter removal by crabs influences patterns of litter dynamics even in riverine mangroves with high hydrodynamic energies. During field experiments, U. occidentalis was offered leaf material equivalent to the daily leaf litter production. These leaves were removed within one hour, suggesting that this crab has a high influence on litter dynamics (Twilley et al. 1997). Since daily consumption rates of U. occidentalis were not determined, comparisons are limited. In contrast to this study and the findings of Twilley et al. (1997), litter processing by crabs is obviously not important in several New World mangrove areas. Flores-Verdugo et al. (1987) reported that almost 90 % of total litter fall was exported from the mangrove areas in a Mexican coastal lagoon. In a Caribean basin mangrove forest high residence times (0.2-0.5 y) of leaf litter were recorded (Twilley et al. 1986). This is in agreement with the study of Jones (1984), who reported that an abundant leaf-eating crab fauna is not common in Caribean forests. Unlike for the New World mangroves, several studies determined consumption rates of litter-consuming grapsid and ocypodid crabs in relation to litter fall in the eastern hemisphere (Table 8). Crabs of the sub-family Sesarminae are numerically dominant members of the benthic fauna in the Indo-West-Pacific region (Macnae 1968). In high intertidal mangrove
56 3 Diet and consumption: Discussion
forests in Australia, crabs removed 71 % and 79 % of the total annual litter fall from the floor in Ceriops tagal and Bruguiera exaristata forests, respectively (Robertson and Daniel 1989). Similar to the Bragança peninsula, these areas were flooded only around spring tides, explaining the high litter removal rates through crabs. Sesarmid crabs in South Africa may also consume considerably amounts of the annual leaf litter fall, ranging between 44 % and 64 % (Emmerson and Mc Gwynne 1992, Steinke et al. 1993, Table 8). Consumption or leaf removal rates for Chiromanthes spp. in Hong Kong and Malaysia were somewhat lower, ranging between 9 and 28 % of the leaf litter (Leh and Sasekumar 1985 (cit in Robertson and Daniel 1989), Lee 1989a). Comparing litter removal rates of mangrove crabs with those of large litter-consuming land crabs in tropical dry and rain forests, a similar high range can be found (11 - 87 %, O´Dowd and Lake 1989, Kellman and Delfosse 1993, Green et al. 1999). Since litter export by tides does not occur in these forests, litter processing by crabs can probably be even higher than in mangrove forests. The results of this study present evidence that the influence of U. cordatus on the litter turnover rate is similar or even higher than that of sesarmine crabs in the Indo-West-Pacific region. The bulk of litter production, and thus nutrients and energy, are retained in the forest. A part of these nutrients and energy is assimilated by the U. cordatus population, but the other part is excreted with faecal material and is then available to other members of the forest community (chapter 5).
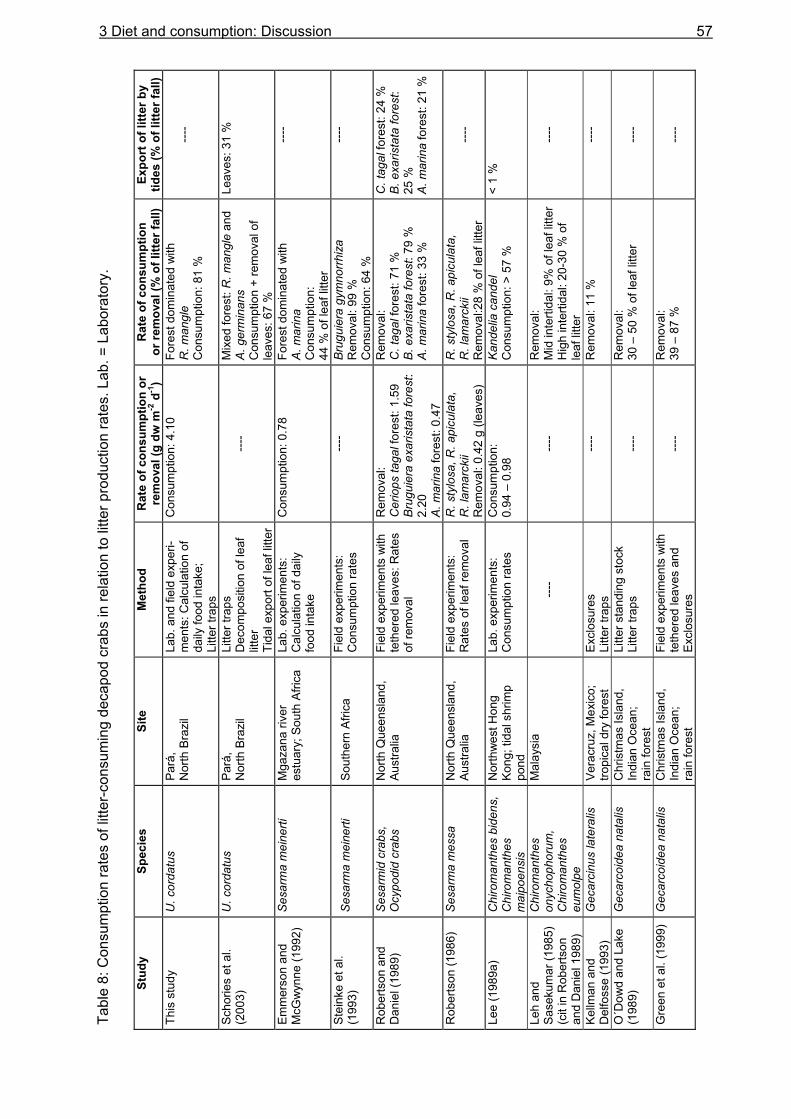
Tabl
e 8:
Con
sum
ptio
n ra
tes
of li
tter-c
onsu
min
g de
capo
d cr
abs
in re
latio
n to
litte
r pro
duct
ion
rate
s. L
ab. =
Lab
orat
ory.
Stud
y Sp
ecie
s Si
te
Met
hod
Rat
e of
con
sum
ptio
n or
re
mov
al (g
dw
m-2
d-1
) R
ate
of c
onsu
mpt
ion
or
rem
oval
(% o
f litt
er fa
ll)
Expo
rt o
f litt
er b
y tid
es (%
of l
itter
fall)
Th
is s
tudy
U
. cor
datu
s Pa
rá,
Nor
th B
razi
l La
b. a
nd fi
eld
expe
ri-m
ents
: Cal
cula
tion
of
daily
food
inta
ke;
Litte
r tra
ps
Con
sum
ptio
n: 4
.10
Fore
st d
omin
ated
with
R
. man
gle
Con
sum
ptio
n: 8
1 %
---
-
Scho
ries
et a
l. (2
003)
U
. cor
datu
s Pa
rá,
Nor
th B
razi
l Li
tter t
raps
D
ecom
posi
tion
of le
af
litte
r Ti
dal e
xpor
t of l
eaf l
itter
----
Mix
ed fo
rest
: R. m
angl
e an
d A.
ger
min
ans
Con
sum
ptio
n +
rem
oval
of
leav
es: 6
7 %
Leav
es: 3
1 %
Emm
erso
n an
d M
cGw
ynne
(199
2)
Sesa
rma
mei
nerti
M
gaza
na ri
ver
estu
ary;
Sou
th A
frica
Lab.
exp
erim
ents
: C
alcu
latio
n of
dai
ly
food
inta
ke
Con
sum
ptio
n: 0
.78
Fore
st d
omin
ated
with
A.
mar
ina
Con
sum
ptio
n:
44 %
of l
eaf l
itter
----
Stei
nke
et a
l. (1
993)
Se
sarm
a m
eine
rti
Sout
hern
Afri
ca
Fiel
d ex
perim
ents
: C
onsu
mpt
ion
rate
s ---
- Br
ugui
era
gym
norrh
iza
Rem
oval
: 99
%
Con
sum
ptio
n: 6
4 %
----
Rob
erts
on a
nd
Dan
iel (
1989
) Se
sarm
id c
rabs
, O
cypo
did
crab
s N
orth
Que
ensl
and,
Au
stra
lia
Fiel
d ex
perim
ents
with
te
ther
ed le
aves
: Rat
es
of re
mov
al
Rem
oval
: C
erio
ps ta
gal f
ores
t: 1.
59
Brug
uier
a ex
aris
tata
fore
st:
2.20
A.
mar
ina
fore
st: 0
.47
Rem
oval
: C
. tag
al fo
rest
: 71
%
B. e
xaris
tata
fore
st: 7
9 %
A.
mar
ina
fore
st: 3
3 %
C. t
agal
fore
st: 2
4 %
B.
exa
rista
ta fo
rest
: 25
%
A. m
arin
a fo
rest
: 21
%
Rob
erts
on (1
986)
Se
sarm
a m
essa
N
orth
Que
ensl
and,
Au
stra
lia
Fiel
d ex
perim
ents
: R
ates
of l
eaf r
emov
al
R. s
tylo
sa, R
. api
cula
ta,
R. l
amar
ckii
Rem
oval
: 0.4
2 g
(leav
es)
R. s
tylo
sa, R
. api
cula
ta,
R. l
amar
ckii
Rem
oval
:28
% o
f lea
f litt
er
---
-
Lee
(198
9a)
Chi
rom
anth
es b
iden
s,
Chi
rom
anth
es
mai
poen
sis
Nor
thw
est H
ong
Kong
; tid
al s
hrim
p po
nd
Lab.
exp
erim
ents
: C
onsu
mpt
ion
rate
s C
onsu
mpt
ion:
0.
94 –
0.9
8
Kand
elia
can
del
Con
sum
ptio
n: >
57
%
< 1
%
Leh
and
Sase
kum
ar (1
985)
(c
it in
Rob
erts
on
and
Dan
iel 1
989)
Chi
rom
anth
es
onyc
hoph
orum
, C
hiro
man
thes
eu
mol
pe
Mal
aysi
a
----
---
-
Rem
oval
: M
id in
terti
dal:
9% o
f lea
f litt
er
Hig
h in
terti
dal:
20-3
0 %
of
leaf
litte
r
----
Kellm
an a
nd
Del
foss
e (1
993)
G
ecar
cinu
s la
tera
lis
Vera
cruz
, Mex
ico;
tro
pica
l dry
fore
st
Excl
osur
es
Litte
r tra
ps
----
R
emov
al: 1
1 %
---
-
O´D
owd
and
Lake
(1
989)
G
ecar
coid
ea n
atal
is
Chr
istm
as Is
land
, In
dian
Oce
an;
rain
fore
st
Litte
r sta
ndin
g st
ock
Litte
r tra
ps
---
-
Rem
oval
: 30
– 5
0 %
of l
eaf l
itter
----
Gre
en e
t al.
(199
9)
Gec
arco
idea
nat
alis
C
hris
tmas
Isla
nd,
Indi
an O
cean
; ra
in fo
rest
Fiel
d ex
perim
ents
with
te
ther
ed le
aves
and
Ex
clos
ures
---
- R
emov
al:
39 –
87
%
---
-
3 Diet and consumption: Discussion 57

58 3 Diet and consumption: Discussion
4 Feeding periodicity and behaviour: Introduction
59
4 FEEDING PERIODICITY AND BEHAVIOUR
4.1 Introduction
Determining spatial and temporal feeding patterns is a major issue in studies on the feeding ecology of organisms. Animals of the intertidal zone must cope with frequent fluctuations of environmental conditions, such as temperature and salinity. Species that live in such a challenging environment are often highly specialised and have evolved particular patterns of activity in time and space as a result of the conflicting requirements (e.g. foraging and protection) (Hogarth 1999). The development of a special feeding rhythm may enhance the exploitation of food resources and was found to reduce interspecific competition for food and agonistic encounters (Hogarth 1999, Jesse 2001). When feeding on the mud surface during ebb tide, U. cordatus is exposed to predation and probably to desiccation, especially during the day. Additional, intraspecific competition for food and burrows may occur. On the Bragança peninsula, predation takes place during the day due to crab collection by man and capture by capucin monkeys. At night, crab racoons are most likely the main predators. Predation also occurs during flood tide when several fish species enter the mangrove forest for feeding (Krumme et al. submitted). The daily feeding periodicity has been investigated for several brachyuran crabs. A clear pattern of feeding activity was found for detritivorous fiddler crabs (Crane 1975, Murai et al. 1983, Burggren and McMahon 1988, Ens et al. 1993, Wiedemeyer 1997, Koch 1999), some herbivorous and omnivorous mangrove crabs (Robertson 1986, Wiedemeyer 1997), and various carnivorous crabs (Hill 1976, Wolff and Cerda 1992, Koch 1999, Jesse 2001, Reigada and Negreiros-Fransozo 2001). Quantitative data about the feeding periodicity of U. cordatus are rare and insufficient for a comprehensive understanding of its feeding patterns. Rademaker (1998) found that the relative weight of the stomach contents fluctuated slightly over a days´ cycle, being higher at night and shortly after high tide. Since only a few specimens were studied, variances of the data were high and further investigations are necessary. The present study therefore aimed to determine the diel feeding periodicity of U. cordatus in more detail, including the tidal component. The degree of stomach fullness was therefore recorded over a days´ cycle. In order to learn more about the crabs feeding periodicity and activity patterns outside burrows and to assess whether results of laboratory experiments agree with findings in the natural environment, behavioural observations in the field were carried out. Activity patterns of U. cordatus have been investigated in a few studies (De Geraldes and De Calventi 1983, Wiedemeyer 1997, Rademaker 1998), yielding contradictory results. Rademaker (1998) noted that U. cordatus was encountered outside the burrows mainly during the day, whereas Wiedemeyer (1997) observed the crabs outside their burrows only during night-time. De Geraldes and De Calventi (1983) reported that U. cordatus was very active outside its burrow
60 4 Feeding periodicity and behaviour: Introduction
both day and night during the rainy season. In the dry season crabs were less active, fed hardly at all and spent much more time inside their burrows. During the present study, the behaviour of U. cordatus was observed with binoculars and was also video-taped continuously over 24 hours, which is a new approach in studies on feeding behaviour of brachyuran crabs. In addition to obtaining data on feeding periodicity, the quality and quantity of the selected food items and the radius of activity were assessed, and aggressive encounters on the sediment surface were recorded. Observations were conducted in the dry and in the rainy season and at different lunar phases. The following questions were addressed: (1) Does U. cordatus show a feeding periodicity related to time of day or tidal cycle? (2) Which activities can be differentiated? Do these activities depend on the time of day, the
tidal cycle or the phase of the moon? (3) How much time do the animals spend on feeding activities outside their burrows? (4) Which food items do the crabs select and how many components are collected within
24 hours? (5) How large is the radius of activity? (6) Is there intraspecific competition for food or burrows?
4 Feeding periodicity and behaviour: Material and Methods
61
4.2 Material and methods
MATERIAL
Equipment used for determination of the gastrointestinal contents: Analytical balance: Sartorius AG Göttingen; BP211D; d = 0.01 mg
Balance: Sartorius AG Göttingen; LC 4200S – 00V1; d = 0.01 g
Stereo microscope: Zeiss; Stemi 2000 (20 x)
Electrical pump: Sartorius AG Göttingen; 16612
Filter equipment: Sartorius AG Göttingen; SM 16831;
6 funnels for filters with 47 mm diameter
Filter for filtration: Whatman Co.; GF/C glass filters (diameter 47 mm)
Oven: Memmert; 600
Sediment thermometer: precision 0.1°C
Thermometer: precision 0.5°C
Equipment used for behavioural observation: Binoculars Camera: Conrad; CCD camera module; black/white; with infra-red LEDs and microphone;
12 V; light sensitivity 0.5 Lux; resolution 290,000 Pixel;
angle of beam 92°
Car battery Infra-red lights: Conrad; M120 FG; 12-14 Volt; range max. 5 m
Television: BARC-O-PCM 2840
Transformer Video receiver: Conrad; module; receiving video and audio signal; 12 V
Video transmitter: Conrad; module; transmission of video and audio signal; 12 V
METHODS
4.2.1 Analysis of gastrointestinal contents
In order to reveal whether the feeding activity of U. cordatus depends on the time of day, on the tidal cycle or on both, the gastrointestinal contents was recorded over two 24 hour periods (2/3.12.1999 and 27/28.6.2000). The experiment comprised two samplings to investigate whether the feeding activity vary between days. On both sampling dates the
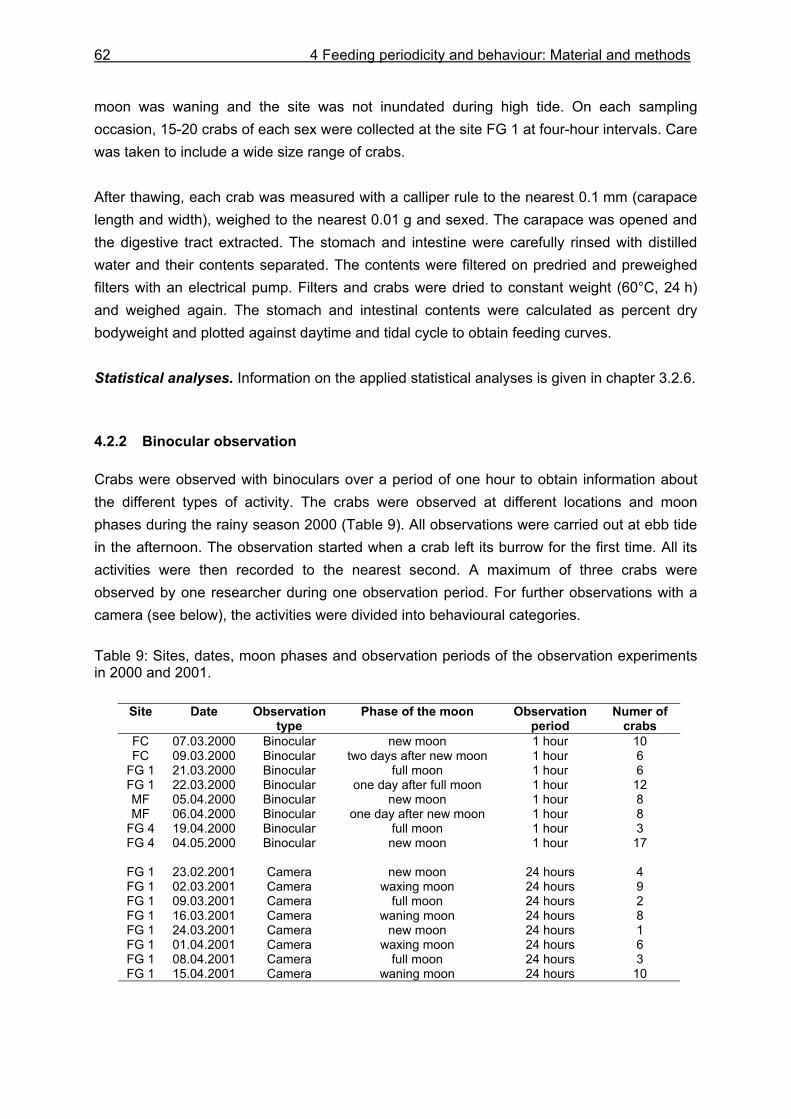
62 4 Feeding periodicity and behaviour: Material and methods
moon was waning and the site was not inundated during high tide. On each sampling occasion, 15-20 crabs of each sex were collected at the site FG 1 at four-hour intervals. Care was taken to include a wide size range of crabs. After thawing, each crab was measured with a calliper rule to the nearest 0.1 mm (carapace length and width), weighed to the nearest 0.01 g and sexed. The carapace was opened and the digestive tract extracted. The stomach and intestine were carefully rinsed with distilled water and their contents separated. The contents were filtered on predried and preweighed filters with an electrical pump. Filters and crabs were dried to constant weight (60°C, 24 h) and weighed again. The stomach and intestinal contents were calculated as percent dry bodyweight and plotted against daytime and tidal cycle to obtain feeding curves. Statistical analyses. Information on the applied statistical analyses is given in chapter 3.2.6. 4.2.2 Binocular observation
Crabs were observed with binoculars over a period of one hour to obtain information about the different types of activity. The crabs were observed at different locations and moon phases during the rainy season 2000 (Table 9). All observations were carried out at ebb tide in the afternoon. The observation started when a crab left its burrow for the first time. All its activities were then recorded to the nearest second. A maximum of three crabs were observed by one researcher during one observation period. For further observations with a camera (see below), the activities were divided into behavioural categories. Table 9: Sites, dates, moon phases and observation periods of the observation experiments in 2000 and 2001.
Site Date Observation type
Phase of the moon Observation period
Numer of crabs
FC 07.03.2000 Binocular new moon 1 hour 10 FC 09.03.2000 Binocular two days after new moon 1 hour 6
FG 1 21.03.2000 Binocular full moon 1 hour 6 FG 1 22.03.2000 Binocular one day after full moon 1 hour 12 MF 05.04.2000 Binocular new moon 1 hour 8 MF 06.04.2000 Binocular one day after new moon 1 hour 8
FG 4 19.04.2000 Binocular full moon 1 hour 3 FG 4 04.05.2000 Binocular new moon 1 hour 17
FG 1 23.02.2001 Camera new moon 24 hours 4 FG 1 02.03.2001 Camera waxing moon 24 hours 9 FG 1 09.03.2001 Camera full moon 24 hours 2 FG 1 16.03.2001 Camera waning moon 24 hours 8 FG 1 24.03.2001 Camera new moon 24 hours 1 FG 1 01.04.2001 Camera waxing moon 24 hours 6 FG 1 08.04.2001 Camera full moon 24 hours 3 FG 1 15.04.2001 Camera waning moon 24 hours 10
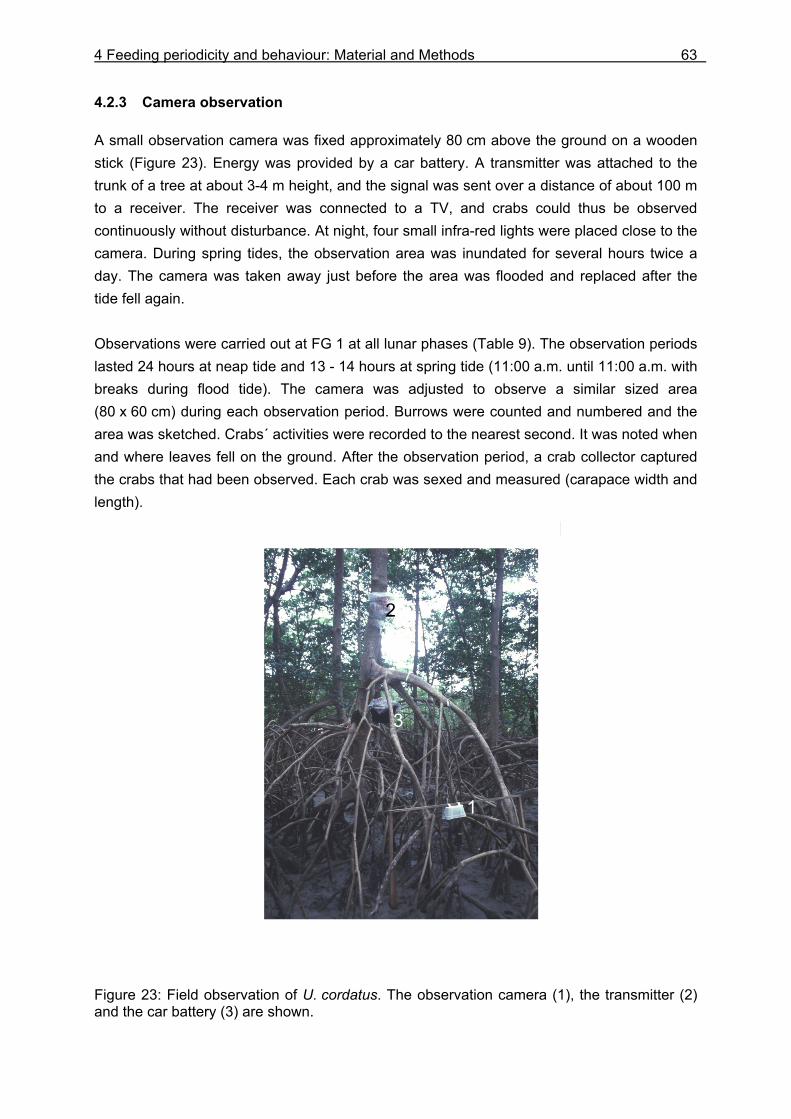
4 Feeding periodicity and behaviour: Material and Methods
63
4.2.3 Camera observation
A small observation camera was fixed approximately 80 cm above the ground on a wooden stick (Figure 23). Energy was provided by a car battery. A transmitter was attached to the trunk of a tree at about 3-4 m height, and the signal was sent over a distance of about 100 m to a receiver. The receiver was connected to a TV, and crabs could thus be observed continuously without disturbance. At night, four small infra-red lights were placed close to the camera. During spring tides, the observation area was inundated for several hours twice a day. The camera was taken away just before the area was flooded and replaced after the tide fell again. Observations were carried out at FG 1 at all lunar phases (Table 9). The observation periods lasted 24 hours at neap tide and 13 - 14 hours at spring tide (11:00 a.m. until 11:00 a.m. with breaks during flood tide). The camera was adjusted to observe a similar sized area (80 x 60 cm) during each observation period. Burrows were counted and numbered and the area was sketched. Crabs´ activities were recorded to the nearest second. It was noted when and where leaves fell on the ground. After the observation period, a crab collector captured the crabs that had been observed. Each crab was sexed and measured (carapace width and length). Figure 23: Field observation of U. cordatus. The observation camera (1), the transmitter (2) and the car battery (3) are shown.
1
3
2
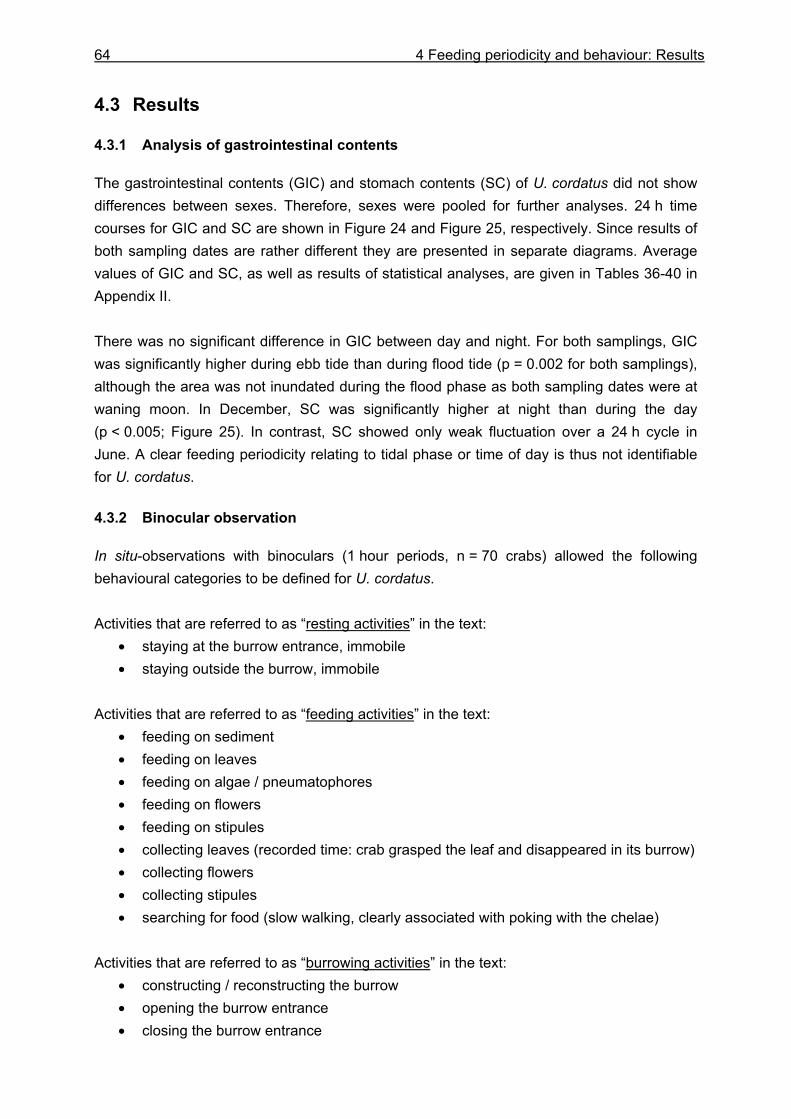
64 4 Feeding periodicity and behaviour: Results
4.3 Results
4.3.1 Analysis of gastrointestinal contents
The gastrointestinal contents (GIC) and stomach contents (SC) of U. cordatus did not show differences between sexes. Therefore, sexes were pooled for further analyses. 24 h time courses for GIC and SC are shown in Figure 24 and Figure 25, respectively. Since results of both sampling dates are rather different they are presented in separate diagrams. Average values of GIC and SC, as well as results of statistical analyses, are given in Tables 36-40 in Appendix II. There was no significant difference in GIC between day and night. For both samplings, GIC was significantly higher during ebb tide than during flood tide (p = 0.002 for both samplings), although the area was not inundated during the flood phase as both sampling dates were at waning moon. In December, SC was significantly higher at night than during the day (p < 0.005; Figure 25). In contrast, SC showed only weak fluctuation over a 24 h cycle in June. A clear feeding periodicity relating to tidal phase or time of day is thus not identifiable for U. cordatus. 4.3.2 Binocular observation
In situ-observations with binoculars (1 hour periods, n = 70 crabs) allowed the following behavioural categories to be defined for U. cordatus. Activities that are referred to as “resting activities” in the text:
• staying at the burrow entrance, immobile • staying outside the burrow, immobile
Activities that are referred to as “feeding activities” in the text:
• feeding on sediment • feeding on leaves • feeding on algae / pneumatophores • feeding on flowers • feeding on stipules • collecting leaves (recorded time: crab grasped the leaf and disappeared in its burrow) • collecting flowers • collecting stipules • searching for food (slow walking, clearly associated with poking with the chelae)
Activities that are referred to as “burrowing activities” in the text:
• constructing / reconstructing the burrow • opening the burrow entrance • closing the burrow entrance
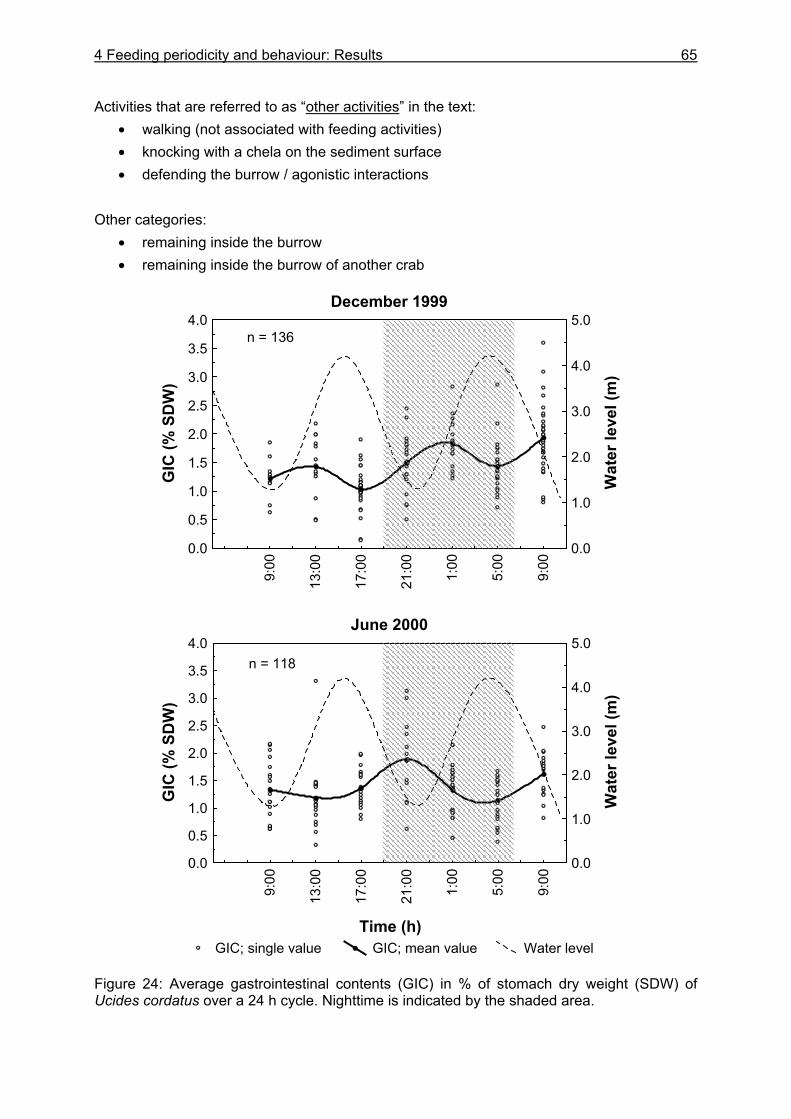
4 Feeding periodicity and behaviour: Results
65
Activities that are referred to as “other activities” in the text: • walking (not associated with feeding activities) • knocking with a chela on the sediment surface • defending the burrow / agonistic interactions
Other categories:
• remaining inside the burrow • remaining inside the burrow of another crab
Figure 24: Average gastrointestinal contents (GIC) in % of stomach dry weight (SDW) of Ucides cordatus over a 24 h cycle. Nighttime is indicated by the shaded area.
December 1999
9:00
13:0
0
17:0
0
21:0
0
1:00
5:00
9:00
.
.
0.0
0.5
1.0
1.5
2.0
2.5
3.0
3.5
4.0
GIC
(% S
DW
)
0.0
1.0
2.0
3.0
4.0
5.0
Wat
er le
vel (
m)
n = 136
June 2000
GIC; single value GIC; mean value Water level
9:00
13:0
0
17:0
0
21:0
0
1:00
5:00
9:00
Time (h)
0.0
0.5
1.0
1.5
2.0
2.5
3.0
3.5
4.0
GIC
(% S
DW
)
0.0
1.0
2.0
3.0
4.0
5.0
Wat
er le
vel (
m)
n = 118
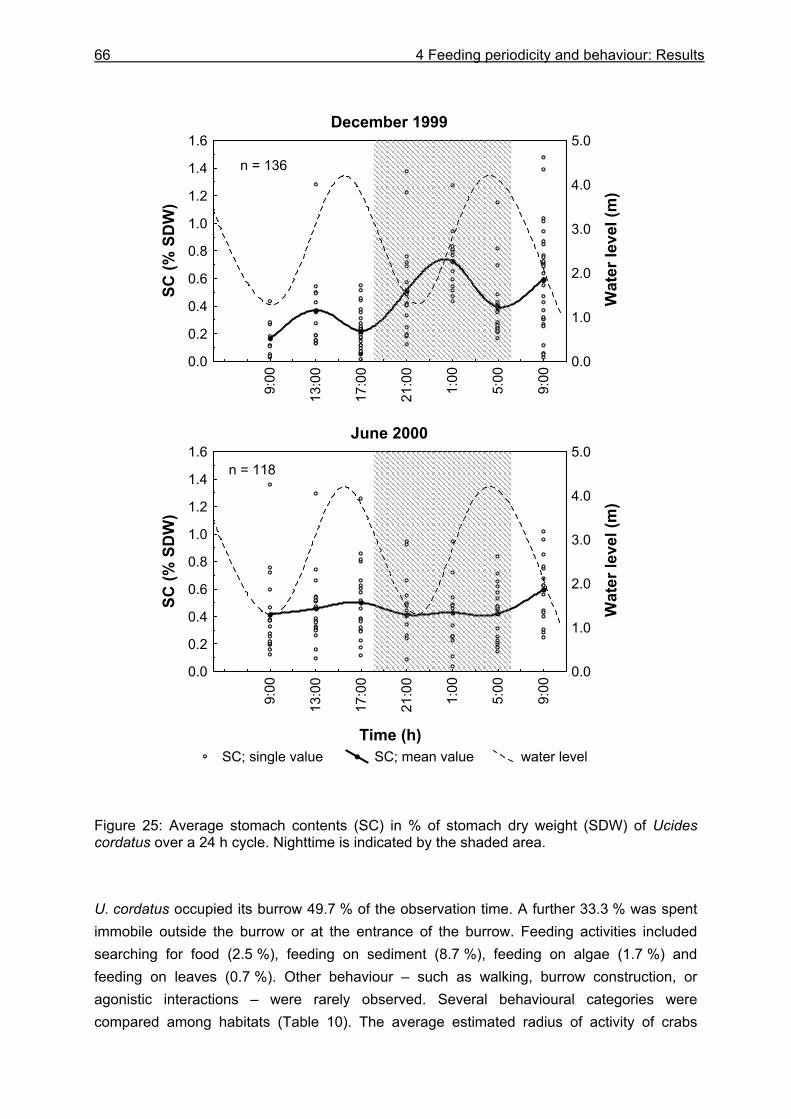
66 4 Feeding periodicity and behaviour: Results
Figure 25: Average stomach contents (SC) in % of stomach dry weight (SDW) of Ucides cordatus over a 24 h cycle. Nighttime is indicated by the shaded area. U. cordatus occupied its burrow 49.7 % of the observation time. A further 33.3 % was spent immobile outside the burrow or at the entrance of the burrow. Feeding activities included searching for food (2.5 %), feeding on sediment (8.7 %), feeding on algae (1.7 %) and feeding on leaves (0.7 %). Other behaviour – such as walking, burrow construction, or agonistic interactions – were rarely observed. Several behavioural categories were compared among habitats (Table 10). The average estimated radius of activity of crabs
December 1999
.
9:00
13:0
0
17:0
0
21:0
0
1:00
5:00
9:00
.
0.0
0.2
0.4
0.6
0.8
1.0
1.2
1.4
1.6
SC (%
SD
W)
0.0
1.0
2.0
3.0
4.0
5.0
Wat
er le
vel (
m)
n = 136
June 2000
SC; single value SC; mean value water level
9:00
13:0
0
17:0
0
21:0
0
1:00
5:00
9:00
Time (h)
0.0
0.2
0.4
0.6
0.8
1.0
1.2
1.4
1.6
SC (%
SD
W)
0.0
1.0
2.0
3.0
4.0
5.0
Wat
er le
vel (
m)
n = 118
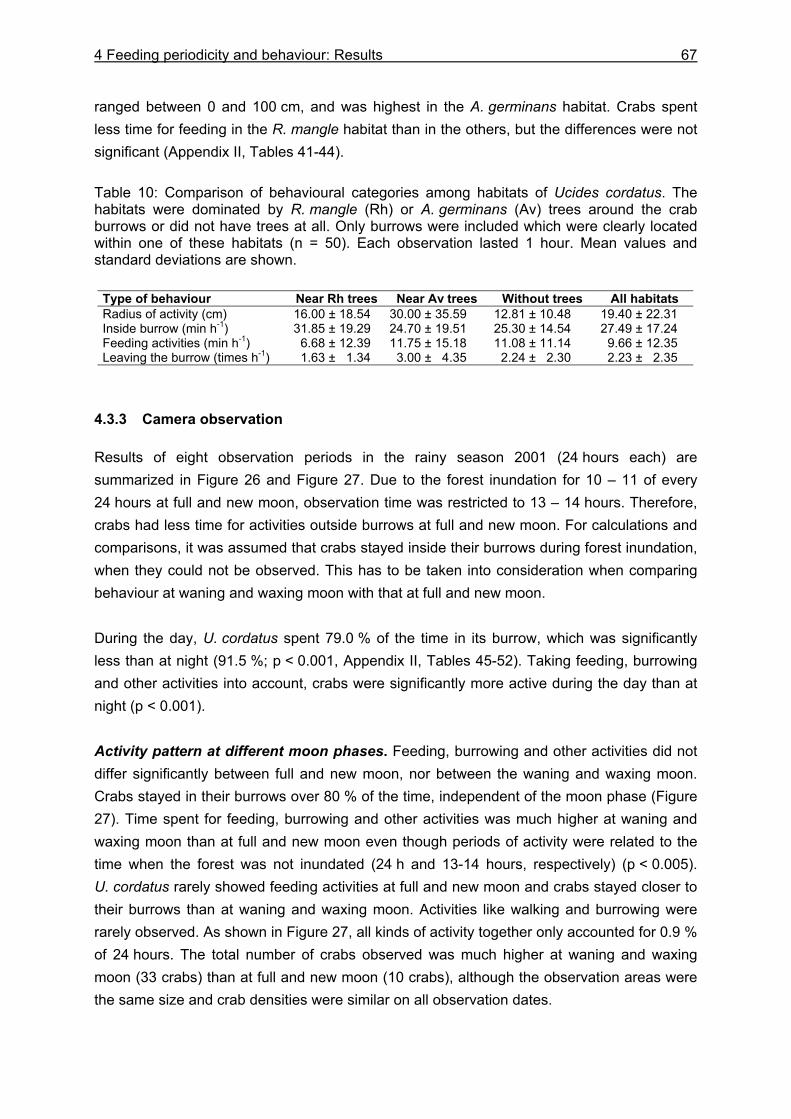
4 Feeding periodicity and behaviour: Results
67
ranged between 0 and 100 cm, and was highest in the A. germinans habitat. Crabs spent less time for feeding in the R. mangle habitat than in the others, but the differences were not significant (Appendix II, Tables 41-44). Table 10: Comparison of behavioural categories among habitats of Ucides cordatus. The habitats were dominated by R. mangle (Rh) or A. germinans (Av) trees around the crab burrows or did not have trees at all. Only burrows were included which were clearly located within one of these habitats (n = 50). Each observation lasted 1 hour. Mean values and standard deviations are shown.
Type of behaviour Near Rh trees Near Av trees Without trees All habitats Radius of activity (cm) 16.00 ± 18.54 30.00 ± 35.59 12.81 ± 10.48 19.40 ± 22.31 Inside burrow (min h-1) 31.85 ± 19.29 24.70 ± 19.51 25.30 ± 14.54 27.49 ± 17.24 Feeding activities (min h-1) 6.68 ± 12.39 11.75 ± 15.18 11.08 ± 11.14 9.66 ± 12.35 Leaving the burrow (times h-1) 1.63 ± 1.34 3.00 ± 4.35 2.24 ± 2.30 2.23 ± 2.35
4.3.3 Camera observation
Results of eight observation periods in the rainy season 2001 (24 hours each) are summarized in Figure 26 and Figure 27. Due to the forest inundation for 10 – 11 of every 24 hours at full and new moon, observation time was restricted to 13 – 14 hours. Therefore, crabs had less time for activities outside burrows at full and new moon. For calculations and comparisons, it was assumed that crabs stayed inside their burrows during forest inundation, when they could not be observed. This has to be taken into consideration when comparing behaviour at waning and waxing moon with that at full and new moon. During the day, U. cordatus spent 79.0 % of the time in its burrow, which was significantly less than at night (91.5 %; p < 0.001, Appendix II, Tables 45-52). Taking feeding, burrowing and other activities into account, crabs were significantly more active during the day than at night (p < 0.001). Activity pattern at different moon phases. Feeding, burrowing and other activities did not differ significantly between full and new moon, nor between the waning and waxing moon. Crabs stayed in their burrows over 80 % of the time, independent of the moon phase (Figure 27). Time spent for feeding, burrowing and other activities was much higher at waning and waxing moon than at full and new moon even though periods of activity were related to the time when the forest was not inundated (24 h and 13-14 hours, respectively) (p < 0.005). U. cordatus rarely showed feeding activities at full and new moon and crabs stayed closer to their burrows than at waning and waxing moon. Activities like walking and burrowing were rarely observed. As shown in Figure 27, all kinds of activity together only accounted for 0.9 % of 24 hours. The total number of crabs observed was much higher at waning and waxing moon (33 crabs) than at full and new moon (10 crabs), although the observation areas were the same size and crab densities were similar on all observation dates.
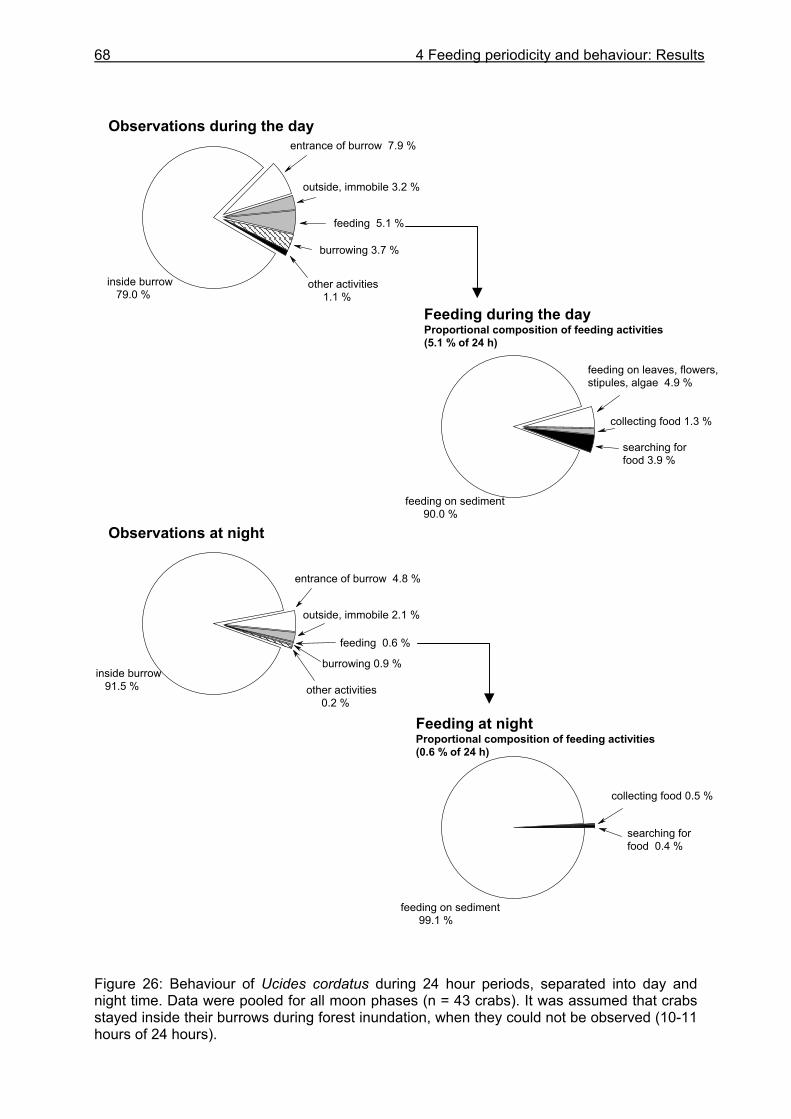
68 4 Feeding periodicity and behaviour: Results
Figure 26: Behaviour of Ucides cordatus during 24 hour periods, separated into day and night time. Data were pooled for all moon phases (n = 43 crabs). It was assumed that crabs stayed inside their burrows during forest inundation, when they could not be observed (10-11 hours of 24 hours).
inside burrow 91.5 %
entrance of burrow 4.8 %
outside, immobile 2.1 %
feeding 0.6 %
burrowing 0.9 %
other activities 0.2 %
Observations at night
inside burrow 79.0 %
entrance of burrow 7.9 %
outside, immobile 3.2 %
feeding 5.1 %
burrowing 3.7 %
other activities 1.1 %
Observations during the day
feeding on sediment 90.0 %
feeding on leaves, flowers,stipules, algae 4.9 %
collecting food 1.3 %
searching forfood 3.9 %
Feeding during the dayProportional composition of feeding activities (5.1 % of 24 h)
feeding on sediment 99.1 %
collecting food 0.5 %
searching forfood 0.4 %
Feeding at nightProportional composition of feeding activities (0.6 % of 24 h)
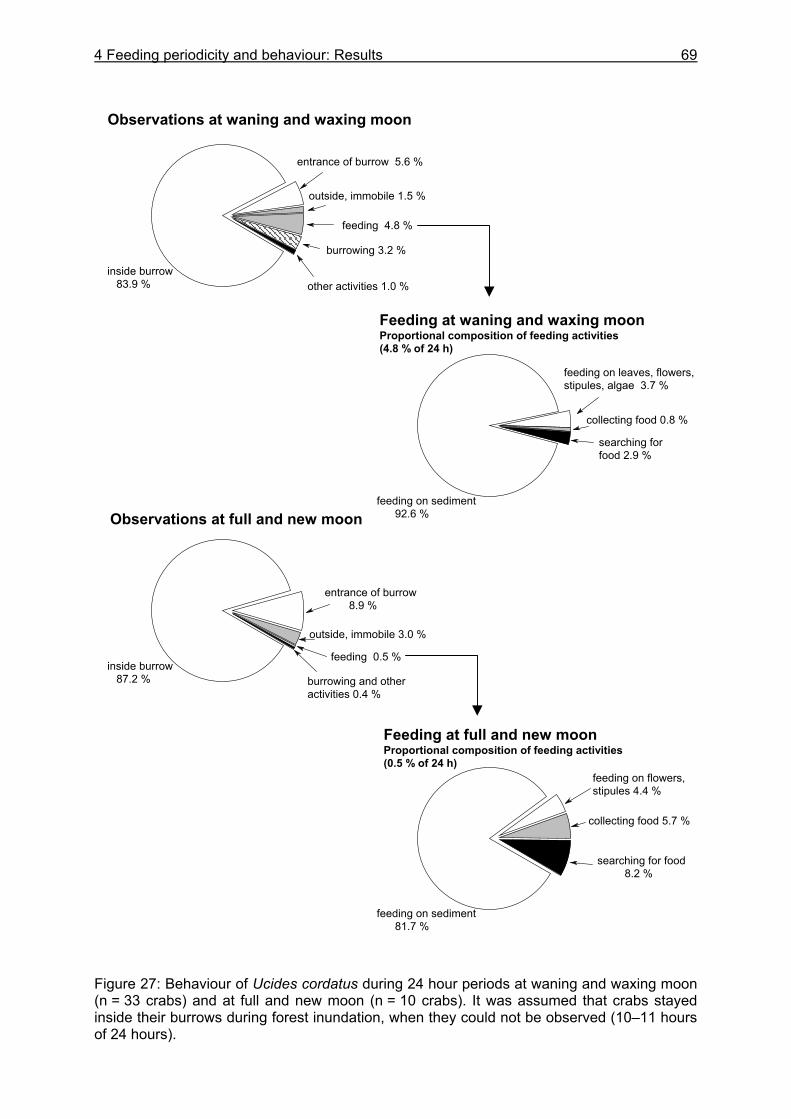
4 Feeding periodicity and behaviour: Results
69
Figure 27: Behaviour of Ucides cordatus during 24 hour periods at waning and waxing moon (n = 33 crabs) and at full and new moon (n = 10 crabs). It was assumed that crabs stayed inside their burrows during forest inundation, when they could not be observed (10–11 hours of 24 hours).
inside burrow 83.9 %
entrance of burrow 5.6 %
outside, immobile 1.5 %
feeding 4.8 %
burrowing 3.2 %
other activities 1.0 %
Observations at waning and waxing moon
inside burrow 87.2 %
entrance of burrow 8.9 %
outside, immobile 3.0 %
feeding 0.5 %
burrowing and otheractivities 0.4 %
Observations at full and new moonfeeding on sediment 92.6 %
feeding on leaves, flowers,stipules, algae 3.7 %
collecting food 0.8 %
searching forfood 2.9 %
Feeding at waning and waxing moonProportional composition of feeding activities(4.8 % of 24 h)
feeding on sediment 81.7 %
feeding on flowers,stipules 4.4 %
collecting food 5.7 %
searching for food 8.2 %
Feeding at full and new moonProportional composition of feeding activities(0.5 % of 24 h)
70 4 Feeding periodicity and behaviour: Results
Time- and tide-dependent activity, including feeding, burrowing and other activities but excluding resting, is presented in Figure 28. At waning and waxing moon, crabs showed a relatively high activity between 11:45 a.m. and 16:45 p.m. as well as between 6:00 a.m. and 7:30 a.m., which includes the time of peak activity. Activities thus decreased towards dusk and increased significantly at dawn. Crabs were much less active at night. Thus, behaviour at waning and waxing moon was mainly light-dependent. No tide-dependent pattern was found at waning at waxing moon. Environmental conditions during full and new moon differed markedly. The areas were inundated during each flood tide for 4-5 hours, during which crabs retreated into their burrows. Burrow entrances were already closed 2-3 hours before flooding. Generally crabs left their burrows again as soon as the tide retreated. In contrast to the observations at waning and waxing moon, the activity of U. cordatus outside burrows was tide-dependent. Furthermore, activities stopped almost completely during periods of heavy rainfall, which occurred more often at full and new moon, particularly at night. In contrast to waning and waxing moon, the activity pattern did not depend on light conditions. The highest activity was observed between 22:45 and 23:00 p.m. As flood tide occurred during dawn and dusk and crabs had retreated into their burrows, their behaviour could not be observed at these times. Feeding activities. Feeding activities outside burrows accounted for 5.1 % of the time during the day (Figure 26). Feeding on sediment predominated over feeding on leaves, flowers, stipules and algae. Mostly, crabs collected food components and pulled them into their burrows without feeding on them at the sediment surface. At night, U. cordatus spent only 0.6 % of its time on feeding activities outside burrows, significantly less than during the day (p < 0.001). At night, crabs fed almost exclusively on sediment. Feeding activities, monitored over 24 hours, are presented in Figure 29. Crabs spent much more time feeding on sediment than on other food items. During feeding on sediment, feeding motions of U. cordatus were very slow and were interrupted from time to time for several seconds to several minutes. Feeding on sediment took place mainly during daytime. Other feeding activities were recorded almost exclusively at daytime. Crabs hardly ever fed on leaves outside their burrows. Time exposure for gathering food items was thus very short since U. cordatus needed only a few seconds to catch an item and to pull it into its burrow. An average of 5.4 crabs was counted per observation area, corresponding to an average number of 11.2 crabs m-2. This has to be regarded as a minimum value since some crabs did not leave their burrows at spring tides, thus the number of observed crabs per area was lower than the density. The average number of crab burrows was 15.1 m-2. Since it was not possible to collect all crabs to verify whether all burrows were occupied, average burrow number represents a maximal crab density. Only a part (37 %) of the observed crabs could be captured by the crab collector after the observation periods. Males and females had an average carapace width of 6.2 cm and 3.9 cm, respectively.
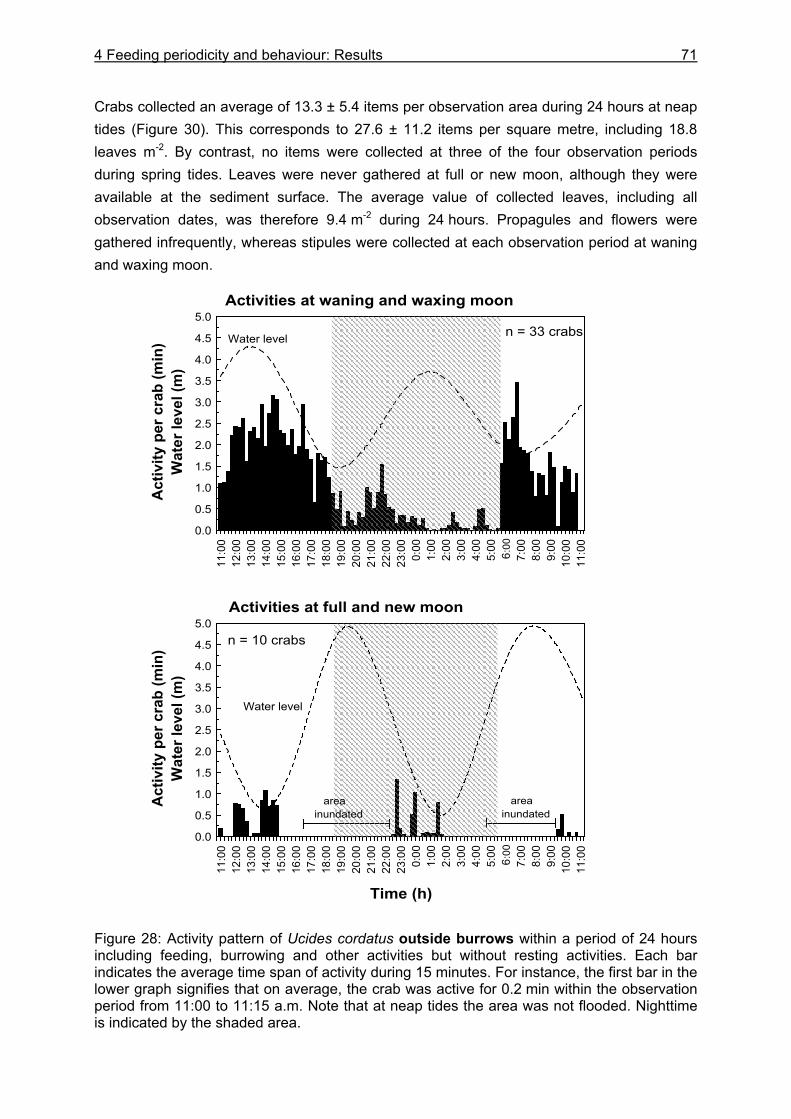
4 Feeding periodicity and behaviour: Results
71
Crabs collected an average of 13.3 ± 5.4 items per observation area during 24 hours at neap tides (Figure 30). This corresponds to 27.6 ± 11.2 items per square metre, including 18.8 leaves m-2. By contrast, no items were collected at three of the four observation periods during spring tides. Leaves were never gathered at full or new moon, although they were available at the sediment surface. The average value of collected leaves, including all observation dates, was therefore 9.4 m-2 during 24 hours. Propagules and flowers were gathered infrequently, whereas stipules were collected at each observation period at waning and waxing moon. Figure 28: Activity pattern of Ucides cordatus outside burrows within a period of 24 hours including feeding, burrowing and other activities but without resting activities. Each bar indicates the average time span of activity during 15 minutes. For instance, the first bar in the lower graph signifies that on average, the crab was active for 0.2 min within the observation period from 11:00 to 11:15 a.m. Note that at neap tides the area was not flooded. Nighttime is indicated by the shaded area.
Activities at full and new moon
11:0
012
:00
13:0
014
:00
15:0
016
:00
17:0
018
:00
19:0
020
:00
21:0
022
:00
23:0
00:
001:
002:
003:
004:
005:
00 6 :00
7:00
8:00
9:00
10:0
011
:00
Time (h)
0.0
0.5
1.0
1.5
2.0
2.5
3.0
3.5
4.0
4.5
5.0
Act
ivity
per
cra
b (m
in)
Wat
er le
vel (
m)
areainundated
areainundated
Water level
n = 10 crabs
Activities at waning and waxing moon
11:0
012
:00
13:0
014
:00
15:0
016
:00
17:0
018
:00
19:0
020
:00
21:0
022
:00
23:0
00:
001:
002:
003:
004:
005:
00 6:00
7:00
8:00
9:00
10:0
011
:00
.
0.0
0.5
1.0
1.5
2.0
2.5
3.0
3.5
4.0
4.5
5.0
Act
ivity
per
cra
b (m
in)
Wat
er le
vel (
m)
Water level n = 33 crabs
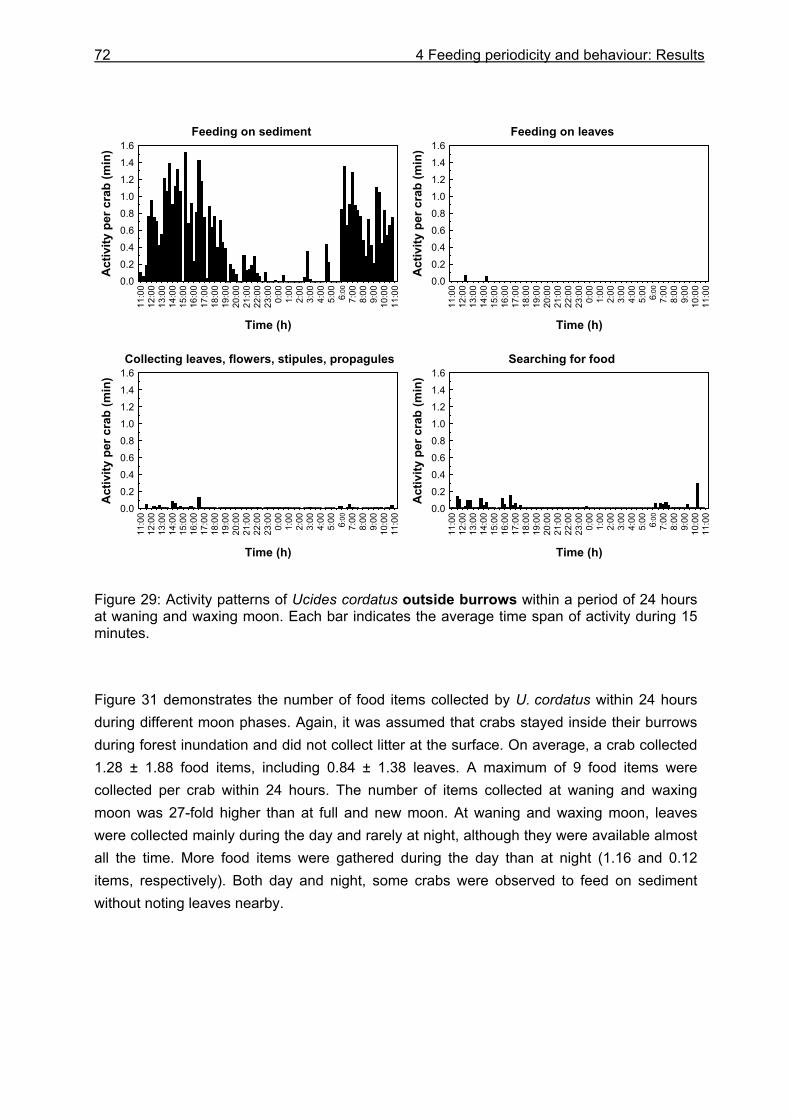
72 4 Feeding periodicity and behaviour: Results
Figure 29: Activity patterns of Ucides cordatus outside burrows within a period of 24 hours at waning and waxing moon. Each bar indicates the average time span of activity during 15 minutes. Figure 31 demonstrates the number of food items collected by U. cordatus within 24 hours during different moon phases. Again, it was assumed that crabs stayed inside their burrows during forest inundation and did not collect litter at the surface. On average, a crab collected 1.28 ± 1.88 food items, including 0.84 ± 1.38 leaves. A maximum of 9 food items were collected per crab within 24 hours. The number of items collected at waning and waxing moon was 27-fold higher than at full and new moon. At waning and waxing moon, leaves were collected mainly during the day and rarely at night, although they were available almost all the time. More food items were gathered during the day than at night (1.16 and 0.12 items, respectively). Both day and night, some crabs were observed to feed on sediment without noting leaves nearby.
Feeding on sediment11
:00
12:0
013
:00
14:0
015
:00
16:0
017
:00
18:0
019
:00
20:0
021
:00
22:0
023
:00
0:00
1:00
2:00
3:00
4:00
5:00 6 :00
7:00
8:00
9:00
10:0
011
:00
Time (h)
0.00.2
0.40.60.8
1.01.21.4
1.6
Act
ivity
per
cra
b (m
in)
Feeding on leaves
11:0
012
:00
13:0
014
:00
15:0
016
:00
17:0
018
:00
19:0
020
:00
21:0
022
:00
23:0
00:
001:
002:
003:
004:
005:
00 6 :00
7:00
8:00
9:00
10:0
011
:00
Time (h)
0.00.2
0.40.60.8
1.01.21.4
1.6
Act
ivity
per
cra
b (m
in)
Collecting leaves, flowers, stipules, propagules
11:0
012
:00
13:0
014
:00
15:0
016
:00
17:0
018
:00
19:0
020
:00
21:0
022
:00
23:0
00:
001:
002:
003:
004:
005:
00 6 :00
7:00
8:00
9:00
10:0
011
:00
Time (h)
0.00.2
0.40.60.8
1.01.21.4
1.6
Act
ivity
per
cra
b (m
in)
Searching for food
11:0
012
:00
13:0
014
:00
15:0
016
:00
17:0
018
:00
19:0
020
:00
21:0
022
:00
23:0
00:
001:
002:
003:
004:
005:
00 6 :00
7:00
8:00
9:00
10:0
011
:00
Time (h)
0.00.2
0.40.60.8
1.01.21.4
1.6
Act
ivity
per
cra
b (m
in)
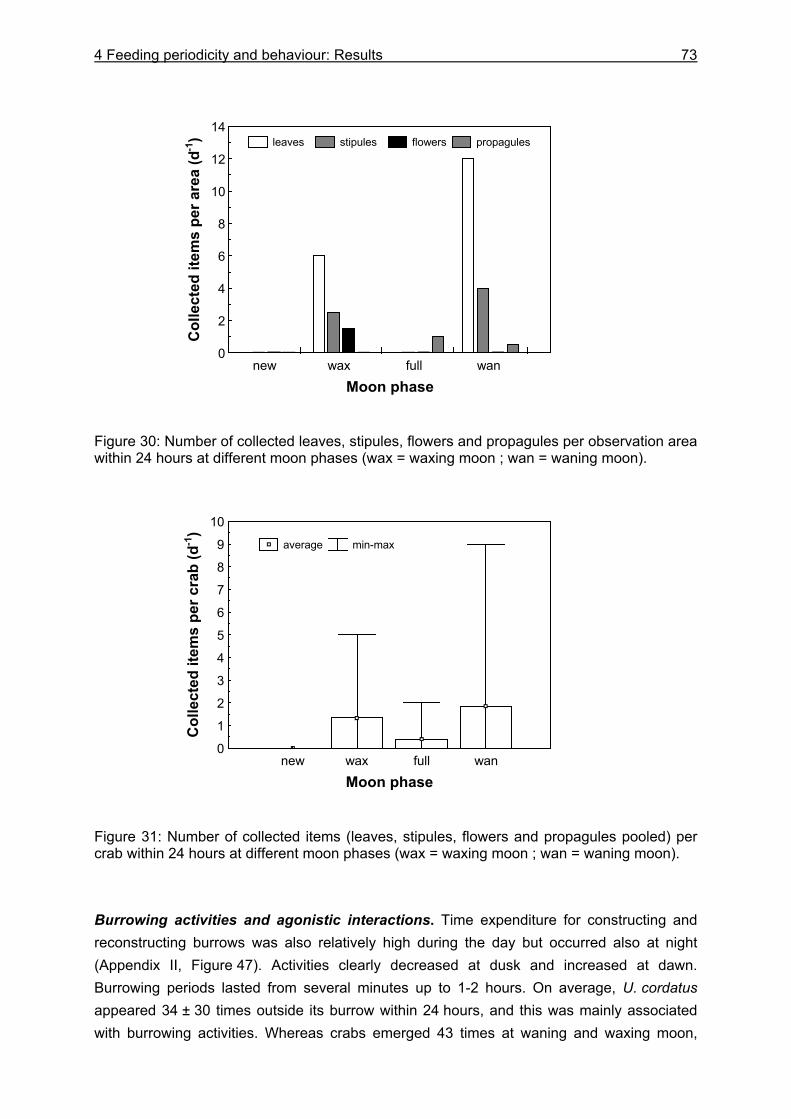
4 Feeding periodicity and behaviour: Results
73
Figure 30: Number of collected leaves, stipules, flowers and propagules per observation area within 24 hours at different moon phases (wax = waxing moon ; wan = waning moon). Figure 31: Number of collected items (leaves, stipules, flowers and propagules pooled) per crab within 24 hours at different moon phases (wax = waxing moon ; wan = waning moon). Burrowing activities and agonistic interactions. Time expenditure for constructing and reconstructing burrows was also relatively high during the day but occurred also at night (Appendix II, Figure 47). Activities clearly decreased at dusk and increased at dawn. Burrowing periods lasted from several minutes up to 1-2 hours. On average, U. cordatus appeared 34 ± 30 times outside its burrow within 24 hours, and this was mainly associated with burrowing activities. Whereas crabs emerged 43 times at waning and waxing moon,
new wax full wanMoon phase
0
1
2
3
4
5
6
7
8
9
10
Col
lect
ed it
ems
per c
rab
(d -1
)
average min-max
new wax full wan Moon phase
0
2
4
6
8
10
12
14
Col
lect
ed it
ems
per a
rea
(d -1
) leaves stipules flowers propagules
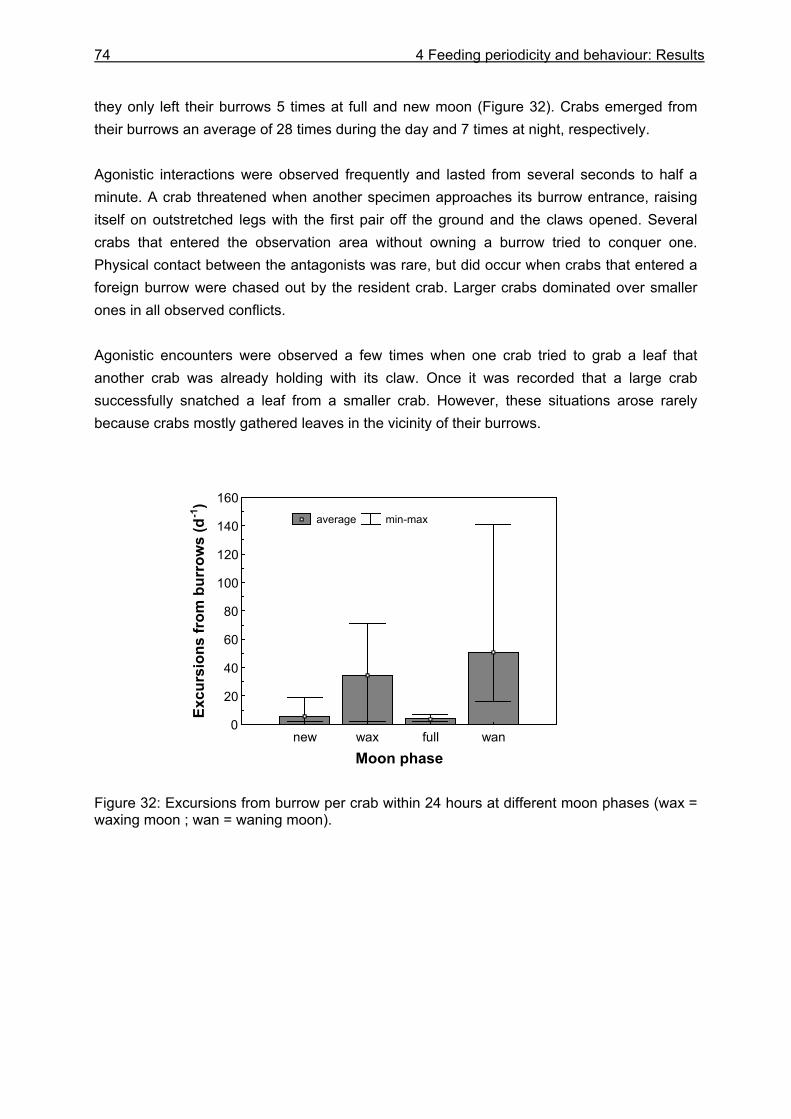
74 4 Feeding periodicity and behaviour: Results
they only left their burrows 5 times at full and new moon (Figure 32). Crabs emerged from their burrows an average of 28 times during the day and 7 times at night, respectively. Agonistic interactions were observed frequently and lasted from several seconds to half a minute. A crab threatened when another specimen approaches its burrow entrance, raising itself on outstretched legs with the first pair off the ground and the claws opened. Several crabs that entered the observation area without owning a burrow tried to conquer one. Physical contact between the antagonists was rare, but did occur when crabs that entered a foreign burrow were chased out by the resident crab. Larger crabs dominated over smaller ones in all observed conflicts. Agonistic encounters were observed a few times when one crab tried to grab a leaf that another crab was already holding with its claw. Once it was recorded that a large crab successfully snatched a leaf from a smaller crab. However, these situations arose rarely because crabs mostly gathered leaves in the vicinity of their burrows. Figure 32: Excursions from burrow per crab within 24 hours at different moon phases (wax = waxing moon ; wan = waning moon).
new wax full wanMoon phase
0
20
40
60
80
100
120
140
160
Excu
rsio
ns fr
om b
urro
ws
(d -1
)
average min-max
4 Feeding periodicity and behaviour: Discussion
75
4.4 Discussion
Gastrointestinal contents. Analyses of the gastrointestinal contents over a one-day cycle indicate that U. cordatus does not show a clear feeding periodicity relating to daytime or tidal phase during neap tides, but feeds more or less continuously or at intervals of a few hours. Since crabs with low stomach and gut contents were rarely found, consumption obviously occurs while an earlier meal is still being digested. Around 50 % of the gastrointestinal contents was digested or voided as faeces within 2-3 hours, emphasising that periods without feeding are usually short (chapter 3.3.4). At night, crabs spent 92 % of their time inside burrows and rarely fed at the sediment surface, suggesting that they were feeding inside burrows during this time, most likely on litter components collected during the day. Food consumption inside burrows must also have occurred during the daytime because crabs´ stomachs contained a high proportion of plant material during the day (chapter 3.3.1) and crabs were rarely observed to feed on litter at the sediment surface. However, the results are somewhat contradictory. Whereas data on the stomach contents in June point to continuous feeding, results in December showed higher feeding rates at night than during the day. The pattern in December is in agreement with the findings of Rademaker (1998) who reported an increase of the stomach contents index of U. cordatus between the afternoon and around midnight, followed by a decrease during the following hours. Possibly, in December – at the end of the dry season – more litter fell than in June, allowing crabs to store more litter in their burrows and to feed on this litter at night. Since litter fall was not recorded at FG 1 before August 2000, this assumption cannot be confirmed. The stomach contents index did not relate to tidal phase, which is in agreement with the fact that the experimental site was not inundated during either 24 h period. The crabs could therefore forage continuously at the sediment surface. In addition, crabs had the possibility to feed inside their burrows regardless of the tidal phase. By contrast, Rademaker (1998), who observed crabs at spring tides when the forest becomes flooded, found feeding peak values shortly after high tide, suggesting that feeding was augmented inside burrows when the forest fell dry after high tide. The high variability of the stomach contents index for each crab collection within 24 hours suggests that litter availability at the sediment surface and in crab burrows differed temporally and spatially. Observation confirmed that surface litter distribution depends on tree density at a given site, as well as on wind, rain and tide. Each crab probably found litter around its burrow at a different time of day. The amount of litter in crab burrows also varied considerably (chapter 3.3.3.1). It is therefore concluded that U. cordatus feeds several times a day, but that feeding periods differ from crab to crab depending on small-scale food availability. This would result in the observed high variability of the stomach contents index among crabs collected at the same time of day.
76 4 Feeding periodicity and behaviour: Discussion
In contrast to U. cordatus, analyses of the gastrointestinal contents of other ocypodid crabs point to a clear feeding periodicity. Many deposit-feeding fiddler crabs have a main feeding peak during daylight low tides (Wiedemeyer 1997, Koch 1999). A secondary, smaller feeding peak at night was observed for Uca maracoani and Uca cumulanta (Koch 1999), probably compensating for shortened feeding periods during the day (Macintosh 1988). Feeding outside burrows occurred only when the forest was not inundated. It was concluded that fiddler crabs did not feed while in their burrows, as they had low stomach contents during these times (Wiedemeyer 1997). Fiddler crabs are dependent on the microorganisms on the sediment surface within the intertidal zone (Burggren and McMahon 1988). In contrast to most herbivorous and deposit-feeding crabs in the mangrove ecosystem, predatory crabs feed mainly during high tide (Wiedemeyer 1997, Koch 1999). In contrast to periodic feeders, U. cordatus collects litter when the forest is not inundated, and may then feed on it inside burrows independently of the tidal phase. Whereas foraging activities of U. cordatus outside burrows depended on forest inundation, feeding on litter inside burrows did not. This behaviour clearly differentiates litter-consuming mangrove crabs from others, making them more independent of environmental conditions at the surface. Feeding activities during day and night. Camera observations at neap tides clearly showed that feeding activities of U. cordatus outside burrows were correlated with light. During dawn most crabs left their burrows to search for food, to collect litter that had fallen at night close to their burrows and to feed on sediment. All feeding activities clearly decreased after dusk, suggesting that they are triggered by light. Whether crabs´ activities also change at dawn and after dusk during new and full moon could not be observed, since the forest was inundated during these times. Whereas U. cordatus collected litter exclusively during daytime, it did feed on sediment during the day and at a reduced level at night. Whether feeding on sediment is restricted to the surface remains uncertain. The nitrogen content was slightly higher and the C:N ratio slightly lower at the sediment surface than in crab burrows (chapter 5.3.1.1), suggesting that the sediment outside burrows is more favourable for the crabs´ nutrition. On the other hand, the organic content and the density of microorganisms were similar at the sediment surface and in crab burrows (chapter 5.3.2.1) and U. cordatus may therefore also feed on burrow sediment. Schwendenmann (1998) reported a higher organic content in surface sediments than in subsurface sediments during the dry season whereas a similar content was found in both layers during the rainy season on the Bragança peninsula. The value of surface and burrow sediment for the nutrition of U. cordatus may therefore fluctuate during the course of the year. Further discussion about the relevance of sediment ingestion for U. cordatus is given in chapter 5.4.2.2. The fact that U. cordatus collected litter exclusively during daytime although it was also available at night suggests that the crabs are visual feeders. However, a low foraging activity
4 Feeding periodicity and behaviour: Discussion
77
at night could also be due to the presence of crab racoons, a predator active at night. However, crab racoons were seen several times during field work at dawn, when crabs were beginning to extend their range of activity and collected litter. This observation points to dependence on daylight for feeding activities at the sediment surface. Disturbances of the crabs by the infra-red light used for filming at night could not be observed during preliminary field and laboratory experiments. Feeding on sediment was observed during the day as well as at night, suggesting that contact chemoreception is more important than vision for this feeding activity. Contact chemoreception is typical for deposit-feeding crab species, for instance fiddler crabs and Ocypode quadrata, which tap the substrate frequently with the outer surface of the major cheliped while moving (Trott and Robertson 1982, Burggren and McMahon 1988). Tapping the substrate with the claws in alternation with feeding on sediment has been observed also for U. cordatus. The gecarcinid crab Cardisoma guanhumi, feeing on leaves, fruits and flowers, was found to “taste” many objects by touching the minor chela to the object and then to the mouthparts, indicating that contact chemoreception is important in initiating the feeding response (Herreid II 1963). In contrast to sediment, “pre-tasting” of leaves was rarely seen in U. cordatus. The crabs usually gathered the food items quickly, suggesting that testing through chemoreception probably occured later inside burrows. Another method of localising food items is most likely the perception of substrate-transmitted acoustic signals. These should work similarly day and night. U. cordatus was very sensitive to movement in the mangrove forest, retreating inside their burrows even when humans were walking quite far away (app. 15 m). Ocypode spp. respond to sounds transmitted through the substrate and also through the air, up to 10 m away, whereas fiddler crabs respond primarily to substrate-transmitted sounds, over a range of about 1 m (Burggren and McMahon 1988). It is assumed that U. cordatus can perceive the substrate-transmitted sounds of R. mangle propagules falling onto the sediment surface. Whereas this study is in agreement with the observations of Rademaker (1998), who worked on the same peninsula and noticed U. cordatus outside its burrow mainly during the day, Branco (1993) and De Geraldes and De Calventi (1983) reported similar activities outside burrows day and night. In the Canal Sta. Cruz mangrove ecosystem, northeastern Brazil, U. cordatus was encountered outside burrows only during night-time (Wiedemeyer 1997). Since no information about U. cordatus predators was given, it can only be assumed that predation was lower at night than during the day. The maximum daily temperature in this area reached 38°C in the dry season (Wiedemeyer 1997), which could also have resulted in a reduction of the activity level outside burrows at daytime. However, since 24 hour observations in this study indicate that U. cordatus is a visual feeder the question arises how the crabs may find their food at night in the Canal Sta. Cruz mangrove ecosystem. Even though Wiedemeyer (1997) observed crabs outside burrows at night, reports on litter
78 4 Feeding periodicity and behaviour: Discussion
collecting crabs during this time are not given. Since crabs were only observed over 4 hour periods, litter collection during the day might have been missed. In this context the question arises whether or to what extent the activity pattern of U. cordatus is driven by an internal clock. This has not been investigated by this study and is a worthwhile topic for further research. The diel or tidal activity rhythms of various brachyuran crabs are regulated by an internal clock. Some terrestrial crabs, for instance Gecarcinus lateralis, Cardisoma guanhumi, Ocypode quadrata and Coenobita clypeatus have been found to show circadian and cirdatidal rhythms of activity (Palmer 1971). The existence of endogenous circatidal or circalunidian rhythms has been also reported for several fiddler crabs (Atkinson and Naylor 1973, Honegger 1973) as well as for various other intertidal crabs (Williams 1969, Atkinson and Parsons 1973, Imafuku 1981, Williams et al. 1985, Palmer and Williams 1986, Palmer and Williams 1993, Warman and Naylor 1995). It is conceivable that U. cordatus also possess an internal clock, governing circadian and/or circalunadian patterns in locomotion and feeding. The observed activity pattern of U. cordatus could thus be dependent on an underlying endogenous rhythm – the result of an evolutionary process - as well as abiotic (e.g. temperature, inundation frequency) and biotic factors (e.g. predators) which usually differ among habitats. Like U. cordatus on the Bragança peninsula, the litter-consuming crab Sesarma messa was a less active feeder outside burrows at night than in the daytime in an Australian mangrove forest (Robertson 1986, Micheli 1993). The red land crab Gecarcoidea natalis is also mainly active diurnally (Green 1997). It was shown that moisture is the most important factor governing surface activity, and thus activity outside burrows was higher during the wet season (Green 1997, Adamczewska and Morris 2001). By contrast, the crabs Gecarcinus lateralis, Cardisoma guanhumi, Ocypode quadrata, Coenobita clypeatus, Coenobita ornatus and Coenobita danae were found to be predominantly night-active (Bliss and Cannon Sprague 1958, Palmer 1971, Reigada and Negreiros-Fransozo 2001). Feeding activities at different lunar phases. Camera observations revealed much higher crab activity outside burrows during neap ebb tides than during spring ebb tides. Activity during spring ebb tides was restricted to about 4 – 5.5 hours, since crabs retreated to their burrows 2 – 3 hours before the forest was inundated. Since Rademaker (1998) reported that the burrows are in contact with the groundwater table, it is suggested that U. cordatus is able to detect the incoming tide by the water level inside its burrows. The 2 - 3 hours buffer assures that crabs cannot be surprised by the flood tide. Binocular observations showed that in the dry season, crabs spent much more of the daytime feeding during spring tides, but during rainy-season spring tides feeding activities were rare and the range of activity was low. A possible explanation for this difference could be the very heavy rain that fell, sometimes for several hours, during all 24-hour observations at spring tides during the rainy season. During rainfall, crabs could be observed at the
4 Feeding periodicity and behaviour: Discussion
79
mouths of their burrows, but activity ceased almost completely. It is suggested that visibility and perception of sound-transmitted signals important for successful foraging were restricted during heavy rainfall. In addition, the detection of approaching predators or conspecifics was certainly reduced, and crabs therefore could not afford to leave the neighbourhood of their burrows. Predation pressure might be higher at spring ebb tides than neap ebb tides since feeding periods of predators at the sediment surface are much shorter. This would also explain why crabs did not gather leaves in the vicinity of their burrows even during periods without rainfall. Changes in salinity at the sediment surface and in the upper part of crab burrows due to heavy rainfall during full and new moons could also have affected activity patterns of U. cordatus. However, since crabs which were kept in fresh water in the laboratory did not die even after several weeks (Diele, pers. comm.), this explanation is rather unlikely. Most terrestrial mangrove crabs show both hyper- and hypo-osmoregulation and are thus able to keep their blood concentration relatively stable in both media (Bliss 1968). Although crabs rarely showed feeding activities outside burrows at spring tides, they were regularly seen resting at the entrances of their burrows. This might have a social function, as a crab which presents itself at the surface from time to time demonstrates that its burrow is occupied. In contrast to this study, De Geraldes and De Calventi (1983) stated that the activities of U. cordatus were much higher during the rainy season than the dry season, when crabs fed hardly at all and spent much more time inside their burrows. This was attributed to the higher risk of desiccation during the dry season. The foraging activity of the red crab Gecarcoidea natalis in the rain forest on Christmas Island was coupled to rain fall and numbers of foraging crabs increased dramatically across the transition from dry to wet season, followed by a decrease in activity after several rain-free days (O´Dowd and Lake 1989). Crabs inhabiting the rain forest are obviously more exposed to desiccation on the soil surface than U. cordatus. Since the rain forest is not flooded by tides, humidity in and slightly above the sediment is probably much lower during the dry season than in the high intertidal mangrove forest. Similar to U. cordatus, the soldier crab Mictyris longicarpus, a predator on meiofauna on sandy tidal flats in Australia, was significantly more active on sunny than on rainy or overcast days (Dittmann 1998). However, during the study presented here, crabs showed much higher activity during spring tides in the dry season than in the rainy season, suggesting that rainfall hampered activity. It is not known whether the low activity was attributable entirely to rainfall, or whether tidal phases or other biotic or abiotic factors also had an influence. Since litter was rarely collected at spring tides the question arises whether crabs feed less during this time. For answering this question, a comparative stomach content analysis of crabs captured at neap and spring tides is needed. However, it is also possible that crabs
80 4 Feeding periodicity and behaviour: Discussion
stored enough litter in their burrows in advance, allowing them to maintain normal feeding rates during times when the forest was flooded. It would thus be worthwhile to investigate whether the litter quantity in crab burrows differs among the different moon phases. Litter removal. Leaf removal rates during neap tides were high (18.8 leaves m-2d-1) and exceeded the average daily leaf fall 3.5 - 4-fold. This can be explained by the fact that observations were carried out beneath the canopies of high R. mangle trees (Figure 23) where the leaf fall is much higher than the forest average. The high removal rates through crabs were observed only during neap tides, suggesting that the majority of the litter remained within the forest. During these times crabs are obviously food limited. This is in agreement with the calculations of litter consumption rates in relation to litter fall (chapter 3.3.5). On the other hand, low litter removal rates at spring tides during the rainy season indicate that the bulk of litter is then washed out of the forest. However, rainy days at spring tides account only for a small proportion of the year. High litter removal rates coincided with a high density of observed crabs (11.2 m-2), which far exceeded the average crab density at three other sites at Furo Grande and one site at Furo do Chato where densities were determined along transects, including the whole range of habitats in the forest (Rademaker 1998, Diele 2000). Since the filmed areas were small (80 x 60 cm) and located close to the stilt roots of R. mangle trees, they are not representative for the whole forest and unsuitable to determine average crab densities. Instead, the high local densities indicate the value of these areas. They are shaded and provide a soft, humid soil, regular litter fall and - due to the stilt roots - shelter against predators. Attempts to collect all observed crabs for measurement after the observation period failed every time. The smaller crabs in particular could not be captured by the crab collector, as their burrows had forked galleries and more than one entrance. Big crabs could sometimes not be caught due to the depth of their burrows or hindering stilt roots. High densities of U. cordatus burrows close to the stilt roots of R. mangle were also reported by De Castro (1986). Radius of activity. The radius of activity and thus the foraging radius of U.cordatus is relatively small (on average 19 cm, maximal 1 m), probably because the main food source is more or less predictable in time and space. Crabs usually only collect leaves in the vicinity of their burrows. The foraging radii therefore show little overlapping. Increasing foraging distance with crab size, as was reported for the hermit crab Coenobita cavipes feeding on mangrove propagules and algae (Barnes 1997) and the fiddler crab Uca tangeri (Ens et al. 1993), was not observed. It was expected that the greater energy demand of large U.cordatus (chapter 5.4.3) would be reflected in a greater foraging radius but observations do not confirm this assumption. The foraging radius was higher near A. germinans than R. mangle trees, and foraging occurred more often in the former habitat. This is probably because crabs favour R. mangle leaves, and will invest time searching for them rather than consume A. germinans leaves. It is assumed that the foraging radius of U. cordatus depends
4 Feeding periodicity and behaviour: Discussion
81
on the habitat, the availability of litter, the density of crabs and, as previously discussed, the activity patterns of predators. Burrowing activities. Burrowing took place both day and night and was the second most frequently observed behaviour, after feeding. Similar to feeding activities, burrow construction began to increase just before sunrise and dropped at sunset, when the forest was not inundated. Even though the temperature was highest in the afternoon, burrowing and walking activities were then equal or more frequent than in the morning. High temperatures are apparently not a problem for the crabs, as they can always return to their burrows, which provide contact with the groundwater table. Burrowing during spring tides was rare, suggesting that it was not profitable due to regular inundation and heavy rainfall, which always occurred during spring tides. Both events probably reduce the stability of the burrows due to infiltration of water. It is assumed that energy expenses are higher for burrowing than for other activities, since crabs have to walk across the galleries many times and to push mud up to the surface. Crabs emerged from the burrows 43 times within 24 hours at neap tides, and this was partly related to burrowing activities. Although crabs closed the entrances of their burrows before the forest was inundated, predation occurred during flood tide. For instance, claws and legs of U. cordatus were found in 12 % of investigated stomachs of the catfish Arius herzbergii (Brenner, pers. comm.). This species may enter crab burrows or feeds on specimens which do not own a burrow. In contrast to most herbivorous and deposit-feeding crabs in the mangrove ecosystem, predatory crabs feed mainly during high tide (Wiedemeyer 1997, Koch 1999). Eurytium limosum enters the burrows of other crabs, where it probably consumes the inhabitants (Koch 1999). Agonistic behaviour. The main times of litter collection, the early morning and the afternoon, coincided with the occurrence of agonistic interactions. Walking activities were also more frequent then and the radius of activity was higher. Agonistic encounters could not be observed at night, since crabs usually stayed inside or close to the entrances of their burrows. Agonistic behaviour included threats, fighting and flight inside burrows, and showed that U.cordatus is territorial. The lateral stretched posture of the major cheliped of U. cordatus is a classical threat posture not only in ocypodids but in brachyuran crabs in general (Burggren and McMahon 1988). The carapace of U. cordatus was turned into a vertical position, obviously to increase the apparent size. The observations of this study are in agreement with the study of Branco (1993) who reported that U. cordatus which had invaded an occupied burrow was immediately excluded. A pronounced territorialism of U. cordatus was also found by Alcantara-Filho (1978) and De Geraldes and De Calventi (1983). In agreement with this study, the larger crab usually won the agonistic encounter in some other ocypodid species (Crane 1975, Brooke 1981).
82 4 Feeding periodicity and behaviour: Discussion
The following main characteristics of the feeding behaviour of U. cordatus could be revealed during camera observations: Feeding activities of U. cordatus outside burrows were correlated with light, decreasing significantly after dusk and increasing at dawn. Litter material was only collected during the day, suggesting that the crab is a visual feeder. The gastrointestinal contents investigated over a day´s cycle showed that U. cordatus is not a periodic feeder. It is therefore concluded that U. cordatus feeds several times within the course of a day and that feeding inside burrows takes place at day and night. Competition for food occurred rarely due to the small foraging radius. Feeding activities outside burrows were very rare at full and new moon and periods of lowest activity usually coincided with heavy rainfall. It was concluded that visual detection of food, predators and conspecifics as well as the perception of substrate transmitted signals were complicated during rainfall. High crab densities close to the stilt roots of R. mangle trees coincided with high litter production and high litter removal rates during neap tides through crabs. It is concluded that the U. cordatus population is food limited in the investigated forest stand.
5 Assimilation: Introduction
83
5 ASSIMILATION AND MICROBIOLOGICAL INVESTIGATIONS
5.1 Introduction
Assimilation efficiency. Plant material generally contains little nitrogen (Mattson 1980, Allen 1989), fresh and decomposing mangrove leaves are no exception (Camilleri 1989, Micheli 1993, Steinke et al. 1993, Wafar et al. 1997, Skov and Hartnoll 2002). Leaves have a much higher ratio of carbon to nitrogen (C:N ratio) than arthropod tissue (Allen 1989) and therefore supply too little nitrogen for the maintenance of herbivore animals (Russell-Hunter 1970). Thus, nitrogen is frequently a limiting resource for herbivores (Russell-Hunter 1970, Boyd and Goodyear 1971, Mattson 1980, Wolcott and Wolcott 1987). In contrast, carbon, as a source of energy, is usually available in sufficient amounts. The growth rates of herbivorous crabs may be therefore limited by the food quality (high C:N ratio) even though plant material is abundant (Wolcott and Wolcott 1987, Burggren and McMahon 1988). Land crabs kept in the laboratory on a plant diet supplemented with protein showed higher growth rates than crabs fed on plant material alone (Wolcott and Wolcott 1984, Wolcott and Wolcott 1987, Ostrensky et al. 1995). The slow growth rate obtained for U. cordatus in the Caeté estuary might thus also be related to a deficiency of nitrogen (Diele 2000). In addition to an unfavourable C:N ratio, mangrove leaves have high concentrations of polyphenolic compounds, including tannin (Neilson et al. 1986) that hamper ingestion by mangrove crabs (Giddens et al. 1986). Thus, it was hypothesised that herbivorous crabs let leaves age in burrows before consumption (Giddens et al. 1986, Nascimento 1993), thereby reducing the tannin content and the C:N ratio (Giddens et al. 1986). This leaf-ageing hypothesis will be tested for U. cordatus in the Caeté estuary. One question addressed in this study is whether the large mangrove crab U. cordatus obtains adequate quantities of nitrogen for its maintenance on a litter diet alone, and which proportion of nitrogen, carbon and energy, available in its diet, is assimilated. Assimilation is defined as the part of consumption that is retained for production, including gonoproducts and respiration, but excluding faeces and excreta (Crisp 1984). Previous studies have focussed on assimilation by litter-consuming grapsid and small ocypodid crabs and found a wide range of assimilation rates for organic matter (9 – 59 %), carbon (1 – 56 %) and nitrogen (4 – 50 %) (Giddens et al. 1986, Dye and Lasiak 1987, Emmerson and Mc Gwynne 1992, Micheli 1993, Kwok and Lee 1995, Lee 1997, Koch and Wolff 2002). Information about the assimilation of large herbivorous land crabs is rare, and the presented assimilation rates are also widely scattered (Wolcott and Wolcott 1984, Wolcott and Wolcott 1987, Greenaway and Linton 1995, Greenaway and Raghaven 1998). Koch (1999) calculated the assimilation of U. cordatus indirectly by determining production and respiration, but did not ascertain assimilation efficiencies for carbon and nitrogen. The present study will determine the assimilation efficiency of U. cordatus for the first time directly.
84 5 Assimilation: Introduction
The following questions were addressed: (1) What is the content of organic matter, carbon, nitrogen and energy of plant material,
sediment, stomach contents, gut contents, and faeces of U. cordatus? (2) What is the nutritive value of leaf material in crab burrows? How long do the crabs store
leaves in their burrows? (3) What is the assimilation efficiency of U. cordatus feeding on R. mangle or A. germinans
leaves in different stages of decomposition with regard to dry matter, carbon, nitrogen and energy content?
(4) Is U. cordatus nitrogen limited on the Bragança peninsula? (5) What is the importance of faeces production by U. cordatus for the flow of nutrients and
energy in the mangrove forest? Microbiological investigations. Since the limited protein content of plant material may not be sufficient to maintain the crabs’ metabolism, this study aims to examine whether bacterial biomass may be of importance for the nutrition of U. cordatus. Bacterial biomass has a high content of nitrogen and a favourable C:N ratio (Kihlberg 1972), which allows high assimilation rates in animals feeding on bacteria (Hargrave 1970, Reyes and Tiedje 1976, Dye and Lasiak 1987). Bacteria constitute a rich food source for deposit-feeding species (Robertson and Newell 1982, Dye and Lasiak 1987, Wolfrath 1992). In addition to their potential nutritive value, microorganisms also show diverse metabolic capabilities. Thus, if ingested microorganisms survive and proliferate in the digestive tract, or if they liberate enzymes that remain active in the gut milieu, they can augment or extend the digestive and metabolic capabilities of the animal (Martin and Kukor 1984). Gut microorganisms apparently serve two main functions, (a) the degradation of natural polymers, which the host cannot digest, and (b) the supply of growth factors, such as vitamins and amino acids, which are lacking in the diet. The presence of cellulolytic bacteria for instance were reported from the stomach and gut of Penaeoidea (Hood et al. 1971, Wainwright and Mann 1982, Dempsey and Kitting 1987, Dempsey et al. 1989) and also from the hepatopancreas of terrestrial and semi-terrestrial isopods (Zimmer and Topp 1998a, Zimmer et al. 2002). The presence of bacteria has been reported from the digestive tract of some brachyuran crabs, including different feeding types (detritivores, scavengers, carnivores), habitats (mangroves, saltmarsh, sand/mudflat) and continents (North America, South America, Australia) (Harris 1993a, Nascimento 1993). Information on the abundance, biomass, community structure and functional role of those bacteria is almost completely lacking. Some studies have focussed on the composition of the bacterial community on the food and in the digestive tract of terrestrial isopods (Ullrich et al. 1991), penaeid shrimps (Dempsey and Kitting 1987, Dempsey et al. 1989) and thalassinid prawns (Harris et al. 1991). The change in bacterial species composition as leaf litter is transformed to faeces while passing through the intestinal tract has not been investigated in brachyuran crabs so far.
5 Assimilation: Introduction
85
Almost all studies were based on current and traditional cultivation techniques that are considered to be inadequate for studying microbial diversity from environmental samples (Amann et al. 1990, Webster et al. 2001) and likely provide a biased picture of the structure and dynamics of microbial communities (Wagner et al. 1993). Cultivation techniques do not detect species for which the applied cultivation conditions are not suitable or which have entered a nonculturable state (Amann et al. 1995). Alternatively, fluorescence in situ hybridization (FISH) with rRNA-targeted oligonucleotide probes is a technique that allows phylogenetic identification of bacteria and can provide information regarding the composition of natural communities without prior cultivation (Amann et al. 1990). This approach has been used to quantify microbial groups inhabiting several environments, including marine and soil habitats (Llobet-Brossa et al. 1998, Glöckner et al. 1999), the earthworm gut (Fischer et al. 1995) and the cricket hindgut (Santo Domingo et al. 1998). During this study, FISH will be used the first time to determine the microbial community structure on mangrove leaves and in the stomach, intestine, and faeces of a brachyuran crab. The following questions were addressed: (1) What is the abundance and diversity of the microbial community in the digestive tract and
on the faeces of U. cordatus as well as in sediment, water and on mangrove leaf surfaces? Do the microbial abundances in the digestive tract vary with crab size or sex?
(2) Do microorganisms, located on mangrove leaves or in sediment, constitute an important supplementary food source for U. cordatus?
(3) Do microorganisms present a characteristic community in the digestive tract? Are they involved in the degradation of plant material?
86 5 Assimilation: Material and methods
5.2 Material and methods
MATERIAL
Equipment used for elemental analysis and microbiological investigations: Analytical balance: Mettler-Toledo; AT21; d = 0.01 mg (ZMT)
Sartorius; BP211D; d = 0.01 mg (Bragança)
Autoclave: Wolf; LaM-201
Automatic Elemental Analyser: Fisons; NA 2100 Protein Nitrogen Analyser Centrifuges: Eppendorf; 5415C (Bragança)
Heraeus instruments; Biofuge fresco (MPI)
Conductometer: WTW; LF-197; Sensor: WTW; Tetra Con 325
Filters: Millipore; GTTP; diameter 25 mm; pore size 0.2 µm
Sartorius; Cellulose nitrate support filters; diameter 25 mm; pore size 0.45 µm
Hand-Refractometer: ATAGO; S/Mill-E
Microscopes: Zeiss; Axioplan and Axioplan 2 imaging; equipped with:
High-pressure mercury bulb: HBO100
Ocular: 10x / 25
Objective: 100x
Camera (Axioplan 2 imaging): Diagnostic Instruments; Spot
Filter sets:
filter set excitation filter [nm] colour splitter [nm] emission filter [nm] dye
01 BP 365/12 FT 395 LP 397 DAPI
HQ-Cy3 HQ 545/50 Q 565 LP HQ 610/75 Cy3
Oven: Gesellschaft für Geochemie & Consulting; TS-50-HS-1-2-105-98 (ZMT)
Maxi oven (MPI)
Memmert; 600 (Bragança)
Oximeter: WTW; Oxi-325 pH meter: Lutron; PH-201
Sediment thermometer: precision 0.1°C
Silver cups: HEKAtec; 10.5 x 9.0 mm
Thermometer: precision 0.5°C
Tin cups: HEKAtec; 10 x 10 mm
Ultrasound: Bandelin; Berlin; Sonopuls HD70
5 Assimilation: Material and methods
87
Vortex: Janke & Kunkel; VF2
Water bath: Jürgens; GFL
Equipment used for calorimetry:
Bomb calorimeter: Jürgens; Julius Peters
Chemicals used for elemental analysis:
Acetanilide: standard for elementary analysis; Merck
C = 71.1 % (± 0.03 %)
N = 10.36 % (± 0.02 %)
M = 135.17 g / mol Apple leaf standard SRM1515: Calibration sample for CHNS; HEKAtec
C = 47.65 % (± 0.2 %)
N = 2.25 % (± 0.19 %) HCl: Merck; 0.1 N Leco sediment standard: Calibration sample for CHNS; Leco Corporation
C = 0.91 % (± 0.04 %)
N = 0.016 % (± 0.006 %)
L-Isoleucine: Calibration sample for CHNS; Aldrich; 99 %
C = 54.939 % (± 1.0 %)
N = 10.678 % (± 0.8 %)
Chemicals used for microbiological investigations: Calcofluor White: Merck; with 10% KOH; 0.1 %
Citifluor: Citifluor Ltd.; London, UK; AF1 (Glycerol / PBS solution)
Cy3-labeled oligonucleotides: Interactiva Biotechnologie GmbH, Ulm, Germany
DAPI (4´,6´-Diamino-2-phenylindol): Sigma; working solution 1µg/µl
di-Sodium hydrogen phosphate Heptahydrate (HNa2PO4-7H20): Merck; > 98.0 % EDTA: Fluka
Ethanol: Merck; 96%
Formamid: Fluka; >99%
Immersol: Zeiss; 518 N
Paraformaldehyde (CH2O)n : Synth; > 90%
Potassium chloride (KCl): Merck; > 99.5 %
SDS (Sodium dodecyl sulfate): Fluka
Sodium chloride (NaCl): Merck; > 99.5 %
88 5 Assimilation: Material and methods
Sodium dihydrogen phosphate monohydrate (NaH2PO4-H20): Merck; > 99.0% Sodium pyrophosphate (Na-PPi): Merck; > 99.0%
Tris: Biomol
Tween 80
Working solutions used for microbiological investigations:
PBS (Phosphate Buffered Saline) (10x): 1230 mM NaCl 50 mM NaH2PO4 50 mM Na2HPO4
pH 7.2; autoclave
Extraction puffer : 20-26 g/l NaCl 0.66 g/l KCl 0.624 g/l NaH2PO4
1.485 g/l Na2HPO4 0.19 g/l NaHCO3
adjust to pH 7 50 mM EDTA 2.5 mM sodium pyrophosphate (Na-PPi) 0.01 % Tween 80
Hybridization buffer: 900 mM NaCl 20 mM Tris-HCl (pH 7.4) Formamid (concentration depending on probe: Table 13) 0.01 % SDS 50 ng of Cy3-labeled oligonucleotide competitor oligonucleotide for the probes ALF968, BET42a, and GAM42a (probes and all concentrations: Table 13)
Washing buffer: NaCl (concentration depending on % formamide in hybridization buffer: Table 13) 20 mM Tris-HCl (pH 7.4) 5 mM EDTA 0.01 % SDS
5 Assimilation: Material and methods
89
METHODS 5.2.1 Assimilation
5.2.1.1 Sampling
Sediment, litter material, gastrointestinal contents and faeces of U. cordatus were sampled at FG and AF during the dry season 2000 and the rainy season 2001 (Table 11). Sediment. Sediment was taken (a) from the mud surface adjacent to the entrance of crab burrows and (b) from the deepest part of crab burrows. Control sediments were sampled between burrows from (c) the sediment surface and (d) a depth of 70 cm with a soil corer. Contamination of the samples with nitrogen was avoided by covering hands and arms with sterile gloves or plastic bags, respectively. All samples were transported on ice. In the laboratory, the samples were dried (40°C) to constant weight and than frozen (-20°C) until further processing. The following abiotic parameters were measured at 70 cm depth (bore holes) and in the deepest part of the burrows: sediment temperature, pH and oxygen of pore water. The sediment temperature was also determined at the sediment surface. Three water samples of 50 ml were taken from each bore hole and burrow to measure the salinity. Plant material. Sampling was conducted at several sites (Table 11) and at neap and spring tide in order to include a wide range of forest stands and areas with different inundation parameters. Various litter components were collected at each sampling site and date (Table 11). With the exception of green leaves all components were taken from the sediment surface between crab burrows. The samples were pooled for each component and sampling site. In addition, leaf material was taken from crab burrows at FG 1 and AF and was pooled for each burrow. All samples were dried (40°C) to constant dry weight, ground with an electrical mill at the “Empresa Brasileira de Pesquisa Agropecuária” (EMBRAPA, Belém, Brazil) and kept frozen (-20°C) until analyses. Gastrointestinal contents. Males and females of 2 size classes were captured by a crab collector, transported on ice and then stored in a freezer (-20°C). After thawing each crab was sexed, weighed, and its carapace length and width were measured. Stomach and intestinal contents were separated by rinsing the digestive tract with distilled water. Crabs and the empty stomachs were dried (60°C, 48 h) and their dry weights determined. The stomach and intestinal contents were also dried (40°C, 24 h) and kept frozen (-20°C).
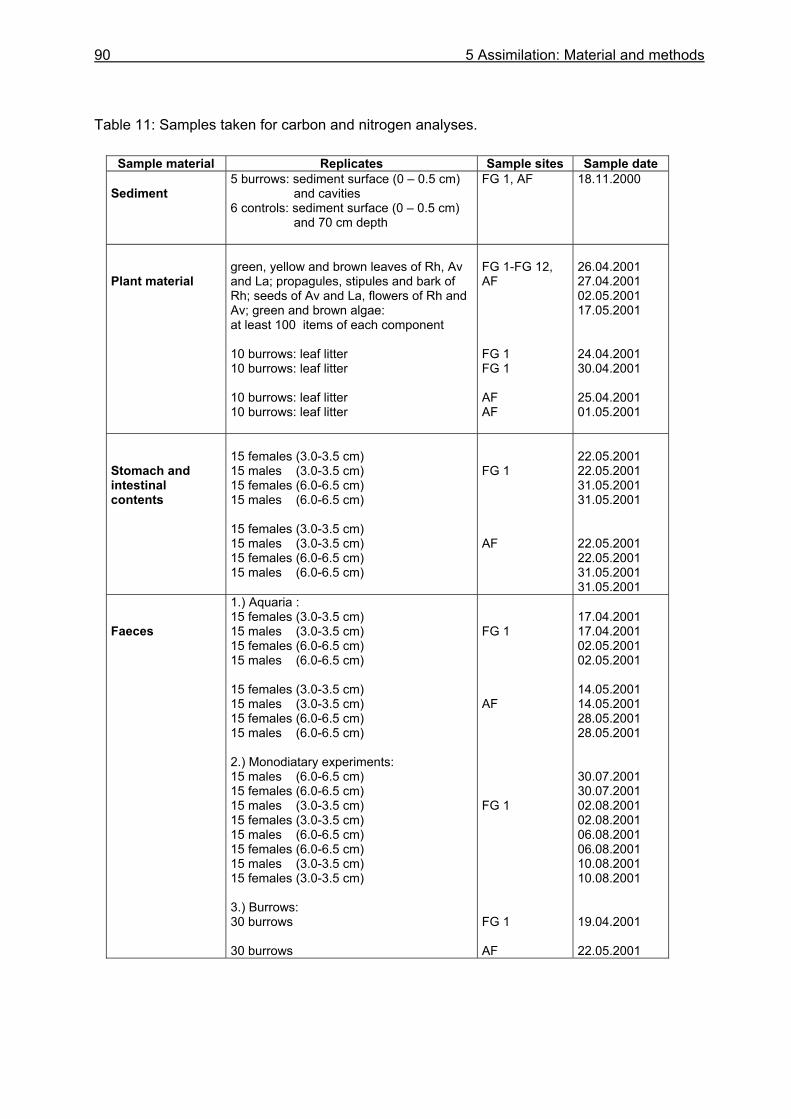
90 5 Assimilation: Material and methods
Table 11: Samples taken for carbon and nitrogen analyses.
Sample material Replicates Sample sites Sample date Sediment
5 burrows: sediment surface (0 – 0.5 cm) and cavities 6 controls: sediment surface (0 – 0.5 cm) and 70 cm depth
FG 1, AF
18.11.2000
Plant material
green, yellow and brown leaves of Rh, Av and La; propagules, stipules and bark of Rh; seeds of Av and La, flowers of Rh and Av; green and brown algae: at least 100 items of each component 10 burrows: leaf litter 10 burrows: leaf litter 10 burrows: leaf litter 10 burrows: leaf litter
FG 1-FG 12, AF FG 1 FG 1 AF AF
26.04.2001 27.04.2001 02.05.2001 17.05.2001 24.04.2001 30.04.2001 25.04.2001 01.05.2001
Stomach and intestinal contents
15 females (3.0-3.5 cm) 15 males (3.0-3.5 cm) 15 females (6.0-6.5 cm) 15 males (6.0-6.5 cm) 15 females (3.0-3.5 cm) 15 males (3.0-3.5 cm) 15 females (6.0-6.5 cm) 15 males (6.0-6.5 cm)
FG 1 AF
22.05.2001 22.05.2001 31.05.2001 31.05.2001 22.05.2001 22.05.2001 31.05.2001 31.05.2001
Faeces
1.) Aquaria : 15 females (3.0-3.5 cm) 15 males (3.0-3.5 cm) 15 females (6.0-6.5 cm) 15 males (6.0-6.5 cm) 15 females (3.0-3.5 cm) 15 males (3.0-3.5 cm) 15 females (6.0-6.5 cm) 15 males (6.0-6.5 cm) 2.) Monodiatary experiments: 15 males (6.0-6.5 cm) 15 females (6.0-6.5 cm) 15 males (3.0-3.5 cm) 15 females (3.0-3.5 cm) 15 males (6.0-6.5 cm) 15 females (6.0-6.5 cm) 15 males (3.0-3.5 cm) 15 females (3.0-3.5 cm) 3.) Burrows: 30 burrows 30 burrows
FG 1 AF FG 1 FG 1 AF
17.04.2001 17.04.2001 02.05.2001 02.05.2001 14.05.2001 14.05.2001 28.05.2001 28.05.2001 30.07.2001 30.07.2001 02.08.2001 02.08.2001 06.08.2001 06.08.2001 10.08.2001 10.08.2001 19.04.2001 22.05.2001
5 Assimilation: Material and methods
91
Faeces. Three types of faeces were sampled for the analysis of carbon and nitrogen (Table 11). Males and females of two size classes were captured at FG 1 and AF and kept separately in glass aquaria free of substrate, water and food. Each aquarium was covered with black plastic film to provide a light shield. Faeces were collected at 1 hour intervals until faeces production had ceased for several hours. The crabs were transferred to a bucket with ambient estuarine water for 5 minutes every 4 hours to avoid desiccation. Monodietary experiments were used to evaluate the assimilation efficiency of U. cordatus for different food items. Males and females were kept separately in glass aquaria with filtered salt water (20 µm sieve) but without food. After faeces production had ceased for several hours, crabs were fed with a particular food item but kept in the aquaria without water or substrate. The following food items were offered in different experiments: green and yellow leaves of R. mangle, A. germinans and L. racemosa and pneumatophors of R. mangle. The food was preweighed, offered for 6 hours and the unconsumed parts were then dried and weighed again. All faeces that were produced during the following 30 hours (including the 6 hours of food availability) were removed from the aquaria at intervals of 1 hour and the crabs were transferred to water every 4 hours. Faeces were also collected at the entrance of crab burrows. The burrows were selected at random, length and width of the burrow entrances were measured with a calliper rule to the nearest millimetre and the entrances were widened carefully. Only fresh faeces were collected and stored on ice. All samples were dried (40°C, 24 h) and then frozen (-20°C) until further processing. The temperature of the sediment surface and the air were measured during all sampling occasions. 5.2.1.2 Sample processing
Elemental analysis. The measurement of organic carbon and nitrogen content was conducted with an elemental analyser at the ZMT (Bremen) and at the “Universidade Federal Fluminense” (UFF, Niteroí, Brazil). All samples, apart from the litter material, were homogenized with a mortar and pestle and then dried (40°C, 24 h). At least two subsamples of each sample were transferred to silver cups and weighed using 10-40 mg of sediment, 2-12 mg of litter material, 6-9 mg of stomach contents, 7-13 mg of intestinal contents, and 6-27 mg of faeces. Inorganic carbon was removed by acidification with 100-200 µl of 0.1 N hydrochloric acid and evaporation at 40°C for 24 hours. The cups with the sample material were pressed with a hand-press to small pellets. At the UFF, tin cups were used instead of silver cups and the acidification took place in centrifuge tubes before the subsamples were transferred to the tin cups.
92 5 Assimilation: Material and methods
Several standard substances were used as quality standards after every fifth sample: Leco sediment standard for sediment samples, Apple leaf standard for litter samples and L-isoleucine for samples of stomach contents, intestinal contents and faeces. These standard samples were dried as indicated and than weighed into tin cups. At the ZMT, L-isoleucine was used for a 40 point calibration. The cups were oxidised in an oxygen flow by high temperature flash combustion (1000°C). The oxidation products were transported in a helium flow to a chromatographic column, in which carbon and nitrogen oxides were separated. Detection was realised with a thermal-conductivity cell. The elemental analyser at the UFF was calibrated with acetanilide. Calorimetry. The measurement of the energy content or calorific value was performed for green, yellow and brown leaves of R. mangle, A. germinans and L. racemosa and the faeces collected during the monodietary experiments. Measurements were conducted with an oxygen bomb calorimeter at the Chemistry Department of the University of Bremen. The caloric value of a sample may be broadly defined as the heat liberated when it is burned with oxygen in an enclosure of constant volume. The energy released by the combustion is absorbed by water of a known volume and temperature and the resulting temperature change of the water is noted. The heat obtained from combustion of the sample is compared with the heat obtained from combustion of a similar amount of benzoic acid whose caloric value is known. Each sample of leaf material was analysed at least three times. Faeces of 3 crabs each had to be pooled due to small amounts produced by each crab. Only faeces of the same sex and size class were pooled. Between 0.5 and 1 g of ground and dried material was pressed with a hand-press. During this process a preweighed thin iron wire was placed into the sample pellet. The pellet was weighed to the nearest 0.01 mg and fixed by the wire within the bomb calorimeter. The sample was ignited and the temperature change of the water was recorded at 0.5 minute intervals until the temperature reached a constant value. The temperature increase was converted into the calorific value of the sample using the following formula:
p
ZSNt0 m
)QQQ(DCH ++−⋅= H0 [J] = Calorific value C [J/K] = Heat capacity of the bomb calorimeter Dt = Temperature increase due to combustion of the sample QN [J] = Heat quantity that arise from the formation of aqueous nitric acid from the air
nitrogen inside the bomb and from the nitrogen bound in the sample
5 Assimilation: Material and methods
93
QS [J] = Heat quantity that arise from the formation of aqueous sulphuric acid from gaseous sulfur dioxide
QZ [J] = Heat quantity that does not come from the combustion of the sample mp [g] = Weight of the sample Statistical analyses. Information on the applied statistical analyses is given in chapter 3.2.6. 5.2.2 Microbiological investigations
5.2.2.1 Sampling
Samples for the determination of microbial abundances and community structure were collected during the dry season 2000 and 2001 (Table 12). All sample types were fixed with 4 % paraformaldehyde (final concentration), which was buffered with phosphate saline (PBS 1x, pH 7.2). Samples were transported on ice until further processing in the laboratory. Sediment. Sediment was taken with a soil corer at random locations between crab burrows but a distance of at least 50 cm from burrow entrances was maintained. Subsamples (2 ml) from the surface and from 70 cm depth were taken with plastic syringes with cut tips. These samples are referred to as sediment controls in the following. Sediment from the deepest part of the burrows was collected by using sterile gloves. A 2 ml subsample was taken with a plastic syringe. All samples were fixed immediately and stored on ice. To allow conversion of microbial abundances per g dry weight to g wet weight of the sediment, samples for water content determination were collected at all sites. The following abiotic parameters were measured: temperature at the sediment surface, at 70 cm depth and in the burrows; pH, oxygen and salinity in the water of the bore holes and in the burrows. Water. 20 ml samples were taken from the surface water of the tidal channel Furo Grande with the incoming and outgoing tide using sterile plastic syringes. Temperature, pH, oxygen and salinity were measured at the water surface. Water samples (20 ml) of the crab burrows were taken with a hand pump connected to a plastic tube. Burrows were chosen at random but care was taken to include only burrows with similar topographic heights. Plastic tubes were inserted into the burrows to the maximal possible depth of 30 cm 3 days before the sampling. In a distance of about 1 m from the burrow entrances, the ends of the tubes were tied up to sticks to avoid blockage by sediment and infiltration of water during high tide. This method allowed water to be pumped out of the burrows without walking close to the entrances again, which usually causes water movement in the burrows.
94 5 Assimilation: Material and methods
Water samples were fixed immediately and filtered with a hand pump the same day onto polycarbonate membrane filters, using cellulose nitrate support filters beneath to help distribute the microorganisms more evenly. The filters were kept in the freezer (– 20°C) until analysis. Temperature, pH, oxygen and salinity of the burrow water were measured. Leaves. In order to collect freshly fallen leaves, 5x5 m nets with a 3-mm-mesh were placed under R. mangle and A. germinans trees and fallen leaves were collected. Some of these leaves were tied to prop roots with a thin nylon thread and placed on the sediment surface. Three days after exposure these leaves were collected. Leaves were also taken from crab burrows. The depth of the burrows and the depth of the leaf location were determined. The animals were captured, sexed and measured (carapace length and width). All leaves were taken with sterile gloves, transferred to plastic bags and transported on ice. A piece of 2x2 cm was cut with a sterile razor blade at each side of the centre rib, cut into 2 pieces, transferred to a 2 ml microfuge tube und fixed for 2-4 hours at 4°C. Then, the leaf pieces were stored in 2 ml of a 1:1 mix of PBS / ethanol at -20°C until further analyses. Gastrointestinal contents. Males and females of 2 size classes (Table 12) were captured by a crab collector and put on ice immediately. The stomach and intestinal contents were taken the same day, as described earlier (5.2.1.1), but without distilled water. The fresh weights of both contents were measured and the samples fixed. Each crab was sexed, measured (carapace length and width) and its fresh and dry weight (60°C, 48 h) were measured. The empty stomach was also dried (60°C, 24 h) and weighed. Faeces. A monodietary experiment was conducted to determine microbial abundance and community structure in the faeces of U. cordatus. Crabs were kept separately in glass aquaria with filtered estuarine water (20 µm sieve) without food. Within 24 hours all faeces production stopped. The water in the aquaria was then removed and crabs were fed with R. mangle or A. germinans leaves. The faeces were collected in intervals of 1 h until faeces production had ceased for several hours. Crabs were transferred to estuarine water every 4 h for 5 minutes to avoid desiccation. Faeces were also collected at the entrance of the crab burrows as described earlier (5.2.1.1). All samples of sediment, gastrointestinal contents and faeces were fixed 2-4 h at 4°C. Then, subsamples were transferred to 1.5 ml microfuge tubes, washed with PBS (1x) twice (centrifugation at 7000 rpm for 5 minutes, pour off supernatant; resuspension) and stored in 1.5 ml of a 1:1 mix of PBS / ethanol at –20°C until further processing.
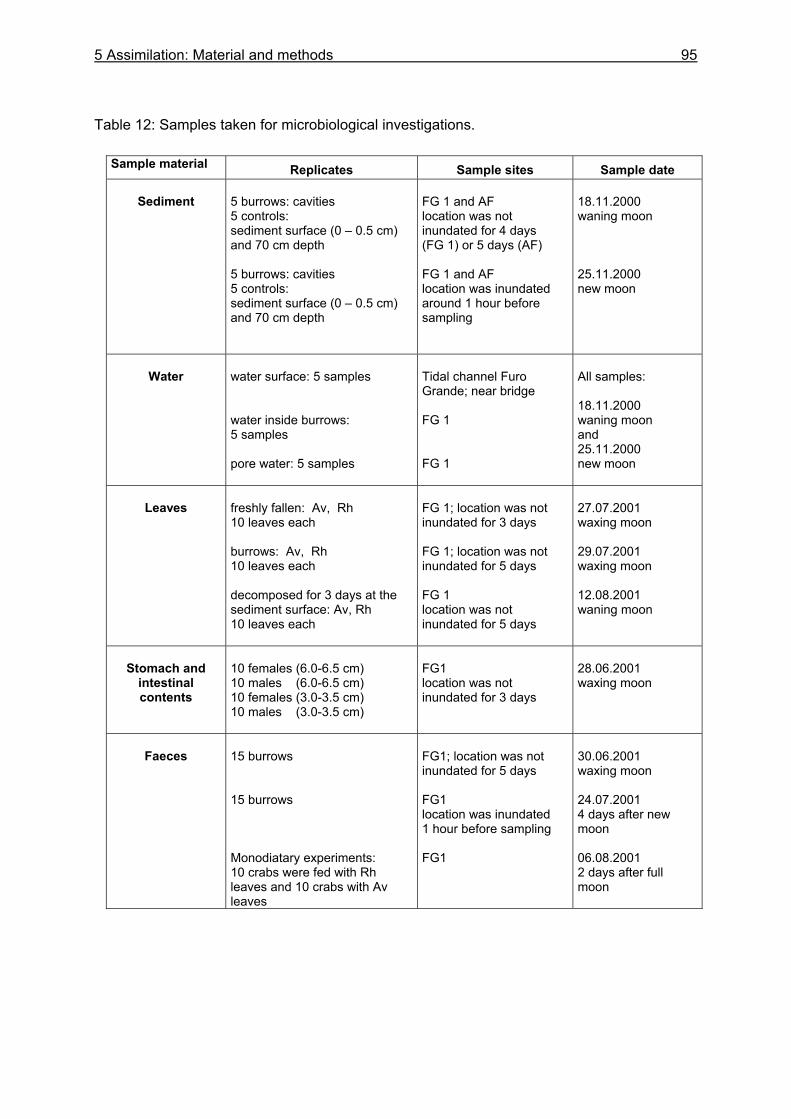
5 Assimilation: Material and methods
95
Table 12: Samples taken for microbiological investigations.
Sample material Replicates Sample sites Sample date
Sediment
5 burrows: cavities 5 controls: sediment surface (0 – 0.5 cm) and 70 cm depth 5 burrows: cavities 5 controls: sediment surface (0 – 0.5 cm) and 70 cm depth
FG 1 and AF location was not inundated for 4 days (FG 1) or 5 days (AF) FG 1 and AF location was inundated around 1 hour before sampling
18.11.2000 waning moon 25.11.2000 new moon
Water
water surface: 5 samples water inside burrows: 5 samples pore water: 5 samples
Tidal channel Furo Grande; near bridge FG 1 FG 1
All samples: 18.11.2000 waning moon and 25.11.2000 new moon
Leaves
freshly fallen: Av, Rh 10 leaves each burrows: Av, Rh 10 leaves each decomposed for 3 days at the sediment surface: Av, Rh 10 leaves each
FG 1; location was not inundated for 3 days FG 1; location was not inundated for 5 days FG 1 location was not inundated for 5 days
27.07.2001 waxing moon 29.07.2001 waxing moon 12.08.2001 waning moon
Stomach and
intestinal contents
10 females (6.0-6.5 cm) 10 males (6.0-6.5 cm) 10 females (3.0-3.5 cm) 10 males (3.0-3.5 cm)
FG1 location was not inundated for 3 days
28.06.2001 waxing moon
Faeces
15 burrows 15 burrows Monodiatary experiments: 10 crabs were fed with Rh leaves and 10 crabs with Av leaves
FG1; location was not inundated for 5 days FG1 location was inundated 1 hour before sampling FG1
30.06.2001 waxing moon 24.07.2001 4 days after new moon 06.08.2001 2 days after full moon
96 5 Assimilation: Material and methods
5.2.2.2 Sample processing
Each sample of sediment, faeces, stomach and intestinal contents was resuspended and 100-200 µl of aliquot was transferred to 500-1000 µl of a 1:1 mix of PBS / ethanol in a 1.5 ml microfuge tube. This aliquot was sonicated for 20 seconds (sediment, faeces), 30 seconds (intestinal contents), or 5 x 30 seconds with breaks of 30 seconds (stomach contents) at low intensity (14 W) using 1-second sonication pulses. Leaf pieces (2 x 2 cm2) were transferred to 3 ml of extraction buffer in a 50 ml tube, vortexed for 2 min and kept on ice for 1 h. The following treatment was repeated 5 times: the sample was vortexed for 2 min and sonicated for 2 min (35 W) using continuous sonication pulses. All treatments were tested in advance to find the best method for detachment and dispersal of cells for further processing. For filtration, cellulose nitrate support filters were placed beneath the membrane filters to improve the distribution of cells. Aliquots (20-200 µl) from the sonicated samples were added to 10 ml of distilled water and filtered onto the membrane filters. Filters were air-dried and stored in petri dishes at -20°C until DAPI staining or hybridization. The water content of the sediment was measured by weighing the wet and dried (60°C to constant weight) samples. Oligonucleotide probes. Fluorescently labeled oligonucleotide probes were used to determine the presence of the following groups of microorganisms:
• Bacteria • Bacteroidetes (including Cytophaga and Flavobacteria) • α- β- and γ-subgroup of the Proteobacteria • Archaea • High-G+C-content gram-positive bacteria • Eukaryotes
Specificities, target positions, hybridization conditions, and references for the probes are given in Table 13. The microbial probe (EUB I-III) was used to determine the number of detectable cells that belong to the domain Bacteria. A negative control probe with the antisense sequence of the microbial probe was used to check for nonspecific hybridisation (NON 338). Hybridization. The hybridization method was performed as described in Glöckner et al. (1999).The hybridization and washing buffer were prepared freshly. Each filter was cut into 10 sections, and one section of each filter was used for the hybridization with one CY3-labeled oligonucleotide probe shown in Table 13. The filter sections were placed on glass slides and covered with 20 µl hybridization buffer. Probes ALF968, BET42a, and GAM42a were used with competitor oligonucleotides. Slides were put into an equilibrated chamber and incubated at 46°C for at least 90 minutes and maximal 3 hours. The filters were
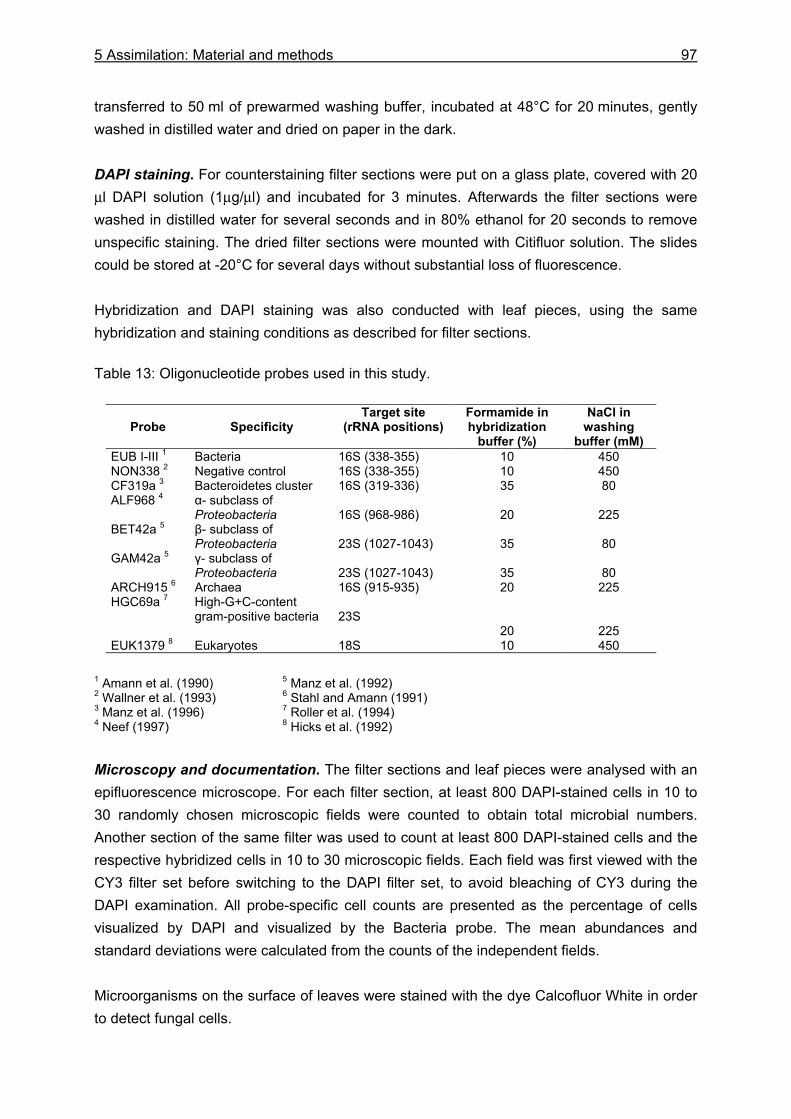
5 Assimilation: Material and methods
97
transferred to 50 ml of prewarmed washing buffer, incubated at 48°C for 20 minutes, gently washed in distilled water and dried on paper in the dark. DAPI staining. For counterstaining filter sections were put on a glass plate, covered with 20 µl DAPI solution (1µg/µl) and incubated for 3 minutes. Afterwards the filter sections were washed in distilled water for several seconds and in 80% ethanol for 20 seconds to remove unspecific staining. The dried filter sections were mounted with Citifluor solution. The slides could be stored at -20°C for several days without substantial loss of fluorescence. Hybridization and DAPI staining was also conducted with leaf pieces, using the same hybridization and staining conditions as described for filter sections. Table 13: Oligonucleotide probes used in this study.
Probe
Specificity
Target site (rRNA positions)
Formamide in hybridization
buffer (%)
NaCl in washing
buffer (mM) EUB I-III 1 Bacteria 16S (338-355) 10 450 NON338 2 Negative control 16S (338-355) 10 450 CF319a 3 Bacteroidetes cluster 16S (319-336) 35 80 ALF968 4 α- subclass of
Proteobacteria 16S (968-986)
20
225
BET42a 5 β- subclass of Proteobacteria
23S (1027-1043)
35
80
GAM42a 5 γ- subclass of Proteobacteria
23S (1027-1043)
35
80
ARCH915 6 Archaea 16S (915-935) 20 225 HGC69a 7 High-G+C-content
gram-positive bacteria 23S
20
225 EUK1379 8 Eukaryotes 18S 10 450
1 Amann et al. (1990) 5 Manz et al. (1992) 2 Wallner et al. (1993) 6 Stahl and Amann (1991) 3 Manz et al. (1996) 7 Roller et al. (1994) 4 Neef (1997) 8 Hicks et al. (1992) Microscopy and documentation. The filter sections and leaf pieces were analysed with an epifluorescence microscope. For each filter section, at least 800 DAPI-stained cells in 10 to 30 randomly chosen microscopic fields were counted to obtain total microbial numbers. Another section of the same filter was used to count at least 800 DAPI-stained cells and the respective hybridized cells in 10 to 30 microscopic fields. Each field was first viewed with the CY3 filter set before switching to the DAPI filter set, to avoid bleaching of CY3 during the DAPI examination. All probe-specific cell counts are presented as the percentage of cells visualized by DAPI and visualized by the Bacteria probe. The mean abundances and standard deviations were calculated from the counts of the independent fields. Microorganisms on the surface of leaves were stained with the dye Calcofluor White in order to detect fungal cells.
98 5 Assimilation: Material and methods
Photos of selected microscopic fields were taken with a connected camera and visualised on a computer. Bacterial biomass. Bacterial abundances were converted to carbon biomass in order to get a rough estimate of bacterial biomass. The cell carbon conversion factor of 0.87 x 10⁻¹³ g C µm-3 (Rublee 1982) can be used for sediment samples. This conversion factor has also been applied to mangrove sediments in Australia (Alongi 1988, Alongi et al. 1989). The cell volume (V) was calculated with the following formula (Bratbak 1985): V = (π/4) · W2 · (L – W/3) where L refers to the length and W to the width of the cells. This formula applies both to rods and cocci. Since the number of cocci and rods were not determined in this study, and probably varied among samples, the cell volume and carbon content were calculated separately for cocci and rods, and the range of calculated carbon contents is presented instead of a mean value. The nitrogen content of bacterial biomass was calculated based on a C:N ratio of 6, as reported by Nagata (1986). The same conversion factors were used for bacteria on leaf surfaces and in the stomach, intestine, and faeces in order to get a rough estimate of bacterial biomass. No conversion factors for these samples were found in the literature. Since nutrient conditions in the stomach and gut are likely very different from outside, cell carbon conversion factors determined for sediments are probably not appropriate to gut bacteria. Bratbak (1985) reported that the carbon content of bacteria varies among species, and also depends on nutrient conditions and other environmental factors. Therefore, calculated values have to be regarded with caution. In addition, it has to be considered that the DAPI-stained cells represent the total number of microorganisms, of which bacteria are only a part. According to Alongi (1988), bacteria account for ~91 % of total microbial biomass, with algae and protozoa constituting 7 and 2 % of the total surface sediment biomass, respectively. Statistical analyses. Information on the applied statistical analyses is given in chapter 3.2.6.
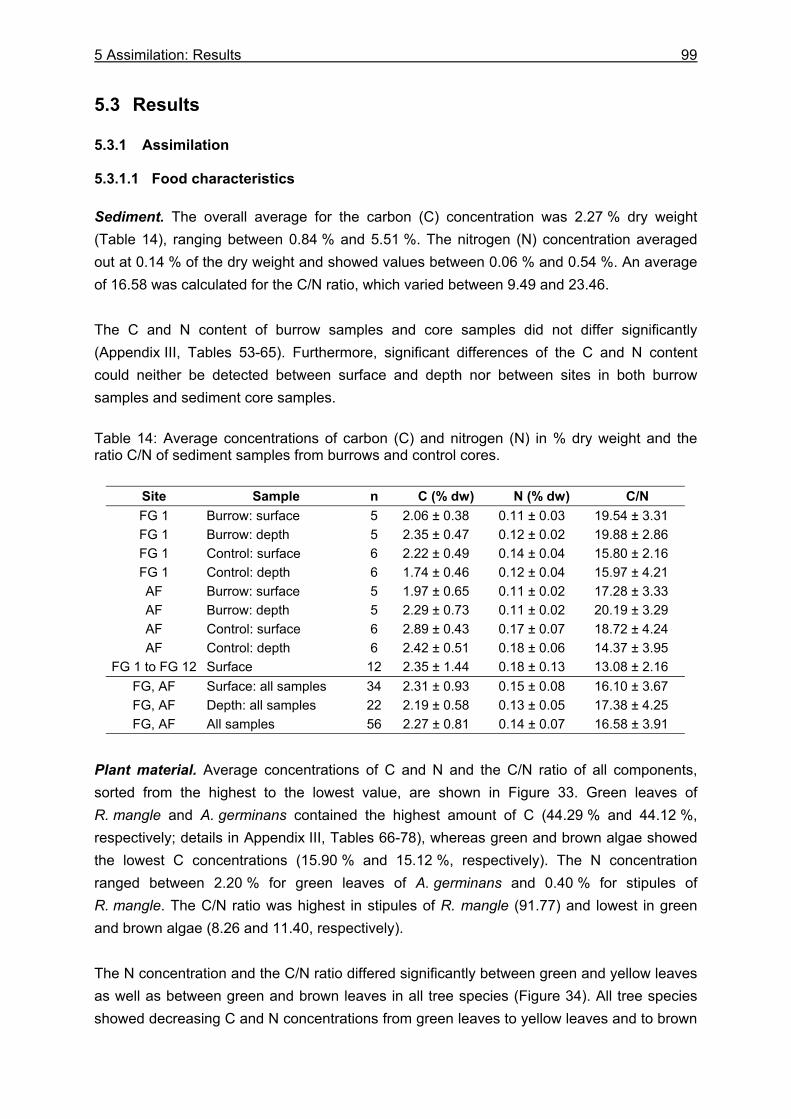
5 Assimilation: Results
99
5.3 Results
5.3.1 Assimilation
5.3.1.1 Food characteristics
Sediment. The overall average for the carbon (C) concentration was 2.27 % dry weight (Table 14), ranging between 0.84 % and 5.51 %. The nitrogen (N) concentration averaged out at 0.14 % of the dry weight and showed values between 0.06 % and 0.54 %. An average of 16.58 was calculated for the C/N ratio, which varied between 9.49 and 23.46. The C and N content of burrow samples and core samples did not differ significantly (Appendix III, Tables 53-65). Furthermore, significant differences of the C and N content could neither be detected between surface and depth nor between sites in both burrow samples and sediment core samples. Table 14: Average concentrations of carbon (C) and nitrogen (N) in % dry weight and the ratio C/N of sediment samples from burrows and control cores.
Plant material. Average concentrations of C and N and the C/N ratio of all components, sorted from the highest to the lowest value, are shown in Figure 33. Green leaves of R. mangle and A. germinans contained the highest amount of C (44.29 % and 44.12 %, respectively; details in Appendix III, Tables 66-78), whereas green and brown algae showed the lowest C concentrations (15.90 % and 15.12 %, respectively). The N concentration ranged between 2.20 % for green leaves of A. germinans and 0.40 % for stipules of R. mangle. The C/N ratio was highest in stipules of R. mangle (91.77) and lowest in green and brown algae (8.26 and 11.40, respectively). The N concentration and the C/N ratio differed significantly between green and yellow leaves as well as between green and brown leaves in all tree species (Figure 34). All tree species showed decreasing C and N concentrations from green leaves to yellow leaves and to brown
Site Sample n C (% dw) N (% dw) C/N FG 1 Burrow: surface 5 2.06 ± 0.38 0.11 ± 0.03 19.54 ± 3.31 FG 1 Burrow: depth 5 2.35 ± 0.47 0.12 ± 0.02 19.88 ± 2.86 FG 1 Control: surface 6 2.22 ± 0.49 0.14 ± 0.04 15.80 ± 2.16 FG 1 Control: depth 6 1.74 ± 0.46 0.12 ± 0.04 15.97 ± 4.21 AF Burrow: surface 5 1.97 ± 0.65 0.11 ± 0.02 17.28 ± 3.33 AF Burrow: depth 5 2.29 ± 0.73 0.11 ± 0.02 20.19 ± 3.29 AF Control: surface 6 2.89 ± 0.43 0.17 ± 0.07 18.72 ± 4.24 AF Control: depth 6 2.42 ± 0.51 0.18 ± 0.06 14.37 ± 3.95
FG 1 to FG 12 Surface 12 2.35 ± 1.44 0.18 ± 0.13 13.08 ± 2.16 FG, AF Surface: all samples 34 2.31 ± 0.93 0.15 ± 0.08 16.10 ± 3.67 FG, AF Depth: all samples 22 2.19 ± 0.58 0.13 ± 0.05 17.38 ± 4.25 FG, AF All samples 56 2.27 ± 0.81 0.14 ± 0.07 16.58 ± 3.91
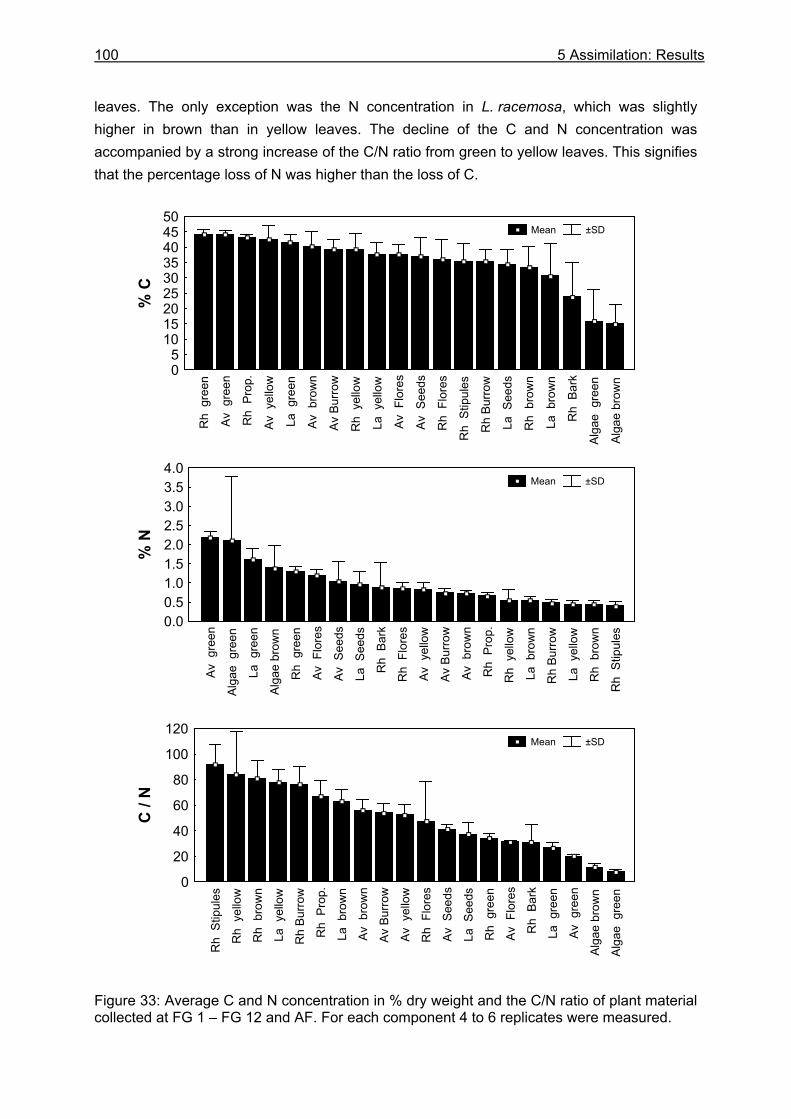
100 5 Assimilation: Results
leaves. The only exception was the N concentration in L. racemosa, which was slightly higher in brown than in yellow leaves. The decline of the C and N concentration was accompanied by a strong increase of the C/N ratio from green to yellow leaves. This signifies that the percentage loss of N was higher than the loss of C.
Figure 33: Average C and N concentration in % dry weight and the C/N ratio of plant material collected at FG 1 – FG 12 and AF. For each component 4 to 6 replicates were measured.
Rh
gre
en
Av g
reen
Rh
Pro
p.
Av y
ello
w
La g
reen
Av b
row
n
Av B
urro
w
Rh
yel
low
La y
ello
w
Av F
lore
s
Av S
eeds
Rh
Flo
res
Rh
Stip
ules
Rh
Burro
w
La S
eeds
Rh
bro
wn
La b
row
n
Rh
Bar
k
Alga
e g
reen
Alga
e br
own
05
101520253035404550
% C
Mean ±SD
Av g
reen
Alga
e g
reen
La g
reen
Alga
e br
own
Rh
gre
en
Av F
lore
s
Av S
eeds
La S
eeds
Rh
Bar
k
Rh
Flo
res
Av y
ello
w
Av B
urro
w
Av b
row
n
Rh
Pro
p.
Rh
yel
low
La b
row
n
Rh
Burro
w
La y
ello
w
Rh
bro
wn
Rh
Stip
ules
0.00.51.01.52.02.53.03.54.0
% N
Mean ±SD
Rh
Stip
ules
Rh
yel
low
Rh
bro
wn
La y
ello
w
Rh
Burro
w
Rh
Pro
p.
La b
row
n
Av b
row
n
Av B
urro
w
Av y
ello
w
Rh
Flo
res
Av S
eeds
La S
eeds
Rh
gre
en
Av F
lore
s
Rh
Bar
k
La g
reen
Av g
reen
Alga
e br
own
Alga
e g
reen
0
20
40
60
80
100
120
C /
N
Mean ±SD
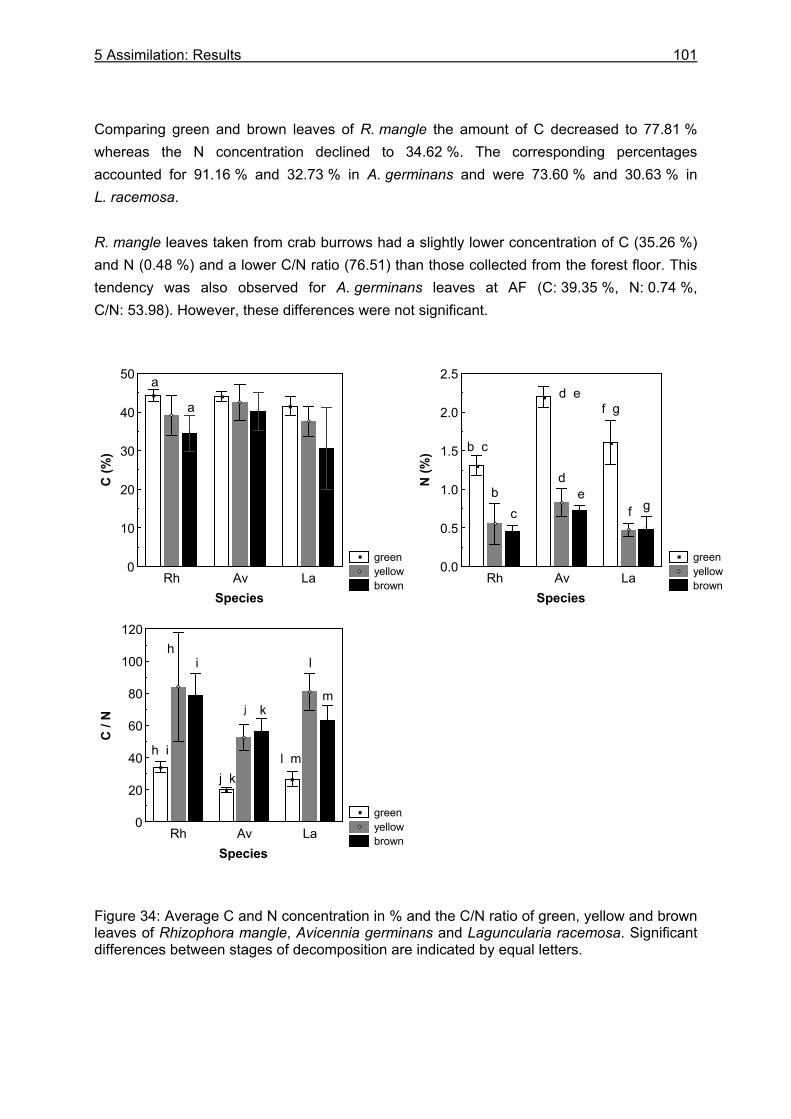
5 Assimilation: Results
101
Comparing green and brown leaves of R. mangle the amount of C decreased to 77.81 % whereas the N concentration declined to 34.62 %. The corresponding percentages accounted for 91.16 % and 32.73 % in A. germinans and were 73.60 % and 30.63 % in L. racemosa. R. mangle leaves taken from crab burrows had a slightly lower concentration of C (35.26 %) and N (0.48 %) and a lower C/N ratio (76.51) than those collected from the forest floor. This tendency was also observed for A. germinans leaves at AF (C: 39.35 %, N: 0.74 %, C/N: 53.98). However, these differences were not significant.
Figure 34: Average C and N concentration in % and the C/N ratio of green, yellow and brown leaves of Rhizophora mangle, Avicennia germinans and Laguncularia racemosa. Significant differences between stages of decomposition are indicated by equal letters.
green yellow brownRh Av La
Species
0
10
20
30
40
50
C (%
)
a
a
green yellow brownRh Av La
Species
0.0
0.5
1.0
1.5
2.0
2.5
N (%
) b c
cb
d e
ed
f g
f g
green yellow brownRh Av La
Species
0
20
40
60
80
100
120
C /
N
hi
j k
k
l m
m
l
j
h i
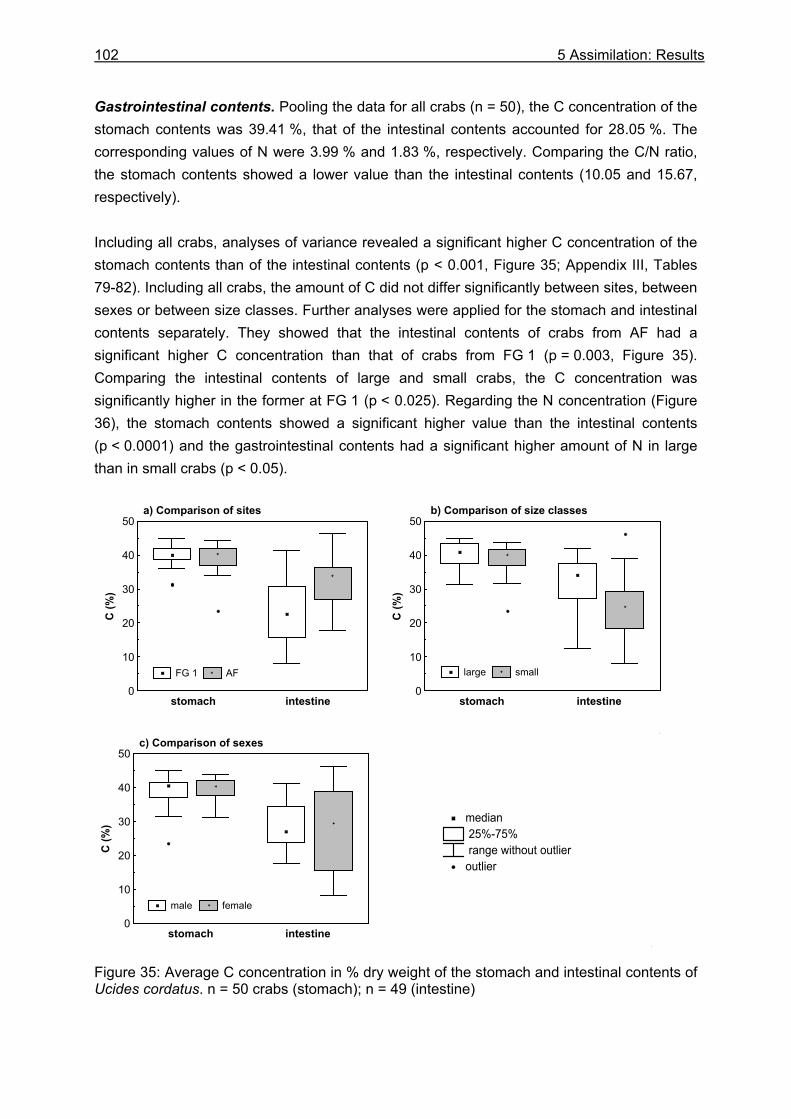
102 5 Assimilation: Results
Gastrointestinal contents. Pooling the data for all crabs (n = 50), the C concentration of the stomach contents was 39.41 %, that of the intestinal contents accounted for 28.05 %. The corresponding values of N were 3.99 % and 1.83 %, respectively. Comparing the C/N ratio, the stomach contents showed a lower value than the intestinal contents (10.05 and 15.67, respectively). Including all crabs, analyses of variance revealed a significant higher C concentration of the stomach contents than of the intestinal contents (p < 0.001, Figure 35; Appendix III, Tables 79-82). Including all crabs, the amount of C did not differ significantly between sites, between sexes or between size classes. Further analyses were applied for the stomach and intestinal contents separately. They showed that the intestinal contents of crabs from AF had a significant higher C concentration than that of crabs from FG 1 (p = 0.003, Figure 35). Comparing the intestinal contents of large and small crabs, the C concentration was significantly higher in the former at FG 1 (p < 0.025). Regarding the N concentration (Figure 36), the stomach contents showed a significant higher value than the intestinal contents (p < 0.0001) and the gastrointestinal contents had a significant higher amount of N in large than in small crabs (p < 0.05).
Figure 35: Average C concentration in % dry weight of the stomach and intestinal contents of Ucides cordatus. n = 50 crabs (stomach); n = 49 (intestine)
stomach intestine
a) Comparison of sites
0
10
20
30
40
50
C (%
)
FG 1 AF
stomach intestine
b) Comparison of size classes
0
10
20
30
40
50
C (%
)
large small
stomach intestine
c) Comparison of sexes
0
10
20
30
40
50
C (%
)
male female
median 25%-75% range without outlier outlier
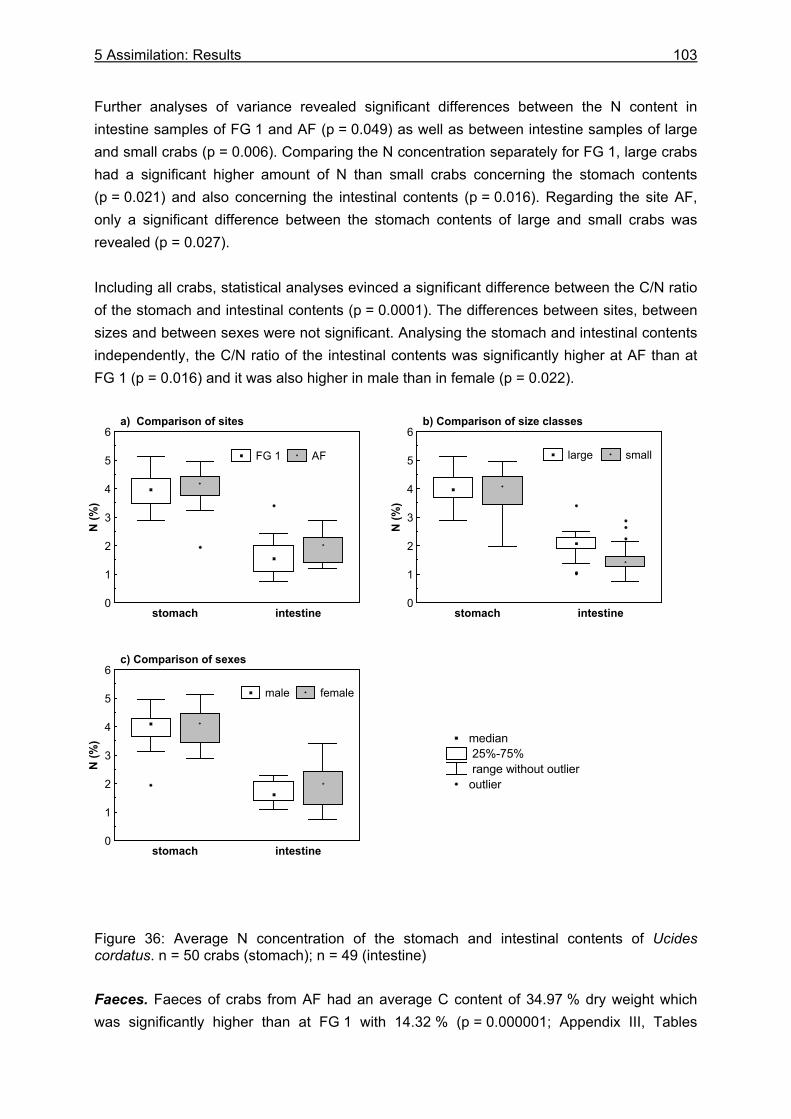
5 Assimilation: Results
103
Further analyses of variance revealed significant differences between the N content in intestine samples of FG 1 and AF (p = 0.049) as well as between intestine samples of large and small crabs (p = 0.006). Comparing the N concentration separately for FG 1, large crabs had a significant higher amount of N than small crabs concerning the stomach contents (p = 0.021) and also concerning the intestinal contents (p = 0.016). Regarding the site AF, only a significant difference between the stomach contents of large and small crabs was revealed (p = 0.027). Including all crabs, statistical analyses evinced a significant difference between the C/N ratio of the stomach and intestinal contents (p = 0.0001). The differences between sites, between sizes and between sexes were not significant. Analysing the stomach and intestinal contents independently, the C/N ratio of the intestinal contents was significantly higher at AF than at FG 1 (p = 0.016) and it was also higher in male than in female (p = 0.022).
Figure 36: Average N concentration of the stomach and intestinal contents of Ucides cordatus. n = 50 crabs (stomach); n = 49 (intestine) Faeces. Faeces of crabs from AF had an average C content of 34.97 % dry weight which was significantly higher than at FG 1 with 14.32 % (p = 0.000001; Appendix III, Tables
stomach intestine
a) Comparison of sites
0
1
2
3
4
5
6
N (%
)
FG 1 AF
stomach intestine
b) Comparison of size classes
0
1
2
3
4
5
6
N (%
)
large small
stomach intestine
c) Comparison of sexes
0
1
2
3
4
5
6
N (%
)
male female
median 25%-75% range without outlier outlier
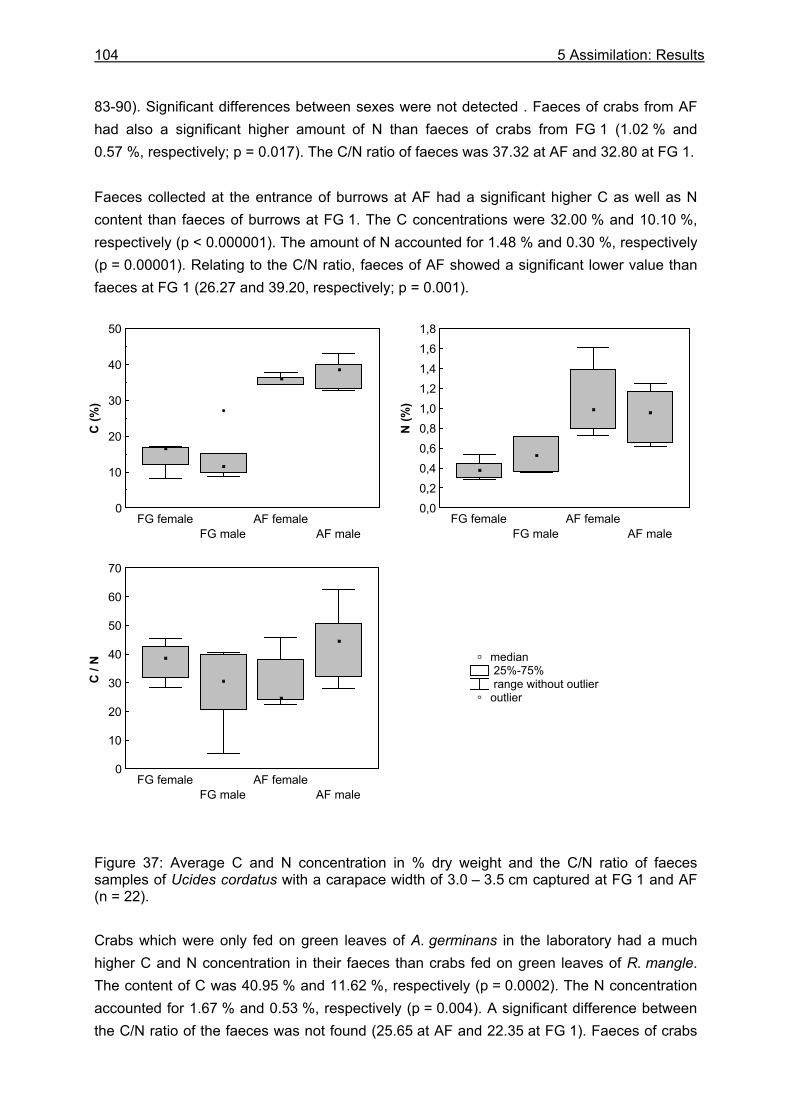
104 5 Assimilation: Results
83-90). Significant differences between sexes were not detected . Faeces of crabs from AF had also a significant higher amount of N than faeces of crabs from FG 1 (1.02 % and 0.57 %, respectively; p = 0.017). The C/N ratio of faeces was 37.32 at AF and 32.80 at FG 1. Faeces collected at the entrance of burrows at AF had a significant higher C as well as N content than faeces of burrows at FG 1. The C concentrations were 32.00 % and 10.10 %, respectively (p < 0.000001). The amount of N accounted for 1.48 % and 0.30 %, respectively (p = 0.00001). Relating to the C/N ratio, faeces of AF showed a significant lower value than faeces at FG 1 (26.27 and 39.20, respectively; p = 0.001).
Figure 37: Average C and N concentration in % dry weight and the C/N ratio of faeces samples of Ucides cordatus with a carapace width of 3.0 – 3.5 cm captured at FG 1 and AF (n = 22). Crabs which were only fed on green leaves of A. germinans in the laboratory had a much higher C and N concentration in their faeces than crabs fed on green leaves of R. mangle. The content of C was 40.95 % and 11.62 %, respectively (p = 0.0002). The N concentration accounted for 1.67 % and 0.53 %, respectively (p = 0.004). A significant difference between the C/N ratio of the faeces was not found (25.65 at AF and 22.35 at FG 1). Faeces of crabs
FG femaleFG male
AF femaleAF male
0
10
20
30
40
50
C (%
)
FG femaleFG male
AF femaleAF male
0,00,20,40,60,81,01,21,41,61,8
N (%
)
FG femaleFG male
AF femaleAF male
0
10
20
30
40
50
60
70
C /
N median 25%-75% range without outlier outlier
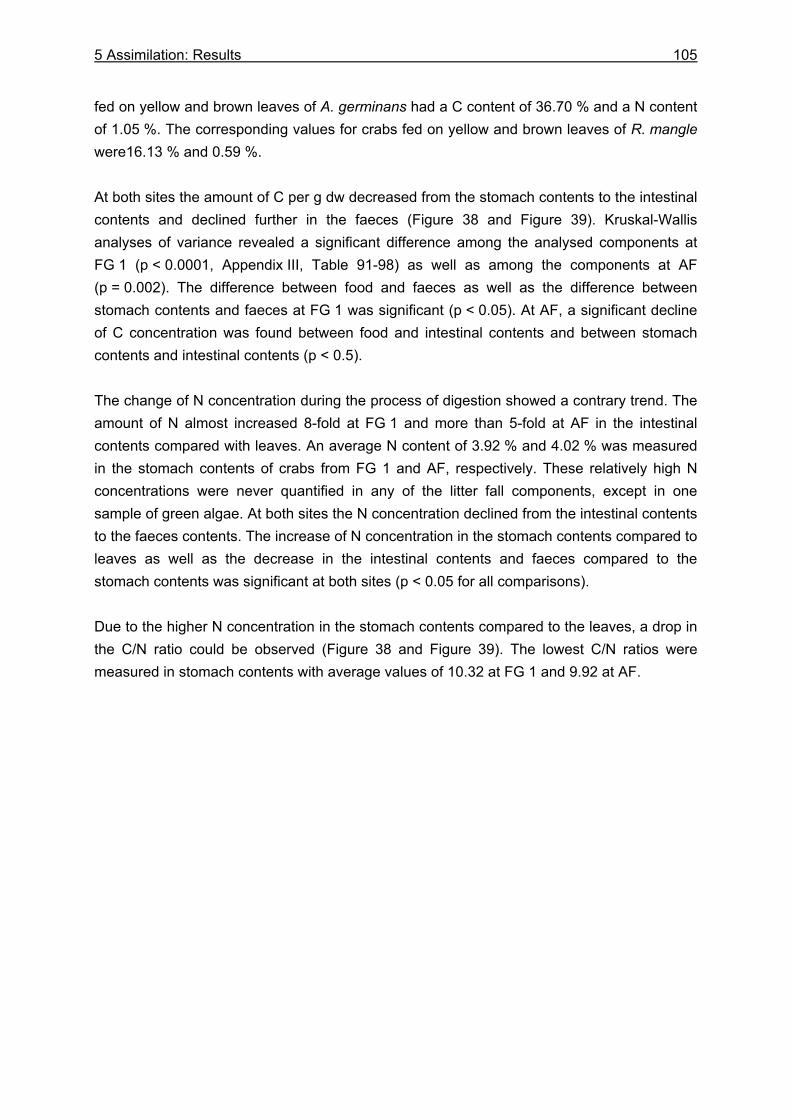
5 Assimilation: Results
105
fed on yellow and brown leaves of A. germinans had a C content of 36.70 % and a N content of 1.05 %. The corresponding values for crabs fed on yellow and brown leaves of R. mangle were16.13 % and 0.59 %. At both sites the amount of C per g dw decreased from the stomach contents to the intestinal contents and declined further in the faeces (Figure 38 and Figure 39). Kruskal-Wallis analyses of variance revealed a significant difference among the analysed components at FG 1 (p < 0.0001, Appendix III, Table 91-98) as well as among the components at AF (p = 0.002). The difference between food and faeces as well as the difference between stomach contents and faeces at FG 1 was significant (p < 0.05). At AF, a significant decline of C concentration was found between food and intestinal contents and between stomach contents and intestinal contents (p < 0.5). The change of N concentration during the process of digestion showed a contrary trend. The amount of N almost increased 8-fold at FG 1 and more than 5-fold at AF in the intestinal contents compared with leaves. An average N content of 3.92 % and 4.02 % was measured in the stomach contents of crabs from FG 1 and AF, respectively. These relatively high N concentrations were never quantified in any of the litter fall components, except in one sample of green algae. At both sites the N concentration declined from the intestinal contents to the faeces contents. The increase of N concentration in the stomach contents compared to leaves as well as the decrease in the intestinal contents and faeces compared to the stomach contents was significant at both sites (p < 0.05 for all comparisons). Due to the higher N concentration in the stomach contents compared to the leaves, a drop in the C/N ratio could be observed (Figure 38 and Figure 39). The lowest C/N ratios were measured in stomach contents with average values of 10.32 at FG 1 and 9.92 at AF.
106 5 Assimilation: Results
Figure 38: Average C and N concentrations in % dry weight and the C/N ratio of food, stomach contents, intestinal contents, and faeces for U. cordatus feeding at FG 1.
.
Food Stomach Intestine Faeces0
10
20
30
40
50
C (%
)
Rh
yello
w
Rh
brow
nAl
gae
Lab.
Burro
w
Fiel
d
Sedi
men
t
Rh
Prop
.
.
Food Stomach Intestine Faeces0
1
2
3
4
5
N (%
)
Rh
yello
wR
h br
own
Alga
e
Lab.
Burro
w
Fiel
d
Sedi
men
t
Rh
Prop
.
.
Food Stomach Intestine Faeces0
20
40
60
80
100
120
C /
N
Rh
yello
w
Rh
brow
nAl
gae
Lab.
Burro
w
Fiel
d
Sedi
men
t
Rh
Prop
.
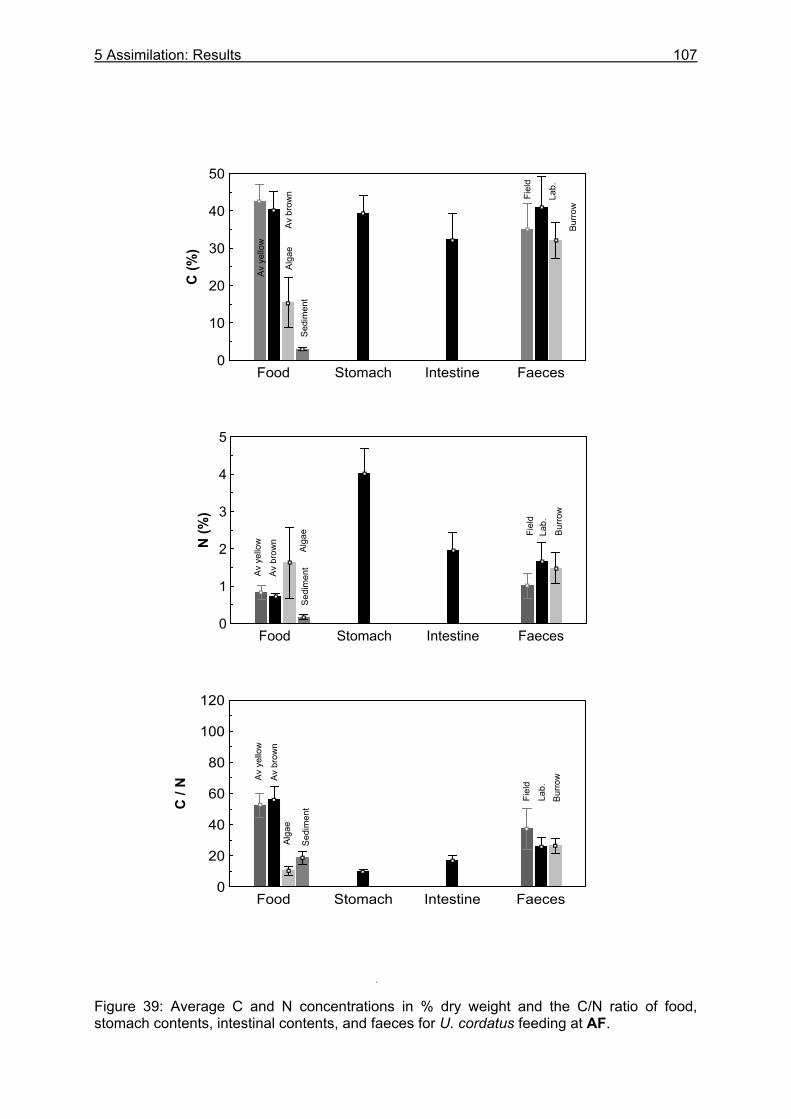
5 Assimilation: Results
107
Figure 39: Average C and N concentrations in % dry weight and the C/N ratio of food, stomach contents, intestinal contents, and faeces for U. cordatus feeding at AF.
.
Food Stomach Intestine Faeces0
10
20
30
40
50C
(%)
Av y
ello
w
Av b
row
nAl
gae
Lab.
Burro
w
Fiel
d
Sedi
men
t
.
Food Stomach Intestine Faeces0
1
2
3
4
5
N (%
)
Av y
ello
w
Av b
row
n
Alga
e Lab.
Burro
w
Fiel
d
Sedi
men
t
.
Food Stomach Intestine Faeces0
20
40
60
80
100
120
C /
N Av y
ello
w
Av b
row
nAl
gae
Lab.
Burro
w
Fiel
d
Sedi
men
t
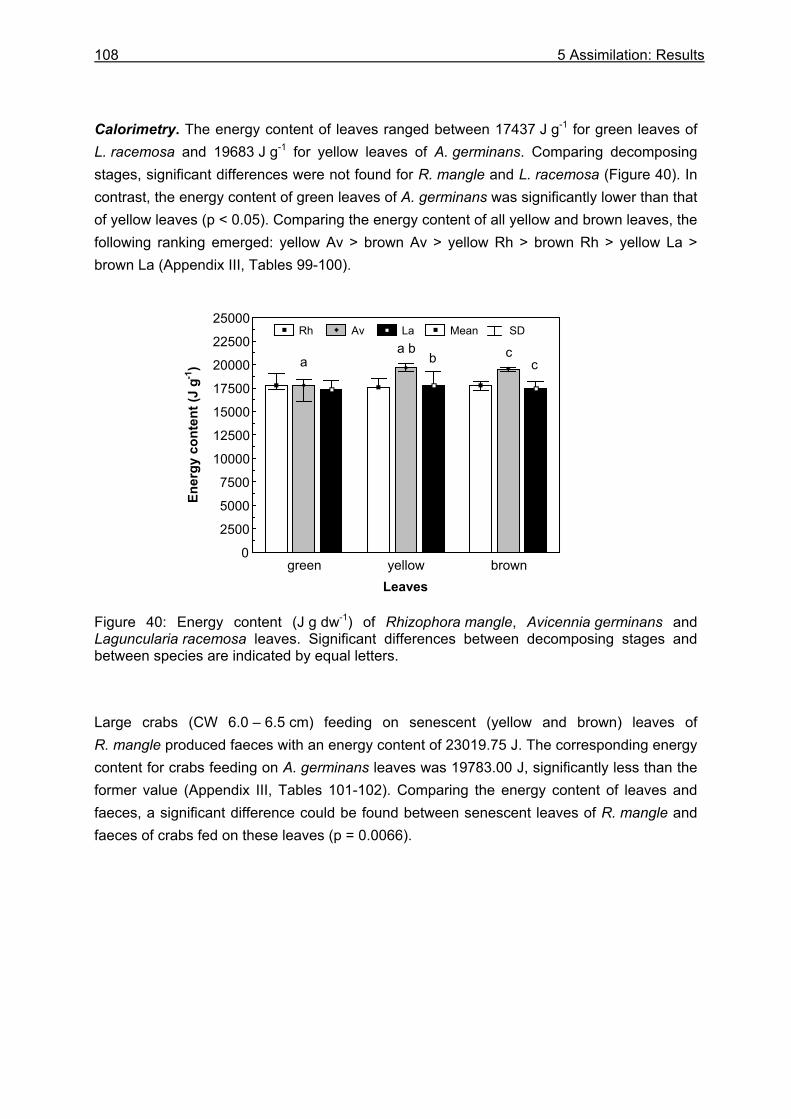
108 5 Assimilation: Results
Calorimetry. The energy content of leaves ranged between 17437 J g-1 for green leaves of L. racemosa and 19683 J g-1 for yellow leaves of A. germinans. Comparing decomposing stages, significant differences were not found for R. mangle and L. racemosa (Figure 40). In contrast, the energy content of green leaves of A. germinans was significantly lower than that of yellow leaves (p < 0.05). Comparing the energy content of all yellow and brown leaves, the following ranking emerged: yellow Av > brown Av > yellow Rh > brown Rh > yellow La > brown La (Appendix III, Tables 99-100). Figure 40: Energy content (J g dw-1) of Rhizophora mangle, Avicennia germinans and Laguncularia racemosa leaves. Significant differences between decomposing stages and between species are indicated by equal letters. Large crabs (CW 6.0 – 6.5 cm) feeding on senescent (yellow and brown) leaves of R. mangle produced faeces with an energy content of 23019.75 J. The corresponding energy content for crabs feeding on A. germinans leaves was 19783.00 J, significantly less than the former value (Appendix III, Tables 101-102). Comparing the energy content of leaves and faeces, a significant difference could be found between senescent leaves of R. mangle and faeces of crabs fed on these leaves (p = 0.0066).
green yellow brownLeaves
0
2500
5000
7500
10000
12500
15000
17500
20000
22500
25000
Ener
gy c
onte
nt (J
g-1
)
Rh Av La Mean SD
aa b
b cc
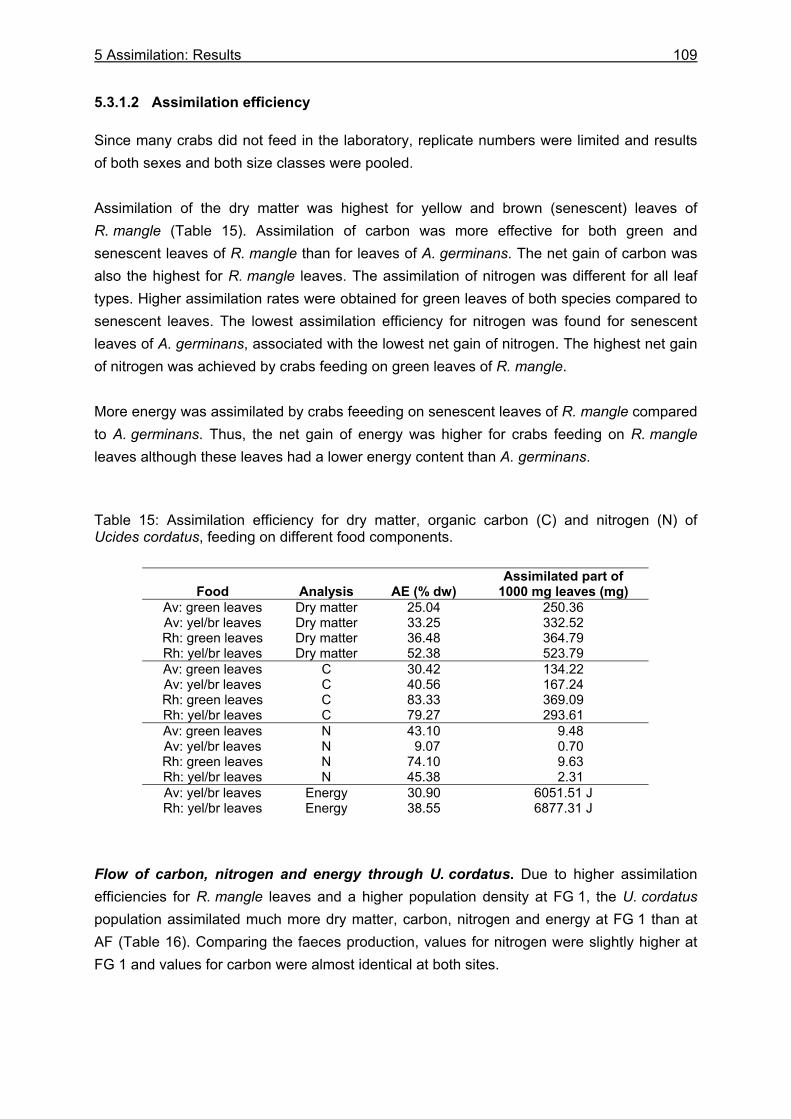
5 Assimilation: Results
109
5.3.1.2 Assimilation efficiency
Since many crabs did not feed in the laboratory, replicate numbers were limited and results of both sexes and both size classes were pooled. Assimilation of the dry matter was highest for yellow and brown (senescent) leaves of R. mangle (Table 15). Assimilation of carbon was more effective for both green and senescent leaves of R. mangle than for leaves of A. germinans. The net gain of carbon was also the highest for R. mangle leaves. The assimilation of nitrogen was different for all leaf types. Higher assimilation rates were obtained for green leaves of both species compared to senescent leaves. The lowest assimilation efficiency for nitrogen was found for senescent leaves of A. germinans, associated with the lowest net gain of nitrogen. The highest net gain of nitrogen was achieved by crabs feeding on green leaves of R. mangle. More energy was assimilated by crabs feeeding on senescent leaves of R. mangle compared to A. germinans. Thus, the net gain of energy was higher for crabs feeding on R. mangle leaves although these leaves had a lower energy content than A. germinans. Table 15: Assimilation efficiency for dry matter, organic carbon (C) and nitrogen (N) of Ucides cordatus, feeding on different food components.
Food
Analysis AE (% dw)
Assimilated part of 1000 mg leaves (mg)
Av: green leaves Dry matter 25.04 250.36 Av: yel/br leaves Dry matter 33.25 332.52 Rh: green leaves Dry matter 36.48 364.79 Rh: yel/br leaves Dry matter 52.38 523.79 Av: green leaves C 30.42 134.22 Av: yel/br leaves C 40.56 167.24 Rh: green leaves C 83.33 369.09 Rh: yel/br leaves C 79.27 293.61 Av: green leaves N 43.10 9.48 Av: yel/br leaves N 9.07 0.70 Rh: green leaves N 74.10 9.63 Rh: yel/br leaves N 45.38 2.31 Av: yel/br leaves Energy 30.90 6051.51 J Rh: yel/br leaves Energy 38.55 6877.31 J
Flow of carbon, nitrogen and energy through U. cordatus. Due to higher assimilation efficiencies for R. mangle leaves and a higher population density at FG 1, the U. cordatus population assimilated much more dry matter, carbon, nitrogen and energy at FG 1 than at AF (Table 16). Comparing the faeces production, values for nitrogen were slightly higher at FG 1 and values for carbon were almost identical at both sites.
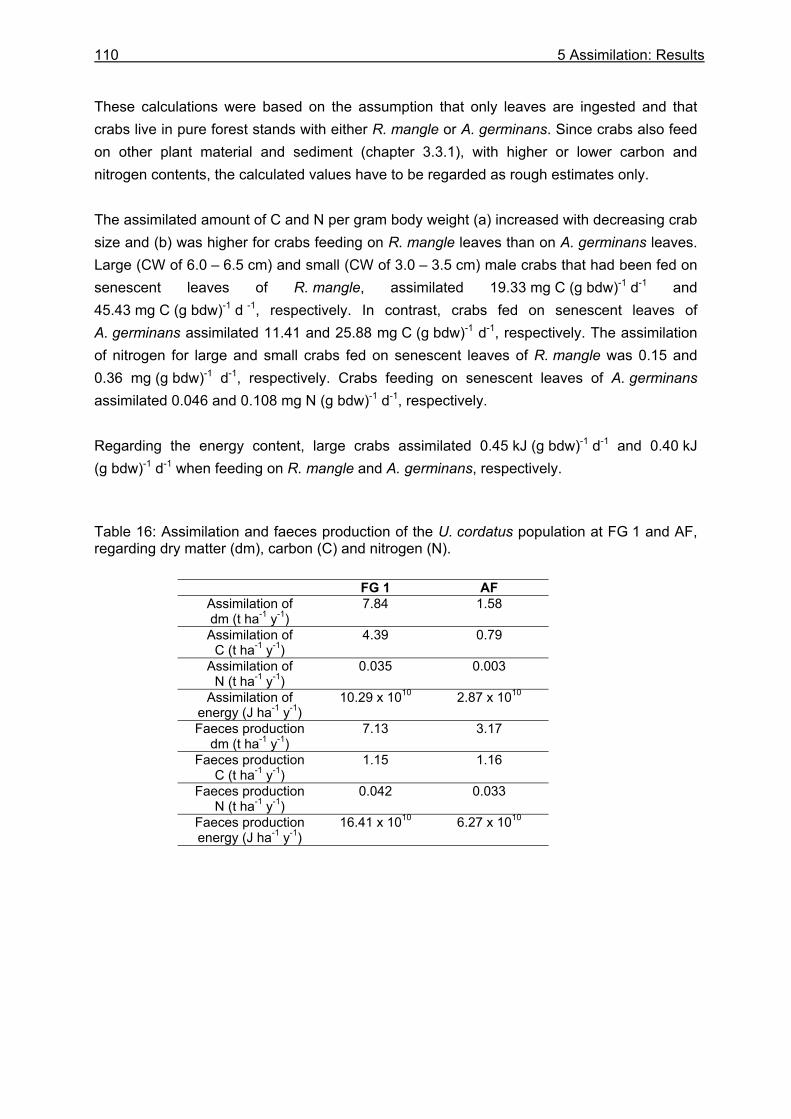
110 5 Assimilation: Results
These calculations were based on the assumption that only leaves are ingested and that crabs live in pure forest stands with either R. mangle or A. germinans. Since crabs also feed on other plant material and sediment (chapter 3.3.1), with higher or lower carbon and nitrogen contents, the calculated values have to be regarded as rough estimates only. The assimilated amount of C and N per gram body weight (a) increased with decreasing crab size and (b) was higher for crabs feeding on R. mangle leaves than on A. germinans leaves. Large (CW of 6.0 – 6.5 cm) and small (CW of 3.0 – 3.5 cm) male crabs that had been fed on senescent leaves of R. mangle, assimilated 19.33 mg C (g bdw)-1 d-1 and 45.43 mg C (g bdw)-1 d -1, respectively. In contrast, crabs fed on senescent leaves of A. germinans assimilated 11.41 and 25.88 mg C (g bdw)-1 d-1, respectively. The assimilation of nitrogen for large and small crabs fed on senescent leaves of R. mangle was 0.15 and 0.36 mg (g bdw)-1 d-1, respectively. Crabs feeding on senescent leaves of A. germinans assimilated 0.046 and 0.108 mg N (g bdw)-1 d-1, respectively. Regarding the energy content, large crabs assimilated 0.45 kJ (g bdw)-1 d-1 and 0.40 kJ (g bdw)-1 d-1 when feeding on R. mangle and A. germinans, respectively. Table 16: Assimilation and faeces production of the U. cordatus population at FG 1 and AF, regarding dry matter (dm), carbon (C) and nitrogen (N).
FG 1 AF Assimilation of dm (t ha-1 y-1)
7.84 1.58
Assimilation of C (t ha-1 y-1)
4.39 0.79
Assimilation of N (t ha-1 y-1)
0.035 0.003
Assimilation of energy (J ha-1 y-1)
10.29 x 10¹⁰ 2.87 x 10¹⁰
Faeces production dm (t ha-1 y-1)
7.13 3.17
Faeces production C (t ha-1 y-1)
1.15 1.16
Faeces production N (t ha-1 y-1)
0.042 0.033
Faeces production energy (J ha-1 y-1)
16.41 x 10¹⁰ 6.27 x 10¹⁰
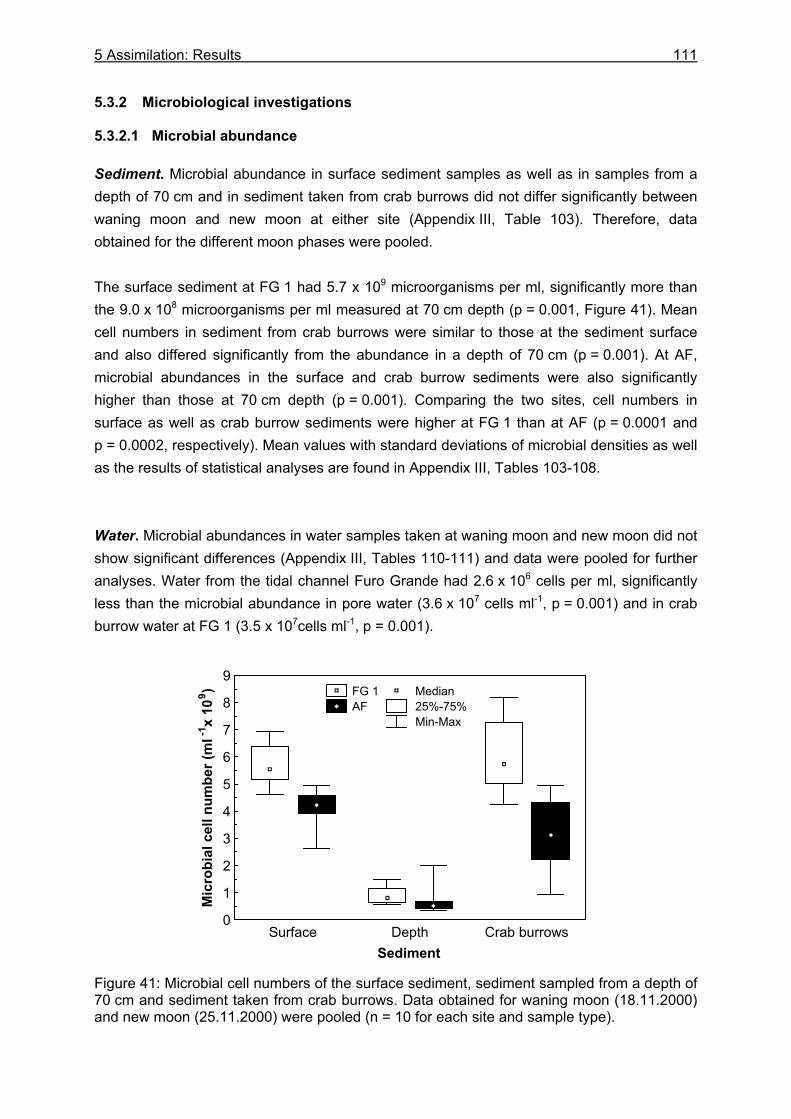
5 Assimilation: Results
111
5.3.2 Microbiological investigations
5.3.2.1 Microbial abundance
Sediment. Microbial abundance in surface sediment samples as well as in samples from a depth of 70 cm and in sediment taken from crab burrows did not differ significantly between waning moon and new moon at either site (Appendix III, Table 103). Therefore, data obtained for the different moon phases were pooled. The surface sediment at FG 1 had 5.7 x 10⁹ microorganisms per ml, significantly more than the 9.0 x 10⁸ microorganisms per ml measured at 70 cm depth (p = 0.001, Figure 41). Mean cell numbers in sediment from crab burrows were similar to those at the sediment surface and also differed significantly from the abundance in a depth of 70 cm (p = 0.001). At AF, microbial abundances in the surface and crab burrow sediments were also significantly higher than those at 70 cm depth (p = 0.001). Comparing the two sites, cell numbers in surface as well as crab burrow sediments were higher at FG 1 than at AF (p = 0.0001 and p = 0.0002, respectively). Mean values with standard deviations of microbial densities as well as the results of statistical analyses are found in Appendix III, Tables 103-108. Water. Microbial abundances in water samples taken at waning moon and new moon did not show significant differences (Appendix III, Tables 110-111) and data were pooled for further analyses. Water from the tidal channel Furo Grande had 2.6 x 10⁶ cells per ml, significantly less than the microbial abundance in pore water (3.6 x 10⁷ cells ml-1, p = 0.001) and in crab burrow water at FG 1 (3.5 x 10⁷cells ml-1, p = 0.001). Figure 41: Microbial cell numbers of the surface sediment, sediment sampled from a depth of 70 cm and sediment taken from crab burrows. Data obtained for waning moon (18.11.2000) and new moon (25.11.2000) were pooled (n = 10 for each site and sample type).
Surface Depth Crab burrowsSediment
0
1
2
3
4
5
6
7
8
9
Mic
robi
al c
ell n
umbe
r (m
l-1x
109 ) FG 1 Median
AF 25%-75% Min-Max
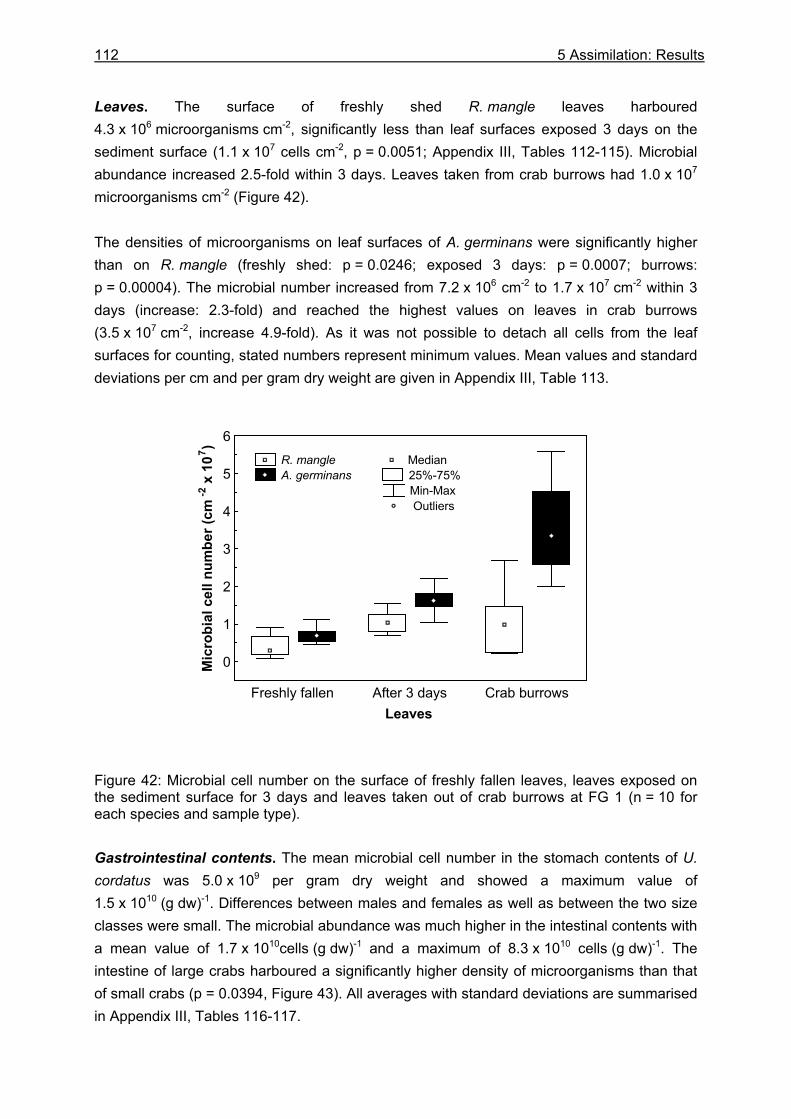
112 5 Assimilation: Results
Leaves. The surface of freshly shed R. mangle leaves harboured 4.3 x 10⁶ microorganisms cm-2, significantly less than leaf surfaces exposed 3 days on the sediment surface (1.1 x 10⁷ cells cm-2, p = 0.0051; Appendix III, Tables 112-115). Microbial abundance increased 2.5-fold within 3 days. Leaves taken from crab burrows had 1.0 x 10⁷ microorganisms cm-2 (Figure 42). The densities of microorganisms on leaf surfaces of A. germinans were significantly higher than on R. mangle (freshly shed: p = 0.0246; exposed 3 days: p = 0.0007; burrows: p = 0.00004). The microbial number increased from 7.2 x 106 cm-2 to 1.7 x 107 cm-2 within 3 days (increase: 2.3-fold) and reached the highest values on leaves in crab burrows (3.5 x 107 cm-2, increase 4.9-fold). As it was not possible to detach all cells from the leaf surfaces for counting, stated numbers represent minimum values. Mean values and standard deviations per cm and per gram dry weight are given in Appendix III, Table 113. Figure 42: Microbial cell number on the surface of freshly fallen leaves, leaves exposed on the sediment surface for 3 days and leaves taken out of crab burrows at FG 1 (n = 10 for each species and sample type). Gastrointestinal contents. The mean microbial cell number in the stomach contents of U. cordatus was 5.0 x 10⁹ per gram dry weight and showed a maximum value of 1.5 x 10¹⁰ (g dw)-1. Differences between males and females as well as between the two size classes were small. The microbial abundance was much higher in the intestinal contents with a mean value of 1.7 x 10¹⁰cells (g dw)-1 and a maximum of 8.3 x 10¹⁰ cells (g dw)-1. The intestine of large crabs harboured a significantly higher density of microorganisms than that of small crabs (p = 0.0394, Figure 43). All averages with standard deviations are summarised in Appendix III, Tables 116-117.
Freshly fallen After 3 days Crab burrowsLeaves
0
1
2
3
4
5
6
Mic
robi
al c
ell n
umbe
r (cm
-2 x
107 )
R. mangle Median A. germinans 25%-75%
Min-Max Outliers
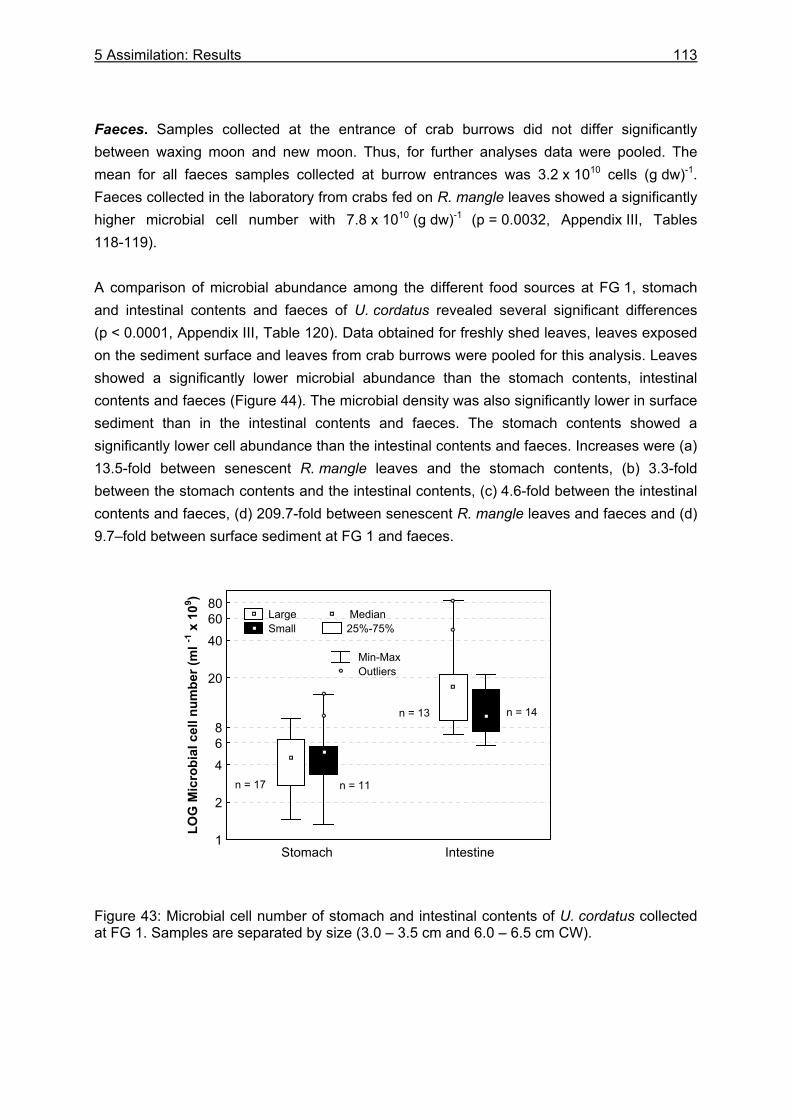
5 Assimilation: Results
113
Faeces. Samples collected at the entrance of crab burrows did not differ significantly between waxing moon and new moon. Thus, for further analyses data were pooled. The mean for all faeces samples collected at burrow entrances was 3.2 x 10¹⁰ cells (g dw)-1. Faeces collected in the laboratory from crabs fed on R. mangle leaves showed a significantly higher microbial cell number with 7.8 x 10¹⁰ (g dw)-1 (p = 0.0032, Appendix III, Tables 118-119). A comparison of microbial abundance among the different food sources at FG 1, stomach and intestinal contents and faeces of U. cordatus revealed several significant differences (p < 0.0001, Appendix III, Table 120). Data obtained for freshly shed leaves, leaves exposed on the sediment surface and leaves from crab burrows were pooled for this analysis. Leaves showed a significantly lower microbial abundance than the stomach contents, intestinal contents and faeces (Figure 44). The microbial density was also significantly lower in surface sediment than in the intestinal contents and faeces. The stomach contents showed a significantly lower cell abundance than the intestinal contents and faeces. Increases were (a) 13.5-fold between senescent R. mangle leaves and the stomach contents, (b) 3.3-fold between the stomach contents and the intestinal contents, (c) 4.6-fold between the intestinal contents and faeces, (d) 209.7-fold between senescent R. mangle leaves and faeces and (d) 9.7–fold between surface sediment at FG 1 and faeces. Figure 43: Microbial cell number of stomach and intestinal contents of U. cordatus collected at FG 1. Samples are separated by size (3.0 – 3.5 cm and 6.0 – 6.5 cm CW).
Stomach Intestine1
2
468
20
406080
LOG
Mic
robi
al c
ell n
umbe
r (m
l-1 x
109 )
Large Median Small 25%-75%
Min-Max Outliers
n = 17 n = 11
n = 13 n = 14
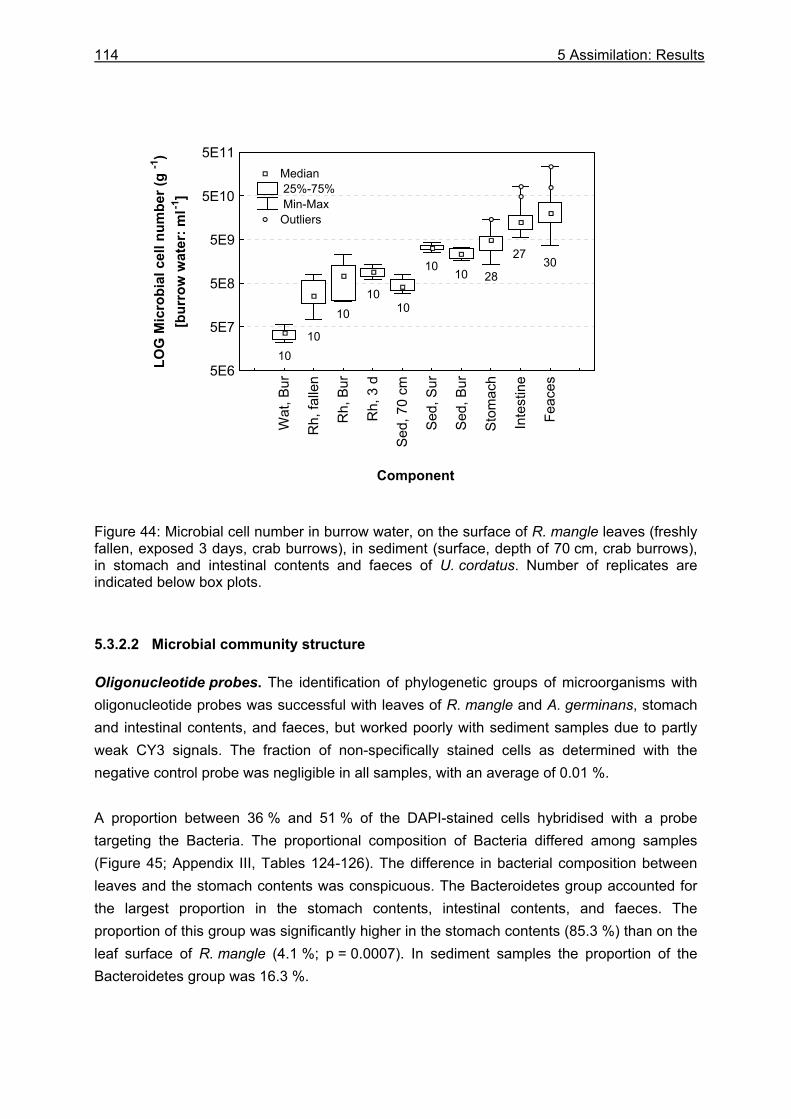
114 5 Assimilation: Results
Figure 44: Microbial cell number in burrow water, on the surface of R. mangle leaves (freshly fallen, exposed 3 days, crab burrows), in sediment (surface, depth of 70 cm, crab burrows), in stomach and intestinal contents and faeces of U. cordatus. Number of replicates are indicated below box plots. 5.3.2.2 Microbial community structure
Oligonucleotide probes. The identification of phylogenetic groups of microorganisms with oligonucleotide probes was successful with leaves of R. mangle and A. germinans, stomach and intestinal contents, and faeces, but worked poorly with sediment samples due to partly weak CY3 signals. The fraction of non-specifically stained cells as determined with the negative control probe was negligible in all samples, with an average of 0.01 %. A proportion between 36 % and 51 % of the DAPI-stained cells hybridised with a probe targeting the Bacteria. The proportional composition of Bacteria differed among samples (Figure 45; Appendix III, Tables 124-126). The difference in bacterial composition between leaves and the stomach contents was conspicuous. The Bacteroidetes group accounted for the largest proportion in the stomach contents, intestinal contents, and faeces. The proportion of this group was significantly higher in the stomach contents (85.3 %) than on the leaf surface of R. mangle (4.1 %; p = 0.0007). In sediment samples the proportion of the Bacteroidetes group was 16.3 %.
Wat
, Bur
Rh,
falle
n
Rh,
Bur
Rh,
3 d
Sed,
70
cm
Sed,
Sur
Sed,
Bur
Stom
ach
Inte
stin
e
Feac
es
Component
5E6
5E7
5E8
5E9
5E10
5E11LO
G M
icro
bial
cel
l num
ber (
g-1
)[b
urro
w w
ater
: ml-1
] Median
25%-75% Min-Max
Outliers
10
3027
281010
1010
10
10
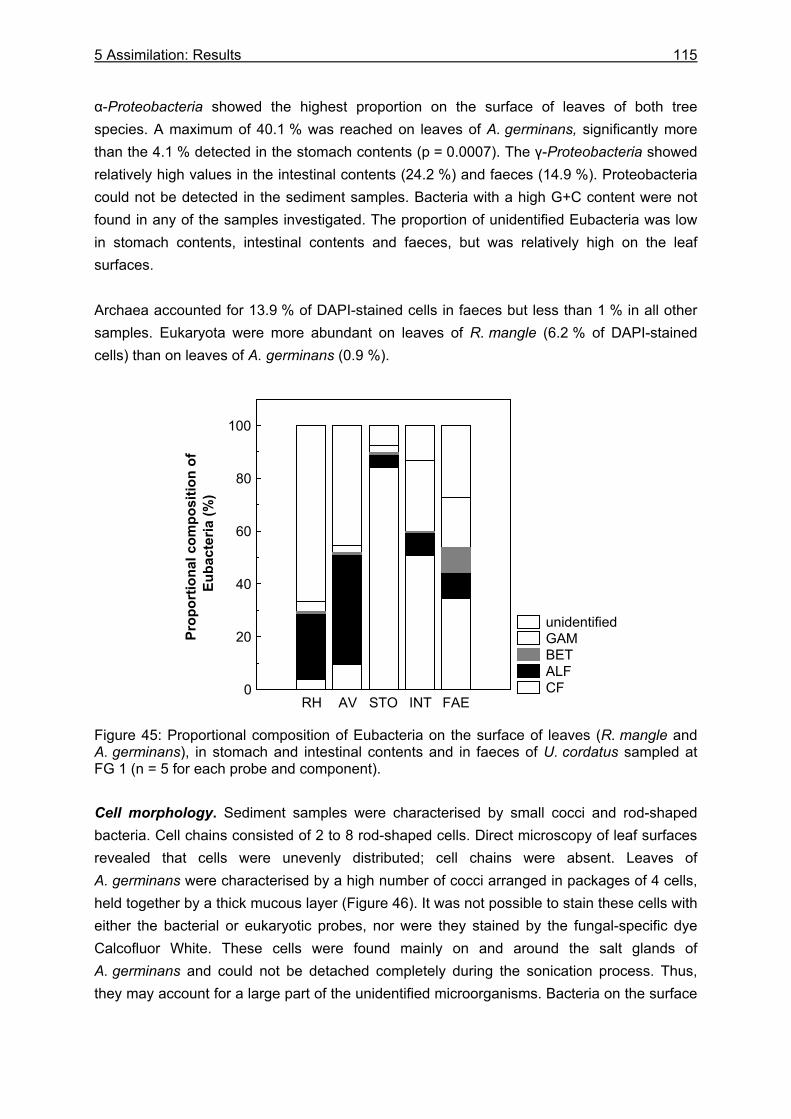
5 Assimilation: Results
115
α-Proteobacteria showed the highest proportion on the surface of leaves of both tree species. A maximum of 40.1 % was reached on leaves of A. germinans, significantly more than the 4.1 % detected in the stomach contents (p = 0.0007). The γ-Proteobacteria showed relatively high values in the intestinal contents (24.2 %) and faeces (14.9 %). Proteobacteria could not be detected in the sediment samples. Bacteria with a high G+C content were not found in any of the samples investigated. The proportion of unidentified Eubacteria was low in stomach contents, intestinal contents and faeces, but was relatively high on the leaf surfaces. Archaea accounted for 13.9 % of DAPI-stained cells in faeces but less than 1 % in all other samples. Eukaryota were more abundant on leaves of R. mangle (6.2 % of DAPI-stained cells) than on leaves of A. germinans (0.9 %). Figure 45: Proportional composition of Eubacteria on the surface of leaves (R. mangle and A. germinans), in stomach and intestinal contents and in faeces of U. cordatus sampled at FG 1 (n = 5 for each probe and component). Cell morphology. Sediment samples were characterised by small cocci and rod-shaped bacteria. Cell chains consisted of 2 to 8 rod-shaped cells. Direct microscopy of leaf surfaces revealed that cells were unevenly distributed; cell chains were absent. Leaves of A. germinans were characterised by a high number of cocci arranged in packages of 4 cells, held together by a thick mucous layer (Figure 46). It was not possible to stain these cells with either the bacterial or eukaryotic probes, nor were they stained by the fungal-specific dye Calcofluor White. These cells were found mainly on and around the salt glands of A. germinans and could not be detached completely during the sonication process. Thus, they may account for a large part of the unidentified microorganisms. Bacteria on the surface
unidentified GAM BET ALF CF
RH AV STO INT FAE0
20
40
60
80
100
Prop
ortio
nal c
ompo
sitio
n of
Eub
acte
ria (%
)
116 5 Assimilation: Results
of R. mangle were more evenly distributed and consisted of cocci and rods. The packages of coccoid cells found on leaves of A. germinans were lacking on leaves of R. mangle. Relatively large vibrioid cells, belonging to the Bacteroidetes group, were found in small and large aggregates in the stomach and intestinal contents. They seem to be monocultures of morphologically identical bacteria and showed a very strong fluorescence. Vibrioid cells were not found in sediment samples or on leaf surfaces. Bacteroidetes cells were also frequent in faecal samples, but these were predominantly rods and filamentous bacteria (Figure 46). The proportion of filaments in the faeces (11.1 %) was significantly higher than in the stomach contents (5.9 %) or intestinal contents (5.7 %, p = 0.0001). 5.3.2.3 Bacterial biomass
Bacterial carbon and nitrogen content in relation to the total organic carbon and nitrogen content is given in Table 17. The surface of mangrove leaves contained a very low amount of bacterial carbon and nitrogen. The highest bacterial carbon and nitrogen concentrations were found in faecal material collected at burrow entrances at FG 1. Table 17: Bacterial carbon and nitrogen content in relation to total carbon and nitrogen content of surface sediment, senescent mangrove leaves, leaves taken from crab burrows, stomach and intestinal contents, and faeces collected at burrow entrances.
Sample Bacterial carbon (% of total organic C in sample)
Bacterial nitrogen (% of total organic N in sample)
Surface sediment FG 1 0.17 – 0.88 0.46 – 2.32 Surface sediment AF 0.10 – 0.49 0.27 – 1.39 Rh leaves: senescent 0.002 – 0.008 0.02 – 0.09 Av leaves: senescent 0.001 – 0.007 0.004 – 0.062 Rh leaves: burrows 0.005 – 0.021 0.07 – 0.25 Av leaves: burrows 0.003 – 0.039 0.02 – 0.34 Stomach contents 0.11 – 0.42 0.18 – 0.68 Intestinal contents 0.17 – 1.95 0.43 – 4.98 Faeces at FG 1 0.66 – 3.27 3.74 – 18.51
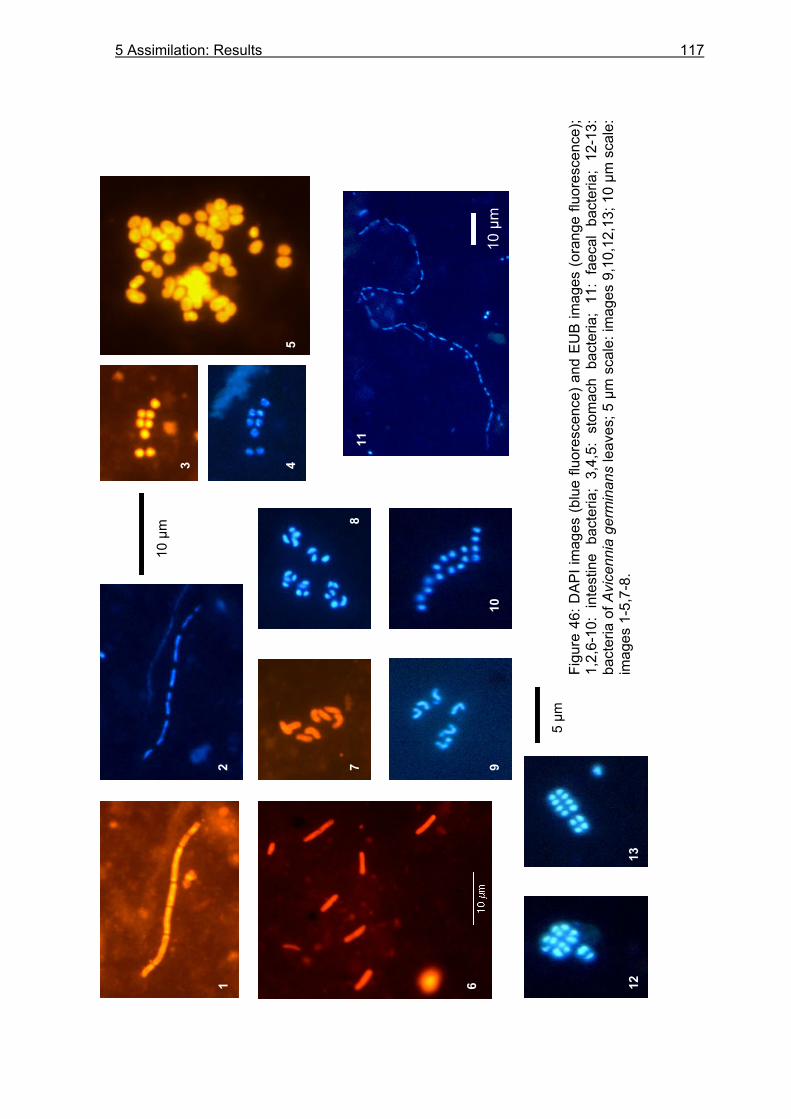
5 As
sim
ilatio
n: R
esul
ts
5 µm
10 µ
m
10 µ
m
12
3 45
6
78
910
11
1213
Figu
re 4
6: D
API i
mag
es (b
lue
fluor
esce
nce)
and
EU
B im
ages
(ora
nge
fluor
esce
nce)
;1,
2,6-
10:
inte
stin
e ba
cter
ia;
3,4,
5: s
tom
ach
bact
eria
; 11
: fa
ecal
bac
teria
; 12
-13:
bact
eria
of A
vice
nnia
ger
min
ans
leav
es; 5
µm
sca
le: i
mag
es 9
,10,
12,1
3; 1
0 µm
sca
le:
imag
es 1
-5,7
-8.
5 Assimilation: Results 117
118 5 Assimilation: Discussion
5.4 Discussion
5.4.1 Assimilation
5.4.1.1 Food characteristics
Carbon and nitrogen content. The high C:N ratios determined for mangrove leaf litter, stipules and propagules (ranging from 52.4 to 81.8) suggest a low nutritional value of the main food sources of U. cordatus. According to Russel-Hunter (1970), a C:N ratio below 17 best allows for a sustainable animal nutrition. The observed additional intake of green and brown algae with low C:N ratios of 8.3 and 11.4 might thus be an essential food compensating the low nutritional value of mangrove litter. In contrast to nitrogen, carbon values were high. Thus, if plant litter is available in ample amounts, enough carbon is provided to U. cordatus. Brown leaves had a lower carbon content than yellow leaves of all tree species, indicating the commencing of decomposition. This coincides with reports of Cundell et al. (1979), who found that the carbon content of yellow R. mangle leaves from Florida decreased from 46.2 % to 36.2 % within 70 days of immersion in the sea, reflecting their microbial degradation. During the same time the nitrogen concentration increased from 0.51 % to 0.89 %. In contrast, R. mangle leaves collected from the forest floor of the Caeté estuary showed a slight decrease in nitrogen when turning from yellow to brown. Since most parts of the Bragança peninsula belong to the high-intertidal and are inundated only around spring tides, collected leaves had decomposed between 0.5 and 7 days (according to spring and neap tide, respectively), much less compared to the study of Cundell et al. (1979). Thus, an increase of nitrogen due to colonization by microorganisms must occur in a later stage of decomposition. In fact, this study revealed that microbial biomass on leaf surfaces was low and increased only 2.5-fold on the surface of R. mangle leaves within 3 days of exposure on the sediment surface. According to Camilleri (1989), the nitrogen content of R. stylosa leaves did not differ between yellow leaves collected from trees and leaves that had aged for 20 days on the forest floor. Thus, the C:N ratio decreased only slightly, similar to R. mangle leaves at the Caeté estuary. Decomposing experiments with A. marina leaves revealed a decrease of both the carbon and the nitrogen content within 20 days (Camilleri 1989). The C:N ratio increased from 30.2 to 52.7. These findings are similar to the decomposing leaves of A. germinans in the Caeté estuary, where the C:N ratio was 20.2 for green leaves and 56.0 for brown leaves. In terms of the C:N ratio (16.1), surface sediment at FG and AF appears to be a favourable food source. U. cordatus has often been seen feeding on sediment, probably using adhered bacteria for its nutrition (chapter 5.4.2.2). The content of organic carbon in the surface sediment (2.31 %) was slightly higher than for samples taken at 70 cm depth (2.19 %), possibly due to a slightly higher concentration of detritus and microorganisms. Koch (2002) reported that surface sediment samples taken from various mangrove areas on the peninsula
5 Assimilation: Discussion
119
had an even lower C:N ratio (14.1) and a slightly higher mean concentration of organic carbon (3.00 %) and nitrogen (0.22 %). The nitrogen content of the sediment was similar to that reported for other mangrove areas (Steinke et al. 1993, Skov and Hartnoll 2002), but was low compared to soils in general (0.1 - 1.1 %, Kihlberg 1972). The carbon content was somewhat lower than that in other mangroves (Skov and Hartnoll 2002) and was at the lower end of the overall range, accounting for 0.2 – 5 % in mineral soils and for 30 – 55 % in organic soils (Allen 1989). The carbon and nitrogen content of sediment taken from crab burrows neither differed from that of surface samples nor from controls. At FG, this may be due to the fact that U. cordatus removes most of the plant litter from the surface, the remaining is flushed away with receding tides. Therefore, high loads of organic material do not accumulate on the sediment surface. Crab faeces, rich in carbon and nitrogen compared to the sediment, are produced at burrow entrances, in the galleries and in deeper parts of the burrows. Burrowing activities by crabs probably mix up the sediment with parts of decomposing leaves and faecal material, thus distributing the nutrients. In addition, it is likely that tidal movement distributes nutrients within the sediment. At AF however, plant litter remains at the sediment surface for weeks and higher carbon concentrations can be expected at the surface. Since samples near decomposing leaves were not taken, it is possible that the whole range of carbon concentrations had not been detected. However, during another sampling occasion, the organic content in surface sediment, burrow sediment and controls at 70 cm depth was twice as much at AF compared to FG, reflecting the higher amount of leaf material on the forest floor and in deeper sediment layers. This indicates a distribution of nutrients within the sediment due to burrowing activities at AF. Energy content. Brown leaves of A. germinans have the highest caloric content of all mangrove leaves investigated and potentially should have the highest value to U. cordatus. However, lower assimilation efficiencies for A. germinans leaves do not support this assumption (chapter 5.3.1.2). The energy content of R. mangle leaves decreased slightly from green to brown leaves at FG, while that of A. germinans leaves at AF increased slightly from green to brown leaves. This difference might be due to a different decomposition speed of the species or longer decomposition times of A. germinans at the forest floor due to the lower inundation frequency at AF. Cundell et al. (1979) reported that the energy content of R. mangle leaves in Florida was only slightly lower after 14 days of immersion in the sea, but after 40 days the value decreased considerably. This was followed by an increase of the energy content after 70 days. The tendency of an increasing energy content after a long decomposition period was also found for Ceriops tagal leaves from Australia (Giddens et al. 1986). Green, yellow and brown leaves of L. racemosa showed only slight differences of their energy content. This is probably also due to the relatively short decomposition times at FG.
120 5 Assimilation: Discussion
Tannins. Flavolans, or condensed tannins, are present in relatively high concentrations in mangrove leaves and they are thought to deter herbivores from feeding on them (Giddens et al. 1986, Neilson et al. 1986, Steinke et al. 1993, Hogarth 1999). Since the tannin content is much higher in Rhizophora than in Avicennia leaves (Hogarth 1999) it was expected that U. cordatus prefers the latter. For instance, fresh and senescent R. stylosa leaf litter had tannin concentrations of 13.3 % dw and 17.4 % dw, respectively, at mangrove areas in northeastern Australia (Micheli 1993, Lee 1997). Even higher values were reported from an Indian mangrove with tannin concentrations of 35.6 % for R. apiculata (Basak et al. 1998). Green leaves of A. marina only had tannin concentrations of 1.8 % in a South African mangrove (Steinke et al. 1993). Several studies revealed that tannins partly leach out of leaves into seawater during decomposition (Cundell et al. 1979, Camilleri and Ribi 1986, Neilson et al. 1986, Robertson 1988) and leaves might thus become more palatable to crabs (Giddens et al. 1986, Steinke et al. 1993). However, U. cordatus does not show preferences for green or decomposing A. germinans leaves despite the low tannin concentrations compared to R. mangle. Since higher assimilation rates were obtained for R. mangle leaves, digestibility is obviously not hampered by tannins. Does leaf-storage occur in crab burrows ? The carbon and nitrogen content of leaves in crab burrows at FG 1 did not differ significantly from leaves collected at the sediment surface, suggesting that leaves were not stored for longer periods in the burrows. Since the amount of plant litter in most burrows was small, crabs probably consume collected leaves within hours to days. At AF, A. germinans leaves taken out of crab burrows had a slightly higher nitrogen content and a slightly lower C:N ratio than leaves collected from the forest floor. Thus, at AF leaf-storage was probably somewhat longer than at FG, but cannot have occurred for very long periods. This may be due to the high availability of leaves at AF during the sampling period and more leaf litter in crab burrows compared to FG 1 (chapter 3.3.3.1). Thus, it is possible that U. cordatus collects more leaves than it is able to process and part of the leaves are eaten later or never. Probably, leaves may partly get lost due to mixing with the sediment during the reconstruction of burrows. Leaves taken from burrows of U. cordatus may have been a few weeks old but they were not stored over periods long enough to lower the C:N ratio considerably. According to several leaf decomposing experiments, a significantly change of the carbon and nitrogen content usually occur between approximately 2.5 to 5 months (Cundell et al. 1979, Twilley et al. 1986, Robertson 1988, Steinke et al. 1993, Wafar et al. 1997). The low nutrient differences between burrow leaves and leaves on the sediment surface are in agreement with the measurements of microbial densities. The increase of microbial density and thus biomass on the surface of burrow leaves was relatively low and does not suggest that leaves had been stored in burrows for longer periods.
5 Assimilation: Discussion
121
In the case of U. cordatus the storage of leaves over several months does not seem to be advantageous as competition for burrows was often observed. Thus, from time to time crabs are forced to leave their burrows, being displaced by larger specimens. It was observed that small crabs were 2.5-fold more abundant in repopulated areas, from which most crabs had been removed before (Diele 2000). The fast recolonization of these areas (Diele, pers. comm..) suggests that competition for burrows is high. The feeding experiments (chapter 3.3.2) also suggest that U. cordatus consumes litter immediately or within several hours to days. Since the U. cordatus population is most likely food limited in many areas on the peninsula, leaf-storage probably cannot be afforded. The consumption of collected litter within burrows is thus most likely an adaptive behaviour for protection against competitors and predators during feeding. In addition, burying prevents leaves from being washed out by the tides and extend the time crabs can feed on them (Hogarth 1999). Unfavourable abiotic factors like high temperatures and low humidity probably also favour feeding inside burrows, where conditions are more stable. Leaf-ageing has been discussed for many small leaf-eating crabs and several studies confirm the findings found for U. cordatus. Sesarma messa consumed 78 % of provided leaf material within 6 hours of burial (Robertson 1988). Chemical analyses of leaves taken from burrows of several other sesarmid crabs revealed that burrow leaves never varied significantly from leaves collected on the sediment surface (Micheli 1993, Skov and Hartnoll 2002). In contrast to this study, Nascimento (1993) reported that leaves were stored and colonized by fungi in burrows of U. cordatus. Some authors stressed that leaf-ageing do occur in sesarmid crabs (Giddens et al. 1986, Steinke et al. 1993). Giddens et al. (1986) suggested leaf-ageing for Neosarmatium smithi since the C:N ratio of leaf litter decreased highly and crabs showed a preference for aged litter. Anyway, the fact that crabs choose a certain decomposition stage over another does not necessarily mean that crabs will store leaves (Skov and Hartnoll 2002), particularly when competition for leaves is high and forest floors are frequently swept clean by crabs (Robertson 1986). Skov and Hartnoll (2002) hypothesised that storage of leaves predominates only when leaf litter fall regularly exceeds the requirement of the forest floor community. Since leaf-ageing could neither be found for U. cordatus in areas with a leaf litter deficiency nor in areas with a relatively high standing litter stock, a support for this hypothesis was not found during this study.
122 5 Assimilation: Discussion
5.4.1.2 Assimilation efficiency
The results of the assimilation efficiency for U. cordatus in terms of dry matter, carbon, nitrogen and energy clearly show that the crabs can breakup and digest R. mangle leaves easier than A. germinans leaves. A. germinans leaves are tougher and have strong veins. Microscopic investigations of faeces revealed that these leaves were more difficult to masticate and digest as they contained left-overs of middle ribs and veins and showed a much coarser structure. Thus, a larger amount of leaf matter was not used by the crabs feeding on A. germinans leaves. However, A. germinans leaves decayed significantly faster than R. mangle leaves when exposed on the sediment surface on the Bragança peninsula (Schories et al. 2003). By contrast, Camilleri (1989) reported that the vascular tissue of A. marina leaves persisted much longer than that of R. stylosa leaves during decomposition. As the percentage of nitrogen increased from senescent leaves of A. germinans and R. mangle to faeces whereas the percentage of carbon decreased from leaves to faeces, crabs assimilated a higher proportion of carbon than of nitrogen. In particular, the percentage of nitrogen in the stomach was very high, which means that in the stomach carbon was assimilated more efficiently than nitrogen. An additional reason for the proportional increase of nitrogen in the stomach could be the presence of enzymes that are released into the stomach. To what extent microbial activity could be responsible for the increased nitrogen content is discussed below. Between stomach and gut and also between gut and faeces the proportion of nitrogen decreased, indicating that in the hepatopancreas and in the gut nitrogen was assimilated in a higher proportion than carbon. The same tendency, a decrease of the C:N ratio between food and gastrointestinal contents, was found for Mictyris longicarpus (Mictyridae) when feeding on sediment (Quinn 1986). The small leaf-eating crab Sesarma messa seemed to remove primarily carbon rather than nitrogen from the mangrove litter, as is reflected by the decrease in carbon but slight increase in nitrogen content of the faeces compared to mangrove litter. This agrees with the results for U. cordatus. U. cordatus showed much higher assimilation rates for nitrogen when feeding on green leaves than on senescent leaves of both tree species (Table 18) due to the higher nitrogen content of green leaves. However, less dry matter was assimilated from the green than the senescent leaves, suggesting that crabs had more difficulties to masticate green leaves due to their tougher leaf structure. This disadvantage is relative in comparison to the high nitrogen content of green leaves. A higher nitrogen assimilation for green leaves than for brown leaves was also reported for the large leaf-eating land crab Cardisoma hirtipes feeding on Ficus macrophylla (Greenaway and Raghaven 1998). The literature on assimilation efficiencies of leaf-eating crabs is widely scattered and somewhat contradictory, partly due to the application of different methods. The values determined for U. cordatus are within the range that was reported for large litter-consuming land crabs and small mangrove crabs (Table 18). The highest assimilation efficiency for dry
5 Assimilation: Discussion
123
matter (82.4 %) was reported from Sesarma meinerti feeding on A. marina leaves that were aged for 6 weeks (Emmerson and Mc Gwynne 1992). Several studies found higher assimilation efficiencies when crabs fed on aged leaf litter compared to senescent leaves (Giddens et al. 1986, Kwok and Lee 1995). Presumably leaves that had decomposed some weeks were easier to breakup by the crabs, confirming the results for U. cordatus which assimilated more dry matter from yellow than from green leaves. However, high assimilation rates as stated for S. meinerti are uncommon for most crabs feeding on leaf litter. Assimilation efficiencies from other leaf-eating crustaceans showed also a wide range (Bärlocher and Kendrick 1975, Ramadhas and Vijayaraghavan 1979). Low values were reported from Gammarus pseudolimnaeus (Amphipoda) feeding on fresh elm leaves (Bärlocher and Kendrick 1975). Since assimilation efficiencies increased highly when mycelium of various fungi was fed, the difficulty to digest leaves was confirmed. In contrast to litter-consuming crabs, detritivore crabs extracting bacteria from the sediment show much higher assimilation rates (Dye and Lasiak 1986, Quinn 1986) due to the favourable C:N ratio of bacterial biomass which is easy to digest (Dye and Lasiak 1987). Higher assimilation efficiencies were usually also reported for carnivore and omnivore crustaceans due to the higher protein content of their food (Moriarty and Barclay 1981, Rosas et al. 1993). 5.4.1.3 Energy and nutrient budget
The daily energy intake of a 65 g ww specimen of U. cordatus was 37.6 kJ, considerably more than the intake of S. meinerti (10.5 kJ d-1) (Emmerson and Mc Gwynne 1992) and the land crab Gecarcoidea natalis (6.1 kJ d-1), both of the same weight as U. cordatus. Whereas U. cordatus assimilated 14.5 kJ daily, Gecarcoidea natalis assimilated only 6.1 kJ d-1
(Greenaway and Linton 1995). Several other studies determined the energy intake of leaf-eating crabs but comparisons are restricted as a size or weight dependency of the daily food or energy intake was not provided. The daily energy intake per gram body weight of U. cordatus decreased with increasing body weight and this tendency is also suggested for other crabs. In addition, most values were obtained during laboratory experiments and might be led to underestimated intake rates. U. cordatus always fed less in the laboratory than in the field. Anyway, it becomes clear that the energy intake of U. cordatus (0.58 kJ bww-1 d-1 for a 65 g ww specimen) is relatively high compared to other leaf-eating crabs, having a range between 0.09 kJ and 0.49 kJ bww-1 d-1 (Emmerson and Mc Gwynne 1992, Micheli 1993, Greenaway and Linton 1995, Lee 1997, Greenaway and Raghaven 1998). Only the energy intake of S. meinerti was higher than that of U. cordatus (Steinke et al. 1993).
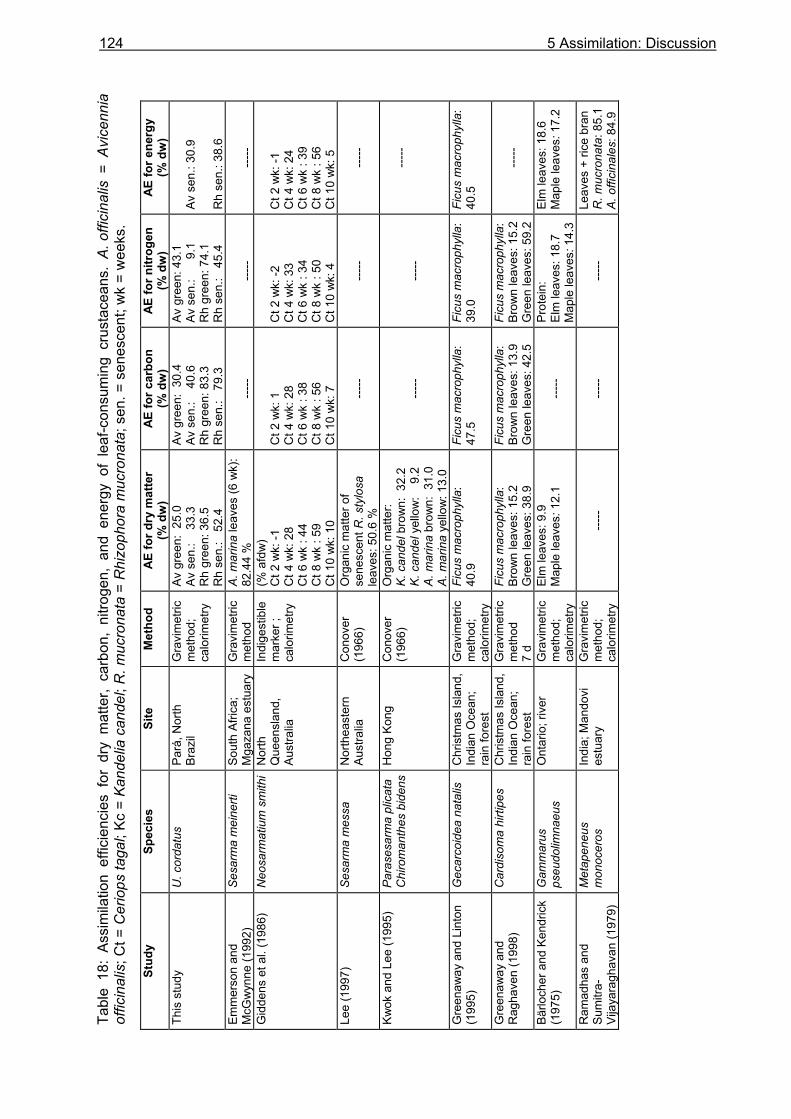
Tabl
e 18
: As
sim
ilatio
n ef
ficie
ncie
s fo
r dr
y m
atte
r, ca
rbon
, ni
troge
n, a
nd e
nerg
y of
lea
f-con
sum
ing
crus
tace
ans.
A. o
ffici
nalis
= A
vice
nnia
of
ficin
alis
; Ct =
Cer
iops
taga
l; Kc
= K
ande
lia c
ande
l; R
. muc
rona
ta =
Rhi
zoph
ora
muc
rona
ta; s
en. =
sen
esce
nt; w
k =
wee
ks.
St
udy
Spec
ies
Site
M
etho
d AE
for d
ry m
atte
r (%
dw
) AE
for c
arbo
n (%
dw
) AE
for n
itrog
en
(% d
w)
AE fo
r ene
rgy
(%
dw
) Th
is s
tudy
U
. cor
datu
s Pa
rá, N
orth
Br
azil
Gra
vim
etric
m
etho
d;
calo
rimet
ry
Av g
reen
: 25
.0
Av s
en.:
33
.3
Rh
gree
n: 3
6.5
Rh
sen.
: 5
2.4
Av g
reen
: 30
.4
Av s
en.:
40
.6
Rh
gree
n: 8
3.3
Rh
sen.
: 7
9.3
Av g
reen
: 43.
1 Av
sen
.:
9.1
R
h gr
een:
74.
1 R
h se
n.:
45.
4
Av s
en.:
30.9
R
h se
n.: 3
8.6
Emm
erso
n an
d M
cGw
ynne
(199
2)
Sesa
rma
mei
nerti
So
uth
Afric
a;
Mga
zana
est
uary
G
ravi
met
ric
met
hod
A. m
arin
a le
aves
(6 w
k):
82.4
4 %
-----
---
--
-----
Gid
dens
et a
l. (1
986)
N
eosa
rmat
ium
sm
ithi
Nor
th
Que
ensl
and,
Au
stra
lia
Indi
gest
ible
m
arke
r ;
calo
rimet
ry
(% a
fdw
) C
t 2 w
k: -1
C
t 4 w
k: 2
8 C
t 6 w
k : 4
4 C
t 8 w
k : 5
9 C
t 10
wk:
10
Ct 2
wk:
1
Ct 4
wk:
28
Ct 6
wk
: 38
Ct 8
wk
: 56
Ct 1
0 w
k: 7
Ct 2
wk:
-2
Ct 4
wk:
33
Ct 6
wk
: 34
Ct 8
wk
: 50
Ct 1
0 w
k: 4
Ct 2
wk:
-1
Ct 4
wk:
24
Ct 6
wk
: 39
Ct 8
wk
: 56
Ct 1
0 w
k: 5
Le
e (1
997)
Se
sarm
a m
essa
N
orth
east
ern
Aust
ralia
C
onov
er
(196
6)
Org
anic
mat
ter o
f se
nesc
ent R
. sty
losa
le
aves
: 50.
6 %
---
--
-----
---
--
Kwok
and
Lee
(199
5)
Para
sesa
rma
plic
ata
Chi
rom
anth
es b
iden
sH
ong
Kong
C
onov
er
(196
6)
Org
anic
mat
ter:
K. c
ande
l bro
wn:
32.
2 K.
can
del y
ello
w:
9.2
A.
mar
ina
brow
n: 3
1.0
A. m
arin
a ye
llow
: 13.
0
---
--
---
--
---
--
Gre
enaw
ay a
nd L
into
n (1
995)
G
ecar
coid
ea n
atal
is
Chr
istm
as Is
land
, In
dian
Oce
an;
rain
fore
st
Gra
vim
etric
m
etho
d;
calo
rimet
ry
Ficu
s m
acro
phyl
la:
40.9
Fi
cus
mac
roph
ylla
: 47
.5
Ficu
s m
acro
phyl
la:
39.0
Fi
cus
mac
roph
ylla
: 40
.5
Gre
enaw
ay a
nd
Rag
have
n (1
998)
C
ardi
som
a hi
rtipe
s
Chr
istm
as Is
land
,In
dian
Oce
an;
rain
fore
st
Gra
vim
etric
m
etho
d 7
d
Ficu
s m
acro
phyl
la:
Brow
n le
aves
: 15.
2 G
reen
leav
es: 3
8.9
Ficu
s m
acro
phyl
la:
Brow
n le
aves
: 13.
9 G
reen
leav
es: 4
2.5
Ficu
s m
acro
phyl
la:
Brow
n le
aves
: 15.
2 G
reen
leav
es: 5
9.2
---
--
Bärlo
cher
and
Ken
dric
k (1
975)
G
amm
arus
ps
eudo
limna
eus
Ont
ario
; riv
er
Gra
vim
etric
m
etho
d;
calo
rimet
ry
Elm
leav
es: 9
.9
Map
le le
aves
: 12.
1
---
-- Pr
otei
n:
Elm
leav
es: 1
8.7
Map
le le
aves
: 14.
3
Elm
leav
es: 1
8.6
Map
le le
aves
: 17.
2
Ram
adha
s an
d Su
mitr
a-Vi
jaya
ragh
avan
(197
9)
Met
apen
eus
mon
ocer
os
Indi
a; M
ando
vi
estu
ary
Gra
vim
etric
m
etho
d;
calo
rimet
ry
---
--
---
--
-----
Leav
es +
rice
bra
n R
. muc
rona
ta: 8
5.1
A. o
ffici
nale
s: 8
4.9
124 5 Assimilation: Discussion
5 Assimilation: Discussion 125
The high daily litter and thus energy intake of U. cordatus is due to a moderate gut passage time (chapter 3.3.4) and a continuous supply of mangrove litter, allowing crabs to feed almost constantly. Also the high mean gastrointestinal contents of U. cordatus and the low litter standing stock at FG suggest that U. cordatus exploits its food sources very efficiently. In addition, most mangrove areas on the peninsula are only inundated around spring tides, allowing a higher mangrove litter supply to benthic organisms compared to daily flooded mangrove areas. Is Ucides cordatus nitrogen limited ? Due to the low nitrogen content of mangrove leaf litter it is suggested that it is unlikely to fulfil the nitrogen requirements of U. cordatus. For the tissue of crustaceans a mean nitrogen content of 6.2 % is declared (Allen 1989), exceeding that of mangrove leaf litter 7.5-13.8-fold, depending on tree species and stage of decomposition. Data about the protein content of muscle tissue of U. cordatus vary highly, ranging among 16.0 % (Ogawa et al. 1973), 73.5 % (Blankensteyn et al. 1997) and 93.1 % (Nascimento 1993). Lutz and Austin (1983) measured a protein content of 76.6 % of land crabs. With a nitrogen assimilation of 0.71 mg bww-1 d-1 and 0.21 mg bww-1 d-1 for 137 g ww specimens feeding on senescent leaves of R. mangle and A. germinans, respectively, U. cordatus gains more nitrogen than the land crabs Cardisoma hirtipes, Gecarcoidea natalis, Gecarcinus lateralis and Cardisoma guanhumi (range: 0.02 -0.06 mg bww-1 d-1) (Wolcott and Wolcott 1984, Wolcott and Wolcott 1987, Greenaway and Linton 1995, Greenaway and Raghaven 1998). Apparently, the higher nitrogen assimilation of U. cordatus is due to a higher daily food intake and a relatively high assimilation efficiency for nitrogen when feeding on decomposing R. mangle leaves. Two large land crabs, Gecarcinus lateralis and Cardisoma guanhumi, were shown to be growth-limited when fed on a natural plant diet and assimilated only 0.04 mg and 0.05 mg N bww-1 d-1 , respectively (Wolcott and Wolcott 1984, Wolcott and Wolcott 1987). Control groups were fed with plants and in addition with soybeans and casein agar, respectively. With these diets assimilation efficiencies increased highly and assimilated nitrogen accounted for 0.44 mg d-1 bww-1 for G. lateralis and 0.40 mg d-1 bww-1 for C. guanhumi. Coinciding with the higher nitrogen assimilation, both crab species showed a higher intermolt growth, indicated by a higher fat and nitrogen content of the tissue and an increase in nonshell dry weight (Wolcott and Wolcott 1984, Wolcott and Wolcott 1987). The fact that the daily assimilated amount of nitrogen in these crabs increased highly due to a nitrogen-supplemented diet suggests that U. cordatus may be nitrogen limited at least at AF (0.21 mg N bww-1 d-1). Since a size dependency of the daily food intake was not provided for G. lateralis and C. guanhumi, comparisons have to be regarded with some caution.
126 5 Assimilation: Discussion
Nitrogen limitation may explain the very slow growth rate estimated for U. cordatus at the Caeté estuary. Males need about 7.1 - 8.7 years to reach the size of 6.5 cm CW (Diele 2000). Ostrenskey et al. (1995) showed that the carapace width of U. cordatus increased 2.5 % within 90 days for specimens feeding on mangrove leaves whereas it increased 5.0 % for crabs feeding on mangrove leaves, vegetables and fish. This suggests that U. cordatus may be nitrogen limited when feeding on a pure plant diet. The mean crab size at a mixed mangrove stand with R. mangle and A. germinans trees was higher (CW 6.13 cm) than at AF (CW 5.24 cm), where crabs had only access to litter from A. germinans (Wessels 1999). Since the mean crab size of females and males did not differ at both sites, differences between sites were not influenced by the proportional composition of females and males. Limitation by litter availability is most unlikely at AF since litter standing stock was higher (this study, Reise 1999, Wessels 1999) and crab density lower (Wessels 1999) than at the mixed forest stand. Thus, difficulties in the breakup of A. germinans leaf litter and a low assimilation efficiency for nitrogen may relate to the lower mean crab size at AF. This is speculative, since growth rates had not been measured. Long-term feeding experiments are necessary to reveal whether U. cordatus is growth limited and which macro or micro nutrients are deficient. Since nitrogen limitation may occur in U. cordatus, feeding strategies are expected that might compensate for the low nitrogen content in its plant diet. Common herbivore strategies for extracting maximum amounts of nitrogen from a low-nitrogen environment are predation, cannibalism, scavenging, the selection of high nitrogen plants, carnivory in juveniles and an increased gut volume or a long gut passage (Wolcott and Wolcott 1984, Wolcott and Wolcott 1987). It could be shown that U. cordatus prefers R. mangle leaves that have a lower nitrogen content than A. germinans leaves but that are easier to digest and from which crabs are able to assimilate nutrients more efficiently. In addition, crabs feed on algae, which have a higher nitrogen content and a more favourable C:N ratio than leaf litter. Carnivory in juveniles was recorded (Diele 2000). Cannibalism, scavenging or predation have never been observed for U. cordatus during this study and have not been reported from local crab collectors or other researchers at the Caeté estuary. Furthermore, stomach content analyses give no indication for the occurrence of predation or cannibalism. In contrast to U. cordatus, predation and cannibalism were reported from other leaf-eating crabs. Predation on fiddler crabs was higher in specimens of C. guanhumi maintained on plants alone than in crabs whose diet was supplemented with nitrogen (Wolcott and Wolcott 1987). Supplementation of the diet of G. lateralis with high-nitrogen food resulted in markedly reduced cannibalism of adults on conspecific juveniles (Wolcott and Wolcott 1984). Sesarmid crabs occasionally consume nematodes, insects, small crustaceans, and also juvenile conspecifics (Giddens et al. 1986). Even if nitrogen-rich food items supplied by predation form only a small proportion of the total diet, they may nevertheless be crucial (Hogarth 1999).
5 Assimilation: Discussion 127
Energy and nutrient budget on the population level. Energy assimilation by the U. cordatus population on an area basis was 3.7 times higher at FG 1 (10291 kJ m-2 y-1) than at AF (2872 kJ m-2 y-1) due to higher assimilation efficiencies for R. mangle leaves and a higher population density at FG 1 (1.65 crabs m-2, Diele 2000) compared to AF (0.62 crabs m-2, Wessels 1999). With a trophic flow model of the Caeté mangrove estuary, an assimilation of the U. cordatus population of 4065 kJ m-2 y-1 was calculated (Wolff et al. 2000). Since this value based on a lower biomass estimate of U. cordatus, assimilation was extrapolated for comparison. This resulted in an assimilation of 7215 kJ m-2 y-1, a value within the range determined by this study. Based on measurements of respiration and production, Koch and Wolff (2002) estimated a much lower assimilation at FC (1309 kJ m-2 y-1). Standardised for the same biomass, assimilation determined by this study was 4.9-fold the value calculated by Koch and Wolff (2002). The determined assimilation efficiencies were 38.6 % and 30.9 % for specimens feeding on decomposing R. mangle and A. germinans leaves, respectively (this study) and 9.5 % (Koch and Wolff 2002). It is assumed that the estimate of the latter study was too low. Since different methods were used in the two studies, the discrepancy remains unclear. Ingestion of nitrogen on the population level was high at FG 1 (0.08 t N ha-1 y-1) but at AF (0.036 t N ha-1 y-1) it was similar to the amount of litter nitrogen consumed or buried by sesarmid crabs in high intertidal forests in tropical Australia (0.015 t - 0.048 t N ha-1 y-1, Robertson et al. 1992). There, litter consumption and removal corresponded to 11 % - 64 % of nitrogen requirements for the forest primary production (Robertson et al. 1992), demonstrating the importance of nutrient recycling through litter processing by crabs. Faeces production of U. cordatus was high (7.13 and 3.17 t ha-1y-1 dry matter at FG 1 and AF, respectively) compared to other crabs reported in the literature. In mangrove forests in tropical Australia 1.12 - 5.22 t ha-1 y-1 were voided as faeces by sesarmid crabs (Robertson and Daniel 1989, Lee 1997). This is due to lower consumption rates of sesarmid crabs compared to U. cordatus, for individual crabs as well as on an area basis. A high amount of the mangrove litter production (43.51 % and 21.55 % at FG 1 and AF, respectively) could be made available as detrital sized particles to other invertebrates within the mangrove and the nearby estuary. In addition, faeces had a much lower and thus more favourable C:N ratio than have mangrove leaves. Faecal material produced by U. cordatus is probably utilized by detritivores as the carbon and nitrogen content of faeces is much higher than in the sediment and bacterial colonization is facilitated. The abundance of fiddler crabs is high at the Caeté estuary (Koch 1999) and it is assumed that these crabs benefit from the faecal material. Beside a favourable C and N content, faecal material of U. cordatus may have further advantages. Giddens et al. (1986) noted that the flavolan fraction is much lower in crab faeces than in leaves, thus greatly increasing the digestibility to detritivores. Since it is suggested that U. cordatus is able to digest a part of the tannins in mangrove leaves, faecal material probably has a much lower tannin content than leaves. The potential significance of the crab faecal material by initiating a coprophagous food chain involving mangrove
128 5 Assimilation: Discussion
invertebrates was investigated by Lee (1997). Individuals of the amphipod Parhyalella sp. fed with a mixture of crab faecal material and mangrove detritus attained a significantly higher moulting frequency, lower mortality rates and a higher assimilation rate for carbon than their conspecifics which were fed with mangrove detritus only. It is assumed that faecal material voided by U. cordatus may also provide a basis of a food chain contributing to mangrove secondary production by small invertebrates. In addition, faecal material that is washed out to the estuary with the tides may then be available to pelagic invertebrates. 5.4.2 Microbiological investigations
5.4.2.1 Microbial abundance and community structure
Methodology. Comparisons with previous studies of microbial populations on mangrove leaves, in mangrove sediments or in the gastrointestinal tract of brachyuran crabs are difficult, due to the use of traditional cultivation-based techniques in these earlier studies. Species determinations were based on physiological and morphological characteristics of bacteria, whereas in-situ hybridisation is based on their phylogenetic classification. Traditional techniques often give a biased picture of community composition since only a small proportion of the bacteria present may be cultivable under the particular conditions used. Zimmer and Topp (1998a) reported that only 0.1 – 1 % of the total number of gut microorganisms (determined directly with fluorescence microscopy) of the isopod Porcellio scaber could be cultivated. In contrast, in this study between 36 and 51 % of the total DAPI-stained cells were identified as Bacteria. Of these, between 28 % (sediment) and 94 % (stomach) could be classified with the specific probes used. Sediment and water. Microbial densities determined during this study (2.6 - 7.0 x 10⁹ cells g dw-1 at the surface) were within the wide range (1.0 x 10⁴ - 4.0 x 10¹¹ cells g dw-1) reported in the literature, which includes studies of mangrove habitats from the low intertidal to the high tidal zone, and from different continents (Matondkar et al. 1980, Dye 1983, Lakshmanaperumalsamy 1987, Alongi 1988, Alongi et al. 1989, Surendran and Chandrika 1993, Alongi 1994). Abundances were only counted for surface sediments in these studies, not for deeper sediment layers or crab burrows. Studies on microbial community composition in mangrove sediments are rare and cultivation-based (Surendran and Chandrika 1993, Shome et al. 1995) and therefore inappropriate for comparisons. Microbial abundances were almost identical at the sediment surface and in the sediment of crab burrows at FG 1. Since burrow water contains at least a low concentration of oxygen, aerobic microorganisms may also proliferate there. In addition, ammonium concentrations in the water of crab burrows were much higher than in water at the sediment surface (Rademaker 1998), probably due to the excretion of uric acid by U. cordatus. Thus, the
5 Assimilation: Discussion
129
growth of nitrifying bacteria is most likely high in crab burrows. This may contribute to the higher microbial density compared to the surrounding sediment at a similar depth. Microbial abundances at 70 cm depth were significantly lower than at the sediment surface, which coincided with anaerobic conditions and a lower organic content. Decreasing microbial abundance with sediment depth is common in marine and estuarine sediments (Rublee 1982, Llobet-Brossa et al. 1998). It is therefore evident that burrowing activities of U. cordatus enhance the oxygenation of deeper sediment layers und promote microbial production in burrow water and sediment. It is suggested that the improved sediment conditions favour the production of infauna inside burrows. Both the surface sediment and the sediment at 70 cm depth showed a significantly greater microbial density at FG 1 than at AF. It has been reported that bacterial densities in mangrove soils are generally higher in more organic-rich sediments (Alongi 1994). However, the organic content in the AF soils was approximately twice as high as that in the FG 1 soils (App. III, Table 65). Sediment pH was higher at FG 1 than AF on most sampling occasions, suggesting that a higher pH was more favourable to the overall microbial growth. Differences in microbial density may be partly attributable to the different tidal regimes at the two sites, with higher inundation rates at FG 1. Alongi (1988) found that bacterial densities in mangrove surface sediments along the north-eastern coast of Australia were usually higher in the lower intertidal than the high tidal zone. In addition, bacterial numbers in mangrove sediments varied over tidal cycles, leading to changes in bacterial activity over very short time scales (Alongi 1994). Water collected from crab burrows and core hole water showed a significantly higher microbial density than water from the tidal channel FG. This is most likely attributable to their higher sediment and detritus load. Differences in nutrient loads and pH no doubt also contributed to differences in microbial abundances. Schwendenmann (1998) found a higher content of dissolved organic nitrogen, inorganic nitrogen (in particular ammonium), and orthophosphate in sediment porewater than in creekwater of the Furo do Chato on the Bragança peninsula. The tidal channel FG had a microbial density (2.6 x 10⁶ cells ml-1) similar to that found in mangrove tidal creeks of the Indus River delta, Pakistan (Bano et al. 1997). Leaves. Microbial densities on freshly shed leaves of R. mangle (3.7 x 10⁸ g-1) and A. germinans (5.2 x 10⁸ g-1) were up to 9-fold lower than in sediment samples. Microbial abundances on senescent R. mangle leaves were in the range of those reported for R. mangle leaves in the Bahamas, also using epifluorescence microscopy (Benner et al. 1988). Studies on microbial populations on burrow leaves are lacking. Since bacterial densities on burrow leaves did not increase greatly compared to senescent leaves it is suggested that leaves had not been stored over long periods, confirming the results of nutrient analyses. Microbial densities were higher on A. germinans than R. mangle
130 5 Assimilation: Discussion
leaves, possibly due to the lower tannin content in Avicennia than in Rhizophora leaves (Hogarth 1999). Tannins are known to inhibit the growth of microorganisms (Kumar and Singh 1984, Bhat et al. 1998). Interspecies differences in microbial densities were even higher for leaves from burrows. The carbon and nitrogen analyses suggest that A. germinans leaves were probably stored by crabs somewhat longer than R. mangle leaves, so more of the initially lower tannin concentrations might have been lost from the leaves through leaching, facilitating microbial colonization. Decomposition experiments with mangrove leaves elsewhere support this suggestion. Bacterial densities on mangrove leaf surfaces were zero when freshly collected, but increased highly after several weeks of exposure on the sediment surface (Cundell et al. 1979, Robertson 1988). In both studies the increase of bacterial density coincided with a decrease of hydrolysable tannins. The most important groups of Bacteria found on the surfaces of R. mangle and A. germinans leaves were α-Proteobacteria (27.1 % and 40.1 %, respectively) and Bacteroidetes (4.1 % and 10.7 %, respectively). Flavobacterium, belonging to the Bacteroidetes, have also been found among the bacteria colonizing the surfaces of A. marina leaves at an Indian mangrove (Abhaykumar and Dube 1991). According to Stolp (1988), Flavobacteria have been isolated from soil, fresh and marine water, and ocean sediments, and are also common in the phyllosphere. A large number of unidentified coccoid cells were found on A. germinas leaves. They were enclosed by a thick mucous layer, which was probably impenetrable to the FISH probes. The proportion of unidentified cells was even higher for R. mangle leaves. Some of these cells may belong to groups not targeted by the probes used. Others might have been in a condition of low activity, with low rRNA concentrations, which could have hampered the binding of probes. Gastrointestinal contents. Microbial growth was observed in the gastrointestinal tract of U. cordatus. Microbial density increased continuously as food passed through the stomach (5.0 x 10⁹ g dw-1) and intestine (1.7 x 10¹⁰ g dw-1), reaching highest values in the faecal material (3.2 x 10¹⁰ g dw-1). Microbial densities found in the digestive tract of U. cordatus are within the wide range of the abundances detected in other arthropods (Hood and Meyers 1973, Reyes and Tiedje 1976, Cruden and Markovetz 1979, Ulrich et al. 1981, Ninawe and Banik 1987, Dempsey et al. 1989, Zimmer and Topp 1998a, Table 19) but data on microbial density in the digestive tract of brachyuran crabs are lacking. An increasing cell density between stomach and intestine was also found in other arthropods, including penaeid shrimps (Dempsey et al. 1989), isopods (Reyes and Tiedje 1976), and crickets (Ulrich et al. 1981). By contrast, several crustaceans contained few or even no microorganisms in their gastrointestinal tract (Boyle and Mitchell 1978, Ninawe and Banik 1987). The high proportion of γ-Proteobacteria in the gut of U. cordatus (24 %) is congruent with other studies. Vibrio, belonging to the γ-Proteobacteria and/or Pseudomonas were the most common bacteria in the gut of crustaceans, including Penaeoidea, Thalassinidea, and the brachyuran crab Callinectes sapidus (Table 19, Davis and Sizemore 1982, Huq et al. 1986).
5 Assimilation: Discussion
131
Faeces. Faeces collected in the field probably harbour a mixture of microbes which were voided from the gut and others introduced from the sediment. The high microbial abundances on faeces – 210-fold higher than those on senescent R. mangle leaves – emphasise the significance of the breakdown of leaves within the digestive tract of U. cordatus. Faeces present a finely shredded material with a high surface area and a high carbon content, being thus a suitable substrate for microorganisms. The increase of the Bacteroidetes group, of which many genera are involved in the degradation of natural polymers, was even higher (673-fold) between leaf surfaces of R. mangle and faeces. In addition, microbial colonization of faeces on the sediment surface will be facilitated if tannins are partly degraded in the digestive tract of the crabs. The decomposition rate of mangrove litter, and thus nutrient transfer into the sediment is therefore highly accelerated due to digestion by U. cordatus. Whereas a large part of the ingested leaf litter is voided as finely shredded faeces after 12 hours of digestion, R. mangle leaves which decomposed inside net bags on the sediment surface in a dry habitat still had 50 % of their initial weight after 47 days (Schories et al. 2003). The high load of bacterial biomass in faecal material compared to the sediment support the suggestion that faeces contribute to the nutrition of detritivorous animals which has already been discussed. Studies investigating the colonization of crustacean faeces by bacteria are otherwise rare. Bacterial density in faecal material of the leaf-consuming searmid crab Neosarmatium smithi was considerably less (89-fold) than found for U. cordatus (Giddens et al. 1986). An increase of bacterial abundance between leaves and faeces of N. smithi was not detected in this study. 5.4.2.2 The role of microorganisms for the nutrition of U. cordatus
U. cordatus was often observed feeding on sediment, but stomach contents analyses demonstrated that sediment accounted for only a small proportion of the total food ingested. Taken together with the low concentration of bacterial carbon (0.2-0.9 % of total C at FG) and nitrogen (0.5-2.3 % of total N at FG) in the sediment, these findings suggest that bacterial biomass is of minor importance to the nutrition of U. cordatus in terms of the food quantity. However, regarding the quality of microbial biomass, ingestion of sediment might be important to U. cordatus. It is assumed that a part of bacteria taken up from the sediment proliferate in the digestive tract, where they are involved in the degradation of compounds such as cellulose, hemicellulose, proteins and lipids (see further discussion below). In addition, sediment particles may assist during the process of mechanically masticating leaves in the gastric mill. Bacterial biomass adherent to mangrove leaves was even lower than in the sediment, indicating that it is negligible for the carbon and nitrogen intake of U. cordatus. By comparison, Alongi (1988) reported that in mangrove surface sediments in Australia with similar organic carbon concentrations as on the Bragança peninsula sediments, but with higher bacterial biomass, bacterial carbon accounted for about 5 % of
132 5 Assimilation: Discussion
the sediment carbon (Alongi 1988). The contribution of bacterial nitrogen in decomposing litter of different mangrove tree species contributed at the most 1.7 % to the measured leaf nitrogen, slightly more than that found for leaves on the Bragança peninsula. Like U. cordatus, several sesarmine crabs have been reported to feed on the mud surface (Micheli 1993, Steinke et al. 1993, Kwok and Lee 1995), probably tapping the microbial resources available from the substrate (Kwok and Lee 1995). It is assumed that nitrogen needed by crabs probably comes from microbial populations in the mud (Micheli 1993, Steinke et al. 1993). However, sediment ingestion and microbial biomass were not quantified in these studies. By contrast, it was reported that the ingestion of sediment is of minor importance for other sesarmines or is ingested only due to its adherence to other food items (Malley 1978, Camilleri 1992, Brogim and Lana 1997). The microbial increase in the gastrointestinal tract of U. cordatus allows for two interpretations. (1) Bacteria are ingested with the food and certain species are lysed and absorbed, whereas others survive and proliferate in the digestive tract, using plant material. These bacteria would therefore be transients (Harris 1993b). Bacteria, or products thereof, may be subsequently utilized by the crab, or may be passed out with the faeces. (2) The bacteria in the digestive tract are residents (symbionts or commensals), which form permanent, relatively stable populations in the different regions of the digestive tract (Harris 1993b, Schmitt-Wagner 2003). The gut microflora of U. cordauts probably consist of a mixture of residents and ingested bacteria. The vibrioid cells in the stomach and intestine, which belong to the Bacteroidetes were not found in the sediment or on leaf surfaces, and most likely represent resident bacterial groups in the digestive tract. In particular, the density of the Bacteroidetes increased continuously as food passed the digestive tract of U. cordatus, suggesting that these bacteria utilize the ingested plant material. During the mastication of litter in the stomach, the overall surface of the material increases, facilitating microbial colonization. Bacterial proliferation in the intestine led to an increase of bacterial carbon (maximal 2.0 % of total C) and nitrogen (maximal 5.0 % of total N), although total organic carbon and nitrogen decreased between the stomach and intestine, indicating the proceeding assimilation of nutrients by the crabs. Since the assimilation efficiency for bacteria is much higher than for leaf material (Hargrave 1970, Reyes and Tiedje 1976, Dye and Lasiak 1987), assimilation of bacterial biomass in the intestine may be of nutritional importance to U. cordatus. It is suggested that the Bacteroidetes, including the Cytophaga, Flavobacteria, and Bacteroides, degrade cellulose and other compounds in the digestive tract of U. cordatus. The density of the Bacteroidetes was even higher in faeces than in the intestinal contents, and it is assumed that cellulose digestion continues in the faecal material. Cytophaga are able to degrade a variety of complex natural polymers, in particular cellulose, chitin, proteins, lipids and cell walls (Starr et al. 1981) and have been found to be involved in cellulose degradation in soil and also in the digestive tract (Stolp 1988). Bacteroides are one of the
5 Assimilation: Discussion
133
major components of the gut microbial community (Starr et al. 1981, Ohkuma et al. 2001), digesting cellulose, hemicellulose, and pectin into volatile fatty acids (Starr et al. 1981). Flavobacteria use mainly glucose, but also hydrolyse starch, casein, chitin, and gelatin (Holmes et al. 1984) and are one of the most commonly reported groups in the gut of aquatic invertebrates (Harris 1993b, Table 19). As in U. cordatus, Bacteroidetes have been found in the guts of Penaeoidea (Dempsey and Kitting 1987), Thalassinidea (Harris et al. 1991) and Isopoda (Reyes and Tiedje 1976). Nascimento (1993) isolated the proteolytic bacteria Bacillus pumilus and Achromobacter delicatulus from the digestive tract of U. cordatus. Cellulase production has been reported for Bacillus pumilus (Kotchoni et al. 2003). Nascimento (1993) concluded that U. cordatus utilize the fungi covering mangrove leaves and the proteins produced by these fungi instead of the leaves themselves. However, this conclusion was based only on the observation that fungi colonize mangrove leaves during decomposition; the abundance, biomass and nutritive value of the fungi and their digestion by the crabs were not investigated. The results of this thesis do not support the suggestion of Nascimento (1993), since U. cordatus does not store leaves for the several weeks required to allow dense colonization with fungi. Since Eukaryota accounted for 6.2 % of cells on the surfaces of R. mangle leaves, it cannot be excluded that fungi were present. However, none of these cells could be stained with a fungal-specific dye. Many of the aquatic Crustacea studied harbour bacteria with protease, lipase, and chitinase enzymes (Hood and Meyers 1973, Ninawe and Banik 1987), but in contrast to termites and cockroaches few species appear to have bacteria able to digest cellulose (Harris 1993b). Cellulolytic bacteria were found in the stomach and gut of Penaeus aztecus, P. setiferus and Mysis stenelopis (Hood et al. 1971, Wainwright and Mann 1982, Dempsey and Kitting 1987, Dempsey et al. 1989) and also in the hepatopancreas from terrestrial and semi-terrestrial isopods (Zimmer and Topp 1998a, Zimmer et al. 2002). Zimmer et al. (2002) found that the ability to digest cellulose was less developed in a marine phytophagous isopod than in a semi-terrestrial isopod, suggesting that the ability to digest cellulose was an important pre-adaptation facilitating a fully terrestrial life-style in isopods. It is conceivable that litter-consuming semi-terrestrial and terrestrial crabs harbour similar cellulolytic bacteria but up to now appropriate studies are lacking. In agreement with this thesis, a number of studies revealed that the bacterial populations isolated from the gut of crustaceans differ in species composition from those isolated from the habitat or diet (Reyes and Tiedje 1976, Dempsey and Kitting 1987, Dempsey et al. 1989, Harris et al. 1991, for review see Harris 1993b, Kostanjšek et al. 2002). Diet has been shown to affect the occurrence of crustacean gut microbes (Mattson 1988, Harris 1993a, Harris 1993b). Harris (1993a) reported an extensive colonization of the gut wall with rod-shaped bacteria only in detritivorous marine Crustacea, while carnivores and scavengers harboured few or no rod-shaped bacteria. Similarly, Mattson (1988) found that trichomycetous fungi were present in the hindgut of herbivorous and detritivorous crabs (Uca spp., Aratus pisonii,
134 5 Assimilation: Discussion
Sesarma spp.) but not in carnivorous crabs. It was suggested that the lack of fungi in carnivorous crabs may be due to their faster gut passage rates, which might allow insufficient time for fungal spores to germinate and affix to the gut wall. U. cordatus prefers R. mangle leaves over A. germinans leaves, which contain lower concentrations of tannins. In addition, crabs show much higher assimilation rates feeding on the former diet, indicating that the crabs are probably able to digest tannins. The fact that crabs do not store leaves in their burrows for periods long enough to allow degradation of condensed tannins through microorganisms prior to consumption also supports this assumption. Determining whether the digestive tract of U. cordatus harbours specific microorganisms capable of tannin degradation or whether crabs possess endogenous enzymes to degrade tannins was beyond the scope of this thesis but is a worthwhile topic for further research. Tannin-protein degrading bacteria have been reported from the digestive tract or faecal material of several herbivores, including koalas, sheep, and goats (Osawa 1992, Brooker et al. 1994, McSweeney et al. 1999). It has also been shown that bacterial endosymbionts in the hepatopancreas of terrestrial and semi-terrestrial isopods contribute to the oxidative degradation of phenolics, including tannins (Zimmer and Topp 1998b, Zimmer 1999, Zimmer et al. 2002), but these endosymbionts were absent in marine isopods (Zimmer et al. 2002). Thus acquiring these endosymbionts may have been another step that facilitated the colonization of land, by improving the ability to digest a terrestrial diet. It is probable that land crabs, feeding on a terrestrial diet, possess similar endosymbionts capable to degrade phenolics. The fact that U. cordatus feeds almost exclusively on plant material and sediment, which are both low in nitrogen, raises the possibility that the gut bacteria found in U. cordatus may be of some nitrogen-related nutritive advantage to the crab. Biological nitrogen fixation, which transforms atmospheric molecular nitrogen to ammonia or organic nitrogen, has been reported for the gut microflora in several aquatic invertebrates, for instance in marine shipworms (Carpenter and Culliney 1975) and sea urchins (Guerinot and Patriquin 1981), and also in wood- or soil- eating termites (Breznak et al. 1973, Breznak and Pankratz 1977, Potrikus and Breznak 1977, Ohkuma et al. 2001, for review see Nardi et al. 2002). Studies investigating nitrogen fixation in the gut of litter-consuming crabs are completely lacking, although researchers reported that the nitrogen budget in several of these crabs is not understood so far (Wolcott and Wolcott 1984, Wolcott and Wolcott 1987). Determining the presence and activity of nitrogen-fixing bacteria in the gut of U. cordatus and other litter-consuming crabs is a worthwhile subject for further research.
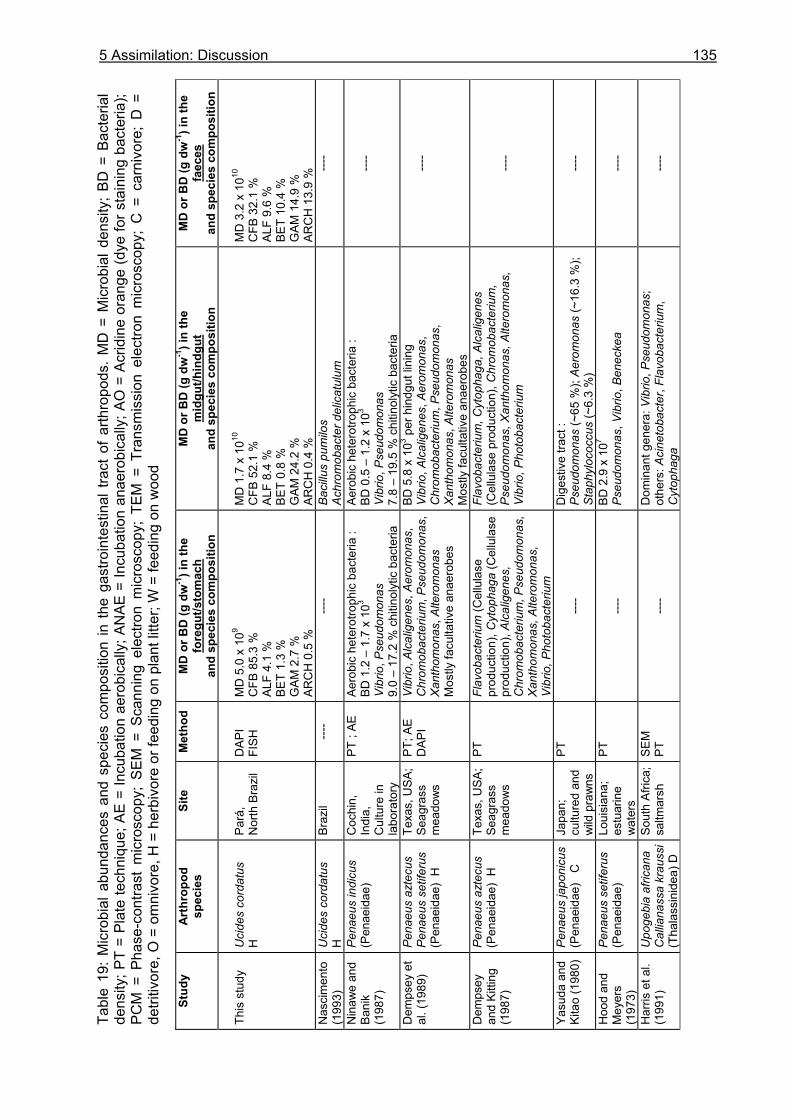
Tabl
e 19
: M
icro
bial
abu
ndan
ces
and
spec
ies
com
posi
tion
in t
he g
astro
inte
stin
al t
ract
of
arth
ropo
ds.
MD
= M
icro
bial
den
sity
; BD
= B
acte
rial
dens
ity; P
T =
Plat
e te
chni
que;
AE
= In
cuba
tion
aero
bica
lly; A
NAE
= In
cuba
tion
anae
robi
cally
; AO
= A
crid
ine
oran
ge (d
ye fo
r sta
inin
g ba
cter
ia);
PCM
= P
hase
-con
trast
mic
rosc
opy;
SEM
= S
cann
ing
elec
tron
mic
rosc
opy;
TEM
= T
rans
mis
sion
ele
ctro
n m
icro
scop
y; C
= c
arni
vore
; D
=
detri
tivor
e, O
= o
mni
vore
, H =
her
bivo
re o
r fee
ding
on
plan
t litt
er; W
= fe
edin
g on
woo
d
Stud
y Ar
thro
pod
spec
ies
Site
M
etho
d M
D o
r BD
(g d
w-1
) in
the
fore
gut/s
tom
ach
and
spec
ies
com
posi
tion
MD
or B
D (g
dw
-1) i
n th
e
mid
gut/h
indg
ut
and
spec
ies
com
posi
tion
MD
or B
D (g
dw
-1) i
n th
e fa
eces
an
d sp
ecie
s co
mpo
sitio
n
This
stu
dy
Uci
des
cord
atus
H
Pará
, N
orth
Bra
zil
DAP
I FI
SH
MD
5.0
x 1
09 C
FB 8
5.3
%
ALF
4.1
%
BET
1.3
%
GAM
2.7
%
ARC
H 0
.5 %
MD
1.7
x 1
010
CFB
52.
1 %
AL
F 8.
4 %
BE
T 0.
8 %
G
AM 2
4.2
%
ARC
H 0
.4 %
MD
3.2
x 1
010
CFB
32.
1 %
AL
F 9.
6 %
BE
T 10
.4 %
G
AM 1
4.9
%
ARC
H 1
3.9
%
Nas
cim
ento
(1
993)
U
cide
s co
rdat
us
H
Braz
il ---
- ---
- Ba
cillu
s pu
milo
s Ac
hrom
obac
ter d
elic
atul
um
----
Nin
awe
and
Bani
k (1
987)
Pena
eus
indi
cus
(Pen
aeid
ae)
Coc
hin,
In
dia,
C
ultu
re in
la
bora
tory
PT ;
AE
Aero
bic
hete
rotro
phic
bac
teria
: BD
1.2
– 1
.7 x
103
Vibr
io, P
seud
omon
as
9.0
– 17
.2 %
chi
tinol
ytic
bac
teria
Aero
bic
hete
rotro
phic
bac
teria
: BD
0.5
– 1
.2 x
103
Vibr
io, P
seud
omon
as
7.8
– 19
.5 %
chi
tinol
ytic
bac
teria
----
Dem
psey
et
al. (
1989
) Pe
naeu
s az
tecu
s Pe
naeu
s se
tifer
us
(Pen
aeid
ae)
H
Texa
s, U
SA;
Seag
rass
m
eado
ws
PT; A
E D
API
Vibr
io, A
lcal
igen
es, A
erom
onas
, C
hrom
obac
teriu
m, P
seud
omon
as,
Xant
hom
onas
, Alte
rom
onas
M
ostly
facu
ltativ
e an
aero
bes
BD 5
.8 x
103 p
er h
indg
ut li
ning
Vi
brio
, Alc
alig
enes
, Aer
omon
as,
Chr
omob
acte
rium
, Pse
udom
onas
, Xa
ntho
mon
as, A
ltero
mon
as
Mos
tly fa
culta
tive
anae
robe
s
----
Dem
psey
an
d Ki
tting
(1
987)
Pena
eus
azte
cus
(Pen
aeid
ae)
H
Texa
s, U
SA;
Seag
rass
m
eado
ws
PT
Flav
obac
teriu
m (C
ellu
lase
pr
oduc
tion)
, Cyt
opha
ga (C
ellu
lase
pr
oduc
tion)
, Alc
alig
enes
, C
hrom
obac
teriu
m, P
seud
omon
as,
Xant
hom
onas
, Alte
rom
onas
, Vi
brio
, Pho
toba
cter
ium
Flav
obac
teriu
m, C
ytop
haga
, Alc
alig
enes
(C
ellu
lase
pro
duct
ion)
, Chr
omob
acte
rium
, Ps
eudo
mon
as, X
anth
omon
as, A
ltero
mon
as,
Vibr
io, P
hoto
bact
eriu
m
----
Yasu
da a
nd
Kita
o (1
980)
Pe
naeu
s ja
poni
cus
(Pen
aeid
ae)
C
Japa
n;
cultu
red
and
wild
pra
wns
PT
----
Dig
estiv
e tra
ct :
Pseu
dom
onas
(~65
%);
Aero
mon
as (~
16.3
%);
Stap
hylo
cocc
us (~
6.3
%)
----
Hoo
d an
d M
eyer
s (1
973)
Pena
eus
setif
erus
(P
enae
idae
)
Loui
sian
a;
estu
arin
e w
ater
s
PT
----
BD 2
.9 x
107
Pseu
dom
onas
, Vib
rio, B
enec
kea
----
Har
ris e
t al.
(199
1)
Upo
gebi
a af
rican
a C
allia
nass
a kr
auss
i (T
hala
ssin
idea
) D
Sout
h Af
rica;
sa
ltmar
sh
SEM
PT
----
Dom
inan
t gen
era:
Vib
rio, P
seud
omon
as;
othe
rs: A
cine
toba
cter
, Fla
voba
cter
ium
, C
ytop
haga
----
5 Assimilation: Discussion 135
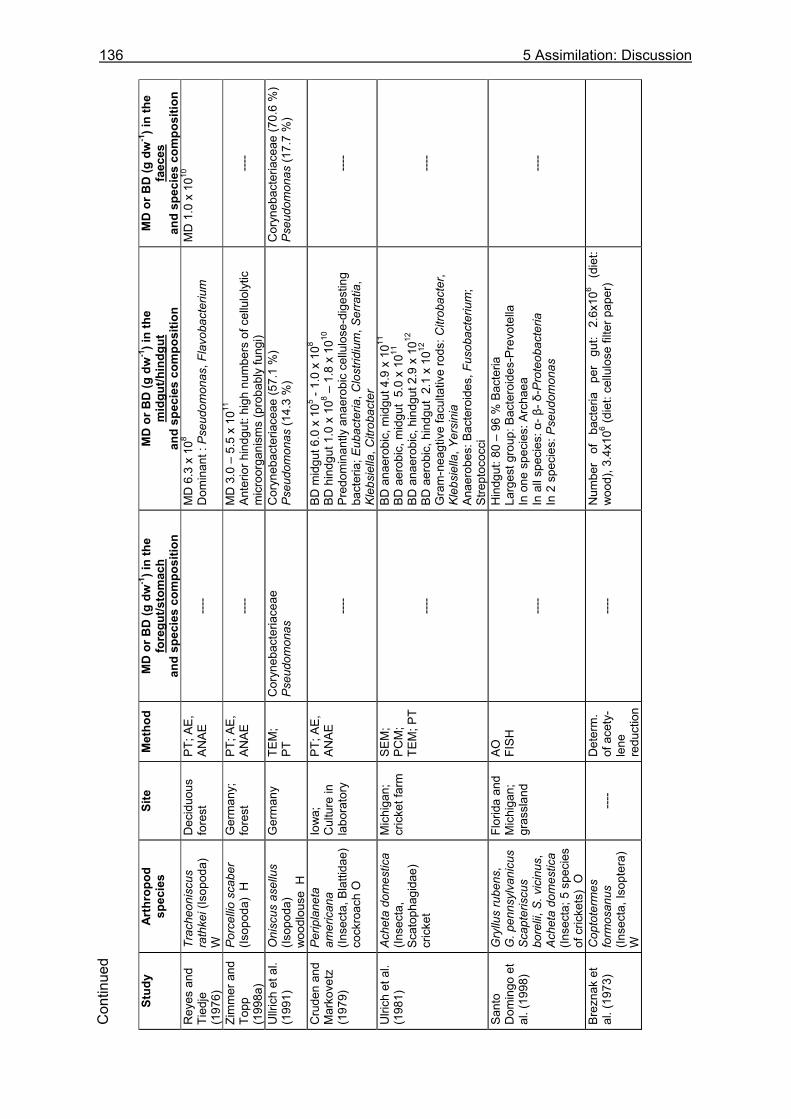
Con
tinue
d
Stud
y Ar
thro
pod
spec
ies
Site
M
etho
d M
D o
r BD
(g d
w-1
) in
the
fore
gut/s
tom
ach
and
spec
ies
com
posi
tion
MD
or B
D (g
dw
-1) i
n th
e
mid
gut/h
indg
ut
and
spec
ies
com
posi
tion
MD
or B
D (g
dw
-1) i
n th
e fa
eces
an
d sp
ecie
s co
mpo
sitio
n
Rey
es a
nd
Tied
je
(197
6)
Trac
heon
iscu
s ra
thke
i (Is
opod
a)
W
Dec
iduo
us
fore
st
PT; A
E,
ANAE
----
MD
6.3
x 1
08
Dom
inan
t : P
seud
omon
as, F
lavo
bact
eriu
m
MD
1.0
x 1
010
Zim
mer
and
To
pp
(199
8a)
Porc
ellio
sca
ber
(Isop
oda)
H
Ger
man
y;
fore
st
PT; A
E,
ANAE
----
MD
3.0
– 5
.5 x
1011
An
terio
r hin
dgut
: hig
h nu
mbe
rs o
f cel
lulo
lytic
m
icro
orga
nism
s (p
roba
bly
fung
i)
---
-
Ullr
ich
et a
l. (1
991)
O
nisc
us a
sellu
s (Is
opod
a)
woo
dlou
se H
Ger
man
y TE
M;
PT
Cor
yneb
acte
riace
ae
Pseu
dom
onas
C
oryn
ebac
teria
ceae
(57.
1 %
) Ps
eudo
mon
as (1
4.3
%)
Cor
yneb
acte
riace
ae (7
0.6
%)
Pseu
dom
onas
(17.
7 %
)
Cru
den
and
Mar
kove
tz
(197
9)
Perip
lane
ta
amer
ican
a (In
sect
a, B
latti
dae)
co
ckro
ach
O
Iow
a;
Cul
ture
in
labo
rato
ry
PT; A
E,
ANAE
----
BD m
idgu
t 6.0
x 1
05 - 1.
0 x
108
BD h
indg
ut 1
.0 x
108 –
1.8
x 1
010
Pred
omin
antly
ana
erob
ic c
ellu
lose
-dig
estin
g ba
cter
ia; E
ubac
teria
, Clo
strid
ium
, Ser
ratia
, Kl
ebsi
ella
, Citr
obac
ter
---
-
Ulri
ch e
t al.
(198
1)
Ache
ta d
omes
tica
(Inse
cta,
Sc
atop
hagi
dae)
cr
icke
t
Mic
higa
n;
cric
ket f
arm
SE
M;
PCM
; TE
M; P
T
----
BD a
naer
obic
, mid
gut 4
.9 x
1011
BD a
erob
ic, m
idgu
t 5.
0 x
1011
BD a
naer
obic
, hin
dgut
2.9
x 1
012
BD a
erob
ic, h
indg
ut 2
.1 x
1012
Gra
m-n
eagt
ive
facu
ltativ
e ro
ds: C
itrob
acte
r, Kl
ebsi
ella
, Yer
sini
a An
aero
bes:
Bac
tero
ides
, Fus
obac
teriu
m;
Stre
ptoc
occi
---
-
Sant
o D
omin
go e
t al
. (19
98)
Gry
llus
rube
ns,
G. p
enns
ylva
nicu
s Sc
apte
riscu
s bo
relii,
S. v
icin
us,
Ache
ta d
omes
tica
(Inse
cta;
5 s
peci
es
of c
ricke
ts)
O
Flor
ida
and
Mic
higa
n;
gras
slan
d
AO
FISH
----
Hin
dgut
: 80
– 96
% B
acte
ria
Larg
est g
roup
: Bac
tero
ides
-Pre
vote
lla
In o
ne s
peci
es: A
rcha
ea
In a
ll sp
ecie
s: α
- β- δ
-Pro
teob
acte
ria
In 2
spe
cies
: Pse
udom
onas
---
-
Brez
nak
et
al. (
1973
) C
opto
term
es
form
osan
us
(Inse
cta,
Isop
tera
) W
---
- D
eter
m.
of a
cety
-le
ne
redu
ctio
n
----
Num
ber
of
bact
eria
pe
r gu
t: 2.
6x10
6 (d
iet:
woo
d), 3
.4x1
06 (die
t: ce
llulo
se fi
lter p
aper
)
136 5 Assimilation: Discussion
6 Conclusions and perspectives
137
6 CONCLUSIONS AND PERSPECTIVES
The different approaches which were applied in this thesis to investigate the feeding ecology of U. cordatus point to the following feeding strategy of U. cordatus: The crab feeds almost exclusively on mangrove litter, roots and bark - food sources which are constantly available in the mangrove forest. Sediment is the only significant food source other than plant material. The diet diversity of U. cordatus is therefore relatively low. Even though litter fall fluctuates over the annual cycle and among forest stands, this main food source is predictable on a long time scale. This is in agreement with the small foraging radius of U. cordatus, indicating that on average the food supply in the vicinity of a burrow is sufficient for maintenance and growth. Crabs may feed on collected plant material inside burrows and thus avoid intraspecific competition and predation during feeding. Activities outside burrows are clearly light-dependent, decreasing significantly after dusk and increasing at dawn. Collection of litter material occurs only during the day, suggesting a visual localisation of food. It is concluded that U. cordatus is not a periodic feeder and consumes litter material inside burrows at day and night. The daily food intake is relatively high compared to other large litter-consuming crabs, due to a more or less continuous feeding, a moderate gut passage time and a large stomach size. Daily consumption of U. cordatus depends highly on the body size, ranging between 3.3 and 1.0 g dw d-1 in large (CW 7.0-7.5 cm) and small males (CW 3.0-3.5 cm), respectively. This corresponds to 6.0 and 19.8 % body dry weight, respectively. Evacuation of the gastrointestinal tract follows an exponential decay function, and most of the food digestion takes place within the first 12 hours. A low litter standing stock in the R. mangle-dominated and the mixed forest stands indicate that crabs exert a high feeding pressure in these areas. Results of experiments with tethered leaves and a low quantity of litter in most investigated burrows also point to a food limitation of the U. cordatus population. The nutritional value and the bacterial biomass of burrow leaves were only slightly different from those of senescent leaves, suggesting that leaves have not been stored in burrows for longer periods. Since the litter production varies temporally and spatially, crabs cannot avoid temporary deficiencies of food which can last up to some weeks. During some periods the litter standing stock was observed to be relatively high, indicating that crabs do not fully exploit the available litter all year around. However, considering the average litter production over the year, the bulk of litter (81 %) is consumed by U. cordatus. It would be of great interest to monitor litter standing stock and litter removal rates in different structured forest stands over a year´s cycle and at different moon phases. This would reveal whether crabs store more leaves prior to periods with low litter availability (spring tides, end of dry season), which was not investigated in this thesis.
In U. cordatus, feeding strategies such as scavenging, predation or cannibalism that can compensate for the low nitrogen content in plant material and are common in other litter-consuming crabs were not observed. Although nutrient analyses revealed a more
138 6 Conclusions and perspectives
disadvantageous C:N ratio and a lower nitrogen and carbon content in R. mangle compared to A. germinans leaves, the former diet is preferred by the crabs. R. mangle leaves are easier to masticate mechanically in the stomach, leading to higher assimilation rates in terms of dry matter, carbon, nitrogen and energy. Assimilation rates of U. cordatus feeding on an R. mangle diet are relatively high compared to other leaf-eating crabs and thus partly compensate for the poor food quality. The consumption of algae, which have a higher nutritional value than mangrove litter, is also important for the crab´s nutrition. Bacteria of the Bacteroidetes group, which highly proliferated in the digestive tract and accounted for the largest proportion of microorganisms, most likely assist in the degradation of cellulose and possibly other natural polymers. Since crabs digest R. mangle leaves more easily than A. germinans leaves, although the former diet is known to have a much higher tannin content, litter digestion is probably not hampered by tannins. It is suggested that gut bacteria or endogenous enzymes also help degrading these phenols. This would represent an important evolutionary step, facilitating the colonization of land by improving the ability to digest mangrove leaves. It is concluded that the quantity of ingested bacterial carbon and nitrogen adherent to leaves and sediment particles is of minor importance to the nutrition of U. cordatus. Nevertheless, the continuous ingestion of microorganisms may be important to obtain new microorganisms which then proliferate in the digestive tract and provide microbial biomass which can easily be assimilated. It could be demonstrated that the microbial community structure changes significantly between food types (leaves, sediment) and the digestive tract. Environmental bacteria differed also morphologically from those in the stomach and intestine. It is therefore suggested that a part of the Bacteroidetes species are residents in the digestive tract where they more or less maintain stable populations and assist in digestion. Several perspectives arise from the results of microbiological investigations. It would be worthwhile to prove the existence and activity of various enzymes – endogenous or microbial – in the digestive tract, e.g. cellulase, amylase, protease, lipase, and enzymes capable to digest phenolics, in particular tannins. Furthermore, it would be of great interest to investigate whether land crabs, feeding on a terrestrial diet, possess endosymbionts involved in the oxidative degradation of phenols as found in semi-terrestrial isopods (Zimmer et al. 2002). Determining the tannin concentrations of R. mangle and A. germinans leaves as well as of crab faeces is subject of ongoing research in the MADAM project and will probably give first indications to which extent tannins can be digested by U. cordatus. The nitrogen intake of U. cordatus is relatively high compared to other large litter-consuming crabs. Nevertheless, the very slow growth rate estimated for the crabs in previous studies (Diele 2000) point to a deficiency of nitrogen or other nutrients that have not been considered so far. Long-term feeding experiments, providing food with different compositions of macro and micro nutrients in comparison to the natural diet are necessary to clarify whether and why U. cordatus is growth limited in the mangrove forest. Whether N2-fixing bacteria, or their
6 Conclusions and perspectives
139
metabolic products, may directly serve as a nitrogen source for the crabs was not investigated in this study but seems possible. Further research could focus on the presence and activity of nitrogen-fixing bacteria in the gut of U. cordatus. With the development of molecular tools to detect nitrogenase (nif) genes as well as enzymes, evidence for nitrogen-fixation can be obtained (Nardi et al. 2002). Investigating the possible shift of the microbial community in regard to different diets, as well as analysing the portion of resident microbes in different parts of the gut are also interesting topics for further research. Starvation experiments could help to distinguish between bacteria being digested and assimilated and such forms possessing the ability to resist complete digestion in the intestinal tract and forming more or less stable populations. Feeding crabs with antibiotics prior to the natural diet could help to reveal whether resident bacteria assist in digestion. In addition to the stomach and intestine, the hepatopancreas should be considered in further experiments as bacteria in the hepatopancreas are involved in the degradation of litter in terrestrial isopods (Zimmer and Topp 1998a, Zimmer et al. 2002). Results point to the following functional role of U. cordatus in the high intertidal of the Bragança peninsula: Litter processing through U. cordatus is very important. Since U. cordatus consumes around 81 % of the litter production, the bulk of nutrients stored in litter material is retained in the mangrove forest. U. cordatus can therefore be classified as a keystone species in this Brazilian high intertidal mangrove forest. Similar high values of litter removal or consumption have only been reported for leaf-eating sesarmine crabs in a high intertidal mangrove forest in Queensland, Australia (Robertson and Daniel 1989) and in South Africa (Steinke et al. 1993). This study demonstrates that litter processing by U. cordatus in New World mangroves can have similar impacts than those observed for sesarmine crabs in the Indo-West-Pacific. Since the present study shows that most of the litter is consumed and not stored in crab burrows, litter decomposition is greatly accelerated due to shredding, gastric mill crushing, digestion and finally elimination as faeces. Although U. cordatus assimilates a great part of the organic carbon and nitrogen of the ingested leaf litter (R. mangle leaves: Assimilation efficiency for C: 79 %; N: 45 %), the finely fragmented faeces are rich in carbon and nitrogen (C: 16.13 %; N: 0.59 %) compared to the sediment (C: 2.22 %; N: 0.14%). Due to this higher nutrient status of faeces, microbial density increased 10-fold between surface sediment and crab faeces collected at burrow entrances. The increase between freshly shed R. mangle leaves and faeces was 210-fold, most likely due to the high surface area of faeces compared to leaves. Considering only bacteria of the Bacteroidetes group, of which many genera are involved in the degradation of natural polymers, increases of bacterial densities between leaf surfaces of R. mangle and faeces were even higher (673-fold). The decomposition of mangrove litter and thus nutrient and energy transfer into the sediment is therefore highly accelerated due to litter processing by U. cordatus.
140 6 Conclusions and perspectives
The detritus pool is fuelled by a high amount of faecal material (7.1 t ha –1 y-1 , equivalent to 16.4 x10⁷ kJ or 47.6 % of litter production at an R. mangle dominated forest). Due to their high nutritive value in terms of carbon, nitrogen, and bacterial biomass compared to sediment, faeces are probably an important food source for detritivorous animals, in particular fiddler crabs. It is suggested that secondary production in the mangrove forest is therefore enhanced due to litter processing by U. cordatus. In addition, small leaf particles that are produced during leaf shredding by U. cordatus also enters the detritus pool and are available to detritivores and further degradation through bacteria. U. cordatus is not only an important link in the food web to detritivores but also to its natural predators (crab racoons, capuchin monkeys, crab hawks, and fish) at the next trophic level. The impact on secondary production of these predators has not been investigated so far, but evidence of predation was given by carapace and claw pieces in litter traps and crab fragments in fish stomachs. Other impacts of U. cordatus on the mangrove ecosystem became apparent. By excavating sediment, U. cordatus operates as an “ecosystem engineer” as described by Lavelle (1997). Due to burrowing activities, water retention and water flow in the soil is probably enhanced, deeper sediment layers become oxygenated and faecal material and thus nutrients are distributed in the sediment. This study showed that the sediment conditions in burrows of U. cordatus are improved. Microbial densities in burrow water and sediment were higher than in pore water and burrow water had also higher oxygen concentrations compared to pore water. It is suggested that these conditions favour the occurrence of infauna along the galleries. Determining whether mangrove trees benefit from the retention of nutrients and the enhanced bacterial production in faecal material was beyond the scope of this study. The results of this thesis support the suggestion of Koch (1999) and Wolff et al. (2000) that mangrove primary production on the peninsula is promoted due to a close coupling of mangrove trees, crabs, and microorganisms and positive feedbacks among all three groups. The study of Smith III et al. (1991) provided evidence for a positive influence of mangrove crabs on primary production, since the exclusion of crabs lowered the reproductive output of mangrove trees. Since crabs feed on mangrove propagules, they probably influence the recruitment success of young seedlings. Whereas a high density of seedlings is reported on the forest floor of mixed mangrove stands at Furo Grande and Furo do Chato (Thüllen 1997, Reise 2002), seedlings of A. germinans and L. racemosa were rare at Furo do Chato (Thüllen 1997). To determine whether the feeding pressure exerted by the crabs over the mangrove seedlings varies among tree species and/or forest stands could be elucidated during long-term crab exclusion experiments. It would be interesting to test the validity of the dominance-predation hypothesis. It states that the intensity of crab predation on propagules is negatively
6 Conclusions and perspectives
141
correlated with the tree density in the forest (Smith III 1987, Smith III et al. 1989, McKee 1995). High exploitation rates of U. cordatus for human consumption at the investigation area have led to the concern that future yields may decrease and aroused interest in developing management recommendations for the sustainable use of this resource. Although recent research has revealed that the crab population on the Bragança peninsula has not been growth over-fished so far, the impact of crab collection has already been demonstrated by a reduced number of large males in exploited areas (Diele 2000). A decimation of the crab population would result in lower litter removal and consumption rates and therefore in a higher export of litter material to the estuary during springtides. One consequence would be a lower mean content of organic matter and thus nutrients in the sediment due to lower faeces production, leaf shredding and lower amounts of decomposing litter remains in burrows. This would reduce the amount of detritus and bacterial biomass in the sediment, most likely leading to a food shortage for detritivores. Secondary production would thus probably be decreasing. Another outcome of a reduced crab density would be an increased predation pressure on the crab population by its natural predators. This could further lower the crab´s biomass on the peninsula and/or that of its predators. Soil structure would also be influenced by lower mean crab densities. Oxygenation of deeper sediment layers and the distribution of nutrients due to burrowing activities would be restricted. The water retention in burrows and the flow of water through the sediment during flood tides and rainfall would be reduced if burrow number declined. It is suggested that the downgraded nutrient, oxygen and water conditions of the sediment would have a negative influence on primary production (Wolff et al. 2000). Since highest crab densities are found in areas with a dense forest stand (high food availability for the crabs and high nutrient availability for the trees) and humid soil, and lowest densities are found in forest gaps, dwarf forests and dry areas, the occurrence of U. cordatus is a clear indicator for the actual state of a specific mangrove forest. On the other hand, a higher litter standing stock, associated with an increased export of organic matter from the mangrove forest would probably promote secondary production in the estuary. According to the local fishermen, the shrimp catch is much higher in years with an infestation of A. germinans trees by Hyblae puera caterpillars which spread out over large areas of the peninsula within a few weeks and lead to a fast accumulation of litter on the forest ground. Litter together with faecal material of caterpillars is exported to the estuary during springtides and is most likely responsible for the higher shrimp production. In addition, a higher litter standing stock around neap tides due to lower litter burial rates could favour insects which feed on litter material on the forest floor.
142 6 Conclusions and perspectives
It is conceivable that a slightly decreased crab density would not lead to a corresponding increase of litter export with the tides but instead individual crabs would collect more litter than previously. As this study points to a food limitation of the U. cordatus population on the peninsula, crabs may thus respond to a higher litter standing stock with higher litter burial and/or consumption rates. U. cordatus is a K-strategist with low growth and production rates, a long life span and a large size of adult specimens. K-strategists usually build populations of quite stable sizes close to the carrying capacity of the habitat (Begon et al. 1998). A reduction in the crab density due to collection by man could lead to an increase in productivity of the crab population due to better food and habitat conditions. Small crabs would replace their larger conspecifics – which are subject of crab collection – in the more favourable habitats with a better food access. The sub-optimal habitats with restricted litter availability (near the road, forest gaps) could then be colonized by even smaller crabs. An increase in productivity is a general finding in aquatic stocks subjected to fishery and would partly explain why the U. cordatus population has not been growth over-fished yet. Whether or to what extent crab collection leads to a shift in the size-frequency distribution of the population is subject of ongoing research in the MADAM project. The results of this thesis clearly show that U. cordatus is a keystone species in the mangrove forest of the Bragança peninsula. The crab strongly influences the flow of organic matter and energy within the forest. This study indicates that U. cordatus probably is the most important litter-consuming mangrove crab in America. Further investigations in other New World mangrove forests are needed to provide evidence that the conclusions found in this study can be generalized.

7 Acknowledgements
143
7 ACKNOWLEDGEMENTS
First of all I would like to thank Prof. Dr. Matthias Wolff for supervising my thesis, for his continuous support and advice, valuable discussions, and for carefully reviewing my work. I am very grateful to Prof. Dr. Wolf Arntz for kindly accepting the second supervision. Many thanks to Prof. Dr. Ulrich Saint-Paul for having given me the opportunity to conduct this thesis, for assistance and the patience in the final phase of this work. I am very grateful to Karen Diele for her continuous encouragement, for helpful discussions and advice and the careful review of the manuscript. Many thanks to Dirk Schories who provided help in many opportunities and whose door was always open for problems and requests. Ao grupo do projeto MADAM em Bragança e Belém, agradeço pelo apoio. Agradecimentos especiais para Rosa Saraiva por sua generosa ajuda e tempo em organizar muitas coisas. Eu sou particularmente grata aos voluntários por sua assistência e ajuda em laboratório e durante trabalhos de campo : Roberta Kelley Pinheiro Soares, Adriana do Socorro da Costa Gonçalves, Jussara Freitas, Priscila Amorim Carmona, Angela Souza Maia, Andréia Cristiane Piedade Lima e Maurício Reis da Silva. Foi um grande prazer trabalhar com vocês! Também agradeço a Airton, Antonio, Marcelo Cohen, Dyânez Francisco Cunha, Joelson, Liang Tsui Hua, Ruben Lará, Ursula Mendoza, Moirah Menezes, Iracilda Sampaio, Horacio Schneider, Cidiane Soares, Terezinha, Heitor Tozzi e Daniela Torres. Meus agradecimentos especiais para João Deusdete, Aldo Melo, Chico Amancio, Guillherme e Nena pelos incontáveis dias de trabalho comigo nos manguezais. Coleta de dados não seria possível sem suas experiências e ajuda. Muito obrigada! Senhor Domingos, muito obrigada pela ajuda e hospitalidade. I am most grateful to many colleagues at the ZMT who provided valuable help during my study. I would like to thank Matthias Birkicht for his professional and enthusiastic support in the laboratory. Many thanks also to Andreas Hanning, Heinfried Pohl, and Mark Wunsch for valuable technical assistance. I thank Annika Wiemann for her assistance in sample preparation for CN analysis. Many thanks to Sabine Dittmann for scientific advice and helpful discussions. I would like to thank Kerstin Kober and Anneken Reise for their friendship and encouragement. Kerstin, many thanks for your support and our interesting discussions about statistics! I am also very grateful to Gaby Boehme, Sabine Kadler, and Silke Meyerholz for their quick and kind assistance with logistical affairs. Many thanks to Uta and Falko Berger, Marion and Rex Glaser, and Gesche Krause for their support and hospitality. Fernando Porto is thanked for

144 7 Acknowledgements
the translation of the summary and Erika Lyons for reading the manuscript. In addition, I thank Boris Koch, Uwe Krumme, and Ulf Mehlig for providing help in different situations. I would like to thank Dr. Rudolf Amann for having given me the opportunity to work in the laboratory for molecular ecology at the Max-Plack Institute for Marine Microbiology. Many thanks to Marc Mussmann for patiently introducing me to fluorescence in situ hybridization, for his interest in my work and valuable discussions. Barbara McGregor is thanked for carefully reading the manuscript. Many thanks to Cornelia Rybarsch-Steinke at the University of Bremen (department of physical chemistry) for kindly introducing me to the secrets of the bomb calorimeter. I am very grateful to Dr. Bastiaan Knoppers who kindly supported and organised my sample analyses at the Universidade Federal Fluminense in Niteroí, Brasil. Many thanks to Waldonier for the measurements at the CN analyser. A special thank you to Elisamara Sabadini for her hospitality, companionship and many hours of assistance in the laboratory. Eu agradeço muito Irineu Lobo Rodrigues Filho e sua família pelo encorajamento e interesse em meu trabalho. Muito obrigada pela ajuda e hospitalidade no Rio de Janeiro. Muito obrigada também à Natalina por todo o apoio, carinho e encorajamento. My special thanks go to Maren Kühl, Ilka Füchtenkord, Gudrun Titze, Susanne Bauer, Barbara Leidinger, and Sabine Grabbert, for their friendship and encouragement over the last years. I am especially grateful to my parents and my sister for their continuous support and confidence, and for being there for me. Many thanks! Finally, I gratefully acknowledge the financial support of this thesis by the co-operation between the Center of Tropical Marine Ecology (ZMT), Bremen, Germany, and the Universidade Federal do Pará (UFPa), Belém, Brazil. This study was carried out within the Mangrove Dynamics and Management (MADAM) project. MADAM is supported by the Ministry for Education, Science, Research and Technology (BMBF; project number: 03F0253A), and the Conselho Nacional de Pesquisa e Tecnologia (CNPq).
8 References
145
8 REFERENCES
Abhaykumar, V. K., and H. C. Dube. 1991. Epiphytic bacteria of mangrove plants Avicennia marina and Sesuvium portulacastrum. Indian Journal of Marine Science 20: 275-276.
Adamczewska, Agnieszka M., and Stephen Morris. 2001. Ecology and behavior of
Gecarcoidea natalis, the Christmas Island Red Crab, during the annual breeding migration. The Biological Bulletin 200: 305-320.
Alcantara-Filho, Pedro. 1978. Contribução ao estudo da biologia e ecologia do caranguejo-
uçá, Ucides cordatus cordatus (Linnaeus, 1763) (Crustacea, Decapoda, Brachyura), no manguezal do Rio Ceará (Brasil). Arquivos de ciências do mar 18(1 / 2): 1-41.
Allen, Stewart E. 1989. Chemical analysis of ecological materials. Oxford, Blackwell
Scientific Publications. Alongi, D. M., K. G. Boto, and F. Tirendi. 1989. Effect of exported mangrove litter on bacterial
productivity and dissolved organic carbon fluxes in adjacent tropical nearshore sediments. Marine ecology progress series 56: 133-144.
Alongi, Daniel M. 1988. Bacterial productivity and microbial biomass in tropical mangrove
sediments. Microbial ecology 15: 59-79. —. 1994. The role of bacteria in nutrient recycling in tropical mangrove and other benthic
ecosystems. Hydrobiologia 285: 19-32. Amann, Rudolf I., Lee Krumholz, and David A. Stahl. 1990. Fluorescent-oligonucleotide
probing of whole cells for determinative, phylogenetic, and environmental studies in microbiology. Journal of Bacteriology 172(2): 762-770.
Amann, Rudolf I., Wolfgang Ludwig, and Karl-Heinz Schleifer. 1995. Phylogenetic
identification and in situ detection of individual microbial cells without cultivation. Microbiological Reviews 59(1): 143-169.
Ashton, Elizabeth C. 2002. Mangrove sesarmid crab feeding experiments in Peninsular
Malaysia. Journal of experimental marine biology and ecology 273: 97-119. Atkinson, R. J. A., and E. Naylor. 1973. Activity rhythms in some burrowing decapods.
Helgoländer wissenschaftliche Meeresuntersuchungen 24: 192-201. Atkinson, R. J. A., and A. Parsons. 1973. Seasonal patterns of migration and locomotor
rhythmicity in populations of Carcinus. Netherlands Journal of Sea Research 7: 81-93.
Bano, Nasreen, Mehr-Un Nisa, Nuzhat Khan, Monawwar Saleem, Paul J. Harrison, Saiyed I.
Ahmed, and Farooq Azam. 1997. Significance of bacteria in the flux of organic matter in the tidal creeks of the mangrove ecosystem of the Indus River delta, Pakistan. Marine ecology progress series 157: 1-12.
Bärlocher, F., and B. Kendrick. 1975. Assimilation efficiency of Gammarus pseudolimnaeus
(Amphipoda) feeding on fungal mycelium or autumn-shed leaves. Oikos 26: 55-59. Barnes, D. K. A. 1997. Ecology of tropical hermit crabs at Quirimba Island, Mozambique: a
novel and locally important food source. Marine ecology progress series 161: 299-302.
146 8 References
Basak, U. C., A. B. Das, and P. Das. 1998. Seasonal changes in organic constituents in
leaves of nine mangrove species. Marine and freshwater research 49: 369-372. Begon, M. E., C. R. Townsend, and J. L. Harper. 1998. Ökologie. Heidelberg, Spektrum
Akademischer Verlag. Behling, Herrmann, Marcelo C. L. Cohen, and Rubén J. Lara. 2001. Studies on Holocene
mangrove ecosystem dynamics of the Bragança peninsula in north-eastern Pará, Brazil. Palaeoecology 167: 225-242.
Benner, Ronald, Robert E. Hodson, and David Kirchman. 1988. Bacterial abundance and
production on mangrove leaves during initial stages of leaching and biodegradation. Ergebnisse der Limnologie 31: 19-26.
Berger, Uta, Marion Glaser, Boris Koch, Gesche Krause, Rubén Lara, Ulrich Saint-Paul, Dirk
Schories et al. 1999. An integrated approach to mangrove dynamics and management. Journal of Coastal Conservation 5: 125-134.
Bhat, Tej K., Singh Bhupinder, and Om P. Sharma. 1998. Microbial degradation of tannins -
A current perspective. Biodegradation 9: 343-357. Blankensteyn, Arno, Dinancor Cunha Filho, and Andrea Santarosa Freire. 1997. Distribuição
estoques pesqueiros e conteúdo protéico do caranguejo do mangue Ucides cordatus (L. 1763) (Brachyura: Ocypodidae) nos manguezais da baía das laranjeiras e adjacências, Paraná, Brasil. Arquivos de biologia e tecnologia 40(2): 331-349.
Bliss, Dorothy E., and Patricia Cannon Sprague. 1958. Diurnal locomotor activity in
Gecarcinus lateralis. The anatomical record 132: 416-417. Boyd, Claude E., and C. Phillip Goodyear. 1971. Nutritive quality of food in ecological
systems. Archiv für Hydrobiologie 69(2): 256-270. Boyle, Paul J., and Ralph Mitchell. 1978. Absence of microorganisms in crustacean digestive
tracts. Science 200: 1157-1159. Branco, Joaquim Olinto. 1993. Aspectos bioecológicos do caranguejo Ucides cordatus
(Linnaeus, 1763) (Crustacea, Decapoda) do manguezal do Itacorubi, Santa Catarina, Brazil. Arquivos de biologia e tecnologia 36(1): 133-148.
Bratbak, Gunnar. 1985. Bacterial biovolume and biomass estimations. Applied and
environmental microbiology 49(6): 1488-1493. Breznak, John A., Winston J. Brill, James W. Mertins, and Harry C. Coppel. 1973. Nitrogen
fixation in termites. Nature 244: 577-580. Breznak, John A., and H. Stuart Pankratz. 1977. In situ morphology of the gut microbiota of
wood-eating termites [Reticulitermes flavipes (Kollar) and Coptotermes formosanus Shiraki]. Applied and environmental microbiology 33(2): 406-426.
Brogim, R. A., and P. C. Lana. 1997. Espectro alimentar de Aratus pisonii, Chasmagnathus
granulata e Sesarma rectum (Decapoda, Grapsidae) em um manguezal da Baia de Paranaguá, Paraná. Iheringia, Ser. Zool. 83: 35-43.
Brooke, M. de L. 1981. Size as a factor influencing the ownership of copulation burrows by
the ghost crab (Ocypode ceratophthalmus). Zeitschrift für Tierpsychologie 55: 63-78.
8 References
147
Brooker, J. D., L. A. O´Donovan, I. Skene, K. R. Clarke, L. Blackall, and P. Muslera. 1994.
Streptococcus caprinus sp.nov., a tannin-resistent ruminal bacterium from feral goats. Letters in Applied Microbiology 18: 313-318.
Burggren, Warren W., and Brian R. McMahon. 1988. Biology of the land crabs. Cambridge,
U.K., Cambridge University Press. Camilleri, J. C. 1989. Leaf choice by crustaceans in a mangrove forest in Queensland.
Marine Biology 102: 453-459. —. 1992. Leaf-litter processing by invertebrates in a mangrove forest in Queensland. Marine
Biology 114: 139-145. Camilleri, J. C., and G. Ribi. 1986. Leaching of dissolved organic carbon (DOC) from dead
leaves, formation of flakes from DOC, and feeding on flakes by crustaceans in mangroves. Marine Biology 91: 337-344.
Carpenter, Edward J., and John L. Culliney. 1975. Nitrogen fixation in marine shipworms.
Science 187: 551-552. Cohen, Marcelo C. L., Rubém J. Lara, Claudio F. Szlafsztein, and Thorsten Dittmar. 2001.
Analysis of mangrove inundation by GIS techniques in H. Barros, ed. Sustainability of estuaries and mangroves: challenges and prospects.
Corrêa Ivo, Carlos Tassito, Antônio Fernandes Dias, and Raimundo Ivan Mota. 1999. Estudo
sobre a biologia do caranguejo-Uçá, Ucides cordatus cordatus (Linnaeus, 1763), capturado no delta do Rio Parnaíba, Estado do Piauí. Boletim Técnico-Científico do CEPENE 7(1): 53-84.
Corrêa Ivo, Carlos Tassito, and Tereza Cristina Vasconcelos Gesteira. 1999. Sinopse das
observações sobre a bioecologia e pesca do caranguejo-Uçá, Ucides cordatus cordatus (Linnaeus, 1763), capturado em estuários de sua área de ocorrência no Brasil. Boletim Técnico-Científico do CEPENE 7(1): 9-52.
Costa, R. S. 1979. Biologia do caranguejo-uçá, Ucides cordatus (Linnaeus, 1763) -
Crustáceo decápode - no Nordeste brasileiro. Boletim cearense de agronomia 20: 1-74.
Crane, Jocelyn. 1975. Fiddler Crabs of the World. Ocypodidae: Genus Uca, Princeton
University Press. Crisp. 1984. Energy flow measurements in Holme, and McIntyre, eds. Methods for the study
of marine benthos. Oxford, Blackwell. Cruden, Diana Loeb, and A. J. Markovetz. 1979. Carboxymethyl cellulose decomposition by
intestinal bacteria of cockroaches. Applied and environmental microbiology 38(3): 369-372.
Cundell, A. M., M. S. Brown, R. Standford, and R. Mitchell. 1979. Microbial degradation of
Rhiziphora mangle leaves immersed in the sea. Estuarine, coastal and shelf science 9: 281-286.
148 8 References
Daan, N. 1973. A quantitative analysis of the food intake of north sea cod, Gadus morhua. Netherlands Journal of Sea Research 6(4): 479-517.
Dahdouh-Guebas, F., M. Giuggioli, A. Oluoch, M. Vannini, and S. Cannicci. 1999. Feeding
habits of non-ocypodid crabs from two mangrove forests in Kenya. Bulletin of Marine Science 64(2): 291-297.
Dahdouh-Guebas, F., M. Verneirt, J. F. Tack, and N. Koedam. 1997. Food preferences of
Neosarmatium meinerti de Man (Decapoda: Sesarminae) and its possible effect on the regeneration of mangroves. Hydrobiologia 347: 83-89.
Davis, John W., and Ronald K. Sizemore. 1982. Incidence of Vibrio species associated with
Blue Crabs (Callinectes sapidus) collected from Galveston Bay, Texas. Applied and environmental microbiology 43(5): 1092-1097.
Day Jr., J. W., W. H. Conner, F. Ley-Lou, R. H. Day, and A. Machado Navarro. 1987. The
productivity and composition of mangrove forests, Laguna de Términos, Mexico. Aquatic Botany 27: 267-284.
De Castro, Antonio Carlos Leal. 1986. Aspectos bio-ecologicos do caranguejo-Uçá, Ucides
cordatus (Linnaeus, 1763), no estuario do rio dos Cachorros e estreito do Coqueiro, Sao Luis - MA. Boletim do Laboratório de Hidrobiologia 7: 7-26.
De Geraldes, Mayra García, and Idelisa Bonnelly De Calventi. 1983. Estudios
experimentales para el mantenimiento en cautiverio del cangrejo Ucides cordatus. Ciencia interamericana 23(1-4): 41-53.
de Lacerda, Luiz D., Dora V. José, Carlos E. de Rezende, Maria Cristina F. Francisco, Júlio
C. Wasserman, and Júlio C. Martins. 1986. Leaf chemical characteristics affecting herbivory in a New World mangrove forest. Biotropica 18(4): 350-355.
del Norte-Campos, A. G. C., and A. Temming. 1994. Daily activity, feeding and rations in
gobies and brown shrimp in the northern wadden sea. Marine ecology progress series 115: 41-53.
Dempsey, A. C., C. L. Kitting, and R. A. Rosson. 1989. Bacterial variability among individual
penaeid shrimp digestive tracts. Crustaceana 56(3): 267-278. Dempsey, Amy Claire, and Christopher L. Kitting. 1987. Characteristics of bacteria isolated
from penaeid shrimp. Crustaceana 52(1): 90-94. Diele, Karen. 2000. Life History and Population Structure of the Exploited Mangrove Crab
Ucides cordatus cordatus (Linnaeus, 1763) (Decapoda: Brachyura) in the Caeté Estuary, North Brazil. Ph. D. thesis, ZMT Contribution 9, Bremen, Germany.
Dittmann, Sabine. 1998. Behaviour and population structure of soldier crabs Mictyris
longicarpus (Latreille): Observations from a tidal flat in tropical North Queensland, Australia. Senckenbergiana maritima 28(4/6): 177-184.
Duke, N. C., J. S. Bunt, and W. T. Williams. 1981. Mangrove litter fall in North-eastern
Australia. I. Annual totals by component in selected species. Australian Journal of Botany 29: 547-553.
Dye, A. H. 1983. A method for the quantitative estimation of bacteria from mangrove
sediments. Estuarine, coastal and shelf science 17: 207-212.
8 References
149
Dye, A. H., and T. A. Lasiak. 1986. Microbenthos, meiobenthos and fiddler crabs: trophic interactions in a tropical mangrove sediment. Marine ecology progress series 32: 259-264.
—. 1987. Assimilation efficiencies of fiddler crabs and deposit-feeding gastropods from
tropical mangrove sediments. Comparative Biochemistry and Physiology 87A(2): 341-344.
Eggers, Douglas M. 1977. Factors in interpreting data obtained by diel sampling of fish
stomachs. Journal of the Fisheries Research Board of Canada 34: 290-294. Elliott, J. M. 1972. Rates of gastric evacuation in brown trout, Salmo trutta L. Freshwater
biology 2: 1-18. Elliott, J. M., and L. Persson. 1978. The estimation of daily rates of food consumption for fish.
Journal of Animal Ecology 47: 977-991. Emmerson, W. D., and L. E. Mc Gwynne. 1992. Feeding and assimilation of mangrove
leaves by the crab Sesarma meinerti de Man in relation to leaf-litter production in Mgazana, a warm-temperate southern African mangrove swamp. Journal of experimental marine biology and ecology 157: 41-53.
Ens, B. J., M. Klaassen, and L. Zwarts. 1993. Flocking and feeding in the fiddler crab (Uca
tangeri): Prey availability as risk-taking behaviour. Netherlands Journal of Sea Research 31(4): 477-494.
Fischer, Kathrin, Dittmar Hahn, Rudolf I. Amann, Otto Daniel, and Josef Zeyer. 1995. In situ
analysis of the bacterial community in the gut of the earthworm Lumbricus terrestris L. by whole-cell hybridization. Canadian Journal of Microbiology 41: 666-673.
Flores-Verdugo, Francisco J., John W. Day, and Raquel Briseño-Dueñas. 1987. Structure,
litter fall, decomposition, and detritus dynamics of mangroves in a Mexican coastal lagoon with an ephemeral inlet. Marine ecology progress series 35: 83-90.
Giddens, R. L., J. S. Lucas, M. J. Neilson, and G. N. Richards. 1986. Feeding ecology of the
mangrove crab Neosarmatium smithi (Crustacea: Decapoda: Sesarmidae). Marine ecology progress series 33: 147-155.
Glaser, Marion. 1999. Sustainability in the management of mangrove crabs (Ucides
cordatus) in coastal Pará (Caeté estuary), North Brazil. Conference of the Development Studies Association (DSA).1-9.
—. 2003. Interrelation between mangrove ecosystem, local economy and social sustainability
in Caeté Estuary, North Brazil. Wetlands Ecology and Management 11: 265-272. Glöckner, Frank Oliver, Bernhard M. Fuchs, and Rudolf Amann. 1999. Bacterioplankton
compositions of lakes and oceans: a first comparison based on fluorescence in situ hybridization. Applied and environmental microbiology 65(8): 3721-3726.
Gondim, C. J. E., and F. B. Araújo. 1996. Redução dos tamanhos dos caranguejos (Ucides
cordatus, L.) capturados nos manguezais de Maracaná, zona do salgado paraense. Manejo de Ecossistemas e Mundanças Globais.
Goulter, P. F. E., and W. G. Allaway. 1979. Litter fall and decomposition in a mangrove
stand, Avicennia marina (Forsk.) Vierh., in Middle Harbour, Sydney. Australian journal of marine and freshwater research 30: 541-546.
150 8 References
Green, Peter T. 1997. Red crabs in rain forest on Christmas Island, Indian Ocean: activity
pattern, density and biomass. Journal of Tropical Ecology 13: 17-38. Green, Peter T., P. S. Lake, and Dennis J. O´Dowd. 1999. Monopolization of litter
processing by a dominant land crab on a tropical oceanic island. Oecologia 119: 435-444.
Greenaway, Peter, and S. M: Linton. 1995. Dietary assimilation and food retention time in the
herbivorous terrestrial crab Gecarcoidea natalis. Physiological Zoology 68(6): 1006-1028.
Greenaway, Peter, and Supriya Raghaven. 1998. Digestive stragegies in two species of leaf-
eating crabs (Brachyura: Gecarcinidae) in a rain forest. Physiological Zoology 71(1): 36-44.
Guerinot, M. L., and D. G. Patriquin. 1981. The association of N2-fixing bacteria with sea
urchins. Marine Biology 62: 197-207. Gurney, L. J., P. W. Froneman, E. A. Pakhomov, and C. D. McQuaid. 2002. Diel feeding
patterns and daily ration estimates of three subantarctic euphausiids in the vicinity of the Prince Edward Islands (Southern Ocean). Deep-Sea Research 49: 3207-3227.
Hargrave, Barry T. 1970. The utilization of benthic microflora by Hyalella azteca
(Amphipoda): 427-437. Harris, J. M. 1993a. Widespread occurence of extensive epimural rod bacteria in the
hindguts of marine Thalassinidae and Brachyura (Crustacea: Decapoda). Marine Biology 116: 615-629.
Harris, Jean M. 1993b. The presence, nature, and role of gut microflora in aquatic
invertebrates: a synthesis. Microbial ecology 25: 195-231. Harris, Jean M., Lindsay J. Seiderer, and Michael I. Lucas. 1991. Gut microflora of two
saltmarsh detritivore thalassinid prawns, Upogebia africana and Callianassa kraussi. Microbial ecology 21: 277-296.
Herreid II, Clyde F. 1963. Observations of the feeding behavior of Cardisoma guanhumi
(Latraille) in Southern Florida. Crustaceana 5: 176-180. Hicks, R. E., R. Amann, and D. A. Stahl. 1992. Dual staining of natural bacterioplankton with
4´,6-diamidino-2-phenylindole and fluorescent oligonucleotide probes targeting kingdom-level 16S rRNA sequences. Applied and environmental microbiology 58(7): 2158-2163.
Hill, B. J. 1976. Natural food, foregut clearance-rate and activity of the crab Scylla serrata.
Marine Biology 34: 109-116. Hogarth, Peter J. 1999. The Biology of Mangroves, Oxford University Press. Holmes, Barry, Thomas A. McMeekin, and Robert J. Owen. 1984. Flavobacterium, a yellow
bacterium in N. R. Krieg, and J. G. Holt, eds. Bergey´s manual of systematic bacteriology, vol I. Baltimore, The Williams and Williams Co.
Honegger, H.-W. 1973. Rhythmic activity responses of the fiddler crab Uca crenulata to
artificial tides and artificial light. Marine Biology 21: 196-202.
8 References
151
Hood, M. A., S. P. Meyers, and A. R. Colmer. 1971. Bacteria of the digestive tract of the white shrimp Penaeus setiferus. Bacteriological Proceedings 71: 48.
Hood, Mary A., and Samuel P. Meyers. 1973. Microbial aspects of penaeid shrimp digestion.
Guf and Caribbean Fisheries Institute 26: 81-91. Huq, Anwarul, Shameem A. Huq, D. Jay Grimes, Mark O´Brien, Ka Hou Chu, Judith
McDowell Capuzzo, and Rita R. Colwell. 1986. Colonization of the gut of the blue crab (Callinectes sapidus) by Vibrio cholerae. Applied and environmental microbiology 52(3): 586-588.
Imafuku, Michio. 1981. Tidal activity rhythm of the hermit crabs, Pagurus geminus McLaughlin. Publications of the Seto Marine Biological Laboratory 16(4/6): 327-336.
INMET. 1992. Normais Climatológicas (1961-1990). Brasilia, DF, Instituto Nacional de
Meteorologia (INMET). Jesse, Sandra. 2001. Comparative ecology of sympatric brachyuran crab species in the
shallow subtidal of the Pacific Coast of North Chile and their importance for the artisanal fishery in Puerto Aldea. Ph. D. thesis, ZMT Contribution 12, Bremen, Germany.
Jobling, M. 1981. Mathematical models of gastric emptying and the estimation of daily rates of food consumption for fish. Journal of fish biology 19: 245-257.
Jones, D. A. 1984. Crabs of the mangal ecosystem in F. D. a. D. Por, I., ed. Hydrobiology ot
the Mangal. The Hague, Dr. W. Junk Publishers. Jones, R. 1974. The rate of elimination of food from the stomachs of haddock
Melanogrammus aeglefinus, cod Gadus morhua and whiting Merlangius merlangus. Journal du Conseil Permanent International pour l´Exploration de la Mer 35(3): 225-243.
Kellman, Martin, and Bianca Delfosse. 1993. Effect of the red land crab (Gecarcinus lateralis)
on leaf litter in a tropical dry forest in Veracruz, Mexico. Journal of Tropical Ecology 9: 55-65.
Kihlberg, Reinhold. 1972. The microbe as a source of food. Annual review of microbiology
26: 427-466. Kiørboe, Thomas. 1978. Laboratory measurements of digestion rate in 0-group flounder
(Platichthys flesus L.) at two temperatures. Ophelia 17(1): 155-161. Kjerfve, B., and L. D. Lacerda. 1993. Mangroves of Brazil, pages 245-272 in L. D. Lacerda,
ed. Conservation and sustainable utilization of mangrove forests in Latin America and African regions. Part 1: Latin America. Mangrove Ecosystems Technical Reports.
Koch, Volker. 1999. Epibenthic production and energy flow in the Caeté mangrove estuary,
North Brazil. Ph. D. thesis, ZMT Contribution 14, Bremen, Germany. Koch, Volker, and Matthias Wolff. 2002. Energy budget and ecological role of mangrove
epibenthos in the Caeté estuary, North Brazil. Marine ecology progress series 228: 119-130.
Kostanjšek, Rok, Jasna Štrus, and Gorazd Avguštin. 2002. Genetic diversity of bacteria
associated with the hindgut of the terrestrial crustacean Porcellio scaber (Crustacea: Isopoda). FEMS Microbiology Ecology 40: 171-179.
152 8 References
Krause, Gesche, Dirk Schories, Marion Glaser, and Karen Diele. 2001. Spatial patterns of
mangrove ecosystems: The bragantinian mangroves of northern Brazil (Bragança, Pará). Ecotropica 7: 93-107.
Krumme, Uwe. 2003. Tidal and diel dynamics in a nursery area: patterns in fish migration in
a mangrove in North Brazil. PhD thesis, University of Bremen. Krumme, Uwe, Ulrich Saint-Paul, and Harald Rosenthal. submitted. Tidal and diel changes in
the structure of a nekton assemblage in small intertidal mangrove creeks in northern Brazil. Aquatic Living Resources.
Kumar, R., and M. Singh. 1984. Tannins: their adverse role in ruminant nutrition. Journal of
agricultural and food chemistry 32: 447-453. Kwok, P. W., and S. Y. Lee. 1995. The growth performances of two mangrove crabs,
Chiromanthes bidens and Parasesarma plicata under different leaf litter diets. Hydrobiologia 295: 141-148.
Kyomo, Joel. 1992. Variations in the feeding habits of males and females of the crab
Sesarma intermedia. Marine ecology progress series 83: 151-155. Lacerda, L. D., J. E. Conde, B. Kjerfve, R. Alvarez-León, C. Alarcón, and J. Polanía. 2002.
American Mangroves, pages 1-62 in L. D. de Lacerda, ed. Mangrove Ecosystems. Function and Management. Berlin, Springer.
Lakshmanaperumalsamy, P. 1987. Nitrogen fixing bacteria, Azotobacter sp. in aquatic
sediment. Fishery technology 24: 126-128. Lavelle, P. 1997. Faunal activities and soil processes: adaptive strategies that determine
ecosystem function. Advances in Ecological Research 27: 93-132. Leach, G. J., and S. Burgin. 1985. Litter production and seasonality of mangroves in Papua
New Guinea. Aquatic Botany 23: 215-224. Lee, S. Y. 1989a. The importance of sesarminae crabs Chiromanthes spp. and inundation
frequency on mangrove (Kandelia candel (L.) Druce) leaf litter turnover in a Hong Kong tidal shrimp pond. Journal of experimental marine biology and ecology 131: 23-43.
—. 1989b. Litter production and turnover of the mangrove Kandelia candel (L.) Druce in a
Hong Kong tidal shrimp pond. Estuarine, coastal and shelf science 29: 75-87. —. 1997. Potential trophic importance of the faecal material of the mangrove sesarmide crab
Sesarma messa. Marine ecology progress series 159: 275-284. —. 1998. Ecological role of grapsid crabs in mangrove ecosystems: a review. Marine and
freshwater research 49: 335-343. Little, M. C., P. J. Reay, and S. J. Grove. 1988. The fish community of an East African
mangrove creek. Journal of Fish Biology 32: 729-747. Llobet-Brossa, Ramon, Enric Rosselló-Mora, and Rudolf Amann. 1998. Microbial community
composition of wadden sea sediments as revealed by fluorescence in situ hybridization. Applied and environmental microbiology 64(7): 2691-2696.

8 References
153
Lugo, Ariel E., and Samuel C. Snedaker. 1974. The ecology of mangroves. Annual review of ecology and systematics 5: 39-64.
Lutz, Peter L., and C. Bruce Austin. 1983. Land crabs: A new resource potential.
Proceedings of the Fisheries Institute 35: 6-16. Macintosh, D. J. 1988. The ecology and physiology of decapods of mangrove swamps,
pages 315-341 in A. A. Fincham, and P. S. Rainbow, eds. Aspects of decapod crustacean biology. Oxford, Clarendon Press.
Macnae, W. 1968. A general account of the fauna and flora of mangrove swamps and forests
in the Indo-West-Pacific region. Advances in Marine Biology 6: 73-270. Malley, D. F. 1978. Degradation of mangrove leaf litter by the tropical sesarmid crab
Chiromanthes onychophorum. Marine Biology 49: 377-386. Manz, Werner, Rudolf Amann, Wolfgang Ludwig, Michael Wagner, and Karl-Heinz
Schleifer. 1992. Phylogenetic oligodeoxynucleotide probes for the major subclasses of Proteobacteria: problems and solutions. Systematic and applied microbiology 15: 593-600.
Manz, Werner, Rudolf Amann, Wolfgang Ludwig, Marc Vancanneyt, and Karl-Heinz
Schleifer. 1996. Application of a suite of 16S rRNA-specific oligonucleotide probes designed to investigate bacteria of the phylum cytophaga-flavobacter-bacteroides in the natural environment. Microbiology 142: 1097-1106.
Martin, Michael M., and Jerome J. Kukor. 1984. Gastrointestinal Microecology; Role of
mycophagy and bacteriophagy in invertebrate nutrition. Mastaller, Michael. 1997. Mangroves: The forgotten forests between land and sea. Kuala
Lumpur, Tropical Press. Matondkar, S. G. P., S. Mahtani, and S. Mavinkurve. 1980. Seasonal variations in the
microflora from mangrove swamps of Goa. Indian Journal of Marine Science 9: 119-120.
Mattson, Robert A. 1988. Occurrence and abundance of eccrinaceous fungi (Trichomycetes)
in Brachyuran crabs from Tampa Bay, Florida. Journal of Crustacean Biology 8(1): 20-30.
Mattson, William J. Jr. 1980. Herbivory in relation to plant nitrogen content. Annual review of
ecology and systematics 11: 119-161. Maynou, Francesc, and Joan E. Cartes. 1998. Daily ration estimates and comparative study
of food consumption in nine species of deep-water decapod crustaceans of the NW Mediterranean. Marine ecology progress series 171: 221-231.
McKee, Karen L. 1995. Mangrove species distribution and propagule predation in Belize: An
exception to the dominance-predation hypothesis. Biotropica 27(3): 334-345. McNeill, S., and T. R. E. Southwood. 1978. The role of nitrogen in the development of
insect/plant relationships, pages 77-98 in J. B. Harborne, ed. Biochemical aspects of plant and animal coevolution. London, Academic Press Inc. London Ltd.
154 8 References
McSweeney, Christopher S., Brian Palmer, Rowan Bunch, and Denis O. Krause. 1999. Isolation and characterization of proteolytic ruminal bacteria from sheep and goats fed the tannin-containing shrup Calliandra calothyrus. Applied and environmental microbiology 65(7): 3075-3083.
Mehlig, Ulf. 2001. Aspects of tree primary production in an equatorial mangrove forest in
Brazil. Ph. D. thesis, ZMT Contribution 16, Bremen, Germany. Mfilinge, P.L., N. Atta, and M. Tsuchiya. 2002. Nutrient dynamics and leaf litter
decomposition in a subtropical mangrove forest at Oura Bay, Okinawa, Japan. Trees 16: 172-180.
Micheli, F., F. Gheradi, and M. Vannini. 1991. Feeding and burrowing ecology of two East
African mangrove crabs. Marine Biology 111: 247-254. Micheli, Fiorenza. 1993. Feeding ecology of mangrove crabs in North Eastern Australia:
mangrove litter consumption by Sesarma messa and Sesarma smithii. Journal of experimental marine biology and ecology 171: 165-186.
Moriarty, D. J. W., and M. C. Barclay. 1981. Carbon and nitrogen content of food and the
assimilation efficiencies of panaeid prawns in the Gulf of Carpentaria. Australian journal of marine and freshwater research 32: 245-251.
Murai, M., S. Goshima, and Y. Nakasone. 1983. Adaptive droving behavior observed in the
fiddler crab Uca vocans vocans. Marine Biology 76: 159-164. Nagata, Toshi. 1986. Carbon and nitrogen content of natural planktonic bacteria. Applied and
environmental microbiology 52(1): 28-32. Nardi, James B., Roderick I. Mackie, and Jeffrey O. Dawson. 2002. Could microbial
symbionts of arthropod guts contribute significantly to nitrogen fixation in terrestrial ecosystems? Journal of Insect Physiology 48: 751-763.
Nascimento, Solange Alves. 1993. Biologia do caranguejo-Uçá (Ucides cordatus). ADEMA,
Aracajú: 48 pp. Nascimento, Solange Alves, Edivaldo Rosas dos Santos, Lourival Bomfim, and Raimundo
Saraiva da Costa. 1982. Estudo bio-ecológico do caranguejo-Uçá (Ucides cordatus) e do manguezal do estado de Sergipe-Nordeste do Brasil, pages 1-12. Sergipe, Brazil, Governo do estado de Sergipe.
Nascimento, Solange Alves, and Edivaldo Rosas Santos. 1982. Estudo ecológico do
caranguejo-Uçá (Ucides cordatus) e do manguezal do litoral do estado de Sergipe, Nordeste do Brasil. Atlantica 5(2): 85.
Neef, Alexander. 1997. Anwendung der in-situ Einzelzell-Identifizierung von Bakterien zur
Populationsanalyse in komplexen mikrobiellen Biozönosen. Ph.D. thesis, Technical University Munich, Germany.
Neilson, M. J., R. L. Giddins, and G. N. Richards. 1986. Effect of tannins on the palatability of
mangrove leaves to the tropical sesarminid crab Neosarmatium smithi. Marine ecology progress series 34: 185-186.
Ninawe, A., and S. Banik. 1987. Chitinolytic bacteria in Penaeus indicus. Journal of
aquaculture in the tropics 2: 89-92.
8 References
155
Nordi, Nivaldo. 1994a. A captura do caranguejo-uçá (Ucides cordatus) durante o evento reprodutivo da espécie: O ponto de vista dos caranguejeiros. Revista Nordestina de Biologia 9(1): 41-47.
—. 1994b. A produção dos catadores de caranguejo-uçá (Ucides cordatus) na região de várzea nova, Paraíba, Brasil. Revista Nordestina de Biologia 9(1): 71-77.
Nunes, Alberto J. P., and G. Jay Parsons. 2000. Size-related feeding and gastric evacuation
measurements for the Southern brown shrimp Penaeus subtilis. Aquaculture 187(1-2): 133-151.
O´Dowd, D. J., and P. S. Lake. 1990. Red crabs in rain forest, Christmas Island: differential herbivory of seedlings. Oikos 58: 289-292.
O´Dowd, Dennis J., and P. S. Lake. 1989. Red crabs in rain forest, Christmas Island:
removal and relocation of leaf-fall. Journal of Tropical Ecology 5: 337-348. —. 1991. Red crabs in rain forest, Christmas Island: removal and fate of fruits and seeds.
Journal of Tropical Ecology 7: 113-122.
Odum, William E., and Eric J. Heald. 1972. Trophic analyses of an estuarine mangrove community. Bulletin of Marine Science 22(3): 671-738.
—. 1975. The detritus-based food web of an estuarine mangrove community, pages 265-286
in L. E. Cronin, ed. Estuarine Research. New York, Academic Press. Ogawa, Masayoshi, Tarcísio Teixeira Alves, Maria da Conceição Caland-Noronha, Carlos
Antonio Esteves Araripe, and Everardo Lima Maia. 1973. Industrialização do caranguejo-uçá, Ucides cordatus (Linnaeus). I - Técnicas para o processamento da carne. Arquivos de ciências do mar 13(1): 31-37.
Ohkuma, Moriya, Satoko Noda, Yuichi Hongoh, and Toshiaki Kudo. 2001. Coevolution of
symbiotic systems of termites and their gut microorganisms. Riken Review 41: 73-74. Osawa, R. 1992. Tannin-protein complex-degrading enterobacteria isolated from the
alimentary tracts of koalas and a selective medium for their enumeration. Applied and environmental microbiology 58(5): 1754-1759.
Ostrensky, Antonio, Ulises Sebastian Sternhain, Enemar Brun, Fábio Xavier Wegbecher,
and Débora Pestana. 1995. Análise da viabilidade técnico-econômica dos cultivos do caranguejo-uçá Ucides cordatus (Linnaeus, 1763) no litoral paraense. Arquivos de biologia e tecnologia 38(3): 939-947.
Pakhomov, E. A., and R. Perissinotto. 1996. Trophodynamics of the hyperiid amphipod
Themisto gaudichaudi in the South Georgia region during late austral summer. Marine ecology progress series 134: 91-100.
Palmer, John D. 1971. Comparative studies of circadian locomotory rhythms in four species of terrestrial crabs. The American Midland Naturalist 85(1): 97-107.
Palmer, John D., and Barbara Williams. 1993. Comparative studies of tidal rhythms. XII.
Persistent photoaccumulation and locomotor rhythms in the crab, Cyclograpsus lavauxi. Marine Behaviour and Physiology 22: 119-129.
Palmer, John D., and Barbara G. Williams. 1986. Comparative studies of tidal rhythms. II.
The dual clock control of the locomotor rhythms of two decapod crustaceans. Marine Behaviour and Physiology 12: 269-278.
156 8 References
Por, Francis Dov. 1994. Guia Ilustrado do Manguezal Brasileiro. São Paulo, ADEMA-SP. Potrikus, C. J., and J. A. Breznak. 1977. Nitrogen-fixing Enterobacter agglomerans isolated
from guts of wood-eating termites. Applied and environmental microbiology 33: 392-399.
Quinn, R. H. 1986. Experimental studies of food ingestion and assimilation of soldier crab,
Mictyris longicarpus Latreille (Decapoda, Mictyridae). Journal of experimental marine biology and ecology 102: 167-181.
Rademaker, Verena. 1998. Ernährungsökologie, Habitatbeschreibung und
Populationsstruktur der Mangrovenkrabbe Ucides cordatus (Linnaeus, 1763) im Caete-Mangrovenästuar, Nordostbrasilien. Diploma thesis, University of Bremen, Germany, Bremen, Germany.
Ramadhas, V., and S. Vijayaraghavan. 1979. Efficiency of energy utilization in the shrimp,
Metapenaeus monoceros fed mangrove leaves. Indian Journal of Marine Science 8(2): 114-115.
Rao, R. G., A. F. Woitchik, L. Goeyens, A. van Riet, J. Kazungu, and F. Dehairs. 1994.
Carbon, nitrogen contents and stable carbon isotope abundance in mangrove leaves from an east African coastal lagoon (Kenya). Aquatic Botany 47: 175-183.
Reigada, Alvaro Luiz Diogo, and Maria Lucia Negreiros-Fransozo. 2001. Feeding activity of
Callinectes ornatus Ordway, 1963 and Callinectes danae Smith, 1869 (Crustacea, Brachyura, Portunidae) in Ubatuba, SP, Brazil. Hydrobiologia 449: 249-252.
Reise, Anneken. 1999. Untersuchungen zum Streufall und Streuumsatz als Basis zur
Charakterisierung des Stoffflusses in verschieden strukturierten Mangrovenwäldern Braganças/Nordostbrasiliens. Diploma thesis, University of Lüneburg, Germany.
—. 2002. Estimates of biomass and productivity in fringe mangroves of North-Brazil. Ph. D.
thesis, University of Bremen, Germany, Bremen, Germany. Reyes, Victor G., and James M. Tiedje. 1976. Ecology of the gut microbiota of
Tracheoniscus rathkei (Crustacea, Isopoda). Pedobiologia 16: 67-74. Robertson, A. I. 1986. Leaf-burying crabs: their influence on energy flow and export from
mixed mangrove forests (Rhizophora spp.) in northeastern Australia. Journal of experimental marine biology and ecology 102: 237-248.
—. 1988. Decomposition of mangrove leaf litter in tropical Australia. Journal of experimental
marine biology and ecology 116: 235-247. Robertson, A. I., and D. M. Alongi. 1992. Tropical Marine Ecosystems: Coastal and Estuarine
Studies. Washington, D.C., American Geophysical Union. Robertson, A. I., D. M. Alongi, and K. G. Boto. 1992. Food chains and carbon fluxes in A. I.
Robertson, and D. M. Alongi, eds. Tropical Mangrove Ecosystems. Washington, DC, American Geophysical Union.
Robertson, A. I., and P. A. Daniel. 1989. The influence of crabs on litter processing in high
intertidal mangrove forests in tropical Australia. Oecologia 78: 191-198.
8 References
157
Robertson, A. I., and N. C. Duke. 1987. Mangroves as nursery sites: comparisons of the abundance and species composition of fish and crustaceans in mangroves and other nearshore habitats in tropical Australia. Marine Biology 96: 193-205.
—. 1990. Mangrove fish-communities in tropical Oueensland, Australia: spatial and temporal
patterns in densities, biomass and community structure. Marine Biology 104: 369-379.
Robertson, J. Roy, and S. Y. Newell. 1982. Experimental studies of particle ingestion by the
sand fiddler crab Uca pugilator (Bosc). Journal of experimental marine biology and ecology 59: 1-21.
Roller, C., M. Wagner, R. Amann, W. Ludwig, and K. H. Schleifer. 1994. In situ probing of
gram-positive bacteria with high DNA G+C content using 23S rRNA-targeted oligonucleotides. Microbiology 140: 2849-2858.
Rosas, Carlos, Cecilia Vanegas, Isaac Tabares, and Judith Ramirez. 1993. Energy balance
of Callinectes rathbunae Contreras 1930 in floating cages in a tropical coastal lagoon. Journal of the World Aquaculture Society 24(1): 71-79.
Rublee, Parke A. 1982. Bacteria and microbial distribution in estuarine sediments, pages
159-182 in V. S. Kennedy, ed. Estuarine comparisons. New York, Academic Press. Russell-Hunter, W. D. 1970. Aquatic productivity: an introduction to some basic aspects of
biological oceanography and limnology. New York, The Macmillan Company. Saenger, Peter, and Samuel C. Snedaker. 1993. Pantropical trends in mangrove above-
ground biomass and annual litterfall. Oecologia 96: 293-299. Santo Domingo, Jorge W., Michael G. Kaufman, Michael J. Klug, and James M. Tiedje.
1998. Characterization of the cricket hindgut microbiota with fluorescently labeled rRNA-targeted oligonucleotide probes. Applied and environmental microbiology 64(2): 752-755.
Sardà, F., and F. J. Valladares. 1990. Gastric evacuation of different foods by Nephrops
norvegicus (Crustacea: Decapoda) and estimation of soft tissue ingested, maximum food intake and cannibalism in captivity. Marine Biology 104: 25-30.
Sasekumar, A., V. C. Chong, M. U. Leh, and R. D´Cruz. 1992. Mangroves as a habitat for
fish and prawns. Hydrobiologia 247: 195-207. Sasekumar, A., and J. J. Loi. 1983. Litter production in three mangrove forest zones in the
Malay peninsula. Aquatic Botany 17: 283-290. Schmitt-Wagner, Dirk. 2003. The intestinal microbiota of soil-feeding termites: microbial
diversity, community structure, and metabolic activities in the highly compartmentalized gut of Cubitermes spp. PhD thesis.
Schories, Dirk, Audrey Barletta-Bergan, Mario Barletta, Uwe Krumme, Ulf Mehlig, and
Verena Rademaker. 2003. The keystone role of leaf-removing crabs in mangrove forests of North Brazil. Wetlands Ecology and Management 11: 243-255.
Schwamborn, R., and M. M. Criales. 2000. Feeding strategy and daily ration of juvenile pink
shrimp (Farfantepenaeus duorarum) in a South Florida seagrass bed. Marine Biology 137: 139-147.
158 8 References
Schwendenmann, Luitgard. 1998. Tidal and seasonal variations of soil and water properties in a Brazilian mangrove ecosystem. Master of Science thesis, University of Karlsruhe, Germany.
Shome, Rajeswari, B. R. Shome, A. B. Mandal, and A. K. Bandopadhyay. 1995. Bacterial flora in mangroves of Andaman - Part I: Isolation, identification and antibiogram studies. Indian Journal of Marine Science 24: 97-98.
Skov, Martin W., and Richard G. Hartnoll. 2002. Paradoxical selective feeding on a low-
nutrient diet: Why do mangrove crabs eat leaves? Oecologia 131: 1-7. Smith III, Thomas J. 1987. Seed predation in relation to tree dominance and distribution in
mangrove forests. Ecology 68(2): 266-273. Smith III, Thomas J., Kevin G. Boto, Stewart D. Frusher, and Raymond L. Giddens. 1991.
Keystone species and mangrove forest dynamics: the influence of burrowing by crabs on soil nutrient status and forest productivity. Estuarine, coastal and shelf science 33: 419-432.
Smith III, Thomas J., Hung T. Chan, Carole C. McIvor, and Michael B. Robblee. 1989. Comparisions of seed predation in tropical tidal forests from three continents. Ecology 70(1): 146-151.
Spalding, M., F. Blasco, and C.D. Field. 1997. World mangrove atlas. Okinawa, Japan, The International society for Mangrove Ecosystems.
Stahl, D. A., and R. Amann. 1991. Development and application of nucleic acid probes,
pages 205-248 in E. Stackebran, and M. Goodfellow, eds. Nucleic acid techniques in bacteria systematics. Chichester, England, John Wiley & Sons Ltd.
Starr, Mortimer P., Heinz Stolp, and Hans G. Trüper. 1981. The prokaryotes, vol II. New
York, Springer Verlag, New York. Steinke, T. D., and L. M. Charles. 1984. Productivity and phenology of Avicennia marina
(Forsk.) Vierh. and Bruguiera gymnorrhiza (L.) Lam. in Mgeni estuary, South Africa, pages 25-36 in H. J. Teas, ed. Physiology and management of mangroves. The Hague, Dr. W. Junk Publishers.
Steinke, T. D., A. Rajh, and A. J. Holland. 1993. The feeding behaviour of the red mangrove
crab Sesarma meinerti De Man, 1887 (Crustacea: Decapoda: Grapsidae) and its effect on the degradation of mangrove leaf litter. African Journal of Marine Science 13: 151-160.
Stolp, Heinz. 1988. Microbial ecology: Organisms, habitats, activities: Cambridge studies in ecology, Cambridge University press.
Surendran, V., and V. Chandrika. 1993. Studies on heterotrophic bacteria in the mangrove
ecosystem near Cochin. CMFRI special publication 53: 66-71. Thorpe, J. E. 1977. Daily ration of adult perch, Perca fluviatilis L. during summer in Loch
Leven, Scotland. Journal of fish biology 11: 55-68.
Thüllen, Nina. 1997. Analyse der Struktur eines Mangrovenwaldgebietes bei Bragança, Nordbrasilien und Untersuchungen ihr zugrunde liegender abiotischer und biotischer Faktoren. Diploma thesis, University of Bremen, Germany.
Trott, T. J., and J. R. Robertson. 1982. Chemoreception and feeding stimulants of the ghost
crab Ocypode quadrata (Fabricius). American Zoologist 22: 853.
8 References
159
Türkay, M. 1970. Die Gecarcinidae Amerikas. Mit einem Anhang über Ucides Rathbun (Crustacea: Decapoda). Senckenbergiana biologica 51(5/6): 333-354.
Twilley, Robert R., Ariel E. Lugo, and Carol Patterson-Zucca. 1986. Litter production and
turnover in basin mangrove forests in Southwest Florida. Ecology 67(3): 670-683. Twilley, Robert R., Mireya Pozo, Victor H. Garcia, Victor H. Rivera-Monroy, Ramon
Zambrano, and Alejandro Bodero. 1997. Litter dynamics in riverine mangrove forests in the Guayas River estuary, Ecuador. Oecologia 111: 109-122.
Ullrich, B., V. Storch, and H. Schairer. 1991. Bacteria on the food, in the intestine and on the
faeces of the woodlouse Oniscus asellus (Crustacea, Isopoda). Pedobiologia 35: 41-51.
Ulrich, R. G., D. A. Buthala, and M. J. Klug. 1981. Microbiota associated with the
gastrointestinal tract of the Common House Cricket, Acheta domestica. Applied and environmental microbiology 41(1): 246-254.
Wafar, S., A. G. Untawale, and M. Wafar. 1997. Litter fall and energy flux in a mangrove
ecosystem. Estuarine, coastal and shelf science 44: 111-124. Wagner, Michael, Rudolf Amann, Hilde Lemmer, and Karl-Heinz Schleifer. 1993. Probing
activated sludge with oligonucleotides specific for Proteobacteria: Inadequacy of culture-dependent methods for describing microbial community structure. Applied and environmental microbiology 59(5): 1520-1525.
Wainwright, P. F., and K. H. Mann. 1982. Effect of antimicrobial substances on the ability of
the mysid shrimp Mysis stenolepis to digest cellulose. Marine ecology progress series 7: 309-313.
Wallner, G., R. Amann, and W. Beisker. 1993. Optimizing fluorescent in situ hybridization
with rRNA-targeted oligonucleotide probes for flow cytometric identification of microorganisms. Cytometry 14: 136-143.
Warman, C. G., and E. Naylor. 1995. Evidence for multiple, cue-specific circatidal clocks in
the shore crab Carcinus maenas. Journal of experimental marine biology and ecology 189: 93-101.
Wassenberg, T. J., and B. J. Hill. 1993. Diet and feeding behaviour of juvenile and adult
banana prawns Penaeus merguiensis in the Gulf of Carpentaria, Australia. Marine ecology progress series 94: 287-295.
Webster, Nicole S., Kate J. Wilson, Linda L. Blackall, and Russel T. Hill. 2001. Phylogenetic
diversity of bacteria associated with the marine sponge Rhopaloeides odorabile. Applied and environmental microbiology 67(1): 434-444.
Wessels, Luisa. 1999. Untersuchungen zur räumlichen Verbreitung bodenlebender
Landkrabben (Ocypodidae) in der Mangrove von Bragança, Pará, Brasilien. Diploma thesis, University of Bonn, Germany.
Wiedemeyer, Winfried. 1997. Analysis of the benthic food web of a mangrove ecosystem at
northeastern Brazil. Ph. D. thesis, University of Kiel, Germany. Williams, B. G., E. Naylor, and T. D. Chatterton. 1985. The activity patterns of New Zealand
mud crabs under field and laboratory conditions. Journal of experimental marine biology and ecology 89: 269-282.
160 8 References
Williams, Barbara G. 1969. The rhythmic activity of Hemigrapsus edwardsi (Hilgendorf).
Journal of experimental marine biology and ecology 3: 215-223. Woitchik, A. F., B. Ohowa, J. M. Kazungu, R. G. Rao, L. Goeyens, and F. Dehairs. 1997.
Nitrogen enrichment during decomposition of mangrove leaf litter in an east African coastal lagoon (Kenya): Relative importance of biological nitrogen fixation. Biogeochemistry 39: 15–35.
Wolcott, D. L., and T. G. Wolcott. 1987. Nitrogen limitation in the herbivorous land crab
Cardisoma guanhumi. Physiological Zoology 60(2): 262-268. Wolcott, Donna L., and Nancy J. O´Connor. 1992. Herbivory in crabs: Adaptations and
ecological considerations. American Zoologist 32: 370-381. Wolcott, Donna L., and Thomas G. Wolcott. 1984. Food quality and cannibalism in the red
land crab, Gecarcinus lateralis. Physiological Zoology 57(3): 318-324. Wolff, Matthias, and Gerardo Cerda. 1992. Feeding ecology of the crab Cancer polyodon in
La Herradura Bay, northern Chile. I. Feeding chronology, food intake, and gross growth and ecological efficiency. Marine ecology progress series 89: 213-219.
Wolff, Matthias, Volker Koch, and Victoria Isaac. 2000. A trophic flow model of the Caeté
mangrove estuary (North Brazil) with considerations for the sustainable use of its resources. Estuarine, coastal and shelf science 50: 1-15.
Wolfrath, Birgit. 1992. Field experiments on feeding of European fiddler crab Uca tangeri.
Marine ecology progress series 90: 39-43. Woodroffe, C. D. 1982. Litter production and decomposition in the New Zealand mangrove,
Avicennia marina var. resinifera. New Zealand Journal of Marine and Freshwater Research 16: 179-188.
Woodroffe, C. D., K. N. Bardsley, P. J. Ward, and J. R. Hanley. 1988. Production of
mangrove litter in a macrotidal embayment, Darwin Harbour, N. T., Australia. Estuarine, coastal and shelf science 26: 581-598.
Yasuda, Kimiaki, and Tadatoshi Kitao. 1980. Bacterial flora in the digestive tract of prawns,
Penaeus japonicus Bate. Aquaculture 19: 229-234. Zar, Jerrold H. 1996. Biostatistical analysis. New Jersey, Prentice Hall. Zimmer, M., J. P. Danko, S. C. Pennings, A. R. Danford, T. H. Carefoot, A. Ziegler, and R. F.
Uglow. 2002. Cellulose digestion and phenol oxidation in coastal isopods (Crustacea: Isopoda). Marine Biology 140(6): 1207-1213.
Zimmer, Martin. 1999. The fate and effects of ingested hydrolyzable tannins in Porcellio
scaber. Journal of Chemical Ecology 25(3): 611-628. Zimmer, Martin, and Werner Topp. 1998a. Microorganisms and cellulose digestion in the gut
of the woodlouse Porcellio scaber. Journal of Chemical Ecology 24(8): 1397-1408. —. 1998b. Nutritional biology of terrestrial isopods (Isopoda: Oniscidea): copper revisited.
Israel Journal of Zoology 44: 453-462. i
9 List of figures
161
9 LIST OF FIGURES
Figure 1: Schematic overview on the topics covered by this thesis. Arrows indicate the flow of organic matter and nutrients within the mangrove forest. Question marks emphasize the investigated stocks and processes. Drawings are modified after Mastaller (1997), Nascimento (1993), and Hogarth (1999)................................ 5
Figure 2: North Brazilian coastline east of the Tocatíns river. The study area near the city of Bragança is highlighted by a small square (below). Source of basic maps: http://rimmer.ngdc.noaa.gov/coast/ ............... 6
Figure 3: Research area with the peninsula and the adjacent Caeté estuary. All cited sampling sites are marked: FG – Furo Grande; FC – Furo do Chato; AF – Avicennia Forest; MF – Mixed Forest. (Image source: Landsat TM 5; December 1999)..................................................................................................................... 7
Figure 4: Average weekly salinity, sum of weekly precipitation, average weekly air temperature and weekly maximum and minimum air temperature measured from 7/2000 to 12/2001. Water samples for salinity measurements were taken from Furo Grande. Precipitation and temperature were measured at the MADAM automatic weather station at Furo Grande. .................................................................................................... 9
Figure 5: Furo Grande and its tidal channels at the northern part of the peninsula. Numbers indicate the sampling sites. (modified after Diele, Franke and Krause 1999; basic map: CPRM – Serviço Ecológico do Brasil – Superintendêncio Regional de Belém 1:100 000 – Indicação: CPRM & MADAM)....................................... 11
Figure 6 : Leaves offered to U. cordatus next to its burrow entrance (left side). Leaves after being pulled out of the burrow (right side). ....................................................................................................................................... 20
Figure 7: Litter trap located at FG 1 between March 2000 and August 2001......................................................... 20 Figure 8: Degree of stomach fullness (D4: full; D0: empty) of U. cordatus, separated by site, sex and size. ........ 24 Figure 9: Proportional composition of the food components in the stomach of U. cordatus. Data for the sites FG 1
and AF were pooled (n = 64). ....................................................................................................................... 25 Figure 10: Frequency of occurrence of the food items in the stomach of U. cordatus. Data for the sites FG 1 and
AF were pooled (n = 64). .............................................................................................................................. 25 Figure 11: Food preference experiments in the laboratory (experimental numbers 2-4 above and 5-7 below, see
Table 1). The average consumption rate (CR) of each experiment is given above the associated Box-Whisker plots. Significant differences between consumption rates are indicated by equal letters (p < 0.05)...................................................................................................................................................................... 26
Figure 12: Food preference experiments with tethered leaves (experimental numbers 15-26, see Table 1). Data obtained from 4 h and 24 h experiments were pooled. The average consumption rate (CR) of each experiment is given in the plots. Significant differences between consumption rates are indicated by equal letters (letter c: p < 0.1; others: p < 0.05)...................................................................................................... 28
Figure 13: Litter components collected at the sediment surface (S) and taken from crab burrows (B) at the sites FG 1, FG 2 and AF. Values are presented as proportions of the total amount of litter. ................................ 30
Figure 14: Litter fall and propagule production at FG 1 collected from 8 litter traps between March 2000 and August 2001. Given are the daily means of dry matter per square metre calculated from fortnightly material collections..................................................................................................................................................... 31
Figure 15: Leaf litter of Rhizophora mangle at FG 1 from March 2000 until August 2001. Given are the daily means of dry matter per square metre calculated from fortnightly material collections. ............................... 32
Figure 16: Leaf litter of Avicennia germinans at FG 1 from March 2000 until August 2001. Given are the daily means of dry matter per square metre calculated from fortnightly material collections. ............................... 32
Figure 17: Evacuation of food from the gastrointestinal tract of two size groups of Ucides cordatus males. The modified model of Elliott (1972) was fit to the data. Evacuation data are shown only for the first 48 h of the experiment, since GIC did not change afterwards. ....................................................................................... 34
Figure 18: Gastrointestinal contents (GIC) plotted against body dry weight (BDW) in females and males of Ucides cordatus. All available GIC data were pooled............................................................................................... 36
Figure 19: Gastrointestinal contents (GIC) in % body dry weight (BDW) plotted against BDW in females and males of Ucides cordatus. All available GIC data were pooled. ................................................................... 36
Figure 20: Body dry weight plotted against carapace width in females and males of Ucides cordatus.................. 37 Figure 21: Daily food intake (DFI) per square metre in females and males of Ucides cordatus separated by size
class. ............................................................................................................................................................ 38 Figure 22: Daily food intake (DFI) in % body dry weight (BDW) in females and males of Ucides cordatus,
calculated with the model of Eggers (1977).................................................................................................. 38 Figure 23: Field observation of U. cordatus. The observation camera (1), the transmitter (2) and the car battery (3)
are shown..................................................................................................................................................... 63 Figure 24: Average gastrointestinal contents (GIC) in % of stomach dry weight (SDW) of Ucides cordatus over a
24 h cycle. Nighttime is indicated by the shaded area.................................................................................. 65 Figure 25: Average stomach contents (SC) in % of stomach dry weight (SDW) of Ucides cordatus over a 24 h
cycle. Nighttime is indicated by the shaded area.......................................................................................... 66 Figure 26: Behaviour of Ucides cordatus during 24 hour periods, separated into day and night time. Data were
pooled for all moon phases (n = 43 crabs). It was assumed that crabs stayed inside their burrows during forest inundation, when they could not be observed (10-11 hours of 24 hours). .......................................... 68
162 9 List of figures
Figure 27: Behaviour of Ucides cordatus during 24 hour periods at waning and waxing moon (n = 33 crabs) and at full and new moon (n = 10 crabs). It was assumed that crabs stayed inside their burrows during forest inundation, when they could not be observed (10–11 hours of 24 hours). ................................................... 69
Figure 28: Activity pattern of Ucides cordatus outside burrows within a period of 24 hours including feeding, burrowing and other activities but without resting activities. Each bar indicates the average time span of activity during 15 minutes. For instance, the first bar in the lower graph signifies that on average, the crab was active for 0.2 min within the observation period from 11:00 to 11:15 a.m. Note that at neap tides the area was not flooded. Nighttime is indicated by the shaded area................................................................. 71
Figure 29: Activity patterns of Ucides cordatus outside burrows within a period of 24 hours at waning and waxing moon. Each bar indicates the average time span of activity during 15 minutes. .......................................... 72
Figure 30: Number of collected leaves, stipules, flowers and propagules per observation area within 24 hours at different moon phases (wax = waxing moon ; wan = waning moon). ........................................................... 73
Figure 31: Number of collected items (leaves, stipules, flowers and propagules pooled) per crab within 24 hours at different moon phases (wax = waxing moon ; wan = waning moon). ........................................................... 73
Figure 32: Excursions from burrow per crab within 24 hours at different moon phases (wax = waxing moon ; wan = waning moon)............................................................................................................................................ 74
Figure 33: Average C and N concentration in % dry weight and the C/N ratio of plant material collected at FG 1 – FG 12 and AF. For each component 4 to 6 replicates were measured. ..................................................... 100
Figure 34: Average C and N concentration in % and the C/N ratio of green, yellow and brown leaves of Rhizophora mangle, Avicennia germinans and Laguncularia racemosa. Significant differences between stages of decomposition are indicated by equal letters. ............................................................................. 101
Figure 35: Average C concentration in % dry weight of the stomach and intestinal contents of Ucides cordatus. n = 50 crabs (stomach); n = 49 (intestine) .................................................................................................. 102
Figure 36: Average N concentration of the stomach and intestinal contents of Ucides cordatus. n = 50 crabs (stomach); n = 49 (intestine)....................................................................................................................... 103
Figure 37: Average C and N concentration in % dry weight and the C/N ratio of faeces samples of Ucides cordatus with a carapace width of 3.0 – 3.5 cm captured at FG 1 and AF (n = 22). ................................... 104
Figure 38: Average C and N concentrations in % dry weight and the C/N ratio of food, stomach contents, intestinal contents, and faeces for U. cordatus feeding at FG 1. ............................................................................... 106
Figure 39: Average C and N concentrations in % dry weight and the C/N ratio of food, stomach contents, intestinal contents, and faeces for U. cordatus feeding at AF. .................................................................................. 107
Figure 40: Energy content (J g dw-1) of Rhizophora mangle, Avicennia germinans and Laguncularia racemosa leaves. Significant differences between decomposing stages and between species are indicated by equal letters.......................................................................................................................................................... 108
Figure 41: Microbial cell numbers of the surface sediment, sediment sampled from a depth of 70 cm and sediment taken from crab burrows. Data obtained for waning moon (18.11.2000) and new moon (25.11.2000) were pooled (n = 10 for each site and sample type). .......................................................................................... 111
Figure 42: Microbial cell number on the surface of freshly fallen leaves, leaves exposed on the sediment surface for 3 days and leaves taken out of crab burrows at FG 1 (n = 10 for each species and sample type)........ 112
Figure 43: Microbial cell number of stomach and intestinal contents of U. cordatus collected at FG 1. Samples are separated by size (3.0 – 3.5 cm and 6.0 – 6.5 cm CW).............................................................................. 113
Figure 44: Microbial cell number in burrow water, on the surface of R. mangle leaves (freshly fallen, exposed 3 days, crab burrows), in sediment (surface, depth of 70 cm, crab burrows), in stomach and intestinal contents and faeces of U. cordatus. Number of replicates are indicated below box plots. ......................... 114
Figure 45: Proportional composition of Eubacteria on the surface of leaves (R. mangle and A. germinans), in stomach and intestinal contents and in faeces of U. cordatus sampled at FG 1 (n = 5 for each probe and component). ............................................................................................................................................... 115
Figure 47: Activity patterns of U. cordatus within a period of 24 hours. Each bar indicates the average time span of activity during 15 minutes. Data of all observations were pooled (n = 43 crabs). ................................... 178
10 List of tables
163
10 LIST OF TABLES
Table 1: Food spectrum and food preferences: Laboratory and field experiments. Crabs kept in the laboratory had a CW of 6.0 - 6.5 cm (Av: A. germinans; Rh: R. mangle; La: L. racemosa; ql: qualitative experiment; qn: quantitative and qualitative experiment; Lab.: Laboratory) ........................................................................... 18
Table 2: Litter material (g dw) taken from crab burrows and from the sediment surface (3.14 m2) at the sites FG 1, FG 2 and AF................................................................................................................................................. 29
Table 3: Contributions of the different litter components to total litter fall. Given are the daily means of dry matter per square metre calculated from August 2000 until August 2001. Average percentages with standard deviation and minimum/maximum values for each component are listed..................................................... 31
Table 4: Daily food intake (DFI) of Ucides cordatus in relation to litter fall and leaf litter data determined for the study site FG 1. ............................................................................................................................................ 35
Table 5: Average gastrointestinal contents (GIC), evacuation rate (ER), daily food intake (DFI) per crab and day, DFI per square metre and day, and DFI as % body dry weight (BDW), separated by sex and size class.... 37
Table 6: Comparison of food preferences and consumption rates of U. cordatus, grapsid and gecarcinid crabs. Where litter components are not specified mangrove leaves are regarded. Rh = R. mangle, La = L. racemosa, Av = A. germinans, A. marina = Avicennia marina, B. gymnorhiza = Bruguiera gymnorhiza, C. tagal = Ceriops tagal, DFI = Daily food intake; ER = Evacuation rate; Field: Field experiments or observations, GIC = Gastrointestinal contents, Lab.: Laboratory experiments............................................. 43
Table 7: Gut evacuation rate (ER), gut clearance time and gut repletion indices of decapod crabs. PL = crabs feed mainly on plant litter; H = herbivorous crabs; C = mainly carnivorous crabs; D = detritivorous crabs; c.l. = confidence limits; T2 / T4 etc.: gut repletion index after 2 h / 4h of starvation. ............................................. 51
Table 8: Consumption rates of litter-consuming decapod crabs in relation to litter production rates. Lab. = Laboratory. ................................................................................................................................................... 57
Table 9: Sites, dates, moon phases and observation periods of the observation experiments in 2000 and 2001. 62 Table 10: Comparison of behavioural categories among habitats of Ucides cordatus. The habitats were
dominated by R. mangle (Rh) or A. germinans (Av) trees around the crab burrows or did not have trees at all. Only burrows were included which were clearly located within one of these habitats (n = 50). Each observation lasted 1 hour. Mean values and standard deviations are shown............................................... 67
Table 11: Samples taken for carbon and nitrogen analyses. ................................................................................. 90 Table 12: Samples taken for microbiological investigations. .................................................................................. 95 Table 13: Oligonucleotide probes used in this study.............................................................................................. 97 Table 14: Average concentrations of carbon (C) and nitrogen (N) in % dry weight and the ratio C/N of sediment
samples from burrows and control cores...................................................................................................... 99 Table 15: Assimilation efficiency for dry matter, organic carbon (C) and nitrogen (N) of Ucides cordatus, feeding
on different food components. .................................................................................................................... 109 Table 16: Assimilation and faeces production of the U. cordatus population at FG 1 and AF, regarding dry matter
(dm), carbon (C) and nitrogen (N). ............................................................................................................. 110 Table 17: Bacterial carbon and nitrogen content in relation to total carbon and nitrogen content of surface
sediment, senescent mangrove leaves, leaves taken from crab burrows, stomach and intestinal contents, and faeces collected at burrow entrances. ................................................................................................. 116
Table 18: Assimilation efficiencies for dry matter, carbon, nitrogen, and energy of leaf-consuming crustaceans. A. officinalis = Avicennia officinalis; Ct = Ceriops tagal; Kc = Kandelia candel; R. mucronata = Rhizophora mucronata; sen. = senescent; wk = weeks................................................................................................. 124
Table 19: Microbial abundances and species composition in the gastrointestinal tract of arthropods. MD = Microbial density; BD = Bacterial density; PT = Plate technique; AE = Incubation aerobically; ANAE = Incubation anaerobically; AO = Acridine orange (dye for staining bacteria); PCM = Phase-contrast microscopy; SEM = Scanning electron microscopy; TEM = Transmission electron microscopy; C = carnivore; D = detritivore, O = omnivore, H = herbivore or feeding on plant litter; W = feeding on wood ... 135
164 10 List of tables
10 LIST OF TABLES/APPENDICES Table 20: Kruskal-Wallis analysis of variance by ranks comparing the consumption rate (g dw h-1) for R. mangle,
L. racemosa and A. germinans leaves by U. cordatus. .............................................................................. 168 Table 21: U-tests comparing the consumption rate (g dw h-1) of green and yellow mangrove leaves by
U. cordatus. ................................................................................................................................................ 169 Table 22: Analyses of variance (t-tests) comparing the consumption rate (g dw h-1) of green and yellow
mangrove leaves by U. cordatus. ............................................................................................................... 169 Table 23: One way analysis of variance comparing the consumption rate (g dw h-1) of yellow R. mangle,
A. germinans and L. racemosa leaves by U. cordatus (12.04.2000). ......................................................... 170 Table 24: One way analysis of variance comparing the consumption rate (g dw h-1) of green R. mangle,
A. germinans and L. racemosa leaves by U. cordatus (25.04.2000). ......................................................... 170 Table 25: One way analysis of variance comparing the consumption rate (g dw h-1) of yellow and green
R. mangle and A. germinans leaves by U. cordatus (29.04.2000). ............................................................ 170 Table 26: Kruskal-Wallis analysis of variance by ranks comparing the consumption rate (g dw h-1) of yellow and
green R. mangle and L. racemosa leaves by U. cordatus (2./4.05.2000)................................................... 171 Table 27: Degree of stomach fullness of U. cordatus, separated by site, sex and size class (N = 64 crabs). ..... 171 Table 28: Proportional composition of the food components in the stomach of U. cordatus, separated by site, sex
and size class (N = 64 crabs). .................................................................................................................... 171 Table 29: Frequency of occurrence of the food components in the stomach of U. cordatus. Data for the different
size classes and sexes were pooled (N = 32 crabs for each sampling site). .............................................. 172 Table 30: Kruskal-Wallis analysis of variance by ranks comparing the litter quantity on the sediment surface and
in crab burrows among habitats. ................................................................................................................ 172 Table 31: Proportional composition of litter components (%) on the sediment surface and in crab burrows
collected at the sites FG 1, AF, and FG 2 (Sed = Sediment; Bur = Burrow)............................................... 173 Table 32: Spearman rank correlation between the percentage composition of litter components on the sediment
surface and in burrows of U. cordatus. ....................................................................................................... 173 Table 33: Litter fall at FG 1 between March 2000 and August 2001. Given are the daily means of dry matter per
square metre calculated from fortnightly collections. .................................................................................. 174 Table 34: Results of the non-linear regression analysis fitting the exponential model to the evacuation data of U.
cordatus...................................................................................................................................................... 174 Table 35: Results of the regression analyses plotting gastrointestinal contents against body dry weight and body
dry weight against carapace width of U. cordatus. ..................................................................................... 175 Table 36: Average gastrointestinal contents (GIC) and stomach contents (SC) in % dry weight of dry stomach
weight of U. cordatus over a 24 h cycle...................................................................................................... 176 Table 37: Analysis of variance (t-test) comparing females and males regarding GIC and SC of U. cordatus (S1 =
Sampling 1, S2 = Sampling 2). ................................................................................................................... 176 Table 38: Analysis of variance (t-test) comparing size classes regarding GIC and SC of U. cordatus (S1 =
Sampling 1, S2 = Sampling 2). ................................................................................................................... 177 Table 39: Analysis of variance (t-test, K-S test) comparing day and night regarding GIC and SC of U. cordatus
(S1 = Sampling 1, S2 = Sampling 2). ......................................................................................................... 177 Table 40: Analysis of variance (t-test, K-S test) comparing ebb tide (ET) and flood tide (FT) regarding GIC and
SC of U cordatus (S1 = Sampling 1, S2 = Sampling 2). ............................................................................. 177 Table 41: Kruskal-Wallis analysis of variance by ranks comparing the radius of activity of U. cordatus in different
habitats....................................................................................................................................................... 177 Table 42: One way analysis of variance comparing the time span (min of 1 h) crabs spent inside their burrows in
different habitats. ........................................................................................................................................ 177 Table 43: Kruskal-Wallis analysis of variance by ranks comparing the time span (min of 1 h) crabs spent for
feeding activities in different habitats.......................................................................................................... 178 Table 44: Kruskal-Wallis analysis of variance by ranks comparing the times crabs left their burrows (h-1) in
different habitats. ........................................................................................................................................ 178 Table 45: K-S-test, comparing the time span (min and % of 12 h) U. cordatus remained inside its burrow at day
and night..................................................................................................................................................... 179 Table 46: K-S-test, comparing the time span (min and % of 12 h) U. cordatus spent for feeding, burrowing and
other activities at day and night. ................................................................................................................. 179 Table 47: K-S-test, comparing the time span (min and % of 12 h) U. cordatus spent for feeding activities at day
and night..................................................................................................................................................... 179 Table 48: Analysis of variance (t-test) comparing the time span (min of 24 h) U. cordatus spent for feeding,
burrowing and other activities at full and new moon with those at waning and waxing moon..................... 179 Table 49: One way analysis of variance comparing the time span (min of 24 h) U. cordatus spent for feeding,
burrowing and other activities at the four observation dates at waning and waxing moon. ........................ 179 Table 50: Analysis of variance (t-test) comparing the time span (min of 24 h) U. cordatus spent for feeding,
burrowing and other activities at waning moon with those at waxing moon................................................ 179
10 List of tables
165
Table 51: Analysis of variance (t-test) comparing the time span (min of 24 h) U. cordatus spent for feeding, burrowing and other activities at full moon with those at new moon. .......................................................... 179
Table 52: K-S-test, comparing the time span U. cordatus remained inside its burrow (min of 24 h) at waning and waxing moon. ............................................................................................................................................. 180
Table 53: 2-factorial analysis of variance comparing the carbon concentration in sediment control samples between sites (FG 1, AF) and depth (surface, 70 cm depth). ..................................................................... 180
Table 54: 2-factorial analysis of variance comparing the nitrogen concentration in sediment control samples between sites (FG 1, AF) and depth (surface, 70 cm depth). ..................................................................... 180
Table 55: 2-factorial analysis of variance comparing the C/N ratio of sediment control samples between sites (FG 1, AF) and depth (surface, 70 cm depth)............................................................................................. 180
Table 56: 2-factorial analysis of variance comparing the carbon concentration of burrow sediment samples between sites (FG 1, AF) and depth (surface, burrow)............................................................................... 181
Table 57: 2-factorial analysis of variance comparing the nitrogen concentration of burrow sediment samples between sites (FG 1, AF) and depth (surface, burrow)............................................................................... 181
Table 58: 2-factorial analysis of variance comparing the C/N ratio of burrow sediment samples between sites (FG 1, AF) and depth (surface, burrow)...................................................................................................... 181
Table 59: 2-factorial analysis of variance comparing the carbon concentration in sediment surface samples between sites (FG 1, AF) and among locations (surface of control samples, surface of burrow samples). 181
Table 60: 2-factorial analysis of variance comparing the nitrogen concentration in sediment surface samples between sites (FG 1, AF) and locations (surface of control samples, surface of burrow samples)............. 181
Table 61: 2-factorial analysis of variance comparing the C/N ratio in sediment surface samples between sites (FG 1, AF) and locations (surface of control samples, surface of burrow samples). .................................. 181
Table 62: 2-factorial analysis of variance comparing the carbon concentration in sediment samples between sites (FG 1, AF) and locations (70 cm depth of control samples, depth of burrow samples). ............................. 182
Table 63: 2-factorial analysis of variance comparing the nitrogen concentration in sediment samples between sites (FG 1, AF) and locations (70 cm depth of control samples, depth of burrow samples). ..................... 182
Table 64: 2-factorial analysis of variance comparing the C/N ratio in sediment samples between sites (FG 1, AF) and locations (70 cm depth of control samples, depth of burrow samples). ............................................... 182
Table 65: Organic content of sediment samples taken at the surface, at 70 cm depth and from crab burrows at FG 1 and AF............................................................................................................................................... 182
Table 66: Average concentrations of carbon and nitrogen in % and the C/N ratio of all litter components. ........ 182 Table 67: One way analysis of variance comparing the carbon concentration of green, yellow and brown
R. mangle leaves........................................................................................................................................ 184 Table 68: One way analysis of variance comparing the carbon concentration of green, yellow and brown
A. germinans leaves. .................................................................................................................................. 184 Table 69: Kruskal-Wallis analysis of variance by ranks comparing mangrove leaves of different stages of
decomposition. ........................................................................................................................................... 184 Table 70: Analysis of variance comparing the nitrogen concentration of green, yellow and brown L. racemosa
leaves. ........................................................................................................................................................ 185 Table 71: Analysis of variance comparing the C/N ratio of green, yellow and brown L. racemosa leaves. ......... 185 Table 72: Average carbon and nitrogen content and the C/N ratio of R. mangle and A. germinans leaves taken
from crab burrows at FG 1 and AF, respectively. ....................................................................................... 185 Table 73: Analysis of variance (t-test) comparing the carbon content of R. mangle and A. germinans leaves taken
from crab burrows at FG 1 and AF, respectively. ....................................................................................... 185 Table 74: U-tests comparing (a) the nitrogen content and (b) the C/N ratio of R. mangle and A. germinans leaves
taken from crab burrows at FG 1 and AF, respectively. ............................................................................. 185 Table 75: Analysis of variance (t-test) comparing the carbon content of R. mangle leaves taken from crab burrows
(Bur) with that of senescent R. mangle leaves collected at the sediment surface (Sur) at FG 1. ............... 185 Table 76: U-tests comparing mangrove leaves taken from crab burrows with leaves collected at the sediment
surface........................................................................................................................................................ 186 Table 77: Analysis of variance (t-test) comparing the C/N ratio of A. germinans leaves taken from crab burrows at
FG 1 with that of senescent A. germinans leaves collected at the sediment surface. ................................ 186 Table 78: Organic content of R. mangle, A. germinans and L. racemosa leaves of different stages of
decomposition. ........................................................................................................................................... 186 Table 79: Average carbon and nitrogen concentrations and the C/N ratio of the stomach and intestinal contents of
U. cordatus. ................................................................................................................................................ 187 Table 80: U-tests comparing the carbon concentration of the gastrointestinal contents between sites, size
classes, and sexes. .................................................................................................................................... 190 Table 81: K-S-tests and t-tests comparing the nitrogen concentration of the gastrointestinal contents between
sites, size classes, and sexes. ................................................................................................................... 190
166 10 List of tables
Table 82: : K-S-tests and t-tests comparing the C/N ratio of the gastrointestinal contents between sites, size classes, and sexes. .................................................................................................................................... 190
Table 83: Average carbon and nitrogen concentrations and the C/N ratio of faeces samples. Crabs had a carapace width of 2.5 - 3.5 cm. Factors: site (FG 1, AF) and sex............................................................... 190
Table 84: 2-factorial analysis of variance comparing the carbon concentration in faeces samples of U. cordatus between sites (FG 1, AF) and sex (f, m). Carapace width: 2.5 – 3.5 cm. ................................................... 191
Table 85: 2-factorial analysis of variance comparing the nitrogen concentration in faeces samples of U. cordatus between sites (FG 1, AF) and sex (f, m). Carapace width: 2.5 – 3.5 cm. ................................................... 191
Table 86: 2-factorial analysis of variance comparing the C/N ratio in faeces samples of U. cordatus between sites (FG 1, AF) and sex (f, m). Carapace width: 2.5 – 3.5 cm. .......................................................................... 192
Table 87: Analysis of variance (t-test) comparing (a) the carbon concentration in faeces samples taken at the entrance of crab burrows at FG 1 and AF, and (b) the C/N ratio of faeces samples taken at the entrance of crab burrows at FG 1 and AF. .................................................................................................................... 192
Table 88: U-test comparing the nitrogen concentration in faeces samples taken at the entrance of crab burrows at FG 1 and AF............................................................................................................................................... 192
Table 89: Analysis of variance (t-test) comparing (a) the carbon, (b) the nitrogen, and (c) the C/N ratio in faeces samples from crabs fed with either R. mangle or A. germinans leaves. ..................................................... 192
Table 90: Organic content of faeces samples of U. cordatus. Crabs were fed with R. mangle leaves (Rh) or A: germinans leaves (Av). .......................................................................................................................... 192
Table 91: Average carbon and nitrogen concentrations and the C/N ratio of R. mangle leaves (data for yellow and brown leaves were pooled), stomach contents, intestinal contents and faeces samples of U. cordatus at FG 1. .......................................................................................................................................................... 193
Table 92: Average carbon and nitrogen concentrations and the C/N ratio of A. germinans leaves (data for yellow and brown leaves were pooled), stomach contents, intestinal contents and faeces samples of U. cordatus at AF............................................................................................................................................................... 193
Table 93: Kruskal-Wallis analysis of variance by ranks comparing the carbon concentration of R. mangle leaves (data for yellow and brown leaves were pooled), stomach contents, intestinal contents and faeces samples of U. cordatus at FG 1. ............................................................................................................................... 193
Table 94: Kruskal-Wallis analysis of variance by ranks comparing the nitrogen concentration of R. mangle leaves (data for yellow and brown leaves were pooled), stomach contents, intestinal contents and faeces samples of U. cordatus at FG 1. ............................................................................................................................... 194
Table 95: Kruskal-Wallis analysis of variance by ranks comparing the C/N ratio of R. mangle leaves (data for yellow and brown leaves were pooled), stomach contents, intestinal contents and faeces samples of U. cordatus at FG 1. ................................................................................................................................... 194
Table 96: Kruskal-Wallis analysis of variance by ranks comparing the carbon concentration of A. germinans leaves (data for yellow and brown leaves were pooled), stomach contents, intestinal contents and faeces samples of U. cordatus at AF. .................................................................................................................... 194
Table 97: Kruskal-Wallis analysis of variance by ranks comparing the nitrogen concentration of A. germinans leaves (data for yellow and brown leaves were pooled), stomach contents, intestinal contents and faeces samples of U. cordatus at AF. .................................................................................................................... 194
Table 98: Kruskal-Wallis analysis of variance by ranks comparing the C/N ratio of A. germinans leaves (data for yellow and brown leaves were pooled), stomach contents, intestinal contents and faeces samples of U. cordatus at AF. ...................................................................................................................................... 194
Table 99: Average energy content of green, yellow and brown R. mangle, A. germinans and L. racemosa leaves.................................................................................................................................................................... 195
Table 100: Analysis of variance comparing the energy content of mangrove leaves between species and between different stages of decomposition............................................................................................................... 195
Table 101: Analysis of variance comparing the energy content of faeces of U. cordatus fed with yellow and brown leaves of A germinans with faeces of crabs fed with yellow and brown leaves of R. mangle. ................... 195
Table 102: Analysis of variance comparing the energy content of mangrove leaves and faeces of U. cordatus. 196 Table 103: Results of t-tests and U-tests comparing the microbial cell concentration (ml-1) of sediment samples
taken at different moon phases. ................................................................................................................. 196 Table 104: Kruskal-Wallis analysis of variance by ranks comparing the microbial cell concentration (ml-1) of
sediment samples at the surface, at a depth of 70 cm and from crab burrows at FG 1. Data obtained for different moon phases were pooled. .......................................................................................................... 196
Table 105: Average microbial cell numbers of sediment samples taken at the surface, at a depth of 70 cm and from crab burrows at FG 1. Data obtained for different moon phases were pooled. .................................. 197
Table 106: Kruskal-Wallis analysis of variance by ranks comparing the microbial cell concentration (ml-1) of sediment samples taken at the surface, at a depth of 70 cm and from crab burrows at AF. Data obtained for different moon phases were pooled. .......................................................................................................... 197
Table 107: Average microbial cell numbers of sediment samples taken at the surface, at a depth of 70 cm and from crab burrows at AF. Data obtained for different moon phases were pooled....................................... 197
10 List of tables
167
Table 108: Results of t-tests and U-tests comparing the microbial cell concentration (ml-1) of (a) surface sediment samples between FG 1 and AF, (b) sediment samples from crab burrows between FG 1 and AF, and (c) sediment samples taken at a depth of 70 cm between FG 1 and AF. Data obtained for different moon phases were pooled. .................................................................................................................................. 197
Table 109: Average microbial cell concentrations (ml-1) of (a) pore water samples, (b) burrow water samples, and (c) water samples of the tidal channel Furo Grande taken at different moon phases................................. 198
Table 110: Results of t-tests and U-tests comparing the microbial cell concentration (ml-1) between water samples at different moon phases. ........................................................................................................................... 198
Table 111: Kruskal-Wallis analysis of variance by ranks comparing the microbial cell concentration (ml-1) of water samples from the tidal channel Furo Grande, water samples taken from crab burrows and pore water samples at FG 1. Data obtained for different moon phases were pooled. .................................................. 198
Table 112: Analysis of variance (t-test) comparing the microbial cell concentration (cm-1) between R. mangle (Rh) and A. germinans (Av) leaves which were (a) freshly shed, (b) exposed on the sediment surface for 3 days, and (c) taken from crab burrows................................................................................................................. 198
Table 113: Average microbial cell numbers (cm-1 and g-1) on the surface of R. mangle and A. germinans leaves which were (a) freshly shed, (b) exposed on the sediment surface for 3 days, and (c) taken from crab burrows....................................................................................................................................................... 199
Table 114: Analysis of variance comparing the microbial cell concentration (cm-1) of A. germinans leaves which were freshly shed, exposed on the sediment surface for 3 days and taken from crab burrows.................. 199
Table 115: Kruskal-Wallis analysis of variance by ranks comparing the microbial cell concentration (cm-1) of R mangle leaves which were freshly shed, exposed on the sediment surface for 3 days and taken from crab burrows....................................................................................................................................................... 199
Table 116: Analysis of variance (t-test) comparing the microbial cell concentration (g-1) between (a) the stomach contents of females (F) and males (M) and (b) the intestinal contents of females and males of U cordatus at FG 1 ........................................................................................................................................................... 199
Table 117: Analysis of variance (t-test) comparing the microbial cell concentration (g-1) between (a) the stomach contents of two size classes and (b) the intestinal contents of two size classes of U. cordatus (CW 2.5 - 3.5 cm / 6.5 - 7.5 cm) at FG 1. ........................................................................................................... 200
Table 118: Analysis of variance (t-test) comparing the microbial cell concentration (ml-1) of faeces of U. cordatus collected at burrow entrances at FG 1 at waxing moon (WAX; 30.06.2001) with those collected at new moon (NEW; 24.07.2001)........................................................................................................................... 200
Table 119: Analysis of variance comparing the microbial cell concentration (ml-1) of faeces samples of U. cordatus fed on R. mangle (Rh) leaves with faeces samples collected at burrow entrances (Bur) at FG 1.................................................................................................................................................................... 200
Table 120: Kruskal-Wallis analysis of variance by ranks comparing the microbial cell concentration (g-1) of R. mangle leaves, surface sediment, stomach contents and intestinal contents of U. cordatus and faeces of the entrance of crab burrows at FG 1. Data obtained for freshly shed leaves, leaves exposed on the sediment surface and leaves taken from crab burrows were pooled. ......................................................... 201
Table 121: Kruskal-Wallis analysis of variance by ranks, comparing the proportion of cell chains of surface sediment at FG 1, stomach contents and intestinal contents of U. cordatus and faeces taken at burrow entrances at FG 1....................................................................................................................................... 201
Table 122: Kruskal-Wallis analysis of variance by ranks comparing the length of cell chains of surface sediment at FG 1, stomach contents and intestinal contents of U. cordatus and faeces taken at burrow entrances at FG 1. .......................................................................................................................................................... 202
Table 123: Kruskal-Wallis analysis of variance by ranks comparing the proportion of filamentous microorganisms of the stomach contents and intestinal contents of U. cordatus and faeces taken at burrow entrances at FG 1. .......................................................................................................................................................... 202
Table 124: Proportional composition of Bacteria and the proportion of Eukaryota on the surface of R. mangle and A. germinans leaves, in surface sediment, in the stomach and intestinal contents, and in faecal material of U. cordatus. ................................................................................................................................................ 202
Table 125: Kruskal-Wallis analysis of variance by ranks comparing the proportion of (a) CF bacteria, (b) ALF bacteria, (c) BET bacteria and (d) GAM bacteria of R. mangle leaves, A. germinans leaves, stomach contents, intestinal contents and faeces of U cordatus. ............................................................................. 203
Table 126: Spearman rank correlation comparing the proportional composition of Bacteria and Archaea of leaves, stomach and intestinal contents, and faeces.............................................................................................. 203
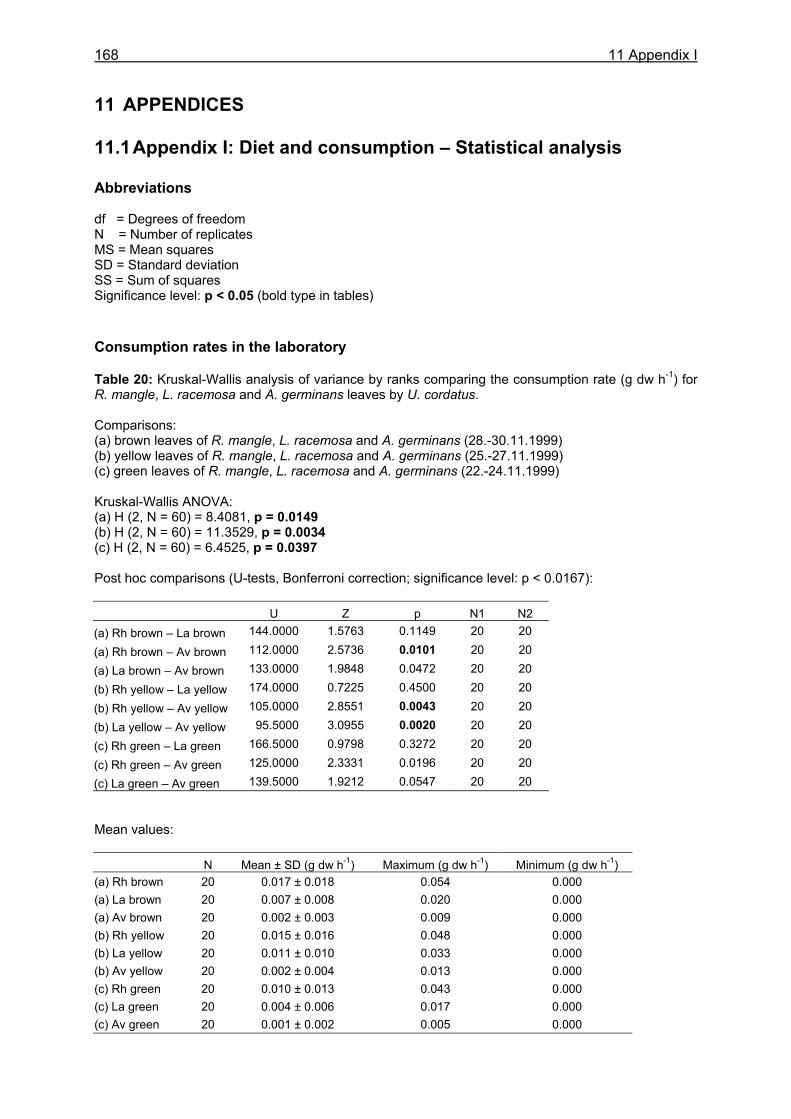
168 11 Appendix I
11 APPENDICES
11.1 Appendix I: Diet and consumption – Statistical analysis
Abbreviations df = Degrees of freedom N = Number of replicates MS = Mean squares SD = Standard deviation SS = Sum of squares Significance level: p < 0.05 (bold type in tables) Consumption rates in the laboratory Table 20: Kruskal-Wallis analysis of variance by ranks comparing the consumption rate (g dw h-1) for R. mangle, L. racemosa and A. germinans leaves by U. cordatus. Comparisons: (a) brown leaves of R. mangle, L. racemosa and A. germinans (28.-30.11.1999) (b) yellow leaves of R. mangle, L. racemosa and A. germinans (25.-27.11.1999) (c) green leaves of R. mangle, L. racemosa and A. germinans (22.-24.11.1999) Kruskal-Wallis ANOVA: (a) H (2, N = 60) = 8.4081, p = 0.0149 (b) H (2, N = 60) = 11.3529, p = 0.0034 (c) H (2, N = 60) = 6.4525, p = 0.0397 Post hoc comparisons (U-tests, Bonferroni correction; significance level: p < 0.0167):
U Z p N1 N2 (a) Rh brown – La brown 144.0000 1.5763 0.1149 20 20
(a) Rh brown – Av brown 112.0000 2.5736 0.0101 20 20
(a) La brown – Av brown 133.0000 1.9848 0.0472 20 20
(b) Rh yellow – La yellow 174.0000 0.7225 0.4500 20 20
(b) Rh yellow – Av yellow 105.0000 2.8551 0.0043 20 20
(b) La yellow – Av yellow 95.5000 3.0955 0.0020 20 20
(c) Rh green – La green 166.5000 0.9798 0.3272 20 20
(c) Rh green – Av green 125.0000 2.3331 0.0196 20 20
(c) La green – Av green 139.5000 1.9212 0.0547 20 20 Mean values:
N Mean ± SD (g dw h-1) Maximum (g dw h-1) Minimum (g dw h-1) (a) Rh brown 20 0.017 ± 0.018 0.054 0.000 (a) La brown 20 0.007 ± 0.008 0.020 0.000 (a) Av brown 20 0.002 ± 0.003 0.009 0.000 (b) Rh yellow 20 0.015 ± 0.016 0.048 0.000 (b) La yellow 20 0.011 ± 0.010 0.033 0.000 (b) Av yellow 20 0.002 ± 0.004 0.013 0.000 (c) Rh green 20 0.010 ± 0.013 0.043 0.000 (c) La green 20 0.004 ± 0.006 0.017 0.000 (c) Av green 20 0.001 ± 0.002 0.005 0.000
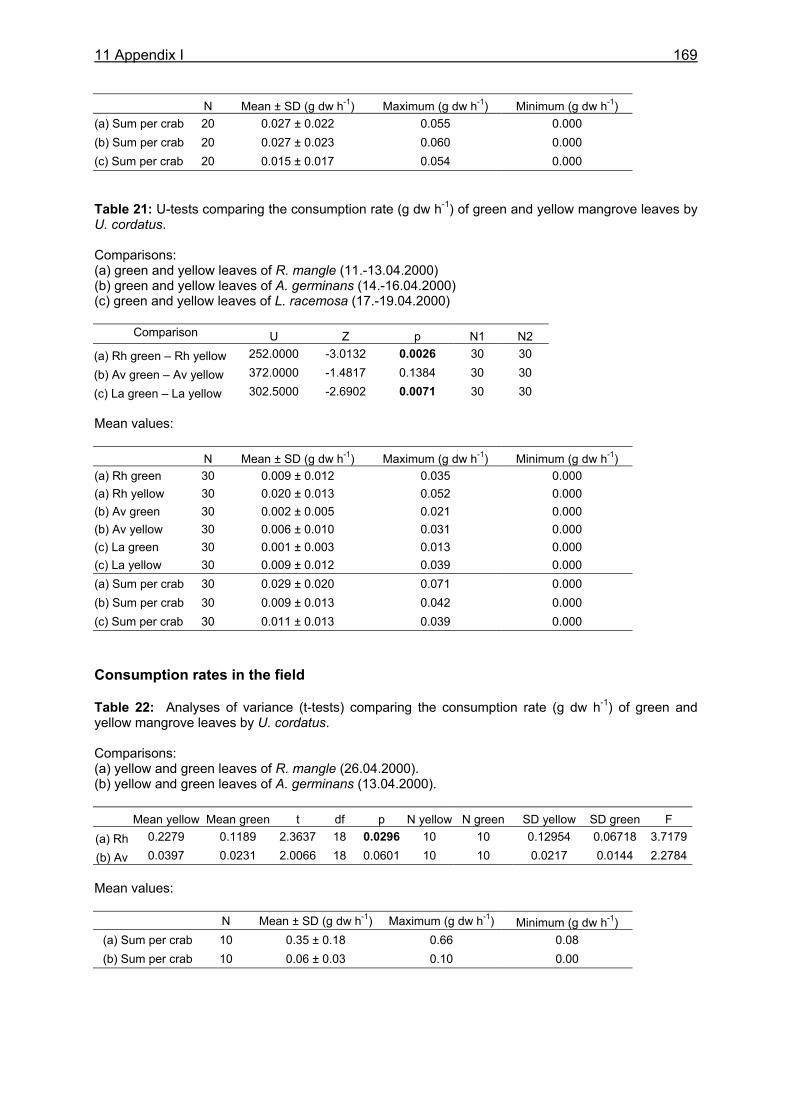
11 Appendix I
169
N Mean ± SD (g dw h-1) Maximum (g dw h-1) Minimum (g dw h-1) (a) Sum per crab 20 0.027 ± 0.022 0.055 0.000 (b) Sum per crab 20 0.027 ± 0.023 0.060 0.000 (c) Sum per crab 20 0.015 ± 0.017 0.054 0.000 Table 21: U-tests comparing the consumption rate (g dw h-1) of green and yellow mangrove leaves by U. cordatus. Comparisons: (a) green and yellow leaves of R. mangle (11.-13.04.2000) (b) green and yellow leaves of A. germinans (14.-16.04.2000) (c) green and yellow leaves of L. racemosa (17.-19.04.2000)
Comparison U Z p N1 N2 (a) Rh green – Rh yellow 252.0000 -3.0132 0.0026 30 30
(b) Av green – Av yellow 372.0000 -1.4817 0.1384 30 30
(c) La green – La yellow 302.5000 -2.6902 0.0071 30 30 Mean values:
N Mean ± SD (g dw h-1) Maximum (g dw h-1) Minimum (g dw h-1) (a) Rh green 30 0.009 ± 0.012 0.035 0.000 (a) Rh yellow 30 0.020 ± 0.013 0.052 0.000 (b) Av green 30 0.002 ± 0.005 0.021 0.000 (b) Av yellow 30 0.006 ± 0.010 0.031 0.000 (c) La green 30 0.001 ± 0.003 0.013 0.000 (c) La yellow 30 0.009 ± 0.012 0.039 0.000 (a) Sum per crab 30 0.029 ± 0.020 0.071 0.000 (b) Sum per crab 30 0.009 ± 0.013 0.042 0.000 (c) Sum per crab 30 0.011 ± 0.013 0.039 0.000 Consumption rates in the field Table 22: Analyses of variance (t-tests) comparing the consumption rate (g dw h-1) of green and yellow mangrove leaves by U. cordatus. Comparisons: (a) yellow and green leaves of R. mangle (26.04.2000). (b) yellow and green leaves of A. germinans (13.04.2000).
Mean yellow Mean green t df p N yellow N green SD yellow SD green F (a) Rh 0.2279 0.1189 2.3637 18 0.0296 10 10 0.12954 0.06718 3.7179
(b) Av 0.0397 0.0231 2.0066 18 0.0601 10 10 0.0217 0.0144 2.2784 Mean values:
N Mean ± SD (g dw h-1) Maximum (g dw h-1) Minimum (g dw h-1) (a) Sum per crab 10 0.35 ± 0.18 0.66 0.08 (b) Sum per crab 10 0.06 ± 0.03 0.10 0.00
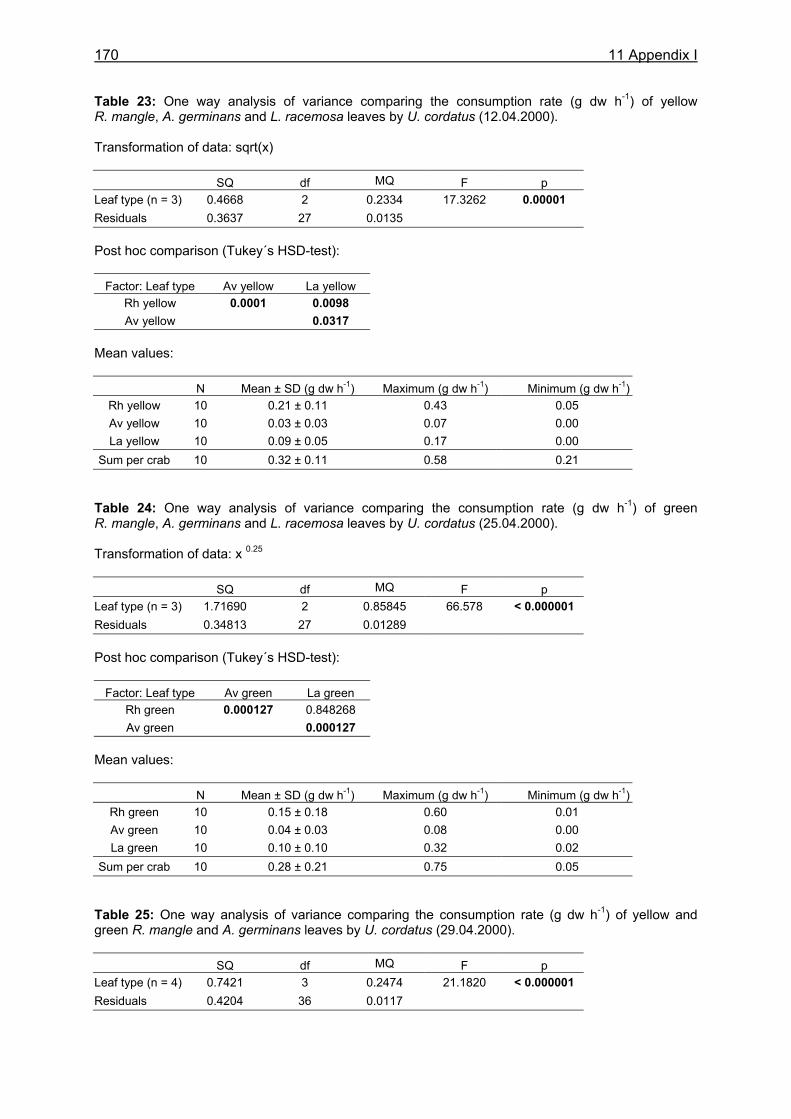
170 11 Appendix I
Table 23: One way analysis of variance comparing the consumption rate (g dw h-1) of yellow R. mangle, A. germinans and L. racemosa leaves by U. cordatus (12.04.2000). Transformation of data: sqrt(x) SQ df MQ F p Leaf type (n = 3) 0.4668 2 0.2334 17.3262 0.00001 Residuals 0.3637 27 0.0135 Post hoc comparison (Tukey´s HSD-test):
Factor: Leaf type Av yellow La yellow Rh yellow 0.0001 0.0098 Av yellow 0.0317
Mean values:
N Mean ± SD (g dw h-1) Maximum (g dw h-1) Minimum (g dw h-1) Rh yellow 10 0.21 ± 0.11 0.43 0.05 Av yellow 10 0.03 ± 0.03 0.07 0.00 La yellow 10 0.09 ± 0.05 0.17 0.00
Sum per crab 10 0.32 ± 0.11 0.58 0.21 Table 24: One way analysis of variance comparing the consumption rate (g dw h-1) of green R. mangle, A. germinans and L. racemosa leaves by U. cordatus (25.04.2000). Transformation of data: x 0.25 SQ df MQ F p Leaf type (n = 3) 1.71690 2 0.85845 66.578 < 0.000001 Residuals 0.34813 27 0.01289 Post hoc comparison (Tukey´s HSD-test):
Factor: Leaf type Av green La green Rh green 0.000127 0.848268 Av green 0.000127
Mean values:
N Mean ± SD (g dw h-1) Maximum (g dw h-1) Minimum (g dw h-1) Rh green 10 0.15 ± 0.18 0.60 0.01 Av green 10 0.04 ± 0.03 0.08 0.00 La green 10 0.10 ± 0.10 0.32 0.02
Sum per crab 10 0.28 ± 0.21 0.75 0.05 Table 25: One way analysis of variance comparing the consumption rate (g dw h-1) of yellow and green R. mangle and A. germinans leaves by U. cordatus (29.04.2000). SQ df MQ F p Leaf type (n = 4) 0.7421 3 0.2474 21.1820 < 0.000001 Residuals 0.4204 36 0.0117
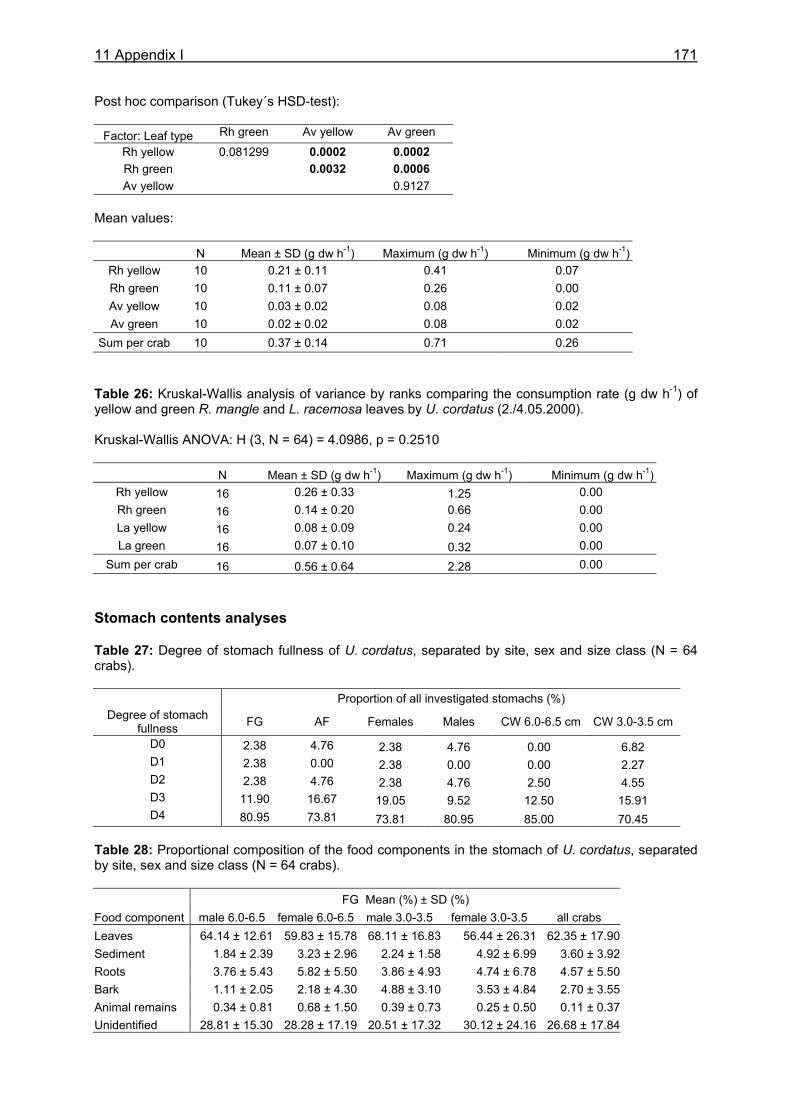
11 Appendix I
171
Post hoc comparison (Tukey´s HSD-test):
Factor: Leaf type Rh green Av yellow Av green
Rh yellow 0.081299 0.0002 0.0002 Rh green 0.0032 0.0006 Av yellow 0.9127
Mean values:
N Mean ± SD (g dw h-1) Maximum (g dw h-1) Minimum (g dw h-1) Rh yellow 10 0.21 ± 0.11 0.41 0.07 Rh green 10 0.11 ± 0.07 0.26 0.00 Av yellow 10 0.03 ± 0.02 0.08 0.02 Av green 10 0.02 ± 0.02 0.08 0.02
Sum per crab 10 0.37 ± 0.14 0.71 0.26 Table 26: Kruskal-Wallis analysis of variance by ranks comparing the consumption rate (g dw h-1) of yellow and green R. mangle and L. racemosa leaves by U. cordatus (2./4.05.2000). Kruskal-Wallis ANOVA: H (3, N = 64) = 4.0986, p = 0.2510
N Mean ± SD (g dw h-1) Maximum (g dw h-1) Minimum (g dw h-1) Rh yellow 16 0.26 ± 0.33 1.25 0.00 Rh green 16 0.14 ± 0.20 0.66 0.00 La yellow 16 0.08 ± 0.09 0.24 0.00 La green 16 0.07 ± 0.10 0.32 0.00
Sum per crab 16 0.56 ± 0.64 2.28 0.00 Stomach contents analyses Table 27: Degree of stomach fullness of U. cordatus, separated by site, sex and size class (N = 64 crabs).
Proportion of all investigated stomachs (%) Degree of stomach
fullness FG AF Females Males CW 6.0-6.5 cm CW 3.0-3.5 cm
D0 2.38 4.76 2.38 4.76 0.00 6.82 D1 2.38 0.00 2.38 0.00 0.00 2.27 D2 2.38 4.76 2.38 4.76 2.50 4.55 D3 11.90 16.67 19.05 9.52 12.50 15.91 D4 80.95 73.81 73.81 80.95 85.00 70.45
Table 28: Proportional composition of the food components in the stomach of U. cordatus, separated by site, sex and size class (N = 64 crabs). FG Mean (%) ± SD (%) Food component male 6.0-6.5 female 6.0-6.5 male 3.0-3.5 female 3.0-3.5 all crabs Leaves 64.14 ± 12.61 59.83 ± 15.78 68.11 ± 16.83 56.44 ± 26.31 62.35 ± 17.90 Sediment 1.84 ± 2.39 3.23 ± 2.96 2.24 ± 1.58 4.92 ± 6.99 3.60 ± 3.92 Roots 3.76 ± 5.43 5.82 ± 5.50 3.86 ± 4.93 4.74 ± 6.78 4.57 ± 5.50 Bark 1.11 ± 2.05 2.18 ± 4.30 4.88 ± 3.10 3.53 ± 4.84 2.70 ± 3.55 Animal remains 0.34 ± 0.81 0.68 ± 1.50 0.39 ± 0.73 0.25 ± 0.50 0.11 ± 0.37 Unidentified 28.81 ± 15.30 28.28 ± 17.19 20.51 ± 17.32 30.12 ± 24.16 26.68 ± 17.84
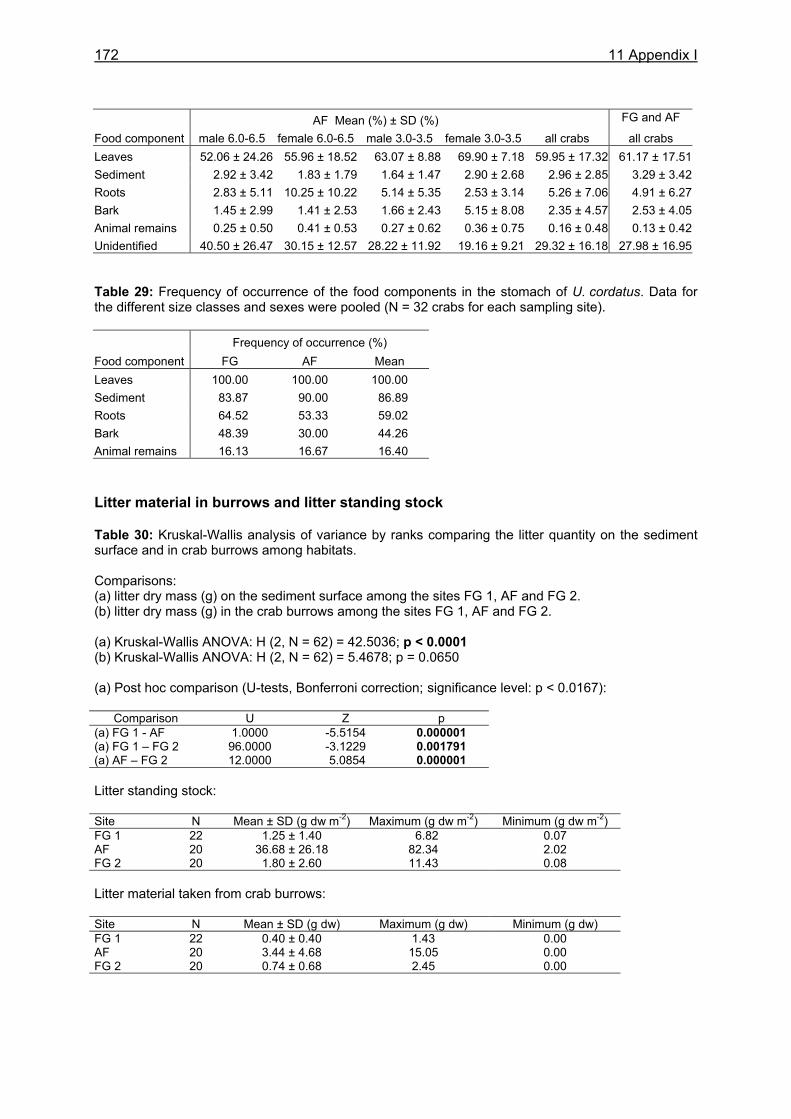
172 11 Appendix I
AF Mean (%) ± SD (%) FG and AF
Food component male 6.0-6.5 female 6.0-6.5 male 3.0-3.5 female 3.0-3.5 all crabs all crabs Leaves 52.06 ± 24.26 55.96 ± 18.52 63.07 ± 8.88 69.90 ± 7.18 59.95 ± 17.32 61.17 ± 17.51Sediment 2.92 ± 3.42 1.83 ± 1.79 1.64 ± 1.47 2.90 ± 2.68 2.96 ± 2.85 3.29 ± 3.42Roots 2.83 ± 5.11 10.25 ± 10.22 5.14 ± 5.35 2.53 ± 3.14 5.26 ± 7.06 4.91 ± 6.27Bark 1.45 ± 2.99 1.41 ± 2.53 1.66 ± 2.43 5.15 ± 8.08 2.35 ± 4.57 2.53 ± 4.05Animal remains 0.25 ± 0.50 0.41 ± 0.53 0.27 ± 0.62 0.36 ± 0.75 0.16 ± 0.48 0.13 ± 0.42Unidentified 40.50 ± 26.47 30.15 ± 12.57 28.22 ± 11.92 19.16 ± 9.21 29.32 ± 16.18 27.98 ± 16.95 Table 29: Frequency of occurrence of the food components in the stomach of U. cordatus. Data for the different size classes and sexes were pooled (N = 32 crabs for each sampling site). Frequency of occurrence (%) Food component FG AF Mean Leaves 100.00 100.00 100.00 Sediment 83.87 90.00 86.89 Roots 64.52 53.33 59.02 Bark 48.39 30.00 44.26 Animal remains 16.13 16.67 16.40 Litter material in burrows and litter standing stock Table 30: Kruskal-Wallis analysis of variance by ranks comparing the litter quantity on the sediment surface and in crab burrows among habitats. Comparisons: (a) litter dry mass (g) on the sediment surface among the sites FG 1, AF and FG 2. (b) litter dry mass (g) in the crab burrows among the sites FG 1, AF and FG 2. (a) Kruskal-Wallis ANOVA: H (2, N = 62) = 42.5036; p < 0.0001 (b) Kruskal-Wallis ANOVA: H (2, N = 62) = 5.4678; p = 0.0650 (a) Post hoc comparison (U-tests, Bonferroni correction; significance level: p < 0.0167):
Comparison U Z p (a) FG 1 - AF 1.0000 -5.5154 0.000001 (a) FG 1 – FG 2 96.0000 -3.1229 0.001791 (a) AF – FG 2 12.0000 5.0854 0.000001 Litter standing stock: Site N Mean ± SD (g dw m-2) Maximum (g dw m-2) Minimum (g dw m-2) FG 1 22 1.25 ± 1.40 6.82 0.07 AF 20 36.68 ± 26.18 82.34 2.02 FG 2 20 1.80 ± 2.60 11.43 0.08 Litter material taken from crab burrows: Site N Mean ± SD (g dw) Maximum (g dw) Minimum (g dw) FG 1 22 0.40 ± 0.40 1.43 0.00 AF 20 3.44 ± 4.68 15.05 0.00 FG 2 20 0.74 ± 0.68 2.45 0.00
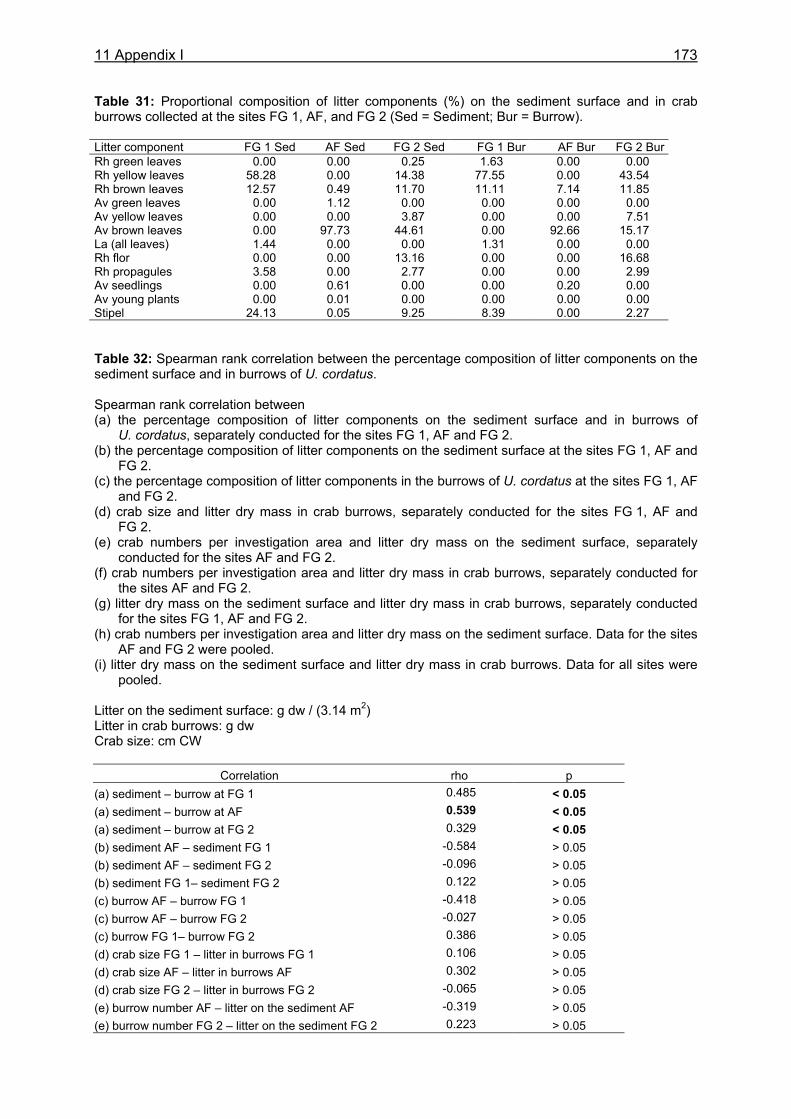
11 Appendix I
173
Table 31: Proportional composition of litter components (%) on the sediment surface and in crab burrows collected at the sites FG 1, AF, and FG 2 (Sed = Sediment; Bur = Burrow). Litter component FG 1 Sed AF Sed FG 2 Sed FG 1 Bur AF Bur FG 2 BurRh green leaves 0.00 0.00 0.25 1.63 0.00 0.00 Rh yellow leaves 58.28 0.00 14.38 77.55 0.00 43.54 Rh brown leaves 12.57 0.49 11.70 11.11 7.14 11.85 Av green leaves 0.00 1.12 0.00 0.00 0.00 0.00 Av yellow leaves 0.00 0.00 3.87 0.00 0.00 7.51 Av brown leaves 0.00 97.73 44.61 0.00 92.66 15.17 La (all leaves) 1.44 0.00 0.00 1.31 0.00 0.00 Rh flor 0.00 0.00 13.16 0.00 0.00 16.68 Rh propagules 3.58 0.00 2.77 0.00 0.00 2.99 Av seedlings 0.00 0.61 0.00 0.00 0.20 0.00 Av young plants 0.00 0.01 0.00 0.00 0.00 0.00 Stipel 24.13 0.05 9.25 8.39 0.00 2.27 Table 32: Spearman rank correlation between the percentage composition of litter components on the sediment surface and in burrows of U. cordatus. Spearman rank correlation between (a) the percentage composition of litter components on the sediment surface and in burrows of
U. cordatus, separately conducted for the sites FG 1, AF and FG 2. (b) the percentage composition of litter components on the sediment surface at the sites FG 1, AF and
FG 2. (c) the percentage composition of litter components in the burrows of U. cordatus at the sites FG 1, AF
and FG 2. (d) crab size and litter dry mass in crab burrows, separately conducted for the sites FG 1, AF and
FG 2. (e) crab numbers per investigation area and litter dry mass on the sediment surface, separately
conducted for the sites AF and FG 2. (f) crab numbers per investigation area and litter dry mass in crab burrows, separately conducted for
the sites AF and FG 2. (g) litter dry mass on the sediment surface and litter dry mass in crab burrows, separately conducted
for the sites FG 1, AF and FG 2. (h) crab numbers per investigation area and litter dry mass on the sediment surface. Data for the sites
AF and FG 2 were pooled. (i) litter dry mass on the sediment surface and litter dry mass in crab burrows. Data for all sites were
pooled. Litter on the sediment surface: g dw / (3.14 m2) Litter in crab burrows: g dw Crab size: cm CW
Correlation rho p (a) sediment – burrow at FG 1 0.485 < 0.05 (a) sediment – burrow at AF 0.539 < 0.05 (a) sediment – burrow at FG 2 0.329 < 0.05 (b) sediment AF – sediment FG 1 -0.584 > 0.05 (b) sediment AF – sediment FG 2 -0.096 > 0.05 (b) sediment FG 1– sediment FG 2 0.122 > 0.05 (c) burrow AF – burrow FG 1 -0.418 > 0.05 (c) burrow AF – burrow FG 2 -0.027 > 0.05 (c) burrow FG 1– burrow FG 2 0.386 > 0.05 (d) crab size FG 1 – litter in burrows FG 1 0.106 > 0.05 (d) crab size AF – litter in burrows AF 0.302 > 0.05 (d) crab size FG 2 – litter in burrows FG 2 -0.065 > 0.05 (e) burrow number AF – litter on the sediment AF -0.319 > 0.05 (e) burrow number FG 2 – litter on the sediment FG 2 0.223 > 0.05
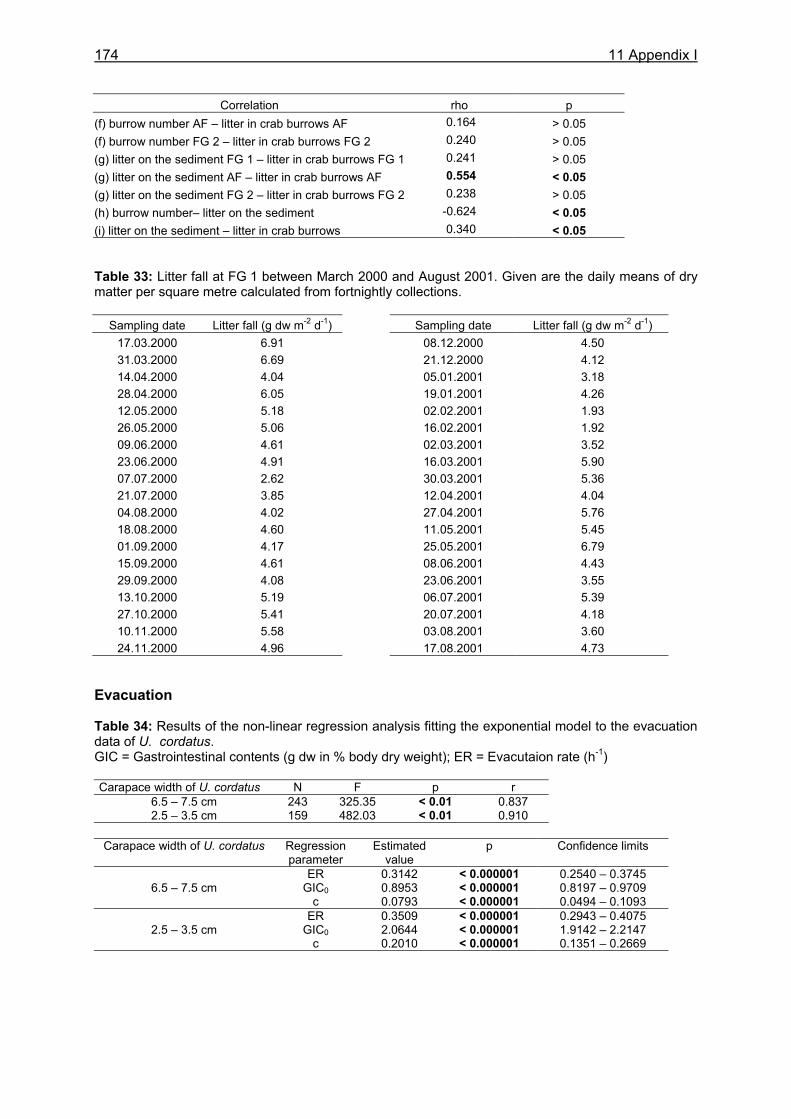
174 11 Appendix I
Correlation rho p (f) burrow number AF – litter in crab burrows AF 0.164 > 0.05 (f) burrow number FG 2 – litter in crab burrows FG 2 0.240 > 0.05 (g) litter on the sediment FG 1 – litter in crab burrows FG 1 0.241 > 0.05 (g) litter on the sediment AF – litter in crab burrows AF 0.554 < 0.05 (g) litter on the sediment FG 2 – litter in crab burrows FG 2 0.238 > 0.05 (h) burrow number– litter on the sediment -0.624 < 0.05 (i) litter on the sediment – litter in crab burrows 0.340 < 0.05 Table 33: Litter fall at FG 1 between March 2000 and August 2001. Given are the daily means of dry matter per square metre calculated from fortnightly collections.
Sampling date Litter fall (g dw m-2 d-1) Sampling date Litter fall (g dw m-2 d-1) 17.03.2000 6.91 08.12.2000 4.50 31.03.2000 6.69 21.12.2000 4.12 14.04.2000 4.04 05.01.2001 3.18 28.04.2000 6.05 19.01.2001 4.26 12.05.2000 5.18 02.02.2001 1.93 26.05.2000 5.06 16.02.2001 1.92 09.06.2000 4.61 02.03.2001 3.52 23.06.2000 4.91 16.03.2001 5.90 07.07.2000 2.62 30.03.2001 5.36 21.07.2000 3.85 12.04.2001 4.04 04.08.2000 4.02 27.04.2001 5.76 18.08.2000 4.60 11.05.2001 5.45 01.09.2000 4.17 25.05.2001 6.79 15.09.2000 4.61 08.06.2001 4.43 29.09.2000 4.08 23.06.2001 3.55 13.10.2000 5.19 06.07.2001 5.39 27.10.2000 5.41 20.07.2001 4.18 10.11.2000 5.58 03.08.2001 3.60 24.11.2000 4.96 17.08.2001 4.73
Evacuation Table 34: Results of the non-linear regression analysis fitting the exponential model to the evacuation data of U. cordatus. GIC = Gastrointestinal contents (g dw in % body dry weight); ER = Evacutaion rate (h-1) Carapace width of U. cordatus N F p r
6.5 – 7.5 cm 243 325.35 < 0.01 0.837 2.5 – 3.5 cm 159 482.03 < 0.01 0.910
Carapace width of U. cordatus Regression
parameter Estimated
value p Confidence limits
ER 0.3142 < 0.000001 0.2540 – 0.3745 GIC0 0.8953 < 0.000001 0.8197 – 0.9709
6.5 – 7.5 cm
c 0.0793 < 0.000001 0.0494 – 0.1093 ER 0.3509 < 0.000001 0.2943 – 0.4075
GIC0 2.0644 < 0.000001 1.9142 – 2.2147
2.5 – 3.5 cm c 0.2010 < 0.000001 0.1351 – 0.2669
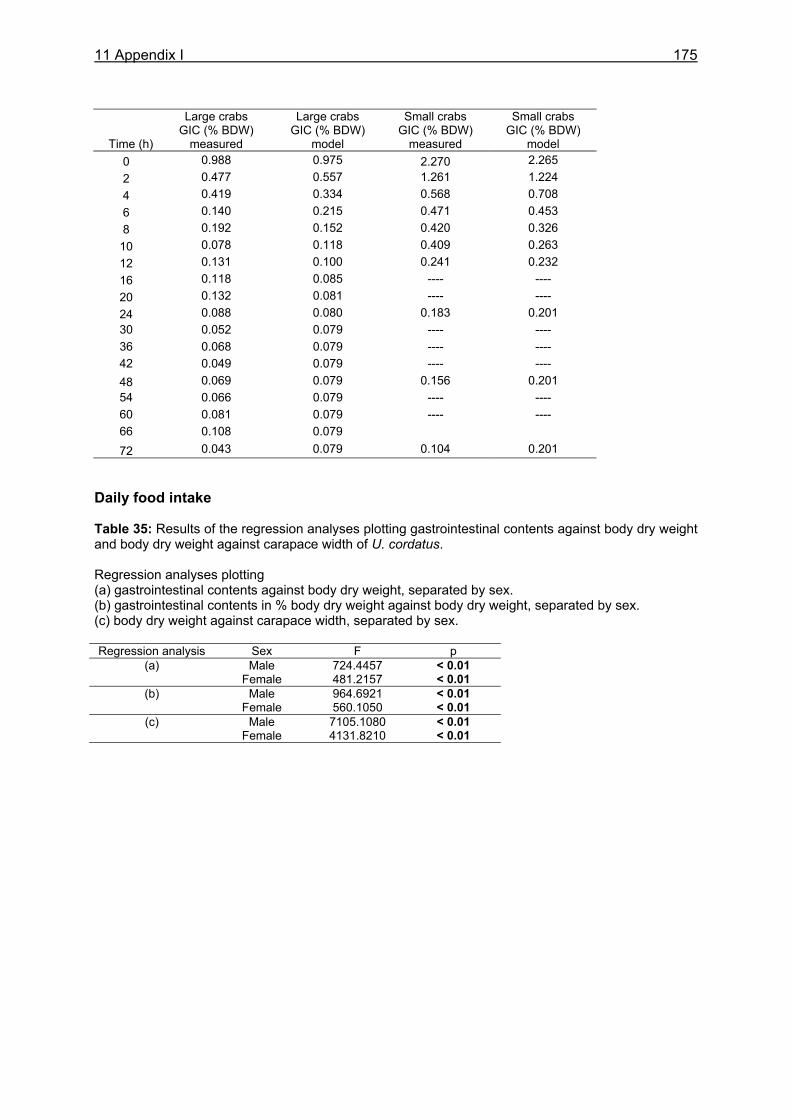
11 Appendix I
175
Time (h)
Large crabs GIC (% BDW)
measured
Large crabs GIC (% BDW)
model
Small crabs GIC (% BDW)
measured
Small crabs GIC (% BDW)
model 0 0.988 0.975 2.270 2.265 2 0.477 0.557 1.261 1.224 4 0.419 0.334 0.568 0.708 6 0.140 0.215 0.471 0.453 8 0.192 0.152 0.420 0.326
10 0.078 0.118 0.409 0.263 12 0.131 0.100 0.241 0.232 16 0.118 0.085 ---- ---- 20 0.132 0.081 ---- ---- 24 0.088 0.080 0.183 0.201 30 0.052 0.079 ---- ---- 36 0.068 0.079 ---- ---- 42 0.049 0.079 ---- ---- 48 0.069 0.079 0.156 0.201 54 0.066 0.079 ---- ---- 60 0.081 0.079 ---- ---- 66 0.108 0.079 72 0.043 0.079 0.104 0.201
Daily food intake Table 35: Results of the regression analyses plotting gastrointestinal contents against body dry weight and body dry weight against carapace width of U. cordatus. Regression analyses plotting (a) gastrointestinal contents against body dry weight, separated by sex. (b) gastrointestinal contents in % body dry weight against body dry weight, separated by sex. (c) body dry weight against carapace width, separated by sex. Regression analysis Sex F p
Male 724.4457 < 0.01 (a) Female 481.2157 < 0.01
Male 964.6921 < 0.01 (b) Female 560.1050 < 0.01
Male 7105.1080 < 0.01 (c) Female 4131.8210 < 0.01
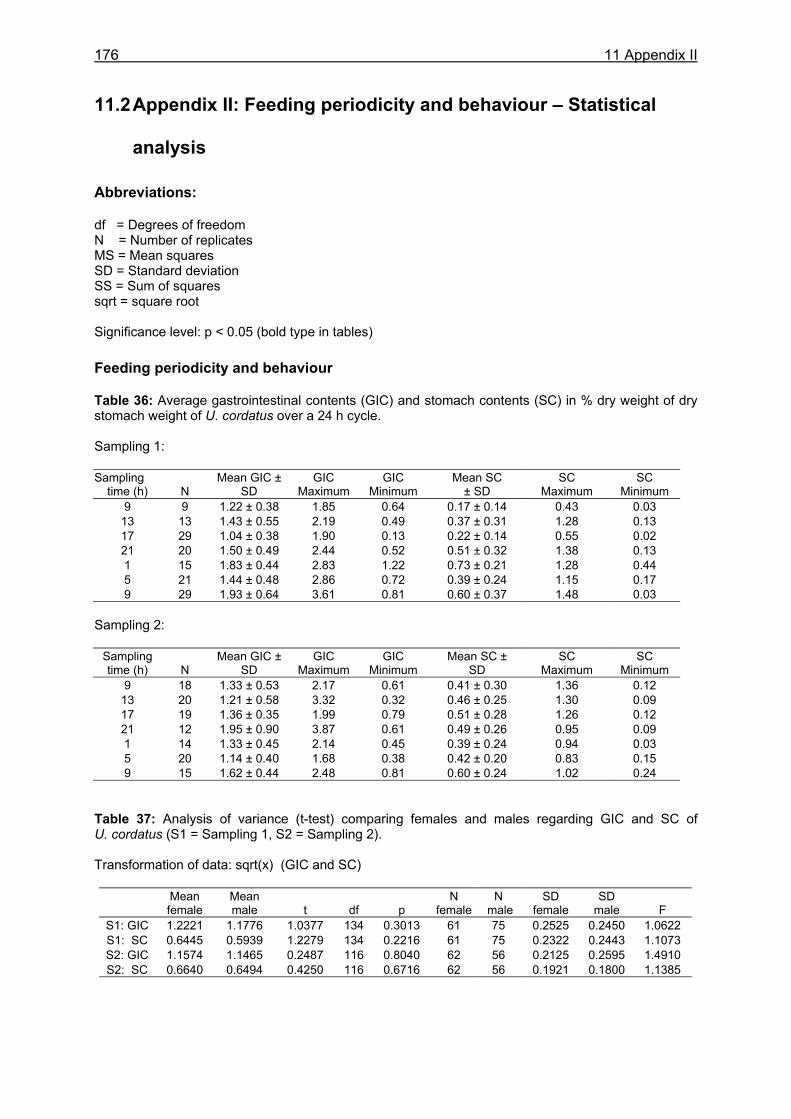
176 11 Appendix II
11.2 Appendix II: Feeding periodicity and behaviour – Statistical
analysis
Abbreviations: df = Degrees of freedom N = Number of replicates MS = Mean squares SD = Standard deviation SS = Sum of squares sqrt = square root Significance level: p < 0.05 (bold type in tables) Feeding periodicity and behaviour Table 36: Average gastrointestinal contents (GIC) and stomach contents (SC) in % dry weight of dry stomach weight of U. cordatus over a 24 h cycle. Sampling 1: Sampling
time (h) N Mean GIC ±
SD GIC
Maximum GIC
Minimum Mean SC
± SD SC
Maximum SC
Minimum 9 9 1.22 ± 0.38 1.85 0.64 0.17 ± 0.14 0.43 0.03 13 13 1.43 ± 0.55 2.19 0.49 0.37 ± 0.31 1.28 0.13 17 29 1.04 ± 0.38 1.90 0.13 0.22 ± 0.14 0.55 0.02 21 20 1.50 ± 0.49 2.44 0.52 0.51 ± 0.32 1.38 0.13 1 15 1.83 ± 0.44 2.83 1.22 0.73 ± 0.21 1.28 0.44 5 21 1.44 ± 0.48 2.86 0.72 0.39 ± 0.24 1.15 0.17 9 29 1.93 ± 0.64 3.61 0.81 0.60 ± 0.37 1.48 0.03
Sampling 2:
Sampling time (h) N
Mean GIC ± SD
GIC Maximum
GIC Minimum
Mean SC ± SD
SC Maximum
SC Minimum
9 18 1.33 ± 0.53 2.17 0.61 0.41 ± 0.30 1.36 0.12 13 20 1.21 ± 0.58 3.32 0.32 0.46 ± 0.25 1.30 0.09 17 19 1.36 ± 0.35 1.99 0.79 0.51 ± 0.28 1.26 0.12 21 12 1.95 ± 0.90 3.87 0.61 0.49 ± 0.26 0.95 0.09 1 14 1.33 ± 0.45 2.14 0.45 0.39 ± 0.24 0.94 0.03 5 20 1.14 ± 0.40 1.68 0.38 0.42 ± 0.20 0.83 0.15 9 15 1.62 ± 0.44 2.48 0.81 0.60 ± 0.24 1.02 0.24
Table 37: Analysis of variance (t-test) comparing females and males regarding GIC and SC of U. cordatus (S1 = Sampling 1, S2 = Sampling 2). Transformation of data: sqrt(x) (GIC and SC)
Mean female
Mean male t df p
N female
N male
SD female
SD male F
S1: GIC 1.2221 1.1776 1.0377 134 0.3013 61 75 0.2525 0.2450 1.0622 S1: SC 0.6445 0.5939 1.2279 134 0.2216 61 75 0.2322 0.2443 1.1073 S2: GIC 1.1574 1.1465 0.2487 116 0.8040 62 56 0.2125 0.2595 1.4910 S2: SC 0.6640 0.6494 0.4250 116 0.6716 62 56 0.1921 0.1800 1.1385
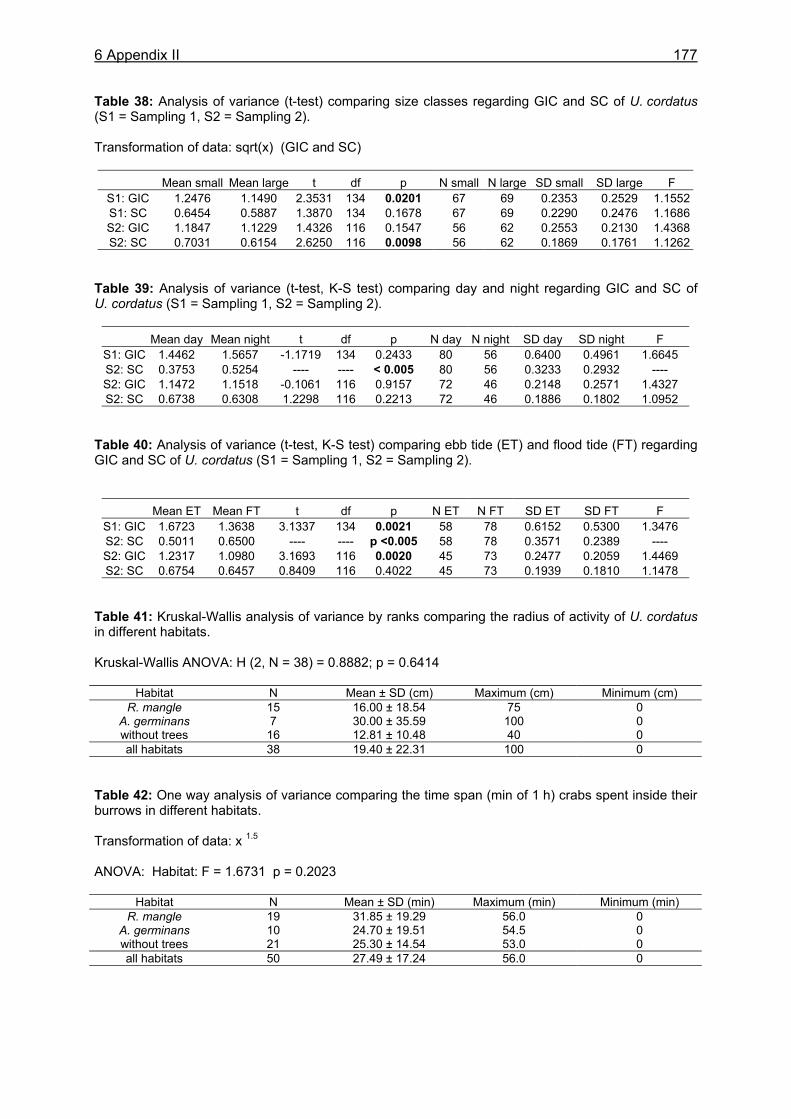
6 Appendix II
177
Table 38: Analysis of variance (t-test) comparing size classes regarding GIC and SC of U. cordatus (S1 = Sampling 1, S2 = Sampling 2). Transformation of data: sqrt(x) (GIC and SC)
Mean small Mean large t df p N small N large SD small SD large F S1: GIC 1.2476 1.1490 2.3531 134 0.0201 67 69 0.2353 0.2529 1.1552S1: SC 0.6454 0.5887 1.3870 134 0.1678 67 69 0.2290 0.2476 1.1686S2: GIC 1.1847 1.1229 1.4326 116 0.1547 56 62 0.2553 0.2130 1.4368S2: SC 0.7031 0.6154 2.6250 116 0.0098 56 62 0.1869 0.1761 1.1262
Table 39: Analysis of variance (t-test, K-S test) comparing day and night regarding GIC and SC of U. cordatus (S1 = Sampling 1, S2 = Sampling 2).
Mean day Mean night t df p N day N night SD day SD night F S1: GIC 1.4462 1.5657 -1.1719 134 0.2433 80 56 0.6400 0.4961 1.6645 S2: SC 0.3753 0.5254 ---- ---- < 0.005 80 56 0.3233 0.2932 ---- S2: GIC 1.1472 1.1518 -0.1061 116 0.9157 72 46 0.2148 0.2571 1.4327 S2: SC 0.6738 0.6308 1.2298 116 0.2213 72 46 0.1886 0.1802 1.0952
Table 40: Analysis of variance (t-test, K-S test) comparing ebb tide (ET) and flood tide (FT) regarding GIC and SC of U. cordatus (S1 = Sampling 1, S2 = Sampling 2).
Mean ET Mean FT t df p N ET N FT SD ET SD FT F S1: GIC 1.6723 1.3638 3.1337 134 0.0021 58 78 0.6152 0.5300 1.3476 S2: SC 0.5011 0.6500 ---- ---- p <0.005 58 78 0.3571 0.2389 ---- S2: GIC 1.2317 1.0980 3.1693 116 0.0020 45 73 0.2477 0.2059 1.4469 S2: SC 0.6754 0.6457 0.8409 116 0.4022 45 73 0.1939 0.1810 1.1478
Table 41: Kruskal-Wallis analysis of variance by ranks comparing the radius of activity of U. cordatus in different habitats. Kruskal-Wallis ANOVA: H (2, N = 38) = 0.8882; p = 0.6414
Habitat N Mean ± SD (cm) Maximum (cm) Minimum (cm) R. mangle 15 16.00 ± 18.54 75 0
A. germinans 7 30.00 ± 35.59 100 0 without trees 16 12.81 ± 10.48 40 0 all habitats 38 19.40 ± 22.31 100 0
Table 42: One way analysis of variance comparing the time span (min of 1 h) crabs spent inside their burrows in different habitats. Transformation of data: x 1.5 ANOVA: Habitat: F = 1.6731 p = 0.2023
Habitat N Mean ± SD (min) Maximum (min) Minimum (min) R. mangle 19 31.85 ± 19.29 56.0 0
A. germinans 10 24.70 ± 19.51 54.5 0 without trees 21 25.30 ± 14.54 53.0 0 all habitats 50 27.49 ± 17.24 56.0 0
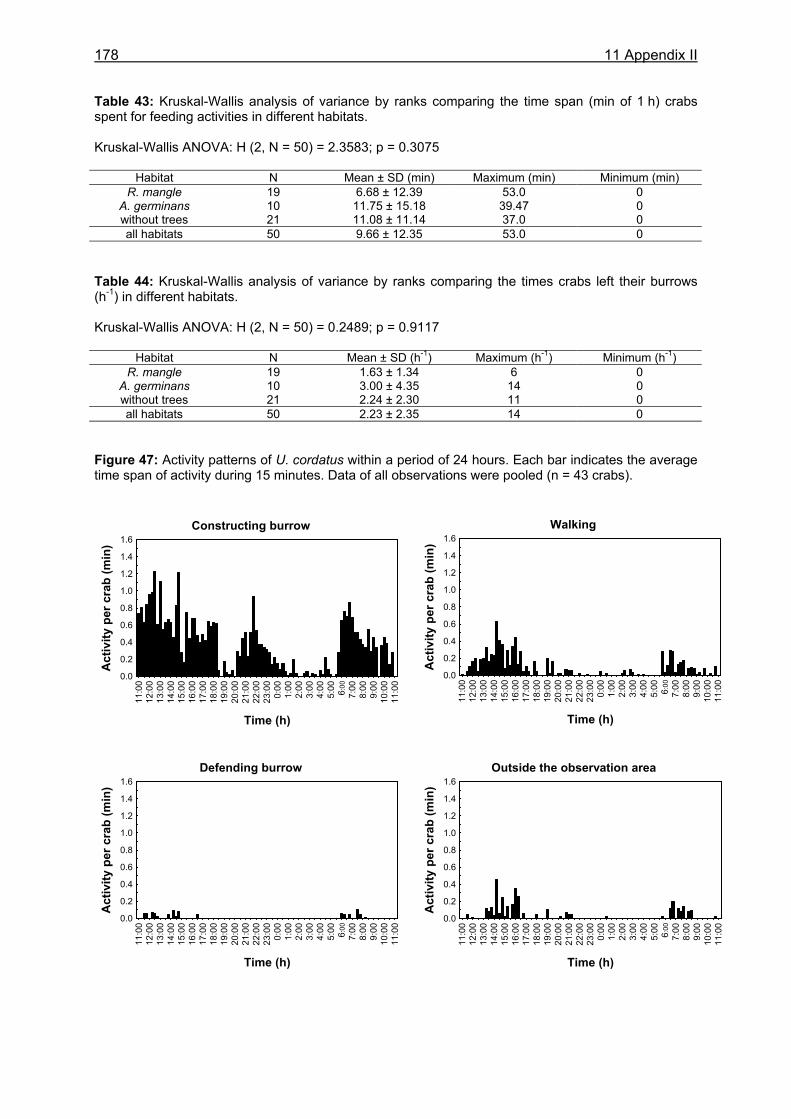
178 11 Appendix II
Table 43: Kruskal-Wallis analysis of variance by ranks comparing the time span (min of 1 h) crabs spent for feeding activities in different habitats. Kruskal-Wallis ANOVA: H (2, N = 50) = 2.3583; p = 0.3075
Habitat N Mean ± SD (min) Maximum (min) Minimum (min) R. mangle 19 6.68 ± 12.39 53.0 0
A. germinans 10 11.75 ± 15.18 39.47 0 without trees 21 11.08 ± 11.14 37.0 0 all habitats 50 9.66 ± 12.35 53.0 0
Table 44: Kruskal-Wallis analysis of variance by ranks comparing the times crabs left their burrows (h-1) in different habitats. Kruskal-Wallis ANOVA: H (2, N = 50) = 0.2489; p = 0.9117
Habitat N Mean ± SD (h-1) Maximum (h-1) Minimum (h-1) R. mangle 19 1.63 ± 1.34 6 0
A. germinans 10 3.00 ± 4.35 14 0 without trees 21 2.24 ± 2.30 11 0 all habitats 50 2.23 ± 2.35 14 0
Figure 47: Activity patterns of U. cordatus within a period of 24 hours. Each bar indicates the average time span of activity during 15 minutes. Data of all observations were pooled (n = 43 crabs).
Constructing burrow
11:0
012
:00
13:0
014
:00
15:0
016
:00
17:0
018
:00
19:0
020
:00
21:0
022
:00
23:0
00:
001:
002:
003:
004:
005:
00 6 :00
7:00
8:00
9:00
10:0
011
:00
Time (h)
0.0
0.2
0.4
0.6
0.8
1.0
1.2
1.4
1.6
Act
ivity
per
cra
b (m
in)
Walking
11:0
012
:00
13:0
014
:00
15:0
016
:00
17:0
018
:00
19:0
020
:00
21:0
022
:00
23:0
00:
001:
002:
003:
004:
005:
00 6:00
7:00
8:00
9:00
10:0
011
:00
Time (h)
0.0
0.2
0.4
0.6
0.8
1.0
1.2
1.4
1.6
Act
ivity
per
cra
b (m
in)
Defending burrow
11:0
012
:00
13:0
014
:00
15:0
016
:00
17:0
018
:00
19:0
020
:00
21:0
022
:00
23:0
00:
001:
002:
003:
004:
005:
00 6:00
7:00
8:00
9:00
10:0
011
:00
Time (h)
0.0
0.2
0.4
0.6
0.8
1.0
1.2
1.4
1.6
Act
ivity
per
cra
b (m
in)
Outside the observation area
11:0
012
:00
13:0
014
:00
15:0
016
:00
17:0
018
:00
19:0
020
:00
21:0
022
:00
23:0
00:
001:
002:
003:
004:
005:
00 6 :00
7:00
8:00
9:00
10:0
011
:00
Time (h)
0.0
0.2
0.4
0.6
0.8
1.0
1.2
1.4
1.6
Act
ivity
per
cra
b (m
in)
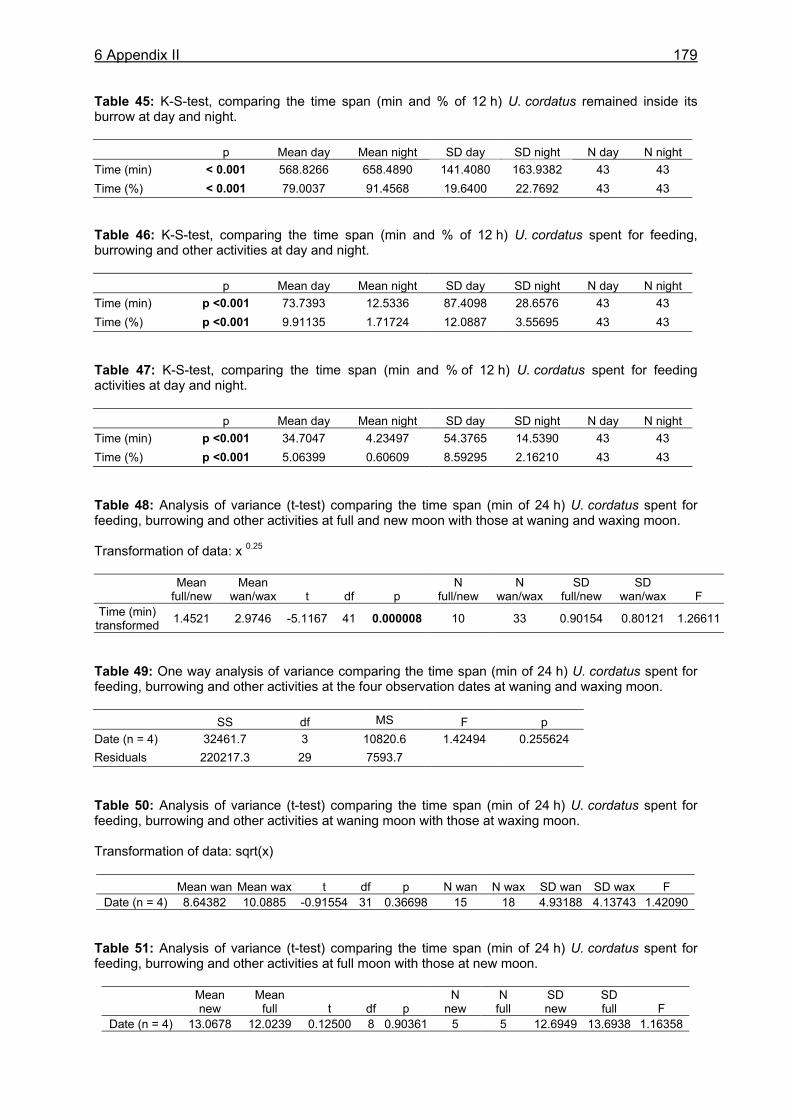
6 Appendix II
179
Table 45: K-S-test, comparing the time span (min and % of 12 h) U. cordatus remained inside its burrow at day and night. p Mean day Mean night SD day SD night N day N night Time (min) < 0.001 568.8266 658.4890 141.4080 163.9382 43 43 Time (%) < 0.001 79.0037 91.4568 19.6400 22.7692 43 43 Table 46: K-S-test, comparing the time span (min and % of 12 h) U. cordatus spent for feeding, burrowing and other activities at day and night. p Mean day Mean night SD day SD night N day N night Time (min) p <0.001 73.7393 12.5336 87.4098 28.6576 43 43 Time (%) p <0.001 9.91135 1.71724 12.0887 3.55695 43 43 Table 47: K-S-test, comparing the time span (min and % of 12 h) U. cordatus spent for feeding activities at day and night. p Mean day Mean night SD day SD night N day N night Time (min) p <0.001 34.7047 4.23497 54.3765 14.5390 43 43 Time (%) p <0.001 5.06399 0.60609 8.59295 2.16210 43 43 Table 48: Analysis of variance (t-test) comparing the time span (min of 24 h) U. cordatus spent for feeding, burrowing and other activities at full and new moon with those at waning and waxing moon. Transformation of data: x 0.25
Mean full/new
Mean wan/wax t df p
N full/new
N wan/wax
SD full/new
SD wan/wax F
Time (min) transformed 1.4521 2.9746 -5.1167 41 0.000008 10 33 0.90154 0.80121 1.26611
Table 49: One way analysis of variance comparing the time span (min of 24 h) U. cordatus spent for feeding, burrowing and other activities at the four observation dates at waning and waxing moon. SS df MS F p Date (n = 4) 32461.7 3 10820.6 1.42494 0.255624 Residuals 220217.3 29 7593.7 Table 50: Analysis of variance (t-test) comparing the time span (min of 24 h) U. cordatus spent for feeding, burrowing and other activities at waning moon with those at waxing moon. Transformation of data: sqrt(x)
Mean wan Mean wax t df p N wan N wax SD wan SD wax F Date (n = 4) 8.64382 10.0885 -0.91554 31 0.36698 15 18 4.93188 4.13743 1.42090
Table 51: Analysis of variance (t-test) comparing the time span (min of 24 h) U. cordatus spent for feeding, burrowing and other activities at full moon with those at new moon.
Mean new
Mean full t df p
N new
N full
SD new
SD full F
Date (n = 4) 13.0678 12.0239 0.12500 8 0.90361 5 5 12.6949 13.6938 1.16358
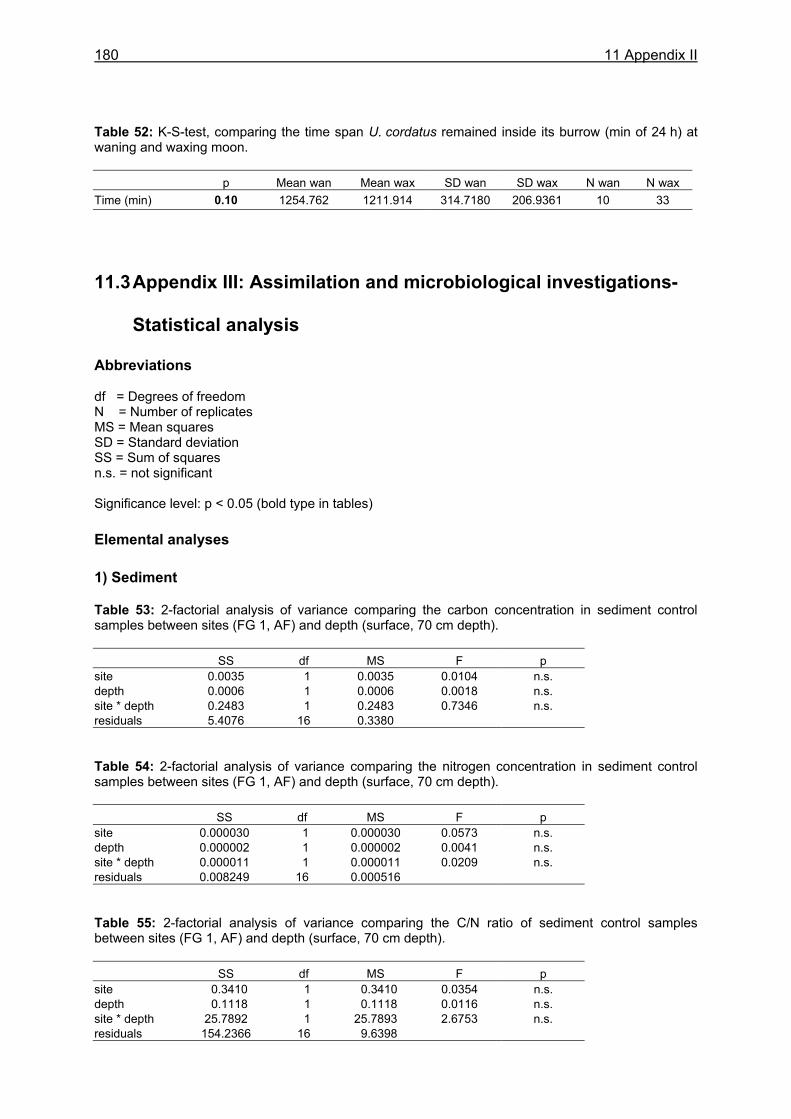
180 11 Appendix II
Table 52: K-S-test, comparing the time span U. cordatus remained inside its burrow (min of 24 h) at waning and waxing moon. p Mean wan Mean wax SD wan SD wax N wan N wax Time (min) 0.10 1254.762 1211.914 314.7180 206.9361 10 33 11.3 Appendix III: Assimilation and microbiological investigations-
Statistical analysis
Abbreviations df = Degrees of freedom N = Number of replicates MS = Mean squares SD = Standard deviation SS = Sum of squares n.s. = not significant Significance level: p < 0.05 (bold type in tables) Elemental analyses 1) Sediment Table 53: 2-factorial analysis of variance comparing the carbon concentration in sediment control samples between sites (FG 1, AF) and depth (surface, 70 cm depth). SS df MS F p site 0.0035 1 0.0035 0.0104 n.s. depth 0.0006 1 0.0006 0.0018 n.s. site * depth 0.2483 1 0.2483 0.7346 n.s. residuals 5.4076 16 0.3380 Table 54: 2-factorial analysis of variance comparing the nitrogen concentration in sediment control samples between sites (FG 1, AF) and depth (surface, 70 cm depth). SS df MS F p site 0.000030 1 0.000030 0.0573 n.s. depth 0.000002 1 0.000002 0.0041 n.s. site * depth 0.000011 1 0.000011 0.0209 n.s. residuals 0.008249 16 0.000516 Table 55: 2-factorial analysis of variance comparing the C/N ratio of sediment control samples between sites (FG 1, AF) and depth (surface, 70 cm depth). SS df MS F p site 0.3410 1 0.3410 0.0354 n.s. depth 0.1118 1 0.1118 0.0116 n.s. site * depth 25.7892 1 25.7893 2.6753 n.s. residuals 154.2366 16 9.6398
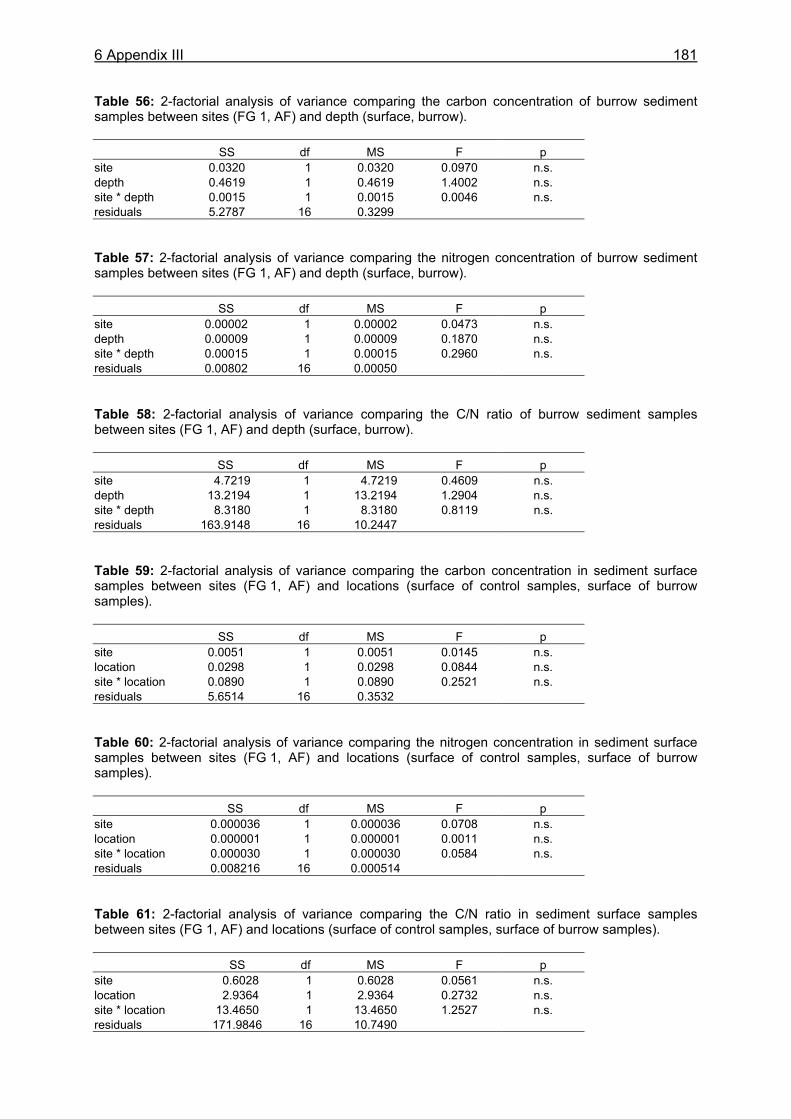
6 Appendix III
181
Table 56: 2-factorial analysis of variance comparing the carbon concentration of burrow sediment samples between sites (FG 1, AF) and depth (surface, burrow). SS df MS F p site 0.0320 1 0.0320 0.0970 n.s. depth 0.4619 1 0.4619 1.4002 n.s. site * depth 0.0015 1 0.0015 0.0046 n.s. residuals 5.2787 16 0.3299 Table 57: 2-factorial analysis of variance comparing the nitrogen concentration of burrow sediment samples between sites (FG 1, AF) and depth (surface, burrow). SS df MS F p site 0.00002 1 0.00002 0.0473 n.s. depth 0.00009 1 0.00009 0.1870 n.s. site * depth 0.00015 1 0.00015 0.2960 n.s. residuals 0.00802 16 0.00050 Table 58: 2-factorial analysis of variance comparing the C/N ratio of burrow sediment samples between sites (FG 1, AF) and depth (surface, burrow). SS df MS F p site 4.7219 1 4.7219 0.4609 n.s. depth 13.2194 1 13.2194 1.2904 n.s. site * depth 8.3180 1 8.3180 0.8119 n.s. residuals 163.9148 16 10.2447 Table 59: 2-factorial analysis of variance comparing the carbon concentration in sediment surface samples between sites (FG 1, AF) and locations (surface of control samples, surface of burrow samples). SS df MS F p site 0.0051 1 0.0051 0.0145 n.s. location 0.0298 1 0.0298 0.0844 n.s. site * location 0.0890 1 0.0890 0.2521 n.s. residuals 5.6514 16 0.3532 Table 60: 2-factorial analysis of variance comparing the nitrogen concentration in sediment surface samples between sites (FG 1, AF) and locations (surface of control samples, surface of burrow samples). SS df MS F p site 0.000036 1 0.000036 0.0708 n.s. location 0.000001 1 0.000001 0.0011 n.s. site * location 0.000030 1 0.000030 0.0584 n.s. residuals 0.008216 16 0.000514 Table 61: 2-factorial analysis of variance comparing the C/N ratio in sediment surface samples between sites (FG 1, AF) and locations (surface of control samples, surface of burrow samples). SS df MS F p site 0.6028 1 0.6028 0.0561 n.s. location 2.9364 1 2.9364 0.2732 n.s. site * location 13.4650 1 13.4650 1.2527 n.s. residuals 171.9846 16 10.7490
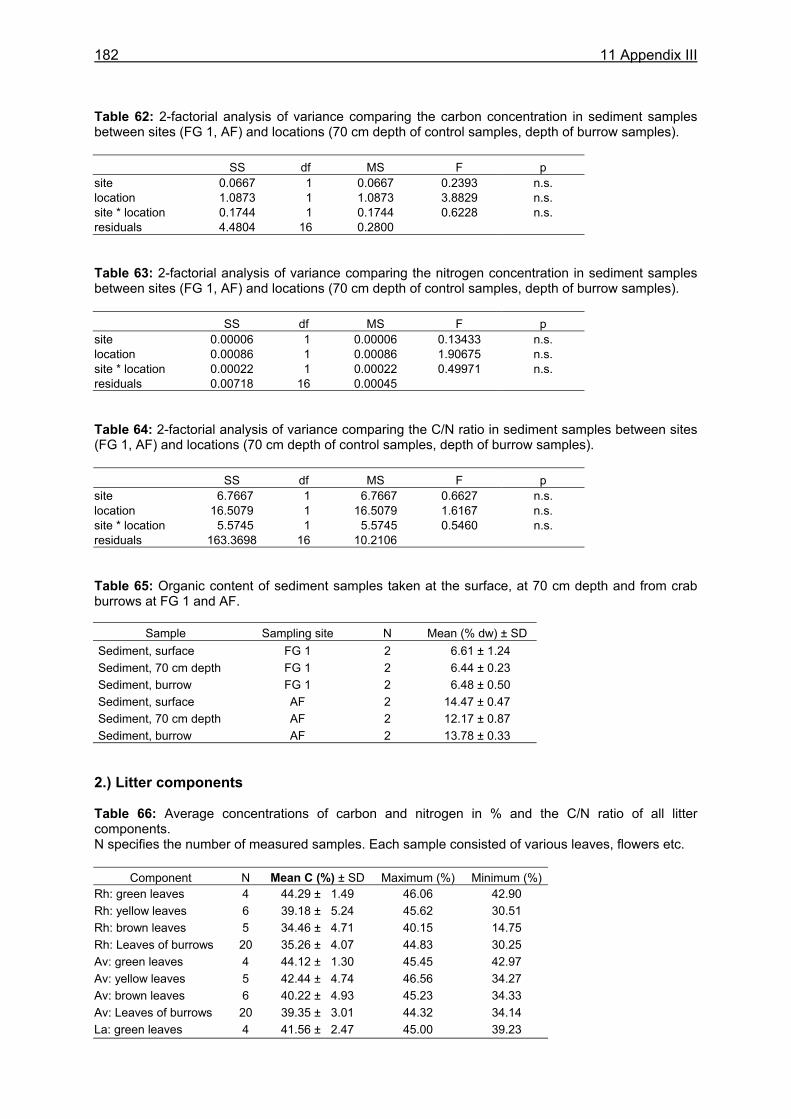
182 11 Appendix III
Table 62: 2-factorial analysis of variance comparing the carbon concentration in sediment samples between sites (FG 1, AF) and locations (70 cm depth of control samples, depth of burrow samples). SS df MS F p site 0.0667 1 0.0667 0.2393 n.s. location 1.0873 1 1.0873 3.8829 n.s. site * location 0.1744 1 0.1744 0.6228 n.s. residuals 4.4804 16 0.2800 Table 63: 2-factorial analysis of variance comparing the nitrogen concentration in sediment samples between sites (FG 1, AF) and locations (70 cm depth of control samples, depth of burrow samples). SS df MS F p site 0.00006 1 0.00006 0.13433 n.s. location 0.00086 1 0.00086 1.90675 n.s. site * location 0.00022 1 0.00022 0.49971 n.s. residuals 0.00718 16 0.00045 Table 64: 2-factorial analysis of variance comparing the C/N ratio in sediment samples between sites (FG 1, AF) and locations (70 cm depth of control samples, depth of burrow samples). SS df MS F p site 6.7667 1 6.7667 0.6627 n.s. location 16.5079 1 16.5079 1.6167 n.s. site * location 5.5745 1 5.5745 0.5460 n.s. residuals 163.3698 16 10.2106 Table 65: Organic content of sediment samples taken at the surface, at 70 cm depth and from crab burrows at FG 1 and AF.
Sample Sampling site N Mean (% dw) ± SD Sediment, surface FG 1 2 6.61 ± 1.24 Sediment, 70 cm depth FG 1 2 6.44 ± 0.23 Sediment, burrow FG 1 2 6.48 ± 0.50 Sediment, surface AF 2 14.47 ± 0.47 Sediment, 70 cm depth AF 2 12.17 ± 0.87 Sediment, burrow AF 2 13.78 ± 0.33
2.) Litter components Table 66: Average concentrations of carbon and nitrogen in % and the C/N ratio of all litter components. N specifies the number of measured samples. Each sample consisted of various leaves, flowers etc.
Component N Mean C (%) ± SD Maximum (%) Minimum (%)Rh: green leaves 4 44.29 ± 1.49 46.06 42.90 Rh: yellow leaves 6 39.18 ± 5.24 45.62 30.51 Rh: brown leaves 5 34.46 ± 4.71 40.15 14.75 Rh: Leaves of burrows 20 35.26 ± 4.07 44.83 30.25 Av: green leaves 4 44.12 ± 1.30 45.45 42.97 Av: yellow leaves 5 42.44 ± 4.74 46.56 34.27 Av: brown leaves 6 40.22 ± 4.93 45.23 34.33 Av: Leaves of burrows 20 39.35 ± 3.01 44.32 34.14 La: green leaves 4 41.56 ± 2.47 45.00 39.23
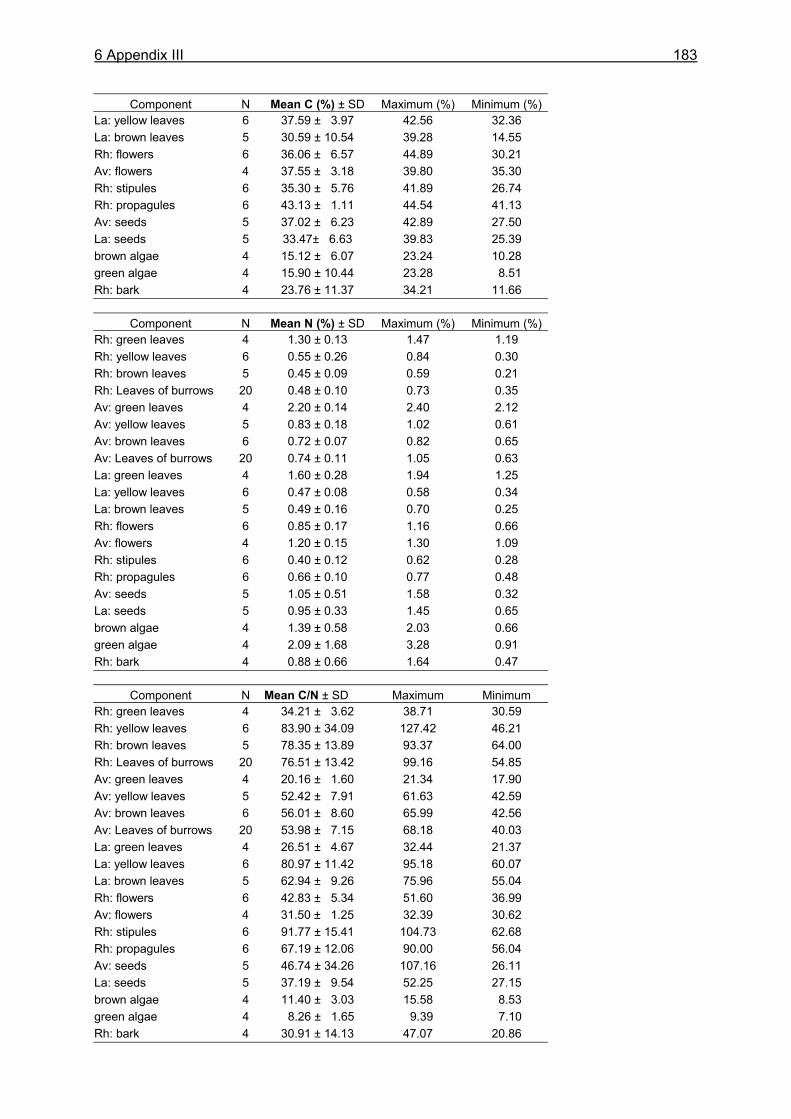
6 Appendix III
183
Component N Mean C (%) ± SD Maximum (%) Minimum (%)La: yellow leaves 6 37.59 ± 3.97 42.56 32.36 La: brown leaves 5 30.59 ± 10.54 39.28 14.55 Rh: flowers 6 36.06 ± 6.57 44.89 30.21 Av: flowers 4 37.55 ± 3.18 39.80 35.30 Rh: stipules 6 35.30 ± 5.76 41.89 26.74 Rh: propagules 6 43.13 ± 1.11 44.54 41.13 Av: seeds 5 37.02 ± 6.23 42.89 27.50 La: seeds 5 33.47± 6.63 39.83 25.39 brown algae 4 15.12 ± 6.07 23.24 10.28 green algae 4 15.90 ± 10.44 23.28 8.51 Rh: bark 4 23.76 ± 11.37 34.21 11.66
Component N Mean N (%) ± SD Maximum (%) Minimum (%)Rh: green leaves 4 1.30 ± 0.13 1.47 1.19 Rh: yellow leaves 6 0.55 ± 0.26 0.84 0.30 Rh: brown leaves 5 0.45 ± 0.09 0.59 0.21 Rh: Leaves of burrows 20 0.48 ± 0.10 0.73 0.35 Av: green leaves 4 2.20 ± 0.14 2.40 2.12 Av: yellow leaves 5 0.83 ± 0.18 1.02 0.61 Av: brown leaves 6 0.72 ± 0.07 0.82 0.65 Av: Leaves of burrows 20 0.74 ± 0.11 1.05 0.63 La: green leaves 4 1.60 ± 0.28 1.94 1.25 La: yellow leaves 6 0.47 ± 0.08 0.58 0.34 La: brown leaves 5 0.49 ± 0.16 0.70 0.25 Rh: flowers 6 0.85 ± 0.17 1.16 0.66 Av: flowers 4 1.20 ± 0.15 1.30 1.09 Rh: stipules 6 0.40 ± 0.12 0.62 0.28 Rh: propagules 6 0.66 ± 0.10 0.77 0.48 Av: seeds 5 1.05 ± 0.51 1.58 0.32 La: seeds 5 0.95 ± 0.33 1.45 0.65 brown algae 4 1.39 ± 0.58 2.03 0.66 green algae 4 2.09 ± 1.68 3.28 0.91 Rh: bark 4 0.88 ± 0.66 1.64 0.47
Component N Mean C/N ± SD Maximum Minimum Rh: green leaves 4 34.21 ± 3.62 38.71 30.59 Rh: yellow leaves 6 83.90 ± 34.09 127.42 46.21 Rh: brown leaves 5 78.35 ± 13.89 93.37 64.00 Rh: Leaves of burrows 20 76.51 ± 13.42 99.16 54.85 Av: green leaves 4 20.16 ± 1.60 21.34 17.90 Av: yellow leaves 5 52.42 ± 7.91 61.63 42.59 Av: brown leaves 6 56.01 ± 8.60 65.99 42.56 Av: Leaves of burrows 20 53.98 ± 7.15 68.18 40.03 La: green leaves 4 26.51 ± 4.67 32.44 21.37 La: yellow leaves 6 80.97 ± 11.42 95.18 60.07 La: brown leaves 5 62.94 ± 9.26 75.96 55.04 Rh: flowers 6 42.83 ± 5.34 51.60 36.99 Av: flowers 4 31.50 ± 1.25 32.39 30.62 Rh: stipules 6 91.77 ± 15.41 104.73 62.68 Rh: propagules 6 67.19 ± 12.06 90.00 56.04 Av: seeds 5 46.74 ± 34.26 107.16 26.11 La: seeds 5 37.19 ± 9.54 52.25 27.15 brown algae 4 11.40 ± 3.03 15.58 8.53 green algae 4 8.26 ± 1.65 9.39 7.10 Rh: bark 4 30.91 ± 14.13 47.07 20.86
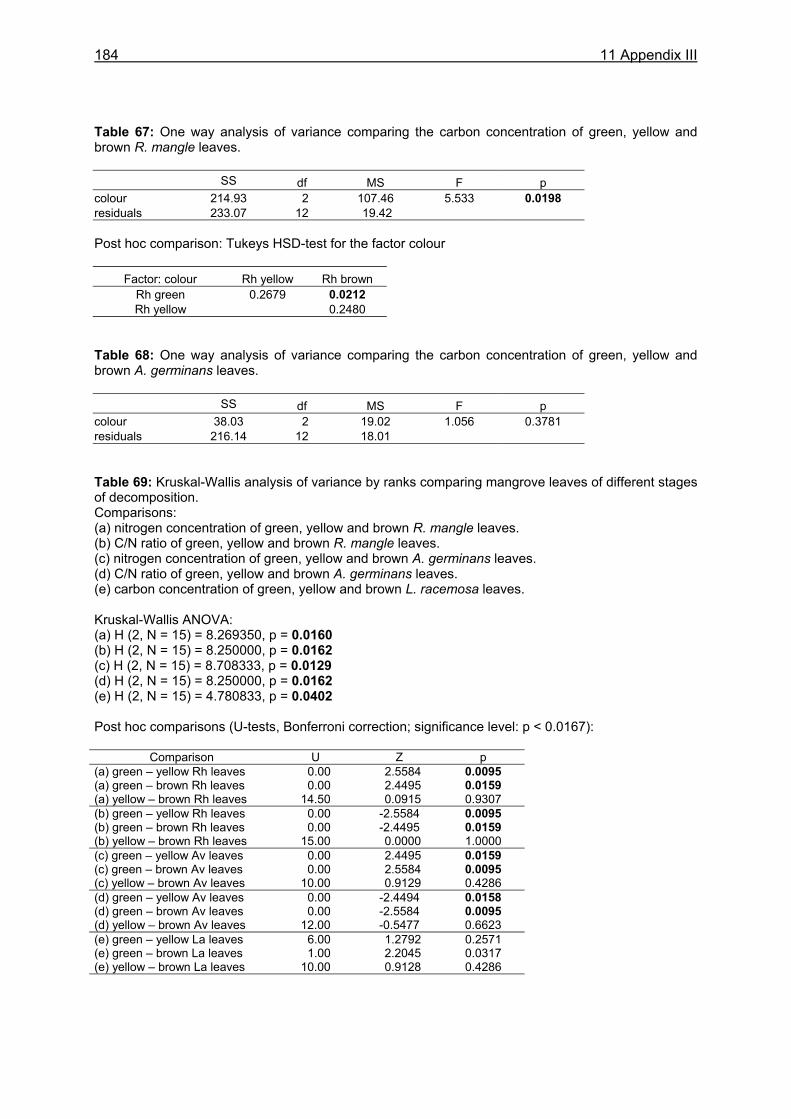
184 11 Appendix III
Table 67: One way analysis of variance comparing the carbon concentration of green, yellow and brown R. mangle leaves. SS df MS F p colour 214.93 2 107.46 5.533 0.0198 residuals 233.07 12 19.42 Post hoc comparison: Tukeys HSD-test for the factor colour
Factor: colour Rh yellow Rh brown Rh green 0.2679 0.0212 Rh yellow 0.2480
Table 68: One way analysis of variance comparing the carbon concentration of green, yellow and brown A. germinans leaves. SS df MS F p colour 38.03 2 19.02 1.056 0.3781 residuals 216.14 12 18.01 Table 69: Kruskal-Wallis analysis of variance by ranks comparing mangrove leaves of different stages of decomposition. Comparisons: (a) nitrogen concentration of green, yellow and brown R. mangle leaves. (b) C/N ratio of green, yellow and brown R. mangle leaves. (c) nitrogen concentration of green, yellow and brown A. germinans leaves. (d) C/N ratio of green, yellow and brown A. germinans leaves. (e) carbon concentration of green, yellow and brown L. racemosa leaves. Kruskal-Wallis ANOVA: (a) H (2, N = 15) = 8.269350, p = 0.0160 (b) H (2, N = 15) = 8.250000, p = 0.0162 (c) H (2, N = 15) = 8.708333, p = 0.0129 (d) H (2, N = 15) = 8.250000, p = 0.0162 (e) H (2, N = 15) = 4.780833, p = 0.0402 Post hoc comparisons (U-tests, Bonferroni correction; significance level: p < 0.0167):
Comparison U Z p (a) green – yellow Rh leaves 0.00 2.5584 0.0095 (a) green – brown Rh leaves 0.00 2.4495 0.0159 (a) yellow – brown Rh leaves 14.50 0.0915 0.9307 (b) green – yellow Rh leaves 0.00 -2.5584 0.0095 (b) green – brown Rh leaves 0.00 -2.4495 0.0159 (b) yellow – brown Rh leaves 15.00 0.0000 1.0000 (c) green – yellow Av leaves 0.00 2.4495 0.0159 (c) green – brown Av leaves 0.00 2.5584 0.0095 (c) yellow – brown Av leaves 10.00 0.9129 0.4286 (d) green – yellow Av leaves 0.00 -2.4494 0.0158 (d) green – brown Av leaves 0.00 -2.5584 0.0095 (d) yellow – brown Av leaves 12.00 -0.5477 0.6623 (e) green – yellow La leaves 6.00 1.2792 0.2571 (e) green – brown La leaves 1.00 2.2045 0.0317 (e) yellow – brown La leaves 10.00 0.9128 0.4286
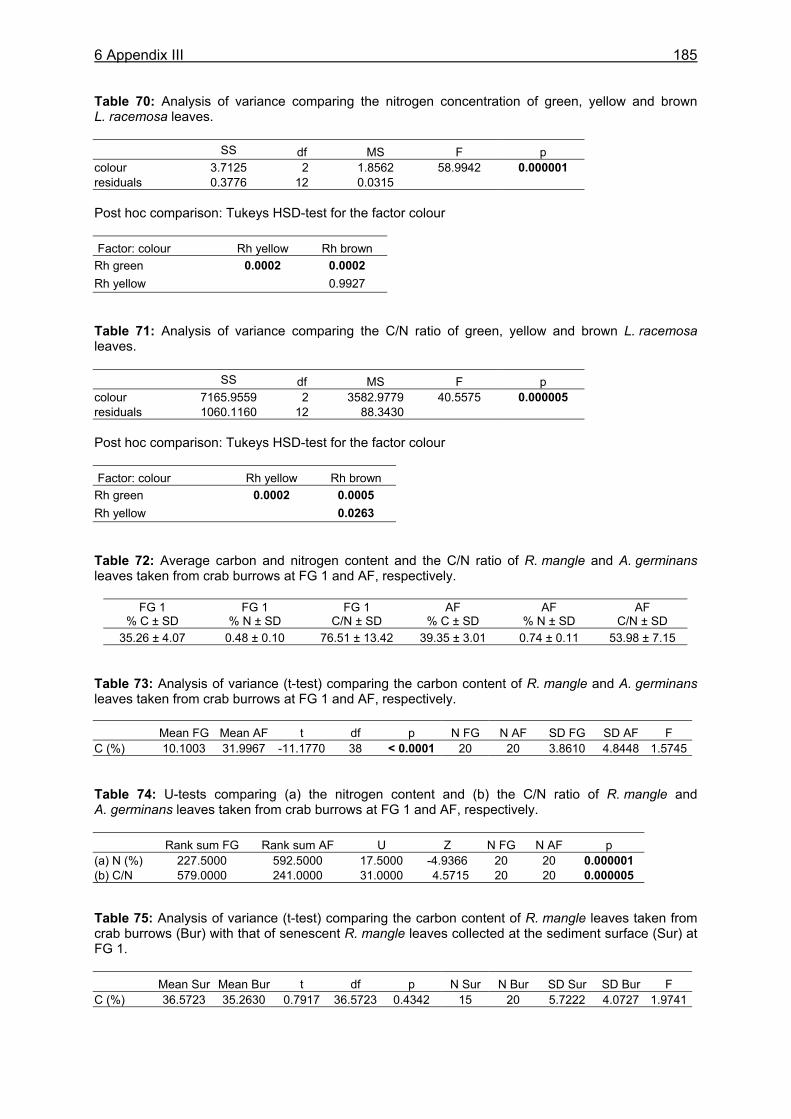
6 Appendix III
185
Table 70: Analysis of variance comparing the nitrogen concentration of green, yellow and brown L. racemosa leaves. SS df MS F p colour 3.7125 2 1.8562 58.9942 0.000001 residuals 0.3776 12 0.0315 Post hoc comparison: Tukeys HSD-test for the factor colour Factor: colour Rh yellow Rh brown Rh green 0.0002 0.0002 Rh yellow 0.9927 Table 71: Analysis of variance comparing the C/N ratio of green, yellow and brown L. racemosa leaves. SS df MS F p colour 7165.9559 2 3582.9779 40.5575 0.000005 residuals 1060.1160 12 88.3430 Post hoc comparison: Tukeys HSD-test for the factor colour Factor: colour Rh yellow Rh brown Rh green 0.0002 0.0005 Rh yellow 0.0263 Table 72: Average carbon and nitrogen content and the C/N ratio of R. mangle and A. germinans leaves taken from crab burrows at FG 1 and AF, respectively.
FG 1 % C ± SD
FG 1 % N ± SD
FG 1 C/N ± SD
AF % C ± SD
AF % N ± SD
AF C/N ± SD
35.26 ± 4.07 0.48 ± 0.10 76.51 ± 13.42 39.35 ± 3.01 0.74 ± 0.11 53.98 ± 7.15 Table 73: Analysis of variance (t-test) comparing the carbon content of R. mangle and A. germinans leaves taken from crab burrows at FG 1 and AF, respectively. Mean FG Mean AF t df p N FG N AF SD FG SD AF F C (%) 10.1003 31.9967 -11.1770 38 < 0.0001 20 20 3.8610 4.8448 1.5745 Table 74: U-tests comparing (a) the nitrogen content and (b) the C/N ratio of R. mangle and A. germinans leaves taken from crab burrows at FG 1 and AF, respectively. Rank sum FG Rank sum AF U Z N FG N AF p (a) N (%) 227.5000 592.5000 17.5000 -4.9366 20 20 0.000001 (b) C/N 579.0000 241.0000 31.0000 4.5715 20 20 0.000005 Table 75: Analysis of variance (t-test) comparing the carbon content of R. mangle leaves taken from crab burrows (Bur) with that of senescent R. mangle leaves collected at the sediment surface (Sur) at FG 1. Mean Sur Mean Bur t df p N Sur N Bur SD Sur SD Bur F C (%) 36.5723 35.2630 0.7917 36.5723 0.4342 15 20 5.7222 4.0727 1.9741
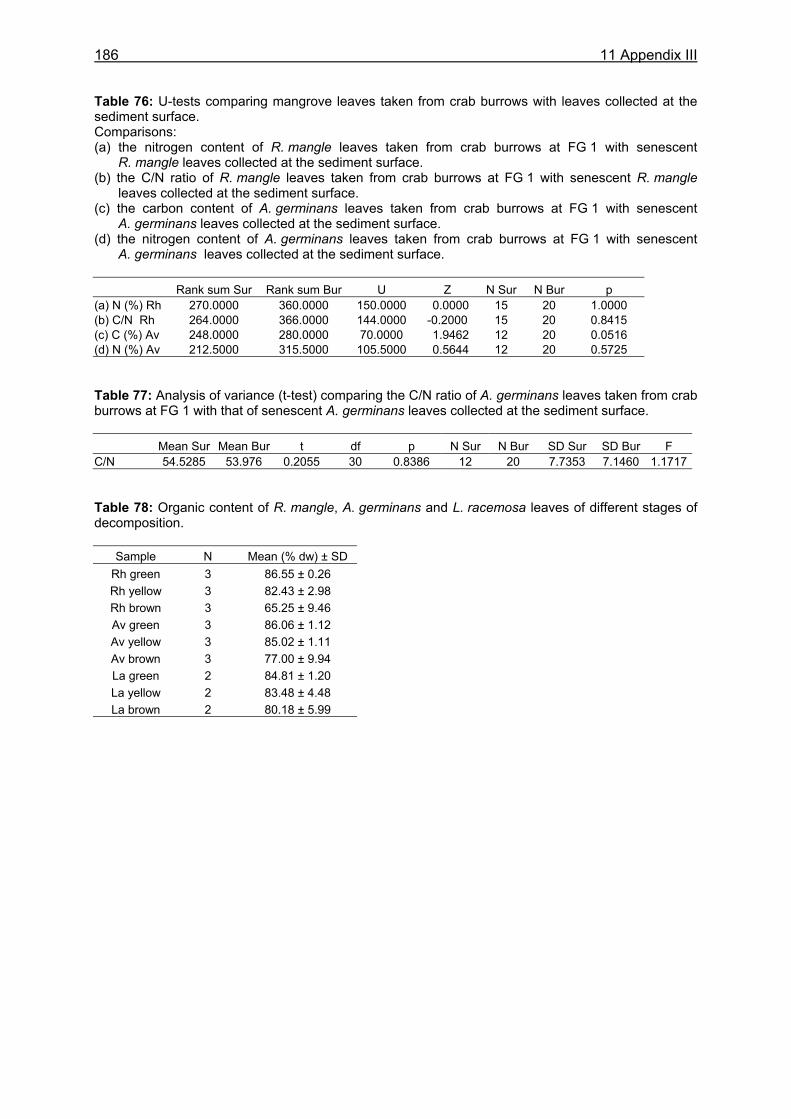
186 11 Appendix III
Table 76: U-tests comparing mangrove leaves taken from crab burrows with leaves collected at the sediment surface. Comparisons: (a) the nitrogen content of R. mangle leaves taken from crab burrows at FG 1 with senescent
R. mangle leaves collected at the sediment surface. (b) the C/N ratio of R. mangle leaves taken from crab burrows at FG 1 with senescent R. mangle
leaves collected at the sediment surface. (c) the carbon content of A. germinans leaves taken from crab burrows at FG 1 with senescent
A. germinans leaves collected at the sediment surface. (d) the nitrogen content of A. germinans leaves taken from crab burrows at FG 1 with senescent
A. germinans leaves collected at the sediment surface. Rank sum Sur Rank sum Bur U Z N Sur N Bur p (a) N (%) Rh 270.0000 360.0000 150.0000 0.0000 15 20 1.0000 (b) C/N Rh 264.0000 366.0000 144.0000 -0.2000 15 20 0.8415 (c) C (%) Av 248.0000 280.0000 70.0000 1.9462 12 20 0.0516 (d) N (%) Av 212.5000 315.5000 105.5000 0.5644 12 20 0.5725 Table 77: Analysis of variance (t-test) comparing the C/N ratio of A. germinans leaves taken from crab burrows at FG 1 with that of senescent A. germinans leaves collected at the sediment surface. Mean Sur Mean Bur t df p N Sur N Bur SD Sur SD Bur F C/N 54.5285 53.976 0.2055 30 0.8386 12 20 7.7353 7.1460 1.1717 Table 78: Organic content of R. mangle, A. germinans and L. racemosa leaves of different stages of decomposition.
Sample N Mean (% dw) ± SD Rh green 3 86.55 ± 0.26 Rh yellow 3 82.43 ± 2.98 Rh brown 3 65.25 ± 9.46 Av green 3 86.06 ± 1.12 Av yellow 3 85.02 ± 1.11 Av brown 3 77.00 ± 9.94 La green 2 84.81 ± 1.20 La yellow 2 83.48 ± 4.48 La brown 2 80.18 ± 5.99
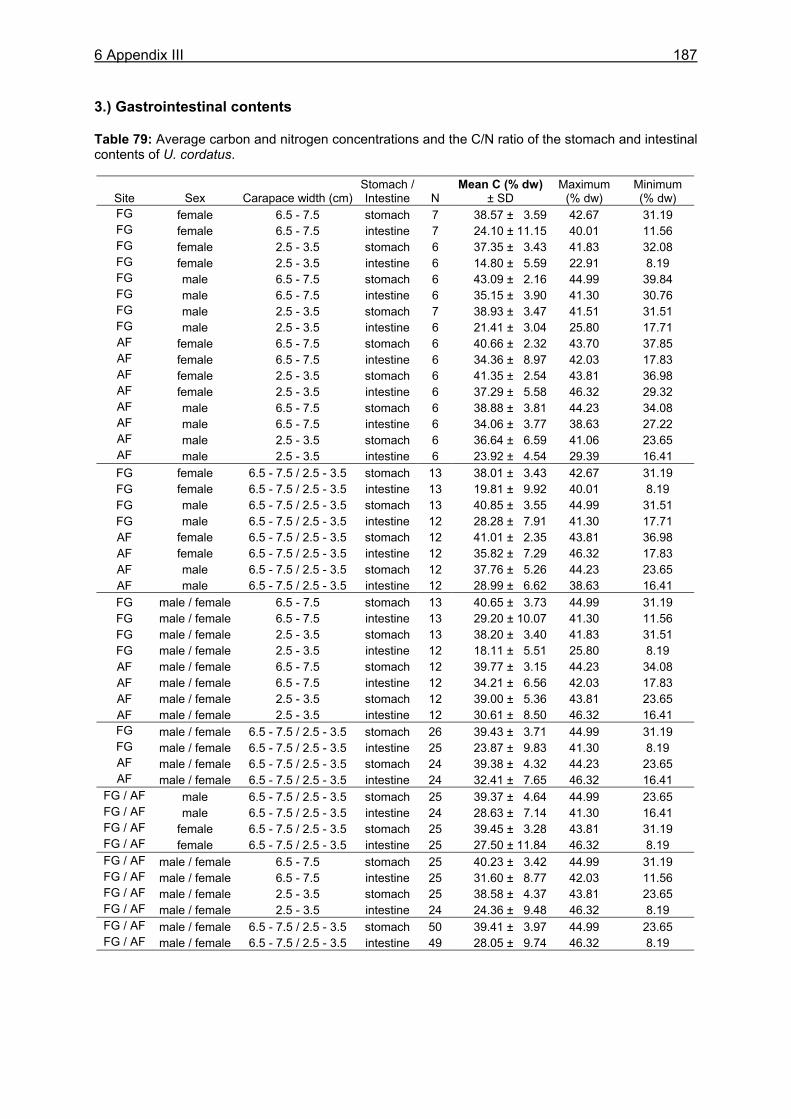
6 Appendix III
187
3.) Gastrointestinal contents Table 79: Average carbon and nitrogen concentrations and the C/N ratio of the stomach and intestinal contents of U. cordatus.
Site Sex Carapace width (cm)
Stomach / Intestine N
Mean C (% dw) ± SD
Maximum (% dw)
Minimum (% dw)
FG female 6.5 - 7.5 stomach 7 38.57 ± 3.59 42.67 31.19 FG female 6.5 - 7.5 intestine 7 24.10 ± 11.15 40.01 11.56 FG female 2.5 - 3.5 stomach 6 37.35 ± 3.43 41.83 32.08 FG female 2.5 - 3.5 intestine 6 14.80 ± 5.59 22.91 8.19 FG male 6.5 - 7.5 stomach 6 43.09 ± 2.16 44.99 39.84 FG male 6.5 - 7.5 intestine 6 35.15 ± 3.90 41.30 30.76 FG male 2.5 - 3.5 stomach 7 38.93 ± 3.47 41.51 31.51 FG male 2.5 - 3.5 intestine 6 21.41 ± 3.04 25.80 17.71 AF female 6.5 - 7.5 stomach 6 40.66 ± 2.32 43.70 37.85 AF female 6.5 - 7.5 intestine 6 34.36 ± 8.97 42.03 17.83 AF female 2.5 - 3.5 stomach 6 41.35 ± 2.54 43.81 36.98 AF female 2.5 - 3.5 intestine 6 37.29 ± 5.58 46.32 29.32 AF male 6.5 - 7.5 stomach 6 38.88 ± 3.81 44.23 34.08 AF male 6.5 - 7.5 intestine 6 34.06 ± 3.77 38.63 27.22 AF male 2.5 - 3.5 stomach 6 36.64 ± 6.59 41.06 23.65 AF male 2.5 - 3.5 intestine 6 23.92 ± 4.54 29.39 16.41 FG female 6.5 - 7.5 / 2.5 - 3.5 stomach 13 38.01 ± 3.43 42.67 31.19 FG female 6.5 - 7.5 / 2.5 - 3.5 intestine 13 19.81 ± 9.92 40.01 8.19 FG male 6.5 - 7.5 / 2.5 - 3.5 stomach 13 40.85 ± 3.55 44.99 31.51 FG male 6.5 - 7.5 / 2.5 - 3.5 intestine 12 28.28 ± 7.91 41.30 17.71 AF female 6.5 - 7.5 / 2.5 - 3.5 stomach 12 41.01 ± 2.35 43.81 36.98 AF female 6.5 - 7.5 / 2.5 - 3.5 intestine 12 35.82 ± 7.29 46.32 17.83 AF male 6.5 - 7.5 / 2.5 - 3.5 stomach 12 37.76 ± 5.26 44.23 23.65 AF male 6.5 - 7.5 / 2.5 - 3.5 intestine 12 28.99 ± 6.62 38.63 16.41 FG male / female 6.5 - 7.5 stomach 13 40.65 ± 3.73 44.99 31.19 FG male / female 6.5 - 7.5 intestine 13 29.20 ± 10.07 41.30 11.56 FG male / female 2.5 - 3.5 stomach 13 38.20 ± 3.40 41.83 31.51 FG male / female 2.5 - 3.5 intestine 12 18.11 ± 5.51 25.80 8.19 AF male / female 6.5 - 7.5 stomach 12 39.77 ± 3.15 44.23 34.08 AF male / female 6.5 - 7.5 intestine 12 34.21 ± 6.56 42.03 17.83 AF male / female 2.5 - 3.5 stomach 12 39.00 ± 5.36 43.81 23.65 AF male / female 2.5 - 3.5 intestine 12 30.61 ± 8.50 46.32 16.41 FG male / female 6.5 - 7.5 / 2.5 - 3.5 stomach 26 39.43 ± 3.71 44.99 31.19 FG male / female 6.5 - 7.5 / 2.5 - 3.5 intestine 25 23.87 ± 9.83 41.30 8.19 AF male / female 6.5 - 7.5 / 2.5 - 3.5 stomach 24 39.38 ± 4.32 44.23 23.65 AF male / female 6.5 - 7.5 / 2.5 - 3.5 intestine 24 32.41 ± 7.65 46.32 16.41
FG / AF male 6.5 - 7.5 / 2.5 - 3.5 stomach 25 39.37 ± 4.64 44.99 23.65 FG / AF male 6.5 - 7.5 / 2.5 - 3.5 intestine 24 28.63 ± 7.14 41.30 16.41 FG / AF female 6.5 - 7.5 / 2.5 - 3.5 stomach 25 39.45 ± 3.28 43.81 31.19 FG / AF female 6.5 - 7.5 / 2.5 - 3.5 intestine 25 27.50 ± 11.84 46.32 8.19 FG / AF male / female 6.5 - 7.5 stomach 25 40.23 ± 3.42 44.99 31.19 FG / AF male / female 6.5 - 7.5 intestine 25 31.60 ± 8.77 42.03 11.56 FG / AF male / female 2.5 - 3.5 stomach 25 38.58 ± 4.37 43.81 23.65 FG / AF male / female 2.5 - 3.5 intestine 24 24.36 ± 9.48 46.32 8.19 FG / AF male / female 6.5 - 7.5 / 2.5 - 3.5 stomach 50 39.41 ± 3.97 44.99 23.65 FG / AF male / female 6.5 - 7.5 / 2.5 - 3.5 intestine 49 28.05 ± 9.74 46.32 8.19
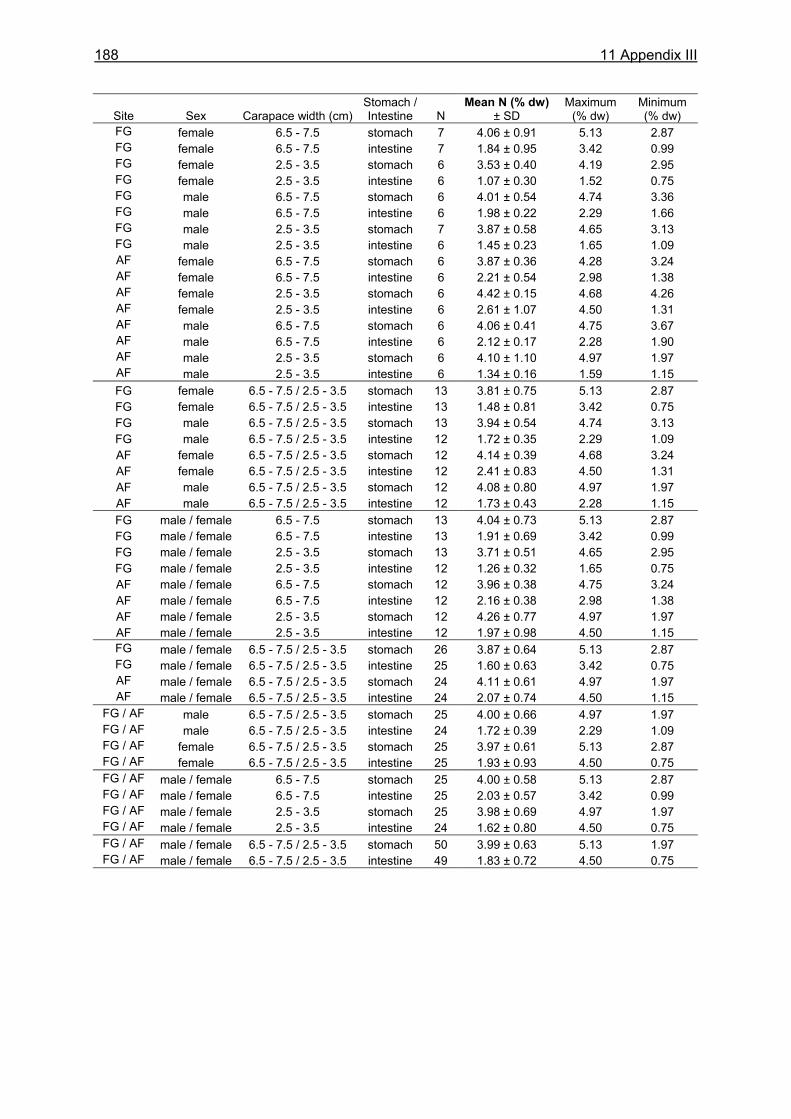
188 11 Appendix III
Site Sex Carapace width (cm)
Stomach /Intestine N
Mean N (% dw) ± SD
Maximum (% dw)
Minimum (% dw)
FG female 6.5 - 7.5 stomach 7 4.06 ± 0.91 5.13 2.87 FG female 6.5 - 7.5 intestine 7 1.84 ± 0.95 3.42 0.99 FG female 2.5 - 3.5 stomach 6 3.53 ± 0.40 4.19 2.95 FG female 2.5 - 3.5 intestine 6 1.07 ± 0.30 1.52 0.75 FG male 6.5 - 7.5 stomach 6 4.01 ± 0.54 4.74 3.36 FG male 6.5 - 7.5 intestine 6 1.98 ± 0.22 2.29 1.66 FG male 2.5 - 3.5 stomach 7 3.87 ± 0.58 4.65 3.13 FG male 2.5 - 3.5 intestine 6 1.45 ± 0.23 1.65 1.09 AF female 6.5 - 7.5 stomach 6 3.87 ± 0.36 4.28 3.24 AF female 6.5 - 7.5 intestine 6 2.21 ± 0.54 2.98 1.38 AF female 2.5 - 3.5 stomach 6 4.42 ± 0.15 4.68 4.26 AF female 2.5 - 3.5 intestine 6 2.61 ± 1.07 4.50 1.31 AF male 6.5 - 7.5 stomach 6 4.06 ± 0.41 4.75 3.67 AF male 6.5 - 7.5 intestine 6 2.12 ± 0.17 2.28 1.90 AF male 2.5 - 3.5 stomach 6 4.10 ± 1.10 4.97 1.97 AF male 2.5 - 3.5 intestine 6 1.34 ± 0.16 1.59 1.15 FG female 6.5 - 7.5 / 2.5 - 3.5 stomach 13 3.81 ± 0.75 5.13 2.87 FG female 6.5 - 7.5 / 2.5 - 3.5 intestine 13 1.48 ± 0.81 3.42 0.75 FG male 6.5 - 7.5 / 2.5 - 3.5 stomach 13 3.94 ± 0.54 4.74 3.13 FG male 6.5 - 7.5 / 2.5 - 3.5 intestine 12 1.72 ± 0.35 2.29 1.09 AF female 6.5 - 7.5 / 2.5 - 3.5 stomach 12 4.14 ± 0.39 4.68 3.24 AF female 6.5 - 7.5 / 2.5 - 3.5 intestine 12 2.41 ± 0.83 4.50 1.31 AF male 6.5 - 7.5 / 2.5 - 3.5 stomach 12 4.08 ± 0.80 4.97 1.97 AF male 6.5 - 7.5 / 2.5 - 3.5 intestine 12 1.73 ± 0.43 2.28 1.15 FG male / female 6.5 - 7.5 stomach 13 4.04 ± 0.73 5.13 2.87 FG male / female 6.5 - 7.5 intestine 13 1.91 ± 0.69 3.42 0.99 FG male / female 2.5 - 3.5 stomach 13 3.71 ± 0.51 4.65 2.95 FG male / female 2.5 - 3.5 intestine 12 1.26 ± 0.32 1.65 0.75 AF male / female 6.5 - 7.5 stomach 12 3.96 ± 0.38 4.75 3.24 AF male / female 6.5 - 7.5 intestine 12 2.16 ± 0.38 2.98 1.38 AF male / female 2.5 - 3.5 stomach 12 4.26 ± 0.77 4.97 1.97 AF male / female 2.5 - 3.5 intestine 12 1.97 ± 0.98 4.50 1.15 FG male / female 6.5 - 7.5 / 2.5 - 3.5 stomach 26 3.87 ± 0.64 5.13 2.87 FG male / female 6.5 - 7.5 / 2.5 - 3.5 intestine 25 1.60 ± 0.63 3.42 0.75 AF male / female 6.5 - 7.5 / 2.5 - 3.5 stomach 24 4.11 ± 0.61 4.97 1.97 AF male / female 6.5 - 7.5 / 2.5 - 3.5 intestine 24 2.07 ± 0.74 4.50 1.15
FG / AF male 6.5 - 7.5 / 2.5 - 3.5 stomach 25 4.00 ± 0.66 4.97 1.97 FG / AF male 6.5 - 7.5 / 2.5 - 3.5 intestine 24 1.72 ± 0.39 2.29 1.09 FG / AF female 6.5 - 7.5 / 2.5 - 3.5 stomach 25 3.97 ± 0.61 5.13 2.87 FG / AF female 6.5 - 7.5 / 2.5 - 3.5 intestine 25 1.93 ± 0.93 4.50 0.75 FG / AF male / female 6.5 - 7.5 stomach 25 4.00 ± 0.58 5.13 2.87 FG / AF male / female 6.5 - 7.5 intestine 25 2.03 ± 0.57 3.42 0.99 FG / AF male / female 2.5 - 3.5 stomach 25 3.98 ± 0.69 4.97 1.97 FG / AF male / female 2.5 - 3.5 intestine 24 1.62 ± 0.80 4.50 0.75 FG / AF male / female 6.5 - 7.5 / 2.5 - 3.5 stomach 50 3.99 ± 0.63 5.13 1.97 FG / AF male / female 6.5 - 7.5 / 2.5 - 3.5 intestine 49 1.83 ± 0.72 4.50 0.75
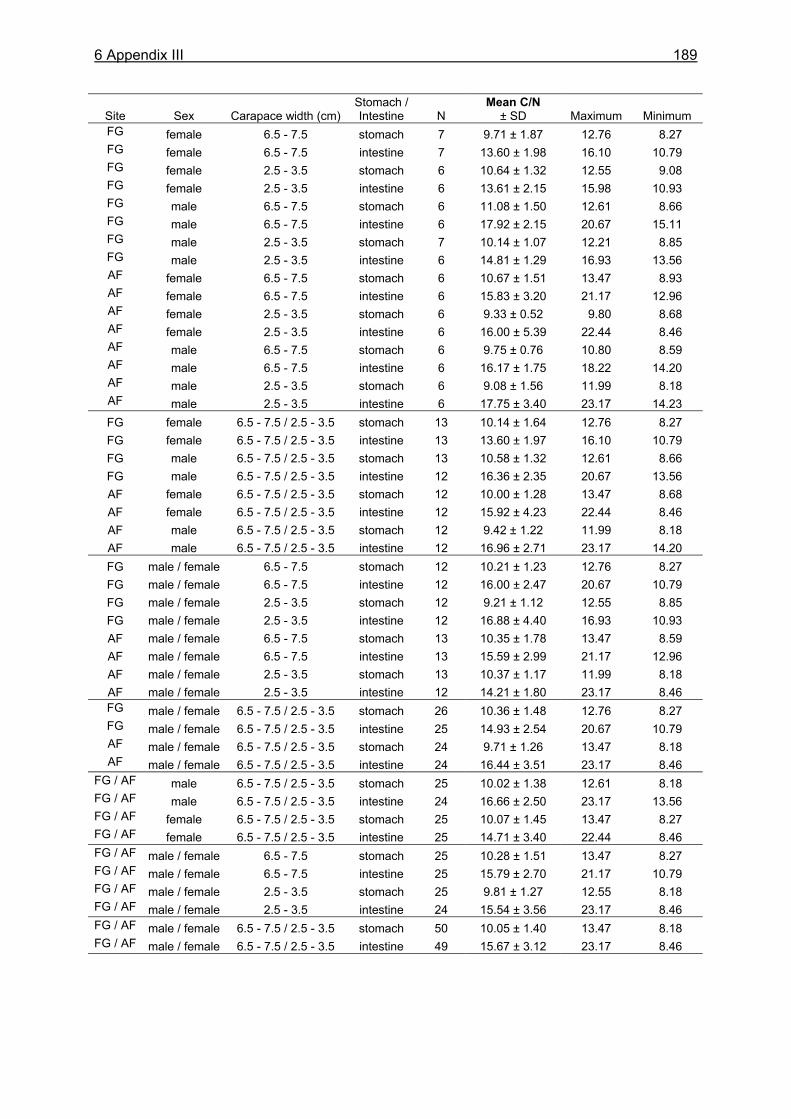
6 Appendix III
189
Site Sex Carapace width (cm)
Stomach / Intestine N
Mean C/N ± SD Maximum Minimum
FG female 6.5 - 7.5 stomach 7 9.71 ± 1.87 12.76 8.27 FG female 6.5 - 7.5 intestine 7 13.60 ± 1.98 16.10 10.79 FG female 2.5 - 3.5 stomach 6 10.64 ± 1.32 12.55 9.08 FG female 2.5 - 3.5 intestine 6 13.61 ± 2.15 15.98 10.93 FG male 6.5 - 7.5 stomach 6 11.08 ± 1.50 12.61 8.66 FG male 6.5 - 7.5 intestine 6 17.92 ± 2.15 20.67 15.11 FG male 2.5 - 3.5 stomach 7 10.14 ± 1.07 12.21 8.85 FG male 2.5 - 3.5 intestine 6 14.81 ± 1.29 16.93 13.56 AF female 6.5 - 7.5 stomach 6 10.67 ± 1.51 13.47 8.93 AF female 6.5 - 7.5 intestine 6 15.83 ± 3.20 21.17 12.96 AF female 2.5 - 3.5 stomach 6 9.33 ± 0.52 9.80 8.68 AF female 2.5 - 3.5 intestine 6 16.00 ± 5.39 22.44 8.46 AF male 6.5 - 7.5 stomach 6 9.75 ± 0.76 10.80 8.59 AF male 6.5 - 7.5 intestine 6 16.17 ± 1.75 18.22 14.20 AF male 2.5 - 3.5 stomach 6 9.08 ± 1.56 11.99 8.18 AF male 2.5 - 3.5 intestine 6 17.75 ± 3.40 23.17 14.23 FG female 6.5 - 7.5 / 2.5 - 3.5 stomach 13 10.14 ± 1.64 12.76 8.27 FG female 6.5 - 7.5 / 2.5 - 3.5 intestine 13 13.60 ± 1.97 16.10 10.79 FG male 6.5 - 7.5 / 2.5 - 3.5 stomach 13 10.58 ± 1.32 12.61 8.66 FG male 6.5 - 7.5 / 2.5 - 3.5 intestine 12 16.36 ± 2.35 20.67 13.56 AF female 6.5 - 7.5 / 2.5 - 3.5 stomach 12 10.00 ± 1.28 13.47 8.68 AF female 6.5 - 7.5 / 2.5 - 3.5 intestine 12 15.92 ± 4.23 22.44 8.46 AF male 6.5 - 7.5 / 2.5 - 3.5 stomach 12 9.42 ± 1.22 11.99 8.18 AF male 6.5 - 7.5 / 2.5 - 3.5 intestine 12 16.96 ± 2.71 23.17 14.20 FG male / female 6.5 - 7.5 stomach 12 10.21 ± 1.23 12.76 8.27 FG male / female 6.5 - 7.5 intestine 12 16.00 ± 2.47 20.67 10.79 FG male / female 2.5 - 3.5 stomach 12 9.21 ± 1.12 12.55 8.85 FG male / female 2.5 - 3.5 intestine 12 16.88 ± 4.40 16.93 10.93 AF male / female 6.5 - 7.5 stomach 13 10.35 ± 1.78 13.47 8.59 AF male / female 6.5 - 7.5 intestine 13 15.59 ± 2.99 21.17 12.96 AF male / female 2.5 - 3.5 stomach 13 10.37 ± 1.17 11.99 8.18 AF male / female 2.5 - 3.5 intestine 12 14.21 ± 1.80 23.17 8.46 FG male / female 6.5 - 7.5 / 2.5 - 3.5 stomach 26 10.36 ± 1.48 12.76 8.27 FG male / female 6.5 - 7.5 / 2.5 - 3.5 intestine 25 14.93 ± 2.54 20.67 10.79 AF male / female 6.5 - 7.5 / 2.5 - 3.5 stomach 24 9.71 ± 1.26 13.47 8.18 AF male / female 6.5 - 7.5 / 2.5 - 3.5 intestine 24 16.44 ± 3.51 23.17 8.46
FG / AF male 6.5 - 7.5 / 2.5 - 3.5 stomach 25 10.02 ± 1.38 12.61 8.18 FG / AF male 6.5 - 7.5 / 2.5 - 3.5 intestine 24 16.66 ± 2.50 23.17 13.56 FG / AF female 6.5 - 7.5 / 2.5 - 3.5 stomach 25 10.07 ± 1.45 13.47 8.27 FG / AF female 6.5 - 7.5 / 2.5 - 3.5 intestine 25 14.71 ± 3.40 22.44 8.46 FG / AF male / female 6.5 - 7.5 stomach 25 10.28 ± 1.51 13.47 8.27 FG / AF male / female 6.5 - 7.5 intestine 25 15.79 ± 2.70 21.17 10.79 FG / AF male / female 2.5 - 3.5 stomach 25 9.81 ± 1.27 12.55 8.18 FG / AF male / female 2.5 - 3.5 intestine 24 15.54 ± 3.56 23.17 8.46 FG / AF male / female 6.5 - 7.5 / 2.5 - 3.5 stomach 50 10.05 ± 1.40 13.47 8.18 FG / AF male / female 6.5 - 7.5 / 2.5 - 3.5 intestine 49 15.67 ± 3.12 23.17 8.46
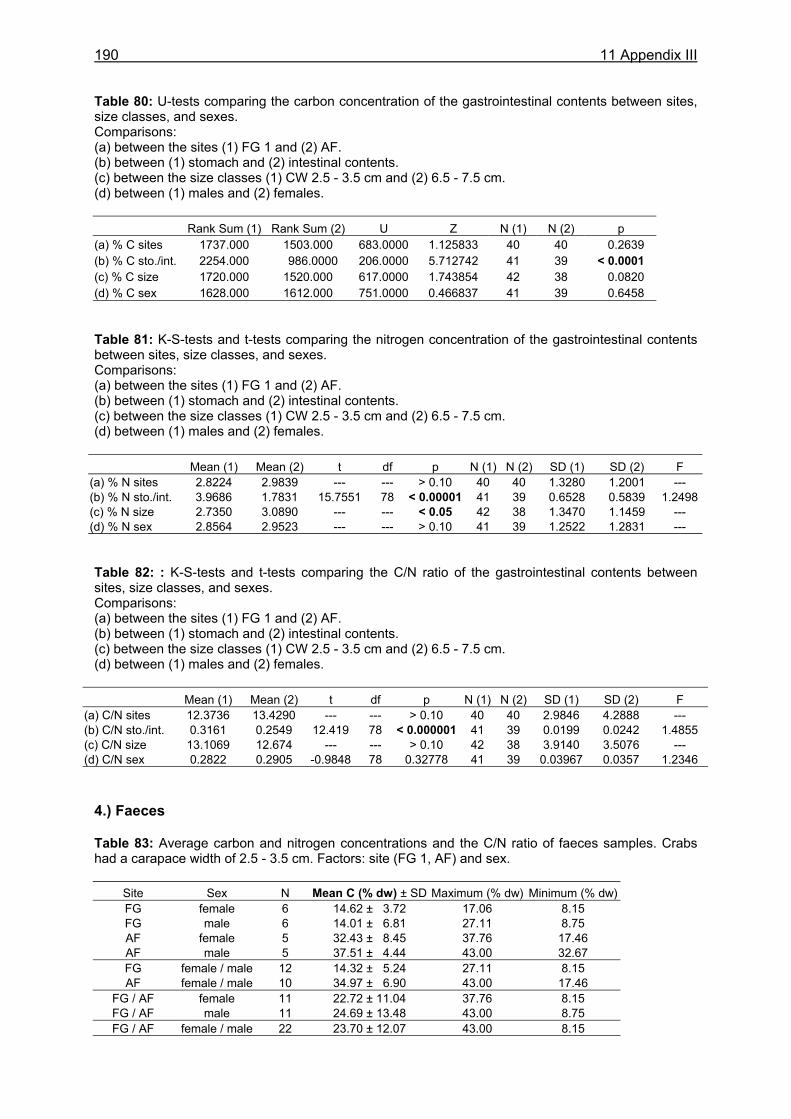
190 11 Appendix III
Table 80: U-tests comparing the carbon concentration of the gastrointestinal contents between sites, size classes, and sexes. Comparisons: (a) between the sites (1) FG 1 and (2) AF. (b) between (1) stomach and (2) intestinal contents. (c) between the size classes (1) CW 2.5 - 3.5 cm and (2) 6.5 - 7.5 cm. (d) between (1) males and (2) females. Rank Sum (1) Rank Sum (2) U Z N (1) N (2) p (a) % C sites 1737.000 1503.000 683.0000 1.125833 40 40 0.2639 (b) % C sto./int. 2254.000 986.0000 206.0000 5.712742 41 39 < 0.0001 (c) % C size 1720.000 1520.000 617.0000 1.743854 42 38 0.0820 (d) % C sex 1628.000 1612.000 751.0000 0.466837 41 39 0.6458 Table 81: K-S-tests and t-tests comparing the nitrogen concentration of the gastrointestinal contents between sites, size classes, and sexes. Comparisons: (a) between the sites (1) FG 1 and (2) AF. (b) between (1) stomach and (2) intestinal contents. (c) between the size classes (1) CW 2.5 - 3.5 cm and (2) 6.5 - 7.5 cm. (d) between (1) males and (2) females.
Mean (1) Mean (2) t df p N (1) N (2) SD (1) SD (2) F (a) % N sites 2.8224 2.9839 --- --- > 0.10 40 40 1.3280 1.2001 --- (b) % N sto./int. 3.9686 1.7831 15.7551 78 < 0.00001 41 39 0.6528 0.5839 1.2498(c) % N size 2.7350 3.0890 --- --- < 0.05 42 38 1.3470 1.1459 --- (d) % N sex 2.8564 2.9523 --- --- > 0.10 41 39 1.2522 1.2831 --- Table 82: : K-S-tests and t-tests comparing the C/N ratio of the gastrointestinal contents between sites, size classes, and sexes. Comparisons: (a) between the sites (1) FG 1 and (2) AF. (b) between (1) stomach and (2) intestinal contents. (c) between the size classes (1) CW 2.5 - 3.5 cm and (2) 6.5 - 7.5 cm. (d) between (1) males and (2) females.
Mean (1) Mean (2) t df p N (1) N (2) SD (1) SD (2) F (a) C/N sites 12.3736 13.4290 --- --- > 0.10 40 40 2.9846 4.2888 --- (b) C/N sto./int. 0.3161 0.2549 12.419 78 < 0.000001 41 39 0.0199 0.0242 1.4855 (c) C/N size 13.1069 12.674 --- --- > 0.10 42 38 3.9140 3.5076 --- (d) C/N sex 0.2822 0.2905 -0.9848 78 0.32778 41 39 0.03967 0.0357 1.2346
4.) Faeces Table 83: Average carbon and nitrogen concentrations and the C/N ratio of faeces samples. Crabs had a carapace width of 2.5 - 3.5 cm. Factors: site (FG 1, AF) and sex.
Site Sex N Mean C (% dw) ± SD Maximum (% dw) Minimum (% dw) FG female 6 14.62 ± 3.72 17.06 8.15 FG male 6 14.01 ± 6.81 27.11 8.75 AF female 5 32.43 ± 8.45 37.76 17.46 AF male 5 37.51 ± 4.44 43.00 32.67 FG female / male 12 14.32 ± 5.24 27.11 8.15 AF female / male 10 34.97 ± 6.90 43.00 17.46
FG / AF female 11 22.72 ± 11.04 37.76 8.15 FG / AF male 11 24.69 ± 13.48 43.00 8.75 FG / AF female / male 22 23.70 ± 12.07 43.00 8.15
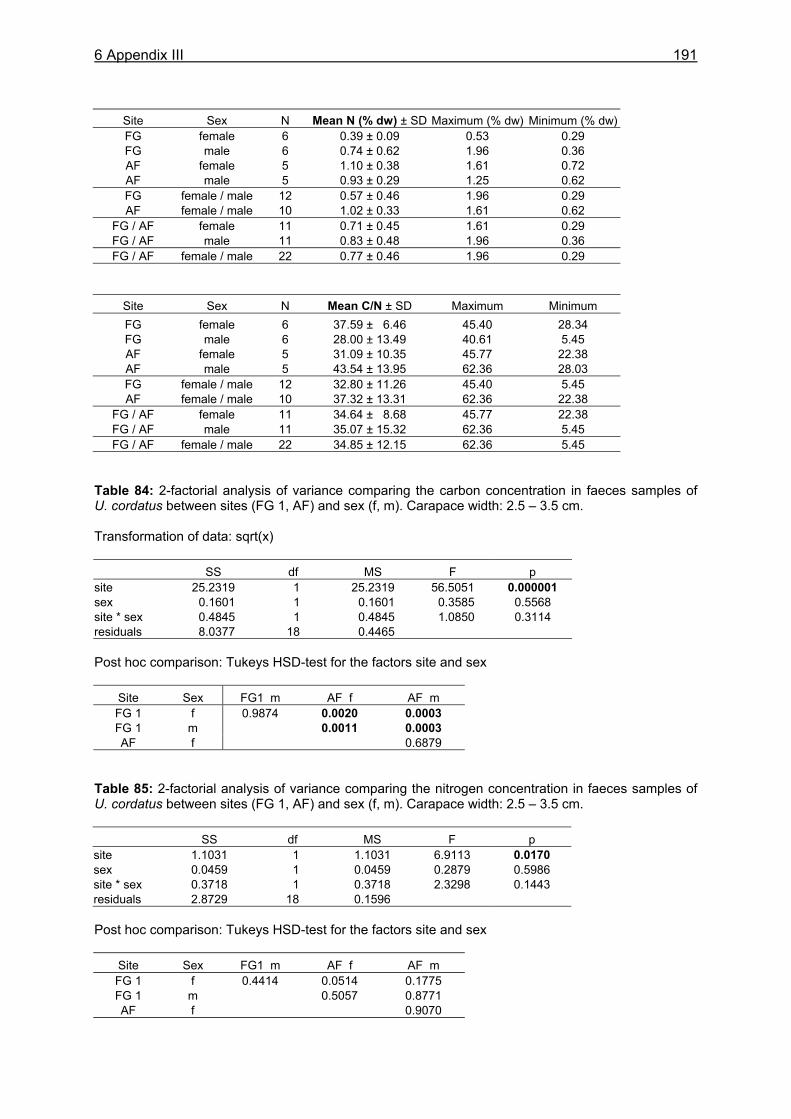
6 Appendix III
191
Site Sex N Mean N (% dw) ± SD Maximum (% dw) Minimum (% dw) FG female 6 0.39 ± 0.09 0.53 0.29 FG male 6 0.74 ± 0.62 1.96 0.36 AF female 5 1.10 ± 0.38 1.61 0.72 AF male 5 0.93 ± 0.29 1.25 0.62 FG female / male 12 0.57 ± 0.46 1.96 0.29 AF female / male 10 1.02 ± 0.33 1.61 0.62
FG / AF female 11 0.71 ± 0.45 1.61 0.29 FG / AF male 11 0.83 ± 0.48 1.96 0.36 FG / AF female / male 22 0.77 ± 0.46 1.96 0.29
Site Sex N Mean C/N ± SD Maximum Minimum FG female 6 37.59 ± 6.46 45.40 28.34 FG male 6 28.00 ± 13.49 40.61 5.45 AF female 5 31.09 ± 10.35 45.77 22.38 AF male 5 43.54 ± 13.95 62.36 28.03 FG female / male 12 32.80 ± 11.26 45.40 5.45 AF female / male 10 37.32 ± 13.31 62.36 22.38
FG / AF female 11 34.64 ± 8.68 45.77 22.38 FG / AF male 11 35.07 ± 15.32 62.36 5.45 FG / AF female / male 22 34.85 ± 12.15 62.36 5.45
Table 84: 2-factorial analysis of variance comparing the carbon concentration in faeces samples of U. cordatus between sites (FG 1, AF) and sex (f, m). Carapace width: 2.5 – 3.5 cm. Transformation of data: sqrt(x) SS df MS F p site 25.2319 1 25.2319 56.5051 0.000001 sex 0.1601 1 0.1601 0.3585 0.5568 site * sex 0.4845 1 0.4845 1.0850 0.3114 residuals 8.0377 18 0.4465 Post hoc comparison: Tukeys HSD-test for the factors site and sex
Site Sex FG1 m AF f AF m FG 1 f 0.9874 0.0020 0.0003 FG 1 m 0.0011 0.0003 AF f 0.6879
Table 85: 2-factorial analysis of variance comparing the nitrogen concentration in faeces samples of U. cordatus between sites (FG 1, AF) and sex (f, m). Carapace width: 2.5 – 3.5 cm.
SS df MS F p site 1.1031 1 1.1031 6.9113 0.0170 sex 0.0459 1 0.0459 0.2879 0.5986 site * sex 0.3718 1 0.3718 2.3298 0.1443 residuals 2.8729 18 0.1596 Post hoc comparison: Tukeys HSD-test for the factors site and sex
Site Sex FG1 m AF f AF m FG 1 f 0.4414 0.0514 0.1775 FG 1 m 0.5057 0.8771 AF f 0.9070
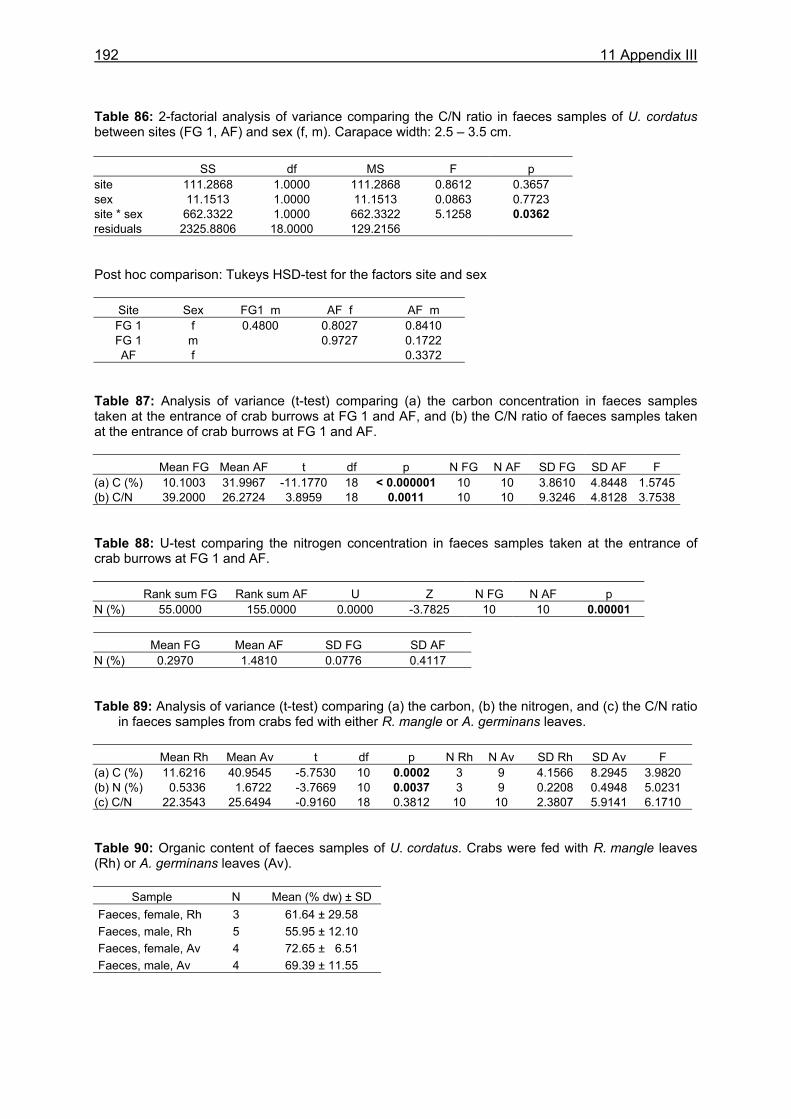
192 11 Appendix III
Table 86: 2-factorial analysis of variance comparing the C/N ratio in faeces samples of U. cordatus between sites (FG 1, AF) and sex (f, m). Carapace width: 2.5 – 3.5 cm. SS df MS F p site 111.2868 1.0000 111.2868 0.8612 0.3657 sex 11.1513 1.0000 11.1513 0.0863 0.7723 site * sex 662.3322 1.0000 662.3322 5.1258 0.0362 residuals 2325.8806 18.0000 129.2156 Post hoc comparison: Tukeys HSD-test for the factors site and sex
Site Sex FG1 m AF f AF m FG 1 f 0.4800 0.8027 0.8410 FG 1 m 0.9727 0.1722 AF f 0.3372
Table 87: Analysis of variance (t-test) comparing (a) the carbon concentration in faeces samples taken at the entrance of crab burrows at FG 1 and AF, and (b) the C/N ratio of faeces samples taken at the entrance of crab burrows at FG 1 and AF. Mean FG Mean AF t df p N FG N AF SD FG SD AF F (a) C (%) 10.1003 31.9967 -11.1770 18 < 0.000001 10 10 3.8610 4.8448 1.5745(b) C/N 39.2000 26.2724 3.8959 18 0.0011 10 10 9.3246 4.8128 3.7538 Table 88: U-test comparing the nitrogen concentration in faeces samples taken at the entrance of crab burrows at FG 1 and AF. Rank sum FG Rank sum AF U Z N FG N AF p N (%) 55.0000 155.0000 0.0000 -3.7825 10 10 0.00001 Mean FG Mean AF SD FG SD AF N (%) 0.2970 1.4810 0.0776 0.4117 Table 89: Analysis of variance (t-test) comparing (a) the carbon, (b) the nitrogen, and (c) the C/N ratio
in faeces samples from crabs fed with either R. mangle or A. germinans leaves. Mean Rh Mean Av t df p N Rh N Av SD Rh SD Av F (a) C (%) 11.6216 40.9545 -5.7530 10 0.0002 3 9 4.1566 8.2945 3.9820 (b) N (%) 0.5336 1.6722 -3.7669 10 0.0037 3 9 0.2208 0.4948 5.0231 (c) C/N 22.3543 25.6494 -0.9160 18 0.3812 10 10 2.3807 5.9141 6.1710 Table 90: Organic content of faeces samples of U. cordatus. Crabs were fed with R. mangle leaves (Rh) or A. germinans leaves (Av).
Sample N Mean (% dw) ± SD Faeces, female, Rh 3 61.64 ± 29.58 Faeces, male, Rh 5 55.95 ± 12.10 Faeces, female, Av 4 72.65 ± 6.51 Faeces, male, Av 4 69.39 ± 11.55
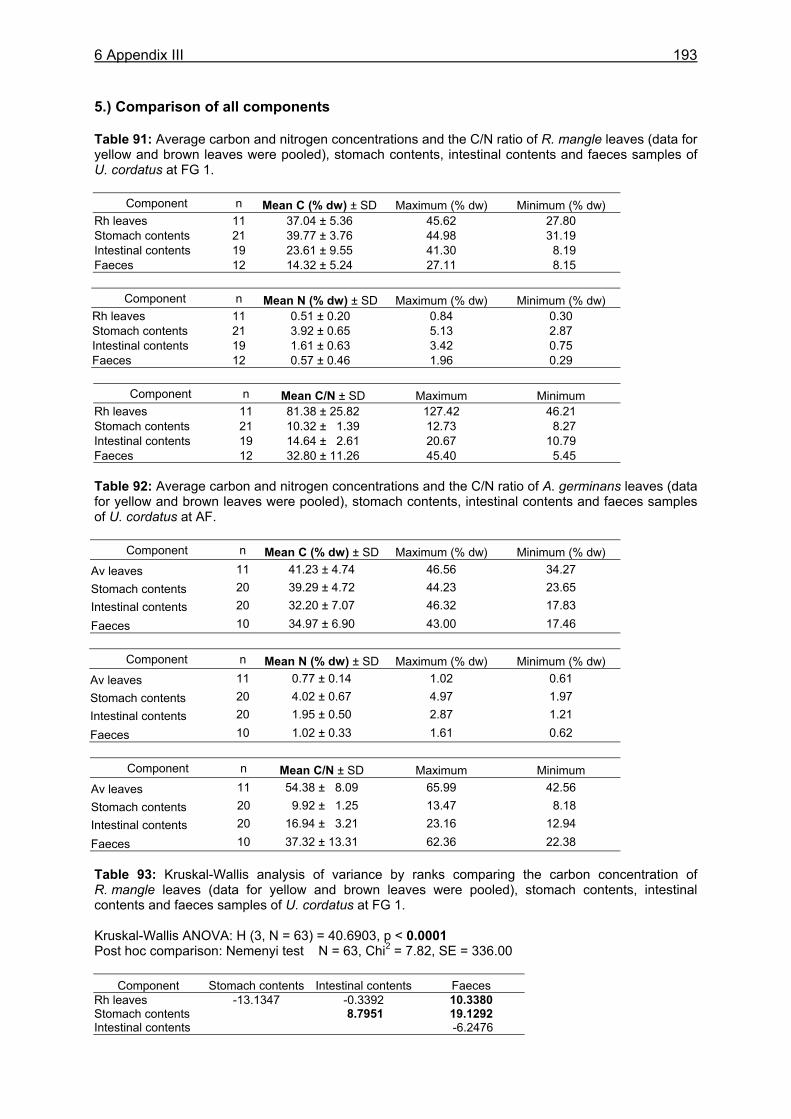
6 Appendix III
193
5.) Comparison of all components Table 91: Average carbon and nitrogen concentrations and the C/N ratio of R. mangle leaves (data for yellow and brown leaves were pooled), stomach contents, intestinal contents and faeces samples of U. cordatus at FG 1.
Component n Mean C (% dw) ± SD Maximum (% dw) Minimum (% dw) Rh leaves 11 37.04 ± 5.36 45.62 27.80 Stomach contents 21 39.77 ± 3.76 44.98 31.19 Intestinal contents 19 23.61 ± 9.55 41.30 8.19 Faeces 12 14.32 ± 5.24 27.11 8.15
Component n Mean N (% dw) ± SD Maximum (% dw) Minimum (% dw) Rh leaves 11 0.51 ± 0.20 0.84 0.30 Stomach contents 21 3.92 ± 0.65 5.13 2.87 Intestinal contents 19 1.61 ± 0.63 3.42 0.75 Faeces 12 0.57 ± 0.46 1.96 0.29
Component n Mean C/N ± SD Maximum Minimum Rh leaves 11 81.38 ± 25.82 127.42 46.21 Stomach contents 21 10.32 ± 1.39 12.73 8.27 Intestinal contents 19 14.64 ± 2.61 20.67 10.79 Faeces 12 32.80 ± 11.26 45.40 5.45 Table 92: Average carbon and nitrogen concentrations and the C/N ratio of A. germinans leaves (data for yellow and brown leaves were pooled), stomach contents, intestinal contents and faeces samples of U. cordatus at AF.
Component n Mean C (% dw) ± SD Maximum (% dw) Minimum (% dw) Av leaves 11 41.23 ± 4.74 46.56 34.27 Stomach contents 20 39.29 ± 4.72 44.23 23.65 Intestinal contents 20 32.20 ± 7.07 46.32 17.83
Faeces 10 34.97 ± 6.90 43.00 17.46
Component n Mean N (% dw) ± SD Maximum (% dw) Minimum (% dw) Av leaves 11 0.77 ± 0.14 1.02 0.61 Stomach contents 20 4.02 ± 0.67 4.97 1.97 Intestinal contents 20 1.95 ± 0.50 2.87 1.21
Faeces 10 1.02 ± 0.33 1.61 0.62
Component n Mean C/N ± SD Maximum Minimum Av leaves 11 54.38 ± 8.09 65.99 42.56 Stomach contents 20 9.92 ± 1.25 13.47 8.18 Intestinal contents 20 16.94 ± 3.21 23.16 12.94
Faeces 10 37.32 ± 13.31 62.36 22.38 Table 93: Kruskal-Wallis analysis of variance by ranks comparing the carbon concentration of R. mangle leaves (data for yellow and brown leaves were pooled), stomach contents, intestinal contents and faeces samples of U. cordatus at FG 1. Kruskal-Wallis ANOVA: H (3, N = 63) = 40.6903, p < 0.0001 Post hoc comparison: Nemenyi test N = 63, Chi2 = 7.82, SE = 336.00
Component Stomach contents Intestinal contents Faeces Rh leaves -13.1347 -0.3392 10.3380 Stomach contents 8.7951 19.1292 Intestinal contents -6.2476
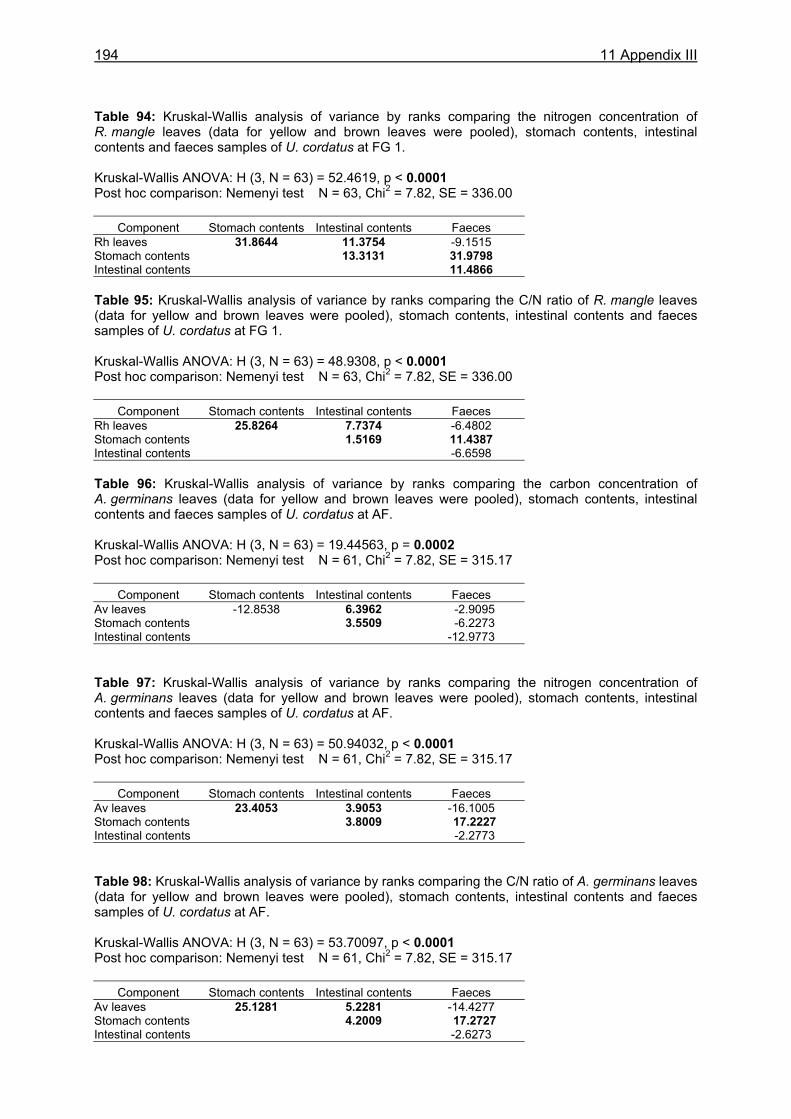
194 11 Appendix III
Table 94: Kruskal-Wallis analysis of variance by ranks comparing the nitrogen concentration of R. mangle leaves (data for yellow and brown leaves were pooled), stomach contents, intestinal contents and faeces samples of U. cordatus at FG 1. Kruskal-Wallis ANOVA: H (3, N = 63) = 52.4619, p < 0.0001 Post hoc comparison: Nemenyi test N = 63, Chi2 = 7.82, SE = 336.00
Component Stomach contents Intestinal contents Faeces Rh leaves 31.8644 11.3754 -9.1515 Stomach contents 13.3131 31.9798 Intestinal contents 11.4866 Table 95: Kruskal-Wallis analysis of variance by ranks comparing the C/N ratio of R. mangle leaves (data for yellow and brown leaves were pooled), stomach contents, intestinal contents and faeces samples of U. cordatus at FG 1. Kruskal-Wallis ANOVA: H (3, N = 63) = 48.9308, p < 0.0001 Post hoc comparison: Nemenyi test N = 63, Chi2 = 7.82, SE = 336.00
Component Stomach contents Intestinal contents Faeces Rh leaves 25.8264 7.7374 -6.4802 Stomach contents 1.5169 11.4387 Intestinal contents -6.6598 Table 96: Kruskal-Wallis analysis of variance by ranks comparing the carbon concentration of A. germinans leaves (data for yellow and brown leaves were pooled), stomach contents, intestinal contents and faeces samples of U. cordatus at AF. Kruskal-Wallis ANOVA: H (3, N = 63) = 19.44563, p = 0.0002 Post hoc comparison: Nemenyi test N = 61, Chi2 = 7.82, SE = 315.17
Component Stomach contents Intestinal contents Faeces Av leaves -12.8538 6.3962 -2.9095 Stomach contents 3.5509 -6.2273 Intestinal contents -12.9773 Table 97: Kruskal-Wallis analysis of variance by ranks comparing the nitrogen concentration of A. germinans leaves (data for yellow and brown leaves were pooled), stomach contents, intestinal contents and faeces samples of U. cordatus at AF. Kruskal-Wallis ANOVA: H (3, N = 63) = 50.94032, p < 0.0001 Post hoc comparison: Nemenyi test N = 61, Chi2 = 7.82, SE = 315.17
Component Stomach contents Intestinal contents Faeces Av leaves 23.4053 3.9053 -16.1005 Stomach contents 3.8009 17.2227 Intestinal contents -2.2773 Table 98: Kruskal-Wallis analysis of variance by ranks comparing the C/N ratio of A. germinans leaves (data for yellow and brown leaves were pooled), stomach contents, intestinal contents and faeces samples of U. cordatus at AF. Kruskal-Wallis ANOVA: H (3, N = 63) = 53.70097, p < 0.0001 Post hoc comparison: Nemenyi test N = 61, Chi2 = 7.82, SE = 315.17
Component Stomach contents Intestinal contents Faeces Av leaves 25.1281 5.2281 -14.4277 Stomach contents 4.2009 17.2727 Intestinal contents -2.6273
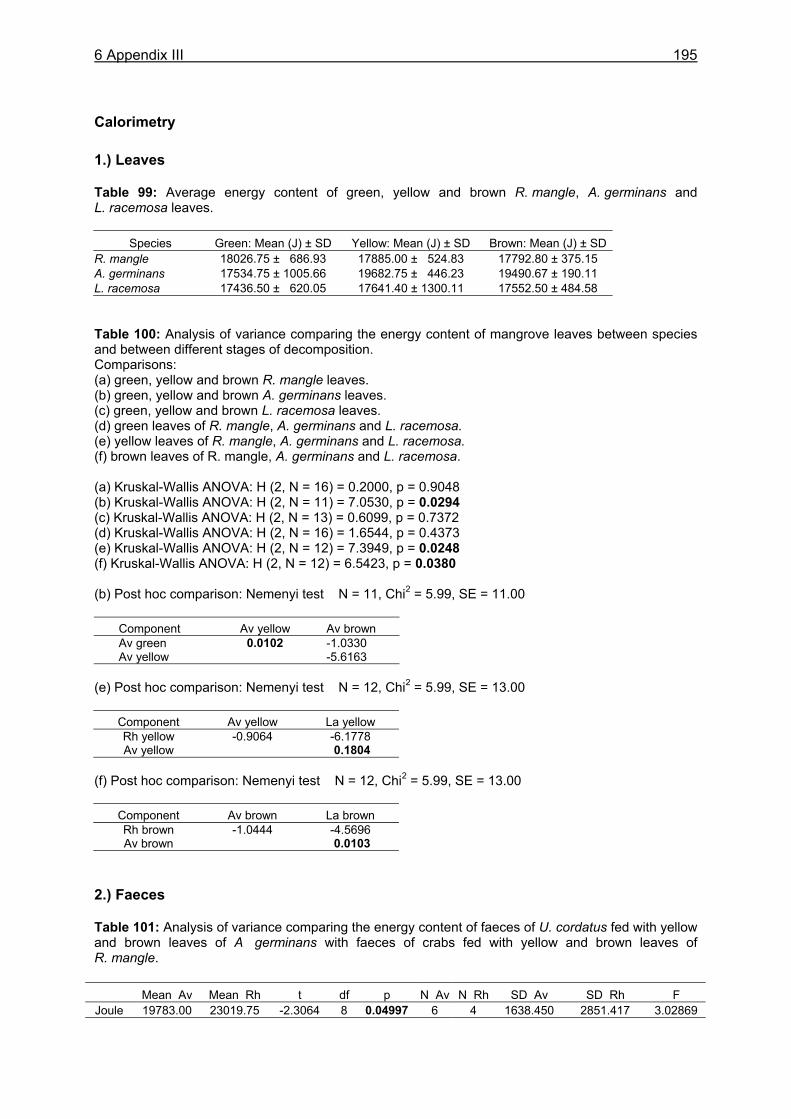
6 Appendix III
195
Calorimetry 1.) Leaves Table 99: Average energy content of green, yellow and brown R. mangle, A. germinans and L. racemosa leaves.
Species Green: Mean (J) ± SD Yellow: Mean (J) ± SD Brown: Mean (J) ± SD R. mangle 18026.75 ± 686.93 17885.00 ± 524.83 17792.80 ± 375.15 A. germinans 17534.75 ± 1005.66 19682.75 ± 446.23 19490.67 ± 190.11 L. racemosa 17436.50 ± 620.05 17641.40 ± 1300.11 17552.50 ± 484.58 Table 100: Analysis of variance comparing the energy content of mangrove leaves between species and between different stages of decomposition. Comparisons: (a) green, yellow and brown R. mangle leaves. (b) green, yellow and brown A. germinans leaves. (c) green, yellow and brown L. racemosa leaves. (d) green leaves of R. mangle, A. germinans and L. racemosa. (e) yellow leaves of R. mangle, A. germinans and L. racemosa. (f) brown leaves of R. mangle, A. germinans and L. racemosa. (a) Kruskal-Wallis ANOVA: H (2, N = 16) = 0.2000, p = 0.9048 (b) Kruskal-Wallis ANOVA: H (2, N = 11) = 7.0530, p = 0.0294 (c) Kruskal-Wallis ANOVA: H (2, N = 13) = 0.6099, p = 0.7372 (d) Kruskal-Wallis ANOVA: H (2, N = 16) = 1.6544, p = 0.4373 (e) Kruskal-Wallis ANOVA: H (2, N = 12) = 7.3949, p = 0.0248 (f) Kruskal-Wallis ANOVA: H (2, N = 12) = 6.5423, p = 0.0380 (b) Post hoc comparison: Nemenyi test N = 11, Chi2 = 5.99, SE = 11.00
Component Av yellow Av brown Av green 0.0102 -1.0330 Av yellow -5.6163
(e) Post hoc comparison: Nemenyi test N = 12, Chi2 = 5.99, SE = 13.00
Component Av yellow La yellow Rh yellow -0.9064 -6.1778 Av yellow 0.1804
(f) Post hoc comparison: Nemenyi test N = 12, Chi2 = 5.99, SE = 13.00
Component Av brown La brown Rh brown -1.0444 -4.5696 Av brown 0.0103
2.) Faeces Table 101: Analysis of variance comparing the energy content of faeces of U. cordatus fed with yellow and brown leaves of A germinans with faeces of crabs fed with yellow and brown leaves of R. mangle.
Mean Av Mean Rh t df p N Av N Rh SD Av SD Rh F Joule 19783.00 23019.75 -2.3064 8 0.04997 6 4 1638.450 2851.417 3.02869
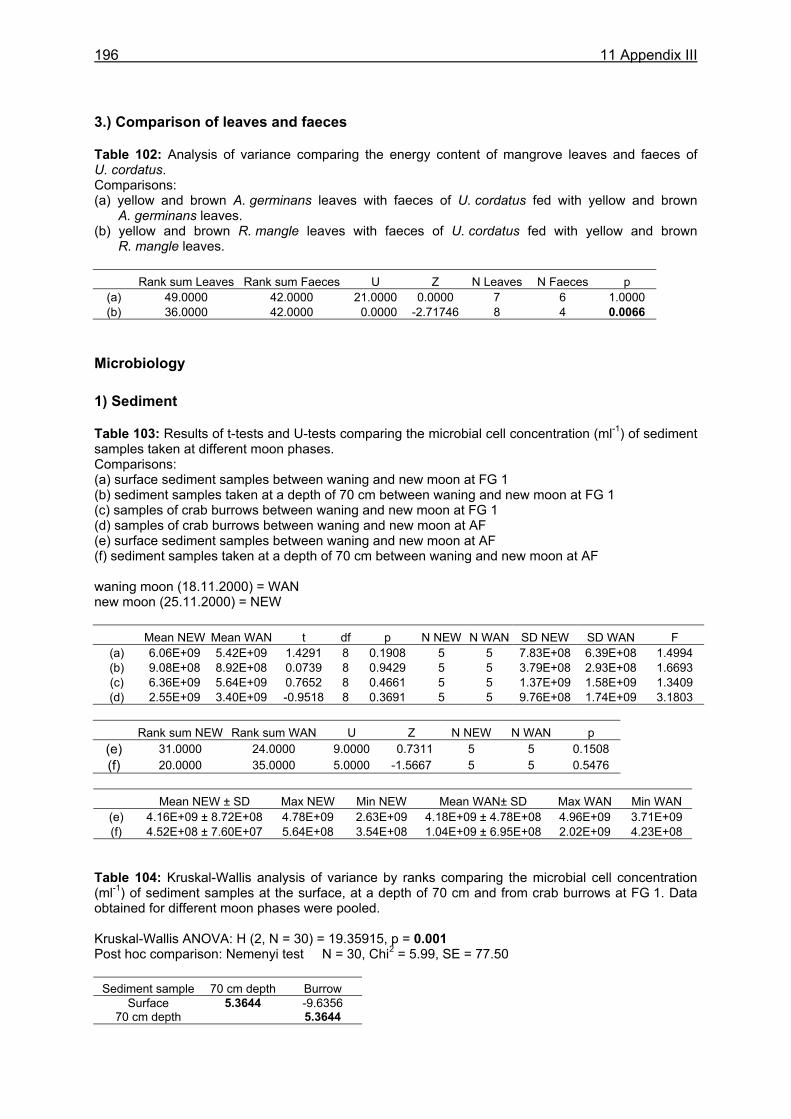
196 11 Appendix III
3.) Comparison of leaves and faeces Table 102: Analysis of variance comparing the energy content of mangrove leaves and faeces of U. cordatus. Comparisons: (a) yellow and brown A. germinans leaves with faeces of U. cordatus fed with yellow and brown
A. germinans leaves. (b) yellow and brown R. mangle leaves with faeces of U. cordatus fed with yellow and brown
R. mangle leaves. Rank sum Leaves Rank sum Faeces U Z N Leaves N Faeces p
(a) 49.0000 42.0000 21.0000 0.0000 7 6 1.0000 (b) 36.0000 42.0000 0.0000 -2.71746 8 4 0.0066
Microbiology 1) Sediment Table 103: Results of t-tests and U-tests comparing the microbial cell concentration (ml-1) of sediment samples taken at different moon phases. Comparisons: (a) surface sediment samples between waning and new moon at FG 1 (b) sediment samples taken at a depth of 70 cm between waning and new moon at FG 1 (c) samples of crab burrows between waning and new moon at FG 1 (d) samples of crab burrows between waning and new moon at AF (e) surface sediment samples between waning and new moon at AF (f) sediment samples taken at a depth of 70 cm between waning and new moon at AF waning moon (18.11.2000) = WAN new moon (25.11.2000) = NEW Mean NEW Mean WAN t df p N NEW N WAN SD NEW SD WAN F
(a) 6.06E+09 5.42E+09 1.4291 8 0.1908 5 5 7.83E+08 6.39E+08 1.4994 (b) 9.08E+08 8.92E+08 0.0739 8 0.9429 5 5 3.79E+08 2.93E+08 1.6693 (c) 6.36E+09 5.64E+09 0.7652 8 0.4661 5 5 1.37E+09 1.58E+09 1.3409 (d) 2.55E+09 3.40E+09 -0.9518 8 0.3691 5 5 9.76E+08 1.74E+09 3.1803
Rank sum NEW Rank sum WAN U Z N NEW N WAN p
(e) 31.0000 24.0000 9.0000 0.7311 5 5 0.1508 (f) 20.0000 35.0000 5.0000 -1.5667 5 5 0.5476
Mean NEW ± SD Max NEW Min NEW Mean WAN± SD Max WAN Min WAN
(e) 4.16E+09 ± 8.72E+08 4.78E+09 2.63E+09 4.18E+09 ± 4.78E+08 4.96E+09 3.71E+09 (f) 4.52E+08 ± 7.60E+07 5.64E+08 3.54E+08 1.04E+09 ± 6.95E+08 2.02E+09 4.23E+08
Table 104: Kruskal-Wallis analysis of variance by ranks comparing the microbial cell concentration (ml-1) of sediment samples at the surface, at a depth of 70 cm and from crab burrows at FG 1. Data obtained for different moon phases were pooled. Kruskal-Wallis ANOVA: H (2, N = 30) = 19.35915, p = 0.001 Post hoc comparison: Nemenyi test N = 30, Chi2 = 5.99, SE = 77.50
Sediment sample 70 cm depth Burrow Surface 5.3644 -9.6356
70 cm depth 5.3644
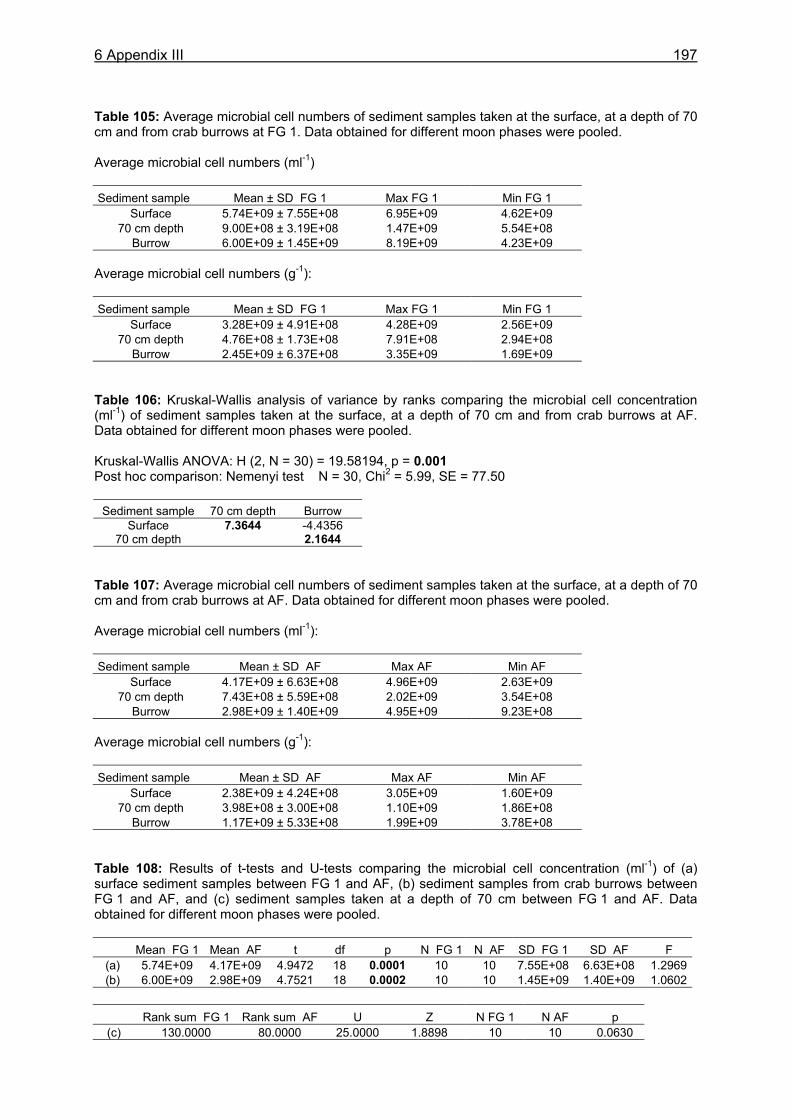
6 Appendix III
197
Table 105: Average microbial cell numbers of sediment samples taken at the surface, at a depth of 70 cm and from crab burrows at FG 1. Data obtained for different moon phases were pooled. Average microbial cell numbers (ml-1) Sediment sample Mean ± SD FG 1 Max FG 1 Min FG 1
Surface 5.74E+09 ± 7.55E+08 6.95E+09 4.62E+09 70 cm depth 9.00E+08 ± 3.19E+08 1.47E+09 5.54E+08
Burrow 6.00E+09 ± 1.45E+09 8.19E+09 4.23E+09 Average microbial cell numbers (g-1): Sediment sample Mean ± SD FG 1 Max FG 1 Min FG 1
Surface 3.28E+09 ± 4.91E+08 4.28E+09 2.56E+09 70 cm depth 4.76E+08 ± 1.73E+08 7.91E+08 2.94E+08
Burrow 2.45E+09 ± 6.37E+08 3.35E+09 1.69E+09 Table 106: Kruskal-Wallis analysis of variance by ranks comparing the microbial cell concentration (ml-1) of sediment samples taken at the surface, at a depth of 70 cm and from crab burrows at AF. Data obtained for different moon phases were pooled. Kruskal-Wallis ANOVA: H (2, N = 30) = 19.58194, p = 0.001 Post hoc comparison: Nemenyi test N = 30, Chi2 = 5.99, SE = 77.50
Sediment sample 70 cm depth Burrow Surface 7.3644 -4.4356
70 cm depth 2.1644 Table 107: Average microbial cell numbers of sediment samples taken at the surface, at a depth of 70 cm and from crab burrows at AF. Data obtained for different moon phases were pooled. Average microbial cell numbers (ml-1): Sediment sample Mean ± SD AF Max AF Min AF
Surface 4.17E+09 ± 6.63E+08 4.96E+09 2.63E+09 70 cm depth 7.43E+08 ± 5.59E+08 2.02E+09 3.54E+08
Burrow 2.98E+09 ± 1.40E+09 4.95E+09 9.23E+08 Average microbial cell numbers (g-1): Sediment sample Mean ± SD AF Max AF Min AF
Surface 2.38E+09 ± 4.24E+08 3.05E+09 1.60E+09 70 cm depth 3.98E+08 ± 3.00E+08 1.10E+09 1.86E+08
Burrow 1.17E+09 ± 5.33E+08 1.99E+09 3.78E+08 Table 108: Results of t-tests and U-tests comparing the microbial cell concentration (ml-1) of (a) surface sediment samples between FG 1 and AF, (b) sediment samples from crab burrows between FG 1 and AF, and (c) sediment samples taken at a depth of 70 cm between FG 1 and AF. Data obtained for different moon phases were pooled. Mean FG 1 Mean AF t df p N FG 1 N AF SD FG 1 SD AF F
(a) 5.74E+09 4.17E+09 4.9472 18 0.0001 10 10 7.55E+08 6.63E+08 1.2969 (b) 6.00E+09 2.98E+09 4.7521 18 0.0002 10 10 1.45E+09 1.40E+09 1.0602
Rank sum FG 1 Rank sum AF U Z N FG 1 N AF p
(c) 130.0000 80.0000 25.0000 1.8898 10 10 0.0630
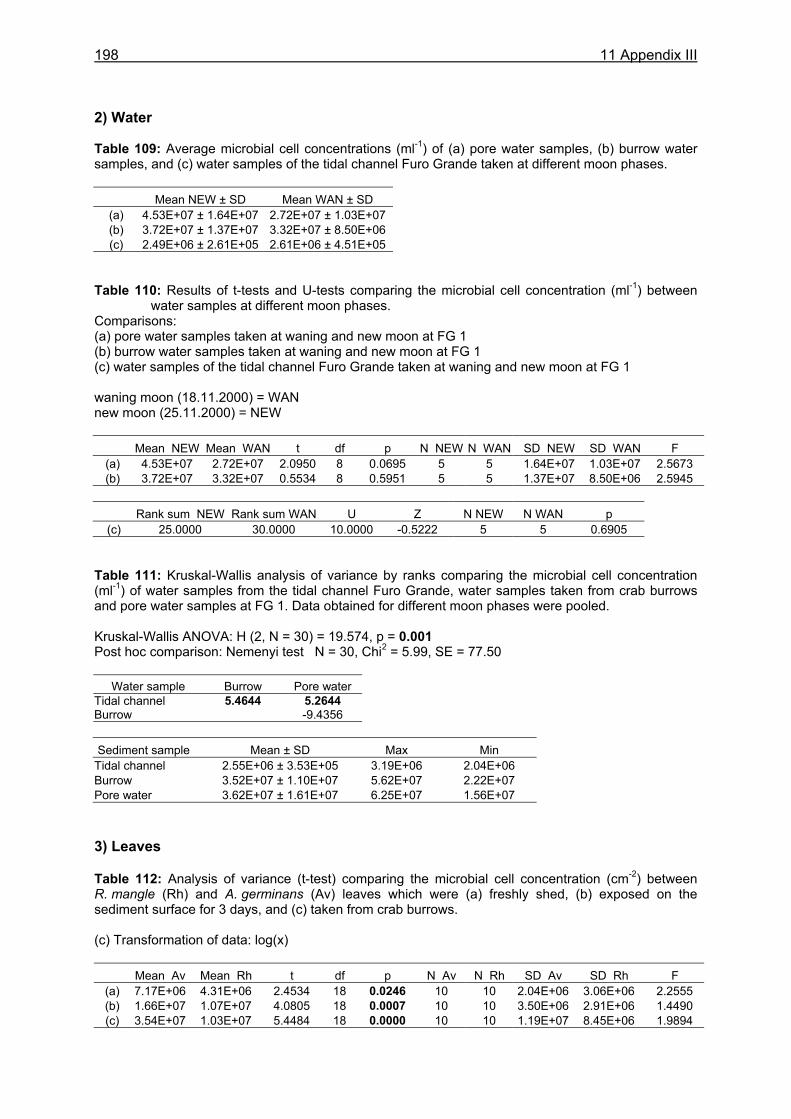
198 11 Appendix III
2) Water Table 109: Average microbial cell concentrations (ml-1) of (a) pore water samples, (b) burrow water samples, and (c) water samples of the tidal channel Furo Grande taken at different moon phases.
Mean NEW ± SD Mean WAN ± SD (a) 4.53E+07 ± 1.64E+07 2.72E+07 ± 1.03E+07 (b) 3.72E+07 ± 1.37E+07 3.32E+07 ± 8.50E+06 (c) 2.49E+06 ± 2.61E+05 2.61E+06 ± 4.51E+05
Table 110: Results of t-tests and U-tests comparing the microbial cell concentration (ml-1) between
water samples at different moon phases. Comparisons: (a) pore water samples taken at waning and new moon at FG 1 (b) burrow water samples taken at waning and new moon at FG 1 (c) water samples of the tidal channel Furo Grande taken at waning and new moon at FG 1 waning moon (18.11.2000) = WAN new moon (25.11.2000) = NEW Mean NEW Mean WAN t df p N NEW N WAN SD NEW SD WAN F
(a) 4.53E+07 2.72E+07 2.0950 8 0.0695 5 5 1.64E+07 1.03E+07 2.5673 (b) 3.72E+07 3.32E+07 0.5534 8 0.5951 5 5 1.37E+07 8.50E+06 2.5945
Rank sum NEW Rank sum WAN U Z N NEW N WAN p
(c) 25.0000 30.0000 10.0000 -0.5222 5 5 0.6905 Table 111: Kruskal-Wallis analysis of variance by ranks comparing the microbial cell concentration (ml-1) of water samples from the tidal channel Furo Grande, water samples taken from crab burrows and pore water samples at FG 1. Data obtained for different moon phases were pooled. Kruskal-Wallis ANOVA: H (2, N = 30) = 19.574, p = 0.001 Post hoc comparison: Nemenyi test N = 30, Chi2 = 5.99, SE = 77.50
Water sample Burrow Pore water Tidal channel 5.4644 5.2644 Burrow -9.4356 Sediment sample Mean ± SD Max Min Tidal channel 2.55E+06 ± 3.53E+05 3.19E+06 2.04E+06 Burrow 3.52E+07 ± 1.10E+07 5.62E+07 2.22E+07 Pore water 3.62E+07 ± 1.61E+07 6.25E+07 1.56E+07 3) Leaves Table 112: Analysis of variance (t-test) comparing the microbial cell concentration (cm-2) between R. mangle (Rh) and A. germinans (Av) leaves which were (a) freshly shed, (b) exposed on the sediment surface for 3 days, and (c) taken from crab burrows. (c) Transformation of data: log(x) Mean Av Mean Rh t df p N Av N Rh SD Av SD Rh F
(a) 7.17E+06 4.31E+06 2.4534 18 0.0246 10 10 2.04E+06 3.06E+06 2.2555 (b) 1.66E+07 1.07E+07 4.0805 18 0.0007 10 10 3.50E+06 2.91E+06 1.4490 (c) 3.54E+07 1.03E+07 5.4484 18 0.0000 10 10 1.19E+07 8.45E+06 1.9894
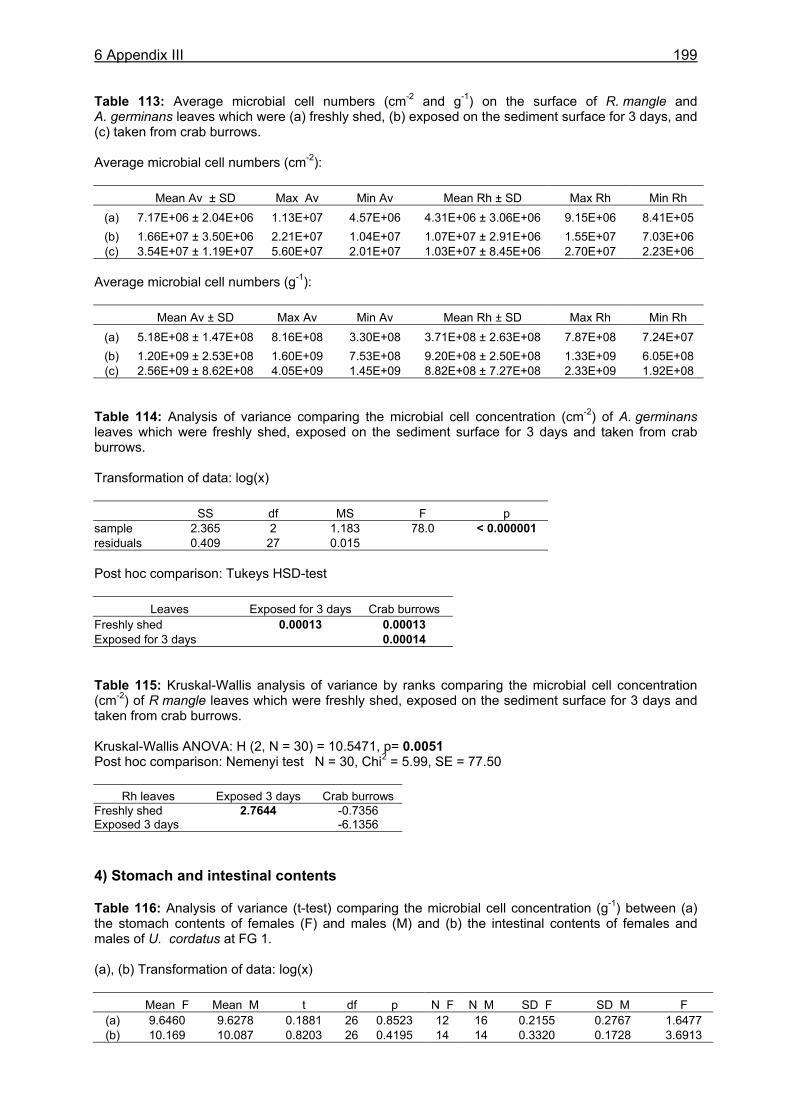
6 Appendix III
199
Table 113: Average microbial cell numbers (cm-2 and g-1) on the surface of R. mangle and A. germinans leaves which were (a) freshly shed, (b) exposed on the sediment surface for 3 days, and (c) taken from crab burrows. Average microbial cell numbers (cm-2):
Mean Av ± SD Max Av Min Av Mean Rh ± SD Max Rh Min Rh (a) 7.17E+06 ± 2.04E+06 1.13E+07 4.57E+06 4.31E+06 ± 3.06E+06 9.15E+06 8.41E+05 (b) 1.66E+07 ± 3.50E+06 2.21E+07 1.04E+07 1.07E+07 ± 2.91E+06 1.55E+07 7.03E+06 (c) 3.54E+07 ± 1.19E+07 5.60E+07 2.01E+07 1.03E+07 ± 8.45E+06 2.70E+07 2.23E+06
Average microbial cell numbers (g-1):
Mean Av ± SD Max Av Min Av Mean Rh ± SD Max Rh Min Rh (a) 5.18E+08 ± 1.47E+08 8.16E+08 3.30E+08 3.71E+08 ± 2.63E+08 7.87E+08 7.24E+07 (b) 1.20E+09 ± 2.53E+08 1.60E+09 7.53E+08 9.20E+08 ± 2.50E+08 1.33E+09 6.05E+08 (c) 2.56E+09 ± 8.62E+08 4.05E+09 1.45E+09 8.82E+08 ± 7.27E+08 2.33E+09 1.92E+08
Table 114: Analysis of variance comparing the microbial cell concentration (cm-2) of A. germinans leaves which were freshly shed, exposed on the sediment surface for 3 days and taken from crab burrows. Transformation of data: log(x) SS df MS F p sample 2.365 2 1.183 78.0 < 0.000001 residuals 0.409 27 0.015 Post hoc comparison: Tukeys HSD-test
Leaves Exposed for 3 days Crab burrows Freshly shed 0.00013 0.00013 Exposed for 3 days 0.00014 Table 115: Kruskal-Wallis analysis of variance by ranks comparing the microbial cell concentration (cm-2) of R mangle leaves which were freshly shed, exposed on the sediment surface for 3 days and taken from crab burrows. Kruskal-Wallis ANOVA: H (2, N = 30) = 10.5471, p= 0.0051 Post hoc comparison: Nemenyi test N = 30, Chi2 = 5.99, SE = 77.50
Rh leaves Exposed 3 days Crab burrows Freshly shed 2.7644 -0.7356 Exposed 3 days -6.1356 4) Stomach and intestinal contents Table 116: Analysis of variance (t-test) comparing the microbial cell concentration (g-1) between (a) the stomach contents of females (F) and males (M) and (b) the intestinal contents of females and males of U. cordatus at FG 1. (a), (b) Transformation of data: log(x) Mean F Mean M t df p N F N M SD F SD M F
(a) 9.6460 9.6278 0.1881 26 0.8523 12 16 0.2155 0.2767 1.6477 (b) 10.169 10.087 0.8203 26 0.4195 14 14 0.3320 0.1728 3.6913
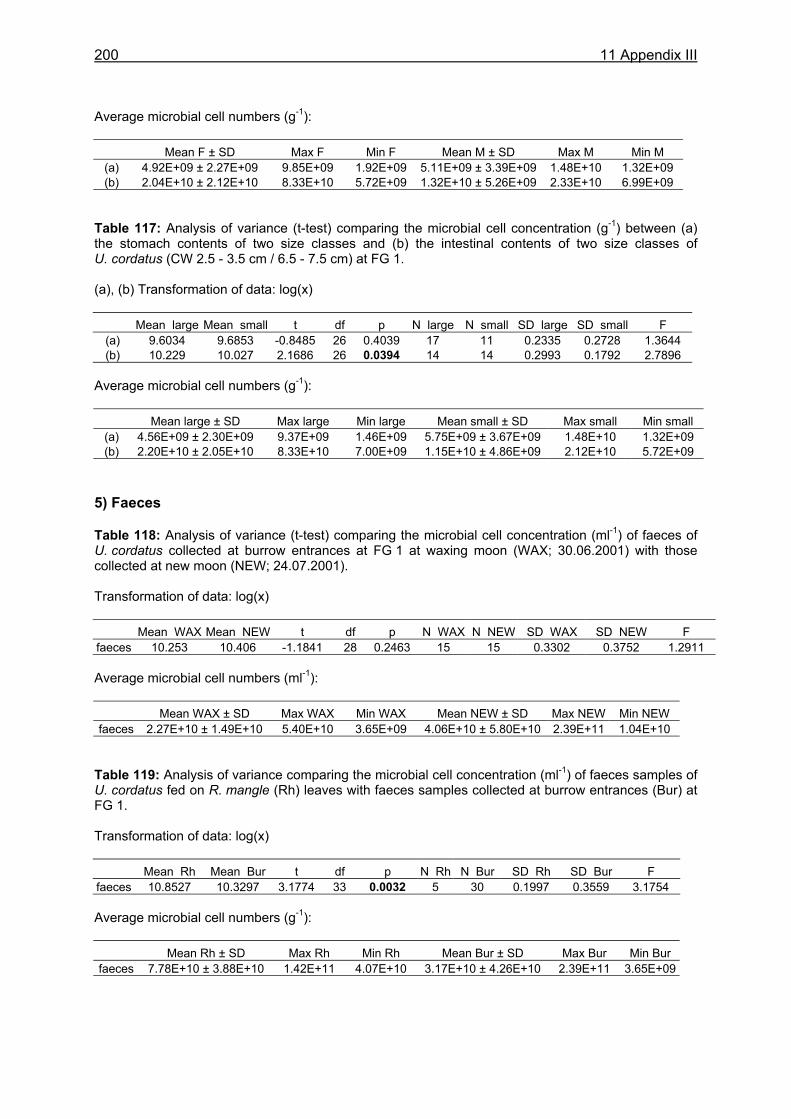
200 11 Appendix III
Average microbial cell numbers (g-1):
Mean F ± SD Max F Min F Mean M ± SD Max M Min M (a) 4.92E+09 ± 2.27E+09 9.85E+09 1.92E+09 5.11E+09 ± 3.39E+09 1.48E+10 1.32E+09 (b) 2.04E+10 ± 2.12E+10 8.33E+10 5.72E+09 1.32E+10 ± 5.26E+09 2.33E+10 6.99E+09
Table 117: Analysis of variance (t-test) comparing the microbial cell concentration (g-1) between (a) the stomach contents of two size classes and (b) the intestinal contents of two size classes of U. cordatus (CW 2.5 - 3.5 cm / 6.5 - 7.5 cm) at FG 1. (a), (b) Transformation of data: log(x) Mean large Mean small t df p N large N small SD large SD small F
(a) 9.6034 9.6853 -0.8485 26 0.4039 17 11 0.2335 0.2728 1.3644 (b) 10.229 10.027 2.1686 26 0.0394 14 14 0.2993 0.1792 2.7896
Average microbial cell numbers (g-1):
Mean large ± SD Max large Min large Mean small ± SD Max small Min small (a) 4.56E+09 ± 2.30E+09 9.37E+09 1.46E+09 5.75E+09 ± 3.67E+09 1.48E+10 1.32E+09 (b) 2.20E+10 ± 2.05E+10 8.33E+10 7.00E+09 1.15E+10 ± 4.86E+09 2.12E+10 5.72E+09
5) Faeces Table 118: Analysis of variance (t-test) comparing the microbial cell concentration (ml-1) of faeces of U. cordatus collected at burrow entrances at FG 1 at waxing moon (WAX; 30.06.2001) with those collected at new moon (NEW; 24.07.2001). Transformation of data: log(x) Mean WAX Mean NEW t df p N WAX N NEW SD WAX SD NEW F faeces 10.253 10.406 -1.1841 28 0.2463 15 15 0.3302 0.3752 1.2911 Average microbial cell numbers (ml-1):
Mean WAX ± SD Max WAX Min WAX Mean NEW ± SD Max NEW Min NEW faeces 2.27E+10 ± 1.49E+10 5.40E+10 3.65E+09 4.06E+10 ± 5.80E+10 2.39E+11 1.04E+10
Table 119: Analysis of variance comparing the microbial cell concentration (ml-1) of faeces samples of U. cordatus fed on R. mangle (Rh) leaves with faeces samples collected at burrow entrances (Bur) at FG 1. Transformation of data: log(x) Mean Rh Mean Bur t df p N Rh N Bur SD Rh SD Bur F faeces 10.8527 10.3297 3.1774 33 0.0032 5 30 0.1997 0.3559 3.1754 Average microbial cell numbers (g-1):
Mean Rh ± SD Max Rh Min Rh Mean Bur ± SD Max Bur Min Bur faeces 7.78E+10 ± 3.88E+10 1.42E+11 4.07E+10 3.17E+10 ± 4.26E+10 2.39E+11 3.65E+09
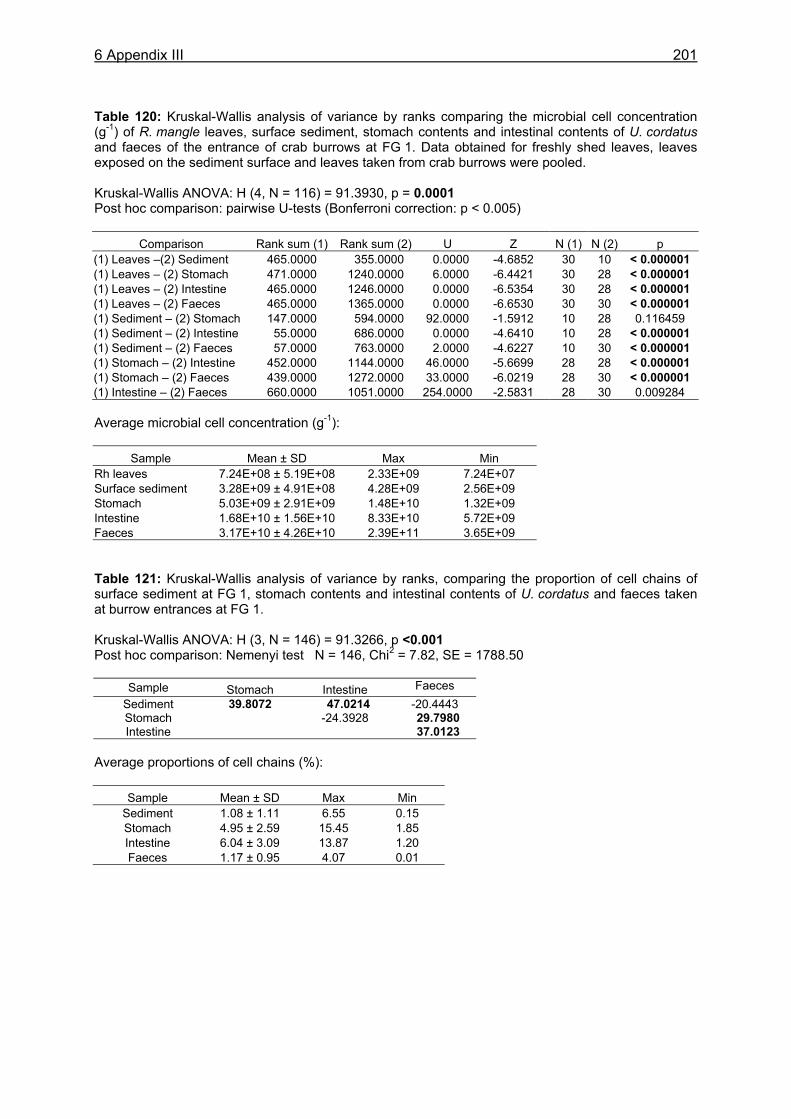
6 Appendix III
201
Table 120: Kruskal-Wallis analysis of variance by ranks comparing the microbial cell concentration (g-1) of R. mangle leaves, surface sediment, stomach contents and intestinal contents of U. cordatus and faeces of the entrance of crab burrows at FG 1. Data obtained for freshly shed leaves, leaves exposed on the sediment surface and leaves taken from crab burrows were pooled. Kruskal-Wallis ANOVA: H (4, N = 116) = 91.3930, p = 0.0001 Post hoc comparison: pairwise U-tests (Bonferroni correction: p < 0.005)
Comparison Rank sum (1) Rank sum (2) U Z N (1) N (2) p (1) Leaves –(2) Sediment 465.0000 355.0000 0.0000 -4.6852 30 10 < 0.000001 (1) Leaves – (2) Stomach 471.0000 1240.0000 6.0000 -6.4421 30 28 < 0.000001 (1) Leaves – (2) Intestine 465.0000 1246.0000 0.0000 -6.5354 30 28 < 0.000001 (1) Leaves – (2) Faeces 465.0000 1365.0000 0.0000 -6.6530 30 30 < 0.000001 (1) Sediment – (2) Stomach 147.0000 594.0000 92.0000 -1.5912 10 28 0.116459 (1) Sediment – (2) Intestine 55.0000 686.0000 0.0000 -4.6410 10 28 < 0.000001 (1) Sediment – (2) Faeces 57.0000 763.0000 2.0000 -4.6227 10 30 < 0.000001 (1) Stomach – (2) Intestine 452.0000 1144.0000 46.0000 -5.6699 28 28 < 0.000001 (1) Stomach – (2) Faeces 439.0000 1272.0000 33.0000 -6.0219 28 30 < 0.000001 (1) Intestine – (2) Faeces 660.0000 1051.0000 254.0000 -2.5831 28 30 0.009284 Average microbial cell concentration (g-1):
Sample Mean ± SD Max Min Rh leaves 7.24E+08 ± 5.19E+08 2.33E+09 7.24E+07 Surface sediment 3.28E+09 ± 4.91E+08 4.28E+09 2.56E+09 Stomach 5.03E+09 ± 2.91E+09 1.48E+10 1.32E+09 Intestine 1.68E+10 ± 1.56E+10 8.33E+10 5.72E+09 Faeces 3.17E+10 ± 4.26E+10 2.39E+11 3.65E+09 Table 121: Kruskal-Wallis analysis of variance by ranks, comparing the proportion of cell chains of surface sediment at FG 1, stomach contents and intestinal contents of U. cordatus and faeces taken at burrow entrances at FG 1. Kruskal-Wallis ANOVA: H (3, N = 146) = 91.3266, p <0.001 Post hoc comparison: Nemenyi test N = 146, Chi2 = 7.82, SE = 1788.50
Sample Stomach Intestine Faeces Sediment 39.8072 47.0214 -20.4443 Stomach -24.3928 29.7980 Intestine 37.0123
Average proportions of cell chains (%):
Sample Mean ± SD Max Min Sediment 1.08 ± 1.11 6.55 0.15 Stomach 4.95 ± 2.59 15.45 1.85 Intestine 6.04 ± 3.09 13.87 1.20 Faeces 1.17 ± 0.95 4.07 0.01
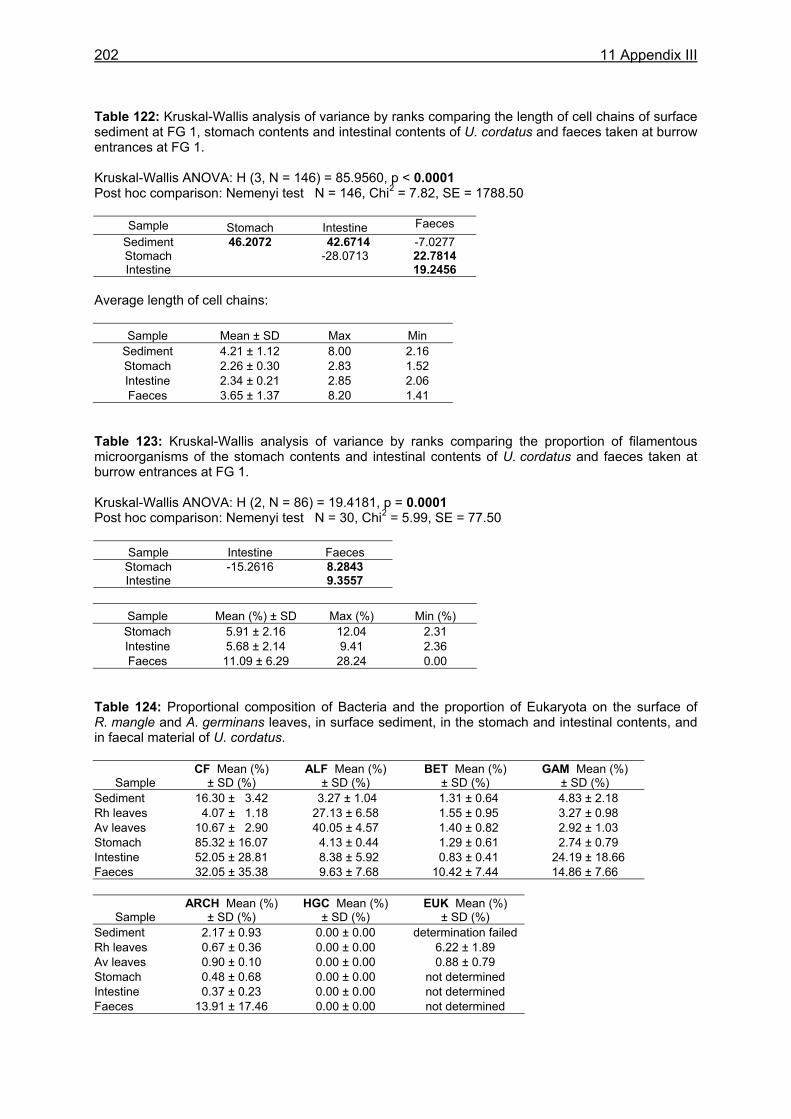
202 11 Appendix III
Table 122: Kruskal-Wallis analysis of variance by ranks comparing the length of cell chains of surface sediment at FG 1, stomach contents and intestinal contents of U. cordatus and faeces taken at burrow entrances at FG 1. Kruskal-Wallis ANOVA: H (3, N = 146) = 85.9560, p < 0.0001 Post hoc comparison: Nemenyi test N = 146, Chi2 = 7.82, SE = 1788.50
Sample Stomach Intestine Faeces Sediment 46.2072 42.6714 -7.0277 Stomach -28.0713 22.7814 Intestine 19.2456
Average length of cell chains:
Sample Mean ± SD Max Min Sediment 4.21 ± 1.12 8.00 2.16 Stomach 2.26 ± 0.30 2.83 1.52 Intestine 2.34 ± 0.21 2.85 2.06 Faeces 3.65 ± 1.37 8.20 1.41
Table 123: Kruskal-Wallis analysis of variance by ranks comparing the proportion of filamentous microorganisms of the stomach contents and intestinal contents of U. cordatus and faeces taken at burrow entrances at FG 1. Kruskal-Wallis ANOVA: H (2, N = 86) = 19.4181, p = 0.0001 Post hoc comparison: Nemenyi test N = 30, Chi2 = 5.99, SE = 77.50
Sample Intestine Faeces Stomach -15.2616 8.2843 Intestine 9.3557
Sample Mean (%) ± SD Max (%) Min (%)
Stomach 5.91 ± 2.16 12.04 2.31 Intestine 5.68 ± 2.14 9.41 2.36 Faeces 11.09 ± 6.29 28.24 0.00
Table 124: Proportional composition of Bacteria and the proportion of Eukaryota on the surface of R. mangle and A. germinans leaves, in surface sediment, in the stomach and intestinal contents, and in faecal material of U. cordatus.
Sample CF Mean (%)
± SD (%) ALF Mean (%)
± SD (%) BET Mean (%)
± SD (%) GAM Mean (%)
± SD (%) Sediment 16.30 ± 3.42 3.27 ± 1.04 1.31 ± 0.64 4.83 ± 2.18 Rh leaves 4.07 ± 1.18 27.13 ± 6.58 1.55 ± 0.95 3.27 ± 0.98 Av leaves 10.67 ± 2.90 40.05 ± 4.57 1.40 ± 0.82 2.92 ± 1.03 Stomach 85.32 ± 16.07 4.13 ± 0.44 1.29 ± 0.61 2.74 ± 0.79 Intestine 52.05 ± 28.81 8.38 ± 5.92 0.83 ± 0.41 24.19 ± 18.66 Faeces 32.05 ± 35.38 9.63 ± 7.68 10.42 ± 7.44 14.86 ± 7.66
Sample ARCH Mean (%)
± SD (%) HGC Mean (%)
± SD (%) EUK Mean (%)
± SD (%) Sediment 2.17 ± 0.93 0.00 ± 0.00 determination failed Rh leaves 0.67 ± 0.36 0.00 ± 0.00 6.22 ± 1.89 Av leaves 0.90 ± 0.10 0.00 ± 0.00 0.88 ± 0.79 Stomach 0.48 ± 0.68 0.00 ± 0.00 not determined Intestine 0.37 ± 0.23 0.00 ± 0.00 not determined Faeces 13.91 ± 17.46 0.00 ± 0.00 not determined
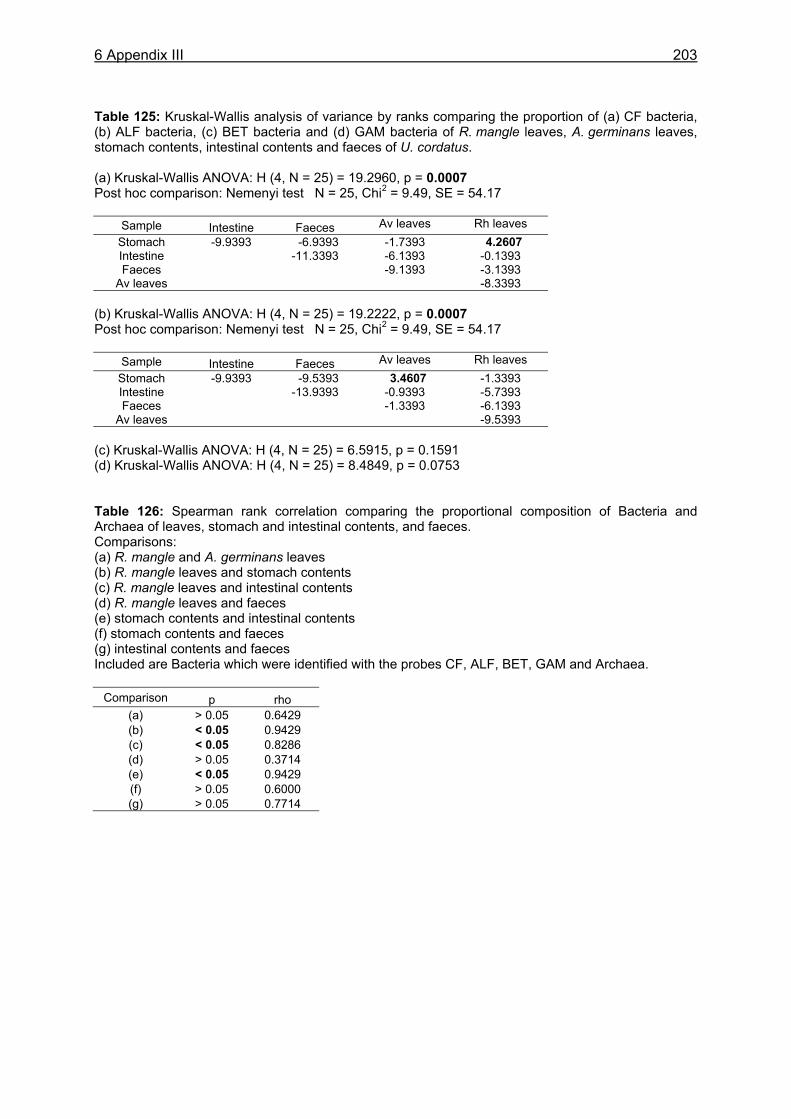
6 Appendix III
203
Table 125: Kruskal-Wallis analysis of variance by ranks comparing the proportion of (a) CF bacteria, (b) ALF bacteria, (c) BET bacteria and (d) GAM bacteria of R. mangle leaves, A. germinans leaves, stomach contents, intestinal contents and faeces of U. cordatus. (a) Kruskal-Wallis ANOVA: H (4, N = 25) = 19.2960, p = 0.0007 Post hoc comparison: Nemenyi test N = 25, Chi2 = 9.49, SE = 54.17
Sample Intestine Faeces Av leaves Rh leaves Stomach -9.9393 -6.9393 -1.7393 4.2607 Intestine -11.3393 -6.1393 -0.1393 Faeces -9.1393 -3.1393
Av leaves -8.3393 (b) Kruskal-Wallis ANOVA: H (4, N = 25) = 19.2222, p = 0.0007 Post hoc comparison: Nemenyi test N = 25, Chi2 = 9.49, SE = 54.17
Sample Intestine Faeces Av leaves Rh leaves Stomach -9.9393 -9.5393 3.4607 -1.3393 Intestine -13.9393 -0.9393 -5.7393 Faeces -1.3393 -6.1393
Av leaves -9.5393 (c) Kruskal-Wallis ANOVA: H (4, N = 25) = 6.5915, p = 0.1591 (d) Kruskal-Wallis ANOVA: H (4, N = 25) = 8.4849, p = 0.0753 Table 126: Spearman rank correlation comparing the proportional composition of Bacteria and Archaea of leaves, stomach and intestinal contents, and faeces. Comparisons: (a) R. mangle and A. germinans leaves (b) R. mangle leaves and stomach contents (c) R. mangle leaves and intestinal contents (d) R. mangle leaves and faeces (e) stomach contents and intestinal contents (f) stomach contents and faeces (g) intestinal contents and faeces Included are Bacteria which were identified with the probes CF, ALF, BET, GAM and Archaea.
Comparison p rho (a) > 0.05 0.6429 (b) < 0.05 0.9429 (c) < 0.05 0.8286 (d) > 0.05 0.3714 (e) < 0.05 0.9429 (f) > 0.05 0.6000 (g) > 0.05 0.7714


![Modulhandbuch Wissenschaftszentrum Weihenstephan fur ... · (Research Practical in Terrestrial Ecology) [WZ1082] Fischbiologie und Aquakultur (Fish Biology and Aquaculture) [Fischbio]](https://img.pdfslide.org/doc/110x75/5d57e73c88c99345018bbd84/modulhandbuch-wissenschaftszentrum-weihenstephan-fur-research-practical.jpg)