Embed Size (px)
Citation preview
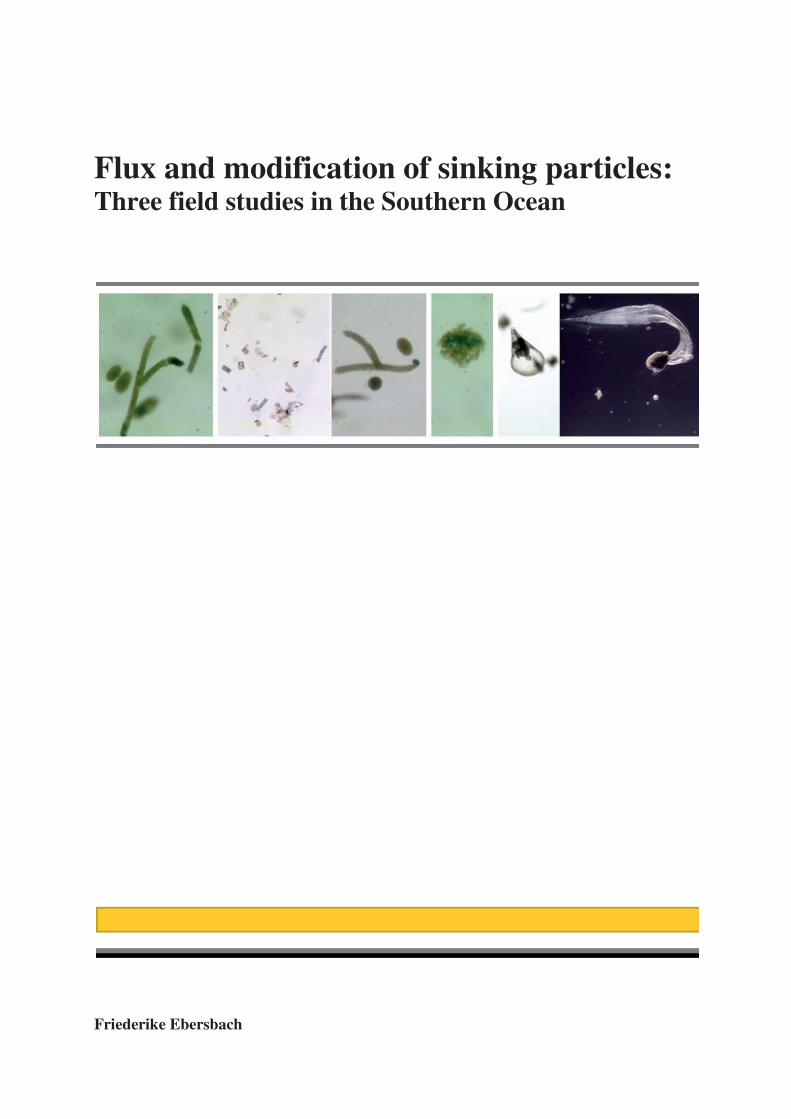
Flux and modification of sinking particles: Three field studies in the Southern Ocean
Friederike Ebersbach


ii
iii
Die vorliegende Arbeit wurde in der Zeit von Mai 2007 bis Oktober 2010 an der Universität
Bremen durchgeführt. Die Untersuchungen fanden am Alfred-Wegener-Institut für Polar- und
Meeresforschung in Bremerhaven (Deutschland) und am Antarctic Climate and Ecosystems
Cooperative Research Centre in Hobart, Tasmanien (Australien) statt.
Gutachter:
1. Gutachter: Prof. Dr. Dieter Wolf-Gladrow 2. Gutachter: Prof. Dr. Ulrich Bathmann
weitere Prüfer:
Prof. Dr. Kai Bischof
Dr. Eva-Maria Nöthig
weitere Mitglieder des Prüfungsausschusses:
Isabelle Schulz
Sina Wolzenburg
Tag des Promotionskolloquiums: 13. Dezember 2010

iv
v
Danksagung
Diese Arbeit hätte ohne die Hilfe vieler verschiedener Leute nicht entstehen können
und allen, die mich darin unterstützt haben, gilt mein Dank. Besonders bedanken möchte ich mich bei meinen beiden Gutachtern, Dieter Wolf-
Gladrow und Uli Bathmann, für die Zeit und die fachliche Unterstützung, die sie meiner Doktorarbeit gewährt haben. Ergiebige Diskussion über forschungsspezifische Fragestellungen, wie auch lange Gespräche nicht-wissenschaftlicher Natur trugen erheblich zum Erfolg dieser Arbeit bei. Ebenso danke ich den weiteren Mitgliedern des Prüfungsausschusses, dass sie sich Zeit für mich nehmen.
Ich danke Evi Nöthig, Uta Passow und Christina De La Rocha dafür, mich jeweils ein Stück des Weges zur Fertigstellung dieser Arbeit betreuend begleitet zu haben. Philipp Assmy hat mir ausführlich und geduldig auf viele Fragen geantwortet und das danke ich ihm sehr.
Der Arbeitsgruppe Biogeochemie des AWI danke ich für die gute Arbeitsatmosphäre, wozu die nette Bürogemeinschaft mit Scarlett ihren Teil beitrug. Die Unterstützung in Laborfragen durch die Technischen Assistentinnen war hervorragend und ich bedanke mich bei den geduldigen Helferinnen. Außerdem sind die vielen Diskussionen mit Doktoranden und Diplomanden zu erwähnen, die so manch beflügelnde Idee hervorbrachte.
Ich möchte Victor Smetacek und dem gesamten LOHAFEX-Team für dieses spannende Projekt danken, sowie der Crew von Polarstern für eine außergewöhnliche und unvergessliche Fahrt.
Ganz besonders möchte ich mich bei Tom Trull bedanken, der im Jahre 2005 während
2 Hobart, Tasmanien, mein Interesse für die genaue Untersuchung von absinkendem partikulären Material im Ozean überhaupt erst geweckt hat. Ihm verdanke ich nicht nur, dass mich dieser Forschungsschwerpunkt in den Bann geschlagen hat, sondern auch viel Wissen auf diesem Gebiet, vor allem bei der praktischen Anwendung an Bord. Die andauernde Kooperation im Laufe meiner Doktorarbeit sowie die erneute mehrmonatige Aufnahme in seiner Arbeitsgruppe in Hobart, haben meine Arbeit enorm bereichert.
Viele weitere Menschen standen mir in der Zeit meiner Arbeit hilfreich zur Seite, all
Jene einzeln zu nennen, würde diesen Rahmen sprengen. Daher danke ich stellvertretend denen, die in der Endphase (meist spontan) ein Ohr für das eine oder andere Anliegen von mir hatten, Daniela, Andi und Stefan.
Desweiteren danke ich der Graduiertenschule GLOMAR der Universität Bremen für
die großzügige Förderung durch ein Stipendium, ohne die ich diese Doktorarbeit nicht hätte durchführen können, und für die tatkräftige Unterstützung bei jeglichen die Arbeit betreffenden Angelegenheiten. Das Netzwerk, das durch den guten Zusammenhalt innerhalb der GLOMAR-Doktoranden bestand, konnte mich das eine ums andere Mal stärken.
Was wäre die Arbeit ohne Freunde? Ich bin sehr froh, durch meine Arbeit gute und
enge Freundschaften geknüpft haben zu dürfen, die über diese Zeit hinaus bestehen sollen. Auch den Freundeskreisen danke ich, die außerhalb der Arbeit bereits bestanden oder neu hinzugekommen sind, und die Zeit nach wie vor überdauern.
Der Sport als bester Ausgleich zur Denkarbeit hat mich über so manche anstrengende
Phase hinweggerettet, ob laufen, schwimmen, klettern oder reiten. Hiermit danke ich ganz
vi
speziell meinen Kletterfreunden und -freundinnen, die so ziemlich jede meiner Stimmungen mitgemacht haben und mich in den allermeisten Fällen aufmuntern konnten.
Sehr am Herzen liegt es mir, mich bei meiner Familie zu bedanken. Sie hat mir immer
den Rücken freigehalten und war für mich da, wenn ich sie brauchte. Meinem Bruder danke ich, meiner Schwester danke ich dafür, dass sie genau so ist, wie sie ist, und meinen Eltern danke ich besonders für ihr Vertrauen.
Zuletzt möchte ich Stefan danken ohne ihn wäre ich nicht die, die ich bin.
vii
Table of contents
I. Summary .................................................................................................................... 1
I.1 Zusammenfassung .................................................................................................. 3
I.2 Summary ................................................................................................................ 7
II. General Introduction ............................................................................................... 9
II.1 The role of carbon in the ocean........................................................................... 11
II.2 The role of iron in the ocean ............................................................................... 17
II.3 Export of organic matter to depth ....................................................................... 20
II.4 Techniques to study vertical flux ........................................................................ 25
II.5 Aims of the thesis ................................................................................................ 30
III. Manuscripts ......................................................................................................... 33
III.1 List of Manuscripts and declaration of own contribution ................................. 35
III.2 Manuscript 1 ...................................................................................................... 37
III.3 Manuscript 2 ...................................................................................................... 63
III.4 Manuscript 3 .................................................................................................... 113
III.5 Manuscript 4 .................................................................................................... 145
IV. Synthesis and future perspectives .................................................................... 189
IV.1 Synthesis .......................................................................................................... 191
IV.2 Conclusions ..................................................................................................... 201
IV.3 Future perspectives .......................................................................................... 204
References................................................................................................................ 207
Eidesstattliche Erklärung ......................................................................................... 217
Appendix 1 .............................................................................................................. 219

viii

1
I. Summary

2
I. Zusammenfassung
3
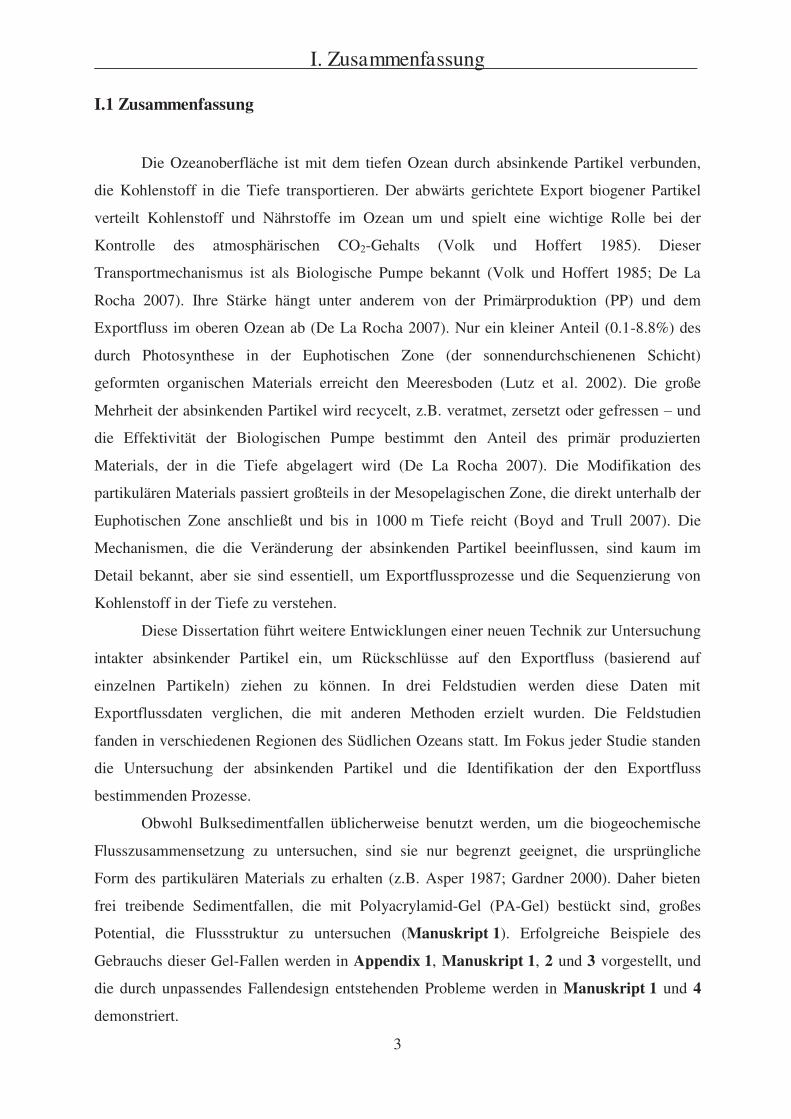
I.1 Zusammenfassung
Die Ozeanoberfläche ist mit dem tiefen Ozean durch absinkende Partikel verbunden,
die Kohlenstoff in die Tiefe transportieren. Der abwärts gerichtete Export biogener Partikel
verteilt Kohlenstoff und Nährstoffe im Ozean um und spielt eine wichtige Rolle bei der
Kontrolle des atmosphärischen CO2-Gehalts (Volk und Hoffert 1985). Dieser
Transportmechanismus ist als Biologische Pumpe bekannt (Volk und Hoffert 1985; De La
Rocha 2007). Ihre Stärke hängt unter anderem von der Primärproduktion (PP) und dem
Exportfluss im oberen Ozean ab (De La Rocha 2007). Nur ein kleiner Anteil (0.1-8.8%) des
durch Photosynthese in der Euphotischen Zone (der sonnendurchschienenen Schicht)
geformten organischen Materials erreicht den Meeresboden (Lutz et al. 2002). Die große
Mehrheit der absinkenden Partikel wird recycelt, z.B. veratmet, zersetzt oder gefressen und
die Effektivität der Biologischen Pumpe bestimmt den Anteil des primär produzierten
Materials, der in die Tiefe abgelagert wird (De La Rocha 2007). Die Modifikation des
partikulären Materials passiert großteils in der Mesopelagischen Zone, die direkt unterhalb der
Euphotischen Zone anschließt und bis in 1000 m Tiefe reicht (Boyd and Trull 2007). Die
Mechanismen, die die Veränderung der absinkenden Partikel beeinflussen, sind kaum im
Detail bekannt, aber sie sind essentiell, um Exportflussprozesse und die Sequenzierung von
Kohlenstoff in der Tiefe zu verstehen.
Diese Dissertation führt weitere Entwicklungen einer neuen Technik zur Untersuchung
intakter absinkender Partikel ein, um Rückschlüsse auf den Exportfluss (basierend auf
einzelnen Partikeln) ziehen zu können. In drei Feldstudien werden diese Daten mit
Exportflussdaten verglichen, die mit anderen Methoden erzielt wurden. Die Feldstudien
fanden in verschiedenen Regionen des Südlichen Ozeans statt. Im Fokus jeder Studie standen
die Untersuchung der absinkenden Partikel und die Identifikation der den Exportfluss
bestimmenden Prozesse.
Obwohl Bulksedimentfallen üblicherweise benutzt werden, um die biogeochemische
Flusszusammensetzung zu untersuchen, sind sie nur begrenzt geeignet, die ursprüngliche
Form des partikulären Materials zu erhalten (z.B. Asper 1987; Gardner 2000). Daher bieten
frei treibende Sedimentfallen, die mit Polyacrylamid-Gel (PA-Gel) bestückt sind, großes
Potential, die Flussstruktur zu untersuchen (Manuskript 1). Erfolgreiche Beispiele des
Gebrauchs dieser Gel-Fallen werden in Appendix 1, Manuskript 1, 2 und 3 vorgestellt, und
die durch unpassendes Fallendesign entstehenden Probleme werden in Manuskript 1 und 4
demonstriert.
I. Zusammenfassung
4
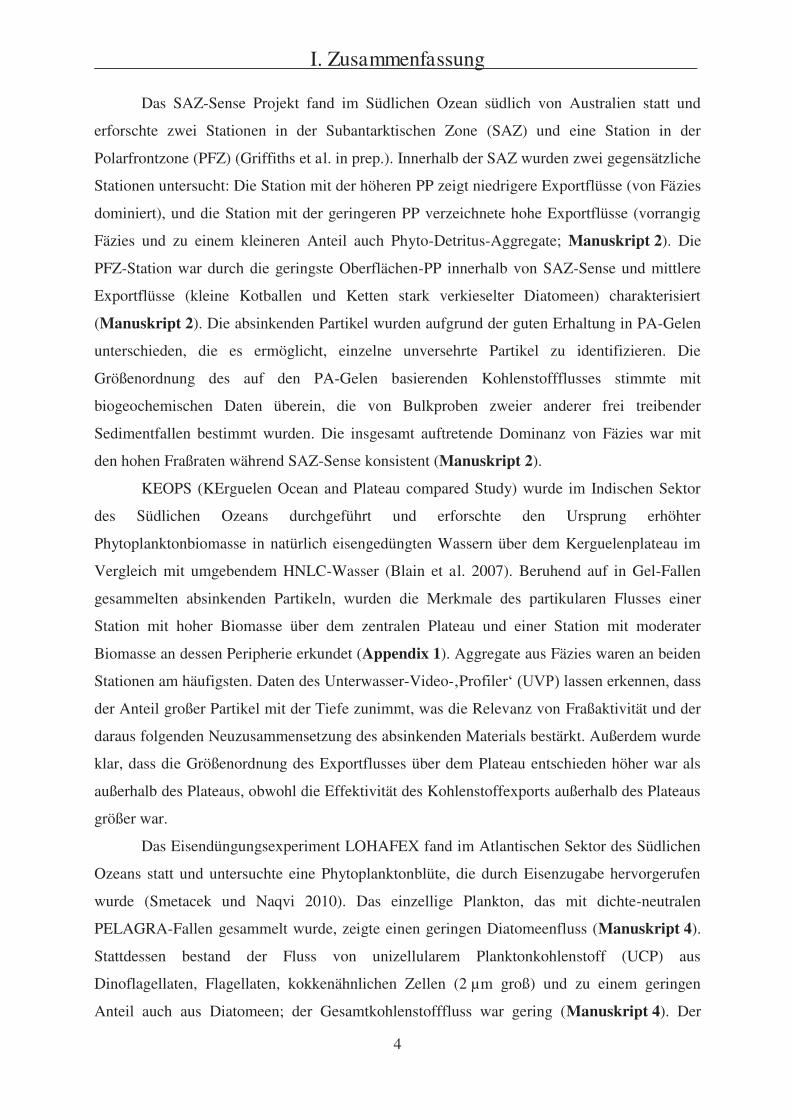
Das SAZ-Sense Projekt fand im Südlichen Ozean südlich von Australien statt und
erforschte zwei Stationen in der Subantarktischen Zone (SAZ) und eine Station in der
Polarfrontzone (PFZ) (Griffiths et al. in prep.). Innerhalb der SAZ wurden zwei gegensätzliche
Stationen untersucht: Die Station mit der höheren PP zeigt niedrigere Exportflüsse (von Fäzies
dominiert), und die Station mit der geringeren PP verzeichnete hohe Exportflüsse (vorrangig
Fäzies und zu einem kleineren Anteil auch Phyto-Detritus-Aggregate; Manuskript 2). Die
PFZ-Station war durch die geringste Oberflächen-PP innerhalb von SAZ-Sense und mittlere
Exportflüsse (kleine Kotballen und Ketten stark verkieselter Diatomeen) charakterisiert
(Manuskript 2). Die absinkenden Partikel wurden aufgrund der guten Erhaltung in PA-Gelen
unterschieden, die es ermöglicht, einzelne unversehrte Partikel zu identifizieren. Die
Größenordnung des auf den PA-Gelen basierenden Kohlenstoffflusses stimmte mit
biogeochemischen Daten überein, die von Bulkproben zweier anderer frei treibender
Sedimentfallen bestimmt wurden. Die insgesamt auftretende Dominanz von Fäzies war mit
den hohen Fraßraten während SAZ-Sense konsistent (Manuskript 2).
KEOPS (KErguelen Ocean and Plateau compared Study) wurde im Indischen Sektor
des Südlichen Ozeans durchgeführt und erforschte den Ursprung erhöhter
Phytoplanktonbiomasse in natürlich eisengedüngten Wassern über dem Kerguelenplateau im
Vergleich mit umgebendem HNLC-Wasser (Blain et al. 2007). Beruhend auf in Gel-Fallen
gesammelten absinkenden Partikeln, wurden die Merkmale des partikularen Flusses einer
Station mit hoher Biomasse über dem zentralen Plateau und einer Station mit moderater
Biomasse an dessen Peripherie erkundet (Appendix 1). Aggregate aus Fäzies waren an beiden
Stationen am häufigsten. Daten des Unterwasser-Video- P
der Anteil großer Partikel mit der Tiefe zunimmt, was die Relevanz von Fraßaktivität und der
daraus folgenden Neuzusammensetzung des absinkenden Materials bestärkt. Außerdem wurde
klar, dass die Größenordnung des Exportflusses über dem Plateau entschieden höher war als
außerhalb des Plateaus, obwohl die Effektivität des Kohlenstoffexports außerhalb des Plateaus
größer war.
Das Eisendüngungsexperiment LOHAFEX fand im Atlantischen Sektor des Südlichen
Ozeans statt und untersuchte eine Phytoplanktonblüte, die durch Eisenzugabe hervorgerufen
wurde (Smetacek und Naqvi 2010). Das einzellige Plankton, das mit dichte-neutralen
PELAGRA-Fallen gesammelt wurde, zeigte einen geringen Diatomeenfluss (Manuskript 4).
Stattdessen bestand der Fluss von unizellularem Planktonkohlenstoff (UCP) aus
Dinoflagellaten, Flagellaten, kokkenähnlichen Zellen (2 μm groß) und zu einem geringen
Anteil auch aus Diatomeen; der Gesamtkohlenstofffluss war gering (Manuskript 4). Der
I. Zusammenfassung
5
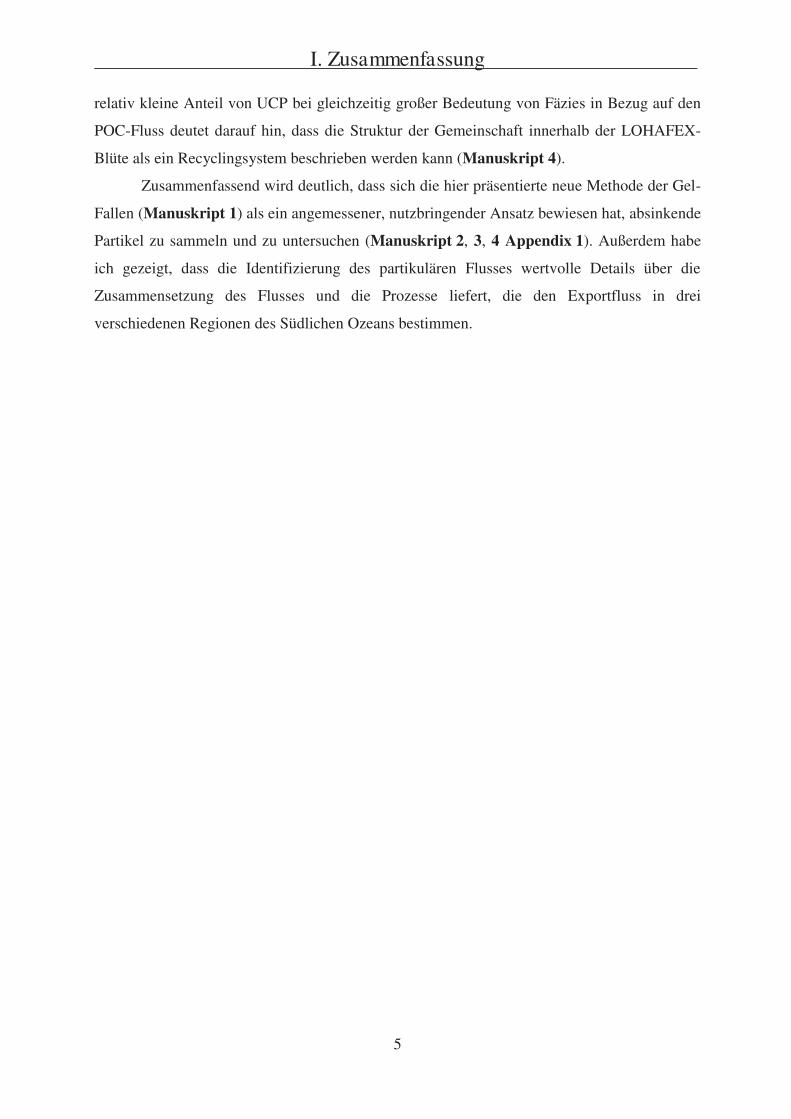
relativ kleine Anteil von UCP bei gleichzeitig großer Bedeutung von Fäzies in Bezug auf den
POC-Fluss deutet darauf hin, dass die Struktur der Gemeinschaft innerhalb der LOHAFEX-
Blüte als ein Recyclingsystem beschrieben werden kann (Manuskript 4).
Zusammenfassend wird deutlich, dass sich die hier präsentierte neue Methode der Gel-
Fallen (Manuskript 1) als ein angemessener, nutzbringender Ansatz bewiesen hat, absinkende
Partikel zu sammeln und zu untersuchen (Manuskript 2, 3, 4 Appendix 1). Außerdem habe
ich gezeigt, dass die Identifizierung des partikulären Flusses wertvolle Details über die
Zusammensetzung des Flusses und die Prozesse liefert, die den Exportfluss in drei
verschiedenen Regionen des Südlichen Ozeans bestimmen.

6
I. Summary
7
I.2 Summary
The surface ocean is coupled with the deep ocean via sinking particles that transport
carbon to depth. The downward export of biogenic particles redistributes carbon and nutrients
in the ocean and plays a significant role in controlling atmospheric CO2 levels (Volk and
Hoffert 1985). This transport mechanism is known as the biological pump (Volk and Hoffert
1985; De La Rocha 2007). The strength of the biological pump depends on factors such as
surface primary production (PP) and export flux in the upper ocean (De La Rocha 2007). Only
a small amount (0.1-8.8%) of the organic material being formed in the euphotic zone (the
sunlit surface layer) through photosynthesis reaches the seafloor (Lutz et al. 2002). The vast
majority of the sinking particles is recycled, e.g. respired, degraded or grazed upon and the
efficiency of the biological pump determines the fraction of primarily produced material
settling to depth (De La Rocha 2007). Most of the modification of the particulate matter
occurs in the mesopelagic zone, which adjoins beneath the euphotic layer and reaches down to
1000 m (Boyd and Trull 2007). However, the mechanisms influencing alteration of sinking
particles are not known in detail, but they are essential to understand export flux processes and
the sequestration of carbon at depth.
This thesis introduces further developments of a novel technique to examine intact
sinking particles making it possible to draw conclusions on export fluxes on the base of
individual particles. In three field studies, these data were compared to export flux data
received with other sampling technologies. The field studies took place in different regions of
the Southern Ocean. The focus of all studies was to investigate sinking particles and identify
export driving processes.
Although bulk sediment samples are commonly used for studying the biogeochemical
flux composition, they are limited in terms of preserving the original forms of particulate
matter (e.g. Asper 1987; Gardner 2000). Hence, free-floating sediment traps equipped with
polyacrylamide gels (PA gels) provide great potential to examine flux structure
(Manuscript 1). Successful examples of using these gels trap are given in Appendix 1,
Manuscript 1, 2 and 3, and the problems that might arise due to unsuitable trap design are
demonstrated in Manuscript 1 and 4.
The SAZ-Sense project was situated in the Southern Ocean south of Australia and
studied two sites in the Subantarctic Zone (SAZ) and one site in the Polar Frontal Zone (PFZ)
(Grifiths et al. in prep.). Within the SAZ, two contrasting sites in terms of surface biomass
accumulation and export fluxes were investigated: The site with higher PP showed lower
I. Summary
8
export fluxes (dominated by faecal material), and the site with lower PP had high export fluxes
(mainly faecal material and to a small extent also of phyto-detritus aggregates; Manuscript 2).
The PFZ site was characterised by the lowest surface PP within SAZ-Sense and intermediate
export flux (small faecal pellets and chains of heavily silicified diatoms; Manuscript 2). The
sinking particles were distinguished because of their good preservation in PA gels, which
allows identifying intact individual particles. The magnitude of the PA gel based carbon flux
agreed with biogeochemical data obtained from bulk samples of two other free-floating
sediment traps (Manuscript 2). The overall dominance of faecal material was consistent with
the high grazing rates detected during the SAZ-Sense study (Manuscript 2).
KEOPS (KErguelen Ocean and Plateau compared Study) was carried out in the Indian
Sector of the Southern Ocean and examined the origin of elevated phytoplankton biomass in
naturally iron-fertilised waters over the Kerguelen Plateau in comparison to surrounding
HNLC-waters (Blain et al. 2007). Based on sinking particles collected with gel traps the
characteristics of the particulate flux of a high biomass site over the central plateau and a
moderate biomass site at its periphery were ascertained (Appendix 1). Aggregates of faecal
material were most abundant at both sites. Data from the underwater video profiler (UVP)
revealed that the fraction of large particles increased with depth, supporting the relevance of
grazing and subsequent repackaging of the sinking material (Manuscript 3). Furthermore, it
became evident that the magnitude of export flux over the plateau is much higher than off the
plateau despite the fact that the efficiency of carbon export is higher off the plateau
(Manuscript 3).
The iron fertilisation experiment LOHAFEX was carried out in the Atlantic Section of
the Southern Ocean and investigated a phytoplankton bloom that was induced by iron addition
(Smetacek and Naqvi 2010). The unicellular plankton collected with neutrally buoyant
PELAGRA traps displayed low diatom flux (Manuscript 4). Instead, unicellular plankton
carbon (UCP) flux was provided by dinoflagellates, flagellates, coccoid cells (2 μm in size)
and to a small extent diatoms; overall C flux was low (Manuscript 4). Whereas the fraction of
UCP was relatively small, faecal material was highly important with regard to POC flux. This
indicates that community structure within the LOHAFEX bloom can be described as a
recycling system.
In conclusion, the presented novel technique of using gel traps has proved to be a
valuable, good approach to collect and investigate sinking particles. Moreover, I showed that
the identification of the particulate flux provides valuable details on flux composition and
export flux determining processes in three different regions of the Southern Ocean.

9
II. General Introduction

10
II. General Introduction
11
II.1 The role of carbon in the oceans
In the oceans, carbon is essential for life of any form. It enters the ocean as CO2 at the
surface, where equilibrium between atmospheric (gaseous) CO2 and aqueous (dissolved) CO2
is established through a steady exchange. In the oceans, CO2 exists as free CO2, as bicarbonate
(HCO3-) and as carbonate ion (CO3
2-). Different phytoplankton species use different CO2
sources for primary production (PP), but they all need sunlight as energy source. Thus, in the
euphotic zone (the sunlit layer of the ocean) biomass is formed by primary producers and the
dissolved inorganic carbon (DIC) is converted into organic carbon.
This organic material is now part of the production and recycling system of carbon in
the water column where it is passed on into the food web. Only a small fraction of the carbon
that entered the ocean at its surface settles down to the seafloor as particulate matter. During
this transit through the water column particles undergo changes in form and composition.
However, little is known about modification processes of sinking particles.
The amount of particulate organic carbon (POC) that reaches the deep ocean varies
between 0.1 and 8.8% of PP (Lutz et al. 2002). The surface ocean, where CO2 is taken up by
phytoplankton, is coupled with the deep ocean (>1000 m), where some of this carbon is
mesopelagic zone (100-1000 is located
directly underneath the euphotic zone. In order to better understand the mechanisms
determining the ocean uptake of CO2 and the subsequent burial of carbon in the deep sea this
study will focus on export processes with a special emphasis on particulate fluxes in the
mesopelagic zone (e.g. Boyd and Trull 2007).
II. General Introduction
12
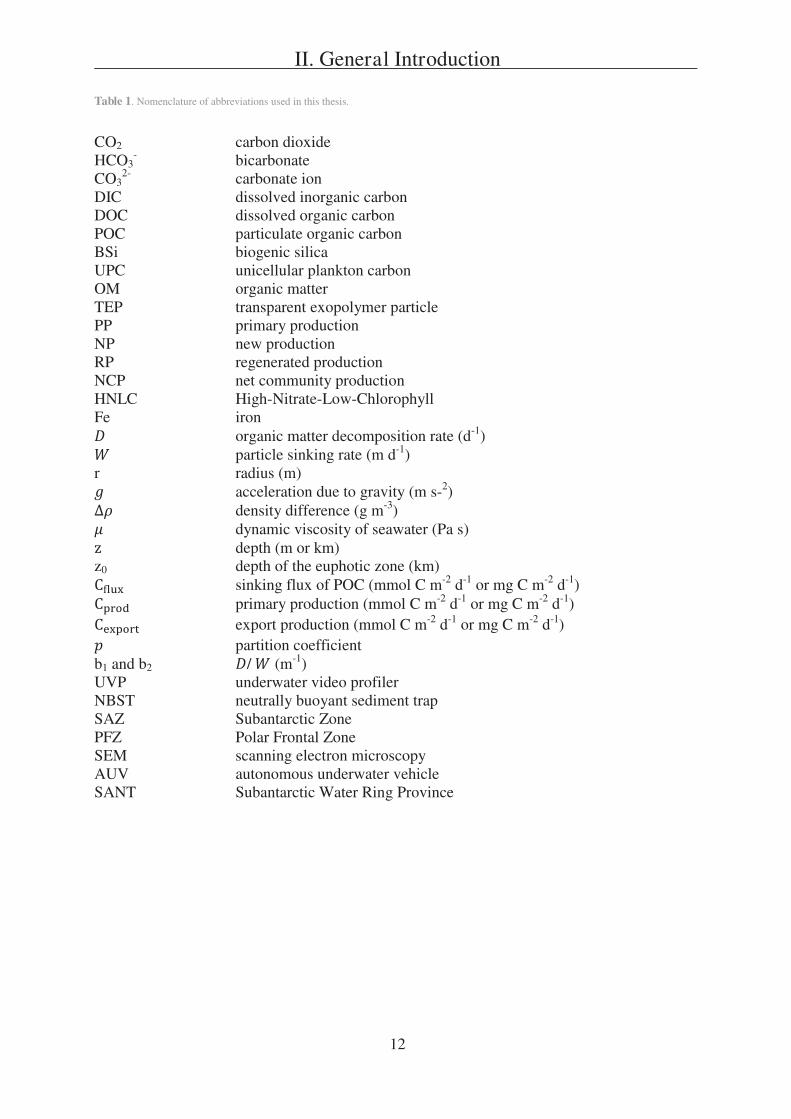
Table 1. Nomenclature of abbreviations used in this thesis.
CO2 carbon dioxide HCO3
- bicarbonate CO3
2- carbonate ion DIC dissolved inorganic carbon DOC dissolved organic carbon POC particulate organic carbon BSi biogenic silica UPC unicellular plankton carbon OM organic matter TEP transparent exopolymer particle PP primary production NP new production RP regenerated production NCP net community production HNLC High-Nitrate-Low-Chlorophyll Fe iron
organic matter decomposition rate (d-1) particle sinking rate (m d-1)
r radius (m) acceleration due to gravity (m s-2)
density difference (g m-3) dynamic viscosity of seawater (Pa s) depth (m or km)
z0 depth of the euphotic zone (km) sinking flux of POC (mmol C m-2 d-1 or mg C m-2 d-1) primary production (mmol C m-2 d-1 or mg C m-2 d-1)
export production (mmol C m-2 d-1 or mg C m-2 d-1) partition coefficient
b1 and b2 / (m-1) UVP underwater video profiler NBST neutrally buoyant sediment trap SAZ Subantarctic Zone PFZ Polar Frontal Zone SEM scanning electron microscopy AUV autonomous underwater vehicle SANT Subantarctic Water Ring Province
II. General Introduction
13
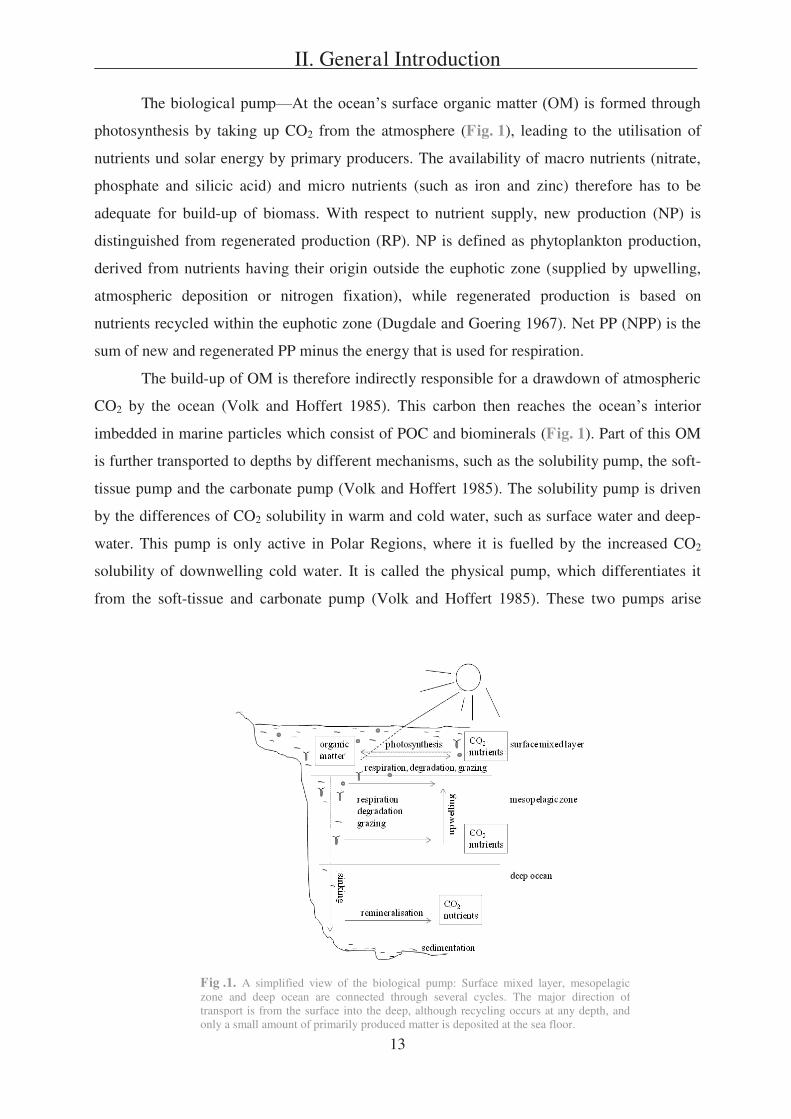
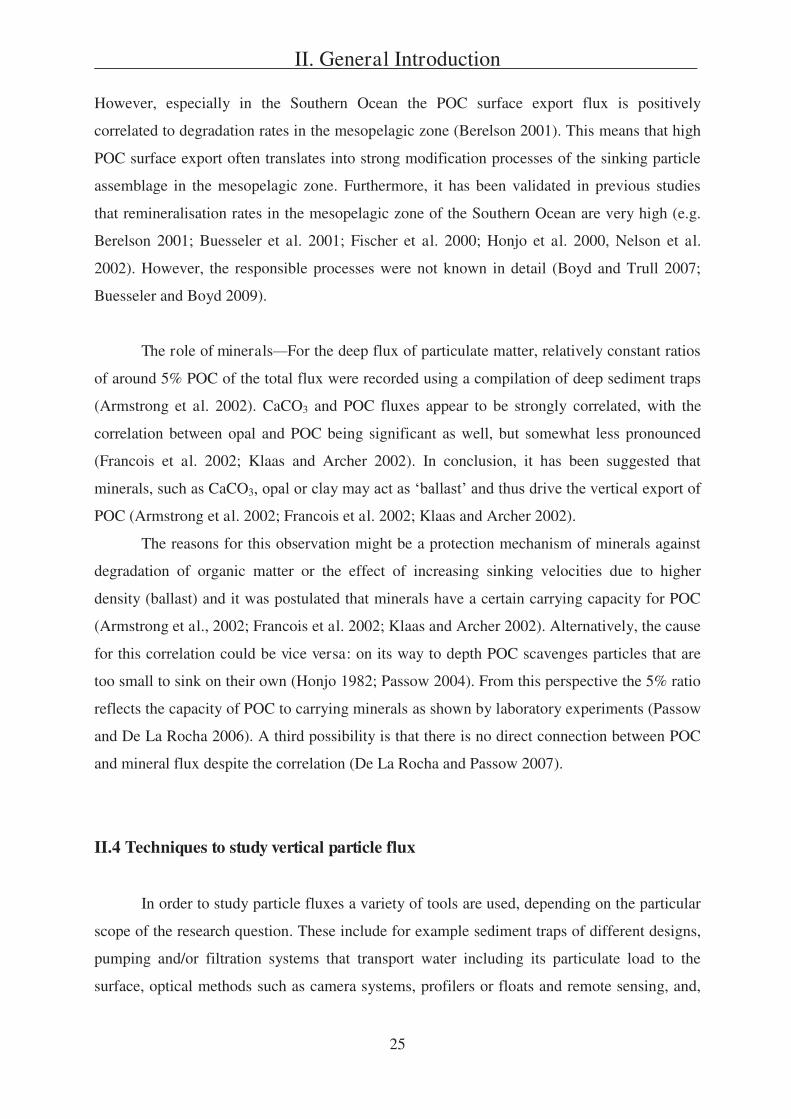
The biological pump At t
photosynthesis by taking up CO2 from the atmosphere (Fig. 1), leading to the utilisation of
nutrients und solar energy by primary producers. The availability of macro nutrients (nitrate,
phosphate and silicic acid) and micro nutrients (such as iron and zinc) therefore has to be
adequate for build-up of biomass. With respect to nutrient supply, new production (NP) is
distinguished from regenerated production (RP). NP is defined as phytoplankton production,
derived from nutrients having their origin outside the euphotic zone (supplied by upwelling,
atmospheric deposition or nitrogen fixation), while regenerated production is based on
nutrients recycled within the euphotic zone (Dugdale and Goering 1967). Net PP (NPP) is the
sum of new and regenerated PP minus the energy that is used for respiration.
The build-up of OM is therefore indirectly responsible for a drawdown of atmospheric
CO2 by the ocean (Volk and Hoffert 1985). This carbon then reaches the
imbedded in marine particles which consist of POC and biominerals (Fig. 1). Part of this OM
is further transported to depths by different mechanisms, such as the solubility pump, the soft-
tissue pump and the carbonate pump (Volk and Hoffert 1985). The solubility pump is driven
by the differences of CO2 solubility in warm and cold water, such as surface water and deep-
water. This pump is only active in Polar Regions, where it is fuelled by the increased CO2
solubility of downwelling cold water. It is called the physical pump, which differentiates it
from the soft-tissue and carbonate pump (Volk and Hoffert 1985). These two pumps arise
Fig .1. A simplified view of the biological pump: Surface mixed layer, mesopelagic zone and deep ocean are connected through several cycles. The major direction of transport is from the surface into the deep, although recycling occurs at any depth, and only a small amount of primarily produced matter is deposited at the sea floor.
II. General Introduction
14
from biological fluxes of organic material and calcium carbonate (CaCO3) and are referred to
as biological pump (Volk and Hoffert 1985; Ducklow et al. 2001; De La Rocha 2007). These
transport mechanisms apply for both pools, for particulate organic material (POM) as well as
for dissolved organic material (DOM).
The strength and efficiency of the biological pump is determined by several factors,
such as production of OM and biominerals at the surface, settling of particulate material into
the deep and remineralisation of these particles (De La Rocha 2007). The appearance of
particles formed at the surface is influenced predominantly by the plankton community in the
upper layer. On the one hand, phytoplankton composition regulates the original material,
which can vary from small picoplankton to large diatom cells, whereas, on the other hand, OM
provided by primary producers can be mediated by zooplankton. The particles supplying the
pool of potentially exported material can therefore either be amorphous and fluffy (e.g. phyto-
detritus) or compact and dense (e.g. faecal pellets) or anything in between (e.g. coagulation of
faecal matter and/or aggregates of phytoplankton material) (compare also II.3.). If they survive
bacterial degradation or zooplankton and chemical dissolution on their way to depth, the
sinking particles might reach the bottom of the ocean and be buried or consumed by organisms
living at the seafloor. This certainly depends on their sinking velocity ( ), which according to
Stokes law (equation (1)) depends on particle size (of the radius r) and density ( as density
difference between particle and seawater):
(1)
with being the acceleration due to gravity and the dynamic viscosity of seawater.
Large particles may sink at faster rates than smaller ones. However, this can be reversed by
taking into account their morphology because large particles might be very fluffy and less
dense, while small particles may be more compact and enser. Beside particle creation due to
plankton interactions, mineral availability also affects particle characteristics as they might
increase particle density (compare also II.3).
The strength and efficiency of the biological pump depends on many more factors,
such as the level of photosynthetic production and nutrient limitation, the amount of
zooplankton grazing and the degree of oxidative mineralisation at different depths in the water
column, followed by aggregation and settling. Thus, it is indispensable to examine the
complex system of biogeochemical cycles in the ocean including its interactions in order to
receive a better picture of processes such as the biological pump. This was one of the major
reasons for creating JGOFS, the Joint Global Ocean Flux Studies (see below).
II. General Introduction
15
Carbon cycle in the ocean
processes involved in global change to policy makers. In 1987, JGOFS was approved as a
Large Scale Ocean Project by the Scientific Committee on Oceanic Research (SCOR). The
oceans with international participati
on a global scale the processes controlling the time varying fluxes of carbon and associated
the response of oceanic biogeochemical processes to anthropogenic perturbations, in particular
SCOR 1990).
One of the initiatives of JGOFS was AESOPS (Antarctic Environment and Southern
Ocean Study), which focussed on two distinct regions: the Ross-Sea continental shelf and the
southwest Pacific Sector of the Southern Ocean (Smith et al. 2000). Some of the AESOPS
results will be discussed in more detail in II.3. In the Atlantic Sector of the Southern Ocean,
JGOFS projects were conducted by POLARSTERN (e.g. Dubischar and Bathmann 2002;
Rutgers van der Loeff et al. 1997; 2002). For a review of Southern Ocean JGOFS see
Bathmann et al. (2000).
Knowledge on biogeochemical cycles and interaction between particular processes has
increased enormously in the last 30 years. But some uncertainty, for instance on feedback
mechanisms between rising CO2-levels in the atmosphere and ocean uptake of CO2, is left and
the debate about global change is ongoing. The beginning of interactions between science and
policy in the 1980s was followed by numerous meetings, workshops and conferences. The
International Panel for Climate Change (IPCC) was established in 1988. The 4th and most
recent IPCC Assessment report, which is a result of a joined work program by the
international science community, was published in 2007 and has been widely discussed. Minor
differences of opinions and some uncertainties notwithstanding the overall picture of the
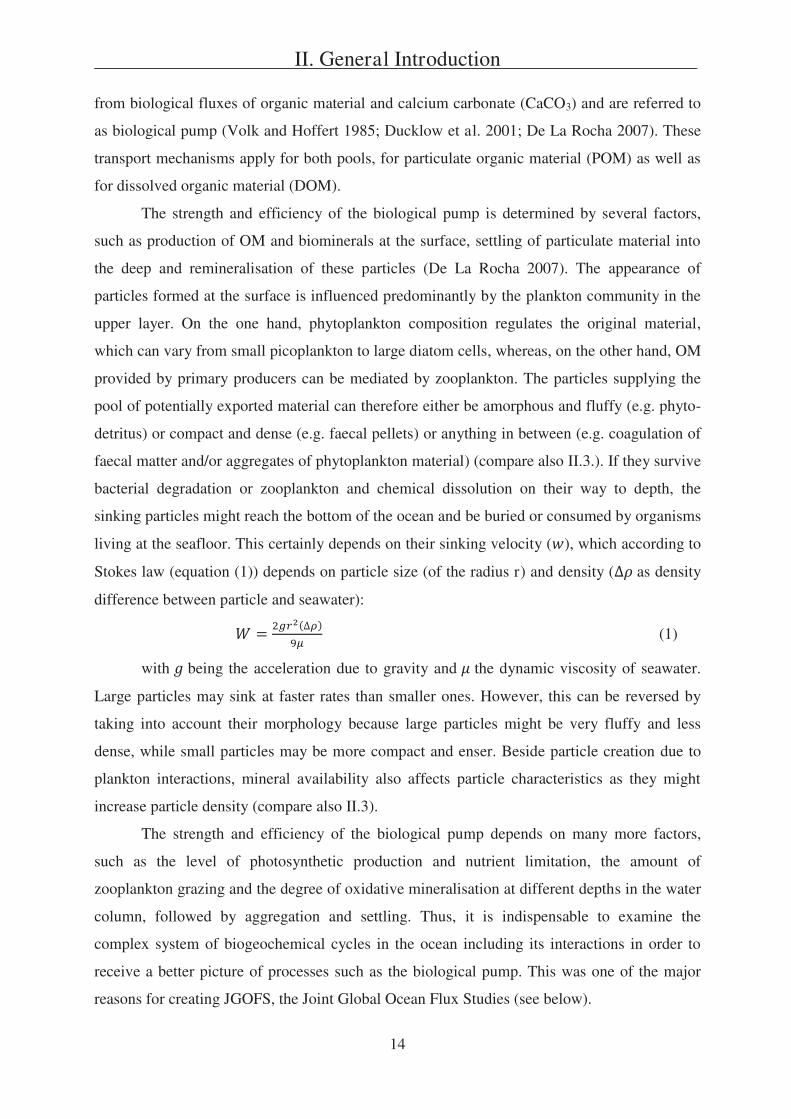
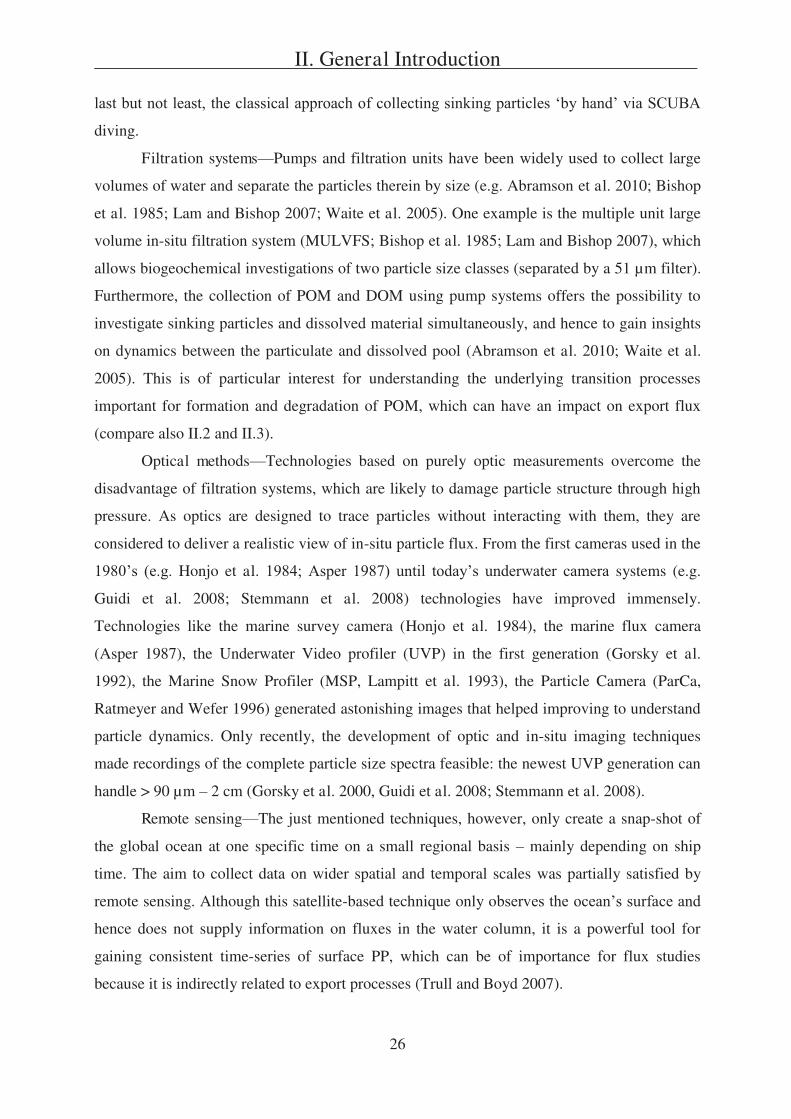
global carbon cycle is becoming clearer (Fig. 2). However, the role of anthropogenic input and
its relevance for global change is much less apparent and still heavily under debate.
II. General Introduction
16
Fig. 2. The global carbon cycle for the 1990s (IPCC report, 2007). Numbers in black show reservoirs and fluxes prior to the industrial revolution and red numbers indicate anthropogenic input (data from Sabine at al. 2004; Sarmiento and Gruber 2006). GPP is annual gross (terrestrial) primary production.
Beside the land biosphere, the oceans make up for the largest carbon reservoir: they
have taken up more than 100 Gt C since the industrial revolution as a result of the unbalanced
CO2 fluxes between ocean and atmosphere (Fig. 2). Had the ocean not acted as a carbon sink,
CO2 level increase in the atmosphere from pre-industrial times (value of 180 ppm) until today
would have been about three times higher (Sabine et al. 2004).
Marine productivity accounts for roughly half the global PP with the other half being
provided by the terrestrial biosphere (Fig. 2). However, within different marine ecosystems
and throughout different ocean basins, neither the PP nor the efficiency of the biological pump
and the subsequent export fluxes are in the same range.
One third of the global oceans are characterised as so called High-Nitrate-Low-
Chlorophyll (HNLC) areas (i.e. areas with marginal productivity). Despite high nitrate levels,
PP in HNLC-waters is comparably low. Large areas of the Southern Ocean, the equatorial
Pacific and the northern North Pacific Ocean are affected by this phenomenon. It became
obvious that in these regions the biological pump is not operating at its full capacity. Another
factor limiting build-up of biomass (i.e. being essential to PP) besides macro nutrients are
micro nutrients (compare II.1). It was therefore suggested that micro nutrients, in particular
iron, might be limiting for phytoplankton growth rates in HNLC-areas (Martin et al. 1991).
II. General Introduction
17
II.2 The role of iron in the oceans
In the late 1980s the trace metal iron (Fe) came into focus as the limiting factor for PP
in HNLC areas (Martin and Gordon 1988; Martin et al. 1989). As postulated by Martin (1990)
atmospheric Fe input via dust was much higher during the last glacial maximum, coinciding
with increased PP in vast regions of the ocean, more efficient CO2 uptake by phytoplankton
and consequently lower CO2 levels in the atmosphere. The so-
since been investigated in HNLC-waters, with bottle experiments as well as iron-fertilisation
experiments (for areas up to 300 km2) and modelling studies (see Boyd et al. (2007) for a
recent review).
Since the beginning of the 1990s several mesoscale iron addition experiments were
performed in waters from Equatorial to Polar Regions (Table 2), and have verified that iron
enrichment enhances PP (de Baar et al. 2005; Boyd et al. 2007). In spite of biomass
accumulation at the surface and CO2 uptake of the growing phytoplankton community, the
response of export fluxes is less clear (Boyd et al. 2007). Thus, it is not proved that iron
induced blooms transport CO2 to depth when these blooms decline. This topic is still heavily
under debate (Buesseler et al. 2008). Iron fertilisation has been proposed as one way to
sequester carbon and thus counteract the rising atmospheric CO2 levels due to human impact
(Smetacek and Naqvi 2008), but has also been strongly disapproved (Chisholm et al. 2001).
However, the scientific as well as political interest has attributed a lot of effort to studying iron
limitation in-situ in the last 20 years by conducting multiple iron enrichment experiments in
different parts of the Ocean (Table 2).
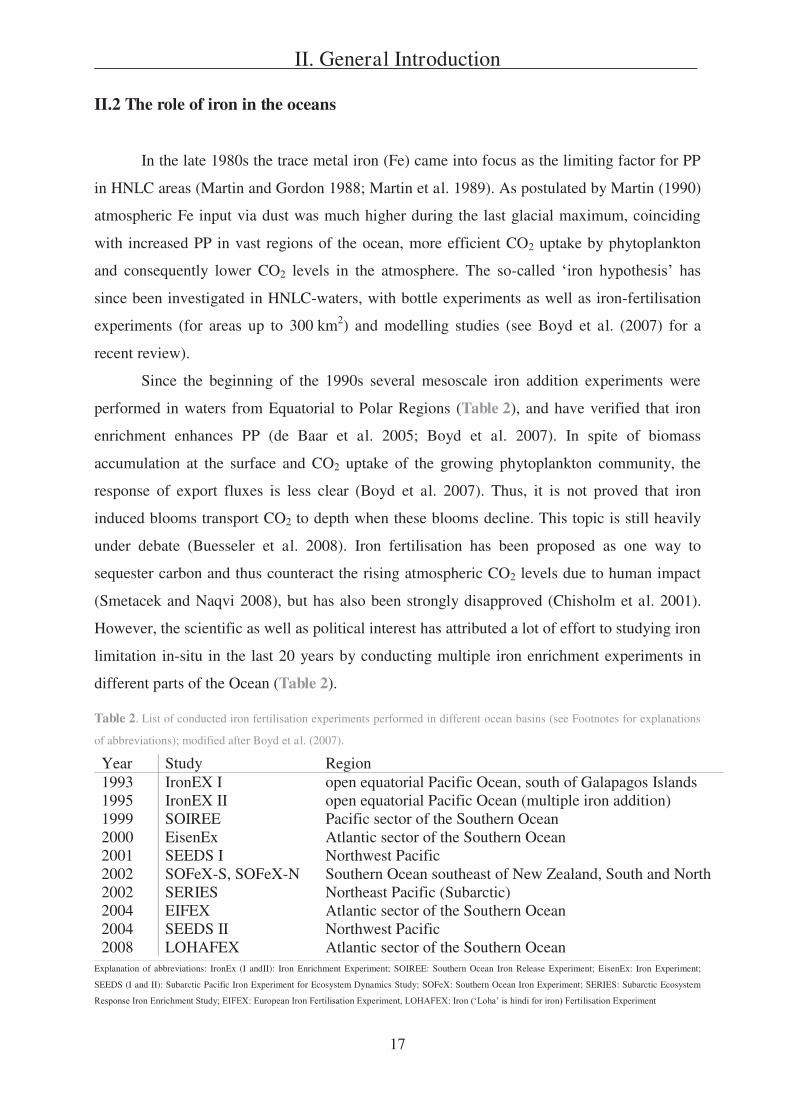
Table 2. List of conducted iron fertilisation experiments performed in different ocean basins (see Footnotes for explanations
of abbreviations); modified after Boyd et al. (2007).
Year� Study� Region�1993� IronEX I� open equatorial Pacific Ocean, south of Galapagos Islands�1995� IronEX II� open equatorial Pacific Ocean (multiple iron addition)�1999� SOIREE� Pacific sector of the Southern Ocean�2000� EisenEx� Atlantic sector of the Southern Ocean�2001� SEEDS I� Northwest Pacific�2002� SOFeX-S, SOFeX-N� Southern Ocean southeast of New Zealand, South and North�2002� SERIES� Northeast Pacific (Subarctic)�2004� EIFEX� Atlantic sector of the Southern Ocean�2004� SEEDS II� Northwest Pacific�2008� LOHAFEX� Atlantic sector of the Southern Ocean�
Explanation of abbreviations: IronEx (I andII): Iron Enrichment Experiment; SOIREE: Southern Ocean Iron Release Experiment; EisenEx: Iron Experiment;
SEEDS (I and II): Subarctic Pacific Iron Experiment for Ecosystem Dynamics Study; SOFeX: Southern Ocean Iron Experiment; SERIES: Subarctic Ecosystem
lisation Experiment
II. General Introduction
18
This study focuses mainly on the Southern Ocean and therefore only experiments that
took place in this region (plus the two initial experiments that demonstrated feasibility) are
discussed in more detail. The phenomenon of natural iron fertilisation will be considered as
well again concentrating on Southern Ocean sites.
Iron fertilisation experiments
established (Martin 1990), the first iron fertilisation experiment IronEx I was conducted in
HNLC-waters of the open equatorial Pacific Ocean near the Galapagos Islands (Martin et al.
1994, Coale et al. 1996a, 1998). The results demonstrated a direct and unequivocal biological
response to added iron: PP and Chla increased, biomass levels in all classes counted were
higher than in the non-fertilised surrounding waters and there was evidence for increased
grazing (Martin et al. 1994). During IronEx II, where multiple iron addition was performed in
waters somewhat west to the IronEx I side, massive blooms were produced and a large
drawdown in atmospheric CO2 and nutrients was detected (Coale et al. 1996a). Furthermore,
the results indicated that iron enrichment favours diatoms which are known to be the main
driver of POC export to depth in vast areas of the ocean. Taking into consideration that most
HNLC areas are situated in the Southern Ocean where diatoms also are a key species in regard
to PP and export fluxes, similar experiments in these regions were a desideratum (Coale et al.
1996a).
In late austral summer 1999, the meso-scale Southern Ocean Iron RElease Experiment
(SOIREE) took place in the Pacific sector of the Southern Ocean in a HNLC area and
examined a diatom bloom responding to iron addition (Boyd et al. 2000). Despite increased
growth rates and a shift towards larger cells IN-patch (with iron addition), no increasing export
in comparison to OUT-patch stations (without iron addition) was observed with sediment traps
deployed at 110 and 310 m, respectively (Boyd et al. 2000; Trull and Armand 2001; Trull et al.
2001; Waite and Nodder 2001). The positive response of the phytoplankton community to iron
addition but the absence of enhanced export during this first iron enrichment experiment in the
Southern Ocean was motivation to investigate other regions of the Southern Ocean. The goal
of the Southern Ocean Iron Enrichment Experiment SOFeX, which was conducted south of
New Zealand in austral summer 2002, was to compare two different regimes in regard to iron
fertilisations: SOFeX-North was characterised by high nitrate and low silicic acid and SOFeX-
South by high nitrate and high silicic acid (Coale et al. 2004; Buesseler et al. 2004). Although
PP in the north was dominated by nonsilicious phytoplankton, export fluxes increased (in both
patches, SOFeX-North and South) after iron addition (Coale et al. 2004). This indicated that
iron-limited carbon removal from these waters played a strong role (Coale et al. 2004).
II. General Introduction
19
Moreover, three iron enrichment experiments conducted by the Alfred Wegener
Institute for Polar and Marine Research (AWI, Bremerhaven, Germany) with RV Polarstern
were performed in the Atlantic Sector of the Southern Ocean: EisenEx in spring 2000 (Assmy
et al. 2007), the European Iron Fertilisation Experiment (EIFeX) in summer 2004 (Bathmann
2005) and LOHAFEX in summer 2008 (see Manuscript 4 and Chapter III). During EisenEx a
strong species-specific response of the iron induced diatom bloom was observed, but the fate
of the EisenEx bloom is not known (Assmy et al. 2007). The EIFex bloom showed a decline at
the end (Hoffmann et al. 2006) which was followed by a sinking event that was detected in the
water column as well as in the sediments (Peeken et al. 2006; Smetacek et al. in prep.). So far,
this experiment was the only one to observe enhanced export fluxes to depths associated with
iron addition. Due to ship time constraints it was only possible to partially investigate the fate
of these two stimulated bloom before their final decline. That is why LOHAFEX, a third iron
enrichment experiment, was designed to allow for a complete examination of the senescent
bloom (http://www.awi.de/en/home/lohafex/).
Natural iron fertilisation Beside atmospheric input in form of dust it has also been
observed that surface water plumes off islands can be enriched in Fe (e.g. Martin et al. 1994)
or that upwelling water can have an impact on Fe levels (e.g. Coale et al. 1996b). In the
Southern Ocean, albeit being the largest HNLC area, several mechanisms such as upwelling of
iron-rich deep water, lateral advection of Fe from the continental shelf or the release of
dissolved Fe from ice melting can account for natural iron fertilisation (e.g. Karl et al. 1991;
Ishii et al. 1998). For instance, it has been documented that phytoplankton blooms do occur in
the vicinity of islands (Sullivan et al. 1993; Tyrell et al. 2005). Two studies on continuously
occurring natural iron fertilisation were performed in the Indian Sector of the Southern Ocean:
the CROZet natural iron bloom and EXport experiment (CROZEX) in austral spring to
summer 2004/2005 (Pollard et al. 2007) and the KErguelen Ocean and Plateau compared
Study (KEOPS) in austral summer 2005 (Blain et al. 2007). The naturally occurring bloom off
the Kerguelen Island was found to be contingent on persistent iron fertilisation but its duration
was due to the concomitant supply of macronutrients from surrounding waters and from below
(Blain et al. 2007). Within this bloom, a smaller increase in export flux than in PP was
observed (Blain et al. 2007, Trull et al. 2001). This may partly reflect greater biomass
accumulation over the plateau but also stronger recycling (Trull et al. 2001), which is
consistent with the faecal material dominated particle flux (Appendix 1). During KEOPS, the
surface phytoplankton community was dominated by diatoms (Armand et al. 2008), which
stands in contrast to CROZEX, where silicic acid concentrations were limiting diatom growth
II. General Introduction
20
in some regions of the bloom (Poulton et al. 2007). Accordingly, phytoplankton community
structure showed significant differences within the iron stimulated bloom during CROZEX
and was dominated by Phaeocystis antarctica in regions of low silicic acid concentrations
(Poulton et al. 2007). Carbon export deeper in the water column revealed association with
biomass accumulation at the surface (Marsh et al. 2007) and Pollard et al. (2007) postulated
that deep POC export was clearly linked to Fe-fertilised productivity at the surface.
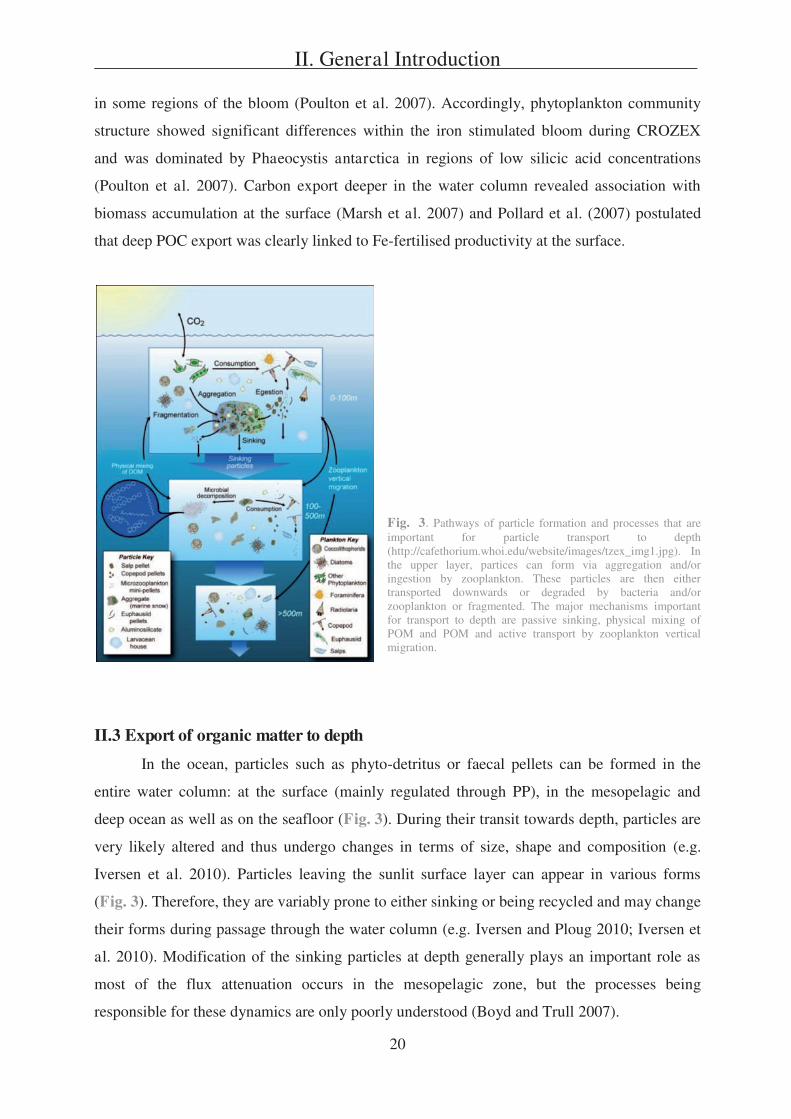
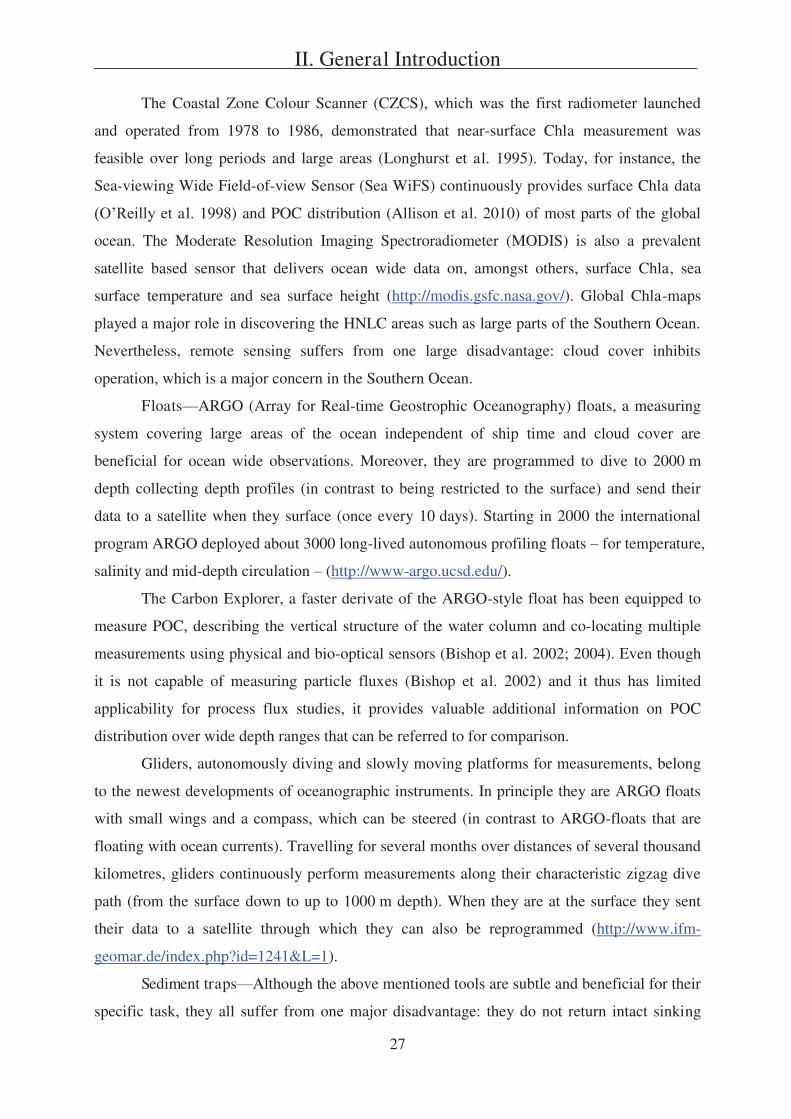
Fig. 3. Pathways of particle formation and processes that are important for particle transport to depth (http://cafethorium.whoi.edu/website/images/tzex_img1.jpg). In the upper layer, partices can form via aggregation and/or ingestion by zooplankton. These particles are then either transported downwards or degraded by bacteria and/or zooplankton or fragmented. The major mechanisms important for transport to depth are passive sinking, physical mixing of POM and POM and active transport by zooplankton vertical migration.
II.3 Export of organic matter to depth
In the ocean, particles such as phyto-detritus or faecal pellets can be formed in the
entire water column: at the surface (mainly regulated through PP), in the mesopelagic and
deep ocean as well as on the seafloor (Fig. 3). During their transit towards depth, particles are
very likely altered and thus undergo changes in terms of size, shape and composition (e.g.
Iversen et al. 2010). Particles leaving the sunlit surface layer can appear in various forms
(Fig. 3). Therefore, they are variably prone to either sinking or being recycled and may change
their forms during passage through the water column (e.g. Iversen and Ploug 2010; Iversen et
al. 2010). Modification of the sinking particles at depth generally plays an important role as
most of the flux attenuation occurs in the mesopelagic zone, but the processes being
responsible for these dynamics are only poorly understood (Boyd and Trull 2007).
II. General Introduction
21
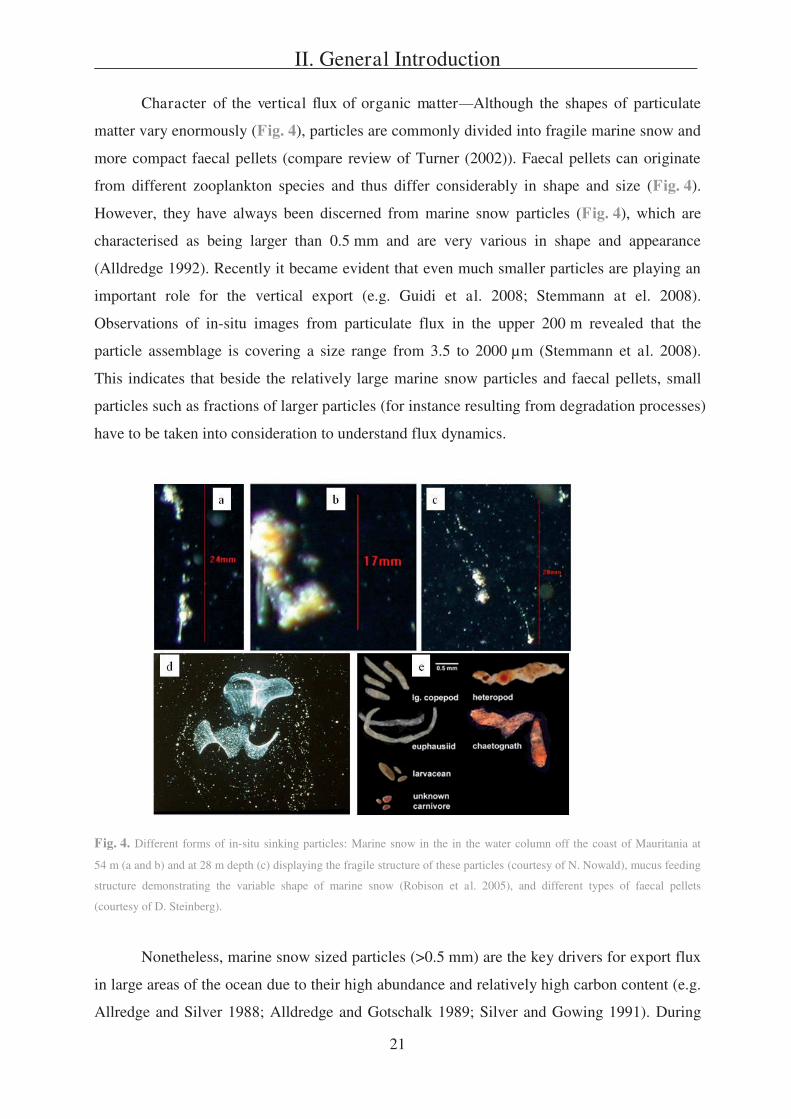
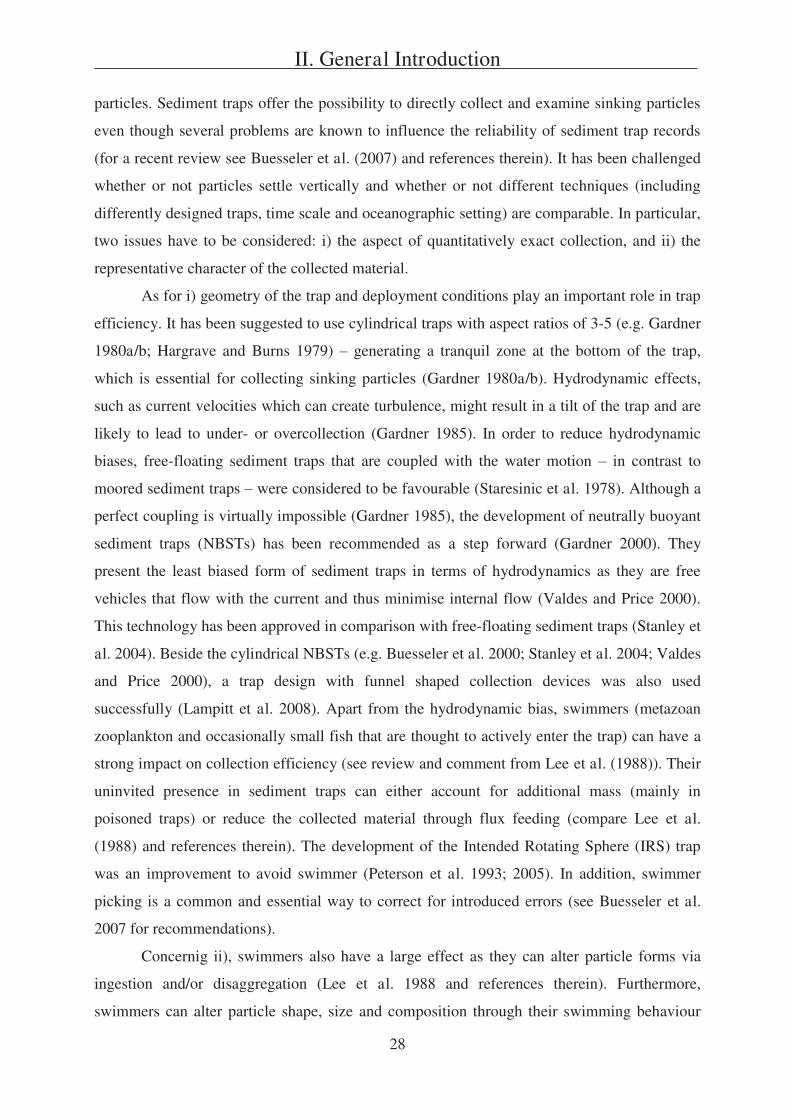
Character of the vertical flux of organic matter Although the shapes of particulate
matter vary enormously (Fig. 4), particles are commonly divided into fragile marine snow and
more compact faecal pellets (compare review of Turner (2002)). Faecal pellets can originate
from different zooplankton species and thus differ considerably in shape and size (Fig. 4).
However, they have always been discerned from marine snow particles (Fig. 4), which are
characterised as being larger than 0.5 mm and are very various in shape and appearance
(Alldredge 1992). Recently it became evident that even much smaller particles are playing an
important role for the vertical export (e.g. Guidi et al. 2008; Stemmann at el. 2008).
Observations of in-situ images from particulate flux in the upper 200 m revealed that the
particle assemblage is covering a size range from 3.5 to 2000 μm (Stemmann et al. 2008).
This indicates that beside the relatively large marine snow particles and faecal pellets, small
particles such as fractions of larger particles (for instance resulting from degradation processes)
have to be taken into consideration to understand flux dynamics.
Fig. 4. Different forms of in-situ sinking particles: Marine snow in the in the water column off the coast of Mauritania at
54 m (a and b) and at 28 m depth (c) displaying the fragile structure of these particles (courtesy of N. Nowald), mucus feeding
structure demonstrating the variable shape of marine snow (Robison et al. 2005), and different types of faecal pellets
(courtesy of D. Steinberg).
Nonetheless, marine snow sized particles (>0.5 mm) are the key drivers for export flux
in large areas of the ocean due to their high abundance and relatively high carbon content (e.g.
Allredge and Silver 1988; Alldredge and Gotschalk 1989; Silver and Gowing 1991). During
II. General Introduction
22
the past few decades a whole range of terms was used to describe sinking particles being in
general r
(Alldredge and Youngbluth 1985; Shanks and Trent 1980) or organic aggregates of faecal
origin (Waite et al. 2005). Kiorboe (2001) proposed to distinguish between aggregates that
were formed via physical coagulation or through zooplankton-mediated aggregation. In
general, two pathways to create marine snow are postulated they are either produced by
zooplankton or by coagulation of smaller particles (Alldredge 1992). Examples for the second
pathway are the rare events of mass sinking of phytoplankton blooms that might lead to a
downward flux of coagulated phytoplankton cells (see review of Beaulieu (2002) and
references therein). More recently Lam and Bishop (2007) suggested a
However, it makes sense to adhere to the concept of marine snow and faeces in general.
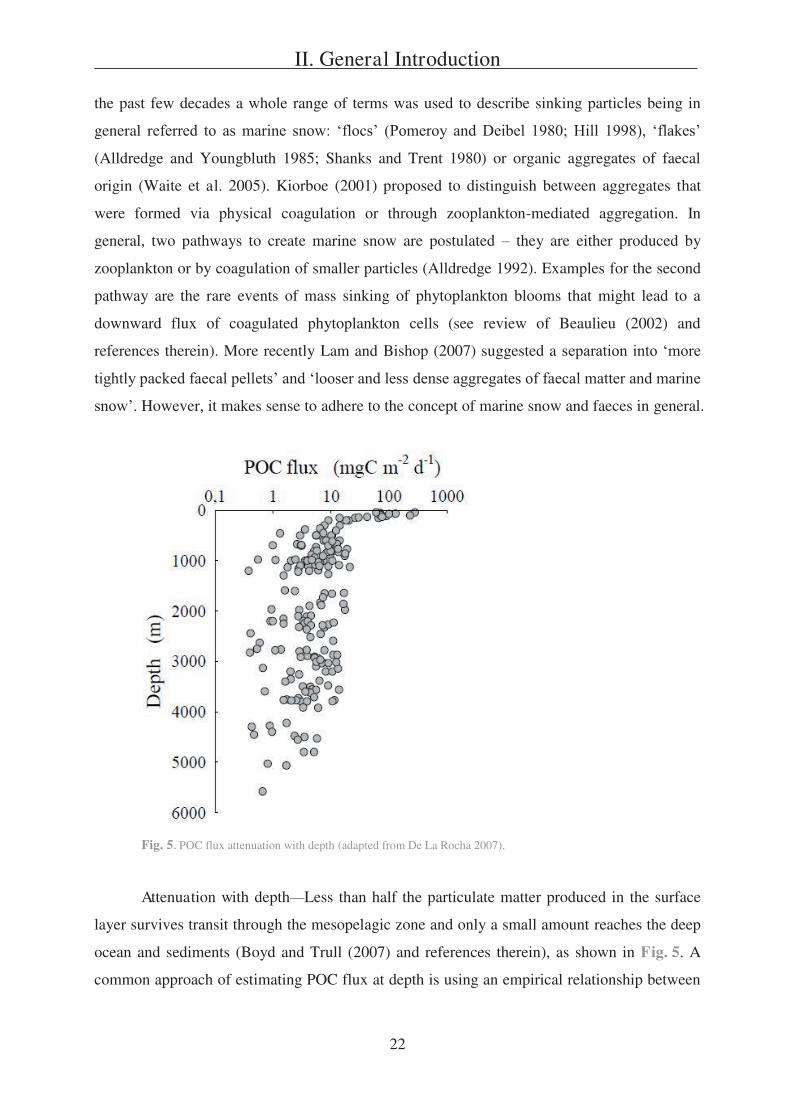
Fig. 5. POC flux attenuation with depth (adapted from De La Rocha 2007).
Attenuation with depth Less than half the particulate matter produced in the surface
layer survives transit through the mesopelagic zone and only a small amount reaches the deep
ocean and sediments (Boyd and Trull (2007) and references therein), as shown in Fig. 5. A
common approach of estimating POC flux at depth is using an empirical relationship between
II. General Introduction
23
surface POC and either surface PP (Suess 1980) or export flux (Martin et al. 1987), as
depicted in equation (2) or (3), respectively:
(2)
(3)
POC flux ( ) at depth z (in km) is defined as a function of PP of organic carbon in
surface waters or POC export from the base of the euphotic zone (z0 (in km)). In many areas,
POC flux cannot solely be predicted based on PP values (e.g. Bishop 1989; Boyd and Newton
1995; Lampitt and Antia 1997), indicating that the magnitude of PP may not be the most
important factor in determining flux to depths (Boyd and Newton 1999). Buesseler (1998)
claimed that varying food web dynamics and species assemblages, rather than higher PP at the
surface, may lead to an increasing flux to depth. Thus, surface PP and export from the
euphotic zone are decoupled in most cases (Buesseler 1998; Boyd and Newton 1995, 1999). In
conclusion, variations in POC flux into the deep ocean cannot be described by variability in
PP or export from the surface layer alone (Lutz et al. 2002).
Lutz et al. (2002) also stated that constant power law relationships (such as equation
(3)) generally overestimate deep water POC fluxes and hence underestimate particle retention
in the water column. Instead, they recommend using a region-specific empirical flux algorithm
(equation (4), modified after Andersson et al. (2004)), where POC flux ( ) at depth z (in m)
is partitioned into a pool of fresh, labile POC degrading rapidly relative to its sinking rate
( ) and a pool of rapidly sinking or very refractory POC without significant
decomposition during transit to depth ( ). The two relationships for / are b1 and b2,
where is the organic matter decomposition rate (d-1) and the particle sinking rate (m d-1).
(4)
Based on the comparison of PP and flux dynamics in the water column (from surface
traps and moored sediment traps at depth), it became obvious that conditions and forcings that
serve to create and attenuate variability in flux are concentrated within 1000 m below the
euphotic zone (e.g. Honjo 1996; Buessler 1998; Lutz et al. 2002). A compilation of AESOPS
surveys (see II.1) suggests that in the mesopelagic zone up to 90% of surface POC are
remineralised in the Southern Ocean (Honjo et al. 2000), whereas below 1000 m changes in
POC fluxes are not significant (Nelson et al. 2002).
II. General Introduction
24
Regional variability on the Example of the Southern Ocean In the global ocean, the
fraction of NPP that is sinking out of the surface ocean (POC surface export flux) generally
ranges between 2 and 20%, with values reaching 50% in some regions (Boyd and Trull (2007)
and references therein). The fraction that sinks beyond 1000 m ranges from 6 to 25%
(Berelson 2001; Francois et al. 2002; Martin et al. 1987).
Compilations of trap data showed that the annual average POC export to the deep
ocean varies more than 10-fold globally (see Boyd and Trull (2007) and references therein).
Fischer et al. (2000) for instance reported POC fluxes at 1000 m that ranged from 0.01 g m-2 y-
1 in the Northwest Weddell Sea to 5.15 g m-2 y-1 at Cape Blanc. In the Southern Ocean, POC
export at 1000 m can range from 0.01 to 2.53 g m-2 y-1, with fluxes at the Polar Front being the
highest (Fischer et al. 2000). This coincides with relatively uniform POC fluxes of 1.7-
2.3 g m-2 y-1 at 1000 m depth within the Polar Frontal Zone (PFZ) and the Antarctic Zone
(Honjo et al. 2000) and POC fluxes at the same depth between 1.7 and 2.5 g m-2 y-1, in the
Ross Gyre and PFZ or Antarctic Circumpolar Current (Nelson et al. 2002). Within the Atlantic
Sector of the Southern Ocean POC fluxes between 800 and 1600 m are in the range of 0.03
and 5.13 g m-2 y-1 (Antia et al. 2001). According to Boyd and Trull (2007) remineralisation
length scales in the Southern Ocean may differ from those in other regions. Generally, the
Southern Ocean might be primarily affected by seasonal and interannual variability, rather
than being characterised by any regime of high or low export efficiency (Lampitt and Antia
1997).
Although the Southern Ocean is one of the oceans which has been studied the least,
several data sets on surface conditions and flux rates (including PP, surface POC export flux
and deep POC export flux) exist and demonstrate the specifics of this ocean basin. These
characteristics allow the Southern Ocean to be distinguished from other regions
oceans in many respects. Deep surface mixed layers and only moderate seasonal warming and
stratification are characteristic for the open Southern Ocean (e.g. Trull et al. 2001). Compared
to lower latitudes POC surface export fluxes at 100 m are relatively high in the Southern
Ocean with 30-50% of NPP (e.g. Buesseler, 1998; Nelson et al. 2002; Pondaven et al. 2000).
Buesseler et al. (2001) therefore concluded that the Southern Ocean is characterised by one of
the most efficient biological pumps. This is also in agreement with the findings of several
other studies showing that high surface POC export fluxes are not necessarily associated with
high PP but could also follow moderate phytoplankton biomass accumulation at the surface
(e.g. Rutgers van der Loeff et al. 1997) like it is characteristic for parts of the Southern Ocean.
II. General Introduction
25
However, especially in the Southern Ocean the POC surface export flux is positively
correlated to degradation rates in the mesopelagic zone (Berelson 2001). This means that high
POC surface export often translates into strong modification processes of the sinking particle
assemblage in the mesopelagic zone. Furthermore, it has been validated in previous studies
that remineralisation rates in the mesopelagic zone of the Southern Ocean are very high (e.g.
Berelson 2001; Buesseler et al. 2001; Fischer et al. 2000; Honjo et al. 2000, Nelson et al.
2002). However, the responsible processes were not known in detail (Boyd and Trull 2007;
Buesseler and Boyd 2009).
The role of minerals For the deep flux of particulate matter, relatively constant ratios
of around 5% POC of the total flux were recorded using a compilation of deep sediment traps
(Armstrong et al. 2002). CaCO3 and POC fluxes appear to be strongly correlated, with the
correlation between opal and POC being significant as well, but somewhat less pronounced
(Francois et al. 2002; Klaas and Archer 2002). In conclusion, it has been suggested that
minerals, such as CaCO3 rtical export of
POC (Armstrong et al. 2002; Francois et al. 2002; Klaas and Archer 2002).
The reasons for this observation might be a protection mechanism of minerals against
degradation of organic matter or the effect of increasing sinking velocities due to higher
density (ballast) and it was postulated that minerals have a certain carrying capacity for POC
(Armstrong et al., 2002; Francois et al. 2002; Klaas and Archer 2002). Alternatively, the cause
for this correlation could be vice versa: on its way to depth POC scavenges particles that are
too small to sink on their own (Honjo 1982; Passow 2004). From this perspective the 5% ratio
reflects the capacity of POC to carrying minerals as shown by laboratory experiments (Passow
and De La Rocha 2006). A third possibility is that there is no direct connection between POC
and mineral flux despite the correlation (De La Rocha and Passow 2007).
II.4 Techniques to study vertical particle flux
In order to study particle fluxes a variety of tools are used, depending on the particular
scope of the research question. These include for example sediment traps of different designs,
pumping and/or filtration systems that transport water including its particulate load to the
surface, optical methods such as camera systems, profilers or floats and remote sensing, and,
II. General Introduction
26
diving.
Filtration systems Pumps and filtration units have been widely used to collect large
volumes of water and separate the particles therein by size (e.g. Abramson et al. 2010; Bishop
et al. 1985; Lam and Bishop 2007; Waite et al. 2005). One example is the multiple unit large
volume in-situ filtration system (MULVFS; Bishop et al. 1985; Lam and Bishop 2007), which
allows biogeochemical investigations of two particle size classes (separated by a 51 μm filter).
Furthermore, the collection of POM and DOM using pump systems offers the possibility to
investigate sinking particles and dissolved material simultaneously, and hence to gain insights
on dynamics between the particulate and dissolved pool (Abramson et al. 2010; Waite et al.
2005). This is of particular interest for understanding the underlying transition processes
important for formation and degradation of POM, which can have an impact on export flux
(compare also II.2 and II.3).
Optical methods Technologies based on purely optic measurements overcome the
disadvantage of filtration systems, which are likely to damage particle structure through high
pressure. As optics are designed to trace particles without interacting with them, they are
considered to deliver a realistic view of in-situ particle flux. From the first cameras used in the
Honjo et al. systems (e.g.
Guidi et al. 2008; Stemmann et al. 2008) technologies have improved immensely.
Technologies like the marine survey camera (Honjo et al. 1984), the marine flux camera
(Asper 1987), the Underwater Video profiler (UVP) in the first generation (Gorsky et al.
1992), the Marine Snow Profiler (MSP, Lampitt et al. 1993), the Particle Camera (ParCa,
Ratmeyer and Wefer 1996) generated astonishing images that helped improving to understand
particle dynamics. Only recently, the development of optic and in-situ imaging techniques
made recordings of the complete particle size spectra feasible: the newest UVP generation can
handle > 90 μm 2 cm (Gorsky et al. 2000, Guidi et al. 2008; Stemmann et al. 2008).
Remote sensing The just mentioned techniques, however, only create a snap-shot of
the global ocean at one specific time on a small regional basis mainly depending on ship
time. The aim to collect data on wider spatial and temporal scales was partially satisfied by
remote sensing. Although this satellite-based technique only o
hence does not supply information on fluxes in the water column, it is a powerful tool for
gaining consistent time-series of surface PP, which can be of importance for flux studies
because it is indirectly related to export processes (Trull and Boyd 2007).
II. General Introduction
27
The Coastal Zone Colour Scanner (CZCS), which was the first radiometer launched
and operated from 1978 to 1986, demonstrated that near-surface Chla measurement was
feasible over long periods and large areas (Longhurst et al. 1995). Today, for instance, the
Sea-viewing Wide Field-of-view Sensor (Sea WiFS) continuously provides surface Chla data
et al. 1998) and POC distribution (Allison et al. 2010) of most parts of the global
ocean. The Moderate Resolution Imaging Spectroradiometer (MODIS) is also a prevalent
satellite based sensor that delivers ocean wide data on, amongst others, surface Chla, sea
surface temperature and sea surface height (http://modis.gsfc.nasa.gov/). Global Chla-maps
played a major role in discovering the HNLC areas such as large parts of the Southern Ocean.
Nevertheless, remote sensing suffers from one large disadvantage: cloud cover inhibits
operation, which is a major concern in the Southern Ocean.
Floats ARGO (Array for Real-time Geostrophic Oceanography) floats, a measuring
system covering large areas of the ocean independent of ship time and cloud cover are
beneficial for ocean wide observations. Moreover, they are programmed to dive to 2000 m
depth collecting depth profiles (in contrast to being restricted to the surface) and send their
data to a satellite when they surface (once every 10 days). Starting in 2000 the international
program ARGO deployed about 3000 long-lived autonomous profiling floats for temperature,
salinity and mid-depth circulation (http://www-argo.ucsd.edu/).
The Carbon Explorer, a faster derivate of the ARGO-style float has been equipped to
measure POC, describing the vertical structure of the water column and co-locating multiple
measurements using physical and bio-optical sensors (Bishop et al. 2002; 2004). Even though
it is not capable of measuring particle fluxes (Bishop et al. 2002) and it thus has limited
applicability for process flux studies, it provides valuable additional information on POC
distribution over wide depth ranges that can be referred to for comparison.
Gliders, autonomously diving and slowly moving platforms for measurements, belong
to the newest developments of oceanographic instruments. In principle they are ARGO floats
with small wings and a compass, which can be steered (in contrast to ARGO-floats that are
floating with ocean currents). Travelling for several months over distances of several thousand
kilometres, gliders continuously perform measurements along their characteristic zigzag dive
path (from the surface down to up to 1000 m depth). When they are at the surface they sent
their data to a satellite through which they can also be reprogrammed (http://www.ifm-
geomar.de/index.php?id=1241&L=1).
Sediment traps Although the above mentioned tools are subtle and beneficial for their
specific task, they all suffer from one major disadvantage: they do not return intact sinking
II. General Introduction
28
particles. Sediment traps offer the possibility to directly collect and examine sinking particles
even though several problems are known to influence the reliability of sediment trap records
(for a recent review see Buesseler et al. (2007) and references therein). It has been challenged
whether or not particles settle vertically and whether or not different techniques (including
differently designed traps, time scale and oceanographic setting) are comparable. In particular,
two issues have to be considered: i) the aspect of quantitatively exact collection, and ii) the
representative character of the collected material.
As for i) geometry of the trap and deployment conditions play an important role in trap
efficiency. It has been suggested to use cylindrical traps with aspect ratios of 3-5 (e.g. Gardner
1980a/b; Hargrave and Burns 1979) generating a tranquil zone at the bottom of the trap,
which is essential for collecting sinking particles (Gardner 1980a/b). Hydrodynamic effects,
such as current velocities which can create turbulence, might result in a tilt of the trap and are
likely to lead to under- or overcollection (Gardner 1985). In order to reduce hydrodynamic
biases, free-floating sediment traps that are coupled with the water motion in contrast to
moored sediment traps were considered to be favourable (Staresinic et al. 1978). Although a
perfect coupling is virtually impossible (Gardner 1985), the development of neutrally buoyant
sediment traps (NBSTs) has been recommended as a step forward (Gardner 2000). They
present the least biased form of sediment traps in terms of hydrodynamics as they are free
vehicles that flow with the current and thus minimise internal flow (Valdes and Price 2000).
This technology has been approved in comparison with free-floating sediment traps (Stanley et
al. 2004). Beside the cylindrical NBSTs (e.g. Buesseler et al. 2000; Stanley et al. 2004; Valdes
and Price 2000), a trap design with funnel shaped collection devices was also used
successfully (Lampitt et al. 2008). Apart from the hydrodynamic bias, swimmers (metazoan
zooplankton and occasionally small fish that are thought to actively enter the trap) can have a
strong impact on collection efficiency (see review and comment from Lee et al. (1988)). Their
uninvited presence in sediment traps can either account for additional mass (mainly in
poisoned traps) or reduce the collected material through flux feeding (compare Lee et al.
(1988) and references therein). The development of the Intended Rotating Sphere (IRS) trap
was an improvement to avoid swimmer (Peterson et al. 1993; 2005). In addition, swimmer
picking is a common and essential way to correct for introduced errors (see Buesseler et al.
2007 for recommendations).
Concernig ii), swimmers also have a large effect as they can alter particle forms via
ingestion and/or disaggregation (Lee et al. 1988 and references therein). Furthermore,
swimmers can alter particle shape, size and composition through their swimming behaviour
II. General Introduction
29
(Dilling and Alldredge 2001; Goldthwait et al. 2004). Another point is the disintegration of
marine snow by the collection devices of the sediment traps (Gardner 1985). Due to shear
motion in the vicinity of the deployed sediment trap the fragile material might easily be
destroyed during collection making it difficult to determine the original shape of the sinking
particles. Already at the very beginning of sediment trap studies the validity of collected
material was doubted: Within the trap new aggregates may potentially be formed from
particles that sank into it (as observed with a camera attached to a sediment trap by Asper
(1987)). Another concern for particle preservation within the trap is the effect of processes
such as chemical solution and/or bacterial degradation of the collected material (compare
Gardner (2000) and references therein).
II. General Introduction
30
II.5 Aims of the thesis
The main focus of this thesis is to investigate particle flux in the mesopelagic zone by
introducing free-floating gel traps and to compare results of this novel technique with other
sampling technologies as they were assessed in three different regions of the Southern Ocean.
The following hypotheses will be tested in this study:
I Structure and composition of sinking particles provide information on the
mechanisms of particle flux and modification.
II Free-floating gel traps are well suited to collect intact sinking particles.
III Different magnitude and composition of biogenic particle fluxes in different
regions of the Southern Ocean can be categorised as biogeochemical provinces.
Much is known about processes at the surface ocean, where DIC is converted into
organic carbon through photosynthesis, leading to a build-up of biomass. It is also known that
only a small amount of carbon that is fixed during PP settles at the seafloor where it is buried
for thousands of years and that the biological pump can act as a mechanism to transport carbon
to depths. Taking into consideration that the vast majority of the initially produced POC is lost
during transit through the water column, it becomes clear that processes which determine the
efficiency of the biological pump are essential to understand flux dynamics in the oceans. Due
to most of the flux modification occurring in the mesopelagic zone, it is necessary to ask the
question of what is happening to sinking particles within this zone. In order to address this
question, a technique is required that allows studying the flux on the base of individual
particles.
The aim of this study is to test a novel technique, consisting of the combination of free-
floating sediment traps and polyacrylamide gels (PA gels), which will be referred to as gel
-floating sediment traps, NBSTs and camera
systems, these gel traps were used to investigate different areas of the Southern Ocean. Being
a large sink of atmospheric CO2, the Southern Ocean is of particular interest to understanding
export flux processes. Due to the importance of the mesopelagic zone in terms of flux
alteration, I will focus on processes within the mesopelagic zone in three parts of the Southern
Ocean.
II. General Introduction
31
The following specific questions were addressed:
1) Can polyacrylamide gels capture the forms of individual sinking particles in a way that
allows conclusions to be drawn on flux dynamics?
2) How do particle fluxes differ between two regions of the Southern Ocean south of
Australia, where different surface plankton communities are present?
3) Are the processes in naturally iron fertilised waters on the Kerguelen Plateau in the
Indian Sector of the Southern Ocean mirrored in sizes and forms of the sinking particle
assemblage in comparison to surrounding waters?
4) What is the fate of unicellular plankton during an iron fertilisation experiment in the
Atlantic Sector of the Southern Ocean recycling or sinking?
Question 1 will be answered in Manuscript 1, which is a method script that is introducing
gel traps as a technique to examine particulate flux on the base of individual sinking particles.
Furthermore, it demonstrates the advantages over traditional sediment traps and shows its
limitations in regard to compatibility of trap and gel container where the sample is collected in.
The second question is addressed in Manuscript 2, presenting a field study in the
Southern Ocean south of Australia. During this project three sites (P1, P2, and P3) were
studied in two different regions (SAZ and PFZ). Manuscript 2 is focusing on a comparison of
particulate export within the sites and is based on data received from three different sediment
trap types, one of which were gel traps as described in Manuscript 1.
Manuscript 3 and Appendix 1 are dealing with question 3. In Appendix 1 the results of
export fluxes determined with gel traps in an area of natural iron fertilisation and surrounding
HNLC-waters in the Indian Sector of the Southern Ocean are presented. Manuscript 3
compares these gel trap based fluxes with particle fluxes received from an underwater camera
system.
Question 4 is discussed in Manuscript 4 that reports on the composition of export fluxes
following an iron fertilisation experiment, which was conducted in the Atlantic Sector of the
Southern Ocean. Flux data were mainly obtained from NBST bulk samples, and to a minor
extent also from NBST PA gels.
Each of these manuscripts (Manuscript 1-4, Appendix 1) is organised as a scientific
paper, with a separate introduction, result and discussion section. Chapter VI provides a
synthesis by placing the main conclusions of the manuscripts in a broader context, thus
outlining suggestions for future research.

32

33
III. Manuscripts

34
III. List of Manuscripts
35
III.1 List of Manuscripts and declaration of own contribution
Manuscript 1:
A unique opportunity to study intact marine particles: The combination of Polyacrylamide
gels and sediment traps (F. Ebersbach, T. W. Trull, D. M. Davies, C. Moy)
The method was tested by me in the laboratory at the ACE CRC in Hobart, TAS, Australia
(with the help of technicians). I performed all necessary steps to accomplish the described
method the combination of Polyacrylamide (PA) gels and sediment traps in the
laboratory at ACE CRC and at the AWI, and I successfully applied it during three cruises
in the Southern Ocean and North-West Pacific. The manuscript was primarily written by
me.
Based on the plan to conduct some additional laboratory tests on buffers and means of
preservation that will be conducted beginning 2011 by my Co-Authors T. Trull and D.
Davies, we decided to postpone submission of the manuscript to Limnology and
Oceanography: Methods until then. The manuscript would benefit from these further
improvements of the technique.
Manuscript 2:
Controls on mesopelagic particle fluxes in the Sub-Antarctic and Polar Frontal Zones in the
Southern Ocean south of Australia in summer perspectives from free-drifting sediment traps
(F. Ebersbach, T.W. Trull, D. M. Davies, S. G. Bray)
All data that are related to the gel method were obtained by me (including several steps
between image analysis and conversion into carbon flux). I made the calculations for
Tables 1, 6 8 and Fig. 5 9.
The manuscript was predominantly written by me and I also dealt with the two reviews.
On 30 June, the manuscript was accepted by Deep-Sea Research II.
Manuscript 3:
Optical imaging of mesopelagic particles indicates deep carbon flux beneath a natural iron
fertilized bloom in the Southern Ocean
(M.J. Jouandet, T. W. Trull, M. Picharel, F. Ebersbach, L. Stemmann, S. Blain)
III. List of Manuscripts
36
I provided one of the two data sets that are presented (compare also Appendix 1).
Furthermore, I was involved in discussing the two approaches of obtaining particulate
export flux rates and contributed to writing the manuscript.
After considering comments of two reviewers the manuscript was re-submitted to
Limnology and Oceanography on 25 October 2010.
Manuscript 4:
Sedimentation patterns of phyto- and protozooplankton during the iron fertilisation
experiment LOHAFEX in the Southern Ocean
(F. Ebersbach, P. Assmy, E. Nöthig)
This manuscript is entirely based on my own work: participation in the cruise and sample
collection on board, microscopic work and analysis in the laboratory (TEP) at AWI,
carbon flux estimates and data interpretation.
I wrote the manuscript and plan to submit it to Journal of Marine Systems. Due to an
overview paper on LOHAFEX being in preparation, I did not intend to anticipate any
general conclusions and thus restricted this manuscript to my own data.
Appendix 1:
Ebersbach, F., Trull, T., 2008. Sinking particle properties from polyacrylamide gels during the
KErguelen Ocean and Plateau compared Study (KEOPS): Zooplankton control of carbon
export in an area of persistent natural iron inputs in the Southern Ocean. Limnology and
Oceanography 53 (1), 212-224.
This paper was written by T. Trull and me together as outcome of my stay within his
working group and my successful participation in the KEOPS cruise. Moreover, this work
provided the basic ideas for the concept for this thesis.
The manuscript was published in January 2008 in Limnology and Oceanography.

37
Manuscript 1

38
III. Manuscript 1
39
A unique opportunity to study intact sinking particles: The combination of
Polyacrylamide gels and sediment traps
F. Ebersbach1, T.W. Trull2, 3, 4, D.M. Davies2,, C. Moy2
(order needs to be discussed prior to submission)
1 International Graduate School for Marine Science (GLOMAR),University of Bremen, and Alfred
Wegener Institute for Polar and Marine Research, Am Handelshafen 12, 27570 Bremerhaven,
Germany
2 Antarctic Climate and Ecosystems Cooperative Research Centre, Hobart, 7001, Australia
3 Centre for Australian Weather and Climate Research, a partnership of the Bureau of Meteorology and
the Commonwealth Scientific and Industrial Research Organisation, Hobart, 7001, Australia
4 Institute for Marine and Antarctic Studies, University of Tasmania, Hobart, 7001, Australia
(Draft September 2010 in preparation for L&O: Methods)
III. Manuscript 1
40
Acknowledgements
This work received support from the Australian Government Cooperative Research Centre Program.
This research was in part supported by the Australian Government Cooperative Research Centres
Programme through the Antarctic Climate and Ecosystems CRC (ACE CRC), Australian Antarctic
Science projects #2720 and #1156, the Australian Antarctic Division, CSIRO Marine and Atmospheric
Research, the US National Science Foundation (VERTIGO Award #0301139), the French-Australian
Science and Technology Program (Award #FR040170), the Australian Antarctic Science Program
(AAS#1156) and the Captain and Crew of RSV Aurora Australis. F.E. was supported by the German
Science Foundation (DFG) through the Excellence Initiative in the frame of the International Graduate
School for Marine Science (GLOMAR) of the University of Bremen.
III. Manuscript 1
41
Abstract
Identifying the character of sinking particles is essential to the evaluation of ecosystem controls on
particle export, yet most sediment trap studies collect sinking particles into tubes or cups that allow the
particles to clump together. This makes the identification of particle characteristics as they existed in
the water column difficult and subject to biases. Placing a layer of transparent viscous water-soluble
gel of polyacrylamide into sediment traps keeps particles isolated from each other and allows the
characterization of their sizes, shapes, and individual origins. This technique was introduced more than
30 years ago (Jannasch et al. 1980) but has not been widely applied or described in detail in an easily
available article. As a stimulus to its use, and with an emphasis on open ocean applications, we present
simple recipes for gel preparation, deployment, recovery, and processing for microscopic image
analysis. We also describe a few useful methodological modifications and indicate avenues for further
development.
III. Manuscript 1
42
Introduction
Only a small amount of particulate organic carbon (POC), the material produced in the
euphotic zone of the ocean s surface waters, reaches the sea floor via the biological pump (Volk and
Hoffert 1985). The vast majority (80-98%) of the sinking particles is recycled in the water column,
with most alteration taking place in the mesopelagic zone
underneath the euphotic layer and reaches down to 1000 m (e.g. Boyd and Trull 2007; Buesseler and
Boyd 2009). Various particle sources lead to the formation of different types of sinking particles,
collectively referred to as marine snow (Alldredge 1992). Aggregation of phytoplankton results in
bacterial solubilization (e.g. Bidle and Azam 1999; Iversen et al. 2010) or biological mediation (e.g.
Noji et al. 1991; Dilling and Alldredge 2000), act as particle sinks. Grazing repackages particles
demonstrating the complexity of interactions in terms of food-web structure. Particle composition,
however, provides insights into food-web dynamics and underlying processes that occur in the
mesopelagic zone.
In the past decades, POC fluxes have been investigated with different types of sediment traps
(see Buesseler et al. 2007a for a recent review) or filtration units (e.g. Lam and Bishop 2007), but the
sampling procedure can strongly impair shape and structure of the collected material. This problem is
particularly important in the assessment of the hypothesized dominant role of aggregates in modulating
export (e.g. Boyd and Newton 1995; 1999; Michaels and Silver 1988; Riebesell and Wolf-Gladrow
1992), because it is difficult if not impossible to tell whether the aggregates recovered in traps formed
in the ocean or in the trap. Optical methods utilizing camera systems (e.g. Asper 1987; Stemmann et al.
2008; Guidi et al. 2008) or senor floats (e.g. Bishop et al. 2002) provide powerful means to investigate
particle fluxes over a wide depths range, but do not return material to the surface. Albeit offering the
possibility to -diving (e.g. Alldredge and Silver
1988) is depth limited.
The overall goal is to collect sinking particles in a way that is representative of the in-situ flux,
and in a way that facilitates the optical and chemical characterization of their forms. The use of
polyacrylamide gel (PA gel) in sediment traps was first introduced in an attempt to obtain a flux time
series by Jannasch et al. (1980) and rediscovered by Lundsgard (1995), who deployed sediment traps
with PA gels to study flux characteristics by keeping particles separated as they settle into the gel.
Recently, PA gels have been used successfully in sediment traps to enable characterization of fragile
particles, including studies in coastal (e.g. Kiorboe et al. 1994; Lundsgaard et al. 1999; Waite et al.
2005) and open ocean settings (e.g. Ebersbach and Trull 2008; Ebersbach et al. 2010; Jackson et al.
2005; Waite and Nodder 2001; Waite et al. 2000) or to validate model estimates (e.g. Boyd et al. 2002;
Jackson et al. 2005). This perspective affects the design of the sediment trap deployment system, the
deployment duration, and the choice of the receiving gel (density, viscosity, incorporation of poison).
The advantage over previously used methods is that the collected material is preserved as well
III. Manuscript 1
43
separated, individual particles retaining their delicate form by virtue of the gentle deceleration as they
settle in the graded viscosity gel.
Our approach of studying particle flux with PA gels on free-floating sediment traps combines
the benefits of both collection and preservation of marine snow particles and the unique possibility to
investigate POC flux on the basis of individual particles. The traps can easily be deployed at depths of
1000 m and deeper offering the opportunity to study the entire mesopelagic zone.
Materials and Procedures
The method for collecting intact sinking particles in PA gels consists of the following Steps: (i)
the PA gels are prepared in an onshore laboratory, (ii) the PA gels are installed in the gel traps and the
brine (see below for properties) decanted onto them at sea prior to deployment, (iii) the sediment traps
(referred to as gel traps) are deployed, (iv) the gel traps are recovered and overlying brine is drained,
(v) low-magnification microscopy of the PA gels completed promptly on board, and (vi) high-
magnification microscopy is carried out onshore.
Design of the gel trap To deploy a gel trap, several aspects have to be taken into
consideration: the design of the sampling device, the matching of the trap to the gel container (see
below for details), and the position of the gel trap in the water column. It is well known that the design
of the sediment trap has a large impact on collecting sinking particles (e.g. Gardner 2000; Buesseler et
al. 2007a). The trap design is a plain cylinder of appropriate aspect ratio (see Assessment for further
discussion) with no baffle, a base with a stopcock, and fittings that allow it to be clamped to a cable
(Fig. 1). It is essential that the gel container diameter be matched to that of the cylinder to reduce
particle and wall interactions. Fig. 2 illustrates that the gel completely covers the trap base. Gel
containers were made from 500 ml Nalgene straight-side, wide-mouth polycarbonate containers,
modified by replacing the bottoms with an optically clear polycarbonate base for optimal illumination
and photo-microscopy. The containers have air-tight screw top lids for long-term storage.
PA gel preparation in the laboratory The acrylamide monomer is a potent neurotoxin and
carcinogen (refer to the appropriate material safety data sheets for this and the TEMED and persulfate).
No specific precautions are necessary for the resultant polymer. In order to prepare the brine, seawater
with salinity similar to the site of deployment was filtered through 2 quartz filters (nominal pore size
0.8 μm) and the salinity of the filtered seawater (FSW) adjusted to 50 psu by the addition of 15 g L-1 of
sodium chloride. Brine is used to ensure that the gel is sufficiently dense to remain at the bottom of the
container when deployed. The brine can be buffered by the addition of sodium tetraborate (see Table 1
for chemicals and quantities), which has proved essential for preserving calcareous material; this is an
important improvement over previous methods. Although gels have been observed to preserve organic
particles, addition of mercuric chloride (30 mg L-1) can be made at this point (see Assessment for
details). The FSW brine is then degassed by boiling for one hour and cooled afterwards while flushing
III. Manuscript 1
44
with nitrogen to ensure complete removal of oxygen which would otherwise destroy the free radical
sulfate ions that initiate the formation of linear polyacrylamide. The nitrogen flush can be stopped once
the TEMED catalyst has been added. The polymerization reaction is exothermic and hence the
reactants should be kept cool in an ice bath.
40% acrylamide solution is mixed into the FSW brine and while the solution is stirred
continuously, ammonium persulfate (initiator) is added. Once completely dissolved, the nitrogen flush
is stopped and TEMED (catalyst) is gradually added while stirring gently with a glass rod. The PA gel
will immediately start to thicken and the reaction is complete within a day. Tiny air bubbles that might
form in the solution during the reaction will disperse within a few days. After the polymerization is
finished, the PA gel can be transferred into the gel containers to form a 4 cm thick layer. The PA gel
can be stored at ambient temperature in a sealed container indefinitely.
Preparation of gel trap and PA gel onboard At least one day before deploying the trap, the
PA gel is moistened with a few mL of FSW brine taking care not to disturb the gel and then closing the
gel container. This procedure allows the top layer of the PA gel to soften, thus creating a viscosity
gradient that will gently decelerate the sinking particles and protect their fragile shapes as they enter
the gel. Immediately prior to deployment, the gel container and trap are assembled and additional brine
is decanted on top of the PA gel (a depth of 10 15 cm) to ensure a smooth viscosity gradient between
the softened gel surface and seawater. The higher density prevents washing out of the sample. Finally,
the gel trap is filled with FSW taking care to not disturb the density gradient. The trap opening is kept
covered until its clamped to the cable and about to be immersed.
Deployment and recovery of the gel traps The free-floating sediment trap array is shown in
Fig. 1. The spacing of several trap tubes at various depths (100 to 150 m apart) allows comparison of
the collected particle flux over a wide depth range. During deployment and recovery it is important to
keep the traps vertical because tilting might lead to an outflow of the PA gel or destruction of the
fragile material within it. The potential hazard of contamination with particles from the surface layer or
the atmosphere is minimized through fast and efficient deployment and recovery. Usually, the gel traps
are deployed for 24 hours (see Assessment for further discussion).
Sample treatment, storage and further processing Immediately after recovery, the tubes are
clamped vertically in a rack and drained carefully by opening the bottom stopcock. This reduces the
risk of surface particles entering the trap during recovery and settling in the gel. However, the drainage
has to be carried out slowly enough to minimize turbulence in the vicinity of the PA gel, which would
disturb the collected material. Once the PA gels are drained, the gel containers can be taken out of the
tube and the remaining overlying brine is carefully removed with a 50 mL plastic syringe equipped
with a short length of fine-bore tubing which allows seawater to be removed but offers too much
resistance if it contacts the viscous gel. Hence, any particles or swimmers that might originate from the
surface layer (where it may have entered the trap tube during recovery) are eliminated. The sealed gel
III. Manuscript 1
45
containers are stored at 4°C and can be kept for several months. It is also possible to freeze the
samples. Further means of preservation are discussed in the Assessment section.
Microscopic examination Immediately following recovery, particles were examined in dark-
field transmitted light with a Zeiss Stemi 2000 CS stereo-microscope coupled to a Leica DFC280 1.5
megapixel camera, with live recording to Leica Firecam software on an Apple Powerbook G4
computer. The PA gels were photographed under low magnification (6.5 to 50x) against an etched-
glass grid of 36 cells (12.5x14 mm each cell) on board (compare Ebersbach and Trull 2008) capturing
the delicate forms of the particles while fresh and insuring against unforeseen degradation problems or
loss. High magnification microscopy is conducted onshore (see Fig. 3).
Assessment
We want to emphasize the power of this technique to study downward particle flux as a main
contributor to the biological pump. The improvements and changes in the method, as compared to
previously applied approaches, are summarized in Table 2 and will be clarified below.
Gel properties In general, we follow the method of Lundsgard (1995) to prepare our PA gels.
We modified the PA gel density by increasing the amount of acrylamide from 8% to 16%, which
results in a more viscous gel described by Jannasch et al. (1980) as having the consistency of cold
honey. This prevents particles from sinking through the gel and flattening or becoming clumps and
suspends the sinking material within the topmost centimeter of the PA gel keeping them within the
narrow depth of field of the microscope as opposed to letting it settle to the bottom prior to
microscopic investigations (Lundsgaard et al. 1999). A sufficient gel thickness of around 4 cm is
advisable as particles may eventually (after many months) reach the bottom of the gel container (this is
discussed in more detail below).
Despite its toxic ingredients and the health hazards that arise during the procedure of
polymerizing the acrylamide (see Materials and Procedures) the polymer end product is non-toxic and
suits our application. We attempted to avoid the toxic preliminary steps by making the gels from
powdered PA that would not have posed a health issue. Not surprisingly, a PA gel based on the
monomer-free recipe is easily soluble in FSW, it dissolves immediately and hence is unsuitable. Other
materials, such as Ficoll, Carboxy-methyl cellulose or other substrates like resins could be looked at as
an alternative approach. A major consideration is to produce an optically clear substance thus we
conclude that the benefits of PA gels prepared as described justify the additional precautions.
Modifications of gel trap design The cylindrical trap design minimizes impacts with the
collected material (Fig. 2) and has widely been used in the past (e.g. Lundsgaard et al. 1999; Waite and
Nodder 2001; Waite et al. 2000) and to further minimize contact with particles we deliberately did not
include a baffle at the mouth. The accuracy of fit of the gel in the trap tube (Fig. 2) is essential for the
quantitative catch of the material and largely improves the reliability of the gel technique because it not
III. Manuscript 1
46
only minimizes contact with trap wall but also representatively samples the POC flux for different
particles. Earlier approaches were focused on only observing the particles: Waite et al. (2000), for
instance, found a lot of individual sinking diatoms and aggregates which would hardly have been
recognizable in a bulk sample. Our modification provides the possibility of comparing PA gel based
POC fluxes with POC flux estimates from sediment trap bulk samples and camera systems (Ebersbach
and Trull 2008; Ebersbach et al. 2010; Jouandet et al. subm.).
The advantage of using free-floating surface-tethered sediment traps (as shown in Fig. 1) is that
they are coupled to water motion and thus reduce hydrodynamic biases (e.g. Gardner 2000). Neutrally
buoyant sediment traps (NBSTs), which drift freely and are coupled to water motion, are even less
biased by hydrodynamic effects (Gardner 2000; Buesseler et al. 2007a). Unfortunately, our field tests
of the neutrally buoyant funnel-shaped PELAGRA trap (Lampit et al. 2008) equipped with PA gels
were not successful. The potential sources of several interferences for sinking particles are shown in
Fig. 4. Firstly, when rolling along the
with the wall (and get damaged) or/and with each other (and break, collide, clump together and form
aterial before it
leaves the sampling funnel at the bottom. Secondly, the bottom funnel opening is narrower than the gel
surface causing the particles to concentrate in one area of the gel. Furthermore, small-scale motion in
the vicinity of the opening might create turbulence which can again have an impact on particle
structure. Thus, material settling into the PA gel is probably heavily affected by physical stress. The
non-uniform distribution of collected material from a two days deployment of a PA gel with a
PELAGRA trap (Fig. 5) demonstrates that the impact on particle forms impedes the advantages of PA
gels making them incompatible with the PELAGRA traps. Because these particles have been altered by
their contact with the funnel (Fig. 5), funnel traps are not as reliable as cylindrical traps to obtain
particles in the forms that they exist in the sea and a promising future direction could be cylindrical
NBSTs equipped with PA gels (McDonell and Buesseler 2010).
Deployment and recovery of the gel trap Apa
evenly distributed and separated particles, thus allowing identification of individual particles under the
microscope (Fig. 6a shows a perfect example). Particle coverage can easily be regulated via
deployment time the longer the trap is left in the water collecting material, the more will settle into
the gel, and vice versa. A deployment time of 24 hours was successful in several studies (e.g.
Ebersbach and Trull 2008; Ebersbach et al. 2010). Of course, productivity of the study area also plays
an important role and has to be considered the higher the flux the shorter a deployment. Although
deployment time (Lamborg et al. 2008) and seasonal background (Buesseler et al. 2007b) were similar
for these two studies, the amount of material collected in PA gels was very different at the two
contrasting sites (pers. observation F. Ebersbach). While the PA gels from the low productive waters
were nearly empty, the gels from the area of high productivity were almost overloaded (Fig. 6c and d).
III. Manuscript 1
47
The former were difficult to analyze because the trapped few particles may not be representative,
whereas the latter made it almost impossible to distinguish individual particles. As for the operations
onboard it is self evident that a careful handling is necessary to minimize biases, such as the collection
of surface particles during recovery (as presented in Fig. 6b).
Particle size and composition from PA gels Ship movement becomes the biggest restriction
for microscopic investigations of viscous PA gels on board. However, low-magnification microscopy
on board and successive image analysis (Ebersbach and Trull 2008) provide the data on fresh particle
size spectra (Ebersbach and Trull 2008; Ebersbach et al. 2010; Jackson et al. 2005). Any detailed
investigation of the particles themselves requires high magnification microscopy to be carried out in a
laboratory onshore. Because of the three-dimensional nature of the particles, confocal microscopy
remains an excellent approach to assessing densities of picoplankton and larger phytoplankton in three
dimensions within particles, and the change in these densities with depth (Waite et al. 2000).
Means of preservation Ideally a means of preservation would halt further sinking of the
particles into the PA gel, stop bacterial growth and prevent the dissolution of calcareous material. The
PA gels have been observed microscopically to act as a preservative in themselves which is why
Jannasch et al. (1980) did not use a preservative but they suggested that traditional poisons could be
compatible. They also proposed freezing the PA gel for storage, and our laboratory tests confirm that
freezing a air gel properties. Freezing stops bacterial degradation, keeps the
particle structure within the gel, and prevents particles from further sinking. For short-term (<1 month)
transits from a research vessel to shore, refrigeration has been seen to be adequate to preserve particle
integrity (Waite et al., 2000), and poses fewer risks to any whole organisms embedded in particles. We
found that high concentrations of mercuric chloride (HgCl2), a common preservative and fixative in
sediment trap work, produced an unacceptably cloudy gel but at lower concentrations (30 mg L-1) the
PA gel was unaffected. Lundsgaard (1995) successfully used formalin with a PA gel as an alternative
to freezing. So far, we relied on the preserving potential of PA gels as such (as it is entirely anoxic) and
did not use extra means of fixation (e.g. Ebersbach and Trull 2008; Ebersbach et al. 2010). The
addition of a borate buffer (Table 1) to maintain the pH above 9 preventing dissolution is an important
modification and successfully preserves all particles long term.
The collected material might possibly settle to the bottom of the gel container, although it
might take several months. Other than freezing the PA gel, this could be stopped with chemical post
recovery hardening. When a PA gel simply dries out on the air, it shrinks and affects embedded
particles, and the hardened gel is full of tiny air bubbles disturbing its optical clear properties. We
found no other means of hardening the PA gel.
III. Manuscript 1
48
Discussion and Recommendation
The method described here offers the unique opportunity to study particle flux in a way that is
systems: it retrieves intact sinking particles to the surface. The deployment of our free-floating
sediment traps equipped with a PA gel (as shown in Fig. 1) easily provides means of collecting
material over a wide depths range from surface layers down to 1000 m (deeper deployment seem
possible if adequate equipment is available). By using gel equipped free-floating sediment traps,
sinking particles are collected in-situ in the water column, and brought to the surface in a PA gel. The
gels can be scanned at sea and investigated in detail in the laboratory onshore. Therewith, our method
overcomes the disadvantage of pure optical methods (where images of the sinking material are
recorded in-situ but particles are not retained).
dvantages:
(i) PA gels form optically clear, thermally stable solutions in either fresh or seawater. Due
to the transparency of the gel, the particles can be studied in detail under the
microscope without removal.
(ii) The PA gels are chemically stable and can be prepared months in advance. Gel filled
containers (ready for deployment) can easily be shipped to the study area. The gel
samples (after a successful deployment) can also be stored and transported during the
next couple of months.
(iii) The polymeric nature of the PA gels limits unwanted colligative effects, such as
changes in ionic strength or osmotic pressure, so that they do not provoke cell lysis or
mineral precipitation and the use of a buffer prevents dissolution of calcareous
particles.
(iv) The PA gels offer sufficient viscosity to isolate individual particles. Provided the gels
are prepared with a viscosity gradient at the surface they even allow very fine features
to be recovered intact.
(v) Because of the lack of particle perturbation, the gels allow the estimation of particle
size distributions using optical methods and image analysis.
(vi) The matrix of the gels permits the use of biochemical techniques for the study of
particles, such as application of stains.
The use of PA gels allows the identification of individual particles and subsequent separation
into particle groups, such as different types of fecal pellets and aggregates (Ebersbach and Trull 2008;
Ebersbach et al. 2010). In addition, image analysis allows particle size distributions of the sedimenting
material to be generated (Jackson et al. 2005) such that particle flux data can be compared in detail
with models and predictions (Boyd et al., 2002). The fact that carbon flux can be estimated
independently for each group, gives insights into changes of particle composition with depths and their
III. Manuscript 1
49
contribution to overall POC flux. This, in turns, is evident for the impact of food-web dynamics.
sediment traps in order to validate assumptions made on downward particle flux. Moreover, we advise
the use of free-floating sediment traps as they are a powerful tool to avoid hydrodynamic effects during
collection of sinking material. Given the key benefits of the PA gels (i to vi, see above) a deployment
with NBSTs promises to reveal further insights into particle flux (Mc Donell and Buesseler 2010).
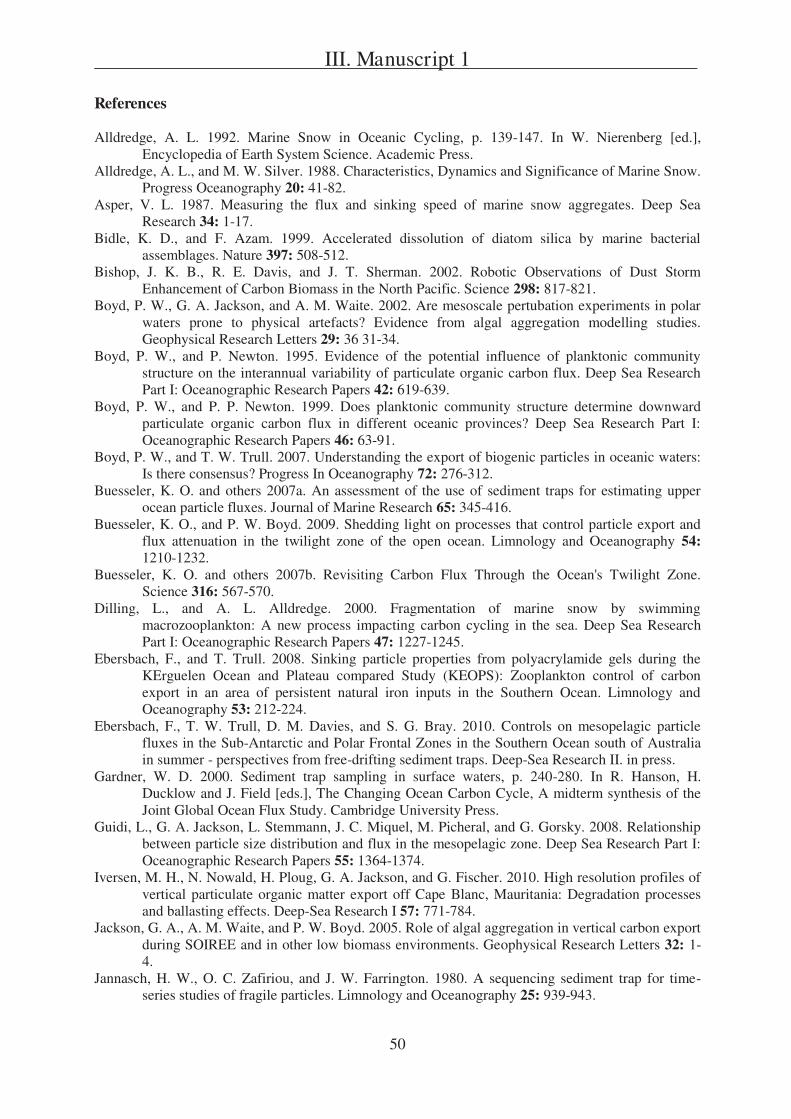
III. Manuscript 1
50
References Alldredge, A. L. 1992. Marine Snow in Oceanic Cycling, p. 139-147. In W. Nierenberg [ed.],
Encyclopedia of Earth System Science. Academic Press. Alldredge, A. L., and M. W. Silver. 1988. Characteristics, Dynamics and Significance of Marine Snow.
Progress Oceanography 20: 41-82. Asper, V. L. 1987. Measuring the flux and sinking speed of marine snow aggregates. Deep Sea
Research 34: 1-17. Bidle, K. D., and F. Azam. 1999. Accelerated dissolution of diatom silica by marine bacterial
assemblages. Nature 397: 508-512. Bishop, J. K. B., R. E. Davis, and J. T. Sherman. 2002. Robotic Observations of Dust Storm
Enhancement of Carbon Biomass in the North Pacific. Science 298: 817-821. Boyd, P. W., G. A. Jackson, and A. M. Waite. 2002. Are mesoscale pertubation experiments in polar
waters prone to physical artefacts? Evidence from algal aggregation modelling studies. Geophysical Research Letters 29: 36 31-34.
Boyd, P. W., and P. Newton. 1995. Evidence of the potential influence of planktonic community structure on the interannual variability of particulate organic carbon flux. Deep Sea Research Part I: Oceanographic Research Papers 42: 619-639.
Boyd, P. W., and P. P. Newton. 1999. Does planktonic community structure determine downward particulate organic carbon flux in different oceanic provinces? Deep Sea Research Part I: Oceanographic Research Papers 46: 63-91.
Boyd, P. W., and T. W. Trull. 2007. Understanding the export of biogenic particles in oceanic waters: Is there consensus? Progress In Oceanography 72: 276-312.
Buesseler, K. O. and others 2007a. An assessment of the use of sediment traps for estimating upper ocean particle fluxes. Journal of Marine Research 65: 345-416.
Buesseler, K. O., and P. W. Boyd. 2009. Shedding light on processes that control particle export and flux attenuation in the twilight zone of the open ocean. Limnology and Oceanography 54: 1210-1232.
Buesseler, K. O. and others 2007b. Revisiting Carbon Flux Through the Ocean's Twilight Zone. Science 316: 567-570.
Dilling, L., and A. L. Alldredge. 2000. Fragmentation of marine snow by swimming macrozooplankton: A new process impacting carbon cycling in the sea. Deep Sea Research Part I: Oceanographic Research Papers 47: 1227-1245.
Ebersbach, F., and T. Trull. 2008. Sinking particle properties from polyacrylamide gels during the KErguelen Ocean and Plateau compared Study (KEOPS): Zooplankton control of carbon export in an area of persistent natural iron inputs in the Southern Ocean. Limnology and Oceanography 53: 212-224.
Ebersbach, F., T. W. Trull, D. M. Davies, and S. G. Bray. 2010. Controls on mesopelagic particle fluxes in the Sub-Antarctic and Polar Frontal Zones in the Southern Ocean south of Australia in summer - perspectives from free-drifting sediment traps. Deep-Sea Research II. in press.
Gardner, W. D. 2000. Sediment trap sampling in surface waters, p. 240-280. In R. Hanson, H. Ducklow and J. Field [eds.], The Changing Ocean Carbon Cycle, A midterm synthesis of the Joint Global Ocean Flux Study. Cambridge University Press.
Guidi, L., G. A. Jackson, L. Stemmann, J. C. Miquel, M. Picheral, and G. Gorsky. 2008. Relationship between particle size distribution and flux in the mesopelagic zone. Deep Sea Research Part I: Oceanographic Research Papers 55: 1364-1374.
Iversen, M. H., N. Nowald, H. Ploug, G. A. Jackson, and G. Fischer. 2010. High resolution profiles of vertical particulate organic matter export off Cape Blanc, Mauritania: Degradation processes and ballasting effects. Deep-Sea Research I 57: 771-784.
Jackson, G. A., A. M. Waite, and P. W. Boyd. 2005. Role of algal aggregation in vertical carbon export during SOIREE and in other low biomass environments. Geophysical Research Letters 32: 1-4.
Jannasch, H. W., O. C. Zafiriou, and J. W. Farrington. 1980. A sequencing sediment trap for time-series studies of fragile particles. Limnology and Oceanography 25: 939-943.
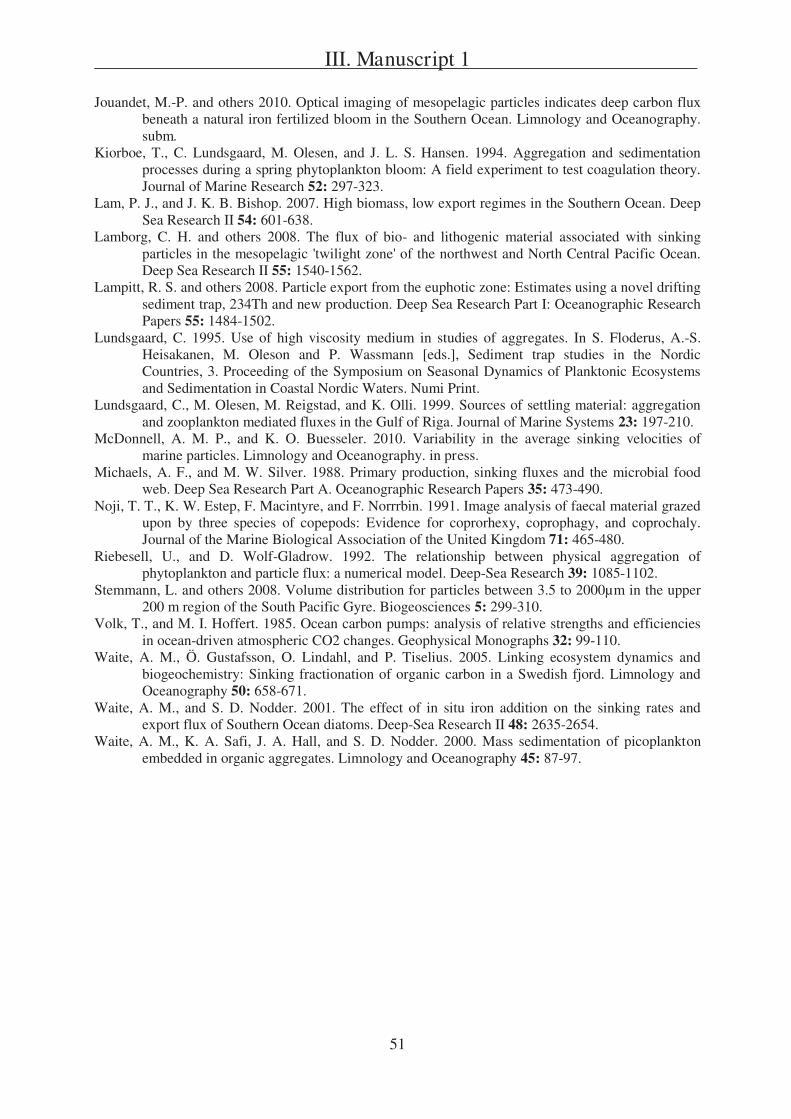
III. Manuscript 1
51
Jouandet, M.-P. and others 2010. Optical imaging of mesopelagic particles indicates deep carbon flux beneath a natural iron fertilized bloom in the Southern Ocean. Limnology and Oceanography. subm.
Kiorboe, T., C. Lundsgaard, M. Olesen, and J. L. S. Hansen. 1994. Aggregation and sedimentation processes during a spring phytoplankton bloom: A field experiment to test coagulation theory. Journal of Marine Research 52: 297-323.
Lam, P. J., and J. K. B. Bishop. 2007. High biomass, low export regimes in the Southern Ocean. Deep Sea Research II 54: 601-638.
Lamborg, C. H. and others 2008. The flux of bio- and lithogenic material associated with sinking particles in the mesopelagic 'twilight zone' of the northwest and North Central Pacific Ocean. Deep Sea Research II 55: 1540-1562.
Lampitt, R. S. and others 2008. Particle export from the euphotic zone: Estimates using a novel drifting sediment trap, 234Th and new production. Deep Sea Research Part I: Oceanographic Research Papers 55: 1484-1502.
Lundsgaard, C. 1995. Use of high viscosity medium in studies of aggregates. In S. Floderus, A.-S. Heisakanen, M. Oleson and P. Wassmann [eds.], Sediment trap studies in the Nordic Countries, 3. Proceeding of the Symposium on Seasonal Dynamics of Planktonic Ecosystems and Sedimentation in Coastal Nordic Waters. Numi Print.
Lundsgaard, C., M. Olesen, M. Reigstad, and K. Olli. 1999. Sources of settling material: aggregation and zooplankton mediated fluxes in the Gulf of Riga. Journal of Marine Systems 23: 197-210.
McDonnell, A. M. P., and K. O. Buesseler. 2010. Variability in the average sinking velocities of marine particles. Limnology and Oceanography. in press.
Michaels, A. F., and M. W. Silver. 1988. Primary production, sinking fluxes and the microbial food web. Deep Sea Research Part A. Oceanographic Research Papers 35: 473-490.
Noji, T. T., K. W. Estep, F. Macintyre, and F. Norrrbin. 1991. Image analysis of faecal material grazed upon by three species of copepods: Evidence for coprorhexy, coprophagy, and coprochaly. Journal of the Marine Biological Association of the United Kingdom 71: 465-480.
Riebesell, U., and D. Wolf-Gladrow. 1992. The relationship between physical aggregation of phytoplankton and particle flux: a numerical model. Deep-Sea Research 39: 1085-1102.
Stemmann, L. and others 2008. Volume distribution for particles between 3.5 to 2000μm in the upper 200 m region of the South Pacific Gyre. Biogeosciences 5: 299-310.
Volk, T., and M. I. Hoffert. 1985. Ocean carbon pumps: analysis of relative strengths and efficiencies in ocean-driven atmospheric CO2 changes. Geophysical Monographs 32: 99-110.
Waite, A. M., Ö. Gustafsson, O. Lindahl, and P. Tiselius. 2005. Linking ecosystem dynamics and biogeochemistry: Sinking fractionation of organic carbon in a Swedish fjord. Limnology and Oceanography 50: 658-671.
Waite, A. M., and S. D. Nodder. 2001. The effect of in situ iron addition on the sinking rates and export flux of Southern Ocean diatoms. Deep-Sea Research II 48: 2635-2654.
Waite, A. M., K. A. Safi, J. A. Hall, and S. D. Nodder. 2000. Mass sedimentation of picoplankton embedded in organic aggregates. Limnology and Oceanography 45: 87-97.
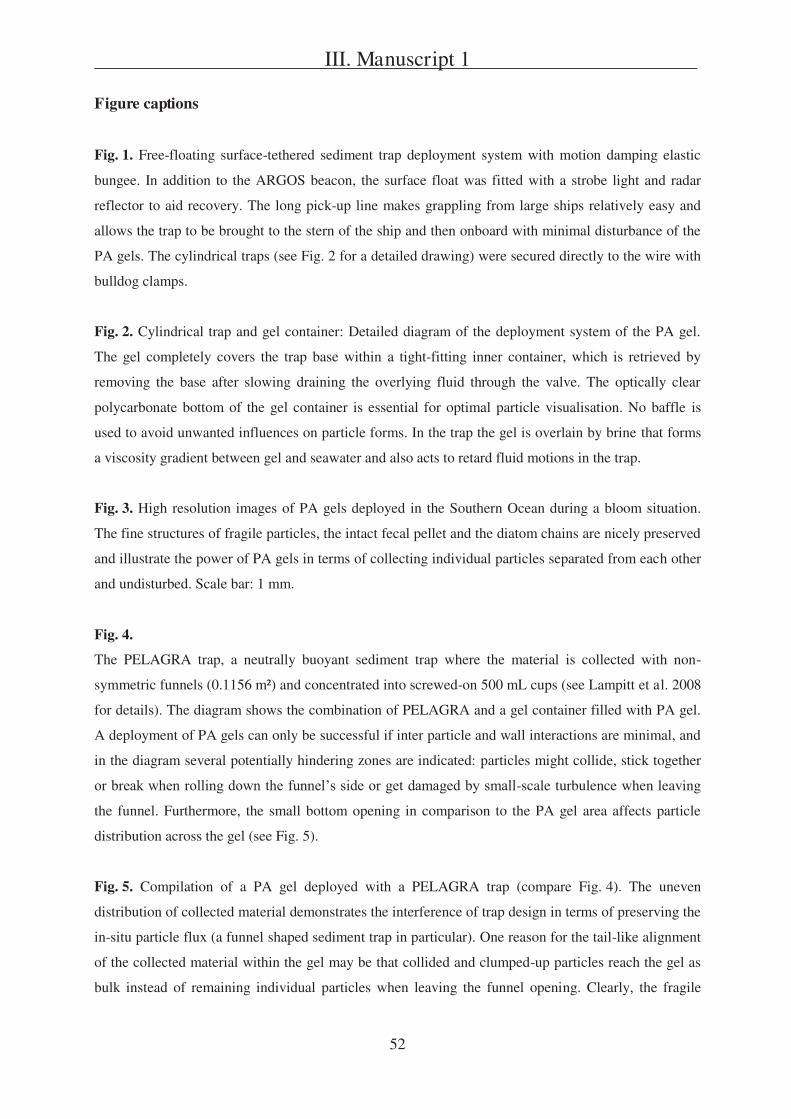
III. Manuscript 1
52
Figure captions
Fig. 1. Free-floating surface-tethered sediment trap deployment system with motion damping elastic
bungee. In addition to the ARGOS beacon, the surface float was fitted with a strobe light and radar
reflector to aid recovery. The long pick-up line makes grappling from large ships relatively easy and
allows the trap to be brought to the stern of the ship and then onboard with minimal disturbance of the
PA gels. The cylindrical traps (see Fig. 2 for a detailed drawing) were secured directly to the wire with
bulldog clamps.
Fig. 2. Cylindrical trap and gel container: Detailed diagram of the deployment system of the PA gel.
The gel completely covers the trap base within a tight-fitting inner container, which is retrieved by
removing the base after slowing draining the overlying fluid through the valve. The optically clear
polycarbonate bottom of the gel container is essential for optimal particle visualisation. No baffle is
used to avoid unwanted influences on particle forms. In the trap the gel is overlain by brine that forms
a viscosity gradient between gel and seawater and also acts to retard fluid motions in the trap.
Fig. 3. High resolution images of PA gels deployed in the Southern Ocean during a bloom situation.
The fine structures of fragile particles, the intact fecal pellet and the diatom chains are nicely preserved
and illustrate the power of PA gels in terms of collecting individual particles separated from each other
and undisturbed. Scale bar: 1 mm.
Fig. 4.
The PELAGRA trap, a neutrally buoyant sediment trap where the material is collected with non-
symmetric funnels (0.1156 m²) and concentrated into screwed-on 500 mL cups (see Lampitt et al. 2008
for details). The diagram shows the combination of PELAGRA and a gel container filled with PA gel.
A deployment of PA gels can only be successful if inter particle and wall interactions are minimal, and
in the diagram several potentially hindering zones are indicated: particles might collide, stick together
-scale turbulence when leaving
the funnel. Furthermore, the small bottom opening in comparison to the PA gel area affects particle
distribution across the gel (see Fig. 5).
Fig. 5. Compilation of a PA gel deployed with a PELAGRA trap (compare Fig. 4). The uneven
distribution of collected material demonstrates the interference of trap design in terms of preserving the
in-situ particle flux (a funnel shaped sediment trap in particular). One reason for the tail-like alignment
of the collected material within the gel may be that collided and clumped-up particles reach the gel as
bulk instead of remaining individual particles when leaving the funnel opening. Clearly, the fragile
III. Manuscript 1
53
structures of sinking particles have been disrupted. Moreover, the annular accumulation of material in
the gel has been caused by the smaller exit funnel diameter.
Fig. 6. Examples of particles collected in PA gels. Samples a) and b) are from a Southern Ocean site, c)
and d) from the Northwest Pacific (deployment was during a summer bloom in each case); depicted is
one grid cell (1.25 × 1.4 cm) of a PA gel. Scale bar: 1 cm. a) represents the perfect distribution of
material from a 24 h deployment (at 100 m, unpoisoned) showing that individual particles are collected
separated from each other, b) illustrates the results of a gel trap recovery (unpoisoned) from 200 m that
included dragging through the surface layer (and probably collected many individual phytoplankton
cells and chains meanwhile) for more than 30 min (Ebersbach and Trull 2008), c) and d) show nearly
overloaded PA after three day deployments at 150 m (note the negligible difference in particle
preservation between the unpoisoned PA gel (c) and the poisoned PA gel (d) taking into
consideration that images were taken immediately after recovery).
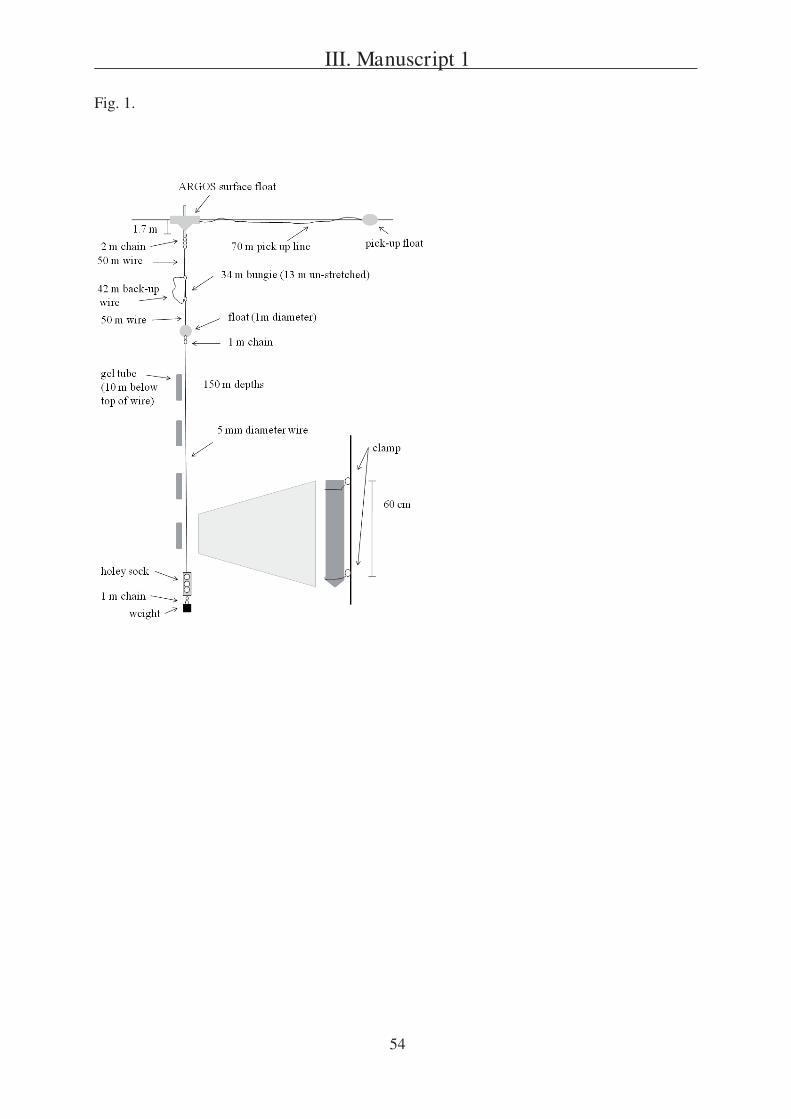
III. Manuscript 1
54
Fig. 1.
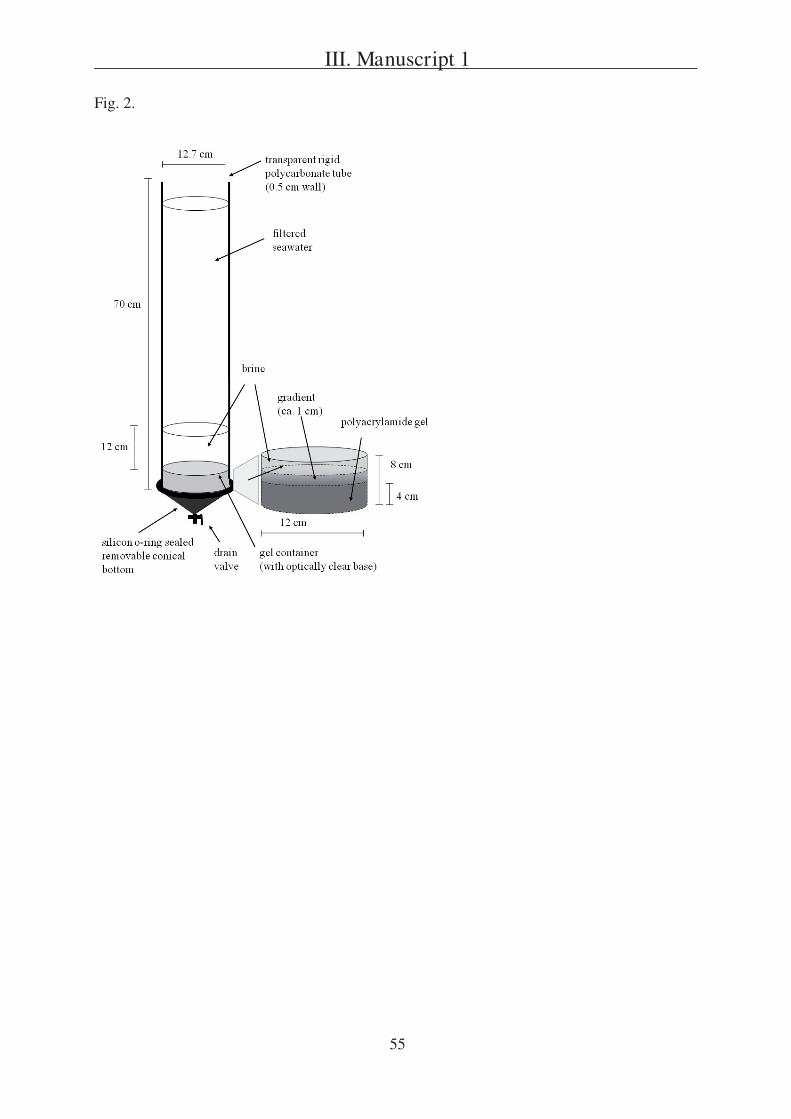
III. Manuscript 1
55
Fig. 2.
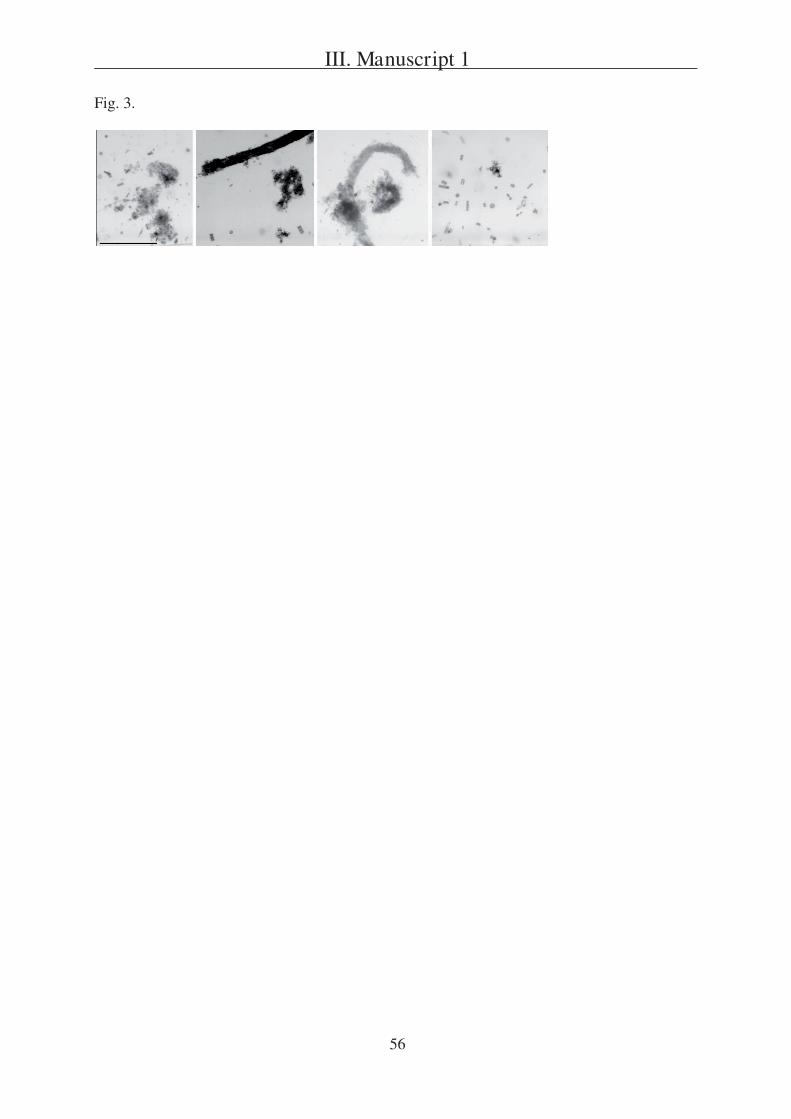
III. Manuscript 1
56
Fig. 3.
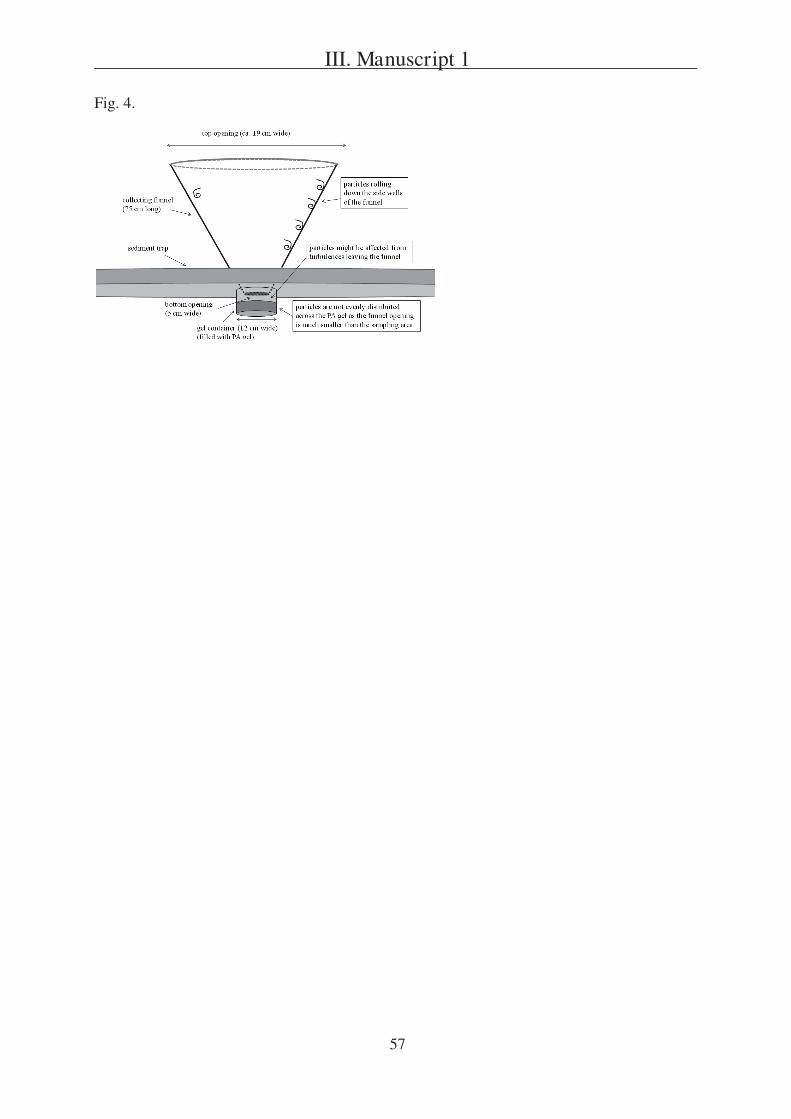
III. Manuscript 1
57
Fig. 4.
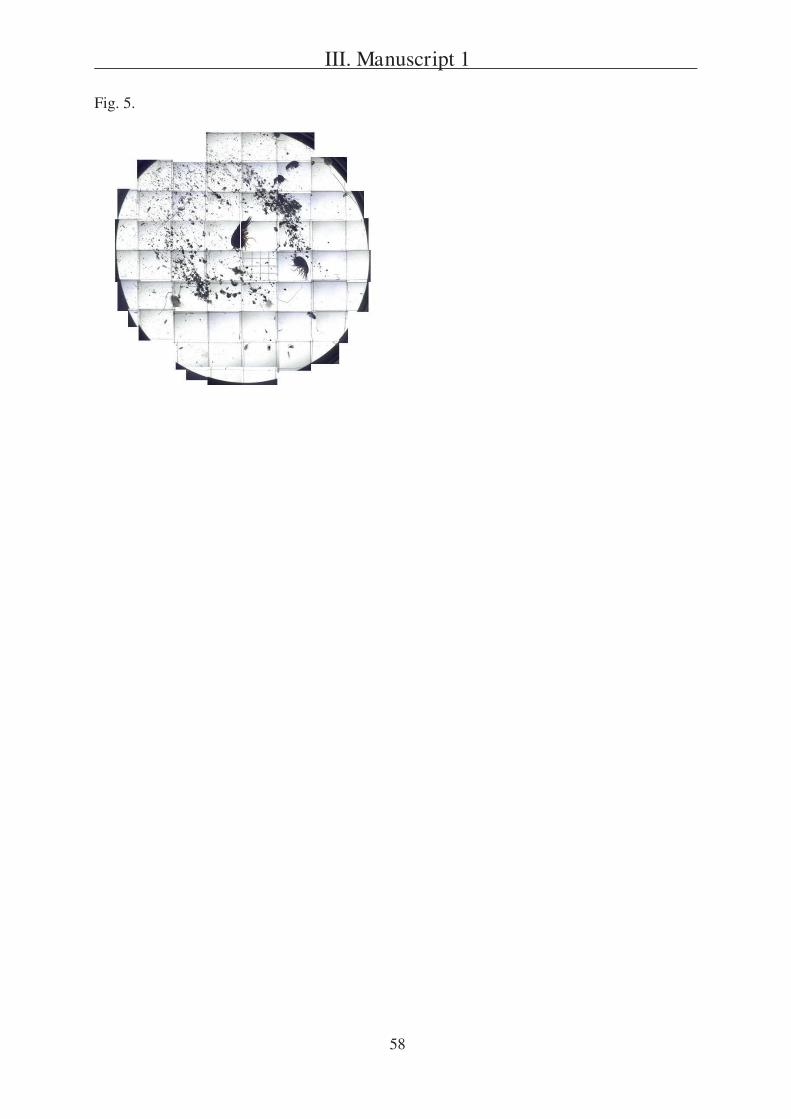
III. Manuscript 1
58
Fig. 5.
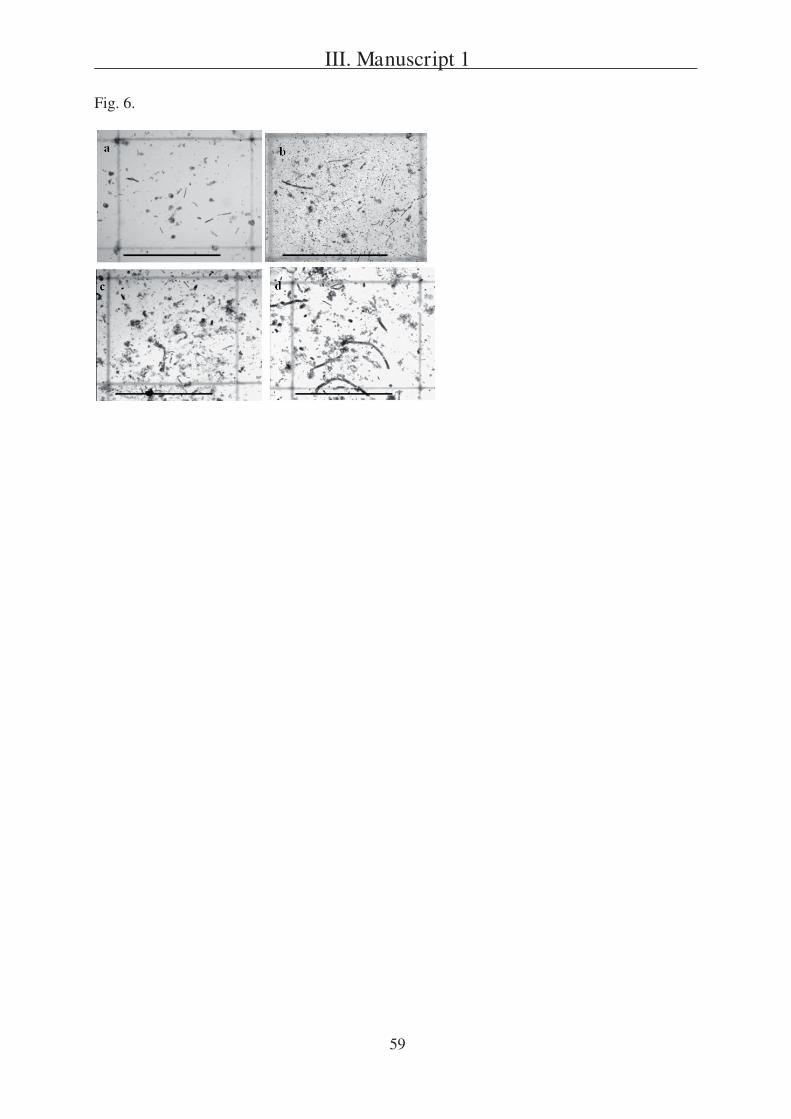
III. Manuscript 1
59
Fig. 6.
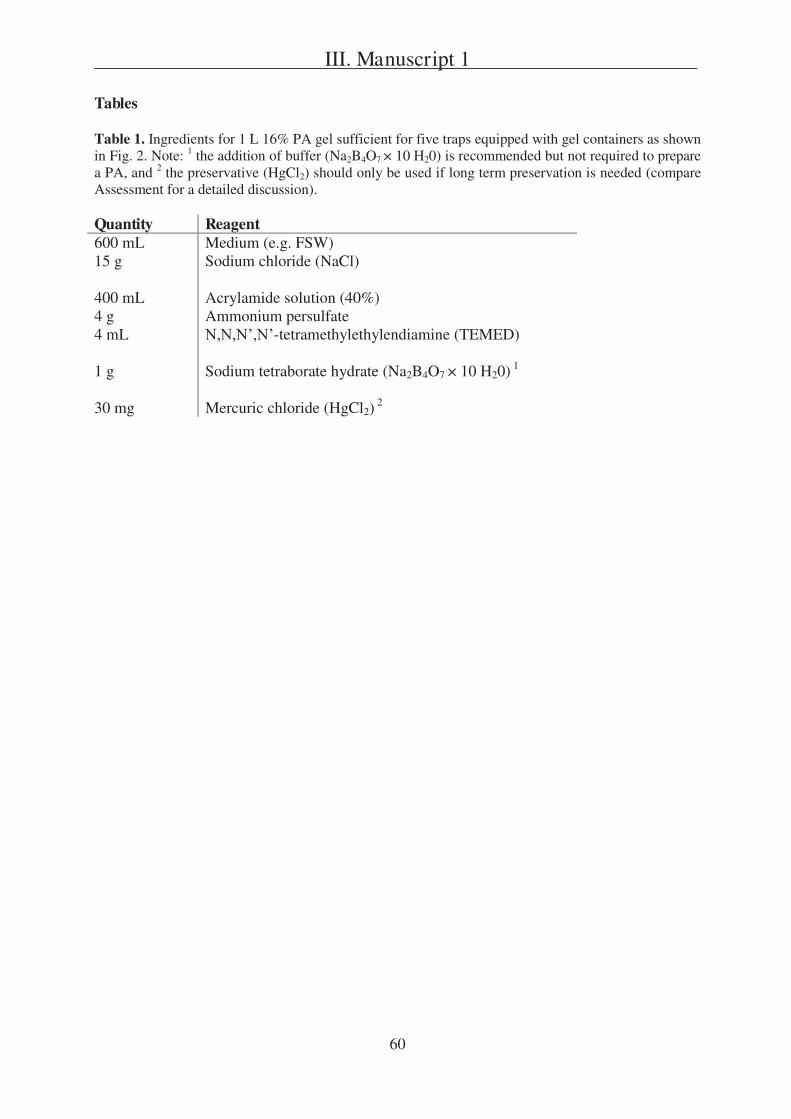
III. Manuscript 1
60
Tables
Table 1. Ingredients for 1 L 16% PA gel sufficient for five traps equipped with gel containers as shown in Fig. 2. Note: 1 the addition of buffer (Na2B4O7 × 10 H20) is recommended but not required to prepare a PA, and 2 the preservative (HgCl2) should only be used if long term preservation is needed (compare Assessment for a detailed discussion). Quantity Reagent 600 mL 15 g
Medium (e.g. FSW) Sodium chloride (NaCl)
400 mL Acrylamide solution (40%) 4 g Ammonium persulfate 4 mL -tetramethylethylendiamine (TEMED) 1 g 30 mg
Sodium tetraborate hydrate (Na2B4O7 × 10 H20) 1 Mercuric chloride (HgCl2)
2
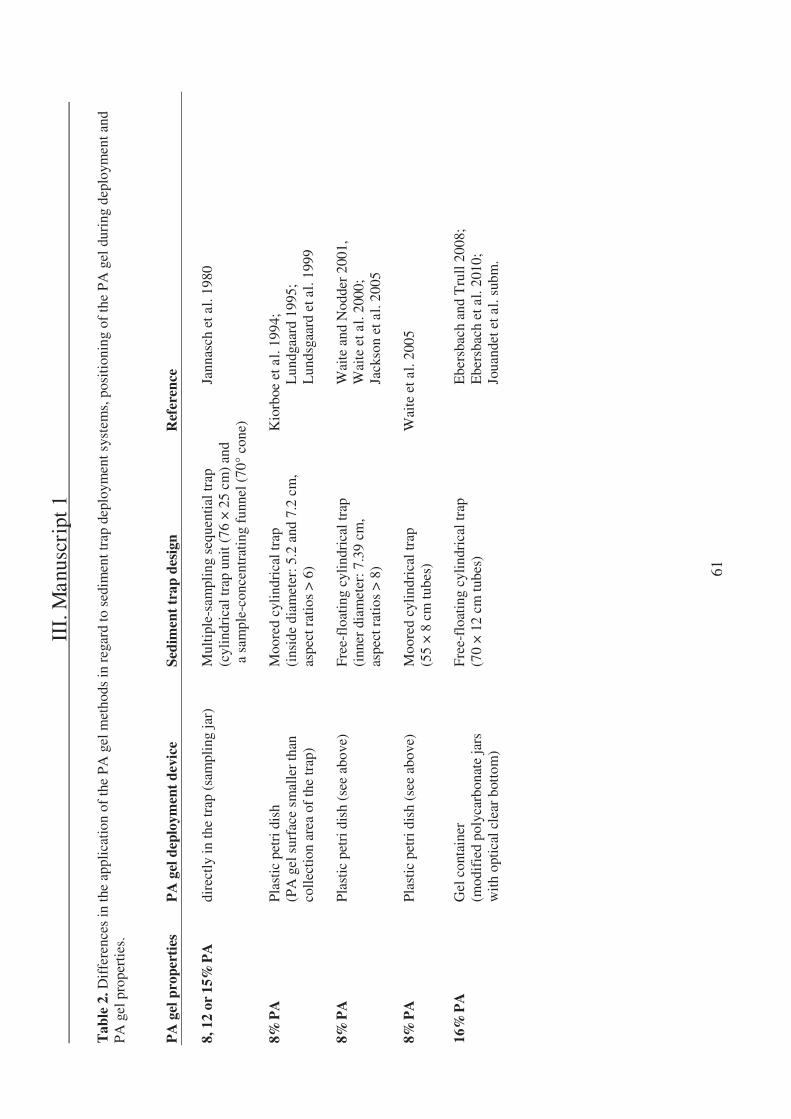
II
I. M
anus
crip
t 1
61
Tab
le 2
. Dif
fere
nces
in th
e ap
plic
atio
n of
the
PA g
el m
etho
ds in
reg
ard
to s
edim
ent t
rap
depl
oym
ent s
yste
ms,
pos
ition
ing
of th
e PA
gel
dur
ing
depl
oym
ent a
nd
PA g
el p
rope
rtie
s.
PA
gel
pro
pert
ies
PA
gel
dep
loym
ent
devi
ce
Se
dim
ent t
rap
desi
gn
Ref
eren
ce
8, 1
2 or
15%
PA
di
rect
ly in
the
trap
(sa
mpl
ing
jar)
M
ulti
ple-
sam
plin
g se
quen
tial t
rap
Ja
nnas
ch e
t al.
1980
(c
ylin
dric
al tr
ap u
nit (
76 ×
25
cm)
and
a s
ampl
e-co
ncen
trat
ing
funn
el (
70°
cone
) 8%
PA
Plas
tic p
etri
dis
h
M
oore
d cy
lindr
ical
trap
Kio
rboe
et a
l. 19
94;
(PA
gel
sur
face
sm
alle
r th
an
(i
nsid
e di
amet
er: 5
.2 a
nd 7
.2 c
m,
L
undg
aard
199
5;
colle
ctio
n ar
ea o
f th
e tr
ap)
as
pect
rat
ios
> 6
)
Lun
dsga
ard
et a
l. 19
99
8%
PA
Plas
tic p
etri
dis
h (s
ee a
bove
)
Free
-flo
atin
g cy
lindr
ical
trap
W
aite
and
Nod
der
2001
, (i
nner
dia
met
er: 7
.39
cm,
Wai
te e
t al.
2000
; as
pect
rat
ios
> 8
)
Jack
son
et a
l. 20
05
8% P
A
Pl
astic
pet
ri d
ish
(see
abo
ve)
M
oore
d cy
lindr
ical
trap
Wai
te e
t al.
2005
(5
5 ×
8 c
m tu
bes)
16
% P
A
G
el c
onta
iner
Free
-flo
atin
g cy
lind
rica
l tra
p
E
bers
bach
and
Tru
ll 20
08;
(mod
ifie
d po
lyca
rbon
ate
jars
(70
× 1
2 cm
tube
s)
E
bers
bach
et a
l. 20
10;
wit
h op
tical
cle
ar b
otto
m)
Jo
uand
et e
t al.
subm
.

62

63
Manuscript 2

64
III. Manuscript 2
65
Controls on mesopelagic particle fluxes in the Sub-Antarctic and Polar Frontal
Zones in the Southern Ocean south of Australia in summer perspectives from
free-drifting sediment traps
Friederike Ebersbach1, 2, Thomas W. Trull2, 3, 4, Diana M. Davies2 and Stephen G. Bray2
1 International Graduate School for Marine Science (GLOMAR),University of Bremen, and Alfred
Wegener Institute for Polar and Marine Research, Am Handelshafen 12, 27570 Bremerhaven,
Germany
2 Antarctic Climate and Ecosystems Cooperative Research Centre, Hobart, 7001, Australia
3 Centre for Australian Weather and Climate Research, a partnership of the Bureau of Meteorology
and the Commonwealth Scientific and Industrial Research Organisation, Hobart, 7001, Australia
4 Institute for Marine and Antarctic Studies, University of Tasmania, Hobart, 7001, Australia
(Manuscript accepted in Deep-Sea Research on 30 June 2010)
III. Manuscript 2
66
Abstract
The SAZ-Sense project examined ecosystem controls on Southern Ocean carbon export during
austral summer (January February 2007) at three locations: P1 in the low biomass Subantarctic Zone
(SAZ) west of Tasmania, P3 in a region of elevated biomass in the SAZ east of Tasmania fuelled by
enhanced iron supply, and P2 in High-Nutrient/Low Chlorophyll (HNLC) Polar Frontal Zone (PFZ)
waters south of P1 and P3. Sinking particles were collected using: i) a cylindrical time-series (PPS3/3)
trap for bulk geochemical fluxes, ii) indented rotating sphere (IRS) traps operated as in-situ settling
columns to determine the flux distribution across sinking-rate fractions, and iii) cylindrical traps filled
with polyacrylamide gels to obtain intact particles for image analysis.
Particulate organic carbon (POC) flux at 150 m (PPS3/3 trap) was highest at P1, lower at P2,
and lowest at P3 (3.3 ± 1.8, 2.1 ± 0.9, and 0.9 ± 0.4 mmol m2 d-1, respectively). Biogenic silica (BSi)
flux was very low in the SAZ (0.2 ± 0.2 and 0.02 ± 0.005 mmol m-2 d-1 at P1 and P3, respectively) and
much higher in the PFZ (2.3 ± 0.5 mmol m2 d-1 at P2). Hence, the high biomass site P3 did not exhibit
a correspondingly high flux of either POC or BSi. Separation of sinking-rate fractions with the IRS
traps (at 170 and 320 m depth) was only successful at the PFZ site P2, where a relatively uniform
distribution of flux was observed with ~ 1/3 of the POC sinking faster than 100 m d-1 and 1/3 sinking
slower than 10 m d-1.
Analysis of thousands of particles collected with the gel traps (at 140, 190, 240, and 290 m
depth) enabled us to identify 5 different categories: fluff-aggregates (low-density porous or amorphous
aggregates), faecal-aggregates (denser aggregates composed of different types of particles), cylindrical
and ovoid faecal pellets, and isolated phyto-cells (chains and single cells). Faecal-aggregates
dominated the flux at all sites, and were larger in size at P1 in comparison to P3. The PFZ site P2
differed strongly from both SAZ sites in having a much higher abundance of diatoms and relatively
small-sized faecal-aggregates. Overall, the particle images suggest that grazing was an important
influence on vertical export at all three sites, with differences in the extents of large aggregate
formation and direct diatom export further influencing the differences among the sites.
III. Manuscript 2
67
1. Introduction
The downward transfer of particulate organic carbon within the sea by biological processes,
known as the biological pump, had a strong influence in maintaining low pre-industrial atmospheric
CO2 levels (Volk and Hoffert, 1985). Its response to industrial CO2 emissions is uncertain, and is
expected to be relatively moderate, but merits consideration in assessing the magnitude of emissions
reductions required for stabilization of atmospheric CO2 (Falkowski et al., 2000; Matear and Hirst,
1999; Sarmiento and Le Quéré, 1996). The overall strength of the biological pump can be thought of
as consisting of 3 steps: i) primary production of organic matter by photosynthesis, ii) export of a
fraction of this production from the euphotic zone as sinking particles, and iii) attenuation of this
sinking flux by mesopelagic processes that limit the depth to which it is transferred and thus the
duration over which it remains isolated from the atmosphere. Each of these steps exhibits similar
variance and thus has similar potential importance in the control of the pump efficiency (Boyd and
Trull, 2007; Kwon et al., 2009), but the factors controlling these steps are still under debate (Boyd and
Trull, 2007; Buesseler and Boyd, 2009).
Attempts to predict the organic carbon export flux from primary production or phytoplankton
biomass accumulation have not been very successful, because primary and export production are often
decoupled by other aspects of ecosystem structure (e.g. Bishop, 1989; Boyd and Newton, 1995; 1999;
Buesseler 1991; Buesseler and Boyd, 2009). Of particular interest is determining the conditions under
which phytoplankton can be directly exported via physical flocculation and sinking, without passing
through higher trophic levels that engender respiration losses of POC (Alldredge and Jackson, 1995;
Michaels and Silver, 1988; Turner 2002).
Globally distributed deep ocean sediment trap programs have revealed some of the factors that
correlate with high POC flux, including the presence of ballast minerals (primarily autochthonous
biogenic carbonates and silica, and secondarily allochthonous lithogenic particles) and the occurrence
of strong seasonality (Armstrong et al., 2002; Francois et al., 2002; Klaas and Archer, 2002; Lampitt
and Antia, 1997; Lutz et al., 2002; 2007). But the importance of minerals is less clear at mesopelagic
depths, where POC dominates particle contents to a much greater degree, particle size and porosity are
strong influences on sinking rates (Alldredge, 1998; Alldredge and Gotschalk, 1988; De La Rocha and
Passow, 2007; Passow, 2004; Stemmann et al., 2004), and where the vast majority of flux attenuation
occurs (Buesseler et al., 2007a; Martin et al., 1987).
In this context of uncertainty regarding the controls on particle export and attenuation,
particularly at mesopelagic depths, methods that directly examine the forms and compositions of
sinking particles are useful. In this study, we used three different types of mesopelagic free-drifting
sediment traps to determine i) POC and mineral ballast fluxes, ii) particle sinking rates, and iii)
particle sizes and shapes. These methods let us examine several currently debated aspects of the
controls on POC flux, including the roles of phytoplankton flocs, zooplankton faecal pellets, ballast
minerals, and particle aggregation processes.
III. Manuscript 2
68
2. Material and Methods
2.1 Study area
The SAZ-Sense study took place in the Australian sector of the Southern Ocean and was
carried out during midsummer (17th January 20th February 2007). Three process stations were
studied in detail: P1 in the SAZ west of Tasmania, P3 in the SAZ east of Tasmania and P2 in the PFZ
further south (Fig. 1), with a much more limited set of measurements carried out at intervening
transect stations (see Griffith et al., this issue, for an overview). This paper focuses exclusively on the
process stations, which were each occupied for approximately 6 days. Sites P1 and P2 have been
examined previously, including a process study (overview in Trull et al., 2001a), but this was the first
process study at P3.
Site P1 is representative of a large proportion of the circumpolar SAZ, in terms of exhibiting
iron limitation, seasonally low silicate levels, non-limiting nitrate and phosphate levels, low to
moderate biomass throughout much of the year, and a mixed phytoplankton community that includes
cyanobacteria, coccolithophores, small diatoms, and flagellates (Rintoul and Trull, 2001; Sedwick et
al., 1999; 2008; Trull et al., 2001b; Wang et al., 2003). Site P2 is also representative of circumpolar
conditions for the PFZ. It has very low dissolved iron levels, non-limiting macro-nutrient
concentrations year-round, lower biomass with a pronounced summer maximum, and a phytoplankton
community dominated by diatoms. These differences in surface water communities are also reflected
in the composition of sinking particles reaching the deep sea, with carbonates dominating sediment
trap collections at P1 and silica dominating P2 (Trull et al., 2001b).
Site P3 differs from the circumpolar conditions that prevail at P1 and P2, in that it receives
inputs of southward flowing oligotrophic waters from eddies generated by the East Australian Current
an influence that has been increasing strongly in recent decades (Hill et al., 2008). Increased iron
supply is observed in this region of the SAZ (Bowie et al., 2009), as are surface biomass levels as
observed by satellite remote sensing (Mongin et al., this issue). Thus, this site offers the opportunity to
observe the response of export to natural iron inputs to the Subantarctic Zone, which can be compared
to other Southern Ocean natural iron fertilisation studies such as CROZEX (Pollard et al., 2007) and
KEOPS (Blain et al., 2007).
In the absence of sustained observations, the main indication of the seasonal context of the
SAZ-Sense study comes from satellite observations. Ocean colour observations show the
development of seasonal blooms with biomass accumulation starting in December 2006 at P1 and P2,
and in February 2007 at P3 (Mongin et al., this issue). Based on those satellite ocean colour
observations, the bloom at P3 was still growing, while the peak at P1 was already over and at P2 the
bloom was strongly declining. Prior to the cruise, surface Chl a levels based on SeaWiFS images were
highest at P3, somewhat lower at P1 and lowest at P2 (~ 0.4, ~ 0.3, and ~ 0.25 mg m-3, respectively;
Mongin et al., this issue).
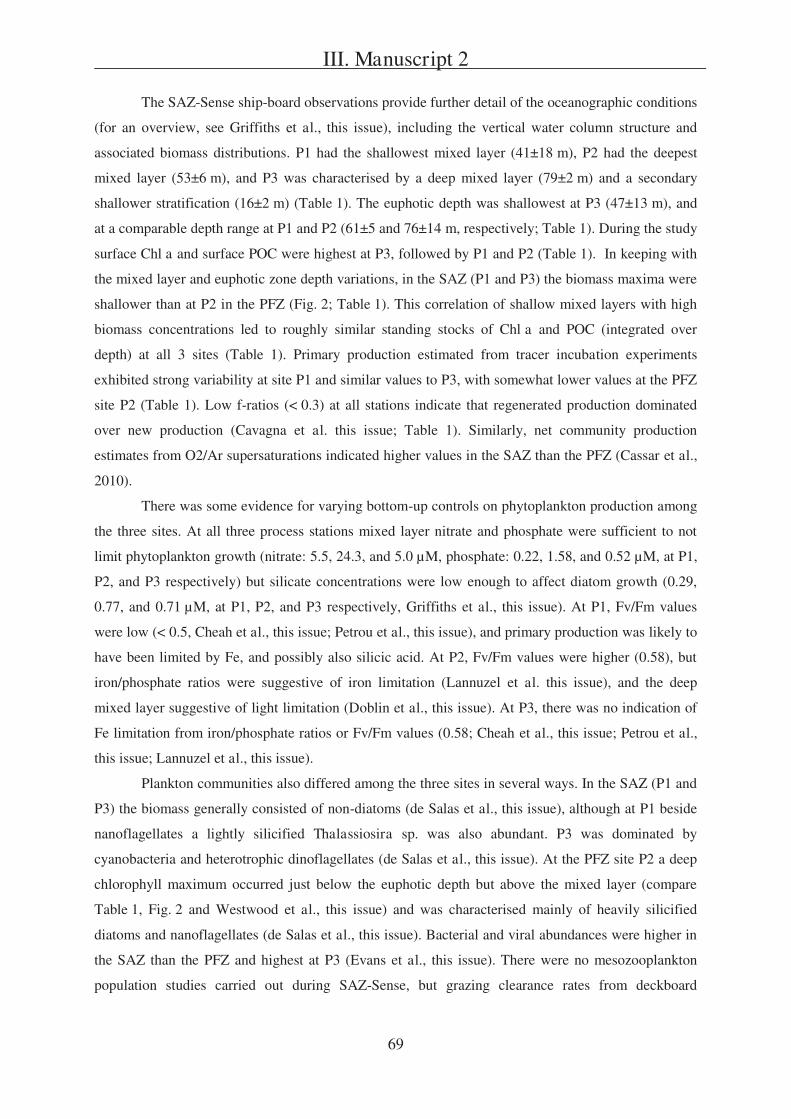
III. Manuscript 2
69
The SAZ-Sense ship-board observations provide further detail of the oceanographic conditions
(for an overview, see Griffiths et al., this issue), including the vertical water column structure and
associated biomass distributions. P1 had the shallowest mixed layer (41±18 m), P2 had the deepest
mixed layer (53±6 m), and P3 was characterised by a deep mixed layer (79±2 m) and a secondary
shallower stratification (16±2 m) (Table 1). The euphotic depth was shallowest at P3 (47±13 m), and
at a comparable depth range at P1 and P2 (61±5 and 76±14 m, respectively; Table 1). During the study
surface Chl a and surface POC were highest at P3, followed by P1 and P2 (Table 1). In keeping with
the mixed layer and euphotic zone depth variations, in the SAZ (P1 and P3) the biomass maxima were
shallower than at P2 in the PFZ (Fig. 2; Table 1). This correlation of shallow mixed layers with high
biomass concentrations led to roughly similar standing stocks of Chl a and POC (integrated over
depth) at all 3 sites (Table 1). Primary production estimated from tracer incubation experiments
exhibited strong variability at site P1 and similar values to P3, with somewhat lower values at the PFZ
site P2 (Table 1). Low f-ratios (< 0.3) at all stations indicate that regenerated production dominated
over new production (Cavagna et al. this issue; Table 1). Similarly, net community production
estimates from O2/Ar supersaturations indicated higher values in the SAZ than the PFZ (Cassar et al.,
2010).
There was some evidence for varying bottom-up controls on phytoplankton production among
the three sites. At all three process stations mixed layer nitrate and phosphate were sufficient to not
limit phytoplankton growth (nitrate: 5.5, 24.3, and 5.0 μM, phosphate: 0.22, 1.58, and 0.52 μM, at P1,
P2, and P3 respectively) but silicate concentrations were low enough to affect diatom growth (0.29,
0.77, and 0.71 μM, at P1, P2, and P3 respectively, Griffiths et al., this issue). At P1, Fv/Fm values
were low (< 0.5, Cheah et al., this issue; Petrou et al., this issue), and primary production was likely to
have been limited by Fe, and possibly also silicic acid. At P2, Fv/Fm values were higher (0.58), but
iron/phosphate ratios were suggestive of iron limitation (Lannuzel et al. this issue), and the deep
mixed layer suggestive of light limitation (Doblin et al., this issue). At P3, there was no indication of
Fe limitation from iron/phosphate ratios or Fv/Fm values (0.58; Cheah et al., this issue; Petrou et al.,
this issue; Lannuzel et al., this issue).
Plankton communities also differed among the three sites in several ways. In the SAZ (P1 and
P3) the biomass generally consisted of non-diatoms (de Salas et al., this issue), although at P1 beside
nanoflagellates a lightly silicified Thalassiosira sp. was also abundant. P3 was dominated by
cyanobacteria and heterotrophic dinoflagellates (de Salas et al., this issue). At the PFZ site P2 a deep
chlorophyll maximum occurred just below the euphotic depth but above the mixed layer (compare
Table 1, Fig. 2 and Westwood et al., this issue) and was characterised mainly of heavily silicified
diatoms and nanoflagellates (de Salas et al., this issue). Bacterial and viral abundances were higher in
the SAZ than the PFZ and highest at P3 (Evans et al., this issue). There were no mesozooplankton
population studies carried out during SAZ-Sense, but grazing clearance rates from deckboard
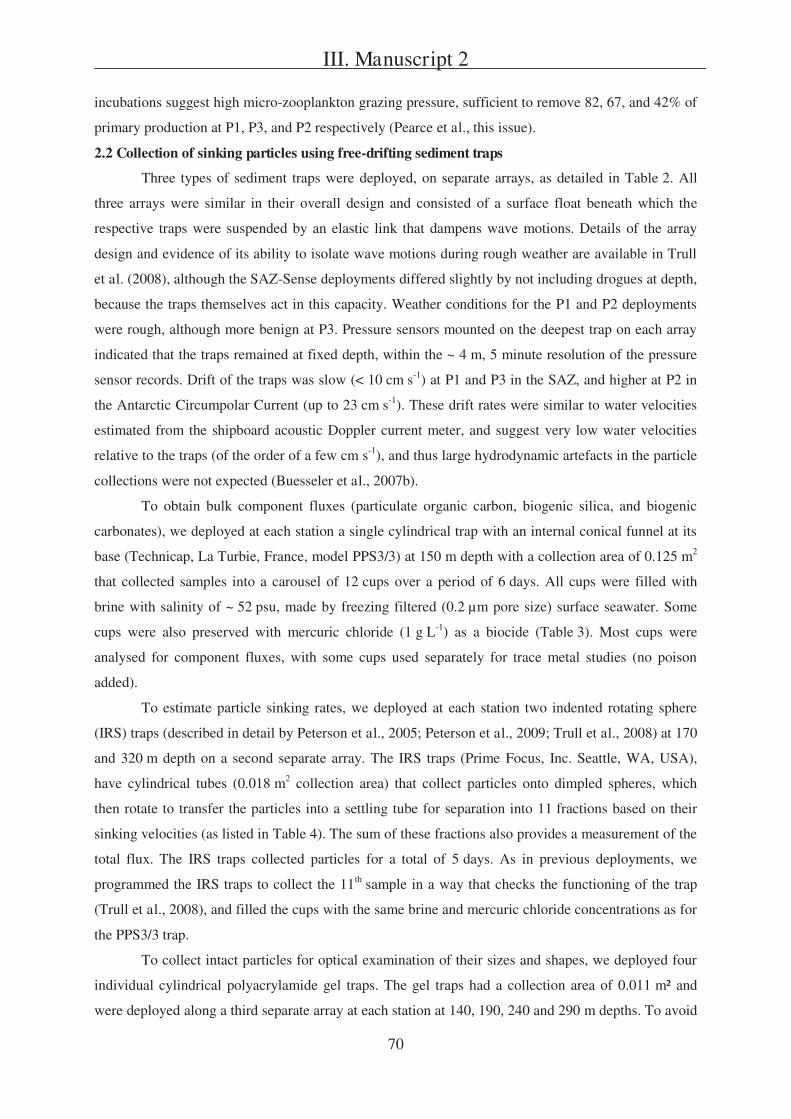
III. Manuscript 2
70
incubations suggest high micro-zooplankton grazing pressure, sufficient to remove 82, 67, and 42% of
primary production at P1, P3, and P2 respectively (Pearce et al., this issue).
2.2 Collection of sinking particles using free-drifting sediment traps
Three types of sediment traps were deployed, on separate arrays, as detailed in Table 2. All
three arrays were similar in their overall design and consisted of a surface float beneath which the
respective traps were suspended by an elastic link that dampens wave motions. Details of the array
design and evidence of its ability to isolate wave motions during rough weather are available in Trull
et al. (2008), although the SAZ-Sense deployments differed slightly by not including drogues at depth,
because the traps themselves act in this capacity. Weather conditions for the P1 and P2 deployments
were rough, although more benign at P3. Pressure sensors mounted on the deepest trap on each array
indicated that the traps remained at fixed depth, within the ~ 4 m, 5 minute resolution of the pressure
sensor records. Drift of the traps was slow (< 10 cm s-1) at P1 and P3 in the SAZ, and higher at P2 in
the Antarctic Circumpolar Current (up to 23 cm s-1). These drift rates were similar to water velocities
estimated from the shipboard acoustic Doppler current meter, and suggest very low water velocities
relative to the traps (of the order of a few cm s-1), and thus large hydrodynamic artefacts in the particle
collections were not expected (Buesseler et al., 2007b).
To obtain bulk component fluxes (particulate organic carbon, biogenic silica, and biogenic
carbonates), we deployed at each station a single cylindrical trap with an internal conical funnel at its
base (Technicap, La Turbie, France, model PPS3/3) at 150 m depth with a collection area of 0.125 m2
that collected samples into a carousel of 12 cups over a period of 6 days. All cups were filled with
brine with salinity of ~ 52 psu, made by freezing filtered (0.2 μm pore size) surface seawater. Some
cups were also preserved with mercuric chloride (1 g L-1) as a biocide (Table 3). Most cups were
analysed for component fluxes, with some cups used separately for trace metal studies (no poison
added).
To estimate particle sinking rates, we deployed at each station two indented rotating sphere
(IRS) traps (described in detail by Peterson et al., 2005; Peterson et al., 2009; Trull et al., 2008) at 170
and 320 m depth on a second separate array. The IRS traps (Prime Focus, Inc. Seattle, WA, USA),
have cylindrical tubes (0.018 m2 collection area) that collect particles onto dimpled spheres, which
then rotate to transfer the particles into a settling tube for separation into 11 fractions based on their
sinking velocities (as listed in Table 4). The sum of these fractions also provides a measurement of the
total flux. The IRS traps collected particles for a total of 5 days. As in previous deployments, we
programmed the IRS traps to collect the 11th sample in a way that checks the functioning of the trap
(Trull et al., 2008), and filled the cups with the same brine and mercuric chloride concentrations as for
the PPS3/3 trap.
To collect intact particles for optical examination of their sizes and shapes, we deployed four
individual cylindrical polyacrylamide gel traps. The gel traps had a collection area of 0.011 m² and
were deployed along a third separate array at each station at 140, 190, 240 and 290 m depths. To avoid
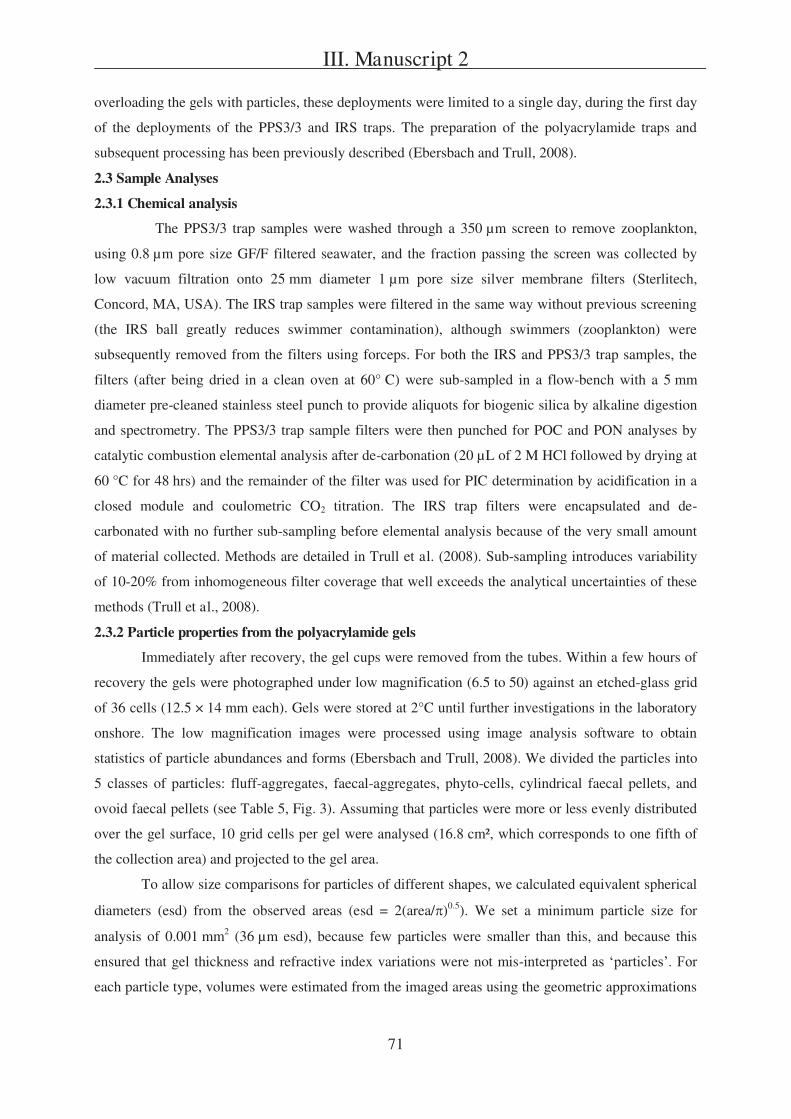
III. Manuscript 2
71
overloading the gels with particles, these deployments were limited to a single day, during the first day
of the deployments of the PPS3/3 and IRS traps. The preparation of the polyacrylamide traps and
subsequent processing has been previously described (Ebersbach and Trull, 2008).
2.3 Sample Analyses
2.3.1 Chemical analysis
The PPS3/3 trap samples were washed through a 350 μm screen to remove zooplankton,
using 0.8 μm pore size GF/F filtered seawater, and the fraction passing the screen was collected by
low vacuum filtration onto 25 mm diameter 1 μm pore size silver membrane filters (Sterlitech,
Concord, MA, USA). The IRS trap samples were filtered in the same way without previous screening
(the IRS ball greatly reduces swimmer contamination), although swimmers (zooplankton) were
subsequently removed from the filters using forceps. For both the IRS and PPS3/3 trap samples, the
filters (after being dried in a clean oven at 60° C) were sub-sampled in a flow-bench with a 5 mm
diameter pre-cleaned stainless steel punch to provide aliquots for biogenic silica by alkaline digestion
and spectrometry. The PPS3/3 trap sample filters were then punched for POC and PON analyses by
catalytic combustion elemental analysis after de-carbonation (20 μL of 2 M HCl followed by drying at
60 °C for 48 hrs) and the remainder of the filter was used for PIC determination by acidification in a
closed module and coulometric CO2 titration. The IRS trap filters were encapsulated and de-
carbonated with no further sub-sampling before elemental analysis because of the very small amount
of material collected. Methods are detailed in Trull et al. (2008). Sub-sampling introduces variability
of 10-20% from inhomogeneous filter coverage that well exceeds the analytical uncertainties of these
methods (Trull et al., 2008).
2.3.2 Particle properties from the polyacrylamide gels
Immediately after recovery, the gel cups were removed from the tubes. Within a few hours of
recovery the gels were photographed under low magnification (6.5 to 50) against an etched-glass grid
of 36 cells (12.5 × 14 mm each). Gels were stored at 2°C until further investigations in the laboratory
onshore. The low magnification images were processed using image analysis software to obtain
statistics of particle abundances and forms (Ebersbach and Trull, 2008). We divided the particles into
5 classes of particles: fluff-aggregates, faecal-aggregates, phyto-cells, cylindrical faecal pellets, and
ovoid faecal pellets (see Table 5, Fig. 3). Assuming that particles were more or less evenly distributed
over the gel surface, 10 grid cells per gel were analysed (16.8 cm², which corresponds to one fifth of
the collection area) and projected to the gel area.
To allow size comparisons for particles of different shapes, we calculated equivalent spherical
diameters (esd) from the observed areas (esd = 2(area/ )0.5). We set a minimum particle size for
analysis of 0.001 mm2 (36 μm esd), because few particles were smaller than this, and because this
ensured that gel thickness and refractive index variations were not mis-
each particle type, volumes were estimated from the imaged areas using the geometric approximations
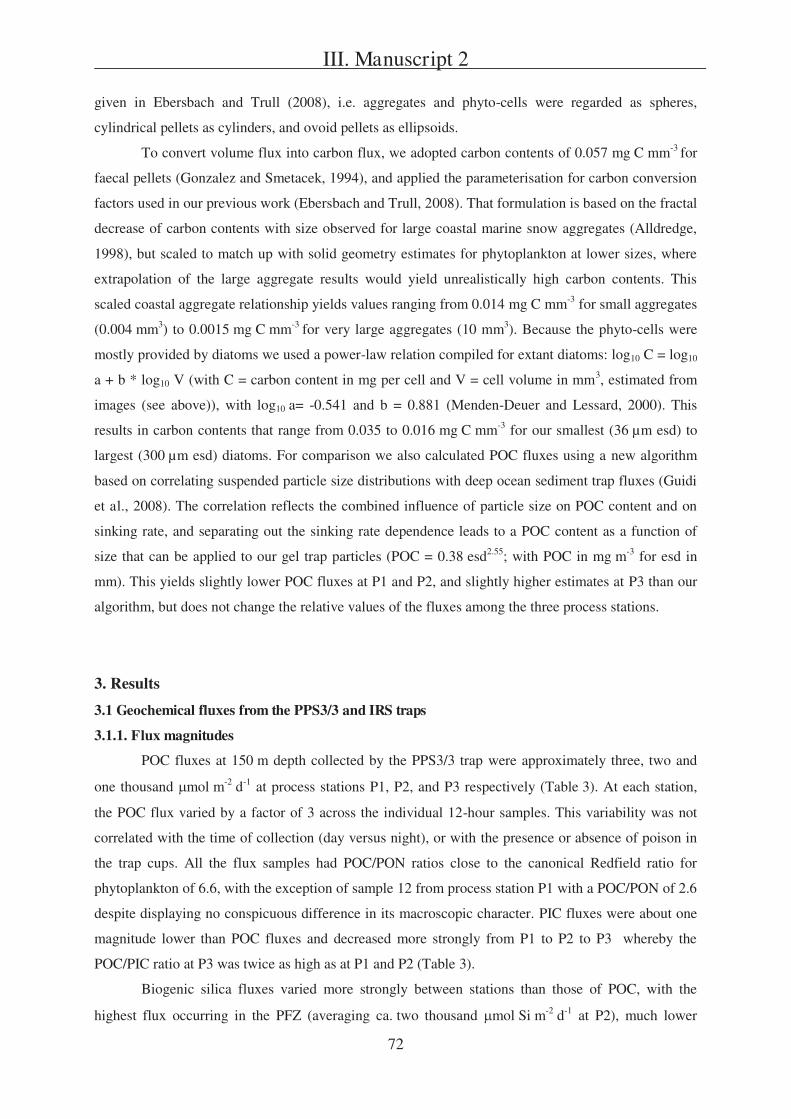
III. Manuscript 2
72
given in Ebersbach and Trull (2008), i.e. aggregates and phyto-cells were regarded as spheres,
cylindrical pellets as cylinders, and ovoid pellets as ellipsoids.
To convert volume flux into carbon flux, we adopted carbon contents of 0.057 mg C mm-3 for
faecal pellets (Gonzalez and Smetacek, 1994), and applied the parameterisation for carbon conversion
factors used in our previous work (Ebersbach and Trull, 2008). That formulation is based on the fractal
decrease of carbon contents with size observed for large coastal marine snow aggregates (Alldredge,
1998), but scaled to match up with solid geometry estimates for phytoplankton at lower sizes, where
extrapolation of the large aggregate results would yield unrealistically high carbon contents. This
scaled coastal aggregate relationship yields values ranging from 0.014 mg C mm-3 for small aggregates
(0.004 mm3) to 0.0015 mg C mm-3 for very large aggregates (10 mm3). Because the phyto-cells were
mostly provided by diatoms we used a power-law relation compiled for extant diatoms: log10 C = log10
a + b * log10 V (with C = carbon content in mg per cell and V = cell volume in mm3, estimated from
images (see above)), with log10 a= -0.541 and b = 0.881 (Menden-Deuer and Lessard, 2000). This
results in carbon contents that range from 0.035 to 0.016 mg C mm-3 for our smallest (36 μm esd) to
largest (300 μm esd) diatoms. For comparison we also calculated POC fluxes using a new algorithm
based on correlating suspended particle size distributions with deep ocean sediment trap fluxes (Guidi
et al., 2008). The correlation reflects the combined influence of particle size on POC content and on
sinking rate, and separating out the sinking rate dependence leads to a POC content as a function of
size that can be applied to our gel trap particles (POC = 0.38 esd2.55; with POC in mg m-3 for esd in
mm). This yields slightly lower POC fluxes at P1 and P2, and slightly higher estimates at P3 than our
algorithm, but does not change the relative values of the fluxes among the three process stations.
3. Results
3.1 Geochemical fluxes from the PPS3/3 and IRS traps
3.1.1. Flux magnitudes
POC fluxes at 150 m depth collected by the PPS3/3 trap were approximately three, two and
one thousand mol m-2 d-1 at process stations P1, P2, and P3 respectively (Table 3). At each station,
the POC flux varied by a factor of 3 across the individual 12-hour samples. This variability was not
correlated with the time of collection (day versus night), or with the presence or absence of poison in
the trap cups. All the flux samples had POC/PON ratios close to the canonical Redfield ratio for
phytoplankton of 6.6, with the exception of sample 12 from process station P1 with a POC/PON of 2.6
despite displaying no conspicuous difference in its macroscopic character. PIC fluxes were about one
magnitude lower than POC fluxes and decreased more strongly from P1 to P2 to P3 whereby the
POC/PIC ratio at P3 was twice as high as at P1 and P2 (Table 3).
Biogenic silica fluxes varied more strongly between stations than those of POC, with the
highest flux occurring in the PFZ (averaging ca. two thousand mol Si m-2 d-1 at P2), much lower
III. Manuscript 2
73
fluxes in the western SAZ and lowest values in the eastern SAZ (less than one tenth and one hundredth
of the PFZ flux at P1 and P3, respectively). The high BSi flux at P2 was not accompanied by high
POC, and this site exhibited the lowest, POC/BSi ratio (Table 3). The low surface silicate at all sites
(Cavagna et al., this issue) together with high BSi fluxes at P2 underline the importance of silicate and
therefore diatoms for export controls at the PFZ-site. In contrast, the low BSi fluxes and high POC/BSi
ratios at the SAZ-sites P1 and P3 suggests that diatoms were not important for POC flux in the SAZ,
where CaCO3 dominated biogenic mineral fluxes (Table 3). As for POC, BSi fluxes among the
individual cups varied strongly, ~ 2-fold at P2 and P3, and more than 10-fold at P1, and no
correlations of BSi flux with time of collection or use of poison were evident.
The IRS trap total fluxes (obtained by summing all sinking-rate fractions; Table 4) gave
similar POC and BSi fluxes at 170 m depth to those obtained with the much larger diameter PPS3/3
trap at 150 m depth. This provides considerable encouragement that the fluxes were not strongly
biased by flow past the traps, because this hydrodynamic bias is thought to vary strongly with trap
diameter (Gust and Kozerski, 2000). It also suggests that potential biases from zooplankton entering
the traps were accounted for, given that sieving of zooplankton from the poisoned and un-poisoned
PPS3/3 trap cups gave similar results to the IRS trap in which zooplankton were excluded by the
indented rotating sphere and direct removal using forceps.
3.1.2. Fluxes as a function of sinking rates from the IRS traps
Technical problems precluded deployment of the IRS traps at P1, and the low flux at P3 only
allowed estimation of the total flux by combining the fractions (Table 4). Thus, separation of the
particle flux into different sinking-rate fractions was only possible at P2, where sufficient material was
obtained in all 11 sinking rate fractions to allow analysis of POC and BSi for both the 170 and 320 m
depth traps (but not PON or PIC; Table 4). These data suggest that the POC (and BSi) flux was
relatively evenly spread across the full range of sinking-rate fractions (with each containing 11% or
less of the flux), but with somewhat higher fluxes in two fractions a relatively fast sinking fraction
(the 410-850 m d-1 fraction in the 170 m trap, and the 205-410 m d-1 fraction in the 320 m trap) and a
relatively slow sinking fraction (the 2.3-26 m d-1 fraction at both depths). For the 170 m depth trap,
this fast fraction contained 17% of the POC flux, and the slow fraction 28% of the POC flux. For the
320 m depth trap, the respective contributions were somewhat smaller (12 and 15% respectively), but
still stood out as the two largest fractions.
3.2 Particle characteristics from the gel traps
3.2.1 Classification of sinking particles
The single day deployments of the gels yielded even coverage of particles across the gel
surfaces, and sparse, well separated particle distributions optimal for image analysis. Different particle
types were identifiable (Fig. 3, Table 5), including diatoms (mainly as chains but also a few individual
cells), intact faecal pellets, and aggregates of these and other more amorphous materials. Within the
faecal pellets cylindrical and ovoid pellets were distinguished. A wide range of aggregates was present
III. Manuscript 2
74
(Fig. 4 and 5) and reflects the large variety of components that account for marine snow (Alldredge
and Gotschalk, 1990). A minority of the aggregates appeared to be rather fluffy and will be referred to
as fluff-aggregates. The others are either more compact or seem to be composed of smaller particles
and will be referred to as faecal-aggregates (Table 5, Fig. 3).
3.2.2 General characteristics of the particle fluxes
Small particles were most abundant at every site, with numerical fluxes dropping by 4 orders
of magnitude as size (esd) increased from 0.01 to 0.1 cm (Fig. 6). Nonetheless, the volume and carbon
fluxes were mainly carried by mid-sized and larger particles (esd of 0.05 and 0.1 cm; Fig. 7 and 8).
The carbon flux was dominated by slightly smaller particles than the volume flux (compare Fig. 7
and 8), because the larger particles were assumed to have lower carbon densities (see Methods section
2.3.2). The overall importance of the large particles in controlling the carbon flux is emphasised by the
cumulative carbon flux (Fig. 9). It clearly shows that the large particles that only make up 5-10% of
the numerical flux provide more than half of the carbon flux.
3.2.3. Differences in particle flux characteristics among the sites
Total volume flux of particles from the gel traps was highest at P1, followed by P2 and P3
(Table 6). The carbon fluxes calculated from the images showed the same trend, P1 > P2 > P3, and
decreased from around 10000 to 600 μmol C m-2 d-1 (Table 7). The sites also differed in the number
and the nature of the particles observed. In terms of particle numbers, P2 had the highest flux,
followed by P1 and P3 (Table 6). This was due to the very large number of very small particles
(mainly phytoplankton cells) at P2 (Table 6, Fig. 6). The larger, flux-dominating particles were
predominantly faecal-aggregates at all sites, followed by large cylindrical faecal pellets, with rarer
occurrences of ovoid faecal pellets (as is apparent from the images in Fig. 4 and quantified in Table 6).
Fluff-aggregates did not play a large role at any of the sites (Tables 6, 7), although it is of course
possible that fluffy material, such as phyto-detritus or feeding structures, were included within some of
the less tightly packed faecal-aggregates. Particle composition at P3 was similar to P1 in being
dominated by faecal-aggregates and having a dearth of phyto-cells, but the dominance of the faecal-
aggregates is somewhat reduced by the presence of cylindrical faecal pellets (Table 7).
The sizes of the particles within the different particle classes also varied among the sites. The
faecal-aggregates were largest at P1, where their volumes were almost twice that of the faecal-
aggregates at P2 and P3 (Table 9). Fluff-aggregates were four to ten times smaller than faecal-
aggregates; they were larger at P2 than P1, and absent at P3. The largest cylindrical pellets were found
at P3, followed by P1 (half the volume or length) and then P2 (circa one order of magnitude smaller).
Pellets at P2 were somewhat wider (lower aspect ratios) than at P1 and P3. Within the category of
ovoid faecal pellets, at least two size classes can be distinguished (see particles labelled e, h, and i in
Fig. 3) and at P1 more of the larger ones were found (Table 8). Phyto-cells did not differ appreciably
in size between the sites.
III. Manuscript 2
75
3.3 Variations of flux and particle composition with depth
A decrease of the POC flux with increasing depth (from 170 to 320 m) was recognisable in the
IRS traps at P2 and P3: by almost half at P2, and even more strongly to one fifth at P3 (Table 4). The
greater depth resolution of the gels as compared to the IRS traps (Table 2) gives further insights into
the flux variation with depth. In particular, the shallowest gel trap revealed distinct differences among
the stations. At the SAZ-sites P1 and P3, the flux at 140 m was lower than the flux at 190 m, which
then decreased slightly by 290 m. Whereas P2 (PFZ) showed a relatively high flux at 140 m in
comparison to 190 m and then a continuous strong decrease with depth.
Except at the shallowest depths at P1, the total volume flux decreased with increasing depths
(Fig. 7, Table 6). In regard to total carbon flux, variations with depth were complex (Fig. 8, Table 7).
At P2 the faecal-aggregate fluxes, and thus the carbon fluxes, dropped by one half from the surface to
290 m depth, whereas at P1 and P3 changes in the faecal-aggregate and carbon fluxes were much less
pronounced (Table 7). At P2, where phyto-cells were important, their carbon flux declined with depth.
For the faecal pellets no trends with depth were recognisable.
4. Discussion
4.1 Overview
We first discuss the sediment trap results, beginning with technical aspects of trap function,
followed by comparisons of the flux magnitudes for the different trap types and the 3 process stations
(section 4.2). Next we examine the particle characteristics as observed in the gel traps (section 4.3).
Finally, we consider the probable ecosystem controls on the particle fluxes, including comparing the
SAZ-Sense results to other studies (section 4.4).
4.2 Vertical export determined by sediment traps
4.2.1 Functioning of the sediment traps
Hydrodynamic effects can impair trapping efficiency (e.g. Gust and Kozerski, 2000; Buesseler
et al., 2007b), but because of the very low relative water velocities for all three sediment trap types
(see section 2.2), this influence is likely to have been minimal. This view is corroborated by the even
coverage of particles across the surface of the gels, and the fine structures preserved within them. It
also appears that the entry of zooplankton into the traps is unlikely to have strongly biased the flux
results for two reasons: i) the PPS3/3 results were indistinguishable between poisoned and unpoisoned
cups, and ii) the total fluxes from the IRS trap with its zooplankton excluding indented rotating sphere,
were only slightly lower than the fluxes from the open-mouthed PPS3/3 trap, and within the
uncertainties defined by the standard deviations of the individual cups (Table 3 and 4).
The fidelity of the separation of the sinking particles by settling speed by the IRS trap requires
careful evaluation. Ideally, when operated in sinking-rate mode, it transfers particles from the
indented-rotating-sphere into the settling tube, where they enter successive cups in the carousel
III. Manuscript 2
76
according to their sinking rates (Peterson et al., 2005). For the IRS rotation interval and carousel cycle
duration of 6 hours used here, this results in fractions with sinking rates ranging from >850 m d-1 to
~2.3 m d-1 (Table 3). The effectiveness of this separation requires evaluation. A particular concern is
the possibility that very slow-sinking particles remain in the funnel beyond the duration of a full
carousel rotation (6 hours in this study and our previous work; Trull et al., 2008), and are thus
transferred into the subsequent cycle where they could be erroneously collected into the carousel
fractions that collect faster sinking particles. Programming the collection interval of the last cup in the
cycle (#11) to have the same one minute duration as the first cup in the subsequent cycle (#1) provides
some quality control on this issue (Trull et al. 2008).
As shown in Table 3, for the IRS trap at P2, the POC flux collected in the 11th cup at 170 m
and 320 m depths were similar and these amounts are only slightly less than the POC fluxes collected
by the first cups for these traps. This suggests that carry-over was significant. If so, the fluxes
observed in the other cups should be reduced for this contribution. For example, the flux to each cup
could be considered to represent the sum of the contribution from the most recent IRS rotation and a
background of a steady flux of slow sinking particles (Armstrong et al., 2009). However, there are
aspects of the flux distribution over the 11 fractions that suggest that this is an over-simplification. The
POC flux per cup duration for many sinking rate fractions is less than the POC flux to the 11th cups
(e.g. cups 6-10 for both the 170 and 320 m deployments). Indeed, the POC flux per cup duration for
the 11th cups is much larger than that for the preceding 10th cups. This suggests that the high fluxes per
cup duration in the 11th cups may be induced by the carousel rotation, perhaps by causing particles that
have accumulated at the mouth of the cup to enter the cup. In our previous work, we found large
colonial radiolaria in the 11th cups, and attributed the high fluxes per cup duration to their unusual
presence (Trull et al., 2008). These or other unusual organisms were not discernable in the present
study, but the material in the 11th cups had high POC/BSi ratios in comparison to the preceding 10th
cups, suggesting that the material entering the 11th cups was different in character. One way to
rationalise these results is to consider that very slowly sinking material has not completely left the
settling tube within six hours, and the motion of the carousel as it turns to cup #11 and then again to
cup #1 causes some or all of the this material to be moved further along the settling tube and into the
cups. Thus the carry-over quantity to subsequent cups would be an aliquot related to the carousel
motion, rather than a steady background flux. In other words, correction for carry-over should be equal
to (or less than) the 11th cup fluxes, rather than depending on the duration that the cups were open.
Correcting for carry-over in this way does not change the overall character of the distribution
of POC flux across the sinking-rate fractions, rather it emphasises the initial perspective from the
uncorrected data that the flux is spread across the full range of sinking fractions, but with an elevated
flux from two classes of particles a relatively fast sinking fraction, and a very slow sinking fraction
(see corrected flux values in Table 4).
III. Manuscript 2
77
4.2.2 Flux characteristics of the three sites
In terms of POC flux, the same sequence was observed for all the trap types deployed (P1 >
P2 > P3), although the flux estimates vary in magnitude for the different trap types (Tables 3, 4 and 7).
In comparison to the PPS3/3 and IRS traps, which tend to be similar, the gel traps gave the highest
POC flux values for each site, and also a wider range in relative fluxes among the sites than for the
measured POC fluxes in the PPS3/3 and IRS traps. The POC fluxes from PPS3/3 and IRS traps were
determined directly via geochemical analysis, while the gel trap flux estimates were based on
converting particle volume as identified through microscopic observations into units of carbon (see
section 2.3.2). Because most of the flux is carried by faecal-aggregates at all three sites, it is likely that
the conversion factor for this particle type is the cause of this difference. The fact that the faecal-
aggregates are somewhat inhomogeneous as they might originate from processed material (see section
4.3) supports this conclusion. At P3 where faecal-aggregates contribute much less to total volume flux
due to their overall smaller size and numbers (Table 6 and 8), their relative contribution to POC flux is
still similar to the other stations (Table 7) suggesting that carbon content of the larger faecal-
aggregates might be overestimated. This perspective is consistent with the small differences between
our estimates and those obtained with the algorithm from Guidi et al. (2008). At P1, where large
faecal-aggregates were dominant, our POC flux was higher than that from the Guidi algorithm, as it
was to a lesser degree at P2. At P3, in contrast, our flux appears to be underestimated, which might be
explained by the high abundance of small and relatively compact particles.
The complex flux variations with depth as estimated from the gel traps (see section 3.3) could
be affected by small scale variations in time and space (notice also the relatively high standard
deviation of up to 1/3 of the mean for POC flux with PP3/3 traps; Table 3). In addition they could
reflect the introduction of biases from the volume-to-carbon algorithms used in estimates from the gel
traps (discussed above).
Furthermore, when comparing fluxes among the three sites, we have to keep in mind, that the
collected material is derived from the mesopelagic (see Table 2 for trap deployment depths). The
largest flux attenuation is often found higher up in the water column (for instance at the pycnocline at
50-60 depths (Reigstad et al., 2008)). Since the euphotic depth was between 34 and 90 m (Table 1)
during this study, the sinking particles underwent heavy processing before they reached the traps
(140 m or deeper; Table 2). Certainly, some of the particulate matter was remineralised between the
base of the mixed layer and 140 m (Cassar et al., 2010). Thus the collected particles represent the
mesopelagic flux and differ considerably from surface particles leaving the euphotic zone.
4.3 Composition of particles
The particle categories identified from the gel traps (see 3.2.1, Fig. 3 and Table 5) provide
some insights into the forms of the sinking material during SAZ-Sense. However, it is important to
keep in mind that inferences based on these observations are uncertain because the formation
pathways remain unknown. For example, since marine snow aggregates capture surrounding particles
III. Manuscript 2
78
as they travel through the water column (Alldredge and Silver, 1988) the identification of the collected
material cannot necessarily identify the ecological pathways that initiated vertical export. Bacterial
degradation may also have altered particle composition and shape (Azam, 1998). Moreover, the
sinking particles collected at 140 m depth or deeper (Table 2) have already left the euphotic zone,
where most of the flux alteration occurred.
Based on their structural appearance the aggregates were separated into fluff-aggregates and
faecal-aggregates (Fig. 3, Table 5). Different fluff-aggregates resembled different types of aggregates
found during earlier studies and might possibly include phyto-detritus, flocculent faecal pellets or
larvacean houses (e.g. Fowler and Knauer, 1986; Alldredge and Silver, 1988; Alldredge and
Gotschalk, 1989). Microscopic observations reveal that most of the faecal-aggregates were composed
of smaller particles with distinct cylindrical and ovoid shapes resembling individual faecal pellets, or
at least tightly packed and optically opaque sub-units similar to those detected by Alldredge and
Gotschalk (1990). However, within this particle type a large variety of shapes and forms occurred
(Fig. 4 and 5): some were relatively compact and consisted of agglomerated faecal pellets, while
others contained less distinct material, such as loose faecal matter, phyto detritus, or feeding structures
or exopolymeric polysaccharide particles. Our observations are very similar to particles collected from
the PFZ south of New Zealand using large volume in-situ filtration system (MULVFS) by Lam and
Bishop (2007), who found intact faecal pellets as well as aggregates of faecal matter and marine snow.
They concluded that the material was heavily processed by zooplankton a view which we share
based on our observations of large numbers of aggregates containing at least some faecal matter.
Wexels Riser et al. (2008) studied the vertical flux regulation by zooplankton in the northern Barents
Sea, where the importance of faecal pellets in terms of carbon flux below the euphotic layer was
decreasing. They proposed that faecal pellets were transferred into unidentifiable organic matter that is
to a large extent faecal pellet derived which resembles our faecal-aggregates. Since the particles of
this class vary a lot, their origin might be due to several different formation pathways. In addition to
direct faecal material production as a result of grazing, it is likely that the sinking material underwent
other processes, such as fragmentation of particles into smaller ones (Dilling and Alldredge, 2000;
Noji et al., 1991). According to Dilling and Alldredge (2000) large zooplankton such as euphausiids
are capable of fragmenting marine snow and Noji et al. (1991) observed copepods breaking up faecal
pellets. This could explain some of the large size range and variety in shapes within the faecal-
aggregates. Unfortunately, zooplankton data from SAZ-Sense are not available for comparison. But
the faecal pellets as preserved in the gels and divided into cylindrical and ovoid pellets provide some
indication of probable taxa (Fig. 3). The cylindrical faecal pellets were probably derived from
copepods and euphausiids, and the ovoid faecal pellets may originate from small copepods or
larvaceans (Gonzalez, 1992; Turner, 2002; Wilson et al., 2008; Wexels Riser et al., 2008).
Phyto-cells were most important at the diatom dominated PFZ site P2 (Table 6 and 7), where
they were collected as chains and rarely also as individual cells (Fig. 6). These highly silicified diatom
III. Manuscript 2
79
species (e.g. Fragilariopsis kerguelensis; de Salas et al., this issue) might have entered the gel trap
individually, or within aggregates which then fell apart in the traps. Since diatom aggregates have
been collected in previous studies (e.g. Waite and Nodder, 2001; Waite at al. 2005), it is quite possible
that our phyto-cells reached the traps within fluff- or faecal-aggregates. Indeed, our images of PFZ
particles (Fig. 5) were very similar to those of Waite et al. (2005) for aggregates in the SAZ east of
New Zealand.
4.4 Ecosystem controls on the flux
4.4.1 Influence of particle types on vertical export
Gross primary production (GPP) and net primary production (NPP) at P1 were about twice as
high as at P3 and three times higher than at P2 (Table 1). At P1 and P2 POC fluxes were
approximately one magnitude lower than GPP, and at P3 almost two magnitudes. Considering these
variations among all three sites implies that primary production and carbon flux were not coupled in a
linear way (Table 1). This is consistent with the perspective developed in earlier work. Boyd and
Newton (1995; 1999) suggested that details of ecosystem structure are as influential as primary
production in the control of export. The particles identified in the gel traps make clear that
zooplankton were an important regulator of export throughout the study region, contributing strongly
to the flux either as faecal pellets or faecal-aggregates (Fig 4 and 5). This is in agreement with the
estimated high importance of grazing from shipboard incubation experiments which suggested that, in
the eastern and western SAZ, grazing removed on average 67 and 82% of the primary production,
respectively (Pearce et al.; this issue). The smaller and more compact faecal-aggregates at P2 and P3,
in comparison to the larger and fluffier faecal-aggregates at P1 (Table 8, Fig. 5), suggests that the
impact of grazing is more pronounced in the eastern SAZ and the PFZ. This is supported by the
relatively large contribution of faecal pellets to the flux in the eastern SAZ (Table 7). In contrast, the
higher abundance of fluff-aggregates and the somewhat looser appearance of the faecal-aggregates in
the western SAZ suggest the possible importance of different processes in the water column, e.g.
coagulation of phytoplankton and formation of phyto-detritus. Nevertheless, hardly any unprocessed
phytoplankton material was found in the traps (Fig. 4 and 5). This in part probably reflects the distance
between the biomass distributions in shallow mixed layers and the traps (Fig. 2, Table 9), and
emphasises the point that we measured mesopelagic fluxes (compare also section 4.2.2), for which
considerable degradation had already occurred during the transit out of the mixed layer and into the
traps.
4.4.2 Impact of particle sizes and structure on sinking rates and export
According to Stokes law for spherical particle settling (ws 2
velocity, ws
and inversely proportional to the viscosity of the s
influenced individual particle sinking rates, because particle size varied more than an order of
magnitude (Figure 7), although median particle size varied by less than 50% among the sites (Table 8)
III. Manuscript 2
80
so that the influence of size on total flux may not have been particularly strong. Particle excess density
(partly controlled by porosity) may have been more important than size in terms of sinking rates, and
thus in terms of degradation prior to reaching the traps, given the variations between tightly packed
and more fluffy or amorphous faecal-aggregates (Fig. 4 and 5). This may have contributed to the high
flux attenuation with depth that was found at P2. Regarding the ballasting effect, the presence of
calcium carbonate and silica minerals have been demonstrated to influence POC export to traps in the
ocean interior (Armstrong et al., 2002; Francois et al., 2002; Klaas and Archer, 2002), although their
role may be less relevant closer to the ocean surface (Passow, 2004; Trull et al., 2008). Therefore, the
highest CaCO3 flux at P1 might have enhanced export as previously suggested for this region
(Cardinal et al., 2005).
Biogenic silica only played a role at P2 (Table 3) and indicates the importance of diatoms for
the export in the PFZ. However, the evenly distributed BSi content over particles sinking at different
rates as obtained from the IRS trap (Table 4) does not support the view that the mineral had the
dominant impact on settling rates of the sinking material. This would agree with the finding that the
slow sinking and the fast sinking fraction at P2 (see 3.1.2 and Table 4) appear to be composed of
similar chemical composition as far as POC and BSi are concerned. In general, POC/BSi ratios show
no clear trend as a function of sinking rate across all the fractions. This suggests that sinking rates did
not depend strongly on mineral ballast contents (this perspective is likely to extend to all mineral
contents, given that PIC contents at P2 were very low, less than 10 % of BSi contents (Table 3) and
based on historical data (Trull et al., 2001b), lithogenic fluxes at this site were probably also very
low). However, material without BSi, may have sunk extremely slowly. This is consistent with the
very high POC/BSi ratios in cup 11 for the fraction sinking at less than 2.3 m d-1 in the IRS traps
(Table 4).
The PFZ site P2 also shows the strongest attenuation with depth (Table 9). This might result
from the high abundance of small particles (Table 8, Fig. 4 and 5) that could possibly be too small to
sink, as generally for the same particle type sinking rates decrease with decreasing particle size
(Alldredge and Gotschalk, 1988; Ploug et al., 2008). Therefore both phyto-cells and tiny faecal-
aggregates could contribute to the slow sinking fraction (2.3-6 m d-1) as collected in the IRS trap
(Table 4). The fast sinking fraction (410-850 m d-1) may contain larger faecal-aggregates and/or faecal
pellets.
BSi export was high in the PFZ (P2), but low in the SAZ (P1 and P3). In agreement with
literature (e.g. Cardinal et al., 2005), fluxes of BSi and POC were strongly decoupled at P2, and thus
POC to biomineral ratios were high in the SAZ and low in the PFZ. Based on the finding of many
empty diatoms in the gels (mainly Fragilariopsis kerguelensis, Fig. 5), this might be a mechanism for
the downwards transport of silicate at this site.
III. Manuscript 2
81
4.4.3 Estimates of export efficiency
Export-ratios (e-ratios; e-ratio = POC/NPP (Table 9) based on NPP from Cavagna et al., (this
issue) and POC as collected in the traps (Table 3, 4, 7) were generally low: on average 0.13, 0.19 and
0.02 at P1, P2 and P3, respectively (Table 9). Sequence and magnitudes coincide with the e-ratio
calculations based on export production estimated from 234Th water column inventories from Jacquet
et al. (this issue), who concluded that low export efficiency in the more productive eastern SAZ (P3)
in contrast to the higher export in the less productive western SAZ (P1) was somewhat unexpected.
The high e-ratios at P2 may mirror the higher export efficiency due to the post bloom situation or the
impact of large diatoms on carbon flux as suggested by Boyd and Newton (1995). The observation
that export at P3 was least efficient despite highest primary production (Table 9) coincides with
relatively small faecal-aggregates (Fig. 4 and 5, Table 8) and low ballast mineral content, suggesting
that slow sinking may have influenced export flux. The distance between the shallow mixed layers,
where biomass production and export occurred, and the deeper mesopelagic traps influences our
ability to assign the cause of the variations in the trap-based e-ratios among the sites. In particular, the
greater distance at P3 than at P1 and P2 (Figure 2) may have contributed to its lower apparent e-ratio.
Because export efficiency may of course vary seasonally (Wassmann, 1990; Honjo, 1996), it
is important to take the seasonal context of the study into account. According to Mongin et al. (this
issue), the bloom in the western SAZ (P1) had not reached its peak. The large amount of relatively
unprocessed and fresh material at P1 (see 4.4.1; Fig. 4 and 5), supports the idea that we encountered a
growing bloom. In the eastern SAZ (P3) the blooming event occurred over a longer time period
without a distinct peak prior to the cruise, and in the PFZ (P2) the peak biomass period had already
passed (Mongin et al., this issue). This is in agreement with the more compact (and more processed)
particles at these sites (P2 and P3) if we assume that phytoplankton has been grazed down and
zooplankton mediated particles were produced. The large number of empty diatoms in the gel traps at
the P2 site (Fig. 5, Table 6) could be a result of bloom senescence at the sampling time.
Recently, the term high biomass, low export condition (HBLE) has been suggested for settings
like we found at P1 (Lam and Bishop, 2007). According to these authors the most important factors
determining POC export during the Southern Ocean Iron Experiment (SOFeX) were biological
processes that affected the fragmentation and remineralisation of large particles coinciding with the
view that faecal-aggregates usually are the main contributors to POC flux as previous studies have
indicated (e.g. Bishop et al., 1977; 1987). This is in agreement with the dominance of more or less
heavily processed particles (faecal-aggregates) during SAZ-Sense and also agrees with many other
studies in Polar regions (e.g. Blain et al., 2007; Pollard et al., 2007; Wassmann et al., 2008).
an era of climate chang et al., 2008) indicate that vertical carbon export
was mainly driven by grazing and pelagic retention (Reigstad et al., 2008) and the production of fast
sinking faecal pellets (Wexels Riser et al., 2008). This coincides with results from the Kerguelen
III. Manuscript 2
82
Ocean and Plateau compared Study (KEOPS) that was carried out in PFZ waters (Blain et. al., 2007),
where most of the particle flux originated from faecal matter (Ebersbach and Trull, 2008). Similar to
our dominating faecal-aggregates, KEOPS reported on aggregates of faecal matter that were
responsible for downward POC export. A comparison of flux spectra from SAZ-Sense (Fig. 6) and
KEOPS (Ebersbach and Trull, 2008) validates this. Compared with particle distribution during
KEOPS, the PFZ site P2 shows a slight shift towards smaller particles. The SAZ sites differ somewhat
from each other: at P3 the range of particle sizes lies in the average distribution found during KEOPS,
but large particles are not present at all, and at P1 the trend is somewhat shifted towards larger
particles. Overall, the generally similar characteristics at KEOPS and SAZ-Sense indicate similar
export mechanisms.
In contrast, POC export during the Southern Ocean Iron Release Experiment SOIREE, that
took place under similar conditions (HNLC and iron fertilised waters; Boyd et al., 2000) was driven
by phyto-detrital aggregates (Waite and Nodder, 2001). Jackson et al. (2005) compared measured
particle fluxes from SOIREE with model estimates and yielded number flux spectra, which resemble
our particle distribution in regard to overall trends. However, the SOIREE particles in total were much
smaller (as small as 0.8 μm in diameter), the abundance of the 10 μm sized particles (our smallest)
was about one magnitude higher and the decrease towards larger particles was less steep (for the
0.4 cm size class the difference exceeds two magnitudes), suggesting that during SOIREE the flux was
carried by larger particles. This agrees with the dominance of large marine-snow aggregates entirely
composed of diatoms observed in SOIREE gels (Waite and Nodder, 2001) and is in opposite to the
more tightly packed faecal-aggregates responsible for POC flux during SAZ-Sense. Marine-snow
aggregates have also been observed in many other studies, where aggregation of phytoplankton was
pre-dominant (e.g. Alldredge and Gottschalk, 1989; Passow et al., 1994; Waite et al., 2005; Pollard et
al., 2007; Salter et al., 2007). The CROZet natural iron bloom and EXport experiment (CROZEX), for
instance, also suggests an important role for the direct export of a diverse range of diatoms (Salter et
al., 2007).
Thus, the different export mechanisms and the subsequently different particle regimes
highlight the importance of studying flux composition in detail. As shown by various studies on
particle size distribution in different regions of the ocean (e.g. Ebersbach and Trull, 2008; Jackson et
al., 2005; Guidi et al., 2008; Stemmann et al., 2008; Jouandet et al., 2010), the approach of
determining particle size spectra provides insights in the context of carbon transport from the surface
ocean into the mesopelagic zone. This is an important step towards prediction of carbon flux in
response to changing environments.
III. Manuscript 2
83
5. Conclusions
The overall results are a clear reminder that simple indices, such as satellite estimates of
phytoplankton biomass, are a poor guide to ecosystem function in general, or to export production
specifically. The elevated biomass observed at P3, which is present throughout the year as indicated
by satellite remote sensing (Mongin et al., this issue), was not accompanied by elevated primary or
new production, and did not translate into increased sinking flux, at least not during the short
shipboard observational period reported here. This provides a cautionary note, as have other studies of
natural iron fertilisation (Pollard et al., 2007; Blain et al., 2007), about the effectiveness of iron inputs
(which were elevated at the P3 site; Bowie et al, 2009) to increase biological pump strength. The clear
influence of zooplankton grazing in the control of particle production and export observed via the use
of the polyacrylamide gel traps emphasises the influence of higher trophic levels on biological pump
responses to stimulation of photosynthesis. This perspective, known as the ecumenical iron
hypothesis, considers the impact of grazers on primary production in iron-limited ecosystems (Cullen,
1995; Morel et al., 1991). It was originally formulated based on general ecological principles, and has
less commonly been directly demonstrated. The combination of three trap types to obtain geochemical
flux measurements, particle sinking rate estimates, and images of intact particles is powerful and will
benefit other studies in the future.
III. Manuscript 2
84
Acknowledgements
This research was in part supported by the Australian Government Cooperative Research Centres
Programme through the Antarctic Climate and Ecosystems CRC (ACE CRC), Australian Antarctic
Science projects #2720 and #1156, the Australian Antarctic Division, CSIRO Marine and Atmospheric
Research, and the captain and crew of RSV Aurora Australis. The NERC Earth Observation Data
Acquisition and Analysis Service (NEODAAS) supplied data for the ocean color image provided by
the Plymouth Marine Laboratory. The Institute National des Sciences de l'Univers (INSU, France)
provided the PPS3/3 trap, and F. Dehair (Vrije Universiteit Brussel, Belgium) provided one IRS trap.
Thanks to D. Mclaughlin (moorings preparation), C. Moy (gel preparation), M. Rosenberg (assistance
with trap deployments), C. Bloomfield (biogenic silica analysis), and T. Rodemann (UTAS Central
Science Laboratory, elemental analysis). U. Passow, U. Bathmann, E. Nöthig, C. Klaas, D. Wolf-
Gladrow and B. Griffiths are thanked for thoughtful discussions, as are two anonymous reviewers who
helped to improve the manuscript. F. Ebersbach was funded by GLOMAR (PhD scholarship).
III. Manuscript 2
85
References Alldredge, A.L., 1998. The carbon, nitrogen and mass content of marine snow as a function of
aggregate size. Deep-Sea Research I 45, 529-541. Alldredge, A.L., Gotschalk, C., 1988. In situ settling behaviour of marine snow. Limnology
and Oceanography 33 (3), 330-351. Alldredge, A.L., Gotschalk, C., 1989. Direct observations of the mass flocculation of diatom
blooms: characteristics, settling velocities and formation of diatom aggregates. Deep-Sea Research 36 (2), 159-171.
Alldredge, A.L., Gotschalk, C., 1990. The relative contribution of marine snow of different origins to biological processes in coastal waters. Continental Shelf Research 10 (1), 41-58.
Alldredge, A.L., Jackson, G.A., 1995. Aggregation in marine systems. Deep-Sea Research II 42, 1-7.
Alldredge, A.L., Silver, M.W., 1988. Characteristics, Dynamics and Significance of Marine Snow. Progress in Oceanography 20, 41-82.
Armstrong, R.A., Lee, C., Hedges, J.I., Honjo, S., Wakeham, S.G., 2002. A new, mechanical model for organic carbon fluxes in the ocean based on the quantitative association of POC with ballast minerals. Deep-Sea Research II 49, 219-236.
Armstrong, R.A., Peterson, M.L., Lee, C., Wakeham, S.G., 2009. Settling velocity spectra and the ballast ratio hypothesis. Deep-Sea Research II 56 (18), 1470-1478.
Azam, F., 1998. Oceanography: Microbial Control of Carbon Flux: The Plot Thickens. Science 280 (5364), 694-696.
Bishop, J.K.B., 1989. Regional extremes in particulate matter composition and flux: effects on the chemistry of the ocean interior. In: Berger, W.H., Smetacek, V., Wefer, G. (Eds.), Dahlem Workshop Life Science Report - Productivity of the oceans: Present and Past. John Wiley and Sons, New York, pp. 117-138.
Bishop, J.K.B., Edmond, J.M., Ketten, D.R., Bacon, M.P., Silker, W.B., 1977. The chemistry, biology, and vertical flux of particulate matter from the upper 400 m of the equatorial Atlantic Ocean. Deep-Sea Research 24 (6), 511-548.
Bishop, J.K.B., Stepien, J.C., Wiebe, P.H., 1987. Particulate matter distributions, chemistry and flux in the Panama basin: response to environment forcing. Progress in Oceanography 17 (1-2), 1-59.
Blain, S., Quéguiner, B., Armand, L., Belviso, S., Bombled, B., Bopp, L., Bowie, A., Brunet, C., Brussaard, C., Carlotti, F., Christaki, U., Corbiere, A., Durand, I., Ebersbach, F., Fuda, J.-L., Garcia, N., Gerringa, L., Griffiths, B., Guige, C., Guillerm, C., Jacquet, S.H.M., Jeandel, C., Laan, P., Lefevre, D., Lo Monaco, C., Malits, A., Mosseri, J., Obernosterer, I., Park, Y.-H., Picheral, M., Pondaven, P., Remenyi, T., Sandroni, V., Sarthou, G., Savoye, N., Scouarnec, L., Souhaut, M., Thuiller, D., Timmermans, K., Trull, T., Uitz, J., van Beek, P., Veldhuis, M., Vincent, D., Viollier, E., Vong, L., Wagener, T., 2007. Effect of natural iron fertilization on carbon sequestration in the Southern Ocean. Nature 446, 1070-1075.
Bowie, A.R., Lannuzel, D., Remenyi, T.A., Wagener, T., Lam, P.J., Boyd, P.W., Guieu, C., Townsend, A.T., Trull, T.W., 2009. Biogeochemical iron budgets of the Southern Ocean south of Australia demonstrate that summertime supply decouples iron and nutrient cycles in the subantarctic zone. Global Biogeochemical Cycles 23, GB4034, doi:10.1029/2009GB003500.
Boyd, P., Newton, P., 1995. Evidence of the potential influence of planktonic community structure on the interannual variability of particulate organic carbon flux. Deep-Sea Research I 42 (5), 619-639.
Boyd, P.W., Newton, P.P., 1999. Does planktonic community structure determine downward particulate organic carbon flux in different oceanic provinces? Deep-Sea Research I: 46 (1), 63-91.
Boyd, P.W., Trull, T.W., 2007. Understanding the export of biogenic particles in oceanic waters: Is there consensus? Progress in Oceanography 72 (4), 276-312.
Boyd, P.W., Watson, A.J., Law, C.S., Abraham, E.R., Trull, T., Murdoch, R., Bakker, D.C.E., Bowie, A.R., Buesseler, K.O., Chang, H., Charette, M., Croot, P., Downing, K., Frew, R., Gall, M., Hadfield, M., Hall, J., Harvey, M., Jameson, G., LaRoche, J., Liddicoat, M., Ling, R., Maldonado, M.T., McKay, R.M., Nodder, S., Pickmere, S., Pridmore, R., Rintoul, S., Safi, K., Sutton, P., Strzepek,
III. Manuscript 2
86
R., Tanneberger, K., Turner, S., Waite, A., Zeldis, J., 2000. A mesoscale phytoplankton bloom in the polar Southern Ocean stimulated by iron fertilization. Nature 407 (6805), 695-702.
Buesseler, K.O., 1991. Do upper-ocean sediment traps provide an accurate record of particle flux? Nature 353, 420-423.
Buesseler, K.O., Boyd, P.W., 2009. Shedding light on processes that control particle export and flux attenuation in the twilight zone of the open ocean. Limnology and Oceanography 54 (4), 1210-1232.
Buesseler, K.O., Lamborg, C., Boyd, P.W., Lam, P.J., Trull, T.W., Bidigare, R.R., Bishop, J.K.B., Casciotti, K.L., Dehairs, F., Elskens, M., Honda, M., Karl, D.M., Siegel, D.A., Silver, M.W., Steinberg, D.K., Valdes, J., Van Mooy, B., Wilson, S., 2007a. Revisiting Carbon Flux Through the Ocean's Twilight Zone. Science 316, 567-570.
Buesseler, K.O., Antia, A.V., Chen, M., Fowler, S.W., Gardner, W.D., Gustafsson, O., Harada, K., Michaels, A.F., van der Loef, M.R., Sarin, M., Steinberg, D.K., Trull, T., 2007b, An assessment of the use of sediment traps for estimating upper ocean particle fluxes. Journal of Marine Research 65, 345-416.
Cardinal, D., Savoye, N., Trull, T.W., Andre, L., Kopczynska, E.E., Dehairs, F., 2005. Variations of carbon remineralisation in the Southern Ocean illustrated by the Baxs proxy. Deep-Sea Research I 52, 355-370.
Cassar, N., DiFiore, P., Barnett, B.A., Bender, M.L., Bowie, A.R., Tilbrook, B., Petrou, K., Westwood, K.J., Wright, S.W., Lefevre, D., 2010. The influence of iron and light on carbon export production in the subantarctic and polar frontal zones, submitted to Biogeosciences.
Cavagna, A-.J., Elskens, M., Griffiths, F. B., Fripiat, F., Jacquet, S.H.M., Westwood, K.J., Dehairs, F., 2010. Contrasting regimes of productivity and potential for carbon export in the Sub-Antarctic Zone and Polar Frontal Zone south of Tasmania. Deep-Sea Research II, this issue.
Cheah, W., McMinn, A., Griffiths, F.B., Westwood, K., Webb, J., Molina, E., Wright S.W., van den Enden R., 2010. Assessing Sub-Antarctic Zone primary productivity from fast repetition rate fluorometry. Deep-Sea Research II, this issue.
Cullen, J.J., 1995. Status of the iron hypothesis after the Open-Ocean Enrichment Experiment. Limnology and Oceanography 40 (7), 1336-1343.
De La Rocha, C., Passow, U., 2007. Factors influencing the sinking of POC and the efficiency of the biological carbon pump. Deep-Sea Research II 54, 639-658.
de Salas, M.F., Eriksen, R., Davidson, A.T., Wright, S., 2010. Protistan communities in the Australian sector of the subantarctic zone during SAZ-Sense, Deep-Sea Research II, this issue.
Dilling, L., Alldredge, A.L., 2000. Fragmentation of marine snow by swimming macrozooplankton: A new process impacting carbon cycling in the sea. Deep-Sea Research I 47 (7), 1227-1245.
Doblin M.A., Ralph P.J., Petrou K.L., Shelly K., Westwood K., van den Enden R, Wright S.W., Griffiths F.B., 2010 Diel variation of chl-a fluorescence, phytoplankton pigments and productivity in the Sub-Antarctic Zone. Deep-Sea Research II, this issue.
Ebersbach, F., Trull, T., 2008. Sinking particle properties from polyacrylamide gels during the KErguelen Ocean and Plateau compared Study (KEOPS): Zooplankton control of carbon export in an area of persistent natural iron inputs in the Southern Ocean. Limnology and Oceanography 53 (1), 212-224.
Evans, C., Thomson, P.G., Davidson, A.T., Bowie, A.R., van den Enden, R., Witte, H., Brussaard, C.P.D., 2010. Potential implications of climate change-induced shifts in microbial distribution for carbon cycling in the Australian Southern Ocean. Deep-Sea Research II, this issue.
Falkowski, P.G., Scholes, R.J., Boyle, E.A., Canadell, J., Canfield, D., Elser, J., Gruber, N., Hibbard, K., Hogberg, P., Linder, S., Mackenzie, F.T., Moore, B.I., Pedersen, T., Rosenthal, Y., Seitzinger, S., Smetacek, V., Steffen, W., 2000. The global carbon cycle: a test of our knowledge of Earth as a system. Science 290, 291-296.
Fowler, S.W., Knauer, G.A., 1986. Role of large particles in the transport of elements and organic compounds through the oceanic water column. Progress in Oceanography 16 (3), 147-194.
Francois, R., Honjo, S., Krishfield, R., Manganini, S., 2002. Factors controlling the flux of the organic carbon to the bathypelagic zone of the ocean. Global Biogeochemical Cycles 16 (4), 1087, 34 1-20, doi:10.1029/2001GB001722.
III. Manuscript 2
87
Gonzalez, H.E., 1992. The distribution and abundance of krill faecal material and oval pellets in the Scotia and Weddell Seas (Antarctica) and their role in particulate flux. Polar Biology 12, 81-91.
Gonzalez, H.E., Smetacek, V., 1994. The possible role of the cyclopoid copepod Oithona in retarding vertical flux of zooplankton faecal material. Marine Ecology Progress Series 113, 233-246.
Griffiths, F.B., Bowie, A.R., Dehairs, F., Trull, T.W., 2010. Oceanographic setting of the Sub-Antarctic zone south of Australia. Deep-Sea Research II, this issue.
Guidi, L., Jackson, G.A., Stemmann, L., Carlos Miquel, J., Picheral, M., Gorsky, G., 2008. Relationship between particle size distribution and flux in the mesopelagic zone. Deep-Sea Research I 55, 1364-1374.
Gust, G., Kozerski, H.-P., 2000. In situ sinking-particle flux from collection rates of cylindrical traps. Marine Ecology Progress Series 208, 93-106.
Hill, K.S., Rintoul, S.R., Coleman, R., Ridgeway, K.R., 2008. Wind forced low frequency variability of the East Australia Current. Geophysical Research Letters 35 (L08602), doi:10.1029/2007GL032912.
Honjo, S., 1996. Fluxes of particles to the interior of the open ocean. In: Ittekkot, V., Aschauffer, P., Honjo, S., Depetris, P. (Eds.), Particle Flux in the Oceans. SCOPE 57, Wileys, New York, 91-154.
Jackson, G.A., Waite, A.M., Boyd, P.W., 2005. Role of algal aggregation in vertical carbon export during SOIREE and in other low biomass environments. Geophysical Research Letters 32 (L13507), 1-4, doi:10.1029/2005GL023180.
Jacquet, S.H.M, P. Lam, T. Trull, K. Buesseler, Dehairs, F., 2010. Carbon export production in the Polar Front Zone and Subantarctic Zone south of Tasmania. Deep-Sea Research II, this issue.
Jouandet, M.-P., Trull, T.W., Picharel, M., Guidi, L., Ebersbach, F., Stemmann, L., Blain, S., 2010. Optical imaging of mesopelagic particles indicated deep carbon flux beneath a natural iron fertilized bloom in the Southern Ocean, submitted to Limnology and Oceanography.
Klaas, C., Archer, D.E., 2002. Association of sinking organic matter with various types of mineral ballast in the deep sea: Implication for the rain ratio. Global Biogeochemical Cycles 16 (4), 63 61-14, doi:10.1029/2001GB001765.
Kwon, E.Y., Primeau, F., Sarmiento, J.L., 2009. The impact of remineralization depth on the air-sea carbon balance. Nature Geoscience 2, 630-635.
Lam, P.J., Bishop, J.K.B., 2007. High biomass, low export regimes in the Southern Ocean. Deep-Sea Research II 54, 601-638.
Lampitt, R.S., Antia, A.N., 1997. Particle flux in the deep seas: regional characteristics and temporal variability. Deep-Sea Research I 44 (8), 1377-1403.
Lannuzel, D., Remenyi, T., Lam, P.J., Townsend, A., Ibisanmi, E., Butler, E., Wagener,T., Schoemann, V., Bowie, A.R., 2010. Distribution of dissolved and particulate iron in the sub-Antarctic and Polar Frontal Southern Ocean (Australian sector). Deep-Sea Research II, this issue.
Lutz, M., Dunbar, R., Caldeira, K., 2002. Regional variability in the vertical flux of particulate organic carbon in the ocean interior. Global Biogeochemical Cycles 16 (3), 1037, 11 11-18, doi:10.1029/2000GB001383.
Lutz, M.J., Caldeira, K., Dunbar, R.B., Behrenfeld, M.J., 2007. Seasonal rhythms of net primary production and particulate organic carbon flux to depth describe the efficiency of biological pump in the global ocean. Journal of Geophysical Research 112 (C10011), 1-26, doi:10.1029/2006JC003706.
Martin, J.H., Knauer, G.A., Karl, D.M., Broenkow, W.W., 1987. VERTEX: carbon cycling in the northeast Pacific. Deep-Sea Research 34 (2), 267-285.
Matear, R., Hirst, A.C., 1999. Climate change feedback on the future oceanic CO2 uptake. Tellus 51 (3), 722-733.
Menden-Deuer, S., Lessard, E.J., 2000. Carbon to volume relationship for dinoflagellates, diatoms, and other protist plankton. Limnology and Oceanography 45 (3), 569-579.
Michaels, A.F., Silver, M.W., 1988. Primary production, sinking fluxes and the microbial food web. Deep-Sea Research A 35 (4), 473-490.
Mongin, M., Matear, R., Chamberlain, M., 2010. Seasonal and spatial variability of remotely sensed chlorophyll and physical fields in the SAZ-Sense region. Deep-Sea Research II, this issue.
III. Manuscript 2
88
Noji, T.T., Estep, K.W., MacIntyre, F., Norrrbin, F., 1991. Image analysis of faecal material grazed upon by three species of copepods: Evidence for coprorhexy, coprophagy, and coprochaly. Journal of the Marine Biological Association of the United Kingdom 71 (2), 465-480.
Morel, F.M.M., Rueter, J.G., Price, N.M., 1991. Iron nutrition of phytoplankton and its possible importance in the ecology of ocean regions with high nutrients and low biomass. Oceanography 4 (2), 56-61.
Passow, U., 2004. Switching perspectives: Do mineral fluxes determine particulate organic carbon or vice versa? Geochemistry Geophysics Geosystems 5 (4), 1-5, doi:10.1029/2003GC000670.
Passow, U., Alldredge, A.L., Logan, B.E., 1994. The role of particulate carbohydrate exudates in the floccolation of diatom blooms. Deep-Sea Research I 42 (2), 335-357.
Pearce I., Davidson A., Thomson P., Wright S., van den Enden R., 2010. Marine microbial ecology in the Subantarctic Zone: rates of bacterial and phytoplankton growth and grazing by heterotrophic protists. Deep-Sea Research II, this issue.
Peterson, M.L., Wakeham, S.G., Lee, C., Askea, M.A., Miquel, J.C., 2005. Novel techniques for collection of sinking particles in the ocean and determining their settling rates. Limnology and Oceanography Methods 3, 520-532.
Peterson, M.L., Fabres, J., Wakeham, S.G., Lee, C., Miquel, J.C., 2009. Sampling the vertical particle flux in the upper water column using a large diameter free-drifting Net-Trap adapted to an Indented Rotating Sphere sediment trap. Deep-Sea Research II 56, 1547-1557.
Petrou K., Hassler C.S, Doblin M.A., Shelly K., Schoemann V., van den Enden R., Wright S.W., Ralph P.J., 2010. Iron limitation and high light stress on phytoplankton populations from the Australian sub-Antarctic zone (SAZ). Deep-Sea Research II, this issue.
Ploug, H., Iversen, M.H., Fischer, G., 2008. Ballast, sinking velocity, and apparent diffusivity within marine snow and zooplankton fecal pellets: Implications for substrate turnover by attached bacteria. Limnology and Oceanography 52 (5), 1878-1886.
Pollard, R., Sanders, R., Lucas, M., Statham, P., 2007. The Crozet Natural Iron Bloom and Export Experiment (CROZEX). Deep-Sea Research II 54 (18-20), 1905-1914.
Reigstad, M., Wexel Riser, C., Wassmann, P., Ratkova, T., 2008. Vertical export of particulate organic carbon: Attenuation, composition and loss rates in the northern Barents Sea, Deep-Sea Research II 55, 2308-2319.
Rintoul, S., Trull, T.W., 2001. Seasonal evolution of the mixed layer in the Subantarctic Zone south of Australia. Journal of Geophysical Research 106 (C12), 31 447-462, doi:10.1029/2000JC000329.
Salter, I., Lampitt, R.S., Sanders, S., Poulton, A.J., Kemp, A.E.S., Boorman, B., Saw, K., Pearce, R., 2007. Estimating carbon, silica and diatom export from a naturally fertilised phytoplankton bloom in the Southern Ocean using PELAGRA: a novel drifting sediment trap. Deep-Sea Research II 54, 2223-2259.
Sarmiento, J.L., Le Quéré, C., 1996. Oceanic Carbon Dioxide Uptake in a Model of Century-Scale Global Warming. Science 274, 1346-1350.
Sedwick, P.N., DiTullio, G.R., Hutchins, D.A., Boyd, P.W., Griffiths, B.F., Crossley, A.C., Trull, T.W., Quéguiner, B., 1999. Limitation of algal growth by iron deficiency in the Australian Subantarctic region. Geophysical Research Letters 26 (18), 2865-2868, doi:10.1029/1998GL002284.
Sedwick, P.N., Bowie, A., Trull, T.W., 2008. Dissolved iron in the Australian sector of the Southern Ocean (CLIVAR SR3 section): Meridional and seasonal trends. Deep-Sea Research I 55, 911-925.
Stemmann, L., Jackson, G.A., Ianson, D., 2004. A vertical model of particle size distributions and fluxes in the midwater column that includes biological and physical processes - Part I: model formulation. Deep-Sea Research I 51, 865-884.
Stemmann, L., Eloire, D., Sciandra, A., Jackson, G.A., Guidi, L., Picheral, M., Gorsky, G., 2008. Volume distribution for particles between 3.5 and 2000 μm in the upper 200 m region of the South Pacific Gyre. Biogeosciences 5, 299-310.
Turner, J.T., 2002. Zooplankton fecal pellets, marine snow and sinking phytoplankton blooms. Aquatic Microbial Ecology 27, 57-102.
Trull, T.W., Bray, S.G., Buesseler, K.O., Lamborg, C.H., Manganini, S., Moy, C., Valdes, J., 2008. In situ measurement of mesopelagic particle sinking rates and the control of carbon transfer to
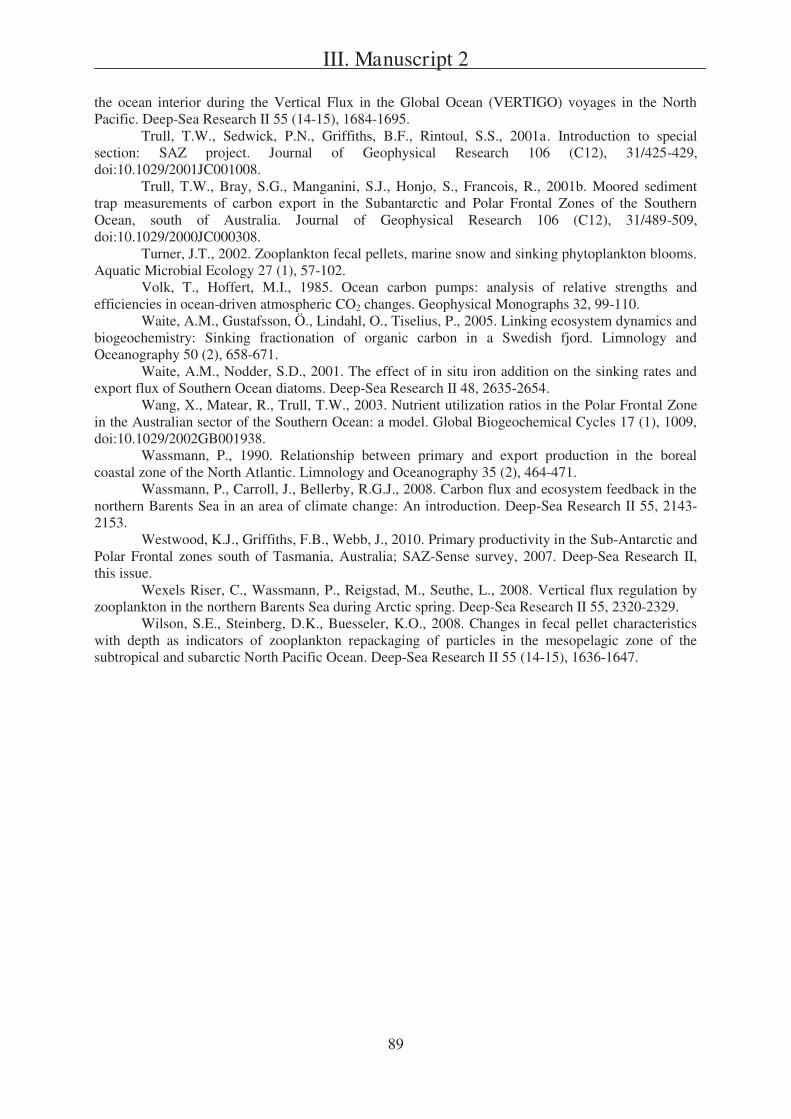
III. Manuscript 2
89
the ocean interior during the Vertical Flux in the Global Ocean (VERTIGO) voyages in the North Pacific. Deep-Sea Research II 55 (14-15), 1684-1695.
Trull, T.W., Sedwick, P.N., Griffiths, B.F., Rintoul, S.S., 2001a. Introduction to special section: SAZ project. Journal of Geophysical Research 106 (C12), 31/425-429, doi:10.1029/2001JC001008.
Trull, T.W., Bray, S.G., Manganini, S.J., Honjo, S., Francois, R., 2001b. Moored sediment trap measurements of carbon export in the Subantarctic and Polar Frontal Zones of the Southern Ocean, south of Australia. Journal of Geophysical Research 106 (C12), 31/489-509, doi:10.1029/2000JC000308.
Turner, J.T., 2002. Zooplankton fecal pellets, marine snow and sinking phytoplankton blooms. Aquatic Microbial Ecology 27 (1), 57-102.
Volk, T., Hoffert, M.I., 1985. Ocean carbon pumps: analysis of relative strengths and efficiencies in ocean-driven atmospheric CO2 changes. Geophysical Monographs 32, 99-110.
Waite, A.M., Gustafsson, Ö., Lindahl, O., Tiselius, P., 2005. Linking ecosystem dynamics and biogeochemistry: Sinking fractionation of organic carbon in a Swedish fjord. Limnology and Oceanography 50 (2), 658-671.
Waite, A.M., Nodder, S.D., 2001. The effect of in situ iron addition on the sinking rates and export flux of Southern Ocean diatoms. Deep-Sea Research II 48, 2635-2654.
Wang, X., Matear, R., Trull, T.W., 2003. Nutrient utilization ratios in the Polar Frontal Zone in the Australian sector of the Southern Ocean: a model. Global Biogeochemical Cycles 17 (1), 1009, doi:10.1029/2002GB001938.
Wassmann, P., 1990. Relationship between primary and export production in the boreal coastal zone of the North Atlantic. Limnology and Oceanography 35 (2), 464-471.
Wassmann, P., Carroll, J., Bellerby, R.G.J., 2008. Carbon flux and ecosystem feedback in the northern Barents Sea in an area of climate change: An introduction. Deep-Sea Research II 55, 2143-2153.
Westwood, K.J., Griffiths, F.B., Webb, J., 2010. Primary productivity in the Sub-Antarctic and Polar Frontal zones south of Tasmania, Australia; SAZ-Sense survey, 2007. Deep-Sea Research II, this issue.
Wexels Riser, C., Wassmann, P., Reigstad, M., Seuthe, L., 2008. Vertical flux regulation by zooplankton in the northern Barents Sea during Arctic spring. Deep-Sea Research II 55, 2320-2329.
Wilson, S.E., Steinberg, D.K., Buesseler, K.O., 2008. Changes in fecal pellet characteristics with depth as indicators of zooplankton repackaging of particles in the mesopelagic zone of the subtropical and subarctic North Pacific Ocean. Deep-Sea Research II 55 (14-15), 1636-1647.
III. Manuscript 2
90
Figure captions
Fig. 1.
Map of SAZ-Sense cruise track and station locations, superimposed on the surface chlorophyll
distribution (MERIS ocean colour 1-km resolution composite image for 5-11 Feb. 2007 courtesy of
the Plymouth Marine Laboratory Remote Sensing Group; colour-scale is logarithmic from 0.01 to
60 μg Chla L-1). Process Station P1, west of Tasmania in low-biomass Subantarctic waters was visited
first, followed by P2 in the Polar Frontal Zone, and finally P3 in the high biomass SAZ east of
Tasmania. Each Process Station was occupied for approximately 6 days. The image corresponds to the
time of the transect from P2 to P3.
Fig. 2.
Biomass distributions at P1, P2 and P3 based on (upper panel) the particulate contribution to beam
attenuation, at 660 nm using a Wetlabs C-Star transmissometer and (lower panel) chlorophyll
fluorescence, at 695 nm from excitation at 470 nm using a Wetlabs ECO-Fl fluorometer. The lower
values of near-surface fluorescence were obtained during daylight, and reflect insolation quenching.
Fig. 3.
Particle categories as defined from photo-microscopy of particles collected by the 24 hour
deployments of the free-drifting gel traps: Fluff-aggregates (c and k), faecal-aggregates (b, g, and m)
cylindrical faecal pellets (a, f and j), ovoid faecal pellets (e, h, and i), and phyto-cells (d and l). While
the fluff-aggregates resemble phyto-detritus (k) or feeding-structures (large particles in c), the faecal-
aggregates appear to be composed of relatively compact material (b), and sometimes even have
distinct shapes similar to a pellet (upper left particle in g) or they can be made of somewhat more
degraded faecal material (upper particle in m). The large cylindrical faecal pellets are likely to
originate from euphausiids (a and left pellet in j), whereas the smaller pellets presumably are of
copepod origin (f, and upper and right pellet in j). The ovoid faecal pellets show two size classes, the
larger pellets (i and left pellet in e) versus the smaller ones (h and right pellet in e). Phyto-cells are in
general the smallest particles found.
Fig. 4.
Images of the gels (grid cells: 12.5x14 mm) from the gel traps showing the difference among the sites.
The SAZ stations are shown at top (images A and B from station P1; images C and D from station P3)
and the PFZ station at bottom (images E and F from station P2). The dominance of larger particles in
the SAZ (A D) in contrast to small particles in the PFZ (E, F) is clear. Particle variations with depth
were complex (see text), but abundance generally decreased from the shallowest to the deepest trap at
III. Manuscript 2
91
each station, as shown here from left to right (images A, C, E from 140 m; images B, D, F from
290 m).
Fig. 5.
Detailed photos of individual particles collected with the gel traps are reflecting the difference in
particles size: the SAZ (upper panel) is dominated by large particles, while in the PFZ (lower panel)
phyto-cells and small aggregates are more abundant. SAZ-particles represent (from left to right in the
upper panel): intact ovoid and cylindrical faecal pellet, degrading cylindrical faecal pellet and faecal-
aggregate. PFZ-particles are mainly phyto-cells (distributed over all images in the lower panel) and
small fluff-aggregates and fluffy faecal-aggregates (lower left image). Scale bar for all photos: 1 mm.
Fig. 6.
Number flux spectra from the Gel-traps, indicating the variations with depth (140, 190, 240 and
290 m).
Fig. 7.
Size fractioned volume flux spectra showing the greater importance of large particles to the volume
flux than to the numerical flux (compare Fig. 6).
Fig. 8.
Estimated POC flux spectra from the piece-wise volume to POC conversion function that incorporates
carbon content estimates for phytoplankton, faecal pellets, and aggregates (see 2.3.2). This function
shifts the peak carbon flux to somewhat smaller particle sizes than the peak volume flux (because of
the increasing porosity of large aggregates as modelled by fractal geometry).
Fig. 9.
Cumulative POC flux as a function of cumulative numerical flux indicating that more than half the
flux is delivered by the largest 10% of the particles, even at the P2 site where small particles were
abundant (see Fig. 4).
III. Manuscript 2
92
Fig. 1.
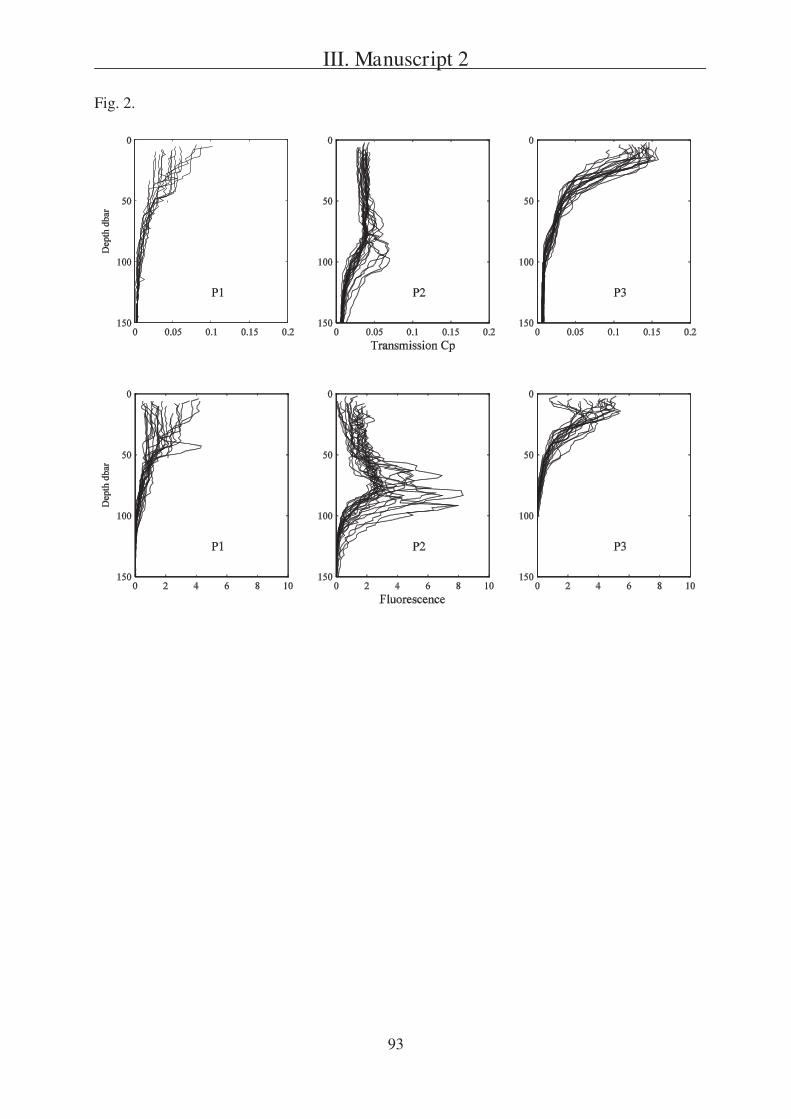
III. Manuscript 2
93
Fig. 2.
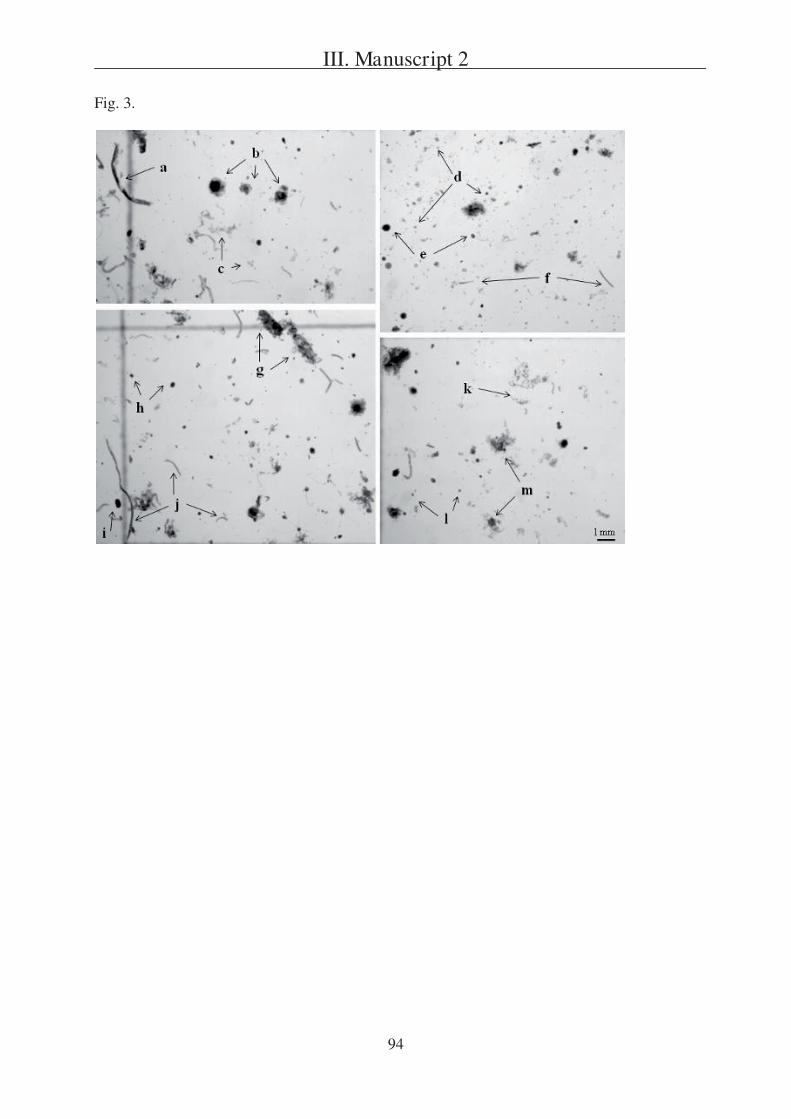
III. Manuscript 2
94
Fig. 3.
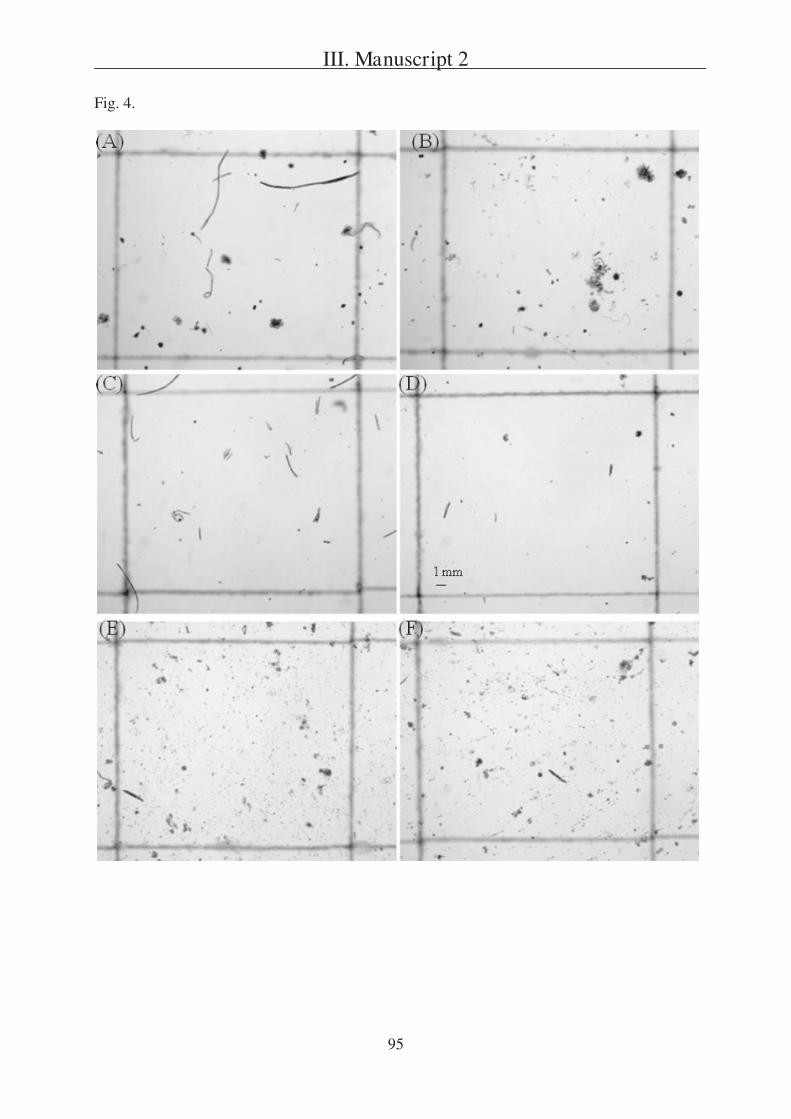
III. Manuscript 2
95
Fig. 4.
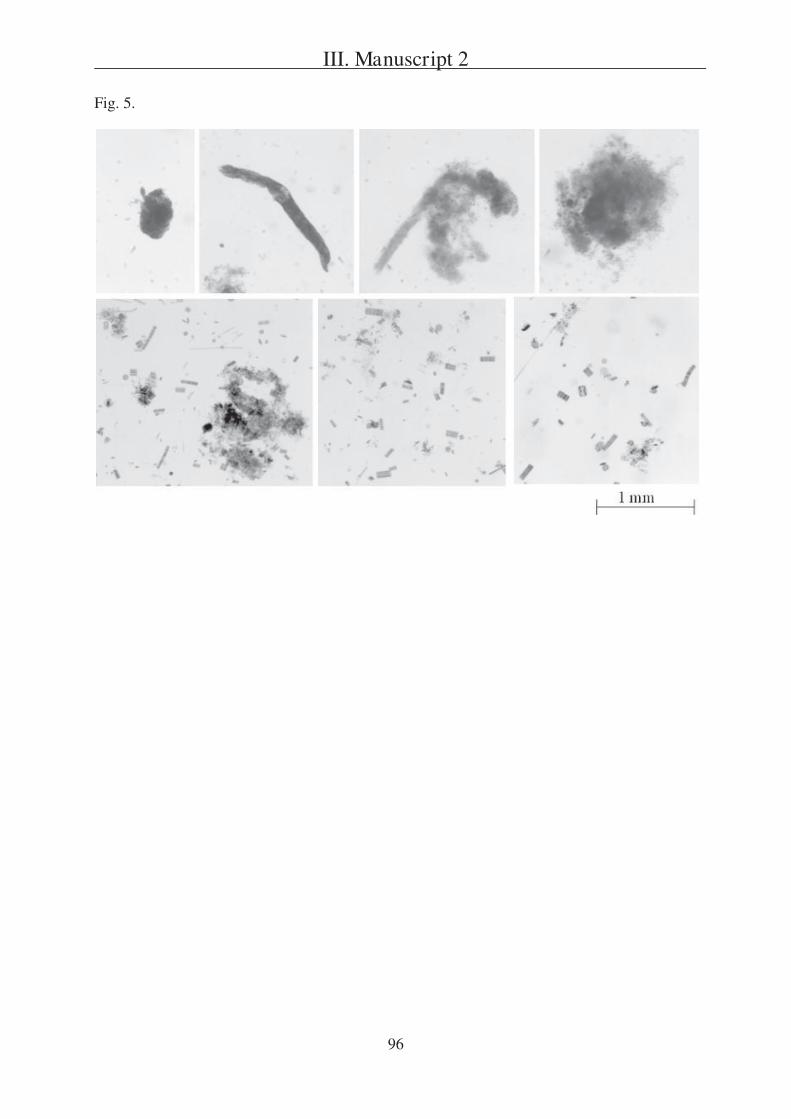
III. Manuscript 2
96
Fig. 5.
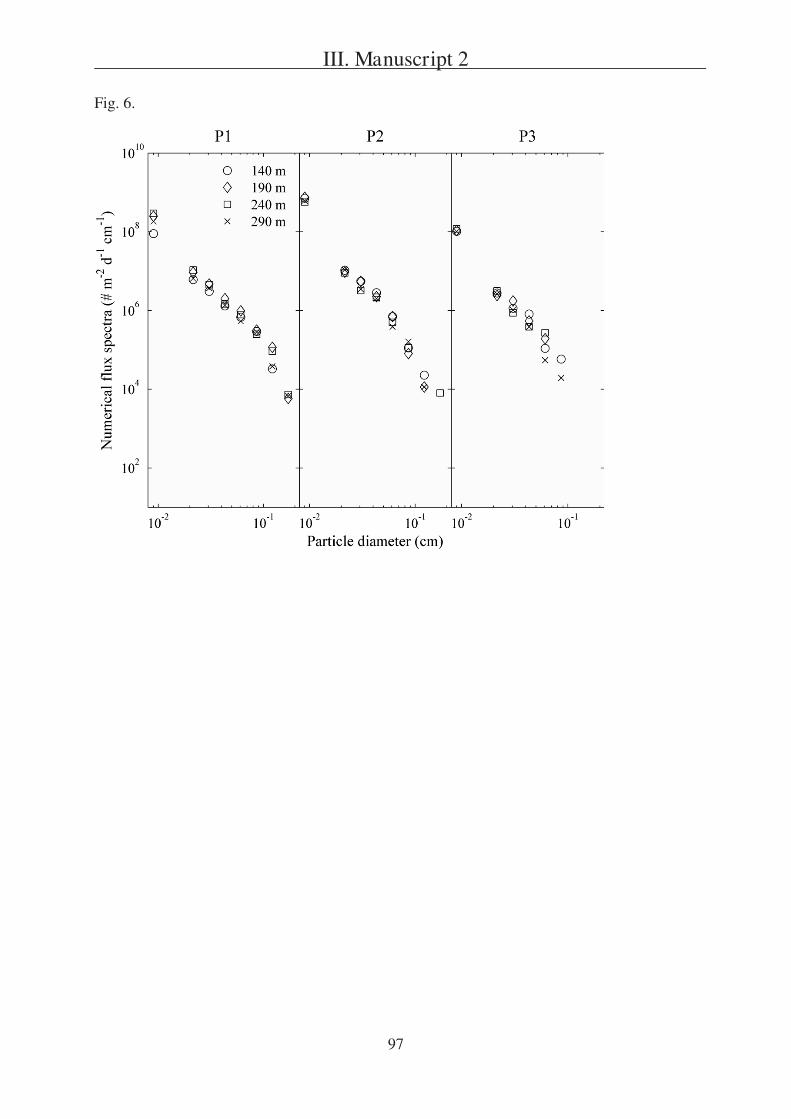
III. Manuscript 2
97
Fig. 6.
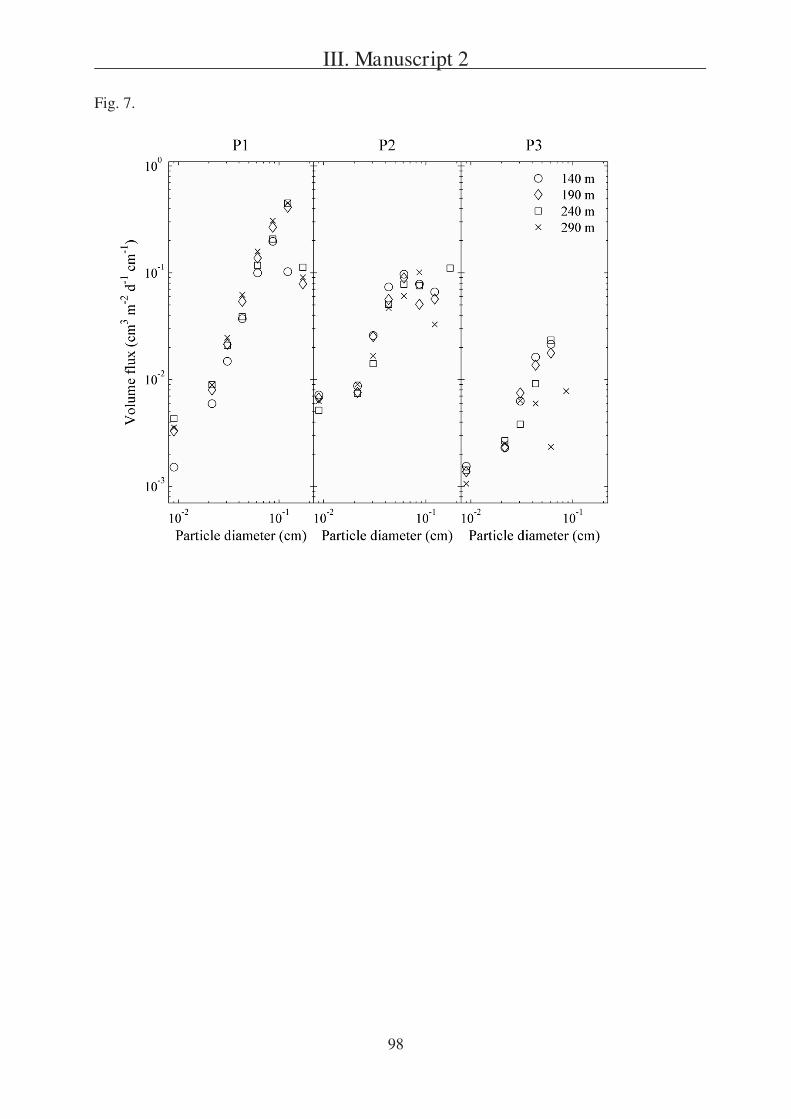
III. Manuscript 2
98
Fig. 7.
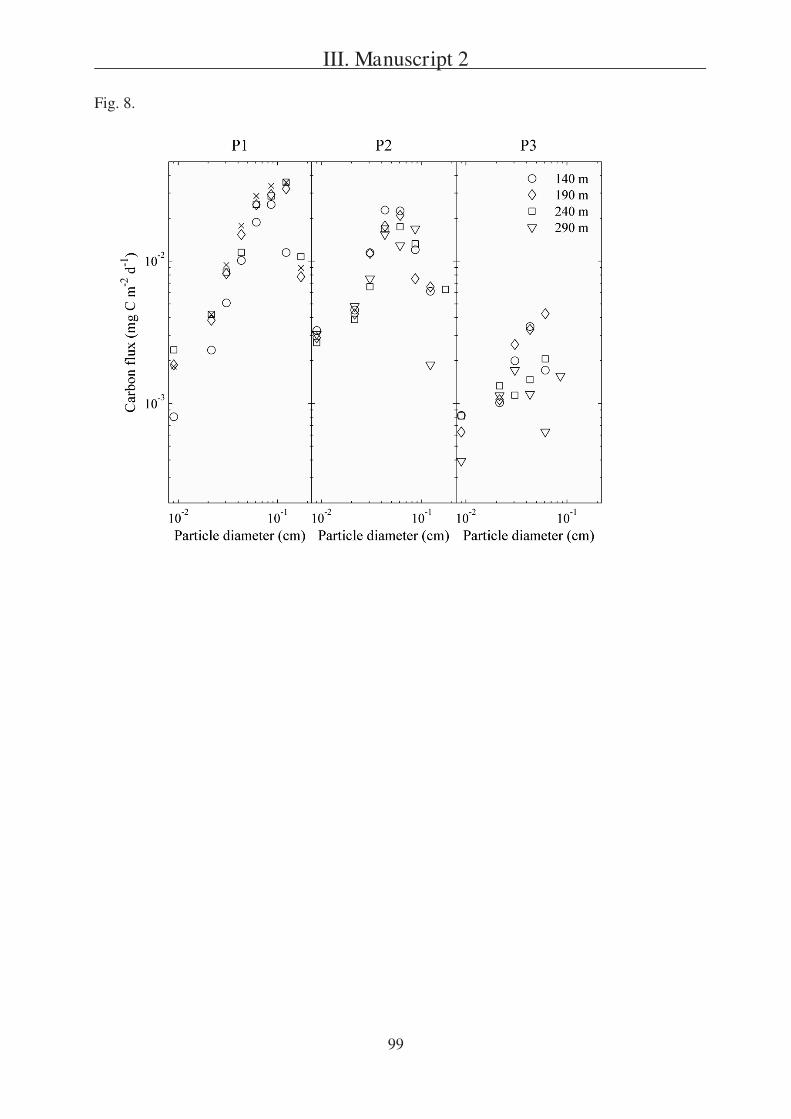
III. Manuscript 2
99
Fig. 8.
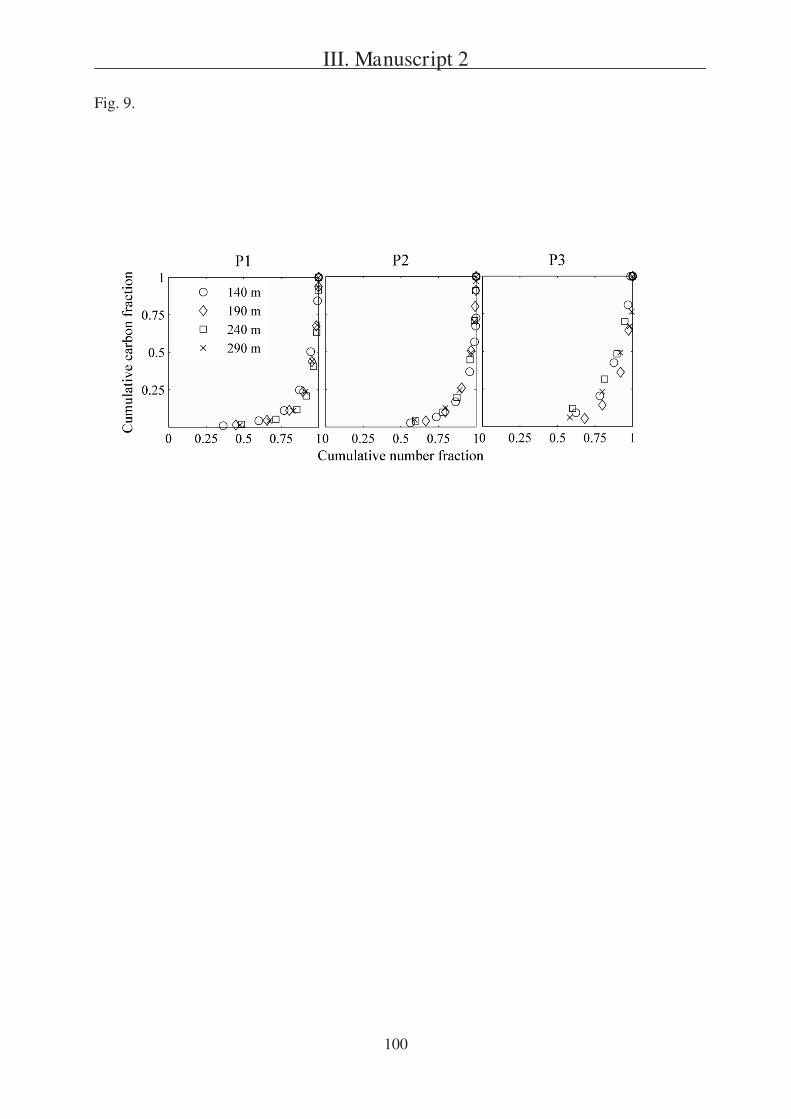
III. Manuscript 2
100
Fig. 9.
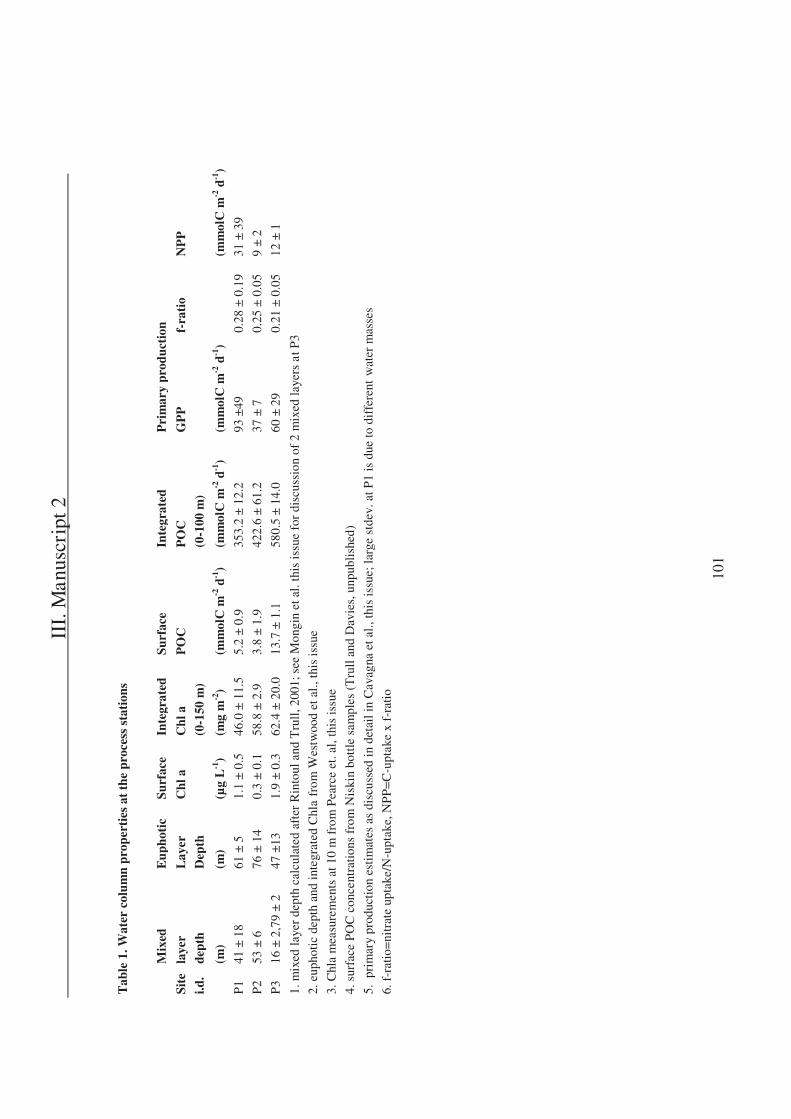
II
I. M
anus
crip
t 2
101
Tab
le 1
. Wat
er c
olum
n pr
oper
ties
at
the
proc
ess
stat
ions
M
ixed
E
upho
tic
Surf
ace
Inte
grat
ed
Surf
ace
Inte
grat
ed
Pri
mar
y pr
oduc
tion
Site
la
yer
Lay
er
Chl
a
Chl
a
PO
C
PO
C
GP
P
f-ra
tio
NP
P
i.d.
dept
h D
epth
(0-1
50 m
)
(0-1
00 m
)
(m
) (m
) (μ
g L
-1)
(mg
m-2
) (m
mol
C m
-2 d
-1)
(mm
olC
m-2
d-1
) (m
mol
C m
-2 d
-1)
(m
mol
C m
-2 d
-1)
P1
41 ±
18
61 ±
5
1.1
± 0.
5 46
.0 ±
11.
5 5.
2 ±
0.9
353.
2 ±
12.2
93
±49
0.
28 ±
0.1
9 31
± 3
9
P2
53 ±
6
76 ±
14
0.3
± 0.
1 58
.8 ±
2.9
3.
8 ±
1.9
422.
6 ±
61.2
37
± 7
0.
25 ±
0.0
5 9
± 2
P3
16 ±
2,7
9 ±
2 47
±13
1.
9 ±
0.3
62.4
± 2
0.0
13.7
± 1
.1
580.
5 ±
14.0
60
± 2
9 0.
21 ±
0.0
5 12
± 1
1. m
ixed
laye
r de
pth
calc
ulat
ed a
fter
Rin
toul
and
Tru
ll, 2
001;
see
Mon
gin
et a
l. th
is is
sue
for
disc
ussi
on o
f 2
mix
ed la
yers
at P
3
2. e
upho
tic
dept
h an
d in
tegr
ated
Chl
a fr
om W
estw
ood
et a
l., th
is is
sue
3. C
hla
mea
sure
men
ts a
t 10
m f
rom
Pea
rce
et. a
l, th
is is
sue
4. s
urfa
ce P
OC
con
cent
rati
ons
from
Nis
kin
bott
le s
ampl
es (
Tru
ll a
nd D
avie
s, u
npub
lish
ed)
5. p
rim
ary
prod
uctio
n es
tim
ates
as
disc
usse
d in
det
ail i
n C
avag
na e
t al.,
this
issu
e; la
rge
stde
v. a
t P1
is d
ue to
dif
fere
nt w
ater
mas
ses
6. f
-rat
io=
nitr
ate
upta
ke/N
-upt
ake,
NP
P=
C-u
ptak
e x
f-ra
tio
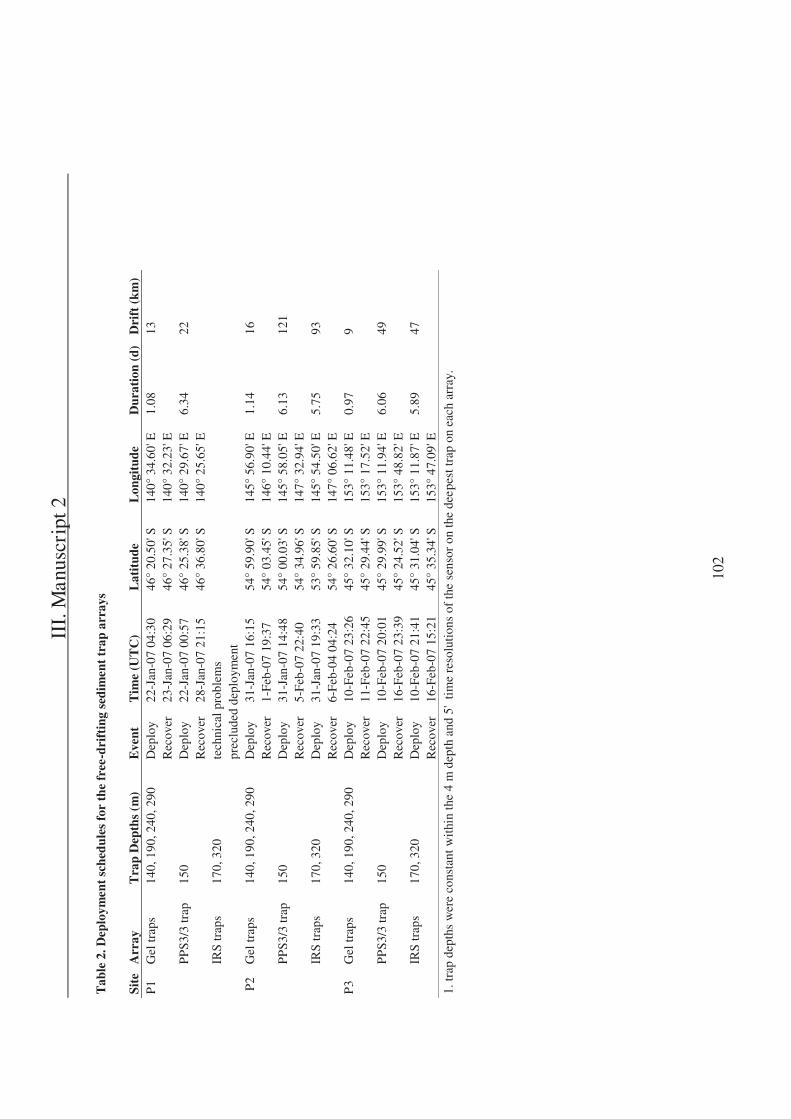
II
I. M
anus
crip
t 2
102
Tab
le 2
. Dep
loym
ent
sche
dule
s fo
r th
e fr
ee-d
rift
ing
sedi
men
t tr
ap a
rray
s
Si
te
Arr
ay
Tra
p D
epth
s (m
) E
vent
T
ime
(UT
C)
Lat
itud
e L
ongi
tude
D
urat
ion
(d)
Dri
ft (
km)
P1
Gel
trap
s 14
0, 1
90, 2
40, 2
90
Dep
loy
22-J
an-0
7 04
:30
46°
20.5
0' S
14
0° 3
4.60
' E
1.08
13
Rec
over
23
-Jan
-07
06:2
9 46
° 27
.35'
S
140°
32.
23' E
PP
S3/3
trap
15
0 D
eplo
y 22
-Jan
-07
00:5
7 46
° 25
.38'
S
140°
29.
67' E
6.
34
22
R
ecov
er
28-J
an-0
7 21
:15
46°
36.8
0' S
14
0° 2
5.65
' E
IR
S tr
aps
170,
320
te
chni
cal p
robl
ems
pr
eclu
ded
depl
oym
ent
P2
Gel
trap
s 14
0, 1
90, 2
40, 2
90
Dep
loy
31-J
an-0
7 16
:15
54°
59.9
0' S
14
5° 5
6.90
' E
1.14
16
Rec
over
1-
Feb
-07
19:3
7 54
° 03
.45'
S
146°
10.
44' E
PP
S3/3
trap
15
0 D
eplo
y 31
-Jan
-07
14:4
8 54
° 00
.03'
S
145°
58.
05' E
6.
13
121
R
ecov
er
5-F
eb-0
7 22
:40
54°
34.9
6' S
14
7° 3
2.94
' E
IR
S tr
aps
170,
320
D
eplo
y 31
-Jan
-07
19:3
3 53
° 59
.85'
S
145°
54.
50' E
5.
75
93
R
ecov
er
6-F
eb-0
4 04
:24
54°
26.6
0' S
14
7° 0
6.62
' E
P3
Gel
trap
s 14
0, 1
90, 2
40, 2
90
Dep
loy
10-F
eb-0
7 23
:26
45°
32.1
0' S
15
3° 1
1.48
' E
0.97
9
R
ecov
er
11-F
eb-0
7 22
:45
45°
29.4
4' S
15
3° 1
7.52
' E
P
PS3
/3 tr
ap
150
Dep
loy
10-F
eb-0
7 20
:01
45°
29.9
9' S
15
3° 1
1.94
' E
6.06
49
Rec
over
16
-Feb
-07
23:3
9 45
° 24
.52'
S
153°
48.
82' E
IRS
trap
s 17
0, 3
20
Dep
loy
10-F
eb-0
7 21
:41
45°
31.0
4' S
15
3° 1
1.87
' E
5.89
47
Rec
over
16
-Feb
-07
15:2
1 45
° 35
.34'
S
153°
47.
09' E
1.
trap
dep
ths
wer
e co
nsta
nt w
ithi
n th
e 4
m d
epth
and
5'
tim
e re
solu
tion
s of
the
sens
or o
n th
e de
epes
t tra
p on
eac
h ar
ray.
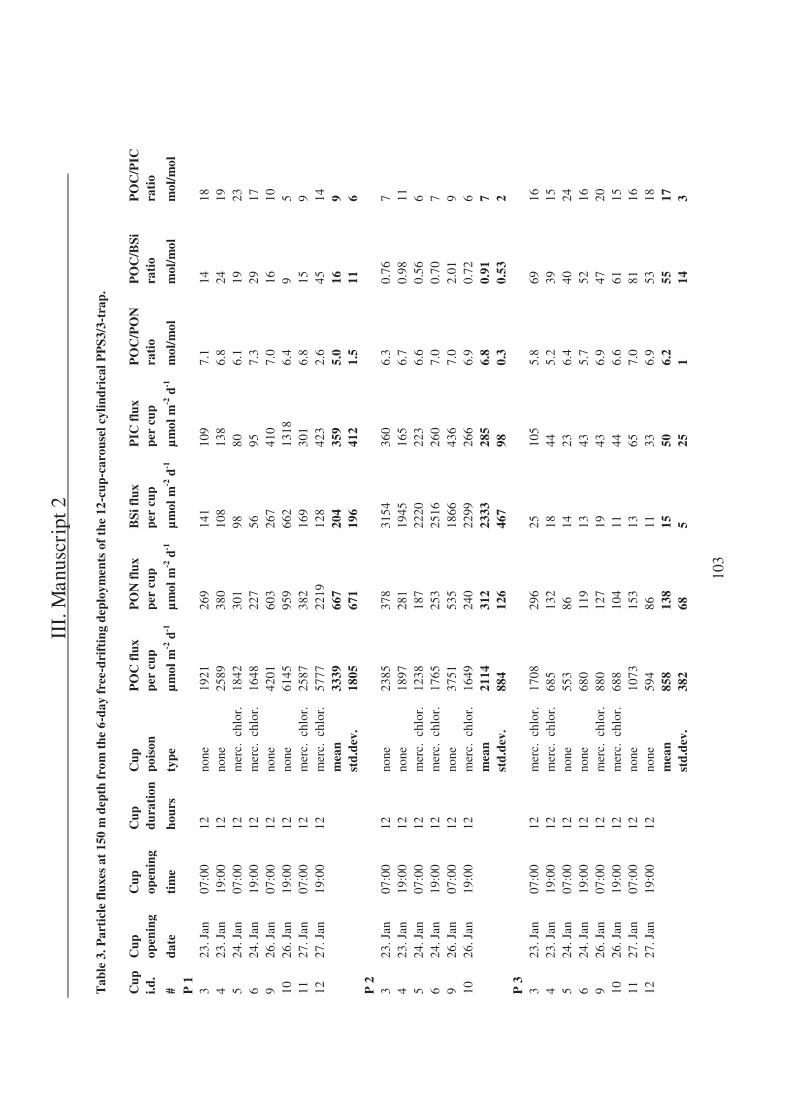
II
I. M
anus
crip
t 2
103
Tab
le 3
. Par
ticl
e fl
uxes
at
150
m d
epth
fro
m t
he 6
-day
fre
e-dr
ifti
ng d
eplo
ymen
ts o
f th
e 12
-cup
-car
ouse
l cyl
indr
ical
PP
S3/3
-tra
p.
Cup
C
up
Cup
C
up
Cup
P
OC
flu
x P
ON
flu
x B
Si f
lux
PIC
flu
x P
OC
/PO
N
PO
C/B
Si
PO
C/P
IC
i.d.
open
ing
open
ing
dura
tion
po
ison
pe
r cu
p pe
r cu
p pe
r cu
p pe
r cu
p ra
tio
rati
o ra
tio
# da
te
tim
e ho
urs
type
μ
mol
m-2
d-1
μ
mol
m-2
d-1
μ
mol
m-2
d-1
μ
mol
m-2
d-1
m
ol/m
ol
mol
/mol
m
ol/m
ol
P 1
3 23
. Jan
07
:00
12
none
19
21
269
141
109
7.1
14
18
4 23
. Jan
19
:00
12
none
25
89
380
108
138
6.8
24
19
5 24
. Jan
07
:00
12
mer
c. c
hlor
. 18
42
301
98
80
6.1
19
23
6 24
. Jan
19
:00
12
mer
c. c
hlor
. 16
48
227
56
95
7.3
29
17
9 26
. Jan
07
:00
12
none
42
01
603
267
410
7.0
16
10
10
26. J
an
19:0
0 12
no
ne
6145
95
9 66
2 13
18
6.4
9 5
11
27. J
an
07:0
0 12
m
erc.
chl
or.
2587
38
2 16
9 30
1 6.
8 15
9
12
27. J
an
19:0
0 12
m
erc.
chl
or.
5777
22
19
128
423
2.6
45
14
mea
n 33
39
667
204
359
5.0
16
9
st
d.de
v.
1805
67
1 19
6 41
2 1.
5 11
6
P 2
3 23
. Jan
07
:00
12
none
23
85
378
3154
36
0 6.
3 0.
76
7 4
23. J
an
19:0
0 12
no
ne
1897
28
1 19
45
165
6.7
0.98
11
5
24. J
an
07:0
0 12
m
erc.
chl
or.
1238
18
7 22
20
223
6.6
0.56
6
6 24
. Jan
19
:00
12
mer
c. c
hlor
. 17
65
253
2516
26
0 7.
0 0.
70
7 9
26. J
an
07:0
0 12
no
ne
3751
53
5 18
66
436
7.0
2.01
9
10
26. J
an
19:0
0 12
m
erc.
chl
or.
1649
24
0 22
99
266
6.9
0.72
6
mea
n 21
14
312
2333
28
5 6.
8 0.
91
7
st
d.de
v.
884
126
467
98
0.3
0.53
2
P 3
3 23
. Jan
07
:00
12
mer
c. c
hlor
. 17
08
296
25
105
5.8
69
16
4 23
. Jan
19
:00
12
mer
c. c
hlor
. 68
5 13
2 18
44
5.
2 39
15
5
24. J
an
07:0
0 12
no
ne
553
86
14
23
6.4
40
24
6 24
. Jan
19
:00
12
none
68
0 11
9 13
43
5.
7 52
16
9
26. J
an
07:0
0 12
m
erc.
chl
or.
880
127
19
43
6.9
47
20
10
26. J
an
19:0
0 12
m
erc.
chl
or.
688
104
11
44
6.6
61
15
11
27. J
an
07:0
0 12
no
ne
1073
15
3 13
65
7.
0 81
16
12
27
. Jan
19
:00
12
none
59
4 86
11
33
6.
9 53
18
m
ean
858
138
15
50
6.2
55
17
std.
dev.
38
2 68
5
25
1 14
3
II
I. M
anus
crip
t 2
104
1. ti
mes
are
UT
C, l
ocal
tim
e w
as U
TC
+11
h, a
nd th
us c
ups
ran
dusk
to d
awn
(18:
00 to
06:
00)
and
daw
n to
dus
k (0
6:00
to 1
8:00
) da
ily
2. p
arti
cles
wer
e w
ashe
d th
roug
h a
350
um s
cree
n to
rem
ove
zoop
lank
ton
and
coll
ecte
d on
a 1
mm
sil
ver
filt
er
3. tr
ace
met
al f
luxe
s w
ere
mea
sure
d in
cup
s #
1, 2
, 7 a
nd 8
for
eac
h tr
ap, r
espe
ctiv
ely,
and
add
itio
nall
y in
cup
s 11
and
12
at P
2 (a
nd a
re r
epor
ted
in B
owie
et a
l., 2
009)
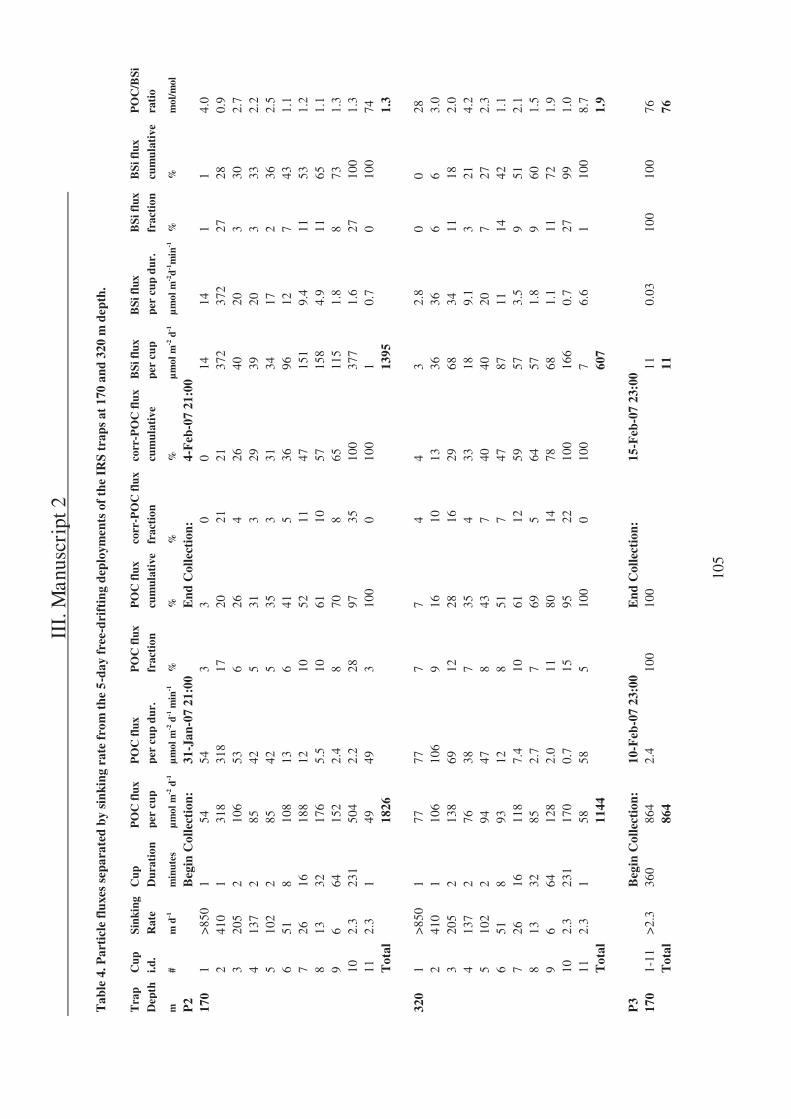
II
I. M
anus
crip
t 2
105
Tab
le 4
. Par
ticl
e fl
uxes
sep
arat
ed b
y si
nkin
g ra
te f
rom
the
5-d
ay f
ree-
drif
ting
dep
loym
ents
of
the
IRS
trap
s at
170
and
320
m d
epth
.
T
rap
Cup
Si
nkin
g C
up
PO
C f
lux
PO
C f
lux
PO
C f
lux
PO
C f
lux
corr
-PO
C f
lux
corr
-PO
C f
lux
BSi
flu
x B
Si f
lux
BSi
flu
x B
Si f
lux
PO
C/B
Si
Dep
th
i.d.
Rat
e D
urat
ion
per
cup
per
cup
dur.
fr
acti
on
cum
ulat
ive
frac
tion
cu
mul
ativ
e pe
r cu
p pe
r cu
p du
r.
frac
tion
cu
mul
ativ
e ra
tio
m
# m
d-1
m
inut
es
μm
ol m
-2 d
-1
μm
ol m
-2 d
-1 m
in-1
%
%
%
%
μ
mol
m-2
d-1
μ
mol
m-2
d-1m
in-1
%
%
m
ol/m
ol
P2
B
egin
Col
lect
ion:
31
-Jan
-07
21:0
0 E
nd C
olle
ctio
n:
4-F
eb-0
7 21
:00
17
0 1
>85
0 1
54
54
3 3
0 0
14
14
1 1
4.0
2
410
1 31
8 31
8 17
20
21
21
37
2 37
2 27
28
0.
9
3 20
5 2
106
53
6 26
4
26
40
20
3 30
2.
7
4 13
7 2
85
42
5 31
3
29
39
20
3 33
2.
2
5 10
2 2
85
42
5 35
3
31
34
17
2 36
2.
5
6 51
8
108
13
6 41
5
36
96
12
7 43
1.
1
7 26
16
18
8 12
10
52
11
47
15
1 9.
4 11
53
1.
2
8 13
32
17
6 5.
5 10
61
10
57
15
8 4.
9 11
65
1.
1
9 6
64
152
2.4
8 70
8
65
115
1.8
8 73
1.
3
10
2.3
231
504
2.2
28
97
35
100
377
1.6
27
100
1.3
11
2.
3 1
49
49
3 10
0 0
100
1 0.
7 0
100
74
T
otal
18
26
13
95
1.
3
320
1 >
850
1 77
77
7
7 4
4 3
2.8
0 0
28
2
410
1 10
6 10
6 9
16
10
13
36
36
6 6
3.0
3
205
2 13
8 69
12
28
16
29
68
34
11
18
2.
0
4 13
7 2
76
38
7 35
4
33
18
9.1
3 21
4.
2
5 10
2 2
94
47
8 43
7
40
40
20
7 27
2.
3
6 51
8
93
12
8 51
7
47
87
11
14
42
1.1
7
26
16
118
7.4
10
61
12
59
57
3.5
9 51
2.
1
8 13
32
85
2.
7 7
69
5 64
57
1.
8 9
60
1.5
9
6 64
12
8 2.
0 11
80
14
78
68
1.
1 11
72
1.
9
10
2.3
231
170
0.7
15
95
22
100
166
0.7
27
99
1.0
11
2.
3 1
58
58
5 10
0 0
100
7 6.
6 1
100
8.7
T
otal
11
44
60
7
1.9
P
3
B
egin
Col
lect
ion:
10
-Feb
-07
23:0
0 E
nd C
olle
ctio
n:
15-F
eb-0
7 23
:00
170
1-11
>
2.3
360
864
2.4
100
100
11
0.03
10
0 10
0 76
Tot
al
864
11
76
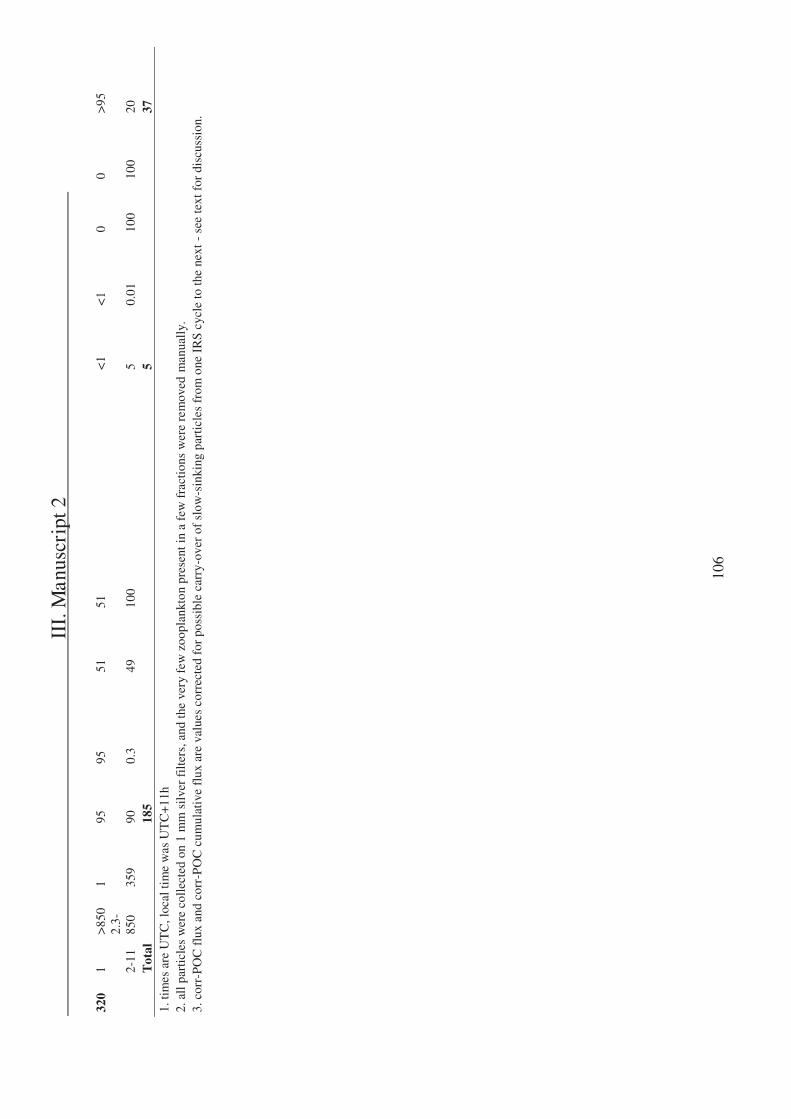
II
I. M
anus
crip
t 2
106
320
1 >
850
1 95
95
51
51
<
1 <
1 0
0 >
95
2-
11
2.3-
850
359
90
0.3
49
100
5 0.
01
100
100
20
T
otal
18
5
5
37
1. ti
mes
are
UT
C, l
ocal
tim
e w
as U
TC
+11
h 2.
all
par
ticl
es w
ere
coll
ecte
d on
1 m
m s
ilve
r fi
lter
s, a
nd th
e ve
ry f
ew z
oopl
ankt
on p
rese
nt in
a f
ew f
ract
ions
wer
e re
mov
ed m
anua
lly.
3. c
orr-
PO
C f
lux
and
corr
-PO
C c
umul
ativ
e fl
ux a
re v
alue
s co
rrec
ted
for
poss
ible
car
ry-o
ver
of s
low
-sin
king
par
ticl
es f
rom
one
IR
S cy
cle
to th
e ne
xt -
see
text
for
dis
cuss
ion.
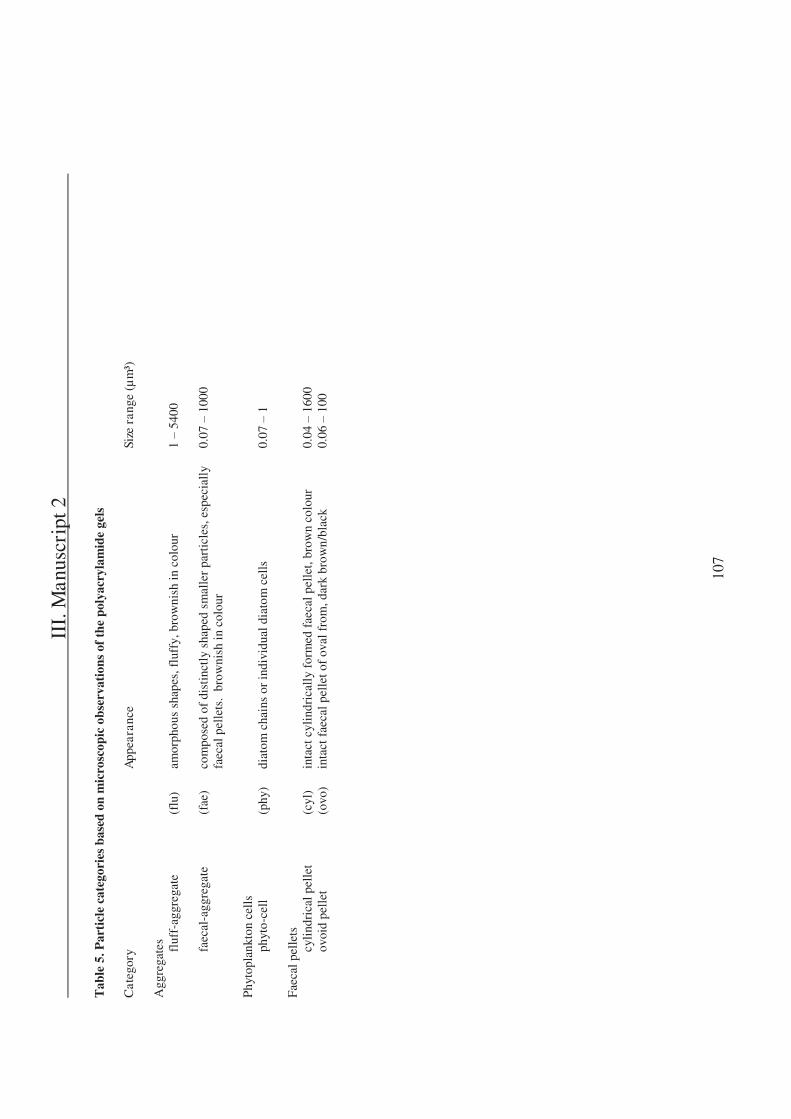
II
I. M
anus
crip
t 2
107
Tab
le 5
. Par
ticl
e ca
tego
ries
bas
ed o
n m
icro
scop
ic o
bser
vati
ons
of t
he p
olya
cryl
amid
e ge
ls
Cat
egor
y
App
eara
nce
Si
ze r
ange
(μ
m³)
A
ggre
gate
s fl
uff-
aggr
egat
e
(flu
) am
orph
ous
shap
es, f
luff
y, b
row
nish
in c
olou
r
1 5
400
faec
al-a
ggre
gate
(f
ae)
com
pose
d of
dis
tinc
tly
shap
ed s
mal
ler
part
icle
s, e
spec
iall
y 0.
07
100
0 fa
ecal
pel
lets
. br
owni
sh in
col
our
Phy
topl
ankt
on c
ells
ph
yto-
cell
(phy
) di
atom
cha
ins
or in
divi
dual
dia
tom
cel
ls
0.07
1
Fa
ecal
pel
lets
cy
lind
rica
l pel
let
(c
yl)
inta
ct c
ylin
dric
ally
for
med
fae
cal p
elle
t, br
own
colo
ur
0.04
1
600
ov
oid
pell
et
(o
vo)
inta
ct f
aeca
l pel
let o
f ov
al f
rom
, dar
k br
own/
blac
k
0.06
1
00
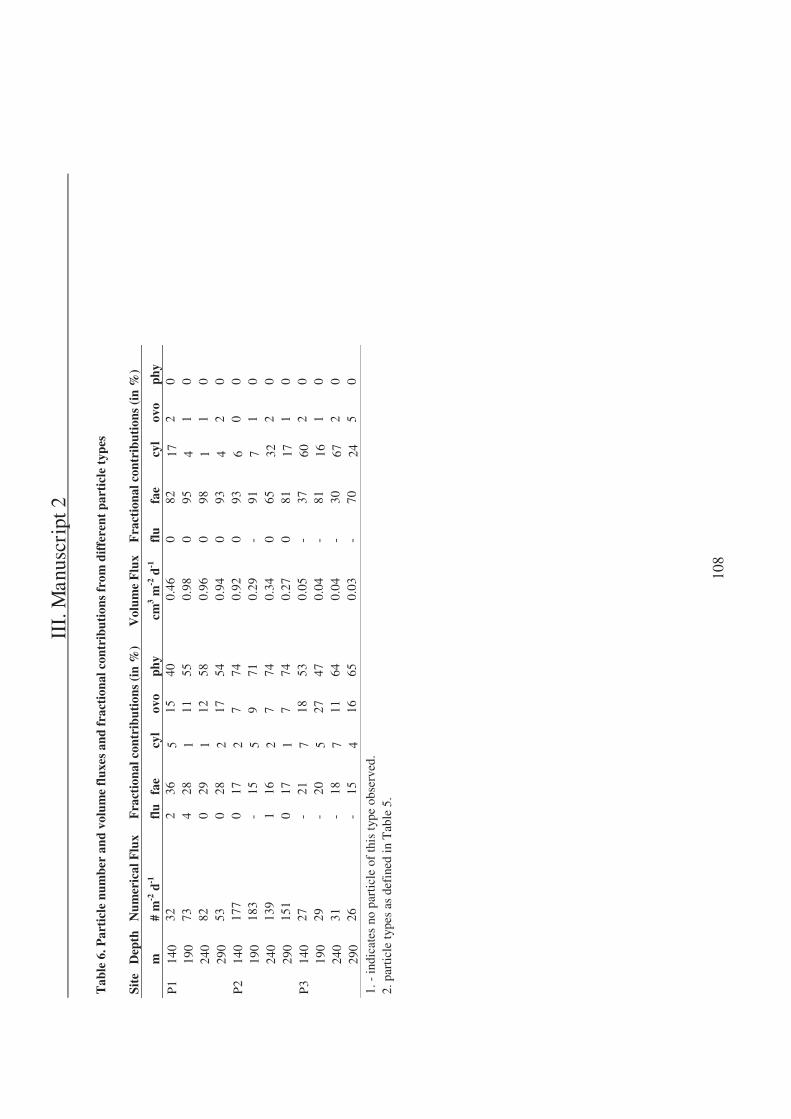
II
I. M
anus
crip
t 2
108
Tab
le 6
. Par
ticl
e nu
mbe
r an
d vo
lum
e fl
uxes
and
fra
ctio
nal c
ontr
ibut
ions
fro
m d
iffe
rent
par
ticl
e ty
pes
Si
te
Dep
th
Num
eric
al F
lux
Fra
ctio
nal c
ontr
ibut
ions
(in
%)
Vol
ume
Flu
x F
ract
iona
l con
trib
utio
ns (
in %
)
m
#
m-2
d-1
fl
u fa
e cy
l ov
o ph
y c
m3 m
-2 d
-1
flu
fae
cyl
ovo
phy
P1
140
32
2 36
5
15
40
0.46
0
82
17
2 0
19
0 73
4
28
1 11
55
0.
98
0 95
4
1 0
24
0 82
0
29
1 12
58
0.
96
0 98
1
1 0
29
0 53
0
28
2 17
54
0.
94
0 93
4
2 0
P2
140
177
0 17
2
7 74
0.
92
0 93
6
0 0
19
0 18
3 -
15
5 9
71
0.29
-
91
7 1
0
24
0 13
9 1
16
2 7
74
0.34
0
65
32
2 0
29
0 15
1 0
17
1 7
74
0.27
0
81
17
1 0
P3
140
27
- 21
7
18
53
0.05
-
37
60
2 0
19
0 29
-
20
5 27
47
0.
04
- 81
16
1
0
24
0 31
-
18
7 11
64
0.
04
- 30
67
2
0
29
0 26
-
15
4 16
65
0.
03
- 70
24
5
0
1. -
indi
cate
s no
par
ticl
e of
this
type
obs
erve
d.
2. p
arti
cle
type
s as
def
ined
in T
able
5.
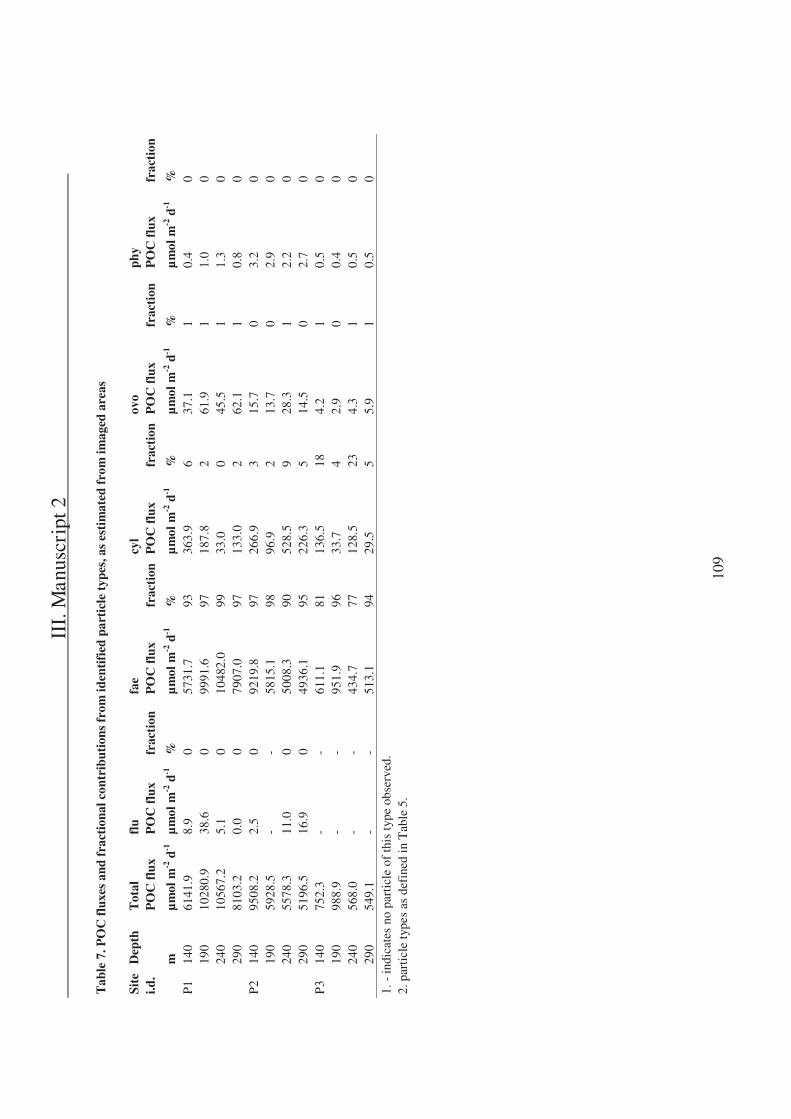
II
I. M
anus
crip
t 2
109
Tab
le 7
. PO
C f
luxe
s an
d fr
acti
onal
con
trib
utio
ns f
rom
iden
tifi
ed p
arti
cle
type
s, a
s es
tim
ated
fro
m im
aged
are
as
Site
D
epth
T
otal
fl
u
fae
cy
l
ovo
ph
y
i.d.
P
OC
flu
x P
OC
flu
x fr
acti
on
PO
C f
lux
frac
tion
P
OC
flu
x fr
acti
on
PO
C f
lux
frac
tion
P
OC
flu
x fr
acti
on
m
μ
mol
m-2
d-1
μ
mol
m-2
d-1
%
μ
mol
m-2
d-1
%
μ
mol
m-2
d-1
%
μ
mol
m-2
d-1
%
μ
mol
m-2
d-1
%
P
1 14
0 61
41.9
8.
9 0
5731
.7
93
363.
9 6
37.1
1
0.4
0
190
1028
0.9
38.6
0
9991
.6
97
187.
8 2
61.9
1
1.0
0
240
1056
7.2
5.1
0 10
482.
0 99
33
.0
0 45
.5
1 1.
3 0
29
0 81
03.2
0.
0 0
7907
.0
97
133.
0 2
62.1
1
0.8
0 P
2 14
0 95
08.2
2.
5 0
9219
.8
97
266.
9 3
15.7
0
3.2
0
190
5928
.5
- -
5815
.1
98
96.9
2
13.7
0
2.9
0
240
5578
.3
11.0
0
5008
.3
90
528.
5 9
28.3
1
2.2
0
290
5196
.5
16.9
0
4936
.1
95
226.
3 5
14.5
0
2.7
0 P
3 14
0 75
2.3
- -
611.
1 81
13
6.5
18
4.2
1 0.
5 0
19
0 98
8.9
- -
951.
9 96
33
.7
4 2.
9 0
0.4
0
240
568.
0 -
- 43
4.7
77
128.
5 23
4.
3 1
0.5
0
290
549.
1 -
- 51
3.1
94
29.5
5
5.9
1 0.
5 0
1. -
indi
cate
s no
par
ticl
e of
this
type
obs
erve
d.
2. p
arti
cle
type
s as
def
ined
in T
able
5.
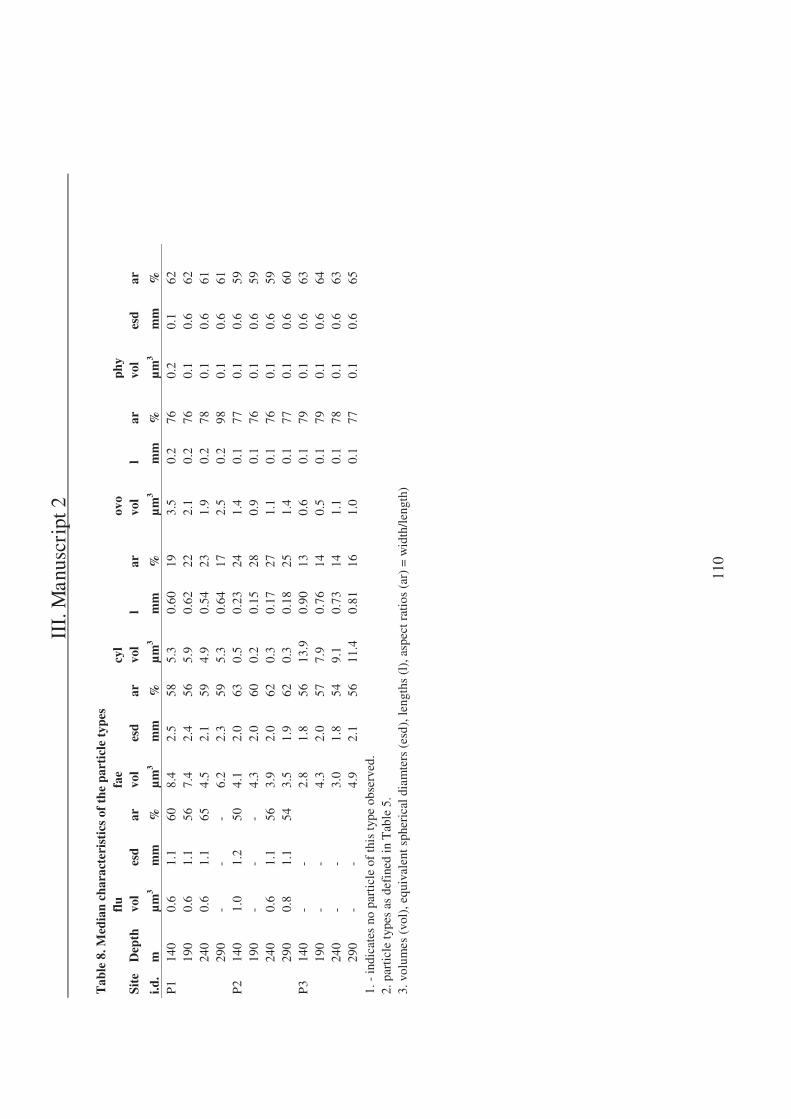
II
I. M
anus
crip
t 2
110
Tab
le 8
. Med
ian
char
acte
rist
ics
of t
he p
arti
cle
type
s
flu
fae
cyl
ovo
phy
Site
D
epth
vo
l es
d ar
vo
l es
d ar
vo
l l
ar
vol
l ar
vo
l es
d ar
i.d.
m
μm
3 m
m
%
μm
3 m
m
%
μm
3 m
m
%
μm
3 m
m
%
μm
3 m
m
%
P1
140
0.6
1.1
60
8.4
2.5
58
5.3
0.60
19
3.
5 0.
2 76
0.
2 0.
1 62
190
0.6
1.1
56
7.4
2.4
56
5.9
0.62
22
2.
1 0.
2 76
0.
1 0.
6 62
240
0.6
1.1
65
4.5
2.1
59
4.9
0.54
23
1.
9 0.
2 78
0.
1 0.
6 61
290
- -
- 6.
2 2.
3 59
5.
3 0.
64
17
2.5
0.2
98
0.1
0.6
61
P2
140
1.0
1.2
50
4.1
2.0
63
0.5
0.23
24
1.
4 0.
1 77
0.
1 0.
6 59
190
- -
- 4.
3 2.
0 60
0.
2 0.
15
28
0.9
0.1
76
0.1
0.6
59
24
0 0.
6 1.
1 56
3.
9 2.
0 62
0.
3 0.
17
27
1.1
0.1
76
0.1
0.6
59
29
0 0.
8 1.
1 54
3.
5 1.
9 62
0.
3 0.
18
25
1.4
0.1
77
0.1
0.6
60
P3
140
- -
2.
8 1.
8 56
13
.9
0.90
13
0.
6 0.
1 79
0.
1 0.
6 63
190
- -
4.
3 2.
0 57
7.
9 0.
76
14
0.5
0.1
79
0.1
0.6
64
24
0 -
-
3.0
1.8
54
9.1
0.73
14
1.
1 0.
1 78
0.
1 0.
6 63
290
- -
4.
9 2.
1 56
11
.4
0.81
16
1.
0 0.
1 77
0.
1 0.
6 65
1.
- in
dica
tes
no p
arti
cle
of th
is ty
pe o
bser
ved.
2. p
arti
cle
type
s as
def
ined
in T
able
5.
3. v
olum
es (
vol)
, equ
ival
ent s
pher
ical
dia
mte
rs (
esd)
, len
gths
(l)
, asp
ect r
atio
s (a
r) =
wid
th/l
engt
h)
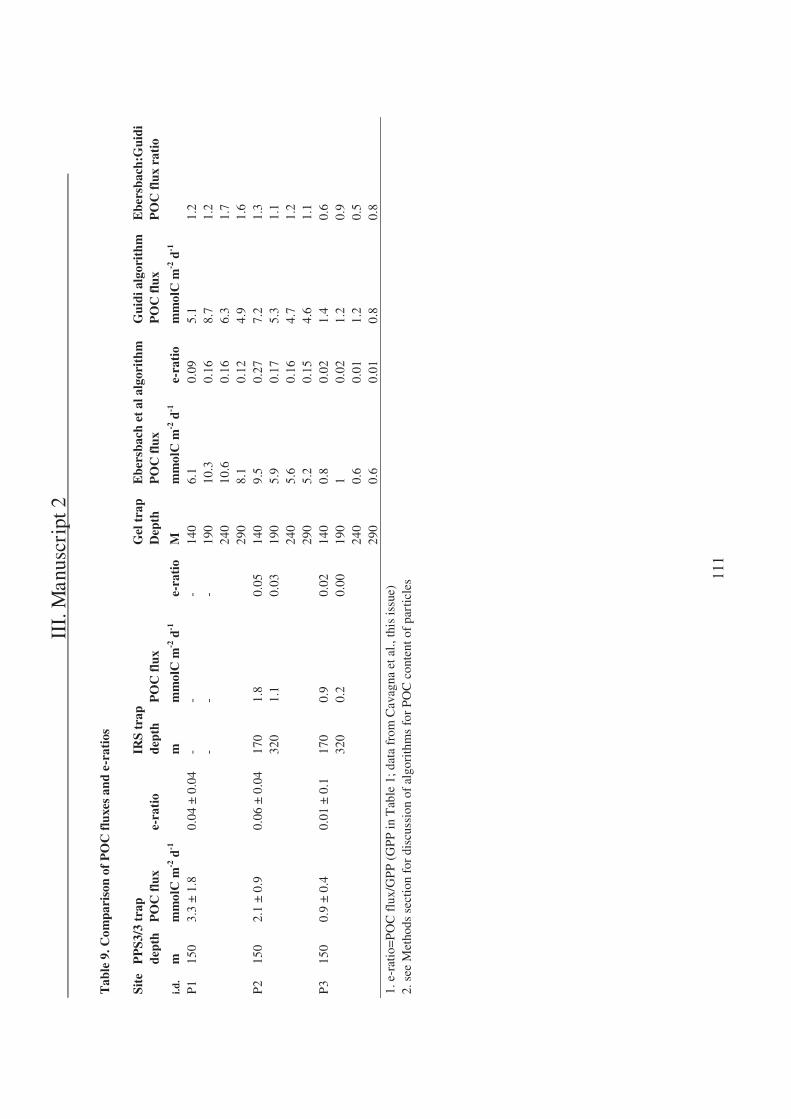
II
I. M
anus
crip
t 2
111
Tab
le 9
. Com
pari
son
of P
OC
flu
xes
and
e-ra
tios
Si
te
PP
S3/3
tra
p
IRS
trap
Gel
tra
p E
bers
bach
et
al a
lgor
ithm
G
uidi
alg
orit
hm
Ebe
rsba
ch:G
uidi
dept
h P
OC
flu
x e-
rati
o de
pth
PO
C f
lux
D
epth
P
OC
flu
x
PO
C f
lux
PO
C f
lux
rati
o
i.d.
m
mm
olC
m-2
d-1
m
mm
olC
m-2
d-1
e-
rati
o M
m
mol
C m
-2 d
-1
e-ra
tio
mm
olC
m-2
d-1
P1
150
3.3
± 1.
8 0.
04 ±
0.0
4 -
- -
140
6.1
0.09
5.
1 1.
2
-
- -
190
10.3
0.
16
8.7
1.2
24
0 10
.6
0.16
6.
3 1.
7
290
8.1
0.12
4.
9 1.
6 P
2 15
0 2.
1 ±
0.9
0.06
± 0
.04
170
1.8
0.05
14
0 9.
5 0.
27
7.2
1.3
320
1.1
0.03
19
0 5.
9 0.
17
5.3
1.1
24
0 5.
6 0.
16
4.7
1.2
29
0 5.
2 0.
15
4.6
1.1
P3
150
0.9
± 0.
4 0.
01 ±
0.1
17
0 0.
9 0.
02
140
0.8
0.02
1.
4 0.
6
32
0 0.
2 0.
00
190
1 0.
02
1.2
0.9
24
0 0.
6 0.
01
1.2
0.5
29
0 0.
6 0.
01
0.8
0.8
1. e
-rat
io=
PO
C f
lux/
GP
P (
GPP
in T
able
1; d
ata
from
Cav
agna
et a
l., th
is is
sue)
2. s
ee M
etho
ds s
ectio
n fo
r di
scus
sion
of
algo
rith
ms
for
PO
C c
onte
nt o
f pa
rtic
les
II
I. M
anus
crip
t 2
112

113
Manuscript 3

114
III. Manuscript 3
115
Optical imaging of mesopelagic particles indicates deep carbon flux beneath a
natural iron fertilized bloom in the Southern Ocean.
Marie-Paule Jouandet1, Thomas W. Trull1,2, Lionel Guidi3, Marc Picheral4, Friederike Ebersbach 5,
Lars Stemmann 3, Stéphane Blain6,7
1Antarctic Climate and Ecosystems CRC, Institute for Marine and Antarctic Studies, University of
Tasmania, Hobart, 7001, Australia.
2CSIRO Marine and Atmospheric Research, Hobart, 7001, Australia.
3Department of Oceanography, University of Hawaii, 1000 Pope Road, MSB205, Honolulu, HI 96822
4 -Paris 6, 06230
Villefranche-sur-Mer, France..
5International Graduate School for Marine Science (GLOMAR), University of Bremen, and Alfred
Wegener Institute for Polar and Marine Research, Bremerhaven, Germany.
6UMPC Univ Paris 06, UMR 7621, LOMIC, Observatoire Océanologique , F-66650 Banyuls sur mer
France.
7CNRS, UMR 7621, LOMIC, Observatoire Océanologique, 66650 Banyuls sur mer France.
III. Manuscript 3
116
Acknowledgements
Thanks to the KEOPS shipboard science team and the officers and crew of RV Marion
Dufresne for their efforts. Australian involvement in KEOPS and this post-voyage project received
support from the Australian Commonwealth Cooperative Research Centre Program and Australian
Antarctic Sciences Award 1156. L.G. contribution was partly supported by the Center for Microbial
Oceanography, Research and Education (C-MORE) (NSF grant EF-0424599) and the Gordon and
Betty Moore foundation. We also thank two anonymous referees for their valuable comments.
Abstract
We recorded vertical profiles of size distributions of particles (ranging from 0.052 to several
mm in equivalent spherical diameter) in the natural iron fertilized bloom southeast of Kerguelen Island
(Southern Ocean) and in surrounding High Nutrient Low Chlorophyll (HNLC) waters with an Under
Water Video Profiler (UVP) during the KEOPS cruise (Jan.-Feb 2005). Total particle numerical
abundance (TPN) and total particle volume (TPV) in the 0-200 m layer were respectively 3-fold and
20-fold higher in the bloom, and integrated TPV was correlated to integrated chlorophyll
concentration. The difference persisted well into the ocean interior with a 10-fold higher TPV at 400
m depth beneath the natural iron fertilized bloom. Below 400 m, increases in TPV values at the bloom
stations reflect the suspension of bottom sediments. Bloom waters had a greater proportion of large
particles from the surface to 400 m and also exhibited an increase of this proportion with depth
compared to HNLC waters. Multiple visits to the bloom reference station, A3, suggest preferential
removal of large particles as the bloom declined. Comparing our particle abundance size spectra with
those observed previously in polyacrylamide gel filled sediment traps allows us to estimate
mesopelagic particle sinking rates. These results suggest that particles sink faster in the HNLC waters
than beneath the bloom. The fact that sinking speeds were not a simple monotonic function of particle
size and varied spatially highlights the need to go beyond parameterisations of sinking rate as a
function of size alone.
III. Manuscript 3
117
Introduction
The biological carbon pump is a key process influencing the atmospheric carbon dioxide (CO2)
concentration (Volk and Hoffert, 1985), and depends on both the magnitude of primary production (PP)
in the surface mixed layer and the fraction of this organic matter that is exported to depth. Artificial
iron fertilization experiments have demonstrated an enhancement of primary production associated
with a shift in the structure of the phytoplankton community toward larger diatoms (de Baar et al.,
2005), but the extent of carbon export to the ocean interior remains difficult to quantify (Boyd et al.,
2007). The issue of carbon export has also been addressed in natural iron fertilization studies, which
have observed an increase in shallow export compared to High Nutrient Low Chlorophyll (HNLC)
surrounding waters (Blain et al., 2007; Pollard et al., 2007).
The amount of POC produced in the euphotic zone that is transferred through the mesopelagic
zone by sinking particles depends on their sinking velocities and the rate at which they decompose or
are consumed. The specific shape of the resultant POC flux profile is usually described as an empirical
function of shallow export (Martin et al, 1987), but has been shown to vary from place to place
(Berelson et al., 2002; Buesseler et al., 2007; Guidi et al., 2009). Flux attenuation has mainly been
investigated using sediment traps, although this approach can only provide sparse observations, and
may be biased by swimmer contamination, sample degradation, and hydrodynamic effects (Buesseler
et al., 2007). These limitations underscore the utility of indirect methods to obtain estimates of flux,
such as optical observations of in situ particle concentrations (Gorsky et al., 2000) associated to the
use of empirical relationship, and this is the primary approach applied in this study.
The KErguelen Ocean and Plateau compared Study (KEOPS) investigated a naturally iron-
fertilized portion of the Southern Ocean, which is the largest HNLC region in the global ocean. The
study area was located to the south-east of the Kerguelen Islands in the Indian sector of the Southern
Ocean where a well-developed bloom is observed every summer in satellite chlorophyll images (Blain
et al., 2007; Mongin et al., 2008). The bloom was found to be sustained by the supply of iron and
major nutrients to surface waters from iron-rich deep water by vertical winter and diapycnal mixing
(Blain et al., 2007). Export estimated from the seasonal surface mixed layer carbon budget and from
the 234Th deficit method at 100 m suggested that the carbon export was more than two-fold higher over
the plateau than in adjacent HNLC waters (Jouandet et al., 2008; Savoye et al., 2008) but that the
efficiency, defined as the 234Th based export production to primary production ratio, was higher in the
HNLC waters (Savoye et al., 2008). The difference appeared to be due to a higher bacterial activity in
the iron fertilized waters (Obernosterer et al., 2008). The effect of iron on the biological carbon pump
in the mesopelagic zone was inferred from the distribution of excess, non-lithogenic particulate barium,
which indicated lower remineralisation between 125 and 400 m beneath the bloom than in the HNLC
waters (Jacquet et al., 2008). Deployment of surface-tethered free-drifting sediment traps indicated
higher export from the centre of the bloom than in surrounding HNLC waters, at 200 m depth (Trull et
III. Manuscript 3
118
al., 2008), and optical examination of particles trapped in polyacrylamide gels suggested export was
dominated by fecal pellets and fecal aggregates within the bloom (Ebersbach and Trull, 2008).
These previous studies at the KEOPS site only examined export in the upper ~200 m. Only 3
free-drifting trap deployments were successful and one of these experienced technical problems
(Ebersbach and Trull, 2008), and thus could not fully assess carbon export to the ocean interior. In this
paper we examine in-situ particle concentrations and size spectra obtained from 25 vertical profiles
using an Underwater Video Profiler (UVP). The objectives of the present study are three-fold. Firstly,
to estimate to what extent the Kerguelen natural iron fertilization increases the abundance of particles
in the water column, in and below the surface mixed layer. Secondly, to see if particle size spectra
evolve with depth in the bloom and in the surrounding HNLC waters in order to estimate the processes
controlling the export. Finally to investigate the response of particle sinking speeds to iron inputs, by
comparison of the UVP particle abundances to those obtained from polyacrylamide gel filled sediment
traps (Ebersbach and Trull, 2008).
Materials and methods
Site description The KEOPS project has been summarized in an overview article and detailed in a
special volume (Blain et al., 2007; 2008). In brief, the KEOPS cruise took place from 19 January to 13
February 2005. Satellite images (composite of MODIS and MERIS images provided by ACRI Co.)
were used to determine the position of the stations and indicated that the phytoplankton bloom started
in November, peaked in late December, and was in decline by the time of the voyage, reaching
background levels by the end of February (Blain et al., 2007; Mongin et al., 2008). Three transects (A,
B, C) of 11 stations each were carried out crossing the Kerguelen Plateau and extending into the off-
shelf deep waters (deep being defined as water >1000 m; Figure 1). These transects crossed distinct
biogeochemical provinces with stations A1-A5 and B1-B5 in the heart of the iron natural fertilized
bloom (Figure 1), characterized by high Chl a and low nutrient concentrations (Blain et al., 2007;
Mosseri et al., 2008) and the off shore stations (A9-A11, B9-B11, C9-C11) characterized by HNLC
conditions. A3 and C11 were considered to be reference stations for the bloom and HNLC conditions,
respectively (Blain et al., 2007), and were visited multiple times to examine temporal changes. Station
A3 was sampled twice early in the voyage (A3-1: 22/01/05, A3-2: 23/01/05) and
again near the end (A3-3: 12/02/2005), and -1:
26/01/2005 and C11-2: 05/02/2005).
As indicated in Figure 1, the eastward flowing Antarctic Circumpolar Current is divided by
the Kerguelen plateau, with some flow transiting the plateau in association with the Polar Front just
south of the Kerguelen islands, and the majority flowing around the southern edge of the plateau in the
Fawn Trough (Park et al., 2008a). This southern branch turns northward along the eastern edge of the
plateau before continuing on its circumpolar path. These flows influence the intensity of the
phytoplankton bloom. Stations A1-A5 and B1-B5 on the central plateau were characterized by weak
III. Manuscript 3
119
geostrophic currents (3 5 cm s-1) and an anticyclonic flow and exhibited the highest biomass. Stations
C1, C3, and C5 were influenced by the relatively strong (up to 18 cm s-1) northerly flow bringing
HNLC waters onto this southern border of the plateau, and exhibited relatively low chlorophyll. The
stations to the east of the plateau (A9-11, B9-11, C9-11) were generally in HNLC conditions, but with
somewhat higher biomass downstream of the plateau along the A and B transects than on the C
transect.
All the bloom stations were dominated by the micro-phytoplankton size class, primarily
composed of diatoms. The HNLC stations exhibited similar community structure, but with a greater
contribution from the nano-phytoplankton size class (Uitz et al., 2009). The decline of the bloom
during the study period was associated with a change in diatom community structure shifting from an
initial bloom of Chaetoceros hyalochaete species to a quite monospecific bloom of Eucampia
antarctica (Armand et al., 2008). In contrast, only small changes were observed between the two visits
to the HNLC station, where Fragilariopsis pseudonana was the most abundant diatom and the larger
open-ocean species Fragilariopsis kerguelensis dominated the diatom carbon biomass. Zooplankton
communities were dominated by copepods, particularly by large- and medium-size calanoid species, at
all stations but with a 4 fold higher depth integrated (0-200 m) biomass in the bloom compared to
outside (Carlotti et al., 2008).
Underwater Video Profiler (UVP) deployments - During the KEOPS A, B, and C transects, 25 vertical
profiles, from the surface to 500 m for the plateau stations and to 1000 m for the off-shelf stations,
were carried out with the Underwater Video Profiler (UVP) constructed in the Laboratoire
known volume of 10.53 L. The number of pixels was converted to surface areas, using the results of
size and volume calibrations conducted in a seawater tank using natural particles of different types to
determine the conversion between pixels to metric units (Picheral et al., unpubl.). The equivalent
spherical diameter (ESD) of particles larger than 0.052
projected area in the image, assuming spherical shape. Images were recorded digitally by two cameras
(the second camera with a higher magnification observes a portion of the illuminated volume) at a rate
of 12 images per second and processed with custom made image analysis software (Gorsky et al.,
2000).
The resulting particles sizes were binned into 27 ESD intervals (from 0.052 mm to 27 mm,
spaced geometrically), and concentrations were averaged over 5 m depth intervals referenced to
simultaneously acquired CTD bio-optical data. The UVP was equipped with sensors for temperature,
salinity, fluorescence, and turbidity (backscattered red light). We examined size spectra showing a
minimum of 5 particles per bin and depth interval (this criterion eliminated bins greater than 3.34 mm,
Table 1) and divided each 0.527 mm) and large
particles (0.527 mm <ESD< 3.34 mm). The particle results are presented in terms of their number and
volume concentration within each size, N (# L-1) and V (mm3 L-1), respectively. The CTD and sensor
III. Manuscript 3
120
data allow the particle image statistics to be compared to physical water column structure. We
estimated surface mixed layer depth defined as the depth where the potential density differs by 2%
from the surface value (Price, 1978). These ranged from ~50 to ~110 m depth, and are shown in
Figure 2.
Results
Total Particle concentration and volume distributions along the A, B and C transects The individual
profiles of Total Particle Number (TPN), Total Particle Volume (TPV), and fluorescence are shown in
Figure 2, arranged according to their longitudes along the A, B, and C transects to provide a picture of
the overall spatial distribution. Several broad characteristics emerge from this picture: i) surface waters
have the highest values of TPN and TPV, and these are higher over the plateau than outside, ii) TPN
and TPV values decrease rapidly beneath the mixed layer, iii) values at mid-depths (200-400 m) are
very low at all the stations (with the exception of C3), and iv) many stations over the plateau show
near-bottom TPN enrichments (below 400 m). In the following paragraphs we examine these
characteristics in more detail.
In the surface mixed layer, the maximum TPN and TPV at the bloom stations (A1, A3, A5,
B1, B3, B5) averaged 1.4x10³ ± 0.2x10³ # L-1 and 183 ± 34 mm3 L-1, respectively. In contrast, the
HNLC stations were characterized by at least 3-fold lower values with TPN under 500 # L-1 and TPV
under 50 mm3 L-1. The smallest TPN (73 ± 15 # L-1) and TPV (1.8 ± 0.5 mm3 L-1) occurred at HNLC
stations C5 and C11. The overall spatial distribution of the surface mixed layer TPN and TPV values
is similar to that for phytoplankton fluorescence (Figure 2), and this leads to a correlation of TPV and
Chl a when integrated over the top 200 m (Figure 3). The correlation is largely defined by two end-
members - the highest values in the bloom over the plateau including the first two visits to the A3
bloom reference station, and the lowest values at the off-plateau stations including the C11 HNLC
reference station (Figure 3). Within the subset of the bloom stations, there is less correlation, with
varying Chl a levels accompanied by relatively constant TPV values. One possible explanation is an
increase in Chl a levels per cell in response to self-shading in the bloom, but data to test this are not
available.
Below the mixed layer, TPN and TPV both decreased very rapidly from the surface values, by
a factor of 10 (TPN = 128 ± 33 # L-1 and TPV= 17 ± 10 # L-1 at 200 m depth) at the bloom stations.
Broadly similar vertical profiles occurred at the HNLC stations (Figure 2). These strong decreases
with depth also occurred in phytoplankton fluorescence (Figure 2), suggesting that the profiles below
the mixed layer (down to 200 m) are controlled by active exchange of surface and subsurface waters
(as mediated by energetic internal waves and reflected in high estimates for the vertical eddy
diffusivity, Park et al. (2008b)).
Below 200 m depth, phytoplankton fluorescence is minimal, and the TPN and TPV values
decrease relatively slowly, only a factor of 1.7 from 200 to 400 m in contrast to the 10-fold decrease
III. Manuscript 3
121
from surface maxima to 200 m depth. Vertical mixing is much less active at these depths, which are
below the remnant temperature minimum layer at ~200 m depth that reflects the maximum depth of
winter mixing (Blain et al., 2007). In this layer, particle populations may be controlled primarily by
biological processes.
Within about 100 m from the bottom, many on-plateau stations exhibit sharp increases in TPN
values, and less strongly in TPV values (Figure 2). This presumably represents resuspension of bottom
sediments, as has also been suggested based on particulate iron measurements (Chever et al, 2010).
This explanation may also apply to the somewhat elevated TPN and TPV between 200 and 400 m that
was observed only at station C3 (TPN ranging between 220 and 502 # L-1, and TPV between 23 and
125 mm3 L-1), with the particles possibly derived from the shelf near Heard Island. There is no
evidence of TPN or TPV increases at similar depths in any of the off-plateau stations, including
stations A9 and B9 which are directly downstream from the plateau, suggesting that the resuspended
particles are not transported far laterally.
In the sections that follow we discuss the 0-200 m and 200-400 m depth bands separately.
Phytoplankton dominates TPN in the first band, and these waters exhibit strong decreases in particle
number and volume with depth. Extant phytoplankton is essentially absent in the second band, and
changes in particle numbers with depth are smaller and steadier. We refer to these two bands as the
surface and mesopelagic layers.
For the surface layer we focus on temporal changes related to bloom and particle formation
dynamics, and for the mesopelagic layer we emphasize the estimation of the changes in particle
abundances and sizes with depth to demonstrate biological or/and physical controls on material
transfer to the ocean interior. We focus on stations A3 and C11 which are respectively reference
stations for the bloom and the HNLC area (Blain et al., 2007) and also examine HNLC station C5
where particle size distributions were also determined from polyacrylamide-gel filled sediment traps
(Ebersbach and Trull, 2008).
Vertical distributions of small and large particles in the 0-200 m surface layer at the bloom and
HNLC reference stations - The vertical distributions of the small particle volumes
(0.052 0.527 mm; SPV) and large particle volumes (0.527 mm <ESD< 3.34 mm; LPV) for
the A3 bloom reference station (A3-1: 22/01/05, A3-2: 23/01/05, A3-3: 12/02/05), and the HNLC
stations C11 (C11-1: 26/01/05 ; C11-2: 05/02/05) and C5 are shown in Figure 4. This set of sites and
profiles lets us examine differences between the bloom and HNLC waters, variations with depth, and
changes with time. As noted above in discussing Figure 2, the A3 bloom station has higher TPV than
the HNLC stations. Figure 4 shows that this higher TPV is accompanied by a greater proportion of
large particles, throughout the water column.
Vertical distributions of SPV and LPV differed between the bloom and HNLC sites. At the A3
bloom station, LPV showed high values from the surface to ~150 m depth before decreasing strongly.
At the HNLC sites the near surface particle abundances did not extend as deeply, dropping to low
III. Manuscript 3
122
values at ~120 m. This difference does not appear to be driven by the differences in the depth of the
mixed layers, because mixed layer depths were similar or slightly deeper at the HNLC sites (Figure 4
and 5), and generally shallower than the depths at which particle volumes decreased strongly (Figure
4). The bloom sites exhibited double maxima in LPV values, the first one around 50 m and the second
one between 100 and 140 m, but no structure in SPV profiles. In contrast, the HNLC sites exhibited
profiles with single maxima in LPV, which were echoed by SPV values, at much shallower depth (60-
70 m). LPV and SPV values in these maxima were more than six-fold lower than at the bloom
stations.
These interesting features in the LPV and SPV distributions were correlated to the profiles of
phytoplankton fluorescence and turbidity (Figure 5). In the bloom, fluorescence profiles were also
characterized by first maxima around 50 m and second maxima at 120 m although these features were
not as strong as in the LPV profiles (Figure 4). Weak maxima in fluorescence corresponding to the
SPV/LPV maxima were also present for the HNLC stations. Turbidity exhibits a maximum only at the
depth of the deeper LPV feature at A3. Taken together, these observations suggest that the LPV, and
to a lesser degree the SPV, distributions correspond with those of phytoplankton for both the bloom
and HNLC environments in surface waters.
Changes over time were minimal at the C11 HNLC reference site, but dramatic at the A3
bloom reference site between the first two visits (A3-1 and A3-2 just one day apart) and the last visit
20 days later (A3-3). By the time of the last A3-3 visit the LPV values had decreased more than 5-fold
in comparison to the A3-1 and A3-2 visits, yet the double maxima persisted. This makes it clear that
the lower values were not the result of HNLC waters arriving at the bloom site, but of temporal
evolution of the bloom, a perspective consistent with the slow circulation in this region (as detailed in
the Methods section). The intensity of the shallow sub-surface maximum at 50 m decreased with time
from 160 mm3 L-1 (A3-1) to 27 mm3 L-1(A3-3) and the deeper maximum at 100-140 m from 108
mm3 L-1 (A3-1) to 20 mm3 L-1 (A3-3). The volume of small particles also decreased three-fold from
7.4 ± 0.7 mm3 L-1 to 2.2 ± 0.3 mm3 L-1.
Vertical distributions of the large and small particle volumes in the mesopelagic layer (depth >
200 m) at the bloom and HNLC reference stations Figure 6 focuses on the profiles between 200 and
400 m depth. As noted for surface waters in the previous section, large particles dominated at all sites,
and contributed more strongly to total particle volume TPV, the sum of SPV and LPV, at the bloom
stations. The first two visits to the A3 bloom site exhibited monotonic decreases in all particle volume
parameters with depth, with the steepest decrease of the LPV at A3-1. Most of the difference between
A3-1 and A3-2 comes from lower LPV (12 mm3 L-1) at 200 m while LPV values were similar at
400 m depth, equal to an average of 5.4 ± 0.8 mm3 L-1 (n=2). These profiles contrast with the C11
HNLC reference site, which exhibited fairly constant values with depth, and the C5 site at which LPV
increased with depth. The last visit to A3 (A3-3), when particle concentrations were greatly
III. Manuscript 3
123
diminished, showed a profile similar to the HNLC sites, with an LPV increase by 40 % between 200 m
and 400 m at A3-3, though still an SPV decrease with depth.
Variations in particle size spectra So far we have discussed the results by binning the particle
properties into two classes: small and large. In this section we discuss the continuum of particle sizes
observed by the UVP, using particle size distributions. Particle number distributions (n) were
calculated by dividing the abundance of particles (N) within a given bin by the width of the equivalent
spherical diameter (ESD) bin, and are thus in units of # cm-4. The size distributions for each stations
are shown for 3 depth layers : i) at 5m intervals between 30 and 70 m, where the first maximum in
LPV occurs, ii) between 100 and 140 m, where the second LPV maximum occurs, and iii) in the
mesopelagic layer from 200 m to 400 m (Figure 7). The general pattern for all stations is a decrease of
-
procedure, but this does not affect the total values of TPN or the slopes in the spectra). This pattern,
expected from coagulation models (Jackson et al., 2005), has also been observed in previous studies
(Mc Cave, 1984; Jackson et al., 1997; Stemmann et al., 2008c).
Changes with depth in the shape of the particle number size distributions were observed for
each station. To investigate these changes in detail we followed the approach of Guidi et al. (2009)
and computed the slope (m) of the particle number size distributions according to the equation ln(n)=
m ln(ESD) + c. The slope m is negative (because all sites have more small than large particles), and
more negative values of m correspond to steeper particle distributions that have a smaller proportion of
large particles.
As seen on Figure 7 (D), the particles during the two first visits of A3 were larger than in the
HNLC environment and demonstrate the effect of iron on the particle size spectra. Previous study had
shown an increase of size of particle in response to iron addition during SOIREE (Jackson et al.,
2005). Two m maxima were observed at 50 m and 120 m at A3-1 and A3-2, corresponding to an
increase of the proportion of large particles. These features correspond to the LPV maxima pointed out
in Figure 4.
Profiles of m below 200 m at A3-2, A3-3, C11-1, and C5 were characterized by a slight
increase of m with depth, while the m profile at A3-1 was quite flat, and C11-2 was characterized by a
decrease in m with depth. Similar values of m, and similar variations with depth, have been observed
at many other sites, and those observed for the bloom stations over the Kerguelen plateau fit within the
cluster-6 classification for productive waters in the classification scheme developed for a globally
distributed set of observations by Guidi et al. (2009).
Carbon export flux The particulate organic carbon export flux (FPOC) can be estimated from the size
spectra using the empirical relationship:
FPOC= Adb
where A (12.5) and b (3.81) were estimated by Guidi et al. (2008) by comparison of size
spectra to deep ocean moored and free floating sediment trap POC fluxes for sites distributed around
III. Manuscript 3
124
the global ocean. The value of b is lower than the value of 5 that would be expected for spherical
constant density particles (for which mass increases as d3, and sinking speed as d2), and this is
consistent with increasing porosity with size for marine aggregates (Alldredge and Gotschalk, 1988).
We estimated fluxes in this way for the same depth and sites where free-drifting sediment traps were
deployed (Ebersbach and Trull, 2008; Trull et al., 2008). The resulting fluxes at 200, 330 and 400 m
were highest at the first visit of A3 and decreased from 869 to 57 mg m-2 d-1 at 200 m, from 325 to
65 mg m-2 d-1 at 330 m and from 259 to 95 65 mg m-2 d-1 at 400 m by the time of the last visit (Table
2). Considering the HNLC environment, POC fluxes were quite similar at 200 m between the different
visits of C11 and C5 (32 ± 3 mg m-2 d-1, n=3). More variability was observed at 330 m (400 m) with
values ranging from 24 mg m-2 d-1 (40 mg m-2 d-1) at C11-1 to 52 mg m-2 d-1 (67 mg m-2 d-1) at C5.
These fluxes were still more than 3-fold lower than fluxes in productive iron fertilized bloom waters.
POC flux at 200 m, 330 m, and 400 m were also derived from the size of particles recorded in
polyacrylamide-gel sediment traps using an empirical algorithm between the carbon content and the
volume of particles (Ebersbach and Trull, 2008). These values are compared to the POC flux derived
from the algorithm of Guidi et al. (2008) at the last visit of A3 and C5 (Table 2). A good agreement is
observed between both methods for both stations except at 330 m for A3. The difference observed
could result from the parameterization from Guidi et al. (2008) which assumes constant values of A
and b for all depths.
As for the POC fluxes derived from the gel traps (Ebersbach and Trull, 2008), POC fluxes
derived from UVP particle sizes are more than two fold higher than the POC flux measured in a
drifting cylindrical sediment trap (Trull et al., 2008), suggesting that POC flux estimation from optical
images tends to overestimate the flux. Nevertheless all methods show an increase of the POC flux in
the bloom at 200 m in comparison to the HNLC waters. The UVP data provide new results at depth;
specifically the inferred flux is still higher at 400 m depth beneath the bloom in comparison to the
surrounding HNLC waters. These results emphasize an increase of the intensity of the biological pump
in a natural iron fertilized bloom.
Particle sinking speed estimation The average particle velocity (wi) for each size class, i, can be
estimated by dividing the number flux spectra (Fi in # m-2 d-1 cm-1) estimated from gel traps by
simultaneous measurements of the number spectra (ni in # m-3 cm-1) derived from the UVP according
to:
wi (ESD)= Fi (ESD) x (ni (ESD))-1 with i referring to the size class
Simultaneous measurements of Fi and ni were only realised at A3-3 and C5 at 200 m and 330 m, and
430 nking speed at 430 m as particle abundances was affected by
resuspension at this depth (cf Figure 2). Fi was derived from the microscopic image analyses of the gel
trap cups over the 0.155 to 2.855 mm particle size interval, binning into nine size classes (Table 1)
(Ebersbach and Trull, 2008). The 17 bins used for the number spectra determination with the UVP
III. Manuscript 3
125
were combined to compare to these 9 bins (gathering bins 5-6, 6-8, 8-9, 9-11, 11-12, 12-14, 14-15, 15-
17,17-18). The resulting sinking velocities are shown in Figure 8.
These results suggest particles sink faster in the HNLC environment compared to the bloom.
This difference is driven by the higher trap flux number spectrum at C5 compared to A3 with the
greatest difference occurring at 330 m, and is thus subject to the possibility that it results from
differences in the efficiency of particle collection by the traps at the two sites, although deployment
conditions were similar (Ebersbach and Trull, 2008).
The general pattern of sinking speeds as a function of size was remarkably similar for the two
depths (200 and 330 m) and two sites (A3 and C5) where direct comparison of gel-traps and UVP
results was possible. - a decrease of wi from the first size class to the second one followed by an
increase to reach a maximum for the 0.5-0.7 mm size class, except at A3-330 m where a continuous
decrease with size was observed. The fastest wi was computed at C5 with value of 1400 m d-1, seven
fold higher than the maxima at A3. This high value results from a high number flux recorded by the
gel trap while the UVP number spectrum was low. In contrast, the high values for the size class 0.5-
0.7 mm at A3-200 m, C5-200 m and C5-300 m results from a sharp decrease of ni for a similar Fi. The
wi for particles with ESD up to 0.7 mm decrease with increasing ESD. No sinking speeds could be
computed for the 2 largest size classes (ESD>1.4 mm) at A3-200 and 330 m and C5-330 m as no
particles this large were recorded by the gel trap. Concerning the variation of the sinking speed with
depth, wi was characterized by a decrease from 200 m to 330 m with the largest decrease noticed at
A3-330 m. This decrease is due to the diminution of Fi (Figure 8 A).
Discussion
Comparison of bloom and HNLC environments The overall objective of this work was to assess the
impact of iron on the intensity of the biological carbon pump. The UVP images clearly show that more
and larger particles are present beneath the bloom than in surrounding waters, and that this extends
deep into the mesopelagic ocean (to 400 m depth). Figures 2, 3, 4, and 5 reveal that the higher
production of particles in the natural iron fertilized bloom is linked to the stronger surface
phytoplankton production. Figures 6 and 7 indicate that differences in particle processing also occur at
mesopelagic depths. The analysis of the gel traps showed that the sinking material was dominated by
fecal material at 100, 200 and 330 m depth demonstrating that the formation of large particles results
mainly from grazing rather than diatom aggregation (Ebersbach and Trull, 2008).
At the time of the bloom (A3-1 and A3-2) FPOC and LPV in the mesopelagic waters were
characterized by decreases with depth associated with an increase of the proportion of large particles.
Several mechanisms could account for this pattern, among them the most likely are particle alteration
processes such as fragmentation and/or remineralisation and/or zooplankton grazing. No increase of
small particle volume was observed in the mesopelagic layer and thus fragmentation seems unlikely.
Microbial consumption of particles is also known to affect particle geometry and to decrease particle
III. Manuscript 3
126
volume (Stemmann et al., 2004) but this process is unlikely to promote an increase of the fraction of
large particles and remineralisation rate based on excess barium concentrations was low in the
mesopelagic zone (Jacquet at al., 2008). Consumption by zooplankton appears most likely to be
responsible for the decrease of LPV and for the increase of the proportion of larger particles by
repackaging through the excretion of larger fecal pellets. Of course, the shift towards a greater
proportion of larger particles with depth could also reflect temporal change in the delivery of particles
produced at the surface, with production of fewer smaller particles at the end of the bloom as seen on
Figure 7 at the last visit of A3.
The last visit at A3 was characterized by an increase of TPV with depth in the mesopelagic
layer, which could reflect the decline in particle delivery from the bloom above, or temporal
variability between the timing of production in surface and export at depth as previously described in
Savoye at al. (2008). Another contributing explanation could come from the decrease of sinking speed
with depth (shown in Figure 8), since a slowdown in particle settling would lead to an accumulation
with depth proportional to the diminution of the settling rate.
Sinking speed The sinking speed computed using gel trap and UVP data was lower in the natural
iron fertilized bloom compared to the HNLC waters for the whole size spectrum. Phytoplankton
community was dominated by diatoms in the bloom and in the HNLC waters but with difference in
silicification degree (Mosseri et al., 2008). The stronger silicification in the HNLC waters could
contribute to the high sinking speed in the HNLC waters, via an increase of ballast. Higher porosity in
the bloom derived particles, as a result of differing grazing and aggregation processes could also
contribute to this result.
The fact that the sinking speed is not a simple monotonic function of particle size was a
surprising result and was also observed by McDonnell and Buesseler (2010) in the Southern Ocean
(West Antarctic Peninsula) using the same computational method. Nevertheless the variation of
sinking speed observed in this study is different from the one reported in McDonnell and Buesseler
(2010). The sinking speed was maximal for the middle size class (0.5-0.7 mm) in our study whereas
they computed maximal sinking speeds for the smallest and largest size classes, dominated by diatom
aggregates and krill fecal pellets, respectively. These results, in addition to comparison with sinking
speeds from the literature (Figure 9) highlight the need to go beyond parameterisations of sinking rate
as a function of size alone, as derived previously from in-situ studies (Alldredge and Gotschalk, 1989;
Syvitski et al., 1995) and models (Stokes law, Stemmann et al., 2004b) .
Comparison between the study of McDonnell and Buesseler (2010) and our results shows also
discrepancy in the variation of sinking speed with depth. Sinking speed was characterized by an
increase with depth in waters of the Antarctic Peninsula while our study demonstrated a decrease of
the sinking speed with depth, by more than a factor of 2. This decrease was unexpected considering
the study of Berelson et al. (2002) that argued for increasing sinking rates with depth based on deep
ocean moored traps. This finding is of crucial importance, as parameterisations consistent with
III. Manuscript 3
127
increasing sinking speed (Najjar et al., 1992; Maier Reimer, 1993; Sarmiento et al., 1993; Schmitter et
al., 2005) or constant sinking speed (Gregg et al., 2003) for flux attenuation have been used in large
scale biogeochemical models to explain regional variations in the biological pump. The decrease of
the sinking speed in the present study is associated to an increase of the proportion of larger particles
(cf Figure 7) which would be consistent with a decrease of porosity in large particles (Ploug et al.,
2008). Overall, the observed sinking speed variability with environment and depth indicates that
global relationships between particle concentrations and flux are oversimplifications for the estimation
of POC flux.
Our sinking speed estimation approach is admittedly indirect, and it is perhaps possible that
the complex relationships between the size of the particles and their sinking speed results from low
efficiency of the gel trap to collect large particles or/and the fact that some unknown fraction of the
larger particles seen by the UVP is not sinking (e.g. zooplankton). These estimations of sinking rate
also assume that no sorting or particle size conversions occur during trapping, which is debateable
(Buesseler et al., 2007), although the fine and complex structures observed in the gel traps favour
relatively undisturbed collection. Focusing only on the small size classes (ESD < 0.5 mm), where UVP
and gel trap are most likely to sample the same material, also shows no correlation between sinking
speed and size.
III. Manuscript 3
128
References:
Alldredge, A.L., and C. Gotschalk. 1988. In situ settling behavior of marine snow. Limnol. Oceanogr. 33: 339 351. Alldredge, A.L., and C. Gotschalk. 1989. Direct observations of the mass flocculation of diatom
blooms: characteristics, settling velocities and formation of diatom aggregates. Deep-Sea Res. 36: 159 171.
Azetsu-Scott, K., B.D. Johnson. 1992. Measuring physical characteristics of particles: a new method of simultaneous measurement for size, settling velocity and density of constituent matter. Deep-Sea Res. I 39: 1057 1066.
Armand, L.K., V. Cornet-Barthaux, J. Mosseri, B. Quéguiner. 2008. Late summer diatom biomass and community structure on and around the naturally iron-fertilized Kerguelen Plateau in the Southern Ocean. Deep-Sea Res. II 55: 653 676.
Berelson, W. M. 2002. Particle settling rates increase with depth in the ocean. Deep-Sea Res. II 49: 237 251.
Blain, S., B. Quéguiner, L. Armand, S. Belviso, B. Bombled, L. Bopp, A. Bowie, C. Brunet, K. Brussaard, F. Carlotti, U. Christaki, A. Corbière, I. Durand, F. Ebersbach, J. L. Fuda, N. Garcia, L. J. A. Gerringa, F. B. Griffiths, C. Guigue, C. Guillerm, S. Jacquet, C. Jeandel, P. Laan, D. Lefèvre, C. Lomonaco, A. Malits, J. Mosseri, I. Obernosterer, Y. H. Park, M. Picheral, P. Pondaven, T. Remenyi, V. Sandroni, G. Sarthou, N. Savoye, L. Scouarnec, M. Souhault, D. Thuillers, K. R. Timmermans, T. Trull, J. Uitz, P. Van-Beek, M. J. W. Veldhuis, D. Vincent, E. Viollier, L. Vong, et T. Wagener. 2007. Impacts of natural iron fertilisation on carbon sequestration in the Southern Ocean. Nature 446: 1070 1074.
Blain S., B. Quéguiner, T. W. Trull. 2008. The natural iron fertilization experiment KEOPS (Kerguelen Ocean and Plateau compared Study): an overview. Deep Sea Res. II 55: 559 565.
Boyd, P. W., T. Jickells, C. S. Law, S. Blain, E. A. Boyle, K. O. Buesseler,K. H. Coale, J. J. Cullen, H. J. W. de Baar, M. Follows, M. Harvey, C. Lancelot, M. Levasseur, N. P. J. Owens, R. Pollard, R. B. Rivkin, J. Sarmiento, V. Schoemann,V. Smetacek, S. Takeda, A. Tsuda, S. Turner, A. J. Watson. 2007. Mesoscale Iron Enrichment Experiments 1993-2005: Synthesis and Future Directions. Science 315: 612 617.
Buesseler, K., C. Lamborg, P.W. Boyd, P. Lam, T. Trull, B. T. Bidigare, R. Bishop, C. James, F. Dehairs, M. Elskens, M. Honda, D. Karl, D. Siegel, M. Silver, D. Steinberg, J. Valdes, B.
316: 567 570.
Buesseler, K. O., A.N. Antia, M. Chen, S.W. Fowler, W.D Gadner, O. Gustafsson, K. Harada, A.F. Michaels, M. Rutgers van der Loeff , M. Sarin, D.K. Steinberg, T. Trull. 2007. An assessment of the use of sediment traps for estimating upper ocean particle fluxes. J. Mar. Res. 65: 345416.
Carder, K.L., R.G. Steward, P. R. Betzer. 1982. In situ holographic measurements of the sizes and settling rates of oceanic particulates. J. Geophys. Res. 87 : 5681 5685.
Carlotti, F., D. Thibault-Botha, A. Nowaczyk, and D. Lefèvre. 2008. Zooplankton community structure, biomass and role in carbon fluxes during the second half of a phytoplankton bloom in the Eastern sector of the Kerguelen shelf (January - February 2005). Deep-Sea Res. II 55: 720 733.
Chever, F., G. Sarthou, E. Bucciarelli, S. Blain, and A. R. Bowie. 2010. An iron budget during the natural iron fertilisation experiment KEOPS (Kerguelen Islands, Southern Ocean). Biogeosci. 7: 455 468.
De Baar, H.J.W., P.W. Boyd, K.H. Coale, M.R. Landry, A. Tsuda, P. Assmy, D.C.E. Bakker, Y. Bozec, R.T. Barber, M.A. Brzezinski, K.O., Buesseler, E. Boye, P.L. Croot, F. Gervais, M.Y., Gorbunov, P.J., Harrison, W.T., Hiscock, P., Laan, C., Lancelot, C.S.,Law, M. Levasseur, A. Marchetti, F.J. Millero, J. Nishioka, Y. Nojiri, T. van Oijen, U. Riebesell, M.J.A. Rijkenberg, H. Saito, S. Takeda, K.R. Timmermans, M.J.W. Veldhuis, A.M. Waite, C-H. Wong. 2005. Synthesis of iron fertilization experiments. J. Geophys. Res.-Oceans. 110: C09S16, doi:10.1029/2004JC002601.
III. Manuscript 3
129
Diercks, A.R., V.L. Asper. 1997. In situ settling speeds of marine snow aggregates below the mixed layer: Black Sea and Gulf of Mexico. Deep-Sea Res. I 44: 385 398.
Ebersbach, F., and T.W. Trull. 2008. Sinking particle properties from polyacrylamide gels during KEOPS : controls on carbon export in an area of persistent natural iron inputs in the Southern Ocean. Limnol. Oceanogr. 53: 212 224.
Gorsky, G., M. Picheral, and L. Stemmann. 2000. Use of the underwater video profiler for the study of aggregate dynamics in the North Mediterranean. Estuar. Coast. Shelf Sci. 50:121 128.
Gregg, W., P. Ginoux, P. Schopf, and N. Casey. 2003. Phytoplankton and iron: validation of a global three-dimensional ocean biogeochemical model. Deep-Sea Res. II 50: 3143 3169.
Guidi, L., A.G. Jackson, L. Stemmann, J. C. Miquel, M. Picheral, G. Gorsky. 2008. Relationship between particle size distribution and flux in the mesopelagic zone. Deep-Sea Res. 55: 13641374.
Guidi, L., L. Stemmann, G. A. Jackson, F. Ibanez, H. Claustre, L. Legendre, M. Picheral, G. Gorsky. 2009. Effects of phytoplankton community on production, size and export of large aggregates: A world-ocean analysis. Limnol. Oceanogr. 54: 1951 1963.
Jackson, G.A., R. Maffione, D.K. Costello, A.L. Alldredge, B.E. Logan, H.G. Dam. 1997. Particle size spectra between 1 μm and 1 cm at Monterey Bay determined using multiple instruments. Deep-Sea Res. I 44: 1739 1767.
Jackson, G.A., A.M. Waite, P.W. Boyd. 2005. Role of algal aggregation in vertical carbon export during SOIREE and in other low biomass environments. Geophys. Res. Lett. 32: doi:10.1029/2005GL023180.
Jacquet, S. H. M., F. Dehairs, N. Savoye, I. Obernosterer, U. Christaki, C. Monnin, D. Cardinal. 2008. Mesopelagic organic carbon behaviour station in the Kerguelen Plateau region tracked by biogenic particulate Ba. Deep-Sea Res. II 55: 868 879.
Jouandet, M.P., S. Blain, N. Metzl., C. Brunet, T. W. Trull, I. Obernosterer. 2008. A seasonal carbon budget for a naturally iron-fertilized bloom over the Kerguelen Plateau in the Southern Ocean. Deep-Sea Res. II 55:856 867.
Maier-Reimer, E. 1993. Geochemical cycles in an ocean general circulation model. Preindustrial tracer distributions. Glob. Biogeochem. Cyc. 7: 645 677.
Martin, J.H., G.A. Knauer, D.M. Karl, W.W. Broenkow. 1987. VERTEX: carbon cycling in the northeast Pacific. Deep-Sea Res. 43: 267 285.
McCave, I.N. 1983. Particulate size spectra, behaviour, and origin of nepheloid layers over the Nova Scotian continental rise. J. Geophys. Res- Oceans 88: 7647 7666.
McDonnell A. M. P., and K. O. Buesseler. 2010. Variability in the average sinking velocity of marine particles. Limnol. Oceanogr. 55: 2085 2096.
Mongin M., E. Molina, T. W. Trull. 2008. Seasonality and scale of the Kerguelen plateau phytoplankton bloom: a remote sensing and modeling analysis of the influence of natural iron fertilization in the Southern Ocean. Deep Sea Res. II 55: 880 892.
Mosseri J., B. Quéguiner, L. Armand, and V. Cornet-Barthaux. 2008. Impact of iron on silicon utilization by diatoms in the Southern Ocean: a case study of the Si/N cycle decoupling in a naturally iron-enriched area. Deep Sea Res. II 55: 801 819.
Najjar, R., J. Sarmiento, and J. Toggweiler. 1992. Downward transport and fate of organic matter in the ocean: simulations with a general circulation model. Glob. Biogeochem. Cyc. 6: 45 76.
Obernosterer, I., U. Christaki, D. Lefèvre, P. Catala, F. Van Wambeke, and P. Lebaron. 2008. Rapid bacterial mineralization of organic carbon produced during a phytoplankton bloom induced by natural iron fertilization in the Southern Ocean. Deep-Sea Res. II 55: 777 789.
Park, Y. H., F. Roquet, J.L. Fuda, I. Durand. 2008a. Large scale circulation over and around the Kerguelen Plateau. Deep-Sea Res. II 55: 566 581.
Park Y.H., J.L. Fuda, I. Durand, and A. C. Naveira Garabato. 2008b. Internal tides and vertical mixing over the Kerguelen Plateau. Deep Sea Res. II. 55: 583 593
Ploug, H., M.H. Iversen, G. Fischer. 2008. Ballast, sinking velocity, and apparent diffusivity within marine snow and zooplankton fecal pellets:Implications for substrate turnover by attached bacteria. Limnol. Oceanogr. 53: 1878 1886.
III. Manuscript 3
130
Pollard, R. T., H. J. Venables, J. F. Read, and J. T. Allen. 2007. Large-scale circulation around the Crozet Plateau controls an annual phytoplankton bloom in the Crozet Basin. Deep-Sea Res. II 54: 1915 1929.
Price, J.F., C.N.K. Mooers, J.C. Van Leer. 1978. Observation and simulation of storm-induced mixed-layer deepening. J. Phys. Oceanogr. 8, 582 599.
Sarmiento, J., R. Slater, M. Fasham, H. Ducklow, J. Toggweiler, and G. Evans. 1993. A seasonal three-dimensional ecosystem model of nitrogen cycling in the North Atlantic euphotic zone. Glob. Biogeochem. Cyc. 7 : 417 450.
Savoye, N., T. W. Trull, S. H. M. Jacquet, J. Navez, and F. Dehairs. 2008. 234Th-based export fluxes during a natural iron fertilization experiment in the Southern Ocean (KEOPS). Deep-Sea Res. II 55: 841 855.
Shanks, A.L., and J.D. Trent. 1980. Marine snow-sinking rates and potential role in vertical flux. Deep-Sea Res. I 27: 137 143.
Smayda, T.J. 1970. The suspension and sinking of phytoplankton in the sea (RV). Oceanogr. and Mar. Biol. 8, 353 414.
Stemmann, L., G. Gorsky, J. C. Marty, M. Picheral, and J. C. Miquel. 2002. Four-year study of large-particle vertical distribution (0 1000 m) in the NW Mediterranean in relation to hydrology, phytoplankton, and vertical flux. Deep-Sea Res. II 49: 2143 2162.
Stemmann, L., G. A. Jackson, and G. Gorsky. 2004. A vertical model of particle size distributions and fluxes in the midwater column that includes biological and physical processes part II: Application to a three-year survey in the NW Mediterranean Sea. Deep-Sea Res. I 51: 885908.
Stemmann, L., D. Eloire, A. Sciandra, G. A. Jackson, L. Guidi, M. Picheral, and G. Gorsky. 2008c. upper 200 m region of the
South Pacific Gyre. Biogeosc. 5: 299 310. Syvitski, J.P.M., K.W. Asprey, K.W.G. Leblanc. 1995. In-situ characteristics of particles settling
within a deep-water estuary. Deep-Sea Res. II 42: 223 256. Trull, T. W., D. Davies, K. Casciotti. 2008. Insights into nutrient assimilation and export in naturally
iron-fertilized waters of the Southern Ocean from nitrogen, carbon and oxygen isotopes. Deep-Sea Res. II 55: 820 840.
Uitz, J., H. Claustre, B. Griffiths, J. Ras, and V. Sandroni. 2009. A phytoplankton class-specific primary production model applied to the Kerguelen Islands region (Southern Ocean). Deep Sea Research I 56: 541 560.
Volk, T., and M.I. Hoffert. 1985. Ocean carbon pumps: Analysis of relative strengths and efficiencies in ocean-driven atmospheric CO2 changes. In: E.T. Sundquist and W.S. Broecker (eds) The Carbon Cycle and Atmospheric CO2: Natural Variations Archean to Present. Geophys. Monogr. Ser.. 32: 99 110.
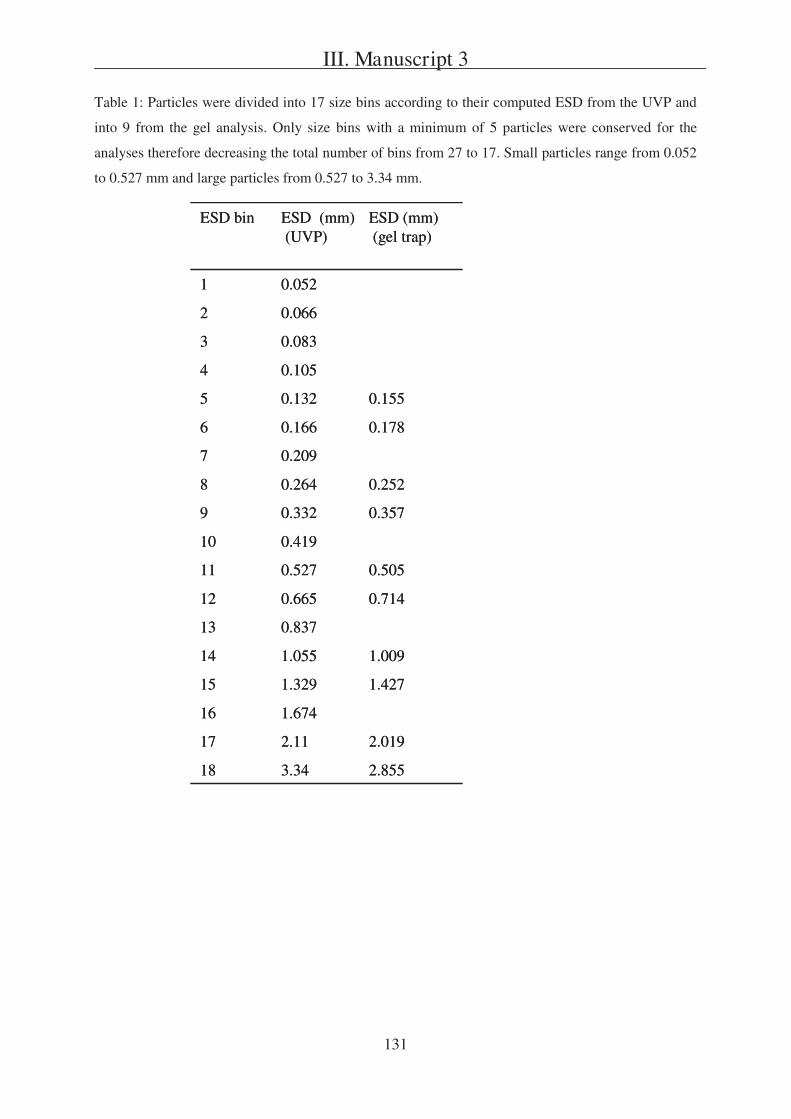
III. Manuscript 3
131
Table 1: Particles were divided into 17 size bins according to their computed ESD from the UVP and
into 9 from the gel analysis. Only size bins with a minimum of 5 particles were conserved for the
analyses therefore decreasing the total number of bins from 27 to 17. Small particles range from 0.052
to 0.527 mm and large particles from 0.527 to 3.34 mm.
0.0521
2.8553.3418
2.0192.1117
1.67416
1.4271.32915
1.0091.05514
0.83713
0.7140.66512
0.5050.52711
0.41910
0.3570.3329
0.2520.2648
0.2097
0.1780.1666
0.1550.1325
0.1054
0.0833
0.0662
ESD (mm)(gel trap)
ESD (mm)(UVP)
ESD bin
0.0521
2.8553.3418
2.0192.1117
1.67416
1.4271.32915
1.0091.05514
0.83713
0.7140.66512
0.5050.52711
0.41910
0.3570.3329
0.2520.2648
0.2097
0.1780.1666
0.1550.1325
0.1054
0.0833
0.0662
ESD (mm)(gel trap)
ESD (mm)(UVP)
ESD bin
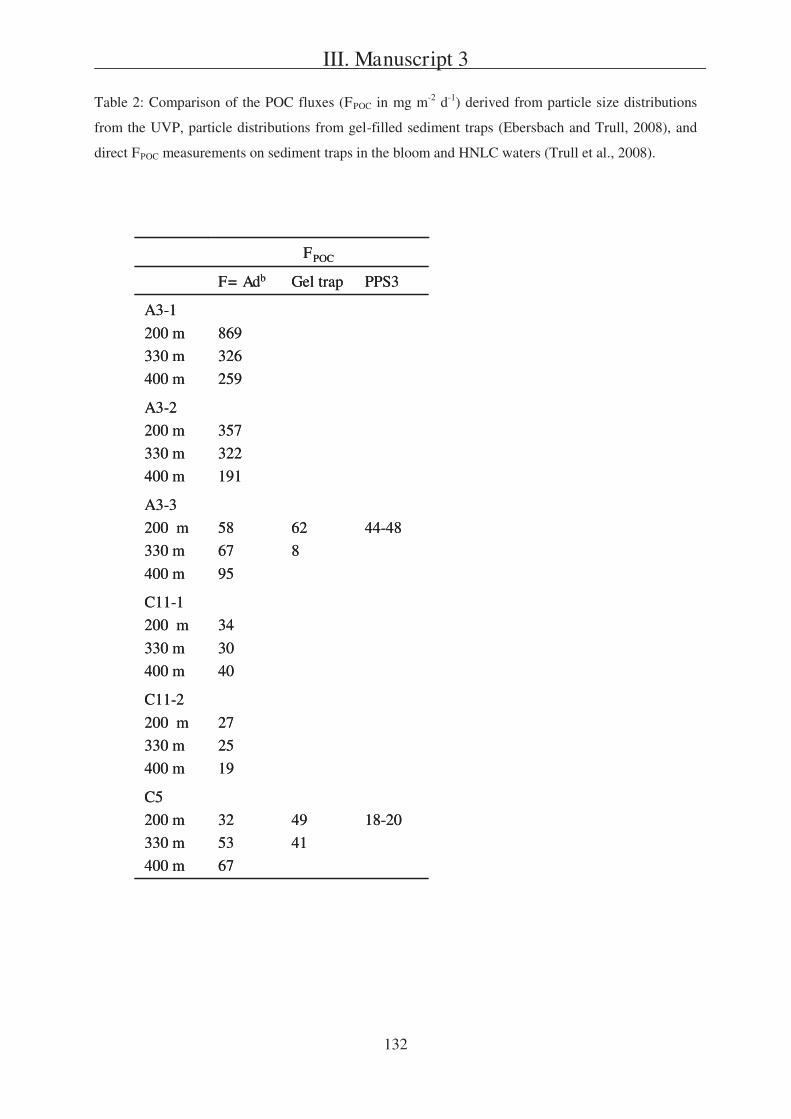
III. Manuscript 3
132
Table 2: Comparison of the POC fluxes (FPOC in mg m-2 d-1) derived from particle size distributions
from the UVP, particle distributions from gel-filled sediment traps (Ebersbach and Trull, 2008), and
direct FPOC measurements on sediment traps in the bloom and HNLC waters (Trull et al., 2008).
FPOC
27
25
19
C11-2
200 m
330 m
400 m
18-2049
41
32
53
67
C5
200 m
330 m
400 m
34
30
40
C11-1
200 m
330 m
400 m
44-4862
8
58
67
95
A3-3
200 m
330 m
400 m
357
322
191
A3-2
200 m
330 m
400 m
869
326
259
A3-1
200 m
330 m
400 m
PPS3Gel trapF= Adb
FPOC
27
25
19
C11-2
200 m
330 m
400 m
18-2049
41
32
53
67
C5
200 m
330 m
400 m
34
30
40
C11-1
200 m
330 m
400 m
44-4862
8
58
67
95
A3-3
200 m
330 m
400 m
357
322
191
A3-2
200 m
330 m
400 m
869
326
259
A3-1
200 m
330 m
400 m
PPS3Gel trapF= Adb
III. Manuscript 3
133
Figure caption
Figure 1: Monthly mean chlorophyll concentration for January 2005 from MODIS data. The currents
and fronts are from Park et al. (2008a). Plateau bathymetry is shown by black contours (at 500, 1000,
2000 m). The three transects A, B, and C, each with 11 stations, are shown in black. A3 was
designated as the bloom reference station and C11 as the HNLC references station (Blain et al., 2007).
C5 also exhibited HNLC characteristics, and was the site of the HNLC sediment trap deployment
(Ebersbach and Trull, 2008).
Figure 2: Near surface vertical distribution of the total particle number (TPN), volume (TPV) and
fluorescence for transects A (A), B (B), and C (C) in the water column. The black lines show the
mixed layer depth.
Figure 3: Comparison of the total particle volume, TPV, to phytoplankton fluorescence integrated on
the 0-200 m surface layer for all KEOPS stations.
Figure 4: Vertical profiles of small (SPV), large (LPV) and total (TPV) particle volumes in the water
column (0-550 m) for the 3 visits at A3, two visits at C11, and single visit at C5. Mixed layer depth is
indicated by a black line.
Figure 5: Density (A), fluorescence (B) and turbidity (C) vertical distributions for the 3 visits at A3,
two visits at C11 and single visit at C5 in the water column (0-550 m).
Figure 6: Vertical profiles of SPV, LPV, and TPV for the 3 visits at A3, two visits at C11 and single
visit at C5 in the mesopelagic layer (200-400 m).
Figure 7: A-Compilation of the particle size distributions for the layers 50-90 m (A), 100-140 m (B),
and 200-400 m (C) for the 3 visits at A3, two visits at C11 and single visit at C5. (D) Vertical profiles
of the slopes (m) of the particle size distributions at these sites. Grey line is the m (-4) value for the
global ocean from Guidi et al. (2009).
Figure 8: Number flux spectra from the polyacrylamide-gel filled traps as calculated from the data of
Ebersbach and Trull (2008) (A) and number spectra for water column particles at the trap depths from
the UVP images (B) at A3 and C5. Settling velocities as a function of size (ESD) in the natural iron
enriched bloom (A3) and in HNLC waters (C5) at 200 m (C) and 330 m (D) estimated by comparing
the gel-trap and UVP data.
III. Manuscript 3
134
Figure 9: Comparison of particle sinking velocities estimated here with previous results using the
same approach from McDonnell and Buesseler, 2010 (PS1, PS2, PS3) and other approaches (from
Guidi et al., 2008; Circle: Smayda, 1970; triangle: Shanks and Trent, 1980; cross: Carder et al., 1982;
plus sign: Azetsu-Scott and Johnson, 1992; Empirical relationships: 1 Alldredge and Gotschalk,
1988; 2 Alldredge and Gotschalk, 1989; 3 Syvitski et al., 1995). Settling velocities calculated
using the coagulation model (Stemmann et al., 2004b) with different parameter values (5 Dr ¼ 0.08,
D ¼ 2.33; 6 Dr ¼ 0.01, D ¼ 1.79) are also reported. The regression line 7 is the settling speed
predicted by Stokes Law. The dashed line 8 is the settling speed calculated in Guidi et al. (2008).
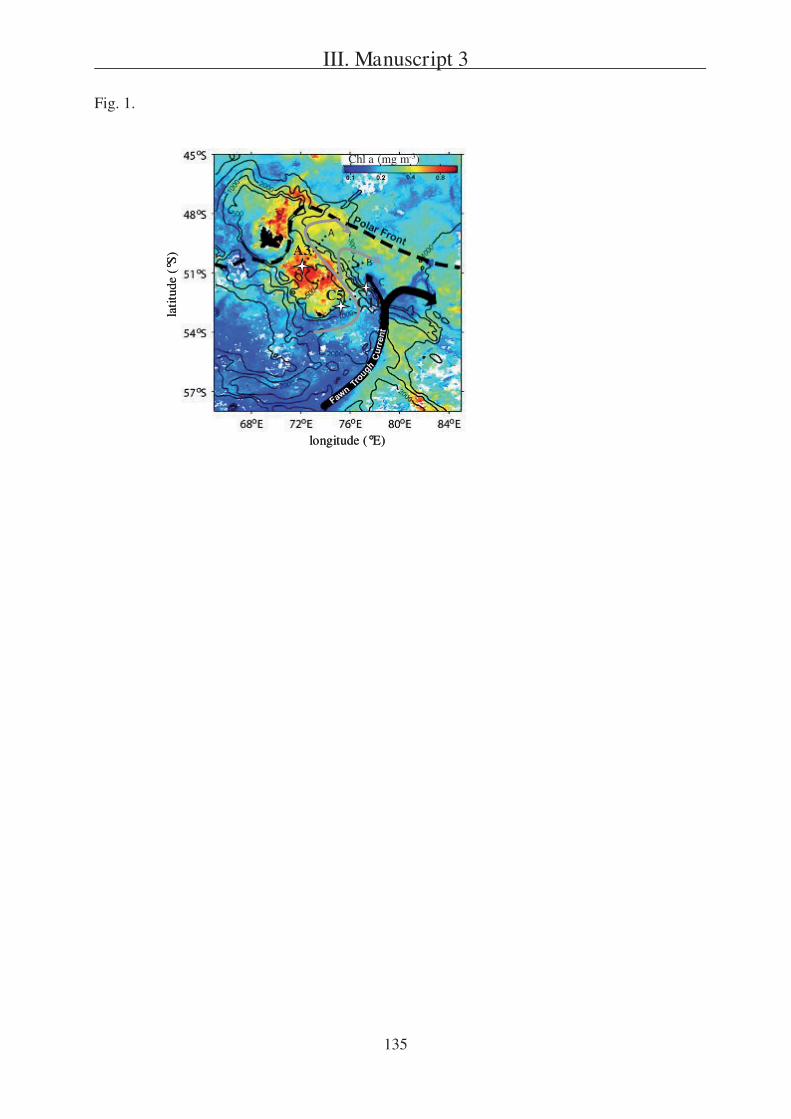
III. Manuscript 3
135
Fig. 1.
latit
ude
(°S
)
longitude (°E)
Chl a (mg m-3)la
titud
e (°
S)
longitude (°E)
Chl a (mg m-3)
A3
C5 C11
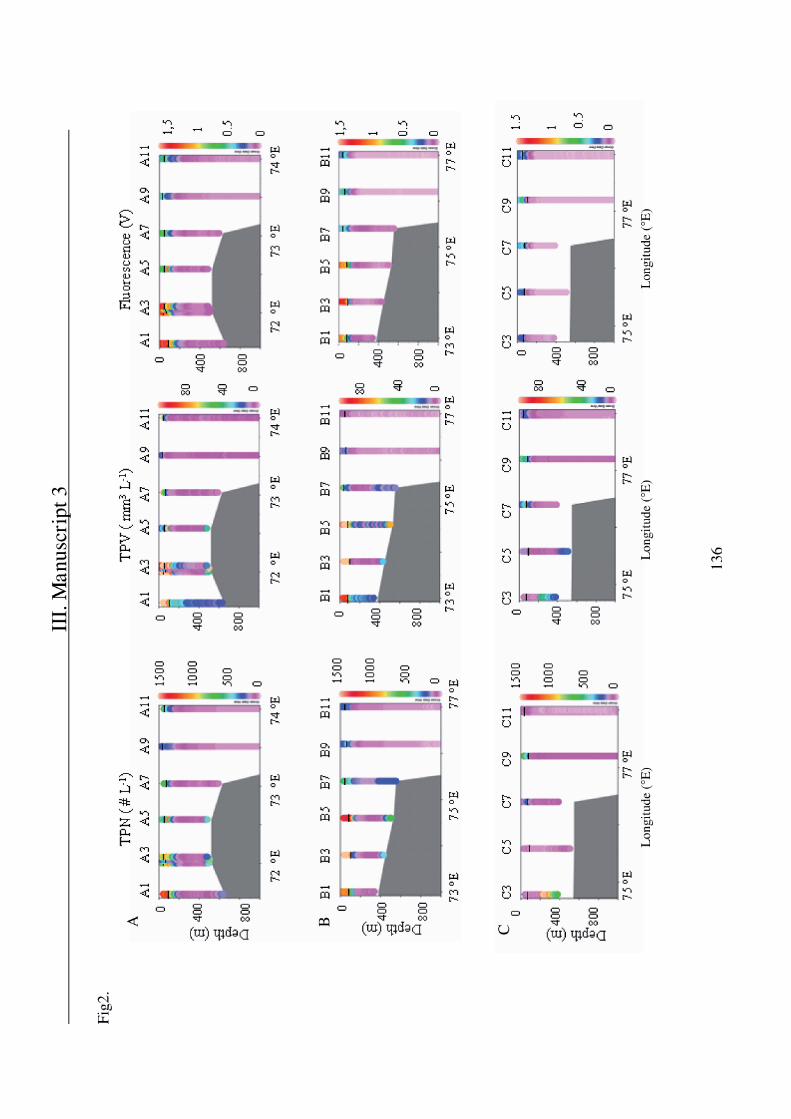
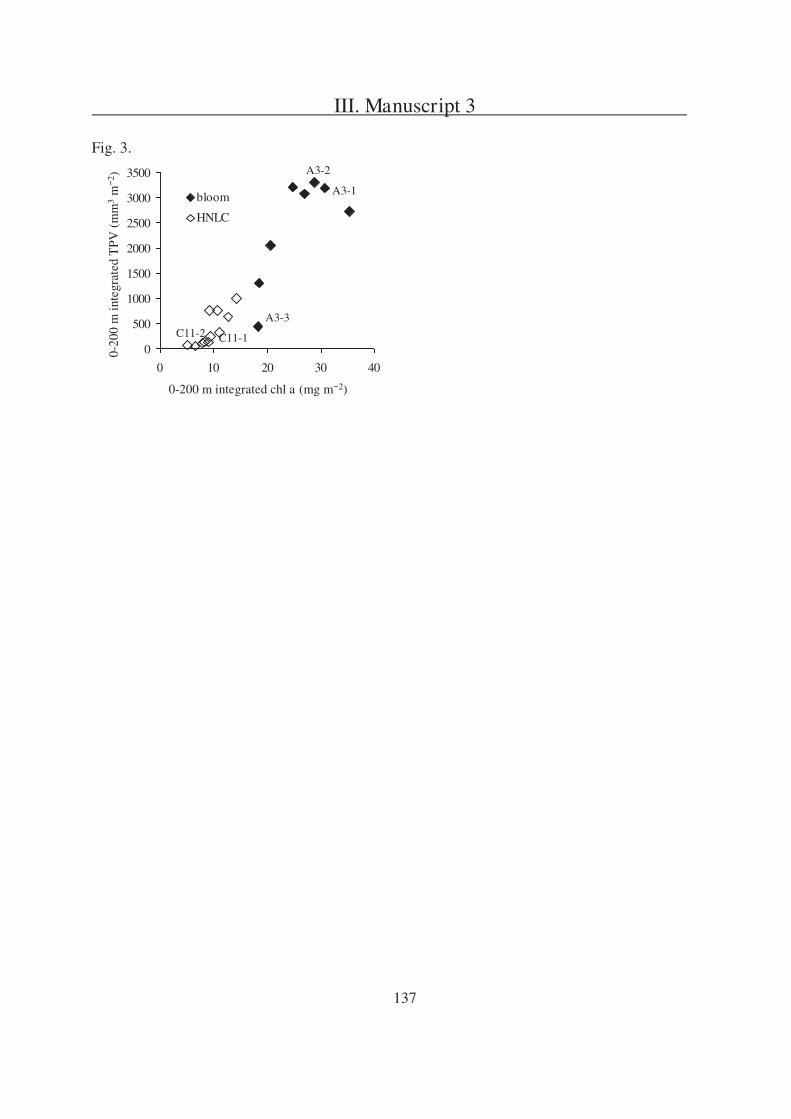
III. Manuscript 3
137
Fig. 3.
0-200 m integrated chl a (mg m 2)
0-20
0 m
inte
grat
edT
PV
(m
m3
m2 )
0
500
1000
1500
2000
2500
3000
3500
0 10 20 30 40
bloom
HNLC
C11-1C11-2
A3-1
A3-2
A3-3
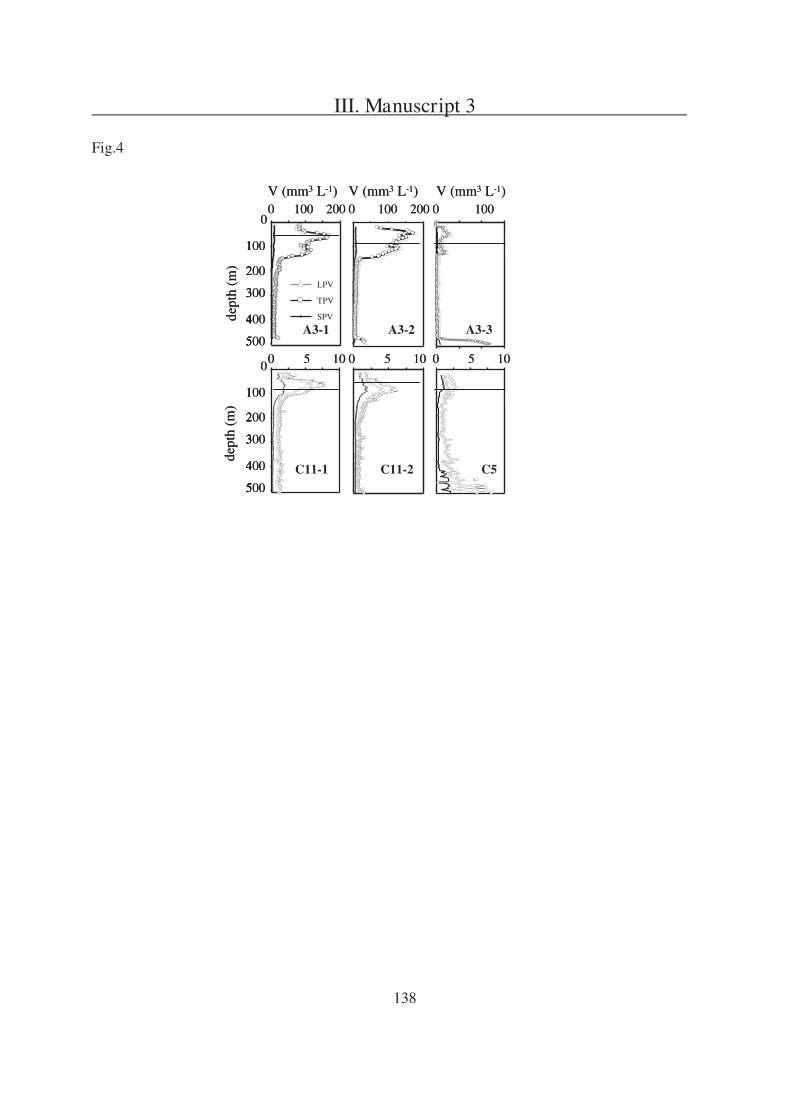
III. Manuscript 3
138
Fig.4
LPV
TPV
SPV
0
100
200
300
400
500
0
100
200
300
400
500
0 100 200 0 100 200 0 100
0 5 10 0 5 10 0 5 10
V (mm3 L-1) V (mm3 L-1) V (mm3 L-1)
dept
h (m
)de
pth
(m)
LPV
TPV
SPV
0
100
200
300
400
500
0
100
200
300
400
500
0 100 200 0 100 200 0 100
0 5 10 0 5 10 0 5 10
V (mm3 L-1) V (mm3 L-1) V (mm3 L-1)
LPV
TPV
SPV
0
100
200
300
400
500
0
100
200
300
400
500
0 100 200 0 100 200 0 100
0 5 10 0 5 10 0 5 10
V (mm3 L-1) V (mm3 L-1) V (mm3 L-1)
0
100
200
300
400
500
0
100
200
300
400
500
0 100 200 0 100 200 0 100
0 5 10 0 5 10 0 5 10
V (mm3 L-1) V (mm3 L-1) V (mm3 L-1)
dept
h (m
)de
pth
(m)
A3-1 A3-2 A3-3
C11-1 C11-2 C5
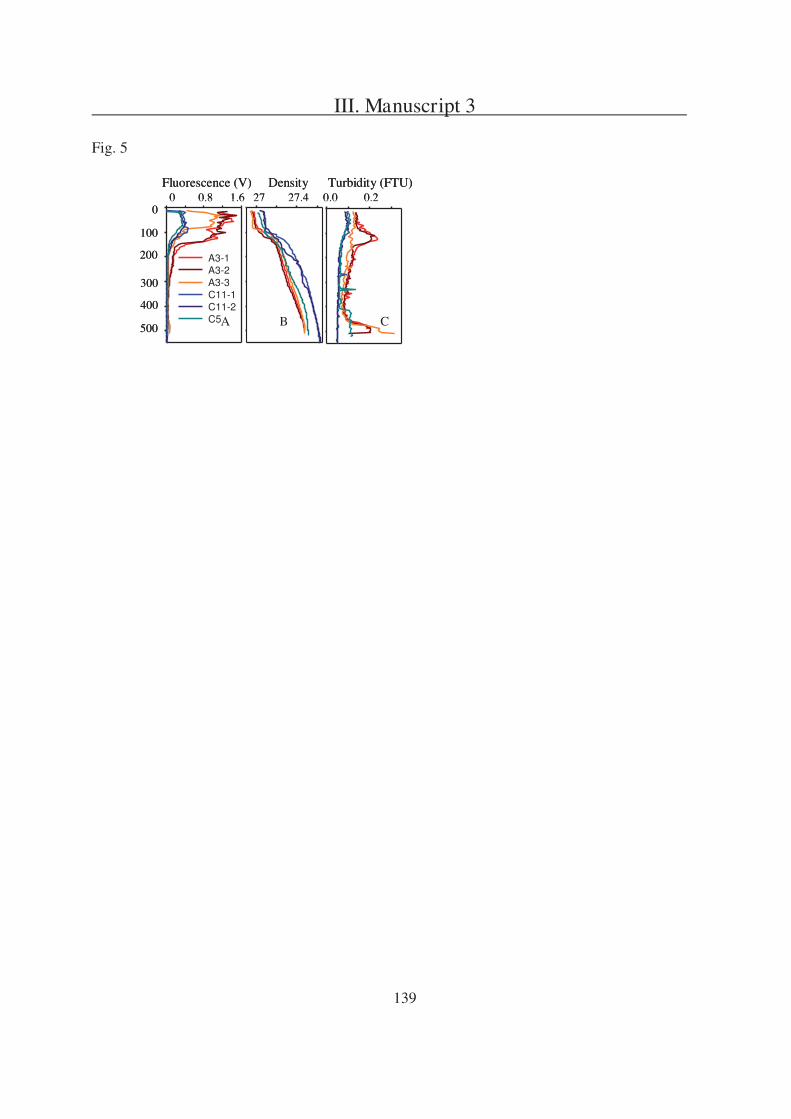
III. Manuscript 3
139
Fig. 5
A3-1
A3-2
A3-3
C11-1
C11-2
C5
0 0.8 1.6 27 27.4 0.0 0.2 0
200
400
100
500
300
Fluorescence (V) Density Turbidity (FTU)
A3-1
A3-2
A3-3
C11-1
C11-2
C5
0 0.8 1.6 27 27.4 0.0 0.2 0
200
400
100
500
300
Fluorescence (V) Density Turbidity (FTU)
B A C
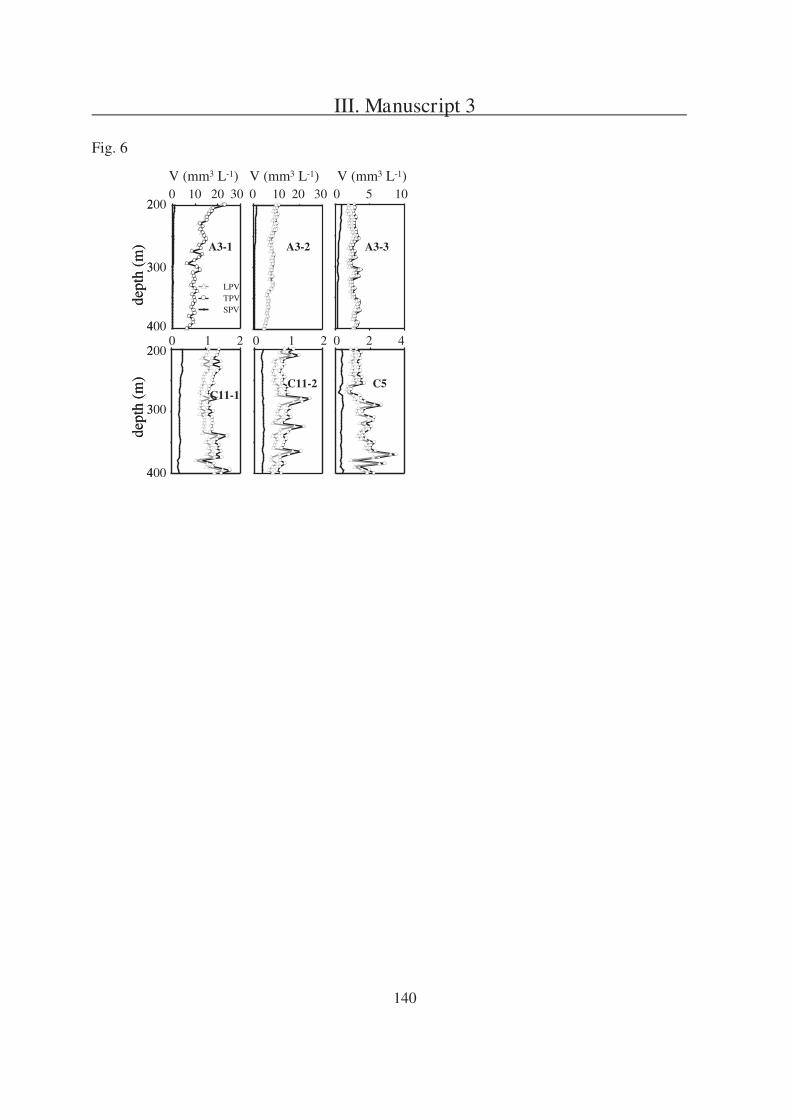
III. Manuscript 3
140
Fig. 6
LPVTPVSPV
200
300
400
200
300
400
0 10 20 30 0 10 20 30 0 5 10
0 1 2 0 1 2 0 2 4
V (mm3 L-1) V (mm3 L-1) V (mm3 L-1)
dept
h (m
)de
pth
(m)
LPVTPVSPV
200
300
400
200
300
400
0 10 20 30 0 10 20 30 0 5 10
0 1 2 0 1 2 0 2 4
V (mm3 L-1) V (mm3 L-1) V (mm3 L-1)
dept
h (m
)de
pth
(m)
A3-1 A3-2
C11-2 C5 C11-1
A3-3
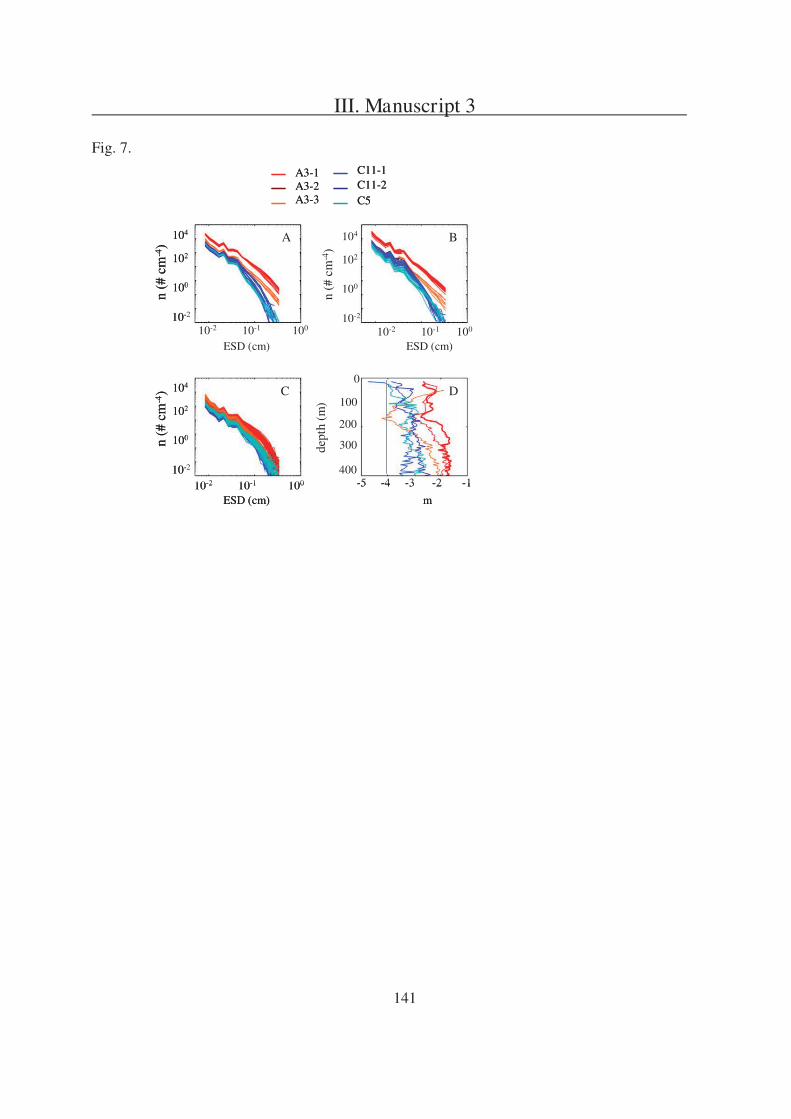
III. Manuscript 3
141
Fig. 7.
A3-1A3-2A3-3
C11-1C11-2C5
A3-1A3-2A3-3
C11-1C11-2C5
ESD (cm) m
10-2
100
102
104
10-2
100
102
104
10-2
100
102
104
400
300
200
100
10-2 10-1 100 10-2 10-1 100
10-2 10-1 100 -5 -4 -3 -2 -1
ESD (cm) ESD (cm)
dept
h (m
)
n (#
cm
-4)
n (#
cm
-4)
n (#
cm
-4)
A B
C D0
ESD (cm) m
10-2
100
102
104
10-2
100
102
104
10-2
100
102
104
400
300
200
100
10-2 10-1 100 10-2 10-1 100
10-2 10-1 100 -5 -4 -3 -2 -1
ESD (cm) ESD (cm)
dept
h (m
)
n (#
cm
-4)
n (#
cm
-4)
n (#
cm
-4)
A B
C D0
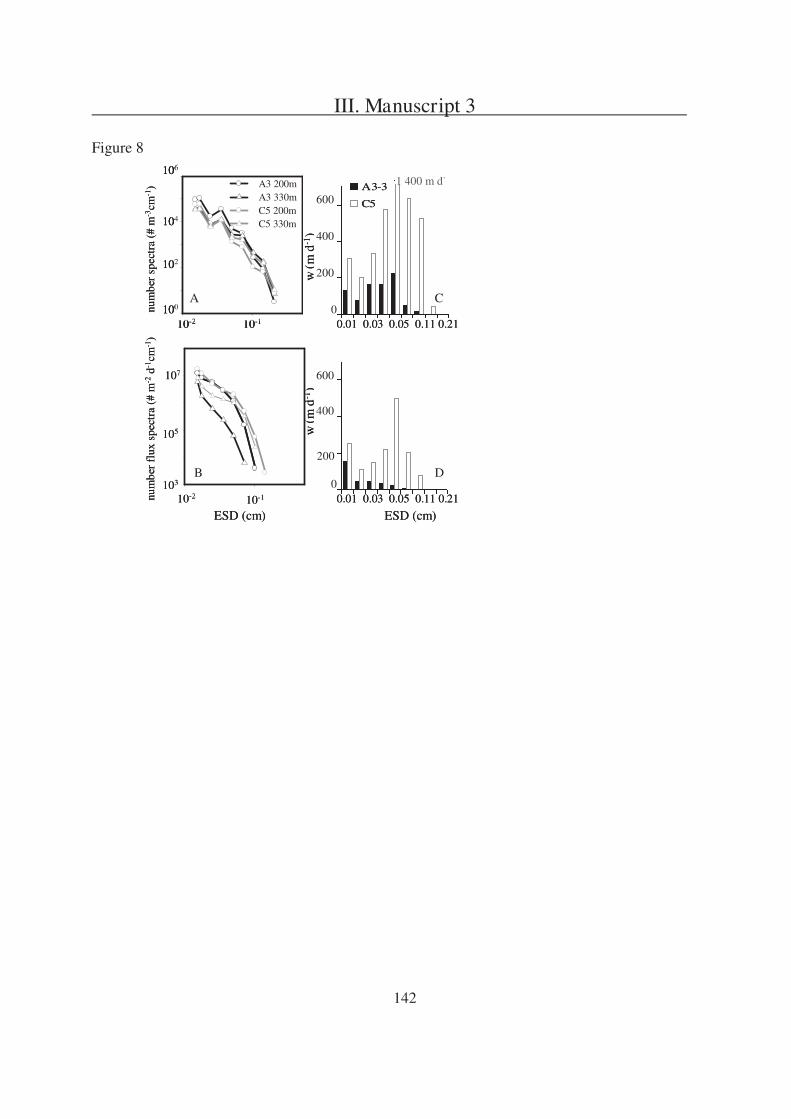
III. Manuscript 3
142
Figure 8
num
ber
flux
spe
ctra
(# m
-2d-1
cm-1
)nu
mbe
rsp
ectr
a(#
m-3
cm-1
) A3 200mA3 330mC5 200mC5 330m
106
104
102
100
10-2 10-1
10-2 10-1
ESD (cm) ESD (cm)
w(m
d-1
)w
(m d
-1)
103
105
107
0.01 0.03 0.05 0.11 0.21
0.01 0.03 0.05 0.11 0.21
0
200
400
600
A3-3
C5
0
200
400
600
400
200
0
0
200
400
600
600
num
ber
flux
spe
ctra
(# m
-2d-1
cm-1
)nu
mbe
rsp
ectr
a(#
m-3
cm-1
) A3 200mA3 330mC5 200mC5 330m
106
104
102
100
10-2 10-1
A3 200mA3 330mC5 200mC5 330m
106
104
102
100
10-2 10-1
10-2 10-1
ESD (cm) ESD (cm)
w(m
d-1
)w
(m d
-1)
103
105
107
0.01 0.03 0.05 0.11 0.21
0.01 0.03 0.05 0.11 0.21
0
200
400
600
A3-3
C5
0
200
400
600
400
200
0
0
200
400
600
600
1 400 m d-
1
B
A C
D
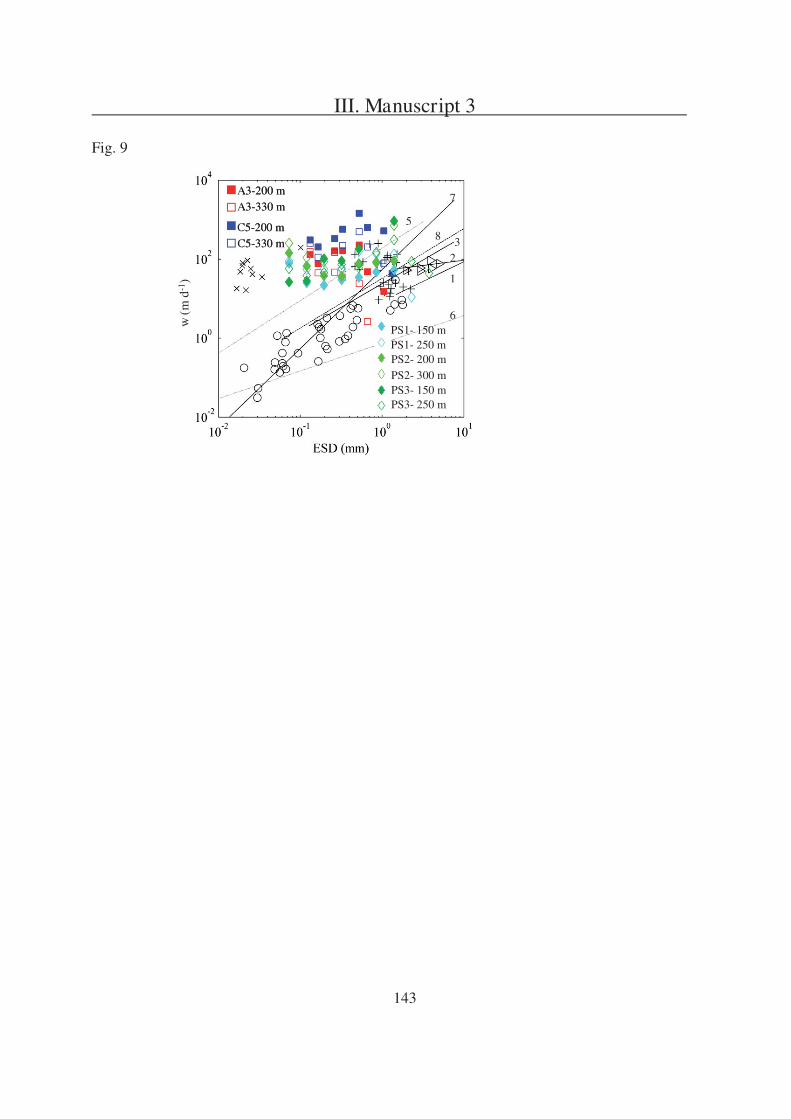
III. Manuscript 3
143
Fig. 9
C5-330 mC5-200 m
A3-330 mA3-200 m
PS1- 250 mPS2- 200 mPS2- 300 mPS3- 150 mPS3- 250 m
PS1- 150 m
w(m
d-1
)
6
5
7
8 3
1
2C5-330 mC5-200 m
A3-330 mA3-200 m
C5-330 mC5-200 m
A3-330 mA3-200 m
PS1- 250 mPS2- 200 mPS2- 300 mPS3- 150 mPS3- 250 m
PS1- 150 m
w(m
d-1
)
6
5
7
8 3
1
2

III. Manuscript 3
144

145
Manuscript 4

146
III. Manuscript 4
147
Sedimentation patterns of phyto- and protozooplankton during the iron
fertilisation experiment LOHAFEX in the Southern Ocean
Friederike Ebersbach1 ,2 , Philipp Assmy1 ,2, Eva-Maria Nöthig1
1 Alfred Wegener Institute for Polar and Marine Research, Am Handelshafen 12, 27570 Bremerhaven,
Germany
2 International Graduate School for Marine Science (GLOMAR), University of Bremen, Germany
(Draft 28 October 2010 in preparation for Journal of Marine Systems)
III. Manuscript 4
148
Abstract
The LOHAFEX project, a meso-scale iron fertilisation experiment that was conducted in the
Atlantic Sector of the Southern Ocean during austral summer (January March 2009), examined the
response of the plankton community to iron addition. Furthermore, the fate of the iron induced
phytoplankton bloom (IN stations) was studied and compared to surrounding waters (OUT stations).
Sinking particles were collected using i) bulk samples of neutrally buoyant sediment traps (NBSTs)
for biogeochemical fluxes and microscopic investigations, and ii) polyacrylamide gel equipped NBSTs
in order to visualise shape and structure of intact particles.
Small flagellates, in particular Phaeocystis antarctica, and unidentified Prasinophytes
dominated the iron stimulated phytoplankton bloom. Diatom build-up was limited due to very low
silicic acid concentrations (<2 μmol L-1) at the surface. Although the surface plankton community
showed an increase at IN in comparison to OUT stations, the export fluxes responded only with a
slight increase. The sinking particle assemblage indicated no detectable difference between IN and
OUT stations. Biogenic particles mainly consisted of faecal matter. Overall, it is evident that the
ecosystem structure prevailing during LOHAFEX was characterised though recycling.
III. Manuscript 4
149
1. Introduction
Particulate organic carbon (POC) is built up in the sunlit surface ocean, and is transported
downwards via the biological pump (Volk and Hoffert 1985; De La Rocha 2007). The mesopelagic
(depth range of 100 1000 m) and the deep ocean (>1000 m depth) are coupled to processes in the
euphotic zone (e.g. primary production (PP)) via sinking particles (e.g. Boyd and Trull 2007). Particle
formation largely depends on the phytoplankton community prevailing at the surface and food web
structure in the mesopelagic zone (Boyd and Trull 2007; Buesseler and Boyd 2009), resulting in
various forms of particles, such as marine snow or faecal pellets (Turner 2002). Transparent
Exopolymer Particles (TEP) are known to play an important role in the sedimentation of particulate
matter (Passow et al. 2001; Passow 2002) since they stimulate formation of marine snow and facilitate
incorporation of small particles into larger aggregates that would otherwise be too small to sink on
their own (Passow et al. 2001). High TEP production and subsequent sinking of phytoplankton blooms
has been widely observed in several regions (see Passow (2002) for a recent review).
Particle formation and flux in the world oceans have been a matter of intense discussion
because of the ability of the surface ocean to take up CO2 from the atmosphere and sequester it at
depth. The Southern Ocean, which acts as large sink for atmospheric CO2, is therefore of particular
interest. Large parts of the Southern Ocean are characterised as High-Nitrate-Low-Chlorophyll
(HNLC) areas, were PP is low despite high nitrate and phosphate concentrations. Martin (1990)
- might be a limiting factor for
phytoplankton growth. So far, 11 scientific in situ iron fertilisation experiments have univocally
et
al. (2007) for a recent review) and the fertilisation of oceanic waters can be seen as one possibility to
sequester parts of anthropogenic CO2 concentrations in the atmosphere (Smetacek and Naqvi 2008).
In the Southern Ocean four iron fertilisation experiments were carried out in the last decade:
the Southern Ocean Iron RElease Experiment (SOIREE) in the Pacific sector (Boyd et al. 2000), the
Southern Ocean Iron Experiment North and South (SOFeX-N and -S) in the Australian sector (Coale
et al. 2004), and the Iron Experiment (EisenEx) (Assmy et al. 2007) and the European Iron
Fertilisation Experiment (EIFEX) (Bathmann 2005) in the Atlantic sector. So far, EIFEX was the only
iron fertilisation experiment, where an export event subsequent to the collapse of the iron-induced
bloom could be followed through the deep water column (Smetacek at el. in prep.). During SOFeX a
shallow carbon export (< 200 m) was reported (Coale et al. 2004). Unfortunately, the fate of the
EIFEX bloom could not be studied in detail due to ship time constraints. Th
Hindi word for iron) was designed in consideration
of having enough time to allow examining the build-up and demise of the iron-induced bloom and
minimise the effects of dilution with unfertilised waters respectively. Therefore, the duration of the
experiment and the size of the fertilised patch were maximized as far as ship time and logistics
permitted (Smetacek and Naqvi 2008).
III. Manuscript 4
150
This manuscript is focussed on studying the contribution of phytoplankton and
protozooplankton to POC export fluxes by using neutrally buoyant sediment traps, of which some
were equipped with polyacrylamide (PA) gels in order to preserve intact sinking particles. Species
composition was determined microscopically, converted into C fluxes, and compared with the particle
assemblage as collected with the PA gels. The combination of both approaches provides insights into
particle dynamics that regulated export flux during LOHAFEX. In addition, the analysed distribution
of TEP in the water column as well as in the trap material allows speculation on particle formation.
2. Material and Methods
2.1 Study area
The meso-scale iron fertilisation experiment LOHAFEX was carried out in the Atlantic Sector
of the Southern Ocean (Fig. 1). It took place during austral summer within a meso-scale eddy in the
south-western Atlantic Sector of the Antarctic Circumpolar Current (ACC). Over the course of the
experiment, mixed layer depth ranged from 50-75 m, and the chosen eddy provided a coherent water
mass (Murty et al. 2010). LOHAFEX was conducted over a period of 39 days (26 January to 5 March
2009), being the longest iron enrichment experiment to date. The centre of the eddy was fertilised with
10 t dissolved ferrous sulphate (FeSO4) on January 26 (d0) creating a patch of approximately 300 km2
(Smetacek and Naqvi 2010). A second fertilisation followed after 3 weeks on February 17 (d21),
where another 10 t FeSO4 were added. For tracking the fertilised patch, it was marked by two floating
surface buoys (Mazzocchi et al. 2009). In order to compare fertilised with un-fertilised waters,
throughout the experiment it was distinguished between stations inside and outside the patch, referred
to as IN- and OUT-stations, respectively. The stations were allocated (as IN or OUT) on the basis of
several parameters, such as Fv/Fm ratios, and concentrations of chlorophyll, pCO2, and the tracer SF6
(Smetacek and Naqvi 2010).
2.2 Sampling procedure onboard
2.2.1 Sinking material
To collect sinking particles, PELAGRA-traps, funnel shaped neutrally buoyant sediment traps
(Lampitt et al. 2008) were deployed. Trap deployments were successful at 200 and 450 m for several
distinct time intervals inside and outside the fertilised patch (Table 1), but a complete coverage over
the course of the experiment was not achieved due to technical problems and weather conditions.
Bulk samples were preserved with formalin (2%), split on board using a rotary splitter
identical to that described by Lamborg et al. (2008) and stored at 4° C until processing in the
laboratory on shore.
PA gels were prepared onshore prior to the cruise following the method of Ebersbach et al. (in
prep.). Unfortunately, some of the PELAGRA traps equipped with a PA gel, suffered from technical
problems (Table 1). For this reason PA gels samples are only available from the beginning and the end
III. Manuscript 4
151
of the experiment (Table 1). Successful PA gels were photographed on board as described in
Ebersbach and Trull (2008) in order to document the state of the fresh material.
2.2.2 Water column
For TEP measurements within the water column (as opposed to sinking particulate material)
water samples of 250 ml were collected with Niskin bottles attached to a conductivity temperature
depth (CTD) rosette at discrete depth in the upper 500 m (Table 2).
2.3 Microscopic analyses and data processing
The planktonic composition of the material collected with the PELAGRA traps was examined
using inverted light and epiflourescence microscopy (Axiovert 135, 200; Zeiss, Oberkochen,
Germany) following the method of Utermöhl (1958). 10 or 50 mL of each split were settled in 10 or
50 mL sedimentation chambers (Hydrobios; Kiel, Germany) for 48 h. Unicellular organisms were
identified and counted at three magnifications, 100, 200, and 400 ×, respectively, according to the size
of the respective organisms. Dependent on their abundance, unicellular organisms were counted in
transects, quarter, half or whole chambers, and identified down to the species level.
In order to determine species-specific biovolumes 10-20 individuals per species/group were
measured with 400 × magnification and biovolumes estimated according to Hillebrand et al. (1999).
Using equation (1) these biovolumes were converted into carbon content after Menden-Deuer and
Lessard (2000), with a and b being defined in their Table 4, in pg and in μm3.
(1)
This calculation distinguishes between different types of protists and two size classes of
diatoms (smaller or larger than 3000 μm3), which is displayed in different a and b values (Menden-
Deuer and Lessard 2000). Based on abundance of the protists and their corresponding carbon content
per unicellular organism, the vertical carbon flux (mg C m-2 d-1) was determined and will be referred to
as unicellular plankton carbon (UPC) flux. Thus, UPC accounts for phytoplankton carbon (PPC) as
well as for protozooplankton biomass.
2.4 TEP analyses
Water samples were processed on board a few hours off collection following the protocol of
Passow and Alldredge (1995). Each sample was split into half to receive duplicates of 100 mL. After
being stained with alcian blue (Passow and Alldredge 1995), the samples were frozen at -20° C in
sealed polycarbonate tubes until further processing in the laboratory on shore.
Staining of TEP particles from the PELAGRA-splits was performed according to an adapted
method as described in detail in Passow et al. (2001) was applied.
TEP measurements were conducted with the colorimetric method (Pharma Spec UV-1700;
Shimadzu) according to Passow and Alldredge (1995). For calibrating the TEP measurement, a
calibration curve for the alcian blue solution was prepared with gum xanthan and the factor fx
estimated (Passow and Alldredge 1995). TEP concentration (CTEP) is then expressed as gum xanthan
III. Manuscript 4
152
equivalent (μg L-1) and can be estimated with equation (2), where E787 is the absorption of the sample
at a wavelength of 787 nm, C787 the absorption of the blank at the same wavelength, and Vf the filtered
volume (L).
(2)
For the concentration of TEP in the water column, depth integrated values were estimated over
100, 200 and 500 m, respectively. CTEP flux of the trap samples are referred to as TEP flux
3. Results
3.1 Flux characteristics from PA gels
During the LOHAHEX iron fertilisation experiment flux at 450 m predominantly consisted of
large and relatively compact particles (Fig. 2). The sinking particles preserved in the PA gels suggest
that the material was heavily processed before entering the trap as evidenced by the low abundance of
fragile phyto-detritus aggregates. The temporal resolution is unfortunately very coarse because PA gel
samples are only available from d0-d3, d26-d27 and d34 (Table 1) and thus temporal trends are not
shown in detail. However, only small differences in regard to flux composition are detectable between
the gels of the beginning and the end of the experiment, except the considerable number of large
metazoan in the initial gels (Fig. 3). Towards the end, slightly more compact aggregates were present
(Fig. 3b), but due to the low temporal resolution and the probability of a strong bias of the sinking
particles during collecting (compare 4.1.1) this observation is not representative for the vertical flux.
3.2 Magnitude of unicellular plankton carbon (UPC) fluxes
UPC flux rates at IN and OUT stations were low throughout the first half of the LOHAFEX
study and did not differ significantly from each other, after three weeks IN-fluxes were somewhat
higher than OUT-fluxes (Fig. 4). Due to the limited number of deployments at 200 m (Table 1), flux
dynamics over the course of the experiment were not well captured and are therefore not considered in
detail.
At 450 m, UPC flux from the PELAGRA trap was very low throughout the experiment (IN
and OUT) with some temporal variation (Table 3). The IN-trap in the period d29-d33 had somewhat
lower fluxes in comparison to that of d23-d28 and d34-d37. The three traps were deployed directly
one after another (Table 1), but there was no indication for a mal-functioning of any of these traps.
3.3 Composition of UPC fluxes
The collected plankton was divided into different groups of phytoplankton and
protozooplankton based on microscopic investigations (compare 2.3). Phytoplankton was
distinguished into diatoms, flagellates, silicoflagellates, coccoid cells, and autotrophic dinoflagellates.
Within the flagellates Phaeocystis antarctica was considered separately, and within autotrophic
dinoflagellates Ceratium pentagonum, because they were important constituents of the phytoplankton
III. Manuscript 4
153
assemblage at the surface. For diatoms also the C flux equivalent of intact empty and broken frustules
was considered, in order to allow direct comparison with full cells and estimate the amount of carbon
that was lost due to mortality. Protozooplankton was divided into heterotrophic dinoflagellates, ciliates
(here only tintinnid ciliates were found), foraminifera, radiolaria, and heliozoa. Among the protozoa
only dinoflagellates accounted for carbon transport to depth. To avoid confusion, it is important to
remember that dinoflagellate flux was provided by both, autotrophic (e.g. C. pentagonum) and
heterotrophic species. Apart from heterotrophic dinoflagellates, the protozoa consisted either almost
entirely of empty or broken individuals or their abundance was very low (see below for details).
flux, these species were not accounted for UPC estimates. UPC flux was carried by diatoms,
flagellates, coccoid cells and dinoflagellates in variable fractions (Fig. 5). The species are listed in
Table 4, and it is indicated, whether they were found at IN and/or OUT stations and at which depth,
and whether they contributed to UPC flux.
3.3.1 Phytoplankton
3.3.1.1 Diatoms
Generally, C flux of diatoms was very low (Fig. 6a). In the beginning, diatom C flux was
comparably high inside the patch, decreased by 50% in the following three weeks, increased to the
highest diatom C flux in the fourth week, but was halved afterwards (Table 3). Outside the patch,
diatom C fluxes were very similar (Table 3). Overall contribution of diatom C flux to the UPC flux
was just under a quarter at the most and in most cases less than 10% (Fig. 5).
The vast majority of sinking diatom frustules was empty and/or broken (Fig. 6b), whereas the
ratio of full to empty and broken frustules (F:EB) was slightly higher at 200 m than at 450 m
(Table 3). At 450 m the F:EB ratio was in most cases less than 0.5 (Table 3). Exceptions of 0.59 and
1.03 F:EB were detected in the beginning (Table 3), which coincides with higher diatom C fluxes
(Fig. 6a). Moreover, it is striking that the flux of Fragilariopsis kerguelensis after 11 days showed a
strong increase in empty and broken frustules, which is more than one order of magnitude higher than
prior to iron addition (Fig. 6c).
In terms of C flux, the weekly silicified diatom Ephemera cf. planamembranacea played the
most important role, followed by F. kerguelensis and Thalassionema nitzschioides (Fig. 7a-c).
Notable, the large cylindrical diatoms (Corethron pennatum, Corethron inerme, Proboscia alata,
Rhizosilenia spp.) vanished from the 450 m flux after 10 days and only returned as a few empty and/or
broken frustules later in the experiment (Fig. 6d). Generally, most diatoms encountered during
LOHAFEX were present in the lower size range reported in the literature for the respective species.
3.3.1.2 Flagellates
The C flux of flagellates at 450 m differeed largely between IN and OUT stations: Inside the
patch flagellate C fluxes increased with time, while they remained at the initial level outside the patch
III. Manuscript 4
154
(Table 3). Although absolute flagellate fluxes at 200 m were not variable (Table 3), their contribution
to overall UPC flux increased with time (Fig. 5).
Most abundant at any time and depth were the smallest flagellates (up to 5 μm in size), and the
large flagellates (>10 μm) were rarest, but the C flux was predominantly carried by the mid-sized (5-
10 μm) and large flagellates (Fig. 8). At 450 m inside the patch, the flux of small flagellates increased
in the first two weeks, showed a similar distribution in terms of size classes in the period of d23-d28 as
in the beginning and then followed again a shift towards small flagellates (Fig. 8).
Phaeocystis antarctica, which was not present in C flux (at 200 m) or had low numbers
(450 m) inside the patch in the beginning, showed an increase with time (Table 3). No regular trend
was detected (Fig. 9), and they provided between 6 and 19% of flagellate C flux at 450 m and up to of
27% at 200 m depth (Fig. 8, Table 3). Outside the patch, the contribution of Phaeocystis antarctica
decreased towards the end (Table 3, Fig. 8, 9).
The coccolithophore Emiliania huxleyi continuously contributed to the flux. But its abundance
could not be determined due to many broken individuals that were not countable.
The Silicoflagellate Dictyocha speculum (Table 4) showed very low abundances in the UPC
flux (<0.1%) throughout the experiment. Moreover, only empty or broken individuals were present
and therefore Dictyocha speculum was not followed further.
3.3.1.3 Coccoid cells
The carbon flux of coccoid cells (2 μm in diameter) at 200 m was relatively low at any time
and site during the experiment, and showed a slight decrease towards the end (d26/d27). Despite the
decline of absolute coccoid cell flux, its contribution to total UPC flux increased due to a decrease of
the other components, such as diatoms, flagellates and dinoflagellates (Table 3; Fig. 5).
At 450 m inside the patch, coccoid cell C flux increased by one order of magnitude after three
weeks (Table 3) and hence provided 4% of total UPC flux at the end (Fig. 5). Outside the patch, the
absolute C flux of coccoid cells at 450 m remained as low as in the beginning (Table 3), but their
relative importance increased up to 3% (Fig. 5).
3.3.1.4 Autotrophic dinoflagellates
See 3.3.2.1.
3.3.2 Protozoa
3.3.2.1 Dinoflagellates
Although autotrophic and heterotrophic dinoflagellates were counted separately, they are here
combined to simplify matters because they were not divided into autotrophic and heterotrophic species
when considering C flux. During the experiment, dinoflagellates at 450 m inside the patch accounted
for half or more of the UPC flux, except the low fluxes in the second week (Table 3, Fig. 5).
Afterwards, their contribution increased enormously by one order of magnitude (Table 3) and
dominated the UPC flux (Fig. 5). The strongest contribution of dinoflagellates to C flux was detected
at 200 m in the first two weeks, but it strongly decreased towards the end (Fig. 5, Table 3). Outside the
III. Manuscript 4
155
patch dinoflagellates showed a decrease of C flux by one half towards the end of the fourths week
(Table 3, Fig. 5).
As one example for development with time, the magnitude of the (autotrophic) dinoflagellate
C. pentagonum is given (Fig. 10). However, it was present as individual specimen as well as
incorporated in aggregates and faecal pellets (Fig. 11).
3.3.2.2 Ciliates
Within the group of ciliates, only tintinnid ciliates were present (Table 4) and the flux
consisted entirely of empty and/or crashed loricae (Fig. 11). The abundance of tintinnid loricae
increased strongly inside the patch at 200 m and at 450 m, with Acanthostomella norvegica being the
dominant species (Table 5). Outside the patch, tintinnid ciliate abundance was always somewhat
lower, and also showed an increase at 450 m (Table 5). The highest abundance occurred three weeks
within the experiment inside the patch at 450 m (Table 5). All loricae collected between d6 and d10
were crashed, which was the case for the majority in the other samples as well, but not as pronounced
(Table 5).
Among the tintinnid ciliates collected, A. norvegica was dominant at IN and OUT stations and
A.
norvegica) very likely also belong to this species but were crashed beyond recognition adding to the
already high fraction of A. norvegica (Table 5). Second most important were Stenosonella avellana,
especially outside the patch, and Cymatocyclis antarctica (Table 5).
3.3.2.3 Foraminifera
The vast majority of the collected foraminifera was empty; in all samples, except one, not
more than 6% of them were full; only between d6 and d10 18% were full (Table 6). Some of the
empty individuals were also broken and showed explicit signs/traces of grazing, such as broken spines
and/or tests (Fig. 11). The ratio of full to empty and broken tests did not show a tendency, but
indicates low ratios or even total absence of full houses towards to end in 450 m depth (Table 6).
Among the total number of foraminifera the non-spinos species Neogloboquadrina sp.
accounted for most of the individuals (Table 6). Due to heavily fractured houses and broken spines,
the spinos foraminifers could not always be determined to species level. Thus, Globigerina bulloides
and Turborotalita quinqueloba were not distinguished, but counted as spinos foraminifera.
3.3.2.4 Radiolaria
Radiolaria played a minor role in the protozoan flux. A few Nasselaria and Spumellaria were
present whereas Phaeodaria were completely absent (Table 4). Inside the patch, only empty and/or
broken individuals were found and no trend with depth or time was recognisable (Table 7). Those very
few individuals that were full occurred outside the patch (at 200 m in #5, and at 450 m in #8 and #10),
where abundances in general were slightly higher than inside (Table 7).
III. Manuscript 4
156
Heliozoa flux was very small (<0.1%o of UPC) and did not differ between 200 and 450 m,
thus they are not considered in detail for this study. The dominant species was Sticholonche zanclea
(Table 4).
3.4 TEP concentration
3.4.1 Water column TEP
Throughout the experiment TEP concentrations were highest in the surface layer (upper 20 m)
and decreased with increasing depth by approximately one third from the surface to 500 m (Fig. 12a,
b). The strongest decrease was detected within the upper 100 m. This is the case for both, IN and OUT
stations. In the beginning, TEP concentrations were comparably low, especially below 100 m
(Fig. 12a; Table 8). Inside the patch, TEP values were highest at all depths after approximately two
weeks, remained at that high level from d12 until d24, and decreased towards to end of the experiment
(Fig. 12a; Table 8). Unfortunately, TEP profiles outside the patch are only available for the second
half of the experiment (Table 2). The first two TEP profiles (d16 and d22) resemble each other, but a
decrease at the end (d35) is also detectable (Fig. 12b).
Depth integrated TEP also represented a muted increase from d0 until d24, followed by a
slight decrease towards the end (Fig. 12c). The increasing tendency of TEP in 500 m is somewhat
slower than that in 200 m. The total amount of TEP in the water column is very similar inside and
outside the patch (Fig. 12a-c).
TEP and Chla in the surface layer (at 10 m depth) are not correlated (Fig. 12d). Surface TEP
varied between 86 and 95 μg L-1 (Table 8) and did not follow a trend with time, while Chla increased
towards highest values at d24 and then decreased again (Fig. 12d).
3.4.1 TEP flux
TEP flux at 200 m was highest two weeks after iron addition, where it accounted for 34% d-1
of water column TEP (Table 8). At 450 m, TEP flux constituted 12% d-1 or less of the TEP in stock in
the water column (Table 8). TEP flux at 450 m strongly increased from 0 to 4.26 mg m-2 d-1 in the
fourth week, followed by a decrease (Table 8). Difference between IN and OUT-station were small
(Fig. 13a).
4. Discussion
4.1 Trap accuracy
The successful PELAGRA trap deployments considered for this study (Table 1) allow
studying flux dynamics based on biogeochemical fluxes (Table 3), because over- or undersampling
was not evident. However, particles collected with PA gels deployed with the PELAGRA traps are not
preserved as undisturbed as anticipated (Fig. 2, 3 and 4.1.2 for details). This suggests that the sinking
particles were heavily biased as they settled into the collection funnel (Ebersbach et al. in prep.) and
have to be regarded with suspicion when drawing conclusions on flux composition.
III. Manuscript 4
157
4.1.1 Biogeochemical fluxes
Although sinking fluxes intercepted with PELAGRA traps have been reported in previous
studies (e.g. Lampitt et al. 2008), the daily flux rates have to be viewed with caution, because export
events may occur in pulses. Given the fact that during LOHAFEX most PELAGRA traps were
deployed for several days (Table 1) and between successive deployments large difference in average
daily fluxes of UPC were collected (Fig. 4), non continuous fluxes of sinking material is suggested.
This seemed to have been the case in the second half of the experiment in particular (Fig. 4; Table 3).
4.1.1 PA gels
The particle assemblage in the PA gels from the first 2 days as compared to those that were
collected well after iron enrichment during the phase of biomass build-up at the surface, are very
similar in appearance (Fig. 3). One reason for this similarity might be that flux characteristics were not
influenced by iron fertilisation (see 4.5.2). Another reason could have been the impact of the
PELAGRA trap design on the sampling procedure and the subsequent destruction of the collected
particles. Possibly, structure and form of the particles were altered in the trap funnel before they
settled into the PA gel (Ebersbach et al. in prep.). This makes the identification of individual particles
in these gels very difficult (Fig. 3), especially those that appear to be heavily reworked and may be
attributed to faecal aggregates (compare 4.3).
4.2 Magnitude of flux
The small difference in the UPC flux between the fertilised patch and surrounding waters
(Table 3; Fig. 4) suggests that the iron-induced increase in primary production did not result in an
increased export signal at depth. In comparison to total POC flux, UPC accounted for less than 10% in
most cases, and for even less than 5% in the second half of the LOHAFEX study, where total UPC
fluxes had increased (Table 3). The conspicuously higher contribution of UPC of 28 and 45% to POC
at the beginning of the experiment indicates that UPC flux was more important to overall export
before iron was added to the system, and might have resulted from a previous natural bloom that
occurred in this region prior to our arrival. This is supported by additional evidences, such as the very
low silicic acid (Si(OH)4) concentrations in the upper 100 m (0.5-2 μM) at d0 (Pratihary et al. 2010)
and the 234Th-profiles, which implied that an export of particles from the surface waters had occurred
in the past approximately two months (Rengarajan et al. 2010). Thus, the LOHAFEX eddy had
probably experienced a diatom bloom prior to the experiment that had depleted surface silicic acid
concentrations and accounted for the surface deficit in the 234Th signal (Mazzocchi et al. 2009).
Whereas the decline of UPC flux over the first three weeks (Fig. 4) probably depicts the fading of the
previous bloom, the noticeable high UPC flux in the fourth week of the LOHAFEX experiment might
mirror the settling of the bloom induced by iron addition. However, UPC flux was still very low and
more or less within the variability of the data.
The low fluxes collected with the PELAGRA traps agree with vertical particle profiles
recorded with the Underwater Video Profiler (UVP), the transmissometer profiles, and 234Th
III. Manuscript 4
158
measurements (Mazzocchi et al. 2009). This suggests that only a small fraction of the algal biomass
that was built up at the surface settled out of the mixed layer. Instead, it must have been maintained in
the surface layer. This is in contrast to EIFEX, where a massive sinking event of the senescent bloom
was observed at the end of the experiment (Smetacek et al. in prep.). During LOHAFEX, on the
contrary, UPC played a minor role for export flux.
4.3 Composition of the flux
First of all, it stands out that full diatoms were very rare in the UPC flux during LOHAFEX,
which contradicts findings of previous iron fertilisation experiments in the Southern Ocean (compare
Boyd et al. 2007 and references therein). However, UPC flux depicts the phytoplankton composition
of the surface layer. The iron induced bloom was dominated by small flagellates, in particular
Phaeocystis antarctica and unidentified Prasinophytes (Assmy et al. 2010), which agrees with their
consistent presence in the UPC flux following the evolving bloom (Table 3; Fig. 5, 8 and 9).
Especially, the highest Phaeocystis antarctica flux in the third week (Fig. 9) coincides with high
Phaeocystis antarctica abundances at the surface a few days before (P. Assmy pers. comm.). In
coincidence with the surface community, flux was dominated by small flagellates, although the fewer
but larger individuals were carrying the C flux (Fig. 8).
The observation that with time the size spectrum of flagellates at 450 m shifted towards
smaller individuals and the abundance of the even smaller coccoid cells also increased (Fig. 8,
Table 3), suggests selective grazing. Due to heavy grazing pressure by large copepods in the surface
waters, only small individuals escaped, which would also explain the increasing relative importance of
coccoid cells at 200 m, in spite of decreasing absolute numbers (Table 3).
In regard to diatom flux, the large increase of empty and broken frustules in response to iron
addition (Fig. 6) confirms strong grazing at the surface. This is in agreement with many broken diatom
frustules showing traces of handling by copepods and being incorporated into faecal aggregates
(Fig. 11). The flux of empty and broken diatom frustules is also depicted in an increasing BSi flux at
the same time (P. Martin, unpubl. data). Despite low SiOH44- levels during LOHAFEX, diatoms
showed high in-situ growth rates in the surface layer but did not accumulate biomass (pers. comm. P.
Assmy), indicative of high grazing pressure. Moreover, the shift within the diatom community in the
trap material from large cylindrical diatoms, such as Corethron pennatum, C. inerme, Proboscia alata,
and Rhizosilenia spp., at the beginning of the experiment (Fig. 6d), towards smaller and partly heavily
silicified pennate diatoms indicates a shift in the surface community which is supported by water
column observations (P. Assmy, unpubl. data). While the former species likely constituted a signal
from a previous bloom, the latter species contributed a relatively constant but low flux of mainly
empty frustules to the deep water column for the remainder of the experiment.
While phyto-detritus did not contribute to C flux to a large extend, particulate transport was
dominated by heavily processed material as demonstrated in the PA gels (Fig.2 and 3). Most of these
particles appear to be of faecal origin, which supports the finding of grazing playing the most
III. Manuscript 4
159
important role for export flux of organic material. Besides the obvious presence of faecal matter, traces
of grazing also become evident by the striking dominance of empty and/or broken individuals of
diatoms, radiolaria, silicoflagellates, and foraminifera in the flux (Table 6 and 7).
Moreover, cells of C. pentagonum as well as empty loricae of tintinnid ciliates were frequently
found in faecal material (Fig. 11). Tintinnids are efficient grazers of small flagellates that dominated
the iron induced bloom and responded to the enhanced food supply at the surface with increasing
abundances (Mazzocchi et al. 2009). However they were themselves kept in check by copepod grazers
as evidenced by the increase in empty or even crashed loricae of tintinnid ciliates that contributed to
the flux (Table 5). The strong decrease of C. pentagonum and their incorporation in faecal material
towards the end of the experiment is further evidence of heavy copepod grazing pressure (Mazzocchi
et al. 2009). Thus trophic cascades played an important role in channelling carbon through the pelagic
food web and eventually led to an export flux dominated by faecal material as evidenced by the PA
gels (Fig. 2 and 3).
The presence of copepods is also mirrored in their grazing traces, for instance in forms of
bitten spines of foraminifera, the large abundance of broken diatom frustules, and C. pentagonum and
tintinnid loricae being incorporated in faecal aggregates (Fig. 11).
4.4. The role of TEP for export processes
The distribution of TEP in the water column (Fig. 12) resembled typical TEP profiles (Passow
2002). Compared to other Southern Ocean studies, TEP did not play an important role during
LOHAFEX, where TEP concentrations were about one order of magnitude lower than previously
determined (Passow et al. 1995; Hong et al. 1997).
In regard to the development of TEP production with time, the negligible differences between
IN and OUT stations and the small changes within TEP profiles down to 500 m over the course of the
experiment (Fig. 12a and b) support the low importance of TEP for particle aggregation in this
ecosystem. Several studies have shown, that diverse phytoplankton communities are positively
correlated to TEP production (Passow (2002) and references therein). This was also observed for
flagellate dominated blooms and in particular for Phaeocystis. However, during LOHAFEX TEP at
depths had increased slightly (Fig. 12a), and TEP integrated over the water column only showed minor
variation with time (Fig. 12c). If at all, a small increase two weeks after the initial fertilisation could
be detected (Fig. 12a-c). Furthermore, no positive correlation between TEP and Chla was detected at
the surface (10 m depth) (Fig. 12d), suggesting that the production of TEP did not respond to iron
addition.
In contrast, TEP flux at 450 m shows a strong increase from the first week to the maximal
TEP concentrations four weeks after iron release (Fig. 13a). This finding stands in opposite to the
more or less invariant TEP profiles in the upper 500 m (Fig. 12) and raises the question whether water
column sampling was not conducted appropriate (detailed discussion below). Apart from the 12% d-1
TEP that arrived at 450 m in the third week, TEP fluxes accounted for 8% d-1 at the most (Table 8).
III. Manuscript 4
160
Although only a small fraction of TEP was recovered at depth, it was still more than the nearly 2% d-1
that were measured in the only other TEP flux study available (Passow et al. 2001). Considering the
different environmental conditions (Santa Barbara Channel with much higher TEP concentration in the
water column (Passow et al. 2001)), a comparison to the LOHAFEX site does not make sense.
The observation that TEP flux seems to be totally unrelated to UPC flux (Fig. 13b), but shows
a positive correlation with POC flux (at 450 m inside the patch; Fig. 13c) indicates that neither TEP
production nor UPC flux responded to iron addition with a simple increase. In contrast, it is an
evidence for export being not driven by phyto-detritus aggregates (which would have been displayed
in UPC flux), but through a different pathway such as formation of faecal matter aggregates. It has
been observed that zooplankton, especially copepods, may also contribute to TEP production (Prieto et
al. 2001), although the mechanisms are not clear. The high abundance of copepods during LOHAFEX
(Mazzocchi et al. 2009) could be one explanation for the positive relation between TEP flux and POC
flux (Fig. 13c), assuming that TEP is incorporated into faecal aggregates produced by copepods. This
would agree with the findings of (Passow et al. 2001), who proposed grazing as a possible sink for
TEP loss.
It is likely that the sampling protocol for TEP in the water column was not sufficient to
capturing TEP distribution representatively. Possibly, faecal aggregates, which appeared to have
carried TEP to depths, might not have been collected adequately with this technique. Moreover, the
spontaneous and short sinking events (compare also 4.1.1) might not have been collected in a
representative way with our sampling frequency (Table 2). As each TEP profile only represents a
snapshot of the overall picture (Fig. 12), a higher resolution with time and depths might have provided
more inside into TEP dynamics and its role for export. Nonetheless, it has to be taken into account that
only a very small fraction of the integrated TEP was exported (Table 8) and thus, uncertainties within
the data might be large.
4.5 Comparison to previous iron fertilisation experiments
With respect to the composition of the surface phytoplankton community as well as the
sinking material, the LOHAFEX iron enrichment study differs considerably from comparable studies
conducted in the Southern Ocean. This might be due to several reasons. First of all, LOHAFEX was
carried out in the northern part of the ACC in waters strongly depleted in silicic acid and thus
dominated by phytoflagellates. Previous iron fertilisation experiments were conducted in silicic acid
enriched waters and thus dominated by diatoms. (Boyd et al. (2007) and references therein), except
SOFeX-North, where silicic acid concentrations were <3 μmol L-1 (Coale et al. 2004). SOFeX
investigated the response of iron addition to waters, that are only limited by iron (SOFex-South) and
those that are co-limited by iron and silicic acid (SOFeX-North; Coale et al. 2004). Despite low silicic
acid concentrations, enhanced export fluxes were detected in the fertilised area of SOFeX-North, but
data on rates are not available (Coale et al. 2004). However, export fluxes during SOFex-North were
probably regulated through phyto-detritus (Bishop et al. 2004; Coale et al. 2004). This result stands in
III. Manuscript 4
161
opposite to LOHAFEX, where the sinking particle assemblage predominantly consisted of faecal
material (compare 4.3). In respect to flux composition, LOHAFEX might have resembled CROZEX, a
naturally iron fertilisation experiment conducted in the Indian Sector of the Southern Ocean (Pollard et
al. 2007). During CROZEX, parts of the iron fertilised bloom was provided by flagellates due to
insufficient silicic acid concentrations for diatom growth (Poulton et al. 2007) and nonetheless
translated into enhanced export rates in comparison to HNLC waters (Pollard et al. 2007).
5. Conclusions
The sinking particle assemblage during LOHAFEX reveals no detectable difference between
fertilised and unfertilised waters. Despite a positive response of the surface plankton community to
iron addition, export flux seems to have reacted to the changing conditions in the euphotic zone with
only a slight increase. Our results indicate that fertilising the ecosystem of the Si-limited northern band
of the ACC will not result in an enhanced export of carbon to the deep water column but in a retention
system that will recycle most of the iron-induced biomass build-up in the surface mixed layer.
Considering the sparse resolution of data points and the uncertainties (compare 4.1 and 4.4)
the results suggest that the sampling resolution was probably too coarse in regard to time and space. A
higher special and temporal resolution might have shed more light on flux dynamics. Furthermore, it is
possible that more insights into export processes would have been gained if moored deep sea traps
were deployed in addition. One trap could have been positioned directly under the fertilised patch and
a second trap mooring could have been deployed outside the patch. This would have provided some
means to compare IN and OUT deep fluxes, although finding a good position for the IN trap would
not have been an easy task because the patch was moving with the eddy field (Fig. 1). However,
examining deep fluxes (close to the sea floor) could have been useful to prove the observation that
iron fertilisation appeared to have only little effect on export flux during the LOHAFEX study.
III. Manuscript 4
162
References
Assmy, P., J. Henjes, C. Klaas, and V. Smetacek. 2007. Mechanisms determining species dominance in a phytoplankton bloom induced by the iron fertilization experiment EisenEx in the Southern Ocean. Deep Sea Research I 54: 340-362.
Assmy, P., F. Ebersbach, N. Fuchs, C. Klaas, M. Montresor, and V. Smetacek. 2010. Phyto- and Protozooplankton, p. 81-86. In H. Bornemann and B. Chiaventone [eds.], Reports on Polar and Marine Research. The expedition of the Research Vessel "Polarstern" to the Antarctic on 2009 (ANT-XXV/3-LOHAFEX). Alfred Wegener Institute.
Bathmann, U. 2005. Ecological and Biogeochemical Response of Antarctic Ecosystems to Iron Fertilzation and Implications on Global Carbon Cycle. Ocean and Polar Research 27: 231-235.
Bishop, J. K. B., T. J. Wood, R. E. Davis, and J. T. Sherman. 2004. Robotic Observations of Enhanced Biomass and Export at 55°S During SOFex. Science 304: 417-420.
Boyd, P. W. and others 2007. Mesoscale Iron Enrichment Experiments 1993-2005: Synthesis and Future Directions. Science 315: 612-617.
Boyd, P. W., and T. W. Trull. 2007. Understanding the export of biogenic particles in oceanic waters: Is there consensus? Progress In Oceanography 72: 276-312.
Boyd, P. W. and others 2000. A mesoscale phytoplankton bloom in the polar Southern Ocean stimulated by iron fertilization. Nature 407: 695-702.
Buesseler, K. O., and P. W. Boyd. 2009. Shedding light on processes that control particle export and flux attenuation in the twilight zone of the open ocean. Limnology and Oceanography 54: 1210-1232.
Coale, K. H. and others 2004. Southern Ocean Iron Enrichment Experiment: Carbon Cycling on High- and Low-Si Waters. Science 304: 408-414.
De La Rocha, C. L. 2007. The Biological Pump, p. 1-29. In D. H. Heinrich and K. T. Karl [eds.], Treatise on Geochemistry. Pergamon.
Ebersbach, F., and T. Trull. 2008. Sinking particle properties from polyacrylamide gels during the KErguelen Ocean and Plateau compared Study (KEOPS): Zooplankton control of carbon export in an area of persistent natural iron inputs in the Southern Ocean. Limnology and Oceanography 53: 212-224.
Ebersbach, F., T. W. Trull, D. M. Diana, and C. Moy. 2010. A unique opportunity to study intact sinking particles: The combination of Polyacrylamide gels and sediment traps. Limnology and Oceanography: Methods in prep.
Hillebrand, H., C.-D. Dürselen, D. Kirschtel, U. Pollinger, and Z. Tamar. 1999. Biovolume calculation for pelagic and benthic microalgae. J. Phycol. 35: 403-424.
Hong, Y., W. O. J. Smith, and A.-M. White. 1997. Studies on transparent exoplolymer particles (TEP) produced in the Ross Sea (Antarctica) and by Phaeocystis Antarctia (Prymnesiophyceae). Journal of Phycology 33: 368-376.
Lamborg, C. H. and others 2008. The flux of bio- and lithogenic material associated with sinking particles in the mesopelagic 'twilight zone' of the northwest and North Central Pacific Ocean. Deep Sea Research II 55: 1540-1562.
Lampitt, R. S. and others 2008. Particle export from the euphotic zone: Estimates using a novel drifting sediment trap, 234Th and new production. Deep Sea Research Part I: Oceanographic Research Papers 55: 1484-1502.
Martin, J. H. 1990. Glacial-Interglacial CO2 Change: The Iron Hypothesis. Paleoceanography 5: 1-13. Mazzocchi, M. G. and others 2009. A non-diatom plankton bloom controlled by copepod grazing and
amphipod predation: Preliminary results from the LOHAFEX iron-fertilisation experiment. Globec International Newsletter: 3-6.
Menden-Deuer, S., and E. J. Lessard. 2000. Carbon to volume relationship for dinoflagellates, diatoms, and other protist plankton. Limnology and Oceanography 45: 569-579.
Murty, V. S. N. and others 2010. Physical Oceanography, p. 16-26. In H. Bornemann and B. Chiaventone [eds.], Reports on Polar and Marine Research. The expedition of the Research Vessel "Polarstern" to the Antarctic on 2009 (ANT-XXV/3-LOHAFEX). Alfred Wegener Institute.
III. Manuscript 4
163
Passow, U. 2002. Transparent exopolymer particles (TEP) in aquatic environments. Progress in Oceanography 55: 287-333.
Passow, U., and A. L. Alldredge. 1995. A dye-binding assay for the spectrophotometric measurement of transparent exoplomer particles (TEP). Linmology and Oceanography 40: 1326-1335.
Passow, U., W. Kozlowski, and M. Vernet. 1995. Palmer LTER: Temporal variability of transparent exoplomymer particles in Arthur Harbor during the 1994-1995 growth season. Antartic Journal of the United States 30: 265-266.
Passow, U., R. F. Shipe, A. Murray, D. K. Pak, M. A. Brzezinski, and A. L. Alldredge. 2001. The origin of transparent exopolymer particles (TEP) and their role in the sedimentation of particulate matter. Continental Shelf Research 21: 327-346.
Pollard, R., R. Sanders, M. Lucas, and P. Statham. 2007. The Crozet Natural Iron Bloom and Export Experiment (CROZEX). Deep Sea Research II 54: 1905-1914.
Poulton, A. J., C. M. Moore, S. Seeyave, M. I. Lucas, S. Fielding, and P. Ward. 2007. Phytoplankton community composition around the Crozet Plateau, with emphasise on diatoms and Phaeocycsis. Deep-Sea Research II 54: 1905-1914.
Pratihary, A. K., D. Baraniya, and S. W. A. Naqvi. 2010. Macro nutrients, p. 29-30. In H. Bornemann and B. Chiaventone [eds.], Reports on Polar and Marine Research. The expedition of the Research Vessel "Polarstern" to the Antarctic on 2009 (ANT-XXV/3-LOHAFEX). Alfred Wegener Institute.
Prieto, L., F. Sommer, H. Stibor, and W. Koeve. 2001. Effects of planktonic copepods on transparent exopolymeric particles (TEP) abundance and size spectra. Journal of Plankton Research 23: 515-525.
Rengarajan, R., M. Soares, and M. M. Rutgers Van Der Loeff. 2010. Natural Rasionuclides and Radium Isotopes, p. 48-53. In H. Bornemann and B. Chiaventone [eds.], Reports of Polar and Marine Research. The expedition of the Research Vessel "Polarstern" to the Antarctic on 2009 (ANT-XXV/3-LOHAFEX). Alfred Wegener Institute.
Smetacek, V., and S. W. A. Naqvi. 2008. The next generation of iron fertiisation experiments in the Southern Ocean. Philosophical Transactions of the Royal Society London A. 366: 3947-3967.
Smetacek, V., and S. W. A. Naqvi. 2010. Summery and Iternary, p. 9-12. In H. Bornemann and B. Chiaventone [eds.], Reports on Polar and Marine Research. The expedition of the Research Vessel "Polarstern" to the Antarctic on 2009 (ANT-XXV/3-LOHAFEX). Alfred Wegener Institute.
Smetacek, V. and others 2010. Massive carbon flux to the deep sea from an iron-fertilized phytoplankton bloom in the Southern Ocean. Nature in prep.
Turner, J. T. 2002. Zooplankton fecal pellets, marine snow and sinking phytoplankton blooms. Aquatic Microbial Ecology 27: 57-102.
Utermöhl, H. 1958. Zur Vervollkommnung der quantitativen Phytoplankton-Methodik. Mitteilungen/Internationale Vereinigung für Theoretische und Angewandte Limnologie 9: 1-13.
Volk, T., and M. I. Hoffert. 1985. Ocean carbon pumps: analysis of relative strengths and efficiencies in ocean-driven atmospheric CO2 changes. Geophysical Monographs 32: 99-110.
III. Manuscript 4
164
Figures
Fig. 1. MODIS image of the LOHAFEX study area showing Chla surface concentrations in the period
12 to 14 February. The iron induced bloom is encircled and its elongated form is recognisable. Note
the size of the much larger phytoplankton blooms in the northeast of the (artificial) LOHAFEX bloom
for comparison. (Source: http://modis.gsfc.nasa.gov/)
Fig. 2. Image of entire PA gel (Gel 10; see Table 1 for deployment time), in which particulate flux of a
24 h sampling period from the second half of the LOHAFEX study is preserved. The uneven
distribution of the particulate matter points to a strong impact of the trap design on the collection
procedure (see 4.1.1 for a detailed discussion).
Fig. 3. Detailed images of PA gels as they were obtained during LOHAFEX: a) Gel 1-3 (beginning of
the experiment), b) Gel 10-12 (end of the experiment). See Table 1 for deployment details. No
considerable difference of flux composition between beginning and end of the experiment is evident
and the majority of the collected particles appear to be of faecal origin. (Scale bar: 1 mm)
Fig. 4. Total Unicellular Planktonic Carbon (UPC) flux determined from PELAGRA trap samples:
Development of IN and OUT fluxes at 200 and 450 m, respectively.
Fig. 5. Relative Unicellular Plankton Carbon (UPC) flux of the C flux carrying groups i) diatoms, ii)
flagellates, iii) dinoflagellates, and iv) coccoid cells: Development over the course of the experiment
a) at 200 m (IN and OUT), b) at 450 m IN, and c) at 450 m OUT.
Fig. 6. Contribution of diatoms to the flux at 450 m inside the patch: Development over the course of
the experiment. (Note the different scales on the y-axis) a) total diatom C flux (only full frustules), b)
total diatom C flux (full frustules) and C flux equivalent (empty and broken frustules), c) full, empty
and broken of F. kerguelensis, d) full, empty and broken frustules of large cylindrical diatoms (C.
pennatum, C. inerme, Proboscia alata, Rhizosilenia spp.).
Fig. 7. C flux and ratio of full to empty and broken frustules of some selected abundant diatoms
species: a) and d) F. kerguelensis, b) and e) T. nitzschioides and c) and f) Ephemera cf.
planamembranacea.
Fig. 8. Relative fluxes of different sizes classes (2.5-5 μm, 5-10 μm, >10μm) and the separate
contribution of Phaeocystis antarctica within the flagellates C flux: Development over the course of
the experiment a) at 200 m (IN and OUT), b) at 450 m IN, and c) at 450 m OUT.
III. Manuscript 4
165
Fig. 9. C flux of the flagellate Phaeocystis antarctica that was amongst the important primary
producers in the surface community: Development of IN and OUT fluxes at 200 and 450 m,
respectively.
Fig. 10. C flux of the surface autotrophic dinoflagellate Ceratium pentagonum,: Development of IN
and OUT fluxes at 200 and 450 m, respectively.
Fig. 11. Images showing the flux composition as examined with the microscope (from bulk sediment
trap samples; a, b, c, f: 450 m; e, d: 200 m): a) dinoflagellate Gyrodinium spec. and faecal material, b)
broken radiolaria embedded in faecal matter, c) shells of protozoan origin (for instance empty tintinnid
loricae) integrated in faecal material, d) empty foraminifera with broken spines and C. pentagonum
incorporated in faecal material, e) broken Proboscia alata, C. pentagonum, and faecal matter, f) faecal
material containing empty tintinnid loricae, C. pentagonum as well as recognisable individual faecal
pellets.
Fig. 12. TEP distribution in the upper 500 m of the water column: profiles a) inside, and b) profiles
outside the patch, c) integrated TEP over the water column. d) relation of surface TEP (at 10 m) to
Chla. (See Table 2 for sampling details of water column TEP.)
Fig. 13. TEP flux at 200 m and 450 m over the course of the experiment: a) absolute TEP flux, b)
relation between TEP and UPC flux, and c) relation between TEP and POC flux.
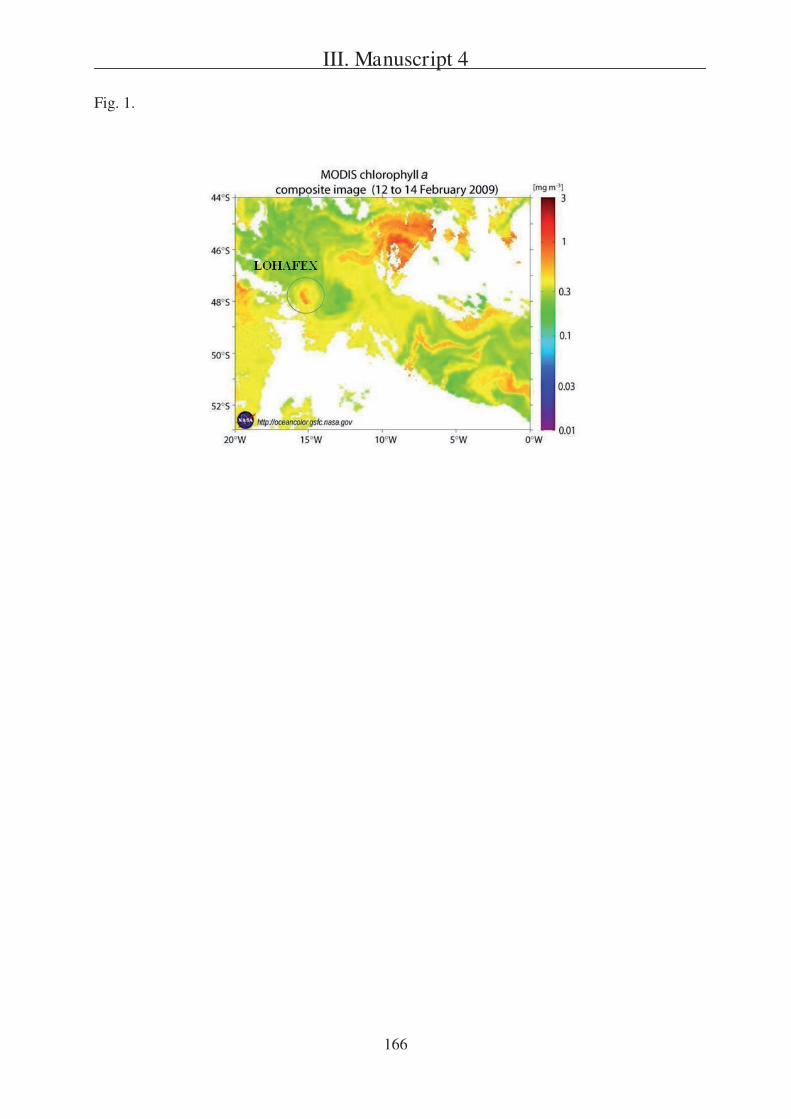
III. Manuscript 4
166
Fig. 1.
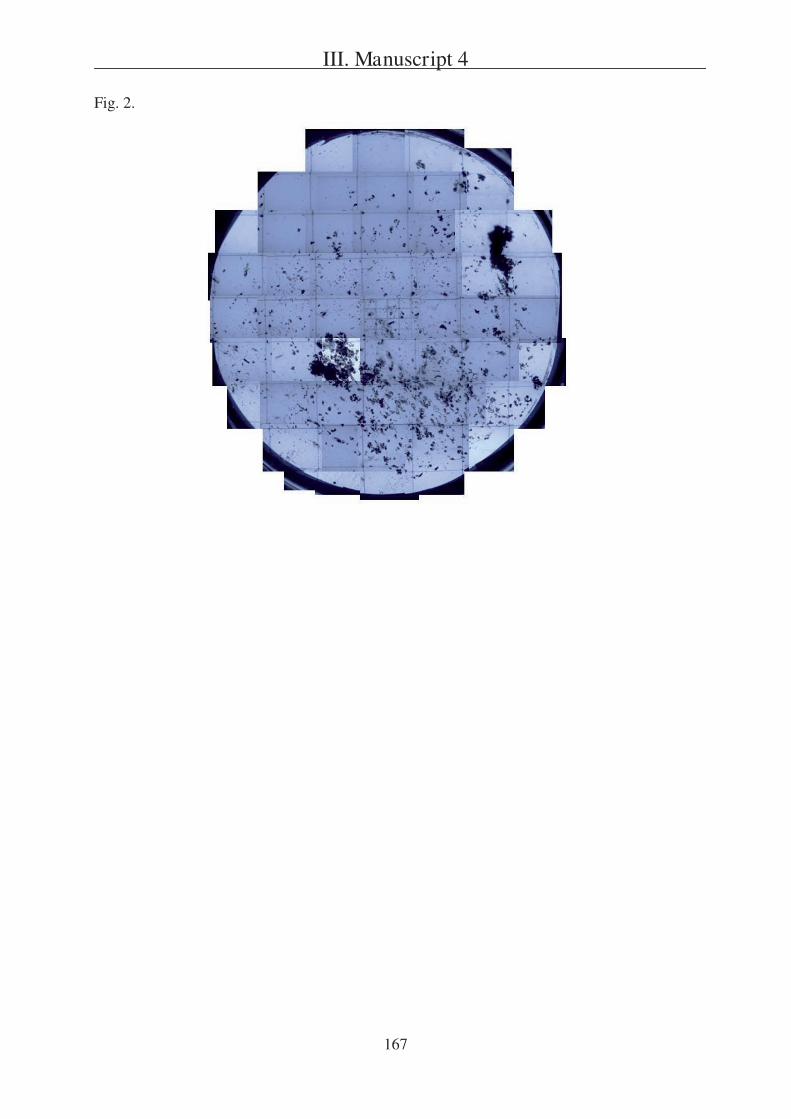
III. Manuscript 4
167
Fig. 2.
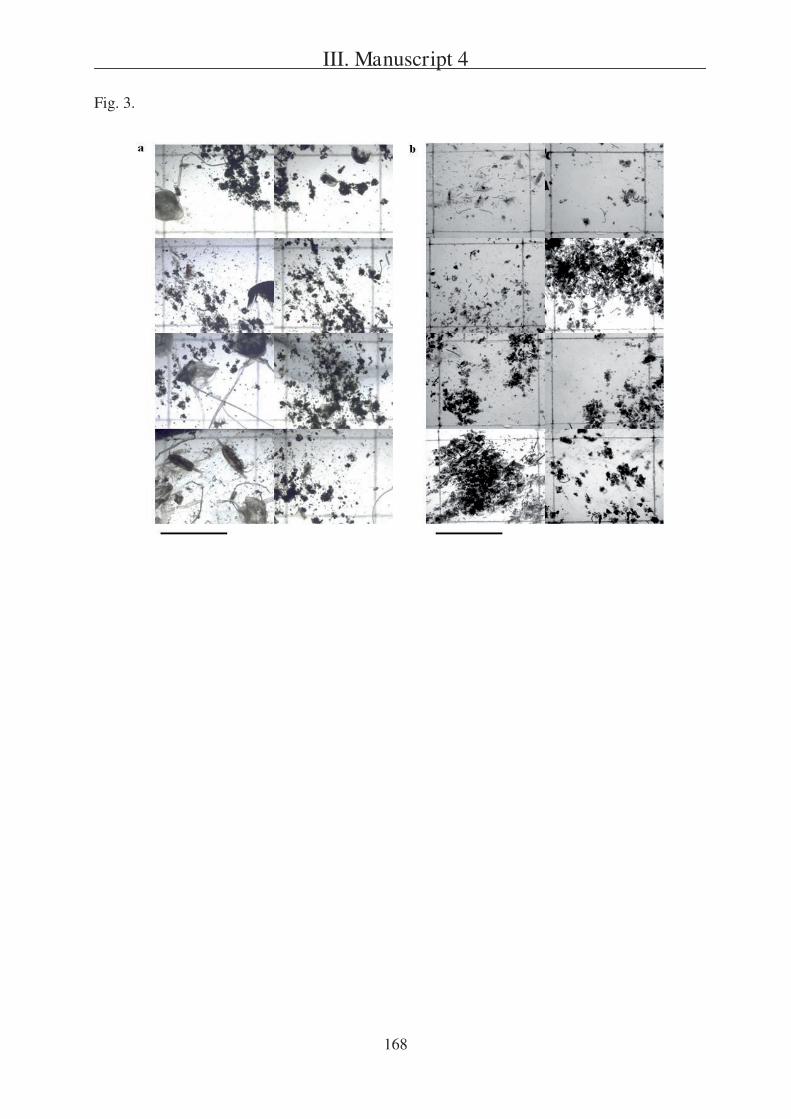
III. Manuscript 4
168
Fig. 3.
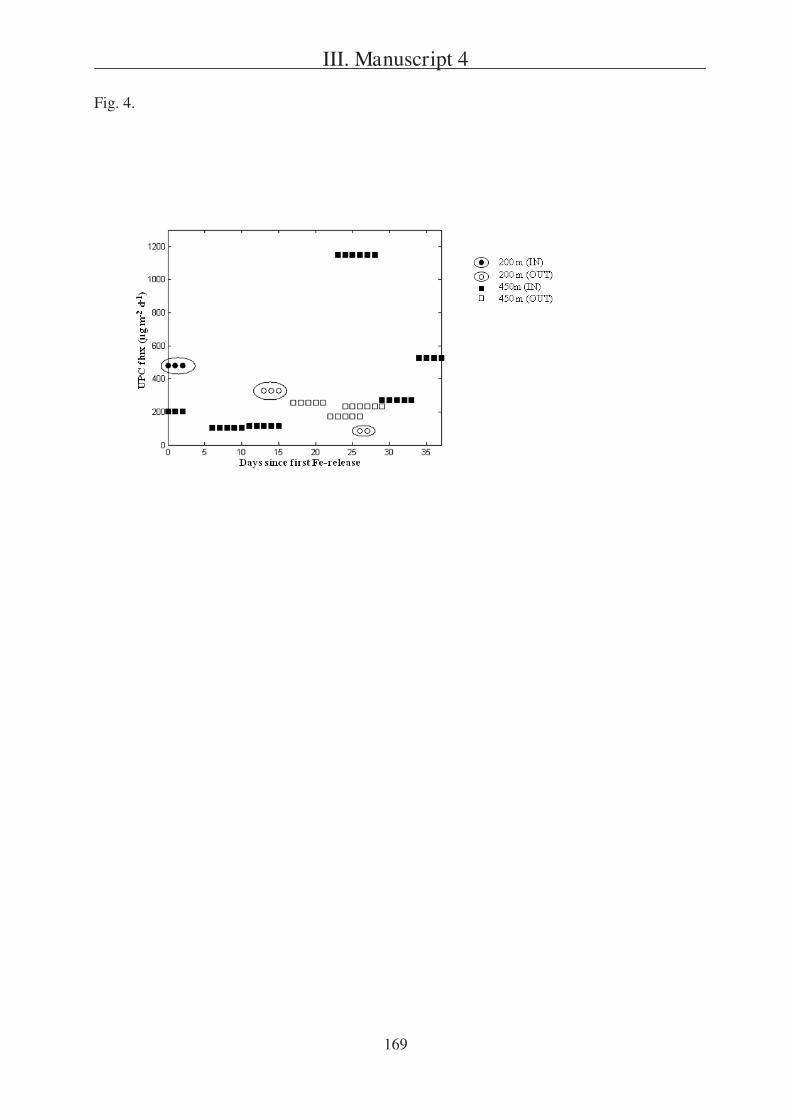
III. Manuscript 4
169
Fig. 4.
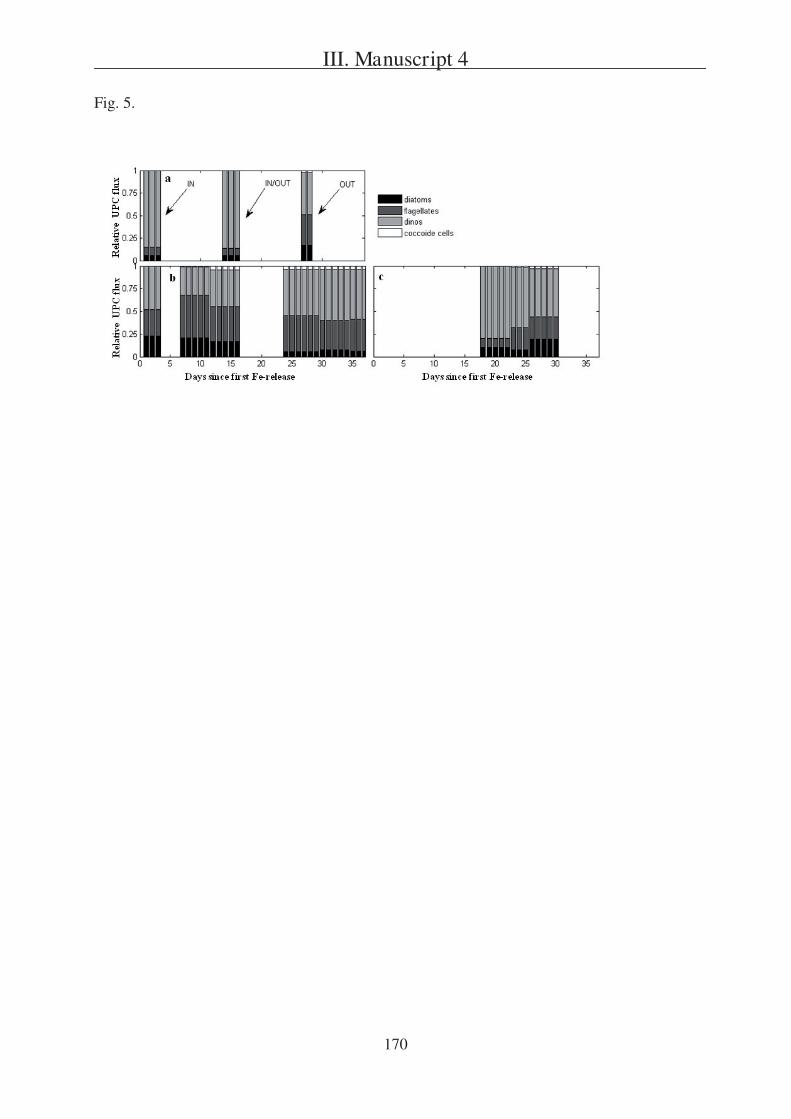
III. Manuscript 4
170
Fig. 5.
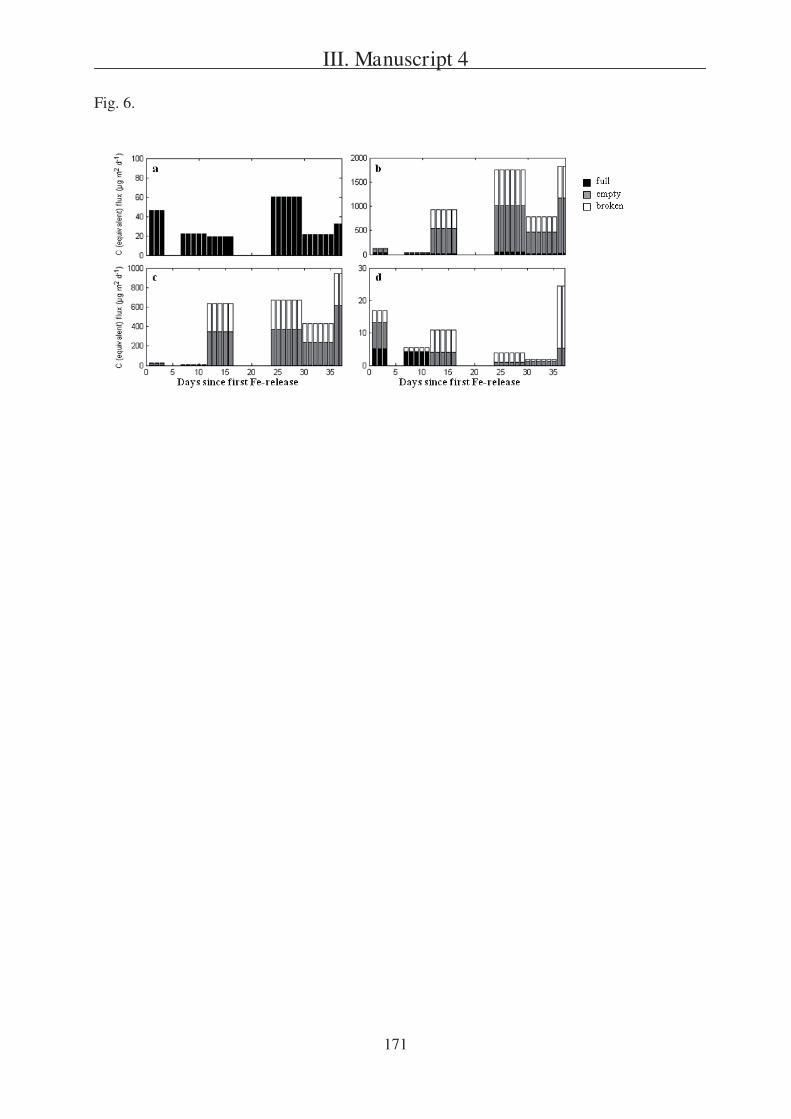
III. Manuscript 4
171
Fig. 6.
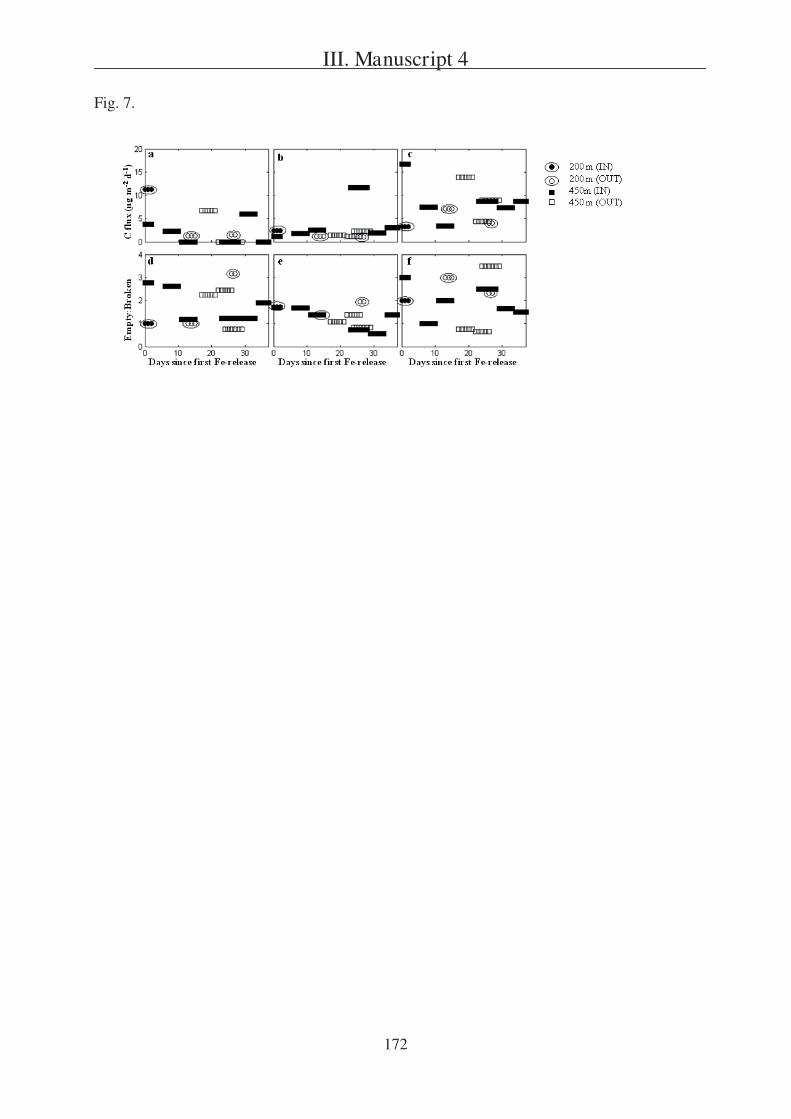
III. Manuscript 4
172
Fig. 7.
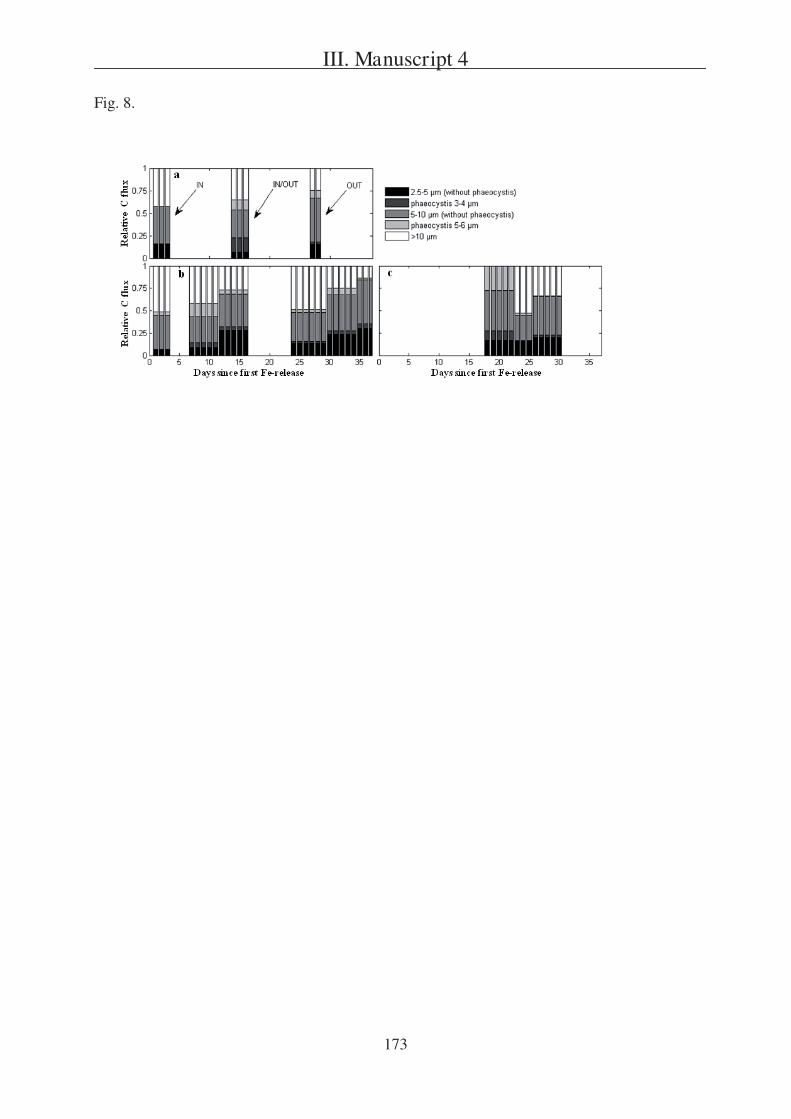
III. Manuscript 4
173
Fig. 8.
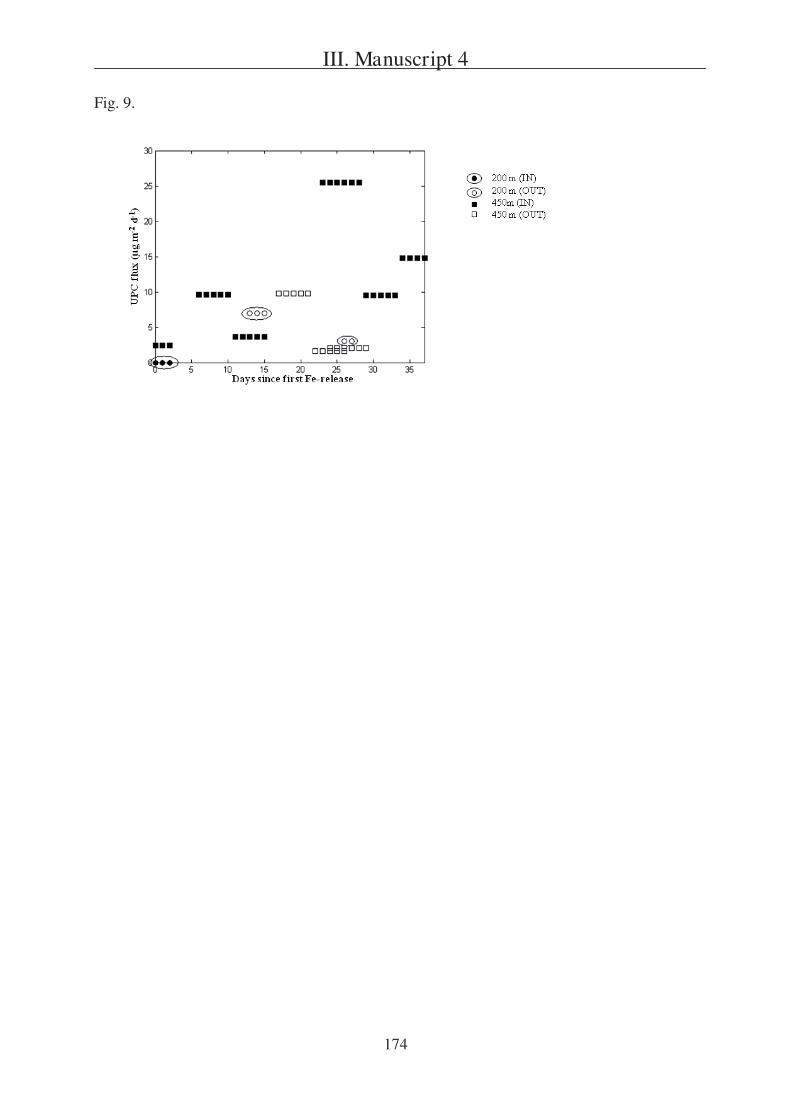
III. Manuscript 4
174
Fig. 9.
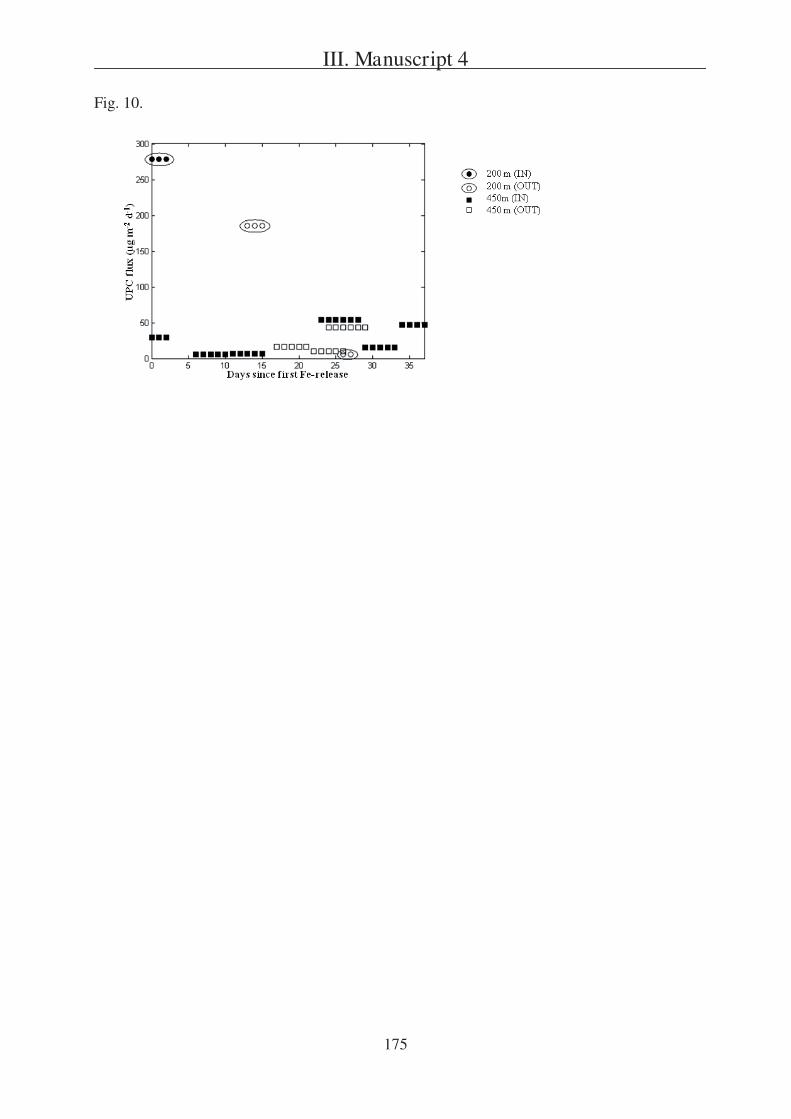
III. Manuscript 4
175
Fig. 10.
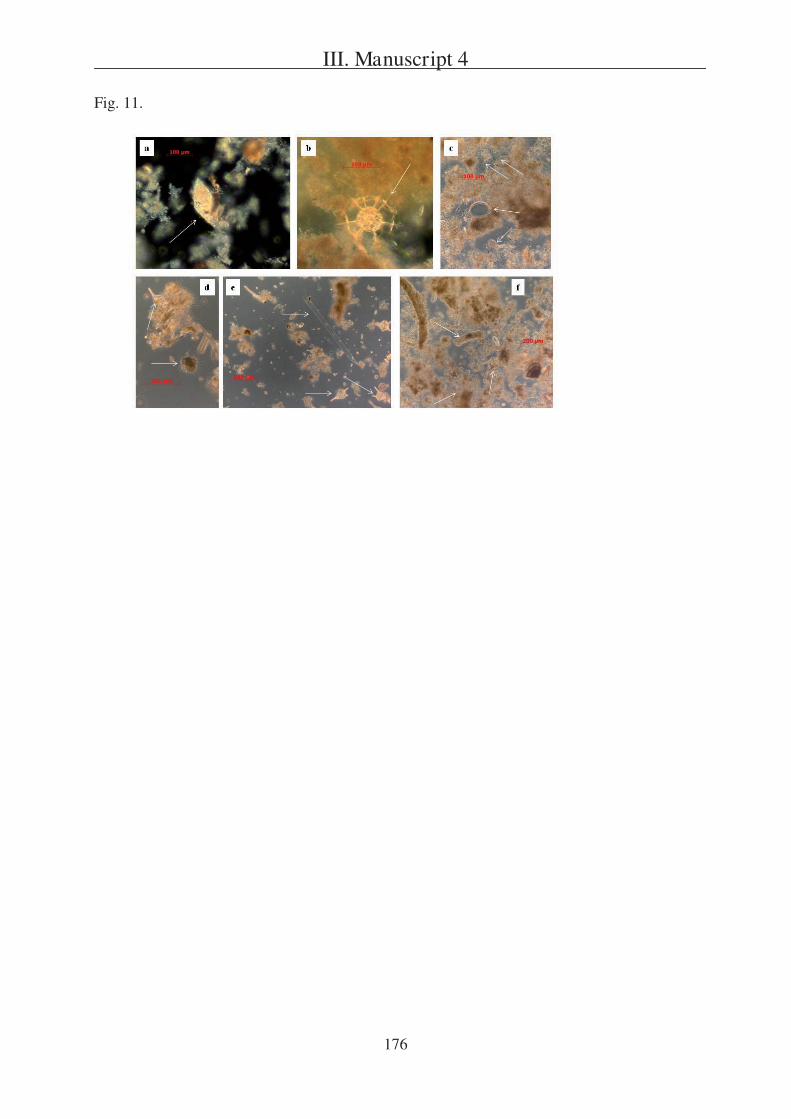
III. Manuscript 4
176
Fig. 11.
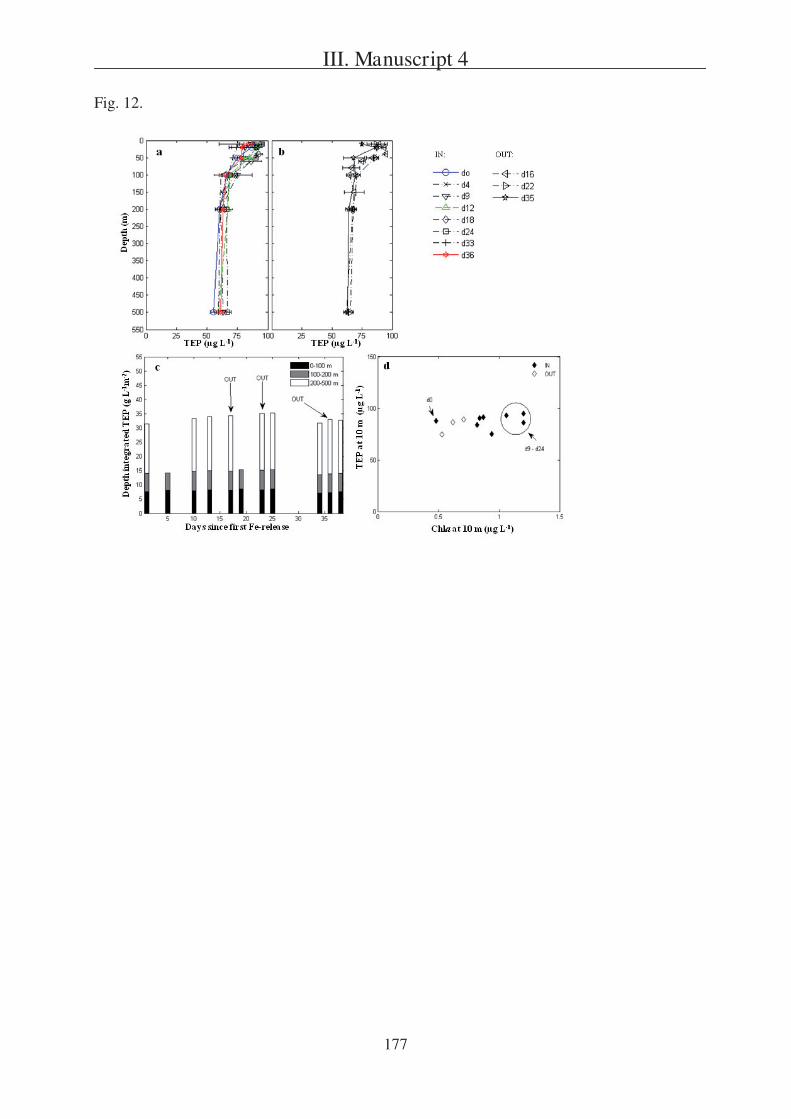
III. Manuscript 4
177
Fig. 12.
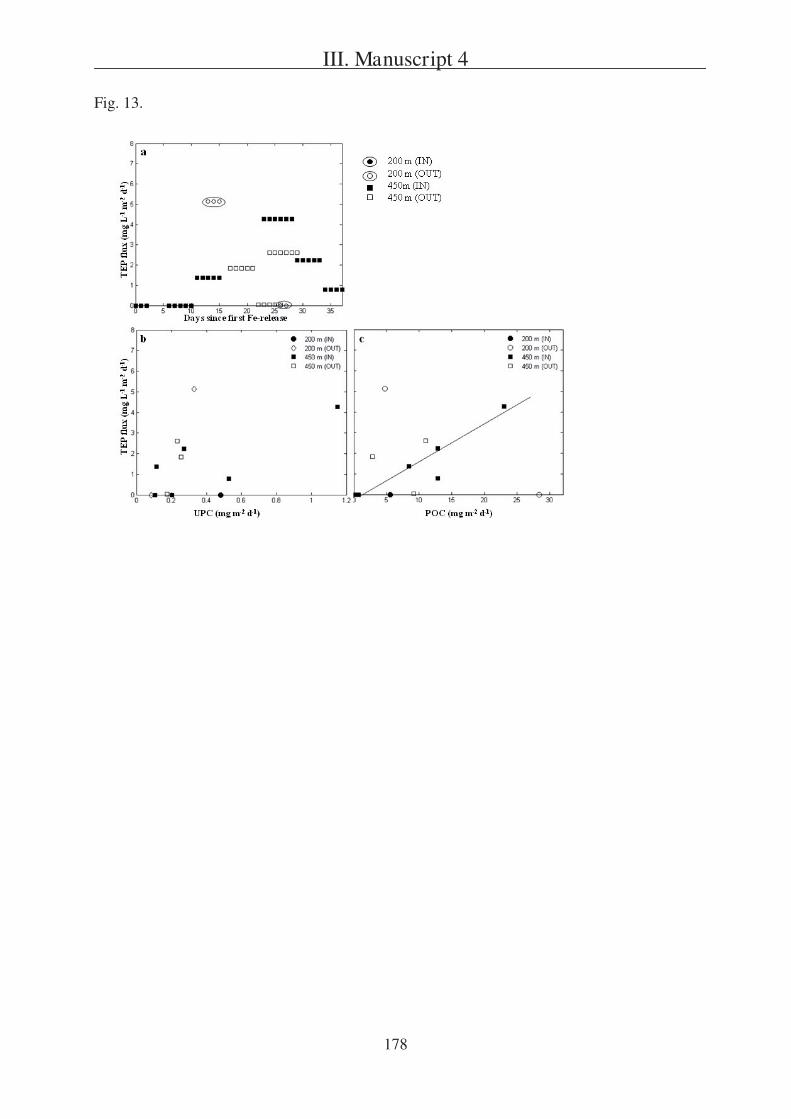
III. Manuscript 4
178
Fig. 13.
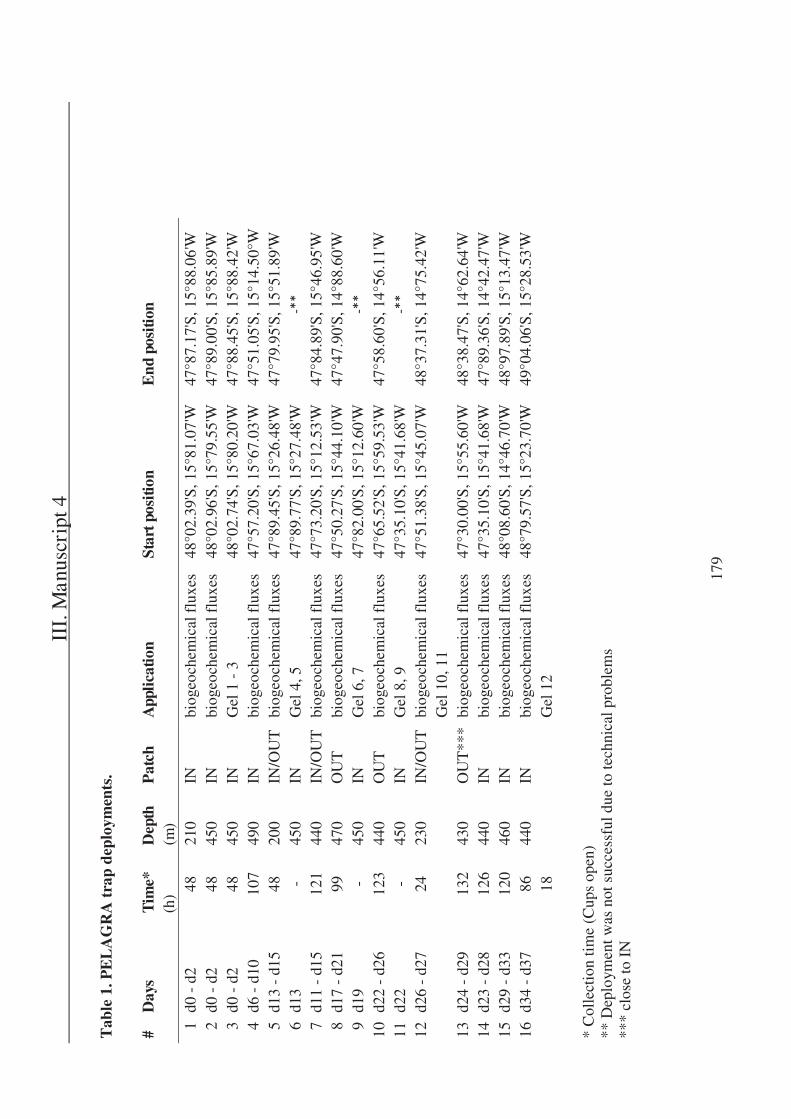
II
I. M
anus
crip
t 4
179
Tab
le 1
. PE
LA
GR
A t
rap
depl
oym
ents
.
# D
ays
Tim
e*
Dep
th
Pat
ch
App
licat
ion
Star
t pos
ition
E
nd p
ositi
on
(h)
(m)
1 d0
- d
2 48
21
0 IN
bi
ogeo
chem
ical
flu
xes
48°0
2.39
'S, 1
5°81
.07'
W
47°8
7.17
'S, 1
5°88
.06'
W
2 d0
- d
2 48
45
0 IN
bi
ogeo
chem
ical
flu
xes
48°0
2.96
'S, 1
5°79
.55'
W
47°8
9.00
'S, 1
5°85
.89'
W
3 d0
- d
2 48
45
0 IN
G
el 1
- 3
48
°02.
74'S
, 15°
80.2
0'W
47
°88.
45'S
, 15°
88.4
2'W
4
d6 -
d10
10
7 49
0 IN
bi
ogeo
chem
ical
flu
xes
47°5
7.20
'S, 1
5°67
.03'
W
47°5
1.05
'S, 1
5°14
.50°
W
5 d1
3 -
d15
48
200
IN/O
UT
bi
ogeo
chem
ical
flu
xes
47°8
9.45
'S, 1
5°26
.48'
W
47°7
9.95
'S, 1
5°51
.89'
W
6 d1
3 -
450
IN
Gel
4, 5
47
°89.
77'S
, 15°
27.4
8'W
��
��7
d11
- d1
5 12
1 44
0 IN
/OU
T
biog
eoch
emic
al f
luxe
s 47
°73.
20'S
, 15°
12.5
3'W
47
°84.
89'S
, 15°
46.9
5'W
8
d17
- d2
1 99
47
0 O
UT
bi
ogeo
chem
ical
flu
xes
47°5
0.27
'S, 1
5°44
.10'
W
47°4
7.90
'S, 1
4°88
.60'
W
9 d1
9 -
450
IN
Gel
6, 7
47
°82.
00'S
, 15°
12.6
0'W
��
��10
d2
2 -
d26
123
440
OU
T
biog
eoch
emic
al f
luxe
s 47
°65.
52'S
, 15°
59.5
3'W
47
°58.
60'S
, 14°
56.1
1'W
11
d2
2 -
450
IN
Gel
8, 9
47
°35.
10'S
, 15°
41.6
8'W
��
��12
d2
6 -
d27
24
230
IN/O
UT
bi
ogeo
chem
ical
flu
xes
47°5
1.38
'S, 1
5°45
.07'
W
48°3
7.31
'S, 1
4°75
.42'
W
Gel
10,
11
13
d24
- d2
9 13
2 43
0 O
UT
***
biog
eoch
emic
al f
luxe
s 47
°30.
00'S
, 15°
55.6
0'W
48
°38.
47'S
, 14°
62.6
4'W
14
d2
3 -
d28
126
440
IN
biog
eoch
emic
al f
luxe
s 47
°35.
10'S
, 15°
41.6
8'W
47
°89.
36'S
, 14°
42.4
7'W
15
d2
9 -
d33
120
460
IN
biog
eoch
emic
al f
luxe
s 48
°08.
60'S
, 14°
46.7
0'W
48
°97.
89'S
, 15°
13.4
7'W
16
d3
4 -
d37
86
440
IN
biog
eoch
emic
al f
luxe
s 48
°79.
57'S
, 15°
23.7
0'W
49
°04.
06'S
, 15°
28.5
3'W
18
G
el 1
2
* C
olle
ctio
n tim
e (C
ups
open
) **
Dep
loym
ent w
as n
ot s
ucce
ssfu
l due
to te
chni
cal p
robl
ems
***
clos
e to
IN
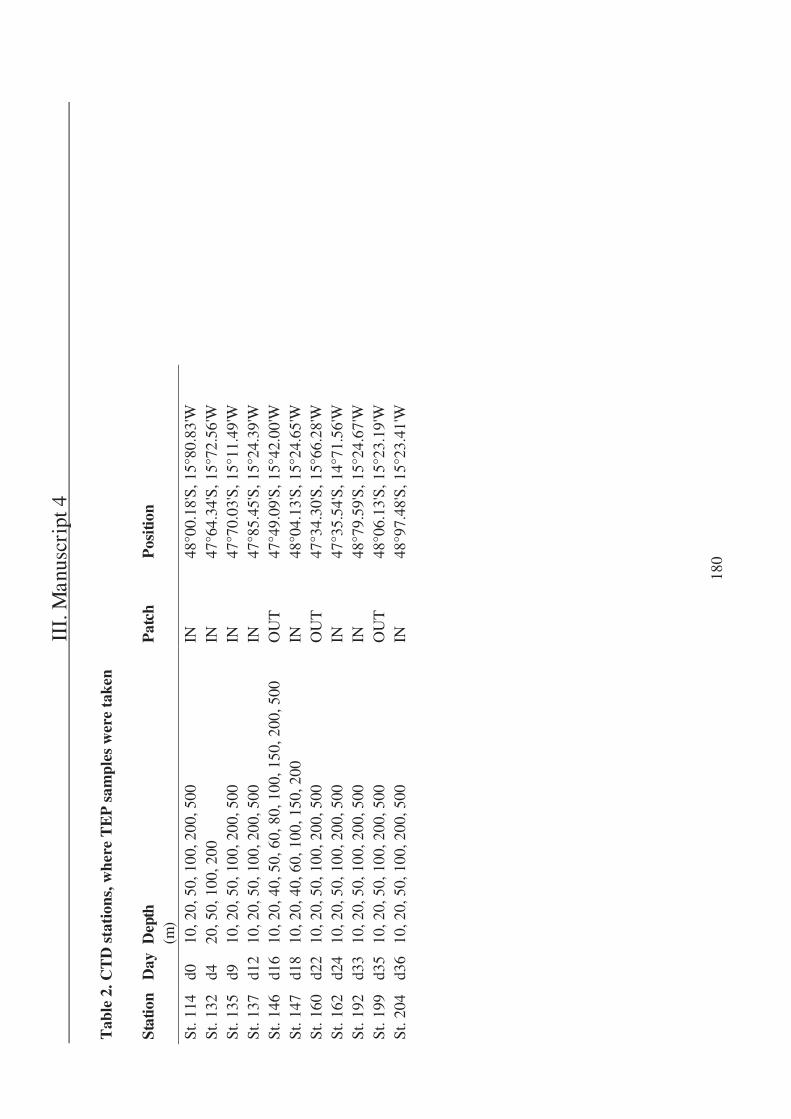
II
I. M
anus
crip
t 4
180
Tab
le 2
. CT
D s
tati
ons,
whe
re T
EP
sam
ples
wer
e ta
ken
Stat
ion
Day
D
epth
P
atch
P
ositi
on
(m)
St. 1
14
d0
10, 2
0, 5
0, 1
00, 2
00, 5
00
IN
48°0
0.18
'S, 1
5°80
.83'
W
St. 1
32
d4
20, 5
0, 1
00, 2
00
IN
47°6
4.34
'S, 1
5°72
.56'
W
St. 1
35
d9
10, 2
0, 5
0, 1
00, 2
00, 5
00
IN
47°7
0.03
'S, 1
5°11
.49'
W
St. 1
37
d12
10, 2
0, 5
0, 1
00, 2
00, 5
00
IN
47°8
5.45
'S, 1
5°24
.39'
W
St. 1
46
d16
10, 2
0, 4
0, 5
0, 6
0, 8
0, 1
00, 1
50, 2
00, 5
00
OU
T
47°4
9.09
'S, 1
5°42
.00'
W
St. 1
47
d18
10, 2
0, 4
0, 6
0, 1
00, 1
50, 2
00
IN
48°0
4.13
'S, 1
5°24
.65'
W
St. 1
60
d22
10, 2
0, 5
0, 1
00, 2
00, 5
00
OU
T
47°3
4.30
'S, 1
5°66
.28'
W
St. 1
62
d24
10, 2
0, 5
0, 1
00, 2
00, 5
00
IN
47°3
5.54
'S, 1
4°71
.56'
W
St. 1
92
d33
10, 2
0, 5
0, 1
00, 2
00, 5
00
IN
48°7
9.59
'S, 1
5°24
.67'
W
St. 1
99
d35
10, 2
0, 5
0, 1
00, 2
00, 5
00
OU
T
48°0
6.13
'S, 1
5°23
.19'
W
St. 2
04
d36
10, 2
0, 5
0, 1
00, 2
00, 5
00
IN
48°9
7.48
'S, 1
5°23
.41'
W
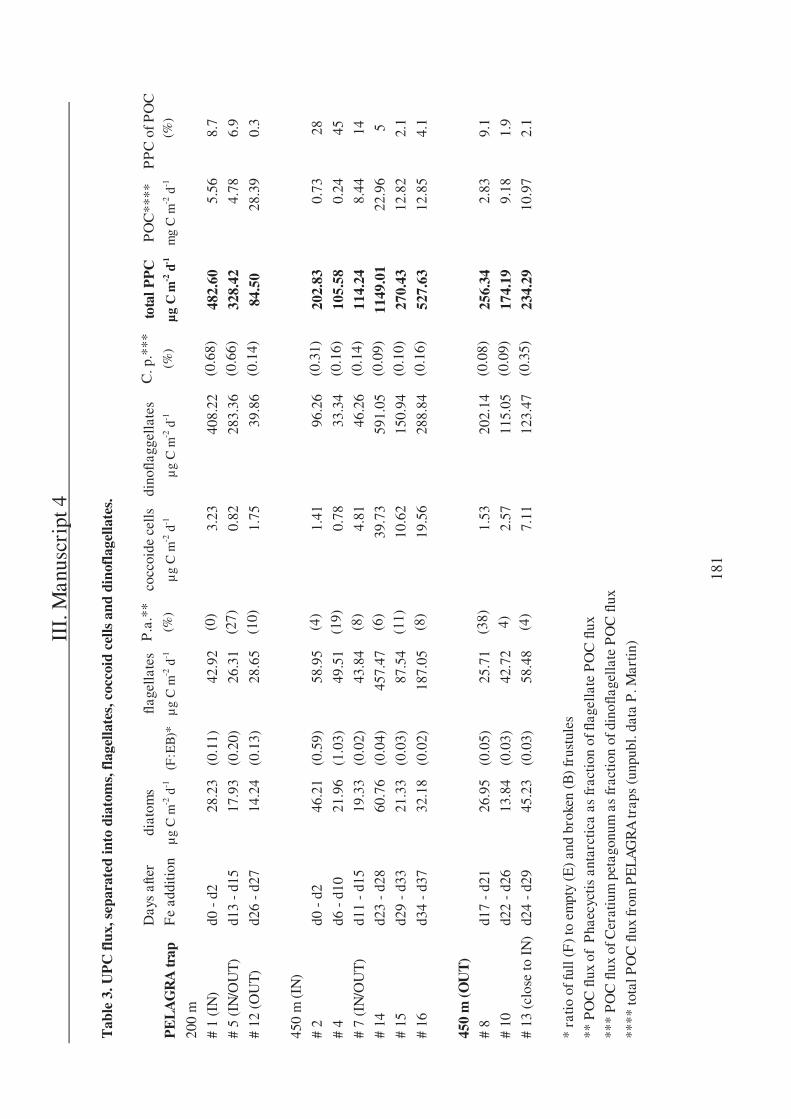
II
I. M
anus
crip
t 4
181
Tab
le 3
. UP
C fl
ux, s
epar
ated
into
dia
tom
s, fl
agel
late
s, c
occo
id c
ells
and
din
ofla
gella
tes.
Day
s af
ter
diat
oms
flag
ella
tes
P.a
.**
cocc
oide
cel
ls
dino
flag
gell
ates
C
. p.*
**
tota
l PP
C
PO
C**
**
PP
C o
f PO
C
PE
LA
GR
A tr
ap
Fe
addi
tion
μg
C m
-2 d
-1
(F:E
B)*
μ
g C
m-2
d-1
(%
) μ
g C
m-2
d-1
μ
g C
m-2
d-1
(%
) μg
C m
-2 d
-1
mg
C m
-2 d
-1
(%)
200
m
# 1
(IN
) d0
- d
2 28
.23
(0.1
1)
42.9
2 (0
) 3.
23
408.
22
(0.6
8)
482.
60
5.56
8.
7
# 5
(IN
/OU
T)
d13
- d1
5 17
.93
(0.2
0)
26.3
1 (2
7)
0.82
28
3.36
(0
.66)
32
8.42
4.
78
6.9
# 12
(O
UT)
d2
6 -
d27
14.2
4 (0
.13)
28
.65
(10)
1.
75
39.8
6 (0
.14)
84
.50
28.3
9 0.
3
450
m (
IN)
# 2
d0 -
d2
46.2
1 (0
.59)
58
.95
(4)
1.41
96
.26
(0.3
1)
202.
83
0.73
28
# 4
d6 -
d10
21
.96
(1.0
3)
49.5
1 (1
9)
0.78
33
.34
(0.1
6)
105.
58
0.24
45
# 7
(IN
/OU
T)
d11
- d1
5 19
.33
(0.0
2)
43.8
4 (8
) 4.
81
46.2
6 (0
.14)
11
4.24
8.
44
14
# 14
d2
3 -
d28
60.7
6 (0
.04)
45
7.47
(6
) 39
.73
591.
05
(0.0
9)
1149
.01
22.9
6 5
# 15
d2
9 -
d33
21.3
3 (0
.03)
87
.54
(11)
10
.62
150.
94
(0.1
0)
270.
43
12.8
2 2.
1
# 16
d3
4 -
d37
32.1
8 (0
.02)
18
7.05
(8
) 19
.56
288.
84
(0.1
6)
527.
63
12.8
5 4.
1
450
m (O
UT
) #
8 d1
7 -
d21
26.9
5 (0
.05)
25
.71
(38)
1.
53
202.
14
(0.0
8)
256.
34
2.83
9.
1
# 10
d2
2 -
d26
13.8
4 (0
.03)
42
.72
4)
2.57
11
5.05
(0
.09)
17
4.19
9.
18
1.9
# 13
(cl
ose
to I
N)
d24
- d2
9 45
.23
(0.0
3)
58.4
8 (4
) 7.
11
123.
47
(0.3
5)
234.
29
10.9
7 2.
1
* ra
tio o
f ful
l (F
) to
em
pty
(E)
and
brok
en (
B)
frus
tule
s
** P
OC
flux
of
Pha
ecyc
tis a
ntar
ctic
a as
frac
tion
of fl
agel
late
PO
C fl
ux
***
PO
C fl
ux o
f Cer
atiu
m p
etag
onum
as
frac
tion
of d
inof
lage
llate
PO
C fl
ux
****
tota
l PO
C fl
ux fr
om P
ELA
GR
A tr
aps
(unp
ubl.
data
P. M
arti
n)
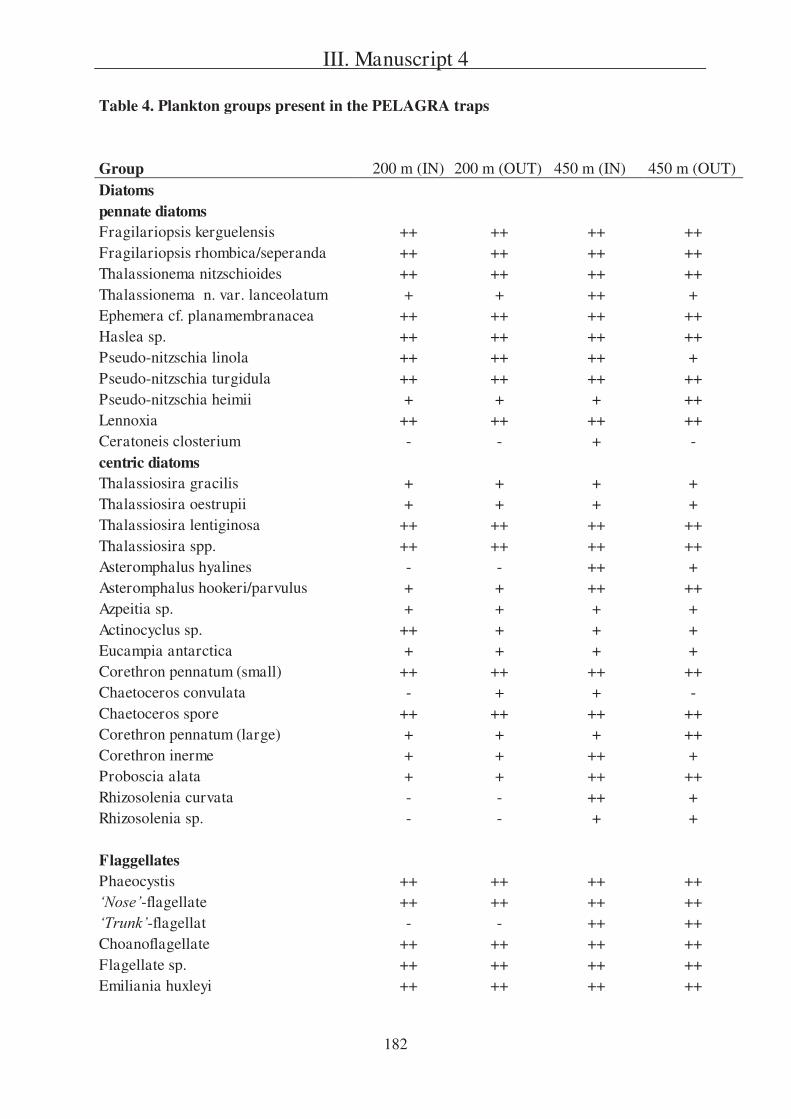
III. Manuscript 4
182
Table 4. Plankton groups present in the PELAGRA traps
Group 200 m (IN) 200 m (OUT) 450 m (IN) 450 m (OUT) Diatoms pennate diatoms Fragilariopsis kerguelensis ++ ++ ++ ++ Fragilariopsis rhombica/seperanda ++ ++ ++ ++ Thalassionema nitzschioides ++ ++ ++ ++ Thalassionema n. var. lanceolatum + + ++ + Ephemera cf. planamembranacea ++ ++ ++ ++ Haslea sp. ++ ++ ++ ++ Pseudo-nitzschia linola ++ ++ ++ + Pseudo-nitzschia turgidula ++ ++ ++ ++ Pseudo-nitzschia heimii + + + ++ Lennoxia ++ ++ ++ ++ Ceratoneis closterium - - + - centric diatoms Thalassiosira gracilis + + + + Thalassiosira oestrupii + + + + Thalassiosira lentiginosa ++ ++ ++ ++ Thalassiosira spp. ++ ++ ++ ++ Asteromphalus hyalines - - ++ + Asteromphalus hookeri/parvulus + + ++ ++ Azpeitia sp. + + + + Actinocyclus sp. ++ + + + Eucampia antarctica + + + + Corethron pennatum (small) ++ ++ ++ ++ Chaetoceros convulata - + + - Chaetoceros spore ++ ++ ++ ++ Corethron pennatum (large) + + + ++ Corethron inerme + + ++ + Proboscia alata + + ++ ++ Rhizosolenia curvata - - ++ + Rhizosolenia sp. - - + +
Flaggellates Phaeocystis ++ ++ ++ ++
-flagellate ++ ++ ++ ++ -flagellat - - ++ ++
Choanoflagellate ++ ++ ++ ++ Flagellate sp. ++ ++ ++ ++ Emiliania huxleyi ++ ++ ++ ++
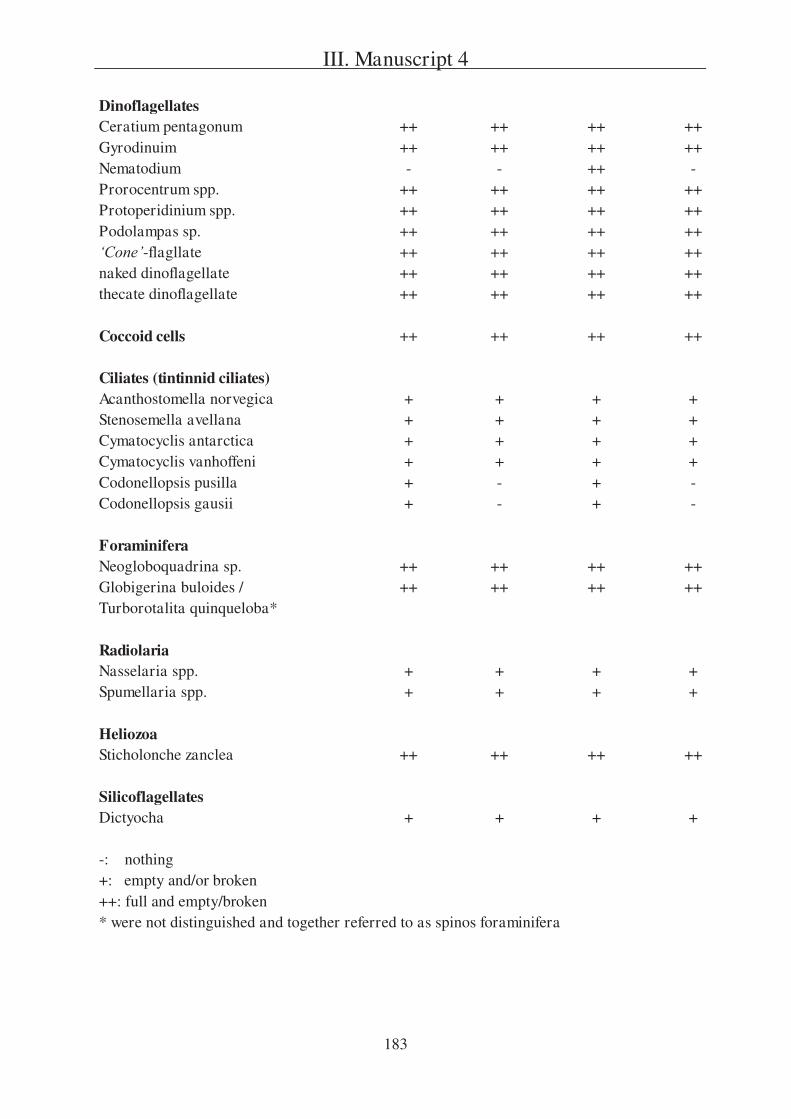
III. Manuscript 4
183
Dinoflagellates Ceratium pentagonum ++ ++ ++ ++ Gyrodinuim ++ ++ ++ ++ Nematodium - - ++ - Prorocentrum spp. ++ ++ ++ ++ Protoperidinium spp. ++ ++ ++ ++ Podolampas sp. ++ ++ ++ ++
-flagllate ++ ++ ++ ++ naked dinoflagellate ++ ++ ++ ++ thecate dinoflagellate ++ ++ ++ ++
Coccoid cells ++ ++ ++ ++
Ciliates (tintinnid ciliates) Acanthostomella norvegica + + + + Stenosemella avellana + + + + Cymatocyclis antarctica + + + + Cymatocyclis vanhoffeni + + + + Codonellopsis pusilla + - + - Codonellopsis gausii + - + -
Foraminifera Neogloboquadrina sp. ++ ++ ++ ++ Globigerina buloides / ++ ++ ++ ++ Turborotalita quinqueloba*
Radiolaria Nasselaria spp. + + + + Spumellaria spp. + + + +
Heliozoa Sticholonche zanclea ++ ++ ++ ++
Silicoflagellates Dictyocha + + + +
-: nothing +: empty and/or broken ++: full and empty/broken * were not distinguished and together referred to as spinos foraminifera
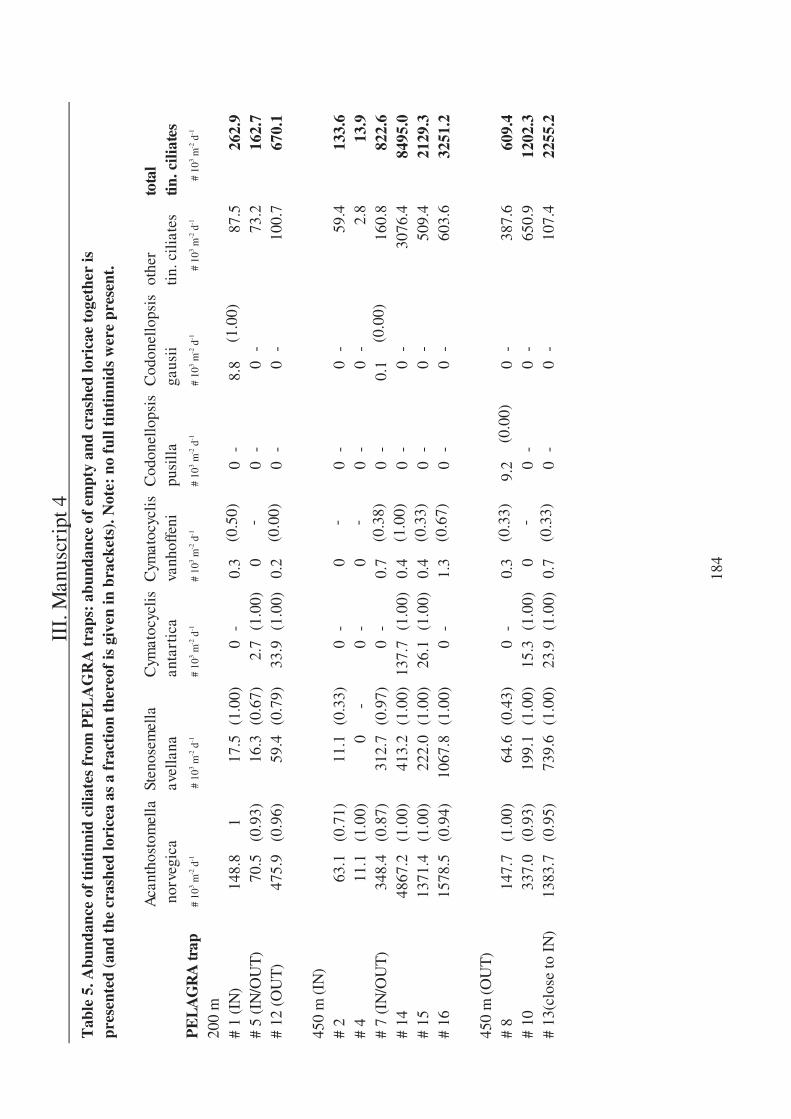
II
I. M
anus
crip
t 4
184
Tab
le 5
. Abu
ndan
ce o
f ti
ntin
nid
cilia
tes
from
PE
LA
GR
A t
raps
: ab
unda
nce
of e
mpt
y an
d cr
ashe
d lo
rica
e to
geth
er is
pr
esen
ted
(and
the
cra
shed
lori
cea
as a
fra
ctio
n th
ereo
f is
giv
en in
bra
cket
s). N
ote:
no
full
tint
inni
ds w
ere
pres
ent.
Aca
ntho
stom
ella
St
enos
emel
la
Cym
atoc
yclis
C
ymat
ocyc
lis
Cod
onel
lops
is
Cod
onel
lops
is
othe
r to
tal
nor
vegi
ca
avel
lana
an
tart
ica
vanh
offe
ni
pusi
lla
gaus
ii
tin. c
iliat
es
tin. c
iliat
es
PE
LA
GR
A tr
ap
# 10
3 m-2
d-1
#
103 m
-2 d
-1
#
103 m
-2 d
-1
# 10
3 m-2
d-1
#
103 m
-2 d
-1
# 10
3 m-2
d-1
#
103 m
-2 d
-1
# 10
3 m-2
d-1
200
m
# 1
(IN
) 14
8.8
1 17
.5
(1.0
0)
0 -
0.3
(0.5
0)
0 -
8.8
(1.0
0)
87.5
26
2.9
# 5
(IN
/OU
T)
70.5
(0
.93)
16
.3
(0.6
7)
2.7
(1.0
0)
0 -
0 -
0 -
73.2
16
2.7
# 12
(O
UT
) 47
5.9
(0.9
6)
59.4
(0
.79)
33
.9
(1.0
0)
0.2
(0.0
0)
0 -
0 -
100.
7 67
0.1
450
m (
IN)
# 2
63.1
(0
.71)
11
.1
(0.3
3)
0 -
0 -
0 -
0 -
59.4
13
3.6
# 4
11.1
(1
.00)
0
- 0
- 0
- 0
- 0
- 2.
8 13
.9
# 7
(IN
/OU
T)
348.
4 (0
.87)
31
2.7
(0.9
7)
0 -
0.7
(0.3
8)
0 -
0.1
(0.0
0)
160.
8 82
2.6
# 14
48
67.2
(1
.00)
41
3.2
(1.0
0)
137.
7 (1
.00)
0.
4 (1
.00)
0
- 0
- 30
76.4
84
95.0
#
15
1371
.4
(1.0
0)
222.
0 (1
.00)
26
.1
(1.0
0)
0.4
(0.3
3)
0 -
0 -
509.
4 21
29.3
#
16
1578
.5
(0.9
4)
1067
.8
(1.0
0)
0 -
1.3
(0.6
7)
0 -
0 -
603.
6 32
51.2
450
m (
OU
T)
# 8
147.
7 (1
.00)
64
.6
(0.4
3)
0 -
0.3
(0.3
3)
9.2
(0.0
0)
0 -
387.
6 60
9.4
# 10
33
7.0
(0.9
3)
199.
1 (1
.00)
15
.3
(1.0
0)
0 -
0 -
0 -
650.
9 12
02.3
#
13(c
lose
to I
N)
1383
.7
(0.9
5)
739.
6 (1
.00)
23
.9
(1.0
0)
0.7
(0.3
3)
0 -
0 -
107.
4 22
55.2
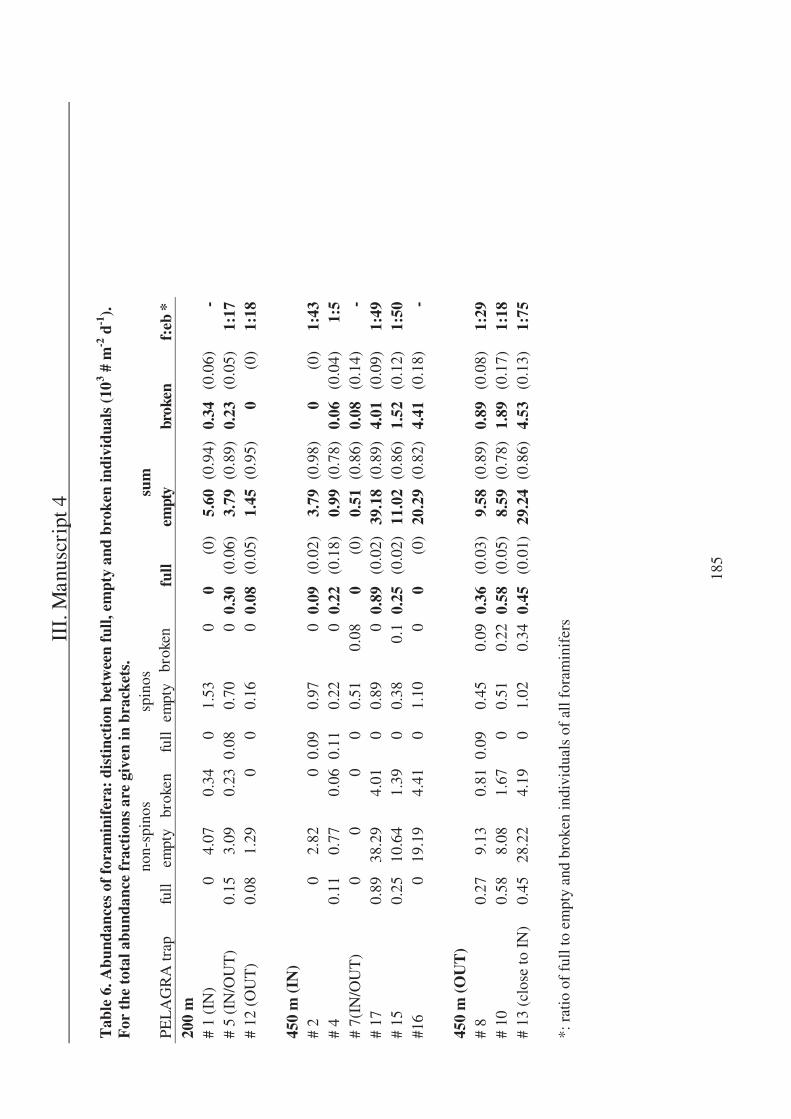
II
I. M
anus
crip
t 4
185
Tab
le 6
. Abu
ndan
ces
of f
oram
inif
era:
dis
tinc
tion
bet
wee
n fu
ll, e
mpt
y an
d br
oken
indi
vidu
als
(103 #
m-2
d-1
).
For
the
tot
al a
bund
ance
fra
ctio
ns a
re g
iven
in b
rack
ets.
no
n-sp
inos
sp
inos
su
m
PEL
AG
RA
trap
fu
ll em
pty
brok
en
full
empt
y br
oken
fu
ll em
pty
brok
en
f:eb
*
200
m
# 1
(IN
) 0
4.07
0.
34
0 1.
53
0 0
(0)
5.60
(0
.94)
0.
34
(0.0
6)
- #
5 (I
N/O
UT
) 0.
15
3.09
0.
23
0.08
0.
70
0 0.
30
(0.0
6)
3.79
(0
.89)
0.
23
(0.0
5)
1:17
#
12 (
OU
T)
0.08
1.
29
0 0
0.16
0
0.08
(0
.05)
1.
45
(0.9
5)
0 (0
) 1:
18
450
m (
IN)
# 2
0 2.
82
0 0.
09
0.97
0
0.09
(0
.02)
3.
79
(0.9
8)
0 (0
) 1:
43
# 4
0.11
0.
77
0.06
0.
11
0.22
0
0.22
(0
.18)
0.
99
(0.7
8)
0.06
(0
.04)
1:
5 #
7(IN
/OU
T)
0 0
0 0
0.51
0.
08
0 (0
) 0.
51
(0.8
6)
0.08
(0
.14)
-
# 17
0.
89
38.2
9 4.
01
0 0.
89
0 0.
89
(0.0
2)
39.1
8 (0
.89)
4.
01
(0.0
9)
1:49
#
15
0.25
10
.64
1.39
0
0.38
0.
1 0.
25
(0.0
2)
11.0
2 (0
.86)
1.
52
(0.1
2)
1:50
#1
6 0
19.1
9 4.
41
0 1.
10
0 0
(0)
20.2
9 (0
.82)
4.
41
(0.1
8)
-
450
m (
OU
T)
# 8
0.27
9.
13
0.81
0.
09
0.45
0.
09
0.36
(0
.03)
9.
58
(0.8
9)
0.89
(0
.08)
1:
29
# 10
0.
58
8.08
1.
67
0 0.
51
0.22
0.
58
(0.0
5)
8.59
(0
.78)
1.
89
(0.1
7)
1:18
#
13 (
clos
e to
IN
) 0.
45
28.2
2 4.
19
0 1.
02
0.34
0.
45
(0.0
1)
29.2
4 (0
.86)
4.
53
(0.1
3)
1:75
*: r
atio
of
full
to e
mpt
y an
d br
oken
indi
vidu
als
of a
ll fo
ram
inif
ers
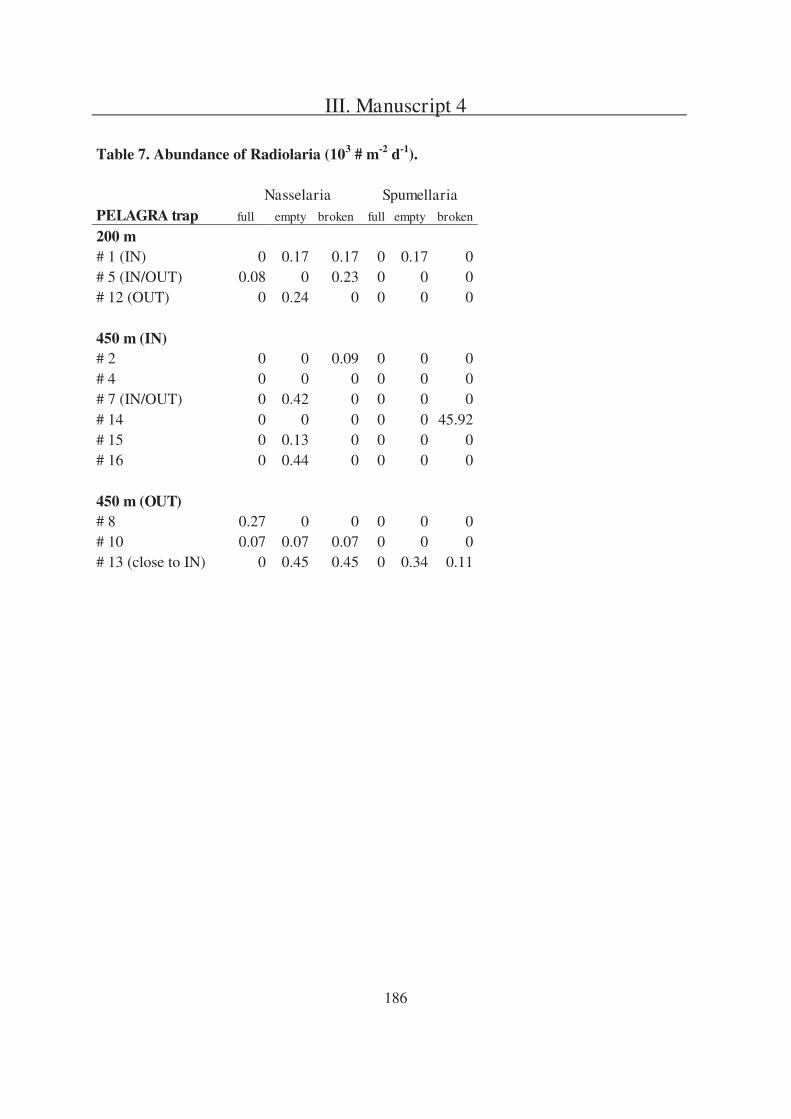
III. Manuscript 4
186
Table 7. Abundance of Radiolaria (103 # m-2 d-1).
Nasselaria Spumellaria PELAGRA trap full empty broken full empty broken
200 m # 1 (IN) 0 0.17 0.17 0 0.17 0 # 5 (IN/OUT) 0.08 0 0.23 0 0 0 # 12 (OUT) 0 0.24 0 0 0 0
450 m (IN) # 2 0 0 0.09 0 0 0 # 4 0 0 0 0 0 0 # 7 (IN/OUT) 0 0.42 0 0 0 0 # 14 0 0 0 0 0 45.92 # 15 0 0.13 0 0 0 0 # 16 0 0.44 0 0 0 0
450 m (OUT) # 8 0.27 0 0 0 0 0 # 10 0.07 0.07 0.07 0 0 0 # 13 (close to IN) 0 0.45 0.45 0 0.34 0.11
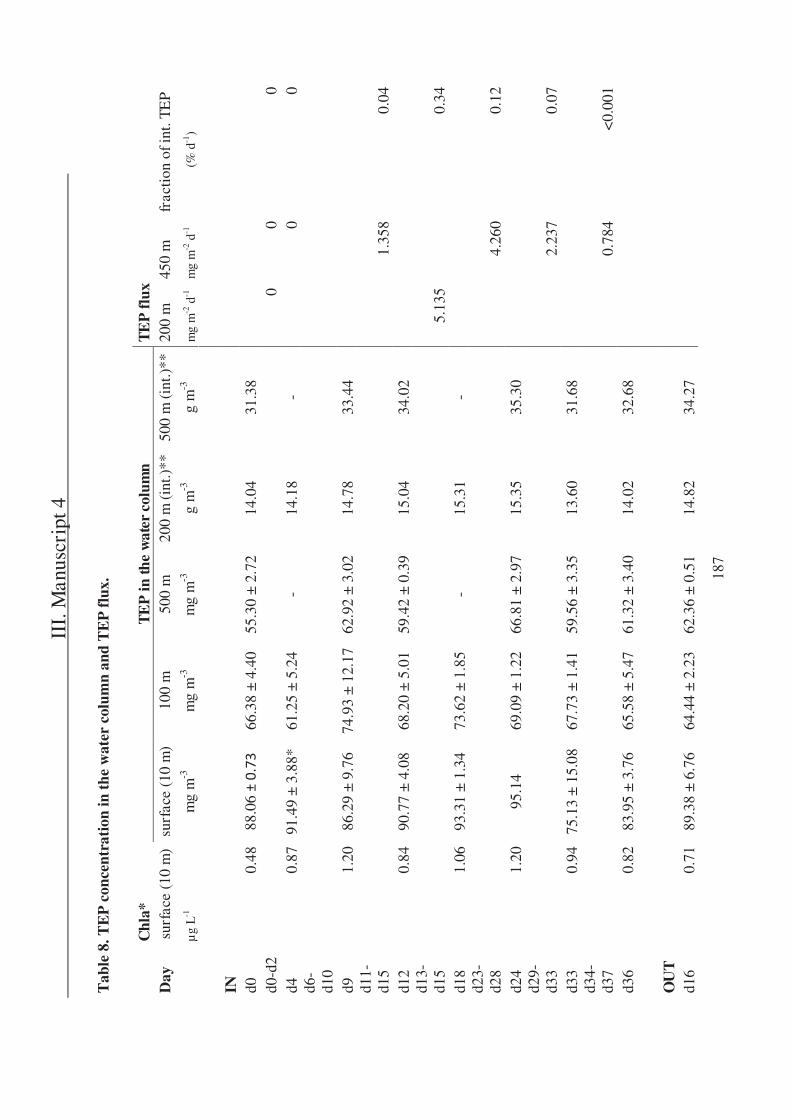
III.
Man
uscr
ipt 4
187
Tab
le 8
. TE
P c
once
ntra
tion
in t
he w
ater
col
umn
and
TE
P f
lux.
Chl
a*
T
EP
in th
e w
ater
col
umn
TE
P f
lux
Day
su
rfac
e (1
0 m
) su
rfac
e (1
0 m
) 10
0 m
50
0 m
20
0 m
(in
t.)**
50
0 m
(in
t.)**
20
0 m
45
0 m
fr
actio
n of
int.
TE
P
μ
g L-1
m
g m
-3
mg
m-3
m
g m
-3
g m
-3
g m
-3
mg
m-2
d-1
m
g m
-2 d
-1
(% d
-1)
IN
d0
0.48
88
.06
����
�
66.3
8 ±
4.40
55
.30
± 2.
72
14.0
4 31
.38
d0
-d2
0 0
0 d4
0.
87
91.4
9 ±
3.88
* 61
.25
± 5.
24
- 14
.18
-
0 0
d6-
d10
d9
1.
20
86.2
9 ±
9.76
74
.93
± 12
.17
62.9
2 ±
3.02
14
.78
33.4
4
d11-
d15
1.
358
0.04
d1
2 0.
84
90.7
7 ±
4.08
68
.20
± 5.
01
59.4
2 ±
0.39
15
.04
34.0
2
d13-
d15
5.13
5 0.
34
d18
1.06
93
.31
± 1.
34
73.6
2 ±
1.85
-
15.3
1 -
d2
3-d2
8
4.26
0 0.
12
d24
1.20
95
.14
69.0
9 ±
1.22
66
.81
± 2.
97
15.3
5 35
.30
d2
9-d3
3
2.23
7 0.
07
d33
0.94
75
.13
± 15
.08
67.7
3 ±
1.41
59
.56
± 3.
35
13.6
0 31
.68
d3
4-d3
7
0.78
4 <
0.00
1 d3
6 0.
82
83.9
5 ±
3.76
65
.58
± 5.
47
61.3
2 ±
3.40
14
.02
32.6
8
OU
T
d1
6 0.
71
89.3
8 ±
6.76
64
.44
± 2.
23
62.3
6 ±
0.51
14
.82
34.2
7
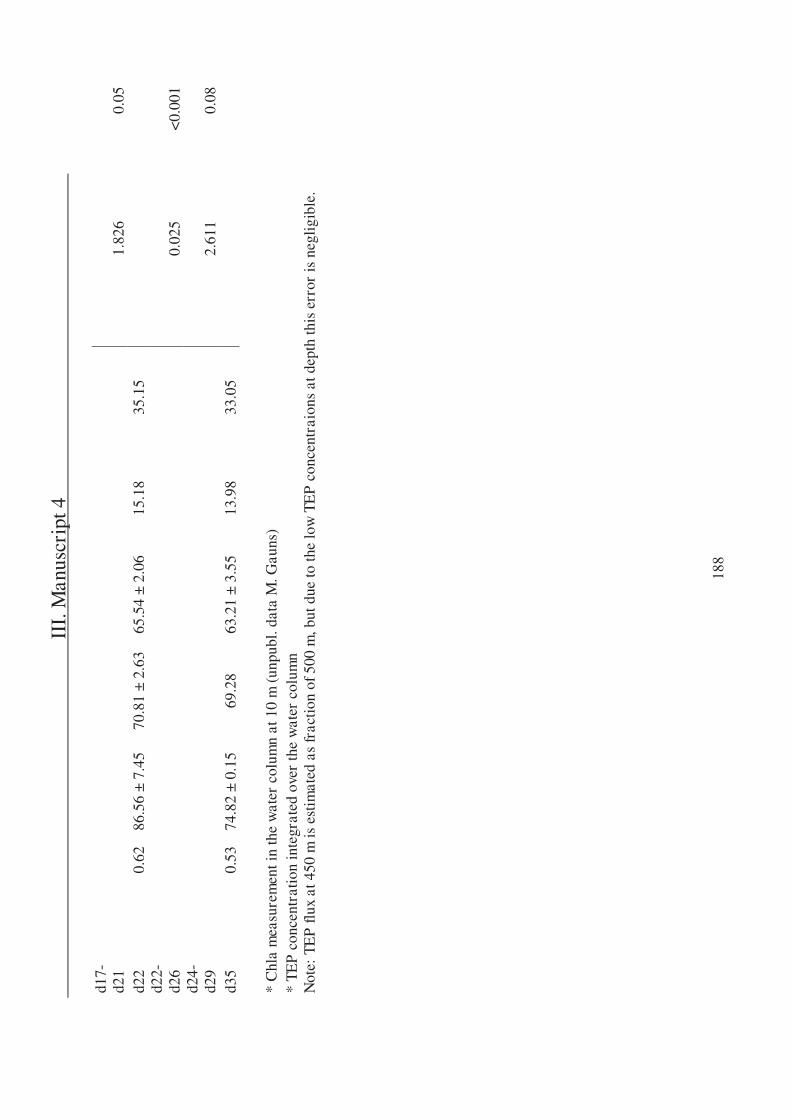
III.
Man
uscr
ipt 4
188
d17-
d21
1.
826
0.05
d2
2 0.
62
86.5
6 ±
7.45
70
.81
± 2.
63
65.5
4 ±
2.06
15
.18
35.1
5
d22-
d26
0.
025
<0.
001
d24-
d29
2.
611
0.08
d3
5 0.
53
74.8
2 ±
0.15
69
.28
63.2
1 ±
3.55
13
.98
33.0
5
* C
hla
mea
sure
men
t in
the
wat
er c
olum
n at
10
m (
unpu
bl. d
ata
M. G
auns
) *
TE
P c
once
ntra
tion
inte
grat
ed o
ver
the
wat
er c
olum
n N
ote:
TE
P fl
ux a
t 450
m is
est
imat
ed a
s fr
actio
n of
500
m, b
ut d
ue to
the
low
TE
P c
once
ntra
ions
at d
epth
this
err
or is
neg
ligib
le.
189
IV. Synthesis and future perspectives

190
IV. Synthesis and future perspectives
191
IV.1 Synthesis
The objective of this thesis was to investigate the mechanisms that influence particle
fluxes and modification in the mesopelagic zone. This was done by successfully applying a novel
technique gel equipped free-floating sediment traps and using the obtained results to relate to
data received with other
camera systems. This new method was then used in three field studies in the Southern Ocean
within the framework of climate change and iron fertilisation experiments in a HNLC domain.
A comparison of the three export flux studies presented in this thesis reveals that flux
dynamics are highly variable within the investigated regions and in different areas of the
Southern Ocean (Manuscript 2, 3 and 4, and Appendix 1). This is in good agreement with
previous studies (e.g. Berelson 2001; Fischer et al. 2000; Honjo et al. 2000; Nelson et al. 2002)
and once more emphasises the need to investigate flux-determining processes. The composition
of the export flux examined in these three field studies shows strong similarities by being mainly
due to faecal material, highlighting the importance of grazing in the studied areas. Evidence for
grazer-regulated ecosystems can also be determined through parameters such as zooplankton
community or the biogeochemical composition of the sinking material as has been done routinely
in previous studies (e.g. Steinberg et al. 2008; Kobari et al. 2008). Nevertheless, a detailed
investigation of sinking particles will help to advance our understanding on the variations in flux
dynamics.
In the following, I will recapitulate the specific questions of my thesis (II.5) and provide
answers as well as directions for further research areas.
Can polyacrylamide gels capture the forms of individual sinking particles in a way that
allows conclusions to be drawn on flux dynamics? I showed that sediment traps perform
reasonable well to determine POC flux in a qualitative manner (Manuscript 1-4, Appendix 1).
Since their first deployment in the 1970s techniques improved substantially (as described in the
recent review by Buesseler et al. (2007)). Above all, it was the understanding of the functioning
of sediment traps and the ability to consider biases (and correct for them) that helped to improve
their technical reliability. Despite all limitations (Buesseler et al. (2007) and references therein),
sediment traps offer the possibility to examine in-situ
IV. Synthesis and future perspectives
192
lack the prospect to investigate undisturbed particulate flux, the improvement of the methodology
described in Manuscript 1 particles (Fig. 6 and 7).
The physical properties of the material are almost unaffected when it is captured by such means
and the collected sinking particles are therefore representative for the composition of fluxes as
they occur in the water column. In this work, I introduced the combination of free-floating
sediment traps and polyacrylamide (PA) gels to collect intact individual particles and preserve
them for several months (Manuscript 1).
The idea to equip sediment traps with gels is not new. Jannasch et al. (1980) used PA gels
in a multiple-sampling sequential sediment trap in an attempt to obtain flux time-series. Although
perspectives of this approach appeared promising, it was not until 15 years later. Lundsgard
(1995) suggested deploying sediment traps with PA gels to study flux characteristics by keeping
particles separated as they settle into the gel. This slightly modified technique according to
Lundsgaard (1995) was applied successfully in order to investigate structure and composition of
individual sinking particles in both coastal (e.g. Kiorboe et al. 1994; Lundsgaard et al. 1999;
Waite et al. 2005) and open ocean settings (e.g. Appendix 1; Waite et al. 2000; Waite and
Nodder 2001) or to validate model estimates (e.g. Boyd et al. 2002; Jackson et al. 2005). Here we
modified the approach of Lundsgaard (1995) to allow quantitative flux estimates in addition to
collecting intact and preserved individual sinking particles (Manuscript 1 and 2, and
Appendix 1).
With respect to sediment traps, the greatest improvement since JGOFS was the
development of neutrally buoyant sediment traps (NBSTs). These sediment traps float freely in
the water column and are therefore least biased by hydrodynamics (Lampitt et al. 2008; Valdes
and Price 2000). Because of the opportunities offered by PA gels, NBSTs were also equipped
with gels recently. In 2009, both available types of NBSTs, the cylindrical trap as introduced by
Valdes and Price (2000) and the funnel-shaped PELAGRA traps as described in Lampitt et al.
(2008) were deployed in combination with PA gels. This study shows that the design of the traps
largely affects the success of deploying PA gels and that PELAGRA traps and gels are
incompatible, mainly due to their funnel design (Manuscript 1). However, McDonnell and
Buesseler (2010) demonstrated that cylindrical NBSTs and PA gels work together perfectly,
making it a promising approach for future studies.
One disadvantage of relying on sediment traps is the fact that some impact on collecting
material caused by hydrodynamics will always remain, even for NBSTs (Gardner 2000). Using
IV. Synthesis and future perspectives
193
an optical technique in combination with a sediment trap would therefore offer the possibility to
receive impressions of the entire flux spectrum in-situ, in its natural environment. Modern camera
systems, such as the UVP (Guidi et al. 2008; Stemmann et al. 2008) deliver particle flux spectra
of a high resolution and allow for the collecting of large data sets. Manuscript 3 demonstrates
the advantages of comparing flux data received from PA gels (deployed with a free-floating
sediment trap) and the UVP (mounted on a CDT) during the KEOPS study (see below and
Appendix 1 for details). This approach could be used in further studies, preferably with a camera
mounted directly on top of the gel trap. This would provide valuable insights on the particles
settling into the gel. Sediment traps have been equipped with camera systems in the very
beginning of the trap era (e.g. Asper 1987), but somehow this combined application seems to
have fallen into oblivion. Especially considering how particles are preserved within the PA gels,
an additional tool such as the combination with a camera would be powerful. A camera system
could for instance be used to determine sinking velocities of particles afterwards collected and
thus help to understand flux dynamics.
The advantage of using PA gels in free floating sediment traps is that the collected
material is maintained as intact and individual particles in the gels (Manuscript 1). Using
advanced microscopic investigations such as scanning electron microscopy (SEM) would provide
insights into structures on the fine scale, e.g. through high-resolution images of phytoplankton
composition of the respective particles. Another possibility to analyse particles preserved in the
gels in more detail is the use of dyes. Laboratory tests showed that Alcian Blue, which is staining
TEPs, Transparent Exopolymer Particles, (Passow and Alldredge 1995), is not compatible with
PA gels. However, other stains, such as the viability stain FDA (Garvey et al. 2007), need to be
tested to show whether it is possible to differentiate fresh and vital sinking material from sinking
material which was already processed repeatedly on its journey through the water column.
In conclusion, collecting sinking particles in PA gels provide a great opportunity to
improve our knowledge on the appearance and formation of sinking particles and can give a more
realistic picture about their modification in the water column. This technique possesses several
possibilities to further improve our understanding of modification processes in sinking material
along the ideas proposed in this thesis.
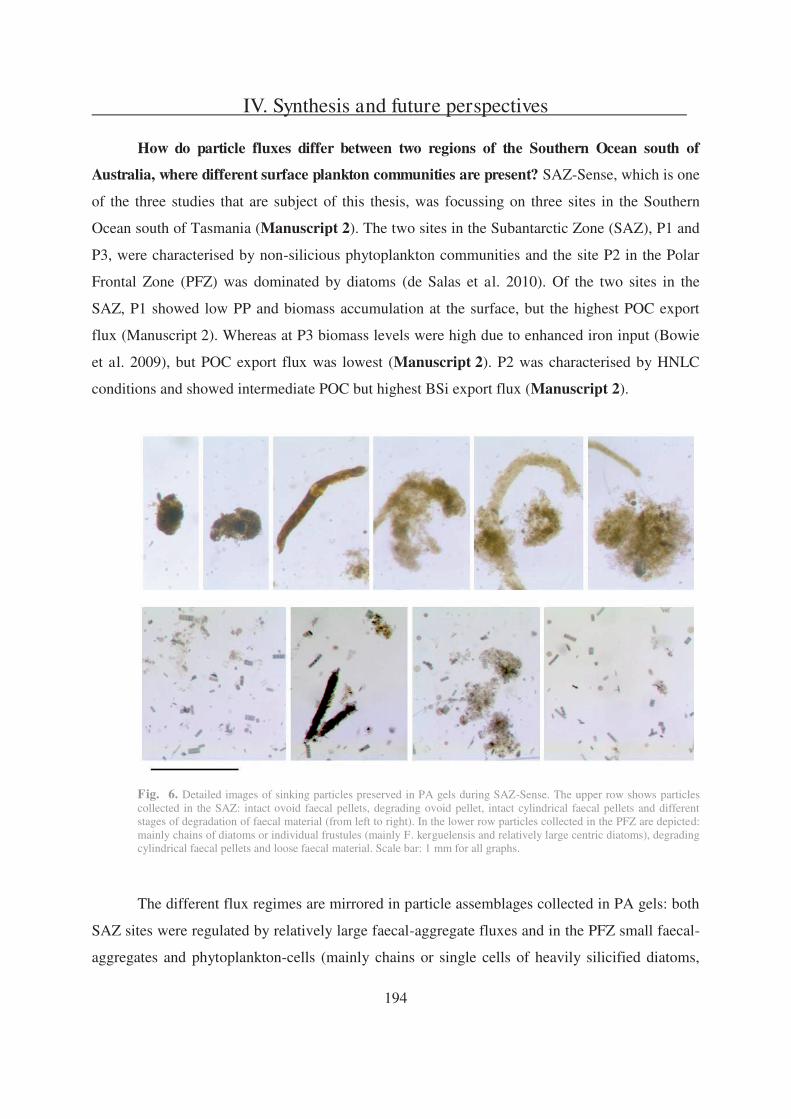
IV. Synthesis and future perspectives
194
How do particle fluxes differ between two regions of the Southern Ocean south of
Australia, where different surface plankton communities are present? SAZ-Sense, which is one
of the three studies that are subject of this thesis, was focussing on three sites in the Southern
Ocean south of Tasmania (Manuscript 2). The two sites in the Subantarctic Zone (SAZ), P1 and
P3, were characterised by non-silicious phytoplankton communities and the site P2 in the Polar
Frontal Zone (PFZ) was dominated by diatoms (de Salas et al. 2010). Of the two sites in the
SAZ, P1 showed low PP and biomass accumulation at the surface, but the highest POC export
flux (Manuscript 2). Whereas at P3 biomass levels were high due to enhanced iron input (Bowie
et al. 2009), but POC export flux was lowest (Manuscript 2). P2 was characterised by HNLC
conditions and showed intermediate POC but highest BSi export flux (Manuscript 2).
Fig. 6. Detailed images of sinking particles preserved in PA gels during SAZ-Sense. The upper row shows particles collected in the SAZ: intact ovoid faecal pellets, degrading ovoid pellet, intact cylindrical faecal pellets and different stages of degradation of faecal material (from left to right). In the lower row particles collected in the PFZ are depicted: mainly chains of diatoms or individual frustules (mainly F. kerguelensis and relatively large centric diatoms), degrading cylindrical faecal pellets and loose faecal material. Scale bar: 1 mm for all graphs.
The different flux regimes are mirrored in particle assemblages collected in PA gels: both
SAZ sites were regulated by relatively large faecal-aggregate fluxes and in the PFZ small faecal-
aggregates and phytoplankton-cells (mainly chains or single cells of heavily silicified diatoms,
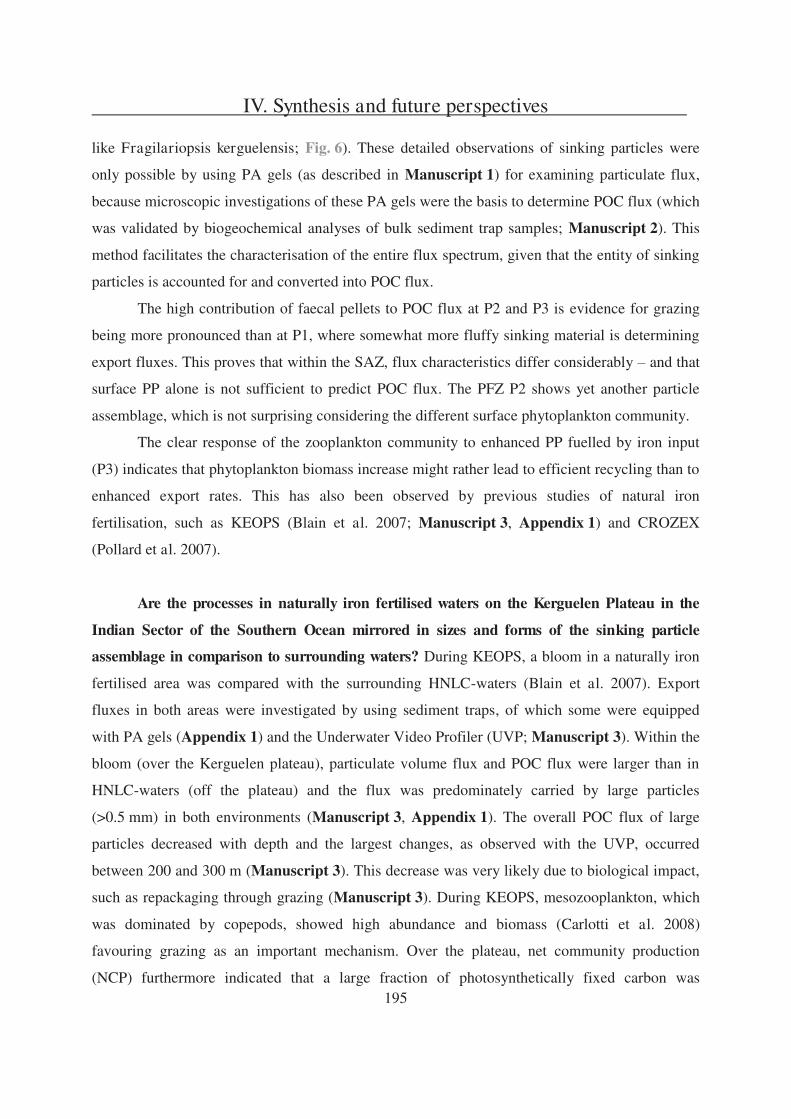
IV. Synthesis and future perspectives
195
like Fragilariopsis kerguelensis; Fig. 6). These detailed observations of sinking particles were
only possible by using PA gels (as described in Manuscript 1) for examining particulate flux,
because microscopic investigations of these PA gels were the basis to determine POC flux (which
was validated by biogeochemical analyses of bulk sediment trap samples; Manuscript 2). This
method facilitates the characterisation of the entire flux spectrum, given that the entity of sinking
particles is accounted for and converted into POC flux.
The high contribution of faecal pellets to POC flux at P2 and P3 is evidence for grazing
being more pronounced than at P1, where somewhat more fluffy sinking material is determining
export fluxes. This proves that within the SAZ, flux characteristics differ considerably and that
surface PP alone is not sufficient to predict POC flux. The PFZ P2 shows yet another particle
assemblage, which is not surprising considering the different surface phytoplankton community.
The clear response of the zooplankton community to enhanced PP fuelled by iron input
(P3) indicates that phytoplankton biomass increase might rather lead to efficient recycling than to
enhanced export rates. This has also been observed by previous studies of natural iron
fertilisation, such as KEOPS (Blain et al. 2007; Manuscript 3, Appendix 1) and CROZEX
(Pollard et al. 2007).
Are the processes in naturally iron fertilised waters on the Kerguelen Plateau in the
Indian Sector of the Southern Ocean mirrored in sizes and forms of the sinking particle
assemblage in comparison to surrounding waters? During KEOPS, a bloom in a naturally iron
fertilised area was compared with the surrounding HNLC-waters (Blain et al. 2007). Export
fluxes in both areas were investigated by using sediment traps, of which some were equipped
with PA gels (Appendix 1) and the Underwater Video Profiler (UVP; Manuscript 3). Within the
bloom (over the Kerguelen plateau), particulate volume flux and POC flux were larger than in
HNLC-waters (off the plateau) and the flux was predominately carried by large particles
(>0.5 mm) in both environments (Manuscript 3, Appendix 1). The overall POC flux of large
particles decreased with depth and the largest changes, as observed with the UVP, occurred
between 200 and 300 m (Manuscript 3). This decrease was very likely due to biological impact,
such as repackaging through grazing (Manuscript 3). During KEOPS, mesozooplankton, which
was dominated by copepods, showed high abundance and biomass (Carlotti et al. 2008)
favouring grazing as an important mechanism. Over the plateau, net community production
(NCP) furthermore indicated that a large fraction of photosynthetically fixed carbon was
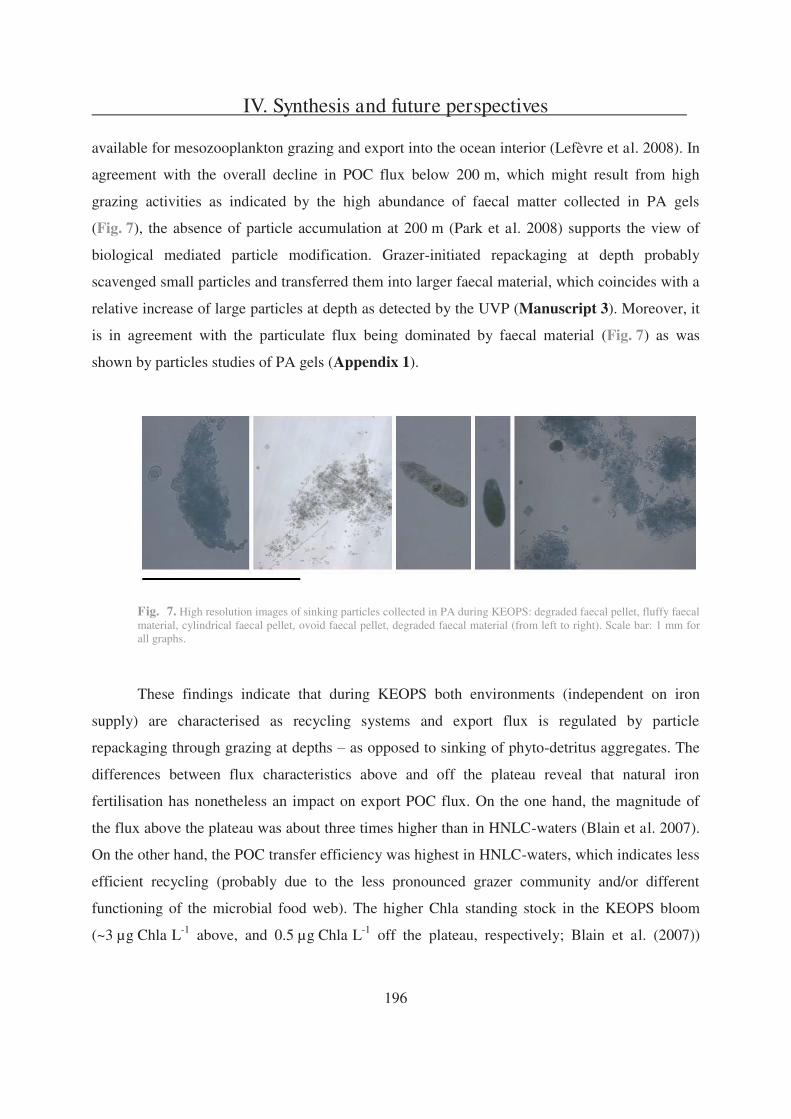
IV. Synthesis and future perspectives
196
available for mesozooplankton grazing and export into the ocean interior (Lefèvre et al. 2008). In
agreement with the overall decline in POC flux below 200 m, which might result from high
grazing activities as indicated by the high abundance of faecal matter collected in PA gels
(Fig. 7), the absence of particle accumulation at 200 m (Park et al. 2008) supports the view of
biological mediated particle modification. Grazer-initiated repackaging at depth probably
scavenged small particles and transferred them into larger faecal material, which coincides with a
relative increase of large particles at depth as detected by the UVP (Manuscript 3). Moreover, it
is in agreement with the particulate flux being dominated by faecal material (Fig. 7) as was
shown by particles studies of PA gels (Appendix 1).
Fig. 7. High resolution images of sinking particles collected in PA during KEOPS: degraded faecal pellet, fluffy faecal material, cylindrical faecal pellet, ovoid faecal pellet, degraded faecal material (from left to right). Scale bar: 1 mm for all graphs.
These findings indicate that during KEOPS both environments (independent on iron
supply) are characterised as recycling systems and export flux is regulated by particle
repackaging through grazing at depths as opposed to sinking of phyto-detritus aggregates. The
differences between flux characteristics above and off the plateau reveal that natural iron
fertilisation has nonetheless an impact on export POC flux. On the one hand, the magnitude of
the flux above the plateau was about three times higher than in HNLC-waters (Blain et al. 2007).
On the other hand, the POC transfer efficiency was highest in HNLC-waters, which indicates less
efficient recycling (probably due to the less pronounced grazer community and/or different
functioning of the microbial food web). The higher Chla standing stock in the KEOPS bloom
(~3 μg Chla L-1 above, and 0.5 μg Chla L-1 off the plateau, respectively; Blain et al. (2007))
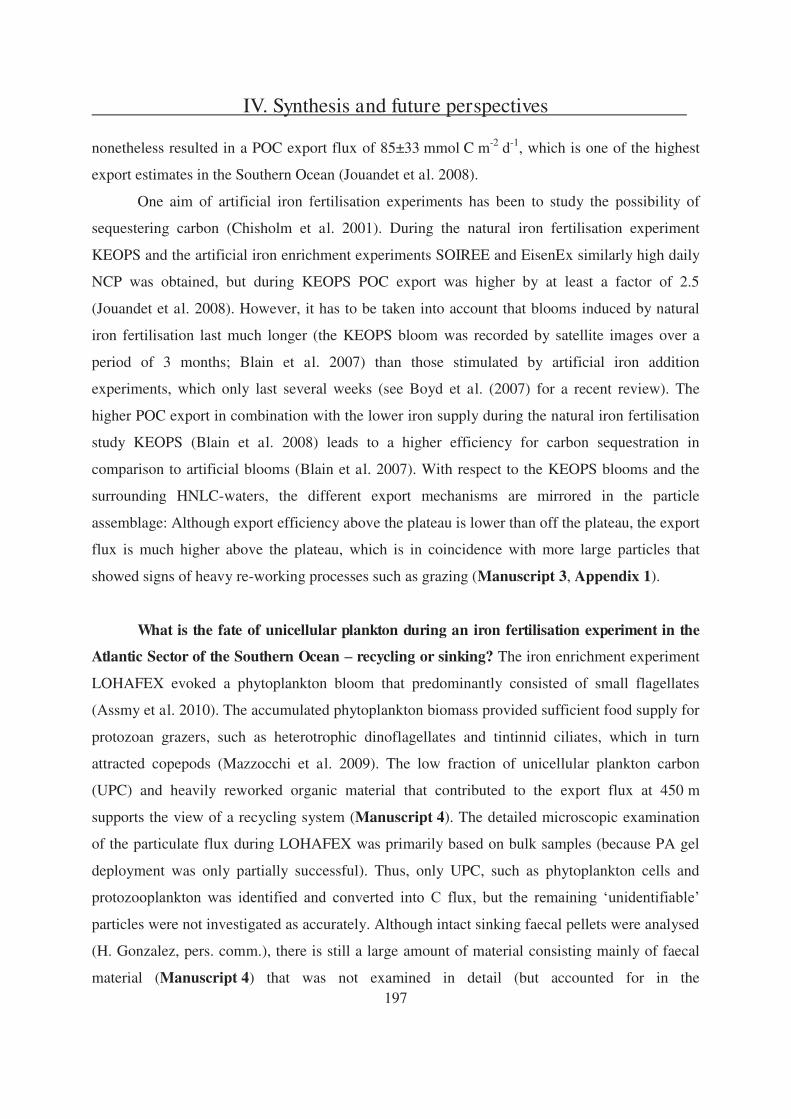
IV. Synthesis and future perspectives
197
nonetheless resulted in a POC export flux of 85±33 mmol C m-2 d-1, which is one of the highest
export estimates in the Southern Ocean (Jouandet et al. 2008).
One aim of artificial iron fertilisation experiments has been to study the possibility of
sequestering carbon (Chisholm et al. 2001). During the natural iron fertilisation experiment
KEOPS and the artificial iron enrichment experiments SOIREE and EisenEx similarly high daily
NCP was obtained, but during KEOPS POC export was higher by at least a factor of 2.5
(Jouandet et al. 2008). However, it has to be taken into account that blooms induced by natural
iron fertilisation last much longer (the KEOPS bloom was recorded by satellite images over a
period of 3 months; Blain et al. 2007) than those stimulated by artificial iron addition
experiments, which only last several weeks (see Boyd et al. (2007) for a recent review). The
higher POC export in combination with the lower iron supply during the natural iron fertilisation
study KEOPS (Blain et al. 2008) leads to a higher efficiency for carbon sequestration in
comparison to artificial blooms (Blain et al. 2007). With respect to the KEOPS blooms and the
surrounding HNLC-waters, the different export mechanisms are mirrored in the particle
assemblage: Although export efficiency above the plateau is lower than off the plateau, the export
flux is much higher above the plateau, which is in coincidence with more large particles that
showed signs of heavy re-working processes such as grazing (Manuscript 3, Appendix 1).
What is the fate of unicellular plankton during an iron fertilisation experiment in the
Atlantic Sector of the Southern Ocean recycling or sinking? The iron enrichment experiment
LOHAFEX evoked a phytoplankton bloom that predominantly consisted of small flagellates
(Assmy et al. 2010). The accumulated phytoplankton biomass provided sufficient food supply for
protozoan grazers, such as heterotrophic dinoflagellates and tintinnid ciliates, which in turn
attracted copepods (Mazzocchi et al. 2009). The low fraction of unicellular plankton carbon
(UPC) and heavily reworked organic material that contributed to the export flux at 450 m
supports the view of a recycling system (Manuscript 4). The detailed microscopic examination
of the particulate flux during LOHAFEX was primarily based on bulk samples (because PA gel
deployment was only partially successful). Thus, only UPC, such as phytoplankton cells and
protozo
particles were not investigated as accurately. Although intact sinking faecal pellets were analysed
(H. Gonzalez, pers. comm.), there is still a large amount of material consisting mainly of faecal
material (Manuscript 4) that was not examined in detail (but accounted for in the
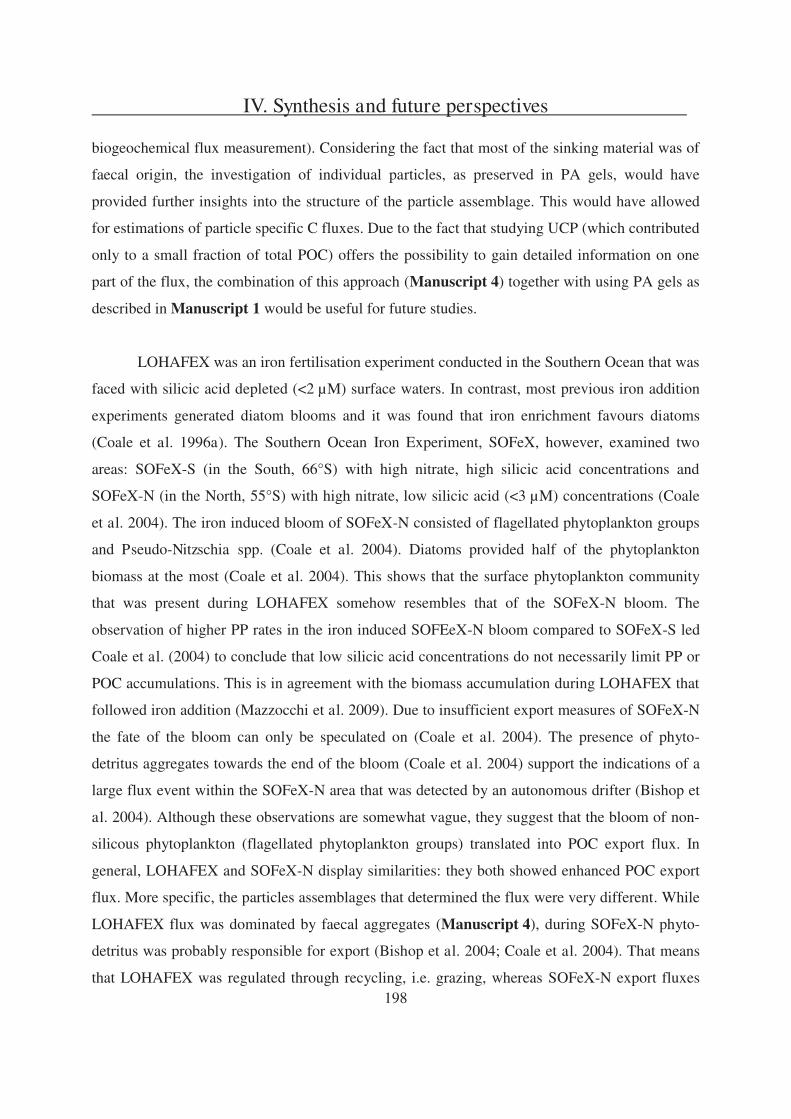
IV. Synthesis and future perspectives
198
biogeochemical flux measurement). Considering the fact that most of the sinking material was of
faecal origin, the investigation of individual particles, as preserved in PA gels, would have
provided further insights into the structure of the particle assemblage. This would have allowed
for estimations of particle specific C fluxes. Due to the fact that studying UCP (which contributed
only to a small fraction of total POC) offers the possibility to gain detailed information on one
part of the flux, the combination of this approach (Manuscript 4) together with using PA gels as
described in Manuscript 1 would be useful for future studies.
LOHAFEX was an iron fertilisation experiment conducted in the Southern Ocean that was
faced with silicic acid depleted (<2 μM) surface waters. In contrast, most previous iron addition
experiments generated diatom blooms and it was found that iron enrichment favours diatoms
(Coale et al. 1996a). The Southern Ocean Iron Experiment, SOFeX, however, examined two
areas: SOFeX-S (in the South, 66°S) with high nitrate, high silicic acid concentrations and
SOFeX-N (in the North, 55°S) with high nitrate, low silicic acid (<3 μM) concentrations (Coale
et al. 2004). The iron induced bloom of SOFeX-N consisted of flagellated phytoplankton groups
and Pseudo-Nitzschia spp. (Coale et al. 2004). Diatoms provided half of the phytoplankton
biomass at the most (Coale et al. 2004). This shows that the surface phytoplankton community
that was present during LOHAFEX somehow resembles that of the SOFeX-N bloom. The
observation of higher PP rates in the iron induced SOFEeX-N bloom compared to SOFeX-S led
Coale et al. (2004) to conclude that low silicic acid concentrations do not necessarily limit PP or
POC accumulations. This is in agreement with the biomass accumulation during LOHAFEX that
followed iron addition (Mazzocchi et al. 2009). Due to insufficient export measures of SOFeX-N
the fate of the bloom can only be speculated on (Coale et al. 2004). The presence of phyto-
detritus aggregates towards the end of the bloom (Coale et al. 2004) support the indications of a
large flux event within the SOFeX-N area that was detected by an autonomous drifter (Bishop et
al. 2004). Although these observations are somewhat vague, they suggest that the bloom of non-
silicous phytoplankton (flagellated phytoplankton groups) translated into POC export flux. In
general, LOHAFEX and SOFeX-N display similarities: they both showed enhanced POC export
flux. More specific, the particles assemblages that determined the flux were very different. While
LOHAFEX flux was dominated by faecal aggregates (Manuscript 4), during SOFeX-N phyto-
detritus was probably responsible for export (Bishop et al. 2004; Coale et al. 2004). That means
that LOHAFEX was regulated through recycling, i.e. grazing, whereas SOFeX-N export fluxes
IV. Synthesis and future perspectives
199
consisted of material that was not reworked. This shows once again that export flux driving
processes are highly variable, even under apparently similar conditions.
The only iron fertilisation experiment conducted in the Southern Ocean that showed
enhanced export flux as a response to iron addition was the European Iron Fertilisation
Experiment EIFEX (Peeken et al. 2006; Smetacek et al. in prep.). EIXEF was also situated in the
Atlantic Sector, but surface waters were not depleted in silicic acid and thus the build-up of a
diatom bloom was induced by adding iron (Bathmann 2005). Towards the decline of the EIFEX
bloom the sinking out of phyto-detritus material was observed in the deep water column (Peeken
et al. 2006). Unfortunately the fate of this sinking matter could not be studied in detail due to ship
time constrains. Because the composition of the export flux during EIFEX probably resembled
the structure of that detected during SOFeX-N, it appears that these two communities were
regulated through similar processes but differed considerably from LOHAFEX. During
LOHAFEX, in contrast, the sinking of the iron-stimulated bloom might have been impeded
through the prevailing recycling system, which seemed to control the LOHAFEX community.
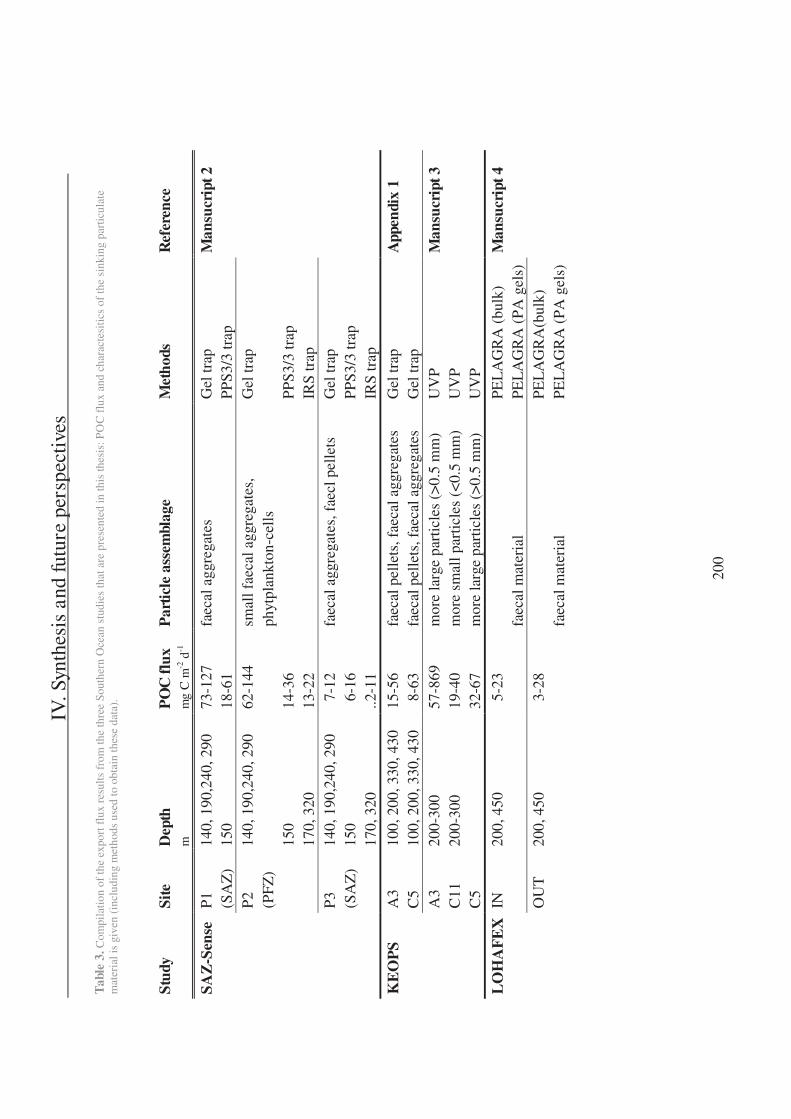
IV
. Syn
thes
is a
nd fu
ture
per
spec
tives
200
Tab
le 3
. Com
pila
tion
of th
e ex
port
flu
x re
sults
fro
m th
e th
ree
Sout
hern
Oce
an s
tudi
es th
at a
re p
rese
nted
in th
is th
esis
: PO
C f
lux
and
char
acte
sitic
s of
the
sink
ing
part
icul
ate
mat
eria
l is
give
n (i
nclu
ding
met
hods
use
d to
obt
ain
thes
e da
ta).
Stud
y Si
te
Dep
th
PO
C f
lux
Par
ticle
ass
embl
age
Met
hods
R
efer
ence
m
m
g C
m-2
d-1
SAZ
-Sen
se
P1
140,
190
,240
, 290
73
-127
fa
ecal
agg
rega
tes
Gel
trap
M
ansu
crip
t 2
(SA
Z)
150
18-6
1 PP
S3/3
trap
P2
14
0, 1
90,2
40, 2
90
62-1
44
smal
l fae
cal a
ggre
gate
s,
Gel
trap
(P
FZ)
phyt
plan
kton
-cel
ls
150
14-3
6 PP
S3/3
trap
17
0, 3
20
13-2
2 IR
S tr
ap
P3
140,
190
,240
, 290
7
-12
faec
al a
ggre
gate
s, f
aecl
pel
lets
G
el tr
ap
(SA
Z)
150
6-1
6 PP
S3/3
trap
17
0, 3
20
..2-1
1 IR
S tr
ap
KE
OP
S A
3 10
0, 2
00, 3
30, 4
30
15-5
6 fa
ecal
pel
lets
, fae
cal a
ggre
gate
s G
el tr
ap
App
endi
x 1
C5
100,
200
, 330
, 430
8
-63
faec
al p
elle
ts, f
aeca
l agg
rega
tes
Gel
trap
A
3 20
0-30
0 57
-869
m
ore
larg
e pa
rtic
les
(>0.
5 m
m)
UV
P
Man
sucr
ipt 3
C
11
200-
300
19-4
0 m
ore
smal
l par
ticle
s (<
0.5
mm
) U
VP
C
5 32
-67
mor
e la
rge
part
icle
s (>
0.5
mm
) U
VP
LO
HA
FE
X
IN
200,
450
5
-23
PEL
AG
RA
(bu
lk)
Man
sucr
ipt 4
fa
ecal
mat
eria
l PE
LA
GR
A (
PA g
els)
O
UT
20
0, 4
50
3-2
8 PE
LA
GR
A(b
ulk)
fa
ecal
mat
eria
l PE
LA
GR
A (
PA g
els)
IV. Synthesis and future perspectives
201
IV.2 Conclusions
This thesis aims to contribute to understanding of the mechanisms that are relevant for
modification processes of sinking particles in the mesopelagic zone, with emphasis on the
Southern Ocean. By way of a conclusion, I will now reconsider the hypotheses put forward in the
introduction (II.5)
I. Structure and composition of sinking particles provide information on the
mechanisms of particle flux and modification.
Within the three field studies presented in this thesis, I showed that the examination of
individual sinking particles reveal valuable information on export determining processes, such as
grazing and particle repackaging at depth (Manuscript 2, 3, 4, Appendix 1). The different
particle assemblages mirror the varying ecosystems in the respective parts of the Southern Ocean
(Table 3). The identification of faecal material (intact faecal pellets and/or faecal aggregates)
clearly indicates grazing as important mechanism for export flux, while the occurrence of phyto-
detritus aggregates is evident for the sinking of relatively fresh unprocessed material. Despite the
gained knowledge on the particle assemblage, the formation pathways of sinking particles still
remain unknown. For example, since marine snow captures surrounding particles as it is
travelling through the water column, the identification of the collected material cannot
necessarily identify the ecological pathways that initiated vertical export. Thus, even the
recognition of individual sinking particles is not able to entirely explain the unknowns of
particulate flux modification. Moreover, the sinking particles collected during the presented
studies (Manuscript 2, 3, 4, Appendix 1) have already left the euphotic zone, where a critical
fraction of the flux alteration occurred. For this reason, I would recommend a higher depth
resolution for sample collection, particularly in the euphotic layer and upper mesopelagic zone.
II. Free-floating gel traps are sufficient to collect intact sinking particles.
The combination of free-floating sediment traps and PA gels for collection and
preservation of sinking particles is a powerful tool to examine fluxes of intact particles
(Manuscript 1, 2, 3, 4, Appendix 1). I have shown that this method is a very reliable technique
once important requirements in terms of design (e.g. fitting of trap sampling devices and gel
container) are met (Manuscript 1). Several successful deployments proved that PA gels can

IV. Synthesis and future perspectives
202
provide valuable additional information on structure and composition of sinking particles
(Manuscript 2, 3, Appendix 1). The application of PA gels for studying particulate flux
therefore offers the possibility to improve our understanding on the base of intact individual
sinking particles
III. Different magnitude and composition of biogenic particle fluxes in different
regions of the Southern Ocean can be categorised as biogeochemical provinces.
The three field studies presented in this thesis were each located in different regions of the
Southern Ocean: SAZ-Sense in the Australian Sector (Manuscript 2), KEOPS in the Indian
Sector (Manuscript 3, Appendix 1), and LOHAHEX in the Atlantic Sector (Manuscript 4).
Although these field studies were carried out in similar latitudes (between 45° S and 55° S), the
export flux showed considerable differences in terms of magnitude and sinking particle
assemblage (Table 3).
According to Longhurst (1998), who separated the ocean basins into different
biogeochemical provinces, SAZ-Sense, KEOPS and LOHAFEX altogether belong to
Subantarctic Water Ring Province (SANT). These biogeochemical provinces are established
based on regional characteristics such as oceanic fronts (Longhurst 1998). The SANT occupies a
zone between ~35° S and the Antarctic Polar Front at ~55° S, with several regimes distinguished
in this area. The fact that the iron induced phytoplankton bloom during LOHAFEX was mainly
provided by small flagellates assigns this (iron-limited) region to the oligotrophic regime, which
is typically controlled through grazing (of predominantly copepods). This is consistent with the
comparably low flux and the predominance of faecal material (Table 3). The KEOPS bloom
occurred in Fe-replete waters within the oligotrophic regime and is depicted in intermediate
export fluxes, which mainly consists of intact faecal pellets and faecal aggregates (Table 3).
During SAZ-Sense, three different regimes were investigated, P1 in Fe-replete oligotrophic
waters, P3 in Fe-limited oligotrophic waters and P2 in the frontal regime (Table 3). At P2 even
frustules of diatoms (large centric diatoms or chains of F. kerguelensis) were collected separately
and not integrated into marine snow implying single cell and/or diatom chain sinking. Although
the mechanisms behind this observation are not clear it is evidence for a decoupling of POC and
biogenic silica flux.
IV. Synthesis and future perspectives
203
By using PA gel equipped free-floating sediment traps (Manuscript 1), I could
demonstrate that grazing and the resultant flux of predominantly faecal matter was driving export
fluxes in large areas of the SAZ-Sense study, during KEOPS and during LOHAFEX (Table 3).
Considering the good preservation of fragile particles in PA gels, the absence of fluffy phyto-
detritus within the sinking particulate matter collected in most cases during the presented studies
indicates that sinking of marine snow was not important in any of these export regimes. Due to
the finding of export flux being dominated by faecal material as opposed to marine snow I
suggest that faecal material is much more relevant to POC flux than is marine snow.
To sum up, therefore, I can state that the findings of my thesis verify all three hypotheses.
IV. Synthesis and future perspectives
204
IV.3 Future perspectives
This thesis is based upon three export flux studies in different parts of the Southern Ocean
and I concluded that POC flux to depth is regulated through grazing followed by the production
of faecal material. Seasonal variability was not investigated, since all of these studies were
conducted in austral summer. A comparison with flux regimes during autumn, winter or early
spring, when surface PP is much lower, should be assessed in the future. Due to the lower
abundance of protozooplankton in the beginning of the growth season, different export regimes
(e.g. marine snow driven flux) might be prevailing. With the deployment of PA gels, it would be
feasible to collect these possibly very fragile and fluffy aggregates.
Additionally, I would like to use PA gel based particulate fluxes for studying other ocean
areas, in particular the Arctic Ocean, which, like the Southern Ocean, is highly sensitive to
climate change (e.g. ice cover and water temperature). Even though the Southern Ocean and the
Arctic Ocean are similar in many respects, there are significant differences regarding, for
example, the mixed layer depth, seasonal mixing, and influence of landmasses (and the
subsequent input of lithogenic material).
One possible framework for using PA gels in the Arctic is the long-term study
HAUSGARTEN that was established in 1999 by the AWI in Fram Strait (Soltwedel et al. 2005).
Flux samples from 15 permanent sampling sites (1000-5500 m depth) obtained by annually
moored sediment traps showed that the settling material is of quite variable composition
(Soltwedel et al. 2005) and the seasonal patterns show large variation (Bauerfeind et al. 2009).
Hence, the composition and structure of the particulate flux is of high interest. Therefore, the
deployment of PA gels might provide additional insights into export driving processes.
I very much appreciate the opportunity of looking at intact in-situ particle fluxes (as the
PA gels allow it) as it reveals a great amount of details about flux characteristic. Respect goes to
scuba divers in the 1970s and 80s who first realised that such a thing as marine snow exists in the
water column. Today, autonomous underwater vehicle (AUV) can dive down to thousands of
meters and are able to take detailed images and we still do not completely understand the
modification processes of sinking particles during their transit to depth. Nonetheless, I
recommend using the sense of sight more, as it might tell much more than laboratory analyses in
some respects. If it was not so difficult for practical reason I would suggest more direct

IV. Synthesis and future perspectives
205
observations of sinking particles, either by scuba diving or by relying on AUVs. Keeping in mind
that little is known about the fate of sinking particles in the mesopelagic, this would contribute to
shedding more lig

206
References
207
References
Abramson, L., C. Lee, Z. Liu, S. G. Wakeham, and J. Szlosek. 2010. Exchange between
suspended and sinking particles in the northwest Mediterranean as inferred from the organic composition of in situ pump and sediment trap samples. Limnology and Oceanography 55: 752-739.
Alldredge, A. L. 1992. Marine Snow in Oceanic Cycling, p. 139-147. In W. Nierenberg [ed.], Encyclopedia of Earth System Science. Academic Press.
Alldredge, A. L., and C. Gotschalk. 1989. Direct observations of the mass flocculation of diatom blooms: charactersitics, settling velocities and formation of diatom aggregates. Deep Sea Research 36: 159-171.
Alldredge, A. L., and M. W. Silver. 1988. Characteristics, Dynamics and Significance of Marine Snow. Progress Oceanography 20: 41-82.
Alldredge, A. L., and M. L. Youngbluth. 1985. The significance of macroscopic aggregates (marine snow) as sites of heterotrophic bacterial production in the mesopelagic zone at the subtropical Atlantic. Deep Sea Research 32: 1445-1456.
Allison, D. B., D. Stramski, and G. Mitchell. 2010. Seasonal and interannual variability of particulate organic carbon within the Southern Ocean from satellite ocean color observation. Journal of Geophysical Research 115: 1-18.
Andersson, J. H., J. W. M. Wijsman, P. J. Herman, J. J. Middelburg, K. Soetaert, and K. Heip. 2004. Respiration patterns in the deep sea. Geophysical Research Letter 31: 1-4.
Antia, A. N. and others 2001. Basin-wide particulate carbon flux in the Atlantic Ocean: Regional export patterns and potential for atmospheric CO2 sequestration. Global Biogeochemical Cycles 15: 845-862.
Armand, L. K., V. Cornet-Barthaux, J. Mosseri, and B. Quéguiner. 2008. Late summer diatom biomass and community structure on and around the naturally iron-fertilised Kerguelen Plateau in the Southern Ocean. Deep Sea Research Part II: Topical Studies in Oceanography 55: 653-676.
Armstrong, R. A., C. Lee, J. I. Hedges, S. Honjo, and S. G. Wakeham. 2002. A new, mechanical model for organic carbon fluxes in the ocean based on the quantitative association of POC with ballast minerals. Deep-Sea Resarch II 49: 219-236.
Asper, V. L. 1987. Measuring the flux and sinking speed of marine snow aggregates. Deep Sea Research 34: 1-17.
Assmy, P., F. Ebersbach, N. Fuchs, C. Klaas, M. Montresor, and V. Smetacek. 2010. Phyto- and Protozooplankton, p. 81-86. In H. Bornemann and B. Chiaventone [eds.], Reports on Polar and Marine Research. The expedition of the Research Vessel "Polarstern" to the Antarctic on 2009 (ANT-XXV/3-LOHAFEX). Alfred Wegener Institute.
Assmy, P., J. Henjes, C. Klaas, and V. Smetacek. 2007. Mechanisms determining species dominance in a phytoplankton bloom induced by the iron fertilization experiment EisenEx in the Southern Ocean. Deep Sea Research I 54: 340-362.
Bathmann, U. 2005. Ecological and Biogeochemical Response of Antarctic Ecosystems to Iron Fertilzation and Implications on Global Carbon Cycle. Ocean and Polar Research 27: 231-235.
Bathmann, U., J. Priddle, P. Tréguer, M. I. Lucas, J. Hall, and J. Parslow. 2000. Plankton ecology and biogeochemestry in the Southern Ocean: A review of the Southern Ocean JGOFS, p. 300-337. In R. B. Hanson, H. W. Ducklow and J. G. Field [eds.], The Changing Ocean
References
208
Carbon Cycle, A midterm synthesis of the Joint Global Ocean Flux Study. International Geosphere-Biosphere Programme Book Series. Cambrigde University Press.
Bauerfeind, E. and others 2009. Particle sedimentation patterns in the eastern Fram Strait during 2000-2005: Results from the Arctic long-term observatory HAUSGARTEN. Deep-Sea Research I 56: 1471-1487.
Beaulieu, S. E. 2002. Accumulation and fate of phytodetritus on the sea floor. Oceanography and Marine Biology: an Annual Review 40: 171-232.
Berelson, W. M. 2001. The Flux of Particulate Organic Carbon Into the Ocean Interior: A comparison of Four U.S. JGOFS Regional Studies. Oceanography 14: 59-67.
Bishop, J. K. B. 1989. Regional extremes in particulate matter composition and flux: effects on the chemistry of the ocean interior, p. 117-138. In W. H. Berger, V. Smetacek and G. Wefer [eds.], Dahlem Workshop Life Science Report - Productivity of the oceans: Present and Past. John Wiley and Sons.
Bishop, J. K. B., R. E. Davis, and J. T. Sherman. 2002. Robotic Observations of Dust Storm Enhancement of Carbon Biomass in the North Pacific. Science 298: 817-821.
Bishop, J. K. B., D. Schupack, R. M. Sherrell, and M. Conte. 1985. A multiple-unit large-volume in-situ filtration system for sampling oceanic particulate matter in mesoscale environments. Advances in Chemistry Series 9: 155-175.
Bishop, J. K. B., T. J. Wood, R. E. Davis, and J. T. Sherman. 2004. Robotic Observations of Enhanced Biomass and Export at 55°S During SOFex. Science 304: 417-420.
Blain, S. and others 2007. Effect of natural iron fertilization on carbon sequestration in the Southern Ocean. Nature 446: 1070-1075.
Blain, S., G. Sarthou, and P. Laan. 2008. Distribution of dissolved iron during the natural iron-fertilization experiment KEOPS (Kerguelen Plateau, Southern Ocean). Deep Sea Research Part II: Topical Studies in Oceanography 55: 594-605.
Bowie, A. R. and others 2009. Biogeochemical iron budgets of the Southern Ocean south of Australia demonstrate that summertime supply decouples iron and nutrient cycles in the subantarctic zone. Global Biogeochemical Cycles GB4034.
Boyd, P. W., G. A. Jackson, and A. M. Waite. 2002. Are mesoscale pertubation experiments in polar waters prone to physical artefacts? Evidence from algal aggregation modelling studies. Geophysical Research Letters 29: 36 31-34.
Boyd, P. W. and others 2007. Mesoscale Iron Enrichment Experiments 1993-2005: Synthesis and Future Directions. Science 315: 612-617.
Boyd, P. W., and P. Newton. 1995. Evidence of the potential influence of planktonic community structure on the interannual variability of particulate organic carbon flux. Deep Sea Research Part I: Oceanographic Research Papers 42: 619-639.
Boyd, P. W., and P. P. Newton. 1999. Does planktonic community structure determine downward particulate organic carbon flux in different oceanic provinces? Deep Sea Research Part I: Oceanographic Research Papers 46: 63-91.
Boyd, P. W., and T. W. Trull. 2007. Understanding the export of biogenic particles in oceanic waters: Is there consensus? Progress In Oceanography 72: 276-312.
Boyd, P. W. and others 2000. A mesoscale phytoplankton bloom in the polar Southern Ocean stimulated by iron fertilization. Nature 407: 695-702.
Buesseler, K. O. 1998. The decoupling of production and particulate export in the surface ocean. Global Biogeochemical Cycles 12: 297-310.
Buesseler, K. O., J. E. Andrews, S. M. Pike, and M. A. Charette. 2004. The effect of iron fertilization on carbon sequestration in the Southern Ocean. Science 304: 414-417.
References
209
Buesseler, K. O. and others 2007. An assessment of the use of sediment traps for estimating upper ocean particle fluxes. Journal of Marine Research 65: 345-416.
---. 2001. Upper ocean export of particulate organic carbon and biogenic silica in the Southern Ocean along 170°W. Deep-Sea Research II 48: 4275-4297.
Buesseler, K. O., and P. W. Boyd. 2009. Shedding light on processes that control particle export and flux attenuation in the twilight zone of the open ocean. Limnology and Oceanography 54: 1210-1232.
Buesseler, K. O. and others 2008. Ocean Iron Fertilisation-Moving Forward in a Sea of Uncertainty. Science 319: 162.
---. 2000. A comparison of the quantity and quality of material caught in a neutrally bouyant versus a surface-tethered sediment trap. Deep-Sea Research I 47: 227-294.
Carlotti, F., D. Thibault-Botha, A. Nowaczyk, and D. Lefèvre. 2008. Zooplankton community structure, biomass and role in carbon fluxes during the second half of a phytoplankton bloom in the eastern sector of the Kerguelen Shelf (January-February 2005). Deep Sea Research Part II: Topical Studies in Oceanography 55: 720-733.
Chrisholm, S. W., P. G. Falkowski, and J. J. Cullen. 2001. Dis-Crediting Ocean Fertilization. Science 294: 309-310.
Coale, K. H., S. E. Fitzwater, R. M. Gordon, K. S. Johnson, and R. T. Barber. 1996b. Control of community growth and export production by upwelled iron in the equatorial Pacific Ocean. Nature 379: 621-624.
Coale, K. H. and others 2004. Southern Ocean Iron Enrichment Experiment: Carbon Cycling on High- and Low-Si Waters. Science 304: 408-414.
Coale, K. H., K. S. Johnson, S. E. Fitzwater, S. P. G. Blain, T. P. Stanton, and T. L. Coley. 1998. IronEx-I, an in situ iron-enrichment experiment: Experimental design, implementation and results. Deep Sea Research Part II: Topical Studies in Oceanography 45: 919-945.
Coale, K. H. and others 1996a. A massive phytoplankton bloom induced by an ecosystem-scale iron fertilisation experiment in the equatorial Pacific Ocean. Nature 383: 495-501.
de Baar, H. J. W. and others 2005. Synthesis of iron fertilisation experiments: From the Iron Age in the Age of Enlightenment. Journal of Geophysical Research 110: 1-24.
De La Rocha, C., and U. Passow. 2007. Factors influencing the sinking of POC and the efficiency of the biological carbon pump. Deep Sea Research II 54: 639-658.
De La Rocha, C. L. 2007. The Biological Pump, p. 1-29. In D. H. Heinrich and K. T. Karl [eds.], Treatise on Geochemistry. Pergamon.
de Salas, M. F., R. Eriksen, A. T. Davidson, and S. Wright. 2010. Protistan communities in the Australian sector of the subantarctic zone during SAZ-Sense. Deep-Sea Research II in press.
Dilling, L., and A. L. Alldredge. 2000. Fragmentation of marine snow by swimming macrozooplankton: A new process impacting carbon cycling in the sea. Deep Sea Research Part I: Oceanographic Research Papers 47: 1227-1245.
Dubischar, C. D., and U. Bathmann. 2002. The occurrence of faecal material in relation to different pelagic systems in the Southern Ocean and its importance for vertical flux Deep-Sea Research II 49: 3229-3242.
Ducklow, H. W., D. K. Steinberg, and K. O. Buesseler. 2001. Upper Ocean Carbon Export and the Biological Pump. Oceanography 14: 50-58.
Dugdale, R. C., and J. J. Goering. 1967. Uptake of new and regenerated forms of nitrogen in primary productivity. Limnology and Oceanography 12: 196 206.
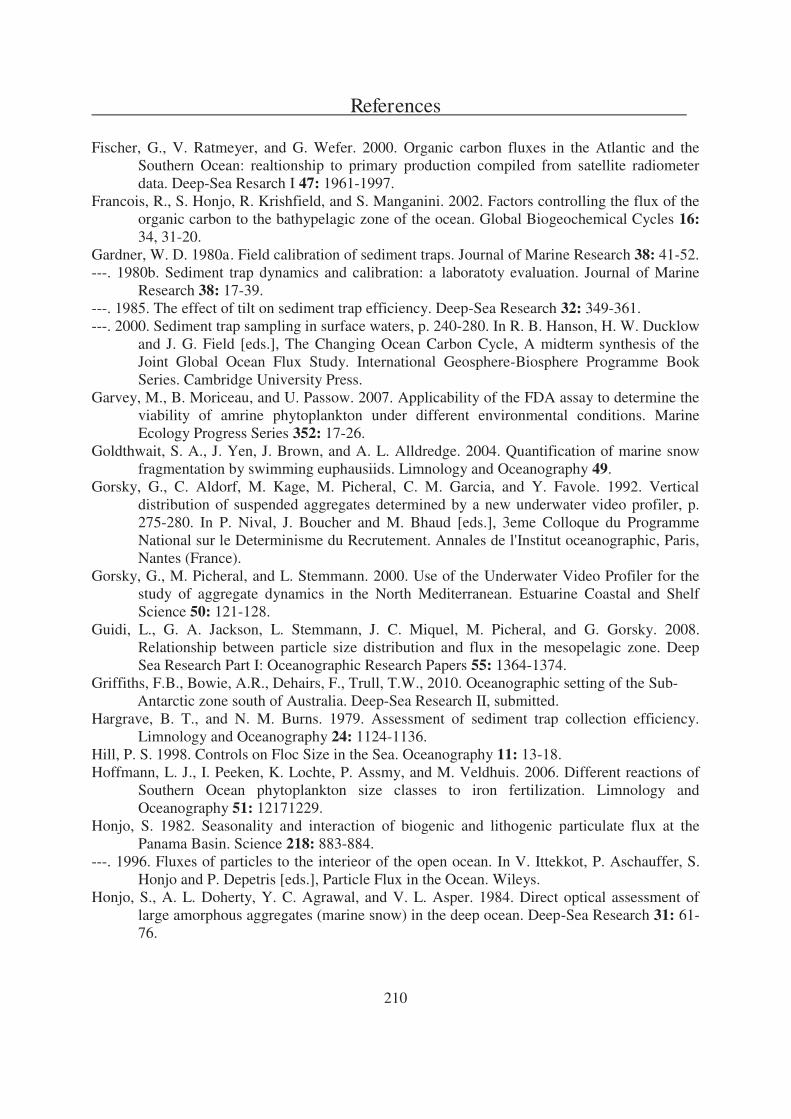
References
210
Fischer, G., V. Ratmeyer, and G. Wefer. 2000. Organic carbon fluxes in the Atlantic and the Southern Ocean: realtionship to primary production compiled from satellite radiometer data. Deep-Sea Resarch I 47: 1961-1997.
Francois, R., S. Honjo, R. Krishfield, and S. Manganini. 2002. Factors controlling the flux of the organic carbon to the bathypelagic zone of the ocean. Global Biogeochemical Cycles 16: 34, 31-20.
Gardner, W. D. 1980a. Field calibration of sediment traps. Journal of Marine Research 38: 41-52. ---. 1980b. Sediment trap dynamics and calibration: a laboratoty evaluation. Journal of Marine
Research 38: 17-39. ---. 1985. The effect of tilt on sediment trap efficiency. Deep-Sea Research 32: 349-361. ---. 2000. Sediment trap sampling in surface waters, p. 240-280. In R. B. Hanson, H. W. Ducklow
and J. G. Field [eds.], The Changing Ocean Carbon Cycle, A midterm synthesis of the Joint Global Ocean Flux Study. International Geosphere-Biosphere Programme Book Series. Cambridge University Press.
Garvey, M., B. Moriceau, and U. Passow. 2007. Applicability of the FDA assay to determine the viability of amrine phytoplankton under different environmental conditions. Marine Ecology Progress Series 352: 17-26.
Goldthwait, S. A., J. Yen, J. Brown, and A. L. Alldredge. 2004. Quantification of marine snow fragmentation by swimming euphausiids. Limnology and Oceanography 49.
Gorsky, G., C. Aldorf, M. Kage, M. Picheral, C. M. Garcia, and Y. Favole. 1992. Vertical distribution of suspended aggregates determined by a new underwater video profiler, p. 275-280. In P. Nival, J. Boucher and M. Bhaud [eds.], 3eme Colloque du Programme National sur le Determinisme du Recrutement. Annales de l'Institut oceanographic, Paris, Nantes (France).
Gorsky, G., M. Picheral, and L. Stemmann. 2000. Use of the Underwater Video Profiler for the study of aggregate dynamics in the North Mediterranean. Estuarine Coastal and Shelf Science 50: 121-128.
Guidi, L., G. A. Jackson, L. Stemmann, J. C. Miquel, M. Picheral, and G. Gorsky. 2008. Relationship between particle size distribution and flux in the mesopelagic zone. Deep Sea Research Part I: Oceanographic Research Papers 55: 1364-1374.
Griffiths, F.B., Bowie, A.R., Dehairs, F., Trull, T.W., 2010. Oceanographic setting of the Sub- Antarctic zone south of Australia. Deep-Sea Research II, submitted.
Hargrave, B. T., and N. M. Burns. 1979. Assessment of sediment trap collection efficiency. Limnology and Oceanography 24: 1124-1136.
Hill, P. S. 1998. Controls on Floc Size in the Sea. Oceanography 11: 13-18. Hoffmann, L. J., I. Peeken, K. Lochte, P. Assmy, and M. Veldhuis. 2006. Different reactions of
Southern Ocean phytoplankton size classes to iron fertilization. Limnology and Oceanography 51: 12171229.
Honjo, S. 1982. Seasonality and interaction of biogenic and lithogenic particulate flux at the Panama Basin. Science 218: 883-884.
---. 1996. Fluxes of particles to the interieor of the open ocean. In V. Ittekkot, P. Aschauffer, S. Honjo and P. Depetris [eds.], Particle Flux in the Ocean. Wileys.
Honjo, S., A. L. Doherty, Y. C. Agrawal, and V. L. Asper. 1984. Direct optical assessment of large amorphous aggregates (marine snow) in the deep ocean. Deep-Sea Research 31: 61-76.
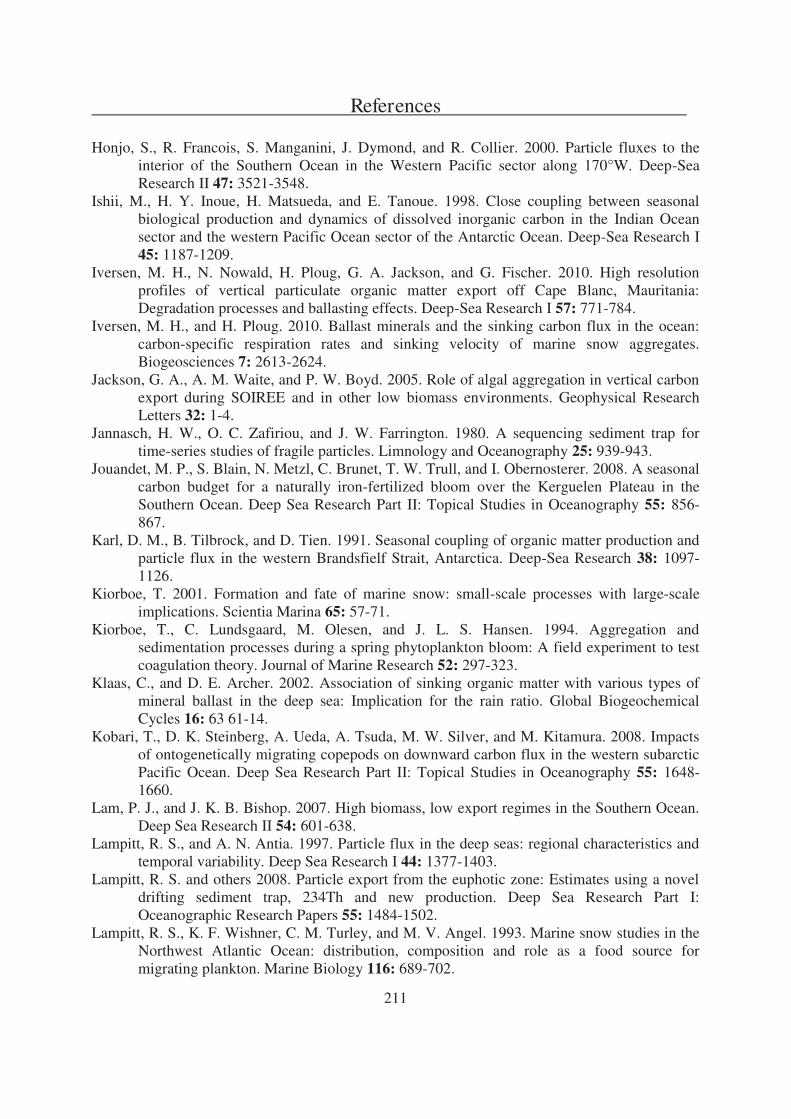
References
211
Honjo, S., R. Francois, S. Manganini, J. Dymond, and R. Collier. 2000. Particle fluxes to the interior of the Southern Ocean in the Western Pacific sector along 170°W. Deep-Sea Research II 47: 3521-3548.
Ishii, M., H. Y. Inoue, H. Matsueda, and E. Tanoue. 1998. Close coupling between seasonal biological production and dynamics of dissolved inorganic carbon in the Indian Ocean sector and the western Pacific Ocean sector of the Antarctic Ocean. Deep-Sea Research I 45: 1187-1209.
Iversen, M. H., N. Nowald, H. Ploug, G. A. Jackson, and G. Fischer. 2010. High resolution profiles of vertical particulate organic matter export off Cape Blanc, Mauritania: Degradation processes and ballasting effects. Deep-Sea Research I 57: 771-784.
Iversen, M. H., and H. Ploug. 2010. Ballast minerals and the sinking carbon flux in the ocean: carbon-specific respiration rates and sinking velocity of marine snow aggregates. Biogeosciences 7: 2613-2624.
Jackson, G. A., A. M. Waite, and P. W. Boyd. 2005. Role of algal aggregation in vertical carbon export during SOIREE and in other low biomass environments. Geophysical Research Letters 32: 1-4.
Jannasch, H. W., O. C. Zafiriou, and J. W. Farrington. 1980. A sequencing sediment trap for time-series studies of fragile particles. Limnology and Oceanography 25: 939-943.
Jouandet, M. P., S. Blain, N. Metzl, C. Brunet, T. W. Trull, and I. Obernosterer. 2008. A seasonal carbon budget for a naturally iron-fertilized bloom over the Kerguelen Plateau in the Southern Ocean. Deep Sea Research Part II: Topical Studies in Oceanography 55: 856-867.
Karl, D. M., B. Tilbrock, and D. Tien. 1991. Seasonal coupling of organic matter production and particle flux in the western Brandsfielf Strait, Antarctica. Deep-Sea Research 38: 1097-1126.
Kiorboe, T. 2001. Formation and fate of marine snow: small-scale processes with large-scale implications. Scientia Marina 65: 57-71.
Kiorboe, T., C. Lundsgaard, M. Olesen, and J. L. S. Hansen. 1994. Aggregation and sedimentation processes during a spring phytoplankton bloom: A field experiment to test coagulation theory. Journal of Marine Research 52: 297-323.
Klaas, C., and D. E. Archer. 2002. Association of sinking organic matter with various types of mineral ballast in the deep sea: Implication for the rain ratio. Global Biogeochemical Cycles 16: 63 61-14.
Kobari, T., D. K. Steinberg, A. Ueda, A. Tsuda, M. W. Silver, and M. Kitamura. 2008. Impacts of ontogenetically migrating copepods on downward carbon flux in the western subarctic Pacific Ocean. Deep Sea Research Part II: Topical Studies in Oceanography 55: 1648-1660.
Lam, P. J., and J. K. B. Bishop. 2007. High biomass, low export regimes in the Southern Ocean. Deep Sea Research II 54: 601-638.
Lampitt, R. S., and A. N. Antia. 1997. Particle flux in the deep seas: regional characteristics and temporal variability. Deep Sea Research I 44: 1377-1403.
Lampitt, R. S. and others 2008. Particle export from the euphotic zone: Estimates using a novel drifting sediment trap, 234Th and new production. Deep Sea Research Part I: Oceanographic Research Papers 55: 1484-1502.
Lampitt, R. S., K. F. Wishner, C. M. Turley, and M. V. Angel. 1993. Marine snow studies in the Northwest Atlantic Ocean: distribution, composition and role as a food source for migrating plankton. Marine Biology 116: 689-702.
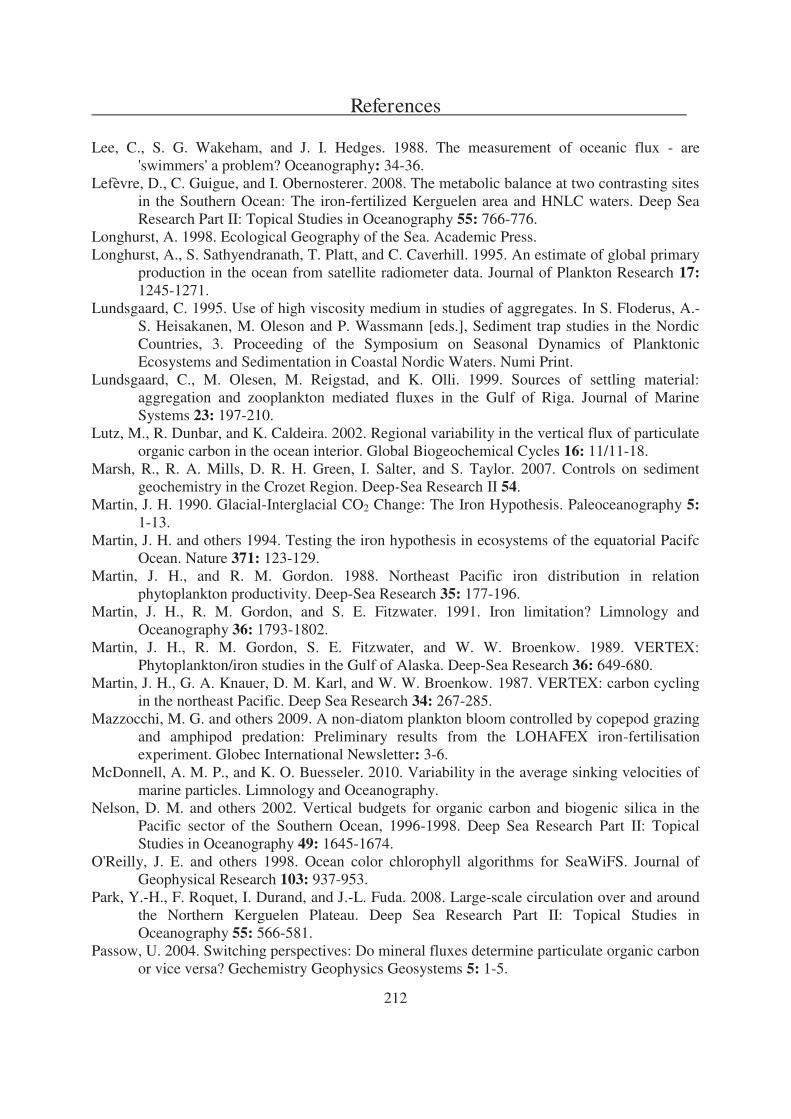
References
212
Lee, C., S. G. Wakeham, and J. I. Hedges. 1988. The measurement of oceanic flux - are 'swimmers' a problem? Oceanography: 34-36.
Lefèvre, D., C. Guigue, and I. Obernosterer. 2008. The metabolic balance at two contrasting sites in the Southern Ocean: The iron-fertilized Kerguelen area and HNLC waters. Deep Sea Research Part II: Topical Studies in Oceanography 55: 766-776.
Longhurst, A. 1998. Ecological Geography of the Sea. Academic Press. Longhurst, A., S. Sathyendranath, T. Platt, and C. Caverhill. 1995. An estimate of global primary
production in the ocean from satellite radiometer data. Journal of Plankton Research 17: 1245-1271.
Lundsgaard, C. 1995. Use of high viscosity medium in studies of aggregates. In S. Floderus, A.-S. Heisakanen, M. Oleson and P. Wassmann [eds.], Sediment trap studies in the Nordic Countries, 3. Proceeding of the Symposium on Seasonal Dynamics of Planktonic Ecosystems and Sedimentation in Coastal Nordic Waters. Numi Print.
Lundsgaard, C., M. Olesen, M. Reigstad, and K. Olli. 1999. Sources of settling material: aggregation and zooplankton mediated fluxes in the Gulf of Riga. Journal of Marine Systems 23: 197-210.
Lutz, M., R. Dunbar, and K. Caldeira. 2002. Regional variability in the vertical flux of particulate organic carbon in the ocean interior. Global Biogeochemical Cycles 16: 11/11-18.
Marsh, R., R. A. Mills, D. R. H. Green, I. Salter, and S. Taylor. 2007. Controls on sediment geochemistry in the Crozet Region. Deep-Sea Research II 54.
Martin, J. H. 1990. Glacial-Interglacial CO2 Change: The Iron Hypothesis. Paleoceanography 5: 1-13.
Martin, J. H. and others 1994. Testing the iron hypothesis in ecosystems of the equatorial Pacifc Ocean. Nature 371: 123-129.
Martin, J. H., and R. M. Gordon. 1988. Northeast Pacific iron distribution in relation phytoplankton productivity. Deep-Sea Research 35: 177-196.
Martin, J. H., R. M. Gordon, and S. E. Fitzwater. 1991. Iron limitation? Limnology and Oceanography 36: 1793-1802.
Martin, J. H., R. M. Gordon, S. E. Fitzwater, and W. W. Broenkow. 1989. VERTEX: Phytoplankton/iron studies in the Gulf of Alaska. Deep-Sea Research 36: 649-680.
Martin, J. H., G. A. Knauer, D. M. Karl, and W. W. Broenkow. 1987. VERTEX: carbon cycling in the northeast Pacific. Deep Sea Research 34: 267-285.
Mazzocchi, M. G. and others 2009. A non-diatom plankton bloom controlled by copepod grazing and amphipod predation: Preliminary results from the LOHAFEX iron-fertilisation experiment. Globec International Newsletter: 3-6.
McDonnell, A. M. P., and K. O. Buesseler. 2010. Variability in the average sinking velocities of marine particles. Limnology and Oceanography.
Nelson, D. M. and others 2002. Vertical budgets for organic carbon and biogenic silica in the Pacific sector of the Southern Ocean, 1996-1998. Deep Sea Research Part II: Topical Studies in Oceanography 49: 1645-1674.
O'Reilly, J. E. and others 1998. Ocean color chlorophyll algorithms for SeaWiFS. Journal of Geophysical Research 103: 937-953.
Park, Y.-H., F. Roquet, I. Durand, and J.-L. Fuda. 2008. Large-scale circulation over and around the Northern Kerguelen Plateau. Deep Sea Research Part II: Topical Studies in Oceanography 55: 566-581.
Passow, U. 2004. Switching perspectives: Do mineral fluxes determine particulate organic carbon or vice versa? Gechemistry Geophysics Geosystems 5: 1-5.
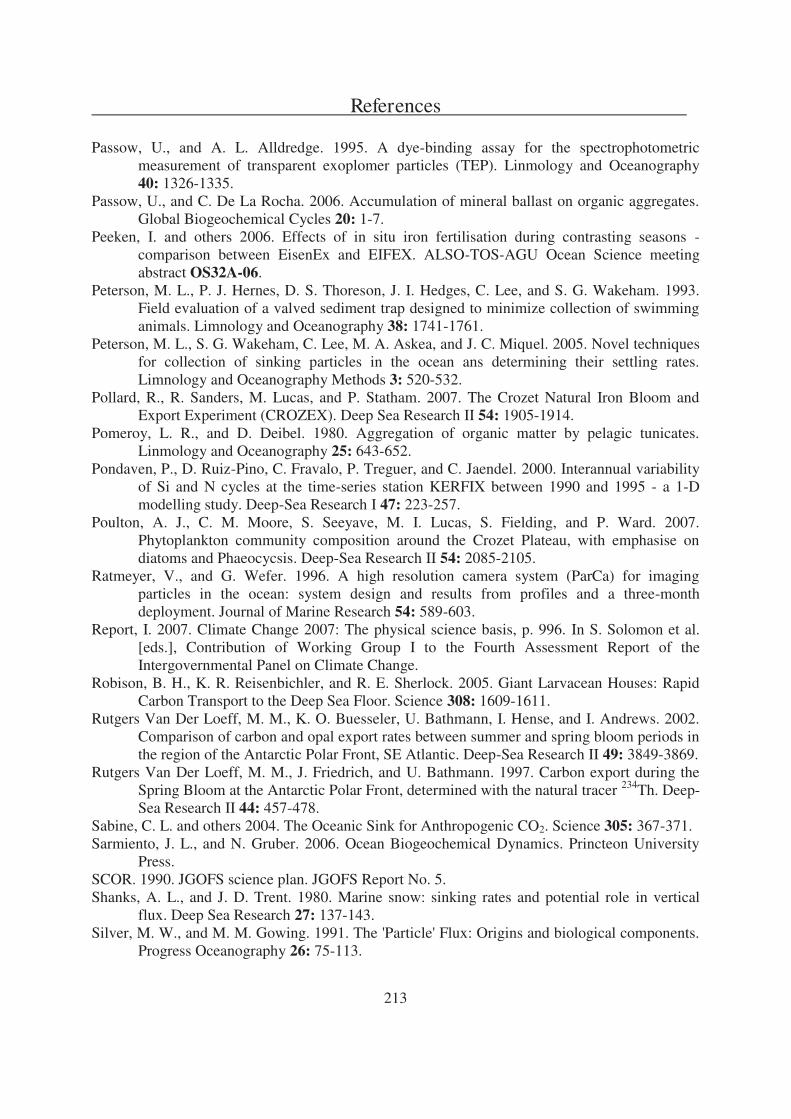
References
213
Passow, U., and A. L. Alldredge. 1995. A dye-binding assay for the spectrophotometric measurement of transparent exoplomer particles (TEP). Linmology and Oceanography 40: 1326-1335.
Passow, U., and C. De La Rocha. 2006. Accumulation of mineral ballast on organic aggregates. Global Biogeochemical Cycles 20: 1-7.
Peeken, I. and others 2006. Effects of in situ iron fertilisation during contrasting seasons - comparison between EisenEx and EIFEX. ALSO-TOS-AGU Ocean Science meeting abstract OS32A-06.
Peterson, M. L., P. J. Hernes, D. S. Thoreson, J. I. Hedges, C. Lee, and S. G. Wakeham. 1993. Field evaluation of a valved sediment trap designed to minimize collection of swimming animals. Limnology and Oceanography 38: 1741-1761.
Peterson, M. L., S. G. Wakeham, C. Lee, M. A. Askea, and J. C. Miquel. 2005. Novel techniques for collection of sinking particles in the ocean ans determining their settling rates. Limnology and Oceanography Methods 3: 520-532.
Pollard, R., R. Sanders, M. Lucas, and P. Statham. 2007. The Crozet Natural Iron Bloom and Export Experiment (CROZEX). Deep Sea Research II 54: 1905-1914.
Pomeroy, L. R., and D. Deibel. 1980. Aggregation of organic matter by pelagic tunicates. Linmology and Oceanography 25: 643-652.
Pondaven, P., D. Ruiz-Pino, C. Fravalo, P. Treguer, and C. Jaendel. 2000. Interannual variability of Si and N cycles at the time-series station KERFIX between 1990 and 1995 - a 1-D modelling study. Deep-Sea Research I 47: 223-257.
Poulton, A. J., C. M. Moore, S. Seeyave, M. I. Lucas, S. Fielding, and P. Ward. 2007. Phytoplankton community composition around the Crozet Plateau, with emphasise on diatoms and Phaeocycsis. Deep-Sea Research II 54: 2085-2105.
Ratmeyer, V., and G. Wefer. 1996. A high resolution camera system (ParCa) for imaging particles in the ocean: system design and results from profiles and a three-month deployment. Journal of Marine Research 54: 589-603.
Report, I. 2007. Climate Change 2007: The physical science basis, p. 996. In S. Solomon et al. [eds.], Contribution of Working Group I to the Fourth Assessment Report of the Intergovernmental Panel on Climate Change.
Robison, B. H., K. R. Reisenbichler, and R. E. Sherlock. 2005. Giant Larvacean Houses: Rapid Carbon Transport to the Deep Sea Floor. Science 308: 1609-1611.
Rutgers Van Der Loeff, M. M., K. O. Buesseler, U. Bathmann, I. Hense, and I. Andrews. 2002. Comparison of carbon and opal export rates between summer and spring bloom periods in the region of the Antarctic Polar Front, SE Atlantic. Deep-Sea Research II 49: 3849-3869.
Rutgers Van Der Loeff, M. M., J. Friedrich, and U. Bathmann. 1997. Carbon export during the Spring Bloom at the Antarctic Polar Front, determined with the natural tracer 234Th. Deep-Sea Research II 44: 457-478.
Sabine, C. L. and others 2004. The Oceanic Sink for Anthropogenic CO2. Science 305: 367-371. Sarmiento, J. L., and N. Gruber. 2006. Ocean Biogeochemical Dynamics. Princteon University
Press. SCOR. 1990. JGOFS science plan. JGOFS Report No. 5. Shanks, A. L., and J. D. Trent. 1980. Marine snow: sinking rates and potential role in vertical
flux. Deep Sea Research 27: 137-143. Silver, M. W., and M. M. Gowing. 1991. The 'Particle' Flux: Origins and biological components.
Progress Oceanography 26: 75-113.
References
214
Smetacek, V., and S. W. A. Naqvi. 2008. The next generation of iron fertiisation experiments in the Southern Ocean. Philosophical Transactions of the Royal Society London A. 366: 3947-3967.
Smetacek, V. and others 2010. Massive carbon flux to the deep sea from an iron-fertilized phytoplankton bloom in the Southern Ocean. Nature in prep.
Smith, W. O., R. F. Anderson, J. Keith Moore, L. A. Codispoti, and J. M. Morrison. 2000. The US Southern Ocean Joint Global Ocean Flux Study: an introduction to AESOPS. Deep Sea Research Part II: Topical Studies in Oceanography 47: 3073-3093.
Soltwedel, T. and others 2005. HAUSGARTEN Multidisciplinary Investigations at a Deep-Sea, Long-Term Observatory in the Arctic Ocean. Oceanography 18: 46-61.
Stanley, R. H. R., K. O. Buesseler, S. Manganini, D. K. Steinberg, and J. R. Valdes. 2004. A comparison of major and minor elemental fluxes collected using neutrally bouyant and surface-tethered traps. Deep-Sea Research I 51: 1387-1395.
Staresinic, N., G. Rowe, D. Shaughnessy, and A. J. Williams Iii. 1978. Measurement of the vertical flux of particulate organic matter with a free-drifting sediment trap. Limnology and Oceanography 23: 559-563.
Steinberg, D. K., J. S. Cope, S. E. Wilson, and T. Kobari. 2008. A comparison of mesopelagic mesozooplankton community structure in the subtropical and subarctic North Pacific Ocean. Deep Sea Research Part II: Topical Studies in Oceanography 55: 1615-1635.
Stemmann, L. and others 2008. Volume distribution for particles between 3.5 to 2000μm in the upper 200 m region of the South Pacific Gyre. Biogeosciences 5: 299-310.
Suess, E. 1980. Particulate organic carbon flux in the oceans - surface productivity and oxygen utilization. Nature 288: 260-263.
Sullivan, C. W., K. R. Arrigo, C. R. Mcclain, J. C. Comiso, and J. Firestone. 1993. Distributions of Phytoplankton Blooms in the Southern Ocean. Science 262.
Trull, T., and L. Armand. 2001. Insights into Southern Ocean carbon export from the d13C of particles and dissolved inorganic carbon during the SOIREE iron release experiment. Deep Sea Research II 48: 2655-2680.
Trull, T. W., S. G. Bray, S. J. Manganini, S. Honjo, and R. Francois. 2001. Moored sediment trap measurements of carbon export in the Subantarctic and Polar Frontal Zones of the Southern Ocean, south of Australia. Journal of Geophysical Research 106: 31/489-509.
Turner, J. T. 2002. Zooplankton fecal pellets, marine snow and sinking phytoplankton blooms. Aquatic Microbial Ecology 27: 57-102.
Tyrell, T., A. Merico, J. J. Waniek, C.-S. Wong, N. Metzl, and F. Whitney. 2005. Effect of seafloor depth and phytoplankton blooms in high nitrate low chlorophyll (HNLC) regions. Journal of Geophysical Research 110: 1-12.
Valdes, J. R., and J. F. Price. 2000. A neutrally bouyant, upper ocean sediment trap. Atmospheric and Oceanographic Technology 17: 62-68.
Volk, T., and M. I. Hoffert. 1985. Ocean carbon pumps: analysis of relative strengths and efficiencies in ocean-driven atmospheric CO2 changes. Geophysical Monographs 32: 99-110.
Waite, A. M., Ö. Gustafsson, O. Lindahl, and P. Tiselius. 2005. Linking ecosystem dynamics and biogeochemistry: Sinking fractionation of organic carbon in a Swedish fjord. Limnology and Oceanography 50: 658-671.
Waite, A. M., and S. D. Nodder. 2001. The effect of in situ iron addition on the sinking rates and export flux of Southern Ocean diatoms. Deep-Sea Research II 48: 2635-2654.
References
215
Waite, A. M., K. A. Safi, J. A. Hall, and S. D. Nodder. 2000. Mass sedimentation of picoplankton embedded in organic aggregates. Limnology and Oceanography 45: 87-97.
Websites: http://cafethorium.whoi.edu/website/projects/tzex.html http://www.awi.de/en/home/lohafex/ http://modis.gsfc.nasa.gov/ http://www-argo.ucsd.edu/ http://www.ifm-geomar.de/index.php?id=1241&L=1

216
217
Eidesstattliche Erklärung Gemäß §6(5) Nr. 1-3 der Promotionsordnung des Fachbereichs 2 Hiermit erkläre ich, dass ich die vorliegende Arbeit ohne unerlaubte fremde Hilfe angefertigt habe, keine anderen als die angegebenen Quellen und Hilfmittel benutzt und die den benutzten Werken wörtlich oder inhaltlich entnommenen Stellen als solche kenntlich gemacht habe. Bremen, den

218

219
Appendix 1

220
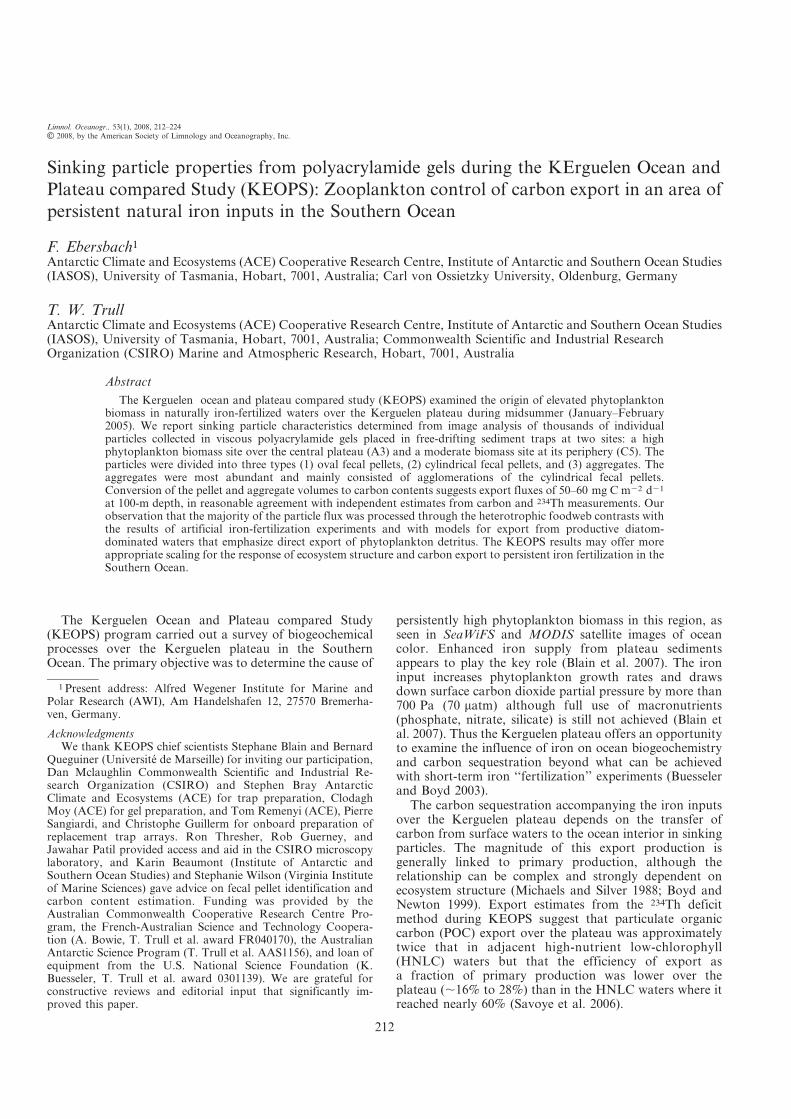
Sinking particle properties from polyacrylamide gels during the KErguelen Ocean and
Plateau compared Study (KEOPS): Zooplankton control of carbon export in an area of
persistent natural iron inputs in the Southern Ocean
F. Ebersbach1Antarctic Climate and Ecosystems (ACE) Cooperative Research Centre, Institute of Antarctic and Southern Ocean Studies(IASOS), University of Tasmania, Hobart, 7001, Australia; Carl von Ossietzky University, Oldenburg, Germany
T. W. TrullAntarctic Climate and Ecosystems (ACE) Cooperative Research Centre, Institute of Antarctic and Southern Ocean Studies(IASOS), University of Tasmania, Hobart, 7001, Australia; Commonwealth Scientific and Industrial ResearchOrganization (CSIRO) Marine and Atmospheric Research, Hobart, 7001, Australia
Abstract
The Kerguelen ocean and plateau compared study (KEOPS) examined the origin of elevated phytoplanktonbiomass in naturally iron-fertilized waters over the Kerguelen plateau during midsummer (January–February2005). We report sinking particle characteristics determined from image analysis of thousands of individualparticles collected in viscous polyacrylamide gels placed in free-drifting sediment traps at two sites: a highphytoplankton biomass site over the central plateau (A3) and a moderate biomass site at its periphery (C5). Theparticles were divided into three types (1) oval fecal pellets, (2) cylindrical fecal pellets, and (3) aggregates. Theaggregates were most abundant and mainly consisted of agglomerations of the cylindrical fecal pellets.Conversion of the pellet and aggregate volumes to carbon contents suggests export fluxes of 50–60 mg C m22 d21
at 100-m depth, in reasonable agreement with independent estimates from carbon and 234Th measurements. Ourobservation that the majority of the particle flux was processed through the heterotrophic foodweb contrasts withthe results of artificial iron-fertilization experiments and with models for export from productive diatom-dominated waters that emphasize direct export of phytoplankton detritus. The KEOPS results may offer moreappropriate scaling for the response of ecosystem structure and carbon export to persistent iron fertilization in theSouthern Ocean.
The Kerguelen Ocean and Plateau compared Study(KEOPS) program carried out a survey of biogeochemicalprocesses over the Kerguelen plateau in the SouthernOcean. The primary objective was to determine the cause of
persistently high phytoplankton biomass in this region, asseen in SeaWiFS and MODIS satellite images of oceancolor. Enhanced iron supply from plateau sedimentsappears to play the key role (Blain et al. 2007). The ironinput increases phytoplankton growth rates and drawsdown surface carbon dioxide partial pressure by more than700 Pa (70 matm) although full use of macronutrients(phosphate, nitrate, silicate) is still not achieved (Blain etal. 2007). Thus the Kerguelen plateau offers an opportunityto examine the influence of iron on ocean biogeochemistryand carbon sequestration beyond what can be achievedwith short-term iron ‘‘fertilization’’ experiments (Buesselerand Boyd 2003).
The carbon sequestration accompanying the iron inputsover the Kerguelen plateau depends on the transfer ofcarbon from surface waters to the ocean interior in sinkingparticles. The magnitude of this export production isgenerally linked to primary production, although therelationship can be complex and strongly dependent onecosystem structure (Michaels and Silver 1988; Boyd andNewton 1999). Export estimates from the 234Th deficitmethod during KEOPS suggest that particulate organiccarbon (POC) export over the plateau was approximatelytwice that in adjacent high-nutrient low-chlorophyll(HNLC) waters but that the efficiency of export asa fraction of primary production was lower over theplateau (,16% to 28%) than in the HNLC waters where itreached nearly 60% (Savoye et al. 2006).
1 Present address: Alfred Wegener Institute for Marine andPolar Research (AWI), Am Handelshafen 12, 27570 Bremerha-ven, Germany.
AcknowledgmentsWe thank KEOPS chief scientists Stephane Blain and Bernard
Queguiner (Universite de Marseille) for inviting our participation,Dan Mclaughlin Commonwealth Scientific and Industrial Re-search Organization (CSIRO) and Stephen Bray AntarcticClimate and Ecosystems (ACE) for trap preparation, ClodaghMoy (ACE) for gel preparation, and Tom Remenyi (ACE), PierreSangiardi, and Christophe Guillerm for onboard preparation ofreplacement trap arrays. Ron Thresher, Rob Guerney, andJawahar Patil provided access and aid in the CSIRO microscopylaboratory, and Karin Beaumont (Institute of Antarctic andSouthern Ocean Studies) and Stephanie Wilson (Virginia Instituteof Marine Sciences) gave advice on fecal pellet identification andcarbon content estimation. Funding was provided by theAustralian Commonwealth Cooperative Research Centre Pro-gram, the French-Australian Science and Technology Coopera-tion (A. Bowie, T. Trull et al. award FR040170), the AustralianAntarctic Science Program (T. Trull et al. AAS1156), and loan ofequipment from the U.S. National Science Foundation (K.Buesseler, T. Trull et al. award 0301139). We are grateful forconstructive reviews and editorial input that significantly im-proved this paper.
Limnol. Oceanogr., 53(1), 2008, 212–224
E 2008, by the American Society of Limnology and Oceanography, Inc.
212
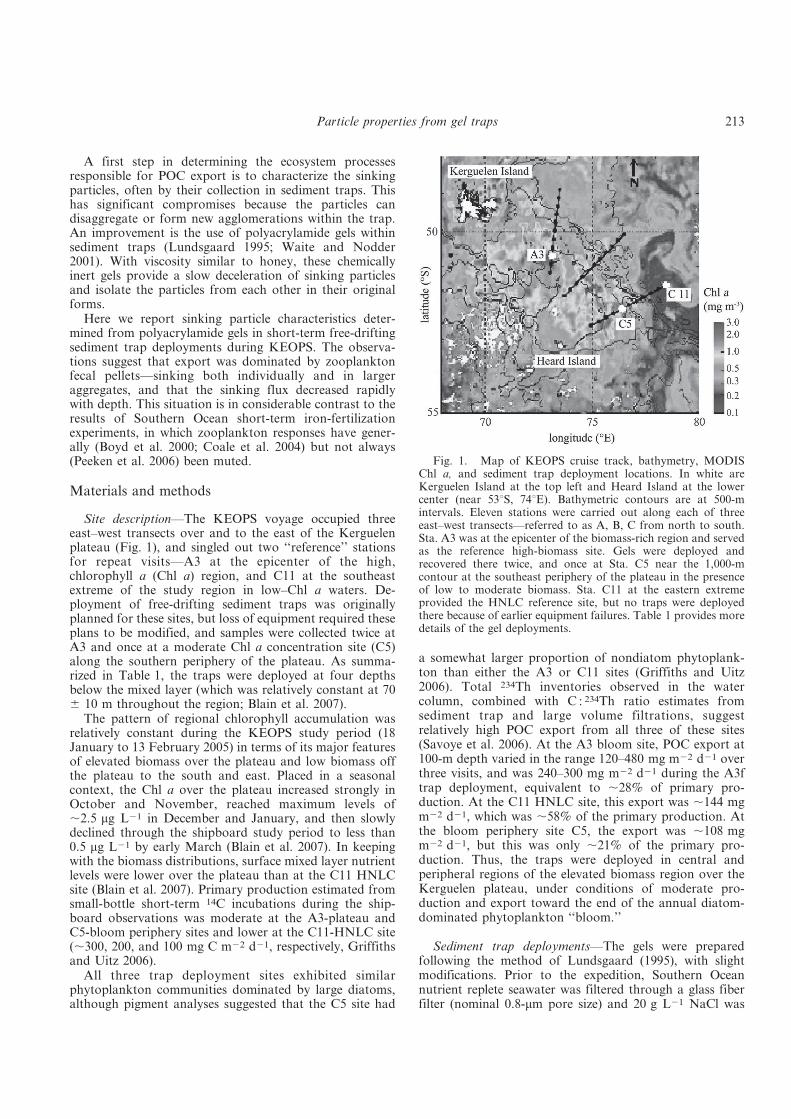
A first step in determining the ecosystem processesresponsible for POC export is to characterize the sinkingparticles, often by their collection in sediment traps. Thishas significant compromises because the particles candisaggregate or form new agglomerations within the trap.An improvement is the use of polyacrylamide gels withinsediment traps (Lundsgaard 1995; Waite and Nodder2001). With viscosity similar to honey, these chemicallyinert gels provide a slow deceleration of sinking particlesand isolate the particles from each other in their originalforms.
Here we report sinking particle characteristics deter-mined from polyacrylamide gels in short-term free-driftingsediment trap deployments during KEOPS. The observa-tions suggest that export was dominated by zooplanktonfecal pellets—sinking both individually and in largeraggregates, and that the sinking flux decreased rapidlywith depth. This situation is in considerable contrast to theresults of Southern Ocean short-term iron-fertilizationexperiments, in which zooplankton responses have gener-ally (Boyd et al. 2000; Coale et al. 2004) but not always(Peeken et al. 2006) been muted.
Materials and methods
Site description—The KEOPS voyage occupied threeeast–west transects over and to the east of the Kerguelenplateau (Fig. 1), and singled out two ‘‘reference’’ stationsfor repeat visits—A3 at the epicenter of the high,chlorophyll a (Chl a) region, and C11 at the southeastextreme of the study region in low–Chl a waters. De-ployment of free-drifting sediment traps was originallyplanned for these sites, but loss of equipment required theseplans to be modified, and samples were collected twice atA3 and once at a moderate Chl a concentration site (C5)along the southern periphery of the plateau. As summa-rized in Table 1, the traps were deployed at four depthsbelow the mixed layer (which was relatively constant at 706 10 m throughout the region; Blain et al. 2007).
The pattern of regional chlorophyll accumulation wasrelatively constant during the KEOPS study period (18January to 13 February 2005) in terms of its major featuresof elevated biomass over the plateau and low biomass offthe plateau to the south and east. Placed in a seasonalcontext, the Chl a over the plateau increased strongly inOctober and November, reached maximum levels of,2.5 mg L21 in December and January, and then slowlydeclined through the shipboard study period to less than0.5 mg L21 by early March (Blain et al. 2007). In keepingwith the biomass distributions, surface mixed layer nutrientlevels were lower over the plateau than at the C11 HNLCsite (Blain et al. 2007). Primary production estimated fromsmall-bottle short-term 14C incubations during the ship-board observations was moderate at the A3-plateau andC5-bloom periphery sites and lower at the C11-HNLC site(,300, 200, and 100 mg C m22 d21, respectively, Griffithsand Uitz 2006).
All three trap deployment sites exhibited similarphytoplankton communities dominated by large diatoms,although pigment analyses suggested that the C5 site had
a somewhat larger proportion of nondiatom phytoplank-ton than either the A3 or C11 sites (Griffiths and Uitz2006). Total 234Th inventories observed in the watercolumn, combined with C : 234Th ratio estimates fromsediment trap and large volume filtrations, suggestrelatively high POC export from all three of these sites(Savoye et al. 2006). At the A3 bloom site, POC export at100-m depth varied in the range 120–480 mg m22 d21 overthree visits, and was 240–300 mg m22 d21 during the A3ftrap deployment, equivalent to ,28% of primary pro-duction. At the C11 HNLC site, this export was ,144 mgm22 d21, which was ,58% of the primary production. Atthe bloom periphery site C5, the export was ,108 mgm22 d21, but this was only ,21% of the primary pro-duction. Thus, the traps were deployed in central andperipheral regions of the elevated biomass region over theKerguelen plateau, under conditions of moderate pro-duction and export toward the end of the annual diatom-dominated phytoplankton ‘‘bloom.’’
Sediment trap deployments—The gels were preparedfollowing the method of Lundsgaard (1995), with slightmodifications. Prior to the expedition, Southern Oceannutrient replete seawater was filtered through a glass fiberfilter (nominal 0.8-mm pore size) and 20 g L21 NaCl was
Fig. 1. Map of KEOPS cruise track, bathymetry, MODISChl a, and sediment trap deployment locations. In white areKerguelen Island at the top left and Heard Island at the lowercenter (near 53uS, 74uE). Bathymetric contours are at 500-mintervals. Eleven stations were carried out along each of threeeast–west transects—referred to as A, B, C from north to south.Sta. A3 was at the epicenter of the biomass-rich region and servedas the reference high-biomass site. Gels were deployed andrecovered there twice, and once at Sta. C5 near the 1,000-mcontour at the southeast periphery of the plateau in the presenceof low to moderate biomass. Sta. C11 at the eastern extremeprovided the HNLC reference site, but no traps were deployedthere because of earlier equipment failures. Table 1 provides moredetails of the gel deployments.
Particle properties from gel traps 213
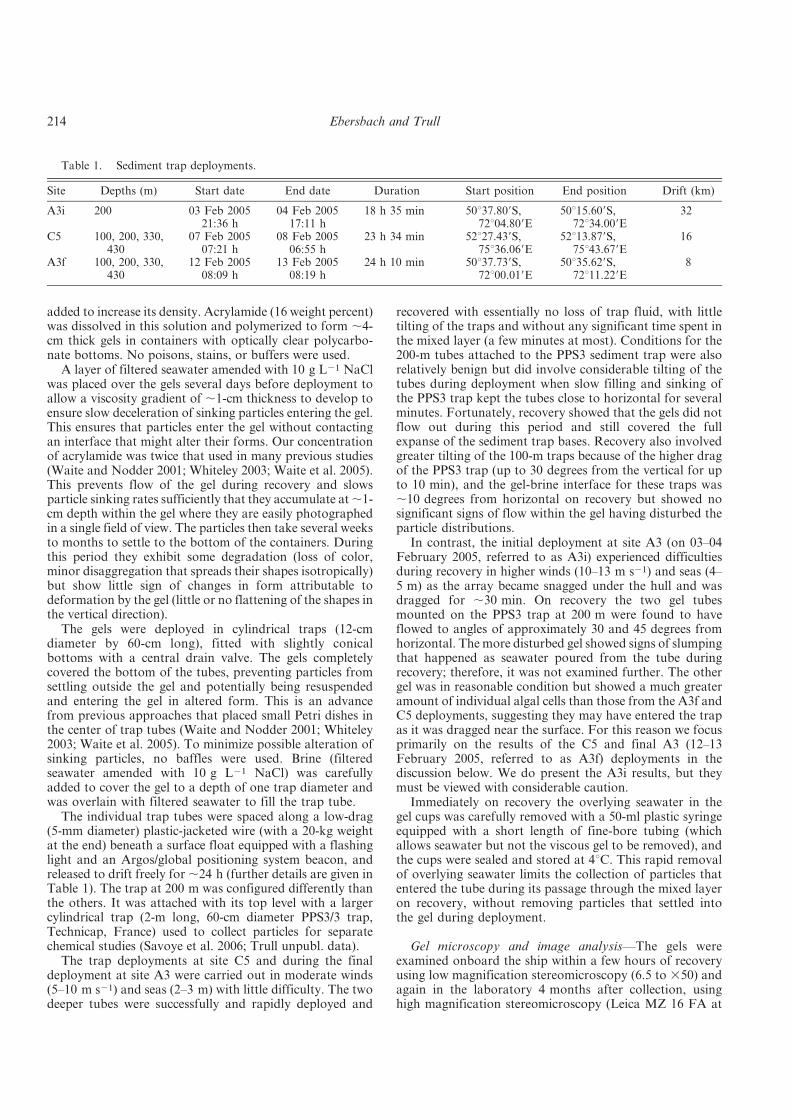
added to increase its density. Acrylamide (16 weight percent)was dissolved in this solution and polymerized to form ,4-cm thick gels in containers with optically clear polycarbo-nate bottoms. No poisons, stains, or buffers were used.
A layer of filtered seawater amended with 10 g L21 NaClwas placed over the gels several days before deployment toallow a viscosity gradient of ,1-cm thickness to develop toensure slow deceleration of sinking particles entering the gel.This ensures that particles enter the gel without contactingan interface that might alter their forms. Our concentrationof acrylamide was twice that used in many previous studies(Waite and Nodder 2001; Whiteley 2003; Waite et al. 2005).This prevents flow of the gel during recovery and slowsparticle sinking rates sufficiently that they accumulate at,1-cm depth within the gel where they are easily photographedin a single field of view. The particles then take several weeksto months to settle to the bottom of the containers. Duringthis period they exhibit some degradation (loss of color,minor disaggregation that spreads their shapes isotropically)but show little sign of changes in form attributable todeformation by the gel (little or no flattening of the shapes inthe vertical direction).
The gels were deployed in cylindrical traps (12-cmdiameter by 60-cm long), fitted with slightly conicalbottoms with a central drain valve. The gels completelycovered the bottom of the tubes, preventing particles fromsettling outside the gel and potentially being resuspendedand entering the gel in altered form. This is an advancefrom previous approaches that placed small Petri dishes inthe center of trap tubes (Waite and Nodder 2001; Whiteley2003; Waite et al. 2005). To minimize possible alteration ofsinking particles, no baffles were used. Brine (filteredseawater amended with 10 g L21 NaCl) was carefullyadded to cover the gel to a depth of one trap diameter andwas overlain with filtered seawater to fill the trap tube.
The individual trap tubes were spaced along a low-drag(5-mm diameter) plastic-jacketed wire (with a 20-kg weightat the end) beneath a surface float equipped with a flashinglight and an Argos/global positioning system beacon, andreleased to drift freely for,24 h (further details are given inTable 1). The trap at 200 m was configured differently thanthe others. It was attached with its top level with a largercylindrical trap (2-m long, 60-cm diameter PPS3/3 trap,Technicap, France) used to collect particles for separatechemical studies (Savoye et al. 2006; Trull unpubl. data).
The trap deployments at site C5 and during the finaldeployment at site A3 were carried out in moderate winds(5–10 m s21) and seas (2–3 m) with little difficulty. The twodeeper tubes were successfully and rapidly deployed and
recovered with essentially no loss of trap fluid, with littletilting of the traps and without any significant time spent inthe mixed layer (a few minutes at most). Conditions for the200-m tubes attached to the PPS3 sediment trap were alsorelatively benign but did involve considerable tilting of thetubes during deployment when slow filling and sinking ofthe PPS3 trap kept the tubes close to horizontal for severalminutes. Fortunately, recovery showed that the gels did notflow out during this period and still covered the fullexpanse of the sediment trap bases. Recovery also involvedgreater tilting of the 100-m traps because of the higher dragof the PPS3 trap (up to 30 degrees from the vertical for upto 10 min), and the gel-brine interface for these traps was,10 degrees from horizontal on recovery but showed nosignificant signs of flow within the gel having disturbed theparticle distributions.
In contrast, the initial deployment at site A3 (on 03–04February 2005, referred to as A3i) experienced difficultiesduring recovery in higher winds (10–13 m s21) and seas (4–5 m) as the array became snagged under the hull and wasdragged for ,30 min. On recovery the two gel tubesmounted on the PPS3 trap at 200 m were found to haveflowed to angles of approximately 30 and 45 degrees fromhorizontal. Themore disturbed gel showed signs of slumpingthat happened as seawater poured from the tube duringrecovery; therefore, it was not examined further. The othergel was in reasonable condition but showed a much greateramount of individual algal cells than those from the A3f andC5 deployments, suggesting they may have entered the trapas it was dragged near the surface. For this reason we focusprimarily on the results of the C5 and final A3 (12–13February 2005, referred to as A3f) deployments in thediscussion below. We do present the A3i results, but theymust be viewed with considerable caution.
Immediately on recovery the overlying seawater in thegel cups was carefully removed with a 50-ml plastic syringeequipped with a short length of fine-bore tubing (whichallows seawater but not the viscous gel to be removed), andthe cups were sealed and stored at 4uC. This rapid removalof overlying seawater limits the collection of particles thatentered the tube during its passage through the mixed layeron recovery, without removing particles that settled intothe gel during deployment.
Gel microscopy and image analysis—The gels wereexamined onboard the ship within a few hours of recoveryusing low magnification stereomicroscopy (6.5 to 350) andagain in the laboratory 4 months after collection, usinghigh magnification stereomicroscopy (Leica MZ 16 FA at
Table 1. Sediment trap deployments.
Site Depths (m) Start date End date Duration Start position End position Drift (km)
A3i 200 03 Feb 200521:36 h
04 Feb 200517:11 h
18 h 35 min 50u37.809S,72u04.809E
50u15.609S,72u34.009E
32
C5 100, 200, 330,430
07 Feb 200507:21 h
08 Feb 200506:55 h
23 h 34 min 52u27.439S,75u36.069E
52u13.879S,75u43.679E
16
A3f 100, 200, 330,430
12 Feb 200508:09 h
13 Feb 200508:19 h
24 h 10 min 50u37.739S,72u00.019E
50u35.629S,72u11.229E
8
214 Ebersbach and Trull
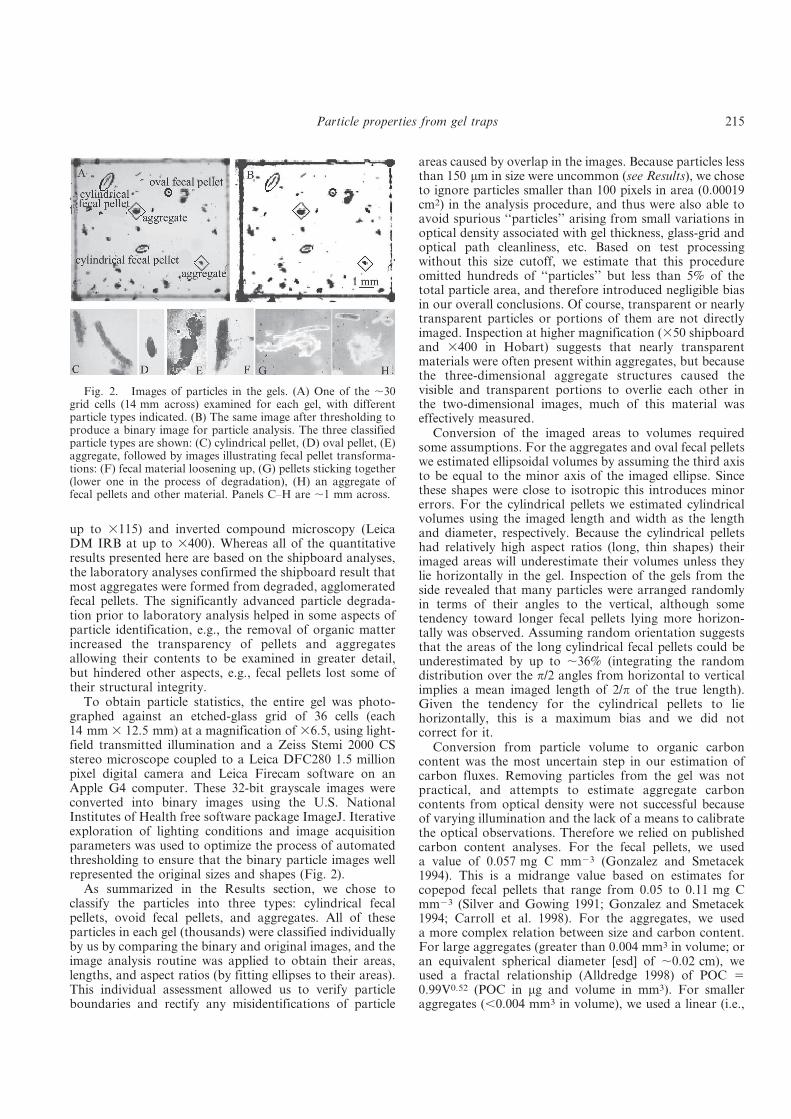
up to 3115) and inverted compound microscopy (LeicaDM IRB at up to 3400). Whereas all of the quantitativeresults presented here are based on the shipboard analyses,the laboratory analyses confirmed the shipboard result thatmost aggregates were formed from degraded, agglomeratedfecal pellets. The significantly advanced particle degrada-tion prior to laboratory analysis helped in some aspects ofparticle identification, e.g., the removal of organic matterincreased the transparency of pellets and aggregatesallowing their contents to be examined in greater detail,but hindered other aspects, e.g., fecal pellets lost some oftheir structural integrity.
To obtain particle statistics, the entire gel was photo-graphed against an etched-glass grid of 36 cells (each14 mm 3 12.5 mm) at a magnification of 36.5, using light-field transmitted illumination and a Zeiss Stemi 2000 CSstereo microscope coupled to a Leica DFC280 1.5 millionpixel digital camera and Leica Firecam software on anApple G4 computer. These 32-bit grayscale images wereconverted into binary images using the U.S. NationalInstitutes of Health free software package ImageJ. Iterativeexploration of lighting conditions and image acquisitionparameters was used to optimize the process of automatedthresholding to ensure that the binary particle images wellrepresented the original sizes and shapes (Fig. 2).
As summarized in the Results section, we chose toclassify the particles into three types: cylindrical fecalpellets, ovoid fecal pellets, and aggregates. All of theseparticles in each gel (thousands) were classified individuallyby us by comparing the binary and original images, and theimage analysis routine was applied to obtain their areas,lengths, and aspect ratios (by fitting ellipses to their areas).This individual assessment allowed us to verify particleboundaries and rectify any misidentifications of particle
areas caused by overlap in the images. Because particles lessthan 150 mm in size were uncommon (see Results), we choseto ignore particles smaller than 100 pixels in area (0.00019cm2) in the analysis procedure, and thus were also able toavoid spurious ‘‘particles’’ arising from small variations inoptical density associated with gel thickness, glass-grid andoptical path cleanliness, etc. Based on test processingwithout this size cutoff, we estimate that this procedureomitted hundreds of ‘‘particles’’ but less than 5% of thetotal particle area, and therefore introduced negligible biasin our overall conclusions. Of course, transparent or nearlytransparent particles or portions of them are not directlyimaged. Inspection at higher magnification (350 shipboardand 3400 in Hobart) suggests that nearly transparentmaterials were often present within aggregates, but becausethe three-dimensional aggregate structures caused thevisible and transparent portions to overlie each other inthe two-dimensional images, much of this material waseffectively measured.
Conversion of the imaged areas to volumes requiredsome assumptions. For the aggregates and oval fecal pelletswe estimated ellipsoidal volumes by assuming the third axisto be equal to the minor axis of the imaged ellipse. Sincethese shapes were close to isotropic this introduces minorerrors. For the cylindrical pellets we estimated cylindricalvolumes using the imaged length and width as the lengthand diameter, respectively. Because the cylindrical pelletshad relatively high aspect ratios (long, thin shapes) theirimaged areas will underestimate their volumes unless theylie horizontally in the gel. Inspection of the gels from theside revealed that many particles were arranged randomlyin terms of their angles to the vertical, although sometendency toward longer fecal pellets lying more horizon-tally was observed. Assuming random orientation suggeststhat the areas of the long cylindrical fecal pellets could beunderestimated by up to ,36% (integrating the randomdistribution over the p/2 angles from horizontal to verticalimplies a mean imaged length of 2/p of the true length).Given the tendency for the cylindrical pellets to liehorizontally, this is a maximum bias and we did notcorrect for it.
Conversion from particle volume to organic carboncontent was the most uncertain step in our estimation ofcarbon fluxes. Removing particles from the gel was notpractical, and attempts to estimate aggregate carboncontents from optical density were not successful becauseof varying illumination and the lack of a means to calibratethe optical observations. Therefore we relied on publishedcarbon content analyses. For the fecal pellets, we useda value of 0.057 mg C mm23 (Gonzalez and Smetacek1994). This is a midrange value based on estimates forcopepod fecal pellets that range from 0.05 to 0.11 mg Cmm23 (Silver and Gowing 1991; Gonzalez and Smetacek1994; Carroll et al. 1998). For the aggregates, we useda more complex relation between size and carbon content.For large aggregates (greater than 0.004 mm3 in volume; oran equivalent spherical diameter [esd] of ,0.02 cm), weused a fractal relationship (Alldredge 1998) of POC 5
0.99V0.52 (POC in mg and volume in mm3). For smalleraggregates (,0.004 mm3 in volume), we used a linear (i.e.,
Fig. 2. Images of particles in the gels. (A) One of the ,30grid cells (14 mm across) examined for each gel, with differentparticle types indicated. (B) The same image after thresholding toproduce a binary image for particle analysis. The three classifiedparticle types are shown: (C) cylindrical pellet, (D) oval pellet, (E)aggregate, followed by images illustrating fecal pellet transforma-tions: (F) fecal material loosening up, (G) pellets sticking together(lower one in the process of degradation), (H) an aggregate offecal pellets and other material. Panels C–H are ,1 mm across.
Particle properties from gel traps 215
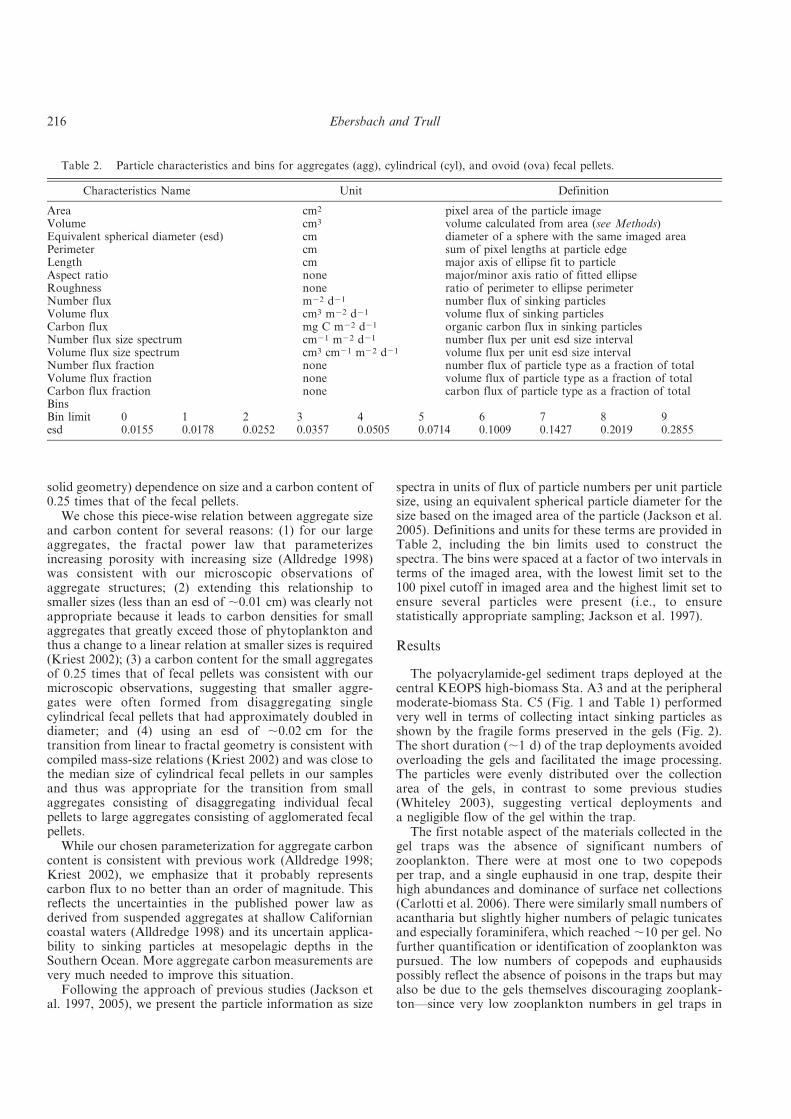
solid geometry) dependence on size and a carbon content of0.25 times that of the fecal pellets.
We chose this piece-wise relation between aggregate sizeand carbon content for several reasons: (1) for our largeaggregates, the fractal power law that parameterizesincreasing porosity with increasing size (Alldredge 1998)was consistent with our microscopic observations ofaggregate structures; (2) extending this relationship tosmaller sizes (less than an esd of ,0.01 cm) was clearly notappropriate because it leads to carbon densities for smallaggregates that greatly exceed those of phytoplankton andthus a change to a linear relation at smaller sizes is required(Kriest 2002); (3) a carbon content for the small aggregatesof 0.25 times that of fecal pellets was consistent with ourmicroscopic observations, suggesting that smaller aggre-gates were often formed from disaggregating singlecylindrical fecal pellets that had approximately doubled indiameter; and (4) using an esd of ,0.02 cm for thetransition from linear to fractal geometry is consistent withcompiled mass-size relations (Kriest 2002) and was close tothe median size of cylindrical fecal pellets in our samplesand thus was appropriate for the transition from smallaggregates consisting of disaggregating individual fecalpellets to large aggregates consisting of agglomerated fecalpellets.
While our chosen parameterization for aggregate carboncontent is consistent with previous work (Alldredge 1998;Kriest 2002), we emphasize that it probably representscarbon flux to no better than an order of magnitude. Thisreflects the uncertainties in the published power law asderived from suspended aggregates at shallow Californiancoastal waters (Alldredge 1998) and its uncertain applica-bility to sinking particles at mesopelagic depths in theSouthern Ocean. More aggregate carbon measurements arevery much needed to improve this situation.
Following the approach of previous studies (Jackson etal. 1997, 2005), we present the particle information as size
spectra in units of flux of particle numbers per unit particlesize, using an equivalent spherical particle diameter for thesize based on the imaged area of the particle (Jackson et al.2005). Definitions and units for these terms are provided inTable 2, including the bin limits used to construct thespectra. The bins were spaced at a factor of two intervals interms of the imaged area, with the lowest limit set to the100 pixel cutoff in imaged area and the highest limit set toensure several particles were present (i.e., to ensurestatistically appropriate sampling; Jackson et al. 1997).
Results
The polyacrylamide-gel sediment traps deployed at thecentral KEOPS high-biomass Sta. A3 and at the peripheralmoderate-biomass Sta. C5 (Fig. 1 and Table 1) performedvery well in terms of collecting intact sinking particles asshown by the fragile forms preserved in the gels (Fig. 2).The short duration (,1 d) of the trap deployments avoidedoverloading the gels and facilitated the image processing.The particles were evenly distributed over the collectionarea of the gels, in contrast to some previous studies(Whiteley 2003), suggesting vertical deployments anda negligible flow of the gel within the trap.
The first notable aspect of the materials collected in thegel traps was the absence of significant numbers ofzooplankton. There were at most one to two copepodsper trap, and a single euphausid in one trap, despite theirhigh abundances and dominance of surface net collections(Carlotti et al. 2006). There were similarly small numbers ofacantharia but slightly higher numbers of pelagic tunicatesand especially foraminifera, which reached ,10 per gel. Nofurther quantification or identification of zooplankton waspursued. The low numbers of copepods and euphausidspossibly reflect the absence of poisons in the traps but mayalso be due to the gels themselves discouraging zooplank-ton—since very low zooplankton numbers in gel traps in
Table 2. Particle characteristics and bins for aggregates (agg), cylindrical (cyl), and ovoid (ova) fecal pellets.
Characteristics Name Unit Definition
Area cm2 pixel area of the particle imageVolume cm3 volume calculated from area (see Methods)Equivalent spherical diameter (esd) cm diameter of a sphere with the same imaged areaPerimeter cm sum of pixel lengths at particle edgeLength cm major axis of ellipse fit to particleAspect ratio none major/minor axis ratio of fitted ellipseRoughness none ratio of perimeter to ellipse perimeterNumber flux m22 d21 number flux of sinking particlesVolume flux cm3 m22 d21 volume flux of sinking particlesCarbon flux mg C m22 d21 organic carbon flux in sinking particlesNumber flux size spectrum cm21 m22 d21 number flux per unit esd size intervalVolume flux size spectrum cm3 cm21 m22 d21 volume flux per unit esd size intervalNumber flux fraction none number flux of particle type as a fraction of totalVolume flux fraction none volume flux of particle type as a fraction of totalCarbon flux fraction none carbon flux of particle type as a fraction of totalBinsBin limit 0 1 2 3 4 5 6 7 8 9esd 0.0155 0.0178 0.0252 0.0357 0.0505 0.0714 0.1009 0.1427 0.2019 0.2855
216 Ebersbach and Trull
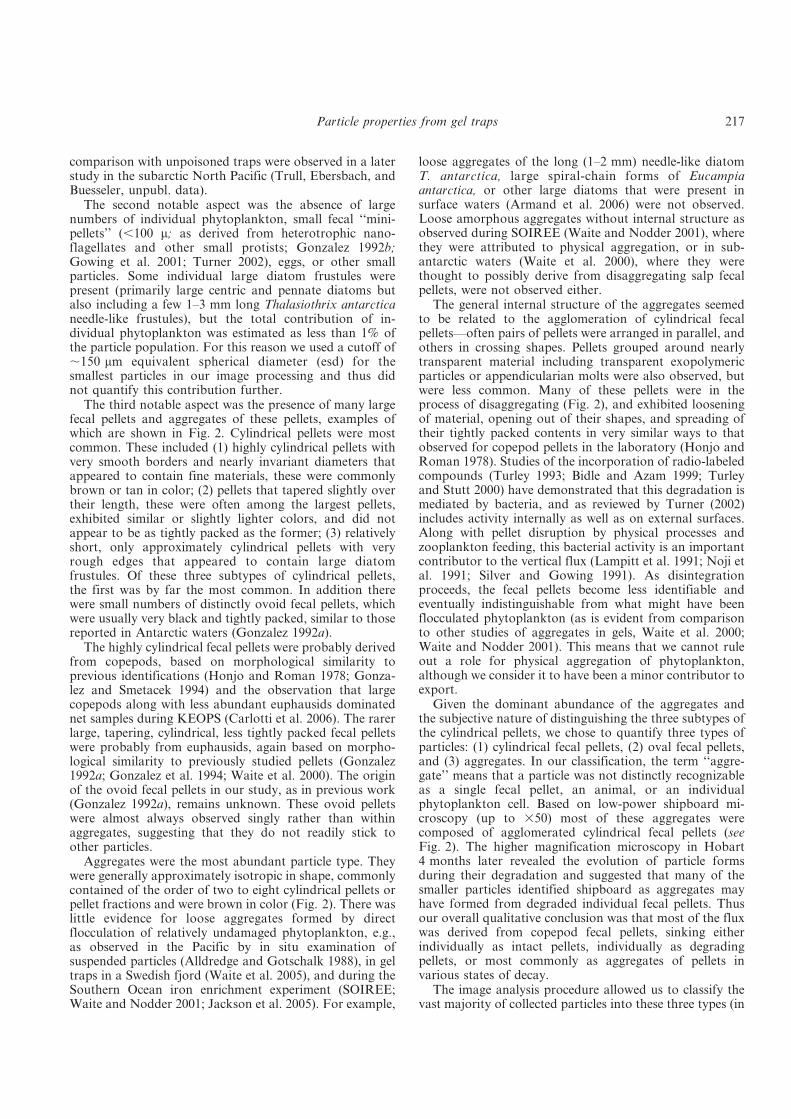
comparison with unpoisoned traps were observed in a laterstudy in the subarctic North Pacific (Trull, Ebersbach, andBuesseler, unpubl. data).
The second notable aspect was the absence of largenumbers of individual phytoplankton, small fecal ‘‘mini-pellets’’ (,100 m; as derived from heterotrophic nano-flagellates and other small protists; Gonzalez 1992b;Gowing et al. 2001; Turner 2002), eggs, or other smallparticles. Some individual large diatom frustules werepresent (primarily large centric and pennate diatoms butalso including a few 1–3 mm long Thalasiothrix antarcticaneedle-like frustules), but the total contribution of in-dividual phytoplankton was estimated as less than 1% ofthe particle population. For this reason we used a cutoff of,150 mm equivalent spherical diameter (esd) for thesmallest particles in our image processing and thus didnot quantify this contribution further.
The third notable aspect was the presence of many largefecal pellets and aggregates of these pellets, examples ofwhich are shown in Fig. 2. Cylindrical pellets were mostcommon. These included (1) highly cylindrical pellets withvery smooth borders and nearly invariant diameters thatappeared to contain fine materials, these were commonlybrown or tan in color; (2) pellets that tapered slightly overtheir length, these were often among the largest pellets,exhibited similar or slightly lighter colors, and did notappear to be as tightly packed as the former; (3) relativelyshort, only approximately cylindrical pellets with veryrough edges that appeared to contain large diatomfrustules. Of these three subtypes of cylindrical pellets,the first was by far the most common. In addition therewere small numbers of distinctly ovoid fecal pellets, whichwere usually very black and tightly packed, similar to thosereported in Antarctic waters (Gonzalez 1992a).
The highly cylindrical fecal pellets were probably derivedfrom copepods, based on morphological similarity toprevious identifications (Honjo and Roman 1978; Gonza-lez and Smetacek 1994) and the observation that largecopepods along with less abundant euphausids dominatednet samples during KEOPS (Carlotti et al. 2006). The rarerlarge, tapering, cylindrical, less tightly packed fecal pelletswere probably from euphausids, again based on morpho-logical similarity to previously studied pellets (Gonzalez1992a; Gonzalez et al. 1994; Waite et al. 2000). The originof the ovoid fecal pellets in our study, as in previous work(Gonzalez 1992a), remains unknown. These ovoid pelletswere almost always observed singly rather than withinaggregates, suggesting that they do not readily stick toother particles.
Aggregates were the most abundant particle type. Theywere generally approximately isotropic in shape, commonlycontained of the order of two to eight cylindrical pellets orpellet fractions and were brown in color (Fig. 2). There waslittle evidence for loose aggregates formed by directflocculation of relatively undamaged phytoplankton, e.g.,as observed in the Pacific by in situ examination ofsuspended particles (Alldredge and Gotschalk 1988), in geltraps in a Swedish fjord (Waite et al. 2005), and during theSouthern Ocean iron enrichment experiment (SOIREE;Waite and Nodder 2001; Jackson et al. 2005). For example,
loose aggregates of the long (1–2 mm) needle-like diatomT. antarctica, large spiral-chain forms of Eucampiaantarctica, or other large diatoms that were present insurface waters (Armand et al. 2006) were not observed.Loose amorphous aggregates without internal structure asobserved during SOIREE (Waite and Nodder 2001), wherethey were attributed to physical aggregation, or in sub-antarctic waters (Waite et al. 2000), where they werethought to possibly derive from disaggregating salp fecalpellets, were not observed either.
The general internal structure of the aggregates seemedto be related to the agglomeration of cylindrical fecalpellets—often pairs of pellets were arranged in parallel, andothers in crossing shapes. Pellets grouped around nearlytransparent material including transparent exopolymericparticles or appendicularian molts were also observed, butwere less common. Many of these pellets were in theprocess of disaggregating (Fig. 2), and exhibited looseningof material, opening out of their shapes, and spreading oftheir tightly packed contents in very similar ways to thatobserved for copepod pellets in the laboratory (Honjo andRoman 1978). Studies of the incorporation of radio-labeledcompounds (Turley 1993; Bidle and Azam 1999; Turleyand Stutt 2000) have demonstrated that this degradation ismediated by bacteria, and as reviewed by Turner (2002)includes activity internally as well as on external surfaces.Along with pellet disruption by physical processes andzooplankton feeding, this bacterial activity is an importantcontributor to the vertical flux (Lampitt et al. 1991; Noji etal. 1991; Silver and Gowing 1991). As disintegrationproceeds, the fecal pellets become less identifiable andeventually indistinguishable from what might have beenflocculated phytoplankton (as is evident from comparisonto other studies of aggregates in gels, Waite et al. 2000;Waite and Nodder 2001). This means that we cannot ruleout a role for physical aggregation of phytoplankton,although we consider it to have been a minor contributor toexport.
Given the dominant abundance of the aggregates andthe subjective nature of distinguishing the three subtypes ofthe cylindrical pellets, we chose to quantify three types ofparticles: (1) cylindrical fecal pellets, (2) oval fecal pellets,and (3) aggregates. In our classification, the term ‘‘aggre-gate’’ means that a particle was not distinctly recognizableas a single fecal pellet, an animal, or an individualphytoplankton cell. Based on low-power shipboard mi-croscopy (up to 350) most of these aggregates werecomposed of agglomerated cylindrical fecal pellets (seeFig. 2). The higher magnification microscopy in Hobart4 months later revealed the evolution of particle formsduring their degradation and suggested that many of thesmaller particles identified shipboard as aggregates mayhave formed from degraded individual fecal pellets. Thusour overall qualitative conclusion was that most of the fluxwas derived from copepod fecal pellets, sinking eitherindividually as intact pellets, individually as degradingpellets, or most commonly as aggregates of pellets invarious states of decay.
The image analysis procedure allowed us to classify thevast majority of collected particles into these three types (in
Particle properties from gel traps 217
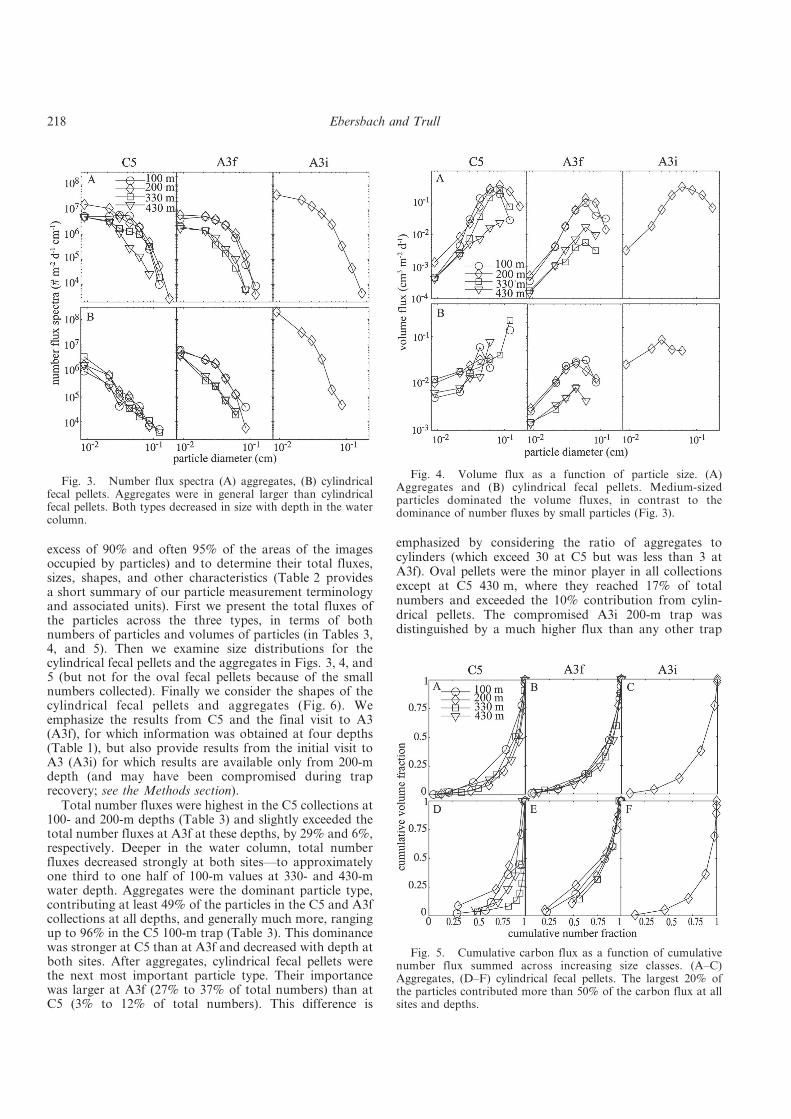
excess of 90% and often 95% of the areas of the imagesoccupied by particles) and to determine their total fluxes,sizes, shapes, and other characteristics (Table 2 providesa short summary of our particle measurement terminologyand associated units). First we present the total fluxes ofthe particles across the three types, in terms of bothnumbers of particles and volumes of particles (in Tables 3,4, and 5). Then we examine size distributions for thecylindrical fecal pellets and the aggregates in Figs. 3, 4, and5 (but not for the oval fecal pellets because of the smallnumbers collected). Finally we consider the shapes of thecylindrical fecal pellets and aggregates (Fig. 6). Weemphasize the results from C5 and the final visit to A3(A3f), for which information was obtained at four depths(Table 1), but also provide results from the initial visit toA3 (A3i) for which results are available only from 200-mdepth (and may have been compromised during traprecovery; see the Methods section).
Total number fluxes were highest in the C5 collections at100- and 200-m depths (Table 3) and slightly exceeded thetotal number fluxes at A3f at these depths, by 29% and 6%,respectively. Deeper in the water column, total numberfluxes decreased strongly at both sites—to approximatelyone third to one half of 100-m values at 330- and 430-mwater depth. Aggregates were the dominant particle type,contributing at least 49% of the particles in the C5 and A3fcollections at all depths, and generally much more, rangingup to 96% in the C5 100-m trap (Table 3). This dominancewas stronger at C5 than at A3f and decreased with depth atboth sites. After aggregates, cylindrical fecal pellets werethe next most important particle type. Their importancewas larger at A3f (27% to 37% of total numbers) than atC5 (3% to 12% of total numbers). This difference is
emphasized by considering the ratio of aggregates tocylinders (which exceed 30 at C5 but was less than 3 atA3f). Oval pellets were the minor player in all collectionsexcept at C5 430 m, where they reached 17% of totalnumbers and exceeded the 10% contribution from cylin-drical pellets. The compromised A3i 200-m trap wasdistinguished by a much higher flux than any other trap
Fig. 3. Number flux spectra (A) aggregates, (B) cylindricalfecal pellets. Aggregates were in general larger than cylindricalfecal pellets. Both types decreased in size with depth in the watercolumn.
Fig. 4. Volume flux as a function of particle size. (A)Aggregates and (B) cylindrical fecal pellets. Medium-sizedparticles dominated the volume fluxes, in contrast to thedominance of number fluxes by small particles (Fig. 3).
Fig. 5. Cumulative carbon flux as a function of cumulativenumber flux summed across increasing size classes. (A–C)Aggregates, (D–F) cylindrical fecal pellets. The largest 20% ofthe particles contributed more than 50% of the carbon flux at allsites and depths.
218 Ebersbach and Trull
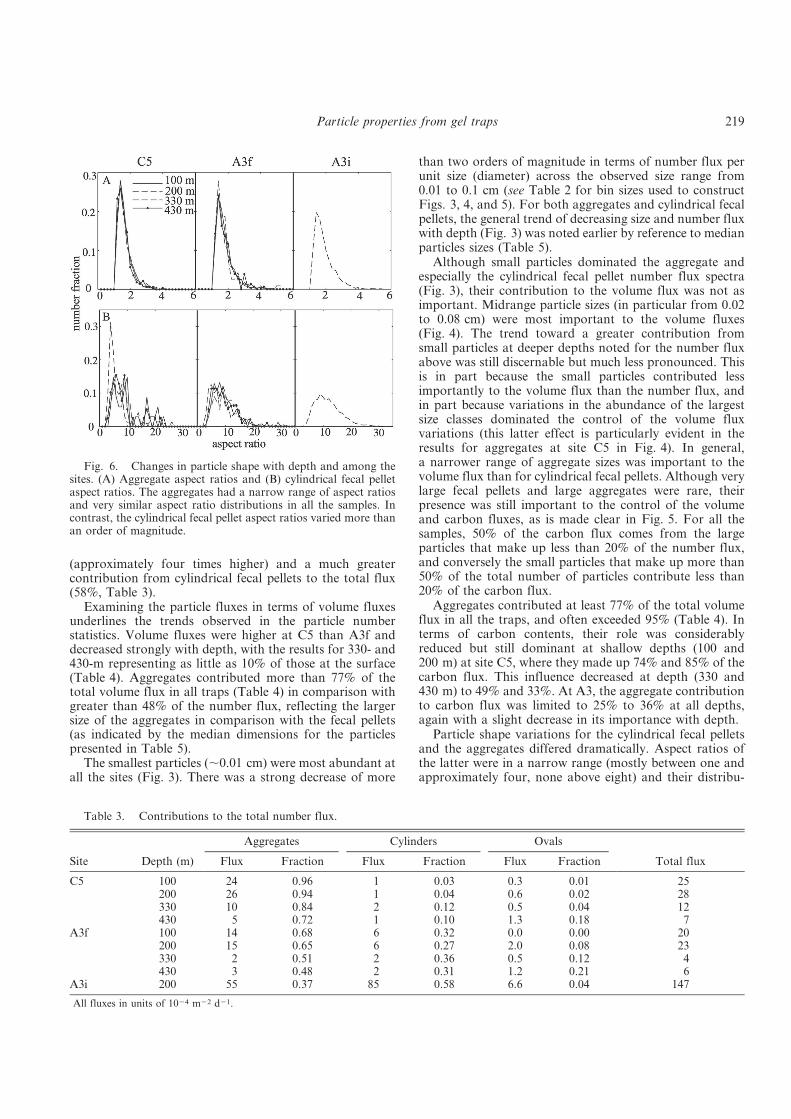
(approximately four times higher) and a much greatercontribution from cylindrical fecal pellets to the total flux(58%, Table 3).
Examining the particle fluxes in terms of volume fluxesunderlines the trends observed in the particle numberstatistics. Volume fluxes were higher at C5 than A3f anddecreased strongly with depth, with the results for 330- and430-m representing as little as 10% of those at the surface(Table 4). Aggregates contributed more than 77% of thetotal volume flux in all traps (Table 4) in comparison withgreater than 48% of the number flux, reflecting the largersize of the aggregates in comparison with the fecal pellets(as indicated by the median dimensions for the particlespresented in Table 5).
The smallest particles (,0.01 cm) were most abundant atall the sites (Fig. 3). There was a strong decrease of more
than two orders of magnitude in terms of number flux perunit size (diameter) across the observed size range from0.01 to 0.1 cm (see Table 2 for bin sizes used to constructFigs. 3, 4, and 5). For both aggregates and cylindrical fecalpellets, the general trend of decreasing size and number fluxwith depth (Fig. 3) was noted earlier by reference to medianparticles sizes (Table 5).
Although small particles dominated the aggregate andespecially the cylindrical fecal pellet number flux spectra(Fig. 3), their contribution to the volume flux was not asimportant. Midrange particle sizes (in particular from 0.02to 0.08 cm) were most important to the volume fluxes(Fig. 4). The trend toward a greater contribution fromsmall particles at deeper depths noted for the number fluxabove was still discernable but much less pronounced. Thisis in part because the small particles contributed lessimportantly to the volume flux than the number flux, andin part because variations in the abundance of the largestsize classes dominated the control of the volume fluxvariations (this latter effect is particularly evident in theresults for aggregates at site C5 in Fig. 4). In general,a narrower range of aggregate sizes was important to thevolume flux than for cylindrical fecal pellets. Although verylarge fecal pellets and large aggregates were rare, theirpresence was still important to the control of the volumeand carbon fluxes, as is made clear in Fig. 5. For all thesamples, 50% of the carbon flux comes from the largeparticles that make up less than 20% of the number flux,and conversely the small particles that make up more than50% of the total number of particles contribute less than20% of the carbon flux.
Aggregates contributed at least 77% of the total volumeflux in all the traps, and often exceeded 95% (Table 4). Interms of carbon contents, their role was considerablyreduced but still dominant at shallow depths (100 and200 m) at site C5, where they made up 74% and 85% of thecarbon flux. This influence decreased at depth (330 and430 m) to 49% and 33%. At A3, the aggregate contributionto carbon flux was limited to 25% to 36% at all depths,again with a slight decrease in its importance with depth.
Particle shape variations for the cylindrical fecal pelletsand the aggregates differed dramatically. Aspect ratios ofthe latter were in a narrow range (mostly between one andapproximately four, none above eight) and their distribu-
Fig. 6. Changes in particle shape with depth and among thesites. (A) Aggregate aspect ratios and (B) cylindrical fecal pelletaspect ratios. The aggregates had a narrow range of aspect ratiosand very similar aspect ratio distributions in all the samples. Incontrast, the cylindrical fecal pellet aspect ratios varied more thanan order of magnitude.
Table 3. Contributions to the total number flux.
Site Depth (m)
Aggregates Cylinders Ovals
Total fluxFlux Fraction Flux Fraction Flux Fraction
C5 100 24 0.96 1 0.03 0.3 0.01 25200 26 0.94 1 0.04 0.6 0.02 28330 10 0.84 2 0.12 0.5 0.04 12430 5 0.72 1 0.10 1.3 0.18 7
A3f 100 14 0.68 6 0.32 0.0 0.00 20200 15 0.65 6 0.27 2.0 0.08 23330 2 0.51 2 0.36 0.5 0.12 4430 3 0.48 2 0.31 1.2 0.21 6
A3i 200 55 0.37 85 0.58 6.6 0.04 147
All fluxes in units of 1024 m22 d21.
Particle properties from gel traps 219
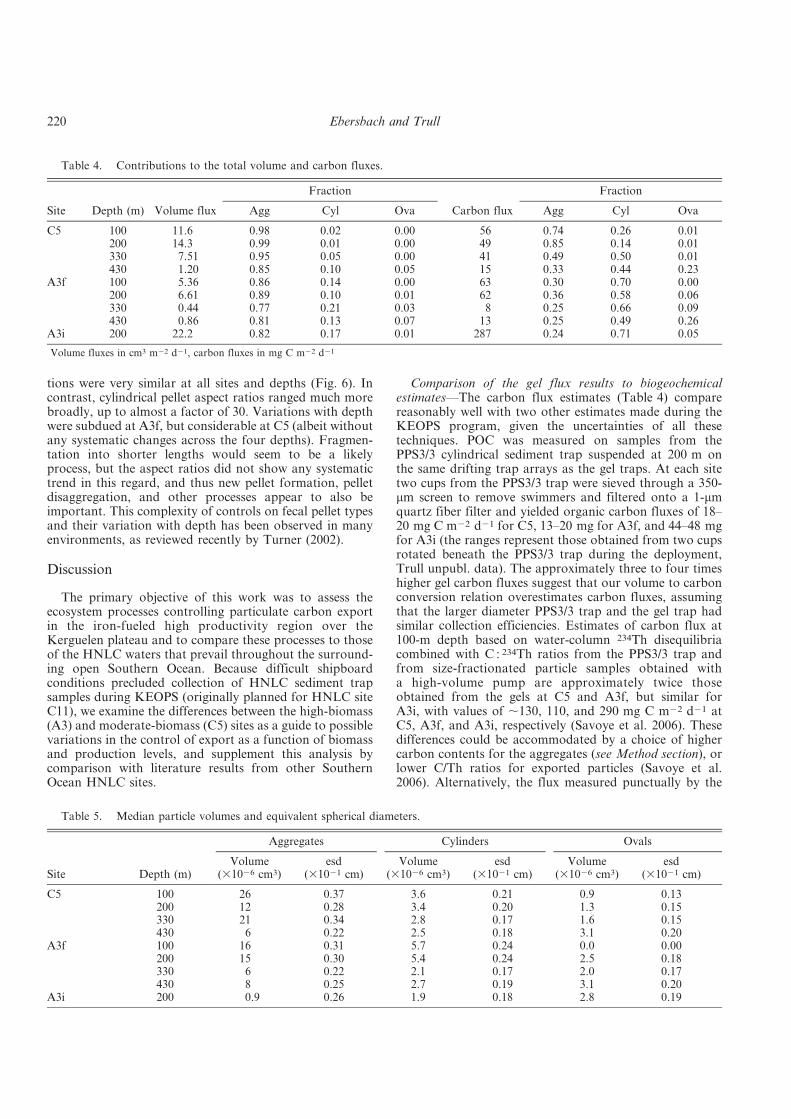
tions were very similar at all sites and depths (Fig. 6). Incontrast, cylindrical pellet aspect ratios ranged much morebroadly, up to almost a factor of 30. Variations with depthwere subdued at A3f, but considerable at C5 (albeit withoutany systematic changes across the four depths). Fragmen-tation into shorter lengths would seem to be a likelyprocess, but the aspect ratios did not show any systematictrend in this regard, and thus new pellet formation, pelletdisaggregation, and other processes appear to also beimportant. This complexity of controls on fecal pellet typesand their variation with depth has been observed in manyenvironments, as reviewed recently by Turner (2002).
Discussion
The primary objective of this work was to assess theecosystem processes controlling particulate carbon exportin the iron-fueled high productivity region over theKerguelen plateau and to compare these processes to thoseof the HNLC waters that prevail throughout the surround-ing open Southern Ocean. Because difficult shipboardconditions precluded collection of HNLC sediment trapsamples during KEOPS (originally planned for HNLC siteC11), we examine the differences between the high-biomass(A3) and moderate-biomass (C5) sites as a guide to possiblevariations in the control of export as a function of biomassand production levels, and supplement this analysis bycomparison with literature results from other SouthernOcean HNLC sites.
Comparison of the gel flux results to biogeochemicalestimates—The carbon flux estimates (Table 4) comparereasonably well with two other estimates made during theKEOPS program, given the uncertainties of all thesetechniques. POC was measured on samples from thePPS3/3 cylindrical sediment trap suspended at 200 m onthe same drifting trap arrays as the gel traps. At each sitetwo cups from the PPS3/3 trap were sieved through a 350-mm screen to remove swimmers and filtered onto a 1-mmquartz fiber filter and yielded organic carbon fluxes of 18–20 mg C m22 d21 for C5, 13–20 mg for A3f, and 44–48 mgfor A3i (the ranges represent those obtained from two cupsrotated beneath the PPS3/3 trap during the deployment,Trull unpubl. data). The approximately three to four timeshigher gel carbon fluxes suggest that our volume to carbonconversion relation overestimates carbon fluxes, assumingthat the larger diameter PPS3/3 trap and the gel trap hadsimilar collection efficiencies. Estimates of carbon flux at100-m depth based on water-column 234Th disequilibriacombined with C : 234Th ratios from the PPS3/3 trap andfrom size-fractionated particle samples obtained witha high-volume pump are approximately twice thoseobtained from the gels at C5 and A3f, but similar forA3i, with values of ,130, 110, and 290 mg C m22 d21 atC5, A3f, and A3i, respectively (Savoye et al. 2006). Thesedifferences could be accommodated by a choice of highercarbon contents for the aggregates (see Method section), orlower C/Th ratios for exported particles (Savoye et al.2006). Alternatively, the flux measured punctually by the
Table 5. Median particle volumes and equivalent spherical diameters.
Site Depth (m)
Aggregates Cylinders Ovals
Volume(31026 cm3)
esd(31021 cm)
Volume(31026 cm3)
esd(31021 cm)
Volume(31026 cm3)
esd(31021 cm)
C5 100 26 0.37 3.6 0.21 0.9 0.13200 12 0.28 3.4 0.20 1.3 0.15330 21 0.34 2.8 0.17 1.6 0.15430 6 0.22 2.5 0.18 3.1 0.20
A3f 100 16 0.31 5.7 0.24 0.0 0.00200 15 0.30 5.4 0.24 2.5 0.18330 6 0.22 2.1 0.17 2.0 0.17430 8 0.25 2.7 0.19 3.1 0.20
A3i 200 0.9 0.26 1.9 0.18 2.8 0.19
Table 4. Contributions to the total volume and carbon fluxes.
Site Depth (m) Volume flux
Fraction
Carbon flux
Fraction
Agg Cyl Ova Agg Cyl Ova
C5 100 11.6 0.98 0.02 0.00 56 0.74 0.26 0.01200 14.3 0.99 0.01 0.00 49 0.85 0.14 0.01330 7.51 0.95 0.05 0.00 41 0.49 0.50 0.01430 1.20 0.85 0.10 0.05 15 0.33 0.44 0.23
A3f 100 5.36 0.86 0.14 0.00 63 0.30 0.70 0.00200 6.61 0.89 0.10 0.01 62 0.36 0.58 0.06330 0.44 0.77 0.21 0.03 8 0.25 0.66 0.09430 0.86 0.81 0.13 0.07 13 0.25 0.49 0.26
A3i 200 22.2 0.82 0.17 0.01 287 0.24 0.71 0.05
Volume fluxes in cm3 m22 d21, carbon fluxes in mg C m22 d21
220 Ebersbach and Trull
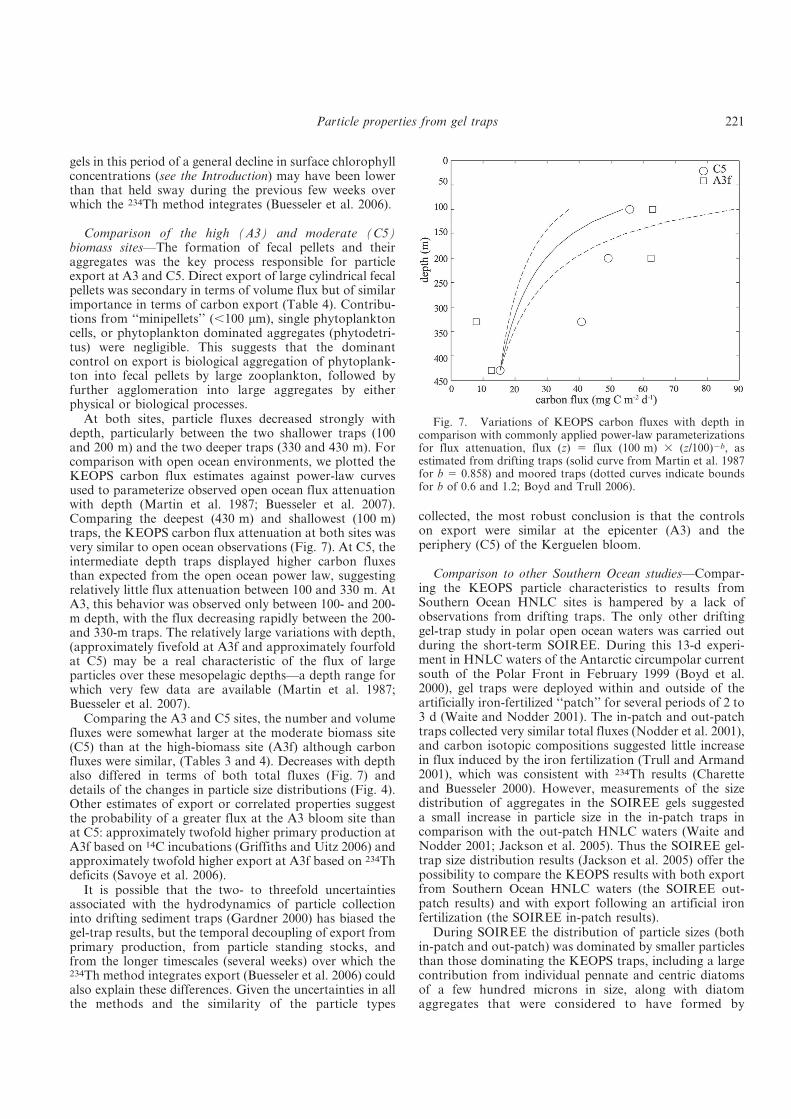
gels in this period of a general decline in surface chlorophyllconcentrations (see the Introduction) may have been lowerthan that held sway during the previous few weeks overwhich the 234Th method integrates (Buesseler et al. 2006).
Comparison of the high (A3) and moderate (C5)biomass sites—The formation of fecal pellets and theiraggregates was the key process responsible for particleexport at A3 and C5. Direct export of large cylindrical fecalpellets was secondary in terms of volume flux but of similarimportance in terms of carbon export (Table 4). Contribu-tions from ‘‘minipellets’’ (,100 mm), single phytoplanktoncells, or phytoplankton dominated aggregates (phytodetri-tus) were negligible. This suggests that the dominantcontrol on export is biological aggregation of phytoplank-ton into fecal pellets by large zooplankton, followed byfurther agglomeration into large aggregates by eitherphysical or biological processes.
At both sites, particle fluxes decreased strongly withdepth, particularly between the two shallower traps (100and 200 m) and the two deeper traps (330 and 430 m). Forcomparison with open ocean environments, we plotted theKEOPS carbon flux estimates against power-law curvesused to parameterize observed open ocean flux attenuationwith depth (Martin et al. 1987; Buesseler et al. 2007).Comparing the deepest (430 m) and shallowest (100 m)traps, the KEOPS carbon flux attenuation at both sites wasvery similar to open ocean observations (Fig. 7). At C5, theintermediate depth traps displayed higher carbon fluxesthan expected from the open ocean power law, suggestingrelatively little flux attenuation between 100 and 330 m. AtA3, this behavior was observed only between 100- and 200-m depth, with the flux decreasing rapidly between the 200-and 330-m traps. The relatively large variations with depth,(approximately fivefold at A3f and approximately fourfoldat C5) may be a real characteristic of the flux of largeparticles over these mesopelagic depths—a depth range forwhich very few data are available (Martin et al. 1987;Buesseler et al. 2007).
Comparing the A3 and C5 sites, the number and volumefluxes were somewhat larger at the moderate biomass site(C5) than at the high-biomass site (A3f) although carbonfluxes were similar, (Tables 3 and 4). Decreases with depthalso differed in terms of both total fluxes (Fig. 7) anddetails of the changes in particle size distributions (Fig. 4).Other estimates of export or correlated properties suggestthe probability of a greater flux at the A3 bloom site thanat C5: approximately twofold higher primary production atA3f based on 14C incubations (Griffiths and Uitz 2006) andapproximately twofold higher export at A3f based on 234Thdeficits (Savoye et al. 2006).
It is possible that the two- to threefold uncertaintiesassociated with the hydrodynamics of particle collectioninto drifting sediment traps (Gardner 2000) has biased thegel-trap results, but the temporal decoupling of export fromprimary production, from particle standing stocks, andfrom the longer timescales (several weeks) over which the234Th method integrates export (Buesseler et al. 2006) couldalso explain these differences. Given the uncertainties in allthe methods and the similarity of the particle types
collected, the most robust conclusion is that the controlson export were similar at the epicenter (A3) and theperiphery (C5) of the Kerguelen bloom.
Comparison to other Southern Ocean studies—Compar-ing the KEOPS particle characteristics to results fromSouthern Ocean HNLC sites is hampered by a lack ofobservations from drifting traps. The only other driftinggel-trap study in polar open ocean waters was carried outduring the short-term SOIREE. During this 13-d experi-ment in HNLC waters of the Antarctic circumpolar currentsouth of the Polar Front in February 1999 (Boyd et al.2000), gel traps were deployed within and outside of theartificially iron-fertilized ‘‘patch’’ for several periods of 2 to3 d (Waite and Nodder 2001). The in-patch and out-patchtraps collected very similar total fluxes (Nodder et al. 2001),and carbon isotopic compositions suggested little increasein flux induced by the iron fertilization (Trull and Armand2001), which was consistent with 234Th results (Charetteand Buesseler 2000). However, measurements of the sizedistribution of aggregates in the SOIREE gels suggesteda small increase in particle size in the in-patch traps incomparison with the out-patch HNLC waters (Waite andNodder 2001; Jackson et al. 2005). Thus the SOIREE gel-trap size distribution results (Jackson et al. 2005) offer thepossibility to compare the KEOPS results with both exportfrom Southern Ocean HNLC waters (the SOIREE out-patch results) and with export following an artificial ironfertilization (the SOIREE in-patch results).
During SOIREE the distribution of particle sizes (bothin-patch and out-patch) was dominated by smaller particlesthan those dominating the KEOPS traps, including a largecontribution from individual pennate and centric diatomsof a few hundred microns in size, along with diatomaggregates that were considered to have formed by
Fig. 7. Variations of KEOPS carbon fluxes with depth incomparison with commonly applied power-law parameterizationsfor flux attenuation, flux (z) 5 flux (100 m) 3 (z/100)2b, asestimated from drifting traps (solid curve from Martin et al. 1987for b 5 0.858) and moored traps (dotted curves indicate boundsfor b of 0.6 and 1.2; Boyd and Trull 2006).
Particle properties from gel traps 221
coagulation (Waite and Nodder 2001; Jackson et al. 2005).Fecal pellet statistics from the SOIREE gels have not beenpublished, but their abundance was low (Waite and Nodder2001; Jackson et al. 2005), and negligible mesozooplanktongrazing was observed (Zeldis 2001). Interestingly, theparticle number flux spectra from SOIREE (both in-patchand out-patch) exhibit values of 109 decreasing to107 cm21 m22 d21 across the size interval from 0.01 to0.1 cm (Jackson et al. 2005), for which the KEOPS numberspectra exhibit a similar decrease but much lower values(107 decreasing to 105 cm21 m22 d21; Fig. 3). The 100-foldhigher particle flux numbers were a surprise given thatorganic carbon fluxes estimated for SOIREE from free-drifting sediment traps and 234Th disequilibria (,90 to160 mg C m22 d21; Charette and Buesseler 2000; Nodderand Waite 2001; Waite and Nodder 2001) were similar tothose estimated for KEOPS using these methods (,20–50 mg C m22 d21 from the traps, Trull unpubl. data, and100–300 mg C m22 d21 from 234Th disequilibria, Savoye etal. 2006). This difference raises the importance of variabilityin the volume-carbon conversion relation for marineparticles (see the Methods section). The SOIREE particlesin this 0.01- to 0.1-cm size range were predominantly fluffydiatom aggregates (Waite and Nodder 2001; Jackson et al.2005), while those during KEOPS were tightly compactedfecal pellets and aggregates of those pellets.
In comparison with the SOIREE results, the KEOPSresults suggest that persistent natural iron inputs lead toa much greater fraction of export being derived fromzooplankton fecal pellets and large aggregates than occursin either Southern Ocean HNLC waters (SOIREE out-patch results) or following artificial iron fertilization ofthese waters (SOIREE in-patch results). This perspectiveneeds to be tempered by the fact that coupling ofphytoplankton production, zooplankton grazing, and themagnitude of particle export is highly variable seasonally(Wassmann 1998), and thus both the SOIREE and KEOPSresults represent brief moments in possibly large-amplitudevariability in this coupling.
The Kerguelen time series study (Kerfix) in HNLCwaters to the west of Kerguelen Island offers another usefulcomparison for the KEOPS results. Direct studies ofexported particle characteristics are not available, butsynthesis of carbon budgets (Jeandel et al. 1998) andsimulation of seasonal cycles is consistent with zooplank-ton grazing control of phytoplankton biomass, withouta requirement for physical phytoplankton aggregation toenhance export (Mongin et al. 2006). Observations ofzooplankton populations and feeding experiments alsosuggest that zooplankton are capable of removing allprimary production in this Indian sector of the SouthernOcean (Mayzaud et al. 2002). Thus, in contrast to thecomparison with the SOIREE results, it appears thatzooplankton mediated removal of biomass may besimilarly important in HNLC waters near the Kerguelenplateau as it is in the high-biomass waters over the plateau.This result is consistent with the observation of generallysimilar zooplankton population structures on-plateau andoff-plateau during KEOPS, but with more of the largestclass of zooplankton present on-plateau in the high-
biomass region (Carlotti et al. 2006). More detailedcomparisons with other observations of particle exportand its coupling to primary production and ecosystemstructure are beyond the scope of this paper and hamperedby the short period of the KEOPS export observations.Additional discussion of these issues is available in Dunneet al. (2005) and Boyd and Trull (2006).
Implications for the response of carbon export topersistent iron fertilization—Two aspects of our limitedobservations merit emphasis, in the context of attemptingto understand the sensitivity of ecosystem structure andcarbon export to natural and artificial iron fertilization: (1)direct export of phytoplankton or phytoplankton aggre-gates was negligible, (2) zooplankton grazing, large fecalpellet formation, and in particular agglomeration of largefecal pellets into large aggregates controlled export.
These results differ from those of Southern Ocean short-term iron-fertilization experiments, in which zooplanktonresponses have generally (Boyd et al. 2000; Coale et al.2004) but not always (Peeken et al. 2006) been muted.Moreover, they differ from the view that nutrient-richwaters that develop high biomass usually export a signifi-cant fraction of it directly as phytoplankton aggregatesrather than via fecal pellets from higher trophic levels(Boyd and Newton 1995, 1999; Turner 2002). Whether thisdifference simply reflects the short-term aspect of theKEOPS observations or a more fundamental aspect ofpersistently iron-fertilized Southern Ocean waters is not yetclear and will require more sustained observations of themechanisms of export.
Possible reasons why zooplankton might have been moreimportant during KEOPS than during artificial ironfertilizations include the predictability of the annuallyoccurring Kerguelen plateau phytoplankton bloom and therelatively modest phytoplankton levels that develop withinit (,3 mg Chl a L21, Blain et al. 2007), which are close tothose estimated to be sufficient to induce efficientaggregation (Jackson and Lochmann 1993; Boyd et al.2005; Jackson et al. 2005). There is evidence for animportant role for zooplankton in export from other recentgel-trap studies in polar waters. Euphausid fecal pelletsdominated export in subantarctic waters east of NewZealand (Waite et al. 2000) and in Antarctic coastal watersin Prydz Bay (Whiteley 2003). In contrast, phytodetritralaggregates were important in Antarctic waters duringSOIREE, both in and outside the iron-fertilized waters(Waite and Nodder 2001; Boyd et al. 2002; Jackson et al.2005), during the Subarctic Ecosystem Response to IronEnrichment Study (SERIES) (Boyd et al. 2005), and inpolar waters in a Swedish Fjord (Waite et al. 2005). Thesedifferences emphasize that site, season, and ecosystemspecific controls on carbon export are likely to be the rulerather than the exception.
References
ALLDREDGE, A. L. 1998. The carbon, nitrogen and mass content ofmarine snow as a function of aggregate size. Deep-Sea Res. I45: 529–541.
222 Ebersbach and Trull
———, AND C. GOTSCHALK. 1988. In situ settling behavior ofmarine snow. Limnol. Oceanogr. 33: 339–351.
ARMAND, L. K., V. BARTHAUX, AND B. QUEGUINER. 2006.Phytoplankton responses within and peripheral to thenaturally iron-fertilized Kerguelen region. ASLO-TOS-AGUOcean Sciences meeting abstracts, OS35M–08.
BIDLE, K. D., AND F. AZAM. 1999. Accelerated dissolution ofdiatom silica by marine bacterial assemblages. Nature 397:
508–512.BLAIN, S., AND oTHERS. 2007. Impacts of natural iron fertilisation
on the Southern Ocean. Nature 446: 1070–1074. [doi:10.1038/nature05700].
BOYD, P. W., G. A. JACKSON, AND A. WAITE. 2002. Are mesoscaleperturbation experiments in polar waters prone to physicalartefacts? Evidence from algal aggregation modeling studies.Geophys. Res. Lett. 29 [doi: 10.1029/2001GL014210].
———, AND P. NEWTON. 1995. Evidence of the potential influenceof planktonic community structure on the interannualvariability of particulate carbon flux. Deep-Sea Res. I 42:
619–639.———, AND ———. 1999. Does planktonic community struc-
ture determine downward particulate organic carbon fluxin different oceanic provinces? Deep-Sea Res. I 46: 63–91.
———, AND T. W. TRULL. 2006. Understanding the export ofmarine biogenic particles: Is there consensus? Prog. Oceanogr.4: 276–312. [doi:10.1016/j.pocean.2006.1010.1007].
———, AND oTHERS. 2000. A mesoscale phytoplankton bloom inthe Southern Ocean stimulated by iron fertilization. Nature407: 695–702.
———, AND ———. 2005. The evolution and termination of aniron-induced mesoscale bloom in the northeast subarcticPacific. Limnol. Oceanogr. 50: 1872–1886.
BUESSELER, K. O., AND P. W. BOYD. 2003. Does ocean fertilizationwork? Science 300: 67–68. [doi:10.1126/science.1082959].
———, AND oTHERS. 2006. An assessment of particulate organiccarbon to thorium-234 ratios in the ocean and their impact onthe application of 234Th as a POC flux proxy Mar. Chem. 100:213–233. [doi:10.1016/j.marchem.2005.10.013].
———, AND ———. 2007. Revisiting carbon flux through theocean’s twilight zone Science 316: 567–570. [doi:10.1126/science.1137959].
CARLOTTI, F., D. BOTHA, D. LEFEVRE, A. NOWACZYK, M. CLEMENT,AND D. VINCENT. 2006. Mesozooplankton size structure andbiomass above the Kerguelen Plateau (Southern Ocean)during KEOPS: First results on two contrasted areas.ASLO-TOS-AGU Ocean Sciences meeting abstract,OS35M–13.
CARROLL, M. L., J.-C. MIQUEL, AND S. W. FOWLER. 1998. Seasonalpatterns and depths—specific trends of zooplankton fecalpellet fluxes in the northwest Mediterranean Sea. Deep-SeaRes. I 45: 1303–1318.
CHARETTE, M. A., AND K. O. BUESSELER. 2000. Does ironfertilization enhance carbon export in the Southern Ocean?Geochem Geophys. Geosyst. 1 [doi:2000GC000069].
COALE, K. H., AND oTHERS. 2004. Southern Ocean iron enrichmentexperiment: Carbon cycling in high and low-Si waters. Science304: 408–414.
DUNNE, J. P., R. A. ARMSTRONG, A. GNANADESIKAN, AND J. L.SARMIENTO. 2005. Empirical and mechanistic models for theparticle export ratio Glob. Biogeochem. Cycles 19: GB4026[doi:4010.1029/2004GB002390, 002005].
GARDNER, W. D. 2000. Sediment trap sampling in surface waters,p. 240–281. In R. B. Hanson, H. W. Ducklow and J. G. Field[eds.], The changing ocean carbon cycle: A midterm synthesis
of the Joint Global Ocean Flux Study. International Geo-sphere-Biosphere Program Block Series. Cambridge Univ.Press.
GONZALEZ, H. E. 1992a. The distribution and abundance of krillfaecel material and oval pellets in the Scotia and Weddell Seas(Antarctica) and their role in particle flux. Polar Biol. 12:
81–91.———. 1992b. Distribution and abundance of minipellets around
the Antarctic peninsula. Implications for protistan feedingbehaviour. Mar. Ecol. Prog. Ser. 90: 223–236.
———, F. K. KURBJEWEIT, AND U. V. BATHMANN. 1994.Occurrence of cyclopoid copepods and faecal material in theHalley Bay region, Antarctica, during January–February1991. Polar Biol. 14: 331–342.
———, AND V. S. SMETACEK. 1994. The possible role ofcyclopoid copepod Oithona in retarding vertical flux ofzooplankton faecal material. Mar. Ecol. Prog. Ser. 113:
233–246.GOWING, M. M., D. L. GARRISON, H. B. KUNZE, AND D. J.
WINCHELL. 2001. Biological components of Ross Sea short-term particle fluxes in the austral summer of 1995–96. Deep-Sea Res. I 48: 2645–2671.
GRIFFITHS, F. B., AND J. UITZ. 2006. Photosynthetic parameters,size-fractionated chlorophyll and primary production duringthe KEOPS expedition East of Kerguelen Island January–February 2005. ASLO-TOS-AGU Ocean Sciences meetingabstract, OS35M–09.
HONJO, S., AND M. R. ROMAN. 1978. Marine copepod fecal pellets:Production, preservation, and sedimentation. J. Mar. Res. 36:45–57.
JACKSON, G. A., AND S. E. LOCHMANN. 1993. Modelling co-agulation of algae in marine ecosystems, p. 387–414. In J.Buffle and H. P. van Leeuen [eds.], Environmental particles.Lewis Publ., Ann Arbor, Michigan.
———, R. MAFFIONE, D. K. COSTELLO, A. L. ALLDREDGE, B. E.LOGAN, AND H. G. DAM. 1997. Particle size spectra between1 mm and 1 cm at Monterey Bay determined using multipleinstruments. Deep-Sea Res. I 44: 1739–1767.
———, A. M. WAITE, AND P. W. BOYD. 2005. Role of algalaggregation in vertical carbon export during SOIREE and inother low biomass environments. Geophys. Res. Lett. 32 [doi:10.1029/2005GL023180].
JEANDEL, C., AND oTHERS. 1998. KERFIX, a time-series station inthe Southern Ocean: A presentation. J. Mar. Syst. 17:
555–570.KRIEST, I. 2002. Different parameterizations of marine snow in
a 1D-model and their influence on representation of marinesnow, nitrogen budget and sedimentation. Deep-Sea Res. I 49:2133–2162.
LAMPITT, R. S., T. NOJI, AND B. V. BODUNGEN. 1991. Whathappens to zooplankton faecal pellets? Implications formaterial flux. Mar. Biol. 104: 15–23.
LUNDSGAARD, C. 1995. Use of a high viscosity medium in studiesof aggregates, p. 141–152. In S. Floderus, A.-S. Heisakanen,M. Oleson and P. Wassmann [eds.], Sediment trap studies inthe Nordic countries 3. Proceeding of the Symposium onSeasonal Dynamics of Planktonic Ecosystems and Sedimen-tation in Coastal Nordic Waters. Numi Print, Oy.
MARTIN, J. H., G. A. KNAUER, D. M. KARL, AND W. W.BROENKOW. 1987. VERTEX: Carbon cycling in the NortheastPacific. Deep-Sea Res. 34: 267–285.
MAYZAUD, P., V. TIRELLI, A. ERRHIF, J. P. LABAT, S. RAZOULS, AND
R. PERISSINOTTO. 2002. Carbon intake by zooplankton:Importance and role of zooplankton grazing in the Indiansector of the Southern Ocean. Deep-Sea Res. II 49:
3169–3188.
Particle properties from gel traps 223
MICHAELS, A. F., AND M. W. SILVER. 1988. Primary production,sinking fluxes and the microbial food web. Deep-Sea Res. 35:473–490.
MONGIN, M., D. M. NELSON, P. PONDAVEN, AND P. TREGUER. 2006.Simulation of upper-ocean biogeochemistry with a flexible-composition phytoplankton model: C, N and Si cycling andFe limitation in the Southern Ocean. Deep-Sea Res. II 53:
601–619.NODDER, S. D., M. A. CHARETTE, A. M. WAITE, T. W. TRULL, P.
W. BOYD, J. ZELDIS, AND K. O. BUESSELER. 2001. Particletransformation and export flux during an in situ iron-stimulated bloom in the Southern Ocean. Geophys. Res.Lett. 28: 2409–2412.
———, AND A. M. WAITE. 2001. Is carbon export in the SouthernOcean enhanced by iron-stimulated increases in biologicalproduction? Sediment trap results from an in situ ironenrichment experiment. Deep-Sea Res. II 48: 2681–2702.
NOJI, T. T., K. W. ESTEP, F. MACINTYRE, AND F. NORRBIN. 1991.Image analysis of faecal material grazed upon by three speciesof copepods: Evidence for coprorhexy, coprophagy, andcoprochaly. J. Mar. Biol. Assoc. U.K. 71: 46–48.
PEEKEN, I., AND oTHERS. 2006. Effect of in situ iron fertilisationduring contrasting seasons—comparison between EisenExand EIFEX. ASLO-TOS-AGU Ocean Sciences meetingabstract, OS32A–06.
SAVOYE, N., T. TRULL, S. JAQUET, AND F. DEHAIRS. 2006. 234Th-based export production during the KEOPS natural ironfertilization. ASLO-TOS-AGU Ocean Sciences meeting ab-stract, OS33F–04.
SILVER, M. W., AND M. M. GOWING. 1991. The ‘particle’ flux:Origins and biological components. Prog. Oceanogr. 26:
75–113.TRULL, T. W., AND L. ARMAND. 2001. Insights into Southern
Ocean carbon export from the d13C of particles and dissolvedinorganic carbon during the SOIREE iron fertilisationexperiment. Deep-Sea Res. II 48: 2655–2680.
TURLEY, C. M. 1993. The effect of pressure on leucineand thymidine incorporation by free-living bacteriaattached to sinking oceanic particles. Deep-Sea Res. I 40:
2193–2206.———, AND E. D. STUTT. 2000. Depth-related cell-specific
bacterial leucine incorporation rates on particles and itsbiogeochemical significance in the Northwest Mediterranean.Limnol. Oceanogr. 45: 419–425.
TURNER, J. T. 2002. Zooplankton fecal pellets, marine snow andsinking phytoplankton blooms. Aquat. Microb. Ecol. 27:
57–102.WAITE, A. M., O. GUSTAFSSON, O. LINDAHL, AND P. TISELIUS. 2005.
Linking ecosystem dynamics and biogeochemistry: Sinkingfractionation of organic carbon in a Swedish fjord. Limnol.Oceanogr. 50: 658–671.
———, AND S. D. NODDER. 2001. The effect of in situ ironaddition on the sinking rates and export flux of SouthernOcean diatoms. Deep-Sea Res. II 48: 2635–2654.
———, K. A. SAFI, J. A. HALL, AND S. D. NODDER. 2000. Masssedimentation of picoplankton embedded in organic aggre-gates. Limnol. Oceanogr. 45: 87–97.
WASSMANN, P. 1998. Retention versus export food chains:Processes controlling sinking loss from marine pelagicsystems. Hybrobiologica 363: 29–57.
WHITELEY, M. 2003. The influence of Antarctic krill (Euphausiasuperba) on carbon fluxes in the Southern Ocean. Honoursthesis, Univ. of Western Australia.
ZELDIS, J. 2001. Mesozooplankton community composition,grazing, nutrition, and export production at the SOIREEsite. Deep-Sea Res. II 48: 2615–2634.
Received: 26 July 2006Accepted: 21 June 2007Amended: 31 July 2007
224 Ebersbach and Trull