Embed Size (px)
Citation preview
The Influence of Amorphous, Sub-Micrometer Silica Particles in Cement Pastes and Mortars with Very
Low Water-to-Cement Ratios(Ultra-High Performance Concrete)
Der Fakultät für Biologie, Chemie und Geowissenschaften
der Universität Bayreuth
zur
Erlangung des akademischen Grades eines Doktors der Naturwissenschaften (Dr. rer. nat.) im Fach Chemie
vorgelegt von
Tina Oertel
geboren in Weimar
Würzburg, 2013

Die vorliegende Arbeit wurde in der Zeit von Januar 2010 bis August 2013 am Fraunhofer–
Institut für Silicatforschung unter Betreuung von Herrn Prof. Dr. Gerhard Sextl (Inhaber des
Lehrstuhls für chemische Technologie der Materialsynthese der Julius-Maximilians-
Universität in Würzburg) in Zusammenarbeit mit dem Lehrstuhl für Anorganische Chemie I
an der Fakultät für Biologie, Chemie und Geowissenschaften der Universität Bayreuth unter
Betreuung von Herrn Prof. Dr. Josef Breu angefertigt.
Amtierender Dekan: Prof. Dr. Rhett Kempe
Dissertation eingereicht am: 12.11.2013
Zulassung durch die Promotionskommission: 20.11.2013
Wissenschaftliches Kolloquium: 21.03.2014
Prüfungsausschuss:
Prof. Dr. Josef Breu (Erstgutachter)
Prof. Dr. Gerhard Sextl (Zweitgutachter)
Prof. Dr. Stephan Förster (Vorsitz)
Prof. Dr. Hans Keppler

The Influence of Amorphous, Sub-Micrometer Silica
Particles in Cement Pastes and Mortars with Very
Low Water-to-Cement Ratios
(Ultra-High Performance Concrete)
PhD Thesis
Tina Oertel
Würzburg, 2013

Dissertation Tina Oertel, 2013
- i -
TABLE OF CONTENTS
List of abbreviations ........................................................................................................... iv
1 Summary ......................................................................................................................... 1
2 Zusammenfassung .......................................................................................................... 3
3 Introduction .................................................................................................................... 6
3.1 Amorphous silica particles ................................................................................... 6
3.1.1 Terminology ....................................................................................................... 6
3.1.2 Synthesis and production methods ..................................................................... 6
3.1.3 Structure and surface chemistry ......................................................................... 7
3.1.4 Stability in water towards sedimentation and coagulation ................................. 9
3.1.5 Dissolution of silica and formation of oligomeric silicate species ................... 10
3.1.6 Interaction with cations in alkaline solutions ................................................... 11
3.2 Cementitious materials ....................................................................................... 13
3.2.1 Composition of Portland cement ...................................................................... 13
3.2.2 Hydration of Portland cement .......................................................................... 15
3.2.3 Calcium–silicate–hydrate phases ..................................................................... 17
3.2.4 Effect of silica components .............................................................................. 19
3.2.5 Ultra-high performance concrete ..................................................................... 20
3.3 Research objectives ............................................................................................. 21
4 Synopsis ......................................................................................................................... 23
4.1 Reactivity of amorphous silica and investigations on primary hydration ..... 23
4.2 Reactions in UHPC containing various types of reactive silica ...................... 27
4.3 Primary particle size and agglomerate size effects of amorphous silica ........ 32
4.4 Individual contribution to the publications ...................................................... 36
Dissertation Tina Oertel, 2013
- ii -
5 Literature ...................................................................................................................... 37
6 Results (Publications) ................................................................................................... 41
6.1 Reactivity of amorphous silica and investigations on primary hydration ..... 41
6.1.1 Abstract ............................................................................................................ 41
6.1.2 Introduction ...................................................................................................... 41
6.1.3 Experimental procedures .................................................................................. 44
6.1.3.1 Materials ........................................................................................................... 44
6.1.3.2 Preparation of pastes ........................................................................................ 45
6.1.3.3 Characterization methods ................................................................................. 46
6.1.3.4 Procedure for dissolution test ........................................................................... 47
6.1.4 Results and discussion ...................................................................................... 47
6.1.4.1 Characterization of silica .................................................................................. 47
6.1.4.2 Solubility of silica in highly alkaline medium ................................................. 51
6.1.4.3 Discussion of silica reactivities in a cementitious environment ...................... 54
6.1.4.4 Investigations of UHPC pastes containing silica ............................................. 55
6.1.5 Conclusions ...................................................................................................... 60
6.1.6 Acknowledgments ............................................................................................ 61
6.1.7 References ........................................................................................................ 61
6.2 Reactions in UHPC containing various types of reactive silica ...................... 64
6.2.1 Abstract ............................................................................................................ 64
6.2.2 Introduction ...................................................................................................... 64
6.2.3 Experimental procedures .................................................................................. 66
6.2.3.1 Materials ........................................................................................................... 66
6.2.3.2 Characterization methods ................................................................................. 67
6.2.3.3 Quantification of crystalline phases ................................................................. 68
6.2.4 Results and discussion ...................................................................................... 69
6.2.4.1 Calorimetric analysis ........................................................................................ 69
6.2.4.2 Microstructure .................................................................................................. 71
6.2.4.3 Development of the content of crystalline phases ............................................ 74
6.2.4.4 Compressive strength ....................................................................................... 77
Dissertation Tina Oertel, 2013
- iii -
6.2.4.5 Preferred reactions in UHPC containing various types of reactive silica ........ 78
6.2.5 Conclusions ...................................................................................................... 79
6.2.6 Acknowledgments ............................................................................................ 79
6.2.7 References ........................................................................................................ 80
6.3 Primary particle size and agglomerate size effects of amorphous silica ........ 82
6.3.1 Abstract ............................................................................................................ 82
6.3.2 Introduction ...................................................................................................... 82
6.3.3 Experimental procedures .................................................................................. 83
6.3.3.1 Synthesis of Stoeber suspensions and powders ................................................ 83
6.3.3.2 Components of UHPC mortars ........................................................................ 84
6.3.3.3 UHPC mortar and sample preparation ............................................................. 84
6.3.3.4 Characterization methods and test procedures ................................................. 85
6.3.3.5 Calculation of particle packing density ............................................................ 86
6.3.4 Results and discussion ...................................................................................... 86
6.3.4.1 Characterization of silica .................................................................................. 86
6.3.4.2 Particle packing density ................................................................................... 89
6.3.4.3 Characterization of hardened UHPC samples .................................................. 91
6.3.5 Conclusions ...................................................................................................... 94
6.3.6 Acknowledgements .......................................................................................... 95
6.3.7 References ........................................................................................................ 95
7 List of publications ....................................................................................................... 97
7.1 Publications .......................................................................................................... 97
7.2 Presentations, posters and conference proceedings ......................................... 97
7.3 Reports ................................................................................................................. 97
Acknowledgements ............................................................................................................. 98
(Eidesstattliche) Versicherungen und Erklärungen ........................................................ 99
Dissertation Tina Oertel, 2013
- iv -
LIST OF ABBREVIATIONS
Conventional cement chemical nomenclature C = CaO S = SiO2 F = Fe2O3 A = Al2O3 H = H2O = SO3
Cement minerals and hydration products
C3A aluminate 3CaO·Al2O3
C3A·3C ·H32 ettringite 3CaO·Al2O3·3CaSO4·32H2O C4AF aluminate ferrite 4CaO·Al2O3·Fe2O3
CH portlandite Ca(OH)2 C3S alite 3CaO·SiO2 C2S belite 2CaO·SiO2 C H2 gypsum CaSO4·2H2O C–S–H phases calcium–silicate–hydrate phases variable, e.g. 3CaO·2SiO2·4H2O
Cementitious terms
OC ordinary Portland concrete SCM supplementary cementitious material UHPC ultra-high performance concrete w/c ratio water-to-cement ratio
Analytical methods
BET nitrogen adsorption (method by Brunauer, Emmet and Teller) CSP cross section polishing DLS dynamic light scattering EDX energy dispersive X-ray spectroscopy FIB focused ion beam technique FD Fraunhofer diffraction IR infrared spectroscopy NMR nuclear magnetic resonance spectroscopy SEM scanning electron microscopy 29Si MAS NMR 29Si magic angle spinning solid-state NMR TEM transmission electron microscopy XRD X-ray diffraction XRF X-ray fluorescence spectroscopy
Dissertation Tina Oertel, 2013
- 1 -
1 SUMMARY1
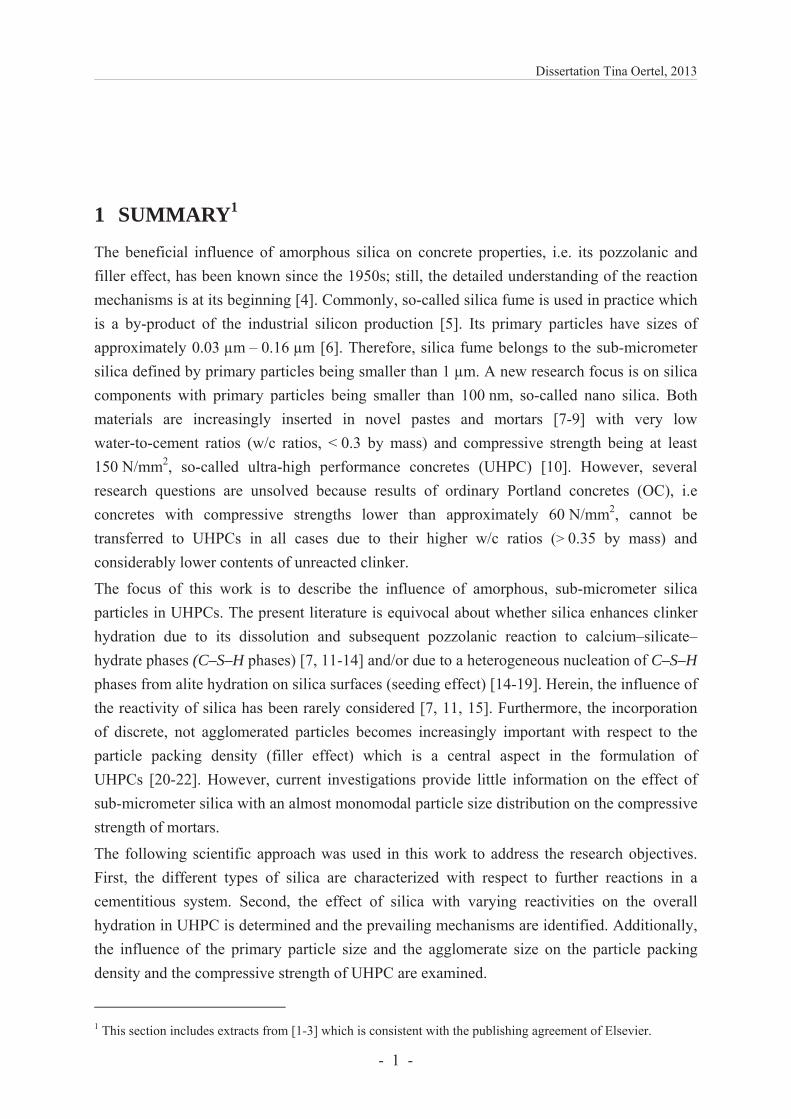
The beneficial influence of amorphous silica on concrete properties, i.e. its pozzolanic and filler effect, has been known since the 1950s; still, the detailed understanding of the reaction mechanisms is at its beginning [4]. Commonly, so-called silica fume is used in practice which is a by-product of the industrial silicon production [5]. Its primary particles have sizes of approximately 0.03 μm – 0.16 μm [6]. Therefore, silica fume belongs to the sub-micrometer silica defined by primary particles being smaller than 1 μm. A new research focus is on silica components with primary particles being smaller than 100 nm, so-called nano silica. Both materials are increasingly inserted in novel pastes and mortars [7-9] with very low water-to-cement ratios (w/c ratios, < 0.3 by mass) and compressive strength being at least 150 N/mm2, so-called ultra-high performance concretes (UHPC) [10]. However, several research questions are unsolved because results of ordinary Portland concretes (OC), i.e concretes with compressive strengths lower than approximately 60 N/mm2, cannot be transferred to UHPCs in all cases due to their higher w/c ratios (> 0.35 by mass) and considerably lower contents of unreacted clinker.
The focus of this work is to describe the influence of amorphous, sub-micrometer silica particles in UHPCs. The present literature is equivocal about whether silica enhances clinker hydration due to its dissolution and subsequent pozzolanic reaction to calcium–silicate–hydrate phases (C–S–H phases) [7, 11-14] and/or due to a heterogeneous nucleation of C–S–H phases from alite hydration on silica surfaces (seeding effect) [14-19]. Herein, the influence of the reactivity of silica has been rarely considered [7, 11, 15]. Furthermore, the incorporation of discrete, not agglomerated particles becomes increasingly important with respect to the particle packing density (filler effect) which is a central aspect in the formulation of UHPCs [20-22]. However, current investigations provide little information on the effect of sub-micrometer silica with an almost monomodal particle size distribution on the compressive strength of mortars.
The following scientific approach was used in this work to address the research objectives. First, the different types of silica are characterized with respect to further reactions in a cementitious system. Second, the effect of silica with varying reactivities on the overall hydration in UHPC is determined and the prevailing mechanisms are identified. Additionally, the influence of the primary particle size and the agglomerate size on the particle packing density and the compressive strength of UHPC are examined.
1 This section includes extracts from [1-3] which is consistent with the publishing agreement of Elsevier.
[1-3]
Dissertation Tina Oertel, 2013
- 2 -
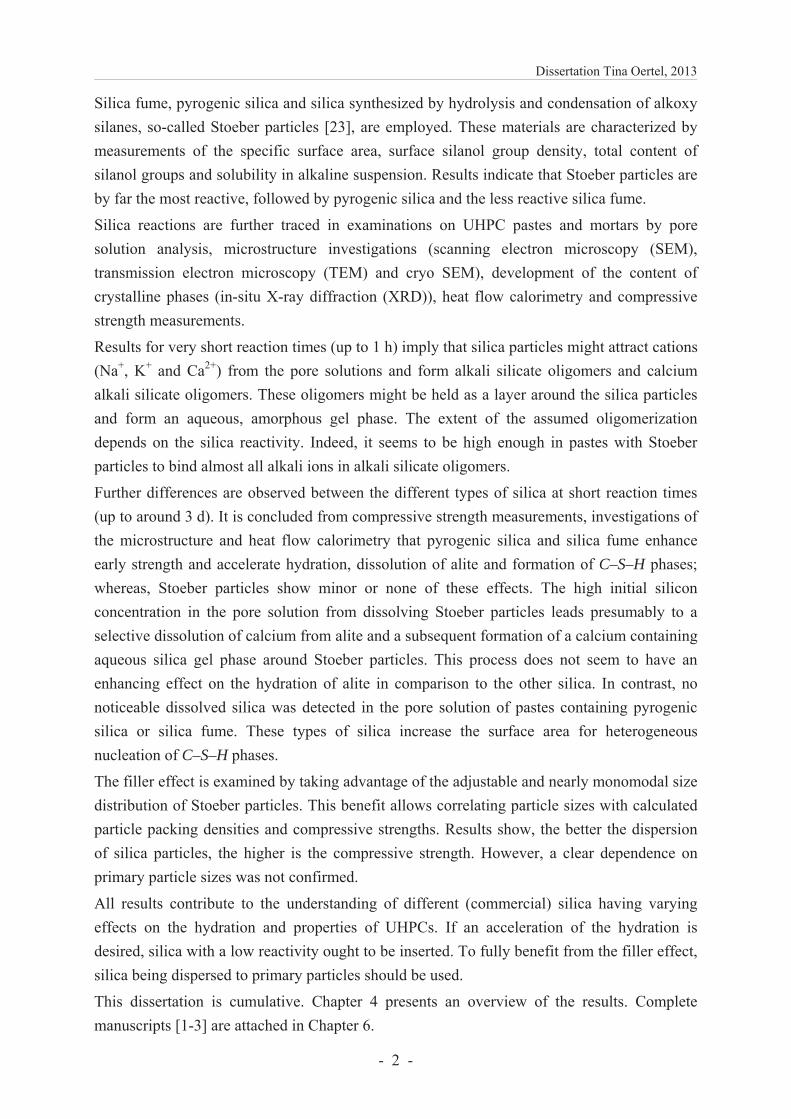
Silica fume, pyrogenic silica and silica synthesized by hydrolysis and condensation of alkoxy silanes, so-called Stoeber particles [23], are employed. These materials are characterized by measurements of the specific surface area, surface silanol group density, total content of silanol groups and solubility in alkaline suspension. Results indicate that Stoeber particles are by far the most reactive, followed by pyrogenic silica and the less reactive silica fume.
Silica reactions are further traced in examinations on UHPC pastes and mortars by pore solution analysis, microstructure investigations (scanning electron microscopy (SEM), transmission electron microscopy (TEM) and cryo SEM), development of the content of crystalline phases (in-situ X-ray diffraction (XRD)), heat flow calorimetry and compressive strength measurements.
Results for very short reaction times (up to 1 h) imply that silica particles might attract cations (Na+, K+ and Ca2+) from the pore solutions and form alkali silicate oligomers and calcium alkali silicate oligomers. These oligomers might be held as a layer around the silica particles and form an aqueous, amorphous gel phase. The extent of the assumed oligomerization depends on the silica reactivity. Indeed, it seems to be high enough in pastes with Stoeber particles to bind almost all alkali ions in alkali silicate oligomers.
Further differences are observed between the different types of silica at short reaction times (up to around 3 d). It is concluded from compressive strength measurements, investigations of the microstructure and heat flow calorimetry that pyrogenic silica and silica fume enhance early strength and accelerate hydration, dissolution of alite and formation of C–S–H phases; whereas, Stoeber particles show minor or none of these effects. The high initial silicon concentration in the pore solution from dissolving Stoeber particles leads presumably to a selective dissolution of calcium from alite and a subsequent formation of a calcium containing aqueous silica gel phase around Stoeber particles. This process does not seem to have an enhancing effect on the hydration of alite in comparison to the other silica. In contrast, no noticeable dissolved silica was detected in the pore solution of pastes containing pyrogenic silica or silica fume. These types of silica increase the surface area for heterogeneous nucleation of C–S–H phases.
The filler effect is examined by taking advantage of the adjustable and nearly monomodal size distribution of Stoeber particles. This benefit allows correlating particle sizes with calculated particle packing densities and compressive strengths. Results show, the better the dispersion of silica particles, the higher is the compressive strength. However, a clear dependence on primary particle sizes was not confirmed.
All results contribute to the understanding of different (commercial) silica having varying effects on the hydration and properties of UHPCs. If an acceleration of the hydration is desired, silica with a low reactivity ought to be inserted. To fully benefit from the filler effect, silica being dispersed to primary particles should be used.
This dissertation is cumulative. Chapter 4 presents an overview of the results. Complete manuscripts [1-3] are attached in Chapter 6.
Dissertation Tina Oertel, 2013
- 3 -
2 ZUSAMMENFASSUNG
Seit den 1950ern Jahren ist der positive Einfluss amorphen Silicas, das heißt die puzzo-lanische Reaktion und der Füllereffekt, auf Betoneigenschaften bekannt, jedoch steht die Wissenschaft bei einer genauen Beschreibung der Reaktionsmechanismen noch ganz am An-fang [4]. In der Praxis wird gewöhnlich so genannter Silicastaub verwendet, der als Nebenprodukt bei der industriellen Herstellung von Silicium anfällt [5]. Seine Primärpartikel sind ca. 0.03 μm – 0.16 μm groß [6]. Damit gehört Silicastaub zu den so genannten Submicrometer-Silica, die sich durch Primärpartikelgrößen kleiner als 1 μm auszeichnen. Einen neuen Forschungsschwerpunkt stellen Silica mit Primärpartikelgrößen von unter 100 nm dar, die Nanosilica. Beide Materialien werden zunehmend in neuartigen Leimen und Mörteln mit sehr geringen Wasser-zu-Zement-Verhältnissen (definiert durch einen masse-bezogen w/z-Wert < 0.3) und Mindestdruckfestigkeiten von 150 N/mm2 verwendet [7-9], so genannte Ultrahochleistungsbetone (UHPC2) [10]. Verschiedene Fragestellungen sind aller-dings nach wie vor unbeantwortet, da Erkenntnisse für Normalbetone3 nicht immer direkt auf UHPC übertragen werden können. Grund dafür sind höhere massebezogene w/z-Werte (> 0.35) und deutlich niedrigere Gehalte an unhydratisiertem Klinker in Normalbetonen.
Die vorliegende Arbeit befasst sich mit dem Einfluss amorpher Submicrometer-großer Silica-partikel in UHPC. Dem bisherigen Forschungsstand kann nicht eindeutig entnommen werden, ob Silica die Klinkerhydratation beschleunigt weil es sich auflöst und anschließend puzzola-nisch zu Calcium-Silicat-Hydrat-Phasen (C–S–H-Phasen) reagiert [7, 11-14] oder weil die Silicaoberfläche für die heterogene Keimbildung von C–S–H-Phasen aus der Hydratation von Alit zur Verfügung steht [14-19]. Dabei wurde der Einfluss der Silicareaktivität bisher nur selten betrachtet [7, 11, 15]. Ein anderer zentraler Aspekt ist, dass nicht-agglomerierte Partikel dazu beitragen die an UHPC gestellten Anforderungen der Packungsdichte zu erfül-len (Füllereffekt) [20-22]. Jedoch geben derzeitige Untersuchungen wenig Aufschluss da-rüber, welchen Einfluss Submicrometer-Silica mit einer nahezu monomodalen Partikel-größenverteilung auf die Druckfestigkeit von Mörteln haben.
Folgende Herangehensweise wurde zur Untersuchung der bisher weitgehend unbeantworteten Fragestellungen gewählt. Zunächst werden die verwendeten Silica unter Berücksichtigung ihrer späteren Reaktion in einem zementären System charakterisiert. Anschließend wird die
2 Die Abkürzung stammt aus der englischen Bezeichnung „ultra-high performance concrete“ und wird auch im deutschsprachigen Raum überwiegend verwendet. 3 Betone mit maximalen Druckfestigkeiten von 60 N/mm2
Dissertation Tina Oertel, 2013
- 4 -
Auswirkung von Silica mit unterschiedlichen Reaktivitäten auf die Gesamthydratation unter-sucht und vorherrschende Reaktionsmechanismen identifiziert. Außerdem wird der Einfluss der Primärpartikelgröße und der Agglomeratgröße auf die Packungsdichte und die Druck-festigkeit von UHPC bestimmt.
Verwendete Silica sind Stoeberpartikel4, pyrogenes Silica und Silicastaub. Sie werden hinsichtlich der spezifischen Oberfläche, der Dichte der Oberflächensilanolgruppen, des Gesamtgehalts an Silanolgruppen und der Löslichkeit in alkalischen Suspensionen charakterisiert. Die Ergebnisse weisen darauf hin, dass Stoeberpartikel am reaktivsten sind, gefolgt von weniger reaktivem pyrogenen Silica und Silicastaub.
Reaktionen der Silicapartikel werden durch Untersuchungen in UHPC Leimen und Mörteln weiter verfolgt. Hierzu gehören die Analyse der Porenlösung, Untersuchungen zur Mikrostruktur (Rasterelektronenmikroskopie, Transmissionselektronenmikroskopie und Kryo-Rasterelektronenmikroskopie), die quantitative Entwicklung der kristallinen Phasen (in-situ Röntgendiffraktion), Wärmeflusskalorimetrie und die Druckfestigkeit.
Ergebnisse für sehr kurze Reaktionszeiten (bis zu 1 h) weisen darauf hin, dass Silicapartikel die Kationen (Na+, K+ und Ca2+) aus der Porenlösung anziehen und wahrscheinlich Alkalisilicat-Oligomere und Calciumalkalisilicat-Oligomere gebildet werden, die sich als wässrige, amorphe Gelschicht um die Silicapartikel legen könnten. Dabei scheint das Ausmaß dieser Oligomerisation von der Silicareaktivität abhängig zu sein. Tatsächlich könnte diese Reaktion in Leimen mit Stoeberpartikeln bevorzugt ablaufen, so dass nahezu alle Alkaliionen in Alkalisilicat-Oligomeren gebunden werden.
Weitere Unterschiede zwischen den Silica können für kurze Reaktionszeiten (bis zu 3 d) beobachtet werden. Ergebnisse der Druckfestigkeit, Mikrostrukturuntersuchung und Wärmeflusskalorimetrie weisen darauf hin, dass pyrogenes Silica und Silicastaub die Frühfestigkeit verbessern sowie die Auflösung von Alit und die Bildung von C–S–H-Phasen beschleunigen. Grund dafür ist vermutlich, dass durch diese Silica die Oberfläche für die heterogene Keimbildung der C–S–H-Phasen vervielfacht wird. Indessen zeigen Stoeber-partikel nur geringfügige bis keine dieser Auswirkungen. Obwohl die hohe Silicium-Konzen-tration in der Porenlösung von Leimen mit Stoeberpartikeln vermutlich zu einem selektiven Lösen von Calcium aus Alit führt und sich eine Calcium-reiche wässrige Silica-Gel-Phase um Stoeber Partikel bildet, beschleunigt dieser Prozess die Hydratation von Alit im Vergleich zu den anderen Silica nicht.
Untersuchungen zum Füllereffekt bedienen sich hier der einstellbaren, nahezu monomodalen Partikelgrößenverteilung von Stoeberpartikeln, die eine Korrelation zwischen Partikelgröße und berechneter Packungsdichte sowie der Druckfestigkeit erlaubt. Ergebnisse zeigen, dass die Druckfestigkeit mit zunehmender Dispergierung der Silicapartikel auf ihre primäre Größe steigt. Dennoch hat sich kein eindeutiger Zusammenhang zur Primärpartikelgröße bestätigt. 4 durch Hydrolyse und Kondensation von Alkoxysilanen synthetisiert [23]
Dissertation Tina Oertel, 2013
- 5 -
Als Erkenntnis dieser Arbeit kann festgestellt werden, dass unterschiedliche (kommerzielle) Silica auch verschiedene Auswirkungen auf die Eigenschaften von UHPC haben können. Ist eine Beschleunigung der Hydratation gewünscht, sollte Silica mit einer geringen Reaktivität zum Einsatz kommen. Der Füllereffekt kann nur ausgeschöpft werden, wenn die Silicapartikel auf Primärpartikelgröße dispergiert sind.
Diese Dissertation ist kumulativ. Die Ergebnisse sind im 4. Kapitel zusammengefasst und werden im Detail in den Veröffentlichungen [1-3], siehe 6. Kapitel, besprochen.
Dissertation Tina Oertel, 2013
- 6 -
3 INTRODUCTION5
3.1 Amorphous silica particles
3.1.1 TerminologyX-ray amorphous silica particles are the topic of this thesis. To simplify matters, the author refers to them by using the term ‘silica’. If their primary particles are smaller than 1 μm (sub-micrometer range), they are referred to as sub-micrometer silica; the corresponding compound with a liquid is a silica suspension. Materials with primary particles being smaller than 100 nm (nanometer range) are referred to as nano silica; their homogeneous mixture with a liquid is a sol.
3.1.2 Synthesis and production methods
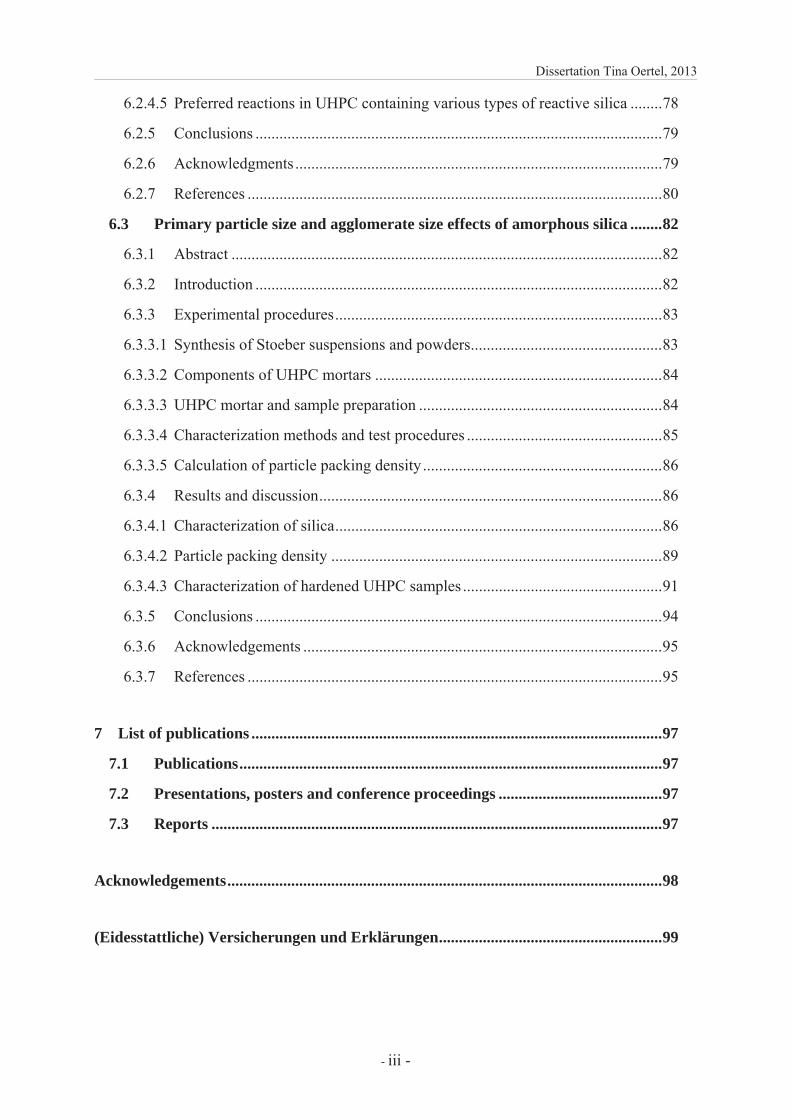
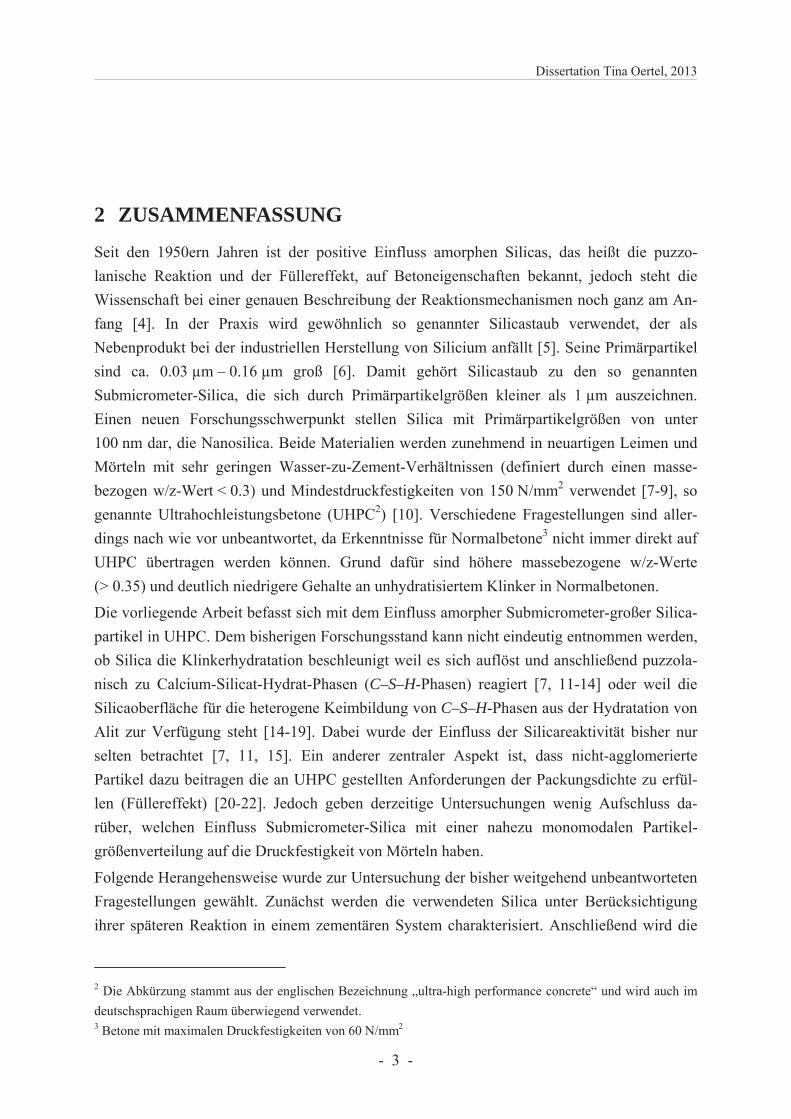
Sol-gel processes are common to synthesize silica with a very high purity. One example is the Stoeber process [23] in which tetraethyl orthosilicate (Si(OC2H5)4) hydrolyses and conden-sates in an ethanolic (C2H5OH) solution with ammonia (NH3) catalysis (Equation 1). Thereby, spherical particles are formed, so-called Stoeber particles (Figure 1 a). Their size is adjustable in the nanometer and sub-micrometer range by the relative concentrations of precursors (Si(OC2H5)4 and H2O) and the catalyst (NH3).
Equation 1: Si(OC2H5)4 + 2 H2O SiO2 + 4 C2H5OH
Very pure silica is produced on an industrial scale in a flame hydrolysis reaction of silicon tetrachloride (SiCl4) at about 1800 °C [24-26]. Herein, hydrogen and oxygen react to H2O, and the hydrolysis and condensation of SiCl4 subsequently proceeds (Equation 2) [25]. The product is referred to as pyrogenic or fumed silica (Figure 1 b). Its primary particles, being in the nanometer size range, form aggregates.
Equation 2: SiCl4 + 2 H2 + O2 SiO2 + 4 HCl
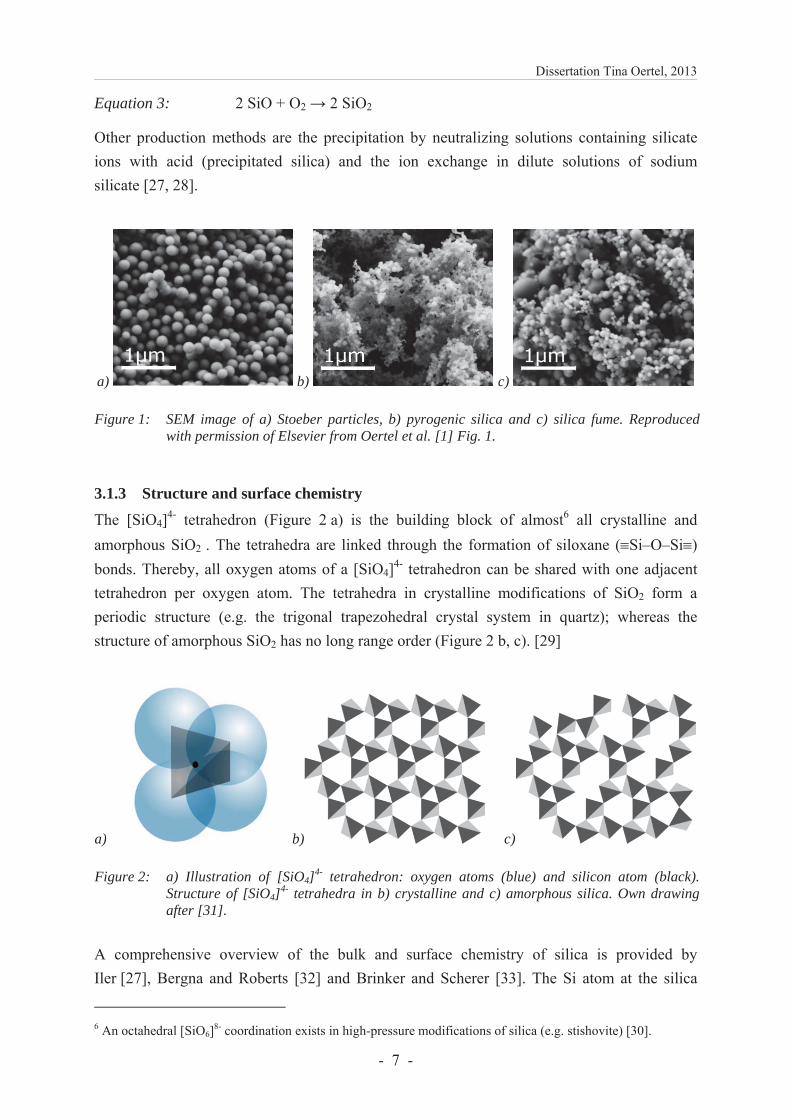
Silica fume (also referred to as micro silica, Figure 1 c) is a by-product in the industrial pro-duction of silicon [5, 26]. Thereby, quartz is reduced to gaseous silicon monoxide (SiO) in an electric arc furnace at temperatures above 2000 °C [26]. A certain amount of SiO oxidizes in the exhaust air to spherical particles (Equation 3) [26]. Primary particles of silica fume have sizes of approx. 0.03 μm – 0.16 μm [6] and form aggregates. Silica fume is less pure than Stoeber particles or pyrogenic silica. 5 This section includes extracts from [1-3] which is consistent with the publishing agreement of Elsevier.
Dissertation Tina Oertel, 2013
- 7 -
Equation 3: 2 SiO + O2 2 SiO2
Other production methods are the precipitation by neutralizing solutions containing silicate ions with acid (precipitated silica) and the ion exchange in dilute solutions of sodium silicate [27, 28].
a) b) c)
Figure 1: SEM image of a) Stoeber particles, b) pyrogenic silica and c) silica fume. Reproduced with permission of Elsevier from Oertel et al. [1] Fig. 1.
3.1.3 Structure and surface chemistry
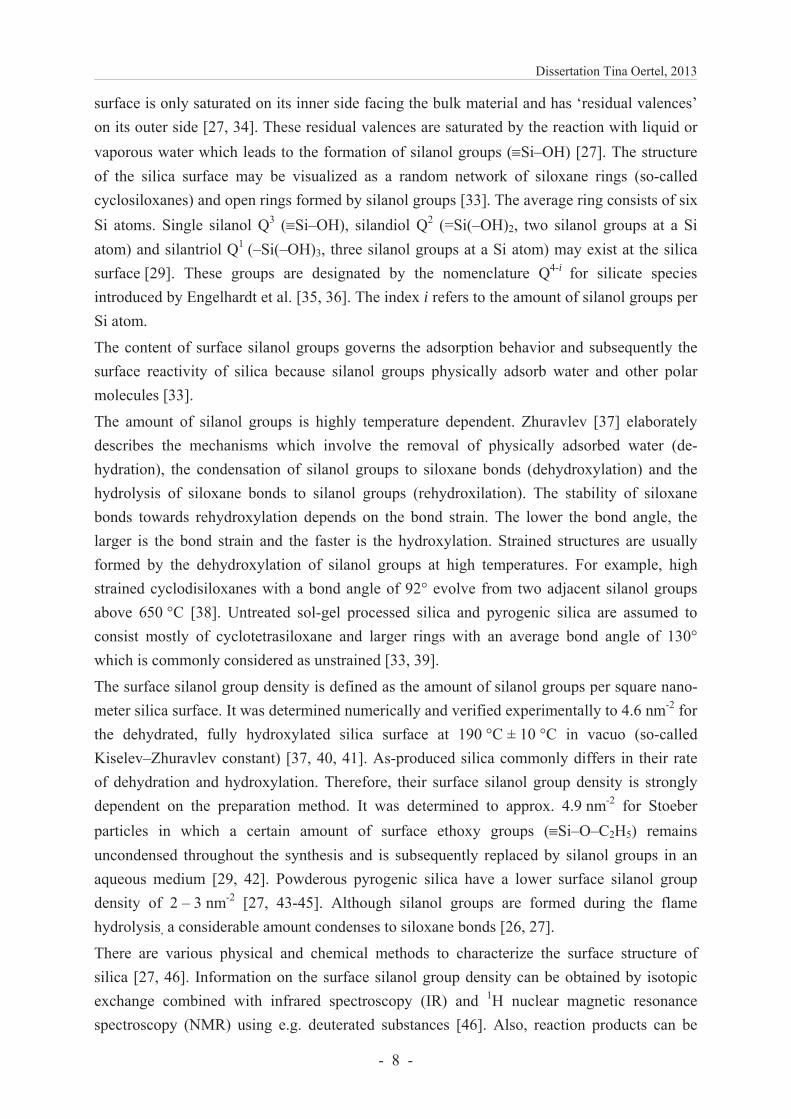
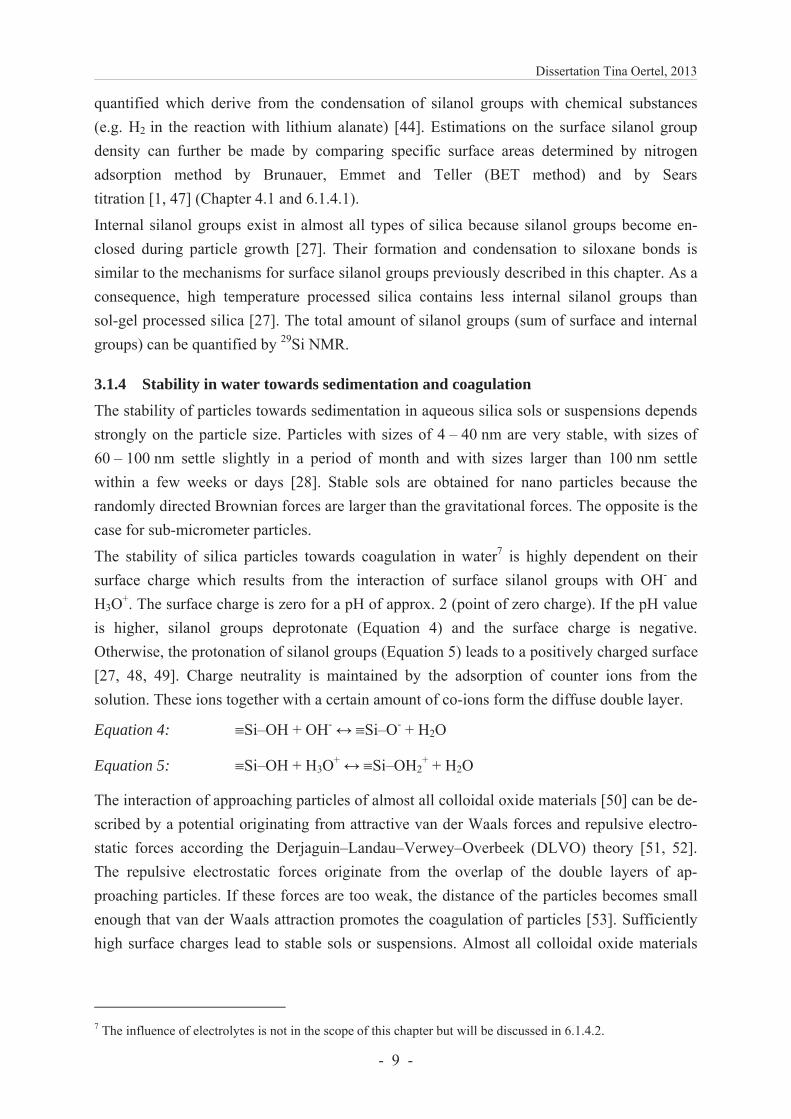
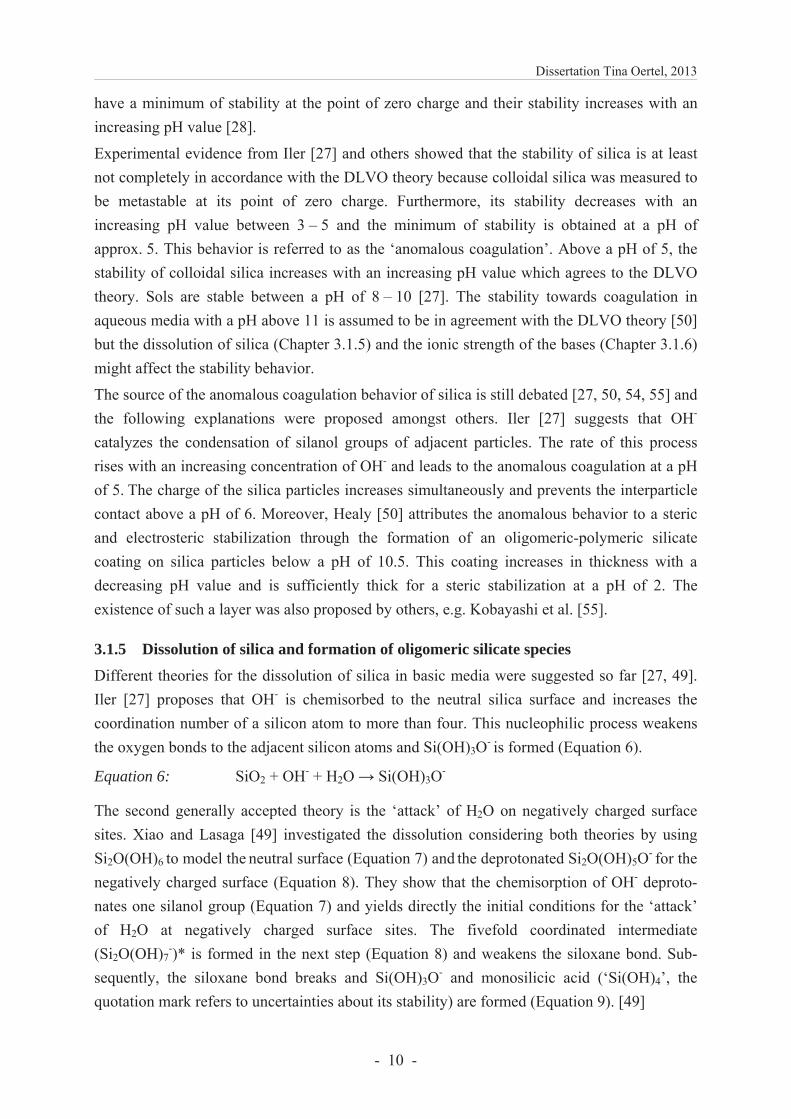
The [SiO4]4- tetrahedron (Figure 2 a) is the building block of almost6 all crystalline and amorphous SiO2 . The tetrahedra are linked through the formation of siloxane ( Si–O–Si ) bonds. Thereby, all oxygen atoms of a [SiO4]4- tetrahedron can be shared with one adjacent tetrahedron per oxygen atom. The tetrahedra in crystalline modifications of SiO2 form a periodic structure (e.g. the trigonal trapezohedral crystal system in quartz); whereas the structure of amorphous SiO2 has no long range order (Figure 2 b, c). [29]
Eitel 1975 ist quelle in fußnote [30]
a) b) c)
Figure 2: a) Illustration of [SiO4]4- tetrahedron: oxygen atoms (blue) and silicon atom (black).
Structure of [SiO4]4- tetrahedra in b) crystalline and c) amorphous silica. Own drawing
after [31].
A comprehensive overview of the bulk and surface chemistry of silica is provided by Iler [27], Bergna and Roberts [32] and Brinker and Scherer [33]. The Si atom at the silica
6 An octahedral [SiO6]8- coordination exists in high-pressure modifications of silica (e.g. stishovite) [30].
Dissertation Tina Oertel, 2013
- 8 -
surface is only saturated on its inner side facing the bulk material and has ‘residual valences’ on its outer side [27, 34]. These residual valences are saturated by the reaction with liquid or vaporous water which leads to the formation of silanol groups ( Si–OH) [27]. The structure of the silica surface may be visualized as a random network of siloxane rings (so-called cyclosiloxanes) and open rings formed by silanol groups [33]. The average ring consists of six Si atoms. Single silanol Q3 ( Si–OH), silandiol Q2 (=Si(–OH)2, two silanol groups at a Si atom) and silantriol Q1 (–Si(–OH)3, three silanol groups at a Si atom) may exist at the silica surface [29]. These groups are designated by the nomenclature Q4-i for silicate species introduced by Engelhardt et al. [35, 36]. The index i refers to the amount of silanol groups per Si atom.
The content of surface silanol groups governs the adsorption behavior and subsequently the surface reactivity of silica because silanol groups physically adsorb water and other polar molecules [33].
The amount of silanol groups is highly temperature dependent. Zhuravlev [37] elaborately describes the mechanisms which involve the removal of physically adsorbed water (de-hydration), the condensation of silanol groups to siloxane bonds (dehydroxylation) and the hydrolysis of siloxane bonds to silanol groups (rehydroxilation). The stability of siloxane bonds towards rehydroxylation depends on the bond strain. The lower the bond angle, the larger is the bond strain and the faster is the hydroxylation. Strained structures are usually formed by the dehydroxylation of silanol groups at high temperatures. For example, high strained cyclodisiloxanes with a bond angle of 92° evolve from two adjacent silanol groups above 650 °C [38]. Untreated sol-gel processed silica and pyrogenic silica are assumed to consist mostly of cyclotetrasiloxane and larger rings with an average bond angle of 130° which is commonly considered as unstrained [33, 39].
The surface silanol group density is defined as the amount of silanol groups per square nano-meter silica surface. It was determined numerically and verified experimentally to 4.6 nm-2 for the dehydrated, fully hydroxylated silica surface at 190 °C ± 10 °C in vacuo (so-called Kiselev–Zhuravlev constant) [37, 40, 41]. As-produced silica commonly differs in their rate of dehydration and hydroxylation. Therefore, their surface silanol group density is strongly dependent on the preparation method. It was determined to approx. 4.9 nm-2 for Stoeber particles in which a certain amount of surface ethoxy groups ( Si–O–C2H5) remains uncondensed throughout the synthesis and is subsequently replaced by silanol groups in an aqueous medium [29, 42]. Powderous pyrogenic silica have a lower surface silanol group density of 2 – 3 nm-2 [27, 43-45]. Although silanol groups are formed during the flame hydrolysis, a considerable amount condenses to siloxane bonds [26, 27].
There are various physical and chemical methods to characterize the surface structure of silica [27, 46]. Information on the surface silanol group density can be obtained by isotopic exchange combined with infrared spectroscopy (IR) and 1H nuclear magnetic resonance spectroscopy (NMR) using e.g. deuterated substances [46]. Also, reaction products can be
Dissertation Tina Oertel, 2013
- 9 -
quantified which derive from the condensation of silanol groups with chemical substances (e.g. H2 in the reaction with lithium alanate) [44]. Estimations on the surface silanol group density can further be made by comparing specific surface areas determined by nitrogen adsorption method by Brunauer, Emmet and Teller (BET method) and by Sears titration [1, 47] (Chapter 4.1 and 6.1.4.1).
Internal silanol groups exist in almost all types of silica because silanol groups become en-closed during particle growth [27]. Their formation and condensation to siloxane bonds is similar to the mechanisms for surface silanol groups previously described in this chapter. As a consequence, high temperature processed silica contains less internal silanol groups than sol-gel processed silica [27]. The total amount of silanol groups (sum of surface and internal groups) can be quantified by 29Si NMR.
3.1.4 Stability in water towards sedimentation and coagulation
The stability of particles towards sedimentation in aqueous silica sols or suspensions depends strongly on the particle size. Particles with sizes of 4 – 40 nm are very stable, with sizes of 60 – 100 nm settle slightly in a period of month and with sizes larger than 100 nm settle within a few weeks or days [28]. Stable sols are obtained for nano particles because the randomly directed Brownian forces are larger than the gravitational forces. The opposite is the case for sub-micrometer particles.
The stability of silica particles towards coagulation in water7 is highly dependent on their surface charge which results from the interaction of surface silanol groups with OH- and H3O+. The surface charge is zero for a pH of approx. 2 (point of zero charge). If the pH value is higher, silanol groups deprotonate (Equation 4) and the surface charge is negative. Otherwise, the protonation of silanol groups (Equation 5) leads to a positively charged surface [27, 48, 49]. Charge neutrality is maintained by the adsorption of counter ions from the solution. These ions together with a certain amount of co-ions form the diffuse double layer.
Equation 4: Si–OH + OH- Si–O- + H2O
Equation 5: Si–OH + H3O+ Si–OH2+ + H2O
The interaction of approaching particles of almost all colloidal oxide materials [50] can be de-scribed by a potential originating from attractive van der Waals forces and repulsive electro-static forces according the Derjaguin–Landau–Verwey–Overbeek (DLVO) theory [51, 52]. The repulsive electrostatic forces originate from the overlap of the double layers of ap-proaching particles. If these forces are too weak, the distance of the particles becomes small enough that van der Waals attraction promotes the coagulation of particles [53]. Sufficiently high surface charges lead to stable sols or suspensions. Almost all colloidal oxide materials
7 The influence of electrolytes is not in the scope of this chapter but will be discussed in 6.1.4.2.
Dissertation Tina Oertel, 2013
- 10 -
have a minimum of stability at the point of zero charge and their stability increases with an increasing pH value [28].
Experimental evidence from Iler [27] and others showed that the stability of silica is at least not completely in accordance with the DLVO theory because colloidal silica was measured to be metastable at its point of zero charge. Furthermore, its stability decreases with an increasing pH value between 3 – 5 and the minimum of stability is obtained at a pH of approx. 5. This behavior is referred to as the ‘anomalous coagulation’. Above a pH of 5, the stability of colloidal silica increases with an increasing pH value which agrees to the DLVO theory. Sols are stable between a pH of 8 – 10 [27]. The stability towards coagulation in aqueous media with a pH above 11 is assumed to be in agreement with the DLVO theory [50] but the dissolution of silica (Chapter 3.1.5) and the ionic strength of the bases (Chapter 3.1.6) might affect the stability behavior.
The source of the anomalous coagulation behavior of silica is still debated [27, 50, 54, 55] and the following explanations were proposed amongst others. Iler [27] suggests that OH-
catalyzes the condensation of silanol groups of adjacent particles. The rate of this process rises with an increasing concentration of OH- and leads to the anomalous coagulation at a pH of 5. The charge of the silica particles increases simultaneously and prevents the interparticle contact above a pH of 6. Moreover, Healy [50] attributes the anomalous behavior to a steric and electrosteric stabilization through the formation of an oligomeric-polymeric silicate coating on silica particles below a pH of 10.5. This coating increases in thickness with a decreasing pH value and is sufficiently thick for a steric stabilization at a pH of 2. The existence of such a layer was also proposed by others, e.g. Kobayashi et al. [55].
3.1.5 Dissolution of silica and formation of oligomeric silicate species
Different theories for the dissolution of silica in basic media were suggested so far [27, 49]. Iler [27] proposes that OH- is chemisorbed to the neutral silica surface and increases the coordination number of a silicon atom to more than four. This nucleophilic process weakens the oxygen bonds to the adjacent silicon atoms and Si(OH)3O- is formed (Equation 6).
Equation 6: SiO2 + OH- + H2O Si(OH)3O-
The second generally accepted theory is the ‘attack’ of H2O on negatively charged surface sites. Xiao and Lasaga [49] investigated the dissolution considering both theories by using Si2O(OH)6 to model the neutral surface (Equation 7) and the deprotonated Si2O(OH)5O-
for the
negatively charged surface (Equation 8). They show that the chemisorption of OH- deproto-nates one silanol group (Equation 7) and yields directly the initial conditions for the ‘attack’ of H2O at negatively charged surface sites. The fivefold coordinated intermediate (Si2O(OH)7
-)* is formed in the next step (Equation 8) and weakens the siloxane bond. Sub-sequently, the siloxane bond breaks and Si(OH)3O- and monosilicic acid (‘Si(OH)4’, the quotation mark refers to uncertainties about its stability) are formed (Equation 9). [49]
Dissertation Tina Oertel, 2013
- 11 -
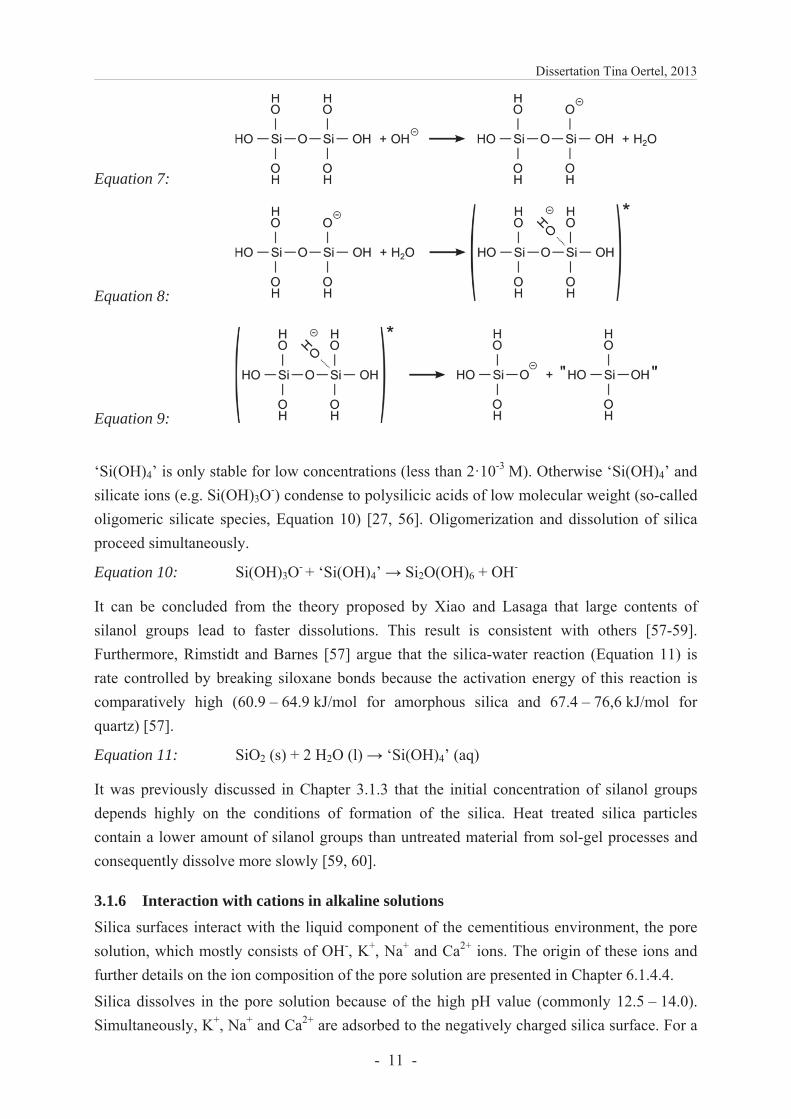
Equation 7:
Equation 8:
Equation 9:
‘Si(OH)4’ is only stable for low concentrations (less than 2·10-3 M). Otherwise ‘Si(OH)4’ and silicate ions (e.g. Si(OH)3O-) condense to polysilicic acids of low molecular weight (so-called oligomeric silicate species, Equation 10) [27, 56]. Oligomerization and dissolution of silica proceed simultaneously.
Equation 10: Si(OH)3O- + ‘Si(OH)4’ Si2O(OH)6 + OH-
It can be concluded from the theory proposed by Xiao and Lasaga that large contents of silanol groups lead to faster dissolutions. This result is consistent with others [57-59]. Furthermore, Rimstidt and Barnes [57] argue that the silica-water reaction (Equation 11) is rate controlled by breaking siloxane bonds because the activation energy of this reaction is comparatively high (60.9 – 64.9 kJ/mol for amorphous silica and 67.4 – 76,6 kJ/mol for quartz) [57].
Equation 11: SiO2 (s) + 2 H2O (l) ‘Si(OH)4’ (aq)
It was previously discussed in Chapter 3.1.3 that the initial concentration of silanol groups depends highly on the conditions of formation of the silica. Heat treated silica particles contain a lower amount of silanol groups than untreated material from sol-gel processes and consequently dissolve more slowly [59, 60].
3.1.6 Interaction with cations in alkaline solutions
Silica surfaces interact with the liquid component of the cementitious environment, the pore solution, which mostly consists of OH-, K+, Na+ and Ca2+ ions. The origin of these ions and further details on the ion composition of the pore solution are presented in Chapter 6.1.4.4.
Silica dissolves in the pore solution because of the high pH value (commonly 12.5 – 14.0). Simultaneously, K+, Na+ and Ca2+ are adsorbed to the negatively charged silica surface. For a
Dissertation Tina Oertel, 2013
- 12 -
deeper insight, the detailed processes at the silica surface have to be considered. They are discussed in the following.
The dissolution rate of silica is affected by alkali metal cations and was found to be higher for KOH solutions than for NaOH solutions [61]. When silica is dissolved in these alkaline solu-tions, alkali ions and silicate ions mostly react to monomeric, dimeric or tetrameric alkali sili-cate species, e.g. Si(OH)2O2M-, Si2(OH)4O3M- and Si4(OH)6O6M- with M = Na, K (so-called alkali silicate oligomers8) [62]. The rate of oligomerization depends on the alkali metal cation [61, 62]. More highly polymerized silica species are found in the presence of K+ than of Na+ [61, 62]. Eventually, alkali silicate oligomers solidify to a gel by further condensation.
Ca2+ can promote such a gel formation process [63]. Different mechanisms were proposed so far. Gaboriaud et al. [63] assume that a Ca2+ ion links two silicate oligomers containing deprotonated silanol groups and the Ca2+ ion is later ‘extracted’ from this intermediate phase by the formation of a siloxane bond between both oligomers. Leemann et al. [64] propose that bound alkali ions are replaced by Ca2+ in the alkali silicate oligomers and possibly calcium silicate structures close to C–S–H phases are formed [64-66]. Allen and Matijevic [66] argue that Ca2+ has the smaller solvated volume and the greater polarizability than alkali ions; therefore, the ion exchange probably proceeds until all alkali ions are replaced in the oligomers. In other words, the stable phase in a highly alkaline environment containing Ca2+, Na+ and K+ might be calcium-containing oligomers and their polymers which result from further condensation. The described effect is utilized in the chemical stabilization of soil using sodium water glass and calcium chloride, the so-called Joosten method [67, 68]. The reactants are injected into the soil one after another (at first sodium water glass) and a gel is formed in the interstices between the soil particles.
If the dissolution velocity of the silica is comparably low, further interactions of the cations and the silica surface need to be considered. Cations are attracted to the silica surface and interact with the deprotonated silanol groups [27, 60, 69, 70]. Iler [27] proposes that metal cations are covalently bonded (Equation 12, Equation 13). Thereby, one positive charge remains at the divalent ion because it is unlikely that two adjacent deprotonated silanol groups are located close enough at the silica surface to be neutralized by one Ca2+ ion. If a critical concentration of adsorbed Ca2+ is exceeded, silica particles coagulate, probably because deprotonated silanol groups attract Si–O–Ca+ groups from an adjacent particle [27, 70].
Equation 12: Si–O- + M+ Si–OM, M=Na, K
Equation 13: Si–O- + Ca2+ Si–OCa+
It is further assumed that ions diffuse into silica particles [48, 55, 60, 71, 72]. Tadros and Lyklema [69], Despas et al. [71] and Kobayashi et al. [55] propose that OH-, Na+ and K+ are small enough to penetrate into pores of Stoeber particles or precipitated silica. Thus, a certain
8 Pure solutions of alkali silicate oligomers are better known as water glass.
Dissertation Tina Oertel, 2013
- 13 -
amount of internal silanol groups is deprotonated. These pores are not detected by the BET method, presumably because they seem to be either impermeable to nitrogen [48, 55] or they exist only in aqueous suspension and are compacted during the preparatory drying of the samples [60]. It is further proposed that the microporosity vanishes by heating the samples to 800°C due to the condensation of silanol groups [55, 60, 72].
In conclusion, the interactions described in this chapter highly depend on the content of silanol groups, which in turn are related to the conditions of formation of the silica previously discussed in Chapter 3.1.2.
3.2 Cementitious materials
3.2.1 Composition of Portland cement Portland cement clinker, a hydraulic binder, is produced by the calcination of limestone, clay and pyrite ash at 1450 °C [73]. Thereby, the clinker minerals alite, belite, aluminate and aluminate ferrite form.
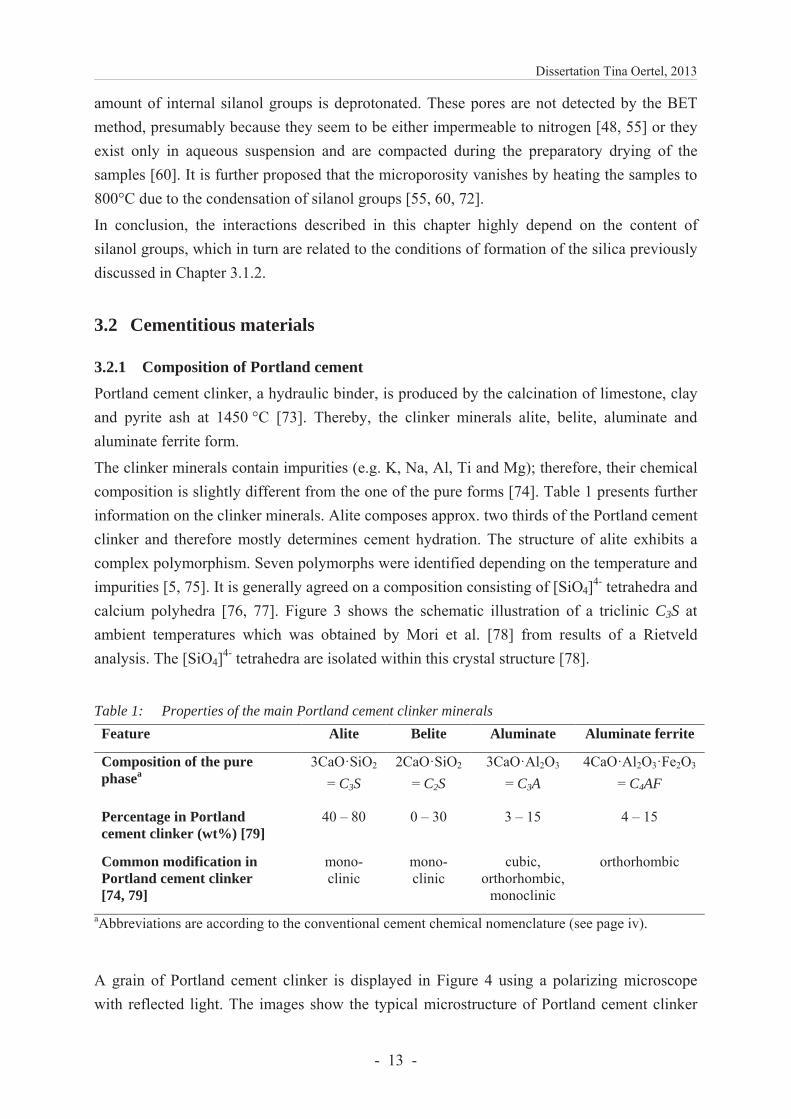
The clinker minerals contain impurities (e.g. K, Na, Al, Ti and Mg); therefore, their chemical composition is slightly different from the one of the pure forms [74]. Table 1 presents further information on the clinker minerals. Alite composes approx. two thirds of the Portland cement clinker and therefore mostly determines cement hydration. The structure of alite exhibits a complex polymorphism. Seven polymorphs were identified depending on the temperature and impurities [5, 75]. It is generally agreed on a composition consisting of [SiO4]4- tetrahedra and calcium polyhedra [76, 77]. Figure 3 shows the schematic illustration of a triclinic C3S at ambient temperatures which was obtained by Mori et al. [78] from results of a Rietveld analysis. The [SiO4]4- tetrahedra are isolated within this crystal structure [78].
Table 1: Properties of the main Portland cement clinker minerals
Feature Alite Belite Aluminate Aluminate ferrite
Composition of the pure phasea
3CaO·SiO2
= C3S 2CaO·SiO2
= C2S
3CaO·Al2O3
= C3A 4CaO·Al2O3·Fe2O3
= C4AF
Percentage in Portland cement clinker (wt%) [79]
40 – 80 0 – 30 3 – 15 4 – 15
Common modification in Portland cement clinker [74, 79]
mono-clinic
mono-clinic
cubic, orthorhombic,
monoclinic
orthorhombic
aAbbreviations are according to the conventional cement chemical nomenclature (see page iv).
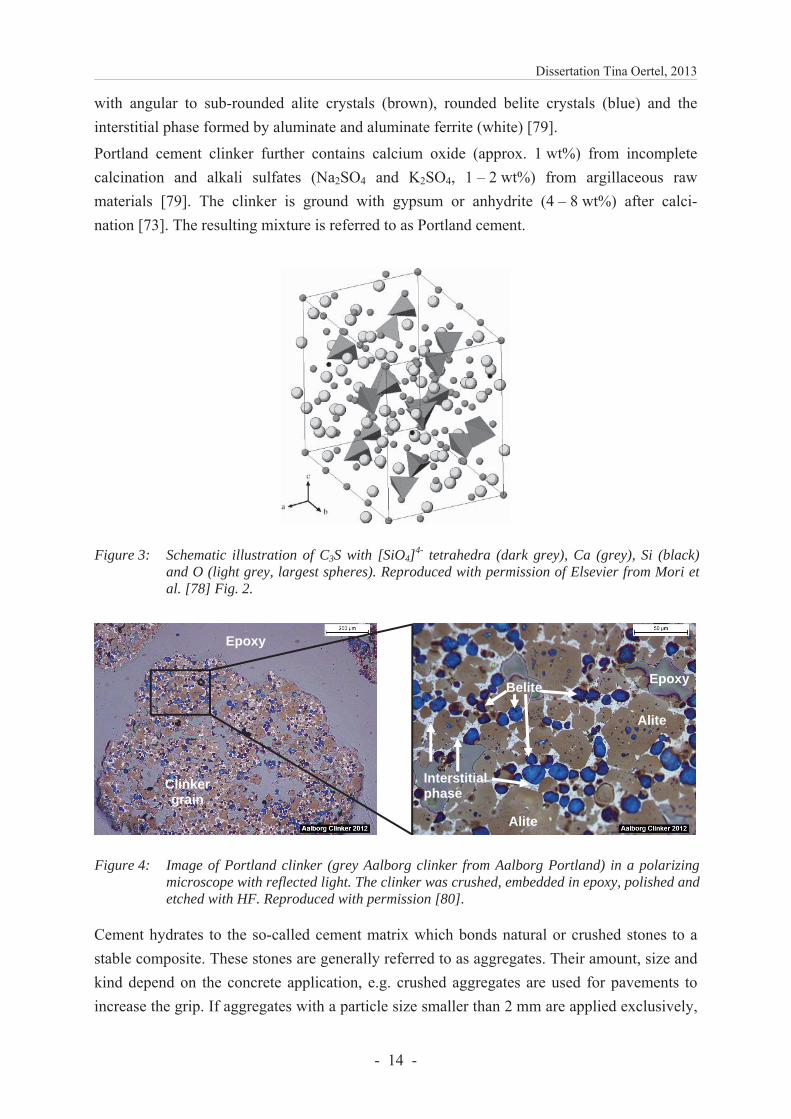
A grain of Portland cement clinker is displayed in Figure 4 using a polarizing microscope with reflected light. The images show the typical microstructure of Portland cement clinker
Dissertation Tina Oertel, 2013
- 14 -
with angular to sub-rounded alite crystals (brown), rounded belite crystals (blue) and the interstitial phase formed by aluminate and aluminate ferrite (white) [79].
Portland cement clinker further contains calcium oxide (approx. 1 wt%) from incomplete calcination and alkali sulfates (Na2SO4 and K2SO4, 1 – 2 wt%) from argillaceous raw materials [79]. The clinker is ground with gypsum or anhydrite (4 – 8 wt%) after calci-nation [73]. The resulting mixture is referred to as Portland cement.
Figure 3: Schematic illustration of C3S with [SiO4]4- tetrahedra (dark grey), Ca (grey), Si (black)
and O (light grey, largest spheres). Reproduced with permission of Elsevier from Mori et al. [78] Fig. 2.
Figure 4: Image of Portland clinker (grey Aalborg clinker from Aalborg Portland) in a polarizing microscope with reflected light. The clinker was crushed, embedded in epoxy, polished and etched with HF. Reproduced with permission [80].
Cement hydrates to the so-called cement matrix which bonds natural or crushed stones to a stable composite. These stones are generally referred to as aggregates. Their amount, size and kind depend on the concrete application, e.g. crushed aggregates are used for pavements to increase the grip. If aggregates with a particle size smaller than 2 mm are applied exclusively,
Alite
EpoxyBelite
Alite
Interstitialphase
Epoxy
Clinkergrain
Dissertation Tina Oertel, 2013
- 15 -
the composite is named mortar; otherwise, it is designated as concrete. Mixtures without aggregates are referred to as cement pastes.
The terms concrete, mortar and paste refer to the liquid fluids after water addition as well as to the hardened products after clinker hydration.
3.2.2 Hydration of Portland cement
The hydration of the clinker minerals is a dissolution-precipitation process as was shown by Le Chatelier in 1904. The following definition of Odler [[74] p. 24] demonstrates its extended meaning in cementitious science: “In strictly chemical terms hydration is a reaction of an
anhydrous compound with water, yielding a new compound, a hydrate. In cement chemistry
hydration is understood to be the reaction of a non-hydrated cement or one of its constituents
with water, associated with both chemical and physio-chemical changes of the system […]”.
The hydration of Portland cement clinker minerals is a complex reaction and its sub-processes are still under investigations [81]. The main processes, however, are well known [5, 73, 74, 82]. The current state of knowledge is summarized in Bullard et al. [81] and Stark [83].
In the following, the hydration of the individual clinker minerals and the reaction products are considered. In its reaction with water (H)9, alite forms portlandite (CH)9 and C–S–H phases (e.g. C1.5+m SH1+m+n)9, Equation 14 [76]. Thereby, alite dissolves congruently to ionic species (Equation 15) in the first seconds after mixing with water [74, 81].
Equation 14: C3S + (2.5 + n) H C1.5+m SH1+m+n + (1.5 – m) CH
Equation 15: 3CaO·SiO2 + 3 H2O 3 Ca2+ + Si(OH)2O22- + 4 OH-
After a few minutes, the dissolution decelerates (induction period) despite the solution being far from saturation [81]. There is no overall agreement on the reason for the induction period, but the following models exist with respect to recent research [4, 81]. It is supposed that a metastable barrier covers the alite surface and blocks further dissolution. Although, there is evidence that at least an intermediate calcium silicate phase forms on C3S nanoparticles [84], direct evidence on alite grains is still absent [81]. In another hypothesis, it is assumed that the alite dissolution rate declines rapidly because the solution is still undersaturated with respect to Equation 15 but supersaturated with respect to an immediate precipitation of a C–S–H phase [81].
Despite the induction period, alite hydrates rapidly and governs early hydration of clinker. C–S–H phases are formed by heterogeneous nucleation on alite surfaces and homogeneous nucleation.
Hydration mechanisms of belite are similar to that of alite but they proceed more slowly [74, 85] and a significantly lower amount of portlandite is formed (Equation 16) [76].
Equation 16: C2S + (1.5 + n) H C1.5+m SH1+m+n + (0.5 – m) CH
9Abbreviations are according to the conventional cement chemical nomenclature (see page iv).
Dissertation Tina Oertel, 2013
- 16 -
Aluminate reacts the fastest of all clinker minerals. The composition of the reaction products highly depends on the presence of calcium sulfates [79]. If they are absent, hexagonal crystals of calcium aluminate hydrates (C4AH13, C2AH8)10 are formed very rapidly (Equation 17) and bridge the interparticular space like a house of cards resulting in a very rapid setting of the concrete (so-called false set) [79].
Equation 17: 2 C3A + 21 H C4AH13 + C2AH8
This rapid setting is undesirable because it does not allow a processing of fresh concrete. If calcium sulfate, e.g. gypsum (C H2)10, is present, a certain amount of ettringite (C3A·3C ·H32)10 is primarily formed immediately at the start of hydration [85-87] which prevents the false set (Equation 18) [74, 79].
Equation 18: C3A + 3 C H2 + 26 H C3A·3C ·H32
Similarly to alite, there is a rapid decrease of this reaction after some minutes. Possible explanations are that calcium and sulfate ions might be adsorbed, or a diffusion barrier might be formed on the aluminate phase by ettringite [81].
Hydration mechanisms of the aluminate ferrite are still under discussion. In general, it reacts similarly to aluminate but more slowly [85], and the reaction seems to be related to the content of calcium sulfate [79].
In Portland cements, the described reactions highly depend on the composition of the clinker mineral, the particle size of cement grains, the w/c ratio, chemical compounds (e.g. retarders, accelerators and superplasticizers) and further reactants (e.g. silica fume, ground granulated blast furnace slag and fly ash)11.
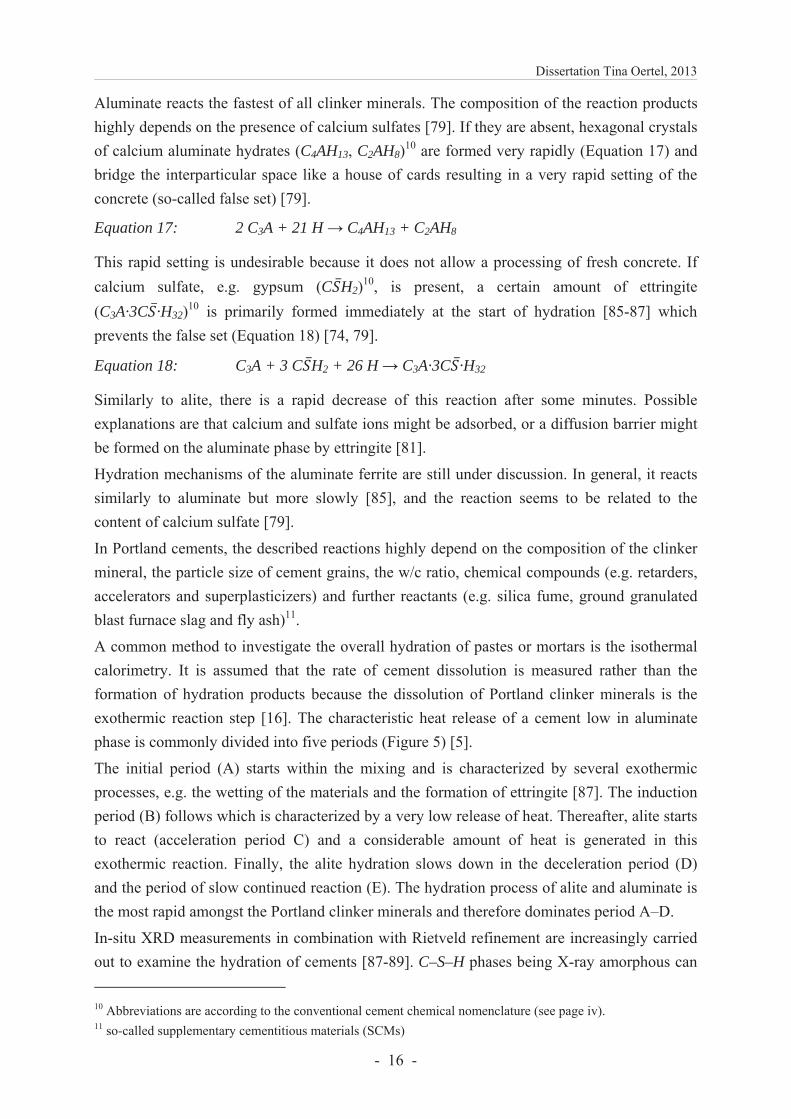
A common method to investigate the overall hydration of pastes or mortars is the isothermal calorimetry. It is assumed that the rate of cement dissolution is measured rather than the formation of hydration products because the dissolution of Portland clinker minerals is the exothermic reaction step [16]. The characteristic heat release of a cement low in aluminate phase is commonly divided into five periods (Figure 5) [5].
The initial period (A) starts within the mixing and is characterized by several exothermic processes, e.g. the wetting of the materials and the formation of ettringite [87]. The induction period (B) follows which is characterized by a very low release of heat. Thereafter, alite starts to react (acceleration period C) and a considerable amount of heat is generated in this exothermic reaction. Finally, the alite hydration slows down in the deceleration period (D) and the period of slow continued reaction (E). The hydration process of alite and aluminate is the most rapid amongst the Portland clinker minerals and therefore dominates period A–D.
In-situ XRD measurements in combination with Rietveld refinement are increasingly carried out to examine the hydration of cements [87-89]. C–S–H phases being X-ray amorphous can 10 Abbreviations are according to the conventional cement chemical nomenclature (see page iv). 11 so-called supplementary cementitious materials (SCMs)
Dissertation Tina Oertel, 2013
- 17 -
be quantified by applying calibration procedures such as the internal standard method [9] or the G factor method [90].
Figure 5: Heat release of a C3A low Portland cement paste (low w/c ratio) with the periods of cement hydration: A) initial period, B) induction period, C) acceleration period, D) deceleration period and E) period of slow continued reaction. Source: own illustration.
3.2.3 Calcium–silicate–hydrate phases
C–S–H phases are poorly ordered phases with very variable composition [91]. Their C/S molar ratios are between approx. 1.2 – 2.3 with a mean value of 1.75 [92] and depend, amongst others, on the w/c ratio of the starting mixture [74] and additional silica components (e.g. silica fume) [18].
Models for the structure of C–S–H phases were recently summarized by Richardson [91]. He categorized them into two groups according the polymerization degree of the silicate ions: structures based on isolated [SiO4]4- tetrahedra (Q0) and structures containing linear chains of [SiO4]4- tetrahedra (Q2), the ‘dreierkette-based’ models. It was stated that ‘dreierkette-based’ models fit experimental observations better [91]. Most of these models relate the structure of the C–S–H phases to a 1.4 nm tobermorite like structure, though highly distorted and in some cases intermixed with a structure similar to jennite [74, 91].
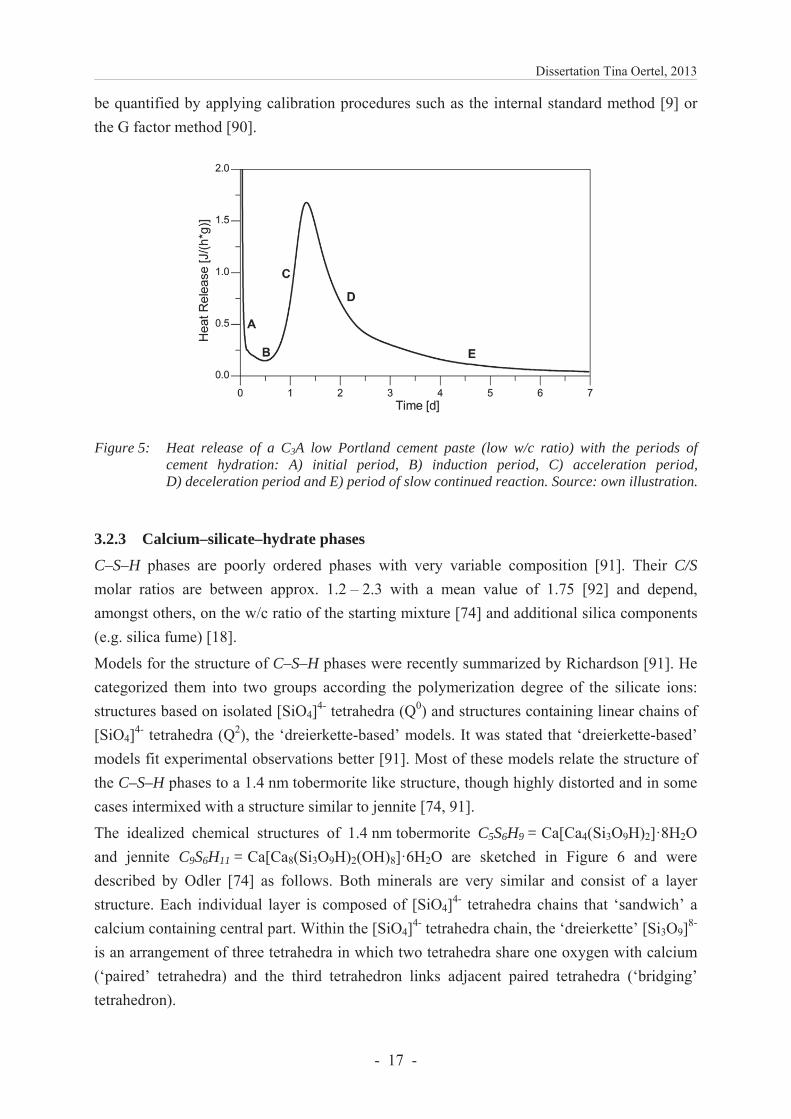
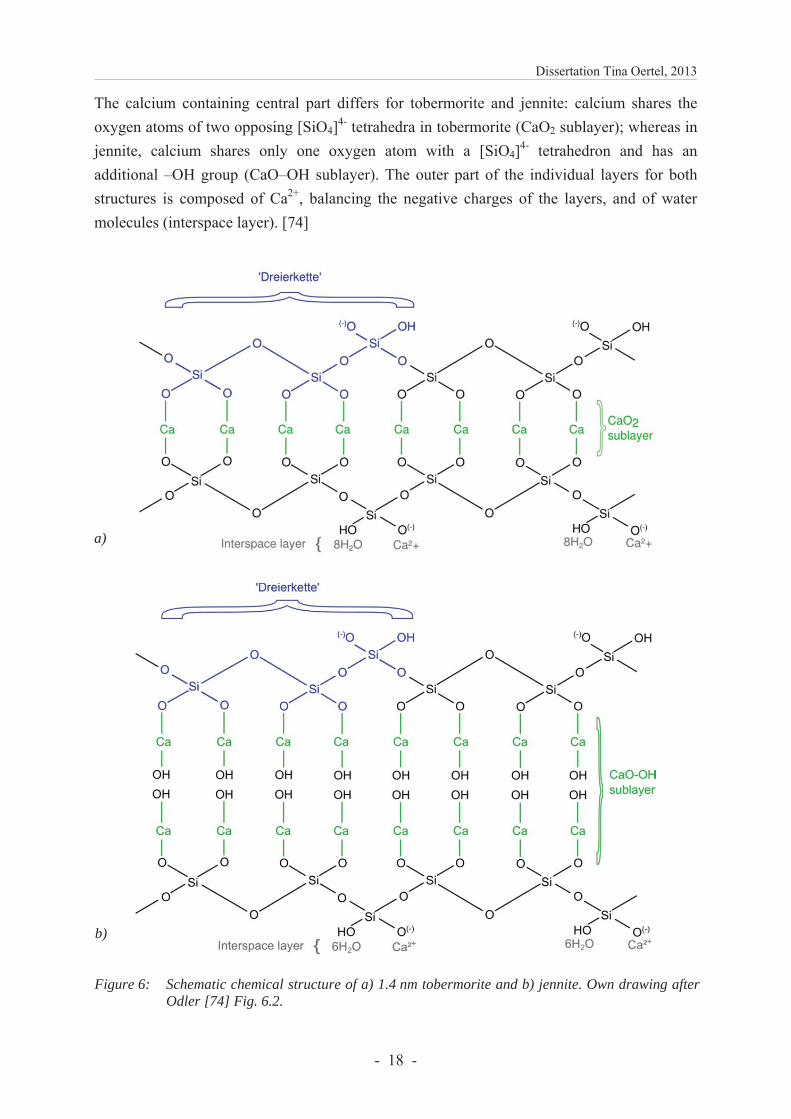
The idealized chemical structures of 1.4 nm tobermorite C5S6H9 = Ca[Ca4(Si3O9H)2]·8H2O and jennite C9S6H11 = Ca[Ca8(Si3O9H)2(OH)8]·6H2O are sketched in Figure 6 and were described by Odler [74] as follows. Both minerals are very similar and consist of a layer structure. Each individual layer is composed of [SiO4]4- tetrahedra chains that ‘sandwich’ a calcium containing central part. Within the [SiO4]4- tetrahedra chain, the ‘dreierkette’ [Si3O9]8-
is an arrangement of three tetrahedra in which two tetrahedra share one oxygen with calcium (‘paired’ tetrahedra) and the third tetrahedron links adjacent paired tetrahedra (‘bridging’ tetrahedron).
Dissertation Tina Oertel, 2013
- 18 -
The calcium containing central part differs for tobermorite and jennite: calcium shares the oxygen atoms of two opposing [SiO4]4- tetrahedra in tobermorite (CaO2 sublayer); whereas in jennite, calcium shares only one oxygen atom with a [SiO4]4- tetrahedron and has an additional –OH group (CaO–OH sublayer). The outer part of the individual layers for both structures is composed of Ca2+, balancing the negative charges of the layers, and of water molecules (interspace layer). [74]
Figure 6: Schematic chemical structure of a) 1.4 nm tobermorite and b) jennite. Own drawing afterOdler [74] Fig. 6.2.
a)
b)
Dissertation Tina Oertel, 2013
- 19 -
A complete structure determination and refinement of jennite and 1.4 nm tobermorite is presented by Bonaccorsi et al. [93, 94].
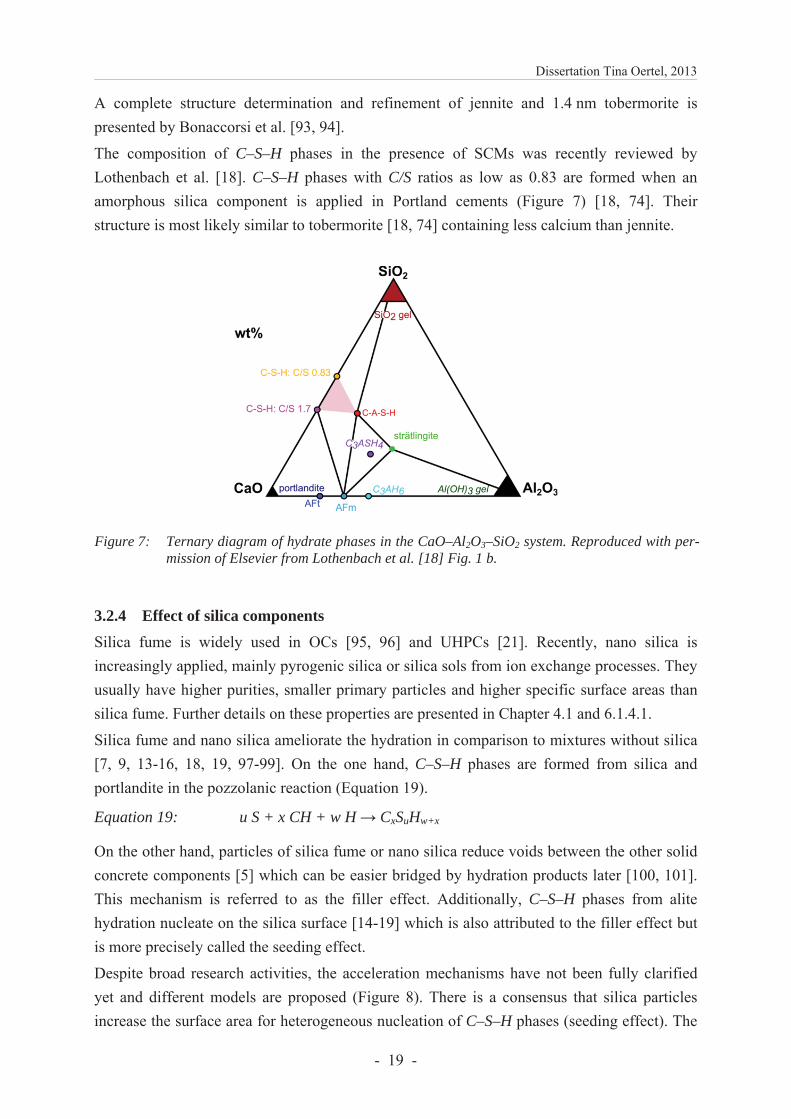
The composition of C–S–H phases in the presence of SCMs was recently reviewed by Lothenbach et al. [18]. C–S–H phases with C/S ratios as low as 0.83 are formed when an amorphous silica component is applied in Portland cements (Figure 7) [18, 74]. Their structure is most likely similar to tobermorite [18, 74] containing less calcium than jennite.
Figure 7: Ternary diagram of hydrate phases in the CaO–Al2O3–SiO2 system. Reproduced with per-mission of Elsevier from Lothenbach et al. [18] Fig. 1 b.
3.2.4 Effect of silica components Silica fume is widely used in OCs [95, 96] and UHPCs [21]. Recently, nano silica is increasingly applied, mainly pyrogenic silica or silica sols from ion exchange processes. They usually have higher purities, smaller primary particles and higher specific surface areas than silica fume. Further details on these properties are presented in Chapter 4.1 and 6.1.4.1.
Silica fume and nano silica ameliorate the hydration in comparison to mixtures without silica [7, 9, 13-16, 18, 19, 97-99]. On the one hand, C–S–H phases are formed from silica and portlandite in the pozzolanic reaction (Equation 19).
Equation 19: u S + x CH + w H CxSuHw+x
On the other hand, particles of silica fume or nano silica reduce voids between the other solid concrete components [5] which can be easier bridged by hydration products later [100, 101]. This mechanism is referred to as the filler effect. Additionally, C–S–H phases from alite hydration nucleate on the silica surface [14-19] which is also attributed to the filler effect but is more precisely called the seeding effect.
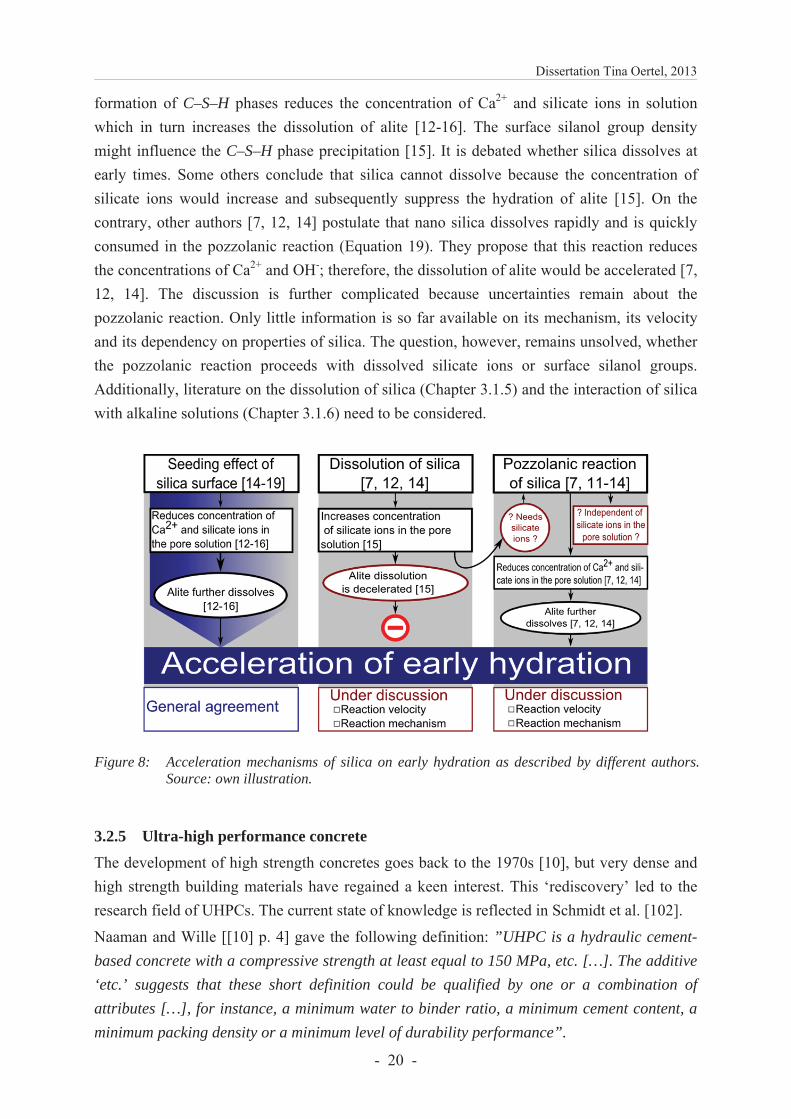
Despite broad research activities, the acceleration mechanisms have not been fully clarified yet and different models are proposed (Figure 8). There is a consensus that silica particles increase the surface area for heterogeneous nucleation of C–S–H phases (seeding effect). The
Dissertation Tina Oertel, 2013
- 20 -
formation of C–S–H phases reduces the concentration of Ca2+ and silicate ions in solution which in turn increases the dissolution of alite [12-16]. The surface silanol group density might influence the C–S–H phase precipitation [15]. It is debated whether silica dissolves at early times. Some others conclude that silica cannot dissolve because the concentration of silicate ions would increase and subsequently suppress the hydration of alite [15]. On the contrary, other authors [7, 12, 14] postulate that nano silica dissolves rapidly and is quickly consumed in the pozzolanic reaction (Equation 19). They propose that this reaction reduces the concentrations of Ca2+ and OH-; therefore, the dissolution of alite would be accelerated [7, 12, 14]. The discussion is further complicated because uncertainties remain about the pozzolanic reaction. Only little information is so far available on its mechanism, its velocity and its dependency on properties of silica. The question, however, remains unsolved, whether the pozzolanic reaction proceeds with dissolved silicate ions or surface silanol groups. Additionally, literature on the dissolution of silica (Chapter 3.1.5) and the interaction of silica with alkaline solutions (Chapter 3.1.6) need to be considered.
Figure 8: Acceleration mechanisms of silica on early hydration as described by different authors.Source: own illustration.
3.2.5 Ultra-high performance concrete
The development of high strength concretes goes back to the 1970s [10], but very dense and high strength building materials have regained a keen interest. This ‘rediscovery’ led to the research field of UHPCs. The current state of knowledge is reflected in Schmidt et al. [102].
Naaman and Wille [[10] p. 4] gave the following definition: ”UHPC is a hydraulic cement-
based concrete with a compressive strength at least equal to 150 MPa, etc. […]. The additive
‘etc.’ suggests that these short definition could be qualified by one or a combination of
attributes […], for instance, a minimum water to binder ratio, a minimum cement content, a
minimum packing density or a minimum level of durability performance”.
Dissertation Tina Oertel, 2013
- 21 -
UHPC is further characterized by a very dense structure and a low capillary porosity. Franke et al. [103] proved that its matrix mostly contains gel pores and almost no capillary pores
which results in a very high resistance towards chemical attack (e.g. sulphuric acid).
The drastic reduction of the w/c ratio was only possible because new superplasticizers were developed which further ensured the fluidity of concrete [104, 105]. The molecular structure of polycarboxylate ether is comb like with an anionic backbone and non-ionic side branches [104, 106]. The backbones adsorb on the positively charged surface of a cement grain and the non-ionic side branches function as spacer to the next grain.
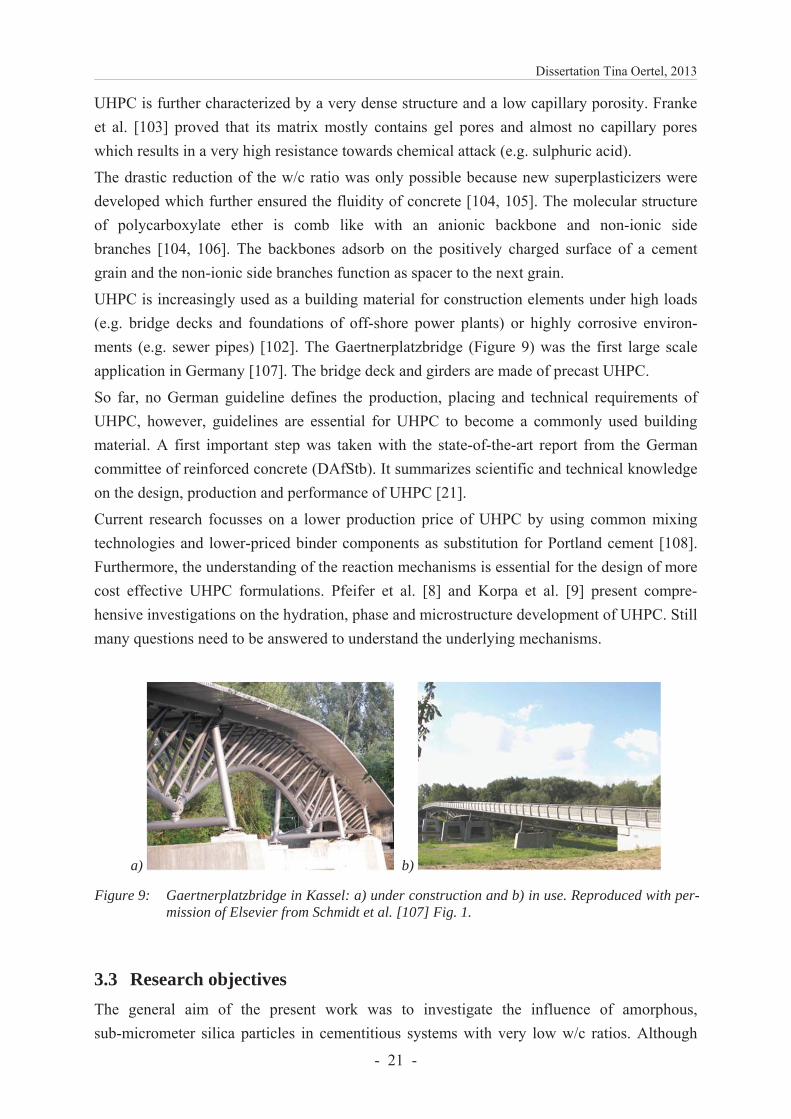
UHPC is increasingly used as a building material for construction elements under high loads (e.g. bridge decks and foundations of off-shore power plants) or highly corrosive environ-ments (e.g. sewer pipes) [102]. The Gaertnerplatzbridge (Figure 9) was the first large scale application in Germany [107]. The bridge deck and girders are made of precast UHPC.
So far, no German guideline defines the production, placing and technical requirements of UHPC, however, guidelines are essential for UHPC to become a commonly used building material. A first important step was taken with the state-of-the-art report from the German committee of reinforced concrete (DAfStb). It summarizes scientific and technical knowledge on the design, production and performance of UHPC [21].
Current research focusses on a lower production price of UHPC by using common mixing technologies and lower-priced binder components as substitution for Portland cement [108]. Furthermore, the understanding of the reaction mechanisms is essential for the design of more cost effective UHPC formulations. Pfeifer et al. [8] and Korpa et al. [9] present compre-hensive investigations on the hydration, phase and microstructure development of UHPC. Still many questions need to be answered to understand the underlying mechanisms.
a) b)
Figure 9: Gaertnerplatzbridge in Kassel: a) under construction and b) in use. Reproduced with per-mission of Elsevier from Schmidt et al. [107] Fig. 1.
3.3 Research objectives The general aim of the present work was to investigate the influence of amorphous, sub-micrometer silica particles in cementitious systems with very low w/c ratios. Although
Dissertation Tina Oertel, 2013
- 22 -
silica fume is widely used in OC and UHPC to ameliorate concrete properties, the detailed understanding of the reaction mechanisms of SCMs is still at its beginning [4]. One reason for this limited knowledge is the often lacking characterization of SCMs in examinations on the reactive surface area and the particle size distribution [4].
An important parameter to describe the reactivity is the specific surface area which is considered by most of the authors [12-15, 97]. However, other parameters such as the content of surface silanol groups are rarely investigated and discussed [7, 11, 15]. Furthermore, research results are available for OC, but current studies provide little information on the interaction of silica fume and nano silica in mortars with a low w/c ratio. Whether silica enhances the clinker hydration in UHPC due to an increased surface area for the nucleation of C–S–H phases [14-19] or due to its dissolution and subsequent pozzolanic reaction [7, 12, 14], is still unclear.
Therefore, the first objective of this work was to evaluate the reactivity of different types of silica in a cementitious environment based on their specific surface area, surface silanol group density, total content of silanol groups (including internal groups) and solubility in alkaline suspension. Silica reactions were further traced in examinations on UHPC pastes by cryo SEM and pore solution analyses in the first hour of hydration. The results were published in ‘Amorphous silica in ultra-high performance concrete: First hour of hydration’ [1] (Chapter 6.1).
The second aim was to determine the effect of various types of reactive silica on the overall hydration by means of typical investigation methods (heat flow calorimetry and compressive strength measurement) as well as in-situ and high-resolution methods which are relatively new to the cementitious community (in-situ XRD and TEM analyses of cross sections). The corresponding publication ‘Influence of amorphous silica on the hydration in ultra-high performance concrete’ [2] is provided in Chapter 6.2 and presents information on the pre-ferred reactions in UHPC containing various types of reactive silica.
The following considerations lead to the third objective of the present work which is to determine the influence of ‘Primary particle size and agglomerate size effects of amorphous silica in ultra-high performance concrete’ [3] (Chapter 6.3). The incorporation of discrete, not agglomerated particles becomes increasingly important with respect to the particle packing density which is a central aspect in the formulation of UHPCs [10]. Such particles can be obtained via sol-gel methods e.g. from the Stoeber process which further allows the synthesis of particles with target primary particle sizes. In contrast, silica fume is a by-product and therefore particle sizes, particle size distributions and agglomerate sizes are only marginally controllable. Thus, the incorporation of Stoeber particles in UHPC enables an examination of the influence of primary particle sizes, narrow particle size distributions and defined agglomeration states (e.g. dispersed to primary particles) on UHPC properties.
Dissertation Tina Oertel, 2013
- 23 -
4 SYNOPSIS
4.1 Reactivity of amorphous silica and investigations on primary hydration12
It is challenging to in-situ determine the interactions between silica particles and cement components in the fresh and hardened mortar. Up to now, no method is available which directly measures the dissolution velocity of a solid component in a suspension with a high solids content (e.g. water/solids = 0.19 for UHPC paste). For this reason, indirect methods are carried out to investigate the dissolution of silica particles and clinker minerals in this study.
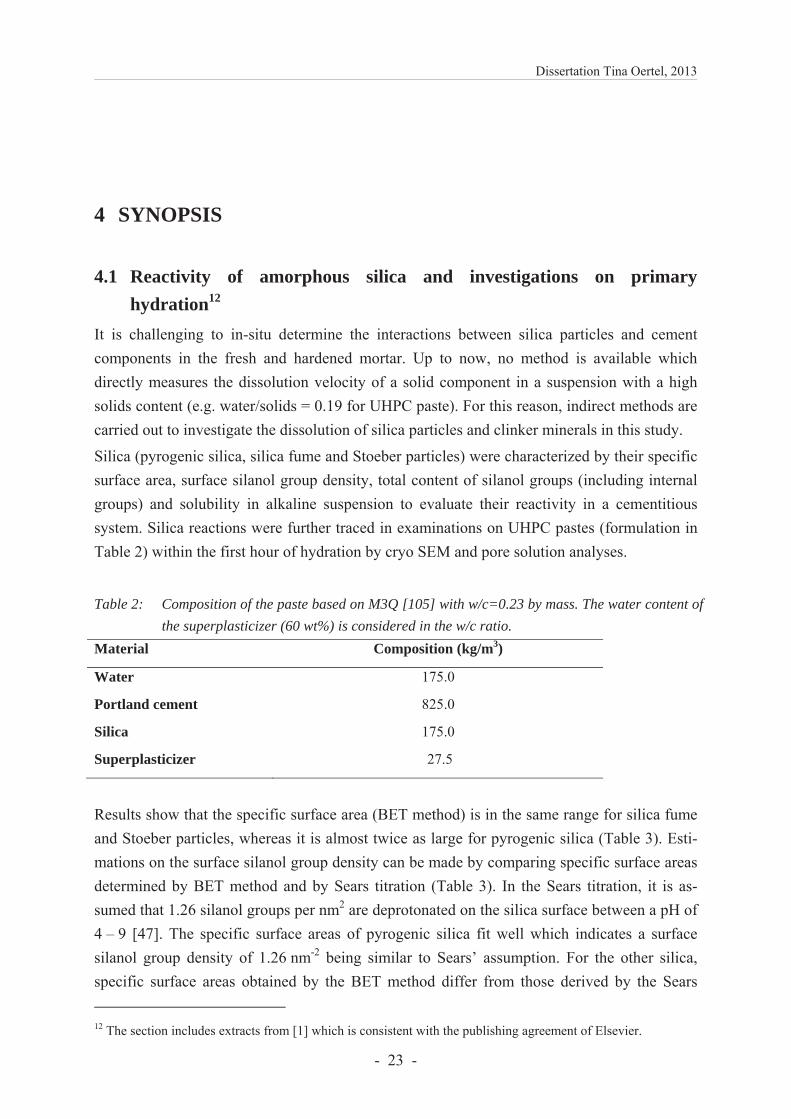
Silica (pyrogenic silica, silica fume and Stoeber particles) were characterized by their specific surface area, surface silanol group density, total content of silanol groups (including internal groups) and solubility in alkaline suspension to evaluate their reactivity in a cementitious system. Silica reactions were further traced in examinations on UHPC pastes (formulation in Table 2) within the first hour of hydration by cryo SEM and pore solution analyses.
Table 2: Composition of the paste based on M3Q [105] with w/c=0.23 by mass. The water content of
the superplasticizer (60 wt%) is considered in the w/c ratio.
Material Composition (kg/m3)
Water 175.0
Portland cement 825.0
Silica 175.0
Superplasticizer 27.5
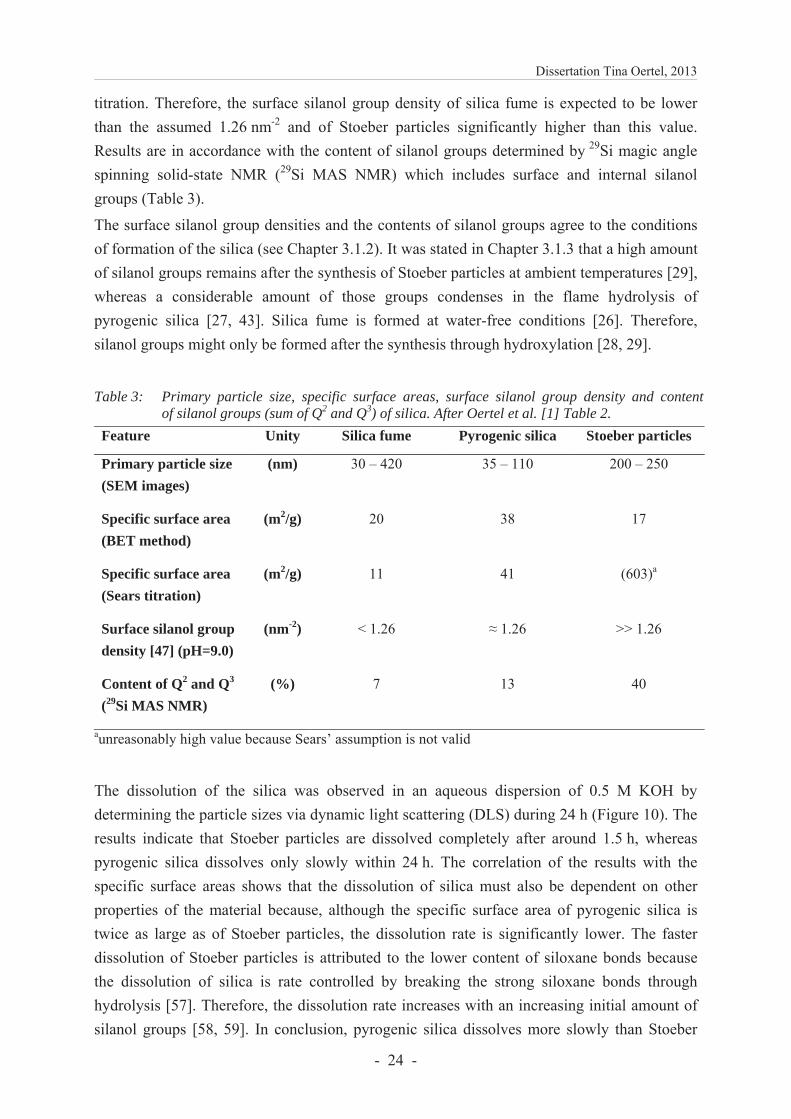
Results show that the specific surface area (BET method) is in the same range for silica fume and Stoeber particles, whereas it is almost twice as large for pyrogenic silica (Table 3). Esti-mations on the surface silanol group density can be made by comparing specific surface areas determined by BET method and by Sears titration (Table 3). In the Sears titration, it is as-sumed that 1.26 silanol groups per nm2 are deprotonated on the silica surface between a pH of 4 – 9 [47]. The specific surface areas of pyrogenic silica fit well which indicates a surface silanol group density of 1.26 nm-2 being similar to Sears’ assumption. For the other silica, specific surface areas obtained by the BET method differ from those derived by the Sears 12 The section includes extracts from [1] which is consistent with the publishing agreement of Elsevier.
Dissertation Tina Oertel, 2013
- 24 -
titration. Therefore, the surface silanol group density of silica fume is expected to be lower than the assumed 1.26 nm-2 and of Stoeber particles significantly higher than this value. Results are in accordance with the content of silanol groups determined by 29Si magic angle spinning solid-state NMR (29Si MAS NMR) which includes surface and internal silanol groups (Table 3).
The surface silanol group densities and the contents of silanol groups agree to the conditions of formation of the silica (see Chapter 3.1.2). It was stated in Chapter 3.1.3 that a high amount of silanol groups remains after the synthesis of Stoeber particles at ambient temperatures [29], whereas a considerable amount of those groups condenses in the flame hydrolysis of pyrogenic silica [27, 43]. Silica fume is formed at water-free conditions [26]. Therefore, silanol groups might only be formed after the synthesis through hydroxylation [28, 29].
Table 3: Primary particle size, specific surface areas, surface silanol group density and content
of silanol groups (sum of Q2 and Q3) of silica. After Oertel et al. [1] Table 2.
Feature Unity Silica fume Pyrogenic silica Stoeber particles
Primary particle size (SEM images)
(nm) 30 – 420 35 – 110 200 – 250
Specific surface area (BET method)
(m2/g) 20 38 17
Specific surface area (Sears titration)
(m2/g) 11 41 (603)a
Surface silanol group density [47] (pH=9.0)
(nm-2) < 1.26 1.26 >> 1.26
Content of Q2 and Q3
(29Si MAS NMR) (%) 7 13 40
aunreasonably high value because Sears’ assumption is not valid
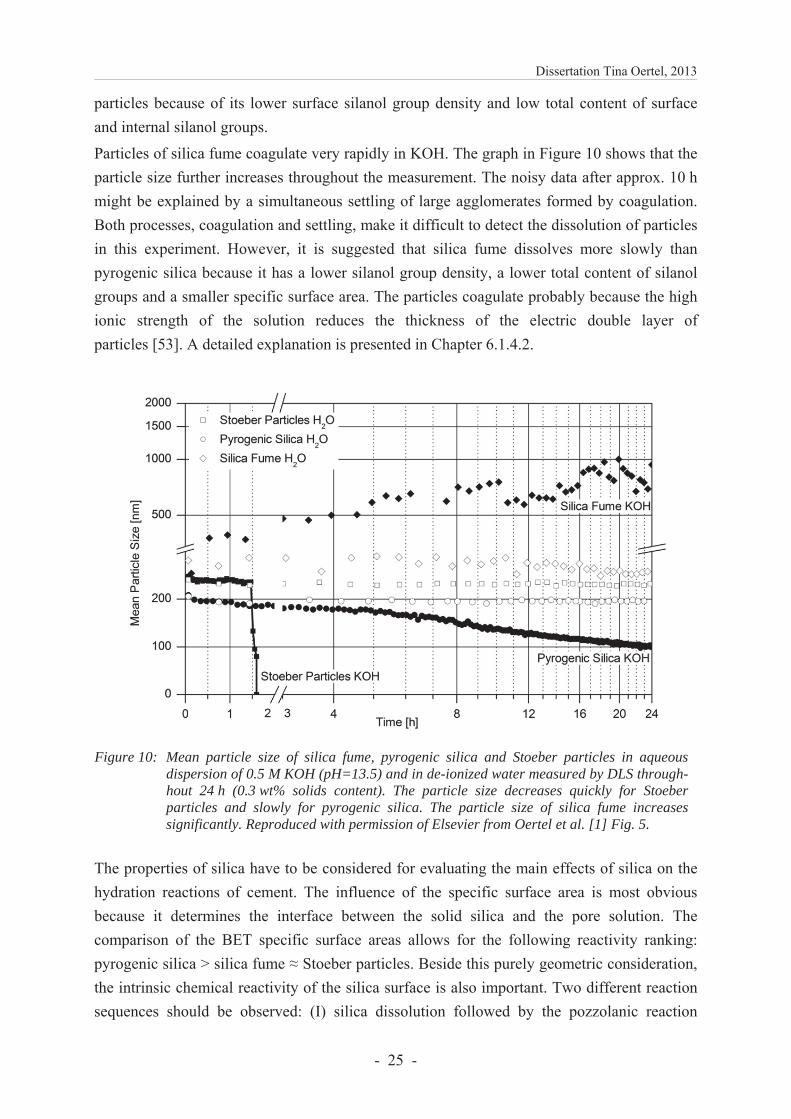
The dissolution of the silica was observed in an aqueous dispersion of 0.5 M KOH by determining the particle sizes via dynamic light scattering (DLS) during 24 h (Figure 10). The results indicate that Stoeber particles are dissolved completely after around 1.5 h, whereas pyrogenic silica dissolves only slowly within 24 h. The correlation of the results with the specific surface areas shows that the dissolution of silica must also be dependent on other properties of the material because, although the specific surface area of pyrogenic silica is twice as large as of Stoeber particles, the dissolution rate is significantly lower. The faster dissolution of Stoeber particles is attributed to the lower content of siloxane bonds because the dissolution of silica is rate controlled by breaking the strong siloxane bonds through hydrolysis [57]. Therefore, the dissolution rate increases with an increasing initial amount of silanol groups [58, 59]. In conclusion, pyrogenic silica dissolves more slowly than Stoeber
Dissertation Tina Oertel, 2013
- 25 -
particles because of its lower surface silanol group density and low total content of surface and internal silanol groups.
Particles of silica fume coagulate very rapidly in KOH. The graph in Figure 10 shows that the particle size further increases throughout the measurement. The noisy data after approx. 10 h might be explained by a simultaneous settling of large agglomerates formed by coagulation. Both processes, coagulation and settling, make it difficult to detect the dissolution of particles in this experiment. However, it is suggested that silica fume dissolves more slowly than pyrogenic silica because it has a lower silanol group density, a lower total content of silanol groups and a smaller specific surface area. The particles coagulate probably because the high ionic strength of the solution reduces the thickness of the electric double layer of particles [53]. A detailed explanation is presented in Chapter 6.1.4.2.
Figure 10: Mean particle size of silica fume, pyrogenic silica and Stoeber particles in aqueous dispersion of 0.5 M KOH (pH=13.5) and in de-ionized water measured by DLS through-hout 24 h (0.3 wt% solids content). The particle size decreases quickly for Stoeber particles and slowly for pyrogenic silica. The particle size of silica fume increases significantly. Reproduced with permission of Elsevier from Oertel et al. [1] Fig. 5.
The properties of silica have to be considered for evaluating the main effects of silica on the hydration reactions of cement. The influence of the specific surface area is most obvious because it determines the interface between the solid silica and the pore solution. The comparison of the BET specific surface areas allows for the following reactivity ranking: pyrogenic silica > silica fume Stoeber particles. Beside this purely geometric consideration, the intrinsic chemical reactivity of the silica surface is also important. Two different reaction sequences should be observed: (I) silica dissolution followed by the pozzolanic reaction
Dissertation Tina Oertel, 2013
- 26 -
and (II) the heterogeneous nucleation of C–S–H phases from alite hydration on silica surfaces. The surface silanol group density is decisive for either sequence because it significantly affects the dissolution and the adsorption of ions which possibly has an influence on the nucleation of C–S–H phases. Additionally, the total content of silanol groups of an entire particle needs to be taken in account for path I. As a consequence, Stoeber particles should be by far most reactive, followed by pyrogenic silica and the least reactive silica fume.
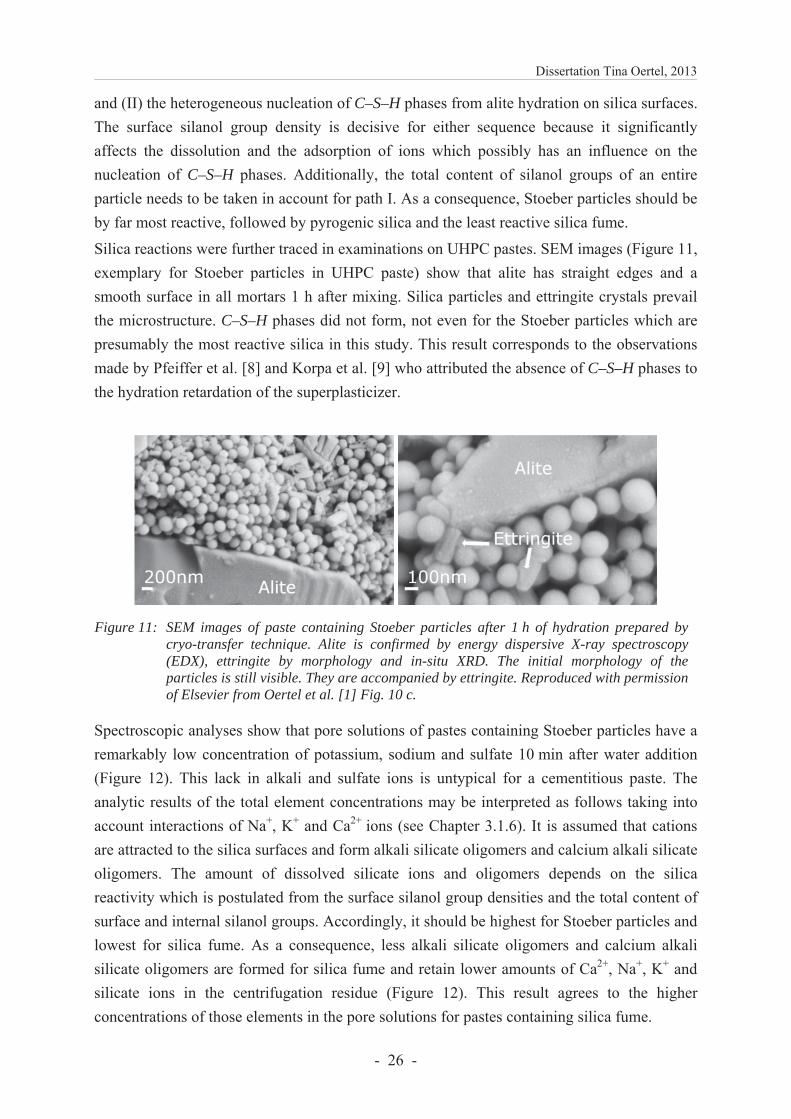
Silica reactions were further traced in examinations on UHPC pastes. SEM images (Figure 11, exemplary for Stoeber particles in UHPC paste) show that alite has straight edges and a smooth surface in all mortars 1 h after mixing. Silica particles and ettringite crystals prevail the microstructure. C–S–H phases did not form, not even for the Stoeber particles which are presumably the most reactive silica in this study. This result corresponds to the observations made by Pfeiffer et al. [8] and Korpa et al. [9] who attributed the absence of C–S–H phases to the hydration retardation of the superplasticizer.
Figure 11: SEM images of paste containing Stoeber particles after 1 h of hydration prepared by cryo-transfer technique. Alite is confirmed by energy dispersive X-ray spectroscopy (EDX), ettringite by morphology and in-situ XRD. The initial morphology of the particles is still visible. They are accompanied by ettringite. Reproduced with permission of Elsevier from Oertel et al. [1] Fig. 10 c.
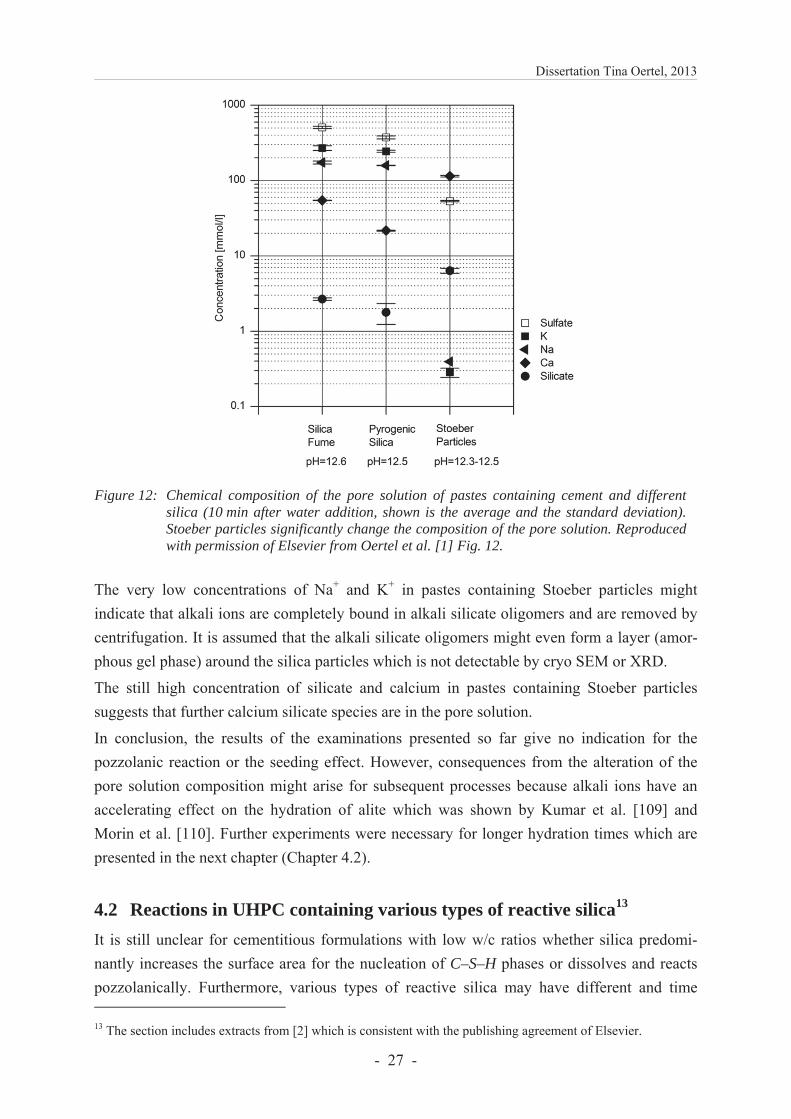
Spectroscopic analyses show that pore solutions of pastes containing Stoeber particles have a remarkably low concentration of potassium, sodium and sulfate 10 min after water addition (Figure 12). This lack in alkali and sulfate ions is untypical for a cementitious paste. The analytic results of the total element concentrations may be interpreted as follows taking into account interactions of Na+, K+ and Ca2+ ions (see Chapter 3.1.6). It is assumed that cations are attracted to the silica surfaces and form alkali silicate oligomers and calcium alkali silicate oligomers. The amount of dissolved silicate ions and oligomers depends on the silica reactivity which is postulated from the surface silanol group densities and the total content of surface and internal silanol groups. Accordingly, it should be highest for Stoeber particles and lowest for silica fume. As a consequence, less alkali silicate oligomers and calcium alkali silicate oligomers are formed for silica fume and retain lower amounts of Ca2+, Na+, K+ and silicate ions in the centrifugation residue (Figure 12). This result agrees to the higher concentrations of those elements in the pore solutions for pastes containing silica fume.
Dissertation Tina Oertel, 2013
- 27 -
Figure 12: Chemical composition of the pore solution of pastes containing cement and different silica (10 min after water addition, shown is the average and the standard deviation). Stoeber particles significantly change the composition of the pore solution. Reproduced with permission of Elsevier from Oertel et al. [1] Fig. 12.
The very low concentrations of Na+ and K+ in pastes containing Stoeber particles might indicate that alkali ions are completely bound in alkali silicate oligomers and are removed by centrifugation. It is assumed that the alkali silicate oligomers might even form a layer (amor-phous gel phase) around the silica particles which is not detectable by cryo SEM or XRD.
The still high concentration of silicate and calcium in pastes containing Stoeber particles suggests that further calcium silicate species are in the pore solution.
In conclusion, the results of the examinations presented so far give no indication for the pozzolanic reaction or the seeding effect. However, consequences from the alteration of the pore solution composition might arise for subsequent processes because alkali ions have an accelerating effect on the hydration of alite which was shown by Kumar et al. [109] and Morin et al. [110]. Further experiments were necessary for longer hydration times which are presented in the next chapter (Chapter 4.2).
4.2 Reactions in UHPC containing various types of reactive silica13
It is still unclear for cementitious formulations with low w/c ratios whether silica predomi-nantly increases the surface area for the nucleation of C–S–H phases or dissolves and reacts pozzolanically. Furthermore, various types of reactive silica may have different and time 13 The section includes extracts from [2] which is consistent with the publishing agreement of Elsevier.
Dissertation Tina Oertel, 2013
- 28 -
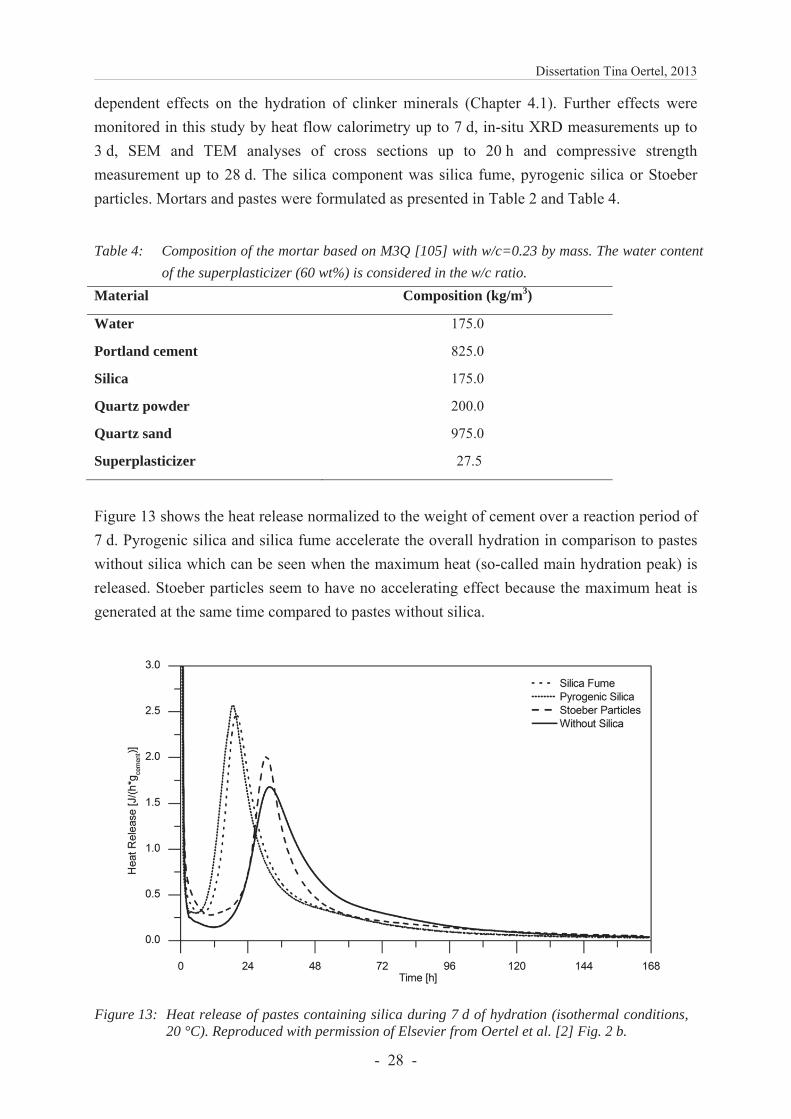
dependent effects on the hydration of clinker minerals (Chapter 4.1). Further effects were monitored in this study by heat flow calorimetry up to 7 d, in-situ XRD measurements up to 3 d, SEM and TEM analyses of cross sections up to 20 h and compressive strength measurement up to 28 d. The silica component was silica fume, pyrogenic silica or Stoeber particles. Mortars and pastes were formulated as presented in Table 2 and Table 4.
Table 4: Composition of the mortar based on M3Q [105] with w/c=0.23 by mass. The water content
of the superplasticizer (60 wt%) is considered in the w/c ratio.
Material Composition (kg/m3)
Water 175.0
Portland cement 825.0
Silica 175.0
Quartz powder 200.0
Quartz sand 975.0
Superplasticizer 27.5
Figure 13 shows the heat release normalized to the weight of cement over a reaction period of 7 d. Pyrogenic silica and silica fume accelerate the overall hydration in comparison to pastes without silica which can be seen when the maximum heat (so-called main hydration peak) is released. Stoeber particles seem to have no accelerating effect because the maximum heat is generated at the same time compared to pastes without silica.
Figure 13: Heat release of pastes containing silica during 7 d of hydration (isothermal conditions, 20 °C). Reproduced with permission of Elsevier from Oertel et al. [2] Fig. 2 b.
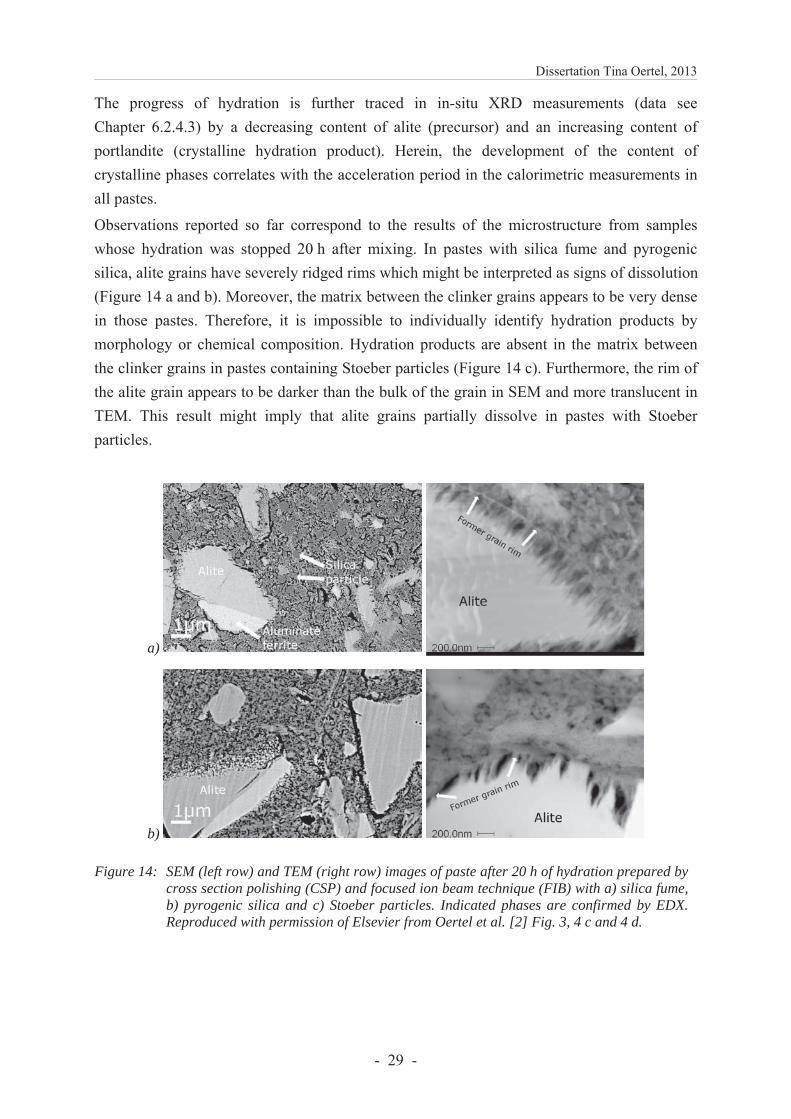
Dissertation Tina Oertel, 2013
- 29 -
The progress of hydration is further traced in in-situ XRD measurements (data see Chapter 6.2.4.3) by a decreasing content of alite (precursor) and an increasing content of portlandite (crystalline hydration product). Herein, the development of the content of crystalline phases correlates with the acceleration period in the calorimetric measurements in all pastes.
Observations reported so far correspond to the results of the microstructure from samples whose hydration was stopped 20 h after mixing. In pastes with silica fume and pyrogenic silica, alite grains have severely ridged rims which might be interpreted as signs of dissolution (Figure 14 a and b). Moreover, the matrix between the clinker grains appears to be very dense in those pastes. Therefore, it is impossible to individually identify hydration products by morphology or chemical composition. Hydration products are absent in the matrix between the clinker grains in pastes containing Stoeber particles (Figure 14 c). Furthermore, the rim of the alite grain appears to be darker than the bulk of the grain in SEM and more translucent in TEM. This result might imply that alite grains partially dissolve in pastes with Stoeber particles.
a)
b)
Figure 14: SEM (left row) and TEM (right row) images of paste after 20 h of hydration prepared by cross section polishing (CSP) and focused ion beam technique (FIB) with a) silica fume, b) pyrogenic silica and c) Stoeber particles. Indicated phases are confirmed by EDX. Reproduced with permission of Elsevier from Oertel et al. [2] Fig. 3, 4 c and 4 d.
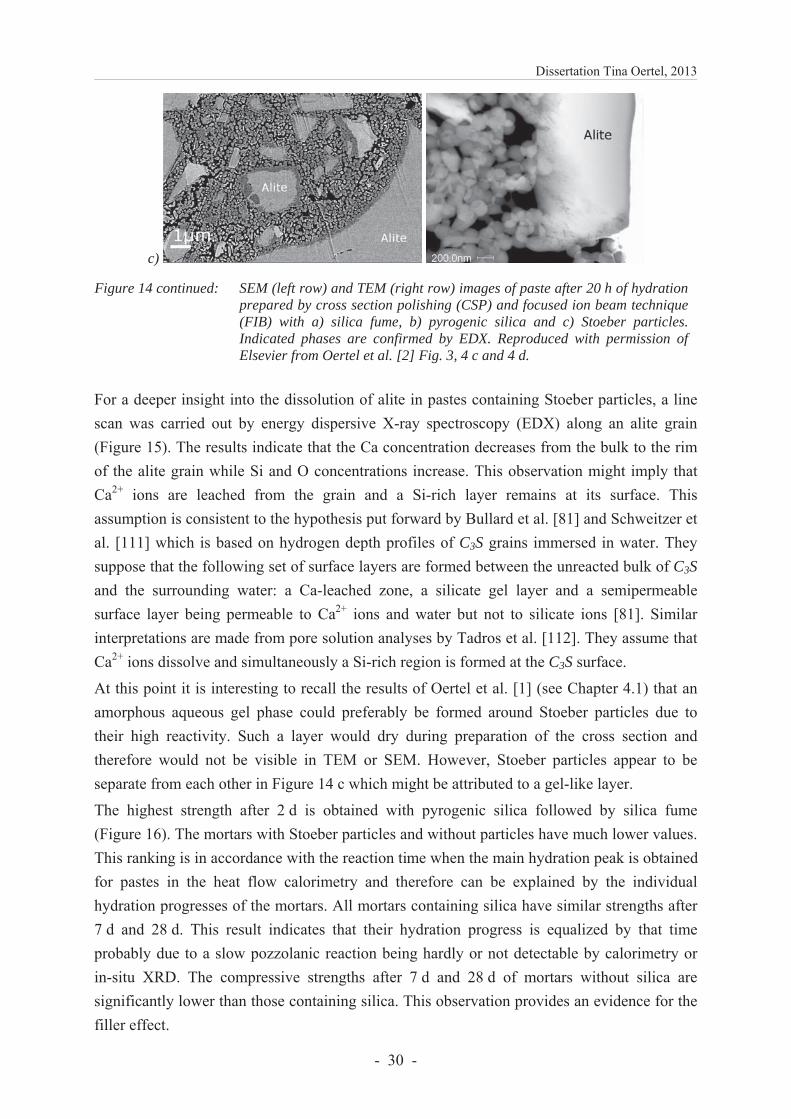
Dissertation Tina Oertel, 2013
- 30 -
c)
Figure 14 continued: SEM (left row) and TEM (right row) images of paste after 20 h of hydration prepared by cross section polishing (CSP) and focused ion beam technique (FIB) with a) silica fume, b) pyrogenic silica and c) Stoeber particles. Indicated phases are confirmed by EDX. Reproduced with permission ofElsevier from Oertel et al. [2] Fig. 3, 4 c and 4 d.
For a deeper insight into the dissolution of alite in pastes containing Stoeber particles, a line scan was carried out by energy dispersive X-ray spectroscopy (EDX) along an alite grain (Figure 15). The results indicate that the Ca concentration decreases from the bulk to the rim of the alite grain while Si and O concentrations increase. This observation might imply that Ca2+ ions are leached from the grain and a Si-rich layer remains at its surface. This assumption is consistent to the hypothesis put forward by Bullard et al. [81] and Schweitzer et al. [111] which is based on hydrogen depth profiles of C3S grains immersed in water. They suppose that the following set of surface layers are formed between the unreacted bulk of C3S and the surrounding water: a Ca-leached zone, a silicate gel layer and a semipermeable surface layer being permeable to Ca2+ ions and water but not to silicate ions [81]. Similar interpretations are made from pore solution analyses by Tadros et al. [112]. They assume that Ca2+ ions dissolve and simultaneously a Si-rich region is formed at the C3S surface.
At this point it is interesting to recall the results of Oertel et al. [1] (see Chapter 4.1) that an amorphous aqueous gel phase could preferably be formed around Stoeber particles due to their high reactivity. Such a layer would dry during preparation of the cross section and therefore would not be visible in TEM or SEM. However, Stoeber particles appear to be separate from each other in Figure 14 c which might be attributed to a gel-like layer.
The highest strength after 2 d is obtained with pyrogenic silica followed by silica fume (Figure 16). The mortars with Stoeber particles and without particles have much lower values. This ranking is in accordance with the reaction time when the main hydration peak is obtained for pastes in the heat flow calorimetry and therefore can be explained by the individual hydration progresses of the mortars. All mortars containing silica have similar strengths after 7 d and 28 d. This result indicates that their hydration progress is equalized by that time probably due to a slow pozzolanic reaction being hardly or not detectable by calorimetry or in-situ XRD. The compressive strengths after 7 d and 28 d of mortars without silica are significantly lower than those containing silica. This observation provides an evidence for the filler effect.
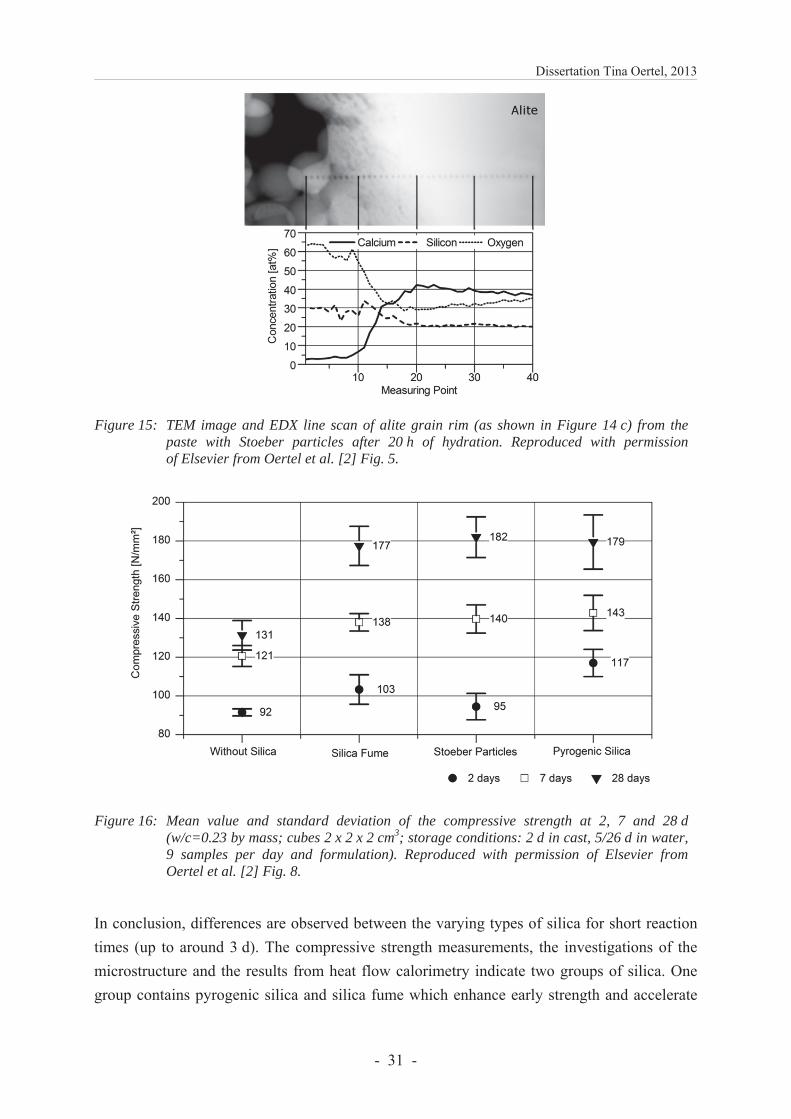
Dissertation Tina Oertel, 2013
- 31 -
Figure 15: TEM image and EDX line scan of alite grain rim (as shown in Figure 14 c) from the paste with Stoeber particles after 20 h of hydration. Reproduced with permission of Elsevier from Oertel et al. [2] Fig. 5.
Figure 16: Mean value and standard deviation of the compressive strength at 2, 7 and 28 d (w/c=0.23 by mass; cubes 2 x 2 x 2 cm3; storage conditions: 2 d in cast, 5/26 d in water, 9 samples per day and formulation). Reproduced with permission of Elsevier fromOertel et al. [2] Fig. 8.
In conclusion, differences are observed between the varying types of silica for short reaction times (up to around 3 d). The compressive strength measurements, the investigations of the microstructure and the results from heat flow calorimetry indicate two groups of silica. One group contains pyrogenic silica and silica fume which enhance early strength and accelerate
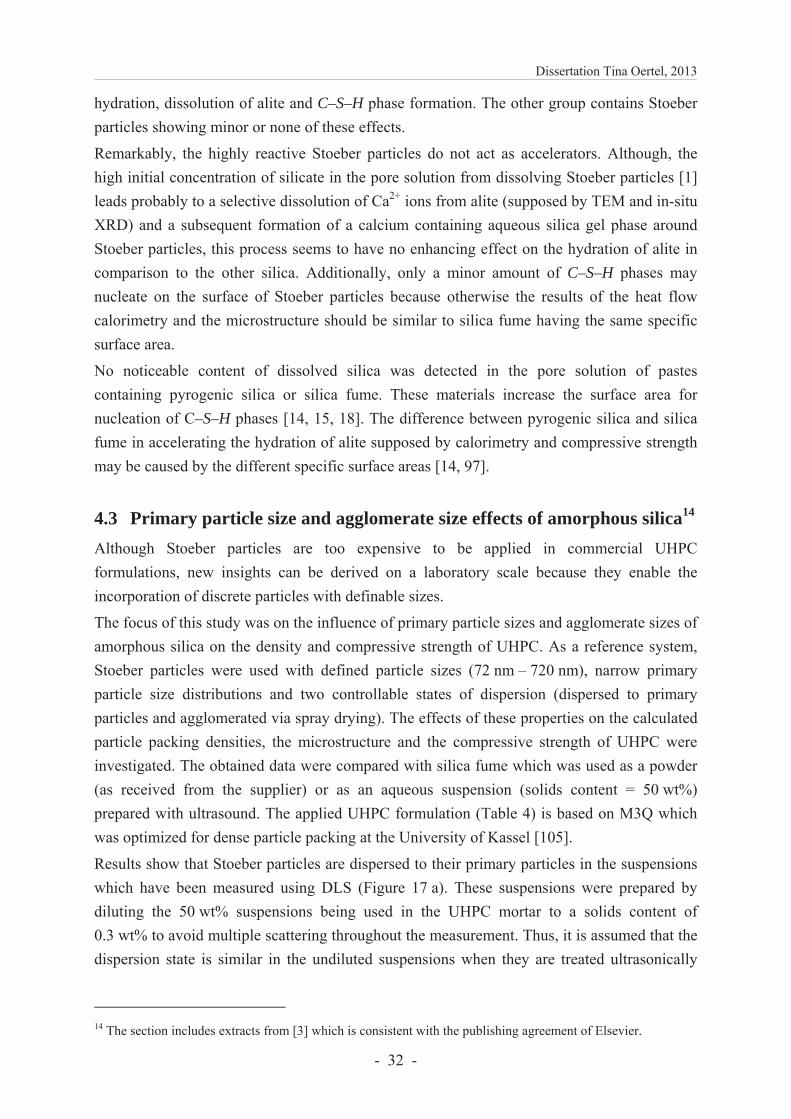
Dissertation Tina Oertel, 2013
- 32 -
hydration, dissolution of alite and C–S–H phase formation. The other group contains Stoeber particles showing minor or none of these effects.
Remarkably, the highly reactive Stoeber particles do not act as accelerators. Although, the high initial concentration of silicate in the pore solution from dissolving Stoeber particles [1] leads probably to a selective dissolution of Ca2+ ions from alite (supposed by TEM and in-situ XRD) and a subsequent formation of a calcium containing aqueous silica gel phase around Stoeber particles, this process seems to have no enhancing effect on the hydration of alite in comparison to the other silica. Additionally, only a minor amount of C–S–H phases may nucleate on the surface of Stoeber particles because otherwise the results of the heat flow calorimetry and the microstructure should be similar to silica fume having the same specific surface area.
No noticeable content of dissolved silica was detected in the pore solution of pastes containing pyrogenic silica or silica fume. These materials increase the surface area for nucleation of C–S–H phases [14, 15, 18]. The difference between pyrogenic silica and silica fume in accelerating the hydration of alite supposed by calorimetry and compressive strength may be caused by the different specific surface areas [14, 97].
4.3 Primary particle size and agglomerate size effects of amorphous silica14
Although Stoeber particles are too expensive to be applied in commercial UHPC formulations, new insights can be derived on a laboratory scale because they enable the incorporation of discrete particles with definable sizes.
The focus of this study was on the influence of primary particle sizes and agglomerate sizes of amorphous silica on the density and compressive strength of UHPC. As a reference system, Stoeber particles were used with defined particle sizes (72 nm – 720 nm), narrow primary particle size distributions and two controllable states of dispersion (dispersed to primary particles and agglomerated via spray drying). The effects of these properties on the calculated particle packing densities, the microstructure and the compressive strength of UHPC were investigated. The obtained data were compared with silica fume which was used as a powder (as received from the supplier) or as an aqueous suspension (solids content = 50 wt%) prepared with ultrasound. The applied UHPC formulation (Table 4) is based on M3Q which was optimized for dense particle packing at the University of Kassel [105].
Results show that Stoeber particles are dispersed to their primary particles in the suspensions which have been measured using DLS (Figure 17 a). These suspensions were prepared by diluting the 50 wt% suspensions being used in the UHPC mortar to a solids content of 0.3 wt% to avoid multiple scattering throughout the measurement. Thus, it is assumed that the dispersion state is similar in the undiluted suspensions when they are treated ultrasonically
14 The section includes extracts from [3] which is consistent with the publishing agreement of Elsevier.
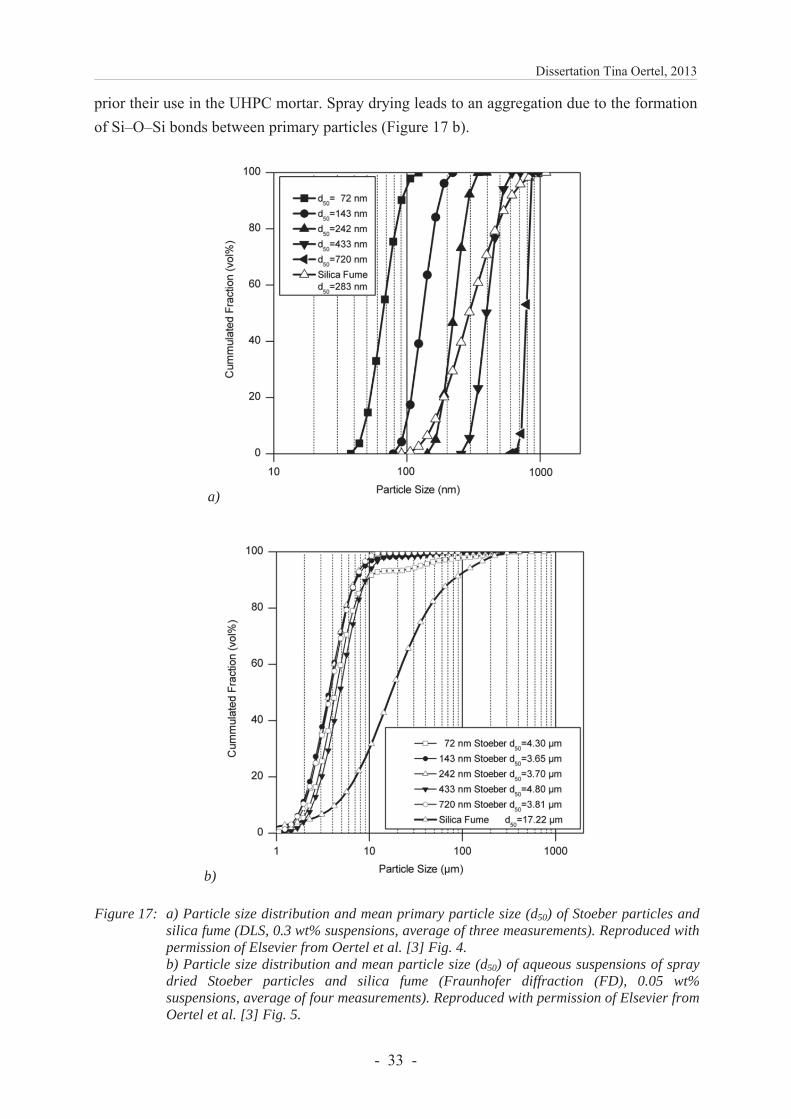
Dissertation Tina Oertel, 2013
- 33 -
prior their use in the UHPC mortar. Spray drying leads to an aggregation due to the formation of Si–O–Si bonds between primary particles (Figure 17 b).
a)
b)
Figure 17: a) Particle size distribution and mean primary particle size (d50) of Stoeber particles and silica fume (DLS, 0.3 wt% suspensions, average of three measurements). Reproduced with permission of Elsevier from Oertel et al. [3] Fig. 4. b) Particle size distribution and mean particle size (d50) of aqueous suspensions of spray dried Stoeber particles and silica fume (Fraunhofer diffraction (FD), 0.05 wt% suspensions, average of four measurements). Reproduced with permission of Elsevier from Oertel et al. [3] Fig. 5.
Dissertation Tina Oertel, 2013
- 34 -
Results for silica fume were different. During the formation of silica fume at high tem-peratures (> 2000 °C) in the electric arc furnace, primary particles condense and are bound immediately to aggregates of several spheres [6]. The particles detected in DLS (Figure 17 a) have to be considered as aggregates into which silica fume can be dispersed by using in-tensive ultrasonic treatment of the aqueous 50 wt% suspension. Moreover, agglomerates (Figure 17 b) will possibly exist in the mortar when silica fume is used as a powder; they result from cooling and storing in the silo.
The particle packing density is calculated for the UHPC mortars by mathematical combination of the measured particle size distributions of all solid mortar components until the void content is minimized. Calculations were performed with the program WinCem which was developed by the research group Schmidt et al. [113]. Results show that the particle packing density of the mortar increases with decreasing mean particle sizes of the silica component (Figure 18 a). The UHPC formulation without any addition of silica has the lowest particle packing density. The calculated densities can be interpreted as the free volume in the unreacted mixture of solid components (25.5 % for mortars without silica, 19.1 % for mortars with silica fume). Furthermore, these calculated free volumes seem to be proportional to mea-sured porosities from mercury intrusion (11.3 vol% for mortars without silica, 7.8 vol% for mortars with silica fume). This result supports the hypothesis that silica particles reduce voids between the other solid concrete components (filler effect, see Chapter 3.2.4) [5, 100, 101].
Whether there is a reasonable dependence of compressive strength (7 d after sample prepa-ration) on the particle size of the used silica component, may be evaluated by considering the linear correlation (Figure 18 b) between the mean values of compressive strength and the cal-culated particle packing densities. Although the packing density provides information on the ‘unhydrated state’ of the components, its influence on the compressive strength is still noticeable when primary particles (Stoeber) or aggregates (silica fume) of amorphous silica were incorporated as a suspension into the mortar (correlation coefficient [114] r = 0.85). The correlation is considerably lower (r = 0.51) by application of silica powders. Assuming that packing density is the main influence factor on strength, this result may be interpreted as implying that no mortar mixing procedure could completely disperse silica to the particle size distributions on which the packing density calculations were based. It is most likely that silica agglomerates of varying size and differing dispersability have a substantial influence on the achievable packing density and its effects on compressive strength.
In conclusion, the better the dispersion of the silica particles, the higher is the compressive strength. Therefore, it is clear that the dispersion of silica into primary particles or the smallest aggregates possible is mandatory for further improvement of the compressive strength. Ideal silica fume dispersion by a common mortar mixing procedure might be impossible, but the dispersion of silica fume in water using ultrasound leads to at least some improvements [6]. Thus the properties of UHPC may be enhanced by incorporating an ameliorated dispersion of silica e.g. through commercial silica sols.
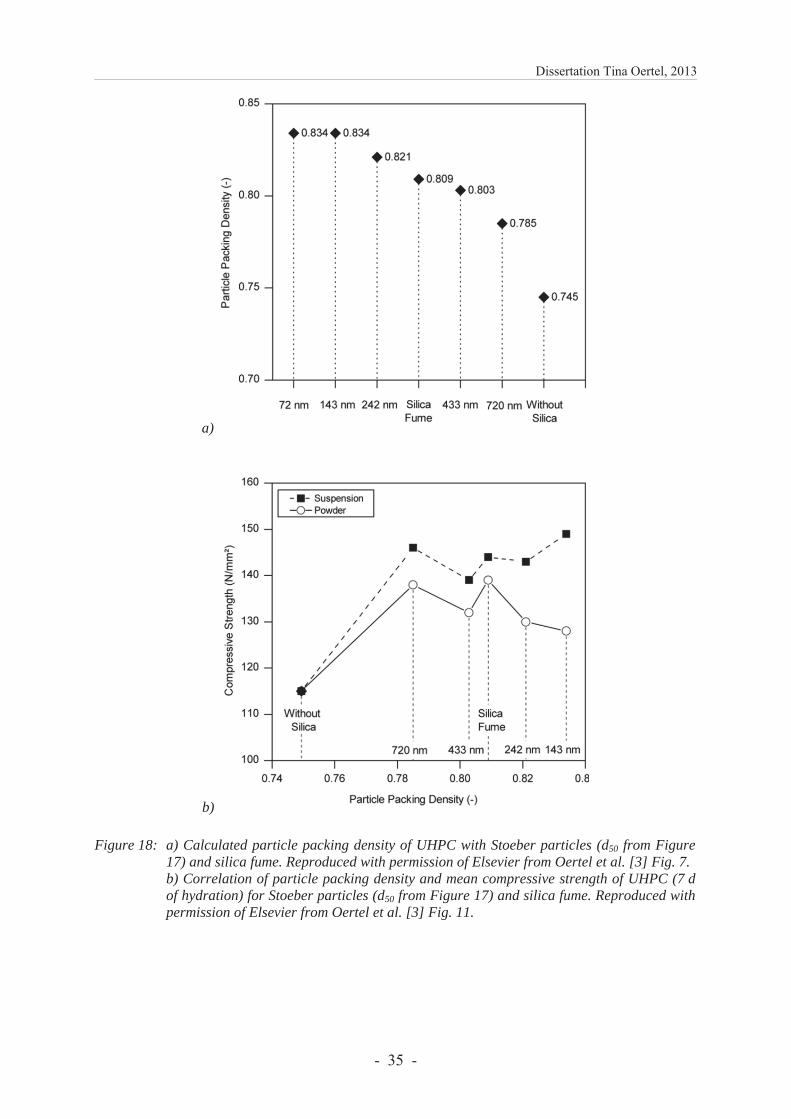
Dissertation Tina Oertel, 2013
- 35 -
a)
b)
Figure 18: a) Calculated particle packing density of UHPC with Stoeber particles (d50 from Figure17) and silica fume. Reproduced with permission of Elsevier from Oertel et al. [3] Fig. 7.b) Correlation of particle packing density and mean compressive strength of UHPC (7 d of hydration) for Stoeber particles (d50 from Figure 17) and silica fume. Reproduced with permission of Elsevier from Oertel et al. [3] Fig. 11.
Dissertation Tina Oertel, 2013
- 36 -
4.4 Individual contribution to the publications
Amorphous silica in ultra-high performance concrete: First hour of hydration I created the concept with the support of Dr. F. Hutter and Prof. Dr. U. Helbig. Stoeber particles were synthesized and further processed by me. Moreover, I developed and carried out the method to determine the dissolution rate of silica particles in KOH via DLS as well as the procedure for pore solution analysis. All UHPC pastes were prepared by myself. Results were interpreted and the publication was written by me with the contribution of my co-authors Dr. F. Hutter, Prof. Dr. U. Helbig and Prof. Dr. G. Sextl. Characterization of silica particles (SEM, BET, XRD, XRF and Sears) and analyses of the pore solution (ICP) were carried out by colleagues from the Fraunhofer–Institute ISC. Dr. R. Bertermann did NMR measurements and calculations. In-situ XRD and cryo-SEM analyses were done by Dr. J. Göske. I got strong support by Prof. Dr. U. Helbig with the interpretation of the in-situ XRD data. My individual contribution amounts to 80 %.
Influence of amorphous silica on the hydration in ultra-high performance concrete I created the concept with the support of Dr. F. Hutter and Prof. Dr. U. Helbig. Stoeber particles were synthesized and further processed by me. Moreover, I prepared all pastes and mortars and tested compressive strengths. XRD measurements were done by me. Prof. Dr. U. Helbig did the Rietveld analyses and we discussed the implications together to find correct microstructure-properties correlation. Results were interpreted and the publication was written by me with the contribution of my co-authors Prof. Dr. U. Helbig, Dr. F. Hutter, Dr. H. Kletti and Prof. Dr. G. Sextl. Heat flow calorimetry was measured by Dipl.-Ing. R. Tänzer. CSP and FIB sample preparation as well as SEM and TEM analyses were done by colleagues from the Fraunhofer–Institute under my instructions. In-situ XRD measurements of pastes were done by Dr. J. Göske. My individual contribution amounts to 70 %.
Primary particle size and agglomerate size effects of amorphous silica in ultra-high performance concrete The concept was created by me and Dr. F. Hutter. It is based on the project ‘Chemically Bonded Ceramics by Nanotechnological Improvements of Structure (03X0067E)’ from the German Federal Ministry of Education and Research. Particle sizes were measured by me. Further, I cast and tested mortar samples with the support of J. Prieschl. Results were interpreted and the publication was written by me with the contribution of my co-authors Dr. F. Hutter, Dipl.-Ing. R. Tänzer, Prof. Dr. U. Helbig and Prof. Dr. G. Sextl. Stoeber particles were mostly synthesized by J. Prieschl. XRD, FD, XRF, CSP sample preparation and most of the SEM analyses were carried out by colleagues from the Fraunhofer–Institute. Dipl.-Ing. R. Tänzer calculated the particle packing densities and measured mercury intrusion porosities. My individual contribution amounts to 75 %.
Dissertation Tina Oertel, 2013
- 37 -
5 LITERATURE
[1] Oertel T., Hutter F., Helbig U. et al., submitted to Cem. Concr. Res. CEMCON-D-13-00342 (2013).
[2] Oertel T., Helbig U., Hutter F. et al., submitted to Cem. Concr. Res. CEMCON-D-13-00452 (2013).
[3] Oertel T., Hutter F., Tänzer R. et al., Cem. Concr. Comp. 37 (2013) 61-67.
[4] Scrivener K.L., Nonat A., Cem. Concr. Res. 41 (2011) 651-665.
[5] Taylor H. F. W., Cement chemistry, 2nd ed, Thomas Telford Publishing, London (1997).
[6] Diamond S., Sahu S., Mater. Struct. 39 (2006) 849-859.
[7] Qing Y., Zenan Z., Deyu K. et al., Constr. Build. Mater. 21 (2007) 439-545.
[8] Pfeifer C., Möser B., Stark J., ZKG International 63 (2010) 71-79.
[9] Korpa A., Kowald T., Trettin R., Cem. Concr. Res. 39 (2009) 69-76.
[10] Naaman A.E., Wille K., proceedings of 3rd Hipermat: International symposium on UHPC and nanotechnology for high performance construction materials, Kassel (2012) 3-16.
[11] Mostafa N.Y., Brown P.W., Thermochim. Acta 435 (2005) 162-167.
[12] Greenberg S.A., J. Phys. Chem. 65 (1961) 12-16.
[13] Korpa A., Trettin R., Böttger K.G. et al., Adv. Cem. Res. 20 (2008) 35-46.
[14] Korpa A., Kowald T., Trettin R., Cem. Concr. Res. 38 (2008) 955-962.
[15] Björnström J., Martinelli A., Matic A. et al., Chem. Phys. L. 392 (2004) 242-248.
[16] Thomas J.J., Jennings H.M., Chen J.J., J. Phys. Chem. C 113 (2009) 4327-4334.
[17] Krauss H.W., Budelmann H., proceedings of Tagung Bauchemie, Dübendorf (2012) 35-42.
[18] Lothenbach B., Scrivener K., Hooton R.D., Cem. Concr. Res. 41 (2011) 1244-1256.
[19] Land G., Stephan D., J. Mater. Sci. 47 (2012) 1011-1017.
[20] Geisenhanslüke C., Beton- und Stahlbetonbau 100 (2005) 65-68.
[21] Schmidt M. et al., Sachstandsbericht Ultrahochfester Beton, Beuth Verlag, Berlin (2008).
[22] Reschke T., Siebel E., Thielen G., beton (1999) 719-724.
[23] Stoeber W., Fink A., J. Colloid and Interface Sci. 26 (1968) 62-69.
[24] Bergna H.E., Chapter 2: The language of colloidal science and silica chemistry, in Colloidalsilica: Fundamentals and applications, Editor: Bergna H.E., Roberts W.O., CRC Press Taylor & Francis Group, Boca Raton (2006).
[25] Wagner E., Brünner H., Angew. Chemie 72 (1960) 744-750.
[26] Khavryuchenko V.D., Khavryuchenko O.V., Lisnyak V.V., Critical Reviews in Solid State and Materials Sciences 36 (2011) 47-65.
[27] Iler R.K., The chemistry of silica, New York (1978).
Dissertation Tina Oertel, 2013
- 38 -
[28] Ullmann's encyclopedia of industrial chemistry, Colloidal Silica, 6th ed, Whiley-VCH publisher (2003).
[29] Bergna H.E., Chapter 3: Colloidal chemistry of silica: An overview, in Colloidal silica: Fundamentals and applications, Editor: Bergna H.E., Roberts W.O., CRC Press Taylor & Francis Group, Boca Raton (2006).
[30] Eitel W., Volume VI: silicate structures and dispersoid systems, in Silicate science, Editor: Eitel W., Academic Press, New York (1975).
[31] Xavax at de.wikipedia, http://de.wikipedia.org/w/index.php?title=Datei:Quarzstruktur_SiO4-Tetraeder.svg&filetimestamp=20091221101244 (last accessed 08.11.2013).
[32] Bergna H.E., Roberts W.O., Colloidal silica: Fundamentals and applications, CRC Press Taylor & Francis Group, Boca Raton (2006).
[33] Brinker C.J., Scherer G.W., Sol-gel science: The physics and chemistry of sol-gel processing, Academic Press, San Diego (1990).
[34] Haber F., Zeitschrift für Elektrochemie 20 (1914) 521.
[35] Engelhardt G., Zeigan D., Jancke H. et al., Zeitschrift für anorganische und allgemeine Chemie 418 (1975) 17.
[36] Engelhardt G., Jancke H., Hoebbel D. et al., Zeitschrift Chemie 14 (1974) 109-110.
[37] Zhuravlev L.T., Colloids and surfaces A: physicochemical and engineering aspects 173 (2000) 1-38.
[38] Bunker B.C., Haaland D.M., Ward, K.J. et al., Surface Sci. 210 (1989) 406-428.
[39] Zavodinsky V.G., Kuyanov I.A., Zavodinskaya O.M., J. Non-Crystalline Solids 243 (1999) 123-136.
[40] Zhuravlev L.T., React. Kinet. Catal. Lett. 50 (1993) 15-25.
[41] Zhuravlev L.T., Pure & Appl. Chem. 61 (1989) 1969-1976.
[42] Suratwala T.I., Hanna M.L., Miller E.L. et al., J. Non-Crystalline Solids 316 (2003) 349-363.
[43] Degussa, Technical Bulletin Fine Particles 11 (2006).
[44] Mathias J., Wannemacher G., J. Colloid and Interface Sci. 125 (1988) 61-68.
[45] Wisser F.M., Abele M., Gasthauer M. et al., J. Colloid and Interface Sci. 374 (2012) 77-82.
[46] Unger K.K., Chapter 23: Surface structure of amorphous and crystalline porous silicas: status and prospects, in Colloidal silica: fundamentals and application, Editor: Bergna H.E., Roberts W.O., CRC Press Taylor & Francis group, Boca Raton (2006).
[47] Sears G.W., Analytical Chem. 28 (1956) 1981-1983.
[48] Perram J.W., J. Chem. Soc. Faraday Trans. 2 69 (1973) 993-1003.
[49] Xiao Y., Lasaga A.C., Geochim. Cosmochim. Acta 60 (1996) 2283-2295.
[50] Healy T.W., Chapter 20: Stability of aqueous silica sols, in Colloidal silica: Fundamentals and applications, Editor: Bergna H.E., Roberts W.O., CRC Press Taylor & Francis Group, Boca Raton (2006).
[51] Derjaguin B., Landau L., Acta Physico Chemica URSS 14 (1941) 633-662.
[52] Verwey E.J.W., Overbeek J.T.G., Theory of the stability of lyophobic colloids, Elsevier Publishing Company, New York (1948).
[53] Verwey E.J.W., J. Phys. Chem. 51 (1947) 631-636.
[54] Dumont F., Chapter 2: Stability of sols: Do the silica hydrosols obey the DLVO theory?, in Colloidal silica: fundamentals and applications, Editor: Bergna H.E., Roberts W.O., CRC Press Taylor & Francis Group, Boca Raton (2006).
Dissertation Tina Oertel, 2013
- 39 -
[55] Kobayashi M., Skarba M., Galletto P. et al., J. Colloid and Interface Sci. 292 (2005) 139-147.
[56] Fertani-Gmati M., Jemal M., Thermochim. Acta 513 (2011) 43-48.
[57] Rimstidt J.D., Barnes H.L., Geochim. Cosmochim. Acta 44 (1980) 1683-1699.
[58] Berger G., Cadore E., Schott J. et al., Geochim. Cosmochim. Acta 58 (1994) 541-551.
[59] Rimer J.D., Trofymluk O., Navrotsky A. et al., Chem. Mater. 19 (2007) 4189-4197.
[60] Yates D.E., Healy T.W., J. Colloid and Interface Sci. 55 (1976) 9-19.
[61] Wijnen P.W., Beelen T.P., de Haan J.W. et al., J. Non-Crystalline Solids 109 (1989) 85-94.
[62] Tanaka M., Takahashi K., Analytical Sci. 15 (1999) 1241-1250.
[63] Gaboriaud F., Nonat A., Chaumont D., J. Phys. Chem. B 103 (1999) 5775-5781.
[64] Leemann A., Le Saout G., Winnefeld F., et al., J. Am. Ceram. Soc. 94 (2011) 1243-1249.
[65] Macphee D.E., Luke K., Glasser F.P. et al., J. Am. Ceram. Soc. 72 (1989) 646-654.
[66] Allen L.H., Matijevic E., J. Colloid and Interface Sci. 31 (1969) 286-296.
[67] Joosten H.J., Das Joostenverfahren zur chemischen Bodenverfestigung und Abdichtung in seiner Entwicklung und Anwendung von 1925 bis heute, Selbstverlag, Haarlem (1953).
[68] Vogel H., Dränfähige Stabilisierungsinjektionen in erosions- und suffosionsanfälligen Lockergesteinen, doctoral thesis, Darmstadt (1999).
[69] Tadros T.F., Lyklema J., J. Electroanal. Chem. 17 (1968) 267-275.
[70] Iler R.K., J. Colloid and Interface Sci. 53 (1975) 476-488.
[71] Despas C., Walcarius A., Bessière J., Langmuir 15 (1999) 3186-3196.
[72] Wan Q., Ramsey C., Baran G., J. Therm. Anal. Calorim. 99 (2010) 237–243.
[73] Collepardi M., The new concrete, Grafiche Tintoretto Publisher, Villorba (2006).
[74] Odler I., Hydration, setting and hardening of Portland cement, in Lea's chemistry of cement and concrete, Editor: Hewlett P.C., 4th ed, Elsevier Ltd. publisher, London (2004).
[75] Dunstettera F., de Noirfontainea M.N., Courtial M., Cem. Concr. Comp. 36 (2006) 39-53.
[76] Lea F.M., The Chemistry of Cement and Concrete, 3rd ed, Edward Arnold publisher, Glasgow (1970).
[77] Jost K.H., Ziemer B., Seydel R., Acta Cryst. B 33 (1977) 1696-1700.
[78] Mori K., Fukunaga T., Shiraishi Y. et al., Cem. Concr. Res. 36 (2006) 2033-2038.
[79] Stark, J., Wicht, B., Anorganische Bindemittel - Zement - Kalk - Spezielle Bindemittel -, Bauhaus-Universität Weimar, Weimar (1998).
[80] Personal communication with Maria Rosenberger Rasch, Aalborg Portland (2012).
[81] Bullard J.W., Jennings H.M., Livingston R.A. et al., Cem. Concr. Res. 41 (2011) 1208-1223.
[82] Mindess S., Young J.F., Concrete, Prentice Hall publisher, Englewood Cliffs (1981).
[83] Stark, J., Cem. Concr. Res. 41 (2011) 666-678.
[84] Bellmann F., Damidot D., Möser B. et al., Cem. Concr. Res. 40 (2010) 875-884.
[85] Lothenbach B., Winnefeld F., Cem. Concr. Res. 36 (2006) 209-226.
[86] Merlini M., Artioli G., Cerulli T. et al., Cem. Concr. Res. 38 (2008) 477-486.
[87] Hesse C., Goetz-Neunhoeffer F., Neubauer J., Cem. Concr. Res. 41 (2011) 123-128.
[88] Jansen D., Bergold S.T., Goetz-Neunhoeffer F. et al., J. Appl. Crystallography 44 (2011) 895-901.
Dissertation Tina Oertel, 2013
- 40 -
[89] Bergold S.T., Goetz-Neunhoefer F., Neubauer J., proceedings of 18th Ibausil: Internationale Baustofftagung, Weimar (2012) 0261-0267.
[90] Jansen D., Goetz-Neunhoeffer F., Stabler C. et al., Cem. Concr. Res. 41 (2011) 602-608.
[91] Richardson I.G., Cem. Concr. Res. 38 (2008) 137-158.
[92] Richardson I.G., Cem. Concr. Res. 29 (1999) 1131-1147.
[93] Bonaccorsi E., Merlino S., Kampf A.R., J. Am. Ceram. Soc. 88 (2005) 505-512.
[94] Bonaccorsi E., Merlino S., Taylor H.F.W., Cem. Concr. Res. 34 (2004) 1481-1488.
[95] Fédération Internationale de la Précontrainte, Condensed silica fume in concrete - FIP state of art report, Thomas Telford Publishing, London (1988).
[96] The Concrete Society, Concrete Society Technical Report No. 41: Microsilica in concrete, The Concrete Society publisher (1993).
[97] Jo B., Kim C., Tae G. et al., Constr. Build. Mater. 21 (2007) 1351-1355.
[98] Senff L., Labrincha J.A., Ferreira V.M. et al., Constr. Build. Mater. 23 (2009) 2487-2491.
[99] Senff L., Hotza D., Repette W.L. et al., Constr. Build. Mater. 24 (2010) 1432-1437.
[100] Krauss H.W., Budelmann H., proceedings RILEM 79, Hongkong (2011) 58-65.
[101] Kumar A., Bishnoi S., Scrivener K.L., Cem. Concr. Res. 42 (2012) 903-918.
[102] Schmidt M., Fehling E., Glotzbach C. et al. , Ultra-high performance concrete and nanotechnology in construction, Structural materials and engineering series publisher, Kassel (2012).
[103] Franke L., Deckelmann G., Schmidt H., proceedings of 17th Ibausil: Internationale Baustofftagung, Weimar (2009).
[104] Scrivener K.L., Kirkpatrick R.J., Cem. Concr. Res. 38 (2008) 128-136.
[105] Fröhlich S., Schmidt M., proceedings of 3rd Hipermat: International symposium on UHPC and nanotechnology for high performance construction materials, Kassel (2012) 225-232.
[106] Hommer H., J. Europ. Ceram. Soc. 29 (2009) 1847-1853.
[107] Schmidt M., Amrhein K., Braun T. et al, Cem. Concr. Comp. 36 (2013) 3-7.
[108] Wang C., Yang C., Liu F. et al., Cem. Concr. Comp. 34 (2012) 538-544.
[109] Kumar A., Sant G., Patapy C. et al., Cem. Concr. Res. 42 (2012) 1513-1523.
[110] Morin V., Garrault S., Begarin F. et al., Cem. Concr. Res. 40 (2010) 1459-1464.
[111] Schweitzer J.W., Livingston R.A., Rolfs C. et al., proceedings of 12th ICCC: International congress on the chemsitry of cement, Montreal (2007).
[112] Tadros M.E., Skalny J., Kalyoncu R.S., J. Am. Ceram. Soc. 59 (1976) 344-347.
[113] Fehling E., Schmidt M., Teichmann T. et al., Entwicklung, Dauerhaftigkeit und Berechnung Ultrahochfester Betone (UHPC), Forschungsbericht DFG FE 497/1-1, Kassel University Press, Kassel (2005).
[114] Lawner Weinberg S., Knapp Abramowitz S., Data Analysis for the Behavioral Sciences Using SPSS, Cambridge university press, New York (2002).
Dissertation Tina Oertel, 2013
- 41 -
6 RESULTS (PUBLICATIONS)15
6.1 Reactivity of amorphous silica and investigations on primary hydration16
Amorphous silica in ultra-high performance concrete: First hour of hydration
Submitted to Cement & Concrete Research
Tina Oertela, b, *, Frank Huttera, Uta Helbiga, Gerhard Sextla, c
aFraunhofer–Institute for Silicate Research ISC, Neunerplatz 2, 97082 Würzburg, Germany bChair for Inorganic Chemistry I, University Bayreuth, Universitätsstr. 30, 95440 Bayreuth, Germany cChair for Chemical Technology of Advanced Materials, Julius Maximilians University, Röntgenring 11, 97070 Würzburg, Germany *corresponding author
6.1.1 Abstract
Amorphous silica in the sub-micrometer size range is widely used to accelerate cement hydration. Investigations including properties of silica which differ from the specific surface area are rare. In this study, the reactivity of varying types of silica was evaluated based on their specific surface area, surface silanol group density, content of silanol groups and solubility in an alkaline suspension. Pyrogenic silica, silica fume and silica synthesized by hydrolysis and condensation of alkoxy silanes, so-called Stoeber particles, were employed. Influences of the silica within the first hour were further examined in pastes with water/cement ratios of 0.23 using in-situ X-ray diffraction, cryo scanning electron microscopy and pore solution analysis. It was shown that Stoeber particles change the composition of the pore solution. Na+, K+, Ca2+ and silicate ions seem to react to oligomers. The extent of this reaction might be highest for Stoeber particles due to their high reactivity.
6.1.2 Introduction
Ultra-high performance concrete (UHPC) was recently defined by Naaman and Wille [1] as a cement-based concrete with a compressive strength at least equal to 150 N/mm2. This very 15 References, figures and tables are renumbered in each publication. 16 The reuse of this manuscript agrees to the publishing agreement of Elsevier.
Dissertation Tina Oertel, 2013
- 42 -
dense and durable concrete is achieved by reducing the water/cement ratio (w/c ratio) to less than 0.3 by mass and by adding amorphous silica [2, 3]. Silica fume is the most commonly used amorphous silica in cementitious systems. Its beneficial influence on concrete properties has been known since the 1950s but the topic is currently regaining considerable interest with a new focus on silica components with primary particles smaller than 100 nm, so-called nano silica. Those nano silica could further improve UHPC because of their advanced properties (e.g. higher purities, smaller primary particles and higher specific surface areas) [4].
Before the effects of silica in cementitious systems are discussed, the dissolution of silica in highly alkaline solutions needs to be considered. The chemical reactions involved are fundamental to describe the reaction mechanisms of silica components in cementitious systems. In water, the silica surface and monosilicic acid (‘Si(OH)4’, the quotation mark refers to uncertainties about its stability) exhibit a depolymerization-polymerization equilibrium shown in Equation 1 [5]. ‘Si(OH)4’ is only stable for low concentrations (less than 2·10-3 M). Otherwise, ‘Si(OH)4’ and silicate ions (e.g. H3SiO4
-) condense to polysilicic acids of low molecular weight (so-called oligomeric silicate species, Equation 2) [5, 6].
Equation 1: SiO2 (s) + 2 H2O (l) ‘Si(OH)4’ (aq)
Equation 2: H3SiO4- + ‘Si(OH)4’ H6Si2O7 + OH-
Silicate ions (H3SiO4-, H2SiO4
2-, HSiO43- and SiO4
4-) are formed by deprotonation of ‘Si(OH)4’ (e.g. H3SiO4
- according to Equation 3) when the pH is above 9 and by dissolution of silica (e.g. H3SiO4
- according to Equation 4) when the pH rises above 10.7 [5]. Oligomerization and dissolution of silica proceed simultaneously.
Equation 3: ‘Si(OH)4’ + OH- H3SiO4- + H2O
Equation 4: SiO2 + OH- + H2O H3SiO4-
The hydration of the Portland cement clinker minerals17, 18 (alite C3S, belite C2S, aluminate C3A and aluminate ferrite C4AF) is a complex reaction and its sub-processes are still under investigation [7]. The main processes, however, are well known [7-11]. Generally, alite hydrates and forms portlandite17 (CH) and calcium silicate hydrate phases17 (C–S–H phases, C3S2H4, CxSuHw+x). This chemical reaction is approximately represented by Equation 5 [10, 12].
Equation 5: 2 C3S + 7 H C3S2H4 + 3 CH
Thereby, alite (C3S = 3CaO·SiO2) dissolves congruently (Equation 6) in the first seconds after mixing with water to ionic species [7].
17 Abbreviations are according to the conventional cement chemistry notation: C=CaO, S=SiO2, A=Al2O3, F=Fe2O3, H=H2O and =SO3. 18 Alite, belite, aluminate and aluminate ferrite contain impurities. Therefore their chemical composition is slightly different than the composition of the pure minerals C3S, C2S, C3A and C4AF.
Dissertation Tina Oertel, 2013
- 43 -
Equation 6: 3CaO·SiO2 + 3 H2O 3 Ca2+ + H2SiO42- + 4 OH-
Besides alite, the aluminate phase determines early processes. It reacts with calcium sulfate17
(C H2) to ettringite17 (C6A 3H32, Equation 7) [9, 10] which is formed to a certain amount quickly after the addition of water [13-15].
Equation 7: C3A + 3 C H2 + 26 H C6A 3H32
The effects of silica in cementitious systems were most often studied for so-called ordinary concretes (OC), i.e. for concretes with compressive strengths lower than approx. 60 N/mm2 and w/c ratios higher than 0.35 by mass [16-21]. The beneficial contribution of silica in those concretes is twofold. On the one hand, C–S–H phases are formed in the pozzolanic reaction with portlandite (Equation 8) which results from the hydration of alite (Equation 5).
Equation 8: uS + xCH + wH CxSuHw+x
On the other hand, silica particles fill voids between particles of cement and other components because they are significantly smaller (so-called filler effect) [8]. The prerequisite for an optimal effect is the dispersion to primary particles [22]. The filler effect supports the formation of a denser microstructure because the gaps between the particles are minimized which have to be bridged by hydration products [23]. Furthermore, C–S–H phases from alite hydration nucleate on the silica surface [18, 24]. This process is also attributed to the filler effect but is more precisely called the seeding effect.
It is commonly observed and accepted that the addition of silica accelerates the cement hydration [16-20, 25-28], but the exact mechanism is not yet known and different models are proposed. The acceleration is generally attributed to the seeding effect because the hydration proceeds faster in the presence of nucleation sites for C–S–H phases [29]. Some others conclude that silica cannot dissolve because the concentration of silicate ions would increase and subsequently suppress the hydration of alite [16]. On the contrary, other authors [17, 25, 26, 30] postulate that silica dissolves rapidly in the pore solution of concrete (Equation 4) prior to the pozzolanic reaction (Equation 8). They propose that the pozzolanic reaction reduces the concentrations of Ca2+ and OH- ions and therefore the dissolution of alite would be accelerated [17, 25, 26, 30].
The discussion is further complicated because differing properties of different types of silica may affect the reaction mechanism. The specific surface area was identified as the most important factor [16, 17, 26, 27, 30]. Some authors further assume that the content of Si–OH groups (so-called silanol groups) is also of crucial importance [16, 25, 31]. The silanol group density depends on the conditions during the synthesis of the silica. Although silanol groups form during the synthesis at high temperatures (e.g. the flame hydrolysis of SiCl4), a considerable amount of those groups condenses to Si–O–Si bonds (so-called siloxane bonds) and aggregates of individual particles are formed when silanol groups of adjacent particles condense [5, 32]. Otherwise, a considerably higher amount of silanol groups remains
Dissertation Tina Oertel, 2013
- 44 -
after the hydrolysis and condensation of alkoxy silanes at ambient temperatures (e.g. using the Stoeber process [33]) [34]. In detail, a certain amount of surface ethoxy groups ( Si–O–C2H5) does not condense throughout the Stoeber process. They are subsequently replaced by silanol groups in an aqueous medium [34, 35]. One might expect that the silanol group density has an influence on the silica reactivity because silanol groups adsorb ions, water and other polar molecules [36]. If a surface consists mostly of siloxane bonds, it is considered to be hydrophobic because of the lower concentration of adsorption sites [36].
Two mechanisms were proposed so far to describe the acceleration of the cement hydration when the amount of silanol groups is increased. On the one hand, Björnström et al. [16] suggest that silicate ions from the dissolution of alite (Equation 6) preferentially react with those groups. On the other hand, Mostafa et al. [31] and Quing et al. [25] assume that silanol groups react with portlandite to C–S–H phases (Equation 8). Besides [16, 25, 31], there are only a few studies which distinguished between different types of silica (e. g. silica from flame hydrolysis or silica prepared by the Stoeber process) and their particular influence on cement hydration.
The described observations were mostly made on OC, but it is of interest to investigate how well the results may be transferred to UHPC. In the literature described so far, only Quing et al. [25] and Korpa et al. [26, 28] used w/c ratios less than 0.3 by mass which are suitable for UHPC. The major difference between both cementitious systems is that the clinker minerals fully hydrate in OC (approximately a w/c ratio of 0.38 by mass is necessary [8]), whereas the amount of water is insufficient for a complete hydration in UHPC. Subsequently, less portlandite is available in UHPC for the pozzolanic reaction of silica in comparison to OC.
The aim of this study is to further investigate if certain silica properties have an influence on the early hydration of UHPC and if there is a prevalent reaction mechanism. Three different silica components are used: conventional silica fume, commercial pyrogenic silica and Stoeber particles synthesized by hydrolyzing alkoxy silanes. They are characterized for their specific surface areas, silanol group densities and solubilities in alkaline suspension. Based on the results, their hypothetical reactivities in a cementitious environment are evaluated. Further effects are investigated directly in the mixtures of cement, silica and water (so-called pastes) with very low w/c ratios (suitable for UHPC) by in-situ X-ray diffraction (XRD), cryo scanning electron microscopy (cryo SEM) and pore solution analysis.
6.1.3 Experimental procedures
6.1.3.1 Materials
The following types of silica were used: silica fume (Silicoll P®, undensified, Sika GmbH, Germany), pyrogenic silica (AEROSIL® OX 50, Evonik Industries, Germany) and Stoeber particles (prepared at Fraunhofer–Institute ISC).
Silica fume and pyrogenic silica are formed in high temperature processes: pyrogenic silica in a flame hydrolysis reaction of silicon tetrachloride at about 1800 °C (Equation 9) [37, 38] and
Dissertation Tina Oertel, 2013
- 45 -
silica fume as a by-product of the industrial silicon production through oxidization of gaseous SiO at temperatures above 2000 °C (Equation 10) [8, 38, 39].
Equation 9: SiCl4 + 2 H2 + O2 SiO2 + 4 HCl
Equation 10: 2 SiO + O2 2 SiO2
The suspension of Stoeber particles was synthesized by hydrolysis and condensation of tetraethyl orthosilicate (Si(OC2H5)4) to amorphous silica particles in an ethanolic (C2H5OH) solution with ammonia (NH3) catalysis (Equation 11) [33]. 6750.0 g of C2H5OH (CSC Jäckle Chemie GmbH, Germany), 337.5 g of aqueous NH3 solution (25 %, Sigma–Aldrich Chemie GmbH, Germany), 337.5 g of Si(OC2H5)4 (98 %, Sigma–Aldrich Chemie GmbH, Germany) and 281.3 g of de-ionized water were mixed in a round-bottom flask and rested for 24 h at room temperature. The mean particle size of 242 nm was adjusted by the relative concentrations of precursors (Si(OC2H5)4, H2O) and catalyst (NH3). After synthesis, C2H5OH and NH3 were stepwise exchanged with de-ionized water by rotary evaporation. This exchange is sufficient to replace surface ethoxy groups with silanol groups [35] and to remove adsorbed NH4
+ ions from the silica surface (confirmed by infrared spectroscopy and X-ray photoelectron spectroscopy, data not shown). The aqueous suspension was concentrated to 50 wt% by further rotary evaporation. The temperature was maintained below 40 °C during the whole process.
Equation 11: Si(OC2H5)4 + 2 H2O SiO2 + 4 C2H5OH
The Portland cement CEM I 52.5R HS/NA (high initial strength R, high sulfate resistance HS, low alkali content NA; Holcim Sulfo 5, Holcim AG, Germany) was used with the following composition of clinker minerals and contents of alkalis and sulfates in wt%: C3S 64.6, C2S 12.8, C3A 0.2, C4AF 16.6, K2O 0.39, Na2O 0.48 and SO3 2.19 (provided by the supplier).
Polycarboxylate ether (SikaViscoCrete®–2810, Sika GmbH, Germany) was applied as super-plasticizer. Its water content (60 wt%) was considered in the calculation of the w/c ratio.
6.1.3.2 Preparation of pastes
The applied paste formulation (Table 1) was based on the UHPC formulation M3Q developed by Fröhlich and Schmidt [40]. The w/c ratio was 0.23 by mass. Silica fume, pyrogenic silica or Stoeber particles were used as silica component. These pastes are further referred to as UHPC pastes.
Powderous silica (silica fume and pyrogenic silica) was premixed with cement by a handheld kitchen mixer (1 min). The superplasticizer was dissolved in de-ionized water. Then, the UHPC pastes were prepared by mixing the powder blend with the solution of superplasticizer and water. As soon as the pastes had liquefied, they were further mixed for 4 min.
For UHPC pastes with the Stoeber particle suspension, the superplasticizer was first homogenized with the cement in a grinding dish to a powder and subsequently mixed with the aqueous silica suspension (50 wt% according to M3Q) using the kitchen mixer (4 min). This
Dissertation Tina Oertel, 2013
- 46 -
modification was necessary because attempts to dissolve the superplasticizer in the silica suspension led to a gelation of the silica particles.
Table 1: Composition of UHPC paste based on M3Q [40] with w/c=0.23 by mass. Material Density (g/cm3) Content per volume (kg/m3)
Water 1.0 175.0
Portland cement 3.0 825.0
Silica 2.2 175.0
Superplasticizer 1.1 27.5
6.1.3.3 Characterization methods
Silica particles were imaged by scanning electron microscopy (SEM; Carl Zeiss Supra 25). The specific surface area was measured by nitrogen adsorption (BET method; Quantachrome Autosorb 3B) after drying of the sample for 16 h at 110 °C and 10-6 bar. Further characterization was done by X-ray fluorescence spectroscopy (XRF; PANalytical Axios–Advanced) and X-ray diffraction (XRD; Philips PW 1710).
Stoeber particles for investigation by 29Si magic angle spinning solid-state NMR spectroscopy (29Si MAS NMR; Bruker Avance 500) were freeze-dried from the suspension to minimize the influence of the drying procedure on the silica surface. Pyrogenic silica and silica fume were measured as received. The quantification of the relative amounts of Qn groups (n=1, 2, 3 and 4) is based on a Gaussian fit of the spectrum (spinning rate=7000 Hz).
In the Sears titration [41], the amount of sodium hydroxide (NaOH) was measured which increases the pH of an aqueous silica suspension from 4.0 to 9.0. 1.5 g silica, 100 ml de-ionized water and 30 g NaCl were mixed in a beaker and acidified with 0.1 M HCl to pH 4.0. The specific surface area was calculated from the amount of consumed NaOH using Sears’ assumption that 1.26 silanol groups per nm2 are deprotonated at the silica surface between pH 4.0 and pH 9.0. Sears based his assumption on titration studies with colloidal silica prepared by ion exchange in dilute solutions of sodium silicate. Detailed experimental procedures and the empiric equation are given in Sears [41].
Dynamic light scattering (DLS) was carried out using a Malvern Zetasizer Nano–ZS ZEN3600 device (polystyrene cuvettes, measured undisturbed, 25 °C) to determine the particle size of silica in aqueous suspensions and to monitor the dissolution process (further information in Chapter 6.1.3.4).
Samples of UHPC paste were investigated by in-situ XRD recorded with a PANalytical X’Pert Pro diffractometer using Cu K radiation. A secondary nickel filter was used to suppress fluorescence. Samples were transferred to the sample holder immediately after mixing; the surface was smoothed and sealed with a Kapton® polyimide foil to prevent
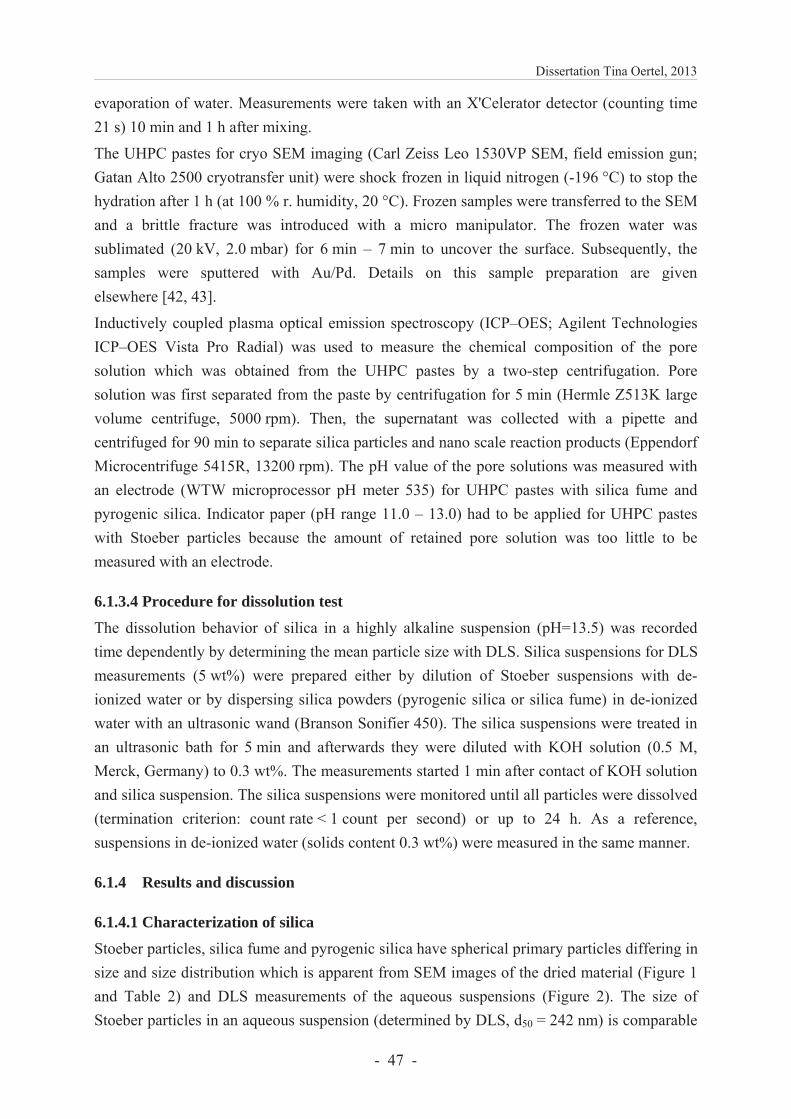
Dissertation Tina Oertel, 2013
- 47 -
evaporation of water. Measurements were taken with an X'Celerator detector (counting time 21 s) 10 min and 1 h after mixing.
The UHPC pastes for cryo SEM imaging (Carl Zeiss Leo 1530VP SEM, field emission gun; Gatan Alto 2500 cryotransfer unit) were shock frozen in liquid nitrogen (-196 °C) to stop the hydration after 1 h (at 100 % r. humidity, 20 °C). Frozen samples were transferred to the SEM and a brittle fracture was introduced with a micro manipulator. The frozen water was sublimated (20 kV, 2.0 mbar) for 6 min – 7 min to uncover the surface. Subsequently, the samples were sputtered with Au/Pd. Details on this sample preparation are given elsewhere [42, 43].
Inductively coupled plasma optical emission spectroscopy (ICP–OES; Agilent Technologies ICP–OES Vista Pro Radial) was used to measure the chemical composition of the pore solution which was obtained from the UHPC pastes by a two-step centrifugation. Pore solution was first separated from the paste by centrifugation for 5 min (Hermle Z513K large volume centrifuge, 5000 rpm). Then, the supernatant was collected with a pipette and centrifuged for 90 min to separate silica particles and nano scale reaction products (Eppendorf Microcentrifuge 5415R, 13200 rpm). The pH value of the pore solutions was measured with an electrode (WTW microprocessor pH meter 535) for UHPC pastes with silica fume and pyrogenic silica. Indicator paper (pH range 11.0 – 13.0) had to be applied for UHPC pastes with Stoeber particles because the amount of retained pore solution was too little to be measured with an electrode.
6.1.3.4 Procedure for dissolution test
The dissolution behavior of silica in a highly alkaline suspension (pH=13.5) was recorded time dependently by determining the mean particle size with DLS. Silica suspensions for DLS measurements (5 wt%) were prepared either by dilution of Stoeber suspensions with de-ionized water or by dispersing silica powders (pyrogenic silica or silica fume) in de-ionized water with an ultrasonic wand (Branson Sonifier 450). The silica suspensions were treated in an ultrasonic bath for 5 min and afterwards they were diluted with KOH solution (0.5 M, Merck, Germany) to 0.3 wt%. The measurements started 1 min after contact of KOH solution and silica suspension. The silica suspensions were monitored until all particles were dissolved (termination criterion: count rate < 1 count per second) or up to 24 h. As a reference, suspensions in de-ionized water (solids content 0.3 wt%) were measured in the same manner.
6.1.4 Results and discussion
6.1.4.1 Characterization of silica
Stoeber particles, silica fume and pyrogenic silica have spherical primary particles differing in size and size distribution which is apparent from SEM images of the dried material (Figure 1 and Table 2) and DLS measurements of the aqueous suspensions (Figure 2). The size of Stoeber particles in an aqueous suspension (determined by DLS, d50 = 242 nm) is comparable
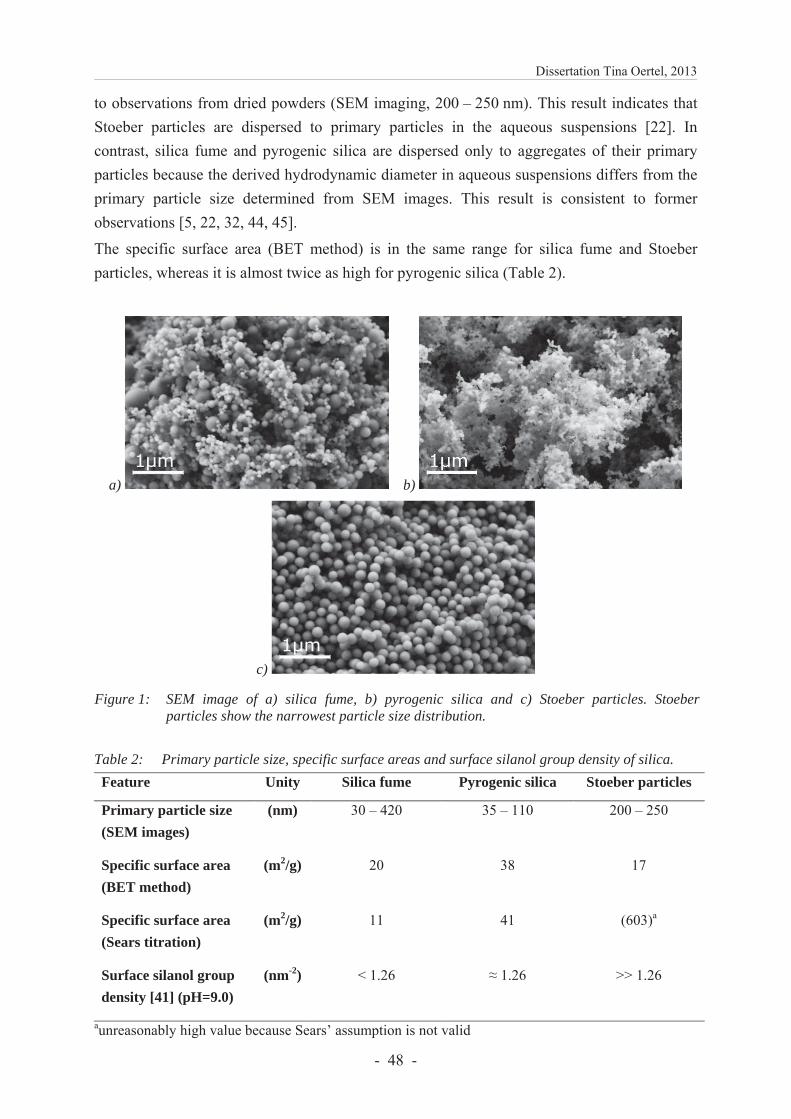
Dissertation Tina Oertel, 2013
- 48 -
to observations from dried powders (SEM imaging, 200 – 250 nm). This result indicates that Stoeber particles are dispersed to primary particles in the aqueous suspensions [22]. In contrast, silica fume and pyrogenic silica are dispersed only to aggregates of their primary particles because the derived hydrodynamic diameter in aqueous suspensions differs from the primary particle size determined from SEM images. This result is consistent to former observations [5, 22, 32, 44, 45].
The specific surface area (BET method) is in the same range for silica fume and Stoeber particles, whereas it is almost twice as high for pyrogenic silica (Table 2).
a) b)
c)
Figure 1: SEM image of a) silica fume, b) pyrogenic silica and c) Stoeber particles. Stoeber particles show the narrowest particle size distribution.
Table 2: Primary particle size, specific surface areas and surface silanol group density of silica. Feature Unity Silica fume Pyrogenic silica Stoeber particles
Primary particle size (SEM images)
(nm) 30 – 420 35 – 110 200 – 250
Specific surface area (BET method)
(m2/g) 20 38 17
Specific surface area (Sears titration)
(m2/g) 11 41 (603)a
Surface silanol group density [41] (pH=9.0)
(nm-2) < 1.26 1.26 >> 1.26
aunreasonably high value because Sears’ assumption is not valid
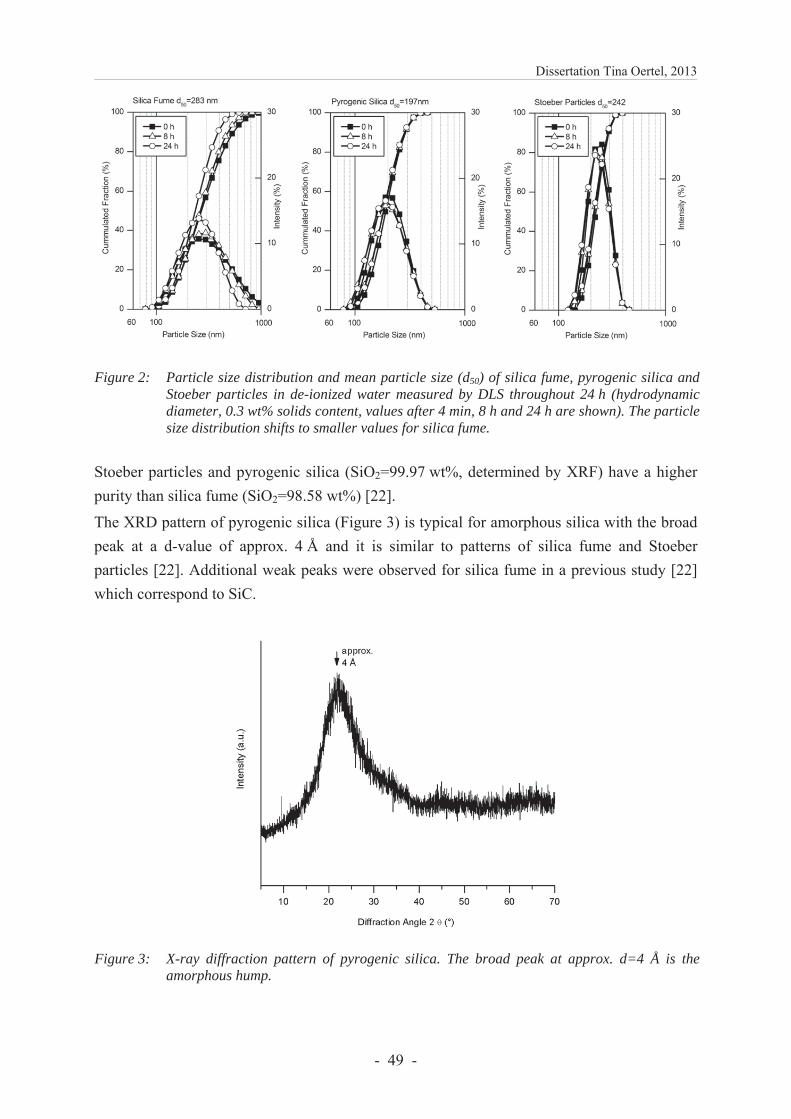
Dissertation Tina Oertel, 2013
- 49 -
Figure 2: Particle size distribution and mean particle size (d50) of silica fume, pyrogenic silica and Stoeber particles in de-ionized water measured by DLS throughout 24 h (hydrodynamic diameter, 0.3 wt% solids content, values after 4 min, 8 h and 24 h are shown). The particle size distribution shifts to smaller values for silica fume.
Stoeber particles and pyrogenic silica (SiO2=99.97 wt%, determined by XRF) have a higher purity than silica fume (SiO2=98.58 wt%) [22].
The XRD pattern of pyrogenic silica (Figure 3) is typical for amorphous silica with the broad peak at a d-value of approx. 4 Å and it is similar to patterns of silica fume and Stoeber particles [22]. Additional weak peaks were observed for silica fume in a previous study [22] which correspond to SiC.
Figure 3: X-ray diffraction pattern of pyrogenic silica. The broad peak at approx. d=4 Å is the amorphous hump.
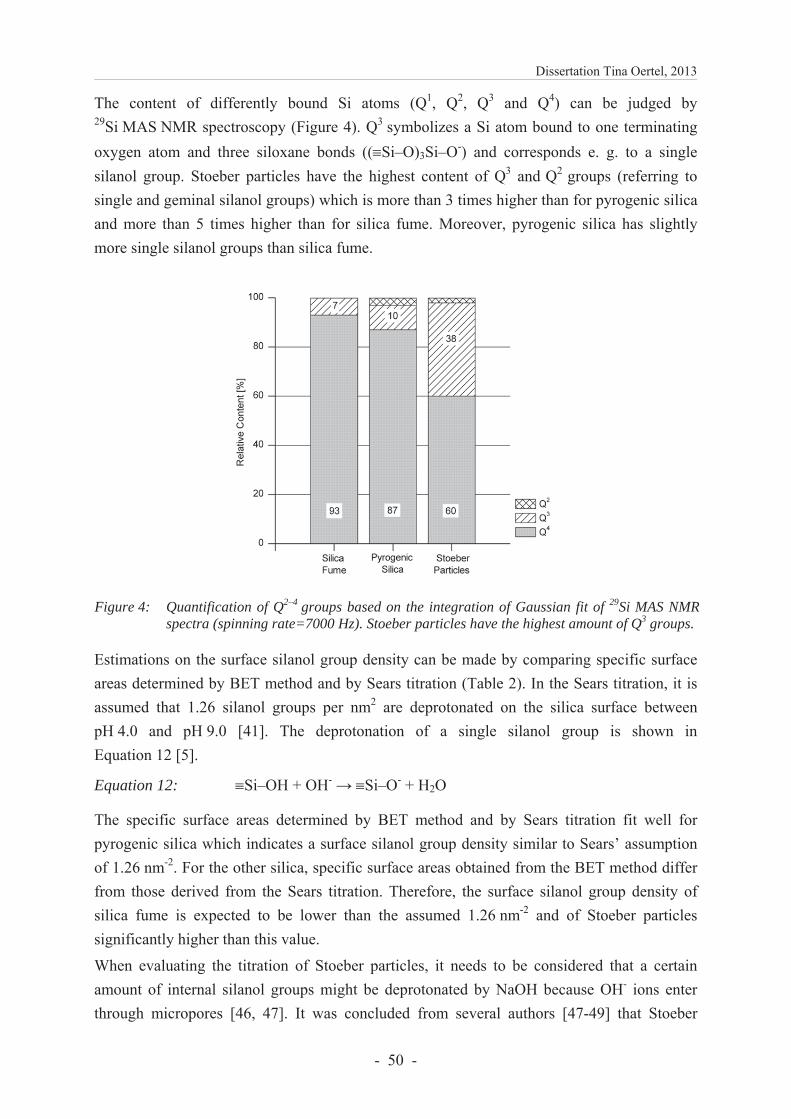
Dissertation Tina Oertel, 2013
- 50 -
The content of differently bound Si atoms (Q1, Q2, Q3 and Q4) can be judged by 29Si MAS NMR spectroscopy (Figure 4). Q3 symbolizes a Si atom bound to one terminating oxygen atom and three siloxane bonds (( Si–O)3Si–O-) and corresponds e. g. to a single silanol group. Stoeber particles have the highest content of Q3 and Q2 groups (referring to single and geminal silanol groups) which is more than 3 times higher than for pyrogenic silica and more than 5 times higher than for silica fume. Moreover, pyrogenic silica has slightly more single silanol groups than silica fume.
Figure 4: Quantification of Q2–4 groups based on the integration of Gaussian fit of 29Si MAS NMR spectra (spinning rate=7000 Hz). Stoeber particles have the highest amount of Q3 groups.
Estimations on the surface silanol group density can be made by comparing specific surface areas determined by BET method and by Sears titration (Table 2). In the Sears titration, it is assumed that 1.26 silanol groups per nm2 are deprotonated on the silica surface between pH 4.0 and pH 9.0 [41]. The deprotonation of a single silanol group is shown in Equation 12 [5].
Equation 12: Si–OH + OH- Si–O- + H2O
The specific surface areas determined by BET method and by Sears titration fit well for pyrogenic silica which indicates a surface silanol group density similar to Sears’ assumption of 1.26 nm-2. For the other silica, specific surface areas obtained from the BET method differ from those derived from the Sears titration. Therefore, the surface silanol group density of silica fume is expected to be lower than the assumed 1.26 nm-2 and of Stoeber particles significantly higher than this value.
When evaluating the titration of Stoeber particles, it needs to be considered that a certain amount of internal silanol groups might be deprotonated by NaOH because OH- ions enter through micropores [46, 47]. It was concluded from several authors [47-49] that Stoeber
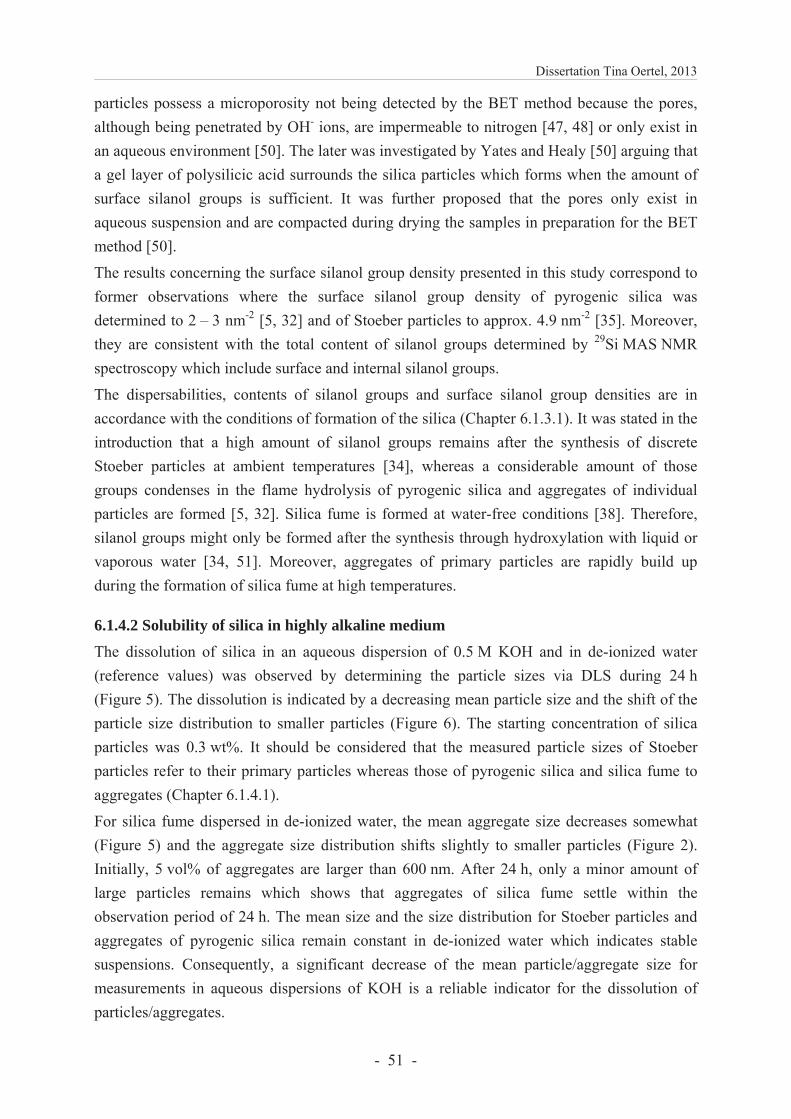
Dissertation Tina Oertel, 2013
- 51 -
particles possess a microporosity not being detected by the BET method because the pores, although being penetrated by OH- ions, are impermeable to nitrogen [47, 48] or only exist in an aqueous environment [50]. The later was investigated by Yates and Healy [50] arguing that a gel layer of polysilicic acid surrounds the silica particles which forms when the amount of surface silanol groups is sufficient. It was further proposed that the pores only exist in aqueous suspension and are compacted during drying the samples in preparation for the BET method [50].
The results concerning the surface silanol group density presented in this study correspond to former observations where the surface silanol group density of pyrogenic silica was determined to 2 – 3 nm-2 [5, 32] and of Stoeber particles to approx. 4.9 nm-2 [35]. Moreover, they are consistent with the total content of silanol groups determined by 29Si MAS NMR spectroscopy which include surface and internal silanol groups.
The dispersabilities, contents of silanol groups and surface silanol group densities are in accordance with the conditions of formation of the silica (Chapter 6.1.3.1). It was stated in the introduction that a high amount of silanol groups remains after the synthesis of discrete Stoeber particles at ambient temperatures [34], whereas a considerable amount of those groups condenses in the flame hydrolysis of pyrogenic silica and aggregates of individual particles are formed [5, 32]. Silica fume is formed at water-free conditions [38]. Therefore, silanol groups might only be formed after the synthesis through hydroxylation with liquid or vaporous water [34, 51]. Moreover, aggregates of primary particles are rapidly build up during the formation of silica fume at high temperatures.
6.1.4.2 Solubility of silica in highly alkaline medium
The dissolution of silica in an aqueous dispersion of 0.5 M KOH and in de-ionized water (reference values) was observed by determining the particle sizes via DLS during 24 h (Figure 5). The dissolution is indicated by a decreasing mean particle size and the shift of the particle size distribution to smaller particles (Figure 6). The starting concentration of silica particles was 0.3 wt%. It should be considered that the measured particle sizes of Stoeber particles refer to their primary particles whereas those of pyrogenic silica and silica fume to aggregates (Chapter 6.1.4.1).
For silica fume dispersed in de-ionized water, the mean aggregate size decreases somewhat (Figure 5) and the aggregate size distribution shifts slightly to smaller particles (Figure 2). Initially, 5 vol% of aggregates are larger than 600 nm. After 24 h, only a minor amount of large particles remains which shows that aggregates of silica fume settle within the observation period of 24 h. The mean size and the size distribution for Stoeber particles and aggregates of pyrogenic silica remain constant in de-ionized water which indicates stable suspensions. Consequently, a significant decrease of the mean particle/aggregate size for measurements in aqueous dispersions of KOH is a reliable indicator for the dissolution of particles/aggregates.
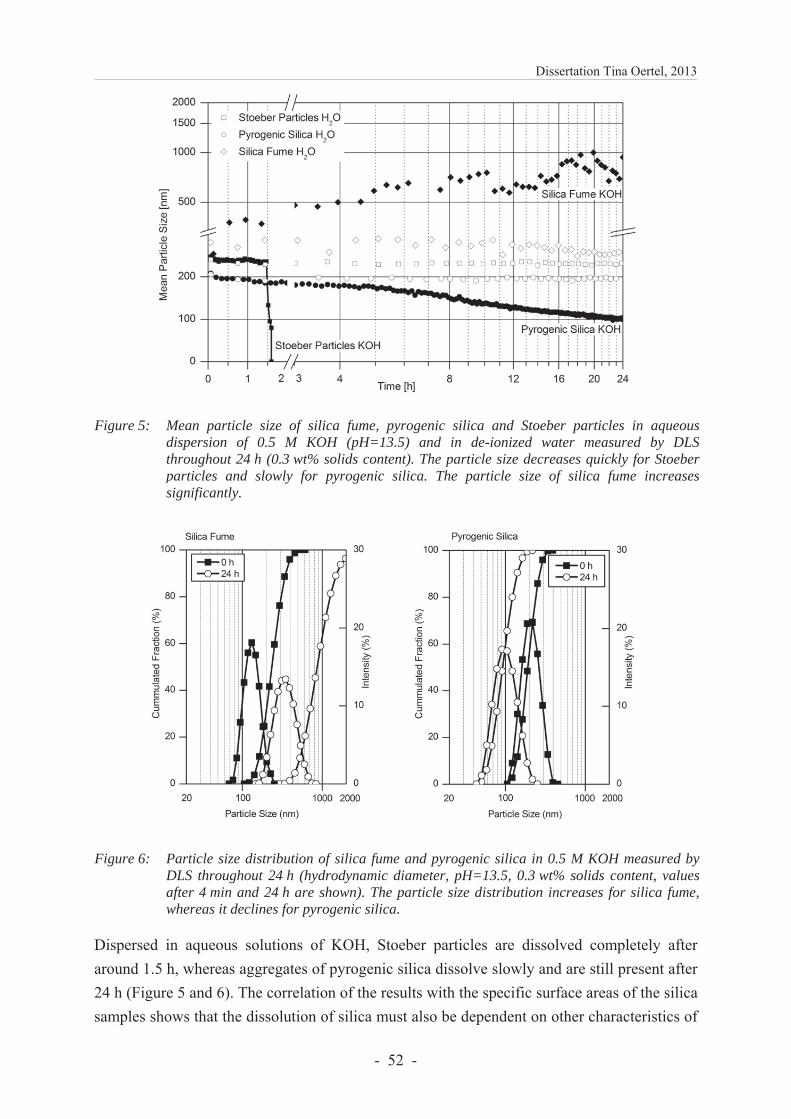
Dissertation Tina Oertel, 2013
- 52 -
Figure 5: Mean particle size of silica fume, pyrogenic silica and Stoeber particles in aqueous dispersion of 0.5 M KOH (pH=13.5) and in de-ionized water measured by DLS throughout 24 h (0.3 wt% solids content). The particle size decreases quickly for Stoeber particles and slowly for pyrogenic silica. The particle size of silica fume increases significantly.
Figure 6: Particle size distribution of silica fume and pyrogenic silica in 0.5 M KOH measured by DLS throughout 24 h (hydrodynamic diameter, pH=13.5, 0.3 wt% solids content, values after 4 min and 24 h are shown). The particle size distribution increases for silica fume, whereas it declines for pyrogenic silica.
Dispersed in aqueous solutions of KOH, Stoeber particles are dissolved completely after around 1.5 h, whereas aggregates of pyrogenic silica dissolve slowly and are still present after 24 h (Figure 5 and 6). The correlation of the results with the specific surface areas of the silica samples shows that the dissolution of silica must also be dependent on other characteristics of
Dissertation Tina Oertel, 2013
- 53 -
the material. In detail, the specific surface area of pyrogenic silica is twice as high as of Stoeber particles but the dissolution rate is significantly lower. The faster dissolution of Stoeber particles is attributed to the higher amount of silanol groups and the lower amount of siloxane bonds (Chapter 6.1.4.1) because silica dissolution is rate controlled by breaking the strong siloxane bonds through hydrolysis [52]. Therefore, the dissolution rate of silica increases with an increasing initial amount of silanol groups [53, 54] depending strongly on the conditions of formation as was previously discussed in Chapter 6.1.4.1. In conclusion, pyrogenic silica dissolves more slowly than Stoeber particles because of its lower surface silanol group density and low total content of silanol groups.
The dissolution behavior of silica fume could not be observed via DLS. The aggregates coagulate very rapidly in KOH to clusters (approx. 5 μm, data not shown). They are too large to be measured by DLS commonly employed in the range of 0.002 – 2 μm [55]. The size of remaining clusters can be determined after filtering the suspension with a 0.45 μm syringe filter 1 min after its preparation (Figure 5 and 6). The results give evidence that the coagu-lation proceeds throughout the measurement because the particle size increases. The noisy data after approx. 10 h might be explained by a simultaneous settling of large agglomerates formed by coagulation. Both, coagulation and settling, make it difficult to detect the dissolution of particles in this experiment. However, it is suggested that silica fume dissolves more slowly than pyrogenic silica because it has a lower silanol group density, a lower total content of silanol groups and a smaller specific surface area (Chapter 6.1.4.1).
An explanation for the different coagulation behavior might be given by the Derjaguin–Landau–Verwey–Overbeek theory (DLVO theory). It describes the interaction of approaching particles of almost all oxide colloidal materials by a potential originating from attractive van der Waals forces and repulsive electrostatic forces [56-58]. The stability of silica particles towards coagulation is strongly dependent on the negative surface charge which results from the deprotonation of silanol groups through OH- (Equation 12) [5]. Charge neutrality between the silica particles and the aqueous medium is maintained by the adsorption of counter ions (K+ in this experiment) and co-ions (OH- in this experiment) which form the so-called double layer. The repulsive electrostatic forces originate from the overlap of the electric double layers of approaching particles [59]. One can conclude that sufficiently high surface charges prevent a coagulation of silica fume, pyrogenic silica and Stoeber particles in de-ionized water (reference values).
The DLVO theory further explains the influence of the ionic strength of the dispersion medium. The ionic strength of the KOH solution reduces the thickness of the electric double layer of the particles in comparison to those in de-ionized water [59]. This compression of the double layer decreases the electrostatic repulsive force. In consequence, if the repulsive force is too low, the distance of the particles becomes small enough that van der Waals attraction promotes the coagulation of particles [59]. Besides the ionic strength, the particle size has a significant influence on the electrostatic repulsive force. The thickness of the double layer is
Dissertation Tina Oertel, 2013
- 54 -
independent of the particle size. Subsequently, the ratio of particle size to thickness of the electric double layer decreases with an increasing particle size and the electrostatic repulsive force is reduced. According to the results of this experiment, the repulsive forces seem to be large enough for Stoeber particles and pyrogenic silica to prevent the coagulation of particles in KOH suspensions; however, they are too low for particles of silica fume which subsequently coagulate.
Although silica particles dissolve under the given conditions in the KOH solution and therefore their coagulation behavior might not be completely conform to the DLVO theory, the described size dependency of the coagulation is in accordance to the observation that Stoeber particles with a size of 740 nm coagulate in KOH suspensions (procedure similar to Chapter 6.1.3.4, data not shown). Therefore, it is concluded that aggregates of silica fume (283 nm) might be too large to be stabilized towards coagulation, whereas Stoeber particles (242 nm) and aggregates of pyrogenic silica (197 nm) seem to be too small to coagulate under the given conditions.
Apart from the DLVO theory, some authors [50, 60] propose that stabilizing layers other than the double layer determine the stability of silica particles in aqueous suspensions. Jenkins et al. [60] suggest that the repulsion of particles is enhanced with an increasing amount of deprotonated silanol groups on the silica surface. These silanol groups attract solvated counter ions forming a layer around the silica particles. The gel layer of polysilicic acid suggested by Yates and Healy [50] (previously described in Chapter 6.1.4.1) is also strongly related to the amount of surface silanol groups. The conclusion can be drawn for both layers that agglomerates of silica fume should have the lowest stability towards coagulation in alkaline media because they have the lowest amount of silanol groups.
6.1.4.3 Discussion of silica reactivities in a cementitious environment
The properties of silica have to be considered for evaluating the main effects of silica on the hydration reactions of cement. The influence of the specific surface area is most obvious because it determines the interface between the solid silica and the pore solution. The comparison of the BET specific surface areas allows for the following reactivity ranking: pyrogenic silica > silica fume Stoeber particles.
Beside this purely geometric consideration, the intrinsic chemical reactivity of the silica surface is also important. Two different reaction sequences (path I and II) should be observed:
Path I) silica dissolution (Equation 4) followed by the pozzolanic reaction (Equation 8),
Path II) alite dissolution (Equation 6) and hydration (Equation 5), in which silica is not consumed but C–S–H phases nucleate on its surface (seeding effect).
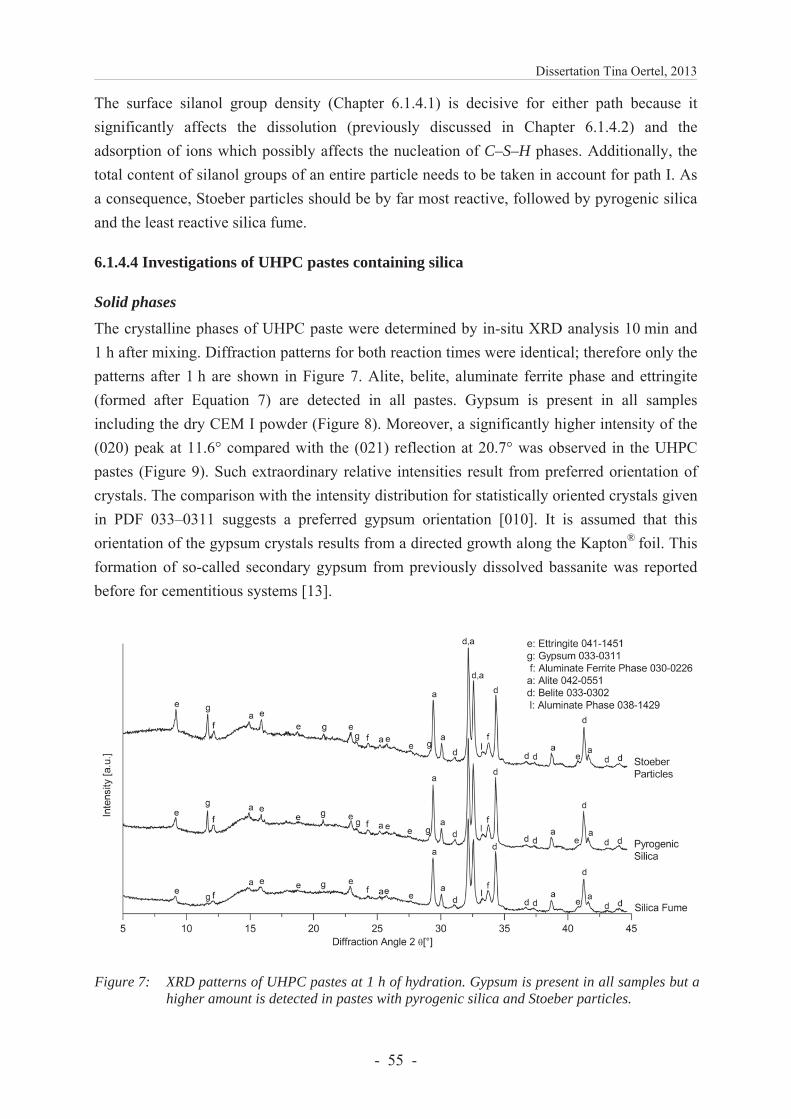
Dissertation Tina Oertel, 2013
- 55 -
The surface silanol group density (Chapter 6.1.4.1) is decisive for either path because it significantly affects the dissolution (previously discussed in Chapter 6.1.4.2) and the adsorption of ions which possibly affects the nucleation of C–S–H phases. Additionally, the total content of silanol groups of an entire particle needs to be taken in account for path I. As a consequence, Stoeber particles should be by far most reactive, followed by pyrogenic silica and the least reactive silica fume.
6.1.4.4 Investigations of UHPC pastes containing silica
Solid phases The crystalline phases of UHPC paste were determined by in-situ XRD analysis 10 min and 1 h after mixing. Diffraction patterns for both reaction times were identical; therefore only the patterns after 1 h are shown in Figure 7. Alite, belite, aluminate ferrite phase and ettringite (formed after Equation 7) are detected in all pastes. Gypsum is present in all samples including the dry CEM I powder (Figure 8). Moreover, a significantly higher intensity of the (020) peak at 11.6° compared with the (021) reflection at 20.7° was observed in the UHPC pastes (Figure 9). Such extraordinary relative intensities result from preferred orientation of crystals. The comparison with the intensity distribution for statistically oriented crystals given in PDF 033–0311 suggests a preferred gypsum orientation [010]. It is assumed that this orientation of the gypsum crystals results from a directed growth along the Kapton® foil. This formation of so-called secondary gypsum from previously dissolved bassanite was reported before for cementitious systems [13].
Figure 7: XRD patterns of UHPC pastes at 1 h of hydration. Gypsum is present in all samples but a higher amount is detected in pastes with pyrogenic silica and Stoeber particles.
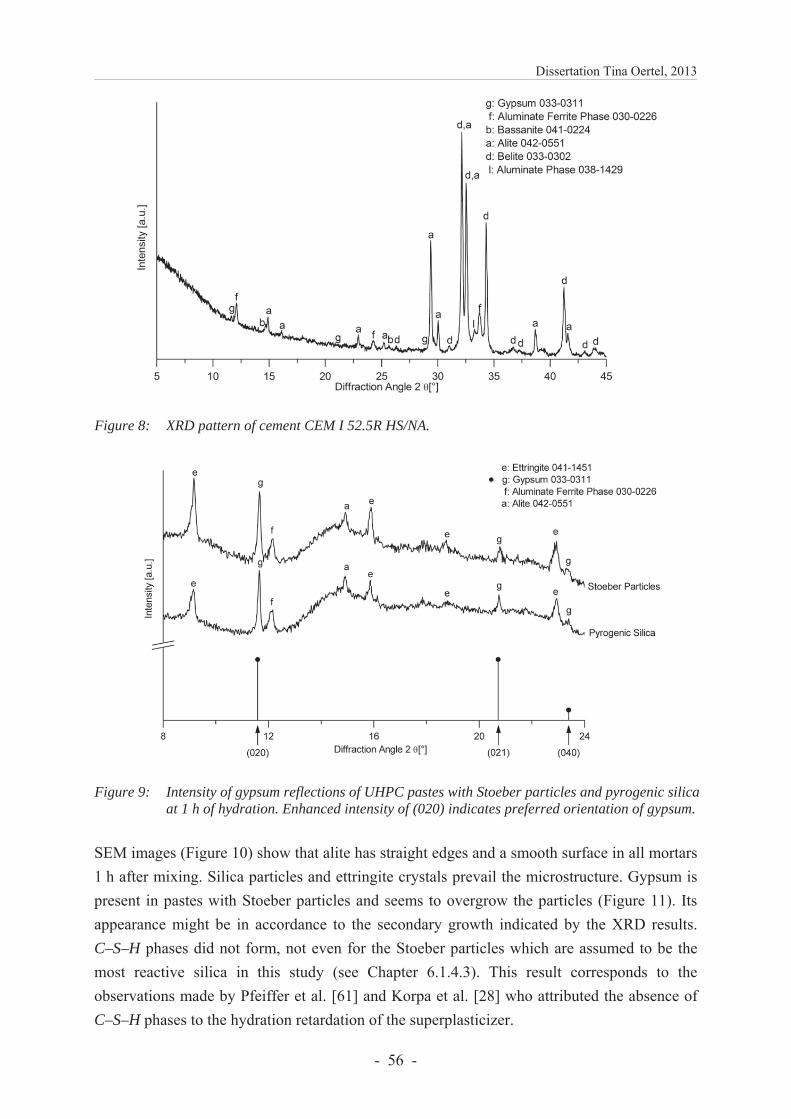
Dissertation Tina Oertel, 2013
- 56 -
Figure 8: XRD pattern of cement CEM I 52.5R HS/NA.
Figure 9: Intensity of gypsum reflections of UHPC pastes with Stoeber particles and pyrogenic silica at 1 h of hydration. Enhanced intensity of (020) indicates preferred orientation of gypsum.
SEM images (Figure 10) show that alite has straight edges and a smooth surface in all mortars 1 h after mixing. Silica particles and ettringite crystals prevail the microstructure. Gypsum is present in pastes with Stoeber particles and seems to overgrow the particles (Figure 11). Its appearance might be in accordance to the secondary growth indicated by the XRD results. C–S–H phases did not form, not even for the Stoeber particles which are assumed to be the most reactive silica in this study (see Chapter 6.1.4.3). This result corresponds to the observations made by Pfeiffer et al. [61] and Korpa et al. [28] who attributed the absence of C–S–H phases to the hydration retardation of the superplasticizer.
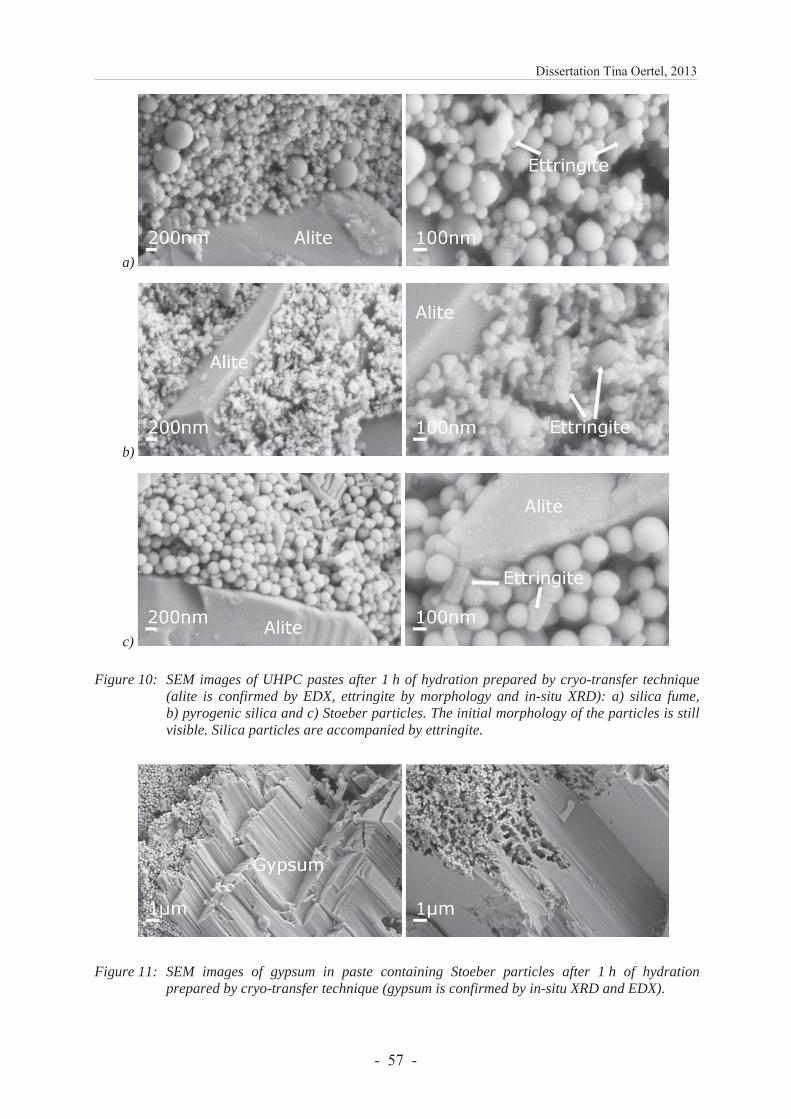
Dissertation Tina Oertel, 2013
- 57 -
a)
b)
c)
Figure 10: SEM images of UHPC pastes after 1 h of hydration prepared by cryo-transfer technique (alite is confirmed by EDX, ettringite by morphology and in-situ XRD): a) silica fume, b) pyrogenic silica and c) Stoeber particles. The initial morphology of the particles is still visible. Silica particles are accompanied by ettringite.
c)
Figure 11: SEM images of gypsum in paste containing Stoeber particles after 1 h of hydration prepared by cryo-transfer technique (gypsum is confirmed by in-situ XRD and EDX).
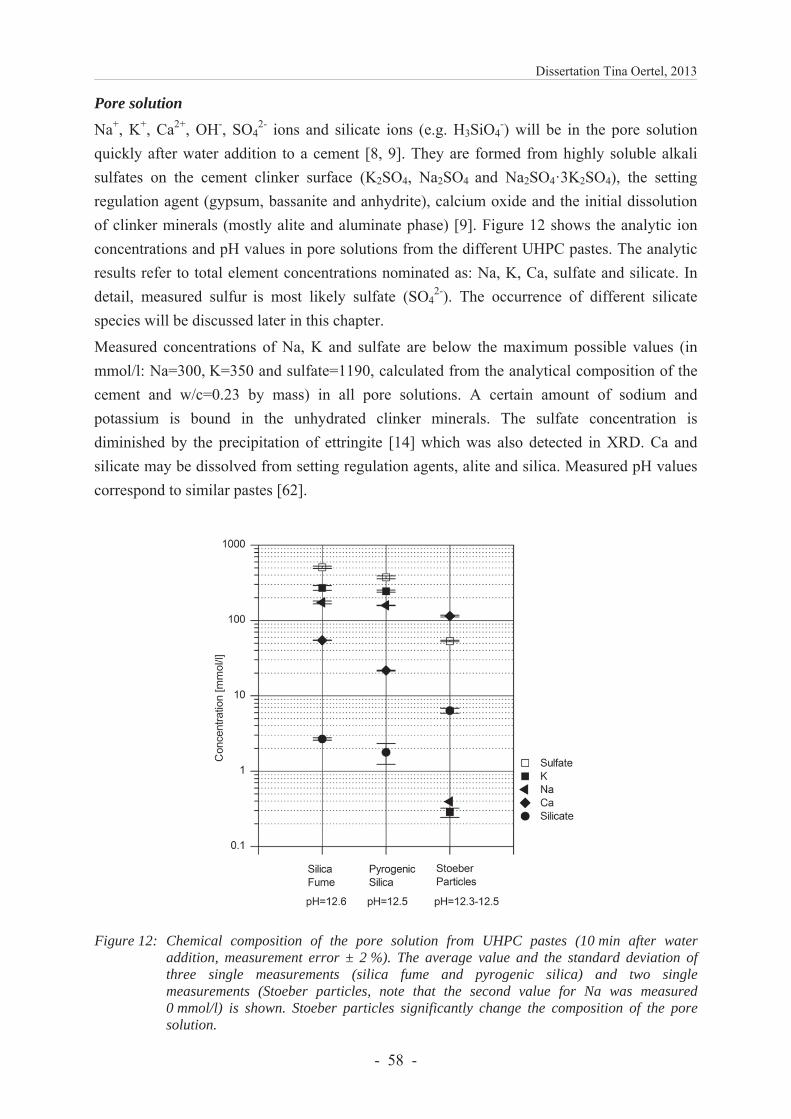
Dissertation Tina Oertel, 2013
- 58 -
Pore solution Na+, K+, Ca2+, OH-, SO4
2- ions and silicate ions (e.g. H3SiO4-) will be in the pore solution
quickly after water addition to a cement [8, 9]. They are formed from highly soluble alkali sulfates on the cement clinker surface (K2SO4, Na2SO4 and Na2SO4·3K2SO4), the setting regulation agent (gypsum, bassanite and anhydrite), calcium oxide and the initial dissolution of clinker minerals (mostly alite and aluminate phase) [9]. Figure 12 shows the analytic ion concentrations and pH values in pore solutions from the different UHPC pastes. The analytic results refer to total element concentrations nominated as: Na, K, Ca, sulfate and silicate. In detail, measured sulfur is most likely sulfate (SO4
2-). The occurrence of different silicate species will be discussed later in this chapter.
Measured concentrations of Na, K and sulfate are below the maximum possible values (in mmol/l: Na=300, K=350 and sulfate=1190, calculated from the analytical composition of the cement and w/c=0.23 by mass) in all pore solutions. A certain amount of sodium and potassium is bound in the unhydrated clinker minerals. The sulfate concentration is diminished by the precipitation of ettringite [14] which was also detected in XRD. Ca and silicate may be dissolved from setting regulation agents, alite and silica. Measured pH values correspond to similar pastes [62].
Figure 12: Chemical composition of the pore solution from UHPC pastes (10 min after water addition, measurement error ± 2 %). The average value and the standard deviation of three single measurements (silica fume and pyrogenic silica) and two single measurements (Stoeber particles, note that the second value for Na was measured 0 mmol/l) is shown. Stoeber particles significantly change the composition of the pore solution.
Dissertation Tina Oertel, 2013
- 59 -
Pastes containing pyrogenic silica show slightly lower concentrations for all measured elements than samples with silica fume. Remarkably, in the pore solution of pastes with Stoeber particles, K and Na concentrations drop by a factor of about 10-3, sulfate by about 10-1, whereas silicate and Ca concentrations increase. This lack in Na, K and sulfate is untypical for a cementitious paste. Different interactions at the interface between silica particles and the pore solution depending on the silica type may be assumed from the results.
For a deeper insight, the detailed processes at the silica surface have to be considered. As was already stated in the introduction, simultaneously to the dissolution of silica in basic media (Equation 4), oligomeric silicate species are formed (Equation 2) [5, 6]. The degree of this polymerization depends on the pH value and the concentration of ions in solution [5]. Na+ and K+ ions mostly lead to the formation of low molecular alkali silicate species (monomeric, dimeric or tetrameric ions, e.g. Si(OH)2O2M-, Si2(OH)4O3M- and Si4(OH)6O6M- with M = Na, K) [63, 64], so-called alkali silicate oligomers like in water glass solutions. Eventually, they solidify to a gel by further condensation. Ca2+ ions can promote such a gel formation process [65], different mechanisms for this formation were proposed [65]. Bound sodium and potassium can also be replaced by calcium in the alkali silicate oligomers (so-called calcium alkali silicate oligomers) and possibly calcium silicate structures close to C–S–H phases are formed [66-68].
The analytic results of the total element concentrations of Na, K, Ca and silicate can be interpreted as follows taking into account those interactions of Na+, K+, Ca2+ and silicate ions. Although present in the pore solution after formation, alkali silicate oligomers and calcium alkali silicate oligomers do not contribute to the analytical results of Na, K, Ca and silicate. They may be removed by centrifugating together with clinker species and silica particles. As a consequence, analytical results for Na, K and Ca are understood as Na+, K+ and Ca2+ ions.
Having the ranking of silica reactivities (Chapter 6.1.4.3) and the discussed interactions of Na+, K+ and Ca2+ ions in mind, the results of the pore solution analyses can be understood as a consequence of the silica reactivities. Na+ and K+ ions enter the pore solution immediately [9, 15] and might be attracted to the negatively charged silica surface in the very early moment of mixing. They originate from alkali sulfates which are a relic from the cement production and cover the clinker minerals. Ca2+ ions enter the solution somewhat later. They are dissolved from calcium sulfates having a slower dissolution velocity than alkali sulfates [9]. After the dissolution of alkali sulfates, clinker minerals dissolve and provide additional Ca2+ ions. Na+, K+ and Ca2+ ions interact with dissolved silicate ions to alkali silicate oligomers and calcium alkali silicate oligomers. The amount of dissolved silicate ions and oligomers depends on the silica reactivity which is postulated from the surface silanol group densities and total content of silanol groups (Chapter 6.1.4.3). Accordingly, it should be highest for Stoeber particles and lowest for silica fume. As a consequence, less alkali silicate oligomers and calcium alkali silicate oligomers are formed with silica fume and retain lower amounts of Ca, Na, K and
Dissertation Tina Oertel, 2013
- 60 -
silicate in the centrifugation residue (Figure 12). This result agrees to the higher concen-trations of those elements in the pore solutions in case of pastes containing silica fume.
The very low concentrations of Na and K in pastes containing Stoeber particles might indicate that alkali ions are almost completely bound in alkali silicate oligomers and removed by centrifugation. It is assumed, that the alkali silicate oligomers might even form a layer (amorphous gel phase) around the silica particles which is not detectable by cryo SEM or XRD. The still high concentration of silicate and Ca suggests that calcium silicate species are in the pore solution. The lower concentration of sulfates is in correspondence with the precipitation of secondary gypsum as observed by cryo SEM and XRD.
6.1.5 Conclusions
In this study, the effects of different types of silica (Stoeber particles, silica fume and pyrogenic silica) on the hydration of UHPC pastes were investigated within the first hour. Two different reaction sequences for silica (path I and II) can be observed in a cementitious environment: either silica dissolves followed by a pozzolanic reaction (path I) or C–S–H phases from the hydration of alite nucleate at its surface (path II).
The silica reactivity was discussed considering different properties of silica. Surface silanol group densities, total contents of silanol groups and solubilities in alkaline suspensions indicate that Stoeber particles should be by far the most reactive, followed by pyrogenic silica and the less reactive silica fume. A different reactivity ranking is postulated (pyrogenic silica > silica fume Stoeber particles) if the specific surface area is considered which is twice as high for pyrogenic silica as for silica fume or Stoeber particles.
Silica reactions were further traced in UHPC pastes within the first hour of hydration by investigating the solid phases and the pore solution. The results give no indication for the reactivity ranking assumed from the specific surface area or for any reaction following path I or II. Instead, silica particles seem to attract cations (Na+, K+ and Ca2+) from the pore solutions and form alkali silicate oligomers and calcium silicate oligomers. These oligomers might be held as a layer around the silica particles and form an aqueous, amorphous gel phase. The extent of the assumed oligomerization depends on the silica reactivity postulated from the surface silanol group density and the total content of silanol groups. Indeed, it seems to be high enough in pastes with Stoeber particles to bind almost all alkali ions in alkali silicate oligomers. The corresponding decline of alkali ions in the pore solution may have an impact on the subsequent processes because alkali ions accelerate the hydration of alite [69, 70]. Therefore, the alite hydration in UHPC pastes containing Stoeber particles might not be as fast as in UHPC pastes containing other silica. Reaction path I seems to be more likely for Stoeber particles than for the less reactive pyrogenic silica and silica fume.
Further studies should investigate the effect of silica with different reactivities for an extended observation period to fully clarify the influence on the hydration (path I, II or both) and the resulting properties of UHPC.
Dissertation Tina Oertel, 2013
- 61 -
6.1.6 Acknowledgements
The authors thank Johannes Prieschl for the Sears titration and XRD measurements, Kirsten Langguth for her support in taking SEM images, Rüdiger Bertermann for measuring and quantifying 29Si NMR, Jürgen Göske for in-situ XRD measurements, Susanne Winter for cryo SEM preparation and imaging and Werner Hopp for ICP measurements. Professor Josef Breu is acknowledged for his advices and discussions throughout the implementation of this work. Also, many thanks go to Joachim Krakehl and Holger Kletti for fruitful discussions. The research was funded by the Elite Network of Bavaria in the International Graduate School ‘Structure, Reactivity and Properties of Oxide Materials’ and partially by the German Federal Ministry of Education and Research in the project ‘Chemically Bonded Ceramics by Nanotechnological Improvements of Structure (03X0067E)’.
6.1.7 References [1] Naaman A.E., Wille K., proceedings of 3rd Hipermat: International symposium on UHPC and
nanotechnology for high performance construction materials, Kassel (2012) 3-16.
[2] Fehling E., Schmidt M., Teichmann T. et al., Entwicklung, Dauerhaftigkeit und Berechnung Ultrahochfester Betone (UHPC), Forschungsbericht DFG FE 497/1-1, Kassel University Press, Kassel (2005).
[3] Verein Deutscher Zementwerke, Reaktive Zusatzstoffe (Typ II), in Zement-Taschenbuch, 51st ed, Verlag Bau+Technik GmbH, Düsseldorf (2008).
[4] Schmidt M., Nanotechnologie: Neue Ansätze für die Entwicklung von Hochleistungs-bindemitteln und -betonen, in proceedings of 17th Ibausil: Internationale Baustofftagung, Weimar (2009).
[5] Iler R.K., The chemistry of silica, New York (1978).
[6] Fertani-Gmati M., Jemal M., Thermochim. Acta 513 (2011) 43-48.
[7] Bullard J.W., Jennings H.M., Livingston R.A. et al., Cem. Concr. Res. 41 (2011) 1208-1223.
[8] Taylor H. F. W., Cement chemistry, 2nd ed, Thomas Telford Publishing, London (1997).
[9] Odler I., Hydration, setting and hardening of Portland cement, in Lea's chemistry of cement and concrete, 4th ed, Elsevier Ltd. publisher, London (2004).
[10] Mindess S., Young J.F., Concrete, Prentice Hall publisher, Englewood Cliffs (1981).
[11] Scrivener K.L., Nonat A., Cem. Concr. Res. 41 (2011) 651-665.
[12] Lea F.M., The Chemistry of Cement and Concrete, 3rd ed, Edward Arnold publisher, Glasgow (1970).
[13] Merlini M., Artioli G., Cerulli T. et al., Cem. Concr. Res. 38 (2008) 477-486.
[14] Hesse C., Goetz-Neunhoeffer F., Neubauer J., Cem. Concr. Res. 41 (2011) 123-128.
[15] Lothenbach B., Winnefeld F., Cem. Concr. Res. 36 (2006) 209-226.
[16] Björnström J., Martinelli A., Matic A. et al., Chem. Phys. L. 392 (2004) 242-248.
[17] Jo B., Kim C., Tae G. et al., Constr. Build. Mater. 21 (2007) 1351-1355.
[18] Lothenbach B., Scrivener K., Hooton R.D., Cem. Concr. Res. 41 (2011) 1244-1256.
[19] Senff L., Labrincha J.A., Ferreira V.M. et al., Constr. Build. Mater. 23 (2009) 2487-2491.
[20] Senff L., Hotza D., Repette W.L. et al., Constr. Build. Mater. 24 (2010) 1432-1437.
Dissertation Tina Oertel, 2013
- 62 -
[21] Shih J.Y., Chang T.P., Hsiao T.C., Mater. Sci. Eng. A 424 (2006) 266-274.
[22] Oertel T., Hutter F., Tänzer R. et al., Cem. Concr. Comp. 37 (2013) 61-67.
[23] Krauss H.W., Budelmann H., proceedings RILEM 79, Hongkong (2011) 58-65.
[24] Krauss H.W., Budelmann H., proceedings of Tagung Bauchemie, Dübendorf (2012) 35-42.
[25] Qing Y., Zenan Z., Deyu K. et al., Constr. Build. Mater. 21 (2007) 439-545.
[26] Korpa A., Kowald T., Trettin R., Cem. Concr. Res. 38 (2008) 955-962.
[27] Korpa A., Trettin R., Böttger K.G. et al., Adv. Cem. Res. 20 (2008) 35-46.
[28] Korpa A., Kowald T., Trettin R., Cem. Concr. Res. 39 (2009) 69-76.
[29] Thomas J.J., Jennings H.M., Chen J.J., J. Phys. Chem. C 113 (2009) 4327-4334.
[30] Greenberg S.A., J. Phys. Chem. 65 (1961) 12-16.
[31] Mostafa N.Y., Brown P.W., Thermochim. Acta 435 (2005) 162-167.
[32] Degussa, Technical Bulletin Fine Particles 11 (2006).
[33] Stoeber W., Fink A., J. Colloid and Interface Sci. 26 (1968) 62-69.
[34] Bergna H.E., Chapter 3: Colloidal chemistry of silica: An overview, in Colloidal silica: Fundamentals and applications, CRC Press Taylor & Francis Group, Boca Raton (2006).
[35] Suratwala T.I., Hanna M.L., Miller E.L. et al., J. Non-Crystalline Solids 316 (2003) 349-363.
[36] Brinker C.J., Scherer G.W., Sol-gel science: The physics and chemistry of sol-gel processing, Academic Press, San Diego (1990).
[37] Bergna H.E., Chapter 2: The language of colloidal science and silica chemistry, in Colloidal silica: Fundamentals and applications, CRC Press Taylor & Francis Group, Boca Raton (2006).
[38] Khavryuchenko V.D., Khavryuchenko O.V., Lisnyak V.V., Critical Reviews in Solid State and Materials Sciences 36 (2011) 47-65.
[39] Fédération Internationale de la Précontrainte, Condensed silica fume in concrete - FIP state of art report, Thomas Telford Publishing, London (1988).
[40] Fröhlich S., Schmidt M., proceedings of 3rd Hipermat: International symposium on UHPC and nanotechnology for high performance construction materials, Kassel (2012) 225-232.
[41] Sears G.W., Analytical Chem. 28 (1956) 1981-1983.
[42] Göske, J., Winter, S., Pöllmann, H., et al., Beton- und Stahlbetonbau 105 (2010) 521-528.
[43] Fylak M., Göske J., Kachler W., et al., Microscopy and Analysis 20 (2006) 9-12.
[44] Diamond S., Sahu S., Mater. Struct. 39 (2006) 849-859.
[45] Orts-Gil G., Natte K., Drescher D. et al., J. Nanopart. Res. 13 (2011) 1593-1604.
[46] Despas C., Walcarius A., Bessière J., Langmuir 15 (1999) 3186-3196.
[47] Kobayashi M., Skarba M., Galletto P. et al., J. Colloid and Interface Sci. 292 (2005) 139-147.
[48] Perram J.W., J. Chem. Soc. Faraday Trans. 2 69 (1973) 993-1003.
[49] Wan Q., Ramsey C., Baran G., J. Therm. Anal. Calorim. 99 (2010) 237-243.
[50] Yates D.E., Healy T.W., J. Colloid and Interface Sci. 55 (1976) 9-19.
[51] Ullmann's encyclopedia of industrial chemistry, Colloidal Silica, 6th ed, Whiley-VCH publisher (2003).
[52] Rimstidt J.D., Barnes H.L., Geochim. Cosmochim. Acta 44 (1980) 1683-1699.
[53] Berger G., Cadore E., Schott J. et al., Geochim. Cosmochim. Acta 58 (1994) 541-551.
Dissertation Tina Oertel, 2013
- 63 -
[54] Rimer J.D., Trofymluk O., Navrotsky A. et al., Chem. Mater. 19 (2007) 4189-4197.
[55] Tscharnuter W., Photon correlation spectroscopy in particle sizing, in Encyclopedia of Analytical Chemistry, John Wiley & Sons Ltd, Chichester (2000).
[56] Derjaguin B., Landau L., Acta Physico Chemica URSS 14 (1941) 633-662.
[57] Verwey E.J.W., Overbeek J.T.G., Theory of the stability of lyophobic colloids, Elsevier Publishing Company, New York (1948).
[58] Healy T.W., Chapter 20: Stability of aqueous silica sols, in Colloidal silica: Fundamentals and applications, CRC Press Taylor & Francis Group, Boca Raton (2006).
[59] Verwey E.J.W., J. Phys. Chem. 51 (1947) 631-636.
[60] Jenkins S., Kirk S.R., Persson M. et al., J. Colloid and Interface Sci. (2009) 351-361.
[61] Pfeifer C., Möser B., Stark J., ZKG International 63 (2010) 71-79.
[62] Schröfl, C., Omega-Methoxypoly(ethylenoxid)-Methacrylsäureester-co-Methacrylsäure-co-Methallylsulfonsäure-Polycarboxylate als Fließmittel für ultra-hochfesten Beton: Synthese, Wirkmechanismus und Untersuchungen zum Synergismus von selektiv adsorbierenden Polymergemischen, doctoral thesis, München (2010).
[63] Tanaka M., Takahashi K., Analytical Sci. 15 (1999) 1241-1250.
[64] Berninger A.M., Mikrostrukturelle Eigenschaften von Quarz als Bestandteil spät reagierender, alkaliempfindlicher Zuschläge, doctoral thesis, Weimar (2004).
[65] Gaboriaud F., Nonat A., Chaumont D., J. Phys. Chem. B 103 (1999) 5775-5781.
[66] Leemann A., Le Saout G., Winnefeld F., et al., J. Am. Ceram. Soc. 94 (2011) 1243-1249.
[67] Macphee D.E., Luke K., Glasser F.P. et al., J. Am. Ceram. Soc. 72 (1989) 646-654.
[68] Allen L.H., Matijevic E., J. Colloid and Interface Sci. 31 (1969) 286-296.
[69] Kumar A., Sant G., Patapy C. et al., Cem. Concr. Res. 42 (2012) 1513-1523.
[70] Morin V., Garrault S., Begarin F. et al., Cem. Concr. Res. 40 (2010) 1459-1464.
Dissertation Tina Oertel, 2013
- 64 -
6.2 Reactions in UHPC containing various types of reactive silica19
Influence of amorphous silica on the hydration in ultra-high performance concrete
Submitted to Cement & Concrete Research
Tina Oertela, b, *, Uta Helbigc, Frank Huttera, Holger Klettid, Gerhard Sextla, e
aFraunhofer–Institute for Silicate Research ISC, Neunerplatz 2, 97082 Würzburg, Germany bChair for Inorganic Chemistry I, University Bayreuth, Universitätsstr. 30, 95440 Bayreuth, Germany cChair for Crystallography and X-ray Methods, Technische Hochschule Nürnberg Georg Simon Ohm, Wassertorstraße 10, 90489 Nürnberg, Germany dChair for Building Materials, Bauhaus–Universität Weimar, Coudraystr. 11, 99423 Weimar, Germany eChair for Chemical Technology of Advanced Materials, Julius Maximilians University, Röntgenring 11, 97070 Würzburg, Germany *corresponding author
6.2.1 Abstract Amorphous silica particles (silica) are used in ultra-high performance concretes to densify the microstructure and accelerate the clinker hydration. It is still unclear whether silica predominantly increases the surface for the nucleation of C–S–H phases or dissolves and reacts pozzolanically. Furthermore, varying types of silica may have different and time dependent effects on the clinker hydration. These effects were monitored in this study by calorimetric analysis, scanning and transmission electron microscopy, in-situ X-ray diffraction and compressive strength measurements. The silica component was silica fume, pyrogenic silica or silica synthesized by a wet-chemical route (Stoeber particles). Water-to-cement ratios were 0.23. Differences are observed between the silica for short reaction times (up to 3 d). Results indicate that silica fume and pyrogenic silica accelerate alite hydration by increasing the surface for nucleation of C–S–H phases. Stoeber particles show no accelerating effect possibly due to their enhanced dissolution tendency.
6.2.2 Introduction
The development of high strength concretes goes back to the 1970s [1], but has regained a keen interest leading to new research efforts for ultra-high performance concretes (UHPCs). UHPC is defined by its high compressive strength, dense structure and low capillary porosity [2]. These properties are obtained via a low water-to-cement ratio (w/c < 0.3 by mass), amorphous silica particles (so-called silica) as supplementary material and an optimal packing of the particles [3]. A commonly used silica component is silica fume which is a
19 The reuse of this manuscript agrees to the publishing agreement of Elsevier.
Dissertation Tina Oertel, 2013
- 65 -
by-product of the industrial silicon production with particle sizes in the sub-micrometer range [4-6]. Silica with primary particles smaller than 100 nm (so-called nano silica) is increasingly applied to optimize UHPC for highly challenging practical applications [7]. Still, some problems remain unsolved, mostly because results for so-called ordinary concretes (OC), i.e. for concretes with compressive strength lower than approx. 60 MPa and w/c ratios higher than 0.35 by mass, cannot be transferred to UHPCs in all cases. At least for stoichiometric reasons, the amount of water (H)20 is insufficient in UHPC for a complete hydration of the clinker minerals (alite C3S, belite C2S, aluminate C3A and aluminate ferrite C4AF)20 and less portlandite and water is available for the pozzolanic reaction of silica in comparison to OC.
Two reaction processes should be considered in UHPC containing silica:
The silica surface works as a nucleation center for the formation of calcium silicate hydrate phases (C–S–H phases, CxSuHw+x, C3S2H4)20 produced by hydration of (e. g.) alite (Equation 1), the so-called seeding effect [8-12]. Silica (S)20 reacts pozzolanically (Equation 2) with portlandite (CH)20 produced by hydration of (e. g.) alite (Equation 1) [13-16].
Equation 1: 2 C3S + 7 H C3S2H4 + 3 CH
Equation 2: uS + xCH + wH CxSuHw+x
Clearly, the two processes do not exclude each other, but there may be a chance to observe different reaction products at different reaction times for the two processes.
Undissolved silica particles may generally form a denser microstructure by reducing voids between the other solid concrete components (so-called filler effect) [4, 17, 18]. The seeding effect is one of the principal mechanisms contributing to the filler effect [10]. Further mechanisms of the filler effect (e.g. increase of particle packing density) were not in the scope of this study, but were partly studied before in Oertel et al. [19].
Previously, we examined the reactivity of varying types of silica (silica fume, pyrogenic silica and silica synthesized by hydrolysis and condensation of alkoxy silanes, so-called Stoeber particles) and further traced the reactions of these silica in pastes with a low w/c ratio within the first hour of hydration [20]. The reactivities of the silica were classified from highest to lowest based on the surface silanol group density, total content of silanol groups and solubility in alkaline suspension: Stoeber particles >> pyrogenic silica > silica fume. Our experimental results gave no indication for the seeding effect or the pozzolanic reaction within the first hour of hydration. Instead, it was assumed that silicate ions react with cations (Na+, K+ and Ca2+) from the pore solution to alkali silicate oligomers and calcium silicate oligomers. The amount of silicate ions and oligomers depends on the reactivity of the silica.
20 H=H2O, C=CaO, S=SiO2, A=Al2O3 and F=Fe2O3 according to conventional cement chemistry notation
Dissertation Tina Oertel, 2013
- 66 -
The aim of this study is to determine if the seeding effect or the pozzolanic reaction is preferred for cementitious systems with a low w/c ratio containing various types of reactive silica. Thereby, the emphasis was to evaluate the effects of silica in practical relevant paste and mortar formulations. Heat flow calorimetry (up to 7 d) and measurements of the compressive strength (2, 7 and 28 d) are used to examine the overall evolution of the hydration reactions. The content of crystalline phases is detected by in-situ X-ray diffraction (XRD, up to 3 d). The microstructure of the pastes is investigated 20 h after mixing by transmission electron microscopy (TEM) and scanning electron microscopy (SEM). Herein, the samples were prepared using cross section polishing (CSP) [21] and focused ion beam technique (FIB) [22] which are both relatively new to the cementitious community. Paste and mortars are formulated with a w/c ratio and a silica content which are typical for UHPC. This combination of exterior and in-situ methods helped to draw a clearer picture on the overall hydration of real UHPC systems containing various types of reactive silica.
6.2.3 Experimental procedures
6.2.3.1 Materials
The following types of silica were used which are identical to previous studies [19, 20]: silica fume (Silicoll P®, Sika GmbH, Germany, undensified powder), pyrogenic silica (AEROSIL® OX 50, Evonik Industries, Germany, powder) and Stoeber particles (prepared at Fraunhofer–Institute ISC based on the Stoeber process [23], mean particle size of 242 nm, aqueous suspension 50 wt%). Details on their properties (morphology, specific surface area, SiO2 content, surface silanol group densities, content of silanol groups and solubilities in alkaline suspension) and the synthesis of Stoeber particles were given in Oertel et al. [19, 20]. Silica fume and pyrogenic silica are formed in high temperature processes [5, 24], whereas Stoeber particles are synthesized at ambient temperatures.
Pastes were prepared as described in Oertel et al. [20] using silica, Portland cement (CEM I 52.5R HS/NA, Holcim Sulfo 5, Holcim AG, Germany, content21 of clinker minerals in wt%: C3S 64.6, C2S 12.8, C3A 0.2, C4AF 16.6), superplasticizer (polycarboxylate ether, SikaViscoCrete®–2810, Sika GmbH, Germany, water content of 60 wt% considered in the calculation of the w/c ratio) and de-ionized water. Mortars were composed of silica, Portland cement, superplasticizer, de-ionized water, quartz powder (W12: 0.3 – 110 μm, Quarzwerke Frechen, Germany) and quartz sand (F32: 0.125 – 0.5 mm, Quarzwerke Frechen, Germany). They were mixed under similar conditions but with an intensive mixer (Eirich EL1, rotation speed: 1000 rpm).
The formulations of the pastes and mortars were based on UHPC formulated by Fröhlich and Schmidt [25] with a w/c ratio of 0.23 by mass (Table 1). Furthermore, samples without any addition of silica were prepared.
21 provided by the supplier
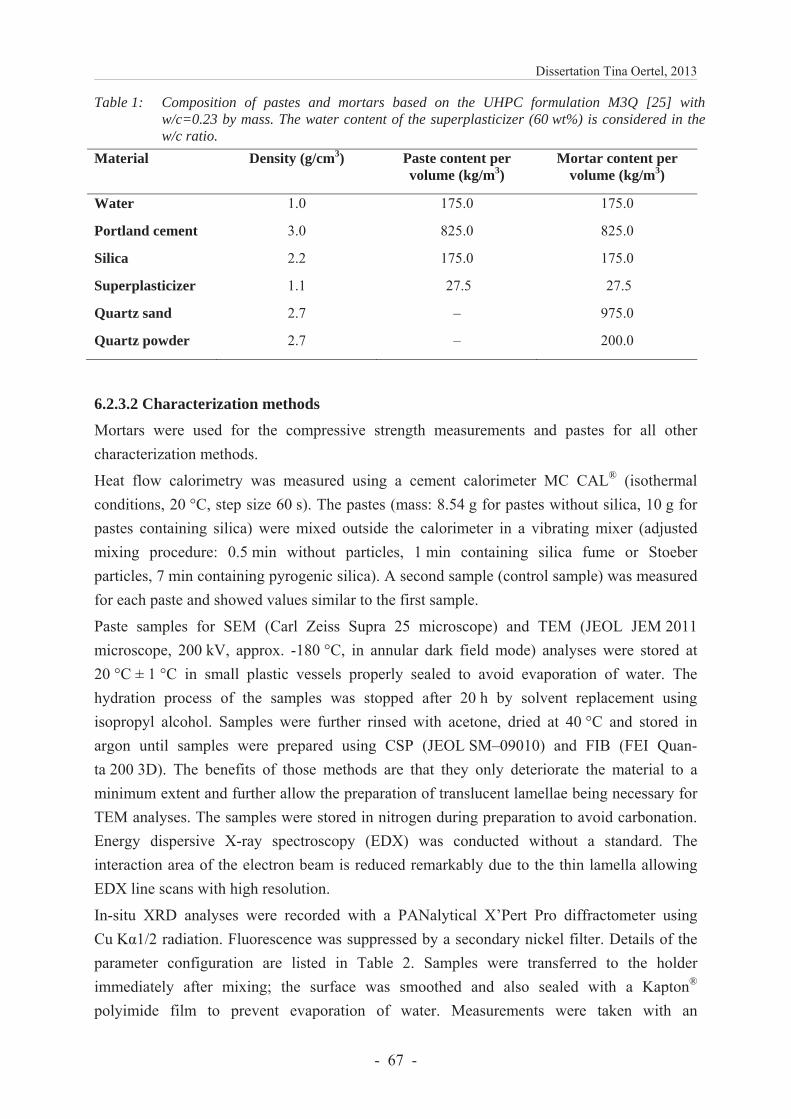
Dissertation Tina Oertel, 2013
- 67 -
Table 1: Composition of pastes and mortars based on the UHPC formulation M3Q [25] withw/c=0.23 by mass. The water content of the superplasticizer (60 wt%) is considered in the w/c ratio.
Material Density (g/cm3) Paste content per volume (kg/m3)
Mortar content per volume (kg/m3)
Water 1.0 175.0 175.0
Portland cement 3.0 825.0 825.0
Silica 2.2 175.0 175.0
Superplasticizer 1.1 27.5 27.5
Quartz sand 2.7 – 975.0
Quartz powder 2.7 – 200.0
6.2.3.2 Characterization methods Mortars were used for the compressive strength measurements and pastes for all other characterization methods.
Heat flow calorimetry was measured using a cement calorimeter MC CAL® (isothermal conditions, 20 °C, step size 60 s). The pastes (mass: 8.54 g for pastes without silica, 10 g for pastes containing silica) were mixed outside the calorimeter in a vibrating mixer (adjusted mixing procedure: 0.5 min without particles, 1 min containing silica fume or Stoeber particles, 7 min containing pyrogenic silica). A second sample (control sample) was measured for each paste and showed values similar to the first sample.
Paste samples for SEM (Carl Zeiss Supra 25 microscope) and TEM (JEOL JEM 2011 microscope, 200 kV, approx. -180 °C, in annular dark field mode) analyses were stored at 20 °C ± 1 °C in small plastic vessels properly sealed to avoid evaporation of water. The hydration process of the samples was stopped after 20 h by solvent replacement using isopropyl alcohol. Samples were further rinsed with acetone, dried at 40 °C and stored in argon until samples were prepared using CSP (JEOL SM–09010) and FIB (FEI Quan-ta 200 3D). The benefits of those methods are that they only deteriorate the material to a minimum extent and further allow the preparation of translucent lamellae being necessary for TEM analyses. The samples were stored in nitrogen during preparation to avoid carbonation. Energy dispersive X-ray spectroscopy (EDX) was conducted without a standard. The interaction area of the electron beam is reduced remarkably due to the thin lamella allowing EDX line scans with high resolution.
In-situ XRD analyses were recorded with a PANalytical X’Pert Pro diffractometer using Cu K 1/2 radiation. Fluorescence was suppressed by a secondary nickel filter. Details of the parameter configuration are listed in Table 2. Samples were transferred to the holder immediately after mixing; the surface was smoothed and also sealed with a Kapton® polyimide film to prevent evaporation of water. Measurements were taken with an
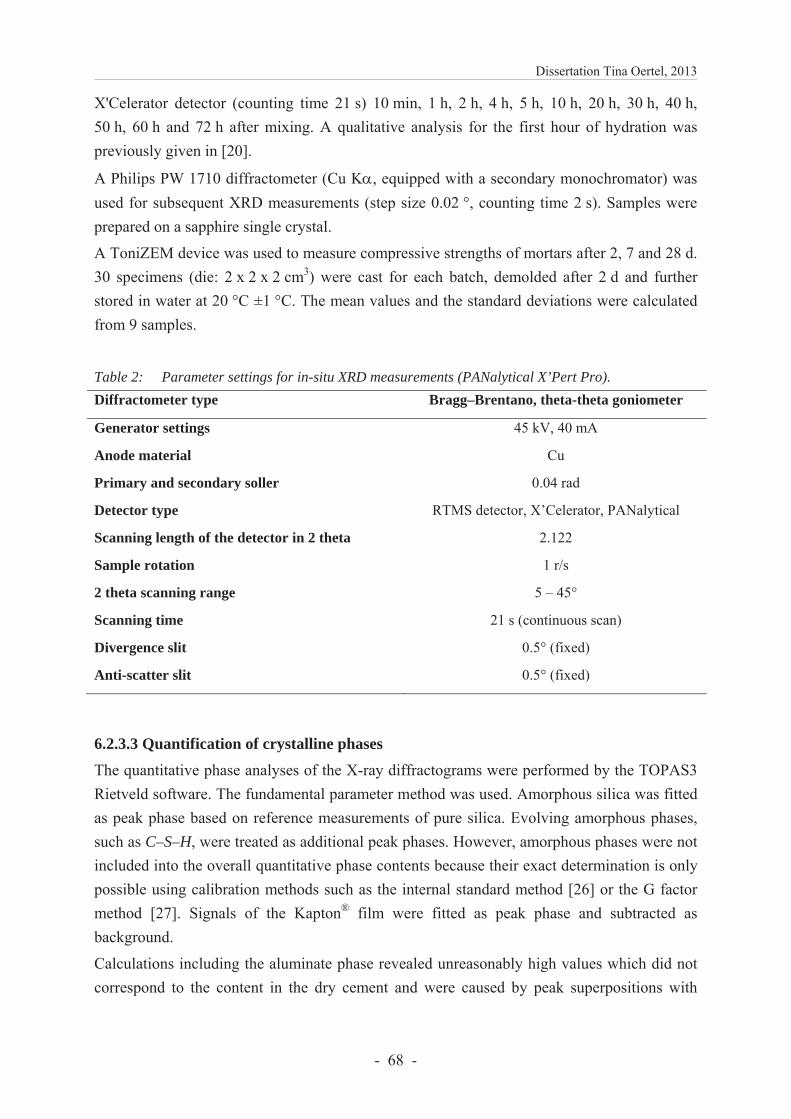
Dissertation Tina Oertel, 2013
- 68 -
X'Celerator detector (counting time 21 s) 10 min, 1 h, 2 h, 4 h, 5 h, 10 h, 20 h, 30 h, 40 h, 50 h, 60 h and 72 h after mixing. A qualitative analysis for the first hour of hydration was previously given in [20].
A Philips PW 1710 diffractometer (Cu K , equipped with a secondary monochromator) was used for subsequent XRD measurements (step size 0.02 °, counting time 2 s). Samples were prepared on a sapphire single crystal.
A ToniZEM device was used to measure compressive strengths of mortars after 2, 7 and 28 d. 30 specimens (die: 2 x 2 x 2 cm3) were cast for each batch, demolded after 2 d and further stored in water at 20 °C ±1 °C. The mean values and the standard deviations were calculated from 9 samples.
Table 2: Parameter settings for in-situ XRD measurements (PANalytical X’Pert Pro).
Diffractometer type Bragg–Brentano, theta-theta goniometer
Generator settings 45 kV, 40 mA
Anode material Cu
Primary and secondary soller 0.04 rad
Detector type RTMS detector, X’Celerator, PANalytical
Scanning length of the detector in 2 theta 2.122
Sample rotation 1 r/s
2 theta scanning range 5 – 45°
Scanning time 21 s (continuous scan)
Divergence slit 0.5° (fixed)
Anti-scatter slit 0.5° (fixed)
6.2.3.3 Quantification of crystalline phases
The quantitative phase analyses of the X-ray diffractograms were performed by the TOPAS3 Rietveld software. The fundamental parameter method was used. Amorphous silica was fitted as peak phase based on reference measurements of pure silica. Evolving amorphous phases, such as C–S–H, were treated as additional peak phases. However, amorphous phases were not included into the overall quantitative phase contents because their exact determination is only possible using calibration methods such as the internal standard method [26] or the G factor method [27]. Signals of the Kapton® film were fitted as peak phase and subtracted as background.
Calculations including the aluminate phase revealed unreasonably high values which did not correspond to the content in the dry cement and were caused by peak superpositions with
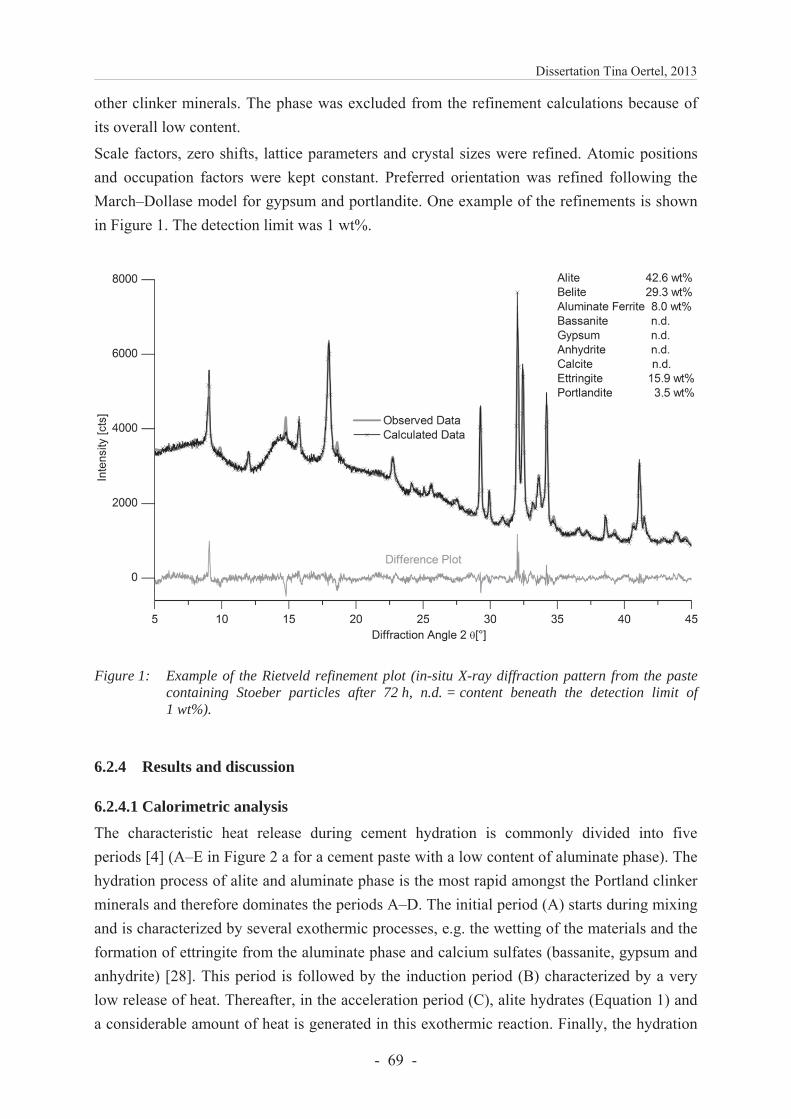
Dissertation Tina Oertel, 2013
- 69 -
other clinker minerals. The phase was excluded from the refinement calculations because of its overall low content.
Scale factors, zero shifts, lattice parameters and crystal sizes were refined. Atomic positions and occupation factors were kept constant. Preferred orientation was refined following the March–Dollase model for gypsum and portlandite. One example of the refinements is shown in Figure 1. The detection limit was 1 wt%.
Figure 1: Example of the Rietveld refinement plot (in-situ X-ray diffraction pattern from the paste containing Stoeber particles after 72 h, n.d. = content beneath the detection limit of 1 wt%).
6.2.4 Results and discussion
6.2.4.1 Calorimetric analysis
The characteristic heat release during cement hydration is commonly divided into five periods [4] (A–E in Figure 2 a for a cement paste with a low content of aluminate phase). The hydration process of alite and aluminate phase is the most rapid amongst the Portland clinker minerals and therefore dominates the periods A–D. The initial period (A) starts during mixing and is characterized by several exothermic processes, e.g. the wetting of the materials and the formation of ettringite from the aluminate phase and calcium sulfates (bassanite, gypsum and anhydrite) [28]. This period is followed by the induction period (B) characterized by a very low release of heat. Thereafter, in the acceleration period (C), alite hydrates (Equation 1) and a considerable amount of heat is generated in this exothermic reaction. Finally, the hydration
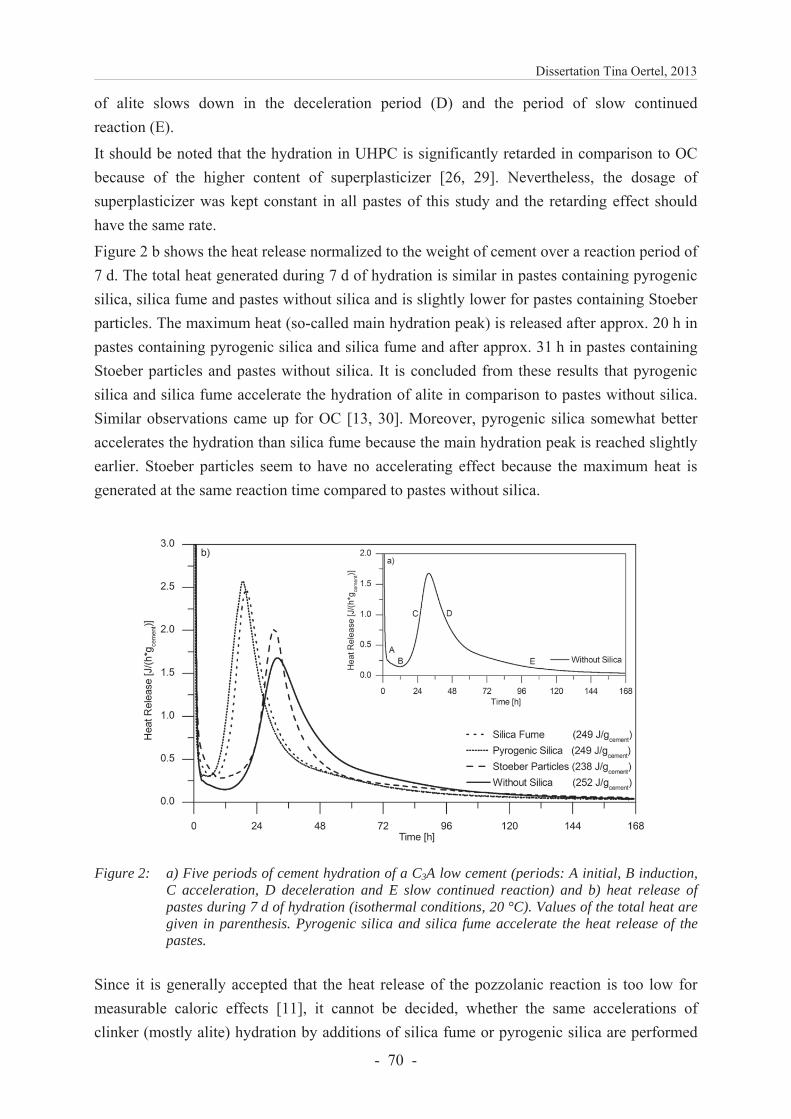
Dissertation Tina Oertel, 2013
- 70 -
of alite slows down in the deceleration period (D) and the period of slow continued reaction (E).
It should be noted that the hydration in UHPC is significantly retarded in comparison to OC because of the higher content of superplasticizer [26, 29]. Nevertheless, the dosage of superplasticizer was kept constant in all pastes of this study and the retarding effect should have the same rate.
Figure 2 b shows the heat release normalized to the weight of cement over a reaction period of 7 d. The total heat generated during 7 d of hydration is similar in pastes containing pyrogenic silica, silica fume and pastes without silica and is slightly lower for pastes containing Stoeber particles. The maximum heat (so-called main hydration peak) is released after approx. 20 h in pastes containing pyrogenic silica and silica fume and after approx. 31 h in pastes containing Stoeber particles and pastes without silica. It is concluded from these results that pyrogenic silica and silica fume accelerate the hydration of alite in comparison to pastes without silica. Similar observations came up for OC [13, 30]. Moreover, pyrogenic silica somewhat better accelerates the hydration than silica fume because the main hydration peak is reached slightly earlier. Stoeber particles seem to have no accelerating effect because the maximum heat is generated at the same reaction time compared to pastes without silica.
Figure 2: a) Five periods of cement hydration of a C3A low cement (periods: A initial, B induction, C acceleration, D deceleration and E slow continued reaction) and b) heat release of pastes during 7 d of hydration (isothermal conditions, 20 °C). Values of the total heat are given in parenthesis. Pyrogenic silica and silica fume accelerate the heat release of the pastes.
Since it is generally accepted that the heat release of the pozzolanic reaction is too low for measurable caloric effects [11], it cannot be decided, whether the same accelerations of clinker (mostly alite) hydration by additions of silica fume or pyrogenic silica are performed
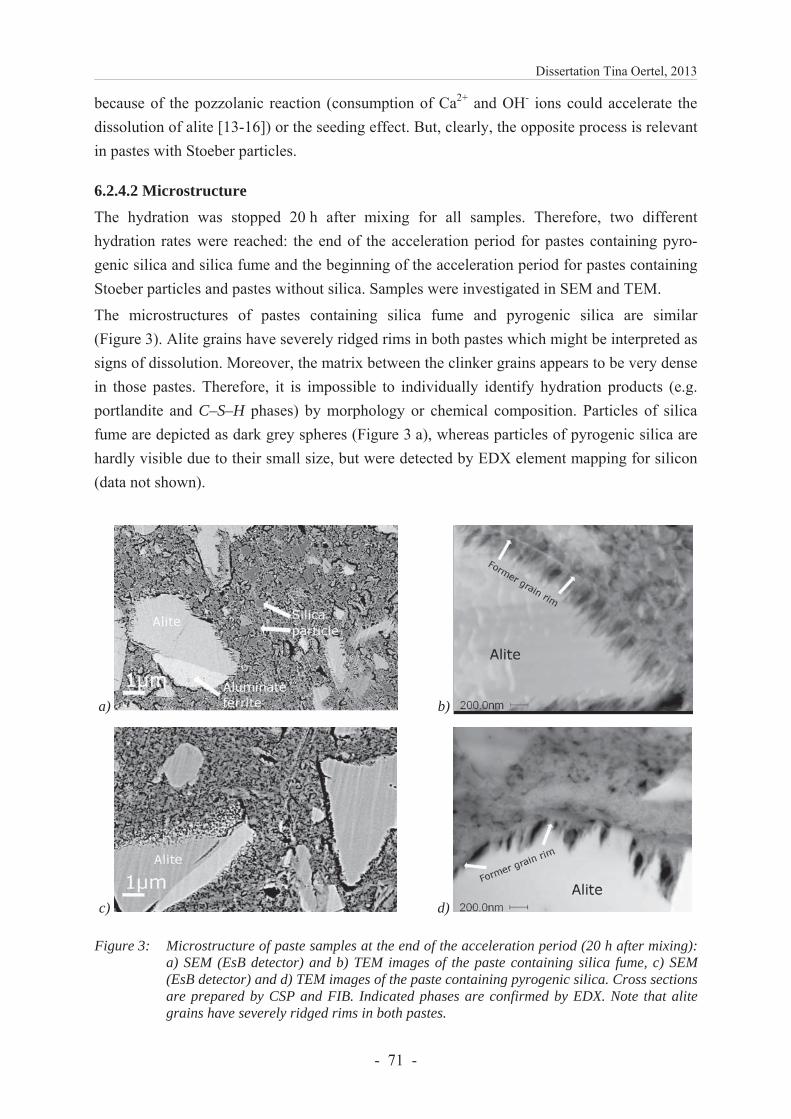
Dissertation Tina Oertel, 2013
- 71 -
because of the pozzolanic reaction (consumption of Ca2+ and OH- ions could accelerate the dissolution of alite [13-16]) or the seeding effect. But, clearly, the opposite process is relevant in pastes with Stoeber particles.
6.2.4.2 Microstructure
The hydration was stopped 20 h after mixing for all samples. Therefore, two different hydration rates were reached: the end of the acceleration period for pastes containing pyro-genic silica and silica fume and the beginning of the acceleration period for pastes containing Stoeber particles and pastes without silica. Samples were investigated in SEM and TEM.
The microstructures of pastes containing silica fume and pyrogenic silica are similar (Figure 3). Alite grains have severely ridged rims in both pastes which might be interpreted as signs of dissolution. Moreover, the matrix between the clinker grains appears to be very dense in those pastes. Therefore, it is impossible to individually identify hydration products (e.g. portlandite and C–S–H phases) by morphology or chemical composition. Particles of silica fume are depicted as dark grey spheres (Figure 3 a), whereas particles of pyrogenic silica are hardly visible due to their small size, but were detected by EDX element mapping for silicon (data not shown).
a) b)
c) d)
Figure 3: Microstructure of paste samples at the end of the acceleration period (20 h after mixing): a) SEM (EsB detector) and b) TEM images of the paste containing silica fume, c) SEM (EsB detector) and d) TEM images of the paste containing pyrogenic silica. Cross sections are prepared by CSP and FIB. Indicated phases are confirmed by EDX. Note that alite grains have severely ridged rims in both pastes.
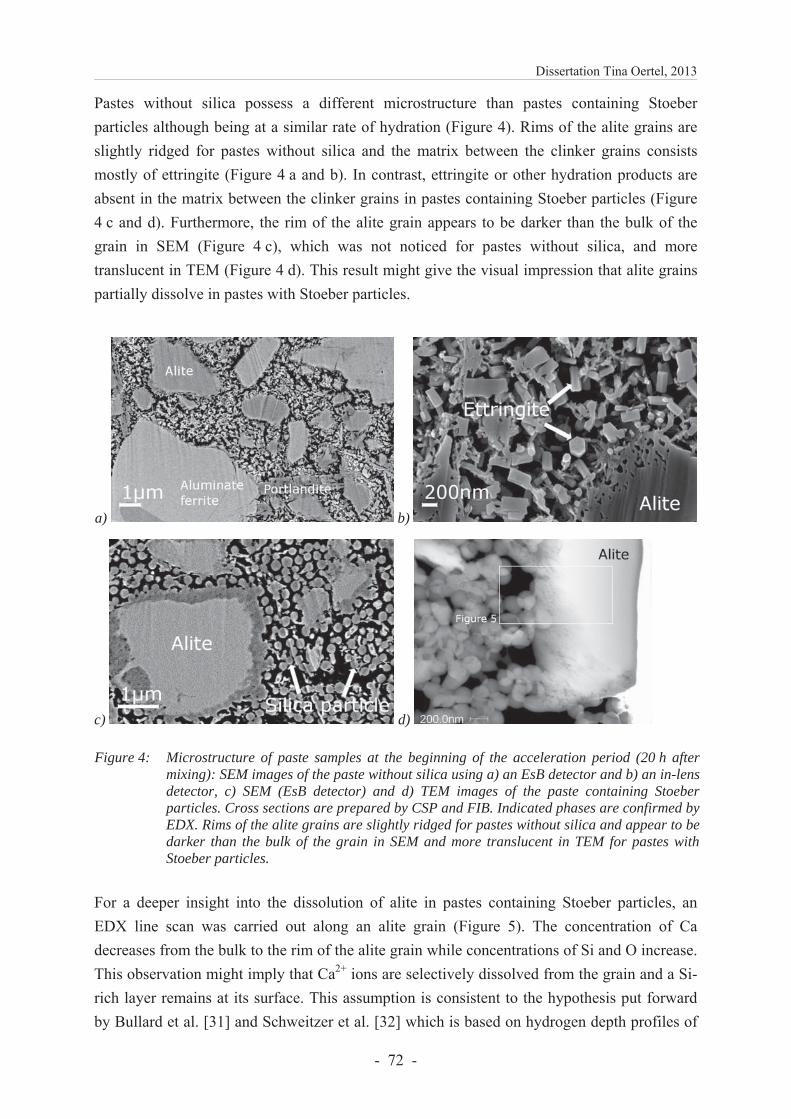
Dissertation Tina Oertel, 2013
- 72 -
Pastes without silica possess a different microstructure than pastes containing Stoeber particles although being at a similar rate of hydration (Figure 4). Rims of the alite grains are slightly ridged for pastes without silica and the matrix between the clinker grains consists mostly of ettringite (Figure 4 a and b). In contrast, ettringite or other hydration products are absent in the matrix between the clinker grains in pastes containing Stoeber particles (Figure 4 c and d). Furthermore, the rim of the alite grain appears to be darker than the bulk of the grain in SEM (Figure 4 c), which was not noticed for pastes without silica, and more translucent in TEM (Figure 4 d). This result might give the visual impression that alite grains partially dissolve in pastes with Stoeber particles.
a) b)
c) d)
Figure 4: Microstructure of paste samples at the beginning of the acceleration period (20 h after mixing): SEM images of the paste without silica using a) an EsB detector and b) an in-lens detector, c) SEM (EsB detector) and d) TEM images of the paste containing Stoeber particles. Cross sections are prepared by CSP and FIB. Indicated phases are confirmed by EDX. Rims of the alite grains are slightly ridged for pastes without silica and appear to be darker than the bulk of the grain in SEM and more translucent in TEM for pastes with Stoeber particles.
For a deeper insight into the dissolution of alite in pastes containing Stoeber particles, an EDX line scan was carried out along an alite grain (Figure 5). The concentration of Ca decreases from the bulk to the rim of the alite grain while concentrations of Si and O increase. This observation might imply that Ca2+ ions are selectively dissolved from the grain and a Si-rich layer remains at its surface. This assumption is consistent to the hypothesis put forward by Bullard et al. [31] and Schweitzer et al. [32] which is based on hydrogen depth profiles of
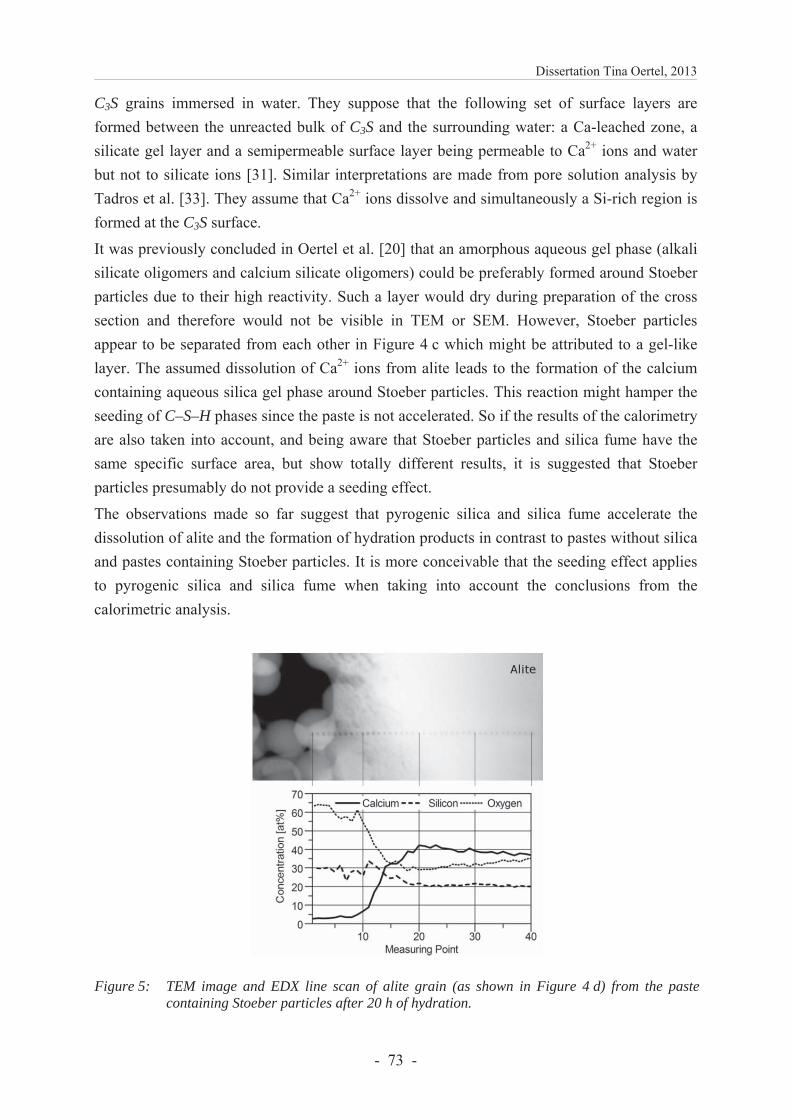
Dissertation Tina Oertel, 2013
- 73 -
C3S grains immersed in water. They suppose that the following set of surface layers are formed between the unreacted bulk of C3S and the surrounding water: a Ca-leached zone, a silicate gel layer and a semipermeable surface layer being permeable to Ca2+ ions and water but not to silicate ions [31]. Similar interpretations are made from pore solution analysis by Tadros et al. [33]. They assume that Ca2+ ions dissolve and simultaneously a Si-rich region is formed at the C3S surface.
It was previously concluded in Oertel et al. [20] that an amorphous aqueous gel phase (alkali silicate oligomers and calcium silicate oligomers) could be preferably formed around Stoeber particles due to their high reactivity. Such a layer would dry during preparation of the cross section and therefore would not be visible in TEM or SEM. However, Stoeber particles appear to be separated from each other in Figure 4 c which might be attributed to a gel-like layer. The assumed dissolution of Ca2+ ions from alite leads to the formation of the calcium containing aqueous silica gel phase around Stoeber particles. This reaction might hamper the seeding of C–S–H phases since the paste is not accelerated. So if the results of the calorimetry are also taken into account, and being aware that Stoeber particles and silica fume have the same specific surface area, but show totally different results, it is suggested that Stoeber particles presumably do not provide a seeding effect.
The observations made so far suggest that pyrogenic silica and silica fume accelerate the dissolution of alite and the formation of hydration products in contrast to pastes without silica and pastes containing Stoeber particles. It is more conceivable that the seeding effect applies to pyrogenic silica and silica fume when taking into account the conclusions from the calorimetric analysis.
Figure 5: TEM image and EDX line scan of alite grain (as shown in Figure 4 d) from the paste containing Stoeber particles after 20 h of hydration.
Dissertation Tina Oertel, 2013
- 74 -
6.2.4.3 Development of the content of crystalline phases The content of crystalline phases within 3 d of hydration is presented in Figure 6. The progress of hydration is investigated by the decreasing content of alite (precursor) and the increase in portlandite (crystalline reaction product). C–S–H phases are formed simultaneous-ly with portlandite during the hydration of alite (Equation 1). However, the amount of this amorphous phase could not be determined from the present data (Chapter 6.2.3.3).
Changes are rather distinct in pastes containing pyrogenic silica and silica fume between 10 h and 20 h, whereas less alite reacts and less portlandite is formed in pastes containing Stoeber particles during this reaction period. On the contrary, the content of alite and portlandite in the paste without silica changes at a later reaction time (between 20 h to 40 h). Generally, a corre-lation with the acceleration period in the calorimetric measurements can be observed for all pastes.
Results agree well to those of the microstructure. The decreasing content of alite and the increase in portlandite in pastes with silica fume and pyrogenic silica is in accordance to the assumed dissolution of alite and the densification of the microstructure by reaction products. The amount of alite and portlandite is unchanged up to 20 h in pastes without silica which is consistent with the previously observed loose microstructure and the almost unaltered alite grains. The alite concentration in pastes with Stoeber particles starts to decrease after 10 h, but the formation of portlandite is delayed by approx. 5 h. This result might yield the unlikely hypothesis that although alite dissolves, the formation of hydration products (C–S–H phases and portlandite) is retarded. It seems to be more probable that the decrease in the detected concentration of alite is caused by a Ca-selective dissolution which alters the lattice parameters. This assumption corresponds to the previous implications from SEM, TEM and EDX.
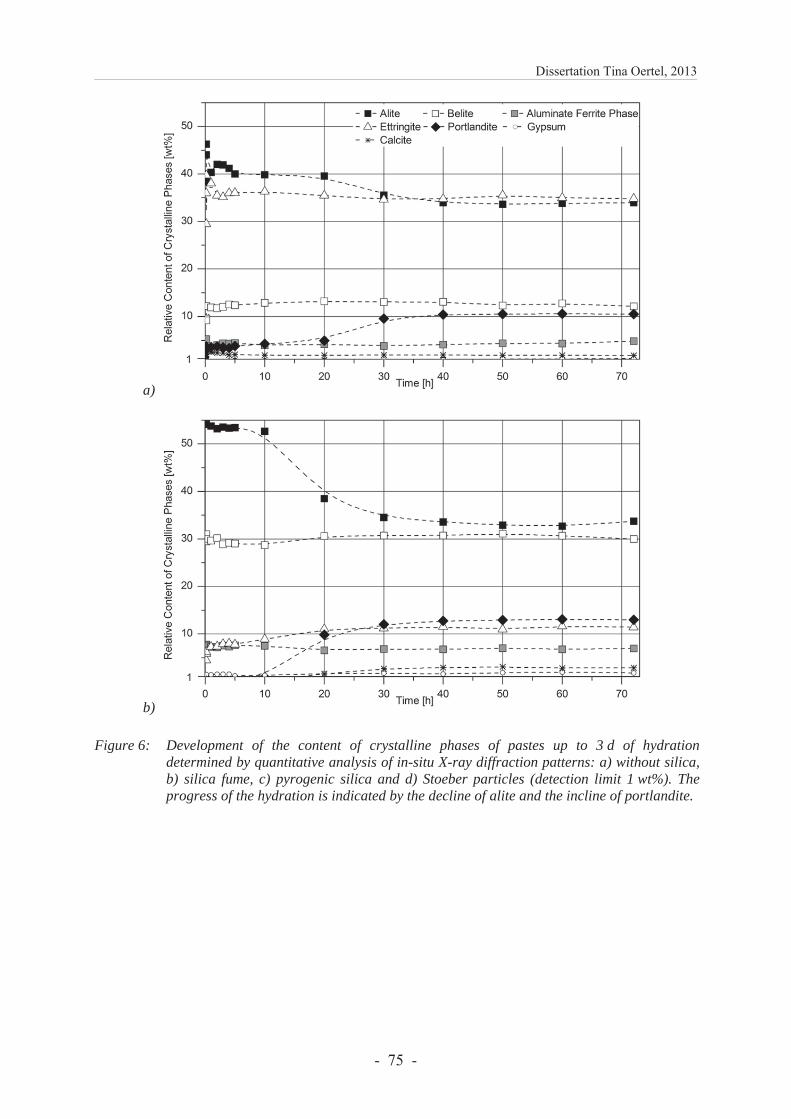
Dissertation Tina Oertel, 2013
- 75 -
a)
b)
Figure 6: Development of the content of crystalline phases of pastes up to 3 d of hydration determined by quantitative analysis of in-situ X-ray diffraction patterns: a) without silica, b) silica fume, c) pyrogenic silica and d) Stoeber particles (detection limit 1 wt%). The progress of the hydration is indicated by the decline of alite and the incline of portlandite.
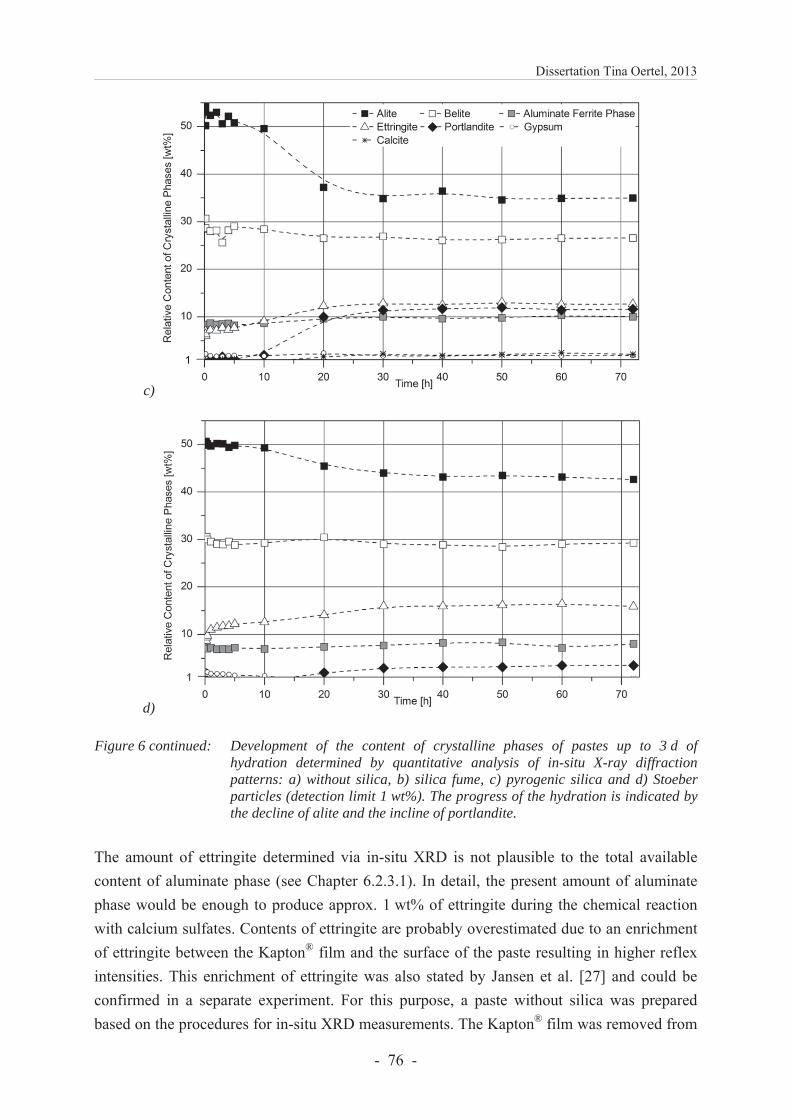
Dissertation Tina Oertel, 2013
- 76 -
c)
d)
Figure 6 continued: Development of the content of crystalline phases of pastes up to 3 d of hydration determined by quantitative analysis of in-situ X-ray diffraction patterns: a) without silica, b) silica fume, c) pyrogenic silica and d) Stoeber particles (detection limit 1 wt%). The progress of the hydration is indicated by the decline of alite and the incline of portlandite.
The amount of ettringite determined via in-situ XRD is not plausible to the total available content of aluminate phase (see Chapter 6.2.3.1). In detail, the present amount of aluminate phase would be enough to produce approx. 1 wt% of ettringite during the chemical reaction with calcium sulfates. Contents of ettringite are probably overestimated due to an enrichment of ettringite between the Kapton® film and the surface of the paste resulting in higher reflex intensities. This enrichment of ettringite was also stated by Jansen et al. [27] and could be confirmed in a separate experiment. For this purpose, a paste without silica was prepared based on the procedures for in-situ XRD measurements. The Kapton® film was removed from
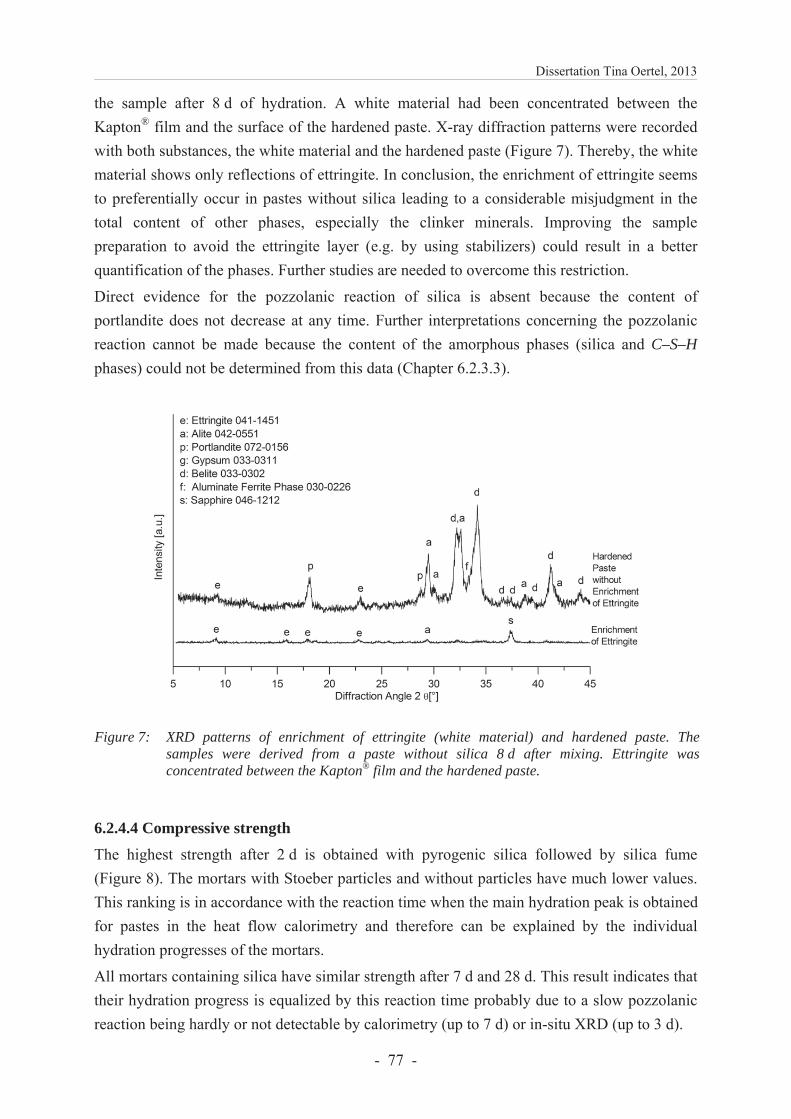
Dissertation Tina Oertel, 2013
- 77 -
the sample after 8 d of hydration. A white material had been concentrated between the Kapton® film and the surface of the hardened paste. X-ray diffraction patterns were recorded with both substances, the white material and the hardened paste (Figure 7). Thereby, the white material shows only reflections of ettringite. In conclusion, the enrichment of ettringite seems to preferentially occur in pastes without silica leading to a considerable misjudgment in the total content of other phases, especially the clinker minerals. Improving the sample preparation to avoid the ettringite layer (e.g. by using stabilizers) could result in a better quantification of the phases. Further studies are needed to overcome this restriction.
Direct evidence for the pozzolanic reaction of silica is absent because the content of portlandite does not decrease at any time. Further interpretations concerning the pozzolanic reaction cannot be made because the content of the amorphous phases (silica and C–S–H phases) could not be determined from this data (Chapter 6.2.3.3).
Figure 7: XRD patterns of enrichment of ettringite (white material) and hardened paste. The samples were derived from a paste without silica 8 d after mixing. Ettringite was concentrated between the Kapton® film and the hardened paste.
6.2.4.4 Compressive strength
The highest strength after 2 d is obtained with pyrogenic silica followed by silica fume (Figure 8). The mortars with Stoeber particles and without particles have much lower values. This ranking is in accordance with the reaction time when the main hydration peak is obtained for pastes in the heat flow calorimetry and therefore can be explained by the individual hydration progresses of the mortars.
All mortars containing silica have similar strength after 7 d and 28 d. This result indicates that their hydration progress is equalized by this reaction time probably due to a slow pozzolanic reaction being hardly or not detectable by calorimetry (up to 7 d) or in-situ XRD (up to 3 d).
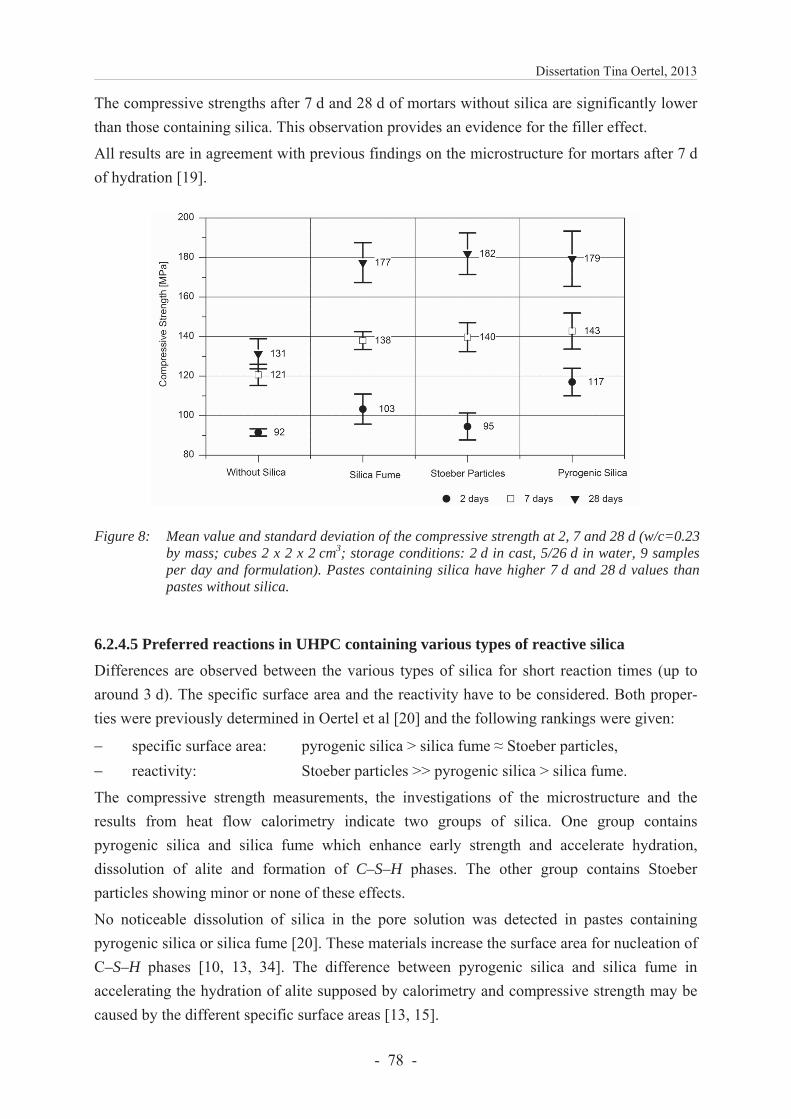
Dissertation Tina Oertel, 2013
- 78 -
The compressive strengths after 7 d and 28 d of mortars without silica are significantly lower than those containing silica. This observation provides an evidence for the filler effect.
All results are in agreement with previous findings on the microstructure for mortars after 7 d of hydration [19].
Figure 8: Mean value and standard deviation of the compressive strength at 2, 7 and 28 d (w/c=0.23 by mass; cubes 2 x 2 x 2 cm3; storage conditions: 2 d in cast, 5/26 d in water, 9 samples per day and formulation). Pastes containing silica have higher 7 d and 28 d values than pastes without silica.
6.2.4.5 Preferred reactions in UHPC containing various types of reactive silica
Differences are observed between the various types of silica for short reaction times (up to around 3 d). The specific surface area and the reactivity have to be considered. Both proper-ties were previously determined in Oertel et al [20] and the following rankings were given:
specific surface area: pyrogenic silica > silica fume Stoeber particles, reactivity: Stoeber particles >> pyrogenic silica > silica fume.
The compressive strength measurements, the investigations of the microstructure and the results from heat flow calorimetry indicate two groups of silica. One group contains pyrogenic silica and silica fume which enhance early strength and accelerate hydration, dissolution of alite and formation of C–S–H phases. The other group contains Stoeber particles showing minor or none of these effects.
No noticeable dissolution of silica in the pore solution was detected in pastes containing pyrogenic silica or silica fume [20]. These materials increase the surface area for nucleation of C–S–H phases [10, 13, 34]. The difference between pyrogenic silica and silica fume in accelerating the hydration of alite supposed by calorimetry and compressive strength may be caused by the different specific surface areas [13, 15].
Dissertation Tina Oertel, 2013
- 79 -
Remarkably, the highly reactive Stoeber particles do not act as accelerator. Although the high initial concentration of silicate in the pore solution from dissolving Stoeber particles [20] leads probably to a selective dissolution of Ca2+ ions from alite (supposed by TEM and in-situ XRD) and a subsequent formation of a calcium containing aqueous silica gel phase around Stoeber particles, this process seems to have no enhancing effect on the hydration of alite in comparison to the other silica. Additionally, only a minor amount of C–S–H phases may nucleate on the surface of Stoeber particles because otherwise the results of the heat flow calorimetry and the microstructure should be similar to silica fume having the same specific surface area.
6.2.5 Conclusions
The influence of amorphous silica (pyrogenic silica, silica fume and Stoeber particles) on the hydration of UHPC was investigated with respect to the dissolution of silica and subsequent pozzolanic reaction and the heterogeneous nucleation of C–S–H phases from the hydration of alite on silica surfaces. The tested types of silica differ in their reactivity and subsequently in their role during the hydration of UHPC. Differences were observed for short reaction times (up to around 3 d) but were equalized afterwards by the filler effect and assumedly a pozzolanic reaction.
If an acceleration of the hydration is desired, silica with a lower reactivity from high temperature processes should be used which will multiply the nucleation of C–S–H phases on the silica surface. Otherwise, highly reactive silica from sol-gel processes can be applied if the densification by the filler effect is desired but an early acceleration of the hydration is unwanted or unnecessary. The acceleration might be diminished in those systems because only a minor amount of C–S–H phases seems to nucleate on the silica surface.
The results contribute to the understanding why different commercial nano silica, from different production processes and with varying properties, can have different effects on the performance of UHPCs. It is suggested to determine the reactivity of silica materials with unknown properties prior to their usage in UHPC [20].
6.2.6 Acknowledgements
The authors thank Ricarda Tänzer for measuring heat flow calorimetry, Werner Stracke and Hans Jürgen Seel for CSP and FIB preparation of cross sections, Werner Stracke for SEM imaging, Alexander Reinhold for TEM imaging and Jürgen Göske for measuring in-situ XRD. Professor Josef Breu is acknowledged for his advices and discussions throughout the implementation of this work. The research was funded by the Elite Network of Bavaria in the International Graduate School ‘Structure, Reactivity and Properties of Oxide Materials’ and partially by the German Federal Ministry of Education and Research (Chemically Bonded Ceramics by Nanotechnological Improvements of Structure – 03X0067E).
Dissertation Tina Oertel, 2013
- 80 -
6.2.7 References [1] Naaman A.E., Wille K., proceedings of 3rd Hipermat: International symposium on UHPC and
nanotechnology for high performance construction materials, Kassel (2012) 3-16.
[2] Fehling E., Schmidt M., Teichmann T. et al., Entwicklung, Dauerhaftigkeit und Berechnung Ultrahochfester Betone (UHPC), Forschungsbericht DFG FE 497/1-1, Kassel University Press, Kassel (2005).
[3] Verein Deutscher Zementwerke, Ultrahochfester Beton, in Zement-Taschenbuch, 51st ed, Verlag Bau+Technik GmbH, Düsseldorf (2008).
[4] Taylor H. F. W., Cement chemistry, 2nd ed, Thomas Telford Publishing, London (1997).
[5] Khavryuchenko V.D., Khavryuchenko O.V., Lisnyak V.V., Critical Reviews in Solid State and Materials Sciences 36 (2011) 47-65.
[6] Diamond S., Sahu S., Mater. Struct. 39 (2006) 849-859.
[7] Schmidt M., Nanotechnologie: Neue Ansätze für die Entwicklung von Hochleistungsbindemitteln und -betonen, in proceedings of 17th Ibausil: Internationale Baustofftagung, Weimar (2009).
[8] Krauss H.W., Budelmann H., proceedings of Tagung Bauchemie, Dübendorf (2012) 35-42.
[9] Deschner F., Winnefeld F., Lothenbach B., et al., Cem. Concr. Res. 42 (2012) 1389-1400.
[10] Lothenbach B., Scrivener K., Hooton R.D., Cem. Concr. Res. 41 (2011) 1244-1256.
[11] Thomas J.J., Jennings H.M., Chen J.J., J. Phys. Chem. C 113 (2009) 4327-4334.
[12] Land G., Stephan D., J. Mater. Sci. 47 (2012) 1011-1017.
[13] Korpa A., Kowald T., Trettin R., Cem. Concr. Res. 38 (2008) 955-962.
[14] Qing Y., Zenan Z., Deyu K. et al., Constr. Build. Mater. 21 (2007) 439-545.
[15] Jo B., Kim C., Tae G. et al., Constr. Build. Mater. 21 (2007) 1351-1355.
[16] Greenberg S.A., J. Phys. Chem. 65 (1961) 12-16.
[17] Krauss H.W., Budelmann H., proceedings RILEM 79, Hongkong (2011) 58-65.
[18] Kumar A., Bishnoi S., Scrivener K.L., Cem. Concr. Res. 42 (2012) 903-918.
[19] Oertel T., Hutter F., Tänzer R. et al., Cem. Concr. Comp. 37 (2013) 61-67.
[20] Oertel T., Hutter F., Helbig U. et al., submitted to Cem. Concr. Res., CEMCON-D-13-00342. (2013).
[21] Shibata, M., JEOL News 39 (2004).
[22] Reyntjens S., Puers R., J. Micromech. Microeng. 11 (2011) 287-300.
[23] Stöber W., Fink A., J. Colloid and Interface Sci. 26 (1968) 62-69.
[24] Bergna H.E., Chapter 2: The language of colloidal science and silica chemistry, in Colloidal silica: Fundamentals and applications, Editor: Bergna H.E., Roberts W.O., CRC Press Taylor & Francis Group, Boca Raton (2006).
[25] Fröhlich S., Schmidt M., proceedings of 3rd Hipermat: International symposium on UHPC and nanotechnology for high performance construction materials, Kassel (2012) 225-232.
[26] Korpa A., Kowald T., Trettin R., Cem. Concr. Res. 39 (2009) 69-76.
[27] Jansen D., Goetz-Neunhoeffer F., Stabler C. et al., Cem. Concr. Res. 41 (2011) 602-608.
[28] Hesse C., Goetz-Neunhoeffer F., Neubauer J., Cem. Concr. Res. 41 (2011) 123-128.
[29] Pfeifer C., Möser B., Stark J., ZKG International 63 (2010) 71-79.
[30] Senff L., Labrincha J.A., Ferreira V.M. et al., Constr. Build. Mater. 23 (2009) 2487-2491.
Dissertation Tina Oertel, 2013
- 81 -
[31] Bullard J.W., Jennings H.M., Livingston R.A. et al., Cem. Concr. Res. 41 (2011) 1208-1223.
[32] Schweitzer J.W., Livingston R.A., Rolfs C. et al., proceedings of 12th ICCC: International congress on the chemsitry of cement, Montreal (2007).
[33] Tadros M.E., Skalny J., Kalyoncu R.S., J. Am. Ceram. Soc. 59 (1976) 344-347.
[34] Björnström J., Martinelli A., Matic A. et al., Chem. Phys. L. 392 (2004) 242-248.
Dissertation Tina Oertel, 2013
- 82 -
6.3 Primary particle size and agglomerate size effects of amorphous silica22
Primary particle size and agglomerate size effects of amorphous silica in ultra-high performance concrete
Cement & Concrete Composites 37 (2013) 61–67
Tina Oertela, b, *, Frank Huttera, Ricarda Tänzerc, Uta Helbiga, Gerhard Sextla, d
aFraunhofer–Institute for Silicate Research ISC, Neunerplatz 2, 97082 Würzburg, Germany bInorganic Chemistry I, University Bayreuth, Universitätsstr. 30, 95440 Bayreuth, Germany cBuilding Materials and Construction Chemistry, Technical University Berlin, Gustav-Meyer-Allee 25, 13355 Berlin, Germany dChair for Chemical Technology of Advanced Materials, Julius Maximilians University, Röntgenring 11, 97070 Würzburg, Germany *corresponding author
6.3.1 Abstract Silica fume is widely used in ultra-high performance concrete (UHPC). However, it is a by-product in the industrial silicon production and therefore far from an optimized additive. Silica fume improves the compressive strength, but its detailed reaction mechanisms in concretes with low water/cement ratios are not yet fully understood. This study focuses on the influence of primary particle sizes and sizes of agglomerates of different amorphous silicas in UHPC. As a reference system, wet-chemically synthesized silica was used with very high purity, defined particle sizes, narrow primary particle size distributions and controllable agglomerate sizes. The obtained data were compared to silica fume. The results indicate that non-agglomerated silica particles produce the highest strength after 7 d, but a clear dependence on primary particle sizes, as suggested by calculations of packing density, was not confirmed. UHPC may be improved by incorporating an ameliorated dispersion of silica e.g. through commercial silica sols.
6.3.2 Introduction
In recent years, ultra-high performance concrete (UHPC) has generated considerable interest due to its high compressive strength, dense structure and low capillary porosity [1]. The next generation of infrastructure will very likely necessitate fiber-reinforced UHPCs to fulfill the demands of flexural strength, toughness and durability [2].
Since the 1990s, the particle packing density has become a central aspect in the formulation of UHPCs [2]. Geisenhanslücke [3] presents an excellent summary of the particle packing 22 The reuse of this manuscript is consistent with the publishing agreement of Elsevier.
Dissertation Tina Oertel, 2013
- 83 -
theories and their further development to suit UHPC formulations. Sub-micrometer particles are the key ingredient because they fill pores between larger particles of cement, sand and other fillers. Commonly, undensified silica fume is used for this purpose [4]. Due to the low water/cement (w/c) ratios (< 0.25 by mass) in UHPC systems, pozzolanic reaction of the silica with portlandite from clinker hydration to form C–S–H phases is limited and the filler effect seems to be predominant.
Although many investigations exist on the function of silica fume in concrete, it is still of interest how silica fume or other forms of silica could be improved in terms of purity, particle size and particle size distribution to exhibit even better results. The optimization of silica addition may lead to further improvements of UHPC. But, as a by-product of an industrial production process silica fume is far from an optimized concrete additive [5]. It lacks in purity and a controllability of the particle size and the particle size distribution [6, 7]. How these characteristics influence the performance of UHPC is still unclear.
To answer this question, we prepared UHPC with wet-chemically synthesized silica (Stoeber particles [8]) as a reference system. These spherical particles have a high chemical purity (SiO2 of 99.97 wt%), a definable particle size and a narrow particle size distribution. Furthermore, agglomeration of these particles can be avoided. Particle size ranges from 72 nm to 720 nm to cover the primary particle size distribution of the silica fume used.
We investigated the effects of these particle characteristics on the calculated particle packing densities, the microstructure and the compressive strength of UHPC. The nearly monomodal size distribution of Stoeber particles allows one to correlate particle sizes with calculated particle packing densities and compressive strengths. Also different states of dispersion are considered by adding silica dispersed to primary particle sizes (suspension) or as agglomerated particles (powder).
6.3.3 Experimental procedures
6.3.3.1 Synthesis of Stoeber suspensions and powders
Stoeber suspensions were synthesized by hydrolysis and condensation of tetraethyl orthosilicate (TEOS) to amorphous silica particles in an ethanolic solution with ammonia (NH3) catalysis [8].
Si(OC2H5)4 + 2 H2O SiO2 + 4 C2H5OH
The particle size (e.g. 72, 143, 242, 433 and 720 nm) is adjustable by the relative concentrations of precursors (TEOS, H2O) and catalyst (NH3).
After synthesis, ethanol was stepwise exchanged with water by rotary evaporation. The further treatment was twofold. The aqueous Stoeber suspension was concentrated to a solids content of 50 wt% by further rotary evaporation. During the whole process, the temperature was maintained below 40 °C. Otherwise, powders of Stoeber particles were obtained by spray
Dissertation Tina Oertel, 2013
- 84 -
drying (Buechi spray dryer B–290, inlet temperature 220 °C, outlet temperature 105 °C) of aqueous Stoeber suspensions (solids content approx. 1 wt%) [9].
6.3.3.2 Components of UHPC mortars
UHPC mortars were prepared from Portland cement type CEM I 52.5R HS/NA (Holcim Sulfo 5, Holcim AG, Germany) with high initial strength (R), high sulfate resistance (HS) and low alkali content (NA). An analysis of the clinker phases was provided by the supplier (in wt%: C3S = 64.6, C2S = 12.8, C3A = 0.2 and C4AF = 16.6). The aggregates used were quartz powder and quartz sand (W12: 0.3 – 110 μm and F32: 0.125 – 0.5 mm, Quarzwerke Frechen, Germany). Polycarboxylate ether (ViscoCrete®–2810, Sika GmbH, Germany) was used as superplasticizer. Its water content of 60 wt% was considered in the calculation of the w/c ratio (0.23).
Silica addition was either Stoeber particles (Chapter 6.3.3.1) or silica fume (Sika® Silicoll P, Sika GmbH, Germany) which was an ‘as produced’ fume and therefore never exposed to a densification process.
6.3.3.3 UHPC mortar and sample preparation
The applied UHPC formulation (Table 1) is based on M3Q. M3Q was developed at the University of Kassel and its composition was optimized for dense particle packing (see Chapter 6.3.3.5 and 6.3.4.2) [10]. Samples without any silica were prepared besides samples with Stoeber particles or silica fume.
Mortars were mixed in two different procedures:
(a) Silica powders were premixed with cement, quartz sand and quartz powder for 30 min in a tumbling mixer. Superplasticizer was dissolved in water. This solution was added to the powder blend and mixed with a handheld kitchen mixer for 4.5 min (procedure: 3 min mixing, 1 min break, 1.5 min mixing).
(b) For preparations with silica suspensions, the superplasticizer was first mixed with the cement in a grinding dish. This pretreated cement was mixed with quartz sand and quartz powder in a tumbling mixer (30 min). Then, the silica suspension was added to the tumbled powder blend and mixed with the handheld mixer for 4.5 min. The solids content of the silica suspension (50 wt%) was adjusted to represent the appropriate amount to fully replace water and silica in the UHPC formulation. This mixing procedure was necessary because attempting to dissolve the superplasticizer in the silica suspension leads to gelation or precipitation.
For each set of Stoeber particles (mean primary particle sizes of 72, 143, 242, 433 or 720 nm), two mortars were prepared: one with the corresponding suspension (procedure b) and one with the spray dried powder (procedure a). Also silica fume was added either as a powder as received from the supplier or as 50 wt% aqueous suspension from preparation with an ultrasonic wand (Branson Sonifier 450).
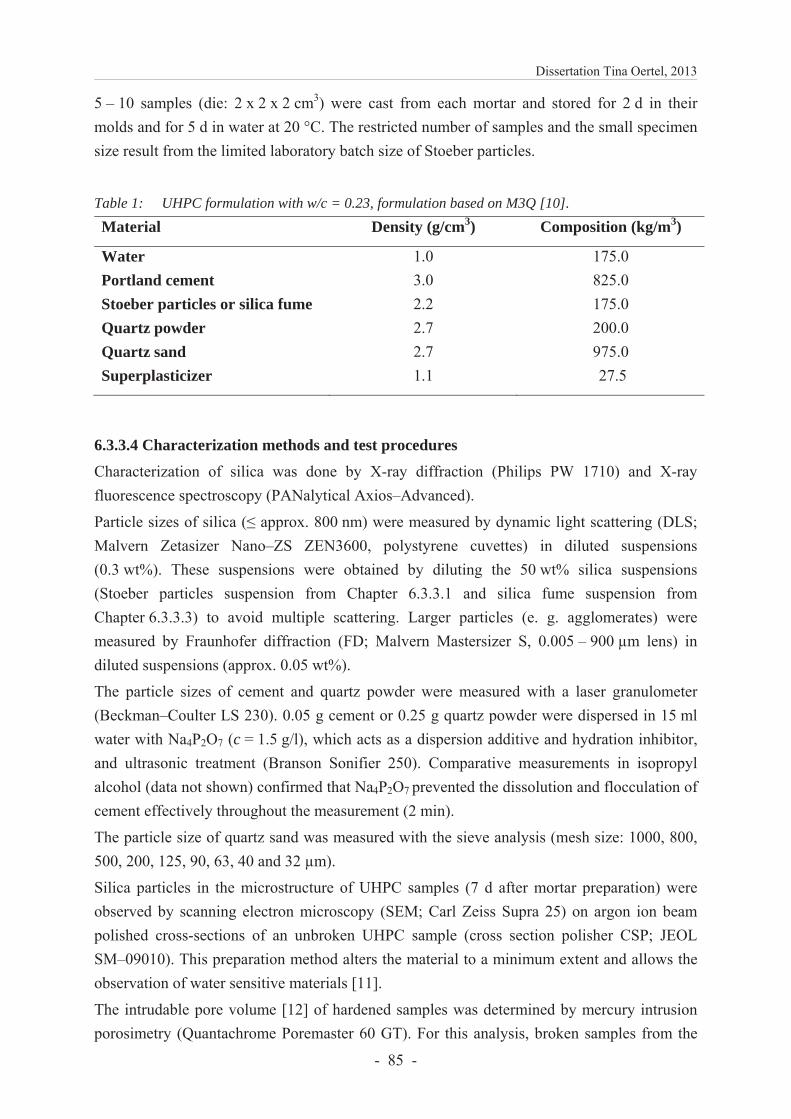
Dissertation Tina Oertel, 2013
- 85 -
5 – 10 samples (die: 2 x 2 x 2 cm3) were cast from each mortar and stored for 2 d in their molds and for 5 d in water at 20 °C. The restricted number of samples and the small specimen size result from the limited laboratory batch size of Stoeber particles.
Table 1: UHPC formulation with w/c = 0.23, formulation based on M3Q [10].
Material Density (g/cm3) Composition (kg/m3)
Water 1.0 175.0 Portland cement 3.0 825.0 Stoeber particles or silica fume 2.2 175.0 Quartz powder 2.7 200.0 Quartz sand 2.7 975.0 Superplasticizer 1.1 27.5
6.3.3.4 Characterization methods and test procedures
Characterization of silica was done by X-ray diffraction (Philips PW 1710) and X-ray fluorescence spectroscopy (PANalytical Axios–Advanced).
Particle sizes of silica ( approx. 800 nm) were measured by dynamic light scattering (DLS; Malvern Zetasizer Nano–ZS ZEN3600, polystyrene cuvettes) in diluted suspensions (0.3 wt%). These suspensions were obtained by diluting the 50 wt% silica suspensions (Stoeber particles suspension from Chapter 6.3.3.1 and silica fume suspension from Chapter 6.3.3.3) to avoid multiple scattering. Larger particles (e. g. agglomerates) were measured by Fraunhofer diffraction (FD; Malvern Mastersizer S, 0.005 – 900 μm lens) in diluted suspensions (approx. 0.05 wt%).
The particle sizes of cement and quartz powder were measured with a laser granulometer (Beckman–Coulter LS 230). 0.05 g cement or 0.25 g quartz powder were dispersed in 15 ml water with Na4P2O7 (c = 1.5 g/l), which acts as a dispersion additive and hydration inhibitor, and ultrasonic treatment (Branson Sonifier 250). Comparative measurements in isopropyl alcohol (data not shown) confirmed that Na4P2O7 prevented the dissolution and flocculation of cement effectively throughout the measurement (2 min).
The particle size of quartz sand was measured with the sieve analysis (mesh size: 1000, 800, 500, 200, 125, 90, 63, 40 and 32 μm).
Silica particles in the microstructure of UHPC samples (7 d after mortar preparation) were observed by scanning electron microscopy (SEM; Carl Zeiss Supra 25) on argon ion beam polished cross-sections of an unbroken UHPC sample (cross section polisher CSP; JEOL SM–09010). This preparation method alters the material to a minimum extent and allows the observation of water sensitive materials [11].
The intrudable pore volume [12] of hardened samples was determined by mercury intrusion porosimetry (Quantachrome Poremaster 60 GT). For this analysis, broken samples from the
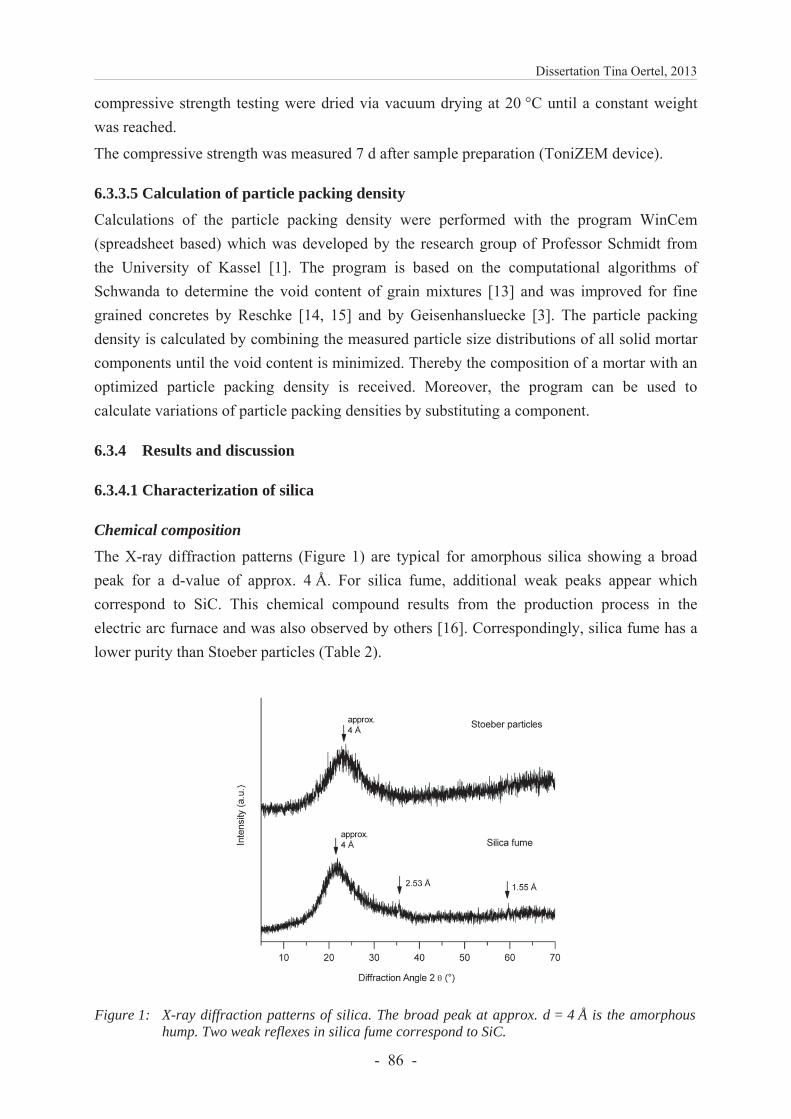
Dissertation Tina Oertel, 2013
- 86 -
compressive strength testing were dried via vacuum drying at 20 °C until a constant weight was reached.
The compressive strength was measured 7 d after sample preparation (ToniZEM device).
6.3.3.5 Calculation of particle packing density
Calculations of the particle packing density were performed with the program WinCem (spreadsheet based) which was developed by the research group of Professor Schmidt from the University of Kassel [1]. The program is based on the computational algorithms of Schwanda to determine the void content of grain mixtures [13] and was improved for fine grained concretes by Reschke [14, 15] and by Geisenhansluecke [3]. The particle packing density is calculated by combining the measured particle size distributions of all solid mortar components until the void content is minimized. Thereby the composition of a mortar with an optimized particle packing density is received. Moreover, the program can be used to calculate variations of particle packing densities by substituting a component.
6.3.4 Results and discussion
6.3.4.1 Characterization of silica
Chemical composition The X-ray diffraction patterns (Figure 1) are typical for amorphous silica showing a broad peak for a d-value of approx. 4 Å. For silica fume, additional weak peaks appear which correspond to SiC. This chemical compound results from the production process in the electric arc furnace and was also observed by others [16]. Correspondingly, silica fume has a lower purity than Stoeber particles (Table 2).
Figure 1: X-ray diffraction patterns of silica. The broad peak at approx. d = 4 Å is the amorphous hump. Two weak reflexes in silica fume correspond to SiC.
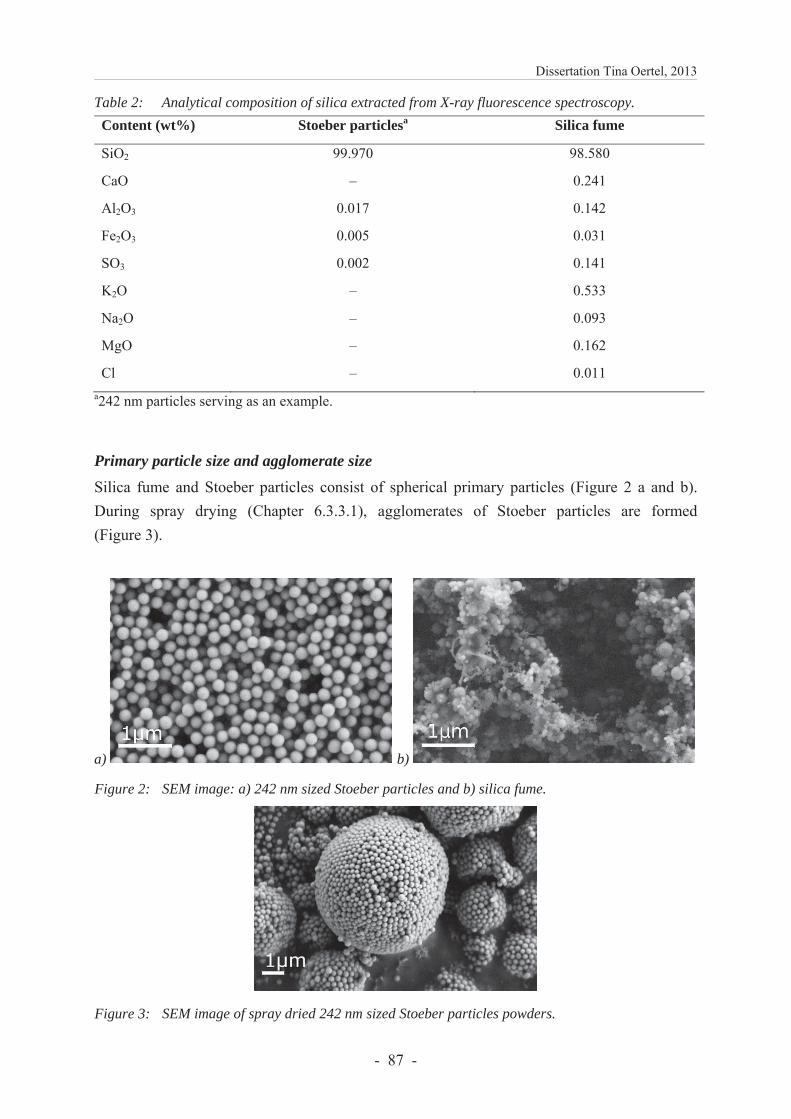
Dissertation Tina Oertel, 2013
- 87 -
Table 2: Analytical composition of silica extracted from X-ray fluorescence spectroscopy.
Content (wt%) Stoeber particlesa Silica fume
SiO2 99.970 98.580
CaO – 0.241
Al2O3 0.017 0.142
Fe2O3 0.005 0.031
SO3 0.002 0.141
K2O – 0.533
Na2O – 0.093
MgO – 0.162
Cl – 0.011 a242 nm particles serving as an example.
Primary particle size and agglomerate size Silica fume and Stoeber particles consist of spherical primary particles (Figure 2 a and b). During spray drying (Chapter 6.3.3.1), agglomerates of Stoeber particles are formed (Figure 3).
a) b)
Figure 2: SEM image: a) 242 nm sized Stoeber particles and b) silica fume.
Figure 3: SEM image of spray dried 242 nm sized Stoeber particles powders.
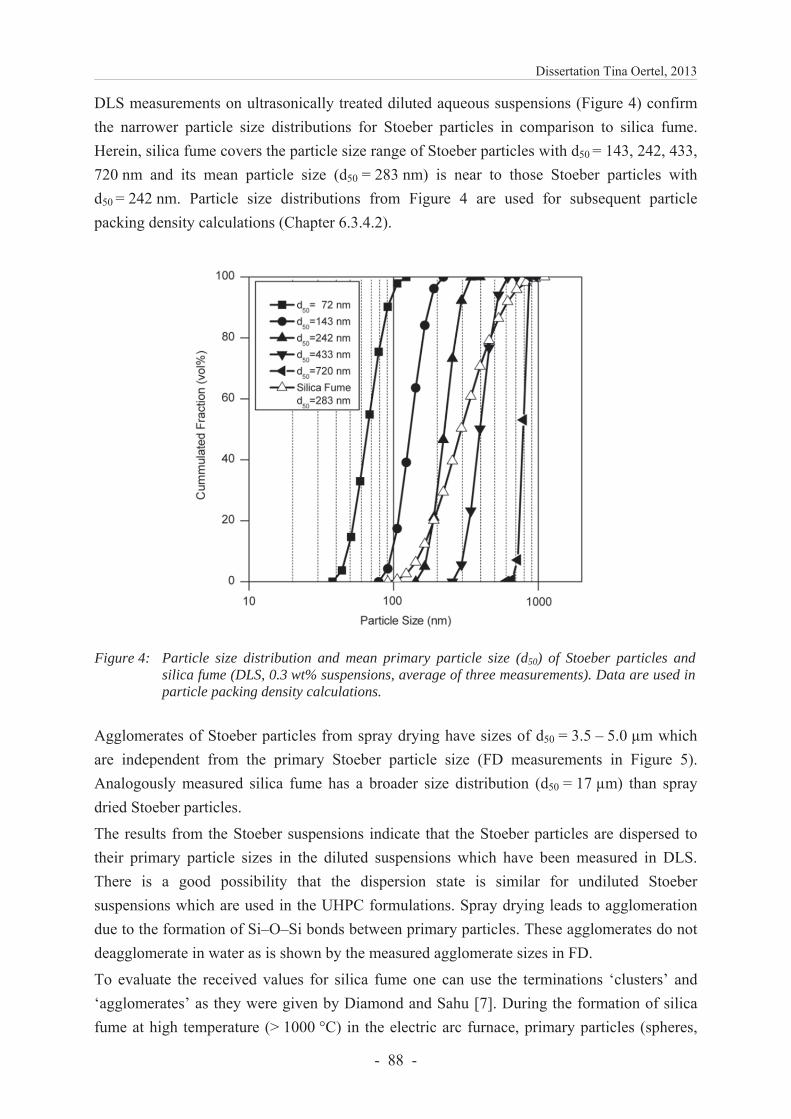
Dissertation Tina Oertel, 2013
- 88 -
DLS measurements on ultrasonically treated diluted aqueous suspensions (Figure 4) confirm the narrower particle size distributions for Stoeber particles in comparison to silica fume. Herein, silica fume covers the particle size range of Stoeber particles with d50 = 143, 242, 433, 720 nm and its mean particle size (d50 = 283 nm) is near to those Stoeber particles with d50 = 242 nm. Particle size distributions from Figure 4 are used for subsequent particle packing density calculations (Chapter 6.3.4.2).
Figure 4: Particle size distribution and mean primary particle size (d50) of Stoeber particles and silica fume (DLS, 0.3 wt% suspensions, average of three measurements). Data are used in particle packing density calculations.
Agglomerates of Stoeber particles from spray drying have sizes of d50 = 3.5 – 5.0 μm which are independent from the primary Stoeber particle size (FD measurements in Figure 5). Analogously measured silica fume has a broader size distribution (d50 = 17 μm) than spray dried Stoeber particles.
The results from the Stoeber suspensions indicate that the Stoeber particles are dispersed to their primary particle sizes in the diluted suspensions which have been measured in DLS. There is a good possibility that the dispersion state is similar for undiluted Stoeber suspensions which are used in the UHPC formulations. Spray drying leads to agglomeration due to the formation of Si–O–Si bonds between primary particles. These agglomerates do not deagglomerate in water as is shown by the measured agglomerate sizes in FD.
To evaluate the received values for silica fume one can use the terminations ‘clusters’ and ‘agglomerates’ as they were given by Diamond and Sahu [7]. During the formation of silica fume at high temperature (> 1000 °C) in the electric arc furnace, primary particles (spheres,
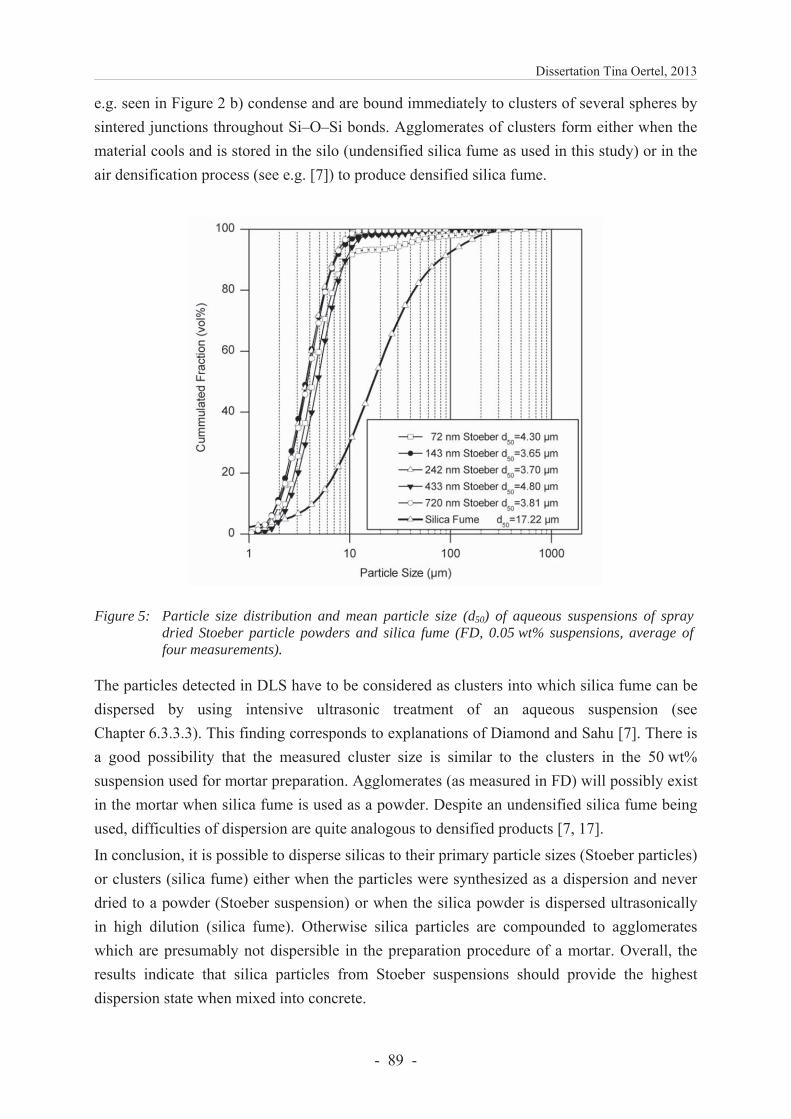
Dissertation Tina Oertel, 2013
- 89 -
e.g. seen in Figure 2 b) condense and are bound immediately to clusters of several spheres by sintered junctions throughout Si–O–Si bonds. Agglomerates of clusters form either when the material cools and is stored in the silo (undensified silica fume as used in this study) or in the air densification process (see e.g. [7]) to produce densified silica fume.
Figure 5: Particle size distribution and mean particle size (d50) of aqueous suspensions of spray dried Stoeber particle powders and silica fume (FD, 0.05 wt% suspensions, average of four measurements).
The particles detected in DLS have to be considered as clusters into which silica fume can be dispersed by using intensive ultrasonic treatment of an aqueous suspension (see Chapter 6.3.3.3). This finding corresponds to explanations of Diamond and Sahu [7]. There is a good possibility that the measured cluster size is similar to the clusters in the 50 wt% suspension used for mortar preparation. Agglomerates (as measured in FD) will possibly exist in the mortar when silica fume is used as a powder. Despite an undensified silica fume being used, difficulties of dispersion are quite analogous to densified products [7, 17].
In conclusion, it is possible to disperse silicas to their primary particle sizes (Stoeber particles) or clusters (silica fume) either when the particles were synthesized as a dispersion and never dried to a powder (Stoeber suspension) or when the silica powder is dispersed ultrasonically in high dilution (silica fume). Otherwise silica particles are compounded to agglomerates which are presumably not dispersible in the preparation procedure of a mortar. Overall, the results indicate that silica particles from Stoeber suspensions should provide the highest dispersion state when mixed into concrete.
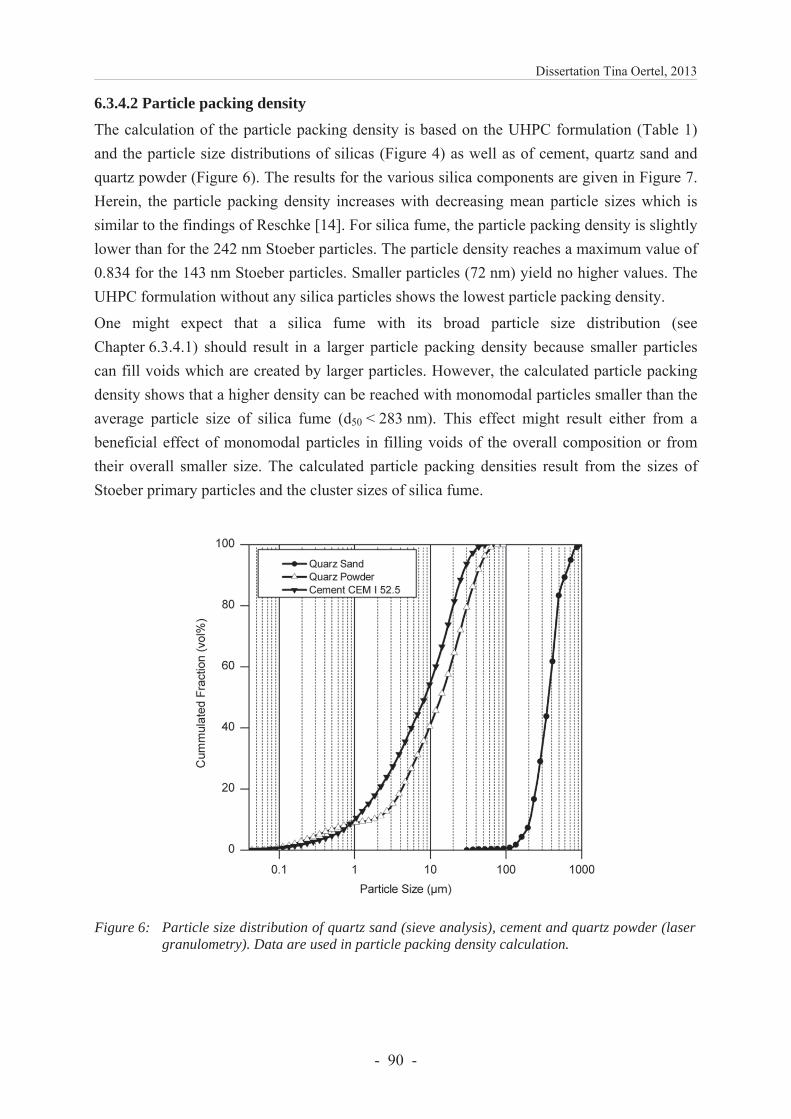
Dissertation Tina Oertel, 2013
- 90 -
6.3.4.2 Particle packing density
The calculation of the particle packing density is based on the UHPC formulation (Table 1) and the particle size distributions of silicas (Figure 4) as well as of cement, quartz sand and quartz powder (Figure 6). The results for the various silica components are given in Figure 7. Herein, the particle packing density increases with decreasing mean particle sizes which is similar to the findings of Reschke [14]. For silica fume, the particle packing density is slightly lower than for the 242 nm Stoeber particles. The particle density reaches a maximum value of 0.834 for the 143 nm Stoeber particles. Smaller particles (72 nm) yield no higher values. The UHPC formulation without any silica particles shows the lowest particle packing density.
One might expect that a silica fume with its broad particle size distribution (see Chapter 6.3.4.1) should result in a larger particle packing density because smaller particles can fill voids which are created by larger particles. However, the calculated particle packing density shows that a higher density can be reached with monomodal particles smaller than the average particle size of silica fume (d50 < 283 nm). This effect might result either from a beneficial effect of monomodal particles in filling voids of the overall composition or from their overall smaller size. The calculated particle packing densities result from the sizes of Stoeber primary particles and the cluster sizes of silica fume.
Figure 6: Particle size distribution of quartz sand (sieve analysis), cement and quartz powder (laser granulometry). Data are used in particle packing density calculation.
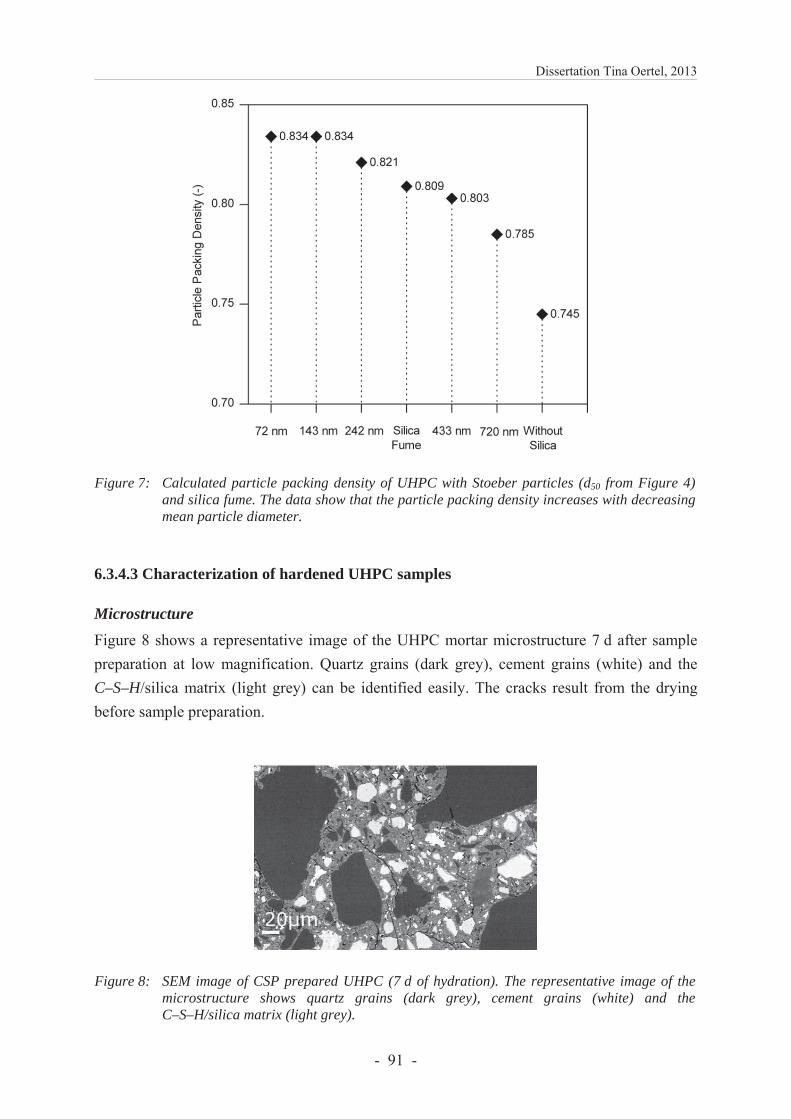
Dissertation Tina Oertel, 2013
- 91 -
Figure 7: Calculated particle packing density of UHPC with Stoeber particles (d50 from Figure 4) and silica fume. The data show that the particle packing density increases with decreasing mean particle diameter.
6.3.4.3 Characterization of hardened UHPC samples
Microstructure Figure 8 shows a representative image of the UHPC mortar microstructure 7 d after sample preparation at low magnification. Quartz grains (dark grey), cement grains (white) and the C–S–H/silica matrix (light grey) can be identified easily. The cracks result from the drying before sample preparation.
Figure 8: SEM image of CSP prepared UHPC (7 d of hydration). The representative image of the microstructure shows quartz grains (dark grey), cement grains (white) and the C–S–H/silica matrix (light grey).
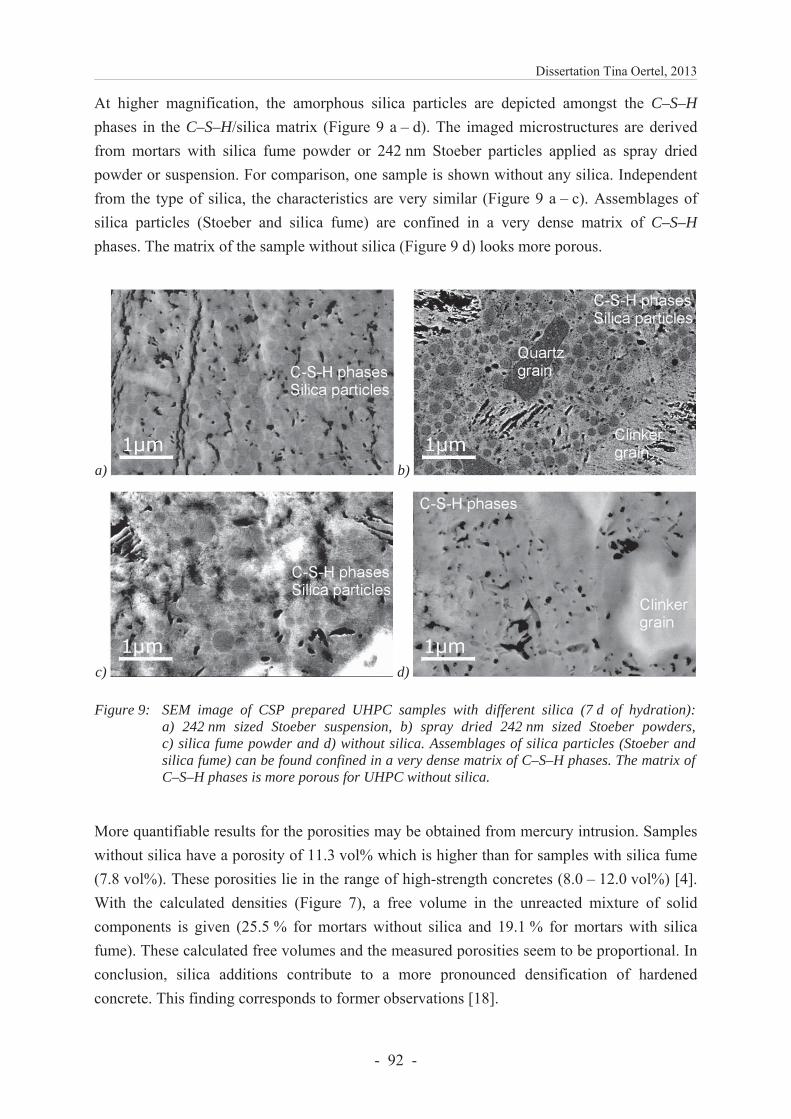
Dissertation Tina Oertel, 2013
- 92 -
At higher magnification, the amorphous silica particles are depicted amongst the C–S–H phases in the C–S–H/silica matrix (Figure 9 a – d). The imaged microstructures are derived from mortars with silica fume powder or 242 nm Stoeber particles applied as spray dried powder or suspension. For comparison, one sample is shown without any silica. Independent from the type of silica, the characteristics are very similar (Figure 9 a – c). Assemblages of silica particles (Stoeber and silica fume) are confined in a very dense matrix of C–S–H phases. The matrix of the sample without silica (Figure 9 d) looks more porous.
a) b)
c) d)
Figure 9: SEM image of CSP prepared UHPC samples with different silica (7 d of hydration): a) 242 nm sized Stoeber suspension, b) spray dried 242 nm sized Stoeber powders, c) silica fume powder and d) without silica. Assemblages of silica particles (Stoeber and silica fume) can be found confined in a very dense matrix of C–S–H phases. The matrix ofC–S–H phases is more porous for UHPC without silica.
More quantifiable results for the porosities may be obtained from mercury intrusion. Samples without silica have a porosity of 11.3 vol% which is higher than for samples with silica fume (7.8 vol%). These porosities lie in the range of high-strength concretes (8.0 – 12.0 vol%) [4]. With the calculated densities (Figure 7), a free volume in the unreacted mixture of solid components is given (25.5 % for mortars without silica and 19.1 % for mortars with silica fume). These calculated free volumes and the measured porosities seem to be proportional. In conclusion, silica additions contribute to a more pronounced densification of hardened concrete. This finding corresponds to former observations [18].
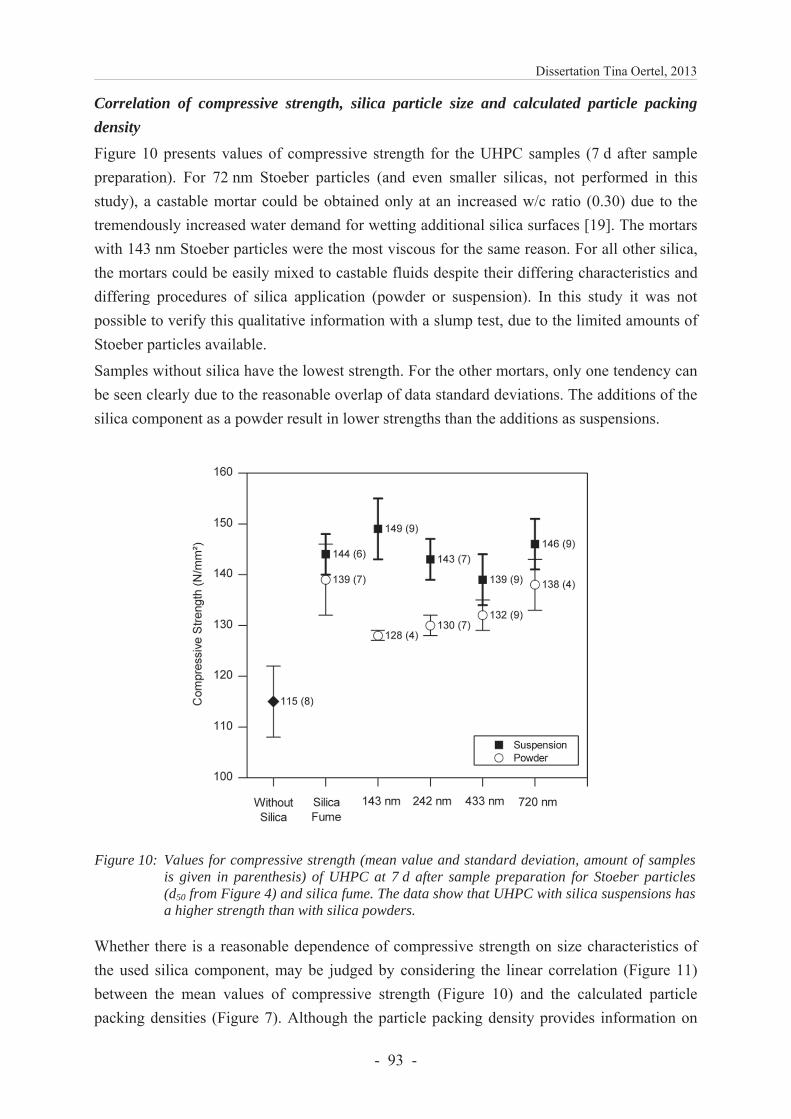
Dissertation Tina Oertel, 2013
- 93 -
Correlation of compressive strength, silica particle size and calculated particle packing density Figure 10 presents values of compressive strength for the UHPC samples (7 d after sample preparation). For 72 nm Stoeber particles (and even smaller silicas, not performed in this study), a castable mortar could be obtained only at an increased w/c ratio (0.30) due to the tremendously increased water demand for wetting additional silica surfaces [19]. The mortars with 143 nm Stoeber particles were the most viscous for the same reason. For all other silica, the mortars could be easily mixed to castable fluids despite their differing characteristics and differing procedures of silica application (powder or suspension). In this study it was not possible to verify this qualitative information with a slump test, due to the limited amounts of Stoeber particles available.
Samples without silica have the lowest strength. For the other mortars, only one tendency can be seen clearly due to the reasonable overlap of data standard deviations. The additions of the silica component as a powder result in lower strengths than the additions as suspensions.
Figure 10: Values for compressive strength (mean value and standard deviation, amount of samples is given in parenthesis) of UHPC at 7 d after sample preparation for Stoeber particles (d50 from Figure 4) and silica fume. The data show that UHPC with silica suspensions has a higher strength than with silica powders.
Whether there is a reasonable dependence of compressive strength on size characteristics of the used silica component, may be judged by considering the linear correlation (Figure 11) between the mean values of compressive strength (Figure 10) and the calculated particle packing densities (Figure 7). Although the particle packing density provides information on
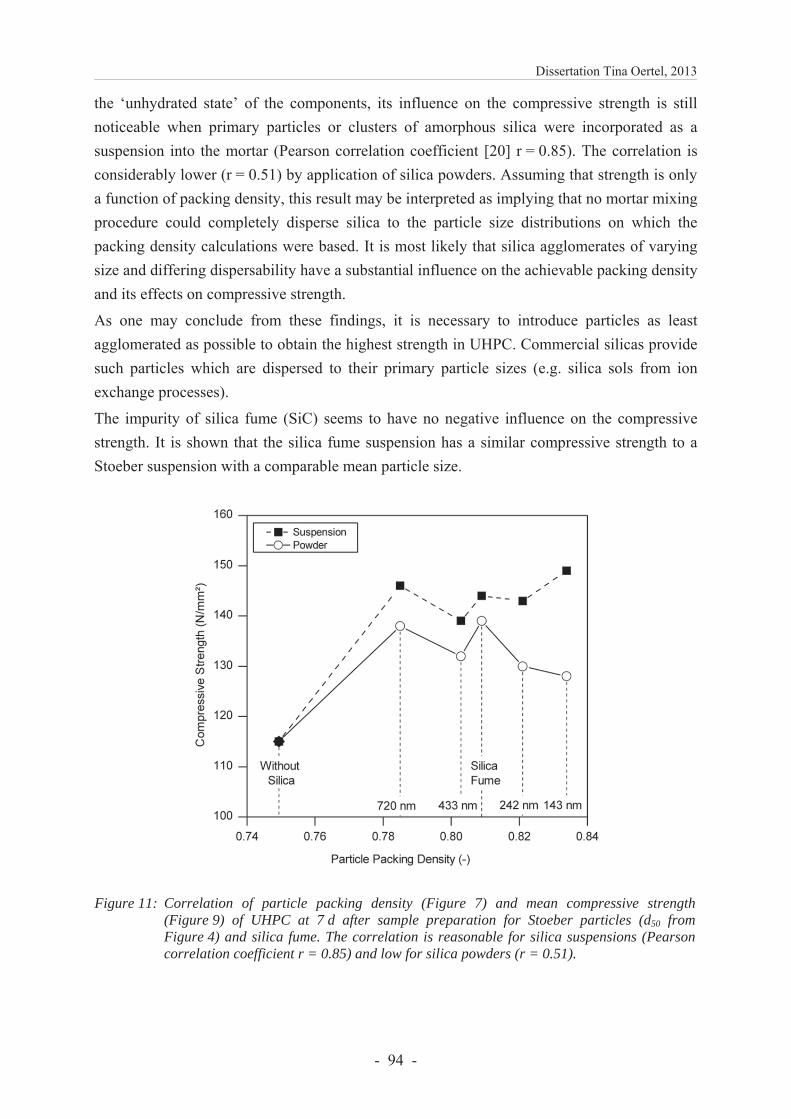
Dissertation Tina Oertel, 2013
- 94 -
the ‘unhydrated state’ of the components, its influence on the compressive strength is still noticeable when primary particles or clusters of amorphous silica were incorporated as a suspension into the mortar (Pearson correlation coefficient [20] r = 0.85). The correlation is considerably lower (r = 0.51) by application of silica powders. Assuming that strength is only a function of packing density, this result may be interpreted as implying that no mortar mixing procedure could completely disperse silica to the particle size distributions on which the packing density calculations were based. It is most likely that silica agglomerates of varying size and differing dispersability have a substantial influence on the achievable packing density and its effects on compressive strength.
As one may conclude from these findings, it is necessary to introduce particles as least agglomerated as possible to obtain the highest strength in UHPC. Commercial silicas provide such particles which are dispersed to their primary particle sizes (e.g. silica sols from ion exchange processes).
The impurity of silica fume (SiC) seems to have no negative influence on the compressive strength. It is shown that the silica fume suspension has a similar compressive strength to a Stoeber suspension with a comparable mean particle size.
Figure 11: Correlation of particle packing density (Figure 7) and mean compressive strength (Figure 9) of UHPC at 7 d after sample preparation for Stoeber particles (d50 from Figure 4) and silica fume. The correlation is reasonable for silica suspensions (Pearson correlation coefficient r = 0.85) and low for silica powders (r = 0.51).
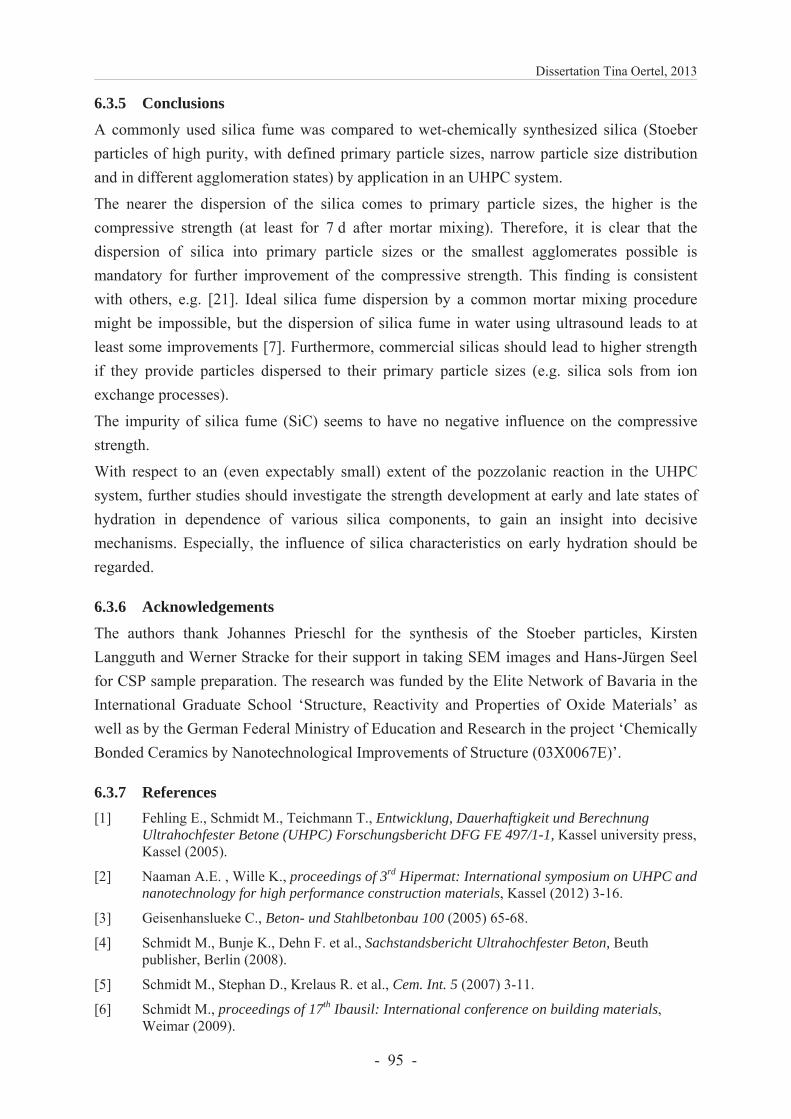
Dissertation Tina Oertel, 2013
- 95 -
6.3.5 Conclusions
A commonly used silica fume was compared to wet-chemically synthesized silica (Stoeber particles of high purity, with defined primary particle sizes, narrow particle size distribution and in different agglomeration states) by application in an UHPC system.
The nearer the dispersion of the silica comes to primary particle sizes, the higher is the compressive strength (at least for 7 d after mortar mixing). Therefore, it is clear that the dispersion of silica into primary particle sizes or the smallest agglomerates possible is mandatory for further improvement of the compressive strength. This finding is consistent with others, e.g. [21]. Ideal silica fume dispersion by a common mortar mixing procedure might be impossible, but the dispersion of silica fume in water using ultrasound leads to at least some improvements [7]. Furthermore, commercial silicas should lead to higher strength if they provide particles dispersed to their primary particle sizes (e.g. silica sols from ion exchange processes).
The impurity of silica fume (SiC) seems to have no negative influence on the compressive strength.
With respect to an (even expectably small) extent of the pozzolanic reaction in the UHPC system, further studies should investigate the strength development at early and late states of hydration in dependence of various silica components, to gain an insight into decisive mechanisms. Especially, the influence of silica characteristics on early hydration should be regarded.
6.3.6 Acknowledgements
The authors thank Johannes Prieschl for the synthesis of the Stoeber particles, Kirsten Langguth and Werner Stracke for their support in taking SEM images and Hans-Jürgen Seel for CSP sample preparation. The research was funded by the Elite Network of Bavaria in the International Graduate School ‘Structure, Reactivity and Properties of Oxide Materials’ as well as by the German Federal Ministry of Education and Research in the project ‘Chemically Bonded Ceramics by Nanotechnological Improvements of Structure (03X0067E)’.
6.3.7 References [1] Fehling E., Schmidt M., Teichmann T., Entwicklung, Dauerhaftigkeit und Berechnung
Ultrahochfester Betone (UHPC) Forschungsbericht DFG FE 497/1-1, Kassel university press, Kassel (2005).
[2] Naaman A.E. , Wille K., proceedings of 3rd Hipermat: International symposium on UHPC and nanotechnology for high performance construction materials, Kassel (2012) 3-16.
[3] Geisenhanslueke C., Beton- und Stahlbetonbau 100 (2005) 65-68.
[4] Schmidt M., Bunje K., Dehn F. et al., Sachstandsbericht Ultrahochfester Beton, Beuth publisher, Berlin (2008).
[5] Schmidt M., Stephan D., Krelaus R. et al., Cem. Int. 5 (2007) 3-11.
[6] Schmidt M., proceedings of 17th Ibausil: International conference on building materials, Weimar (2009).
Dissertation Tina Oertel, 2013
- 96 -
[7] Diamond S., Sahu S., Mater. Struct. 39 (2006) 849-859.
[8] Stoeber W., Fink A., J. Colloid Interface Sci. 26 (1968) 62-69.
[9] Masters K., Spray Drying Handbook, 4th ed, Longman Group UK Limited publisher, Harlow Essex (1985).
[10] Froehlich S., Schmidt M., proceedings of 3rd Hipermat: International symposium on UHPC and nanotechnology for high performance construction materials, Kassel (2012) 225–232.
[11] Shibata M., JEOL News 39 (2004).
[12] Diamond S., Cem. Concr. Res. 30 (2000) 1517-1525.
[13] Schwanda F., beton 9 (1959) 12-17.
[14] Reschke T.: Der Einfluss der Granulometrie der Feinstoffe auf die Gefuegeentwicklung und die Festigkeit von Beton, doctoral thesis, Weimar (2001).
[15] Reschke T., Siebel E., Thielen G., beton (1999) 719-724.
[16] Tobón J.I., Restrepo O.J., Payá J., Dyna 77 (2010) 37-46.
[17] Diamond S., Sahu S., Thaulow N., Cem. Concr. Res. 34 (2004) 1625-1632.
[18] Pfeifer C., Moeser B., Stark J., proceedings of 17th Ibausil: International conference on building materials, Weimar (2009).
[19] Qing Y., Zenan Z., Deyu K., Constr. Build. Mater 21 (2007) 439-545.
[20] Lawner Weinberg S., Knapp Abramowitz S., Data Analysis for the Behavioral Sciences Using SPSS, Cambridge university press, New York (2002).
[21] Marchuk V., beton 52 (2002) 393-398.
Dissertation Tina Oertel, 2013
- 97 -
7 LIST OF PUBLICATIONS
7.1 PublicationsOertel T., Hutter F., Tänzer R., Helbig U., Sextl G., Primary particle size and
agglomerate size effects of amorphous silica in ultra-high performance concrete, Cem.
Concr. Comp. 37 (2013) 61-67.
Oertel T., Hutter F., Helbig U., Sextl G., Amorphous silica in ultra-high performance
concrete: First hour of hydration, submitted to Cem. Concr. Res.
Oertel T., Helbig U., Hutter F., Kletti H., Sextl G., Influence of amorphous silica on
the hydration in ultra-high performance concrete, submitted to Cem. Concr. Res.
7.2 Presentations, posters and conference proceedings Oertel T., Hutter F., Helbig U., Sextl G., Influence of nano silica properties on UHPC,
in: Ludwig H.M. (Ed.) proceedings of 18th Ibausil: Internationale Baustofftagung,
Weimar (2012) 2.0178-85.
Oertel T., Hutter F., Helbig U., Sextl G., Determining the reactivity of nano silica and
its influence on early hydration of ultra-high performance concrete, in: Winnefeld F.,
Deschner F. (Ed.) proceedings of Tagung Bauchemie, GDCH - Fachgruppe Bau-
chemie, Dübendorf (2012) 193-194.
Oertel T., Hutter F., Helbig U., Sextl G., Investigation of wet-chemically synthesized
silica in UHPC: Effect of particle size and aggregation state, in: Schmidt M., Fehling
E., Glotzbach C. et al. (Ed.) Proceedings of Hipermat 3rd: International Symposium on
UHPC and Nanotechnology for High Performance Construction Materials, Kassel
(2012).
Oertel T., Langner J., Hutter F., Gellermann C., Sextl G., Spray drying of silica
nanoparticles for ultra-high performance concrete, in: Teipel U. (Ed.) Produkt-
gestaltung in der Parikeltechnologie, Pfinztal (2011) 391-399.
7.3 Reports
Hutter F., Oertel T., Prieschl J., Kalthärtende Keramik durch nanotechnologische Gefügeoptimierung: final project report: grant number 03X0067E, in: TechnischeInformationsbibliothek (2013) signature F12B3714.
Dissertation Tina Oertel, 2013
- 98 -
ACKNOWLEDGEMENTS
I would like to express my very great appreciation to Prof. Dr. Gerhard Sextl for his guidance
and constant support as well as for the opportunity to carry this research study at the
Fraunhofer–Institute for Silicate Research with its excellent analytical facilities. My great
appreciation also goes to Prof. Dr. Josef Breu for his advices and discussions throughout the
implementation of this work. I am particularly grateful for the assistance given by Prof.
Dr. Uta Helbig. Her strong mineralogical background, willingness to carry out the Rietveld
analyses and constant support significantly advanced the quality of this work. Scientific
advice given by Dr. Frank Hutter has been a great help in critically reviewing my
experimental work and conclusions. Carsten Gellermann is acknowledged for his very helpful
assistance.
I wish to acknowledge Johannes Prieschl for the synthesis of Stoeber particles, the Sears
titration and XRD measurements as well as Kirsten Langguth for her support in taking SEM
images. Furthermore, I would like to thank Dr. Rüdiger Bertermann for measuring and
quantifying 29Si NMR, Dr. Werner Hopp for ICP measurements, Werner Stracke and Hans
Jürgen Seel for CSP and FIB preparation of cross sections, Werner Stracke for SEM analyses
and Dr. Alexander Reinhold for TEM analyses. Special thanks are extended to my colleagues
at the Fraunhofer–Institute for Silicate Research for their advice.
Ricarda Tänzer is gratefully acknowledged for measuring heat flow calorimetry. I would like
to thank Jürgen Göske for in-situ XRD measurements and Susanne Winter for cryo SEM
preparation and analyses. Fruitful discussions with Prof. Dr. Hans Roggendorf, Dr. Michael
Bräu, Dr. Sebastian Seufert, Dr. Christoph Hesse, Dr. Joachim Krakehl and Dr. Holger Kletti
have been a great help. I particularly acknowledge Prof. Douglas Hooton for his kind support
throughout my research stay with his scientific group at the University of Toronto.
The financial support from the Elite Network of Bavaria is gratefully acknowledged as well as
the interdisciplinary exchange throughout the international graduate school ‘Structure,
Reactivity and Properties of Oxide Materials’. Financial support given by the German Federal
Ministry of Education and Research in the project ‘Chemically Bonded Ceramics by
Nanotechnological Improvements of Structure (03X0067E)’ was greatly appreciated.
Last but not least, I would like to thank Christian and my family, in particular my parents
Gabriele and Helge, for their endless support and encouragement throughout this journey.
Dissertation Tina Oertel, 2013
- 99 -
(EIDESSTATTLICHE) VERSICHERUNGEN UND
ERKLÄRUNGEN
(§ 5 Nr. 4 PromO)
Hiermit erkläre ich, dass keine Tatsachen vorliegen, die mich nach den gesetzlichen
Bestimmungen über die Führung akademischer Grade zur Führung eines Doktorgrades
unwürdig erscheinen lassen.
(§ 8 S. 2 Nr. 5 PromO)
Hiermit erkläre ich mich damit einverstanden, dass die elektronische Fassung meiner
Dissertation unter Wahrung meiner Urheberrechte und des Datenschutzes einer gesonderten
Überprüfung hinsichtlich der eigenständigen Anfertigung der Dissertation unterzogen werden
kann.
(§ 8 S. 2 Nr. 7 PromO)
Hiermit erkläre ich eidesstattlich, dass ich die Dissertation selbständig verfasst und keine
anderen als die von mir angegebenen Quellen und Hilfsmittel benutzt habe.
Ich habe die Dissertation nicht bereits zur Erlangung eines akademischen Grades anderweitig
eingereicht und habe auch nicht bereits diese oder eine gleichartige Doktorprüfung endgültig
nicht bestanden.
(§ 8 S. 2 Nr. 9 PromO)
Hiermit erkläre ich, dass ich keine Hilfe von gewerbliche Promotionsberatern bzw. -
vermittlern in Anspruch genommen habe und auch künftig nicht nehmen werde.
Würzburg, den 12. November 2013
Tina Oertel


![Baustoffdesign Einführung.ppt [Kompatibilitätsmodus] · containing cement, sand and chemical admixtures etc. Machine foundation Earthquake retrofit Pile top. Baustoffdesign Composition](https://img.pdfslide.org/doc/110x75/5dd13028d6be591ccb64a4e7/baustoffdesign-einfhrungppt-kompatibilittsmodus-containing-cement-sand-and.jpg)