Embed Size (px)
Citation preview
Sehr geehrte Damen und Herren,
für Rückfragen zu der beigefügten Publikation „IPO Watch Europe Q2 2016“ stehen Ihnen folgende Ansprechpartner gerne zur Verfügung:
Nadja [email protected]. +49 211 981-2978
Christoph [email protected]. +49 69 9585-3415
Dirk [email protected]. +49 89 5790-5806
Dr. Rüdiger [email protected]. +49 211 981-2839
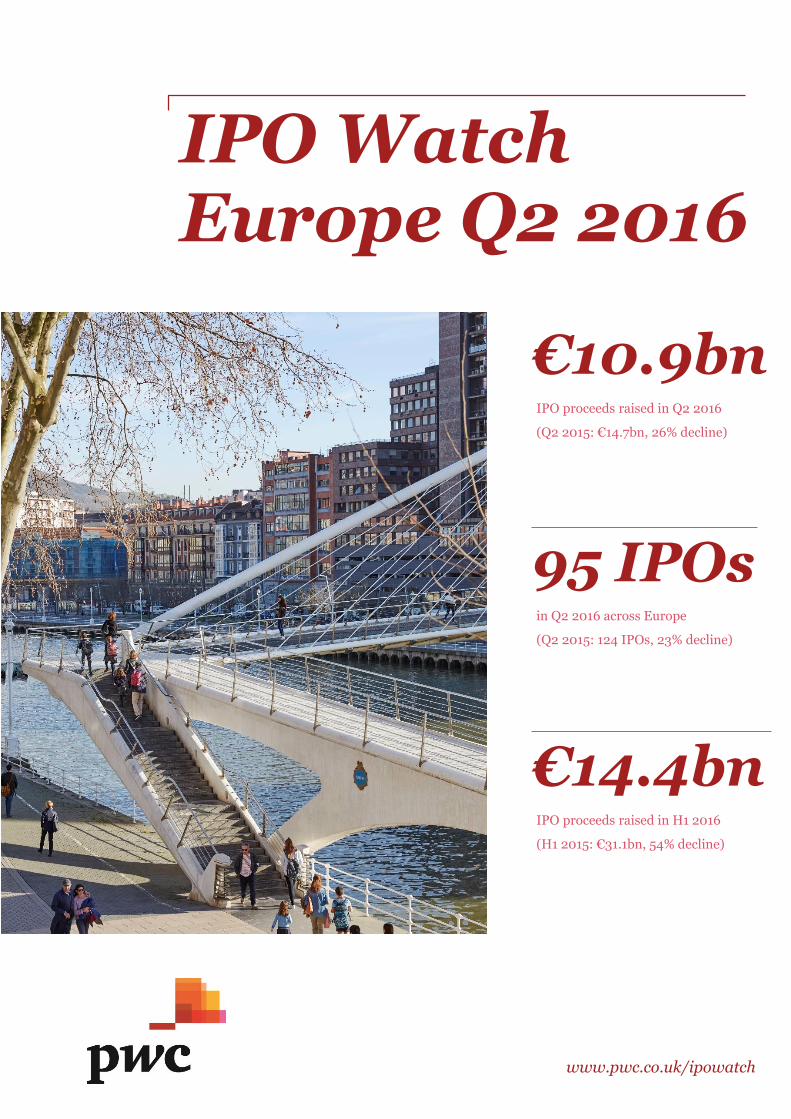
IPO Watch Europe Q2 2016
www.pwc.co.uk/ipowatch
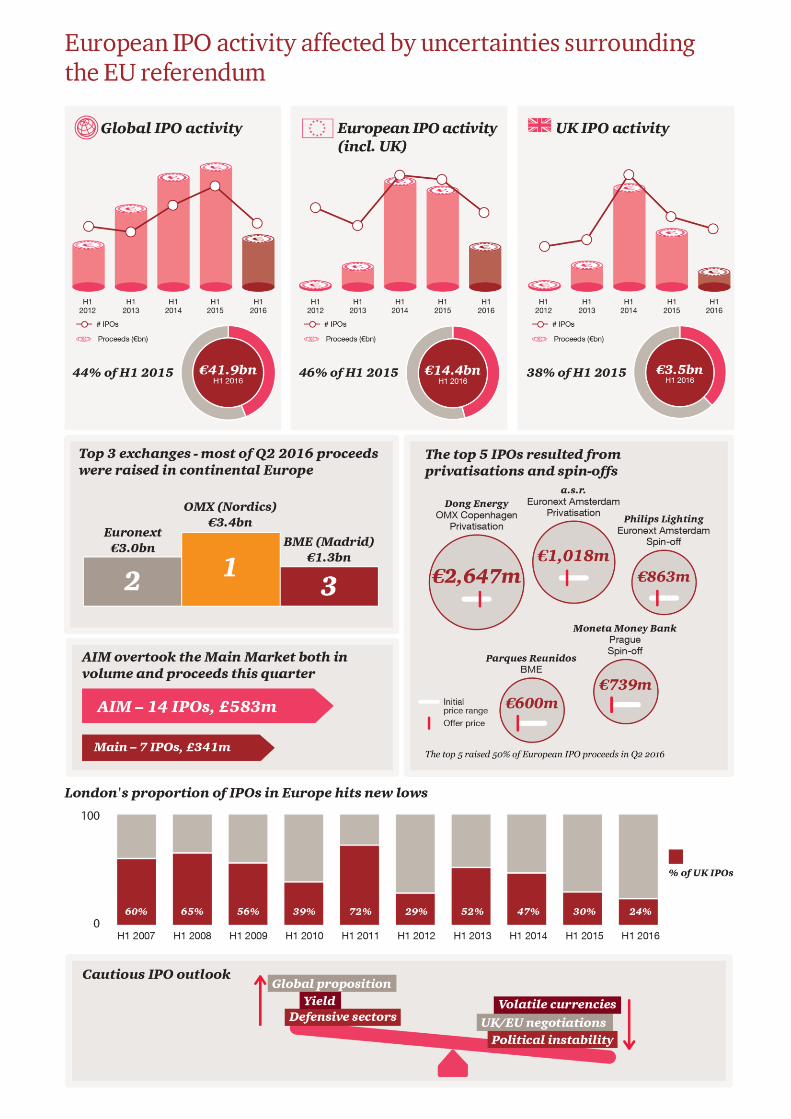
€10.9bnIPO proceeds raised in Q2 2016
(Q2 2015: €14.7bn, 26% decline)
95 IPOsin Q2 2016 across Europe
(Q2 2015: 124 IPOs, 23% decline)
€14.4bnIPO proceeds raised in H1 2016
(H1 2015: €31.1bn, 54% decline)
3 | IPO Watch Europe Q2 2016
4IPO Watch Europe Q2 2016 |
European IPO trends 4
Market volatility 6
Pricing and performance of top 5 IPOs 7
The sector story 8
London focus
Overview 9
Relative performance of London IPOs 10
PE trends and the sector story 11
Global perspective 12
Appendix 13
Contacts 16
Contents
Stay tuned
“Following the referendum result, there have been a number of transactions postponed due to concerns over market uncertainties. That said, the majority of companies pursuing IPOs for the second half of the year are maintaining their plans. Improved political stability and greater clarity over the UK’s progress on negotiations with the EU will be key to IPO activity picking up again post the traditional quiet summer period. Provided this is the case, the successful completion of the first IPOs coming to market post-summer will set the tone for the remainder of the year. Whilst I do not see activity coming to a standstill, European IPO levels are unlikely to reach the €25bn mark for the year.”Mark HughesPartner, UK Capital Markets Leader at PwC
5 | IPO Watch Europe Q2 2016
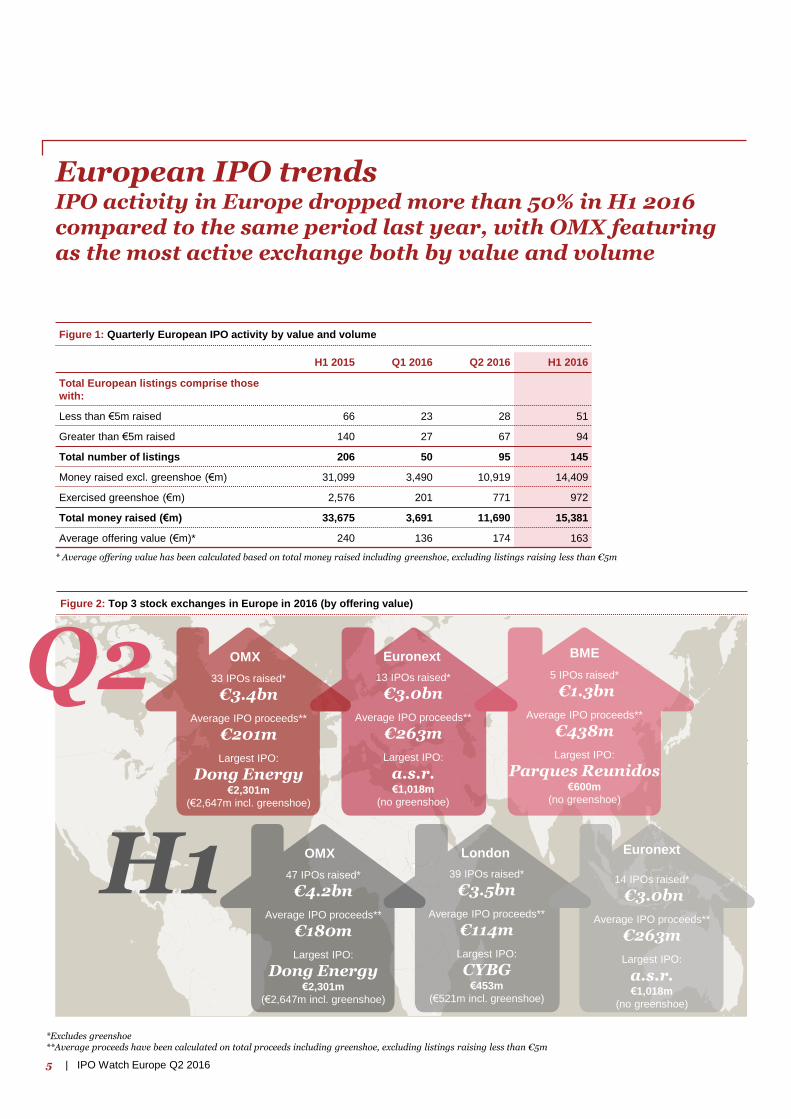
European IPO trendsIPO activity in Europe dropped more than 50% in H1 2016 compared to the same period last year, with OMX featuring as the most active exchange both by value and volume
Figure 1: Quarterly European IPO activity by value and volume
* Average offering value has been calculated based on total money raised including greenshoe, excluding listings raising less than €5m
H1 2015 Q1 2016 Q2 2016 H1 2016
Total European listings comprise those
with:
Less than €5m raised 66 23 28 51
Greater than €5m raised 140 27 67 94
Total number of listings 206 50 95 145
Money raised excl. greenshoe (€m) 31,099 3,490 10,919 14,409
Exercised greenshoe (€m) 2,576 201 771 972
Total money raised (€m) 33,675 3,691 11,690 15,381
Average offering value (€m)* 240 136 174 163
Figure 2: Top 3 stock exchanges in Europe in Q2 2016 (by offering value)
*Excludes greenshoe**Average proceeds have been calculated on total proceeds including greenshoe, excluding listings raising less than €5m
Figure 2: Top 3 stock exchanges in Europe in 2016 (by offering value)
London
39 IPOs raised*
€3.5bn
Average IPO proceeds**
€114m
Largest IPO:
CYBG€453m
(€521m incl. greenshoe)
Euronext
14 IPOs raised*
€3.0bn
Average IPO proceeds**
€263m
Largest IPO:
a.s.r.€1,018m
(no greenshoe)
OMX
47 IPOs raised*
€4.2bn
Average IPO proceeds**
€180m
Largest IPO:
Dong Energy€2,301m
(€2,647m incl. greenshoe)
H1
Euronext
13 IPOs raised*
€3.0bn
Average IPO proceeds**
€263m
Largest IPO:
a.s.r.€1,018m
(no greenshoe)
BME
5 IPOs raised*
€1.3bn
Average IPO proceeds**
€438m
Largest IPO:
Parques Reunidos€600m
(no greenshoe)
OMX
33 IPOs raised*
€3.4bn
Average IPO proceeds**
€201m
Largest IPO:
Dong Energy€2,301m
(€2,647m incl. greenshoe)
Q2
6IPO Watch Europe Q2 2016 |
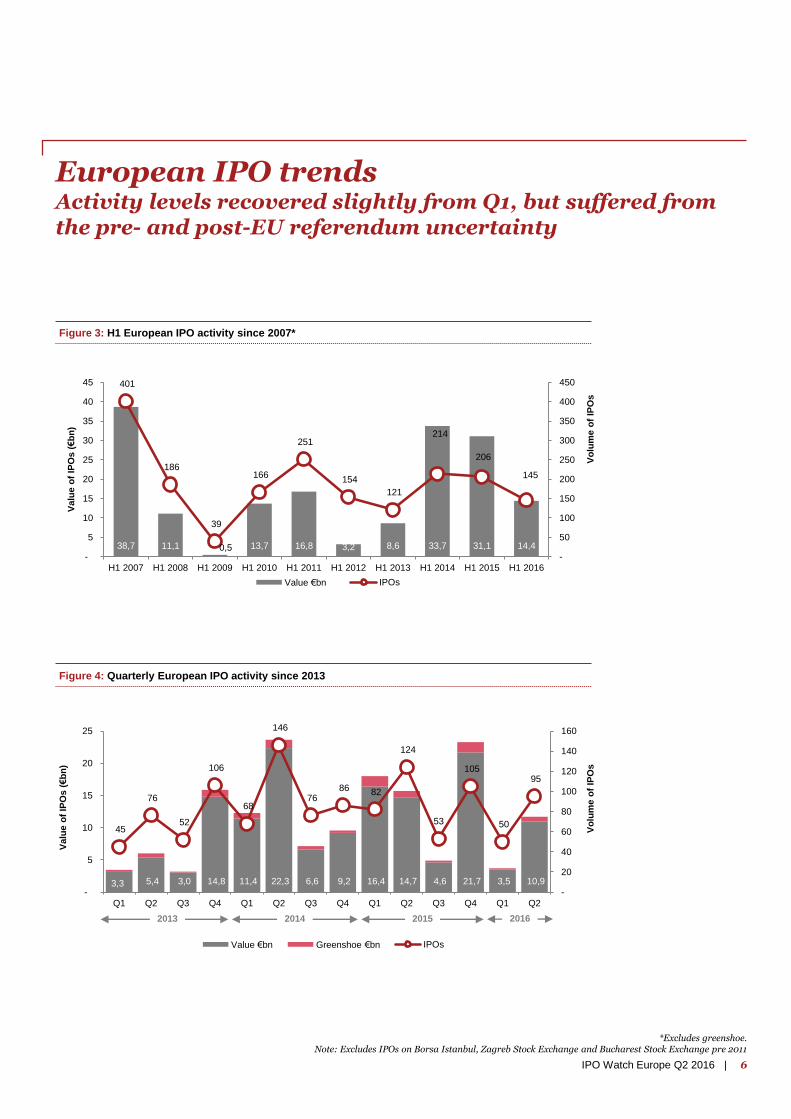
European IPO trendsActivity levels recovered slightly from Q1, but suffered from the pre- and post-EU referendum uncertainty
Figure 3: H1 European IPO activity since 2007*
Figure 4: Quarterly European IPO activity since 2013
Vo
lum
e o
f IP
Os
Vo
lum
e o
f IP
Os
3,3 5,4 3,0 14,8 11,4 22,3 6,6 9,2 16,4 14,7 4,6 21,7 3,5 10,9
45
76
52
106
68
146
76 86 82
124
53
105
50
95
-
20
40
60
80
100
120
140
160
-
5
10
15
20
25
Q1 Q2 Q3 Q4 Q1 Q2 Q3 Q4 Q1 Q2 Q3 Q4 Q1 Q2
Valu
e o
f IP
Os (€b
n)
Value €bn Greenshoe €bn IPOs
*Excludes greenshoe. Note: Excludes IPOs on Borsa Istanbul, Zagreb Stock Exchange and Bucharest Stock Exchange pre 2011
38,7 11,1 0,5 13,7 16,8 3,2 8,6 33,7 31,1 14,4
401
186
39
166
251
154
121
214
206
145
-
50
100
150
200
250
300
350
400
450
-
5
10
15
20
25
30
35
40
45
H1 2007 H1 2008 H1 2009 H1 2010 H1 2011 H1 2012 H1 2013 H1 2014 H1 2015 H1 2016
Valu
e o
f IP
Os (€b
n)
Value €bn IPOs
2013 2014 2015 2016
7 | IPO Watch Europe Q2 2016
Falling oil prices,
Chinese economy
slowdown and
threat of
impending bear
market
China stock
market
turmoil
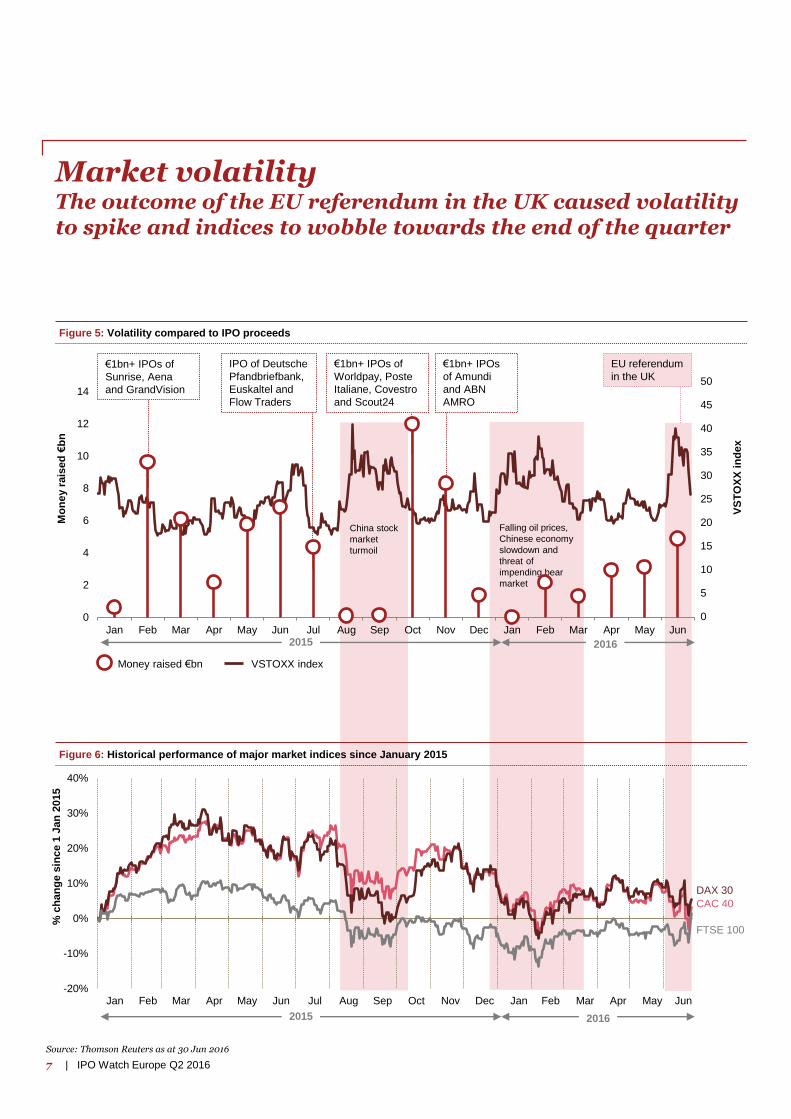
Market volatility The outcome of the EU referendum in the UK caused volatility to spike and indices to wobble towards the end of the quarter
Figure 5: Volatility compared to IPO proceeds
Mo
ne
y r
ais
ed
€b
n
Money raised €bn VSTOXX index
Source: Thomson Reuters as at 30 Jun 2016
€1bn+ IPOs of
Sunrise, Aena
and GrandVision
IPO of Deutsche
Pfandbriefbank,
Euskaltel and
Flow Traders
€1bn+ IPOs of
Worldpay, Poste
Italiane, Covestro
and Scout24
VS
TO
XX
in
dex
€1bn+ IPOs
of Amundi
and ABN
AMRO
Figure 6: Historical performance of major market indices since January 2015
-20%
-10%
0%
10%
20%
30%
40%
Jan Feb Mrz Apr Mai Jun Jul Aug Sep Okt Nov Dez Jan Feb Mrz Apr Mai Jun
% c
ha
ng
e s
inc
e 1
Jan
2015
DAX 30
CAC 40
FTSE 100
2015 2016
2015 2016
0
5
10
15
20
25
30
35
40
45
50
0
2
4
6
8
10
12
14
Jan Feb Mar Apr May Jun Jul Aug Sep Oct Nov Dec Jan Feb Mar Apr May Jun
EU referendum
in the UK
Jan Feb Mar Apr May Jun Jul Aug Sep Oct Nov Dec Jan Feb Mar Apr May Jun
8IPO Watch Europe Q2 2016 |
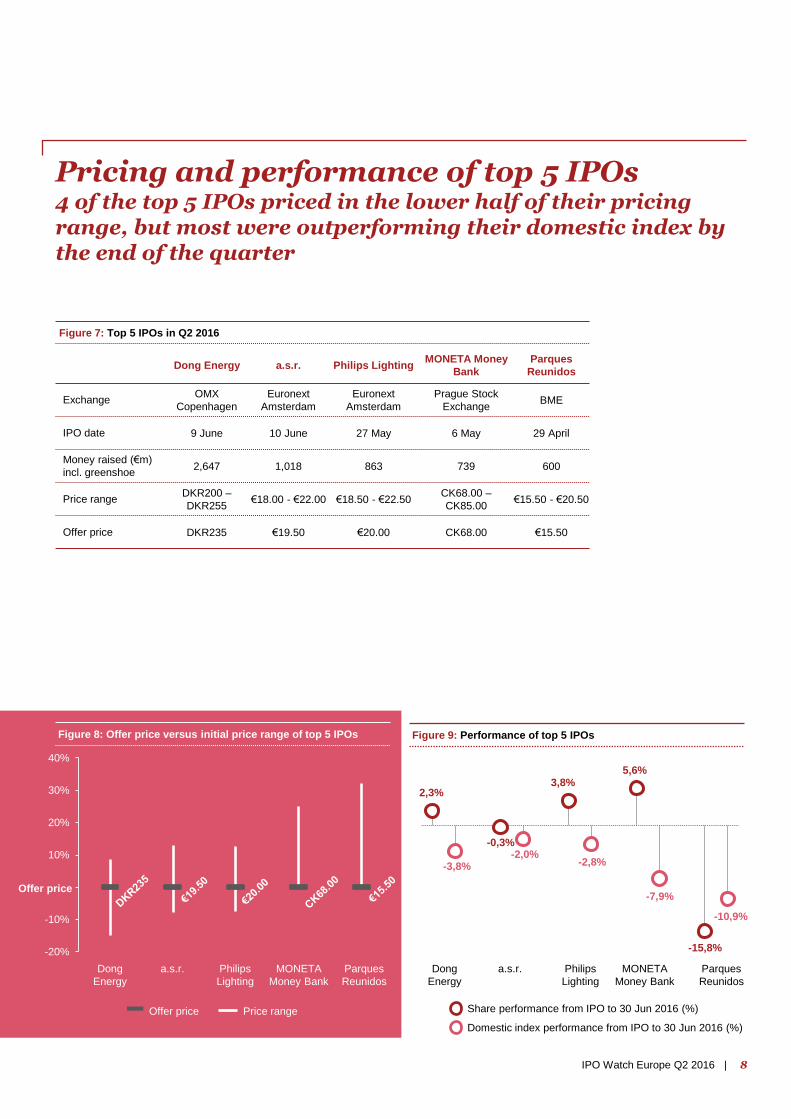
Pricing and performance of top 5 IPOs4 of the top 5 IPOs priced in the lower half of their pricing range, but most were outperforming their domestic index by the end of the quarter
Figure 7: Top 5 IPOs in Q2 2016
Figure 8: Offer price versus initial price range of top 5 IPOs
Dong Energy a.s.r. Philips LightingMONETA Money
Bank
Parques
Reunidos
ExchangeOMX
Copenhagen
Euronext
Amsterdam
Euronext
Amsterdam
Prague Stock
ExchangeBME
IPO date 9 June 10 June 27 May 6 May 29 April
Money raised (€m)
incl. greenshoe2,647 1,018 863 739 600
Price rangeDKR200 –
DKR255€18.00 - €22.00 €18.50 - €22.50
CK68.00 –
CK85.00€15.50 - €20.50
Offer price DKR235 €19.50 €20.00 CK68.00 €15.50
-20%
-10%
0%
10%
20%
30%
40%
Offer price Price range
Figure 9: Performance of top 5 IPOs
Share performance from IPO to 30 Jun 2016 (%)
2,3%
-3,8%
-0,3%-2,0%
3,8%
-2,8%
5,6%
-7,9%
-15,8%
-10,9%
Domestic index performance from IPO to 30 Jun 2016 (%)
Dong
Energy
a.s.r. Philips
Lighting
MONETA
Money Bank
Parques
Reunidos
Dong
Energy
a.s.r. Philips
Lighting
MONETA
Money Bank
Parques
Reunidos
Offer price
9 | IPO Watch Europe Q2 2016
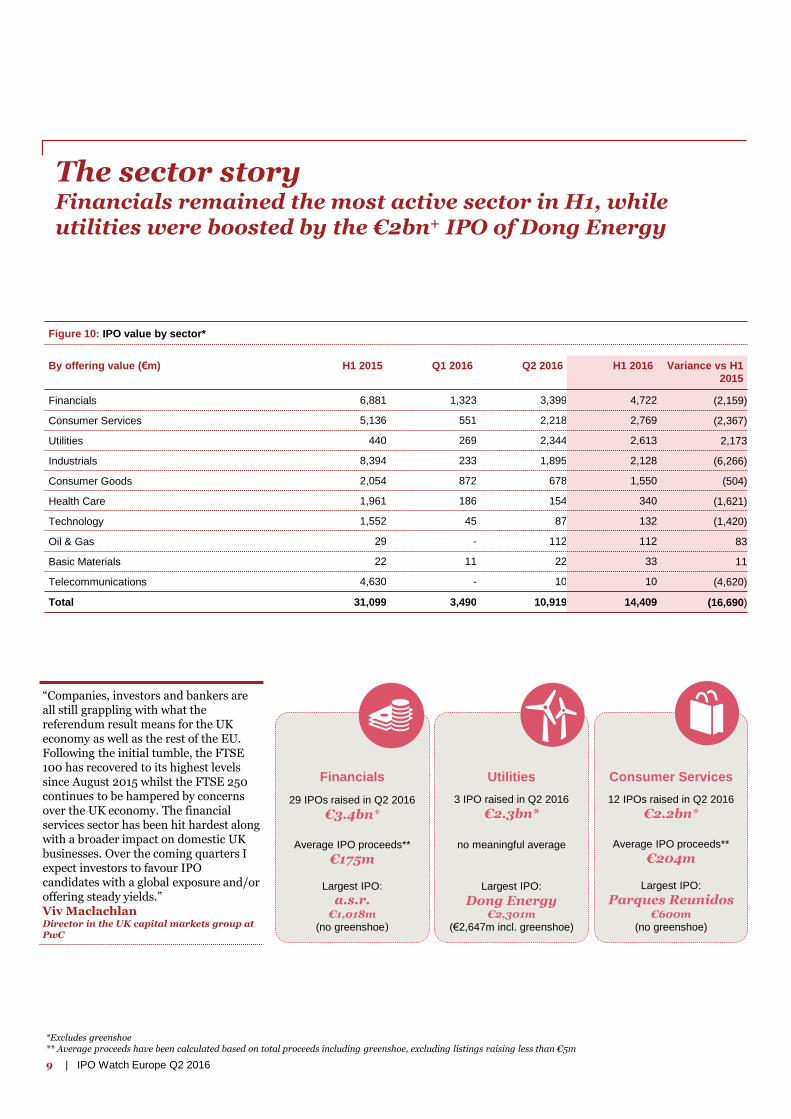
By offering value (€m) H1 2015 Q1 2016 Q2 2016 H1 2016 Variance vs H1
2015
Financials 6,881 1,323 3,399 4,722 (2,159)
Consumer Services 5,136 551 2,218 2,769 (2,367)
Utilities 440 269 2,344 2,613 2,173
Industrials 8,394 233 1,895 2,128 (6,266)
Consumer Goods 2,054 872 678 1,550 (504)
Health Care 1,961 186 154 340 (1,621)
Technology 1,552 45 87 132 (1,420)
Oil & Gas 29 - 112 112 83
Basic Materials 22 11 22 33 11
Telecommunications 4,630 - 10 10 (4,620)
Total 31,099 3,490 10,919 14,409 (16,690)
The sector storyFinancials remained the most active sector in H1, while utilities were boosted by the €2bn+ IPO of Dong Energy
*Excludes greenshoe** Average proceeds have been calculated based on total proceeds including greenshoe, excluding listings raising less than €5m
Figure 10: IPO value by sector*
Consumer Services
12 IPOs raised in Q2 2016
€2.2bn*
Average IPO proceeds**
€204m
Largest IPO:
Parques Reunidos€600m
(no greenshoe)
Utilities
3 IPO raised in Q2 2016
€2.3bn*
no meaningful average
Largest IPO:
Dong Energy€2,301m
(€2,647m incl. greenshoe)
Financials
29 IPOs raised in Q2 2016
€3.4bn*
Average IPO proceeds**
€175m
Largest IPO:
a.s.r.€1,018m
(no greenshoe)
“Companies, investors and bankers are all still grappling with what the referendum result means for the UK economy as well as the rest of the EU. Following the initial tumble, the FTSE 100 has recovered to its highest levels since August 2015 whilst the FTSE 250 continues to be hampered by concerns over the UK economy. The financial services sector has been hit hardest along with a broader impact on domestic UK businesses. Over the coming quarters I expect investors to favour IPO candidates with a global exposure and/or offering steady yields.”Viv MaclachlanDirector in the UK capital markets group at PwC
10IPO Watch Europe Q2 2016 |
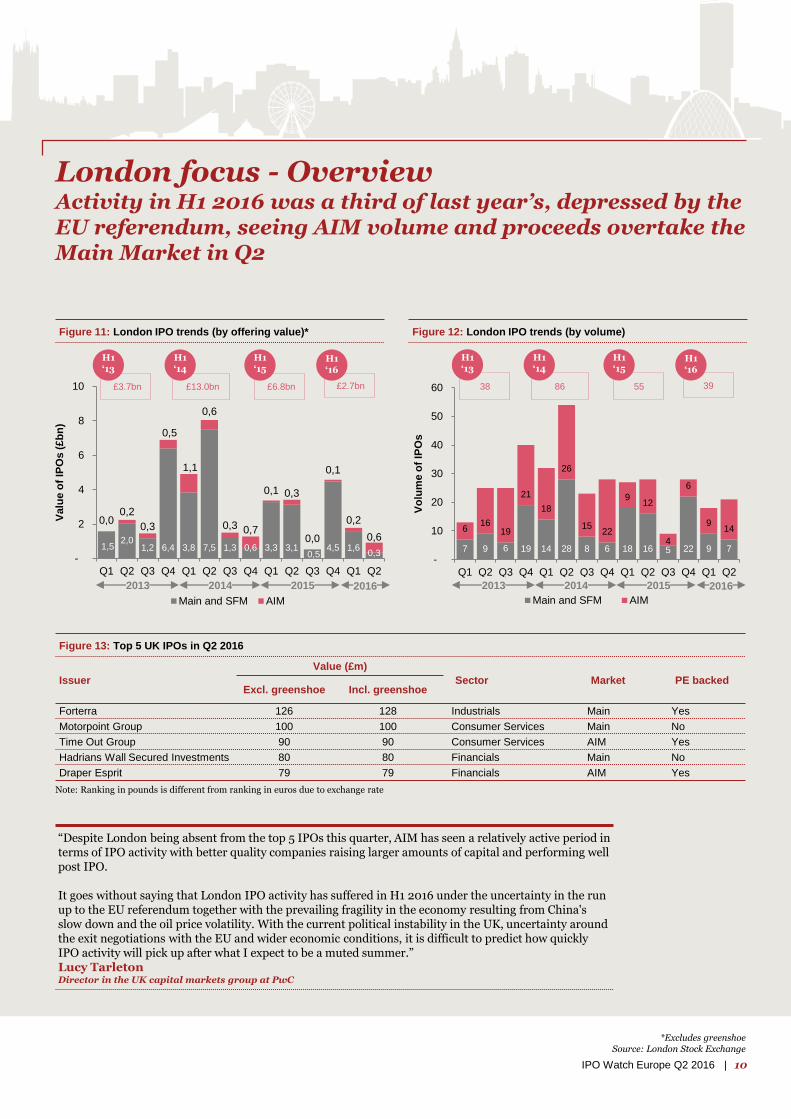
London focus - OverviewActivity in H1 2016 was a third of last year’s, depressed by the EU referendum, seeing AIM volume and proceeds overtake the Main Market in Q2
Figure 11: London IPO trends (by offering value)* Figure 12: London IPO trends (by volume)
7 9 6 19 14 28 8 6 18 16 5 22 9 7
616
19
21
18
26
1522
912
4
6
914
-
10
20
30
40
50
60
Q1 Q2 Q3 Q4 Q1 Q2 Q3 Q4 Q1 Q2 Q3 Q4 Q1 Q2
Vo
lum
e o
f IP
Os
Main and SFM AIM
1,52,0
1,2 6,4 3,8 7,5 1,3 0,6 3,3 3,10,5
4,5 1,60,3
0,00,2
0,3
0,5
1,1
0,6
0,3 0,7
0,1 0,3
0,0
0,1
0,2
0,6
-
2
4
6
8
10
Q1 Q2 Q3 Q4 Q1 Q2 Q3 Q4 Q1 Q2 Q3 Q4 Q1 Q2
Valu
e o
f IP
Os (
£b
n)
Main and SFM AIM
2013 2014 2015 2016
Issuer
Value (£m)
Sector Market PE backedExcl. greenshoe Incl. greenshoe
Forterra 126 128 Industrials Main Yes
Motorpoint Group 100 100 Consumer Services Main No
Time Out Group 90 90 Consumer Services AIM Yes
Hadrians Wall Secured Investments 80 80 Financials Main No
Draper Esprit 79 79 Financials AIM Yes
Figure 13: Top 5 UK IPOs in Q2 2016
*Excludes greenshoeSource: London Stock Exchange
“Despite London being absent from the top 5 IPOs this quarter, AIM has seen a relatively active period in terms of IPO activity with better quality companies raising larger amounts of capital and performing well post IPO.
It goes without saying that London IPO activity has suffered in H1 2016 under the uncertainty in the run up to the EU referendum together with the prevailing fragility in the economy resulting from China's slow down and the oil price volatility. With the current political instability in the UK, uncertainty around the exit negotiations with the EU and wider economic conditions, it is difficult to predict how quickly IPO activity will pick up after what I expect to be a muted summer.”Lucy TarletonDirector in the UK capital markets group at PwC
£3.7bn £13.0bn £6.8bn
H1‘13
H1‘14
H1‘15
£2.7bn
H1‘16
Note: Ranking in pounds is different from ranking in euros due to exchange rate
38 86 55
H1‘13
H1‘14
H1‘15
39
H1‘16
2013 2014 2015 2016
11 | IPO Watch Europe Q2 2016
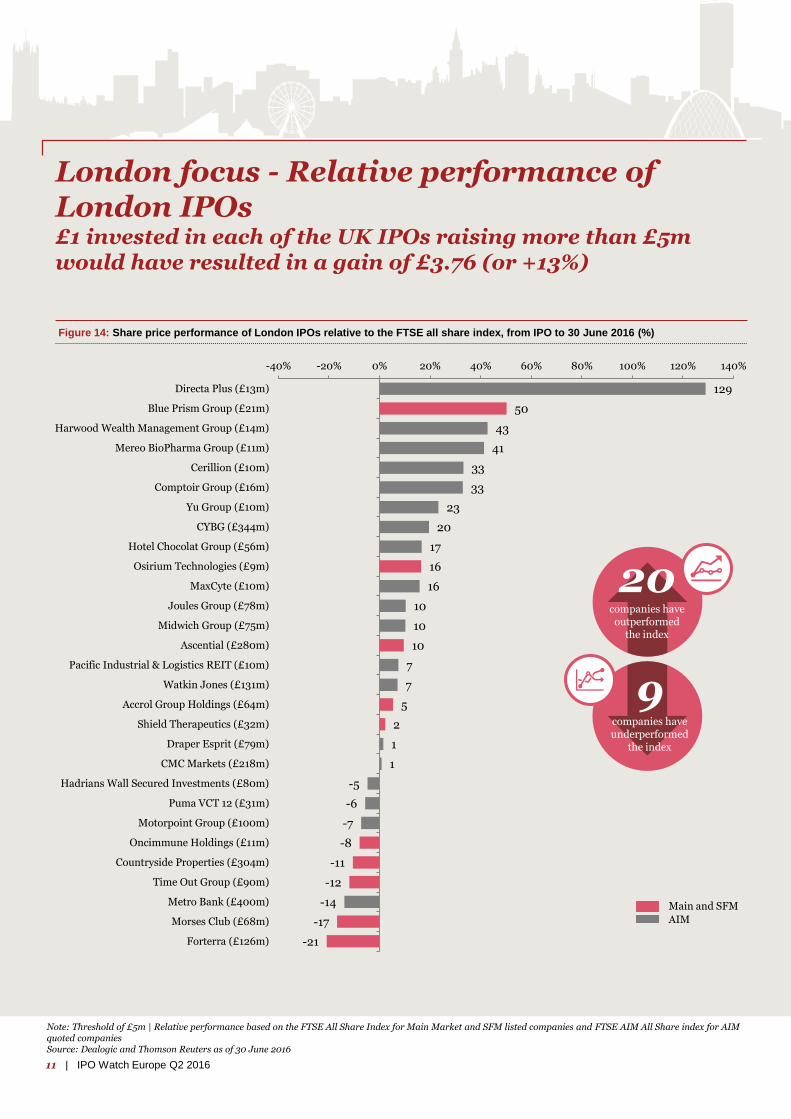
129
50
43
41
33
33
23
20
17
16
16
10
10
10
7
7
5
2
1
1
-5
-6
-7
-8
-11
-12
-14
-17
-21
-40% -20% 0% 20% 40% 60% 80% 100% 120% 140%
Directa Plus (£13m)
Blue Prism Group (£21m)
Harwood Wealth Management Group (£14m)
Mereo BioPharma Group (£11m)
Cerillion (£10m)
Comptoir Group (£16m)
Yu Group (£10m)
CYBG (£344m)
Hotel Chocolat Group (£56m)
Osirium Technologies (£9m)
MaxCyte (£10m)
Joules Group (£78m)
Midwich Group (£75m)
Ascential (£280m)
Pacific Industrial & Logistics REIT (£10m)
Watkin Jones (£131m)
Accrol Group Holdings (£64m)
Shield Therapeutics (£32m)
Draper Esprit (£79m)
CMC Markets (£218m)
Hadrians Wall Secured Investments (£80m)
Puma VCT 12 (£31m)
Motorpoint Group (£100m)
Oncimmune Holdings (£11m)
Countryside Properties (£304m)
Time Out Group (£90m)
Metro Bank (£400m)
Morses Club (£68m)
Forterra (£126m)
London focus - Relative performance of London IPOs£1 invested in each of the UK IPOs raising more than £5m would have resulted in a gain of £3.76 (or +13%)
Figure 14: Share price performance of London IPOs relative to the FTSE all share index, from IPO to 30 June 2016 (%)
Note: Threshold of £5m | Relative performance based on the FTSE All Share Index for Main Market and SFM listed companies and FTSE AIM All Share index for AIM quoted companies Source: Dealogic and Thomson Reuters as of 30 June 2016
9companies have underperformed
the index
20companies have outperformed
the index
Main and SFM
AIM
12IPO Watch Europe Q2 2016 |
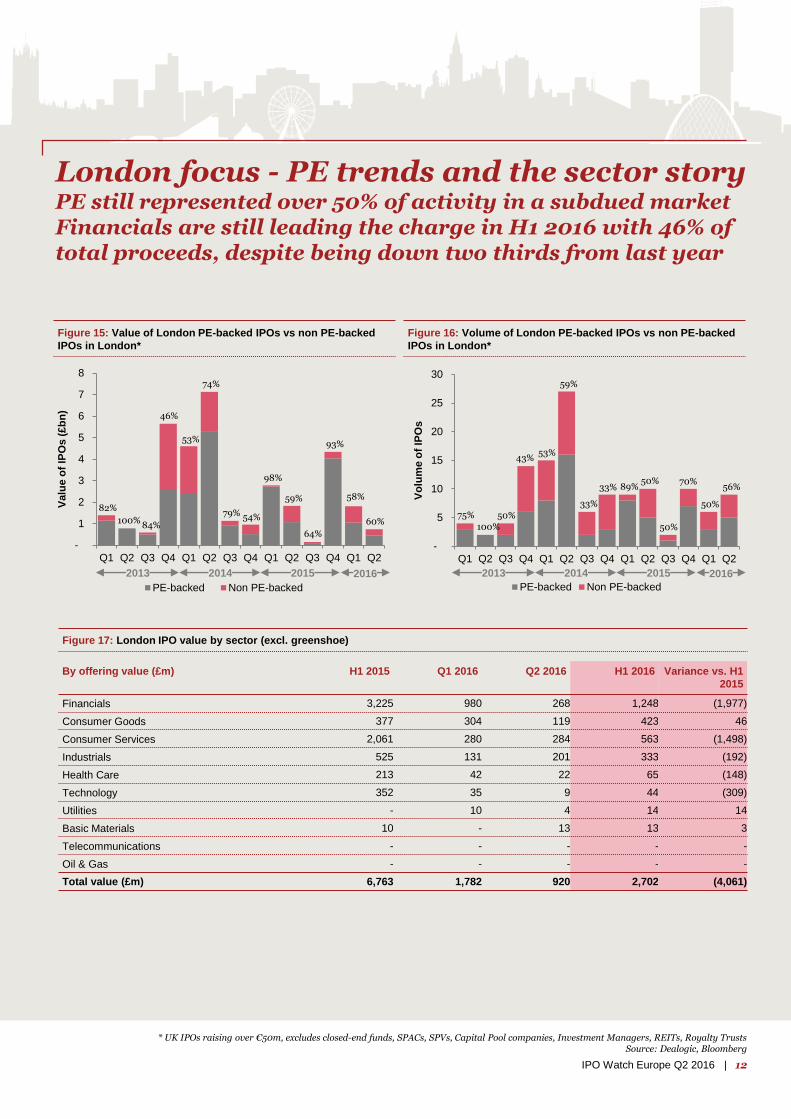
London focus - PE trends and the sector story PE still represented over 50% of activity in a subdued marketFinancials are still leading the charge in H1 2016 with 46% of total proceeds, despite being down two thirds from last year
Figure 16: Volume of London PE-backed IPOs vs non PE-backed
IPOs in London*
Figure 15: Value of London PE-backed IPOs vs non PE-backed
IPOs in London*
* UK IPOs raising over €50m, excludes closed-end funds, SPACs, SPVs, Capital Pool companies, Investment Managers, REITs, Royalty TrustsSource: Dealogic, Bloomberg
By offering value (£m) H1 2015 Q1 2016 Q2 2016 H1 2016 Variance vs. H1
2015
Financials 3,225 980 268 1,248 (1,977)
Consumer Goods 377 304 119 423 46
Consumer Services 2,061 280 284 563 (1,498)
Industrials 525 131 201 333 (192)
Health Care 213 42 22 65 (148)
Technology 352 35 9 44 (309)
Utilities - 10 4 14 14
Basic Materials 10 - 13 13 3
Telecommunications - - - - -
Oil & Gas - - - - -
Total value (£m) 6,763 1,782 920 2,702 (4,061)
Figure 17: London IPO value by sector (excl. greenshoe)
-
5
10
15
20
25
30
Q1 Q2 Q3 Q4 Q1 Q2 Q3 Q4 Q1 Q2 Q3 Q4 Q1 Q2
Vo
lum
e o
f IP
Os
PE-backed Non PE-backed
-
1
2
3
4
5
6
7
8
Q1 Q2 Q3 Q4 Q1 Q2 Q3 Q4 Q1 Q2 Q3 Q4 Q1 Q2
Valu
e o
f IP
Os (
£b
n)
PE-backed Non PE-backed
82%
100%84%
46%
53%
74%
79% 54%
98%
59%
64%
93%
58%
75%
100%
50%
43%53%
59%
33%
33% 89%50%
50%
70%
50%
60%
56%
2013 2014 2015 2016 2013 2014 2015 2016
13 | IPO Watch Europe Q2 2016
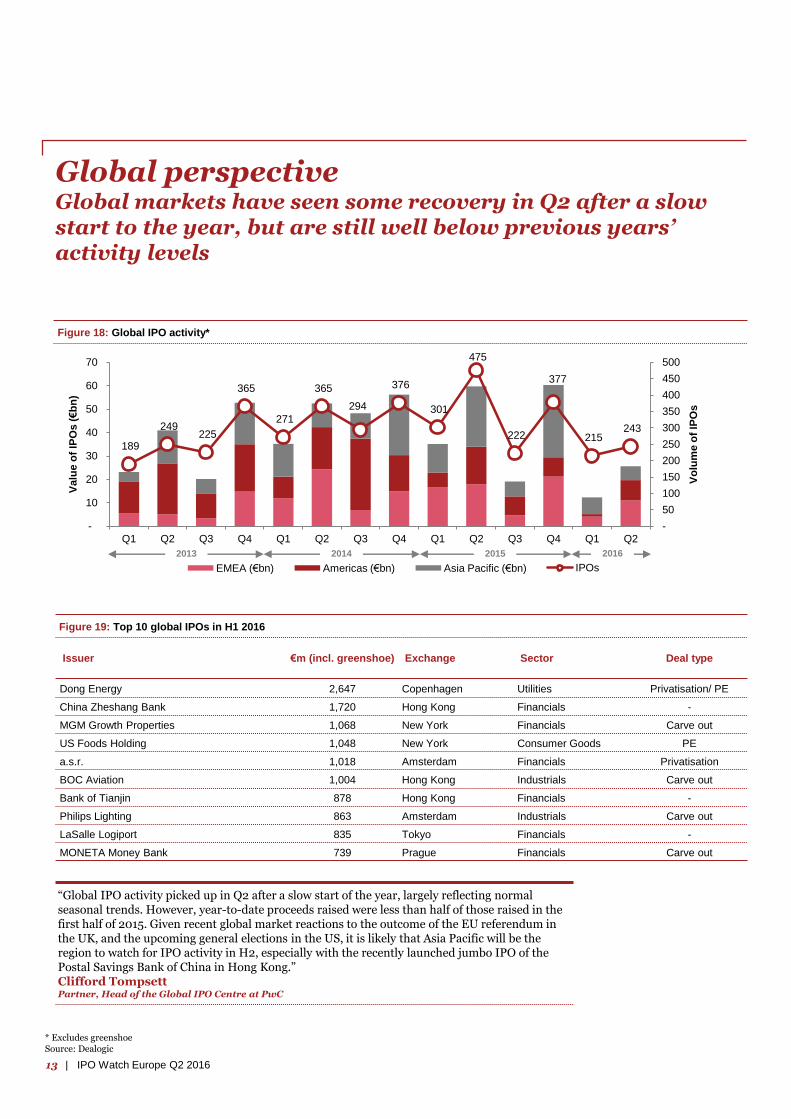
Global perspective Global markets have seen some recovery in Q2 after a slow start to the year, but are still well below previous years’ activity levels
Figure 18: Global IPO activity*
189
249 225
365
271
365
294
376
301
475
222
377
215 243
-
50
100
150
200
250
300
350
400
450
500
-
10
20
30
40
50
60
70
Q1 Q2 Q3 Q4 Q1 Q2 Q3 Q4 Q1 Q2 Q3 Q4 Q1 Q2
Vo
lum
e o
f IP
Os
Valu
e o
f IP
Os (€b
n)
EMEA (€bn) Americas (€bn) Asia Pacific (€bn) IPOs
* Excludes greenshoeSource: Dealogic
Issuer €m (incl. greenshoe) Exchange Sector Deal type
Dong Energy 2,647 Copenhagen Utilities Privatisation/ PE
China Zheshang Bank 1,720 Hong Kong Financials -
MGM Growth Properties 1,068 New York Financials Carve out
US Foods Holding 1,048 New York Consumer Goods PE
a.s.r. 1,018 Amsterdam Financials Privatisation
BOC Aviation 1,004 Hong Kong Industrials Carve out
Bank of Tianjin 878 Hong Kong Financials -
Philips Lighting 863 Amsterdam Industrials Carve out
LaSalle Logiport 835 Tokyo Financials -
MONETA Money Bank 739 Prague Financials Carve out
Figure 19: Top 10 global IPOs in H1 2016
2013 2014 2015 2016
“Global IPO activity picked up in Q2 after a slow start of the year, largely reflecting normal seasonal trends. However, year-to-date proceeds raised were less than half of those raised in the first half of 2015. Given recent global market reactions to the outcome of the EU referendum in the UK, and the upcoming general elections in the US, it is likely that Asia Pacific will be the region to watch for IPO activity in H2, especially with the recently launched jumbo IPO of the Postal Savings Bank of China in Hong Kong.”Clifford TompsettPartner, Head of the Global IPO Centre at PwC
14IPO Watch Europe Q2 2016 |
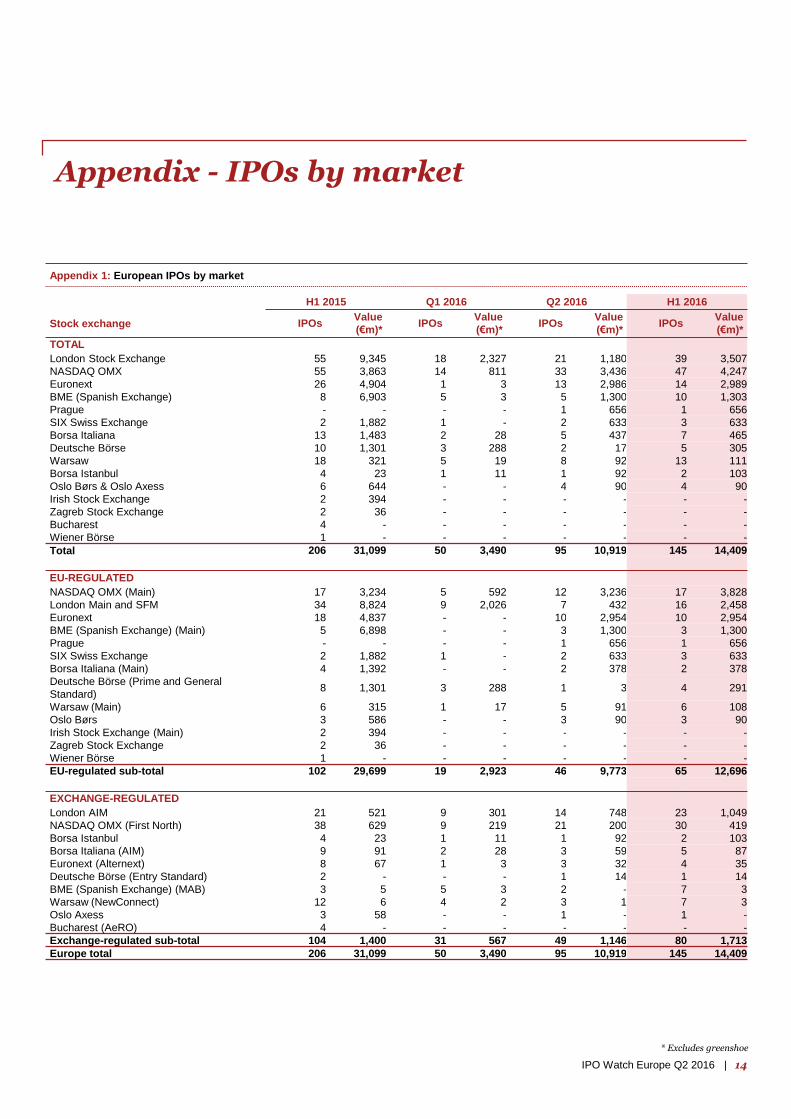
Appendix - IPOs by market
* Excludes greenshoe
Appendix 1: European IPOs by market
H1 2015 Q1 2016 Q2 2016 H1 2016
Stock exchange IPOs Value
(€m)* IPOs
Value
(€m)* IPOs
Value
(€m)* IPOs
Value
(€m)*
TOTAL
London Stock Exchange 55 9,345 18 2,327 21 1,180 39 3,507
NASDAQ OMX 55 3,863 14 811 33 3,436 47 4,247
Euronext 26 4,904 1 3 13 2,986 14 2,989
BME (Spanish Exchange) 8 6,903 5 3 5 1,300 10 1,303
Prague - - - - 1 656 1 656
SIX Swiss Exchange 2 1,882 1 - 2 633 3 633
Borsa Italiana 13 1,483 2 28 5 437 7 465
Deutsche Börse 10 1,301 3 288 2 17 5 305
Warsaw 18 321 5 19 8 92 13 111
Borsa Istanbul 4 23 1 11 1 92 2 103
Oslo Børs & Oslo Axess 6 644 - - 4 90 4 90
Irish Stock Exchange 2 394 - - - - - -
Zagreb Stock Exchange 2 36 - - - - - -
Bucharest 4 - - - - - - -
Wiener Börse 1 - - - - - - -
Total 206 31,099 50 3,490 95 10,919 145 14,409
EU-REGULATED
NASDAQ OMX (Main) 17 3,234 5 592 12 3,236 17 3,828
London Main and SFM 34 8,824 9 2,026 7 432 16 2,458
Euronext 18 4,837 - - 10 2,954 10 2,954
BME (Spanish Exchange) (Main) 5 6,898 - - 3 1,300 3 1,300
Prague - - - - 1 656 1 656
SIX Swiss Exchange 2 1,882 1 - 2 633 3 633
Borsa Italiana (Main) 4 1,392 - - 2 378 2 378
Deutsche Börse (Prime and General
Standard) 8 1,301 3 288 1 3 4 291
Warsaw (Main) 6 315 1 17 5 91 6 108
Oslo Børs 3 586 - - 3 90 3 90
Irish Stock Exchange (Main) 2 394 - - - - - -
Zagreb Stock Exchange 2 36 - - - - - -
Wiener Börse 1 - - - - - - -
EU-regulated sub-total 102 29,699 19 2,923 46 9,773 65 12,696
EXCHANGE-REGULATED
London AIM 21 521 9 301 14 748 23 1,049
NASDAQ OMX (First North) 38 629 9 219 21 200 30 419
Borsa Istanbul 4 23 1 11 1 92 2 103
Borsa Italiana (AIM) 9 91 2 28 3 59 5 87
Euronext (Alternext) 8 67 1 3 3 32 4 35
Deutsche Börse (Entry Standard) 2 - - - 1 14 1 14
BME (Spanish Exchange) (MAB) 3 5 5 3 2 - 7 3
Warsaw (NewConnect) 12 6 4 2 3 1 7 3
Oslo Axess 3 58 - - 1 - 1 -
Bucharest (AeRO) 4 - - - - - - -
Exchange-regulated sub-total 104 1,400 31 567 49 1,146 80 1,713
Europe total 206 31,099 50 3,490 95 10,919 145 14,409
15 | IPO Watch Europe Q2 2016
*Excludes greenshoe
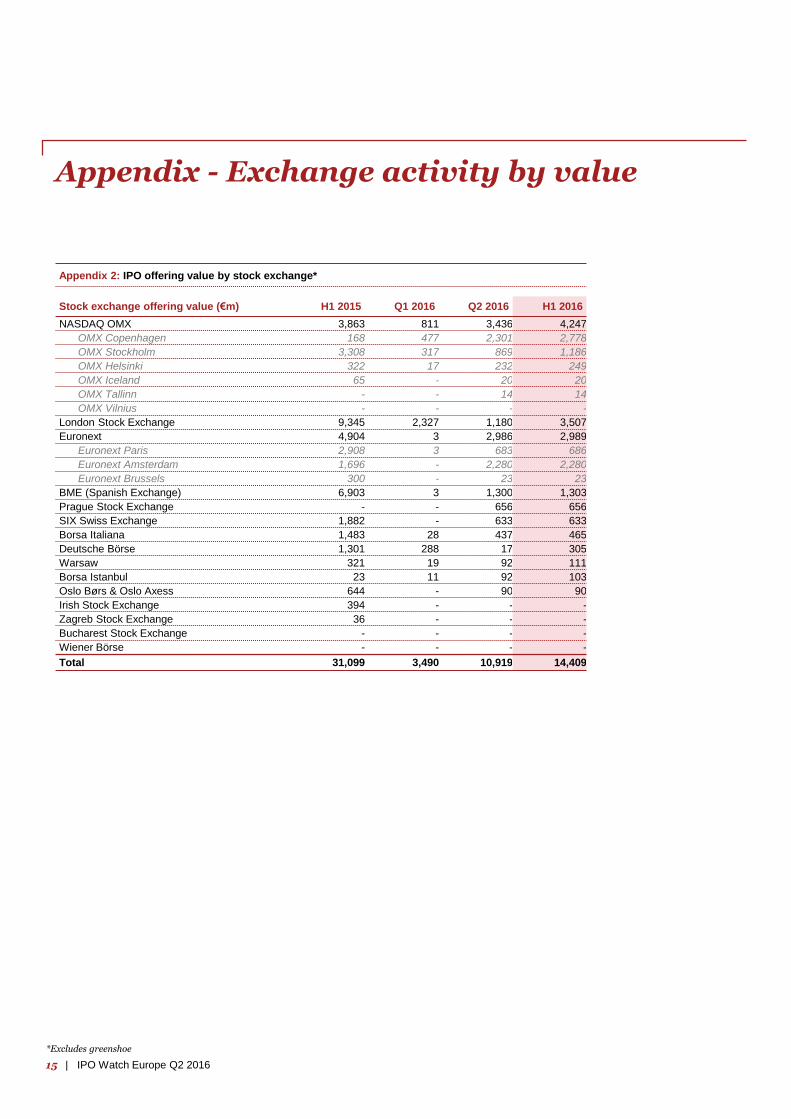
Appendix - Exchange activity by value
Stock exchange offering value (€m) H1 2015 Q1 2016 Q2 2016 H1 2016
NASDAQ OMX 3,863 811 3,436 4,247
OMX Copenhagen 168 477 2,301 2,778
OMX Stockholm 3,308 317 869 1,186
OMX Helsinki 322 17 232 249
OMX Iceland 65 - 20 20
OMX Tallinn - - 14 14
OMX Vilnius - - - -
London Stock Exchange 9,345 2,327 1,180 3,507
Euronext 4,904 3 2,986 2,989
Euronext Paris 2,908 3 683 686
Euronext Amsterdam 1,696 - 2,280 2,280
Euronext Brussels 300 - 23 23
BME (Spanish Exchange) 6,903 3 1,300 1,303
Prague Stock Exchange - - 656 656
SIX Swiss Exchange 1,882 - 633 633
Borsa Italiana 1,483 28 437 465
Deutsche Börse 1,301 288 17 305
Warsaw 321 19 92 111
Borsa Istanbul 23 11 92 103
Oslo Børs & Oslo Axess 644 - 90 90
Irish Stock Exchange 394 - - -
Zagreb Stock Exchange 36 - - -
Bucharest Stock Exchange - - - -
Wiener Börse - - - -
Total 31,099 3,490 10,919 14,409
Appendix 2: IPO offering value by stock exchange*
16IPO Watch Europe Q2 2016 |
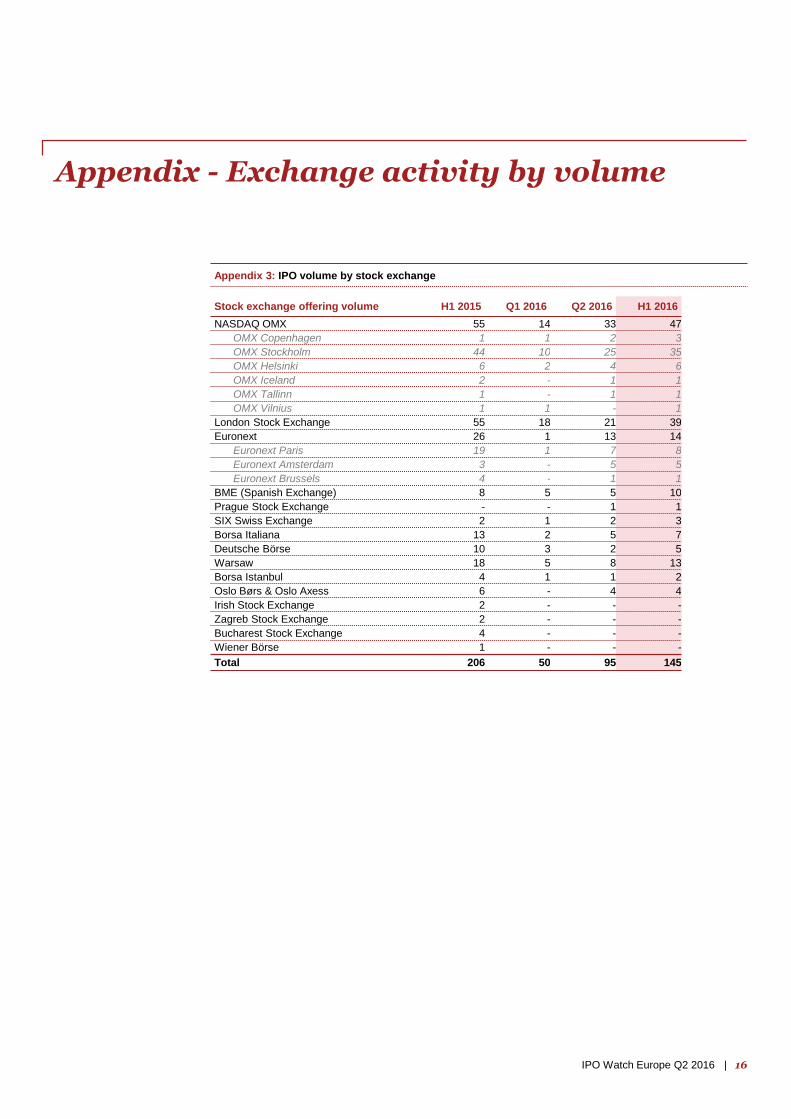
Stock exchange offering volume H1 2015 Q1 2016 Q2 2016 H1 2016
NASDAQ OMX 55 14 33 47
OMX Copenhagen 1 1 2 3
OMX Stockholm 44 10 25 35
OMX Helsinki 6 2 4 6
OMX Iceland 2 - 1 1
OMX Tallinn 1 - 1 1
OMX Vilnius 1 1 - 1
London Stock Exchange 55 18 21 39
Euronext 26 1 13 14
Euronext Paris 19 1 7 8
Euronext Amsterdam 3 - 5 5
Euronext Brussels 4 - 1 1
BME (Spanish Exchange) 8 5 5 10
Prague Stock Exchange - - 1 1
SIX Swiss Exchange 2 1 2 3
Borsa Italiana 13 2 5 7
Deutsche Börse 10 3 2 5
Warsaw 18 5 8 13
Borsa Istanbul 4 1 1 2
Oslo Børs & Oslo Axess 6 - 4 4
Irish Stock Exchange 2 - - -
Zagreb Stock Exchange 2 - - -
Bucharest Stock Exchange 4 - - -
Wiener Börse 1 - - -
Total 206 50 95 145
Appendix - Exchange activity by volume
Appendix 3: IPO volume by stock exchange
This publication has been prepared for general guidance on matters of interest only, and does not constitute professional
advice. You should not act upon the information contained in this publication without obtaining specific professional advice.
No representation or warranty (express or implied) is given as to the accuracy or completeness of the information contained in
this publication, and, to the extent permitted by law, PricewaterhouseCoopers LLP, its members, employees and agents do
not accept or assume any liability, responsibility or duty of care for any consequences of you or anyone else acting, or
refraining to act, in reliance on the information contained in this publication or for any decision based on it.
© 2016 PricewaterhouseCoopers LLP. All rights reserved. In this document, “PwC” refers to PricewaterhouseCoopers LLP
which is a member firm of PricewaterhouseCoopers International Limited, each member firm of which is a separate legal
entity.
Contacts
IPO Watch Europe surveys all new primary market equity IPOs on Europe’s principal stock markets and market segments (including exchanges in the EU, Iceland Norway, Turkey and Switzerland) on a quarterly basis. Movements between markets on the same exchange are excluded.
This survey was conducted between 1 April and 30 June 2016 and captures IPOs based on their first trading date. All market data is sourced from the stock markets themselves and has not been independently verified by PricewaterhouseCoopers LLP.
About IPO Watch Europe
Katherine Howbrook (Press office)+44 (0) 20 7212 [email protected]
Mark Hughes (Partner, UK Capital Markets leader)+44 (0) 20 7804 [email protected]
Vivienne Maclachlan (Director, Capital Markets)+44 (0) 20 7804 [email protected]
Lucy Tarleton (Director, Capital Markets)+44 (0) 20 7212 [email protected]
17 | IPO Watch Europe Q2 2016


![Französische Übersetzung des IPO von Johann … · ii ipo = § 2 ipm] Il y aura de part & d’autre un oubli perpétuël & une amnistie générale de tout ce qui a été fait depuis](https://img.pdfslide.org/doc/110x75/5b9b388e09d3f291158cc9ca/franzoesische-uebersetzung-des-ipo-von-johann-ii-ipo-2-ipm-il-y-aura-de.jpg)