Embed Size (px)
Citation preview
Astronomy & Astrophysics AA/2018/32789 – accepted 11/11/2018 output c©ESO 2018November 26, 2018
From Solar to Stellar Flare Characteristics
- On a new Peak Size Distribution for G-, K- and M-Dwarf Star Flares -
Konstantin Herbst1, Athanasios Papaioannou2, Saša Banjac1, and Bernd Heber1
1 Institut für Experimentelle und Angewandte Physik, Christian-Albrechts-Universität zu Kiel, 24118 Kiel, Germanye-mail: [email protected]
2 Institute for Astronomy, Astrophysics, Space Applications and Remote Sensing (IAASARS), National Observatory of Athens, I.Metaxa & Vas. Pavlou St., 15236 Penteli, Greece
ABSTRACT
Context. The connection between solar energetic proton events and X-ray flares has been the focus of many studies over the pastthirteen years. In the course of these investigations several peak size distribution functions based on GOES measurements of bothquantities have been developed (see, e.g., Belov et al. 2005, 2007; Cliver et al. 2012). In more recent studies (see, e.g., Segura et al.2010; Tilley et al. 2017) one of those functions has been used to estimate the stellar proton fluence around the M-dwarf star ADLeonis. However, a comparison of the existing peak size distribution functions reveals strong discrepancies with respect to each other.Aims. The aim of this paper is to derive a new peak size distribution function, which can be utilized to give a more realistic estimateof the stellar proton flux of G-, K- and M-dwarf stars.Methods. By updating and extending the GOES-based peak size distribution down to B-class X-ray flare intensities with the help ofSphinX data from the solar minimum conditions of 2009 and newly derived GOES data between 1975 and 2005 a new power-law peaksize distribution function for solar protons fluxes (E>10 MeV) is developed. However, it’s resulting slope differs from values reportedin literature (see, e.g., Belov et al. 2005, 2007; Cliver et al. 2012; Cliver & D’Huys 2018). Therefore, also a double-power-law peaksize distribution function is developed. An extension to much higher X-ray flare intensities (10−1) W/m2 and above, for the first time,results in an approximation of best and worst case scenarios of the stellar proton flux around G-, K- and M-dwarf stars.Results. Investigating the impact of the newly developed peak size distribution function for G-, K- and M-dwarf star flare intensitieswe show that in case of the worst case scenario previous studies may underestimate the stellar proton flux by roughly one to fiveorders of magnitude.
Key words. Sun:flares — Sun:particle emission — Sun:X-Rays, Gamma Rays — stars:flares
1. Introduction
Solar energetic particle (SEP) events originate from solar flares(SFs) and/or coronal mass ejections (CMEs) and are divided intotwo classes: the impulsive and gradual ones. Whether or not anevent is classified as impulsive or gradual strongly depends on itsparent solar source (i.e., SF, CME, see Reames 1999, 2013, forfurther information). While impulsive SEP events are most likelyassociated with SFs (see, e.g., Klein & Posner 2005) originat-ing in resonant stochastic acceleration or magnetic reconnection(Aschwanden 2002) particles in gradual events may be acceler-ated by CME-driven shocks (Reames 1999; Kahler 2001; Cane& Lario 2006).
However, observations have indicated that these two cate-gories are not able to cover the variety of the observed SEP eventproperties (Cane et al. 2010; Papaioannou et al. 2016), and thata third class of so-called hybrid events exists during which bothSFs and CME- driven shocks accelerate particles that contributeto large SEP events (see, e.g., Kocharov & Torsti 2002; Kallen-rode 2003). Although these hybrid events may look like gradualevents they also show properties of impulsive events (see, e.g.,Vainio et al. 2007), which may either result from acceleration ofremnant ions at shock waves (Reames 2002) or from interactionsof CMEs (Gopalswamy et al. 2002; Kahler & Vourlidas 2014).
An armada of spacecraft widely distributed in heliolongitudehave allowed the observation of SEP events filling a very broadregion around the Sun. Thereby, SEP events have been observedover a wide range of longitudes (see, e.g., Richardson et al. 2014;Dresing et al. 2014; Lario et al. 2016). Possible interpretationsof the resulting widespread events include the propagation ofCME-driven shocks that are able to inject SEPs over broad an-gular regions (Rouillard et al. 2012; Lario et al. 2016), cross-field diffusion (Dresing et al. 2012; Dröge et al. 2014) and/or theperpendicular transport of particles through processes other thandiffusion (Wiedenbeck et al. 2012).
Thus, in order to decode the characteristics of SEP events itis mandatory to establish empirical and/or semi- empirical sta-tistical relations between the characteristics (e.g., peak flux, du-ration, fluence) of the SEP event and the observed properties ofthe parent solar events (see, e.g., Belov et al. 2005; Cliver et al.2012; Papaioannou et al. 2016).
It has been shown that peak size distributions (PSDs) of so-lar flares that are associated to SEP events follow a power law:f (x) ≈ x−α (Hudson 1978; Belov et al. 2005). This representa-tion of the relation between solar flares and SEP events points tothe fact that X-ray and charged particle fluxes, originating fromthe same solar event, have an almost linear relation. These dis-tribution functions depend on several different factors such as,e.g., the sample used in the analysis and the employed binning.
Article number, page 1 of 10
A&A proofs: manuscript no. output
This has led to differences of the derived slope (i.e. different αparameters) that consequently lead to differences in the expected>10 MeV peak proton flux values.
These relations also become important for studies of ex-trasolar environments for instance, e.g., the radiation environ-ment around cool K- and M-dwarf stars. Because their Habit-able Zone (HZ) is at small orbital separations a detection of or-biting planets within it becomes highly likely. Thus, these starsare favored targets to investigate (Earth-like) rocky exoplanetsby spectroscopy, which will be the focus of future missions likethe James Webb Space Telescope (JWST, see, e.g., Gardner et al.2006) or the European Extremely Large Telescope (E-ELT, see,e.g., Gilmozzi & Spyromilio 2007) with focus on the search forbiogenic molecules, the so-called biosignatures. Hence, in orderto understand the upcoming measurements to best extent, theeffects of (Extreme) Ultraviolet - (E)UV - radiation (spanningwavelengths from 124 nm down to 10 nm) and stellar energeticparticles on the atmospheric climate and chemistry have to bestudied. This has been the focus of numerous recent studies thatare set out to explore the habitability of exoplanets (see, e.g.,Shields et al. 2016; Robinson 2017; Lingam & Loeb 2017).
However, although it is not possible to measure SEP-relatedstellar proton fluxes directly, a solar peak size distribution func-tion might be used to quantify the expected radiation environ-ment based on stellar X-rays (see, e.g., Segura et al. 2010). Itshould also be noted that a) stellar CMEs (Odert et al. 2017),b) the relation between CMEs-flares to other stellar systems(Moschou et al. 2017a,b), and c) the identification of the ex-pected size of the exoplanetary magnetospheres (Patsourakos &Georgoulis 2017) are currently under investigation by the scien-tific community, which highlights the wealth of ideas and effortsthat solar and space physics can bring to the exoplanet researchfocus.
Our investigation was initiated by the identification of largedifferences between the published peak size distribution func-tions that have been widely used in the solar-space community.However, also stellar and exoplanetary research efforts quite re-cently utilized PSDs to, e.g., estimate the impact of stellar cos-mic rays on the exoplanetary atmospheric chemistry (see, e.g.,Segura et al. 2010; Tilley et al. 2017). We will show that drawnconclusions are subject to the choice of the PSD function.
In this study we will: (i) first, cross-compare and evaluatethe different functions that are available in literature (see Belovet al. 2005, 2007; Cliver et al. 2012, based on the E > 10 MeVGOES data), and (ii) second, investigate the extention of thepeak-size distributions of proton fluxes and associated soft X-Ray flares from Q to >X10-class. In order to do so, we willemploy new data from the Solar Photometer in X-rays (SphinX)mission aboard the Complex Orbital Observations Near-Earth ofActivity of the Sun-Photon (CORONAS-Photon) spacecraft (seeGryciuk et al. 2017) that measured the X-ray flux during the so-lar minimum of 2009 and we shall further utilize results fromCane et al. (2010).
Based on these measurements, we will show that a new ana-lytic distribution function is needed in order to properly describethe peak X-ray intensity to peak proton flux relationship forflares below the C-class flares. Furthermore, we will use the pro-posed distribution function to describe not only the solar but alsothe stellar soft X-ray peak-flux to proton peak-flux relationshipof G-, K- and M-dwarf star. Our findings shall be compared toprevious studies (see, e.g., Segura et al. 2010; Youngblood et al.2016; Tilley et al. 2017) pointing towards a cross-quantificationof the stellar proton fluxes and their corresponding fluences.
2. Data used in the analysis
2.1. SphinX and its Publicly Available Flare List
SphinX, a spectrophotometer on board the CORONAS-Photonsatellite (Kotov 2011), observed the solar soft X-ray emissionduring the period of extremely low solar activity of 2009 witha time resolution of 1–5 sec (Sylwester et al. 2008, 2011, 2012;Gburek et al. 2011a,b, 2013; Kowalinski 2012). Thereby, the de-tectors observed the solar soft X-ray emission in an energy rangesimilar to that of GOES (1–8 Å) by covering 1.2 to 15 keV (0.8–10 Å). Launched on 30 January, 2009 the spacecraft was put intoa low polar orbit at an altitude of 550 km with an inclination of82.5 degrees. Although the mission was terminated unexpect-edly at the end of 2009, SphinX (almost) continuously measuredthe X-ray flux between February 22 and November 29, 2009.
In 2009, SphinX was the only instrument that reliably mea-sured the solar X-ray emission with high temporal and energyresolution. The sensitivity level of SphinX, thereby, was almosta factor of 100 lower than what can be achieved with GOES (around 3.73·10−9 W/m2). Therewith, multiple events could beobserved at levels never measured before. According to Gryciuket al. (2017), within its nine-month operation more than 1600 X-ray flares were detected. In addition to the known flare classes(A, B, C, M and X), which represent flux values between 1·10−8
and 1·10−4 W/m2 (see, e.g., Lang 2001), Gryciuk et al. (2017) in-troduced two new flare classes: S ("small" = 1·10−9 W/m2) andQ ("quiet" = 1·10−10 W/m2).
Based on the SphinX flare list, we generated a flare catalogof 93 Q-, 150 S-, 154 A-, 59 B- and three C-class flares for thesolar minimum of 2009 including the corresponding GOES pro-ton fluxes available at http://www.ieap.uni-kiel.de/et/ag-heber/SphinX.
2.2. Peak Proton Flux Data
In order to investigate the soft X-Ray flares and their associatedproton peak-size distributions, we correlated the measured X-rayfluxes to the > 10 MeV integral proton fluxes that are calcu-lated by the differential proton measurements1. These measure-ments are routinely made by the Energetic Particle Sensor (EPS)– one of the four instruments of the Space Environment Monitor(SEM) – on board the Geostationary Operational EnvironmentalSatellites (GOES) (Onsager et al. 1996).
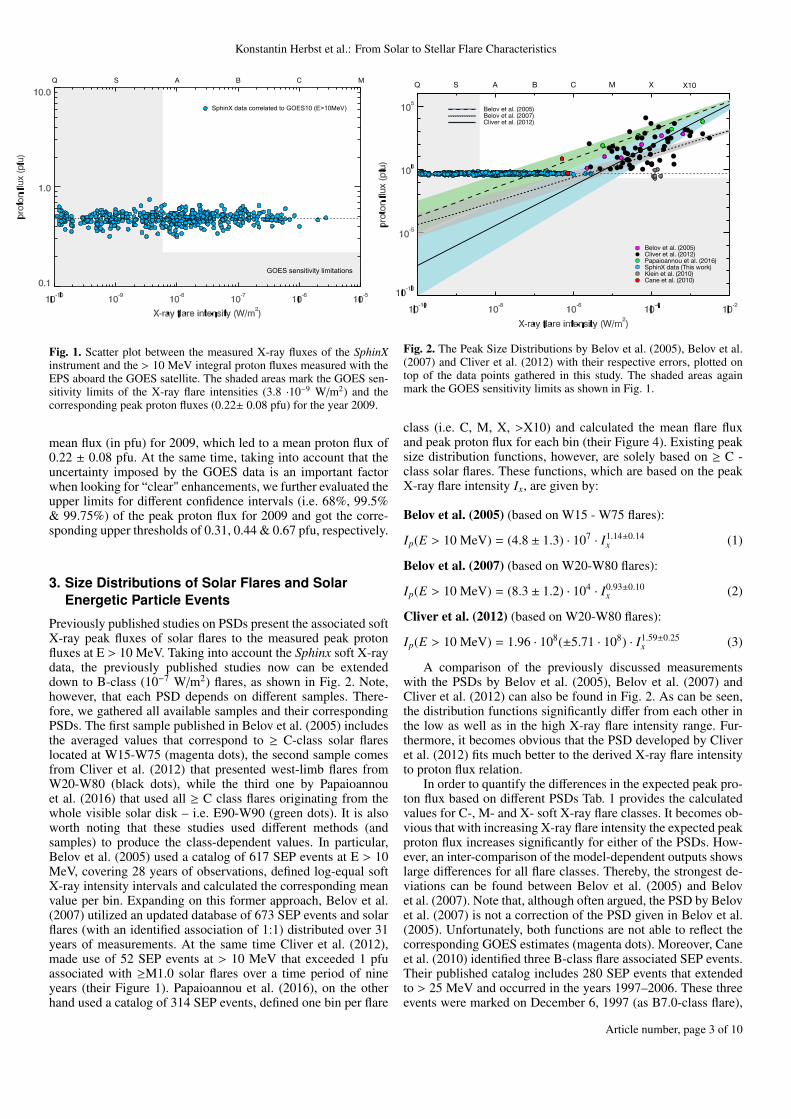
Thus, we first retrieved the 5-min averaged integral protonflux > 10 MeV data from https://satdat.ngdc.noaa.gov/sem/goes/data/. The solar flares identified in the Sphinx flarecatalog did not result to a considerable enhancement in the inte-grated GOES proton fluxes above 10, 50 and 100 MeV (availableat https://satdat.ngdc.noaa.gov/sem/goes/data/new_plots/). Therefore, we evaluated the background and standarddeviation of the proton fluxes during a time interval of four hoursafter the soft X-ray peak for the selected flares. The upper limitof the GOES proton intensity was consequently set as three stan-dard deviations above background (see Klein et al. 2010). As canbe seen in Fig. 1 this results in a population with a mean protonflux value of 0.485 pfu (dashed line). Additionally, we evaluatedthe sensitivity level of GOES for the same time period. There-fore, we used 5-min averaged data and calculated the observed
1 The differential proton flux at a set of different energy channels(ranges) per unit solid angle are measured in particles / cm2 s sec MeV.The integral proton fluxes utilized in our study result from the integra-tion of the product of these differential proton fluxes and their unit ispfu (particle flux unit), i.e. particles / cm2 s sec
Article number, page 2 of 10
Konstantin Herbst et al.: From Solar to Stellar Flare Characteristics
GOES sensitivity limitations
SphinX data correlated to GOES10 (E>10MeV)
MCBASQ
Fig. 1. Scatter plot between the measured X-ray fluxes of the SphinXinstrument and the > 10 MeV integral proton fluxes measured with theEPS aboard the GOES satellite. The shaded areas mark the GOES sen-sitivity limits of the X-ray flare intensities (3.8 ·10−9 W/m2) and thecorresponding peak proton fluxes (0.22± 0.08 pfu) for the year 2009.
mean flux (in pfu) for 2009, which led to a mean proton flux of0.22 ± 0.08 pfu. At the same time, taking into account that theuncertainty imposed by the GOES data is an important factorwhen looking for “clear" enhancements, we further evaluated theupper limits for different confidence intervals (i.e. 68%, 99.5%& 99.75%) of the peak proton flux for 2009 and got the corre-sponding upper thresholds of 0.31, 0.44 & 0.67 pfu, respectively.
3. Size Distributions of Solar Flares and SolarEnergetic Particle Events
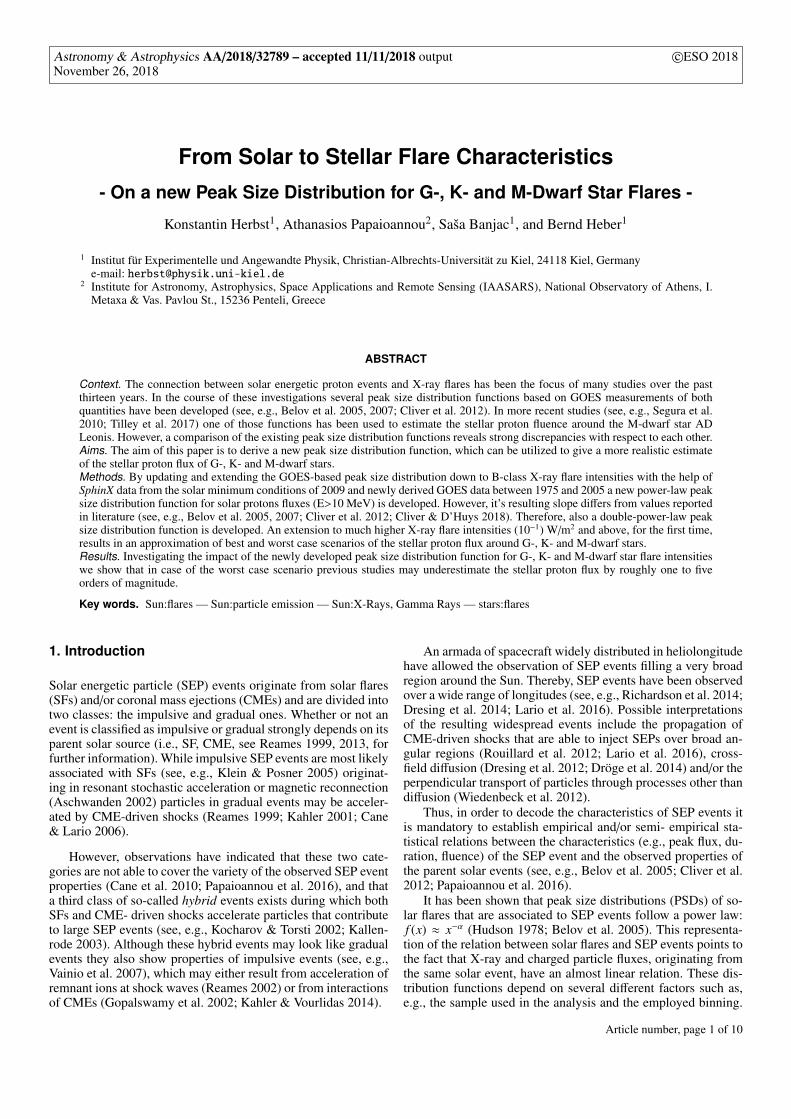
Previously published studies on PSDs present the associated softX-ray peak fluxes of solar flares to the measured peak protonfluxes at E > 10 MeV. Taking into account the Sphinx soft X-raydata, the previously published studies now can be extendeddown to B-class (10−7 W/m2) flares, as shown in Fig. 2. Note,however, that each PSD depends on different samples. There-fore, we gathered all available samples and their correspondingPSDs. The first sample published in Belov et al. (2005) includesthe averaged values that correspond to ≥ C-class solar flareslocated at W15-W75 (magenta dots), the second sample comesfrom Cliver et al. (2012) that presented west-limb flares fromW20-W80 (black dots), while the third one by Papaioannouet al. (2016) that used all ≥ C class flares originating from thewhole visible solar disk – i.e. E90-W90 (green dots). It is alsoworth noting that these studies used different methods (andsamples) to produce the class-dependent values. In particular,Belov et al. (2005) used a catalog of 617 SEP events at E > 10MeV, covering 28 years of observations, defined log-equal softX-ray intensity intervals and calculated the corresponding meanvalue per bin. Expanding on this former approach, Belov et al.(2007) utilized an updated database of 673 SEP events and solarflares (with an identified association of 1:1) distributed over 31years of measurements. At the same time Cliver et al. (2012),made use of 52 SEP events at > 10 MeV that exceeded 1 pfuassociated with ≥M1.0 solar flares over a time period of nineyears (their Figure 1). Papaioannou et al. (2016), on the otherhand used a catalog of 314 SEP events, defined one bin per flare
Belov et al. (2005)Belov et al. (2007)Cliver et al. (2012)
Belov et al. (2005)Cliver et al. (2012)Papaioannou et al. (2016)SphinX data (This work)Klein et al. (2010)Cane et al. (2010)
X X10MCBASQ
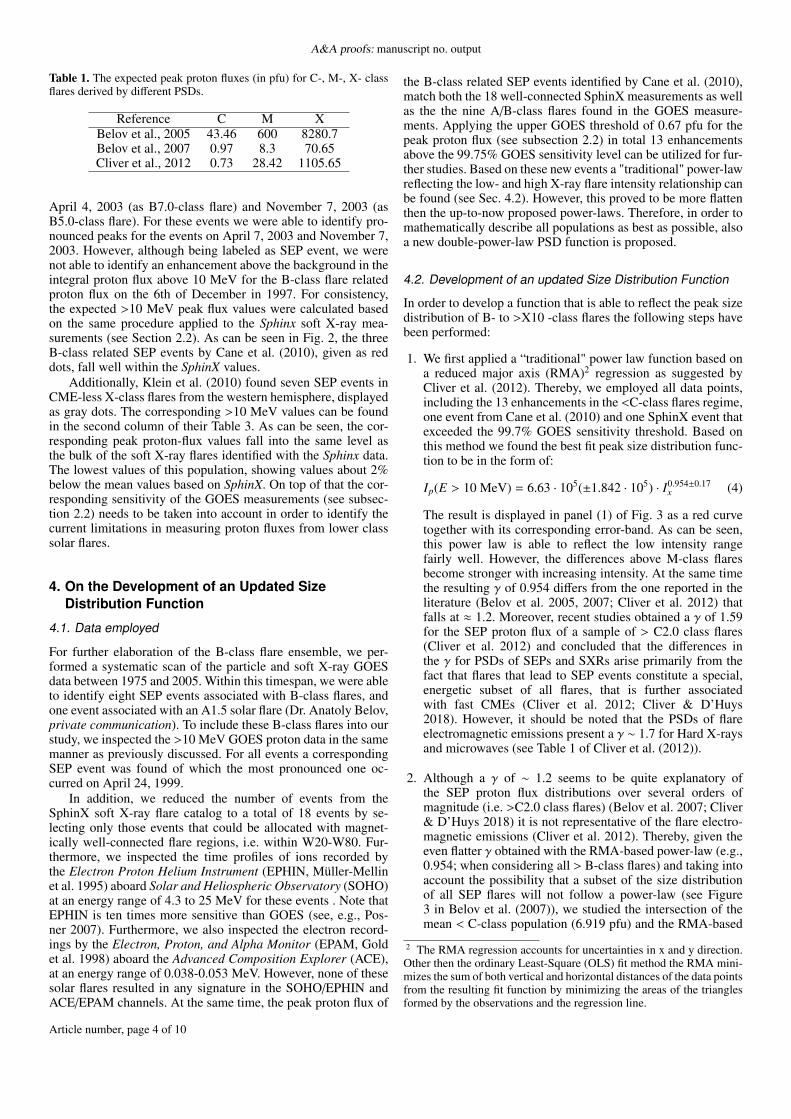
Fig. 2. The Peak Size Distributions by Belov et al. (2005), Belov et al.(2007) and Cliver et al. (2012) with their respective errors, plotted ontop of the data points gathered in this study. The shaded areas againmark the GOES sensitivity limits as shown in Fig. 1.
class (i.e. C, M, X, >X10) and calculated the mean flare fluxand peak proton flux for each bin (their Figure 4). Existing peaksize distribution functions, however, are solely based on ≥ C -class solar flares. These functions, which are based on the peakX-ray flare intensity Ix, are given by:
Belov et al. (2005) (based on W15 - W75 flares):
Ip(E > 10 MeV) = (4.8 ± 1.3) · 107 · I1.14±0.14x (1)
Belov et al. (2007) (based on W20-W80 flares):
Ip(E > 10 MeV) = (8.3 ± 1.2) · 104 · I0.93±0.10x (2)
Cliver et al. (2012) (based on W20-W80 flares):
Ip(E > 10 MeV) = 1.96 · 108(±5.71 · 108) · I1.59±0.25x (3)
A comparison of the previously discussed measurementswith the PSDs by Belov et al. (2005), Belov et al. (2007) andCliver et al. (2012) can also be found in Fig. 2. As can be seen,the distribution functions significantly differ from each other inthe low as well as in the high X-ray flare intensity range. Fur-thermore, it becomes obvious that the PSD developed by Cliveret al. (2012) fits much better to the derived X-ray flare intensityto proton flux relation.
In order to quantify the differences in the expected peak pro-ton flux based on different PSDs Tab. 1 provides the calculatedvalues for C-, M- and X- soft X-ray flare classes. It becomes ob-vious that with increasing X-ray flare intensity the expected peakproton flux increases significantly for either of the PSDs. How-ever, an inter-comparison of the model-dependent outputs showslarge differences for all flare classes. Thereby, the strongest de-viations can be found between Belov et al. (2005) and Belovet al. (2007). Note that, although often argued, the PSD by Belovet al. (2007) is not a correction of the PSD given in Belov et al.(2005). Unfortunately, both functions are not able to reflect thecorresponding GOES estimates (magenta dots). Moreover, Caneet al. (2010) identified three B-class flare associated SEP events.Their published catalog includes 280 SEP events that extendedto > 25 MeV and occurred in the years 1997–2006. These threeevents were marked on December 6, 1997 (as B7.0-class flare),
Article number, page 3 of 10
A&A proofs: manuscript no. output
Table 1. The expected peak proton fluxes (in pfu) for C-, M-, X- classflares derived by different PSDs.
Reference C M XBelov et al., 2005 43.46 600 8280.7Belov et al., 2007 0.97 8.3 70.65Cliver et al., 2012 0.73 28.42 1105.65
April 4, 2003 (as B7.0-class flare) and November 7, 2003 (asB5.0-class flare). For these events we were able to identify pro-nounced peaks for the events on April 7, 2003 and November 7,2003. However, although being labeled as SEP event, we werenot able to identify an enhancement above the background in theintegral proton flux above 10 MeV for the B-class flare relatedproton flux on the 6th of December in 1997. For consistency,the expected >10 MeV peak flux values were calculated basedon the same procedure applied to the Sphinx soft X-ray mea-surements (see Section 2.2). As can be seen in Fig. 2, the threeB-class related SEP events by Cane et al. (2010), given as reddots, fall well within the SphinX values.
Additionally, Klein et al. (2010) found seven SEP events inCME-less X-class flares from the western hemisphere, displayedas gray dots. The corresponding >10 MeV values can be foundin the second column of their Table 3. As can be seen, the cor-responding peak proton-flux values fall into the same level asthe bulk of the soft X-ray flares identified with the Sphinx data.The lowest values of this population, showing values about 2%below the mean values based on SphinX. On top of that the cor-responding sensitivity of the GOES measurements (see subsec-tion 2.2) needs to be taken into account in order to identify thecurrent limitations in measuring proton fluxes from lower classsolar flares.
4. On the Development of an Updated SizeDistribution Function
4.1. Data employed
For further elaboration of the B-class flare ensemble, we per-formed a systematic scan of the particle and soft X-ray GOESdata between 1975 and 2005. Within this timespan, we were ableto identify eight SEP events associated with B-class flares, andone event associated with an A1.5 solar flare (Dr. Anatoly Belov,private communication). To include these B-class flares into ourstudy, we inspected the >10 MeV GOES proton data in the samemanner as previously discussed. For all events a correspondingSEP event was found of which the most pronounced one oc-curred on April 24, 1999.
In addition, we reduced the number of events from theSphinX soft X-ray flare catalog to a total of 18 events by se-lecting only those events that could be allocated with magnet-ically well-connected flare regions, i.e. within W20-W80. Fur-thermore, we inspected the time profiles of ions recorded bythe Electron Proton Helium Instrument (EPHIN, Müller-Mellinet al. 1995) aboard Solar and Heliospheric Observatory (SOHO)at an energy range of 4.3 to 25 MeV for these events . Note thatEPHIN is ten times more sensitive than GOES (see, e.g., Pos-ner 2007). Furthermore, we also inspected the electron record-ings by the Electron, Proton, and Alpha Monitor (EPAM, Goldet al. 1998) aboard the Advanced Composition Explorer (ACE),at an energy range of 0.038-0.053 MeV. However, none of thesesolar flares resulted in any signature in the SOHO/EPHIN andACE/EPAM channels. At the same time, the peak proton flux of
the B-class related SEP events identified by Cane et al. (2010),match both the 18 well-connected SphinX measurements as wellas the the nine A/B-class flares found in the GOES measure-ments. Applying the upper GOES threshold of 0.67 pfu for thepeak proton flux (see subsection 2.2) in total 13 enhancementsabove the 99.75% GOES sensitivity level can be utilized for fur-ther studies. Based on these new events a "traditional" power-lawreflecting the low- and high X-ray flare intensity relationship canbe found (see Sec. 4.2). However, this proved to be more flattenthen the up-to-now proposed power-laws. Therefore, in order tomathematically describe all populations as best as possible, alsoa new double-power-law PSD function is proposed.
4.2. Development of an updated Size Distribution Function
In order to develop a function that is able to reflect the peak sizedistribution of B- to >X10 -class flares the following steps havebeen performed:
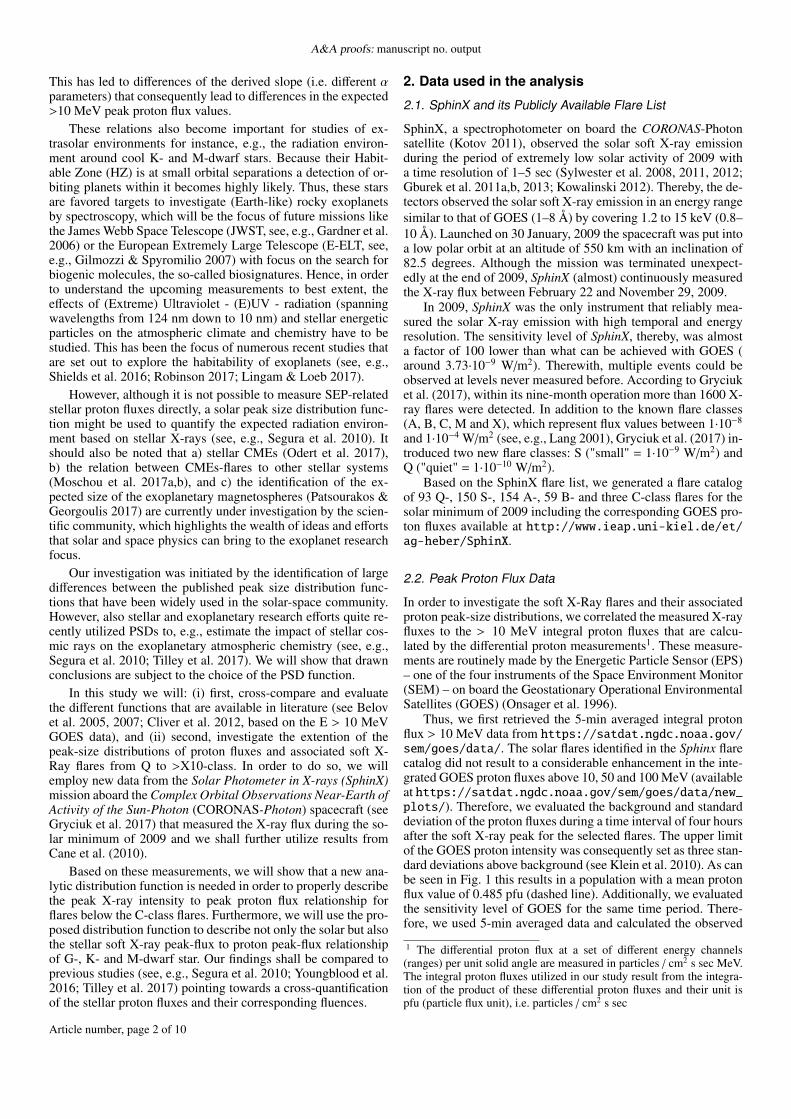
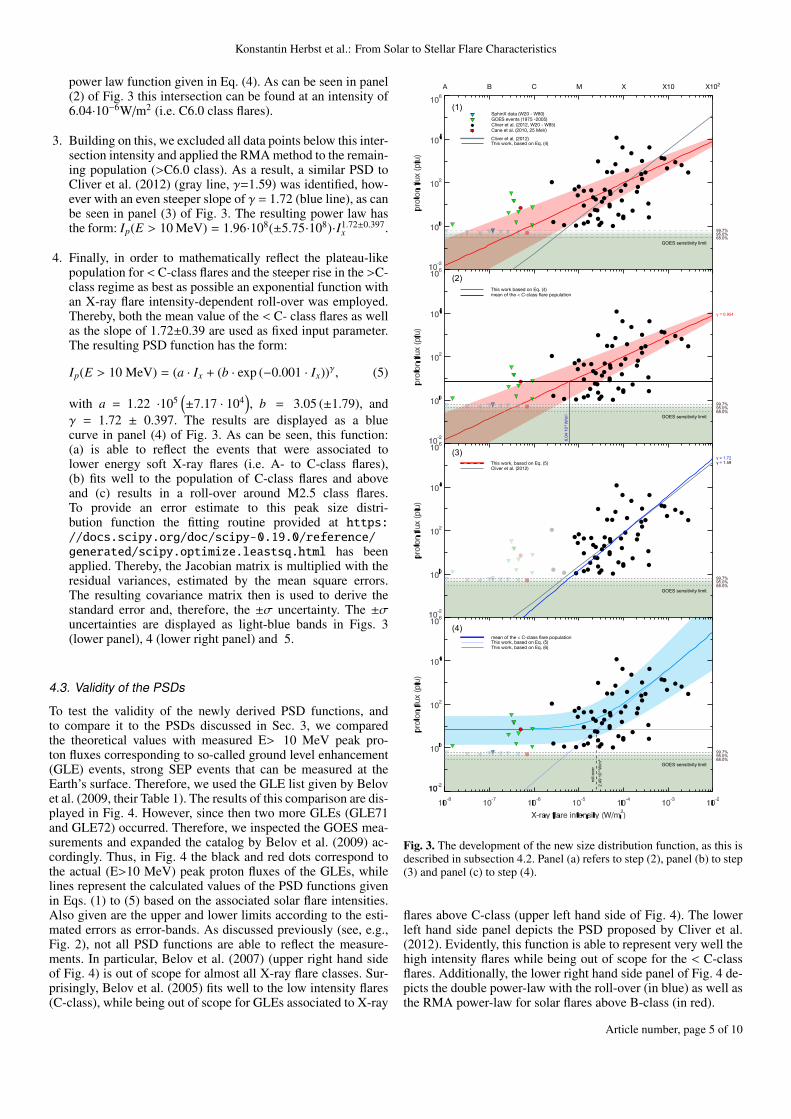
1. We first applied a “traditional" power law function based ona reduced major axis (RMA)2 regression as suggested byCliver et al. (2012). Thereby, we employed all data points,including the 13 enhancements in the <C-class flares regime,one event from Cane et al. (2010) and one SphinX event thatexceeded the 99.7% GOES sensitivity threshold. Based onthis method we found the best fit peak size distribution func-tion to be in the form of:
Ip(E > 10 MeV) = 6.63 · 105(±1.842 · 105) · I0.954±0.17x (4)
The result is displayed in panel (1) of Fig. 3 as a red curvetogether with its corresponding error-band. As can be seen,this power law is able to reflect the low intensity rangefairly well. However, the differences above M-class flaresbecome stronger with increasing intensity. At the same timethe resulting γ of 0.954 differs from the one reported in theliterature (Belov et al. 2005, 2007; Cliver et al. 2012) thatfalls at ≈ 1.2. Moreover, recent studies obtained a γ of 1.59for the SEP proton flux of a sample of > C2.0 class flares(Cliver et al. 2012) and concluded that the differences inthe γ for PSDs of SEPs and SXRs arise primarily from thefact that flares that lead to SEP events constitute a special,energetic subset of all flares, that is further associatedwith fast CMEs (Cliver et al. 2012; Cliver & D’Huys2018). However, it should be noted that the PSDs of flareelectromagnetic emissions present a γ ∼ 1.7 for Hard X-raysand microwaves (see Table 1 of Cliver et al. (2012)).
2. Although a γ of ∼ 1.2 seems to be quite explanatory ofthe SEP proton flux distributions over several orders ofmagnitude (i.e. >C2.0 class flares) (Belov et al. 2007; Cliver& D’Huys 2018) it is not representative of the flare electro-magnetic emissions (Cliver et al. 2012). Thereby, given theeven flatter γ obtained with the RMA-based power-law (e.g.,0.954; when considering all > B-class flares) and taking intoaccount the possibility that a subset of the size distributionof all SEP flares will not follow a power-law (see Figure3 in Belov et al. (2007)), we studied the intersection of themean < C-class population (6.919 pfu) and the RMA-based
2 The RMA regression accounts for uncertainties in x and y direction.Other then the ordinary Least-Square (OLS) fit method the RMA mini-mizes the sum of both vertical and horizontal distances of the data pointsfrom the resulting fit function by minimizing the areas of the trianglesformed by the observations and the regression line.
Article number, page 4 of 10
Konstantin Herbst et al.: From Solar to Stellar Flare Characteristics
power law function given in Eq. (4). As can be seen in panel(2) of Fig. 3 this intersection can be found at an intensity of6.04·10−6W/m2 (i.e. C6.0 class flares).
3. Building on this, we excluded all data points below this inter-section intensity and applied the RMA method to the remain-ing population (>C6.0 class). As a result, a similar PSD toCliver et al. (2012) (gray line, γ=1.59) was identified, how-ever with an even steeper slope of γ = 1.72 (blue line), as canbe seen in panel (3) of Fig. 3. The resulting power law hasthe form: Ip(E > 10 MeV) = 1.96·108(±5.75·108)·I1.72±0.397
x .
4. Finally, in order to mathematically reflect the plateau-likepopulation for < C-class flares and the steeper rise in the >C-class regime as best as possible an exponential function withan X-ray flare intensity-dependent roll-over was employed.Thereby, both the mean value of the < C- class flares as wellas the slope of 1.72±0.39 are used as fixed input parameter.The resulting PSD function has the form:
Ip(E > 10 MeV) = (a · Ix + (b · exp (−0.001 · Ix))γ, (5)
with a = 1.22 ·105(±7.17 · 104
), b = 3.05 (±1.79), and
γ = 1.72 ± 0.397. The results are displayed as a bluecurve in panel (4) of Fig. 3. As can be seen, this function:(a) is able to reflect the events that were associated tolower energy soft X-ray flares (i.e. A- to C-class flares),(b) fits well to the population of C-class flares and aboveand (c) results in a roll-over around M2.5 class flares.To provide an error estimate to this peak size distri-bution function the fitting routine provided at https://docs.scipy.org/doc/scipy-0.19.0/reference/generated/scipy.optimize.leastsq.html has beenapplied. Thereby, the Jacobian matrix is multiplied with theresidual variances, estimated by the mean square errors.The resulting covariance matrix then is used to derive thestandard error and, therefore, the ±σ uncertainty. The ±σuncertainties are displayed as light-blue bands in Figs. 3(lower panel), 4 (lower right panel) and 5.
4.3. Validity of the PSDs
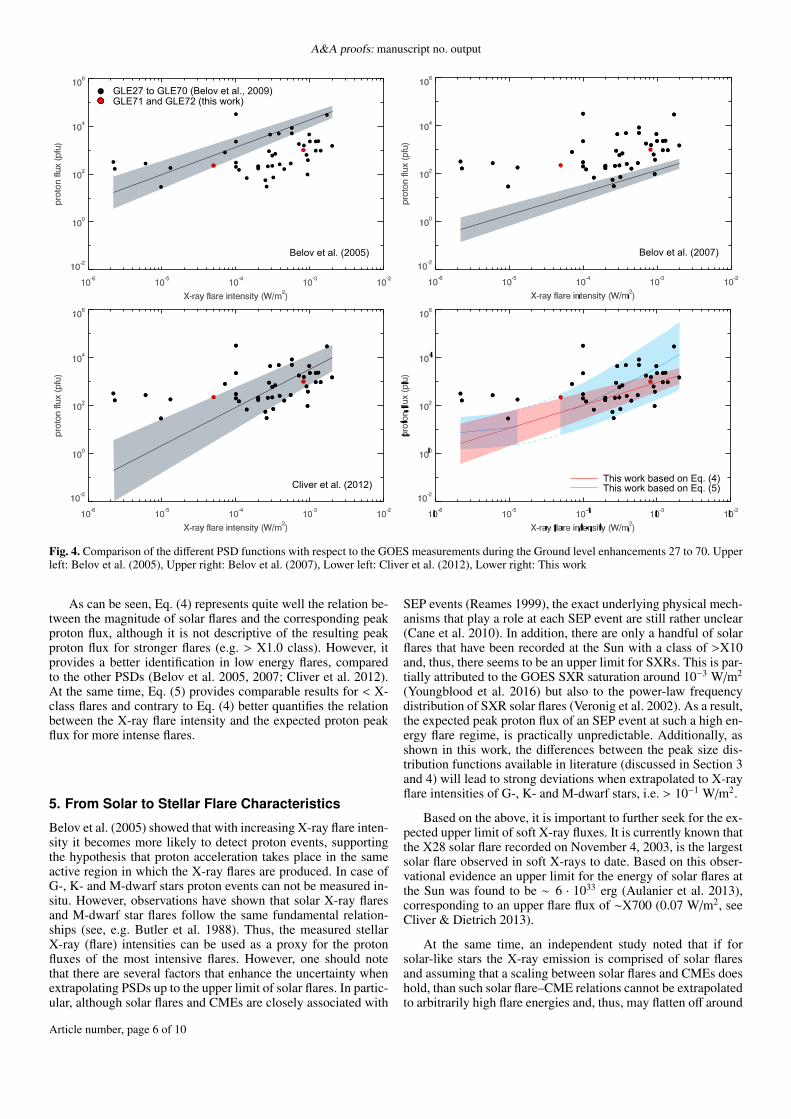
To test the validity of the newly derived PSD functions, andto compare it to the PSDs discussed in Sec. 3, we comparedthe theoretical values with measured E> 10 MeV peak pro-ton fluxes corresponding to so-called ground level enhancement(GLE) events, strong SEP events that can be measured at theEarth’s surface. Therefore, we used the GLE list given by Belovet al. (2009, their Table 1). The results of this comparison are dis-played in Fig. 4. However, since then two more GLEs (GLE71and GLE72) occurred. Therefore, we inspected the GOES mea-surements and expanded the catalog by Belov et al. (2009) ac-cordingly. Thus, in Fig. 4 the black and red dots correspond tothe actual (E>10 MeV) peak proton fluxes of the GLEs, whilelines represent the calculated values of the PSD functions givenin Eqs. (1) to (5) based on the associated solar flare intensities.Also given are the upper and lower limits according to the esti-mated errors as error-bands. As discussed previously (see, e.g.,Fig. 2), not all PSD functions are able to reflect the measure-ments. In particular, Belov et al. (2007) (upper right hand sideof Fig. 4) is out of scope for almost all X-ray flare classes. Sur-prisingly, Belov et al. (2005) fits well to the low intensity flares(C-class), while being out of scope for GLEs associated to X-ray
68.0%95.0%99.7%
GOES sensitivity limit
68.0%95.0%99.7%
GOES sensitivity limit
68.0%95.0%99.7%
GOES sensitivity limit
γ = 1.72
γ = 0.954
γ = 1.59
6.04·10-
6W/m
2
2.49·10-
5W/m
2
roll-over
mean of the < C-class flare populationThis work, based on Eq. (5)This work, based on Eq. (6)
This work, based on Eq. (5)Cliver et al. (2012)
This work based on Eq. (4)mean of the < C-class flare population
X X10 X102MCBA
SphinX data (W20 - W80)GOES events (1975 -2005)Cliver et al. (2012, W20 - W85)Cane et al. (2010, 25 MeV)
Cliver et al. (2012)This work, based on Eq. (4)
68.0%95.0%99.7%
GOES sensitivity limit
(1)
(2)
(3)
(4)
Fig. 3. The development of the new size distribution function, as this isdescribed in subsection 4.2. Panel (a) refers to step (2), panel (b) to step(3) and panel (c) to step (4).
flares above C-class (upper left hand side of Fig. 4). The lowerleft hand side panel depicts the PSD proposed by Cliver et al.(2012). Evidently, this function is able to represent very well thehigh intensity flares while being out of scope for the < C-classflares. Additionally, the lower right hand side panel of Fig. 4 de-picts the double power-law with the roll-over (in blue) as well asthe RMA power-law for solar flares above B-class (in red).
Article number, page 5 of 10
A&A proofs: manuscript no. output
GLE27 to GLE70 (Belov et al., 2009)GLE71 and GLE72 (this work)
Belov et al. (2005)
Cliver et al. (2012)
Belov et al. (2007)
This work based on Eq. (4)This work based on Eq. (5)
Fig. 4. Comparison of the different PSD functions with respect to the GOES measurements during the Ground level enhancements 27 to 70. Upperleft: Belov et al. (2005), Upper right: Belov et al. (2007), Lower left: Cliver et al. (2012), Lower right: This work
As can be seen, Eq. (4) represents quite well the relation be-tween the magnitude of solar flares and the corresponding peakproton flux, although it is not descriptive of the resulting peakproton flux for stronger flares (e.g. > X1.0 class). However, itprovides a better identification in low energy flares, comparedto the other PSDs (Belov et al. 2005, 2007; Cliver et al. 2012).At the same time, Eq. (5) provides comparable results for < X-class flares and contrary to Eq. (4) better quantifies the relationbetween the X-ray flare intensity and the expected proton peakflux for more intense flares.
5. From Solar to Stellar Flare Characteristics
Belov et al. (2005) showed that with increasing X-ray flare inten-sity it becomes more likely to detect proton events, supportingthe hypothesis that proton acceleration takes place in the sameactive region in which the X-ray flares are produced. In case ofG-, K- and M-dwarf stars proton events can not be measured in-situ. However, observations have shown that solar X-ray flaresand M-dwarf star flares follow the same fundamental relation-ships (see, e.g. Butler et al. 1988). Thus, the measured stellarX-ray (flare) intensities can be used as a proxy for the protonfluxes of the most intensive flares. However, one should notethat there are several factors that enhance the uncertainty whenextrapolating PSDs up to the upper limit of solar flares. In partic-ular, although solar flares and CMEs are closely associated with
SEP events (Reames 1999), the exact underlying physical mech-anisms that play a role at each SEP event are still rather unclear(Cane et al. 2010). In addition, there are only a handful of solarflares that have been recorded at the Sun with a class of >X10and, thus, there seems to be an upper limit for SXRs. This is par-tially attributed to the GOES SXR saturation around 10−3 W/m2
(Youngblood et al. 2016) but also to the power-law frequencydistribution of SXR solar flares (Veronig et al. 2002). As a result,the expected peak proton flux of an SEP event at such a high en-ergy flare regime, is practically unpredictable. Additionally, asshown in this work, the differences between the peak size dis-tribution functions available in literature (discussed in Section 3and 4) will lead to strong deviations when extrapolated to X-rayflare intensities of G-, K- and M-dwarf stars, i.e. > 10−1 W/m2.
Based on the above, it is important to further seek for the ex-pected upper limit of soft X-ray fluxes. It is currently known thatthe X28 solar flare recorded on November 4, 2003, is the largestsolar flare observed in soft X-rays to date. Based on this obser-vational evidence an upper limit for the energy of solar flares atthe Sun was found to be ∼ 6 · 1033 erg (Aulanier et al. 2013),corresponding to an upper flare flux of ∼X700 (0.07 W/m2, seeCliver & Dietrich 2013).
At the same time, an independent study noted that if forsolar-like stars the X-ray emission is comprised of solar flaresand assuming that a scaling between solar flares and CMEs doeshold, than such solar flare–CME relations cannot be extrapolatedto arbitrarily high flare energies and, thus, may flatten off around
Article number, page 6 of 10
Konstantin Herbst et al.: From Solar to Stellar Flare Characteristics
Cliver
&Dietrich(2013)
Shibayam
aet
al.(2013)
Kepler measurements of Sun-like starsuppersolarlim
it
upperactiveG-typestarlim
it
ADLeo(04/1985,9.0
W/m
2 )Prox
Cen
(03/2016,6.02W/m
2 )
GJ876
(06/2015,1
.1∙1
0-1W/m
2 )
SphinX data (W20 - W80)GOES events (1975 -2005)Cliver et al. (2012, W20 - W80)Cane et al. (2010, 25 MeV)
Belov et al. (2005)Belov et al. (2007)Cliver et al. (2012)This work, based on Eq. (4)This work, based on Eq. (5)best & worst case scenario
99.7 % GOES level (2009)
5 ∙105
X-ray flare intensity (W/m2)
proton
flux(pfu)
10-8 10-6 10-4
10-5
100
105
1015
1010
10-2 100 102
X105X104X103X102X10XMCB
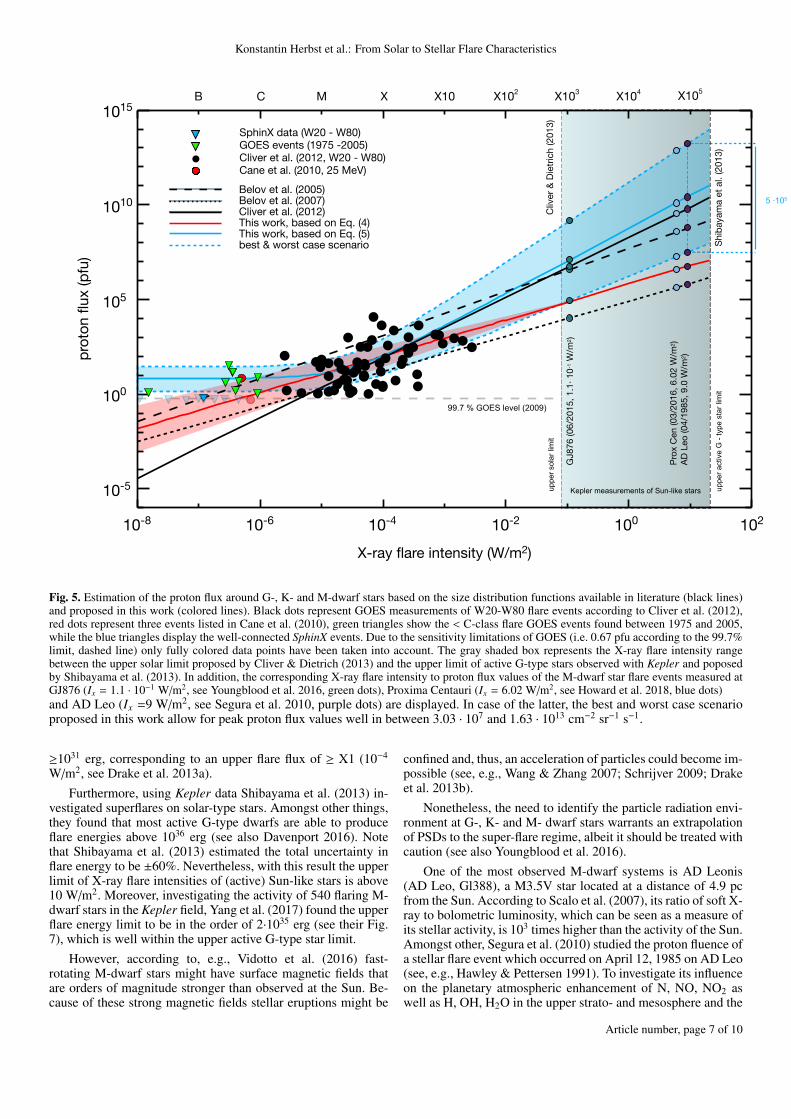
Fig. 5. Estimation of the proton flux around G-, K- and M-dwarf stars based on the size distribution functions available in literature (black lines)and proposed in this work (colored lines). Black dots represent GOES measurements of W20-W80 flare events according to Cliver et al. (2012),red dots represent three events listed in Cane et al. (2010), green triangles show the < C-class flare GOES events found between 1975 and 2005,while the blue triangles display the well-connected SphinX events. Due to the sensitivity limitations of GOES (i.e. 0.67 pfu according to the 99.7%limit, dashed line) only fully colored data points have been taken into account. The gray shaded box represents the X-ray flare intensity rangebetween the upper solar limit proposed by Cliver & Dietrich (2013) and the upper limit of active G-type stars observed with Kepler and poposedby Shibayama et al. (2013). In addition, the corresponding X-ray flare intensity to proton flux values of the M-dwarf star flare events measured atGJ876 (Ix = 1.1 · 10−1 W/m2, see Youngblood et al. 2016, green dots), Proxima Centauri (Ix = 6.02 W/m2, see Howard et al. 2018, blue dots)and AD Leo (Ix =9 W/m2, see Segura et al. 2010, purple dots) are displayed. In case of the latter, the best and worst case scenarioproposed in this work allow for peak proton flux values well in between 3.03 · 107 and 1.63 · 1013 cm−2 sr−1 s−1.
≥1031 erg, corresponding to an upper flare flux of ≥ X1 (10−4
W/m2, see Drake et al. 2013a).Furthermore, using Kepler data Shibayama et al. (2013) in-
vestigated superflares on solar-type stars. Amongst other things,they found that most active G-type dwarfs are able to produceflare energies above 1036 erg (see also Davenport 2016). Notethat Shibayama et al. (2013) estimated the total uncertainty inflare energy to be ±60%. Nevertheless, with this result the upperlimit of X-ray flare intensities of (active) Sun-like stars is above10 W/m2. Moreover, investigating the activity of 540 flaring M-dwarf stars in the Kepler field, Yang et al. (2017) found the upperflare energy limit to be in the order of 2·1035 erg (see their Fig.7), which is well within the upper active G-type star limit.
However, according to, e.g., Vidotto et al. (2016) fast-rotating M-dwarf stars might have surface magnetic fields thatare orders of magnitude stronger than observed at the Sun. Be-cause of these strong magnetic fields stellar eruptions might be
confined and, thus, an acceleration of particles could become im-possible (see, e.g., Wang & Zhang 2007; Schrijver 2009; Drakeet al. 2013b).
Nonetheless, the need to identify the particle radiation envi-ronment at G-, K- and M- dwarf stars warrants an extrapolationof PSDs to the super-flare regime, albeit it should be treated withcaution (see also Youngblood et al. 2016).
One of the most observed M-dwarf systems is AD Leonis(AD Leo, Gl388), a M3.5V star located at a distance of 4.9 pcfrom the Sun. According to Scalo et al. (2007), its ratio of soft X-ray to bolometric luminosity, which can be seen as a measure ofits stellar activity, is 103 times higher than the activity of the Sun.Amongst other, Segura et al. (2010) studied the proton fluence ofa stellar flare event which occurred on April 12, 1985 on AD Leo(see, e.g., Hawley & Pettersen 1991). To investigate its influenceon the planetary atmospheric enhancement of N, NO, NO2 aswell as H, OH, H2O in the upper strato- and mesosphere and the
Article number, page 7 of 10
A&A proofs: manuscript no. output
resulting ozone depletion. According to Thomas et al. (2007)and Rodger et al. (2008), the 1859 Carrington solar proton eventmay have lead to a local O3 depletion of ∼10%. This solar protonevent had a calculated fluence of ∼ 1010 cm2 for protons withenergies >30 MeV, which is roughly four times larger than thesolar proton fluence of the February, 1956 event, the largest eventof the modern era (Rodger et al. 2008).
Figure 5 shows the extrapolation of the proton flux to X-rayflare intensities of G-, K- and M-dwarf stars, which is assumed tobe within the upper solar and active G-type like star limitations( 10−1 - 10 W/m2), based on the peak size distribution functionsby Belov et al. (2005) (solid line), Belov et al. (2007) (dottedline) and Cliver et al. (2012) (dashed line). In addition the ex-trapolations due to Eqs. (4) and (5) are shown as red and blueline, respectively. It is obvious that the different slopes of thePSD functions (i.e., γ = 1.59 according to Cliver et al. 2012,while γ = 0.945 according to Eq. (4) and γ = 1.72 accordingto Eq. (5)) result in differences in the high X-ray flare intensityregimes.
However, as observed at the Sun, a certain variety of theX-ray flare intensity-dependent peak proton flux values is ex-pected. As can be seen our double-power-law function is thefirst PSD function that provides an error estimate of the expectedpeak proton fluxes for X-ray flares > 10−1W/m2. Thereby both,the lower and upper level, represent extreme cases of the X-rayflare intensity-dependent peak proton fluxes that can be expectedaround G-, K- and M-dwarf stars, and therefore in the followingare denoted as best case and worst case scenario, respectively. Itbecomes obvious, that for superflares the expected peak protonflux values can differ by up to seven orders of magnitude.
Segura et al. (2010) used different scaling relations for M-dwarf stars utilizing the broadband near-UV and the 1-8 Å flareflux based on Mitra-Kraev et al. (2005) to estimate the X-rayflare intensity for the flare event of April 1985 observed on ADLeo. Based on the estimated X-ray flare intensity value of 9W/m2, they applied the PSD function by Belov et al. (2005) andcalculated the corresponding peak proton flux of 5.9·108 cm−2
sr−1 s−1 for protons with E > 10 MeV. They concluded that theevent fluence was in the order of 200 times higher than the flu-ence of the Carrington event (7.5 ·109 cm−2, see Segura et al.2010).
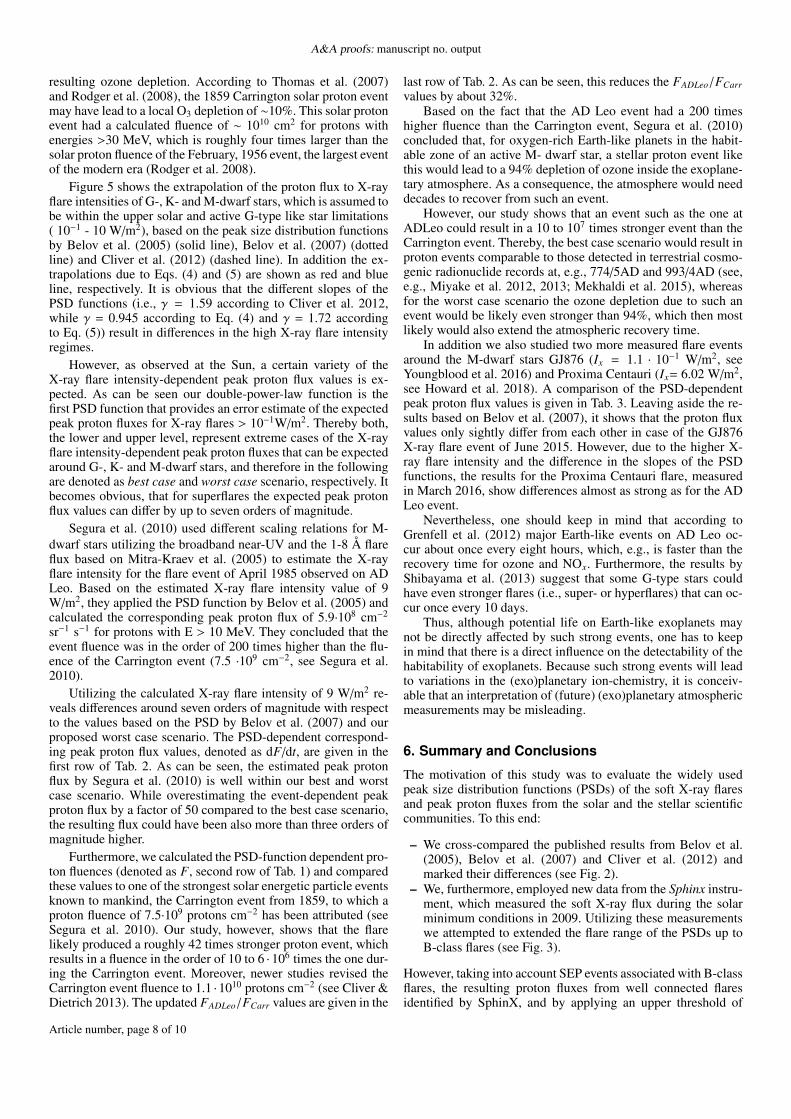
Utilizing the calculated X-ray flare intensity of 9 W/m2 re-veals differences around seven orders of magnitude with respectto the values based on the PSD by Belov et al. (2007) and ourproposed worst case scenario. The PSD-dependent correspond-ing peak proton flux values, denoted as dF/dt, are given in thefirst row of Tab. 2. As can be seen, the estimated peak protonflux by Segura et al. (2010) is well within our best and worstcase scenario. While overestimating the event-dependent peakproton flux by a factor of 50 compared to the best case scenario,the resulting flux could have been also more than three orders ofmagnitude higher.
Furthermore, we calculated the PSD-function dependent pro-ton fluences (denoted as F, second row of Tab. 1) and comparedthese values to one of the strongest solar energetic particle eventsknown to mankind, the Carrington event from 1859, to which aproton fluence of 7.5·109 protons cm−2 has been attributed (seeSegura et al. 2010). Our study, however, shows that the flarelikely produced a roughly 42 times stronger proton event, whichresults in a fluence in the order of 10 to 6 · 106 times the one dur-ing the Carrington event. Moreover, newer studies revised theCarrington event fluence to 1.1 ·1010 protons cm−2 (see Cliver &Dietrich 2013). The updated FADLeo/FCarr values are given in the
last row of Tab. 2. As can be seen, this reduces the FADLeo/FCarrvalues by about 32%.
Based on the fact that the AD Leo event had a 200 timeshigher fluence than the Carrington event, Segura et al. (2010)concluded that, for oxygen-rich Earth-like planets in the habit-able zone of an active M- dwarf star, a stellar proton event likethis would lead to a 94% depletion of ozone inside the exoplane-tary atmosphere. As a consequence, the atmosphere would needdecades to recover from such an event.
However, our study shows that an event such as the one atADLeo could result in a 10 to 107 times stronger event than theCarrington event. Thereby, the best case scenario would result inproton events comparable to those detected in terrestrial cosmo-genic radionuclide records at, e.g., 774/5AD and 993/4AD (see,e.g., Miyake et al. 2012, 2013; Mekhaldi et al. 2015), whereasfor the worst case scenario the ozone depletion due to such anevent would be likely even stronger than 94%, which then mostlikely would also extend the atmospheric recovery time.
In addition we also studied two more measured flare eventsaround the M-dwarf stars GJ876 (Ix = 1.1 · 10−1 W/m2, seeYoungblood et al. 2016) and Proxima Centauri (Ix= 6.02 W/m2,see Howard et al. 2018). A comparison of the PSD-dependentpeak proton flux values is given in Tab. 3. Leaving aside the re-sults based on Belov et al. (2007), it shows that the proton fluxvalues only sightly differ from each other in case of the GJ876X-ray flare event of June 2015. However, due to the higher X-ray flare intensity and the difference in the slopes of the PSDfunctions, the results for the Proxima Centauri flare, measuredin March 2016, show differences almost as strong as for the ADLeo event.
Nevertheless, one should keep in mind that according toGrenfell et al. (2012) major Earth-like events on AD Leo oc-cur about once every eight hours, which, e.g., is faster than therecovery time for ozone and NOx. Furthermore, the results byShibayama et al. (2013) suggest that some G-type stars couldhave even stronger flares (i.e., super- or hyperflares) that can oc-cur once every 10 days.
Thus, although potential life on Earth-like exoplanets maynot be directly affected by such strong events, one has to keepin mind that there is a direct influence on the detectability of thehabitability of exoplanets. Because such strong events will leadto variations in the (exo)planetary ion-chemistry, it is conceiv-able that an interpretation of (future) (exo)planetary atmosphericmeasurements may be misleading.
6. Summary and Conclusions
The motivation of this study was to evaluate the widely usedpeak size distribution functions (PSDs) of the soft X-ray flaresand peak proton fluxes from the solar and the stellar scientificcommunities. To this end:
– We cross-compared the published results from Belov et al.(2005), Belov et al. (2007) and Cliver et al. (2012) andmarked their differences (see Fig. 2).
– We, furthermore, employed new data from the Sphinx instru-ment, which measured the soft X-ray flux during the solarminimum conditions in 2009. Utilizing these measurementswe attempted to extended the flare range of the PSDs up toB-class flares (see Fig. 3).
However, taking into account SEP events associated with B-classflares, the resulting proton fluxes from well connected flaresidentified by SphinX, and by applying an upper threshold of
Article number, page 8 of 10
Konstantin Herbst et al.: From Solar to Stellar Flare Characteristics
previous studies This work
BE05 BE07 CL12 RMA best case DPL mean worst case
dF/dt (cm−2 sr−1 s−1) 5.88·108 6.41·105 6.45·109 5.39·106 3.03·107 2.45·1010 1.63·1013
F(cm−2) 1.50·1012 1.63·109 1.64·1013 1.38·1010 7.73·1010 6.26·1013 4.17·1016
FADLeo/FCarr,S E10 200 0.22 2187 1.83 10.31 8340 5.55·106
FADLeo/FCarr,CL13 136 0.15 1491 1.25 7 5687 3.79·106
Table 2. Estimated proton fluxes and fluences of the AD Leo flare event on April 12, 1985 According to the different PSDs and Carrington eventfluences. Here the values based on the PSDs by Belov et al. (2005, denoted as BE05), Belov et al. (2007, denoted as BE07), Cliver et al. (2012,denoted as CL12), the RMA-based function given in Eq. (4, denoted as RMA) and the double power-law function given in Eq.(5) are presented.
previous studies This work
BE05 BE07 CL12 RMA best case DPL mean worst case
GJ876 3.88·106 1.10·104 5.86·106 8.07·104 8.93·104 1.26·107 1.45·109
Proxima Centauri 3.72·108 4.41·105 3.40·109 3.67·106 1.78·107 1.23·1010 6.97·1012
ADLeonis 5.88·108 6.41·105 6.45·109 5.39·106 3.03·107 2.45·1010 1.63·1013
Table 3. Estimated proton fluxes in pfu of observed stellar flares of the M-dwarf stars GJ876 (observed in June, 2015, IX = 1.1·10−1W/m2, seeYoungblood et al. 2016), Proxima Centauri (observed in March, 2016, IX = 6.02 W/m2, see Howard et al. 2018) and AD Leonis (observed in April,1989, IX = 9 W/m2, see Segura et al. 2010).
0.67 pfu (99.7%) for the sensitivity of GOES measurements,we first attempted to derive a “typical" PSD utilizing a simpleRMA power-law. However, this led to a γ of 0.954 and proved tounderestimate the expected peak proton flux for stronger flares(see Fig. 3 and Fig. 4). Nonetheless, it was shown that a sim-ple power-law represents very well the population > C2.0 flaresCliver et al. (2012) and > C6.0 flares (this work).
Eq. (4) represents a power-law in the SEP proton fluxes thatfor the first time takes into account < C-class flares. However, theresulting γ of 0.945 differs significantly from the ones reportedin literature (Belov et al. 2005, 2007; Cliver et al. 2012).
Moreover, we proposed a new peak size distribution functionin form of a double power-law like exponential function (see,e.g. Band et al. 1993) with an M-class flare intensity dependentroll-over at around 2.5 · 10−5 W/m2 (M2.5 flares, see Eq. (5) andFig 3) in order to reflect the plateau-like B-class population asbest as possible.
One should further note that based on the upper flare flux ofactive G-type stars (1036erg, see Shibayama et al. 2013) and thecorresponding estimated flare flux of the AD Leo event of IX= 9W/m2 (Segura et al. 2010), which is well within the limitations,the PSDs presented in this work, is within reasonable agreementto the expected high flare energies. Nonetheless, it seems that anupper limit in the high energy flare regime is inevitable, sincethe peak flux of solar flares follows a power-law with an indexof ∼2, as shown by data (Veronig et al. 2002; Yashiro et al. 2006;Cliver et al. 2012) and theory (Aschwanden & Freeland 2012),consequently constraining the related peak proton fluxes.
In order to estimate the stellar proton flux around G-, K- andM-dwarf stars PSD functions have to be extended to flares withintensities well above X10 values. Segura et al. (2010) and Tilleyet al. (2017), thereby, have based their estimates for the pro-ton flux around flare-rich M-dwarf stars on the PDS function byBelov et al. (2005). A comparison of the G-, K- and M-dwarf starpeak X-ray flare intensity to peak proton flux correlation basedon the PDS functions by Belov et al. (2005), Belov et al. (2007),Cliver et al. (2012), the RMA-based PSD function proposed inEq. (4), as well as the double power-law function given in Eq.
(5) showed strong differences in the order of up to seven ordersof magnitude (see Fig. 5). These discrepancies are also reflectedwhen the stellar proton fluence is calculated (see Tabs. 2 and 3).Based on our findings we could show, that an AD Leo-like flarecan result in proton events in the order of 10 to 107 times strongerthan the Carrington event. While the first can be compared to theextreme solar events recorded in terrestrial cosmogenic radionu-clide records (Miyake et al. 2012, 2013; Mekhaldi et al. 2015)the latter would have dramatic consequences for Earth-like exo-planets in the habitable zone of such flaring stars.
As a result Segura et al. (2010), who found the fluence tobe 200 times higher then the Carrington event, concluded that i)such a strong stellar proton event would lead to a 94% depletionof ozone inside the exoplanetary atmosphere of an oxygen-richEarth-like planets in the habitable zone of an active M- dwarfstar, and 2) that it would take decades for the atmosphere to re-cover from that. While our best case scenario (lower limit Eq.(5))most likely would lead to a much weaker depletion of ozone, theozone depletion due to the April 1985 event would likely be evenstronger than 94%, which probably would also extend the atmo-spheric recovery time when the proton flux of our worst casescenario is applicable. It is also worth noting that such strong (oreven stronger events) are not as rare as one might think. Accord-ing to Grenfell et al. (2012) major Earth-like events on AD Leooccur about once every eight hours, which, e.g., is faster than therecovery time for ozone and NOx. Furthermore, Shibayama et al.(2013) suggest that some G-type stars could have even strongerflares (super- or hyperflares) that can occur once every 10 days.This however, among others, strongly depends on how the flu-ence is distributed over the energy of the primary CR particles.Thus, knowing the stellar radiation environment, and, therefore,being able to model the radiation exposure on the surface of an(Earth-like) exoplanet is crucial in order to assess its habitabilityand has to be studied in much more detail in the future.
Undoubtedly, there are several uncertainties when trying toquantify the radiation environment at Earth-like exoplanets: (i)first, one needs to utilize scaling-laws derived from measure-ments of our star; the Sun (which provides an upper limit for
Article number, page 9 of 10
A&A proofs: manuscript no. output
the corresponding flare flux, orders of magnitude less then whatis expected in stellar environments) (see Fig. 5). However, thisis a necessary first step that allows one to start working towardsthis problem (Segura et al. 2010; Youngblood et al. 2016); (ii)adding to this uncertainty, more sensitive measurements at thelow energy flare regime are necessary in order to clearly extendthe PSDs and (iii) the discrepancy between the slopes of the sizedistributions of proton flares and the general population of SXRflares is still under debate. In this work, we summarized theseuncertainties and their effects, utilizing all observational data athand. Additionally, we derived a new “traditional" PSD and fur-ther proposed a mathematical double-power-law PSD, both ofwhich are able to reflect the relation between the flux of solarflares and the expected peak proton flux, to some extent. Finally,we quantified the effect of the usage of these PSDs to the exo-planetary environment for three known (published) cases (seeFig. 5 and Table 3). Thereby, this work provides the currentknown limitations for both the solar and stellar physics commu-nity with respect to the employed scaling laws and further showsthe necessity for more sensitive measurements in the low as wellas high energy flare regime.Acknowledgements. We thank the SphinX collaboration for providing the X-ray intensity profiles,the flare catalog and the flare list via http://156.17.94.1/sphinx_l1_catalogue/SphinX_cat_main.html as well as the GOEScollaboration for providing their data via https://satdat.ngdc.noaa.gov/sem/goes/data/. KH and AP would like to thank Anatoly Belov, Ed Cliverand Ludwig Klein for stimulating discussions. SB thanks for financial supportby the Deutsche Forschungsgesellschaft, DFG, via the project The Influenceof Cosmic Rays on Exoplanetary Atmospheric Biosignatures (Project number282759267). We would also like to thank our co-workers M. Sinnhuber and V.Schmidt (Karlsruhe Institute of Technology), as well as H. Rauer, L. Grennfelland M. Scheucher from the Deutsches Zentrum für Luft- und Raumfahrt (DLR)Berlin and the Technical University of Berlin.
ReferencesAschwanden, M. J. 2002, Space Sci. Rev., 101, 91Aschwanden, M. J. & Freeland, S. L. 2012, The Astrophysical Journal, 754, 112Aulanier, G., Démoulin, P., Schrijver, C., et al. 2013, Astronomy & Astrophysics,
549, A66Band, D., Matteson, J., Ford, L., et al. 1993, ApJ, 413, 281Belov, A., Garcia, H., Kurt, V., & Mavromichalaki, E. 2005, Cosmic Research,
43, 171Belov, A., Kurt, V., Mavromichalaki, H., & Gerontidou, M. 2007, Sol. Phys.,
246, 457Belov, A. V., Erosehnko, E. A., Kryakunova, O. N., G., K. V., & Yanke, V. G.
2009, PROCEEDINGS OF THE 31st ICRCButler, C. J., Rodonó, M., & Foing, B. J. 1988, A&A, 206Cane, H. & Lario, D. 2006, Space Sci. Rev., 123Cane, H. V., Richardson, I. G., & von Rosenvinge, T. T. 2010, J. Geophys. Res.,
115, 1Cliver, E. W. & Dietrich, W. F. 2013, Journal of Space Weather and Space Cli-
mate, 3, A31Cliver, E. W. & D’Huys, E. 2018, The Astrophysical Journal, 864, 48Cliver, E. W., Ling, A. G., Belov, A., & Yashiro, S. 2012, ApJ, 756, L29 (4pp)Davenport, J. R. A. 2016, ApJ, 829, 23Drake, J. J., Cohen, O., Yashiro, S., & Gopalswamy, N. 2013a, The Astrophysical
Journal, 764, 170Drake, J. J., Cohen, O., Yashiro, S., & Gopalswamy, N. 2013b, The Astrophysical
Journal, 764, 170Dresing, N., Gómez-Herrero, R., Heber, B., et al. 2014, A&A, 567, A27Dresing, N., Gomez-Herrero, R., Klassen, A., et al. 2012, Sol. Phys., 281, 281Dröge, W., Kartavykh, Y., Dresing, N., Heber, B., & Klassen, A. 2014, J. Geo-
phys. Res. [Space Phys.], 119, 6074Gardner, J. P., Mather, J. C., Clampin, M., et al. 2006, Space Science Reviews,
123, 485Gburek, S., Siarkowski, M., Kepa, A., et al. 2011a, Solar Syst. Res., 45Gburek, S., Sylwester, J., & Kowalinski, e. a. 2013, Solar Phys., 283Gburek, S., Sylwester, J., & Kowalinski, M., e. a. 2011b, Solar Syst. Res., 45Gilmozzi, R. & Spyromilio, J. 2007, The Messenger, 127, 3Gold, R., Krimigis, S., Hawkins, S., et al. 1998, in The Advanced Composition
Explorer Mission (Springer), 541–562
Gopalswamy, N., Yashiro, S., Michalek, G., et al. 2002, ApJ, 572, L103Grenfell, J. L., Grießmeier, J.-M., von Paris, P., et al. 2012, Astrobiology, 12,
1109Gryciuk, M., Siarkowski, M., & Sylwester, J., e. a. 2017, Sol. Phys., 292, 77Hawley, S. L. & Pettersen, B. R. 1991, ApJ, 378, 725Howard, W. S., Tilley, M. A., Corbett, H., et al. 2018, ArXiv e-prints
[arXiv:1804.02001]Hudson, H. 1978, Sol. Phys., 57, 237Kahler, S. W. 2001, J. Geophys. Res. [Space Phys.], 106, 20947Kahler, S. W. & Vourlidas, A. 2014, ApJ, 784, 47Kallenrode, M.-B. 2003, J. Phys. G: Nucl. Part. Phys., 29, 965Klein, K.-L. & Posner, A. 2005, å, 438, 1029Klein, K.-L., Trottet, G., & Klassen, A. 2010, Sol. Phys., 263, 185Kocharov, L. & Torsti, J. 2002, Sol. Phys., 207, 149Kotov, Y. 2011, Solar Syst. Res., 45Kowalinski, M. 2012, In: Romaniuk, R. (ed.) Photonics Applications in As-
tronomy, Communications, Industry, and High-Energy Physics Experiments,Proc. SPIE, 8454
Lang, K. R. 2001, The Cambridge Encyclopedia of the Sun, 268Lario, D., Kwon, R.-Y., Vourlidas, A., Raouafi, N., & Haggerty, D. 2016, ApJ,
819, 72Lingam, M. & Loeb, A. 2017, International Journal of Astrobiology, 1Mekhaldi, F., Muscheler, R., Adolphi, F., et al. 2015, Nature Communications,
6, 8611 EPMitra-Kraev, U., Harra, L. K., Güdel, M., et al. 2005, A&A, 431, 679Miyake, F., Masuda, K., & Nakamura, T. 2013, Nature Communications, 4, 1748
EPMiyake, F., Nagaya, K., Masuda, K., & Nakamura, T. 2012, Nature, 486, 240 EPMoschou, S.-P., Drake, J. J., & Cohen, Ofer, e. a. 2017a, The Astrophysical Jour-
nal, 850, 191Moschou, S. P., Drake, J. J., & Cohen, O. 2017b, in AASTCS5 Radio Exploration
of Planetary Habitability, Proceedings of the conference 7-12 May, 2017 inPalm Springs, CA. Published in Bulletin of the American Astronomical So-ciety, Vol. 49, No. 3, id. 202.11, Vol. 49
Müller-Mellin, R., Kunow, H., Fleißner, V., et al. 1995, Solar Physics, 162, 483Odert, P., Leitzinger, M., Hanslmeier, A., & Lammer, H. 2017, Monthly Notices
of the Royal Astronomical Society, 472, 876Onsager, T., Grubb, R., Kunches, J., et al. 1996, in GOES-8 and Beyond, Vol.
2812, International Society for Optics and Photonics, 281–291Papaioannou, A., Sandberg, I., Anastasiadis, A., Kouloumvakos, A., & Geor-
goulis, M. K., e. a. 2016, J. Space Weather Space Clim., 6, A42Patsourakos, S. & Georgoulis, M. 2017, Solar Physics, 292, 89Posner, A. 2007, Space Weather, 5, 05001Reames, D. V. 1999, Space Sci. Rev., 90Reames, D. V. 2002, ApJ, 571, L63Reames, D. V. 2013, Space Sci. Rev., 175Richardson, I., von Rosenvinge, T., Cane, H., Christian, E., & Cohen, C. e. a.
2014, Sol. Phys., 289, 3059–3107Robinson, T. D. 2017, arXiv preprint arXiv:1701.05205Rodger, C. J., Verronen, P. T., Clilverd, M. A., Seppälä, A., & Turunen, E. 2008,
Journal of Geophysical Research: Atmospheres, 113, n/a, d23302Rouillard, A., Sheeley, N., Tylka, A., Vourlidas, A., & Ng, C. e. a. 2012, ApJ,
752, 44Scalo, J., Kaltenegger, L., Segura, A. G., et al. 2007, Astrobiology, 7, 85Schrijver, C. J. 2009, Advances in Space Research, 43, 739Segura, A., Walkoicz, L. M., Meadows, V., Kasting, J., & Hawley, S. 2010, As-
trobiology, 10Shibayama, T., Maehara, H., Notsu, S., et al. 2013, ApJS, 209, 5Shields, A. L., Ballard, S., & Johnson, J. A. 2016, Phys. Rep., 663, 1Sylwester, B., Sylwester, J., Siarkowski, M., Engell, A. J., & Kuzin, S. 2011,
Cent. Eur. Astrophys. Bull., 35Sylwester, J., Kowalinski, M., Gburek, S., et al. 2012, ApJ, 751Sylwester, J., Kuzin, S., Kotov, Y., Farnik, F., & Reale, F. 2008, Astrophys. J.
Lett, 29Thomas, B. C., Jackman, C. H., & Melott, A. L. 2007, Geophysical Research
Letters, 34, n/a, l06810Tilley, M. A., Segura, A., Meadows, V. S., Hawley, S., & Davenport, J. 2017,
ArXiv e-prints [arXiv:1711.08484]Vainio, R., Agueda, N., Aran, A., & Lario, D. 2007, Space weather: research
towards applications in Europe (Springer, Dordrecht, The Netherlands)Veronig, A., Temmer, M., Hanslmeier, A., Otruba, W., & Messerotti, M. 2002,
Astronomy & Astrophysics, 382, 1070Vidotto, A. A., Donati, J.-F., Jardine, M., et al. 2016, MNRAS, 455, L52Wang, Y. & Zhang, J. 2007, ApJ, 665, 1428Wiedenbeck, M., Cohen, C., Nitta, N., Gomez-Herrero, R., & Haggerty, D. 2012,
ApJ, 762, 54Yang, H., Liu, J., Gao, Q., et al. 2017, ApJ, 849, 36Yashiro, S., Akiyama, S., Gopalswamy, N., & Howard, R. 2006, The Astrophys-
ical Journal Letters, 650, L143Youngblood, A., France, K., Loyd, R. P., et al. 2016, The Astrophysical Journal,
824, 101
Article number, page 10 of 10