Embed Size (px)
Citation preview
Aus dem Institut für Virologie und Immunbiologie
Der Universität Würzburg
Vorstand: Professor Dr. med. Axel Rethwilm
Generation of tools to investigate Chikungunya virus
Inaugural – Dissertation
Zur Erlangung der Doktorwürde der
Medizinischen Fakultät
der
Bayerischen Julius-Maximilians-Universität zu Würzburg
vorgelegt von
Vu Xuan Nghia
aus Vietnam
Würzburg, Juli 2008
Referent: Prof. Dr. A. Rethwilm
Korreferent: Prof. Dr. K. Brehm
Dekan: Prof. Dr. Matthias Frosh
Tag der mündlichen Prüfung:
Der Promovend ist Arzt

I dedicate my thesis to my wife and my sons
i
CONTENTS
Page
1. Introduction 1
1.1. Chikungunya virus and re-emergence of Chikungunya virus 1
1.2. The genome and replicative cycle of CHIKV 3
1.2.1. Genome structure and organization 3
1.2.2. The replication-cycle of CHIKV 6
1.3. CHIKV clinical manifestation 7
1.4. The development of antiviral drugs and tools of viral diagnosis 9
1.5. The aim of thesis 10
2. Materials 11
2.1. Enzymes and Buffers 11
2.2. Antibiotics 11
2.3. Competent cells 11
2.4. Antibodies 11
2.5. Vectors 12
2.6. Oligonucleotids 12
2.7. Kits 13
2.8. Others 13
2.9. Media, solutions and buffers 14
2.9.1. Bacteria cultures 14
2.9.2. Buffers and solutions for analysis and cloning DNA 14
2.9.3. Buffers and solutions for protein analysis 15
2.10. Standard solutions and buffers 19
2.11. Blood samples 20
2.11.1. Blood sample control 20
2.11.2. CHIKV patient’s sera 20
2.11.3. Vietnamese donor blood samples 20
3. Methods 21
3.1. Make competent E.coli cells 21
3.2. Isolation of DNA plasmids from E.coli 21
ii
3.2.1. Mini-prep 21
3.2.2. Maxi-prep 22
3.2.3. Measurement concentration of DNA plasmids 22
3.3. Running a DNA gel 22
3.4. Isolation DNA fragments from agarose gel 23
3.5. Restriction digest 23
3.6. Ligation 23
3.7. Sub-cloning DNA by PCR with Pfu DNA polamerase 24
3.7.1. Reaction mixture set up 24
3.7.2. Thermal cycling conditions 25
3.8. Expression and purification protein methods 25
3.8.1. Expression protein methods 26
3.8.1.1. Small-scale expression protein method 26
3.8.1.2. Large-scale expression protein method 27
3.8.2. Protein purification methods 28
3.9. Protein estimation 30
3.10. Sodium dodecyl sulphate polyacrylamide gel electrophoresis (SDS-
PAGE)
31
3.11. Western Blot assay 32
3.12. Enzyme-Linked Immunosorbent Assay (ELISA) 33
3.13. Immunofluoresencens assy (IFA) 35
3.14. Western Blot assay with CHIKV-infected cells 36
4. Results 37
4.1. Construction of expression vectors 38
4.1.1. Construction of pET200 C expression vector 38
4.1.2. Construction of pET200 E1 and E2 expression vectors 41
4.1.3. Construction of nsp2 and nsp2-protease expression vectors 44
4.2. Protein expression and purification of the C, E1 and E2 proteins 48
4.2.1. The C protein 48
4.2.1.1. Pilot expression 48
4.2.1.2. Purification of the recombinant C protein 50
4.2.2. Expression and purification of E1 and E2 proteins 52
iii
4.2.2.1. Pilot expression 52
4.2.2.2. Purification of the E1 and E2 recombinant proteins 54
4.2.3. The protease protein 58
4.2.3.1. Pilot protease expression 58
4.2.3.2. Protease expression 60
4.3. Serologic testing 64
4.3.1. Establishment of an immunoblotting assay with patient derived sera 64
4.3.2. Analysis of anti-CHIKV reactivity in serum samples from healthy
Vietnamese blood donors
66
4.3.3. Development of an anti-CHIKV antibody ELISA 67
4.3.4. Analysis of serum reactivity by immunofluoresence 69
4.3.5. Analysis of the patient derived antibody responses by Western
blotting using antigens from CHIKV-infected cells
70
5.Discussion 72
5.1. Development of serological assays for CHIKV diagnostic 72
5.2. Serological diagnoses in Vietnamese blood donors 75
6. Summary 77
7. Tables 79
8. Abbreviations 93
9. List of figures 95
10. References 97
1
1. Introduction
1.1. Chikungunya virus and re-emergence of Chikungunya diseases
Chikungunaya virus (CHIKV) is the prototype of the Alphavirus genus of the family
Togaviridae. Togaviridae consists of two genera, Alphavirus and Rubivirus. There are
approximately 40 alphaviruses able to infect various vertebrates such as humans,
rodents, birds, and horses and in addition invertebrates. Transmission between species
and individuals occurs via mosquito vectors, making the alphaviruses a member of
arboviruses, or arthropod borne viruses. There are approximately 30 known species of
arthropod-borne viruses (Calisher at el., 1988)
CHIKV was first reported in Africa by causing an epidemic in 1952 in the Southern
Province of Tanganyika that renamed Tanzania. The name of CHIK was given by a
local name for "that which bends up" in reference to the stooped posture as a result of
the arthritic symptoms of the disease (Robinson et al., 1955; Lumsden, 1955).
Since the first description of CHIKV numerous outbreaks have been described in India,
Southeast Africa and sub-Saharan Africa. The spread of CHIKV from Africa to Asia
was recorded by causing severe outbreaks in these areas. In Asia, CHIKV was first
isolated in 1958 in Bangkok, Thailand (Hammon, 1960). Subsequently, many Asian
countries have reported CHIKV infections such as: the Philippines, Thailand,
Singapore, Indonesia, India, Japan, Vietnam, Kampuchea and Myanmar throughout the
1960s and 1970s (Halstead et al., 1963; Thaikruea et al., 1997; Shah et al., 1964; Rao et
al., 1965; Thaung et al., 1975; Campos et al., 1969; Macasaet, 1970; Jupp, 1988;
Thaikruea, 1997; Macasaet, 1970). The cases of CHIKV-infection in these epidemics
were up to 31% in Bangkok, Thailand (Halstead et al., 1963), and ranged from 15% to
25% in Vellore, India (Rao et al., 1965).
Recently, CHIKV has emerged in Southeast Asia and the Pacific region (Mackenzie,
2001; Laras, 2005). In India, the outbreak of CHIKV disease caused 1.3 million cases in
13 States in 2005-2006 after 32 year absence. In the same time, the outbreaks were also
reported in the Indian Ocean such as the Comoros, Madagascar, Mayotte, Mauritius, La
Reunion and the Sychelles (Lahariya and Pradhan, 2006; Enserink, 2006). On the
Comoros Islands more than 500 cases were reported during an outbreak at the beginning
2
of 2005. Subsequently, the virus was spread to other islands, such as Reunion and
Mayotte, Mauritius, Madagascar (Simon, 2007). Especially, in Reunion approximately
266,000 cases which stand for one third of the population were infected with CHIKV
and 237 deaths were considered to be caused by CHIKV. During this period about 9000
cases of CHIKV in the Seychelles, 7290 in Mayotte and 6000 in Mauritius have also
been reported.
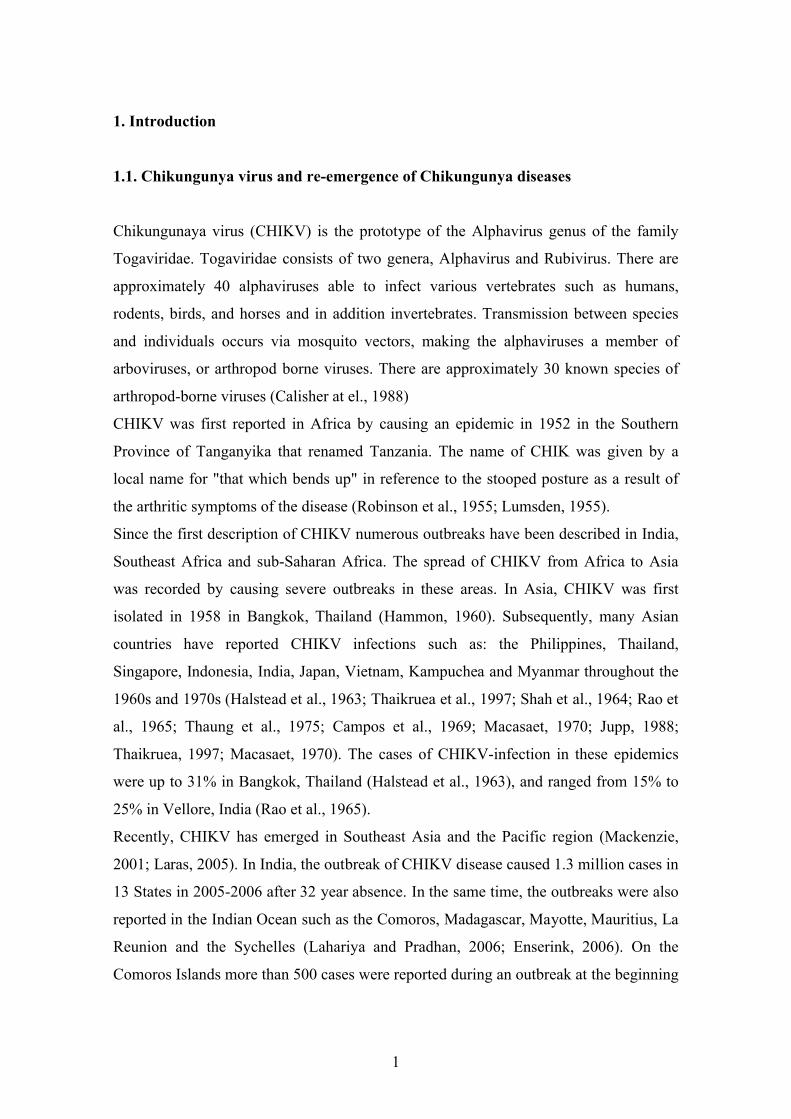
Recently, CHIKV has attracted more attention when the virus caused an outbreak in a
temperate region such as Italy where the virus caused approximately two hundred cases
(Lines, 2007). Tourism is thought to be the reason for virus introduction to Europe
(Chastel, 2005; Depoortere, 2006; Service, 2007). Travelers were infected with CHIKV
during visiting the outbreak places and they became a reservoir of virus when they
backed home (Bodenmann, 2006; Hochedez., 2007; Krastinova, 2006; Panning, 2006;
Pfeffer, 2006). The recent CHIKV outbreaks are presented in figure 1.
Figure 1: Distribution of recent CHIKV outbreaks (MARTIN ENSERINK-SCIENCE
VOL. 318. 21 DECEMBER 2007)
3
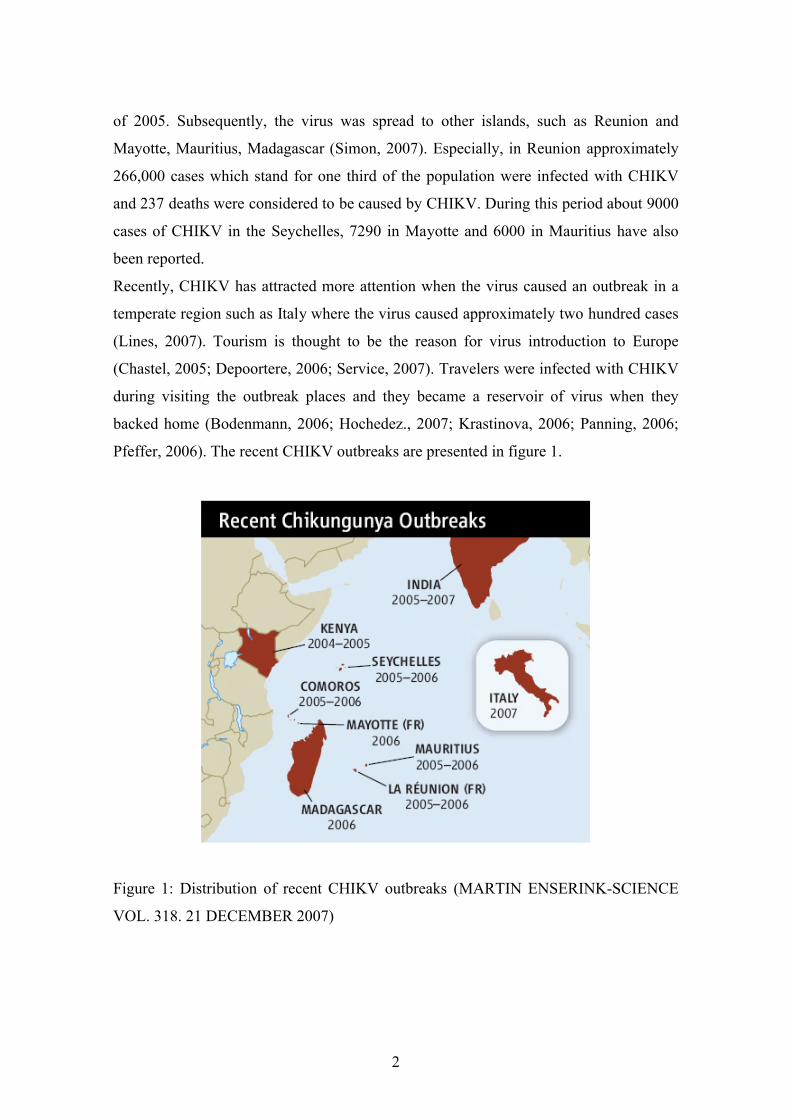
CHIKV is transmitted by mosquitoes in which the virus has a cycle of replication before
replication in human. The mosquitoes were considered to be the main vectors for
CHIKV Aedes albopictus and Aedes aegypti (Hammon, 1960; Thaikruea, 1997). The
other Aedes species have also been reported to transmit the virus (Griffin, 2007;
Pialoux, 2007). There is a different geography distribution of these vectors. In Asia,
Ae.aegypti is the main vector of CHIKV (Jupp, 1988), whereas Ae. albopictus (common
name Asian tiger mosquito) is shown to be the main vector in islands of the Indian
Ocean (Enserink, 2006; Reiter, 2006). Ae.albopictus is also thought to be the main
vector for transmission of CHIKV in Italy where due to climate change this vector now
appears to be epidemic (Enserink, 2007; Knudsen, 1996; Gratz, 2004). Furthermore,
reports indicate Ae.albopictus to replicate and transmit the old African genotype of
CHIKV as well as the recent Indian Ocean strain of CHIKV better than those of
Ae.egypti (Konishi, 1986; Mangiafico, 1971; Tesh, 1976) and other Aedes species
(Charrel, 2007).
Figure 2: A female Ae. aegypti (right) and a female Ae. albopictus (left) feeding on a
human (Image Centers for Disease Control Public Health Image Library).
1.2. The genome and replicative cycle of CHIKV
1.2.1. Genome structure and organization
CHIKV is an enveloped particle and has a single-stranded RNA genome of positive
polarity. The genome is approximately 12000 nucleotides in length (Schlesinger and
4
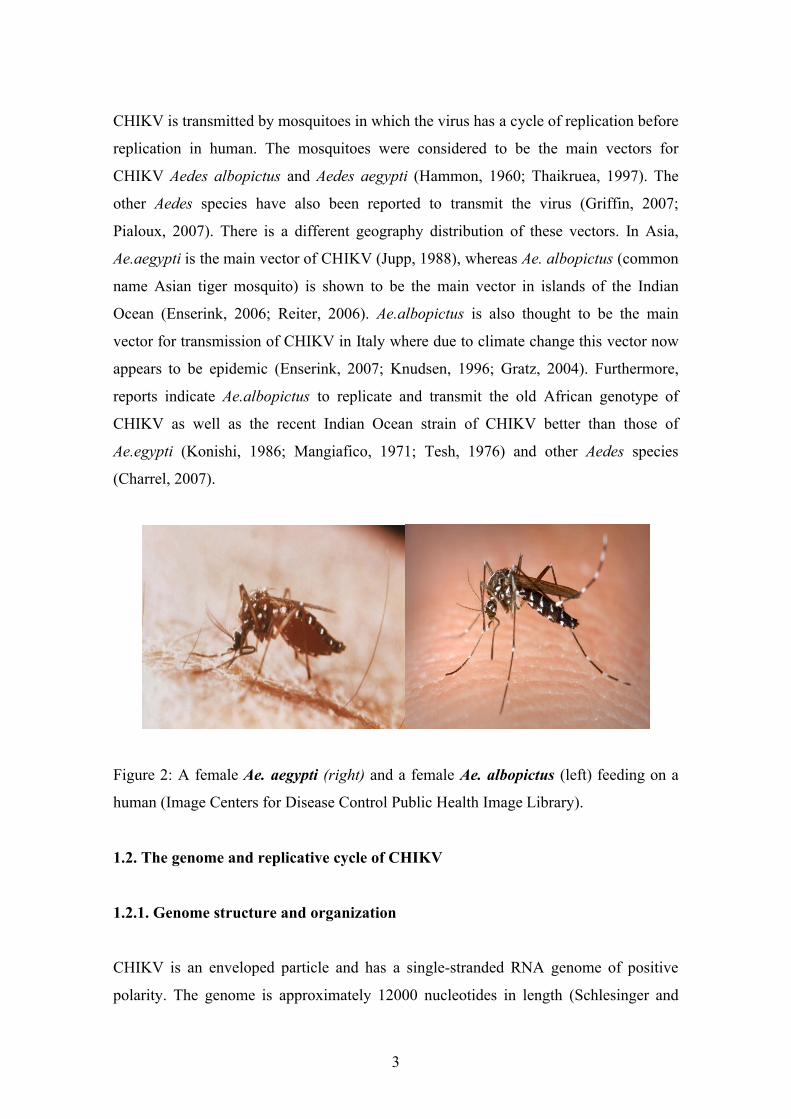
Schlesinger 2001; Strauss and Strauss 1994). Under electron microscopy in green
monkey kidney (Vero) cells CHIKV particles reveal a characteristic Alphavirus
morphology (Fig.3 and Simizu et al., 1984)
Figure 3: Electron micrograph of purified CHIKV virions. CHIKV virions exhibit
typical alphavirus structure. In thin sections the virus shows a roughly spherical shape
with a diameter of 42 nm composed of a 25–30 nm core which is surrounded by an
envelope (reproduced from Simizu et al., 1984).
The genomic RNA acts as cellular messenger RNA. Therefore, the 5’ end is capped
with a 7-methylguanosine, while the 3’ end is polyadenylated. The genome is divided
into two major domains: a nonstructural domain, covering the first two thirds of the
genomic RNA, which are directly translated in the non-structural proteins and a
structural domain covering the last third of the genome, encoding the structural proteins
of the virus.
5
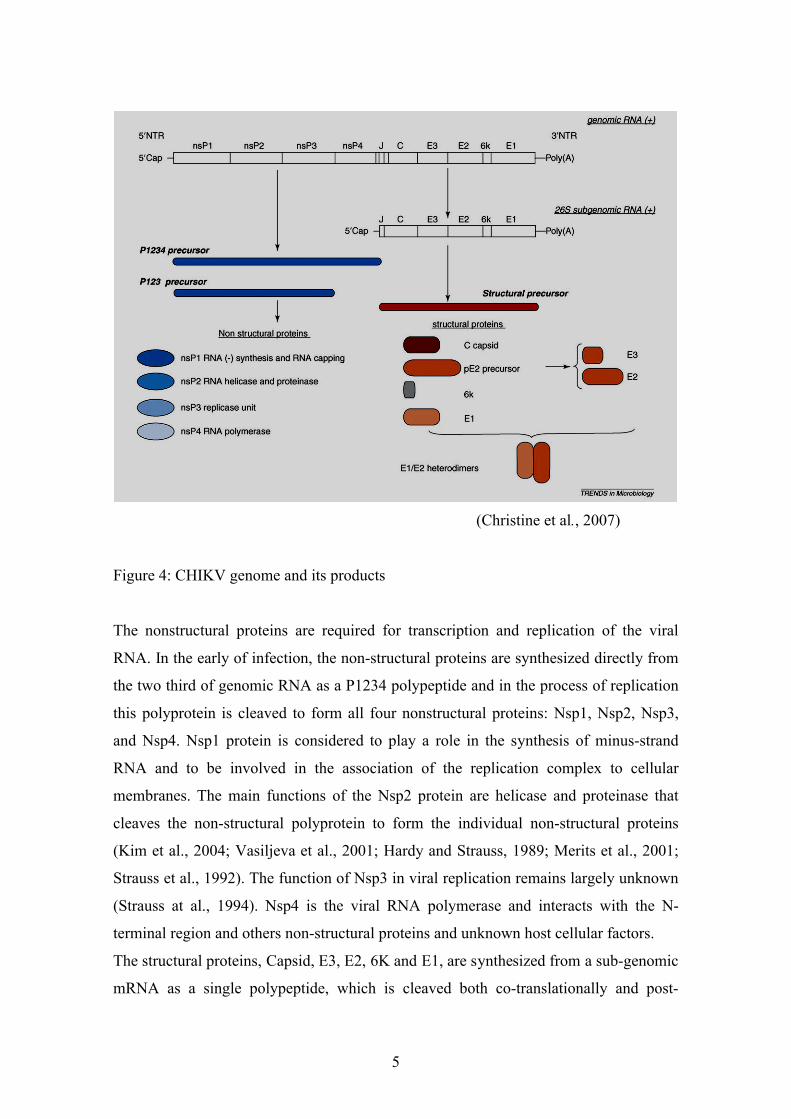
(Christine et al., 2007)
Figure 4: CHIKV genome and its products
The nonstructural proteins are required for transcription and replication of the viral
RNA. In the early of infection, the non-structural proteins are synthesized directly from
the two third of genomic RNA as a P1234 polypeptide and in the process of replication
this polyprotein is cleaved to form all four nonstructural proteins: Nsp1, Nsp2, Nsp3,
and Nsp4. Nsp1 protein is considered to play a role in the synthesis of minus-strand
RNA and to be involved in the association of the replication complex to cellular
membranes. The main functions of the Nsp2 protein are helicase and proteinase that
cleaves the non-structural polyprotein to form the individual non-structural proteins
(Kim et al., 2004; Vasiljeva et al., 2001; Hardy and Strauss, 1989; Merits et al., 2001;
Strauss et al., 1992). The function of Nsp3 in viral replication remains largely unknown
(Strauss at al., 1994). Nsp4 is the viral RNA polymerase and interacts with the N-
terminal region and others non-structural proteins and unknown host cellular factors.
The structural proteins, Capsid, E3, E2, 6K and E1, are synthesized from a sub-genomic
mRNA as a single polypeptide, which is cleaved both co-translationally and post-
6
translationally to form structural proteins (Strauss & Strauss, 1986, 1988; Faragher et
al., 1988). These structural proteins have important functions in the replication of virus
and particularly in the interaction with the host. This interaction was presented by the
production of antibodies which played important roles in the recovery from infection
(Griffin, 1977). Antibodies can neutralize virus infectivity and decline virus by the
complement systems (Jahrling, 1983).
The junction region is located in between the nonstructural and structural domains and
functions to promote transcription of an intracellular subgenomic 26S RNA. In addition
to the junction region, there are two other untranslated regions: one at the 5’-end, which
is required for plus-strand RNA synthesis (Ou et al., 1983; Strauss & Strauss, 1994) and
the other which is located at the 3’ end between the stop codon of the E1 gene and the
poly (A) tail. This region is mainly involved in translation of viral proteins rather than
in replication of the genomic RNA (Leathers et al., 1993; Kuh et al., 1991).
1.2.2. The replication-cycle of CHIKV
CHIKV replicates in the vertebrate as well as in the insect host. Principally, the process
of virus replication is similar, but the budding of virions is different. In invertebrate
cells, virus is released by exocytosis rather than at the plasma membrane (Miller, 1992;
Stollar, 1975). In addition, the lifelong infections of virus are supported by
noncytopathic infection in invertebrate cells, whereas virus is treated by the immune
system after infection in vertebrates. Some human patients suffer from long-lasting
symptoms. This could be explained by discovering CHIKV tropism for muscular
satellite cells that are considered as reservoirs for virus or virus-encoded components for
longer than expected periods (Ozden et al., 2007).
In order to penetrate into vertebrate cells, the interaction between the envelope proteins
of CHIKV and receptors of host cells is required. The cellular receptors for CHIKV is
still unknown, however, in other Alphavirus the laminin receptor, glycosaminoglycans
and DC-SIGN (CD209) molecules are involved in viral uptake. By endocytosis of
clathrin-coated vesicles the virus is transported into the cell. Due to reduction of the pH
in the vesicle the activation of the E1 protein from the E1-E2 complex is promoted viral
and endosomal membrane fuses, resulting in the release of the nucleocapsid into the
7
cytoplasm. In the cytoplasm, the replication of CHIKV is performed. Firstly, the
translation of P1234 precursor polyprotein and RNA replication are carried out. The
P1234 polyproteins are translated directly from the viral genome and the process of
RNA replication is started by the synthesis of a full-length minus-strand RNA, which is
used as a template for the synthesis of the viral genome and to transcribe the 26S sub-
genomic plus-strand RNA from the internal promoter in the junction region. Both
processes are interlinked. After cleavage from the P1234 polyprotein, Nsp4 associates
with P123 and unknown host partners to regulate the synthesis of minus-strand RNA.
The switch from genome replication to transcription of sub-genomic 26S positive-strand
RNA is also regulated by non-structural proteins which were cleaved from the P123
polyproteins.
The structural protein precursor is translated from the 26S subgenomic RNA, which
serves as mRNA. The mature structural protein precursor (C-E3-E2-6k-E1) is
cotranslationally cleaved. The capsid protein is produced by autocatalytic cleavage from
the N-terminal region of structural polyprotein precursor and encapsidates the viral
genomic RNA, resulting in the rapid assembly of nucleocapsid cores in the cytoplasm.
In parallel, after being cleaved from the envelope polyprotein precursor, E2 and E1 are
transferred to the plasma membrane. Finally, the packaging of virus is performed in
cytoplasma by the process of assembly of nucleocapsid cores with glycoproteins and
virus is released by budding through the cellular membrane to form an enveloped
virion.
1.3. CHIKV clinical manifestation
Normally CHIKV is not transmitted between humans. CHIKV disease in humans is
caused by the bite of an infected mosquito or by transmission of CHIKV infected blood.
During feeding blood meal, the mosquito deposits virus-infected saliva extravascularly
(Turell, 1995). In typical infected patients, viraemia is highest for the first four days,
then declines and is cleared by an immunosystem on day five. The human disease is
characterised by a sudden onset of fever up to 39-400C (Deller and Russell, 1967),
which is followed by rash and joint pains (McGill, 1995; Adebajo, 1996; Jadhav, 1965).
The manifestation of joint pains is typical symmetrical, poly-articular, and migratory
8
(Kennedy, 1980; Deller and Russell, 1968; Fourie and Morrison, 1979). Joints may be
swollen and present redness, and limitation of movement. Fluid in the synovial bursa is
uncommon (Brighton, 1983).
Other typical symptoms of CHIKV disease are skin manifestations, presenting on the
face, trunk and limbs. The rash can occur when temperature declines and along with
itch.
Most CHIKV infected patients have common symptoms such as headache, retro-orbital
pain, photophobia, lumbar back pain, chills, weakness, malaise, nausea, vomiting and
myalgia, but the presence or frequency of the symptoms in the individual patient are
highly variable (Brighton, 1981; McGill, 1995; Calisher, 1999; Munasinghe, 1966).
During the recent outbreak in Reunion and in the first outbreak in India, neurological
complications such as meningoencephalitis occurred in a small proportion of patients
(Quatresous, 2006; Chatterjee, 1965). Mother to child transmission of CHIKV has been
also reported (Robillard, 2006). While most symptoms disappear completely in weeks
or month, in some cases the patients suffered from chronic joint disease for several
years, which may result in joint destructed after 15 years in rare cases (Brighton et al.,
1983; McGill, 1995; Calisher, 1999; Brighton and Simson, 1984).
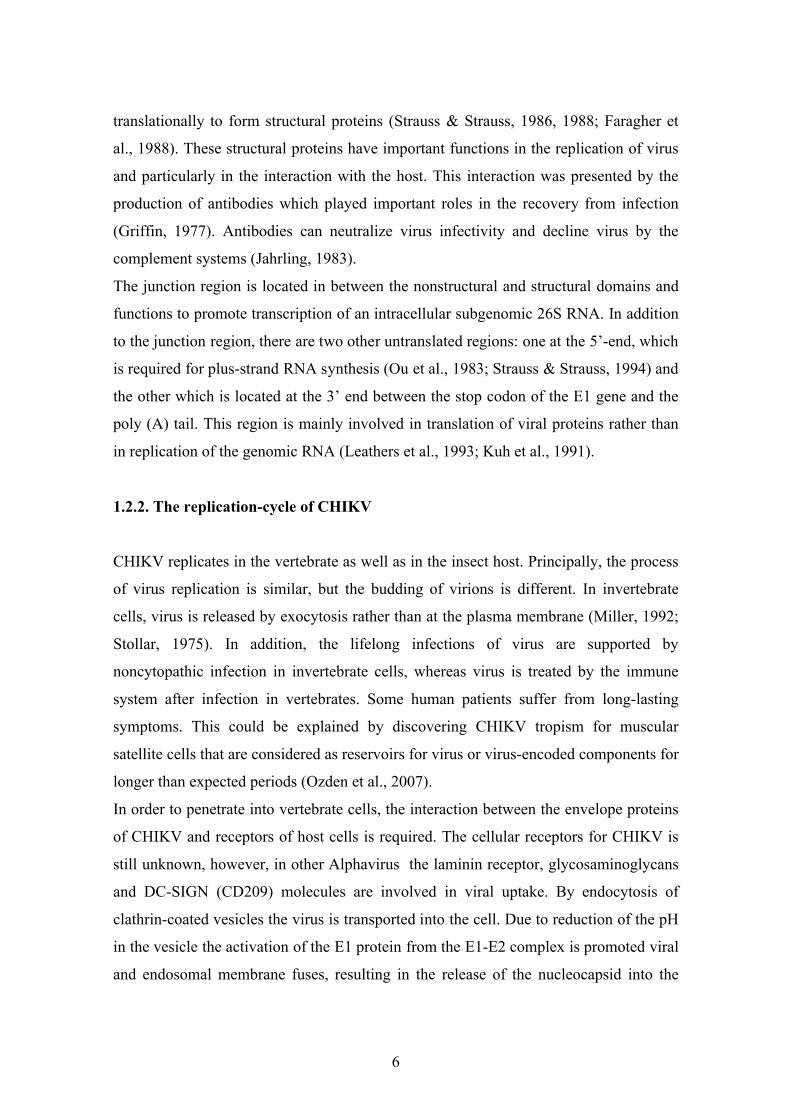
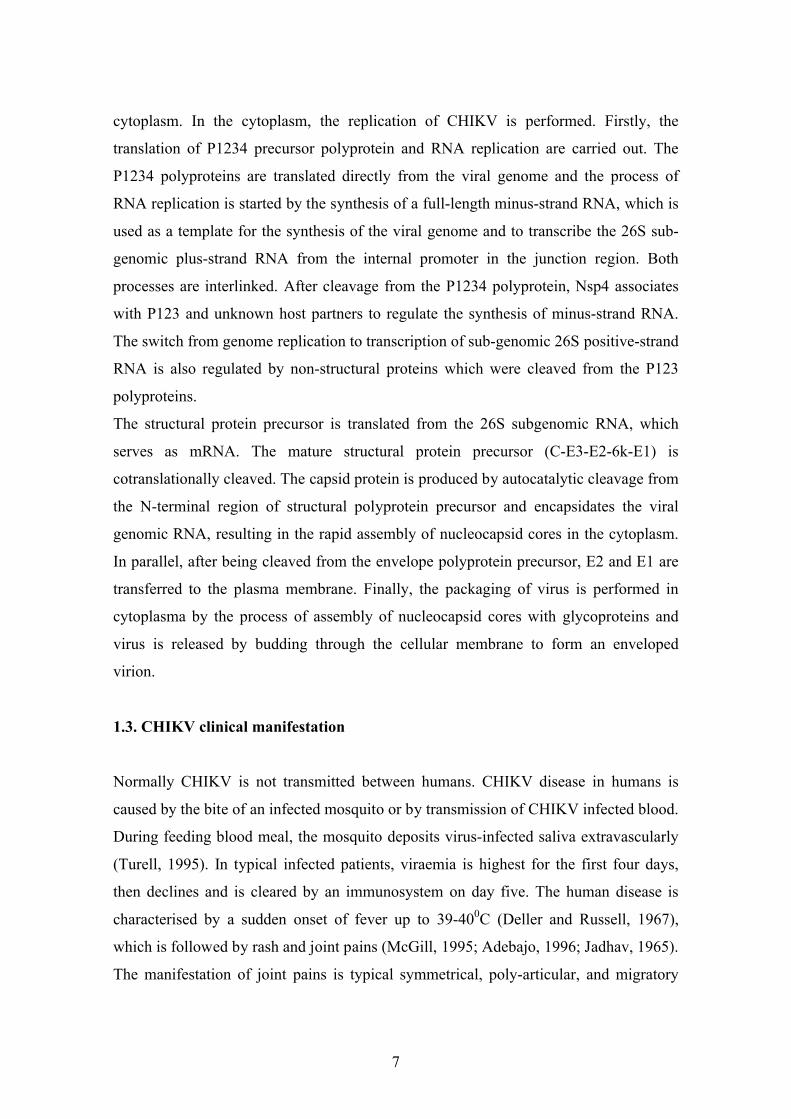
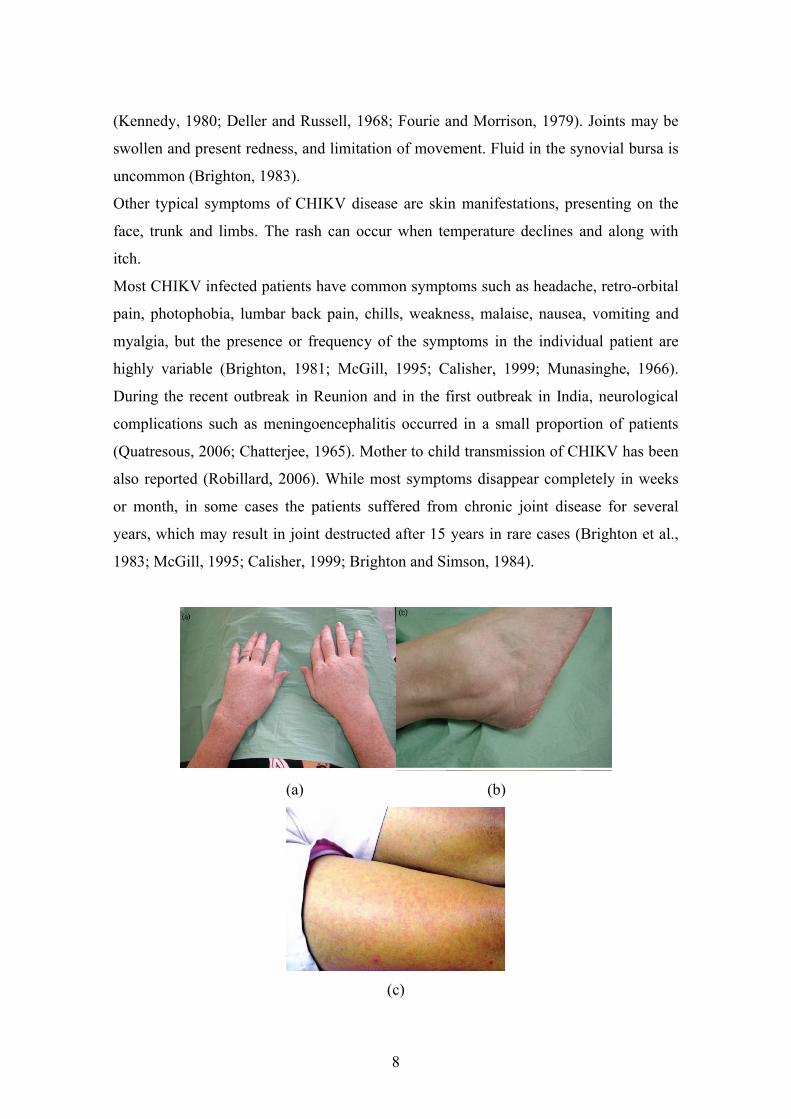
(a) (b)
(c)
9
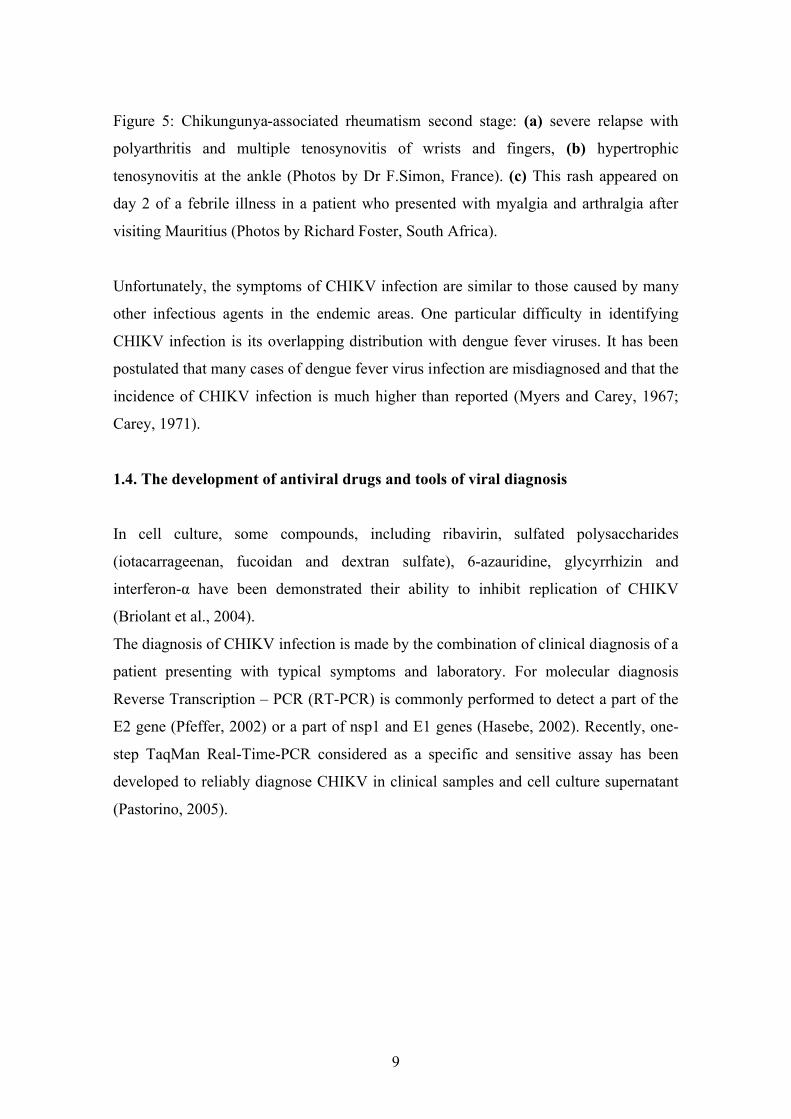
Figure 5: Chikungunya-associated rheumatism second stage: (a) severe relapse with
polyarthritis and multiple tenosynovitis of wrists and fingers, (b) hypertrophic
tenosynovitis at the ankle (Photos by Dr F.Simon, France). (c) This rash appeared on
day 2 of a febrile illness in a patient who presented with myalgia and arthralgia after
visiting Mauritius (Photos by Richard Foster, South Africa).
Unfortunately, the symptoms of CHIKV infection are similar to those caused by many
other infectious agents in the endemic areas. One particular difficulty in identifying
CHIKV infection is its overlapping distribution with dengue fever viruses. It has been
postulated that many cases of dengue fever virus infection are misdiagnosed and that the
incidence of CHIKV infection is much higher than reported (Myers and Carey, 1967;
Carey, 1971).
1.4. The development of antiviral drugs and tools of viral diagnosis
In cell culture, some compounds, including ribavirin, sulfated polysaccharides
(iotacarrageenan, fucoidan and dextran sulfate), 6-azauridine, glycyrrhizin and
interferon-α have been demonstrated their ability to inhibit replication of CHIKV
(Briolant et al., 2004).
The diagnosis of CHIKV infection is made by the combination of clinical diagnosis of a
patient presenting with typical symptoms and laboratory. For molecular diagnosis
Reverse Transcription – PCR (RT-PCR) is commonly performed to detect a part of the
E2 gene (Pfeffer, 2002) or a part of nsp1 and E1 genes (Hasebe, 2002). Recently, one-
step TaqMan Real-Time-PCR considered as a specific and sensitive assay has been
developed to reliably diagnose CHIKV in clinical samples and cell culture supernatant
(Pastorino, 2005).
10
1.5. The aim of thesis
To combat the CHIKV outbreaks, which exploded worldwide and caused thousands of
reported cases in new geographical areas, the development of new diagnostic tools is
highly desirable. Although many new techniques have been developed and established
recently, inconveniences still remain. Virus culture, followed by detection of viral
antigens is sensitive, but must be performed under strict BSL3 bio-safety conditions.
This is a laborious and time-consuming technique, which can not be used in routine
diagnostic. Therefore, this method is used only for virus identification at the beginning
of an epidemic. In order to develop diagnostic tools on a serological level, bacterial
expression vectors for the non-structural and structural proteins of CHIKV were
constructed. The proteins were purified and characterized and used for Western blot and
the development of ELISA assays. The tests were evaluated with pre-screened positive
sera and, in addition, with sera from healthy human blood donors from Germany. We
aimed to use the established analysis to screen samples, from countries with a high
CHIKV incidence. Vietnam is the easternmost country in the Indochina peninsula in
Southeast Asia. The climate of Vietnam varies greatly from one region of the country to
another. The south of Vietnam is a mere 8 degrees north of the Equator, whereas the
most northern point is almost on the tropic of Cancer. Most regions in Vietnam have a
subtropical climate and are hot, at least in the summer, and wet most of the year. With
the climate condition this is perfect environment for development of Ae.agypti, due of
the CHIKV vectors. Dengue virus infections in victims have often been reported, but
there are only a few old reports on CHIKV (Vu et al., 1967; Anonym, 1969). Thus, the
newly developed test will be used to screen Vietnamese serum samples and to gain an
inside in the situation of CHIKV seroprevalence in Vietnam.
11
2. Materials
2.1. Enzymes and Buffers
CIAP (calf intestine alkaline phosphatase)
SAP (Shrimp Alkaline Phosphatase)
Klenow-Polymerase
Restriction enzymes
Mung Bean Nuclease
T4 DNA-Ligase
T4 DNA-Polymerase
MBI Fermentas
MBI Fermentas
NEB, MBI-Fermentas
MBI Fermentas
MBI Fermentas
MBI Fermentas
MBI Fermentas
2.2. Antibiotics
Antibiotics Stock Solution Working Solution
Ampicilline 100μg/μl 100μg/ml
Kanamycine 50μg/μl 50μl/ml
2.3. Competent cells
TOP 10 cells
DH5α
BL 21 star
Invitrogen
Reference from Invitrogen
Invitrogen
2.4. Antibodies
Antibodies were diluted for Western blotting and Elisa
First antibodies
His-Tagged antibody
Second antibodies
Goat Anti-mouse IgG Jackson Immuno Research
Dilution
1: 1000
1:10000
Identification
His-Tagged
protein
12
Goat Anti-Human IgG
Goat Anti-Human IgG-
Alkaline Phosphatase
Jackson Immuno Research
Sigma
1:10000
1:1000
2.5. Vectors
Clonging vectors
pCR II
pCR XL
Invitrogen
Invitrogen
Expression vectors
PET 200/D
PET 101/D
Invitrogen
Invitrogen
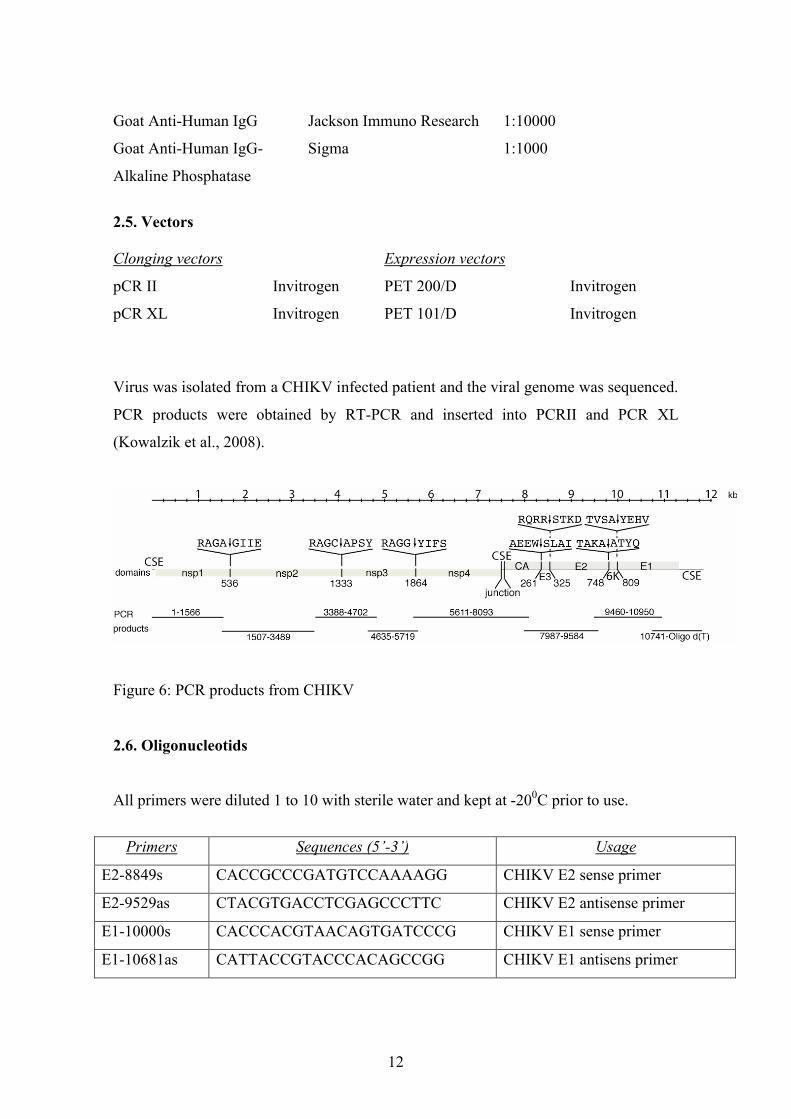
Virus was isolated from a CHIKV infected patient and the viral genome was sequenced.
PCR products were obtained by RT-PCR and inserted into PCRII and PCR XL
(Kowalzik et al., 2008).
Figure 6: PCR products from CHIKV
2.6. Oligonucleotids
All primers were diluted 1 to 10 with sterile water and kept at -200C prior to use.
Primers Sequences (5’-3’) Usage
E2-8849s CACCGCCCGATGTCCAAAAGG CHIKV E2 sense primer
E2-9529as CTACGTGACCTCGAGCCCTTC CHIKV E2 antisense primer
E1-10000s CACCCACGTAACAGTGATCCCG CHIKV E1 sense primer
E1-10681as CATTACCGTACCCACAGCCGG CHIKV E1 antisens primer
13
C-7567s CACCATGGAGTTCATCCCAACCC CHIKV C sense primer
C-8350as CTACCACTCTTCGGCTCCCTCAG CHIKV C antisense primer
NSP2-1683s CACCGGAATAATAGAGACTCCGAG CHIKV NSP2 sense primer
NSP2-4077as CTAACATCCTGCTCGGGTGGCC CHIKV NSP2 antisense primer
pET200-PR s CACCACACTTTCCGGCGACCCGTG CHIKV protease sense primer
pET200-PR as CTAACATCCTGCTCGGGTGACCTG CHIKV protease antisense primer
pET101-PR s ATGACACTTTCCGGCGACCCGTGG CHIKV protease sense primer
pET101-PR as ACATCCTGCTCGGGTGACCTGTC CHIKV protease antisense primer
2.7. Kits
Big Dye Terminator v1.1 Cycle Sequencing Kit
ECL TM Western Blot Detection Kit
NucleoBond PC500 Reagents
Qiaquick PCR Purification Kit
Qiaquick Gel extraction Kit
Applied Biosystems
Amersham Biosciences
Macherey-Nagel
Qiagen
Qiagen
2.8. Others
Blot Filterpaper
Hybond-ECL Nitrocellulosemembran
Plastic Material
X-ray film Retina XBD
Filters (0,22 μm, 0,45 μm)
INTAS UV system
Sonicator-Sonifier 250
FPLCTM system
Ni-NTA supperflow cartridges
Schleicher & Schuell
Amersham Biosciences
Costar, Eppendorf, Falcon,
Greiner, Nunc, Roth
Fotochemische Werke GmbH
Schleicher & Schuell
Branson
Amersham Biosciences
Invitrogen
In addition, the normal laboratory equipments with centrifuges, pipettes, vortex, power
supplies etc. were used.
14
2.9. Media, solutions and buffers
2.9.1. Bacteria cultures
5x LB-Medium LB Broth Base Lennox L
(Invitrogen #12780-029)
NaCl
α-D Glucose
H2O
Autoclave
100g
25g
5g
Up to 1000ml
LB-Agar LB Broth Base Lennox L
Agar
NaCl
H2O
Autoclave
40g
40g
10g
Up to 1000ml
After autoclaving the LB-Agar was cooled down and Ampicillin 100µg/ml and
Kanamycine 50 µg/ml were added. Then LB-Agar was poured in plates and kept at 40C
until use.
2.9.2. Buffers and solutions for analysis and cloning DNA
50x TAE Tris
Acetic acid
EDTA pH 8.0
2 M
5.71%
50 mM
Preparative competent
cell buffer 1
Kaliumacetat
RbCl2
CaCl2
MnCl2
Glycerin
30 mM
100 mM
10 mM
50 mM
15%
Adjusted to pH 5.8 with acetic acid 10% and filtered by 0.2μl filter, kept at 40C.
15
Preparative
competent cell
buffer 2
MOPS
RbCl2
CaCl2
Glycerin
10 mM
100 mM
75 mM
15%
Adjusted to pH 6.5 with KOH 1M and filtered by 0.2μl filter, kept at 40C.
Miniprep solution 1 Tris-HCl pH 8.0 25mM
Glucose 50mM
EDTA pH 8.0 10 mM
Autoclave
Miniprep solution 2 NaOH 0.2 N
SDS 1%
Miniprep solution 3 Natrium Acetat 3M
Adjust pH 2.0 with Acetic acid
Autoclave
TE/RNase TE 0.1x
RNase A 100μg/ml
Tris/MgCl2 Tris-HCl pH 9.0 200 mM
MgCl2 5 mM
Autoclave
2.9.3. Buffers and solutions for protein analysis
2x SDS-PAGE
Sample Buffer
1. Combine the following
reagents:
0.5 M Tris-HCl, pH 6.8
Glycerol (100%)
β-mercaptoethanol
Bromophenol Blue
2.5 ml
2.0 ml
0.4 ml
0.02 g
16
SDS 0.4 g
2. Bring the volume to 10 ml with sterile water.
3. Aliquot and freeze at -20°C until use
1x SDS-PAGE
Sample Buffer
1. Combine the following
reagents:
0.5 M Tris-HCl, pH 6.8
Glycerol (100%)
β-mercaptoethanol
Bromophenol Blue
SDS
1.25 ml
1.0 ml
0.2 ml
0.01g
0.2g
2. Bring the volume to 10 ml with sterile water.
3. Aliquot and freeze at -20°C until use.
Coomassie gel stain
(1l)
Coomassie blue R-250
Methanol
H2O
Acetic acid
1.0 g
450 ml
450 ml
100 ml
Coomassie gel
destain (1l) Methanol
H2O
Acetic acid
100 ml
800 ml
100 ml
Lysis Buffer for
pilot analysis of
recombinant
proteins
Potassium phosphate, pH 7.8
NaCl
KCl
Glycerol
Triton X-100
Imidazole
50 mM
400 mM
100 mM
10%
0.5%
10 mM
Prepare 1 M stock solutions of KH2PO4 and K2HPO4.
17
For 100 ml, dissolve the following reagents in 90 ml of deionized water:
KH2PO4
K2HPO4
NaCl
KCl
Glycerol
Triton X-100
imidazole
0.3 ml
4.7 ml
2.3 g
0.75 g
10 ml
0.5 ml
68 mg
Mix thoroughly and adjust pH to 7.8 with HCl. Bring the volume to 100 ml.
Store at +4°C.
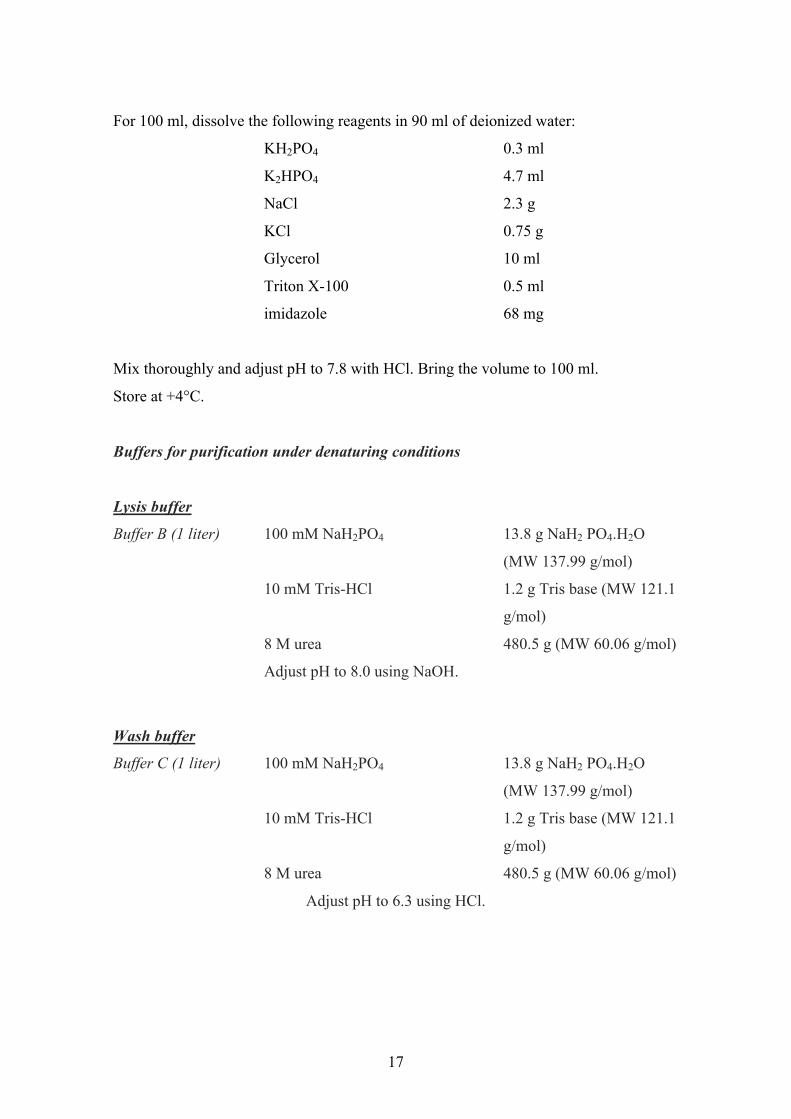
Buffers for purification under denaturing conditions
Lysis buffer
Buffer B (1 liter) 100 mM NaH2PO4 13.8 g NaH2 PO4.H2O
(MW 137.99 g/mol)
10 mM Tris-HCl 1.2 g Tris base (MW 121.1
g/mol)
8 M urea 480.5 g (MW 60.06 g/mol)
Adjust pH to 8.0 using NaOH.
Wash buffer
Buffer C (1 liter) 100 mM NaH2PO4 13.8 g NaH2 PO4.H2O
(MW 137.99 g/mol)
10 mM Tris-HCl 1.2 g Tris base (MW 121.1
g/mol)
8 M urea 480.5 g (MW 60.06 g/mol)
Adjust pH to 6.3 using HCl.
18
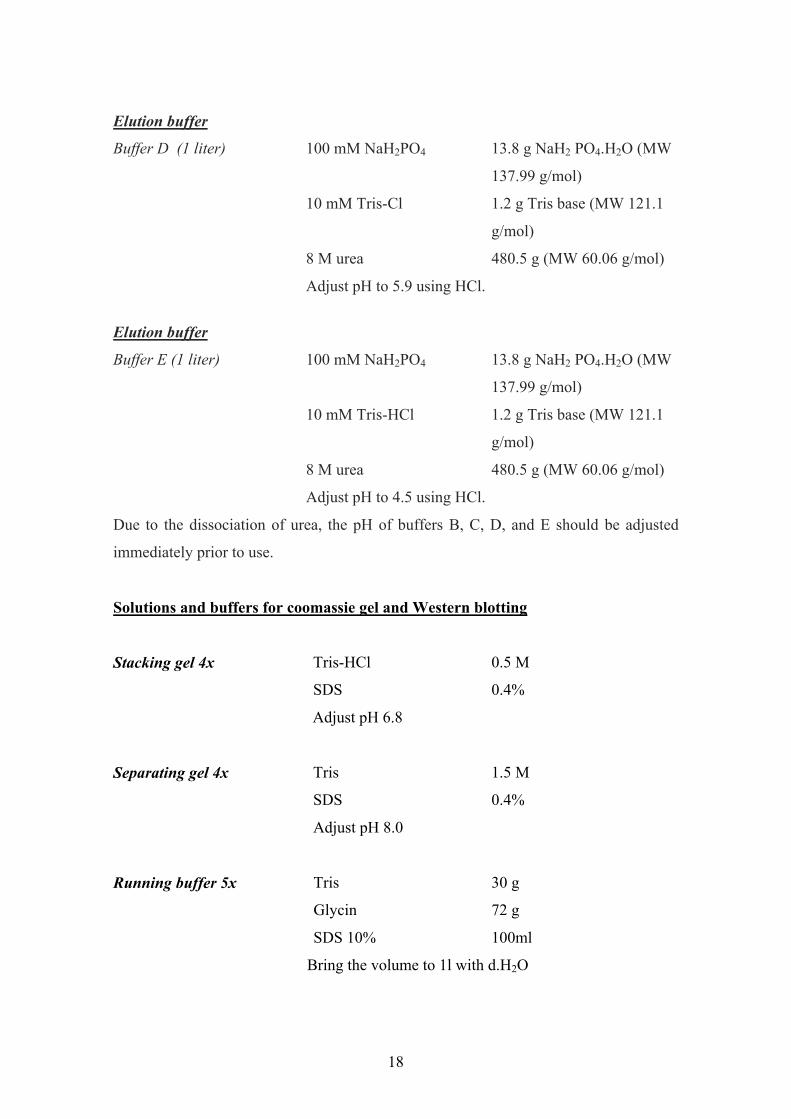
Elution buffer
Buffer D (1 liter) 100 mM NaH2PO4 13.8 g NaH2 PO4.H2O (MW
137.99 g/mol)
10 mM Tris-Cl 1.2 g Tris base (MW 121.1
g/mol)
8 M urea 480.5 g (MW 60.06 g/mol)
Adjust pH to 5.9 using HCl.
Elution buffer
Buffer E (1 liter) 100 mM NaH2PO4 13.8 g NaH2 PO4.H2O (MW
137.99 g/mol)
10 mM Tris-HCl 1.2 g Tris base (MW 121.1
g/mol)
8 M urea 480.5 g (MW 60.06 g/mol)
Adjust pH to 4.5 using HCl.
Due to the dissociation of urea, the pH of buffers B, C, D, and E should be adjusted
immediately prior to use.
Solutions and buffers for coomassie gel and Western blotting
Stacking gel 4x Tris-HCl
SDS
0.5 M
0.4%
Adjust pH 6.8
Separating gel 4x Tris 1.5 M
SDS 0.4%
Adjust pH 8.0
Running buffer 5x Tris
Glycin
SDS 10%
30 g
72 g
100ml
Bring the volume to 1l with d.H2O
19
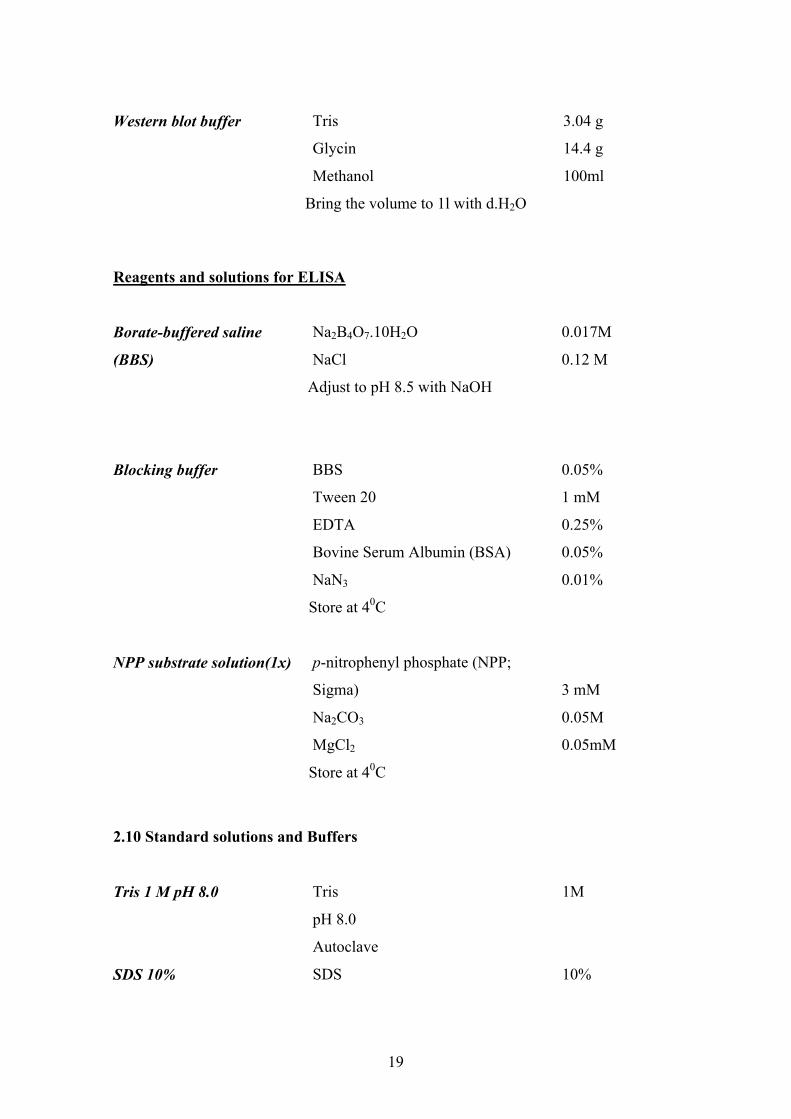
Western blot buffer Tris
Glycin
Methanol
3.04 g
14.4 g
100ml
Bring the volume to 1l with d.H2O
Reagents and solutions for ELISA
Borate-buffered saline
(BBS)
Na2B4O7.10H2O
NaCl
0.017M
0.12 M
Adjust to pH 8.5 with NaOH
Blocking buffer BBS
Tween 20
EDTA
Bovine Serum Albumin (BSA)
NaN3
0.05%
1 mM
0.25%
0.05%
0.01%
Store at 40C
NPP substrate solution(1x) p-nitrophenyl phosphate (NPP;
Sigma)
Na2CO3
MgCl2
3 mM
0.05M
0.05mM
Store at 40C
2.10 Standard solutions and Buffers
Tris 1 M pH 8.0 Tris
pH 8.0
Autoclave
1M
SDS 10% SDS 10%
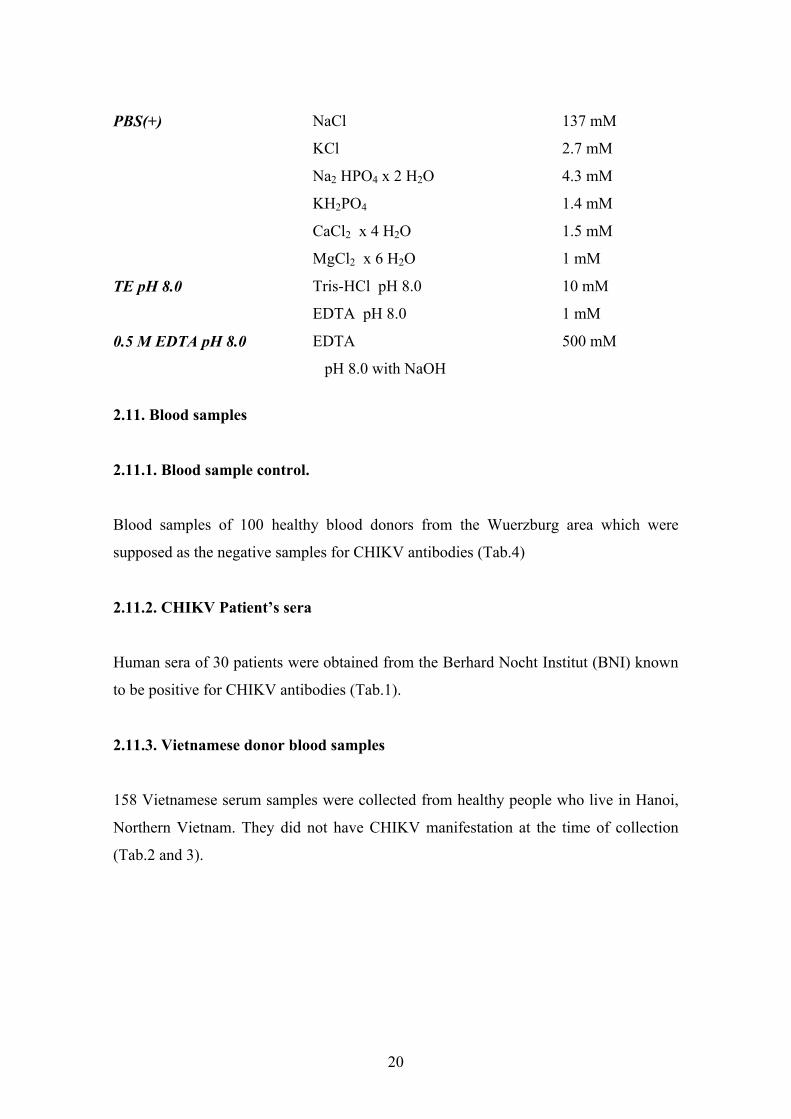
20
PBS(+) NaCl
KCl
Na2 HPO4 x 2 H2O
KH2PO4
CaCl2 x 4 H2O
MgCl2 x 6 H2O
137 mM
2.7 mM
4.3 mM
1.4 mM
1.5 mM
1 mM
TE pH 8.0 Tris-HCl pH 8.0
EDTA pH 8.0
10 mM
1 mM
0.5 M EDTA pH 8.0 EDTA 500 mM
pH 8.0 with NaOH
2.11. Blood samples
2.11.1. Blood sample control.
Blood samples of 100 healthy blood donors from the Wuerzburg area which were
supposed as the negative samples for CHIKV antibodies (Tab.4)
2.11.2. CHIKV Patient’s sera
Human sera of 30 patients were obtained from the Berhard Nocht Institut (BNI) known
to be positive for CHIKV antibodies (Tab.1).
2.11.3. Vietnamese donor blood samples
158 Vietnamese serum samples were collected from healthy people who live in Hanoi,
Northern Vietnam. They did not have CHIKV manifestation at the time of collection
(Tab.2 and 3).
21
3. Methods
3.1. Make competent E. coli cells
1. Innoculate competent E.coli cells into 5ml LB 1x without antibiotics and
incubate on the shaker at 370C overnight.
2. Next day, inoculate 1 ml cell culture overnight into 100ml LB 1x and incubate
on the shaker at 370C for 2-3 h to get OD600= 0.2-0.3.
3. When samples are ready, pour cell culture into sterile centrifuge falcon 50ml (2
falcons) and put on ice for 10 min. Spin at 2,500g (6,000 rpm) for 10 min.
Remove supernatant.
4. Resuspend the cell pellet in 20ml ice-cold competent cell buffer 1.
5. Put sample on ice for 10 min. Spin at 2,500g for 10 min.
6. Pour off supernatant and resuspend in 4ml competent cell buffer 2. Vortex and
keep on ice for 15 min.
7. Aliquot 200 μl into 1.5ml tubes and quickly freeze in nitrogen. Store at -80°C.
Should last 40 days.
3.2. Isolation of DNA plasmids from E.coli
3.2.1 .Mini-prep
1. Grow bacterial colonies overnight in 3ml LB solution with antibiotics
(Ampicillin 100g/ml or Kanamicin 50g/ml)
2. Take out 1.5 ml bacteria and spin down for 30 sec. Remove supernatant.
3. Add 200 μl Solution 1. Vortex the pellet and keep on ice for 5 min.
4. Add 200 μl Solution 2. Vortex and wait for 5min on ice.
5. Add 250 μl Solution 3. Vortex and keep on ice for 10 min.
6. Spin at 13,000 rpm for 1 min in room temperature.
7. Remove the supernatant and put in new tube.
8. Add 3x volume of 95% cold Ethanol.
9. Invert to mix and spin for 3 min at room temperature or 40C.
22
10. Discard supernatant.
11. Add 500 μl 70% cold Ethanol. Spin 2 min (RT or 40 C) and remove supernatant
12. Dry pellet 10 min at RT.
13. Resuspend in 50-100 μl TE.
3.2.2. Maxi-prep
DNA plasmid maxiprep protocol follows standard protocol from Invitrogen which use
kit NucleoBond PC500.
3.2.3. Measurement concentration of DNA plasmids
The DNA purified by Maxi-prep was measured by spectrophotometer as follow:
1. DNA was diluted into 1:100 in TE buffer or d.H2O and transferred in cuvettes.
2. Samples were measured by spectrophotometer at OD260
3. The concentration of DNA was calculated by formula: ds DNA (μg/m1) =
Dilution factor * OD260 * 50μg/ml
4. Dilute the DNA in the final concentration 1μg/μl.
5. Keep the DNA in - 200C.
3.3. Running a DNA gel
1. Set up gel container and place in 1 or 2 combs.
2. Pour a 0.8% agarose gel. If mixture is already made, microwave for about 60
sec. (or until melted), then let cool until can place hand comfortably on glass.
3. Set up gel and make sure that there is enough TAE buffer to cover the top of the
gel. Place as many dots of gel loading dye as you have samples on a small piece
of Parafilm. Pipette samples up and down to mix in the dye and then load the
appropriate lane. Fill lanes-add 6μL 1 Kb DNA Ladder to first lane.
4. For PCR products, add 5μl sample. For Restriction Digests, add 20μl or more
sample.
5. Run at 90 V until the bands were at expected points.
23
6. Take a picture of gel using INTAS UV system. Cut out desired DNA band at
wave length 320nm.
3.4. Isolation DNA fragments from agarose gel
After finishing running the DNA gel, the desired DNA bands were excised from the
agarose gel with a clean, sharp scalpel.
And then follow QIAquick Gel Extraction Kit Protocol.
3.5. Restriction digest
DNA volume should never be more than 25% of total volume and enzyme volume
should never be more than 10% of total vol.
1. Add the following in order:
DNA
Enzym buffer 10x
Enzymes
dH2O
10μg = 10μl
10 μl
10U
Add to 100 μl
2. Pipette up and down a few times (without introducing air bubbles)
3. Incubate at 37°C for at least 2 h or overnight.
4. Run a 0.8 % agarose gel.
5. Take a picture and cut out desired DNA band using a UV light board and a
razor. Store band in a 1.5mL tube at 4°C until ready to use.
3.6. Ligation
1. Thaw 10x T4 DNA Ligase Buffer. Set up 1 control (just vector) and X samples
(vector + insert). Adjust volumes accordingly.
24
Vector + insert Control (vector only)
Vector
Insert
10x T4 DNA Ligase Buffer
T4 DNA Ligase
dH2O
3 μl
8 μl
2 μl
1 μl
6 μl
Vector
Insert
10x T4 DNA Ligase Buffer
T4 DNA Ligase
dH2O
3 μl
-
2 μl
1 μl
14 μl
Final Reaction volume will be 20 μl.
2. Mix in 1.5mL Eppendorf tube in this order: water, buffer, vector, insert,
enzymes.
3. Incubate overnight in a 14°C water bath in cold room.
3.7. Sub cloning DNA by PCR with Pfu DNA polymerase
PCR is based on the enzymatic amplification of a fragment of DNA that is flanked by
two 'primers', short oligonucleotides that hybridize to the opposite strands of the target
sequence and then prime synthesis of the complementary DNA sequence by DNA
polymerase. The chain reaction is a three-step process, denaturation, annealing, and
extension which are repeated in several cycles.
The reactions are controlled by changing the temperature.
3.7.1. Reaction mixture set up
1. Gently vortex and briefly centrifuge all solutions after thawing.
2. Keep solutions on ice
3. Add to a thin-walled PCR tubes, on ice.
Reaction mixture
ReagentFinal
concentrationSterile deionized water - 37.5µl
10x Pfu buffer with MgSO4 1x 5µl
2 mM dNTP mix 0.2 mM of each 1µl
25
Forward primer 0.1-1 µM 2µl
Reverse primer 0.1-1 µM 2µl
Template DNA 50 pg-1 µg 2µl
Pfu DNA Polymerase 1.25 u/50 µl 0.5µl
50µl
Gently vortex the sample and briefly centrifuge to collect all drops from walls of tube,
place samples in a thermal cycle preheated to 95°C and start PCR.
3.7.2. Thermal cycling conditions:
Step Temperature, °C Time, min Number of cycles
Initial denaturation 95 3
Denaturation 95 0.5
Annealing (depend on Tm
of primers)45-55 0.5 30
Extension 70 2
Final extension 70 5
Pause 4
When program was completely finished, the PCR products were analyzed and purified
by procedures described above.
3.8. Expression and purification protein methods
A primary consideration for recombinant protein expression and purification is the
experimental purpose for which the protein will be utilized. For biochemical and
structural studies, it is often important to optimize conditions for the expression of
soluble, functionally active protein, whereas for antigen production, the protein can be
expressed either in native or denatured form. Freshly transformed bacterial colonies
often express recombinant proteins at different levels. Therefore, comparison of the
26
signals produced after colony blotting to identify highly expressing colonies can help
significantly, while establishing expression cultures.
Optimal growth and expression conditions for the protein of interest should be
established with small-scale cultures before large-scale protein purification is attempted.
In order to judge the toxicity of an expressed protein, cell growth before and especially
after induction of expression should be monitored.
3.8.1. Expression protein methods
3.8.1.1. Small-scale expression protein method.
Before proceeding with a large scale preparation, small-scale expression experiment is
highly recommended and should be performed. The cells can be lysed in a small volume
of sample buffer and analyzed directly by SDS-PAGE. Small expression cultures
provide a rapid way to judge the effects of varied growth conditions on expression
levels. Expression levels vary between different colonies of freshly transformed cells,
and small scale preparations permit the selection of clones featuring optimal expression
rates.
The following is a basic protocol for the expression and screening of small cultures.
1. Pick single colonies of transformants and culture them in 3 ml LB medium
containing Kanamycine (50μg/ml). Grow the culture overnight at 370C with
shaking.
2. Use 500μl of the overnight culture to inoculate 10ml of prewarmed LB
medium containing Kanamycine (50μg/ml), and grow at 370C with shaking for
2 h, until they reach mid-log (OD600 = 0.5-0.7).
3. Induce the cultures by adding IPTG to final concentration 1mM. Before
induction, take out 1ml culture that serves as a noninduced control (t0).
Harvest the cells by centrifugation for 1min. at 13,000 rpm, and discard
supernatants.
4. Grow the cultures for an additional 4 h. At 2 hly intervals, 1ml of the culture is
taken and the cells are harvested by centrifugation for 1 min at 13,000 rpm,
27
discard supernatants. Collect the cell pellets, and keep at -200C until all the
samples are ready for processing.
5. The cell pellets of the rest of the cultures are resuspended in 2ml lysis buffer.
Lyse cells by sonication 6 x 10s with 10 s pauses at 200-300W keep lysates on
ice at all time.
6. Centrifuge the lysate for 30 min at 15,000 rpm to collect the cellular debris
and the supernatant for analysis.
7. Add SDS-PAGE sample buffer to the samples at time points and the cellular
debris with final concentration 1x SDS-PAGE buffer and boil for 5 min at
950C.
8. Analyze the samples by SDS-PAGE and Western blotting.
3.8.1.2. Large-scale expression protein method (1 liter)
1. Inoculate 20 ml of LB broth containing 50 μg/ml kanamycine. Grow at 37°C
overnight with vigorous shaking.
2. Inoculate a 1 liter culture (LB, 50 μg/ml kanamycin) 1:50 with the noninduced
overnight culture. Grow at 37°C with vigorous shaking until an OD600 of 0.5-
0.7 is reached.
3. Take a 1 ml sample immediately before induction. This sample is the
noninduced control; pellet cells and resuspend in 50 μl 2x SDS-PAGE sample
buffer. Freeze until use.
1. Induce expression by adding IPTG to a final concentration of 1 mM.
2. Incubate the culture for an additional 4-5 h. Collect a second 1 ml sample. This
is the induced control; pellet cells in a microcentrifuge and resuspend in 50 μl
2x PAGE sample buffer. Freeze until use.
3. Harvest the cells by centrifugation at 4700 rpm for 20 min. Freeze the cells in
dry ice-ethanol or liquid nitrogen, or store cell pellet overnight at -20°C.
28
3.8.2. Protein purification method
Expression of recombinant proteins in E. coli can lead to the formation of insoluble
aggregates; these are known as inclusion bodies. Strong denaturants such as 8 M urea
completely solubilize inclusion bodies, and 6xHis-tagged proteins.
Under denaturing conditions, the 6xHis-Tag fusion protein will be fully exposed so that
binding to the Ni-NTA matrix will improve, and the efficiency of the purification
procedure will be optimized by reducing the potential for nonspecific binding and
contaminated proteins.
Batch purification of 6xHis-tagged proteins from E. coli under denaturing
conditions
The purification method carried out followed the protocols offered by Qiagen with
modifications.
Firstly, the cell lysates were prepared under denaturing condition as follows:
1. The cell pellets were thawed on ice for 15 min and resuspended in buffer B at 5
ml per gram wet weight.
2. The cell pellets were lysed by sonication 6 x 10s with 10 s pauses at 200-300W,
lysates were kept on ice at all time, taking care to avoid foaming.
3. Lysis is complete when the solution becomes translucent.
4. Lysates were centrifuged at 4,500 rpm for 30 min at RT by Multifuge 1s-r
(Heraeus) to pellet the cellular debris. Save supernatant (cleared lysate).
5. The cellular debris was resuspended in buffer B. 40μl of the debris solution as
well as supernatant were taken out and added with 40μl 2x SDS-PAGE.
Then the supernatant was brought to the next step.
1. Ni-NTA agarose beads were equilibrated by washing with 2 x 1.5ml H2O and
then with 2 x 1.5ml buffer B (washing, mix, spin 3 min at 3500rpm at RT by
Biofuge fresco-Heraeus, discard supernatant)
2. Add the Ni-NTA agarose beads to the supernatant and mix gently by rotation
200rpm on a rotary shaker for 60 min at RT.
3. Spin 3 min at 3500rpm in RT by Multifuge 1s-r (Heraeus). Discard unbound
materials (keep 40μl for SDS-PAGE)
29
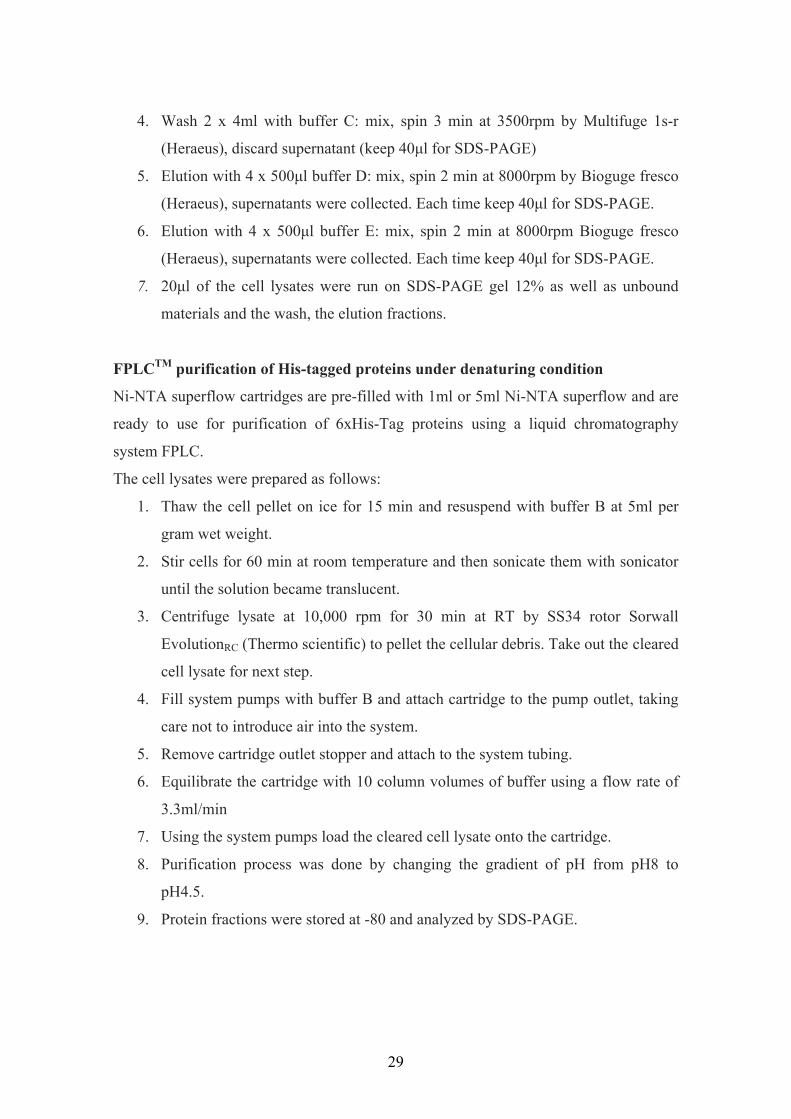
4. Wash 2 x 4ml with buffer C: mix, spin 3 min at 3500rpm by Multifuge 1s-r
(Heraeus), discard supernatant (keep 40μl for SDS-PAGE)
5. Elution with 4 x 500μl buffer D: mix, spin 2 min at 8000rpm by Bioguge fresco
(Heraeus), supernatants were collected. Each time keep 40μl for SDS-PAGE.
6. Elution with 4 x 500μl buffer E: mix, spin 2 min at 8000rpm Bioguge fresco
(Heraeus), supernatants were collected. Each time keep 40μl for SDS-PAGE.
7. 20μl of the cell lysates were run on SDS-PAGE gel 12% as well as unbound
materials and the wash, the elution fractions.
FPLCTM purification of His-tagged proteins under denaturing condition
Ni-NTA superflow cartridges are pre-filled with 1ml or 5ml Ni-NTA superflow and are
ready to use for purification of 6xHis-Tag proteins using a liquid chromatography
system FPLC.
The cell lysates were prepared as follows:
1. Thaw the cell pellet on ice for 15 min and resuspend with buffer B at 5ml per
gram wet weight.
2. Stir cells for 60 min at room temperature and then sonicate them with sonicator
until the solution became translucent.
3. Centrifuge lysate at 10,000 rpm for 30 min at RT by SS34 rotor Sorwall
EvolutionRC (Thermo scientific) to pellet the cellular debris. Take out the cleared
cell lysate for next step.
4. Fill system pumps with buffer B and attach cartridge to the pump outlet, taking
care not to introduce air into the system.
5. Remove cartridge outlet stopper and attach to the system tubing.
6. Equilibrate the cartridge with 10 column volumes of buffer using a flow rate of
3.3ml/min
7. Using the system pumps load the cleared cell lysate onto the cartridge.
8. Purification process was done by changing the gradient of pH from pH8 to
pH4.5.
9. Protein fractions were stored at -80 and analyzed by SDS-PAGE.
30
3.9. Protein estimation
Proteins were determined by ELISA plate reader (Vmax Molecular devices) using
Bradford assay with a Protein Assay kit (Bio-rad), in which bovine serum albumin
(BSA) was used as standard. Briefly, the procedure as follows:
Build up a standard curve
1. Prepare samples
Dilution the Bradford reagent at 1:4 with dH2O
BSA was diluted at final concentration 1µg/1µl
Standard samples were prepared by adding different BSA concentrations
(3µg-30µg) in each eppendorf tube containing 1ml diluted Bradford
reagent.
Protein samples were also added into eppendorf tubes containing 1ml
diluted Bradford reagent with different concentrations.
The eppendorf tubes were vortexed and incubated at RT for 5 min
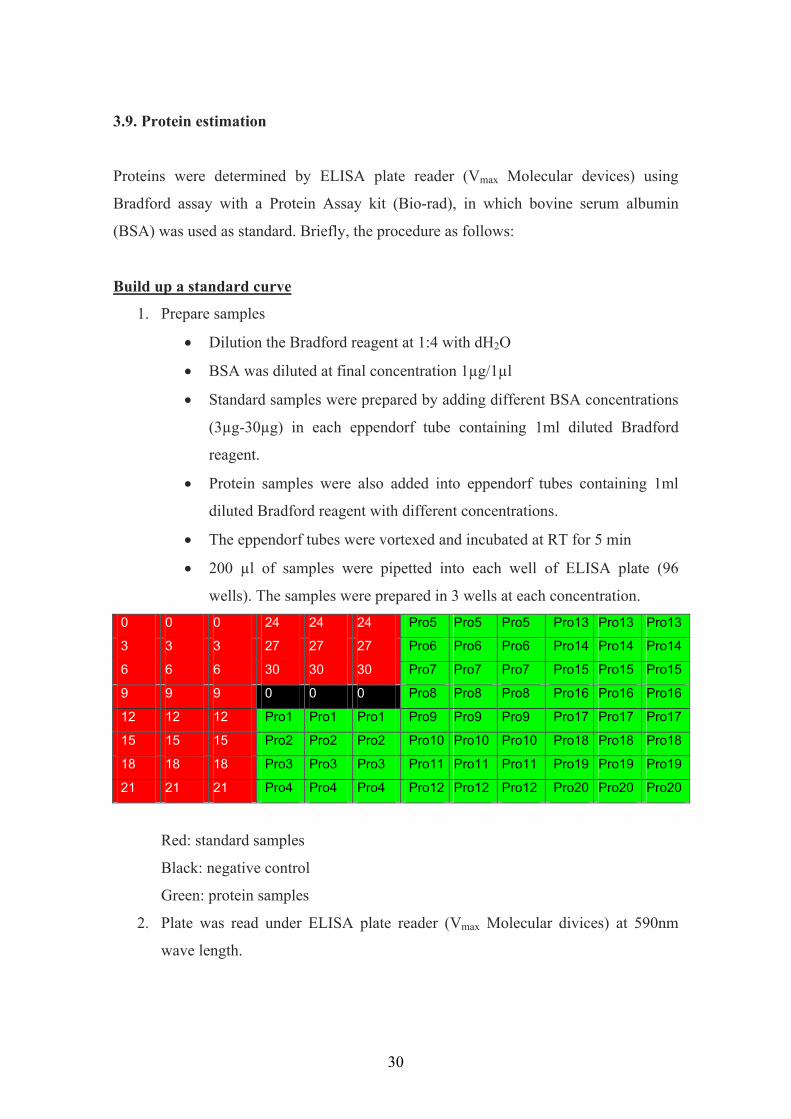
200 µl of samples were pipetted into each well of ELISA plate (96
wells). The samples were prepared in 3 wells at each concentration.
0 0 0 24 24 24 Pro5 Pro5 Pro5 Pro13 Pro13 Pro13
3 3 3 27 27 27 Pro6 Pro6 Pro6 Pro14 Pro14 Pro14
6 6 6 30 30 30 Pro7 Pro7 Pro7 Pro15 Pro15 Pro15
9 9 9 0 0 0 Pro8 Pro8 Pro8 Pro16 Pro16 Pro16
12 12 12 Pro1 Pro1 Pro1 Pro9 Pro9 Pro9 Pro17 Pro17 Pro17
15 15 15 Pro2 Pro2 Pro2 Pro10 Pro10 Pro10 Pro18 Pro18 Pro18
18 18 18 Pro3 Pro3 Pro3 Pro11 Pro11 Pro11 Pro19 Pro19 Pro19
21 21 21 Pro4 Pro4 Pro4 Pro12 Pro12 Pro12 Pro20 Pro20 Pro20
Red: standard samples
Black: negative control
Green: protein samples
2. Plate was read under ELISA plate reader (Vmax Molecular divices) at 590nm
wave length.
31
3. Standard curve was built up by data of standard samples using Microsoft Exel
program.
Calculate the concentration of proteins
The concentration of proteins was measured by the standard curve.
3.10. Sodium dodecyl sulphate polyacrylamide gel electrophoresis (SDS-PAGE)
This is a very common method of gel electrophoresis for separating proteins by mass.
SDS-PAGE was first employed by U.K Laemmli and is known as Laemmli method.
The proteins are dissolved in sodium dodecyl sulfate (SDS), a detergent that breaks up
the interactions between proteins, and then electrophorised. The smallest molecules
move through the gel faster, while larger molecules take longer and result in bands
closer to the top of the gel.
Casting the Gel: The gel used for SDS-PAGE is made out of acrylamide, which forms
cross-linked polymers of polyacrylamide. Standard gels are typically composed of two
layers, the stacking gel (top layer) and separating or resolving gel (lower layer). The
stacking layer contains a low percentage of acylamide and has low pH, while the
acrylamide concentration of the separating gel varies according to the samples to be run
and has higher pH. The differences in pH and acrylamide concentration at the stacking
and separating gel provide better resolution and sharper bands in the separating gel.
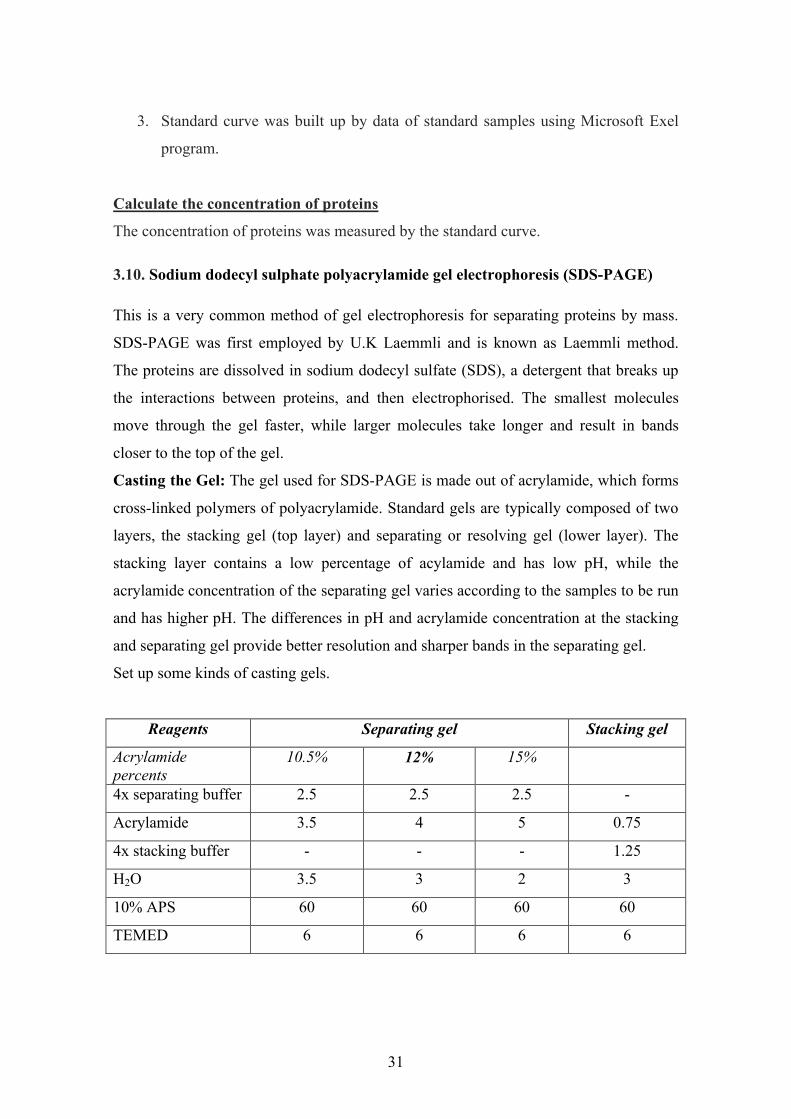
Set up some kinds of casting gels.
Reagents Separating gel Stacking gel
Acrylamidepercents
10.5% 12% 15%
4x separating buffer 2.5 2.5 2.5 -
Acrylamide 3.5 4 5 0.75
4x stacking buffer - - - 1.25
H2O 3.5 3 2 3
10% APS 60 60 60 60
TEMED 6 6 6 6
32
Electrophoresis: The gel is submerged in the buffer and the proteins denatured by SDS
are applied to one end of a layer of the gel. The proteins which are negatively charged
migrate across the gel to the positive pole when electricity is applied through the gel.
Due to differential migration based on their size, larger proteins are closer to the top of
the gel while smaller proteins move to the bottom of the gel. After a given period of
time, proteins might have separated roughly according to their sizes. Proteins of known
molecular weight (marker proteins) can be run in a separate lane in the gel for
calibration.
Staining and analysis: After the electrophoresis run, the gel is stained with Coomassie
Brilliant Blue for visualization of the proteins. Coomassie blue staining is based on the
binding of the dye, which binds nonspecifically to virtually all proteins, and gives a blue
colour. During the destain steps, any dye that is not bound to proteins diffuses out of the
gel to remove the background. The proteins are detected as blue bands on a clear
background. Within the gel different proteins will be seen as separate bands depending
on their sizes. The molecular weight of a protein in the band can be estimated by
comparing it with the marker proteins of known molecular weights.
3.11. Western blot assay
The fractions to be analyzed were mixed in SDS-PAGE buffer and heated for 5 min at
950C.
Twelve percent sodium dodecyl sulfate-polyacrylamide gel electrophoresis (SDS-
PAGE) was used to evaluate visually the level of protein expression, the relative
molecular size, and to analyze the homogeneity of purified fractions. Protein bands were
visualized after Coomassie blue staining and destained with destaining solution.
The fractions separated by SDS-PAGE also were transferred to a nitrocellulose
membrane using semi-dry Western blot assay.
This protocol describes the procedure for transferring protein from a mini
polyacrylamide gel onto a nitrocellulose membrane using the semi-dry transfer method.
1. 5 sheets of Whatman the same size as the mini SDS-PAGE gel were cut out.
2. A Nitrocellulose membrane to the size of the gel was prepared.
33
3. Both sheets of Whatman and the membrane were soaked by blot buffer for 5
min.
4. Assemble sandwich (Bottom up on the surface of a wet semi-dry transfer plate)
3 sheets of Whatman
Membrane
Polyacrylamide gel
2 sheets of Whatman
5. Use a roller to roll over the sandwich gently to remove trapped air bubbles.
Apply few milliliter of blot buffer on the top of the sandwich to avoid drying out
during transfer.
6. Power was applied at 200 mA for 1h.
For immune reaction, the nitrocellulose membrane was blocked with 5% nonfat dried
milk in PBS at room temperature for 30 min. The membrane was incubated with first
antibodies diluted in 5% nonfat dried milk in PBS at 40C overnight. After two times
washing with PBS, the membrane was incubated with second antibodies diluted in PBS
at room temperature for 1 h. Blots were finally washed in PBS and bound antibodies
were visualized onto Biomax films (Kodak) by chemiluminescence (ECL kit,
Amersham).
3.12. Emzyme-Linked Immunosorbent Assay (ELISA)
The ELISA is a fundamental tool of clinical immunology, and is used as an initial
screen for detecting and quantitating substances such as: proteins, peptides, antibodies
and hormone. Based on the principle of antigen-antibody and antibody-antibody
interactions, this test allows for easy visualization of results.
An ELISA is the first and most basic test to determine if an individual is positive for a
selected pathogen, such as Chikungunia virus. The test is performed in a 8 cm x 12 cm
plastic plate which contains an 8 x 12 matrix of 96 wells, each of which are about 1 cm
high and 0.7 cm in diameter.
34
The procedure as follows:
Coating CHIKV Proteins to microplate
1. The proteins were diluted at final concentration of 220μg/ml in PBSN
(Phosphate Buffered Saline Natriumazid). Coat the wells of a microtiter plate
with 50 μl the protein dilution by a multichannel pipet and tips.
2. The plate was covered by an adhesive plastic and incubated overnight at 40C.
3. Remove the coating solution and rinse the plate three times by filling the wells
with deionized water. The solution was removed by flicking the plate over a sink
and the remaining solution was removed by patting the plate on a paper towel.
Blocking
1. The remaining protein-binding sites in the coated wells were blocked by adding
50μl blocking buffer.
2. The plate was wrapped and incubated for 30 min. at RT.
3. Rinse the plate twice with deionized water.
Incubation with sera and second antibodies
1. Add 50μl of diluted sera (sera were diluted in blocking buffer at 1:100) to each
well.
2. Cover the plate with adhesive plastic and incubate at RT for 2 h.
3. Wash the plate three times with deionized water.
4. Add 50μl of conjugated anti human second antibody, diluted at 1:5000 in
blocking buffer.
5. Cover the plate with adhesive plastic and incubate at RT for 2 h.
6. Rinse the plate three times with deionized water.
Add substrate and measure hydrolysis
1. Dispense 75μl of the NPP (p-Nitrophenyl Phosphate) substrate solution per well
with a multichannel pipet and incubate four 1 h at RT.
2. After sufficient color development (yellow color) read the absorbance of each
well with a plate reader under 405nm filter.
35
3.13. Immunofluorescens assay
Immunofluorescene assay (IFA) is the method in which a fluorescent-labelled antibody
is used to detect the presence or determine the location of the corresponding antigen and
can be visualized under UV-micoscope.
Cell preparation
Vero cells (ATCC No.CCL81) were splited and grown on sterile glass cover slips.
When the density was sufficient, the cells were infected with CHIKV. After infection,
the cells were harvested by centrifugation and washed with PBS.
Preparation of slides
1. The cells were resuspended in sufficient PBS and 25 μl were placed into the well
area on the slide.
2. The specimen was dried thoroughly at RT and it was fixed by fresh acetone at
RT for 10 min. Slides were stored at 40C for overnight or freezed at -200C for
longer storage periods.
Procedure
1. The wells of the slide were incubated with 25 µl sera at appropriate dilution in
PBS for 90 min. in a moist chamber at 370C.
2. Wash two times with PBS without MgCl2 and CaCl2
3. Rinse in PBS-0.1% Tween 20 for 3 min. two times.
4. Wash two times with PBS without MgCl2 and CaCl2
5. Incubate slides with 25 µl FITC labelled anti-human-IgG conjugate dilution 1:40
plus Evens Blue for 45 min. in a moist chamber at 370C.
6. Wash two times with PBS without MgCl2 and CaCl2.
7. Rinse in PBS-0.1% Tween 20 for 3 min. two times.
8. Wash two times with PBS without MgCl2 and CaCl2.
9. Dry and add drop of mounting fluid to the centre of each well and place
coverslip over the mounting fluid and ensure that no air bubbles are trapped.
36
3.14. Western blot assay with CHIKV infected cells
In this method, the anti CHIKV antibodies were used to detect the CHIKV antigens,
which were present in infected cells.
Cell preparation
Vero cells were cultured and when the cell density was sufficent, the cells were infected
with high titer virus stocks for 36 h. This time point ensured that viral proteins were
produced at high levels and the cells were still viable when harvested. Cells were lysed
in RIPA-buffer using the Qiagen shredder as described by the manufacturer.
Western blotting
Cellular proteins were subsequently separated by SDS-PAGE and transferred to
nitrocellulose. The membranes were blocked and incubated with sera and second
antibodies. After washing, the membranes were developed to identify protein by ECL
Western blot kit. All this was performed as described above.
37
4. Results
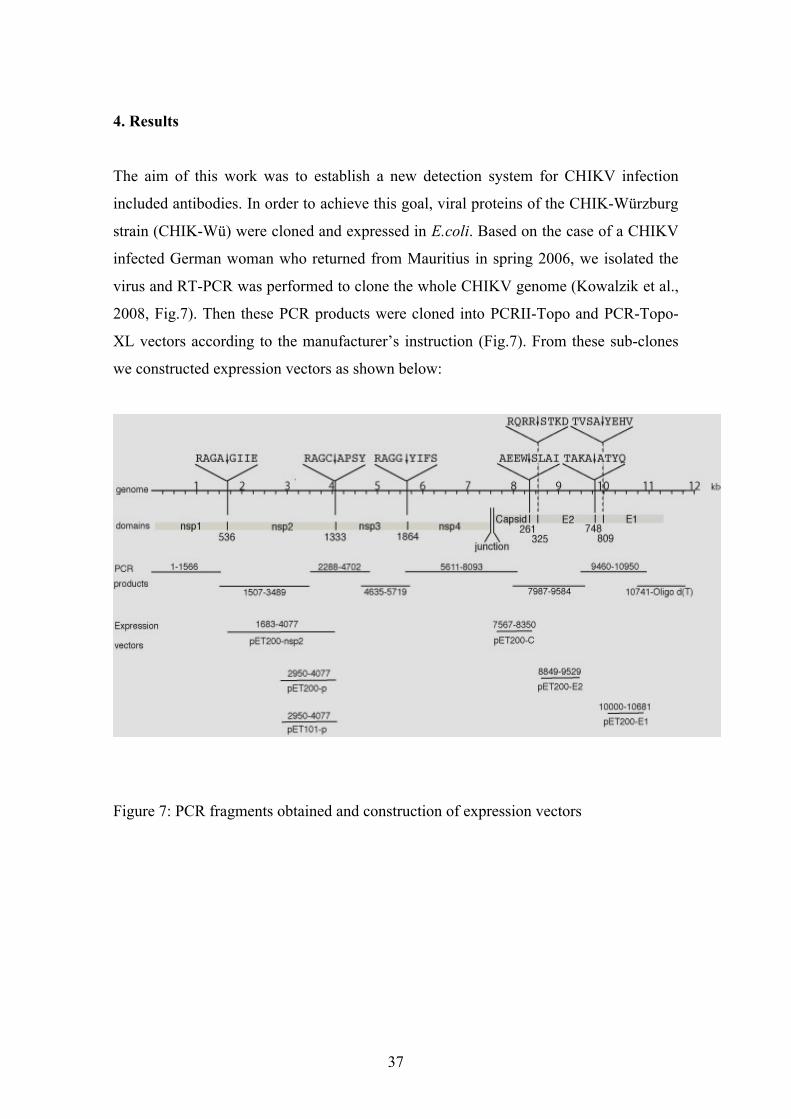
The aim of this work was to establish a new detection system for CHIKV infection
included antibodies. In order to achieve this goal, viral proteins of the CHIK-Würzburg
strain (CHIK-Wü) were cloned and expressed in E.coli. Based on the case of a CHIKV
infected German woman who returned from Mauritius in spring 2006, we isolated the
virus and RT-PCR was performed to clone the whole CHIKV genome (Kowalzik et al.,
2008, Fig.7). Then these PCR products were cloned into PCRII-Topo and PCR-Topo-
XL vectors according to the manufacturer’s instruction (Fig.7). From these sub-clones
we constructed expression vectors as shown below:
Figure 7: PCR fragments obtained and construction of expression vectors
38
4.1. Construction of expression vectors
4.1.1. Construction of pET 200 C expression vector.
To express the CHIKV C protein, the C coding region was amplified from CHIK-Wü
subclones by PCR. The C of CHIKV is composed of 261 amino acids in length and
expressed by 783 bp, which is initiated by a start codon at position 7567-7569. Thus,
the C ORF sequence was encoded on two different genomic clones (Fig.7). To construct
the pET200/D-TOPO-C expression vector, both PCRII 5611-8093 and PCRII 7987-
9584 sub-clones were employed (Fig.7). The PCRII 5611-8093 and the PCRII 7987-
9584 vectors were digested with restriction enzymes ClaI and XbaI, as shown in Figure
8. The 1887 bp fragment of PCRII 5611-8093 (blue) and the rest of PCRII 7987-9584
were isolated using agarose gel electrophoresis and subsequently purified using the
QIAquick Gel Extraction Kit according to the manufacturer’s instruction. The 1887 bp
fragment and the rest of PCRII 7987-9584 were ligated by overnight incubation at 14ºC
with T4 DNA ligase. The ligation reaction was subsequently transformed into
chemically competent E. coli TOP10 cells, plated on LB agar plates containing
kanamycin and incubated overnight at 37ºC. The plasmid DNA of the resulting colonies
were isolated by the MiniPrep DNA Purification protocol as described above and
analyzed by subsequent restriction analysis. The nucleotide sequence was determined
by DNA-sequencing. The correct constructs, which contained the Capsid-ORF, were
used for further cloning of the expression constructs for the C protein.
39
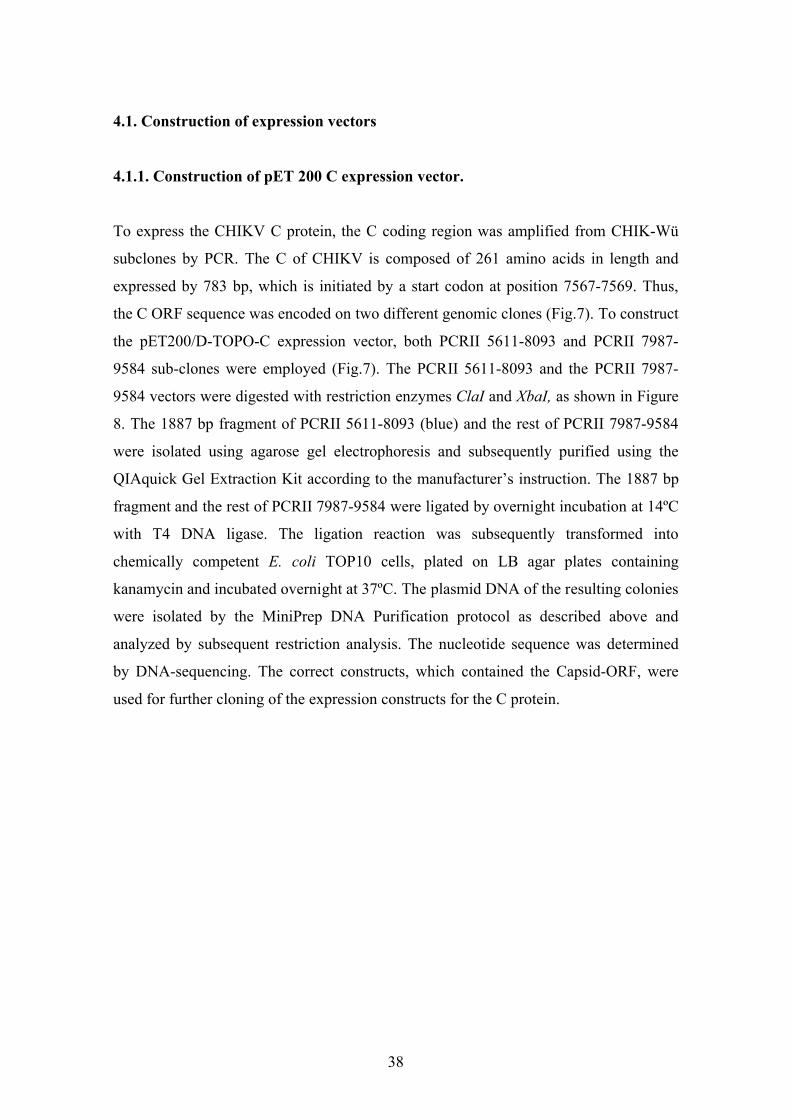
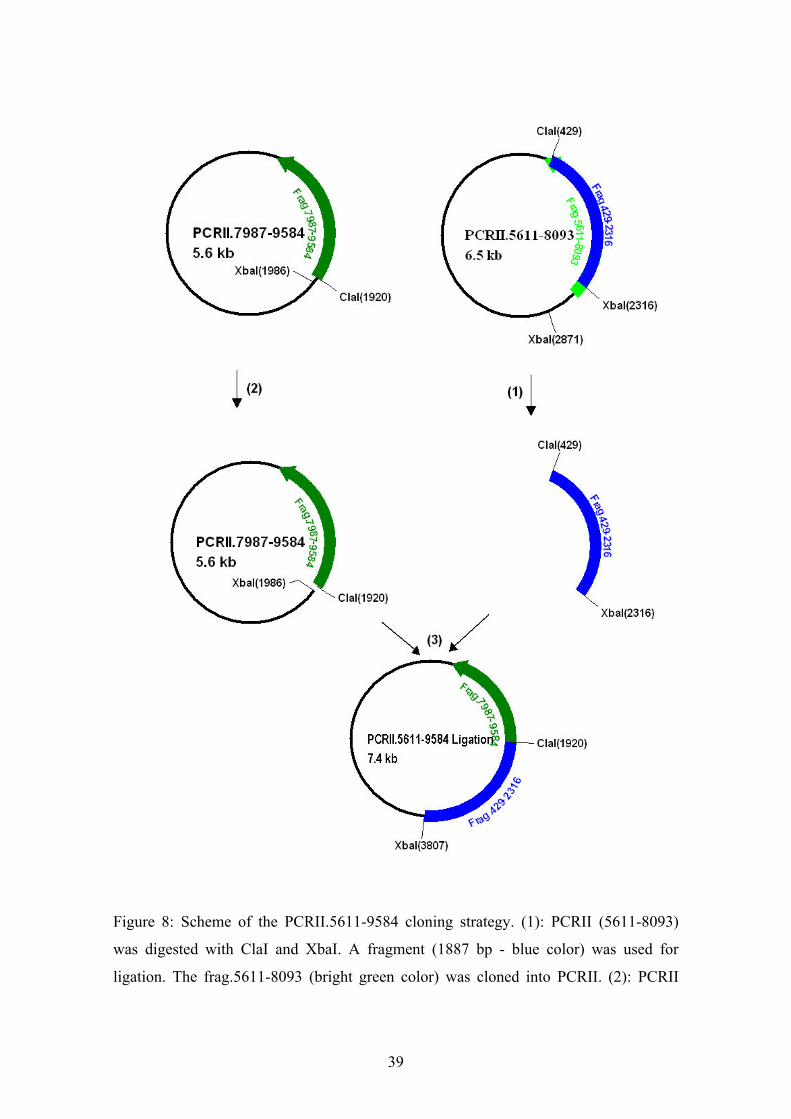
Figure 8: Scheme of the PCRII.5611-9584 cloning strategy. (1): PCRII (5611-8093)
was digested with ClaI and XbaI. A fragment (1887 bp - blue color) was used for
ligation. The frag.5611-8093 (bright green color) was cloned into PCRII. (2): PCRII
40
7987-9584 was digested with ClaI and XbaI. The insert (7897-9584 green color) was
cloned into PCRII vector. The XbaI-ClaI fragment was removed after digestion. The
remaining vector was used for ligation. (3): PCRII 5611-9584 was constructed by
ligation of the PCRII 7987-9584 backbone with the fragment 429-2316 derived from
PCRII 5611-8093.
For protein expression it was necessary to transfer the coding sequences into a bacterial
expression clone. Therefore, the PCRII 5611-9584 was used to amplify the C coding
DNA sequence (783 bp) with Pfu polymerase and primers Cs and Ca according to the
protocol described in the materials and methods. After amplification, the PCR product
was analyzed on a 0.8% agarose gel (Fig.9) and purified by using the PureLink quick
extraction gel method. The purified PCR product was transformed with the TOPO
cloning reaction by using the pET200/D-TOPO vector according to the manufacture’s
protocol and transformed into E. coli TOP10 competent cells. The transformants were
plated on LB agar plates containing kanamycin. Colonies were screened by extracting
the plasmid DNA using the MiniPrep DNA Purification protocol, as described above
and subsequent digesting with EcoRI. The DNA was sequenced with primers in both
directions. The expression construct was named pET200-TOPO-C.
41
M C1 C2
C
1 2 3
1000
10000
M C1 C2
C
1 2 3
1000
10000
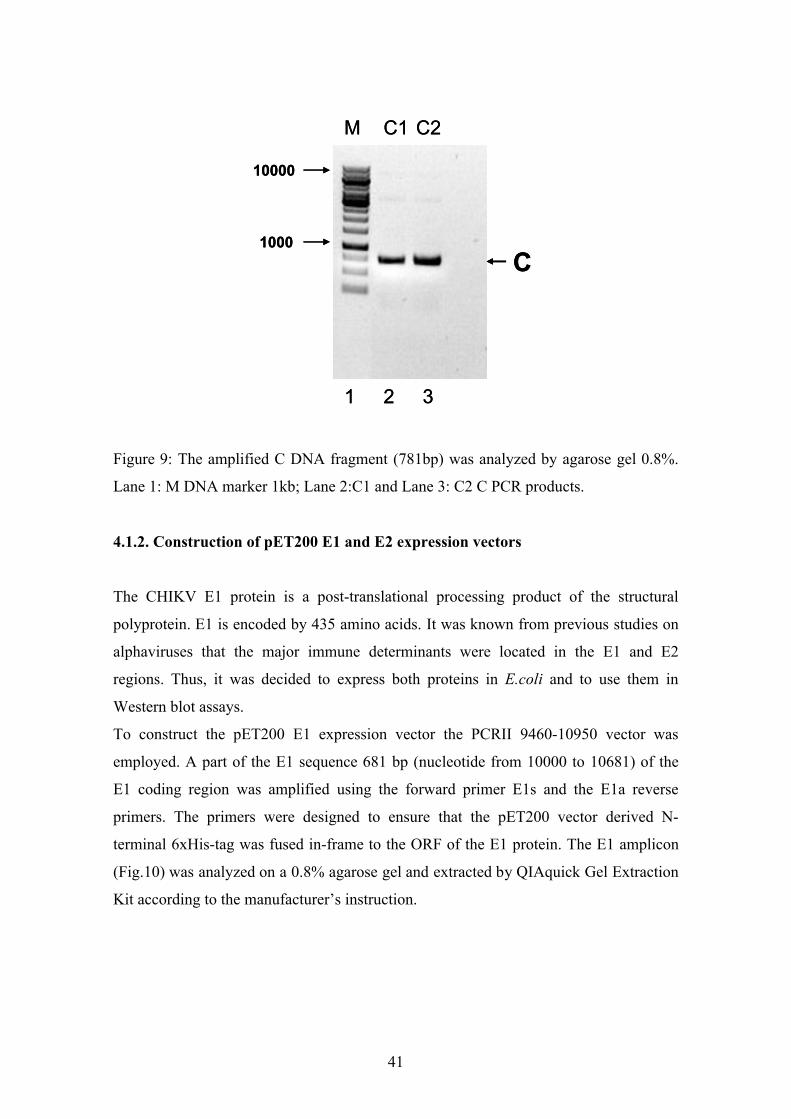
Figure 9: The amplified C DNA fragment (781bp) was analyzed by agarose gel 0.8%.
Lane 1: M DNA marker 1kb; Lane 2:C1 and Lane 3: C2 C PCR products.
4.1.2. Construction of pET200 E1 and E2 expression vectors
The CHIKV E1 protein is a post-translational processing product of the structural
polyprotein. E1 is encoded by 435 amino acids. It was known from previous studies on
alphaviruses that the major immune determinants were located in the E1 and E2
regions. Thus, it was decided to express both proteins in E.coli and to use them in
Western blot assays.
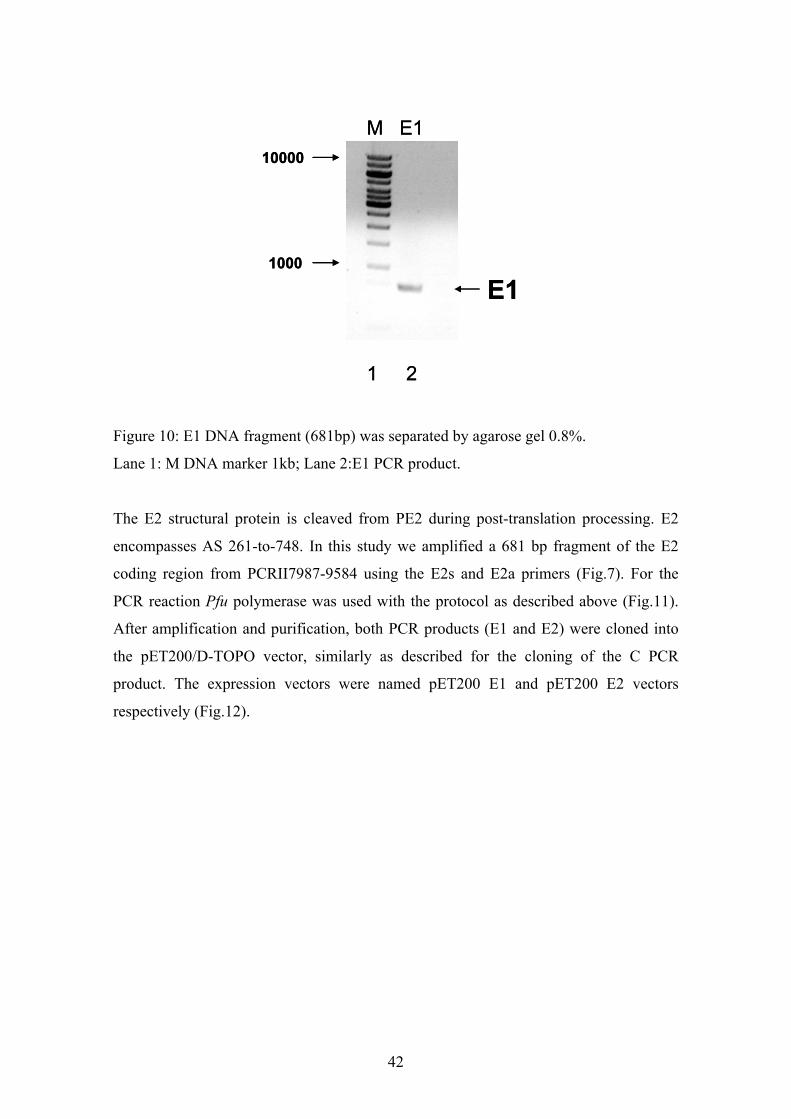
To construct the pET200 E1 expression vector the PCRII 9460-10950 vector was
employed. A part of the E1 sequence 681 bp (nucleotide from 10000 to 10681) of the
E1 coding region was amplified using the forward primer E1s and the E1a reverse
primers. The primers were designed to ensure that the pET200 vector derived N-
terminal 6xHis-tag was fused in-frame to the ORF of the E1 protein. The E1 amplicon
(Fig.10) was analyzed on a 0.8% agarose gel and extracted by QIAquick Gel Extraction
Kit according to the manufacturer’s instruction.
42
M E1
1 2
E11000
10000
M E1
1 2
E11000
10000
Figure 10: E1 DNA fragment (681bp) was separated by agarose gel 0.8%.
Lane 1: M DNA marker 1kb; Lane 2:E1 PCR product.
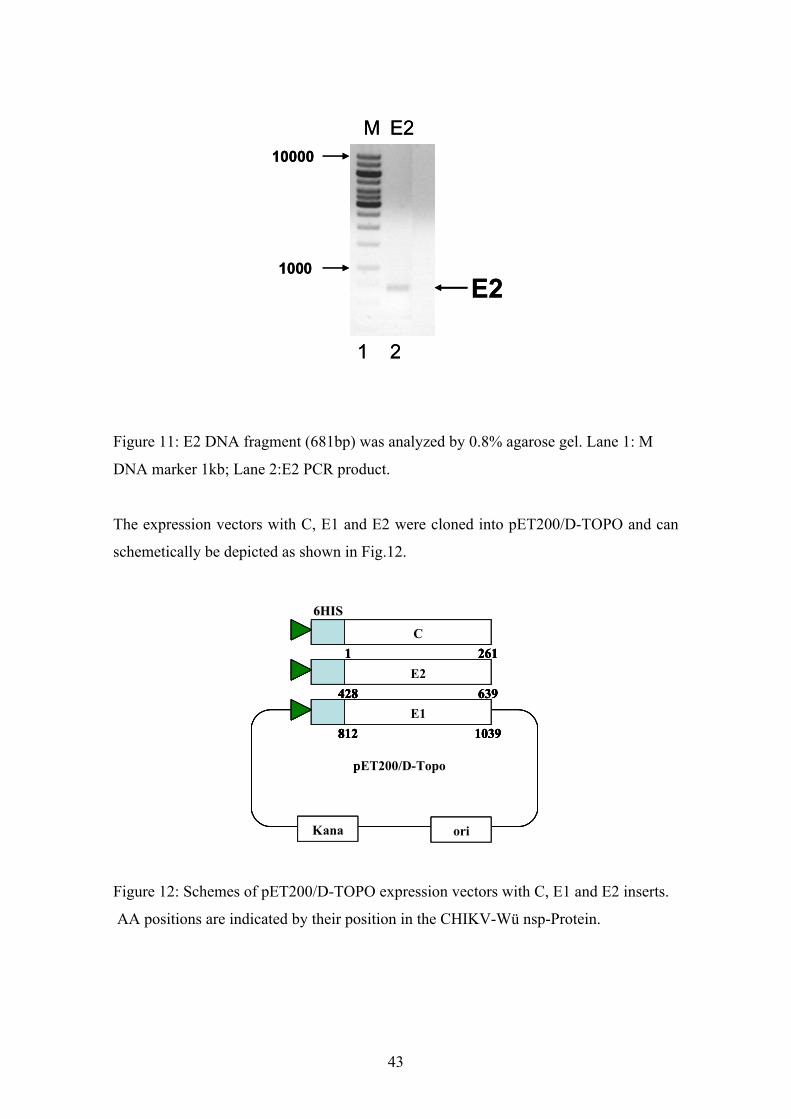
The E2 structural protein is cleaved from PE2 during post-translation processing. E2
encompasses AS 261-to-748. In this study we amplified a 681 bp fragment of the E2
coding region from PCRII7987-9584 using the E2s and E2a primers (Fig.7). For the
PCR reaction Pfu polymerase was used with the protocol as described above (Fig.11).
After amplification and purification, both PCR products (E1 and E2) were cloned into
the pET200/D-TOPO vector, similarly as described for the cloning of the C PCR
product. The expression vectors were named pET200 E1 and pET200 E2 vectors
respectively (Fig.12).
43
M E2
E2
1 2
1000
10000
M E2
E2
1 2
1000
10000
Figure 11: E2 DNA fragment (681bp) was analyzed by 0.8% agarose gel. Lane 1: M
DNA marker 1kb; Lane 2:E2 PCR product.
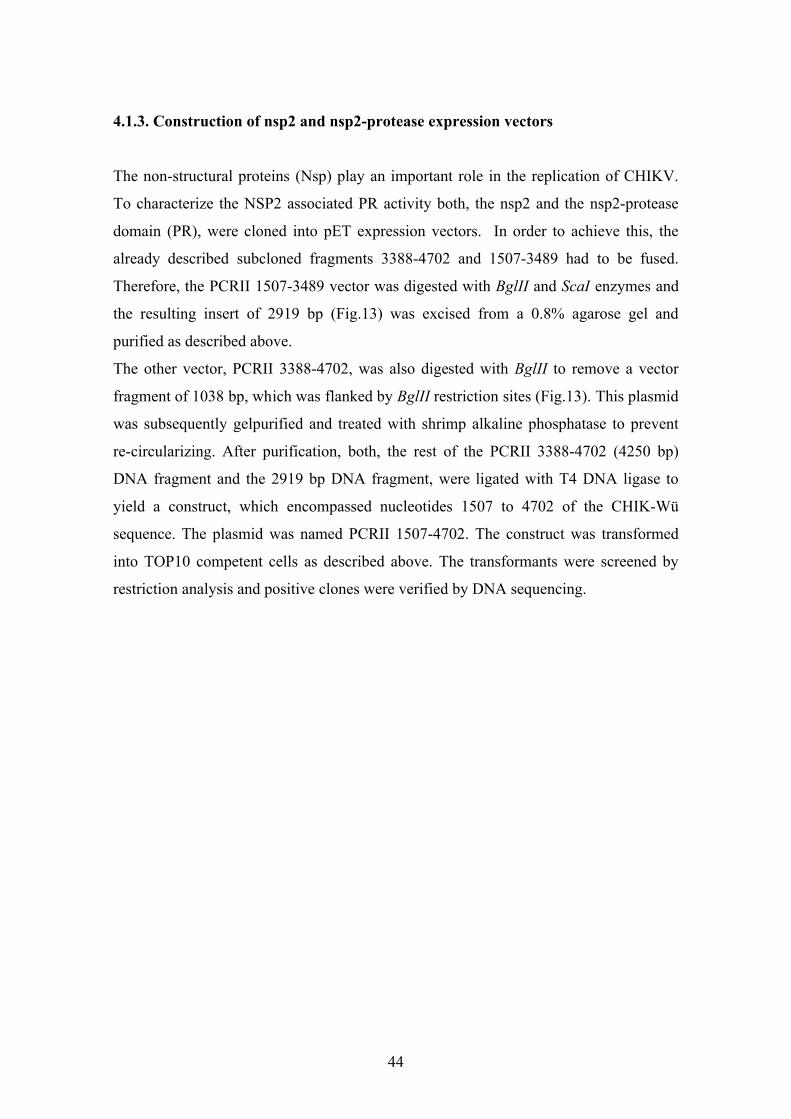
The expression vectors with C, E1 and E2 were cloned into pET200/D-TOPO and can
schemetically be depicted as shown in Fig.12.
oriKana
E1
pET-200
6HIS6HIS
812 1039
E2
428 639
C
1 261
oriKana
E1
pET200/D-Topo
6HIS6HIS
812 1039
E2
428 639
C
1 261
oriKana
E1
pET-200
6HIS6HIS
812 1039
E2
428 639
C
1 261
oriKana
E1
pET200/D-Topo
6HIS6HIS
812 1039
E2
428 639
C
1 261
Figure 12: Schemes of pET200/D-TOPO expression vectors with C, E1 and E2 inserts.
AA positions are indicated by their position in the CHIKV-Wü nsp-Protein.
44
4.1.3. Construction of nsp2 and nsp2-protease expression vectors
The non-structural proteins (Nsp) play an important role in the replication of CHIKV.
To characterize the NSP2 associated PR activity both, the nsp2 and the nsp2-protease
domain (PR), were cloned into pET expression vectors. In order to achieve this, the
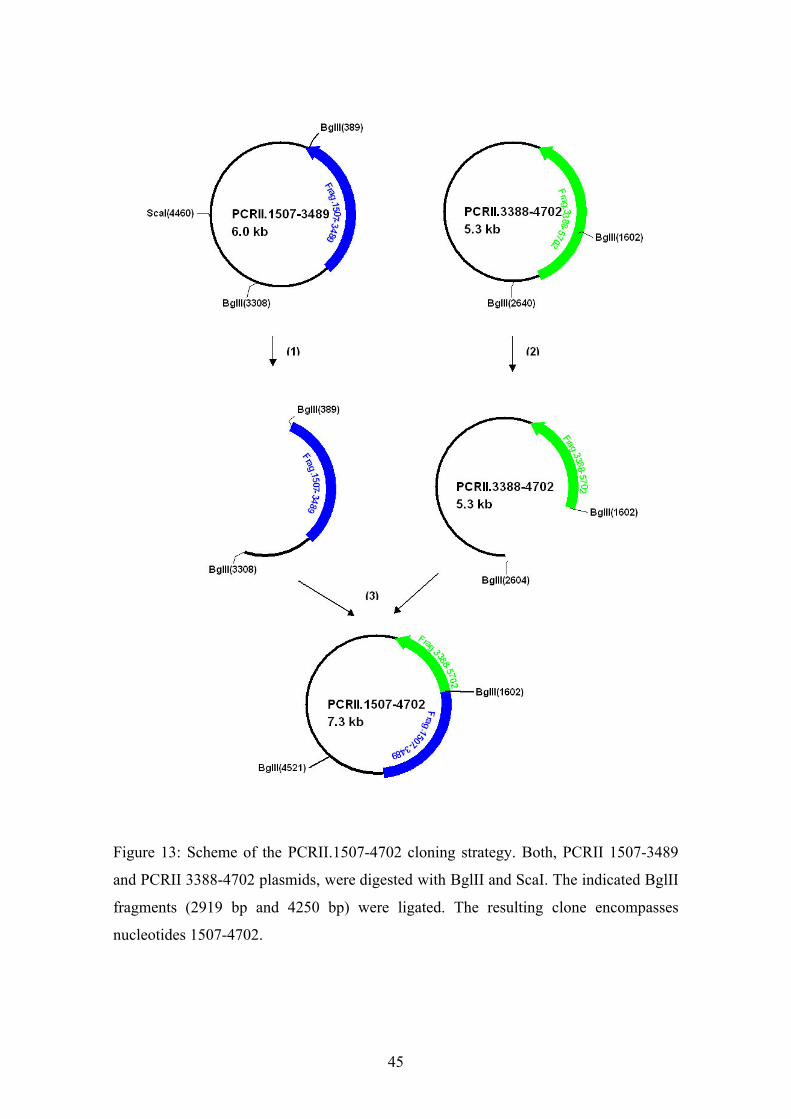
already described subcloned fragments 3388-4702 and 1507-3489 had to be fused.
Therefore, the PCRII 1507-3489 vector was digested with BglII and ScaI enzymes and
the resulting insert of 2919 bp (Fig.13) was excised from a 0.8% agarose gel and
purified as described above.
The other vector, PCRII 3388-4702, was also digested with BglII to remove a vector
fragment of 1038 bp, which was flanked by BglII restriction sites (Fig.13). This plasmid
was subsequently gelpurified and treated with shrimp alkaline phosphatase to prevent
re-circularizing. After purification, both, the rest of the PCRII 3388-4702 (4250 bp)
DNA fragment and the 2919 bp DNA fragment, were ligated with T4 DNA ligase to
yield a construct, which encompassed nucleotides 1507 to 4702 of the CHIK-Wü
sequence. The plasmid was named PCRII 1507-4702. The construct was transformed
into TOP10 competent cells as described above. The transformants were screened by
restriction analysis and positive clones were verified by DNA sequencing.
45
Figure 13: Scheme of the PCRII.1507-4702 cloning strategy. Both, PCRII 1507-3489
and PCRII 3388-4702 plasmids, were digested with BglII and ScaI. The indicated BglII
fragments (2919 bp and 4250 bp) were ligated. The resulting clone encompasses
nucleotides 1507-4702.
46
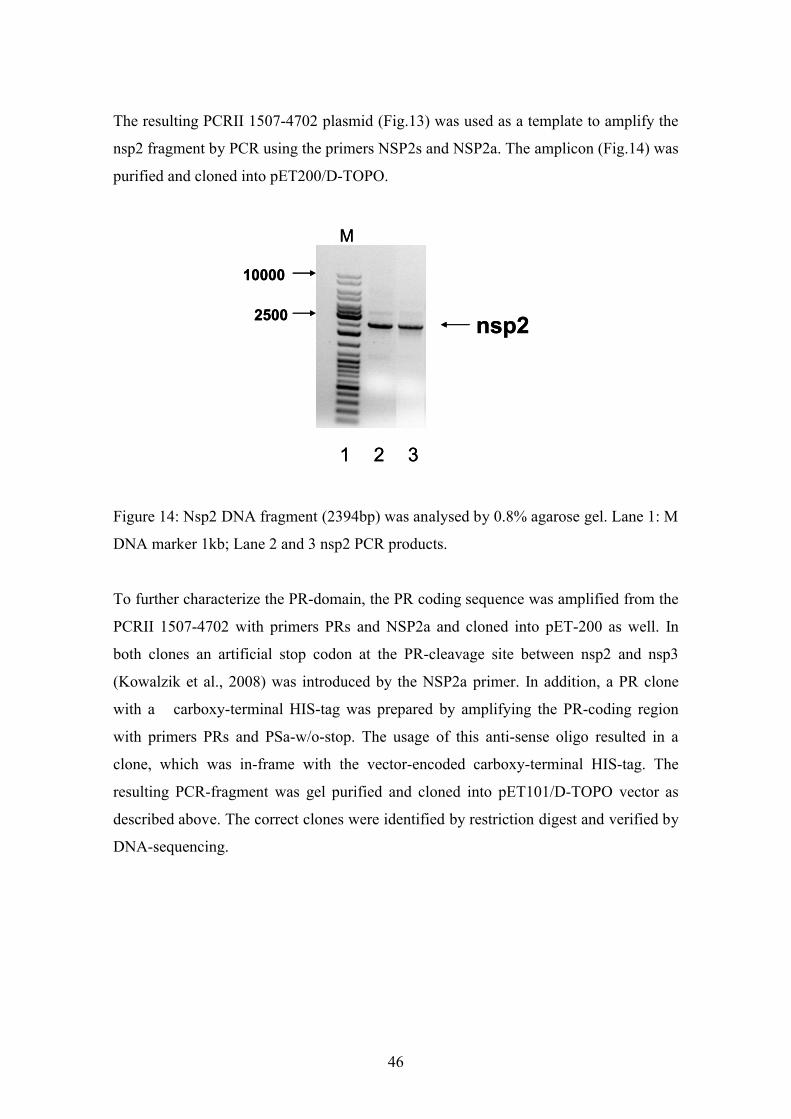
The resulting PCRII 1507-4702 plasmid (Fig.13) was used as a template to amplify the
nsp2 fragment by PCR using the primers NSP2s and NSP2a. The amplicon (Fig.14) was
purified and cloned into pET200/D-TOPO.
M
nsp2
1 2 3
10000
2500
M
nsp2
1 2 3
10000
2500
Figure 14: Nsp2 DNA fragment (2394bp) was analysed by 0.8% agarose gel. Lane 1: M
DNA marker 1kb; Lane 2 and 3 nsp2 PCR products.
To further characterize the PR-domain, the PR coding sequence was amplified from the
PCRII 1507-4702 with primers PRs and NSP2a and cloned into pET-200 as well. In
both clones an artificial stop codon at the PR-cleavage site between nsp2 and nsp3
(Kowalzik et al., 2008) was introduced by the NSP2a primer. In addition, a PR clone
with a carboxy-terminal HIS-tag was prepared by amplifying the PR-coding region
with primers PRs and PSa-w/o-stop. The usage of this anti-sense oligo resulted in a
clone, which was in-frame with the vector-encoded carboxy-terminal HIS-tag. The
resulting PCR-fragment was gel purified and cloned into pET101/D-TOPO vector as
described above. The correct clones were identified by restriction digest and verified by
DNA-sequencing.

47
1 2 3
PR
10000
1200
M
1 2 3
PR
10000
1200
M
Figure 15: Protease DNA fragments (1024bp) was analyzed by 0.8% agarose gel. Lane
1: M DNA marker 1kb; Lane 2 and 3 protease PCR products.
These plasmids are depicted as follows (Fig.10).
oriKana
Nsp2
pET200/D-Topo
6HIS6HIS
536 1333
protease
992 1333
oriKana
Nsp2
pET200/D-Topo
6HIS6HIS
536 1333
protease
992 1333
Ampori
protease
pET101/D-Topo
6HIS6HIS
992 1333
Ampori
protease
pET101/D-Topo
6HIS6HIS
992 1333
Figure 16: Scheme of nsp2 and nsp2-PR clones in pET200/D-TOPO and pET101/D-
TOPO. AA positions are indicated by their position in the CHIKV-Wü nsp-Protein.
48
4.2. Protein expression and purification of the C, E1 and E2 proteins
4.2.1. The C protein
4.2.1.1. Pilot expression
To express the structural proteins C, E2 and E1 the coding sequences were cloned into
pET-vectors as described above. The vectorderived protein expression is directed by the
T7 promoter. Therefore, BL21-DE-star competent cells, which express the T7 RNA-
polymerase under the control of an IPTG inducible lacUV5 promoter (Dubendorff and
Studier, 1991; Studier et al.,1990), were transformed with the expression plasmids. In
addition, this bacterial strain carries a mutation in the RNase E gene, which improves
RNA stability (Grunberg-Manago, 1999; Lopez et al., 1999). To optimize protein
stability and solubility, induction times were varied in pilot-experiments. Therefore,
several colonies were grown as over-night cultures in small-scale volumes and diluted
at the next day 1:20 to grow the bacteria in the exponentional phase, at the time of
induction. The protein expression was induced by adding IPTG to 1mM final
concentration for 2 and 4 h. After induction, bacteria were collected by centrifugation
for 1 min at 13000 rpm and analyzed by coomassie blue stained 12% PAGE and
Western blot analyses. For the latter, gels were blotted onto a nitrocellulose membrane.
HIS-tagged proteins were detected with a monoclonal anti-HIS antibody at a dilution of
1:1000 and by employing the ECL detection system.
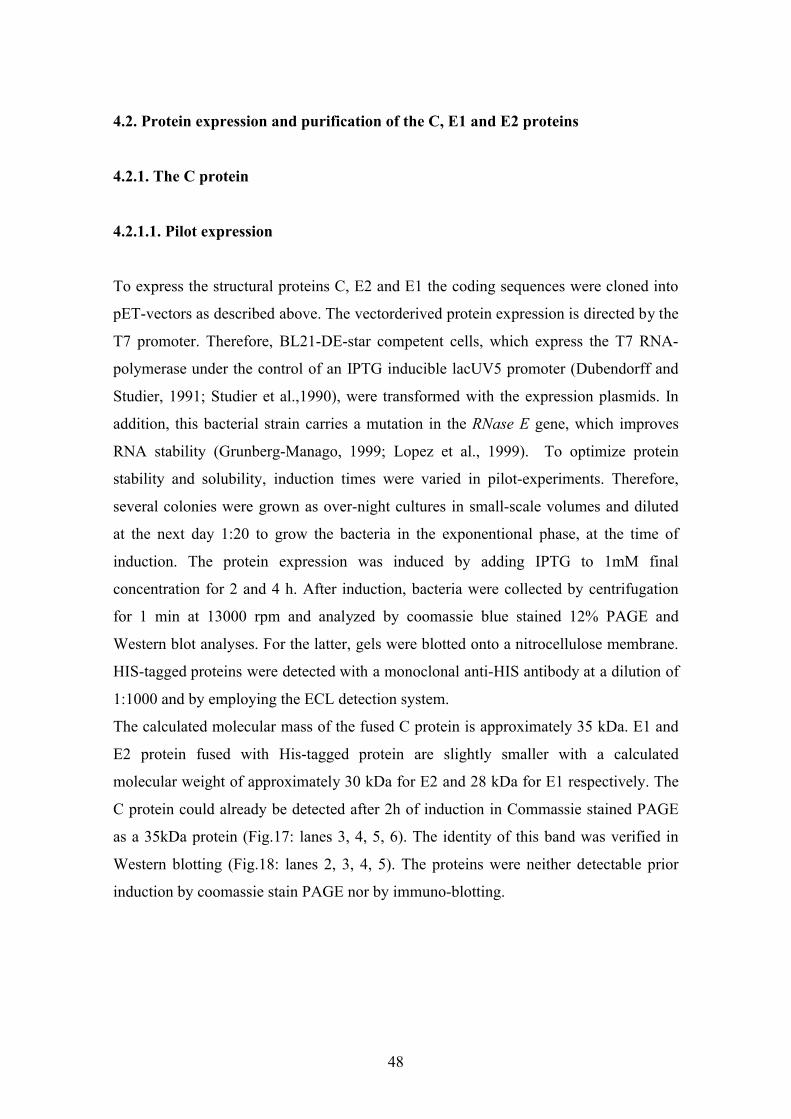
The calculated molecular mass of the fused C protein is approximately 35 kDa. E1 and
E2 protein fused with His-tagged protein are slightly smaller with a calculated
molecular weight of approximately 30 kDa for E2 and 28 kDa for E1 respectively. The
C protein could already be detected after 2h of induction in Commassie stained PAGE
as a 35kDa protein (Fig.17: lanes 3, 4, 5, 6). The identity of this band was verified in
Western blotting (Fig.18: lanes 2, 3, 4, 5). The proteins were neither detectable prior
induction by coomassie stain PAGE nor by immuno-blotting.
49
M 0 D
C
M 0 2 4 S
1 2 63 4 5
43
72
kDa
hours
M 0 D
C
M 0 2 4 S
1 2 63 4 5
43
72
kDaM 0 D
C
M 0 2 4 S
1 2 63 4 5
43
72
kDa
hours
Figure 17: Analysis of the recombinant C protein expression by coomassie blue stained
PAGE. The time of IPTG induction is indicated above the lanes. Lane 1: protein
marker. Lane 2: prior induction; lane 3-4: samples after 2, 4 h of expression,
respectively. Protein solubility was analyzed at 4 h of induction (lanes 5: soluble and
lane 6: insoluble).
The optimal induction time for HIS-tagged Capsid protein expression was found to be 4
h. Both coomassie blue stained PAGE and Western blot analysis demonstrated that the
amount of the HIS-tagged C protein increased during the induction period from 2 to 4 h.
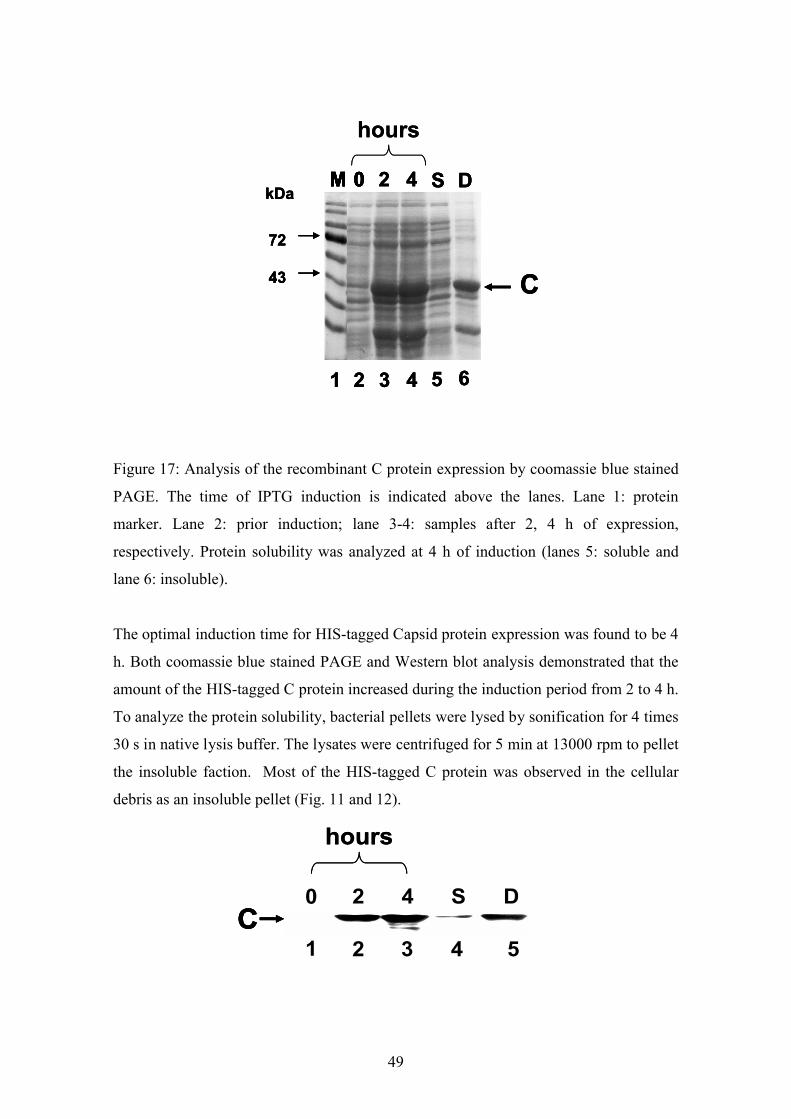
To analyze the protein solubility, bacterial pellets were lysed by sonification for 4 times
30 s in native lysis buffer. The lysates were centrifuged for 5 min at 13000 rpm to pellet
the insoluble faction. Most of the HIS-tagged C protein was observed in the cellular
debris as an insoluble pellet (Fig. 11 and 12).
0h 2h 4h0 2 4 S D
21 3 4 5C
hours
0h 2h 4h0 2 4 S D
21 3 4 5C
0h 2h 4h0 2 4 S D
21 3 4 5C
hours
50
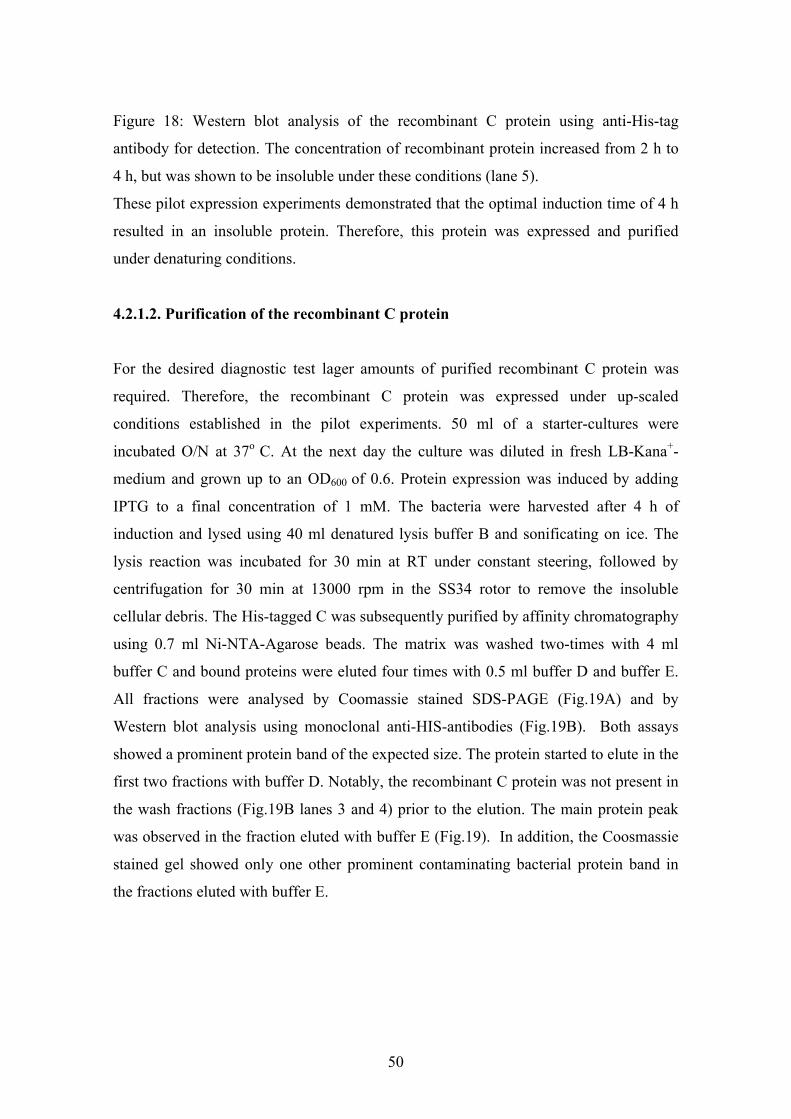
Figure 18: Western blot analysis of the recombinant C protein using anti-His-tag
antibody for detection. The concentration of recombinant protein increased from 2 h to
4 h, but was shown to be insoluble under these conditions (lane 5).
These pilot expression experiments demonstrated that the optimal induction time of 4 h
resulted in an insoluble protein. Therefore, this protein was expressed and purified
under denaturing conditions.
4.2.1.2. Purification of the recombinant C protein
For the desired diagnostic test lager amounts of purified recombinant C protein was
required. Therefore, the recombinant C protein was expressed under up-scaled
conditions established in the pilot experiments. 50 ml of a starter-cultures were
incubated O/N at 37o C. At the next day the culture was diluted in fresh LB-Kana+-
medium and grown up to an OD600 of 0.6. Protein expression was induced by adding
IPTG to a final concentration of 1 mM. The bacteria were harvested after 4 h of
induction and lysed using 40 ml denatured lysis buffer B and sonificating on ice. The
lysis reaction was incubated for 30 min at RT under constant steering, followed by
centrifugation for 30 min at 13000 rpm in the SS34 rotor to remove the insoluble
cellular debris. The His-tagged C was subsequently purified by affinity chromatography
using 0.7 ml Ni-NTA-Agarose beads. The matrix was washed two-times with 4 ml
buffer C and bound proteins were eluted four times with 0.5 ml buffer D and buffer E.
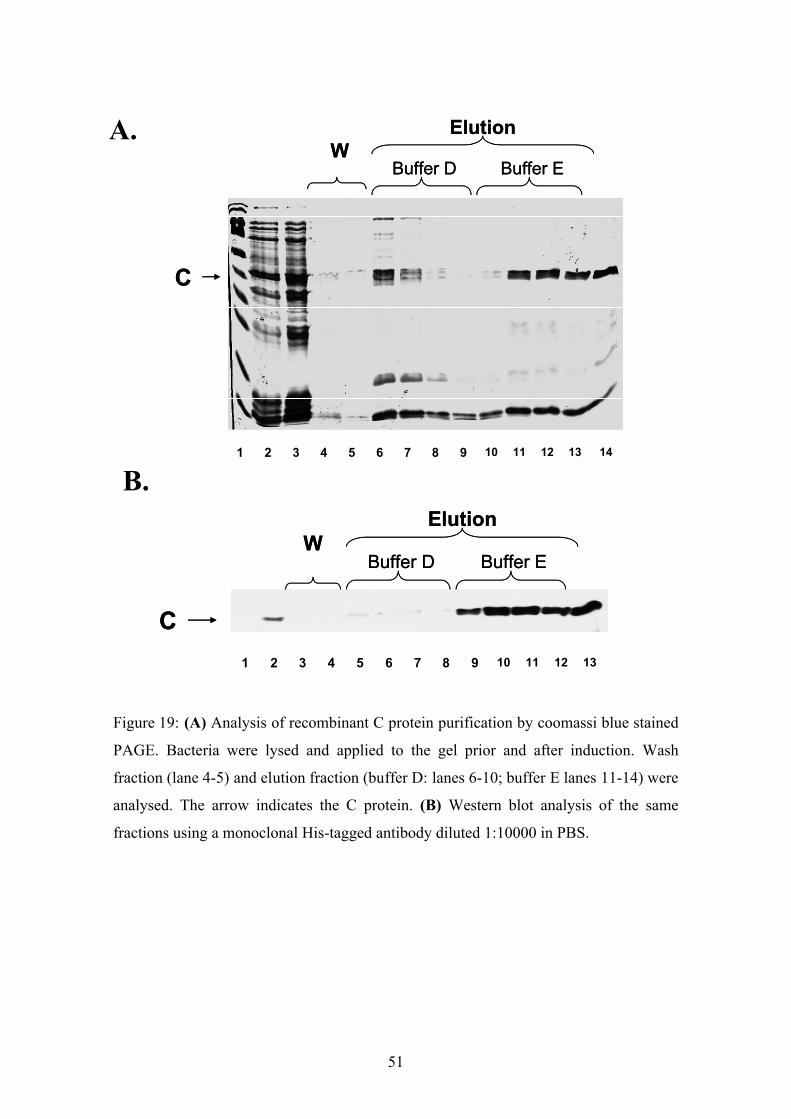
All fractions were analysed by Coomassie stained SDS-PAGE (Fig.19A) and by
Western blot analysis using monoclonal anti-HIS-antibodies (Fig.19B). Both assays
showed a prominent protein band of the expected size. The protein started to elute in the
first two fractions with buffer D. Notably, the recombinant C protein was not present in
the wash fractions (Fig.19B lanes 3 and 4) prior to the elution. The main protein peak
was observed in the fraction eluted with buffer E (Fig.19). In addition, the Coosmassie
stained gel showed only one other prominent contaminating bacterial protein band in
the fractions eluted with buffer E.
51
C
1413121110987654321
WBuffer D Buffer E
Elution
C
1413121110987654321 1413121110987654321
WBuffer D Buffer E
Elution
C
13121110987654321
WBuffer D Buffer E
Elution
C
13121110987654321 13121110987654321
WBuffer D Buffer E
Elution
Figure 19: (A) Analysis of recombinant C protein purification by coomassi blue stained
PAGE. Bacteria were lysed and applied to the gel prior and after induction. Wash
fraction (lane 4-5) and elution fraction (buffer D: lanes 6-10; buffer E lanes 11-14) were
analysed. The arrow indicates the C protein. (B) Western blot analysis of the same
fractions using a monoclonal His-tagged antibody diluted 1:10000 in PBS.
A.
B.
52
4.2.2. Expression and purification of E1 and E2 proteins
4.2.2.1. Pilot expression
In order to identify the optimal expression conditions for E1 and E2 recombinant
proteins, both pET200-E1 and pET200-E2 expression vectors were used in pilot
expression experiments. The BL21-DE3-Star competent E.coli was transformed with
expression vectors. Overnight cultures were diluted 1:20 and grown for additional 2 h at
370C so that the bacteria cultures reached the log-phase. Protein expression was induced
by adding IPTG to a final concentration of 1mM. To determine the optimal expression
time, the bacteria were harvested after 2 and 4 h of induction. Bacteria were collected
by centrifugation at 13000 rpm for 1 min at RT. The cell pellets were lyzed with native
lysis buffer and sonificated 4 times for 10 s on ice. The lysates were centrifuged to
separate the soluble from insoluble proteins and both fractions were analysed by SDS-
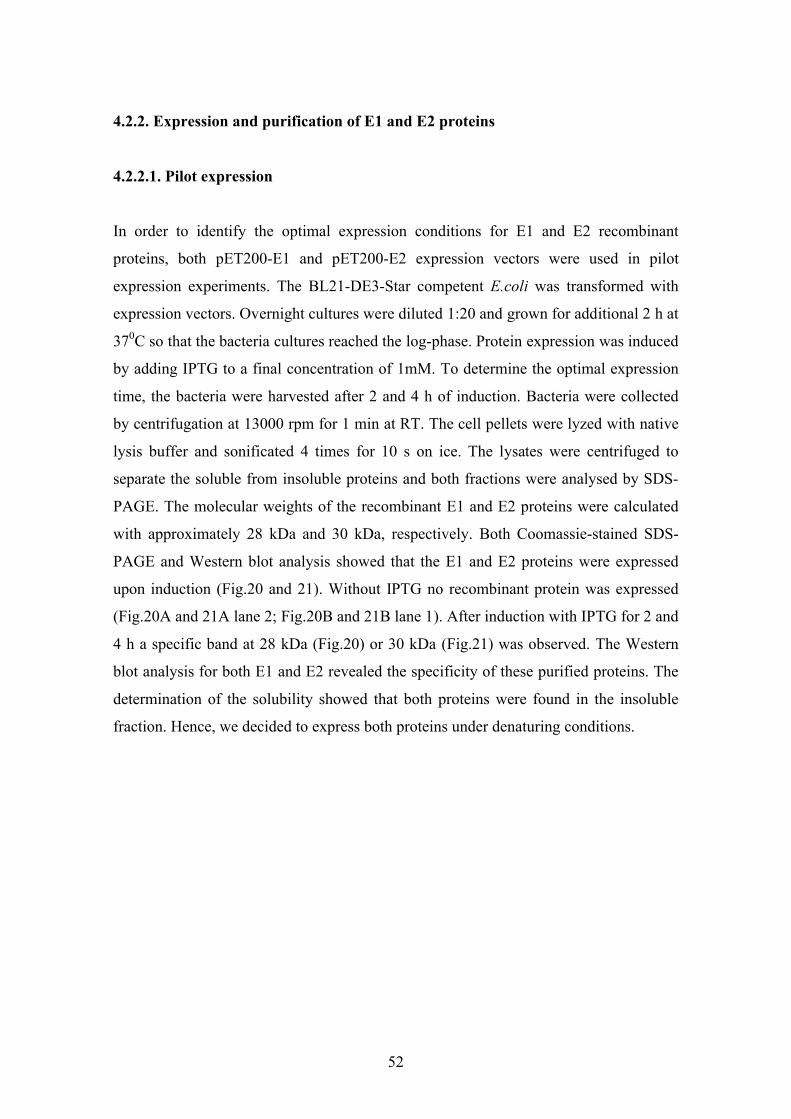
PAGE. The molecular weights of the recombinant E1 and E2 proteins were calculated
with approximately 28 kDa and 30 kDa, respectively. Both Coomassie-stained SDS-
PAGE and Western blot analysis showed that the E1 and E2 proteins were expressed
upon induction (Fig.20 and 21). Without IPTG no recombinant protein was expressed
(Fig.20A and 21A lane 2; Fig.20B and 21B lane 1). After induction with IPTG for 2 and
4 h a specific band at 28 kDa (Fig.20) or 30 kDa (Fig.21) was observed. The Western
blot analysis for both E1 and E2 revealed the specificity of these purified proteins. The
determination of the solubility showed that both proteins were found in the insoluble
fraction. Hence, we decided to express both proteins under denaturing conditions.
53
M 0 2 4 Deb Sup
61 2 3 4 5
E1
hours
M 0 2 4 Deb Sup
61 2 3 4 5
E1
hours
0 2 4 Deb Sup
1 2 3 4 5
E1
hours
0 2 4 Deb Sup
1 2 3 4 5
E1
hours
Figure 20: (A) Coomassie blue stained PAGE of E1 test expression. Lane 2 shows
sample taken prior to induction, whereas lanes 3-4 show samples after 2 and 4h of
expression, respectively. Protein solubility at 4h of induction was low (lanes 5 and 6).
Marker: lane 1. (B) Western blot analysis of the recombinant E1 using anti-His-tagged
antibody for detection at a dilution of 1: 1000.
A.
B.
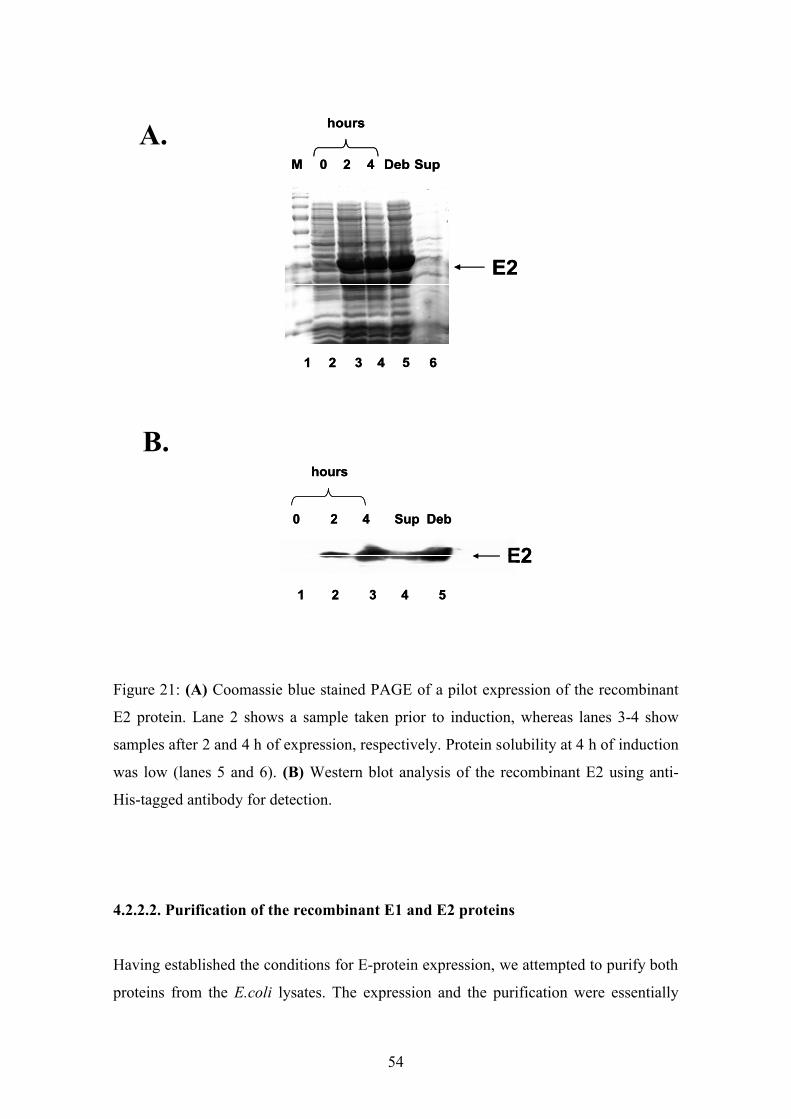
54
M 0 2 4 Deb Sup
E2
61 2 3 4 5
hours
M 0 2 4 Deb Sup
E2
61 2 3 4 5
hours
E2
0 2 4 DebSup
1 2 3 4 5
hours
E2
0 2 4 DebSup
1 2 3 4 5
hours
Figure 21: (A) Coomassie blue stained PAGE of a pilot expression of the recombinant
E2 protein. Lane 2 shows a sample taken prior to induction, whereas lanes 3-4 show
samples after 2 and 4 h of expression, respectively. Protein solubility at 4 h of induction
was low (lanes 5 and 6). (B) Western blot analysis of the recombinant E2 using anti-
His-tagged antibody for detection.
4.2.2.2. Purification of the recombinant E1 and E2 proteins
Having established the conditions for E-protein expression, we attempted to purify both
proteins from the E.coli lysates. The expression and the purification were essentially
A.
B.
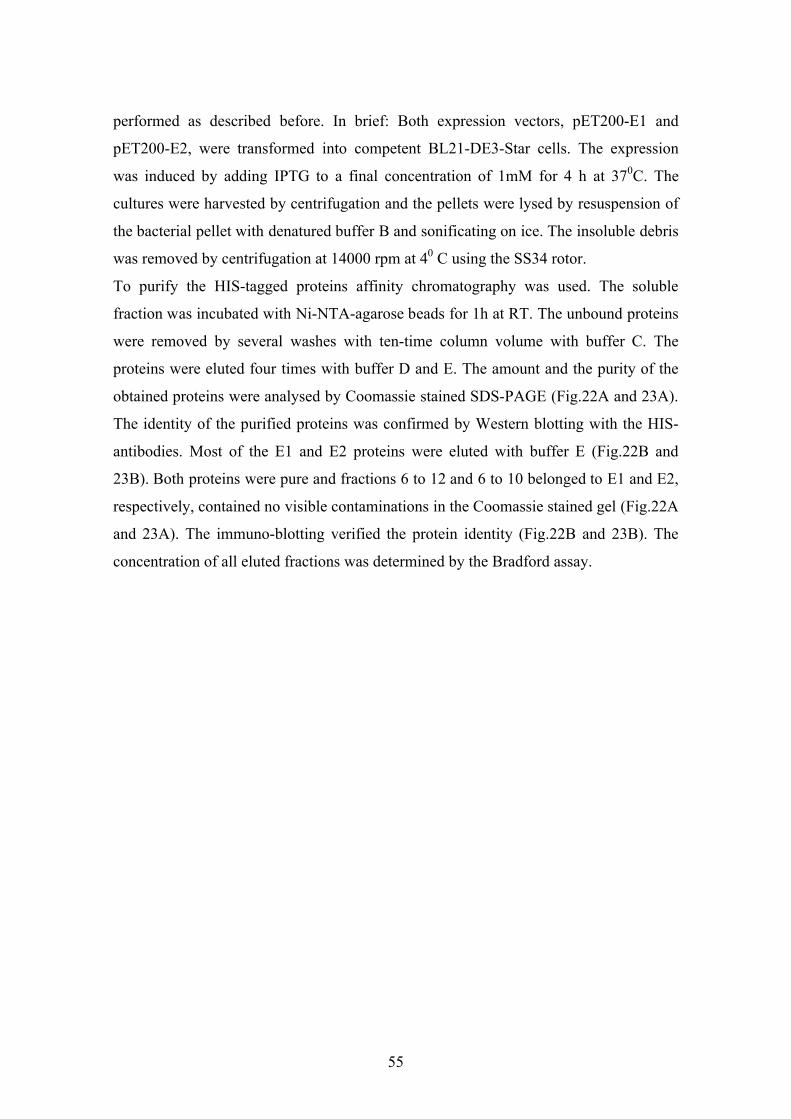
55
performed as described before. In brief: Both expression vectors, pET200-E1 and
pET200-E2, were transformed into competent BL21-DE3-Star cells. The expression
was induced by adding IPTG to a final concentration of 1mM for 4 h at 370C. The
cultures were harvested by centrifugation and the pellets were lysed by resuspension of
the bacterial pellet with denatured buffer B and sonificating on ice. The insoluble debris
was removed by centrifugation at 14000 rpm at 40 C using the SS34 rotor.
To purify the HIS-tagged proteins affinity chromatography was used. The soluble
fraction was incubated with Ni-NTA-agarose beads for 1h at RT. The unbound proteins
were removed by several washes with ten-time column volume with buffer C. The
proteins were eluted four times with buffer D and E. The amount and the purity of the
obtained proteins were analysed by Coomassie stained SDS-PAGE (Fig.22A and 23A).
The identity of the purified proteins was confirmed by Western blotting with the HIS-
antibodies. Most of the E1 and E2 proteins were eluted with buffer E (Fig.22B and
23B). Both proteins were pure and fractions 6 to 12 and 6 to 10 belonged to E1 and E2,
respectively, contained no visible contaminations in the Coomassie stained gel (Fig.22A
and 23A). The immuno-blotting verified the protein identity (Fig.22B and 23B). The
concentration of all eluted fractions was determined by the Bradford assay.
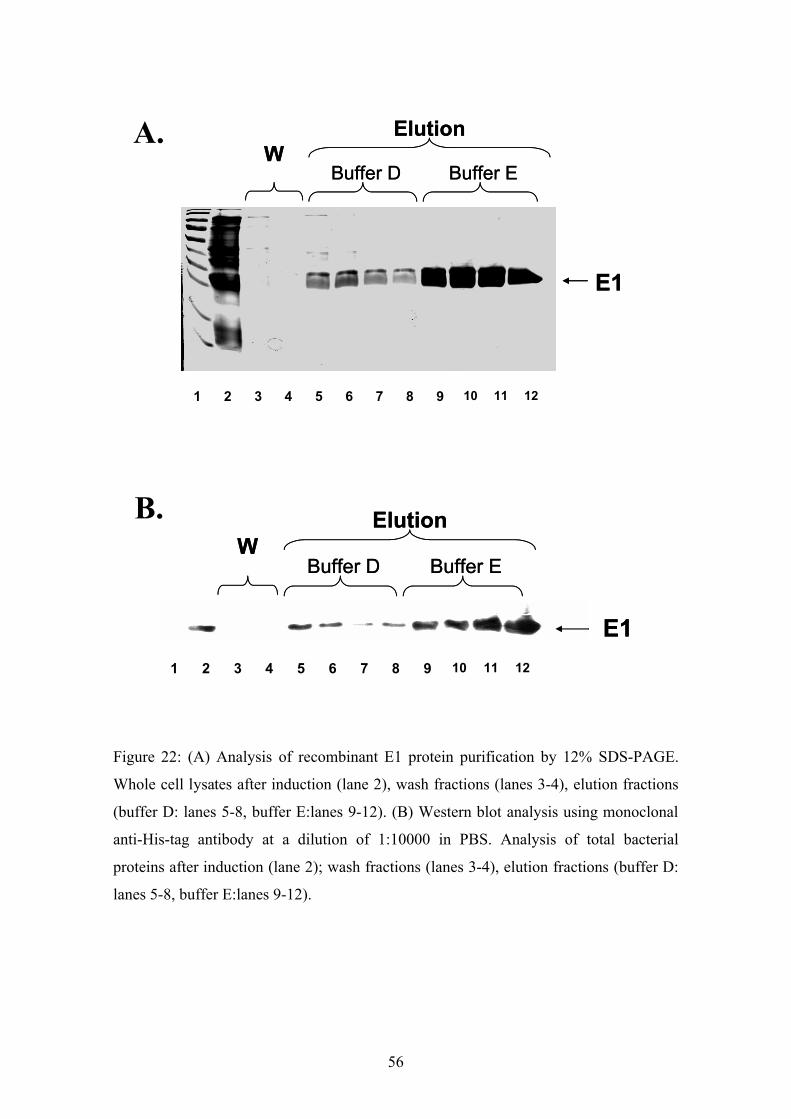
56
E1
WBuffer D Buffer E
Elution
121110987654321
E1
WBuffer D Buffer E
Elution
121110987654321 121110987654321
E1
121110987654321
WBuffer D Buffer E
Elution
E1
121110987654321 121110987654321
WBuffer D Buffer E
Elution
Figure 22: (A) Analysis of recombinant E1 protein purification by 12% SDS-PAGE.
Whole cell lysates after induction (lane 2), wash fractions (lanes 3-4), elution fractions
(buffer D: lanes 5-8, buffer E:lanes 9-12). (B) Western blot analysis using monoclonal
anti-His-tag antibody at a dilution of 1:10000 in PBS. Analysis of total bacterial
proteins after induction (lane 2); wash fractions (lanes 3-4), elution fractions (buffer D:
lanes 5-8, buffer E:lanes 9-12).
A.
B.
57
E2
121110987654321
WBuffer D Buffer E
Elution
E2
121110987654321 121110987654321
WBuffer D Buffer E
Elution
E2
121110987654321
WBuffer D Buffer E
Elution
E2
121110987654321 121110987654321
WBuffer D Buffer E
Elution
Figure 23: (A) Analysis of the recombinant E2 protein purification. Whole bacterial
lysates after induction (lane 2). Wash fractions (lanes 3-4), elution fractions (buffer D:
lanes 5-8, buffer E: lanes 9-12). (B) Western blot analysis using monoclonal anti-His-
tagged antibody at a dilution of 1:10000 in PBS. Analysis of total bacterial protein after
induction (lane 2); wash fractions (lanes 3-4), elution fractions (buffer D: lanes 5-8,
buffer E: lanes 9-12).
A.
B.
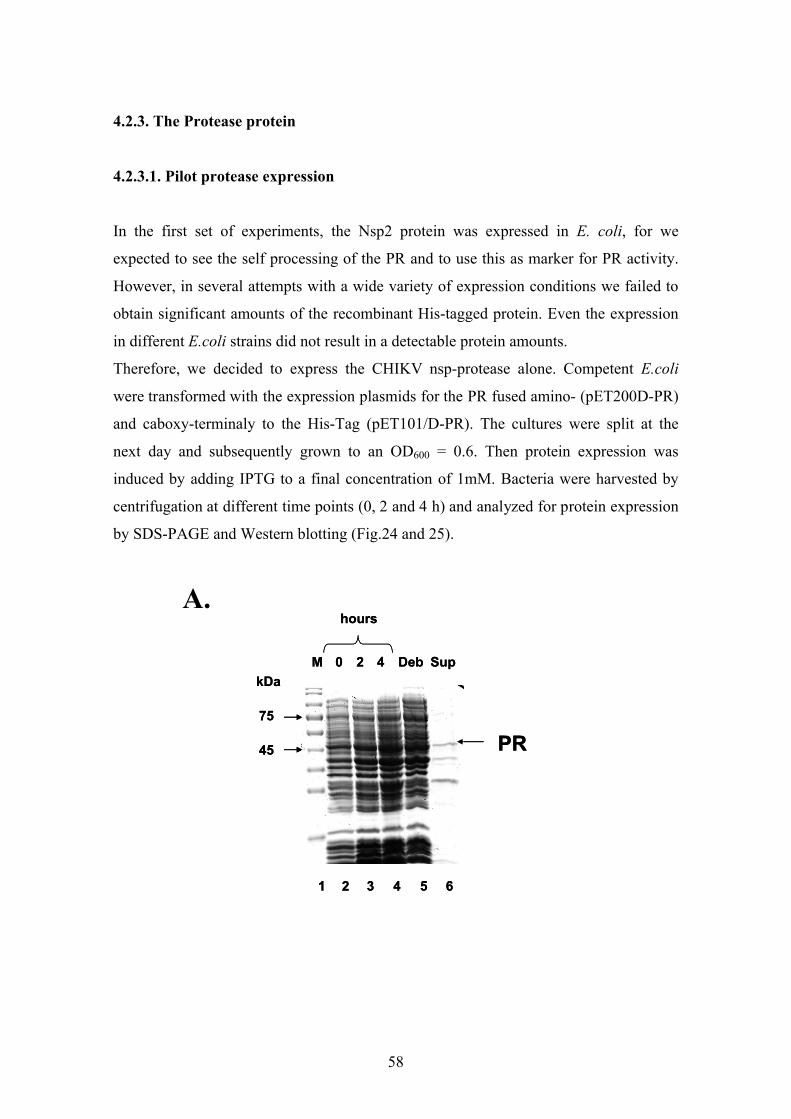
58
4.2.3. The Protease protein
4.2.3.1. Pilot protease expression
In the first set of experiments, the Nsp2 protein was expressed in E. coli, for we
expected to see the self processing of the PR and to use this as marker for PR activity.
However, in several attempts with a wide variety of expression conditions we failed to
obtain significant amounts of the recombinant His-tagged protein. Even the expression
in different E.coli strains did not result in a detectable protein amounts.
Therefore, we decided to express the CHIKV nsp-protease alone. Competent E.coli
were transformed with the expression plasmids for the PR fused amino- (pET200D-PR)
and caboxy-terminaly to the His-Tag (pET101/D-PR). The cultures were split at the
next day and subsequently grown to an OD600 = 0.6. Then protein expression was
induced by adding IPTG to a final concentration of 1mM. Bacteria were harvested by
centrifugation at different time points (0, 2 and 4 h) and analyzed for protein expression
by SDS-PAGE and Western blotting (Fig.24 and 25).
M 0 2 4 Deb Sup
PR
61 2 3 4 5
45
75
kDa
hours
M 0 2 4 Deb Sup
PR
61 2 3 4 5
45
75
kDa
hoursA.
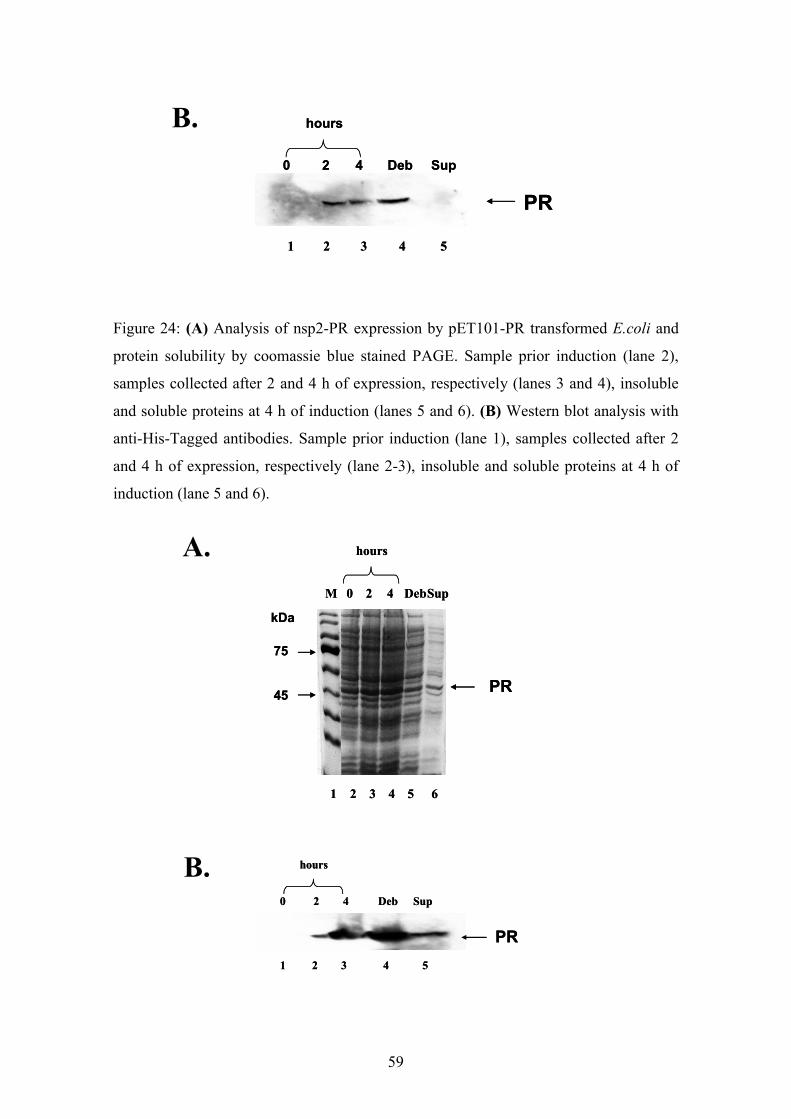
59
0 2 4 Deb Sup
PR
1 2 3 4 5
hours
0 2 4 Deb Sup
PR
1 2 3 4 5
hours
Figure 24: (A) Analysis of nsp2-PR expression by pET101-PR transformed E.coli and
protein solubility by coomassie blue stained PAGE. Sample prior induction (lane 2),
samples collected after 2 and 4 h of expression, respectively (lanes 3 and 4), insoluble
and soluble proteins at 4 h of induction (lanes 5 and 6). (B) Western blot analysis with
anti-His-Tagged antibodies. Sample prior induction (lane 1), samples collected after 2
and 4 h of expression, respectively (lane 2-3), insoluble and soluble proteins at 4 h of
induction (lane 5 and 6).
M 0 2 4 DebSup
PR
61 2 3 4 5
45
75
kDa
hours
M 0 2 4 DebSup
PR
61 2 3 4 5
45
75
kDa
hours
0 2 4 Deb Sup
PR
1 2 3 4 5
hours
0 2 4 Deb Sup
PR
1 2 3 4 5
hours
B.
B.
A.
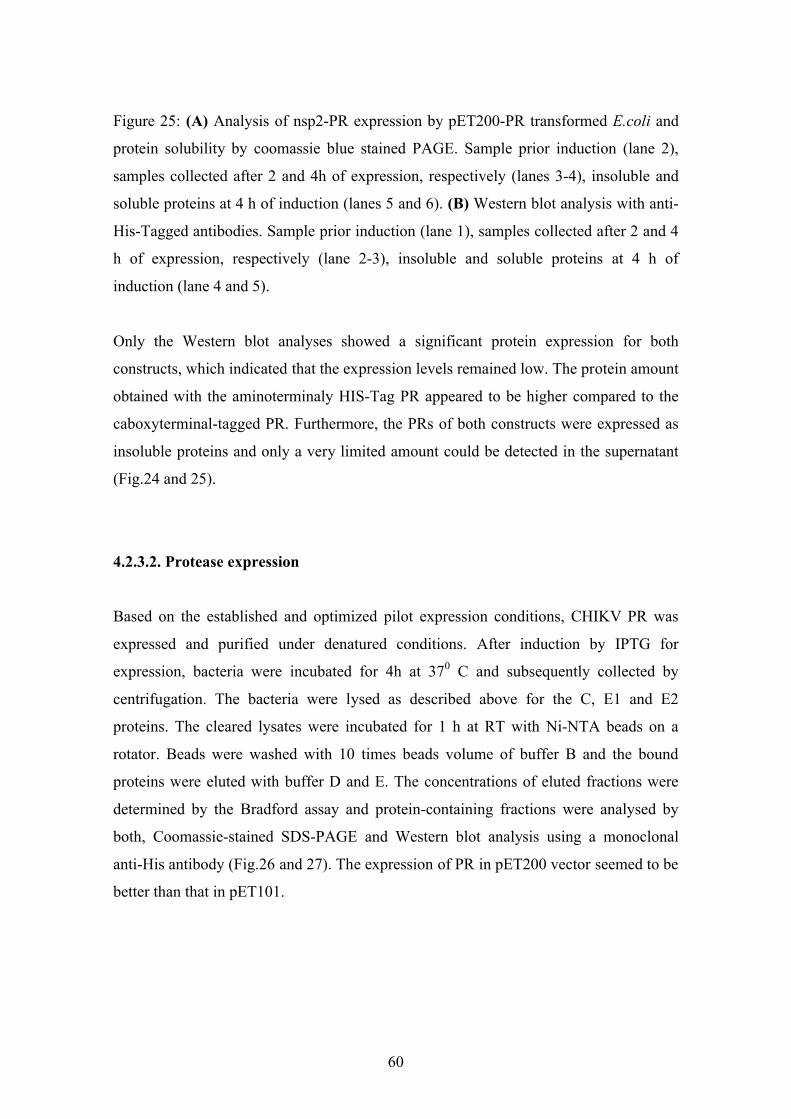
60
Figure 25: (A) Analysis of nsp2-PR expression by pET200-PR transformed E.coli and
protein solubility by coomassie blue stained PAGE. Sample prior induction (lane 2),
samples collected after 2 and 4h of expression, respectively (lanes 3-4), insoluble and
soluble proteins at 4 h of induction (lanes 5 and 6). (B) Western blot analysis with anti-
His-Tagged antibodies. Sample prior induction (lane 1), samples collected after 2 and 4
h of expression, respectively (lane 2-3), insoluble and soluble proteins at 4 h of
induction (lane 4 and 5).
Only the Western blot analyses showed a significant protein expression for both
constructs, which indicated that the expression levels remained low. The protein amount
obtained with the aminoterminaly HIS-Tag PR appeared to be higher compared to the
caboxyterminal-tagged PR. Furthermore, the PRs of both constructs were expressed as
insoluble proteins and only a very limited amount could be detected in the supernatant
(Fig.24 and 25).
4.2.3.2. Protease expression
Based on the established and optimized pilot expression conditions, CHIKV PR was
expressed and purified under denatured conditions. After induction by IPTG for
expression, bacteria were incubated for 4h at 370 C and subsequently collected by
centrifugation. The bacteria were lysed as described above for the C, E1 and E2
proteins. The cleared lysates were incubated for 1 h at RT with Ni-NTA beads on a
rotator. Beads were washed with 10 times beads volume of buffer B and the bound
proteins were eluted with buffer D and E. The concentrations of eluted fractions were
determined by the Bradford assay and protein-containing fractions were analysed by
both, Coomassie-stained SDS-PAGE and Western blot analysis using a monoclonal
anti-His antibody (Fig.26 and 27). The expression of PR in pET200 vector seemed to be
better than that in pET101.
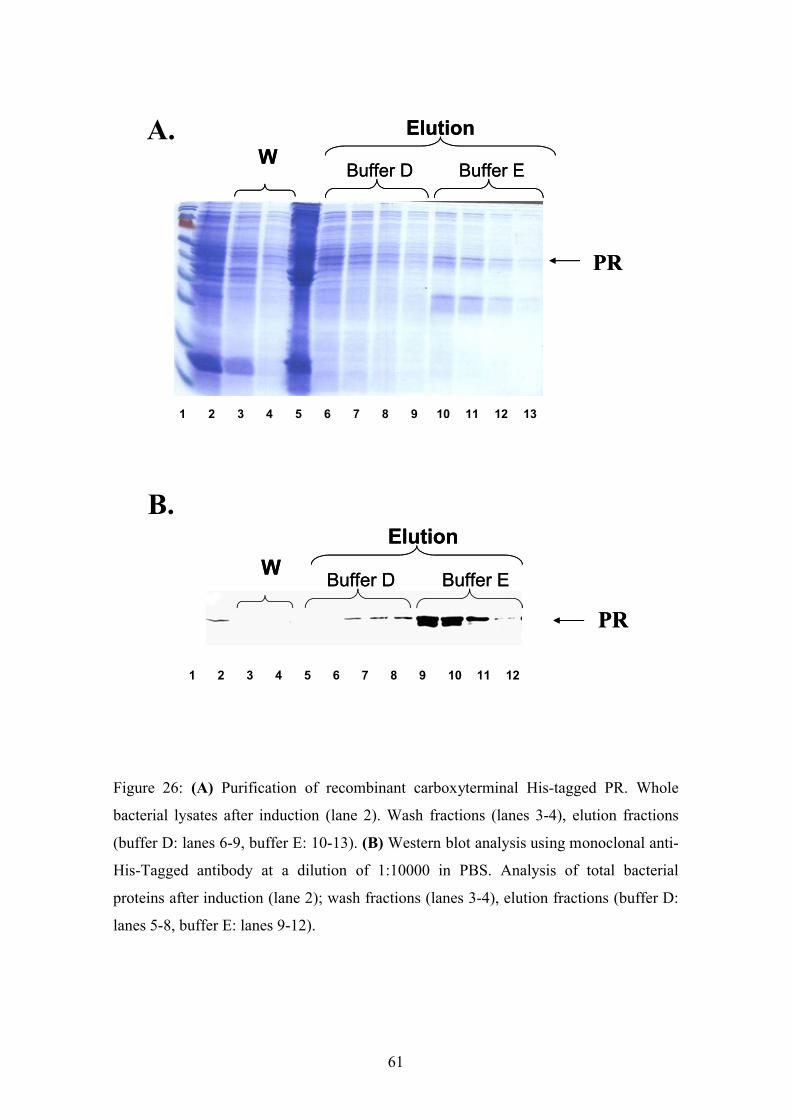
61
PR
13121110987654321
WBuffer D Buffer E
Elution
PR
13121110987654321 13121110987654321
WBuffer D Buffer E
Elution
PR
121110987654321
WBuffer D Buffer E
Elution
PR
121110987654321 121110987654321
WBuffer D Buffer E
Elution
Figure 26: (A) Purification of recombinant carboxyterminal His-tagged PR. Whole
bacterial lysates after induction (lane 2). Wash fractions (lanes 3-4), elution fractions
(buffer D: lanes 6-9, buffer E: 10-13). (B) Western blot analysis using monoclonal anti-
His-Tagged antibody at a dilution of 1:10000 in PBS. Analysis of total bacterial
proteins after induction (lane 2); wash fractions (lanes 3-4), elution fractions (buffer D:
lanes 5-8, buffer E: lanes 9-12).
A.
B.
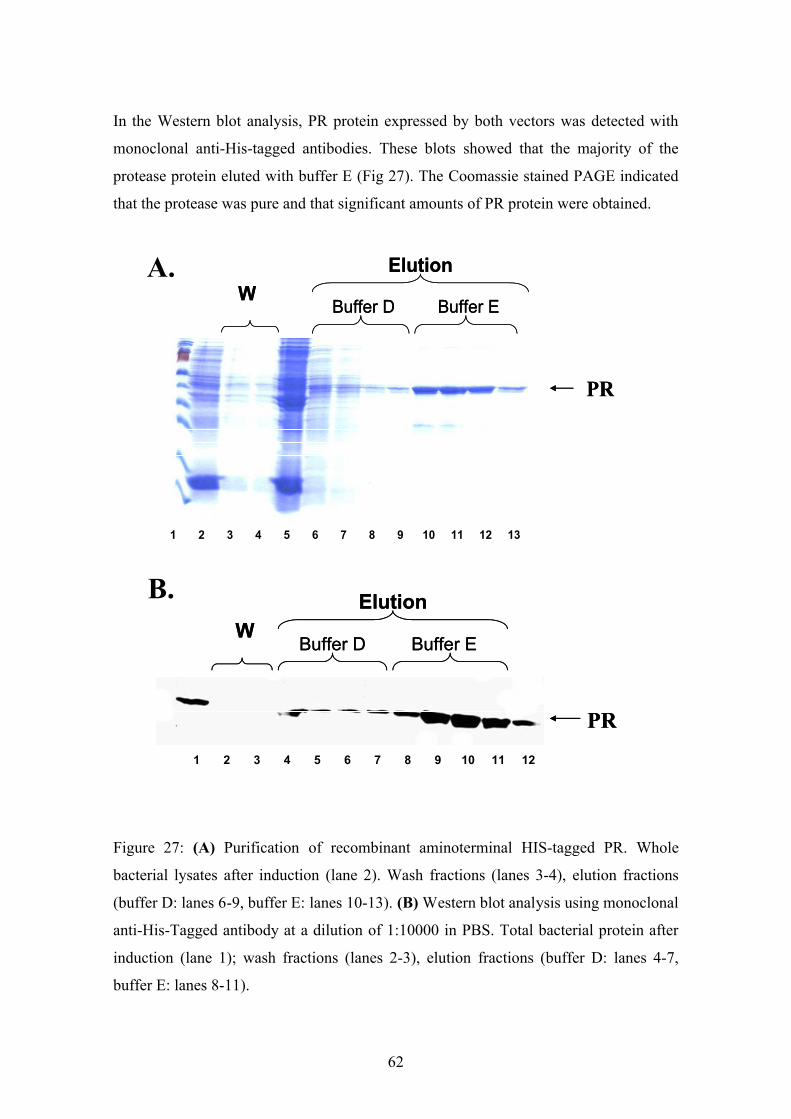
62
In the Western blot analysis, PR protein expressed by both vectors was detected with
monoclonal anti-His-tagged antibodies. These blots showed that the majority of the
protease protein eluted with buffer E (Fig 27). The Coomassie stained PAGE indicated
that the protease was pure and that significant amounts of PR protein were obtained.
PR
13121110987654321
WBuffer D Buffer E
Elution
PR
13121110987654321 13121110987654321
WBuffer D Buffer E
Elution
PR
121110987654321
WBuffer D Buffer E
Elution
PR
121110987654321 121110987654321
WBuffer D Buffer E
Elution
Figure 27: (A) Purification of recombinant aminoterminal HIS-tagged PR. Whole
bacterial lysates after induction (lane 2). Wash fractions (lanes 3-4), elution fractions
(buffer D: lanes 6-9, buffer E: lanes 10-13). (B) Western blot analysis using monoclonal
anti-His-Tagged antibody at a dilution of 1:10000 in PBS. Total bacterial protein after
induction (lane 1); wash fractions (lanes 2-3), elution fractions (buffer D: lanes 4-7,
buffer E: lanes 8-11).
A.
B.
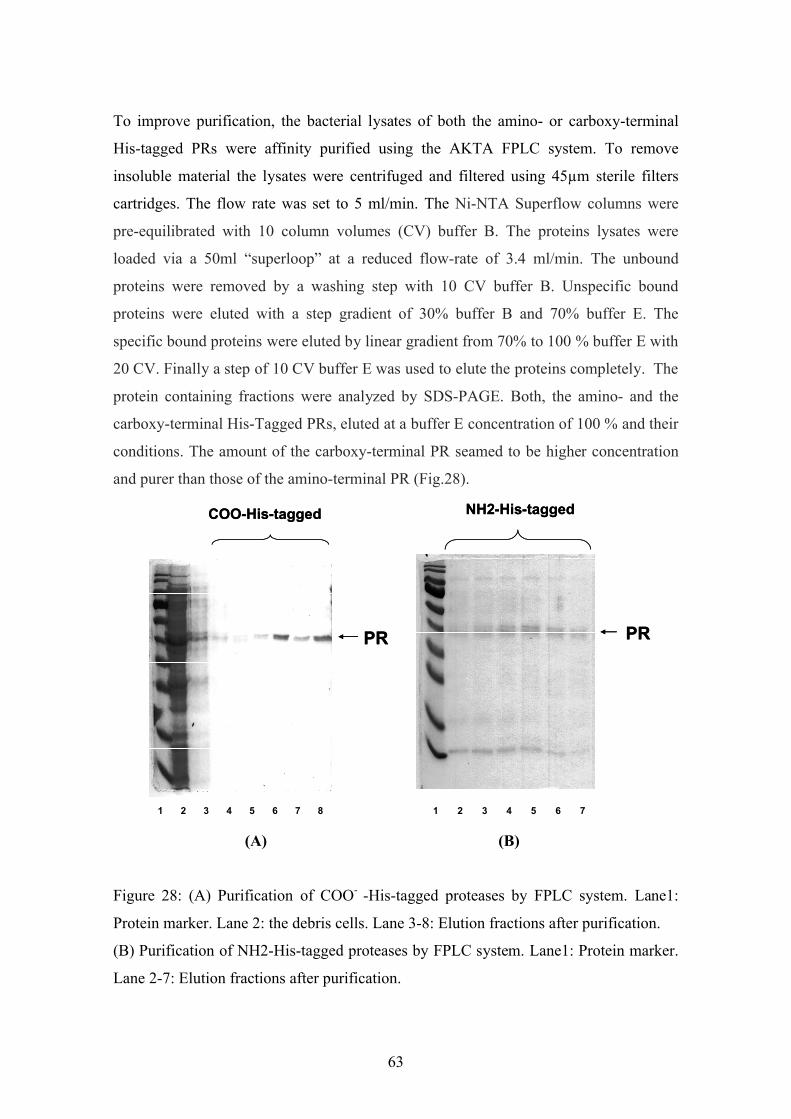
63
To improve purification, the bacterial lysates of both the amino- or carboxy-terminal
His-tagged PRs were affinity purified using the AKTA FPLC system. To remove
insoluble material the lysates were centrifuged and filtered using 45µm sterile filters
cartridges. The flow rate was set to 5 ml/min. The Ni-NTA Superflow columns were
pre-equilibrated with 10 column volumes (CV) buffer B. The proteins lysates were
loaded via a 50ml “superloop” at a reduced flow-rate of 3.4 ml/min. The unbound
proteins were removed by a washing step with 10 CV buffer B. Unspecific bound
proteins were eluted with a step gradient of 30% buffer B and 70% buffer E. The
specific bound proteins were eluted by linear gradient from 70% to 100 % buffer E with
20 CV. Finally a step of 10 CV buffer E was used to elute the proteins completely. The
protein containing fractions were analyzed by SDS-PAGE. Both, the amino- and the
carboxy-terminal His-Tagged PRs, eluted at a buffer E concentration of 100 % and their
conditions. The amount of the carboxy-terminal PR seamed to be higher concentration
and purer than those of the amino-terminal PR (Fig.28).
PR
NH2-His-tagged
PR
87654321
COO-His-tagged
7654321
PR
NH2-His-tagged
PR
87654321 87654321
COO-His-tagged
7654321 7654321
(A) (B)
Figure 28: (A) Purification of COO- -His-tagged proteases by FPLC system. Lane1:
Protein marker. Lane 2: the debris cells. Lane 3-8: Elution fractions after purification.
(B) Purification of NH2-His-tagged proteases by FPLC system. Lane1: Protein marker.
Lane 2-7: Elution fractions after purification.
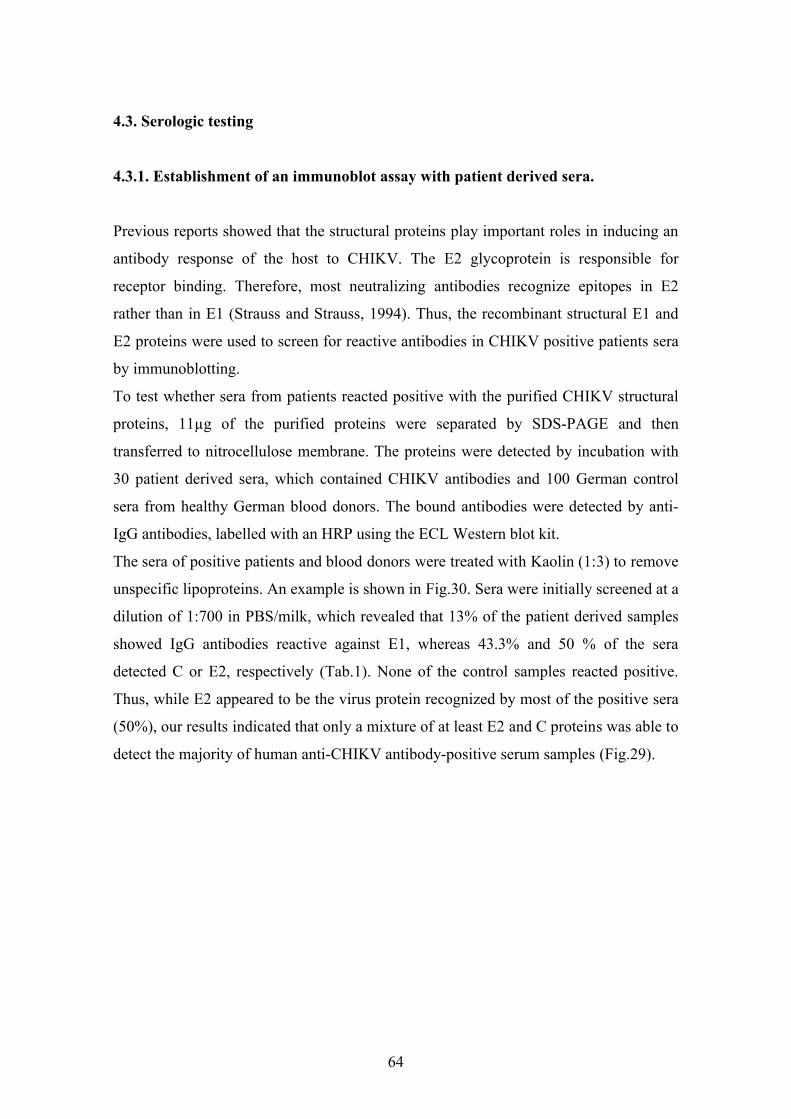
64
4.3. Serologic testing
4.3.1. Establishment of an immunoblot assay with patient derived sera.
Previous reports showed that the structural proteins play important roles in inducing an
antibody response of the host to CHIKV. The E2 glycoprotein is responsible for
receptor binding. Therefore, most neutralizing antibodies recognize epitopes in E2
rather than in E1 (Strauss and Strauss, 1994). Thus, the recombinant structural E1 and
E2 proteins were used to screen for reactive antibodies in CHIKV positive patients sera
by immunoblotting.
To test whether sera from patients reacted positive with the purified CHIKV structural
proteins, 11µg of the purified proteins were separated by SDS-PAGE and then
transferred to nitrocellulose membrane. The proteins were detected by incubation with
30 patient derived sera, which contained CHIKV antibodies and 100 German control
sera from healthy German blood donors. The bound antibodies were detected by anti-
IgG antibodies, labelled with an HRP using the ECL Western blot kit.
The sera of positive patients and blood donors were treated with Kaolin (1:3) to remove
unspecific lipoproteins. An example is shown in Fig.30. Sera were initially screened at a
dilution of 1:700 in PBS/milk, which revealed that 13% of the patient derived samples
showed IgG antibodies reactive against E1, whereas 43.3% and 50 % of the sera
detected C or E2, respectively (Tab.1). None of the control samples reacted positive.
Thus, while E2 appeared to be the virus protein recognized by most of the positive sera
(50%), our results indicated that only a mixture of at least E2 and C proteins was able to
detect the majority of human anti-CHIKV antibody-positive serum samples (Fig.29).
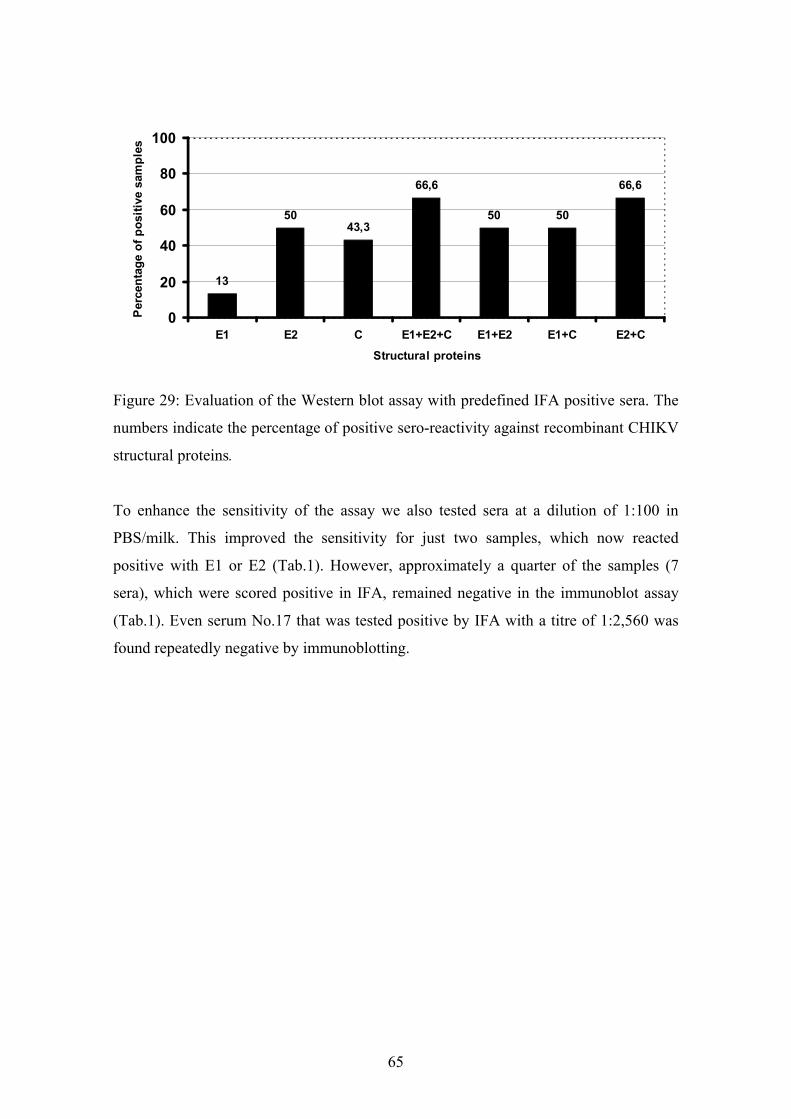
65
13
5043,3
66,6
50 50
66,6
0
20
40
60
80
100
E1 E2 C E1+E2+C E1+E2 E1+C E2+C
Structural proteins
Per
cen
tag
e o
f p
osi
tive
sam
ple
s
Figure 29: Evaluation of the Western blot assay with predefined IFA positive sera. The
numbers indicate the percentage of positive sero-reactivity against recombinant CHIKV
structural proteins.
To enhance the sensitivity of the assay we also tested sera at a dilution of 1:100 in
PBS/milk. This improved the sensitivity for just two samples, which now reacted
positive with E1 or E2 (Tab.1). However, approximately a quarter of the samples (7
sera), which were scored positive in IFA, remained negative in the immunoblot assay
(Tab.1). Even serum No.17 that was tested positive by IFA with a titre of 1:2,560 was
found repeatedly negative by immunoblotting.
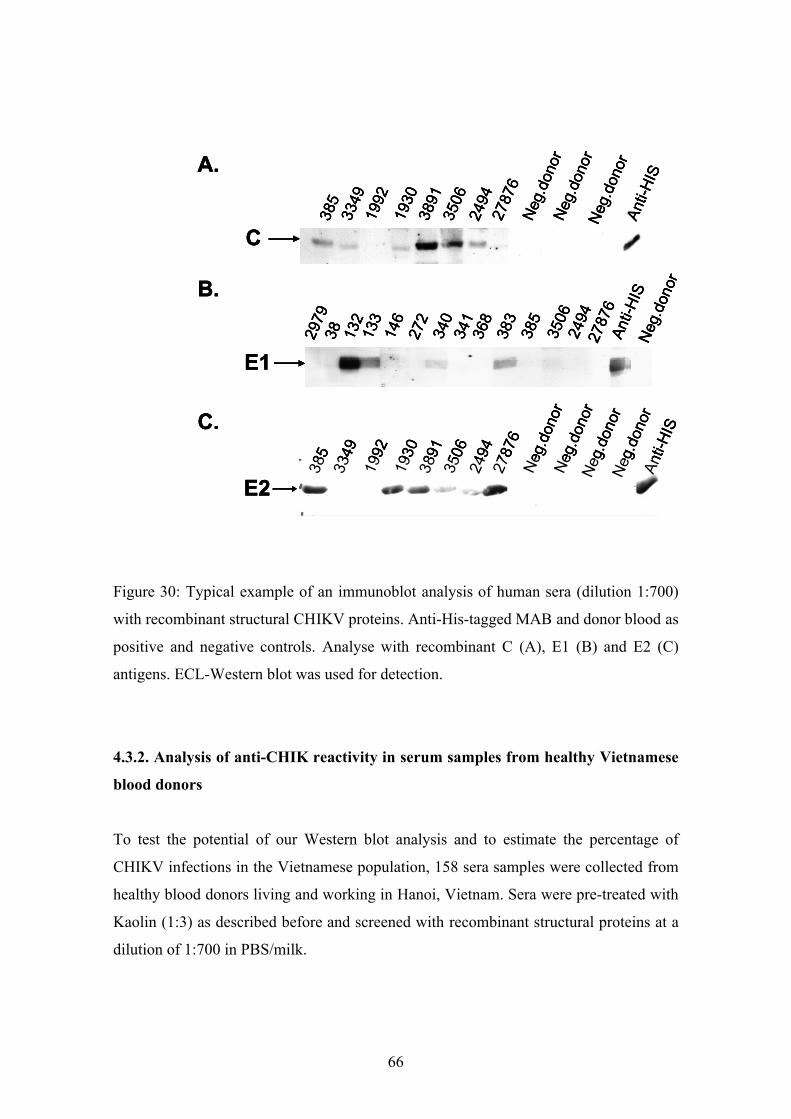
66
C
385
3349
1992
1930
3891
3506
2494
2787
6N
eg.d
onor
Neg
.don
or
Ant
i-HIS
Neg
.don
or
E1
2979
38 132
146
272
340
341
383
385
3506
Ant
i-HIS
2787
6
133
368
2494
Neg
.don
or
E2
385
3349
1992
1930
3891
3506
2494
2787
6N
eg.d
onor
Neg
.don
or
Ant
i-HIS
Neg
.don
orN
eg.d
onor
A.
B.
C.
C
385
3349
1992
1930
3891
3506
2494
2787
6N
eg.d
onor
Neg
.don
or
Ant
i-HIS
Neg
.don
or
E1
2979
38 132
146
272
340
341
383
385
3506
Ant
i-HIS
2787
6
133
368
2494
Neg
.don
or
E2
385
3349
1992
1930
3891
3506
2494
2787
6N
eg.d
onor
Neg
.don
or
Ant
i-HIS
Neg
.don
orN
eg.d
onor
A.
B.
C.
C
385
3349
1992
1930
3891
3506
2494
2787
6N
eg.d
onor
Neg
.don
or
Ant
i-HIS
Neg
.don
or
E1
2979
38 132
146
272
340
341
383
385
3506
Ant
i-HIS
2787
6
133
368
2494
Neg
.don
or
E2
385
3349
1992
1930
3891
3506
2494
2787
6N
eg.d
onor
Neg
.don
or
Ant
i-HIS
Neg
.don
orN
eg.d
onor
A.
B.
C.
Figure 30: Typical example of an immunoblot analysis of human sera (dilution 1:700)
with recombinant structural CHIKV proteins. Anti-His-tagged MAB and donor blood as
positive and negative controls. Analyse with recombinant C (A), E1 (B) and E2 (C)
antigens. ECL-Western blot was used for detection.
4.3.2. Analysis of anti-CHIK reactivity in serum samples from healthy Vietnamese
blood donors
To test the potential of our Western blot analysis and to estimate the percentage of
CHIKV infections in the Vietnamese population, 158 sera samples were collected from
healthy blood donors living and working in Hanoi, Vietnam. Sera were pre-treated with
Kaolin (1:3) as described before and screened with recombinant structural proteins at a
dilution of 1:700 in PBS/milk.
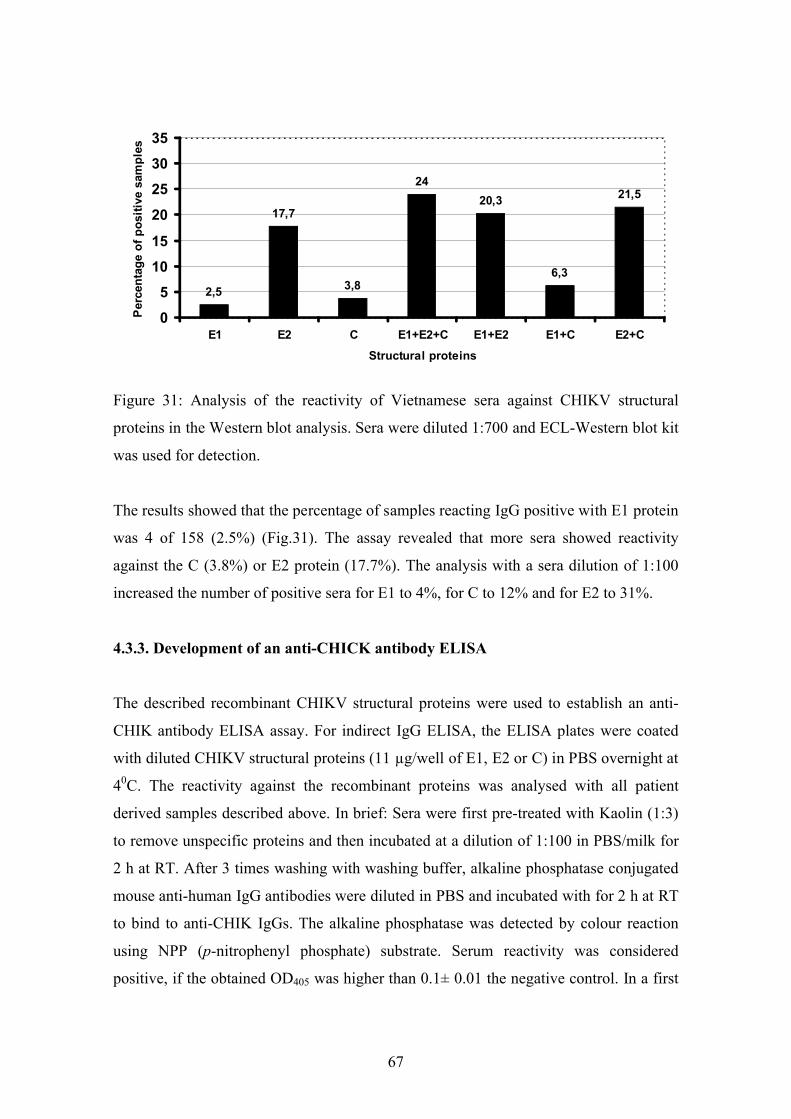
67
2,5
17,7
3,8
24
20,3
6,3
21,5
0
5
10
15
20
25
30
35
E1 E2 C E1+E2+C E1+E2 E1+C E2+C
Structural proteins
Per
cen
tag
e o
f p
osi
tive
sam
ple
s
Figure 31: Analysis of the reactivity of Vietnamese sera against CHIKV structural
proteins in the Western blot analysis. Sera were diluted 1:700 and ECL-Western blot kit
was used for detection.
The results showed that the percentage of samples reacting IgG positive with E1 protein
was 4 of 158 (2.5%) (Fig.31). The assay revealed that more sera showed reactivity
against the C (3.8%) or E2 protein (17.7%). The analysis with a sera dilution of 1:100
increased the number of positive sera for E1 to 4%, for C to 12% and for E2 to 31%.
4.3.3. Development of an anti-CHICK antibody ELISA
The described recombinant CHIKV structural proteins were used to establish an anti-
CHIK antibody ELISA assay. For indirect IgG ELISA, the ELISA plates were coated
with diluted CHIKV structural proteins (11 µg/well of E1, E2 or C) in PBS overnight at
40C. The reactivity against the recombinant proteins was analysed with all patient
derived samples described above. In brief: Sera were first pre-treated with Kaolin (1:3)
to remove unspecific proteins and then incubated at a dilution of 1:100 in PBS/milk for
2 h at RT. After 3 times washing with washing buffer, alkaline phosphatase conjugated
mouse anti-human IgG antibodies were diluted in PBS and incubated with for 2 h at RT
to bind to anti-CHIK IgGs. The alkaline phosphatase was detected by colour reaction
using NPP (p-nitrophenyl phosphate) substrate. Serum reactivity was considered
positive, if the obtained OD405 was higher than 0.1± 0.01 the negative control. In a first
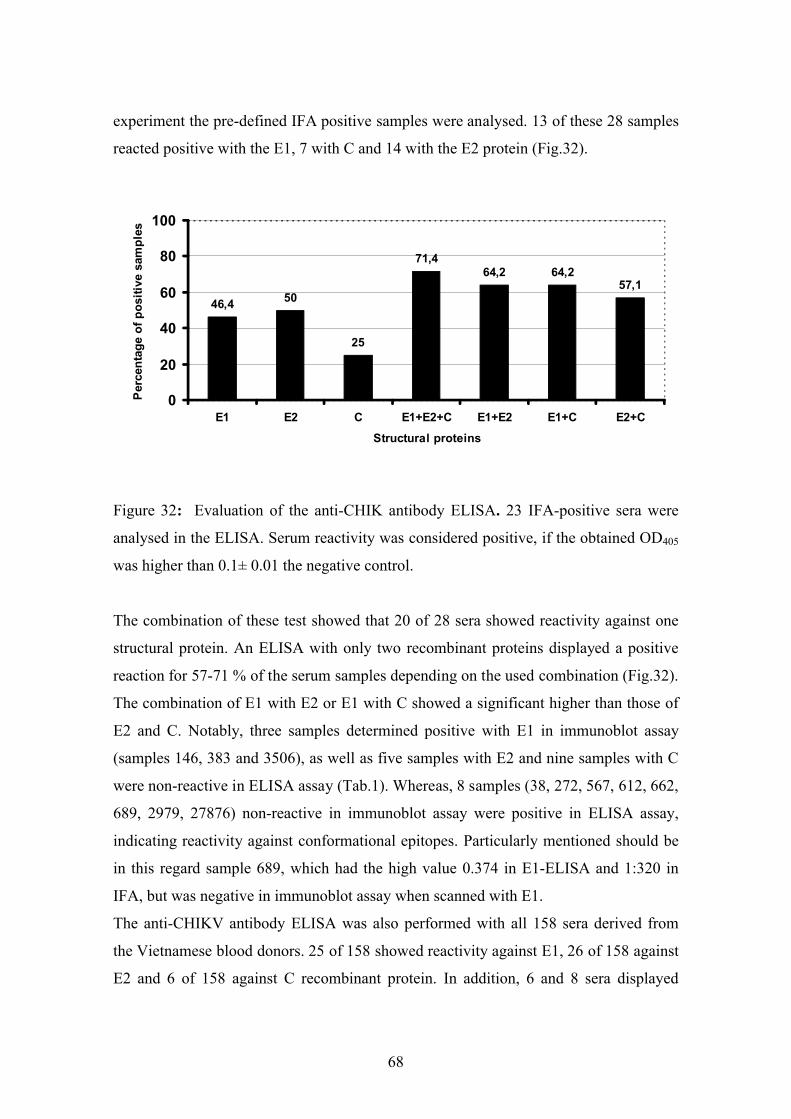
68
experiment the pre-defined IFA positive samples were analysed. 13 of these 28 samples
reacted positive with the E1, 7 with C and 14 with the E2 protein (Fig.32).
46,4 50
25
71,464,2 64,2
57,1
0
20
40
60
80
100
E1 E2 C E1+E2+C E1+E2 E1+C E2+C
Structural proteins
Per
cen
tag
e o
f p
osi
tive
sam
ple
s
Figure 32: Evaluation of the anti-CHIK antibody ELISA. 23 IFA-positive sera were
analysed in the ELISA. Serum reactivity was considered positive, if the obtained OD405
was higher than 0.1± 0.01 the negative control.
The combination of these test showed that 20 of 28 sera showed reactivity against one
structural protein. An ELISA with only two recombinant proteins displayed a positive
reaction for 57-71 % of the serum samples depending on the used combination (Fig.32).
The combination of E1 with E2 or E1 with C showed a significant higher than those of
E2 and C. Notably, three samples determined positive with E1 in immunoblot assay
(samples 146, 383 and 3506), as well as five samples with E2 and nine samples with C
were non-reactive in ELISA assay (Tab.1). Whereas, 8 samples (38, 272, 567, 612, 662,
689, 2979, 27876) non-reactive in immunoblot assay were positive in ELISA assay,
indicating reactivity against conformational epitopes. Particularly mentioned should be
in this regard sample 689, which had the high value 0.374 in E1-ELISA and 1:320 in
IFA, but was negative in immunoblot assay when scanned with E1.
The anti-CHIKV antibody ELISA was also performed with all 158 sera derived from
the Vietnamese blood donors. 25 of 158 showed reactivity against E1, 26 of 158 against
E2 and 6 of 158 against C recombinant protein. In addition, 6 and 8 sera displayed
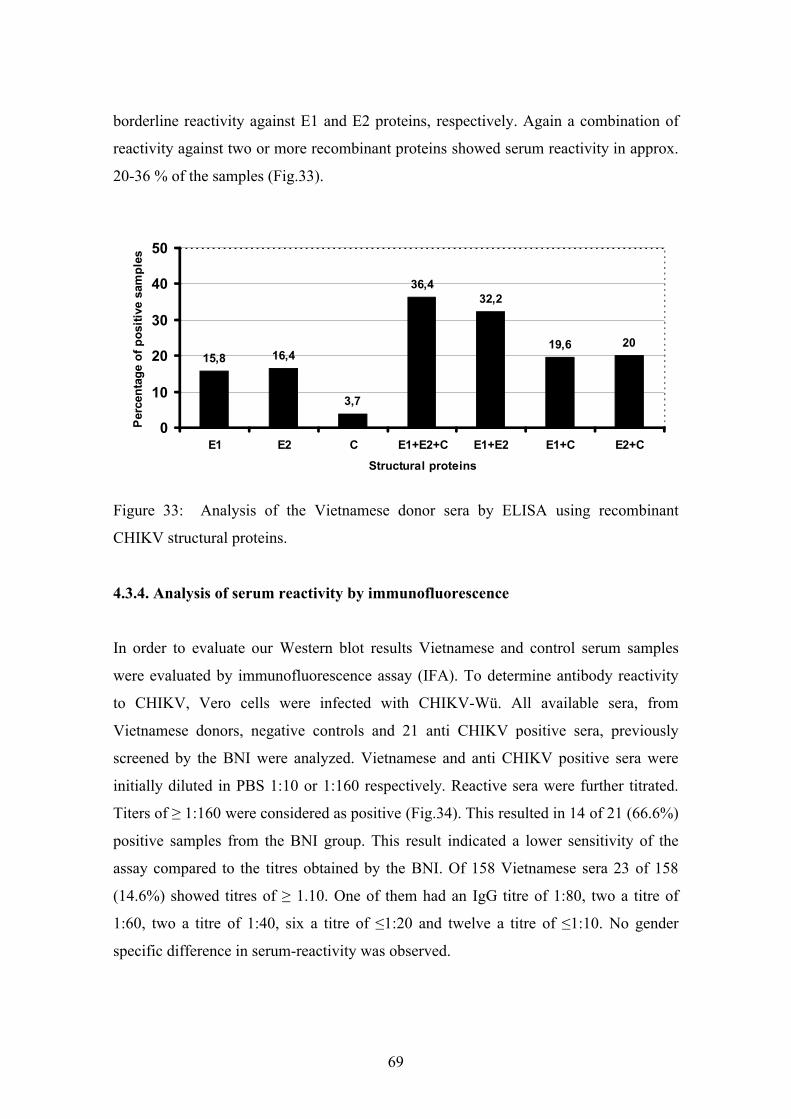
69
borderline reactivity against E1 and E2 proteins, respectively. Again a combination of
reactivity against two or more recombinant proteins showed serum reactivity in approx.
20-36 % of the samples (Fig.33).
15,8 16,4
3,7
36,432,2
19,6 20
0
10
20
30
40
50
E1 E2 C E1+E2+C E1+E2 E1+C E2+C
Structural proteins
Per
cen
tag
e o
f p
osi
tive
sam
ple
s
Figure 33: Analysis of the Vietnamese donor sera by ELISA using recombinant
CHIKV structural proteins.
4.3.4. Analysis of serum reactivity by immunofluorescence
In order to evaluate our Western blot results Vietnamese and control serum samples
were evaluated by immunofluorescence assay (IFA). To determine antibody reactivity
to CHIKV, Vero cells were infected with CHIKV-Wü. All available sera, from
Vietnamese donors, negative controls and 21 anti CHIKV positive sera, previously
screened by the BNI were analyzed. Vietnamese and anti CHIKV positive sera were
initially diluted in PBS 1:10 or 1:160 respectively. Reactive sera were further titrated.
Titers of ≥ 1:160 were considered as positive (Fig.34). This resulted in 14 of 21 (66.6%)
positive samples from the BNI group. This result indicated a lower sensitivity of the
assay compared to the titres obtained by the BNI. Of 158 Vietnamese sera 23 of 158
(14.6%) showed titres of ≥ 1.10. One of them had an IgG titre of 1:80, two a titre of
1:60, two a titre of 1:40, six a titre of ≤1:20 and twelve a titre of ≤1:10. No gender
specific difference in serum-reactivity was observed.
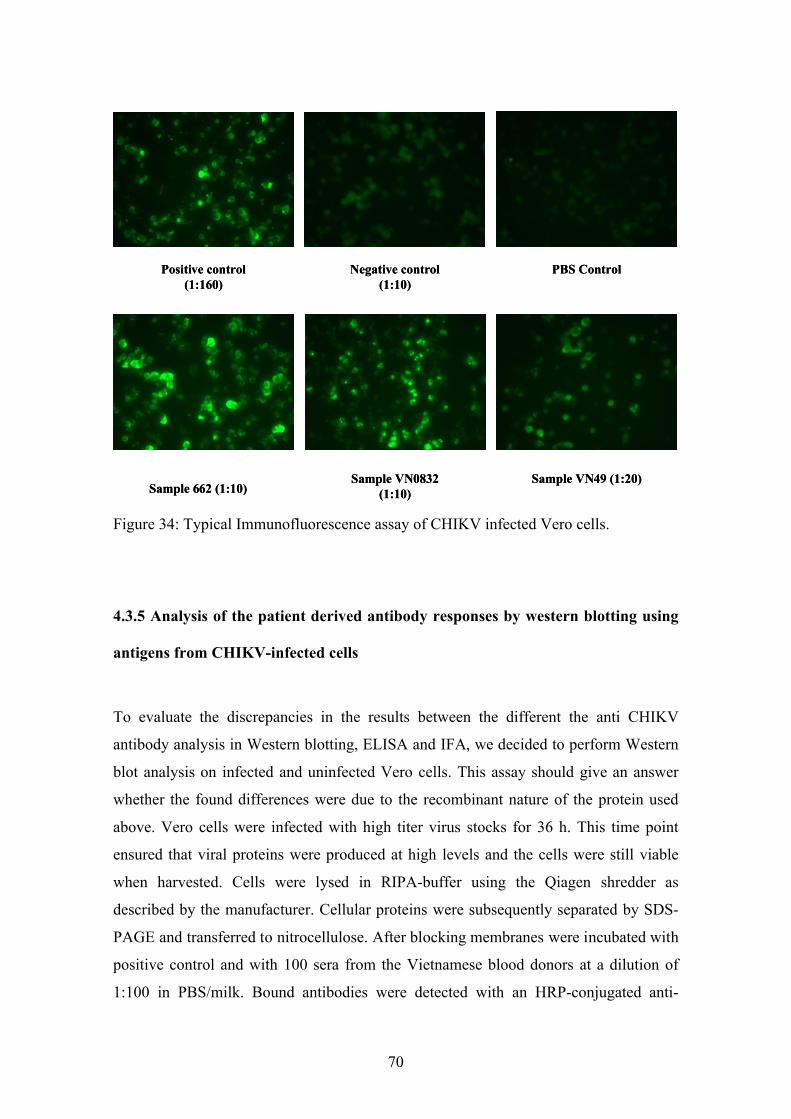
70
Positive control(1:160)
Negative control(1:10)
PBS Control
Sample 662 (1:10)Sample VN0832
(1:10)Sample VN49 (1:20)
Positive control(1:160)
Negative control(1:10)
PBS Control
Sample 662 (1:10)Sample VN0832
(1:10)Sample VN49 (1:20)
Figure 34: Typical Immunofluorescence assay of CHIKV infected Vero cells.
4.3.5 Analysis of the patient derived antibody responses by western blotting using
antigens from CHIKV-infected cells
To evaluate the discrepancies in the results between the different the anti CHIKV
antibody analysis in Western blotting, ELISA and IFA, we decided to perform Western
blot analysis on infected and uninfected Vero cells. This assay should give an answer
whether the found differences were due to the recombinant nature of the protein used
above. Vero cells were infected with high titer virus stocks for 36 h. This time point
ensured that viral proteins were produced at high levels and the cells were still viable
when harvested. Cells were lysed in RIPA-buffer using the Qiagen shredder as
described by the manufacturer. Cellular proteins were subsequently separated by SDS-
PAGE and transferred to nitrocellulose. After blocking membranes were incubated with
positive control and with 100 sera from the Vietnamese blood donors at a dilution of
1:100 in PBS/milk. Bound antibodies were detected with an HRP-conjugated anti-
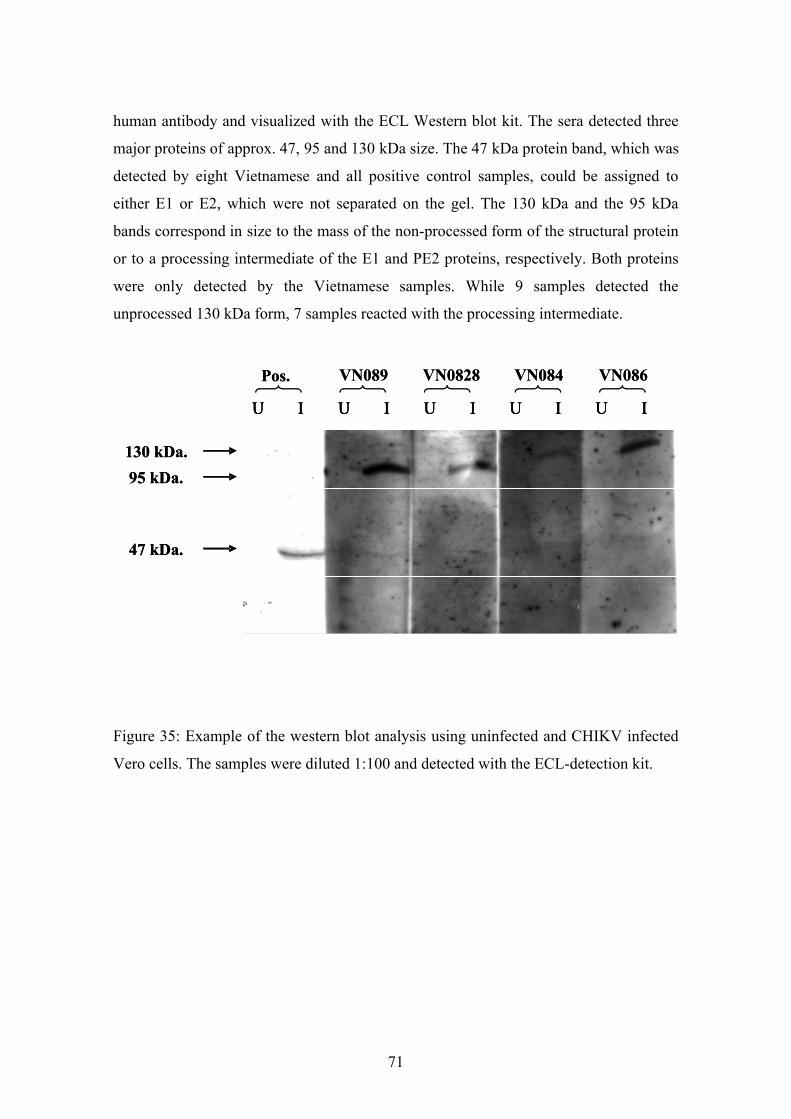
71
human antibody and visualized with the ECL Western blot kit. The sera detected three
major proteins of approx. 47, 95 and 130 kDa size. The 47 kDa protein band, which was
detected by eight Vietnamese and all positive control samples, could be assigned to
either E1 or E2, which were not separated on the gel. The 130 kDa and the 95 kDa
bands correspond in size to the mass of the non-processed form of the structural protein
or to a processing intermediate of the E1 and PE2 proteins, respectively. Both proteins
were only detected by the Vietnamese samples. While 9 samples detected the
unprocessed 130 kDa form, 7 samples reacted with the processing intermediate.
IUIUIUIUIU IUIUIUIUIU
Pos. VN089 VN0828 VN084 VN086
130 kDa.
95 kDa.
47 kDa.
IUIUIUIUIU IUIUIUIUIU
Pos. VN089 VN0828 VN084 VN086
130 kDa.
95 kDa.
47 kDa.
Figure 35: Example of the western blot analysis using uninfected and CHIKV infected
Vero cells. The samples were diluted 1:100 and detected with the ECL-detection kit.
72
5. Discussion
5.1. Development of serological assays for CHIKV diagnoses
In order to diagnose CHIKV infection, many methods have been performed in the
laboratory so far. Depending on the phase of infection, different methods were applied
to detect CHIKV. In the early stage viremia is present usually between 48 hours and 4
days of illness (Suranjith, 2007). Thus, virus isolation and PCR assays were the main
methods in this stage. To isolate CHIKV is a traditional diagnostic tool that is usually
possible to perform with human sera within 3-5 days of disease onset. However, the
isolation of virus requires the time of cell culture incubation of at least 1-2 days. In
addition, virus isolation must be performed in biosafety level 3 facilities. The PCR
method is highly sensitive and also suitable for early CHIKV diagnosis (Edwards et al.,
2007; Laurent et al., 2007; Santhosh et al., 2007; Hasebe, 2002; Pfeffer, 2002; Yadav,
2000; Pastorino, 2005; Balsubramaniam et al., 2002). Unfortunately, both methods are
not available in many public health laboratory centers, particularly in developing
countries.
To overcome the limitation of these methods, serological tests for CHIKV diagnosis
were developed and analysed in this thesis. Serological tests are the methods of choice
to detect CHIKV after 2 weeks of illness when viremia declines. Serological methods
are performed to identify antibodies that demonstrate the interaction between the human
body and specific infectious agents. Serological tests are easy and fast method to access
the CHIKV epidemiology. In CHIKV infection, serological tests could be used to detect
both anti-CHIKV IgM in the early phase of infection antibodies and specific IgG after 2
weeks (Pialoux et al., 2007).
To develop the serological assays, the CHIKV structural proteins (E1, E2 and C) were
used to screen anti-CHIKV IgG antibody in the sera of CHIKV infected patients, as
well as in a German blood donor cohort. The structural proteins E1, E2 and C are the
major antigenic components of CHIKV. To test the ability of CHIKV recombinant
structural proteins to be detected by anti CHIKV IgG, the CHIKV patient sera obtained
from BNI Hamburg which contain anti CHIKV antibodies and German donor blood
samples were used. In the immunoblot assay, the results revealed that in the case of
73
combining the results of the recombinant proteins these proteins could be recognized by
the majority of positive samples (up to 77%). As predicted, none of the German donor
blood samples reacted with the structural proteins. Particularly, the mixture of E2 and C
proteins appeared suitable for anti-CHIKV antibody recognition. In ELISA assay, the
recombinant structural proteins were also used as antigens. The results showed that the
major of positive sera (71.4%) could recognize the recombinant proteins combining the
results of individual assays. The superiority of combining suggests that anti individual
recombinant antigens in the serodiagnosis of CHIKV infection has already been
mentioned (Muthumani et al. 2008). Among the structural proteins, the E2 recombinant
protein reacted best. This result suggests that the ability of E2 protein to elicit antibody
is better. In neutralization tests and in mice protection assays it was shown that E2 was
also able to elicit antibody responses. These antibodies were efficient in neutralizing
virus infectivity and in protecting mice from challenge with new virus (Mathews and
Roehrig, 1982; Grosfeld et al., 1989). Conversely, most monoclonal antibodies, which
were specific for El epitopes, did not have the ability of virus protection in both
neutralization and infectivity protection assays (Razumov, 1991).
However, in comparison with IFA from BNI Hamburg, ELISA and immunoblot
methods were less sensitive than BNI’s IFA. There were 7 negative samples (567, 759,
798, 1122, 1294, 1302, 1444-Tab.1) in the immunoblotting assay that scored positive in
BNI-IFA, particularly, sample 567 with high titer and there were 10 negative samples
(368, 554, 555, 798, 1122, 1294, 1302, 1444, 2494 and 3506-Tab.1) in the ELISA
assay. Furthermore, the results in both methods, immunoblotting and ELISA, were not
congruent.
It has been suggested that various factors could account for the different results
observed in this study: (I) The cross-reactivity between different alphaviruses is one of
the major disadvantages of serological techniques (Greiser-Wilke et al., 1991; Gould et
al., 2006; Suhrbier and La Linn, 2004; Weaver and Barrett, 2004). In Alphaviruses
cross-reactive epitopes were found on the nuclecapsid and envelope proteins. These
epitopes could account for the observed differences seen in the different detection
assays used (Moore et al., 1974; Hunt et al., 1985). On nucleocapsid proteins, conserved
epitopes are presented in most alphaviruses (Greiser-Wilke et al., 1989) and in animal
models non-neutralizing antibodies were induced by these group-reactive epitopes
74
(Schmaljohn et al., 1983). For envelope proteins E1 and E2 of alphaviruses, monoclonal
antibodies showed relatively broad cross-reactivity in ELISA assay (Roehrign et al.,
1982; Wust et al., 1989). Whereas, in neutralization assay, the E2 glycoprotein-specific
monoclonal antibodies was found to be restricted to the homologous and some closely
related viruses only (Stec et al., 1986; Olmsted, 1986; Roehrig and Mathews, 1985). (II)
Another reason of the failure to detect the structural recombinant proteins might be
strain differences. Based on the phylogenetic analyses of partial E1 sequences of
CHIKV from African and Asian isolates, it has suggested that there exist three distinct
CHIKV phylogroups: Asian, Eastern/Central/Southern African (ECSA) and West
Africa isolates (Powers et al., 2000). The structural recombinant proteins were
expressed and purified from CHIKV-Wü, which has been identified by phylogenetic
analysis to be closely related to the strain described by Schuffenecker from the recent
Indian Ocean outbreak (Schuffenecker et al., 2006; Kowalzik et al., 2008). The CHIKV
positive sera obtained from BNI Hamburg were collected from patients who might be
infected with other CHIKV strains. (III) Another explanation for the inconsistent results
might be the dependence of the detection system on conformational epitopes which are
different between fixed infected cells and recombinant proteins. It has been
demonstrated that the reactivity between antigens and antibodies depend on
conformation, in particular of the glycoproteins. Epitopes consist of about 10 amino
acids, but usually 3-4 amino acids are responsible for the recognition by antibodies. (IV)
Furthermore, different antigens used in the various test could be an additional
explanation of the results. CHIKV C, E1 and E2 proteins are the main antigens
recognized by patient sera. However, other antigens, such as the precursor polyproteins,
pE2 or non-structural proteins, which are all present in CHIKV-infected Vero cells
(Fig.35) and objects from the recombinant tests.
It should be pointed out that the in-house IFA was less sensitive than the BNI’s IFA,
possibly reflecting the greater experience with the IFA diagnosis of the BNI team. For
example, sample 132 was positive with a titer of 1:20480 at BNI, but it was only 1:320
in the in-house IFA (Tab.1).
75
5.2. Serological diagnoses in Vietnamese blood donors
The recombinant proteins were also used as antigens for screening the anti-CHIKV
antibodies in Vietnamese donor blood samples.
In the past very few papers showed that Vietnam was affected by CHIKV infection.
Thus, in order to screen anti-CHIKV antibodies in Vietnamese blood donors, 158
samples were used in immunoblotting. Up to 24% of Vietnamese sera recognized the
recombinant proteins. In the parallel with immunoblotting, the ELISA method was
performed. The results revealed that the percentage of positive in Vietnamese sera was
up to 36 % (56 out of 158 samples). These results suggested that CHIKV might
circulate in Vietnam. In Vietnam the climate and temperature conditions are suitable for
mosquitoes such as Ae. aegypti and Ae. albopictus, which are also known to be the main
vectors for dengue fever (Gubler, 1988). Vietnam is a country with regular dengue fever
outbreaks (Thai et al. 2005). Thus, the Vietnamese population is at high risk to be
infected with both CHIKV and dengue fever virus. Both infectious agents are
transmitted by the same vectors and can cause clinical symptoms that can easily be
mixed up. Recently, a sero survey was carried out in Indian islands. It was shown that
the CHIKV seroprevalence was 15.3%, while that of dengue fever was 25.4% (Padbidri
et al. 2002). In another study, on Grande Comore Island, the seroprevalence of CHIKV
was 63% (Sergon, 2007). In the outbreak in Kenya in 2004, the CHIKV infection rate
reacched 72% of the study population (Sergon, 2008) and in Senegal, in the outbreak of
the late 1990s, the seroprevalence of CHIKV was 35.3% (Thonnon, 1999). During the
late 1970’s in Gabon, serological surveys revealed that 20% of the population were
infected with CHIKV (Jan et al., 1978; Saluzzo et al., 1982). In the Vietnamese war, the
America solders were often doubtfully infected by CHIKV (Deller, 1968). Since the
clinical manifestations of dengue fever infection can be very variable (Hoang et al.,
2006), our results suggest that infection by CHIKV is frequently misdiagnosed as
dengue fever.
However, it must be pointed out that the results of immunobloting, ELISA and IFA with
the Vietnamese sera were also inconsistent (Tab.3 and 4). The reason for this is
probably the source of our antigens which were derived from a virus identified in the
recent Indian Ocean outbreak. Vietnamese sera applied in the assays might not contain

76
the specific antibodies which could react with the recombinant proteins. Therefore, the
isolation of a current Vietnamese CHIKV is of prime interest.
77
6. Summary
CHIKV is the prototype of Alphaviruses and it causes an acute febrile illness with rash,
severely painful arthralgias, and sometimes arthritis. While CHIKV has first been
identified in the 1950s in Africa, recent outbreaks of CHIKV in the islands of the Indian
Ocean and particular in Italia have re-drawn attention to CHIKV. In the past CHIKV
disease was considered self-limiting and non-fatal. However, a number of deaths on
Reunion (Anonym, 2006) during the outbreak, which was affected directly or indirectly
by CHIKV, have changed this view. To defeat CHIKV outbreaks diagnostic tools and
anti CHIKV therapies are urgently needed. In this thesis, we generated tools to
investigate CHIKV at the molecular level by serological tests.
CHIKV was isolated from a German woman who was infected during her holidays on
the Mauritius Island. To characterize this viral isolate the complete viral genome was
amplified by PCR and molecular cloned. In order to analyse antibody responses of
infected individuals some of the structural and non-structural genes were subcloned in
bacterial expression vectors. The NSP2, proteinase, capsid, E1 and E2 were
subsequently expressed in E.coli using purified successfully.
In this thesis, the structural proteins were used to develop a screening test for anti-
CHIKV antibodies in patient derived serum samples. These tests were evaluated with
pre-characterized anti-CHIKV sera (30 samples) obtained from the BNI Hamburg and
100 serum samples from German blood donors used as negative controls.
Immunoblotting analysis revealed that up to 77% of precharacterised positive sera could
recognize the recombinant proteins and there were no detectable reactivity of CHIKV-
negative German donor sera. The recombinant proteins were also recognized by 71.4%
of positive sera in the newly established ELISA. In order to go further in analyses of the
results, an in house IFA was performed. Positive sera (21 samples) were used. The
results showed that all of them reacted positive, but this assay was less sensitive than
the IFA from BNI. In comparison with the IFA result from BNI Hamburg, the results
were not congruent in all test performed. This could be due to various drawbacks of the
tests. A cross reaction in Alphaviruses and the different strains are mentioned as well as
the denatured forms of the structural proteins. Besides the main structural proteins (E1,
78
E2 and C), other proteins such as non-structural proteins, uncleaved precursor proteins
could participate in the different outcomes of serological assays.
In order to go further in the CHIKV diagnoses, the CHIKV recombinant proteins were
applied to screen the anti-CHIKV antibodies in the Vietnamese population, who are
considered to live in the high risk regions. In serological tests, 158 sera of Vietnamese
donors were incubated with the recombinant proteins or the fixed CHIKV infected cells.
The results showed that 24% of Vietnamese donor sera recognized the recombinant
proteins in immunoblot assay, while 36% scored positive in the ELISA assay. In IFA,
the sera considered positive were 11.4%. While some discrepancies in serological tests
were found, these results showed that the ratio of CHIKV-positive sera seem to be equal
to the other regions in the world, which are affected by CHIKV. It is suggested that
CHIKV infection in Vietnam has been repeatedly misdiagnosed. This study cohort
consisted only of samples originating from Hanoi area of Northern Vietnam, thus,
future studies should expand to include samples from other Vietnam areas. To do this
the various subtypes of the virus in the different regions should be isolated and the
sequences of these viruses should be well characterized.
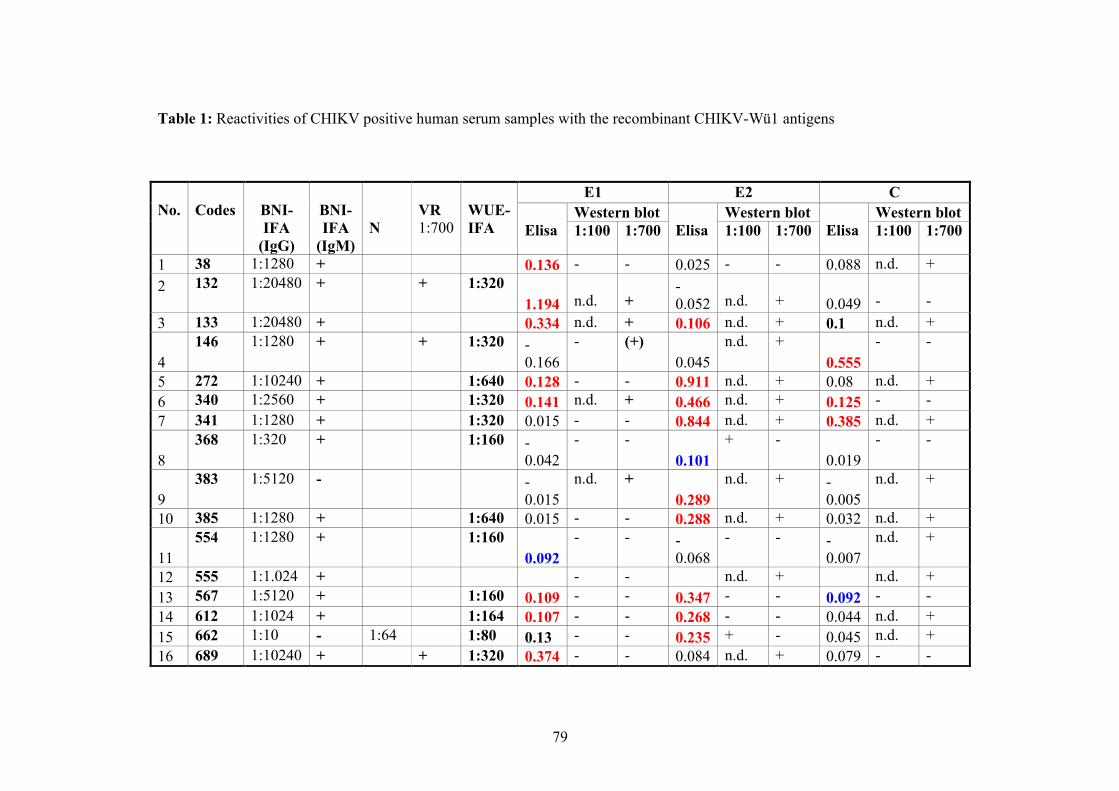
79
Table 1: Reactivities of CHIKV positive human serum samples with the recombinant CHIKV-Wü1 antigens
E1 E2 CWestern blot Western blot Western blotNo. Codes BNI-
IFA(IgG)
BNI-IFA
(IgM)N
VR1:700
WUE-IFA Elisa 1:100 1:700 Elisa 1:100 1:700 Elisa 1:100 1:700
1 38 1:1280 + 0.136 - - 0.025 - - 0.088 n.d. +
2 132 1:20480 + + 1:3201.194 n.d. +
-0.052 n.d. + 0.049 - -
3 133 1:20480 + 0.334 n.d. + 0.106 n.d. + 0.1 n.d. +
4146 1:1280 + + 1:320 -
0.166- (+)
0.045n.d. +
0.555
- -
5 272 1:10240 + 1:640 0.128 - - 0.911 n.d. + 0.08 n.d. +6 340 1:2560 + 1:320 0.141 n.d. + 0.466 n.d. + 0.125 - -
7 341 1:1280 + 1:320 0.015 - - 0.844 n.d. + 0.385 n.d. +
8368 1:320 + 1:160 -
0.042- -
0.101+ -
0.019- -
9383 1:5120 - -
0.015n.d. +
0.289n.d. + -
0.005n.d. +
10 385 1:1280 + 1:640 0.015 - - 0.288 n.d. + 0.032 n.d. +
11554 1:1280 + 1:160
0.092- - -
0.068- - -
0.007n.d. +
12 555 1:1.024 + - - n.d. + n.d. +13 567 1:5120 + 1:160 0.109 - - 0.347 - - 0.092 - -14 612 1:1024 + 1:164 0.107 - - 0.268 - - 0.044 n.d. +
15 662 1:10 - 1:64 1:80 0.13 - - 0.235 + - 0.045 n.d. +16 689 1:10240 + + 1:320 0.374 - - 0.084 n.d. + 0.079 - -
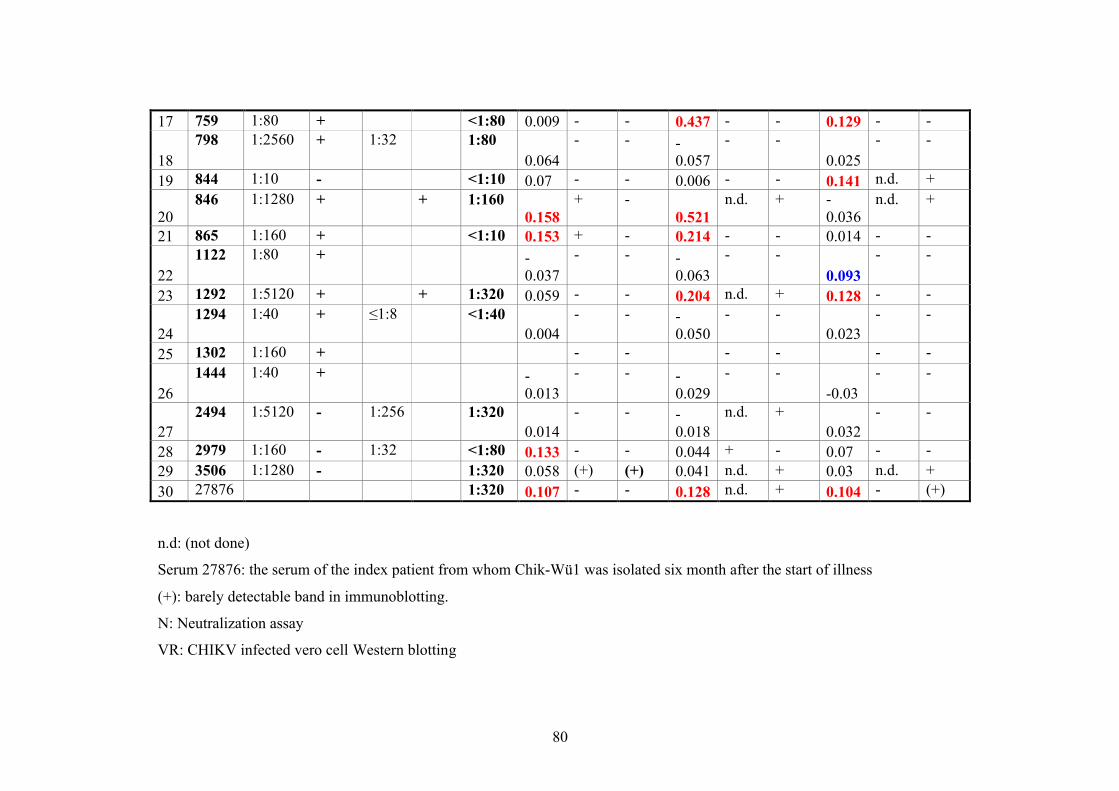
80
17 759 1:80 + <1:80 0.009 - - 0.437 - - 0.129 - -
18798 1:2560 + 1:32 1:80
0.064- - -
0.057- -
0.025- -
19 844 1:10 - <1:10 0.07 - - 0.006 - - 0.141 n.d. +
20846 1:1280 + + 1:160
0.158+ -
0.521n.d. + -
0.036n.d. +
21 865 1:160 + <1:10 0.153 + - 0.214 - - 0.014 - -
221122 1:80 + -
0.037- - -
0.063- -
0.093
- -
23 1292 1:5120 + + 1:320 0.059 - - 0.204 n.d. + 0.128 - -
241294 1:40 + ≤1:8 <1:40
0.004- - -
0.050- -
0.023- -
25 1302 1:160 + - - - - - -
261444 1:40 + -
0.013- - -
0.029- -
-0.03- -
272494 1:5120 - 1:256 1:320
0.014- - -
0.018n.d. +
0.032- -
28 2979 1:160 - 1:32 <1:80 0.133 - - 0.044 + - 0.07 - -29 3506 1:1280 - 1:320 0.058 (+) (+) 0.041 n.d. + 0.03 n.d. +
30 27876 1:320 0.107 - - 0.128 n.d. + 0.104 - (+)
n.d: (not done)
Serum 27876: the serum of the index patient from whom Chik-Wü1 was isolated six month after the start of illness
(+): barely detectable band in immunoblotting.
N: Neutralization assay
VR: CHIKV infected vero cell Western blotting
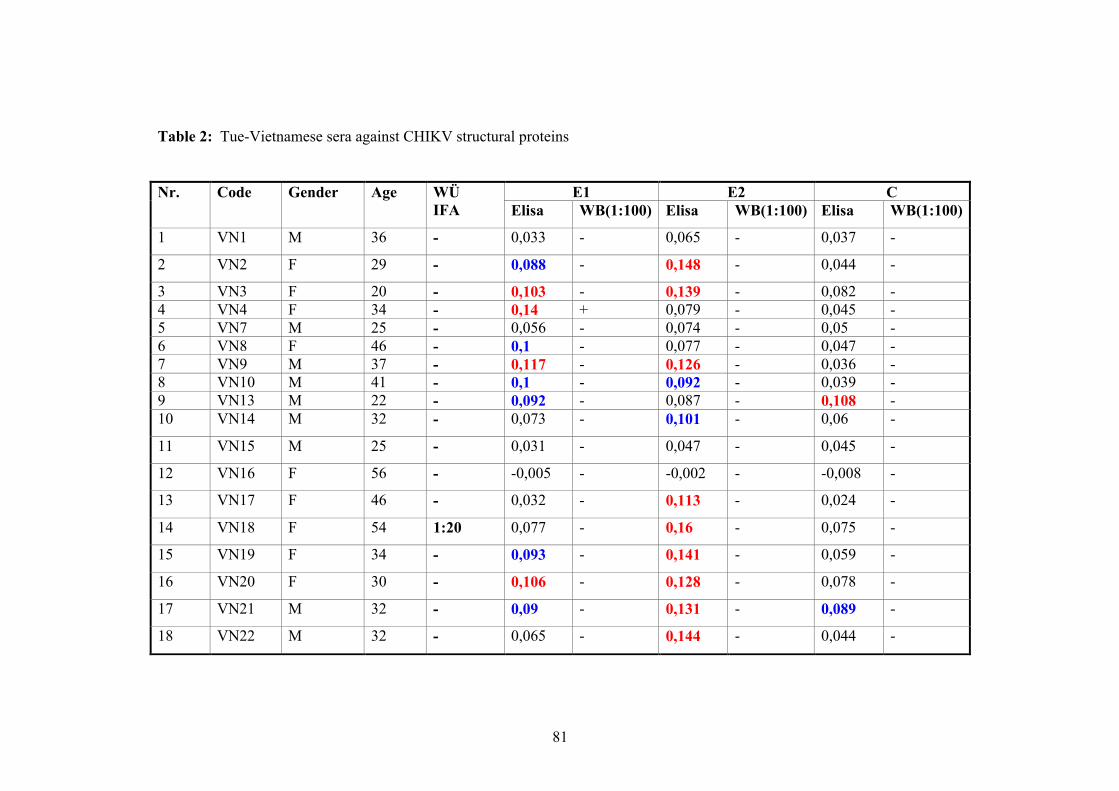
81
Table 2: Tue-Vietnamese sera against CHIKV structural proteins
E1 E2 CNr. Code Gender Age WÜIFA Elisa WB(1:100) Elisa WB(1:100) Elisa WB(1:100)
1 VN1 M 36 - 0,033 - 0,065 - 0,037 -
2 VN2 F 29 - 0,088 - 0,148 - 0,044 -
3 VN3 F 20 - 0,103 - 0,139 - 0,082 -4 VN4 F 34 - 0,14 + 0,079 - 0,045 -5 VN7 M 25 - 0,056 - 0,074 - 0,05 -6 VN8 F 46 - 0,1 - 0,077 - 0,047 -7 VN9 M 37 - 0,117 - 0,126 - 0,036 -8 VN10 M 41 - 0,1 - 0,092 - 0,039 -9 VN13 M 22 - 0,092 - 0,087 - 0,108 -10 VN14 M 32 - 0,073 - 0,101 - 0,06 -
11 VN15 M 25 - 0,031 - 0,047 - 0,045 -
12 VN16 F 56 - -0,005 - -0,002 - -0,008 -
13 VN17 F 46 - 0,032 - 0,113 - 0,024 -
14 VN18 F 54 1:20 0,077 - 0,16 - 0,075 -
15 VN19 F 34 - 0,093 - 0,141 - 0,059 -
16 VN20 F 30 - 0,106 - 0,128 - 0,078 -
17 VN21 M 32 - 0,09 - 0,131 - 0,089 -
18 VN22 M 32 - 0,065 - 0,144 - 0,044 -
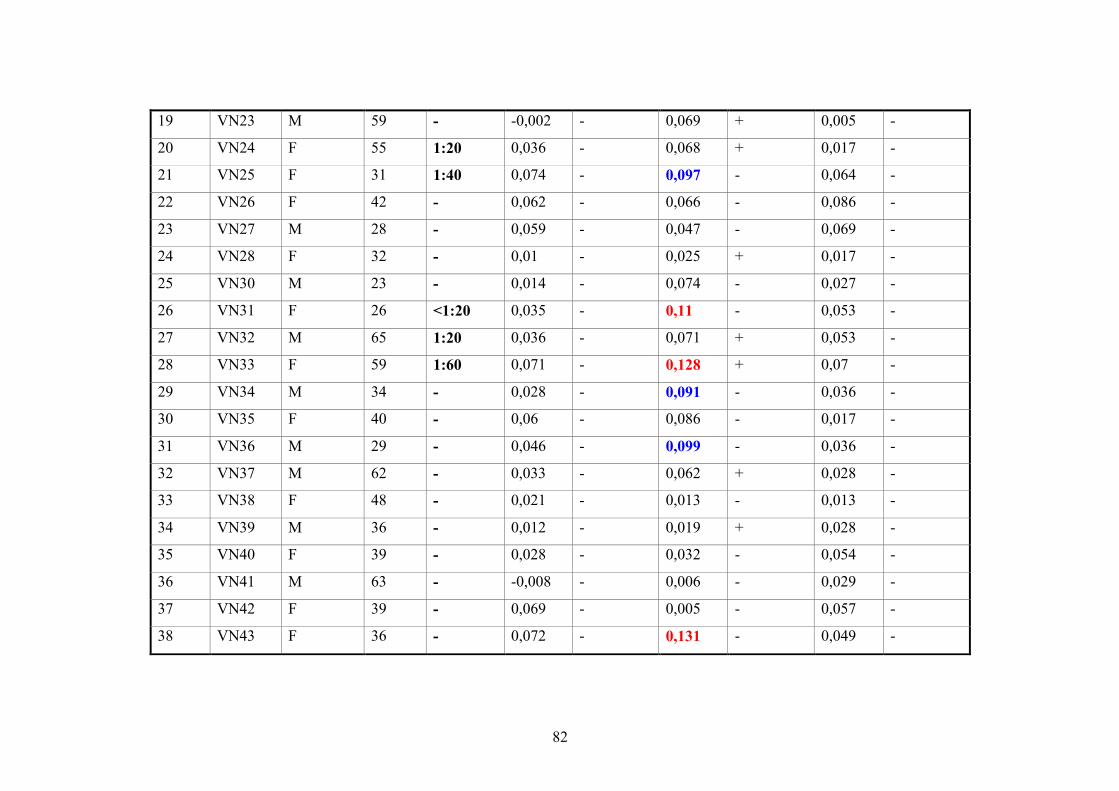
82
19 VN23 M 59 - -0,002 - 0,069 + 0,005 -
20 VN24 F 55 1:20 0,036 - 0,068 + 0,017 -
21 VN25 F 31 1:40 0,074 - 0,097 - 0,064 -
22 VN26 F 42 - 0,062 - 0,066 - 0,086 -
23 VN27 M 28 - 0,059 - 0,047 - 0,069 -
24 VN28 F 32 - 0,01 - 0,025 + 0,017 -
25 VN30 M 23 - 0,014 - 0,074 - 0,027 -
26 VN31 F 26 <1:20 0,035 - 0,11 - 0,053 -
27 VN32 M 65 1:20 0,036 - 0,071 + 0,053 -
28 VN33 F 59 1:60 0,071 - 0,128 + 0,07 -
29 VN34 M 34 - 0,028 - 0,091 - 0,036 -
30 VN35 F 40 - 0,06 - 0,086 - 0,017 -
31 VN36 M 29 - 0,046 - 0,099 - 0,036 -
32 VN37 M 62 - 0,033 - 0,062 + 0,028 -
33 VN38 F 48 - 0,021 - 0,013 - 0,013 -
34 VN39 M 36 - 0,012 - 0,019 + 0,028 -
35 VN40 F 39 - 0,028 - 0,032 - 0,054 -
36 VN41 M 63 - -0,008 - 0,006 - 0,029 -
37 VN42 F 39 - 0,069 - 0,005 - 0,057 -
38 VN43 F 36 - 0,072 - 0,131 - 0,049 -
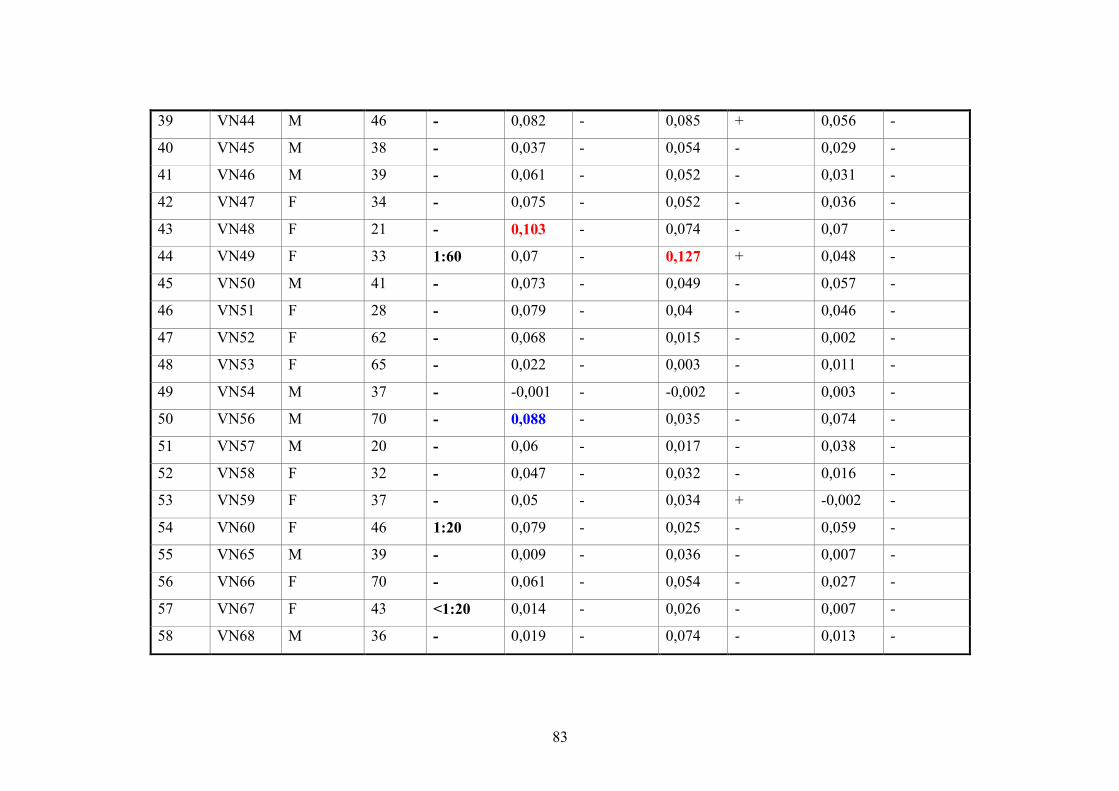
83
39 VN44 M 46 - 0,082 - 0,085 + 0,056 -
40 VN45 M 38 - 0,037 - 0,054 - 0,029 -
41 VN46 M 39 - 0,061 - 0,052 - 0,031 -
42 VN47 F 34 - 0,075 - 0,052 - 0,036 -
43 VN48 F 21 - 0,103 - 0,074 - 0,07 -
44 VN49 F 33 1:60 0,07 - 0,127 + 0,048 -
45 VN50 M 41 - 0,073 - 0,049 - 0,057 -
46 VN51 F 28 - 0,079 - 0,04 - 0,046 -
47 VN52 F 62 - 0,068 - 0,015 - 0,002 -
48 VN53 F 65 - 0,022 - 0,003 - 0,011 -
49 VN54 M 37 - -0,001 - -0,002 - 0,003 -
50 VN56 M 70 - 0,088 - 0,035 - 0,074 -
51 VN57 M 20 - 0,06 - 0,017 - 0,038 -
52 VN58 F 32 - 0,047 - 0,032 - 0,016 -
53 VN59 F 37 - 0,05 - 0,034 + -0,002 -
54 VN60 F 46 1:20 0,079 - 0,025 - 0,059 -
55 VN65 M 39 - 0,009 - 0,036 - 0,007 -
56 VN66 F 70 - 0,061 - 0,054 - 0,027 -
57 VN67 F 43 <1:20 0,014 - 0,026 - 0,007 -
58 VN68 M 36 - 0,019 - 0,074 - 0,013 -
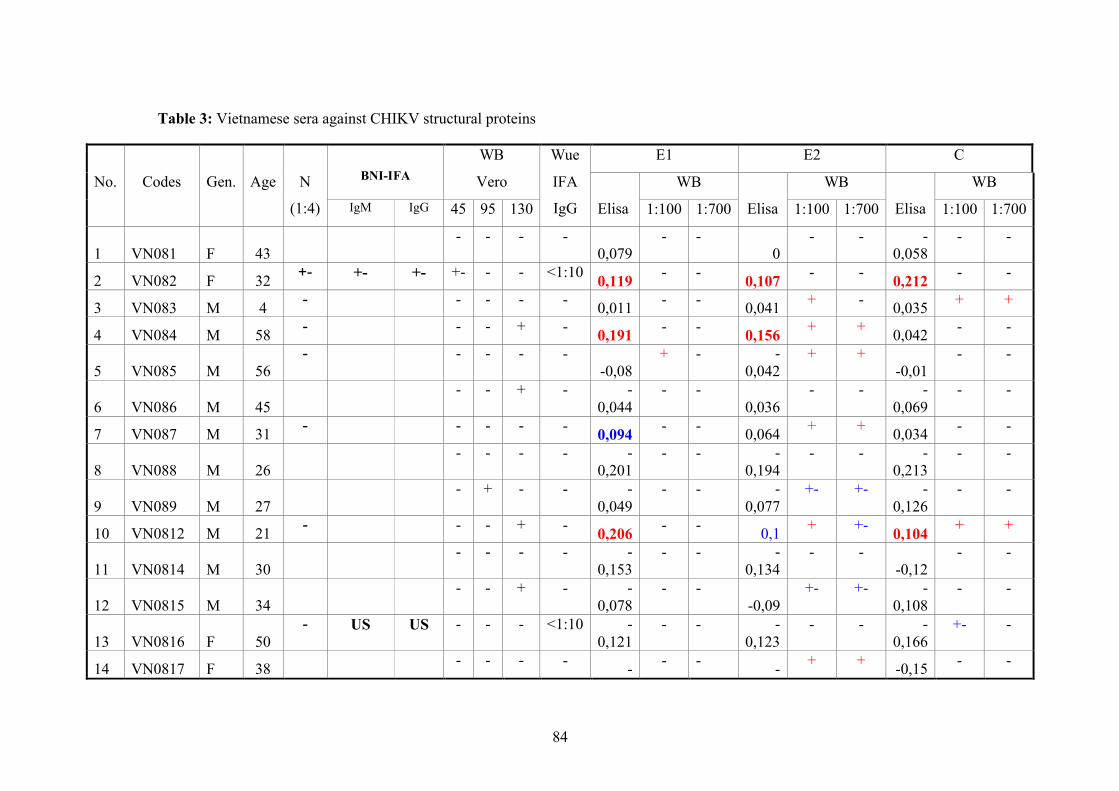
84
Table 3: Vietnamese sera against CHIKV structural proteins
E1 E2 CBNI-IFA
WB
Vero WB WB WBNo. Codes Gen. Age N
(1:4) IgM IgG 45 95 130
Wue
IFA
IgG Elisa 1:100 1:700 Elisa 1:100 1:700 Elisa 1:100 1:700
1 VN081 F 43- - - -
0,079- -
0- - -
0,058- -
2 VN082 F 32+- +- +- +- - - <1:10
0,119- -
0,107- -
0,212- -
3 VN083 M 4- - - - -
0,011- -
0,041+ -
0,035+ +
4 VN084 M 58- - - + -
0,191- -
0,156+ +
0,042- -
5 VN085 M 56- - - - -
-0,08+ - -
0,042+ +
-0,01- -
6 VN086 M 45- - + - -
0,044- -
0,036- - -
0,069- -
7 VN087 M 31- - - - -
0,094- -
0,064+ +
0,034- -
8 VN088 M 26- - - - -
0,201- - -
0,194- - -
0,213- -
9 VN089 M 27- + - - -
0,049- - -
0,077+- +- -
0,126- -
10 VN0812 M 21- - - + -
0,206- -
0,1+ +-
0,104+ +
11 VN0814 M 30- - - - -
0,153- - -
0,134- -
-0,12- -
12 VN0815 M 34- - + - -
0,078- -
-0,09+- +- -
0,108- -
13 VN0816 F 50- US US - - - <1:10 -
0,121- - -
0,123- - -
0,166+- -
14 VN0817 F 38- - - -
-- -
-+ +
-0,15- -
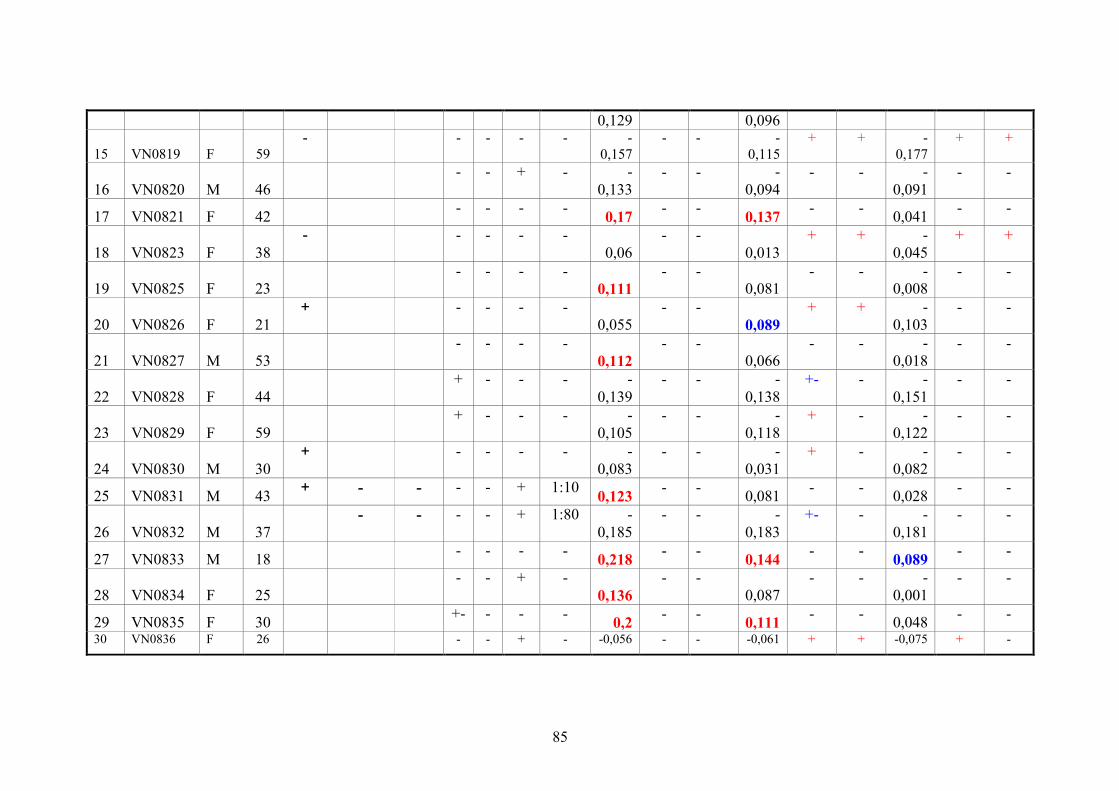
85
0,129 0,096
15 VN0819 F 59- - - - - -
0,157- - -
0,115+ + -
0,177+ +
16 VN0820 M 46- - + - -
0,133- - -
0,094- - -
0,091- -
17 VN0821 F 42- - - -
0,17- -
0,137- -
0,041- -
18 VN0823 F 38- - - - -
0,06- -
0,013+ + -
0,045+ +
19 VN0825 F 23- - - -
0,111- -
0,081- - -
0,008- -
20 VN0826 F 21+ - - - -
0,055- -
0,089+ + -
0,103- -
21 VN0827 M 53- - - -
0,112- -
0,066- - -
0,018- -
22 VN0828 F 44+ - - - -
0,139- - -
0,138+- - -
0,151- -
23 VN0829 F 59+ - - - -
0,105- - -
0,118+ - -
0,122- -
24 VN0830 M 30+ - - - - -
0,083- - -
0,031+ - -
0,082- -
25 VN0831 M 43+ - - - - + 1:10
0,123- -
0,081- -
0,028- -
26 VN0832 M 37- - - - + 1:80 -
0,185- - -
0,183+- - -
0,181- -
27 VN0833 M 18- - - -
0,218- -
0,144- -
0,089- -
28 VN0834 F 25- - + -
0,136- -
0,087- - -
0,001- -
29 VN0835 F 30+- - - -
0,2- -
0,111- -
0,048- -
30 VN0836 F 26 - - + - -0,056 - - -0,061 + + -0,075 + -
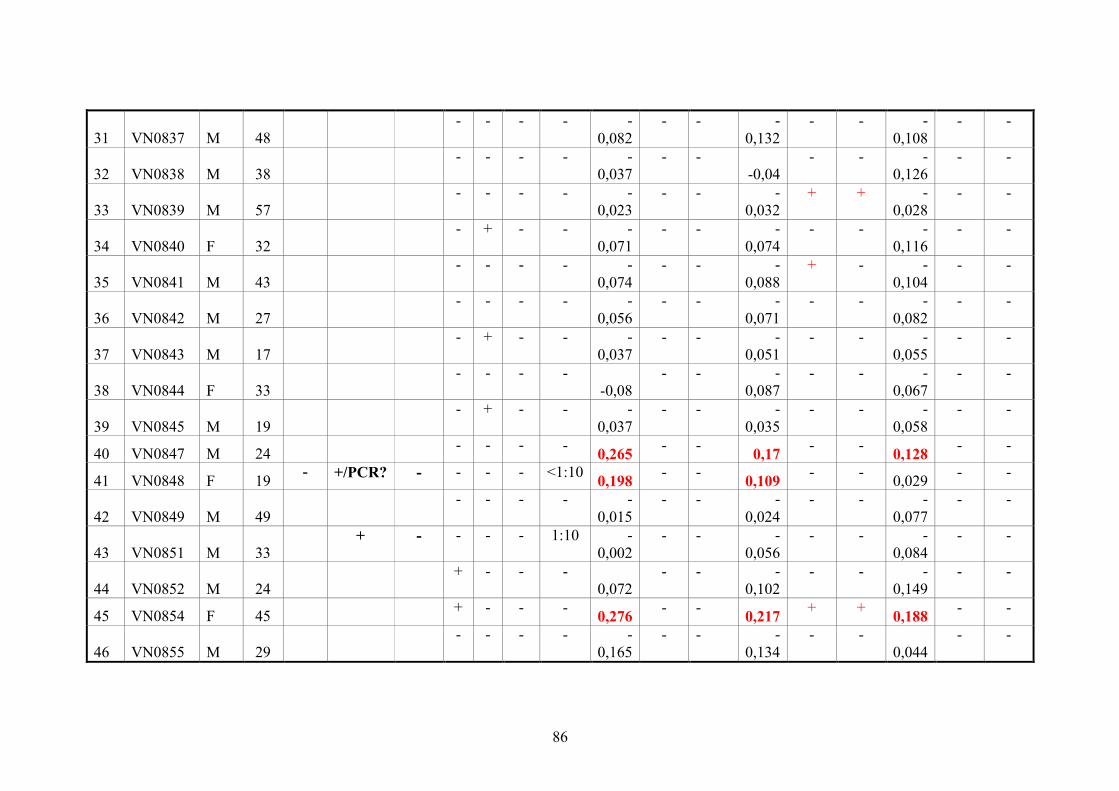
86
31 VN0837 M 48- - - - -
0,082- - -
0,132- - -
0,108- -
32 VN0838 M 38- - - - -
0,037- -
-0,04- - -
0,126- -
33 VN0839 M 57- - - - -
0,023- - -
0,032+ + -
0,028- -
34 VN0840 F 32- + - - -
0,071- - -
0,074- - -
0,116- -
35 VN0841 M 43- - - - -
0,074- - -
0,088+ - -
0,104- -
36 VN0842 M 27- - - - -
0,056- - -
0,071- - -
0,082- -
37 VN0843 M 17- + - - -
0,037- - -
0,051- - -
0,055- -
38 VN0844 F 33- - - -
-0,08- - -
0,087- - -
0,067- -
39 VN0845 M 19- + - - -
0,037- - -
0,035- - -
0,058- -
40 VN0847 M 24- - - -
0,265- -
0,17- -
0,128- -
41 VN0848 F 19- +/PCR? - - - - <1:10
0,198- -
0,109- -
0,029- -
42 VN0849 M 49- - - - -
0,015- - -
0,024- - -
0,077- -
43 VN0851 M 33+ - - - - 1:10 -
0,002- - -
0,056- - -
0,084- -
44 VN0852 M 24+ - - -
0,072- - -
0,102- - -
0,149- -
45 VN0854 F 45+ - - -
0,276- -
0,217+ +
0,188- -
46 VN0855 M 29- - - - -
0,165- - -
0,134- -
0,044- -
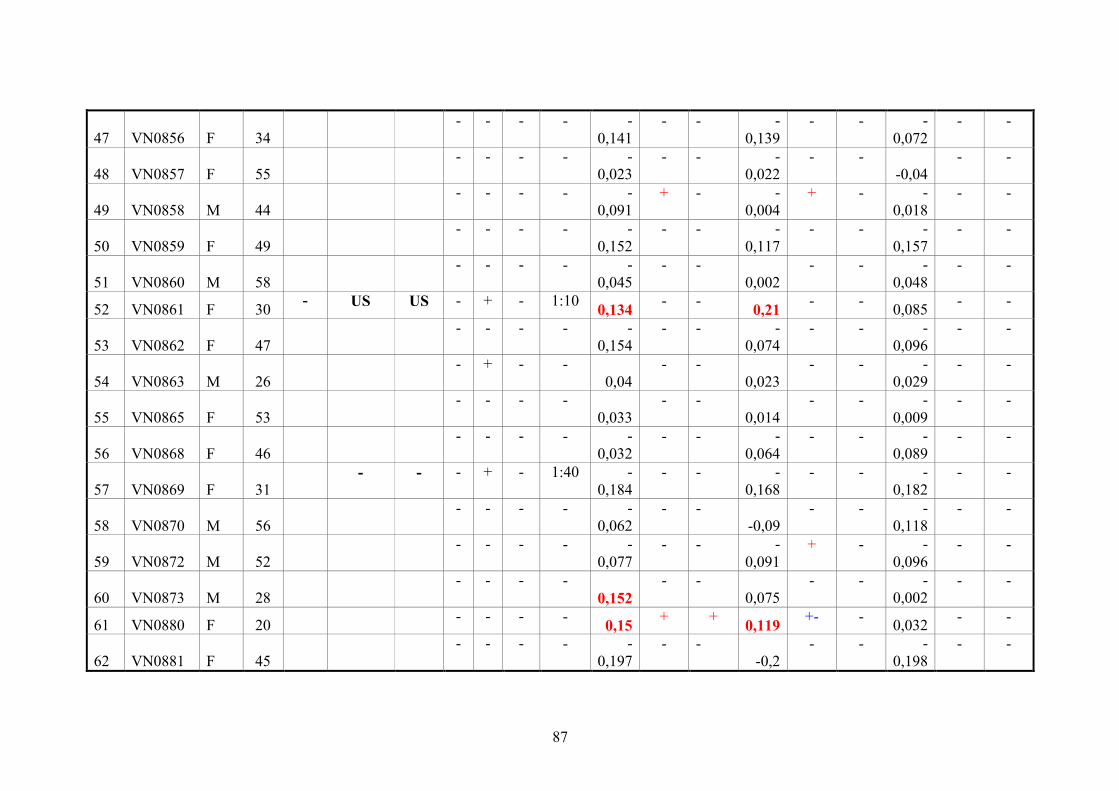
87
47 VN0856 F 34- - - - -
0,141- - -
0,139- - -
0,072- -
48 VN0857 F 55- - - - -
0,023- - -
0,022- -
-0,04- -
49 VN0858 M 44- - - - -
0,091+ - -
0,004+ - -
0,018- -
50 VN0859 F 49- - - - -
0,152- - -
0,117- - -
0,157- -
51 VN0860 M 58- - - - -
0,045- -
0,002- - -
0,048- -
52 VN0861 F 30- US US - + - 1:10
0,134- -
0,21- -
0,085- -
53 VN0862 F 47- - - - -
0,154- - -
0,074- - -
0,096- -
54 VN0863 M 26- + - -
0,04- -
0,023- - -
0,029- -
55 VN0865 F 53- - - -
0,033- -
0,014- - -
0,009- -
56 VN0868 F 46- - - - -
0,032- - -
0,064- - -
0,089- -
57 VN0869 F 31- - - + - 1:40 -
0,184- - -
0,168- - -
0,182- -
58 VN0870 M 56- - - - -
0,062- -
-0,09- - -
0,118- -
59 VN0872 M 52- - - - -
0,077- - -
0,091+ - -
0,096- -
60 VN0873 M 28- - - -
0,152- -
0,075- - -
0,002- -
61 VN0880 F 20- - - -
0,15+ +
0,119+- -
0,032- -
62 VN0881 F 45- - - - -
0,197- -
-0,2- - -
0,198- -
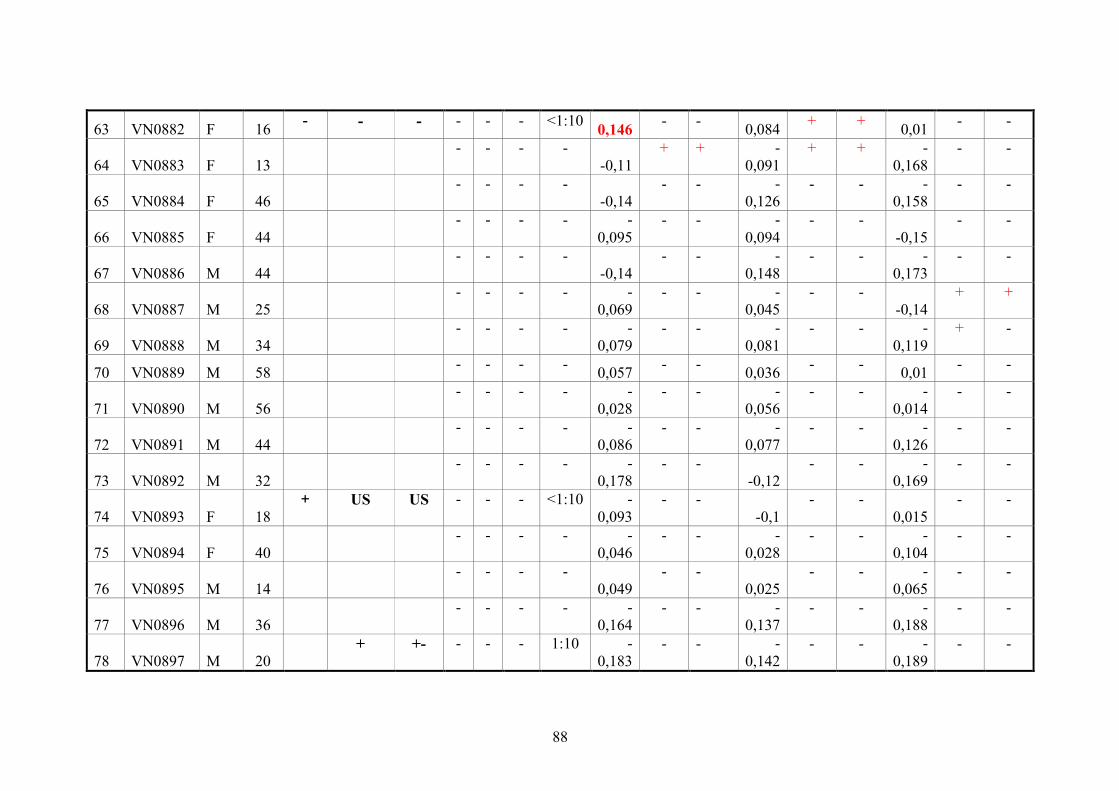
88
63 VN0882 F 16- - - - - - <1:10
0,146- -
0,084+ +
0,01- -
64 VN0883 F 13- - - -
-0,11+ + -
0,091+ + -
0,168- -
65 VN0884 F 46- - - -
-0,14- - -
0,126- - -
0,158- -
66 VN0885 F 44- - - - -
0,095- - -
0,094- -
-0,15- -
67 VN0886 M 44- - - -
-0,14- - -
0,148- - -
0,173- -
68 VN0887 M 25- - - - -
0,069- - -
0,045- -
-0,14+ +
69 VN0888 M 34- - - - -
0,079- - -
0,081- - -
0,119+ -
70 VN0889 M 58- - - -
0,057- -
0,036- -
0,01- -
71 VN0890 M 56- - - - -
0,028- - -
0,056- - -
0,014- -
72 VN0891 M 44- - - - -
0,086- - -
0,077- - -
0,126- -
73 VN0892 M 32- - - - -
0,178- -
-0,12- - -
0,169- -
74 VN0893 F 18+ US US - - - <1:10 -
0,093- -
-0,1- -
0,015- -
75 VN0894 F 40- - - - -
0,046- - -
0,028- - -
0,104- -
76 VN0895 M 14- - - -
0,049- -
0,025- - -
0,065- -
77 VN0896 M 36- - - - -
0,164- - -
0,137- - -
0,188- -
78 VN0897 M 20+ +- - - - 1:10 -
0,183- - -
0,142- - -
0,189- -
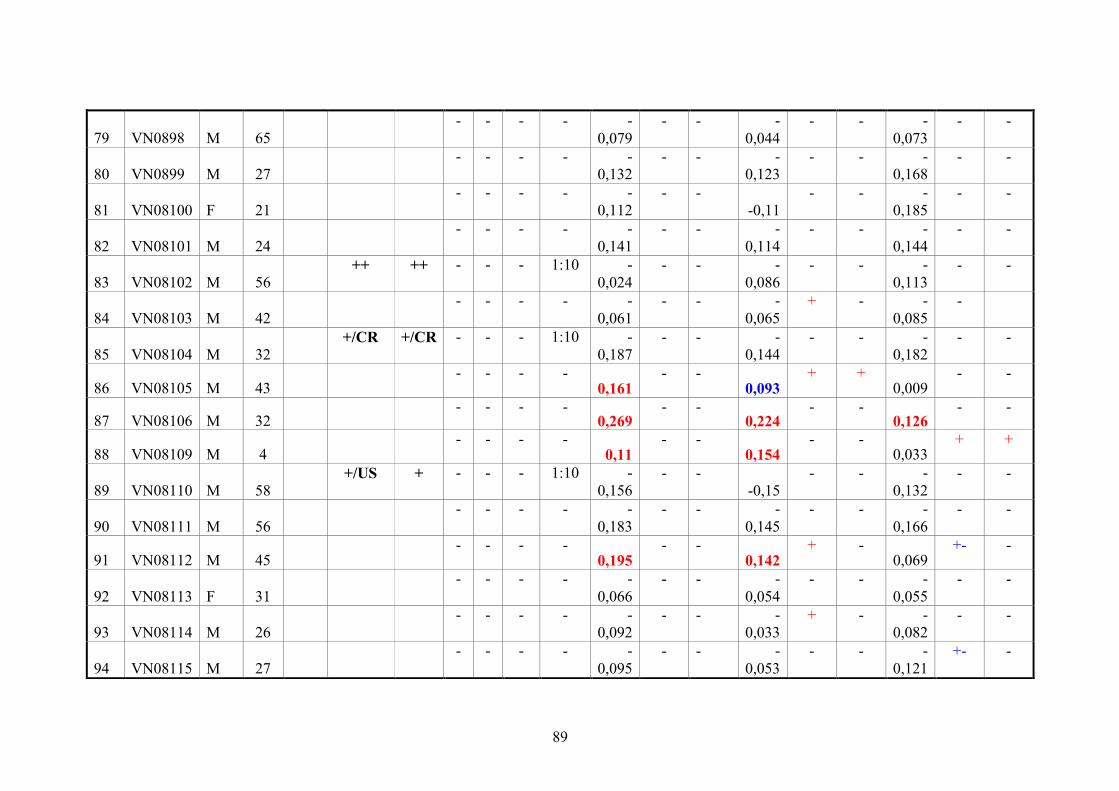
89
79 VN0898 M 65- - - - -
0,079- - -
0,044- - -
0,073- -
80 VN0899 M 27- - - - -
0,132- - -
0,123- - -
0,168- -
81 VN08100 F 21- - - - -
0,112- -
-0,11- - -
0,185- -
82 VN08101 M 24- - - - -
0,141- - -
0,114- - -
0,144- -
83 VN08102 M 56++ ++ - - - 1:10 -
0,024- - -
0,086- - -
0,113- -
84 VN08103 M 42- - - - -
0,061- - -
0,065+ - -
0,085-
85 VN08104 M 32+/CR +/CR - - - 1:10 -
0,187- - -
0,144- - -
0,182- -
86 VN08105 M 43- - - -
0,161- -
0,093+ +
0,009- -
87 VN08106 M 32- - - -
0,269- -
0,224- -
0,126- -
88 VN08109 M 4- - - -
0,11- -
0,154- -
0,033+ +
89 VN08110 M 58+/US + - - - 1:10 -
0,156- -
-0,15- - -
0,132- -
90 VN08111 M 56- - - - -
0,183- - -
0,145- - -
0,166- -
91 VN08112 M 45- - - -
0,195- -
0,142+ -
0,069+- -
92 VN08113 F 31- - - - -
0,066- - -
0,054- - -
0,055- -
93 VN08114 M 26- - - - -
0,092- - -
0,033+ - -
0,082- -
94 VN08115 M 27- - - - -
0,095- - -
0,053- - -
0,121+- -
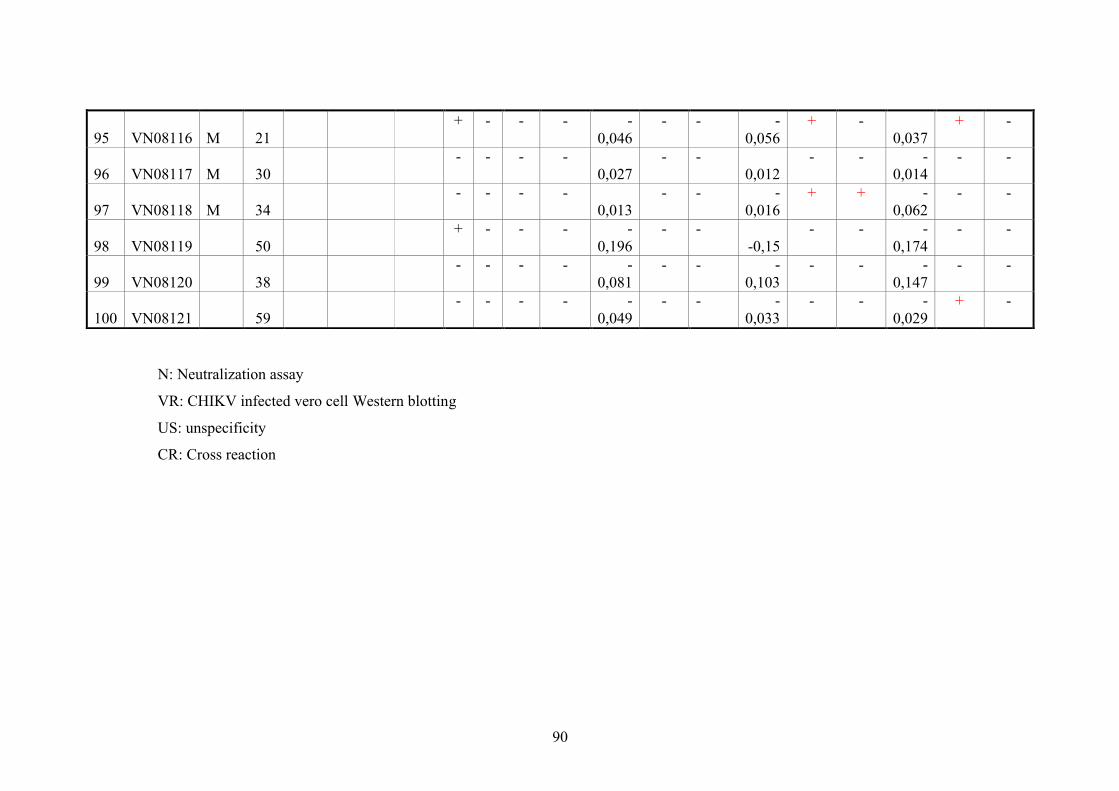
90
95 VN08116 M 21+ - - - -
0,046- - -
0,056+ -
0,037+ -
96 VN08117 M 30- - - -
0,027- -
0,012- - -
0,014- -
97 VN08118 M 34- - - -
0,013- - -
0,016+ + -
0,062- -
98 VN08119 50+ - - - -
0,196- -
-0,15- - -
0,174- -
99 VN08120 38- - - - -
0,081- - -
0,103- - -
0,147- -
100 VN08121 59- - - - -
0,049- - -
0,033- - -
0,029+ -
N: Neutralization assay
VR: CHIKV infected vero cell Western blotting
US: unspecificity
CR: Cross reaction
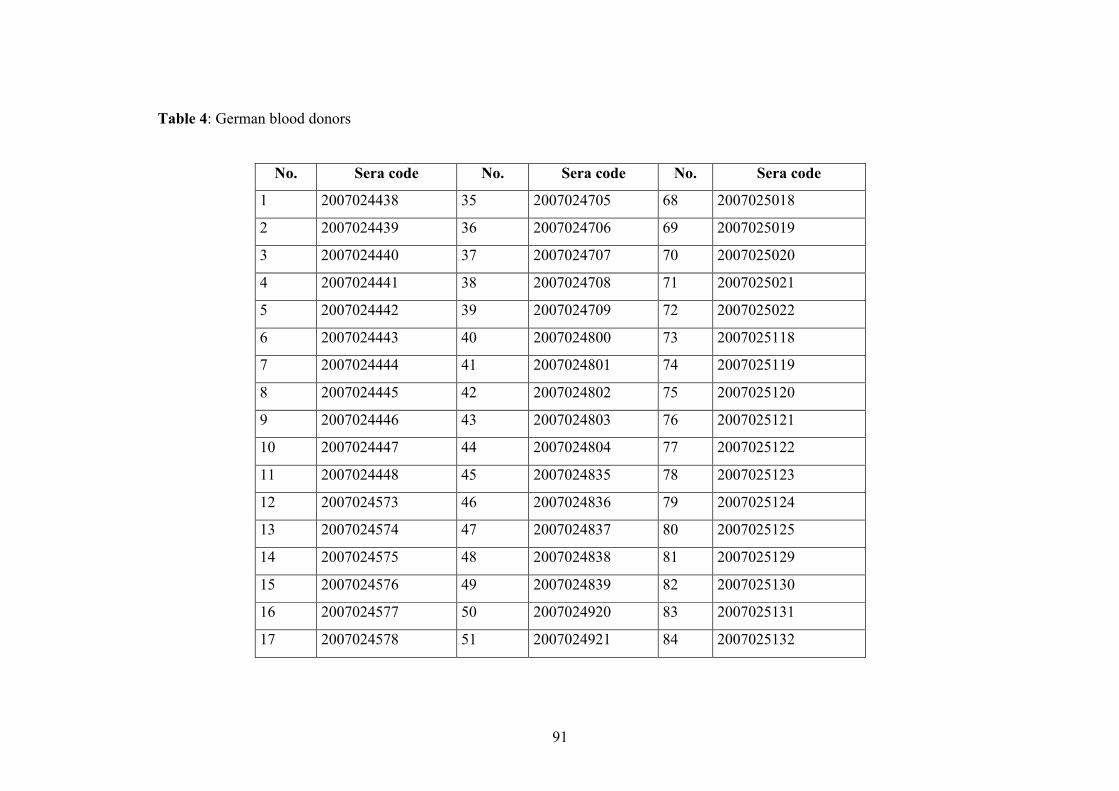
91
Table 4: German blood donors
No. Sera code No. Sera code No. Sera code
1 2007024438 35 2007024705 68 2007025018
2 2007024439 36 2007024706 69 2007025019
3 2007024440 37 2007024707 70 2007025020
4 2007024441 38 2007024708 71 2007025021
5 2007024442 39 2007024709 72 2007025022
6 2007024443 40 2007024800 73 2007025118
7 2007024444 41 2007024801 74 2007025119
8 2007024445 42 2007024802 75 2007025120
9 2007024446 43 2007024803 76 2007025121
10 2007024447 44 2007024804 77 2007025122
11 2007024448 45 2007024835 78 2007025123
12 2007024573 46 2007024836 79 2007025124
13 2007024574 47 2007024837 80 2007025125
14 2007024575 48 2007024838 81 2007025129
15 2007024576 49 2007024839 82 2007025130
16 2007024577 50 2007024920 83 2007025131
17 2007024578 51 2007024921 84 2007025132
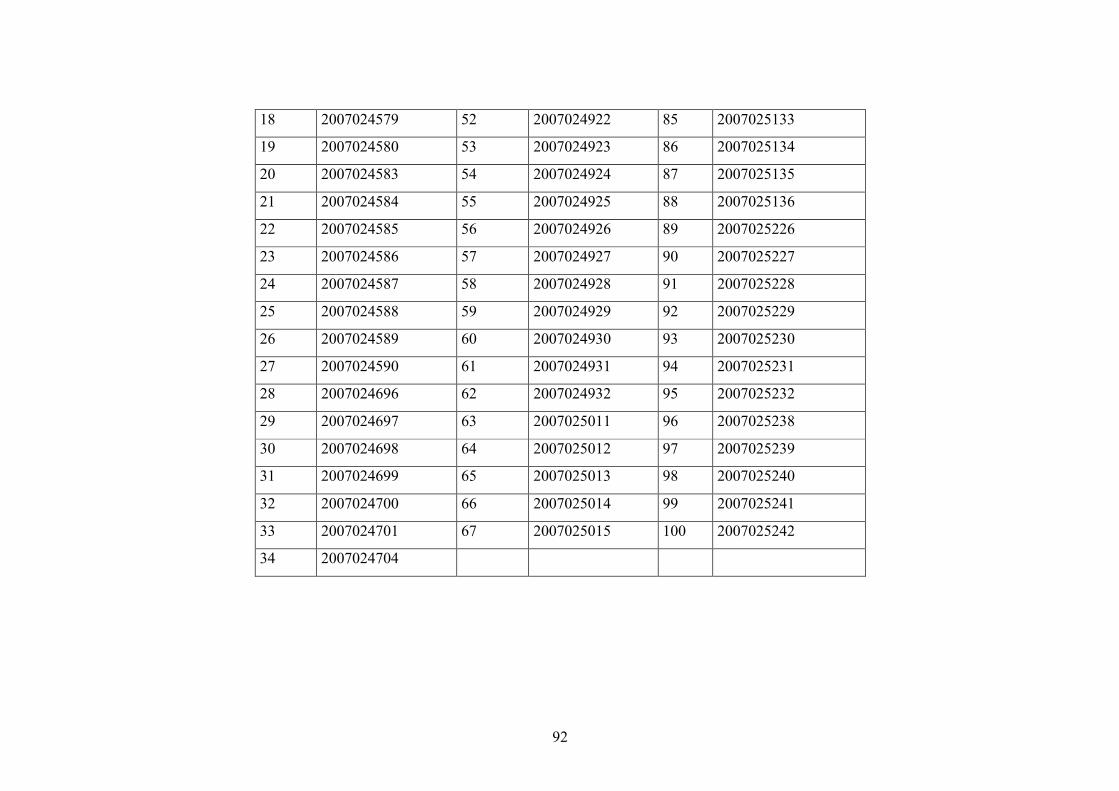
92
18 2007024579 52 2007024922 85 2007025133
19 2007024580 53 2007024923 86 2007025134
20 2007024583 54 2007024924 87 2007025135
21 2007024584 55 2007024925 88 2007025136
22 2007024585 56 2007024926 89 2007025226
23 2007024586 57 2007024927 90 2007025227
24 2007024587 58 2007024928 91 2007025228
25 2007024588 59 2007024929 92 2007025229
26 2007024589 60 2007024930 93 2007025230
27 2007024590 61 2007024931 94 2007025231
28 2007024696 62 2007024932 95 2007025232
29 2007024697 63 2007025011 96 2007025238
30 2007024698 64 2007025012 97 2007025239
31 2007024699 65 2007025013 98 2007025240
32 2007024700 66 2007025014 99 2007025241
33 2007024701 67 2007025015 100 2007025242
34 2007024704
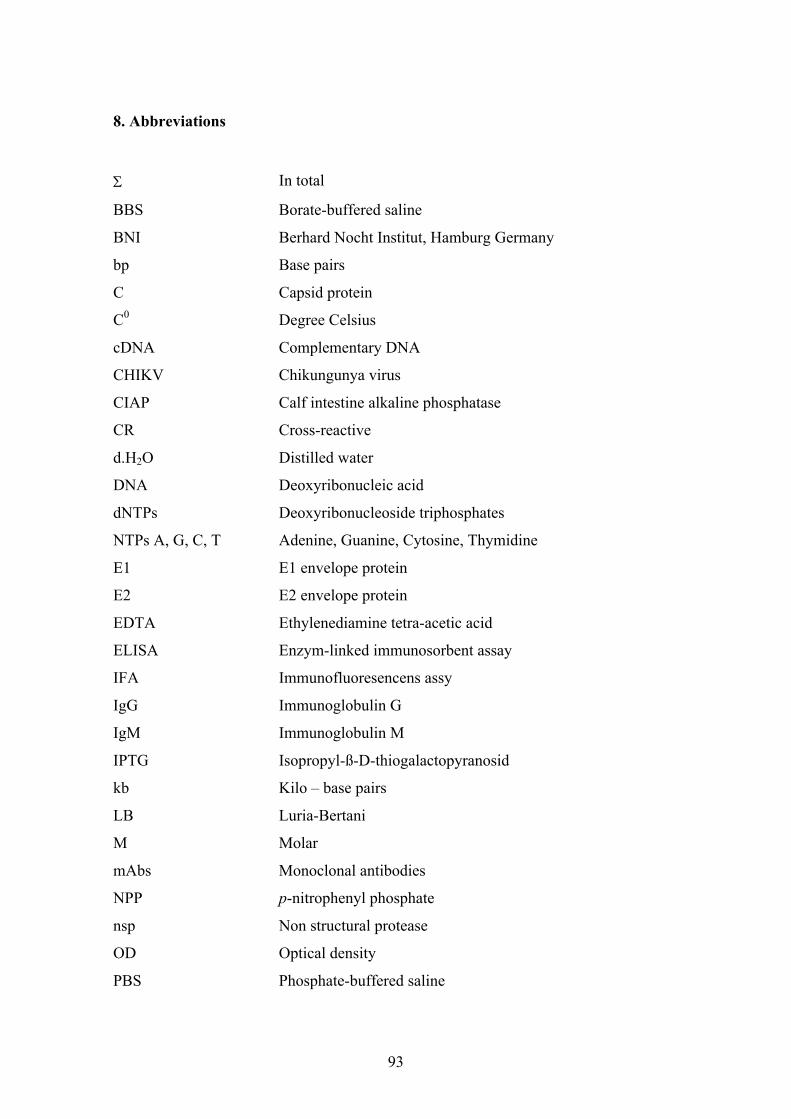
93
8. Abbreviations
In total
BBS Borate-buffered saline
BNI Berhard Nocht Institut, Hamburg Germany
bp Base pairs
C Capsid protein
C0 Degree Celsius
cDNA Complementary DNA
CHIKV Chikungunya virus
CIAP Calf intestine alkaline phosphatase
CR Cross-reactive
d.H2O Distilled water
DNA Deoxyribonucleic acid
dNTPs Deoxyribonucleoside triphosphates
NTPs A, G, C, T Adenine, Guanine, Cytosine, Thymidine
E1 E1 envelope protein
E2 E2 envelope protein
EDTA Ethylenediamine tetra-acetic acid
ELISA Enzym-linked immunosorbent assay
IFA Immunofluoresencens assy
IgG Immunoglobulin G
IgM Immunoglobulin M
IPTG Isopropyl-ß-D-thiogalactopyranosid
kb Kilo – base pairs
LB Luria-Bertani
M Molar
mAbs Monoclonal antibodies
NPP p-nitrophenyl phosphate
nsp Non structural protease
OD Optical density
PBS Phosphate-buffered saline
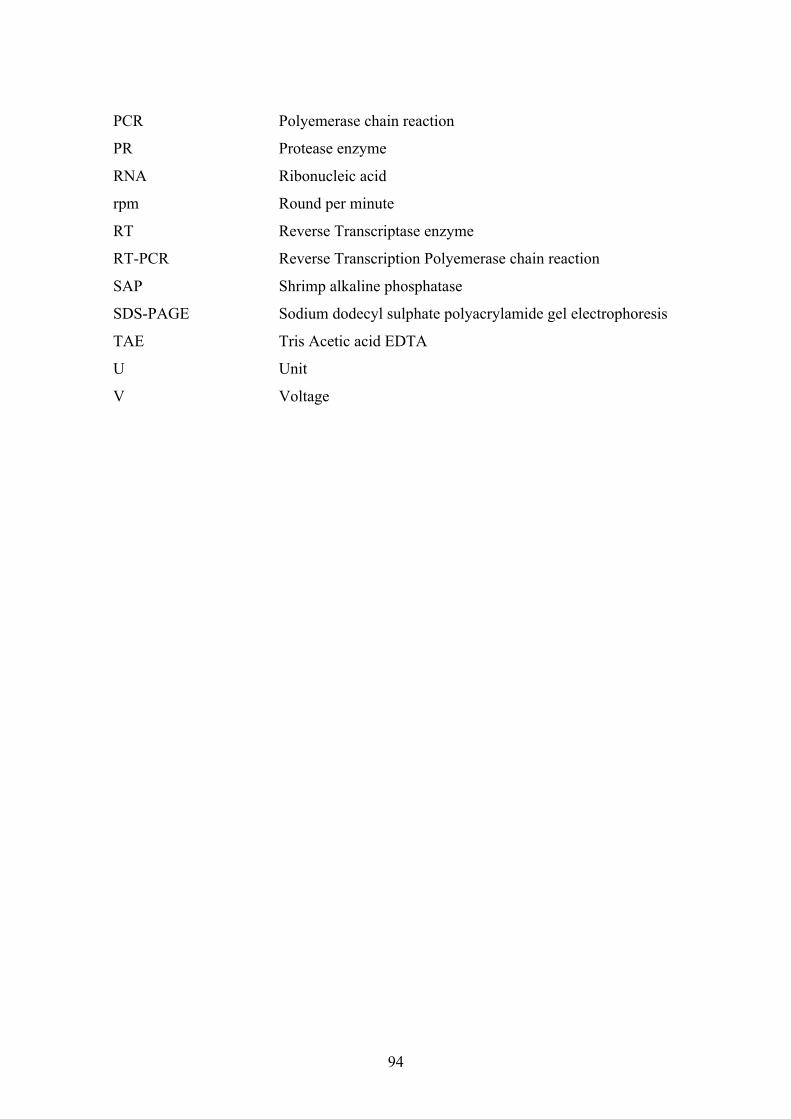
94
PCR Polyemerase chain reaction
PR Protease enzyme
RNA Ribonucleic acid
rpm Round per minute
RT Reverse Transcriptase enzyme
RT-PCR Reverse Transcription Polyemerase chain reaction
SAP Shrimp alkaline phosphatase
SDS-PAGE Sodium dodecyl sulphate polyacrylamide gel electrophoresis
TAE Tris Acetic acid EDTA
U Unit
V Voltage
95
9. List of figures
Pages
Figure 1 Distribution of recent CHIKV outbreaks 2
Figure 2 A female Ae. aegypti (right) and a female Ae. albopictus (left)
feeding on a human
3
Figure 3 Electron micrograph of purified CHIKV virions 4
Figure 4 CHIKV genome and its products 5
Figure 5 Chikungunya-associated rheumatism second stage 8
Figure 6 PCR products from CHIKV 12
Figure 7 PCR fragments obtained and construction of expression vectors 37
Figure 8 Scheme of the PCRII.5611-9584 cloning strategy 39
Figure 9 The amplified C DNA fragment (781bp) was analyzed by
Agarose Gel
41
Figure 10 E1 DNA fragment (681bp) was separated by agarose gel 42
Figure 11 E2 DNA fragment (681bp) was analyzed by agarose gel 43
Figure 12 Schemes of pET200/D-TOPO expression vectors with C, E1 and
E2 inserts
43
Figure 13 Scheme of the PCRII.1507-4702 cloning strategy 45
Figure 14 Nsp2 DNA fragment (2394bp) was analysed by 0.8% agarose gel 46
Figure 15 Protease DNA fragments (1024bp) was analyzed by 0.8% agarose
gel
47
Figure 16 Scheme of nsp2 and nsp2-PR clones in pET200/D-TOPO and
pET101/D-TOPO
47
Figure 17 Analysis of the recombinant C protein expression by coomassie
blue stained PAGE.
49
Figure 18 Western blot analysis of the recombinant C protein using anti-
His-tag antibody for detection.
49
Figure 19 Analysis of recombinant C protein purification by Coomassi blue
stained PAGE and Western blotting
51
Figure 20 Coomassie blue stained PAGE and Western blotting of E1 test
expression
53
96
Figure 21 Coomassie blue stained PAGE and Western blotting of a pilot
expression of the recombinant E2 protein.
54
Figure 22 Analysis of recombinant E1 protein purification by 12% SDS-
PAGE and Western blotting.
56
Figure 23 Analysis of the recombinant E2 protein purification by 12% SDS-
PAGE and Western blotting.
57
Figure 24 Analysis of nsp2-PR expression by pET101-PR transformed
E.coli and protein solubility by coomassie blue stained PAGE and
Western blotting
59
Figure 25 Analysis of nsp2-PR expression by pET200-PR transformed
E.coli and protein solubility by coomassie blue stained PAGE and
Western blotting
60
Figure 26 Purification of recombinant carboxyterminal HIS-tagged PR 61
Figure 27 Purification of recombinant aminoterminal HIS-tagged PR 62
Figure 28 Purification of COO-- and NH2–HIS tagged proteases by FPLC
system
63
Figure 29 Evaluation of the Western blot assay with predefined IFA positive
sera
65
Figure 30 Typical example of an immunoblot analysis of human sera 66
Figure 31 Analysis of the reactivity of Vietnamese sera against CHIKV
structural proteins in the Western blot analysis
67
Figure 32 Evaluation of the anti-CHIK antibody ELISA 68
Figure 33 Analysis of the Vietnamese donor sera by ELISA using
recombinant CHIKV structural proteins
69
Figure 34 Typical Immunofluorescence assay of CHIKV infected Vero cells 70
Figure 35 Example of the western blot analysis using uninfected and
CHIKV infected Vero cells
71
97
10. References
Adebajo, A. O. (1996). Rheumatic manifestations of tropical diseases. Curr Opin
Rheumatol 8, 85–89.
Black WC. Bennett KE. Gorrochotegui-Escalante N et al., (2002). Flavivirus
susceptibility in Aedes aegypti. Archives of Medical Research 33, 379–388.
Blackbum N.K., Besselaar T.G. and Gibson G. (1995). Antigenic relationship
between chikungunya virus strains and o’nyong nyong virus using monoclonal
antibodies. Virol., 146, 69-73.
Bodenmann P, Genton B (2006). Chikungunya, an epidemic in real time. Lancet
368,258
Brighton, S. W. and Simson, I. W. (1984). A destructive arthropathy following
Chikungunya virus arthritis – a possible association. Clin Rheumatol 3, 253–258.
Brighton, S. W. (1981). Chikungunya virus infections. S Afr Med J 59, 552.
Brighton, S. W., Prozesky, O. W. and de la Harpe, A. L. (1983). Chikungunya
virus infection. A retrospective study of 107 cases. S Afr Med J 63, 313–315.
Briolant, S., Garin, D., Scaramozzino, N., Jouan, A. and Crance, J. M. (2004).
In vitro inhibition of Chikungunya and Semliki Forest viruses replication by
antiviral compounds, synergistic effect of interferon-α and ribavirin combination.
Antiviral Res 61, 111–117.
Calisher, C. H. (1999). Chikungunya, O’nyong nyong and Mayaro viruses
(Togaviridae). In Encyclopedia of Virology, 2nd edn. 236–241.
Calisher, C. H., and N. Karabatsos. (1988). Arbovirus serogroups, definition and
geographic distribution. In T. P. Monath (ed.), The arboviruses, epidemiology and
ecology, vol. I. CRC Press, Inc., Boca Raton, Fla. 19-57.
98
Campos, L.E. et al. (1969). Isolation of chikungunya virus in the Philippines. Acta
Med. Philippina 5, 152–155.
Carey, D. E. (1971). Chikungunya and dengue, a case of mistaken identity? J Hist
Med Allied Sci 26, 243–262.
Charrel RN, de Lamballerie X, Raoult D. (2007). Chikungunya outbreaks-the
globalization of vectorborne diseases. N Engl J Med; 356, 769-71.
Chastel C (2005). Chikungunya virus, its recent spread to the southern Indian Ocean
and Reunion Island (2005–2006). Bull Acad Natl Med 189, 1827–1835.
Chatterjee SN, Chakravarti SK, Mitra AC, et al. (1965). Virological
investigation of cases with neurological complications during the outbreak of
haemorrhagic fever in Calcutta. J Indian Med Assoc; 45, 314 – 316.
Christine Chevillon, Laurence Briant, Francois Renaud and Christian Devaux.
(2007). Review, The Chikungunya threat, an ecological and evolutionary
perspective. Cell, 80-88.
Deller, J. J., Jr and Russell, P. K. (1967). An analysis of fevers of unknown origin
in American soldiers in Vietnam. Ann Intern Med 66, 1129–1143.
Deller, J. J., Jr and Russell, P. K. (1968). Chikungunya disease. Am J Trop Med
Hyg 17, 107–111.
Depoortere E., Coulombier D., (2006). Chikungunya risk assessment for Europe,
recommendations for action. Euro Surveill 11, E060511 060512.
Dubendorff, J. W., and studier, F. W. (1991). Controlling basal expression in an
inducible T7 expression system by blocking the target T7 promoter with lac
repressor. J. Mol. Biol. 219, 45-59.
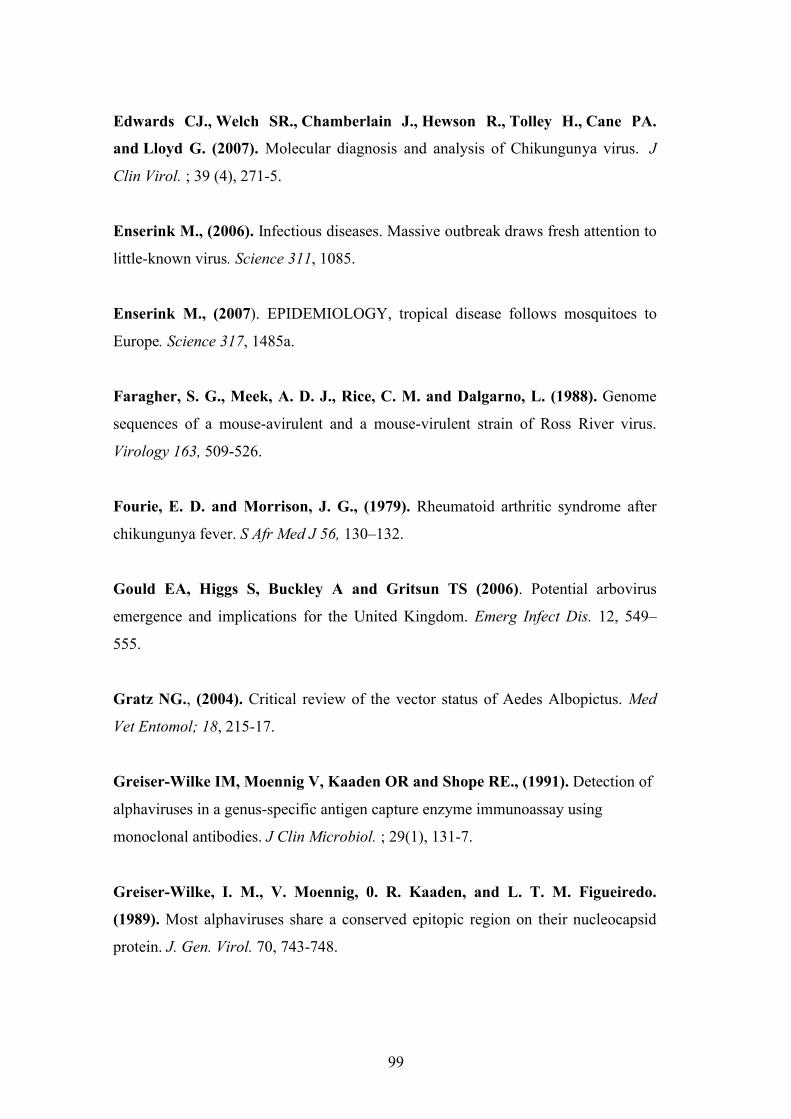
99
Edwards CJ., Welch SR., Chamberlain J., Hewson R., Tolley H., Cane PA.
and Lloyd G. (2007). Molecular diagnosis and analysis of Chikungunya virus. J
Clin Virol. ; 39 (4), 271-5.
Enserink M., (2006). Infectious diseases. Massive outbreak draws fresh attention to
little-known virus. Science 311, 1085.
Enserink M., (2007). EPIDEMIOLOGY, tropical disease follows mosquitoes to
Europe. Science 317, 1485a.
Faragher, S. G., Meek, A. D. J., Rice, C. M. and Dalgarno, L. (1988). Genome
sequences of a mouse-avirulent and a mouse-virulent strain of Ross River virus.
Virology 163, 509-526.
Fourie, E. D. and Morrison, J. G., (1979). Rheumatoid arthritic syndrome after
chikungunya fever. S Afr Med J 56, 130–132.
Gould EA, Higgs S, Buckley A and Gritsun TS (2006). Potential arbovirus
emergence and implications for the United Kingdom. Emerg Infect Dis. 12, 549–
555.
Gratz NG., (2004). Critical review of the vector status of Aedes Albopictus. Med
Vet Entomol; 18, 215-17.
Greiser-Wilke IM, Moennig V, Kaaden OR and Shope RE., (1991). Detection of
alphaviruses in a genus-specific antigen capture enzyme immunoassay using
monoclonal antibodies. J Clin Microbiol. ; 29(1), 131-7.
Greiser-Wilke, I. M., V. Moennig, 0. R. Kaaden, and L. T. M. Figueiredo.
(1989). Most alphaviruses share a conserved epitopic region on their nucleocapsid
protein. J. Gen. Virol. 70, 743-748.
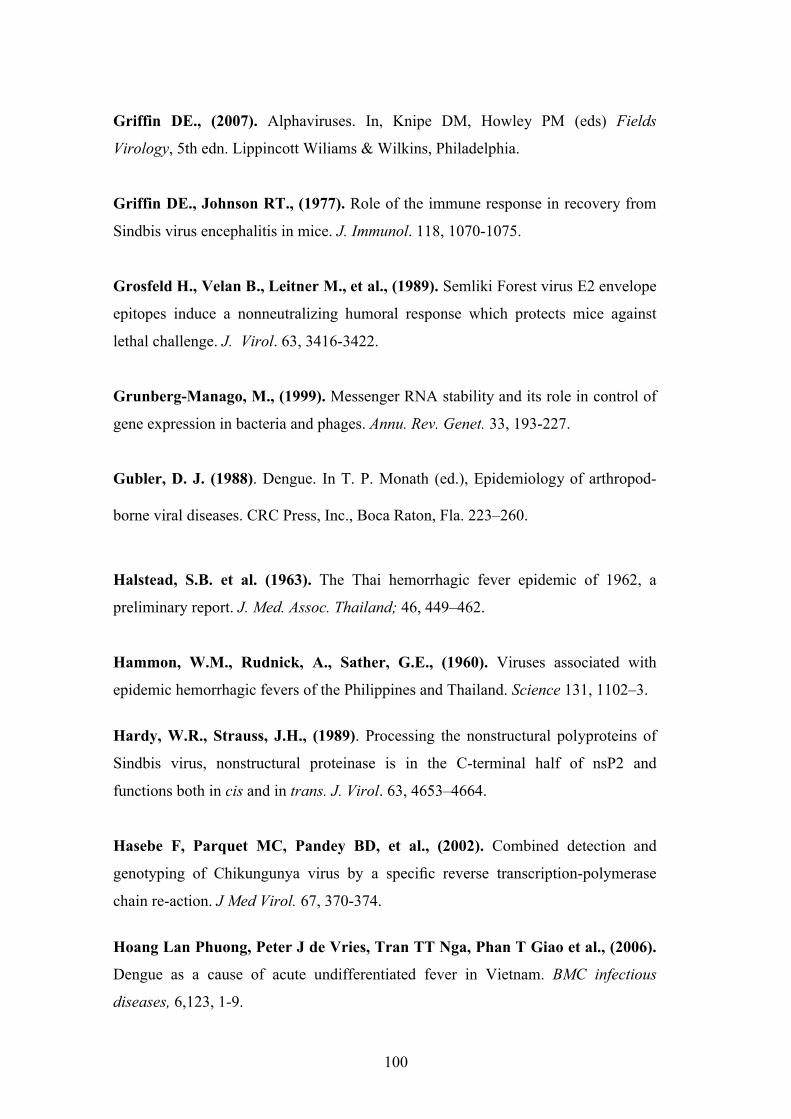
100
Griffin DE., (2007). Alphaviruses. In, Knipe DM, Howley PM (eds) Fields
Virology, 5th edn. Lippincott Wiliams & Wilkins, Philadelphia.
Griffin DE., Johnson RT., (1977). Role of the immune response in recovery from
Sindbis virus encephalitis in mice. J. Immunol. 118, 1070-1075.
Grosfeld H., Velan B., Leitner M., et al., (1989). Semliki Forest virus E2 envelope
epitopes induce a nonneutralizing humoral response which protects mice against
lethal challenge. J. Virol. 63, 3416-3422.
Grunberg-Manago, M., (1999). Messenger RNA stability and its role in control of
gene expression in bacteria and phages. Annu. Rev. Genet. 33, 193-227.
Gubler, D. J. (1988). Dengue. In T. P. Monath (ed.), Epidemiology of arthropod-
borne viral diseases. CRC Press, Inc., Boca Raton, Fla. 223–260.
Halstead, S.B. et al. (1963). The Thai hemorrhagic fever epidemic of 1962, a
preliminary report. J. Med. Assoc. Thailand; 46, 449–462.
Hammon, W.M., Rudnick, A., Sather, G.E., (1960). Viruses associated with
epidemic hemorrhagic fevers of the Philippines and Thailand. Science 131, 1102–3.
Hardy, W.R., Strauss, J.H., (1989). Processing the nonstructural polyproteins of
Sindbis virus, nonstructural proteinase is in the C-terminal half of nsP2 and
functions both in cis and in trans. J. Virol. 63, 4653–4664.
Hasebe F, Parquet MC, Pandey BD, et al., (2002). Combined detection and
genotyping of Chikungunya virus by a specific reverse transcription-polymerase
chain re-action. J Med Virol. 67, 370-374.
Hoang Lan Phuong, Peter J de Vries, Tran TT Nga, Phan T Giao et al., (2006).
Dengue as a cause of acute undifferentiated fever in Vietnam. BMC infectious
diseases, 6,123, 1-9.
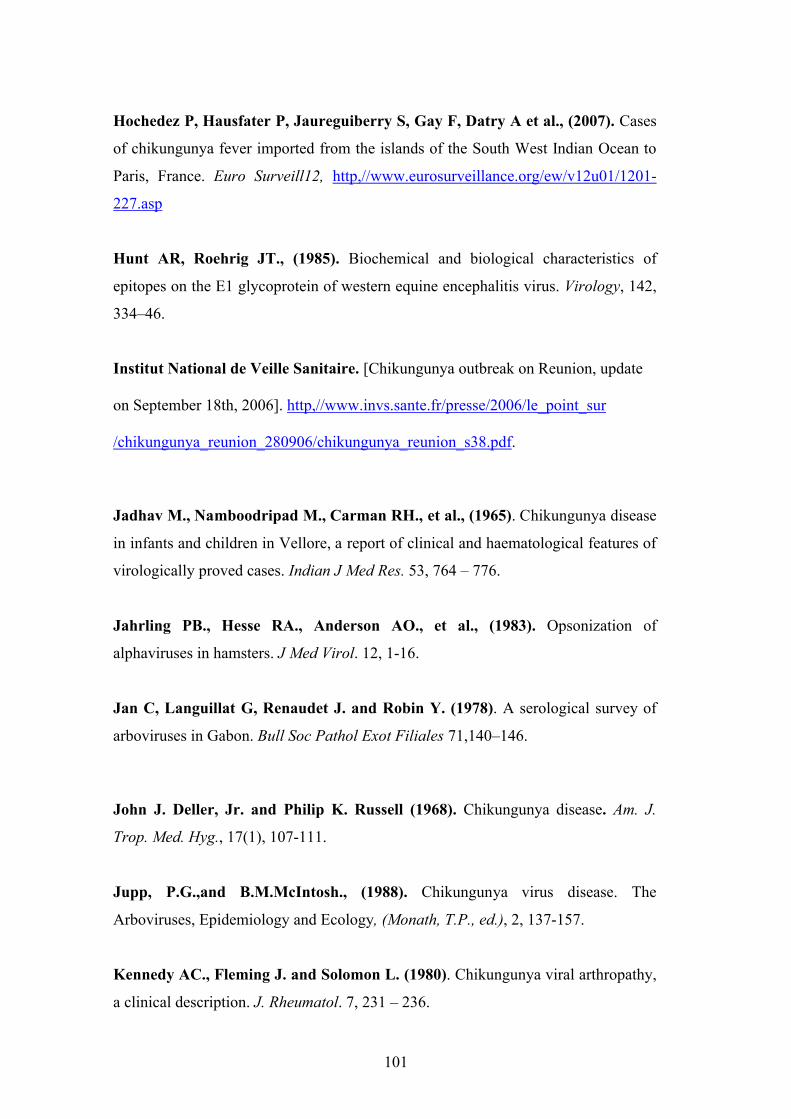
101
Hochedez P, Hausfater P, Jaureguiberry S, Gay F, Datry A et al., (2007). Cases
of chikungunya fever imported from the islands of the South West Indian Ocean to
Paris, France. Euro Surveill12, http,//www.eurosurveillance.org/ew/v12u01/1201-
227.asp
Hunt AR, Roehrig JT., (1985). Biochemical and biological characteristics of
epitopes on the E1 glycoprotein of western equine encephalitis virus. Virology, 142,
334–46.
Institut National de Veille Sanitaire. [Chikungunya outbreak on Reunion, update
on September 18th, 2006]. http,//www.invs.sante.fr/presse/2006/le_point_sur
/chikungunya_reunion_280906/chikungunya_reunion_s38.pdf.
Jadhav M., Namboodripad M., Carman RH., et al., (1965). Chikungunya disease
in infants and children in Vellore, a report of clinical and haematological features of
virologically proved cases. Indian J Med Res. 53, 764 – 776.
Jahrling PB., Hesse RA., Anderson AO., et al., (1983). Opsonization of
alphaviruses in hamsters. J Med Virol. 12, 1-16.
Jan C, Languillat G, Renaudet J. and Robin Y. (1978). A serological survey of
arboviruses in Gabon. Bull Soc Pathol Exot Filiales 71,140–146.
John J. Deller, Jr. and Philip K. Russell (1968). Chikungunya disease. Am. J.
Trop. Med. Hyg., 17(1), 107-111.
Jupp, P.G.,and B.M.McIntosh., (1988). Chikungunya virus disease. The
Arboviruses, Epidemiology and Ecology, (Monath, T.P., ed.), 2, 137-157.
Kennedy AC., Fleming J. and Solomon L. (1980). Chikungunya viral arthropathy,
a clinical description. J. Rheumatol. 7, 231 – 236.
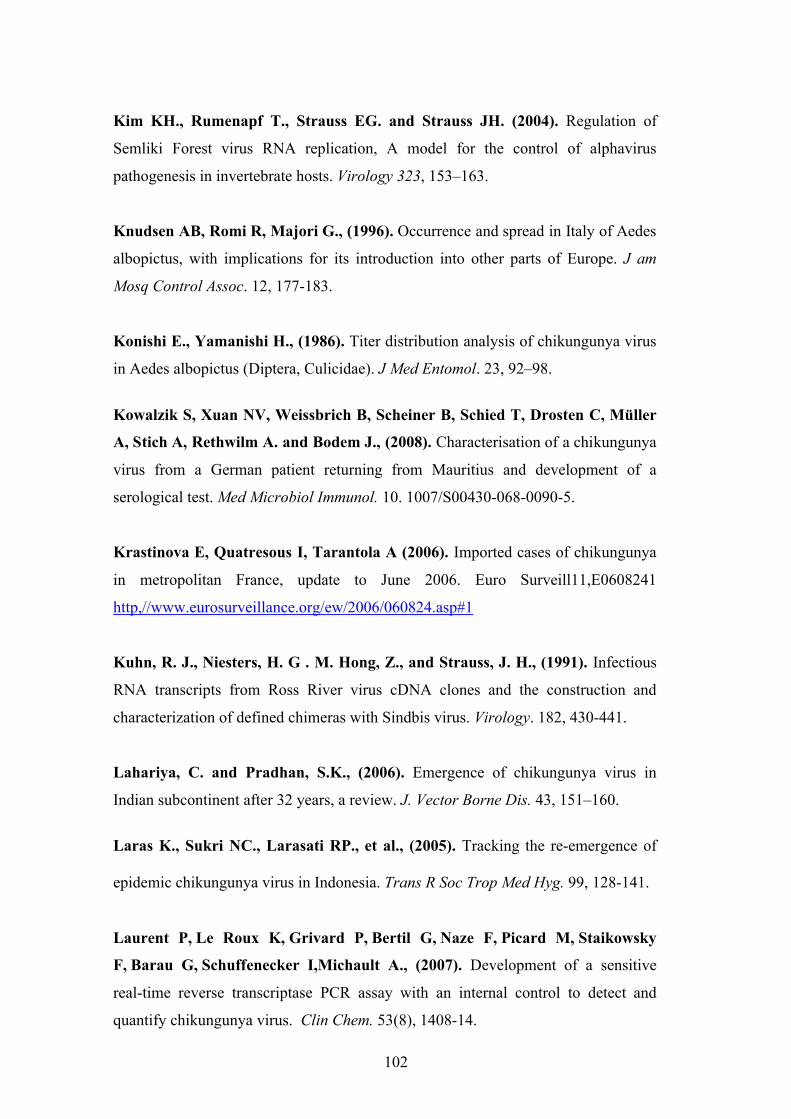
102
Kim KH., Rumenapf T., Strauss EG. and Strauss JH. (2004). Regulation of
Semliki Forest virus RNA replication, A model for the control of alphavirus
pathogenesis in invertebrate hosts. Virology 323, 153–163.
Knudsen AB, Romi R, Majori G., (1996). Occurrence and spread in Italy of Aedes
albopictus, with implications for its introduction into other parts of Europe. J am
Mosq Control Assoc. 12, 177-183.
Konishi E., Yamanishi H., (1986). Titer distribution analysis of chikungunya virus
in Aedes albopictus (Diptera, Culicidae). J Med Entomol. 23, 92–98.
Kowalzik S, Xuan NV, Weissbrich B, Scheiner B, Schied T, Drosten C, Müller
A, Stich A, Rethwilm A. and Bodem J., (2008). Characterisation of a chikungunya
virus from a German patient returning from Mauritius and development of a
serological test. Med Microbiol Immunol. 10. 1007/S00430-068-0090-5.
Krastinova E, Quatresous I, Tarantola A (2006). Imported cases of chikungunya
in metropolitan France, update to June 2006. Euro Surveill11,E0608241
http,//www.eurosurveillance.org/ew/2006/060824.asp#1
Kuhn, R. J., Niesters, H. G . M. Hong, Z., and Strauss, J. H., (1991). Infectious
RNA transcripts from Ross River virus cDNA clones and the construction and
characterization of defined chimeras with Sindbis virus. Virology. 182, 430-441.
Lahariya, C. and Pradhan, S.K., (2006). Emergence of chikungunya virus in
Indian subcontinent after 32 years, a review. J. Vector Borne Dis. 43, 151–160.
Laras K., Sukri NC., Larasati RP., et al., (2005). Tracking the re-emergence of
epidemic chikungunya virus in Indonesia. Trans R Soc Trop Med Hyg. 99, 128-141.
Laurent P, Le Roux K, Grivard P, Bertil G, Naze F, Picard M, Staikowsky
F, Barau G, Schuffenecker I,Michault A., (2007). Development of a sensitive
real-time reverse transcriptase PCR assay with an internal control to detect and
quantify chikungunya virus. Clin Chem. 53(8), 1408-14.
103
Leathers, V., Tanguay, R., Kobayashi, M., and Gallie, D. R., (1993). A
phylogenetically conserved sequence within viral 3’ untranslated RNA pseudoknots
regulates translation. Mol. Cell. Bio. 13, 5331-5347.
Liberek, K., Skowyra, D., Zylicz, M., Johnson, C., Georgopoulos, C., (1991).
The Escherichia coli DnaK chaperone, the 70 kDa heat shock protein eukaryotic
equivalent, changes conformation upon ATP hydrolysis, thus triggering its
dissociation from a bound target protein. J. Biol. Chem. 266, 14491–14496.
Lines J., (2007). Chikungunya in Italy. Bmj. 335-576.
Litzba N., Schuffenecker I., Zeller H., Drosten C. et al., (2008). Evaluation of the
first commercial chikungunya virus indirect immunofluorescence test. J Virol
Methods.149(1), 175-9.
Lopez, P. J., Marchand, I., Joyce, S. A., and Dreyfus, M., (1999). The C-terminal
half of RNAase, which organizes the Escherichia coli degradosome, participates in
mRNA degradation but not rRNA processing in vivo. Mol. Microbiol. 33, 188-199.
Lumsden WH., (1955). "An epidemic of virus disease in Southern Province,
Tanganyika Territory, in 1952-53. II. General description and epidemiology". Trans.
R. Soc. Trop. Med. Hyg. 49 (1), 33–57.
Macasaet FF., (1970). Further observation on chikungunya fever. J Philipp Med
Assoc; 46, 235 – 242.
Mackenzie JS, Chua KB, Daniels PW, et al., (2001). Emerging viral diseases of
Southeast Asia and the Western Pacific. Emerging Infect Dis.7, 497-504.
Mangiafico JA., (1971). Chikungunya virus infection and transmission in five
species of mosquito. Am J Trop Med Hyg. 20, 642-645.
104
Marie Vazeille, Sara Moutailler, Daniel Coudrier et al., (2007). Two
Chikungunya isolates from the outbreak of La Reunion (Indian Ocean) exhibit
different patterns of infection in the mosquito, Aedes albopictus. PLoS ONE. 2(11),
e1168.
Martin Enserink (2007). Chikungunya, No Longer a Third World Disease. Science
21. 1860 – 1861.
Mathews JH., and Roehrig JT., (1982). Determination of the protective epitopes
on the glycoproteins of Venezuelan equine encephalomyelitis virus by passive
transfer of monoclonal antibodies. The Journal of Immunology, 129, 2763-2767.
McGill, P. E., (1995). Viral infections, alpha-viral arthropathy. Baillieres Clin
Rheumato. l 9, 145–150.
Merits, A.,Vasiljeva, L., Ahola, T., Kaariainen, L. and Auvinen, P., (2001).
Proteolytic processing of Semliki Forest virus-specific non-structural polyprotein by
nsP2 protease. J. Gen. Virol. 82, 765–773.
Miller ML and Brown DT (1992). Morphogenesis of Sindbis virus in three
subclones of Aedes albopictus (mosquito) cells. J Virol. 66, 4180-4190.
Moore RM., Moulthrop JI., Sather GE., Holmes CL. and Parker RL., (1974).
Venezuelan equine encephalitis vaccination survey in Arizona and New Mexico.
Public Health Rep. 92, 357–60.
Munasinghe DR. , Amarasekera PJ. and Fernando CF., (1966 ). An epidemic of
dengue-like fever in Ceylon (Chikungunya) - a clinical and haematological study.
Ceylon Med J. 11, 129 – 142 .
105
Muthumani K, Lankaraman KM, Laddy DJ, Sundaram SG, et al.,( 2008)
Immunogenicity of novel consensus-based DNA vaccines against Chikungunya
virus. Vaccine. [Epub ahead of print].
Myers, R. M. and Carey, D. E. (1967). Concurrent isolation from patient of two
arboviruses, chikungunya and dengue type 2. Science, 157, 1307–1308.
No authors list. (1969). Diseases from Vietnam. Calif Med. 111(6), 461-6.
Olmsted, R. A., W. J. Meyer, and R. E. Johnston. (1986). Characterization of
Sindbis virus epitopes important for penetration in cell culture and pathogenesis in
animals. Virology 148, 243-254.
Ou, J-H., Strauss, E G., and Strauss, J. H.(1983). The 5’-terminal sequences of
the genomic RNAs of several alphaviruses. J. Mol. Biol.168, 1-15.
Ozden, S. et al. (2007). Human muscle satellite cells as targets of chikungunya virus
infection. PLoS ONE 2(6), e527.
Padbidri VS., Wairagkar NS., Joshi GD., Umarani UB., Risbud AR., et
al.,(2002). A serological survey of arboviral diseases among the human population
of the Andaman and Nicobar Islands, India. Southeast Asian J Trop Med Public
Health.33(4), 794-800.
Panning M., Grywna K., van Esbroeck M., Emmerich P. and Drosten C. (2007).
Chikungunya fever in travellers returning from the Western Indian Ocean in 2006.
Emerg Infect Dis.
Pastorino B, Bessaud M, Grandadam M, et al,. (2005). Development of a
TaqMan RT-PCR assay without the RNA extraction step for the detection and quan-
tifi cation of African Chikungunya viruses. J Virol Methods; 124, 65-71.
106
Pastorino B., Bessaud M., Pandey BD., Mathenge EG., Morita K.,
BalsubramaniamV., et al., ( 2002). Combined detection and genotyping of
chikungunya virus by a specific reverse transcription polymerase chain reaction. J
Med Virol. 67, 370-4.
Pfeffer M., Linssen B., Parke MD. and Kinney RM., (2002). Specific detection of
chikungunya virus using a RT-PCR/nested PCR combination. J Vet Med B infect dis
Vet Public Health; 49, 49-54.
Pfeffer M. and Loscher T., (2006). Cases of chikungunya imported into Europe.
Euro Surveill 11, E0603162 http,//www.eurosurveillance.org/ew/2006/06031.asp#2.
Pialoux G., Gauzere BA., Jaureguiberry S. and Strobel M (2007). Chikungunya,
an epidemic arbovirosis. Lancet Infect Dis. 7, 319-327
Powers AM., Brault AC., Tesh RB. and Weaver SC., (2000). Re-emergence of
Chikungunya and O’nyong-nyong viruses, Evidence for distinct geographical
lineages and distant evolutionary relationships. J Gen Virol 81, 471–479.
Quatresous I., (2006). Chikungunya outbreak in Reunion, a French ‘overseas
department ’. Euro Surveill; 11, 060202.
Rao, T.R. et al., (1965). Preliminary isolation and identification ofchikungunya
virus from cases of dengue-like illness in Madras City. Indian J. Med. Res. 53, 689–
693.
Razumov IA., Agapov EV., Pereboev AV., Protopopova EV., Lebedeva
SD., Loktev VB., (1991). Study of the antigenic structure of the E1 glycoprotein of
the Venezuelan equine encephalomyelitis virus using monoclonal antibodies. Mol
Gen Mikrobiol Virusol. 6, 21-4.
Reiter P., Fontenille D. and Paupy C., (2006). Aedes albopictus as an epidemic
vector of chikungunya virus, another emerging problem? Lancet Infect Dis. 6, 463-
464.
107
Robillard PY., Boumahni B., Gerardin P., et al. (2006). Vertical maternal fetal
transmission of the Chikungunya virus. Ten cases among 84 pregnant women.
Presse Med.; 35, 785 – 788.
Robinson MC., (1955). "An epidemic of virus disease in Southern Province,
Tanganyika Territory, in 1952-53. I. Clinical features". Trans. R. Soc. Trop. Med.
Hyg. 49, 28–32.
Roehrig, J. T., and J. H. Mathews. (1985). The neutralization site on the E2
glycoprotein of Venezuelan equine encephalomyelitis (TC-83) virus is composed of
multiple conformationally stable epitopes. Virology 142, 347-356.
Roehrig, J. T., D. Gorski, and M. J. Schlesinger (1982). Properties of monoclonal
antibodies directed against the glycoproteins of Sindbis virus. J. Gen. Virol. 59, 421-
425.
Saluzzo JF., Ivanoff B., Languillat G. and Georges AJ. (1982). Serological
survey for arbovirus antibodies in the human and simian populations of the South-
East of Gabon. Bull Soc Pathol Exot Filiales 75, 262–266.
Santhosh SR., Parida MM., Dash PK., Pateriya A., Pattnaik B., Pradhan HK.,
et al., (2007). Development and evaluation of SYBR Green I-based one step real-
time RT-PCR assay for detection and quantification of Chikungunya virus. J Clin
Virol; 39, 188-93.
Schmaljohn AL., Kokuban KM. and Cole GA. (1983). Non-neutralizing
monoclonal antibodies define maturational and pH-dependent antigenic changes in
Sindbis virus E1 glycoprotein. Virology; 130, 144–54.
Schuffenecker I., Iteman I., Michault A., Murri S., Frangeul L. et al., (2006).
Genome microevolution of chikungunya viruses causing the Indian Ocean outbreak.
PLoS Med 3, 1058-1070.
108
Sergon K., Njuguna C., Kalani R., Ofula V., Onyango C, et al., (2008).
Seroprevalence of Chikungunya virus (CHIKV) infection on Lamu Island, Kenya,
October 2004. Am J Trop Med Hyg.; 78, 333-7.
Sergon K., Yahaya AA., Brown J., Bedja SA., Mlindasse M. et al., (2007).
Seroprevalence of Chikungunya virus infection on Grande Comore Island, union of
the Comoros, 2005. Am J Trop Med Hyg.; 76,1189-93.
Service M. (2007). Chikungunya risk of transmission in the USA. WingBeats 18.
Mount Laurel (New Jersey), American Mosquito Control Association.
Shah, K.V. et al., (1964). Virological investigation of the epidemic of
Haemorrhagic fever in Calcutta, isolation of three strains of chikungunya virus.
Indian J. Med. Res. 52, 676–693.
Simizu, B., Yamamoto, K., Hashimoto, K. and Ogata, T. (1984). Structural
proteins of Chikungunya virus. J Virol 51, 254–258.
Simon F., Parola P., Grandadam M., Fourcade S., Oliver M. et al., (2007).
"Chikungunya infection, an emerging rheumatism among travelers returned from
Indian Ocean islands. Report of 47 cases". Medicine (Baltimore) 86, 123–37.
Slesinger, S. and Schlesinger, M.J., (2001). Togaviridae, The viruses and their
replication. In, Knipe, D.M and Howley, P.M. (eds), Fields’ virology, 4th edn. New
York, Lippincott, Williams & Wilkins, 895-916.
Stec, D. S., A. Wadell, C. S. Schmaljohn, G. A. Cole, and A. L. Schmaljohn
(1986). Antibody-selected variation and reversion in Sindbis virus neutralization
epitopes. J. Virol. 57, 715-720.
Stollar V, Shenk TE, Koo R, et al., (1975). Observations on Aedes albopictus cell
cultures persistently infected with Sindbis virus. Ann N Y Acad Sci; 266, 214-230.
109
Strauss, E. G. & Strauss, J. H. (1986). Structure and replication of the alphavirus
genome. In The Togaviridae and Flaviviridae, 35-90.
Strauss, E.G., De Groot, R.J., Levinson, R., Strauss, J.H., (1992). Identification
of the active site residues in the nsP2 proteinase of Sindbis virus. Virology 191, 932–
940.
Strauss, J. H. and Strauss, E. G. (1988). Evolution of RNA viruses. Annual
Review of Microbiology 42, 657-683.
Strauss, J.H., and Strauss, E.G., (1994). The alphaviruses, gene expression,
replication, and evolution. Microbiol Rev 58, 491-562.
Studier, F. W., Rosenberg, A. H., Dunn, J. J., and Dubendorff, J. W. (1990).
Use T7 RNA polymerase to direct expression of cloned genes. Meth. Enzymol. 185,
60-89.
Suhrbier A. and La Linn M. (2004). Clinical and pathologic aspects of arthritis
due to Ross River virus and other alphaviruses. Curr Opin Rheumatol. 16, 374–379.
Suranjith L.Seneviratne, MRCP, Padmalal Gurugama, MBBS and Jennifer
Perera, MD. (2007). Chikungunya Viral Infections, An Emerging Problem. J
Travel Med; 14, 320–325.
Tesh RB., Gubler DJ., Rosen L. (1976). Variation among geographic strains of
Aedes albopictus in susceptibility to infection with Chikungunya virus. Am J Trop
Med Hyg 25, 326–335.
Thai, Khoa T. D., Nga, Tran Thi Thanh, Van Nam, et al., (2005). Incidence of
primary dengue virus infections in Southern Vietnamese children and reactivity
against other flaviviruses. Tropical Medicine & International Health 12, 1553-1557.
110
Thaikruea L., Charearnsook O., Reanphumkarnkit S., et al., (1997).
Chikungunya in Thailand, a re-emerging disease? Southeast Asian J Trop Med
Public Health; 28, 359 – 364.
Thaung U., Ming CK., Swe T., et al., (1975). Epidemiological features of dengue
and chikungunya infections in Burma. Southeast Asian J Trop Med Public Health 6,
276-283.
Thonnon J., Spiegel A., Diallo M., Diallo A., Fontenille D. (1999). Chikungunya
virus outbreak in Senegal in 1996 and 1997. Bull Soc Pathol Exot. ; 92, 79-82.
Turell MJ., Tammariello RF. and Spielman A. (1995). Nonvascular delivery of
St. Louis encephalitis and Venezuelan equine encephalitis viruses by infected
mosquitoes (Diptera, Culicidae) feeding on a vertebrate host. J Med Entomol; 32,
563-568.
Vasiljeva, L., Valmu, L., Kaariainen, L., Merits, A., (2001). Site-specific protease
activity of the carboxyl-terminal domain of Semliki Forest virus replicase protein
nsP2. J. Biol. Chem. 276, 30786–30793.
Vu qui Dai, Nguyen thi kim Thoa, Ly quoc Bang. (1967). Study of anti-CHIK
antibodies in Vietnamese children in Saigon. Bull Soc Pathol Exot Filiales. 60, 353-
9.
Weaver SC. and Barrett D. (2004). Transmission cycles, host range, evolution and
emergence of arboviral disease. Nat Rev Microbiol. 2, 789–801.
Wust CJ., Wolcott Nicholas JA., et al., (1989). Monoclonal antibodies that cross-
react with the E1 glycoprotein of different alphavirus serogroups, characterization
including passive protection in vivo. Virus Res;13, 101-112.
Yadav P, Shouche YS, Munot HP, et al., (2000). Genotyping of chikungunya
virus isolates from India during 1963-2000 by reverse transcription-polymerase
chain reaction. Acta Virol.;47, 125-127.
ACKNOWLEDGEMENTS
I especially want to thank my advisor, Prof. Axel Rethwilm, for giving me a very
interesting project and his guidance during my research and study at Würzburg
University.
Prof. A. Rethwilm and Prof. K. Brehm deserve special thanks as my thesis committee
members and advisors.
I was delighted to interact with Jochen Bodem by his help and having him as my co-
advisor. I also wish to thank every member of the Bodem Lab, past and present, who
made my time here such a pleasure. Particularly, I also would like to thank my
colleague Stefan Kowazik who gave me the CHIKV PCR products.
I would like to thank Christian Drosten from Bernhard Nocht Institute for kindly
supporting me sera of CHIKV patients. I also wish to thank Benedikt Weissbrich, Jörg
Schubert and Barbara Scheiner from Virus diagnosis-Virology Institute for supporting
German blood donors and providing assistance in IFA.
I am grateful to thank Song LH and Xuan NT from Vietnam for kindly supporting sera
of Vietnamese blood donors.
I would regret my doctoral years at Wuerzburg University if I did not join MOET and
DAAD fellowships. Joining these fellowships was not only a turning point in my life,
but also a wonderful experience.
Finally, my deepest gratitude goes to my family, especially my parents, who support
throughout my life and never let me imagine that there was anything I couldn’t do
if I tried.
CURRICULUM VITAEVu Xuan NghiaVersbacher strasse 7, 97078 WürzbzrgTel. 017624627894E-mail: [email protected]
Personal dataFull name: Vu, Xuan NghiaGender: MaleDate of birth: May 24th, 1969Marital status: MarriedNationality: Vietnamese
Education background 1974-1979: Tamhiep primary school, Phuctho district, Hanoi, Vietnam.1979-1983: Tamhiep secondary school, Phuctho district, Hanoi, Vietnam.1983-1986: Ngoctao high school, Phuctho district, Hanoi, Vietnam.1990-1996: Military medical university, Hanoi, Vietnam. (Medical doctor, good, average score: 7.6)1996-1999: Hanoi University of foreign study. (M.A. in foreign language, average)2000-2002: Military medical university, Hanoi, Vietnam. (MSc in Medicine, good, average score: 8.81)
Work experienceOct.1996-Oct.1998: Trainee, Vietnam-German Hospital and Bachmai Hospital.Oct.1998-Oct.2000: Assistant lecturer at department of Immune-Pathophysiology Hanoi Medical University, Hanoi, VietnamSept.2002-Dec.2002: Trainee, National University of Singapore.Oct.2000-2004: Lecturer, Department of Immune-Pathophysiology Hanoi Medical University, Hanoi, VietnamAug.2005-Present: Postgraduate student, Institute for Virology and Immunology
PublicationCharacterisation of a chikungunya virus from a German patient returning from Mauritius and development of a serological test. Med Microbiol Immunol. 10. 1007/S00430-068-0090-5.Study on the effectiveness of H4 cream in treatment of experimental wounds of soft tissues. J. of Medical and Pharmaceutical Information, 2, 2000, 25-28. (Vietnamese)
PosterIsolation, molecular cloning and nucleotide sequencing of a Chikungunya virus from a German patient returning form Mauritius and development of a capsid ELISA assay. Third European Congress of Virology, Nürnberg Germany, Sept. 1-5, 2007. 256.
Würzburg, July 31, 2008