Embed Size (px)
Citation preview
Geographic Information Systems (GIS) The Spatial Dimension to Development Cooperation

Deutsche Gesellschaft fürTechnische Zusammenarbeit (GTZ) GmbH
Postfach 518065726 Eschborn/GermanyT +49 61 96 79-0F +49 61 96 79-11 15E [email protected] www.gtz.de
SELLER Sector NetworkSector Project Land Management
T +49 61 96 79-6429F +49 61 96 79-7173E [email protected] www.gtz.de
Responsible:Yvonne Müller, Dorith von Behaim
Authors:Babette Wehrmann in cooperation with Jelena Glavina
Layout:Babette Wehrmann, Susanne Fritz − golzundfritz.com
Contact to theFederal Ministry for Economic Cooperation and Development:Karin Foljanty
Photos: see last page
Print: October 2009
Eschborn 2009

Preface
GIS – The Spatial Dimension to Development Cooperation
The complexity of development tasks requires tools that help to capture and understand the situation as well as
forecast impacts of our intervention. Geographic Information Systems (GIS) are such a tool. They are increasingly
used in development cooperation. GIS can support the implementation of different types of projects targeting
objectives such as municipal development, regional economic development, agricultural development, sustain-
able resource management, good governance, etc. GIS in development cooperation needs to be understood as
a tool, not as an objective in itself.
In GTZ supported projects and programs, GIS applications are currently mainly used in Central Eastern Europe
(Bosnia-Herzegovina, Serbia, Montenegro, Georgia), Asia (Laos, Cambodia, Philippines, Mongolia) and Africa
(Ethiopia, Mali, Namibia).
This brief guide has been prepared for experts in development cooperation who have come across GIS and who
would like to make up their mind on its application and what possible benefits can be achieved using it in
their project or program. It refers to the two former GTZ GIS guides compiled in 1994 and 2000.
The guide is not supposed to be a blueprint for implementing a GIS. Neither shall or can it turn the reader
into a GIS specialist. It rather should serve to give a first introduction to the issue and point out questions to
be answered when thinking about the implementation of a GIS.
This guide is based on a joint initiative of the GTZ SELLER Network Working Group on Land Management with
its regional focus on Europe, Caucasus and Central Asia as well as the GTZ Sector Project Land Management.
Eschborn, June 2009
Dorith von Behaim
Sector Project Land Management
4
What’s it all about? What does it take? Good practices AnnexesWhat’s GIS for
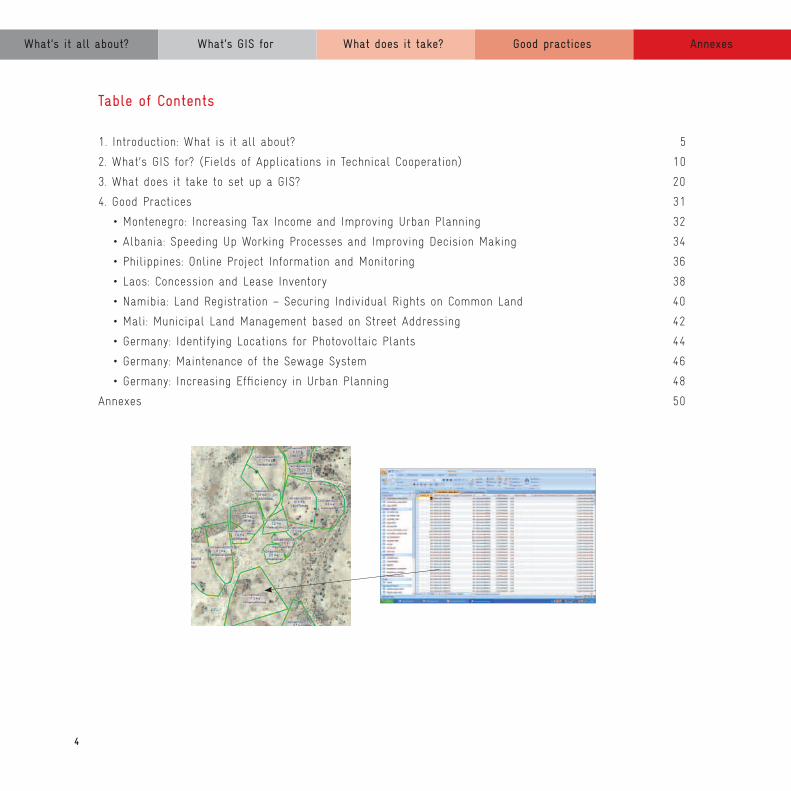
Table of Contents
1. Introduction: What is it all about? 5
2. What’s GIS for? (Fields of Applications in Technical Cooperation) 10
3. What does it take to set up a GIS? 20
4. Good Practices 31
• Montenegro: Increasing Tax Income and Improving Urban Planning 32
• Albania: Speeding Up Working Processes and Improving Decision Making 34
• Philippines: Online Project Information and Monitoring 36
• Laos: Concession and Lease Inventory 38
• Namibia: Land Registration – Securing Individual Rights on Common Land 40
• Mali: Municipal Land Management based on Street Addressing 42
• Germany: Identifying Locations for Photovoltaic Plants 44
• Germany: Maintenance of the Sewage System 46
• Germany: Increasing Efficiency in Urban Planning 48
Annexes 50
5
What’s it all about?
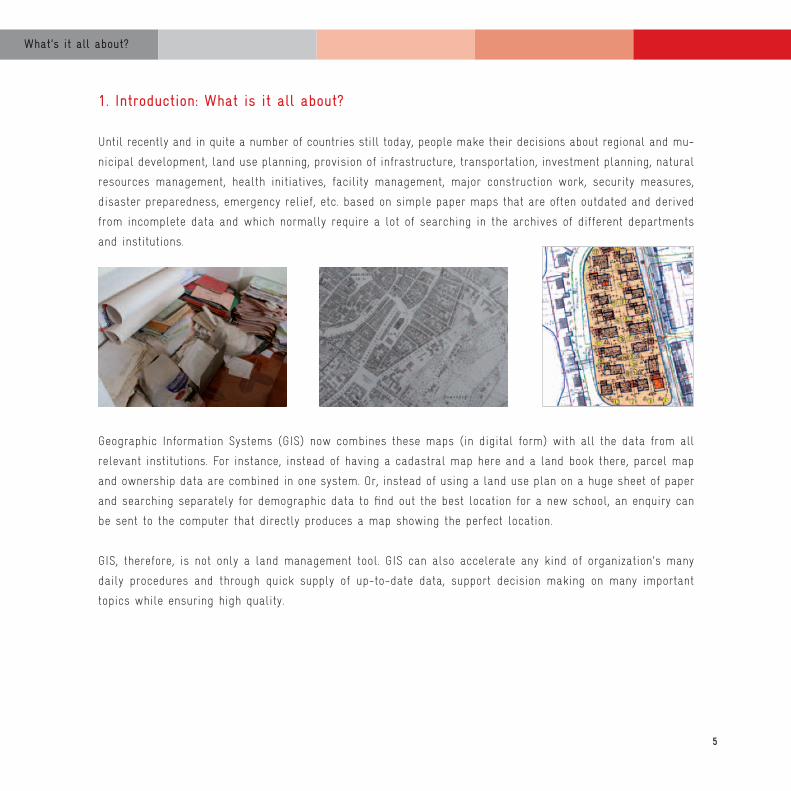
1. Introduction: What is it all about?
Until recently and in quite a number of countries still today, people make their decisions about regional and mu-
nicipal development, land use planning, provision of infrastructure, transportation, investment planning, natural
resources management, health initiatives, facility management, major construction work, security measures,
disaster preparedness, emergency relief, etc. based on simple paper maps that are often outdated and derived
from incomplete data and which normally require a lot of searching in the archives of different departments
and institutions.
Geographic Information Systems (GIS) now combines these maps (in digital form) with all the data from all
relevant institutions. For instance, instead of having a cadastral map here and a land book there, parcel map
and ownership data are combined in one system. Or, instead of using a land use plan on a huge sheet of paper
and searching separately for demographic data to find out the best location for a new school, an enquiry can
be sent to the computer that directly produces a map showing the perfect location.
GIS, therefore, is not only a land management tool. GIS can also accelerate any kind of organization’s many
daily procedures and through quick supply of up-to-date data, support decision making on many important
topics while ensuring high quality.
6
What’s it all about?
GIS is used to support decision making processes in public and private institutions around the world and
can contribute significantly to the design of administrative and management procedures that are more ef-
ficient, transparent and customer-friendly.
Any decision that involves spatial aspects such as where or where not to do something can be solved with
the help of GIS. Enquiries, which would otherwise take a lot of time, can be automated. Adequate areas for
certain activities can be identified as easily as groups of citizens or properties that fall into the same category.
Therefore, GIS can significantly increase efficiency and reduce costs. One major out-put of any GIS application
is a thematic map visualizing the current situation and/or possible solutions.
Just to state a few examples of the benefits of GIS:
• High-quality decision making with new possibilities of data analysis
• Faster insight into data
• Better communication between departments/institutions
• Handling of large data volumes
• Increased transparency and efficiency in public procedures
• Better resource allocation
• Needs-oriented regional and municipal planning
• More efficient land tax collection
• Easy identification of appropriate sites for investments and conservation areas
• etc.
An economic feasibility study recently carried out in three Serbian municipalities has shown that GIS saves
costs and increases the municipal budget within less than five years.

7
What’s it all about?
GIS is a combination of hardware, software and data. It combines graphic data in the form of maps with ad-
ditional data in the form of tables (databases).
A digital map within a GIS consists of three key elements: areas, lines and points. An area can represent a
land parcel, a building or an area with a specific land use (forest, fields, settlement area, industrial zone, etc.).
Lines can represent streets and simple points, for example single houses or trees. Each of those elements
shown on a map is connected to the database where further information like size, name, conditions, restric-
tions or owner can be found. Graphical elements with a similar content are usually compiled in a so-called
layer. For example, any streets of an area can be shown with lines in its own designated thematic layer called
“streets”. A number of thematic layers make up a GIS.
The user can create an overlay of different thematic layers so that – through this combination of data – a
completely new insight into existing data is given (see figure below).
This way, GIS shows a simplified view of the world pointing out all the information relevant to make a certain
decision.
Layer 3: Land use
Layer 2: Parcel and building boundaries
Layer 1: Aerial Photograph

8
What’s it all about?
The first step in setting up a GIS is to combine data from
different sources as well as data containing different infor-
mation. Usually, aerial photographs and, if available, land
parcel maps are taken as a basis. For example, it is possible
to derive a map of land use from an aerial photograph or a
satellite image.
Alternatively, an existing land use plan can be placed over
the photograph as a second layer. As a result, completely
new insight into the data is given. Plan and reality can easily
be compared. With this, illegal developments or construction
can be identified and followed up on.
The various functions of GIS make it possible to carry out
different kinds of analyses of data, to search and identify
locations and to present the results in an adequate way.
The potential benefits of GIS are not limited by technical means but only by available data and their actuality.
Although GIS can derive new information from the combination of existing data, it cannot by itself create base
data, i.e. legal cadastral data.

9
What’s it all about?
GIS in Developing Countries and Countries in Transition
The first sporadic use of GIS in developing countries was introduced in the 1980s. A more widespread use of
GIS started in the early 1990s when personal computers and with them PC-based GIS programs succeeded the
existing workstations, which had been much more expensive and more complicated to use. During the 1990s
the availability of cheap Global Positioning System (GPS) receivers as well as the introduction of e-mail and
internet promoted the use of GIS, facilitating the generation of spatial data, the exchange of data as well as
remote support via email and internet.
Today, GIS is present in most developing countries, although its use differs broadly among individual countries.
Apart from South Africa and some urban centers on the African continent, GIS use in Sub-Saharan Africa is
still limited. GIS use in Latin America and especially in Asia is more widespread. Eastern European countries
are by far the most advanced currently dealing with adapting their procedures and data to EU standards while,
however, still suffering from some of the same obstacles as other countries (see below).
The use of GIS differs not only among and within these regions, being more advanced in more advanced
economies, but also within the countries. Generally, the private sector is much more advanced than the public
sector, weighed down by its well known deficits.
The biggest challenges developing countries are currently facing when it comes to GIS are the availability of
(updated) data, adequate data storage, inter-institutional cooperation in terms of data exchange, access to the
internet as well as adequately trained staff and access to appropriate software. The sustainability of GIS projects
is still questionable in quite a number of countries as they are rarely developed by insiders but most often by
external advisors and consultants who leave the country once the pilot project has been finished leaving the
intended users without sufficient skills to make use of it.
Introducing GIS in developing countries requires much more than a short-term consultant who is an expert
in the use of GIS software. Introducing GIS generally requires a comprehensive approach including capacity
development as well as changes in management, procedures, the legal framework etc. and last but not least
the way of thinking and acting.
10
What’s GIS for
2. What’s GIS for?
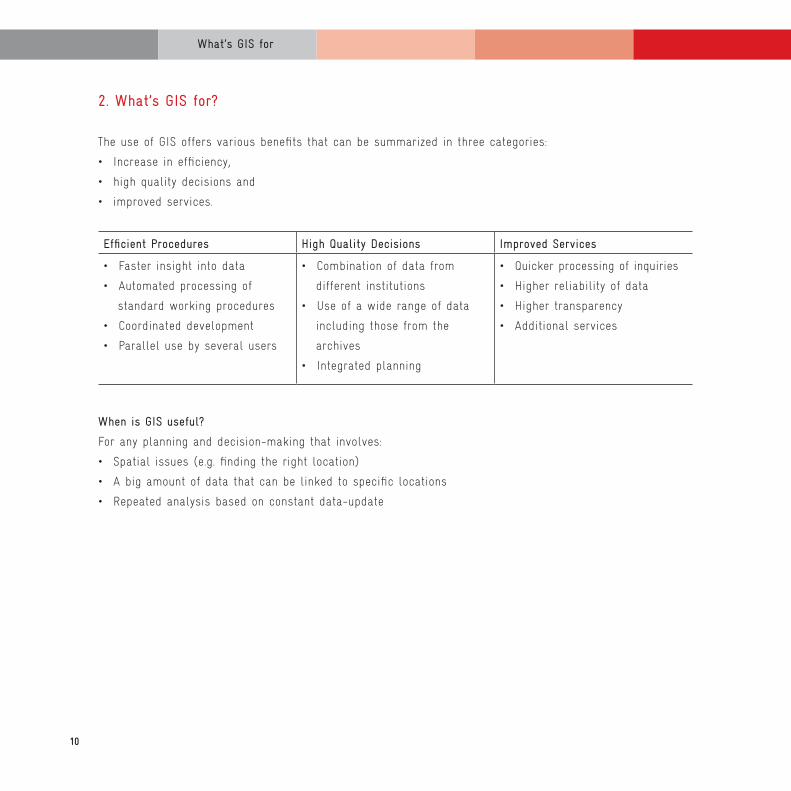
The use of GIS offers various benefits that can be summarized in three categories:
• Increase in efficiency,
• high quality decisions and
• improved services.
Efficient Procedures High Quality Decisions Improved Services
• Faster insight into data
• Automated processing of
standard working procedures
• Coordinated development
• Parallel use by several users
• Combination of data from
different institutions
• Use of a wide range of data
including those from the
archives
• Integrated planning
• Quicker processing of inquiries
• Higher reliability of data
• Higher transparency
• Additional services
When is GIS useful?
For any planning and decision-making that involves:
• Spatial issues (e.g. finding the right location)
• A big amount of data that can be linked to specific locations
• Repeated analysis based on constant data-update

11
What’s GIS for
GIS can be applied in many fields. The figure below gives an overview of the most common fields of application
in developing countries and countries in transition.
Common GIS software packages contain a wide range of general functions applicable for any thematic field.
Further thematic extensions are usually available but can also be programmed by experts. GIS is suitable for
any kind of user, whether beginner or a professional.
Emergency Relief
Taxation
Securing Land Tenure
State Land Inventory
Municipal and Regional Planning
Social Infrastructure Planning
Health Mapping and Planning
Utility Planning and Management
Organizing Municipal Services
Transportation Planning
Slum rehabilitation
Marketing to attract investors
Natural Resource Management
Land Use Planning
Watershed Management
Coastal Zone Management
Environmental Monitoring
Forest Cover Monitoring
Climate Change Mapping
Adaptation to Climate Change
Planning for Renewal Energies
Disaster Preparedness/Early Warning
Project Monitoring
Tourism

12
What’s GIS for
Transparent Project Monitoring
GIS in combination with the internet can significantly in-
crease transparency on the expenditure of public funds. The
so-called web-based GIS can be used to show where ongoing
projects take place, what progress has been made so far,
how much money is involved, which companies are imple-
menting the project etc. Aside from being a monitoring tool
for the city government, such a website demonstrates trans-
parent governance practices. Public participation can further
be increased by enabling visitors to the site to post their
comments in a feature provided for that purpose. Finally,
web-based project monitoring promotes the city as a reliable
destination for investors/donors.
See: Good Practice “Philippines”
Efficient Tax Administration
GIS can help to improve efficiency and transparency of tax
assessment and collection.
First, GIS can be used to calculate and collect real estate
taxes. Arial photographs within a GIS can be used to cal-
culate surfaces and values of parcels or buildings. In the
attached data-base, additional information on the owner and
property can be held. Tax billing can be automated.
Second, GIS can be used to map and monitor the tax payment
status of any direct tax. This information (map) can easily be
made public through web-based GIS.
Example: Tax Payment Status, PhilippinesSee: Good Practice “Montenegro”
13
What’s GIS for
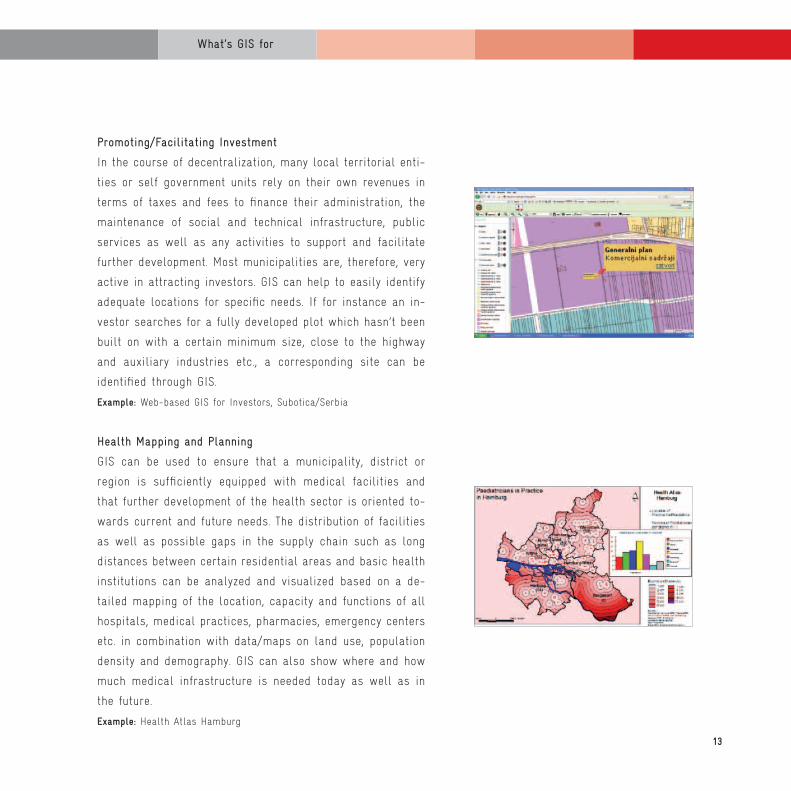
Promoting/Facilitating Investment
In the course of decentralization, many local territorial enti-
ties or self government units rely on their own revenues in
terms of taxes and fees to finance their administration, the
maintenance of social and technical infrastructure, public
services as well as any activities to support and facilitate
further development. Most municipalities are, therefore, very
active in attracting investors. GIS can help to easily identify
adequate locations for specific needs. If for instance an in-
vestor searches for a fully developed plot which hasn’t been
built on with a certain minimum size, close to the highway
and auxiliary industries etc., a corresponding site can be
identified through GIS.
Example: Web-based GIS for Investors, Subotica/Serbia
Health Mapping and Planning
GIS can be used to ensure that a municipality, district or
region is sufficiently equipped with medical facilities and
that further development of the health sector is oriented to-
wards current and future needs. The distribution of facilities
as well as possible gaps in the supply chain such as long
distances between certain residential areas and basic health
institutions can be analyzed and visualized based on a de-
tailed mapping of the location, capacity and functions of all
hospitals, medical practices, pharmacies, emergency centers
etc. in combination with data/maps on land use, population
density and demography. GIS can also show where and how
much medical infrastructure is needed today as well as in
the future.
Example: Health Atlas Hamburg

14
What’s GIS for
Land Use Planning and Natural Resources Management
Natural Resource Management (NRM) often requires the
preparation of a land use plan. GIS can be used to develop
such a plan. Such a technical approach does not exclude
participatory methods. Information collected during Partici-
patory Rural Appraisal (PRA) can easily be integrated into the
GIS. A typical GIS for NRM includes satellite images or aerial
photographs, GPS data, information from soil surveys, topo-
graphic information, statistics and information from PRA. GIS
allows combining information to identify areas of interest
(e.g. for soil and water conservation or forestation).
Example: Integration of Local Resource Map into GIS, Oromia Region, Ethiopia
Watershed Management
The watershed is considered to be the most appropriate
spatial and functional unit to manage complex environmen-
tal problems. Because of the complex nature of watersheds
including natural conditions and human activities, GIS has
been used in watershed management since the invention of
this technology. Its application has been developed from sole
operational support (e.g. descriptive mapping and prepara-
tion of inventories) to complex management issues, including
prescriptive modeling and strategic decision support.
Example: Field Survey in HaTinh, Vietnam
15
What’s GIS for
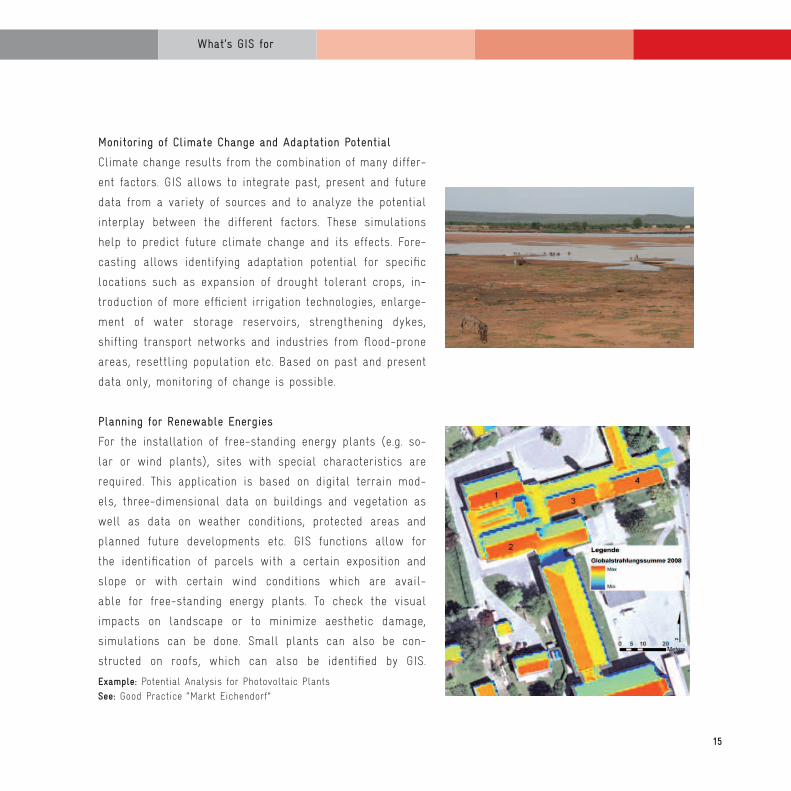
Monitoring of Climate Change and Adaptation Potential
Climate change results from the combination of many differ-
ent factors. GIS allows to integrate past, present and future
data from a variety of sources and to analyze the potential
interplay between the different factors. These simulations
help to predict future climate change and its effects. Fore-
casting allows identifying adaptation potential for specific
locations such as expansion of drought tolerant crops, in-
troduction of more efficient irrigation technologies, enlarge-
ment of water storage reservoirs, strengthening dykes,
shifting transport networks and industries from flood-prone
areas, resettling population etc. Based on past and present
data only, monitoring of change is possible.
Planning for Renewable Energies
For the installation of free-standing energy plants (e.g. so-
lar or wind plants), sites with special characteristics are
required. This application is based on digital terrain mod-
els, three-dimensional data on buildings and vegetation as
well as data on weather conditions, protected areas and
planned future developments etc. GIS functions allow for
the identification of parcels with a certain exposition and
slope or with certain wind conditions which are avail-
able for free-standing energy plants. To check the visual
impacts on landscape or to minimize aesthetic damage,
simulations can be done. Small plants can also be con-
structed on roofs, which can also be identified by GIS.
Example: Potential Analysis for Photovoltaic PlantsSee: Good Practice “Markt Eichendorf”
16
What’s GIS for
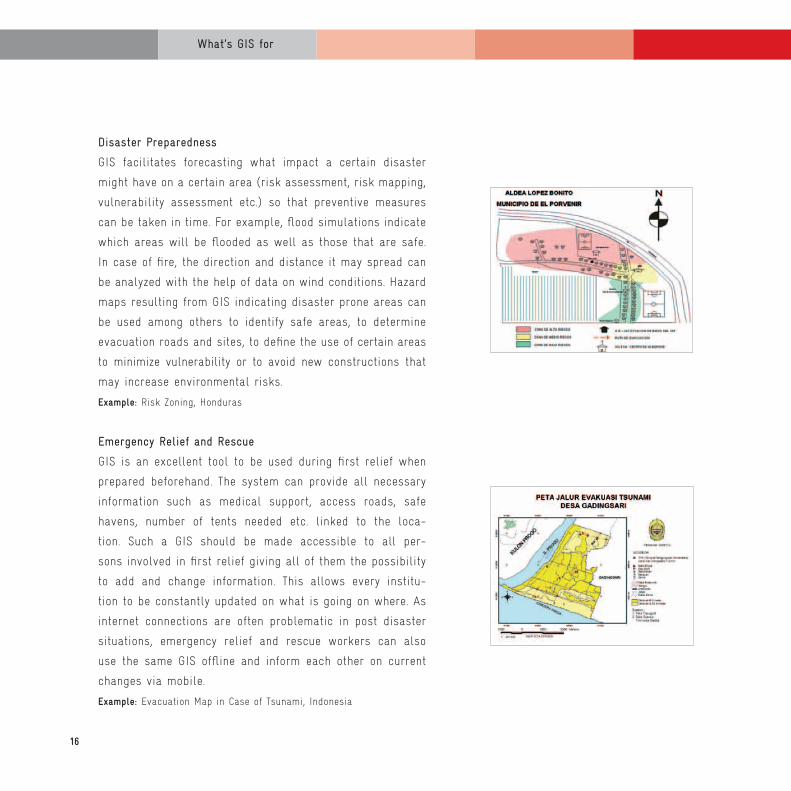
Disaster Preparedness
GIS facilitates forecasting what impact a certain disaster
might have on a certain area (risk assessment, risk mapping,
vulnerability assessment etc.) so that preventive measures
can be taken in time. For example, flood simulations indicate
which areas will be flooded as well as those that are safe.
In case of fire, the direction and distance it may spread can
be analyzed with the help of data on wind conditions. Hazard
maps resulting from GIS indicating disaster prone areas can
be used among others to identify safe areas, to determine
evacuation roads and sites, to define the use of certain areas
to minimize vulnerability or to avoid new constructions that
may increase environmental risks.
Example: Risk Zoning, Honduras
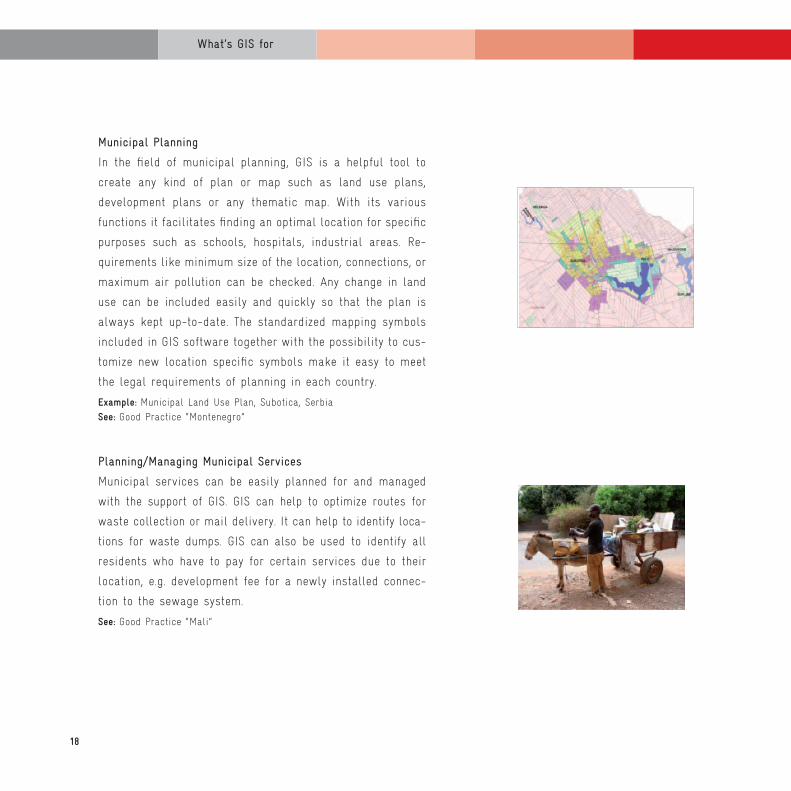
Emergency Relief and Rescue
GIS is an excellent tool to be used during first relief when
prepared beforehand. The system can provide all necessary
information such as medical support, access roads, safe
havens, number of tents needed etc. linked to the loca-
tion. Such a GIS should be made accessible to all per-
sons involved in first relief giving all of them the possibility
to add and change information. This allows every institu-
tion to be constantly updated on what is going on where. As
internet connections are often problematic in post disaster
situations, emergency relief and rescue workers can also
use the same GIS offline and inform each other on current
changes via mobile.
Example: Evacuation Map in Case of Tsunami, Indonesia

17
What’s GIS for
Securing Land Tenure
Many poor people lack tenure security. Slum dwellers fear
evictions. Peasants are increasingly victims of land grabbers,
investors who lease state land from the government without
being aware of or without considering that local people have
traditional use rights over the land. In both cases, conflicts
are almost unavoidable. GIS based on satellite images al-
lows a quick definition of boundaries and registration of
the name of owners or users. Within a short time, titles or
certificates can be given to the people. This approach can be
developed into a full cadastre.
Example: Public Display of Parcel Boundaries, CambodiaSee: Good Practices “Namibia” and “Mali”
State Land Management
State land is a valuable asset for any state. Apart from be-
ing used for public purposes, it is a steady source of income
as parts of state land can be leased or allocated in form
of concessions. However, many governments don’t know how
much state land they own, where it is located, where the
boundaries are, for what purpose it is used, by whom it is
used and for how long, etc. This opens possibilities for il-
legal allocation of public land. It also hampers the decen-
tralization of public land. GIS based on satellite images can
facilitate the identification of state land and be developed
into a state land inventory or a lease/concession register.
Examples: Report on Illegal Allocation of Public Land, Kenya and Sub-Decree on State Land Management, CambodiaSee: Good Practice “Laos”
18
What’s GIS for
Municipal Planning
In the field of municipal planning, GIS is a helpful tool to
create any kind of plan or map such as land use plans,
development plans or any thematic map. With its various
functions it facilitates finding an optimal location for specific
purposes such as schools, hospitals, industrial areas. Re-
quirements like minimum size of the location, connections, or
maximum air pollution can be checked. Any change in land
use can be included easily and quickly so that the plan is
always kept up-to-date. The standardized mapping symbols
included in GIS software together with the possibility to cus-
tomize new location specific symbols make it easy to meet
the legal requirements of planning in each country.
Example: Municipal Land Use Plan, Subotica, SerbiaSee: Good Practice “Montenegro”
Planning/Managing Municipal Services
Municipal services can be easily planned for and managed
with the support of GIS. GIS can help to optimize routes for
waste collection or mail delivery. It can help to identify loca-
tions for waste dumps. GIS can also be used to identify all
residents who have to pay for certain services due to their
location, e.g. development fee for a newly installed connec-
tion to the sewage system.
See: Good Practice “Mali”
19
What’s GIS for
Infrastructure/Utility Planning and Management
GIS is a perfect tool to plan new infrastructure based on
current and future demands as well as to facilitate mainte-
nance of existing utilities. The amount of consumption can be
derived from demographic models so that the infrastructure
networks (e.g. roads, sewage, electricity, gas or telecommu-
nication) can be adjusted to future needs. The maintenance
of the pipes or lines is much easier with GIS as damages
can be located faster and information needed for repair
becomes directly available. Complete databases accessible
by all relevant institutions also prevent damages of pipes by
other companies during construction work.
See: Good Practice “Germany”
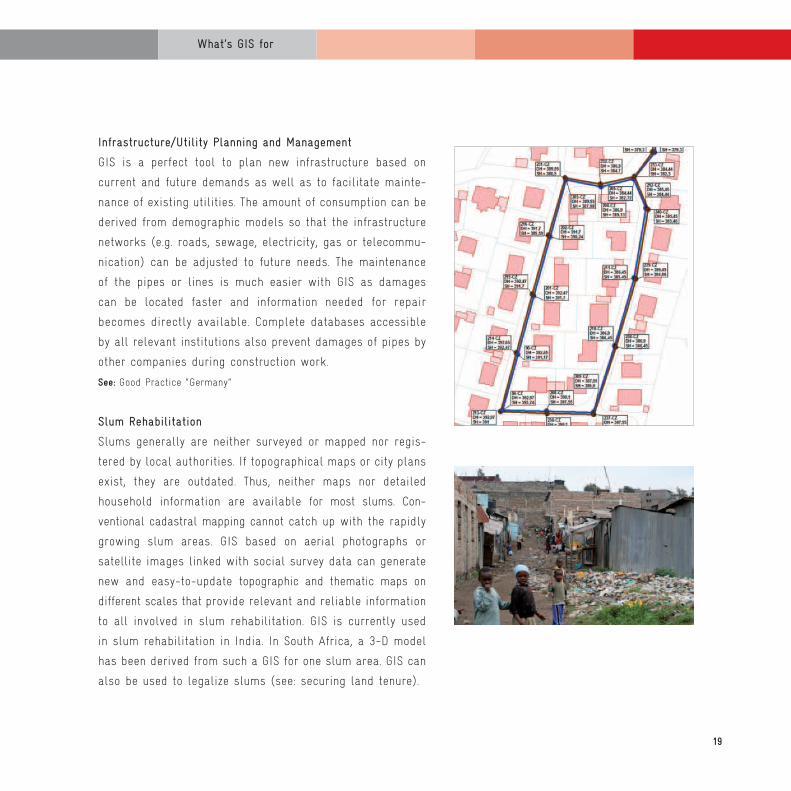
Slum Rehabilitation
Slums generally are neither surveyed or mapped nor regis-
tered by local authorities. If topographical maps or city plans
exist, they are outdated. Thus, neither maps nor detailed
household information are available for most slums. Con-
ventional cadastral mapping cannot catch up with the rapidly
growing slum areas. GIS based on aerial photographs or
satellite images linked with social survey data can generate
new and easy-to-update topographic and thematic maps on
different scales that provide relevant and reliable information
to all involved in slum rehabilitation. GIS is currently used
in slum rehabilitation in India. In South Africa, a 3-D model
has been derived from such a GIS for one slum area. GIS can
also be used to legalize slums (see: securing land tenure).

20
What does it take?
3. What does it take to set up a GIS?
The effort it takes to set up a GIS is often underestimated. Different from ready-made office software such as
Word, which simply allows the user to get started and use it, GIS software is “undressed” or semi-manufac-
tured. It needs to be completed and fed with data to become ready for use. The reason for this is that every
GIS has to be tailor-made for the specific purposes it is supposed to accomplish. Therefore, it needs to be
programmed which data groups are supposed to be able to link with each other. Then the data has to be col-
lected and entered into the system. Later, these data have to be regularly updated. Depending on the purpose
of a GIS, this requires skills and – often – considerable time.
The management aspect of GIS
The implementation of a GIS needs to be understood as a project with clearly defined goals and phases. It is
a complex process that can only be realized step by step. GIS implementation does not only include technical
aspects. As it most often either aims or implies to change working procedures it usually requires adjustments
in the organizational structure of the institution in place. In certain cases, adjustments of the legal frame
are necessary too. Finally, to implement a GIS successfully it is often necessary to change the way of thinking.
Any decision maker willing to start the project of GIS implementation has to be aware of the social, organiza-
tional and legal changes accompanying the introduction of a new technology and, therefore, should positively
support the process by professional change management.
Employees involved in the implementation of a GIS should be organized in a coordinating body. Regular
meetings to exchange information on progress and eventual problems as well as to plan the next steps are
inevitable.
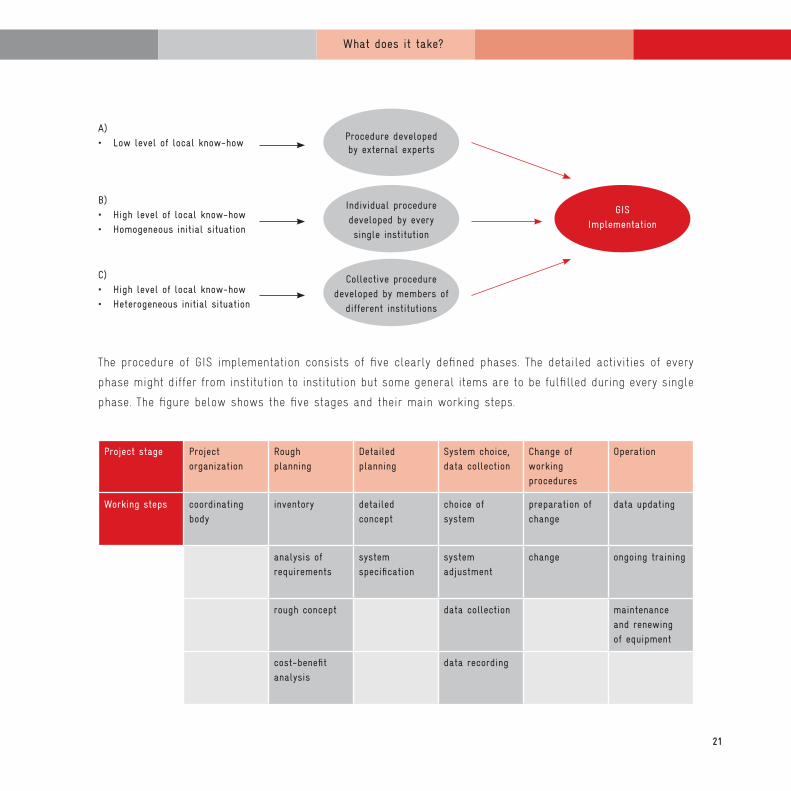
At the beginning of every GIS implementation a clear plan of the whole procedure has to be developed. Three
different ways can lead to such a plan:
21
What does it take?
Procedure developed by external experts
A)• Low level of local know-how
Individual procedure developed by every single institution
GIS Implementation
B)• High level of local know-how• Homogeneous initial situation
C)• High level of local know-how • Heterogeneous initial situation
Collective procedure developed by members of
different institutions
The procedure of GIS implementation consists of five clearly defined phases. The detailed activities of every
phase might differ from institution to institution but some general items are to be fulfilled during every single
phase. The figure below shows the five stages and their main working steps.
Project stage Project organization
Rough planning
Detailed planning
System choice, data collection
Change of working procedures
Operation
Working steps coordinating body
inventory detailed concept
choice of system
preparation of change
data updating
analysis of requirements
system specification
system adjustment
change ongoing training
rough concept data collection maintenance and renewing of equipment
cost-benefit analysis
data recording

22
What does it take?
The implementation of a GIS requires a well-organized and motivated team ready to take over responsibili-
ties right from the beginning. The first step always needs to be a precise definition of the objective: What do
we want to achieve (impact!) through the implementation of this GIS? In the second step, all necessary tasks
have to be defined in detail, priorities set, a time frame agreed upon and responsibilities of all group members
defined.
>> Recommendation: The establishment of a GIS should be organized incrementally, starting with 1-3 simple
and beneficial applications that require a limited number of data and involve only a few active actors so
that visible results can be shown from an early stage.
Efforts
Time
Setting up a GIS can take several months or up to a few years, depending on the size of the system, the avail-
ability of qualified staff, technical equipment and financial means.
Even a running system requires administration and maintenance. Due to the many changes involved (techni-
cal, organizational, social, legal etc.) bottlenecks and interruptions are common while implementing a GIS.
A good far-sighted management can help to avoid or to quickly solve them. Finally, a GIS is never “finished”,
further development and additional applications are always possible.
Costs
Costs of GIS depend on technical equipment, professional consulting, data, staff training and maintenance of the
system. Usually, high initial investment costs are needed to set up the system. The running costs depend on the
type of application. They should not be neglected! In many cases the financing of the system presents a serious
obstacle. In other cases, the system has been received as a “gift”, but never used because of deficient resources
for its maintenance (data updates, new software licenses, spare parts and technical replacements, etc.). How-
ever, it needs to be stated that costs for hardware and software, satellite images and web-based publication of
GIS outputs are constantly decreasing. Depending on the kind of applications, mid-term and long-term revenue
generated by the GIS can be achieved – sometimes covering earlier expenditures (see p. 24).
23
What does it take?
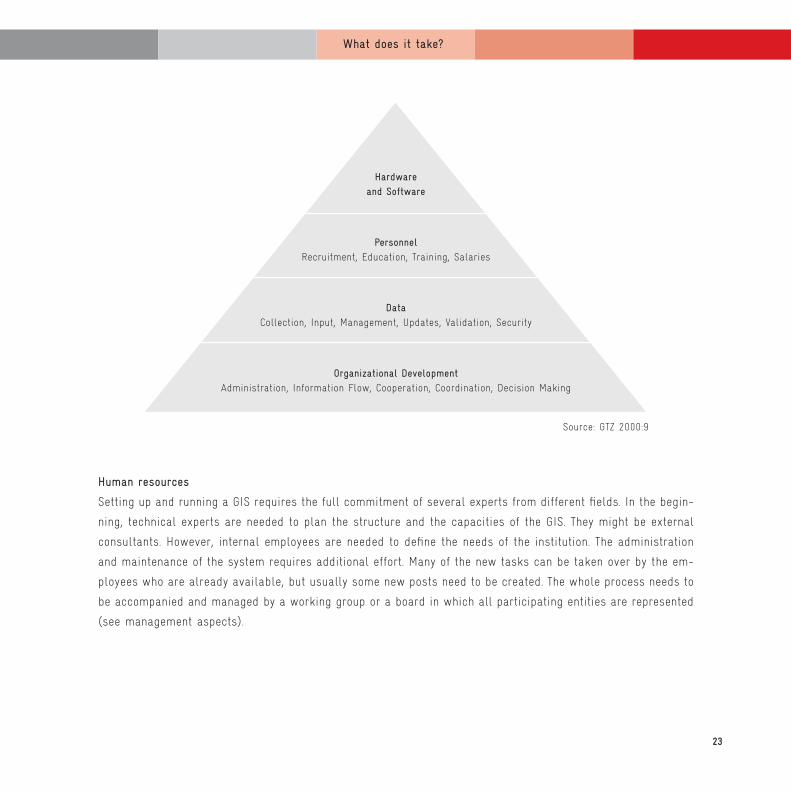
Human resources
Setting up and running a GIS requires the full commitment of several experts from different fields. In the begin-
ning, technical experts are needed to plan the structure and the capacities of the GIS. They might be external
consultants. However, internal employees are needed to define the needs of the institution. The administration
and maintenance of the system requires additional effort. Many of the new tasks can be taken over by the em-
ployees who are already available, but usually some new posts need to be created. The whole process needs to
be accompanied and managed by a working group or a board in which all participating entities are represented
(see management aspects).
Hardwareand Software
PersonnelRecruitment, Education, Training, Salaries
DataCollection, Input, Management, Updates, Validation, Security
Organizational DevelopmentAdministration, Information Flow, Cooperation, Coordination, Decision Making
Source: GTZ 2000:9
24
What does it take?
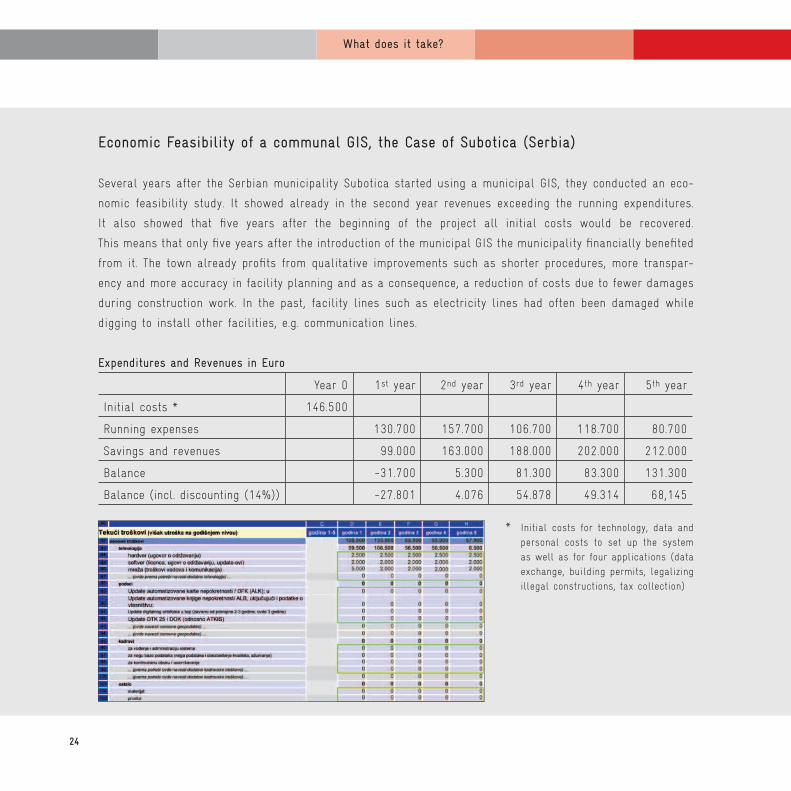
Economic Feasibility of a communal GIS, the Case of Subotica (Serbia)
Several years after the Serbian municipality Subotica started using a municipal GIS, they conducted an eco-
nomic feasibility study. It showed already in the second year revenues exceeding the running expenditures.
It also showed that five years after the beginning of the project all initial costs would be recovered.
This means that only five years after the introduction of the municipal GIS the municipality financially benefited
from it. The town already profits from qualitative improvements such as shorter procedures, more transpar-
ency and more accuracy in facility planning and as a consequence, a reduction of costs due to fewer damages
during construction work. In the past, facility lines such as electricity lines had often been damaged while
digging to install other facilities, e.g. communication lines.
Expenditures and Revenues in Euro
Year 0 1st year 2nd year 3rd year 4th year 5th year
Initial costs * 146.500
Running expenses 130.700 157.700 106.700 118.700 80.700
Savings and revenues 99.000 163.000 188.000 202.000 212.000
Balance -31.700 5.300 81.300 83.300 131.300
Balance (incl. discounting (14%)) -27.801 4.076 54.878 49.314 68,145
* Initial costs for technology, data and personal costs to set up the system as well as for four applications (data exchange, building permits, legalizing illegal constructions, tax collection)

25
What does it take?
Capacity development
The outcome of GIS depends highly on the capacities of the users. GIS being a tool does not by itself provide
useful information. Users need to clearly define the added value they want to produce with the support of
GIS. Once the desired outcome is defined, the necessary data have to be identified and gathered. In brief, GIS
requires highly competent users. This again results in special requirements for capacity development.
Capacity development in GIS needs to focus on two groups:
• GIS professionals establishing, maintaining and applying GIS systems and
• decision makers deciding on the use of GIS and/or coordinating complex GIS projects.
While the first group needs to be trained in technical aspects, the second group only needs to be aware of
possible applications, costs and benefits of the system and on how to make the best use of it. Therefore,
capacity development for the first group requires intensive and long training or even university studies while
capacity development for the decision makers can be provided in a one-week seminar.
26
What does it take?
GIS Capacity development in Serbia
In Serbia, therefore, two different kinds of GIS capacity building programs have been initiated by a GTZ sup-
ported project.
a) Training geodesy and geography students as GIS experts at the University of Belgrade in cooperation
with the GIS department of Technische Universität München (TUM) and the Serbian municipality Subotica.
TUM has many years’ experience with project seminars that allow students to work on a real project
within a municipality, learning not only about GIS but also acquiring a broad spectrum of management
skills. The project seminar in Belgrade runs for one term, parallel to regular courses. It includes one
week GIS training in the lab, one day project planning, individual time for project preparation (group
work), project presentation, site visits, individual/group work in the municipality, interim presentation
and final presentation in the municipality.
b) Qualifying municipal decision makers and managers involved in urban management to understand the
basics of municipal GIS (how it functions), possible applications, main organizational steps to set up and
maintain a GIS, costs and benefits. Another objective is to familiarize future GIS coordinators with the first
steps necessary to start the process. The five-day training stretches over a minimum period of 2 months,
accompanying the trainees in the preparation phase of introducing GIS to their municipalities. The train-
ing refers to existing good practices in the country, offers possibilities to discuss with GIS experts and
decision makers of those towns already working with GIS and relies on a combination of lectures, case
studies, exercises, discussions, group work and coaching activities. It is organized and hosted by the Standing
Conference of Towns and Municipalities, which also offers long-term coaching to former participants of
the training.

27
What does it take?
Preconditions to be fulfilled before setting up a GIS
• Support of the top management (head) of the institution
To implement and use GIS successfully in any institution the full support of the top management is needed.
The decision makers themselves have to be completely convinced of the benefits the system will bring so
that the institution provides support in form of staff, time, financial means and fast decisions. Therefore,
it is recommended to provide the top management with sufficient and realistic information on the efforts
GIS implementation involves before starting the project.
• Readiness for reorganization of the institutional structure
The introduction of a GIS can change working procedures – generally speeding them up. This can require the
reorganization of institutional structures such as changes in administrative procedures or physical reloca-
tion of individuals or teams. In addition, development, administration and maintenance of the system require
continuous communication between involved employees. Therefore, the creation of a new department deal-
ing with GIS-related tasks including technical work as well as coordination and management tasks might
be helpful.
• Telecommunications network
Generally, GIS requires the exchange of large amounts of data. Therefore, all institutions involved have
to be connected by a high-quality wideband. A parallel construction of GIS and telecommunication networks
is possible. However, in case of single thematic applications with limited amounts of data an exchange via
removable medium (e.g. CDrom) might be sufficient.
28
What does it take?
Some technical details on GIS
To fulfill all of its tasks including data retrieval, analyses and presentation, a well-developed GIS requires
extensive technical equipment including computers, hardware, software, scanner, plotter and possibly addi-
tional devices.
Efforts – manpower as well as costs – depend a lot on the software used. The main question when choos-
ing software, therefore, focuses on the costs and the personnel needed. This generally leads to deciding be-
tween quite expensive proprietary software (ESRI being the one most widely used) and open source software
that can be downloaded from the internet free of charge. However, the initial costs are to a certain degree
misleading; open source software needs much more programming and with it the final GIS is often more
difficult to handle. In addition, there are very few people trained in its use while quite a number of peo-
ple are already trained in the use of proprietary software. In case of propriety software, the company can
be contacted for trouble-shooting, while with open source software you are basically on your own. Open
source software, therefore, needs more time for set-up and more qualified people and people to be trained –
resulting in additional costs. On the other hand, open source software allows for very specific tailor-made
solutions. Most of them, however, are available for standard software in the form of devices that can
be purchased in addition to the basic software package. On balance, it boils down to the question if one
prefers to pay a big company for the software and accompanying advice or a technical expert for the
programming and continuous follow-up.
The exact architecture of every GIS depends on the individual circumstances and demands of the institution. In
a municipal GIS, usually several institutions are working together by creating a unique system and putting their
own data at disposal to every involved partner. In the private sector, companies often run their own system.
There is, however, an increasing awareness of sharing data among not only public but also private and public
institutions.
To decide what kind of GIS architecture is suitable for a municipality, it is important to clarify how many em-
ployees will use GIS and what amount of functionality they really need. Often a simple viewing solution with
no editing possibilities is sufficient to fulfill daily working procedures.
29
What does it take?
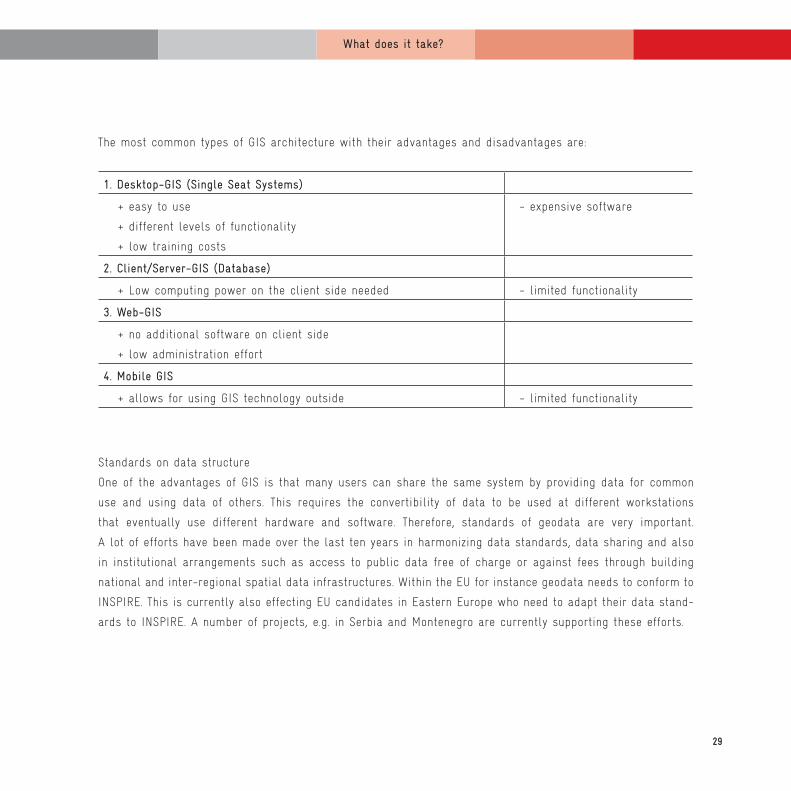
The most common types of GIS architecture with their advantages and disadvantages are:
1. Desktop-GIS (Single Seat Systems)
+ easy to use
+ different levels of functionality
+ low training costs
- expensive software
2. Client/Server-GIS (Database)
+ Low computing power on the client side needed - limited functionality
3. Web-GIS
+ no additional software on client side
+ low administration effort
4. Mobile GIS
+ allows for using GIS technology outside - limited functionality
Standards on data structure
One of the advantages of GIS is that many users can share the same system by providing data for common
use and using data of others. This requires the convertibility of data to be used at different workstations
that eventually use different hardware and software. Therefore, standards of geodata are very important.
A lot of efforts have been made over the last ten years in harmonizing data standards, data sharing and also
in institutional arrangements such as access to public data free of charge or against fees through building
national and inter-regional spatial data infrastructures. Within the EU for instance geodata needs to conform to
INSPIRE. This is currently also effecting EU candidates in Eastern Europe who need to adapt their data stand-
ards to INSPIRE. A number of projects, e.g. in Serbia and Montenegro are currently supporting these efforts.
30
What does it take?
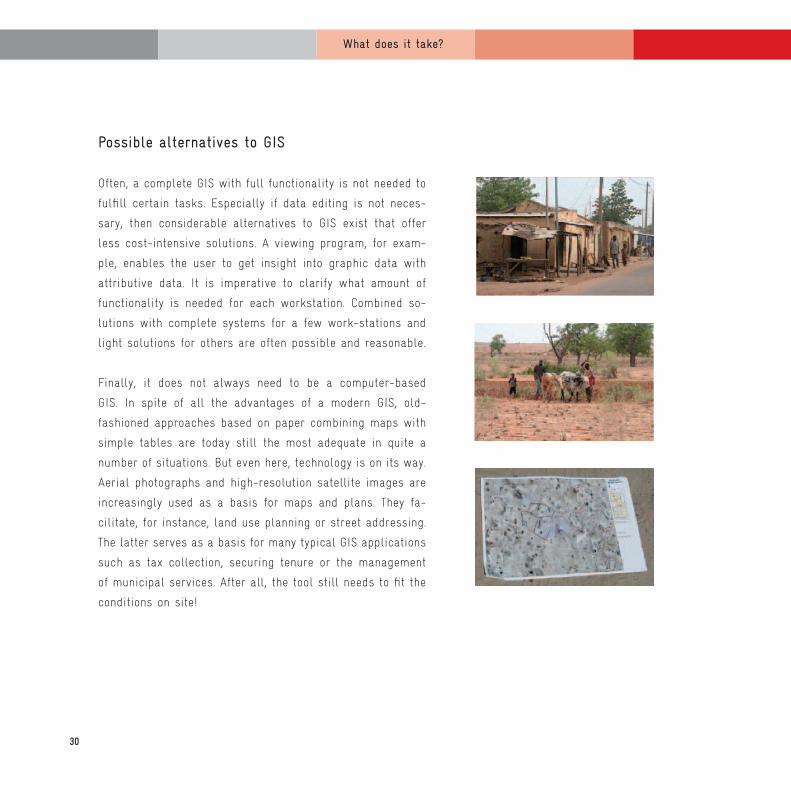
Possible alternatives to GIS
Often, a complete GIS with full functionality is not needed to
fulfill certain tasks. Especially if data editing is not neces-
sary, then considerable alternatives to GIS exist that offer
less cost-intensive solutions. A viewing program, for exam-
ple, enables the user to get insight into graphic data with
attributive data. It is imperative to clarify what amount of
functionality is needed for each workstation. Combined so-
lutions with complete systems for a few work-stations and
light solutions for others are often possible and reasonable.
Finally, it does not always need to be a computer-based
GIS. In spite of all the advantages of a modern GIS, old-
fashioned approaches based on paper combining maps with
simple tables are today still the most adequate in quite a
number of situations. But even here, technology is on its way.
Aerial photographs and high-resolution satellite images are
increasingly used as a basis for maps and plans. They fa-
cilitate, for instance, land use planning or street addressing.
The latter serves as a basis for many typical GIS applications
such as tax collection, securing tenure or the management
of municipal services. After all, the tool still needs to fit the
conditions on site!
31
Good practices
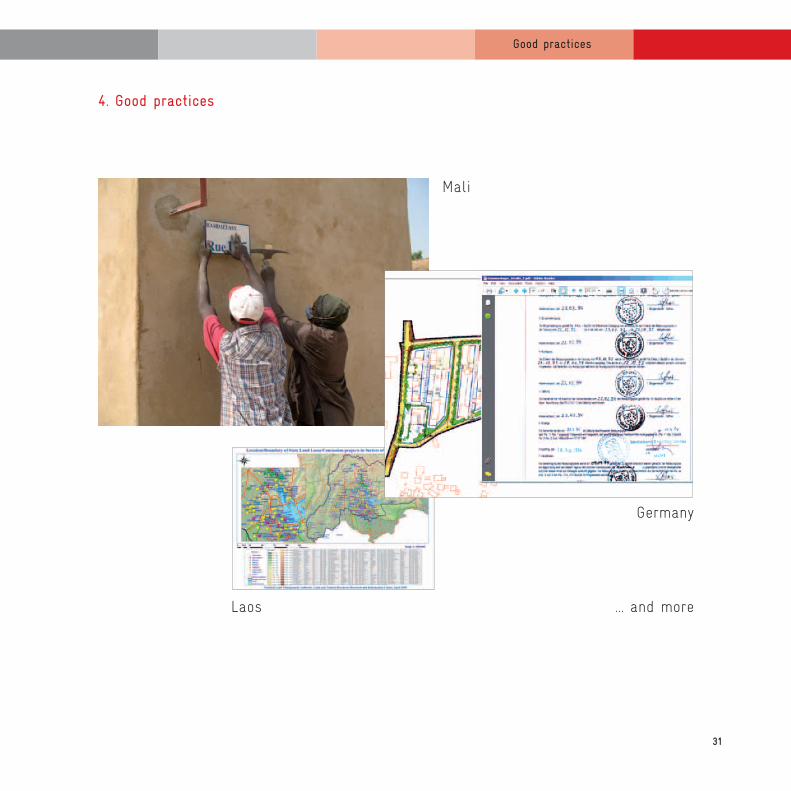
4. Good practices
Germany
Laos
Mali
... and more
32
Good practices
Increasing Tax Income and improving Urban Planning in Montenegro
Initial situation/Problem:Due to a lack of appropriate data there was no systematic and equitable collection of real estate tax which is one of the most important sources of revenue for Montenegrin municipalities. Insufficient databases were also a reason for uncontrolled and uncoordinated competition for different kinds of land uses.
Objective(s):The objective was to improve urban planning and to increase municipal revenues by real estate tax through appropriate use of the existing data of the Real Estate Cadastre and other data.
Methodological approach:Keeping in mind the existing technical preconditions in the municipalities, a GIS was developed using ownership and parcel data from the Real Estate Cadastre. The GIS consists of 2 modules, one for real estate taxation, and another for urban planning. It is designed in a way so that it can be extended to sup-port additional communal tasks as well. The national authority for Real Estate Cadastre enabled direct, regular and free of charge transfer of their data to the municipal database. The implementation was car-ried out in 4 municipalities at the same time in order to foster an intermunicipal exchange of experiences. It was accompanied by capacity building of municipal staff of all relevant departments. By a constant and intensive process of involving the municipal staff, the initial software solution has been significantly improved and amended by new functionalities (e.g. e-payment).
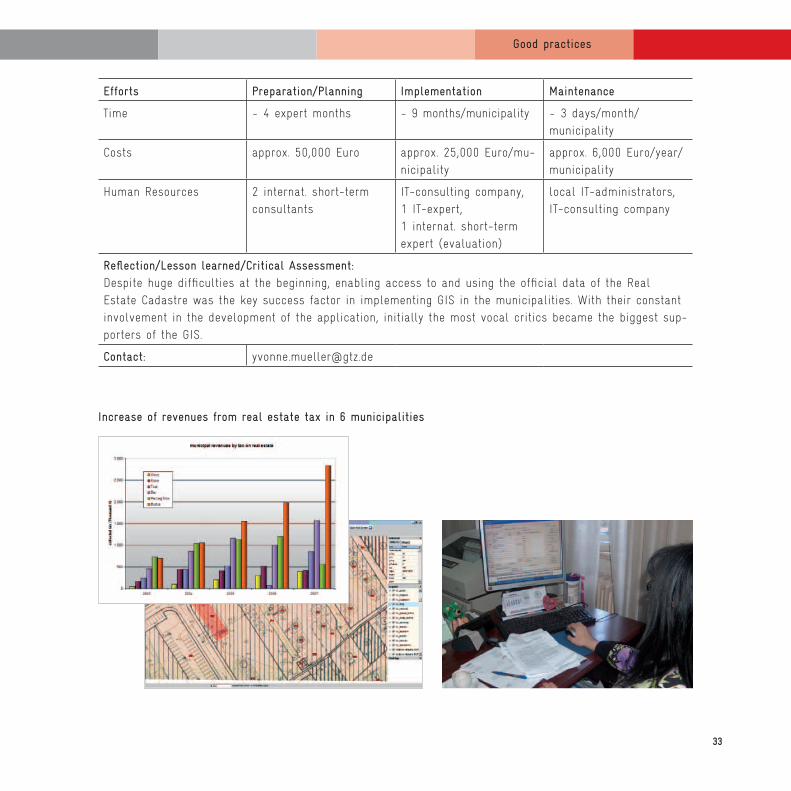
Impact(s) achieved (up to now):Revenues from real estate tax have increased significantly (on average by more than 100% in the first year of application and approx. 30-40% in the following year).• For the first time urban plans and cadastral maps can be easily analyzed together.• Policy now recognizes the importance of investments in municipal IT-infrastructure and professional IT-staff in order to improve effectiveness & efficiency of administrative procedures.• Extension of the GIS by additional modules, e.g. for administration of municipal real estate, has been initiated and financed by municipalities.
33
Good practices
Efforts Preparation/Planning Implementation Maintenance
Time ~ 4 expert months ~ 9 months/municipality ~ 3 days/month/municipality
Costs approx. 50,000 Euro approx. 25,000 Euro/mu-nicipality
approx. 6,000 Euro/year/municipality
Human Resources 2 internat. short-term consultants
IT-consulting company,1 IT-expert, 1 internat. short-term expert (evaluation)
local IT-administrators,IT-consulting company
Reflection/Lesson learned/Critical Assessment:Despite huge difficulties at the beginning, enabling access to and using the official data of the Real Estate Cadastre was the key success factor in implementing GIS in the municipalities. With their constant involvement in the development of the application, initially the most vocal critics became the biggest sup-porters of the GIS.
Contact: [email protected]
Increase of revenues from real estate tax in 6 municipalities

34
Good practices
Speeding up Working Processes and improving Strategic Decision Making on Urban Development in Tirana, Albania
Initial situation/Problem:The Municipality of Tirana (as any other municipality) depends to a large extent on the use of spatial data to achieve its strategic goals. Although many (spatial) data in different formats are available within the municipality, they were hardly used. Reasons were:• Heads and staff of most departments did not know whether and what data was available because data was neither documented nor catalogued properly.• A good understanding of how to make best use of spatial data to support the working processes within the departments didn’t exist in many cases.• Suitable tools to make better use of existing data and to exploit them were not available.
Objective(s):One objective was to support, facilitate and speed up the working processes within the municipality by combining existing data into one system and linking different databases. Another objective was to provide a tool to support better decision making based on more precise knowledge of the actual situation.
Methodological approach:• Initial workshop to get commitment from the management of the municipality for the planning process and to establish a GIS team within the municipality• Workshops/training on GIS basics for staff and management of the municipality to raise their awareness and make them fit to express their needs regarding GIS• Definition of the specific GIS requirements by meeting staff of the involved departments and gathering information about the municipality’s needs • Preparation of a list of products which the GIS must be able to create• Definition of the scope of the GIS• Definition of a data model• Implementation of the GIS• Installation, training, maintenance
Impact(s) achieved (up to now):• Staff and management of the municipality have a clearer picture of what GIS is and what its advantages and benefits are.
• A comprehensive concept for the implementation of the GIS has been prepared.

35
Good practices
Efforts Preparation/Planning Implementation Maintenance
Time About 5 man-months 5 man-months Yearly
Costs About 5 man-months 50.000,- Euro without VAT
10.000 – 20.000 Euro/ year; not including data updates
Human Resources About 5 man-months 5 man-months
Reflection/Lesson learned/Critical Assessment:• Implementing and introducing a GIS within an organization is a full-time project and must be considered as such.• It was shown that it takes quite a while to make people think in the GIS way and to be able to express their needs and requirements for such a system. It is highly recommended to hold a workshop on GIS basics before actually starting interviewing the staff (and heads) of the depart- ments.• Even after the successful implementation of a GIS, do not neglect system maintenance and plan sufficient resources in the organization’s budget for that purpose.
Contact: [email protected]
Document ManagementSystem for Building Permits,Site Permissions etc.
“DevInfo” for reporting on MDGs
Waste Management System
Traffic Simulation Software
Urban Planning
Sharing Data
Sharing Data Sharing Data
Synchronization
Linkage
Linkage Linkage
Municipal GIS WebGIS
GIS Database WebGIS Database
Tax Software

36
Good practices
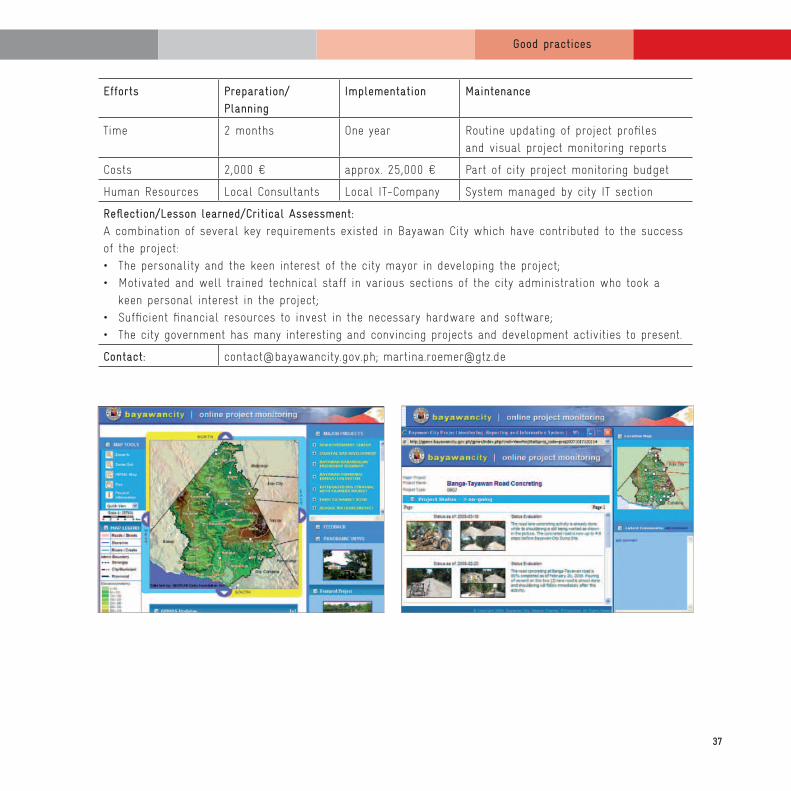
Web-based Online Project Information and Monitoring in Bayawan City, Philippines
Initial situation/Problem:In December 2000, the municipality of Bayawan (population 100,000) became a chartered city. A major benefit of the new administrative status was a considerable increase of tax transfers from the national treasury, which allowed the city government to embark on an ambitious development scheme to improve its physical, social and economic infrastructure. Soon, managing and monitoring the numerous ongoing projects, many of them located in the remote mountainous hinterland, turned difficult. The city started to look for new ways and means to get a faster and more visual “picture” of the actual status of project implementa-tion. Another intention was to provide local residents and tax payers with information on the development activities of the city.
Objective(s):• Keeping management, staff, and the general public informed about what projects are implemented and where and how implementation is progressing in a visually informative way;• Creating an effective publicity and promotional tool to attract potential investors;• Developing an example of transparent and accountable local governance; • Applying up to date ICT in project management and monitoring.
Methodological approach:The online project monitoring system was developed by a GIS service company in close cooperation with the City IT department over a period of one year. As an integral part of the city’s website, it features location, project details and progress of implementation of all development projects of the city government. The status of implementation is shown in photographs and partially in 360 degree panoramic views. An integral part of the project was local capacity building and know how transfer in form of various training courses on topics such as team building, GIS mapping, photography skills, digital image processing and website administration.
Impact(s) achieved (up to now):• Since the official start in December 2004, the system has been maintained and regularly updated by the IT-Section and Monitoring Task group of the city administration;• The online project monitoring system has gained wide interest and has served as a model for similar projects in other parts of the country;• Encouraging positive feedback from local and foreign visitors of the website motivates officials and staff involved in project work;• Various promotional activities of the city to attract local and foreign investment as well as promoting local tourism have been supported;• The reputation of the city as a well managed and administrated location has been enhanced.
37
Good practices
Efforts Preparation/ Planning
Implementation Maintenance
Time 2 months One year Routine updating of project profiles and visual project monitoring reports
Costs 2,000 € approx. 25,000 € Part of city project monitoring budget
Human Resources Local Consultants Local IT-Company System managed by city IT section
Reflection/Lesson learned/Critical Assessment:A combination of several key requirements existed in Bayawan City which have contributed to the success of the project: • The personality and the keen interest of the city mayor in developing the project;• Motivated and well trained technical staff in various sections of the city administration who took a keen personal interest in the project; • Sufficient financial resources to invest in the necessary hardware and software;• The city government has many interesting and convincing projects and development activities to present.
Contact: [email protected]; [email protected]

38
Good practices
Concession and Lease Inventory in Laos
Initial situation/Problem:Over the last decade, Laos experienced a strong increase in foreign direct investment (FDI). Thousands of hectares of state land were granted to foreign companies in form of long-term concessions and leases for commercial plantations often with negative social and environmental impacts. These problems generally derive from the fact that the exact location and boundaries as well as the use of conceded areas are often unclear due to the fact that neither state land nor concessions have ever been mapped or registered. Information about concession projects (location, size, purpose, duration etc.) only exist in bits and pieces within various agencies.
Objective:A comprehensive inventory and mapping of all concession/lease projects nationwide.
Methodological approach:• GTZ supports the Land and Natural Resource Research and Information Centre (LNRRIC). • A small team at LNRRIC was trained in handheld GPS-equipment usage, mapping, ArcGis Map and creating spatial data sets. • The team collects data in the field and cross checks new with already available data.• The team uses GPS to obtain the exact location of concession projects and where possible delineates existing concession areas. • All data is then entered in a Database-System (MS Access) and the mapping is done in ArcGis Software. The location of each concession is added using the GPS data. This data is overlaid with a GIS base map and satellite images to verify it and to identify borders of concession areas that could not be surveyed in the field.
Impact(s) achieved (up to now):• In the pilot province Vientiane, 382 concession/lease projects were identified and entered in the MS Access Database and ArcMap.• The mapping visualizes typical problems: concession projects overlapping each other, concession projects located within conservation/protection area, concession projects or large parts of them actually located in different districts, and not in the district where the agreement was signed, the plantation area being much larger than the agreed size of concession area ...• This project attracted great attention and the Team Leader of the project-team at the LNRIRC had to present results from the pilot province in front of Ministers and the Prime Minister. As a consequence the whole problematic situation of handing out large concession areas to foreign investors without proper survey and planning was discussed at high political level.

39
Good practices
Efforts Preparation/Planning Implementation Maintenance
Time October – November 2008 November – March 2009 No experience yet
Costs 4 GPS Garmin, 60CSx (ca. 2500 USD) Training material (ca. 100 USD) 1 PC (ca. 1600 USD)
2 Off-road Motorbikes, 225 cc (ca. 3800 USD), Logistic, Gasoline, Phone cards, bridge fees, etc. (ca. 4000 USD)
No experience yet
Human Resources GIS – Expert and Land Policy Adviser (ca. 7000 USD/month) Government staff
5 team members from LNRIRC, GIS – Expert and Land Policy Adviser (sup-port and quality check)
No experience yet
Reflection/Lesson learned/Critical Assessment:• This method is time consuming, because all concession/lease projects need to be visited in order to get at least one GPS point. • Many concession projects are too large and without road-access, therefore covering them by motorbike/ walking is often not possible. In the future, the team will work with available satellite images in order to estimate the boundaries and calculate the surface area.• Collected information has to be carefully analyzed and recommendations/lessons drawn.
Contact: [email protected]
Data Entry
Data Collection & Surveying Mapping & Reporting

40
Good practices
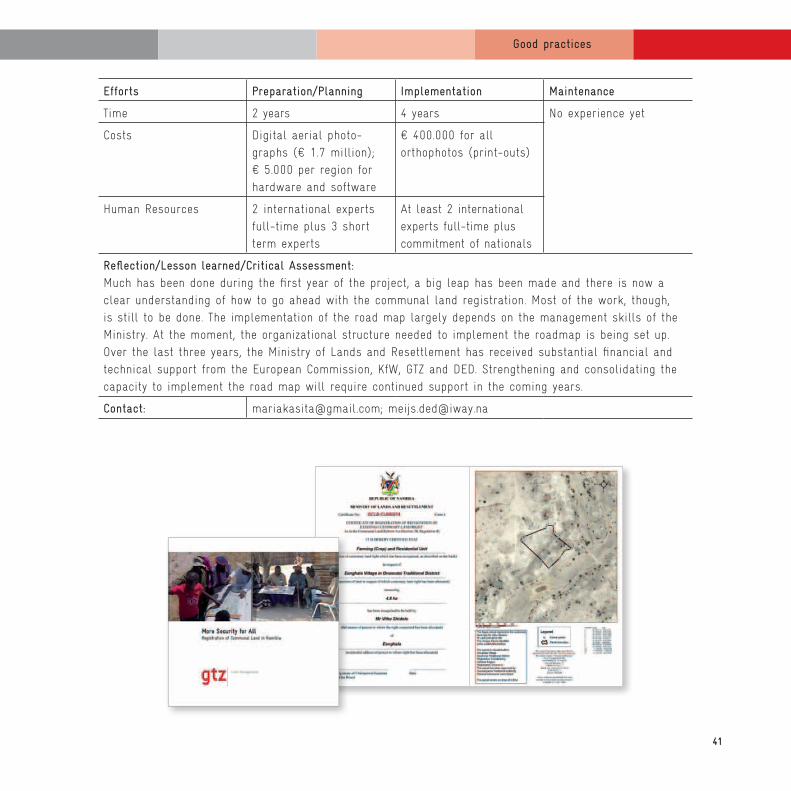
Land Registration in Namibia: Securing Individual Rights on Common Land
Initial situation/Problem:There were two big challenges being faced when the communal land registration program was being facilitated. The first was the need to hasten the process and complete the registration of existing land rights within a rea-sonable time frame. The second challenge was to safeguard the collected information in an organized manner, which was then easy to administer.
Objective:• Improving secure land tenure, especially for the poor in rural areas and thereby• reducing poverty by improving sustainable rural livelihoods • Solving existing land related disputes• Preventing new land disputes as rights to use land are documented and recorded• Revealing areas that are fenced legally and illegally• Providing better information for governing Namibia
Methodological approach:Since 2003 the Ministry of Lands and Resettlement (MLR), together with the Communal Land Boards (CLB), has administered land in the communal areas of Namibia. As the original approach of using hand held GPS for surveying took too much time, new methods based on the use of aerial photos have been devised to fast track the process of land registration. Apart from being faster and more cost-effective, the lines demarcating parcel boundaries that were drawn on the orthophotos could be seen and agreed to by everyone present. In the beginning of 2008, it was agreed to also improve data storage and therefore to develop a comprehen-sive recording system for communal land rights. This Namibia Communal Land Administration System (NCLAS) consists of two parts: the Communal Deeds (based on Microsoft Access) and the Communal Cadastre (based on ArcGIS). Finally, a roadmap has been developed and plans are being prepared to register all existing com-munal land rights by the end of 2012.
Impact(s) achieved (up to now):• The new method to identify properties and boundaries using orthophotos is eight times faster than the old method based on GPS measurements (surveying).• The GIS database has been designed and implemented in all regions and staff is trained.• A road map for the registration of customary land rights has been designed.• The road map is accepted by the Ministry who is now starting to implement it. results from the pilot province in front of Ministers and the Prime Minister. As a consequence the whole problematic situation of handing out large concession areas to foreign investors without proper survey and planning was discussed at high political level. The road map is accepted by the Ministry who is now starting to implement it.
41
Good practices
Efforts Preparation/Planning Implementation Maintenance
Time 2 years 4 years No experience yet
Costs Digital aerial photo-graphs (€ 1.7 million); € 5.000 per region for hardware and software
€ 400.000 for all orthophotos (print-outs)
Human Resources 2 international experts full-time plus 3 short term experts
At least 2 international experts full-time plus commitment of nationals
Reflection/Lesson learned/Critical Assessment:Much has been done during the first year of the project, a big leap has been made and there is now a clear understanding of how to go ahead with the communal land registration. Most of the work, though, is still to be done. The implementation of the road map largely depends on the management skills of the Ministry. At the moment, the organizational structure needed to implement the roadmap is being set up.Over the last three years, the Ministry of Lands and Resettlement has received substantial financial and technical support from the European Commission, KfW, GTZ and DED. Strengthening and consolidating the capacity to implement the road map will require continued support in the coming years.
Contact: [email protected]; [email protected]

42
Good practices
Securing Land Rights, introducing Land Tax and improving Municipal Services in small Towns in Mali: Municipal Land Management based on Street Addressing
Initial situation/Problem:In the course of decentralization, communes were receiving increasing competences in land management ranging from land use planning to the collection of land related taxes. There was, however, no evidence of who held what kind of rights over which piece of land. Mali, as many other African countries, is marked by the juxtaposition of colonial and customary land tenure, the latter being oral and based on its own institutions. Most Malian com-munes are lacking all prerequisites for a computer-based GIS: human capacity, financial means, computers and even electricity. The challenge, therefore, is to develop adequate instruments to secure land rights and to define land uses. A paper-based GIS or simple Land Information System (LIS) is needed.
Objective:• Improving secure land tenure, especially for the poor in rural areas and thereby• reducing poverty and • preventing land related disputes• Establishing a base for land tax collection• Facilitating the decentralization of public land• Facilitating the management of municipal services
Methodological approach:• Identification of pilot communes• Analysis of the demand for GIS: For which purposes (tax collection, land use planning, transfer of public land from national to local level, municipal services etc.) are new land management tools/GIS needed?• Purchase of satellite images and preparation of base maps• Street addressing in all pilot communes as a basis for registration of land rights, tax collection, collection of fees for municipal services etc.• Development and implementation of land management instruments in cooperation with the pilot communes • Regular exchange with the Ministry of Land which is responsible for the dissemination (information, training, adaptation of the legal frame)
Impact(s) achieved (up to now):• Approach for street addressing has been developed and implemented in several municipalities• Simple land administration and land management tools (land register, land tax collection) have been developed and are to be tested.

43
Good practices
Efforts for street addressing
Preparation/Planning Implementation Maintenance
Time 3 months No experience yet
Costs Depending on the material of the signs: € 6-12.000
Human Resources 1-2 Experts/Engineers 3 workers
Reflection/Lesson learned/Critical Assessment:Over the years there have been many attempts to introduce a high-tech GIS in several Malian communes. A lot of time and money has been spent but it doesn’t seem that the GIS will ever be used. The new ap-proach is, therefore, based on low-tech solutions, e. g. securing land tenure without cadastre but just based on land registers using street addressing to identify properties. Sometimes, it doesn’t need to be a sophisticated GIS; sometimes it even doesn’t have to be one at all!
Contact: [email protected]; [email protected], [email protected]

44
Good practices
Identifying suitable Locations for the Construction of Photovoltaic Plants in Markt Eichendorf, Germany
Initial situation/Problem:The construction of photovoltaic plants has been strongly promoted in Germany. Therefore, several municipali-ties are facing an increasing number of authorization processes with companies willing to build solar farms.A GIS-based study of site adequacy considering the long-term planning goals of the municipality and techni-cal requirements offers a transparent and comprehensible instrument for decision making. The basis of this study is an extensive municipal GIS database, including land use plan, landscape plan, cadastral map, natural resource plans and other data. The rural municipality in this example covers about 100 square kilometers.
Objective:Identification of areas most suitable for solar plants according to the following criteria:• solar radiation and technical suitability • absence of conflicts with existing land uses • no negative effect on landscape (visibility)
Methodological approach:The study is based on an extensive GIS database including a digital terrain model. The themes mentioned above were processed by application of advanced GIS functions like a solar module, 3D-functions for calculating slope and visibility and complex geo-processing functions. These functions are available within the software ArcView/ESRI and the extensions Spatial Analyst and 3D-Analyst.
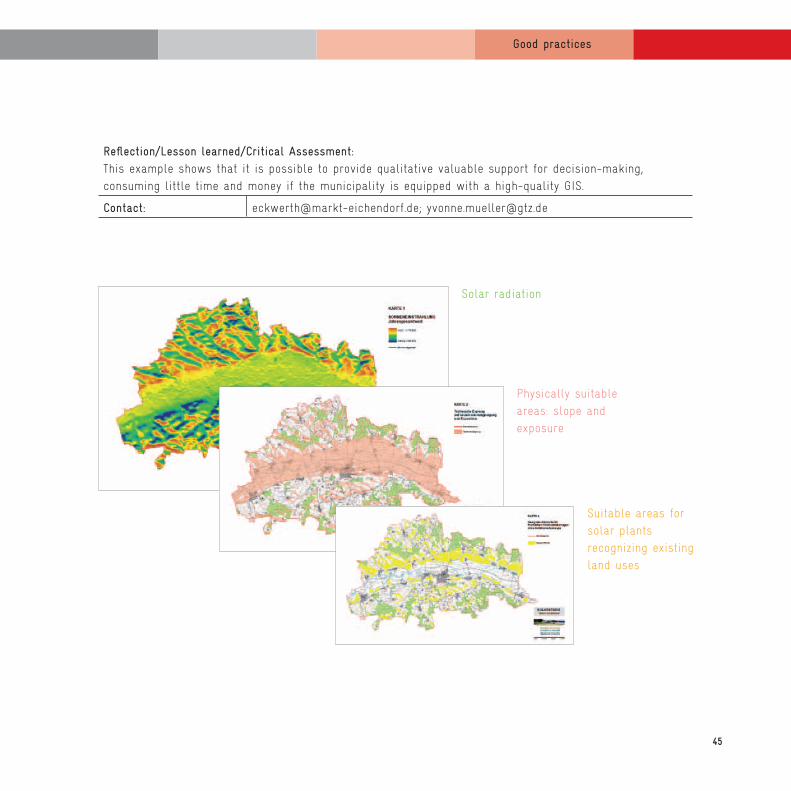
Impact(s) achieved (up to now):The result of the study is a plan that shows areas suitable for solar plants. It considers the planning goals of the municipality and technical aspects of using solar radiation. Therefore, the results guarantee the best performance of a plant and minimal damage to natural resources. By including all the data mentioned above it offers a fast and reliable decision making instrument. Once developed, the same process can be applied in several municipalities.
Efforts Preparation/Planning Implementation Maintenance
Time 2 monthsn/a n/aCosts About 10.000 €
Human Resources 1 engineer
45
Good practices
Reflection/Lesson learned/Critical Assessment:This example shows that it is possible to provide qualitative valuable support for decision-making, consuming little time and money if the municipality is equipped with a high-quality GIS.
Contact: [email protected]; [email protected]
Solar radiation
Physically suitable areas: slope and exposure
Suitable areas for solar plants recognizing existing land uses
46
Good practices
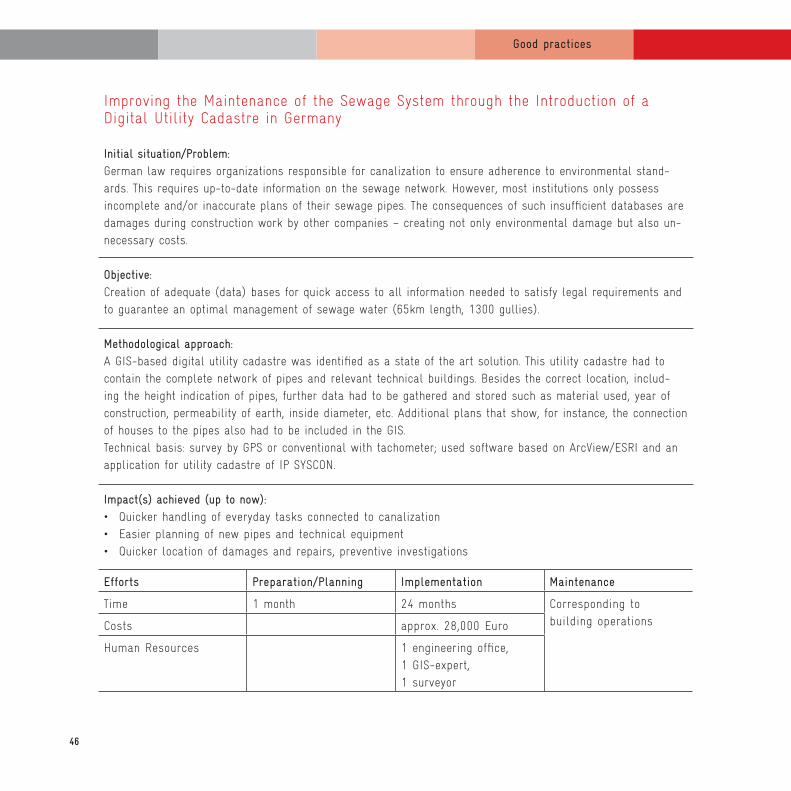
Improving the Maintenance of the Sewage System through the Introduction of a Digital Utility Cadastre in Germany
Initial situation/Problem:German law requires organizations responsible for canalization to ensure adherence to environmental stand-ards. This requires up-to-date information on the sewage network. However, most institutions only possess incomplete and/or inaccurate plans of their sewage pipes. The consequences of such insufficient databases are damages during construction work by other companies – creating not only environmental damage but also un-necessary costs.
Objective:Creation of adequate (data) bases for quick access to all information needed to satisfy legal requirements and to guarantee an optimal management of sewage water (65km length, 1300 gullies).
Methodological approach:A GIS-based digital utility cadastre was identified as a state of the art solution. This utility cadastre had to contain the complete network of pipes and relevant technical buildings. Besides the correct location, includ-ing the height indication of pipes, further data had to be gathered and stored such as material used, year of construction, permeability of earth, inside diameter, etc. Additional plans that show, for instance, the connection of houses to the pipes also had to be included in the GIS.Technical basis: survey by GPS or conventional with tachometer; used software based on ArcView/ESRI and an application for utility cadastre of IP SYSCON.
Impact(s) achieved (up to now):• Quicker handling of everyday tasks connected to canalization• Easier planning of new pipes and technical equipment• Quicker location of damages and repairs, preventive investigations
Efforts Preparation/Planning Implementation Maintenance
Time 1 month 24 months Corresponding to building operationsCosts approx. 28,000 Euro
Human Resources 1 engineering office,1 GIS-expert,1 surveyor
47
Good practices
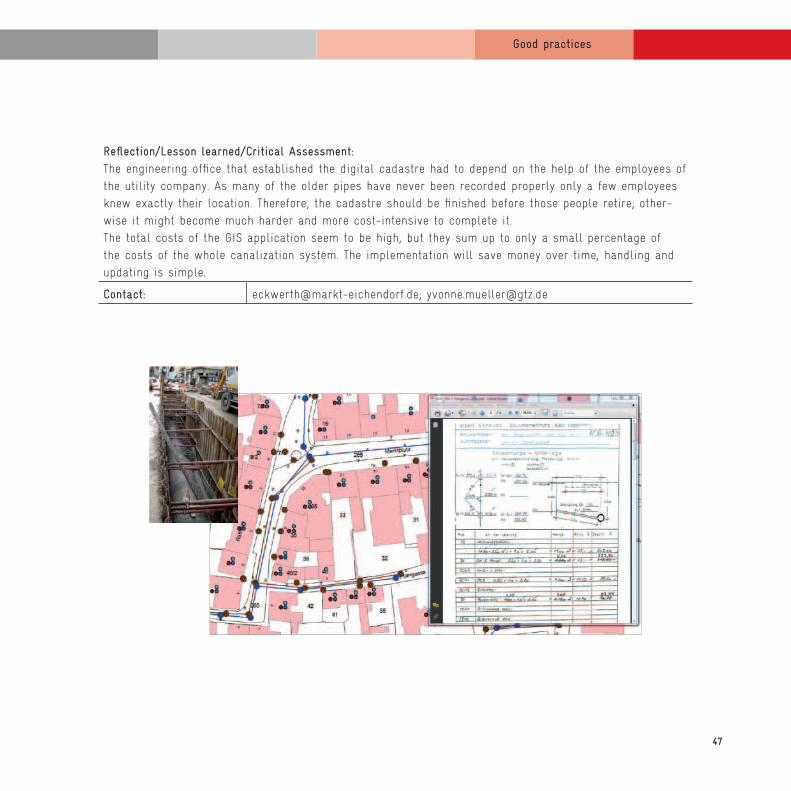
Reflection/Lesson learned/Critical Assessment:The engineering office that established the digital cadastre had to depend on the help of the employees of the utility company. As many of the older pipes have never been recorded properly only a few employees knew exactly their location. Therefore, the cadastre should be finished before those people retire; other-wise it might become much harder and more cost-intensive to complete it. The total costs of the GIS application seem to be high, but they sum up to only a small percentage of the costs of the whole canalization system. The implementation will save money over time, handling and updating is simple.
Contact: [email protected]; [email protected]

48
Good practices
Increasing Efficiency in Urban Planning through the Integration of analogous legally binding Land-use Plans into the City-GIS in Erding, Germany
Initial situation/Problem:The city has at its disposal a widely developed GIS. Yet the binding land use plans are not integrated. There are about 80 plans and an additional 160 plans of modification that are used simultaneously by different employ-ees. The handling and access to these partly worn out plans is time-consuming and difficult. Also, because of their age and conditions the plans are in danger of becoming unreadable.
Objective:Speeding-up procedures and facilitating high-quality decision making by:• Parallel use of plans by different employees• Quick access to data• Conservation of plans• Combination of these plans with other data like aerial photographs or real estate cadastre
Methodological approach:The analogous plans were scanned to a digital raster format and transformed to a PDF-document resulting in a simple digital copy of the original. The plans were then georeferenced to allow their overlay with other maps and aerial photographs. Textual appointments and plan symbols were cut out and transferred to a PDF-docu-ment and then linked to the plan in the GIS as another layer. Finally, the area of validity of each plan had to be digitized guaranteeing an effective management of all plans (digital archive of plans).
Impact(s) achieved (up to now):All plans are available in digital form; their parallel use and the combination with other data are possible. The integration into GIS allows an effective management of all plans & their modifications.
Efforts Preparation/Planning Implementation Maintenance
Time 3 months
Costs About 20.000 € 150 € per new plan
Human Resources 1 engineer
49
Good practices
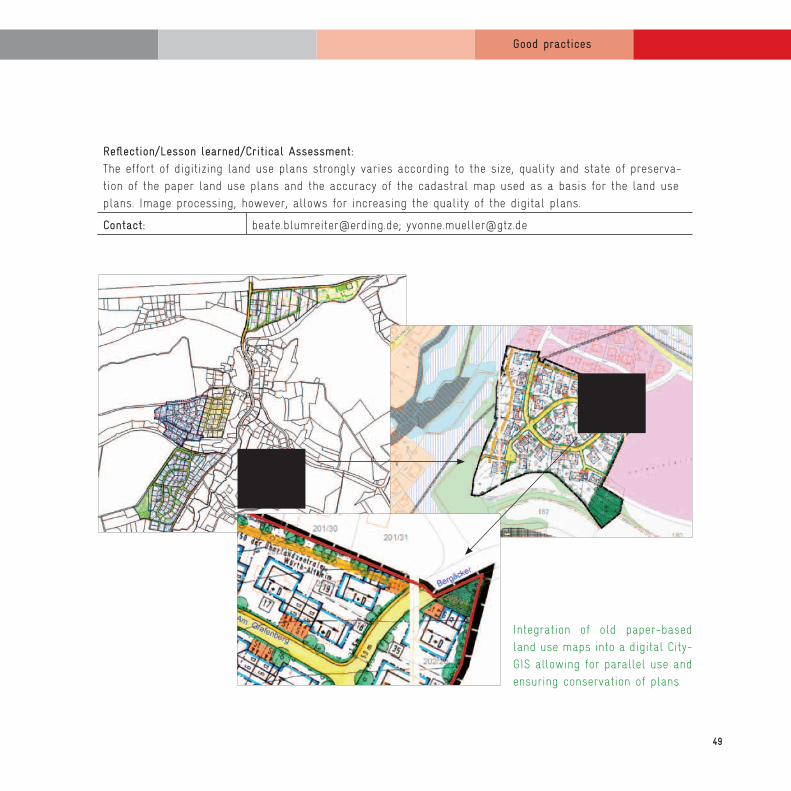
Reflection/Lesson learned/Critical Assessment:The effort of digitizing land use plans strongly varies according to the size, quality and state of preserva-tion of the paper land use plans and the accuracy of the cadastral map used as a basis for the land use plans. Image processing, however, allows for increasing the quality of the digital plans.
Contact: [email protected]; [email protected]
Integration of old paper-based land use maps into a digital City-GIS allowing for parallel use and ensuring conservation of plans
50
Annexes
5. Annexes
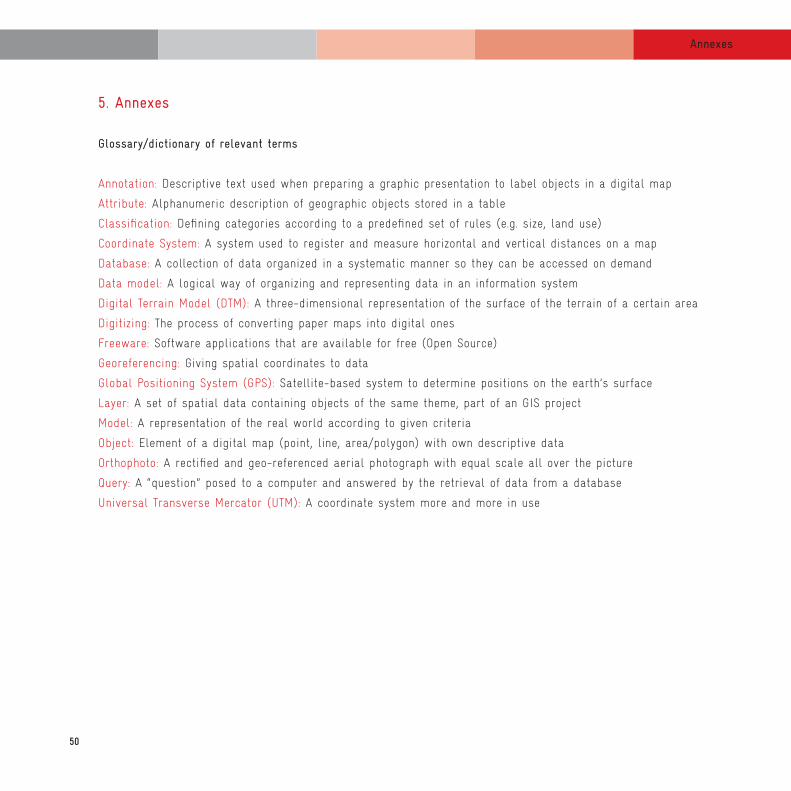
Glossary/dictionary of relevant terms
Annotation: Descriptive text used when preparing a graphic presentation to label objects in a digital map
Attribute: Alphanumeric description of geographic objects stored in a table
Classification: Defining categories according to a predefined set of rules (e.g. size, land use)
Coordinate System: A system used to register and measure horizontal and vertical distances on a map
Database: A collection of data organized in a systematic manner so they can be accessed on demand
Data model: A logical way of organizing and representing data in an information system
Digital Terrain Model (DTM): A three-dimensional representation of the surface of the terrain of a certain area
Digitizing: The process of converting paper maps into digital ones
Freeware: Software applications that are available for free (Open Source)
Georeferencing: Giving spatial coordinates to data
Global Positioning System (GPS): Satellite-based system to determine positions on the earth’s surface
Layer: A set of spatial data containing objects of the same theme, part of an GIS project
Model: A representation of the real world according to given criteria
Object: Element of a digital map (point, line, area/polygon) with own descriptive data
Orthophoto: A rectified and geo-referenced aerial photograph with equal scale all over the picture
Query: A “question” posed to a computer and answered by the retrieval of data from a database
Universal Transverse Mercator (UTM): A coordinate system more and more in use
51
Annexes
Annotated Bibliography
Introduction into GIS
• An Introduction to Geographical Information Systems
Heywood, S. Cornelius, S. Carver, Pearson Education, 2006, 419 pages; Provides vivid and comprehen-
sive descriptions of all fundamentals of GIS as well as of organizational and management issues of a
GIS project, many examples and figures, very suitable for GIS starters.
• Fundamentals of Geographic Information Systems
M. N. DeMers, New Mexico state University, John Wiley and Sons Inc., 2005, 459 pages; Covers all
relevant topics of GIS basics like data models, storage, analysis, graphical outputs, applications, very
scientific language.
• GIS Fundamentals, a First Text on Geographic Information Systems
P. Bolstad, Eider Press, 2008, 620 pages; A technical introduction into GIS covering the topics: spatial
data models, map projections and coordinate systems, aerial photographs and satellite images, digital
data, vector and raster spatial analyses, terrain and cartographic modeling, metadata, standards and a
description of future trends, combination of theory and application.
• Geographical Information Systems – Management Issues and Application
P. A. Longley, M. F. Goodchild, D. J. Maguire, D. W. Rhind, John Wiley and Sons, Inc., 1999, 1001 pages;
Covers a wide range of topics containing principles of GIS, technical issues, management issues, applica-
tions, very extensive, going into all details of GIS, very informative but requires a lot of time.
• GIS for Everyone
D. E. Davies, The ESRI press, 2003, 163 pages; Covers a wide range of information on digital maps, very
descriptive and colorful, closely linked to ESRI-products, including CD with tutorial exercises and data,
very suitable for GIS starters.
• Concepts and Techniques of Geographic Information Systems
C. P. Lo, A. K. W. Yeung, Prentice-Hall Inc., 2002, 470 pages: Covers a wide range of technical topics like
digital maps, data quality and standards, data processing, visualization, remote sensing, spatial analysis
and modeling, very technical and extensive, only a few figures.

52
Annexes
• Thematic Cartography and Geographic Visualization
T. A. Slocum, R. B. McMaster, F. K. Kessler, H. H. Howard, Pearson Prentice Hall, 2005, 509 pages; Provides
extensive information on presentation of thematic data and mapping, suitable as further reading after having
implemented at least some test applications, fundamental knowledge required.
• Dictionary of GIS Terminology
The ESRI Press, 2001, 128 pages; Gives concise but easily understandable definitions of 1200 terms
related to GIS, cartography, remote sensing.
GIS Applications
• Land Administration
P. F. Dale, J. D. McLaughlin, Oxford University Press Inc., 1999, 184 pages; Provides an overview on
relevant topics like land registration, land evaluation, fiscal cadastre, policy and economic issues in land
administration, management of land administration, presents recent advances in building formal property
systems throughout the world and reviews the role of property in advancing a society’s economic and
social agenda.
• Urban Planning and Development Applications of GIS
S. Easa, American Society of Civil Engineers, 2000, 306 pages;Presents various GIS applications related to
urban planning and development, such as public utilities, storm water and waste management, transpor-
tation, cultural and natural resources, disaster management, suitable for getting an idea of the possibili-
ties of GIS.
• Disaster Response: GIS for Public Safety
G. Amdahl, Environmental Systems Research Institute, 2001, 108 pages; Strategies for mitigation, response,
and recovery from both natural and human disasters, such as fires, floods or toxic spills, are presented in
case studies.
• Transportation GIS
L. Lang, The ESRI Press, 1999, 118 pages; Provides a deep insight into possibilities of GIS in the field of
transportation, covers topics like monitoring train locations, tracking flight paths and noise levels, plan-
ning for highway maintenance, or improving bus routes, managing equipment and infrastructure, easy to
read, includes CD with multimedia presentations.
53
Annexes
• GIS in Real Estate: Integrating, Analyzing, and Presenting Locational Information
G. H. Castle (Editor), The Appraisal Institute, 1998, 206 pages; Presents case studies of commercial and
residential use of GIS in real estate in public and private sector.
• GIS for the Urban Environment
J. Maantay, J. Ziegler, The ESRI Press, 2006, 596 pages; Starts from zero by defining basic terms,
covers general topics like spatial modeling, data classification, data visualization, data sources, presents
case studies, easy to understand and very informative.
GIS in Technical Cooperation
• Geographische Informationssysteme – Einsatz in Projekten der Technischen Zusammenarbeit
GTZ, 1994, 99 pages; Provides an overview on practical implementation of GIS in technical cooperation
projects.
• Experiences with GIS-Application in the Framework of German Technical Cooperation
GTZ, 2000, 252 pages; Presents a wide range of experiences and various types of GIS applications within
the frame-work of German technical cooperation projects.
• GIS Guideline for Local Self-Government in Serbia
GTZ, SCTM, RGZ, 2008, 66 pages (available in English and Serbian language); Guideline focussing on
management aspects dealing with institutional, legal, financial, organisational aspects of setting up a
municipal GIS.
Alternatives to GIS
• Street Addressing and the Management of Cities
C. Farvaque-Vitkovic, L. Godin, H. Leroux, F. Verdet and R. Chavez (World Bank publication), 2005, 264
pages; Provides an exhaustive overview on the many applications of street addressing, including examples
from all over Africa (available on the web).
54
Annexes
Useful links
• Google Earth http://earth.google.com/intl/en/index.html
• GIS.com http://www.gis.com
Public information portal on GIS, data, software, applications
• FreeGIS http://www.freegis.org/
Software overview on Free Geographic Information Systems
• GIS Runder Tisch e.V. http://www.rtg.bv.tum.de
• GIS Guideline for Serbian Local Self-Governments http://skgo.org/publikacije
Download of a detailed manual for GIS implementation adjusted to circumstances in Serbia
• Open Geospatial Consortium, Inc. http://www.opengeospatial.org/
Standards for geospatial and location based services
• INSPIRE http://inspire-jrc.ec.europa.eu
http://inspire-geoportal.eu
Information on the Infrastructure for Spatial Information in Europe (INSPIRE) Directive
• Examples of public GIS portals
• Municipality of Subotica, Serbia: http://suboticagis.rs
• Municipality of Tirana, Albania: http://www.tirana.gov.al
• City of Niš, Serbia: http://gis.ni.rs/?map=ni
• City of Houston, USA: http://houstoncrimemaps.com/
• City of Lyon, France: http://plu.grandlyon.com/plu.php#
• Metropolitan Region Hamburg: http://www.geodaten.metropolregion.hamburg.de

55
Annexes
Acknowledgements This booklet benefited greatly from the valuable insights and contributions by Sekou Ba, Matthias Bartels,
Reinhold Bäuerle, Branko Begovic, Patrick Bühler, Mirsad Buljevic, Thomas Christiansen, Wim Dekkers, Luan
Dervishej, Jean-Luc Horisberger, Bernd Leonhard, Marcel Meijs, Yvonne Müller, Kemal Osmanovic, Robert
Riethmüller, Harald Rojahn, Martina Römer, Oliver Schoenweger, Ulrich Voerkelius and Michael Wagner. Special
thanks are due to Johanna da Rocha Abreu for the proofreading of the text.
´ ´
´
Photos, Maps and Graphs:
City of Subotica: cover page (top left); pages 13 (top), 18 (top), 24;
Cambodian-German Land Management and Administration Project (GTZ/LMAP): page 17 (top);
Deckers, Wim: pages 31 (top left), 43 (left and right);
Dervishej, Luan: page 35;
Donaubauer, Andreas: page 15 (bottom);
GTZ-IS; German-Indonesian Tsunami Early Warning System (GITEWS), WP 6300: page 16 (bottom);
GTZ-Sector Project Disaster Preparedness: page 16 (top);
GTZ-Sector Project Land Management: page 41 (left);
Land Use Planning and Natural Resource Management Project in Oromia Region (GTZ LUPO),
Ethiopia: page 14 (top);
Lao-German Land Policy Development Project (GTZ): pages 31 (bottom left), 39;
Meijs, Marcel: pages 4, 41 (right);
Müller, Yvonne: page 33;
Riethmüller, Robert: pages 12 (top and bottom), 14 (bottom), 37 (left and right);
Schilcher, Matthäus: page 8;
Traub, K.P. (published before in GTZ GIS-Newsletter 10/2003): page 13 (bottom);
Voerkelius, Ulrich: pages 5 (right), 7, 19 (top), 31 (right), 45, 47, 49;
Wehrmann, Babette: cover page (top right); pages 5 (left and middle), 11, 15 (top), 17 (bottom),
18 (bottom), 19 (bottom), 25, 30 (top and middle);
Witmer, Richard: page 30 (bottom).

Deutsche Gesellschaft fürTechnische Zusammenarbeit (GTZ) GmbH
SELLER Sector NetworkSector Project Land Management
Postfach 518065726 Eschborn/GermanyT +49 61 96 79-6429F +49 61 96 79-7173E [email protected] www.gtz.de