Embed Size (px)
Citation preview
GESCHÄFTSBERICHT 2007ANNUAL REPORT 2007
Pearl_2007.qxp:Pearl_2005 18.3.2008 11:18 Uhr Seite 1
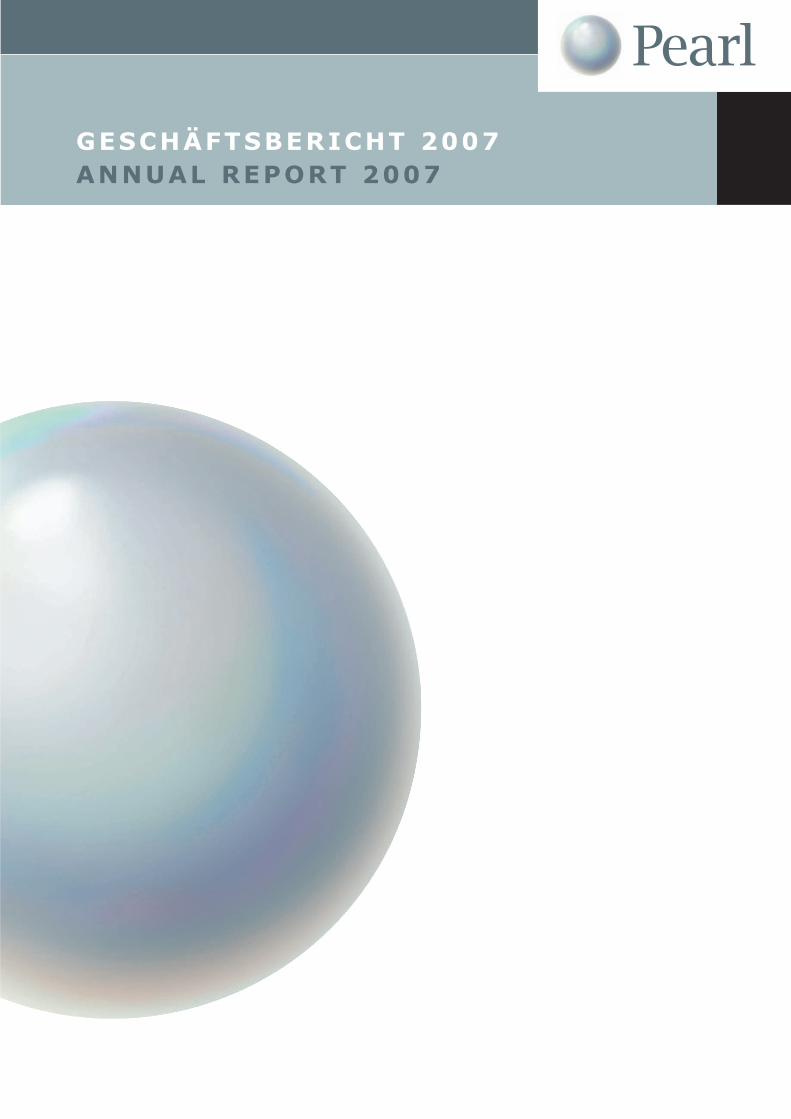
WERTENTWICKLUNG 2007PERFORMANCE 2007
2
JAHRESBERICHT 2007
31.1
2.0
0
31.0
3.0
1
30.0
6.0
1
30.0
9.0
1
31.1
2.0
1
31.0
3.0
2
30.0
6.0
2
30.0
9.0
2
31.1
2.0
2
31.0
3.0
3
30.0
6.0
3
30.0
9.0
3
31.1
2.0
3
31.0
3.0
4
30.0
6.0
4
30.0
9.0
4
31.1
2.0
4
31.0
3.0
5
30.0
6.0
5
30.0
9.0
5
31.1
2.0
5
31.0
3.0
6
30.0
6.0
6
30.0
9.0
6
31.1
2.0
6
31.0
3.0
7
30.0
6.0
7
30.0
9.0
7
31.1
2.0
7
140%
130%
120%
110%
100%
90%
80%
70%
MITTELKURS- UND NAV-ENTWICKLUNG
MID-MARKET PRICE AND NAV DEVELOPMENT
NAV – NAV
NAV inkl. ausgeschüttetem und aufgelaufenem Zins – NAV incl. accrued and paid-out coupon
Mittelkurs – Mid-market price
Pearl_2007.qxp:Pearl_2005 18.3.2008 11:18 Uhr Seite 2
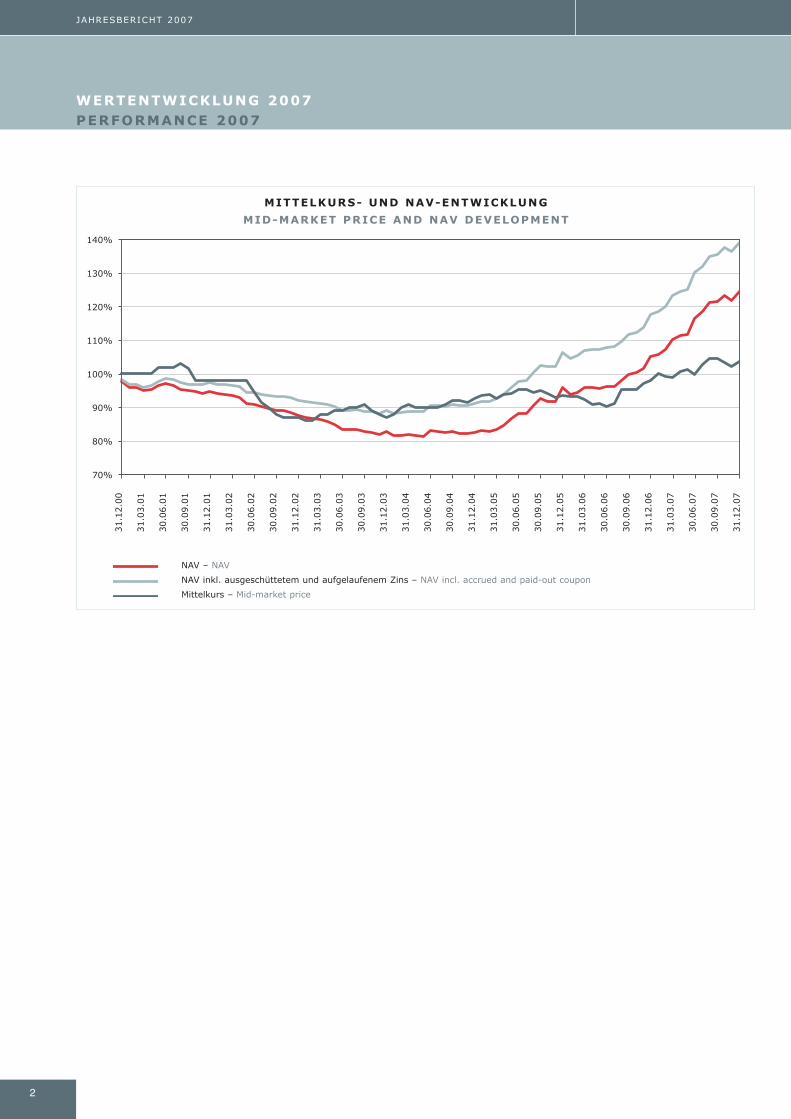
31.12.2007 31.12.2006
124.45% 105.20%
14.50% 12.50%
138.95% 117.70%
103.75% 98.00%
-16.63% -6.84%
EUR 126’809’816 EUR 129’998’324
EUR 694’601’797 EUR 564’338’811
EUR 352’317’439 EUR 363’182’525
84.56% 81.28%
Kennzahlen
Key figures
Geprüfter Innerer Wert (NAV)
Audited Net Asset Value (NAV)
Aufgelaufener und bezahlter Zins seit Emission
Accrued and paid interest since inception
Theoretischer NAV (mit aufgelaufenem und ausbezahltem Zins)
Theoretical NAV (if no interest accrued and paid to date)
Mittelkurs
Mid-market price
Discount zum NAV
Discount to NAV
Netto Liquidität
Net liquidity
Geprüfter Wert der Private Equity-Investitionen
Audited value of private equity investments
Nicht abgerufene Zahlungsversprechen
Undrawn commitments
Investitionsgrad
Investment level
Overcommitment 27.45% 33.58%
3
ANNUAL REPORT 2007
Firmenprofil
Pearl Holding Limited («Pearl») ist eine Private Equity-
Investmentgesellschaft mit Sitz in Guernsey. Die von der
Pearl Holding emittierte Wandelanleihe eröffnet sowohl
institutionellen als auch privaten Investoren die
Möglichkeit, an einem professionell betreuten und breit
diversifizierten Portfolio aus Beteiligungen an Private
Equity-Partnerships, börsennotierten Private Equity-
Gesellschaften und Direktinvestitionen zu partizipieren. Der
Gesamterlös der drei Emissionen seit September 2000 ist
EUR 660 Mio. Der Rückzahlungsbetrag (108% des Nominal-
betrages) bei Fälligkeit am 30. September 2014 sowie die
Zinszahlungen werden durch einen Versicherungsvertrag
mit der European International Reinsurance Company,
einer Tochtergesellschaft der Swiss Re, garantiert. Dieser
Vertrag wurde von der Swiss Re rückversichert. Der
sicherungsvermögens- und spezialfondsfähigen Wandelan-
leihe wurde von Standard & Poor’s ein AA Rating vergeben.
Company profile
Pearl Holding Limited (“Pearl”) is a Guernsey-registered pri-
vate equity investment company. Pearl Holding’s convert-
ible bond enables institutional and private investors to par-
ticipate in a professionally managed, broadly diversified
portfolio of investments in private equity partnerships, list-
ed private equity vehicles and direct investments. Since
inception in September 2000, EUR 660 million has been
raised in three closings. The redemption amount (108% of
the nominal amount) of the bond as well as the annual
coupon of 2% are insured until maturity on 30 September
2014 under an arrangement with European International
Reinsurance Company, a wholly-owned subsidiary of Swiss
Re. The convertible bond, which is eligible for the invest-
ment of prime stock reserves in Germany, has been given
an AA rating by Standard & Poor’s.
Pearl_2007.qxp:Pearl_2005 18.3.2008 11:18 Uhr Seite 3
INHALTSVERZEICHNISTABLE OF CONTENTS
4
JAHRESBERICHT 2007
Dieses Dokument ist nicht als Anlagewerbung oder Verkaufsprospekt gedacht und stellt weder eine Offerte noch den
Versuch der Aufforderung zur Offertenstellung für das hier beschriebene Produkt dar. Dieser Bericht wurde unter
Verwendung von Finanzdaten erstellt, die den Büchern und sonstigen Aufzeichnungen des Unternehmens per
Berichtsdatum entnommen wurden. Die im Bericht der Vermögensverwaltungsgesellschaft im Einzelnen aufgeführ-
ten Grafiken und Zahlen wurden nicht geprüft. In diesem Bericht wird die bisherige Performance beschrieben, die
nicht unbedingt ein Indikator für künftige Ergebnisse sein muss. Die Haftung des Unternehmens für Handlungen,
die auf der Grundlage der zur Verfügung gestellten Informationen vorgenommen werden, ist ausgeschlossen.
Wertentwicklung 2007 Seite 2
Daten und Fakten Seite 6
Pearl Holding Limited Seite 7
Vorwort des Verwaltungsrates Seite 8
Vereinfachte Strukturdarstellung Seite 11
Bericht des Investment Managers Seite 13
Rückblick auf die Private Equity-Industrie 2007 Seite 14
Wertentwicklung des Pearl-Portfolios Seite 23
Investitionsverlauf Seite 25
Portfolio-Allokation Seite 29
Portfolio-Übersicht Seite 32
Neue Zahlungsversprechen Seite 37
Neue Direktinvestitionen Seite 42
Ausgewählte Investitionen der Partnerships Seite 44
Ausgewählte Realisierungen Seite 47
Ausblick auf das Jahr 2008 Seite 50
Ausblick 2008 für Pearl Seite 53
Finanzzahlen Seite 55
Bericht des Wirtschaftsprüfers Seite 58
Finanzzahlen Seite 59
Kurs- und Performance-Informationen Seite 80
Pearl_2007.qxp:Pearl_2005 18.3.2008 11:18 Uhr Seite 4
5
ANNUAL REPORT 2007
This document is not intended to be an investment advertisement or sales instrument; it constitutes neither an
offer nor an attempt to solicit offers for the product described herein. This report was prepared using financial
information contained in the company's books and records as of the reporting date. The charts and figures de-
tailed in the Investment Manager’s Report have not been audited. This report describes past performance, which
may not be indicative of future results. The company does not accept any liability for actions taken on the basis
of the information provided.
Performance 2007 Page 2
Facts and Figures Page 6
Pearl Holding Limited Page 7
Statement of the Board of Directors Page 8
Simplified Structural Overview Page 11
Investment Manager’s Report Page 13
Review on the Private Equity Industry in 2007 Page 14
Performance of the Pearl Portfolio Page 23
Investment Activity Page 25
Portfolio Allocation Page 29
Portfolio Overview Page 32
New Commitments to Partnerships Page 37
New Direct Investments Page 42
Selected Investments by Partnerships Page 44
Selected Portfolio Realizations Page 47
Outlook for 2008 Page 50
Outlook for 2008 for Pearl Page 53
Financial Figures Page 55
Auditor’s Statement Page 58
Financial Figures Page 59
Price and Performance Information Page 80
Pearl_2007.qxp:Pearl_2005 18.3.2008 11:18 Uhr Seite 5

DATEN UND FAKTENFACTS AND FIGURES
6
Pearl Convertible Bond
Issuer Pearl Holding Limited, Guernsey
Capital Protection The principal amount of the bond
is protected at maturity under
insurance arrangements by Pearl
Holding Limited and European
International Reinsurance
Company, and reinsured by
Swiss Re
Launch Date 29 September 2000
Issue Size EUR 660 million
Coupon 2% p.a. on 30 September
of each year,
until 30 September 2014
Maturity 30 September 2014
Redemption 108%
Initial Conversion Price EUR 100
Conversion Period 1 October 2012 until
31 August 2014
Rating AA rating by Standard & Poor’s
Status Fulfills stringent investment regu-
lations for German investors
Stock Exchange Listed on Luxembourg Stock
Exchange
Security Numbers Switzerland 1.140.571
Germany 558.527
ISIN XS0117871698
Settlement Euroclear/Clearstream
Pearl Holding Limited
Fees Management Fee: 1.5% p.a.
Insurance Fee: 1.8% p.a.
Reporting Monthly Report
Quarterly Report
Annual Report
Pearl-Wandelanleihe
Emittent Pearl Holding Limited, Guernsey
Kapitalschutz Kapitalgarantie auf den Nominal-
wert bei Fälligkeit durch Pearl
Holding Limited und European
International Reinsurance
Company, rückversichert durch
Swiss Re
Erstemission 29. September 2000
Emissionsvolumen EUR 660 Mio.
Kupon 2% p.a. zahlbar jeweils
am 30. September,
bis 30. September 2014
Fälligkeit 30. September 2014
Rückzahlung 108%
Anfänglicher EUR 100
Wandelpreis
Wandlungsfrist 1. Oktober 2012 bis
31. August 2014
Rating AA Rating von Standard & Poor’s
Status Sicherungsvermögens- und
spezialfondsfähig
Börse Notierung an der Börse in
Luxemburg
Kennnummern Schweiz 1.140.571
Deutschland 558.527
ISIN XS0117871698
Settlement Euroclear/Clearstream
Pearl Holding Limited
Gebühren Management-Gebühr: 1.5% p.a.
Versicherungsprämie: 1.8% p.a.
Berichte Monatsbericht
Quartalsbericht
Jahresbericht
JAHRESBERICHT 2007
Pearl_2007.qxp:Pearl_2005 18.3.2008 11:19 Uhr Seite 6
7
ANNUAL REPORT 2007
PEARL HOLDING LIMITED
Pearl_2007.qxp:Pearl_2005 18.3.2008 11:19 Uhr Seite 7
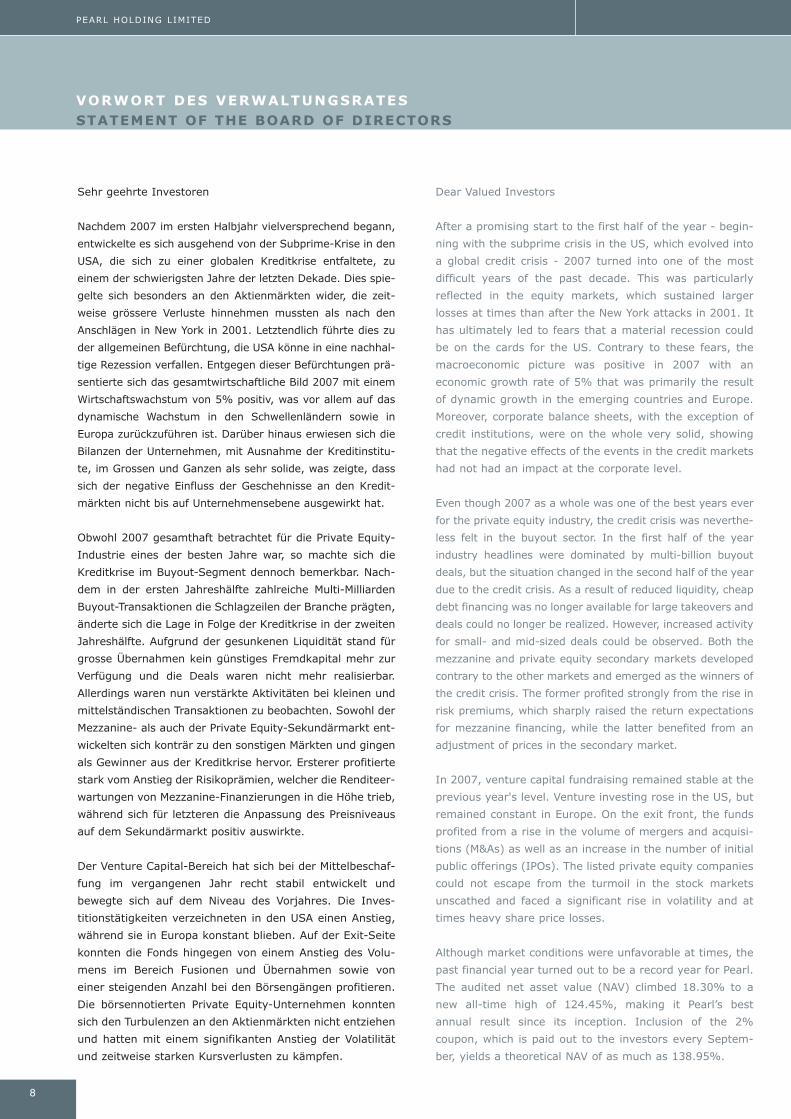
Dear Valued Investors
After a promising start to the first half of the year - begin-
ning with the subprime crisis in the US, which evolved into
a global credit crisis - 2007 turned into one of the most
difficult years of the past decade. This was particularly
reflected in the equity markets, which sustained larger
losses at times than after the New York attacks in 2001. It
has ultimately led to fears that a material recession could
be on the cards for the US. Contrary to these fears, the
macroeconomic picture was positive in 2007 with an
economic growth rate of 5% that was primarily the result
of dynamic growth in the emerging countries and Europe.
Moreover, corporate balance sheets, with the exception of
credit institutions, were on the whole very solid, showing
that the negative effects of the events in the credit markets
had not had an impact at the corporate level.
Even though 2007 as a whole was one of the best years ever
for the private equity industry, the credit crisis was neverthe-
less felt in the buyout sector. In the first half of the year
industry headlines were dominated by multi-billion buyout
deals, but the situation changed in the second half of the year
due to the credit crisis. As a result of reduced liquidity, cheap
debt financing was no longer available for large takeovers and
deals could no longer be realized. However, increased activ ity
for small- and mid-sized deals could be observed. Both the
mezzanine and private equity secondary markets developed
contrary to the other markets and emerged as the winners of
the credit crisis. The former profited strongly from the rise in
risk premiums, which sharply raised the return expectations
for mezzanine financing, while the latter benefited from an
adjustment of prices in the secondary market.
In 2007, venture capital fundraising remained stable at the
previous year's level. Venture investing rose in the US, but
remained constant in Europe. On the exit front, the funds
profited from a rise in the volume of mergers and acquisi-
tions (M&As) as well as an increase in the number of initial
public offerings (IPOs). The listed private equity companies
could not escape from the turmoil in the stock markets
unscathed and faced a significant rise in volatility and at
times heavy share price losses.
Although market conditions were unfavorable at times, the
past financial year turned out to be a record year for Pearl.
The audited net asset value (NAV) climbed 18.30% to a
new all-time high of 124.45%, making it Pearl’s best
annual result since its inception. Inclusion of the 2%
coupon, which is paid out to the investors every Septem-
ber, yields a theoretical NAV of as much as 138.95%.
VORWORT DES VERWALTUNGSRATESSTATEMENT OF THE BOARD OF DIRECTORS
8
Sehr geehrte Investoren
Nachdem 2007 im ersten Halbjahr vielversprechend begann,
entwickelte es sich ausgehend von der Subprime-Krise in den
USA, die sich zu einer globalen Kreditkrise entfaltete, zu
einem der schwierigsten Jahre der letzten Dekade. Dies spie-
gelte sich besonders an den Aktienmärkten wider, die zeit-
weise grössere Verluste hinnehmen mussten als nach den
Anschlägen in New York in 2001. Letztendlich führte dies zu
der allgemeinen Befürchtung, die USA könne in eine nachhal-
tige Rezession verfallen. Entgegen dieser Befürchtungen prä-
sentierte sich das gesamtwirtschaftliche Bild 2007 mit einem
Wirtschaftswachstum von 5% positiv, was vor allem auf das
dynamische Wachstum in den Schwellenländern sowie in
Europa zurückzuführen ist. Da rüber hinaus erwiesen sich die
Bilanzen der Unternehmen, mit Ausnahme der Kreditinstitu-
te, im Grossen und Ganzen als sehr solide, was zeigte, dass
sich der negative Einfluss der Geschehnisse an den Kredit-
märkten nicht bis auf Unternehmensebene ausgewirkt hat.
Obwohl 2007 gesamthaft betrachtet für die Private Equity-
Industrie eines der besten Jahre war, so machte sich die
Kreditkrise im Buyout-Segment dennoch bemerkbar. Nach-
dem in der ersten Jahreshälfte zahlreiche Multi-Milliarden
Buyout-Transaktionen die Schlagzeilen der Branche prägten,
änderte sich die Lage in Folge der Kreditkrise in der zweiten
Jahreshälfte. Aufgrund der gesunkenen Liquidität stand für
grosse Übernahmen kein günstiges Fremdkapital mehr zur
Verfügung und die Deals waren nicht mehr realisierbar.
Allerdings waren nun verstärkte Aktivitäten bei kleinen und
mittelständischen Transaktionen zu beobachten. Sowohl der
Mezzanine- als auch der Private Equity-Sekundärmarkt ent-
wickelten sich konträr zu den sonstigen Märkten und gingen
als Gewinner aus der Kreditkrise hervor. Ersterer profitierte
stark vom Anstieg der Risiko prämien, welcher die Renditeer-
wartungen von Mezzanine-Finanzierungen in die Höhe trieb,
während sich für letzteren die Anpassung des Preisniveaus
auf dem Sekundärmarkt positiv auswirkte.
Der Venture Capital-Bereich hat sich bei der Mittelbeschaf-
fung im vergangenen Jahr recht stabil entwickelt und
bewegte sich auf dem Niveau des Vorjahres. Die Inves -
titionstätigkeiten verzeichneten in den USA einen Anstieg,
während sie in Europa konstant blieben. Auf der Exit-Seite
konnten die Fonds hingegen von einem Anstieg des Volu-
mens im Bereich Fusionen und Übernahmen sowie von
einer steigenden Anzahl bei den Börsengängen profitieren.
Die börsennotierten Private Equity-Unternehmen konnten
sich den Turbulenzen an den Aktienmärkten nicht entziehen
und hatten mit einem signifikanten Anstieg der Volatilität
und zeitweise starken Kursverlusten zu kämpfen.
PEARL HOLDING LIMITED
Pearl_2007.qxp:Pearl_2005 18.3.2008 11:19 Uhr Seite 8
9
The highest ever recorded annual growth in the NAV was
primarily driven by revaluations of the partnerships during
the course of the year. The development of the buyout sec-
tor and the direct investments was particularly pleasing.
This positive development essentially reflects the advanced
level of maturity of the portfolio, as the underlying partner-
ships now in the post-investment period are exiting their
investments, realizing the profits and distributing the pro-
ceeds to the investors. Thanks to these revaluations, the
falls in the share prices of the listed private equity com-
panies that had been triggered by the stock market correc-
tions could be more than offset.
With 30 new investments, of which 14 were primary funds,
nine were secondary portfolios and seven were direct
investments, Pearl saw a high level of commitment activity
again in 2007. A total of EUR 121 million in new commit-
ments were made during the past financial year.
With EUR 175 million in capital calls, the level of investment
activity was higher than in the previous year, whereby most
of the funds went to the buyout sector. The picture in terms
of distributions, which at EUR 215 million clearly surpassed
the figure for 2006, was also very pleasing for the investors.
Thus, last year, the distributions exceeded the capital calls
for new investments from the underlying portfolio partner-
ships. The investment level of Pearl nevertheless increased
by over 4% year on year to 84.56% due to the valuation
adjustments in the private equity portfolio. The objective of
maintaining a full investment level was thus achieved.
The level of diversification of the portfolio was high at year-
end 2007 not only by the type of investment, i.e. primary,
secondary and direct investments as well as listed private
equity companies, but also by financing stage, geographic-
al region, industry sector and vintage year.
The Board of Directors believe that the advanced level of
maturity of the portfolio as well as its broad diversification
are the decisive factors why Pearl is likely to continue to
perform positively, if not quite as strongly due to macroecon-
omic conditions, in the coming year.
We would like to take this opportunity to thank you, the
investors, for the confidence you have shown in Pearl and
to assure you that we will do our utmost again in the
coming year to meet your high expectations.
The Board of Directors
Guernsey, March 2008
Für Pearl war das abgelaufene Geschäftsjahr, ungeachtet des
zeitweise recht unfreundlichen Marktumfeldes, ein Rekord-
jahr. Der geprüfte Innere Wert (NAV) verzeichnete einen
Anstieg von 18.30% auf das Allzeithoch von 124.45%, was
für Pearl das beste Jahresergebnis seit Auflegung bedeutet.
Unter Berücksichtigung des 2%igen Zinskupons, der jeweils
im September an die Investoren ausbezahlt wird, ergibt sich
sogar ein theoretischer Innerer Wert von 138.95%.
Hauptgrund für den höchsten jemals verzeichneten Jahres-
zuwachs des Inneren Wertes sind die Neubewertungen der
Partnerships, welche im Laufe des Jahres vorgenommen
werden konnten. Besonders erfreulich entwickelten sich der
Buyout-Bereich sowie die Direktinvestitionen. Dabei ist
hauptsächlich der fortgeschrittene Reifegrad des Portfolios
für die positive Entwicklung verantwortlich, da die unterlie-
genden Partnerships nach Zeiten der Investition nun durch
die Veräusserung ihrer Beteiligungen vermehrt Gewinne
realisieren und diese als Ausschüttungen an die Investoren
weitergeben können. Dank der vorgenommenen Aufwer-
tungen konnten die durch die Aktienmarktkorrekturen aus-
gelösten Einbrüche bei den börsennotierten Beteiligungsge-
sellschaften mehr als ausgeglichen werden.
Mit 30 neuen Beteiligungen, davon 14 Primärfonds, neun
Sekundärportfolios und sieben Direktinvestitionen, bewegten
sich die Commitmentaktivitäten von Pearl 2007 erneut auf
hohem Niveau. Insgesamt beliefen sich die neuen Zahlungs-
zusagen im abgelaufenen Geschäftsjahr auf EUR 121 Mio.
Die Investitionstätigkeiten konnten mit Kapitalabrufen in
Höhe von EUR 175 Mio. das Vorjahresergebnis übertreffen,
wobei die meisten Gelder an das Buyout-Segment flossen.
Sehr erfreulich für die Investoren gestaltete sich das Bild
auch bei den Rückflüssen, welche mit EUR 215 Mio. das
Ergebnis von 2006 deutlich übertreffen konnten. Die
Rückflüsse waren damit im vergangenen Jahr höher als
die Abrufe der dem Portofolio zugrunde liegenden Partner -
ships für neue Investitionen. Der Investitionsgrad von Pearl
steigerte sich dennoch aufgrund der Bewertungs-
anpas sungen im Private Equity-Portfolio gegenüber dem
Vorjahr um mehr als 4% auf 84.56%. Das Ziel, den vollen
Investitionsgrad beizubehalten, konnte somit eingehalten
werden.
Das Portfolio weist per Jahresende einen breiten Diversifi-
kationsgrad auf, sowohl was die Beteiligungsarten, also
Primär-, Sekundär- sowie Direktinvestitionen und börsen-
notierte Beteiligungsgesellschaften angeht, als auch im
Hinblick auf Finanzierungsstadien, geografische Regionen,
Industriesektoren und Gründungsjahre.
PEARL HOLDING LIMITED
Pearl_2007.qxp:Pearl_2005 18.3.2008 11:19 Uhr Seite 9

10
Der fortgeschrittene Reifegrad des Portfolios sowie die brei-
te Diversifikation sind nach Meinung des Verwaltungsrates
die entscheidenden Faktoren, weshalb Pearl auch im kom-
menden Jahr weiterhin, wenn auch aufgrund des gesamt-
wirtschaftlichen Umfeldes etwas weniger stark, wachsen
dürfte.
An dieser Stelle möchten wir uns bei Ihnen, den Investo-
ren, für das entgegengebrachte Vertrauen bedanken und
Ihnen versichern, dass wir auch im kommenden Jahr alles
daran setzen werden, Ihre hohen Erwartungen zu erfüllen.
Der Verwaltungsrat
Guernsey, im März 2008
PEARL HOLDING LIMITED
Pearl_2007.qxp:Pearl_2005 18.3.2008 11:19 Uhr Seite 10
11
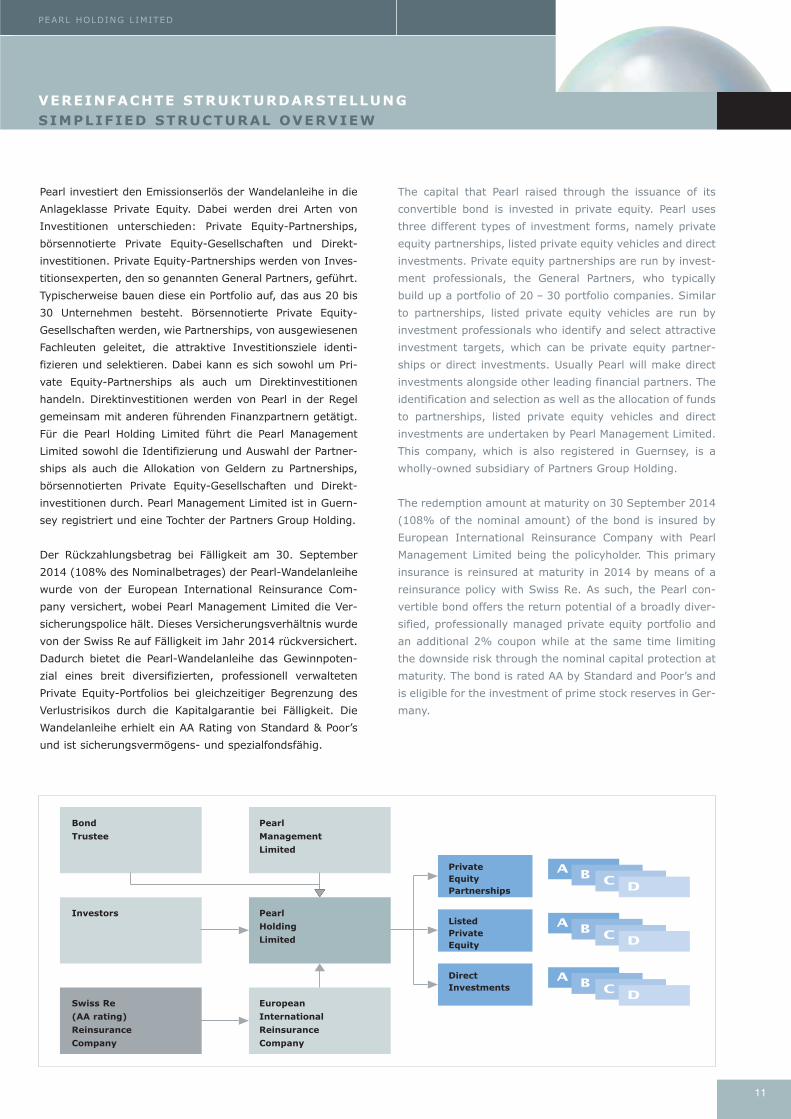
The capital that Pearl raised through the issuance of its
convertible bond is invested in private equity. Pearl uses
three different types of investment forms, namely private
equity partnerships, listed private equity vehicles and direct
investments. Private equity partnerships are run by invest-
ment professionals, the General Partners, who typically
build up a portfolio of 20 – 30 portfolio companies. Similar
to partnerships, listed private equity vehicles are run by
investment professionals who identify and select attractive
investment targets, which can be private equity partner-
ships or direct investments. Usually Pearl will make direct
investments alongside other leading financial partners. The
identification and selection as well as the allocation of funds
to partnerships, listed private equity vehicles and direct
investments are undertaken by Pearl Management Limited.
This company, which is also registered in Guernsey, is a
wholly-owned subsidiary of Partners Group Holding.
The redemption amount at maturity on 30 September 2014
(108% of the nominal amount) of the bond is insured by
European International Reinsurance Company with Pearl
Management Limited being the policyholder. This primary
insurance is reinsured at maturity in 2014 by means of a
reinsurance policy with Swiss Re. As such, the Pearl con-
vertible bond offers the return potential of a broadly diver-
sified, professionally managed private equity portfolio and
an additional 2% coupon while at the same time limiting
the downside risk through the nominal capital protection at
maturity. The bond is rated AA by Standard and Poor’s and
is eligible for the investment of prime stock reserves in Ger-
many.
Pearl investiert den Emissionserlös der Wandelanleihe in die
Anlageklasse Private Equity. Dabei werden drei Arten von
Investitionen unterschieden: Private Equity-Partnerships,
börsennotierte Private Equity-Gesellschaften und Direkt-
investitionen. Private Equity-Partnerships werden von Inves -
titionsexperten, den so genannten General Partners, geführt.
Typischerweise bauen diese ein Portfolio auf, das aus 20 bis
30 Unternehmen besteht. Börsennotierte Private Equity-
Gesellschaften werden, wie Partnerships, von ausgewiesenen
Fachleuten geleitet, die attraktive Investitionsziele identi -
fizieren und selektieren. Dabei kann es sich sowohl um Pri-
vate Equity-Partnerships als auch um Direktinvestitionen
handeln. Direktinvestitionen werden von Pearl in der Regel
gemeinsam mit anderen führenden Finanzpartnern getätigt.
Für die Pearl Holding Limited führt die Pearl Management
Limited sowohl die Identifizierung und Auswahl der Partner -
ships als auch die Allokation von Geldern zu Partnerships,
börsennotierten Private Equity-Gesellschaften und Direkt -
investitionen durch. Pearl Management Limited ist in Guern-
sey registriert und eine Tochter der Partners Group Holding.
Der Rückzahlungsbetrag bei Fälligkeit am 30. September
2014 (108% des Nominalbetrages) der Pearl-Wandelanleihe
wurde von der European International Reinsurance Com-
pany versichert, wobei Pearl Management Limited die Ver -
sicherungspolice hält. Dieses Versicherungsverhältnis wurde
von der Swiss Re auf Fälligkeit im Jahr 2014 rückversichert.
Dadurch bietet die Pearl-Wandelanleihe das Gewinnpoten -
zial eines breit diversifizierten, professionell verwalteten
Private Equity-Portfolios bei gleichzeitiger Begrenzung des
Verlust risikos durch die Kapitalgarantie bei Fälligkeit. Die
Wandelanleihe erhielt ein AA Rating von Standard & Poor’s
und ist sicherungsvermögens- und spezialfondsfähig.
PEARL HOLDING LIMITED
VEREINFACHTE STRUKTURDARSTELLUNG SIMPLIFIED STRUCTURAL OVERVIEW
A B C D
A B C D
A B C D
Bond
Trustee
Swiss Re
(AA rating)
Reinsurance
Company
European
International
Reinsurance
Company
Pearl
Holding
Limited
PrivateEquityPartnerships
Listed PrivateEquity
DirectInvestments
Investors
Pearl
Management
Limited
Pearl_2007.qxp:Pearl_2005 18.3.2008 11:19 Uhr Seite 11

12
JAHRESBERICHT 2007
Pearl_2007.qxp:Pearl_2005 18.3.2008 11:19 Uhr Seite 12
13
BERICHT DES INVESTMENT MANAGERSINVESTMENT MANAGER’S REPORT
ANNUAL REPORT 2007
Pearl_2007.qxp:Pearl_2005 18.3.2008 11:19 Uhr Seite 13
14
BERICHT DES INVESTMENT MANAGERS
The Janus character of the year 2007
In Roman mythology, Janus is the god of gates and doors as
well as of beginnings and endings: he is usually depicted with
two faces looking in opposite directions. For investors, the
year 2007 had two faces as well and will be remembered as
a Janus year. The first half was characterized by euphoria
and buoyant equity markets, interrupted only briefly by tur-
bulence in late February and early March. In contrast, the
second half of 2007 proved to be one of the most difficult
periods for investors in the past decade, characterized by
financial market unrest and increasing risks to real economic
growth in the US. This episode of a global credit crisis, dried-
up liquidity and spread widening on the interbank and credit
markets originated from rising delinquency rates on principal
and interest payments in the US subprime mortgage market.
Concerns about mortgage-backed securities and structured
credit products led to a flight to safety and liquidity. Spreads
on asset-backed commercial papers widened sharply, syndi-
cation of leveraged loans froze and equities declined due to
simultaneous hedge fund action in August, the ongoing sub-
prime crisis in the US as well as the heavy write-downs in the
financial sector in November. Ongoing uncertainty about the
situation in the credit market and its potential spillover
effects on the real economy in the US led to mounting fears
that the US might enter a recession, which would have a
severe impact on global economic growth.
Overall healthy economic picture despite the credit
crisis
A look at the overall economic picture for 2007 shows that
the world economy expanded with a GDP growth of around
5% in real terms, which is in line with the previous year.
The market turbulence definitely had an impact on econ -
omic growth during the year and brought growth rates back
down to normal levels, especially in the US. Supported by
dynamic growth in the emerging markets and in Europe,
though, the world economy still reached the growth level of
the record year 2006. Moreover, by and large corporate
balance sheets were solid, with firms exhibiting low debt
and high cash levels and continued strong earnings growth.
So the negative effects of the events in the credit markets
had not had an impact at the corporate level, albeit with the
exception of the credit institutions, which were hit hard by
the crisis and leading in some cases to posting losses due
to major write-offs in the second half of the year.
Impact of the credit crisis on the LBO market
The headlines in the previous year and again in the first half
of 2007 were dominated by announcements of multi-billion
Der Janus-Charakter des Jahres 2007
Janus, der Gott der Türen und Tore sowie des Anfangs und
des Endes in der römischen Mythologie, wird üblicherweise
doppelköpfig mit zwei Gesichtern dargestellt, die in ent-
gegengesetzte Richtungen schauen. Der sogenannte
Januskopf gilt daher als Symbol der Zwiespältigkeit und als
ein zwiespältiges Jahr wird den Investoren das Jahr 2007 in
Erinnerung bleiben. Die erste Jahreshälfte zeichnete sich
bis auf die kurzfristigen Turbulenzen Ende Februar und
Anfang März durch Euphorie und steigende Aktienkurse
aus. Im Gegensatz dazu erwies sich die zweite Jahreshälf-
te als eine der schwierigsten Perioden der letzten zehn
Jahre, gekennzeichnet von turbulenten Finanzmärkten und
einem steigenden Risiko für das reale Wirtschaftswachstum
in den USA. Durch Nichtzahlungen von Schulden bei Fällig-
keit im Markt für minderklassige Hypotheken in den USA
entstand eine globale Kreditkrise mit stark sinkender Liqui-
dität und steigenden Risikoprämien im Zwischenbankenge-
schäft und auf den Kreditmärkten. Die Besorgnis über
hypothekarisch gesicherte Wertpapiere und strukturierte
Kreditprodukte führte zu einer allgemeinen Flucht Richtung
Sicherheit und Liquidität. Die Risikoprämien für durch Ver-
mögenswerte besicherte Wertpapiere stiegen dramatisch,
die Syndizierung fremdfinanzierter Kredite kam zum Erlie-
gen und Aktien verloren an Wert, zum einen durch Hedge-
fonds, welche im August gleichzeitig grössere Transaktio-
nen durchführten, zum anderen aufgrund der weiterhin
andauernden Kreditkrise in den USA sowie der signifikanten
Ab schrei bungen im Finanzsektor im Laufe des Novembers.
Die an haltende Unsicherheit über die Situation an den Kre-
dit märkten und deren mögliche Auswirkungen auf die Real-
wirtschaft in den USA führten letztlich zu einer steigenden
Befürchtung, dass die USA in eine Rezession verfallen
könnte, was wiederum drastische Auswirkungen auf das
globale Wirtschaftswachstum hätte.
Gesunde Gesamtwirtschaft trotz Krise
Ein Blick auf das gesamtwirtschaftliche Bild in 2007 zeigt ein
reales globales Wirtschaftswachstum von 5%, ähnlich wie
im Vorjahr. Die Marktturbulenzen hatten definitiv einen Ein-
fluss und haben die Wachstumsraten, besonders in den
USA, auf ein normales Niveau zurückgebracht. Unterstützt
durch das dynamische Wachstum in den Schwellenländern
und in Europa erreichte die Weltwirtschaft dennoch das
Wachstum des Rekordjahres 2006. Die Unternehmens-
bilanzen zeigten mit niedrigen Fremdkapitalquoten, viel
liquiden Mitteln und anhaltend starken Anstiegen der Erträ-
ge im Grossen und Ganzen solide Werte. Der negative Ein-
fluss der Geschehnisse an den Kreditmärkten blieb auf
Unternehmensebene somit aus; lediglich die kreditverge-
RÜCKBLICK AUF DIE PRIVATE EQUITY-INDUSTRIE 2007REVIEW ON THE PRIVATE EQUITY INDUSTRY IN 2007
Pearl_2007.qxp:Pearl_2005 18.3.2008 11:19 Uhr Seite 14
15
INVESTMENT MANAGER’S REPORT
leveraged buyout (LBO) deals in the private equity industry.
The record-breaking RJR Nabisco LBO in the late 1980s,
which closed at USD 32 billion, suddenly appeared relative-
ly small compared to the USD 40 billion plus deals of Bell
Canada Enterprises and TXU. Obviously, the amount of debt
financing that was used for these deals was substantial.
Moreover, the debt necessary to realize investments of this
size was available at low cost in the market during the first
half of 2007 and private equity investors coped with rising
prices for transactions by making use of a sufficient amount
of debt in the LBOs. So as transaction sizes rose, leverage
in the buyout sector also increased to record levels. As the
average deal size grew, only a small number of public firms
were still considered too large to be a target for a private
equity takeover. Rising debt levels in the transactions was
not a worry as long as the cost of the debt financing remain -
ed at the low levels of the first half of the year.
But the picture changed in the second half of the year when
the liquid credit market ground to an abrupt halt in the
wake of the subprime crisis, thereby slowing down the buy-
out market. The large- and mega-large LBOs suddenly had
hardly any access to debt financing as credit spreads widen -
ed sharply and increased the cost of debt financing sig -
nificantly, which in turn made multi-billion LBOs difficult to
realize. For the same reasons, large public to private trans-
actions also experienced difficulties after several years of
continuous growth in total volume: the market turmoil sent
capital costs for buyout firms higher and reduced the strike
zone after years of steady expansion, causing a significant
downturn in large-cap public to private volume as well.
Is this a bad thing for the private equity industry? This is
definitely not a question that can be answered with a
simple yes or no. Various statistics indicate that the credit
crisis has certainly not disrupted the entire industry. On the
contrary, there was a remarkable level of activity in the
small- and mid-cap buyout universe up to an enterprise
value of USD 1 billion during the second half of 2007. The
number of mega deals in the buyout sector, though, de -
c reased, indicating a shift from large- to mid-cap LBOs. Due to
the increase in the number of smaller deals with enterprise
values of below USD 1 billion and the contribution of the
mega deals during the first half of the year, the total vol -
ume for 2007 still showed strong results.
Shift from large- to mid-cap deals
The paradigm shift from large to smaller deals during the
year is reflected in the annual figures for the different
regions as well. Buyouts valued at more than USD 1 billion
more than doubled in the US compared to 2006 to a total
benden Banken, die durch die Krise substanziell getroffen
wurden, mussten in der zweiten Jahreshälfte aufgrund von
signifikanten Abschreibungen teilweise Verluste hinnehmen.
Auswirkungen der Kreditkrise auf den LBO-Markt
Die Schlagzeilen des Vorjahres und der ersten Hälfte von
2007 waren geprägt von fremdfinanzierten Firmenübernah-
men (LBOs) in Milliardenhöhe durch Private Equity-Unter-
nehmen. Der RJR Nabisco-Rekord der 80er Jahre in Höhe von
USD 32 Mrd. sah neben den USD 40 Mrd.-Deals von Bell
Canada Enterprises und TXU nun vergleichsweise klein aus.
Verständlicherweise war der Fremdkapitalanteil in diesen
Transaktionen substanziell. Das notwendige Fremdkapital
war während der ersten Jahreshälfte im Markt jedoch sehr
günstig verfügbar und die Private Equity-Investoren konnten
daher die steigenden Preise der Transaktionen dadurch auf-
bringen, dass sie ihre Übernahmen zu einem grossen Teil mit
Fremdkapital finanzierten. Mit dem Anstieg der Transaktions-
grössen nahm also auch das benötigte Fremdkapital im Buy-
out-Segment auf ein rekordverdächtiges Niveau zu. Durch
die immer grösser werdenden Deals gab es nur noch wenige
börsennotierte Unternehmen, von denen man dachte, dass
sie aufgrund ihrer Grösse nicht Ziel einer Private Equity-
Übernahme sein könnten. Der steigende Fremdkapitalbedarf
stellte auch kein Problem dar, so lange sich die Finanzie-
rungskosten weiterhin auf so niedrigem Niveau bewegen
würden wie in der ersten Jahreshälfte.
In der zweiten Jahreshälfte änderte sich jedoch das Bild:
die liquiden Kreditmärkte kamen in Folge der Krise plötzlich
zum Erliegen und sorgten für eine Abkühlung des Buyout-
Marktes. Für grosse und Mega-Deals stand von einem auf
den anderen Tag kaum noch Fremdfinanzierung zur Verfü-
gung, da die Risikoprämien signifikant anstiegen und die
Kosten in die Höhe trieben, was wiederum dazu führte,
dass die grossen LBOs kaum noch zu realisieren waren. Aus
ähnlichen Gründen sahen sich auch die grossen Public-to-
Private-Transaktionen nach Jahren konstanten Wachstums
auf einmal mit Schwierigkeiten konfrontiert: Die Unruhen
am Markt liessen die Kapitalkosten für Buyout-Unterneh-
men in die Höhe schnellen und reduzierten die Preise, die
für Public-to-Private-Deals bezahlt wurden, nach einer ste-
tigen Expansion in den Jahren zuvor. Dies wiederum führte
dazu, dass das Volumen von grossen Public-to-Private-
Deals signifikant zurückging.
War diese Entwicklung schlecht für die Private Equity-Indu-
strie? Diese Frage kann nicht einfach mit Ja oder Nein
beantwortet werden, aber wie verschiedene Statistiken zei-
gen, hat die Krise die Industrie als Ganzes nicht beeinträch-
tigt. Im Gegenteil: Während die Anzahl der Mega-Deals
Pearl_2007.qxp:Pearl_2005 18.3.2008 11:19 Uhr Seite 15
16
BERICHT DES INVESTMENT MANAGERS
of USD 451 billion, but only driven by the mega transac-
tions of the first six months. Middle-market deals valued at
between USD 100 million and USD 1 billion were up by
23%, an increase that can be attributed to the shift from
large to more medium-sized transactions in the second half
of the year, while smaller deals worth less than USD 100
million declined by 50% to USD 5 billion.
In Europe, buyouts valued at between EUR 250 million and
EUR 1 billion increased by over 38% in 2007, while deals in
the EUR 250 million to EUR 500 million range were up by
43% for the same reasons that caused the jump in the
middle market in the US. The value of EUR 1 billion plus
buyouts in 2007 fell by 14% since the majority of the mega
buyouts that boosted the numbers for this segment took
place in the US. By value, EUR 1 billion plus deals still com-
prised half of the European buyout market in 2007, but
down from 59% in 2006.
The value of Asian buyout deals decreased by 21% to USD
42 billion while the number of deals increased by 17%,
implying a larger number of deals, but with a smaller value.
There were only four buyout deals with a transaction value
of over USD 1 billion in 2007, compared to 12 deals of that
size in 2006, indicating a shift from mega deals to smaller
transactions in Asia, too.
Fundraising flattens
The overall picture on the buyout fundraising side still show -
ed high levels despite the credit crisis. However, after
seeing record fundraising levels in the first half of the year,
the credit crunch seemed to affect fundraising for buyout
funds in the second half of 2007. Out of the slightly over
USD 200 billion that were raised by buyout funds in 2007 –
just below the 2006 volume – approximately two thirds
came in during the first six months. After very strong
growth over the past 24 months, fundraising volumes
appear to be normalizing but remain at solid levels.
A healthy correction and a flight to quality
Although the correction in the debt markets was the domi-
nating negative headline during the past year, it had sev -
eral positive aspects which need to be taken into account as
well, since they should have a positive impact on the indus -
try in the long run. The ready availability of cheap debt
before the crisis not only produced an increase in the num-
ber of mega deals, but also led to high returns that were
often driven by recapitalizations. Private equity sponsors
could finance distributions to their investors via leverage, a
fact that took the focus off the core activity, namely value
zurückging, waren die Aktivitäten im klein- und mittelstän-
dischen Buyout-Segment bis zu einem Unternehmenswert
von USD 1 Mrd. in der zweiten Jahreshälfte bemerkenswert
hoch, ein Indiz für den Wechsel von grossen zu mittelgros-
sen Transaktionen. Aufgrund dieser Zunahme kleinerer
Deals und der noch in der ersten Jahreshälfte abgeschlos-
senen Mega-Deals blieb das Buyout-Investitionsvolumen
auch 2007 auf einem weiterhin hohen Niveau.
Verschiebung von grossen zu mittelgrossen Deals
Der Paradigmenwechsel von grossen zu kleineren Deals im
Laufe des Jahres spiegelt sich in allen Regionen wider.
Übernahmen über USD 1 Mrd. haben sich in den USA im
Ver gleich zu 2006 zwar auf USD 451 Mrd. mehr als verdop-
pelt, allerdings nur getrieben durch die in den ersten sechs
Monaten abgeschlossenen Mega-Transaktionen. Das mittle-
re Segment zwischen USD 100 Mio. und USD 1 Mrd. erfuhr
einen Zuwachs von 23%, was auf die Verschiebung von
grossen zu mittleren Deals in der zweiten Jahreshälfte
zurückzuführen ist, während Unter nehmens käufe unter
USD 100 Mio. um 50% auf USD 5 Mrd. zurückgingen.
In Europa stiegen Buyouts zwischen EUR 250 Mio. und EUR
1 Mrd. in 2007 um 38%, während das Segment zwischen
EUR 250 Mio. und EUR 500 Mio. sogar um 43% anwuchs,
was in beiden Fällen auf die gleichen Gründe zurückzufüh-
ren ist, die auch in den USA in diesem Bereich für die
Zunahme sorgten. Das Gesamtvolumen bei Transaktionen
über EUR 1 Mrd. ging 2007 hingegen um 14% zurück, da
die Mehrheit der Mega-Deals in den USA stattfand. Gesamt-
haft machten die Transaktionen über EUR 1 Mrd. weiterhin
rund die Hälfte des europäischen Buyout-Marktes in 2007
aus, allerdings weniger als 2006, als sie noch für 59% des
Volumens verantwortlich waren.
Asiatische Buyout-Deals gingen um 21% auf einen Gesamt-
wert von USD 42 Mrd. zurück, während die Anzahl der
Transaktionen um 17% anstieg, was eine grössere Anzahl
Deals mit geringerem Volumen impliziert. Insgesamt gab es
2007 in Asien lediglich vier Deals, deren Transaktionsvolu-
men die USD 1 Mrd.-Grenze überschritt, im Vergleich zu
zwölf im Vorjahr. Diese Abnahme zeigt auch in Asien die
Verschiebung von Mega-Deals zu kleineren Transaktionen.
Fundraising flacht ab
Das Fundraising im Buyout-Segment bleibt trotz Kreditkri-
se noch auf einem hohen Niveau. Dennoch hatte der
Zusammenbruch der Kreditmärkte auch hier einen Einfluss,
nachdem sich die Mittelbeschaffung in der ersten Jahres-
hälfte noch in rekordverdächtigen Regionen bewegt hatte.
Pearl_2007.qxp:Pearl_2005 18.3.2008 11:19 Uhr Seite 16
17
INVESTMENT MANAGER’S REPORT
creation in their portfolio companies. The rising cost of
capital necessitates a shift in focus towards value creation
in the buyout segment and operational value add is gaining
in importance as the opportunities for capital arbitrage
become more limited. Private equity sponsors have to focus
on their core competencies as a result of the credit crisis,
with corporate restructuring, cost reduction and organic
and external growth turning into key factors again, leading
to a reinforcement of general partner qualities.
Record M&A volume supports private equity industry
The value of global mergers and acquisitions (M&A) hit a
new record, despite the US subprime crisis and the liquid -
ity problems in the credit markets, also driven by the mega
buyouts of TXU, First Data, Alltell and Hilton in the first half
of the year. Overall, announced takeover bids increased by
24% compared to the previous year to some EUR 4’500 bil-
lion. Transaction values decreased during the third and
fourth quarters after the record-breaking first half of 2007,
while the number of small- and mid-cap M&A transactions
increased as financing for mega deals dried up.
M&A activity involving private equity firms nevertheless
reached a record USD 791 billion, representing 18% of the
overall market. During the first half of the year, private
equity funds accounted for a large part of the M&A volume
Über USD 200 Mrd. wurden 2007 von Buyout-Fonds einge-
worben, leicht weniger als im Vorjahr. Zwei Drittel des Volu-
mens stammen aus der ersten Jahreshälfte. Nach dem
extrem starken Wachstum der letzten 24 Monate scheint
sich das Fundraising nun auf einem normalen, aber soliden
Niveau einzupendeln.
Gesunde Korrektur und die Flucht Richtung Qualität
Obwohl die Korrektur an den Fremdkapitalmärkten definitiv
die dominierende Negativ-Schlagzeile des letzten Jahres war,
so brachte sie auch einige gute Aspekte mit sich, die nicht
ausser Acht gelassen werden sollten, da sie langfristig einen
positiven Einfluss auf die Industrie haben werden. Die güns -
tige Verfügbarkeit von Fremdkapital, wie sie vor der Krise zu
beobachten war, hat nicht nur die Anzahl der Mega-Transak-
tionen erhöht, sondern zusätzlich zu hohen Renditen geführt,
die allerdings vielfach auf Rekapitalisierungen beruhten. Pri-
vate Equity-Häuser konnten Ausschüttungen über Fremdka-
pital finanzieren, was den Fokus von der eigentlichen Aufga-
be, nämlich der Schaffung von Mehrwert in den Portfolioun-
ternehmen, ablenkte. Der Anstieg der Kapitalkosten führt
nun dazu, dass es wieder mehr darum geht, Mehrwert zu
schaffen und auf operativer Ebene zu optimieren, da die
Arbitrage-Opportunitäten über Fremdkapital limitiert sind.
Private Equity-Häuser müssen sich also in Folge der Krise
wieder vermehrt auf ihre Kern aufgaben konzentrieren,
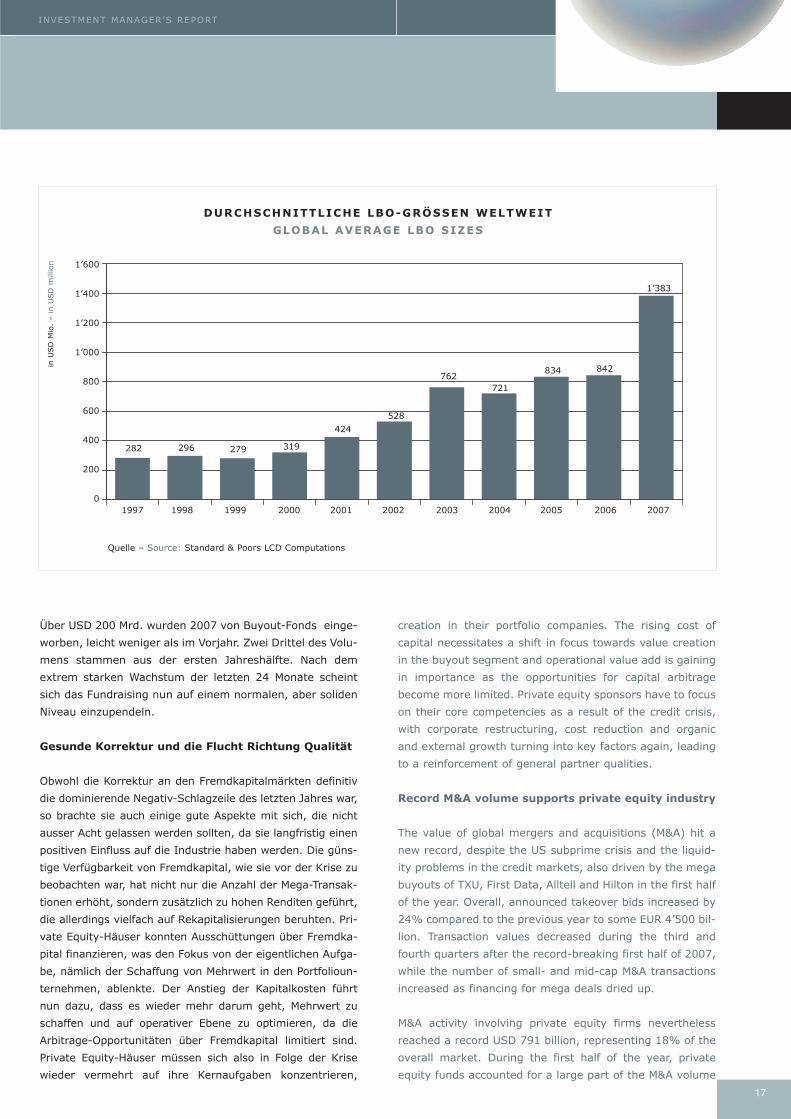
Quelle – Source: Standard & Poors LCD Computations
1’600
1’400
1’200
1’000
800
600
400
200
0
in U
SD
Mio
. –
in U
SD
mill
ion
282 296 279 319
424
528
762721
834 842
1’383
1997 1998 1999 2000 2001 2002 2003 2004 2005 2006 2007
DURCHSCHNITTLICHE LBO-GRÖSSEN WELTWEIT
GLOBAL AVERAGE LBO SIZES
Pearl_2007.qxp:Pearl_2005 18.3.2008 11:19 Uhr Seite 17
18
BERICHT DES INVESTMENT MANAGERS
due to their participation in leveraged billion dollar transac-
tions. In the wake of the credit crunch, the private equity
sponsors have almost completely withdrawn from the M&A
space and made room for the strategic investors who aim
to acquire companies in their own segment.
Mezzanine’s comeback in the aftermath of the credit
crisis
Mezzanine debt lost market share relative to senior and
second lien debt in the first half of 2007 as financial spon-
sors were, to a certain extent, able to substitute mezzani-
ne with senior debt due to the favorable credit market envir -
onment and the low level of risk aversion. This trend went
into reverse in the summer, with mezzanine again coming
to the fore: the use and the terms and conditions of mez-
zanine tranches improved significantly. Mezzanine lenders
returned to favor, supported by rising demand for loans
that have fixed interest rates and warrants tied to a com-
pany’s equity, making them less susceptible to credit mar-
ket fluctuations. Pricing started to profit from rising credit
spreads which increased the return potential for mezzanine
debt. Moreover, the credit crisis generated possibilities to
include equity kickers in mezzanine transactions again,
generating additional returns and increased investor pro-
tection. Finally, transaction risks were reduced through
Restrukturierungen, Kosten ein spa rungen sowie organisches
und externes Wachstum, was letztlich die Fähig keit der
General Partner wieder in den Vordergrund rücken lässt.
Rekord-M&A-Volumen treibt Private Equity-Industrie
Das weltweite Volumen von Fusionen und Übernahmen
(M&A) hat trotz der Subprime-Krise in den USA und den
Korrekturen an den Kreditmärkten einen neuen Höchst-
stand erreicht, unter anderem unterstützt durch die Mega-
Buyouts von TXU, First Data, Alltel und Hilton in der ersten
Jahreshälfte. Gesamthaft stiegen die ausgewiesenen Über-
nahmeangebote im Vergleich zum Vorjahr um 24% auf
etwa EUR 4’500 Mrd. Transaktionsvolumen sind allerdings
im dritten und vierten Quartal gesunken, nachdem in den
ersten sechs Monaten Rekordwerte erreicht wurden; so
wurden vermehrt kleine und mittlere M&A-Transaktionen
durchgeführt, da für die Mega-Deals kein Fremdkapital
mehr zur Verfügung stand.
Die M&A-Aktivitäten mit Private Equity-Beteiligung erreich-
ten mit einem Volumen von USD 791 Mrd. dennoch einen
neuen Rekord und machten damit 18% des gesamten
Marktvolumens aus. Während der ersten sechs Monate des
Jahres waren Private Equity-Fonds durch ihre Beteiligungen
in fremdkapitalfinanzierten Milliarden-Transaktionen gar für
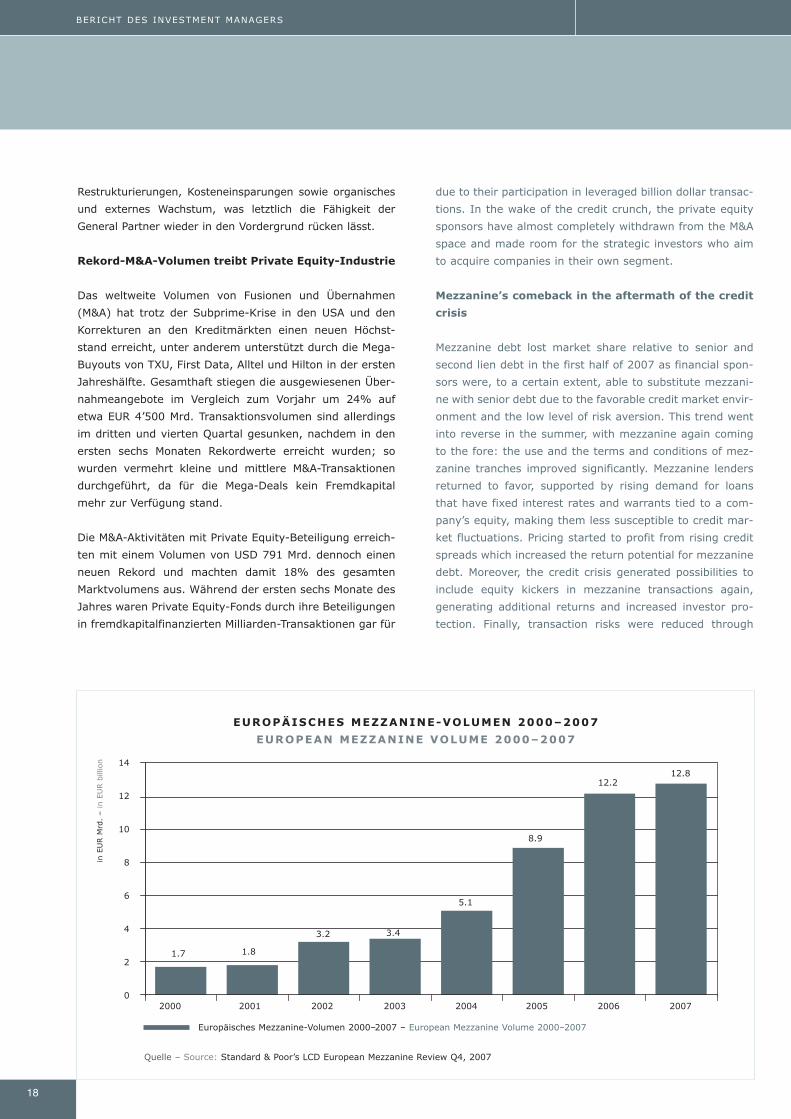
Quelle – Source: Standard & Poor’s LCD European Mezzanine Review Q4, 2007
14
12
10
8
6
4
2
0
in E
UR M
rd.
– in E
UR b
illio
n
1.7 1.8
3.2 3.4
5.1
8.9
12.212.8
2000 2001 2002 2003 2004 2005 2006 2007
EUROPÄISCHES MEZZANINE-VOLUMEN 2000–2007
EUROPEAN MEZZANINE VOLUME 2000–2007
Europäisches Mezzanine-Volumen 2000–2007 – European Mezzanine Volume 2000–2007
Pearl_2007.qxp:Pearl_2005 18.3.2008 11:19 Uhr Seite 18
19
INVESTMENT MANAGER’S REPORT
lower leverage levels. Mezzanine debt thus profited signifi-
cantly from the difficulties in the credit market. As a conse-
quence, mezzanine volume again set an annual record in
Europe with a solid increase as compared to the previous
year. In the US, where the market is based on independent
mezzanine providers, the total new-issue sponsored leverag -
ed loan volume, which includes mezzanine, indicated healthy
growth in this region as well.
Venture capital: trend to maturity
The venture segment has matured since the bursting of the
technology bubble in 2000 and the quality of the invest-
ments has improved, providing great potential for invest -
ors. In addition, a new growth segment has emerged with -
in venture which offers highly attractive opportunities.
Growth investments are typically made in fast-growing
companies that demonstrate a strong history of expansion
and are typically profitable or demonstrate a clear view to
profitability.
Global venture capital fundraising activity was relatively
stable over the past twelve months and in line with the pre-
vious year. Total US fundraising volume increased from USD
32 billion by 229 funds in 2006 to USD 35 billion by 235
funds in 2007. In Europe, 64 venture funds raised USD 5.5
billion in 2007, a slight increase on the USD 5.3 billion in
the previous year. Established venture capital and growth
funds turned their focus to investing the capital that had
been recently raised, as demonstrated by the record num-
ber of investments last year. The pace of venture investing
in the US continued to pick up throughout 2007, whereas
in Europe it remained broadly constant. Deal sizes in -
creased in Europe, though, confirming the trend towards
larger, later-stage deals.
The exit environment for venture-backed companies was
benign over the past 12 months, as can be seen by the
increase in M&A value and IPO offerings: the disclosed
value of venture-backed M&As climbed by almost 50% over
the previous year to USD 25.4 billion, while the number of
venture-backed IPOs enhanced by the same percentage to
a total of 86 in 2007. Significant growth in the IPO market
led to a situation where going public was a viable alterna-
tive to an M&A exit. As a result, companies could afford to
resist M&A offers, which often elicited even higher bids
from potential acquirers. As a consequence of the most
recent market downturn, trade sales became the flavor of
the day with significant prices being paid for established
market leaders that have developed disruptive technologies
and products. For example, the leading global entertain-
ment content company Viacom demonstrated its willing -
einen Grossteil des gesamten M&A-Volumens verantwort-
lich. Im Anschluss an die Kreditkrise haben sich die Private
Equity-Häuser dann fast komplett von Fusionen und Über-
nahmen zurückgezogen und so Platz für strategische Inves -
toren geschaffen, die zum Ziel haben, Unternehmen ihres
Segmentes zu akquirieren.
Kreditkrise bringt Mezzanine zurück
Mezzanine-Fremdkapital verlor in der ersten Jahreshälfte im
Vergleich zu vorrangigen Verbindlichkeiten Marktanteile, da
Finanzinvestoren Mezzanine aufgrund der günstigen Kredit -
märkte und der allgemein geringen Risikoaversion zu einem
gewissen Teil durch vorrangige Verbindlichkeiten ersetzten.
Diese Entwicklung erfuhr im Laufe des Sommers eine Kehrt -
wende und Mezzanine gewann wieder an Bedeutung: Bedin-
gungen und Konditionen von Mezzanine verbesserten sich
signifikant und die Präsenz nahm dadurch deutlich zu. Die
Anbieter von Mezzanine waren wieder im Geschäft, unter-
stützt durch die gestiegene Nachfrage nach Krediten mit fes -
ten Zinsen und Eigenkapitaloptionen, die dazu führen, dass
die Kredite weniger anfällig gegenüber Fluktuationen im Kre-
ditmarkt sind. Auch die Preisgestaltung profitierte vom
Anstieg der Risikoprämien, wodurch sich das Rendite -
potenzial von Mezzanine-Fremdkapital wieder erhöhte.
Ausserdem entstanden durch die Krise Möglichkeiten, Equity-
Kicker in die Mezzanine-Transaktionen einzubauen, was
zusätzliche Renditequellen schafft und für die Investoren eine
höhere Absicherung mit sich bringt. Zu guter Letzt wurde das
Transaktionsrisiko durch einen geringeren Fremdkapitalanteil
bei den Deals reduziert. Aus diesen Gründen hat Mezzanine
von den Schwierigkeiten an den Kreditmärkten stark profi-
tiert. Das Mezzanine-Volumen in Europa konnte daher wiede-
rum einen leichten Anstieg im Vergleich zum Vorjahr und
somit einen Rekord für 2007 verbuchen. In den USA, wo der
Markt im Wesentlichen von unabhängigen Mezzanine-Anbie-
tern kontrolliert wird, deutet der Anstieg des gesamten neu
aufgelegten LBO-Kreditvolumens, das Mezzanine beinhaltet,
auf ein solides Wachstum auch in dieser Region hin.
Venture Capital ist gereift
Das Venture-Segment hat sich seit dem Platzen der Technolo-
gie-Blase in 2000 stark weiterentwickelt und die Qualität der
Investitionen hat sich im Laufe der letzten Jahre deutlich ver-
bessert, was für den Investor ein enormes Potenzial bedeutet.
Zusätzlich ist das Wachstumssegment aus dem Venture-
Bereich hervorgetreten, welches äusserst interessante Mög-
lichkeiten bietet. Wachstumsinvestitionen werden üblicher-
weise in schnell wachsende Unternehmen getätigt, welche in
der Vergangenheit stark expandiert haben und bereits profita-
bel sind oder unmittelbar vor der Profitabilität stehen.
Pearl_2007.qxp:Pearl_2005 18.3.2008 11:19 Uhr Seite 19
20
BERICHT DES INVESTMENT MANAGERS
ness to pay up for nextgeneration companies such as
XFire in order to be able to participate in new trends such
as social networking within the gaming space. XFire was
backed by Pearl partnership Draper Fisher Jurvetson and
New Enterprise Associates as well as Granite Global
Ventures. Growth opportunities have therefore been very
interesting and offer significant upside potential.
Another characteristic of venture capital, namely the
importance of a long-term investment horizon, is illustrated
by Swiss technology company u-blox. Since the J-curve for
venture capital investments is pronounced and requires a
strong conviction and perseverance, it is essential to have
a clear understanding of the quality and the upside poten-
tial of the investment. In the case of u-blox, an investment
period of ten years was necessary between founding the
company in 1997 and the IPO on the SWX Swiss Exchange
in October 2007.
Market turmoil supports secondary buyers
In the first half of 2007, sellers’ pricing expectations in the
secondary market were at an unreasonably high level.
However, by the end of the first half of 2007 the market
correction had caused sellers to lower their pricing expec-
tations to more realistic levels thanks to the basic function
of supply and demand. Many holders of private equity port-
folios, especially banks, entered the market to sell their
portfolios driven by an increased need for liquidity. At the
same time, the number of potential buyers in the second -
ary market remained relatively stable. Because the supply
increased but the demand remained more or less constant,
the prices for portfolios dropped to balance the disequilib -
rium – a favorable dynamic for secondary buyers. Anal -
ogous to the case of mezzanine financing, the credit crisis
can therefore be said to have had a positive impact for
secondary buyers.
Turbulent year for the listed private equity asset
class
After a solid performance in the first half of 2007, the listed
private equity stocks suffered disproportionally in the second
half amid the global financial market turmoil. Concerns about
the debt financing of private equity in general and the nega -
tive performance of the stock markets led to a significant in -
crease in volatility. In many cases, the market seemed to over-
react and ceased to differentiate between the portfolio qual -
ities of individual listed private equity companies: the funda-
mental data of the companies was no longer reflected in the
actual stock prices. Overall, as measured by the LPX50 Index,
the listed private equity asset class closed 2007 down 15%.
Die globalen Fundraising-Aktivitäten im Venture Capital-
Bereich bewegten sich im abgelaufenen Jahr auf dem
Niveau des Vorjahres. Das Gesamtvolumen in den USA
wuchs von USD 32 Mrd. aufgenommen von 229 Fonds auf
USD 35 Mrd., die von 235 Fonds eingeworben wurden. In
Europa sammelten 64 Venture-Fonds Neugelder in Höhe von
USD 5.5 Mrd. in 2007, was einem leichten Anstieg gegen -
über den USD 5.3 Mrd. des Vorjahres entspricht. Die bekann-
ten Venture Capital- und Wachstumsfonds legen ihren Fokus
derzeit darauf, das in den letzten Jahren gesammelte Kapi-
tal zu investieren, was die rekordverdächtigen Zahlen für
2007 auf der Investitionsseite belegen. So verzeichneten die
USA erneut einen Anstieg, während das Investitionsvolumen
in Europa relativ konstant blieb. Dabei ist die Grösse der
Deals in Europa angestiegen, was den Trend hin zu grö -
sseren Spätphasenfinanzierungen bestätigt.
Das Exit-Umfeld für durch Venture Capital unterstützte
Unternehmen erwies sich in den letzten zwölf Monaten als
freundlich, was im Anstieg des M&A-Volumens und der Bör-
sengänge zu erkennen ist: das Gesamtvolumen bekannt-
gegebener M&A-Transaktionen, die Venture Capital beinhal-
ten, stieg um nahezu 50% im Vergleich zum Vorjahr auf
USD 25.4 Mrd., während die Gesamtzahl der Börsen gänge
von Unternehmen, bei denen Venture Capital involviert war,
um den gleichen Prozentsatz auf 86 IPOs in 2007 stieg. Der
signifikante Anstieg stellt unter Beweis, dass der Börsen -
gang wieder eine interessante Alternative zu einem Exit
durch eine Fusion oder Übernahme ist. In Folge konnten es
sich die Unternehmen nun leisten, Übernahmeangebote
abzulehnen, was wiederum zu einer Erhöhung der Preise
führte. Im Rahmen der Marktturbulenzen haben auch Ver-
käufe an strategische Investoren wieder an Bedeutung
gewonnen: Für etablierte Marktführer, die bahnbrechende
Technologien oder Produkte entwickelt haben, zahlten stra-
tegische Investoren hohe Preise. Ein Beispiel hierfür ist das
führende global agierende Unterhaltungsunternehmen Via-
com, welches bereit war, für Firmen der nächsten Genera-
tion, wie etwa XFire, einen Aufpreis zu zahlen, um so an
neuen Trends, wie in diesem Falle dem Networking unter
Computerspielern, teilzunehmen. XFire wurde von den
Pearl-Partnerships Draper Fisher Jurvetson und New Enter-
prise Associates sowie Granite Globale Ventures unter-
stützt. Das mit Wachstumsfinanzierungen verbundene
Wertsteigerungspotenzial hat sich im abgelaufenen Jahr
erneut deutlich unter Beweis gestellt.
Ein weiteres Merkmal von Venture Capital – die Wichtigkeit
eines langfristigen Investitionshorizontes – hat weiterhin
Bestand und wird am Beispiel des Schweizer Technologie -
unternehmens u-blox deutlich. Da es bei Venture-Investi tionen
einen J-Kurven-Effekt gibt und starke Überzeugung und Aus-
Pearl_2007.qxp:Pearl_2005 18.3.2008 11:19 Uhr Seite 20
21
INVESTMENT MANAGER’S REPORT
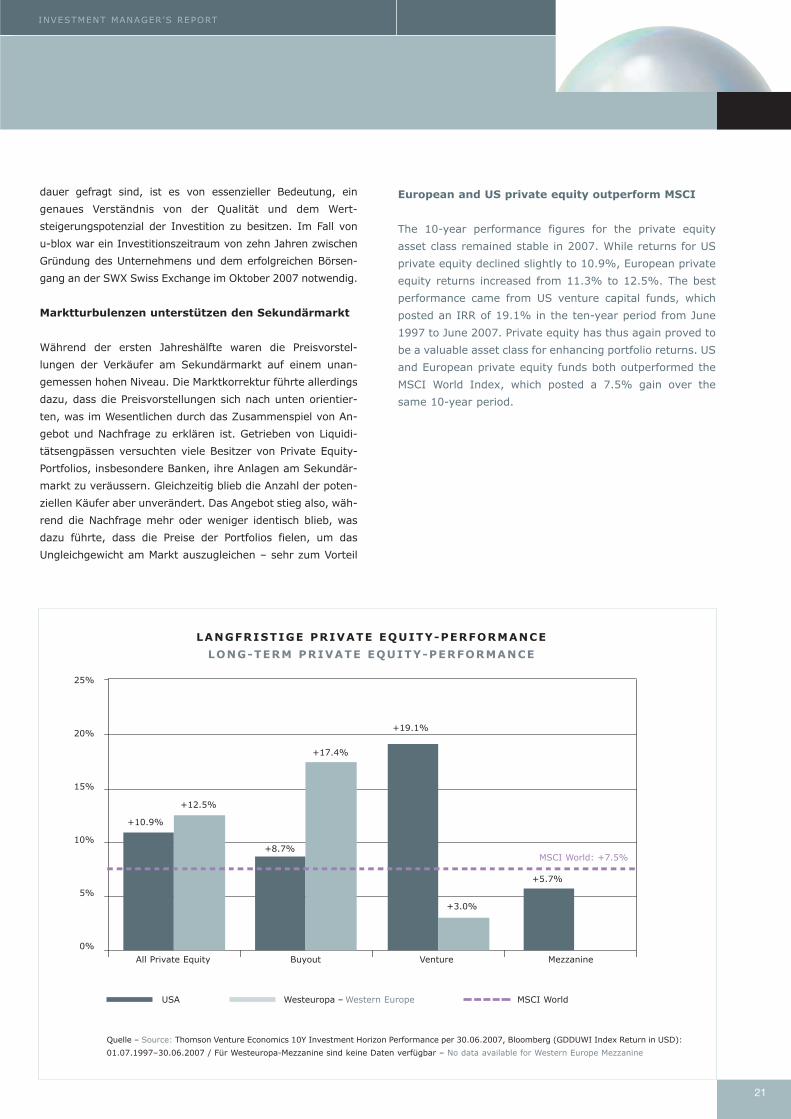
European and US private equity outperform MSCI
The 10-year performance figures for the private equity
asset class remained stable in 2007. While returns for US
private equity declined slightly to 10.9%, European private
equity returns increased from 11.3% to 12.5%. The best
performance came from US venture capital funds, which
posted an IRR of 19.1% in the ten-year period from June
1997 to June 2007. Private equity has thus again proved to
be a valuable asset class for enhancing portfolio returns. US
and European private equity funds both outperformed the
MSCI World Index, which posted a 7.5% gain over the
same 10-year period.
dauer gefragt sind, ist es von essenzieller Be deutung, ein
genaues Verständnis von der Qualität und dem Wert -
steigerungspotenzial der Investition zu besitzen. Im Fall von
u-blox war ein Investitionszeitraum von zehn Jahren zwischen
Gründung des Unternehmens und dem erfolgreichen Börsen-
gang an der SWX Swiss Exchange im Oktober 2007 notwendig.
Marktturbulenzen unterstützen den Sekundärmarkt
Während der ersten Jahreshälfte waren die Preisvorstel -
lungen der Verkäufer am Sekundärmarkt auf einem unan -
gemessen hohen Niveau. Die Marktkorrektur führte allerdings
dazu, dass die Preisvorstellungen sich nach unten orientier-
ten, was im Wesentlichen durch das Zusammenspiel von An -
gebot und Nachfrage zu erklären ist. Getrieben von Liquidi-
tätsengpässen versuchten viele Besitzer von Private Equity-
Portfolios, insbesondere Banken, ihre Anlagen am Sekundär-
markt zu veräussern. Gleichzeitig blieb die Anzahl der poten-
ziellen Käufer aber unverändert. Das Angebot stieg also, wäh-
rend die Nachfrage mehr oder weniger identisch blieb, was
dazu führte, dass die Preise der Portfolios fielen, um das
Ungleichgewicht am Markt auszugleichen – sehr zum Vorteil
Quelle – Source: Thomson Venture Economics 10Y Investment Horizon Performance per 30.06.2007, Bloomberg (GDDUWI Index Return in USD):
01.07.1997–30.06.2007 / Für Westeuropa-Mezzanine sind keine Daten verfügbar – No data available for Western Europe Mezzanine
LANGFRISTIGE PRIVATE EQUITY-PERFORMANCE
LONG-TERM PRIVATE EQUITY-PERFORMANCE
USA Westeuropa – Western Europe MSCI World
25%
20%
15%
10%
5%
0%
+10.9%
+12.5%
+8.7%
+17.4%
+19.1%
+3.0%
+5.7%
All Private Equity Buyout Venture Mezzanine
MSCI World: +7.5%
Pearl_2007.qxp:Pearl_2005 18.3.2008 11:19 Uhr Seite 21
22
der Käufer von Sekundärportfolios. Ähnlich wie bei Mezzani-
ne hatte die Kreditkrise demnach auch für den Sekundär-
markt einen positiven Effekt für die Käuferseite des Seg-
ments.
Turbulentes Jahr für Listed Private Equity
Nach einer äusserst soliden Entwicklung in der ersten Jah-
reshälfte erlitten die Aktien börsennotierter Private Equity-
Unternehmen im Rahmen der globalen Korrekturen über-
proportionale Verluste in der zweiten Hälfte von 2007. Die
Sorgen um die Fremdfinanzierung im Private Equity-Bereich
generell sowie die negative Entwicklung der Aktienmärkte
führten zu einem drastischen Anstieg der Volatilität. In vie-
len Fällen hatte es den Anschein, dass die Märkte überrea-
gierten und die unterschiedliche Qualität der Portfolios der
verschiedenen börsennotierten Unternehmen nicht mehr in
Betracht zogen: Die Fundamentaldaten spiegelten sich in
den Aktienkursen nicht mehr wider. Gesamthaft betrachtet
verlor die börsennotierte Private Equity-Anlageklasse im
abgelaufenen Jahr gemessen am LPX 50 etwa 15%.
Private Equity besser als Aktienmärkte
Die Gesamtperformance über die letzten zehn Jahre blieb
für die Anlageklasse Private Equity in 2007 stabil. Während
die Rendite (IRR) von Private Equity über den 10-Jahres-
Zeitraum vom Juni 1997 bis Juni 2007 in den USA mit
einem Plus 10.9% leicht rückläufig ist, stieg sie in Europa
von 11.3% auf 12.5%. Die grösste Rendite verbuchen US
Venture Capital-Fonds mit einer internen Verzinsung von
19.1%. Private Equity erweist sich somit weiterhin als wert-
volle Anlageklasse, um Portfoliorenditen zu erhöhen.
Sowohl amerikanische als auch europäische Private Equity-
Fonds rentieren langfristig besser als der MSCI World
Index, der im gleichen Zeitraum von zehn Jahren eine Ren-
dite von 7.5% aufweist.
BERICHT DES INVESTMENT MANAGERS
Pearl_2007.qxp:Pearl_2005 18.3.2008 11:19 Uhr Seite 22
23
INVESTMENT MANAGER’S REPORT
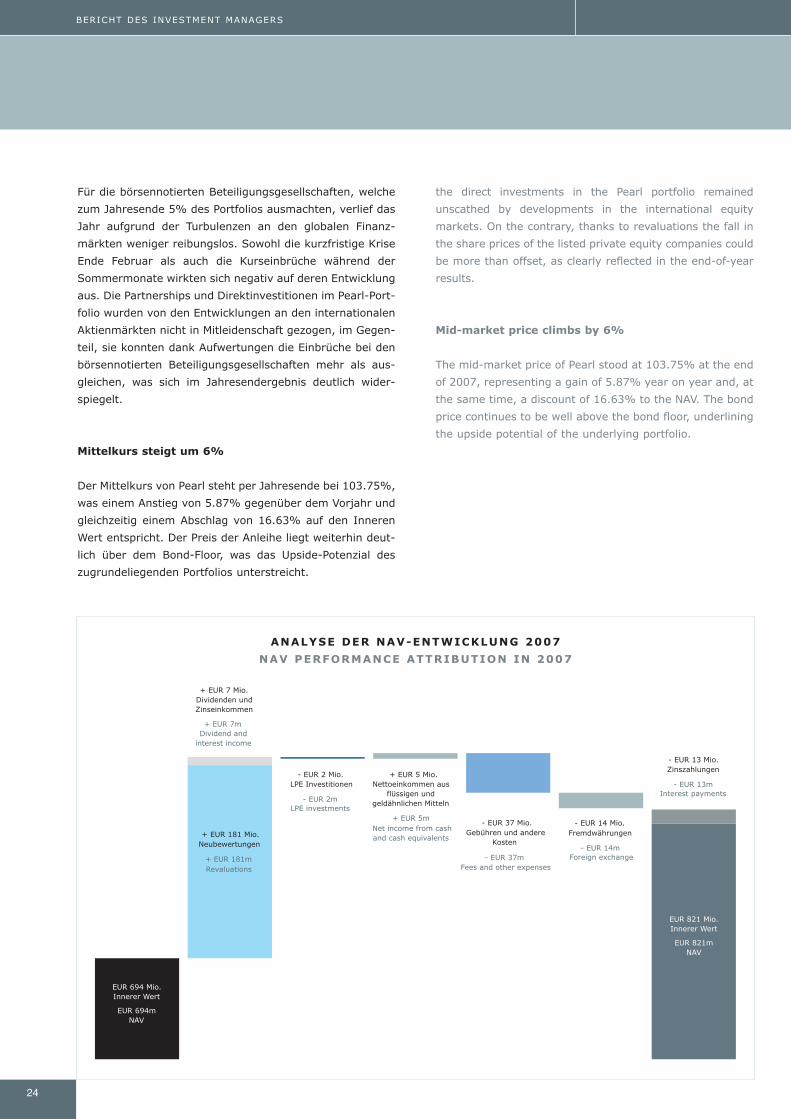
2007 was the most successful financial year for Pearl
since its inception. Over the past twelve months, the
net asset value has climbed by over 18% and ended
the year at a new all-time high of 124.45%. In view of
the turmoil in the international financial markets in
the second half of the year, this is a remarkable result.
Pearl’s most successful year to date
Despite the turmoil in the international financial markets
triggered by the subprime crisis in the US, 2007 was an
extremely successful year for Pearl. With an audited net
asset value (NAV), measured at fair market value in accord -
ance with International Financial Reporting Standards
(IFRS), of 124.45% and an increase of 18.30% over the past
twelve months, it proved to be the most successful year in
Pearl’s history, despite adverse conditions at times. This
result meant that Pearl could continue the upward trend that
it has sustained since May 2004 during the past financial
year and close the year at an all-time high. Since the bond-
holders’ meeting on the amendment of the terms and condi-
tions of the bond in December 2005, the NAV has increased
by a remarkable 33.00%, a clear indication that extending
the maturity of the bond and more intensive investment activ -
ity thanks to the favorable private equity environment have
already paid off. Inclusion of the 2% coupon, which is paid
out to the investors every September, yields a theoretical
NAV of as much as 138.95%: since its inception in 2000,
Pearl has already distributed a total of around EUR 92 million
in interest payments to the bondholders.
The record growth in the NAV of Pearl is primarily due to
revaluations of the partnerships, especially those in the buy-
out sector, and the direct investments in the Pearl portfolio
that were effected during the course of the year on the back
of the positive private equity environment. This is attribu -
table, in particular, to the greater maturity of the portfolio:
now, in the post-investment period, the underlying partner -
ships are gradually realizing the investments that have per-
formed well and are distributing the proceeds to the inves-
tors. To be revalued were, among others, the secondary
portfolio Partners Group SPP1 Limited and the buyout
partnerships Global PE Fund IV, Newbridge III and EQT IV.
The turmoil in the global financial markets meant that the
year did not go so smoothly for the listed private equity
companies, which at year’s end constituted 5% of the Pearl
portfolio. Both the short-lived crisis at the end of February
and the slump in share prices during the summer months
adversely impacted their performance. The partnerships and
Das Geschäftsjahr 2007 war für Pearl das erfolg-
reichste Jahr seit Auflegung. Der Innere Wert stieg in
den vergangenen zwölf Monaten um über 18% und
beendete das Jahr auf einem neuen Höchststand von
124.45%. In Anbetracht der Turbulenzen an den
internationalen Finanzmärkten in der zweiten Hälfte
des Jahres stellt dieser Anstieg ein beeindruckendes
Ergebnis dar.
Erfolgreichstes Jahr für Pearl
Trotz der durch die Subprime-Krise in den USA ausgelös -
ten Turbulenzen an den internationalen Finanzmärkten
war 2007 für Pearl ein äusserst erfolgreiches Jahr. Mit
einem geprüften Inneren Wert (NAV) bewertet nach IFRS-
Rechnungslegungsstandard zu fairen Marktwerten von
124.45% und einem Zuwachs von 18.30% über die ver-
gangenen zwölf Monate war es trotz teilweise widriger
Bedingungen das erfolgreichste Jahr in der Geschichte
von Pearl. Mit diesem Ergebnis konnte Pearl im abgelau-
fenen Geschäftsjahr den seit Mai 2004 anhaltenden Auf-
wärtstrend weiter fortsetzen und schloss das Jahr auf
einem Allzeithoch. Seit der Obligationärsversammlung zur
Anpassung der Anleihebedingungen im Dezember 2005
stieg der NAV gar um beachtliche 33.00%, ein deutliches
Zeichen dafür, dass sich die Laufzeitverlängerung und die
durch das freundliche Private Equity-Umfeld intensivere
Investitionsaktivität bereits ausgezahlt haben. Berück-
sichtigt man zudem noch den 2%igen Zinskupon, der
jeweils im September an die Investoren ausbezahlt wird,
resultiert sogar ein theoretischer Innerer Wert von
138.95%: Seit Auflegung im Jahr 2000 hat Pearl nämlich
bereits insgesamt Zinszahlungen von rund EUR 92 Mio. an
die Anleiheninhaber ausgeschüttet.
Der Rekordzuwachs des Inneren Wertes von Pearl ist vor
allem auf Neubewertungen der Partnerships, besonders
im Buyout-Bereich, und der Direktbeteiligungen im Pearl-
Portfolio zurückzuführen, welche im Laufe des Jahres
aufgrund des positiven Private Equity-Umfeldes vor-
genommen werden konnten. Verantwortlich dafür ist
besonders der fortgeschrittene Reifegrad des Portfolios,
da die dem Portfolio zugrunde liegenden Partnerships
nach Zeiten der Investitionen nun ihre Beteiligungen,
die sich gut entwickelt haben, nach und nach veräussern
und Ausschüttungen an die Investoren vornehmen.
Aufgewertet wurden unter anderem das Sekundärport -
folio Partners Group SPP1 Limited, sowie die Buyout-
Partnerships Global PE Fund IV, Newbridge III oder EQT
IV.
WERTENTWICKLUNG DES PEARL-PORTFOLIOSPERFORMANCE OF THE PEARL PORTFOLIO
Pearl_2007.qxp:Pearl_2005 18.3.2008 11:19 Uhr Seite 23
24
BERICHT DES INVESTMENT MANAGERS
the direct investments in the Pearl portfolio remained
unscathed by developments in the international equity
markets. On the contrary, thanks to revaluations the fall in
the share prices of the listed private equity companies could
be more than offset, as clearly reflected in the end-of-year
results.
Mid-market price climbs by 6%
The mid-market price of Pearl stood at 103.75% at the end
of 2007, representing a gain of 5.87% year on year and, at
the same time, a discount of 16.63% to the NAV. The bond
price continues to be well above the bond floor, underlining
the upside potential of the underlying portfolio.
Für die börsennotierten Beteiligungsgesellschaften, welche
zum Jahresende 5% des Portfolios ausmachten, verlief das
Jahr aufgrund der Turbulenzen an den globalen Finanz-
märkten weniger reibungslos. Sowohl die kurzfristige Krise
Ende Februar als auch die Kurseinbrüche während der
Sommermonate wirkten sich negativ auf deren Entwicklung
aus. Die Partnerships und Direktinvestitionen im Pearl-Port-
folio wurden von den Entwicklungen an den internationalen
Aktienmärkten nicht in Mitleidenschaft gezogen, im Gegen-
teil, sie konnten dank Aufwertungen die Einbrüche bei den
börsennotierten Beteiligungsgesellschaften mehr als aus-
gleichen, was sich im Jahresendergebnis deutlich wider-
spiegelt.
Mittelkurs steigt um 6%
Der Mittelkurs von Pearl steht per Jahresende bei 103.75%,
was einem Anstieg von 5.87% gegenüber dem Vorjahr und
gleichzeitig einem Abschlag von 16.63% auf den Inneren
Wert entspricht. Der Preis der Anleihe liegt weiterhin deut-
lich über dem Bond-Floor, was das Upside-Potenzial des
zugrundeliegenden Portfolios unterstreicht.
ANALYSE DER NAV-ENTWICKLUNG 2007
NAV PERFORMANCE ATTRIBUTION IN 2007
Pearl_2007.qxp:Pearl_2005 18.3.2008 11:19 Uhr Seite 24
25
INVESTMENT MANAGER’S REPORT
30 new investments
A high level of commitment activity was again kept up in
2007 so as to maintain a full investment level. A total of 14
new capital commitments were made to primary funds,
whereby the focus was on buyout investments in North
America and Europe. Pearl, however, also made individual
commitments in the venture capital and special situations
sectors. During the course of the year, nine secondary port-
folios were also acquired and seven direct investments
were made. During the past financial year, commitments in
the order of EUR 121 million were thus spoken.
Pearl maintained an overcommitment level (undrawn commit-
ments less net liquidity divided by the NAV) of around 27% at
the end of the year. This overcommitment strategy, which
defines the size and the timing of commitments based on
modeled and actual distribution flows from the portfolio
investments, enables Pearl to maintain a full investment level.
By the end of 2007, the Pearl portfolio comprised 191 part-
nerships (thereof 160 primary investments and 31 second -
ary investments), 33 direct investments and 39 listed pri-
vate equity companies.
Continued high level of investment activity
Capital calls were slightly up from the EUR 167 million of the
previous year, but did not quite manage to match the record
level of 2005. A total of EUR 175 million was drawn down for
investments by the partnerships as well as for direct invest-
ments. At 74%, the lion’s share went once again to buyout,
followed by 18% for venture capital and 8% for special situ-
ations financings. Last year, direct investments were made in,
among others, US-headquartered Micro-Poise Measurement
Systems, a provider of measurement and inspection systems
and aftermarket services to the automotive industry, AHT
Cooling Systems, a company active in the area of industrial
refrigeration and deep freezing, publishing house and market -
ing company The Reader’s Digest (RDA), radio company Uni-
vision Communications and Cengage (fka Thomson Learning,
Inc.), a globally leading specialist information group. Larger
sums were also drawn down by partnerships in the Pearl port-
folio. Among these were: Terra Firma Capital Partners II for
the purpose of the acquisition of the EMI Group, one of the
world’s largest music companies and the largest global music
publisher; Clayton, Dubilier & Rice Fund VII for the acquisi-
tion of US-based food service distributor US Foodservice; and
Carlyle Partners IV for the acquisition of North American tire
manufacturer Goodyear Tire & Rubber Co.
30 neue Beteiligungen
Um den vollen Investitionsgrad beizubehalten, wurden die
Commitmentaktivitäten in 2007 weiterhin auf einem hohen
Niveau gehalten: Insgesamt hat Pearl 14 neue Kapitalzusa-
gen an Primärfonds abgegeben, wobei der Fokus hierbei auf
Buyout-Investitionen in Nordamerika und Europa gelegt
wurde. Vereinzelt tätigte Pearl aber auch Zahlungsverspre-
chen im Bereich Venture Capital und Special Situations. Im
Laufe des Jahres wurden zudem neun Sekundärportfolios
erworben und sieben Direktinvestitionen getätigt. Damit
wurden im abgeschlossenen Geschäftsjahr Zahlungszusa-
gen in Höhe von EUR 121 Mio. abgegeben.
Pearl bleibt damit per Jahresende zu rund 27% übercommit-
ted (nichtabgerufene Commitments abzüglich Nettoliquidität
dividiert durch den Inneren Wert). Diese Overcommitment-
Strategie, die Umfang und zeitliche Planung von Zahlungs-
versprechen basierend auf modellierten und tatsächlichen
Zahlungsströmen der Portfoliobeteiligungen definiert, erlaubt
es Pearl, den vollen Investitionsgrad aufrechtzuerhalten.
Per Ende 2007 besteht das Pearl-Portfolio nunmehr aus 191
Partnerships (davon 160 Primärbeteiligungen und 31
Sekundärbeteiligungen) sowie 33 Direktbeteiligungen und
39 börsennotierten Beteiligungsgesellschaften.
Investitionsaktivität weiterhin auf hohem Niveau
Im Vergleich zu den EUR 167 Mio. des Vorjahres stiegen die
Kapitalabrufe in 2007 leicht an, erreichten jedoch nicht ganz
das Volumen des Rekordjahres 2005. Insgesamt wurden Gel-
der in Höhe von EUR 175 Mio. für Investitionen der Partner -
ships sowie für Direktinvestitionen abgerufen. Der grösste
Anteil davon ging mit 74% wiederum an den Buyout-Bereich,
gefolgt von 18% für Venture Capital-Finanzierungen und 8%
für den Bereich Special Situations. Direktinvestitionen wurden
im vergangenen Jahr unter anderen in Micro-Poise Measure-
ment Systems, einem in den USA ansässigen Unternehmen
des Bereiches Mess- und Kontrollverfahren sowie Wartungs-
dienstleistungen für die Automobilindustrie, AHT Cooling
Systems, einem Unternehmen des Bereiches der industriellen
Kühlung und Tiefkühlung, in das Verlagshaus und Marketing-
unternehmen The Reader’s Digest (RDA), das Rundfunk-
unternehmen Univision Communications und Cengage (ehe-
mals Thomson Learning, Inc.), einem weltweit führenden
Fachinformationskonzern, getätigt. Des Weiteren wurden
aber auch von den Partnerships im Pearl-Portfolio grössere
Summen abgerufen, so unter anderem von Terra Firma Cap -
ital Partners II für die Übernahme der EMI Group, einem der
INVESTITIONSVERLAUFINVESTMENT ACTIVITY
Pearl_2007.qxp:Pearl_2005 18.3.2008 11:19 Uhr Seite 25
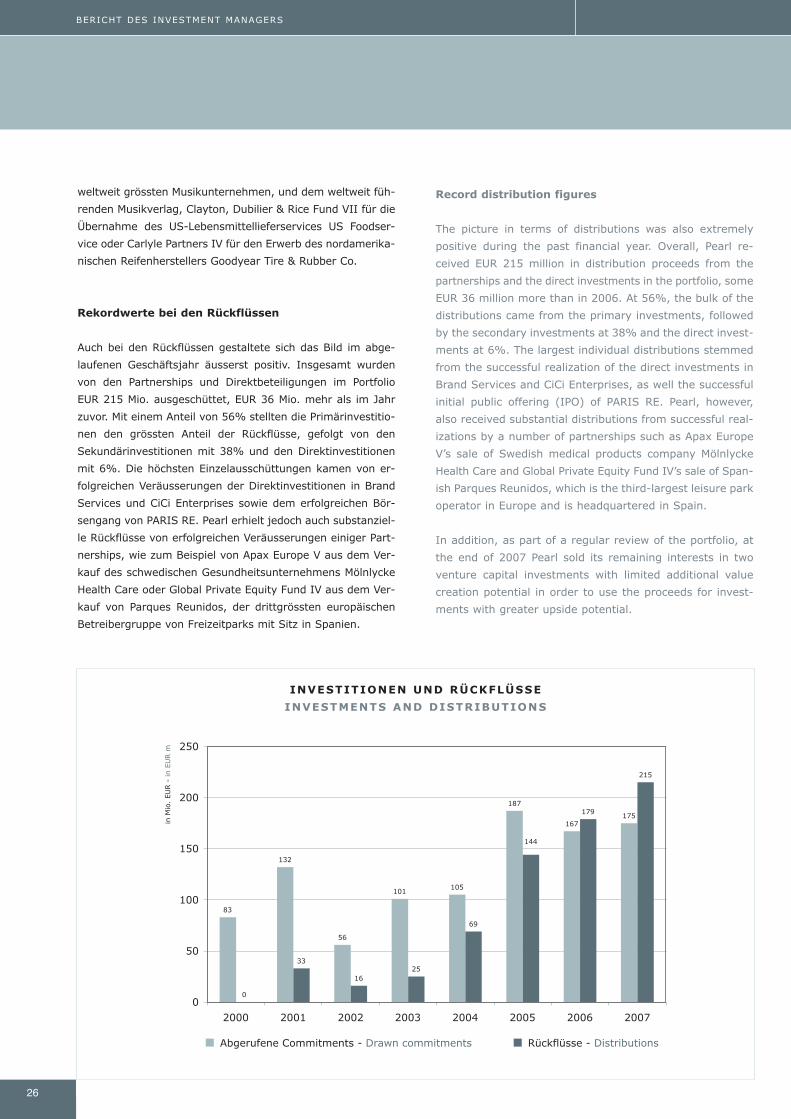
26
BERICHT DES INVESTMENT MANAGERS
weltweit grössten Musikunternehmen, und dem weltweit füh-
renden Musikverlag, Clayton, Dubilier & Rice Fund VII für die
Übernahme des US-Lebensmittellieferservices US Foodser -
vice oder Carlyle Partners IV für den Erwerb des nordamerika-
nischen Reifenherstellers Goodyear Tire & Rubber Co.
Rekordwerte bei den Rückflüssen
Auch bei den Rückflüssen gestaltete sich das Bild im abge-
laufenen Geschäftsjahr äusserst positiv. Insgesamt wurden
von den Partnerships und Direktbeteiligungen im Portfolio
EUR 215 Mio. ausgeschüttet, EUR 36 Mio. mehr als im Jahr
zuvor. Mit einem Anteil von 56% stellten die Primärinvestitio-
nen den grössten Anteil der Rückflüsse, gefolgt von den
Sekundärinvestitionen mit 38% und den Direktinvestitionen
mit 6%. Die höchsten Einzelausschüttungen kamen von er -
folg reichen Veräusserungen der Direktinvestitionen in Brand
Services und CiCi Enterprises sowie dem erfolgreichen Bör-
sengang von PARIS RE. Pearl erhielt jedoch auch substanziel-
le Rückflüsse von erfolgreichen Veräusserungen einiger Part-
nerships, wie zum Beispiel von Apax Europe V aus dem Ver-
kauf des schwedischen Gesundheitsunternehmens Mölnlycke
Health Care oder Global Private Equity Fund IV aus dem Ver-
kauf von Parques Reunidos, der drittgrössten europäischen
Betreibergruppe von Freizeitparks mit Sitz in Spanien.
Record distribution figures
The picture in terms of distributions was also extremely
positive during the past financial year. Overall, Pearl re -
ceived EUR 215 million in distribution proceeds from the
partnerships and the direct investments in the portfolio, some
EUR 36 million more than in 2006. At 56%, the bulk of the
distributions came from the primary investments, followed
by the secondary investments at 38% and the direct invest-
ments at 6%. The largest individual distributions stemmed
from the successful realization of the direct investments in
Brand Services and CiCi Enterprises, as well the successful
initial public offering (IPO) of PARIS RE. Pearl, however,
also received substantial distributions from successful real -
izations by a number of partnerships such as Apax Europe
V’s sale of Swedish medical products company Mölnlycke
Health Care and Global Private Equity Fund IV’s sale of Span -
ish Parques Reunidos, which is the third-largest leisure park
operator in Europe and is headquartered in Spain.
In addition, as part of a regular review of the portfolio, at
the end of 2007 Pearl sold its remaining interests in two
venture capital investments with limited additional value
creation potential in order to use the proceeds for invest-
ments with greater upside potential.
INVESTITIONEN UND RÜCKFLÜSSE
INVESTMENTS AND DISTRIBUTIONS
Pearl_2007.qxp:Pearl_2005 18.3.2008 11:19 Uhr Seite 26
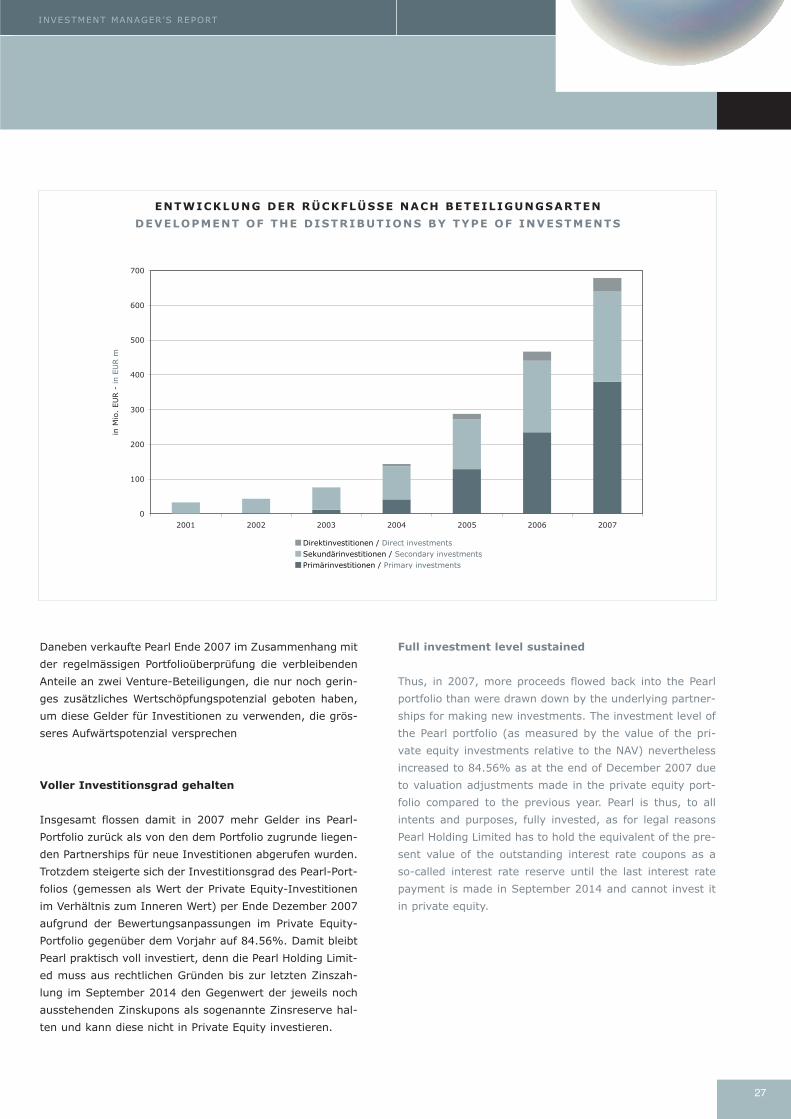
27
INVESTMENT MANAGER’S REPORT
ENTWICKLUNG DER RÜCKFLÜSSE NACH BETEILIGUNGSARTEN
DEVELOPMENT OF THE DISTRIBUTIONS BY TYPE OF INVESTMENTS
Daneben verkaufte Pearl Ende 2007 im Zusammenhang mit
der regelmässigen Portfolioüberprüfung die verbleibenden
Anteile an zwei Venture-Beteiligungen, die nur noch gerin-
ges zusätzliches Wertschöpfungspotenzial geboten haben,
um diese Gelder für Investitionen zu verwenden, die grös-
seres Aufwärtspotenzial versprechen
Voller Investitionsgrad gehalten
Insgesamt flossen damit in 2007 mehr Gelder ins Pearl-
Portfolio zurück als von den dem Portfolio zugrunde liegen-
den Partnerships für neue Investitionen abgerufen wurden.
Trotzdem steigerte sich der Investitionsgrad des Pearl-Port-
folios (gemessen als Wert der Private Equity-Investitionen
im Verhältnis zum Inneren Wert) per Ende Dezember 2007
aufgrund der Bewertungsanpassungen im Private Equity-
Portfolio gegenüber dem Vorjahr auf 84.56%. Damit bleibt
Pearl praktisch voll investiert, denn die Pearl Holding Limit -
ed muss aus rechtlichen Gründen bis zur letzten Zinszah-
lung im September 2014 den Gegenwert der jeweils noch
ausstehenden Zinskupons als sogenannte Zinsreserve hal-
ten und kann diese nicht in Private Equity investieren.
Full investment level sustained
Thus, in 2007, more proceeds flowed back into the Pearl
portfolio than were drawn down by the underlying partner -
ships for making new investments. The investment level of
the Pearl portfolio (as measured by the value of the pri-
vate equity investments relative to the NAV) nevertheless
increased to 84.56% as at the end of December 2007 due
to valuation adjustments made in the private equity port -
folio compared to the previous year. Pearl is thus, to all
intents and purposes, fully invested, as for legal reasons
Pearl Holding Limited has to hold the equivalent of the pre-
sent value of the outstanding interest rate coupons as a
so-called interest rate reserve until the last interest rate
payment is made in September 2014 and cannot invest it
in private equity.
Pearl_2007.qxp:Pearl_2005 18.3.2008 11:19 Uhr Seite 27
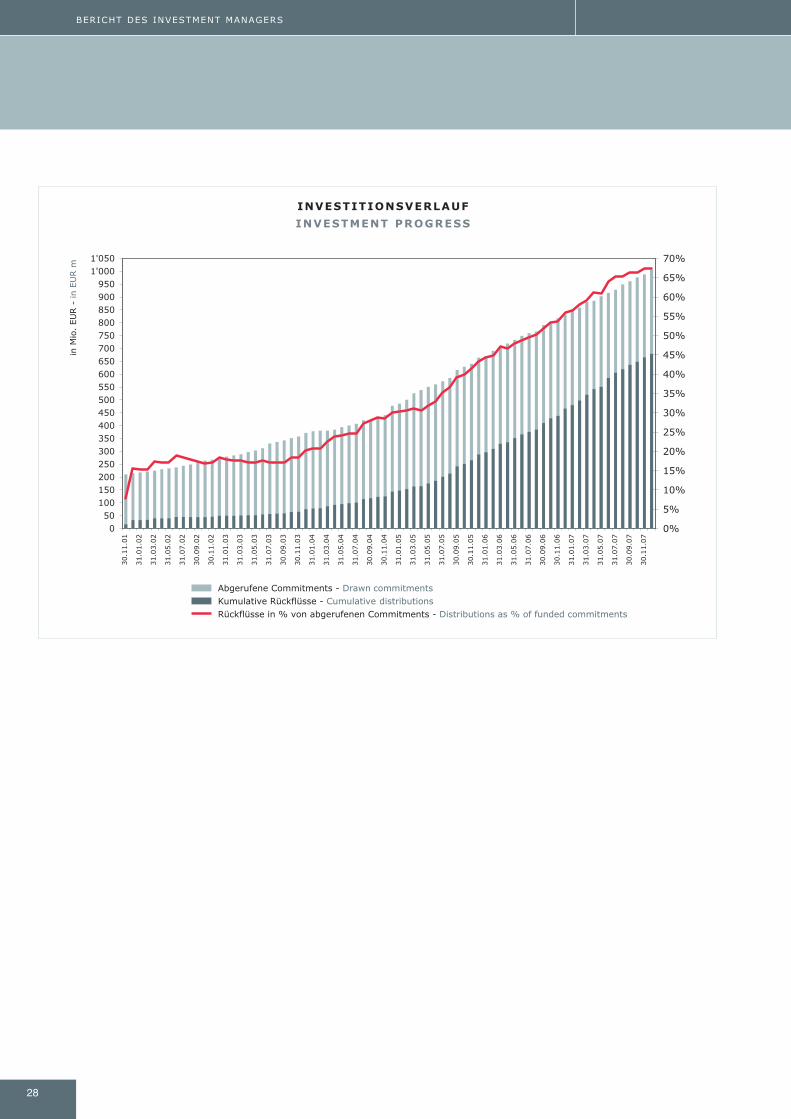
28
BERICHT DES INVESTMENT MANAGERS
INVESTITIONSVERLAUF
INVESTMENT PROGRESS
Pearl_2007.qxp:Pearl_2005 18.3.2008 11:19 Uhr Seite 28
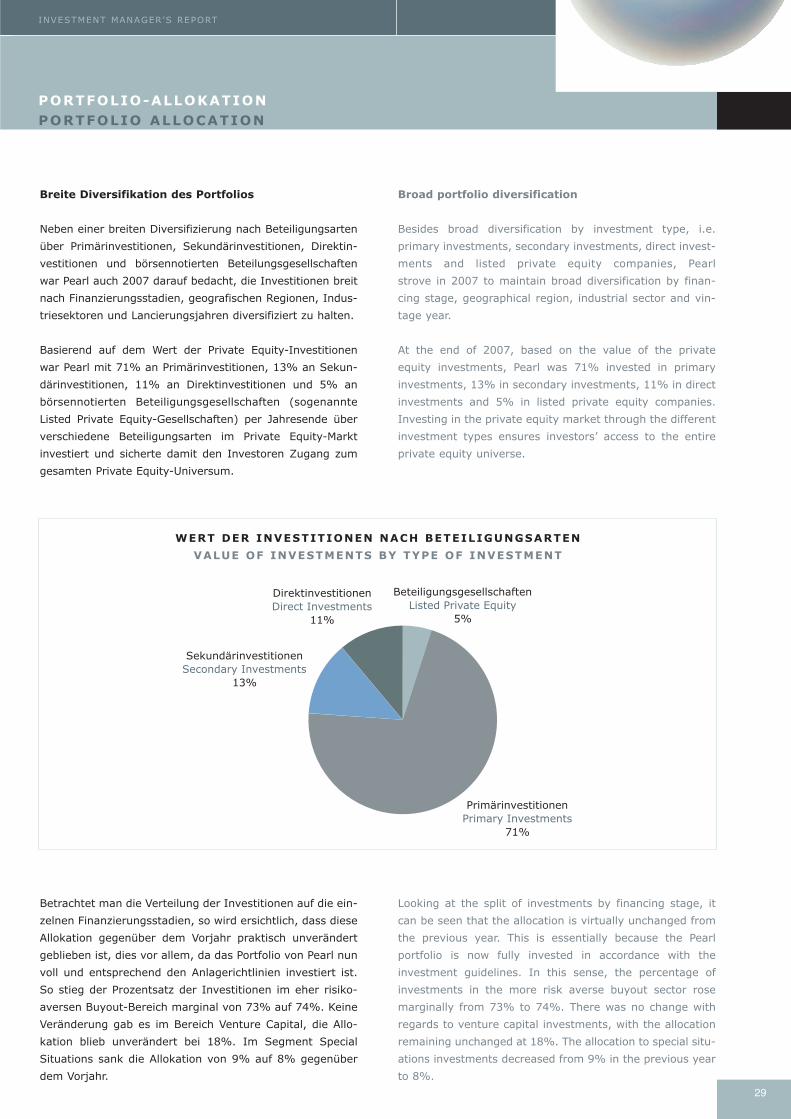
29
INVESTMENT MANAGER’S REPORT
PORTFOLIO-ALLOKATION PORTFOLIO ALLOCATION
Breite Diversifikation des Portfolios
Neben einer breiten Diversifizierung nach Beteiligungsarten
über Primärinvestitionen, Sekundärinvestitionen, Direktin-
vestitionen und börsennotierten Beteilungsgesellschaften
war Pearl auch 2007 darauf bedacht, die Investitionen breit
nach Finanzierungsstadien, geografischen Regionen, Indus -
triesektoren und Lancierungsjahren diversifiziert zu halten.
Basierend auf dem Wert der Private Equity-Investitionen
war Pearl mit 71% an Primärinvestitionen, 13% an Sekun-
därinvestitionen, 11% an Direktinvestitionen und 5% an
börsennotierten Beteiligungsgesellschaften (sogenannte
Listed Private Equity-Gesellschaften) per Jahresende über
verschiedene Beteiligungsarten im Private Equity-Markt
investiert und sicherte damit den Investoren Zugang zum
gesamten Private Equity-Universum.
Betrachtet man die Verteilung der Investitionen auf die ein-
zelnen Finanzierungsstadien, so wird ersichtlich, dass diese
Allokation gegenüber dem Vorjahr praktisch unverändert
geblieben ist, dies vor allem, da das Portfolio von Pearl nun
voll und entsprechend den Anlagerichtlinien investiert ist.
So stieg der Prozentsatz der Investitionen im eher risiko -
aversen Buyout-Bereich marginal von 73% auf 74%. Keine
Veränderung gab es im Bereich Venture Capital, die Allo -
kation blieb unverändert bei 18%. Im Segment Special
Situations sank die Allokation von 9% auf 8% gegenüber
dem Vorjahr.
Broad portfolio diversification
Besides broad diversification by investment type, i.e.
primary investments, secondary investments, direct invest-
ments and listed private equity companies, Pearl
strove in 2007 to maintain broad diversification by finan-
cing stage, geographical region, industrial sector and vin -
tage year.
At the end of 2007, based on the value of the private
equity investments, Pearl was 71% invested in primary
investments, 13% in secondary investments, 11% in direct
investments and 5% in listed private equity companies.
Investing in the private equity market through the different
investment types ensures investors’ access to the entire
private equity universe.
Looking at the split of investments by financing stage, it
can be seen that the allocation is virtually unchanged from
the previous year. This is essentially because the Pearl
portfolio is now fully invested in accordance with the
investment guidelines. In this sense, the percentage of
investments in the more risk averse buyout sector rose
marginally from 73% to 74%. There was no change with
regards to venture capital investments, with the allocation
remaining unchanged at 18%. The allocation to special situ-
ations investments decreased from 9% in the previous year
to 8%.
WERT DER INVESTITIONEN NACH BETEILIGUNGSARTEN
VALUE OF INVESTMENTS BY TYPE OF INVESTMENT
Pearl_2007.qxp:Pearl_2005 18.3.2008 11:19 Uhr Seite 29
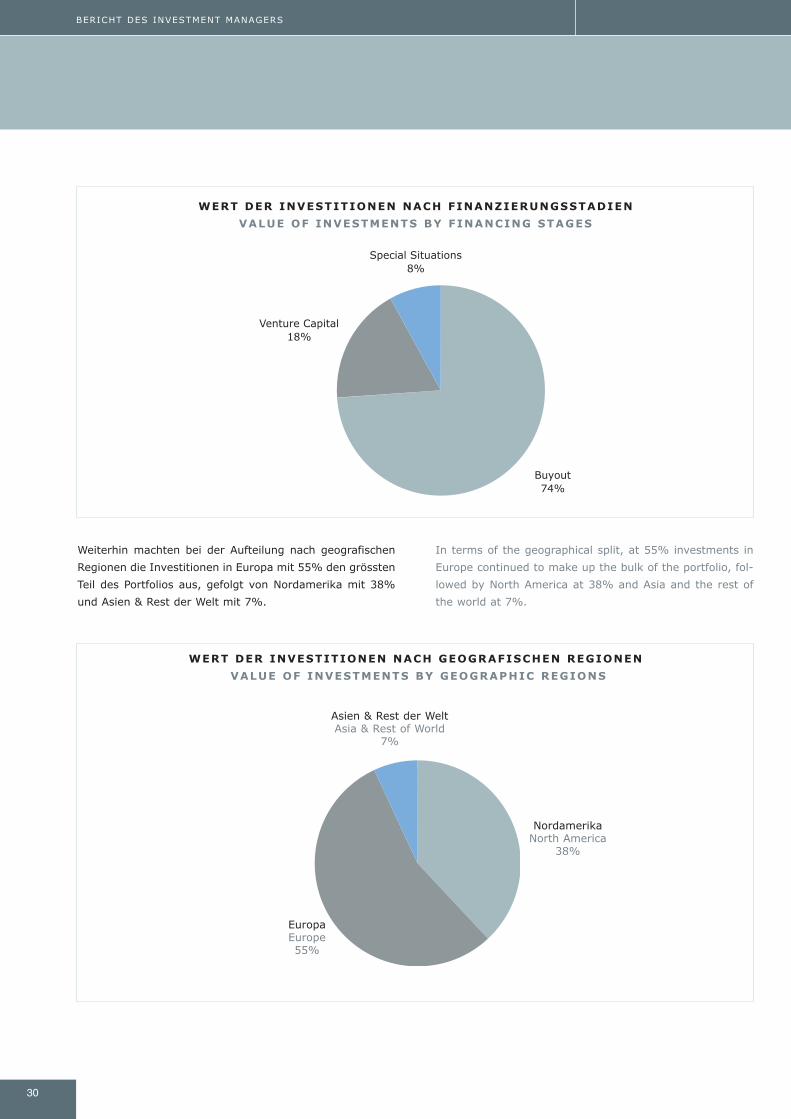
30
BERICHT DES INVESTMENT MANAGERS
Weiterhin machten bei der Aufteilung nach geografischen
Regionen die Investitionen in Europa mit 55% den grössten
Teil des Portfolios aus, gefolgt von Nordamerika mit 38%
und Asien & Rest der Welt mit 7%.
In terms of the geographical split, at 55% investments in
Europe continued to make up the bulk of the portfolio, fol-
lowed by North America at 38% and Asia and the rest of
the world at 7%.
WERT DER INVESTITIONEN NACH FINANZIERUNGSSTADIEN
VALUE OF INVESTMENTS BY FINANCING STAGES
NordamerikaNorth America
38%
EuropaEurope 55%
Asien & Rest der WeltAsia & Rest of World
7%
WERT DER INVESTITIONEN NACH GEOGRAFISCHEN REGIONEN
VALUE OF INVESTMENTS BY GEOGRAPHIC REGIONS
Pearl_2007.qxp:Pearl_2005 18.3.2008 11:19 Uhr Seite 30
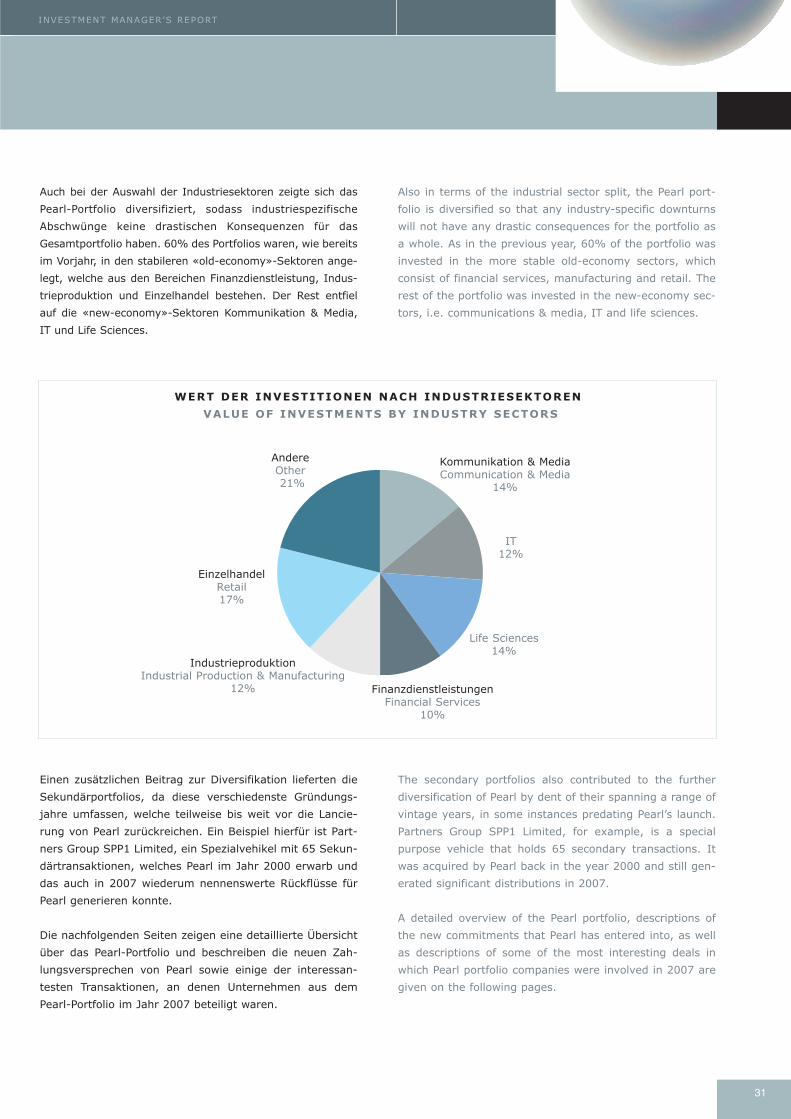
31
INVESTMENT MANAGER’S REPORT
Auch bei der Auswahl der Industriesektoren zeigte sich das
Pearl-Portfolio diversifiziert, sodass industriespezifische
Abschwünge keine drastischen Konsequenzen für das
Gesamtportfolio haben. 60% des Portfolios waren, wie bereits
im Vorjahr, in den stabileren «old-economy»-Sektoren ange-
legt, welche aus den Bereichen Finanzdienstleistung, Indus -
trieproduktion und Einzelhandel bestehen. Der Rest entfiel
auf die «new-economy»-Sektoren Kommunikation & Media,
IT und Life Sciences.
Einen zusätzlichen Beitrag zur Diversifikation lieferten die
Sekundärportfolios, da diese verschiedenste Gründungs-
jahre umfassen, welche teilweise bis weit vor die Lancie-
rung von Pearl zurückreichen. Ein Beispiel hierfür ist Part-
ners Group SPP1 Limited, ein Spezialvehikel mit 65 Sekun-
därtransaktionen, welches Pearl im Jahr 2000 erwarb und
das auch in 2007 wiederum nennenswerte Rückflüsse für
Pearl generieren konnte.
Die nachfolgenden Seiten zeigen eine detaillierte Übersicht
über das Pearl-Portfolio und beschreiben die neuen Zah-
lungsversprechen von Pearl sowie einige der interessan -
testen Transaktionen, an denen Unternehmen aus dem
Pearl-Portfolio im Jahr 2007 beteiligt waren.
Also in terms of the industrial sector split, the Pearl port -
folio is diversified so that any industry-specific downturns
will not have any drastic consequences for the portfolio as
a whole. As in the previous year, 60% of the portfolio was
invested in the more stable old-economy sectors, which
consist of financial services, manufacturing and retail. The
rest of the portfolio was invested in the new-economy sec-
tors, i.e. communications & media, IT and life sciences.
The secondary portfolios also contributed to the further
diversification of Pearl by dent of their spanning a range of
vintage years, in some instances predating Pearl’s launch.
Partners Group SPP1 Limited, for example, is a special
purpose vehicle that holds 65 secondary transactions. It
was acquired by Pearl back in the year 2000 and still gen -
erated significant distributions in 2007.
A detailed overview of the Pearl portfolio, descriptions of
the new commitments that Pearl has entered into, as well
as descriptions of some of the most interesting deals in
which Pearl portfolio companies were involved in 2007 are
given on the following pages.
Life Sciences 14%
FinanzdienstleistungenFinancial Services
10%
IndustrieproduktionIndustrial Production & Manufacturing
12%
EinzelhandelRetail17%
AndereOther21%
Kommunikation & MediaCommunication & Media
14%
WERT DER INVESTITIONEN NACH INDUSTRIESEKTOREN
VALUE OF INVESTMENTS BY INDUSTRY SECTORS
IT12%
Pearl_2007.qxp:Pearl_2005 18.3.2008 11:19 Uhr Seite 31
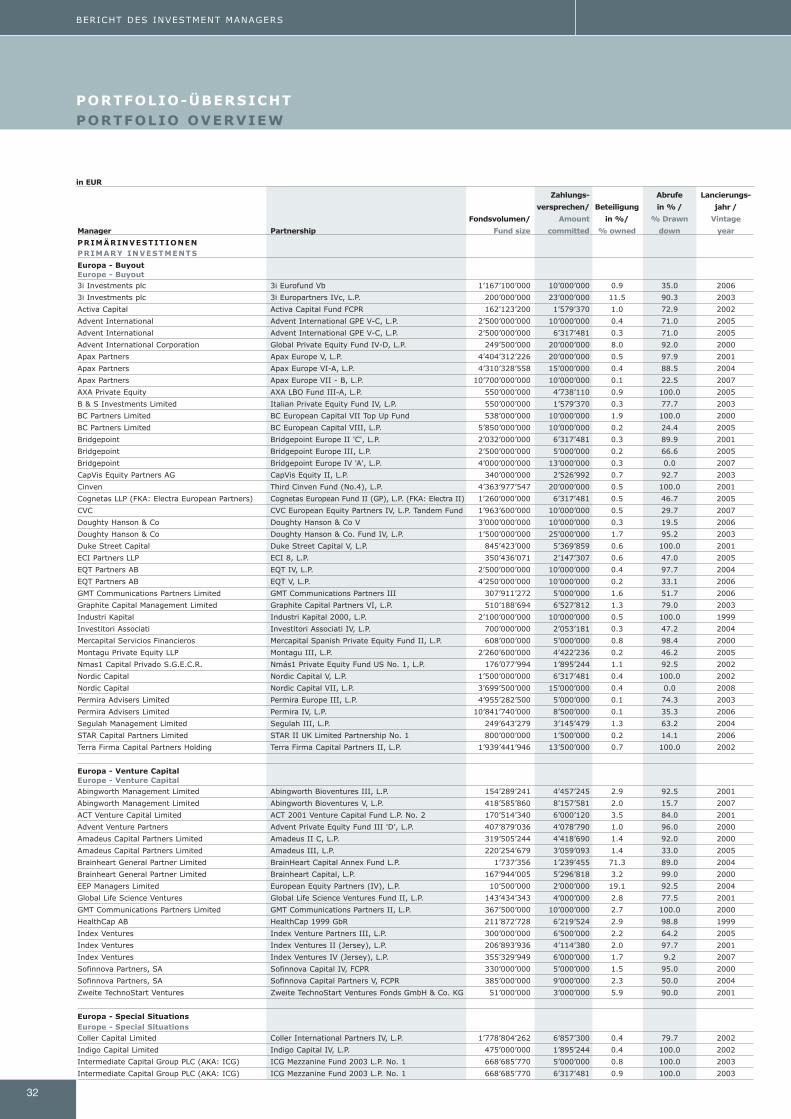
32
BERICHT DES INVESTMENT MANAGERS
PORTFOLIO-ÜBERSICHTPORTFOLIO OVERVIEW
Zahlungs- Abrufe Lancierungs-
versprechen/ Beteiligung in % / jahr /
Fondsvolumen/ Amount in %/ % Drawn Vintage
Manager Partnership Fund size committed % owned down year
PRIMÄRINVESTITIONENPRIMARY INVESTMENTS
Europa - BuyoutEurope - Buyout3i Investments plc 3i Eurofund Vb 1’167’100’000 10’000’000 0.9 35.0 2006
3i Investments plc 3i Europartners IVc, L.P. 200’000’000 23’000’000 11.5 90.3 2003
Activa Capital Activa Capital Fund FCPR 162’123’200 1’579’370 1.0 72.9 2002
Advent International Advent International GPE V-C, L.P. 2’500’000’000 10’000’000 0.4 71.0 2005
Advent International Advent International GPE V-C, L.P. 2’500’000’000 6’317’481 0.3 71.0 2005
Advent International Corporation Global Private Equity Fund IV-D, L.P. 249’500’000 20’000’000 8.0 92.0 2000
Apax Partners Apax Europe V, L.P. 4’404’312’226 20’000’000 0.5 97.9 2001
Apax Partners Apax Europe VI-A, L.P. 4’310’328’558 15’000’000 0.4 88.5 2004
Apax Partners Apax Europe VII - B, L.P. 10’700’000’000 10’000’000 0.1 22.5 2007
AXA Private Equity AXA LBO Fund III-A, L.P. 550’000’000 4’738’110 0.9 100.0 2005
B & S Investments Limited Italian Private Equity Fund IV, L.P. 550’000’000 1’579’370 0.3 77.7 2003
BC Partners Limited BC European Capital VII Top Up Fund 538’000’000 10’000’000 1.9 100.0 2000
BC Partners Limited BC European Capital VIII, L.P. 5’850’000’000 10’000’000 0.2 24.4 2005
Bridgepoint Bridgepoint Europe II 'C', L.P. 2’032’000’000 6’317’481 0.3 89.9 2001
Bridgepoint Bridgepoint Europe III, L.P. 2’500’000’000 5’000’000 0.2 66.6 2005
Bridgepoint Bridgepoint Europe IV 'A', L.P. 4’000’000’000 13’000’000 0.3 0.0 2007
CapVis Equity Partners AG CapVis Equity II, L.P. 340’000’000 2’526’992 0.7 92.7 2003
Cinven Third Cinven Fund (No.4), L.P. 4’363’977’547 20’000’000 0.5 100.0 2001
Cognetas LLP (FKA: Electra European Partners) Cognetas European Fund II (GP), L.P. (FKA: Electra II) 1’260’000’000 6’317’481 0.5 46.7 2005
CVC CVC European Equity Partners IV, L.P. Tandem Fund 1’963’600’000 10’000’000 0.5 29.7 2007
Doughty Hanson & Co Doughty Hanson & Co V 3’000’000’000 10’000’000 0.3 19.5 2006
Doughty Hanson & Co Doughty Hanson & Co. Fund IV, L.P. 1’500’000’000 25’000’000 1.7 95.2 2003
Duke Street Capital Duke Street Capital V, L.P. 845’423’000 5’369’859 0.6 100.0 2001
ECI Partners LLP ECI 8, L.P. 350’436’071 2’147’307 0.6 47.0 2005
EQT Partners AB EQT IV, L.P. 2’500’000’000 10’000’000 0.4 97.7 2004
EQT Partners AB EQT V, L.P. 4’250’000’000 10’000’000 0.2 33.1 2006
GMT Communications Partners Limited GMT Communications Partners III 307’911’272 5’000’000 1.6 51.7 2006
Graphite Capital Management Limited Graphite Capital Partners VI, L.P. 510’188’694 6’527’812 1.3 79.0 2003
Industri Kapital Industri Kapital 2000, L.P. 2’100’000’000 10’000’000 0.5 100.0 1999
Investitori Associati Investitori Associati IV, L.P. 700’000’000 2’053’181 0.3 47.2 2004
Mercapital Servicios Financieros Mercapital Spanish Private Equity Fund II, L.P. 608’000’000 5’000’000 0.8 98.4 2000
Montagu Private Equity LLP Montagu III, L.P. 2’260’600’000 4’422’236 0.2 46.2 2005
Nmas1 Capital Privado S.G.E.C.R. Nmás1 Private Equity Fund US No. 1, L.P. 176’077’994 1’895’244 1.1 92.5 2002
Nordic Capital Nordic Capital V, L.P. 1’500’000’000 6’317’481 0.4 100.0 2002
Nordic Capital Nordic Capital VII, L.P. 3’699’500’000 15’000’000 0.4 0.0 2008
Permira Advisers Limited Permira Europe III, L.P. 4’955’282’500 5’000’000 0.1 74.3 2003
Permira Advisers Limited Permira IV, L.P. 10’841’740’000 8’500’000 0.1 35.3 2006
Segulah Management Limited Segulah III, L.P. 249’643’279 3’145’479 1.3 63.2 2004
STAR Capital Partners Limited STAR II UK Limited Partnership No. 1 800’000’000 1’500’000 0.2 14.1 2006
Terra Firma Capital Partners Holding Terra Firma Capital Partners II, L.P. 1’939’441’946 13’500’000 0.7 100.0 2002
Europa - Venture CapitalEurope - Venture CapitalAbingworth Management Limited Abingworth Bioventures III, L.P. 154’289’241 4’457’245 2.9 92.5 2001
Abingworth Management Limited Abingworth Bioventures V, L.P. 418’585’860 8’157’581 2.0 15.7 2007
ACT Venture Capital Limited ACT 2001 Venture Capital Fund L.P. No. 2 170’514’340 6’000’120 3.5 84.0 2001
Advent Venture Partners Advent Private Equity Fund III 'D', L.P. 407’879’036 4’078’790 1.0 96.0 2000
Amadeus Capital Partners Limited Amadeus II C, L.P. 319’505’244 4’418’690 1.4 92.0 2000
Amadeus Capital Partners Limited Amadeus III, L.P. 220’254’679 3’059’093 1.4 33.0 2005
Brainheart General Partner Limited BrainHeart Capital Annex Fund L.P. 1’737’356 1’239’455 71.3 89.0 2004
Brainheart General Partner Limited Brainheart Capital, L.P. 167’944’005 5’296’818 3.2 99.0 2000
EEP Managers Limited European Equity Partners (IV), L.P. 10’500’000 2’000’000 19.1 92.5 2004
Global Life Science Ventures Global Life Science Ventures Fund II, L.P. 143’434’343 4’000’000 2.8 77.5 2001
GMT Communications Partners Limited GMT Communications Partners II, L.P. 367’500’000 10’000’000 2.7 100.0 2000
HealthCap AB HealthCap 1999 GbR 211’872’728 6’219’524 2.9 98.8 1999
Index Ventures Index Venture Partners III, L.P. 300’000’000 6’500’000 2.2 64.2 2005
Index Ventures Index Ventures II (Jersey), L.P. 206’893’936 4’114’380 2.0 97.7 2001
Index Ventures Index Ventures IV (Jersey), L.P. 355’329’949 6’000’000 1.7 9.2 2007
Sofinnova Partners, SA Sofinnova Capital IV, FCPR 330’000’000 5’000’000 1.5 95.0 2000
Sofinnova Partners, SA Sofinnova Capital Partners V, FCPR 385’000’000 9’000’000 2.3 50.0 2004
Zweite TechnoStart Ventures Zweite TechnoStart Ventures Fonds GmbH & Co. KG 51’000’000 3’000’000 5.9 90.0 2001
Europa - Special SituationsEurope - Special SituationsColler Capital Limited Coller International Partners IV, L.P. 1’778’804’262 6’857’300 0.4 79.7 2002
Indigo Capital Limited Indigo Capital IV, L.P. 475’000’000 1’895’244 0.4 100.0 2002
Intermediate Capital Group PLC (AKA: ICG) ICG Mezzanine Fund 2003 L.P. No. 1 668’685’770 5’000’000 0.8 100.0 2003
Intermediate Capital Group PLC (AKA: ICG) ICG Mezzanine Fund 2003 L.P. No. 1 668’685’770 6’317’481 0.9 100.0 2003
in EUR
Pearl_2007.qxp:Pearl_2005 18.3.2008 11:19 Uhr Seite 32
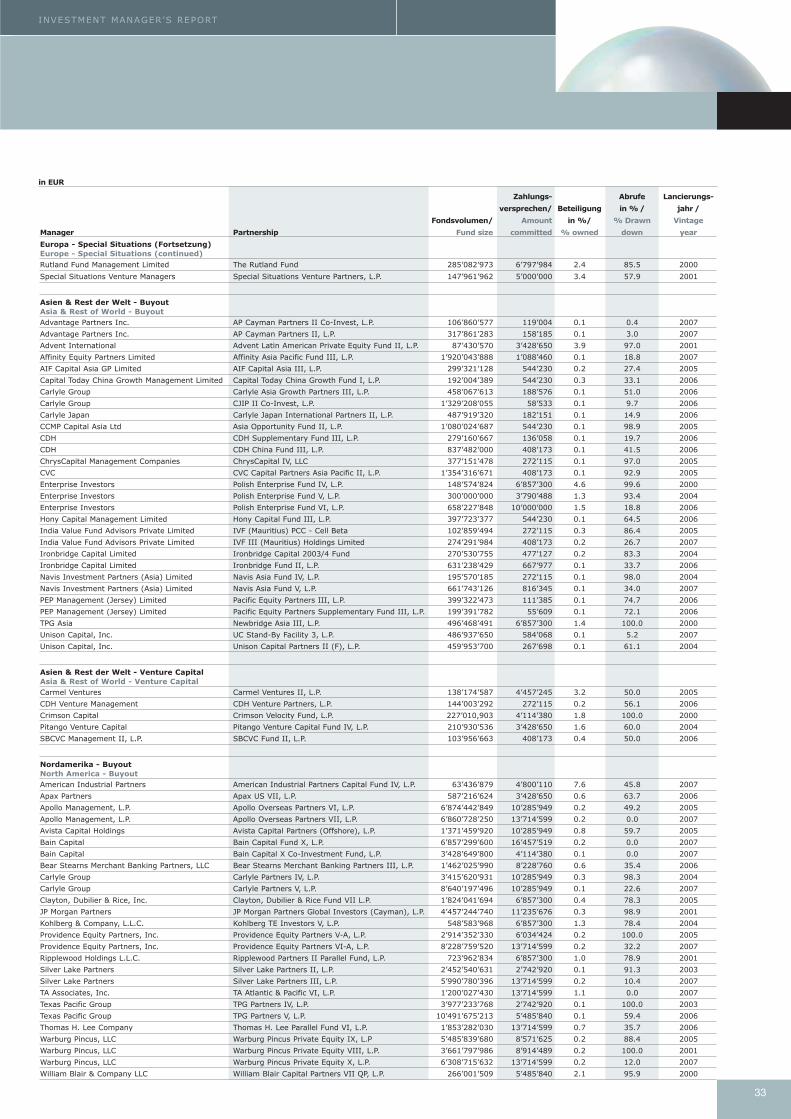
33
INVESTMENT MANAGER’S REPORT
Zahlungs- Abrufe Lancierungs-
versprechen/ Beteiligung in % / jahr /
Fondsvolumen/ Amount in %/ % Drawn Vintage
Manager Partnership Fund size committed % owned down year
Europa - Special Situations (Fortsetzung)Europe - Special Situations (continued)Rutland Fund Management Limited The Rutland Fund 285’082’973 6’797’984 2.4 85.5 2000
Special Situations Venture Managers Special Situations Venture Partners, L.P. 147’961’962 5’000’000 3.4 57.9 2001
Asien & Rest der Welt - BuyoutAsia & Rest of World - BuyoutAdvantage Partners Inc. AP Cayman Partners II Co-Invest, L.P. 106’860’577 119’004 0.1 0.4 2007
Advantage Partners Inc. AP Cayman Partners II, L.P. 317’861’283 158’185 0.1 3.0 2007
Advent International Advent Latin American Private Equity Fund II, L.P. 87’430’570 3’428’650 3.9 97.0 2001
Affinity Equity Partners Limited Affinity Asia Pacific Fund III, L.P. 1’920’043’888 1’088’460 0.1 18.8 2007
AIF Capital Asia GP Limited AIF Capital Asia III, L.P. 299’321’128 544’230 0.2 27.4 2005
Capital Today China Growth Management Limited Capital Today China Growth Fund I, L.P. 192’004’389 544’230 0.3 33.1 2006
Carlyle Group Carlyle Asia Growth Partners III, L.P. 458’067’613 188’576 0.1 51.0 2006
Carlyle Group CJIP II Co-Invest, L.P. 1’329’208’055 58’533 0.1 9.7 2006
Carlyle Japan Carlyle Japan International Partners II, L.P. 487’919’320 182’151 0.1 14.9 2006
CCMP Capital Asia Ltd Asia Opportunity Fund II, L.P. 1’080’024’687 544’230 0.1 98.9 2005
CDH CDH Supplementary Fund III, L.P. 279’160’667 136’058 0.1 19.7 2006
CDH CDH China Fund III, L.P. 837’482’000 408’173 0.1 41.5 2006
ChrysCapital Management Companies ChrysCapital IV, LLC 377’151’478 272’115 0.1 97.0 2005
CVC CVC Capital Partners Asia Pacific II, L.P. 1’354’316’671 408’173 0.1 92.9 2005
Enterprise Investors Polish Enterprise Fund IV, L.P. 148’574’824 6’857’300 4.6 99.6 2000
Enterprise Investors Polish Enterprise Fund V, L.P. 300’000’000 3’790’488 1.3 93.4 2004
Enterprise Investors Polish Enterprise Fund VI, L.P. 658’227’848 10’000’000 1.5 18.8 2006
Hony Capital Management Limited Hony Capital Fund III, L.P. 397’723’377 544’230 0.1 64.5 2006
India Value Fund Advisors Private Limited IVF (Mauritius) PCC - Cell Beta 102’859’494 272’115 0.3 86.4 2005
India Value Fund Advisors Private Limited IVF III (Mauritius) Holdings Limited 274’291’984 408’173 0.2 26.7 2007
Ironbridge Capital Limited Ironbridge Capital 2003/4 Fund 270’530’755 477’127 0.2 83.3 2004
Ironbridge Capital Limited Ironbridge Fund II, L.P. 631’238’429 667’977 0.1 33.7 2006
Navis Investment Partners (Asia) Limited Navis Asia Fund IV, L.P. 195’570’185 272’115 0.1 98.0 2004
Navis Investment Partners (Asia) Limited Navis Asia Fund V, L.P. 661’743’126 816’345 0.1 34.0 2007
PEP Management (Jersey) Limited Pacific Equity Partners III, L.P. 399’322’473 111’385 0.1 74.7 2006
PEP Management (Jersey) Limited Pacific Equity Partners Supplementary Fund III, L.P. 199’391’782 55’609 0.1 72.1 2006
TPG Asia Newbridge Asia III, L.P. 496’468’491 6’857’300 1.4 100.0 2000
Unison Capital, Inc. UC Stand-By Facility 3, L.P. 486’937’650 584’068 0.1 5.2 2007
Unison Capital, Inc. Unison Capital Partners II (F), L.P. 459’953’700 267’698 0.1 61.1 2004
Asien & Rest der Welt - Venture CapitalAsia & Rest of World - Venture CapitalCarmel Ventures Carmel Ventures II, L.P. 138’174’587 4’457’245 3.2 50.0 2005
CDH Venture Management CDH Venture Partners, L.P. 144’003’292 272’115 0.2 56.1 2006
Crimson Capital Crimson Velocity Fund, L.P. 227’010,903 4’114’380 1.8 100.0 2000
Pitango Venture Capital Pitango Venture Capital Fund IV, L.P. 210’930’536 3’428’650 1.6 60.0 2004
SBCVC Management II, L.P. SBCVC Fund II, L.P. 103’956’663 408’173 0.4 50.0 2006
Nordamerika - BuyoutNorth America - BuyoutAmerican Industrial Partners American Industrial Partners Capital Fund IV, L.P. 63’436’879 4’800’110 7.6 45.8 2007
Apax Partners Apax US VII, L.P. 587’216’624 3’428’650 0.6 63.7 2006
Apollo Management, L.P. Apollo Overseas Partners VI, L.P. 6’874’442’849 10’285’949 0.2 49.2 2005
Apollo Management, L.P. Apollo Overseas Partners VII, L.P. 6’860’728’250 13’714’599 0.2 0.0 2007
Avista Capital Holdings Avista Capital Partners (Offshore), L.P. 1’371’459’920 10’285’949 0.8 59.7 2005
Bain Capital Bain Capital Fund X, L.P. 6’857’299’600 16’457’519 0.2 0.0 2007
Bain Capital Bain Capital X Co-Investment Fund, L.P. 3’428’649’800 4’114’380 0.1 0.0 2007
Bear Stearns Merchant Banking Partners, LLC Bear Stearns Merchant Banking Partners III, L.P. 1’462’025’990 8’228’760 0.6 35.4 2006
Carlyle Group Carlyle Partners IV, L.P. 3’415’620’931 10’285’949 0.3 98.3 2004
Carlyle Group Carlyle Partners V, L.P. 8’640’197’496 10’285’949 0.1 22.6 2007
Clayton, Dubilier & Rice, Inc. Clayton, Dubilier & Rice Fund VII L.P. 1’824’041’694 6’857’300 0.4 78.3 2005
JP Morgan Partners JP Morgan Partners Global Investors (Cayman), L.P. 4’457’244’740 11’235’676 0.3 98.9 2001
Kohlberg & Company, L.L.C. Kohlberg TE Investors V, L.P. 548’583’968 6’857’300 1.3 78.4 2004
Providence Equity Partners, Inc. Providence Equity Partners V-A, L.P. 2’914’352’330 6’034’424 0.2 100.0 2005
Providence Equity Partners, Inc. Providence Equity Partners VI-A, L.P. 8’228’759’520 13’714’599 0.2 32.2 2007
Ripplewood Holdings L.L.C. Ripplewood Partners II Parallel Fund, L.P. 723’962’834 6’857’300 1.0 78.9 2001
Silver Lake Partners Silver Lake Partners II, L.P. 2’452’540’631 2’742’920 0.1 91.3 2003
Silver Lake Partners Silver Lake Partners III, L.P. 5’990’780’396 13’714’599 0.2 10.4 2007
TA Associates, Inc. TA Atlantic & Pacific VI, L.P. 1’200’027’430 13’714’599 1.1 0.0 2007
Texas Pacific Group TPG Partners IV, L.P. 3’977’233’768 2’742’920 0.1 100.0 2003
Texas Pacific Group TPG Partners V, L.P. 10’491’675’213 5’485’840 0.1 59.4 2006
Thomas H. Lee Company Thomas H. Lee Parallel Fund VI, L.P. 1’853’282’030 13’714’599 0.7 35.7 2006
Warburg Pincus, LLC Warburg Pincus Private Equity IX, L.P 5’485’839’680 8’571’625 0.2 88.4 2005
Warburg Pincus, LLC Warburg Pincus Private Equity VIII, L.P. 3’661’797’986 8’914’489 0.2 100.0 2001
Warburg Pincus, LLC Warburg Pincus Private Equity X, L.P. 6’308’715’632 13’714’599 0.2 12.0 2007
William Blair & Company LLC William Blair Capital Partners VII QP, L.P. 266’001’509 5’485’840 2.1 95.9 2000
in EUR
Pearl_2007.qxp:Pearl_2005 18.3.2008 11:19 Uhr Seite 33
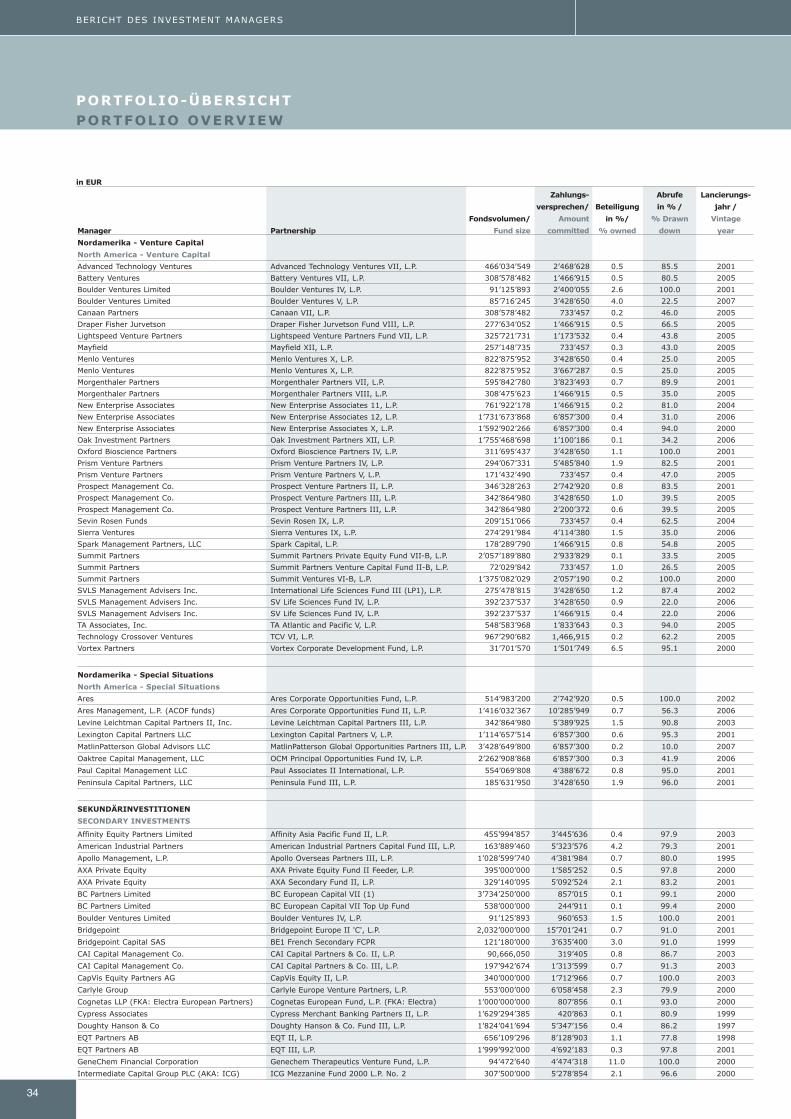
34
BERICHT DES INVESTMENT MANAGERS
PORTFOLIO-ÜBERSICHTPORTFOLIO OVERVIEW
Zahlungs- Abrufe Lancierungs-
versprechen/ Beteiligung in % / jahr /
Fondsvolumen/ Amount in %/ % Drawn Vintage
Manager Partnership Fund size committed % owned down year
Nordamerika - Venture Capital
North America - Venture Capital
Advanced Technology Ventures Advanced Technology Ventures VII, L.P. 466’034’549 2’468’628 0.5 85.5 2001
Battery Ventures Battery Ventures VII, L.P. 308’578’482 1’466’915 0.5 80.5 2005
Boulder Ventures Limited Boulder Ventures IV, L.P. 91’125’893 2’400’055 2.6 100.0 2001
Boulder Ventures Limited Boulder Ventures V, L.P. 85’716’245 3’428’650 4.0 22.5 2007
Canaan Partners Canaan VII, L.P. 308’578’482 733’457 0.2 46.0 2005
Draper Fisher Jurvetson Draper Fisher Jurvetson Fund VIII, L.P. 277’634’052 1’466’915 0.5 66.5 2005
Lightspeed Venture Partners Lightspeed Venture Partners Fund VII, L.P. 325’721’731 1’173’532 0.4 43.8 2005
Mayfield Mayfield XII, L.P. 257’148’735 733’457 0.3 43.0 2005
Menlo Ventures Menlo Ventures X, L.P. 822’875’952 3’428’650 0.4 25.0 2005
Menlo Ventures Menlo Ventures X, L.P. 822’875’952 3’667’287 0.5 25.0 2005
Morgenthaler Partners Morgenthaler Partners VII, L.P. 595’842’780 3’823’493 0.7 89.9 2001
Morgenthaler Partners Morgenthaler Partners VIII, L.P. 308’475’623 1’466’915 0.5 35.0 2005
New Enterprise Associates New Enterprise Associates 11, L.P. 761’922’178 1’466’915 0.2 81.0 2004
New Enterprise Associates New Enterprise Associates 12, L.P. 1’731’673’868 6’857’300 0.4 31.0 2006
New Enterprise Associates New Enterprise Associates X, L.P. 1’592’902’266 6’857’300 0.4 94.0 2000
Oak Investment Partners Oak Investment Partners XII, L.P. 1’755’468’698 1’100’186 0.1 34.2 2006
Oxford Bioscience Partners Oxford Bioscience Partners IV, L.P. 311’695’437 3’428’650 1.1 100.0 2001
Prism Venture Partners Prism Venture Partners IV, L.P. 294’067’331 5’485’840 1.9 82.5 2001
Prism Venture Partners Prism Venture Partners V, L.P. 171’432’490 733’457 0.4 47.0 2005
Prospect Management Co. Prospect Venture Partners II, L.P. 346’328’263 2’742’920 0.8 83.5 2001
Prospect Management Co. Prospect Venture Partners III, L.P. 342’864’980 3’428’650 1.0 39.5 2005
Prospect Management Co. Prospect Venture Partners III, L.P. 342’864’980 2’200’372 0.6 39.5 2005
Sevin Rosen Funds Sevin Rosen IX, L.P. 209’151’066 733’457 0.4 62.5 2004
Sierra Ventures Sierra Ventures IX, L.P. 274’291’984 4’114’380 1.5 35.0 2006
Spark Management Partners, LLC Spark Capital, L.P. 178’289’790 1’466’915 0.8 54.8 2005
Summit Partners Summit Partners Private Equity Fund VII-B, L.P. 2’057’189’880 2’933’829 0.1 33.5 2005
Summit Partners Summit Partners Venture Capital Fund II-B, L.P. 72’029’842 733’457 1.0 26.5 2005
Summit Partners Summit Ventures VI-B, L.P. 1’375’082’029 2’057’190 0.2 100.0 2000
SVLS Management Advisers Inc. International Life Sciences Fund III (LP1), L.P. 275’478’815 3’428’650 1.2 87.4 2002
SVLS Management Advisers Inc. SV Life Sciences Fund IV, L.P. 392’237’537 3’428’650 0.9 22.0 2006
SVLS Management Advisers Inc. SV Life Sciences Fund IV, L.P. 392’237’537 1’466’915 0.4 22.0 2006
TA Associates, Inc. TA Atlantic and Pacific V, L.P. 548’583’968 1’833’643 0.3 94.0 2005
Technology Crossover Ventures TCV VI, L.P. 967’290’682 1,466,915 0.2 62.2 2005
Vortex Partners Vortex Corporate Development Fund, L.P. 31’701’570 1’501’749 6.5 95.1 2000
Nordamerika - Special Situations
North America - Special Situations
Ares Ares Corporate Opportunities Fund, L.P. 514’983’200 2’742’920 0.5 100.0 2002
Ares Management, L.P. (ACOF funds) Ares Corporate Opportunities Fund II, L.P. 1’416’032’367 10’285’949 0.7 56.3 2006
Levine Leichtman Capital Partners II, Inc. Levine Leichtman Capital Partners III, L.P. 342’864’980 5’389’925 1.5 90.8 2003
Lexington Capital Partners LLC Lexington Capital Partners V, L.P. 1’114’657’514 6’857’300 0.6 95.3 2001
MatlinPatterson Global Advisors LLC MatlinPatterson Global Opportunities Partners III, L.P. 3’428’649’800 6’857’300 0.2 10.0 2007
Oaktree Capital Management, LLC OCM Principal Opportunities Fund IV, L.P. 2’262’908’868 6’857’300 0.3 41.9 2006
Paul Capital Management LLC Paul Associates II International, L.P. 554’069’808 4’388’672 0.8 95.0 2001
Peninsula Capital Partners, LLC Peninsula Fund III, L.P. 185’631’950 3’428’650 1.9 96.0 2001
SEKUNDÄRINVESTITIONEN
SECONDARY INVESTMENTS
Affinity Equity Partners Limited Affinity Asia Pacific Fund II, L.P. 455’994’857 3’445’636 0.4 97.9 2003
American Industrial Partners American Industrial Partners Capital Fund III, L.P. 163’889’460 5’323’576 4.2 79.3 2001
Apollo Management, L.P. Apollo Overseas Partners III, L.P. 1’028’599’740 4’381’984 0.7 80.0 1995
AXA Private Equity AXA Private Equity Fund II Feeder, L.P. 395’000’000 1’585’252 0.5 97.8 2000
AXA Private Equity AXA Secondary Fund II, L.P. 329’140’095 5’092’524 2.1 83.2 2001
BC Partners Limited BC European Capital VII (1) 3’734’250’000 857’015 0.1 99.1 2000
BC Partners Limited BC European Capital VII Top Up Fund 538’000’000 244’911 0.1 99.4 2000
Boulder Ventures Limited Boulder Ventures IV, L.P. 91’125’893 960’653 1.5 100.0 2001
Bridgepoint Bridgepoint Europe II 'C', L.P. 2,032’000’000 15’701’241 0.7 91.0 2001
Bridgepoint Capital SAS BE1 French Secondary FCPR 121’180’000 3’635’400 3.0 91.0 1999
CAI Capital Management Co. CAI Capital Partners & Co. II, L.P. 90,666,050 319’405 0.8 86.7 2003
CAI Capital Management Co. CAI Capital Partners & Co. III, L.P. 197’942’674 1’313’599 0.7 91.3 2003
CapVis Equity Partners AG CapVis Equity II, L.P. 340’000’000 1’712’966 0.7 100.0 2003
Carlyle Group Carlyle Europe Venture Partners, L.P. 553’000’000 6’058’458 2.3 79.9 2000
Cognetas LLP (FKA: Electra European Partners) Cognetas European Fund, L.P. (FKA: Electra) 1’000’000’000 807’856 0.1 93.0 2000
Cypress Associates Cypress Merchant Banking Partners II, L.P. 1’629’294’385 420’863 0.1 80.9 1999
Doughty Hanson & Co Doughty Hanson & Co. Fund III, L.P. 1’824’041’694 5’347’156 0.4 86.2 1997
EQT Partners AB EQT II, L.P. 656’109’296 8’128’903 1.1 77.8 1998
EQT Partners AB EQT III, L.P. 1’999’992’000 4’692’183 0.3 97.8 2001
GeneChem Financial Corporation Genechem Therapeutics Venture Fund, L.P. 94’472’640 4’474’318 11.0 100.0 2000
Intermediate Capital Group PLC (AKA: ICG) ICG Mezzanine Fund 2000 L.P. No. 2 307’500’000 5’278’854 2.1 96.6 2000
in EUR
Pearl_2007.qxp:Pearl_2005 18.3.2008 11:19 Uhr Seite 34
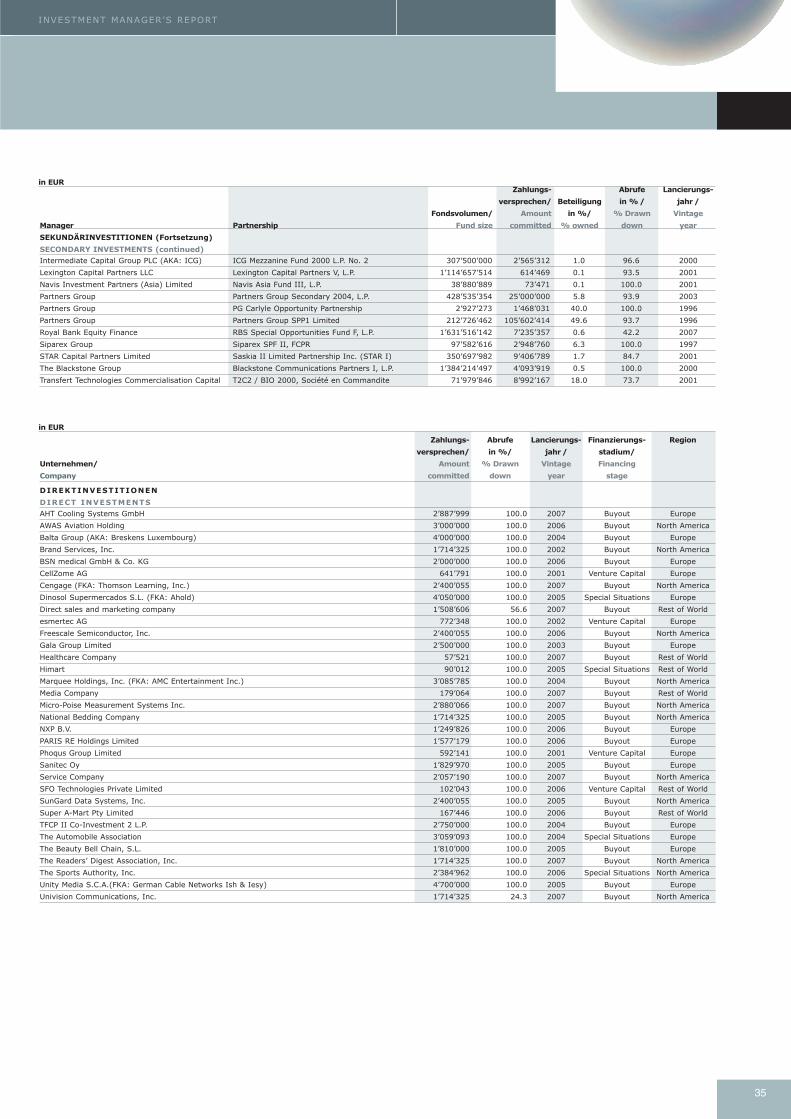
35
INVESTMENT MANAGER’S REPORT
Zahlungs- Abrufe Lancierungs-
versprechen/ Beteiligung in % / jahr /
Fondsvolumen/ Amount in %/ % Drawn Vintage
Manager Partnership Fund size committed % owned down year
SEKUNDÄRINVESTITIONEN (Fortsetzung)
SECONDARY INVESTMENTS (continued)
Intermediate Capital Group PLC (AKA: ICG) ICG Mezzanine Fund 2000 L.P. No. 2 307’500’000 2’565’312 1.0 96.6 2000
Lexington Capital Partners LLC Lexington Capital Partners V, L.P. 1’114’657’514 614’469 0.1 93.5 2001
Navis Investment Partners (Asia) Limited Navis Asia Fund III, L.P. 38’880’889 73’471 0.1 100.0 2001
Partners Group Partners Group Secondary 2004, L.P. 428’535’354 25’000’000 5.8 93.9 2003
Partners Group PG Carlyle Opportunity Partnership 2’927’273 1’468’031 40.0 100.0 1996
Partners Group Partners Group SPP1 Limited 212’726’462 105’602’414 49.6 93.7 1996
Royal Bank Equity Finance RBS Special Opportunities Fund F, L.P. 1’631’516’142 7’235’357 0.6 42.2 2007
Siparex Group Siparex SPF II, FCPR 97’582’616 2’948’760 6.3 100.0 1997
STAR Capital Partners Limited Saskia II Limited Partnership Inc. (STAR I) 350’697’982 9’406’789 1.7 84.7 2001
The Blackstone Group Blackstone Communications Partners I, L.P. 1’384’214’497 4’093’919 0.5 100.0 2000
Transfert Technologies Commercialisation Capital T2C2 / BIO 2000, Société en Commandite 71’979’846 8’992’167 18.0 73.7 2001
Zahlungs- Abrufe Lancierungs- Finanzierungs- Region
versprechen/ in %/ jahr / stadium/
Unternehmen/ Amount % Drawn Vintage Financing
Company committed down year stage
DIREKTINVESTITIONEN
DIRECT INVESTMENTS
AHT Cooling Systems GmbH 2’887’999 100.0 2007 Buyout Europe
AWAS Aviation Holding 3’000’000 100.0 2006 Buyout North America
Balta Group (AKA: Breskens Luxembourg) 4’000’000 100.0 2004 Buyout Europe
Brand Services, Inc. 1’714’325 100.0 2002 Buyout North America
BSN medical GmbH & Co. KG 2’000’000 100.0 2006 Buyout Europe
CellZome AG 641’791 100.0 2001 Venture Capital Europe
Cengage (FKA: Thomson Learning, Inc.) 2’400’055 100.0 2007 Buyout North America
Dinosol Supermercados S.L. (FKA: Ahold) 4’050’000 100.0 2005 Special Situations Europe
Direct sales and marketing company 1’508’606 56.6 2007 Buyout Rest of World
esmertec AG 772’348 100.0 2002 Venture Capital Europe
Freescale Semiconductor, Inc. 2’400’055 100.0 2006 Buyout North America
Gala Group Limited 2’500’000 100.0 2003 Buyout Europe
Healthcare Company 57’521 100.0 2007 Buyout Rest of World
Himart 90’012 100.0 2005 Special Situations Rest of World
Marquee Holdings, Inc. (FKA: AMC Entertainment Inc.) 3’085’785 100.0 2004 Buyout North America
Media Company 179’064 100.0 2007 Buyout Rest of World
Micro-Poise Measurement Systems Inc. 2’880’066 100.0 2007 Buyout North America
National Bedding Company 1’714’325 100.0 2005 Buyout North America
NXP B.V. 1’249’826 100.0 2006 Buyout Europe
PARIS RE Holdings Limited 1’577’179 100.0 2006 Buyout Europe
Phoqus Group Limited 592’141 100.0 2001 Venture Capital Europe
Sanitec Oy 1’829’970 100.0 2005 Buyout Europe
Service Company 2’057’190 100.0 2007 Buyout North America
SFO Technologies Private Limited 102’043 100.0 2006 Venture Capital Rest of World
SunGard Data Systems, Inc. 2’400’055 100.0 2005 Buyout North America
Super A-Mart Pty Limited 167’446 100.0 2006 Buyout Rest of World
TFCP II Co-Investment 2 L.P. 2’750’000 100.0 2004 Buyout Europe
The Automobile Association 3’059’093 100.0 2004 Special Situations Europe
The Beauty Bell Chain, S.L. 1’810’000 100.0 2005 Buyout Europe
The Readers’ Digest Association, Inc. 1’714’325 100.0 2007 Buyout North America
The Sports Authority, Inc. 2’384’962 100.0 2006 Special Situations North America
Unity Media S.C.A.(FKA: German Cable Networks Ish & Iesy) 4’700’000 100.0 2005 Buyout Europe
Univision Communications, Inc. 1’714’325 24.3 2007 Buyout North America
in EUR
in EUR
Pearl_2007.qxp:Pearl_2005 18.3.2008 11:19 Uhr Seite 35
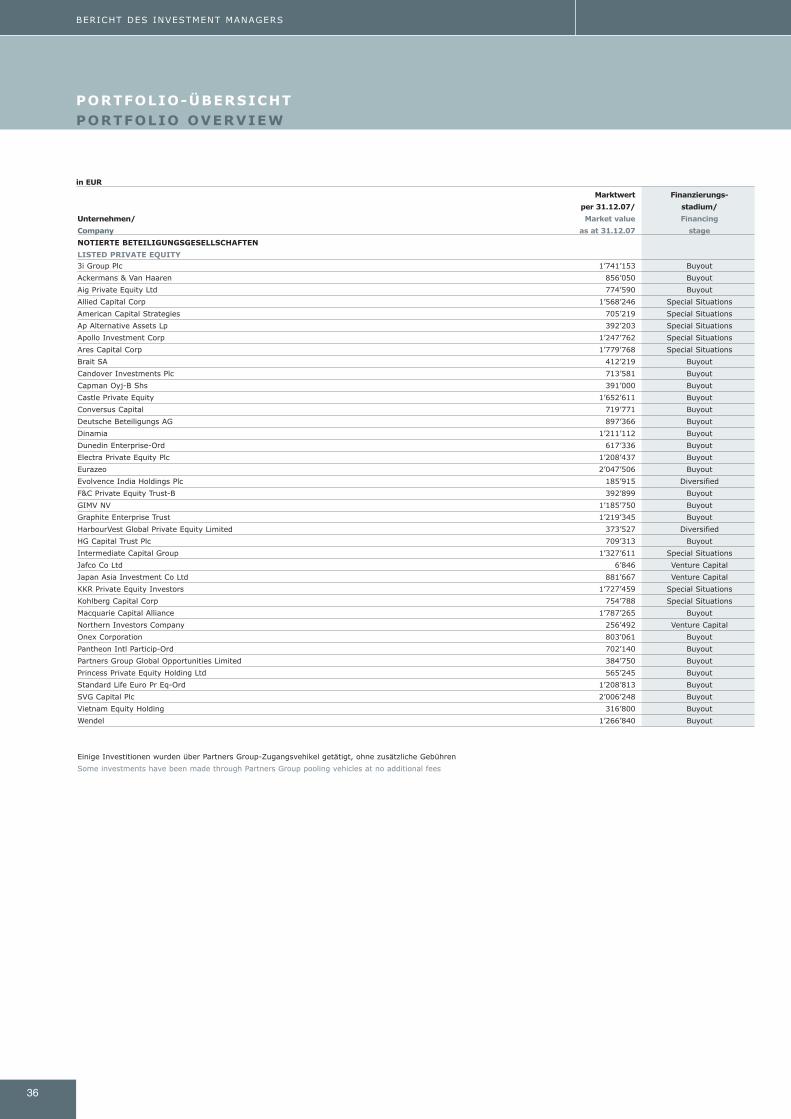
PORTFOLIO-ÜBERSICHTPORTFOLIO OVERVIEW
36
BERICHT DES INVESTMENT MANAGERS
Marktwert Finanzierungs-
per 31.12.07/ stadium/
Unternehmen/ Market value Financing
Company as at 31.12.07 stage
NOTIERTE BETEILIGUNGSGESELLSCHAFTEN
LISTED PRIVATE EQUITY
3i Group Plc 1’741’153 Buyout
Ackermans & Van Haaren 856’050 Buyout
Aig Private Equity Ltd 774’590 Buyout
Allied Capital Corp 1’568’246 Special Situations
American Capital Strategies 705’219 Special Situations
Ap Alternative Assets Lp 392’203 Special Situations
Apollo Investment Corp 1’247’762 Special Situations
Ares Capital Corp 1’779’768 Special Situations
Brait SA 412’219 Buyout
Candover Investments Plc 713’581 Buyout
Capman Oyj-B Shs 391’000 Buyout
Castle Private Equity 1’652’611 Buyout
Conversus Capital 719’771 Buyout
Deutsche Beteiligungs AG 897’366 Buyout
Dinamia 1’211’112 Buyout
Dunedin Enterprise-Ord 617’336 Buyout
Electra Private Equity Plc 1’208’437 Buyout
Eurazeo 2’047’506 Buyout
Evolvence India Holdings Plc 185’915 Diversified
F&C Private Equity Trust-B 392’899 Buyout
GIMV NV 1’185’750 Buyout
Graphite Enterprise Trust 1’219’345 Buyout
HarbourVest Global Private Equity Limited 373’527 Diversified
HG Capital Trust Plc 709’313 Buyout
Intermediate Capital Group 1’327’611 Special Situations
Jafco Co Ltd 6’846 Venture Capital
Japan Asia Investment Co Ltd 881’667 Venture Capital
KKR Private Equity Investors 1’727’459 Special Situations
Kohlberg Capital Corp 754’788 Special Situations
Macquarie Capital Alliance 1’787’265 Buyout
Northern Investors Company 256’492 Venture Capital
Onex Corporation 803’061 Buyout
Pantheon Intl Particip-Ord 702’140 Buyout
Partners Group Global Opportunities Limited 384’750 Buyout
Princess Private Equity Holding Ltd 565’245 Buyout
Standard Life Euro Pr Eq-Ord 1’208’813 Buyout
SVG Capital Plc 2’006’248 Buyout
Vietnam Equity Holding 316’800 Buyout
Wendel 1’266’840 Buyout
Einige Investitionen wurden über Partners Group-Zugangsvehikel getätigt, ohne zusätzliche Gebühren
Some investments have been made through Partners Group pooling vehicles at no additional fees
in EUR
Pearl_2007.qxp:Pearl_2005 18.3.2008 11:19 Uhr Seite 36
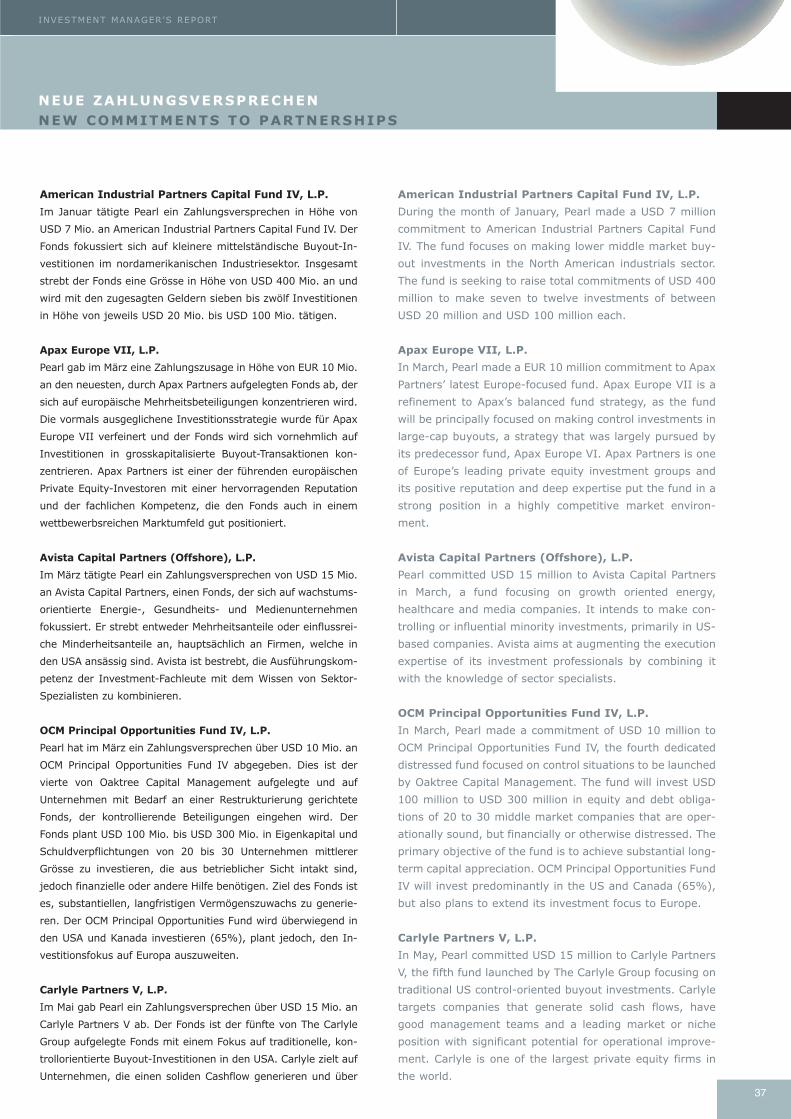
37
INVESTMENT MANAGER’S REPORT
American Industrial Partners Capital Fund IV, L.P.
During the month of January, Pearl made a USD 7 million
commitment to American Industrial Partners Capital Fund
IV. The fund focuses on making lower middle market buy-
out investments in the North American industrials sector.
The fund is seeking to raise total commitments of USD 400
million to make seven to twelve investments of between
USD 20 million and USD 100 million each.
Apax Europe VII, L.P.
In March, Pearl made a EUR 10 million commitment to Apax
Partners’ latest Europe-focused fund. Apax Europe VII is a
refinement to Apax’s balanced fund strategy, as the fund
will be principally focused on making control investments in
large-cap buyouts, a strategy that was largely pursued by
its predecessor fund, Apax Europe VI. Apax Partners is one
of Europe’s leading private equity investment groups and
its positive reputation and deep expertise put the fund in a
strong position in a highly competitive market environ-
ment.
Avista Capital Partners (Offshore), L.P.
Pearl committed USD 15 million to Avista Capital Partners
in March, a fund focusing on growth oriented energy,
healthcare and media companies. It intends to make con-
trolling or influential minority investments, primarily in US-
based companies. Avista aims at augmenting the execution
expertise of its investment professionals by combining it
with the knowledge of sector specialists.
OCM Principal Opportunities Fund IV, L.P.
In March, Pearl made a commitment of USD 10 million to
OCM Principal Opportunities Fund IV, the fourth dedicated
distressed fund focused on control situations to be launched
by Oaktree Capital Management. The fund will invest USD
100 million to USD 300 million in equity and debt obliga-
tions of 20 to 30 middle market companies that are oper -
ationally sound, but financially or otherwise distressed. The
primary objective of the fund is to achieve substantial long-
term capital appreciation. OCM Principal Opportunities Fund
IV will invest predominantly in the US and Canada (65%),
but also plans to extend its investment focus to Europe.
Carlyle Partners V, L.P.
In May, Pearl committed USD 15 million to Carlyle Partners
V, the fifth fund launched by The Carlyle Group focusing on
traditional US control-oriented buyout investments. Carlyle
targets companies that generate solid cash flows, have
good management teams and a leading market or niche
position with significant potential for operational improve-
ment. Carlyle is one of the largest private equity firms in
the world.
American Industrial Partners Capital Fund IV, L.P.
Im Januar tätigte Pearl ein Zahlungsversprechen in Höhe von
USD 7 Mio. an American Industrial Partners Capital Fund IV. Der
Fonds fokussiert sich auf kleinere mittelständische Buyout-In -
ves titionen im nordamerikanischen Industriesektor. Insgesamt
strebt der Fonds eine Grösse in Höhe von USD 400 Mio. an und
wird mit den zugesagten Geldern sieben bis zwölf Investitionen
in Höhe von jeweils USD 20 Mio. bis USD 100 Mio. tätigen.
Apax Europe VII, L.P.
Pearl gab im März eine Zahlungszusage in Höhe von EUR 10 Mio.
an den neuesten, durch Apax Partners aufgelegten Fonds ab, der
sich auf europäische Mehrheitsbeteiligungen konzentrieren wird.
Die vormals ausgeglichene Investitionsstrategie wurde für Apax
Europe VII verfeinert und der Fonds wird sich vornehmlich auf
Investitionen in grosskapitalisierte Buyout-Transaktionen kon-
zentrieren. Apax Partners ist einer der führenden europäischen
Private Equity-Investoren mit einer hervorragenden Reputation
und der fachlichen Kompetenz, die den Fonds auch in einem
wettbewerbsreichen Marktumfeld gut positioniert.
Avista Capital Partners (Offshore), L.P.
Im März tätigte Pearl ein Zahlungsversprechen von USD 15 Mio.
an Avista Capital Partners, einen Fonds, der sich auf wachstums-
orientierte Energie-, Gesundheits- und Medienunternehmen
fokussiert. Er strebt entweder Mehrheitsanteile oder einflussrei-
che Minderheitsanteile an, hauptsächlich an Firmen, welche in
den USA ansässig sind. Avista ist bestrebt, die Ausführungskom-
petenz der Investment-Fachleute mit dem Wissen von Sektor-
Spezialisten zu kombinieren.
OCM Principal Opportunities Fund IV, L.P.
Pearl hat im März ein Zahlungsversprechen über USD 10 Mio. an
OCM Principal Opportunities Fund IV abgegeben. Dies ist der
vierte von Oaktree Capital Management aufgelegte und auf
Unternehmen mit Bedarf an einer Restrukturierung gerichtete
Fonds, der kontrollierende Beteiligungen eingehen wird. Der
Fonds plant USD 100 Mio. bis USD 300 Mio. in Eigenkapital und
Schuldverpflichtungen von 20 bis 30 Unternehmen mittlerer
Grösse zu investieren, die aus betrieblicher Sicht intakt sind,
jedoch finanzielle oder andere Hilfe benötigen. Ziel des Fonds ist
es, substantiellen, langfristigen Vermögenszuwachs zu generie-
ren. Der OCM Principal Opportunities Fund wird überwiegend in
den USA und Kanada investieren (65%), plant jedoch, den In -
ves titionsfokus auf Europa auszuweiten.
Carlyle Partners V, L.P.
Im Mai gab Pearl ein Zahlungsversprechen über USD 15 Mio. an
Carlyle Partners V ab. Der Fonds ist der fünfte von The Carlyle
Group aufgelegte Fonds mit einem Fokus auf traditionelle, kon-
trollorientierte Buyout-Investitionen in den USA. Carlyle zielt auf
Unternehmen, die einen soliden Cashflow generieren und über
NEUE ZAHLUNGSVERSPRECHENNEW COMMITMENTS TO PARTNERSHIPS
Pearl_2007.qxp:Pearl_2005 18.3.2008 11:19 Uhr Seite 37
38
BERICHT DES INVESTMENT MANAGERS
Boulder Ventures V, L.P.
Pearl committed USD 5 million to the US early-stage venture
partnership Boulder Ventures V in May. The fund will follow the
same strategy as its predecessors by investing in start-up,
early- and growth-stage companies, the majority of which are
based in either Colorado or the mid-Atlantic region. The vast
majority of the fund’s investments will be in IT companies
(75%) with the balance in the life science sector (25%). Since
its foundation in 1995, Boulder Ventures has provided funding,
contacts and experience to entrepreneurs to build market-lead -
ing technology companies.
MatlinPatterson Global Opportunities Partners III, L.P.
In June, Pearl committed USD 10 million to MatlinPatterson Glo-
bal Opportunities Partners III. The fund pursues a distressed-
for-control investment strategy, employing a flexible approach
that can involve both discounted toe-hold investments in publi-
cly traded securities and privately negotiated transactions with
distressed companies or sellers. The fund attempts to obtain
control positions in target companies in order to be able to
make fundamental changes to their operations and capital
structures, and to return the businesses to sustainability. The
fund will opportunistically pursue investments across industries
and geographies.
Affinity Asia Pacific Fund II, L.P.
During August, Pearl acquired a USD 5 million stake via a
secondary transaction in Affinity Asia Pacific Fund II. Affinity
was established as an independent firm in 2002 after it spun-
off from UBS Capital Asia Pacific. The fund focuses on buyout
investments alongside local management teams in market-lead -
ing mid-sized businesses located primarily in Hong Kong, Sin-
gapore, Korea, Japan, Australia and Taiwan. Target companies
are (potential) category leaders with defensible franchises. Affi-
nity invests USD 25 million to USD 75 million in companies with
enterprise values of USD 100 million to USD 500 million.
CapVis Equity II, L.P.
In August, Pearl acquired a EUR 1.7 million stake in CapVis
Equity II via a secondary transaction. The fund, managed by the
leading Swiss private equity house for direct private equity
investments CapVis, focuses on mid-cap buyout and expansion
capital transactions of companies with enterprise values of be -
tween EUR 50 million and EUR 300 million. The fund typically
acquires controlling stakes in its portfolio companies. Approxi-
mately 60% of its investments are in Switzerland, 20% in Aus-
tria and 20% in Southern Germany.
Apollo Overseas Partners VII, L.P.
In August, Pearl committed USD 20 million to Apollo Overseas
Partners VII. The fund will pursue the same investment strat -
egy as its predecessor funds, focusing on large-cap buyout as
gute Managementteams wie auch eine führende Markt- oder
Nischenposition mit einem signifikanten Potenzial für operative
Verbesserungen verfügen. Carlyle ist eines der weltweit grössten
Private Equity-Unternehmen.
Boulder Ventures V, L.P.
Pearl hat im Mai ein Zahlungsversprechen über USD 5 Mio. an
den amerikanischen Venture Capital–Fonds Boulder Ventures V
abgegeben. Der Fonds tätigt Frühphasenfinanzierungen und ver-
folgt dabei dieselbe Investitionsstrategie wie seine Vorgänger-
fonds: Investitionen in Neugründungen sowie Früh- und Wachs-
tumsfinanzierungen in Unternehmen, die vor allem in Colorado
und den Mid-Atlantic-Staaten ansässig sind. Mit rund 75% wird
der grösste Anteil in IT-Unternehmen investiert, die restlichen
25% gehen an den Life Sciences-Sektor. Seit der Gründung 1995
hat Boulder Ventures Finanzierungen, Kontakte und Erfahrungen
an Unternehmer weitergegeben, um führende Technologieunter-
nehmen aufzubauen.
MatlinPatterson Global Opportunities Partners III, L.P.
Im Juni hat Pearl ein Zahlungsversprechen über USD 10 Mio. an
MatlinPatterson Global Opportunities Partners III getätigt. Der
Fonds verfolgt einen flexiblen, kontrollorientierten Investitions-
ansatz, der den Aufbau von Einflusspositionen durch den Kauf
von unter den Nennwert gefallenen, öffentlich gehandelten
Wertpapieren wie auch privat ausgehandelten Transaktionen von
Unternehmen oder Verkäufern in Sondersituationen beinhaltet.
Der Fonds ist bestrebt, Mehrheitsbeteiligungen in den jeweiligen
Unternehmen zu erhalten, um wesentliche Änderungen in der
Organisations- sowie in der Kapitalstruktur anzubringen und es
zukunftsfähig zu machen. Der Fonds wird auf opportunistischer
Basis Investitionen über zahlreiche Industrien wie auch geogra-
fische Regionen hinweg tätigen.
Affinity Asia Pacific Fund II, L.P.
Im August tätigte Pearl im Rahmen einer Sekundärtransaktion
eine USD 5 Mio. Zahlungszusage an Affinity Asia Pacific Fund II.
Affinity wurde 2002 als unabhängiges Unternehmen von UBS
Capital Asia Pacific ausgegliedert. Affinity’s Schwerpunkt liegt auf
Buyout-Investitionen an der Seite von lokalen Management-
teams in marktführende, mittelständische Unternehmen, vor-
nehmlich in Hong Kong, Singapur, Korea, Japan, Australien und
Taiwan. Ziel der Investitionen sind potenzielle Marktführer mit
Franchiseverträgen. Der Fonds investiert zwischen USD 25 Mio.
und USD 75 Mio. in Firmen mit einem Unternehmenswert von
USD 100 Mio. bis 500 Mio.
CapVis Equity II, L.P.
Pearl erwarb im August im Rahmen einer Sekundärtransaktion
eine EUR 1.7 Mio. Zahlungszusage an CapVis Equity II. Der
Fonds, der vom führenden Schweizer Private Equity-Haus für
Direktinvestitionen gemanagt wird, fokussiert sich auf mittel-
Pearl_2007.qxp:Pearl_2005 18.3.2008 11:19 Uhr Seite 38
39
INVESTMENT MANAGER’S REPORT
well as complex distressed and corporate partner buyout trans-
actions. The fund will pursue investments in the order of be -
tween USD 200 million to USD 1.5 billion, targeting companies
with strong market positions, solid customer bases and rela -
tively high EBITDA margins.
Bain Capital Fund X, L.P.
Pearl committed USD 24 million to Bain Capital X in October.
Established in 1984, Bain Capital is one of the world’s leading
private equity investment firms with over USD 50 billion in
assets under management. Bain X will follow the same strat egy
as its predecessors, targeting control investments within the
upper mid- and large-cap markets, primarily in the US. The
fund will consist of a mix of leveraged buyouts (LBO),
tur naround and growth investments in businesses with strong
strategic positions and clearly defined plans for growth and
profit improvement.
Cypress Merchant Banking Partners II, L.P.
A secondary investment of USD 0.6 million has been made by
Pearl to Cypress Merchant Banking Partners II in October. The
fund is a New York-based private equity sponsor managing over
USD 3 billion of invested capital, focusing on buyouts in North
America. It invests in privately negotiated transactions,
targeting operating businesses and investing with management
to foster continued growth.
CAI Capital Partners & Co. II
and CAI Capital Partners & Co. III, L.P.
In October, Pearl committed CAD 2.4 million to CAI Capital Part-
ners & Co. II and CAI Capital Partners & Co. III in a combined
secondary transaction. The Canada-based funds specialize in
buyouts, restructurings, acquisitions, recapitalizations and
other corporate growth initiatives. They acquire significant
ownership positions in North American companies, with a
special focus on Canada due to the special experience and
expertise in this country. Few private equity funds have a
special focus on Canada, providing the funds with a special edge.
Warburg Pincus Private Equity X, L.P.
Pearl made a USD 20 million commitment to Warburg Pincus
Private Equity X in October, the tenth global fund raised by War-
burg Pincus, one of the longest-standing US private equity
firms. The fund will follow the same strategy as its prede -
cessors, targeting companies at all stages of development and
therefore pursues a variety of transaction types, including ven-
ture, growth, buyouts, recapitalizations and special situations.
Warburg Pincus Private Equity X has a target fund size of USD
12 billion and will broadly diversify its investments in different
sectors, mainly focussed on energy, financial services, health-
care, life sciences and technology. Investments are primarily
made in North America, complemented by Europe and Asia.
ständische Buyout- und Expansionskapital-Transaktionen von
Firmen mit einem Unternehmenswert zwischen EUR 50 Mio. und
EUR 300 Mio. CapVis erwirbt üblicherweise Mehrheitsbeteiligun-
gen an den Portfoliounternehmen. Rund 60% der Investitionen
werden in der Schweiz, 20% in Österreich und 20% in Süd-
deutschland getätigt.
Apollo Overseas Partners VII, L.P.
Im August tätigte Pearl ein Zahlungsversprechen über USD 20
Mio. an Apollo Overseas Partners VII. Der Fonds wird die Inves -
titionsstrategie der Vorgängerfonds fortfahren und den Schwer-
punkt auf grosse Buyouts sowie komplexe Transaktionen im
Bereich Sondersituationen an der Seite von strategischen Käu-
fern legen. Der Fonds wird Investitionen zwischen USD 200 Mio.
und USD 1.5 Mrd. tätigen und zielgerichtet in Unternehmen
investieren, die eine führende Marktposition, eine solide Kunden-
basis und eine relativ hohe EBITDA-Marge aufweisen.
Bain Capital Fund X, L.P.
Im Oktober hat Pearl ein Zahlungsversprechen über USD 24 Mio.
an Bain Capital X abgegeben. Bain Capital wurde 1984 gegrün-
det und ist heute ein weltweit führendes Private Equity-Unter-
nehmen, das über USD 50 Mrd. an Vermögen verwaltet. Bain X
verfolgt dieselbe Strategie wie seine Vorgängerfonds: kontroll -
orientierte Investitionen im oberen Segment der mittelständi-
schen und grossen Unternehmen, vorwiegend in den USA. Der
Fonds wird einen Mix aus Leveraged Buyouts (LBO) und Investi-
tionen in Turnaround- und Wachstumssituationen beinhalten und
in Unternehmen mit starken strategischen Positionen sowie
klaren Bestrebungen zur Wachstums- und Gewinnmaximierung
inves tieren.
Cypress Merchant Banking Partners II, L.P.
Ein Zahlungsversprechen im Rahmen einer Sekundärtransaktion
in Höhe von USD 0.6 Mio. tätigte Pearl im Oktober an Cypress
Merchant Banking Partners II. Der in New York ansässige Pri vate
Equity-Fonds verwaltet investiertes Kapital von über USD 3 Mrd.
und ist auf Buyout-Transaktionen in Nordamerika spezialisiert.
Seine Transaktionen verhandelt der Fonds privat und zielt darauf
ab, die Unternehmen zu führen und gemeinsam mit dem
Management zu investieren, um so ein beständiges Wachstum
zu erreichen.
CAI Capital Partners & Co. II
und CAI Capital Partners & Co. III, L.P.
Im Oktober gab Pearl in einer Sekundärtransaktion ein Zah-
lungsversprechen von insgesamt CAD 2.4 Mio. an CAI Capital
Partners & Co. II und CAI Capital Partners & Co. III ab. Die in
Kanada ansässigen Fonds sind spezialisiert auf Buyouts,
Restrukturierungen, Akquisitionen, Rekapitalisierungen und
Wachstumsstrategien. Sie übernehmen Mehrheitsbeteiligungen
in nordamerikanischen Unternehmen mit einem speziellen Fokus
Pearl_2007.qxp:Pearl_2005 18.3.2008 11:19 Uhr Seite 39
40
BERICHT DES INVESTMENT MANAGERS
Bain Capital X Co-Investment Fund, L.P.
In November, Pearl committed USD 6 million to Bain
Capital X Co-Investment Fund. Established in 1984, Bain
Capital is one of the world’s leading private equity
investment firms with over USD 50 billion in assets under
management. Bain Capital X Co-Investment Fund will
co-invest in the larger transactions of Bain Capital Fund X,
which will follow the same strategy as its predecessors,
targeting control investments within the upper mid- and
large-cap markets, primarily in the US. The fund will
consist of a mix of leveraged buyouts (LBO), turnaround
and growth investments, in businesses with strong
strategic positions and clearly defined plans for growth and
profit improvement.
TA Atlantic & Pacific VI, L.P.
Pearl committed USD 20 million to TA Atlantic & Pacific VI in
November. The fund will continue to apply the successful invest-
ment approach that TA Associates has developed over the past
three decades and will pursue growth investments with its indus -
try focus on technology, financial- and business services and
healthcare. The fund concentrates on diversified investments in
profitable private companies in growth industries, mainly in
North America but also in Western Europe, particularly in the
United Kingdom. TA Associates was founded in 1968 and is one
of the most established private equity firms in the US.
Boulder Ventures IV, L.P.
In November, Pearl acquired a USD 1.4 million stake in US
early-stage venture partnership Boulder Ventures IV via a
secondary transaction. The fund focuses on start-up, early- and
growth-stage companies, of which the majority are based in
either Colorado or the mid-Atlantic region. The vast majority of
the fund’s investments is in IT companies (75%) with the
balance in the life science sector (25%). The fund is almost fully
drawn.
Bridgepoint Europe IV, L.P.
Pearl committed EUR 13 million to Bridgepoint Europe IV in
November. The fund will focus on control-oriented mid-market
buyout transactions throughout Europe. The strategy of the
fund is to acquire market leaders with the aim of transforming
them into pan-European companies through geographic expan-
sion and add-on acquisitions. Bridgepoint is one of the largest
and longest established European mid-market players with a
highly experienced team and is one of the few private equity
firms which operates various offices in Europe since 1990.
Nordic Capital VII, L.P.
Pearl committed EUR 15 million to Nordic Capital VII in Decem-
ber. The fund will continue the strategy of its predecessor funds
and will pursue a diversified industry approach, with a substan-
auf Kanada aufgrund von besonderer Erfahrung und Fachwissen
in dieser Region. Nur wenige Private Equity-Fonds haben diesen
regionalen Fokus, was einen Wettbewerbsvorteil für CAI Capital
Partners bedeutet.
Warburg Pincus Private Equity X, L.P.
Pearl gab im Oktober ein Zahlungsversprechen in der Höhe von
USD 20 Mio. an den zehnten globalen Fonds von Warburg Pin-
cus, Warburg Pincus Private Equity X, ab. Warburg Pincus ist
eines der ältesten amerikanischen Private Equity-Unterneh-
men. Der Fonds wird dieselbe Strategie wie seine Vorgänger-
fonds verfolgen und gezielt Investitionen in Unternehmen aller
Entwicklungsstadien tätigen. Zu diesem Zweck verwendet der
Fonds verschiedene Transaktionstypen und wird Venture Cap -
ital-Investitionen, Wachstumsfinanzierungen, Buyouts, Rekapi-
talisierungen sowie Finanzierungen für Spezialsituationen täti-
gen. Warburg Pincus Private Equity X strebt eine Fondsgrösse
von USD 12 Mrd. an und wird seine Investitionen in verschie-
denen Sektoren, insbesondere aber in den Segmenten Energie,
Finanzdienstleistungen, Gesundheitswesen, Life Sciences und
Technologie tätigen, um den Fonds breit zu diversifizieren.
Investitionen werden primär in Nordamerika getätigt und
durch solche in Europa und Asien ergänzt.
Bain Capital X Co-Investment Fund, L.P.
Im November hat Pearl ein Zahlungsversprechen über USD 6
Mio. an Bain Capital X Co-Investment Fund abgegeben. Bain
Capital wurde 1984 gegründet und ist heute ein weltweit füh-
rendes Private Equity-Unternehmen, das über USD 50 Mrd. an
Vermögen verwaltet. Bain X Co-Investment Fund beteiligt sich
an den grösseren Transaktion von Bain Capital X, der dieselbe
Strategie wie seine Vorgängerfonds verfolgt: kontrollorientierte
Investitionen im oberen Segment der mittelständischen und
grossen Unternehmen, vorwiegend in den USA. Der Fonds wird
einen Mix aus Leveraged Buyouts (LBO) und Investitionen in
Turnaround- und Wachstumssituationen beinhalten und in
Unternehmen mit starken strategischen Positionen sowie klaren
Bestrebungen zur Wachstums- und Gewinnmaximierung inves -
tieren.
TA Atlantic & Pacific VI, L.P.
Weiter gab Pearl im November ein Zahlungsversprechen über USD
20 Mio. an TA Atlantic & Pacific VI ab. Der Fonds wird die erfolgrei-
che Investitionsstrategie, die von TA Associates über die letzten drei
Dekaden entwickelt wurde, weiterführen und Wachstumsfinanzie-
rungen vorwiegend in Technologie, Finanz- und Geschäftsdienstleis -
tungsunternehmen sowie in der Gesundheitspflege tätigen. Der
Fonds konzentriert sich auf diversifizierte Investitionen in profitable
private Unternehmen in den Wachstumsindustrien, vor allem in
Nordamerika, aber auch in Westeuropa, wo der Fokus auf Grossbri-
tannien liegt. TA Associates wurde 1968 gegründet und zählt heute
zu den etabliertesten Private Equity-Unternehmen in den USA.
Pearl_2007.qxp:Pearl_2005 18.3.2008 11:19 Uhr Seite 40
41
INVESTMENT MANAGER’S REPORT
Boulder Ventures IV, L.P.
Im November hat Pearl in einer Sekundärtransaktion ein Zah-
lungsversprechen über USD 1.4 Mio. an den amerikanischen Ven-
ture Capital–Fonds Boulder Ventures IV abgegeben. Der Fonds
tätigt Investitionen in Neugründungen sowie Früh- und Wachs-
tumsfinanzierungen in Unternehmen, die vor allem in Colorado
und den Mid-Atlantic-Staaten ansässig sind. Mit rund 75% ist der
grösste Anteil in IT-Unternehmen investiert, die restlichen 25%
gehen an den Life Sciences-Sektor. Der Fonds hat das verspro-
chene Kapital nahezu komplett abgerufen.
Bridgepoint Europe IV, L.P.
Ebenfalls im November gab Pearl ein Zahlungsversprechen von
EUR 13 Mio. an Bridgepoint Europe IV ab. Der Fonds wird sich
auf Mehrheitsbeteiligungen bei mittelgrossen Buyout-Investitio-
nen in Europa konzentrieren. Die Strategie besteht darin, markt-
führende Firmen in europaweit tätige Unternehmen zu transfor-
mieren, wobei Bridgepoint Unterstützung in der Expansion und
bei Zukäufen bietet. Bridgepoint ist einer der grössten und eta-
bliertesten europäischen Spezialisten im mittleren Buyout-Seg-
ment mit einem sehr erfahrenen Team und zudem eines der
wenigen Private Equity-Unternehmen, das seit 1990 zahlreiche
Büros in ganz Europa betreibt.
Nordic Capital VII, L.P.
Pearl tätigte im Dezember ein EUR 15 Mio. Zahlungsversprechen
an Nordic Capital VII. Der Fonds wird die Anlagestrategie seines
Vorgängerfonds fortsetzen und breit über Industriesegmente
diversifiziert investieren, dabei aber einen speziellen Fokus auf
den Gesundheitssektor legen. Weiter konzentriert sich der Fonds
auf Buyout-Transaktionen in mittelständische Unternehmen
sowie Grossunternehmen in Skandinavien, beides etablierte und
umkämpfte Märkte, in welchen Nordic Capital einer der grössten
und bestvernetzten Akteure ist. Nordic Capital hat seinen Haupt-
sitz in Stockholm, besitzt ein Büro in Kopenhagen und führt eine
Repräsentanz in Helsinki.
tial part being invested in the healthcare sector. Fur ther, the
fund will invest opportunistically in the upper mid-cap and lower
large-cap Scandinavian buyout sectors, two bestestablished
and competitive sectors in which Nordic Capital is one of the lar-
gest and well-connected players. Nordic Capital is headquarter -
ed in Stockholm, has an office in Copenhagen and maintains a
representative office in Helsinki.
Pearl_2007.qxp:Pearl_2005 18.3.2008 11:19 Uhr Seite 41
42
BERICHT DES INVESTMENT MANAGERS
AHT Cooling Systems GmbH
Pearl completed a direct equity investment in AHT Cooling
Systems in January. The company is active in both
branches of industrial refrigeration and deep freezing, while
its main areas of business are fridges and deep freezes for
supermarkets, ice cream freezers and drink cooling. AHT
Cooling Systems is among the leading global manufacturers
in its sector and employs approximately 650 people, includ -
ing 150 temporary employees to balance peak production
levels.
The Reader’s Digest Association, Inc.
In November 2006, an investor group led by Ripplewood
Holdings announced that it had entered into a definitive
merger agreement to acquire The Reader’s Digest Associ -
ation, Inc., in a USD 2.4 billion transaction. In February
2007, Pearl was invited to invest directly into the equity
transaction as well. Reader’s Digest is a publisher and
direct marketing company that creates and delivers content
and products for magazines, books, recorded music collec-
tions, home videos and online websites. Reader’s Digest
Magazine, its flagship publication, is published in 21 lan -
guages with a monthly circulation of approximately 18 mil-
lion copies.
Univision Communications, Inc
After the announcement in June last year, the acquisition of
Univision by Providence Equity Partners, Thomas H. Lee
Partners and Texas Pacific Group for USD 12.3 billion was
finally approved at the end of March 2007. The company is
the largest Spanish-language broadcaster in the US and its
assets include market-leading television and radio chan-
nels, music recording companies and an internet portal. It
has tremendous growth potential, which is likely to be bol-
stered further by the above-average growth of the Hispanic
population and its spending power in the US. Pearl invested
directly into Univision in March.
Micro-Poise Measurement Systems
In March, Pearl was invited to invest directly into Micro-
Poise Measurement Systems by American Industrial Part-
ners. Micro-Poise Measurement Systems is a US-based glo-
bal provider of measurement systems, inspection systems
and aftermarket services to the automotive and tire
industries. The company, as of today, is a result of the
merger of the three businesses Micro-Poise, Akron
Standard and Balance Engineering, as well as several
add-on acquisitions.
AHT Cooling Systems GmbH
Im Januar beteiligte sich Pearl mit einer Eigenkapital-
Direktinvestition an AHT Cooling Systems. Das Unterneh-
men ist in den Bereichen industrielle Kühlung und Tiefküh-
lung tätig, die Hauptgeschäftsfelder dabei sind Kühl- und
Tiefkühltruhen für Supermärkte, Eiscremetruhen sowie
Getränkekühlung, wo AHT der weltweit führende Hersteller
ist. AHT beschäftigt rund 650 Mitarbeiter, 150 davon sind
temporär angestellt, um während den Spitzenproduktions-
zeiten auszuhelfen.
The Reader’s Digest Association, Inc.
Im November 2006 verkündete eine von Ripplewood Hold -
ings angeführte Investorengruppe, The Reader’s Digest
Association, Inc. für USD 2.4 Mrd. zu übernehmen. Im
Februar 2007 wurde Pearl das Angebot unterbreitet, direkt in
das Eigenkapital von Reader’s Digest, einem Verlagshaus
und Marketingunternehmen, welches Inhalt und Produkte für
Zeitschriften, Bücher, Tonträgerkollektionen, Heimvideos und
Webseiten kreiert und liefert, zu investieren. Die Zeitschrift
Reader’s Digest, die Vorzeigepublikation, wird in 21 Spra-
chen mit einer Auflage von 18 Mio. Kopien veröffentlicht.
Univision Communications, Inc
Die im Juni letzten Jahres angekündigte Akquisition von
Univision durch Providence Equity Partners, Thomas H. Lee
Partners und Texas Pacific Group im Wert von USD 12.3
Mrd. wurde Ende März 2007 bewilligt. Das Unternehmen ist
das grösste spanischsprachige Rundfunkunternehmen der
USA und umfasst marktführende Fernseh- und Radiosen-
der, Musikvertriebe sowie ein Internetportal. Dieser Markt
weist ein enormes Wachstumspotenzial auf, das von dem
überdurchschnittlichen Wachstum der lateinamerikanischen
Bevölkerung in den USA noch weiter unterstützt wird. Pearl
hat im März direkt in Univision investiert.
Micro-Poise Measurement Systems
Im März hat Pearl an der Seite von American Industrial
Partners direkt in Micro-Poise Measurement Systems inves -
tiert. Micro-Poise Measurement Systems ist ein in den USA
ansässiges weltweit tätiges Unternehmen, das Mess- und
Kontrollverfahren sowie Wartungsdienstleistungen für die
Automobilindustrie anbietet. Die Firma, wie sie heute exis -
tiert, entstand aus einem Zusammenschluss der drei Fir-
men Micro-Poise, Akron Standard und Balance Engineering,
sowie einigen Firmen-Zukäufen.
NEUE DIREKTINVESTITIONENNEW DIRECT INVESTMENTS
Pearl_2007.qxp:Pearl_2005 18.3.2008 11:19 Uhr Seite 42
43
INVESTMENT MANAGER’S REPORT
Cengage (fka Thomson Learning, Inc.)
Pearl, alongside Apax Partners, completed a direct equity
investment in Cengage, one of the four market groups of
the Thomson Corporation in June. The company is a leading
global provider of state-of-the-art tailored learning for indi-
viduals, businesses and institutions. Cengage sells its prod -
ucts and services globally through direct channels and via
a network of distributors. The company has offices in 42
countries worldwide and employs more than 12’000 people.
Business Service Company
Pearl co-invested in a multinational business service com-
pany focused on human resource solutions in November.
Direct Sales and Marketing Company
In November, Pearl participated alongside the Carlyle Group
directly in a direct sales and marketing company in Middle
America.
Cengage (ehemals Thomson Learning, Inc.)
Pearl tätigte im Juni an der Seite von Apax Partners eine
Eigenkapital-Direktinvestition in Cengage, einer der vier
Geschäftsbereiche von Thomson Corporation. Das Unter-
nehmen gehört zu den weltweit führenden Anbietern von
Informationen sowie ganzheitlichen Lösungen für hochmo-
dernes und massgeschneidertes Lernen für Privatpersonen,
Institutionen und Unternehmen. Weltweit verkauft Cen gage
seine Produkte und Dienstleistungen sowohl über den
direkten Absatzweg als auch über ein Netzwerk von Ver-
triebspartnern. Das Unternehmen verfügt über Standorte in
42 Ländern und beschäftigt mehr als 12’000 Personen.
Dienstleistungsunternehmen
Pearl tätigte im November eine Co-Investition in ein multi-
nationales Dienstleistungsunternehmen, welches auf Lö -
sungen im Personalbereich spezialisiert ist.
Direktvertriebs- und Marketingunternehmen
Im November tätigte Pearl an der Seite der Carlyle Group
eine Direktinvestition in ein Direktvertriebs- und Marketing-
unternehmen in Mittelamerika.
Pearl_2007.qxp:Pearl_2005 18.3.2008 11:19 Uhr Seite 43
44
BERICHT DES INVESTMENT MANAGERS
Permira IV, L.P.
In May, Pearl partnership Permira, a renowned European buy-
out firm, bought a 53.6% controlling stake in Valentino
Fashion Group (VFG) at a price that values the company at
EUR 2.6 billion. The VFG is one of the most well-known brands
in the Italian fashion industry. It also owns Hugo Boss and has
licensing deals for knitwear company Missoni and Marlboro
Classics as well as high-end fashion brand Valentino SpA.
Apollo Overseas VI, L.P.
Pearl partnership Apollo Overseas VI announced the acqui-
sition of Claire’s Stores, Inc. for approximately USD 3.1 bil-
lion in May. Claire's is a leading international specialty retailer
offering value-priced costume jewelry, accessories and
cosmetics to fashion-aware teens and young adults. Claire’s
has about 3’000 stores in the US, UK, Europe, Canada and
also operates in the Middle East, Japan, Turkey and South
Africa. The company is uniquely positioned as a trend-right
merchandizing company with no direct competition. This,
together with opportunities for further expansion for the
company in Europe and the attractive payback character -
istics of its new stores, make it an appealing investment.
Avista Capital Partners (Offshore), L.P.
In May, Avista Capital Partners completed its acquisition of
BioReliance Corporation for approximately USD 210 million.
Maryland-based BioReliance is a specialist provider of con-
tract biologics safety testing, GMP (Good Manufacturing
Practice) manufacturing and pre-clinical testing services.
The company is focused on the rapidly growing biologics
sector of the pharmaceutical industry and provides its
clients, including most of the largest pharmaceutical and
biopharmaceutical companies in the world, with an attract -
ive alternative to the fixed costs associated with internal
development and manufacturing. BioReliance is thus in an
ideal position to profit from increasing regulatory scrutiny
that is causing a shift towards the outsourcing of non-core
activities in their clients’ industry.
Silver Lake Partners II, L.P.
During the month of May, Pearl partnership Silver Lake,
together with ValueAct Capital, agreed to acquire 100% of
the outstanding equity interest in Acxicom Corporation in
a transaction valued at USD 3 billion, including the assump-
tion of approximately USD 756 million of debt. Acxicom
Corporation, an Arkansas-based company, integrates data,
services and technology to create and deliver customer and
information management solutions for many of the largest,
most respected companies in the world. The core compo-
nents of Acxicom’s innovative solutions are customer data
integration technology, database services, IT outsourcing
and privacy leadership.
Permira IV, L.P.
Die Pearl-Partnership Permira kaufte im Mai eine Mehrheits-
beteiligung von 53.6% an der Valentino Fashion Group zu
einem Preis, welcher die Firma mit EUR 2.6 Mrd. bewertet.
Valentino Fashion Group ist eines der namhaftesten Unter-
nehmen der italienischen Modeindustrie, welches Hugo Boss,
den Strickwaren-Hersteller Missoni, Marlboro Classics sowie
die Luxusmarke Valentino SpA zu seinen Marken zählen kann.
Apollo Overseas VI, L.P.
Im Mai gab die Pearl–Partnership Apollo Overseas VI den
Erwerb von Claire’s Stores, Inc. für rund USD 3.1 Mrd.
bekannt. Claire’s ist ein führender internationaler Einzelhänd-
ler von preiswertem Schmuck, Accessoires und Kosmetik für
modebewusste Mädchen und junge Erwachsene. Claire’s
betreibt über 3’000 Shops in den USA, in England, Europa,
Kanada sowie im Mittleren Osten, in Japan, Südafrika und in
der Türkei. Die einzigartige Positionierung in der Modebran-
che, welche praktisch keine unmittelbare Konkurrenz zulässt,
sowie die Expansionsmöglichkeiten in Europa und die kurzen
Rückzahlungsfristen der neu eröffneten Filialen, lassen auf
eine viel versprechende Investition schliessen.
Avista Capital Partners (Offshore), L.P.
Die Pearl-Partnership Avista Capital Partners erwarb im Mai
die BioReliance Corporation für rund USD 210 Mio. Die in
Maryland ansässige BioReliance ist ein spezialisierter
Anbieter von biologischen Sicherheitsprüfungen, «Good
Manufacturing Practice» und vorklinischen Tests. Das Unter-
nehmen hat sich auf den schnell wachsenden Sektor der
biologischen Präparate in der Pharmaindustrie spezialisiert
und bietet seinen Kunden, darunter die meisten der welt-
grössten Pharma- und Biopharmaunternehmen, attraktive
Alternativen zu der mit hohen Kosten verbundenen eigenen
Entwicklung und Produktion. Dadurch ist BioReliance in
einer idealen Position, um vom Outsourcing-Trend zu profi-
tieren, der durch immer strenger werdende regulatorische
Richtlinien angetrieben wird.
Silver Lake Partners II, L.P.
Im Mai übernahm die Pearl-Partnership Silver Lake zusam-
men mit ValueAct Capital 100% des ausstehenden Eigenka-
pitals an Acxicom Corporation. Das Volumen der Transak-
tion belief sich auf USD 3 Mrd., einschliesslich einer Über-
nahme von USD 756 Mio. an Fremdkapital. Acxicom Corpor -
ation mit Sitz in Arkansas fasst Daten, Dienstleistungen
und Techniken zusammen, um Kunden- und Managementin-
formationssysteme für viele der grössten und angesehens -
ten Unternehmen weltweit zu erstellen. Die Kernbestand -
teile von Acxicom’s innovativen Lösungen bestehen aus
Kundendatenbankintegrations-Technologien, Datenbank -
systemen, IT-Auslagerungen und Datenschutz.
AUSGEWÄHLTE INVESTITIONEN DER PARTNERSHIPSSELECTED INVESTMENTS BY PARTNERSHIPS
Pearl_2007.qxp:Pearl_2005 18.3.2008 11:19 Uhr Seite 44
45
INVESTMENT MANAGER’S REPORT
Doughty Hanson & Co V
During June, Pearl portfolio partnership Doughty Hanson &
Co V acquired Norit, a leading supplier of consumables, com-
ponents and systems to the water and beverage purification
industries, for an undisclosed sum. The company, headquar-
tered in Zenderen in The Netherlands, operates globally
through a network of twelve production sites in seven coun-
tries covering more than 100 countries worldwide. Mark Cor-
bidge, Principal at Doughty Hanson, commented: “Norit is an
excellent business, operating in a number of attractive end
markets with strong growth and earnings potential.”
GMT Communications Partners III, L.P.
In July, Pearl partnership GMT acquired a majority stake in
Melita Cable, which was valued at approximately EUR 170
million. Melita supplies TV, broadband and telephony ser -
vices to Maltese consumers and businesses. It is the sole
Maltese provider of cable television and has recently se -
cured exclusive rights to show this season’s English and Ita l -
ian football leagues as well as UEFA cup and SUPER cup –
all of which are hugely popular in Malta. The communica-
tions sector specialist GMT is expected to build profitable
growth opportunities and synergies between Melita and its
other 17 telecommunication portfolio companies in Europe.
Terra Firma Capital Partners II, L.P.
Pearl partnership Terra Firma completed the acquisition of EMI
Group for a total value of GBP 2.4 billion in August. EMI is one
of the world’s largest music companies and the world’s leading
music publisher. Its recorded music catalog includes tracks
from well-known artists, such as The Beatles, Robbie Williams
and The Rolling Stones. Terra Firma intends to further develop
the publishing catalog while streamlining the recorded music
business and repositioning it for the digital market.
Carlyle Partners IV, L.P.
Pearl partnership Carlyle Partners IV acquired the Engineer -
ed Products division from North American tyre manufactur -
er Goodyear Tire & Rubber Co. for USD 1.5 billion in
August. This is the fourth auto-industry-related portfolio
company to be acquired by Carlyle Partners IV. The divi-
sion, which has been renamed Veyance Technologies Inc.,
develops power transmission products and conveyor belts,
among other industrial commodities, and has manufactu-
ring facilities in twelve countries. Veyance’s proven prod -
ucts, its excellent management team and the significant
growth prospects domestically and abroad made this an
attractive investment opportunity for Carlyle.
Warburg Pincus Private Equity IX, L.P.
In October, Pearl partnership Warburg Pincus acquired an
11.2% stake worth USD 110 million in Havell’s India, imply-
Doughty Hanson & Co V
Die Pearl-Partnership Doughty Hanson & Co V gab im Juni
den Erwerb von Norit, einem führenden Zulieferer von Ver-
brauchsmaterial, Bauteilen und Anlagesystemen für Was-
ser- und Trinkwasser-Kläranlagen, zu einem nicht genann-
ten Betrag bekannt. Das Unternehmen mit Hauptsitz in
Zenderen (Niederlande) ist weltweit in 100 Ländern tätig
und verfügt über ein Netzwerk von zwölf Produktionsstät-
ten in sieben Ländern. Mark Corbidge von Doughty Hanson
kommentiert die Transaktion: «Norit ist ein ausgezeichnetes
Unternehmen, welches in attraktiven Märkten mit einem
hohen Gewinnpotenzial tätig ist.»
GMT Communications Partners III, L.P.
Im Juli erwarb die Pearl-Partnership GMT eine Mehrheitsbetei-
ligung an Melita Cable, das einen geschätzten Unternehmens-
wert von rund EUR 170 Mio. hat. Der einzige Anbieter von
Kabelfernsehen in Malta bietet seinen Privat- und Geschäfts-
kunden TV-, Breitband- und Telefondienstleistungen an. Das
Unternehmen sicherte sich kürzlich die Exklusivrechte für die
Ausstrahlung der englischen und italienischen Fussballmei-
sterschaftsspiele der laufenden Saison sowie des UEFA-Cups
und des SUPER-Cups, welche in Malta grosse Popularität
geniessen. Es darf erwartet werden, dass der Kommunika-
tionsspezialist GMT Wachstum- und Synergiemöglichkeiten
zwischen Melita und seinen weiteren 17 Telekommunikations-
portfoliounternehmen in Europa suchen wird.
Terra Firma Capital Partners II, L.P.
Im August schloss die Pearl-Partnership Terra Firma die
Übernahme der EMI Group für einen Gesamtwert von GBP
2.4 Mrd. ab. EMI ist eines der weltweit grössten Musik-
unternehmen und der weltweit führende Musikverlag. Sein
Musikkatalog beinhaltet Titel von namhaften Künstlern wie
beispielsweise den Beatles, Robbie Williams und den Rolling
Stones. Terra Firma beabsichtigt die Weiterentwicklung des
Verlagskatalogs sowie die Konzentration und Repositionie-
rung des Musikkatalogs für den digitalen Markt.
Carlyle Partners IV, L.P.
Die Pearl-Partnership Carlyle Partners IV gab im August den
Erwerb des Engineered Products-Geschäftsbereiches des nord-
amerikanischen Reifenherstellers Goodyear Tire & Rubber Co.
für USD 1.5 Mrd. bekannt. Dies ist das vierte Portfoliounter-
nehmen aus der Autoindustrie, das Carlyle Partners IV aquiriert
hat. Der Geschäftsbereich, der in Veyance Technologies Inc.
umbenannt wurde, produziert in zwölf Ländern und entwickelt
neben anderen industriellen Gütern auch Produkte zur Energie-
übertragung und Transportbänder. Sowohl die etablierten Pro-
dukte von Veyance als auch das ausgezeichnete Management
und die nationalen und internationalen Wachstumsperspekti-
ven machten den Geschäftsbereich für Carlyle interessant.
Pearl_2007.qxp:Pearl_2005 18.3.2008 11:19 Uhr Seite 45
46
BERICHT DES INVESTMENT MANAGERS
ing a total company value of USD 1.2 billion. Havell’s is one
of India’s largest and fastest growing electrical and power
distribution equipment companies and owns several prestig -
ious global brands. It has branches and representative
offices in over 50 countries and employs over 8’000 people
worldwide. The investment reflects Warburg Pincus’ confi-
dence in the management team, the company’s strong
brand image as well as in the growth potential of the elec-
trical products and power distribution segment.
CVC European Equity Partners IV, L.P. Tandem Fund
The Pearl partnership CVC completed the acquisition of the
Samsonite Corporation in October. The corporation is one of
the world’s largest designers, manufacturers, distributors
and marketers of luggage, casual bags, business cases and
travel-related products. According to CVC, Samsonite is a
highly attractive investment opportunity since it has experi -
enced long term growth with a high correlation to the
growth in the travel industry. Furthermore, there is signifi-
cant potential to continue to grow the business, particular-
ly in Asia.
Warburg Pincus Private Equity IX, L.P.
Im Oktober erwarb die Pearl-Partnership Warburg Pincus für
USD 110 Mio. einen Anteil von 11.2% an Havell’s India, was
einen Unternehmenswert von USD 1.2 Mrd. impliziert.
Havell’s ist eines der grössten und am schnellsten wachsen-
den Unternehmen im Bereich Strom- und Energieversor-
gung in Indien und besitzt in diesem Segment zahlreiche
namhafte globale Marken. Es hat Filialen und Repräsentan-
zen in über 50 Ländern und beschäftigt über 8’000 Mitarbei-
ter weltweit. Warburg Pincus ist sowohl vom Management
als auch vom starken Markennamen überzeugt und glaubt
an das Wachstumspotenzial des Geschäftssegmentes.
CVC European Equity Partners IV, L.P. Tandem Fund
Die Pearl-Partnership CVC hat im Oktober die Übernahme
der Samsonite Corporation abgeschlossen. Das Unterneh-
men ist weltweit einer der grössten Designer, Hersteller,
Vertreiber und Vermarkter von Gepäck, Reiseprodukten,
Freizeit- und Businesstaschen. Laut CVC ist Samsonite eine
äusserst attraktive Investition, da das Unternehmen bereits
ein langfristiges Wachstum aufweist und eine hohe Korrela-
tion zur weiterhin wachsenden Reiseindustrie hat. Des Wei-
teren besteht ein hohes Potenzial, das Wachstum auch
weiterhin fortzusetzen, insbesondere in Asien.
Pearl_2007.qxp:Pearl_2005 18.3.2008 11:19 Uhr Seite 46
47
INVESTMENT MANAGER’S REPORT
Global Private Equity Fund IV-D, L.P.
In January, Advent International, the manager of Pearl
partnership Global Private Equity Fund IV-D, agreed to sell
Parques Reunidos to the United Kingdom buyout firm Can-
dover, which linked up with Great Britain’s leisure market
company Bourne Leisure. The terms of the sale were not
disclosed, but banking sources said that it was worth just
over EUR 900 million. Advent acquired Parques Reunidos in
2003 for EUR 173 million. The European theme park group
Parques Reunidos operates 22 amusement, animal and
water parks in six different countries.
Apax Europe VI, L.P. and
Texas Pacific Group Partners IV, L.P.
Apax Partners together with Texas Pacific Group sold TIM Hel-
las to the Egyptian telecoms entrepreneur Naguib Sawaris for
a total amount of EUR 3.4 billion in February. The two pri vate
equity firms acquired Greek’s third largest mobile operator
from Telecom Italia in June 2005 for EUR 1.6 billion and have
since brought in a new management team, introduced a suc-
cessful turnaround plan and completed the EUR 360 million
follow-on acquisition of Q-Telecom, a smaller Greek mobile
operator. Through the sale, Apax Partners and Texas Pacific
Group will receive 4.5x their original investment.
Apax Europe V, L.P.
In February, Pearl partnership Apax Europe V announced
the sale of Swedish healthcare business Mölnlycke Health
Care to Investor AB and Morgan Stanley for EUR 2.85 bil-
lion. Apax, which had acquired the business just 18 months
ago and subsequently merged it with Medlock Medical Hold -
ings and Regent Medical, is set to realize a substantial
return in excess of ten times its original investment, accord -
ing to banking sources. The transaction is subject to the
approval of the competition authorities.
Apollo Overseas Partners III, L.P.
Pearl partnership Apollo Management sold all the remaining
common shares of Allied Waste Industries, Inc. in an at-
the-market public offering in May. Allied Waste is America's
second largest non-hazardous solid waste services com -
pany and operates from headquarters in Phoenix. It provides
waste collection, transfer, recycling and disposal services to
millions of residential, commercial and industrial customers
in over 100 major markets spanning 37 states and Puerto
Rico. Allied Waste employs over 24’000 people and gener -
ated USD 6 billion of revenue in 2006.
Index Venture Partners III, L.P.
At the beginning of June, Pearl partnership Index Venture
Partners III successfully exited internet site Last.fm with
the sale of the company to US television channel CBS for
Global Private Equity Fund IV-D, L.P.
Advent International, der Manager der Pearl-Partnership Glo-
bal Private Equity Fund IV-D, stimmte im Januar dem Verkauf
von Parques Reunidos zu. Als Käufer agierte die britische
Buyout-Unternehmung Candover, welche sich für eine Über-
nahme mit der in Grossbritanniens Freizeitmarkt tätigen
Bourne Leisure verbündete. Die Verkaufsbedingungen wur-
den nicht bekannt gegeben. Gemäss Bankquellen soll der
Verkauf aber über EUR 900 Mio. eingebracht haben. Advent
kaufte Parques Reunidos im Jahr 2003 für EUR 173 Mio. Par-
ques Reunidos, eine europäische Betreiberin von Freizeit-
parks, unterhält 22 Vergnügungs- und Wasserparks sowie
Zoos in verschiedenen Ländern.
Apax Europe VI, L.P. und
Texas Pacific Group Partners IV, L.P.
Im Februar verkauften Apax Partners und Texas Pacific Group
TIM Hellas an den ägyptischen Telekommunikationsinvestor
Naguib Sawaris für EUR 3.4 Mrd. Die zwei Private Equity-Unter-
nehmen hatten Griechenlands drittgrössten Mobilfunkbetreiber
im Juni 2005 für EUR 1.6 Mrd. von Telecom Italia erworben und
seither ein neues Managementteam eingesetzt, ein erfolgrei-
ches Unternehmenskonzept lanciert und für EUR 360 Mio. Q-
Telecom, einen kleinen griechischen Mobilfunkbetreiber, über-
nommen. Durch den Verkauf erhalten Apax Partners und Texas
Pacific Group ihr eingesetztes Kapital 4.5-mal zurück.
Apax Europe V, L.P.
Die Pearl-Partnership Apax Europe V hat im Februar den Ver-
kauf der schwedischen Mölnlycke Health Care, eines im
Gesundheitswesen tätigen Unternehmens, an Investor AB
und Morgan Stanley bekannt gegeben. Der Wert der Transak-
tion beläuft sich auf EUR 2.85 Mrd. Apax hatte erst vor 18
Monaten im Rahmen der Fusion von Medlock Medical Hold -
ings, Regent Medical und Mölnlycke in das Unternehmen inve-
stiert und realisiert nun durch den Verkauf gemäss Ban -
kenquellen mehr als zehnmal das ursprünglich investierte
Kapital. Die Transaktion bedarf noch der Zustimmung der
zuständigen Wettbewerbsbehörden.
Apollo Overseas Partners III, L.P.
Im Mai verkaufte die Pearl-Partnership Apollo Management
ihren verbleibenden Anteil an der Allied Waste Industries, Inc.
zum Marktpreis an der Börse. Allied Waste, mit Hauptsitz in
Phoenix, ist Amerikas zweitgrösstes Entsorgungsunterneh-
men von ungefährlichem Müll. Das Unternehmen bietet Pri-
vatpersonen sowie Gewerbe- und Industriekunden Dienstleis -
tungen wie die Abholung, den Transport, das Vernichten und
das Recyceln von Müll an. Dabei ist das Unternehmen in über
100 Regionen in 37 amerikanischen Staaten sowie Puerto
Rico tätig. Allied Waste beschäftigt über 24’000 Personen und
erwirtschaftete 2006 einen Umsatz von USD 6 Mrd.
AUSGEWÄHLTE REALISIERUNGENSELECTED PORTFOLIO REALIZATIONS
Pearl_2007.qxp:Pearl_2005 18.3.2008 11:19 Uhr Seite 47
48
BERICHT DES INVESTMENT MANAGERS
USD 280 million. Founded in 2002, Last.fm creates commu-
nities around music by bringing together listeners, artists
and music. The company currently has more than 15 mil-
lion active users in more than 200 countries. According to
media reports, the sale generated a profit of USD 56 mil-
lion for Index Ventures, which bought a 20% stake in the
business in 2006.
PARIS RE
In July, Pearl’s direct investment PARIS RE Holding Limited
was successfully listed on Euronext Paris. By placing 13.6%
of its capital, the company raised a total of EUR 225 million
and reached a market capitalization of EUR 1.67 billion,
based on its first traded price. The issue consisted to 34%
of new shares and to 66% of existing shares. The IPO of the
French reinsurer made its stock market debut in one of
France’s biggest listings so far this year. PARIS RE was for-
med in March 2006 when it acquired all of AXA’s active rein-
surance operations backed by a consortium of international
investors led by Stone Point Capital LLC.
EQT IV, L.P.
At the beginning of July, Pearl partnership EQT IV success-
fully listed Tognum AG on the Frankfurt Stock Exchange,
raising nearly USD 2.1 billion. The IPO generates a multiple
of 11x to EQT and its investors, only sixteen months after
buying the company. Tognum’s main business is high-speed
diesel engines and propulsion systems for ships, trains,
agriculture, industry and power generators. Since the
acquisition by EQT in March 2006, Tognum AG has been
able to improve operations, revenues and profits signifi-
cantly. This is the largest initial public offering (IPO) in Ger-
many since Deutsche Post went public in 2000.
Global Private Equity Fund IV-D, L.P.
In August, product partnership Global Private Equity Fund
IV, managed by Advent International, sold portfolio com -
pany HT Troplast GmbH to investment company Arcapita for
approximately USD 1 billion. Together with The Carlyle
Group, Advent International bought the company in Febru-
ary 2005. It has generated a 3x cost multiple through the
sale. The buyout firms have increased the company’s turn -
over profitability, which had been below industry bench-
marks. HT Troplast GmbH is a global player in the plastics
processing industry, manufacturing synthetic profiles for
windows, doors, shutters and sheets.
CiCi Enterprises, Inc.
During the third quarter, Pearl received full repayment of its
mezzanine loan to CiCi Enterprises, Inc., after lead investor
Levine Leichtman Capital Partners successfully sold its
stake in the pizza chain operator to Toronto-based private
Index Venture Partners III, L.P.
Anfang Juni verkaufte die Pearl-Partnership Index Venture
Partners III die Internetgesellschaft Last.fm für USD 280
Mio. erfolgreich an den amerikanischen TV-Sender CBS.
Gegründet im Jahr 2002, erstellt Last.fm Online-Gemein-
schaften rund um die Musik, indem Hörer, Künstler und
Musik zusammengeführt werden. Zurzeit hat die Plattform
mehr als 15 Mio. aktive Benutzer in über 200 Ländern.
Gemäss Pressemeldungen erzielt Index Ventures mit dem
Verkauf einen Gewinn von USD 56 Mio. auf seinen 20%-
Anteil, den er im Jahr 2006 erworben hatte.
PARIS RE
Im Juli gab die Pearl-Direktinvestition PARIS RE Holding
Limited ihr erfolgreiches Börsendebüt, als sie 13.6% des
Unternehmenskapitals am Eurolist Markt von Euronext
platzierte. Dabei erzielte PARIS RE einen Emissionserlös
von rund EUR 225 Mio. Die Marktkapitalisierung des Unter-
nehmens beträgt gemessen am Ausgabekurs EUR 1.67 Mrd.
Die Ausgabe bestand aus 34% neuen und 66% bestehen-
den Aktien. Der Börsengang des französischen Rückversi-
cherers war in diesem Jahr eine der grössten Erstemissio-
nen Frankreichs. PARIS RE wurde im März 2006 durch die
Übernahme der Versicherungstätigkeiten von AXA gegrün-
det und dabei von einem Konsortium internationaler Inves -
toren, angeführt von Stone Point Capital LLC, unterstützt.
EQT IV, L.P.
Anfang Juli brachte die Pearl-Partnership EQT IV Tognum
AG erfolgreich an die Frankfurter Börse und erzielte dabei
einen Emissionserlös von USD 2.1 Mrd. Durch den Börsen-
gang erhalten EQT und seine Investoren bereits 16 Monate
nach dem Kauf des Unternehmens ihr eingesetztes Kapital
11-mal zurück. Tognum ist einer der führenden Anbieter
von schnelllaufenden und leistungsstarken Dieselmotoren
sowie von kompletten Antriebssystemen für Schiffe, schwe-
re Land- und Schienenfahrzeuge, Industrieantriebe und
dezentralen Energieanlagen. Seit EQT Tognum im März
2006 übernommen hat, konnte das Unternehmen die
Arbeitsprozesse, Erträge und Gewinne bedeutend steigern.
Tognum war der grösste Börsengang in Deutschland, seit
die Deutsche Post im Jahr 2000 an die Börse ging.
Global Private Equity Fund IV-D, L.P.
Im August veräusserte die von Advent International gema-
nagte Pearl-Partnership Global Private Equity Fund IV HT
Troplast GmbH für rund USD 1 Mrd. an die Investmentge-
sellschaft Arcapita. Zusammen mit The Carlye Group
erwarb Advent International den Tür- und Fensterhersteller
im Februar 2005 und erhält nun beim Verkauf das
ursprünglich investierte Kapital dreifach zurück. Die beiden
Buyout-Firmen steigerten die Umsatzrentabilität des Port-
Pearl_2007.qxp:Pearl_2005 18.3.2008 11:19 Uhr Seite 48
49
INVESTMENT MANAGER’S REPORT
equity group OnCap in July 2007. Pearl had originally par-
ticipated in CiCi’s mezzanine financing in 2003. Since then,
CiCi has opened roughly 150 new franchised and corpor -
ate-owned restaurants and now has over 600 locations
throughout the Southwest, Midwest and Southeast United
States.
Polish Enterprise Fund IV, L.P.
In October, Pearl partnership Polish Enterprise Fund IV,
which is managed by Enterprise Investors, successfully
exited part of its holding in Magellan via an initial public
offering (IPO) on the Warsaw Stock Exchange. The listing,
which was heavily oversubscribed, raised USD 13.5 million
in proceeds for Polish Enterprise Fund IV and generated a
return multiple of 10x for the fund. Magellan is a leading
player in the rapidly growing Polish market for financial ser-
vices for medical institutions and suppliers. Polish Enter -
prise Fund IV originally invested in Magellan in 2003
with the aim of supporting the management team in
strengthening the company’s market position. During the
holding period, Magellan achieved rapid growth coupled
with excellent financial performance.
foliounternehmens, welche sich unter dem Industriedurch-
schnitt befand. HT Troplast GmbH ist ein weltweit aktives
Unternehmen der kunststoffverarbeitenden Industrie und
ein führender Hersteller von künstlichen Profilen für Fen-
ster, Haustüren, Sichtschutz sowie Platten.
CiCi Enterprises, Inc.
Während des dritten Quartals erhielt Pearl die Mezzaninefi-
nanzierung von CiCi Enterprises, Inc. vollständig zurück.
Die Rückzahlung erfolgte nach dem erfolgreichen Verkauf
des Pizzeriakettenbetreibers im Juli 2007 durch Hauptinves -
tor Levine Leichtman Capital Partners an das in Toronto
ansässige Private Equity-Haus OnCap. Nachdem sich Pearl
2003 an CiCi’s Mezzaninefinanzierung beteiligte, wurden
rund 150 neue Restaurants – teils über Franchise-Verträge
– eröffnet. Die Kette zählt heute über 600 Filialen im Süd-
westen, Mittleren Westen und Südosten der USA.
Polish Enterprise Fund IV, L.P.
Im Oktober brachte die von Enterprise Investors gemanag-
te Pearl-Partnership Polish Enterprise Fund IV Magellan
erfolgreich an die Warschauer Wertpapierbörse. Der stark
überzeichnete Börsengang brachte für Polish Enterprise
Fund IV, der einen Teil seines Aktienpaketes veräusserte,
einen Erlös im Wert von USD 13.5 Mio., was ein 10x-
Multiple für den Fonds bedeutet. Magellan ist einer der füh-
renden Anbieter im schnell wachsenden polnischen Markt für
Finanzdienstleistungen für medizinische Einrichtungen und
deren Zulieferer. Polish Enterprise Fund IV hatte 2003 unter
anderem mit der Zielsetzung, das Management zu unter-
stützen und die Markposition des Unternehmens zu stär-
ken, in Magellan investiert. Während dieser Zeitspanne
erzielte Magellan schnelles Wachstum gekoppelt mit her-
vorragenden Unternehmensergebnissen.
Pearl_2007.qxp:Pearl_2005 18.3.2008 11:19 Uhr Seite 49
50
BERICHT DES INVESTMENT MANAGERS
Starke Schwellenländer, mässiges Wachstum in
Europa und den USA
Die anhaltende Immobilienkrise in den USA sowie die Tur-
bulenzen an den Kreditmärkten haben das Rezessionsrisiko für
die Vereinigten Staaten erhöht, obwohl die amerikanische
Notenbank (Fed) mit einer Leitzinssenkung massgebend
eingriff, um dem abschwächenden US-Wachstum entge-
genzuwirken. Die US-Wirtschaft wird sich im ersten Halb-
jahr 2008 einem Abschwung nicht entziehen können, sollte
sich jedoch im zweiten Halbjahr, sobald die Mass nahmen
der Fed Wirkung zeigen, wieder erholen.
In Europa machen sich die Auswirkungen des schwächeren
US-Wachstums, die verzögert eintretenden Folgen des star-
ken Euros sowie das aufgrund des eher hohen Engagements
mancher Grossbanken im amerikanischen Kreditmarkt
schwierigere Kreditmarktumfeld, auf die Marktstimmung
bemerkbar. Es wird erwartet, dass sich das Wirtschafts -
wachstum im Jahr 2008 zwar mässigen wird, trotzdem aber
solide bleibt. Dabei werden die hohe Kapazitätsauslastung
und die starke Ertragskraft der Unternehmen die Investi -
tionsausgaben stützen, während die gesunden Arbeits -
märkte den privaten Konsum begünstigen werden.
Die Schwellenländer haben die Weltwirtschaft im Jahr 2007
tatkräftig unterstützt und es darf erwartet werden, dass sie
auch weiterhin helfen werden, die weltweiten Auswirkungen
des Abschwungs in Europa und den USA zu mildern. Das
Wirtschaftswachstum in Asien und Südamerika dürfte im
Jahr 2008 zwar etwas nachgeben, trotzdem aber stabil und
auf einem hohen Niveau bleiben.
Obwohl sich die Weltwirtschaft im Jahr 2008 leicht mässi-
gen dürfte, sollte der positive Trend bei der Entwicklung
von Private Equity-Anlagen dank der soliden zugrunde lie-
genden Fundamentaldaten andauern. Die Anlage klasse Pri-
vate Equity hat einen langfristigen Anlagehorizont und ist
dementsprechend viel stärker vom langfristigen Wachs-
tumsausblick als von kurzfristigen Finanzmarktschwankun-
gen abhängig, weshalb Private Equity die derzeitige Krise
an den Finanzmärkten unversehrt überstehen sollte.
Gesunde Korrektur im Buyout-Markt
Im Jahr 2007 kam die übermässige Liquidität im Kreditmarkt
zum Erliegen, was sich auch in einer Verlangsamung im
Buyout-Markt äusserte. Vor allem grosse und Mega-Buy-
out-Transaktionen haben zurzeit wenig Zugang zu Finanzie-
rungsmöglichkeiten. Im Bereich von kleinen und mittel-
grossen Buyout-Transaktionen bis zu einem Unter -
nehmenswert von USD 1 Mrd. gibt es jedoch eine bemer-
Strong emerging markets, moderate development in
the US and Europe
The ongoing housing crisis in the US and the credit market tur-
moil have increased the risk of recession in the US. The US
central bank, the Federal Reserve, however, has taken decisive
action to counterbalance weaker US economic growth by
aggressively cutting its target interest rate. The US economy is
unlikely to escape an economic downturn in the first half of
2008, but there should be a significant pick-up in growth in the
second half as the effects of the Fed’s action begin to be felt.
In Europe, a number of factors are beginning to weigh on
sentiment, including the effects of weaker economic growth
in the US, the lagging effects of the appreciation of the euro
and more difficult credit market conditions due to some
European banks’ rather high exposure to the US credit mar-
ket. Growth is expected to moderate in 2008, but overall to
remain solid: high capacity utilization and strong corporate
profitability will lend support to investment spending, while
healthy labor markets will encourage private consumption.
The emerging markets were a major source of support for
the world economy in 2007 and going forward they are
expected to continue to help to mitigate the effects of a slow-
down in the US and Europe. Economic growth in the Asian
and South American regions should moderate slightly in
2008, but overall it should remain stable and at a high level.
Although the global economy is expected to moderate
slightly in 2008, the positive trend in the development of
private equity assets should continue during the year due
to sound underlying fundamentals. Given its long-term
investment horizon, the private equity asset class depends
more on the long-term economic growth outlook than on
short-term financial market developments and should,
therefore, manage to emerge from the current crisis in the
international financial markets relatively unscathed.
Healthy correction in the buyout market
In 2007, the abundance of liquidity in the credit market
dried up, slowing down the buyout market. Currently, large
and mega-large deals in particular have limited access to
financing. By contrast, in the small- and mid-cap buyout
universe (with enterprise values of up to USD 1 billion)
there is a remarkable level of activity. With large-cap deals
being difficult to execute until the current credit backlog
has been absorbed and growth expectations have been
adjusted, more general partners from the large and mega
large segment are expected to push into mid-cap deals,
resulting in stiffer competition for deals in the segment. As
AUSBLICK AUF DAS JAHR 2008OUTLOOK FOR 2008
Pearl_2007.qxp:Pearl_2005 18.3.2008 11:19 Uhr Seite 50
51
INVESTMENT MANAGER’S REPORT
a consequence, the global average deal size is expected to
decline and multiples to decrease. Only entry prices in the
upper middle-market – which is benefiting from the fact
that sources of credit are still available for deals in this seg-
ment – are unlikely to come down much further.
The recent turmoil in the credit markets has also had an
adverse effect on the exit environment for buyout transac-
tions: it has become less supportive as the global appetite
for risk has waned and volatility has risen. Thus, invest-
ment cycles in the buyout segment can be expected to
lengthen again: there will be a departure from the ultra
short capital repayment cycles seen during the recent buy-
out boom and a return to normal, pre-boom investment
cycles spanning four to five years.
The rising cost of capital will necessitate a shift in focus
towards value creation in the buyout segment. The import -
ance of operational value add will grow as opportunities for
capital arbitrage become more limited. Corporate restruc-
turing, cost reductions and organic and external growth will
become more important, i.e. there will be a shift whereby
the general partners’ manager qualities will be to the fore.
Thus, the competition for high-quality general partners with
proven track records will likely heat up and gaining access
to top managers will be crucial.
Continuing growth in venture capital
The general outlook for venture and growth capital remains
positive and, in line with this, the investment pace is con-
tinuing to pick up. The improved exit environment for ven-
ture/growth and greater exit visibility are expected to con-
tinue into 2008. These positive liquidity prospects are likely
to raise the overall profile of the investment strategy.
Growth opportunities, especially in Asia, remain compelling.
Higher return potential for mezzanine investments
Since the onset of the credit crisis, the terms and conditions
of mezzanine investments have improved significantly. Pric-
ing, which had only been sustained through higher Euribor
rates, has recently started to benefit from widening credit
spreads. Given that spreads are expected to remain wide in
2008, the return potential for mezzanine debt has clearly
risen. Furthermore, the credit crisis has given rise to the
possibility again of including equity kickers in mezzanine
transactions, generating additional returns, and has
increased investor protection, which is an overall healthy
development in the context of slowing global economic
growth. Lower levels of leverage should also reduce the risk
further.
kenswert hohe Aktivität. Da grosse Transaktionen bis zur
Abarbeitung der aufgestauten unsyndizierten Kredite und
einer Anpassung der Wachstumserwartungen nur schwer
durchzuführen sein werden, wird erwartet, dass General
Partners aus dem Bereich von grossen Unternehmens -
transaktionen vermehrt in den Bereich von mittelgrossen
Transaktionen drängen werden, was zu einer erhöhten Kon-
kurrenz um Investitionsmöglichkeiten in diesem Segment
führen wird. Als Folge kann davon ausgegangen werden,
dass die durchschnittlichen globalen Transaktions grössen
kleiner werden und Einstiegspreise zurückgehen. Nur Ein-
stiegspreise im oberen Bereich von mittelgrossen Transak-
tionen – die immer noch von vorhandenen Finanzierungs-
quellen profitieren – dürften nicht gross fallen.
Die jüngsten Turbulenzen an den Kreditmärkten zeigen
auch ungünstige Auswirkungen auf das Exit-Umfeld für
Buyout-Transaktionen, welches aufgrund des sinkenden
weltweiten Risikoappetits und der steigenden Volatilität
weniger begünstigt wird. Dementsprechend wird eine Ver -
längerung der Investitionszyklen im Buyout-Segment
erwartet: nach den extrem kurzen Investitionszyklen wäh-
rend des Buyout-Booms der letzten Jahre dürften diese nun
wieder auf ein gewöhnlicheres Niveau von vier bis fünf Jah-
ren – wie vor der Hausse – ansteigen.
Die steigenden Kosten bei der Kapitalbeschaffung werden
im Buyout-Segment einen Schwerpunktswechsel Richtung
Wertschöpfung erforderlich machen. Die Bedeutung der
operativen Wertgenerierung wird steigen, da die Möglich -
keiten für Kapitalarbitrage begrenzt sein werden. Als Folge
wird die Bedeutung von Unternehmens restruktu rierung,
Kostensenkung sowie organischem und externem Wachs -
tum steigen, eine Verlagerung, die insbesondere die Fähig -
keiten der General Partners in den Mittelpunkt stellen wird.
Gleichzeitig wird der Konkurrenzkampf für eine Allokation
bei den besten General Partners mit erwiesenem Leis tungs -
ausweis steigen, wobei der Zugang zu diesen Top-Managern
ausschlaggebend sein wird.
Anhaltendes Wachstum im Venture Capital-Bereich
Der allgemeine Ausblick für Venture- und Wachstums -
kapital bleibt positiv und folglich nimmt das Investitions -
tempo in diesem Segment weiterhin zu. Es darf erwartet
werden, dass das verbesserte Exit-Umfeld sowie die stei-
gende Exit-Visibilität für Venture- und Wachstums -
investitionen im Jahr 2008 anhalten werden. Gleichzeitig
verbessern positive Liquiditätsaussichten die Attraktivität
dieser Investitionsstrategie. Besonders in Asien überzeugen
Wachstumsmöglichkeiten weiterhin.
Pearl_2007.qxp:Pearl_2005 18.3.2008 11:19 Uhr Seite 51
INVESTMENT MANAGER’S REPORT
52
BERICHT DES INVESTMENT MANAGERS
Upside potential in the listed private equity market
The listed private equity asset class suffered dispropor -
tionally from the turmoil in the credit market. However, the
correction implies that rising defaults rates and wider credit
spreads are now priced in, and once calm returns to the
credit market there could be some upside potential. The
outlook for listed private equity remains positive, especial-
ly for European and North American buyouts, due to the
good underlying diversified portfolios and the attractive valu -
ations after the recent market correction.
Attractive opportunities in the secondary market
The secondary market currently offers attractive opportun -
ities, especially in Europe and the US. There are some
interesting 2003–2006 vintage year funds with upside
potential on the market. In addition, some financial market
participants, especially banks, have been facing increasing
pressure to sell during the financial market turmoil and due
to liquidity needs, thus adding to the supply of available
secondaries in the market.
Erhöhtes Renditepotenzial bei Mezzanine-Investitionen
Seit der Kreditkrise haben sich die Bedingungen für Mezza-
nineinvestitionen deutlich verbessert. Die Preisge staltung,
die zuvor nur vom hohen Euribor-Zinssatz getragen wurde,
profitiert von den steigenden Risikoaufschlägen und da bei
diesen davon ausgegangen werden kann, dass sie im Jahr
2008 weiterhin hoch bleiben werden, ist das Renditepoten-
zial für Mezzaninefinanzierungen deutlich ge stiegen. Aus-
serdem hat die Kreditkrise den Einschluss von Eigenkapital-
anteilen bei Mezzaninetransaktionen wieder möglich
gemacht. Diese erlauben zusätzliches Rendite potenzial und
verbessern die Absicherung für Investoren, was eine will-
kommene Entwicklung vor dem Hintergrund eines
abschwächenden Weltwirtschafts wachs tums darstellt. Das
Risiko von Mezzanine finan zie rungen reduziert sich zu dem
aufgrund der zurückgehenden Fremd kapitalanteile.
Entwicklungspotenzial bei notierten Private Equity-
Anlagen
Notierte Private Equity-Anlagen haben unter der Kreditkrise
überproportional gelitten. Die Korrektur bedeutet jedoch,
dass steigende Ausfallsquoten und höhere Risikoaufschläge
jetzt im Kaufpreis inbegriffen sind und nach einer Be ruhi gung
der Kreditmärkte ein positives Entwicklungs potenzial entste-
hen dürfte. Der Ausblick für notierte Private Equity-Anlagen
bleibt vor allem für amerikanische und europäische Buyout-
portfolios positiv, da diese starke und diversifizierte zugrun-
deliegende Portfolios aufweisen und aufgrund der jüngsten
Abschläge attraktiv bewertet sind.
Attraktive Möglichkeiten im Sekundärmarkt
Der Sekundärmarkt bietet derzeit vor allem in Europa und
den USA attraktive Investitionsmöglichkeiten. Es befinden
sich interessante Fonds der Gründungssjahre 2003–2006
auf dem Markt, die starkes Entwicklungspotenzial bieten.
Zusätzlich spüren einige Finanzmarktteilnehmer, insbeson-
dere Banken, aufgrund von Liquiditätsbedürfnissen und den
Turbulenzen an den Finanzmärkten einen erhöhten Ver -
äusserungsdruck und erhöhen dementsprechend das Ange-
bot auf dem Sekundärmarkt.
Pearl_2007.qxp:Pearl_2005 18.3.2008 11:19 Uhr Seite 52
53
INVESTMENT MANAGER’S REPORT
AUSBLICK 2008 FÜR PEARLOUTLOOK FOR 2008 FOR PEARL
Private Equity ist eine Anlageklasse mit einem langfristigen
Anlagehorizont und die Entwicklung von Private Equity-
Investitionen hängt viel stärker vom makroökonomischen
Umfeld als von den Schwankungen an den Finanzmärkten
ab. Nach Meinung des Anlageberaters von Pearl wird die
Weltwirtschaft auch 2008 weiterhin – allerdings weniger
stark – wachsen, da er nicht annimmt, dass die USA in eine
nachhaltige Rezession verfällt. Entwicklungsländer, allen
voran Indien und China, wachsen nach wie vor stark. Vor
diesem Hintergrund sollte sich der Aufwärtstrend des Inne-
ren Wertes des Pearl-Portfolios auch 2008 fortsetzen, aller-
dings ist aufgrund der gesamtwirtschaftlichen Situation mit
einem etwas gemässigterem Zuwachs zu rechnen. Der An -
lageberater erwartet, dass die Zahlungszusagen wie auch
die Investitionsaktivitäten des Pearl-Portfolios aufgrund der
sich verändernden Bedingungen auf dem Private Equity-
Markt im Jahr 2008 unter dem Niveau von 2007 sein wer-
den. Pearl und der Anlageberater werden jedoch auch 2008
weiterhin am selektiven Investitionsprozess festhalten um
sicherzustellen, dass die hohen Ansprüche an die Portfolio-
gesellschaften und Direktinvestitionen auch weiterhin
erfüllt werden, um auch in Zukunft eine positive Entwick-
lung von Pearl sicherzustellen. Dank der Reife und der Qua-
lität des diversifizierten Portfolios sowie infolge der regel-
mässigen Rückflüsse bleibt Pearl auch im Jahr 2008 eine
äusserst interessante Anlage.
Private equity is an investment class with a long-term
investment horizon. The development of private equity
investments depends much more on the macroeconomic
environment than on movements in the financial markets.
The Investment Advisor to Pearl believes that the global
economy will continue to grow in 2008 – though at a
slower pace – based on the premise that the US economy
will not enter into a material recession. The emerging coun-
tries, especially India and China, are continuing to grow
strongly. Against this background, the upward trend in the
NAV of the Pearl portfolio should be sustained in 2008,
though in view of the macroeconomic situation its growth is
likely to be more moderate. Given the change in the condi-
tions in the private equity market, the Investment Advisor
anticipates that both the level of new commitments and
investment activity in the Pearl portfolio will be below that
seen in 2007. Pearl and its Investment Advisor, however,
will continue to employ a highly selective investment
approach in 2008 to ensure the strict requirements for
portfolio companies and direct investments are met so as
to secure the positive development of Pearl into the future.
Thanks to the maturity and quality of the diversified port-
folio as well as the regular stream of distributions, Pearl will
remain an extremely interesting investment again in 2008.
Pearl_2007.qxp:Pearl_2005 18.3.2008 11:19 Uhr Seite 53

54
BERICHT DES INVESTMENT MANAGERS
Pearl_2007.qxp:Pearl_2005 18.3.2008 11:19 Uhr Seite 54
55
ANNUAL REPORT 2007
FINANZZAHLENFINANCIAL FIGURES
Pearl_2007.qxp:Pearl_2005 18.3.2008 11:19 Uhr Seite 55
56
DIRECTORS’ ANNUAL REPORT
Directors: N. Carey
U. Wietlisbach
J.-P. Lühmann
Secretary: Aon Services (Guernsey) Limited
Registered Office: Tudor House
PO Box 477
St. Peter Port
Guernsey
GY1 1BT
FINANZZAHLEN
Pearl_2007.qxp:Pearl_2005 18.3.2008 11:19 Uhr Seite 56
57
The directors present their report and audited financial statements for the year from 1 January 2007 to 31 December 2007.
Incorporation
Pearl Holding Limited (the “Company”) is a limited liability company, incorporated and domiciled in Guernsey, Channel Islands.
Principal activity
The principal activity of the Company is the holding of investments for the purpose of capital appreciation.
Dividends
The directors of the Company do not propose a dividend for the year ended 31 December 2007.
Results
The results for the year are shown in the income statement on page 59.
Directors
The directors of the Company are detailed on page 56.
Directors’ responsibilities
The directors are responsible for preparing financial statements for each financial year which give a true and fair view, in accor-
dance with applicable Guernsey law and International Financial Reporting Standards, of the state of affairs of the Company and
of the profit or loss of the Company for that period. In preparing those financial statements, the directors are required to:
‒ select suitable accounting policies and then apply them consistently;
‒ make judgments and estimates that are reasonable and prudent;
‒ state whether applicable accounting standards have been followed subject to any material departures disclosed and
explained in the financial statements; and
‒ prepare the financial statements on the going concern basis unless it is inappropriate to presume that the Company will
continue in business.
The directors confirm that they have complied with the above requirements in preparing the financial statements.
The directors are responsible for keeping proper accounting records which disclose with reasonable accuracy at any time the
financial position of the Company and to enable them to ensure that the financial statements comply with The Companies
(Guernsey) Law, 1994. They are also responsible for safeguarding the assets of the Company and hence for taking reasona-
ble steps for the prevention and detection of fraud and other irregularities.
The maintenance and integrity of the Company’s website is the responsibility of the directors. The work carried out by the
auditors does not involve consideration of these matters and accordingly, the auditors accept no responsibility for any chan-
ges that may have occurred to the financial statements since they were initially presented on the website.
Legislation in Guernsey governing the preparation and dissemination of financial statements may differ from legislation in other
jurisdictions.
Secretary
The secretary of the Company at 31 December 2007 was Aon Insurance Managers (Guernsey) Limited.
Auditors
During the year PricewaterhouseCoopers CI LLP were the auditors of the Company, and a resolution to reappoint them as audi-
tors to the Company will be proposed at the Annual General Meeting.
U. Wietlisbach N. Carey
Director Director Date: 8 February 2008
FINANCIAL FIGURES
DIRECTORS’ REPORT
Pearl_2007.qxp:Pearl_2005 18.3.2008 11:19 Uhr Seite 57
58
FINANZZAHLEN
INDEPENDENT AUDITORS’ REPORT TO THE MEMBERS OFPEARL HOLDING LIMITED
Report on the financial statements
We have audited the accompanying financial statements of Pearl Holding Limited which comprise the balance sheet as of
31 December 2007 and the income statement, the statement of changes in equity and the cash flow statement for the year
then ended and a summary of significant accounting policies and other explanatory notes.
Directors’ Responsibility for the Financial Statements
The directors are responsible for the preparation and fair presentation of these financial statements in accordance with Inter-
national Financial Reporting Standards and with the requirements of Guernsey law. This responsibility includes: designing,
implementing and maintaining internal control relevant to the preparation and fair presentation of financial statements that
are free from material misstatement, whether due to fraud or error; selecting and applying appropriate accounting policies;
and making accounting estimates that are reasonable in the circumstances.
Auditors’ Responsibility
Our responsibility is to express an opinion on these financial statements based on our audit. We conducted our audit in accord -
ance with International Standards on Auditing. Those Standards require that we comply with ethical requirements and plan
and perform the audit to obtain reasonable assurance whether the financial statements are free from material misstatement.
An audit involves performing procedures to obtain audit evidence about the amounts and disclosures in the financial state-
ments. The procedures selected depend on the auditors’ judgement, including the assessment of the risks of material misstate -
ment of the financial statements, whether due to fraud or error. In making those risk assessments, the auditor considers internal
control relevant to the entity’s preparation and fair presentation of the financial statements in order to design audit procedures
that are appropriate in the circumstances, but not for the purpose of expressing an opinion on the effectiveness of the entity’s
internal control. An audit also includes evaluating the appropriateness of accounting policies used and the reasonableness of
accounting estimates made by the directors, as well as evaluating the overall presentation of the financial statements.
We believe that the audit evidence we have obtained is sufficient and appropriate to provide a basis for our audit opinion.
Opinion
In our opinion, the financial statements give a true and fair view of the financial position of the Company as of 31 December
2007, and of its financial performance and its cash flows for the year then ended in accordance with International Financial
Reporting Standards and have been properly prepared in accordance with the requirements of The Companies (Guernsey) Law,
1994.
Without qualifying our opinion, we draw attention to Note 6 and 7 to the financial statements. As indicated in Note 6 and 7,
the financial statements include unquoted investments (funds and direct investments) stated at their fair value of EUR
658’057’108. Because of the inherent uncertainty associated with the valuation of such investments and the absence of a liquid
market, these fair values may differ from their realisable values, and the differences could be material.
Report on other legal and regulatory requirements
We read the other information contained in the Annual Report and consider the implications for our report if we become aware
of any apparent misstatements or material inconsistencies with the financial statements. The other information comprises only
the directors’ report.
In our opinion the information given in the directors’ report is consistent with the financial statements.
This report, including the opinion, has been prepared for and only for the Company’s members as a body in accordance with
Section 64 of The Companies (Guernsey) Law, 1994 and for no other purpose. We do not, in giving this opinion, accept or
assume responsibility for any other purpose or to any other person to whom this report is shown or into whose hands it may
come save where expressly agreed by our prior consent in writing.
PricewaterhouseCoopers CI LLP
Chartered Accountants, Guernsey, Channel Islands
2008
Pearl_2007.qxp:Pearl_2005 18.3.2008 11:19 Uhr Seite 58
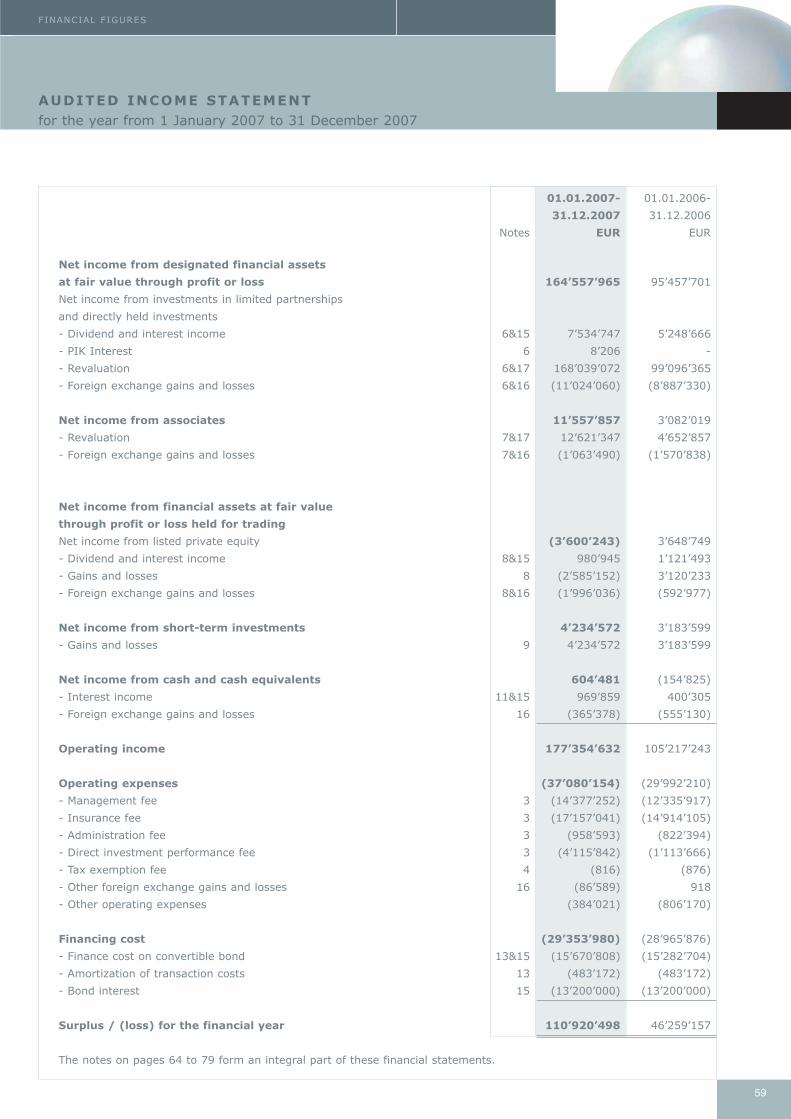
59
FINANCIAL FIGURES
AUDITED INCOME STATEMENTfor the year from 1 January 2007 to 31 December 2007
01.01.2007- 01.01.2006-
31.12.2007 31.12.2006
Notes EUR EUR
Net income from designated financial assets
at fair value through profit or loss 164’557’965 95’457’701
Net income from investments in limited partnerships
and directly held investments
- Dividend and interest income 6&15 7’534’747 5’248’666
- PIK Interest 6 8’206 -
- Revaluation 6&17 168’039’072 99’096’365
- Foreign exchange gains and losses 6&16 (11’024’060) (8’887’330)
Net income from associates 11’557’857 3’082’019
- Revaluation 7&17 12’621’347 4’652’857
- Foreign exchange gains and losses 7&16 (1’063’490) (1’570’838)
Net income from financial assets at fair value
through profit or loss held for trading
Net income from listed private equity (3’600’243) 3’648’749
- Dividend and interest income 8&15 980’945 1’121’493
- Gains and losses 8 (2’585’152) 3’120’233
- Foreign exchange gains and losses 8&16 (1’996’036) (592’977)
Net income from short-term investments 4’234’572 3’183’599
- Gains and losses 9 4’234’572 3’183’599
Net income from cash and cash equivalents 604’481 (154’825)
- Interest income 11&15 969’859 400’305
- Foreign exchange gains and losses 16 (365’378) (555’130)
Operating income 177’354’632 105’217’243
Operating expenses (37’080’154) (29’992’210)
- Management fee 3 (14’377’252) (12’335’917)
- Insurance fee 3 (17’157’041) (14’914’105)
- Administration fee 3 (958’593) (822’394)
- Direct investment performance fee 3 (4’115’842) (1’113’666)
- Tax exemption fee 4 (816) (876)
- Other foreign exchange gains and losses 16 (86’589) 918
- Other operating expenses (384’021) (806’170)
Financing cost (29’353’980) (28’965’876)
- Finance cost on convertible bond 13&15 (15’670’808) (15’282’704)
- Amortization of transaction costs 13 (483’172) (483’172)
- Bond interest 15 (13’200’000) (13’200’000)
Surplus / (loss) for the financial year 110’920’498 46’259’157
The notes on pages 64 to 79 form an integral part of these financial statements.
Pearl_2007.qxp:Pearl_2005 18.3.2008 11:19 Uhr Seite 59
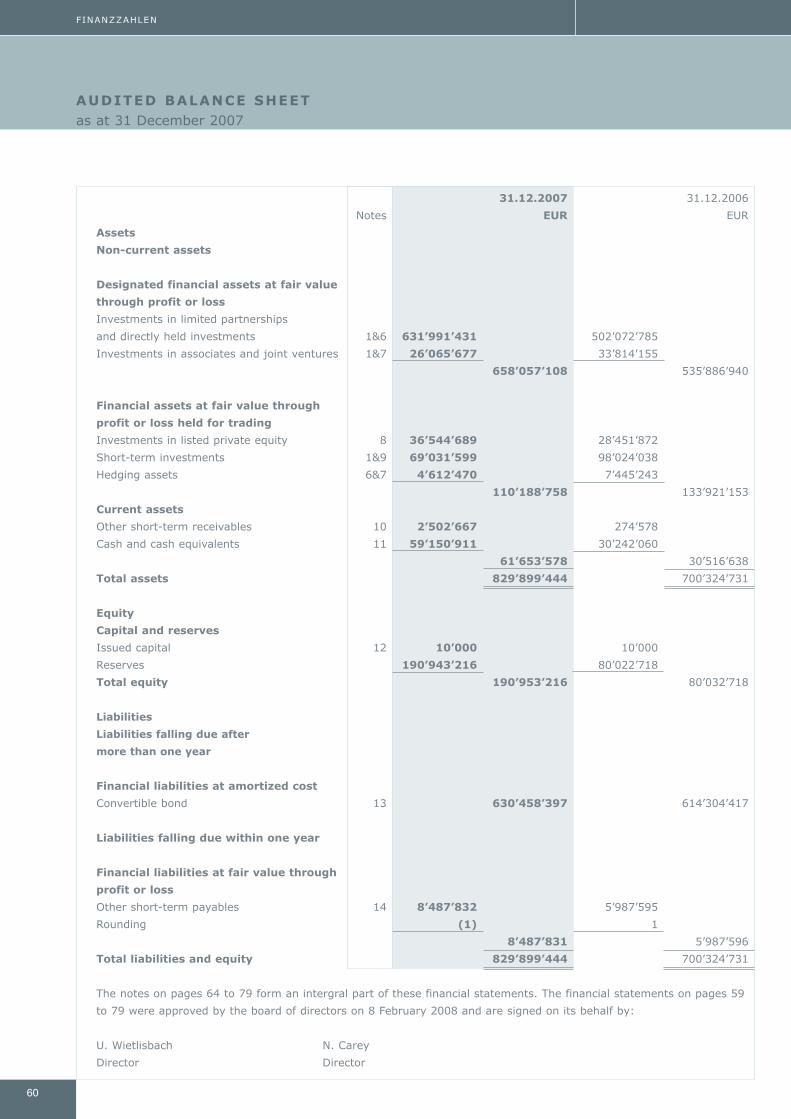
60
FINANZZAHLEN
AUDITED BALANCE SHEETas at 31 December 2007
31.12.2007 31.12.2006
Notes EUR EUR
Assets
Non-current assets
Designated financial assets at fair value
through profit or loss
Investments in limited partnerships
and directly held investments 1&6 631’991’431 502’072’785
Investments in associates and joint ventures 1&7 26’065’677 33’814’155
658’057’108 535’886’940
Financial assets at fair value through
profit or loss held for trading
Investments in listed private equity 8 36’544’689 28’451’872
Short-term investments 1&9 69’031’599 98’024’038
Hedging assets 6&7 4’612’470 7’445’243
110’188’758 133’921’153
Current assets
Other short-term receivables 10 2’502’667 274’578
Cash and cash equivalents 11 59’150’911 30’242’060
61’653’578 30’516’638
Total assets 829’899’444 700’324’731
Equity
Capital and reserves
Issued capital 12 10’000 10’000
Reserves 190’943’216 80’022’718
Total equity 190’953’216 80’032’718
Liabilities
Liabilities falling due after
more than one year
Financial liabilities at amortized cost
Convertible bond 13 630’458’397 614’304’417
Liabilities falling due within one year
Financial liabilities at fair value through
profit or loss
Other short-term payables 14 8’487’832 5’987’595
Rounding (1) 1
8’487’831 5’987’596
Total liabilities and equity 829’899’444 700’324’731
The notes on pages 64 to 79 form an intergral part of these financial statements. The financial statements on pages 59
to 79 were approved by the board of directors on 8 February 2008 and are signed on its behalf by:
U. Wietlisbach N. Carey
Director Director
Pearl_2007.qxp:Pearl_2005 18.3.2008 11:20 Uhr Seite 60
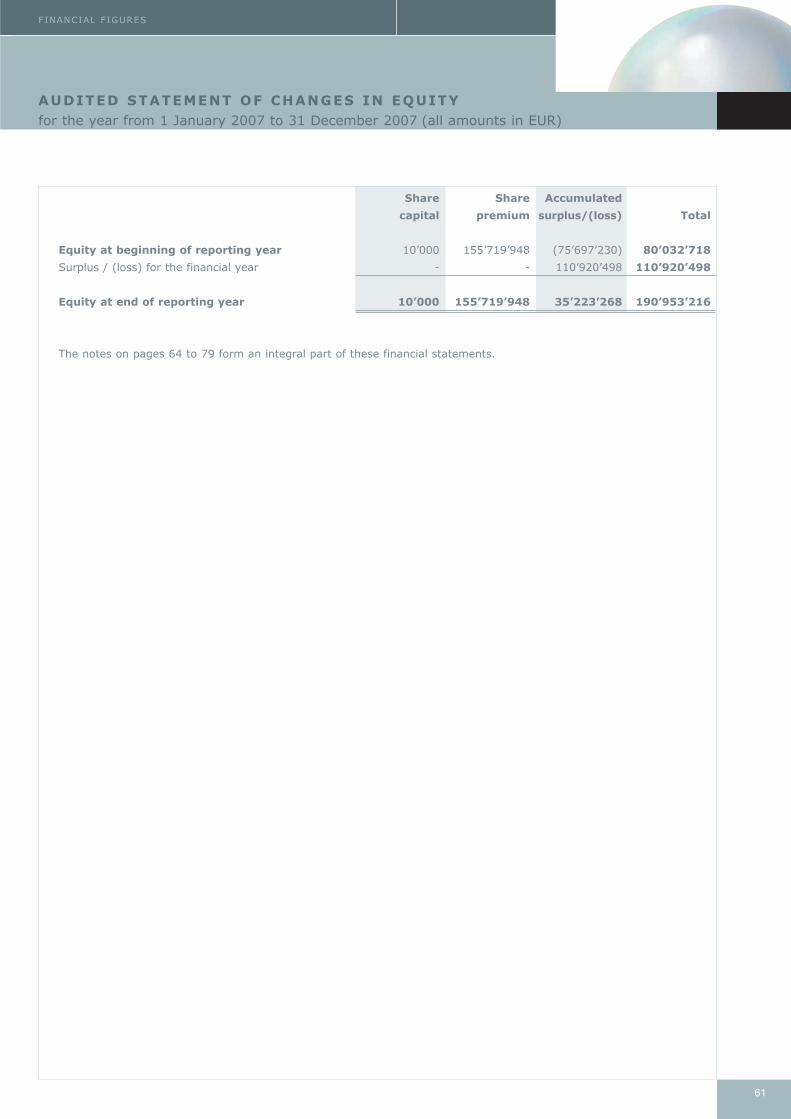
61
FINANCIAL FIGURES
AUDITED STATEMENT OF CHANGES IN EQUITYfor the year from 1 January 2007 to 31 December 2007 (all amounts in EUR)
Share Share Accumulated
capital premium surplus/(loss) Total
Equity at beginning of reporting year 10’000 155’719’948 (75’697’230) 80’032’718
Surplus / (loss) for the financial year - - 110’920’498 110’920’498
Equity at end of reporting year 10’000 155’719’948 35’223’268 190’953’216
The notes on pages 64 to 79 form an integral part of these financial statements.
Pearl_2007.qxp:Pearl_2005 18.3.2008 11:20 Uhr Seite 61

62
FINANZZAHLEN
Share Share Accumulated
capital premium surplus/(loss) Total
Equity at beginning of reporting year 10’000 155’719’948 (121’956’387) 33’773’561
Surplus / (loss) for the financial year - - 46’259’157 46’259’157
Equity at end of reporting year 10’000 155’719’948 (75’697’230) 80’032’718
The notes on pages 64 to 79 form an integral part of these financial statements.
AUDITED STATEMENT OF CHANGES IN EQUITYfor the year from 1 January 2006 to 31 December 2006 (all amounts in EUR)
Pearl_2007.qxp:Pearl_2005 18.3.2008 11:20 Uhr Seite 62
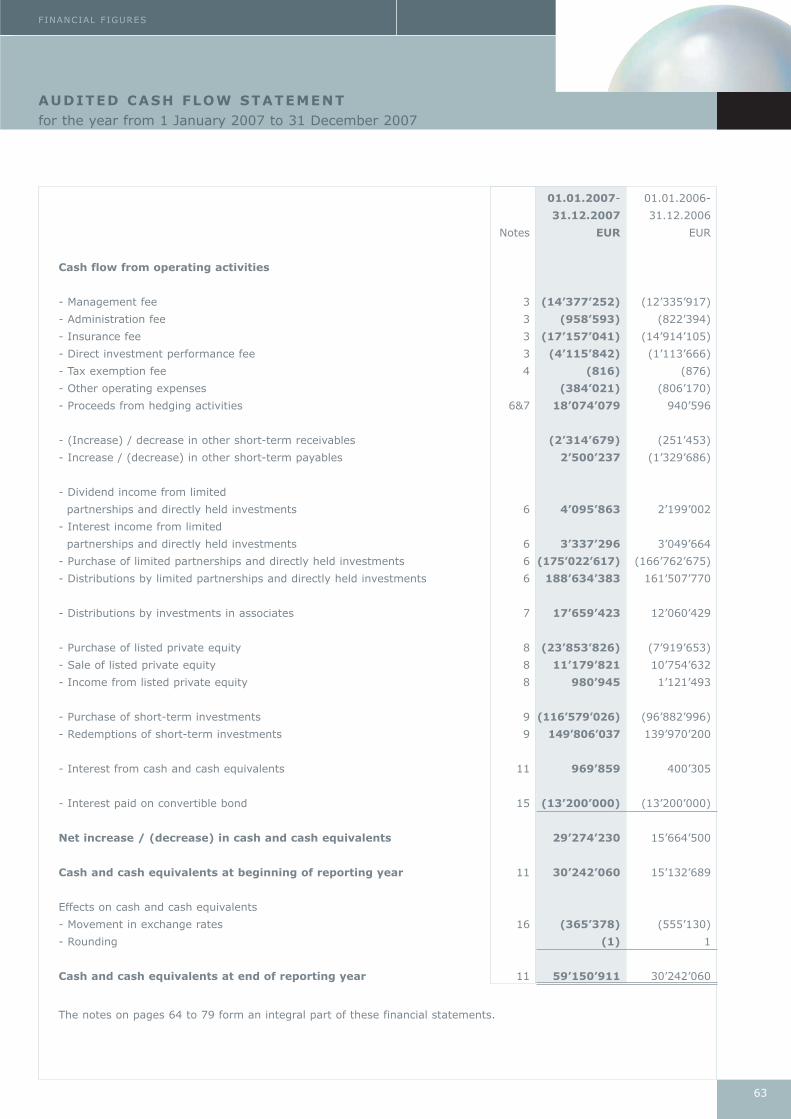
63
FINANCIAL FIGURES
AUDITED CASH FLOW STATEMENTfor the year from 1 January 2007 to 31 December 2007
01.01.2007- 01.01.2006-
31.12.2007 31.12.2006
Notes EUR EUR
Cash flow from operating activities
- Management fee 3 (14’377’252) (12’335’917)
- Administration fee 3 (958’593) (822’394)
- Insurance fee 3 (17’157’041) (14’914’105)
- Direct investment performance fee 3 (4’115’842) (1’113’666)
- Tax exemption fee 4 (816) (876)
- Other operating expenses (384’021) (806’170)
- Proceeds from hedging activities 6&7 18’074’079 940’596
- (Increase) / decrease in other short-term receivables (2’314’679) (251’453)
- Increase / (decrease) in other short-term payables 2’500’237 (1’329’686)
- Dividend income from limited
partnerships and directly held investments 6 4’095’863 2’199’002
- Interest income from limited
partnerships and directly held investments 6 3’337’296 3’049’664
- Purchase of limited partnerships and directly held investments 6 (175’022’617) (166’762’675)
- Distributions by limited partnerships and directly held investments 6 188’634’383 161’507’770
- Distributions by investments in associates 7 17’659’423 12’060’429
- Purchase of listed private equity 8 (23’853’826) (7’919’653)
- Sale of listed private equity 8 11’179’821 10’754’632
- Income from listed private equity 8 980’945 1’121’493
- Purchase of short-term investments 9 (116’579’026) (96’882’996)
- Redemptions of short-term investments 9 149’806’037 139’970’200
- Interest from cash and cash equivalents 11 969’859 400’305
- Interest paid on convertible bond 15 (13’200’000) (13’200’000)
Net increase / (decrease) in cash and cash equivalents 29’274’230 15’664’500
Cash and cash equivalents at beginning of reporting year 11 30’242’060 15’132’689
Effects on cash and cash equivalents
- Movement in exchange rates 16 (365’378) (555’130)
- Rounding (1) 1
Cash and cash equivalents at end of reporting year 11 59’150’911 30’242’060
The notes on pages 64 to 79 form an integral part of these financial statements.
Pearl_2007.qxp:Pearl_2005 18.3.2008 11:20 Uhr Seite 63
64
FINANZZAHLEN
NOTES TO THE AUDITED FINANCIAL STATEMENTS
1 PRINCIPAL ACCOUNTING POLICIES
The accounting policies correspond to those of the audited financial statements for the year ended 31 December 2006,
except for the changes described below. The following accounting policies have been applied consistently in dealing with
items which are considered material in relation to the Company’s financial statements:
As at 1 January 2007 there were new and existing revised International Financial Reporting Standards (IFRS) to be adopt -
ed. The Company has consequently adopted all relevant and below-mentioned Standards since 1 January 2007.
‒ International Financial Reporting Standard 7 (IFRS 7 (effective 1 January 2007)) – Financial Instruments: Disclosures,
and the complementary amendments to IAS 1 – Presentation of financial statements: Capital disclosures.
The adoption of IFRS 7 did not affect the Company’s results of operations or financial position, but resulted in additional
disclosures about the significance of financial instruments for the Company’s financial position and performance, and qual -
itative and quantitative disclosures on the nature and extent of financial risks.
The interpretations IFRIC 7 to 11 (International Financial Reporting Interpretations Committee) are effective for financial
periods after 1 January 2007. These interpretations had no impact on the financial statements of the Company.
The following standards, interpretations and amendments to published standards that are mandatory for accounting
periods beginning on or after 1 January 2008, or later periods have not been early adopted.
– IFRS 8 (effective 1 January 2009): – Segment reporting
– IFRIC 12 (effective 1 January 2008): – Service Concession Arrangements
– IFRIC 13 (effective 1 July 2008): – Customer Loyalty Programmes
– IFRIC 14 (effective 1 January 2008): – The Limit on a Defined Benefit Asset, Minimum Funding Requirements and
their Interaction
The Company assessed the impact of IFRS 8 and concluded that this new standard will result in some additional dis-
closures, but will not affect the Group's results of operations or financial position. The Company will apply IFRS 8 from
accounting periods beginning 1 January 2009.
The Company assessed the impact of the interpretations of IFRIC 11 to 14 and concluded that these new interpretations
will not affect the Company's results of operations or financial position.
Basis of preparation
The financial statements have been prepared in accordance with IFRS and under the historical cost convention as modi-
fied by the revaluation of "financial assets and financial liabilities at fair value through profit or loss".
The preparation of financial statements in conformity with IFRS requires the use of estimates and assumptions that affect
the reported amounts of assets and liabilities and disclosure of contingent assets and liabilities at the date of the finan-
cial statements and the reported amounts of revenues and expenses during the reporting period. Although these esti-
mates are based on management's best knowledge of current events and actions, actual results ultimately may differ
from those estimates.
Net income from short-term investments and cash and cash equivalents
Income from bank deposits is included on an accruals basis. All other realized and unrealized surpluses and losses are
recognized in the income statement.
Pearl_2007.qxp:Pearl_2005 18.3.2008 11:20 Uhr Seite 64
65
FINANCIAL FIGURES
Expenditure
The expenditure is included in the financial statements on an accruals basis.
Borrowing costs are recognized as an expense in the period in which they accrue.
Functional and presentation currency
The financial statements are presented in Euro which is also the currency of the primary economic environment in which it
operates ('The Functional Currency'). Transactions in foreign currencies are translated into Euro at the exchange rate prevail -
ing at the date of the transaction. Monetary assets and liabilities denominated in foreign currencies are translated into Euro
at the exchange rate prevailing at the balance sheet date. Exchange gains and losses are included in the income statement.
Financial assets and financial liabilities at fair value through profit or loss
a) Classification
The Company classifies its investments in debt and equity securities, and related derivatives, as financial assets or finan-
cial liabilities at fair value through profit or loss. These financial assets and financial liabilities are classified as held for
trading or designated by the Board of Directors at fair value through profit or loss at inception.
Financial assets or financial liabilities held for trading are those acquired or incurred principally for the purposes of sell -
ing or repurchasing in the short term.
The Company's policy of hedging the value of non-Euro investments against the Euro does not qualify for hedge account -
ing as defined in IAS 39. Derivative financial instruments are classified as financial assets and liabilities held for trading.
They are initially recognized in the balance sheet at fair value and subsequently remeasured at their fair value. As a result
the unrealized changes in the fair value of these derivatives and the realized net gains / losses on the derivatives that
matured during the period are recognized in the income statement under the heading of “Net income from financial assets
at fair value through profit or loss – Foreign exchange gains and losses”. The fair values of various derivative instruments
used for hedging purposes are disclosed in notes 6 & 7.
Financial assets and financial liabilities designated at fair value through profit or loss at inception consist of investments
in limited partnerships and directly held investments. They are managed and their performance is evaluated on a fair
value basis in accordance with the Company’s documented investment strategy. The Company’s policy is used by the
investment manager and the Board of Directors to evaluate the information about these financial assets and liabilities on
a fair value basis together with other related financial information.
In selecting investments the directors have taken into consideration the accounting and valuation bases of the under-
lying partnerships and select only those investments which adopt an internationally recognized standard.
b) Recognition / Derecognition
All transactions relating to financial assets and financial liabilities at fair value through profit or loss are recognized on the
settlement date.
Any distributions, including return of principal of investment, received from the underlying limited partnerships and directly
held investments are recognized on the distribution date.
Financial assets and financial liabilities at fair value through profit or loss are derecognized when the right to receive cash
flows has expired or where substantially all risks and rewards of ownership have been transferred.
Pearl_2007.qxp:Pearl_2005 18.3.2008 11:20 Uhr Seite 65
NOTES TO THE AUDITED FINANCIAL STATEMENTS(continued)
66
FINANZZAHLEN
c) Measurement
Financial assets and financial liabilities at fair value through profit or loss are initially recognized at fair value. Subsequent
to initial recognition, all financial assets and financial liabilities at fair value through profit or loss are measured at fair
value. Gains and losses arising from changes in the fair value of the financial assets or financial liabilities at fair value
through profit or loss category are presented in the income statement in the period in which they arise. Interest income
from financial assets at fair value through profit or loss is recognized in the income statement within interest income using
the effective interest method. Dividend income from financial assets at fair value through profit or loss is recognized in
the income statement within dividend income when the Company’s right to receive payments is established. Transaction
costs are expensed in the income statement.
d) Fair Value estimation
The fair value of financial instruments traded in active markets (such as listed private equity) is based on quoted market
prices at the balance sheet date. The quoted market price used for financial assets held by the Company is the current bid price.
In assessing the fair value of non-traded financial instruments, the Company uses a variety of methods such as time of
last financing, multiple analysis, discounted cash flow method and third party valuation and makes assumptions that are
based on market conditions existing at each balance sheet date. Quoted market prices or dealer quotes for specific or
similar instruments are used for long-term debt. Other techniques, such as option pricing models and estimated discount -
ed value of future cash flows, are used to determine fair value for the remaining financial instruments.
Short-term investments
The Company classifies its investments in short-term investments as financial assets at fair value through profit or loss.
Short-term investments are defined as monetory investments with maturity between three and twelve months from the
date of purchase and are treated as "financial assets at fair value through profit or loss".
The short-term investments purchased at par are included in the balance sheet at market values ruling at the balance sheet
date. The changes in the fair value are included within “Net income from short-term investments – Gains and losses”.
The short-term investments purchased at a discount are included in the balance sheet at market values ruling at the balance
sheet date. The changes in the fair value and the interest received at maturity are included within “Net income from
short-term investments – Gains and losses”. Upon maturity of the short-term investments purchased at a discount the dif-
ference between the last reported fair value and the maturity amount are included within “Realized gains and losses”.
All transactions relating to short-term investments are recognized on the settlement date.
Investments in associates
Based on the exemption in IAS 28 for venture capital organizations, mutual funds and similar entities, investments in
associates are treated in accordance with IAS 39 (revised 2004) and therefore held as "financial assets at fair value
through profit or loss" and disclosed at fair value. Initially they are recognized at fair value. For the ongoing valuation of
such investments the directors review information provided by underlying partnerships and other business partners and
apply widely recognized valuation methods such as time of last financing, multiple analysis, discounted cash flow method
and third party valuation to estimate a fair value as at the balance sheet date. Associates are entities over which the
Company generally has between 20% and 50% of the voting rights, or over which the Company has significant influence,
but which it does not control.
Cash and cash equivalents
Cash and cash equivalents consist of cash at bank and term deposits with a maturity of three months or less.
Cash and cash equivalents are stated at the carrying amount as this is a reasonable approximation of fair value.
Pearl_2007.qxp:Pearl_2005 18.3.2008 11:20 Uhr Seite 66
67
FINANCIAL FIGURES
2 CRITICAL ACCOUNTING ESTIMATES AND JUDGMENTS
Estimates and judgments are continually evaluated and are based on historical experience and other factors, including
expectations of future events that are believed to be reasonable under the circumstances.
The Company makes estimates and assumptions concerning the future. The resulting accounting estimates will, by defi-
nition, seldom equal the related actual results. The estimates and assumptions that have a significant risk of causing a
material adjustment to the carrying amounts of assets and liabilities within the next financial year are discussed below.
Investments in limited partnerships, directly held investments and associates
For the valuation of such investments the directors review information provided by underlying partnerships and other
business partners and apply widely recognized valuation methods such as time of last financing, multiple analysis,
discounted cash flow method and third party valuation to estimate a fair value as at the balance sheet date. The variety
of valuation bases adopted, quality of management information provided by the underlying partnerships and the lack of
liquid markets for the investments held mean that there are inherent difficulties in determining the fair values of these
investments that cannot be eliminated. Therefore the amounts realized on the sale of investments will differ from the fair
values reflected in these financial statements and the differences may be significant.
3 EXPENSES
Management fee
The management fee is paid quarterly in advance pursuant to the Investment Management Agreement between the Com-
pany and Pearl Management Limited. The quarterly management fee is calculated as 0.375% of the higher of the sum of
Private Equity Net Assets and the undrawn commitments or the Net Assets of the Company.
Administration fee
The administration fee is paid quarterly in advance pursuant to the Administration Agreement between the Company and
Partners Group (Guernsey) Limited. The quarterly administration fee is calculated as 0.025% of the higher of the sum of
Private Equity Net Assets and the undrawn commitments or the Net Assets of the Company.
Insurance fee
The insurance fee is paid quarterly in advance pursuant to the Insurance Trust Agreement between the Company, Pearl
Management Limited and European International Reinsurance Company Limited. The quarterly insurance fee is calcu-
lated as 0.45% of the higher of the sum of Private Equity Net Assets and the undrawn commitments or the Net Assets
of the Company or the Principal Amount of the convertible bond.
Direct investment performance fee
The direct investment performance fee is paid pursuant to the Investment Management Agreement between the Com-
pany and Pearl Management Limited. The direct investment performance fee is calculated as 20% of any net profit distri-
bution resulting from direct private equity investments.
4 TAXATION STATUS
The Company is exempt from Guernsey income tax under the Income Tax (Exempt Bodies) (Guernsey) Ordinances 1989
and 1992 and had been charged an annual exemption fee of GBP 600.
Pearl_2007.qxp:Pearl_2005 18.3.2008 11:20 Uhr Seite 67
68
FINANZZAHLEN
NOTES TO THE AUDITED FINANCIAL STATEMENTS(continued)
5 FINANCIAL RISK MANAGEMENT
Financial risk factors
The Company's activities expose it to a variety of financial risks, including the effects of changes in debt and equity
market prices, foreign currency exchange rates and interest rates. The Company's overall risk management programme
focuses on the unpredictability of financial markets and seeks to minimize potential adverse effects on the financial
performance of the Company. The Company may use derivative financial instruments such as foreign exchange contracts
to hedge certain exposures.
(a) Foreign exchange risk
The Company holds assets denominated in currencies other than the Euro, the functional currency. The value of assets
denominated in other currencies will fluctuate due to changes in exchange rates. Main currency risk for the Company
results from the assets held in US dollar where a change of exchange rates can have a material impact on the value of
assets. A hedging committee meets on a regular basis to consider the foreign exchange rate risk and decides on the use
of derivative financial instruments such as foreign exchange contracts to hedge certain exposure. Furthermore, the risk
management committee reviews the foreign exchange risk on a monthly basis and proposes changes to the actual hedg -
ing positions if necessary.
The annual volatility using cross-currency rates from 1 January 2001 to 31 December 2007 equals 8.3% (8.7% from 1
January 2001 to 31 December 2006) for the US dollar compared to the Euro. Under the assumption that the US dollar
fluctuates with the annual volatility of 8.3% (8.7% in 2006) the value of these assets and the corresponding result would
be either EUR 942’679 higher or lower (EUR 2’765’987 for 2006).
(b) Interest rate risk
The Company invests in interest-bearing mezzanine investments that are exposed to the risk of changes in market inter -
est rates. The interest on the mezzanine loans is partially based on Libor and Euribor rates. A decrease in the market
interest rates can lead to a decrease in interest income of the Company. The overall interest rate risk is considered to be
limited as only a small part of the portfolio depends on variable interest rates.
Cash and cash equivalents are only short-term and therefore interest rate exposure is very limited. At year-end all term-
deposits have fixed interest rates.
Except as above, the income and operating cash flows are substantially independent from changes in market interest rates.
(c) Credit risk
Whilst the Company intends to diversify its portfolio of investments, the Company's investment activities may result in
credit risk relating to investments in which the Company has direct or indirect (through a fund investment) exposure. Bad
credit development or a default of investments in which the Company has direct or indirect exposure will lead to a lower
net asset value and to lower dividend and interest income from limited partnerships and directly held investments.
It is expected that investments will be made in private debt funds. Many of the private debt funds may be wholly unreg u -
lated investment vehicles. In addition, certain of the private debt funds may have limited or no operational history and
have no proven track record in achieving their stated investment objective. The investment risk is managed by an invest-
ment strategy that diversifies the investments in terms of geography, financing stage, industry or time.
Derivative counterparties and cash transactions are limited to high credit quality financial institutions with a minimal
rating of P-1 (Moody's).
Pearl_2007.qxp:Pearl_2005 18.3.2008 11:20 Uhr Seite 68
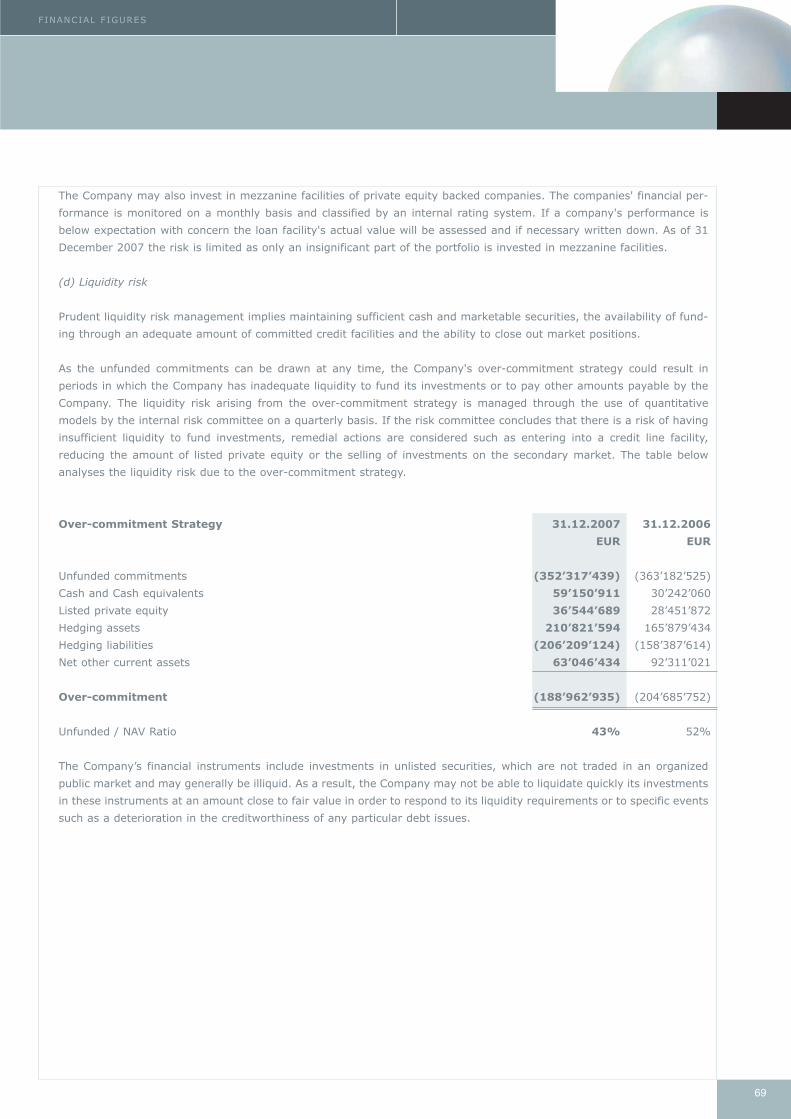
69
FINANCIAL FIGURES
The Company may also invest in mezzanine facilities of private equity backed companies. The companies' financial per-
formance is monitored on a monthly basis and classified by an internal rating system. If a company's performance is
below expectation with concern the loan facility's actual value will be assessed and if necessary written down. As of 31
December 2007 the risk is limited as only an insignificant part of the portfolio is invested in mezzanine facilities.
(d) Liquidity risk
Prudent liquidity risk management implies maintaining sufficient cash and marketable securities, the availability of fund -
ing through an adequate amount of committed credit facilities and the ability to close out market positions.
As the unfunded commitments can be drawn at any time, the Company's over-commitment strategy could result in
periods in which the Company has inadequate liquidity to fund its investments or to pay other amounts payable by the
Company. The liquidity risk arising from the over-commitment strategy is managed through the use of quantitative
models by the internal risk committee on a quarterly basis. If the risk committee concludes that there is a risk of having
insufficient liquidity to fund investments, remedial actions are considered such as entering into a credit line facility,
reducing the amount of listed private equity or the selling of investments on the secondary market. The table below
analyses the liquidity risk due to the over-commitment strategy.
Over-commitment Strategy 31.12.2007 31.12.2006
EUR EUR
Unfunded commitments (352’317’439) (363’182’525)
Cash and Cash equivalents 59’150’911 30’242’060
Listed private equity 36’544’689 28’451’872
Hedging assets 210’821’594 165’879’434
Hedging liabilities (206’209’124) (158’387’614)
Net other current assets 63’046’434 92’311’021
Over-commitment (188’962’935) (204’685’752)
Unfunded / NAV Ratio 43% 52%
The Company’s financial instruments include investments in unlisted securities, which are not traded in an organized
public market and may generally be illiquid. As a result, the Company may not be able to liquidate quickly its investments
in these instruments at an amount close to fair value in order to respond to its liquidity requirements or to specific events
such as a deterioration in the creditworthiness of any particular debt issues.
Pearl_2007.qxp:Pearl_2005 18.3.2008 11:20 Uhr Seite 69
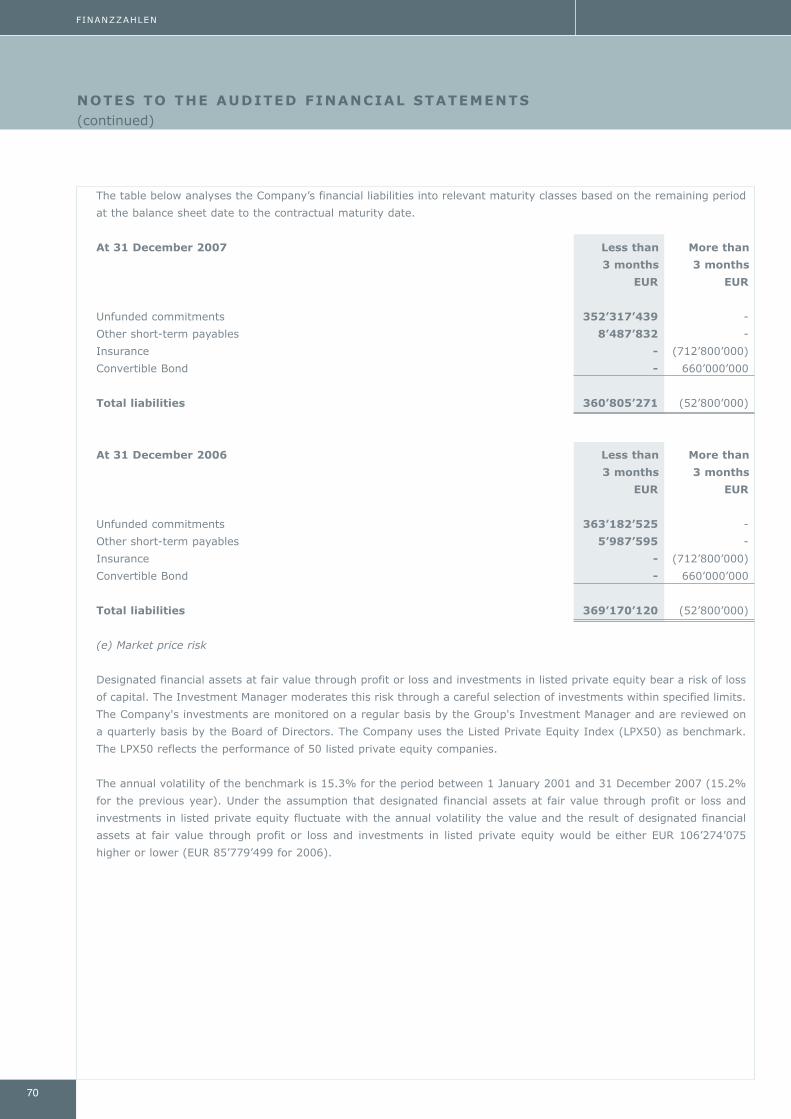
70
FINANZZAHLEN
NOTES TO THE AUDITED FINANCIAL STATEMENTS(continued)
The table below analyses the Company’s financial liabilities into relevant maturity classes based on the remaining period
at the balance sheet date to the contractual maturity date.
At 31 December 2007 Less than More than
3 months 3 months
EUR EUR
Unfunded commitments 352’317’439 -
Other short-term payables 8’487’832 -
Insurance - (712’800’000)
Convertible Bond - 660’000’000
Total liabilities 360’805’271 (52’800’000)
At 31 December 2006 Less than More than
3 months 3 months
EUR EUR
Unfunded commitments 363’182’525 -
Other short-term payables 5’987’595 -
Insurance - (712’800’000)
Convertible Bond - 660’000’000
Total liabilities 369’170’120 (52’800’000)
(e) Market price risk
Designated financial assets at fair value through profit or loss and investments in listed private equity bear a risk of loss
of capital. The Investment Manager moderates this risk through a careful selection of investments within specified limits.
The Company's investments are monitored on a regular basis by the Group's Investment Manager and are reviewed on
a quarterly basis by the Board of Directors. The Company uses the Listed Private Equity Index (LPX50) as benchmark.
The LPX50 reflects the performance of 50 listed private equity companies.
The annual volatility of the benchmark is 15.3% for the period between 1 January 2001 and 31 December 2007 (15.2%
for the previous year). Under the assumption that designated financial assets at fair value through profit or loss and
investments in listed private equity fluctuate with the annual volatility the value and the result of designated financial
assets at fair value through profit or loss and investments in listed private equity would be either EUR 106’274’075
higher or lower (EUR 85’779’499 for 2006).
Pearl_2007.qxp:Pearl_2005 18.3.2008 11:20 Uhr Seite 70
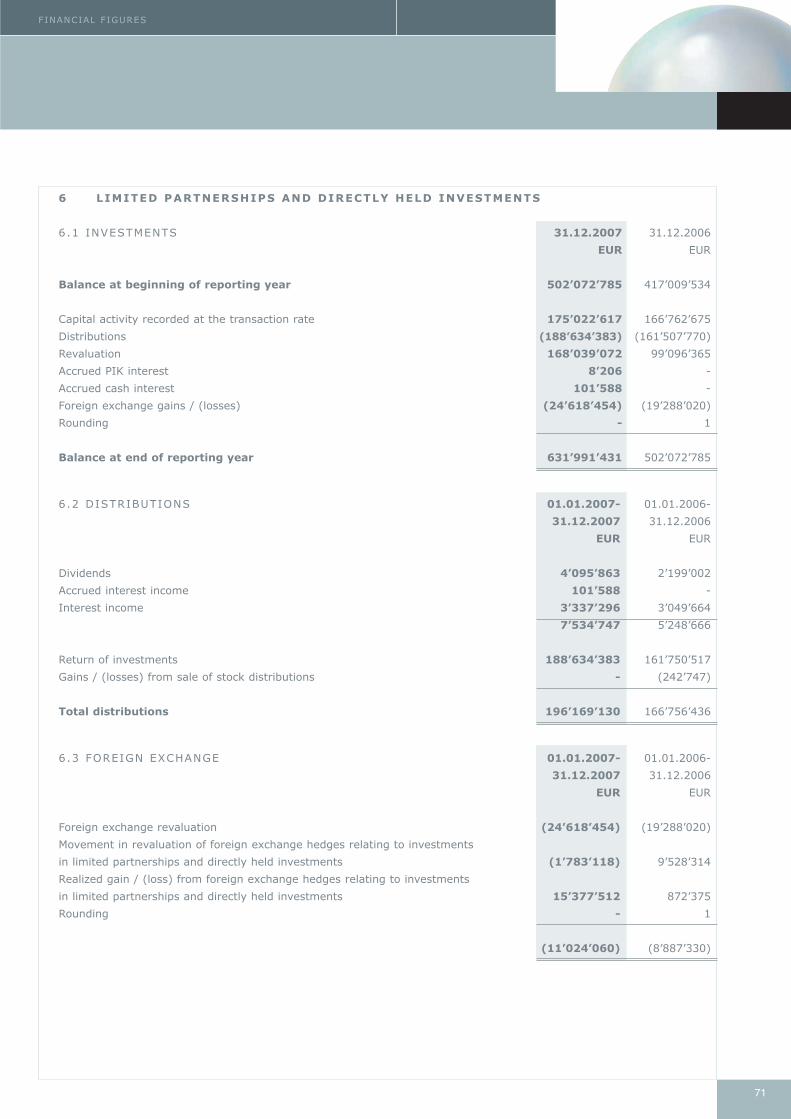
FINANCIAL FIGURES
71
6 LIMITED PARTNERSHIPS AND DIRECTLY HELD INVESTMENTS
6.1 INVESTMENTS 31.12.2007 31.12.2006
EUR EUR
Balance at beginning of reporting year 502’072’785 417’009’534
Capital activity recorded at the transaction rate 175’022’617 166’762’675
Distributions (188’634’383) (161’507’770)
Revaluation 168’039’072 99’096’365
Accrued PIK interest 8’206 -
Accrued cash interest 101’588 -
Foreign exchange gains / (losses) (24’618’454) (19’288’020)
Rounding - 1
Balance at end of reporting year 631’991’431 502’072’785
6.2 DISTRIBUTIONS 01.01.2007- 01.01.2006-
31.12.2007 31.12.2006
EUR EUR
Dividends 4’095’863 2’199’002
Accrued interest income 101’588 -
Interest income 3’337’296 3’049’664
7’534’747 5’248’666
Return of investments 188’634’383 161’750’517
Gains / (losses) from sale of stock distributions - (242’747)
Total distributions 196’169’130 166’756’436
6.3 FOREIGN EXCHANGE 01.01.2007- 01.01.2006-
31.12.2007 31.12.2006
EUR EUR
Foreign exchange revaluation (24’618’454) (19’288’020)
Movement in revaluation of foreign exchange hedges relating to investments
in limited partnerships and directly held investments (1’783’118) 9’528’314
Realized gain / (loss) from foreign exchange hedges relating to investments
in limited partnerships and directly held investments 15’377’512 872’375
Rounding - 1
(11’024’060) (8’887’330)
Pearl_2007.qxp:Pearl_2005 18.3.2008 11:20 Uhr Seite 71
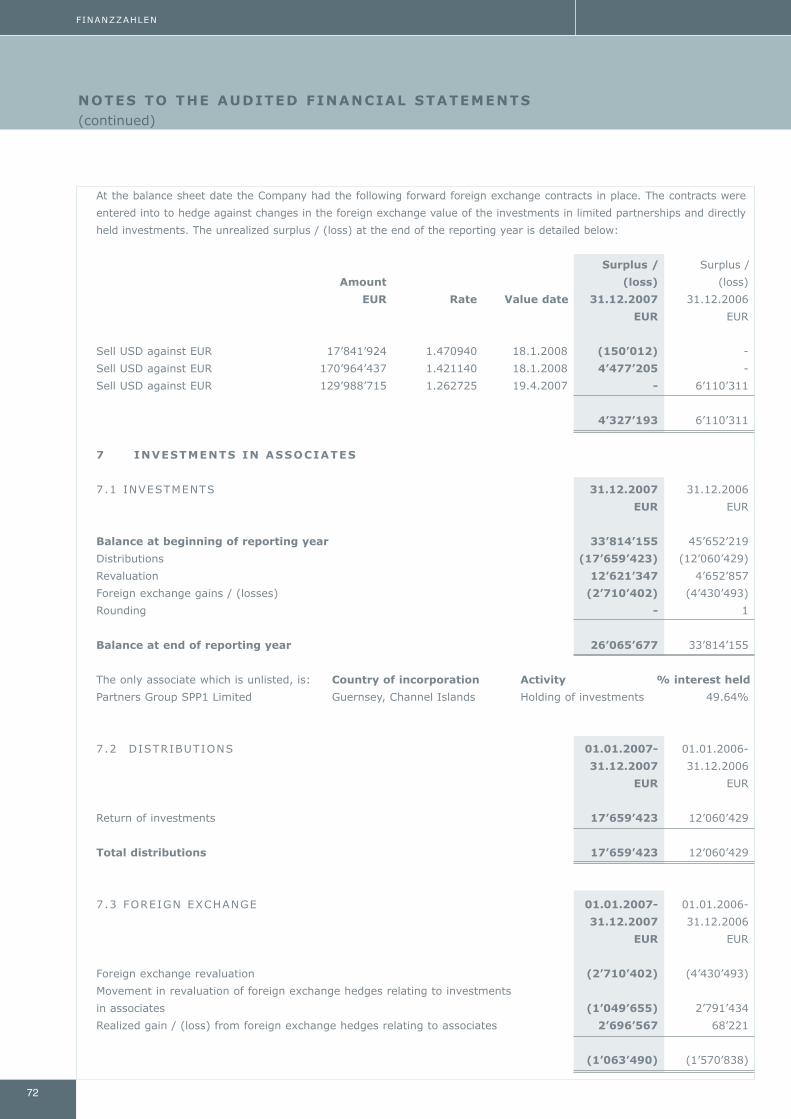
72
FINANZZAHLEN
NOTES TO THE AUDITED FINANCIAL STATEMENTS(continued)
At the balance sheet date the Company had the following forward foreign exchange contracts in place. The contracts were
entered into to hedge against changes in the foreign exchange value of the investments in limited partnerships and directly
held investments. The unrealized surplus / (loss) at the end of the reporting year is detailed below:
Surplus / Surplus /
Amount (loss) (loss)
EUR Rate Value date 31.12.2007 31.12.2006
EUR EUR
Sell USD against EUR 17’841’924 1.470940 18.1.2008 (150’012) -
Sell USD against EUR 170’964’437 1.421140 18.1.2008 4’477’205 -
Sell USD against EUR 129’988’715 1.262725 19.4.2007 - 6’110’311
4’327’193 6’110’311
7 INVESTMENTS IN ASSOCIATES
7.1 INVESTMENTS 31.12.2007 31.12.2006
EUR EUR
Balance at beginning of reporting year 33’814’155 45’652’219
Distributions (17’659’423) (12’060’429)
Revaluation 12’621’347 4’652’857
Foreign exchange gains / (losses) (2’710’402) (4’430’493)
Rounding - 1
Balance at end of reporting year 26’065’677 33’814’155
The only associate which is unlisted, is: Country of incorporation Activity % interest held
Partners Group SPP1 Limited Guernsey, Channel Islands Holding of investments 49.64%
7.2 DISTRIBUTIONS 01.01.2007- 01.01.2006-
31.12.2007 31.12.2006
EUR EUR
Return of investments 17’659’423 12’060’429
Total distributions 17’659’423 12’060’429
7.3 FOREIGN EXCHANGE 01.01.2007- 01.01.2006-
31.12.2007 31.12.2006
EUR EUR
Foreign exchange revaluation (2’710’402) (4’430’493)
Movement in revaluation of foreign exchange hedges relating to investments
in associates (1’049’655) 2’791’434
Realized gain / (loss) from foreign exchange hedges relating to associates 2’696’567 68’221
(1’063’490) (1’570’838)
Pearl_2007.qxp:Pearl_2005 18.3.2008 11:20 Uhr Seite 72
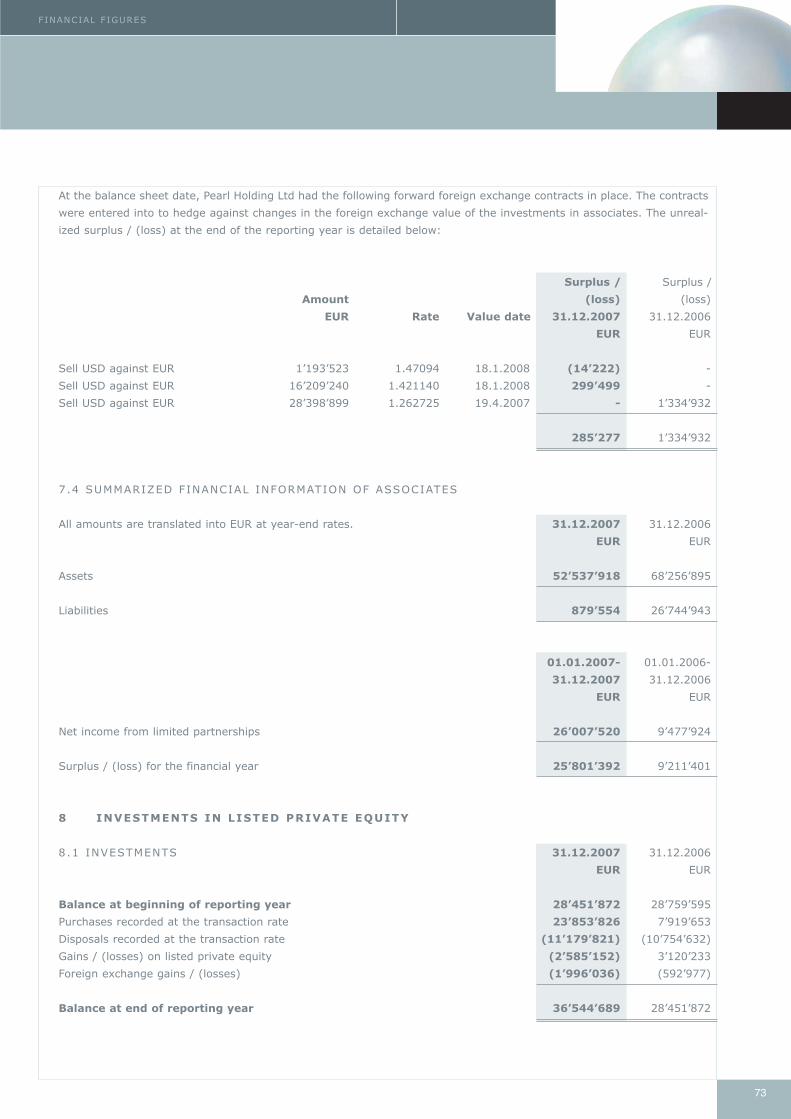
73
FINANCIAL FIGURES
At the balance sheet date, Pearl Holding Ltd had the following forward foreign exchange contracts in place. The contracts
were entered into to hedge against changes in the foreign exchange value of the investments in associates. The unreal -
ized surplus / (loss) at the end of the reporting year is detailed below:
Surplus / Surplus /
Amount (loss) (loss)
EUR Rate Value date 31.12.2007 31.12.2006
EUR EUR
Sell USD against EUR 1’193’523 1.47094 18.1.2008 (14’222) -
Sell USD against EUR 16’209’240 1.421140 18.1.2008 299’499 -
Sell USD against EUR 28’398’899 1.262725 19.4.2007 - 1’334’932
285’277 1’334’932
7.4 SUMMARIZED FINANCIAL INFORMATION OF ASSOCIATES
All amounts are translated into EUR at year-end rates. 31.12.2007 31.12.2006
EUR EUR
Assets 52’537’918 68’256’895
Liabilities 879’554 26’744’943
01.01.2007- 01.01.2006-
31.12.2007 31.12.2006
EUR EUR
Net income from limited partnerships 26’007’520 9’477’924
Surplus / (loss) for the financial year 25’801’392 9’211’401
8 INVESTMENTS IN LISTED PRIVATE EQUITY
8.1 INVESTMENTS 31.12.2007 31.12.2006
EUR EUR
Balance at beginning of reporting year 28’451’872 28’759’595
Purchases recorded at the transaction rate 23’853’826 7’919’653
Disposals recorded at the transaction rate (11’179’821) (10’754’632)
Gains / (losses) on listed private equity (2’585’152) 3’120’233
Foreign exchange gains / (losses) (1’996’036) (592’977)
Balance at end of reporting year 36’544’689 28’451’872
Pearl_2007.qxp:Pearl_2005 18.3.2008 11:20 Uhr Seite 73
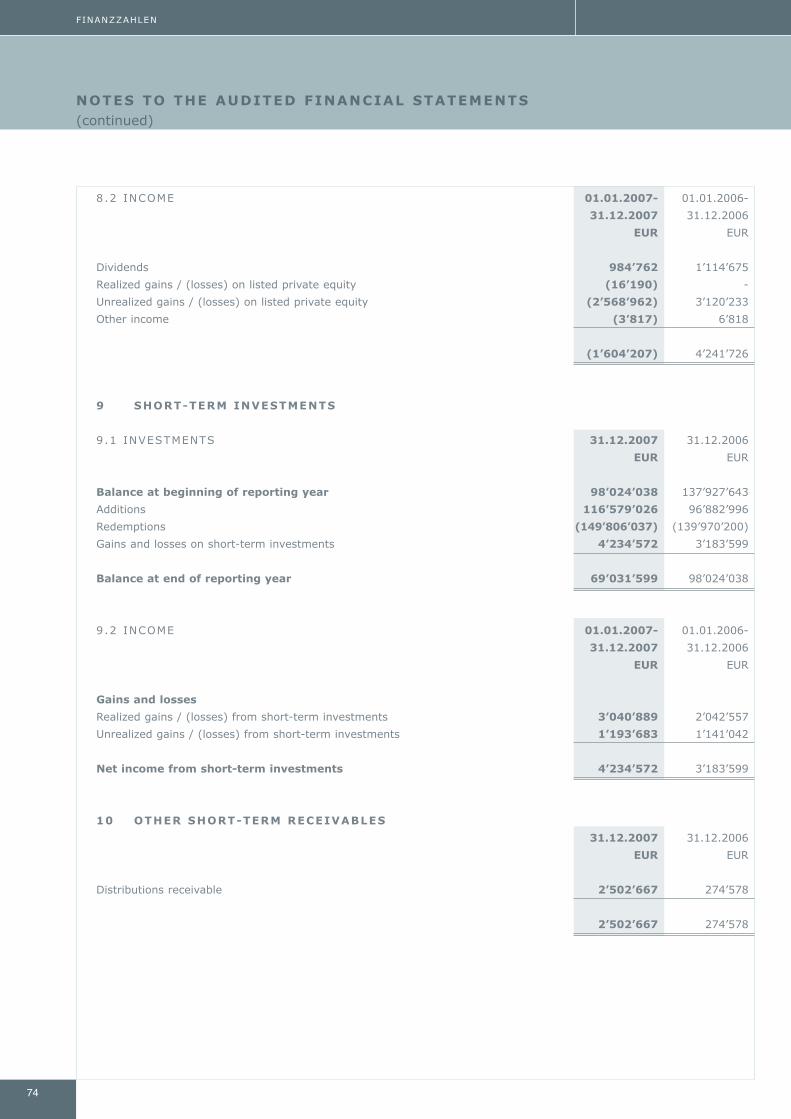
8.2 INCOME 01.01.2007- 01.01.2006-
31.12.2007 31.12.2006
EUR EUR
Dividends 984’762 1’114’675
Realized gains / (losses) on listed private equity (16’190) -
Unrealized gains / (losses) on listed private equity (2’568’962) 3’120’233
Other income (3’817) 6’818
(1’604’207) 4’241’726
9 SHORT-TERM INVESTMENTS
9.1 INVESTMENTS 31.12.2007 31.12.2006
EUR EUR
Balance at beginning of reporting year 98’024’038 137’927’643
Additions 116’579’026 96’882’996
Redemptions (149’806’037) (139’970’200)
Gains and losses on short-term investments 4’234’572 3’183’599
Balance at end of reporting year 69’031’599 98’024’038
9.2 INCOME 01.01.2007- 01.01.2006-
31.12.2007 31.12.2006
EUR EUR
Gains and losses
Realized gains / (losses) from short-term investments 3’040’889 2’042’557
Unrealized gains / (losses) from short-term investments 1’193’683 1’141’042
Net income from short-term investments 4’234’572 3’183’599
10 OTHER SHORT-TERM RECEIVABLES
31.12.2007 31.12.2006
EUR EUR
Distributions receivable 2’502’667 274’578
2’502’667 274’578
NOTES TO THE AUDITED FINANCIAL STATEMENTS(continued)
74
FINANZZAHLEN
Pearl_2007.qxp:Pearl_2005 18.3.2008 11:20 Uhr Seite 74
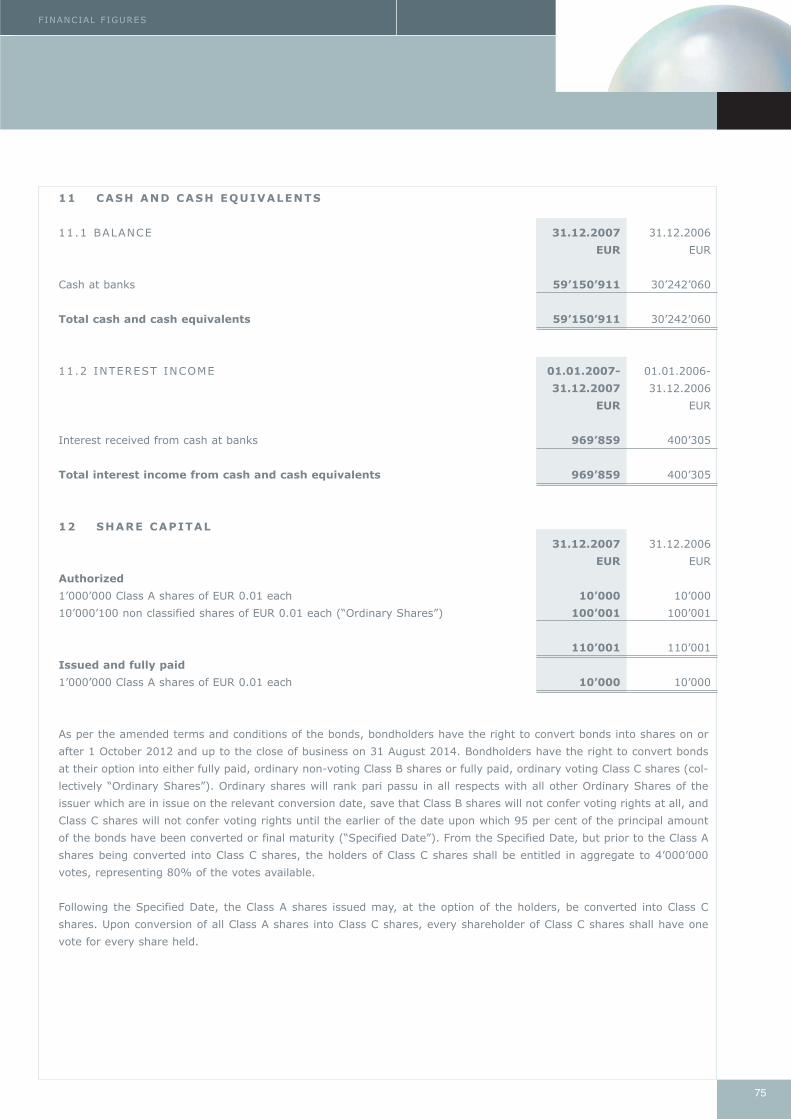
75
FINANCIAL FIGURES
11 CASH AND CASH EQUIVALENTS
11.1 BALANCE 31.12.2007 31.12.2006
EUR EUR
Cash at banks 59’150’911 30’242’060
Total cash and cash equivalents 59’150’911 30’242’060
11.2 INTEREST INCOME 01.01.2007- 01.01.2006-
31.12.2007 31.12.2006
EUR EUR
Interest received from cash at banks 969’859 400’305
Total interest income from cash and cash equivalents 969’859 400’305
12 SHARE CAPITAL
31.12.2007 31.12.2006
EUR EUR
Authorized
1’000’000 Class A shares of EUR 0.01 each 10’000 10’000
10’000’100 non classified shares of EUR 0.01 each (“Ordinary Shares”) 100’001 100’001
110’001 110’001
Issued and fully paid
1’000’000 Class A shares of EUR 0.01 each 10’000 10’000
As per the amended terms and conditions of the bonds, bondholders have the right to convert bonds into shares on or
after 1 October 2012 and up to the close of business on 31 August 2014. Bondholders have the right to convert bonds
at their option into either fully paid, ordinary non-voting Class B shares or fully paid, ordinary voting Class C shares (col-
lectively “Ordinary Shares”). Ordinary shares will rank pari passu in all respects with all other Ordinary Shares of the
issuer which are in issue on the relevant conversion date, save that Class B shares will not confer voting rights at all, and
Class C shares will not confer voting rights until the earlier of the date upon which 95 per cent of the principal amount
of the bonds have been converted or final maturity (“Specified Date”). From the Specified Date, but prior to the Class A
shares being converted into Class C shares, the holders of Class C shares shall be entitled in aggregate to 4’000’000
votes, representing 80% of the votes available.
Following the Specified Date, the Class A shares issued may, at the option of the holders, be converted into Class C
shares. Upon conversion of all Class A shares into Class C shares, every shareholder of Class C shares shall have one
vote for every share held.
Pearl_2007.qxp:Pearl_2005 18.3.2008 11:20 Uhr Seite 75
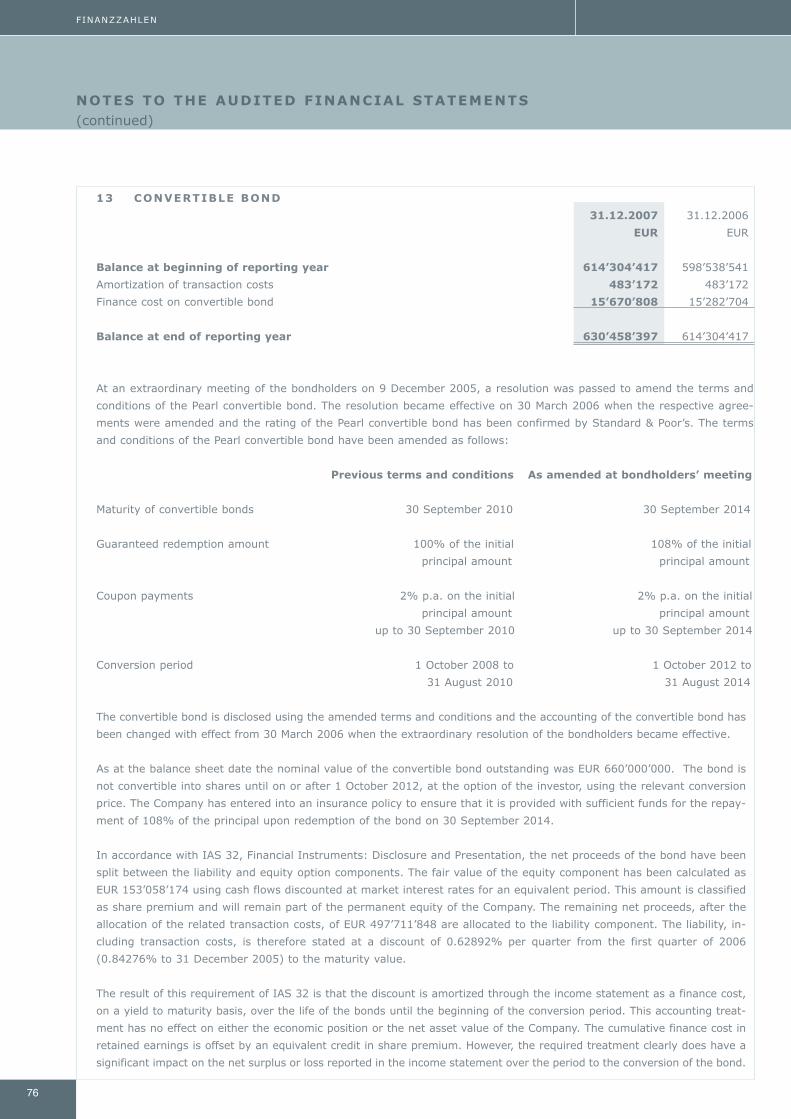
13 CONVERTIBLE BOND
31.12.2007 31.12.2006
EUR EUR
Balance at beginning of reporting year 614’304’417 598’538’541
Amortization of transaction costs 483’172 483’172
Finance cost on convertible bond 15’670’808 15’282’704
Balance at end of reporting year 630’458’397 614’304’417
At an extraordinary meeting of the bondholders on 9 December 2005, a resolution was passed to amend the terms and
conditions of the Pearl convertible bond. The resolution became effective on 30 March 2006 when the respective agree-
ments were amended and the rating of the Pearl convertible bond has been confirmed by Standard & Poor’s. The terms
and conditions of the Pearl convertible bond have been amended as follows:
Previous terms and conditions As amended at bondholders’ meeting
Maturity of convertible bonds 30 September 2010 30 September 2014
Guaranteed redemption amount 100% of the initial 108% of the initial
principal amount principal amount
Coupon payments 2% p.a. on the initial 2% p.a. on the initial
principal amount principal amount
up to 30 September 2010 up to 30 September 2014
Conversion period 1 October 2008 to 1 October 2012 to
31 August 2010 31 August 2014
The convertible bond is disclosed using the amended terms and conditions and the accounting of the convertible bond has
been changed with effect from 30 March 2006 when the extraordinary resolution of the bondholders became effective.
As at the balance sheet date the nominal value of the convertible bond outstanding was EUR 660’000’000. The bond is
not convertible into shares until on or after 1 October 2012, at the option of the investor, using the relevant conversion
price. The Company has entered into an insurance policy to ensure that it is provided with sufficient funds for the repay-
ment of 108% of the principal upon redemption of the bond on 30 September 2014.
In accordance with IAS 32, Financial Instruments: Disclosure and Presentation, the net proceeds of the bond have been
split between the liability and equity option components. The fair value of the equity component has been calculated as
EUR 153’058’174 using cash flows discounted at market interest rates for an equivalent period. This amount is classified
as share premium and will remain part of the permanent equity of the Company. The remaining net proceeds, after the
allocation of the related transaction costs, of EUR 497’711’848 are allocated to the liability component. The liability, in-
cluding transaction costs, is therefore stated at a discount of 0.62892% per quarter from the first quarter of 2006
(0.84276% to 31 December 2005) to the maturity value.
The result of this requirement of IAS 32 is that the discount is amortized through the income statement as a finance cost,
on a yield to maturity basis, over the life of the bonds until the beginning of the conversion period. This accounting treat-
ment has no effect on either the economic position or the net asset value of the Company. The cumulative finance cost in
retained earnings is offset by an equivalent credit in share premium. However, the required treatment clearly does have a
significant impact on the net surplus or loss reported in the income statement over the period to the conversion of the bond.
NOTES TO THE AUDITED FINANCIAL STATEMENTS(continued)
76
FINANZZAHLEN
Pearl_2007.qxp:Pearl_2005 18.3.2008 11:20 Uhr Seite 76
77
FINANCIAL FIGURES
14 OTHER SHORT-TERM PAYABLES
31.12.2007 31.12.2006
EUR EUR
Accrual of interest on convertible bond 3’300’000 3’300’000
Accruals to related parties 5’004’658 2’383’794
Sundry accruals 183’174 303’801
8’487’832 5’987’595
15 DIVIDEND AND INTEREST INCOME AND EXPENSE
01.01.2007- 01.01.2006-
31.12.2007 31.12.2006
EUR EUR
Interest income:
- Dividend and interest income from limited partnerships and directly held investments 7’534’747 5’248’666
- Dividend and interest income from listed private equity 980’945 1’121’493
- Interest on short term investments 4’234’572 -
- Interest income from cash and cash equivalents 969’859 400’305
Total dividend and interest income 13’720’123 6’770’464
Interest expense:
- Finance cost on convertible bond (15’670’808) (15’282’704)
- Bond interest (13’200’000) (13’200’000)
Total interest expense (28’870’808) (28’482’704)
16 FOREIGN EXCHANGE GAINS AND LOSSES
01.01.2007- 01.01.2006-
31.12.2007 31.12.2006
EUR EUR
Foreign exchange gains and losses on:
- Limited partnerships and directly held investments (11’024’060) (8’887’330)
- Investments in associates (1’063’490) (1’570’838)
- Investments in listed private equity (1’996’036) (592’977)
- Cash and cash equivalents (365’378) (555’130)
- Other foreign exchange gains and losses (86’589) 918
(14’535’553) (11’605’357)
Pearl_2007.qxp:Pearl_2005 18.3.2008 11:20 Uhr Seite 77
NOTES TO THE AUDITED FINANCIAL STATEMENTS(continued)
78
FINANZZAHLEN
17 REVALUATION AND REALISED GAIN/LOSS FROM FINANCIAL ASSETS
AT FAIR VALUE THROUGH PROFIT OR LOSS
01.01.2007- 01.01.2006-
31.12.2007 31.12.2006
EUR EUR
Revaluation of:
- Limited partnerships and directly held investments 168’039’072 99’096’365
- Investments in associates 12’621’347 4’652’857
180’660’419 103’749’222
18 COMMITMENTS
31.12.2007 31.12.2006
EUR EUR
Total commitments translated at the rate prevailing at the balance sheet date 1’227’229’489 1’106’123’665
Unfunded commitments translated at the rate prevailing at the balance sheet date 352’317’439 363’182’525
19 DILUTED NET ASSETS PER ORDINARY SHARE
The net assets are calculated by deducting the liabilities falling due within one year from the Total Assets. The 660’000
convertible bonds at a par value of EUR 1’000 each, if converted at EUR 100 per share would result in 6’600’000 shares.
Once 95% of the convertible bonds are converted, the existing 1’000’000 Class A shares will be converted to C shares at
10’000 : 1, resulting in 100 Class C shares after conversion.
31.12.2007 31.12.2006
EUR EUR
Net assets of the company 821’411’613 694’337’135
Outstanding shares at the balance sheet date 100 100
Additional shares due to conversion 6’600’000 6’600’000
Net assets per share after conversion 124.4544 105.2010
20 INSURANCE POLICY
On 29 June 1999, the Company and Pearl Management Limited entered into an Insurance Policy with European Rein-
surance International Company Limited. The Insurance Policy was amended and restated on 30 March 2006 to ensure
that the Company will be provided with sufficient funds to be able to pay 108% of the principal amount of the Bond at
maturity on 30 September 2014.
21 NUMBER OF EMPLOYEES
At the balance sheet date no persons were employed by the Company.
Pearl_2007.qxp:Pearl_2005 18.3.2008 11:20 Uhr Seite 78
79
FINANCIAL FIGURES
22 RELATED PARTY TRANSACTIONS AND BALANCES
Partners Group Holding owns 100% of the Class A shares of the Company.
Partners Group Holding and all its subsidiaries and affiliates are considered to be related parties to the Company. The
directors as disclosed in the Directors’ Report are also considered to be related parties to the Company.
Transactions and balances with related parties
The following transactions were carried out with related parties:
01.01.2007- 01.01.2006-
31.12.2007 31.12.2006
i) Services Notes EUR EUR
Management fee:
- Pearl Management Limited 3 14’377’252 12’335’917
Administration fee:
- Partners Group (Guernsey) Limited 3 958’593 822’394
Insurance fee:
- Pearl Management Limited 3 17’157’041 14’914’105
Direct investment performance fee:
- Pearl Management Limited 3 4’115’842 1’113’666
Directors’ fees paid 47’506 28’889
Reimbursement of fees due to investments in related limited partnerships 1’532’163 794’378
Distributions by investments in associates 7 17’659’423 12’060’429
ii) Year-end balances
Other short-term payables:
- Pearl Management Limited 14 5’004’658 2’383’794
The year-end balances are unsecured, interest free and repayable upon demand.
23 PARENT COMPANY AND ULTIMATE CONTROLLING PARTY
Partners Group Holding, a company organized under Swiss law holds the majority of the Class A shares of the Company.
Pearl_2007.qxp:Pearl_2005 18.3.2008 11:20 Uhr Seite 79
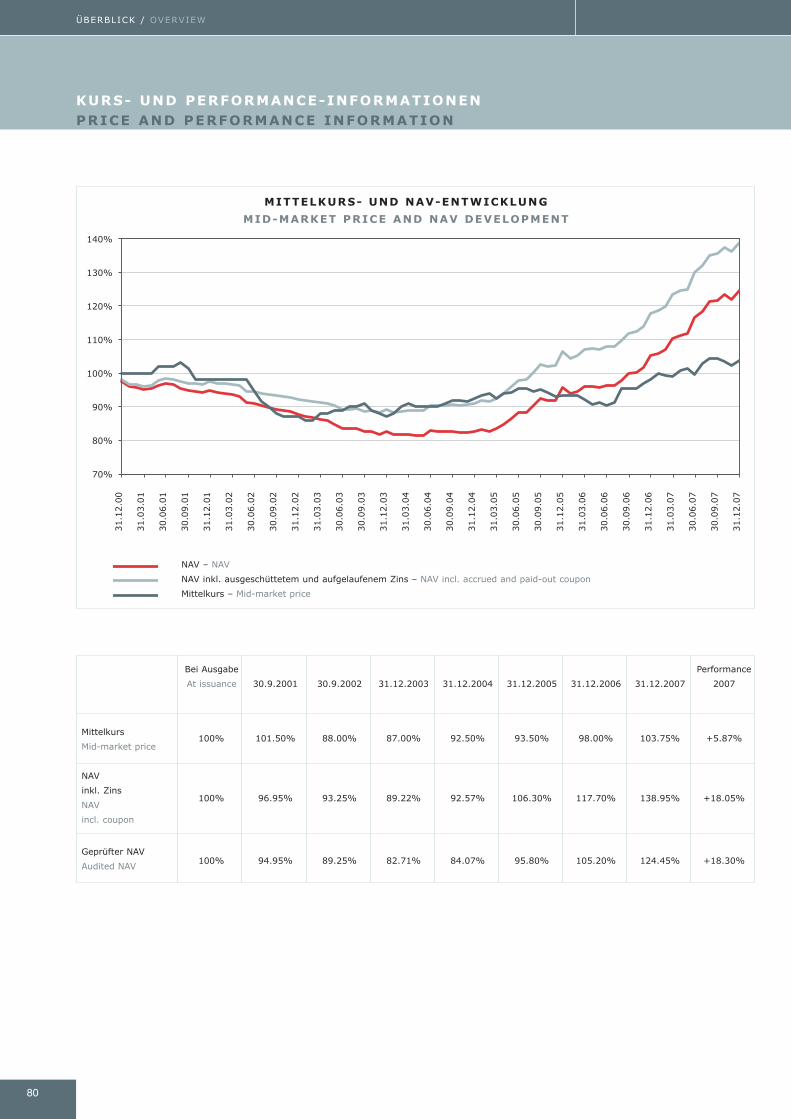
Bei Ausgabe Performance
At issuance 30.9.2001 30.9.2002 31.12.2003 31.12.2004 31.12.2005 31.12.2006 31.12.2007 2007
100% 101.50% 88.00% 87.00% 92.50% 93.50% 98.00% 103.75% +5.87%
100% 96.95% 93.25% 89.22% 92.57% 106.30% 117.70% 138.95% +18.05%
100% 94.95% 89.25% 82.71% 84.07% 95.80% 105.20% 124.45% +18.30%
KURS- UND PERFORMANCE-INFORMATIONENPRICE AND PERFORMANCE INFORMATION
Mittelkurs
Mid-market price
NAV
inkl. Zins
NAV
incl. coupon
Geprüfter NAV
Audited NAV
80
ÜBERBLICK / OVERVIEW
31.1
2.0
0
31.0
3.0
1
30.0
6.0
1
30.0
9.0
1
31.1
2.0
1
31.0
3.0
2
30.0
6.0
2
30.0
9.0
2
31.1
2.0
2
31.0
3.0
3
30.0
6.0
3
30.0
9.0
3
31.1
2.0
3
31.0
3.0
4
30.0
6.0
4
30.0
9.0
4
31.1
2.0
4
31.0
3.0
5
30.0
6.0
5
30.0
9.0
5
31.1
2.0
5
31.0
3.0
6
30.0
6.0
6
30.0
9.0
6
31.1
2.0
6
31.0
3.0
7
30.0
6.0
7
30.0
9.0
7
31.1
2.0
7
140%
130%
120%
110%
100%
90%
80%
70%
MITTELKURS- UND NAV-ENTWICKLUNG
MID-MARKET PRICE AND NAV DEVELOPMENT
NAV – NAV
NAV inkl. ausgeschüttetem und aufgelaufenem Zins – NAV incl. accrued and paid-out coupon
Mittelkurs – Mid-market price
KURS- UND PERFORMANCE-INFORMATIONENPRICE AND PERFORMANCE INFORMATION
Pearl_2007.qxp:Pearl_2005 18.3.2008 11:20 Uhr Seite 80

81
Pearl_2007.qxp:Pearl_2005 18.3.2008 11:20 Uhr Seite 81
ADRESSEN LIST OF ADDRESSES
Sitz der Gesellschaft
Registered office
Pearl Holding Limited
Tudor House
St Peter Port, Guernsey
Channel Islands
Phone +44 1481 711 690
Facsimile +44 1481 730 947
E-mail [email protected]
Info www.pearl-privateequity.net
Investment manager
Pearl Management Limited
Guernsey, Channel Islands
Investors relations
E-mail [email protected]
Revisionsstelle
Auditors
PricewaterhouseCoopers
Guernsey, Channel Islands
Handelsinformation
Trading information
Preisinformation
Price information
Wertpapier-Kennnummer 558.527
Valorennummer 1.140.571
ISIN XS0117871698
Reuters DGZ07
Market Maker DekaBank
Frankfurt a. M., Germany
Phone +49 69 7147 1301
Pearl_2007.qxp:Pearl_2005 18.3.2008 11:20 Uhr Seite 82