Embed Size (px)
Citation preview
Institut für Landtechnik
der Rheinischen Friedrich-Wilhelms-Universität Bonn
Greenhouse gas and ammonia emissions
from dairy barns
Inaugural-Dissertation
zur
Erlangung des Grades
Doktor der Agrarwissenschaften
(Dr. agr.)
der
Landwirtschaftlichen Fakultät
der
Rheinischen Friedrich-Wilhelms-Universität Bonn
vorgelegt im Juni 2013
von
Inga Schiefler
aus
Köln
Referent: Prof. Dr. Wolfgang Büscher
Koreferent: Prof. Dr. Karl-Heinz Südekum
Tag der mündlichen Prüfung: 25.10.2013
Erscheinungsjahr 2013
Copyright 2013
Im Selbstverlag Inga Schiefler
Institut für Landtechnik
Verfahrenstechnik in der tierischen Erzeugung
Rheinische Friedrich-Wilhelms-Universität Bonn
Diese Dissertation wird als Forschungsbericht Agrartechnik des Fachausschusses Forschung
und Lehre der Max-Eyth-Gesellschaft Agrartechnik im VDI (VDI-MEG) Nr. 528, ISSN
0931-6264, geführt und auf dem Hochschulschriftenserver der ULB Bonn http://hss.ulb.uni-
bonn.de/diss_online elektronisch publiziert.
Alle Rechte, auch die der Übersetzung, des Nachdrucks sowie jede Art der
photomechanischen Wiedergabe, auch auszugsweise, bleiben vorbehalten.
GREENHOUSE GAS AND AMMONIA EMISSIONS FROM DAIRY BARNS
Abstract
Livestock farming is blamed to bear the bulk of certain gaseous emissions from agriculture
such as ammonia (NH3) and methane (CH4). Emission measurement in naturally ventilated
buildings in general, but the determination of the air exchange rate in particular, is very
complex. Consequently, there is a lack of knowledge regarding gaseous emissions from
modern, naturally ventilated dairy cattle buildings. The objectives of the thesis comprise
the development and the utilization of measuring and modeling methods in order to
determine NH3 and CH4 emissions from dairy barns.
The first study focused on the development of a robust method for the long-term
measurement of CH4 and NH3 emissions from a naturally ventilated dairy barn. A rough
but solid model for the calculation of the ventilation rate by means of wind parameters was
developed. At zero wind speed, the ventilation level in the building was over 870 m3 h
-1
LU-1
and each m s-1
increase in wind speed increased the ventilation rate by 1,500 m3 h
-1
LU-1
.
The second study presents results of a one-year measurement campaign in a tripartite,
naturally cross ventilated dairy barn allowing for an accurate comparison of the two
housing systems slatted floor and solid floor including emissions from barn and storage.
Emissions from slatted floor including storage with low intensity of slurry homogenization
led to lowest NH3 and CH4 emissions (324.9 123.6 g CH4 LU-1
and 29.8 13.1 g NH3
LU-1
d-1
as annual average, respectively). The effect of slurry homogenization beneath the
slatted floor was affecting the level of both CH4 and NH3 emissions in a similar way (+17
and +29% higher emissions due to higher intensity of manure homogenization).
Furthermore, in the third chapter emission modeling and measuring science was brought
together and discussed in an interdisciplinary study. Therefore, the greenhouse gas
calculation module of the dairy farm-level model DAIRYDYN was validated by long-term
measurement data. The comparison of indicator-modeled CH4 emissions with online
measurements offered relatively moderate deviations in case of very detailed indicator
schemes (between -6.4 and 10.5%) compared with findings from literature.
As a whole, the thesis contributes to the development and improvement of measuring
methods for gaseous emissions from naturally ventilated dairy barns offering links for
further research activities in this field. The thesis provides emission factors for different
housing systems and manure management practices for dairy cows.
GREENHOUSE GAS AND AMMONIA EMISSIONS FROM DAIRY BARNS
Kurzfassung
Die landwirtschaftliche Nutztierhaltung ist für einen Großteil der gasförmigen Emissionen
des Agrarsektors, wie Methan (CH4) und Ammoniak (NH3), verantwortlich. Die Messung
dieser umwelt- oder klimaschädlichen Gase und insbesondere die Bestimmung des
Luftwechsels von frei belüfteten, modernen Tierställen ist jedoch sehr komplex und die
Datengrundlage daher gering. Ziel dieser Arbeit war die Entwicklung und Anwendung von
Messmethoden und Modellen zur Bestimmung von gasförmigen Emissionen aus
Milchviehställen.
Die erste Studie beschreibt die Entwicklung einer robusten Messmethodik für die
Bestimmung der CH4 und NH3 Emissionen aus einem frei belüfteten Milchviehstall. Dazu
wurde anhand von Windparametern ein Luftwechselmodell für das Stallgebäude
entwickelt. Bei Windstille wurde ein Luftvolumenstrom von mehr als 870 m3 h
-1 LU
-1
ermittelt, wobei ein Anstieg der Windgeschwindigkeit um 1 m s-1
eine Erhöhung des
Luftvolumenstroms von etwa 1.500 m3 h
-1 LU
-1 zur Folge hatte.
Die zweite Studie umfasst Ergebnisse einer einjährigen Messreihe in einem frei belüfteten,
dreigeteilten Milchviehstall und ermöglichte einen Vergleich der zwei Haltungsvarianten
„Spaltenboden“ und „planbefestigte Laufflächen“ unter Einbeziehung der Emissionen aus
dem Flüssigmistlager. Das Stallabteil mit Spaltenboden wies bei geringer Intensität des
Flüssigmist-Homogenisierens im Jahresmittel die geringsten NH3 und CH4 Emissionen auf
(324,9 123,6 g CH4 GV-1
d-1
und 29,8 13,1 g NH3 GV-1
d-1
). Das intensive
Homogenisieren des Flüssigmistes unter dem Spaltenboden führte im Jahresmittel sowohl
bei CH4 als auch bei NH3 zu signifikant höheren Emissionsraten im Vergleich zum
weniger intensiven Homogenisieren (+17% bei CH4 und +29% bei NH3).
Darüber hinaus wurden in der dritten Studie Erkenntnisse aus Emissionsmessung und
-modellierung in einer interdisziplinären Arbeit zusammengeführt. Das Klimagas-
Berechnungsmodul des einzelbetrieblichen Simulationsmodells DAIRYDYN wurde
anhand von Ergebnissen aus Langzeit Messungen validiert. Bei Einbeziehung sehr
detaillierter Produktionsparameter in das Modell wurden im Vergleich zur Literatur relativ
geringe Abweichungen (-6,4 bis 10,5%) zu den Messergebnissen festgestellt.
Die vorliegende Arbeit leistet somit einen Beitrag zur Entwicklung und Verbesserung der
Messmethoden für gasförmige Emissionen aus frei belüfteten Milchviehställen und zeigt
weiteren Forschungsbedarf in diesem Themengebiet auf. Darüber hinaus liefert die Arbeit
Emissionsfaktoren für verschiedene Haltungsverfahren bzw. Entmistungsvarianten für
Milchkühe bei unterschiedlichem Flüssigmistmanagement.
TABLE OF CONTENTS I
Table of Contents
List of Figures ................................................................................................................... III
List of Tables ..................................................................................................................... III
General Introduction ........................................................................................................... 1
Chapter 1 Development of a building-specific air ventilation model for estimations of
methane and ammonia emissions from a naturally ventilated dairy barn in
spring ............................................................................................................... 13
1.1 Introduction ........................................................................................................... 15
1.2 Material and Methods ........................................................................................... 17
1.2.1 Site description and production ..................................................................... 17
1.2.2 General procedures ........................................................................................ 19
1.2.3 Measurement of ventilation rates .................................................................. 19
1.2.4 Measurement of gas concentrations .............................................................. 20
1.2.5 Calculation of emissions ................................................................................ 21
1.2.6 Measurement of weather parameters ............................................................. 21
1.3 Results ................................................................................................................... 22
1.3.1 Model for the calculation of the ventilation rate ........................................... 22
1.3.2 Ventilation rate .............................................................................................. 24
1.3.3 Gas concentrations and emissions ................................................................. 24
1.4 Discussion ............................................................................................................. 27
1.5 Conclusions ........................................................................................................... 29
1.6 Acknowledgements ............................................................................................... 30
1.7 References ............................................................................................................. 31
II TABLE OF CONTENTS
Chapter 2 Effect of manure removal and storage management on methane and
ammonia emissions from a naturally ventilated dairy barn ....................... 34
2.1 Introduction ........................................................................................................... 36
2.2 Material and Methods ........................................................................................... 38
2.2.1 Procedures ..................................................................................................... 38
2.2.2 Description of measurement procedures ....................................................... 40
2.2.3 Description of modeling procedure ............................................................... 43
2.3 Results ................................................................................................................... 45
2.4 Discussion ............................................................................................................. 49
2.5 Conclusions ........................................................................................................... 51
2.6 Acknowledgements ............................................................................................... 52
2.7 References ............................................................................................................. 53
Chapter 3 A comparison of emission calculations using different modeled indicators
with 1-year online measurements .................................................................. 57
3.1 Introduction ........................................................................................................... 58
3.2 Material and methods ............................................................................................ 61
3.2.1 Model concept of DAIRYDYN ..................................................................... 61
3.2.2 Measurement installation on Haus Riswick .................................................. 64
3.3 Results ................................................................................................................... 68
3.4 Discussion ............................................................................................................. 72
3.5 Conclusion ............................................................................................................ 74
3.6 Acknowledgments ................................................................................................ 76
3.7 References ............................................................................................................. 77
General Conclusions .......................................................................................................... 80
LIST OF FIGURES IV
List of Figures
Chapter 1
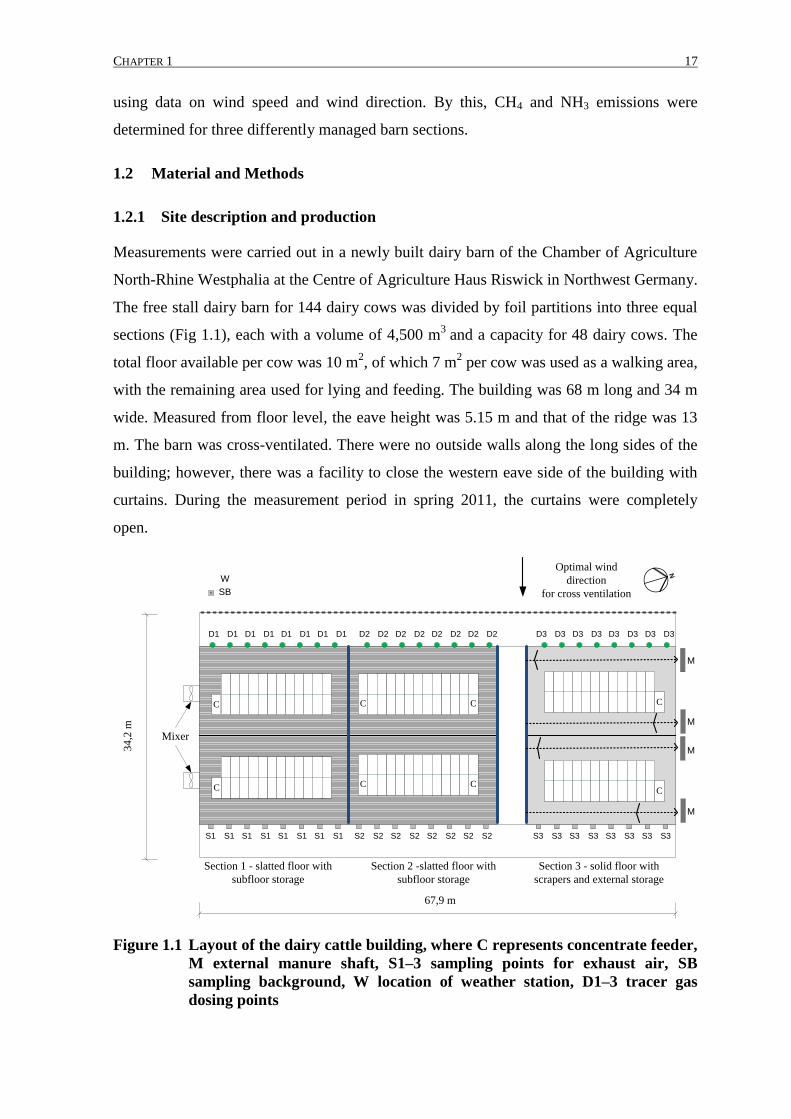
Figure 1.1 Layout of the dairy cattle building, where C represents concentrate feeder,
M external manure shaft, S1–3 sampling points for exhaust air, SB sampling
background, W location of weather station, D1–3 tracer gas dosing points ..... 17
Figure 1.2 Farmstead layout where 1 is free stalls, 2 is the milking house
(Haus Riswick) .................................................................................................. 18
Figure 1.3 Categories of wind speed and measured ventilation rate .................................. 23
Figure 1.4 Ventilation rate by CO2 mass balance and by model ........................................ 24
Figure 1.5 Typical concentrations and emissions of CH4 and NH3 over the course of a
day (24.05.2011); CH4 and NH3 emissions based on VRmod............................. 25
Chapter 2
Figure 2.1 Range of measurement and range of model/literature data ............................... 39
Figure 2.2 Scheme of dairy barn, liquid manure removal and storage ............................... 39
Figure 2.3 Foil partition of the investigated dairy barn ...................................................... 41
Figure 2.4 Sampling points at the eastern eave side of the building (foil partition was
lowered at measurement start) ........................................................................... 43
Figure 2.5 Average CH4 and NH3 emissions of the barn sections over the four seasons.
Standard deviation limited to emissions from the barn. CH4 emissions from
storage derived from model calculation with DAIRYDYN (Scenario 2b and
2c, light grey field). NH3 emissions from storage are estimated by the
authors based on literature findings. .................................................................. 45
Figure 2.6 CH4 emission rates on daily average for (a) slatted floor intensive,
(b) slatted floor not intensive, and (c) solid floor .............................................. 47
Figure 2.7 NH3 emission rates on daily average for (a) slatted floor intensive,
(b) slatted floor not intensive, (c) and solid floor. ............................................. 48
Chapter 3
Figure 3.1 Overview of DAIRYDYN model and relevant modules (following LENGERS
and BRITZ 2012) ................................................................................................ 62
Figure 3.2 Layout of the dairy barn with measuring units (where D is dosing points for
tracer gas injection, S are sampling points, C concentrate feeder, SB is
sampling background and T is temperature measurement) ............................... 65
Figure 3.3 Visualization of model results compared to real measurements and
literature findings for slatted floor conditions (measured and simulated
emissions are rebased to emissions per LU (500 kg of live weight); DK:
Denmark, GER: Germany, CH: Switzerland, *average is built over all
investigated feeding strategies and according to measurements with
14-day manure storage time) ............................................................................. 71
IV LIST OF TABLES
List of Tables
General Introduction
Table I 1 Variables affecting the level of gaseous emissions from dairy barns (own
illustration) .......................................................................................................... 6
Chapter 1
Table 1.1 Air exchange rates, ventilation rate and average wind speed subject to the
tracer gas experiments ....................................................................................... 22
Table 1.2 Categories, expected and measured values of wind speed, ventilation rate
and deviations from the model .......................................................................... 23
Table 1.3 Emission rates of CH4 and NH3 for the three sections; arithmetic means;
only the spring season was considered for annual emission rates; statistical
analysis using the non-parametric Friedman and Bonferroni post hoc test
(α = 0.05); VRmod = ventilation rate by tracer gas model; VRbal = ventilation
rate by CO2 mass balance .................................................................................. 26
Chapter 2
Table 2.1 Description of the tested common practice scenarios ....................................... 38
Table 2.2 Description of measurement periods and conditions ........................................ 42
Table 2.3 Barn level CH4 and NH3 emissions on average over the four seasons .............. 46
Chapter 3
Table 3.1 Methane production equations relevant for the investigated farm unit
(following IPCC 2006 and LENGERS and BRITZ 2012) ..................................... 63
Table 3.2 Per year CO2-eq. derived by different indicators and results of real
measurement on Haus-Riswick. ........................................................................ 68
Table 3.3 Deviations of indicator results from real measurements ................................... 70
GENERAL INTRODUCTION 1
General Introduction
Livestock farming and environment
The interaction of agriculture and environment, namely climate and ecosystems, has
become an important issue in politics, science and consequently in the media worldwide.
Especially livestock farming is blamed to bear the bulk of certain gaseous emissions from
agriculture with impact on the environment, such as ammonia (NH3), methane (CH4) and
nitrous oxide (N2O). Livestock’s contribution to global anthropogenic greenhouse gas
emissions is estimated at 18% in an FAO study (FAO, 2006). Within the European Union
(EU) the share of livestock in total anthropogenic greenhouse gas emissions is given with
9.1% (excl. land use and land use change, LEIP et al. 2010). About 30% of the livestock
sector greenhouse gas emissions originate from dairy farming and another 30% is
stemming from beef cattle1 (LEIP et al., 2010). The relevant greenhouse gases from
agriculture are methane (CH4), nitrous oxide (N2O) and carbon dioxide (CO2).
Furthermore, ammonia (NH3) emissions from agriculture have a significant impact on the
environment.
Methane (CH4)
It is estimated that in Germany 54% of methane (CH4) emissions originate from agriculture
- more than 97% of which are from livestock production (UBA, 2013). With regard to
dairy cattle, about 75-92% of CH4 emissions are coming from enteric fermentation, the rest
is stemming from manure (MONTENY et al., 2001; KÜLLING et al., 2002).
Methane is an odorless and colorless gas with a global warming potential of 21 CO2-
equivalents (on basis of a 100 year global warming potential (UBA, 2012 according to
IPCC, 2006)). In general, CH4 represents a more or less unavoidable by-product of the
microbial anaerobic digestion of organic matter. Regarding enteric fermentation, the bulk
of CH4 emissions is generated in the rumen (87%) and – to a smaller extent – also in the
large intestine (MURRAY et al., 1976). However, even if this own study is considering CH4
because of its role as a greenhouse gas/pollutant, much effort has been made in the past to
reduce enteric CH4 emissions with regard to the corresponding energy loss. It is estimated
that the energy loss by CH4 generation is about 6-7% of gross energy intake (YAN et al.,
1 based on a cradle to gate life cycle assessment
2 GENERAL INTRODUCTION
2000; NISHIDA, et al., 2007). Specific microbes are responsible for the formation of
CH4: Methanogenic Archaea. One of the main tasks of the Methanogenic Archaea is to
utilize the surplus hydrogen which is deriving from fiber digestion. There are several
biochemical processes of CH4 synthesis in the rumen, while the direct synthesis by means
of CO2 is the most important one (ROUVIERE & WOLFE, 1988; FLACHOWSKY & BRADE,
2007; KREUZER, 2011):
(1) .
One further important biochemical process of CH4 synthesis in the rumen is the usage of
formic acid as an H2-acceptor:
(2) 4 .
In addition there are several other carbon sources used for methanogenesis (FLACHOWSKY
& BRADE, 2007).
There is a broad variation (>100%) of CH4 emissions between individual animals
(FLACHOWSKY & BRADE, 2007). Within one species, this may to a certain extent be
explained in production type, live weight, performance and feeding (feed ration, feed
intake, feed conversion ratio). But even in a more or less homogenous dairy cattle herd,
GARNSWORTHY et al. (2012) recently reported broad differences in daily CH4 emissions
between individual cows.
Apart from rumen digestion, liquid manure storage is an important source of CH4
emissions contributing about 20% to total CH4 emissions from cattle as already indicated
above. The biochemical processes of the methanogenesis in liquid manure are similar to
the processes in the rumen: anaerobic digestion of organic compounds performed by the
same microbes. However, differences do occur in temperature, mixing status of the
substrate and the status of carbohydrates, being already digested in the slurry (MONTENY et
al., 2001). Containing a large amount of organic compounds and a high content of
anaerobic microbes, liquid manure offers a high CH4 production potential; thus the level of
CH4 production is mainly determined by temperature and storage time (MONTENY et al.,
2001). Since straw based production systems are usually more aerate, CH4 emissions from
solid manure are expected to be lower than from liquid manure (AMON, 1998). Discussing
CH4 as a pollutant and as a threat for the environment, one should keep in mind that a high
GENERAL INTRODUCTION 3
CH4 yield from slurry storages is a benefit for biogas production (CUELLAR & WEBBER,
2008).
A description of CH4 emission levels, measurement and modeling techniques, as well as
results from experiments in practical dairy farms is given and discussed in chapters 1-3.
Nitrous Oxide (N2O)
The share of agriculture in the German nitrous oxide (N2O) emissions is 76 %, with
fertilization of soils (mineral and manure) playing an important role (UBA, 2013). Nitrous
oxide is a colorless gas with a slightly sweet odor and with a very high global warming
potential of 310 CO2-equivalents (on basis of a 100 year global warming potential (IPCC,
2006; UBA, 2012)). In contrast to CH4, N2O production results from combined aerobic and
anaerobic processes: aerobic nitrification of ammonium (NH4) and anaerobic de-
nitrification of nitrate (NO3). Under optimal conditions, N2O is not an intermediate product
of nitrification but may be produced when oxygen availability is too low. In denitrification,
N2O is an intermediate product (‘hole in the pipe’ model by FIRESTONE & DAVIDSON,
1989; MONTENY et al., 2001; MONTENY et al., 2006). Nitrous oxide emissions are of
relevance in aerated slurry systems or in housing systems with straw, where a passive
aeration is given and an uncontrolled nitrification and denitrification occurs (GROENESTEIN
& VANFAASSEN, 1996). Further, ammonia (NH3) may serve as a precursor for N2O
production (PETERSEN & SOMMER, 2011).
Carbon Dioxide (CO2)
Carbon dioxide (CO2) sources within dairy barns are: respiration of animals and emissions
from feed, manure and in negligible proportion emissions from process energy (fuels,
electricity, e.g. feed mixer). Nevertheless, CO2 from livestock is not considered as net
source of CO2, because it has been ’imported’ into the system by feed stuffs which were
created by photosynthesis (IPCC 2006; HERRERO et al. 2011).
Ammonia (NH3)
Beside greenhouse gases, ammonia (NH3) emissions play an important role in airborne
pollutants from agriculture. Ammonia is a caustic, colorless gas with pungent odor. It is
involved in environmental degradation and acidification and may cause harmful effects in
humans and animals. But not only the direct effects of NH3, also the role as a precursor for
the highly climate relevant gas N2O is of particular importance. In Germany >90% of NH3
4 GENERAL INTRODUCTION
emissions originate in agriculture, in particular in livestock farming. Regarding NH3
emissions from dairy cattle 63% are stemming from field application of manure, 29% from
housing and 8% from manure storage (RÖSEMANN et al., 2011). Ammonia is produced on
emitting surfaces within the barn rather than by the animals themselves. It is known that a
high urea excretion is strongly affecting the NH3 emissions from manure and that feeding
does impact the urea concentration of urine, feces and milk from dairy cows significantly
(DE BOER et al., 2002; MONTENY et al., 2002). About 80% of the N-intake by dairy cows is
excreted by urine and feces, the rest is excreted by milk and a small proportion is
metabolized (TAMMINGA, 1992). As indicated above, manure NH3 is formed primarily
from the hydrolysis of urea from cattle urine (MOBLEY & HAUSINGER, 1989). The enzyme
responsible for the hydrolysis of urea to ammonia (NH3) and carbon dioxide (CO2) is
urease. The following equation shows the process of urea hydrolysis in a liquid
environment (e.g. slurry):
(3) .
The rate of urea hydrolysis depends on the urea concentration and the ‘urease activity’
which is temperature related and requires a pH between 7 and 9. Ammonia hydrolysis is
mostly completed after a few hours, whereas further volatilization may last for months
when manure is stored (MONTENY & ERISMAN, 1998).
In manure (= in the liquid), NH3 exists primarily as two types in a pH- and temperature
dependent equilibrium: ammonia (NH3) and ammonium (NH4+):
(4) .
At pH below 6-7 most Total Ammoniacal Nitrogen (TAN= NH3 + ) is present in
ionized form ( ). Above pH 11, NH3 is predominant. Ammonia is water-soluble and
exists in equilibrium between liquid and gaseous NH3. The amount of gaseous NH3
depends - inter alia - on temperature and air velocity above the surface - high temperatures
and high air velocities result in a higher share of gaseous NH3 (SVENSSON & FERM, 1993;
ERISMAN & MONTENY, 1998).
Emission levels from different housing and manure management systems for dairy cows as
well as measurement techniques and results are presented and discussed in chapters 1 and 2
of this thesis.
GENERAL INTRODUCTION 5
Emission measurements in livestock farming
Much research has been conducted to measure enteric CH4 emissions (in vivo, in vitro,
modeling). For example, very detailed information has been obtained by using respiration
chambers for single animals or by means of tracer gas techniques (e.g. DERNO et al., 2009;
GARNSWORTHY et al., 2012). STORM et al. (2012) present an overview of common
measurement and modeling techniques to quantify enteric CH4 emissions from cattle.
Furthermore, there are several approaches of CH4 emission calculation based on enteric
fermentation (e.g. ELLIS et al., 2007) or on farm level (see chapter 3). Emission
measurement at barn level includes emissions from enteric fermentation (mainly CH4) and
other emission sources within the barn, e.g. from walking areas, slurry pits and feed stuffs
(NH3, CH4 and N2O).
Due to the negative impact on the environment, NH3 emissions from livestock have been
an issue for many years in many Western European countries. Consequently, the
knowledge about NH3 emissions from dairy barns and manure storage is more
comprehensive than about other gases, like CH4 and N2O. However, livestock farming in
Western Europe has been moving towards better animal welfare in recent years, and as a
consequence housing systems for cattle and in particular for dairy cows have changed.
Turned away from tie-stalls, modern dairy barns are designed as free stalls, offering
cubicles and exercise areas. With regard to air quality and heat dispersion, modern barns
are mostly built with large open surfaces and natural ventilation. That implies that existing
emission factors at barn level have to be verified and amended under these modern
conditions. To sum up, there is uncertainty about emission rates from naturally ventilated
dairy cattle buildings.
Emission measurement in naturally ventilated buildings in general, but determination of
the ventilation rate in particular, is complex. There are several methods discussed in the
literature: Tracer gas methods are supposed to deliver the most precise results for naturally
ventilated buildings, but they risk errors from the prerequisite of exact positioning of
dosing and sampling points and the proper mixing of the tracer within the building (e.g.
SAMER et al., 2011b; SCHRADE et al., 2011). Anyway, the preparation of those
measurements is time-consuming and expensive. Balancing methods based on carbon
dioxide (CO2), moisture or heat ratios are simpler, but bear the risk of inaccuracy and
biases due to external sources of the considered unit, and gradients within the building
(PEDERSEN et al., 1998; CIGR, 2002; SAMER et al., 2011a; SAMER et al., 2012). Another
6 GENERAL INTRODUCTION
possibility is computer fluid dynamics modeling, which may be a good option in future,
when the accuracy of the technique has been further improved (WU et al., 2012).
An overview of emission measurements in naturally ventilated dairy barns and an
explanation of usual calculation methods for gaseous emissions is given in chapter 1.
Chapter 1 further presents an approach for the determination of the ventilation rate based
on tracer gas measurements.
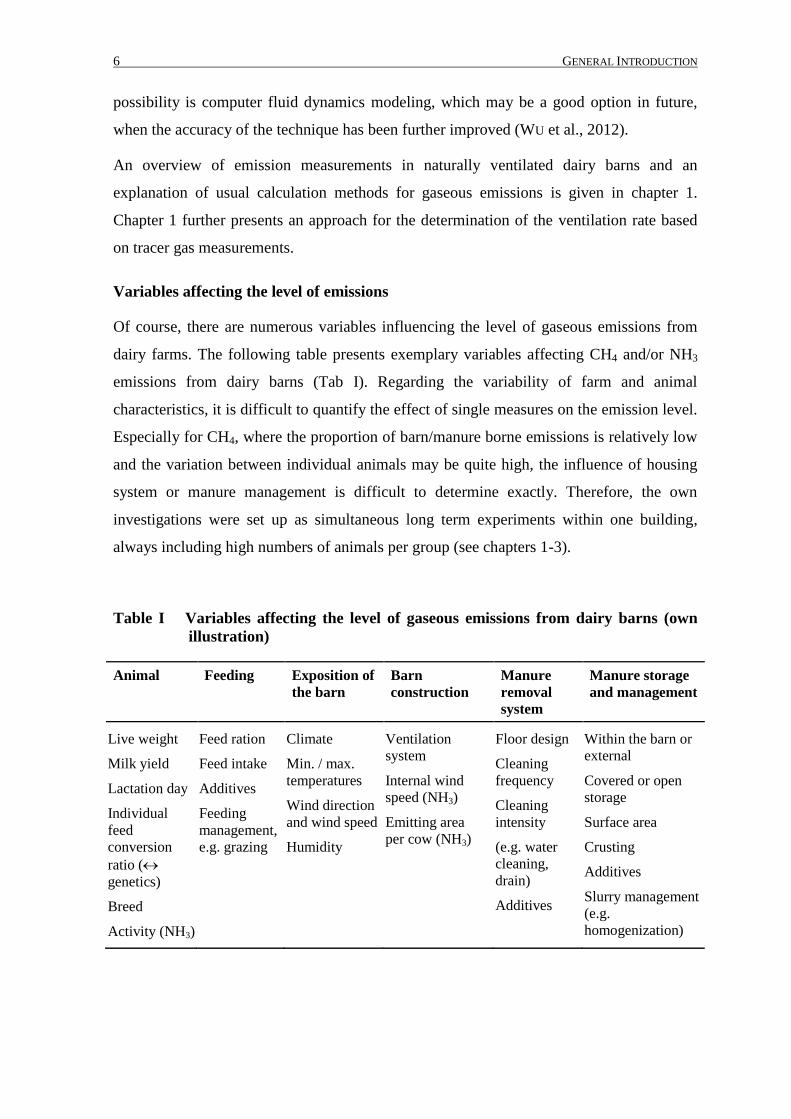
Variables affecting the level of emissions
Of course, there are numerous variables influencing the level of gaseous emissions from
dairy farms. The following table presents exemplary variables affecting CH4 and/or NH3
emissions from dairy barns (Tab I). Regarding the variability of farm and animal
characteristics, it is difficult to quantify the effect of single measures on the emission level.
Especially for CH4, where the proportion of barn/manure borne emissions is relatively low
and the variation between individual animals may be quite high, the influence of housing
system or manure management is difficult to determine exactly. Therefore, the own
investigations were set up as simultaneous long term experiments within one building,
always including high numbers of animals per group (see chapters 1-3).
Table I 1 Variables affecting the level of gaseous emissions from dairy barns (own
illustration)
Animal Feeding Exposition of
the barn
Barn
construction
Manure
removal
system
Manure storage
and management
Live weight
Milk yield
Lactation day
Individual
feed
conversion
ratio (
genetics)
Breed
Activity (NH3)
Feed ration
Feed intake
Additives
Feeding
management,
e.g. grazing
Climate
Min. / max.
temperatures
Wind direction
and wind speed
Humidity
Ventilation
system
Internal wind
speed (NH3)
Emitting area
per cow (NH3)
Floor design
Cleaning
frequency
Cleaning
intensity
(e.g. water
cleaning,
drain)
Additives
Within the barn or
external
Covered or open
storage
Surface area
Crusting
Additives
Slurry management
(e.g.
homogenization)
GENERAL INTRODUCTION 7
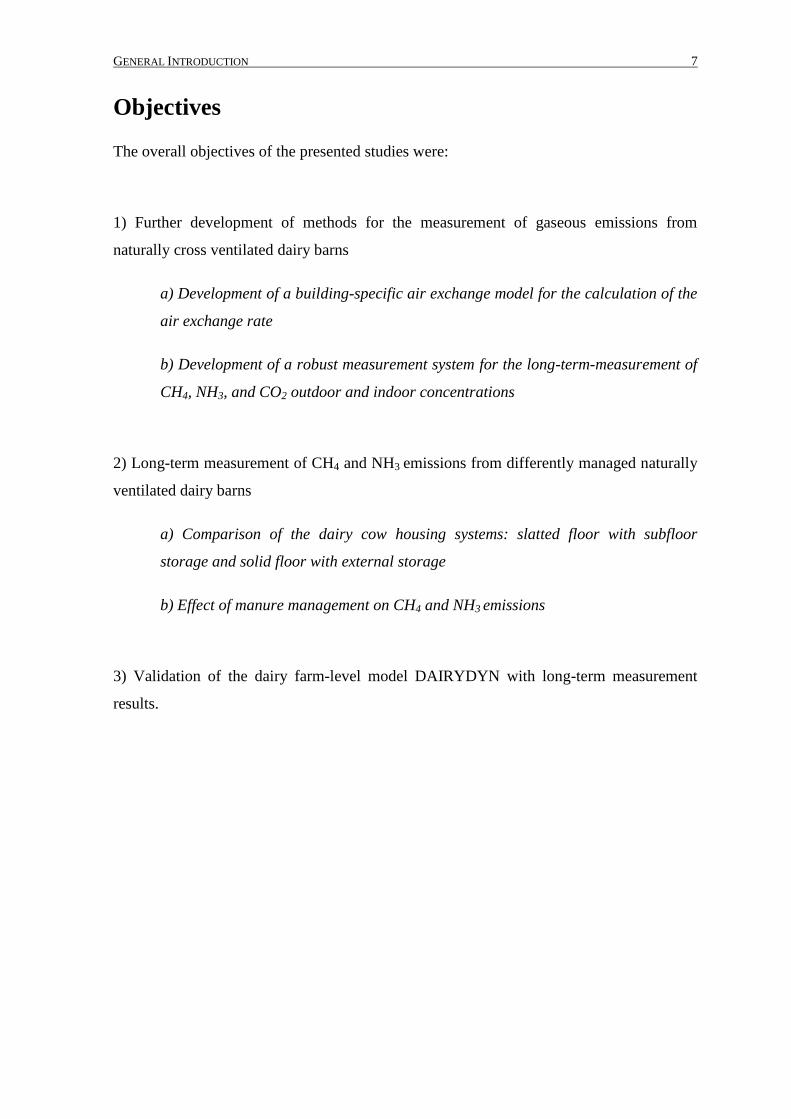
Objectives
The overall objectives of the presented studies were:
1) Further development of methods for the measurement of gaseous emissions from
naturally cross ventilated dairy barns
a) Development of a building-specific air exchange model for the calculation of the
air exchange rate
b) Development of a robust measurement system for the long-term-measurement of
CH4, NH3, and CO2 outdoor and indoor concentrations
2) Long-term measurement of CH4 and NH3 emissions from differently managed naturally
ventilated dairy barns
a) Comparison of the dairy cow housing systems: slatted floor with subfloor
storage and solid floor with external storage
b) Effect of manure management on CH4 and NH3 emissions
3) Validation of the dairy farm-level model DAIRYDYN with long-term measurement
results.
8 GENERAL INTRODUCTION
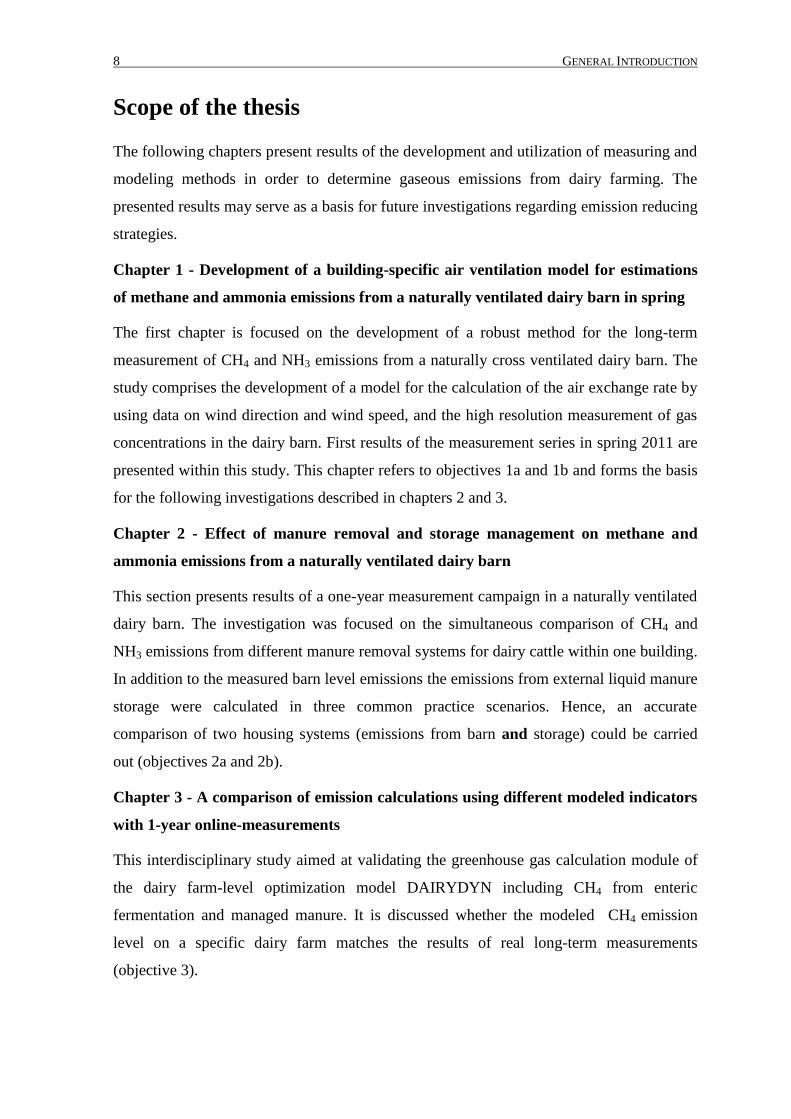
Scope of the thesis
The following chapters present results of the development and utilization of measuring and
modeling methods in order to determine gaseous emissions from dairy farming. The
presented results may serve as a basis for future investigations regarding emission reducing
strategies.
Chapter 1 - Development of a building-specific air ventilation model for estimations
of methane and ammonia emissions from a naturally ventilated dairy barn in spring
The first chapter is focused on the development of a robust method for the long-term
measurement of CH4 and NH3 emissions from a naturally cross ventilated dairy barn. The
study comprises the development of a model for the calculation of the air exchange rate by
using data on wind direction and wind speed, and the high resolution measurement of gas
concentrations in the dairy barn. First results of the measurement series in spring 2011 are
presented within this study. This chapter refers to objectives 1a and 1b and forms the basis
for the following investigations described in chapters 2 and 3.
Chapter 2 - Effect of manure removal and storage management on methane and
ammonia emissions from a naturally ventilated dairy barn
This section presents results of a one-year measurement campaign in a naturally ventilated
dairy barn. The investigation was focused on the simultaneous comparison of CH4 and
NH3 emissions from different manure removal systems for dairy cattle within one building.
In addition to the measured barn level emissions the emissions from external liquid manure
storage were calculated in three common practice scenarios. Hence, an accurate
comparison of two housing systems (emissions from barn and storage) could be carried
out (objectives 2a and 2b).
Chapter 3 - A comparison of emission calculations using different modeled indicators
with 1-year online-measurements
This interdisciplinary study aimed at validating the greenhouse gas calculation module of
the dairy farm-level optimization model DAIRYDYN including CH4 from enteric
fermentation and managed manure. It is discussed whether the modeled CH4 emission
level on a specific dairy farm matches the results of real long-term measurements
(objective 3).
GENERAL INTRODUCTION 9
References
AMON, B., (1998). NH3-. N2O- und CH4-Emissionen aus der Festmistanbindung für
Milchvieh Stall - Lagerung - Ausbringung. Dissertation, Universität für Bodenkultur,
Wien. VDI Schrift 331.
CIGR (2002). Report of Working Group on Climatization of Animal Houses - Heat and
Moisture Production at Animal and House Levels. Eds S. Pedersen & K. Sällvik:
Commission International Du Genie Rural (International Commission of Agricultural
Engineering). Available under: http://www.cigr.org/CIGRWorkingGroupReports.htm
(accessed on 15.04.2013).
CUELLAR, A. & WEBBER, M. (2008). Cow power: the energy and emissions benefits of
converting manure to biogas. Environmental Research Letters 3(3).
DE BOER, I., SMITS, M., MOLLENHORST, H., VAN DUINKERKEN, G. & MONTENY, G. (2002).
Prediction of ammonia emission from dairy barns using feed characteristics part 1:
Relation between feed characteristics and urinary urea concentration. Journal of Dairy
Science 85(12), 3382-3388.
DERNO, M., ELSNER, H., PAETOW, E., SCHOLZE, H. & SCHWEIGEL, M. (2009). Technical
note: A new facility for continuous respiration measurements in lactating cows. Journal of
Dairy Science 92(6), 2804-2808.
ELLIS, J., KEBREAB, E., ODONGO, N., MCBRIDE, B., OKINE, E. & FRANCE, J. (2007).
Prediction of methane production from dairy and beef cattle. Journal of Dairy Science
90(7), 3456-3466.
ERISMAN, J. & MONTENY, G. (1998). Consequences of new scientific findings for future
abatement of ammonia emissions. Environmental Pollution 102, 275-282.
FAO (2006). Livestock's Long Shadow - Environmental Issues and Options. Rome: Food
and Agriculture Orginazation of the United Nations. Available under:
http://www.fao.org/docrep/010/a0701e/a0701e00.HTM (accessed on 15.04.2013).
FIRESTONE, M. & DAVIDSON, E. (1989). Microbiological basis of NO and NO2 production
and consumption in soil. In Exchange of trace gases between terrestrial ecosystems and
the atmosphere Eds M. Andreae & D. Shimel), pp. 7-21. Chichester: John Wiley and Sons,
Dahlem Workshop Report.
FLACHOWSKY, G. & BRADE, W. (2007). Potenziale zur Reduzierung der Methan-
Emissionen bei Wiederkäuern. Züchtungskunde 79(6), 417-465.
GARNSWORTHY, P., CRAIGON, J., HERNANDEZ-MEDRANO, J. & SAUNDERS, N. (2012).
Variation among individual dairy cows in methane measurements made on farm during
milking. Journal of Dairy Science 95(6), 3181-3189.
GROENESTEIN, C. & VANFAASSEN, H. (1996). Volatilization of ammonia, nitrous oxide and
nitric oxide in deep-litter systems for fattening pigs. Journal of Agricultural Engineering
Research 65(4), 269-274.
10 GENERAL INTRODUCTION
HERRERO, M., GERBER, P., VELLINGA, T., GARNETT, T., LEIP, A., OPIO, C., WESTHOEK, H.,
THORNTON, P., OLESEN, J., HUTCHINGS, N., MONTGOMERY, H., SOUSSANA, J., STEINFELD,
H. & MCALLISTER, T. (2011). Livestock and greenhouse gas emissions: The importance of
getting the numbers right. Animal Feed Science and Technology 166-67, 779-782.
IPCC (2006). IPCC Guidelines for National Greenhouse Gas Inventories. Japan:
Intergovernmental Panel on Climate Change, NGGIP Publications.
KREUZER, M. (2011). Strategische Einflussnahme auf die Methanemissionen von
Nutztieren. In Emissionen der Tierhaltung, Treibhausgase, Umweltbewertung, Stand der
Technik (KTBL), pp. 134-144. Kloster Banz, Bad Staffelstein: Kuratorium für Technik und
Bauwesen in der Landwirtschaft e.V. (KTBL). KTBL Schrift 491.
KÜLLING, D. R., DOHME, F., MENZI, H., SUTTER, F., LISCHER, P. & KREUZER, M. (2002).
Methane emissions from differently fed dairy cows and corresponding methane and
nitrogen emissions from their manure during storage. Environmental Monitoring and
Assessment 79, 129–150.
LEIP, A., WEISS, F., WASSENAAR, T., PEREZ, I., FELLMANN, T., LOUDJANI, P., TUBIELLO, F.,
GRANDGIRARD, D., MONNI, S. & BIALA, K. (2010). Evaluation of the livestock sectors's
contribution to the EU greenhouse gas emissions (GGELS) - final report.: European
Commission, Joint Research Centre.
MOBLEY, H. L. T. & HAUSINGER, R. P. (1989). Microbial Ureases: Significance,
Regulation, and Molecular Characterization. Microbiological Reviews 53(1), 85-108.
MONTENY, G., BANNINK, A., & CHADWICK, D. (2006). Greenhouse gas abatement
strategies for animal husbandry. Agriculture Ecosystems & Environment 112(2-3), 163-
170.
MONTENY, G. & ERISMAN, J. (1998). Ammonia emission from dairy cow buildings: A
review of measurement techniques, influencing factors and possibilities for reduction.
Netherlands Journal of Agricultural Science 46(3-4), 225-247.
MONTENY, G., GROENESTEIN, C. & HILHORST, M. (2001). Interactions and coupling
between emissions of methane and nitrous oxide from animal husbandry. Nutrient Cycling
in Agroecosystems 60(1-3), 123-132.
MONTENY, G., SMITS, M., VAN DUINKERKEN, G., MOLLENHORST, H. & DE BOER, I. (2002).
Prediction of ammonia emission from dairy barns using feed characteristics part 11:
Relation between urinary urea concentration and ammonia emission. Journal of Dairy
Science 85(12), 3389-3394.
MURRAY, R. M. M, B. R. & LENG, R. A. (1976). Rates of Production of Methane in Rumen
and Large Intestine of Sheep. British Journal of Nutrition 36(1), 1-14.
NISHIDA, T., ERUDEN, B., HOSODA, K., MATSUYAMA, H., XU, C. & SHIOYA, S. (2007).
Digestibility, methane production and chewing activity of steers fed whole-crop round bale
corn silage preserved at three maturities. Animal Feed Science and Technology 135(1-2),
42-51.
GENERAL INTRODUCTION 11
PEDERSEN, S., TAKAI, H., JOHNSEN, J. O., METZ, J. H. M., KOERKAMP, P., UENK, G. H.,
PHILLIPS, V. R., HOLDEN, M. R., SNEATH, R. W., SHORT, J. L., WHITE, R. P., HARTUNG, J.,
SEEDORF, J., SCHRODER, M., LINKERT, K. H. & WATHES, C. M. (1998). A comparison of
three balance methods for calculating ventilation rates in livestock buildings. Journal of
Agricultural Engineering Research 70(1), 25-37.
PETERSEN, S. & SOMMER, S. (2011). Ammonia and nitrous oxide interactions: Roles of
manure organic matter management. Animal Feed Science and Technology 166-167, 503-
513.
ROUVIERE, P. & WOLFE, R. (1988). Novel Biochemistry of Methanogenesis. Journal of
Biological Chemistry 263(17), 7913-7916.
RÖSEMANN, C., HAENEL, H.-D., PODDEY, E., DÄMMGEN, U., DÖHLER, H., EURICH-
MENDEN, B., LAUBACH, P., DIETERLE, M. & OSTERBURG, B. (2011). Calculations of
gaseous and particulate emissions from German agriculture 1990-2009. In Special Issue
342: Johann Heinrich von Thünen-Institut, Federal Research Institute for Rural Areas,
Forestry and Fisheries.
SAMER, M., AMMON, C., LOEBSIN, C., FIEDLER, M., BERG, W., SANFTLEBEN, P. &
BRUNSCH, R. (2012). Moisture balance and tracer gas technique for ventilation rates
measurement and greenhouse gases and ammonia emissions quantification in naturally
ventilated buildings. Building and Environment 50, 10-20.
SAMER, M., LOEBSIN, C., FIEDLER, M., AMMON, C., BERG, W., SANFTLEBEN, P. &
BRUNSCH, R. (2011a). Heat balance and tracer gas technique for airflow rates measurement
and gaseous emissions quantification in naturally ventilated livestock buildings. Energy
and Buildings 43(12), 3718-3728.
SAMER, M., MULLER, H., FIEDLER, M., AMMON, C., GLASER, M., BERG, W., SANFTLEBEN,
P. & BRUNSCH, R. (2011b). Developing the (85)Kr tracer gas technique for air exchange
rate measurements in naturally ventilated animal buildings. Biosystems Engineering
109(4), 276-287.
SCHRADE, S., KECK, M., ZEYER, K. & EMMENEGGER, L. (2011). Housing systems and a
concept to measure ammonia emissions in case of natural ventilation. Agrarforschung
Schweiz 2(4), 170-175.
STORM, I. M. L. D., HELLWING, A. L. F., NIELSEN, N. I. & MADSEN, J. (2012). Methods for
Measuring and Estimating Methane Emissions from Ruminants. Animals 2, 160-183.
SVENSSON, L. & FERM, M. (1993). Mass-Transfer Coefficient and Equilibrium
Concentration as Key Factors in a New Approach to Estimate Ammonia Emission from
Livestock Manure. Journal of Agricultural Engineering Research 56(1), 1-11.
TAMMINGA, S. (1992). Nutrition Management of Dairy-Cows as a contribution to
pollution-control. Journal of Dairy Science 75(1), 345-357.
12 GENERAL INTRODUCTION
UBA (2012). Nationaler Inventarbericht zum Deutschen Treibhausgasinventar 1990 -
2010. In Berichterstattung unter der Klimarahmenkonvention der Vereinten Nationen und
dem Kyoto-Protokoll 2012 (Ed. Umweltbundesamt).
UBA (2013). Daten zur Umwelt - Umweltzustand in Deutschland. (Ed Umweltbundes-
amt). Available under: http://www.umweltbundesamt-daten-zur-umwelt.de/umweltdaten/
public/theme.do?nodeIdent=3141 (accessed on 04.04.2013).
WU, W., ZHAI, J., ZHANG, G., & NIELSEN, P. (2012). Evaluation of methods for
determining air exchange rate in a naturally ventilated dairy cattle building with large
openings using computational fluid dynamics (CFD). Atmospheric Environment 63, 179-
188.
YAN, T., AGNEW, R., GORDON, F. & PORTER, M. (2000). Prediction of methane energy
output in dairy and beef cattle offered grass silage-based diets. Livestock Production
Science 64(2-3), 253-263.
CHAPTER 1 13
1 Chapter 1 - Development of a building-specific air
ventilation model for estimations of methane and
ammonia emissions from a naturally ventilated dairy
barn in spring2
Abstract
Dairy cow barns are an important source of methane and other environment relevant gases.
Most dairy cow barns are naturally ventilated, making it complex to precisely determine
gaseous emissions at barn level. Furthermore, broad variations in practice resulting from
differences in animal productivity, diet, management and ventilation make it difficult to
determine the influence of housing system and floor type on the emissions. In this investigation
CH4 and NH3 emission rates from a naturally cross ventilated dairy barn were calculated.
Therefore the ventilation rate was determined using a building-specific air exchange model.
This model was designed after performing several tracer gas experiments within the building
and considering various weather conditions. The measured ventilation rate of the building was
significantly correlated with the actual wind conditions outside the barn, leading to a linear
model which allowed prediction of the ventilation rate on an hourly basis with a regression of
0.92. Methane emissions were 331 ± 143 and 261 ± 108 g LU-1
d-1
for the slatted floor sections,
and 387 ± 147 g LU-1
d-1
for the solid floor section. Ammonia emissions were 37.3 ± 18.5 and
24.2 ± 12.4 g LU-1
d-1
for the slatted floor sections, and 35.9 ± 15.2 g LU-1
d-1
for the solid floor
section.
Keywords: ventilation rate; emissions; air exchange rate; tracer gas; manure management
2 This chapter is based on a revised manuscript submitted to the Journal ‘Biosystems Engineering’ as
SCHIEFLER, I. and W. BÜSCHER: Development of a building-specific air ventilation model for estimations of
methane and ammonia emissions from a naturally ventilated dairy barn in spring.
14 CHAPTER 1
Nomenclature
A = impulses at t = 0
AER = Air exchange rate [h-1
]
b = air exchange rate per second [s-1
]
Cinside = concentration of outgoing air [mg m-3
]
Coutside = background concentration [mg m-3
]
d = day
E = emission rate [mg h-1
LU-1
]
LU = livestock unit (500 kg of live weight; 1 cow is 1.4 LU)
n = number of livestock units in the barn
VR = ventilation rate [m-3
h-1
LU-1
]
VRmod = ventilation rate by tracer gas model [m-3
h-1
LU-1
]
VRbal = ventilation rate by CO2 mass balance [m-3
h-1
LU-1
]
t = time [s]
v = wind speed [m s-1
]
V = air volume of the barn [m3]
Y = impulses recorded by the SF6 detector
CHAPTER 1 15
1.1 Introduction
Livestock farming contributes 9.1% of the total greenhouse gas (GHG) emissions in the
European Union with animal barns being of major importance (LEIP et al., 2010). In
addition, barns in general and dairy cow barns in particular are also an important source of
other environment polluting gases like ammonia (NH3; UMWELTBUNDESAMT, 2011). In
general, gaseous emissions from dairy cow barns originate from the animals, and the
manure or slurry present on the floors of walking alleys and in manure channels and pits
inside the building. Most research on GHG emissions from livestock has been conducted at
the individual cow level focussing on enteric methane (CH4) emissions and using either
respiration chambers or the SF6 tracer technique (BELYEA, MARIN, & SEDGWICK, 1985;
BOADI, WITTENBERG, & MCCAUGHEY, 2002; KINSMAN, SAUER, JACKSON, & WOLYNETZ,
1995). In contrast to this emission rates at the barn level (sum of animal and manure/slurry)
have been studied less thoroughly (NGWABIE et al., 2009; SAMER et al., 2011; SCHRADE et
al., 2012).
Reducing environmental pollution from dairy cow husbandry is an important policy to
meet sustainability criteria in the near future. Most dairy cow barns are naturally ventilated
with cross-ventilation occurring regularly due to broad open walls, hence making difficult
the precise determination of gaseous emissions. This may be the most important reason
why there is a lack of data on the influence of the housing system (e.g. type of floor, slurry
storage and management) on gaseous emission levels, as well as on options for reducing
emissions. Substantive data on emission levels related to different housing systems are
necessary to develop recommendations for barn construction and equipment as well as for
management strategies to lower emission rates. However, the outcome of these
investigations would be biased by the broad variations at barn level caused by differences
in building design, animal productivity (age and lactation stage), diet and management.
Several studies have shown that floor design has a strong influence on NH3 emission levels
from dairy cow barns (BRAAM, SMITS, GUNNINK, & SWIERSTRA, 1997; MORSING, STROM,
ZHANG, & KAI, 2008; PEREIRA et al., 2011), whereas their influence on CH4 emission has
been poorly studied. ZHANG et al. (2005) have investigated gaseous emissions from
different housing systems for dairy cows in nine buildings and reported a strong positive
influence of temperature on NH3 emissions. Several other authors reported a similar
relationship for CH4 emissions from liquid manure (MASSE, MASSE, CLAVEAU,
BENCHAAR, & THOMAS, 2008; MONTENY, BANNINK, & CHADWICK, 2006; SOMMER et al.,
16 CHAPTER 1
2007). In addition, MASSE et al. (2008) also reported that frequent removal of manure in
summer reduces CH4 emissions. Recent investigations of SCHRADE et al. (2012) have
shown that, besides outside temperature, wind speed and urea content of the tank milk
were significant variables in determining NH3 emission levels from commercial dairy cow
barns.
The numerous sources of variation at barn level imply that emission measurements in
commercial dairy cow barns to assess the potential of emission reducing options may not
be accurate. Therefore, simultaneous case/control (case: emission reduction system;
control: traditional system) investigations on the same site would be advantageous since
sources of variation would apply to both systems. A major problem for accurate
estimations of emissions from naturally ventilated barns is the difficulty to measure the
building ventilation rate. The tracer technique and the CO2 mass balance are the methods
most used to estimate the ventilation rate. Recent investigations have shown the specific
requirements of the respective investigated building and the need to assess the best
experimental set up for each site (SAMER et al., 2011; SCHRADE et al., 2012; NANNEN,
SCHNEIDER, & BÜSCHER, 2006). DEMMERS et al. (2001) stated that the constant tracer
release method gives the most reliable results and SCHRADE et al. (2012) confirmed this.
SNELL, SEIPELT, & VAN DEN WEGHE (2003) have reported that the tracer decay method
was an appropriate technique within naturally ventilated dairy houses. SAMER et al. (2011)
have further developed this method for cross-ventilated buildings, and came to the
conclusion that linear dosing showed the best results. However, independent of the type of
tracer gas and the dosing and sampling system, one of the main issues is the prerequisite of
total mixing of the tracer gas within the building. A second common approach to estimate
the ventilation rate is calculation by the CO2-balance method (CIGR, 2002; PEDERSEN et
al., 1998). SAMER et al. (2011) recently compared the CO2-balance method with the tracer
gas decay method through summer seasons, and stated that tracer gas techniques showed
more reliable results. There is a great need for improving methods in the determination of
VR of naturally ventilated buildings. Since SF6 has a high global warming potential, one
can expect that its use may be prohibited in several countries in the near future. Building
specific models may help to reduce the required amount of tracer gases.
The objective of this study was to develop a building specific wind-related air exchange
model based on tracer gas experiments in order to calculate the ventilation rate (VR) by
CHAPTER 1 17
using data on wind speed and wind direction. By this, CH4 and NH3 emissions were
determined for three differently managed barn sections.
1.2 Material and Methods
1.2.1 Site description and production
Measurements were carried out in a newly built dairy barn of the Chamber of Agriculture
North-Rhine Westphalia at the Centre of Agriculture Haus Riswick in Northwest Germany.
The free stall dairy barn for 144 dairy cows was divided by foil partitions into three equal
sections (Fig 1.1), each with a volume of 4,500 m3
and a capacity for 48 dairy cows. The
total floor available per cow was 10 m2, of which 7 m
2 per cow was used as a walking area,
with the remaining area used for lying and feeding. The building was 68 m long and 34 m
wide. Measured from floor level, the eave height was 5.15 m and that of the ridge was 13
m. The barn was cross-ventilated. There were no outside walls along the long sides of the
building; however, there was a facility to close the western eave side of the building with
curtains. During the measurement period in spring 2011, the curtains were completely
open.
Section 3 - solid floor with
scrapers and external storage
Section 2 -slatted floor with
subfloor storage
Section 1 - slatted floor with
subfloor storage
0m
0m
34,2
m
67,9 m
C
C C
CCC
CC
Mixer
Optimal wind
direction
for cross ventilationB
M
M
M
M
SB
S1 S1 S1 S1 S1 S1 S1 S1 S2 S2 S2 S2 S2 S2 S2 S2 S3 S3 S3 S3 S3 S3 S3 S3
D1 D1 D1 D1 D1 D1 D1 D1 D2 D2 D2 D2 D2 D2 D2 D2 D3 D3 D3 D3 D3 D3 D3 D3
W
Figure 1.1 Layout of the dairy cattle building, where C represents concentrate feeder,
M external manure shaft, S1–3 sampling points for exhaust air, SB
sampling background, W location of weather station, D1–3 tracer gas
dosing points
18 CHAPTER 1
Barn sections 1 and 2 had a slatted floor with shared subfloor storage of liquid manure
(‘slurry pit’), and a robot system for fully automated water cleaning of the slatted floor.
The cleaning robot on the slatted floor was running continuously, and performed water-
cleaning of each square meter at least 4 times a day (Joz Tech JT100, Joz B.V.,
Netherlands). The slurry stored in the pit was homogenized twice a day for a duration of 30
minutes. The mixer for homogenisation of the liquid manure beneath the slatted floor
sections was located at the gable wall next to section 1 of the barn (Fig. 1.1). This resulted
in a high intensity of homogenization of liquid manure in section 1, and a lower intensity
of homogenization of liquid manure in section 2. By this it was possible to compare two
differently managed slatted floor variations with a solid floor (section 3). Section 3 had a
solid floor with a scraper and an external discharge with a preliminary tank and an external
storage tank. The solid floor was cleaned 20 times a day (hourly, except 4 times distributed
over the day) using four cable pulled scrapers.
The milking parlour was located in a separate building with a cow waiting area (Fig 1.2).
Figure 1.2 Farmstead layout where 1 is free stalls, 2 is the milking house (Haus
Riswick)
Milking was performed in the early morning at 5:30 am and in the afternoon at 3:30 pm.
With the start of milking all cows were driven into the waiting area within the external
milking house for a short period of time. After milking in the rotary parlour each single
CHAPTER 1 19
cow was directed into its respective compartment in the building by selection gates directly
after the milking procedure. Hence, the herd was not completely inside the barn for two
hours in the morning and again in the afternoon. These time periods have not been
considered in the calculations of emission rates.
During the study, the dairy cows were in early or mid lactation, with an average daily milk
yield of 34 kg and an average live weight of 700 kg (≙1.4 LU). The cows were fed once a
day with a grass and a maize silage-based mixed ration, and were able to obtain additional
concentrates related to their production in separate feeding stations (2.5 kg concentrate
feed on average). The total average dry matter feed intake per cow was 19 kg d-1
. The
mean crude protein of the mixed ration was 16.7% (dry matter) and crude fiber was 17.4%
(dry matter).
1.2.2 General procedures
Measurements were conducted from 27 April to 06 June 2011 for 40 days covering the late
spring conditions with an average temperature of 17°C and an average wind speed of 1.5 m
s-1
. The main wind directions were south and west. With completely open walls at the eave
sides of the building one eave side could either be exhaust or incoming air (Fig 1.1).
Considering that the main wind direction was westerly, the exhaust location for
measurement of gas concentrations was chosen at the eastern eave side of the building
while the background sample was taken at the western side of the building. Nevertheless,
only those time periods when the wind direction was between 230° and 330° (delivering a
certain west-to-east cross-ventilation; more than 50% of the measurement period) were
considered for this study, the rest was discarded. This was necessary, because the cross
ventilation was required to determine incoming and exhaust air positions exactly.
1.2.3 Measurement of ventilation rates
The ventilation rates of the barn sections were estimated on basis of the air exchange rate
of the building and the building volume. The air exchange rate was determined for one
section of the building by means of the tracer decay method (see also NIEBAUM, 2001;
SCHNEIDER, 2006; SEIPELT, 1999). It was assumed, that the VRs of the sections were the
same. Cows were inside the building during measurements.
The tracer decay method was performed for twelve 24h periods covering various weather
conditions.
20 CHAPTER 1
The duration of each single tracer gas measurement was about 10–15 minutes, including
dosing, decay and damping times. A mixture of sulphurhexafluroide (SF6) and nitrogen
(N2) in equal parts was released for 90 seconds in one section of the building. The tracer
gas was released as a line source at the windward side of the barn at 4 m height from the
floor, which allowed proper mixing of the tracer within the compartment. The sampling
system used for the tracer gas measurement was the same as used for the gas concentration
measurement (explained in 1.2.4). The SF6-Electron Capture Detector (ECD; Leakmeter
200, Meltron Qualitek Messtechnik GmbH), allowed for a high frequency of impulses and
delivered one value every second.
Regarding one tracer gas experiment, the decay of the exhaust SF6 concentration can be
mathematically described as an exponential function, where Y is impulses recorded by the
SF6 detector, A is the impulses at t = 0, t is the time and b is the air exchange rate of the
building per second.
(1) Y= A exp (-bt)
The term b [s-1
] (AER of the building per second) was converted to AER per hour (*3600),
multiplied with the volume of the building (V in m3) and divided by the number of LUs in
the barn (n) in order to receive the ventilation rate in m3 h
-1 LU
-1 (VR).
(2) VR = b*3600 * V * n-1
Additionally, the CO2 mass balance method (CIGR 2002) was applied in order to compare
results to the tracer gas modeling method.
1.2.4 Measurement of gas concentrations
Each section of the building was equipped with eight sampling points in a row above the
feed alley (exhaust air side of the barn) which were combined to produce a single
aggregate sample for each section. Sampling tubes were located at a 4 m height above floor
level in order to represent the main exhaust air flow below the eaves. The exhaust air was
sampled separately from each barn section and the background by a separate vacuum pump
and tube system into the respective sample bottle. The four sample bottles, four vacuum
pumps, the multiplexer and the gas analyzer were placed in the adjacent building in order
to offer constant conditions. The sample bottles were flushed by overpressure and
constantly provided actual exhaust air samples from the respective barn section or
background. By this, tube distances between sample bottles, multiplexer (used for
CHAPTER 1 21
switching between samples), and gas analyser could be minimised in order to reduce
flushing times (Gas Analyzer 1412 and Multiplexer 1303, Lumasense Technologies SA,
Ballerup, Denmark). The sample interval was chosen 300 s for each sampling point. This
was verified by preliminary tests in which tracer gas was injected in the barn. All materials
used for sampling were polytetrafluoroethylene (PTFE) in order to prevent NH3
accumulation in the tubing system. By heating the final 15 m of the tubes between the barn
and the adjacent building (laid underground) the influence of temperature and
condensation was minimised (BREHME, 2003).
The accuracy of the gas analyzer was checked in the beginning and again after 4 weeks of
measurements by using calibration gases with known concentrations for each gas as well
as pure nitrogen for zero level. The calibration of the gas analyzer was done by the
manufacturer prior to the measurements.
1.2.5 Calculation of emissions
The hourly emission rates of CH4 and NH3 were calculated by using the hourly means of
the measured concentrations [mg m-3
] and the hourly means of the calculated VR [m-3
h-1
LU-1
] according to the following equation:
(3) E = VR * (Cinside-Coutside).
1.2.6 Measurement of weather parameters
A station for weather conditions was positioned at the western side of the barn at a height
of 6 m from floor level. Wind direction, wind speed, air temperature and humidity were
measured at one minute intervals (anemometer and wind vane “Industry”, Lambrecht
GmbH, Germany).
22 CHAPTER 1
1.3 Results
1.3.1 Model for the calculation of the ventilation rate
The results of the tracer gas experiments over 12 days are shown in Table 1.1. For the
model the VR was classified according to eight categories of wind speed. The categories,
expected and measured values of wind speed, VR and deviations from the model are
shown in Table 1.2.
Table 1.1 Air exchange rates, ventilation rate and average wind speed subject to the
tracer gas experiments
Day of tracer gas
experiment Average AER
Average
ventilation rate
m3 LU
-1 h
-1
Average wind
speed m s-1
1 97.8 45.9 6361.6 3072.3 3.1
2 39.1 18.2 2611.5 1228.3 1.0
3 72.5 37.5 4900.6 2550.1 2.7
4 67.2 35.4 4506.1 2354.8 2.0
5 41.1 18.2 2752.2 1204.9 1.3
6 50.2 18.2 3461.0 1254.1 1.7
7 21.8 3.6 1458.1 231.6 0.4
8 36.9 8.1 2437.3 532.1 1.7
9 66.5 37.1 4579.0 2705.6 3.0
10 69.1 26.1 4566.6 1725.9 3.0
11 41.7 16.9 2755.1 1115.9 1.5
12 39.2 8.4 2614.1 556.6 1.4
Based on the data from all the tracer gas experiments the linear VR model for the whole
building with curtains completely open was (see Fig 1.3):
(1) VRmod = 870 + 1499v
The deviation between modeled and measured values ranged from -14 to +31%; R2 was
0.92. This means that the predictability of the model was good for situations where east-
west cross-ventilation occurred. At wind speed below 0.2 m s-1
(detection limit of wind
sensor), the ventilation level in the building was 870 m3 h
-1 LU
-1.
CHAPTER 1 23
In the range of 0-5 m s-1
each m s-1
increase in wind speed increased the ventilation rate by
almost 1,500 m3 h
-1 LU
-1.
Table 1.2 Categories, expected and measured values of wind speed, ventilation rate
and deviations from the model
Wind speed m s-1
Ventilation rate m3 LU
-1 h
-1
Category Expected
mean
Measurement
value
Expected
VR by
model
Measurement
value
Rel.
difference
0.0-0.5 0,25 0.26 0.11 1245 1349.9 155.8 -8%
0.5-1.0 0,75 0.71 0.11 1995 1853.3 540.1 7%
1.0-1.5 1,25 1.27 0.15 2744 3175.5 1333.9 -14%
1.5-2.0 1,75 1.70 0.17 3494 3145.4 1431.9 10%
2.0-2.5 2,25 2.20 0.15 4244 4443.1 2145.7 -6%
2.5-3.0 2,75 2.72 0.14 4993 3764.3 1256.4 31%
3.0-3.5 3,25 3.21 0.16 5743 6199.2 1974.1 -9%
3.5-4.0 3,75 3.84 0.16 6492 6874.5 3533.4 -7%
Figure 1.3 Categories of wind speed and measured ventilation rate
y = 870 +1499x
R² = 0,92
0
2000
4000
6000
8000
10000
12000
0 1 2 3 4 5
Ven
tila
tio
n r
ate
m³
LU
-1h
-1
Wind speed m s-1
24 CHAPTER 1
1.3.2 Ventilation rate
The average VR by model was 3,339 1,365 m3 LU
-1 h
-1, and ranged from 870 - 6,888 m
3
LU-1
h-1
. The average wind speed for the considered wind directions was 1.6 m s-1
.
The average VR by CO2 mass balance was 2,016 765 m3 LU
-1 h
-1 and ranged from 610 -
3,441 m3 LU
-1 h
-1. The VR by CO2 mass balance was significantly lower than VR by
model but following a similar course (Fig 1.4).
Figure 1.4 Ventilation rate by CO2 mass balance and by model
1.3.3 Gas concentrations and emissions
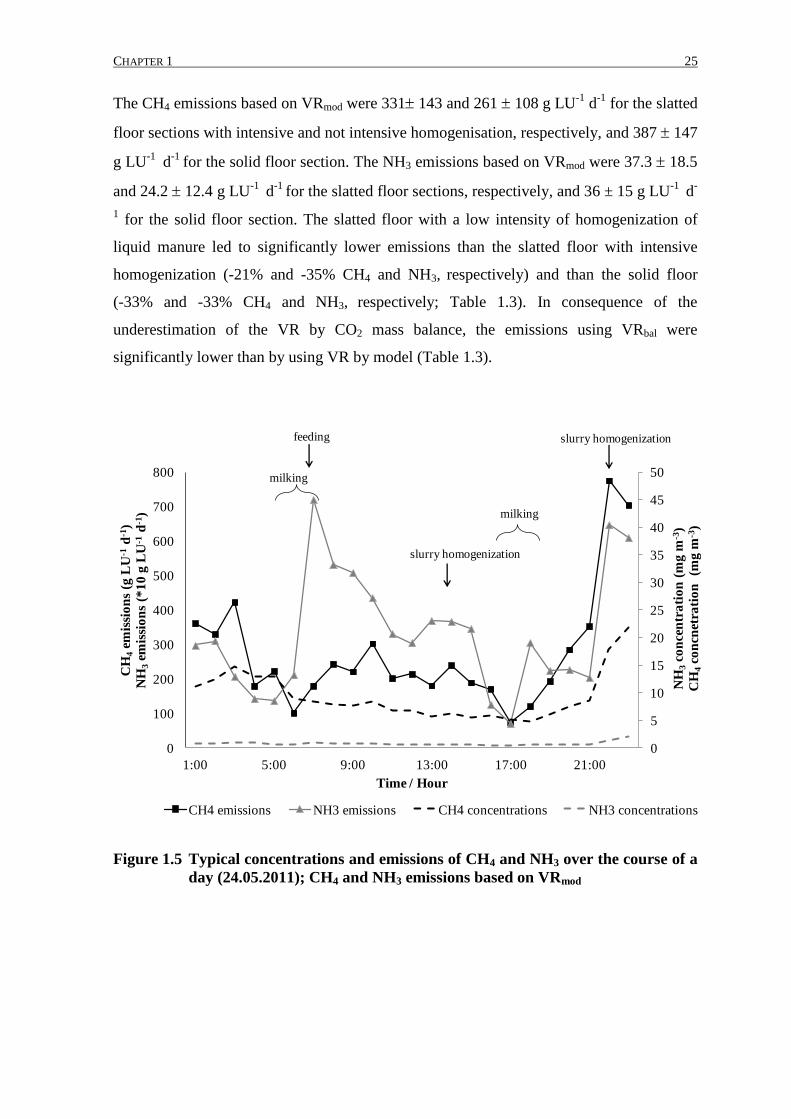
Gas concentrations appeared to fluctuate greatly within a single day which corresponded to
specific activities in the operating procedure of the farm (milking, homogenisation of
liquid manure; Fig 1.5). In particular, CH4 and CO2 concentrations which mainly depend
on the animals’ release decreased immediately when the cows left the barn for milking.
Also, the effect of slurry mixing on the gas concentrations was clear. Ammonia emissions
increased immediately after milking, when the cows came back into the barn. Especially in
the morning, the ammonia emissions increased significantly after feeding (Fig 1.5).
0
1000
2000
3000
4000
5000
6000
7000
27.04.2011 16.05.2011 24.05.2011 01.06.2011
Ven
tila
tio
n r
ate
(m
3 h
-1 L
U-1
)
Date
VR by CO2 mass balance VR by model
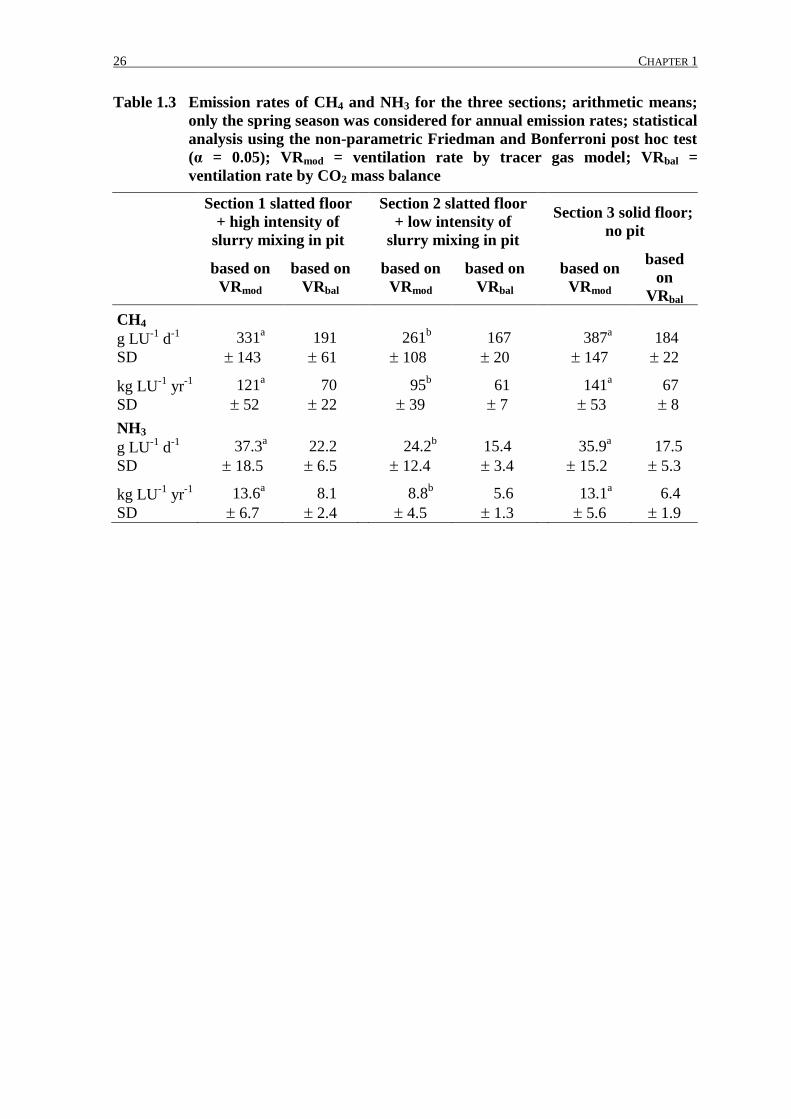
CHAPTER 1 25
The CH4 emissions based on VRmod were 331 143 and 261 108 g LU-1
d-1
for the slatted
floor sections with intensive and not intensive homogenisation, respectively, and 387 147
g LU-1
d-1
for the solid floor section. The NH3 emissions based on VRmod were 37.3 18.5
and 24.2 12.4 g LU-1
d-1
for the slatted floor sections, respectively, and 36 ± 15 g LU-1
d-
1 for the solid floor section. The slatted floor with a low intensity of homogenization of
liquid manure led to significantly lower emissions than the slatted floor with intensive
homogenization (-21% and -35% CH4 and NH3, respectively) and than the solid floor
(-33% and -33% CH4 and NH3, respectively; Table 1.3). In consequence of the
underestimation of the VR by CO2 mass balance, the emissions using VRbal were
significantly lower than by using VR by model (Table 1.3).
Figure 1.5 Typical concentrations and emissions of CH4 and NH3 over the course of a
day (24.05.2011); CH4 and NH3 emissions based on VRmod
0
5
10
15
20
25
30
35
40
45
50
0
100
200
300
400
500
600
700
800
1:00 5:00 9:00 13:00 17:00 21:00
NH
3co
nce
ntr
ati
on
(m
g m
-3)
CH
4co
ncn
etra
tio
n
(mg
m-3
)
CH
4em
issi
on
s (g
LU
-1d
-1)
NH
3em
issi
on
s (*
10
g L
U-1
d-1
)
Time / Hour
CH4 emissions NH3 emissions CH4 concentrations NH3 concentrations
feeding
milking
slurry homogenization
milking
slurry homogenization
26 CHAPTER 1
Table 1.3 Emission rates of CH4 and NH3 for the three sections; arithmetic means;
only the spring season was considered for annual emission rates; statistical
analysis using the non-parametric Friedman and Bonferroni post hoc test
(α = 0.05); VRmod = ventilation rate by tracer gas model; VRbal =
ventilation rate by CO2 mass balance
Section 1 slatted floor
+ high intensity of
slurry mixing in pit
Section 2 slatted floor
+ low intensity of
slurry mixing in pit
Section 3 solid floor;
no pit
based on
VRmod
based on
VRbal
based on
VRmod
based on
VRbal
based on
VRmod
based
on
VRbal
CH4
g LU-1
d-1
SD
331a
143
191
61
261b
108
167
20
387a
147
184
22
kg LU-1
yr-1
SD
121a
52
70
22
95b
39
61
7
141a
53
67
8
NH3
g LU-1
d-1
SD
37.3a
18.5
22.2
6.5
24.2b
12.4
15.4
3.4
35.9a
15.2
17.5
5.3
kg LU-1
yr-1
SD
13.6a
6.7
8.1
2.4
8.8b
4.5
5.6
1.3
13.1a
5.6
6.4
1.9
CHAPTER 1 27
1.4 Discussion
This building-specific model to calculate VRmod was delivering rough, but reasonable
results with minimal effort, and thus serves as preliminary work for further long-term
investigations in this experimental barn. However, the approach has to be further
developed and/or supplemented. Especially for time periods when the curtains are closed
(e.g. in winter), the tracer gas set up has to be adapted and the model to calculate VR has to
be modified. This is of particular importance for the calculation of emission factors, which
must consider measurements during all seasons of the year.
In case of open curtains there were decisive constraints on the applied technology by the
wind direction. Thus the tracer gas technology utilized and the resulting model were
applicable for the determination of VRmod as long as a West-East cross-ventilation was
occurring (R= 0.92). The correlation between wind conditions and VRmod in our own
investigation was quite close; in that regard, SNELL et al. (2003) reported correlations of
0.59–0.84 in four eave-to-ridge ventilated buildings. However, it can be assumed that the
influence of wind speed in a naturally cross-ventilated building is even higher than in eave-
to-ridge ventilated buildings with only small air inlet dimensions (SNELL et al., 2003).
The range of VRmod in our own investigations of 870 – 6,888 m3 LU
-1 h
-1 was broad, but
similar to the range reported by Samer et al. (20113) of about 900 up to slightly over 9,000
m3 LU
-1 h
-1. The obtained results in this study meet the recommendation of DLG (2005)
for Germany, to achieve a VR greater than 700 m³ h-1
per LU in Summer4 for high yielding
dairy cows. The high variation of VR can be explained by the highly fluctuating wind
speed and the close dependency of VR on wind speed.
From a physical point of view, the cross ventilated dairy barn can be seen as an
aerodynamic drag. Considering the inlet dimension of 82.8 m2 per compartment and an
incoming wind speed of e.g. 1 m s-1
, one would expect a ventilation rate of 4,436 m3 LU
-1
h-1
per compartment in the case of no air flow resistance. The VRmod at wind speed of 1 m
s-1
is actually 2,369 m3 LU
-1 h
-1 for one compartment in the own investigation. This shows
that the barn and its equipment as well as the animals inside derive a flow resistance of
53%.
3 converted from air exchange rate, assuming 1.4 LU per cow
4 converted from original recommendation of 1,000 m
3 cow
-1 h
-1
28 CHAPTER 1
The building-specific air exchange model is not transferable from one building to another
without transformation, since the exposition, especially the wind flow (e.g. influenced by
topography or neighbouring buildings) may affect the sensitivity of VR to the wind speed.
However, it might be useful to gather information on the level of flow resistance of several
barns and different barn types.
For both CH4 and NH3 emissions it was possible to record significant differences between
different sections of the building. The lowest emission rates for CH4 and NH3 were found
for the slatted floor with subfloor storage of liquid manure, with a low intensity of
homogenization of the liquid manure. In contrast, ZHANG et al. (2005) found the lowest
NH3 emission rates in a building with solid floors with a smooth surface, scraper and drain.
The levels of NH3 and CH4 emissions using VRmod (37.3, 24.2 and 35.9 g NH3 LU-1
d-1
and
331, 261 and 387 g CH4 LU-1
d-1
for sections 1–3, respectively) agree with the results of
NGWABIE et al. (2009) of 27 g NH3 LU-1
d-1
and 271 g CH4 LU-1
d-1
in March with a
partially slatted floor. SAMER et al. (2011) reported a higher level of emissions (93.6 g NH3
LU-1
d-1
and 456 g CH4 LU
-1 d
-1) whereas these measurements were conducted during
summer seasons.
Applying an equation based on the dry matter intake of dairy cows (equation 2d, ELLIS et
al. 2007) the enteric CH4 release by the cows under investigation is 242 g CH4 d-1
LU-1
. In
relation to the own measurements (VRmod) this would lead to a percentage of CH4
emissions from the barn/manure of 27% (slatted floor intensive), 7% (slatted floor not
intensive), and 37% (solid floor). These findings agree with results from other authors
reporting a percentage of emissions from manure of 7-27% (HINDRICHSEN et al., 2006;
HINDRICHSEN et al., 2005; KÜLLING et al., 2002). When assessing the level of gaseous
emissions the VRmod seems much more realistic than emissions received by VRbal. The
CH4 emissions from barn and storage using VRbal (167-201 g CH4 d-1
LU-1
) were even
below the level expected from enteric fermentation only (242 g CH4 d-1
LU-1
). This leads
to the conclusion that the applied CO2 mass balance is underestimating the VR of the barn.
One reason for this may be that the higher the VR of the barn, the lower the difference
between indoor and outdoor CO2 concentration leading to uncertainties in the calculation
of the VR. Furthermore, there may be other sources of CO2 within the barn not being
considered by the equation.
The reported emission rates are only representative of the spring season and are not
transferable to the whole year, since temperature strongly influences levels of CH4 and
CHAPTER 1 29
NH3 emissions (MASSE et al., 2008; MONTENY et al., 2006; NGWABIE, JEPPSSON,
GUSTAFSSON, & NIMMERMARK, 2011; NGWABIE et al., 2009; SOMMER et al., 2007).
1.5 Conclusions
The building-specific model based on data on wind direction and speed is a rough, but
solid method for estimating VR whereas the CO2 mass balance was underestimating VR. It
was found that each increase of 1 m s-1
increased VRmod by almost 1,500 m3 h
-1 LU
-1.
However, when the curtains are closed and no cross-ventilation is found, other methods to
calculate VR have to be developed. This is of particular importance when determining
emission factors which must consider seasonal effects. In conclusion the development of a
building-specific model for the calculation of VR is complex and time consuming but very
efficient and cost effective for long-term measurements at the same site.
Slurry management, in this case the lower intensity of slurry homogenization within the
subfloor storage, resulted in a 21% reduction in CH4 emissions and a 35% reduction of
NH3 emissions. For a final conclusion and for future investigations comparing the
influence of floor type on gaseous emissions in dairy farming all seasons of the year should
be considered. If emissions from two housing systems are compared, additionally required
external slurry storages and their gaseous emissions have to be included into analyses.

30 CHAPTER 1
1.6 Acknowledgements
We are grateful for the cooperation of the Chamber of Agriculture of North-Rhine
Westphalia, where the measurements were carried out. This investigation was funded by
the Landwirtschaftliche Rentenbank and the Federal Ministry of Food, Agriculture and
Consumer Protection, Germany. We further want to thank Dr. Gert-Jan Monteny for his
support.
CHAPTER 1 31
1.7 References
BELYEA, R. L., MARIN, R. L., & SEDGWICK, H. T. (1985). Utilization of chopped and long
alfalfa by dairy heifers. Journal of Dairy Science, 68(5), 1297-1301.
BOADI, D., WITTENBERG, K., & MCCAUGHEY, W. (2002). Effects of grain supplementation
on methane production of grazing steers using the sulphur (SF6) tracer gas technique.
Canadian Journal of Animal Science, 82(2), 151-157.
BRAAM, C., KETELAARS, J., & SMITS, M. (1997). Effects of floor design and floor cleaning
on ammonia emission from cubicle houses for dairy cows. Netherlands Journal of
Agricultural Science, 45(1), 49-64.
BRAAM, C., SMITS, M., GUNNINK, H., & SWIERSTRA, D. (1997). Ammonia emission from a
double-sloped solid floor in a cubicle house for dairy cows. Journal of Agricultural
Engineering Research, 68(4), 375-386.
BREHME, G. (2003). Richtig messen mit "Innova", in German (Correctly measuring with
Innova). Landtechnik, 58, 195-196.
CIGR (2002). Report of Working Group on Climatization of Animal Houses - Heat and
Moisture Production at Animal and House Levels. Eds S. Pedersen & K. Sällvik:
Commission International Du Genie Rural (International Commission of Agricultural
Engineering). Available under: http://www.cigr.org/CIGRWorkingGroupReports.htm
(accessed on 15.04.2013).
DEMMERS, T. G. M., PHILLIPS, V. R., SHORT, L. S., BURGESS, L. R., HOXEY, R. P., &
WATHES, C. M. (2001). Validation of ventilation rate measurement methods and the
ammonia emission from naturally ventilated dairy and beef buildings in the United
Kingdom. Journal of Agricultural Engineering Research, 79(1), 107-116.
DLG (2005). Merkblatt 336, Vermeidung von Wärmebelastungen für Milchkühe, in
German. Deutsche Landwirtschaftsgelsellschaft e.V.
http://statictypo3.dlg.org/fileadmin/downloads/merkblaetter/dlg-merkblatt_336.pdf
(accessed on: 18.04.2012)
ELLIS, J., KEBREAB, E., ODOGO, N., MCBRIDE, B., OKINE, E., & FRANCE, J., (2007).
Prediction of methane production from dairy and beef cattle. Journal of Dairy Science
90(7), 3456-3466.
HINDRICHSEN, I., WETTSTEIN, H., MACHMULLER, A., JORG, B., KREUZER, M. (2005).
Effect of the carbohydrate composition of feed concentrates on methane emission from
dairy cows and their slurry. Environmental Monitoring and Assessment 107, 329-350.
HINDRICHSEN, I., WETTSTEIN, H., MACHMULLER, A., KREUZER, M. (2006). Methane
emission, nutrient degradation and nitrogen turnover in dairy cows and their slurry at
different milk production scenarios with and without concentrate supplementation.
Agriculture Ecosystems & Environment 113, 150-161.
32 CHAPTER 1
KINSMAN, R., SAUER, F., JACKSON, H., & WOLYNETZ, M. (1995). Methane and carbon
dioxide emissions from dairy cows in full lactation monitored over a six-month period.
Journal of Dairy Science, 78(12), 2760-2766.
KROOSDMA, W., TVELD, J., & SCHOLTENS, R. (1993). Ammonia emission and its reduction
from cubicle houses by flushing. Livestock Production Science, 35(3-4), 293-302.
KÜLLING, D.R., DOHME, F., MENZI, H., SUTTER, F., LISCHER, P., KREUZER, M. (2002).
Methane emissions from differently fed dairy cows and corresponding methane and
nitrogen emissions from their manure during storage. Environmental Monitoring and
Assessment 79, 129–150.
LEIP, A., WEISS, F., WASSENAAR, T., PEREZ, I., FELLMANN, T., LOUDJANI, P., et al. (2010).
Evaluation of the livestock sectors's contribution to the EU greenhouse gas emissions
(GGELS) - final report. European Commission, Joint Research Centre.
MASSE, D., MASSE, L., CLAVEAU, S., BENCHAAR, C., & THOMAS, O. (2008). Methane
emissions from manure storages. Transactions of the ASABE, 51(5), 1775-1781.
MONTENY, G., BANNINK, A., & CHADWICK, D. (2006). Greenhouse gas abatement
strategies for animal husbandry. Agriculture Ecosystems & Environment, 112(2-3).
MORSING, S., STROM, J., ZHANG, G., & KAI, P. (2008). Scale model experiments to
determine the effects of internal airflow and floor design on gaseous emissions from
animal houses. Biosystems Engineering, 99(1), 99-104.
NANNEN, C., SCHNEIDER, T., & BÜSCHER, W. (2006). Automatisierte
Volumenstrommessung in frei gelüfteten Milchviehställen mit Trauf-First-Lüftung, in
German (Automated measurement of ventilation rate in naturally ventilated eave to ridge
dairy houses) Landtechnik, 61, 388-389.
NGWABIE, N., JEPPSSON, K., GUSTAFSSON, G., & NIMMERMARK, S. (2011). Effects of
animal activity and air temperature on methane and ammonia emissions from a naturally
ventilated building for dairy cows. Atmospheric Environment, 45(37).
NGWABIE, N., JEPPSSON, K., NIMMERMARK, S., SWENSSON, C., & GUSTAFSSON, G. (2009).
Multi-location measurements of greenhouse gases and emission rates of methane and
ammonia from a naturally-ventilated barn for dairy cows. Biosystems Engineering, 103(1),
68-77.
NIEBAUM, A. (2001). Quantifizierung gasförmiger Emissionen aus quer gelüfteten
Außenklimaställen für Mastschweine mit Hilfe der Tracergas-Technik, in German. PhD
diss., Göttingen University, Germany.
PEDERSEN, S., TAKAI, H., JOHNSEN, J. O., METZ, J. H. M., KOERKAMP, P., UENK, G. H., et
al. (1998). A comparison of three balance methods for calculating ventilation rates in
livestock buildings. Journal of Agricultural Engineering Research, 70(1), 25-37.
CHAPTER 1 33
PEREIRA, J., FANGUEIRO, D., MISSELBROOK, T. H., CHADWICK, D. R., COUTINHO, J., &
TRINDADE, H. (2011). Ammonia and greenhouse gas emissions from slatted and solid
floors in dairy cattle houses: A scale model study. Biosystems Engineering, 109(2), 148-
157.
PEREIRA, J., MISSELBROOK, T., CHADWICK, D., COUTINHO, J., & TRINDADE, H. (2010).
Ammonia emissions from naturally ventilated dairy cattle buildings and outdoor concrete
yards in Portugal. Atmospheric Environment, 44(28), 3413-3421.
PETERSEN, S., & SOMMER, S. (2011). Ammonia and nitrous oxide interactions: Roles of
manure organic matter management. Animal Feed Science and Technology, 166-67, 503-
513.
SAMER, M., MULLER, H., FIEDLER, M., AMMON, C., GLASER, M., BERG, W., et al. (2011).
Developing the (85)Kr tracer gas technique for air exchange rate measurements in
naturally ventilated animal buildings. Biosystems Engineering, 109(4), 276-287.
SCHNEIDER, T. (2006). Untersuchungen zur Partikelemission eines frei gelüfteten
Putenstalles mit Hilfe der Tracergasmethode, in German (Analysis of the dust emissions
from a naturally ventilated turkey house using the tracer gas method). PhD diss., Bonn
University, Germany.
SCHRADE, S., ZEYER, K., GYGAX, L., EMMENEGGER, L., HARTUNG, E., & KECK, M.
(2012). Ammonia emissions and emission factors of naturally ventilated dairy housing
with solid floors and an outdoor exercise area in Switzerland. Atmospheric Environment,
47, 183-194.
SEIPELT, F. (1999). Quantifizierung und Bewertung gasförmiger Emissionen aus frei
gelüfteten Milchviehställen mit Trauf-First-Lüftung, in German. PhD diss., Göttingen
University, Germany.
SNELL, H. G. J., SEIPELT, F., & VAN DEN WEGHE, H. F. A. (2003). Ventilation rates and
gaseous emissions from naturally ventilated dairy houses. Biosystems Engineering, 86(1),
67-73.
SOMMER, S., PETERSEN, S., SORENSEN, P., POULSEN, H., & MOLLER, H. (2007). Methane
and carbon dioxide emissions and nitrogen turnover during liquid manure storage. Nutrient
Cycling in Agroecosystems, 78(1), 27-36.
UMWELTBUNDESAMT (2011). Daten zur Umwelt, Umwelt und Landwirtschaft, Ausgabe
2011, in German. Dessau Roßlau, Germany. Available under http://www.uba.de/uba-info-
medien/4056.html (accessed on 15.04.2013).
ZHANG, G., STROM, J. S., Li, B., ROM, H. B., MORSING, S., DAHL, P., & WANG, C. (2005).
Emission of ammonia and other contaminant gases from naturally ventilated dairy cattle
buildings. Biosystems Engineering, 92(3), 355-364.
34 CHAPTER 2
2 Chapter 2 - Effect of manure removal and storage
management on methane and ammonia emissions from a
naturally ventilated dairy barn5
Abstract
Dairy barns represent a significant source of gaseous emissions such as methane (CH4) and
ammonia (NH3). There is still a lack of knowledge regarding the influence of the floor design
and manure management on CH4 and NH3 emissions from dairy barns. The objective of this
work was a simultaneous comparison of CH4 and NH3 emissions from different floor designs
and manure-management strategies within the same dairy barn. Therefore long-term emission
measurement data for the barn and model-based estimations for the external manure storage
(using the process-based farm level model DAIRYDYN) were brought together in order to
compare the total emission amounts precisely. The investigated naturally cross-ventilated dairy
barn was divided into three equally sized compartments, each of which was designed for 48
lactating Holstein cows. One compartment had a slatted floor with subfloor storage and was run
with a high intensity of manure homogenization, one compartment had a slatted floor with
subfloor storage and a low intensity of homogenization, and one compartment had a solid floor
with scrapers and external manure storage. On annual average the highest CH4 and NH3
emissions at barn level were found on the slatted floor with high intensity of homogenization
(381.7 ± 149.2 g CH4 LU-1
d-1
and 38.4 ± 15.1 g NH3 LU-1
d-1
). Considering an uncovered
external manure storage in the solid floor scenario on annual average the CH4 emissions from
the solid floor including storage exceeded the level of the slatted floor with intensive
homogenization on annual average (417.8 g CH4 LU-1
d-1
) whereas NH3 emissions remained at
the level of the slatted floor with intensive homogenization (37.9 g NH3 LU-1
d-1
). In all cases
and seasons the lowest emissions were found on slatted floor with low intensity of
homogenization (e.g., 324.9 ± 123.6 g CH4 LU-1
and 29.8 ± 13.1g NH3 LU-1
d-1
on annual
average). The results show that the influence of manure management, especially
homogenization intensity of liquid manure beneath the slatted floor, led to higher differences
than the floor design itself. Thus there is no general recommendation for one of the tested floor
designs (slatted floor or solid floor) regarding CH4 and NH3 emissions.
Keywords: ammonia, methane, emissions, dairy barn, manure storage, emission modeling
5 This chapter is based on a manuscript submitted to the Journal ‘Agriculture, Ecosystems and Environment’
as SCHIEFLER I., LENGERS B., SCHMITHAUSEN A. and W. BÜSCHER: Effect of manure removal and storage
management on methane and ammonia emissions from a naturally ventilated dairy barn. Inga Schiefler was
responsible for the whole manuscript and contributed significantly to all sections except 2.2.3.

CHAPTER 2 35
Nomenclature
d = day
GHG = greenhouse gases
h = hour
LU = livestock unit (500 kg of live weight; 1 cow is 700kg)
VR = ventilation rate [m-3
h-1
]
yr = year
36 CHAPTER 2
2.1 Introduction
Livestock production is a significant source of gaseous emissions, such as methane (CH4),
nitrous oxide (N2O) and ammonia (NH3). Several studies have been published estimating
livestocks’ contribution to the anthropogenic greenhouse gas emissions. The indicated
percentage of livestock worldwide was stated at 18% in an FAO study (FAO, 2006), within
the EU the percentage was estimated at 9.1% by LEIP et al. (2010). However, there is a
broad discussion about where to put the system border and ‘the importance of getting the
numbers right’ (HERRERO et al., 2011). Emission factors on barn level are composed of the
animals’ release and by the emission generation of the manure on floors and channels.
There are several studies in the literature focusing on CH4 emissions from enteric
fermentation (AGUERRE et al., 2011; DERNO et al., 2009; Ellis et al., 2007; GARNSWORTHY
et al., 2012; PLACE et al., 2011; VAN ZIJDERVELD et al., 2011) whereas emissions at the
barn level have been studied less thoroughly (Ngwabie et al., 2009; Samer et al., 2011; Wu
et al., 2012). Furthermore, some studies may be limited to model/scale studies (AGUERRE
et al., 2007; PEREIRA et al., 2011). The proportion of CH4 emissions from manure is
estimated to be about 20% for dairy cattle worldwide (FAO, 2006). Other authors reported
a percentage of CH4 emissions from manure of 7-27% (HINDRICHSEN et al., 2006;
HINDRICHSEN et al., 2005; KÜLLING et al., 2002). The influence of floor design on CH4
emissions at barn level has been poorly studied. However, PEREIRA, et al. (2011) reported
higher emissions from solid floors than from slatted floors at all temperatures, but this
investigation was performed as a scale-model study. PEREIRA et al. (2012) reported a
positive correlation of CH4 release and temperature, and illustrated that CH4 emission from
cattle excreta is increased with temperature up to a temperature of 25°C.
In contrast to CH4 which is mainly directly emitted by the animals, NH3 emissions mainly
originate from feces and urine on floors and channels, and manure storage. Much research
has been conducted to measure NH3 emissions from dairy barns in the past (for instance
BRAAM et al., 1997; KROODSMA et al., 1993; SOMMER et al., 2006). Recent studies of
SCHRADE et al. (2012) and Wu et al. (2012) have investigated the correlation of weather
parameters as well as of production parameters with NH3 emissions in different housing
systems. Since scientists agree on the positive correlation between NH3 emission and
temperature in general, the issue of floor design on NH3 emissions is still not yet clarified
(PEREIRA et al., 2012; PEREIRA, et al., 2011; PEREIRA et al. 2010; SCHRADE, et al., 2012;
WU et al., 2012).
CHAPTER 2 37
Apart from floor design as a matter of construction, the manure management - e.g., slurry
treatment and stirring - may play an important role for the emission levels (PETERSEN and
SOMMER, 2011; PETERSEN et al., 2005; SOMMER et al. 2007; SOMMER et al., 2000).
There are several approaches of slurry storage in dairy farming. The storage may be
entirely or partly within the building (slatted floor with subfloor storage) as a part of the
total barn-level emissions. Other systems (e.g., solid floors with scrapers) include an
external slurry tank, which may be designed in a more or less emitting manner. The
external tank can either be open or covered, e.g., by a gastight foil, solid cover or loose
materials like straw. Furthermore, there are certain effects on the emissions by
management of the stored slurry, in particular stirring or crusting. For instance,
MISSELBROOK et al. (2005) stated that the NH3 emissions of uncrusted storages were more
than twice as high as from crusted storages. Regarding CH4 emissions, anaerobic covered
storages are of major importance in combination with biogas plants (CUELLAR and
WEBBER, 2008; MONTENY et al. 2006). In conclusion, an honest comparison of two dairy
housing systems regarding the level of gaseous emissions should always include manure
storage whether inside or outside the building.
In summary, there is a lack of knowledge regarding the influence of floor design, manure
removal and manure homogenization on CH4 and NH3 emissions. The investigations
reported here were set up in a simultaneous comparison of housing systems within the
same building and covering the same basic parameters (e.g., number of animals, breed,
lactation day, milk yield, feeding and management as well as barn construction and
ventilation).
The objective of this study was to evaluate whether one of the tested manure removal and
related indoor/external manure storage strategies leads to significantly lower CH4 and NH3
emissions on annual average. Therefore, long-term measurement data for the barn- and
model-based estimations for the external storage were brought together in order to compare
the total emission amounts precisely.
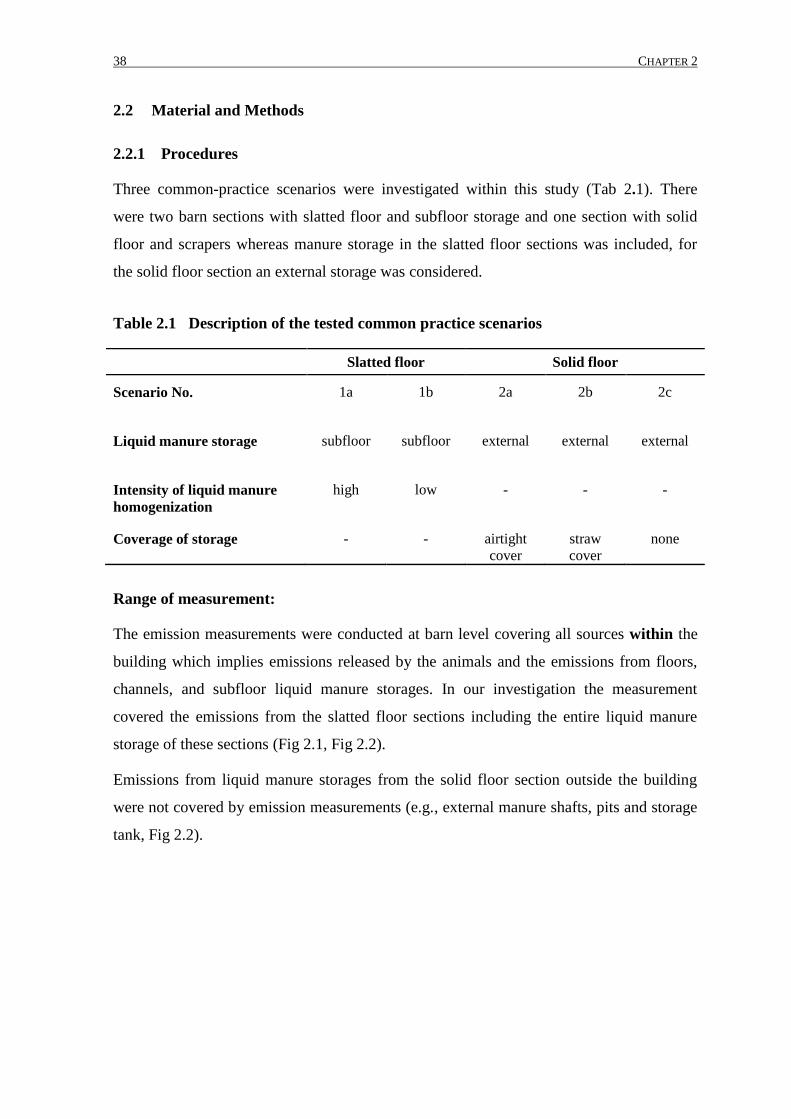
38 CHAPTER 2
2.2 Material and Methods
2.2.1 Procedures
Three common-practice scenarios were investigated within this study (Tab 2.1). There
were two barn sections with slatted floor and subfloor storage and one section with solid
floor and scrapers whereas manure storage in the slatted floor sections was included, for
the solid floor section an external storage was considered.
Table 2.1 Description of the tested common practice scenarios
Slatted floor Solid floor
Scenario No. 1a 1b 2a 2b 2c
Liquid manure storage subfloor subfloor external external external
Intensity of liquid manure
homogenization
high low - - -
Coverage of storage - - airtight
cover
straw
cover
none
Range of measurement:
The emission measurements were conducted at barn level covering all sources within the
building which implies emissions released by the animals and the emissions from floors,
channels, and subfloor liquid manure storages. In our investigation the measurement
covered the emissions from the slatted floor sections including the entire liquid manure
storage of these sections (Fig 2.1, Fig 2.2).
Emissions from liquid manure storages from the solid floor section outside the building
were not covered by emission measurements (e.g., external manure shafts, pits and storage
tank, Fig 2.2).
CHAPTER 2 39
1. Slatted floor with subfloor storage a) high intensity of homogenization
b) low intensity of homogenization
2. Solid floor with external storage a) external tank with gas tight cover
b) external tank with straw cover
c) external tank without coverage
online-
measurement
modelled by
DAIRYDYN (CH4)
Literature (NH3)
a
b
c
Figure 2.1 Range of measurement and range of model/literature data
Foil partition
Feed alley
Slatted floor 1 Slatted floor 2 Solid floor
4x Chain-pulled
scraper
External
manure
shafts
Mixer for
subfloor
storage
Feed alley
Shared subfloor slurry storage with
circulation system
33
,50 34m
67,5068m
Figure 2.2 Scheme of dairy barn, liquid manure removal and storage
40 CHAPTER 2
Range of model DAIRYDYN and literature-based data
The model DAIRYDYN was used to calculate the CH4 emissions from external liquid
manure storage of the entire year, based on specific data of the investigated farm (e.g.,
milk yield, feed composition, body weight). In our investigation the model was applied to
calculate CH4 emissions from storage of manure coming from the solid floor section.
For the estimation of NH3 emissions from liquid manure storage, the authors calculated the
emission factor for the liquid manure storage based on our own measurements of slurry
amount and data from the literature with similar conditions (AMON et al., 2006; BALSARI et
al., 2007; MISSELBROOK, et al., 2005; MISSELBROOK et al., 2000; SMITH et al., 2007).
2.2.2 Description of measurement procedures
The experimental farm was located in Kleve, Germany. The measurements were conducted
from December 2010 to December 2011 covering the entire year (Tab 2.2). Limited by
wind direction and other experimental restrictions, 120 days were included in the final
analysis. 144 lactating Holstein cows with an average milk yield of 34 kg per day were
held in three equally sized sections of a free-stall dairy barn leading to groups of 48
animals in each section. The total average dry matter feed intake per cow was 19 kg d-1
,
with a mean crude protein of the mixed ration of 16.6% (dry matter) and crude fiber of
17.4% (dry matter).
CHAPTER 2 41
Figure 2.3 Foil partition of the investigated dairy barn
The air spaces of the sections were separated by foil partition (Fig 2.3). Two sections of the
barn were equipped with a slatted floor and a shared subfloor manure storage (slalom
system, Fig 2.2). The slurry stored in the pit beneath the slatted floor was stirred twice a
day for 30 minutes from December 2010 to September 2011, and from October 2011 to
December 2011 only once every 10 days. Due to the position of the mixer at the gable wall
of the building it was possible to derive one section with intensively mixed slurry (section
1) and one section with less intensively homogenized and thus less aerated slurry (section
2, Fig 2.2). The slatted floor was water-cleaned by an automated cleaning robot (Joz Tech
JT100, Joz B.V., Netherlands) at least four times a day. The third section of the barn had a
solid floor with four cable-pulled scrapers with a frequency of 20 times a day. There was
an external manure discharge, forwarding the liquid manure to an external slurry pit. The
emitting area (walking area) in all sections was 7 m² per cow.
42 CHAPTER 2
Table 2.2 Description of measurement periods and conditions
Season Measurement
period Temperature
°C
SD
Wind
speed m s-1
SD
Position of
Curtains VR method Comments
Winter
20.12.2010 -
26.01.2011 3.6 ± 4.1 2.1 ± 0.9 closed CO2 mass
balance
07.12.2011 -
21.12.2011 5.9 ± 1.5 3.4 ± 1.0 closed CO2 mass
balance
Spring
03.03.2011 -
16.03.2011 2.7 ± 4.8 1.9 ± 0.7 partly open CO2 mass
balance
very cold
period from
03.-08.03.2011
20.04.2011 -
06.06.2011 17.4 ± 3.1 1.5 ± 0.6 open Model
(tracer gas)
Summer
07.06.2011 -
10.08.2011 18.2 ± 2.7 2.0 ± 0.6 open Model
(tracer gas)
Autumn
25.11.2011 -
05.12.2011 8.2 ± 1.0 2.9 ± 0.6 partly open CO2 mass
balance
The barn was cross-ventilated with an eave height of 5 m and a ridge height of 13 m. The
curtains at the west side of the barn were closed during wintertime. Milking was performed
twice a day in the adjacent building including the waiting area. Milking time was not
included in the emission calculation. The emissions (E) were calculated using the gas
concentrations from the exhaust air (Cexhaust) minus the background concentration
(Cbackground) of the respective section and the ventilation rate of the barn (VR) using the
following equation:
E = VR * (Cexhaust - Cbackground).
The measurements of gas concentrations were performed every 5 minutes at the eastern
eave side (exhaust position), as long as west-to-east cross-ventilation occurred (photo-
acoustic multi-gas analyzer 1412 and a multiplexer 1303, Lumasense Technologies SA,
Ballerup, Denmark). The exhaust air was sampled at eight measurement points at 4 m
height in each section by vacuum pumps and forwarded through poly-tetrafluoro-ethylene
(PTFE) to the multiplexer and gas monitor in the adjacent building (Fig 2.4).
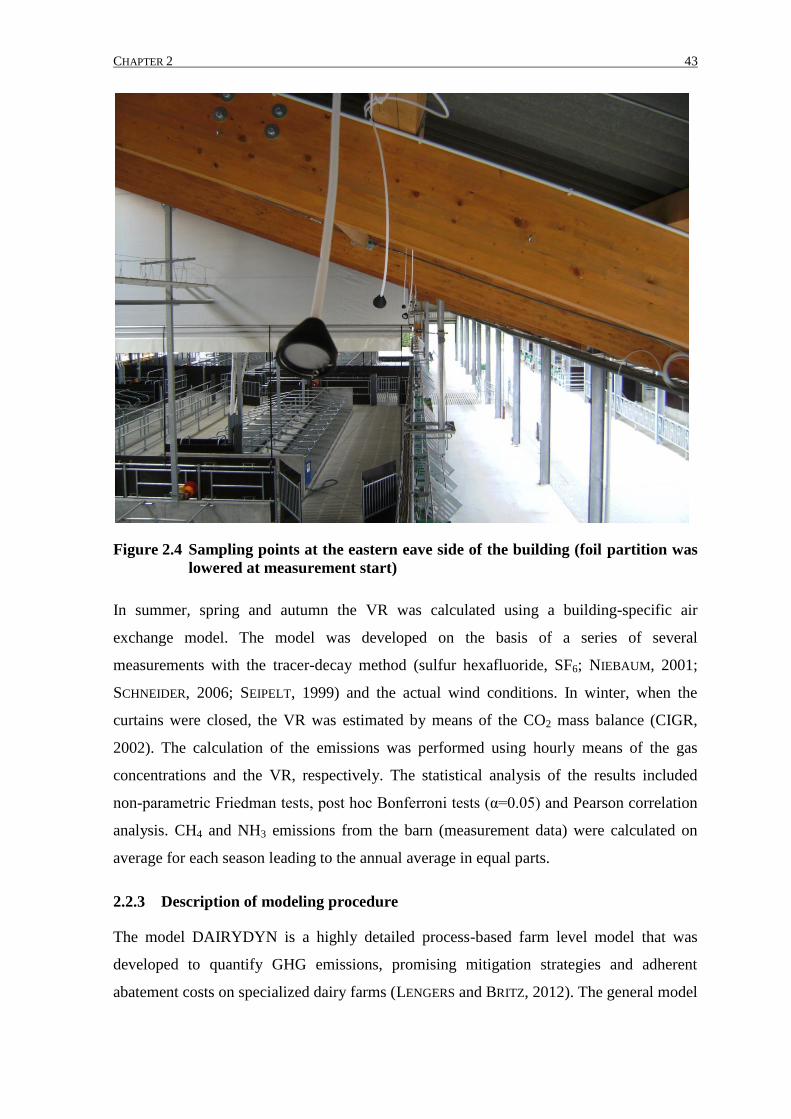
CHAPTER 2 43
Figure 2.4 Sampling points at the eastern eave side of the building (foil partition was
lowered at measurement start)
In summer, spring and autumn the VR was calculated using a building-specific air
exchange model. The model was developed on the basis of a series of several
measurements with the tracer-decay method (sulfur hexafluoride, SF6; NIEBAUM, 2001;
SCHNEIDER, 2006; SEIPELT, 1999) and the actual wind conditions. In winter, when the
curtains were closed, the VR was estimated by means of the CO2 mass balance (CIGR,
2002). The calculation of the emissions was performed using hourly means of the gas
concentrations and the VR, respectively. The statistical analysis of the results included
non-parametric Friedman tests, post hoc Bonferroni tests (α=0.05) and Pearson correlation
analysis. CH4 and NH3 emissions from the barn (measurement data) were calculated on
average for each season leading to the annual average in equal parts.
2.2.3 Description of modeling procedure
The model DAIRYDYN is a highly detailed process-based farm level model that was
developed to quantify GHG emissions, promising mitigation strategies and adherent
abatement costs on specialized dairy farms (LENGERS and BRITZ, 2012). The general model
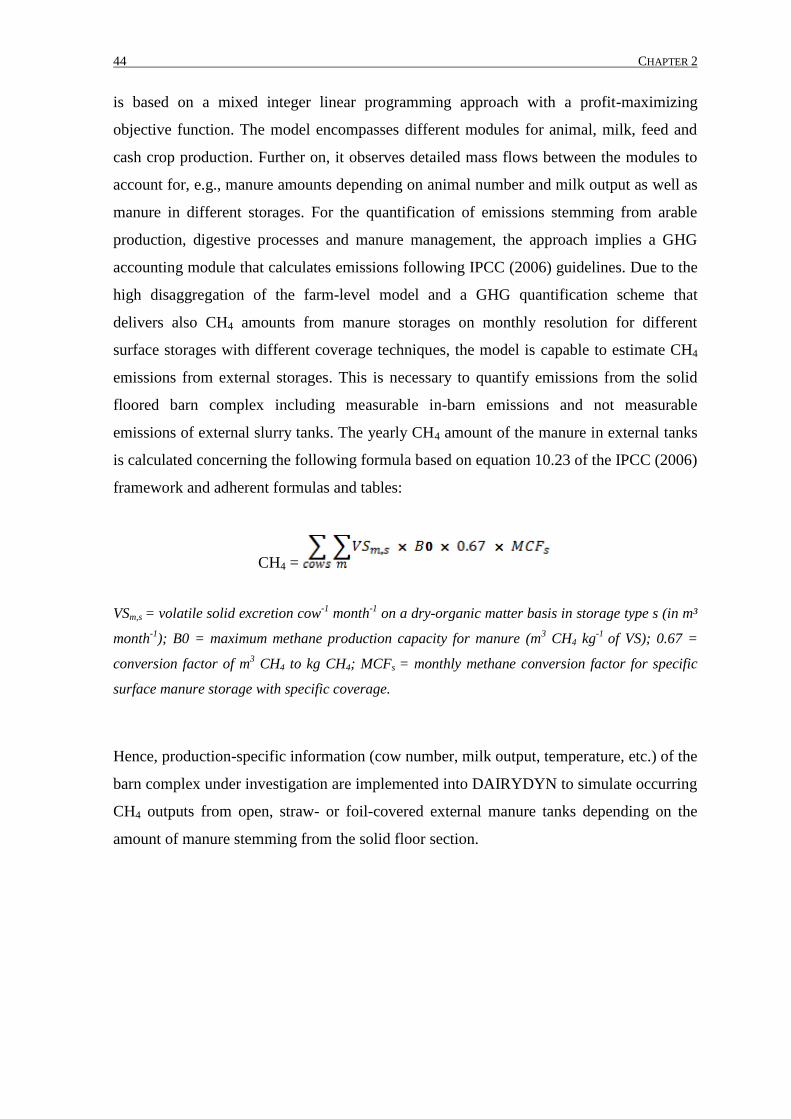
44 CHAPTER 2
is based on a mixed integer linear programming approach with a profit-maximizing
objective function. The model encompasses different modules for animal, milk, feed and
cash crop production. Further on, it observes detailed mass flows between the modules to
account for, e.g., manure amounts depending on animal number and milk output as well as
manure in different storages. For the quantification of emissions stemming from arable
production, digestive processes and manure management, the approach implies a GHG
accounting module that calculates emissions following IPCC (2006) guidelines. Due to the
high disaggregation of the farm-level model and a GHG quantification scheme that
delivers also CH4 amounts from manure storages on monthly resolution for different
surface storages with different coverage techniques, the model is capable to estimate CH4
emissions from external storages. This is necessary to quantify emissions from the solid
floored barn complex including measurable in-barn emissions and not measurable
emissions of external slurry tanks. The yearly CH4 amount of the manure in external tanks
is calculated concerning the following formula based on equation 10.23 of the IPCC (2006)
framework and adherent formulas and tables:
CH4 =
VSm,s = volatile solid excretion cow-1
month-1
on a dry-organic matter basis in storage type s (in m³
month-1
); B0 = maximum methane production capacity for manure (m3 CH4 kg
-1 of VS); 0.67 =
conversion factor of m3 CH4 to kg CH4; MCFs = monthly methane conversion factor for specific
surface manure storage with specific coverage.
Hence, production-specific information (cow number, milk output, temperature, etc.) of the
barn complex under investigation are implemented into DAIRYDYN to simulate occurring
CH4 outputs from open, straw- or foil-covered external manure tanks depending on the
amount of manure stemming from the solid floor section.
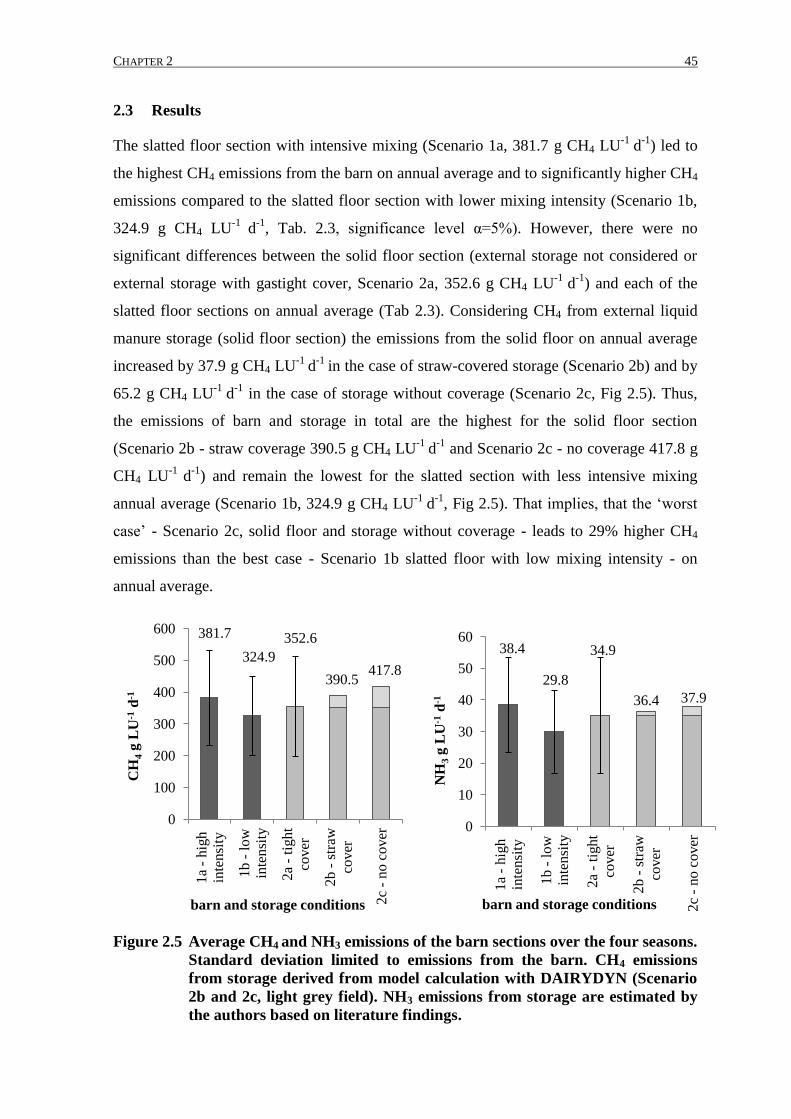
CHAPTER 2 45
2.3 Results
The slatted floor section with intensive mixing (Scenario 1a, 381.7 g CH4 LU-1
d-1
) led to
the highest CH4 emissions from the barn on annual average and to significantly higher CH4
emissions compared to the slatted floor section with lower mixing intensity (Scenario 1b,
324.9 g CH4 LU-1
d-1
, Tab. 2.3, significance level α=5%). However, there were no
significant differences between the solid floor section (external storage not considered or
external storage with gastight cover, Scenario 2a, 352.6 g CH4 LU-1
d-1
) and each of the
slatted floor sections on annual average (Tab 2.3). Considering CH4 from external liquid
manure storage (solid floor section) the emissions from the solid floor on annual average
increased by 37.9 g CH4 LU-1
d-1
in the case of straw-covered storage (Scenario 2b) and by
65.2 g CH4 LU-1
d-1
in the case of storage without coverage (Scenario 2c, Fig 2.5). Thus,
the emissions of barn and storage in total are the highest for the solid floor section
(Scenario 2b - straw coverage 390.5 g CH4 LU-1
d-1
and Scenario 2c - no coverage 417.8 g
CH4 LU-1
d-1
) and remain the lowest for the slatted section with less intensive mixing
annual average (Scenario 1b, 324.9 g CH4 LU-1
d-1
, Fig 2.5). That implies, that the ‘worst
case’ - Scenario 2c, solid floor and storage without coverage - leads to 29% higher CH4
emissions than the best case - Scenario 1b slatted floor with low mixing intensity - on
annual average.
Figure 2.5 Average CH4 and NH3 emissions of the barn sections over the four seasons.
Standard deviation limited to emissions from the barn. CH4 emissions
from storage derived from model calculation with DAIRYDYN (Scenario
2b and 2c, light grey field). NH3 emissions from storage are estimated by
the authors based on literature findings.
381.7
324.9
352.6
390.5 417.8
0
100
200
300
400
500
600
1a
- h
igh
inte
nsi
ty
1b
- l
ow
inte
nsi
ty
2a
- ti
gh
t
cover
2b
- s
traw
cover
2c
- n
o c
over
CH
4 g
LU
-1 d
-1
barn and storage conditions
38.4
29.8
34.9
36.4 37.9
0
10
20
30
40
50
60
1a
- h
igh
inte
nsi
ty
1b
- l
ow
inte
nsi
ty
2a
- ti
gh
t
cover
2b
- s
traw
cover
2c
- n
o c
over
NH
3 g
LU
-1 d
-1
barn and storage conditions
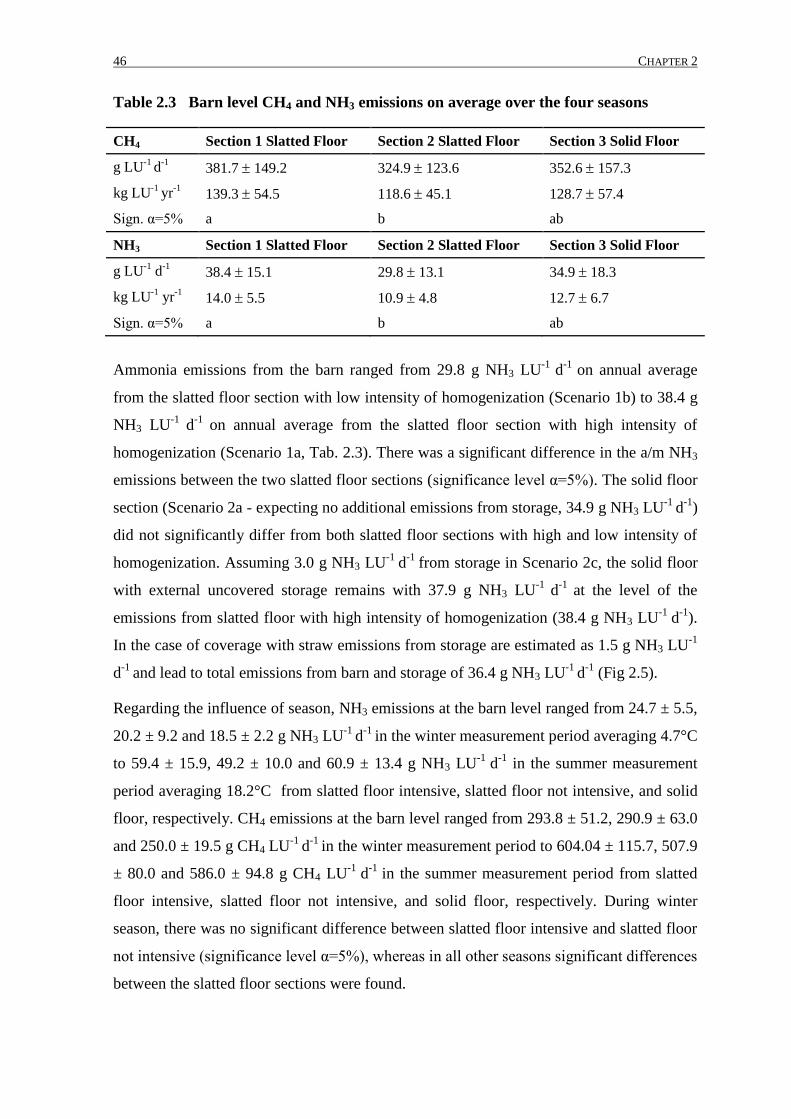
46 CHAPTER 2
Table 2.3 Barn level CH4 and NH3 emissions on average over the four seasons
CH4 Section 1 Slatted Floor Section 2 Slatted Floor Section 3 Solid Floor
g LU-1
d-1
381.7 149.2 324.9 123.6 352.6 157.3
kg LU-1
yr-1
139.3 54.5 118.6 45.1 128.7 57.4
Sign. α=5% a b ab
NH3 Section 1 Slatted Floor Section 2 Slatted Floor Section 3 Solid Floor
g LU-1
d-1
38.4 15.1 29.8 13.1 34.9 18.3
kg LU-1
yr-1
14.0 5.5 10.9 4.8 12.7 6.7
Sign. α=5% a b ab
Ammonia emissions from the barn ranged from 29.8 g NH3 LU-1
d-1
on annual average
from the slatted floor section with low intensity of homogenization (Scenario 1b) to 38.4 g
NH3 LU-1
d-1
on annual average from the slatted floor section with high intensity of
homogenization (Scenario 1a, Tab. 2.3). There was a significant difference in the a/m NH3
emissions between the two slatted floor sections (significance level α=5%). The solid floor
section (Scenario 2a - expecting no additional emissions from storage, 34.9 g NH3 LU-1
d-1
)
did not significantly differ from both slatted floor sections with high and low intensity of
homogenization. Assuming 3.0 g NH3 LU-1
d-1
from storage in Scenario 2c, the solid floor
with external uncovered storage remains with 37.9 g NH3 LU-1
d-1
at the level of the
emissions from slatted floor with high intensity of homogenization (38.4 g NH3 LU-1
d-1
).
In the case of coverage with straw emissions from storage are estimated as 1.5 g NH3 LU-1
d-1
and lead to total emissions from barn and storage of 36.4 g NH3 LU-1
d-1
(Fig 2.5).
Regarding the influence of season, NH3 emissions at the barn level ranged from 24.7 ± 5.5,
20.2 ± 9.2 and 18.5 ± 2.2 g NH3 LU-1
d-1
in the winter measurement period averaging 4.7°C
to 59.4 ± 15.9, 49.2 ± 10.0 and 60.9 ± 13.4 g NH3 LU-1
d-1
in the summer measurement
period averaging 18.2°C from slatted floor intensive, slatted floor not intensive, and solid
floor, respectively. CH4 emissions at the barn level ranged from 293.8 ± 51.2, 290.9 ± 63.0
and 250.0 ± 19.5 g CH4 LU-1
d-1
in the winter measurement period to 604.04 ± 115.7, 507.9
± 80.0 and 586.0 ± 94.8 g CH4 LU-1
d-1
in the summer measurement period from slatted
floor intensive, slatted floor not intensive, and solid floor, respectively. During winter
season, there was no significant difference between slatted floor intensive and slatted floor
not intensive (significance level α=5%), whereas in all other seasons significant differences
between the slatted floor sections were found.
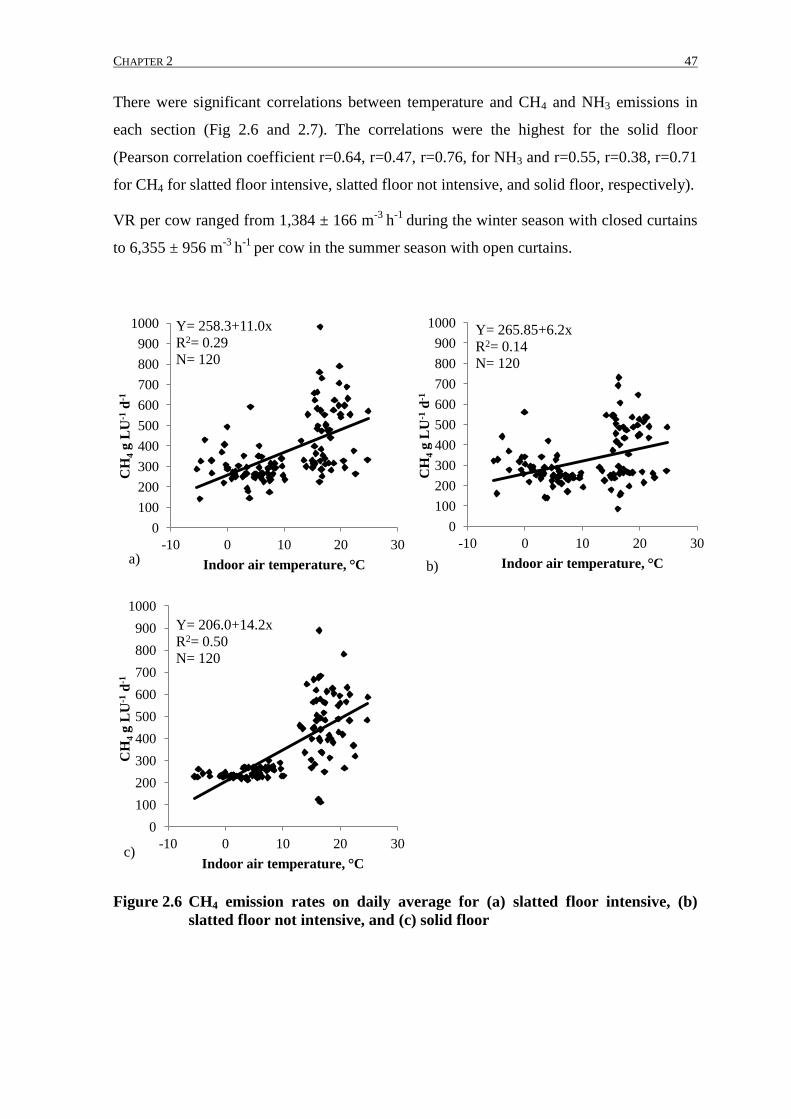
CHAPTER 2 47
There were significant correlations between temperature and CH4 and NH3 emissions in
each section (Fig 2.6 and 2.7). The correlations were the highest for the solid floor
(Pearson correlation coefficient r=0.64, r=0.47, r=0.76, for NH3 and r=0.55, r=0.38, r=0.71
for CH4 for slatted floor intensive, slatted floor not intensive, and solid floor, respectively).
VR per cow ranged from 1,384 ± 166 m-3
h-1
during the winter season with closed curtains
to 6,355 ± 956 m-3
h-1
per cow in the summer season with open curtains.
Figure 2.6 CH4 emission rates on daily average for (a) slatted floor intensive, (b)
slatted floor not intensive, and (c) solid floor
0
100
200
300
400
500
600
700
800
900
1000
-10 0 10 20 30
CH
4 g
LU
-1 d
-1
Indoor air temperature, °C
Y= 258.3+11.0x
R2= 0.29
N= 120
a)
0
100
200
300
400
500
600
700
800
900
1000
-10 0 10 20 30
CH
4 g
LU
-1 d
-1
Indoor air temperature, °C
Y= 206.0+14.2x
R2= 0.50
N= 120
c)
0
100
200
300
400
500
600
700
800
900
1000
-10 0 10 20 30
CH
4 g
LU
-1 d
-1
Indoor air temperature, °C
Y= 265.85+6.2x
R2= 0.14
N= 120
b)
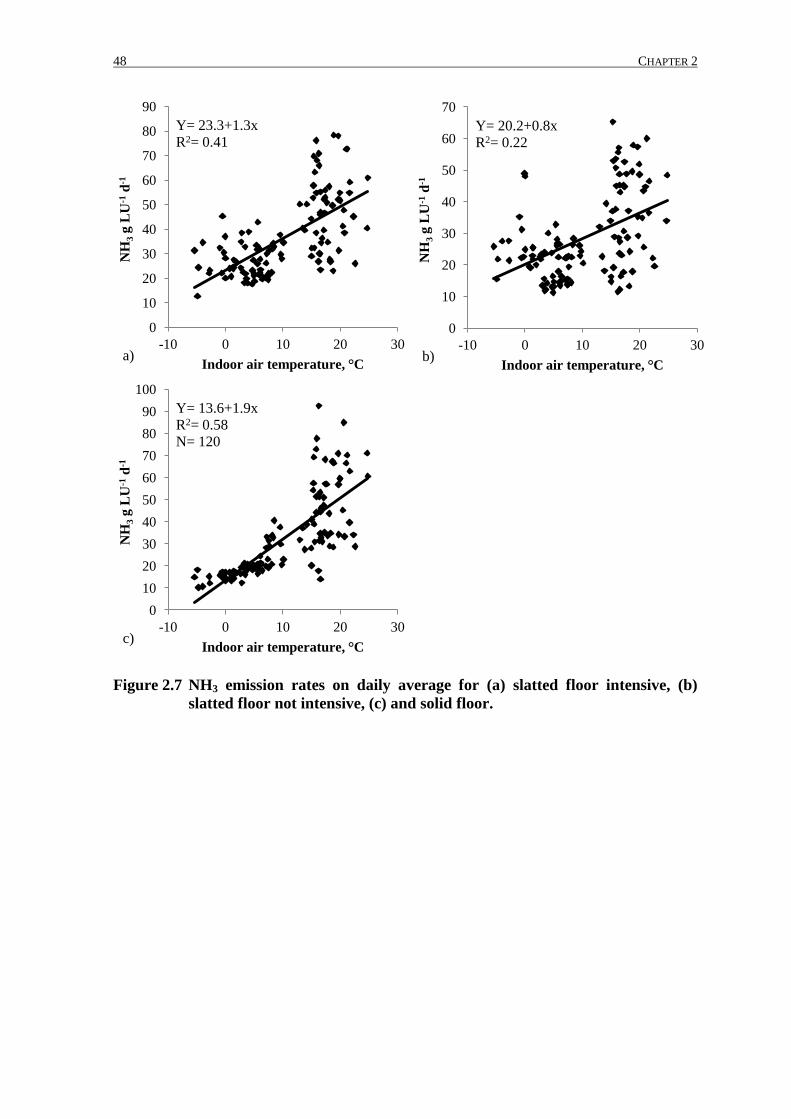
48 CHAPTER 2
Figure 2.7 NH3 emission rates on daily average for (a) slatted floor intensive, (b)
slatted floor not intensive, (c) and solid floor.
0
10
20
30
40
50
60
70
80
90
-10 0 10 20 30
NH
3 g
LU
-1 d
-1
Indoor air temperature, °C
Y= 23.3+1.3x
R2= 0.41
a)
0
10
20
30
40
50
60
70
80
90
100
-10 0 10 20 30
NH
3 g
LU
-1 d
-1
Indoor air temperature, °C
Y= 13.6+1.9x
R2= 0.58
N= 120
c)
0
10
20
30
40
50
60
70
-10 0 10 20 30
NH
3 g
LU
-1 d
-1
Indoor air temperature, °C
Y= 20.2+0.8x
R2= 0.22
b)
CHAPTER 2 49
2.4 Discussion
The applied methods for measuring the gas emissions were suitable and reliable for long-
term-conditions. However, it has to be considered that measurement errors do occur,
especially when calculating the VR. The equation for the CO2 mass balance (CIGR, 2002)
does not, for example, include other CO2 sources in the barn. Further, it has been
developed for mechanically ventilated buildings and is not suitable for naturally ventilated
buildings with large open surfaces since the accuracy decreases with increasing VR.
However, since this method was applied in the situation of closed curtains which leads to a
lower VR, this effect did not affect our own measurements strongly. Further, it has to be
considered that the tracer gas technique in naturally ventilated buildings may also lead to
errors of up to 10% (SCHNEIDER, 2006). For this reason, the applied method is not suitable
to determine minor differences (<10%) between two systems.
The highest average VR was found in the summer period at 6,355 ± 956 m-3
h-1
with open
curtains. This seems to be relatively high with regard to the recommendation of the
German Agricultural Society (DLG 2005), which states that the ventilation rate should be
greater than 1,000 m³ h-1
per cow in summer for high-yielding dairy cows. However,
considering the large open walls in the building and the natural cross-ventilation, the level
of VR is realistic. For instance, SAMER et al. (2011) found ventilation rates of more than
12,000 m³ h-1
per cow in experiments in a naturally cross-ventilated dairy barn during the
summer season.
Our own results for the winter season of 250-294 g CH4 LU-1
d-1
and 19-25 g NH3 LU-1
d-1
correspond with results of NGWABIE et al. (2009) of 278-315 g CH4 LU-1
d-1
and 24-25 g
NH3 LU-1
d-1
which were also measured during the winter season. For the summer season
the measured emission rates of 508-604 g CH4 LU-1
d-1
and 49-61 g NH3 LU-1
d-1
,
respectively, are only slightly varying from the results of SAMER et al. (2011) reported for
the summer season (456 g CH4 LU-1
d-1
and 93 g NH3 LU-1
d-1
). In a recent study, SAMER
et al. (2012) reported even higher emission factors from a naturally ventilated building in
Germany using a tracergas technique (855 g CH4 LU-1
d-1
and 191 g NH3 LU-1
d-1
). Further,
SAMER, et al. (2012) also found high differences between the summer and winter seasons
which corresponds exactly with our findings.
Regarding our investigation the recommendation of one of the applied manure removal
systems ‘slatted floor or solid floor’ with respect to the CH4 and NH3 emissions is not
50 CHAPTER 2
feasible. Due to different management practices, both ‘best’ and ‘worst’ case for CH4 and
NH3 were found within the same floor design. The effect of manure management beneath
the slatted floor is affecting the level of both CH4 and NH3 in a similar way (+17 and +29%
due to higher homogenization level). This agrees with the findings of ZHANG et al. (2005)
who stated that in buildings with high NH3 emissions high CH4 emissions were found at
the same time. Assuming that intensive slurry mixing is leading to a higher aeration of the
slurry one could have expected that the intensive mixing might reduce CH4 emissions.
However, this expectation could not be confirmed in our investigation.
PEREIRA et al. (2011) reported higher CH4 and NH3 emissions from solid floors at all
temperatures in comparison to slatted floors. These findings can be confirmed by our
results only for the case of a low mixing intensity beneath the slatted floor and a high
cleaning intensity. Nevertheless, PEREIRA et al. (2011) performed a scale-model study and
did not consider a large slurry storage. In our investigation on annual average the lowest
emissions from barn and storage in total, both for CH4 and NH3, could be achieved with a
slatted floor and a low mixing intensity. ZHANG et al. (2005) found the lowest NH3
emissions in a barn with a solid floor. The fact that the floor design may not be the main
factor affecting the level of NH3 emissions has also been stated by PEREIRA et al. (2010).
There was a positive effect of temperature on the CH4 and NH3 emissions (Fig 2.6 and
2.7). The coefficient of determination was highest for the solid floor, both for CH4 and
NH3. One reason for the lower number of outliers on the solid floor could be the influence
of the slurry storage beneath the slatted floor sections, leading to higher variations.
Apart from floor design and manure removal within the barn, the design of the external
slurry tank may affect the level of gaseous emissions significantly. The coverage of the
slurry storage with an organic layer such as straw may reduce NH3 emissions, but it may
also enhance the dry matter content of the slurry which may lead to higher NH3 emissions
after field application (AMON et al., 2006). It should be considered that the further
treatment and application of the slurry may affect the NH3 balance dramatically (DINUCCIO
et al., 2012). Regarding mitigation options, it always has to be considered whether a
reduction of emissions of one certain gas may affect an increase of other gaseous
emissions. This effect may occur especially in the case of NH3 and N2O (PETERSEN and
SOMMER, 2011).
CHAPTER 2 51
2.5 Conclusions
This investigation was focused on the comparison of CH4 and NH3 emissions from
different manure removal systems for dairy cattle within one building. The results show
that the influence of manure management, especially homogenization of liquid manure
beneath the slatted floor, led to higher differences than the floor design itself. The effect of
manure management beneath the slatted floor is affecting the level of both CH4 and NH3
emissions in a similar way (+17% and +29% higher emissions due to higher intensity of
manure homogenization). Hence, on annual average the highest CH4 and NH3 emissions at
the barn level were found to be from the slatted floor with high intensity of
homogenization (381.7 ± 149.2 g CH4 LU-1
d-1
and 38.4 ± 15.1 g NH3 LU-1
d-1
).
Considering emissions from external uncovered slurry storage for the solid floor section
CH4 emissions of the solid floor section exceeded the emission level of the slatted floor
with intensive homogenization, whereas NH3 emissions remained at the level of the slatted
floor with intensive homogenization. In all cases and seasons the lowest emissions were
found to be from the slatted floor with low intensity of homogenization (e.g. on annual
average 324.9 ± 123.6 g CH4 LU-1
and 29.8 ± 13.1g NH3 LU-1
d-1
, respectively).
This investigation provides important information regarding the influence of the housing
system and manure management on gaseous emissions of dairy housings, covering all
seasons and comparing floor systems simultaneously within one building and a high
number of animals per group. Unfortunately, the investigation was limited to CH4 and NH3
and did not include N2O which may play an important role regarding the calculation of
CO2-equivalents and the evaluation of mitigation options. Furthermore, the conclusions
from this investigation are not transferable to other housings and sites in general because
there may be many affecting variables in dairy farming (e.g., the feed ration, manure
removal, and cleaning frequency may influence the level of emissions on the different
floors with a different intensity). Further studies at the barn level are required to
consolidate information of the influence of the housing system and of the manure
management under various conditions. Furthermore, the proportion of emissions (CH4,
NH3 and N2O) from slurry storage should be included in future research activities.
52 CHAPTER 2
2.6 Acknowledgements
We are grateful for the cooperation of the Chamber of Agriculture of North-Rhine
Westphalia where the measurements were carried out. This investigation was funded by
the Landwirtschaftliche Rentenbank and the Federal Ministry of Food, Agriculture and
Consumer Protection, Germany. The methodological development of the model
DAIRYDYN used in this study was funded by a grant of the German Science Foundation
(DFG) with the reference number HO 3780/2-1.
CHAPTER 2 53
2.7 References
AGUERRE, M., WATTIAUX, M. & HUNT, T. (2007). Effect of nitrogen intake, straw and
days of storage on pH, temperature and ammonia emission from dairy cow manure.
Journal of Animal Science 85, 331-332.
AGUERRE, M., WATTIAUX, M., POWELL, J., BRODERICK, G. & ARNDT, C. (2011). Effect of
forage-to-concentrate ratio in dairy cow diets on emission of methane, carbon dioxide, and
ammonia, lactation performance, and manure excretion. Journal of Dairy Science 94(6),
3081-3093.
AMON, B., KRYVORUCHKO, V., AMON, T. & ZECHMEISTER-BOLTENSTERN, S. (2006).
Methane, nitrous oxide and ammonia emissions during storage and after application of
dairy cattle slurry and influence of slurry treatment. Agriculture Ecosystems &
Environment 112(2-3), 153-162.
BALSARI, P., AIROLDI, G., DINUCCIO, E. & GIOELLI, F. (2007). Ammonia emissions from
farmyard manure heaps and slurry stores - Effect of environmental conditions and
measuring methods. Biosystems Engineering 97(4), 456-463.
BRAAM, C., KETELAARS, J. & SMITS, M. (1997). Effects of floor design and floor cleaning
on ammonia emission from cubicle houses for dairy cows. Netherlands Journal of
Agricultural Science 45(1), 49-64.
CIGR (2002). Report of Working Group on Climatization of Animal Houses - Heat and
Moisture Production at Animal and House Levels. Eds S. Pedersen & K. Sällvik:
Commission International Du Genie Rural (International Commission of Agricultural
Engineering). Available under: http://www.cigr.org/CIGRWorkingGroupReports.htm
(accessed on 15.04.2013).
CUELLAR, A. & WEBBER, M. (2008). Cow power: the energy and emissions benefits of
converting manure to biogas. Environmental Research Letters 3(3).
DERNO, M., ELSNER, H., PAETOW, E., SCHOLZE, H. & SCHWEIGEL, M. (2009). Technical
note: A new facility for continuous respiration measurements in lactating cows. Journal of
Dairy Science 92(6), 2804-2808.
DINUCCIO, E., GIOELLI, F., BALSARI, P. & DORNO, N. (2012). Ammonia losses from the
storage and application of raw and chemo-mechanically separated slurry. Agriculture
Ecosystems & Environment 153, 16-23.
ELLIS, J., KEBREAB, E., ODONGO, N., MCBRIDE, B., OKINE, E. & FRANCE, J. (2007).
Prediction of methane production from dairy and beef cattle. Journal of Dairy Science
90(7), 3456-3466.
FAO (2006). Livestock's Long Shadow - Environmental Issues and Options. Rome: Food
and Agriculture Orginazation of the United Nations. Available under:
http://www.fao.org/docrep/010/a0701e/a0701e00.HTM (accessed on 15.04.2013).

54 CHAPTER 2
GARNSWORTHY, P., CRAIGON, J., HERNANDEZ-MEDRANO, J. & SAUNDERS, N. (2012).
Variation among individual dairy cows in methane measurements made on farm during
milking. Journal of Dairy Science 95(6), 3181-3189.
HERRERO, M., GERBER, P., VELLINGA, T., GARNETT, T., LEIP, A., OPIO, C., WESTHOEK, H.,
THORNTON, P., OLESEN, J., HUTCHINGS, N., MONTGOMERY, H., SOUSSANA, J., STEINFELD,
H. & MCALLISTER, T. (2011). Livestock and greenhouse gas emissions: The importance of
getting the numbers right. Animal Feed Science and Technology 166-67, 779-782.
HINDRICHSEN, I., WETTSTEIN, H., MACHMULLER, A., JORG, B. & KREUZER, M. (2005).
Effect of the carbohydrate composition of feed concentrates on methane emission from
dairy cows and their slurry. Environmental Monitoring and Assessment 107(1-3), 329-350.
HINDRICHSEN, I., WETTSTEIN, H., MACHMULLER, A. & KREUZER, M. (2006). Methane
emission, nutrient degradation and nitrogen turnover in dairy cows and their slurry at
different milk production scenarios with and without concentrate supplementation.
Agriculture Ecosystems & Environment 113(1-4), 150-161.
IPCC (2006). IPCC Guidelines for National Greenhouse Gas Inventories. Japan:
Intergovernmental Panel on Climate Change, NGGIP Publications.
KROODSMA, W., TVELD, J. & SCHOLTENS, R. (1993). Ammonia emission and its reduction
from cubilcle houses by flushing. Livestock Production Science 35(3-4), 293-302.
KÜLLING, D. R., DOHME, F., MENZI, H., SUTTER, F., LISCHER, P. & KREUZER, M. (2002).
Methane emissions from differently fed dairy cows and corresponding methane and
nitrogen emissions from their manure during storage. Environmental Monitoring and
Assessment 79, 129–150.
LEIP, A., WEISS, F. WASSENAAR, T., PEREZ, I., FELLMANN, T., LOUDJANI, P., TUBIELLO, F.,
GRANDGIRARD, D., MONNI, S. & BIALA, K. (2010). Evaluation of the livestock sectors's
contribution to the EU greenhouse gas emissions (GGELS) - final report.: European
Commission, Joint Research Centre.
LENGERS, B. & BRITZ, W. (2012). The choice of emission indicators in environmental
policy design: an analysis of GHG abatement in different dairy farms based on a bio-
economic model approach. Review of Agricultural and Environmental Studies 93(2), 117-
144.
MISSELBROOK, T., BROOKMAN, S., SMITH, K., CUMBY, T., WILLIAMS, A. & MCCRORY, D.
(2005). Crusting of stored dairy slurry to abate ammonia emissions: Pilot-scale studies.
Journal of Environmental Quality 34(2), 411-419.
MISSELBROOK, T., VAN DER WEERDEN, T., PAIN, B,. JARVIS, S., CHAMBERS, B., SMITH, K.
PHILLIPS, V. & DEMMERS, T. (2000). Ammonia emission factors for UK agriculture.
Atmospheric Environment 34(6), 871-880.
MONTENY, G., BANNINK, A. & CHADWICK, D. (2006). Greenhouse gas abatement
strategies for animal husbandry. Agriculture Ecosystems & Environment 112(2-3), 163-
170.
CHAPTER 2 55
NGWABIE, N., JEPPSSON, K., NIMMERMARK, S., SWENSSON, C. & GUSTAFSSON, G. (2009).
Multi-location measurements of greenhouse gases and emission rates of methane and
ammonia from a naturally-ventilated barn for dairy cows. Biosystems Engineering 103(1),
68-77.
NIEBAUM, A. (2001). Quantifizierung gasförmiger Emissionen aus quer gelüfteten
Außenklimaställen für Mastschweine mit Hilfe der Tracergas-Technik. VDI-MEG-
Schriftenreihe.
PEREIRA, J., FANGUEIRO, D., MISSELBROOK, T., CHADWICK, D., COUTINHO, J. &
TRINDADE, H. (2011a). Ammonia and greenhouse gas emissions from slatted and solid
floors in dairy cattle houses: A scale model study. Biosystems Engineering 109(2), 148-
157.
PEREIRA, J., FANGUEIRO, D., MISSELBROOK, T. H., CHADWICK, D. R., COUTINHO, J. &
TRINDADE, H. (2011b). Ammonia and greenhouse gas emissions from slatted and solid
floors in dairy cattle houses: A scale model study. Biosystems Engineering 109(2), 148-
157.
PEREIRA, J. MISSELBROOK, T. CHADWICK, D. COUTINHO, J. & TRINDADE, H. (2010).
Ammonia emissions from naturally ventilated dairy cattle buildings and outdoor concrete
yards in Portugal. Atmospheric Environment 44(28), 3413-3421.
PEREIRA, J., MISSELBROOK, T., CHADWICK, D., COUTINHO, J., & TRINDADE, H. (2012).
Effects of temperature and dairy cattle excreta characteristics on potential ammonia and
greenhouse gas emissions from housing: A laboratory study. Biosystems Engineering
112(2), 138-150.
PETERSEN, S., AMON, B. & GATTINGER, A. (2005). Methane oxidation in slurry storage
surface crusts. Journal of Environmental Quality 34(2), 455-461.
PETERSEN, S. & SOMMER, S. (2011). Ammonia and nitrous oxide interactions: Roles of
manure organic matter management. Animal Feed Science and Technology 166-67, 503-
513.
PLACE, S. E., PAN, Y., ZHAO, Y. & MITLOEHNER, F. M. (2011). Construction and Operation
of a Ventilated Hood System for Measuring Greenhouse Gas and Volatile Organic
Compound Emissions from Cattle. Animals 1 4, 443-446.
SAMER, M., AMMON, C., LOEBSIN, C., FIEDLER, M., BERG, W., SANFTLEBEN, P. &
BRUNSCH, R. (2012). Moisture balance and tracer gas technique for ventilation rates
measurement and greenhouse gases and ammonia emissions quantification in naturally
ventilated buildings. Building and Environment 50, 10-20.
SAMER, M., MULLER, H., FIEDLER, M., AMMON, C., GLASER, M., BERG, W., SANFTLEBEN,
P. & BRUNSCH, R. (2011). Developing the (85)Kr tracer gas technique for air exchange rate
measurements in naturally ventilated animal buildings. Biosystems Engineering 109(4),
276-287.
56 CHAPTER 2
SCHNEIDER, T. (2006). Untersuchungen zur Partikelemission eines frei gelüfteten
Putenstalles mit Hilfe der Tracergasmethode. Bonn: Dissertation, VDI-MEG Schrift.
SCHRADE, S., ZEYER, K., GYGAX, L., EMMENEGGER, L., HARTUNG, E. & KECK, M. (2012).
Ammonia emissions and emission factors of naturally ventilated dairy housing with solid
floors and an outdoor exercise area in Switzerland. Atmospheric Environment 47, 183-194.
SEIPELT, F. ( ). uantifi ierung und Bewertung gasf rmiger missionen aus frei
gel fteten ilchviehst llen mit Trauf-First-L ftung.
SMITH, K., CUMBY, T., LAPWORTH, J., MISSELBROOK, T. & WILLIAMS, A. (2007). Natural
crusting of slurry storage as an abatement measure for ammonia emissions on dairy farms.
Biosystems Engineering 97(4), 464-471.
SOMMER, S., PETERSEN, S. & SOGAARD, H. (2000). Greenhouse gas emission from stored
livestock slurry. Journal of Environmental Quality 29(3), 744-751.
SOMMER, S., PETERSEN, S., SORENSEN, P., POULSEN, H. & MOLLER, H. (2007). Methane
and carbon dioxide emissions and nitrogen turnover during liquid manure storage. Nutrient
Cycling in Agroecosystems 78(1), 27-36.
SOMMER, S., ZHANG, G., BANNINK, A. CHADWICK, D., MISSELBROOK, T., HARRISON, R.,
HUTCHINGS, N., MENZI, H., MONTENY, G., NI, J., OENEMA, O., WEBB, J. & SPARKS, D.
(2006). Algorithms determining ammonia emission from buildings housing cattle and pigs
and from manure stores. Advances in Agronomy, Vol 89 89, 261-335.
VAN ZIJDERVELD, S., DIJKSTRA, J., PERDOK, H., NEWBOLD, J. & GERRITS, W. (2011).
Dietary inclusion of diallyl disulfide, yucca powder, calcium fumarate, an extruded linseed
product, or medium-chain fatty acids does not affect methane production in lactating dairy
cows. Journal of Dairy Science 94(6), 3094-3104.
WU, W., ZHANG, G. & KAI, P. (2012). Ammonia and methane emissions from two
naturally ventilated dairy cattle buildings and the influence of climatic factors on ammonia
emissions. Atmospheric Environment 61, 232-243.
ZHANG, G., STROM, J. S., LI, B., ROM, H. B., MORSING, S., DAHL, P. & WANG, C. (2005).
Emission of ammonia and other contaminant gases from naturally ventilated dairy cattle
buildings. Biosystems Engineering 92(3), 355-364.
CHAPTER 3 57
3 Chapter 3 - A comparison of emission calculations using
different modeled indicators with 1-year online
measurements6
Abstract
The overall measurement of farm level greenhouse gas (GHG) emissions in dairy production is
not feasible, from either an engineering or administrative point of view. Instead, computational
model systems are used to generate emission inventories, demanding a validation by
measurement data. This paper tests the GHG calculation of the dairy farm-level optimization
model DAIRYDYN, including methane (CH4) from enteric fermentation and managed manure.
The model involves four emission calculation procedures (indicators), differing in the
aggregation level of relevant input variables. The corresponding emission factors used by the
indicators range from default per cow (activity level) emissions up to emission factors based on
feed intake, manure amount and milk production intensity. For validation of the CH4 accounting
of the model one-year CH4 measurements of an experimental free-stall dairy farm in Germany
are compared to model simulation results. An advantage of this interdisciplinary study is given
by the correspondence of the model parameterization and simulation horizon with the
experimental farm´s characteristics and measurement period. The results clarify that modeled
emission inventories (2,898, 4,637, 4,247, 3,600 kg CO2-eq. cow-1
year-1
) lead to more or less
good approximations of online measurements (av. 3,845 kg CO2-eq. cow-1
year-1
(275 owing to
manure management)) depending on the indicator utilized. The more farm-specific
characteristics are used by the GHG indicator; the lower is the bias of the modeled emissions.
Results underline that an accurate emission calculation procedure should capture differences in
energy intake, owing to milk production intensity as well as manure storage time. Despite the
differences between indicator estimates, the deviation of modeled GHGs using detailed
indicators in DAIRYDYN from on-farm measurements is relatively low (between -6.4 and
10.5%), compared with findings from the literature.
Keywords: agricultural modeling; GHG measurement; validity of modeled GHGs; emission
indicators; dairy farm methane emissions
6 This chapter is based on the publication: LENGERS, B.,SCHIEFLER, I. and W. BÜSCHER (2013): A
comparison of emission calculations using different modeled indicators with 1-year online measurements.
Journal of Environmental Monitoring and Assessment (doi:10.1007/s10661-013-3288-y, available under
http://link.springer.com/article/10.1007/s10661-013-3288-y). Inga Schiefler contributed to all sections except
3.2.1.
58 CHAPTER 3
3.1 Introduction
Greenhouse gases from agricultural production systems are discussed broadly in a
scientific as well as a public and political context. As mentioned by the Food and
Agricultural Organization (FAO), in 2007, dairy production systems in particular,
supposedly bore a large part of global agricultural livestock GHG inventories (ca. 16%),
and about 2.7% of global total anthropogenic GHGs (FAO 2010; HAGEMANN et al. 2012).
However, real measurements of emissions are not realizable for a large number of farms,
or even whole regions. Many methods and schemes have been designed to calculate GHG
emissions from arable production systems and animal husbandry, while only knowing
some farm- or regional-specific data on different aggregation levels. Implemented into
specific model approaches - for example, RAINS (ALCAMO et al. 1990); EFEM
(KAZENWADEL and DOLUSCHITZ 1998); MDSM (LOVETT et al. 2006); a study by
HAGEMANN et al. (2012), based on methane equations from KIRCHGESSNER et al. (1991);
or a model approach used by DECARA and JAYET (2000), which calculates GHG
inventories from specified regions in the European context - the available information led
to modeled GHG estimates. Others also developed single-farm approaches for predefined
single-farm types. For instance, SCHILS et al. (2007) used the single farm model DairyWise
for their estimations and WEISKE et al. (2006) presented results using a farm GHG model
which was originally developed by OLESEN et al. (2004)).
Since the modeled GHG emissions have to be seen as a proxy for the actual GHG
emissions of the modeled real-world systems, the question arises if the validity of
computational models is given on a sufficiently high level. This topic has already been
discussed by BURTON and OBEL (1995), depicting the balance of model realism, and the
overall purpose of the modeling approach. The inherent model functions are not able to
show real ongoing biochemical or bio-economic processes precisely. For instance, there
are assumptions and simplifications, and also not yet full understanding of biochemical
processes e.g. in the rumen (STORM et al. 2012). However, the results should, nevertheless,
display an adequate proxy for outputs of the real-world system. But as the predictive
character of a model can only be ‘[...] as good as the accuracy of the mathematical method
or equations [...]’ (ELLIS et al. 2010), it is quite difficult to build up a consistent model
approach for GHG release from complex production systems (HERRERO et al. 2011).
Hence, depending on the specific definition of emission calculation procedures, different
accounting biases concerning the GHG inventories may occur.
CHAPTER 3 59
Validation of GHG modeling is done mostly by using small-scale and/or short-term
measurements (respiration chambers, indirect calorimetry, mass balance, hood
calorimetry). ELLIS et al. (2010) for example used such data for the validation of nine
different ruminant dairy CH4 equations and MILLS et al. (2001) applied it for validation of
their modeling of methanogenesis in a lactating cow. Only TALLEC and HENSEN (2011), up
to now, have compared modeled and measured CH4 estimates over a longer time period of
more than a few days duration (one-month field experiments) from dairy livestock on
grassland, by using a simple Gaussian plume model formerly developed by HENSEN and
SCHARFF (2001). However, as also criticized by the authors themselves, measurements
over one month are not sufficient for accurate validation results. For our purposes, there
are few published CH4 emission factors from modern dairy free-stalls with a slatted floor:
e.g. KÜLLING et al. (2002), SCHNEIDER et al. (2006), SNELL et al. (2003) and ZHANG et al.
(2005).
However, the published data stem mostly from short-term measurement intervals (from 2-3
days per season (SNELL et al. 2003) to several weeks (SCHNEIDER et al. 2006)). Other data,
based on individual animal measurements, are often restricted to a limited number of
animals, and/or do not include emissions from managed manure (e.g. respiration chambers
(DERNO et al. 2009)). Hence, the estimates may be biased by not being able to cover
seasonal and yearly external or internal variability in the production process, when
extrapolating the derived per day emission factors to default one-year emission parameters,
per animal, or per livestock unit (LU; one LU is equivalent to, for example, a cow with a
live weight of 500kg). The comparability of literature estimates is especially hindered with
regard to the differing cattle breeds, milk output intensities and present lactation phase of
the animal population investigated in the studies. Additionally, the above mentioned
studies offer highly varying CH4 emission factors per LU and year, ranging between
2,221.8 kg CO2-eq. and 4,063.9 kg CO2-eq. (ZHANG et al. 2005), and hence would lead to
imprecise validation of emission simulations when applying these as reference. Owing to a
lack of production-specific information about the experimental units underlying these
studies, one is not even able to adjust parameters in a farm-level model approach for
equivalent circumstances, which would perhaps increase the usability of the literature
findings for validation purposes. Furthermore, small-scale measurement results are
regarded as not being appropriate for comparison with long-term calculations for high
animal numbers (STORM et al. 2012).
60 CHAPTER 3
The problem of obtaining reliable data for validation is also of relevance for the simulation
of GHG emissions by the bio-economic dairy farm-level model DAIRYDYN (LENGERS
and BRITZ 2012), for specialized dairy farms on slatted floors. The model allows for
choosing one out of four different emission-calculation schemes (indicators), and accessing
more or fewer aggregated system variables of the dairy production process (e.g. default
emission factors per activity or precisely connected to feed intake). LENGERS and BRITZ
(2012) applied the approach to analyze the effect of GHG accounting on chosen abatement
measures and adherent mitigation costs, if farms are restricted by emission ceilings.
The objective of this study is to test the accuracy of CH4 calculation by different designed
GHG calculation schemes for lactating cows and stored manure of the DAIRYDYN
model. Therefore, we apply the model approach with adherent GHG calculation
procedures on a real existing dairy barn complex. Modeling results are compared with
results from experimental measurements in a free-stall dairy barn in Germany (Haus
Riswick). The experiments are characterized by long-term measurements over one year,
covering seasonal variations, and thus result in more precise values than emission factors
based on projections with only a few measurement days (in contrast to ELLIS et al. (2010)).
For biological processes, long-term estimation horizons are particularly important. Recent
studies have shown that there is a significant variation of individual CH4 emissions
between single cows (278 to 456 g CH4 day-1
; GARNSWORTHY et al. 2012), whereby the
number of animals investigated may play an important role in the measurement accuracy.
Furthermore, the own measurements include emissions from animals’ release, as well as
emissions from liquid manure, hence reflecting all sources of emissions from the dairy
barn. Since the quantification of GHG emissions at barn level (sum of animal and manure)
is studied less thoroughly, this is a clear advantage over some other studies, which may be
limited to the animals’ release (e.g. static respiration chambers), and only measure small
livestock numbers (JOHNSON et al. 1994; MOE and TYRRELL 2010).
To follow the objective, the computational modeling approach, used by the DAIRYDYN
model, will be explained; in particular, concerning the different emission calculation
schemes which can be chosen by the user. Afterwards, the experimental set-up of the dairy
barn on Haus Riswick will be explained, focusing briefly on the measurement approach.
The implementation of specific farm characteristics of the dairy free-stall on Haus Riswick
into DAIRYDYN will allow for simulation and comparison of an equivalent model farm
and adherent CH4 release. The modeled and the measured data cover the same time period
CHAPTER 3 61
with a high representative animal number. This will improve the validation of model
calculations by more reliable results, because seasonal and farm exogenous aspects are also
captured by the measurements.
3.2 Material and methods
3.2.1 Model concept of DAIRYDYN
The DAIRYDYN model is a farm-level model developed by LENGERS and BRITZ (2012),
with an objective function of maximizing net present value of future profits, using different
natural states. DAIRYDYN was built for the process-based modeling of single dairy farm
development, inter alia the occurring GHG emissions combined with the production
process. Therefore, the model user can choose from four different emission calculation
schemes, based on consistency-proven IPCC (Intergovernmental Panel on Climate
Change) methodology with several enhancements.
The model uses a fully dynamic mixed integer linear programming approach. It is
programmed with the general algebraic modeling system GAMS, using the industrial
solver CPLEX (IBM 2011). It enables the user to simulate farm-level development of
specialized dairy farms (including calves, heifers and acreage) over various planning
horizons. Animals are differentiated concerning milk yield potential, lactation number, as
well as lactation phase. Feeding rations can be changed quarterly, whereby self-produced
ground-bait can be supplemented by different concentrates. Manure excretion rates and
adherent nitrogen amounts are also captured on a monthly basis. Beneath the baseline farm
development, management and cost implications through farm-level emission ceilings can
be analyzed, deriving GHG-indicator-specific marginal abatement cost for GHG mitigation
efforts at the single-farm level. Figure 3.1 shows bio-economic interactions between the
modules that are implemented into the used model approach. The inherent emission
calculation rules (indicators) quantify production-specific GHG inventories. Emission
calculations are related to source (manure management, enteric fermentation, arable
production, etc.) and gas type (CH4, N2O and CO2). The measurements on Haus Riswick
were limited to the barn including manure storage and did not include emissions from e.g.
crop production, fertilizers or machines. Hence, only those modules within the dotted line
are of relevance for the following model calculations (Fig 3.1).
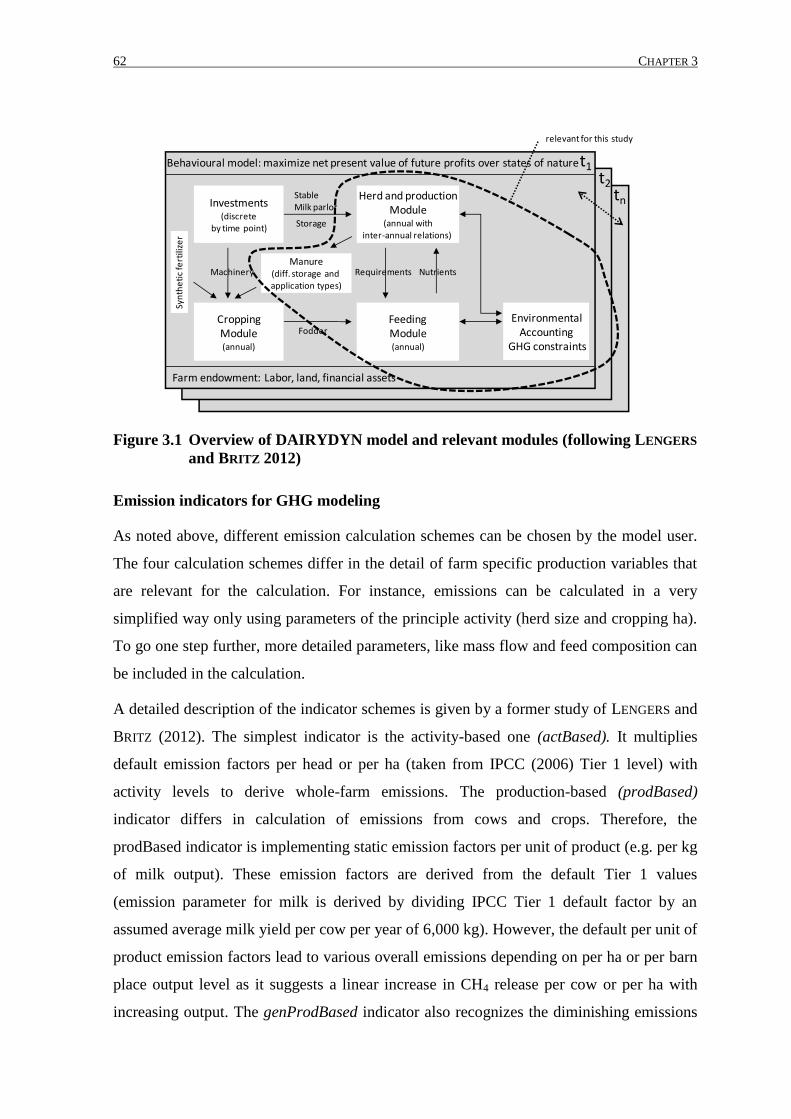
62 CHAPTER 3
Figure 3.1 Overview of DAIRYDYN model and relevant modules (following LENGERS
and BRITZ 2012)
Emission indicators for GHG modeling
As noted above, different emission calculation schemes can be chosen by the model user.
The four calculation schemes differ in the detail of farm specific production variables that
are relevant for the calculation. For instance, emissions can be calculated in a very
simplified way only using parameters of the principle activity (herd size and cropping ha).
To go one step further, more detailed parameters, like mass flow and feed composition can
be included in the calculation.
A detailed description of the indicator schemes is given by a former study of LENGERS and
BRITZ (2012). The simplest indicator is the activity-based one (actBased). It multiplies
default emission factors per head or per ha (taken from IPCC (2006) Tier 1 level) with
activity levels to derive whole-farm emissions. The production-based (prodBased)
indicator differs in calculation of emissions from cows and crops. Therefore, the
prodBased indicator is implementing static emission factors per unit of product (e.g. per kg
of milk output). These emission factors are derived from the default Tier 1 values
(emission parameter for milk is derived by dividing IPCC Tier 1 default factor by an
assumed average milk yield per cow per year of 6,000 kg). However, the default per unit of
product emission factors lead to various overall emissions depending on per ha or per barn
place output level as it suggests a linear increase in CH4 release per cow or per ha with
increasing output. The genProdBased indicator also recognizes the diminishing emissions
Herd and productionModule
(annual withinter-annual relations)
FeedingModule(annual)
EnvironmentalAccounting
GHG constraints
CroppingModule(annual)
Fodder
Requirements
Investments(discrete
by time point)
StableMilk parlor
Machinery
Farm endowment: Labor, land, financial assets
Behavioural model: maximize net present value of future profits over states of nature
Storage
Nutrients
t1t2
tn
Manure(diff. storage and application types)
Syn
the
tic
fert
ilize
r
relevant for this study
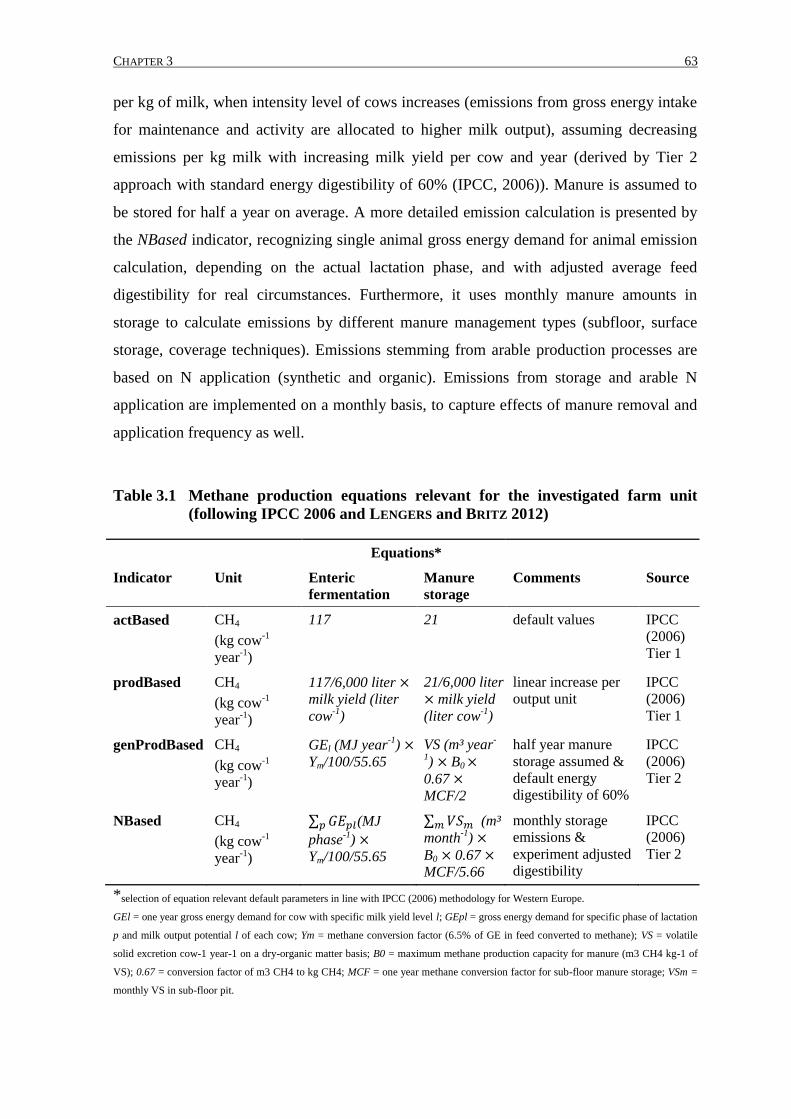
CHAPTER 3 63
per kg of milk, when intensity level of cows increases (emissions from gross energy intake
for maintenance and activity are allocated to higher milk output), assuming decreasing
emissions per kg milk with increasing milk yield per cow and year (derived by Tier 2
approach with standard energy digestibility of 60% (IPCC, 2006)). Manure is assumed to
be stored for half a year on average. A more detailed emission calculation is presented by
the NBased indicator, recognizing single animal gross energy demand for animal emission
calculation, depending on the actual lactation phase, and with adjusted average feed
digestibility for real circumstances. Furthermore, it uses monthly manure amounts in
storage to calculate emissions by different manure management types (subfloor, surface
storage, coverage techniques). Emissions stemming from arable production processes are
based on N application (synthetic and organic). Emissions from storage and arable N
application are implemented on a monthly basis, to capture effects of manure removal and
application frequency as well.
Table 3.1 Methane production equations relevant for the investigated farm unit
(following IPCC 2006 and LENGERS and BRITZ 2012)
Equations*
Indicator Unit Enteric
fermentation
Manure
storage
Comments Source
actBased CH4
(kg cow-1
year-1
)
117 21 default values IPCC
(2006)
Tier 1
prodBased CH4
(kg cow-1
year-1
)
117/6,000 liter
milk yield (liter
cow-1
)
21/6,000 liter
milk yield
(liter cow-1
)
linear increase per
output unit
IPCC
(2006)
Tier 1
genProdBased CH4
(kg cow-1
year-1
)
GEl (MJ year-1
)
Ym/100/55.65
VS (m³ year-
1) B0
0.67
MCF/2
half year manure
storage assumed &
default energy
digestibility of 60%
IPCC
(2006)
Tier 2
NBased CH4
(kg cow-1
year-1
)
(MJ
phase-1
)
Ym/100/55.65
(m³
month-1
)
B0 0.67
MCF/5.66
monthly storage
emissions &
experiment adjusted
digestibility
IPCC
(2006)
Tier 2
*selection of equation relevant default parameters in line with IPCC (2006) methodology for Western Europe.
GEl = one year gross energy demand for cow with specific milk yield level l; GEpl = gross energy demand for specific phase of lactation
p and milk output potential l of each cow; Ym = methane conversion factor (6.5% of GE in feed converted to methane); VS = volatile
solid excretion cow-1 year-1 on a dry-organic matter basis; B0 = maximum methane production capacity for manure (m3 CH4 kg-1 of
VS); 0.67 = conversion factor of m3 CH4 to kg CH4; MCF = one year methane conversion factor for sub-floor manure storage; VSm =
monthly VS in sub-floor pit.
64 CHAPTER 3
The CH4 calculation formulas, implemented into the model to derive emissions from
lactating cows and sub-floor stored manure, are shown in Table 3.1.
Table 3.1 gives a systematic view of the CH4 calculation concepts of the four applied
indicator schemes, for CH4 release from enteric fermentation as well as stored manure
amounts, presenting a growing level of detail from top to bottom.
3.2.2 Measurement installation on Haus Riswick
Site description
Measurements used for model validation were carried out in a newly built dairy barn of the
Chamber of Agriculture North-Rhine Westphalia, at the Centre of Agriculture, Haus
Riswick, in North-Western Germany. The annual average temperature of the investigated
site was 9.8°C (see Fig. 3.2, measured at feed alley with open curtains). The average
outdoor temperature ranged from 4.3°C monthly mean in January 2011 up to 18.6°C
monthly mean in August. Mean humidity in 2011 was 79%, mean wind speed was
1.9 m s-1
and the main wind directions in 2011 were South-West and West (data from
nearest official weather station in Goch). The dairy cows were kept in a free-stall dairy
barn with an external milking parlor, during the whole year. Two equal-sized
compartments (section 1, section 2) of the barn, with separate air-spaces, were considered
for the measurement (Fig. 3.2), and were investigated separately for their CH4 emissions.
Each compartment was designed for 48 dairy cows offering a total area available per cow
of 10 m2. Having no solid eave-side walls, the building is naturally cross-ventilated.
However, there was a facility to close the western eave-side of the building with curtains.
The curtains were open during the summer, partly open in spring and autumn, and closed
during winter. The barn had a slatted floor with subfloor storage of liquid manure, and a
robot system for fully automated water cleaning of the slatted floor. The two power take-
off mixer with electric motors (7.5 KW) for homogenization of the liquid manure beneath
the slatted floor were located at the gable wall, next to section 1 (Fig. 3.2). This resulted in
a high intensity of homogenization of liquid manure in section 1 (‘intensive mixing case’),
and a low intensity of homogenization of liquid manure in section 2 (‘no intensive mixing
case’).
There were 96 lactating Holstein dairy cows in the compartments, with an average milk
yield of 34 kg (28-39) per day, and an average live mass of 700 kg (550-870). Cows in the
measurement-relevant sections were between the 95th
and 190th
day of lactation. The cows
CHAPTER 3 65
were fed once a day with a grass and maize silage-based mixed rations, and were able to
get concentrate feed at concentrate stations additionally, according to their production (2.5
kg per cow and day on average). The total average dry matter feed intake per cow was 19
kg. The mean crude protein of the mixed ration was 16.6% (dry matter) and crude fiber
was 17.4% (dry matter).
Section 2 -slatted floorSection 1 - slatted floor
C
C
CC
CC
Mixer
SB
S1 S1 S1 S1 S1 S1 S1 S1 S2 S2 S2 S2 S2 S2 S2 S2
D1 D1 D1 D1 D1 D1 D1 D1 D2 D2 D2 D2 D2 D2 D2 D2Feed alley
Feed alley
Curtains
Foil
partition
Optimal wind
direction
for cross
ventilation
0m
0m
34
m
42 m
T
Figure 3.2 Layout of the dairy barn with measuring units (where D is dosing points
for tracer gas injection, S are sampling points, C concentrate feeder, SB is
sampling background and T is temperature measurement)
66 CHAPTER 3
General procedures
Measurements were conducted from 20 December 2010 to 05 December 2011, covering all
seasons of the year and various weather conditions.
Gas concentrations were measured in the exhaust air of the compartments. Owing to the
large open walls of the barn, the air-outlet location was highly dependent on wind
direction. Considering the regional conditions, it was assumed that the exhaust location for
measurement of gas concentrations was at the eastern eave-side of the building.
Nevertheless, only those time periods (daily basis) when the wind direction led to a west to
east cross-ventilation were taken into account, the rest was discarded. In 2011, about 50%
of the time period could be used for the analysis. Methane and ammonia emissions from
the barn were calculated on average for each season leading to the annual average in equal
parts.
Measurement of gas concentrations
Measurements of gas concentration were carried out for more than 300 days, recording
exhaust concentrations of CO2 and CH4 for each compartment. Each compartment was
equipped with eight sampling points, in line above the feed alley, put together into one
aggregate sample for each compartment. The background (incoming) air was sampled at
the western side of the building (Fig. 3.2). The exhaust air of the compartments and the
background air were sampled by vacuum pumps through separate polytetrafluoroethylene
(PTFE) sampling tubes into PTFE sample bottles. The sample bottles, the multiplexer
(used for switching between samples) and the gas analyzer were placed in the adjacent
building (multi-gas analyzer 1412, and a multiplexer 1303 Lumasense Technologies SA,
Ballerup, Denmark). On the distance between the barn and the adjacent building the
sampling tubes were laid underground and heated. This procedure was performed in order
to offer constant measuring conditions throughout the whole year and further to avoid
condensation.
The gas analyzer was sent to the manufacturer for calibration after 4 weeks due to a drift in
methane concentrations and afterwards every 6 months. In order to check the accuracy of
the measurement system in the meantime, calibration gases with known concentrations
were used after 4 weeks.
CHAPTER 3 67
Measurement of volumetric air flow rate
The air exchange rate was calculated using the tracer decay method (NIEBAUM 2001;
SAMER et al. 2011; SCHNEIDER et al. 2006; SEIPELT 1999) with a SF6 electronic capture
detector, and converted subsequently into volumetric air flow, per cow per hour. The tracer
gas was released as a line source at the windward side of the barn at a height of 4 m from
the floor, which allowed proper mixing of the tracer within the compartment (Fig. 3.2).
The sampling system used for the tracer gas measurement was the same as used for the gas
concentration measurement. Tracer gas measurements were performed during summer
with open curtains when a cross ventilation (west to east) was given. Based on wind
direction and wind velocity data, the air exchange rate and the volumetric air flow rate
could be estimated for the periods of cross-ventilation. The volumetric air flow rate was
determined on an hourly basis considering the average wind velocity per hour.
In the case of closed curtains, the CO2 mass balance, according to CIGR (2002), was
applied to calculate the volumetric air flow.
Calculation of emissions
The emission rates E [mg h-1
cow-1
] were calculated on an hourly basis, with the measured
gas concentrations and the calculated volumetric air flow rate Qm [m3 h
-1 cow
-1], using the
following equation:
*( )m in outE Q C C .
Where Cin [mg m-3
] is the exhaust concentration and Cout [mg m-3
] is the background
concentration of the relevant gas. Multiplying E by the global warming potential of CH4
(21) leads to emission quantity in CO2-eq (UBA, 2009).
Procedure of comparison
The specific farm characteristics of Haus Riswick were implemented into the model, in
order to simulate the identical farm for comparison of results on CH4 emissions.
Emission factors taken from IPCC (2006) were also elected, corresponding to the average
annual temperature of 9.8°C, and an average live-weight of 700 kg per cow. Limited to the
system boundaries of the experimental farm installation, only emissions from lactating
cows were comparable. Furthermore, only high phase lactating cows, between the 95th
and
190th
day of lactation, were held in the investigated sections of the barn. Implementing a
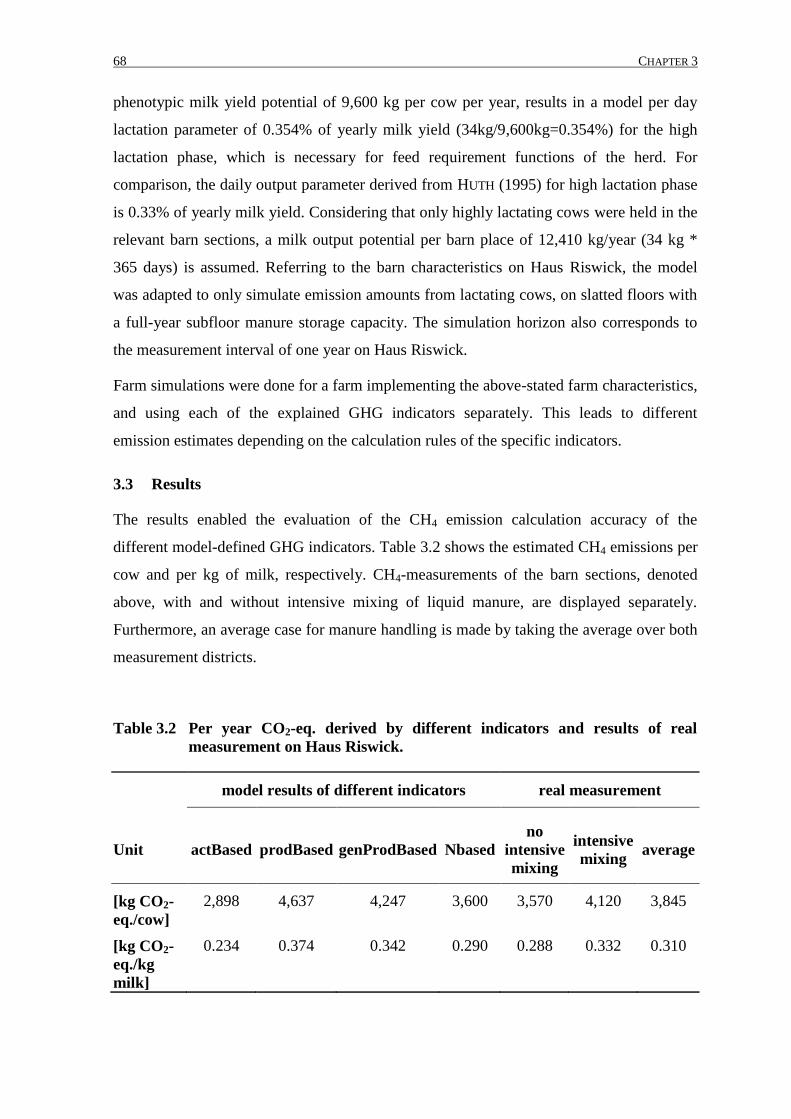
68 CHAPTER 3
phenotypic milk yield potential of 9,600 kg per cow per year, results in a model per day
lactation parameter of 0.354% of yearly milk yield (34kg/9,600kg=0.354%) for the high
lactation phase, which is necessary for feed requirement functions of the herd. For
comparison, the daily output parameter derived from HUTH (1995) for high lactation phase
is 0.33% of yearly milk yield. Considering that only highly lactating cows were held in the
relevant barn sections, a milk output potential per barn place of 12,410 kg/year (34 kg *
365 days) is assumed. Referring to the barn characteristics on Haus Riswick, the model
was adapted to only simulate emission amounts from lactating cows, on slatted floors with
a full-year subfloor manure storage capacity. The simulation horizon also corresponds to
the measurement interval of one year on Haus Riswick.
Farm simulations were done for a farm implementing the above-stated farm characteristics,
and using each of the explained GHG indicators separately. This leads to different
emission estimates depending on the calculation rules of the specific indicators.
3.3 Results
The results enabled the evaluation of the CH4 emission calculation accuracy of the
different model-defined GHG indicators. Table 3.2 shows the estimated CH4 emissions per
cow and per kg of milk, respectively. CH4-measurements of the barn sections, denoted
above, with and without intensive mixing of liquid manure, are displayed separately.
Furthermore, an average case for manure handling is made by taking the average over both
measurement districts.
Table 3.2 Per year CO2-eq. derived by different indicators and results of real
measurement on Haus Riswick.
model results of different indicators real measurement
Unit actBased prodBased genProdBased Nbased
no
intensive
mixing
intensive
mixing average
[kg CO2-
eq./cow]
2,898 4,637 4,247 3,600 3,570 4,120 3,845
[kg CO2-
eq./kg
milk]
0.234 0.374 0.342 0.290 0.288 0.332 0.310
CHAPTER 3 69
As illustrated in Table 3.2, online measurements for CH4 release lie between 3,570 kg and
4,120 kg CO2-eq. per cow per year. Obviously, a high mixing intensity of manure leads to
overall CH4 emissions from the barn, 15.4% higher than in the case of low manure
homogenization. Dividing the average CH4 emissions of 3,845 kg CO2-eq. by the yearly
milk yield potential per barn-place of 12,410 kg leads to 0.310 kg CO2-eq. per kg of milk
on average for the experimental installations on Haus Riswick. Accordant calculation
results by the model show partial great differences, accounting for 2,898 kg up to 4,637 kg
CO2-eq. per cow for the identical farm. Estimates by the actBased indicator lie below the
measurement values. The results from Table 3.2 are taken to quantify the absolute and
relative deviations of indicator GHGs from the actual measured CH4 emissions.
Measurements from the barn part with and without intensive mixing of manure are taken as
a representation of lower and upper boundaries of actually occurring emissions, depending
on the intensity of manure homogenization.
The comparison of indicator-derived CH4 emissions with measurement results is shown in
Table 3.3. Compared with ‘no intensive mixing’ measurements, the NBased indicator leads
to the most adequate CH4 estimates, with only a slight overestimation of 0.9%. As the
defined upper bound by the ‘intensive mixing’ barn section, with 4,120 kg CO2-eq. per
cow, is 15.4% higher than the lower bound, the overestimation of the indicators prodBased
and genProdBased diminishes. The NBased estimation is even 12.6% below the measured
upper value. In contrast, the underestimation of the actBased calculation increases to
29.7%, when compared with the measurements from the intensively homogenized barn
section.
The estimates from the actBased indicator lead to a clear underestimation of actual
emissions per cow, occurring from the barn section with low manure homogenization. The
model-calculations by the prodBased and genProdBased indicators even overestimate the
upper bound. However, overestimating the online-measurements by only 3.1%, the
genProdBased indicator can be identified as a good proxy for dairy cow emissions, with
high rates of subfloor manure homogenization for our specific farm.
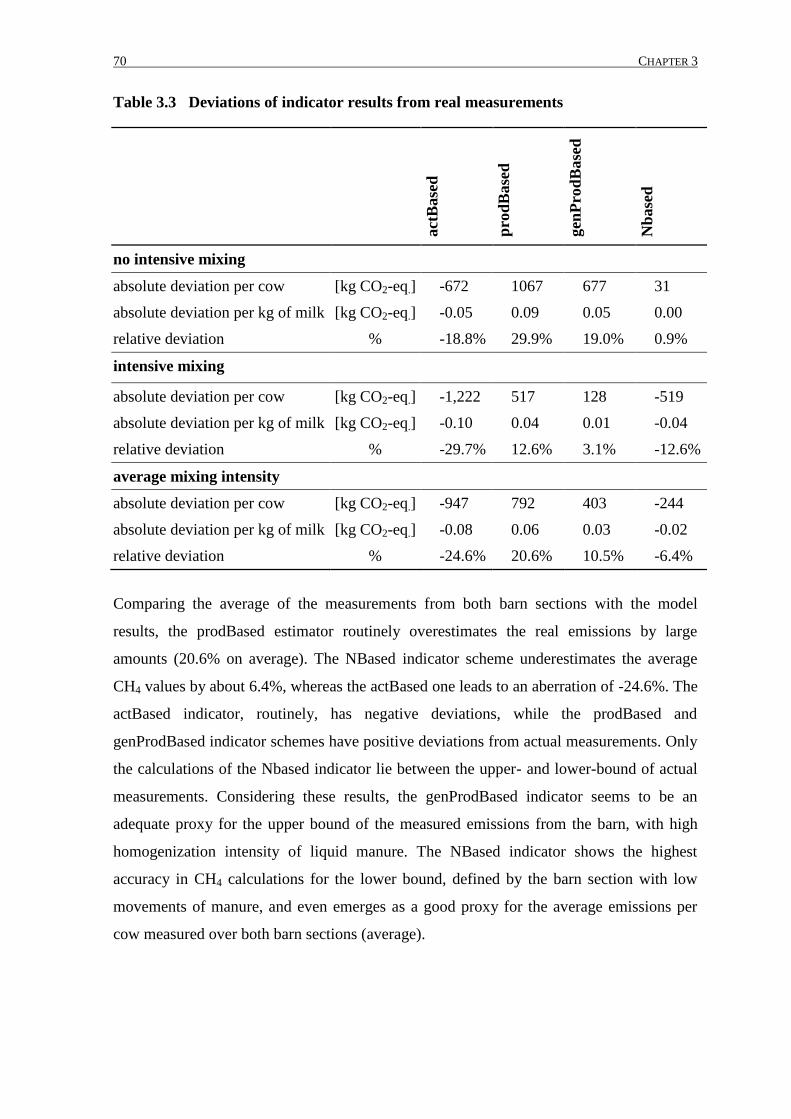
70 CHAPTER 3
Table 3.3 Deviations of indicator results from real measurements
act
Base
d
pro
dB
ase
d
gen
Pro
dB
ase
d
Nb
ase
d
no intensive mixing
absolute deviation per cow [kg CO2-eq.] -672 1067 677 31
absolute deviation per kg of milk [kg CO2-eq.] -0.05 0.09 0.05 0.00
relative deviation % -18.8% 29.9% 19.0% 0.9%
intensive mixing
absolute deviation per cow [kg CO2-eq.] -1,222 517 128 -519
absolute deviation per kg of milk [kg CO2-eq.] -0.10 0.04 0.01 -0.04
relative deviation % -29.7% 12.6% 3.1% -12.6%
average mixing intensity
absolute deviation per cow [kg CO2-eq.] -947 792 403 -244
absolute deviation per kg of milk [kg CO2-eq.] -0.08 0.06 0.03 -0.02
relative deviation % -24.6% 20.6% 10.5% -6.4%
Comparing the average of the measurements from both barn sections with the model
results, the prodBased estimator routinely overestimates the real emissions by large
amounts (20.6% on average). The NBased indicator scheme underestimates the average
CH4 values by about 6.4%, whereas the actBased one leads to an aberration of -24.6%. The
actBased indicator, routinely, has negative deviations, while the prodBased and
genProdBased indicator schemes have positive deviations from actual measurements. Only
the calculations of the Nbased indicator lie between the upper- and lower-bound of actual
measurements. Considering these results, the genProdBased indicator seems to be an
adequate proxy for the upper bound of the measured emissions from the barn, with high
homogenization intensity of liquid manure. The NBased indicator shows the highest
accuracy in CH4 calculations for the lower bound, defined by the barn section with low
movements of manure, and even emerges as a good proxy for the average emissions per
cow measured over both barn sections (average).
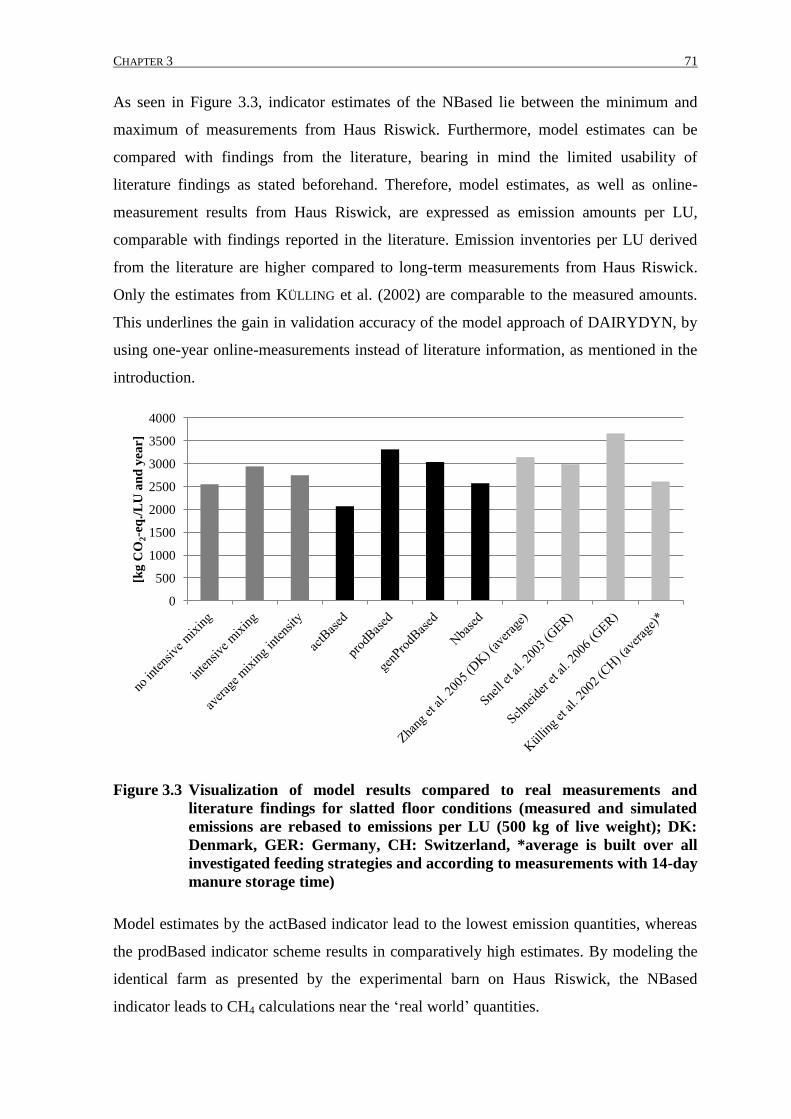
CHAPTER 3 71
As seen in Figure 3.3, indicator estimates of the NBased lie between the minimum and
maximum of measurements from Haus Riswick. Furthermore, model estimates can be
compared with findings from the literature, bearing in mind the limited usability of
literature findings as stated beforehand. Therefore, model estimates, as well as online-
measurement results from Haus Riswick, are expressed as emission amounts per LU,
comparable with findings reported in the literature. Emission inventories per LU derived
from the literature are higher compared to long-term measurements from Haus Riswick.
Only the estimates from KÜLLING et al. (2002) are comparable to the measured amounts.
This underlines the gain in validation accuracy of the model approach of DAIRYDYN, by
using one-year online-measurements instead of literature information, as mentioned in the
introduction.
Figure 3.3 Visualization of model results compared to real measurements and
literature findings for slatted floor conditions (measured and simulated
emissions are rebased to emissions per LU (500 kg of live weight); DK:
Denmark, GER: Germany, CH: Switzerland, *average is built over all
investigated feeding strategies and according to measurements with 14-day
manure storage time)
Model estimates by the actBased indicator lead to the lowest emission quantities, whereas
the prodBased indicator scheme results in comparatively high estimates. By modeling the
identical farm as presented by the experimental barn on Haus Riswick, the NBased
indicator leads to CH4 calculations near the ‘real world’ quantities.
0
500
1000
1500
2000
2500
3000
3500
4000
[kg
CO
2-e
q./
LU
an
d y
ear]
72 CHAPTER 3
3.4 Discussion
The results show that the range of model estimates for CH4 emissions for the dairy barn on
Haus Riswick is quite broad, varying between 18.8% below (actBased) the lower bound to
12.6% above (prodBased) the upper bound.
The overestimation of CH4 by the prodBased indicator is a result of the construction of the
indicator-specific emission parameter per kg of milk. The per kg emission parameter was
derived by dividing the IPCC Tier 1 default value per cow by a potential milk yield of
6,000 kg per year. This routinely overestimates real emissions by multiplying the emission
parameter by the actual milk yield level of 12,410 kg per barn place on Haus Riswick,
assuming a constant per kg milk emission factor with increasing milk yield. Hence,
approximation of CH4 emissions, using the prodBased indicator, are quite inconsistent if
dairy facilities are modeled that deviate from a 6,000 kg average milk yield potential per
cow. Following the results in Table 3.3, using the actBased indicator (meaning default Tier
1 IPCC CH4 parameters per animal) leads to underestimations for a farm with high milk
yield potential, owing to the default emission parameters appropriate for a 6,000 kg milk
yield potential. As further shown in Table 3.3, the genProdBased indicator derives good
estimates in the case of the barn section with high manure homogenization rates. On
average, the model CH4 calculations, using the NBased indicator, produce the best proxy
for actual measured CH4 amounts, owing to recognition of higher manure removal
frequencies, and adjustment to the real average feed digestibility. Not only the small
underestimation of real emissions (-6.4% on average), but also the fact that its estimates lie
between the measured upper- and lower-bound for high and low mixing intensity
underlines the suitability of the most detailed indicator for CH4 emission calculation in
dairy barns. With regard to Figure 3.3, the NBased estimates also lead to per LU emissions
comparable to results from KÜLLING et al. (2002) (only -1.3% deviation), which further
underlines its accuracy and adaptability to other farm types, because experimental
attributes of KÜLLING et al. are comparable to the specified model experiments (KÜLLING
et al. investigated high lactating cows with a lactation of about 31.3 5.1 kg milk d-1
and
an average live weight of 635 56 kg cow-1
).
As the actBased indicator falls back on the most aggregated process variables, and
represents a default and very simple emission accounting, the emission approximation
increases in accuracy compared to real measurements, when incorporating more detailed
process variables into the indicator scheme.
CHAPTER 3 73
This result is in line with findings from ELLIS et al. (2010), who compare GHG simulation
equations with small-scale measurements on dairy cows. They state that the simple Tier 1
approach of IPCC, equivalent to our actBased indicator, leads to the worst emission
estimates in contrast to the NBased one (comparable to Tier 2 methodology of IPCC),
which was also valued as relatively adequate by these authors. Nevertheless, estimated
errors are still rather high, but more detailed approaches have been missing up to now. As
about 80% of the dairy barn CH4 emissions stem from animal rumination it is obvious that
indicators with detailed accounting of feeding patterns and milk output intensity (NBased)
lead to more accurate CH4 calculations (ELLIS et al. 2010). This divergence in GHG
accounting accuracy between default and detailed indicators even increases the stronger
farm characteristics deviate from attributes the simple default emission factors
(actBased/Tier 1) are calibrated on.
The comparison of indicator-modeled CH4 emissions with online measurements should
lead to a validation of the DAIRYDYN model. Compared with findings of other studies,
the model results - except when using the actBased and prodBased indicators - offer
relatively moderate deviations (between -6.4 and 10.5%) from average actual CH4
amounts. For example TALLEC and HENSEN (2011) underestimate real CH4 emissions by
about 25%.
However, it should be noted that the actual measurement results of Haus Riswick may also
include minor measurement errors. For example, the CO2 mass balance method for the
estimation of the air exchange rate bears the risk of inaccuracy, since - beside the cows -
there may be other minor CO2 sources within the barn (e.g. manure, feed and/or machines).
Furthermore, it has to be considered that Haus Riswick represents a well-managed
demonstration farm, having very well-balanced feed rations and performing high-
frequency cleaning of surfaces within the barn. It can be assumed that, in practice, not all
farms are able to fulfill best agricultural practices, and that they may have slightly higher
emissions. Unfortunately, up to this point, we were not able to quantify the portion of
difference between measured and calculated CH4 occurring from the modeling bias or the
measurement error.
74 CHAPTER 3
3.5 Conclusion
Concluding from the former sections, this study underlines that generally the CH4
calculation schemes implemented into the model DAIRYDYN lead to good
approximations of actual barn CH4 release. The highest accuracy in CH4 approximation for
the experimental farm is given by the most detailed indicator (NBased).
Although the different indicator schemes within the model approach of DAIRYDYN may
show adequacy in emission accounting to some degree, the usefulness for political GHG
control instruments is not yet given. The validation of the model, using different GHG
indicators in this study, is only representative of one specific lactation level and barn type.
Hence, further research has to be done to compare modeling results for other intensity
levels and barns. Therefore, our study underlines the advantage of using long-term
measurements of a whole barn system for a high number of animals to ensure
representative estimates including variability within the cow population and the influence
of exogenous parameters over time (e.g. feed quality, temperature…). Special emphasis
should therefore be placed on the use of long-term measurements for model validation
instead of using small scale and short term results.
Furthermore, it has to be emphasized that management options are a relevant variable to
include into modeling approaches. Limiting calculations to default and highly aggregated
GHG calculation schemes may be inadequate for a broad range of dairy farm types due to
the high heterogeneity in the actual farm population.
Certainly, adequate emission accounting is of great relevance (ELLIS et al. 2010). However,
in the case of the enforcement and control of emission ceilings in agricultural dairy
production, induced abatement strategies by the different indicators are of great interest,
leading to different cost implications for the abatement of GHG amounts. Hence, further
research has to be done in this field, capturing engineering costs at the farm level, as well
as administrative costs for control and enforcement.
Also, the model approach has to be developed further to increase the level of detail (e.g. as
done by BANNINK et al. (2011), implementing a more detailed IPCC Tier 3 approach for
dairy cow CH4 estimation). This is of special interest not only for ruminant CH4 emissions
but also for the emissions occurring from manure, as the diet composition also significantly
impacts the CH4 amount stemming from the animals´ excreta (HINDRICHSEN et al. 2005;
KÜLLING et al. 2002).
CHAPTER 3 75
The inclusion of more detailed information from the production process, in order to obtain
less biased emission estimates, hence guarantees more reliable results for a more
diversified range of dairy farms, especially if willing to use modeling results for more
aggregated and political purposes.
In general, our study showed that the exchange between and the combination of modeling
and measuring science is a valuable cooperation, offering the possibilities to improve the
accuracy in modeling and to amend or partly replace the time and cost intensive
measurements in the future.
76 CHAPTER 3
3.6 Acknowledgments
The development of the DAIRYDYN model is funded by a grant from the German Science
Foundation (DFG), reference number HO 3780/2-1. The authors are grateful for the
cooperation of the Chamber of Agriculture of North-Rhine Westphalia where the
measurements were carried out. This investigation was funded by the Landwirtschaftliche
Rentenbank and the Federal Ministry of Food, Agriculture and Consumer Protection,
Germany. The authors want to thank the reviewers as well as the editor for helpful
suggestions and a straightforward review process.
CHAPTER 3 77
3.7 References
ALCAMO, J., SHAW, R. & HORDIJK, L. (1990). The RAINS model of acidification. Science
and strategies in Europe. Dordrecht, Netherlands: Kluwer Academic.
BANNINK, A., VAN SCHIJNDEL, M.W. & DIJKSTRA, J. (2011). A model of enteric
fermentation in dairy cows to estimate methane emission on the Dutch National Inventory
Report using the IPCC Tier 3 approach. Animal Feed Science and Technology, 166–167,
603–618.
BURTON, R.M. & OBEL, B. (1995). The validity of computational models in organization
science: from model realism to purpose of the model. Computational and Mathematical
Organization Theory, 1, 57–71.
CIGR (2002). Climatization of animal houses. In S. Pedersen & K. Sallvik (eds.).
Climatization of animal houses. Working Group Report on: Heat and moisture production
at animal and house level. Denmark: DIAS.
DECARA, S. & JAYET, P.A. (2000). Emissions of greenhouse gases from agriculture: the
heterogeneity of abatement costs in France. European Review of Agricultural Economics,
27(3), 281–303.
DERNO, M., ELSNER, H., PAETOW, E., SCHOLZE, H. & SCHWEIGEL, M. (2009). Technical
note: A new facility for continuous respiration measurements in lactating cows. Journal of
Dairy Science, 92(6), 2804–2808.
ELLIS, J.L., BANNINK, A., FRANCE, J., KEBREAB, E. & DIJKSTRA, J. (2010). Evaluation of
enteric methane prediction equations for dairy cows used in whole farm models. Global
Change Biology, 16, 3246–3256.
FAO (2010). Greenhouse Gas Emissions from the Dairy Sector, A Life Cycle Assessment.
Rome, Italy: Food and Agriculture Organization of the United Nations.
GARNSWORTHY, P., CRAIGON, J., HERNANDEZ-MEDRANO, J. & SAUNDERS, N. (2012).
Variation among individual dairy cows in methane measurements made on farm during
milking. Journal of Dairy Science, 95(6), 3181–3189.
HAGEMANN, M., NDAMBI, A., HEMME, T. & LATACZ-LOHMANN, U. (2012). Contribution
of milk production to global greenhouse gas emissions, an estimation based on typical
farms. Environmental Science and Pollution Research, 19, 390–402.
HENSEN, A., &SCHARFF, H. (2001). Methane emission estimates from landfills obtained
with dynamic plume measurements. Water, Air, and Soil Pollution, 1, 455–464.
HERRERO, M., GERBER, P., VELLINGA, T., GARNETT, T., LEIP, A., OPIO, C., et al. (2011).
Livestock and greenhouse gas emissions: The importance of getting the numbers rights.
Animal Feed Science and Technology, 166–167, 779–782.
HINDRICHSEN, I.K., WETTENSTEIN, H.R., MACHMÜLLER, A., JÖRG, B. & KREUZER, M.
(2005). Effect of the carbohydrate composition of feed concentrates on methane emission
78 CHAPTER 3
from dairy cows and their slurry. Environmental Monitoring and Assessment, 107, 329–
350.
HUTH, F.W. (1995). Die Laktation des Rindes – Analyse, Einfluß, Korrektur. Stuttgart:
Eugen Ulmer GmbH & Co.
IBM (2011). IBM ILOG CPLEX Optimizer, High-performance mathematical programming
solver for linear programming, mixed integer programming, and quadratic programming.
http://www-01.ibm.com/software/integration/optimization/cplex-optimizer/.
IPCC (2006). IPCC Guidelines for National Greenhouse Gas Inventories, Prepared by the
National Greenhouse Gas Inventories Programme. In Eggleston H.S., Buendia L., Miwa
K., Ngara T. and Tanabe K. (eds). Japan: IGES.
JOHNSON, K., HUYLER, M., WESTBERG, H., LAMP, B. & ZIMMERMAN, P. (1994).
Measurement of methane emissions from ruminant livestock using a SF6 tracer technique.
Environmental Science and Technology, 28, 359–362.
KAZENWADEL, G. & DOLUSCHITZ, R. (1998). Modellierung auf Regionsebene durch
Hochrechnung auf Basis einzelbetrieblicher Kennzahlen. Agrarinformatik, 1, 2–8.
Kirchgessner, M., Windisch, W., Müller, H.L. & Kreuzer, M. (1991). Release of methane
and of carbon dioxide by dairy cattle. Agribiological Research, 44, 91–102.
KÜLLING, D.R., DOHME, F., MENZI, H., SUTTER, F., LISCHER, P. & KREUZER, M. (2002).
Methane emissions of differently fed dairy cows and corresponding methane and nitrous
oxide emissions from their manure during storage. Environmental Monitoring and
Assessment, 79, 129–150.
LENGERS, B. & BRITZ, W. (2012). The choice of emission indicators in environmental
policy design: an analysis of GHG abatement in different dairy farms based on a bio-
economic model approach. Review of Agricultural and Environmental Studies, 93(2), 117–
144.
LOVETT, D.K., SHALLOO, L., DILLON, P. & O´MARA, F.P. (2006). A systems approach to
quantify greenhouse gas fluxes from pastoral dairy production as affected by management
regime. Agricultural Systems, 88, 156–179.
MILLS, J.A., DIJKSTRA J., BANNINK, A., CAMMELL S.B., KEBREAB, E. & FRANCE, J.
(2001). A mechanistic model of whole-tract digestion and methanogenesis in the lactating
dairy cow: model development, evaluation, and application. Journal of Animal Science, 79,
1584–1597.
MOE, P.W. & TYRRELL, H.F. (2010). Methane Production in Dairy Cows. Journal of Dairy
Science, 62(10), 1583–1586.
NIEBAUM, A. (2001). Quantifizierung gasförmiger Emissionen aus quergelüfteten
Außenklimaställen für Mastschweine mit Hilfe der Tracergas-Technik. PhD thesis, Georg
August Universität, Göttingen.
CHAPTER 3 79
OLESEN, J.E., WEISKE, A., ASMAN, W.A.H., WEISBJERG, M.R., DJURHUUS, J. & SCHELDE,
K. (2004). FarmGHG. A Model for Estimating Greenhouse Gas Emissions from Livestock
Farms. Documentation. In DJF Internal Report No. 202, p. 54. Tjele, Denmark: Danish
Institute of Agricultural Sciences.
SAMER, M., MÜLLER, H., FIEDLER, M., AMMON, C., GLASER, M., BERG, W., et al. (2011).
Developing the 85Kr tracer gas technique for air exchange rate measurements in naturally
ventilated animal buildings. Biosystems Engineering, 109(4), 276–287.
SCHILS, R.L.M., DE HAAN, M.H.A., HEMMER, J.G.A., VAN DEN POL-VAN DASSELAAR, A.,
de BOER, J.A., EVERS, A.G., HOLSHOF, G., van MIDDELKOOP, J.C. & ZOM, R.L.G. (2007).
DairyWise, A whole-farm dairy model. Journal of Dairy Science, 90, 5334–5346.
SCHNEIDER, F., EICHELSER, R. & NESER, S. (2006). Emissionen aus freigelüfteten Ställen.
Entwicklung von Messmethoden und Ergebnisse der Feldmessungen. Schriftenreihe der
Bayrischen Landesanstalt für Landwirtschaft, 15/2006, 145–157.
SEIPELT, F. (1999). Quantifizierung und Bewertung gasfo rmiger Emissionen aus frei
gelu fteten Milchviehsta llen mit Trauf-First-Lüftung. PhD thesis, Georg August Universität,
Göttingen.
SNELL, H.G.J, SEIPELT, F. & VAN DEN WEGHE, H.F.A. (2003). Ventilation rates and
gaseous emissions from naturally ventilated dairy houses. Biosystems Engineering, 86(1),
67–73.
STORM, I.M.L.D., HELLWING, A.L.F., NIELSEN, N.I. & MADSEN J. (2012). Methods for
measuring and estimating methane emission from ruminants. Animals, 2, 160–183.
TALLEC, T. & HENSEN, A. (2011). Measurement methods comparison campaign of CH4
emissions by grazing livestock. http://www.ttorch.org/wp-
content/uploads/2011/03/FinalReport_3144.pdf. Accessed 06 March 2012.
UBA (2009). Nationaler Inventarbericht zum Deutschen Treibhausgasinventar 1990-2007,
Berichterstattung unter der Klimarahmenkonvention der Vereinten Nationen und dem
Kyoto-Protokoll 2009. Climate Change 02/09.
WEISKE, A., VABITSCH, A., OLESEN, J.E., SCHELDE, K., MICHEL, J., FRIEDRICH, R. &
KALTSCHMITT, M. (2006). Mitigation of greenhouse gas emissions in European
conventional and organic dairy farming. Agriculture, Ecosystems and Environment, 112,
221–232.
ZHANG, G., STROM J.S., Li, B., ROM, H.B., MORSING, S., DAHL, P. & WANG, C. (2005).
Emission of ammonia and other contaminant gases from naturally ventilated dairy cattle
buildings. Biosystems Engineering, 92(3), 355–364.
80 GENERAL CONCLUSIONS
General Conclusions
The investigations presented within this thesis refer to the topic of gaseous emissions from
naturally ventilated dairy barns. The thesis addresses the need for enhancement of methods
for the measurement or calculation of air exchange rates and shall serve as a basis for
future research activities in this field. Furthermore, emission modeling and measuring
science is brought together in an interdisciplinary approach and discussed in detail.
However, apart from the scientific objectives the thesis further contributes to the present
discussion in practical dairy farming, specifically, which floor design and manure removal
strategy in dairy barns causes least impact on the environment.
The following conclusions refer to the objectives of the study mentioned in the
introductive part of this thesis.
1) Further development of methods for the measurement of gaseous emissions from
naturally cross ventilated dairy barns:
a) Development of a building-specific air exchange model for the calculation of the
air exchange rate
There is a great need for improving methods in the determination of air exchange rates of
naturally ventilated buildings. Apart from necessary improvements in accuracy and
feasibility, SF6 has a high global warming potential and one can expect that its usage may
be prohibited in several countries in the near future. Building specific models may help to
reduce the required amount of tracer gases.
The developed method can be seen as a rough, but solid model to estimate the air exchange
rate of the investigated building with minimal effort. Regarding the complexity of tracer
gas measurements in naturally ventilated buildings this result is a step towards the
simplifying the determination of the air exchange rate. However, there is major need for
further development of the building specific air exchange model. In particular, in periods
offering no cross ventilation, e.g. when curtains are closed or when the wind direction is
not appropriate, the developed methodology is not applicable in the present form and has
to be improved.
GENERAL CONCLUSIONS 81
b) Development of a robust measurement system for the long-term measurement of
CH4, NH3, and CO2 outdoor and indoor concentrations.
The system for gas concentration measurement delivered reliable and precise results during
long-term experiments. Although the tube distances within the barn were long and there
were temperature differences between barn and the adjacent building, there were no
problems with condensation or contamination. Unfortunately the gas concentration
measurements were limited to CO2, CH4, and NH3 and were not suitable for N2O. The
author’s assumption for the problems occurred in N2O concentration measurement in the
own investigation is: In contrast to straw based systems, liquid manure systems are
expected to generate only minimal N2O emissions (MONTENY et al., 2006; THORMAN et al.,
2007). Accordingly, with a very high ventilation rate of the barn (see chapter 1), the N2O
indoor concentrations are decreasing even more. Especially differences in concentrations
of incoming and exhaust air are minimal and thus difficult to measure precisely.
With a high global warming potential, even slight N2O emissions may affect the level of
emissions in CO2-equivalents significantly. But apart from this enormous weighting of
even slight N2O emissions in the calculation of CO2-equivalents there is one more reason
to emphasize the importance of N2O measurements for future investigations: Interactions
of N2O with other gaseous emissions. For example, PETERSEN & SOMMER (2011) found
that the reduction of NH3 emissions may result in higher N2O emissions. This interaction is
of particular importance with regard to NH3 or CH4 reduction strategies.
2) Long-term measurement of CH4 and NH3 emissions from differently managed naturally
ventilated dairy barns:
a) Comparison of the dairy cow housing systems: slatted floor with subfloor
storage and solid floor with external storage
This objective includes the very ‘hands-on’ aspect which floor design and manure removal
system is resulting in lowest gaseous emissions. In the own investigation emissions from
slatted floor including storage with low intensity of homogenization led to lowest NH3 and
CH4 emissions in all seasons. However, varying only one factor – slurry homogenization –
emissions from slatted floor increased dramatically. Furthermore, the design of the external
82 GENERAL CONCLUSIONS
slurry tank from solid floor was affecting the balance. This underlines the close
relationship between housing system and its management (objective 2a objective 2b)
Once more it must be emphasized that the whole system, barn and storage, has to be
considered when assessing the emission level of dairy houses and manure management.
This underlines the importance of an integrated approach in the development of mitigation
measures (e.g. additives). Furthermore, there may be several mitigation options that shift
the emission potential from one factor to another, e.g. when reduced emissions from
storage are compensated by higher emissions in field application or by higher emissions of
other gases (AMON et al., 2006; PETERSEN & SOMMER, 2011).
With a shared subfloor storage for liquid manure between the two slatted floor sections it
was not possible to consider separate nutrition balances for the two barn sections. It is also
apparent that there was an exchange of gases between the air above and beneath the slatted
floor. This may have resulted in mixing air between the sections to an unknown extent but
since there were large differences in gas concentrations and emissions between the
sections, this did not strongly affect the own measurements. The shared liquid manure
storage and the position of the mixer at the gable wall of the barn resulted in a higher
homogenization of liquid manure in one of the slatted floor sections. This made it possible
to determine the enormous influence of slurry mixing on emissions on the one hand, but it
hampered the simultaneous comparison of feeding or cleaning procedures between the two
sections on the other hand. However, since there was no opportunity to modify the slurry
tank within the period of investigation, the problem was avoided by a reduced mixing
frequency during specific investigations. Nevertheless, the author recommends the future
separation of the slurry storages in order to ensure optimal conditions for research
activities within the dairy barn.
b) Effect of manure management on CH4 and NH3 emissions
The effect of manure management in the own investigation on CH4 and NH3 emissions was
evident (see chapter 2). One of the main conclusions of this thesis is that manure
management is strongly affecting the level of emissions rather than the barn construction
and the floor design itself (see objective 2a).
GENERAL CONCLUSIONS 83
3) Validation of the dairy farm-level model DAIRYDYN with long-term measurement
results.
The comparison of indicator-modeled CH4 emissions with online measurements should
lead to a validation of CH4 accounting for the DAIRYDYN model. The interdisciplinary
study showed the necessity of very detailed indicator schemes. Compared with findings of
other studies the model results offered relatively moderate deviations. In general, the
exchange between and the combination of modeling and measuring science is a valuable
cooperation, offering the possibilities to (a) improve accuracy in modeling (chapter 3) and
(b) to amend or partly replace the time and cost intensive measurements (chapter 2).
To sum up, reducing livestock sector emissions is an indisputable subject regarding the
environmental impact and thus the sustainability of land use and food production. In order
to receive precise sector- or farm-specific emission factors and to evaluate possible
mitigation strategies, accurate measuring and modeling systems are of particular
importance. There are several promising approaches of both, modeling and measuring
science, successively demanding for further improvement in accuracy, consistency and
effectiveness. The present work contributes to these approaches and may serve as a further
piece of the puzzle within this complex topic. The investigated barn offers favorable
conditions for future research activities. These future research activities should include
N2O measurements in order to reach the long-term objective in the environmental
assessment of farming procedures, the calculation of CO2-equivalents per product unit, in
that case CO2-eq per kg milk.
84 GENERAL CONCLUSIONS
References
AMON, B., KRYVORUCHKO, V., AMON, T. & ZECHMEISTER-BOLTENSTERN, S. (2006).
Methane, nitrous oxide and ammonia emissions during storage and after application of
dairy cattle slurry and influence of slurry treatment. Agriculture Ecosystems &
Environment 112(2-3), 153-162.
MONTENY, G., BANNINK, A. & CHADWICK, D. (2006). Greenhouse gas abatement
strategies for animal husbandry. Agriculture Ecosystems & Environment 112(2-3), 163-
170.
PETERSEN, S. & SOMMER, S. (2011). Ammonia and nitrous oxide interactions: Roles of
manure organic matter management. Animal Feed Science and Technology 166-67, 503-
513.
THORMAN, R., CHADWICK, D., HARRISON, R., BOYLES, L. & MATTHEWS, R. (2007). The
effect on N2O emissions of storage conditions and rapid incorporation of pig and cattle
farmyard manure into tillage land. Biosystems Engineering 97(4), 501-511.

The study presented herein was part of a project funded by the Landwirtschaftliche
Rentenbank and the Chamber of Agriculture of North Rhine-Westphalia.