Embed Size (px)
Citation preview
Institut für Nutzpflanzenwissenschaften und Ressourcenschutz (INRES)
Lehr-und Forschungsbereich Pflanzenernährung
der Rheinischen Friedrich-Wilhelms-Universität zu Bonn
Greenhouse Gas Emissions from Composting and
Anaerobic Digestion Plants
Inaugural – Dissertation
Zur
Erlangung des Grades
Doktor der Agrarwissenschaften
(Dr. agr.)
der
Hohen Landwirtschaftlichen Fakutät
der
Rheinischen Friedrich-Wilhelms-Universität
zu Bonn
Vorgelegt am 01. August 2012
von
Nguyen Thanh Phong
aus Can Tho, Vietnam

Referent: PD. Dr. Joachim Clemens
Korreferent: Prof. Dr. agr. habil. Wolfgang Büscher
Tag der mündlichen Prüfung: 21.09. 2012
Erscheinungsjahr: 2012

Greenhouse Gas Emissions from Composting and Anaerobic Digestion Plants
____________________________________________________________________________
i
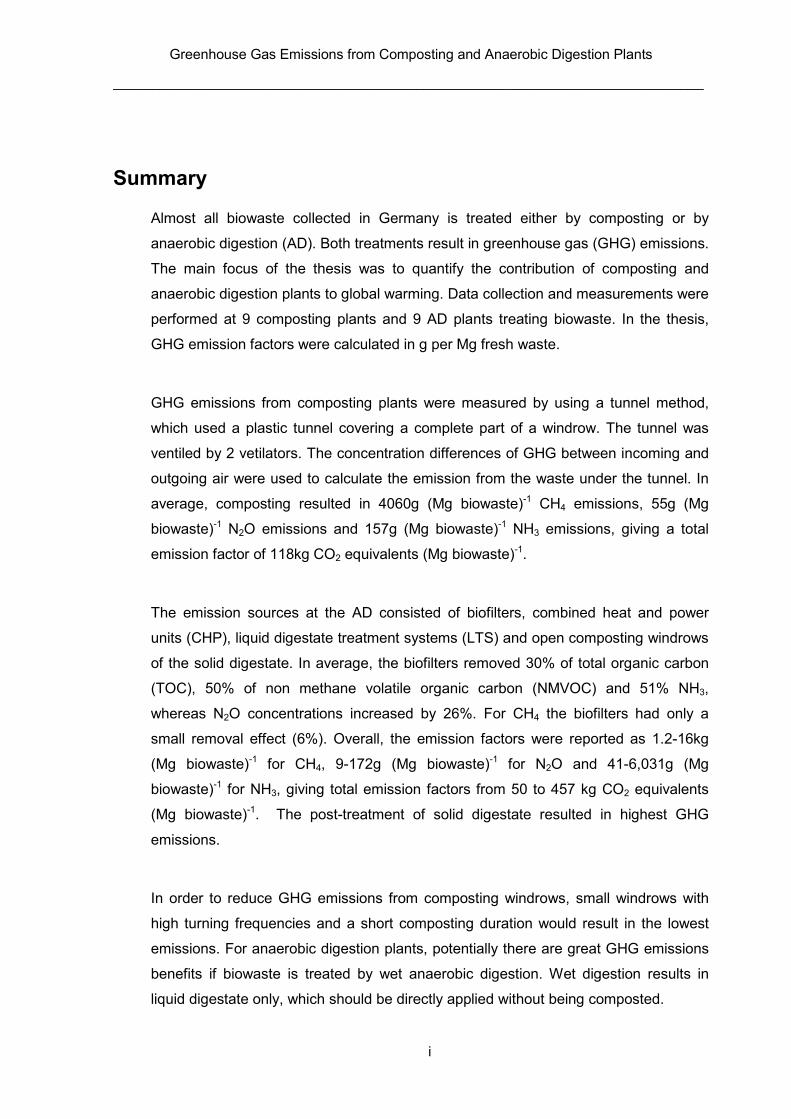
Summary
Almost all biowaste collected in Germany is treated either by composting or by
anaerobic digestion (AD). Both treatments result in greenhouse gas (GHG) emissions.
The main focus of the thesis was to quantify the contribution of composting and
anaerobic digestion plants to global warming. Data collection and measurements were
performed at 9 composting plants and 9 AD plants treating biowaste. In the thesis,
GHG emission factors were calculated in g per Mg fresh waste.
GHG emissions from composting plants were measured by using a tunnel method,
which used a plastic tunnel covering a complete part of a windrow. The tunnel was
ventiled by 2 vetilators. The concentration differences of GHG between incoming and
outgoing air were used to calculate the emission from the waste under the tunnel. In
average, composting resulted in 4060g (Mg biowaste)-1 CH4 emissions, 55g (Mg
biowaste)-1 N2O emissions and 157g (Mg biowaste)-1 NH3 emissions, giving a total
emission factor of 118kg CO2 equivalents (Mg biowaste)-1.
The emission sources at the AD consisted of biofilters, combined heat and power
units (CHP), liquid digestate treatment systems (LTS) and open composting windrows
of the solid digestate. In average, the biofilters removed 30% of total organic carbon
(TOC), 50% of non methane volatile organic carbon (NMVOC) and 51% NH3,
whereas N2O concentrations increased by 26%. For CH4 the biofilters had only a
small removal effect (6%). Overall, the emission factors were reported as 1.2-16kg
(Mg biowaste)-1 for CH4, 9-172g (Mg biowaste)-1 for N2O and 41-6,031g (Mg
biowaste)-1 for NH3, giving total emission factors from 50 to 457 kg CO2 equivalents
(Mg biowaste)-1. The post-treatment of solid digestate resulted in highest GHG
emissions.
In order to reduce GHG emissions from composting windrows, small windrows with
high turning frequencies and a short composting duration would result in the lowest
emissions. For anaerobic digestion plants, potentially there are great GHG emissions
benefits if biowaste is treated by wet anaerobic digestion. Wet digestion results in
liquid digestate only, which should be directly applied without being composted.
Greenhouse Gas Emissions from Composting and Anaerobic Digestion Plants
____________________________________________________________________________
ii
Zusammenfassung (summary in German)
Fast alle gesammelten Bioabfälle werden in Deutschland entweder durch
Kompostierung oder durch Vergärung behandelt. Bei der Behandlung entstehen
Treibhausgase (THG) wie Methan und Lachgas. Ziel der Arbeit war es, diese
Emissionen zu quantifizieren.
Messungen erfolgten an 9 Kompostierungsanlagen (KoA) und 9 Vergärungsanlagen
(VA). THG-Emissionen von KoA wurden mit Hilfe einer Tunnel-Methode, bei der ein
kompletter Teil einer Miete mit einem Kunststoff-Tunnel abgedeckt wurde, gemessen.
Der Tunnel wurde mit Hilfe von zwei Ventilatoren belüftet. Die
Konzentrationsdifferenzen der Treibhausgase zwischen Zu- und Abluft wurden
genutzt, um die Emission der Abfälle unter dem Tunnel zu bestimmen. Im Mittel führte
die Kompostierung zu 4.060g (Mg Bioabfälle)-1 CH4 Emissionen, 55g (Mg Bioabfälle) -
1 N2O Emissionen und 157g (Mg Bioabfälle) -1 NH3 Emissionen. Daraus ergibt sich ein
Emissionsfaktor von 118kg CO2 -Äquivalenten (Mg Bioabfälle) -1.
Die Emissionsquellen an VA waren der Biofilter, das Blockheizkraftwerk (BHKW), die
flüssigen Gärrest-Behandlungssysteme und die offenen Kompostmieten der festen
Gärreste. Im Durchschnitt reduzierten die Biofilter den gesamten organischen
Kohlenstoffs (TOC) um 30%, bzw um 50% des Non-Methane Voltile Organic Carbon
(NMVOC). CH4 wurde am Biofilter nur sehr wenig abgebaut (6%), dagegen
reduzierte sich die NH3-Fracht um 51%. Die N2O Emissionen wurden um 26%
erhöht. Insgesamt wurden 1,2-16kg CH4 (Mg Bioabfälle)-1, 9-172g N2O (Mg
Bioabfälle)-1 und 41-6.031g NH3 (Mg Bioabfälle)-1 emittiert. Daraus ergibt sich ein
Emissionsfaktor von 50 bis 457 kg CO2 -Äquivalenten (Mg Bioabfälle) -1. Die höchsten
Emissionen wurden in der Nachbehandlung der festen Gärreste freigesetzt.
In der Kompostierung können die Emissionen durch kleine Mieten, öfteres Umsetzen
und eine kürzere Behandlungsdauer reduziert werden. Die geringsten Emissionen an
THG sind von der Nassvergärung ohne Separierung zu erwarten. Die
Nachbehandlung von Gärresten führt zu hohen Treibhausgas-Emissionen. Deshalb
sollte Gärrest ohne vorherige Kompostierung direkt angewendet werden.

Greenhouse Gas Emissions from Composting and Anaerobic Digestion Plants
____________________________________________________________________________
iii
Erklärung (Declaration)
Ich versichere, dass ich diese Arbeit selbständig verfaßt habe, keine anderen Quellen und
Hilfsmateralien als die angegebenen benutzt und die Stellen der Arbeit, die anderen
Werken dem Wortlaut oder dem Sinn nach entnommen sind, kenntlich gemacht habe.
Die Arbeit hat in gleicher oder ähnlicher Form keiner anderen Prüfungsbehörde
vorgelegen.
Greenhouse Gas Emissions from Composting and Anaerobic Digestion Plants
____________________________________________________________________________
iv
Acknowledgements
This dissertation could not have been written without support of many people. First of all, I
would like to thank PD.Dr. Joachim Clemens, my first supervior, for the effort, kindness
and patience he had throughout my work. I would like to thank Prof. Dr Wolfgang Büscher
for accepting to be my second suppervior. I thank the Dean and the Faculty of Agriculture
secretariat for helping me in administrative issues. I would like to give a special thank to
colleages in the Plant Nutrient Institute for their help, support, interest and valuable hints.
I am grateful to German Academic Exchange Service (DAAD) for financial support and
Federal Environment Office (UBA) for giving me a great opportunity to do this research
through the project “Determination of emission situation in the recycling of biowaste”
(UFOPLAN, 2009).
I want to particular thank my colleages in gewitra company for great and productive field
trips. I extend my appreciation to Dr. Carsten Cuhls and Dip.Ing Birte Mähl for their
cooperation, assistant and for great inputs as well as rewarding discussions.
Especially, I would like to acknowledge and extend my heartfelt gratitude my entire family,
whose sacrificed and patient love enabled me to complete this work.
Greenhouse Gas Emissions from Composting and Anaerobic Digestion Plants
____________________________________________________________________________
v
Table of Contents
Summary .............................................................................................................................. i
Zusammenfassung (summary in German) ........................................................................ ii
Erklärung (Declaration) ...................................................................................................... iii
Acknowledgements ........................................................................................................... iv
Table of Contents ................................................................................................................ v
List of Abbreviations ....................................................................................................... viii
List of Tables ...................................................................................................................... ix
List of Figures ..................................................................................................................... x
1. CH4, N2O and NH3 EMISSIONS FROM OPEN-WINDROW COMPOSTING IN
GERMANY .................................................................................................................... 1
1.1 Introduction ................................................................................................................. 1
1.2 Hypotheses/ Objectives .............................................................................................. 2
1.2.1 Hypotheses .................................................................................................................... 2 1.2.2 Objectives ...................................................................................................................... 2
1.3 General background ................................................................................................... 2
1.3.1 Generation of biowaste, green waste and AD material in Germany ............................. 2 1.3.2 Composting process ...................................................................................................... 3 1.3.3 GHG formations and emissions ..................................................................................... 4 1.3.4 Methane oxidation in a composting windrow ................................................................. 5 1.3.5 Open composting windrows ........................................................................................... 5 1.3.6 Greenhouse gases......................................................................................................... 7 1.3.7 Quantification of GHG emissions from composting windrows ....................................... 7
1.4 Materials and methods ............................................................................................... 9
1.4.1 Site description and compost system ............................................................................ 9 1.4.2 Biowaste composting ................................................................................................... 10 1.4.3 Green waste composting ............................................................................................. 11 1.4.4 AD material composting ............................................................................................... 12
1.5 Gas concentration and emission measurements ...................................................... 13
1.5.1 Tunnel method ............................................................................................................. 13
Greenhouse Gas Emissions from Composting and Anaerobic Digestion Plants
____________________________________________________________________________
vi
1.5.2 Pore gas measurements .............................................................................................. 14 1.5.3 General overview of emission factors and calculation of CH4, N2O and NH3 emissions
…………………………………………………………………………………………………15
1.6 Results and discussion .............................................................................................17
1.6.1 Profiles of gas concentrations in triangular, trapezoidal and tabular windrows ........... 17 1.6.2 Ratio of CO2/CH4 in compost windrows ....................................................................... 22 1.6.3 Correlation between gas production and emission ...................................................... 26 1.6.4 Emissions of CH4, N2O and NH3 from biowaste composting ....................................... 27 1.6.5 Emissions of CH4, N2O and NH3 from green waste composting ................................. 31 1.6.6 Emissions of CH4, N2O and NH3 from AD material composting................................... 32 1.6.7 Effect of aeration on CH4, N2O and NH3 emissions ..................................................... 34 1.6.8 CO2 equivalent emissions ............................................................................................ 36
1.7 Conclusions ..............................................................................................................38
1.8 References ...............................................................................................................39
2. GREENHOUSE GAS EMISSIONS FROM ANAEROBIC DIGESTION PLANTS IN
GERMANY ...................................................................................................................44
2.1 Introduction ...............................................................................................................44
2.2 Hypotheses/ Objectives ............................................................................................45
2.2.1 Hypotheses .................................................................................................................. 45 2.2.2 Objectives .................................................................................................................... 45
2.3 General background .................................................................................................45
2.3.1 GHG emissions in Germany ........................................................................................ 45 2.3.2 Biowaste generation..................................................................................................... 46 2.3.3 Treatment of biowaste ................................................................................................. 47 2.3.4 Anaerobic digestion process ........................................................................................ 47 2.3.5 Overview of an anaerobic digestion plant .................................................................... 48 2.3.6 Types of anaerobic digestion ....................................................................................... 49 2.3.7 Emission sources ......................................................................................................... 50
2.4 Materials and Methods ..............................................................................................51
2.5 Sites descriptions of AD plants .................................................................................53
2.5.1 PLANT 1 ....................................................................................................................... 53 2.5.2 PLANT 2 ....................................................................................................................... 54 2.5.3 PLANT 3 ....................................................................................................................... 55 2.5.4 PLANT 4 ....................................................................................................................... 56 2.5.5 PLANT 5 ....................................................................................................................... 57 2.5.6 PLANT 6 ....................................................................................................................... 58 2.5.7 PLANT 7 ....................................................................................................................... 59 2.5.8 PLANT 8 ....................................................................................................................... 60 2.5.9 PLANT 9 ....................................................................................................................... 61
Greenhouse Gas Emissions from Composting and Anaerobic Digestion Plants
____________________________________________________________________________
vii
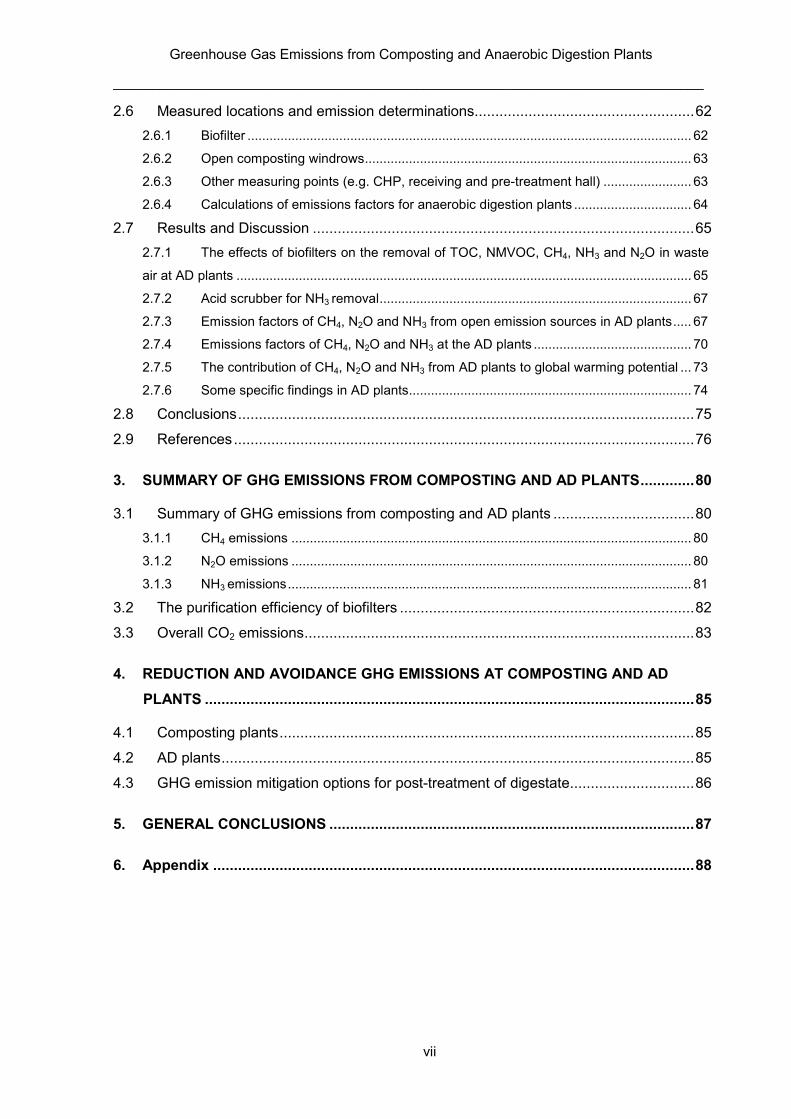
2.6 Measured locations and emission determinations ..................................................... 62
2.6.1 Biofilter ......................................................................................................................... 62 2.6.2 Open composting windrows ......................................................................................... 63 2.6.3 Other measuring points (e.g. CHP, receiving and pre-treatment hall) ........................ 63 2.6.4 Calculations of emissions factors for anaerobic digestion plants ................................ 64
2.7 Results and Discussion ............................................................................................ 65
2.7.1 The effects of biofilters on the removal of TOC, NMVOC, CH4, NH3 and N2O in waste
air at AD plants ............................................................................................................................ 65 2.7.2 Acid scrubber for NH3 removal ..................................................................................... 67 2.7.3 Emission factors of CH4, N2O and NH3 from open emission sources in AD plants ..... 67 2.7.4 Emissions factors of CH4, N2O and NH3 at the AD plants ........................................... 70 2.7.5 The contribution of CH4, N2O and NH3 from AD plants to global warming potential ... 73 2.7.6 Some specific findings in AD plants............................................................................. 74
2.8 Conclusions .............................................................................................................. 75
2.9 References ............................................................................................................... 76
3. SUMMARY OF GHG EMISSIONS FROM COMPOSTING AND AD PLANTS ............. 80
3.1 Summary of GHG emissions from composting and AD plants .................................. 80
3.1.1 CH4 emissions ............................................................................................................. 80 3.1.2 N2O emissions ............................................................................................................. 80 3.1.3 NH3 emissions .............................................................................................................. 81
3.2 The purification efficiency of biofilters ....................................................................... 82
3.3 Overall CO2 emissions .............................................................................................. 83
4. REDUCTION AND AVOIDANCE GHG EMISSIONS AT COMPOSTING AND AD
PLANTS ...................................................................................................................... 85
4.1 Composting plants .................................................................................................... 85
4.2 AD plants .................................................................................................................. 85
4.3 GHG emission mitigation options for post-treatment of digestate .............................. 86
5. GENERAL CONCLUSIONS ........................................................................................ 87
6. Appendix .................................................................................................................... 88
Greenhouse Gas Emissions from Composting and Anaerobic Digestion Plants
____________________________________________________________________________
viii
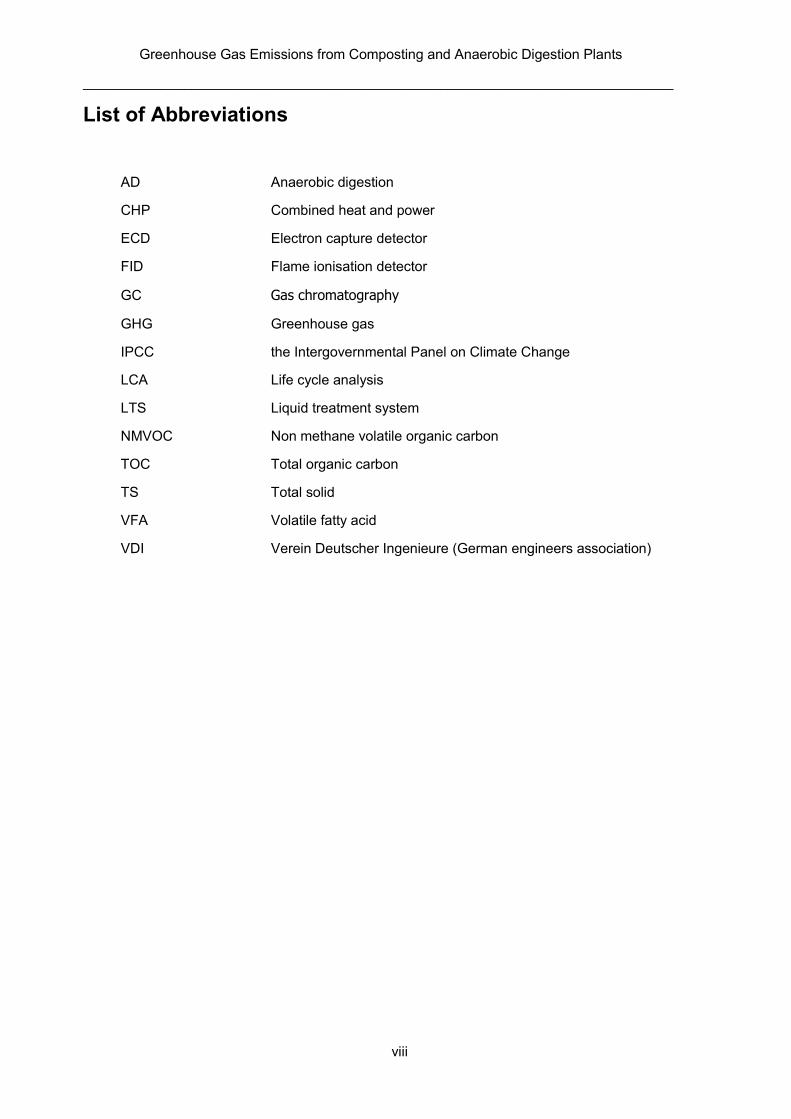
List of Abbreviations
AD Anaerobic digestion
CHP Combined heat and power
ECD Electron capture detector
FID Flame ionisation detector
GC Gas chromatography
GHG Greenhouse gas
IPCC the Intergovernmental Panel on Climate Change
LCA Life cycle analysis
LTS Liquid treatment system
NMVOC Non methane volatile organic carbon
TOC Total organic carbon
TS Total solid
VFA Volatile fatty acid
VDI Verein Deutscher Ingenieure (German engineers association)
Greenhouse Gas Emissions from Composting and Anaerobic Digestion Plants
____________________________________________________________________________
ix
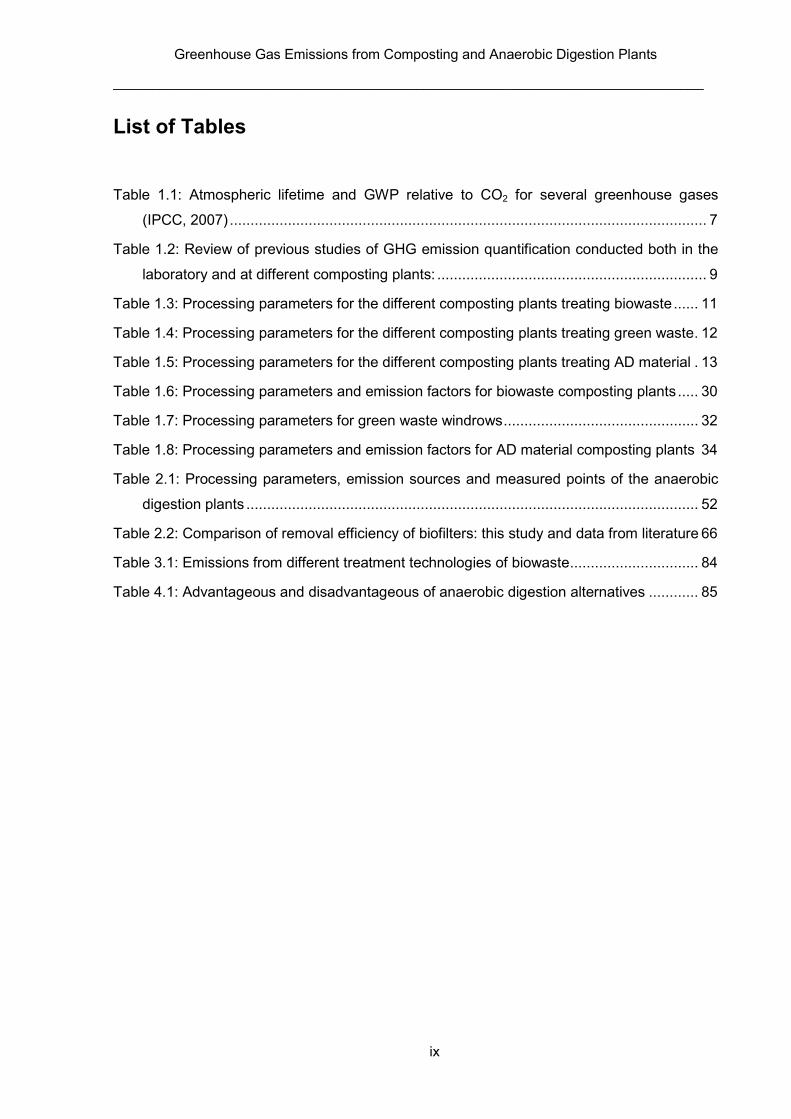
List of Tables
Table 1.1: Atmospheric lifetime and GWP relative to CO2 for several greenhouse gases
(IPCC, 2007) ................................................................................................................... 7
Table 1.2: Review of previous studies of GHG emission quantification conducted both in the
laboratory and at different composting plants: ................................................................. 9
Table 1.3: Processing parameters for the different composting plants treating biowaste ...... 11
Table 1.4: Processing parameters for the different composting plants treating green waste . 12
Table 1.5: Processing parameters for the different composting plants treating AD material . 13
Table 1.6: Processing parameters and emission factors for biowaste composting plants ..... 30
Table 1.7: Processing parameters for green waste windrows ............................................... 32
Table 1.8: Processing parameters and emission factors for AD material composting plants 34
Table 2.1: Processing parameters, emission sources and measured points of the anaerobic
digestion plants ............................................................................................................. 52
Table 2.2: Comparison of removal efficiency of biofilters: this study and data from literature 66
Table 3.1: Emissions from different treatment technologies of biowaste ............................... 84
Table 4.1: Advantageous and disadvantageous of anaerobic digestion alternatives ............ 85
Greenhouse Gas Emissions from Composting and Anaerobic Digestion Plants
____________________________________________________________________________
x
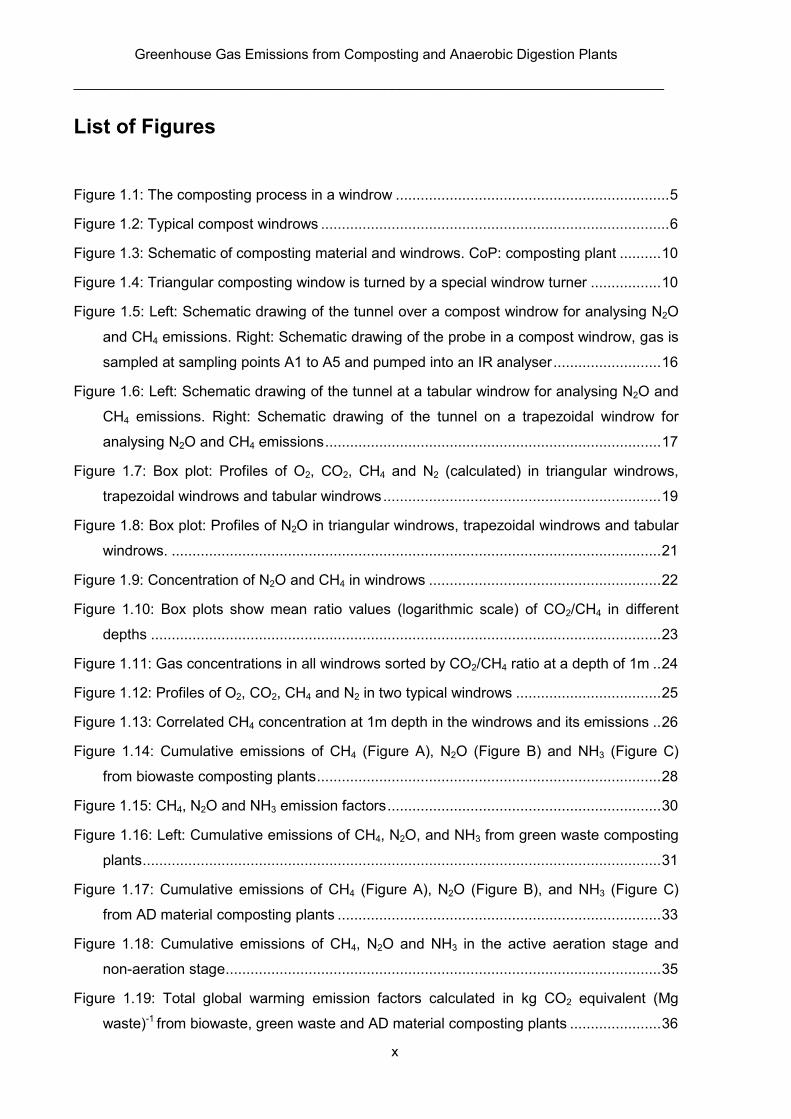
List of Figures
Figure 1.1: The composting process in a windrow .................................................................. 5
Figure 1.2: Typical compost windrows .................................................................................... 6
Figure 1.3: Schematic of composting material and windrows. CoP: composting plant .......... 10
Figure 1.4: Triangular composting window is turned by a special windrow turner ................. 10
Figure 1.5: Left: Schematic drawing of the tunnel over a compost windrow for analysing N2O
and CH4 emissions. Right: Schematic drawing of the probe in a compost windrow, gas is
sampled at sampling points A1 to A5 and pumped into an IR analyser .......................... 16
Figure 1.6: Left: Schematic drawing of the tunnel at a tabular windrow for analysing N2O and
CH4 emissions. Right: Schematic drawing of the tunnel on a trapezoidal windrow for
analysing N2O and CH4 emissions ................................................................................. 17
Figure 1.7: Box plot: Profiles of O2, CO2, CH4 and N2 (calculated) in triangular windrows,
trapezoidal windrows and tabular windrows ................................................................... 19
Figure 1.8: Box plot: Profiles of N2O in triangular windrows, trapezoidal windrows and tabular
windrows. ...................................................................................................................... 21
Figure 1.9: Concentration of N2O and CH4 in windrows ........................................................ 22
Figure 1.10: Box plots show mean ratio values (logarithmic scale) of CO2/CH4 in different
depths ........................................................................................................................... 23
Figure 1.11: Gas concentrations in all windrows sorted by CO2/CH4 ratio at a depth of 1m .. 24
Figure 1.12: Profiles of O2, CO2, CH4 and N2 in two typical windrows ................................... 25
Figure 1.13: Correlated CH4 concentration at 1m depth in the windrows and its emissions .. 26
Figure 1.14: Cumulative emissions of CH4 (Figure A), N2O (Figure B) and NH3 (Figure C)
from biowaste composting plants ................................................................................... 28
Figure 1.15: CH4, N2O and NH3 emission factors .................................................................. 30
Figure 1.16: Left: Cumulative emissions of CH4, N2O, and NH3 from green waste composting
plants ............................................................................................................................. 31
Figure 1.17: Cumulative emissions of CH4 (Figure A), N2O (Figure B), and NH3 (Figure C)
from AD material composting plants .............................................................................. 33
Figure 1.18: Cumulative emissions of CH4, N2O and NH3 in the active aeration stage and
non-aeration stage ......................................................................................................... 35
Figure 1.19: Total global warming emission factors calculated in kg CO2 equivalent (Mg
waste)-1 from biowaste, green waste and AD material composting plants ...................... 36
Greenhouse Gas Emissions from Composting and Anaerobic Digestion Plants
____________________________________________________________________________
xi
Figure 1.20: Mean CH4, N2O and NH3 emission factors g (Mg waste)-1 from the composting of
biowaste, green waste and AD material ........................................................................ 37
Figure 2.1: GHG emissions in Germany from 1990 to 2010 (UBA, 2011) ............................. 46
Figure 2.2: Summary of the statistics collected biowaste in 2009 (UBA, 2011) ..................... 46
Figure 2.3: Main steps and pathways of the degradation of organic material through
anaerobic digestion process (Appels et al., 2008) ......................................................... 48
Figure 2.4: Left: Schematic of batch fermenter. Right: A fermenter is opened for unloading
digestate ....................................................................................................................... 49
Figure 2.5: Left: Schematic of intensive composting tunnel. Right: A front end loader is
unloading material at a composting tunnel .................................................................... 50
Figure 2.6: Schematic waste and gas flow diagram and measuring points (marked in grey) of
plant 1 ........................................................................................................................... 54
Figure 2.7: Schematic waste and gas flow diagram and measuring points (marked in grey) of
plant 2 ........................................................................................................................... 55
Figure 2.8: Schematic waste and gas flow diagram and measuring points (marked in grey) of
plant 3 ........................................................................................................................... 56
Figure 2.9: Schematic waste and gas flow diagram and measuring points (marked in grey) of
plant 4 ........................................................................................................................... 57
Figure 2.10: Schematic waste and gas flow diagram and measuring points (marked in grey)
of plant 5 ....................................................................................................................... 58
Figure 2.11: Schematic waste and gas flow diagram and measuring points (marked in grey)
of plant 6 ....................................................................................................................... 59
Figure 2.12: Schematic waste and gas flow diagram and measuring points (marked in grey)
of plant 7 ....................................................................................................................... 60
Figure 2.13: Schematic waste and gas flow diagram and measuring points (marked in grey)
of plant 8 ....................................................................................................................... 61
Figure 2.14: Schematic waste and gas flow diagram and measuring points (marked in grey)
of plant 9 ....................................................................................................................... 62
Figure 2.15: Left: Sampling of gases at before biofilter and measuring equipments. Right: Foil
covers on a biofilter for CH4, N2O and NH3 concentration measurements ..................... 63
Figure 2.16: Box plots (n=15) show mean gas concentration values (mg/m3) of treated and
untreated air. Box indicates 25 and 75% percentile; - minimum and maximum of total
organic carbon (TOC), methane (CH4), non-methane volatile organic carbon (NMVOC),
ammonia (NH3) and nitrous oxide (N2O) ........................................................................ 66
Greenhouse Gas Emissions from Composting and Anaerobic Digestion Plants
____________________________________________________________________________
xii
Figure 2.17: Gas concentrations before and after acid scrubber at the AD plant 6 ................ 67
Figure 2.18: Emission factors of CH4, N2O and NH3 from emission sources in AD plants. Error
bars show min and max values. Liquid treatment system (LTS) (n=2), Combined heat
and power units (CHP) (n=6), biofilter (n=15), open windrow (n=3) ............................... 69
Figure 2.19: Median emission factors of CH4 g (Mg biowaste)-1 from different AD plants. For
plants 1, 2, 4, 5, 6, 8 and 9, CHP emission data are missing ......................................... 71
Figure 2.20: Median emission factor of N2O g (Mg biowaste)-1 from different AD plants. For
plants 1, 2, 4, 5, 6, 8 and 9, CHP emission data are missing ......................................... 72
Figure 2.21: Median emission factors of NH3 g (Mg biowaste)-1 from different AD plants. For
plants 1, 2, 4, 5, 6, 8 and 9, CHP emission data are missing ......................................... 72
Figure 2.22: Left: The contribution of CH4, N2O and NH3 in form of CO2 equivalent emissions
at AD plants. Right: The contribution of different emission sources at AD plants. For
plants 1, 2, 4, 5, 6, 8 and 9, CHP emission data are missing ......................................... 73
Figure 2.23: Contribution of close emission sources to TOC, CH4, NH3, N2O (left axis) and
CO2 equivalent (right axis) in the plant 3 ........................................................................ 74
Figure 2.24: Contributions of close emission sources to TOC, CH4, NH3, and N2O (left axis)
and CO2 equivalent (right axis) in the plant 6 ................................................................. 75
Figure 3.1: Mean CH4 emission factors (g Mg-1) from different treatments: composting (CoP),
anaerobic digestion (AD), anaerobic digestion with intensive tunnel composting (AD +
TC) and anaerobic digestion with open windrow composting (AD + OW). Bars show
minimum and maximum values, n: number of plants ..................................................... 80
Figure 3.2: Mean N2O emission factors (g Mg-1) from different treatments: composting (CoP),
anaerobic digestion (AD), anaerobic digestion with intensive tunnel composting (AD +
TC) and anaerobic digestion with open windrow composting (AD + OW). Bars show
minimum and maximum values, n: number of plants ..................................................... 81
Figure 3.3: Mean NH3 emission factors (g Mg-1) from different treatments: composting (CoP),
anaerobic digestion (AD), anaerobic digestion with intensive tunnel composting (AD +
TC) and anaerobic digestion with open windrow composting (AD + OW). Bars show
minimum and maximum values, n: number of plants ..................................................... 82
Figure 3.4: Mean biofilter’s efficiencies (n=15) in AD plants. Bars show indicates minimum
and maximum values of total organic carbon (TOC), methane (CH4), non-methane
volatile organic carbon (NMVOC), ammonia (NH3) and nitrous oxide (N2O) .................. 83
Figure 3.5: Mean CO2 equivalent (kg Mg-1) from different treatments……………………...84
Chapter 1: Greenhouse Gas Emissions from Composting Plants
__________________________________________________________________________
________________________________________________________________________ 1
1. CH4, N2O AND NH3 EMISSIONS FROM OPEN-WINDROW
COMPOSTING IN GERMANY
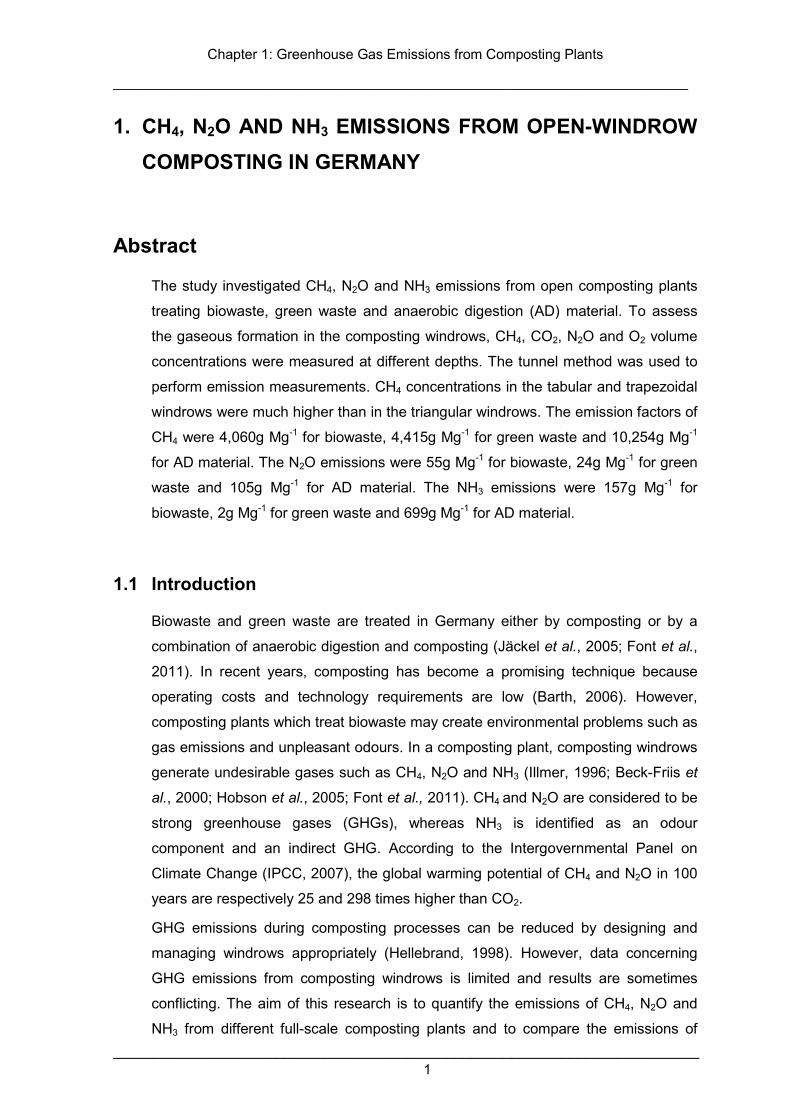
Abstract
The study investigated CH4, N2O and NH3 emissions from open composting plants
treating biowaste, green waste and anaerobic digestion (AD) material. To assess
the gaseous formation in the composting windrows, CH4, CO2, N2O and O2 volume
concentrations were measured at different depths. The tunnel method was used to
perform emission measurements. CH4 concentrations in the tabular and trapezoidal
windrows were much higher than in the triangular windrows. The emission factors of
CH4 were 4,060g Mg-1 for biowaste, 4,415g Mg-1 for green waste and 10,254g Mg-1
for AD material. The N2O emissions were 55g Mg-1 for biowaste, 24g Mg-1 for green
waste and 105g Mg-1 for AD material. The NH3 emissions were 157g Mg-1 for
biowaste, 2g Mg-1 for green waste and 699g Mg-1 for AD material.
1.1 Introduction
Biowaste and green waste are treated in Germany either by composting or by a
combination of anaerobic digestion and composting (Jäckel et al., 2005; Font et al.,
2011). In recent years, composting has become a promising technique because
operating costs and technology requirements are low (Barth, 2006). However,
composting plants which treat biowaste may create environmental problems such as
gas emissions and unpleasant odours. In a composting plant, composting windrows
generate undesirable gases such as CH4, N2O and NH3 (Illmer, 1996; Beck-Friis et
al., 2000; Hobson et al., 2005; Font et al., 2011). CH4 and N2O are considered to be
strong greenhouse gases (GHGs), whereas NH3 is identified as an odour
component and an indirect GHG. According to the Intergovernmental Panel on
Climate Change (IPCC, 2007), the global warming potential of CH4 and N2O in 100
years are respectively 25 and 298 times higher than CO2.
GHG emissions during composting processes can be reduced by designing and
managing windrows appropriately (Hellebrand, 1998). However, data concerning
GHG emissions from composting windrows is limited and results are sometimes
conflicting. The aim of this research is to quantify the emissions of CH4, N2O and
NH3 from different full-scale composting plants and to compare the emissions of
Chapter 1: Greenhouse Gas Emissions from Composting Plants
__________________________________________________________________________
________________________________________________________________________ 2
different windrows. In addition, mitigation options are proposed for minimising
emissions. Investigations were undertaken at nine composting plants in Germany
treating biowaste and green waste, AD and green waste or just green waste.
1.2 Hypotheses/ Objectives
1.2.1 Hypotheses
It is hypothesised that composting windrows generate significant quantities of CH4,
N2O and NH3.
The size of the windrow, turning frequency and composting duration are key
factors in reducing CH4, N2O and NH3 emissions.
1.2.2 Objectives
The objectives were:
• to quantify the emissions of CH4, N2O and NH3 from composting plants treating
biowaste, green waste and AD material.
• to analyse GHG concentrations in windrows and emissions of them.
• to define mitigation options for reducing GHG emissions from composting plants.
1.3 General background
1.3.1 Generation of biowaste, green waste and AD material in Germany
1.3.1.1 Biowaste and green waste generation in Germany
According to VDI 3475 (2005), “biowaste is recyclable waste of animal or plant
origin that is amenable to biodegradation by microorganisms”. Biowaste consists of
garden waste, organic household waste, and waste from commerce and the food
manufacturing industry (Boldrin et al., 2009).
Green waste consists of woody materials, grasses, branches and leaves etc. from
private gardens and public parks (Boldrin et al., 2009).
In Germany, approximately 4 million Mg of green waste and 6-7 million Mg of
biowaste are produced per annum. There are currently around 1,000 composting
plants treating biowaste and green waste (Kranert et al., 2010), of which 600 treat
just biowaste (Weißenfel, 2001 as cited by Jäckel, 2005).
Chapter 1: Greenhouse Gas Emissions from Composting Plants
__________________________________________________________________________
________________________________________________________________________ 3
1.3.1.2 AD material generation in Germany
Anaerobic digestion treats organic waste and produces biogas. Usually, the
organic waste is digested first in anaerobic thermophilic (at 50-55oC) fermenters
with a retention time of around 3 weeks. Biogas produced in the fermenter is
stored and subsequently routed to gas engines for power generation. After the
anaerobic digestion process, the residue is dewatered and the solid residues,
called AD material, are post-treated by composting (Smet et al., 1999). This post-
treatment is essential for obtaining a stable end-product (Mata-Alvarez et al.,
2000). In fact, a considerable amount of CH4 may be contained in this AD material
(Lissens et al., 2004).
1.3.2 Composting process
Composting is an aerobic biological process in which organic material is
decomposed by microorganisms present in the organic material (Paul, 2009,
Figure 1.1). The aims of composting are to achieve a rapid breakdown of organic
substances and a hygienisation effect. The composting process consists of three
phases: thermophilic, maturing and cooling. The thermophilic phase is
characterised by high temperatures when fresh raw material is just mixed. This
phase is important for reducing pathogens and bacteria. The maturing phase is
necessary in order to achieve a stable product. In this phase, the material is
moderately stable. The final phase of the process is the cooling phase, when the
material gets very stable and mature (Paul, 2009).
Oxygen availability, C/N ratio and moisture are the most important parameters for
composting processes (de Guardia et al., 2008; Maeda et al., 2010). In fact oxygen
is required for the composting process because the microorganisms and bacteria
consume oxygen to degrade the organic material. The products are CO2, H2O and
heat (Xu et al., 2007; Maeda et al., 2010). High temperatures in the windrow kill
worm eggs, pathogens and bacteria that may be health hazards to people or
animals. If oxygen is limited during the active phase of composting, aerobic
microbial activities may be inhibited and the temperature gradually decreases
(Fernandes et al., 1994). A C/N ratio of 15 to 30 is recommended for rapid
composting (de Guardia et al., 2008). A high C/N ratio limits microorganism
activities, whereas a low C/N ratio leads to greater NH3 emissions (He et al., 2000;
Pagans et al., 2006; de Guardia et al., 2008; Möller and Stinner, 2009). The
Chapter 1: Greenhouse Gas Emissions from Composting Plants
__________________________________________________________________________
________________________________________________________________________ 4
optimum moisture content for composting is in the range of 50 to 60% (Poincelot,
1974), as cited by Fernandes et al., (2007). A higher moisture content leads to
higher GHG emissions because it creates anaerobic conditions (Tamura and
Osada, 2006).
1.3.3 GHG formations and emissions
The production of CO2, CH4, N2O and NH3 is the result of microbial activities during
the composting process. Composting is an aerobic treatment, but an anaerobic
process in a composting windrow is unavoidable. CH4 is formed due to insufficient
diffusion of O2 into the core of the windrow (Font et al., 2011). It was also reported
that CO2 and CH4 were highest in the centre of the windrows, where no O2 was
detected (Hao, 2001).
Nitrous oxide is a by-product of nitrification and denitrification found in both aerobic
and anaerobic conditions (Paul, 2009). Anoxic conditions are defined as the
absence of oxygen, but oxygen is still available in the form of NO3- and SO4
2-.
Under anaerobic conditions oxygen is absent. The emissions of N2O are affected
by temperature, nitrate content and the aeration rate (Hellebrand, 1998). The
emissions of N2O can be kept at a low rate if aerobic conditions prevail in the
windrows (Hellebrand, 1998). N2O produced during denitrification can be further
reduced to N2 (Hao, 2001). On the other hand, the aerobic nitrification of NH3 to
NO2- and NO3
- may also generate N2O as a by-product (Clemens and Ahlgrimm,
2001; Sánchez-Monedero et al., 2010).
The pH value, NH4+/NH3 equilibrium, quantity and mineralisation intensity of N-
compounds, C/N ratio, temperature, dry matter content and wind speed are the
most important factors influencing NH3 emissions (Martins and Dewes, 1992;
Hellebrand and Kalk, 2001a). During the composting process of animal excrement,
47-77% of the N content in the compost material is emitted in the form of NH3
(Martins and Dewes, 1992). The elevation in temperature and pH increases NH3
emissions. The emission of NH3 is high immediately after the windrow is
established and usually declines after a few weeks (Hansen et al., 2006).
Chapter 1: Greenhouse Gas Emissions from Composting Plants
__________________________________________________________________________
________________________________________________________________________ 5
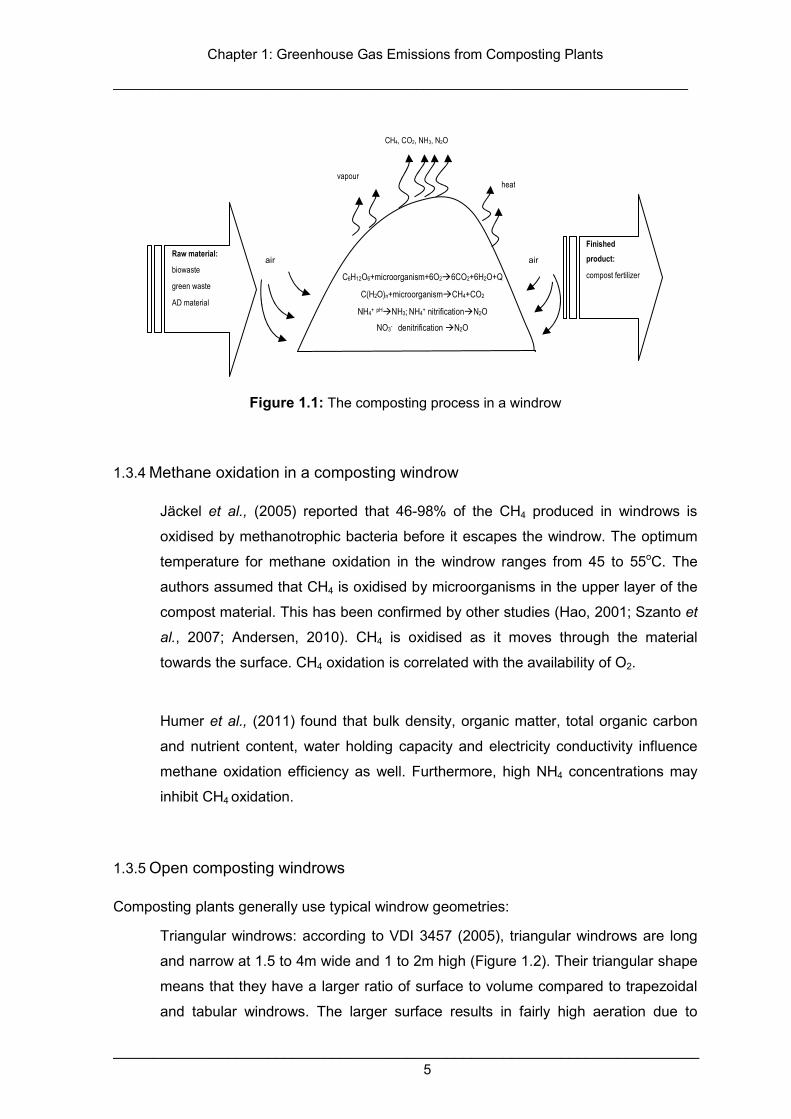
Figure 1.1: The composting process in a windrow
1.3.4 Methane oxidation in a composting windrow
Jäckel et al., (2005) reported that 46-98% of the CH4 produced in windrows is
oxidised by methanotrophic bacteria before it escapes the windrow. The optimum
temperature for methane oxidation in the windrow ranges from 45 to 55oC. The
authors assumed that CH4 is oxidised by microorganisms in the upper layer of the
compost material. This has been confirmed by other studies (Hao, 2001; Szanto et
al., 2007; Andersen, 2010). CH4 is oxidised as it moves through the material
towards the surface. CH4 oxidation is correlated with the availability of O2.
Humer et al., (2011) found that bulk density, organic matter, total organic carbon
and nutrient content, water holding capacity and electricity conductivity influence
methane oxidation efficiency as well. Furthermore, high NH4 concentrations may
inhibit CH4 oxidation.
1.3.5 Open composting windrows
Composting plants generally use typical windrow geometries:
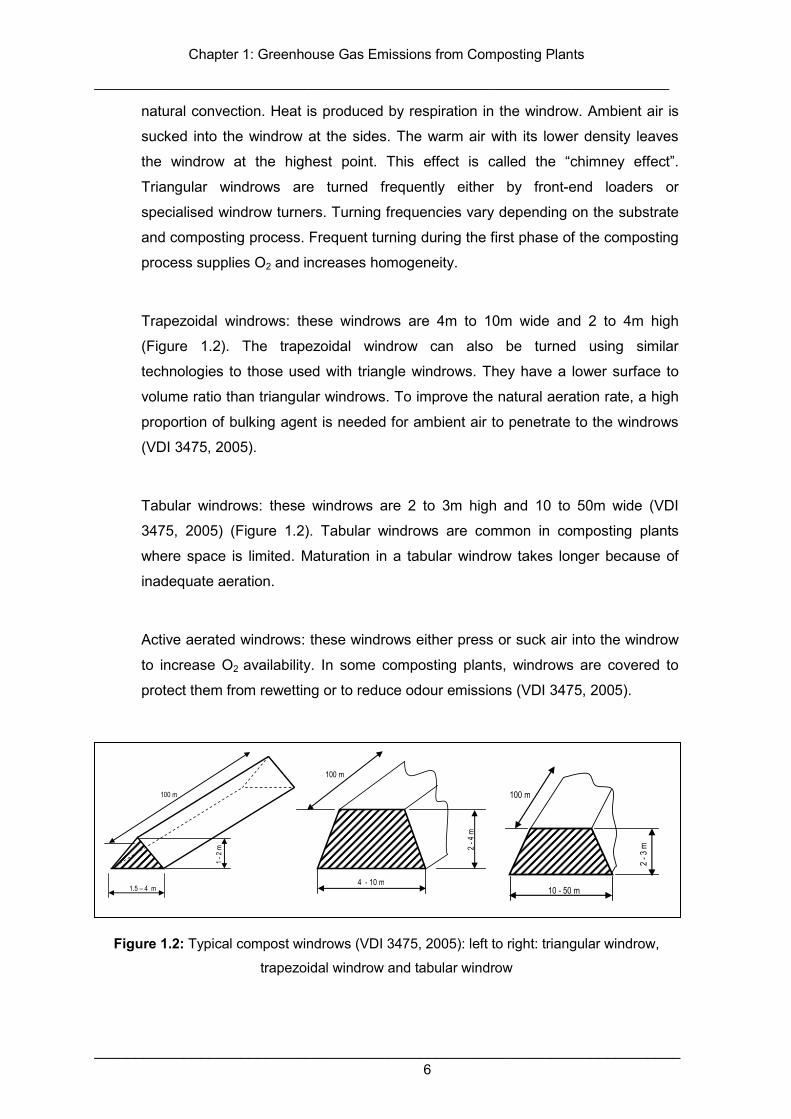
Triangular windrows: according to VDI 3457 (2005), triangular windrows are long
and narrow at 1.5 to 4m wide and 1 to 2m high (Figure 1.2). Their triangular shape
means that they have a larger ratio of surface to volume compared to trapezoidal
and tabular windrows. The larger surface results in fairly high aeration due to
Raw material:
biowaste
green waste
AD material
C6H12O6+microorganism+6O2à6CO2+6H2O+Q
C(H2O)n+microorganismàCH4+CO2
NH4+ pHàNH3; NH4+ nitrificationàN2O
NO3- denitrification àN2O
air air
CH4, CO2, NH3, N2O
heat vapour
Finished
product:
compost fertilizer
Chapter 1: Greenhouse Gas Emissions from Composting Plants
__________________________________________________________________________
_
natural convection. Heat is produced by respiration in the windrow. Ambient air is
sucked into the windrow at the sides. The warm air with its lower density leaves
the windrow at the highest point. This effect is called the “chimney effect”.
Triangular windrows are turned frequently either by front-end loaders or
specialised windrow turners. Turning frequencies vary depending on the substrate
and composting process. Frequent turning during the first phase of the composting
process supplies O2 and increases homogeneity.
Trapezoidal windrows: these windrows are 4m to 10m wide and 2 to 4m high
(Figure 1.2). The trapezoidal windrow can also be turned using similar
technologies to those used with triangle windrows. They have a lower surface to
volume ratio than triangular windrows. To improve the natural aeration rate, a high
proportion of bulking agent is needed for ambient air to penetrate to the windrows
(VDI 3475, 2005).
Tabular windrows: these windrows are 2 to 3m high and 10 to 50m wide (VDI
3475, 2005) (Figure 1.2). Tabular windrows are common in composting plants
where space is limited. Maturation in a tabular windrow takes longer because of
inadequate aeration.
Active aerated windrows: these windrows either press or suck air into the windrow
to increase O2 availability. In some composting plants, windrows are covered to
protect them from rewetting or to reduce odour emissions (VDI 3475, 2005).
1 - 2
m
1.5 – 4 m
100 m
2 - 4
m
4 - 10 m
100 m
2 - 3
m
10 - 50 m
100 m
_______________________________________________________________________ 6
Figure 1.2: Typical compost windrows (VDI 3475, 2005): left to right: triangular windrow,
trapezoidal windrow and tabular windrow
Chapter 1: Greenhouse Gas Emissions from Composting Plants
__________________________________________________________________________
________________________________________________________________________ 7
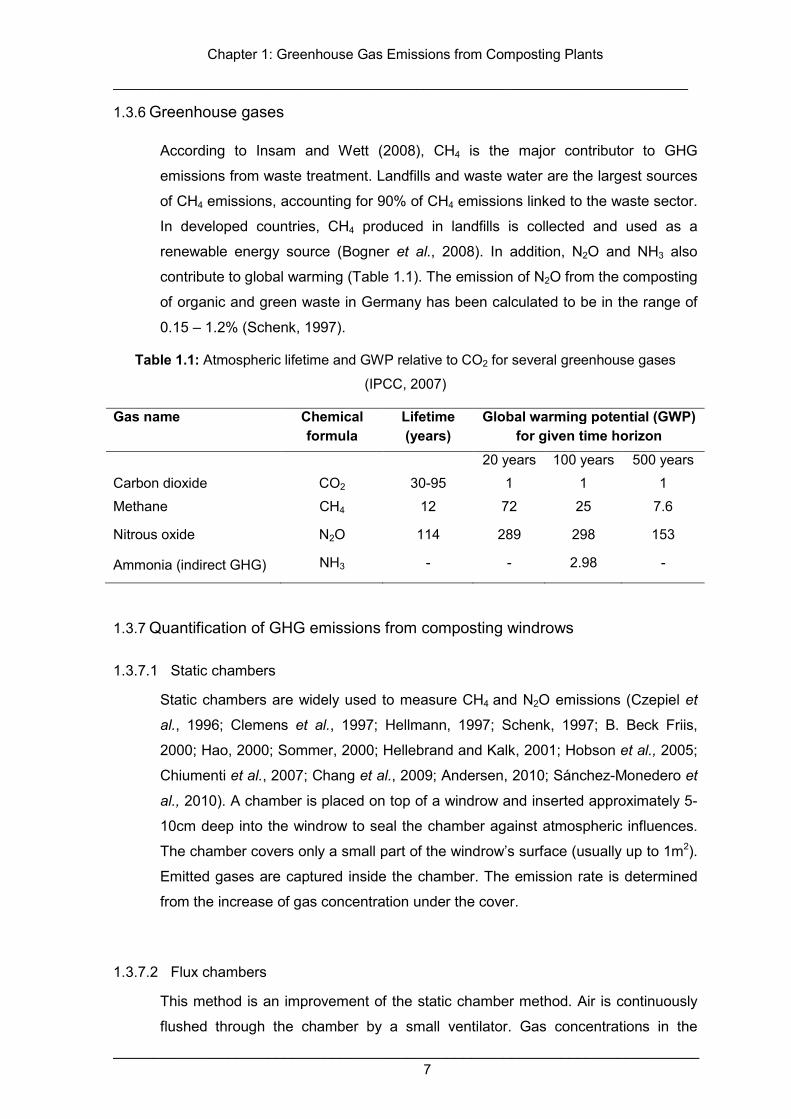
1.3.6 Greenhouse gases
According to Insam and Wett (2008), CH4 is the major contributor to GHG
emissions from waste treatment. Landfills and waste water are the largest sources
of CH4 emissions, accounting for 90% of CH4 emissions linked to the waste sector.
In developed countries, CH4 produced in landfills is collected and used as a
renewable energy source (Bogner et al., 2008). In addition, N2O and NH3 also
contribute to global warming (Table 1.1). The emission of N2O from the composting
of organic and green waste in Germany has been calculated to be in the range of
0.15 – 1.2% (Schenk, 1997).
Table 1.1: Atmospheric lifetime and GWP relative to CO2 for several greenhouse gases
(IPCC, 2007)
Gas name Chemical formula
Lifetime (years)
Global warming potential (GWP) for given time horizon
20 years 100 years 500 years
Carbon dioxide CO2 30-95 1 1 1
Methane CH4 12 72 25 7.6
Nitrous oxide N2O 114 289 298 153
Ammonia (indirect GHG) NH3 - - 2.98 -
1.3.7 Quantification of GHG emissions from composting windrows
1.3.7.1 Static chambers
Static chambers are widely used to measure CH4 and N2O emissions (Czepiel et
al., 1996; Clemens et al., 1997; Hellmann, 1997; Schenk, 1997; B. Beck Friis,
2000; Hao, 2000; Sommer, 2000; Hellebrand and Kalk, 2001; Hobson et al., 2005;
Chiumenti et al., 2007; Chang et al., 2009; Andersen, 2010; Sánchez-Monedero et
al., 2010). A chamber is placed on top of a windrow and inserted approximately 5-
10cm deep into the windrow to seal the chamber against atmospheric influences.
The chamber covers only a small part of the windrow’s surface (usually up to 1m2).
Emitted gases are captured inside the chamber. The emission rate is determined
from the increase of gas concentration under the cover.
1.3.7.2 Flux chambers
This method is an improvement of the static chamber method. Air is continuously
flushed through the chamber by a small ventilator. Gas concentrations in the
Chapter 1: Greenhouse Gas Emissions from Composting Plants
__________________________________________________________________________
________________________________________________________________________ 8
incoming and outgoing air and the flow rate are used to calculate emission rates.
Flux chambers are usually the same size as static chambers (Schenk, 1997; Beck-
Friis et al., 2000; Hao, 2001; Hao, 2007; Xu et al., 2007; Andersen, 2010).
1.3.7.3 Funnel method
This method was described by Andersen (2010). An upside-down funnel covers
1m2 of a windrow and a vent pipe is attached to the top of the funnel. Gases
emitted from the windrow escape from the funnel through the vent pipe. The flux is
calculated by gas concentration and air flow velocity in the vent pipe.
1.3.7.4 Large open dynamic chamber
The large open dynamic chamber can be regarded as a large flux chamber. The
cover is usually tunnel shaped. The tunnels were used in studies of gas emissions
from municipal solid waste (MSW) and farmyard manure composting (Wolter et al.,
2004; El Kader et al., 2007; Amlinger et al., 2008; Park et al., 2011). Table 1.2
shows the emission factors of CH4, N2O and NH3 for green waste, organic
household waste, biowaste, municipal solid waste and animal manure derived from
previous studies.
Chapter 1: Greenhouse Gas Emissions from Composting Plants
__________________________________________________________________________
________________________________________________________________________ 9
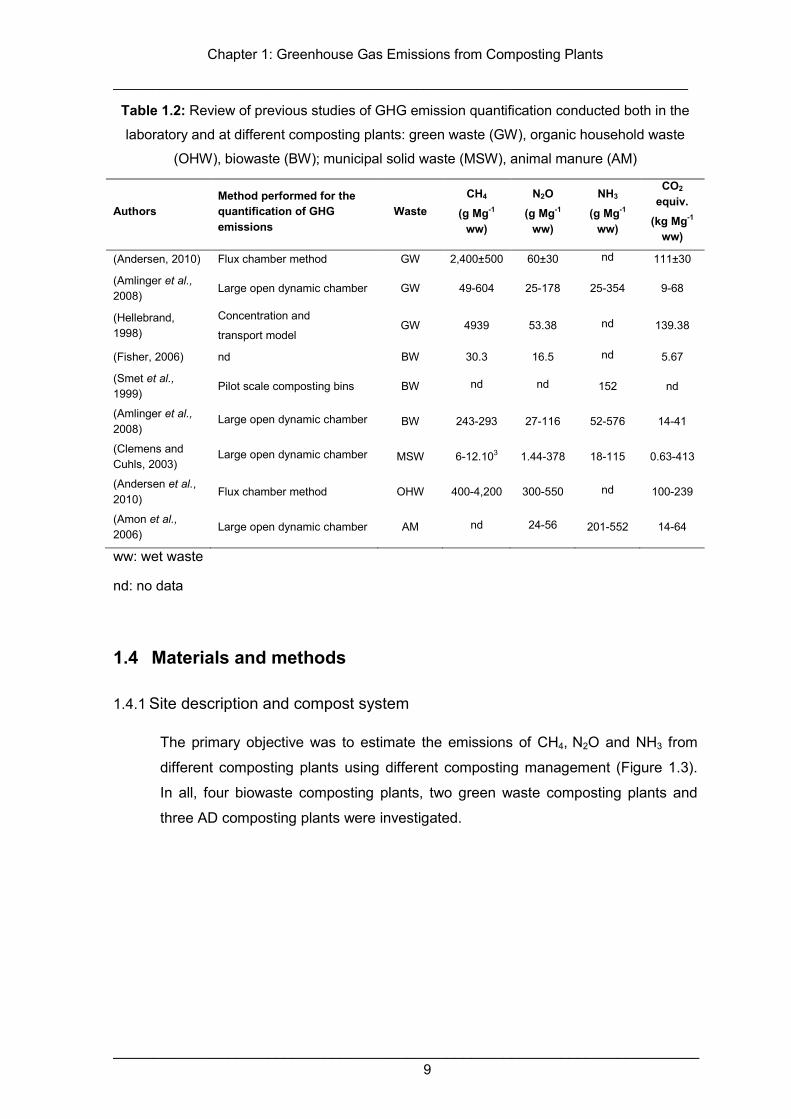
Table 1.2: Review of previous studies of GHG emission quantification conducted both in the
laboratory and at different composting plants: green waste (GW), organic household waste
(OHW), biowaste (BW); municipal solid waste (MSW), animal manure (AM)
Authors Method performed for the quantification of GHG emissions
Waste CH4
(g Mg-1 ww)
N2O
(g Mg-1 ww)
NH3
(g Mg-1 ww)
CO2 equiv.
(kg Mg-1 ww)
(Andersen, 2010) Flux chamber method GW 2,400±500 60±30 nd 111±30
(Amlinger et al., 2008)
Large open dynamic chamber GW 49-604 25-178 25-354 9-68
(Hellebrand, 1998)
Concentration and
transport model GW 4939 53.38 nd 139.38
(Fisher, 2006) nd BW 30.3 16.5 nd 5.67
(Smet et al., 1999)
Pilot scale composting bins BW nd nd 152 nd
(Amlinger et al., 2008)
Large open dynamic chamber BW 243-293 27-116 52-576 14-41
(Clemens and Cuhls, 2003)
Large open dynamic chamber MSW 6-12.103 1.44-378 18-115 0.63-413
(Andersen et al., 2010)
Flux chamber method OHW 400-4,200 300-550 nd 100-239
(Amon et al., 2006)
Large open dynamic chamber AM nd 24-56 201-552 14-64
ww: wet waste
nd: no data
1.4 Materials and methods
1.4.1 Site description and compost system
The primary objective was to estimate the emissions of CH4, N2O and NH3 from
different composting plants using different composting management (Figure 1.3).
In all, four biowaste composting plants, two green waste composting plants and
three AD composting plants were investigated.
Chapter 1: Greenhouse Gas Emissions from Composting Plants
__________________________________________________________________________
________________________________________________________________________ 10
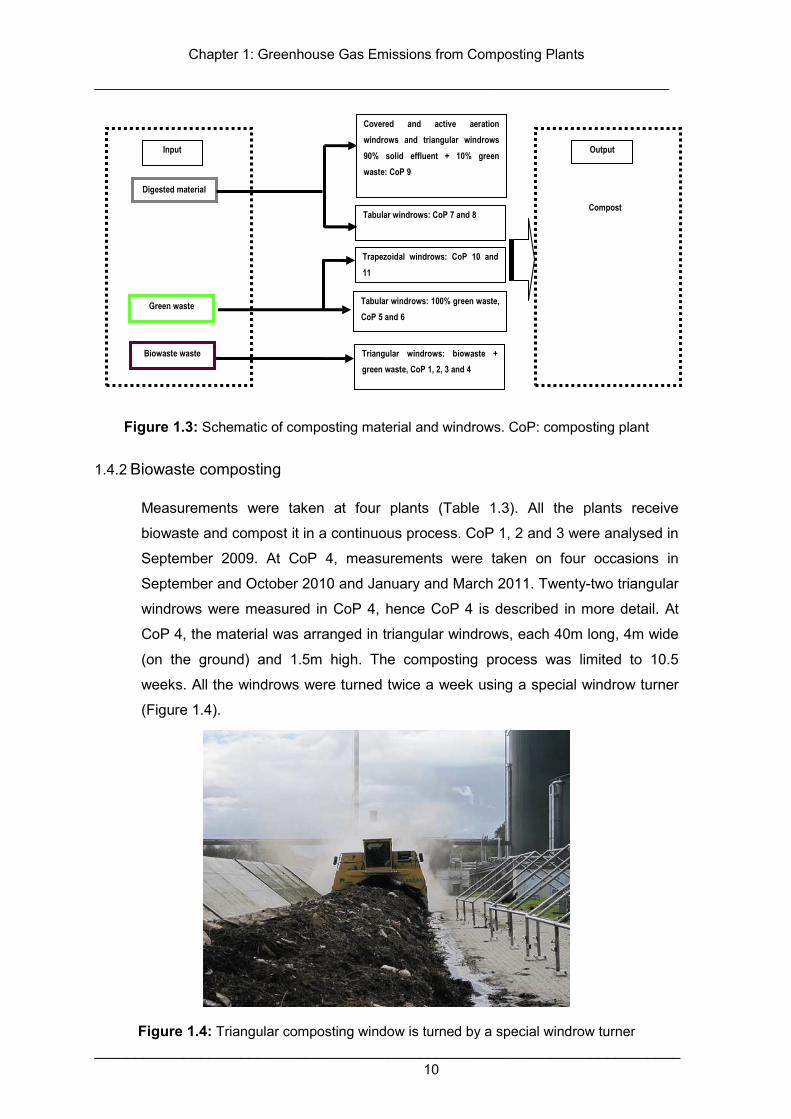
Figure 1.3: Schematic of composting material and windrows. CoP: composting plant
1.4.2 Biowaste composting
Measurements were taken at four plants (Table 1.3). All the plants receive
biowaste and compost it in a continuous process. CoP 1, 2 and 3 were analysed in
September 2009. At CoP 4, measurements were taken on four occasions in
September and October 2010 and January and March 2011. Twenty-two triangular
windrows were measured in CoP 4, hence CoP 4 is described in more detail. At
CoP 4, the material was arranged in triangular windrows, each 40m long, 4m wide
(on the ground) and 1.5m high. The composting process was limited to 10.5
weeks. All the windrows were turned twice a week using a special windrow turner
(Figure 1.4).
Figure 1.4: Triangular composting window is turned by a special windrow turner
Input
Tabular windrows: 100% green waste,
CoP 5 and 6
Covered and active aeration
windrows and triangular windrows
90% solid effluent + 10% green
waste: CoP 9
Tabular windrows: CoP 7 and 8
Triangular windrows: biowaste +
green waste, CoP 1, 2, 3 and 4
Digested material
Biowaste waste
Green waste
Output
Compost
Trapezoidal windrows: CoP 10 and
11
Chapter 1: Greenhouse Gas Emissions from Composting Plants
__________________________________________________________________________
________________________________________________________________________ 11
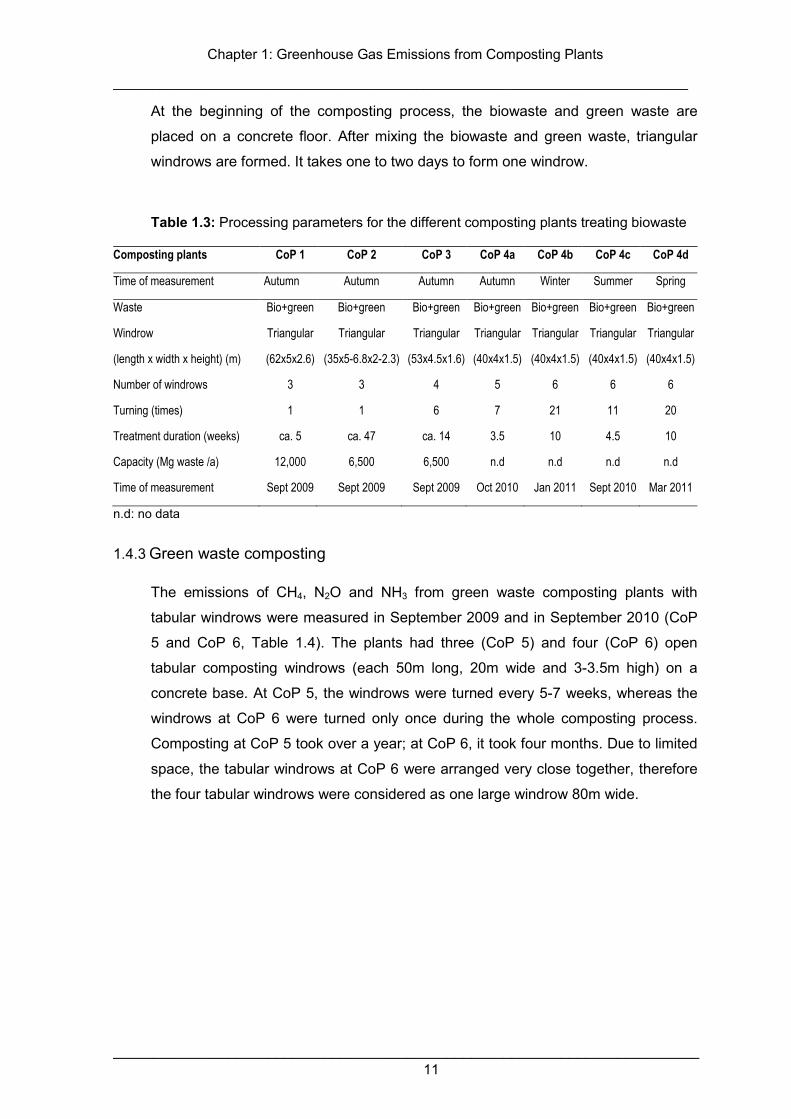
At the beginning of the composting process, the biowaste and green waste are
placed on a concrete floor. After mixing the biowaste and green waste, triangular
windrows are formed. It takes one to two days to form one windrow.
Table 1.3: Processing parameters for the different composting plants treating biowaste
Composting plants CoP 1 CoP 2 CoP 3 CoP 4a CoP 4b CoP 4c CoP 4d
Time of measurement Autumn Autumn Autumn Autumn Winter Summer Spring
Waste Bio+green Bio+green Bio+green Bio+green Bio+green Bio+green Bio+green
Windrow
(length x width x height) (m)
Triangular
(62x5x2.6)
Triangular
(35x5-6.8x2-2.3)
Triangular
(53x4.5x1.6)
Triangular
(40x4x1.5)
Triangular
(40x4x1.5)
Triangular
(40x4x1.5)
Triangular
(40x4x1.5)
Number of windrows 3 3 4 5 6 6 6
Turning (times) 1 1 6 7 21 11 20
Treatment duration (weeks) ca. 5 ca. 47 ca. 14 3.5 10 4.5 10
Capacity (Mg waste /a) 12,000 6,500 6,500 n.d n.d n.d n.d
Time of measurement Sept 2009 Sept 2009 Sept 2009 Oct 2010 Jan 2011 Sept 2010 Mar 2011
n.d: no data
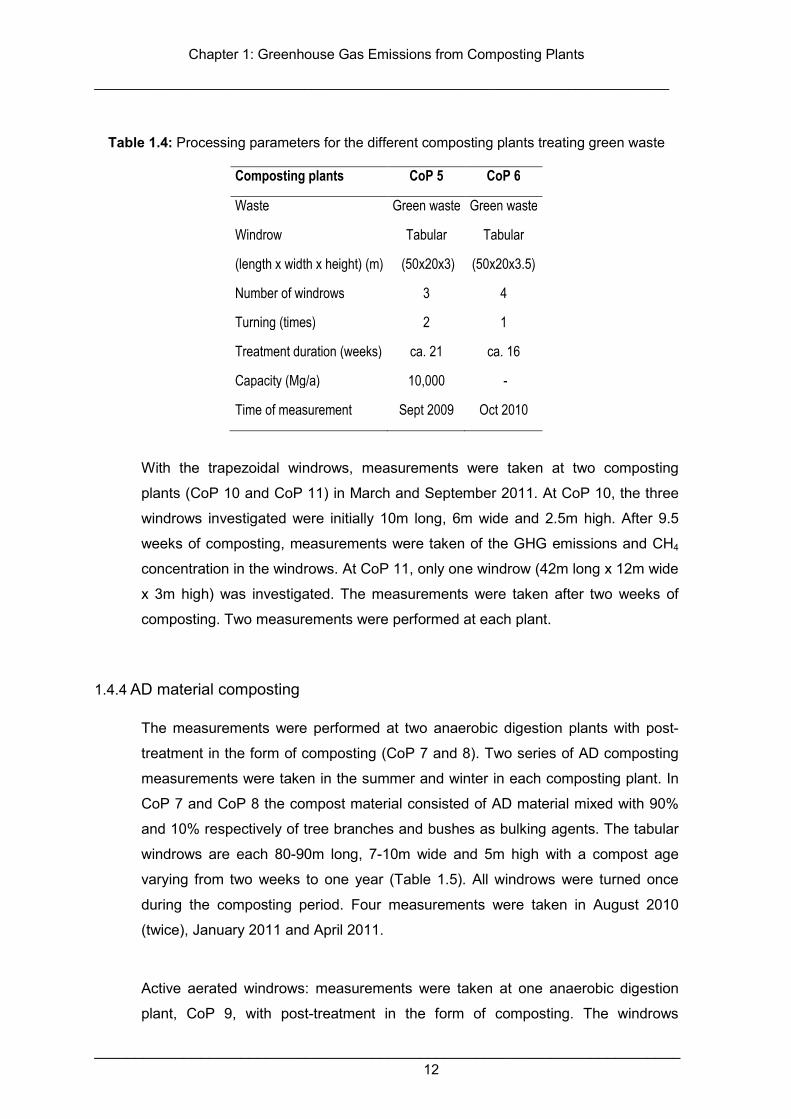
1.4.3 Green waste composting
The emissions of CH4, N2O and NH3 from green waste composting plants with
tabular windrows were measured in September 2009 and in September 2010 (CoP
5 and CoP 6, Table 1.4). The plants had three (CoP 5) and four (CoP 6) open
tabular composting windrows (each 50m long, 20m wide and 3-3.5m high) on a
concrete base. At CoP 5, the windrows were turned every 5-7 weeks, whereas the
windrows at CoP 6 were turned only once during the whole composting process.
Composting at CoP 5 took over a year; at CoP 6, it took four months. Due to limited
space, the tabular windrows at CoP 6 were arranged very close together, therefore
the four tabular windrows were considered as one large windrow 80m wide.
Chapter 1: Greenhouse Gas Emissions from Composting Plants
__________________________________________________________________________
________________________________________________________________________ 12
Table 1.4: Processing parameters for the different composting plants treating green waste
Composting plants CoP 5 CoP 6
Waste Green waste Green waste
Windrow
(length x width x height) (m)
Tabular
(50x20x3)
Tabular
(50x20x3.5)
Number of windrows 3 4
Turning (times) 2 1
Treatment duration (weeks) ca. 21 ca. 16
Capacity (Mg/a) 10,000 -
Time of measurement Sept 2009 Oct 2010
With the trapezoidal windrows, measurements were taken at two composting
plants (CoP 10 and CoP 11) in March and September 2011. At CoP 10, the three
windrows investigated were initially 10m long, 6m wide and 2.5m high. After 9.5
weeks of composting, measurements were taken of the GHG emissions and CH4
concentration in the windrows. At CoP 11, only one windrow (42m long x 12m wide
x 3m high) was investigated. The measurements were taken after two weeks of
composting. Two measurements were performed at each plant.
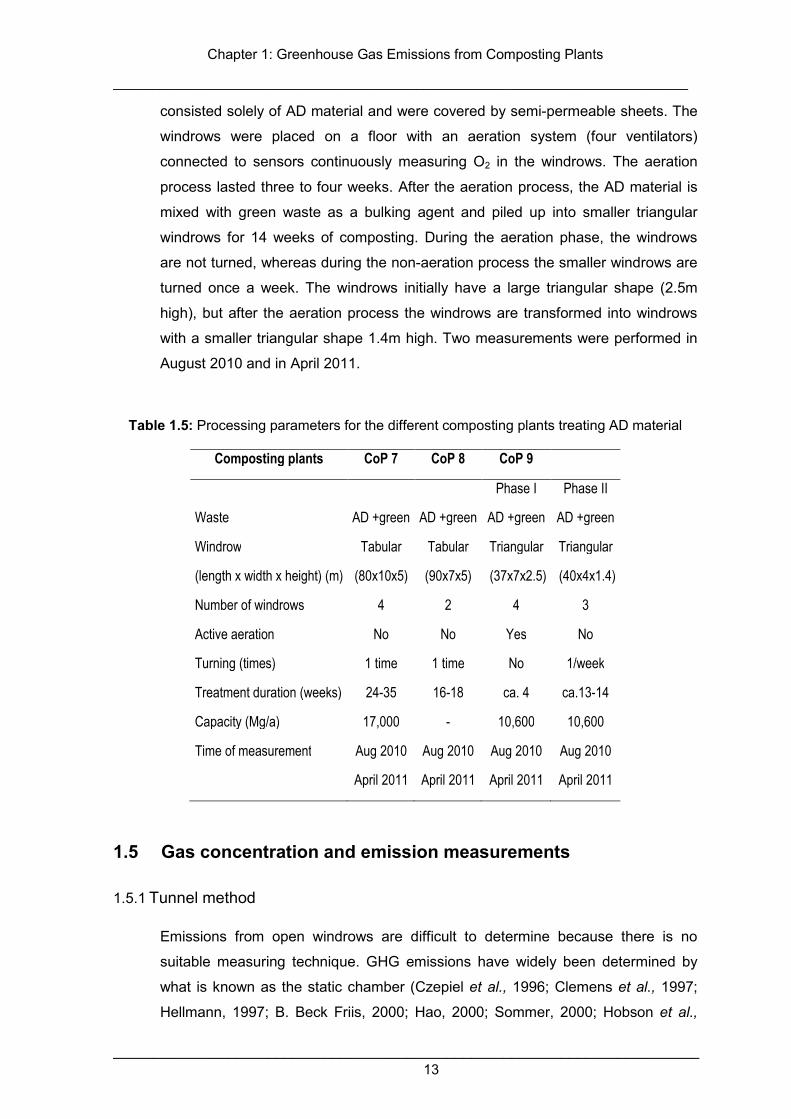
1.4.4 AD material composting
The measurements were performed at two anaerobic digestion plants with post-
treatment in the form of composting (CoP 7 and 8). Two series of AD composting
measurements were taken in the summer and winter in each composting plant. In
CoP 7 and CoP 8 the compost material consisted of AD material mixed with 90%
and 10% respectively of tree branches and bushes as bulking agents. The tabular
windrows are each 80-90m long, 7-10m wide and 5m high with a compost age
varying from two weeks to one year (Table 1.5). All windrows were turned once
during the composting period. Four measurements were taken in August 2010
(twice), January 2011 and April 2011.
Active aerated windrows: measurements were taken at one anaerobic digestion
plant, CoP 9, with post-treatment in the form of composting. The windrows
Chapter 1: Greenhouse Gas Emissions from Composting Plants
__________________________________________________________________________
________________________________________________________________________ 13
consisted solely of AD material and were covered by semi-permeable sheets. The
windrows were placed on a floor with an aeration system (four ventilators)
connected to sensors continuously measuring O2 in the windrows. The aeration
process lasted three to four weeks. After the aeration process, the AD material is
mixed with green waste as a bulking agent and piled up into smaller triangular
windrows for 14 weeks of composting. During the aeration phase, the windrows
are not turned, whereas during the non-aeration process the smaller windrows are
turned once a week. The windrows initially have a large triangular shape (2.5m
high), but after the aeration process the windrows are transformed into windrows
with a smaller triangular shape 1.4m high. Two measurements were performed in
August 2010 and in April 2011.
Table 1.5: Processing parameters for the different composting plants treating AD material
Composting plants CoP 7 CoP 8 CoP 9
Phase I Phase II
Waste AD +green AD +green AD +green AD +green
Windrow
(length x width x height) (m)
Tabular
(80x10x5)
Tabular
(90x7x5)
Triangular
(37x7x2.5)
Triangular
(40x4x1.4)
Number of windrows 4 2 4 3
Active aeration No No Yes No
Turning (times) 1 time 1 time No 1/week
Treatment duration (weeks) 24-35 16-18 ca. 4 ca.13-14
Capacity (Mg/a) 17,000 - 10,600 10,600
Time of measurement Aug 2010
April 2011
Aug 2010
April 2011
Aug 2010
April 2011
Aug 2010
April 2011
1.5 Gas concentration and emission measurements
1.5.1 Tunnel method
Emissions from open windrows are difficult to determine because there is no
suitable measuring technique. GHG emissions have widely been determined by
what is known as the static chamber (Czepiel et al., 1996; Clemens et al., 1997;
Hellmann, 1997; B. Beck Friis, 2000; Hao, 2000; Sommer, 2000; Hobson et al.,
Chapter 1: Greenhouse Gas Emissions from Composting Plants
__________________________________________________________________________
________________________________________________________________________ 14
2005; Andersen, 2010). However, the chambers used covered only a small surface
of the windrow (usually up to 1m2). This method has another disadvantage: gas
emissions via convection cannot be measured using the static chamber method
(Sommer et al., 2004; Andersen, 2010). Convection is an important factor,
because air flows through the windrow and transports gases away from the
windrow into the atmosphere.
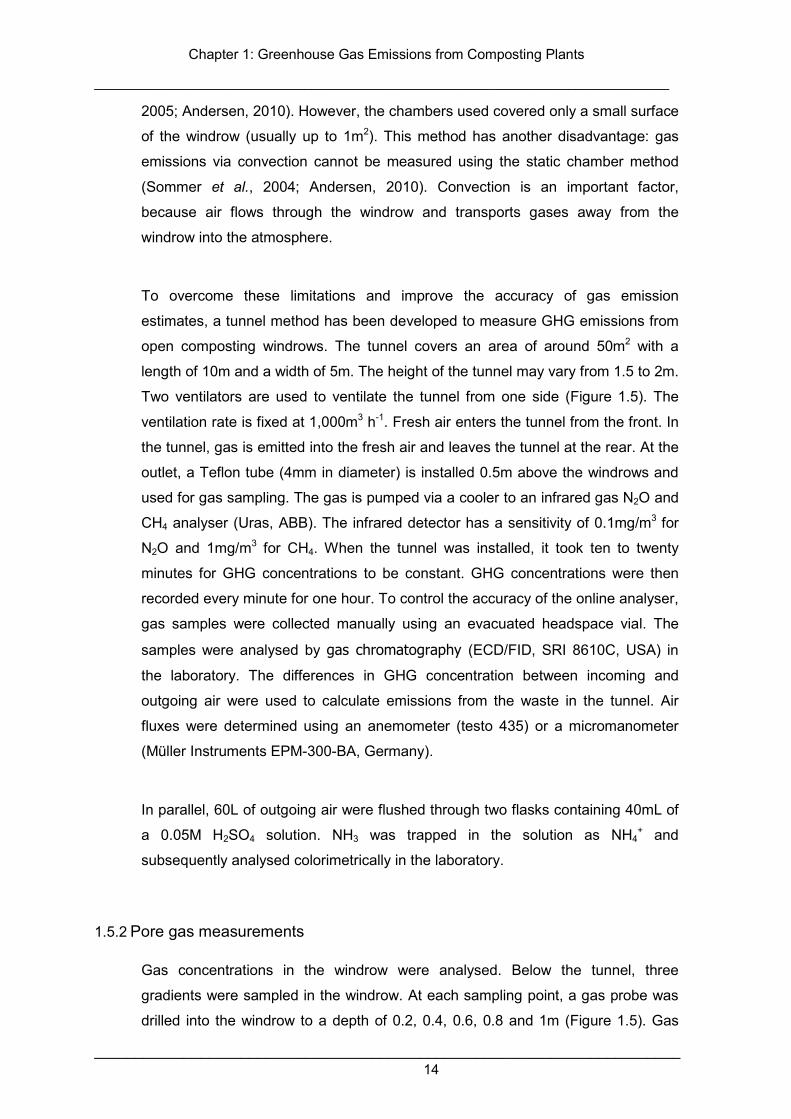
To overcome these limitations and improve the accuracy of gas emission
estimates, a tunnel method has been developed to measure GHG emissions from
open composting windrows. The tunnel covers an area of around 50m2 with a
length of 10m and a width of 5m. The height of the tunnel may vary from 1.5 to 2m.
Two ventilators are used to ventilate the tunnel from one side (Figure 1.5). The
ventilation rate is fixed at 1,000m3 h-1. Fresh air enters the tunnel from the front. In
the tunnel, gas is emitted into the fresh air and leaves the tunnel at the rear. At the
outlet, a Teflon tube (4mm in diameter) is installed 0.5m above the windrows and
used for gas sampling. The gas is pumped via a cooler to an infrared gas N2O and
CH4 analyser (Uras, ABB). The infrared detector has a sensitivity of 0.1mg/m3 for
N2O and 1mg/m3 for CH4. When the tunnel was installed, it took ten to twenty
minutes for GHG concentrations to be constant. GHG concentrations were then
recorded every minute for one hour. To control the accuracy of the online analyser,
gas samples were collected manually using an evacuated headspace vial. The
samples were analysed by gas chromatography (ECD/FID, SRI 8610C, USA) in
the laboratory. The differences in GHG concentration between incoming and
outgoing air were used to calculate emissions from the waste in the tunnel. Air
fluxes were determined using an anemometer (testo 435) or a micromanometer
(Müller Instruments EPM-300-BA, Germany).
In parallel, 60L of outgoing air were flushed through two flasks containing 40mL of
a 0.05M H2SO4 solution. NH3 was trapped in the solution as NH4+ and
subsequently analysed colorimetrically in the laboratory.
1.5.2 Pore gas measurements
Gas concentrations in the windrow were analysed. Below the tunnel, three
gradients were sampled in the windrow. At each sampling point, a gas probe was
drilled into the windrow to a depth of 0.2, 0.4, 0.6, 0.8 and 1m (Figure 1.5). Gas
Chapter 1: Greenhouse Gas Emissions from Composting Plants
__________________________________________________________________________
________________________________________________________________________ 15
from the pore space was sucked into an infrared analyser by a pump to detect
CH4, CO2 and O2 . As a control, gas was sampled using 20ml evacuated
headspace vials. These were subsequently analysed for N2O and CH4 in the
laboratory using GC (ECD/FID). The temperature was also measured at each
depth.
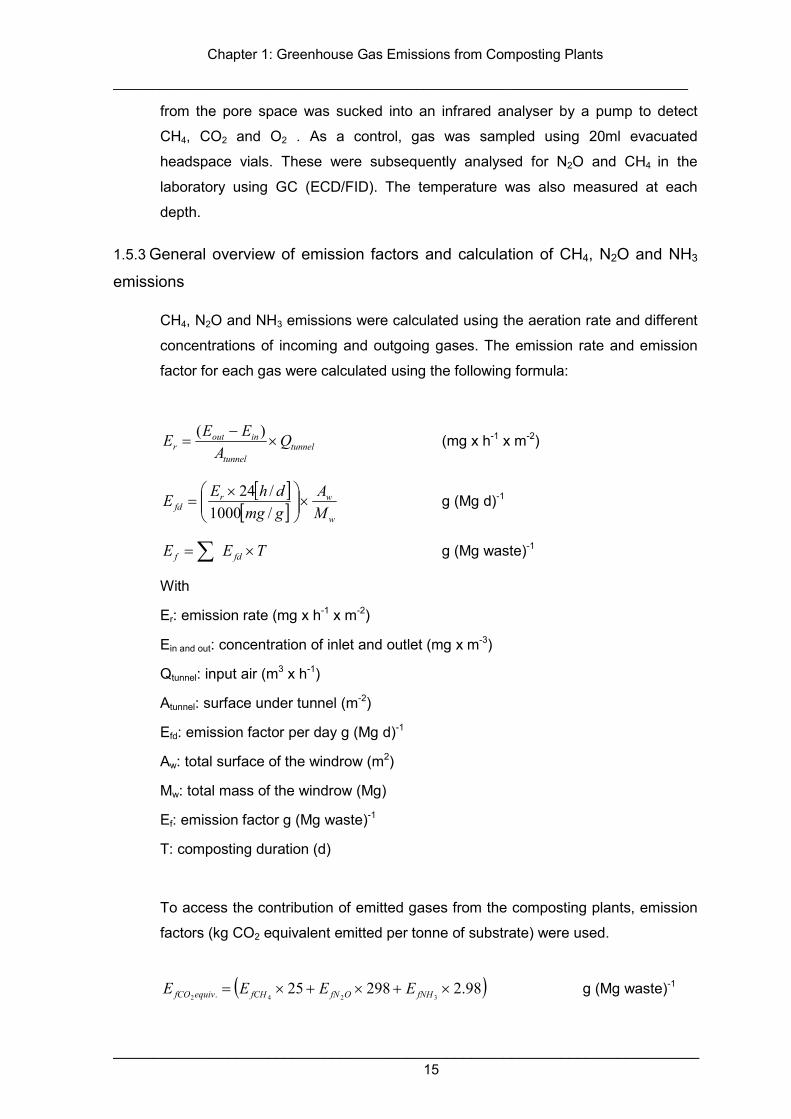
1.5.3 General overview of emission factors and calculation of CH4, N2O and NH3
emissions
CH4, N2O and NH3 emissions were calculated using the aeration rate and different
concentrations of incoming and outgoing gases. The emission rate and emission
factor for each gas were calculated using the following formula:
tunneltunnel
inoutr Q
AEE
E ×−
=)(
(mg x h-1 x m-2)
[ ][ ] w
wrfd M
AgmgdhE
E ×
×=
/1000/24
g (Mg d)-1
TEE fdf ×=∑ g (Mg waste)-1
With
Er: emission rate (mg x h-1 x m-2)
Ein and out: concentration of inlet and outlet (mg x m-3)
Qtunnel: input air (m3 x h-1)
Atunnel: surface under tunnel (m-2)
Efd: emission factor per day g (Mg d)-1
Aw: total surface of the windrow (m2)
Mw: total mass of the windrow (Mg)
Ef: emission factor g (Mg waste)-1
T: composting duration (d)
To access the contribution of emitted gases from the composting plants, emission
factors (kg CO2 equivalent emitted per tonne of substrate) were used.
( )98.2298253242 . ×+×+×= fNHOfNfCHequivfCO EEEE g (Mg waste)-1
Chapter 1: Greenhouse Gas Emissions from Composting Plants
__________________________________________________________________________
________________________________________________________________________ 16
All emission factors were calculated as a mass ratio of gas emitted per initial fresh
matter mass or wet weight (kg Mg-1) of the input material. Only CH4, N2O and NH3
emissions from the composting process were considered.
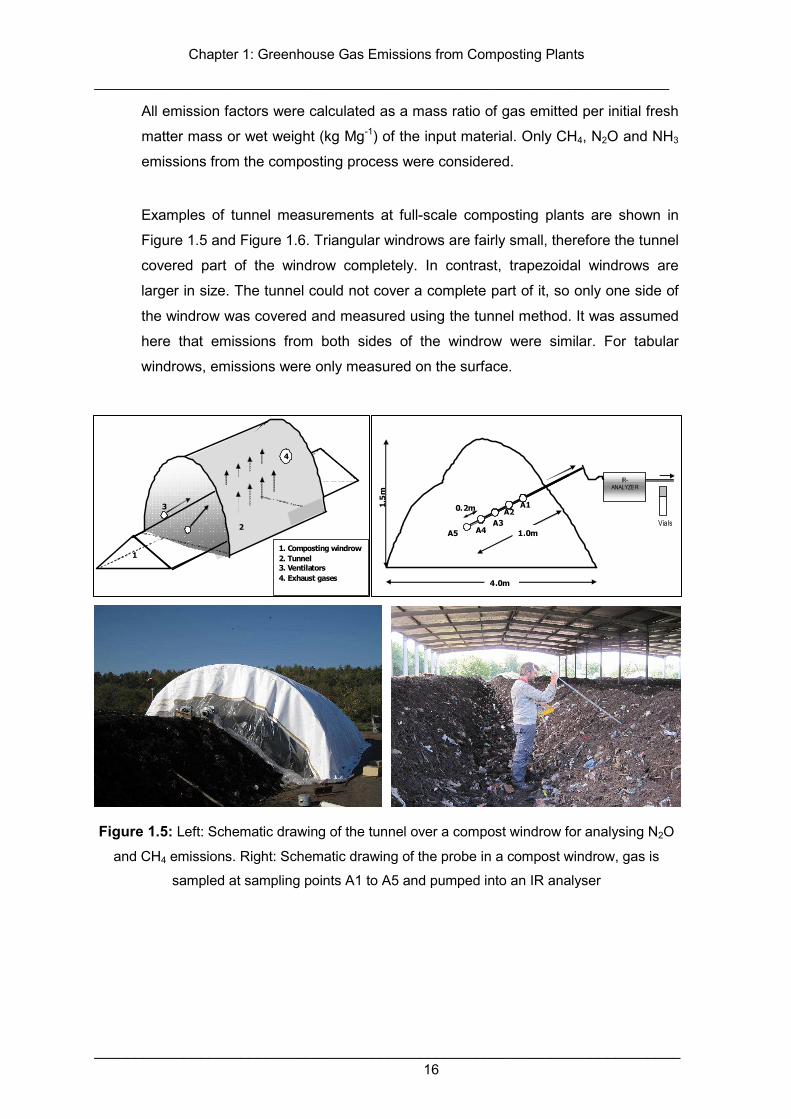
Examples of tunnel measurements at full-scale composting plants are shown in
Figure 1.5 and Figure 1.6. Triangular windrows are fairly small, therefore the tunnel
covered part of the windrow completely. In contrast, trapezoidal windrows are
larger in size. The tunnel could not cover a complete part of it, so only one side of
the windrow was covered and measured using the tunnel method. It was assumed
here that emissions from both sides of the windrow were similar. For tabular
windrows, emissions were only measured on the surface.
Figure 1.5: Left: Schematic drawing of the tunnel over a compost windrow for analysing N2O
and CH4 emissions. Right: Schematic drawing of the probe in a compost windrow, gas is
sampled at sampling points A1 to A5 and pumped into an IR analyser
1
2
3
1
2
3
4
1. Composting windrow 2. Tunnel 3. Ventilators 4. Exhaust gases
1.5m
A4
A2 A3
A1
A5
0.2m
4.0m
1.0m
IR-ANALYZER
Vials

Chapter 1: Greenhouse Gas Emissions from Composting Plants
__________________________________________________________________________
________________________________________________________________________ 17
Figure 1.6: Left: Schematic drawing of the tunnel at a tabular windrow for analysing N2O and
CH4 emissions. Right: Schematic drawing of the tunnel on a trapezoidal windrow for analysing
N2O and CH4 emissions
1.6 Results and discussion
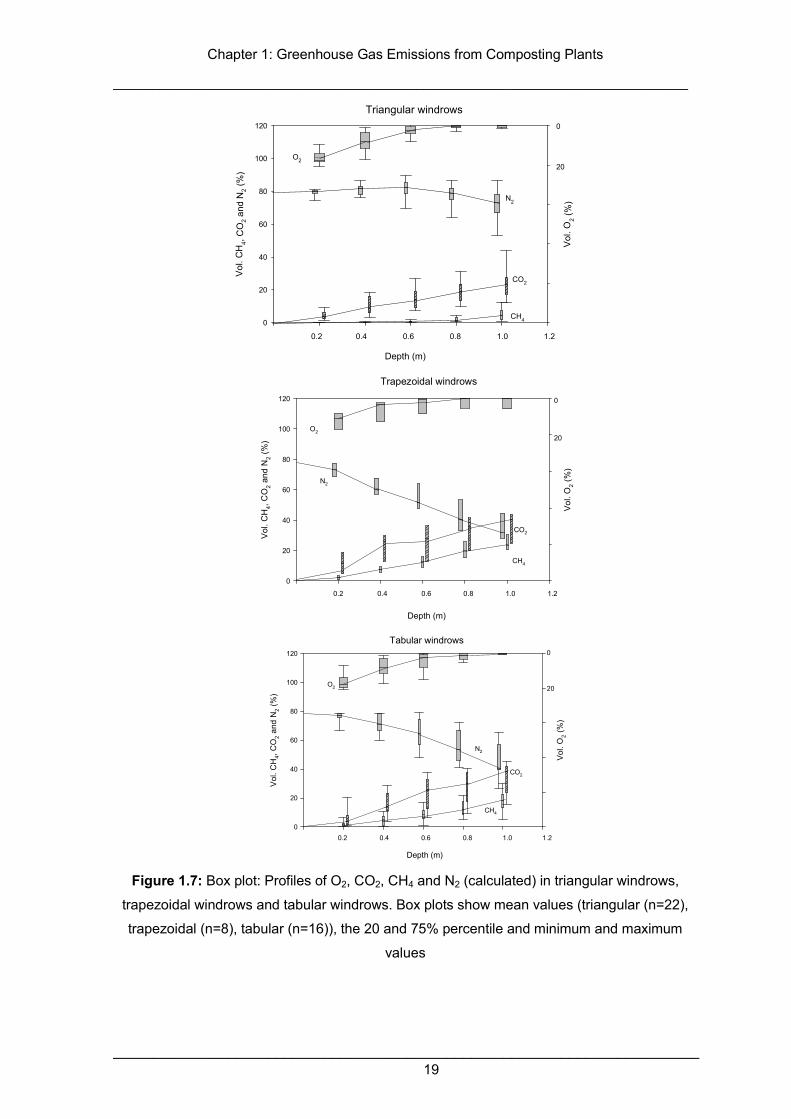
1.6.1 Profiles of gas concentrations in triangular, trapezoidal and tabular windrows
1.6.1.1 CH4, CO2, O2, N2 profiles
Gas concentrations of CH4, O2, N2 and CO2 in triangular, trapezoidal and tabular
windrows differed (Figure 1.7). O2 and N2 concentration in the pores of all windrows
decreased significantly from 0.2 to 1m. Concentrations of CO2 and CH4 increased
with depth. The decrease of O2 from the surface to the lowest point was due to
biological activity that consumed O2 (Xu et al., 2007). The highest O2 concentration
was at 0.2m and the lowest at 1m. In the triangular windrows, at a depth of 0.2m
the mean concentration of O2 was 16.03 ± 3.6%, while at a 1m depth it was 0.3 ±
0.5%. In the trapezoidal windrows, at a depth of 0.2m the mean concentration of
O2 was 11.8 ± 4.8% and at a 1m depth it was 4.5 ± 5.8%. Similarly, in the tabular
Chapter 1: Greenhouse Gas Emissions from Composting Plants
__________________________________________________________________________
________________________________________________________________________ 18
windrows, at a depth of 0.2m the mean concentration of O2 was 16.4 ± 4.7%, while
at a 1m depth it was 0.8 ± 1.7%.
The highest concentrations of CO2 and CH4 were found at a depth of 1m, where
the lowest O2 concentrations were found. The highest CH4 concentrations were
16% for triangular, 31.3% for trapezoidal and 31.5% for tabular windrows. The
highest CH4 concentration in triangular windrows was similar to the windrows (1.3 -
2m high) reported by Georgaki et al., (2009). The highest CO2 concentrations were
58.6% for triangular, 51.6% for trapezoidal and 45.8% for tabular windrows. The
high concentration of CH4 in the windrows indicates that the anaerobic process
occurred partly in the windrows (Sommer, 2001). The pattern of CH4 concentration
in trapezoidal and tabular windrows was fairly similar: the highest CH4
concentration was twice as high as that in triangular windrows. The highest CH4
concentrations found in the study are of the same magnitude as those measured
by Beck-Friis et al., (2000) who found that the concentration of CH4 in large
windrows was much higher than in small windrows.
In both trapezoidal and tabular windrows, mean values of CH4 and CO2 increased
in parallel from 0.6 to 1m. This pattern did not occur in the triangular windrows.
High O2 and CO2 concentrations in the composting windrow are evidence of
aerobic decomposition (Hao, 2001). For example, the decomposition of carbon
hydrate Cm(H2O)n represents organic material that decomposes under anaerobic
conditions to CH4 and CO2, whereas the decomposition of Cm(H2O)n with the
presence of O2 produces CO2 and H2O. If the mean value of CO2 in windrows is
much higher than CH4, this is an indicator of an adequate O2 supply in the
windrows for the composting process.
Chapter 1: Greenhouse Gas Emissions from Composting Plants
__________________________________________________________________________
________________________________________________________________________ 19
Triangular windrows
Depth (m)
Vol
. CH
4, C
O2
and
N2
(%)
0
20
40
60
80
100
120
Vol
. O2
(%)
0
20
N2
CO2
CH4
O2
0.2 0.4 0.6 0.8 1.0 1.2
Trapezoidal windrows
Depth (m)
Vol
. CH
4, C
O2
and
N2
(%)
0
20
40
60
80
100
120
Vol
. O2
(%)
0
20
N2
CO2
CH4
O2
0.2 0.4 0.6 0.8 1.0 1.2
Tabular windrows
Depth (m)
Vol
. CH
4, C
O2
and
N2
(%)
0
20
40
60
80
100
120
Vol
. O2
(%)
0
20
N2
CO2
CH4
O2
0.2 0.4 0.6 0.8 1.0 1.2
Figure 1.7: Box plot: Profiles of O2, CO2, CH4 and N2 (calculated) in triangular windrows,
trapezoidal windrows and tabular windrows. Box plots show mean values (triangular (n=22),
trapezoidal (n=8), tabular (n=16)), the 20 and 75% percentile and minimum and maximum
values
Chapter 1: Greenhouse Gas Emissions from Composting Plants
__________________________________________________________________________
________________________________________________________________________ 20
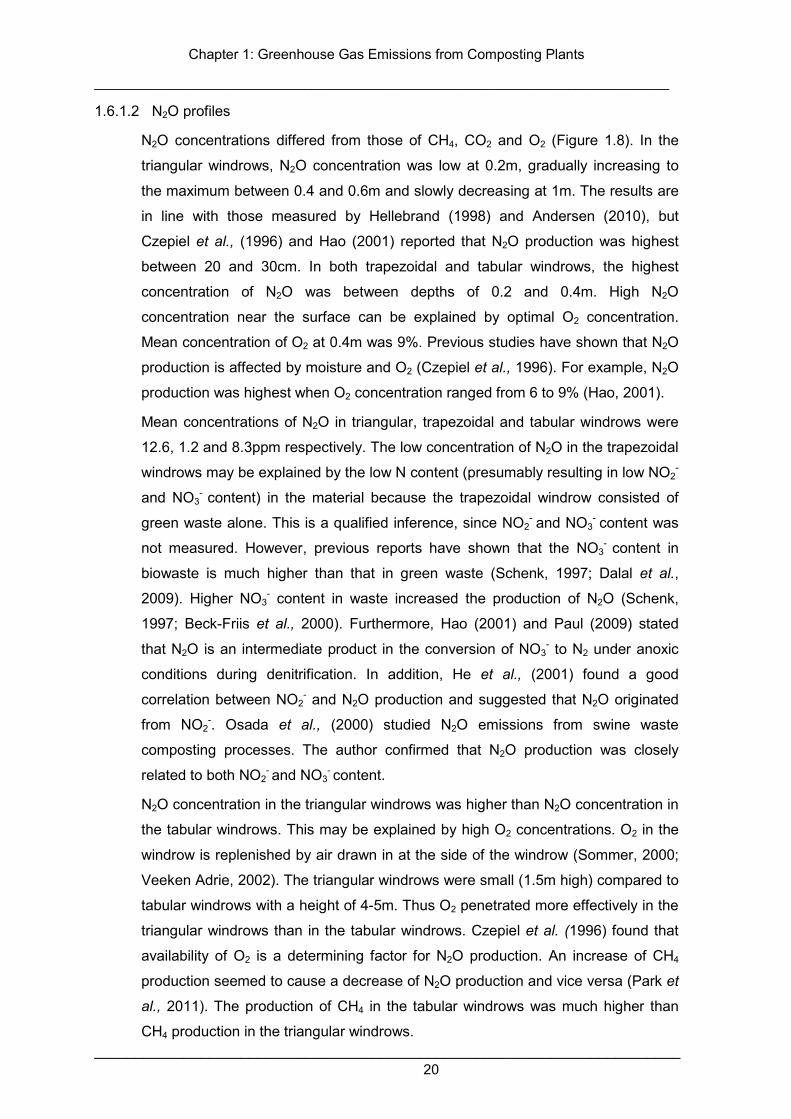
1.6.1.2 N2O profiles
N2O concentrations differed from those of CH4, CO2 and O2 (Figure 1.8). In the
triangular windrows, N2O concentration was low at 0.2m, gradually increasing to
the maximum between 0.4 and 0.6m and slowly decreasing at 1m. The results are
in line with those measured by Hellebrand (1998) and Andersen (2010), but
Czepiel et al., (1996) and Hao (2001) reported that N2O production was highest
between 20 and 30cm. In both trapezoidal and tabular windrows, the highest
concentration of N2O was between depths of 0.2 and 0.4m. High N2O
concentration near the surface can be explained by optimal O2 concentration.
Mean concentration of O2 at 0.4m was 9%. Previous studies have shown that N2O
production is affected by moisture and O2 (Czepiel et al., 1996). For example, N2O
production was highest when O2 concentration ranged from 6 to 9% (Hao, 2001).
Mean concentrations of N2O in triangular, trapezoidal and tabular windrows were
12.6, 1.2 and 8.3ppm respectively. The low concentration of N2O in the trapezoidal
windrows may be explained by the low N content (presumably resulting in low NO2-
and NO3- content) in the material because the trapezoidal windrow consisted of
green waste alone. This is a qualified inference, since NO2- and NO3
- content was
not measured. However, previous reports have shown that the NO3- content in
biowaste is much higher than that in green waste (Schenk, 1997; Dalal et al.,
2009). Higher NO3- content in waste increased the production of N2O (Schenk,
1997; Beck-Friis et al., 2000). Furthermore, Hao (2001) and Paul (2009) stated
that N2O is an intermediate product in the conversion of NO3- to N2 under anoxic
conditions during denitrification. In addition, He et al., (2001) found a good
correlation between NO2- and N2O production and suggested that N2O originated
from NO2-. Osada et al., (2000) studied N2O emissions from swine waste
composting processes. The author confirmed that N2O production was closely
related to both NO2- and NO3
- content.
N2O concentration in the triangular windrows was higher than N2O concentration in
the tabular windrows. This may be explained by high O2 concentrations. O2 in the
windrow is replenished by air drawn in at the side of the windrow (Sommer, 2000;
Veeken Adrie, 2002). The triangular windrows were small (1.5m high) compared to
tabular windrows with a height of 4-5m. Thus O2 penetrated more effectively in the
triangular windrows than in the tabular windrows. Czepiel et al. (1996) found that
availability of O2 is a determining factor for N2O production. An increase of CH4
production seemed to cause a decrease of N2O production and vice versa (Park et
al., 2011). The production of CH4 in the tabular windrows was much higher than
CH4 production in the triangular windrows.
Chapter 1: Greenhouse Gas Emissions from Composting Plants
__________________________________________________________________________
________________________________________________________________________ 21
0.2 0.4 0.6 0.8 1
Depth (m)
N2O
con
cent
ratio
n (p
pm)
0,001
0,01
0,1
1
10
100
Trapezoidal windrows
Depth (m)
N2O
con
cent
ratio
n (p
pm)
0,01
0,1
1
10
100Tabular windrows
0.2 0.4 0.6 0.8 1
Depth (m)
N2O
con
cent
ratio
n (p
pm)
0,1
1
10
100 Triangular windrows
0.2 0.4 0.6 0.8 1
Figure 1.8: Box plot: Profiles of N2O in triangular windrows, trapezoidal windrows and tabular
windrows. Box plots show ▄▄▄ mean values (triangular windrows: n=22, trapezoidal
windrows: n=8, tabular windrows: n=16), the 25 and 75% percentile and minimum and
maximum values
Chapter 1: Greenhouse Gas Emissions from Composting Plants
__________________________________________________________________________
________________________________________________________________________ 22
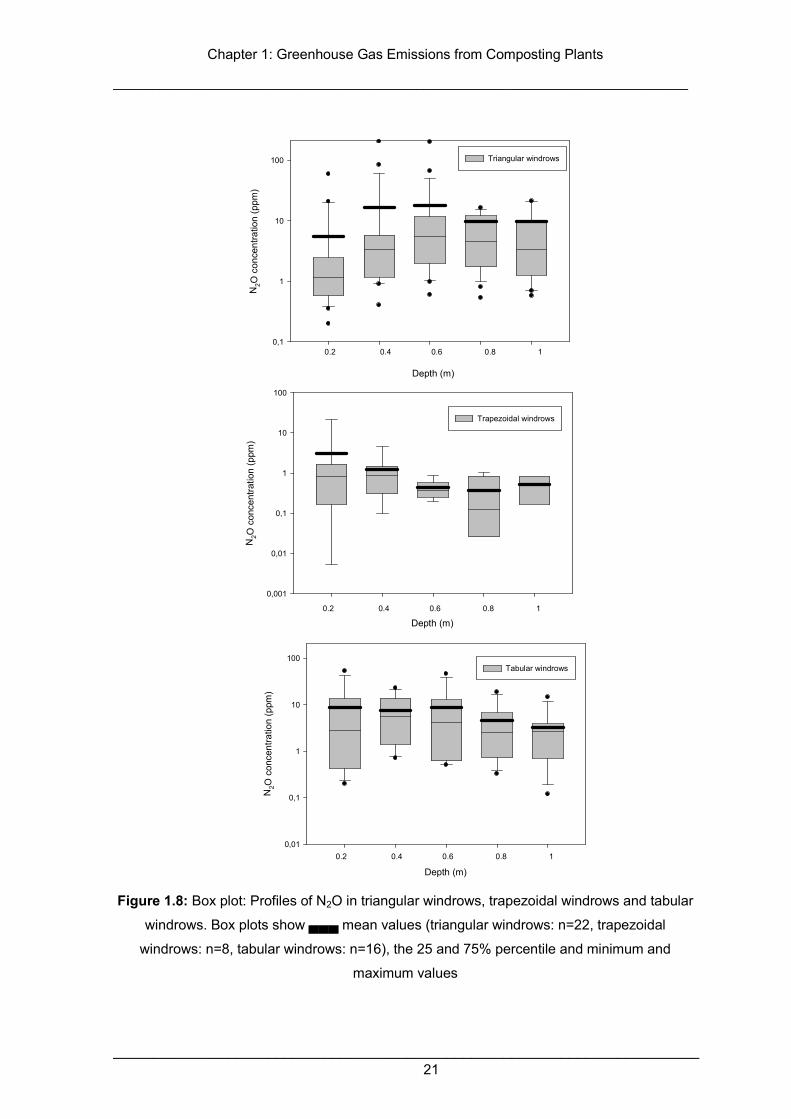
In the windrows, the CH4 and N2O concentrations (%) were negatively correlated
(Figure 1.9). An increase in CH4 concentration led to a decrease in N2O
concentration and vice versa. This result is in line with (Sommer et al., 2004;
Thompson et al., 2004 and Park et al., 2011). When CH4 concentrations were
above 15%, N2O concentrations were below 0.4ppm. Chiumenti et al., (2007)
reported that CH4 production was intensive during the thermophilic phase and low
O2 concentrations in the windrows, whereas N2O occurred mainly in the cooling
phase with the availability of O2 (Sommer, 2001).
CH4 concentrations (%) in the windrows
0 5 10 15 20 25 30
N2O
con
cent
ratio
ns (
%)
in th
e w
indr
ows
No N2O
0.030
0.025
0.020
0.015
0.010
0.005
0.000
Figure 1.9: Concentration of N2O and CH4 in windrows
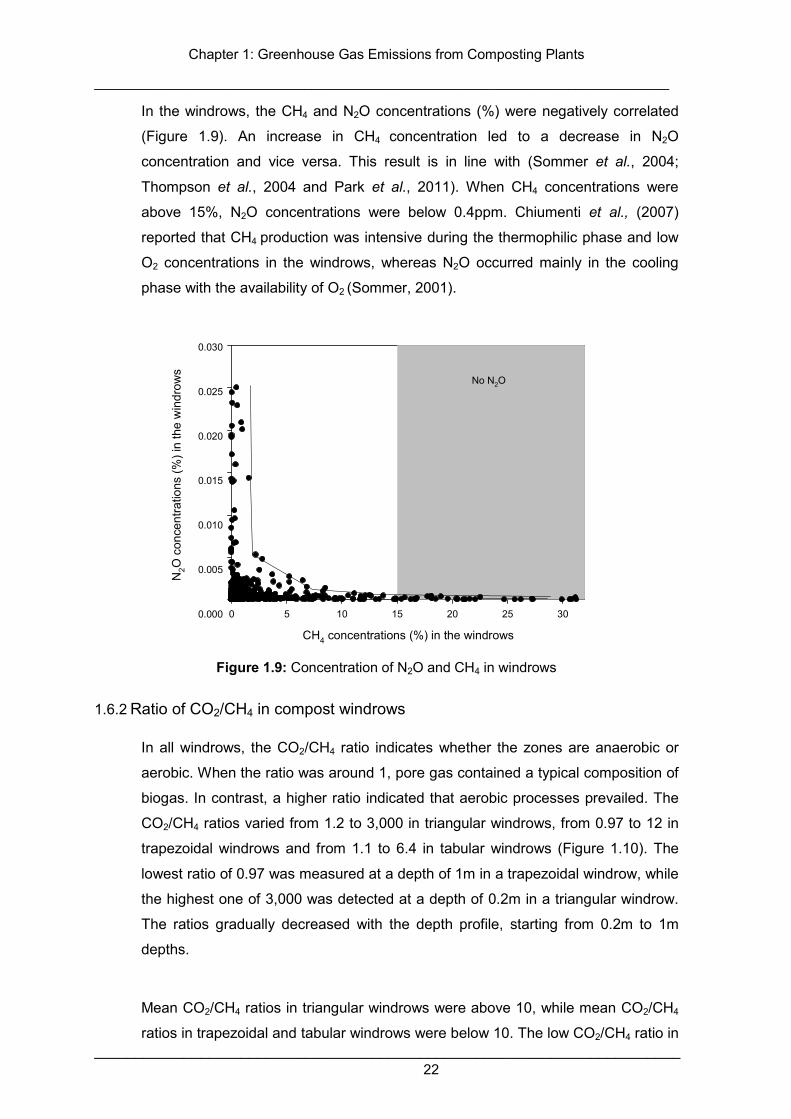
1.6.2 Ratio of CO2/CH4 in compost windrows
In all windrows, the CO2/CH4 ratio indicates whether the zones are anaerobic or
aerobic. When the ratio was around 1, pore gas contained a typical composition of
biogas. In contrast, a higher ratio indicated that aerobic processes prevailed. The
CO2/CH4 ratios varied from 1.2 to 3,000 in triangular windrows, from 0.97 to 12 in
trapezoidal windrows and from 1.1 to 6.4 in tabular windrows (Figure 1.10). The
lowest ratio of 0.97 was measured at a depth of 1m in a trapezoidal windrow, while
the highest one of 3,000 was detected at a depth of 0.2m in a triangular windrow.
The ratios gradually decreased with the depth profile, starting from 0.2m to 1m
depths.
Mean CO2/CH4 ratios in triangular windrows were above 10, while mean CO2/CH4
ratios in trapezoidal and tabular windrows were below 10. The low CO2/CH4 ratio in
Chapter 1: Greenhouse Gas Emissions from Composting Plants
__________________________________________________________________________
________________________________________________________________________ 23
trapezoidal and tabular windrows is an indicator that those windrows established
more anaerobic zones than triangular windrows. Therefore it is likely that more
CH4 was formed in the trapezoidal and tabular windrows. This is in agreement with
previous studies: CH4 production was much higher in a large windrow than in a
small windrow (Beck-Friis et al., 2000; Thompson et al., 2004). Fukumoto et al.,
(2003) evaluated CH4, N2O and NH3 emissions from swine manure windrows. The
authors concluded that the scale of the windrows is a key factor in reducing the
potential of the windrow producing and emitting CH4. Andersen (2010) pointed out
that a small windrow and more frequent turning could reduce CH4 production due
to more O2 being supplied to the windrows.
Depth (m)
Rat
io: C
O2/
CH
4
Triangular windrowsTrapezoidal windrowsTabular windrows
0.0 0.2 0.4 0.6 0.8 1.0 1.2
1000
100
10
1
0.1
Figure 1.10: Box plots show mean ratio values (logarithmic scale) of CO2/CH4 in different
depths of triangular windrows , trapezoidal windrows and tabular windrows
(triangular windrows: n=22; trapezoidal windrows: n=8; tabular windrows: n=16). The box
indicates the 25 and 75% percentiles and minimum and maximum values
In all windrows, gas concentrations at a depth of 1m ranged from 0.3-32% CH4,
5.2-58.6% CO2, 23-87% N2 and 0-16% O2 (Figure 1.11). In triangular windrows,
the CH4 concentration was 0.2 to 16%. In trapezoidal windrows, the CH4
concentration varied from 3 to 31%. In tabular windrows, the CH4 concentration
ranged from 3 to 32%. CH4 concentrations were negatively correlated with the
CO2/CH4 ratio. The CO2/CH4 ratio of tabular windrows ranged from 1 to 3 and in
trapezoidal windrows ranged from 1 to 4, whereas in triangular windrows it varied
from 3 to 200. The differences may be explained by the share of the overall free air
space pore volume in the windrows: tabular and trapezoidal windrows are 4-5m
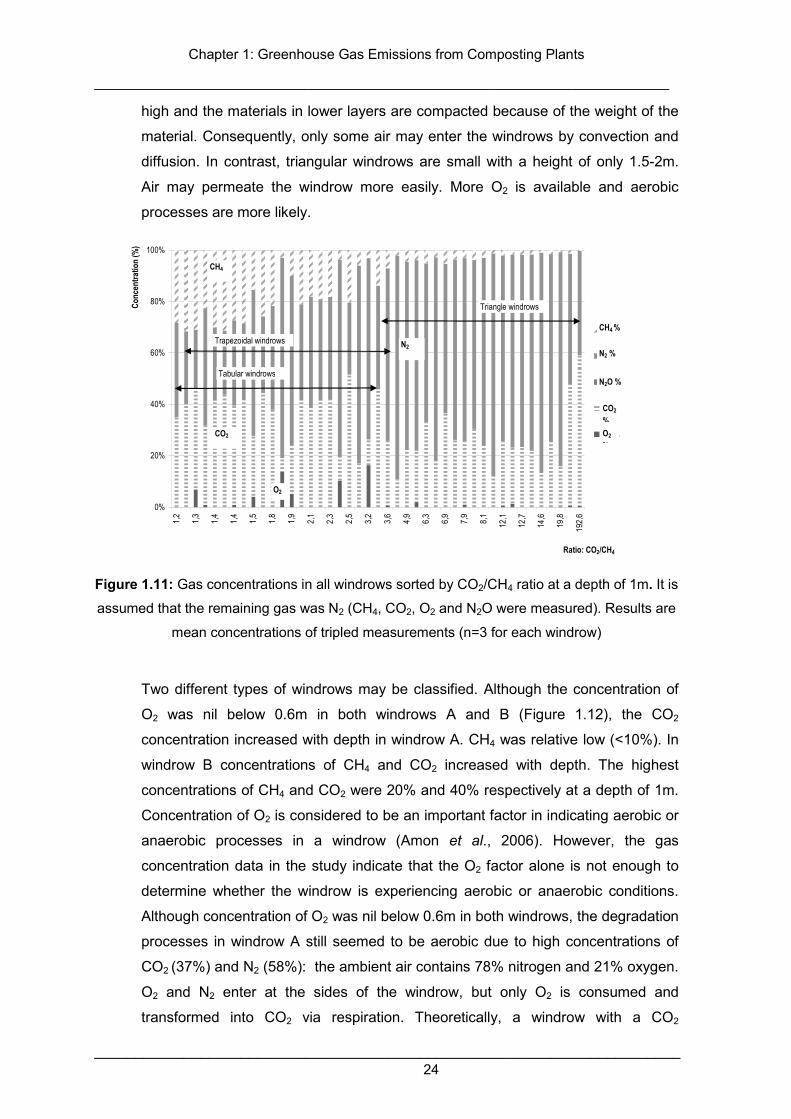
Chapter 1: Greenhouse Gas Emissions from Composting Plants
__________________________________________________________________________
________________________________________________________________________ 24
high and the materials in lower layers are compacted because of the weight of the
material. Consequently, only some air may enter the windrows by convection and
diffusion. In contrast, triangular windrows are small with a height of only 1.5-2m.
Air may permeate the windrow more easily. More O2 is available and aerobic
processes are more likely.
0%
20%
40%
60%
80%
100%
1,2
1,3
1,4
1,4
1,5
1,8
1,9
2,1
2,3
2,5
3,2
3,6
4,9
6,3
6,9
7,9
8,1
12,1
12,7
14,6
19,8
192,
6
Ratio: CO2/CH4
Con
centratio
n (%
)
CH4, %
N2 %
N2O, %
CO2 %
O2 %
Triangle windrows
Trapezoidal windrows
Tabular windrows
CH4
N2
CO2
O2
CH4 %
N2 %
N2O %
CO2
%O2
%
Figure 1.11: Gas concentrations in all windrows sorted by CO2/CH4 ratio at a depth of 1m. It is
assumed that the remaining gas was N2 (CH4, CO2, O2 and N2O were measured). Results are
mean concentrations of tripled measurements (n=3 for each windrow)
Two different types of windrows may be classified. Although the concentration of
O2 was nil below 0.6m in both windrows A and B (Figure 1.12), the CO2
concentration increased with depth in windrow A. CH4 was relative low (<10%). In
windrow B concentrations of CH4 and CO2 increased with depth. The highest
concentrations of CH4 and CO2 were 20% and 40% respectively at a depth of 1m.
Concentration of O2 is considered to be an important factor in indicating aerobic or
anaerobic processes in a windrow (Amon et al., 2006). However, the gas
concentration data in the study indicate that the O2 factor alone is not enough to
determine whether the windrow is experiencing aerobic or anaerobic conditions.
Although concentration of O2 was nil below 0.6m in both windrows, the degradation
processes in windrow A still seemed to be aerobic due to high concentrations of
CO2 (37%) and N2 (58%): the ambient air contains 78% nitrogen and 21% oxygen.
O2 and N2 enter at the sides of the windrow, but only O2 is consumed and
transformed into CO2 via respiration. Theoretically, a windrow with a CO2
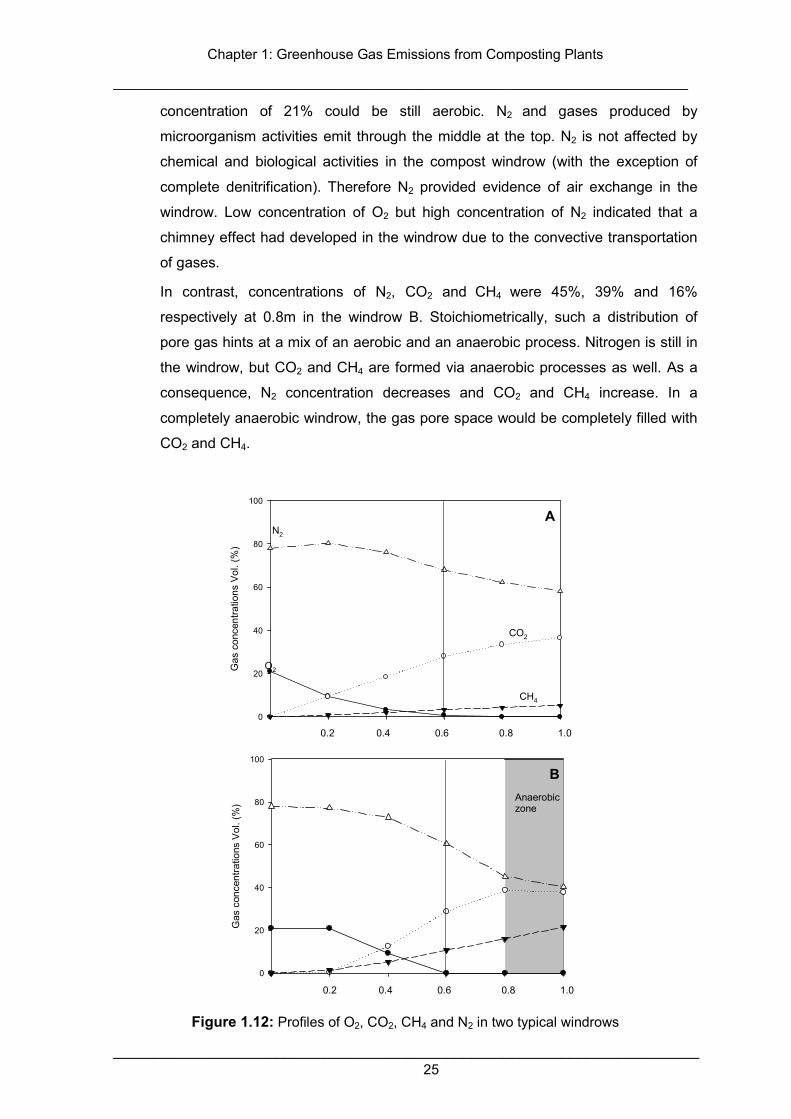
Chapter 1: Greenhouse Gas Emissions from Composting Plants
__________________________________________________________________________
________________________________________________________________________ 25
concentration of 21% could be still aerobic. N2 and gases produced by
microorganism activities emit through the middle at the top. N2 is not affected by
chemical and biological activities in the compost windrow (with the exception of
complete denitrification). Therefore N2 provided evidence of air exchange in the
windrow. Low concentration of O2 but high concentration of N2 indicated that a
chimney effect had developed in the windrow due to the convective transportation
of gases.
In contrast, concentrations of N2, CO2 and CH4 were 45%, 39% and 16%
respectively at 0.8m in the windrow B. Stoichiometrically, such a distribution of
pore gas hints at a mix of an aerobic and an anaerobic process. Nitrogen is still in
the windrow, but CO2 and CH4 are formed via anaerobic processes as well. As a
consequence, N2 concentration decreases and CO2 and CH4 increase. In a
completely anaerobic windrow, the gas pore space would be completely filled with
CO2 and CH4.
Gas
con
cent
ratio
ns V
ol. (
%)
0
20
40
60
80
100
BAnaerobic zone
Gas
con
cent
ratio
ns V
ol. (
%)
0
20
40
60
80
100
A
O2
CO2
N2
CH4
0.2 0.4 0.6 0.8 1.0
0.2 0.4 0.6 0.8 1.0
Figure 1.12: Profiles of O2, CO2, CH4 and N2 in two typical windrows
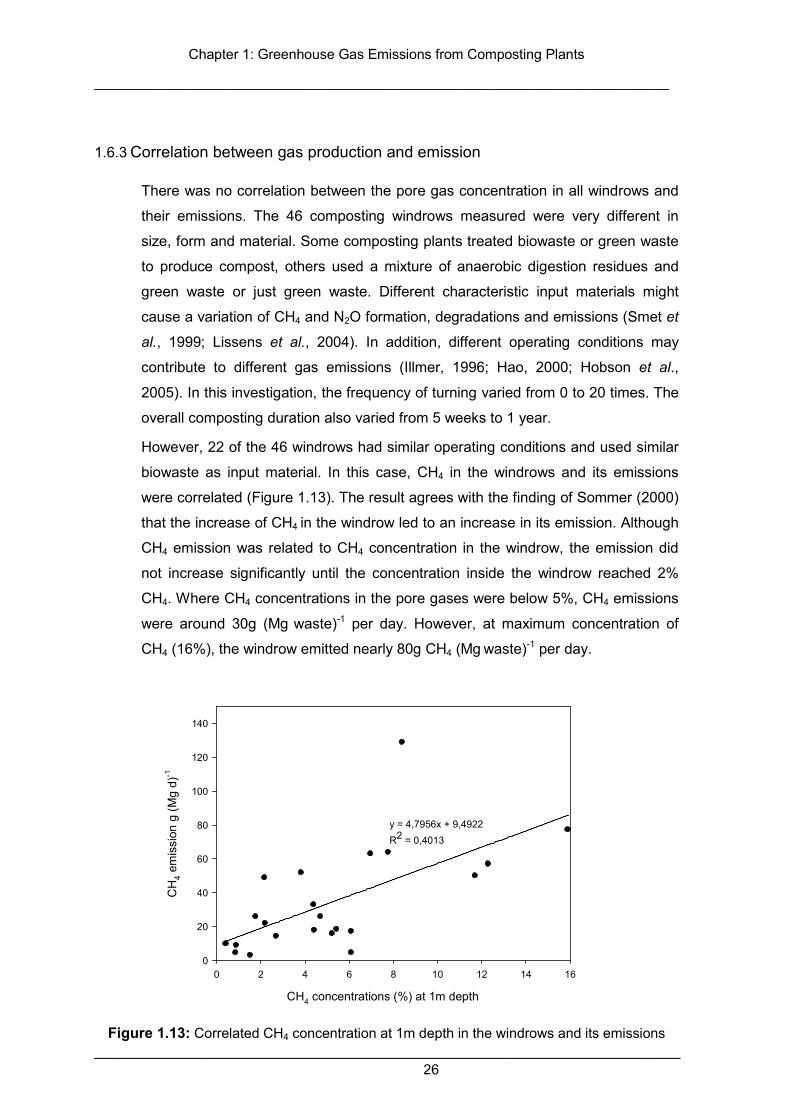
Chapter 1: Greenhouse Gas Emissions from Composting Plants
__________________________________________________________________________
________________________________________________________________________ 26
1.6.3 Correlation between gas production and emission
There was no correlation between the pore gas concentration in all windrows and
their emissions. The 46 composting windrows measured were very different in
size, form and material. Some composting plants treated biowaste or green waste
to produce compost, others used a mixture of anaerobic digestion residues and
green waste or just green waste. Different characteristic input materials might
cause a variation of CH4 and N2O formation, degradations and emissions (Smet et
al., 1999; Lissens et al., 2004). In addition, different operating conditions may
contribute to different gas emissions (Illmer, 1996; Hao, 2000; Hobson et al.,
2005). In this investigation, the frequency of turning varied from 0 to 20 times. The
overall composting duration also varied from 5 weeks to 1 year.
However, 22 of the 46 windrows had similar operating conditions and used similar
biowaste as input material. In this case, CH4 in the windrows and its emissions
were correlated (Figure 1.13). The result agrees with the finding of Sommer (2000)
that the increase of CH4 in the windrow led to an increase in its emission. Although
CH4 emission was related to CH4 concentration in the windrow, the emission did
not increase significantly until the concentration inside the windrow reached 2%
CH4. Where CH4 concentrations in the pore gases were below 5%, CH4 emissions
were around 30g (Mg waste)-1 per day. However, at maximum concentration of
CH4 (16%), the windrow emitted nearly 80g CH4 (Mg waste)-1 per day.
CH4 concentrations (%) at 1m depth
0 2 4 6 8 10 12 14 16
CH
4 em
issi
on g
(M
g d)
-1
0
20
40
60
80
100
120
140
y = 4,7956x + 9,4922
R2 = 0,4013
Figure 1.13: Correlated CH4 concentration at 1m depth in the windrows and its emissions
Chapter 1: Greenhouse Gas Emissions from Composting Plants
__________________________________________________________________________
________________________________________________________________________ 27
1.6.4 Emissions of CH4, N2O and NH3 from biowaste composting
The cumulative CH4, N2O and NH3 emission factors g (Mg waste)-1 of composting
plants varied during the composting process time (Figure 1.14). At CoPs 1, 2, 4a,
4b, 4c and 4d, emissions of CH4 increased sharply during the first five weeks of the
composting process (Figure 1.14A), which confirmed previous results (Hellmann,
1997; Hao, 2000; Hellebrand and Kalk, 2001). At CoP 3, emissions of CH4 were
fairly low at the beginning but started to increase after four weeks. Before biowaste
can be treated at the composting plants, it is stored in waste bins in households for
a certain period (1-2 weeks). Thus, part of the composting process may have
taken place in the waste bins already. Furthermore, different input material may
also contribute to different CH4 emissions.
The N2O emission patterns from CoP 2 and CoP 4a and 4c were fairly similar
(Figure 1.14B). The emission of N2O increased rapidly in the first four weeks. The
emission patterns of N2O resembled those found by Wolter et al., (2004),
Chadwick (2005) and El Kader et al., (2007). However, the emission pattern from
CoP 3, 4b and 4d had a lag phase at the beginning and increased sharply after six
weeks. Similarly, Hellmann (1997) and Beck-Friis et al., (2000) stated that the N2O
emissions increase with compost age. He et al., (2001) reported that over 95% of
the N2O was produced and emitted during the last stage of composting. Emissions
of N2O at CoP 1 remained low during the whole composting process. Hellmann
(1997) studied the release of GHGs during the maturation of open-windrow
composting of biowaste. The study showed that N2O was emitted during the first
few days and last few days of the process, when temperatures were low again.
Czepiel et al., (1996) found no significant statistical correlation between N2O
emission and compost age, but the availability of O2 was a determining factor for
N2O production.
Emissions of NH3 at CoP 4b were highest in the first two weeks, whereas at CoPs
4c and 4d NH3 emissions were high between weeks 3 and 5. NH3 emissions at
CoPs 1, 2, 3 and 4a were quite low (Figure 1.14 C). In general, the emission of
NH3 was high at the beginning and declined after a few weeks. During the curing
phase, there were no NH3 emissions (Beck-Friis et al., 2001).
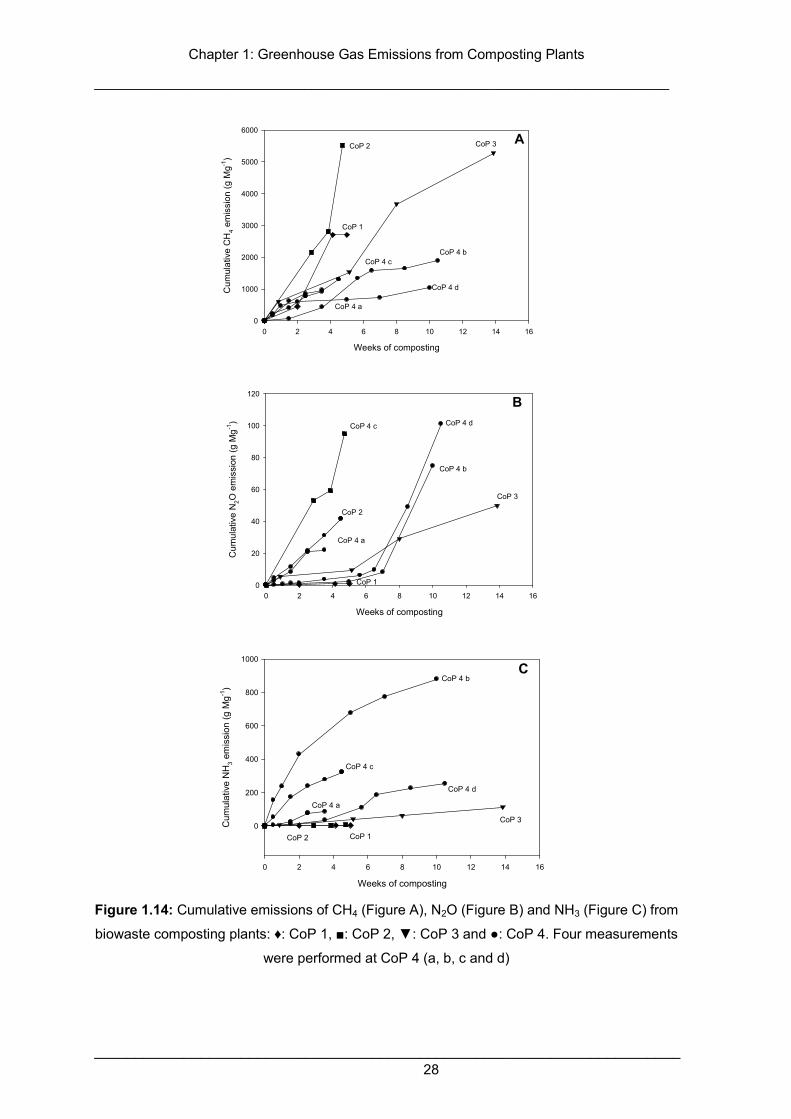
Chapter 1: Greenhouse Gas Emissions from Composting Plants
__________________________________________________________________________
________________________________________________________________________ 28
Weeks of composting
0 2 4 6 8 10 12 14 16
Cum
ulat
ive
CH
4 em
issi
on (
g M
g-1)
0
1000
2000
3000
4000
5000
6000
CoP 1
CoP 2 CoP 3
CoP 4 b
CoP 4 d
CoP 4 a
CoP 4 c
A
Weeks of composting
0 2 4 6 8 10 12 14 16
Cum
ulat
ive
N2O
em
issi
on (
g M
g-1)
0
20
40
60
80
100
120
CoP 4 c
CoP 4 a
CoP 4 d
CoP 4 b
CoP 3
CoP 2
CoP 1
B
Weeks of composting
0 2 4 6 8 10 12 14 16
Cum
ulat
ive
NH
3 em
issi
on (
g M
g-1)
0
200
400
600
800
1000
CoP 1
CoP 4 a
CoP 4 b
CoP 4 c
CoP 4 d
CoP 2
CoP 3
C
Figure 1.14: Cumulative emissions of CH4 (Figure A), N2O (Figure B) and NH3 (Figure C) from
biowaste composting plants: ♦: CoP 1, ■: CoP 2, ▼: CoP 3 and ●: CoP 4. Four measurements
were performed at CoP 4 (a, b, c and d)
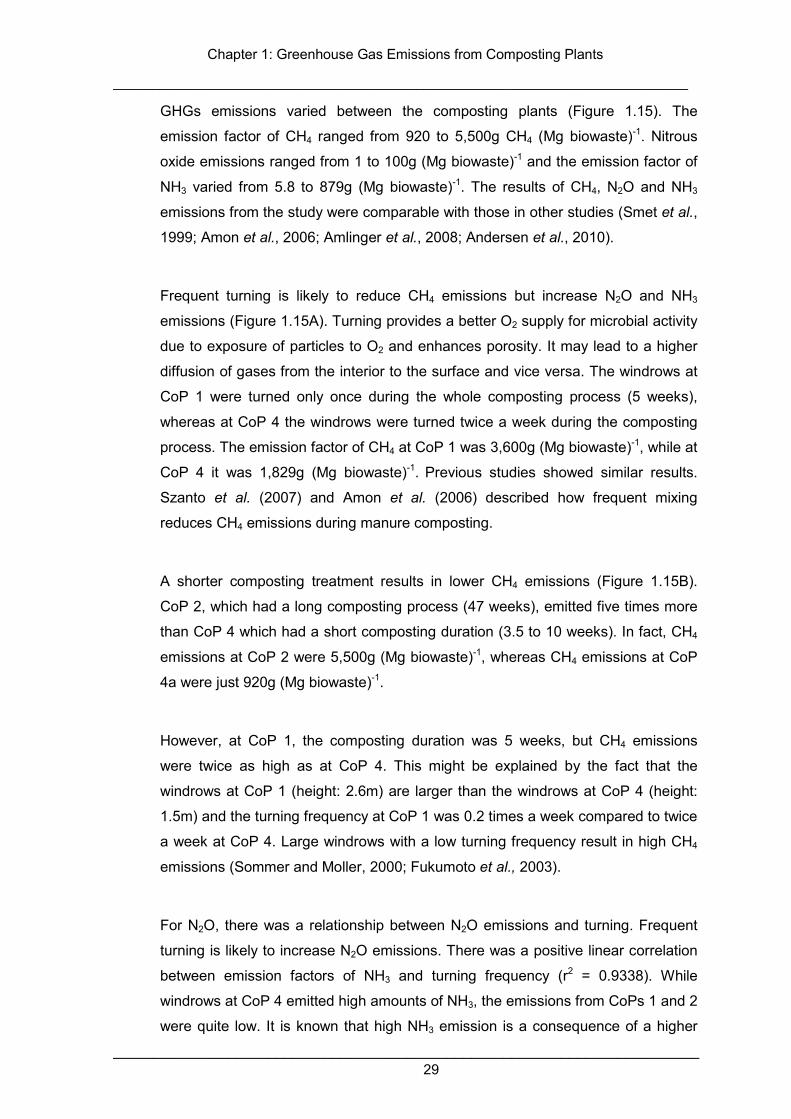
Chapter 1: Greenhouse Gas Emissions from Composting Plants
__________________________________________________________________________
________________________________________________________________________ 29
GHGs emissions varied between the composting plants (Figure 1.15). The
emission factor of CH4 ranged from 920 to 5,500g CH4 (Mg biowaste)-1. Nitrous
oxide emissions ranged from 1 to 100g (Mg biowaste)-1 and the emission factor of
NH3 varied from 5.8 to 879g (Mg biowaste)-1. The results of CH4, N2O and NH3
emissions from the study were comparable with those in other studies (Smet et al.,
1999; Amon et al., 2006; Amlinger et al., 2008; Andersen et al., 2010).
Frequent turning is likely to reduce CH4 emissions but increase N2O and NH3
emissions (Figure 1.15A). Turning provides a better O2 supply for microbial activity
due to exposure of particles to O2 and enhances porosity. It may lead to a higher
diffusion of gases from the interior to the surface and vice versa. The windrows at
CoP 1 were turned only once during the whole composting process (5 weeks),
whereas at CoP 4 the windrows were turned twice a week during the composting
process. The emission factor of CH4 at CoP 1 was 3,600g (Mg biowaste)-1, while at
CoP 4 it was 1,829g (Mg biowaste)-1. Previous studies showed similar results.
Szanto et al. (2007) and Amon et al. (2006) described how frequent mixing
reduces CH4 emissions during manure composting.
A shorter composting treatment results in lower CH4 emissions (Figure 1.15B).
CoP 2, which had a long composting process (47 weeks), emitted five times more
than CoP 4 which had a short composting duration (3.5 to 10 weeks). In fact, CH4
emissions at CoP 2 were 5,500g (Mg biowaste)-1, whereas CH4 emissions at CoP
4a were just 920g (Mg biowaste)-1.
However, at CoP 1, the composting duration was 5 weeks, but CH4 emissions
were twice as high as at CoP 4. This might be explained by the fact that the
windrows at CoP 1 (height: 2.6m) are larger than the windrows at CoP 4 (height:
1.5m) and the turning frequency at CoP 1 was 0.2 times a week compared to twice
a week at CoP 4. Large windrows with a low turning frequency result in high CH4
emissions (Sommer and Moller, 2000; Fukumoto et al., 2003).
For N2O, there was a relationship between N2O emissions and turning. Frequent
turning is likely to increase N2O emissions. There was a positive linear correlation
between emission factors of NH3 and turning frequency (r2 = 0.9338). While
windrows at CoP 4 emitted high amounts of NH3, the emissions from CoPs 1 and 2
were quite low. It is known that high NH3 emission is a consequence of a higher
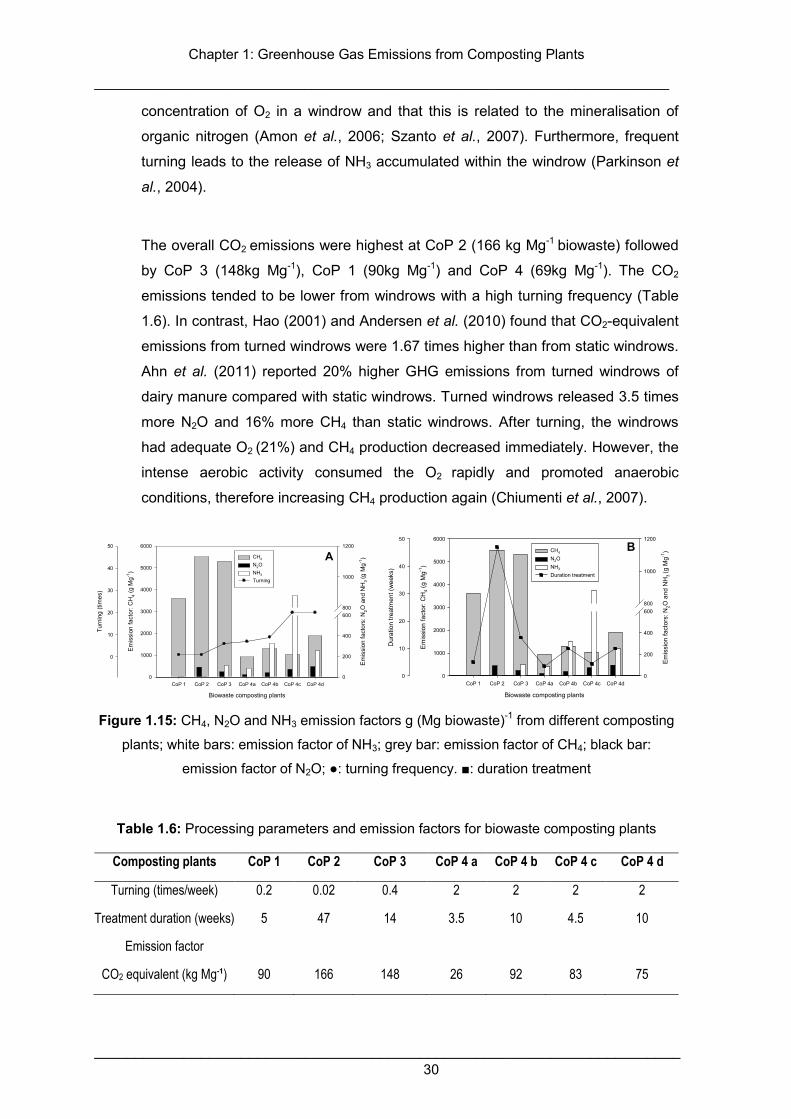
Chapter 1: Greenhouse Gas Emissions from Composting Plants
__________________________________________________________________________
________________________________________________________________________ 30
concentration of O2 in a windrow and that this is related to the mineralisation of
organic nitrogen (Amon et al., 2006; Szanto et al., 2007). Furthermore, frequent
turning leads to the release of NH3 accumulated within the windrow (Parkinson et
al., 2004).
The overall CO2 emissions were highest at CoP 2 (166 kg Mg-1 biowaste) followed
by CoP 3 (148kg Mg-1), CoP 1 (90kg Mg-1) and CoP 4 (69kg Mg-1). The CO2
emissions tended to be lower from windrows with a high turning frequency (Table
1.6). In contrast, Hao (2001) and Andersen et al. (2010) found that CO2-equivalent
emissions from turned windrows were 1.67 times higher than from static windrows.
Ahn et al. (2011) reported 20% higher GHG emissions from turned windrows of
dairy manure compared with static windrows. Turned windrows released 3.5 times
more N2O and 16% more CH4 than static windrows. After turning, the windrows
had adequate O2 (21%) and CH4 production decreased immediately. However, the
intense aerobic activity consumed the O2 rapidly and promoted anaerobic
conditions, therefore increasing CH4 production again (Chiumenti et al., 2007).
Biowaste composting plants
CoP 1 CoP 2 CoP 3 CoP 4a CoP 4b CoP 4c CoP 4d
Em
issi
on fa
ctor
: CH
4 (g
Mg-1
)
0
1000
2000
3000
4000
5000
6000
Em
issi
on fa
ctor
s: N
2O a
nd N
H3
(g M
g-1)
0
200
400
600800
1000
1200
Turn
ing
(tim
es)
0
10
20
30
40
50
CH4
N2O
NH3
Turning
A
Biowaste composting plants
CoP 1 CoP 2 CoP 3 CoP 4a CoP 4b CoP 4c CoP 4d
Em
issi
on fa
ctor
: CH
4 (g
Mg-1
)
0
1000
2000
3000
4000
5000
6000
Em
issi
on fa
ctor
s: N
2O a
nd N
H3 (g
Mg-1
)
0
200
400
600800
1000
1200
Dur
atio
n tr
eatm
ent (
wee
ks)
0
10
20
30
40
50
CH4
N2O
NH3
Duration treatment
B
Figure 1.15: CH4, N2O and NH3 emission factors g (Mg biowaste)-1 from different composting
plants; white bars: emission factor of NH3; grey bar: emission factor of CH4; black bar:
emission factor of N2O; ●: turning frequency. ■: duration treatment
Table 1.6: Processing parameters and emission factors for biowaste composting plants
Composting plants CoP 1 CoP 2 CoP 3 CoP 4 a CoP 4 b CoP 4 c CoP 4 d
Turning (times/week) 0.2 0.02 0.4 2 2 2 2
Treatment duration (weeks) 5 47 14 3.5 10 4.5 10
Emission factor
CO2 equivalent (kg Mg-1)
90
166
148
26
92
83
75
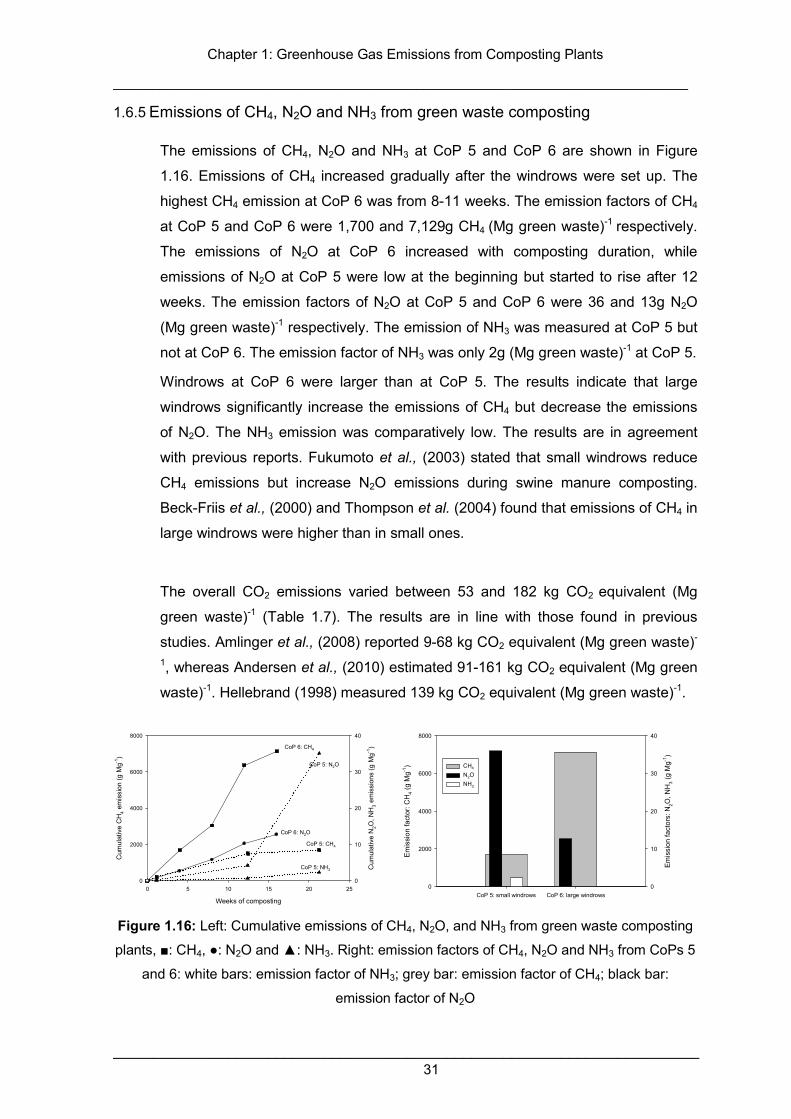
Chapter 1: Greenhouse Gas Emissions from Composting Plants
__________________________________________________________________________
________________________________________________________________________ 31
1.6.5 Emissions of CH4, N2O and NH3 from green waste composting
The emissions of CH4, N2O and NH3 at CoP 5 and CoP 6 are shown in Figure
1.16. Emissions of CH4 increased gradually after the windrows were set up. The
highest CH4 emission at CoP 6 was from 8-11 weeks. The emission factors of CH4
at CoP 5 and CoP 6 were 1,700 and 7,129g CH4 (Mg green waste)-1 respectively.
The emissions of N2O at CoP 6 increased with composting duration, while
emissions of N2O at CoP 5 were low at the beginning but started to rise after 12
weeks. The emission factors of N2O at CoP 5 and CoP 6 were 36 and 13g N2O
(Mg green waste)-1 respectively. The emission of NH3 was measured at CoP 5 but
not at CoP 6. The emission factor of NH3 was only 2g (Mg green waste)-1 at CoP 5.
Windrows at CoP 6 were larger than at CoP 5. The results indicate that large
windrows significantly increase the emissions of CH4 but decrease the emissions
of N2O. The NH3 emission was comparatively low. The results are in agreement
with previous reports. Fukumoto et al., (2003) stated that small windrows reduce
CH4 emissions but increase N2O emissions during swine manure composting.
Beck-Friis et al., (2000) and Thompson et al. (2004) found that emissions of CH4 in
large windrows were higher than in small ones.
The overall CO2 emissions varied between 53 and 182 kg CO2 equivalent (Mg
green waste)-1 (Table 1.7). The results are in line with those found in previous
studies. Amlinger et al., (2008) reported 9-68 kg CO2 equivalent (Mg green waste)-
1, whereas Andersen et al., (2010) estimated 91-161 kg CO2 equivalent (Mg green
waste)-1. Hellebrand (1998) measured 139 kg CO2 equivalent (Mg green waste)-1.
Weeks of composting
0 5 10 15 20 25
Cum
ulat
ive
CH
4 em
issi
on (
g M
g-1)
0
2000
4000
6000
8000
Cum
ulat
ive
N2O
, NH
3 em
issi
ons
(g M
g-1)
0
10
20
30
40
CoP 6: CH4
CoP 5: CH4
CoP 5: NH3
CoP 5: N2O
CoP 6: N2O
CoP 5: small windrows CoP 6: large windrows
Em
issi
on fa
ctor
: CH
4 (g
Mg-1
)
0
2000
4000
6000
8000
Em
issi
on fa
ctor
s: N
2O, N
H3
(g M
g-1)
0
10
20
30
40
CH4
N2O
NH3
Figure 1.16: Left: Cumulative emissions of CH4, N2O, and NH3 from green waste composting
plants, ■: CH4, ●: N2O and ▲: NH3. Right: emission factors of CH4, N2O and NH3 from CoPs 5
and 6: white bars: emission factor of NH3; grey bar: emission factor of CH4; black bar:
emission factor of N2O
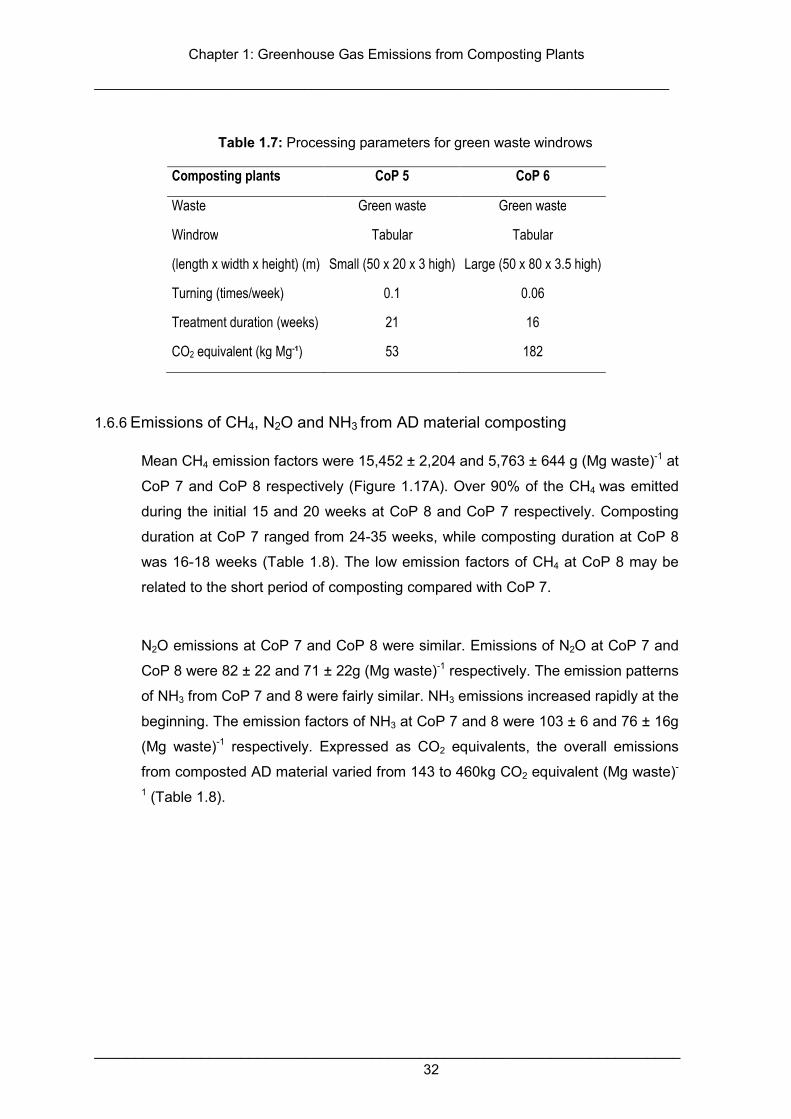
Chapter 1: Greenhouse Gas Emissions from Composting Plants
__________________________________________________________________________
________________________________________________________________________ 32
Table 1.7: Processing parameters for green waste windrows
Composting plants CoP 5 CoP 6
Waste Green waste Green waste
Windrow
(length x width x height) (m)
Tabular
Small (50 x 20 x 3 high)
Tabular
Large (50 x 80 x 3.5 high)
Turning (times/week) 0.1 0.06
Treatment duration (weeks) 21 16
CO2 equivalent (kg Mg-1) 53 182
1.6.6 Emissions of CH4, N2O and NH3 from AD material composting
Mean CH4 emission factors were 15,452 ± 2,204 and 5,763 ± 644 g (Mg waste)-1 at
CoP 7 and CoP 8 respectively (Figure 1.17A). Over 90% of the CH4 was emitted
during the initial 15 and 20 weeks at CoP 8 and CoP 7 respectively. Composting
duration at CoP 7 ranged from 24-35 weeks, while composting duration at CoP 8
was 16-18 weeks (Table 1.8). The low emission factors of CH4 at CoP 8 may be
related to the short period of composting compared with CoP 7.
N2O emissions at CoP 7 and CoP 8 were similar. Emissions of N2O at CoP 7 and
CoP 8 were 82 ± 22 and 71 ± 22g (Mg waste)-1 respectively. The emission patterns
of NH3 from CoP 7 and 8 were fairly similar. NH3 emissions increased rapidly at the
beginning. The emission factors of NH3 at CoP 7 and 8 were 103 ± 6 and 76 ± 16g
(Mg waste)-1 respectively. Expressed as CO2 equivalents, the overall emissions
from composted AD material varied from 143 to 460kg CO2 equivalent (Mg waste)-
1 (Table 1.8).
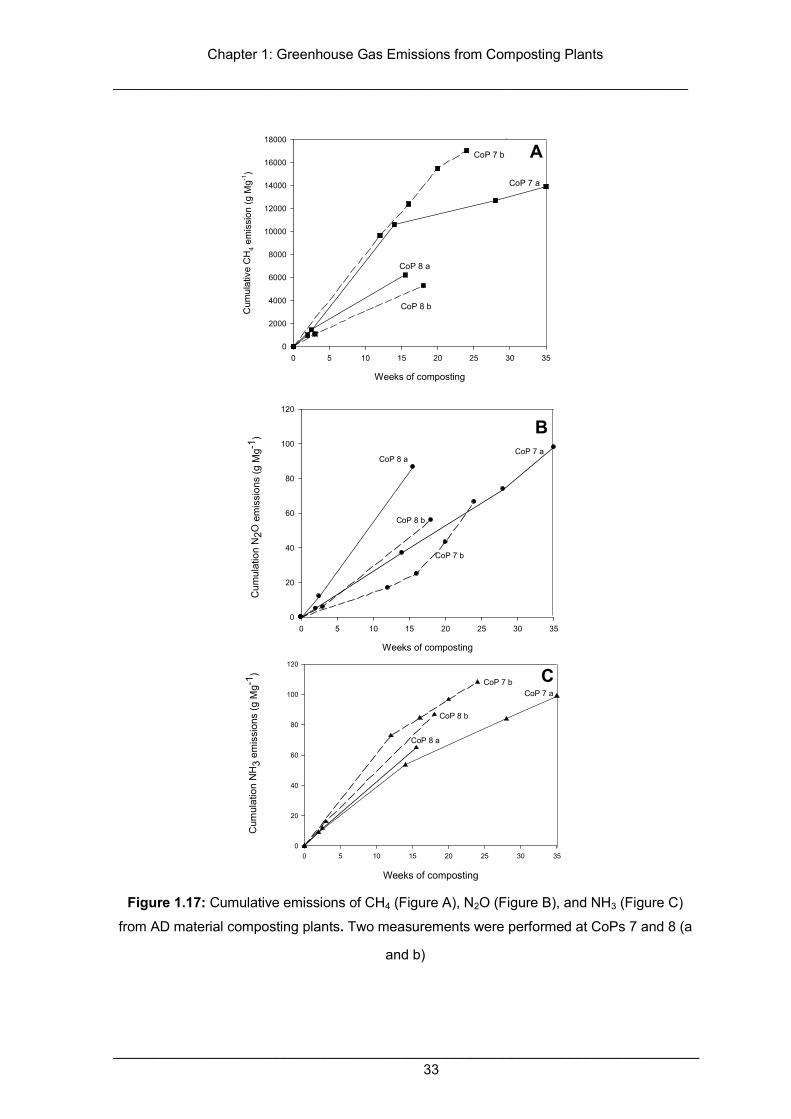
Chapter 1: Greenhouse Gas Emissions from Composting Plants
__________________________________________________________________________
________________________________________________________________________ 33
Weeks of composting
0 5 10 15 20 25 30 350
20
40
60
80
100
120
CoP 7 aCoP 8 a
CoP 8 b
CoP 7 b
KoA 07 a
KoA 07 b
KoA 08 a
KoA 08 b
Weeks of composting
0 5 10 15 20 25 30 35
Cum
ulat
ive
CH
4 em
issi
on (
g M
g-1)
0
2000
4000
6000
8000
10000
12000
14000
16000
18000
CoP 7 a
CoP 7 b
CoP 8 a
CoP 8 b
Weeks of composting
0 5 10 15 20 25 30 35
Cum
ulat
ion
NH
3 em
issi
ons
(g M
g-1)
0
20
40
60
80
100
120
CoP 7 aCoP 7 b
CoP 8 a
CoP 8 b
A
C
B
Cum
ulat
ion
N2O
em
issi
ons
(g M
g-1)
Figure 1.17: Cumulative emissions of CH4 (Figure A), N2O (Figure B), and NH3 (Figure C)
from AD material composting plants. Two measurements were performed at CoPs 7 and 8 (a
and b)
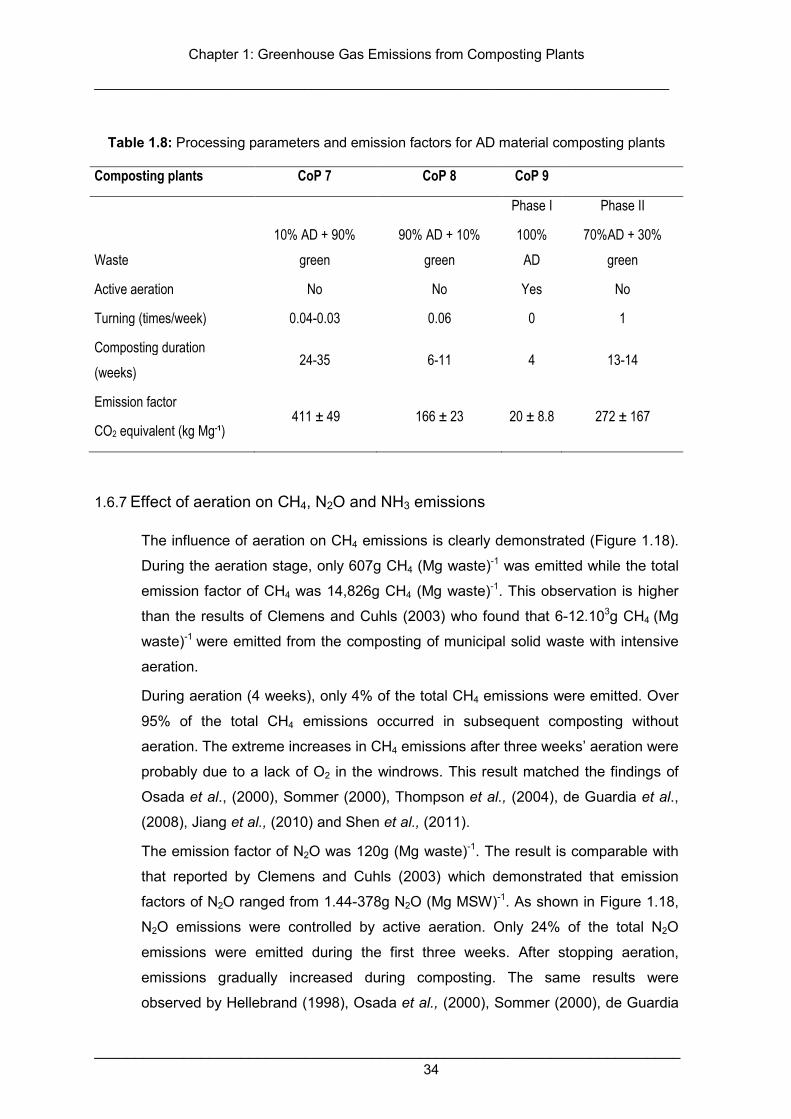
Chapter 1: Greenhouse Gas Emissions from Composting Plants
__________________________________________________________________________
________________________________________________________________________ 34
Table 1.8: Processing parameters and emission factors for AD material composting plants
Composting plants CoP 7 CoP 8 CoP 9
Phase I Phase II
Waste
10% AD + 90%
green
90% AD + 10%
green
100%
AD
70%AD + 30%
green
Active aeration No No Yes No
Turning (times/week) 0.04-0.03 0.06 0 1
Composting duration
(weeks) 24-35 6-11 4 13-14
Emission factor
CO2 equivalent (kg Mg-1) 411 ± 49 166 ± 23 20 ± 8.8 272 ± 167
1.6.7 Effect of aeration on CH4, N2O and NH3 emissions
The influence of aeration on CH4 emissions is clearly demonstrated (Figure 1.18).
During the aeration stage, only 607g CH4 (Mg waste)-1 was emitted while the total
emission factor of CH4 was 14,826g CH4 (Mg waste)-1. This observation is higher
than the results of Clemens and Cuhls (2003) who found that 6-12.103g CH4 (Mg
waste)-1 were emitted from the composting of municipal solid waste with intensive
aeration.
During aeration (4 weeks), only 4% of the total CH4 emissions were emitted. Over
95% of the total CH4 emissions occurred in subsequent composting without
aeration. The extreme increases in CH4 emissions after three weeks’ aeration were
probably due to a lack of O2 in the windrows. This result matched the findings of
Osada et al., (2000), Sommer (2000), Thompson et al., (2004), de Guardia et al.,
(2008), Jiang et al., (2010) and Shen et al., (2011).
The emission factor of N2O was 120g (Mg waste)-1. The result is comparable with
that reported by Clemens and Cuhls (2003) which demonstrated that emission
factors of N2O ranged from 1.44-378g N2O (Mg MSW)-1. As shown in Figure 1.18,
N2O emissions were controlled by active aeration. Only 24% of the total N2O
emissions were emitted during the first three weeks. After stopping aeration,
emissions gradually increased during composting. The same results were
observed by Hellebrand (1998), Osada et al., (2000), Sommer (2000), de Guardia
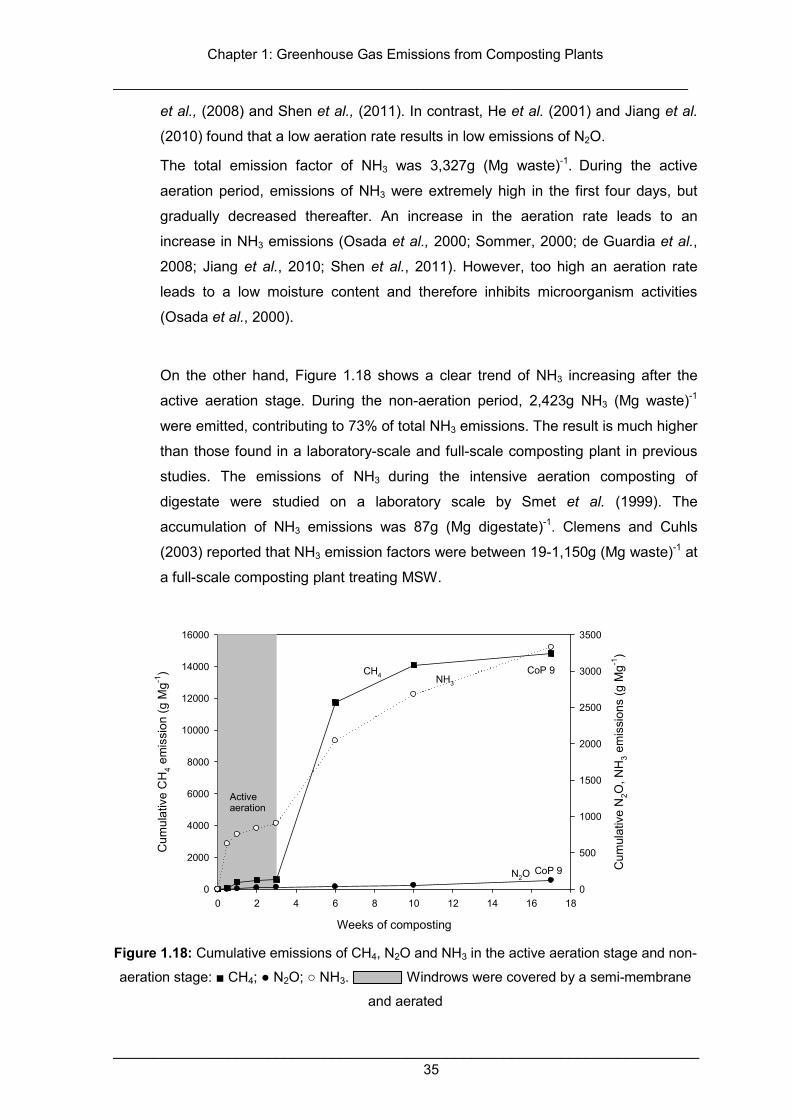
Chapter 1: Greenhouse Gas Emissions from Composting Plants
__________________________________________________________________________
________________________________________________________________________ 35
et al., (2008) and Shen et al., (2011). In contrast, He et al. (2001) and Jiang et al.
(2010) found that a low aeration rate results in low emissions of N2O.
The total emission factor of NH3 was 3,327g (Mg waste)-1. During the active
aeration period, emissions of NH3 were extremely high in the first four days, but
gradually decreased thereafter. An increase in the aeration rate leads to an
increase in NH3 emissions (Osada et al., 2000; Sommer, 2000; de Guardia et al.,
2008; Jiang et al., 2010; Shen et al., 2011). However, too high an aeration rate
leads to a low moisture content and therefore inhibits microorganism activities
(Osada et al., 2000).
On the other hand, Figure 1.18 shows a clear trend of NH3 increasing after the
active aeration stage. During the non-aeration period, 2,423g NH3 (Mg waste)-1
were emitted, contributing to 73% of total NH3 emissions. The result is much higher
than those found in a laboratory-scale and full-scale composting plant in previous
studies. The emissions of NH3 during the intensive aeration composting of
digestate were studied on a laboratory scale by Smet et al. (1999). The
accumulation of NH3 emissions was 87g (Mg digestate)-1. Clemens and Cuhls
(2003) reported that NH3 emission factors were between 19-1,150g (Mg waste)-1 at
a full-scale composting plant treating MSW.
Weeks of composting
0 2 4 6 8 10 12 14 16 18
Cum
ulat
ive
CH
4 em
issi
on (
g M
g-1)
0
2000
4000
6000
8000
10000
12000
14000
16000
Cum
ulat
ive
N2O
, NH
3 em
issi
ons
(g M
g-1)
0
500
1000
1500
2000
2500
3000
3500
Active aeration
NH3
CH4
N2O
CoP 9
CoP 9
Figure 1.18: Cumulative emissions of CH4, N2O and NH3 in the active aeration stage and non-
aeration stage: ■ CH4; ● N2O; ○ NH3. Windrows were covered by a semi-membrane
and aerated
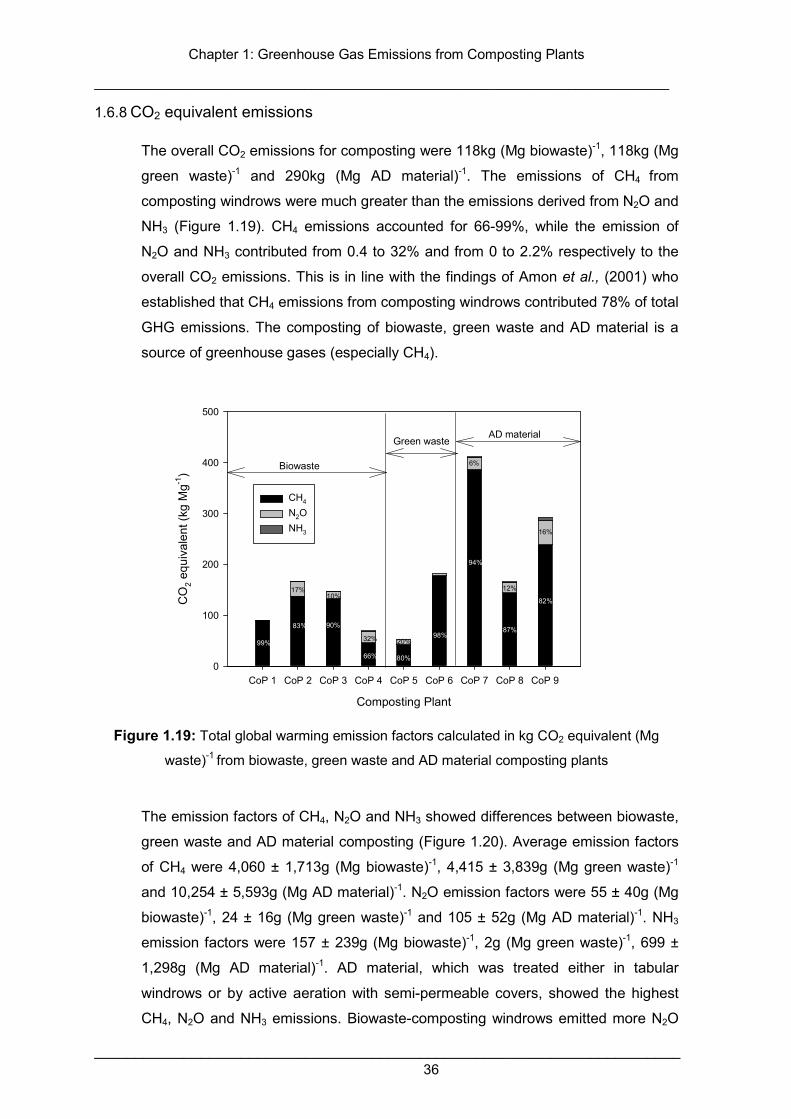
Chapter 1: Greenhouse Gas Emissions from Composting Plants
__________________________________________________________________________
________________________________________________________________________ 36
1.6.8 CO2 equivalent emissions
The overall CO2 emissions for composting were 118kg (Mg biowaste)-1, 118kg (Mg
green waste)-1 and 290kg (Mg AD material)-1. The emissions of CH4 from
composting windrows were much greater than the emissions derived from N2O and
NH3 (Figure 1.19). CH4 emissions accounted for 66-99%, while the emission of
N2O and NH3 contributed from 0.4 to 32% and from 0 to 2.2% respectively to the
overall CO2 emissions. This is in line with the findings of Amon et al., (2001) who
established that CH4 emissions from composting windrows contributed 78% of total
GHG emissions. The composting of biowaste, green waste and AD material is a
source of greenhouse gases (especially CH4).
Composting Plant
CoP 1 CoP 2 CoP 3 CoP 4 CoP 5 CoP 6 CoP 7 CoP 8 CoP 9
CO
2 eq
uiva
lent
(kg
Mg-1
)
0
100
200
300
400
500
CH4
N2O
NH3
Biowaste
Green wasteAD material
99%
83%
17%
90%
10%
66%
32%
80%
20%98%
94%
6%
87%
12%
82%
16%
Figure 1.19: Total global warming emission factors calculated in kg CO2 equivalent (Mg
waste)-1 from biowaste, green waste and AD material composting plants
The emission factors of CH4, N2O and NH3 showed differences between biowaste,
green waste and AD material composting (Figure 1.20). Average emission factors
of CH4 were 4,060 ± 1,713g (Mg biowaste)-1, 4,415 ± 3,839g (Mg green waste)-1
and 10,254 ± 5,593g (Mg AD material)-1. N2O emission factors were 55 ± 40g (Mg
biowaste)-1, 24 ± 16g (Mg green waste)-1 and 105 ± 52g (Mg AD material)-1. NH3
emission factors were 157 ± 239g (Mg biowaste)-1, 2g (Mg green waste)-1, 699 ±
1,298g (Mg AD material)-1. AD material, which was treated either in tabular
windrows or by active aeration with semi-permeable covers, showed the highest
CH4, N2O and NH3 emissions. Biowaste-composting windrows emitted more N2O
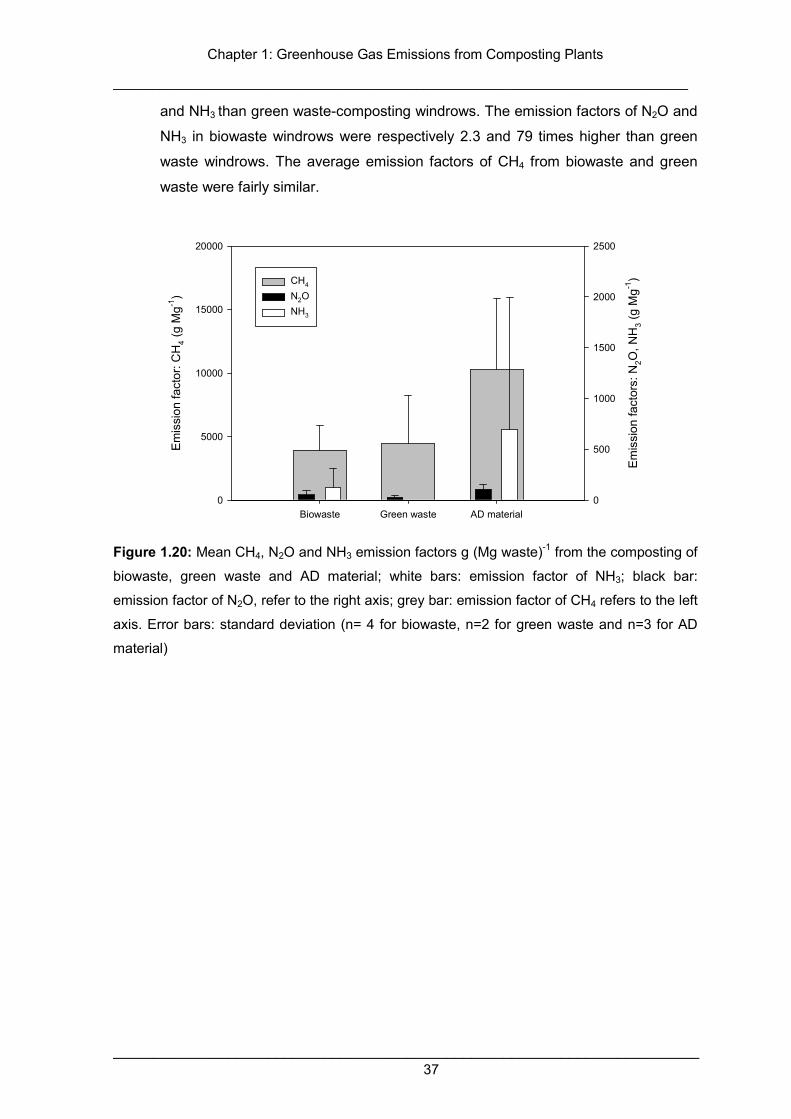
Chapter 1: Greenhouse Gas Emissions from Composting Plants
__________________________________________________________________________
________________________________________________________________________ 37
and NH3 than green waste-composting windrows. The emission factors of N2O and
NH3 in biowaste windrows were respectively 2.3 and 79 times higher than green
waste windrows. The average emission factors of CH4 from biowaste and green
waste were fairly similar.
Biowaste Green waste AD material
Em
issi
on fa
ctor
: CH
4 (g
Mg-1
)
0
5000
10000
15000
20000
Em
issi
on fa
ctor
s: N
2O, N
H3
(g M
g-1)
0
500
1000
1500
2000
2500
CH4
N2O
NH3
Figure 1.20: Mean CH4, N2O and NH3 emission factors g (Mg waste)-1 from the composting of
biowaste, green waste and AD material; white bars: emission factor of NH3; black bar:
emission factor of N2O, refer to the right axis; grey bar: emission factor of CH4 refers to the left
axis. Error bars: standard deviation (n= 4 for biowaste, n=2 for green waste and n=3 for AD
material)
Chapter 1: Greenhouse Gas Emissions from Composting Plants
__________________________________________________________________________
________________________________________________________________________ 38
1.7 Conclusions
The composting of biowaste, green waste and AD material is a source of greenhouse
gases. CH4 is the major contributor to overall CO2 emissions, whereas NH3 emissions
are insignificant. N2O emissions contribute between 1 and 32% of total emissions.
Pore space concentration of CH4 correlated with its emissions in small triangle
windrows.
Analysing O2 concentration alone is not enough to determine whether the windrow is
aerobic or anaerobic. The CO2/CH4 ratio is an important factor in determining whether
the windrows are anaerobic or aerobic.
GHG emissions varied at different plants, indicating that how they are managed is
important in reducing GHG emissions during the composting process. Active aeration
and frequent turning can reduce emissions of CH4 significantly, but they may increase
emissions of N2O and NH3. In order to reduce GHGs, small windrows with high
turning frequencies and a short composting duration would result in the lowest
emissions.
In Germany it is estimated that 4 million Mg biowaste and 6.5 million Mg of green
waste could be treated by composting. Based on these results, biowaste and green
waste composting would result in a 0.13% share of national emissions of N2O and a
1.74% share of national emissions of CH4.
Chapter 1: Greenhouse Gas Emissions from Composting Plants
__________________________________________________________________________
________________________________________________________________________ 39
1.8 References
Amlinger, F., Peyr, S. and Cuhls, C. 2008. Greenhouse gas emissions from composting
and mechanical biological treatment. Waste Management and Research, 26, 47-
60.
Amon, B., Amon, T., Boxberger, J. and Alt, C. 2001. Emissions of NH3, N2O and CH4 from
dairy cows housed in a farmyard manure tying stall (housing, manure storage,
manure spreading). Nutrient Cycling in Agroecosystems, 60, 103-113.
Amon, B., Kryvoruchko, V., Amon, T. and Zechmeister-Boltenstern, S. 2006. Methane,
nitrous oxide and ammonia emissions during storage and after application of dairy
cattle slurry and influence of slurry treatment. Agriculture, Ecosystems and
Environment, 112, 153-162.
Andersen, J. K., Boldrin, A., Christensen, T. H. and Scheutz, C. 2010. Greenhouse gas
emissions from home composting of organic household waste. Waste
Management, 30, 2475-2482.
Andersen, J. K. A. B., Jerker Samuelsson, Thomas H. Christensen and Charlotte Scheutz
2010. Quantification of Greenhouse Gas Emissions from Windrow Composting of
Garden Waste. Waste Management.
Barth, J. 2006. Status of organic waste recycling in the EU. First Baltic Biowaste
Conference 2006.
Beck-Friis, B., Pell, M., Sonesson, U., Jönsson, H. and Kirchmann, H. 2000. Formation
and Emission of N2O and CH4 from Compost Heaps of Organic Household Waster.
Environmental Monitoring and Assessment, 62, 317-331.
Beck-Friis, B., Smårs, S., Jönsson, H. and Kirchmann, H. 2001. Gaseous Emissions of
Carbon Dioxide, Ammonia and Nitrous Oxide from Organic
Household Waste in a Compost Reactor under Different Temperature Regimes. Journal of
Agricultural Engineering Research, 78, 423-430.
Bogner, J., Pipatti, R., Hashimoto, S., Diaz, C., Mareckova, K., Diaz, L., Kjeldsen, P.,
Monni, S., Faaij, A., Qingxian, G., Tianzhu, Z., Mohammed Abdelrafie, A.,
Sutamihardja, R. T. M. and Gregory, R. 2008. Mitigation of global greenhouse gas
emissions from waste: conclusions and strategies from the Intergovernmental
Panel on Climate Change (IPCC) Fourth Assessment Report. Working Group III
(Mitigation). Waste Management and Research, 26, 11-32.
Boldrin, A., Andersen, J. K., Möller, J., Favoino, E. and Christensen, T. H. 2009.
Composting and compost utilization: accounting of greenhouse gases and global
warming contributions. Waste Man Res, 27, 800-812.
Chapter 1: Greenhouse Gas Emissions from Composting Plants
__________________________________________________________________________
________________________________________________________________________ 40
Chadwick, D. R. 2005. Emissions of ammonia, nitrous oxide and methane from cattle
manure heaps: effect of compaction and covering. Atmospheric Environment, 39,
787-799.
Chiumenti, A., Da Borso, F., Rodar, T. and Chiumenti, R. 2007. Swine manure
composting by means of experimental turning equipment. Waste Management, 27,
1774-1782.
Clemens, J. and Ahlgrimm, H.-J. 2001. Greenhouse gases from animal husbandry:
mitigation options. Nutrient Cycling in Agroecosystems, 60, 287-300.
Clemens, J. and Cuhls, C. 2003. Greenhouse gas emissions from mechanical and
biological waste treatment of municipal waste. Environmental Technology, 24,
745-754.
Czepiel, P., Douglas, E., Harriss, R. and Crill, P. 1996. Measurements of N2O from
Composted Organic Wastes. Environmental Science and Technology, 30, 2519-
2525.
Dalal, R., Gibson, I. and Menzies, N. 2009. Nitrous oxide emission from feedlot manure
and green waste compost applied to Vertisols. Biology and Fertility of Soils, 45,
809-819.
de Guardia, A. d., Petiot, C., Rogeau, D. and Druilhe, C. 2008. Influence of aeration rate
on nitrogen dynamics during composting. Waste Management, 28, 575-587.
El Kader, N. A., Robin, P., Paillat, J.-M. and Leterme, P. 2007. Turning, compacting and
the addition of water as factors affecting gaseous emissions in farm manure
composting. Bioresource Technology, 98, 2619-2628.
Fernandes, L., Zhan, W., Patni, N. K. and Jui, P. Y. 1994. Temperature distribution and
variation in passively aerated static compost piles. Bioresource Technology, 48,
257-263.
Fernandes, L., Zhan, W., Patni, N. K. and Jui, P. Y. 2007. Temperature distribution and
variation in passively aerated static compost piles. Bioresource Technology, 48,
257-263.
Fisher, K. 2006. Impact of Energy from Waste and Recycling Policy on UK Greenhouse
Gas Emissions. Final Report.
Font, X., Artola, A. and Sánchez, A. 2011. Detection, Composition and Treatment of
Volatile Organic Compounds from Waste Treatment Plants. Sensors, 11, 4043-
4059.
Fukumoto, Y., Osada, T., Hanajima, D. and Haga, K. 2003. Patterns and quantities of
NH3, N2O and CH4 emissions during swine manure composting without forced
aeration--effect of compost pile scale. Bioresource Technology, 89, 109-114.
Chapter 1: Greenhouse Gas Emissions from Composting Plants
__________________________________________________________________________
________________________________________________________________________ 41
Hansen, M. N., Henriksen, K. and Sommer, S. G. 2006. Observations of production and
emission of greenhouse gases and ammonia during storage of solids separated
from pig slurry: Effects of covering. Atmospheric Environment, 40, 4172-4181.
Hao, X., Chi Chang, Francis J. Larney, and Greg R. Travis 2001. Greenhouse Gas
Emissions during Cattle Feedlot Manure Composting. J. Environ. Qual., 30, 376–
386.
He, Y., Inamori, Y., Mizuochi, M., Kong, H., Iwami, N. and Sun, T. 2000. Measurements of
N2O and CH4 from the aerated composting of food waste. Science of The Total
Environment, 254, 65-74.
He, Y., Inamori, Y., Mizuochi, M., Kong, H., Iwami, N. and Sun, T. 2001. Nitrous Oxide
Emissions from Aerated Composting of Organic Waste. Environmental Science
and Technology, 35, 2347-2351.
Hellebrand, H. and Kalk, W.-D. 2001a. Emission of carbon monoxide during composting
of dung and green waste. Nutrient Cycling in Agroecosystems, 60, 79-82.
Hellebrand, H. and Kalk, W.-D. 2001b. Emission of methane, nitrous oxide, and ammonia
from dung windrows. Nutrient Cycling in Agroecosystems, 60, 83-87.
Hellebrand, H. J. 1998. Emission of Nitrous Oxide and other Trace Gases during
Composting of Grass and Green Waste. Journal of Agricultural Engineering
Research, 69, 365-375.
Hellmann, B., Zelles, L., Palojarvi, A., and Bai, Q. 1997. Emission of Climate-Relevant
Trace Gases and Succession of Microbial Communities during Open-Windrow
Composting. Applied and Environmental Microbiology, 63, 1011-1018
IPCC. 2007. Climate change 2007- the Physical Science Basis. Contribution of Working
Group I to the Fourth Assessment Report of the IPCC. Cambridge University
Press, Cambridge, UK.
Jäckel, U., Thummes, K. and Kämpfer, P. 2005. Thermophilic methane production and
oxidation in compost. FEMS Microbiology Ecology, 52, 175-184.
Jiang, T., Schuchardt, F., Li, G., Guo, R. and Zhao, Y. 2010. Effect of C/N ratio, aeration
rate and moisture content on ammonia and greenhouse gas emission during the
composting. Journal of Environmental Sciences, 23, 1754-1760.
Kranert, M., Gottschall, R., Bruns, C. and Hafner, G. 2010. Energy or compost from green
waste? - A CO2 - Based assessment. Waste Management, 30, 697-701.
Lissens, G., Thomsen, A. B., De Baere, L., Verstraete, W. and Ahring, B. K. 2004.
Thermal Wet Oxidation Improves Anaerobic Biodegradability of Raw and Digested
Biowaste. Environmental Science and Technology, 38, 3418-3424.
Chapter 1: Greenhouse Gas Emissions from Composting Plants
__________________________________________________________________________
________________________________________________________________________ 42
Maeda, K., Morioka, R., Hanajima, D. and Osada, T. 2010. The Impact of Using Mature
Compost on Nitrous Oxide Emission and the Denitrifier Community in the Cattle
Manure Composting Process. Microbial Ecology, 59, 25-36.
Martins, O. and Dewes, T. 1992. Loss of nitrogenous compounds during composting of
animal wastes. Bioresource Technology, 42, 103-111.
Mata-Alvarez, J., Macé, S. and Llabrés, P. 2000. Anaerobic digestion of organic solid
wastes. An overview of research achievements and perspectives. Bioresource
Technology, 74, 3-16.
Möller, K. and Stinner, W. 2009. Effects of different manuring systems with and without
biogas digestion on soil mineral nitrogen content and on gaseous nitrogen losses
(ammonia, nitrous oxides). European Journal of Agronomy, 30, 1-16.
Osada, T., Kuroda, K. and Yonaga, M. 2000. Determination of nitrous oxide, methane,
and ammonia emissions from a swine waste composting process. Journal of
Material Cycles and Waste Management, 2, 51-56.
Pagans, E., Barrena, R., Font, X. and Sánchez, A. 2006. Ammonia emissions from the
composting of different organic wastes. Dependency on process temperature.
Chemosphere, 62, 1534-1542.
Park, K. H., Jeon, J. H., Jeon, K. H., Kwag, J. H. and Choi, D. Y. 2011. Low greenhouse
gas emissions during composting of solid swine manure. Animal Feed Science
and Technology, 166-167, 550-556.
Parkinson, R., Gibbs, P., Burchett, S. and Misselbrook, T. 2004. Effect of turning regime
and seasonal weather conditions on nitrogen and phosphorus losses during
aerobic composting of cattle manure. Bioresource Technology, 91, 171-178.
Paul, J., Dieter Geesing 2009. The compost facility operation manual. Book.
Sánchez-Monedero, M. A., Serramiá, N., Civantos, C. G.-O., Fernández-Hernández, A.
and Roig, A. 2010. Greenhouse gas emissions during composting of two-phase
olive mill wastes with different agroindustrial by-products. Chemosphere, 81, 18-
25.
Schenk, M. K., Appel, S. and Daum, D. 1997. N2O Emission during composting of organic
waste. Acta Hort, 253-262
Smet, E., Van Langenhove, H. and De Bo, I. 1999. The emission of volatile compounds
during the aerobic and the combined anaerobic/aerobic composting of biowaste.
Atmospheric Environment, 33, 1295-1303.
Sommer, S. G. 2001. Effect of composting on nutrient loss and nitrogen availability of
cattle deep litter. European Journal of Agronomy, 14, 123-133.
Chapter 1: Greenhouse Gas Emissions from Composting Plants
__________________________________________________________________________
________________________________________________________________________ 43
Sommer, S. G., McGinn, S. M., Hao, X. and Larney, F. J. 2004. Techniques for measuring
gas emissions from a composting stockpile of cattle manure. Atmospheric
Environment, 38, 4643-4652.
Sommer, S. G. M., H. B. 2000. Emission of greenhouse gases during composting of deep
litter from pig production; effect of straw content. The Journal of Agricultural
Science, 134, 327-335.
Szanto, G. L., Hamelers, H. V. M., Rulkens, W. H. and Veeken, A. H. M. 2007. NH3, N2O
and CH4 emissions during passively aerated composting of straw-rich pig manure.
Bioresource Technology, 98, 2659-2670.
Tamura, T. and Osada, T. 2006. Effect of moisture control in pile-type composting of dairy
manure by adding wheat straw on greenhouse gas emission. International
Congress Series, 1293, 311-314.
Thompson, A. G., Wagner-Riddle, C. and Fleming, R. 2004. Emissions of N2O and CH4
during the Composting of Liquid Swine Manure. Environmental Monitoring and
Assessment, 91, 87-104.
VDI 3475 part II, 2005, Emission control Biological waste treatment facilities composting
and anaerobic digestion plant capacities more than approx. 6000 Mg/a.
Veeken Adrie, D. W. V., Hamelers Bert 2002. Passively aerated composting of straw-rich
pig manure: Effect of compost bed porosity. Compost Science and Utilization.
Wolter, M., Prayitno, S. and Schuchardt, F. 2004. Greenhouse gas emission during
storage of pig manure on a pilot scale. Bioresource Technology, 95, 235-244.
Xu, S., Hao, X., Stanford, K., McAllister, T., Larney, F. and Wang, J. 2007. Greenhouse
gas emissions during co-composting of cattle mortalities with manure. Nutrient
Cycling in Agroecosystems, 78, 177-187.
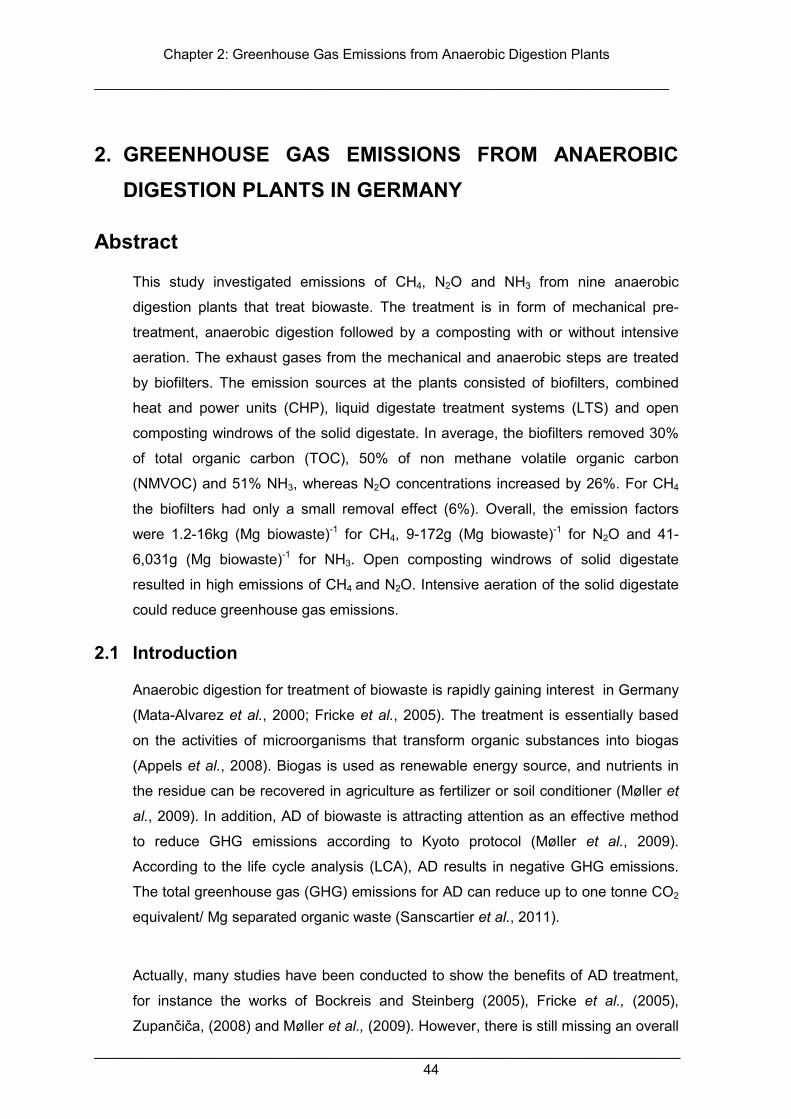
Chapter 2: Greenhouse Gas Emissions from Anaerobic Digestion Plants
__________________________________________________________________________
________________________________________________________________________ 44
2. GREENHOUSE GAS EMISSIONS FROM ANAEROBIC
DIGESTION PLANTS IN GERMANY
Abstract
This study investigated emissions of CH4, N2O and NH3 from nine anaerobic
digestion plants that treat biowaste. The treatment is in form of mechanical pre-
treatment, anaerobic digestion followed by a composting with or without intensive
aeration. The exhaust gases from the mechanical and anaerobic steps are treated
by biofilters. The emission sources at the plants consisted of biofilters, combined
heat and power units (CHP), liquid digestate treatment systems (LTS) and open
composting windrows of the solid digestate. In average, the biofilters removed 30%
of total organic carbon (TOC), 50% of non methane volatile organic carbon
(NMVOC) and 51% NH3, whereas N2O concentrations increased by 26%. For CH4
the biofilters had only a small removal effect (6%). Overall, the emission factors
were 1.2-16kg (Mg biowaste)-1 for CH4, 9-172g (Mg biowaste)-1 for N2O and 41-
6,031g (Mg biowaste)-1 for NH3. Open composting windrows of solid digestate
resulted in high emissions of CH4 and N2O. Intensive aeration of the solid digestate
could reduce greenhouse gas emissions.
2.1 Introduction
Anaerobic digestion for treatment of biowaste is rapidly gaining interest in Germany
(Mata-Alvarez et al., 2000; Fricke et al., 2005). The treatment is essentially based
on the activities of microorganisms that transform organic substances into biogas
(Appels et al., 2008). Biogas is used as renewable energy source, and nutrients in
the residue can be recovered in agriculture as fertilizer or soil conditioner (Møller et
al., 2009). In addition, AD of biowaste is attracting attention as an effective method
to reduce GHG emissions according to Kyoto protocol (Møller et al., 2009).
According to the life cycle analysis (LCA), AD results in negative GHG emissions.
The total greenhouse gas (GHG) emissions for AD can reduce up to one tonne CO2
equivalent/ Mg separated organic waste (Sanscartier et al., 2011).
Actually, many studies have been conducted to show the benefits of AD treatment,
for instance the works of Bockreis and Steinberg (2005), Fricke et al., (2005),
Zupančiča, (2008) and Møller et al., (2009). However, there is still missing an overall
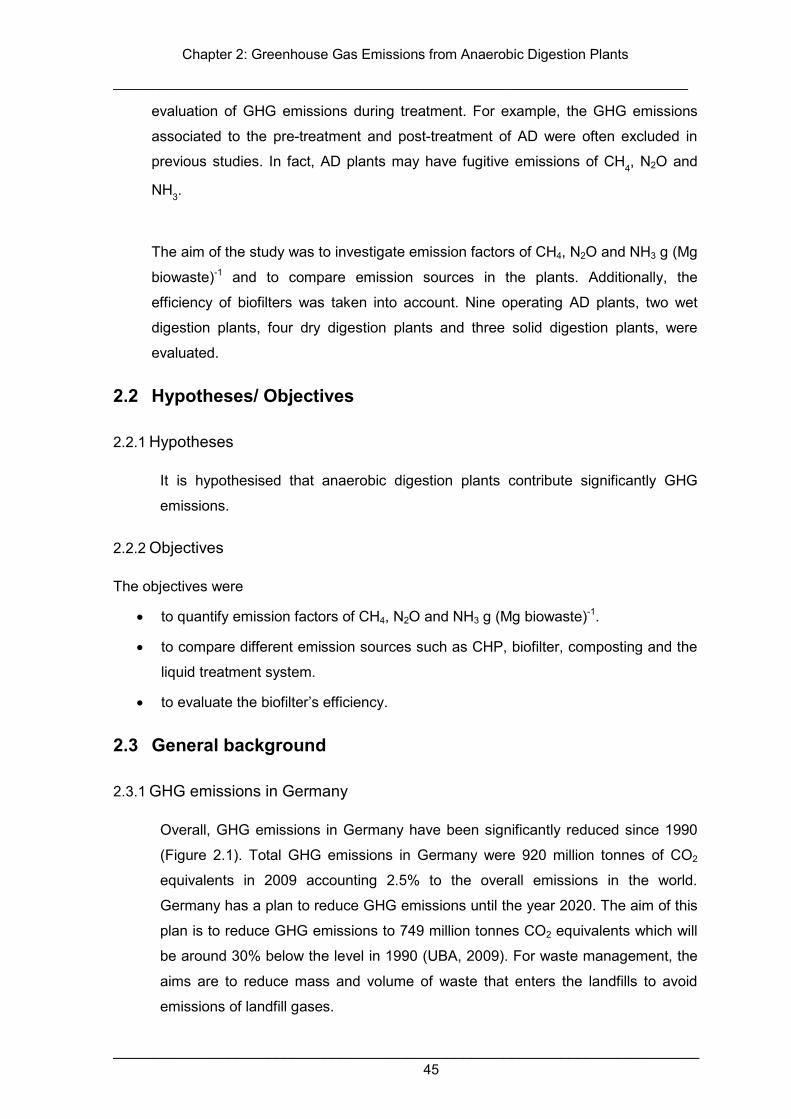
Chapter 2: Greenhouse Gas Emissions from Anaerobic Digestion Plants
__________________________________________________________________________
________________________________________________________________________ 45
evaluation of GHG emissions during treatment. For example, the GHG emissions
associated to the pre-treatment and post-treatment of AD were often excluded in
previous studies. In fact, AD plants may have fugitive emissions of CH4, N2O and
NH3.
The aim of the study was to investigate emission factors of CH4, N2O and NH3 g (Mg
biowaste)-1 and to compare emission sources in the plants. Additionally, the
efficiency of biofilters was taken into account. Nine operating AD plants, two wet
digestion plants, four dry digestion plants and three solid digestion plants, were
evaluated.
2.2 Hypotheses/ Objectives
2.2.1 Hypotheses
It is hypothesised that anaerobic digestion plants contribute significantly GHG
emissions.
2.2.2 Objectives
The objectives were
• to quantify emission factors of CH4, N2O and NH3 g (Mg biowaste)-1.
• to compare different emission sources such as CHP, biofilter, composting and the
liquid treatment system.
• to evaluate the biofilter’s efficiency.
2.3 General background
2.3.1 GHG emissions in Germany
Overall, GHG emissions in Germany have been significantly reduced since 1990
(Figure 2.1). Total GHG emissions in Germany were 920 million tonnes of CO2
equivalents in 2009 accounting 2.5% to the overall emissions in the world.
Germany has a plan to reduce GHG emissions until the year 2020. The aim of this
plan is to reduce GHG emissions to 749 million tonnes CO2 equivalents which will
be around 30% below the level in 1990 (UBA, 2009). For waste management, the
aims are to reduce mass and volume of waste that enters the landfills to avoid
emissions of landfill gases.
Chapter 2: Greenhouse Gas Emissions from Anaerobic Digestion Plants
__________________________________________________________________________
________________________________________________________________________ 46
1990
1991
1992
1993
1994
1995
1996
1997
1998
1999
2000
2001
2002
2003
2004
2005
2006
2007
2008
2009
2010
N.a
.N.
2020
CO
2 eq
uiva
lent
(M
i.ton
)
0
200
400
600
800
1000
1200
1400
CO2
Sum (CH4, N2O and F-gases)
target:749
960920
Figure 2.1: GHG emissions in Germany from 1990 to 2010 (UBA, 2011)
2.3.2 Biowaste generation
In Germany, the generation of biowaste doubled from 6.5 million tonnes in 1996 to
13 million tonnes in 2009. Generally, biowaste consists of animal manure,
agricultural waste, wood processing waste, sewage sludge, garden waste, organic
household waste and food waste. In fact, organic household waste and garden
waste contribute significantly to the total waste in Germany. There were 4 million
tonnes of garden waste and 3.8 million tonnes of organic household waste
collected in 2009, which was equivalent to 31% and 29% of the total biowaste
respectively (UBA, 2011) (Figure 2.2).
Garden waste4. Mio tones
Organic household waste3.8 Mio tones
Food waste0.5 Mio tones
Others0.73 Mio tones
Manure1 Mio tones
Agricultural waste2 Mio tones
Wood processing waste0.18 Mio tones
Sewage sludge0.78 Mio tones
Total13 Mio tones
Figure 2.2: Summary of the statistics collected biowaste in 2009 (UBA, 2011)
Chapter 2: Greenhouse Gas Emissions from Anaerobic Digestion Plants
__________________________________________________________________________
________________________________________________________________________ 47
2.3.3 Treatment of biowaste
Organic waste is collected separately and treated biologically either by composting
or by anaerobic digestion (Weiland, 2000; Clemens and Cuhls, 2003). Since the
anaerobic digestion plants contribute to prevent GHG emissions from fossil fuels
combustion due to energy recovery from biogas (Møller et al., 2009), many
different anaerobic digestion types are applied in Germany. They vary in fermenter
systems, material and digestion conditions. Overall, there are 85 full-scale
anaerobic treatment plants in Germany with capacities from 5.000 to 150.000 Mg
year-1 in Germany (Weiland, 2000; Puchelt, 2000 and UBA, 2009).
2.3.4 Anaerobic digestion process
Anaerobic digestion is a complex biological process in which the organic material
is decomposed in the absence of oxygen. Biogas and digestate are produced
(Duerr et al., 2007). Typical biogas contains 55-65 vol% CH4, 30-40 vol% CO2 and
small amounts of H2S and NH3 (lower than 1%). The production of these trace
gases in the biogas depends on the sulphur and nitrogen content in the substrate
(Duerr et al., 2007; Appels et al., 2008; Papport, 2008; Li et al., 2010). The
anaerobic digestion of organic material basically consists of following steps:
hydrolysis, acidogenesis, acetogenesis and methanogenesis as shown in the
Figure 2.3. The hydrolysis step breaks down high molecular compounds (e.g. lipid,
protein) to soluble substances such as sugar, amino acids and fatty acid. The
second step is acidogenesis, where volatile fatty acid (VFA), acetic acid, H2 and
CO2 are produced. During methanogenesis, VFA are converted into acetic acid
along with H2 and CO2. CH4 and CO2 are formed by conversion of acetate into CH4
and CO2 or by a reaction of H2 and CO2 to produce CH4 (Appels et al., 2008). The
optimal conditions for anaerobic digestion are a neutral pH and a constant
temperature either mesophilic (30-40oC) or thermophilic (50-60oC) (Papport, 2008).
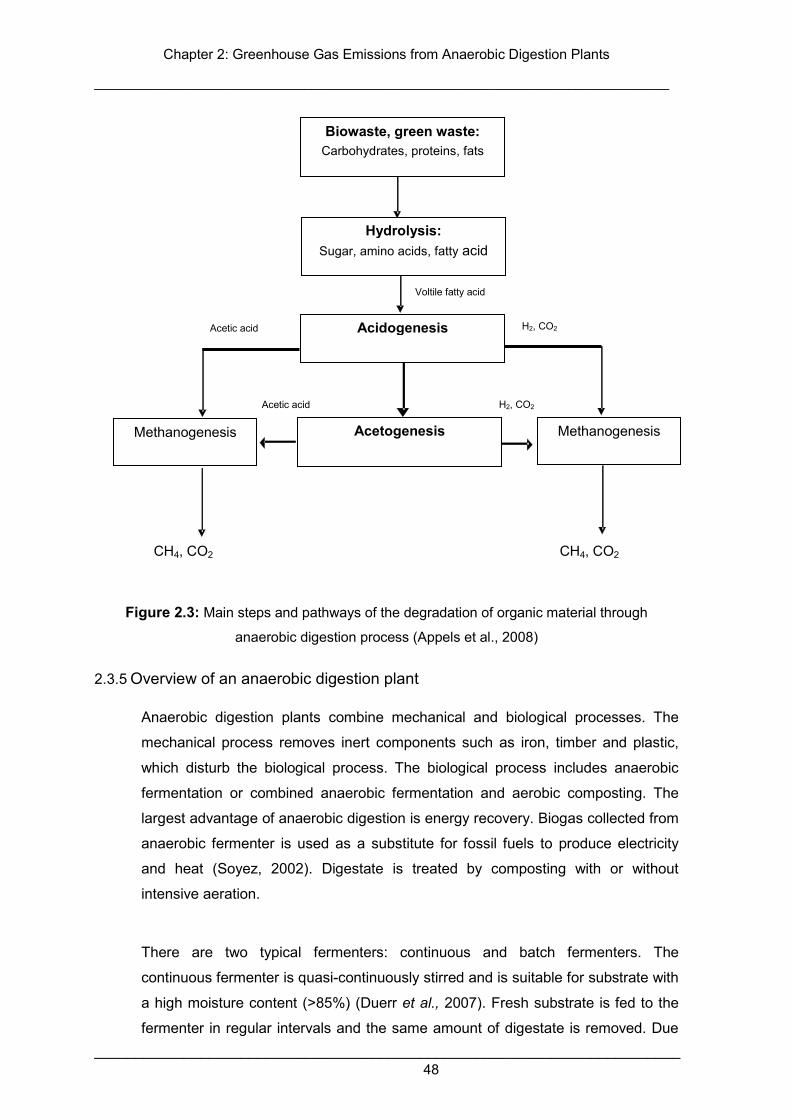
Chapter 2: Greenhouse Gas Emissions from Anaerobic Digestion Plants
__________________________________________________________________________
________________________________________________________________________ 48
Figure 2.3: Main steps and pathways of the degradation of organic material through
anaerobic digestion process (Appels et al., 2008)
2.3.5 Overview of an anaerobic digestion plant
Anaerobic digestion plants combine mechanical and biological processes. The
mechanical process removes inert components such as iron, timber and plastic,
which disturb the biological process. The biological process includes anaerobic
fermentation or combined anaerobic fermentation and aerobic composting. The
largest advantage of anaerobic digestion is energy recovery. Biogas collected from
anaerobic fermenter is used as a substitute for fossil fuels to produce electricity
and heat (Soyez, 2002). Digestate is treated by composting with or without
intensive aeration.
There are two typical fermenters: continuous and batch fermenters. The
continuous fermenter is quasi-continuously stirred and is suitable for substrate with
a high moisture content (>85%) (Duerr et al., 2007). Fresh substrate is fed to the
fermenter in regular intervals and the same amount of digestate is removed. Due
Methanogenesis
CH4, CO2 CH4, CO2
Biowaste, green waste: Carbohydrates, proteins, fats
Acidogenesis
Methanogenesis
Acetic acid H2, CO2
Voltile fatty acid
Hydrolysis: Sugar, amino acids, fatty acid
Acetogenesis
Acetic acid H2, CO2
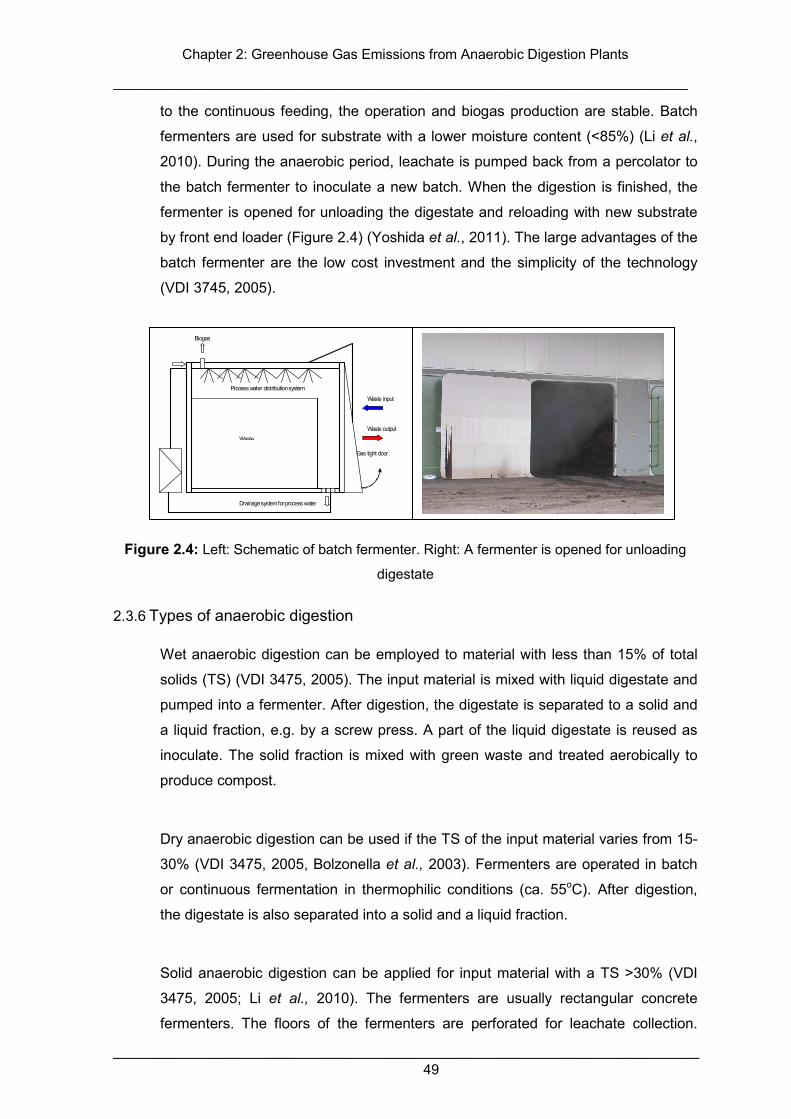
Chapter 2: Greenhouse Gas Emissions from Anaerobic Digestion Plants
__________________________________________________________________________
________________________________________________________________________ 49
to the continuous feeding, the operation and biogas production are stable. Batch
fermenters are used for substrate with a lower moisture content (<85%) (Li et al.,
2010). During the anaerobic period, leachate is pumped back from a percolator to
the batch fermenter to inoculate a new batch. When the digestion is finished, the
fermenter is opened for unloading the digestate and reloading with new substrate
by front end loader (Figure 2.4) (Yoshida et al., 2011). The large advantages of the
batch fermenter are the low cost investment and the simplicity of the technology
(VDI 3745, 2005).
Figure 2.4: Left: Schematic of batch fermenter. Right: A fermenter is opened for unloading
digestate
2.3.6 Types of anaerobic digestion
Wet anaerobic digestion can be employed to material with less than 15% of total
solids (TS) (VDI 3475, 2005). The input material is mixed with liquid digestate and
pumped into a fermenter. After digestion, the digestate is separated to a solid and
a liquid fraction, e.g. by a screw press. A part of the liquid digestate is reused as
inoculate. The solid fraction is mixed with green waste and treated aerobically to
produce compost.
Dry anaerobic digestion can be used if the TS of the input material varies from 15-
30% (VDI 3475, 2005, Bolzonella et al., 2003). Fermenters are operated in batch
or continuous fermentation in thermophilic conditions (ca. 55oC). After digestion,
the digestate is also separated into a solid and a liquid fraction.
Solid anaerobic digestion can be applied for input material with a TS >30% (VDI
3475, 2005; Li et al., 2010). The fermenters are usually rectangular concrete
fermenters. The floors of the fermenters are perforated for leachate collection.
Biogas
Waste
Process water distribution system
Gas tight door
Drainage system for process water
Waste input
Waste output
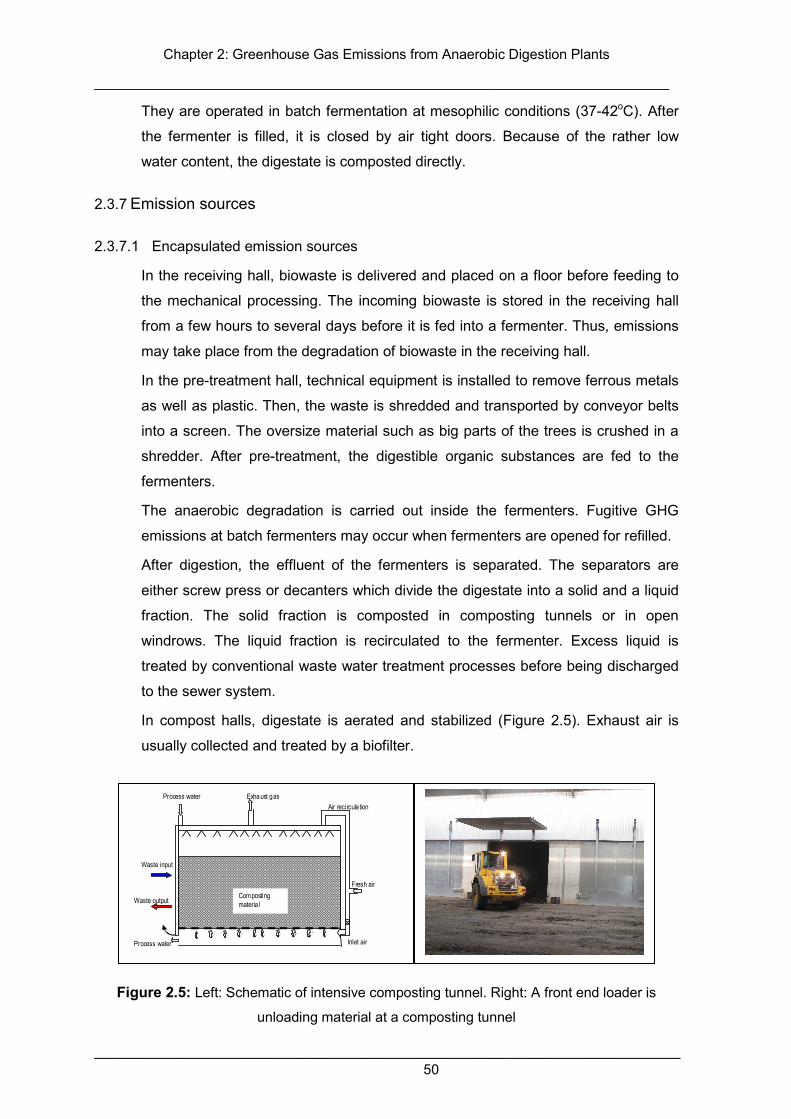
Chapter 2: Greenhouse Gas Emissions from Anaerobic Digestion Plants
__________________________________________________________________________
________________________________________________________________________ 50
They are operated in batch fermentation at mesophilic conditions (37-42oC). After
the fermenter is filled, it is closed by air tight doors. Because of the rather low
water content, the digestate is composted directly.
2.3.7 Emission sources
2.3.7.1 Encapsulated emission sources
In the receiving hall, biowaste is delivered and placed on a floor before feeding to
the mechanical processing. The incoming biowaste is stored in the receiving hall
from a few hours to several days before it is fed into a fermenter. Thus, emissions
may take place from the degradation of biowaste in the receiving hall.
In the pre-treatment hall, technical equipment is installed to remove ferrous metals
as well as plastic. Then, the waste is shredded and transported by conveyor belts
into a screen. The oversize material such as big parts of the trees is crushed in a
shredder. After pre-treatment, the digestible organic substances are fed to the
fermenters.
The anaerobic degradation is carried out inside the fermenters. Fugitive GHG
emissions at batch fermenters may occur when fermenters are opened for refilled.
After digestion, the effluent of the fermenters is separated. The separators are
either screw press or decanters which divide the digestate into a solid and a liquid
fraction. The solid fraction is composted in composting tunnels or in open
windrows. The liquid fraction is recirculated to the fermenter. Excess liquid is
treated by conventional waste water treatment processes before being discharged
to the sewer system.
In compost halls, digestate is aerated and stabilized (Figure 2.5). Exhaust air is
usually collected and treated by a biofilter.
Figure 2.5: Left: Schematic of intensive composting tunnel. Right: A front end loader is
unloading material at a composting tunnel
Process water
Fresh air
Exhaust gas Process water
Waste input
Waste output
Air recirculation
Inlet air
Composting materia l
Chapter 2: Greenhouse Gas Emissions from Anaerobic Digestion Plants
__________________________________________________________________________
________________________________________________________________________ 51
2.3.7.2 Open emission sources
Biofilter: exhaust gases from the encapsulated parts of AD plants are treated by
biofilters before they are released into the atmosphere. In a biofilter, waste gas
passes biofilter material (e.g. wood chip and root bark) and organic compounds
are degraded by microorganisms (Hort et al., 2009). The performance of a biofilter
depends on the composition of the exhaust gas, packing material, nutrient supply,
temperature, pH, pressure drop and residence time (Deshusses et al., 1999).
Combined heat and power units (CHP): CHPs consist of a combustion engine and
a generator. Biogas is used to generate electricity and heat in these combustion
engines. Electricity produced is fed into the local grid, whereas heat is usually used
to maintain temperature in the fermenters. During the combustion process, CH4 is
burned to generate electricity. Some unburned CH4 is emitted into the atmosphere.
By this way, CHP contributes to GHG emissions (Møller et al., 2009).
Liquid treatment system (LTS): in wet anaerobic digestion plants, additional water
is needed to guarantee mixing and pumping of the material. After digestion, there
is excess liquid digestate that needs to be treated before it is discharged into the
environment. The liquid treatment system includes nitrification and denitrification
tanks. During waste water treatment, N2O may be released (Clemens and
Ahlgrimm, 2001; Paul, 2009 and Sánchez-Monedero et al., 2010).
Composting windrows: solid digestate is mixed with green waste and used for
composting. The material is composted either in aerated composting tunnels or in
static windrows.
2.4 Materials and Methods
Nine German AD plants were investigated in the study. The detailed inventories of
the AD plants are listed in Table 2.1.
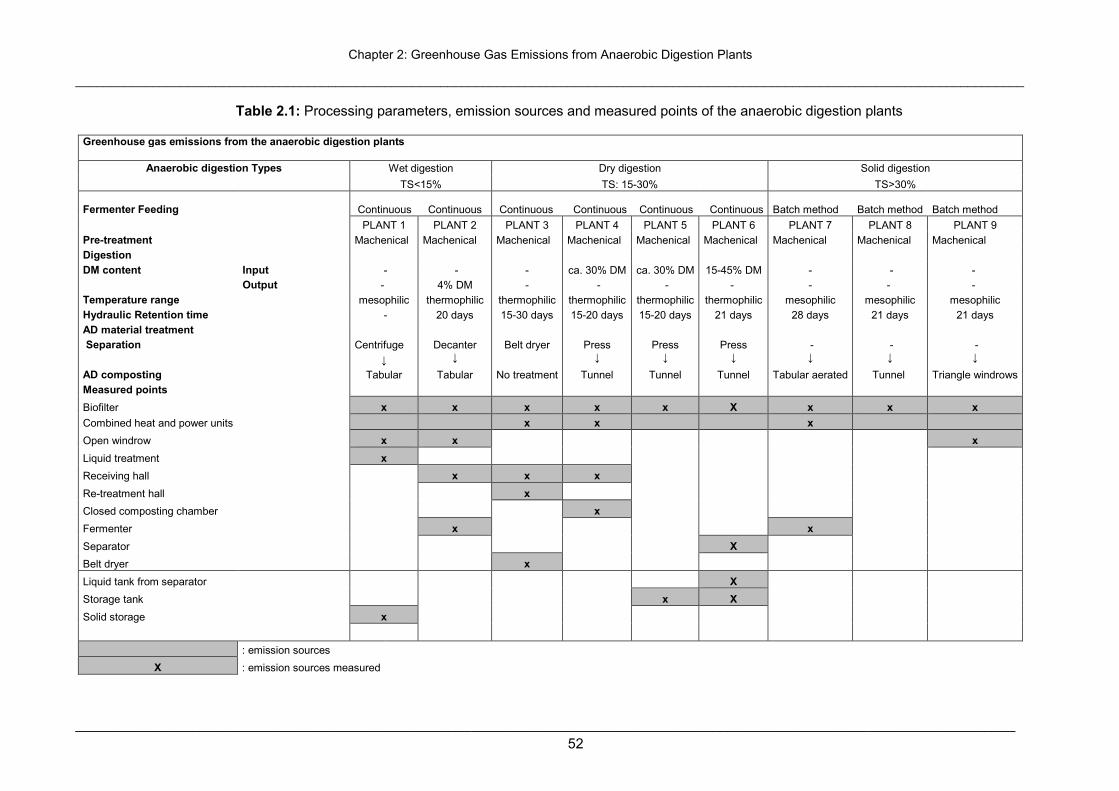
Chapter 2: Greenhouse Gas Emissions from Anaerobic Digestion Plants
_______________________________________________________________________________________________________________________________________
_________________________________________________________________________________________________________________________ 52
Table 2.1: Processing parameters, emission sources and measured points of the anaerobic digestion plants
Greenhouse gas emissions from the anaerobic digestion plants
Anaerobic digestion Types Wet digestion Dry digestion Solid digestion
TS<15% TS: 15-30% TS>30%
Fermenter Feeding Continuous Continuous Continuous Continuous Continuous Continuous Batch method
Batch method Batch method
PLANT 1 PLANT 2 PLANT 3 PLANT 4 PLANT 5 PLANT 6 PLANT 7 PLANT 8 PLANT 9 Pre-treatment Machenical Machenical Machenical Machenical Machenical Machenical Machenical Machenical Machenical Digestion DM content Input - - - ca. 30% DM ca. 30% DM 15-45% DM - - - Output - 4% DM - - - - - - - Temperature range mesophilic thermophilic thermophilic thermophilic thermophilic thermophilic mesophilic mesophilic mesophilic Hydraulic Retention time - 20 days 15-30 days 15-20 days 15-20 days 21 days 28 days 21 days 21 days AD material treatment Separation Centrifuge Decanter Belt dryer Press Press Press - - - ↓ ↓ ↓ ↓ ↓ ↓ ↓ ↓
AD composting Tabular Tabular No treatment Tunnel Tunnel Tunnel Tabular aerated Tunnel Triangle windrows Measured points
Biofilter x x x x x X x x x Combined heat and power units x x x
Open windrow x x x
Liquid treatment x
Receiving hall x x x
Re-treatment hall x
Closed composting chamber x
Fermenter x x
Separator X
Belt dryer x
Liquid tank from separator X
Storage tank x X
Solid storage x
: emission sources
X : emission sources measured
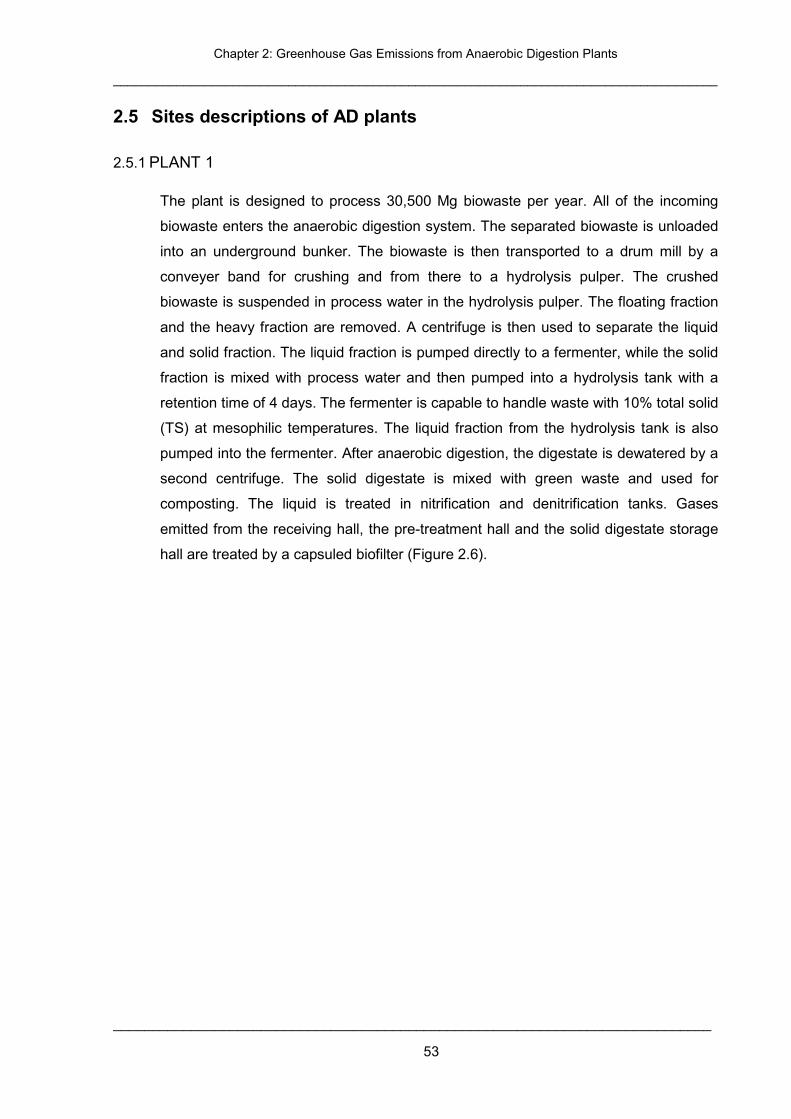
Chapter 2: Greenhouse Gas Emissions from Anaerobic Digestion Plants
______________________________________________________________________________________
_____________________________________________________________________________
53
2.5 Sites descriptions of AD plants
2.5.1 PLANT 1
The plant is designed to process 30,500 Mg biowaste per year. All of the incoming
biowaste enters the anaerobic digestion system. The separated biowaste is unloaded
into an underground bunker. The biowaste is then transported to a drum mill by a
conveyer band for crushing and from there to a hydrolysis pulper. The crushed
biowaste is suspended in process water in the hydrolysis pulper. The floating fraction
and the heavy fraction are removed. A centrifuge is then used to separate the liquid
and solid fraction. The liquid fraction is pumped directly to a fermenter, while the solid
fraction is mixed with process water and then pumped into a hydrolysis tank with a
retention time of 4 days. The fermenter is capable to handle waste with 10% total solid
(TS) at mesophilic temperatures. The liquid fraction from the hydrolysis tank is also
pumped into the fermenter. After anaerobic digestion, the digestate is dewatered by a
second centrifuge. The solid digestate is mixed with green waste and used for
composting. The liquid is treated in nitrification and denitrification tanks. Gases
emitted from the receiving hall, the pre-treatment hall and the solid digestate storage
hall are treated by a capsuled biofilter (Figure 2.6).
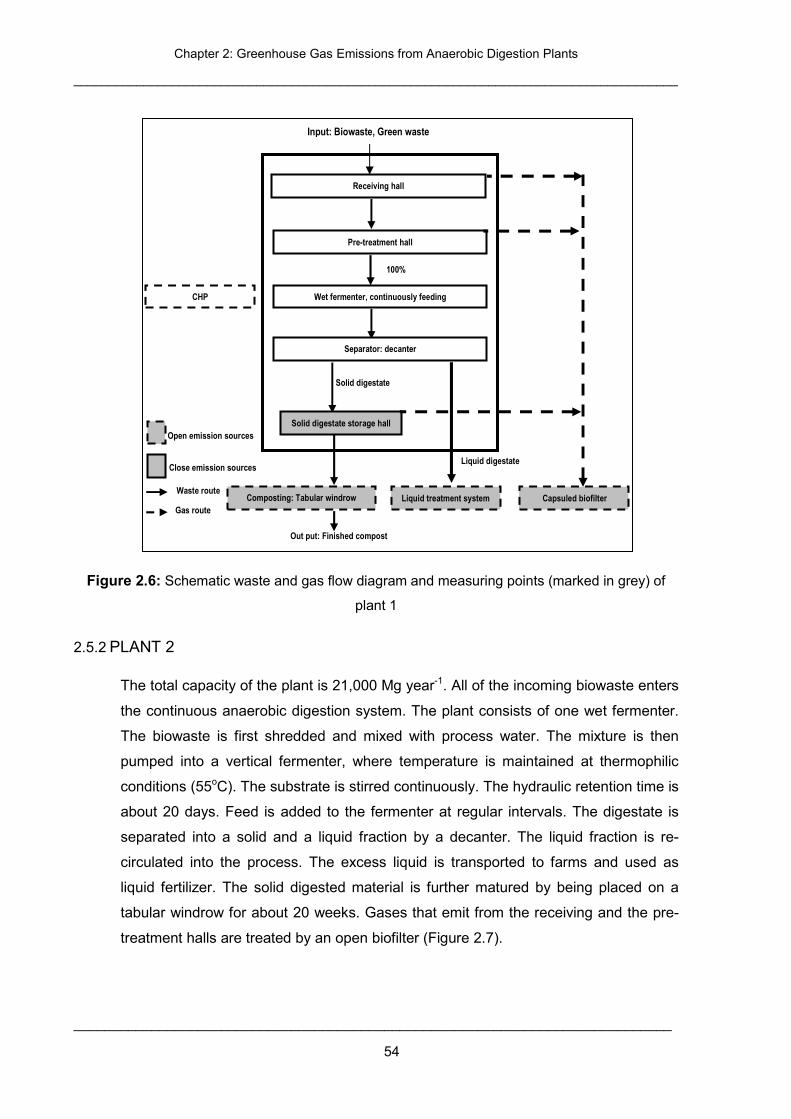
Chapter 2: Greenhouse Gas Emissions from Anaerobic Digestion Plants
______________________________________________________________________________________
_____________________________________________________________________________
54
Figure 2.6: Schematic waste and gas flow diagram and measuring points (marked in grey) of
plant 1
2.5.2 PLANT 2
The total capacity of the plant is 21,000 Mg year-1. All of the incoming biowaste enters
the continuous anaerobic digestion system. The plant consists of one wet fermenter.
The biowaste is first shredded and mixed with process water. The mixture is then
pumped into a vertical fermenter, where temperature is maintained at thermophilic
conditions (55oC). The substrate is stirred continuously. The hydraulic retention time is
about 20 days. Feed is added to the fermenter at regular intervals. The digestate is
separated into a solid and a liquid fraction by a decanter. The liquid fraction is re-
circulated into the process. The excess liquid is transported to farms and used as
liquid fertilizer. The solid digested material is further matured by being placed on a
tabular windrow for about 20 weeks. Gases that emit from the receiving and the pre-
treatment halls are treated by an open biofilter (Figure 2.7).
Receiving hall
Pre-treatment hall
Liquid treatment system
Input: Biowaste, Green waste
Wet fermenter, continuously feeding
Separator: decanter
Composting: Tabular windrow
Liquid digestate
Capsuled biofilter
CHP
Out put: Finished compost
Solid digestate
100%
Solid digestate storage hall Open emission sources
Close emission sources
Waste route
Gas route
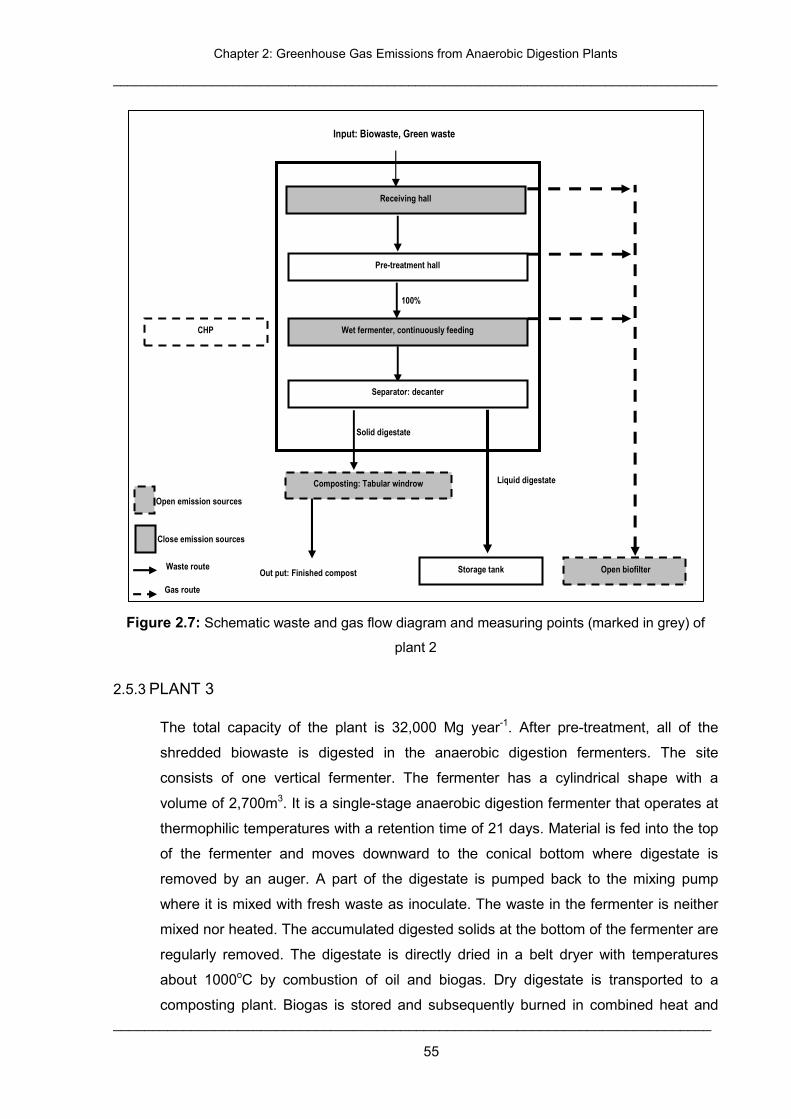
Chapter 2: Greenhouse Gas Emissions from Anaerobic Digestion Plants
______________________________________________________________________________________
_____________________________________________________________________________
55
Figure 2.7: Schematic waste and gas flow diagram and measuring points (marked in grey) of
plant 2
2.5.3 PLANT 3
The total capacity of the plant is 32,000 Mg year-1. After pre-treatment, all of the
shredded biowaste is digested in the anaerobic digestion fermenters. The site
consists of one vertical fermenter. The fermenter has a cylindrical shape with a
volume of 2,700m3. It is a single-stage anaerobic digestion fermenter that operates at
thermophilic temperatures with a retention time of 21 days. Material is fed into the top
of the fermenter and moves downward to the conical bottom where digestate is
removed by an auger. A part of the digestate is pumped back to the mixing pump
where it is mixed with fresh waste as inoculate. The waste in the fermenter is neither
mixed nor heated. The accumulated digested solids at the bottom of the fermenter are
regularly removed. The digestate is directly dried in a belt dryer with temperatures
about 1000oC by combustion of oil and biogas. Dry digestate is transported to a
composting plant. Biogas is stored and subsequently burned in combined heat and
Receiving hall
Pre-treatment hall
Storage tank
Input: Biowaste, Green waste
Wet fermenter, continuously feeding
Separator: decanter
Composting: Tabular windrow Liquid digestate
Open biofilter
CHP
Out put: Finished compost
Solid digestate
100%
Open emission sources
Close emission sources
Waste route
Gas route
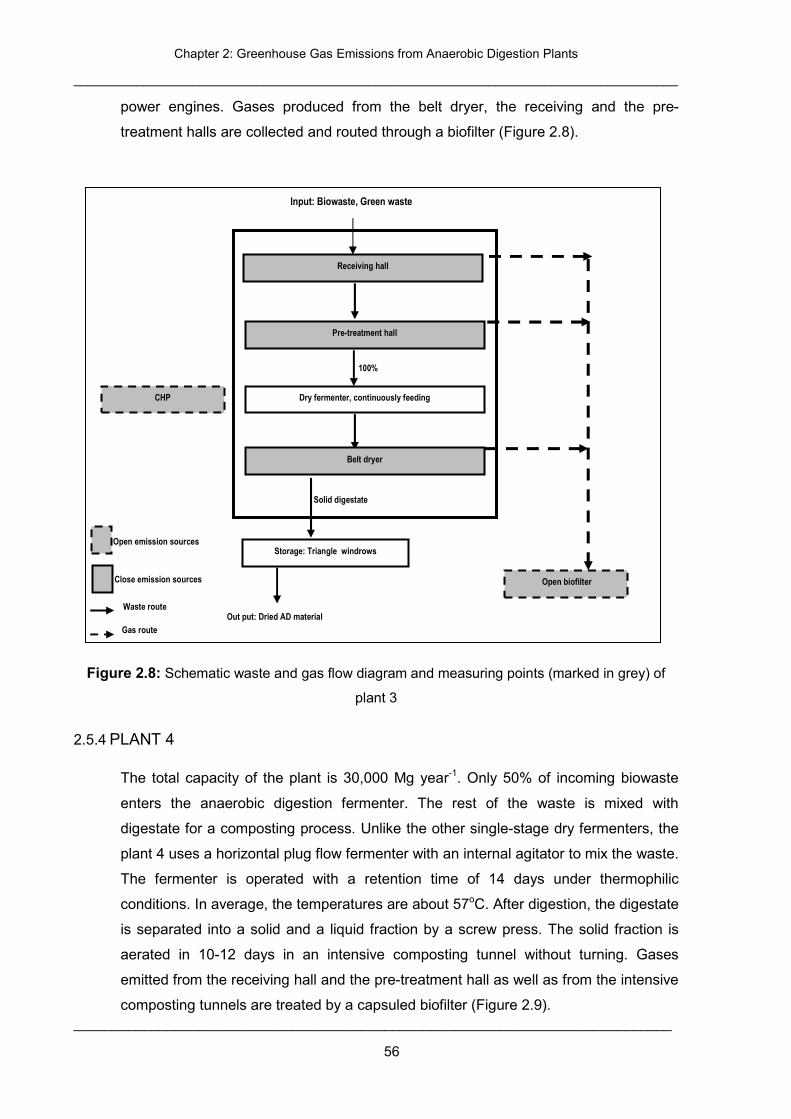
Chapter 2: Greenhouse Gas Emissions from Anaerobic Digestion Plants
______________________________________________________________________________________
_____________________________________________________________________________
56
power engines. Gases produced from the belt dryer, the receiving and the pre-
treatment halls are collected and routed through a biofilter (Figure 2.8).
Figure 2.8: Schematic waste and gas flow diagram and measuring points (marked in grey) of
plant 3
2.5.4 PLANT 4
The total capacity of the plant is 30,000 Mg year-1. Only 50% of incoming biowaste
enters the anaerobic digestion fermenter. The rest of the waste is mixed with
digestate for a composting process. Unlike the other single-stage dry fermenters, the
plant 4 uses a horizontal plug flow fermenter with an internal agitator to mix the waste.
The fermenter is operated with a retention time of 14 days under thermophilic
conditions. In average, the temperatures are about 57oC. After digestion, the digestate
is separated into a solid and a liquid fraction by a screw press. The solid fraction is
aerated in 10-12 days in an intensive composting tunnel without turning. Gases
emitted from the receiving hall and the pre-treatment hall as well as from the intensive
composting tunnels are treated by a capsuled biofilter (Figure 2.9).
Receiving hall
Pre-treatment hall
Input: Biowaste, Green waste
Dry fermenter, continuously feeding
Belt dryer
Storage: Triangle windrows
Open biofilter
CHP
Out put: Dried AD material
Solid digestate
100%
Open emission sources
Close emission sources
Waste route
Gas route
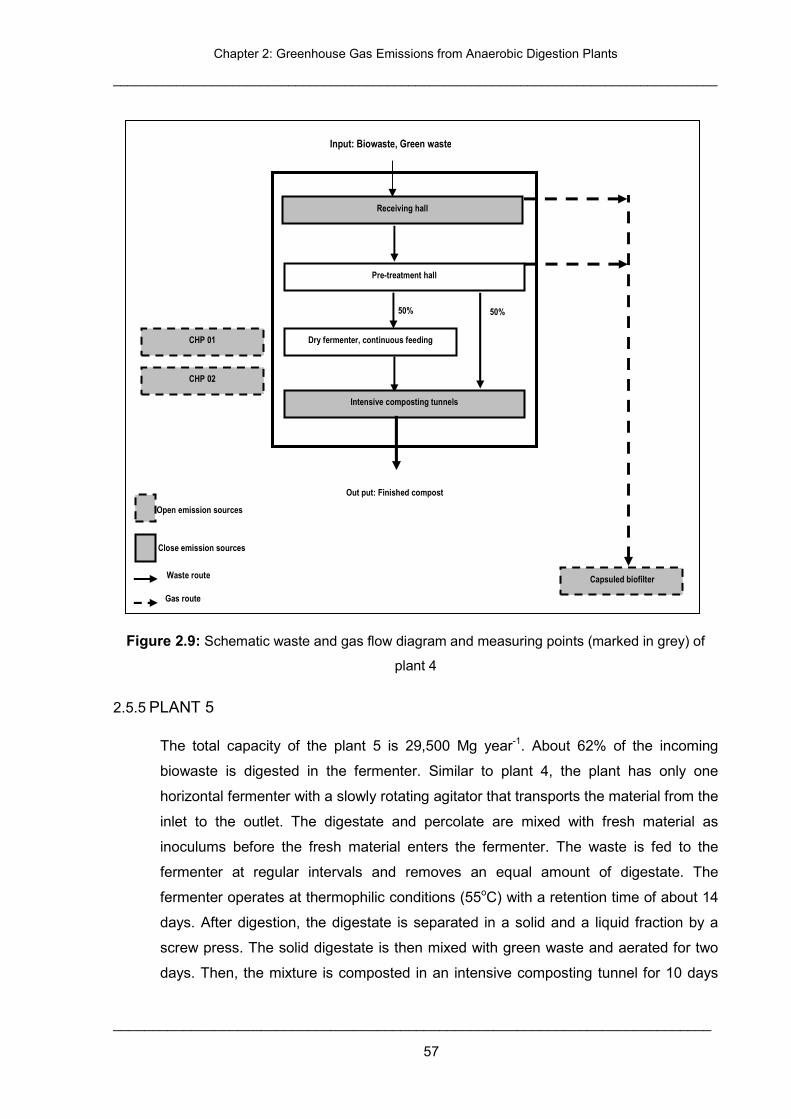
Chapter 2: Greenhouse Gas Emissions from Anaerobic Digestion Plants
______________________________________________________________________________________
_____________________________________________________________________________
57
Figure 2.9: Schematic waste and gas flow diagram and measuring points (marked in grey) of
plant 4
2.5.5 PLANT 5
The total capacity of the plant 5 is 29,500 Mg year-1. About 62% of the incoming
biowaste is digested in the fermenter. Similar to plant 4, the plant has only one
horizontal fermenter with a slowly rotating agitator that transports the material from the
inlet to the outlet. The digestate and percolate are mixed with fresh material as
inoculums before the fresh material enters the fermenter. The waste is fed to the
fermenter at regular intervals and removes an equal amount of digestate. The
fermenter operates at thermophilic conditions (55oC) with a retention time of about 14
days. After digestion, the digestate is separated in a solid and a liquid fraction by a
screw press. The solid digestate is then mixed with green waste and aerated for two
days. Then, the mixture is composted in an intensive composting tunnel for 10 days
Receiving hall
Pre-treatment hall
Input: Biowaste, Green waste
Dry fermenter, continuous feeding
Intensive composting tunnels
Capsuled biofilter
CHP 01
Out put: Finished compost
50%
CHP 02
50%
Open emission sources
Close emission sources
Waste route
Gas route
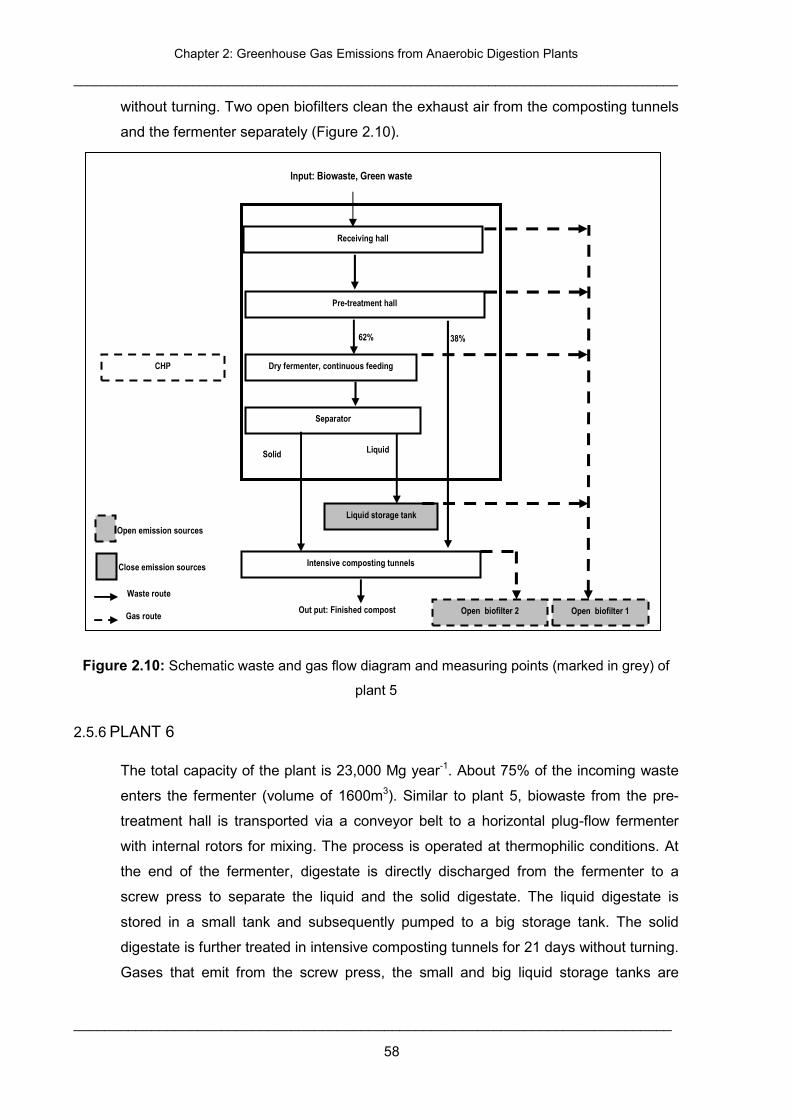
Chapter 2: Greenhouse Gas Emissions from Anaerobic Digestion Plants
______________________________________________________________________________________
_____________________________________________________________________________
58
without turning. Two open biofilters clean the exhaust air from the composting tunnels
and the fermenter separately (Figure 2.10).
Figure 2.10: Schematic waste and gas flow diagram and measuring points (marked in grey) of
plant 5
2.5.6 PLANT 6
The total capacity of the plant is 23,000 Mg year-1. About 75% of the incoming waste
enters the fermenter (volume of 1600m3). Similar to plant 5, biowaste from the pre-
treatment hall is transported via a conveyor belt to a horizontal plug-flow fermenter
with internal rotors for mixing. The process is operated at thermophilic conditions. At
the end of the fermenter, digestate is directly discharged from the fermenter to a
screw press to separate the liquid and the solid digestate. The liquid digestate is
stored in a small tank and subsequently pumped to a big storage tank. The solid
digestate is further treated in intensive composting tunnels for 21 days without turning.
Gases that emit from the screw press, the small and big liquid storage tanks are
Receiving hall
Pre-treatment hall
Input: Biowaste, Green waste
Dry fermenter, continuous feeding
Intensive composting tunnels
Open biofilter 1
CHP
Out put: Finished compost
62% 38%
Open emission sources
Close emission sources
Waste route
Gas route
Liquid storage tank
Separator
Solid Liquid
Open biofilter 2
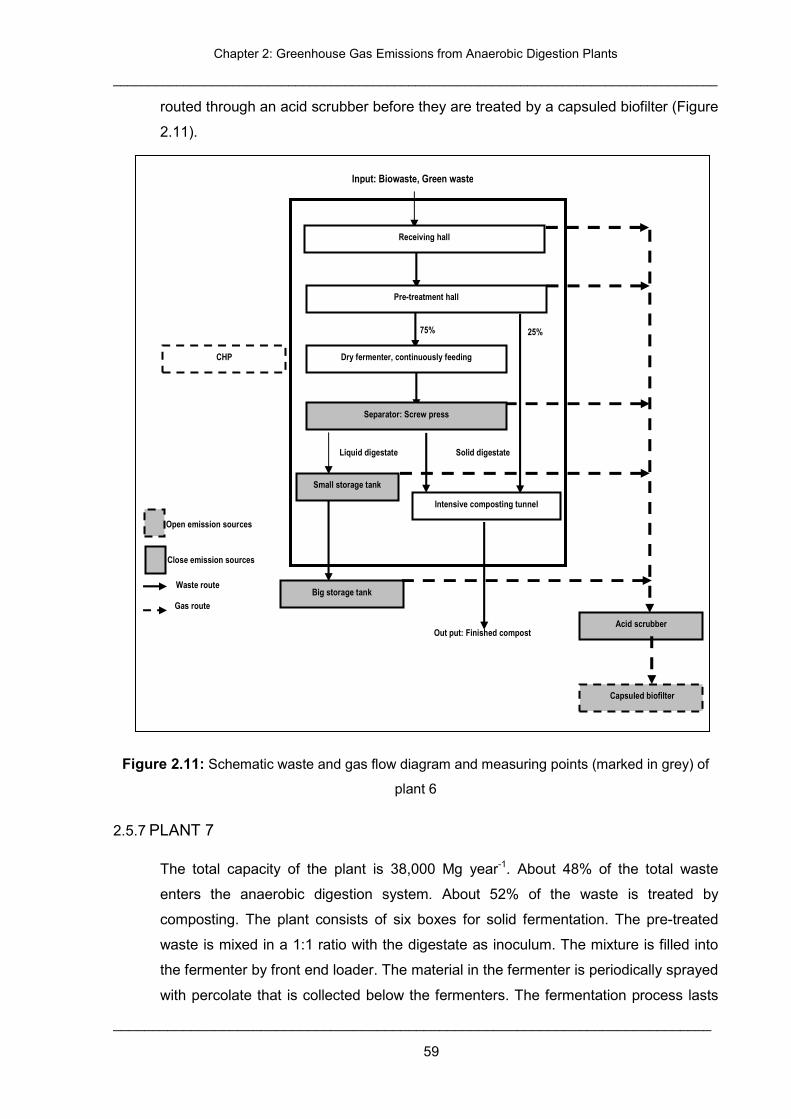
Chapter 2: Greenhouse Gas Emissions from Anaerobic Digestion Plants
______________________________________________________________________________________
_____________________________________________________________________________
59
routed through an acid scrubber before they are treated by a capsuled biofilter (Figure
2.11).
Figure 2.11: Schematic waste and gas flow diagram and measuring points (marked in grey) of
plant 6
2.5.7 PLANT 7
The total capacity of the plant is 38,000 Mg year-1. About 48% of the total waste
enters the anaerobic digestion system. About 52% of the waste is treated by
composting. The plant consists of six boxes for solid fermentation. The pre-treated
waste is mixed in a 1:1 ratio with the digestate as inoculum. The mixture is filled into
the fermenter by front end loader. The material in the fermenter is periodically sprayed
with percolate that is collected below the fermenters. The fermentation process lasts
Receiving hall
Pre-treatment hall
Big storage tank
Input: Biowaste, Green waste
Dry fermenter, continuously feeding
Separator: Screw press
Intensive composting tunnel
Liquid digestate
Capsuled biofilter
CHP
Out put: Finished compost
Solid digestate
75%
Small storage tank
25%
Open emission sources
Close emission sources
Waste route
Gas route
Acid scrubber
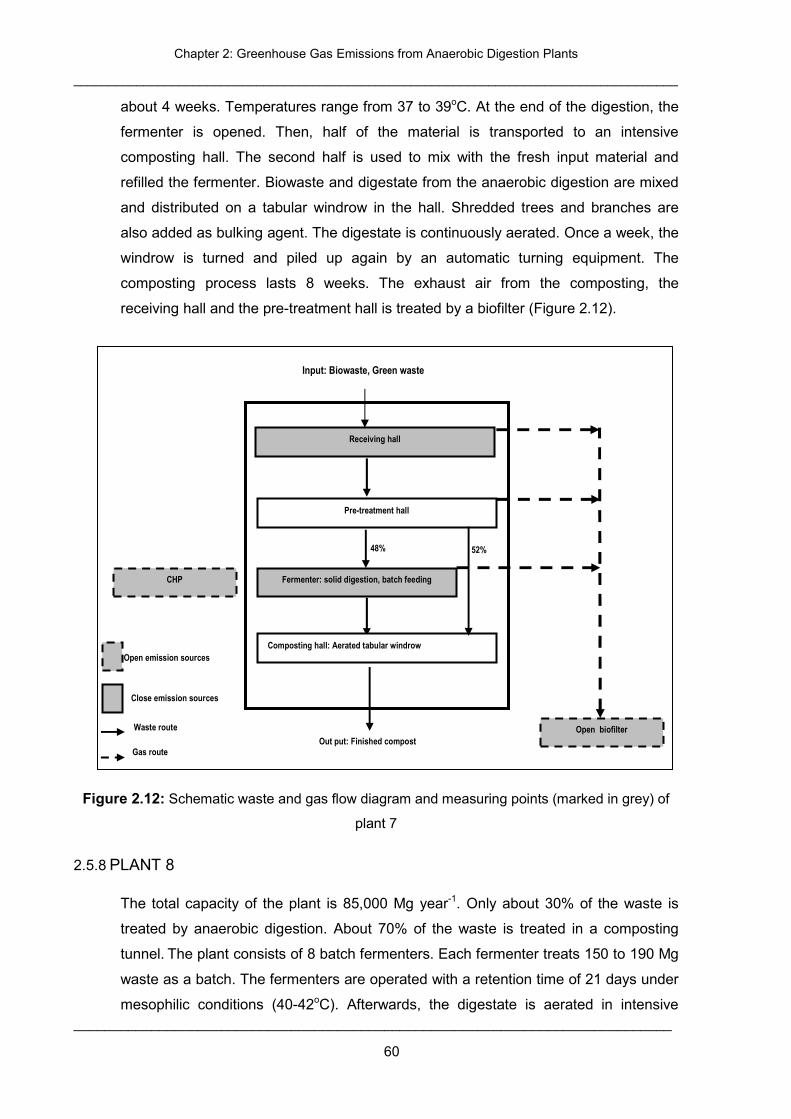
Chapter 2: Greenhouse Gas Emissions from Anaerobic Digestion Plants
______________________________________________________________________________________
_____________________________________________________________________________
60
about 4 weeks. Temperatures range from 37 to 39oC. At the end of the digestion, the
fermenter is opened. Then, half of the material is transported to an intensive
composting hall. The second half is used to mix with the fresh input material and
refilled the fermenter. Biowaste and digestate from the anaerobic digestion are mixed
and distributed on a tabular windrow in the hall. Shredded trees and branches are
also added as bulking agent. The digestate is continuously aerated. Once a week, the
windrow is turned and piled up again by an automatic turning equipment. The
composting process lasts 8 weeks. The exhaust air from the composting, the
receiving hall and the pre-treatment hall is treated by a biofilter (Figure 2.12).
Figure 2.12: Schematic waste and gas flow diagram and measuring points (marked in grey) of
plant 7
2.5.8 PLANT 8
The total capacity of the plant is 85,000 Mg year-1. Only about 30% of the waste is
treated by anaerobic digestion. About 70% of the waste is treated in a composting
tunnel. The plant consists of 8 batch fermenters. Each fermenter treats 150 to 190 Mg
waste as a batch. The fermenters are operated with a retention time of 21 days under
mesophilic conditions (40-42oC). Afterwards, the digestate is aerated in intensive
Receiving hall
Pre-treatment hall
Input: Biowaste, Green waste
Fermenter: solid digestion, batch feeding
Composting hall: Aerated tabular windrow
Open biofilter
CHP
Out put: Finished compost
48% 52%
Open emission sources
Close emission sources
Waste route
Gas route
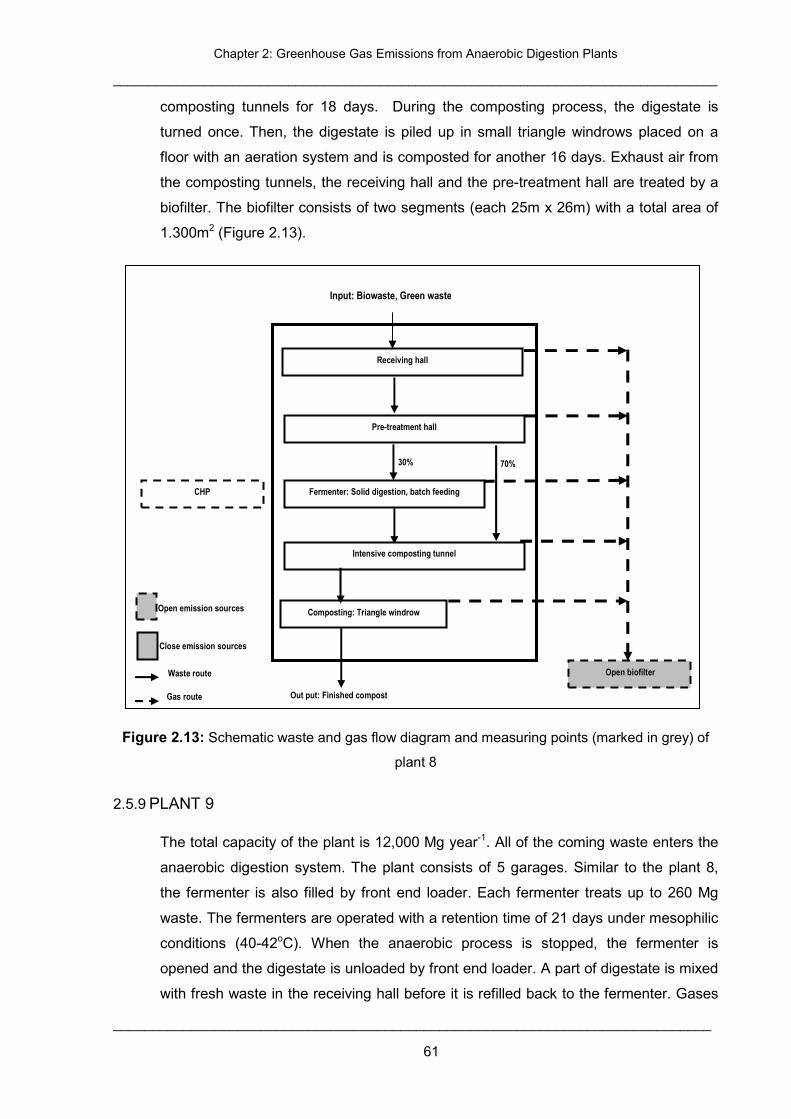
Chapter 2: Greenhouse Gas Emissions from Anaerobic Digestion Plants
______________________________________________________________________________________
_____________________________________________________________________________
61
composting tunnels for 18 days. During the composting process, the digestate is
turned once. Then, the digestate is piled up in small triangle windrows placed on a
floor with an aeration system and is composted for another 16 days. Exhaust air from
the composting tunnels, the receiving hall and the pre-treatment hall are treated by a
biofilter. The biofilter consists of two segments (each 25m x 26m) with a total area of
1.300m2 (Figure 2.13).
Figure 2.13: Schematic waste and gas flow diagram and measuring points (marked in grey) of
plant 8
2.5.9 PLANT 9
The total capacity of the plant is 12,000 Mg year-1. All of the coming waste enters the
anaerobic digestion system. The plant consists of 5 garages. Similar to the plant 8,
the fermenter is also filled by front end loader. Each fermenter treats up to 260 Mg
waste. The fermenters are operated with a retention time of 21 days under mesophilic
conditions (40-42oC). When the anaerobic process is stopped, the fermenter is
opened and the digestate is unloaded by front end loader. A part of digestate is mixed
with fresh waste in the receiving hall before it is refilled back to the fermenter. Gases
Receiving hall
Pre-treatment hall
Input: Biowaste, Green waste
Fermenter: Solid digestion, batch feeding
Intensive composting tunnel
Composting: Triangle windrow
Open biofilter
CHP
Out put: Finished compost
30% 70%
Open emission sources
Close emission sources
Waste route
Gas route
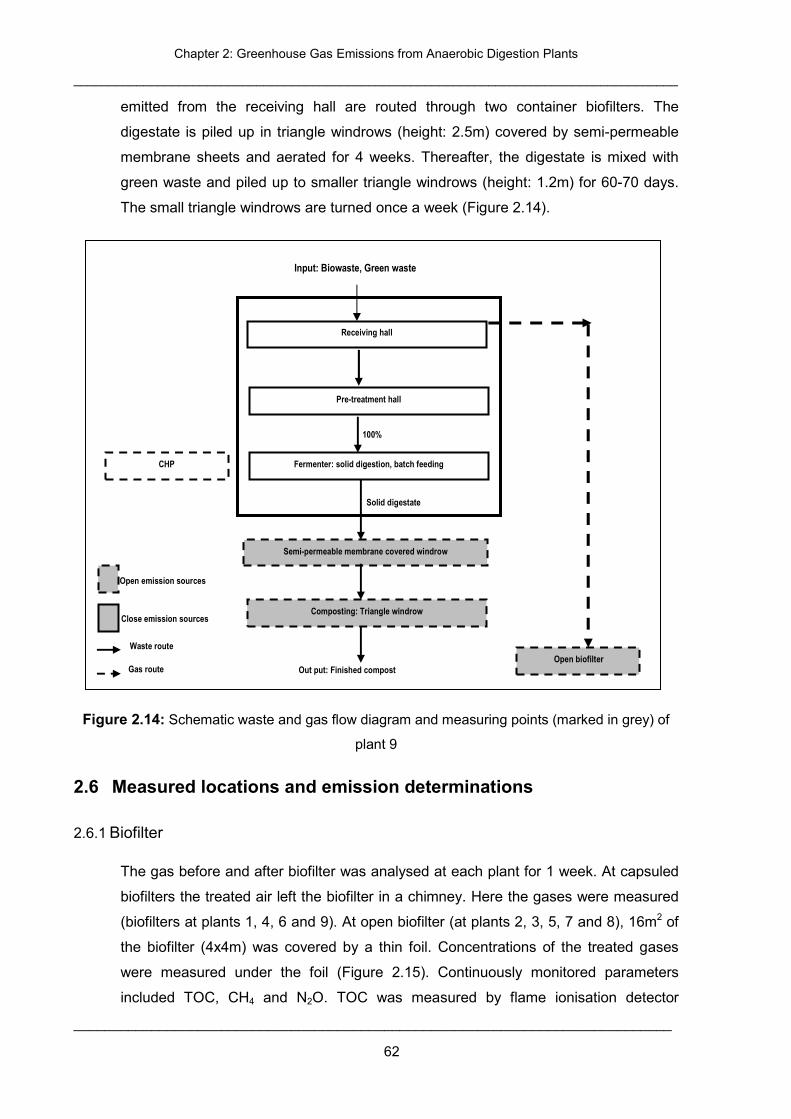
Chapter 2: Greenhouse Gas Emissions from Anaerobic Digestion Plants
______________________________________________________________________________________
_____________________________________________________________________________
62
emitted from the receiving hall are routed through two container biofilters. The
digestate is piled up in triangle windrows (height: 2.5m) covered by semi-permeable
membrane sheets and aerated for 4 weeks. Thereafter, the digestate is mixed with
green waste and piled up to smaller triangle windrows (height: 1.2m) for 60-70 days.
The small triangle windrows are turned once a week (Figure 2.14).
Figure 2.14: Schematic waste and gas flow diagram and measuring points (marked in grey) of
plant 9
2.6 Measured locations and emission determinations
2.6.1 Biofilter
The gas before and after biofilter was analysed at each plant for 1 week. At capsuled
biofilters the treated air left the biofilter in a chimney. Here the gases were measured
(biofilters at plants 1, 4, 6 and 9). At open biofilter (at plants 2, 3, 5, 7 and 8), 16m2 of
the biofilter (4x4m) was covered by a thin foil. Concentrations of the treated gases
were measured under the foil (Figure 2.15). Continuously monitored parameters
included TOC, CH4 and N2O. TOC was measured by flame ionisation detector
Receiving hall
Pre-treatment hall
Input: Biowaste, Green waste
Fermenter: solid digestion, batch feeding
Semi-permeable membrane covered windrow
Composting: Triangle windrow
Open biofilter
CHP
Out put: Finished compost
Solid digestate
100%
Open emission sources
Close emission sources
Waste route
Gas route
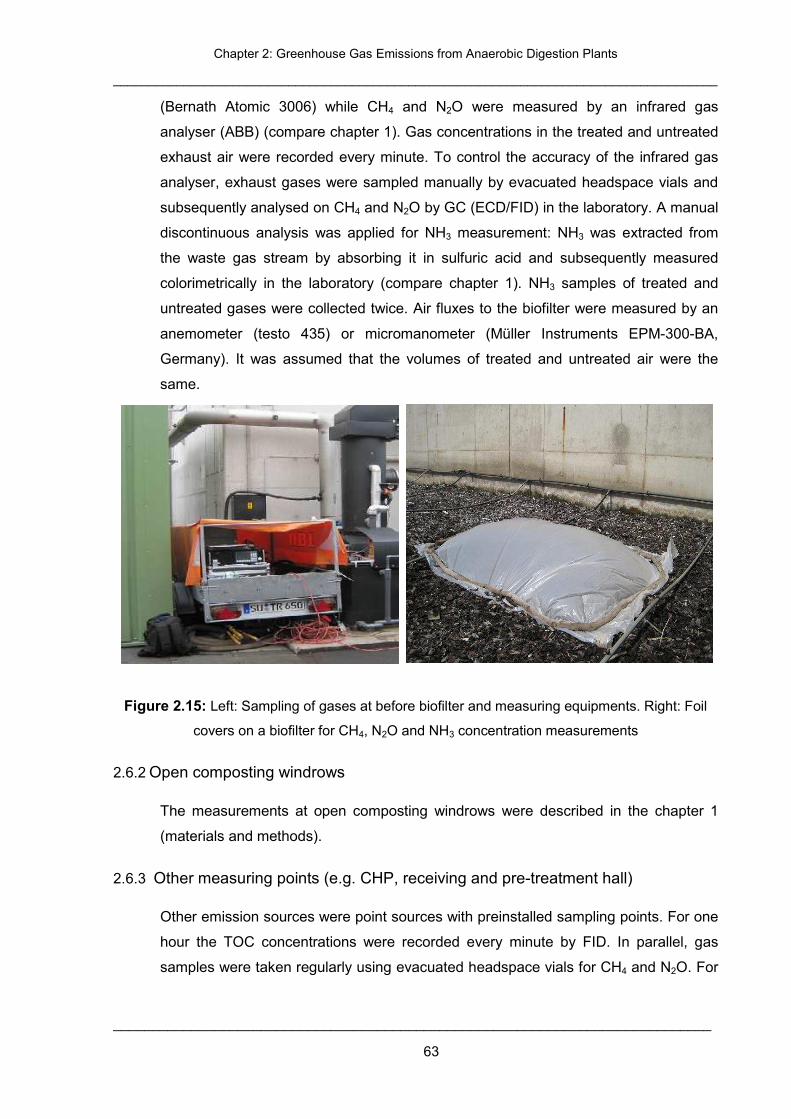
Chapter 2: Greenhouse Gas Emissions from Anaerobic Digestion Plants
______________________________________________________________________________________
_____________________________________________________________________________
63
(Bernath Atomic 3006) while CH4 and N2O were measured by an infrared gas
analyser (ABB) (compare chapter 1). Gas concentrations in the treated and untreated
exhaust air were recorded every minute. To control the accuracy of the infrared gas
analyser, exhaust gases were sampled manually by evacuated headspace vials and
subsequently analysed on CH4 and N2O by GC (ECD/FID) in the laboratory. A manual
discontinuous analysis was applied for NH3 measurement: NH3 was extracted from
the waste gas stream by absorbing it in sulfuric acid and subsequently measured
colorimetrically in the laboratory (compare chapter 1). NH3 samples of treated and
untreated gases were collected twice. Air fluxes to the biofilter were measured by an
anemometer (testo 435) or micromanometer (Müller Instruments EPM-300-BA,
Germany). It was assumed that the volumes of treated and untreated air were the
same.
Figure 2.15: Left: Sampling of gases at before biofilter and measuring equipments. Right: Foil
covers on a biofilter for CH4, N2O and NH3 concentration measurements
2.6.2 Open composting windrows
The measurements at open composting windrows were described in the chapter 1
(materials and methods).
2.6.3 Other measuring points (e.g. CHP, receiving and pre-treatment hall)
Other emission sources were point sources with preinstalled sampling points. For one
hour the TOC concentrations were recorded every minute by FID. In parallel, gas
samples were taken regularly using evacuated headspace vials for CH4 and N2O. For
Chapter 2: Greenhouse Gas Emissions from Anaerobic Digestion Plants
______________________________________________________________________________________
_____________________________________________________________________________
64
NH3, samples were taken by absorbing it in sulfuric acid solution. Air fluxes were also
determined by measuring velocity (m/s) and cross section area (m2).
2.6.4 Calculations of emissions factors for anaerobic digestion plants
The emission factors of CH4, N2O and NH3 g (Mg biowaste)-1 were calculated using
the aeration rates and concentrations of gases. The emission rates and emission
factors for each gas were calculated using the following formula:
1000QE
EMF×
= (g h-1)
w
MFf M
EE
)724( ××= g (Mg waste)-1
With
E: concentration (mg x m-3)
Q: air flow (m3 x h-1)
EMF: emission mass flow (g x h-1)
Mw: total mass of incoming waste (Mg per week)
Ef: emission factor g (Mg waste)-1
The emissions were calculated in form of CO2 equivalent according to IPCC (2007).
N2O and CH4 are potential GHG with respective global warming potentials 298 and 25
times higher than that of CO2 respectively (IPCC, 2007). Additionally, it was assumed
that the CO2 equivalent of NH3 is 2.98 (Cuhls, 2011) and (Wulf, 2002).
)98.229825(3242
×+×+×=∑ fNHOfNfCHequivalentfCO EEEE
Overall GHG emissions from AD plants were calculated by the sum of emissions of
CH4, N2O and NH3 from open emission sources such as biofilter, CHP, open
composting windrows and liquid digestate treatment systems. Emissions from
machinery and energy used in the plants were not considered in the calculations.
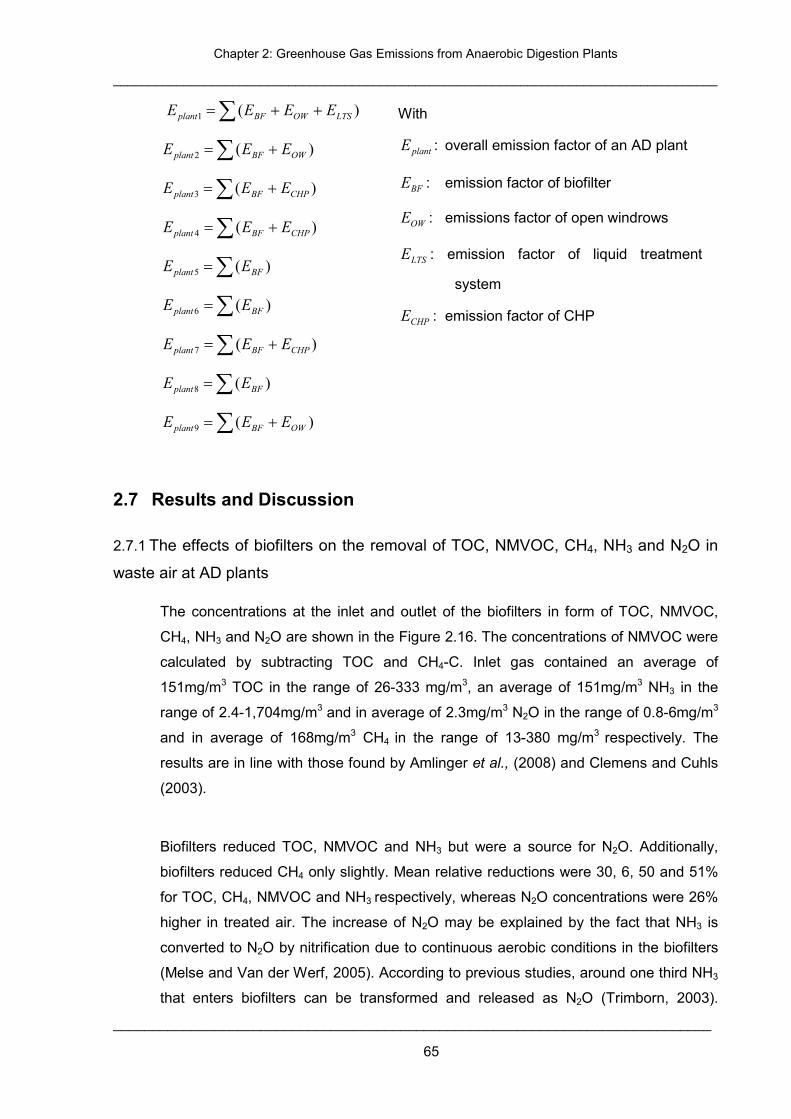
Chapter 2: Greenhouse Gas Emissions from Anaerobic Digestion Plants
______________________________________________________________________________________
_____________________________________________________________________________
65
)(1 LTSOWBFplant EEEE ++=∑
)(2 OWBFplant EEE +=∑
)(3 CHPBFplant EEE +=∑
)(4 CHPBFplant EEE +=∑
)(5 ∑= BFplant EE
)(6 ∑= BFplant EE
)(7 CHPBFplant EEE +=∑
)(8 ∑= BFplant EE
)(9 OWBFplant EEE +=∑
2.7 Results and Discussion
2.7.1 The effects of biofilters on the removal of TOC, NMVOC, CH4, NH3 and N2O in
waste air at AD plants
The concentrations at the inlet and outlet of the biofilters in form of TOC, NMVOC,
CH4, NH3 and N2O are shown in the Figure 2.16. The concentrations of NMVOC were
calculated by subtracting TOC and CH4-C. Inlet gas contained an average of
151mg/m3 TOC in the range of 26-333 mg/m3, an average of 151mg/m3 NH3 in the
range of 2.4-1,704mg/m3 and in average of 2.3mg/m3 N2O in the range of 0.8-6mg/m3
and in average of 168mg/m3 CH4 in the range of 13-380 mg/m3 respectively. The
results are in line with those found by Amlinger et al., (2008) and Clemens and Cuhls
(2003).
Biofilters reduced TOC, NMVOC and NH3 but were a source for N2O. Additionally,
biofilters reduced CH4 only slightly. Mean relative reductions were 30, 6, 50 and 51%
for TOC, CH4, NMVOC and NH3 respectively, whereas N2O concentrations were 26%
higher in treated air. The increase of N2O may be explained by the fact that NH3 is
converted to N2O by nitrification due to continuous aerobic conditions in the biofilters
(Melse and Van der Werf, 2005). According to previous studies, around one third NH3
that enters biofilters can be transformed and released as N2O (Trimborn, 2003).
With
plantE : overall emission factor of an AD plant
BFE : emission factor of biofilter
OWE : emissions factor of open windrows
LTSE : emission factor of liquid treatment
system
CHPE : emission factor of CHP
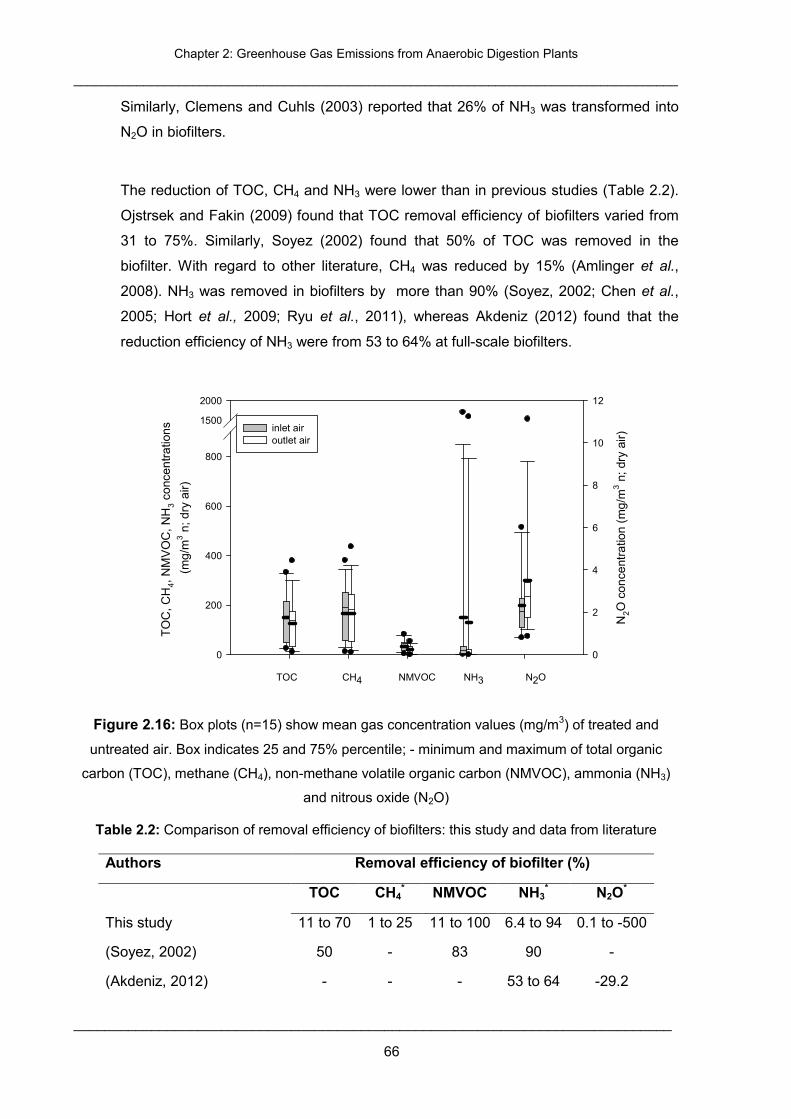
Chapter 2: Greenhouse Gas Emissions from Anaerobic Digestion Plants
______________________________________________________________________________________
_____________________________________________________________________________
66
Similarly, Clemens and Cuhls (2003) reported that 26% of NH3 was transformed into
N2O in biofilters.
The reduction of TOC, CH4 and NH3 were lower than in previous studies (Table 2.2).
Ojstrsek and Fakin (2009) found that TOC removal efficiency of biofilters varied from
31 to 75%. Similarly, Soyez (2002) found that 50% of TOC was removed in the
biofilter. With regard to other literature, CH4 was reduced by 15% (Amlinger et al.,
2008). NH3 was removed in biofilters by more than 90% (Soyez, 2002; Chen et al.,
2005; Hort et al., 2009; Ryu et al., 2011), whereas Akdeniz (2012) found that the
reduction efficiency of NH3 were from 53 to 64% at full-scale biofilters.
TOC CH4 NMVOC NH3 N2O
TO
C, C
H4,
NM
VO
C, N
H3
conc
entr
atio
ns
(mg/
m3 n
; dry
air)
0
200
400
600
800
1500
2000
N2O
con
cent
ratio
n (m
g/m
3 n; d
ry a
ir)
0
2
4
6
8
10
12
inlet airoutlet air
Figure 2.16: Box plots (n=15) show mean gas concentration values (mg/m3) of treated and
untreated air. Box indicates 25 and 75% percentile; - minimum and maximum of total organic
carbon (TOC), methane (CH4), non-methane volatile organic carbon (NMVOC), ammonia (NH3)
and nitrous oxide (N2O)
Table 2.2: Comparison of removal efficiency of biofilters: this study and data from literature
Authors Removal efficiency of biofilter (%)
TOC CH4* NMVOC NH3
* N2O*
This study 11 to 70 1 to 25 11 to 100 6.4 to 94 0.1 to -500
(Soyez, 2002) 50 - 83 90 -
(Akdeniz, 2012) - - - 53 to 64 -29.2
Chapter 2: Greenhouse Gas Emissions from Anaerobic Digestion Plants
______________________________________________________________________________________
_____________________________________________________________________________
67
(Amlinger et al., 2008) - 15 - - -
(Ryu et al., 2011) 95 to 99 - - 92 -
(Lopez et al., 2011) 90 - - - -
(Hort et al., 2009) - - - 94 -
(Chen et al., 2005) - - - 97 to 99 -
(Ojstrsek and Fakin, 2009) 31 to 75 - - - -
(Schlegelmilch et al., 2005) - - - 100 -
(Clemens and Cuhls, 2003) - - - 13 to 89 -
(Trimborn, et al., 2003) 32 to 78 -7 to 26 75 to 100 -35 to 91 -9 to -116
- no data
* Negative values mean a production in the biofilter
2.7.2 Acid scrubber for NH3 removal
The inlet concentrations of TOC, CH4, NH3 and N2O were 215.4, 227.2, 23.5 and
2.4mg m-3 respectively (Figure 2.17). Removal efficiency of the acid scrubber was
48% for NH3. Mean concentrations of TOC, CH4 and N2O were not significant different
before and after the acid scrubber.
TOC CH4 NH3 N2O
Gas
con
cent
ratio
ns (
mg/
m3 ; n
, dry
air)
0
50
100
150
200
250
before acid scrubberafter acid scrubber
Figure 2.17: Gas concentrations before and after acid scrubber at the AD plant 6
2.7.3 Emission factors of CH4, N2O and NH3 from open emission sources in AD plants
The emission factors of CH4 varied from 16 to 819g (Mg biowaste)-1 for liquid
treatment system (LTS), from 50 to 1,500g (Mg biowaste)-1 for CHP, and from 0.4 to
15.4kg (Mg biowaste)-1 for open windrows (Figure 2.18). Liquid digestate still contains
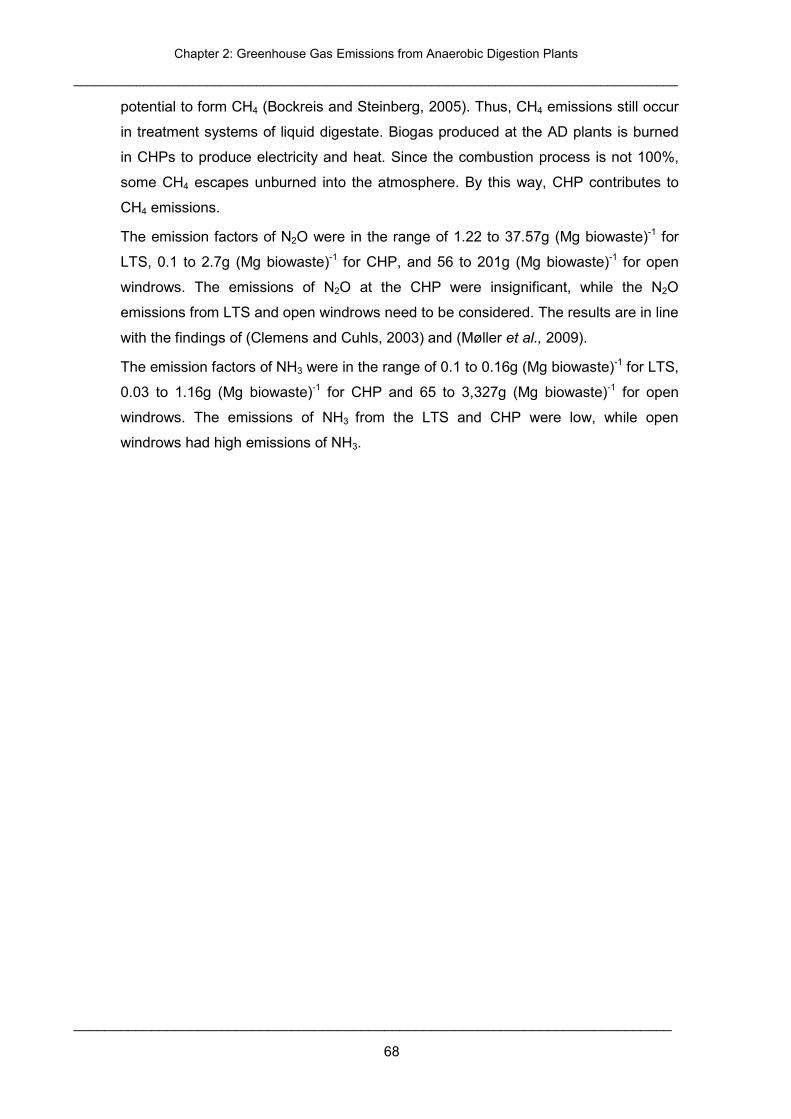
Chapter 2: Greenhouse Gas Emissions from Anaerobic Digestion Plants
______________________________________________________________________________________
_____________________________________________________________________________
68
potential to form CH4 (Bockreis and Steinberg, 2005). Thus, CH4 emissions still occur
in treatment systems of liquid digestate. Biogas produced at the AD plants is burned
in CHPs to produce electricity and heat. Since the combustion process is not 100%,
some CH4 escapes unburned into the atmosphere. By this way, CHP contributes to
CH4 emissions.
The emission factors of N2O were in the range of 1.22 to 37.57g (Mg biowaste)-1 for
LTS, 0.1 to 2.7g (Mg biowaste)-1 for CHP, and 56 to 201g (Mg biowaste)-1 for open
windrows. The emissions of N2O at the CHP were insignificant, while the N2O
emissions from LTS and open windrows need to be considered. The results are in line
with the findings of (Clemens and Cuhls, 2003) and (Møller et al., 2009).
The emission factors of NH3 were in the range of 0.1 to 0.16g (Mg biowaste)-1 for LTS,
0.03 to 1.16g (Mg biowaste)-1 for CHP and 65 to 3,327g (Mg biowaste)-1 for open
windrows. The emissions of NH3 from the LTS and CHP were low, while open
windrows had high emissions of NH3.
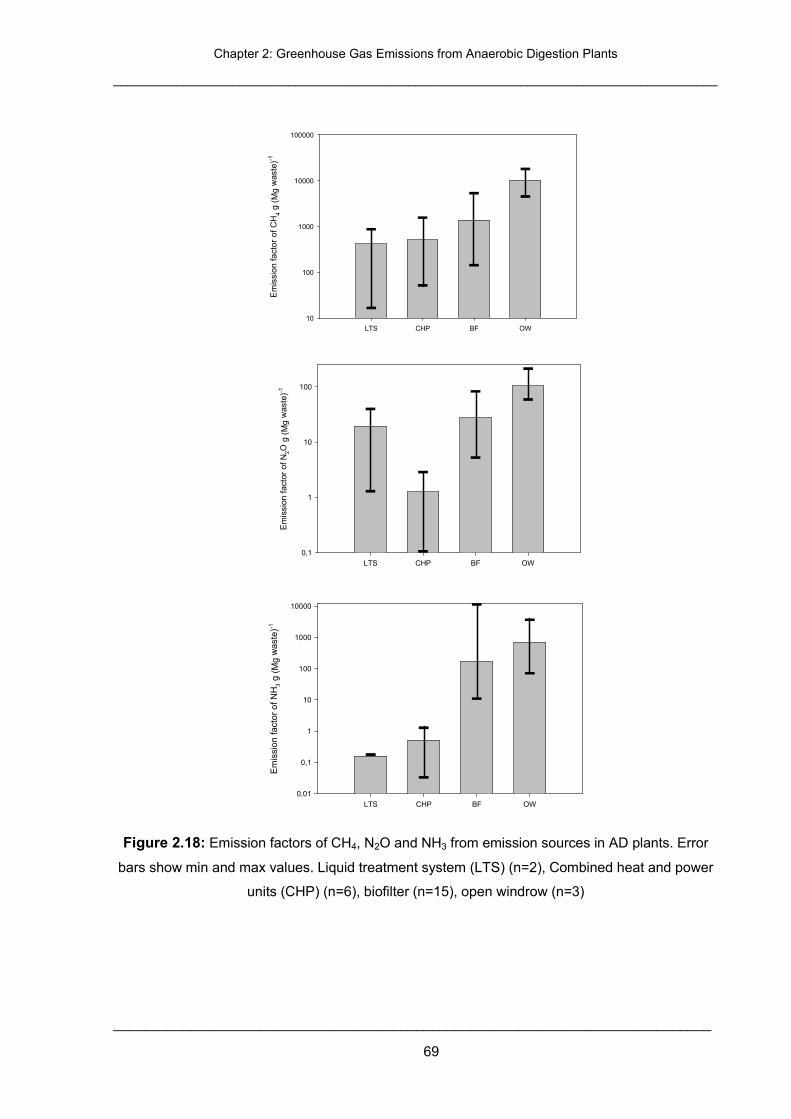
Chapter 2: Greenhouse Gas Emissions from Anaerobic Digestion Plants
______________________________________________________________________________________
_____________________________________________________________________________
69
LTS CHP BF OW
Em
issi
on fa
ctor
of N
H3
g (M
g w
aste
)-1
0,01
0,1
1
10
100
1000
10000
LTS CHP BF OW
Em
issi
on fa
ctor
of C
H4
g (M
g w
aste
)-1
10
100
1000
10000
100000
LTS CHP BF OW
Em
issi
on fa
ctor
of N
2O g
(M
g w
aste
)-1
0,1
1
10
100
Figure 2.18: Emission factors of CH4, N2O and NH3 from emission sources in AD plants. Error
bars show min and max values. Liquid treatment system (LTS) (n=2), Combined heat and power
units (CHP) (n=6), biofilter (n=15), open windrow (n=3)
Chapter 2: Greenhouse Gas Emissions from Anaerobic Digestion Plants
______________________________________________________________________________________
_____________________________________________________________________________
70
2.7.4 Emissions factors of CH4, N2O and NH3 at the AD plants
The CH4 emission factors from AD plants were from 1,246 to 16,567g (Mg biowaste)-1
(Figure 2.19). The median CH4 emission factor was 3,828g (Mg biowaste)-1. The
plants 1, 2 and 9 with open composting windrows showed highest CH4 emissions. The
CH4 emission factors from composting windrows were 16,567, 8,122 and 10,788g (Mg
biowaste)-1 which contributed relatively to 95%, 73% and 96% and of the total CH4
emissions at the plants 1, 2 and 9 respectively.
Emission factors of CH4 from CHPs were measured only in the plants 3, 4 and 7. CH4
emission factors from CHPs varied from 52 to 2,040g (Mg biowaste)-1. The results
were higher than a previous study: Møller et al., (2009) reported that the emission
factors of CH4 from CHP ranged from 16 to 819g (Mg biowaste)-1.
The emission factors of CH4 from biofilters varied from 236 to 5,237g (Mg biowaste)-1.
The results are in line with the findings of Clemens and Cuhls (2003) and Møller et al.,
(2009) but comparatively higher than the results of Soyez (2002), who found that the
emission factors of CH4 were about 100g (Mg waste)-1.
The emissions from open composting windrows (plants 1, 2 and 9) were higher than
the composting process indoors (biofilters at plants 4, 5, 6, 7 and 8) most likely
because the composting process indoors is actively aerated. Adequate air supply
keeps of the windrow aerobic and suppresses the CH4 formation. The anaerobic
conditions in open composting windrows are most likely because of the insufficient O2
supply.
Chapter 2: Greenhouse Gas Emissions from Anaerobic Digestion Plants
______________________________________________________________________________________
_____________________________________________________________________________
71
plant 1 plant 2 plant 3 plant 4 plant 5 plant 6 plant 7 plant 8 plant 9
Eis
sion
fact
or: g
CH
4 (M
g w
aste
)-1
0
2000
4000
6000
8000
10000
12000
14000
16000
18000
BiofilterCHPOpen Composting WindrowLiquid treatment
Figure 2.19: Median emission factors of CH4 g (Mg biowaste)-1 from different AD plants. CHP
emission data are mean values derived fromplants 3, 4 and 7
The emission factors of N2O were in a range of 9-172g (Mg biowaste)-1 (Figure 2.20).
The median N2O emission factor was 64g (Mg biowaste)-1. N2O emissions from open
composting windrows contributed significantly to the total N2O emissions of the AD
plants. The contributions of open composting windrows to the total N2O emissions were
76%, 80% and 94% at the plants 1, 2 and 9 respectively. The N2O emissions from
CHPs were from 0.5 to 5g N2O (Mg biowaste)-1 and contributed only 2-7% to the total
N2O emissions. The N2O emission factors from biofilters ranged from 6.7 to 78g (Mg
biowaste)-1. The N2O emissions from LTS contributed in the range of 2-27% of the total
N2O emissions.
As for CH4 emissions, N2O emissions from the open windrows (plants 1, 2 and 9) were
higher than the composting process indoors (biofilters at plants 4, 5, 6, 7 and 8). The
relative high N2O production from open windrows may be related to long treatment
duration. The N2O emissions increase with the compost age (Beck-Friss et al., 2000).
Other studies found that N2O was emitted during the last stage of composting, when
temperatures were low (He et al., 2001 and Hellmann, 1997).
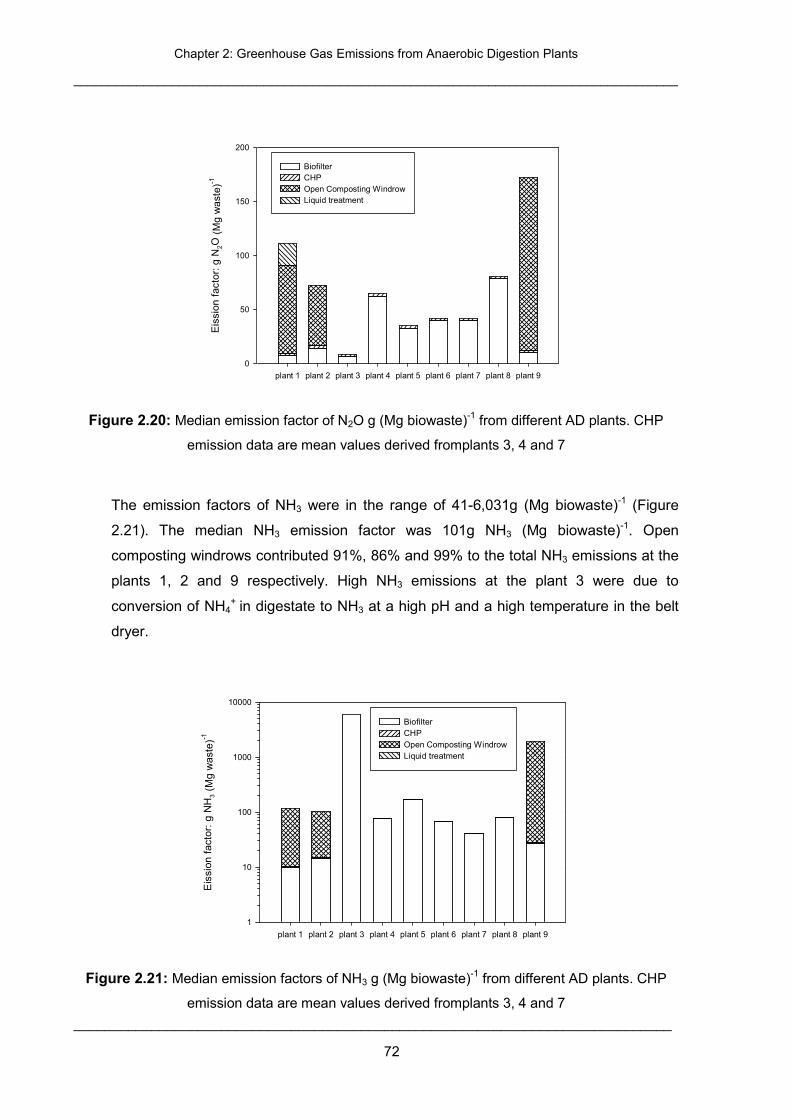
Chapter 2: Greenhouse Gas Emissions from Anaerobic Digestion Plants
______________________________________________________________________________________
_____________________________________________________________________________
72
plant 1 plant 2 plant 3 plant 4 plant 5 plant 6 plant 7 plant 8 plant 9
Eis
sion
fact
or: g
N2O
(M
g w
aste
)-1
0
50
100
150
200
BiofilterCHPOpen Composting WindrowLiquid treatment
Figure 2.20: Median emission factor of N2O g (Mg biowaste)-1 from different AD plants. CHP
emission data are mean values derived fromplants 3, 4 and 7
The emission factors of NH3 were in the range of 41-6,031g (Mg biowaste)-1 (Figure
2.21). The median NH3 emission factor was 101g NH3 (Mg biowaste)-1. Open
composting windrows contributed 91%, 86% and 99% to the total NH3 emissions at the
plants 1, 2 and 9 respectively. High NH3 emissions at the plant 3 were due to
conversion of NH4+ in digestate to NH3 at a high pH and a high temperature in the belt
dryer.
plant 1 plant 2 plant 3 plant 4 plant 5 plant 6 plant 7 plant 8 plant 9
Eis
sion
fact
or: g
NH
3 (M
g w
aste
)-1
1
10
100
1000
10000
BiofilterCHPOpen Composting WindrowLiquid treatment
Figure 2.21: Median emission factors of NH3 g (Mg biowaste)-1 from different AD plants. CHP
emission data are mean values derived fromplants 3, 4 and 7
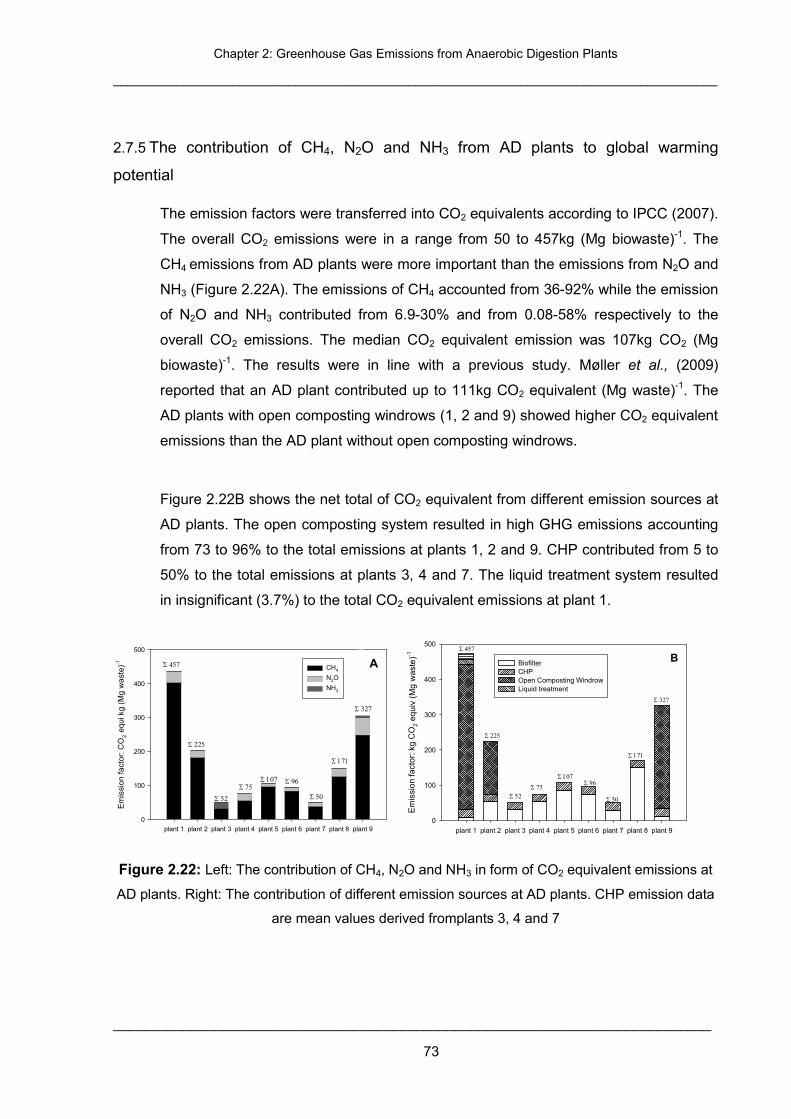
Chapter 2: Greenhouse Gas Emissions from Anaerobic Digestion Plants
______________________________________________________________________________________
_____________________________________________________________________________
73
2.7.5 The contribution of CH4, N2O and NH3 from AD plants to global warming
potential
The emission factors were transferred into CO2 equivalents according to IPCC (2007).
The overall CO2 emissions were in a range from 50 to 457kg (Mg biowaste)-1. The
CH4 emissions from AD plants were more important than the emissions from N2O and
NH3 (Figure 2.22A). The emissions of CH4 accounted from 36-92% while the emission
of N2O and NH3 contributed from 6.9-30% and from 0.08-58% respectively to the
overall CO2 emissions. The median CO2 equivalent emission was 107kg CO2 (Mg
biowaste)-1. The results were in line with a previous study. Møller et al., (2009)
reported that an AD plant contributed up to 111kg CO2 equivalent (Mg waste)-1. The
AD plants with open composting windrows (1, 2 and 9) showed higher CO2 equivalent
emissions than the AD plant without open composting windrows.
Figure 2.22B shows the net total of CO2 equivalent from different emission sources at
AD plants. The open composting system resulted in high GHG emissions accounting
from 73 to 96% to the total emissions at plants 1, 2 and 9. CHP contributed from 5 to
50% to the total emissions at plants 3, 4 and 7. The liquid treatment system resulted
in insignificant (3.7%) to the total CO2 equivalent emissions at plant 1.
plant 1 plant 2 plant 3 plant 4 plant 5 plant 6 plant 7 plant 8 plant 9
Em
issi
on fa
ctor
: CO
2 eq
ui k
g (M
g w
aste
)-1
0
100
200
300
400
500
CH4
N2O
NH3
Σ 457
Σ 52
Σ 107Σ 75
Σ 225327 197
3806
98
Σ 96
Σ 50
Σ 171
Σ 327
A
B
plant 1 plant 2 plant 3 plant 4 plant 5 plant 6 plant 7 plant 8 plant 9
Em
issi
on fa
ctor
: kg
CO
2 eq
uiv
(Mg
was
te)-1
0
100
200
300
400
500
BiofilterCHPOpen Composting WindrowLiquid treatment
Σ 457
Σ 52
Σ 107
Σ 75
Σ 225
Σ 96
Σ 50
Σ 171
Σ 327
B
Figure 2.22: Left: The contribution of CH4, N2O and NH3 in form of CO2 equivalent emissions at
AD plants. Right: The contribution of different emission sources at AD plants. CHP emission data
are mean values derived fromplants 3, 4 and 7
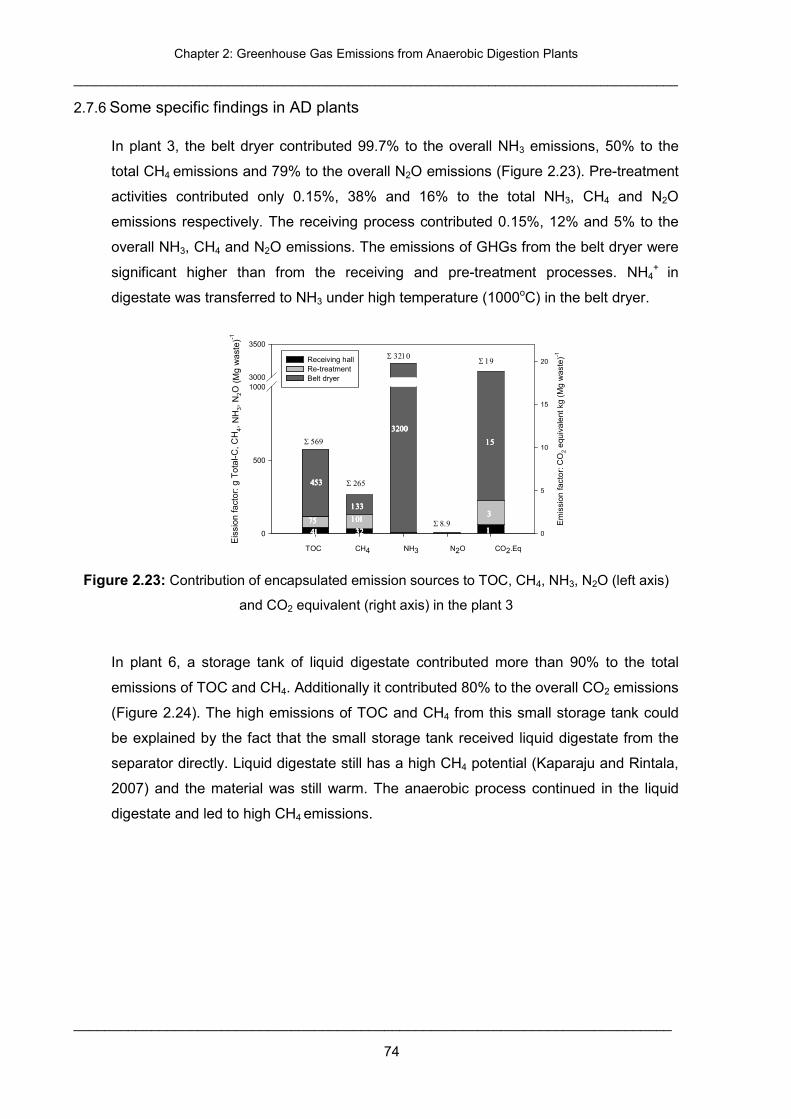
Chapter 2: Greenhouse Gas Emissions from Anaerobic Digestion Plants
______________________________________________________________________________________
_____________________________________________________________________________
74
2.7.6 Some specific findings in AD plants
In plant 3, the belt dryer contributed 99.7% to the overall NH3 emissions, 50% to the
total CH4 emissions and 79% to the overall N2O emissions (Figure 2.23). Pre-treatment
activities contributed only 0.15%, 38% and 16% to the total NH3, CH4 and N2O
emissions respectively. The receiving process contributed 0.15%, 12% and 5% to the
overall NH3, CH4 and N2O emissions. The emissions of GHGs from the belt dryer were
significant higher than from the receiving and pre-treatment processes. NH4+ in
digestate was transferred to NH3 under high temperature (1000oC) in the belt dryer.
Eis
sion
fact
or: g
Tot
al-C
, CH
4, N
H3,
N2O
(M
g w
aste
)-1
0
500
10003000
3500
Em
issi
on fa
ctor
: CO
2 eq
uiva
lent
kg
(Mg
was
te)-1
0
5
10
15
20Receiving hallRe-treatmentBelt dryer
Σ 569
Σ 265
Σ 8.9
Σ 19Σ 3210
4141414175757575
32323232
101101101101
133133133133
3200320032003200
1111
3333
15151515
453453453453
133133133133
TOC CH4 NH3 N2O CO2.Eq
Figure 2.23: Contribution of encapsulated emission sources to TOC, CH4, NH3, N2O (left axis)
and CO2 equivalent (right axis) in the plant 3
In plant 6, a storage tank of liquid digestate contributed more than 90% to the total
emissions of TOC and CH4. Additionally it contributed 80% to the overall CO2 emissions
(Figure 2.24). The high emissions of TOC and CH4 from this small storage tank could
be explained by the fact that the small storage tank received liquid digestate from the
separator directly. Liquid digestate still has a high CH4 potential (Kaparaju and Rintala,
2007) and the material was still warm. The anaerobic process continued in the liquid
digestate and led to high CH4 emissions.
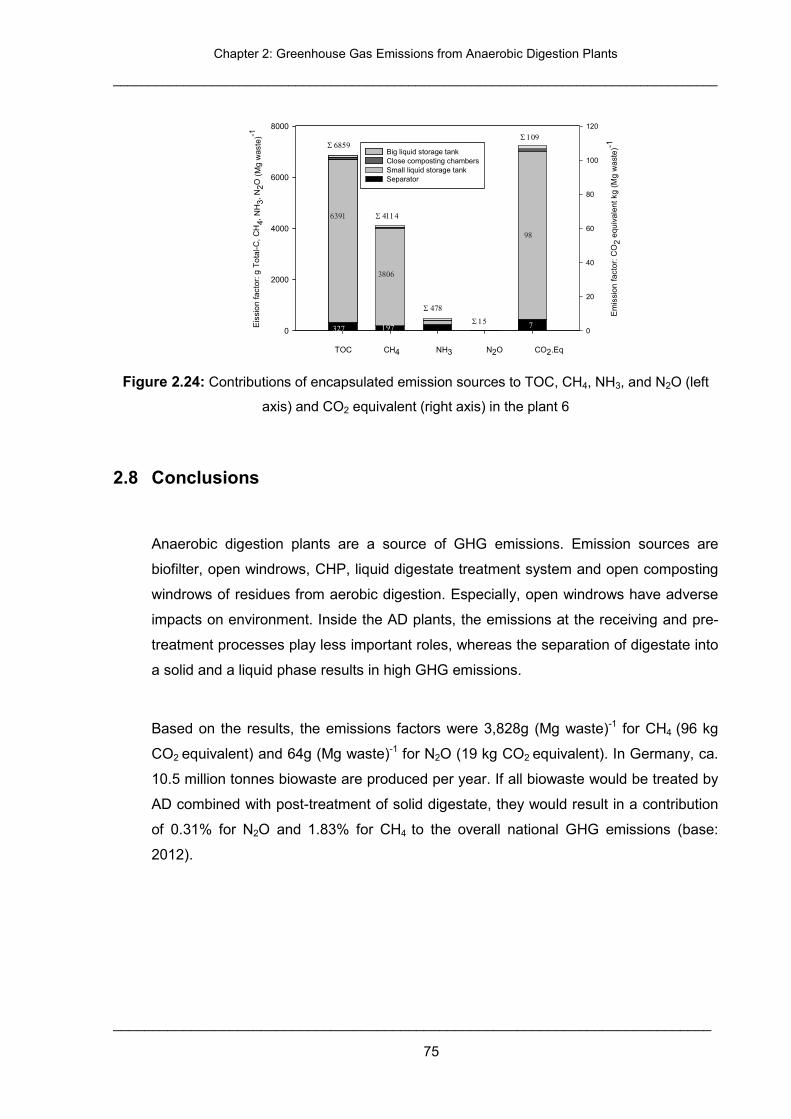
Chapter 2: Greenhouse Gas Emissions from Anaerobic Digestion Plants
______________________________________________________________________________________
_____________________________________________________________________________
75
Eis
sion
fact
or: g
Tot
al-C
, CH
4, N
H3,
N2O
(M
g w
aste
)-1
0
2000
4000
6000
8000
Em
issi
on fa
ctor
: CO
2 eq
uiva
lent
kg
(Mg
was
te)-1
0
20
40
60
80
100
120
Big liquid storage tankClose composting chambersSmall liquid storage tankSeparator
Σ 6859
Σ 478
Σ 15
Σ 109
Σ 41146391
327 197
3806
98
7
TOC CH4 NH3 N2O CO2.Eq
Figure 2.24: Contributions of encapsulated emission sources to TOC, CH4, NH3, and N2O (left
axis) and CO2 equivalent (right axis) in the plant 6
2.8 Conclusions
Anaerobic digestion plants are a source of GHG emissions. Emission sources are
biofilter, open windrows, CHP, liquid digestate treatment system and open composting
windrows of residues from aerobic digestion. Especially, open windrows have adverse
impacts on environment. Inside the AD plants, the emissions at the receiving and pre-
treatment processes play less important roles, whereas the separation of digestate into
a solid and a liquid phase results in high GHG emissions.
Based on the results, the emissions factors were 3,828g (Mg waste)-1 for CH4 (96 kg
CO2 equivalent) and 64g (Mg waste)-1 for N2O (19 kg CO2 equivalent). In Germany, ca.
10.5 million tonnes biowaste are produced per year. If all biowaste would be treated by
AD combined with post-treatment of solid digestate, they would result in a contribution
of 0.31% for N2O and 1.83% for CH4 to the overall national GHG emissions (base:
2012).
Chapter 2: Greenhouse Gas Emissions from Anaerobic Digestion Plants
______________________________________________________________________________________
_____________________________________________________________________________
76
2.9 References
Akdeniz, N. J., K. A. 2012. Full-scale biofilter reduction efficiencies assessed using portable
24-hour sampling units. Journal of the Air and Waste Management Association, 62,
170-182.
Amlinger, F., Peyr, S. and Cuhls, C. 2008. Greenhouse gas emissions from composting and
mechanical biological treatment. Waste Management and Research, 26, 47-60.
Appels, L., Baeyens, J., Degrève, J. and Dewil, R. 2008. Principles and potential of the
anaerobic digestion of waste-activated sludge. Progress in Energy and Combustion
Science, 34, 755-781.
Bockreis, A. and Steinberg, I. 2005. Influence of mechanical-biological waste pre-treatment
methods on the gas formation in landfills. Waste Management, 25, 337-343.
Bolzonella, D., Innocenti, L., Pavan, P., Traverso, P. and Cecchi, F. 2003. Semi-dry
thermophilic anaerobic digestion of the organic fraction of municipal solid waste:
focusing on the start-up phase. Bioresource Technology, 86, 123-129.
Chen, Y.-X., Yin, J. and Wang, K.-X. 2005. Long-term operation of biofilters for biological
removal of ammonia. Chemosphere, 58, 1023-1030.
Clemens, J. and Ahlgrimm, H.-J. 2001. Greenhouse gases from animal husbandry: mitigation
options. Nutrient Cycling in Agroecosystems, 60, 287-300.
Clemens, J. and Cuhls, C. 2003. Greenhouse gas emissions from mechanical and biological
waste treatment of municipal waste. Environmental Technology, 24, 745-754.
Colon, J., Cadena, E., Pognani, M., Barrena, R., Sanchez, A., Font, X. and Artola, A. 2012.
Determination of the energy and environmental burdens associated with the biological
treatment of source-separated Municipal Solid Wastes. Energy and Environmental
Science, 5, 5731-5741.
Cuhls, C. M., Birte. Clemens, Joachim . 2011. Treibhausgas emissionen aus Biogasanlagen.
Umwelt Magazin Ausgabe 1/2 (Luft):44-45.
Czepiel, P., Douglas, E., Harriss, R. and Crill, P. 1996. Measurements of N2O from
Composted Organic Wastes. Environmental Science and Technology, 30, 2519-2525.
Deshusses, M. A., Johnson, C. T. and Leson, G. 1999. Biofiltration of high loads of ethyl
acetate in the presence of toluene. Journal of the Air and Waste Management
Association, 49, 973-979.
Duerr, M., Gair, S., Cruden, A. and McDonald, J. 2007. Hydrogen and electrical energy from
organic waste treatment. International Journal of Hydrogen Energy, 32, 705-709.
Chapter 2: Greenhouse Gas Emissions from Anaerobic Digestion Plants
______________________________________________________________________________________
_____________________________________________________________________________
77
Einola, J.-K. M., Karhu, A. E. and Rintala, J. A. 2008. Mechanically-biologically treated
municipal solid waste as a support medium for microbial methane oxidation to
mitigate landfill greenhouse emissions. Waste Management, 28, 97-111.
Font, X., Artola, A. and Sánchez, A. 2011. Detection, Composition and Treatment of Volatile
Organic Compounds from Waste Treatment Plants. Sensors, 11, 4043-4059.
Forster-Carneiro, T., Perez, M. and Romero, L. I. 2008. Anaerobic digestion of municipal
solid wastes: Dry thermophilic performance. Bioresource Technology, 99, 8180-8184.
Fricke, K., Santen, H. and Wallmann, R. 2005. Comparison of selected aerobic and
anaerobic procedures for MSW treatment. Waste Management, 25, 799-810.
Hellmann, B., Zelles, L., Palojarvi, A. and Bai, Q. 1997. Emission of Climate-Relevant Trace
Gases and Succession of Microbial Communities during Open-Windrow Composting.
Appl. Environ. Microbiol., 63, 1011-1018.
Hogan, K. B., Hoffman, J. S. and Thompson, A. M. 1991. Methane on greenhous agenda.
Nature, 354, 181-182.
Hort, C., Gracy, S., Platel, V. and Moynault, L. 2009. Evaluation of sewage sludge and yard
waste compost as a biofilter media for the removal of ammonia and volatile organic
sulfur compounds (VOSCs). Chemical Engineering Journal, 152, 44-53.
Humer, M., Tintner, J., Böhm, K. and Lechner, P. 2011. Scrutinizing compost properties and
their impact on methane oxidation efficiency. Waste Management, 31, 871-883.
IPCC. 2007. Climate change 2007- the Physical Science Basis. Contribution of Working
Group I to the Fourth Assessment Report of the IPCC. Cambridge University Press,
Cambridge, UK.
Kaparaju, P. and Rintala, J. 2011. Mitigation of greenhouse gas emissions by adopting
anaerobic digestion technology on dairy, sow and pig farms in Finland. Renewable
Energy, 36, 31-41.
Kim, Dong-Hoon and Oh, Sae-Eun. 2011. Continuous high-solids anaerobic co-digestion of
organic solid wastes under mesophilic conditions. Waste Management, 31, 1943-
1948.
Kimochi, Y., Inamori, Y., Mizuochi, M., Xu, K.-Q. and Matsumura, M. 1998. Nitrogen removal
and N2O emission in a full-scale domestic wastewater treatment plant with
intermittent aeration. Journal of Fermentation and Bioengineering, 86, 202-206.
Li, Y., Park, S. Y. and Zhu, J. 2010. Solid-state anaerobic digestion for methane production
from organic waste. Renewable and Sustainable Energy Reviews, 15, 821-826.
Lopez, R., Cabeza, I. O., Giraldez, I. and Diaz, M. J. 2011. Biofiltration of composting gases
using different municipal solid waste-pruning residue composts: Monitoring by using
an electronic nose. Bioresource Technology, 102, 7984-7993.
Chapter 2: Greenhouse Gas Emissions from Anaerobic Digestion Plants
______________________________________________________________________________________
_____________________________________________________________________________
78
Mata-Alvarez, J., Macé, S. and Llabrés, P. 2000. Anaerobic digestion of organic solid wastes.
An overview of research achievements and perspectives. Bioresource Technology,
74, 3-16.
Melse, R. W. and Van der Werf, A. W. 2005. Biofiltration for mitigation of methane emission
from animal husbandry. Environmental Science and Technology, 39, 5460-5468.
Møller, J., Boldrin, A. and Christensen, T. H. 2009. Anaerobic digestion and digestate use:
accounting of greenhouse gases and global warming contribution. Waste
Management and Research, 27, 813-824.
Ojstrsek, A. and Fakin, D. 2009. Colour and TOC reduction using biofilter packed with natural
zeolite for the treatment of textile wastewaters. Desalination and Water Treatment, 33,
147-155.
Paavola, T. and Rintala, J. 2008. Effects of storage on characteristics and hygienic quality of
digestates from four co-digestion concepts of manure and biowaste. Bioresource
Technology, 99, 7041-7050.
Pagans, E. l., Font, X. and Sánchez, A. 2005. Biofiltration for ammonia removal from
composting exhaust gases. Chemical Engineering Journal, 113, 105-110.
Papport J, Z. R., Jenkins BM, William RB 2008. Agency Current Anaerobic Digestion
Technologies Used for Treatment of Municipal Organic Solid Waste. California
Environmental Protection Agency.
Park, K. Y., Inamori, Y., Mizuochi, M. and Ahn, K. H. 2000. Emission and control of nitrous
oxide from a biological wastewater treatment system with intermittent aeration.
Journal of Bioscience and Bioengineering, 90, 247-252.
Paul, J., Dieter Geesing 2009. The compost facility operation manual. Book.
Ryu, H. W., Cho, K. S. and Lee, T. H. 2011. Reduction of ammonia and volatile organic
compounds from food waste-composting facilities using a novel anti-clogging biofilter
system. Bioresource Technology, 102, 4654-4660.
Sánchez-Monedero, M. A., Serramiá, N., Civantos, C. G.-O., Fernández-Hernández, A. and
Roig, A. 2010. Greenhouse gas emissions during composting of two-phase olive mill
wastes with different agroindustrial by-products. Chemosphere, 81, 18-25.
Sanscartier, D., Maclean, H. L. and Saville, B. 2011. Electricity Production from Anaerobic
Digestion of Household Organic Waste in Ontario: Techno-Economic and GHG
Emission Analyses. Environmental Science and Technology, 46, 1233-1242.
Schlegelmilch, M., Streese, J., Biedermann, W., Herold, T. and Stegmann, R. 2005. Odour
control at biowaste composting facilities. Waste Management, 25, 917-927.
Soyez, K., Plickert, S. 2002. Mechanical-Biological Pre-Treatment of Waste – State of the Art
and Potentials of Biotechnology. Universität Potsdam.
Chapter 2: Greenhouse Gas Emissions from Anaerobic Digestion Plants
______________________________________________________________________________________
_____________________________________________________________________________
79
Trimborn, M., Goldbach, H., Clemens, J., Cuhls, C. and Breeger, A., 2003. Reduction of
greenhouse gases in the exhaust air of biofilters at biowaste treatment plants. In:
Band 14 der Bonner Agrikulturchemischen Reihe, Abschlußbericht zum
Forschungsvorhaben AZ:15052 der Deutschen Bundesstiftung Umwelt Osnabrück.
Umwelt Bundes Amt (UBA), 2009. Greenhouse gas emissions in Germany.
Umwelt Bundes Amt (UBA), 2011. Collection and treatment of Biowaste.
VDI 3475 part II, 2005, Emission control Biological waste treatment facilities composting and
anaerobic digestion plant capacities more than approx. 6000 Mg/a.
Weiland, P. 2000. Anaerobic waste digestion in Germany - Status and recent developments.
Biodegradation, 11, 415-421.
Wulf, S. Vandré, R. Clemens, J. 2002. Mitigation options for CH4, N2O and NH3 emissions
from slurry management. Conference paper. Non-CO2 greenhouse gases: scientific
understanding, control options and policy aspects:487-492.
Yoshida, H., Gable, J. J. and Park, J. K. 2011. Evaluation of organic waste diversion
alternatives for greenhouse gas reduction. Resources, Conservation and Recycling,
60, 1-9.
Zupančiča, G. D., Uranjek-Ževartb., Nataša, Roša., Milenko 2008. Full-scale anaerobic co-
digestion of organic waste and municipal sludge. Biomass and Bioenergy, 32, 162-
167.
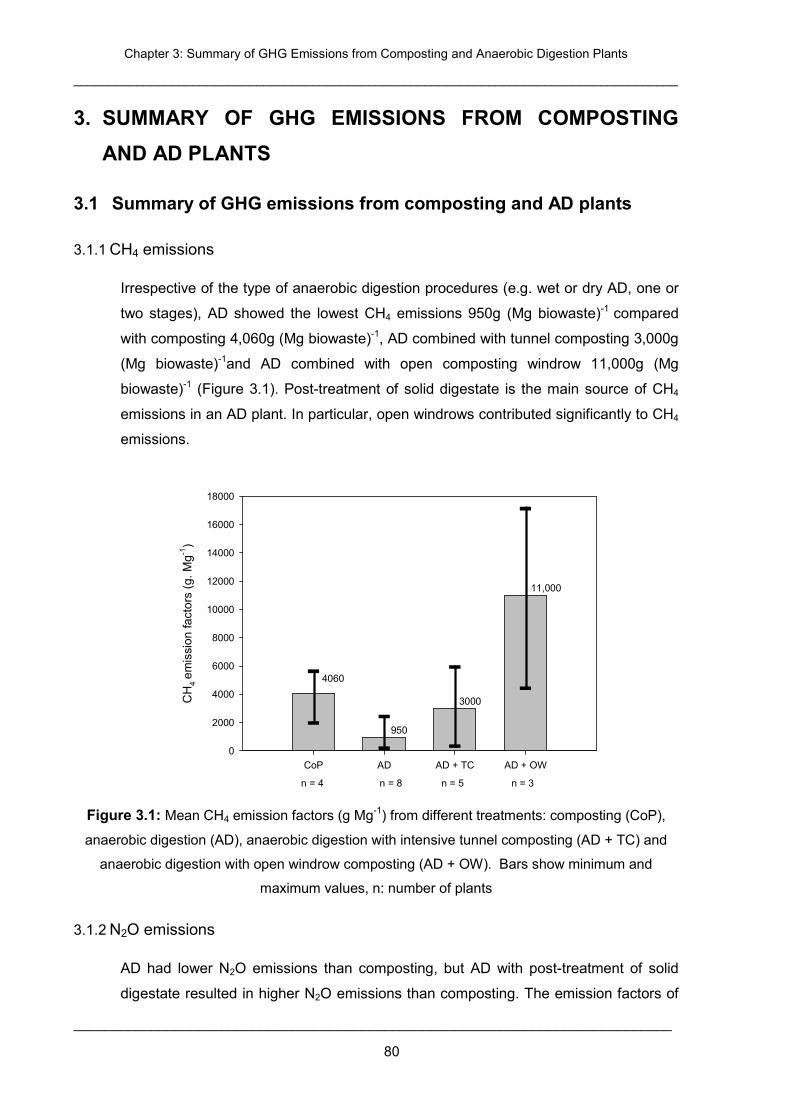
Chapter 3: Summary of GHG Emissions from Composting and Anaerobic Digestion Plants
______________________________________________________________________________________
_____________________________________________________________________________
80
3. SUMMARY OF GHG EMISSIONS FROM COMPOSTING
AND AD PLANTS
3.1 Summary of GHG emissions from composting and AD plants
3.1.1 CH4 emissions
Irrespective of the type of anaerobic digestion procedures (e.g. wet or dry AD, one or
two stages), AD showed the lowest CH4 emissions 950g (Mg biowaste)-1 compared
with composting 4,060g (Mg biowaste)-1, AD combined with tunnel composting 3,000g
(Mg biowaste)-1and AD combined with open composting windrow 11,000g (Mg
biowaste)-1 (Figure 3.1). Post-treatment of solid digestate is the main source of CH4
emissions in an AD plant. In particular, open windrows contributed significantly to CH4
emissions.
CoP AD AD + TC AD + OW
CH
4 em
issi
on fa
ctor
s (g
. Mg-1
)
0
2000
4000
6000
8000
10000
12000
14000
16000
18000
4060
950
3000
11,000
n = 4 n = 8 n = 5 n = 3
Figure 3.1: Mean CH4 emission factors (g Mg-1) from different treatments: composting (CoP),
anaerobic digestion (AD), anaerobic digestion with intensive tunnel composting (AD + TC) and
anaerobic digestion with open windrow composting (AD + OW). Bars show minimum and
maximum values, n: number of plants
3.1.2 N2O emissions
AD had lower N2O emissions than composting, but AD with post-treatment of solid
digestate resulted in higher N2O emissions than composting. The emission factors of
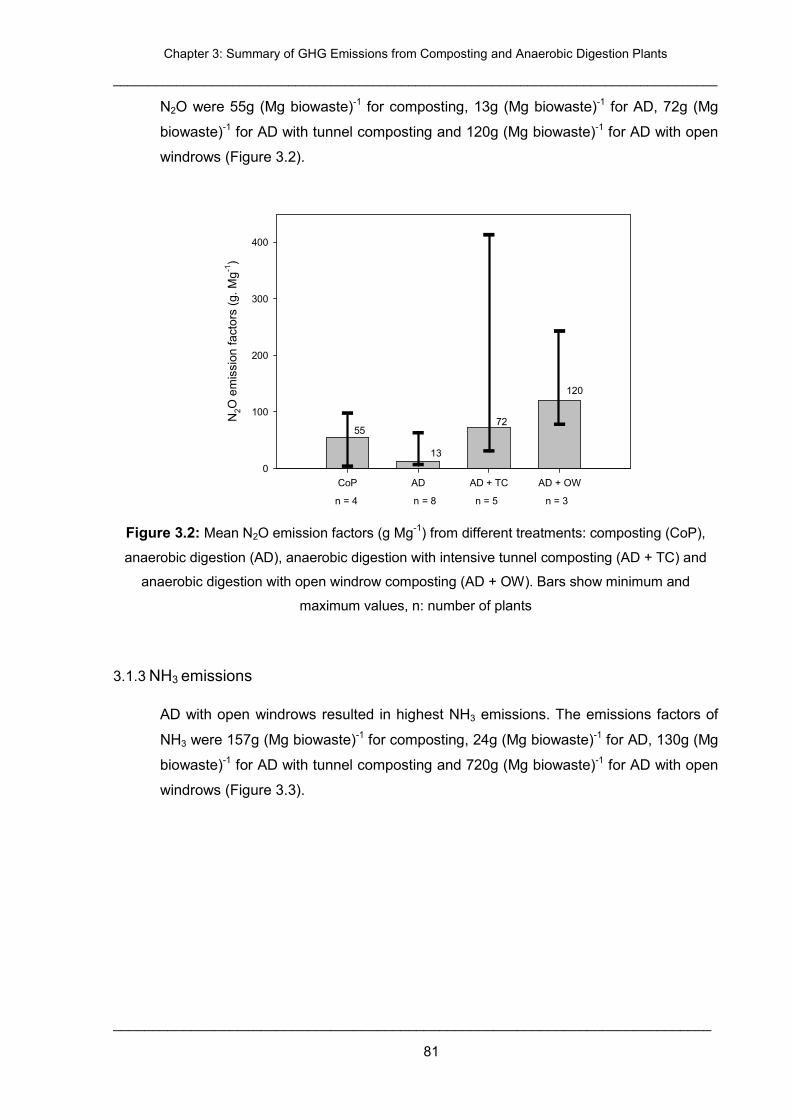
Chapter 3: Summary of GHG Emissions from Composting and Anaerobic Digestion Plants
______________________________________________________________________________________
_____________________________________________________________________________
81
N2O were 55g (Mg biowaste)-1 for composting, 13g (Mg biowaste)-1 for AD, 72g (Mg
biowaste)-1 for AD with tunnel composting and 120g (Mg biowaste)-1 for AD with open
windrows (Figure 3.2).
CoP AD AD + TC AD + OW
N2O
em
issi
on fa
ctor
s (g
. Mg-1
)
0
100
200
300
400
55
13
72
120
n = 4 n = 8 n = 5 n = 3
Figure 3.2: Mean N2O emission factors (g Mg-1) from different treatments: composting (CoP),
anaerobic digestion (AD), anaerobic digestion with intensive tunnel composting (AD + TC) and
anaerobic digestion with open windrow composting (AD + OW). Bars show minimum and
maximum values, n: number of plants
3.1.3 NH3 emissions
AD with open windrows resulted in highest NH3 emissions. The emissions factors of
NH3 were 157g (Mg biowaste)-1 for composting, 24g (Mg biowaste)-1 for AD, 130g (Mg
biowaste)-1 for AD with tunnel composting and 720g (Mg biowaste)-1 for AD with open
windrows (Figure 3.3).
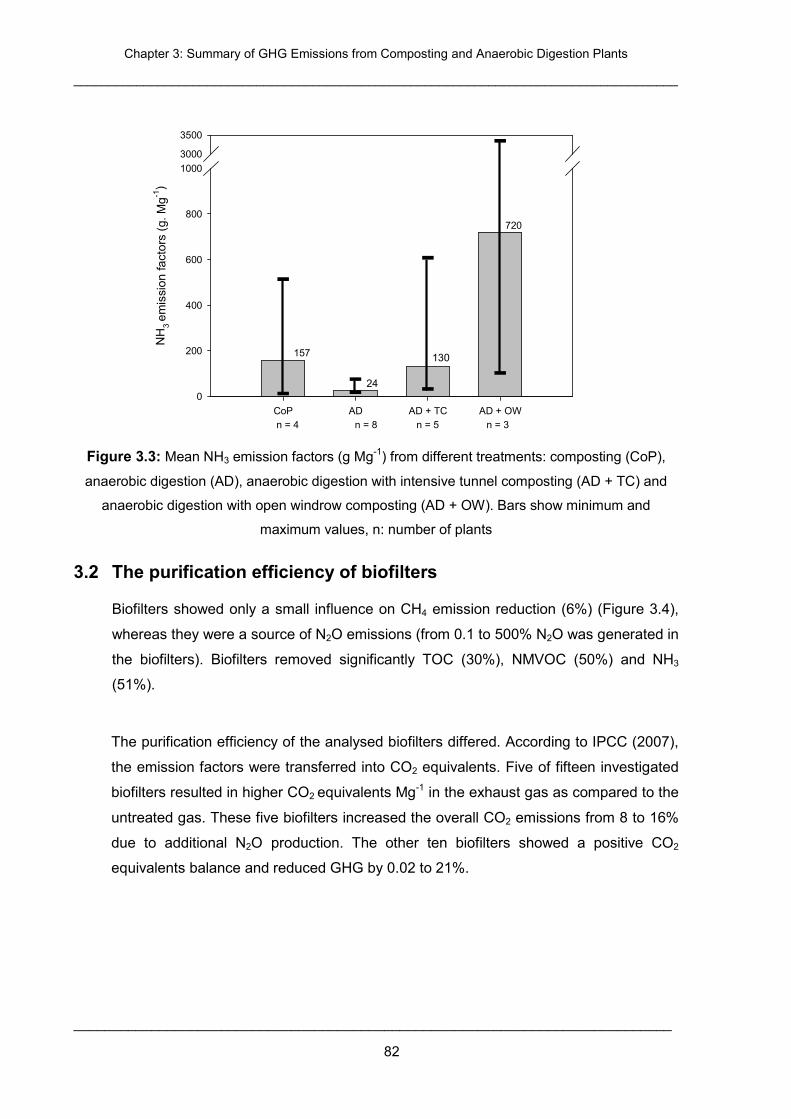
Chapter 3: Summary of GHG Emissions from Composting and Anaerobic Digestion Plants
______________________________________________________________________________________
_____________________________________________________________________________
82
CoP AD AD + TC AD + OW
NH
3 em
issi
on fa
ctor
s (g
. Mg-1
)
0
200
400
600
800
10003000
3500
157
24
130
720
n = 4 n = 8 n = 5 n = 3
Figure 3.3: Mean NH3 emission factors (g Mg-1) from different treatments: composting (CoP),
anaerobic digestion (AD), anaerobic digestion with intensive tunnel composting (AD + TC) and
anaerobic digestion with open windrow composting (AD + OW). Bars show minimum and
maximum values, n: number of plants
3.2 The purification efficiency of biofilters
Biofilters showed only a small influence on CH4 emission reduction (6%) (Figure 3.4),
whereas they were a source of N2O emissions (from 0.1 to 500% N2O was generated in
the biofilters). Biofilters removed significantly TOC (30%), NMVOC (50%) and NH3
(51%).
The purification efficiency of the analysed biofilters differed. According to IPCC (2007),
the emission factors were transferred into CO2 equivalents. Five of fifteen investigated
biofilters resulted in higher CO2 equivalents Mg-1 in the exhaust gas as compared to the
untreated gas. These five biofilters increased the overall CO2 emissions from 8 to 16%
due to additional N2O production. The other ten biofilters showed a positive CO2
equivalents balance and reduced GHG by 0.02 to 21%.
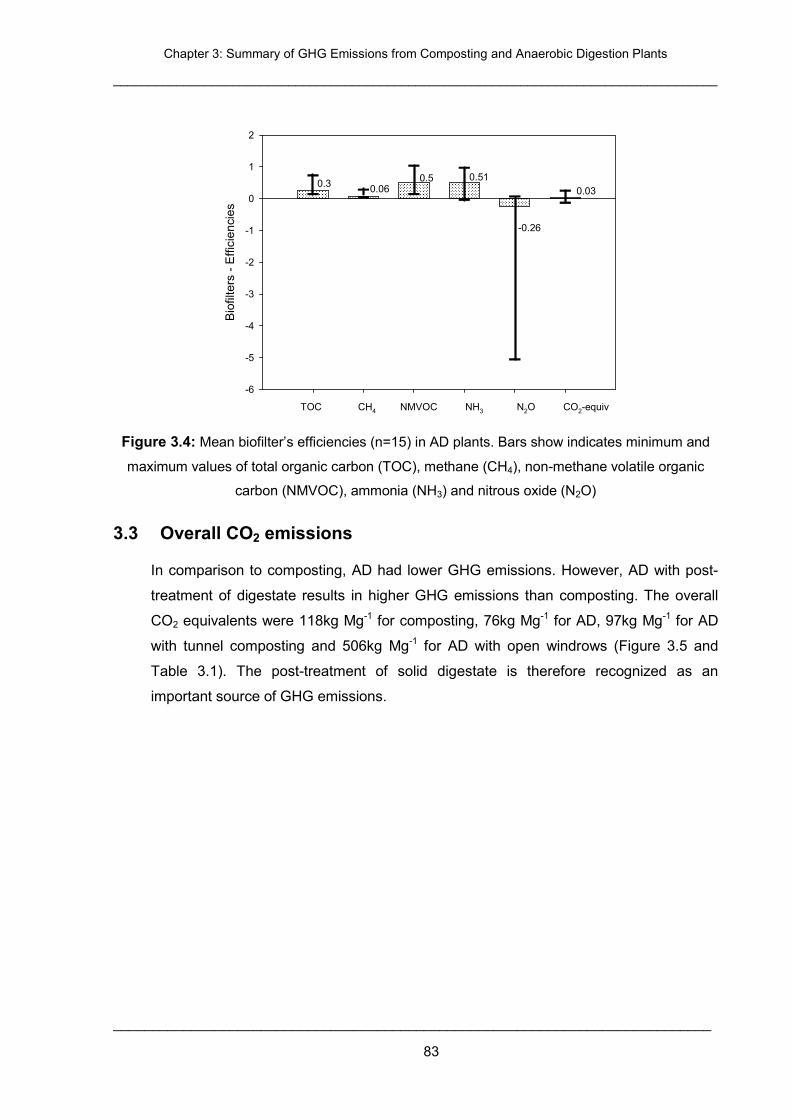
Chapter 3: Summary of GHG Emissions from Composting and Anaerobic Digestion Plants
______________________________________________________________________________________
_____________________________________________________________________________
83
Bio
filte
rs -
Effi
cien
cies
-6
-5
-4
-3
-2
-1
0
1
2
0.3 0.060.5 0.51
-0.26
0.03
TOC CH4 NMVOC NH3 N2O CO2-equiv
Figure 3.4: Mean biofilter’s efficiencies (n=15) in AD plants. Bars show indicates minimum and
maximum values of total organic carbon (TOC), methane (CH4), non-methane volatile organic
carbon (NMVOC), ammonia (NH3) and nitrous oxide (N2O)
3.3 Overall CO2 emissions
In comparison to composting, AD had lower GHG emissions. However, AD with post-
treatment of digestate results in higher GHG emissions than composting. The overall
CO2 equivalents were 118kg Mg-1 for composting, 76kg Mg-1 for AD, 97kg Mg-1 for AD
with tunnel composting and 506kg Mg-1 for AD with open windrows (Figure 3.5 and
Table 3.1). The post-treatment of solid digestate is therefore recognized as an
important source of GHG emissions.
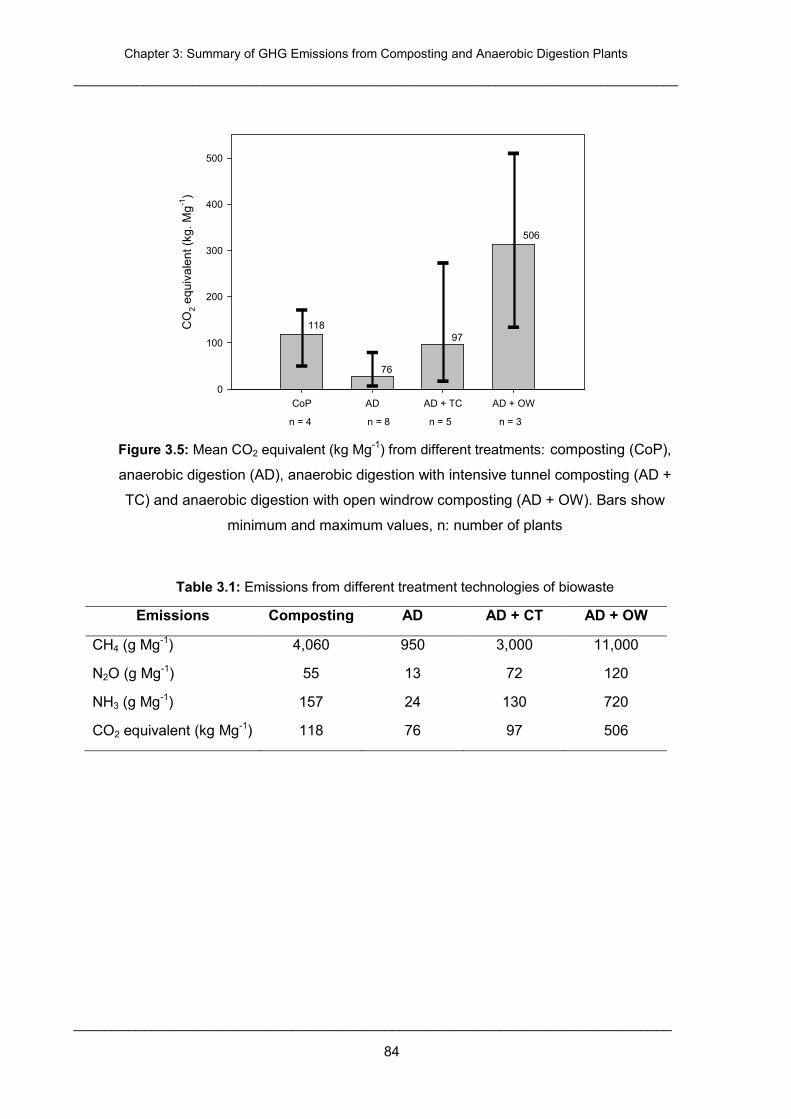
Chapter 3: Summary of GHG Emissions from Composting and Anaerobic Digestion Plants
______________________________________________________________________________________
_____________________________________________________________________________
84
CoP AD AD + TC AD + OW
CO
2 eq
uiva
lent
(kg
. Mg-1
)
0
100
200
300
400
500
118
76
97
506
n = 4 n = 8 n = 5 n = 3
Figure 3.5: Mean CO2 equivalent (kg Mg-1) from different treatments: composting (CoP),
anaerobic digestion (AD), anaerobic digestion with intensive tunnel composting (AD +
TC) and anaerobic digestion with open windrow composting (AD + OW). Bars show
minimum and maximum values, n: number of plants
Table 3.1: Emissions from different treatment technologies of biowaste
Emissions Composting AD AD + CT AD + OW
CH4 (g Mg-1) 4,060 950 3,000 11,000
N2O (g Mg-1) 55 13 72 120
NH3 (g Mg-1) 157 24 130 720
CO2 equivalent (kg Mg-1) 118 76 97 506
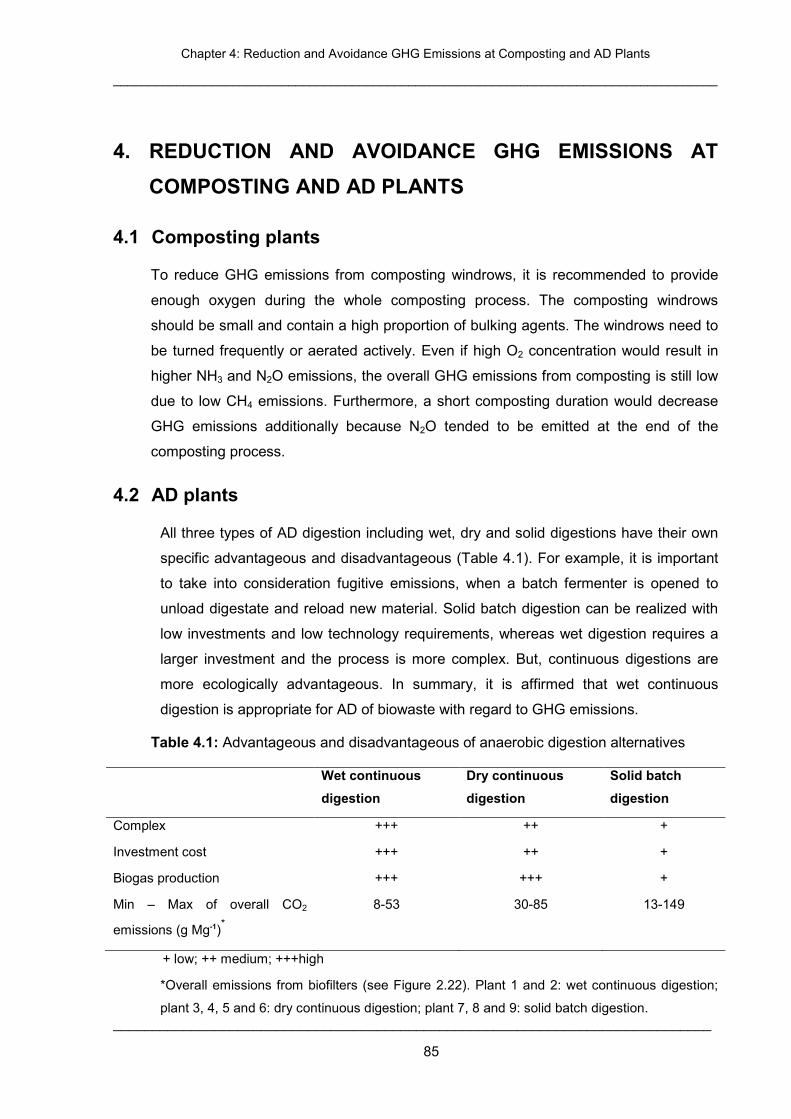
Chapter 4: Reduction and Avoidance GHG Emissions at Composting and AD Plants
______________________________________________________________________________________
_____________________________________________________________________________
85
4. REDUCTION AND AVOIDANCE GHG EMISSIONS AT
COMPOSTING AND AD PLANTS
4.1 Composting plants
To reduce GHG emissions from composting windrows, it is recommended to provide
enough oxygen during the whole composting process. The composting windrows
should be small and contain a high proportion of bulking agents. The windrows need to
be turned frequently or aerated actively. Even if high O2 concentration would result in
higher NH3 and N2O emissions, the overall GHG emissions from composting is still low
due to low CH4 emissions. Furthermore, a short composting duration would decrease
GHG emissions additionally because N2O tended to be emitted at the end of the
composting process.
4.2 AD plants
All three types of AD digestion including wet, dry and solid digestions have their own
specific advantageous and disadvantageous (Table 4.1). For example, it is important
to take into consideration fugitive emissions, when a batch fermenter is opened to
unload digestate and reload new material. Solid batch digestion can be realized with
low investments and low technology requirements, whereas wet digestion requires a
larger investment and the process is more complex. But, continuous digestions are
more ecologically advantageous. In summary, it is affirmed that wet continuous
digestion is appropriate for AD of biowaste with regard to GHG emissions.
Table 4.1: Advantageous and disadvantageous of anaerobic digestion alternatives
Wet continuous
digestion
Dry continuous
digestion
Solid batch
digestion
Complex +++ ++ +
Investment cost +++ ++ +
Biogas production +++ +++ +
Min – Max of overall CO2
emissions (g Mg-1)*
8-53 30-85 13-149
+ low; ++ medium; +++high
*Overall emissions from biofilters (see Figure 2.22). Plant 1 and 2: wet continuous digestion;
plant 3, 4, 5 and 6: dry continuous digestion; plant 7, 8 and 9: solid batch digestion.
Chapter 4: Reduction and Avoidance GHG Emissions at Composting and AD Plants
______________________________________________________________________________________
_____________________________________________________________________________
86
4.3 GHG emission mitigation options for post-treatment of
digestate
The post-treatment of digestate results in high GHG emissions at the investigated AD
plants. AD without post-treatment of digestate is favoured as it shows the lowest GHG
emissions. It can therefore be recommended that the digestate is transported directly to
nearby farms and used as fertilizer. It needs ca. 30 tons digestate for one ha grass or
arable land (Wulf, et al., 2002). Therefore, the land is covered by a layer of only 3 mm
digestate. After application the GHG emissions are reduced significantly due to the
reduction of CH4 emissions.
Potentially there are great GHG emissions benefits if biowaste is treated by wet
anaerobic digestion. Wet digestion results in liquid digestate only, which should be
directly applied without being composted. If anaerobic digestion was performed at
mesophilic condition, sanitation of digestate may be required before it is field applied.
If a separation of liquid and solid digestate is necessary, the post treatment of the solid
material should show only small GHG emissions. For this purpose it is suggested:
• The digestate should be mixed with bulking material.
• The mixture (ca. 50cm high) is aerated in small triangular windrows (maximum
height: 0.5m) for about 2 days. It is assumed that this treatment will create an
aerobic environment in the windrow and stops methane formation.
• The material is piled up to triangular windrows with a height of ca 1.5m. Then
the windrows are aerated for minimum two weeks.
Chapter 5: General Conclusions
______________________________________________________________________________________
_____________________________________________________________________________
87
5. GENERAL CONCLUSIONS
In conclusion, both composting and AD entail GHG emissions. CH4 and N2O are
generated significantly and are the major contributors to the emissions. AD treatment
alone shows the lowest GHG emissions in comparison to composting, AD with tunnel
composting and AD with open windrows composting. Active aerated windrows (tunnel
composting) showed lower emissions than open windrows.
GHG emissions during post treatment of AD material can be limited by intensive
aeration.
In general, it was shown that environmental loads from composting of biowaste were
lower than AD combined with post-treatments of digestate. However, AD generates
biogas, which is used as a renewable energy source. In connection with the energy
recovery and rather low GHG emissions, it is reasonable to believe that wet AD has a
high potential to treat biowaste sustainably.
GHG emissions calculations in the study were linked directly to aerobic and anaerobic
activities at the composting and AD plants. The data on fuel or electricity
consumptions and emissions from the application on land of digestate are missing.
Additionally, GHG emission savings by using biogas as a renewable energy source
were not calculated. Thus, the overall emissions of the composting and anaerobic
digestion plants should be studied in further researches.
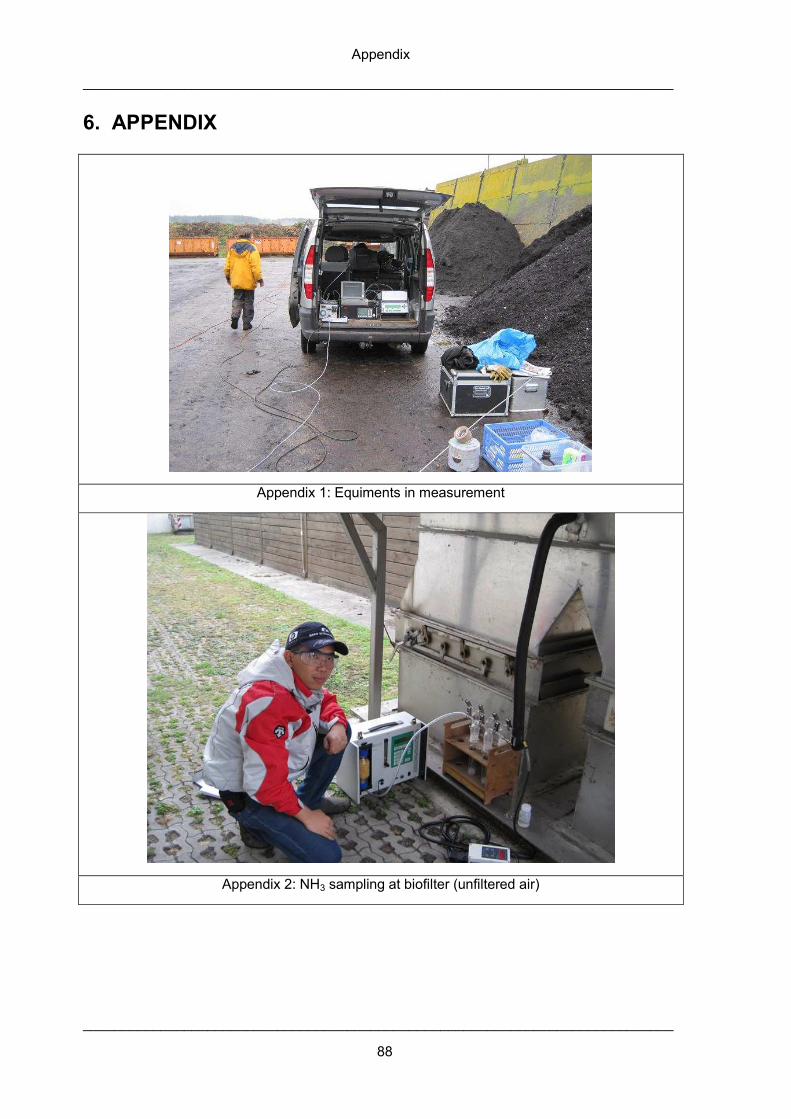
Appendix
____________________________________________________________________________
____________________________________________________________________________
88
6. APPENDIX
Appendix 1: Equiments in measurement
Appendix 2: NH3 sampling at biofilter (unfiltered air)
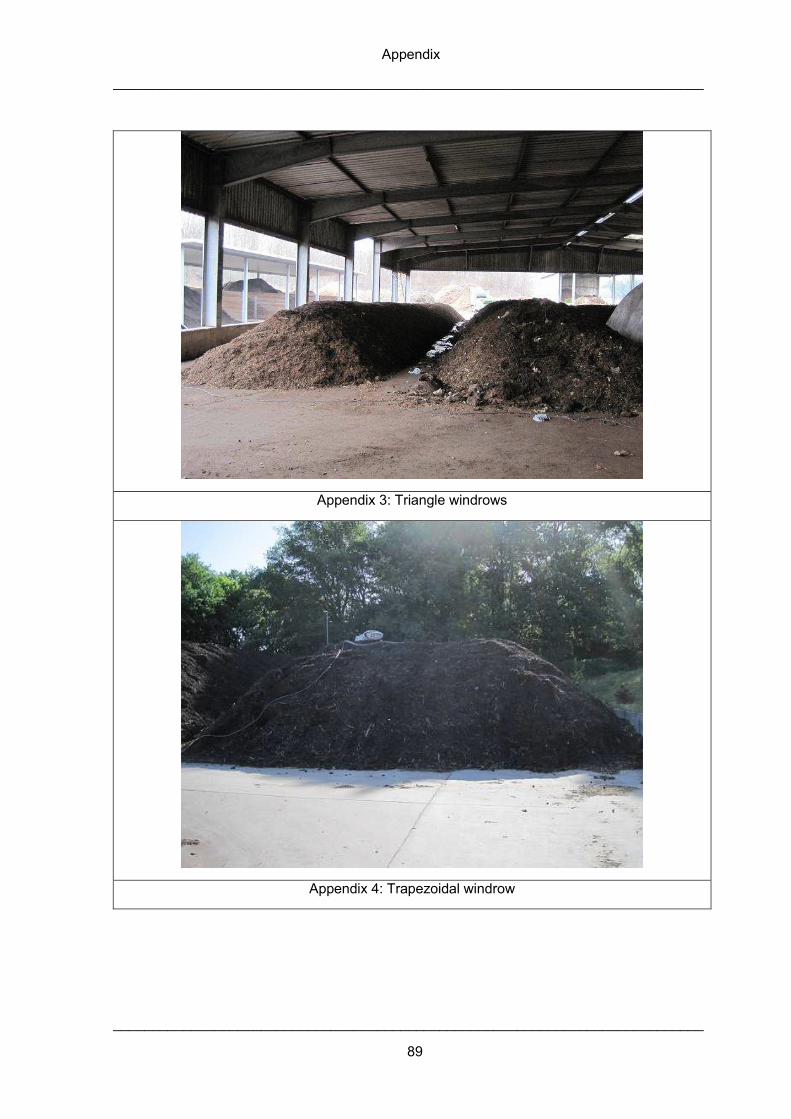
Appendix
____________________________________________________________________________
____________________________________________________________________________
89
Appendix 3: Triangle windrows
Appendix 4: Trapezoidal windrow
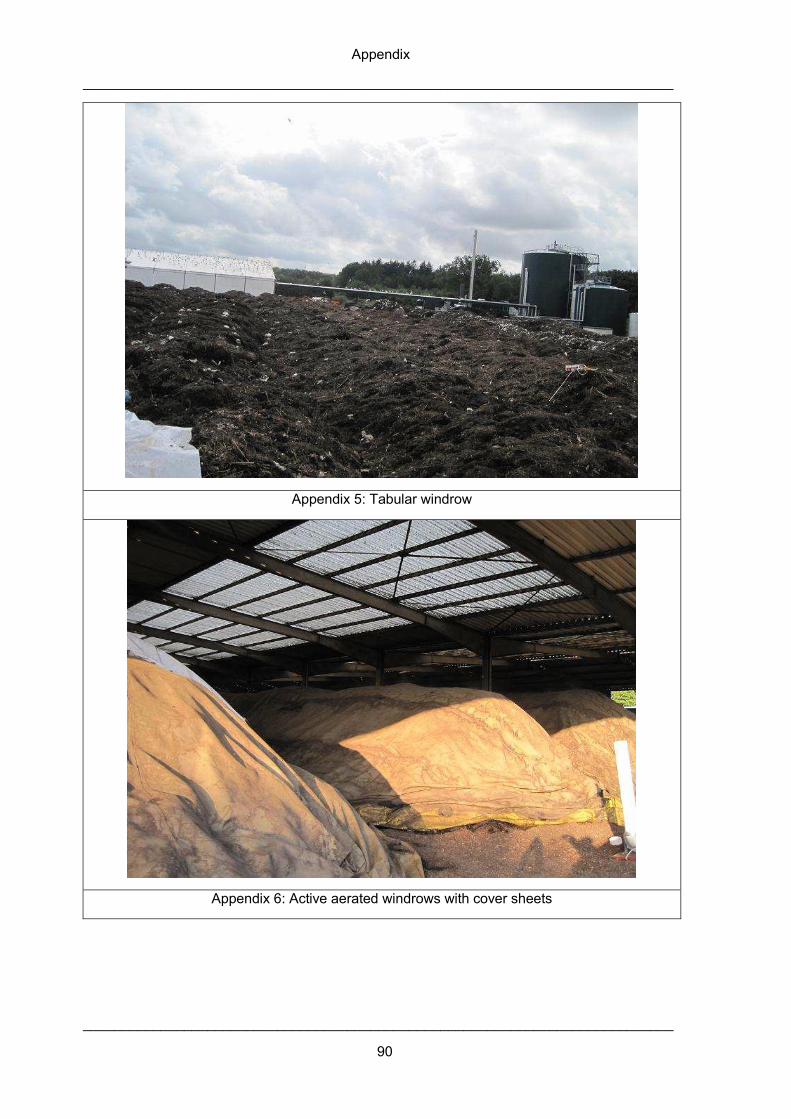
Appendix
____________________________________________________________________________
____________________________________________________________________________
90
Appendix 5: Tabular windrow
Appendix 6: Active aerated windrows with cover sheets
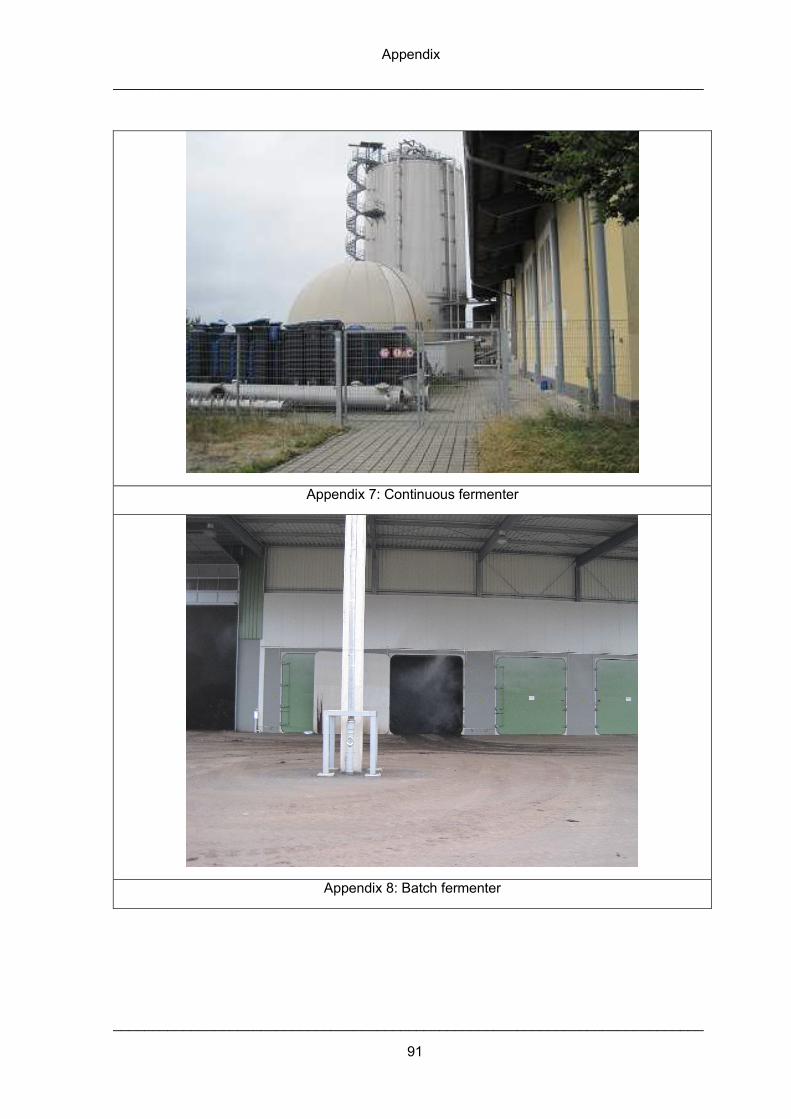
Appendix
____________________________________________________________________________
____________________________________________________________________________
91
Appendix 7: Continuous fermenter
Appendix 8: Batch fermenter
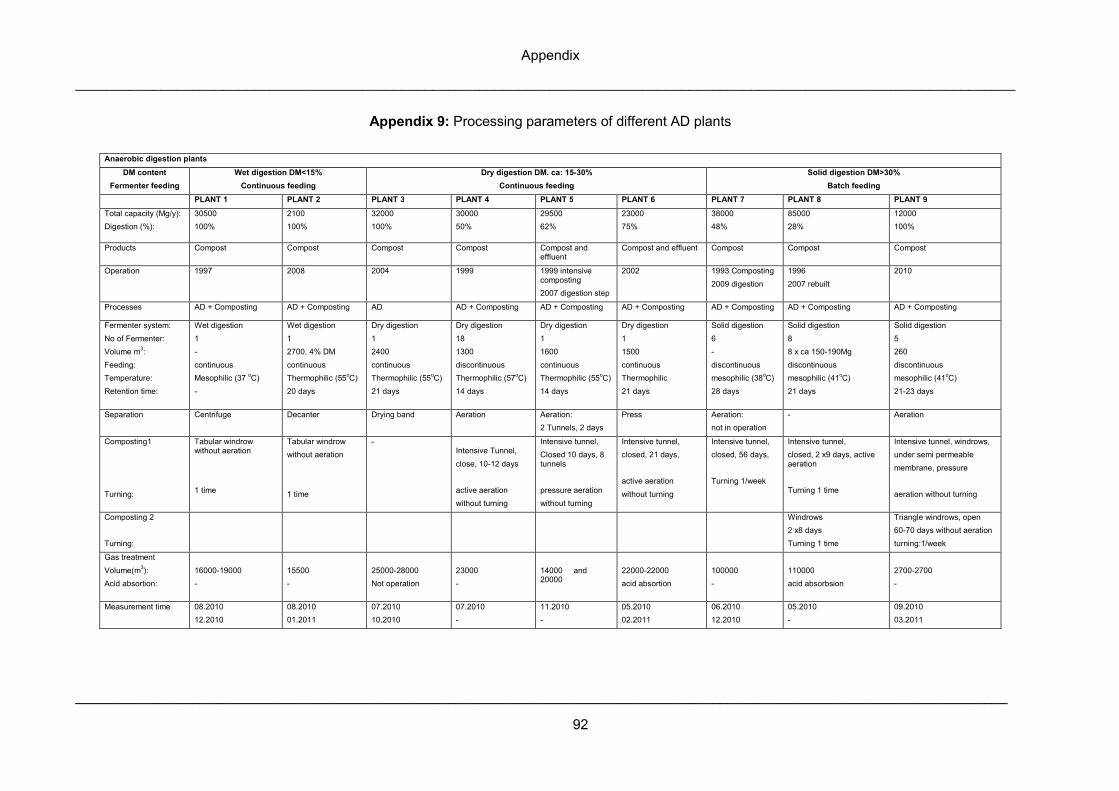
Appendix
_________________________________________________________________________________________________________________________
________________________________________________________________________________________________________________________
92
Appendix 9: Processing parameters of different AD plants
Anaerobic digestion plants
DM content
Fermenter feeding
Wet digestion DM<15%
Continuous feeding
Dry digestion DM. ca: 15-30%
Continuous feeding
Solid digestion DM>30%
Batch feeding
PLANT 1 PLANT 2 PLANT 3 PLANT 4 PLANT 5 PLANT 6 PLANT 7 PLANT 8 PLANT 9
Total capacity (Mg/y):
Digestion (%):
30500
100%
2100
100%
32000
100%
30000
50%
29500
62%
23000
75%
38000
48%
85000
28%
12000
100%
Products Compost Compost Compost Compost Compost and effluent
Compost and effluent Compost Compost Compost
Operation 1997 2008 2004 1999 1999 intensive composting
2007 digestion step
2002 1993 Composting
2009 digestion
1996
2007 rebuilt
2010
Processes AD + Composting AD + Composting AD AD + Composting AD + Composting AD + Composting AD + Composting AD + Composting AD + Composting
Fermenter system:
No of Fermenter:
Volume m3:
Feeding:
Temperature:
Retention time:
Wet digestion
1
-
continuous
Mesophilic (37 oC)
-
Wet digestion
1
2700, 4% DM
continuous
Thermophilic (55oC)
20 days
Dry digestion
1
2400
continuous
Thermophilic (55oC)
21 days
Dry digestion
18
1300
discontinuous
Thermophilic (57oC)
14 days
Dry digestion
1
1600
continuous
Thermophilic (55oC)
14 days
Dry digestion
1
1500
continuous
Thermophilic
21 days
Solid digestion
6
-
discontinuous
mesophilic (38oC)
28 days
Solid digestion
8
8 x ca 150-190Mg
discontinuous
mesophilic (41oC)
21 days
Solid digestion
5
260
discontinuous
mesophilic (41oC)
21-23 days
Separation Centrifuge Decanter Drying band Aeration Aeration:
2 Tunnels, 2 days
Press Aeration:
not in operation
- Aeration
Composting1
Turning:
Tabular windrow without aeration
1 time
Tabular windrow
without aeration
1 time
-
Intensive Tunnel,
close, 10-12 days
active aeration
without turning
Intensive tunnel,
Closed 10 days, 8 tunnels
pressure aeration
without turning
Intensive tunnel,
closed, 21 days,
active aeration
without turning
Intensive tunnel,
closed, 56 days,
Turning 1/week
Intensive tunnel,
closed, 2 x9 days, active aeration
Turning 1 time
Intensive tunnel, windrows,
under semi permeable
membrane, pressure
aeration without turning
Composting 2
Turning:
Windrows
2 x8 days
Turning 1 time
Triangle windrows, open
60-70 days without aeration
turning:1/week
Gas treatment
Volume(m3):
Acid absortion:
16000-19000
-
15500
-
25000-28000
Not operation
23000
-
14000 and 20000
22000-22000
acid absortion
100000
-
110000
acid absorbsion
2700-2700
-
Measurement time 08.2010
12.2010
08.2010
01.2011
07.2010
10.2010
07.2010
-
11.2010
-
05.2010
02.2011
06.2010
12.2010
05.2010
-
09.2010
03.2011
Appendix
_____________________________________________________________________________
_____________________________________________________________________________
93
Appendix
_____________________________________________________________________________
_____________________________________________________________________________
94
Published papers
1. Samantha Antonini, Phong Thanh Nguyen, Ute Arnold, Thomas Eichert, Joachim Clemens,
2012, Solar thermal evaporation of human urine for nitrogen and phosphorous recovery in
Viet Nam, Science of the total environment, 414: 592-599.
2. Nguyen Thanh Phong, Samantha Antonini, Carsten Cuhls, 2008, Collection and
concentration of urine to produce a mineral fertilizer, SANSED workshop “Decentralised
Water Treatment Systems and Benificial Reuse of Generated Substrates”, Can Tho
University, Viet Nam.
3. Ute Arnold, Uwe Klaus, Duong Van Ni, Nguyen Thanh Phong, Carsten Cuhls, Joachim
Clemens, 2007, Implementation of an Advanced Waste Water Treatment system to recycle
and reuse nutrients in Agriculture at Can Tho University, Mekong delta, Viet Nam, Advanced
sanitation 12-13 March 2007, Eurogress, Aachen, Germany.