Embed Size (px)
Citation preview
TECHNISCHE UNIVERSITÄT MÜNCHEN
Department Chemie, Lehrstuhl für Technische Chemie II
Homogeneous and heterogeneous catalyzed
hydrolysis of lignin
Virginia Marie Roberts
Vollständiger Abdruck der von der Fakultät für Chemie
der Technischen Universität München zur Erlangung des akademischen Grades eines
Doktors der Naturwissenschaften (Dr. rer. nat.)
genehmigten Dissertation.
Vorsitzender: Univ.-Prof. Dr. K.-O. Hinrichsen
Prüfer der Dissertation: 1. Univ.-Prof. Dr. J. A. Lercher
2. Univ.-Prof. Dr. U. K. Heiz
Die Dissertation wurde am 11.06.2008 bei der Technischen Universität München
eingereicht und durch die Fakultät für Chemie am 16.07.2008 angenommen.
Acknowledgment
First of all, I would like to thank Johannes (Prof. J. A. Lercher) for the opportunity of working
in his group and for providing me with such an interesting topic. Thank you for your guidance
and support throughout my Ph.D. and also for pushing me when necessary.
I would also like to acknowledge Prof. Angeliki Lemonidou, who spent several months in our
group. Thank you for all your help on the papers.
I am grateful for the financial support granted from the “Fachagentur für nachwachsende
Rohstoffe”. In this context, I would like to mention my project partners from the ICT
Karlsruhe and Dow Germany. Thank you for the good collaboration. Our project meetings
were always very pleasant and of great help to my work. Special thanks goes to Gerd
Unkelbach for showing us around Karlsruhe during our research visit.
Of course, I haven´t forgotten my many students. Thanks goes especially to Richard, Valentin
and Sebastian who contributed a lot to this work.
Xaver! What would I have done without you. Heaven knows. Thanks you so much!
Life at TCII without Elvira and Benjamin? Unimaginable! I love you.
Thank you also to all other colleagues and friends. My dear Andi, every day 11:30, I look
towards the door of our office, waiting for you to enter and kick us to the mensa. Thank you
Wolfgang, Chen, Anna, Christoph, Aon, Martin and Andreas Marx. Tommy, thanks for not
letting me down with my miserable German.
Last but not least, I would like to thank my loving parents.
Virginia
June, 2008

Table of contents
i
Table of contents
1 Introduction 2
1.1 Motivation 2
1.2 Biomass 3
1.2.1 Fuels and energy production from biomass 5
1.2.2 Chemicals production from biomass 6
1.3 Lignin 10
1.3.1 General structure of lignin 10
1.3.2 Recovery of lignin 11
1.3.3 Effect of recovery method and plant origin on the properties of the isolated lignin 15
1.3.4 Lignin conversion 17
1.4 Sub –and supercritical water 22
1.4.1 Properties of sub – and supercritical water 23
1.4.2 Overview on applications of sub –and supercritical water 26
1.4.3 Reaction kinetics in supercritical fluids 28
1.5 Scope of the thesis 33
1.6 References 35
2 Experimental 41
2.1 Autoclaves and tumbling oven 42
2.2 Continuous setup 43
2.3 Product analyis 43
3 A study on hydrothermal treatment of lignin model compounds 48
3.1 Introduction 49
3.1.1 Phenyl alkyl ethers 51
3.1.2 Carbon-carbon bonds 54
3.1.3 Aryl-aryl ethers 55
3.2 Experimental 58
3.3 Results 59
3.3.1 Kinetic investigation on DPE and BPE 59
3.3.2 Density effect on conversion and product distribution 69
3.3.3 Alcoholysis versus hydrolysis 71
3.4 Discussion 72
3.4.1 Diphenyl ether and Benzyl phenyl ether 72
Table of contents
ii
3.4.2 Density effect on conversion and product distribution 79
3.4.3 Alcoholysis versus hydrolysis 81
3.5 Conclusions 82
3.6 References 83
4 Elaboration of an optimized work up procedure for the BCD process 85
4.1 Introduction 86
4.2 Experimantal 89
4.3 Results 90
4.4 Discussion 93
4.5 Conclusions 95
4.6 References 96
5 On the mechanism of base catalyzed depolymerization of lignin 98
5.1 Introduction 99
5.2 Experimental 101
5.3 Results 103
5.4 Discussion 111
5.5 Conclusions 116
5.6 References 117
6 Boric acid as a capping agent to suppress oligomerization reactions during
hydrothermal lignin treatment 119
6.1 Introduction 120
6.2 Experimental 122
6.3 Results 124
6.4 Discussion 129
6.5 Conclusions 132
6.6 References 132
7 Summary 134
7.1 Summary 134
7.2 Zusammenfassung 138

Table of contents
iii
8 Curriculum vitae 142
9 List of publications 143
10 Oral and poster presentations 144
Chapter 1
1
Chapter 1
Introduction
Abstract
The introduction gives a general insight on biomass utilization for energy, fuel and
chemical production. Lignin is introduced, and an overview on its structure, the various
methods of recovery and their effect on the properties of the obtained lignin are given.
Furthermore, applications for sub – and supercritical water as a reaction medium as well as its
properties and effects on reaction kinetics are described.
Chapter 1
2
1 Introduction
1.1 Motivation
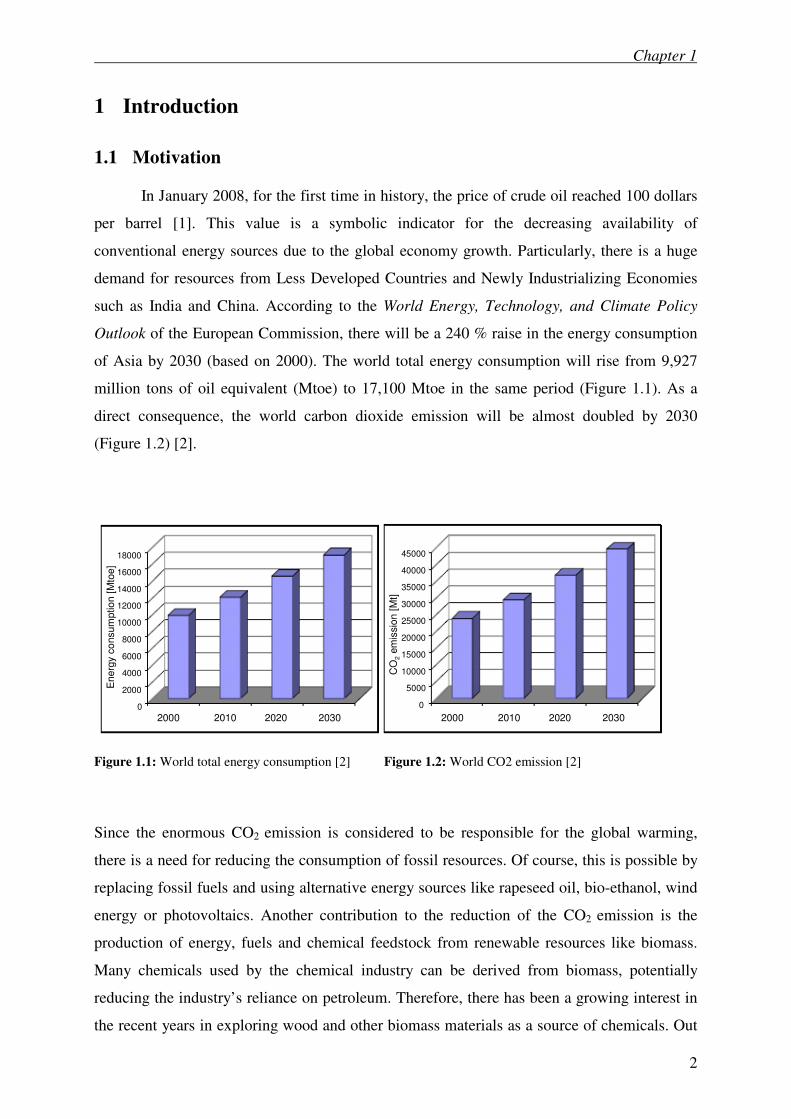
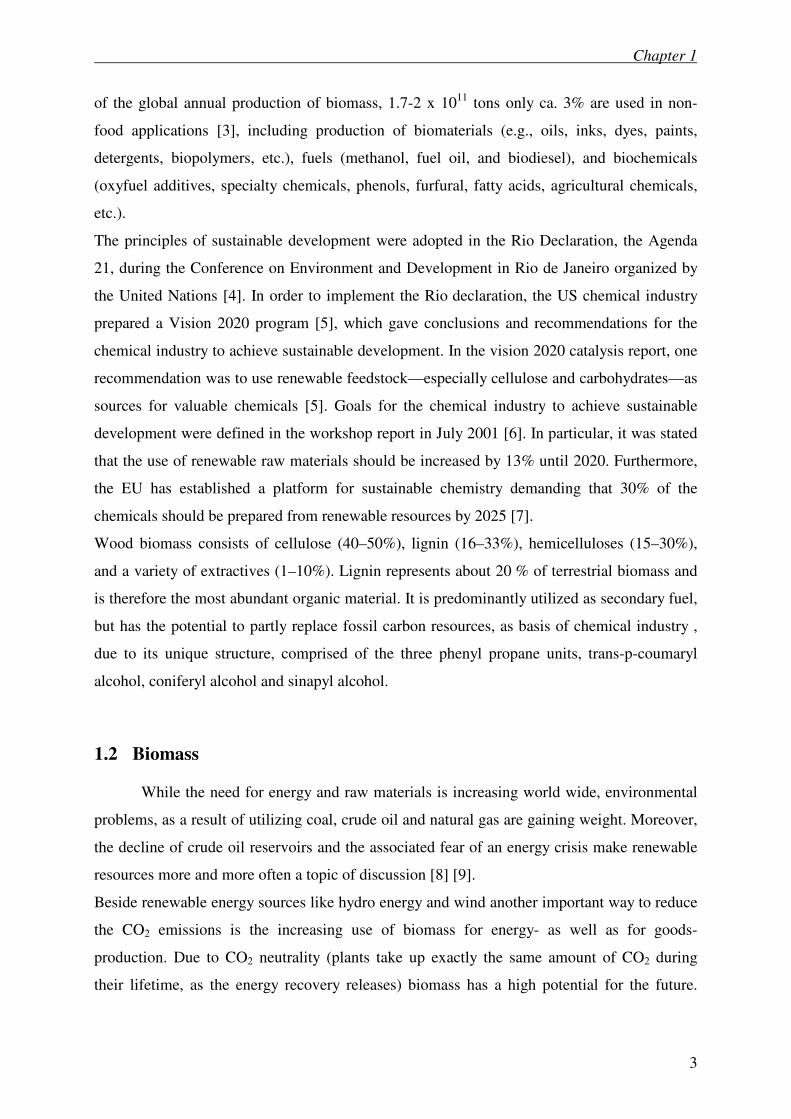
In January 2008, for the first time in history, the price of crude oil reached 100 dollars
per barrel [1]. This value is a symbolic indicator for the decreasing availability of
conventional energy sources due to the global economy growth. Particularly, there is a huge
demand for resources from Less Developed Countries and Newly Industrializing Economies
such as India and China. According to the World Energy, Technology, and Climate Policy
Outlook of the European Commission, there will be a 240 % raise in the energy consumption
of Asia by 2030 (based on 2000). The world total energy consumption will rise from 9,927
million tons of oil equivalent (Mtoe) to 17,100 Mtoe in the same period (Figure 1.1). As a
direct consequence, the world carbon dioxide emission will be almost doubled by 2030
(Figure 1.2) [2].
Figure 1.1: World total energy consumption [2] Figure 1.2: World CO2 emission [2]
Since the enormous CO2 emission is considered to be responsible for the global warming,
there is a need for reducing the consumption of fossil resources. Of course, this is possible by
replacing fossil fuels and using alternative energy sources like rapeseed oil, bio-ethanol, wind
energy or photovoltaics. Another contribution to the reduction of the CO2 emission is the
production of energy, fuels and chemical feedstock from renewable resources like biomass.
Many chemicals used by the chemical industry can be derived from biomass, potentially
reducing the industry’s reliance on petroleum. Therefore, there has been a growing interest in
the recent years in exploring wood and other biomass materials as a source of chemicals. Out
18000
16000
14000
12000
10000
8000
6000
4000
2000
0
Energ
y c
onsum
ption [
Mto
e]
2000 2010 2020 2030 2000 2010 2020 2030
45000
40000
35000
30000
25000
20000
15000
10000
5000
0
CO
2em
issio
n [
Mt]
18000
16000
14000
12000
10000
8000
6000
4000
2000
0
Energ
y c
onsum
ption [
Mto
e]
2000 2010 2020 2030 2000 2010 2020 2030
45000
40000
35000
30000
25000
20000
15000
10000
5000
0
CO
2em
issio
n [
Mt]
Chapter 1
3
of the global annual production of biomass, 1.7-2 x 10¹¹
tons only ca. 3% are used in non-
food applications [3], including production of biomaterials (e.g., oils, inks, dyes, paints,
detergents, biopolymers, etc.), fuels (methanol, fuel oil, and biodiesel), and biochemicals
(oxyfuel additives, specialty chemicals, phenols, furfural, fatty acids, agricultural chemicals,
etc.).
The principles of sustainable development were adopted in the Rio Declaration, the Agenda
21, during the Conference on Environment and Development in Rio de Janeiro organized by
the United Nations [4]. In order to implement the Rio declaration, the US chemical industry
prepared a Vision 2020 program [5], which gave conclusions and recommendations for the
chemical industry to achieve sustainable development. In the vision 2020 catalysis report, one
recommendation was to use renewable feedstock—especially cellulose and carbohydrates—as
sources for valuable chemicals [5]. Goals for the chemical industry to achieve sustainable
development were defined in the workshop report in July 2001 [6]. In particular, it was stated
that the use of renewable raw materials should be increased by 13% until 2020. Furthermore,
the EU has established a platform for sustainable chemistry demanding that 30% of the
chemicals should be prepared from renewable resources by 2025 [7].
Wood biomass consists of cellulose (40–50%), lignin (16–33%), hemicelluloses (15–30%),
and a variety of extractives (1–10%). Lignin represents about 20 % of terrestrial biomass and
is therefore the most abundant organic material. It is predominantly utilized as secondary fuel,
but has the potential to partly replace fossil carbon resources, as basis of chemical industry ,
due to its unique structure, comprised of the three phenyl propane units, trans-p-coumaryl
alcohol, coniferyl alcohol and sinapyl alcohol.
1.2 Biomass
While the need for energy and raw materials is increasing world wide, environmental
problems, as a result of utilizing coal, crude oil and natural gas are gaining weight. Moreover,
the decline of crude oil reservoirs and the associated fear of an energy crisis make renewable
resources more and more often a topic of discussion [8] [9].
Beside renewable energy sources like hydro energy and wind another important way to reduce
the CO2 emissions is the increasing use of biomass for energy- as well as for goods-
production. Due to CO2 neutrality (plants take up exactly the same amount of CO2 during
their lifetime, as the energy recovery releases) biomass has a high potential for the future.
Chapter 1
4
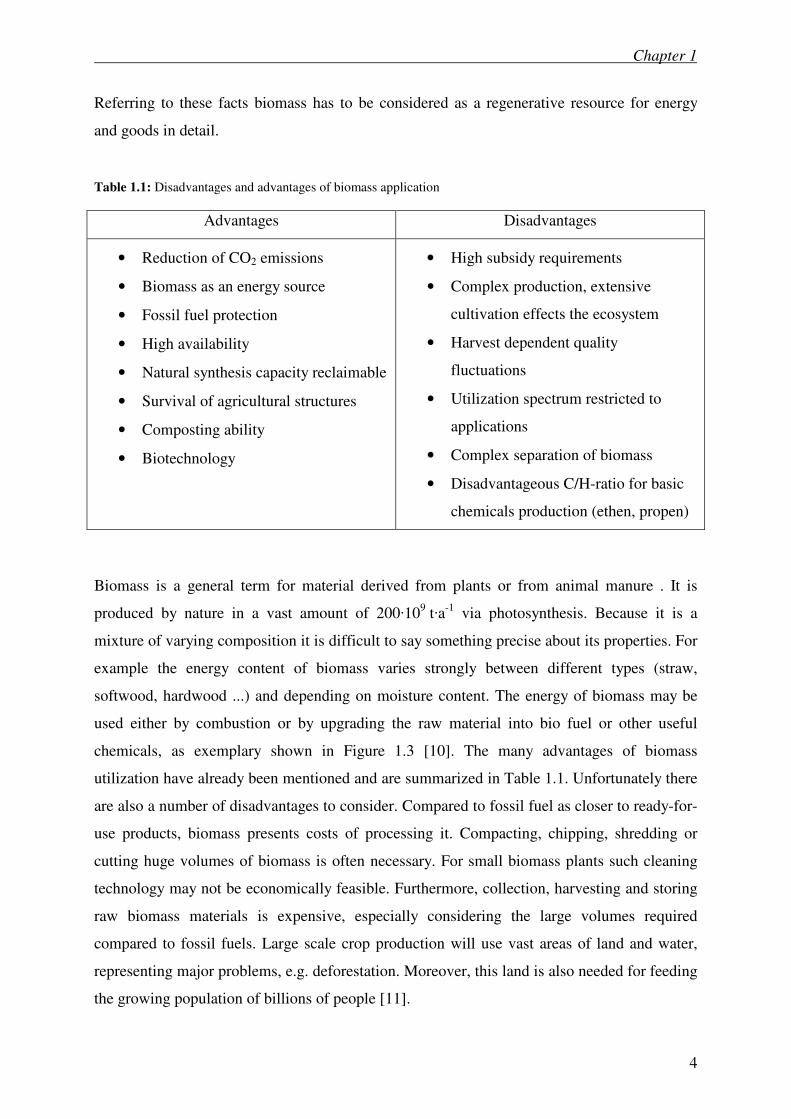
Referring to these facts biomass has to be considered as a regenerative resource for energy
and goods in detail.
Table 1.1: Disadvantages and advantages of biomass application
Advantages Disadvantages
• Reduction of CO2 emissions
• Biomass as an energy source
• Fossil fuel protection
• High availability
• Natural synthesis capacity reclaimable
• Survival of agricultural structures
• Composting ability
• Biotechnology
• High subsidy requirements
• Complex production, extensive
cultivation effects the ecosystem
• Harvest dependent quality
fluctuations
• Utilization spectrum restricted to
applications
• Complex separation of biomass
• Disadvantageous C/H-ratio for basic
chemicals production (ethen, propen)
Biomass is a general term for material derived from plants or from animal manure . It is
produced by nature in a vast amount of 200·109 t·a
-1 via photosynthesis. Because it is a
mixture of varying composition it is difficult to say something precise about its properties. For
example the energy content of biomass varies strongly between different types (straw,
softwood, hardwood ...) and depending on moisture content. The energy of biomass may be
used either by combustion or by upgrading the raw material into bio fuel or other useful
chemicals, as exemplary shown in Figure 1.3 [10]. The many advantages of biomass
utilization have already been mentioned and are summarized in Table 1.1. Unfortunately there
are also a number of disadvantages to consider. Compared to fossil fuel as closer to ready-for-
use products, biomass presents costs of processing it. Compacting, chipping, shredding or
cutting huge volumes of biomass is often necessary. For small biomass plants such cleaning
technology may not be economically feasible. Furthermore, collection, harvesting and storing
raw biomass materials is expensive, especially considering the large volumes required
compared to fossil fuels. Large scale crop production will use vast areas of land and water,
representing major problems, e.g. deforestation. Moreover, this land is also needed for feeding
the growing population of billions of people [11].
Chapter 1
5
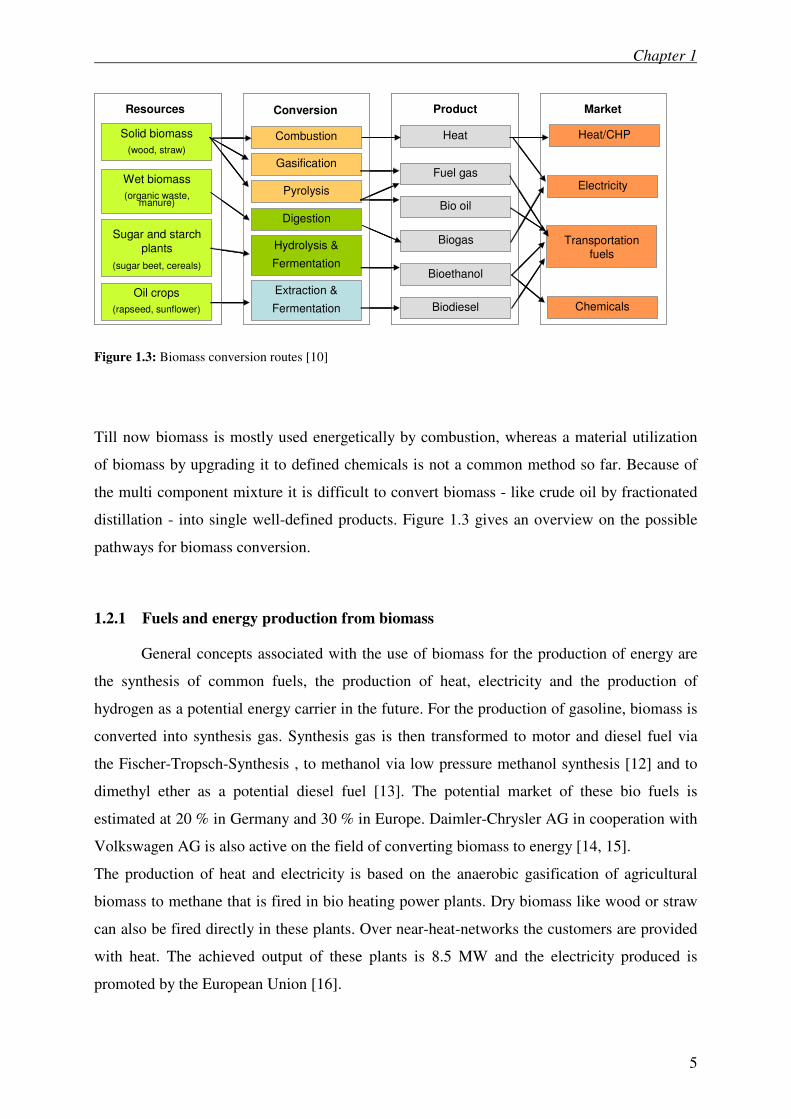
Figure 1.3: Biomass conversion routes [10]
Till now biomass is mostly used energetically by combustion, whereas a material utilization
of biomass by upgrading it to defined chemicals is not a common method so far. Because of
the multi component mixture it is difficult to convert biomass - like crude oil by fractionated
distillation - into single well-defined products. Figure 1.3 gives an overview on the possible
pathways for biomass conversion.
1.2.1 Fuels and energy production from biomass
General concepts associated with the use of biomass for the production of energy are
the synthesis of common fuels, the production of heat, electricity and the production of
hydrogen as a potential energy carrier in the future. For the production of gasoline, biomass is
converted into synthesis gas. Synthesis gas is then transformed to motor and diesel fuel via
the Fischer-Tropsch-Synthesis , to methanol via low pressure methanol synthesis [12] and to
dimethyl ether as a potential diesel fuel [13]. The potential market of these bio fuels is
estimated at 20 % in Germany and 30 % in Europe. Daimler-Chrysler AG in cooperation with
Volkswagen AG is also active on the field of converting biomass to energy [14, 15].
The production of heat and electricity is based on the anaerobic gasification of agricultural
biomass to methane that is fired in bio heating power plants. Dry biomass like wood or straw
can also be fired directly in these plants. Over near-heat-networks the customers are provided
with heat. The achieved output of these plants is 8.5 MW and the electricity produced is
promoted by the European Union [16].
Resources Conversion Product Market
Solid biomass
(wood, straw)
Wet biomass
(organic waste, manure)
Sugar and starch
plants
(sugar beet, cereals)
Oil crops
(rapseed, sunflower)
Combustion
Gasification
Pyrolysis
Digestion
Hydrolysis &
Fermentation
Extraction &
Fermentation
Heat
Fuel gas
Bio oil
Biogas
Bioethanol
Biodiesel
Heat/CHP
Electricity
Transportation fuels
Chemicals
Chapter 1
6
Hydrogen production from biomass is studied on model substances like glucose, sorbitol
(hydrated product of glucose), glycerin (from lipolysis) and ethylene glycol (hydrogenolysis
of sugars). For these purposes heterogeneous catalysts like Pt/Al2O3 or Raney nickel doped
with Sn (SnNi) are used [17]. Reactions take place in aqueous phase at 200 °C and at
2.9 MPa. Depending on the educt, the gained gas contains from 51 to 70 mol-% hydrogen
[18]. Further investigations are focusing on the application of supercritical water as reaction
medium for the conversion of biomass to hydrogen, obtaining gas with 70 vol.-% hydrogen
[19].
1.2.2 Chemicals production from biomass
Recently, there has been a strong political and technical focus on using biomass to
produce transportation fuels [20]. Much less attention has been given to biomass as a
feedstock for organic chemicals. Replacement of petroleum-derived chemicals with those
from biomass will play a key role in sustaining the growth of the chemical industry.
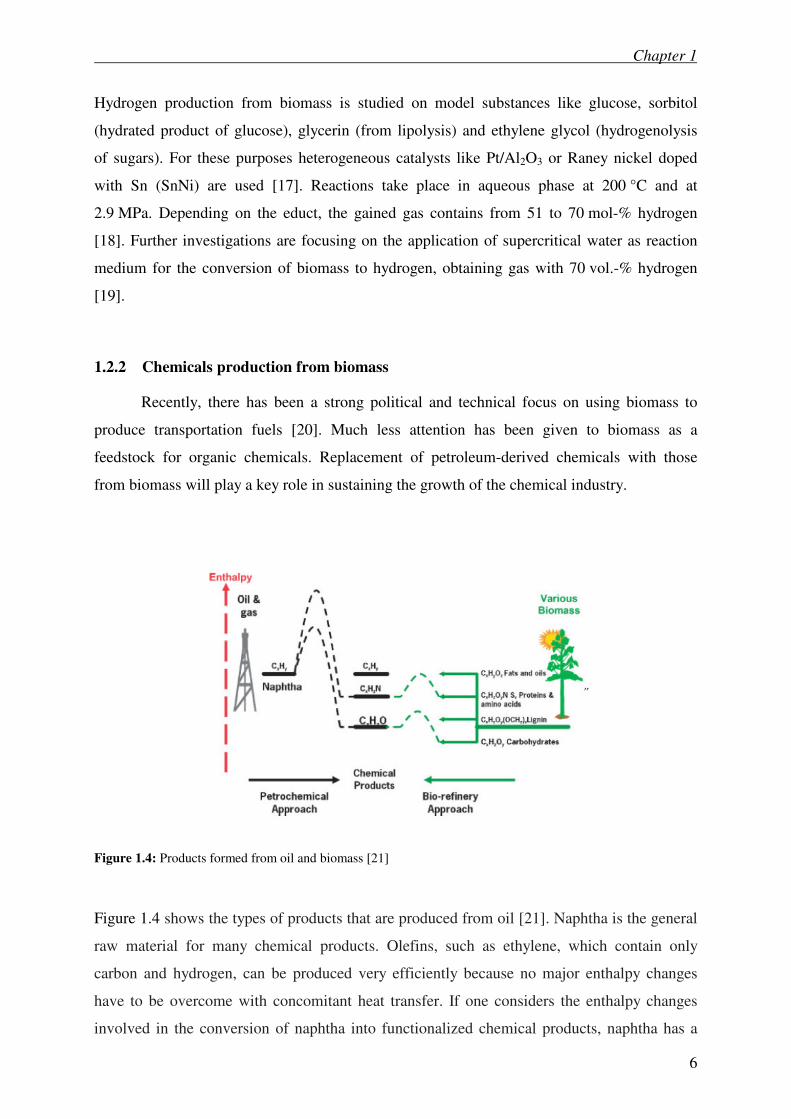
Figure 1.4: Products formed from oil and biomass [21]
Figure 1.4 shows the types of products that are produced from oil [21]. Naphtha is the general
raw material for many chemical products. Olefins, such as ethylene, which contain only
carbon and hydrogen, can be produced very efficiently because no major enthalpy changes
have to be overcome with concomitant heat transfer. If one considers the enthalpy changes
involved in the conversion of naphtha into functionalized chemical products, naphtha has a
Chapter 1
7
calorific value of ca. 45 GJ per tone and requires the use of additional (process) energy in the
form of heat and electricity to produce a product with a significantly lower calorific value
compared to the original fossil raw material. Allied with this, the process conditions at which
reactions are carried out, high temperatures and pressures, as well as corrosive and toxic
substrates and co-reagents are often required. Existing functionalized petrochemicals may be
reduced if biomass components are used [22]. As well as this, if the structure is suitably
similar to the desired product, then probably only a limited number of simple conversion steps
would be required. For example, it is considered that amino acids may be suitable raw
materials for the production of amines [21].
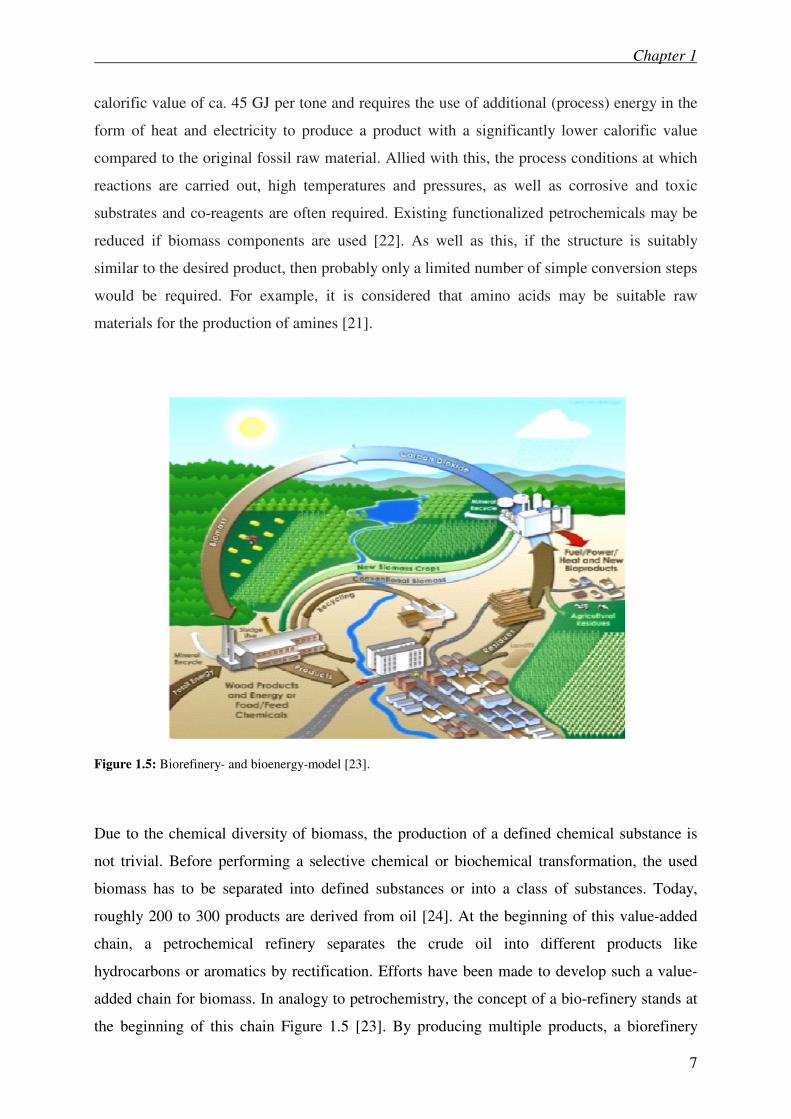
Figure 1.5: Biorefinery- and bioenergy-model [23].
Due to the chemical diversity of biomass, the production of a defined chemical substance is
not trivial. Before performing a selective chemical or biochemical transformation, the used
biomass has to be separated into defined substances or into a class of substances. Today,
roughly 200 to 300 products are derived from oil [24]. At the beginning of this value-added
chain, a petrochemical refinery separates the crude oil into different products like
hydrocarbons or aromatics by rectification. Efforts have been made to develop such a value-
added chain for biomass. In analogy to petrochemistry, the concept of a bio-refinery stands at
the beginning of this chain Figure 1.5 [23]. By producing multiple products, a biorefinery
Chapter 1
8
takes advantage of the various components in biomass and their intermediates therefore
maximizing the value derived from the biomass feedstock. A biorefinery could, for example,
produce one or several low-volume, but high-value, chemical or nutraceutical products and a
low-value, but high-volume liquid transportation fuel such as biodiesel or bioethanol. At the
same time generating electricity and process heat, through combined heat and power
technology, for its own use and perhaps enough for sale of electricity to the local utility. The
high-value products increase profitability, the high-volume fuel helps meet energy needs, and
the power production helps to lower energy costs and reduce greenhouse gas emissions from
traditional power plant facilities. Although some facilities exist that can be called bio-
refineries, the bio-refinery has yet to be fully realized. Future biorefineries may plan a major
role in producing chemicals and materials that traditionally produced from petroleum.
Biomass differs from oil in some crucial points. First of all the physiology and the bio -
chemical diversity of the components of biomass have to be specified before separating them.
Such technologies are already in use when processing cellulose-, starch-, sugar- and oil-
containing plants in paper mills, sugar refineries and oil mills. The basic principles are
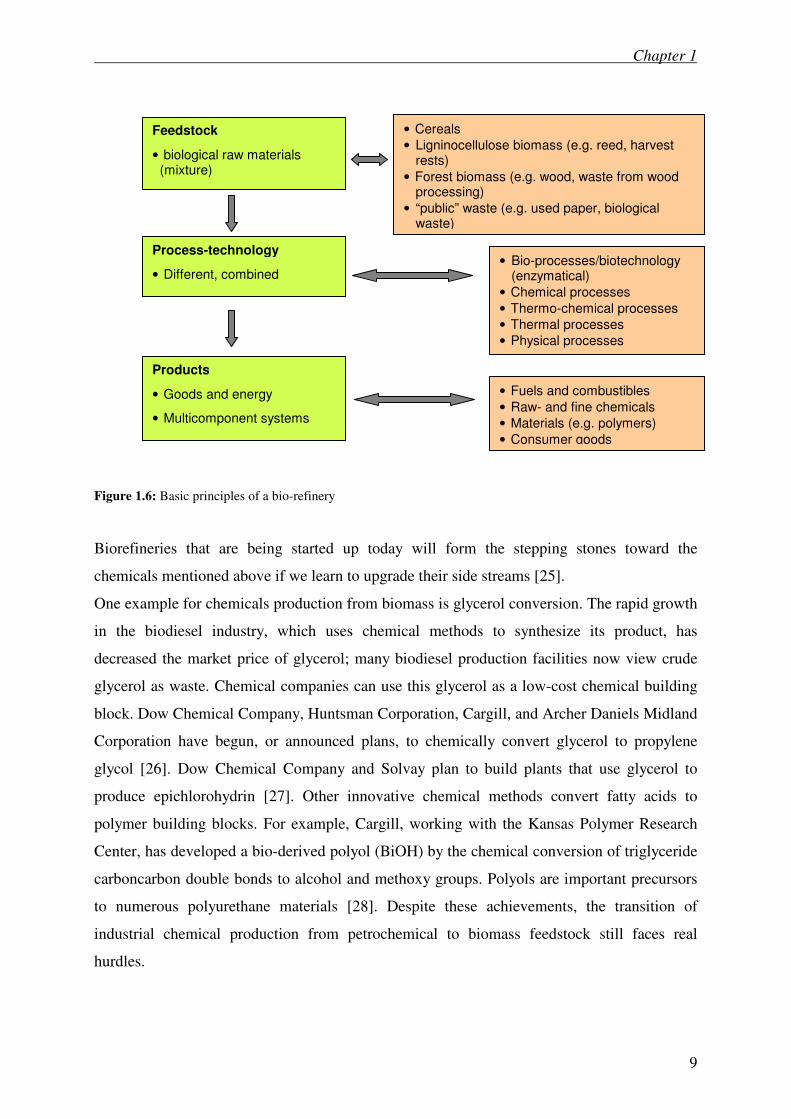
depicted in Figure 1.6. The separation of plant biomass into its principal components (i.e.
biomass-precursors) and the following upgrading processes are depicted in Figure 1.7.
Given the current robust forces driving sustainable production, and available biomass
conversion technologies, biomass-based routes are expected to make a significant impact on
the production of bulk chemicals within 10 years, and a huge impact within 20-30 years.
There is a substitution potential of 10-15 % of fossil oil-based bulk chemicals by bio-based
bulk chemicals, especially for oxygenated bulk chemicals, such as ethylene glycol and
propylene glycol, iso-propanol and acetone, butylene and methylethylketone and for the
replacement of methyl tertiary butyl ether (MTBE) by ethyl tertiary butyl ether (ETBE) [25].
Glycerin, as a byproduct of biodiesel production, is a very favorable short-term option for the
production of ethylene and propy-lene glycols. In the mid-term (10-20 years) there is clear
potential for a bio-based production of ethylene, acrylic acid and N-containing bulk chemicals
such as acrylonitrile, acrylamide and -caprolactam. Technologies involving direct isolation
of aromatic building blocks from biomass, or the conversion of sugars or lignin to aromatics
are still in their infancy.
Chapter 1
9
Figure 1.6: Basic principles of a bio-refinery
Biorefineries that are being started up today will form the stepping stones toward the
chemicals mentioned above if we learn to upgrade their side streams [25].
One example for chemicals production from biomass is glycerol conversion. The rapid growth
in the biodiesel industry, which uses chemical methods to synthesize its product, has
decreased the market price of glycerol; many biodiesel production facilities now view crude
glycerol as waste. Chemical companies can use this glycerol as a low-cost chemical building
block. Dow Chemical Company, Huntsman Corporation, Cargill, and Archer Daniels Midland
Corporation have begun, or announced plans, to chemically convert glycerol to propylene
glycol [26]. Dow Chemical Company and Solvay plan to build plants that use glycerol to
produce epichlorohydrin [27]. Other innovative chemical methods convert fatty acids to
polymer building blocks. For example, Cargill, working with the Kansas Polymer Research
Center, has developed a bio-derived polyol (BiOH) by the chemical conversion of triglyceride
carboncarbon double bonds to alcohol and methoxy groups. Polyols are important precursors
to numerous polyurethane materials [28]. Despite these achievements, the transition of
industrial chemical production from petrochemical to biomass feedstock still faces real
hurdles.
Feedstock
• biological raw materials (mixture)
• Cereals
• Ligninocellulose biomass (e.g. reed, harvest rests)
• Forest biomass (e.g. wood, waste from wood processing)
• “public” waste (e.g. used paper, biological waste)
Process-technology
• Different, combined
Products
• Goods and energy
• Multicomponent systems
• Bio-processes/biotechnology (enzymatical)
• Chemical processes
• Thermo-chemical processes
• Thermal processes
• Physical processes
• Fuels and combustibles
• Raw- and fine chemicals
• Materials (e.g. polymers)
• Consumer goods
Chapter 1
10
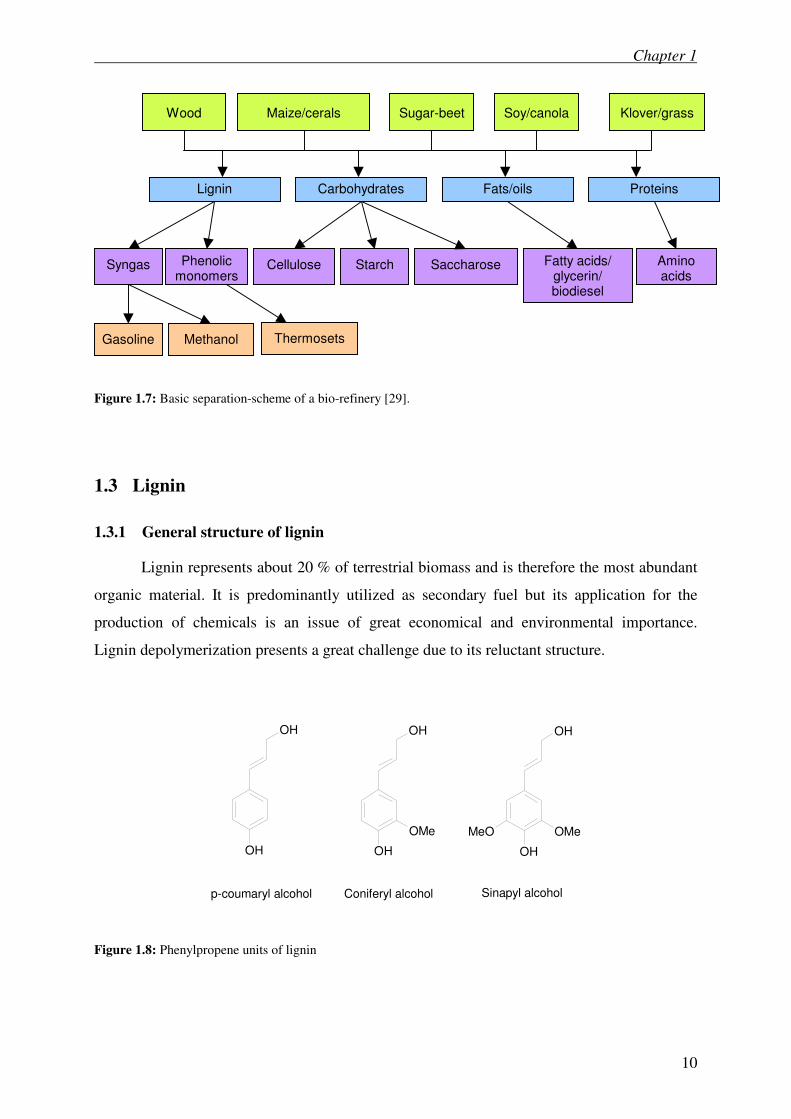
Figure 1.7: Basic separation-scheme of a bio-refinery [29].
1.3 Lignin
1.3.1 General structure of lignin
Lignin represents about 20 % of terrestrial biomass and is therefore the most abundant
organic material. It is predominantly utilized as secondary fuel but its application for the
production of chemicals is an issue of great economical and environmental importance.
Lignin depolymerization presents a great challenge due to its reluctant structure.
OH
OH
OH
OH
OMe
OH
OH
OMeMeO
p-coumaryl alcohol Coniferyl alcohol Sinapyl alcohol
Figure 1.8: Phenylpropene units of lignin
Wood Maize/cerals Sugar-beet Soy/canola Klover/grass
Lignin Carbohydrates Fats/oils Proteins
Syngas Cellulose Starch Saccharose Fatty acids/ glycerin/ biodiesel
Amino acids
Phenolic monomers
Gasoline Methanol Thermosets
Chapter 1
11
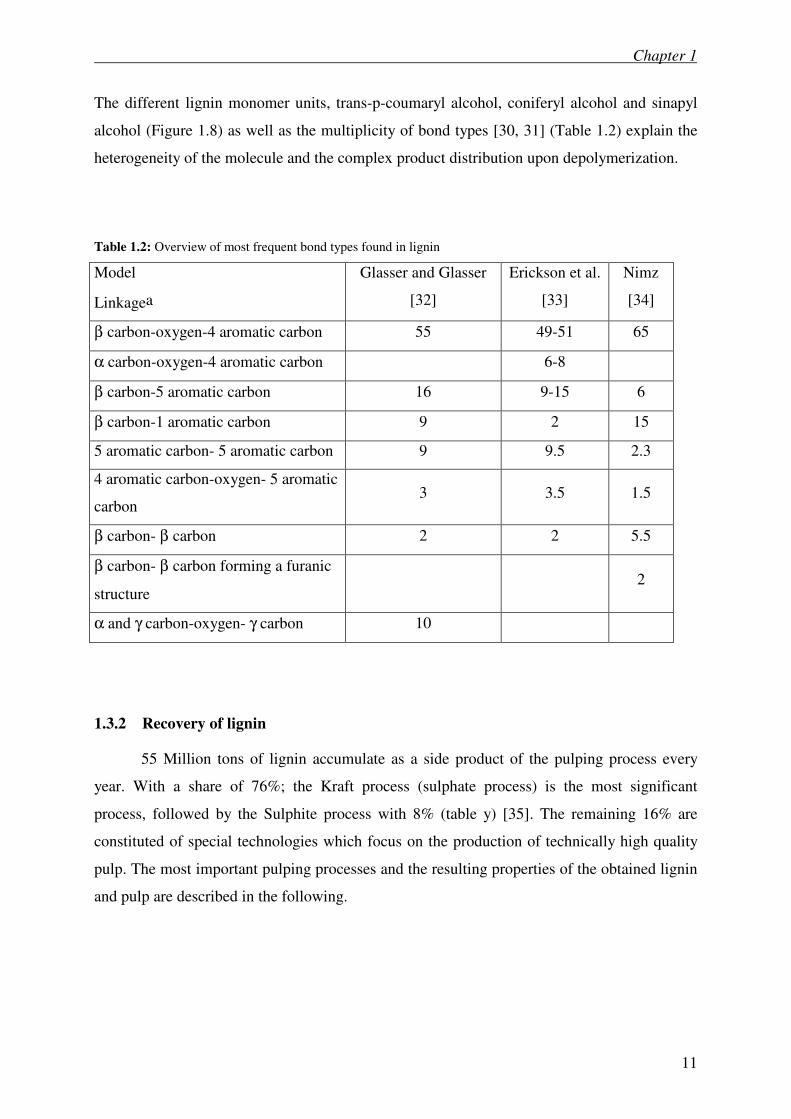
The different lignin monomer units, trans-p-coumaryl alcohol, coniferyl alcohol and sinapyl
alcohol (Figure 1.8) as well as the multiplicity of bond types [30, 31] (Table 1.2) explain the
heterogeneity of the molecule and the complex product distribution upon depolymerization.
Table 1.2: Overview of most frequent bond types found in lignin
Model
Linkagea
Glasser and Glasser
[32]
Erickson et al.
[33]
Nimz
[34]
β carbon-oxygen-4 aromatic carbon 55 49-51 65
α carbon-oxygen-4 aromatic carbon 6-8
β carbon-5 aromatic carbon 16 9-15 6
β carbon-1 aromatic carbon 9 2 15
5 aromatic carbon- 5 aromatic carbon 9 9.5 2.3
4 aromatic carbon-oxygen- 5 aromatic
carbon 3 3.5 1.5
β carbon- β carbon 2 2 5.5
β carbon- β carbon forming a furanic
structure 2
α and γ carbon-oxygen- γ carbon 10
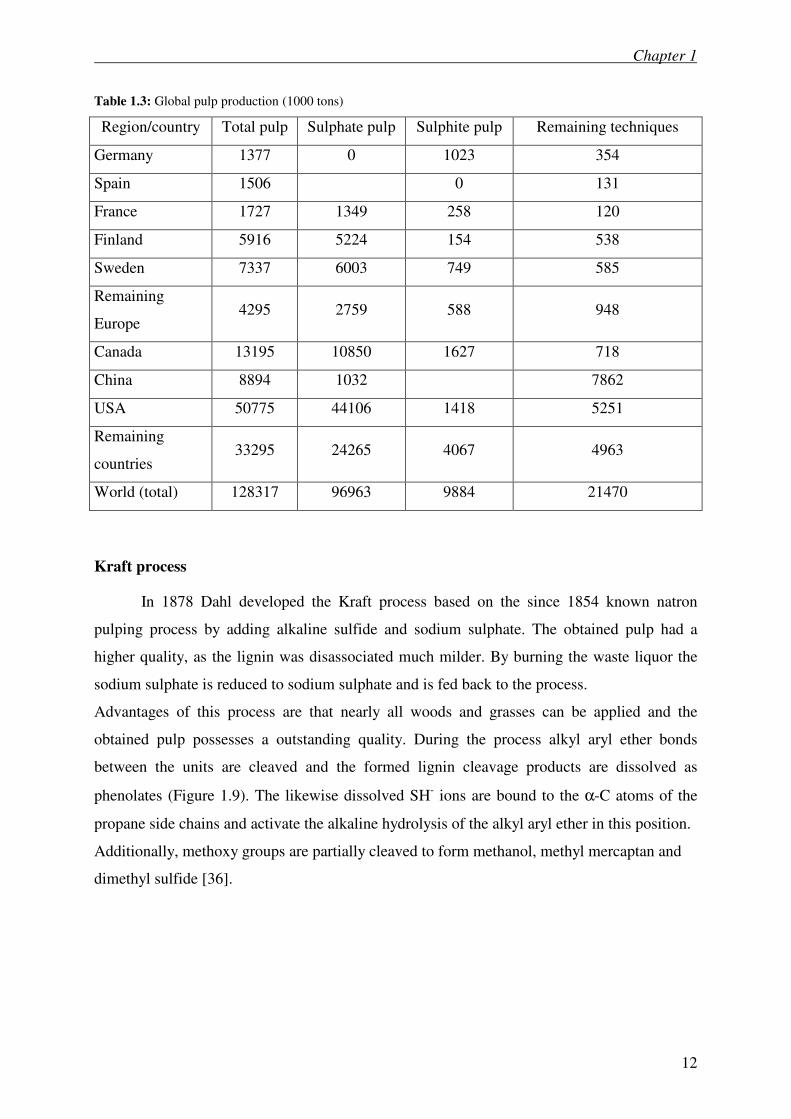
1.3.2 Recovery of lignin
55 Million tons of lignin accumulate as a side product of the pulping process every
year. With a share of 76%; the Kraft process (sulphate process) is the most significant
process, followed by the Sulphite process with 8% (table y) [35]. The remaining 16% are
constituted of special technologies which focus on the production of technically high quality
pulp. The most important pulping processes and the resulting properties of the obtained lignin
and pulp are described in the following.
Chapter 1
12
Table 1.3: Global pulp production (1000 tons)
Region/country Total pulp Sulphate pulp Sulphite pulp Remaining techniques
Germany 1377 0 1023 354
Spain 1506 0 131
France 1727 1349 258 120
Finland 5916 5224 154 538
Sweden 7337 6003 749 585
Remaining
Europe 4295 2759 588 948
Canada 13195 10850 1627 718
China 8894 1032 7862
USA 50775 44106 1418 5251
Remaining
countries 33295 24265 4067 4963
World (total) 128317 96963 9884 21470
Kraft process
In 1878 Dahl developed the Kraft process based on the since 1854 known natron
pulping process by adding alkaline sulfide and sodium sulphate. The obtained pulp had a
higher quality, as the lignin was disassociated much milder. By burning the waste liquor the
sodium sulphate is reduced to sodium sulphate and is fed back to the process.
Advantages of this process are that nearly all woods and grasses can be applied and the
obtained pulp possesses a outstanding quality. During the process alkyl aryl ether bonds
between the units are cleaved and the formed lignin cleavage products are dissolved as
phenolates (Figure 1.9). The likewise dissolved SH- ions are bound to the α-C atoms of the
propane side chains and activate the alkaline hydrolysis of the alkyl aryl ether in this position.
Additionally, methoxy groups are partially cleaved to form methanol, methyl mercaptan and
dimethyl sulfide [36].
Chapter 1
13
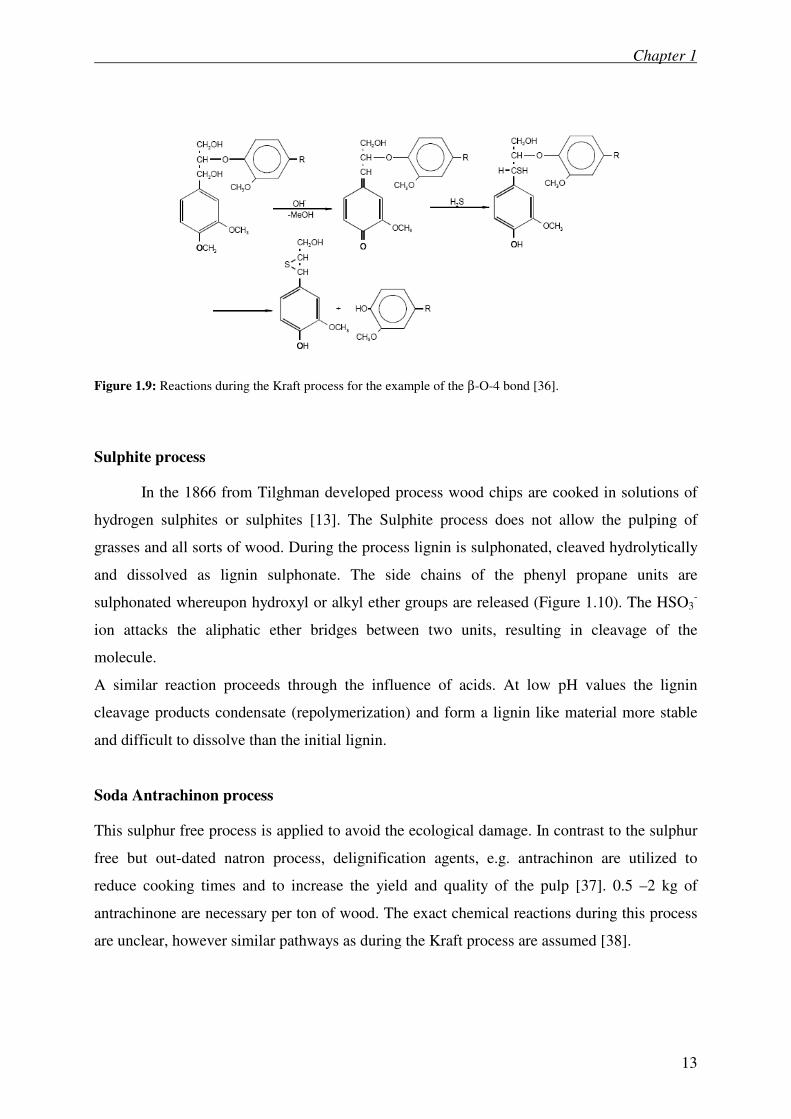
Figure 1.9: Reactions during the Kraft process for the example of the β-O-4 bond [36].
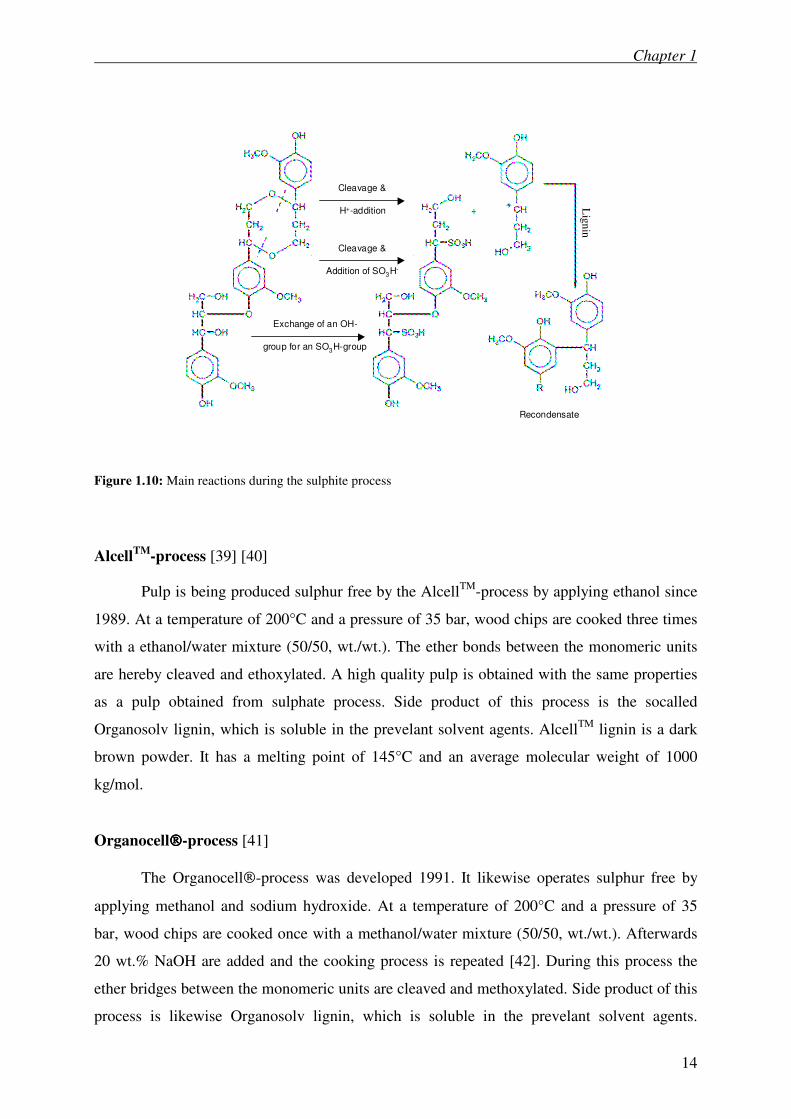
Sulphite process
In the 1866 from Tilghman developed process wood chips are cooked in solutions of
hydrogen sulphites or sulphites [13]. The Sulphite process does not allow the pulping of
grasses and all sorts of wood. During the process lignin is sulphonated, cleaved hydrolytically
and dissolved as lignin sulphonate. The side chains of the phenyl propane units are
sulphonated whereupon hydroxyl or alkyl ether groups are released (Figure 1.10). The HSO3-
ion attacks the aliphatic ether bridges between two units, resulting in cleavage of the
molecule.
A similar reaction proceeds through the influence of acids. At low pH values the lignin
cleavage products condensate (repolymerization) and form a lignin like material more stable
and difficult to dissolve than the initial lignin.
Soda Antrachinon process
This sulphur free process is applied to avoid the ecological damage. In contrast to the sulphur
free but out-dated natron process, delignification agents, e.g. antrachinon are utilized to
reduce cooking times and to increase the yield and quality of the pulp [37]. 0.5 –2 kg of
antrachinone are necessary per ton of wood. The exact chemical reactions during this process
are unclear, however similar pathways as during the Kraft process are assumed [38].
Chapter 1
14
Recondensate
Cleavage &
H+-addition
Cleavage &
Addition of SO3H-
Exchange of an OH-
group for an SO3H-group
Lig
nin
Recondensate
Cleavage &
H+-addition
Cleavage &
Addition of SO3H-
Exchange of an OH-
group for an SO3H-group
Lig
nin
Figure 1.10: Main reactions during the sulphite process
AlcellTM
-process [39] [40]
Pulp is being produced sulphur free by the AlcellTM
-process by applying ethanol since
1989. At a temperature of 200°C and a pressure of 35 bar, wood chips are cooked three times
with a ethanol/water mixture (50/50, wt./wt.). The ether bonds between the monomeric units
are hereby cleaved and ethoxylated. A high quality pulp is obtained with the same properties
as a pulp obtained from sulphate process. Side product of this process is the socalled
Organosolv lignin, which is soluble in the prevelant solvent agents. AlcellTM
lignin is a dark
brown powder. It has a melting point of 145°C and an average molecular weight of 1000
kg/mol.
Organocell-process [41]
The Organocell-process was developed 1991. It likewise operates sulphur free by
applying methanol and sodium hydroxide. At a temperature of 200°C and a pressure of 35
bar, wood chips are cooked once with a methanol/water mixture (50/50, wt./wt.). Afterwards
20 wt.% NaOH are added and the cooking process is repeated [42]. During this process the
ether bridges between the monomeric units are cleaved and methoxylated. Side product of this
process is likewise Organosolv lignin, which is soluble in the prevelant solvent agents.
Chapter 1
15
Organocell lignin is a dark brown powder. It has a melting point of 185°C and an average
molecular weight of 1000 kg/mol.
The lignin applied for this work was an Organosolv lignin. It was either purchased from
Sigma-Aldrich or prepared by the ICT of the “Frauenhofer Institute Karlsruhe” by an
organosolv method developed and optimized by the ICT.
The best results were obtained by extracting beech wood with a solution of ethanol and water
(60:40). The mixture was then heated up to 200 °C in 150 minutes in an autoclave, and kept at
this temperature for one hour. Afterwards the suspension was filtered to separate the lignin
solution from the cellulose. After removing the alcohol by distillation, lignin was gained with
a maximum yield of 14 %.
1.3.3 Effect of recovery method and plant origin on the properties of the isolated lignin
To create a raw material base from which both organic and polymer chemistry can
produce higher processed chemicals from lignin, certain structural properties of lignin must be
fulfilled. The lignin should be available in a large amount, with a constant quality, to a fair
price and with the highest most possible purity and defined structure. To conduct reactions it
is necessary that the lignin is soluble in organic solvents. Furthermore, a high functionality is
preferable as a point of origin for chemical reactions. Disadvantages of the sulphite process
are therefore obvious, as most of the aliphatic hydroxyl groups have been substituted by
sulphonic acid groups. Likewise, the functionality of sulphate lignin has been reduced by the
pulping process.
However, it contains more hydroxyl groups than sulphite lignin, which makes it interessting
for application in the production of phenolic resins. A large disadvantage of both mentioned
processes is that the recovered lignin contains sulphur, which negatively effects following
reactions. Lignins from the AlcellTM
- and Organocell-process contain a large amount of
phenolic and aliphatic hydroxyl groups which were alylated during the recovery process.
Hardwoods with a high content of syringols should be avoided, as the ortho position is a
priori blocked by a methoxy group.
Chapter 1
16
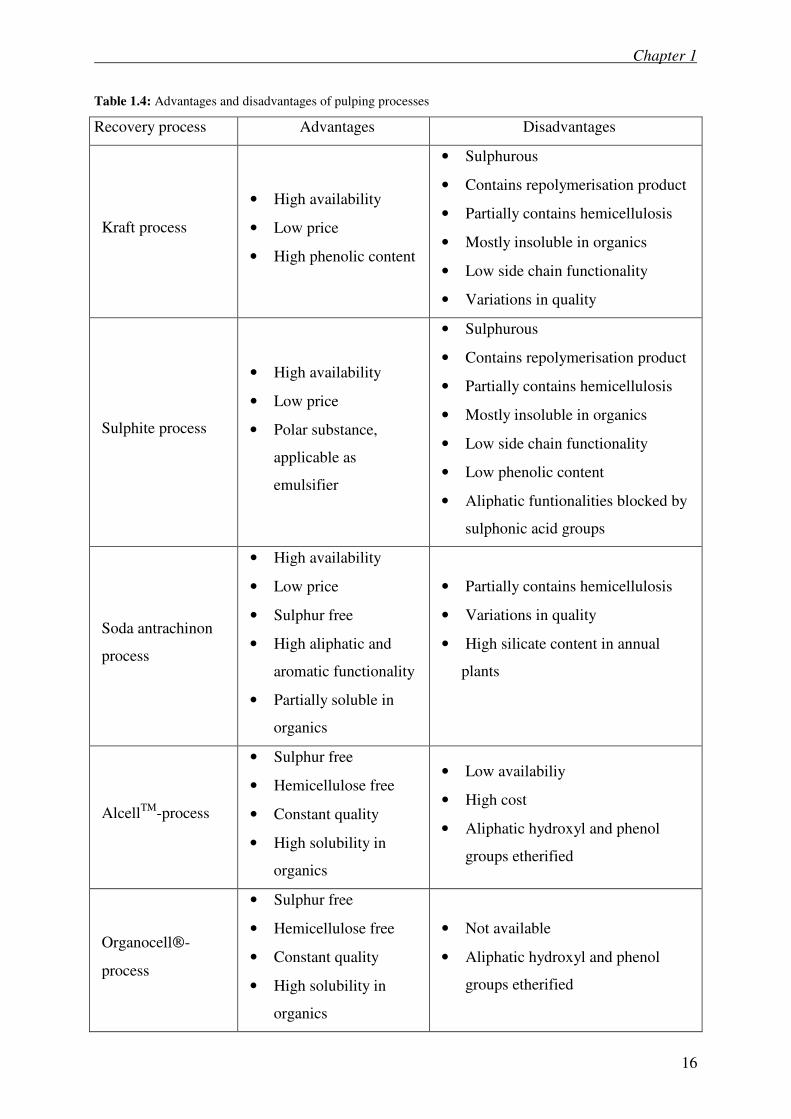
Table 1.4: Advantages and disadvantages of pulping processes
Recovery process Advantages Disadvantages
Kraft process
• High availability
• Low price
• High phenolic content
• Sulphurous
• Contains repolymerisation product
• Partially contains hemicellulosis
• Mostly insoluble in organics
• Low side chain functionality
• Variations in quality
Sulphite process
• High availability
• Low price
• Polar substance,
applicable as
emulsifier
• Sulphurous
• Contains repolymerisation product
• Partially contains hemicellulosis
• Mostly insoluble in organics
• Low side chain functionality
• Low phenolic content
• Aliphatic funtionalities blocked by
sulphonic acid groups
Soda antrachinon
process
• High availability
• Low price
• Sulphur free
• High aliphatic and
aromatic functionality
• Partially soluble in
organics
• Partially contains hemicellulosis
• Variations in quality
• High silicate content in annual
plants
AlcellTM
-process
• Sulphur free
• Hemicellulose free
• Constant quality
• High solubility in
organics
• Low availabiliy
• High cost
• Aliphatic hydroxyl and phenol
groups etherified
Organocell-
process
• Sulphur free
• Hemicellulose free
• Constant quality
• High solubility in
organics
• Not available
• Aliphatic hydroxyl and phenol
groups etherified
Chapter 1
17
Lignins from coniferes and grasses are preferable as they possess an increased amount of the
monomeric unit coniferyl alcohol, in which both ortho positions are free. The choice of the
recovery process and the plant origin are therefore crucial for the resulting quality.
Advantages and disadvantages of the individual isolation processes are summarized in
Table 1.4.
1.3.4 Lignin conversion
The fact that lignin consists of phenolic components was already known in 1939, when
Freudenberg et al. [43] reported that vanillin was produced from lignin by the alkali-
nitrobenzene method. 1960 Kashima [44] reported the conversion of Kraft-lignin by using an
iron oxide catalyst at 673 to 713 K under a hydrogen atmosphere of 19.6 MPa. He obtained
light and heavy oil as well as 20 wt.-% phenol and 14 wt-% benzene. In the mid eighties, the
conversion of lignin into a liquid product was studied by a large number of groups [45],
usually in the presence of hydrogen and a hydrotreating catalyst. Several of theses processes
were carried out in aqueous solutions near the critical point, with organic co-solvents or
alkaline salts added. The goal of these experiments was to convert the lignin into phenolic or
aromatic hydrocarbons. However, the products obtained were often oils or tars that were
extracted with organic solvents. In 1986 and 1987, respectively, Meier et al. [46] and Faix et
al. [47] examined the liquefaction of a variety of lignocellulosic feedstocks (whole woods,
celluloses and lignin) in aqueous solvents at and above the critical temperature of water. Not
only the produced oil was analyzed, also the feedstocks were characterized in terms of their 4-
hydrox phenyl-, guaiacyl- and syringyl-contents. Johnson et al. [48] studied the
hydroliquefaction of two organosolv lignins obtained from aspen in 1988. Reactions were
carried out in a stirred autoclave in the presence of a palladium on carbon catalyst. The
aqueous lignin suspensions were injected into the preheated autoclave to minimize the heat-up
time. The lignins were converted to brown viscous oils (mostly soluble in ethyl acetate) and
carbon containing gases (carbon monoxide, carbon dioxide, methane, and ethane). The
highest yields (70 %) of oil were obtained after 5 to 20 minutes. At longer residence times the
oil-yield decreased due to the production of gases. The apparent molecular weight
distributions of the liquefied lignins were 2-3 fold smaller than the starting lignins, indicating
that substantial depolymerisation had taken place. The volatile fraction of the oils contained
syringols, guajacols, catechols and phenols. In 1990 Funazukuri et al. [49] carried out the
liquefaction of lignin sulphonate in sub and supercritical water in a batch tube-type bomb
Chapter 1
18
reactor. The samples were also subjected to pyrolysis in an argon atmosphere. Much higher
oil yields were obtained with supercritical water than with pyrolysis at 400 °C. Oil yield was
affected by reaction time, temperature and water density. NMR analyses showed that the oil
obtained at short reaction times had relatively high methoxy- and hydroxyl-group contents. In
1999 Miller et al. [50] studied the depolymerisation of Kraft- and organosolv-derived lignins
by alkaline hydroxides in supercritical methanol and ethanol in rapidly heated
batchmicroreactors. In KOH/ethanol at 290 °C, high conversions were realized and only 7 %
of ether insoluble material remained after reaction. These high conversions were realized by
extracting both the filtrate and the filter cake after acidification of the reaction mixture during
the work up process. The maximum yield was reached within 15 minutes. It was shown that
the strongest bases gave higher conversion. An excess of base relative to lignin monomers
was required for maximum conversion. The lowering of the amount of added salt below the
stoichiometric amount led to a large decrease in soluble products, indicating that
stoichiometric reactions occurred. Another approach was followed by Ehara et al. [51] at the
end of the last century. First buna wood was treated in supercritical water, fractioning it into a
water-soluble portion, a methanol-soluble portion and methanol-insoluble residues. The study
was focused on characterizing the lignin-derived products in the methanol-soluble portion and
in the residue. It was found that these products had more phenolic hydroxyl groups than lignin
in the original wood. Furthermore alkaline nitrobenzene oxidation analyses showed much less
oxidation product in the methanol-soluble and in the methanol-residue. This indicated that the
ether linkages of lignin are preferentially cleaved during supercritical water treatment. In 2003
Saisu et al. [52] examined the decomposition of lignin in supercritical water with and without
phenol at 673 K. In the absence of phenol, the yield of tetrahydrofuran-insoluble products,
which are claimed to be formed by polymerization and to have molecular weights higher than
lignin, decreased and the molecular weight distribution of the tetrahydrofuran-soluble fraction
shifted towards lower molecular weights as the water density increased. An increased water
density also enhanced the lignin conversion. In the presence of phenol, the yield of the
insoluble products was lower and the molecular weight distribution of the soluble products
shifted towards lower weights than those in the absence of phenol. Some alkyl phenols were
obtained only in the presence of phenol, because of reactions of phenol with decomposition
products. These results indicate that the reaction of phenol with reactive sites occurred in
supercritical water and suppressed cross-linking reactions among reactive sites of large
fragments. This promoted the decomposition of lignin to lower molecular weight compounds.
At the same time Okuda et al. [53] reported the depolymerisation of waste lignin
Chapter 1
19
(sodiumlignosulfonic acid and alkali lignin) without a catalyst in a mixture of supercritical
water and p-cresol, without char formation. GPC confirmed that the molecular weight
distribution of the original lignin shifted towards smaller molecular weight after reaction at
400 °C for 30 minutes. At higher reaction temperatures the amount of water soluble products
decreased. The chemical species of the tetrahydrofuran soluble products were detected as
phenol, methyl anisole, o-cresol and different alkyl phenols (maximum total yield of water
soluble products: 10.8 % at 400 °C and 33 % at 250 °C). Further investigations with similar
parameters and p-cresol added in 2004 also led to remarkable results [54]. Within a reaction
time of four minutes, lignin, whose averagemolecular weight was 2·103
g·mol-1, was
selectively converted to a compound with a molecular weight of 214 g·mol-1 and identified as
hydroxyphenyl-(hydroxytolyl)-methane (HPHTM) by 1H and 13C NMR. Its yield reached a
maximum of 80 % C after 30 minutes of reaction time. Shabtai et al. [55] [56] developed a
method for the base catalysed depolymerisation of lignin in supercritical water. The lignin
feed was fully dispersed in a dilute alkali hydroxide solution (e.g. 2-3 wt.-% aqueous NaOH
solution which showed the best activities), and subjected to base catalysed depolymerisation
in a flow reactor system. In comparison to Miller et al. [57], where stoichiometric amount of
salt was necessary for a significant conversion in alcohol, Shabtai et al. added the salt in
catalytical amounts in aqueous reaction medium to obtain best results. Reactions were carried
out in a temperature range between 300 and 340 °C. The optimal liquid hourly space velocity
(LHSV) was found to be in the range between 0.5 and 8 h-1. After reaction, the solution was
acidified and the precipitate was extracted with ether. The ether phase was then evaporated to
obtain the depolymerised lignin products (alkylated phenols, alkoxybenzenes, alkoxyphenols
and hydrocarbons) with a maximum yield of ether and ether/water solubles of 76 wt.-%.
Considerable effort has been made to characterize the lignin derived products after reaction in
supercritical water (e.g. 2004 Takada et al. [58]). Here sugi wood was treated with
supercritical water and fractioned into a water-soluble fraction, a methanol-soluble portion
and a methanol-insoluble residue. GPC and gas chromatographic-mass spectrometric (GC-
MS) analyses were performed. The GPC analysis indicated that the methanol-soluble portion
contained lignin derived monomeric and dimeric products. GC-MS detected 31 products
which were expected to be monomeric compounds (e.g. different guajacols, vanillin and
different eugenols). Furthermore, like in the GPC analysis, dimeric compounds were detected.
This clearly indicated that the products detected in the methanol-soluble portion result from
the cleavage of ether linkages and propyl chains of lignin. Recently (2006) Sato et al. [59]
examined the gasification of lignin biomass model compounds in the presence of magnesium
Chapter 1
20
oxide supported nickel catalysts (Ni/MgO) in sub- and supercritical water from 250 to 400 °C.
The main gas products were methane, carbon dioxide and hydrogen. The amount of the
produced gases increased with higher nickel loadings on the magnesium oxide support. The
highest total gas yield in carbon basis was found to be 78 % with 20 wt.-% Ni/MgO catalyst at
400 °C and 0.3 g·cm-1 water density. It was assumed that the metal and the support play
different roles during the gasification of lignin. Sato et al. postulated that MgO decomposed
lignin to reactive intermediates and nickel promoted reactions between intermediates and
water to form gases. The yield of methane and carbon dioxide increased with increasing water
density but then decreased and levelled out to constant values, which indicated that water
density affected the reaction kinetics. This results of Sato et al. were confirmed by Osada
[60]. Here, ruthenium catalysts supported on different substrates were used in supercritical
water to study the gasification of lignin at 400 °C. Methane, carbon dioxide, hydrogen, carbon
monoxide and C2 to C4 gases were obtained as the gaseous products. The catalytic gasification
was enhanced by the increase of water density. Again it was assumed that the gasification of
lignin in supercritical water proceeded through two steps. The first one is the decomposition
to components of low molecular weight. The gasification of these compounds over the metal
catalyst was assumed to be the second step. To prove that only the first step was enhanced by
increasing the water density, experiments were carried out with 4-propyl phenol. The rate of
the gasification of this molecule was not affected by water density, what clearly demonstrated
that the water density only affected the first step of the gasification. The most important
aspects described in this section are summarized in Table 1.5.
Chapter 1
21
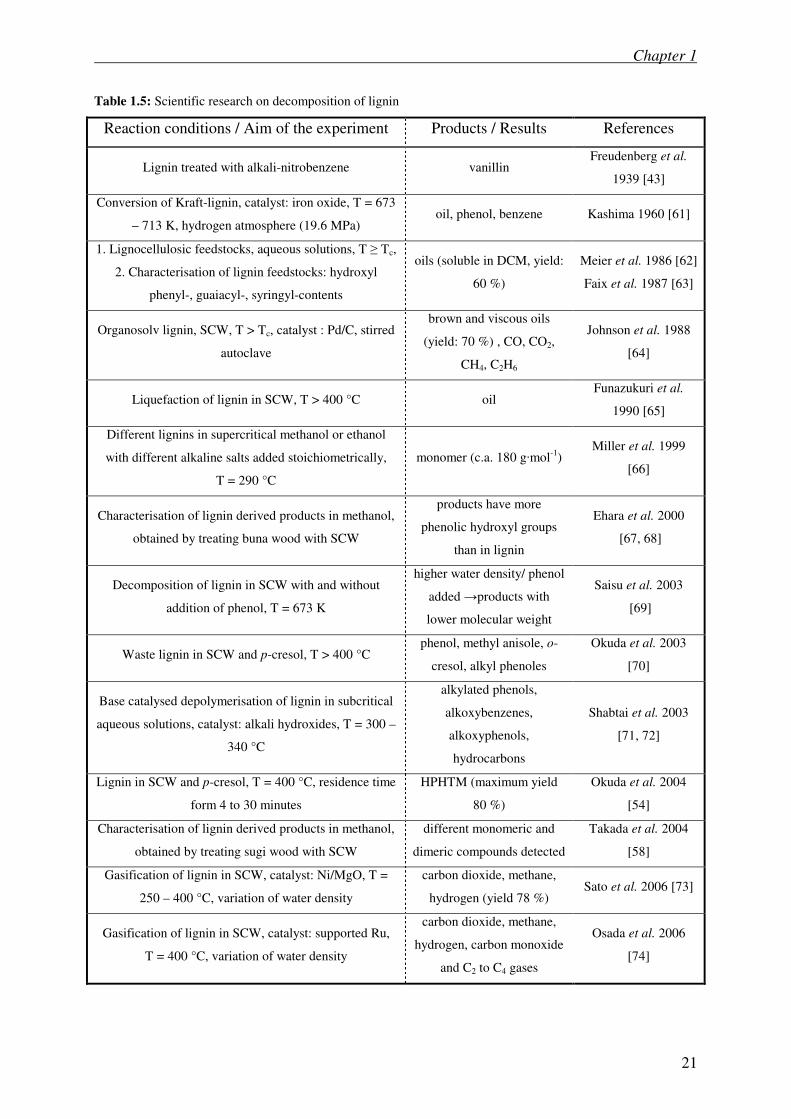
Table 1.5: Scientific research on decomposition of lignin
Reaction conditions / Aim of the experiment Products / Results References
Lignin treated with alkali-nitrobenzene vanillin Freudenberg et al.
1939 [43]
Conversion of Kraft-lignin, catalyst: iron oxide, T = 673
– 713 K, hydrogen atmosphere (19.6 MPa) oil, phenol, benzene Kashima 1960 [61]
1. Lignocellulosic feedstocks, aqueous solutions, T ≥ Tc,
2. Characterisation of lignin feedstocks: hydroxyl
phenyl-, guaiacyl-, syringyl-contents
oils (soluble in DCM, yield:
60 %)
Meier et al. 1986 [62]
Faix et al. 1987 [63]
Organosolv lignin, SCW, T > Tc, catalyst : Pd/C, stirred
autoclave
brown and viscous oils
(yield: 70 %) , CO, CO2,
CH4, C2H6
Johnson et al. 1988
[64]
Liquefaction of lignin in SCW, T > 400 °C oil Funazukuri et al.
1990 [65]
Different lignins in supercritical methanol or ethanol
with different alkaline salts added stoichiometrically,
T = 290 °C
monomer (c.a. 180 g·mol-1
) Miller et al. 1999
[66]
Characterisation of lignin derived products in methanol,
obtained by treating buna wood with SCW
products have more
phenolic hydroxyl groups
than in lignin
Ehara et al. 2000
[67, 68]
Decomposition of lignin in SCW with and without
addition of phenol, T = 673 K
higher water density/ phenol
added →products with
lower molecular weight
Saisu et al. 2003
[69]
Waste lignin in SCW and p-cresol, T > 400 °C phenol, methyl anisole, o-
cresol, alkyl phenoles
Okuda et al. 2003
[70]
Base catalysed depolymerisation of lignin in subcritical
aqueous solutions, catalyst: alkali hydroxides, T = 300 –
340 °C
alkylated phenols,
alkoxybenzenes,
alkoxyphenols,
hydrocarbons
Shabtai et al. 2003
[71, 72]
Lignin in SCW and p-cresol, T = 400 °C, residence time
form 4 to 30 minutes
HPHTM (maximum yield
80 %)
Okuda et al. 2004
[54]
Characterisation of lignin derived products in methanol,
obtained by treating sugi wood with SCW
different monomeric and
dimeric compounds detected
Takada et al. 2004
[58]
Gasification of lignin in SCW, catalyst: Ni/MgO, T =
250 – 400 °C, variation of water density
carbon dioxide, methane,
hydrogen (yield 78 %) Sato et al. 2006 [73]
Gasification of lignin in SCW, catalyst: supported Ru,
T = 400 °C, variation of water density
carbon dioxide, methane,
hydrogen, carbon monoxide
and C2 to C4 gases
Osada et al. 2006
[74]
Chapter 1
22
1.4 Sub –and supercritical water
Since the end of the 1980s, research activity in the field of supercritical fluids has been
growing [75]. Whether a fluid is in gas state or liquid state depends on the kinetic energy of
the particles (temperature) and on the energy of intermolecular interaction. If the kinetic
energy is smaller than the intermolecular interaction energy, then the fluid is a liquid.
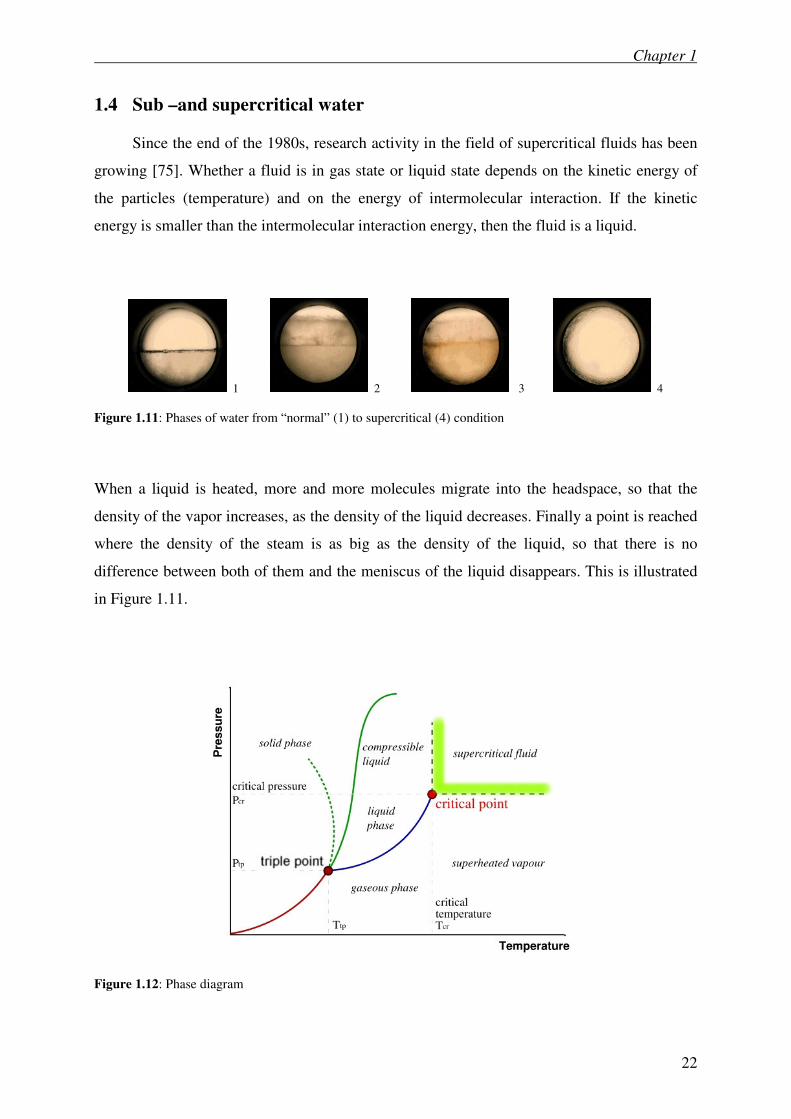
1 2 3 4
Figure 1.11: Phases of water from “normal” (1) to supercritical (4) condition
When a liquid is heated, more and more molecules migrate into the headspace, so that the
density of the vapor increases, as the density of the liquid decreases. Finally a point is reached
where the density of the steam is as big as the density of the liquid, so that there is no
difference between both of them and the meniscus of the liquid disappears. This is illustrated
in Figure 1.11.
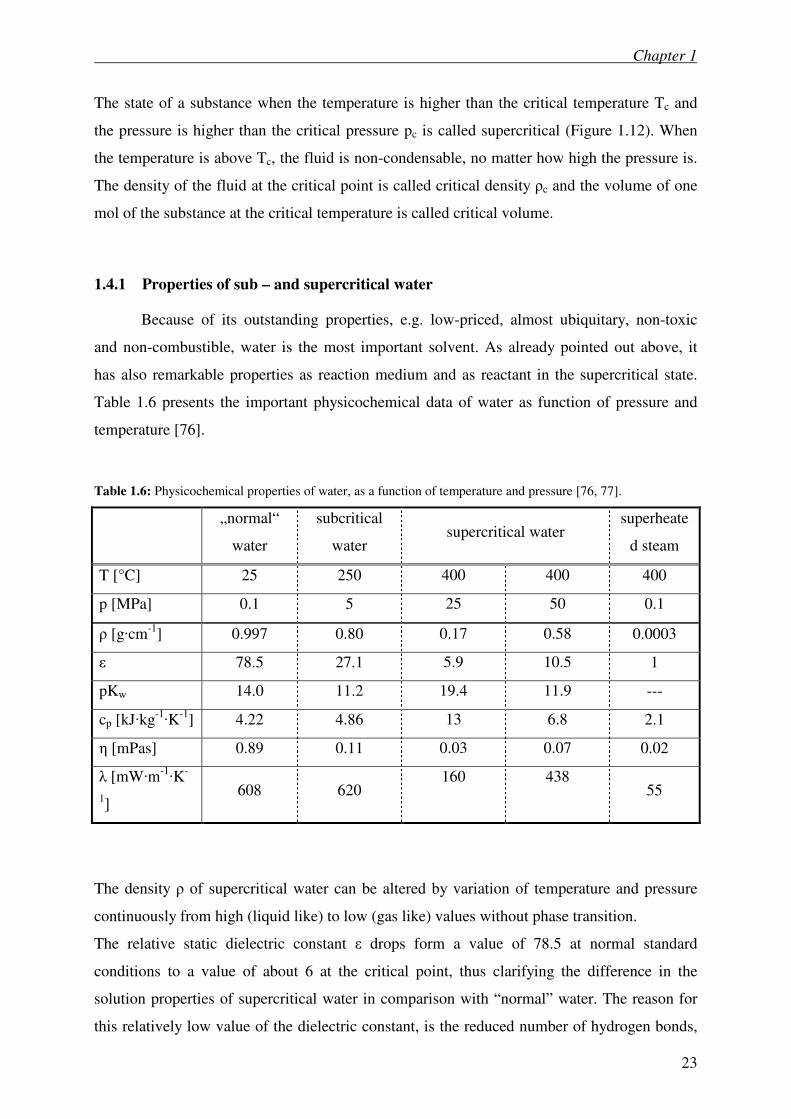
Figure 1.12: Phase diagram
Chapter 1
23
The state of a substance when the temperature is higher than the critical temperature Tc and
the pressure is higher than the critical pressure pc is called supercritical (Figure 1.12). When
the temperature is above Tc, the fluid is non-condensable, no matter how high the pressure is.
The density of the fluid at the critical point is called critical density ρc and the volume of one
mol of the substance at the critical temperature is called critical volume.
1.4.1 Properties of sub – and supercritical water
Because of its outstanding properties, e.g. low-priced, almost ubiquitary, non-toxic
and non-combustible, water is the most important solvent. As already pointed out above, it
has also remarkable properties as reaction medium and as reactant in the supercritical state.
Table 1.6 presents the important physicochemical data of water as function of pressure and
temperature [76].
Table 1.6: Physicochemical properties of water, as a function of temperature and pressure [76, 77].
„normal“
water
subcritical
water supercritical water
superheate
d steam
T [°C] 25 250 400 400 400
p [MPa] 0.1 5 25 50 0.1
ρ [g·cm-1
] 0.997 0.80 0.17 0.58 0.0003
ε 78.5 27.1 5.9 10.5 1
pKw 14.0 11.2 19.4 11.9 ---
cp [kJ·kg-1·K
-1] 4.22 4.86 13 6.8 2.1
η [mPas] 0.89 0.11 0.03 0.07 0.02
λ [mW·m-1·K
-
1]
608 620 160 438
55
The density ρ of supercritical water can be altered by variation of temperature and pressure
continuously from high (liquid like) to low (gas like) values without phase transition.
The relative static dielectric constant ε drops form a value of 78.5 at normal standard
conditions to a value of about 6 at the critical point, thus clarifying the difference in the
solution properties of supercritical water in comparison with “normal” water. The reason for
this relatively low value of the dielectric constant, is the reduced number of hydrogen bonds,
Chapter 1
24
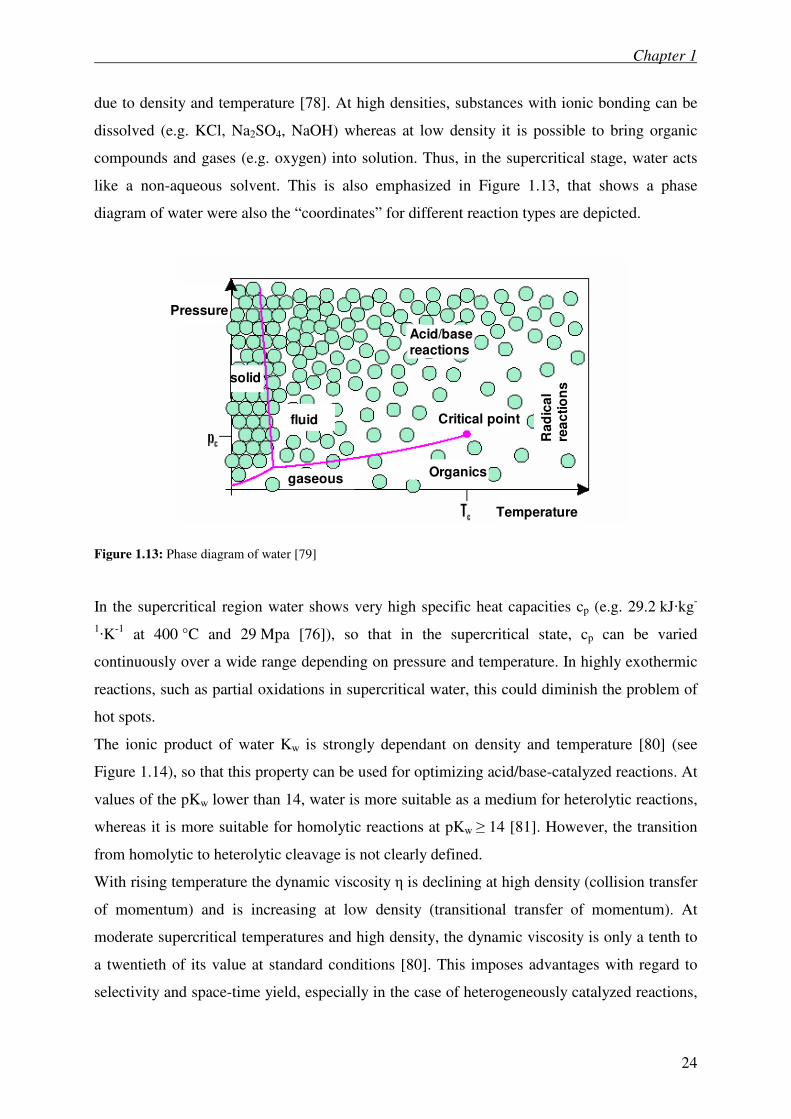
due to density and temperature [78]. At high densities, substances with ionic bonding can be
dissolved (e.g. KCl, Na2SO4, NaOH) whereas at low density it is possible to bring organic
compounds and gases (e.g. oxygen) into solution. Thus, in the supercritical stage, water acts
like a non-aqueous solvent. This is also emphasized in Figure 1.13, that shows a phase
diagram of water were also the “coordinates” for different reaction types are depicted.
Pressure
Temperature
Acid/base reactions
Ra
dic
al
rea
cti
on
s
Critical point
Organicsgaseous
fluid
solid
Pressure
Temperature
Acid/base reactions
Ra
dic
al
rea
cti
on
s
Critical point
Organicsgaseous
fluid
solid
Figure 1.13: Phase diagram of water [79]
In the supercritical region water shows very high specific heat capacities cp (e.g. 29.2 kJ·kg-
1·K
-1 at 400 °C and 29 Mpa [76]), so that in the supercritical state, cp can be varied
continuously over a wide range depending on pressure and temperature. In highly exothermic
reactions, such as partial oxidations in supercritical water, this could diminish the problem of
hot spots.
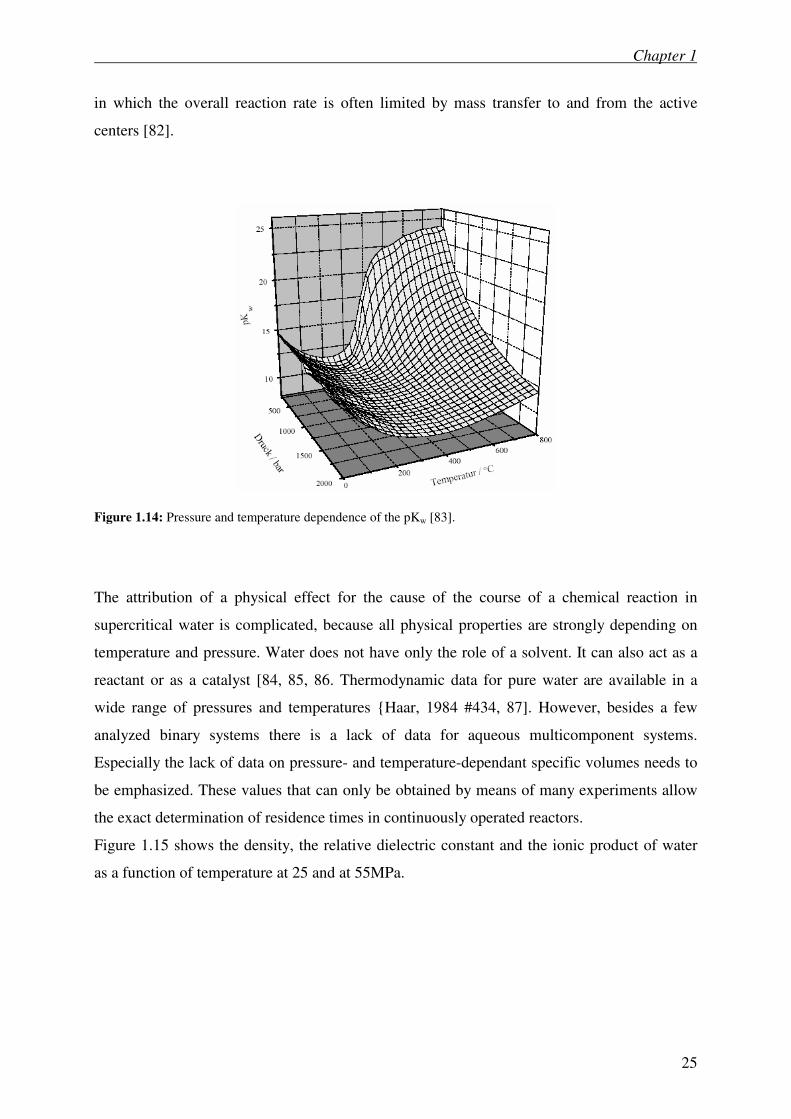
The ionic product of water Kw is strongly dependant on density and temperature [80] (see
Figure 1.14), so that this property can be used for optimizing acid/base-catalyzed reactions. At
values of the pKw lower than 14, water is more suitable as a medium for heterolytic reactions,
whereas it is more suitable for homolytic reactions at pKw ≥ 14 [81]. However, the transition
from homolytic to heterolytic cleavage is not clearly defined.
With rising temperature the dynamic viscosity η is declining at high density (collision transfer
of momentum) and is increasing at low density (transitional transfer of momentum). At
moderate supercritical temperatures and high density, the dynamic viscosity is only a tenth to
a twentieth of its value at standard conditions [80]. This imposes advantages with regard to
selectivity and space-time yield, especially in the case of heterogeneously catalyzed reactions,
Chapter 1
25
in which the overall reaction rate is often limited by mass transfer to and from the active
centers [82].
Figure 1.14: Pressure and temperature dependence of the pKw [83].
The attribution of a physical effect for the cause of the course of a chemical reaction in
supercritical water is complicated, because all physical properties are strongly depending on
temperature and pressure. Water does not have only the role of a solvent. It can also act as a
reactant or as a catalyst [84, 85, 86. Thermodynamic data for pure water are available in a
wide range of pressures and temperatures {Haar, 1984 #434, 87]. However, besides a few
analyzed binary systems there is a lack of data for aqueous multicomponent systems.
Especially the lack of data on pressure- and temperature-dependant specific volumes needs to
be emphasized. These values that can only be obtained by means of many experiments allow
the exact determination of residence times in continuously operated reactors.
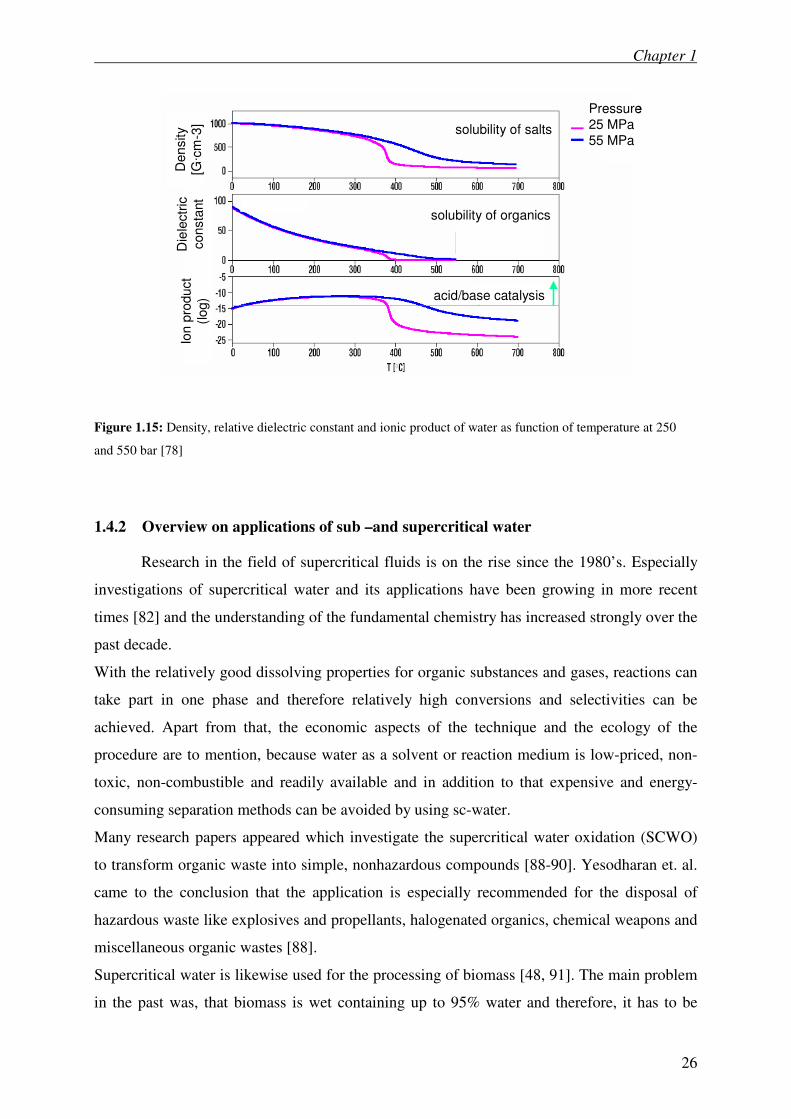
Figure 1.15 shows the density, the relative dielectric constant and the ionic product of water
as a function of temperature at 25 and at 55MPa.
Chapter 1
26
solubility of salts
solubility of organics
acid/base catalysis
Pressure
25 MPa
55 MPa
Den
sity
[G·c
m-3
]D
iele
ctr
ic
consta
nt
Ion p
roduct
(log)
solubility of salts
solubility of organics
acid/base catalysis
Pressure
25 MPa
55 MPa
Den
sity
[G·c
m-3
]D
iele
ctr
ic
consta
nt
Ion p
roduct
(log)
Figure 1.15: Density, relative dielectric constant and ionic product of water as function of temperature at 250
and 550 bar [78]
1.4.2 Overview on applications of sub –and supercritical water
Research in the field of supercritical fluids is on the rise since the 1980’s. Especially
investigations of supercritical water and its applications have been growing in more recent
times [82] and the understanding of the fundamental chemistry has increased strongly over the
past decade.
With the relatively good dissolving properties for organic substances and gases, reactions can
take part in one phase and therefore relatively high conversions and selectivities can be
achieved. Apart from that, the economic aspects of the technique and the ecology of the
procedure are to mention, because water as a solvent or reaction medium is low-priced, non-
toxic, non-combustible and readily available and in addition to that expensive and energy-
consuming separation methods can be avoided by using sc-water.
Many research papers appeared which investigate the supercritical water oxidation (SCWO)
to transform organic waste into simple, nonhazardous compounds [88-90]. Yesodharan et. al.
came to the conclusion that the application is especially recommended for the disposal of
hazardous waste like explosives and propellants, halogenated organics, chemical weapons and
miscellaneous organic wastes [88].
Supercritical water is likewise used for the processing of biomass [48, 91]. The main problem
in the past was, that biomass is wet containing up to 95% water and therefore, it has to be
Chapter 1
27
dried for the classical gas-phase gasification or liquefaction process. This causes high costs
and can be avoided by using sub- and supercritical water [92].
Due to the properties and the advantages of sc-water, there is a wide range of potential
application areas. First of all - because of the good dissolving power of sc-water - it is
possible to conduct the oxidation e.g. of waste in one homogenous phase with water as
solvent. Thus almost complete conversions and no by-product results. The process is
particularly suitable if harmful substances already are in aqueous solution like e.g. industrial
sewage. Another application area is the use of sc-water as a reactant for example for the
gasification of biomass or coal [60, 93]}. In this case high yields of hydrogen are reached,
because half of the hydrogen comes from the water and furthermore the wet biomass has not
been dried before. In addition to that, sc-water as a reactant can be used for the recycling of
plastics, so that the created monomers can be used as raw material for new reactions [94, 95].
Because the dissolving power of water for organic compounds disappears when cooling down
the product, the hydrophobic organic components are separated automatically form the water-
phase. So the costs for separation operations like distillation can be economized. The last
application area to be mentioned here results from the fact, that the ionic product can be
adjusted over a wide range so that reactions take part, which normally demand acid- or base-
catalysis. This renders, primarily in technical important reactions like hydrolysis,
rearrangements, assembling of carbon-carbon-bonds and condensation reactions, the addition
of acids and bases unnecessary and once more the costs can be reduced [79].
Despite all the advantages there are still some problems concerning these techniques, mainly
regarding supercritical water oxidation (SCWO). The high temperatures and pressures as well
as the presence of corrosive ions like chloride, fluoride, sulfate and phosphate and additional
high concentrations of oxygen and extreme pH-values lead to a very high corrosive behavior.
Therefore, corrosion resistant reactors have to be applied [82, 96].
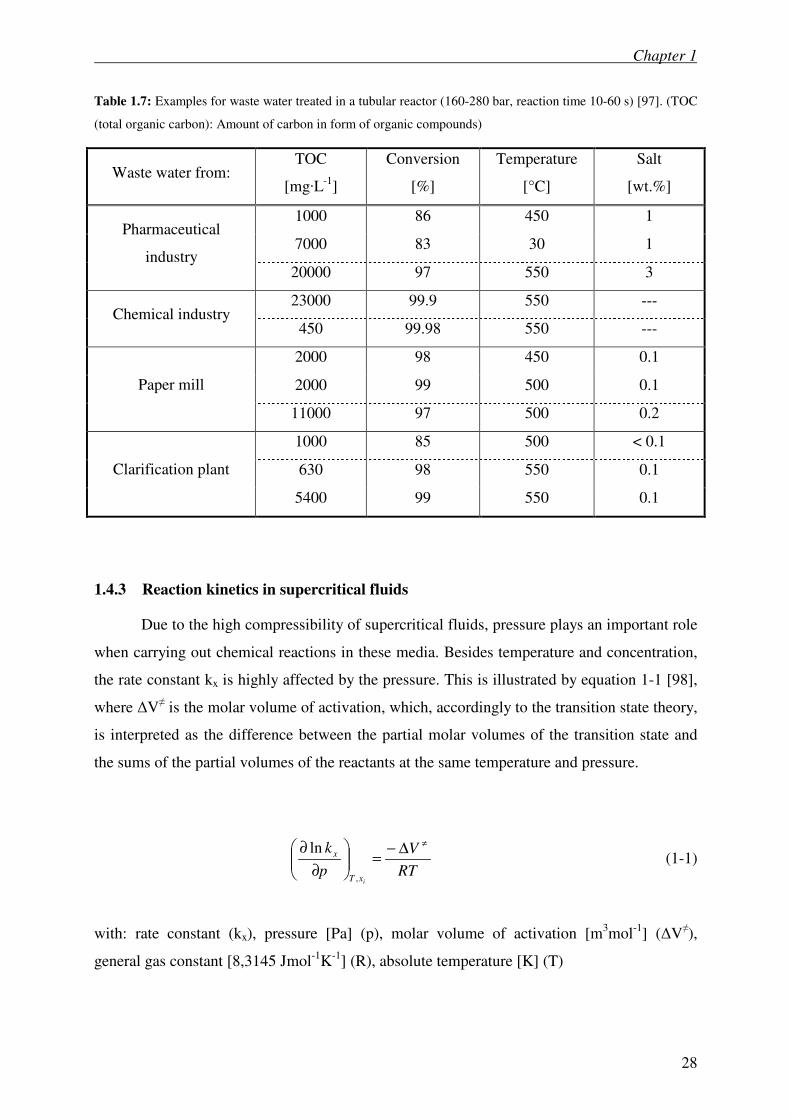
The following table shows successful examples for the treatment of waste water in technical
scale (up to 630 °C, 32 MPa, flow rate 10 kg·h-1
, 20 kg·h-1
air) [97].
Another obstacle in applying water under super critical conditions is the poor solubility of
salts in this media. This has lead to reactor concepts where the deposition of salt does not
occur. An example is the transpiring wall reactor [97] developed at the “Institut für
Technische Chemie” of the “Forschungszentrum Karlsruhe”.
Chapter 1
28
Table 1.7: Examples for waste water treated in a tubular reactor (160-280 bar, reaction time 10-60 s) [97]. (TOC
(total organic carbon): Amount of carbon in form of organic compounds)
Waste water from: TOC
[mg·L-1
]
Conversion
[%]
Temperature
[°C]
Salt
[wt.%]
1000 86 450 1
7000 83 30 1 Pharmaceutical
industry 20000 97 550 3
23000 99.9 550 --- Chemical industry
450 99.98 550 ---
2000 98 450 0.1
2000 99 500 0.1 Paper mill
11000 97 500 0.2
1000 85 500 < 0.1
630 98 550 0.1 Clarification plant
5400 99 550 0.1
1.4.3 Reaction kinetics in supercritical fluids
Due to the high compressibility of supercritical fluids, pressure plays an important role
when carrying out chemical reactions in these media. Besides temperature and concentration,
the rate constant kx is highly affected by the pressure. This is illustrated by equation 1-1 [98],
where ∆V≠ is the molar volume of activation, which, accordingly to the transition state theory,
is interpreted as the difference between the partial molar volumes of the transition state and
the sums of the partial volumes of the reactants at the same temperature and pressure.
RT
V
p
k
ixT
x
≠∆−=
∂
∂
,
ln (1-1)
with: rate constant (kx), pressure [Pa] (p), molar volume of activation [m3mol
-1] (∆V
≠),
general gas constant [8,3145 Jmol-1
K-1
] (R), absolute temperature [K] (T)
Chapter 1
29
Nevertheless, this interpretation of the volume of activation should be treated with caution
when having a look at complex reactions or reactions in supercritical fluids. In these cases
∆V≠ should be considered only as a formal fitting parameter for quantitatively describing the
pressure dependence. For supercritical reactions the value of the volume of activation is often
high, so that considerable changes of the rate constant can be achieved here [99].
Usually the volume of activation is split into two terms (equation 1-2 [100]). The first term
∆V≠
1 is an expression of the difference of the molecular size of the reactants and the transition
state (intrinsic or reaction-specific term). The second term ∆V≠
2 gives information about the
interaction between the reactants and the solvent molecules (extrinsic or solvent-specific
term).
≠≠≠ ∆+∆=∆ 21 VVV (1-2)
For common solutions both terms are approximately the same, whereas in supercritical fluids
the second term often predominates and hence determines the pressure dependence of the
kinetics. The intrinsic part of the volume of activation is in the magnitude of ±30 cm3mol
-1
[101]. Reactions in supercritical fluids are decisively influenced by these solvent-specific
interactions and their uncommon solution properties.
Like normal fluids, supercritical fluids also show the effect known as “clustering“ or “cage”
effect, i.e. the physical properties in the neighborhood of a dissolved particle are
fundamentally different from the average value for the solution. This cluster formation,
occurring increasingly near the critical point, leads to a local increase in density, whereas the
involved cluster molecules are in a dynamic equilibrium with the solvent molecules. A local
reduction of the density around dissolved particles is also possible [102]. In terms of reaction
kinetics, this behavior can become apparent in different ways, so each case has to be
considered separately on the basis of the theory of collisions in solutions [103]. In
diffusion-controlled reactions, the rate can be increased in the fluid phase by a reduction in
viscosity and the increased diffusion of the reactants associated with it. Yet barriers to
diffusion can also arise due to the cage effect [104].
Because of the fact that the diffusion coefficient of supercritical fluids is declining with
increasing pressure, a kinetic controlled reaction can become diffusion controlled by raising
the pressure. Therefore, in reaction networks where only a few steps are diffusion controlled
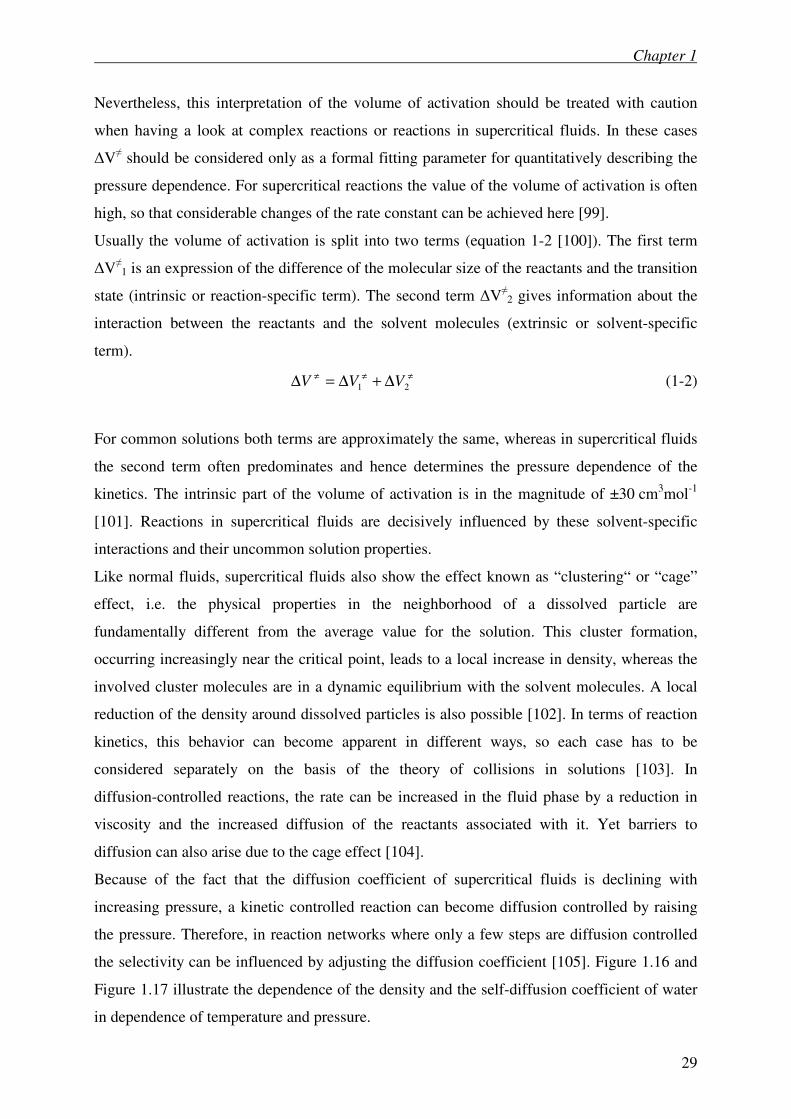
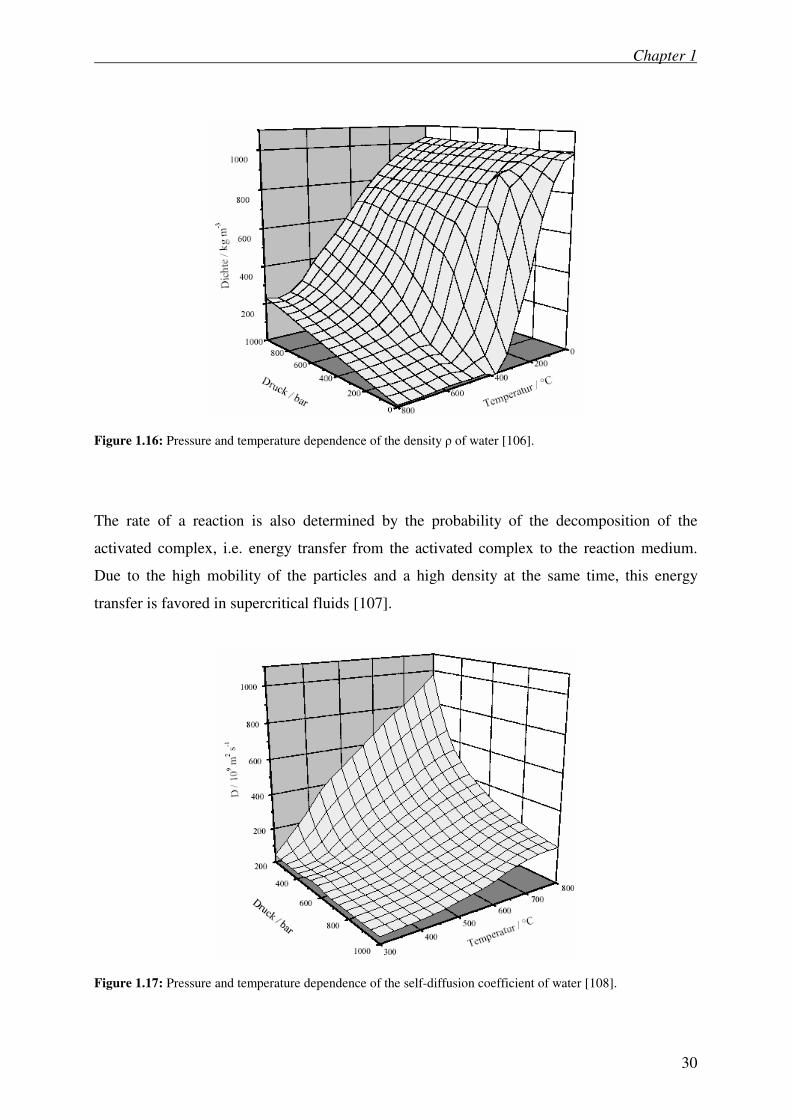
the selectivity can be influenced by adjusting the diffusion coefficient [105]. Figure 1.16 and
Figure 1.17 illustrate the dependence of the density and the self-diffusion coefficient of water
in dependence of temperature and pressure.
Chapter 1
30
Figure 1.16: Pressure and temperature dependence of the density ρ of water [106].
The rate of a reaction is also determined by the probability of the decomposition of the
activated complex, i.e. energy transfer from the activated complex to the reaction medium.
Due to the high mobility of the particles and a high density at the same time, this energy
transfer is favored in supercritical fluids [107].
Figure 1.17: Pressure and temperature dependence of the self-diffusion coefficient of water [108].
Chapter 1
31
According to quantum mechanical calculations, water molecules in a supercritical state are
involved in breaking chemical bonds by significantly reducing the activation barrier [100].
Particularly the aggregation of water molecules leads to complex molecules with many
energetically occupied degrees of freedom. The energy of these molecules is now available to
the activated complex [109].
The lowering of the activation barrier is especially important for kinetic controlled reactions.
Here the reactants pass a maximum of the potential energy. This maximum is equal to the
activated complex C≠.
A + B C≠ P (1-3)
According to the transition-state theory, the activated complex is formed out of a rapid,
antecedent equilibrium and leads to the product P, following a reaction of first order [110].
The difference in the potential energy of the educts and the transition state is the activation
energy. This activation barrier is influenced by the solvent, as it determines the potential
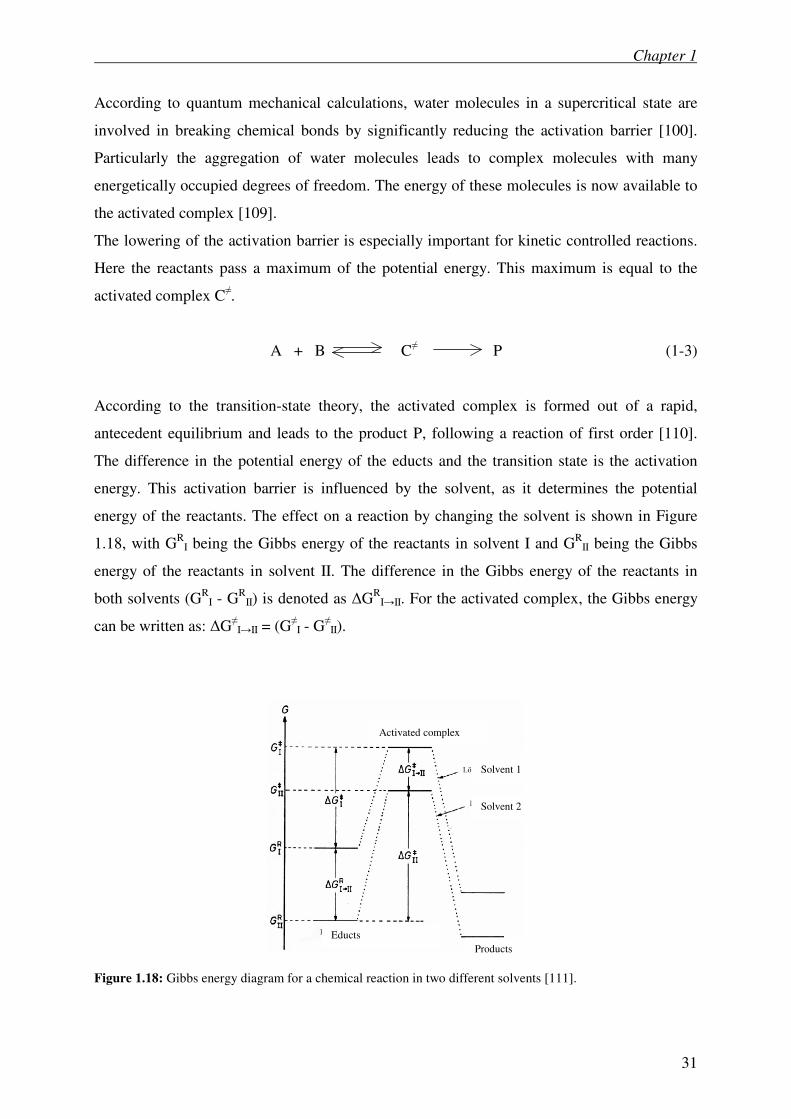
energy of the reactants. The effect on a reaction by changing the solvent is shown in Figure
1.18, with GR
I being the Gibbs energy of the reactants in solvent I and GR
II being the Gibbs
energy of the reactants in solvent II. The difference in the Gibbs energy of the reactants in
both solvents (GR
I - GR
II) is denoted as ∆GR
I→II. For the activated complex, the Gibbs energy
can be written as: ∆G≠
I→II = (G≠
I - G≠
II).
Figure 1.18: Gibbs energy diagram for a chemical reaction in two different solvents [111].
Activated complex
Educts
Products
Solvent 1
Solvent 2
Chapter 1
32
The change of the activation energy is given by:
( ) ( )R
IIII
R
IIIII GGGGGGG ∆−∆−∆−∆=∆−∆=∆∆ ≠≠≠≠≠ . (1-4)
This expression can be simplified by writing:
R
IIIIII GGG →≠→
≠ ∆−∆=∆∆ . (1-5)
Quantitatively this effect is described by equation 1-6:
( )( )
solvABsolvBsolvA GGGRT
kk,,,0
1lnln ≠∆−∆+∆−= . (1-6)
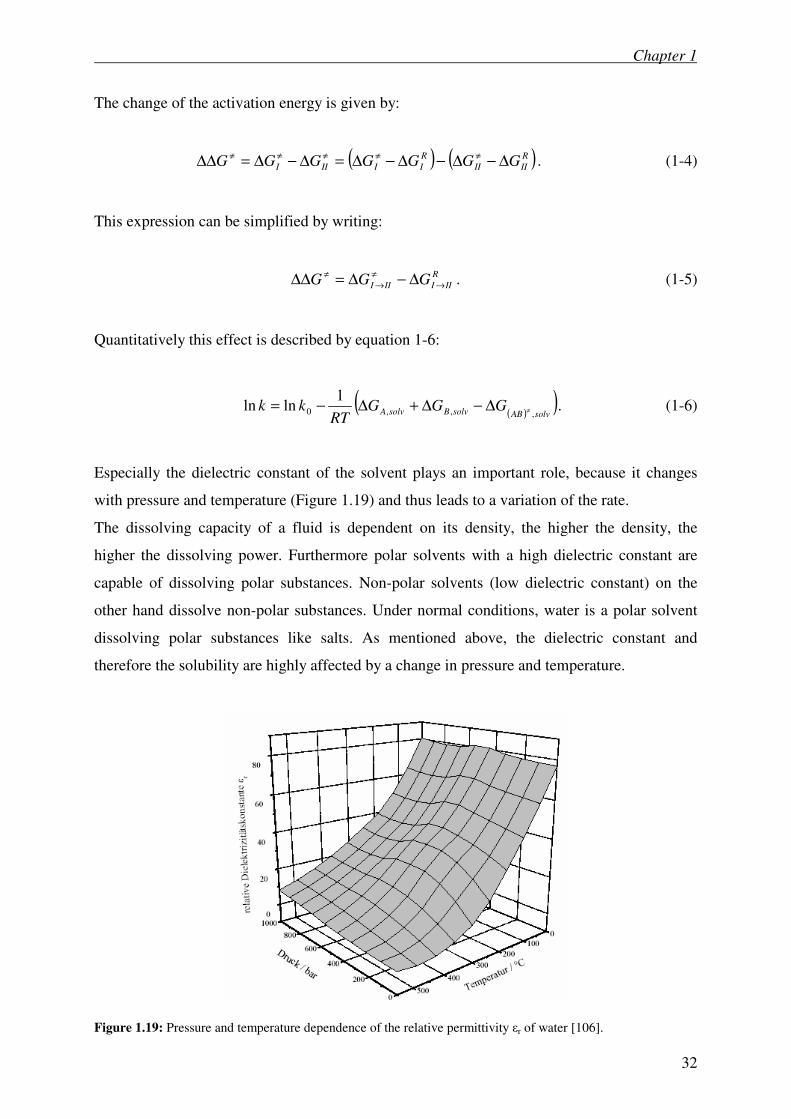
Especially the dielectric constant of the solvent plays an important role, because it changes
with pressure and temperature (Figure 1.19) and thus leads to a variation of the rate.
The dissolving capacity of a fluid is dependent on its density, the higher the density, the
higher the dissolving power. Furthermore polar solvents with a high dielectric constant are
capable of dissolving polar substances. Non-polar solvents (low dielectric constant) on the
other hand dissolve non-polar substances. Under normal conditions, water is a polar solvent
dissolving polar substances like salts. As mentioned above, the dielectric constant and
therefore the solubility are highly affected by a change in pressure and temperature.
Figure 1.19: Pressure and temperature dependence of the relative permittivity εr of water [106].
Chapter 1
33
Studies on the solubility of sodium sulfate and sodium carbonate in sub - and supercritical
water [75] show how salt solubility decreases with temperature and decreasing density of the
solvent. Khan et al. report that the solubility of sodium carbonate in subcritical water
decreases from approximately 10 to 1 wt.% when increasing the temperature from 320 to
370°C [75]. With declining density of the solvent after passing the critical point the solubility
is drastically reduced. At high temperatures (600 °C), high solubility can be realized at high
pressures/densities (up to 60 MPa).
1.5 Scope of the thesis
The application of lignin in industrial processes, with the aim to produce organic
intermediates such as phenolic derivatives or thermosets like phenolic resins, has not been
realized so far. Lignin depolymerization in various solvents and by application of acids and
bases has been a subject of research for a long time [54, 56, 112 ̧Xin M., 2005 #359, 113].
However, up to now, a continuous process producing phenolic derivatives of high quality
(high value chemicals) and in significant amounts has not been developed. The difficulties
herein, lie in the extremely high thermal stability of the polymer, as well as in controlling a
selective bond cleavage into the phenolic monomers. Therefore, the aim of this work was to
optimize reaction engineering and to develope a processing concept for the hydrothermal
lignin conversion. Furthermore, this work represents a fundamental investigation towards
characterization of the reaction products from the catalytic and non-catalytic hydrothermal
lignin depolymerization. The intention in this context was to follow a totally new synthetic
route. Applying high pressures and water as a solvent, formation of tar should be suppressed
and cleavage into small products preferred.
The large amount of various products known from lignin depolymerization reactions give rise
to the challenge of developing an economically and ecologically reasonable process to
produce phenolic compounds with a high selectivity by appropriate choice of pressure,
temperature, reaction time, concentration and catalytic system.
A general insight on biomass and more especially lignin utilization for energy, fuel and
chemical production is given in chapter 1. Lignin is introduced and an overview on its
structure, the various methods of recovery and their effect on the properties of the obtained
lignin are given. Furthermore, applications for sub – and supercritical water as a reaction
medium as well as its properties and effects on reaction kinetics are described.
Chapter 1
34
Chapter 2 explains the continuous setup as well as the batch autoclaves and the tumbling oven
used for the high pressure experiments. The GC methods for analyzing the probe molecules
and the low molecular lignin cleavage products are likewise described.
In chapter 3 the results from the experiments with model compounds representing the various
bonds in lignin are presented and discussed. Emphasis is given to the influence of reaction
conditions and additives on the different reaction pathways possible.
The developed work up procedure to separate and recover the lignin cleavage products is
described in chapter 4. Furthermore, the effect of operation conditions on oil yield and
monomer selectivity are shown, and a mechanism for the base catalyzed depolymerization of
lignin is suggested and discussed.
Chapter 5 covers the phenomenon of lignin repolymerization and shows how it can
successfully be suppressed by the addition of an appropriate blocking agent.
Chapter 6 summarizes the most important results and conclusions.
Chapter 1
35
1.6 References
1. Exchange, N.Y.M., http://www.nymex.com/.
2. European Commission, World energy, technology, and climate policy outlook (WETO
2030), EUR 20366, 2003.
3. Kamm, B., Gruber, P.R., Kamm, M., Biorefineries—Industrial Processes and
Products; Status Quo and Future Directions, Wiley-VCH: Weinheim, Vol. 1, 441.,
2006.
4. Development, R.o.t.U.N.C.o.E.a., Rio de Janeiro, June 3–14, 1992.
http://www.un.org/esa/sustdev, date 2.5.2007.
5. The US Chemical Industry, 1996. http://www.ccrhq.org/vision/index.html, date
2.5.2007.
6. Chemistry, W.R.o.N.P., Technology roadmap, July 2001, Council for Chemical
Research, p. 9. http://www.ccrhq.org, USA, date 3.5.2007.
7. CEFIC, www.cefic.be. Date 2.5.2007.
8. Eggersdorfer, M., Spektrum der Wissenschaft, 1994, June, 96-102.
9. Mülhaupt, R., Chimia, 1996, 50 191-98.
10. Association, E.B.I., www.eubia.org/.
11. Grammelis, P., Skodras, G., Kakaras, E., International Journal of Energy Research,
2006, 30(10), 763 - 75.
12. Ertl, G. and Weitkamp, J., Handbook of Heterogeneous Catalysis. 1 ed. Vol. 4. 1997,
1997, 1856-76.
13. Ullmann’s, 22. Ullmann’s, Encyclopedia of Industrial Cemistry. 6 ed. (electronic
release), dimethylether, 2002.
14. Jopp, K., Volkswagen Magazin, 2003, 1 42-45.
15. Wülst, C., Der Spiegel, 2004, 40 196-200.
16. Centrales Agrar-Rohstoff-Marketing und Entwicklungs-Netzwerk e.V.,
http://www.carmen-ev.de/dt/industrie/foerderung.html.
17. Jacobsen, H., Angewandte Chemie-International Edition, 2004, 43(15), 1912-14.
18. Cortright, R.D.Davda, R.R.Dumesic, J.A.N., 2002. 418(6901): p. 964-967., Nature,
2002, 418 964-67.
19. Boukis, N., NACHRICHTEN -Forschungszentrum Karlsruhe, 2003, 35(3), 99-104.
20. Lewis, N.S., Science, 2007, 315 798.
Chapter 1
36
21. Sanders, J.P.M.Scott, E.L.Weusthuis, R.A.Mooibroek, H., Macromolecular
Bioscience, 2007, 7(2), 105 - 17.
22. Boeriu, C.G., Dam, J. E. G. van, Sander, J. P. M., WA Publishing, London 2005,
2005, 17.
23. Kamm, B. and Kamm, M., http://www.herzoagenda21.de/_PDF/bioraf.pdf.
24. Weissermel, K. and Arpe, H.-J., Industrielle Organische Chemie. 5 ed. 1997,
Weinheim/New York: VCH.
25. Haveren, J.v., Scott, E.L., Sanders, J.P.M., Biofuels Bioproducts and Biorefining,
2007, 2(1), 41 - 57.
26. Fukuda, M. and Mikoshiba, K., BioEssays, 1997, (19), 593.
27. Burgoyne, R.D. and Morgan, A., Phsiol. Rev., 2003, 83 581.
28. Dodds, D.R. and Gross, R.A., Science, 2007, 318 250.
29. Bicker, M., in Fachbereich Chemie. 2005, Technische Universität Darmstadt:
Darmstadt., 2005.
30. Adler, E., Wood Science and Technology, 1977, 11(3), 169-218.
31. Dorrestijn, E., Laarhoven, L. J. J., Arends, I., Mulder, P., J. Anal. Appl. Pyrolysis,
2000, 54(1-2), 153-92.
32. Glasser, W.G. and Glasser, H.R., Paperi ja Puu, 1981, 63(2), 71-83.
33. Erickson, M., Larsson, S., Miksche, G. E., Acta Chem. Scand., 1973, 27 903.
34. Nimz, H., Angew. Chem., 1974, 86 336-44.
35. Römpp, Chemie Lexikon, 9. Auflage, Thieme Verlag, Stuttgart, 1995.
36. Nitz, H., PhD thesis, Fakultät für Chemie und Pharmazie der Albert-Ludwigs-
Universität Freiburg i. Br., 2001.
37. Knoblauch-Mayer, W.G., Dissertation, Hamburg, 1991, 1991.
38. Fang, C., Wenlan, H., Linong, W., Jialuan, Y., Jiaxiang, G., Cellulose Chemistry and
Technology, 1991, 25 383-90.
39. Williamson, P.N., Pulp and Paper Canada, 1987, 88 47-49.
40. Pye, E.K. and Lora, J.H., Tappi J., 1991, 3(97), 113-18.
41. Dahlmann, G. and Schroeter, M.C., Tappi J., 1990, 4(90), 237-40.
42. Lindner, A. and Wegener, G., Das Papier, 1988, 42 V1-V8.
43. Freudenberg, K., Angewandte Chemie, 1939, 52 362-63.
44. Kashima, H., Noguchi Kenkyusho Jiho, 1960, 9 23-35.
Chapter 1
37
45. Chum, H.L., Black, S., Ratcliff, M., Goheen, D., Lignin Hydrotreatmentto low
molecular weight compounds, in Adv. Solar Energy. 1988, Plenum Press: New York.
p. 91-200., 1988.
46. Meier, D. and Faix, O., Fuel, 1986, 65 910-31.
47. Faix, O., Pyrolytic and hydrogenolytic degeneration studies on lignocellulosics, pulps
and lignins. International Symposium on Wood and Pulping Chemistry. 1987. Paris.
48. Johnson, D.K. and Chum, H.L., Lignin Liquefaction in supercritical water, in
Research in thermochemical biomass conversion. 1988, Elsevier Science: London,
New York. p. 485-496., 1988.
49. Funazukuri, T., Fuel, 1990, 69(3), 349-53.
50. Miller, J.E., Evans, L. R., Littlewolf, A., Trudell, D. E., Fuel, 1999, 78 1363-66.
51. Ehara, K., Saka, S., Kawamoto, H., Journal of Wood Science, 2002, 48(4), 320-25.
52. Saisu, M., Sato, T., Watanabe, M., Adschiri, T., Arai, K., Energy Fuels, 2003, 17(4),
922-28.
53. Okuda, K., Ohara, S., Umetsu, M., Takami, S., Adschiri, T. Dissasembly of waste
lignin in supercritical water and p-cresol mixtures. in 14th International Conference
on the properties of water and steam in kyoto. 2003. kyoto, Japan.
54. Okuda, K., Ohara, S., Umetsu, M., Takami, S., Adschiri, T., J. Phys.: Condens.
Matter, 2004, 16 1325-30.
55. Shabtai, J.S., Zmierczak, W.W., Chornet, E., Johnson, D., US2003/0100807 A1, 2003,
56. Shabtai, J.S.Zmierczak, W.W.Chornet, E.Johnson, D., US2003/0115792 A1, 2003.
57. Miller, J.E., Evans, L. R., Littlewolf, A., Trudell, D. E., Fuel, 1999, 78(11), 1363-66.
58. Takada, J. Wood Sci, 2004, 50 253-59.
59. Sato, T., Furusawa, T., Ishiyama, Y., Sugito, H., Miura, Y., Sato, M., Suzuki, N., Itoh,
N., Ind. Eng. Chem. Res., 2006, 45 615.
60. Osada, M., Sato, O., Watanabe, M., Arai, K., Shirai M., Energy Fuels, 2006, 20(3),
930-35.
61. Kashima, H., Noguchi, K. J., 1960, 9 23-35.
62. Meier D., Faix O., Fuel, 1986, 65 910-31.
63. Faix O., Pyrolytic and hydrogenolytic degeneration studies on lignocellulosics, pulps
and lignins. in International Symposium on Wood and Pulping Chemistry. 1987. Paris.
64. Johnson, A., Lignin Liquefaction in supercritical water, in Research in
thermochemical biomass conversion. 1988, Elsevier Science: London, New York. p.
485-96.
Chapter 1
38
65. Toshitaka, F., Fuel, 1990, 69(3), 349-53.
66. Miller, J.E.Evans, L.Littlewolf, A.Trudell, D.E., Fuel, 1999, 78(11), 1363-66.
67. Ehara, K.Saka, S.Kawamoto, H., Journal of Wood Science, 2002, 48(4), 320-25.
68. Ehara, K., Journal of Wood Science, 2002, 48(4), 320-25.
69. Saisu, M., Sato, T., Watanabe, M., Adschiri, T., Arai, K., Energy & Fuels, 2003,
17(4), 922-28.
70. Okuda, K., and Kazuhide, A., Dissasembly of waste lignin in supercritical water and
p-cresol mixtures. in 14th International Conference on the properties of water and
steam in kyoto. 2003. kyoto, Japan.
71. Shabtai, J.S.Zmierczak, W.W.Chornet, E.Johnson, D., US2003/0115792 A1, 2003.
72. Shabtai, J.S., Zmierczak, W.W., Chornet, E., Johnson, D., US2003/0100807 A1, 2003,
73. Sato, T., Furusawa, T., Ishiyama, Y., Sugito, H., Miura, Y., Sato, M., Suzuki, N., Itoh,
N., Industrial & Engineering Chemistry Research, 2006, 45(2), 615-22.
74. Osada, M., Sato, O., Watanabe, M., Arai, K., Shirai, M., Energy & Fuels, 2006, 20(3),
930-35.
75. Khan, M.S. and Rogak, S.N., Journal of Supercritical Fluids, 2004, 30(3), 359-73.
76. Haar, L., Gallagher, J. S., Kell, G. S., NBS / NRC Steam Tables. 1984, Washington
DC: Hemisphere Publishing., 1984.
77. Tödheide, K., Water - a Comprehensive Treatise. 1 ed. Vol. 1. 1972, New York:
Plenum., 1972.
78. Cochran, H.D., Cummings, P.T., Karaborni, S., Fluid Phase Equilibria, 1992, 71 1-16.
79. Kruse, A., NACHRICHTEN - Forschungszentrum Karlsruhe, 2001, 33(1), 59-70.
80. Shaw, R.W., Chem. Eng. News, 1991, 69(51), 26-39.
81. Xu, X., Almeida, C. D., Antal, M. J., Journal of Supercritical Fluids - Symposium on
Supercritical Fluids, 1990, 3(4), 228-32.
82. Bröll, D., Die Reaktionen von Methanol, Methan und Propylen mit und ohne
Silberkatalysatoren, in Fachbereich Chemie der Technischen Universität Darmstadt.
2001, Technische Universität Darmstadt: Darmstadt.
83. Uematsu, M. and Franck, E.U., J. Phys. Chem. Ref. Data, 1980, 9(4), 1291-306.
84. Penninger, J.M.L., Fuel, 1988, 67(4), 490-96.
85. Houser, T.J., Tsao, C., Dyla, J. E., Atten, M. K., Fuel, 1989, 68(3), 323-27.
86. Thornton, T.D. and Savage, P.E., The Journal of Supercritical Fluids - Symposium on
Supercritical Fluids, 1990, 3(4), 240-43.
Chapter 1
39
87. Wagner, W. and Kruse, A., Zustandsgrößen von Wasser und Wasserdampf. 1 ed.,
1998, Berlin: Springer.
88. Yesodharan, S., Curr. Sci., 2002, 82(9), 1112-22.
89. Ding, A., Ind. Eng. Chem. Res., 1996, 35 3257-79.
90. Anitescu, G. and Tavlarides, L.L., Ind. Eng. Chem. Res., 2005, 44(5), 1226-32.
91. Kruse, A., Henningsen, T., Sinag, A., Pfeiffer, J., Ind. Eng. Chem. Res., 2003, 42(16),
3711-17.
92. Kruse, A., Gawlik, A., Ind. Eng. Chem. Res., 2003, 42(2), 267-79.
93. Nywlt, M. and Peter, S., Erdöl & Kohle Erdgas Petrochemie, 1992, 45(9), 349-53.
94. Moriya, T. and Enomoto, H., Polym. Degrad. Stab., 1999, 65(3), 373-86.
95. Shibasaki, Y., Kamimoro, T., Kadokawa, J., Hatano, B., Tagaya, H., Polym. Degrad.
Stab., 2004, 83 481-85.
96. Boukis, N., Schacht, M., Dinjus, E, Forschungszentrum Karlsruhe ITC, Technik und
Umwelt , NACHRICHTEN, 2001, 33 81-90.
97. Abeln, J., Kluth, M., Petrich, G., Schmieder, H., Proceedings of the ICSTR-3,
Bordeaux, France, July 19-23. 1990., 1990.
98. Tiltscher, H. and Hofmann, H., Chemical Engineering Science, 1987, 42(5), 959-77.
99. Bröll, D., Kaul, C., Kramer, A., Krammer, P., Richter, T., Jung, M., Vogel, H.,
Zehner, P., Angewandte Chemie-International Edition, 1999, 38(20), 2999-3014.
100. Shaw, R.W., Brill, T.B., Clifford, A.A., Eckert, C.A., Franck, E.U., Chemical &
Engineering News, 1991, 69(51), 26-39.
101. Reichardt, C., Solvents and Solvent Effects in Organic Chemistry. 2 ed. 1990,
Weinheim: VCH.
102. Debenedetti, P.G., Chemical Engineering Science, 1987, 42(9), 2203-12.
103. Laidler, K.J., Chemical Kinetics. 3 ed. 1987, New York: Harper & Row.
104. Savage, P.E., Gopalan, S, .Mizan, T.I., Martino, C.J., Brock, E.E., Aiche Journal,
1995, 41(7), 1723-78.
105. Bicker, M., Stoffliche Nutzung von Biomasse mit Hilfe überkritischer Fluide - 5-
Hydroxymethylfurfural und Milchsäure, in Fachbereich Chemie. 2005, Technische
Universität Darmstadt: Darmstadt.
106. Haar, L., Gallagher, J. S., Kell, G.S., NBS / NRC Steam Tables. 1984, Washington
DC: Hemisphere Publishing.
107. Benson, S.W., Thermochemical Kinetics. 1 ed. 1976, New York: John Wiley & Sons.
Chapter 1
40
108. Lamb, W.J.Hoffman, G.A.Jonas, J., Journal of Chemical Physics, 1981, 74(12), 6875-
80.
109. Brock, E.E. and Savage, P.E., Aiche Journal, 1995, 41(8), 1874-88.
110. P. G. Jessop and W. Leitner, Chemical Synthesis Using Supercritical Fluids. 1999,
Weinheim / New York: Wiley-VCH Verlag.
111. Reichardt, C., Solvents and Solvent Effects in Organic Chemistry. 1990,
Weinheim/New York: VCH-Verlag.
112. Vigneault, A., Johnson, D. K., Chornet, E., Science in Thermal and Chemical Biomass
Conversion, CPL Press, 2006.
113. Man, X., Okuda, K., Ohara, S., Umetsu, M., Takami, S., Adschiri, T., Journal of Japan
Institute of Energy, 2005, 84 486-93.
Chapter 2
41
Chapter 2
Experimental Section
Abstract
The experimental section describes the continuous setup as well as the batch
autoclaves and the tumbling oven used for the high pressure experiments. The methods of
product analysis are likewise described and examples are given. The applied chemicals, work
up procedures, other methods of product analysis and catalysts preparation will be explained
in the corresponding chapters.
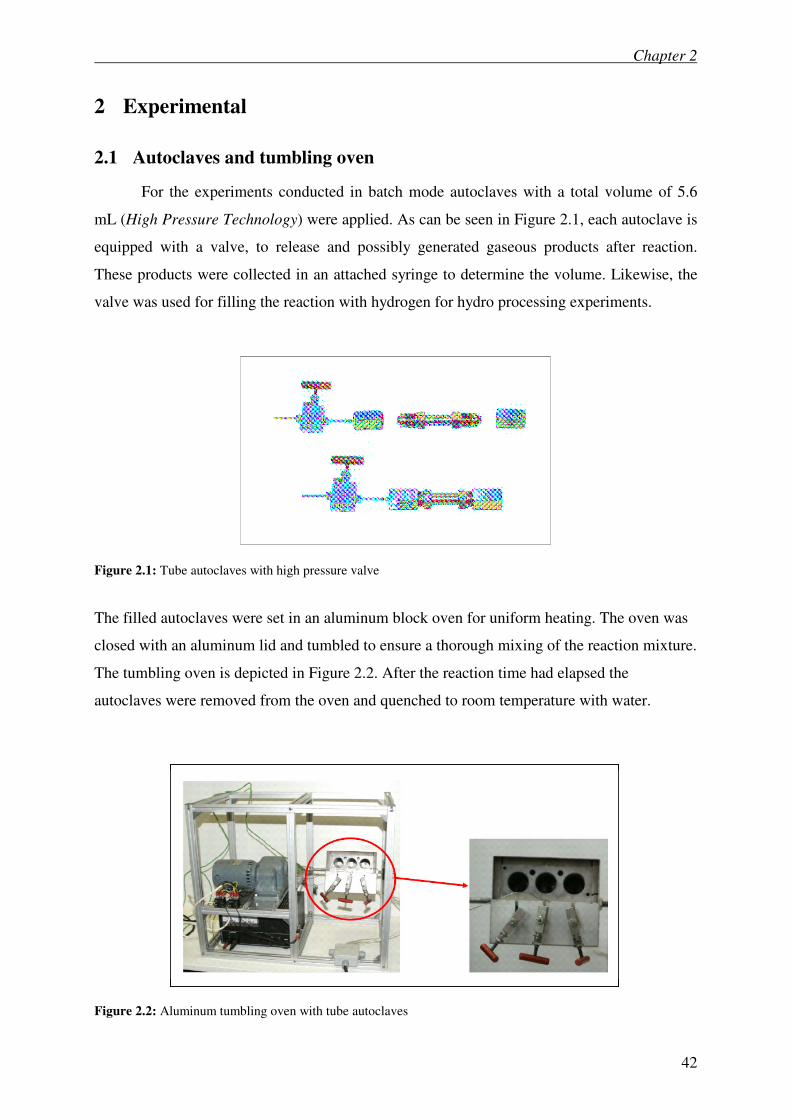
Chapter 2
42
2 Experimental
2.1 Autoclaves and tumbling oven
For the experiments conducted in batch mode autoclaves with a total volume of 5.6
mL (High Pressure Technology) were applied. As can be seen in Figure 2.1, each autoclave is
equipped with a valve, to release and possibly generated gaseous products after reaction.
These products were collected in an attached syringe to determine the volume. Likewise, the
valve was used for filling the reaction with hydrogen for hydro processing experiments.
Figure 2.1: Tube autoclaves with high pressure valve
The filled autoclaves were set in an aluminum block oven for uniform heating. The oven was
closed with an aluminum lid and tumbled to ensure a thorough mixing of the reaction mixture.
The tumbling oven is depicted in Figure 2.2. After the reaction time had elapsed the
autoclaves were removed from the oven and quenched to room temperature with water.
Figure 2.2: Aluminum tumbling oven with tube autoclaves
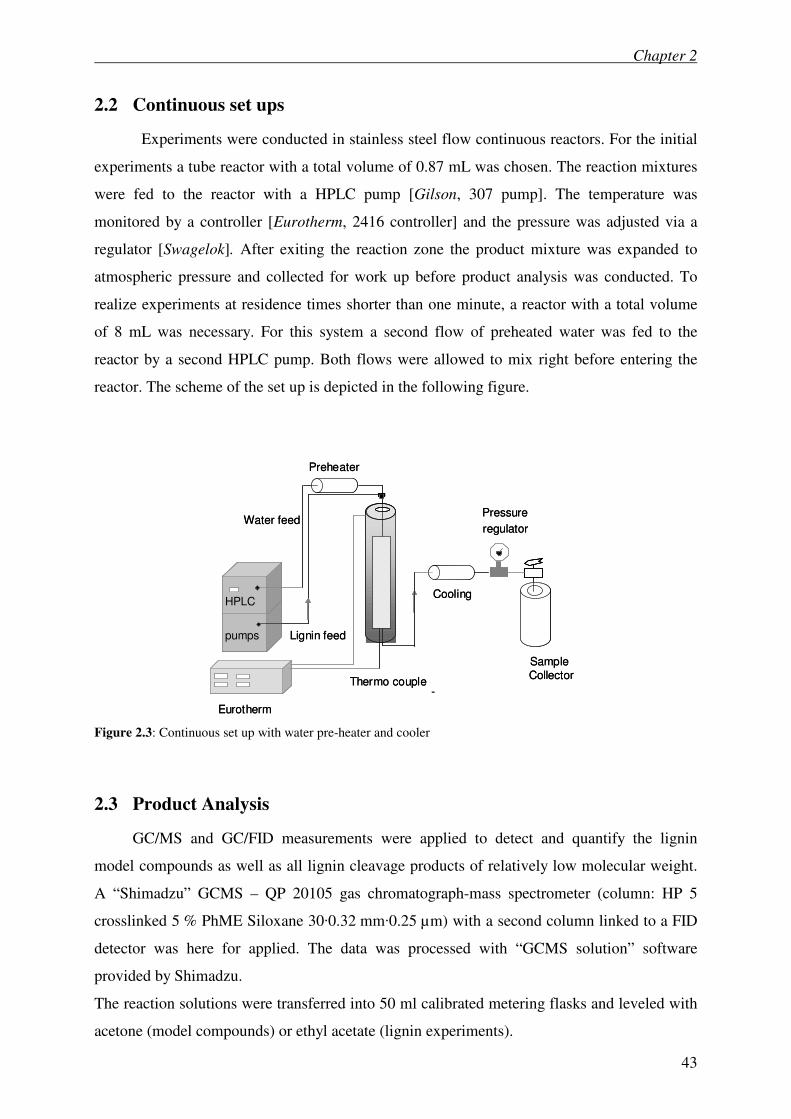
Chapter 2
43
2.2 Continuous set ups
Experiments were conducted in stainless steel flow continuous reactors. For the initial
experiments a tube reactor with a total volume of 0.87 mL was chosen. The reaction mixtures
were fed to the reactor with a HPLC pump [Gilson, 307 pump]. The temperature was
monitored by a controller [Eurotherm, 2416 controller] and the pressure was adjusted via a
regulator [Swagelok]. After exiting the reaction zone the product mixture was expanded to
atmospheric pressure and collected for work up before product analysis was conducted. To
realize experiments at residence times shorter than one minute, a reactor with a total volume
of 8 mL was necessary. For this system a second flow of preheated water was fed to the
reactor by a second HPLC pump. Both flows were allowed to mix right before entering the
reactor. The scheme of the set up is depicted in the following figure.
HPLC
pumps
HPLC
pumps
Pressure
regulatorWater feed
Thermo couple-
Eurotherm
SampleCollector
Preheater
Cooling
Lignin feed
HPLC
pumps
HPLC
pumps
Pressure
regulatorWater feed
Thermo couple-
Eurotherm
SampleCollector
Preheater
Cooling
Lignin feed
Figure 2.3: Continuous set up with water pre-heater and cooler
2.3 Product Analysis
GC/MS and GC/FID measurements were applied to detect and quantify the lignin
model compounds as well as all lignin cleavage products of relatively low molecular weight.
A “Shimadzu” GCMS – QP 20105 gas chromatograph-mass spectrometer (column: HP 5
crosslinked 5 % PhME Siloxane 30·0.32 mm·0.25 µm) with a second column linked to a FID
detector was here for applied. The data was processed with “GCMS solution” software
provided by Shimadzu.
The reaction solutions were transferred into 50 ml calibrated metering flasks and leveled with
acetone (model compounds) or ethyl acetate (lignin experiments).
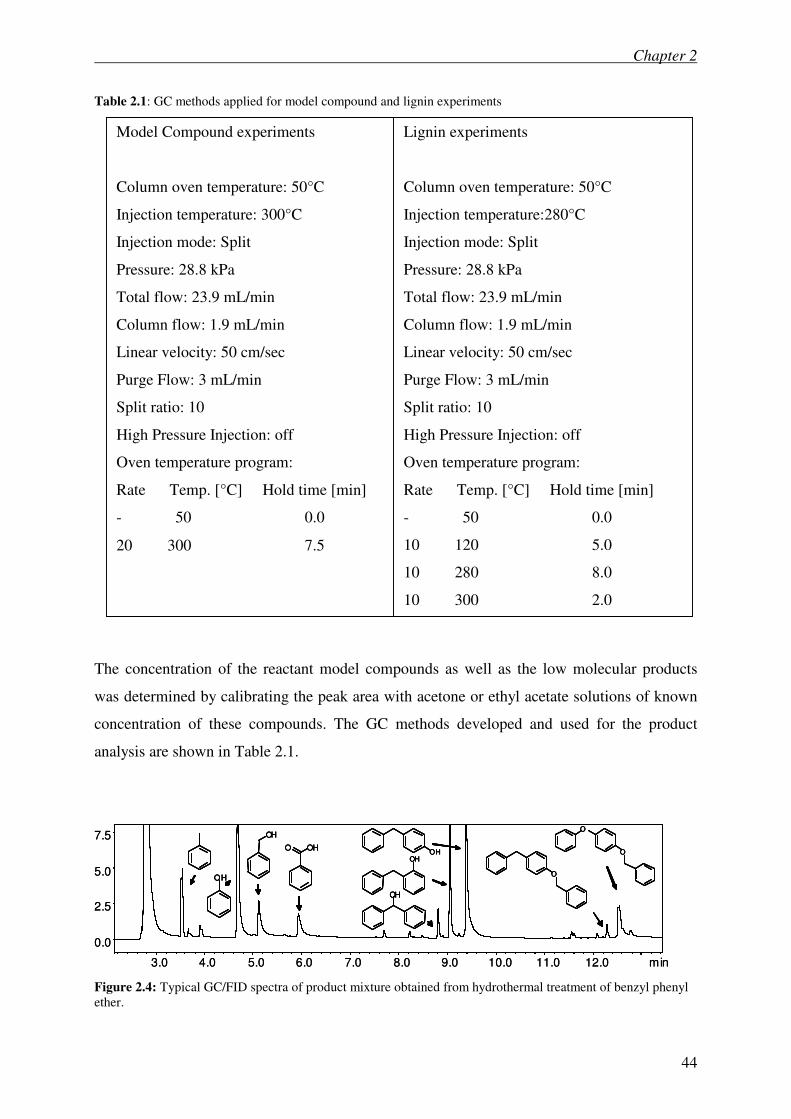
Chapter 2
44
Table 2.1: GC methods applied for model compound and lignin experiments
The concentration of the reactant model compounds as well as the low molecular products
was determined by calibrating the peak area with acetone or ethyl acetate solutions of known
concentration of these compounds. The GC methods developed and used for the product
analysis are shown in Table 2.1.
3.0 4.0 5.0 6.0 7.0 8.0 9.0 10.0 11.0 12.0 min
7.5O
O
O
OHOH
OH
OH
OH
OHO
0.0
2.5
5.0
O
O
O
OHOH
OH
OH
OH
OHO
3.0 4.0 5.0 6.0 7.0 8.0 9.0 10.0 11.0 12.0 min
7.5O
O
O
OHOH
OH
OH
OH
OHO
0.0
2.5
5.0
O
O
O
OHOH
OH
OH
OH
OHO
Figure 2.4: Typical GC/FID spectra of product mixture obtained from hydrothermal treatment of benzyl phenyl
ether.
Model Compound experiments
Column oven temperature: 50°C
Injection temperature: 300°C
Injection mode: Split
Pressure: 28.8 kPa
Total flow: 23.9 mL/min
Column flow: 1.9 mL/min
Linear velocity: 50 cm/sec
Purge Flow: 3 mL/min
Split ratio: 10
High Pressure Injection: off
Oven temperature program:
Rate Temp. [°C] Hold time [min]
- 50 0.0
20 300 7.5
Lignin experiments
Column oven temperature: 50°C
Injection temperature:280°C
Injection mode: Split
Pressure: 28.8 kPa
Total flow: 23.9 mL/min
Column flow: 1.9 mL/min
Linear velocity: 50 cm/sec
Purge Flow: 3 mL/min
Split ratio: 10
High Pressure Injection: off
Oven temperature program:
Rate Temp. [°C] Hold time [min]
- 50 0.0
10 120 5.0
10 280 8.0
10 300 2.0
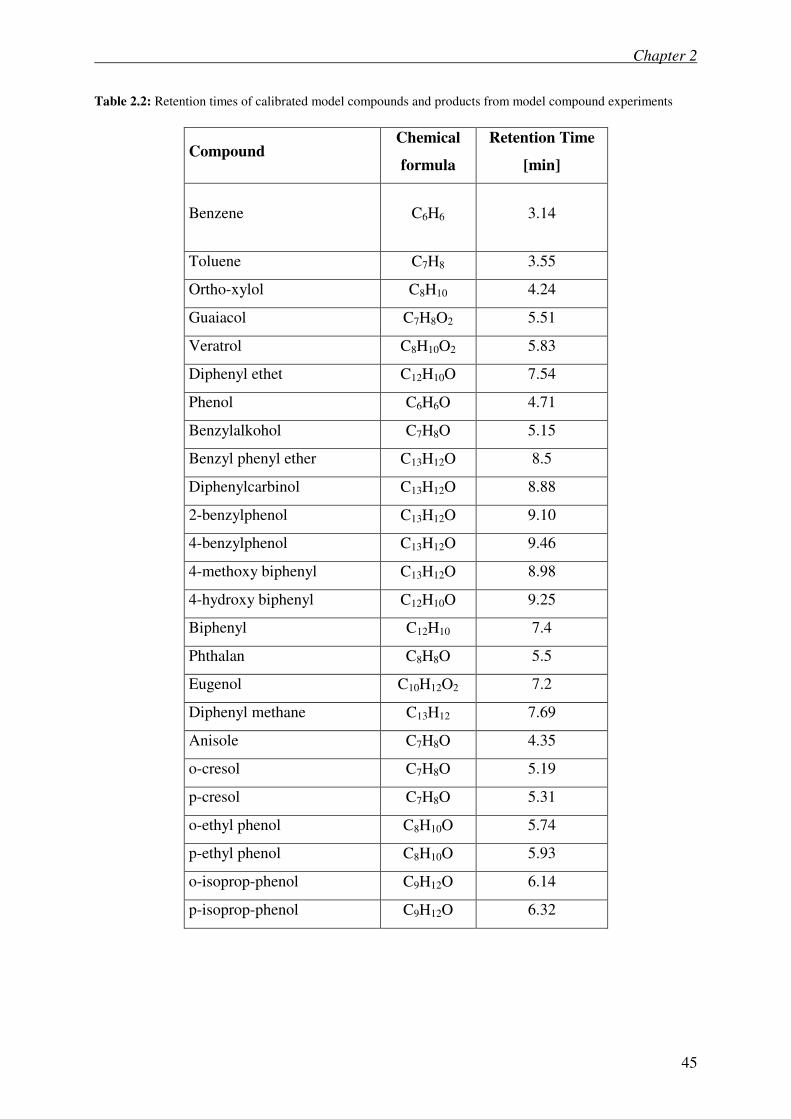
Chapter 2
45
Table 2.2: Retention times of calibrated model compounds and products from model compound experiments
Compound Chemical
formula
Retention Time
[min]
Benzene C6H6 3.14
Toluene C7H8 3.55
Ortho-xylol C8H10 4.24
Guaiacol C7H8O2 5.51
Veratrol C8H10O2 5.83
Diphenyl ethet C12H10O 7.54
Phenol C6H6O 4.71
Benzylalkohol C7H8O 5.15
Benzyl phenyl ether C13H12O 8.5
Diphenylcarbinol C13H12O 8.88
2-benzylphenol C13H12O 9.10
4-benzylphenol C13H12O 9.46
4-methoxy biphenyl C13H12O 8.98
4-hydroxy biphenyl C12H10O 9.25
Biphenyl C12H10 7.4
Phthalan C8H8O 5.5
Eugenol C10H12O2 7.2
Diphenyl methane C13H12 7.69
Anisole C7H8O 4.35
o-cresol C7H8O 5.19
p-cresol C7H8O 5.31
o-ethyl phenol C8H10O 5.74
p-ethyl phenol C8H10O 5.93
o-isoprop-phenol C9H12O 6.14
p-isoprop-phenol C9H12O 6.32
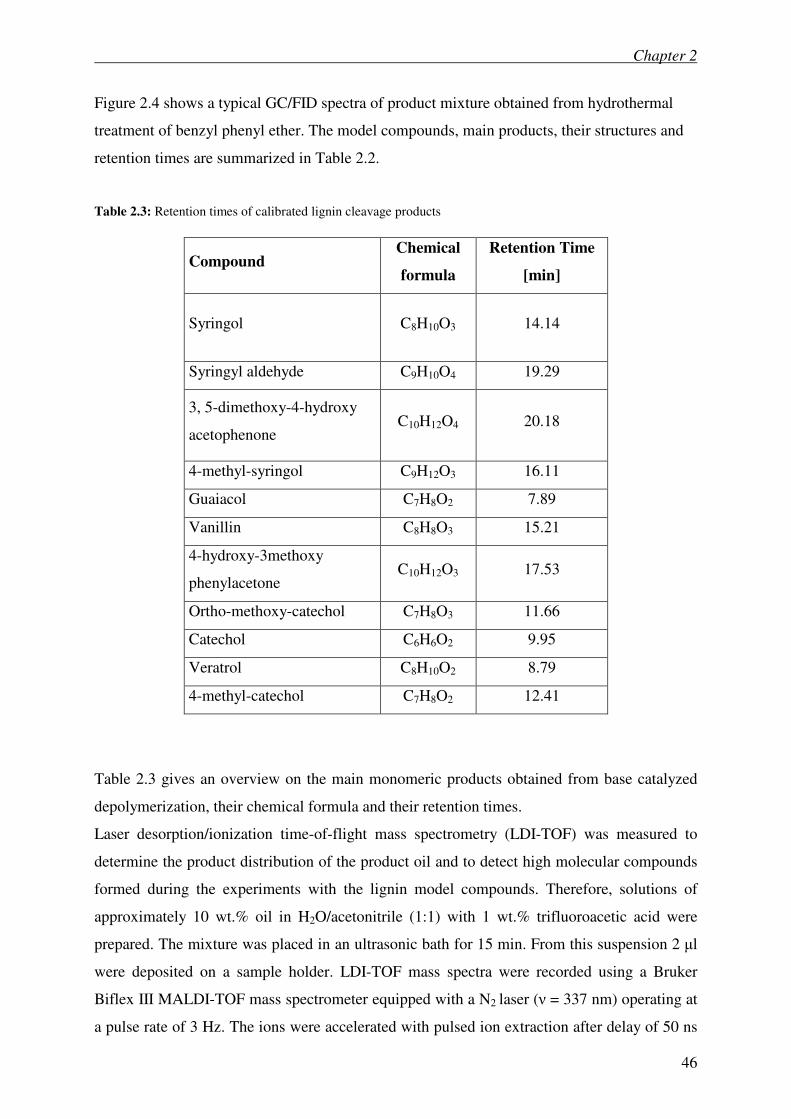
Chapter 2
46
Figure 2.4 shows a typical GC/FID spectra of product mixture obtained from hydrothermal
treatment of benzyl phenyl ether. The model compounds, main products, their structures and
retention times are summarized in Table 2.2.
Table 2.3: Retention times of calibrated lignin cleavage products
Compound Chemical
formula
Retention Time
[min]
Syringol C8H10O3 14.14
Syringyl aldehyde C9H10O4 19.29
3, 5-dimethoxy-4-hydroxy
acetophenone C10H12O4 20.18
4-methyl-syringol C9H12O3 16.11
Guaiacol C7H8O2 7.89
Vanillin C8H8O3 15.21
4-hydroxy-3methoxy
phenylacetone C10H12O3 17.53
Ortho-methoxy-catechol C7H8O3 11.66
Catechol C6H6O2 9.95
Veratrol C8H10O2 8.79
4-methyl-catechol C7H8O2 12.41
Table 2.3 gives an overview on the main monomeric products obtained from base catalyzed
depolymerization, their chemical formula and their retention times.
Laser desorption/ionization time-of-flight mass spectrometry (LDI-TOF) was measured to
determine the product distribution of the product oil and to detect high molecular compounds
formed during the experiments with the lignin model compounds. Therefore, solutions of
approximately 10 wt.% oil in H2O/acetonitrile (1:1) with 1 wt.% trifluoroacetic acid were
prepared. The mixture was placed in an ultrasonic bath for 15 min. From this suspension 2 µl
were deposited on a sample holder. LDI-TOF mass spectra were recorded using a Bruker
Biflex III MALDI-TOF mass spectrometer equipped with a N2 laser (ν = 337 nm) operating at
a pulse rate of 3 Hz. The ions were accelerated with pulsed ion extraction after delay of 50 ns
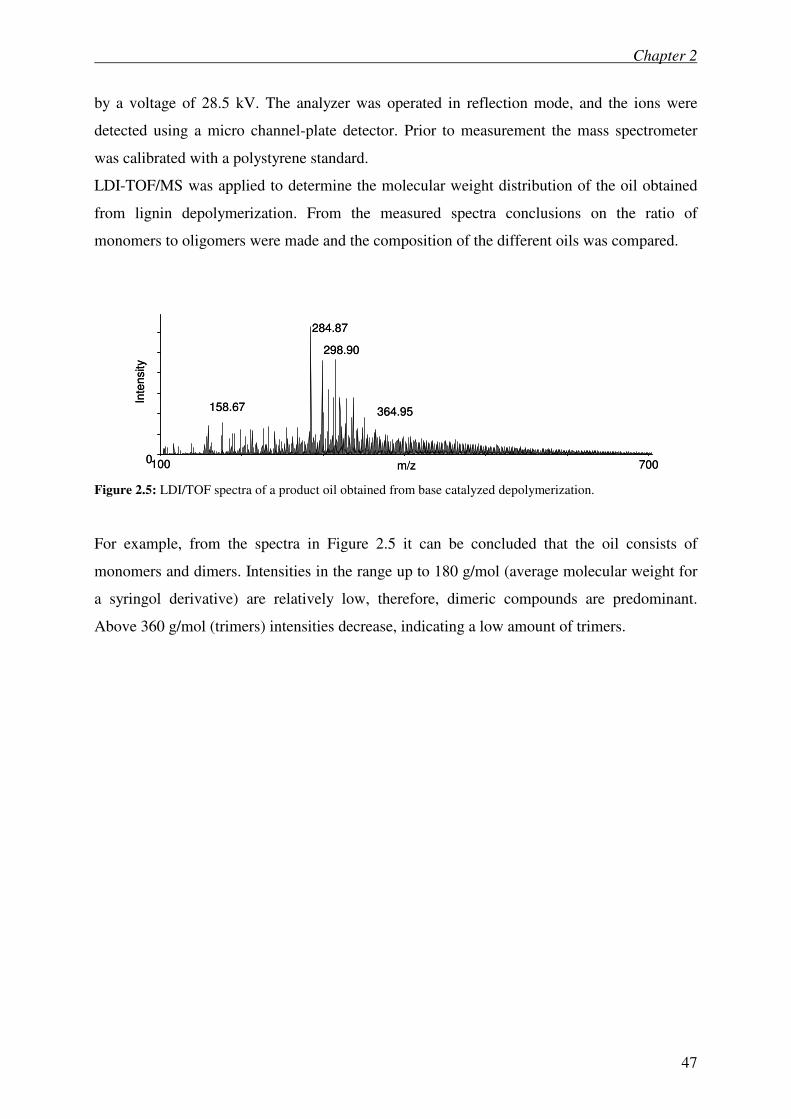
Chapter 2
47
by a voltage of 28.5 kV. The analyzer was operated in reflection mode, and the ions were
detected using a micro channel-plate detector. Prior to measurement the mass spectrometer
was calibrated with a polystyrene standard.
LDI-TOF/MS was applied to determine the molecular weight distribution of the oil obtained
from lignin depolymerization. From the measured spectra conclusions on the ratio of
monomers to oligomers were made and the composition of the different oils was compared.
m/z100 700
Inte
nsity
0
284.87
298.90
158.67 364.95
m/z100 700
Inte
nsity
0
284.87
298.90
158.67 364.95
Figure 2.5: LDI/TOF spectra of a product oil obtained from base catalyzed depolymerization.
For example, from the spectra in Figure 2.5 it can be concluded that the oil consists of
monomers and dimers. Intensities in the range up to 180 g/mol (average molecular weight for
a syringol derivative) are relatively low, therefore, dimeric compounds are predominant.
Above 360 g/mol (trimers) intensities decrease, indicating a low amount of trimers.
Chapter 3
48
Chapter 3
A study on the hydrothermal
treatment of lignin model compounds
Abstract
As to the complexity and diversity of the lignin structure, model compounds were
selected to investigate the behavior of lignin in sub-and supercritical water. Six compounds
were chosen, namely diphenyl ether, benzyl phenyl ether, diphenyl methan, eugenol, 4-
methoxy biphenyl und phthalan to represent the most frequent occuring bond types in lignin.
The influence of solvent density on the pyrolysis and hydrolysis of the compounds was
studied. The influence of solutions of Li-, Na- and K-carbonate differs depending on reaction
conditions and thus solvent properties like density and dielectric constant. At high
temperatures, as applied for DPE conversion alkali carbonates catalyze the reaction, whereas
at lower temperatures hydrolysis is suppressed and pyrolysis enhanced. This chapter also
covers a study on the suitability of applying alcohols as reaction solvents.
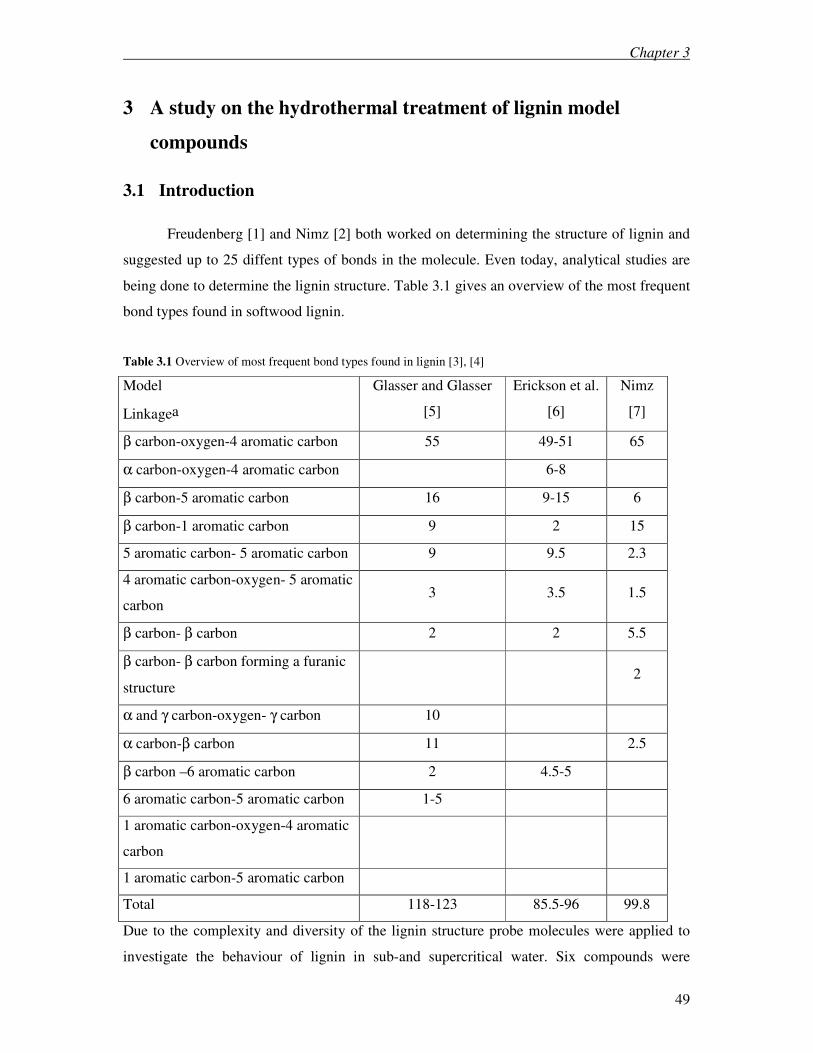
Chapter 3
49
3 A study on the hydrothermal treatment of lignin model
compounds
3.1 Introduction
Freudenberg [1] and Nimz [2] both worked on determining the structure of lignin and
suggested up to 25 diffent types of bonds in the molecule. Even today, analytical studies are
being done to determine the lignin structure. Table 3.1 gives an overview of the most frequent
bond types found in softwood lignin.
Table 3.1 Overview of most frequent bond types found in lignin [3], [4]
Model
Linkagea
Glasser and Glasser
[5]
Erickson et al.
[6]
Nimz
[7]
β carbon-oxygen-4 aromatic carbon 55 49-51 65
α carbon-oxygen-4 aromatic carbon 6-8
β carbon-5 aromatic carbon 16 9-15 6
β carbon-1 aromatic carbon 9 2 15
5 aromatic carbon- 5 aromatic carbon 9 9.5 2.3
4 aromatic carbon-oxygen- 5 aromatic
carbon 3 3.5 1.5
β carbon- β carbon 2 2 5.5
β carbon- β carbon forming a furanic
structure 2
α and γ carbon-oxygen- γ carbon 10
α carbon-β carbon 11 2.5
β carbon –6 aromatic carbon 2 4.5-5
6 aromatic carbon-5 aromatic carbon 1-5
1 aromatic carbon-oxygen-4 aromatic
carbon
1 aromatic carbon-5 aromatic carbon
Total 118-123 85.5-96 99.8
Due to the complexity and diversity of the lignin structure probe molecules were applied to
investigate the behaviour of lignin in sub-and supercritical water. Six compounds were
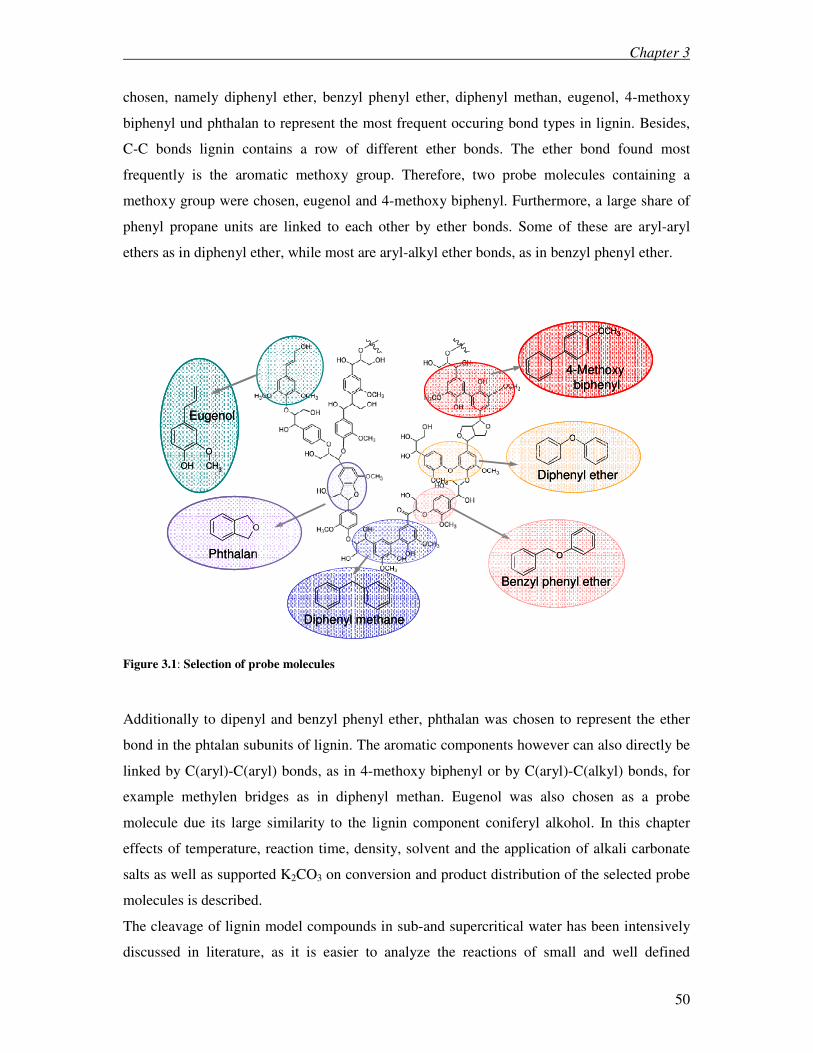
Chapter 3
50
chosen, namely diphenyl ether, benzyl phenyl ether, diphenyl methan, eugenol, 4-methoxy
biphenyl und phthalan to represent the most frequent occuring bond types in lignin. Besides,
C-C bonds lignin contains a row of different ether bonds. The ether bond found most
frequently is the aromatic methoxy group. Therefore, two probe molecules containing a
methoxy group were chosen, eugenol and 4-methoxy biphenyl. Furthermore, a large share of
phenyl propane units are linked to each other by ether bonds. Some of these are aryl-aryl
ethers as in diphenyl ether, while most are aryl-alkyl ether bonds, as in benzyl phenyl ether.
OH
O
CH3
OCH3
O
Diphenyl ether
Diphenyl methane
4-Methoxy
biphenyl
Eugenol
O
O
Benzyl phenyl ether
Phthalan
OH
O
CH3
OCH3
O
Diphenyl ether
Diphenyl methane
4-Methoxy
biphenyl
Eugenol
O
O
Benzyl phenyl ether
Phthalan
Figure 3.1: Selection of probe molecules
Additionally to dipenyl and benzyl phenyl ether, phthalan was chosen to represent the ether
bond in the phtalan subunits of lignin. The aromatic components however can also directly be
linked by C(aryl)-C(aryl) bonds, as in 4-methoxy biphenyl or by C(aryl)-C(alkyl) bonds, for
example methylen bridges as in diphenyl methan. Eugenol was also chosen as a probe
molecule due its large similarity to the lignin component coniferyl alkohol. In this chapter
effects of temperature, reaction time, density, solvent and the application of alkali carbonate
salts as well as supported K2CO3 on conversion and product distribution of the selected probe
molecules is described.
The cleavage of lignin model compounds in sub-and supercritical water has been intensively
discussed in literature, as it is easier to analyze the reactions of small and well defined
Chapter 3
51
molecules. This section is divided into three parts, according to the different bond types:
phenyl alkyl ethers, carbon-carbon bonds and aryl-aryl ether bonds.
3.1.1 Phenyl alkyl ethers
In 1988 Afifi et al. [8] studied the aromatic methoxy linkage in anisole under high
temperatures and pressures, close or exceeding supercritical conditions. Emphasis was put on
the pyrolytic pathways in presence and absence of a hydrogen donor solvent (tetralin). It was
found that at high tetralin to anisole ratios, the most abundant products are phenol and toluene
(4:1). When reacting only anisole in hydrogen or argon atmosphere, a broad variety of
products (benzene, cresols and polymer in addition to phenol and toluene) was found. In both
cases, evidence was provided for a free radical initiation with the initiating step being the
thermolysis of the methyl-oxygen linkage leading to methyl and phenoxy radicals. However,
the propagation steps involved the phenoxymethyl radical which appeared to be able to invert
the oxygen aryl linkage in favour of the aryl carbon linkage through a long lived spiranic
oxiran radical intermediate, thus explaining benzaldehyde and benzyl alcohol formation.
Nelson [9] studied the alkaline cleavage of 2-phenoxy-1-phenyl-1-propanol with electron
donating and withdrawing groups on the phenoxy ring. It was demonstrated that organic free
radicals occur during the thermolysis of lignin model compounds. Townsend et al. [10]
examined the reactions of heteroatom-containing model compounds in water over a range of
reduced water densities of 0 < ρw < 2.1 g·cm-3. Dibenzyl ether (DBE), phentyl phenyl ether
(PPE), guajacol, benzyl phenyl ether and other compounds underwent parallel pyrolysis and
hydrolysis. Furthermore, detailed kinetic analysis of the reactions of DBE, PPE and guajacol
were presented. It was found that hydrolysis proceeded through a transition state that is more
polar than the reactants. The selectivity towards the hydrolysis products increased with the
water loading as the correlating higher dielectric constant stabilizes the polar hydrolysis
transition state over the less polar reactants.
Some preliminary studies were conducted by Aoyama et al. [11] in 1991 on the degradation
of guajacylglycerol-β-aryl ether and other lignin model compounds in organic solvent systems
(e.g. ethanol/water or 2-butanone/water). Di- or trivalent inorganic salts (aluminium chloride,
aluminium sulphate, ferric chloride, ferric sulphate and stannic chloride) were employed as a
Lewis acid in the temperature range between 140 and 170 °C and with reaction time up to 60
minutes. The results indicated that the employed lignin model compounds were susceptible to
Chapter 3
52
degradation in organic solvent systems in the presence of one of these salts. Stannic chloride
was found to be the most suitable catalyst for the degradation of the guajacylglycerol-β-aryl
ether to different phenols substituted with alkyl- and methoxy-groups. The kinetics of
dibenzyl ether hydrothermolysis in hot compressed water was investigated in a continuous
tubular reactor system by González et al. [12]. The pressure was varied form 22.5 to 36.2
MPa in a temperature range from 325 to 390 °C, whereas the water to DBE ratio was held
constant. The thermal scission of DBE yielded equimolar amounts of benzaldehyde and
toluene. The rate constant for the thermolysis in supercritical water decreased with water
density. Furthermore, benzyl alcohol was produced by DBE reversible hydrolysis, catalyzed
by free protons from water dissociation. As the dielectric constant was raised, the reaction
rates for pyrolysis were lowered, but the equilibrium shifted towards the formation of benzyl
alcohol, which is more polar than DBE. The low dipole moment strength of the transition
state complex was further supported by the negative effect of the ionic strength (varied by
addition of a small concentration of NaCl) on the rate constant for DBE hydrolysis.
In this study we selected benzyl phenyl ether (BPE) to represent the most frequent bond type
in lignin. Unlike the aryl aryl type ether bond as in diphenyl ether, aryl alkyl ethers are
already cleaved in subcritical water. The conversion of aryl alkyl ether compounds can
proceed following two different reaction mechanisms. This is also the case for BPE. The
reaction pathways as well as an excerpt of possible products for the treatment of BPE in
subcritical water are depicted in Figure 3.2. The ionic pathway, namely hydrolysis leads to the
formation of benzyl alcohol and phenol (reaction 1). A radical mechanism, where the ether
bond is cleaved in a homolytic manner generates a phenoxy and a benzyl radical species.
Being highly reactive these can recombine either with hydrogen to give phenol and toluene or
can recombine among themselves, with BPE or with the hydrolysis products (reaction 2 & 3).
In this case dimers, trimers, and higher molecular compounds are formed.
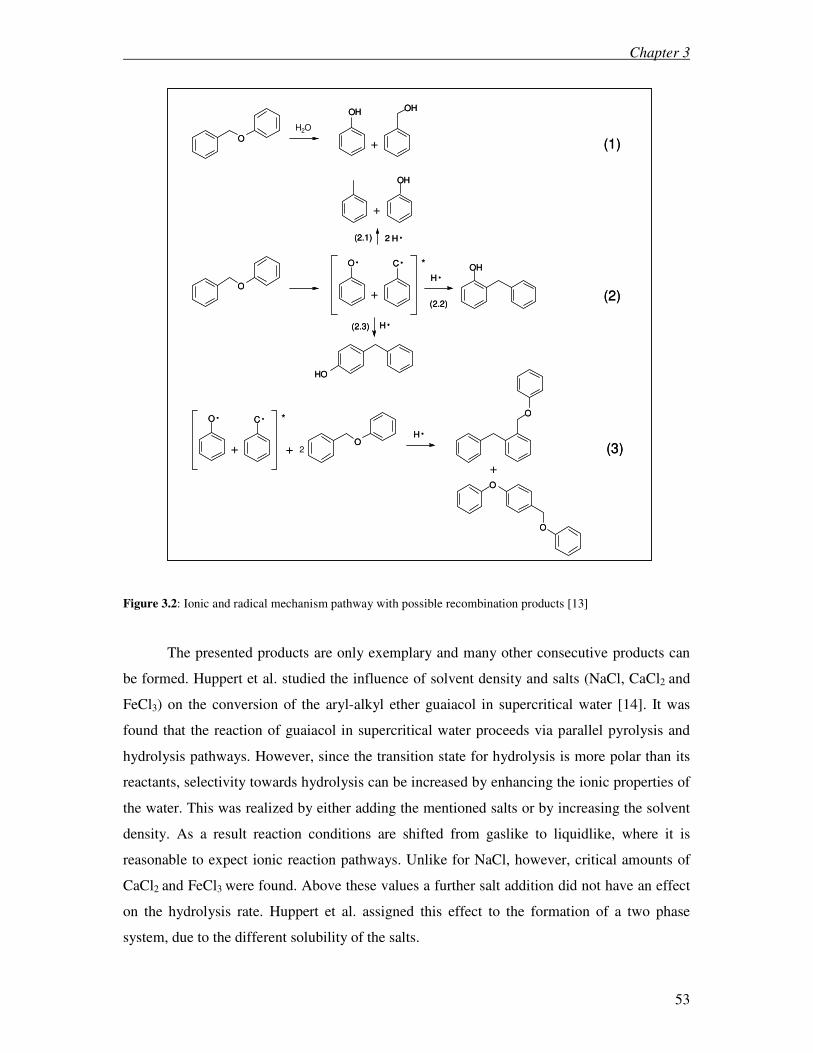
Chapter 3
53
(1)
(2)
(3)
O
OH OH
O
O C OH
OH
O C
O
O
O
O
H
H
H
H2O
+
+
*
+
*
+ 2
+
OH
2
+
H(2.1)
(2.2)
(2.3)
(1)
(2)
(3)
O
OH OH
O
O C OH
OH
O C
O
O
O
O
H
H
H
H2O
+
+
*
+
*
+ 2
+
OH
2
+
H(2.1)
(2.2)
(2.3)
Figure 3.2: Ionic and radical mechanism pathway with possible recombination products [13]
The presented products are only exemplary and many other consecutive products can
be formed. Huppert et al. studied the influence of solvent density and salts (NaCl, CaCl2 and
FeCl3) on the conversion of the aryl-alkyl ether guaiacol in supercritical water [14]. It was
found that the reaction of guaiacol in supercritical water proceeds via parallel pyrolysis and
hydrolysis pathways. However, since the transition state for hydrolysis is more polar than its
reactants, selectivity towards hydrolysis can be increased by enhancing the ionic properties of
the water. This was realized by either adding the mentioned salts or by increasing the solvent
density. As a result reaction conditions are shifted from gaslike to liquidlike, where it is
reasonable to expect ionic reaction pathways. Unlike for NaCl, however, critical amounts of
CaCl2 and FeCl3 were found. Above these values a further salt addition did not have an effect
on the hydrolysis rate. Huppert et al. assigned this effect to the formation of a two phase
system, due to the different solubility of the salts.
Chapter 3
54
Yokoyama et al. came to the same conclusion when investigating the thermolysis of BPE in
sub- and supercritical water [13]. The effect of density on the selectivity was found to be
greater in supercritical water than in subcritical water and it was found, that an increased
density not only favors hydrolysis but also reactions like hydrogen abstraction and radical
recombination. Also Miller et al. studied hydrothermal treatment of BPE [15]. Experiments
were conducted in KOH/ethanol at 290°C for 1 hour and yielded a 30% conversion. Major
products were phenol and ethoxymethyl benzene. Benzyl alcohol and benzene propanol were
also detected in small amounts. It was therefore concluded that solvolysis, and hence an ionic
mechanism dominates over a free radical mechanism under the given conditions.
Here, we present the influence of temperature; residence time and applied alkali carbonate
(lithium-, sodium- and potassium carbonate) on BPE conversion and product distribution in
subcritical water.
3.1.1 Carbon-carbon bonds
The work of Townsend et al. [10] also dealt with model compounds without any
heteroatoms. At the same reaction conditions as the ethers, 1,3-diphenylpropane and 1,2-
diphenylethane underwent only pyrolysis, giving toluene and styrene as major products. In
1994 Katritzky et al. [16] studied the reactions of some benzenoid hydrocarbons in
supercritical water, 15 % aqueous formic acid and 15 % aqueous sodium formate at 460 °C.
For each substrate, a solution in cyclohexane at 460 °C was also examined in order to
distinguish thermolytic (mainly radical) reactions from the ionic reactions in the aqueous
systems. Most substrates showed significant change within 1 h, only biphenyl and 1,1’-
binaphthyl were essentially unreactive. 1-benzylnaphthalene underwent only slow
thermolysis, whereas 1-benzyltetralin underwent rapid homolysis in all media.
Cyclohexylbenzene and –naphthalene showed similar trends in all media. The conversion
rates for the n-alkyl-substituted aromatics were noticeably higher than those for the
cyclohexyl-substituted aromatics. Biaryl linkages were also the scope of the research of Siskin
et al. and Katritzky et al. [17] in 1995. They found that many biaryls (also biaryls containing
heteroatoms), even though unreactive in supercritical water at 460 °C, undergo bond cleavage
and heteroatom removal under reducing conditions in supercritical water. The major
hydrocarbon products were benzene and naphthalene and their C1 to C4 alkylated derivates.
After sufficient reaction time heteroatoms were always removed. Tagaya et al. investigated
the decomposition of model compounds such as prepolymers (e.g. phenol trimers) and
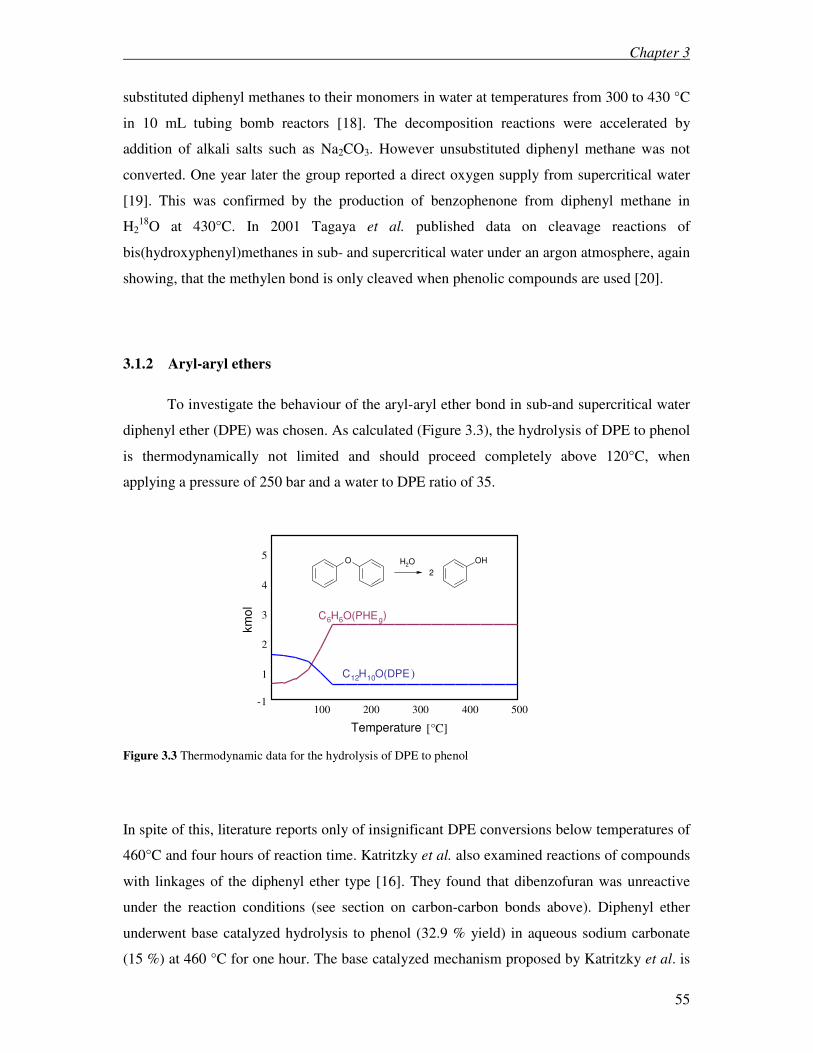
Chapter 3
55
substituted diphenyl methanes to their monomers in water at temperatures from 300 to 430 °C
in 10 mL tubing bomb reactors [18]. The decomposition reactions were accelerated by
addition of alkali salts such as Na2CO3. However unsubstituted diphenyl methane was not
converted. One year later the group reported a direct oxygen supply from supercritical water
[19]. This was confirmed by the production of benzophenone from diphenyl methane in
H218
O at 430°C. In 2001 Tagaya et al. published data on cleavage reactions of
bis(hydroxyphenyl)methanes in sub- and supercritical water under an argon atmosphere, again
showing, that the methylen bond is only cleaved when phenolic compounds are used [20].
3.1.2 Aryl-aryl ethers
To investigate the behaviour of the aryl-aryl ether bond in sub-and supercritical water
diphenyl ether (DPE) was chosen. As calculated (Figure 3.3), the hydrolysis of DPE to phenol
is thermodynamically not limited and should proceed completely above 120°C, when
applying a pressure of 250 bar and a water to DPE ratio of 35.
100 200 300 400 500-1
1
2
3
4
5
km
ol
C6H6O(PHEg)
C12H10O(DPE)
[°C]Temperature
O
2H2O
OH
100 200 300 400 500-1
1
2
3
4
5
km
ol
C6H6O(PHEg)
C12H10O(DPE)
[°C]Temperature [°C]Temperature
O OH
2
H2O
100 200 300 400 500-1
1
2
3
4
5
km
ol
C6H6O(PHEg)
C12H10O(DPE)
[°C]Temperature
O
2H2O
OH
100 200 300 400 500-1
1
2
3
4
5
km
ol
C6H6O(PHEg)
C12H10O(DPE)
[°C]Temperature [°C]Temperature
O OH
2
H2O
Figure 3.3 Thermodynamic data for the hydrolysis of DPE to phenol
In spite of this, literature reports only of insignificant DPE conversions below temperatures of
460°C and four hours of reaction time. Katritzky et al. also examined reactions of compounds
with linkages of the diphenyl ether type [16]. They found that dibenzofuran was unreactive
under the reaction conditions (see section on carbon-carbon bonds above). Diphenyl ether
underwent base catalyzed hydrolysis to phenol (32.9 % yield) in aqueous sodium carbonate
(15 %) at 460 °C for one hour. The base catalyzed mechanism proposed by Katritzky et al. is
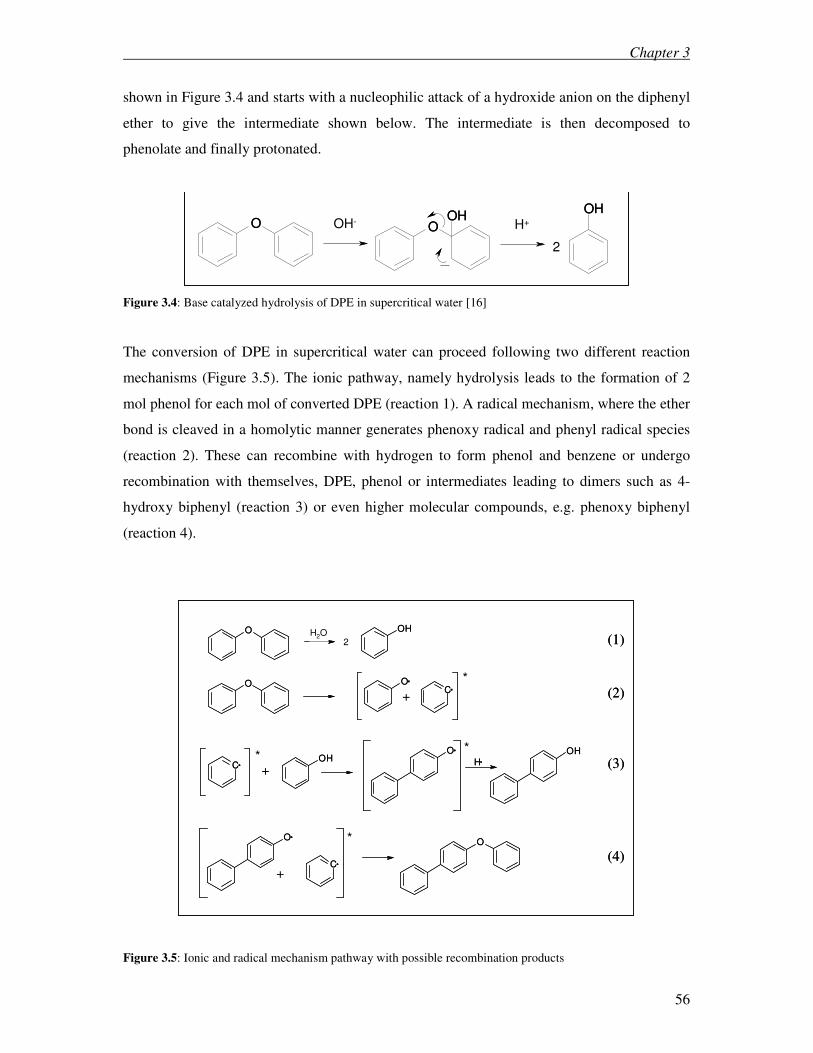
Chapter 3
56
shown in Figure 3.4 and starts with a nucleophilic attack of a hydroxide anion on the diphenyl
ether to give the intermediate shown below. The intermediate is then decomposed to
phenolate and finally protonated.
O OOH
OHOH- H+
2
O OOH
OHOH- H+
2
Figure 3.4: Base catalyzed hydrolysis of DPE in supercritical water [16]
The conversion of DPE in supercritical water can proceed following two different reaction
mechanisms (Figure 3.5). The ionic pathway, namely hydrolysis leads to the formation of 2
mol phenol for each mol of converted DPE (reaction 1). A radical mechanism, where the ether
bond is cleaved in a homolytic manner generates phenoxy radical and phenyl radical species
(reaction 2). These can recombine with hydrogen to form phenol and benzene or undergo
recombination with themselves, DPE, phenol or intermediates leading to dimers such as 4-
hydroxy biphenyl (reaction 3) or even higher molecular compounds, e.g. phenoxy biphenyl
(reaction 4).
(1)
(2)
(3)
(4)
O OH
O O
C
C
OHO
OH
H
O
C
O
2
+
*
*+
*
+
*
H2O (1)
(2)
(3)
(4)
O OH
O O
C
C
OHO
OH
H
O
C
O
2
+
*
*+
*
+
*
H2O
Figure 3.5: Ionic and radical mechanism pathway with possible recombination products
Chapter 3
57
1999 Penninger et al. carried out reactions on diphenyl ether in supercritical water at 415 to
480 °C [21]. At low water density (0 to 0.3 g·cm-3), the conversion of DPE decreased
gradually with an increase of density. The found products were typical for radical-type
polycondensation reactions (e.g. diphenyl, phenyl diphenyl ether, phenoxy diphenyl). At
water densities greater than 0.3 g·cm-3 these products vanished, the conversion of diphenyl
ether increased and phenol as sole reaction product was formed, indicating ionic hydrolysis as
the governing chemistry. Furthermore a proton catalyzed mechanism for the hydrolysis of
diphenyl ether was proposed. It was postulated, that the protons needed for the reaction were
initially generated by the self dissociation of water, a reaction strongly enhanced by density at
supercritical temperatures reaching values comparable to those of liquid water at ambient
temperatures [22]. The next step of the reaction was the protonation of DPE followed by a
decomposition into phenol and phenyl-cation that reacted with water giving a second phenol
molecule and a proton. The proton can then re-enter the reaction cycle. One year later
Penninger et al. used dilute solutions of NaCl in supercritical water, in concentrations from 0
to 3.1 wt.-%, for the hydrolysis of diphenyl ether [23]. The reaction rate at 430 °C and at a
water density of 0.46 g·cm-3
sharply decreased with incremental addition of salt. But an
increase of the rate was observed with continued addition of salt reaching a value almost
twice that of the rate in absence of salt when the salt concentration was 3.1 wt.-%. The
decrease of the rate was attributed to the formation of the ion pair H+ Cl
-. The excess of Cl
-
ions arisen from ionic dissociation of NaCl captured the protons generated by self-
dissociation of water. This was confirmed by calculations of the ionic dissociation equilibria.
It was reported that the formation of protonated DPE, as a critical intermediate species in the
chemistry of the earlier postulated SN1 mechanism, competes with the ion pair for protons and
is consequently restrained. The effect of higher salt concentrations was explained by the
prevailing of a new mechanism, due to the Lewis acid/base behaviour of Na+ and Cl
- ions in
supercritical water. It was supposed that charge transfer in the water cluster surrounding these
ions generated H+ and OH
- ions in the outer hydration shells of the clusters forming an active
species for the diphenyl ether hydrolysis. The rate of hydrolysis, according to this Lewis
acid/base theory, was predicted to be proportional to the square root of the salt concentration
in the super critical water reaction medium, which was also confirmed experimentally.
Diphenyl ether was efficiently hydrolyzed into phenol (up to 50 mol%) by Varga et al. [24].
The group used Lewis acids, such as boron trifluoride and Ni(BF4)2, in supercritical water at
380 °C. The observed side reactions were reported to be insignificant and BF3 was found to
be nearly twice as effective, than HBF4 under the same conditions. Cleavage of diphenyl ether
Chapter 3
58
in supercritical organic solvents as 2,2,2-trifluoroethanol and trifluoroacetic acid with BF3 at
250°C, was less successful and accompanied by Friedel-Crafts side reactions. However,
slightly more than 25 mol% of diphenyl ether were cleaved to phenyl trifluoroacetate in
supercritical trifluoroacetic acid with equimolar BF3 at 250 °C. Shibasaki et al. tried to
optimize the conditions for the cleavage of ether linkages between two aryl substituents [25].
Conversion of dinaphthyl ether to naphthol was attained by the reaction in water with basic
additives added at 430 °C. During the reaction in supercritical water no production of
naphthalene was observed, so that chemical participation of water was suggested. Also
diphenyl ether was decomposed into phenol (maximum yield 72.6) in supercritical water with
10 mmol/mL Na2CO3 added at 430 °C for 3 hours. Furthermore, cleavages of 1,4-diphenoxy
benzene and p-phenoxy phenol were also confirmed.
3.2 Experimental
The experiments were carried out in stainless steel autoclaves at temperatures ranging
from 270 and 400°C and with varying densities depending on the probe molecule. The
density/pressure was adjusted by the amount of the reactor content, while the molar ratio of
water/probe molecule and weight ratio probe molecule/catalyst was held constant. For the
kinetic studies of DPE and BPE, experiments were conducted with 3 wt. % catalyst, and 10
wt. % DPE and 5wt.% BPE, respectively. For these experiments the density in the autoclaves
was adjusted to a value of 0.9 g/cm³. The reactors were set in a preheated alumina block
which was tumbled to ensure thorough mixing. An initial heat up time of 30 min was allowed
to elapse before the reaction time was recorded. After the reaction, the autoclaves were
quenched to room temperature with water. The autoclaves were rinsed with acetone and the
collected washings were combined with the reactor content. This homogeneous solution was
transferred into a 50 ml calibrated metering flask and leveled with further acetone. The
reaction products were identified by GC/MS and quantified by GC/FID-analysis (column: HP
5 cross linked 5 % PhME Siloxane 30·0.32 mm·0.25 µm). The concentration of the reactants
as well as the products was determined by calibrating the peak area with acetone solutions of
known concentration of these compounds. The supported catalysts were prepared by incipient
wetness impregnation, calcined at 550°C, and characterized by XRD, AAS, BET and TPD.
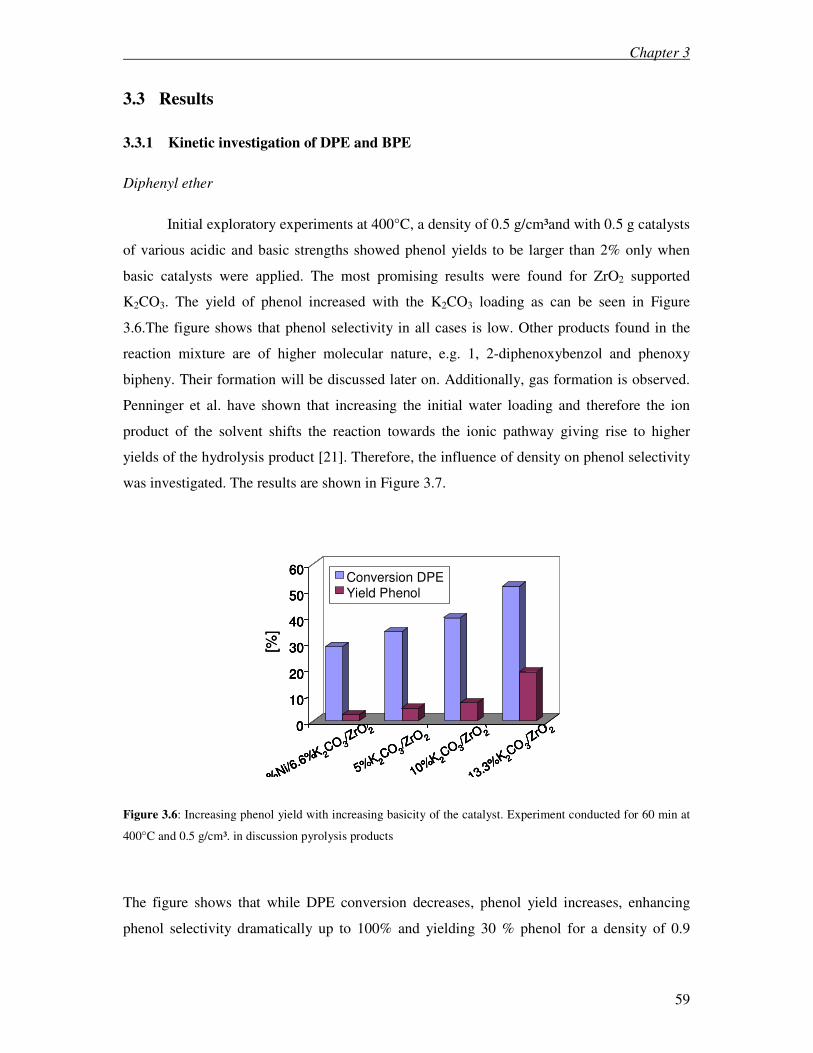
Chapter 3
59
3.3 Results
3.3.1 Kinetic investigation of DPE and BPE
Diphenyl ether
Initial exploratory experiments at 400°C, a density of 0.5 g/cm³and with 0.5 g catalysts
of various acidic and basic strengths showed phenol yields to be larger than 2% only when
basic catalysts were applied. The most promising results were found for ZrO2 supported
K2CO3. The yield of phenol increased with the K2CO3 loading as can be seen in Figure
3.6.The figure shows that phenol selectivity in all cases is low. Other products found in the
reaction mixture are of higher molecular nature, e.g. 1, 2-diphenoxybenzol and phenoxy
bipheny. Their formation will be discussed later on. Additionally, gas formation is observed.
Penninger et al. have shown that increasing the initial water loading and therefore the ion
product of the solvent shifts the reaction towards the ionic pathway giving rise to higher
yields of the hydrolysis product [21]. Therefore, the influence of density on phenol selectivity
was investigated. The results are shown in Figure 3.7.
0
10
20
30
40
50
60
[%]
%Ni/6.6%K 2
CO 3/ZrO 2
5%K 2CO 3
/ZrO 2
10%K 2CO 3
/ZrO 2
13.3%K 2
CO 3/Z
rO 2
Umsatz DPEAusbeute Phenol
0
10
20
30
40
50
60
%Ni/6.6%K 2
CO 3/ZrO 2
5%K 2CO 3
/ZrO 2
10%K 2CO 3
/ZrO 2
13.3%K 2
CO 3/Z
rO 2
Conversion DPEYield Phenol
0
10
20
30
40
50
60
[%]
%Ni/6.6%K 2
CO 3/ZrO 2
5%K 2CO 3
/ZrO 2
10%K 2CO 3
/ZrO 2
13.3%K 2
CO 3/Z
rO 2
Umsatz DPEAusbeute Phenol
0
10
20
30
40
50
60
%Ni/6.6%K 2
CO 3/ZrO 2
5%K 2CO 3
/ZrO 2
10%K 2CO 3
/ZrO 2
13.3%K 2
CO 3/Z
rO 2
Conversion DPEYield Phenol
Figure 3.6: Increasing phenol yield with increasing basicity of the catalyst. Experiment conducted for 60 min at
400°C and 0.5 g/cm³. in discussion pyrolysis products
The figure shows that while DPE conversion decreases, phenol yield increases, enhancing
phenol selectivity dramatically up to 100% and yielding 30 % phenol for a density of 0.9
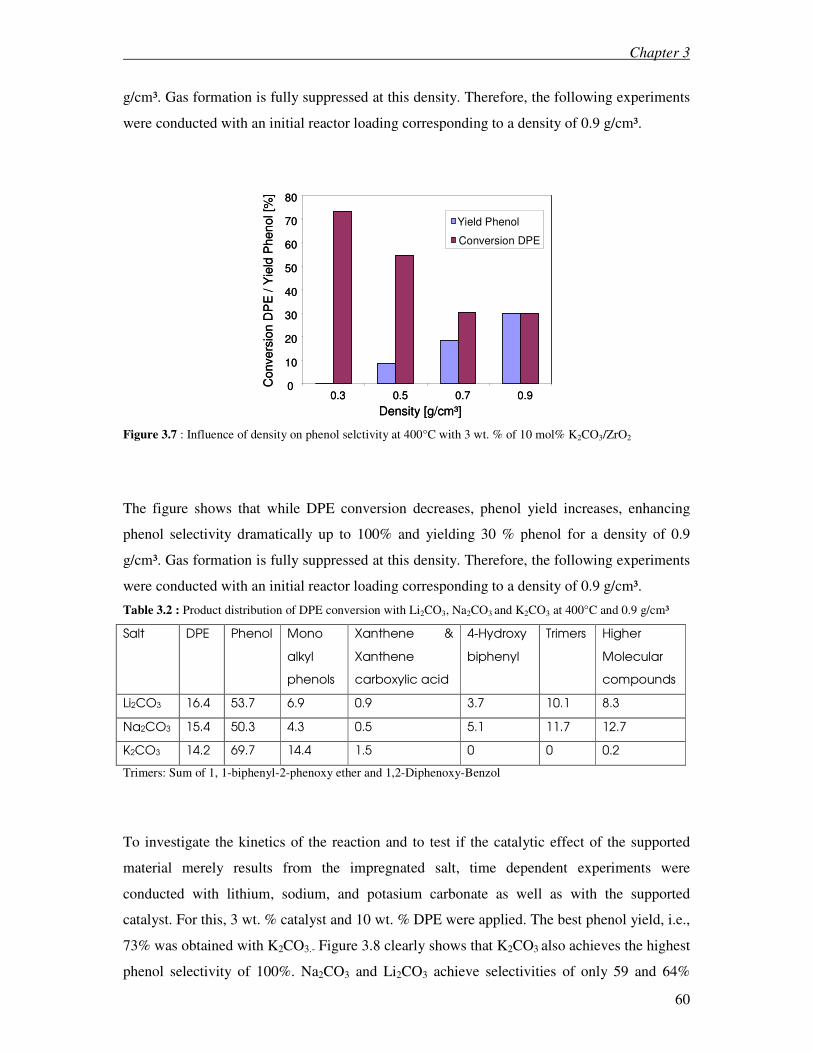
Chapter 3
60
g/cm³. Gas formation is fully suppressed at this density. Therefore, the following experiments
were conducted with an initial reactor loading corresponding to a density of 0.9 g/cm³.
0
10
20
30
40
50
60
70
80
0.3 0.5 0.7 0.9
Density [g/cm³]
Convers
ion D
PE
/ Y
ield
Phen
ol [%
]
Yield Phenol
Conversion DPE
0
10
20
30
40
50
60
70
80
0.3 0.5 0.7 0.9
Density [g/cm³]
Convers
ion D
PE
/ Y
ield
Phen
ol [%
]
Yield Phenol
Conversion DPE
Figure 3.7 : Influence of density on phenol selctivity at 400°C with 3 wt. % of 10 mol% K2CO3/ZrO2
The figure shows that while DPE conversion decreases, phenol yield increases, enhancing
phenol selectivity dramatically up to 100% and yielding 30 % phenol for a density of 0.9
g/cm³. Gas formation is fully suppressed at this density. Therefore, the following experiments
were conducted with an initial reactor loading corresponding to a density of 0.9 g/cm³.
Table 3.2 : Product distribution of DPE conversion with Li2CO3, Na2CO3 and K2CO3 at 400°C and 0.9 g/cm³
Salt DPE Phenol Mono
alkyl
phenols
Xanthene &
Xanthene
carboxylic acid
4-Hydroxy
biphenyl
Trimers Higher
Molecular
compounds
Li2CO3 16.4 53.7 6.9 0.9 3.7 10.1 8.3
Na2CO3 15.4 50.3 4.3 0.5 5.1 11.7 12.7
K2CO3 14.2 69.7 14.4 1.5 0 0 0.2
Trimers: Sum of 1, 1-biphenyl-2-phenoxy ether and 1,2-Diphenoxy-Benzol
To investigate the kinetics of the reaction and to test if the catalytic effect of the supported
material merely results from the impregnated salt, time dependent experiments were
conducted with lithium, sodium, and potasium carbonate as well as with the supported
catalyst. For this, 3 wt. % catalyst and 10 wt. % DPE were applied. The best phenol yield, i.e.,
73% was obtained with K2CO3.- Figure 3.8 clearly shows that K2CO3 also achieves the highest
phenol selectivity of 100%. Na2CO3 and Li2CO3 achieve selectivities of only 59 and 64%
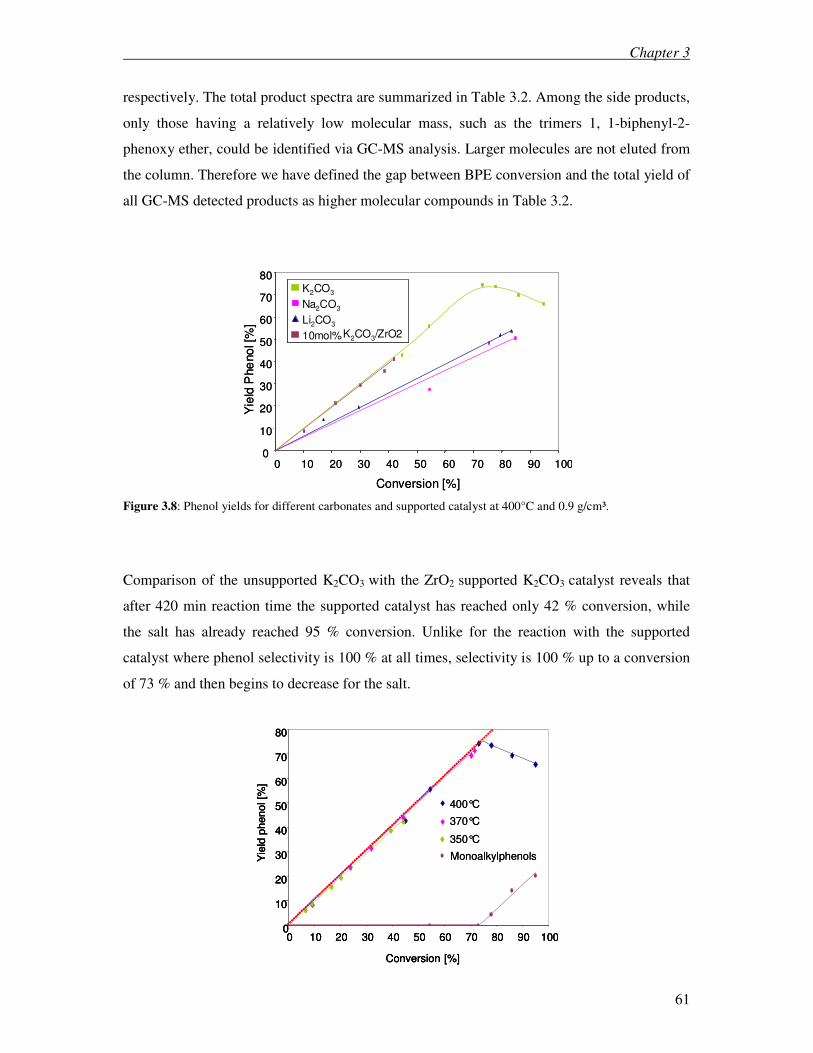
Chapter 3
61
respectively. The total product spectra are summarized in Table 3.2. Among the side products,
only those having a relatively low molecular mass, such as the trimers 1, 1-biphenyl-2-
phenoxy ether, could be identified via GC-MS analysis. Larger molecules are not eluted from
the column. Therefore we have defined the gap between BPE conversion and the total yield of
all GC-MS detected products as higher molecular compounds in Table 3.2.
0
10
20
30
40
50
60
70
80
0 10 20 30 40 50 60 70 80 90 100
Conversion [%]
Yie
ld P
he
no
l [%
]
K2CO3
Na2CO3
Li2CO3
10mol%K2CO3/ZrO2
0
10
20
30
40
50
60
70
80
0 10 20 30 40 50 60 70 80 90 100
Conversion [%]
Yie
ld P
he
no
l [%
]
K2CO3
Na2CO3
Li2CO3
10mol%K2CO3/ZrO2
K2CO3
Na2CO3
Li2CO3
10mol%K2CO3/ZrO2
Figure 3.8: Phenol yields for different carbonates and supported catalyst at 400°C and 0.9 g/cm³.
Comparison of the unsupported K2CO3 with the ZrO2 supported K2CO3 catalyst reveals that
after 420 min reaction time the supported catalyst has reached only 42 % conversion, while
the salt has already reached 95 % conversion. Unlike for the reaction with the supported
catalyst where phenol selectivity is 100 % at all times, selectivity is 100 % up to a conversion
of 73 % and then begins to decrease for the salt.
0
10
20
30
40
50
60
70
80
0 10 20 30 40 50 60 70 80 90 100
Conversion [%]
Yie
ld p
hen
ol [%
]
400°C
370°C
350°C
Monoalkylphenols
0
10
20
30
40
50
60
70
80
0 10 20 30 40 50 60 70 80 90 100
Conversion [%]
Yie
ld p
hen
ol [%
]
0
10
20
30
40
50
60
70
80
0 10 20 30 40 50 60 70 80 90 100
Conversion [%]
Yie
ld p
hen
ol [%
]
400°C
370°C
350°C
Monoalkylphenols
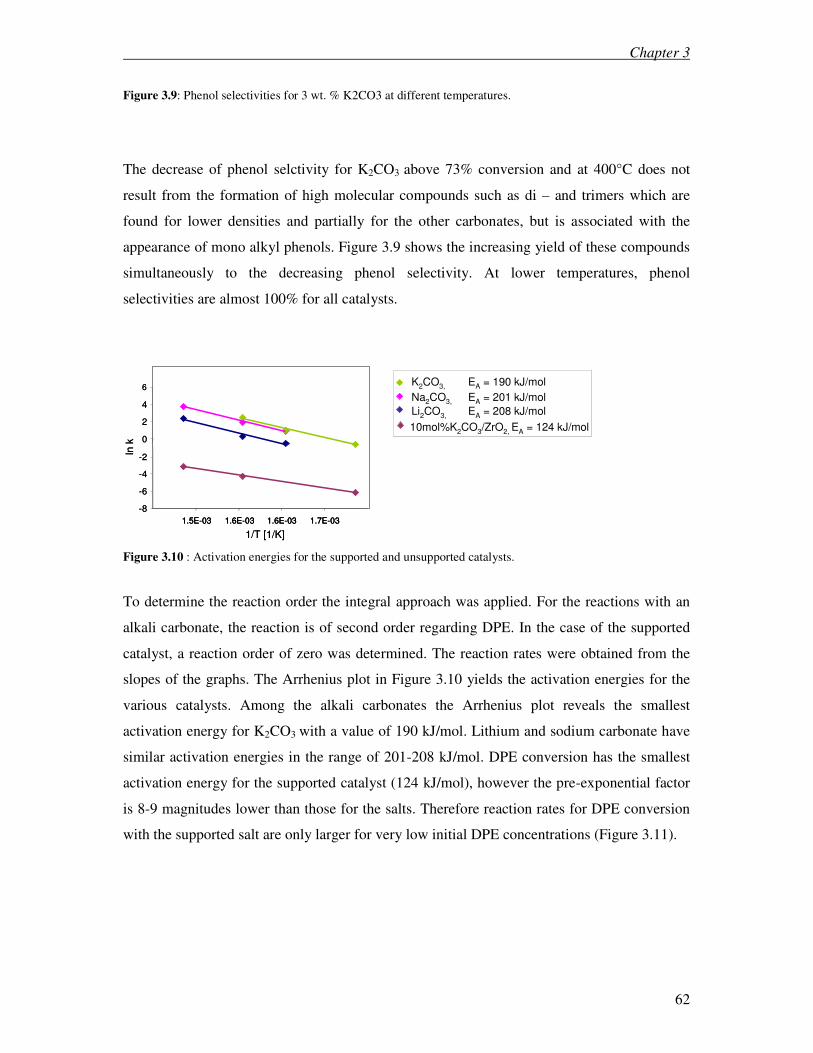
Chapter 3
62
Figure 3.9: Phenol selectivities for 3 wt. % K2CO3 at different temperatures.
The decrease of phenol selctivity for K2CO3 above 73% conversion and at 400°C does not
result from the formation of high molecular compounds such as di – and trimers which are
found for lower densities and partially for the other carbonates, but is associated with the
appearance of mono alkyl phenols. Figure 3.9 shows the increasing yield of these compounds
simultaneously to the decreasing phenol selectivity. At lower temperatures, phenol
selectivities are almost 100% for all catalysts.
-8
-6
-4
-2
0
2
4
6
1.5E-03 1.6E-03 1.6E-03 1.7E-03
1/T [1/K]
lnk
-8
-6
-4
-2
0
2
4
6
1.5E-03 1.6E-03 1.6E-03 1.7E-031.5E-03 1.6E-03 1.6E-03 1.7E-03
1/T [1/K]
lnk
Figure 3.10 : Activation energies for the supported and unsupported catalysts.
To determine the reaction order the integral approach was applied. For the reactions with an
alkali carbonate, the reaction is of second order regarding DPE. In the case of the supported
catalyst, a reaction order of zero was determined. The reaction rates were obtained from the
slopes of the graphs. The Arrhenius plot in Figure 3.10 yields the activation energies for the
various catalysts. Among the alkali carbonates the Arrhenius plot reveals the smallest
activation energy for K2CO3 with a value of 190 kJ/mol. Lithium and sodium carbonate have
similar activation energies in the range of 201-208 kJ/mol. DPE conversion has the smallest
activation energy for the supported catalyst (124 kJ/mol), however the pre-exponential factor
is 8-9 magnitudes lower than those for the salts. Therefore reaction rates for DPE conversion
with the supported salt are only larger for very low initial DPE concentrations (Figure 3.11).
K2CO3, EA = 190 kJ/mol
Na2CO3, EA = 201 kJ/mol
Li2CO3, EA = 208 kJ/mol
10mol%K2CO3/ZrO2, EA = 124 kJ/mol
K2CO3, EA = 190 kJ/mol
Na2CO3, EA = 201 kJ/mol
Li2CO3, EA = 208 kJ/mol
10mol%K2CO3/ZrO2, EA = 124 kJ/mol
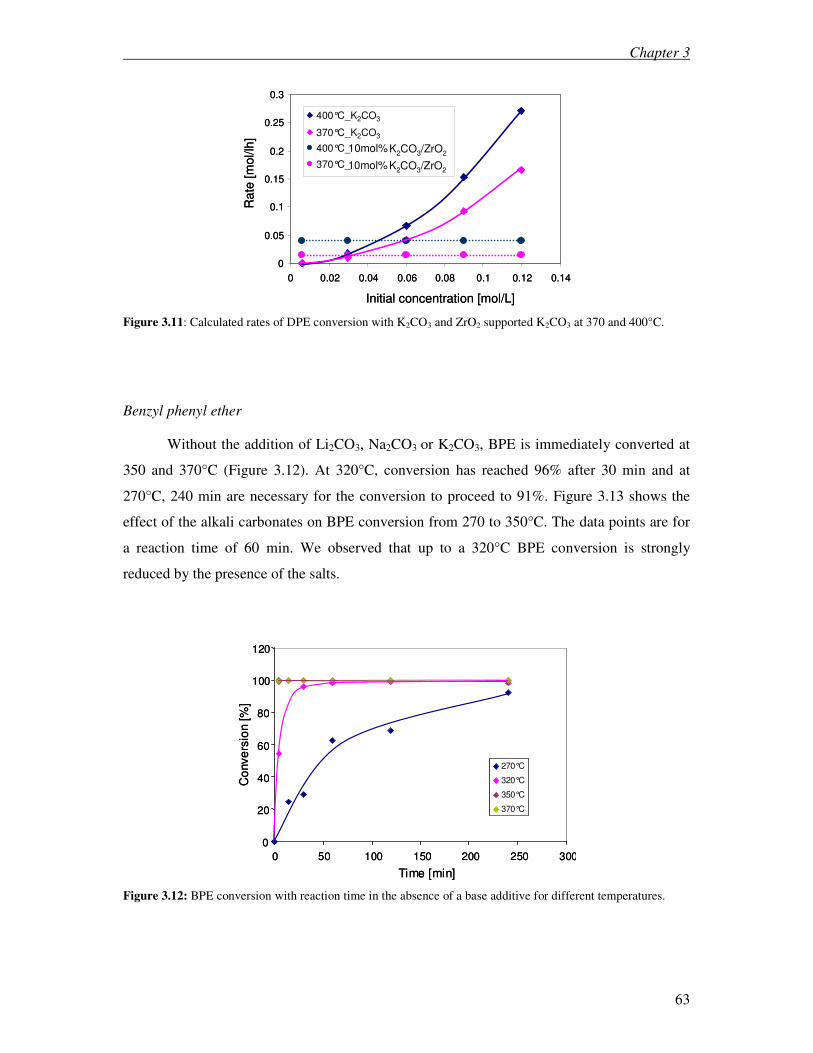
Chapter 3
63
0
0.05
0.1
0.15
0.2
0.25
0.3
0 0.02 0.04 0.06 0.08 0.1 0.12 0.14
Initial concentration [mol/L]
Ra
te [
mol/lh
]
400°C_K2CO3
370°C_K2CO3
400°C_
370°C_
10mol%K2CO3/ZrO2
10mol%K2CO3/ZrO2
0
0.05
0.1
0.15
0.2
0.25
0.3
0 0.02 0.04 0.06 0.08 0.1 0.12 0.14
Initial concentration [mol/L]
Ra
te [
mol/lh
]
400°C_K2CO3
370°C_K2CO3
400°C_
370°C_
10mol%K2CO3/ZrO2
10mol%K2CO3/ZrO2
Figure 3.11: Calculated rates of DPE conversion with K2CO3 and ZrO2 supported K2CO3 at 370 and 400°C.
Benzyl phenyl ether
Without the addition of Li2CO3, Na2CO3 or K2CO3, BPE is immediately converted at
350 and 370°C (Figure 3.12). At 320°C, conversion has reached 96% after 30 min and at
270°C, 240 min are necessary for the conversion to proceed to 91%. Figure 3.13 shows the
effect of the alkali carbonates on BPE conversion from 270 to 350°C. The data points are for
a reaction time of 60 min. We observed that up to a 320°C BPE conversion is strongly
reduced by the presence of the salts.
0
20
40
60
80
100
120
0 50 100 150 200 250 300
Time [min]
Co
nve
rsio
n [
%]
270°C
320°C
350°C
370°C
0
20
40
60
80
100
120
0 50 100 150 200 250 300
Time [min]
Co
nve
rsio
n [
%]
270°C
320°C
350°C
370°C
270°C
320°C
350°C
370°C
Figure 3.12: BPE conversion with reaction time in the absence of a base additive for different temperatures.
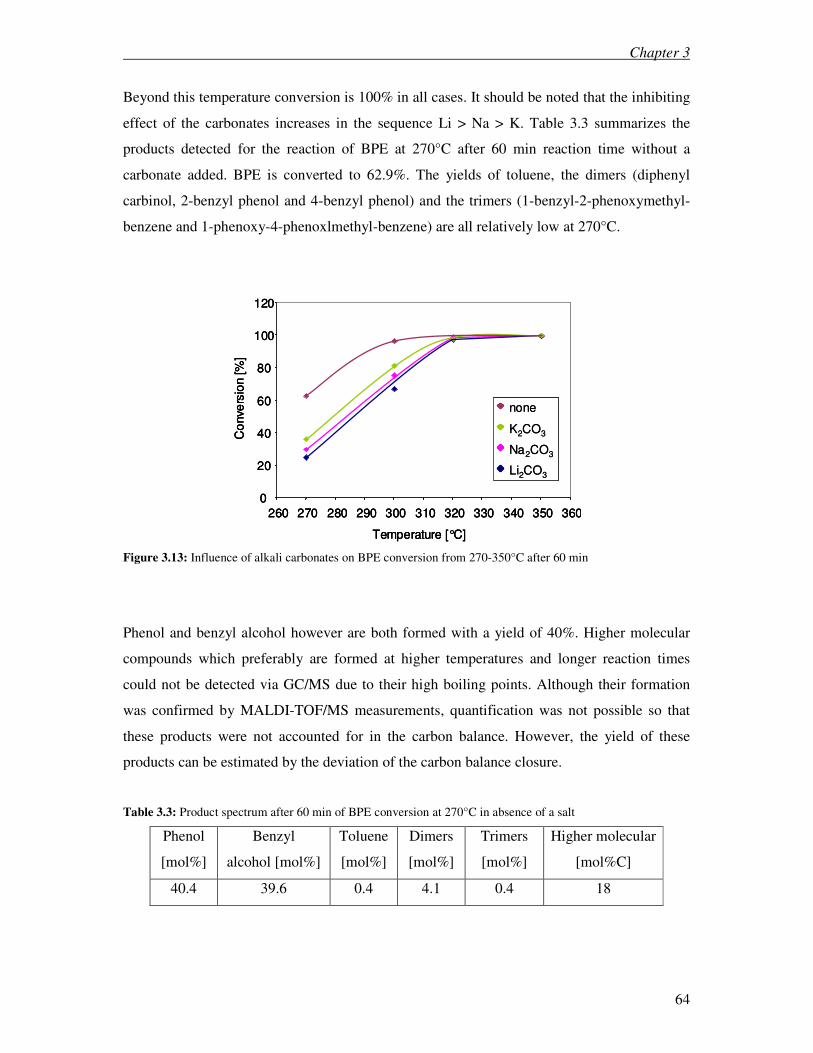
Chapter 3
64
Beyond this temperature conversion is 100% in all cases. It should be noted that the inhibiting
effect of the carbonates increases in the sequence Li > Na > K. Table 3.3 summarizes the
products detected for the reaction of BPE at 270°C after 60 min reaction time without a
carbonate added. BPE is converted to 62.9%. The yields of toluene, the dimers (diphenyl
carbinol, 2-benzyl phenol and 4-benzyl phenol) and the trimers (1-benzyl-2-phenoxymethyl-
benzene and 1-phenoxy-4-phenoxlmethyl-benzene) are all relatively low at 270°C.
0
20
40
60
80
100
120
260 270 280 290 300 310 320 330 340 350 360
Temperature [°C]
Co
nve
rsio
n [%
]
none
K2CO3
Na2CO3
Li2CO3
none
K2CO3
Na2CO3
Li2CO3
0
20
40
60
80
100
120
260 270 280 290 300 310 320 330 340 350 360
Temperature [°C]
Co
nve
rsio
n [%
]
0
20
40
60
80
100
120
260 270 280 290 300 310 320 330 340 350 360
Temperature [°C]
Co
nve
rsio
n [%
]
none
K2CO3
Na2CO3
Li2CO3
none
K2CO3
Na2CO3
Li2CO3
Figure 3.13: Influence of alkali carbonates on BPE conversion from 270-350°C after 60 min
Phenol and benzyl alcohol however are both formed with a yield of 40%. Higher molecular
compounds which preferably are formed at higher temperatures and longer reaction times
could not be detected via GC/MS due to their high boiling points. Although their formation
was confirmed by MALDI-TOF/MS measurements, quantification was not possible so that
these products were not accounted for in the carbon balance. However, the yield of these
products can be estimated by the deviation of the carbon balance closure.
Table 3.3: Product spectrum after 60 min of BPE conversion at 270°C in absence of a salt
Phenol
[mol%]
Benzyl
alcohol [mol%]
Toluene
[mol%]
Dimers
[mol%]
Trimers
[mol%]
Higher molecular
[mol%C]
40.4 39.6 0.4 4.1 0.4 18
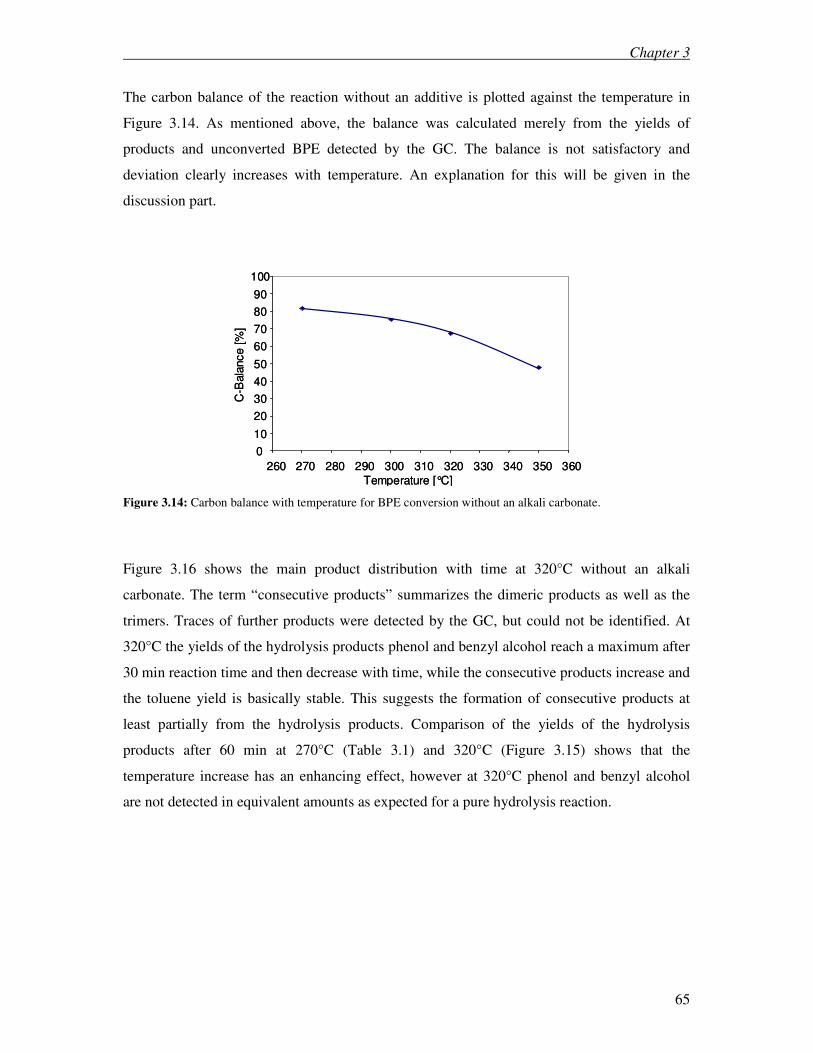
Chapter 3
65
The carbon balance of the reaction without an additive is plotted against the temperature in
Figure 3.14. As mentioned above, the balance was calculated merely from the yields of
products and unconverted BPE detected by the GC. The balance is not satisfactory and
deviation clearly increases with temperature. An explanation for this will be given in the
discussion part.
0
10
20
30
40
50
60
70
80
90
100
260 270 280 290 300 310 320 330 340 350 360
Temperature [°C]
C-B
ala
nce
[%
]
0
10
20
30
40
50
60
70
80
90
100
260 270 280 290 300 310 320 330 340 350 360
Temperature [°C]
C-B
ala
nce
[%
]
Figure 3.14: Carbon balance with temperature for BPE conversion without an alkali carbonate.
Figure 3.16 shows the main product distribution with time at 320°C without an alkali
carbonate. The term “consecutive products” summarizes the dimeric products as well as the
trimers. Traces of further products were detected by the GC, but could not be identified. At
320°C the yields of the hydrolysis products phenol and benzyl alcohol reach a maximum after
30 min reaction time and then decrease with time, while the consecutive products increase and
the toluene yield is basically stable. This suggests the formation of consecutive products at
least partially from the hydrolysis products. Comparison of the yields of the hydrolysis
products after 60 min at 270°C (Table 3.1) and 320°C (Figure 3.15) shows that the
temperature increase has an enhancing effect, however at 320°C phenol and benzyl alcohol
are not detected in equivalent amounts as expected for a pure hydrolysis reaction.
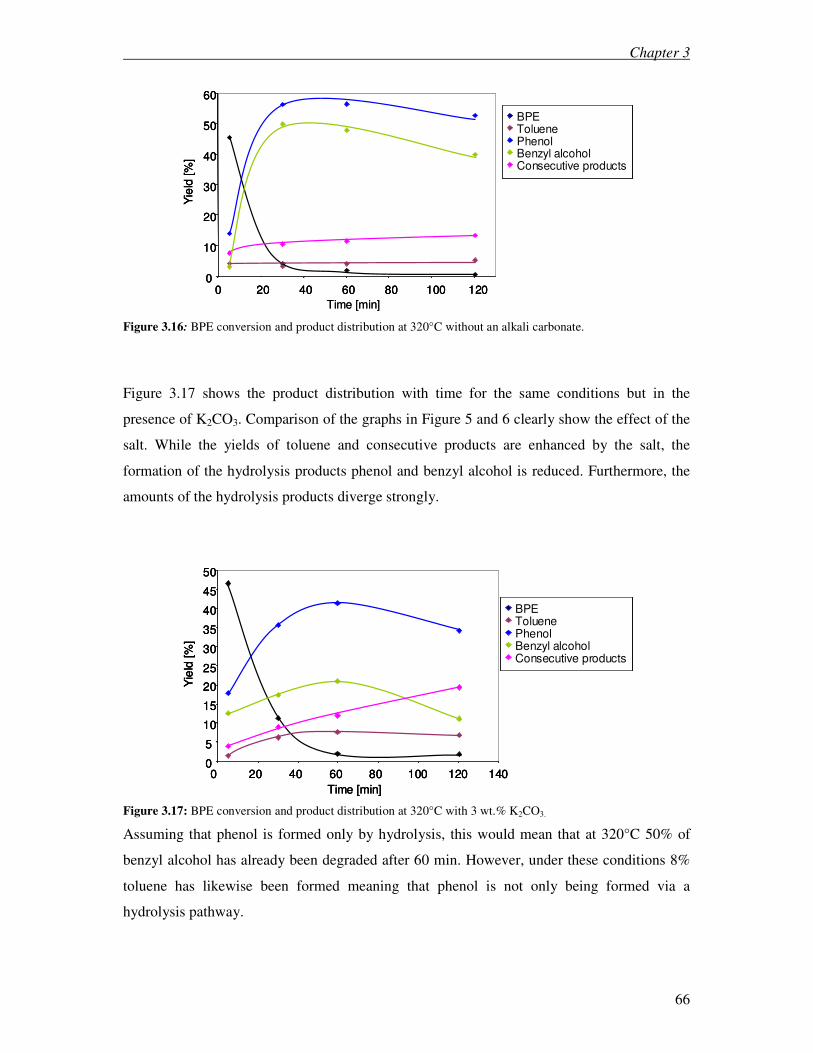
Chapter 3
66
Time [min]
0
10
20
30
40
50
60
0 20 40 60 80 100 120
Yie
ld [%
]
BPEToluenePhenolBenzyl alcoholConsecutive products
Time [min]
0
10
20
30
40
50
60
0 20 40 60 80 100 120
Yie
ld [%
]
0
10
20
30
40
50
60
0 20 40 60 80 100 120
Yie
ld [%
]
BPEToluenePhenolBenzyl alcoholConsecutive products
BPEToluenePhenolBenzyl alcoholConsecutive products
Figure 3.16: BPE conversion and product distribution at 320°C without an alkali carbonate.
Figure 3.17 shows the product distribution with time for the same conditions but in the
presence of K2CO3. Comparison of the graphs in Figure 5 and 6 clearly show the effect of the
salt. While the yields of toluene and consecutive products are enhanced by the salt, the
formation of the hydrolysis products phenol and benzyl alcohol is reduced. Furthermore, the
amounts of the hydrolysis products diverge strongly.
0
5
10
15
20
25
30
35
40
45
50
0 20 40 60 80 100 120 140
Time [min]
Yie
ld [%
]
BPEToluenePhenolBenzyl alcoholConsecutive products
0
5
10
15
20
25
30
35
40
45
50
0 20 40 60 80 100 120 140
Time [min]
Yie
ld [%
]
0
5
10
15
20
25
30
35
40
45
50
0 20 40 60 80 100 120 140
Time [min]
Yie
ld [%
]
BPEToluenePhenolBenzyl alcoholConsecutive products
BPEToluenePhenolBenzyl alcoholConsecutive products
Figure 3.17: BPE conversion and product distribution at 320°C with 3 wt.% K2CO3.
Assuming that phenol is formed only by hydrolysis, this would mean that at 320°C 50% of
benzyl alcohol has already been degraded after 60 min. However, under these conditions 8%
toluene has likewise been formed meaning that phenol is not only being formed via a
hydrolysis pathway.
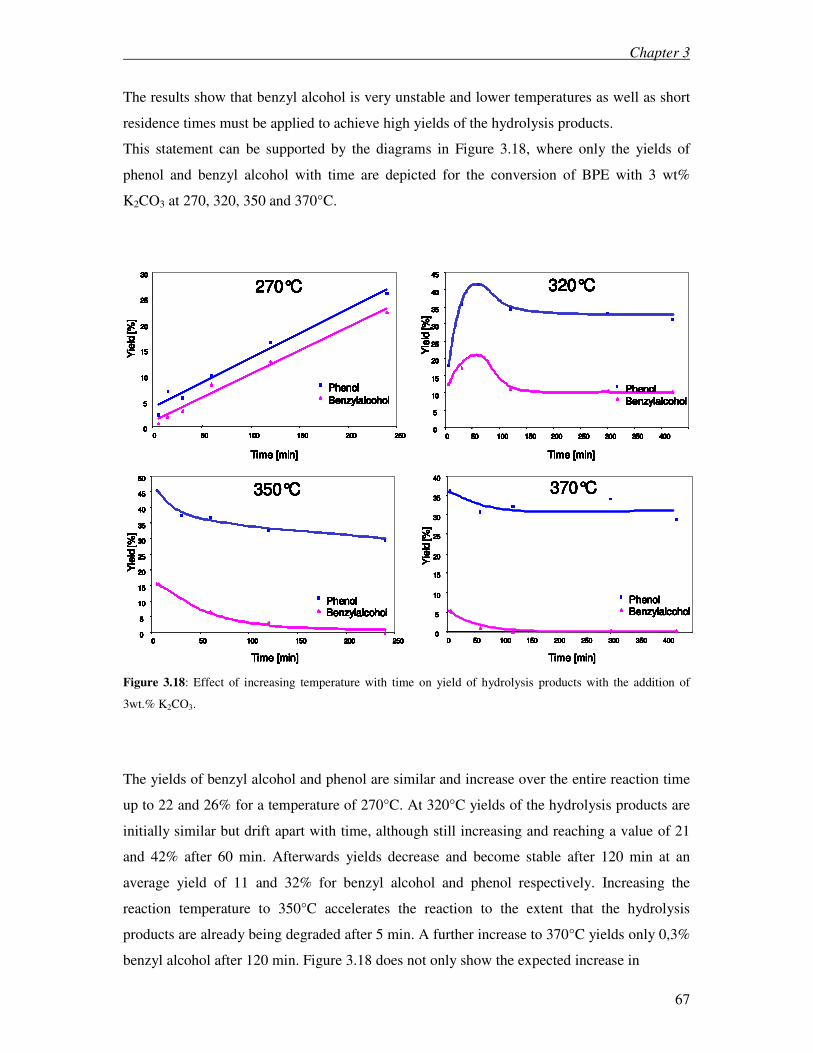
Chapter 3
67
The results show that benzyl alcohol is very unstable and lower temperatures as well as short
residence times must be applied to achieve high yields of the hydrolysis products.
This statement can be supported by the diagrams in Figure 3.18, where only the yields of
phenol and benzyl alcohol with time are depicted for the conversion of BPE with 3 wt%
K2CO3 at 270, 320, 350 and 370°C.
0
5
10
15
20
25
30
0 50 100 150 200 250
Time [min]
Yie
ld[%
]
Phenol
Benzylalcohol
270°C
0
5
10
15
20
25
30
35
40
45
0 50 100 150 200 250 300 350 400
Time [min]
Yie
ld[%
]
PhenolBenzylalcohol
320°C
2500
5
10
15
20
25
30
35
40
45
50
0 50 100 150 200
Time [min]
Yie
ld[%
]
PhenolBenzylalcohol
350°C
Yie
ld[%
]
0
5
10
15
20
25
30
35
40
0 50 100 150 200 250 300 350 400
Time [min]
PhenolBenzylalcohol
370°C
0
5
10
15
20
25
30
0 50 100 150 200 250
Time [min]
Yie
ld[%
]
Phenol
Benzylalcohol
270°C
0
5
10
15
20
25
30
0 50 100 150 200 250
Time [min]
Yie
ld[%
]
Phenol
Benzylalcohol
Phenol
Benzylalcohol
270°C
0
5
10
15
20
25
30
35
40
45
0 50 100 150 200 250 300 350 400
Time [min]
Yie
ld[%
]
PhenolBenzylalcohol
320°C
0
5
10
15
20
25
30
35
40
45
0 50 100 150 200 250 300 350 400
Time [min]
Yie
ld[%
]
PhenolBenzylalcoholPhenolBenzylalcohol
320°C
2500
5
10
15
20
25
30
35
40
45
50
0 50 100 150 200
Time [min]
Yie
ld[%
]
PhenolBenzylalcohol
350°C
0
5
10
15
20
25
30
35
40
45
50
0 50 100 150 200
Time [min]
Yie
ld[%
]
PhenolBenzylalcoholPhenolBenzylalcohol
350°C
Yie
ld[%
]0
5
10
15
20
25
30
0 50 100 150 200 250
Time [min]
Yie
ld[%
]
Phenol
Benzylalcohol
270°C
0
5
10
15
20
25
30
35
40
45
0 50 100 150 200 250 300 350 400
Time [min]
Yie
ld[%
]
PhenolBenzylalcohol
320°C
2500
5
10
15
20
25
30
35
40
45
50
0 50 100 150 200
Time [min]
Yie
ld[%
]
PhenolBenzylalcohol
350°C
Yie
ld[%
]
0
5
10
15
20
25
30
35
40
0 50 100 150 200 250 300 350 400
Time [min]
PhenolBenzylalcohol
370°C
0
5
10
15
20
25
30
0 50 100 150 200 250
Time [min]
Yie
ld[%
]
Phenol
Benzylalcohol
270°C
0
5
10
15
20
25
30
0 50 100 150 200 250
Time [min]
Yie
ld[%
]
Phenol
Benzylalcohol
Phenol
Benzylalcohol
270°C
0
5
10
15
20
25
30
35
40
45
0 50 100 150 200 250 300 350 400
Time [min]
Yie
ld[%
]
PhenolBenzylalcohol
320°C
0
5
10
15
20
25
30
35
40
45
0 50 100 150 200 250 300 350 400
Time [min]
Yie
ld[%
]
PhenolBenzylalcoholPhenolBenzylalcohol
320°C
2500
5
10
15
20
25
30
35
40
45
50
0 50 100 150 200
Time [min]
Yie
ld[%
]
PhenolBenzylalcohol
350°C
0
5
10
15
20
25
30
35
40
45
50
0 50 100 150 200
Time [min]
Yie
ld[%
]
PhenolBenzylalcoholPhenolBenzylalcohol
350°C
Yie
ld[%
]
0
5
10
15
20
25
30
35
40
0 50 100 150 200 250 300 350 400
Time [min]
PhenolBenzylalcohol
370°C
Yie
ld[%
]
0
5
10
15
20
25
30
35
40
0 50 100 150 200 250 300 350 400
Time [min]
PhenolBenzylalcoholPhenolBenzylalcohol
370°C
0
5
10
15
20
25
30
0 50 100 150 200 250
Time [min]
Yie
ld[%
]
Phenol
Benzylalcohol
270°C
0
5
10
15
20
25
30
35
40
45
0 50 100 150 200 250 300 350 400
Time [min]
Yie
ld[%
]
PhenolBenzylalcohol
320°C
2500
5
10
15
20
25
0
5
10
15
20
25
30
0 50 100 150 200 250
Time [min]
Yie
ld[%
]
Phenol
Benzylalcohol
270°C
0
5
10
15
20
25
30
35
40
45
0 50 100 150 200 250 300 350 400
Time [min]
Yie
ld[%
]
PhenolBenzylalcohol
320°C
2500
5
10
15
20
25
30
35
40
45
50
0 50 100 150 200
Time [min]
Yie
ld[%
]
PhenolBenzylalcohol
350°C
Yie
ld[%
]
0
5
10
15
20
25
30
35
40
0 50 100 150 200 250 300 350 400
Time [min]
PhenolBenzylalcohol
370°C
0
5
10
15
20
25
30
0 50 100 150 200 250
Time [min]
Yie
ld[%
]
Phenol
Benzylalcohol
270°C
30
35
40
45
50
0 50 100 150 200
Time [min]
Yie
ld[%
]
PhenolBenzylalcohol
350°C
Yie
ld[%
]
0
5
10
15
20
25
30
35
40
0 50 100 150 200 250 300 350 400
Time [min]
PhenolBenzylalcohol
370°C
0
5
10
15
20
25
30
0 50 100 150 200 250
Time [min]
Yie
ld[%
]
Phenol
Benzylalcohol
270°C
0
5
10
15
20
25
30
0 50 100 150 200 250
Time [min]
Yie
ld[%
]
Phenol
Benzylalcohol
Phenol
Benzylalcohol
270°C
0
5
10
15
20
25
30
35
40
45
0 50 100 150 200 250 300 350 400
Time [min]
Yie
ld[%
]
PhenolBenzylalcohol
320°C
0
5
10
15
20
25
30
35
40
45
0
5
10
15
20
25
30
0 50 100 150 200 250
Time [min]
Yie
ld[%
]
Phenol
Benzylalcohol
Phenol
Benzylalcohol
270°C
0
5
10
15
20
25
30
35
40
45
0 50 100 150 200 250 300 350 400
Time [min]
Yie
ld[%
]
PhenolBenzylalcohol
320°C
0
5
10
15
20
25
30
35
40
45
0 50 100 150 200 250 300 350 400
Time [min]
Yie
ld[%
]
PhenolBenzylalcoholPhenolBenzylalcohol
320°C
2500
5
10
15
20
25
30
35
40
45
50
0 50 100 150 200
Time [min]
Yie
ld[%
]
PhenolBenzylalcohol
350°C
0
5
10
15
20
25
30
35
40
45
50
0 50 100 150 200
Time [min]
Yie
ld[%
]
PhenolBenzylalcoholPhenolBenzylalcohol
350°C
Yie
ld[%
]0 50 100 150 200 250 300 350 400
Time [min]
Yie
ld[%
]
PhenolBenzylalcoholPhenolBenzylalcohol
320°C
2500
5
10
15
20
25
30
35
40
45
50
0 50 100 150 200
Time [min]
Yie
ld[%
]
PhenolBenzylalcohol
350°C
0
5
10
15
20
25
30
35
40
45
50
0 50 100 150 200
Time [min]
Yie
ld[%
]
PhenolBenzylalcoholPhenolBenzylalcohol
350°C
Yie
ld[%
]0
5
10
15
20
25
30
0 50 100 150 200 250
Time [min]
Yie
ld[%
]
Phenol
Benzylalcohol
270°C
0
5
10
15
20
25
30
35
40
45
0 50 100 150 200 250 300 350 400
Time [min]
Yie
ld[%
]
PhenolBenzylalcohol
320°C
2500
5
10
15
20
25
30
35
40
45
50
0 50 100
0
5
10
15
20
25
30
0 50 100 150 200 250
Time [min]
Yie
ld[%
]
Phenol
Benzylalcohol
270°C
0
5
10
15
20
25
30
35
40
45
0 50 100 150 200 250 300 350 400
Time [min]
Yie
ld[%
]
PhenolBenzylalcohol
320°C
2500
5
10
15
20
25
30
35
40
45
50
0 50 100 150 200
Time [min]
Yie
ld[%
]
PhenolBenzylalcohol
350°C
Yie
ld[%
]
0
5
10
15
20
25
30
35
40
0 50 100 150 200 250 300 350 400
Time [min]
PhenolBenzylalcohol
370°C
0
5
10
15
20
25
30
0 50 100 150 200 250
Time [min]
Yie
ld[%
]
Phenol
Benzylalcohol
270°C
0
150 200
Time [min]
Yie
ld[%
]
PhenolBenzylalcohol
350°C
Yie
ld[%
]
0
5
10
15
20
25
30
35
40
0 50 100 150 200 250 300 350 400
Time [min]
PhenolBenzylalcohol
370°C
0
5
10
15
20
25
30
0 50 100 150 200 250
Time [min]
Yie
ld[%
]
Phenol
Benzylalcohol
270°C
0
5
10
15
20
25
30
0 50 100 150 200 250
Time [min]
Yie
ld[%
]
Phenol
Benzylalcohol
Phenol
Benzylalcohol
270°C
0
5
10
15
20
25
30
35
40
45
0 50 100 150 200 250 300 350 400
Time [min]
Yie
ld[%
]
PhenolBenzylalcohol
320°C
0
5
10
15
20
25
30
35
40
45
0 50 100 150 200 250 300 350
5
10
15
20
25
30
0 50 100 150 200 250
Time [min]
Yie
ld[%
]
Phenol
Benzylalcohol
Phenol
Benzylalcohol
270°C
0
5
10
15
20
25
30
35
40
45
0 50 100 150 200 250 300 350 400
Time [min]
Yie
ld[%
]
PhenolBenzylalcohol
320°C
0
5
10
15
20
25
30
35
40
45
0 50 100 150 200 250 300 350 400
Time [min]
Yie
ld[%
]
PhenolBenzylalcoholPhenolBenzylalcohol
320°C
2500
5
10
15
20
25
30
35
40
45
50
0 50 100 150 200
Time [min]
Yie
ld[%
]
PhenolBenzylalcohol
350°C
0
5
10
15
20
25
30
35
40
45
50
0 50 100 150 200
Time [min]
Yie
ld[%
]
PhenolBenzylalcoholPhenolBenzylalcohol
350°C
Yie
ld[%
]400
Time [min]
Yie
ld[%
]
PhenolBenzylalcoholPhenolBenzylalcohol
320°C
2500
5
10
15
20
25
30
35
40
45
50
0 50 100 150 200
Time [min]
Yie
ld[%
]
PhenolBenzylalcohol
350°C
0
5
10
15
20
25
30
35
40
45
50
0 50 100 150 200
Time [min]
Yie
ld[%
]
PhenolBenzylalcoholPhenolBenzylalcohol
350°C
Yie
ld[%
]
0
5
10
15
20
25
30
35
40
0 50 100 150 200 250 300 350 400
Time [min]
PhenolBenzylalcohol
370°C
Yie
ld[%
]
0
5
10
15
20
25
30
35
40
0 50 100 150 200 250 300 350 400
Time [min]
PhenolBenzylalcoholPhenolBenzylalcohol
370°C
Figure 3.18: Effect of increasing temperature with time on yield of hydrolysis products with the addition of
3wt.% K2CO3.
The yields of benzyl alcohol and phenol are similar and increase over the entire reaction time
up to 22 and 26% for a temperature of 270°C. At 320°C yields of the hydrolysis products are
initially similar but drift apart with time, although still increasing and reaching a value of 21
and 42% after 60 min. Afterwards yields decrease and become stable after 120 min at an
average yield of 11 and 32% for benzyl alcohol and phenol respectively. Increasing the
reaction temperature to 350°C accelerates the reaction to the extent that the hydrolysis
products are already being degraded after 5 min. A further increase to 370°C yields only 0,3%
benzyl alcohol after 120 min. Figure 3.18 does not only show the expected increase in
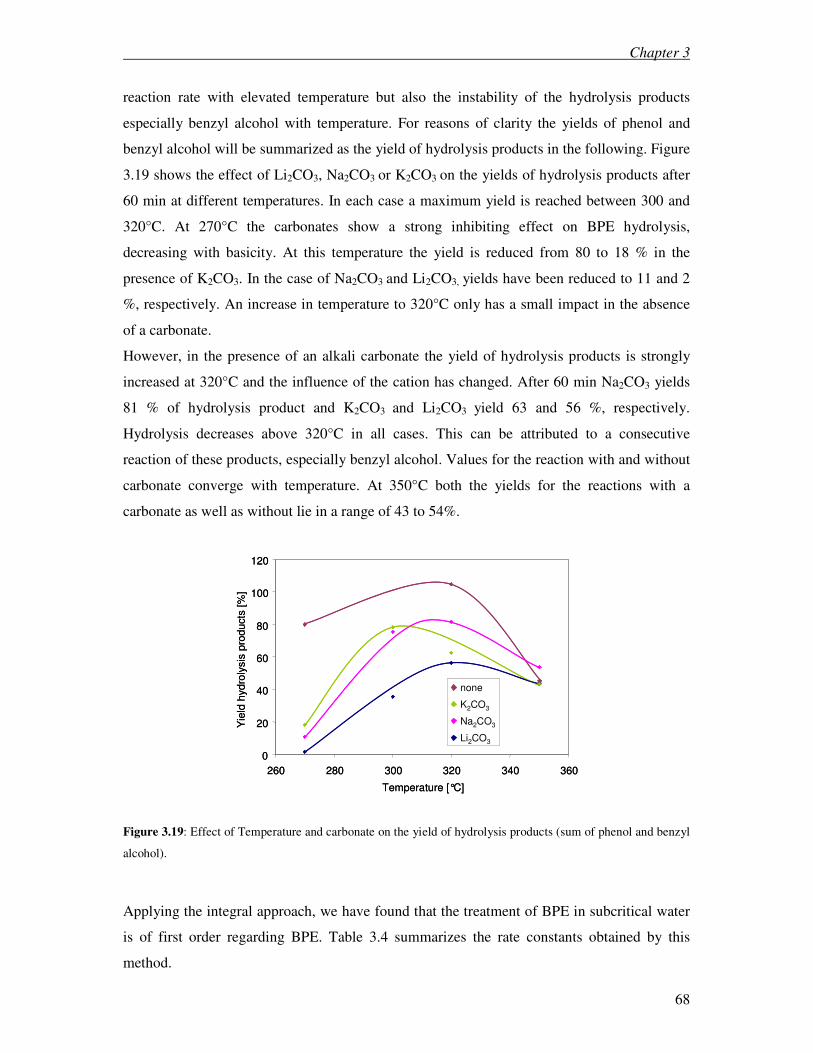
Chapter 3
68
reaction rate with elevated temperature but also the instability of the hydrolysis products
especially benzyl alcohol with temperature. For reasons of clarity the yields of phenol and
benzyl alcohol will be summarized as the yield of hydrolysis products in the following. Figure
3.19 shows the effect of Li2CO3, Na2CO3 or K2CO3 on the yields of hydrolysis products after
60 min at different temperatures. In each case a maximum yield is reached between 300 and
320°C. At 270°C the carbonates show a strong inhibiting effect on BPE hydrolysis,
decreasing with basicity. At this temperature the yield is reduced from 80 to 18 % in the
presence of K2CO3. In the case of Na2CO3 and Li2CO3, yields have been reduced to 11 and 2
%, respectively. An increase in temperature to 320°C only has a small impact in the absence
of a carbonate.
However, in the presence of an alkali carbonate the yield of hydrolysis products is strongly
increased at 320°C and the influence of the cation has changed. After 60 min Na2CO3 yields
81 % of hydrolysis product and K2CO3 and Li2CO3 yield 63 and 56 %, respectively.
Hydrolysis decreases above 320°C in all cases. This can be attributed to a consecutive
reaction of these products, especially benzyl alcohol. Values for the reaction with and without
carbonate converge with temperature. At 350°C both the yields for the reactions with a
carbonate as well as without lie in a range of 43 to 54%.
Yie
ld h
ydro
lysis
pro
ducts
[%
]
0
20
40
60
80
100
120
260 280 300 320 340 360
Temperature [°C]
none
K2CO3
Na2CO3
Li2CO3
Yie
ld h
ydro
lysis
pro
ducts
[%
]
0
20
40
60
80
100
120
260 280 300 320 340 360
Temperature [°C]
none
K2CO3
Na2CO3
Li2CO3
none
K2CO3
Na2CO3
Li2CO3
Figure 3.19: Effect of Temperature and carbonate on the yield of hydrolysis products (sum of phenol and benzyl
alcohol).
Applying the integral approach, we have found that the treatment of BPE in subcritical water
is of first order regarding BPE. Table 3.4 summarizes the rate constants obtained by this
method.
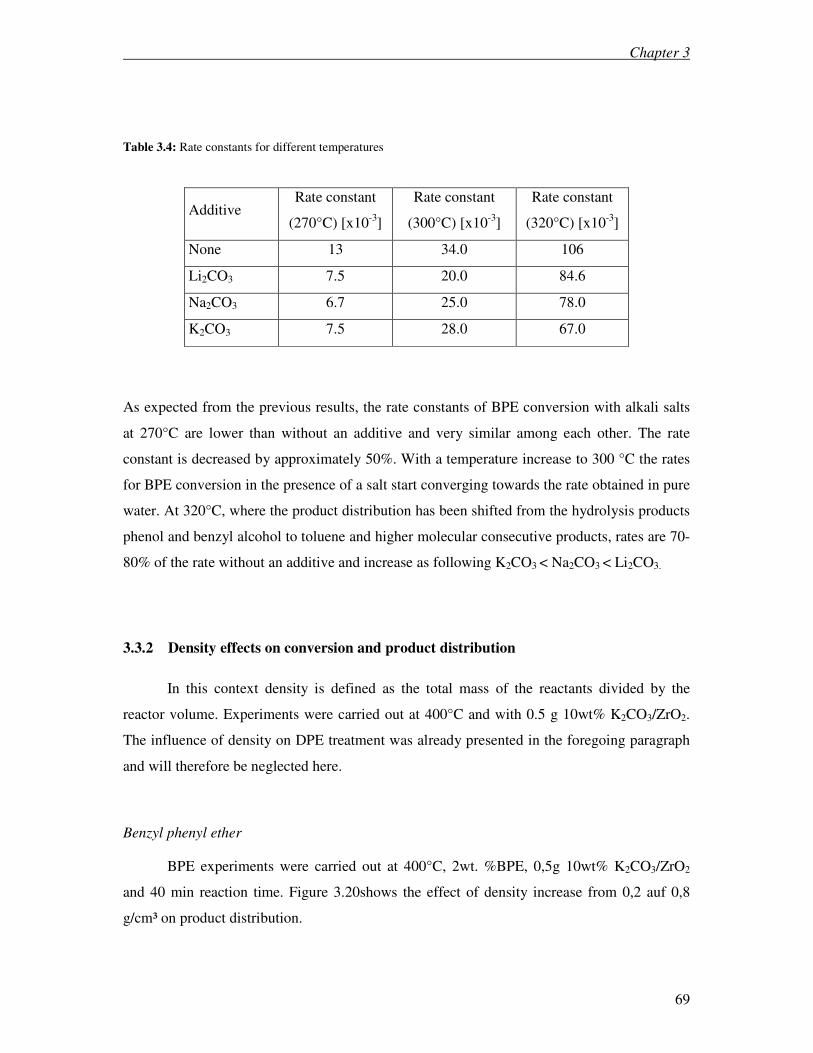
Chapter 3
69
Table 3.4: Rate constants for different temperatures
Additive Rate constant
(270°C) [x10-3
]
Rate constant
(300°C) [x10-3
]
Rate constant
(320°C) [x10-3
]
None 13 34.0 106
Li2CO3 7.5 20.0 84.6
Na2CO3 6.7 25.0 78.0
K2CO3 7.5 28.0 67.0
As expected from the previous results, the rate constants of BPE conversion with alkali salts
at 270°C are lower than without an additive and very similar among each other. The rate
constant is decreased by approximately 50%. With a temperature increase to 300 °C the rates
for BPE conversion in the presence of a salt start converging towards the rate obtained in pure
water. At 320°C, where the product distribution has been shifted from the hydrolysis products
phenol and benzyl alcohol to toluene and higher molecular consecutive products, rates are 70-
80% of the rate without an additive and increase as following K2CO3 < Na2CO3 < Li2CO3.
3.3.2 Density effects on conversion and product distribution
In this context density is defined as the total mass of the reactants divided by the
reactor volume. Experiments were carried out at 400°C and with 0.5 g 10wt% K2CO3/ZrO2.
The influence of density on DPE treatment was already presented in the foregoing paragraph
and will therefore be neglected here.
Benzyl phenyl ether
BPE experiments were carried out at 400°C, 2wt. %BPE, 0,5g 10wt% K2CO3/ZrO2
and 40 min reaction time. Figure 3.20shows the effect of density increase from 0,2 auf 0,8
g/cm³ on product distribution.
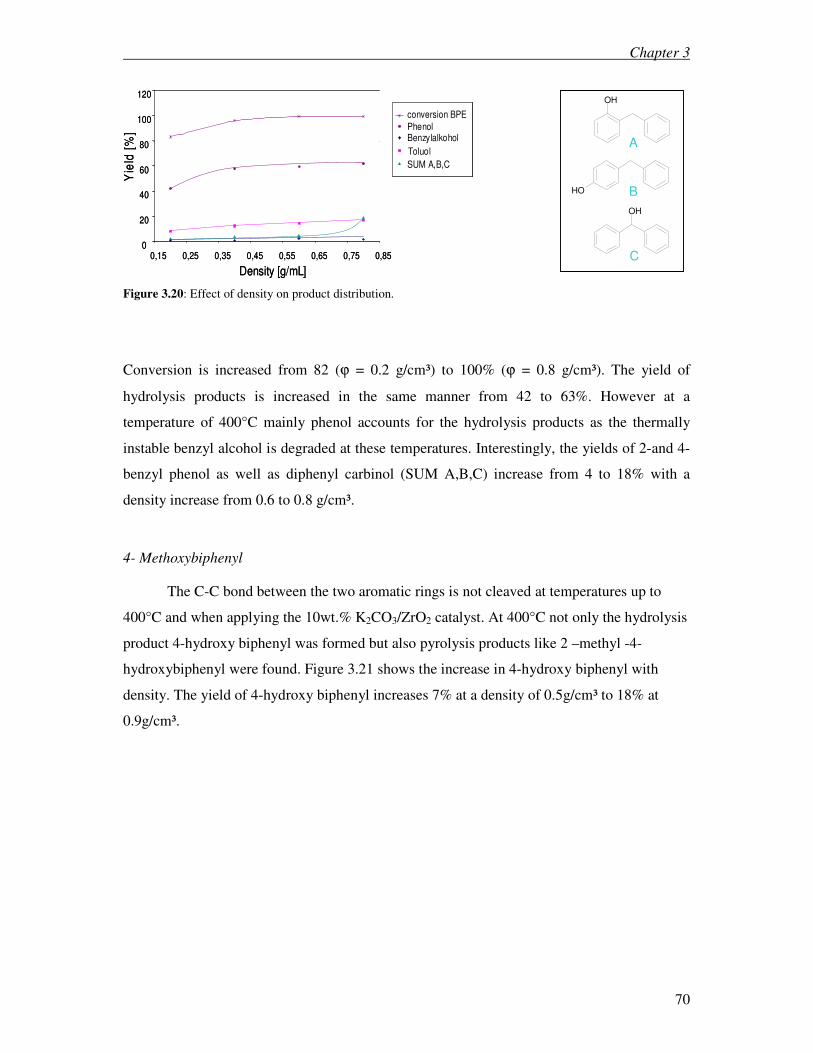
Chapter 3
70
0
20
40
60
80
100
120
0,15 0,25 0,35 0,45 0,55 0,65 0,75 0,85
Density [g/mL]
Yie
ld [
%]
BenzylalkoholPhenol
Toluol
SUM A,B,C
conversion BPE
0
20
40
60
80
100
120
0,15 0,25 0,35 0,45 0,55 0,65 0,75 0,85
Density [g/mL]
Yie
ld [
%]
BenzylalkoholPhenol
Toluol
SUM A,B,C
conversion BPE
BenzylalkoholPhenol
Toluol
SUM A,B,C
conversion BPE
Figure 3.20: Effect of density on product distribution.
Conversion is increased from 82 (ϕ = 0.2 g/cm³) to 100% (ϕ = 0.8 g/cm³). The yield of
hydrolysis products is increased in the same manner from 42 to 63%. However at a
temperature of 400°C mainly phenol accounts for the hydrolysis products as the thermally
instable benzyl alcohol is degraded at these temperatures. Interestingly, the yields of 2-and 4-
benzyl phenol as well as diphenyl carbinol (SUM A,B,C) increase from 4 to 18% with a
density increase from 0.6 to 0.8 g/cm³.
4- Methoxybiphenyl
The C-C bond between the two aromatic rings is not cleaved at temperatures up to
400°C and when applying the 10wt.% K2CO3/ZrO2 catalyst. At 400°C not only the hydrolysis
product 4-hydroxy biphenyl was formed but also pyrolysis products like 2 –methyl -4-
hydroxybiphenyl were found. Figure 3.21 shows the increase in 4-hydroxy biphenyl with
density. The yield of 4-hydroxy biphenyl increases 7% at a density of 0.5g/cm³ to 18% at
0.9g/cm³.
OH
OH
OH
A
B
C
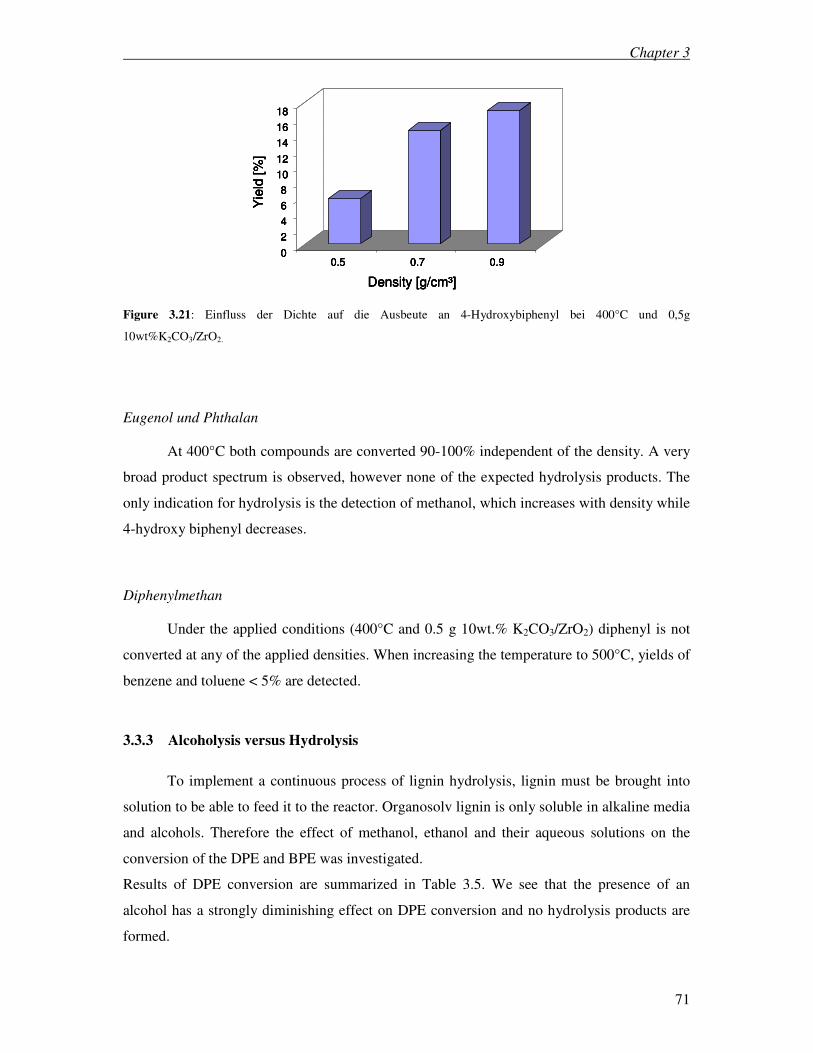
Chapter 3
71
0
2
4
6
8
10
12
14
16
18
Yie
ld [%
]0.5 0.7 0.9
Density [g/cm³]
0
2
4
6
8
10
12
14
16
18
Yie
ld [%
]0.5 0.7 0.9
Density [g/cm³]
0
2
4
6
8
10
12
14
16
18
Yie
ld [%
]0.5 0.7 0.9
Density [g/cm³]
0
2
4
6
8
10
12
14
16
18
Yie
ld [%
]0.5 0.7 0.9
Density [g/cm³] Figure 3.21: Einfluss der Dichte auf die Ausbeute an 4-Hydroxybiphenyl bei 400°C und 0,5g
10wt%K2CO3/ZrO2.
Eugenol und Phthalan
At 400°C both compounds are converted 90-100% independent of the density. A very
broad product spectrum is observed, however none of the expected hydrolysis products. The
only indication for hydrolysis is the detection of methanol, which increases with density while
4-hydroxy biphenyl decreases.
Diphenylmethan
Under the applied conditions (400°C and 0.5 g 10wt.% K2CO3/ZrO2) diphenyl is not
converted at any of the applied densities. When increasing the temperature to 500°C, yields of
benzene and toluene < 5% are detected.
3.3.3 Alcoholysis versus Hydrolysis
To implement a continuous process of lignin hydrolysis, lignin must be brought into
solution to be able to feed it to the reactor. Organosolv lignin is only soluble in alkaline media
and alcohols. Therefore the effect of methanol, ethanol and their aqueous solutions on the
conversion of the DPE and BPE was investigated.
Results of DPE conversion are summarized in Table 3.5. We see that the presence of an
alcohol has a strongly diminishing effect on DPE conversion and no hydrolysis products are
formed.
Chapter 3
72
Table 3.5: Influence of methanol, ethanol and their aqueous solutions on DPE conversion at 400°C, ρ=
0,9g/cm³, 0,5g 10wt%K2CO3/ZrO2, wt%(H2O/alcohol) = 50 and a reaction periode of 1h. For the
fields marked red the autoclaves were not quenched after the reaction
26-30
30-35
0
70
2
EtOH/H2O
n(H2O+EtOH/
DPE) = 35
0
57
4
EtOH/H2O
n(H2O/DPE) =
35
4200Yield Phenol
[%]
1936Conversion
Alcohol [%]
46,69,77,5Conversion
DPE [%]
sc-water
n(H2O/DPE) = 3513,3wt% 3wt%
K2CO3/ K2CO3
ZrO2
Pure MeOH MeOH/H2O
1wt% DPE
26-30
30-35
0
70
2
EtOH/H2O
n(H2O+EtOH/
DPE) = 35
0
57
4
EtOH/H2O
n(H2O/DPE) =
35
4200Yield Phenol
[%]
1936Conversion
Alcohol [%]
46,69,77,5Conversion
DPE [%]
sc-water
n(H2O/DPE) = 3513,3wt% 3wt%
K2CO3/ K2CO3
ZrO2
Pure MeOH MeOH/H2O
1wt% DPE
The table also shows that alcohol itself is being converted during the reaction. Figure 3.22
shows a comparison of the gas chromatograms of the products obtained from the conversion
of BPE in sc-water, methanol and a water/ethanol mixture of 50/50 wt.%.
OHO
2.5 5.0 7.5 10.0 min
0.0
1.0
2.0
3.0
4.0sc-WaterEtOH/H2O = 50wt%
MeOH
OH
OH
OH
OHO
2.5 5.0 7.5 10.0 min
0.0
1.0
2.0
3.0
4.0sc-WaterEtOH/H2O = 50wt%
MeOH
OH
OH
OH
OHO
2.5 5.0 7.5 10.0 min
0.0
1.0
2.0
3.0
4.0sc-WaterEtOH/H2O = 50wt%
MeOH
OH
OH
OH
Figure 3.22: Gas chromatograms of products obtained in various solvents.
Only in the case of BPE conversion in water are hydrolysis products observed in significant
amounts. In methanol and the water/ethanol mixture hydrolysis is suppressed and merely
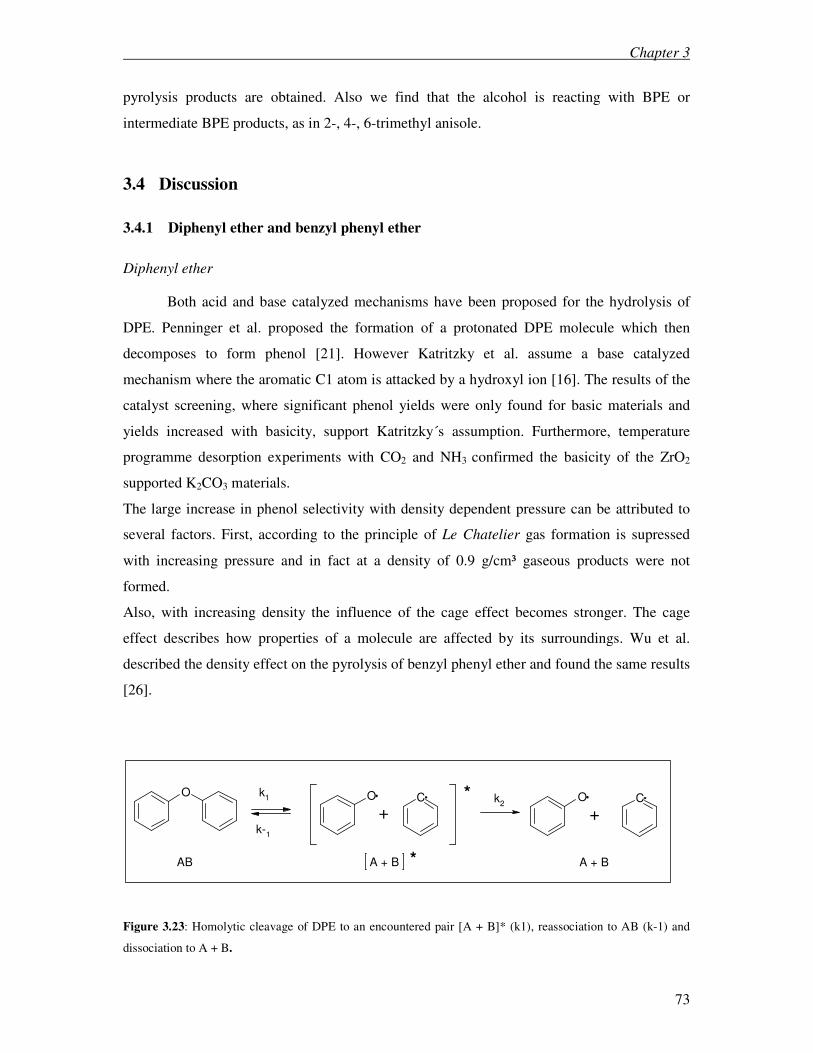
Chapter 3
73
pyrolysis products are obtained. Also we find that the alcohol is reacting with BPE or
intermediate BPE products, as in 2-, 4-, 6-trimethyl anisole.
3.4 Discussion
3.4.1 Diphenyl ether and benzyl phenyl ether
Diphenyl ether
Both acid and base catalyzed mechanisms have been proposed for the hydrolysis of
DPE. Penninger et al. proposed the formation of a protonated DPE molecule which then
decomposes to form phenol [21]. However Katritzky et al. assume a base catalyzed
mechanism where the aromatic C1 atom is attacked by a hydroxyl ion [16]. The results of the
catalyst screening, where significant phenol yields were only found for basic materials and
yields increased with basicity, support Katritzky´s assumption. Furthermore, temperature
programme desorption experiments with CO2 and NH3 confirmed the basicity of the ZrO2
supported K2CO3 materials.
The large increase in phenol selectivity with density dependent pressure can be attributed to
several factors. First, according to the principle of Le Chatelier gas formation is supressed
with increasing pressure and in fact at a density of 0.9 g/cm³ gaseous products were not
formed.
Also, with increasing density the influence of the cage effect becomes stronger. The cage
effect describes how properties of a molecule are affected by its surroundings. Wu et al.
described the density effect on the pyrolysis of benzyl phenyl ether and found the same results
[26].
O k1
k-1
O
C k
2O
C
+*
+
AB A + B * A + B
Figure 3.23: Homolytic cleavage of DPE to an encountered pair [A + B]* (k1), reassociation to AB (k-1) and
dissociation to A + B.
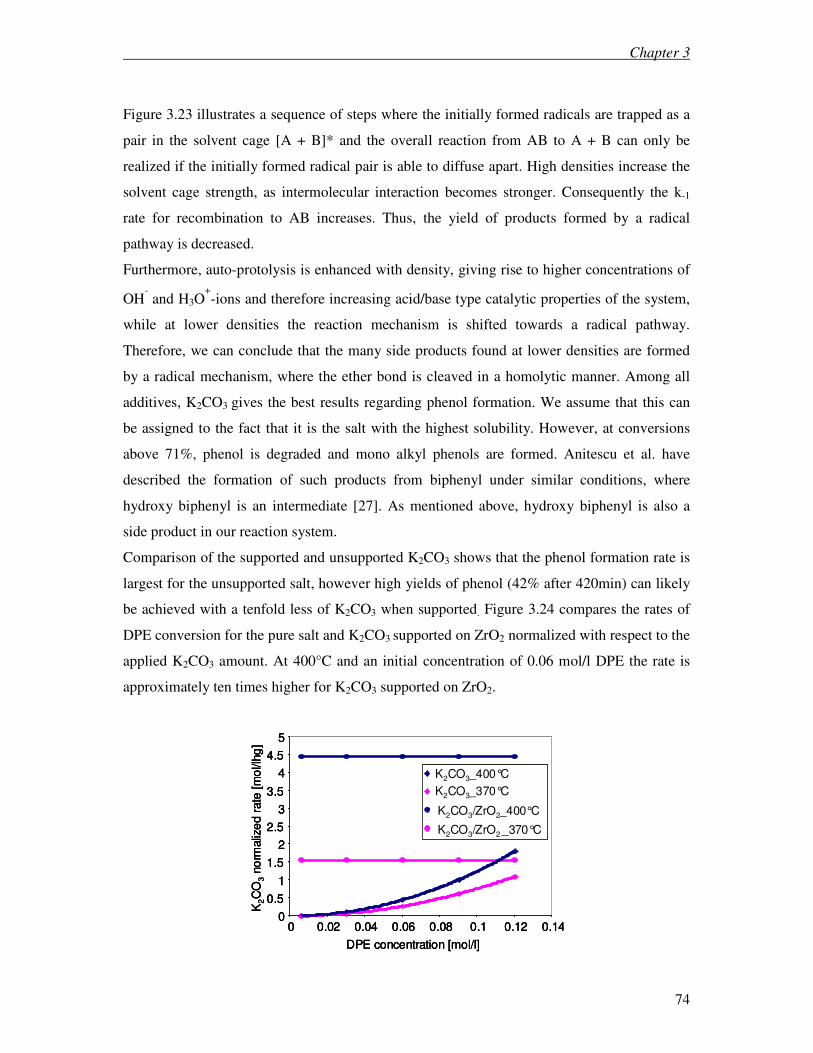
Chapter 3
74
Figure 3.23 illustrates a sequence of steps where the initially formed radicals are trapped as a
pair in the solvent cage [A + B]* and the overall reaction from AB to A + B can only be
realized if the initially formed radical pair is able to diffuse apart. High densities increase the
solvent cage strength, as intermolecular interaction becomes stronger. Consequently the k-1
rate for recombination to AB increases. Thus, the yield of products formed by a radical
pathway is decreased.
Furthermore, auto-protolysis is enhanced with density, giving rise to higher concentrations of
OH- and H3O
+-ions and therefore increasing acid/base type catalytic properties of the system,
while at lower densities the reaction mechanism is shifted towards a radical pathway.
Therefore, we can conclude that the many side products found at lower densities are formed
by a radical mechanism, where the ether bond is cleaved in a homolytic manner. Among all
additives, K2CO3 gives the best results regarding phenol formation. We assume that this can
be assigned to the fact that it is the salt with the highest solubility. However, at conversions
above 71%, phenol is degraded and mono alkyl phenols are formed. Anitescu et al. have
described the formation of such products from biphenyl under similar conditions, where
hydroxy biphenyl is an intermediate [27]. As mentioned above, hydroxy biphenyl is also a
side product in our reaction system.
Comparison of the supported and unsupported K2CO3 shows that the phenol formation rate is
largest for the unsupported salt, however high yields of phenol (42% after 420min) can likely
be achieved with a tenfold less of K2CO3 when supported. Figure 3.24 compares the rates of
DPE conversion for the pure salt and K2CO3 supported on ZrO2 normalized with respect to the
applied K2CO3 amount. At 400°C and an initial concentration of 0.06 mol/l DPE the rate is
approximately ten times higher for K2CO3 supported on ZrO2.
0
0.5
1
1.5
2
2.5
3
3.5
4
4.5
5
0 0.02 0.04 0.06 0.08 0.1 0.12 0.14
DPE concentration [mol/l]
K2C
O3
no
rmaliz
ed
rate
[m
ol/l
hg
]
K2CO3_400°C
K2CO3_370°C
K2CO3/ZrO2_400°C
K2CO3/ZrO2 _370°C
0
0.5
1
1.5
2
2.5
3
3.5
4
4.5
5
0 0.02 0.04 0.06 0.08 0.1 0.12 0.14
DPE concentration [mol/l]
K2C
O3
no
rmaliz
ed
rate
[m
ol/l
hg
]
0
0.5
1
1.5
2
2.5
3
3.5
4
4.5
5
0 0.02 0.04 0.06 0.08 0.1 0.12 0.14
DPE concentration [mol/l]
K2C
O3
no
rmaliz
ed
rate
[m
ol/l
hg
]
K2CO3_400°C
K2CO3_370°C
K2CO3/ZrO2_400°C
K2CO3/ZrO2 _370°C
K2CO3_400°C
K2CO3_370°C
K2CO3/ZrO2_400°C
K2CO3/ZrO2 _370°C
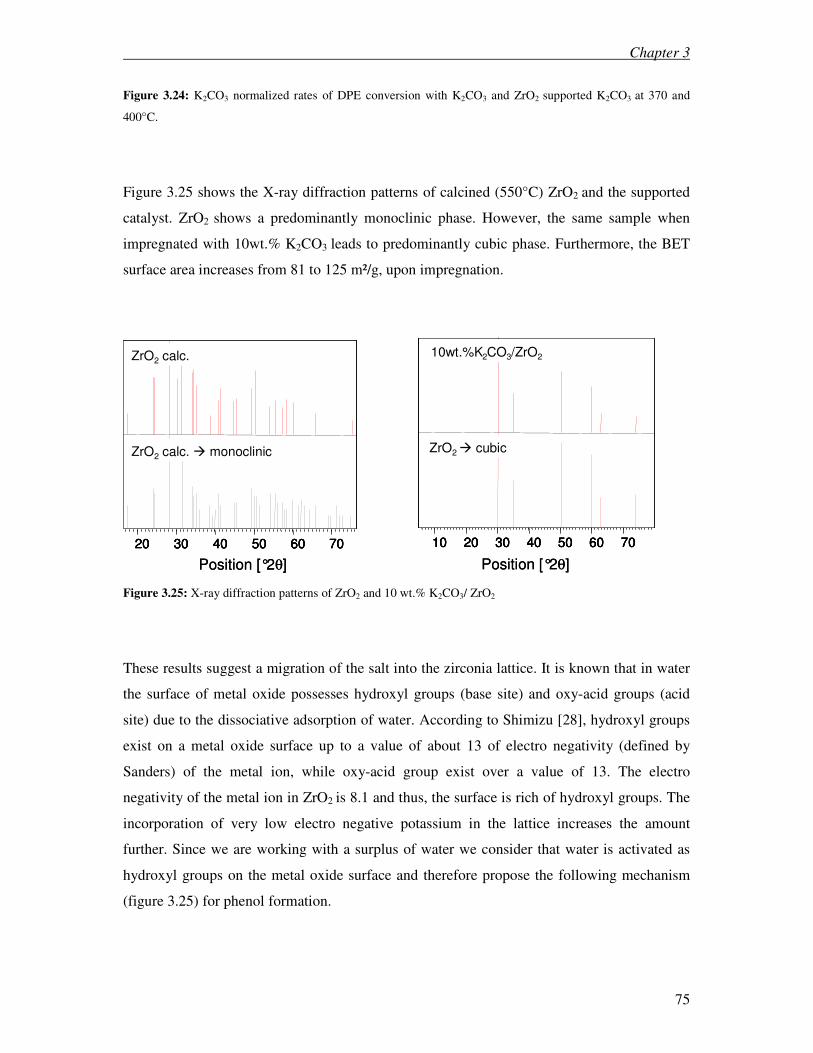
Chapter 3
75
Figure 3.24: K2CO3 normalized rates of DPE conversion with K2CO3 and ZrO2 supported K2CO3 at 370 and
400°C.
Figure 3.25 shows the X-ray diffraction patterns of calcined (550°C) ZrO2 and the supported
catalyst. ZrO2 shows a predominantly monoclinic phase. However, the same sample when
impregnated with 10wt.% K2CO3 leads to predominantly cubic phase. Furthermore, the BET
surface area increases from 81 to 125 m²/g, upon impregnation.
Position [°2θ]Position [°2θ]
20 30 40 50 60 70
ZrO2 calc.
ZrO2 calc. � monoklin
20 30 40 50 60 70
ZrO2 calc.
ZrO2 calc. � monoclinic
10 20 30 40 50 60 70
10wt%K2 CO3/ZrO2
ZrO2 � kubisch
10 20 30 40 50 60 70
10wt.%K 2CO3/ZrO2
ZrO2 � cubic
Position [°2θ]Position [°2θ]
20 30 40 50 60 70
ZrO2 calc.
ZrO2 calc. � monoklin
20 30 40 50 60 70
ZrO2 calc.
ZrO2 calc. � monoclinic
10 20 30 40 50 60 70
10wt%K2 CO3/ZrO2
ZrO2 � kubisch
10 20 30 40 50 60 70
10wt.%K 2CO3/ZrO2
ZrO2 � cubic
Figure 3.25: X-ray diffraction patterns of ZrO2 and 10 wt.% K2CO3/ ZrO2
These results suggest a migration of the salt into the zirconia lattice. It is known that in water
the surface of metal oxide possesses hydroxyl groups (base site) and oxy-acid groups (acid
site) due to the dissociative adsorption of water. According to Shimizu [28], hydroxyl groups
exist on a metal oxide surface up to a value of about 13 of electro negativity (defined by
Sanders) of the metal ion, while oxy-acid group exist over a value of 13. The electro
negativity of the metal ion in ZrO2 is 8.1 and thus, the surface is rich of hydroxyl groups. The
incorporation of very low electro negative potassium in the lattice increases the amount
further. Since we are working with a surplus of water we consider that water is activated as
hydroxyl groups on the metal oxide surface and therefore propose the following mechanism
(figure 3.25) for phenol formation.
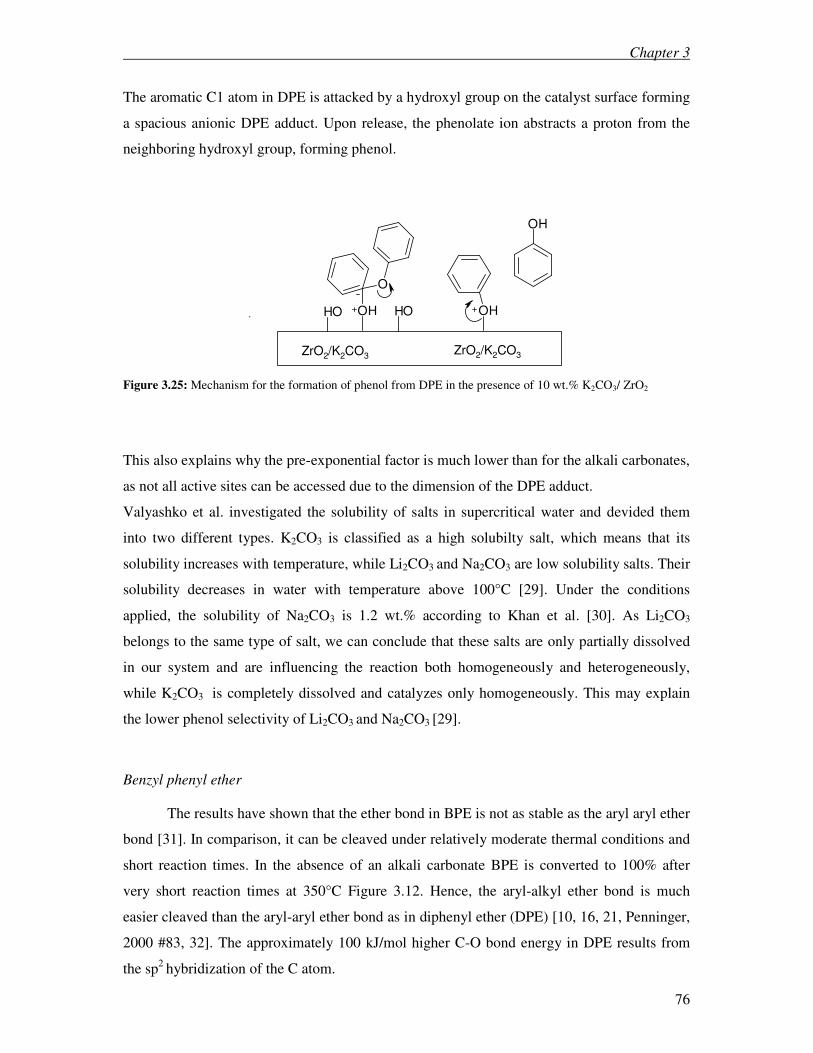
Chapter 3
76
The aromatic C1 atom in DPE is attacked by a hydroxyl group on the catalyst surface forming
a spacious anionic DPE adduct. Upon release, the phenolate ion abstracts a proton from the
neighboring hydroxyl group, forming phenol.
HO
OH
O
OHHO OH
ZrO2/K2CO3ZrO2/K2CO3
+
+ +
Figure 3.25: Mechanism for the formation of phenol from DPE in the presence of 10 wt.% K2CO3/ ZrO2
This also explains why the pre-exponential factor is much lower than for the alkali carbonates,
as not all active sites can be accessed due to the dimension of the DPE adduct.
Valyashko et al. investigated the solubility of salts in supercritical water and devided them
into two different types. K2CO3 is classified as a high solubilty salt, which means that its
solubility increases with temperature, while Li2CO3 and Na2CO3 are low solubility salts. Their
solubility decreases in water with temperature above 100°C [29]. Under the conditions
applied, the solubility of Na2CO3 is 1.2 wt.% according to Khan et al. [30]. As Li2CO3
belongs to the same type of salt, we can conclude that these salts are only partially dissolved
in our system and are influencing the reaction both homogeneously and heterogeneously,
while K2CO3 is completely dissolved and catalyzes only homogeneously. This may explain
the lower phenol selectivity of Li2CO3 and Na2CO3 [29].
Benzyl phenyl ether
The results have shown that the ether bond in BPE is not as stable as the aryl aryl ether
bond [31]. In comparison, it can be cleaved under relatively moderate thermal conditions and
short reaction times. In the absence of an alkali carbonate BPE is converted to 100% after
very short reaction times at 350°C Figure 3.12. Hence, the aryl-alkyl ether bond is much
easier cleaved than the aryl-aryl ether bond as in diphenyl ether (DPE) [10, 16, 21, Penninger,
2000 #83, 32]. The approximately 100 kJ/mol higher C-O bond energy in DPE results from
the sp2
hybridization of the C atom.
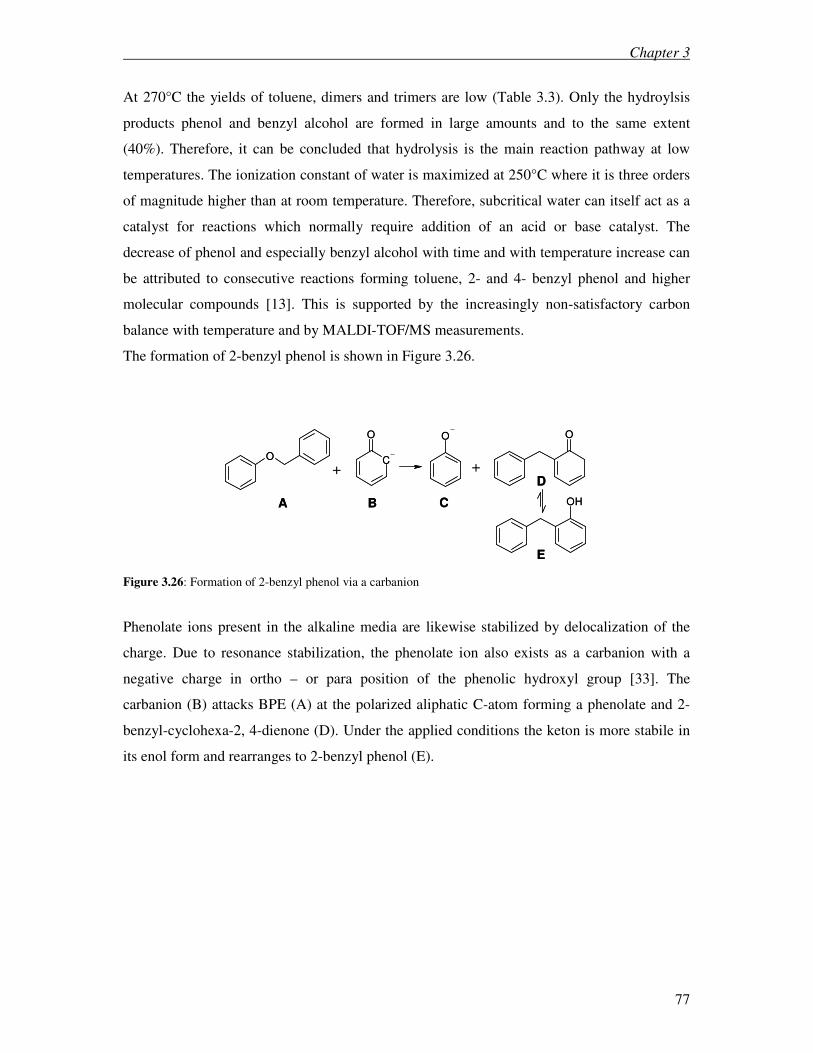
Chapter 3
77
At 270°C the yields of toluene, dimers and trimers are low (Table 3.3). Only the hydroylsis
products phenol and benzyl alcohol are formed in large amounts and to the same extent
(40%). Therefore, it can be concluded that hydrolysis is the main reaction pathway at low
temperatures. The ionization constant of water is maximized at 250°C where it is three orders
of magnitude higher than at room temperature. Therefore, subcritical water can itself act as a
catalyst for reactions which normally require addition of an acid or base catalyst. The
decrease of phenol and especially benzyl alcohol with time and with temperature increase can
be attributed to consecutive reactions forming toluene, 2- and 4- benzyl phenol and higher
molecular compounds [13]. This is supported by the increasingly non-satisfactory carbon
balance with temperature and by MALDI-TOF/MS measurements.
The formation of 2-benzyl phenol is shown in Figure 3.26.
O C
O O O
OH
+ +
A B C
D
E
O C
O O O
OH
+ +
A B C
D
E
Figure 3.26: Formation of 2-benzyl phenol via a carbanion
Phenolate ions present in the alkaline media are likewise stabilized by delocalization of the
charge. Due to resonance stabilization, the phenolate ion also exists as a carbanion with a
negative charge in ortho – or para position of the phenolic hydroxyl group [33]. The
carbanion (B) attacks BPE (A) at the polarized aliphatic C-atom forming a phenolate and 2-
benzyl-cyclohexa-2, 4-dienone (D). Under the applied conditions the keton is more stabile in
its enol form and rearranges to 2-benzyl phenol (E).
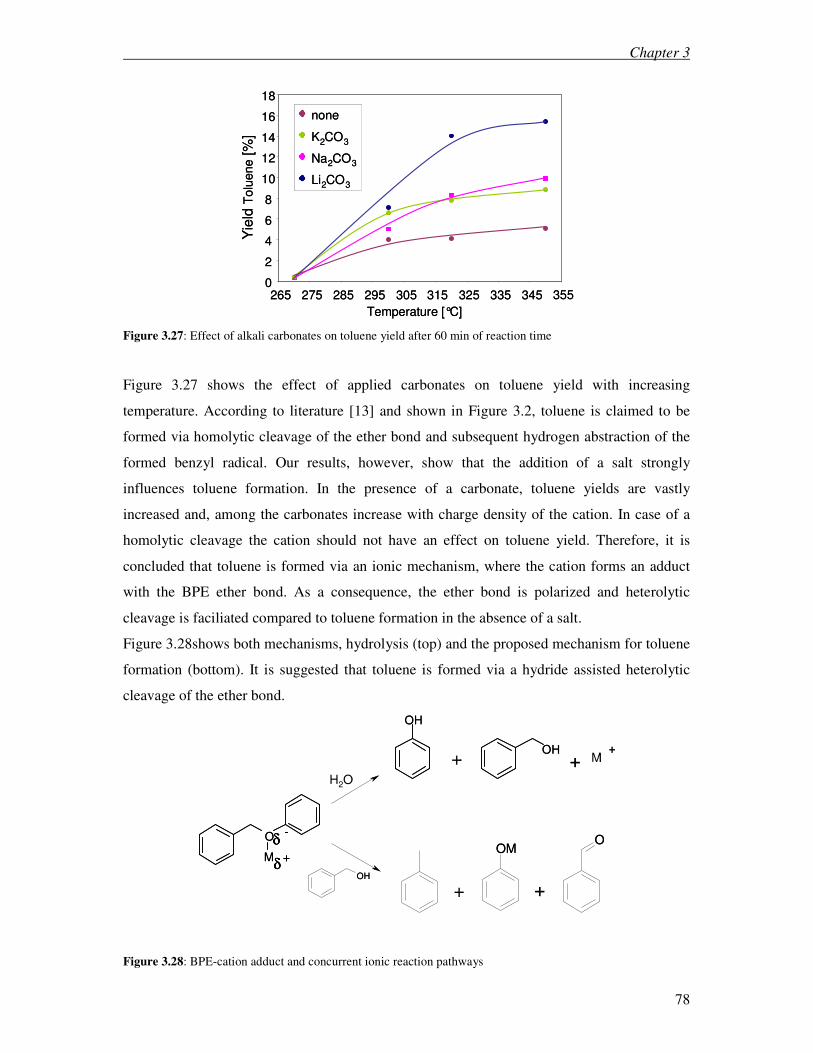
Chapter 3
78
0
2
4
6
8
10
12
14
16
18
265 275 285 295 305 315 325 335 345 355
Temperature [°C]
Yie
ld T
olu
ene
[%]
none
K2CO3
Na2CO3
Li2CO3
none
K2CO3
Na2CO3
Li2CO3
0
2
4
6
8
10
12
14
16
18
265 275 285 295 305 315 325 335 345 355
Temperature [°C]
Yie
ld T
olu
ene
[%]
none
K2CO3
Na2CO3
Li2CO3
none
K2CO3
Na2CO3
Li2CO3
none
K2CO3
Na2CO3
Li2CO3
none
K2CO3
Na2CO3
Li2CO3
Figure 3.27: Effect of alkali carbonates on toluene yield after 60 min of reaction time
Figure 3.27 shows the effect of applied carbonates on toluene yield with increasing
temperature. According to literature [13] and shown in Figure 3.2, toluene is claimed to be
formed via homolytic cleavage of the ether bond and subsequent hydrogen abstraction of the
formed benzyl radical. Our results, however, show that the addition of a salt strongly
influences toluene formation. In the presence of a carbonate, toluene yields are vastly
increased and, among the carbonates increase with charge density of the cation. In case of a
homolytic cleavage the cation should not have an effect on toluene yield. Therefore, it is
concluded that toluene is formed via an ionic mechanism, where the cation forms an adduct
with the BPE ether bond. As a consequence, the ether bond is polarized and heterolytic
cleavage is faciliated compared to toluene formation in the absence of a salt.
Figure 3.28shows both mechanisms, hydrolysis (top) and the proposed mechanism for toluene
formation (bottom). It is suggested that toluene is formed via a hydride assisted heterolytic
cleavage of the ether bond.
O
M
OH
OH
H2O
OM
M+ ++
+
M
δ+
δ-
+
O
OH
O
M
OH
OH
H2O
OM
M+ ++
+
M
δ+
δ+
δ-
δ-
+
O
OH
Figure 3.28: BPE-cation adduct and concurrent ionic reaction pathways
Chapter 3
79
The necessary hydride ions are provided by benzyl alcohol which is oxidized to
benzaldehyde. Benzaldehyde was not detected in our studies, but is known to be formed from
dibenzyl ether under hydrothermal conditions [12]. Small amounts of benzene detected,
indicate that benzaldehyde is decarbonylated and was therefore not detected.
The rsults show that, depending on the temperature, the presence of alkali carbonate has two
different effects on product distribution. As the experiments were conducted under subcritical
conditions we must account for a two phase like system with the following rate equation for
hydrolysis:
r = Α1k1[BPE]1 [H2O]1 + Α2k2[BPE]2 [H2O]2 (1)
where Α1 is the amount of the salt rich aqueous phase and Α2 the amount of the organic phase.
Obviously, hydrolysis takes place in the aqueous phase. Addition of a salt to the system
increases the polarity of the solvent, reducing solubility of BPE in the aqueous phase.
Consequently, phase separation is increased in the presence of a salt. [BPE]1 is diminished
and thus, the hydrolysis rate is strongly reduced, as seen in figure 7. Although [BPE]2 is
increased the reactant (water) availability in the organic phase is poor.
Torry et al. describe the same effect of salt addition on hydrolysis of dibenzyl ether and
benzyl phenyl amine [34].
The general increase in toluene yield in the presence of an alkali carbonate can be ascribed to
the same effect. The concentration [BPE]2 in the organic phase is increased, where hydrolysis
can not proceed. In this phase the salt is not dissolved and should not have an effect.
However, in the aqueous phase the salt enhances the reaction of the remaining BPE by
formation of an intermediate cationic BPE structures as in figure 11 and therewith weakens
the ether bond.
With increasing temperature hydrolysis rates with and without an alkali carbonate converge.
In the range of temperatures applied (270 – 370°C), the dielectric constant decreases almost
independently of the pressure. The declining influence of the added salts on the yield of
hydrolysis products with temperature can, therefore, be explained by their reduced solubility.
Khan et al. report that the solubility of sodium carbonate in subcritical water decreases from
approximately 10 to 1 wt.% when increasing the temperature from 320 to 370°C [12].

Chapter 3
80
3.4.2 Density effects on conversion and product distribution
According to Penninger et al. [21], the density ρw corresponding pressure p can be
calculated with equation 2:
p = cT·T·ρw (3.2),
where cT·[J·g-1·K-1] is the temperature dependent coefficient. The variation of the pressure
with the density at 400 °C is presented in Figure 3.29.
150
250
350
450
550
650
750
0.2 0.4 0.6 0.8 1
Density [g/cm³]
p [bar]
150
250
350
450
550
650
750
0.2 0.4 0.6 0.8 1
Density [g/cm³]
p [bar]
Figure 3.29: Density corresponding pressure for 400°C
The pressure changes from 220 bar (ρw = 0.3 g/cm³) to 660 bar (ρw = 0.9 g/cm³). As already
pointed out in chapter 1, pressure determines many properties of supercritical water. The ionic
product of water Kw is strongly dependant on density and temperature. The pKw of
supercritical water changes from 19.4 at 250 bar to about 10 at 600 bar. This has serious
effects on the reaction type. Therefore this property can be used for optimizing acid/base-
catalyzed reactions. At pKw values lower than 14, water is more suitable as a medium for
heterolytic reactions, whereas it is more suitable for homolytic reactions at pKw ≥ 14. The
transition from homolytic to heterolytic cleavage is not clearly defined; however the reults
clearly show a shift from a pyrolytic to an ionic reaction pathway with density. Another
enhancing effect on hydrolysis results from the increased dielectric constant at high pressures.
Hydrolysis proceeds through a transition state that is more polar than the reactants [14]. The
selectivity towards the hydrolysis products is therefore also increased with the water loading
as the correlating higher dielectric constant stabilizes the polar hydrolysis transition state over
the less polar reactants.
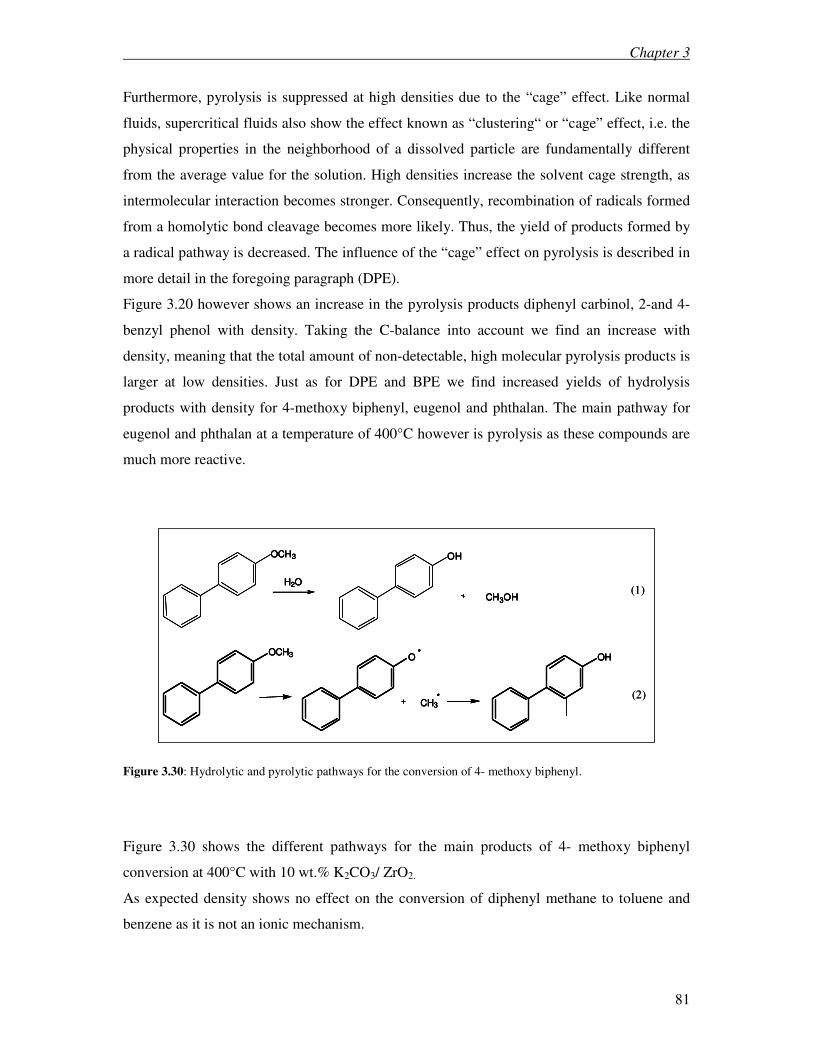
Chapter 3
81
Furthermore, pyrolysis is suppressed at high densities due to the “cage” effect. Like normal
fluids, supercritical fluids also show the effect known as “clustering“ or “cage” effect, i.e. the
physical properties in the neighborhood of a dissolved particle are fundamentally different
from the average value for the solution. High densities increase the solvent cage strength, as
intermolecular interaction becomes stronger. Consequently, recombination of radicals formed
from a homolytic bond cleavage becomes more likely. Thus, the yield of products formed by
a radical pathway is decreased. The influence of the “cage” effect on pyrolysis is described in
more detail in the foregoing paragraph (DPE).
Figure 3.20 however shows an increase in the pyrolysis products diphenyl carbinol, 2-and 4-
benzyl phenol with density. Taking the C-balance into account we find an increase with
density, meaning that the total amount of non-detectable, high molecular pyrolysis products is
larger at low densities. Just as for DPE and BPE we find increased yields of hydrolysis
products with density for 4-methoxy biphenyl, eugenol and phthalan. The main pathway for
eugenol and phthalan at a temperature of 400°C however is pyrolysis as these compounds are
much more reactive.
H2O
OH
CH3OH
OCH3
•
•OCH3 O
CH3
OH
(1)
(2)
H2O
OH
CH3OH
OCH3
•
•OCH3 O
CH3
OH
H2O
OH
CH3OH
OCH3
H2O
OH
CH3OH
OCH3
•
•OCH3 O
CH3
OH
•
•OCH3 O
CH3
OH
(1)
(2)
Figure 3.30: Hydrolytic and pyrolytic pathways for the conversion of 4- methoxy biphenyl.
Figure 3.30 shows the different pathways for the main products of 4- methoxy biphenyl
conversion at 400°C with 10 wt.% K2CO3/ ZrO2.
As expected density shows no effect on the conversion of diphenyl methane to toluene and
benzene as it is not an ionic mechanism.
Chapter 3
82
3.4.3 Alcoholysis versus hydrolysis
The results show that the application of alcohols and alcohol/water solutions as
solvents is unsuitable. Reason here fore are an inhibition of hydrolysis and an enhancement of
pyrolysis. In addition to this the product spectrum is further increased by reaction of the
alcohol with the probe molecules. It should also be noted that a large amount of the alcohol is
gasified. These results are in good agreement with literature. Yokoyama et al. came to the
same conclusion when investigating the thermolysis of BPE in sub- and supercritical water as
well as in sc-methanol [13]. They found that both pyrolysis and hydrolysis occurred in
subcritical and supercritical water, but only pyrolysis occurred in methanol. Miller et al.
studied hydrothermal conversion of BPE [35] in KOH/ethanol at 290°C for 1 hour. Major
products were phenol and ethoxy methyl benzene meaning that ethanol acts not only as a
solvent but also takes part in the reaction.
3.5 Conclusion
We have shown that for all probe molecules containing an ether bond both pyrolysis
and hydrolysis can take place under the applied conditions. By increasing the density it is
possible to enhance the hydrolytic pathway. In the case of the very stable aryl-aryl ether DPE,
an increase in density even enhances hydrolysis up to a phenol selectivity of 100%.
Furthermore, application of 3 wt.% lithium, potassium or sodium carbonate catalyzes DPE
conversion so that significant yields of phenol can be obtained already at 350°C. Phenol
yields are highest for K2CO3. However, when K2CO3 is supported on ZrO2 significant yields
of phenol and a phenol selectivity of 100% can be achieved with much smaller amounts of the
carbonate. We ascribe this to the increased amount of hydroxyl groups in the system, due to
the dissociative absorption of water on the metal oxide carrier. In contrast hereto alkali
carbonates have a totally different effect on BPE conversion in subcritical water. If hydrolysis
is the preferred reaction pathway, the reaction should be conducted in the absence of an alkali
carbonate. We ascribe this to the different properties of the solvent and thus different
solubilities of the salts at the applied conditions. The highest selectivity towards the
hydrolysis products is obtained for 320°C and a reaction time of 60 min. At higher
temperatures and residence times the yields of phenol and especially benzyl alcohol decrease
Chapter 3
83
and higher molecular compounds are formed. The application of alkali carbonates diminishes
BPE hydrolysis and accelerates catalytic cracking via a carbenium ion due to the increased
polarity of water and the formation of an intermediate metal-BPE adduct. The C-C bonds in
diphenyl methane and 4- methoxy biphenyl could not be cleaved at 400°C and in the presence
of 10wt.% K2CO3/ZrO2. We have also shown that the application of alcohols and
alcohol/water solutions as solvents is unsuitable, as hydrolysis is inhibited and pyrolysis
enhanced. In addition to this, the product spectrum is further increased by reaction of the
alcohol with the probe molecules.
As, the largest fraction of bonds in lignin are of the aryl-alkyl ether type, the BPE
investigations give us the most valuable results. We therefore conclude that the applied
temperatures for lignin conversion should not exceed 320°C. Above this temperature
hydrolysis products are degraded and form higher molecular pyrolysis products. In addition to
moderate temperatures high densities/pressures are advantageous for hydrolysis.
3.6 References
1. Freudenberg K., N.A.C., The Constitution and Biosynthesis of Lignins. 1968, New
York: Springer.
2. Nimz H., Angewandte Chemie, 1974, 86 336-44.
3. Glasser W.G., G.H.R., Paperi ja Puu, 1981, 63(2), 71-83.
4. Erikson M., M.G.E., ActaChem. Scand, 1973, 27 903.
5. Glasser, W.G. and Glasser, H.R., Paperi ja Puu, 1981, 63(2), 71-83.
6. Erickson, M.Larsson, S.Miksche, G.E., Acta Chem. Scand., 1973, 27 903.
7. Nimz, H., Angew. Chem., 1974, 86 336-44.
8. Afifi, The upgrading of lignin-derived compounds: case studies on model compounds,
in Research in termochemical biomass conversion. 1988, Elsevier Science: London,
New York. p. 439-51.
9. Nelson, Aqueous, alkaline liquefaction of wood fractions and lignin model
compounds, in Research in thermochemical biomass conversion. 1988, Elsevier
Science: London, New. 1988, Elsevier Science: London, New York.
10. Townsend, S.H.Abraham, M.A.Huppert, G.L.Klein, M.T.Paspek, S.C., Ind. Eng.
Chem. Res., 1988, 27 143.
11. Aoyama, M.Chen, C.L.Robert, D., Journal of the Chinese Chemical Society, 1991,
38(1), 77-85.
12. Gonzalez, G. and Montane, D., AIChE J., 2005, 51(3), 971-81.
13. Yokoyama, Journal of the Japan Petroleum Institute, 1998, 41 243-50.
14. Huppert, G.L.Wu, B.C.Townsend, S.H.Klein, M.T.Paspek, S.C., Ind. Eng. Chem.
Res., 1989, 28(2), 161-65.
15. Miller, J.E.Evans, L.R.Littlewolf, A.Lopez, M., SANdia National Laboratories,
SAND99-0318C, 1999.
Chapter 3
84
16. Katritzky, A.R.Barcock, R.A.Balasubramanian, M.Greenhill, J.V.Siskin, M.Olmstead,
W.N., Energy Fuels, 1994, 8(2), 487-97.
17. Siskin, M.Ferrughelli, D.T.Katritzky, A.R.Rabal, J., Energy Fuels, 1995, 9(2), 331-43.
18. Tagaya, H.Suzuki, Y.Komuro, N.Kadokawa, J., Chem. Lett., 1997, 47.
19. Tagaya, H.Suzuki, Y.Asou, T.Kadokawa, J.Chiba, K., Chem. Lett., 1998, 27(9), 937-
38.
20. Tagaya, H.Suzuki, Y.Komuro, N.Kadokawa, J., Journal of material cycles and waste
management, 2001, 3(1), 32-37.
21. Penninger, J.M.L.Kersten, R.J.A.Baur, H.C.L., Journal of Supercritical Fluids, 1999,
16(2), 119-32.
22. Marshall W. L., J. Phys. Chem. Ref. Data, 1981, 10 295.
23. Penninger, J.M.L.Kersten, R.J.A.Baur, H.C.L., Journal of Supercritical Fluids, 2000,
17(3), 215-26.
24. Varga, T.R.Fazekas, Z.Ikeda, Y.Tomiyasu, H., Journal of Supercritical Fluids, 2002,
23 163-67.
25. Shibasaki, Y.Kamimoro, T.Kadokawa, J.Hatano, B.Tagaya, H., Polym. Degrad. Stab.,
2004, 83 481-85.
26. Wu, B.C.Klein, M.T.Sandler, S.I., Energy Fuels, 1991, 5(3), 453-58.
27. Anitescu, G. and Tavlarides, L.L., Ind. Eng. Chem. Res., 2005, 44(5), 1226-32.
28. Shimizu K., Kodansha, Japan, 1978.
29. Valyashko, V.M., Pure & Appl. Chem., 1997, 69(11), 2271-80.
30. Khan, M.S. and Rogak, S.N., Journal of Supercritical Fluids, 2004, 30(3), 359-73.
31. Roberts, V. and Lercher, J., 2008.
32. Katritzky, A.R., Energy Fuels, 1997, 11(1), 174-82.
33. McDonough, T.J., Tappi J., 1993, 76(8), 186-93.
34. Torry, L.A.Kaminsky, R.Klein, M.T.Klotz, M.R., Journal of Supercritical Fluids,
1992, 5(3), 163-68.
35. Miller, J.E.Evans, L.R.Littlewolf, A.Trudell, D.E., Fuel, 1999, 78(11), 1363-66.
Chapter4
85
Chapter 4
Elaboration of an optimized work up
procedure for the BCD process
Abstract
Hydrothermal depolymerization of lignin yields a wide product spectrum. Products
consist not only of the monomeric lignin building blocks, but to a large extent of oligomers
and polymers. However, when the aim of lignin depolymerization is the production of
chemicals, a high monomeric content is desirable. A novel work up procedure for
hydrothermal lignin depolymerization is presented, which yields a product oil consisting
predominantly of monomers and dimers. The properties of the oil can be tailored by selective
extraction. A variety of solvents were investigated for this purpose and the results presented.
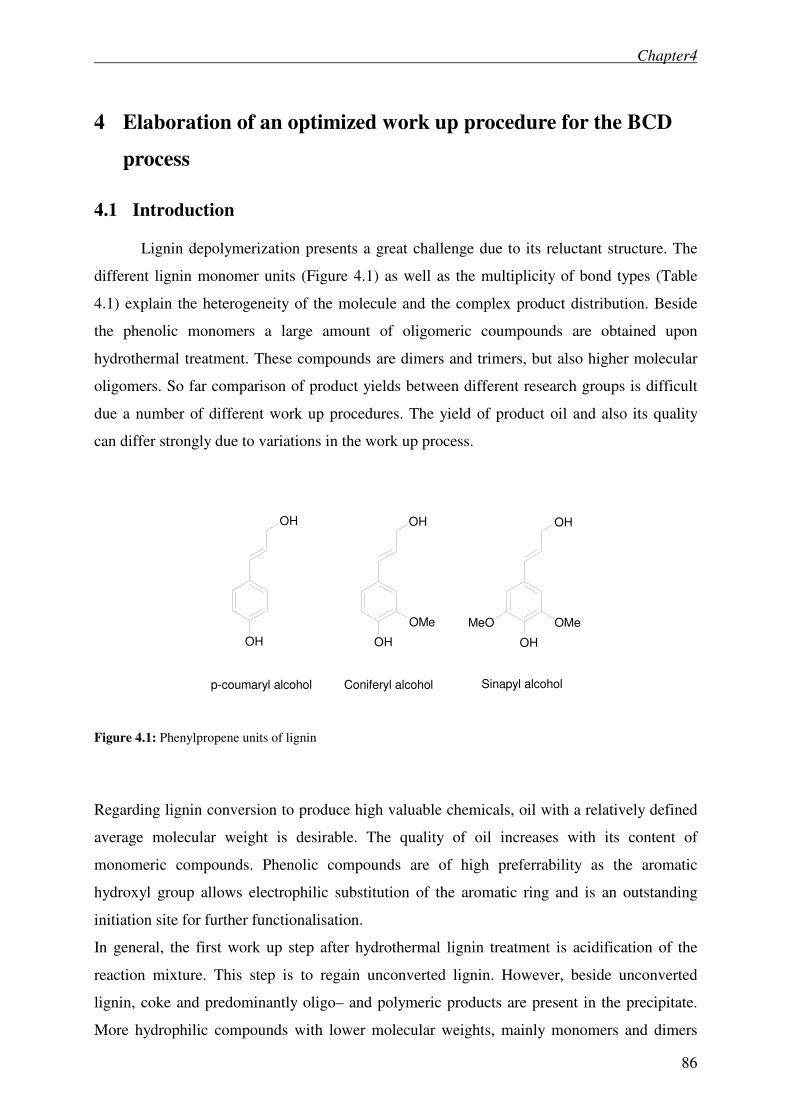
Chapter4
86
4 Elaboration of an optimized work up procedure for the BCD
process
4.1 Introduction
Lignin depolymerization presents a great challenge due to its reluctant structure. The
different lignin monomer units (Figure 4.1) as well as the multiplicity of bond types (Table
4.1) explain the heterogeneity of the molecule and the complex product distribution. Beside
the phenolic monomers a large amount of oligomeric coumpounds are obtained upon
hydrothermal treatment. These compounds are dimers and trimers, but also higher molecular
oligomers. So far comparison of product yields between different research groups is difficult
due a number of different work up procedures. The yield of product oil and also its quality
can differ strongly due to variations in the work up process.
OH
OH
OH
OH
OMe
OH
OH
OMeMeO
p-coumaryl alcohol Coniferyl alcohol Sinapyl alcohol
Figure 4.1: Phenylpropene units of lignin
Regarding lignin conversion to produce high valuable chemicals, oil with a relatively defined
average molecular weight is desirable. The quality of oil increases with its content of
monomeric compounds. Phenolic compounds are of high preferrability as the aromatic
hydroxyl group allows electrophilic substitution of the aromatic ring and is an outstanding
initiation site for further functionalisation.
In general, the first work up step after hydrothermal lignin treatment is acidification of the
reaction mixture. This step is to regain unconverted lignin. However, beside unconverted
lignin, coke and predominantly oligo– and polymeric products are present in the precipitate.
More hydrophilic compounds with lower molecular weights, mainly monomers and dimers
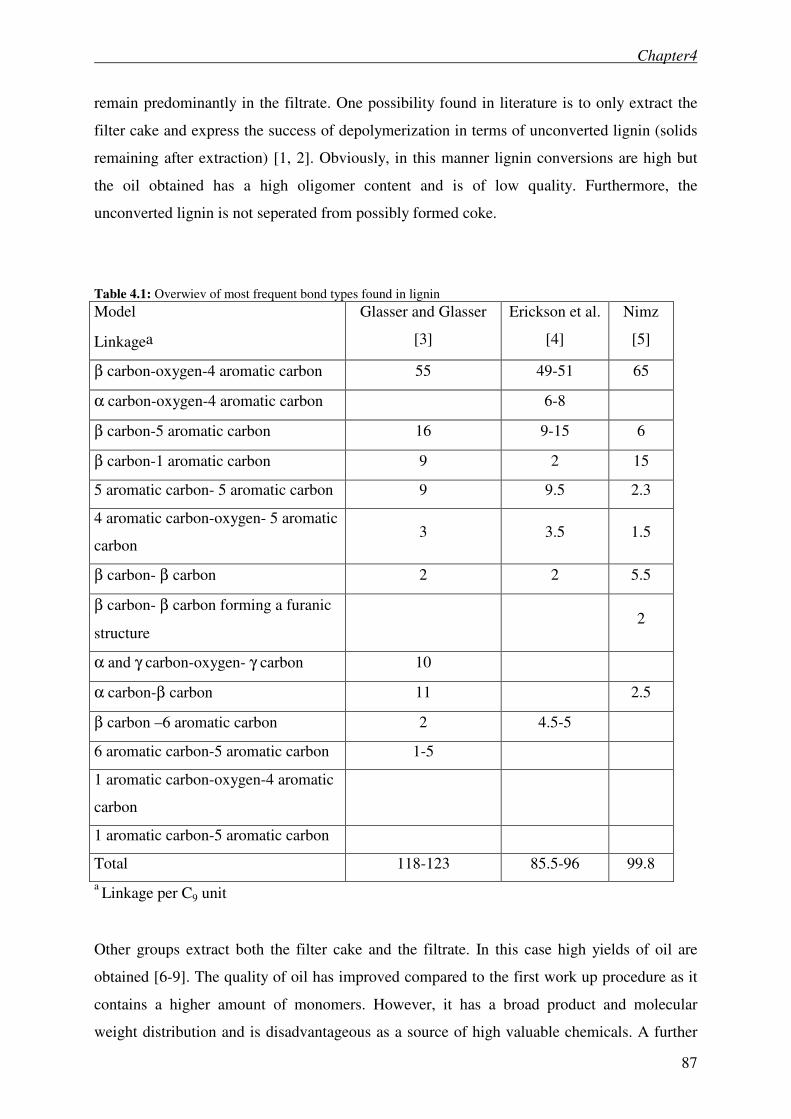
Chapter4
87
remain predominantly in the filtrate. One possibility found in literature is to only extract the
filter cake and express the success of depolymerization in terms of unconverted lignin (solids
remaining after extraction) [1, 2]. Obviously, in this manner lignin conversions are high but
the oil obtained has a high oligomer content and is of low quality. Furthermore, the
unconverted lignin is not seperated from possibly formed coke.
Table 4.1: Overwiev of most frequent bond types found in lignin
Model
Linkagea
Glasser and Glasser
[3]
Erickson et al.
[4]
Nimz
[5]
β carbon-oxygen-4 aromatic carbon 55 49-51 65
α carbon-oxygen-4 aromatic carbon 6-8
β carbon-5 aromatic carbon 16 9-15 6
β carbon-1 aromatic carbon 9 2 15
5 aromatic carbon- 5 aromatic carbon 9 9.5 2.3
4 aromatic carbon-oxygen- 5 aromatic
carbon 3 3.5 1.5
β carbon- β carbon 2 2 5.5
β carbon- β carbon forming a furanic
structure 2
α and γ carbon-oxygen- γ carbon 10
α carbon-β carbon 11 2.5
β carbon –6 aromatic carbon 2 4.5-5
6 aromatic carbon-5 aromatic carbon 1-5
1 aromatic carbon-oxygen-4 aromatic
carbon
1 aromatic carbon-5 aromatic carbon
Total 118-123 85.5-96 99.8
a Linkage per C9 unit
Other groups extract both the filter cake and the filtrate. In this case high yields of oil are
obtained [6-9]. The quality of oil has improved compared to the first work up procedure as it
contains a higher amount of monomers. However, it has a broad product and molecular
weight distribution and is disadvantageous as a source of high valuable chemicals. A further
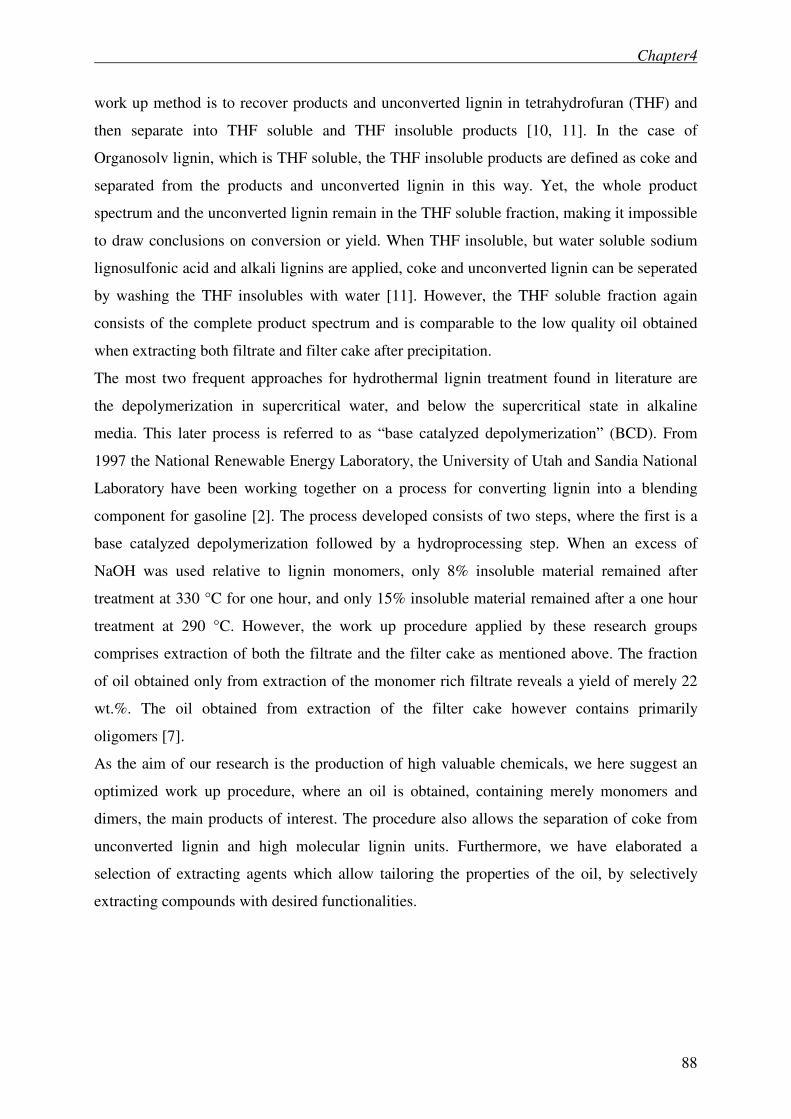
Chapter4
88
work up method is to recover products and unconverted lignin in tetrahydrofuran (THF) and
then separate into THF soluble and THF insoluble products [10, 11]. In the case of
Organosolv lignin, which is THF soluble, the THF insoluble products are defined as coke and
separated from the products and unconverted lignin in this way. Yet, the whole product
spectrum and the unconverted lignin remain in the THF soluble fraction, making it impossible
to draw conclusions on conversion or yield. When THF insoluble, but water soluble sodium
lignosulfonic acid and alkali lignins are applied, coke and unconverted lignin can be seperated
by washing the THF insolubles with water [11]. However, the THF soluble fraction again
consists of the complete product spectrum and is comparable to the low quality oil obtained
when extracting both filtrate and filter cake after precipitation.
The most two frequent approaches for hydrothermal lignin treatment found in literature are
the depolymerization in supercritical water, and below the supercritical state in alkaline
media. This later process is referred to as “base catalyzed depolymerization” (BCD). From
1997 the National Renewable Energy Laboratory, the University of Utah and Sandia National
Laboratory have been working together on a process for converting lignin into a blending
component for gasoline [2]. The process developed consists of two steps, where the first is a
base catalyzed depolymerization followed by a hydroprocessing step. When an excess of
NaOH was used relative to lignin monomers, only 8% insoluble material remained after
treatment at 330 °C for one hour, and only 15% insoluble material remained after a one hour
treatment at 290 °C. However, the work up procedure applied by these research groups
comprises extraction of both the filtrate and the filter cake as mentioned above. The fraction
of oil obtained only from extraction of the monomer rich filtrate reveals a yield of merely 22
wt.%. The oil obtained from extraction of the filter cake however contains primarily
oligomers [7].
As the aim of our research is the production of high valuable chemicals, we here suggest an
optimized work up procedure, where an oil is obtained, containing merely monomers and
dimers, the main products of interest. The procedure also allows the separation of coke from
unconverted lignin and high molecular lignin units. Furthermore, we have elaborated a
selection of extracting agents which allow tailoring the properties of the oil, by selectively
extracting compounds with desired functionalities.
Chapter4
89
4.2 Experimental
The experiments were carried out discontinuously in stainless steel tube autoclaves at
300°C and a reaction time of 40 min. Organosolv lignin was purchased from Sigma Aldrich.
The autoclaves were filled with 5 mL of a 10 wt.% lignin/ 4 wt.% NaOH aqueous solution.
The reactors were set in a preheated alumina block which was tumbled to ensure thorough
mixing. After the reation, the autoclaves were quenched to room temperature with water. The
reactor contents and water washings were combined.
The continuous experiments (conducted by the ICT Karlsruhe) were carried out in a pilot
plant with a maximum temperature of 400°C and a maximum pressure of 300 bar. Figure 4.2
shows the flow diagram of the pilot plant. Two types of organosolv lignin were used; a
purchased one from Sigma Adlrich and a self manufactured one. The continuous experiments
were all conducted with a concentration of 2.5 wt.% lignin in 0.5 wt.% NaOH at 250 bar. The
reaction times varied between 30 seconds and 15 minutes and reaction temperatures between
250°C and 350°C were applied.
Figure 4.2: Flow scheme of the continuous working setup
The work up procedure of all experiments was the same, and is described in the following.
The monomeric reaction products were identified by GC/MS and quantified by GC/FID-
analysis using a “Shimadzu” GCMS – QP 20105 gas chromatograph-mass spectrometer
(column: HP 5 crosslinked 5 % PhME Siloxane). For this purpose the oil was dissolved in
ethyl acetate, transfered into a 50 ml calibrated metering flask and leveled with further ethyl
acetate. The concentration of the main monomeric products was determined by calibrating the
P T
T
P T T T
react
cool
rupture
water
preheat
pulsation attenuator
syringe
mixing
Water exhaust air
pressure relief
exhaust air
Lignin- Suspension
preheater
T
Phenolics
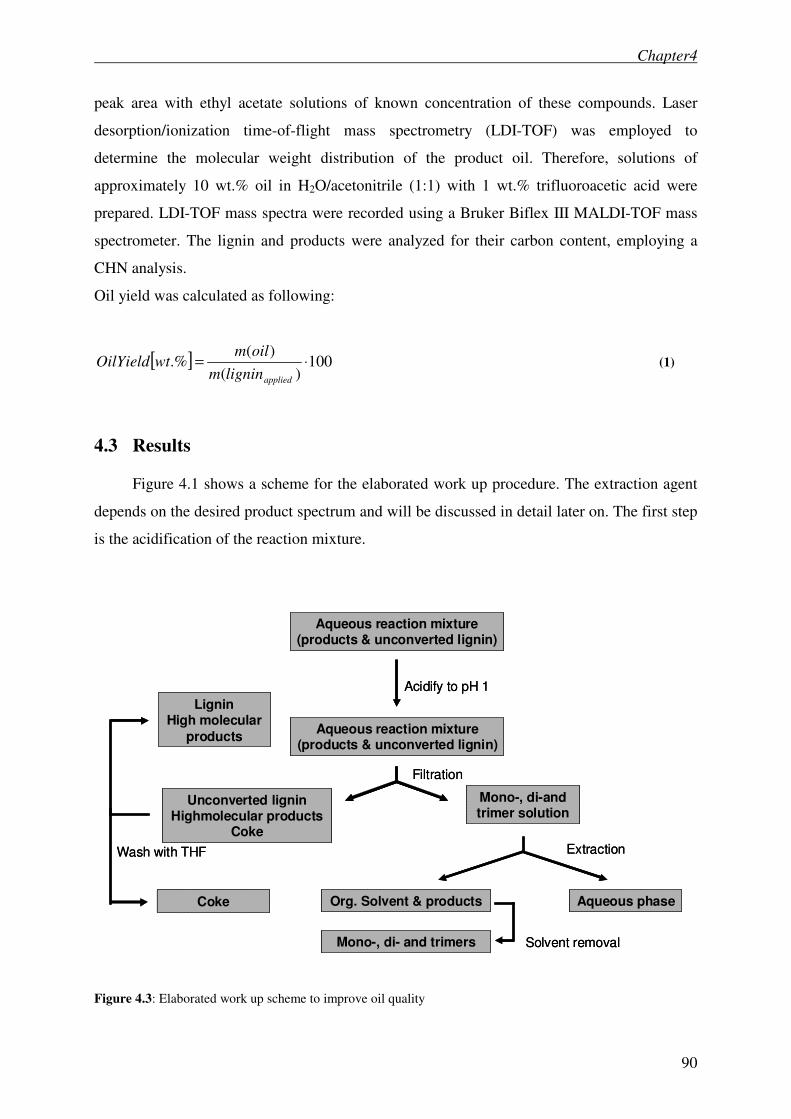
Chapter4
90
peak area with ethyl acetate solutions of known concentration of these compounds. Laser
desorption/ionization time-of-flight mass spectrometry (LDI-TOF) was employed to
determine the molecular weight distribution of the product oil. Therefore, solutions of
approximately 10 wt.% oil in H2O/acetonitrile (1:1) with 1 wt.% trifluoroacetic acid were
prepared. LDI-TOF mass spectra were recorded using a Bruker Biflex III MALDI-TOF mass
spectrometer. The lignin and products were analyzed for their carbon content, employing a
CHN analysis.
Oil yield was calculated as following:
[ ] 100)(
)(.% ⋅=
appliedligninm
oilmwtOilYield (1)
4.3 Results
Figure 4.1 shows a scheme for the elaborated work up procedure. The extraction agent
depends on the desired product spectrum and will be discussed in detail later on. The first step
is the acidification of the reaction mixture.
Aqueous reaction mixture(products & unconverted lignin)
Acidify to pH 1
Aqueous reaction mixture(products & unconverted lignin)
Filtration
Unconverted ligninHighmolecular products
Coke
LigninHigh molecular
products
Coke
Mono-, di-and trimer solution
Extraction
Org. Solvent & products Aqueous phase
Mono-, di- and trimers Solvent removal
Wash with THF
Aqueous reaction mixture(products & unconverted lignin)
Acidify to pH 1
Aqueous reaction mixture(products & unconverted lignin)
Filtration
Unconverted ligninHighmolecular products
Coke
LigninHigh molecular
products
Coke
Mono-, di-and trimer solution
Extraction
Org. Solvent & products Aqueous phase
Mono-, di- and trimers Solvent removal
Wash with THF
Figure 4.3: Elaborated work up scheme to improve oil quality
Chapter4
91
However, if a heterogeneous catalyst was applied during the reaction, it should first be
removed by filtration of the aqueous reaction mixture. Then the mixture is acidified with HCl
to a pH value of 1. This results in the precipitation of unconverted lignin and high molecular
lignin cleavage units. The unconverted lignin would also precipitate at higher pH values,
however Table 4.2 shows that an increasing amount of oil is extracted with decreasing pH. To
determine the extent of extracted products depending on the pH value, the reaction mixture
was repeatingly extracted with decreasing pH.
Table 4.2 shows that at a pH of 5 only 76 wt.% of the total oil was extracted. When increasing
acidity to lower pH values and extracting the reaction mixture the oil yield increased. A
maximum oil yield was obtained at a pH value of 1.
Table 4.2: Influence of pH on the extent of oil extraction
Temperature
[°C]
Pressure
[bar]
Residence time
[sec]
Reaction mixture
[wt.%] pH
Weight oil
[g]
Oil yield
[wt.%]
350 250 600 2.5% Lignin
0.5% NaOH
5
3
1
2.91
0.77
0.15
16.3
4.3
0.8
After adjustment of the pH, the solids were removed from the suspension by filtration, dried
and weighed. The unconverted lignin as well as the precipitated oligomers were retrieved
from the filter cake by washing with THF, while possibly formed coke remained behind. The
acidic filtrate was then repeatedly extracted with an organic solvent to obtain the lignin
cleavage products. The choice of extraction solvent depends on the future application and,
therefore, on the desired properties of the oil. Table 4.4 compares the monomeric compounds
obtained from extraction with the following agents: Ethyl acetate (EA), methylene chlorid,
methyl isobutyl ketone (MIBK) and toluene. We see that the applied extracting agent has a
strong effect on the total content of monomers in the oil. Furthermore, the nature of the
extracted monomers can be selected, depending on the choice of extracting agent. The term
unknown compounds refers to products with a boiling point too high to be analyzed via GC
and are assumed to be di-and trimers. The monomers are classified into groups depending on
their functionalities and the corresponding yields are summarized in the following table.
Extracting with toluene, an oil was obtained with only a small amount of oligomers (33.4 %).
The majority (88 %) of monomers are mono – and dimethoxy phenols (guaiacol, syringol and
their derivatives). The affinity of toluene towards catecholic compounds is very low (2.4 %).
Chapter4
92
The same trend is observed for methylen chloride, yet to a smaller extent. Ethyl acetate and
methyl isobutyl ketone likewise show very similar extraction behaviors among each other. In
contrast to methylen chloride and toluene, these solvents show a high affinity towards
catecholic compounds (16.8 and 14.9 % respectively), while only 23.6 and 20 % of mono and
dimethoxy phenolic compounds are extracted.
After extraction the solvent is removed with a rotor vapour to obtain the product oil.
Unconverted lignin can be regained by washing the filter cake with tetrahydrofuran. Lignin is
dissolved during this procedure while coke is insoluble and can be removed by filtration.
Apart from the oil, other lignin derived products are found in the aqueous phase containing
hydrophilic compounds (ethanol, methanol and heavier hydrophilic aromatics) that were not
extracted during the separation procedure.
Methanol is formed from hydrolysis of the methoxy groups on the aromatic rings, forming
methanol and o-hydroxy phenolic compounds, while ethanol is likely to originate from the
partially hydroxyl substituted alkyl side chains. An indication here for, is that only traces of
alkylated monomers were detected in our studies.
Gas and coke are also formed from lignin, but solely above 320°C. A small amount of product
is lost during the work up procedure in the form of a gas, which is liberated upon acidification
of the reaction mixture.
Table 4.3: Mass balance over products obtained from 10 wt.% lignin and 4 wt.%NaOH at 300°C
Products Yield [wt.%]
Unconverted lignin 80.2
Oil 11.5
Products in water phase 7.7
Total 99.4
The gas was verified as CO2 by passing it into a Ba(OH)2 solution and forming barium
carbonate. CO2 is dissolved in the reaction solution or present as sodium carbonate, which is
liberated upon acidification [12, 13]. The low amount of CO2 liberation observed upon
acidification of the product mixture is in agreement with the satisfactory mass balance and
shows that the amount is negligible.
Yields presented in the table are based on weight percent. CHN analysis of the lignin before
and after treatment yielded 65.7 and 70.9 wt.% carbon, respectively. Thus, lignin undergoes a
structural modification during the reaction. The carbon content of the oil obtained by
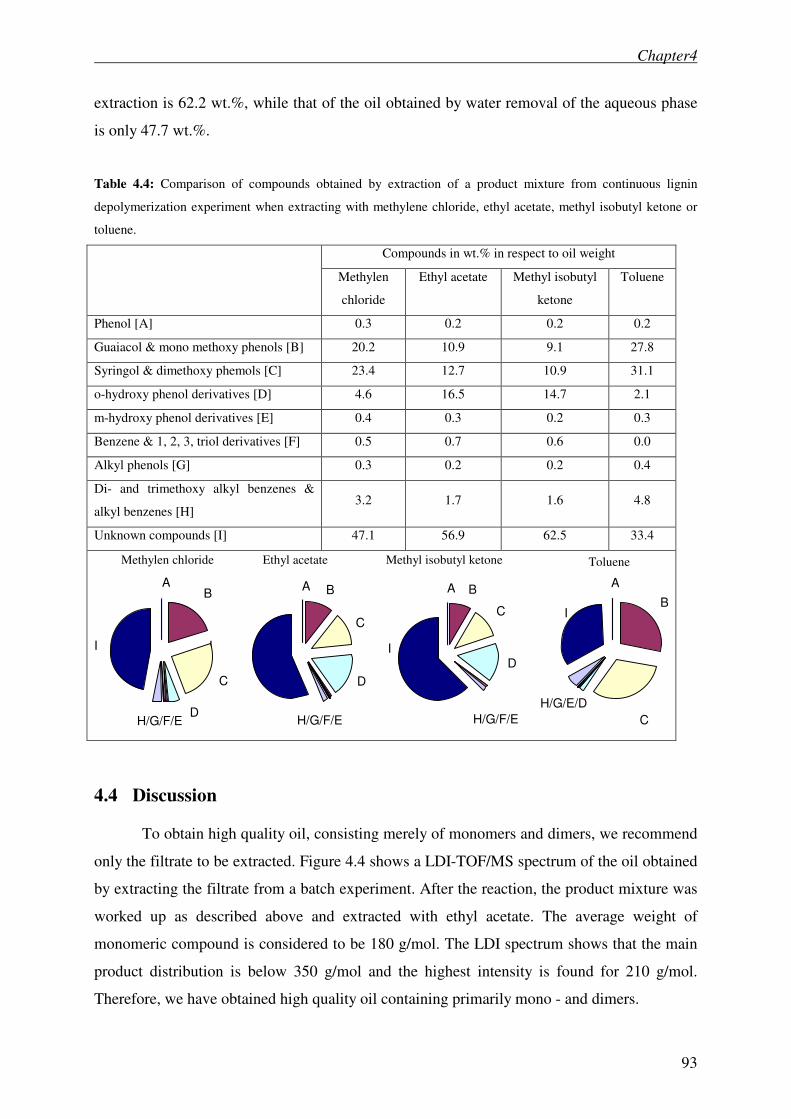
Chapter4
93
extraction is 62.2 wt.%, while that of the oil obtained by water removal of the aqueous phase
is only 47.7 wt.%.
Table 4.4: Comparison of compounds obtained by extraction of a product mixture from continuous lignin
depolymerization experiment when extracting with methylene chloride, ethyl acetate, methyl isobutyl ketone or
toluene.
Compounds in wt.% in respect to oil weight
Methylen
chloride
Ethyl acetate Methyl isobutyl
ketone
Toluene
Phenol [A] 0.3 0.2 0.2 0.2
Guaiacol & mono methoxy phenols [B] 20.2 10.9 9.1 27.8
Syringol & dimethoxy phemols [C] 23.4 12.7 10.9 31.1
o-hydroxy phenol derivatives [D] 4.6 16.5 14.7 2.1
m-hydroxy phenol derivatives [E] 0.4 0.3 0.2 0.3
Benzene & 1, 2, 3, triol derivatives [F] 0.5 0.7 0.6 0.0
Alkyl phenols [G] 0.3 0.2 0.2 0.4
Di- and trimethoxy alkyl benzenes &
alkyl benzenes [H] 3.2 1.7 1.6 4.8
Unknown compounds [I] 47.1 56.9 62.5 33.4
4.4 Discussion
To obtain high quality oil, consisting merely of monomers and dimers, we recommend
only the filtrate to be extracted. Figure 4.4 shows a LDI-TOF/MS spectrum of the oil obtained
by extracting the filtrate from a batch experiment. After the reaction, the product mixture was
worked up as described above and extracted with ethyl acetate. The average weight of
monomeric compound is considered to be 180 g/mol. The LDI spectrum shows that the main
product distribution is below 350 g/mol and the highest intensity is found for 210 g/mol.
Therefore, we have obtained high quality oil containing primarily mono - and dimers.
Methyl isobutyl ketone Ethyl acetate Methylen chloride
A B
C
D I
H/G/F/E
A B
C
D
H/G/F/E
I
AB
C
I
D H/G/F/E
A
B
C
I
H/G/E/D
Toluene
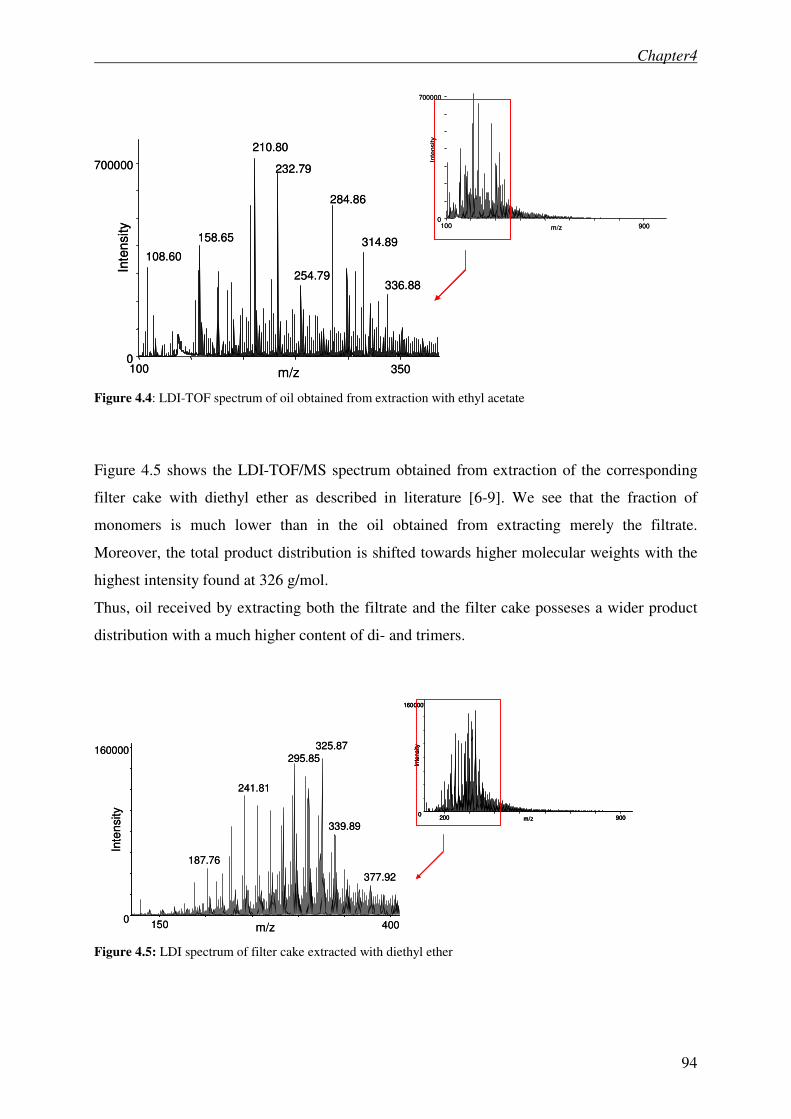
Chapter4
94
m/z100 350
Inte
nsity
700000
0
210.80
336.88
284.86
158.65
108.60
232.79
314.89
254.79
m/z100 900
Inte
nsity
700000
0
m/z100 350
Inte
nsity
700000
0
210.80
336.88
284.86
158.65
108.60
232.79
314.89
254.79
m/z100 900
Inte
nsity
700000
0
Figure 4.4: LDI-TOF spectrum of oil obtained from extraction with ethyl acetate
Figure 4.5 shows the LDI-TOF/MS spectrum obtained from extraction of the corresponding
filter cake with diethyl ether as described in literature [6-9]. We see that the fraction of
monomers is much lower than in the oil obtained from extracting merely the filtrate.
Moreover, the total product distribution is shifted towards higher molecular weights with the
highest intensity found at 326 g/mol.
Thus, oil received by extracting both the filtrate and the filter cake posseses a wider product
distribution with a much higher content of di- and trimers.
m/z150 400
Inte
nsity
160000
0
325.87
339.89
377.92
187.76
241.81
295.85
m/z200 900
Inte
nsity
160000
0
m/z150 400
Inte
nsity
160000
0
325.87
339.89
377.92
187.76
241.81
295.85
m/z200 900
Inte
nsity
160000
0m/z200 900
Inte
nsity
160000
0
Figure 4.5: LDI spectrum of filter cake extracted with diethyl ether
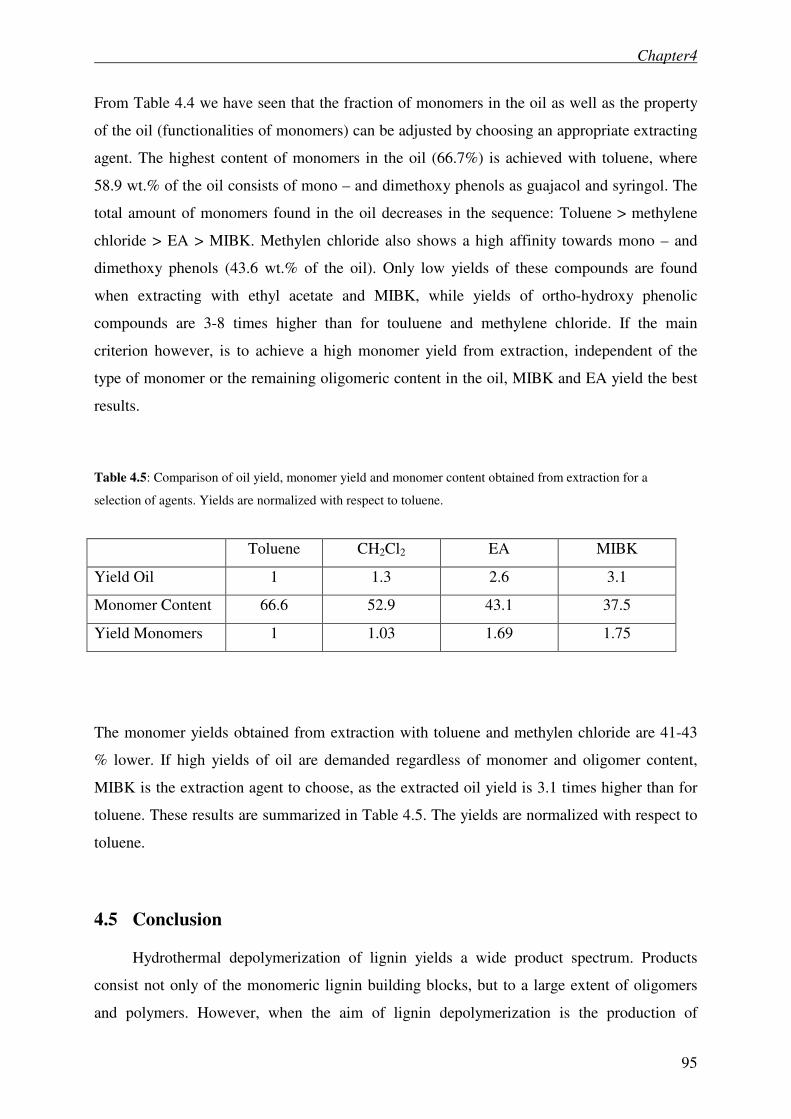
Chapter4
95
From Table 4.4 we have seen that the fraction of monomers in the oil as well as the property
of the oil (functionalities of monomers) can be adjusted by choosing an appropriate extracting
agent. The highest content of monomers in the oil (66.7%) is achieved with toluene, where
58.9 wt.% of the oil consists of mono – and dimethoxy phenols as guajacol and syringol. The
total amount of monomers found in the oil decreases in the sequence: Toluene > methylene
chloride > EA > MIBK. Methylen chloride also shows a high affinity towards mono – and
dimethoxy phenols (43.6 wt.% of the oil). Only low yields of these compounds are found
when extracting with ethyl acetate and MIBK, while yields of ortho-hydroxy phenolic
compounds are 3-8 times higher than for touluene and methylene chloride. If the main
criterion however, is to achieve a high monomer yield from extraction, independent of the
type of monomer or the remaining oligomeric content in the oil, MIBK and EA yield the best
results.
Table 4.5: Comparison of oil yield, monomer yield and monomer content obtained from extraction for a
selection of agents. Yields are normalized with respect to toluene.
Toluene CH2Cl2 EA MIBK
Yield Oil 1 1.3 2.6 3.1
Monomer Content 66.6 52.9 43.1 37.5
Yield Monomers 1 1.03 1.69 1.75
The monomer yields obtained from extraction with toluene and methylen chloride are 41-43
% lower. If high yields of oil are demanded regardless of monomer and oligomer content,
MIBK is the extraction agent to choose, as the extracted oil yield is 3.1 times higher than for
toluene. These results are summarized in Table 4.5. The yields are normalized with respect to
toluene.
4.5 Conclusion
Hydrothermal depolymerization of lignin yields a wide product spectrum. Products
consist not only of the monomeric lignin building blocks, but to a large extent of oligomers
and polymers. However, when the aim of lignin depolymerization is the production of
Chapter4
96
chemicals a high monomeric content is desirable. The elaborated work up procedure
presented here, allows separation of monomers and oligomers from unconverted lignin and
polymeric products by acidification of the reaction mixture in the first process step. A
maximum amount of products is extracted if the product solution is acidified to a pH of 1.
It was shown that following this procedure a product oil is obtained consisiting mainly of
monomers and dimers, which is of great interest for chemical production. Further, by washing
the filter cake with THF, unconverted lignin can be separated from coke and regained.
A selection of extracting agents was elaborated, which allow either maximizing oil yield or
monomer yield, and tailoring the properties of the oil, by selectively extracting compounds
with desired functionalities.
4.6 References
1. Miller, J.E.Evans, L.R.Littlewolf, A.Trudell, D.E., Fuel, 1999, 78(11), 1363-66.
2. Miller, J.E.Evans, L.R.Mudd, J.Brown, K., Sandia National Laboratories, SAND2002-
1318, 2002.
3. Glasser, W.G. and Glasser, H.R., Paperi ja Puu, 1981, 63(2), 71-83.
4. Erickson, M.Larsson, S.Miksche, G.E., Acta Chem. Scand., 1973, 27 903.
5. Nimz, H., Angew. Chem., 1974, 86 336-44.
6. Shabtai, J.S.Zmierczak, W.W.Chornet, E., US5,959,167, 1999.
7. Wooley, R., Biofuels Programm Semiannual Report, National Renewable Energy
Laboratory: Golden, Colorado, 2000.
8. Shabtai, J.S.Zmierczak, W.W.Chornet, E., US2001/6172272 B1, 2001.
9. Shabtai, J.S.Zmierczak, W.W.Chornet, E.Johnson, D., US2003/0100807 A1, 2003, 1-
19.
10. Okuda, K.Ohara, S.Umetsu, M.Takami, S.Adschiri, T., J. Phys.: Condens. Matter,
2004, 16 1325-30.
11. Okuda, K.Ohara, S.Umetsu, M.Takami, S.Adschiri, T. Dissasembly of waste lignin in
supercritical water and p-cresol mixtures. in 14th International Conference on the
properties of water and steam in kyoto. 2003. kyoto, Japan.
12. Vigneault, A.Johnson, D.K.Chornet, E., Science in Thermal and Chemical Biomass
Conversion, CPL Press, 2006.

Chapter4
97
13. Vigneault A, J.D., Chornet E, Advance in the thermal depolymerization of lignin via
base-catalysis, in Science in Thermal and Chemical Biomass Conversion. 2006, CPL
Press.
Chapter 5
98
Chapter 5
On the mechanism of base catalyzed
depolymerization of lignin
Abstract
The products of base catalyzed liquid phase hydrolysis of lignin depend markedly on
the operation conditions. Varying temperature, pressure, catalyst concentration and residence
time the yield of monomers and oligomers from depolymerized lignin can be adjusted It is
shown for the first time that monomers of phenolic derivatives are the sole primary products
of base catalyzed hydrolysis and that oligomers form subsequently. Oligomerization reactions
lead to the frequently observed di,-tri- and tetramers of these phenols.
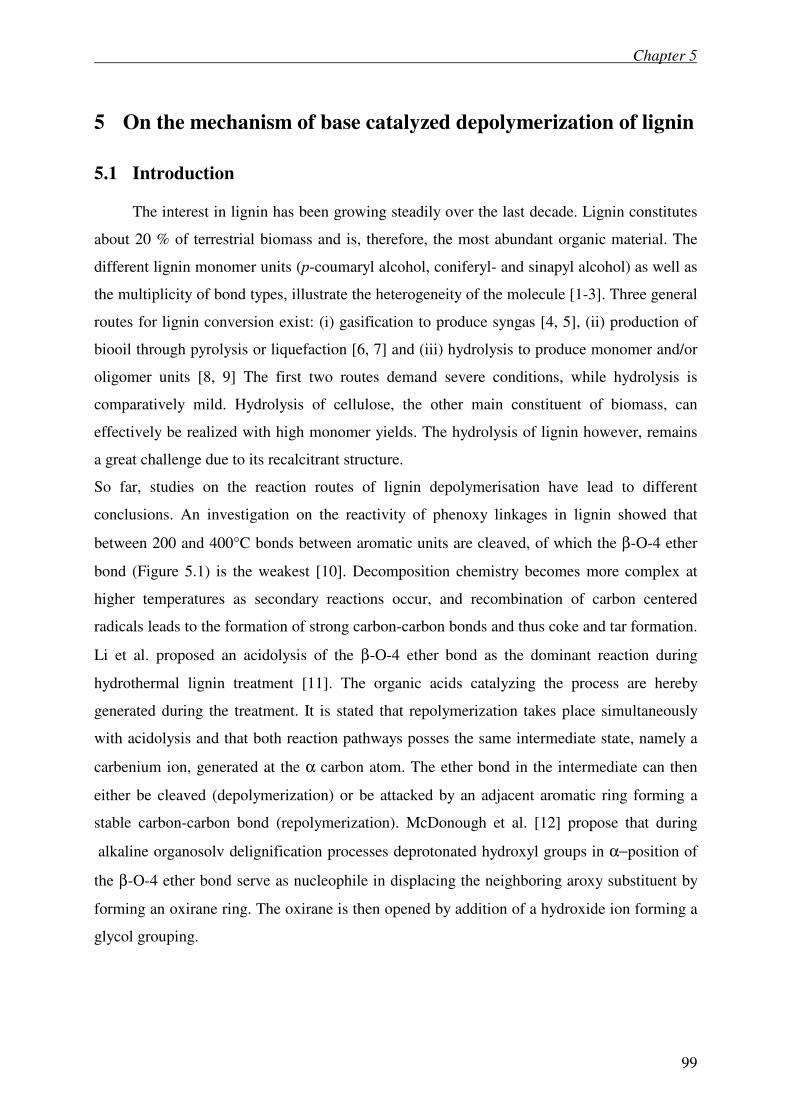
Chapter 5
99
5 On the mechanism of base catalyzed depolymerization of lignin
5.1 Introduction
The interest in lignin has been growing steadily over the last decade. Lignin constitutes
about 20 % of terrestrial biomass and is, therefore, the most abundant organic material. The
different lignin monomer units (p-coumaryl alcohol, coniferyl- and sinapyl alcohol) as well as
the multiplicity of bond types, illustrate the heterogeneity of the molecule [1-3]. Three general
routes for lignin conversion exist: (i) gasification to produce syngas [4, 5], (ii) production of
biooil through pyrolysis or liquefaction [6, 7] and (iii) hydrolysis to produce monomer and/or
oligomer units [8, 9] The first two routes demand severe conditions, while hydrolysis is
comparatively mild. Hydrolysis of cellulose, the other main constituent of biomass, can
effectively be realized with high monomer yields. The hydrolysis of lignin however, remains
a great challenge due to its recalcitrant structure.
So far, studies on the reaction routes of lignin depolymerisation have lead to different
conclusions. An investigation on the reactivity of phenoxy linkages in lignin showed that
between 200 and 400°C bonds between aromatic units are cleaved, of which the β-O-4 ether
bond (Figure 5.1) is the weakest [10]. Decomposition chemistry becomes more complex at
higher temperatures as secondary reactions occur, and recombination of carbon centered
radicals leads to the formation of strong carbon-carbon bonds and thus coke and tar formation.
Li et al. proposed an acidolysis of the β-O-4 ether bond as the dominant reaction during
hydrothermal lignin treatment [11]. The organic acids catalyzing the process are hereby
generated during the treatment. It is stated that repolymerization takes place simultaneously
with acidolysis and that both reaction pathways posses the same intermediate state, namely a
carbenium ion, generated at the α carbon atom. The ether bond in the intermediate can then
either be cleaved (depolymerization) or be attacked by an adjacent aromatic ring forming a
stable carbon-carbon bond (repolymerization). McDonough et al. [12] propose that during
alkaline organosolv delignification processes deprotonated hydroxyl groups in α−position of
the β-O-4 ether bond serve as nucleophile in displacing the neighboring aroxy substituent by
forming an oxirane ring. The oxirane is then opened by addition of a hydroxide ion forming a
glycol grouping.
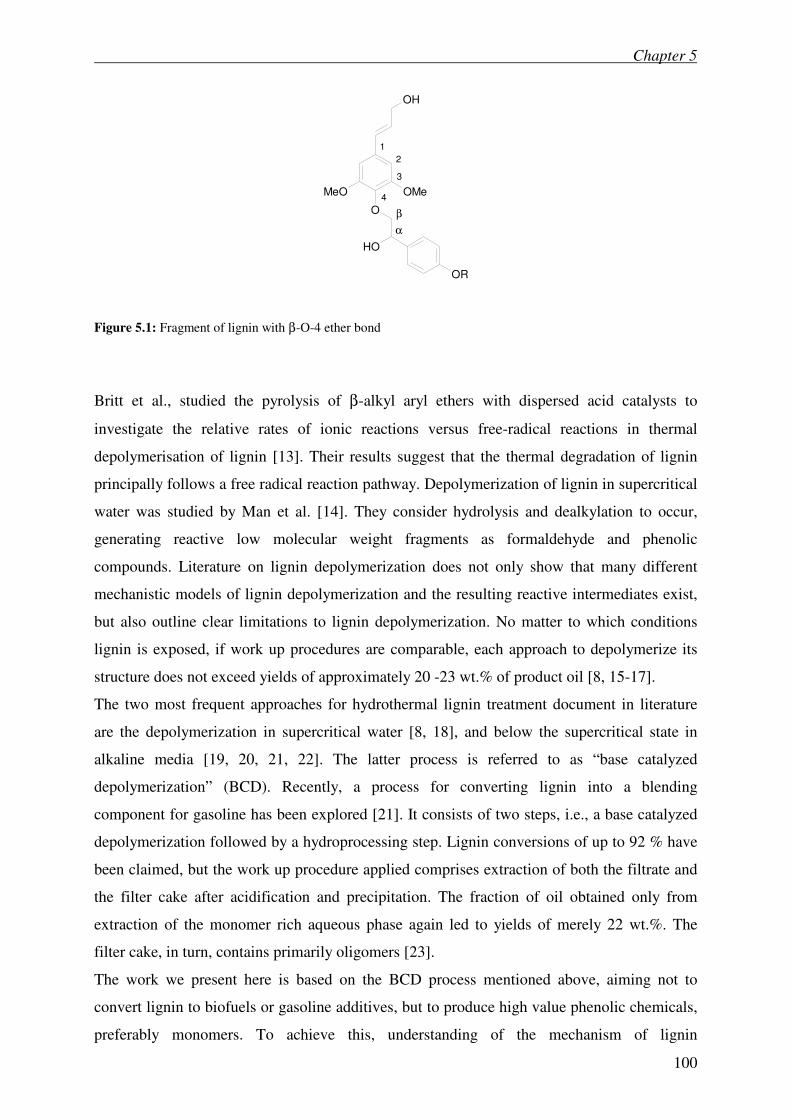
Chapter 5
100
OH
OMeMeO
OR
OH
O β
α
1
2
3
4
Figure 5.1: Fragment of lignin with β-O-4 ether bond
Britt et al., studied the pyrolysis of β-alkyl aryl ethers with dispersed acid catalysts to
investigate the relative rates of ionic reactions versus free-radical reactions in thermal
depolymerisation of lignin [13]. Their results suggest that the thermal degradation of lignin
principally follows a free radical reaction pathway. Depolymerization of lignin in supercritical
water was studied by Man et al. [14]. They consider hydrolysis and dealkylation to occur,
generating reactive low molecular weight fragments as formaldehyde and phenolic
compounds. Literature on lignin depolymerization does not only show that many different
mechanistic models of lignin depolymerization and the resulting reactive intermediates exist,
but also outline clear limitations to lignin depolymerization. No matter to which conditions
lignin is exposed, if work up procedures are comparable, each approach to depolymerize its
structure does not exceed yields of approximately 20 -23 wt.% of product oil [8, 15-17].
The two most frequent approaches for hydrothermal lignin treatment document in literature
are the depolymerization in supercritical water [8, 18], and below the supercritical state in
alkaline media [19, 20, 21, 22]. The latter process is referred to as “base catalyzed
depolymerization” (BCD). Recently, a process for converting lignin into a blending
component for gasoline has been explored [21]. It consists of two steps, i.e., a base catalyzed
depolymerization followed by a hydroprocessing step. Lignin conversions of up to 92 % have
been claimed, but the work up procedure applied comprises extraction of both the filtrate and
the filter cake after acidification and precipitation. The fraction of oil obtained only from
extraction of the monomer rich aqueous phase again led to yields of merely 22 wt.%. The
filter cake, in turn, contains primarily oligomers [23].
The work we present here is based on the BCD process mentioned above, aiming not to
convert lignin to biofuels or gasoline additives, but to produce high value phenolic chemicals,
preferably monomers. To achieve this, understanding of the mechanism of lignin
Chapter 5
101
depolymerization is essential. Here, we report the effects of operation conditions, i.e.,
lignin/NaOH weight ratio, lignin concentration, temperature, pressure and residence time, on
oil yield and monomer selectivity of the oil. Moreover, kinetic studies on products formation
and an attempt to understand the mechanism for lignin depolymerization are presented.
5.2 Experimental
Experiments were conducted in stainless steel flow continuous reactors. For the initial
experiments a tube reactor with a total volume of 0.87 cm³ was chosen. Organosolv lignin
obtained from Sigma Aldrich was applied for all experiments. Lignin depolymerization was
performed in an aqueous basic solution with lignin/NaOH weight ratios varying from 2.5 to 5.
The reaction mixtures were fed to the reactor with a HPLC pump [Gilson, 307 pump]. To
investigate the effect of lignin concentration, the lignin/NaOH weight ratio was kept constant
at a 2.5, while the concentration of lignin was varied between 2.5 and 10 wt.%. The
temperature (240-340°C) was set by means of a Eurotherm, 2416controller and the pressure
(250-315bar) was adjusted via a regulator [Swagelok]. After exiting the reaction zone the
product mixture was expanded to atmospheric pressure and collected for work up before
product analysis was conducted. To realize experiments at residence times shorter than 1 min,
a reactor with a total volume of 8 cm³ was necessary. For this system a second flow of
preheated water was fed to the reactor by a second HPLC pump. Both flows were allowed to
mix right before entering the reactor. The scheme of the set up is depicted in Figure 5.2.
HPLC
pumps
HPLC
pumps
Pressure
regulatorWater feed
Thermo couple-
Eurotherm
SampleCollector
Preheater
Cooling
Lignin feed
HPLC
pumps
HPLC
pumps
Pressure
regulatorWater feed
Thermo couple-
Eurotherm
SampleCollector
Preheater
Cooling
Lignin feed
Figure 5.2: Continuous set up with water preheater and cooler
Chapter 5
102
A scheme of the work up procedure is shown in Figure 5.3. The reaction mixture is first
acidified with HCl to a pH value of 1. This results in the precipitation of unconverted lignin
and high molecular lignin cleavage units. After adjusting the pH, the solids are removed from
the suspension by filtration, dried and weighed. The unconverted lignin as well as the
precipitated oligomers can be retrieved from the filter cake by washing with THF while
possibly formed coke remains behind. The acidic filtrate is then repeatedly extracted with
ethyl acetate to obtain the formed monomers, dimers and trimers. After extraction ethyl
acetate is removed and dark brown oil is received which is dried overnight at 60°C before
being weighed. Lignin conversion, oil yield, and monomer yield as well as selectivity are
calculated as following:
[ ][ ]
100)(
)()(.% ⋅
−=
applied
iltercakeTHFwashedFapplied
ligninm
ligninmligninmwtersionLigninConv (1)
[ ] 100)(
)(.%Pr ⋅=
appliedligninm
productmwtoductYield (2)
Beside the products contained in the oil, coke and gaseous products formed at elevated
temperatures, ethanol, methanol and some organic products remain in the aqueous phase
during extraction. A small amount of product, i.e., CO2 dissolved in water or present as
sodium carbonate is lost as it is liberated during the acidification step.
The monomeric reaction products were identified by GC/MS and quantified by GC/FID-
analysis using a “Shimadzu” GCMS – QP 20105 gas chromatograph-mass spectrometer
(column: HP 5 crosslinked 5 % PhME Siloxane). For this purpose the oil was dissolved in
ethyl acetate, transferred into a 50 ml calibrated metering flask and leveled with further ethyl
acetate. The concentration of the main monomeric products was determined by calibrating the
peak area with ethyl acetate solutions of known concentration of these compounds.
Laser desorption/ionization time-of-flight mass spectrometry (LDI-TOF) was employed to
determine the molecular weight distribution of the product oil. Therefore, solutions of
approximately 10 wt.% oil in H2O/acetonitrile (1:1) with 0.1 wt.% trifluoroacetic acid were
prepared. LDI-TOF mass spectra were recorded using a Bruker Biflex III MALDI-TOF mass
spectrometer. The lignin and products were analyzed for their carbon content, employing
CHN analysis.
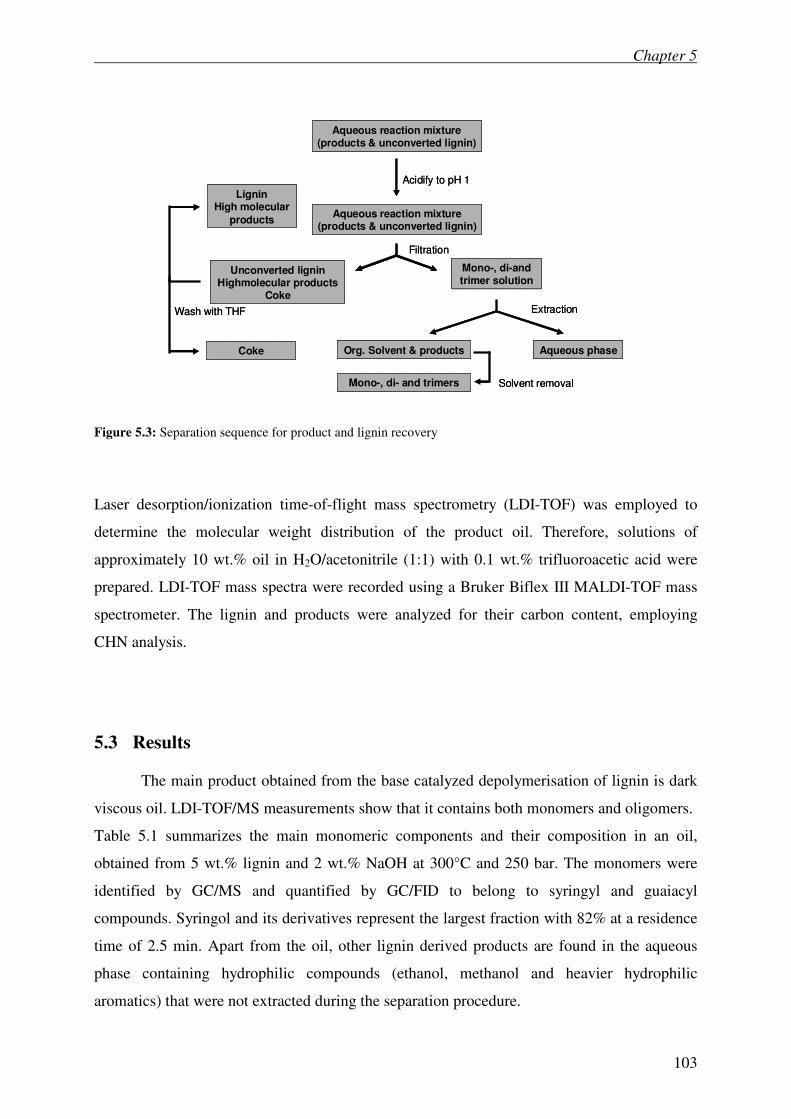
Chapter 5
103
Aqueous reaction mixture(products & unconverted lignin)
Acidify to pH 1
Aqueous reaction mixture(products & unconverted lignin)
Filtration
Unconverted ligninHighmolecular products
Coke
LigninHigh molecular
products
Coke
Mono-, di-and trimer solution
Extraction
Org. Solvent & products Aqueous phase
Mono-, di- and trimers Solvent removal
Wash with THF
Aqueous reaction mixture(products & unconverted lignin)
Acidify to pH 1
Aqueous reaction mixture(products & unconverted lignin)
Filtration
Unconverted ligninHighmolecular products
Coke
LigninHigh molecular
products
Coke
Mono-, di-and trimer solution
Extraction
Org. Solvent & products Aqueous phase
Mono-, di- and trimers Solvent removal
Wash with THF
Figure 5.3: Separation sequence for product and lignin recovery
Laser desorption/ionization time-of-flight mass spectrometry (LDI-TOF) was employed to
determine the molecular weight distribution of the product oil. Therefore, solutions of
approximately 10 wt.% oil in H2O/acetonitrile (1:1) with 0.1 wt.% trifluoroacetic acid were
prepared. LDI-TOF mass spectra were recorded using a Bruker Biflex III MALDI-TOF mass
spectrometer. The lignin and products were analyzed for their carbon content, employing
CHN analysis.
5.3 Results
The main product obtained from the base catalyzed depolymerisation of lignin is dark
viscous oil. LDI-TOF/MS measurements show that it contains both monomers and oligomers.
Table 5.1 summarizes the main monomeric components and their composition in an oil,
obtained from 5 wt.% lignin and 2 wt.% NaOH at 300°C and 250 bar. The monomers were
identified by GC/MS and quantified by GC/FID to belong to syringyl and guaiacyl
compounds. Syringol and its derivatives represent the largest fraction with 82% at a residence
time of 2.5 min. Apart from the oil, other lignin derived products are found in the aqueous
phase containing hydrophilic compounds (ethanol, methanol and heavier hydrophilic
aromatics) that were not extracted during the separation procedure.
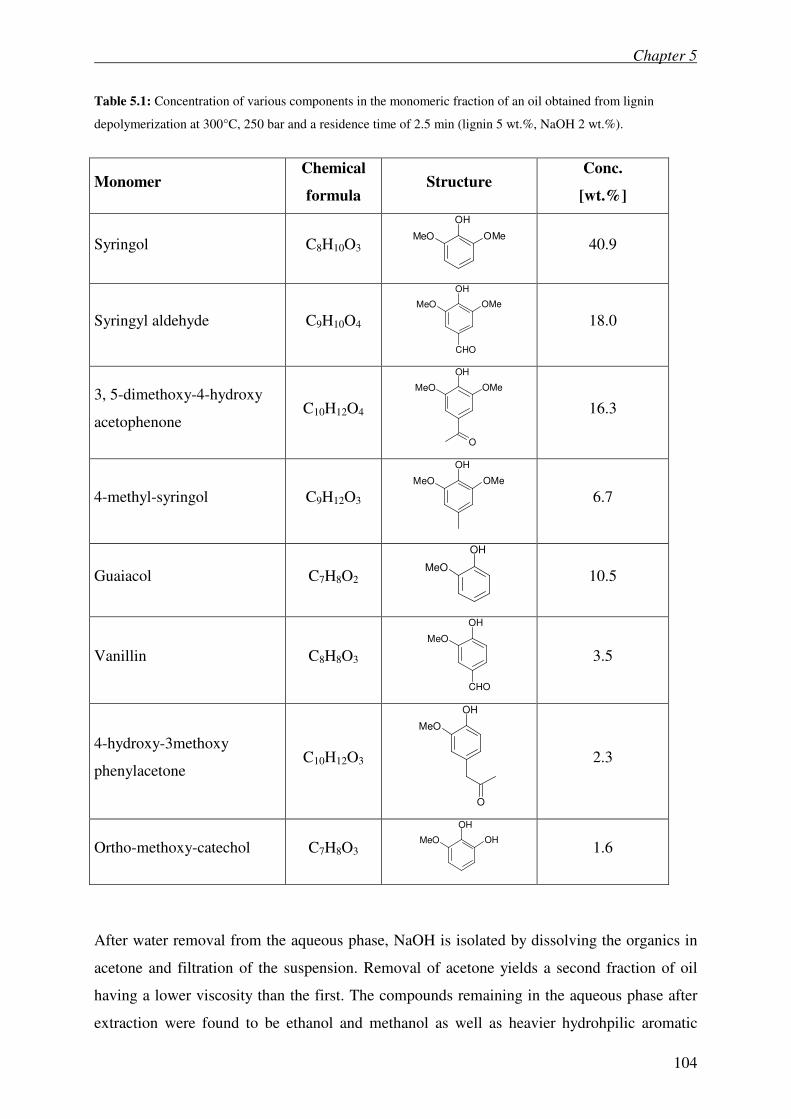
Chapter 5
104
Table 5.1: Concentration of various components in the monomeric fraction of an oil obtained from lignin
depolymerization at 300°C, 250 bar and a residence time of 2.5 min (lignin 5 wt.%, NaOH 2 wt.%).
Monomer Chemical
formula Structure
Conc.
[wt.%]
Syringol C8H10O3
OH
OMeMeO
40.9
Syringyl aldehyde C9H10O4
OH
OMeMeO
CHO
18.0
3, 5-dimethoxy-4-hydroxy
acetophenone C10H12O4
OH
OMeMeO
O
16.3
4-methyl-syringol C9H12O3
OH
OMeMeO
6.7
Guaiacol C7H8O2
OH
MeO
10.5
Vanillin C8H8O3
OH
MeO
CHO
3.5
4-hydroxy-3methoxy
phenylacetone C10H12O3
OH
MeO
O
2.3
Ortho-methoxy-catechol C7H8O3
OH
OHMeO
1.6
After water removal from the aqueous phase, NaOH is isolated by dissolving the organics in
acetone and filtration of the suspension. Removal of acetone yields a second fraction of oil
having a lower viscosity than the first. The compounds remaining in the aqueous phase after
extraction were found to be ethanol and methanol as well as heavier hydrohpilic aromatic
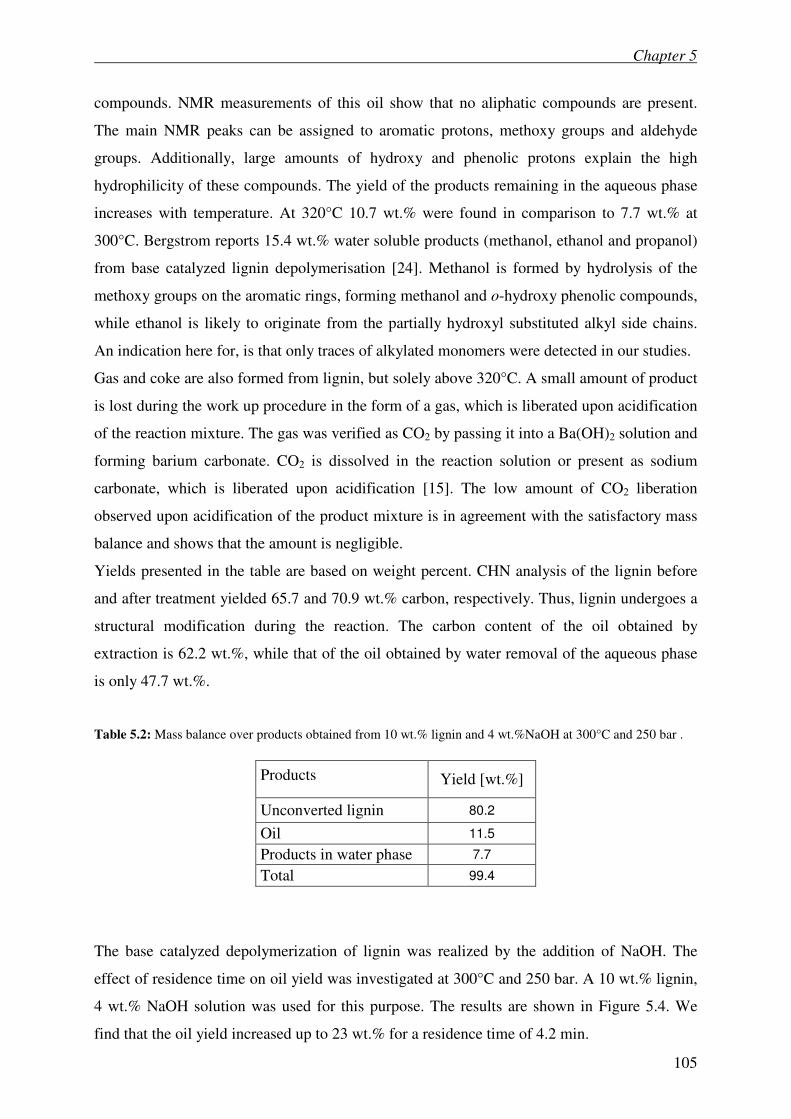
Chapter 5
105
compounds. NMR measurements of this oil show that no aliphatic compounds are present.
The main NMR peaks can be assigned to aromatic protons, methoxy groups and aldehyde
groups. Additionally, large amounts of hydroxy and phenolic protons explain the high
hydrophilicity of these compounds. The yield of the products remaining in the aqueous phase
increases with temperature. At 320°C 10.7 wt.% were found in comparison to 7.7 wt.% at
300°C. Bergstrom reports 15.4 wt.% water soluble products (methanol, ethanol and propanol)
from base catalyzed lignin depolymerisation [24]. Methanol is formed by hydrolysis of the
methoxy groups on the aromatic rings, forming methanol and o-hydroxy phenolic compounds,
while ethanol is likely to originate from the partially hydroxyl substituted alkyl side chains.
An indication here for, is that only traces of alkylated monomers were detected in our studies.
Gas and coke are also formed from lignin, but solely above 320°C. A small amount of product
is lost during the work up procedure in the form of a gas, which is liberated upon acidification
of the reaction mixture. The gas was verified as CO2 by passing it into a Ba(OH)2 solution and
forming barium carbonate. CO2 is dissolved in the reaction solution or present as sodium
carbonate, which is liberated upon acidification [15]. The low amount of CO2 liberation
observed upon acidification of the product mixture is in agreement with the satisfactory mass
balance and shows that the amount is negligible.
Yields presented in the table are based on weight percent. CHN analysis of the lignin before
and after treatment yielded 65.7 and 70.9 wt.% carbon, respectively. Thus, lignin undergoes a
structural modification during the reaction. The carbon content of the oil obtained by
extraction is 62.2 wt.%, while that of the oil obtained by water removal of the aqueous phase
is only 47.7 wt.%.
Table 5.2: Mass balance over products obtained from 10 wt.% lignin and 4 wt.%NaOH at 300°C and 250 bar .
Products Yield [wt.%]
Unconverted lignin 80.2
Oil 11.5
Products in water phase 7.7
Total 99.4
The base catalyzed depolymerization of lignin was realized by the addition of NaOH. The
effect of residence time on oil yield was investigated at 300°C and 250 bar. A 10 wt.% lignin,
4 wt.% NaOH solution was used for this purpose. The results are shown in Figure 5.4. We
find that the oil yield increased up to 23 wt.% for a residence time of 4.2 min.
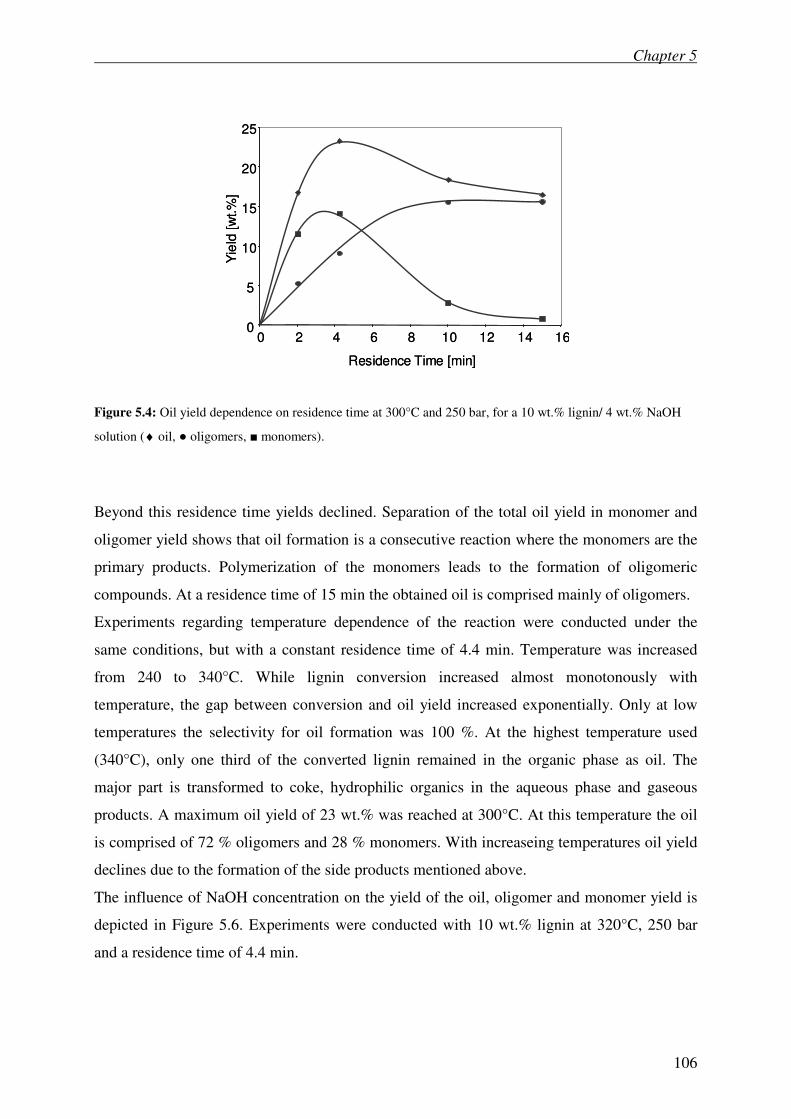
Chapter 5
106
0
5
10
15
20
25
0 2 4 6 8 10 12 14 16
Residence Time [min]
Yie
ld [w
t.%
]
0
5
10
15
20
25
0 2 4 6 8 10 12 14 16
Residence Time [min]
Yie
ld [w
t.%
]
Figure 5.4: Oil yield dependence on residence time at 300°C and 250 bar, for a 10 wt.% lignin/ 4 wt.% NaOH
solution (♦ oil, ● oligomers, ■ monomers).
Beyond this residence time yields declined. Separation of the total oil yield in monomer and
oligomer yield shows that oil formation is a consecutive reaction where the monomers are the
primary products. Polymerization of the monomers leads to the formation of oligomeric
compounds. At a residence time of 15 min the obtained oil is comprised mainly of oligomers.
Experiments regarding temperature dependence of the reaction were conducted under the
same conditions, but with a constant residence time of 4.4 min. Temperature was increased
from 240 to 340°C. While lignin conversion increased almost monotonously with
temperature, the gap between conversion and oil yield increased exponentially. Only at low
temperatures the selectivity for oil formation was 100 %. At the highest temperature used
(340°C), only one third of the converted lignin remained in the organic phase as oil. The
major part is transformed to coke, hydrophilic organics in the aqueous phase and gaseous
products. A maximum oil yield of 23 wt.% was reached at 300°C. At this temperature the oil
is comprised of 72 % oligomers and 28 % monomers. With increaseing temperatures oil yield
declines due to the formation of the side products mentioned above.
The influence of NaOH concentration on the yield of the oil, oligomer and monomer yield is
depicted in Figure 5.6. Experiments were conducted with 10 wt.% lignin at 320°C, 250 bar
and a residence time of 4.4 min.
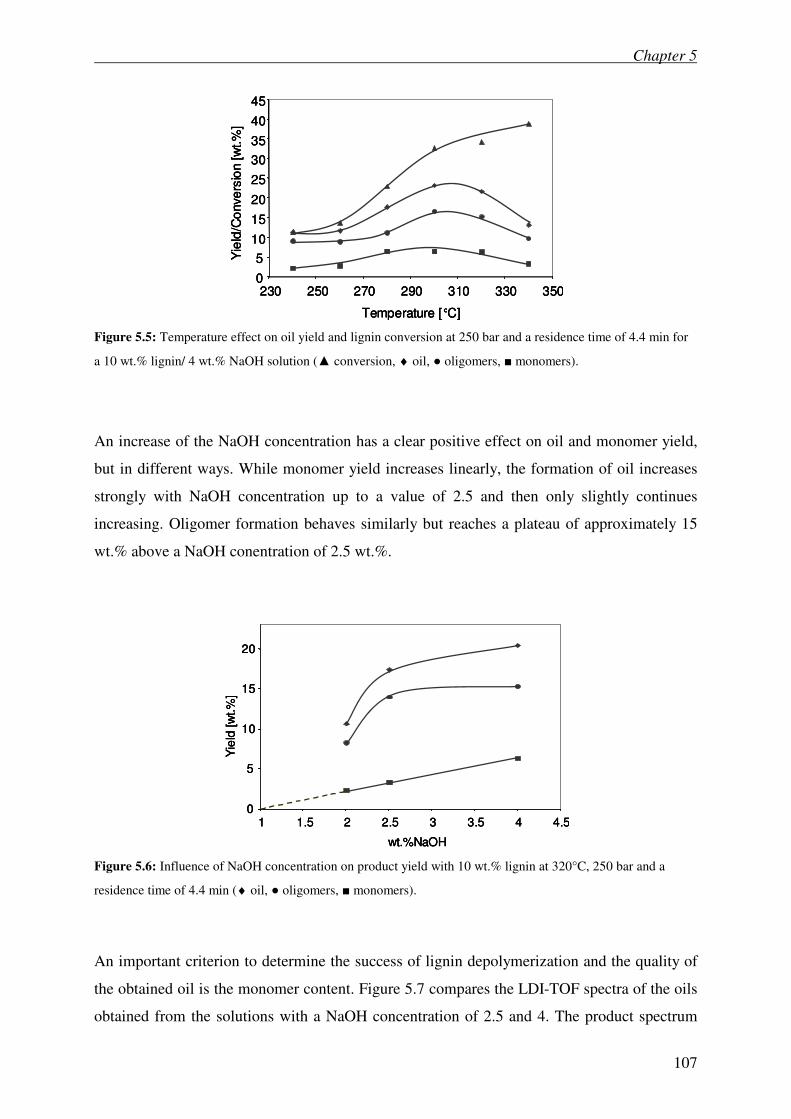
Chapter 5
107
0
5
10
15
20
25
30
35
40
45
230 250 270 290 310 330 350
Temperature [°C]
Yie
ld/C
onve
rsio
n [w
t.%
]
0
5
10
15
20
25
30
35
40
45
230 250 270 290 310 330 350
Temperature [°C]
Yie
ld/C
onve
rsio
n [w
t.%
]
0
5
10
15
20
25
30
35
40
45
230 250 270 290 310 330 350
Temperature [°C]
Yie
ld/C
onve
rsio
n [w
t.%
]
Figure 5.5: Temperature effect on oil yield and lignin conversion at 250 bar and a residence time of 4.4 min for
a 10 wt.% lignin/ 4 wt.% NaOH solution (▲ conversion, ♦ oil, ● oligomers, ■ monomers).
An increase of the NaOH concentration has a clear positive effect on oil and monomer yield,
but in different ways. While monomer yield increases linearly, the formation of oil increases
strongly with NaOH concentration up to a value of 2.5 and then only slightly continues
increasing. Oligomer formation behaves similarly but reaches a plateau of approximately 15
wt.% above a NaOH conentration of 2.5 wt.%.
0
5
10
15
20
1 1.5 2 2.5 3 3.5 4 4.5
wt.%NaOH
Yie
ld [w
t.%
]
0
5
10
15
20
1 1.5 2 2.5 3 3.5 4 4.5
wt.%NaOH
Yie
ld [w
t.%
]
0
5
10
15
20
1 1.5 2 2.5 3 3.5 4 4.5
wt.%NaOH
Yie
ld [w
t.%
]
Figure 5.6: Influence of NaOH concentration on product yield with 10 wt.% lignin at 320°C, 250 bar and a
residence time of 4.4 min (♦ oil, ● oligomers, ■ monomers).
An important criterion to determine the success of lignin depolymerization and the quality of
the obtained oil is the monomer content. Figure 5.7 compares the LDI-TOF spectra of the oils
obtained from the solutions with a NaOH concentration of 2.5 and 4. The product spectrum
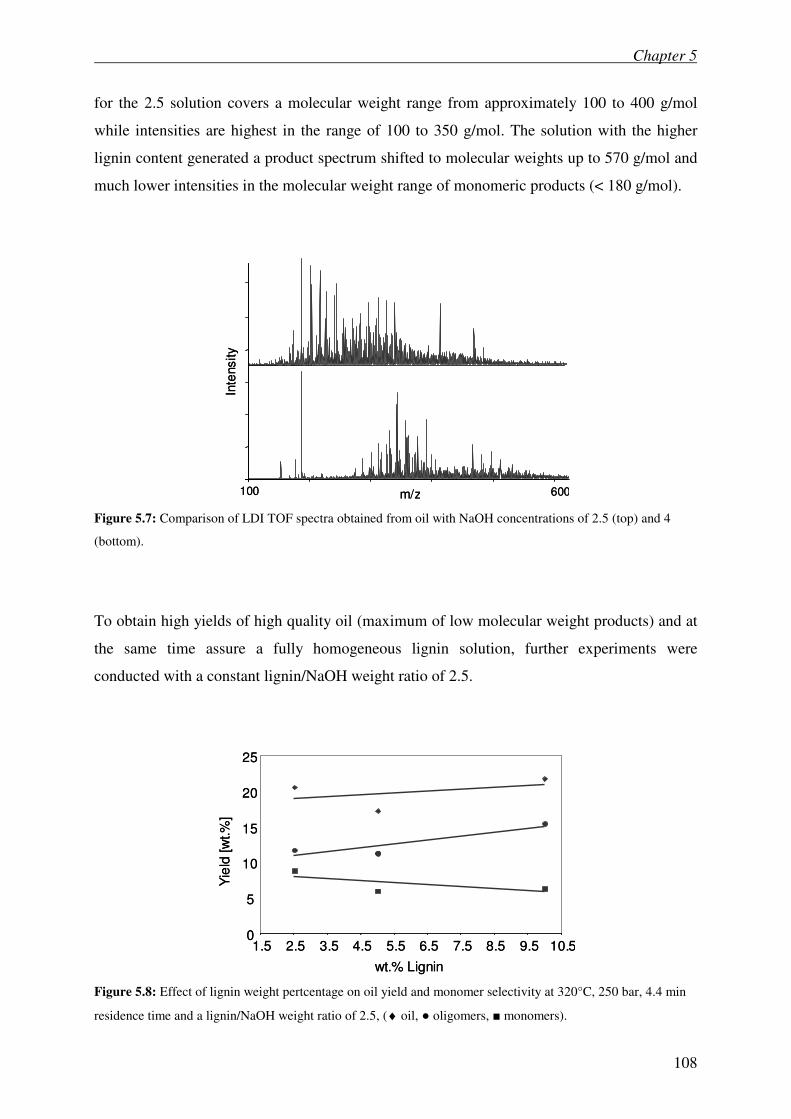
Chapter 5
108
for the 2.5 solution covers a molecular weight range from approximately 100 to 400 g/mol
while intensities are highest in the range of 100 to 350 g/mol. The solution with the higher
lignin content generated a product spectrum shifted to molecular weights up to 570 g/mol and
much lower intensities in the molecular weight range of monomeric products (< 180 g/mol).
m/z100 600
Inte
nsity
m/z100 600
Inte
nsity
Figure 5.7: Comparison of LDI TOF spectra obtained from oil with NaOH concentrations of 2.5 (top) and 4
(bottom).
To obtain high yields of high quality oil (maximum of low molecular weight products) and at
the same time assure a fully homogeneous lignin solution, further experiments were
conducted with a constant lignin/NaOH weight ratio of 2.5.
0
5
10
15
20
25
1.5 2.5 3.5 4.5 5.5 6.5 7.5 8.5 9.5 10.5
wt.% Lignin
Yie
ld [w
t.%
]
0
5
10
15
20
25
1.5 2.5 3.5 4.5 5.5 6.5 7.5 8.5 9.5 10.5
wt.% Lignin
Yie
ld [w
t.%
]
Figure 5.8: Effect of lignin weight pertcentage on oil yield and monomer selectivity at 320°C, 250 bar, 4.4 min
residence time and a lignin/NaOH weight ratio of 2.5, (♦ oil, ● oligomers, ■ monomers).
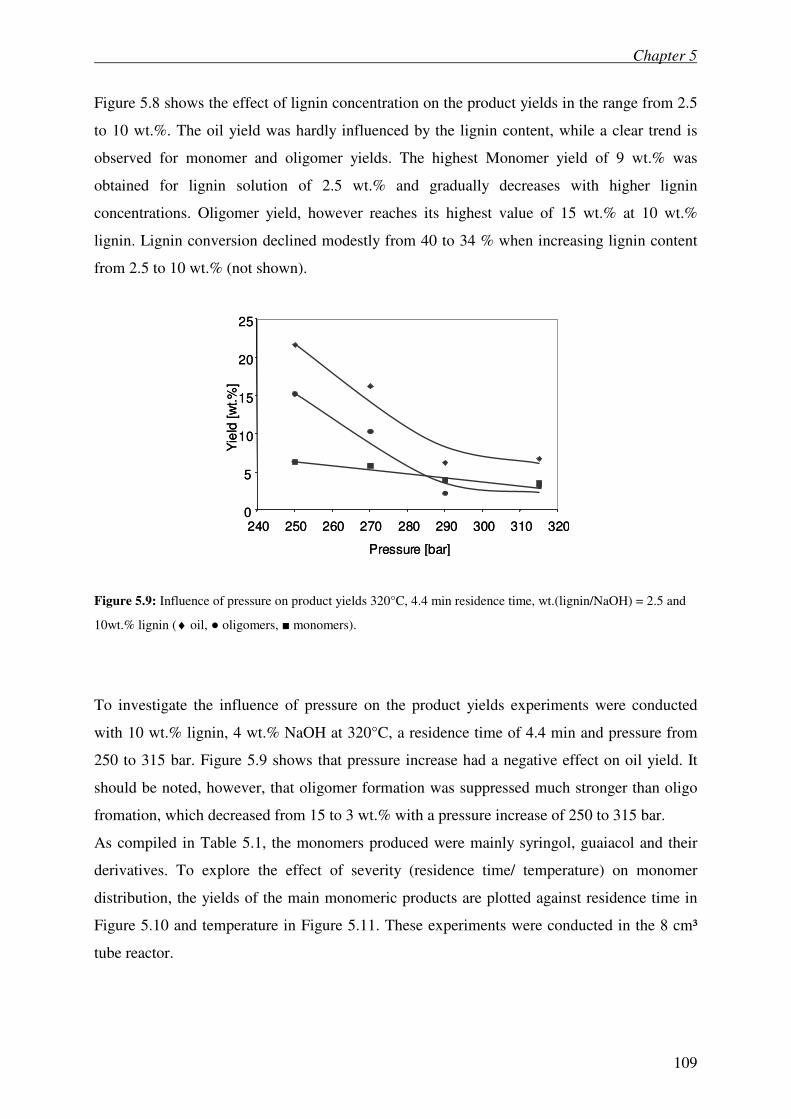
Chapter 5
109
Figure 5.8 shows the effect of lignin concentration on the product yields in the range from 2.5
to 10 wt.%. The oil yield was hardly influenced by the lignin content, while a clear trend is
observed for monomer and oligomer yields. The highest Monomer yield of 9 wt.% was
obtained for lignin solution of 2.5 wt.% and gradually decreases with higher lignin
concentrations. Oligomer yield, however reaches its highest value of 15 wt.% at 10 wt.%
lignin. Lignin conversion declined modestly from 40 to 34 % when increasing lignin content
from 2.5 to 10 wt.% (not shown).
0
5
10
15
20
25
240 250 260 270 280 290 300 310 320
Pressure [bar]
Yie
ld [w
t.%
]
0
5
10
15
20
25
240 250 260 270 280 290 300 310 320
Pressure [bar]
Yie
ld [w
t.%
]
Figure 5.9: Influence of pressure on product yields 320°C, 4.4 min residence time, wt.(lignin/NaOH) = 2.5 and
10wt.% lignin (♦ oil, ● oligomers, ■ monomers).
To investigate the influence of pressure on the product yields experiments were conducted
with 10 wt.% lignin, 4 wt.% NaOH at 320°C, a residence time of 4.4 min and pressure from
250 to 315 bar. Figure 5.9 shows that pressure increase had a negative effect on oil yield. It
should be noted, however, that oligomer formation was suppressed much stronger than oligo
fromation, which decreased from 15 to 3 wt.% with a pressure increase of 250 to 315 bar.
As compiled in Table 5.1, the monomers produced were mainly syringol, guaiacol and their
derivatives. To explore the effect of severity (residence time/ temperature) on monomer
distribution, the yields of the main monomeric products are plotted against residence time in
Figure 5.10 and temperature in Figure 5.11. These experiments were conducted in the 8 cm³
tube reactor.
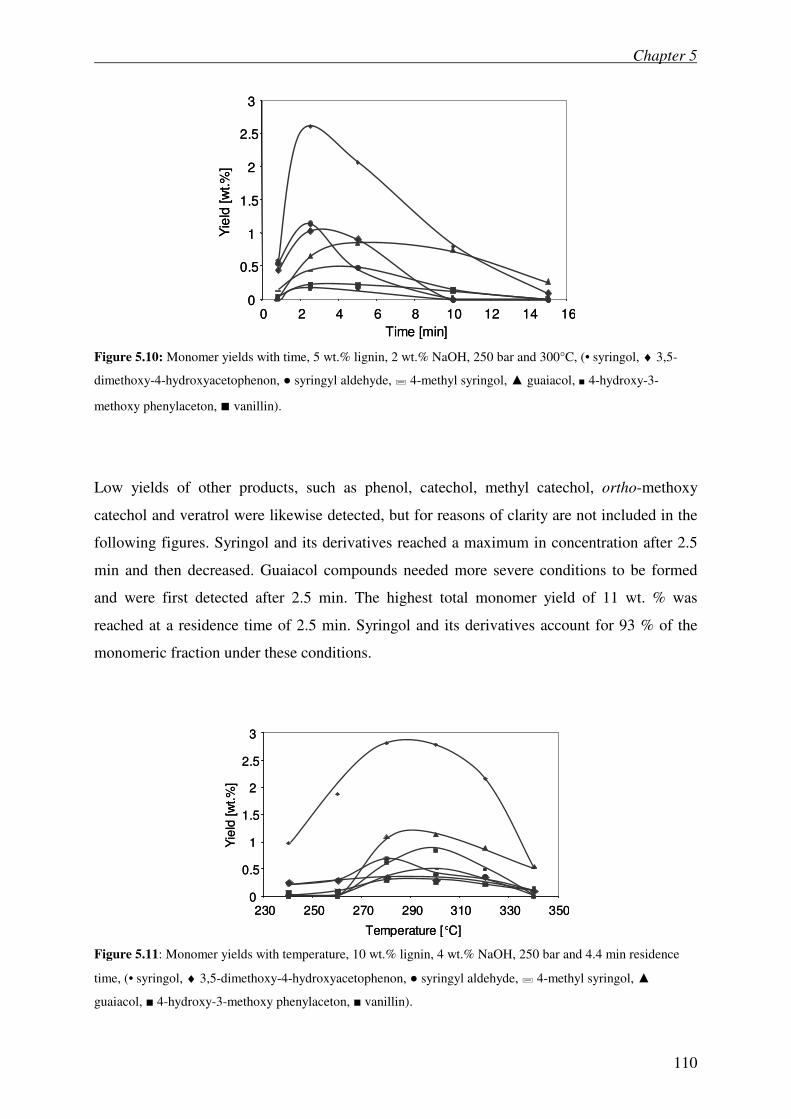
Chapter 5
110
0
0.5
1
1.5
2
2.5
3
0 2 4 6 8 10 12 14 16
Time [min]
Yie
ld [w
t.%
]
0
0.5
1
1.5
2
2.5
3
0 2 4 6 8 10 12 14 16
Time [min]
Yie
ld [w
t.%
]
Figure 5.10: Monomer yields with time, 5 wt.% lignin, 2 wt.% NaOH, 250 bar and 300°C, (• syringol, ♦ 3,5-
dimethoxy-4-hydroxyacetophenon, ● syringyl aldehyde, � 4-methyl syringol, ▲ guaiacol, ■ 4-hydroxy-3-
methoxy phenylaceton, ■ vanillin).
Low yields of other products, such as phenol, catechol, methyl catechol, ortho-methoxy
catechol and veratrol were likewise detected, but for reasons of clarity are not included in the
following figures. Syringol and its derivatives reached a maximum in concentration after 2.5
min and then decreased. Guaiacol compounds needed more severe conditions to be formed
and were first detected after 2.5 min. The highest total monomer yield of 11 wt. % was
reached at a residence time of 2.5 min. Syringol and its derivatives account for 93 % of the
monomeric fraction under these conditions.
3
0
0.5
1
1.5
2
2.5
230 250 270 290 310 330 350
Temperature [°C]
Yie
ld [w
t.%
]
3
0
0.5
1
1.5
2
2.5
230 250 270 290 310 330 350
Temperature [°C]
Yie
ld [w
t.%
]
Figure 5.11: Monomer yields with temperature, 10 wt.% lignin, 4 wt.% NaOH, 250 bar and 4.4 min residence
time, (• syringol, ♦ 3,5-dimethoxy-4-hydroxyacetophenon, ● syringyl aldehyde, � 4-methyl syringol, ▲
guaiacol, ■ 4-hydroxy-3-methoxy phenylaceton, ■ vanillin).
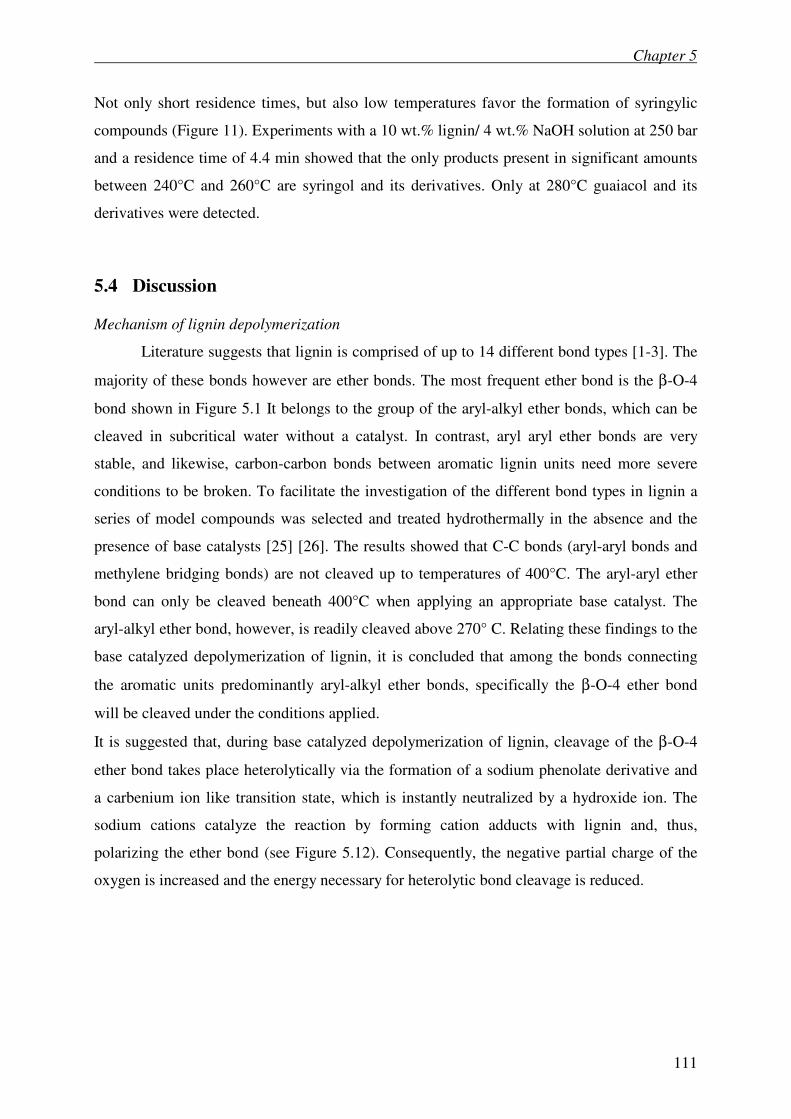
Chapter 5
111
Not only short residence times, but also low temperatures favor the formation of syringylic
compounds (Figure 11). Experiments with a 10 wt.% lignin/ 4 wt.% NaOH solution at 250 bar
and a residence time of 4.4 min showed that the only products present in significant amounts
between 240°C and 260°C are syringol and its derivatives. Only at 280°C guaiacol and its
derivatives were detected.
5.4 Discussion
Mechanism of lignin depolymerization
Literature suggests that lignin is comprised of up to 14 different bond types [1-3]. The
majority of these bonds however are ether bonds. The most frequent ether bond is the β-O-4
bond shown in Figure 5.1 It belongs to the group of the aryl-alkyl ether bonds, which can be
cleaved in subcritical water without a catalyst. In contrast, aryl aryl ether bonds are very
stable, and likewise, carbon-carbon bonds between aromatic lignin units need more severe
conditions to be broken. To facilitate the investigation of the different bond types in lignin a
series of model compounds was selected and treated hydrothermally in the absence and the
presence of base catalysts [25] [26]. The results showed that C-C bonds (aryl-aryl bonds and
methylene bridging bonds) are not cleaved up to temperatures of 400°C. The aryl-aryl ether
bond can only be cleaved beneath 400°C when applying an appropriate base catalyst. The
aryl-alkyl ether bond, however, is readily cleaved above 270° C. Relating these findings to the
base catalyzed depolymerization of lignin, it is concluded that among the bonds connecting
the aromatic units predominantly aryl-alkyl ether bonds, specifically the β-O-4 ether bond
will be cleaved under the conditions applied.
It is suggested that, during base catalyzed depolymerization of lignin, cleavage of the β-O-4
ether bond takes place heterolytically via the formation of a sodium phenolate derivative and
a carbenium ion like transition state, which is instantly neutralized by a hydroxide ion. The
sodium cations catalyze the reaction by forming cation adducts with lignin and, thus,
polarizing the ether bond (see Figure 5.12). Consequently, the negative partial charge of the
oxygen is increased and the energy necessary for heterolytic bond cleavage is reduced.
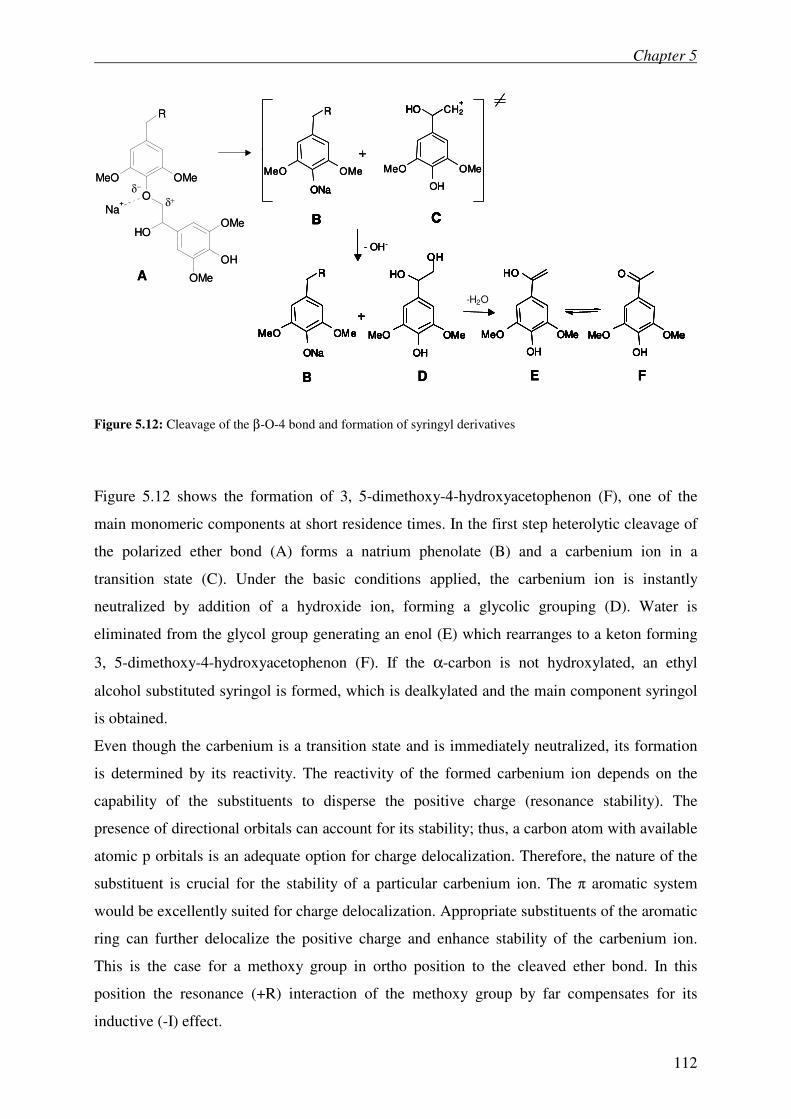
Chapter 5
112
A
R
OMeMeO OMeMeO
OH
CH2
+
R
OMeMeO
+
+
ONa
ONa
HO
B C
+
R
OMeMeO
+
+
ONa
ONa
HO
B C
D
- OH-
OMeMeO
OH
OH
OH
OMeMeO
OH
OH
OH
B
-H2O-H2O
OMeMeO
OH
OH
OMeMeO
OH
OH
OMeMeO
OH
O
OMeeMeO
OH
O
FE
Na+
R
O
OH
OH
MeO OMe
OMe
OMe
δ+
δ−
A
R
OMeMeO OMeMeO
OH
CH2
+
R
OMeMeO
+
+
ONa
ONa
HO
B C
+
R
OMeMeO
+
+
ONa
ONa
HO
B C
D
- OH-
OMeMeO
OH
OH
OH
OMeMeO
OH
OH
OH
B
-H2O-H2O
OMeMeO
OH
OH
OMeMeO
OH
OH
OMeMeO
OH
O
OMeeMeO
OH
O
FE
R
OMeMeO OMeMeO
OH
CH2
+
R
OMeMeO
+
+
ONa
ONa
HO
B C
+
R
OMeMeO
+
+
ONa
ONa
HO
B C
D
- OH-
OMeMeO
OH
OH
OH
OMeMeO
OH
OH
OH
B
-H2O-H2O
OMeMeO
OH
OH
OMeMeO
OH
OH
OMeMeO
OH
O
OMeeMeO
OH
O
FE
Na+
R
O
OH
OH
MeO OMe
OMe
OMe
δ+
δ−
Figure 5.12: Cleavage of the β-O-4 bond and formation of syringyl derivatives
Figure 5.12 shows the formation of 3, 5-dimethoxy-4-hydroxyacetophenon (F), one of the
main monomeric components at short residence times. In the first step heterolytic cleavage of
the polarized ether bond (A) forms a natrium phenolate (B) and a carbenium ion in a
transition state (C). Under the basic conditions applied, the carbenium ion is instantly
neutralized by addition of a hydroxide ion, forming a glycolic grouping (D). Water is
eliminated from the glycol group generating an enol (E) which rearranges to a keton forming
3, 5-dimethoxy-4-hydroxyacetophenon (F). If the α-carbon is not hydroxylated, an ethyl
alcohol substituted syringol is formed, which is dealkylated and the main component syringol
is obtained.
Even though the carbenium is a transition state and is immediately neutralized, its formation
is determined by its reactivity. The reactivity of the formed carbenium ion depends on the
capability of the substituents to disperse the positive charge (resonance stability). The
presence of directional orbitals can account for its stability; thus, a carbon atom with available
atomic p orbitals is an adequate option for charge delocalization. Therefore, the nature of the
substituent is crucial for the stability of a particular carbenium ion. The π aromatic system
would be excellently suited for charge delocalization. Appropriate substituents of the aromatic
ring can further delocalize the positive charge and enhance stability of the carbenium ion.
This is the case for a methoxy group in ortho position to the cleaved ether bond. In this
position the resonance (+R) interaction of the methoxy group by far compensates for its
inductive (-I) effect.
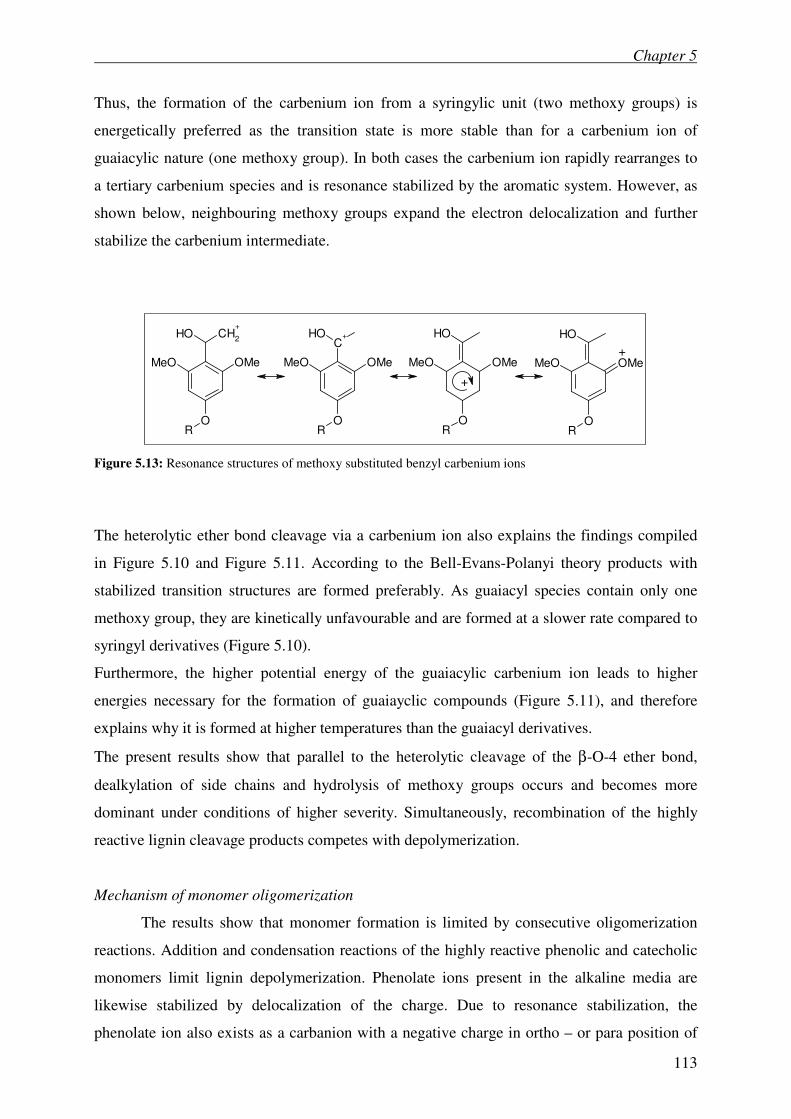
Chapter 5
113
Thus, the formation of the carbenium ion from a syringylic unit (two methoxy groups) is
energetically preferred as the transition state is more stable than for a carbenium ion of
guaiacylic nature (one methoxy group). In both cases the carbenium ion rapidly rearranges to
a tertiary carbenium species and is resonance stabilized by the aromatic system. However, as
shown below, neighbouring methoxy groups expand the electron delocalization and further
stabilize the carbenium intermediate.
O
OH CH2
+
R
MeO OMe
C+
O
OH
R
MeO OMe
OH
MeO OMe
OR
OH
MeO OMe
OR
+
+
Figure 5.13: Resonance structures of methoxy substituted benzyl carbenium ions
The heterolytic ether bond cleavage via a carbenium ion also explains the findings compiled
in Figure 5.10 and Figure 5.11. According to the Bell-Evans-Polanyi theory products with
stabilized transition structures are formed preferably. As guaiacyl species contain only one
methoxy group, they are kinetically unfavourable and are formed at a slower rate compared to
syringyl derivatives (Figure 5.10).
Furthermore, the higher potential energy of the guaiacylic carbenium ion leads to higher
energies necessary for the formation of guaiayclic compounds (Figure 5.11), and therefore
explains why it is formed at higher temperatures than the guaiacyl derivatives.
The present results show that parallel to the heterolytic cleavage of the β-O-4 ether bond,
dealkylation of side chains and hydrolysis of methoxy groups occurs and becomes more
dominant under conditions of higher severity. Simultaneously, recombination of the highly
reactive lignin cleavage products competes with depolymerization.
Mechanism of monomer oligomerization
The results show that monomer formation is limited by consecutive oligomerization
reactions. Addition and condensation reactions of the highly reactive phenolic and catecholic
monomers limit lignin depolymerization. Phenolate ions present in the alkaline media are
likewise stabilized by delocalization of the charge. Due to resonance stabilization, the
phenolate ion also exists as a carbanion with a negative charge in ortho – or para position of
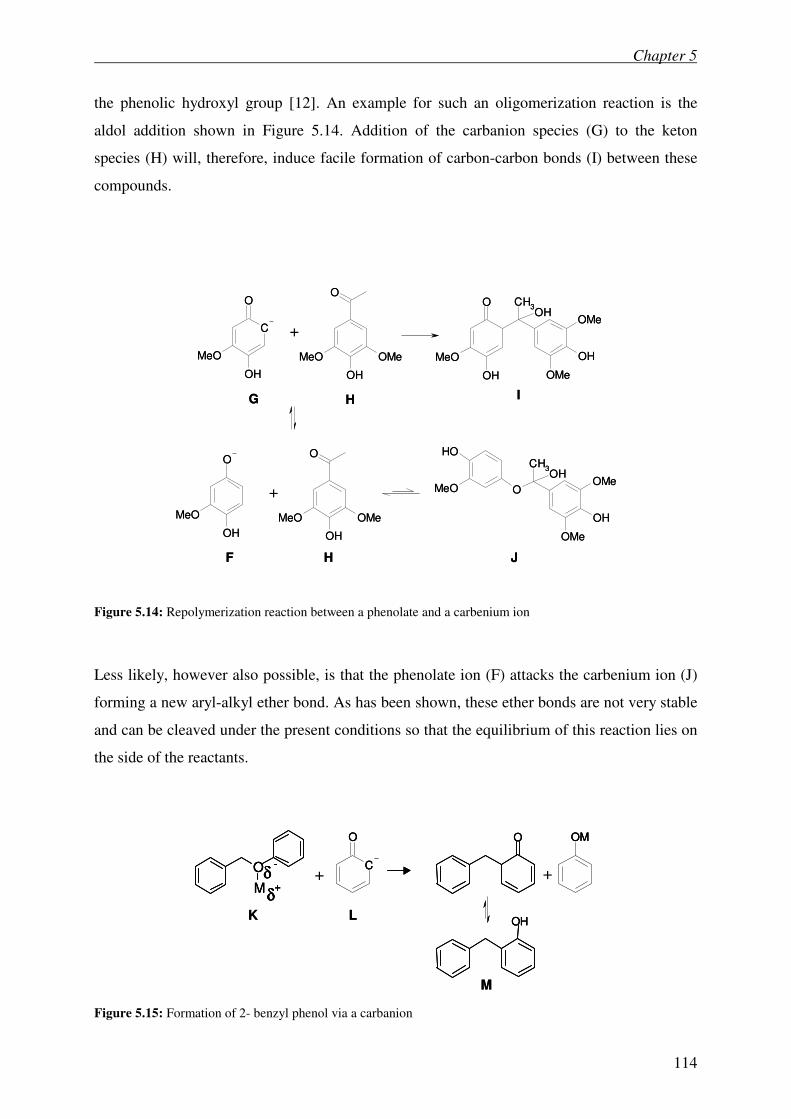
Chapter 5
114
the phenolic hydroxyl group [12]. An example for such an oligomerization reaction is the
aldol addition shown in Figure 5.14. Addition of the carbanion species (G) to the keton
species (H) will, therefore, induce facile formation of carbon-carbon bonds (I) between these
compounds.
OMeMeO
OH
O
O
MeO
OH
MeO
OH
O
OMe
OMe
OH
CH3OH
MeO
OH
O
C
OMeMeO
OH
O
OMe
OMe
OH
CH3OH
O
OH
MeO
+
+
F
G
H
I
J
H
OMeMeO
OH
O
O
MeO
OH
MeO
OH
O
OMe
OMe
OH
CH3OH
MeO
OH
O
C
OMeMeO
OH
O
OMe
OMe
OH
CH3OH
O
OH
MeO
+
+
F
G
H
I
J
H
Figure 5.14: Repolymerization reaction between a phenolate and a carbenium ion
Less likely, however also possible, is that the phenolate ion (F) attacks the carbenium ion (J)
forming a new aryl-alkyl ether bond. As has been shown, these ether bonds are not very stable
and can be cleaved under the present conditions so that the equilibrium of this reaction lies on
the side of the reactants.
O
Mδ+
δ- C
O
+
O
OH
OM
+
K L
M
O
Mδ+
δ- C
O
+
O
OH
OM
+O
Mδ+
δ+
δ-
δ- C
O
+
O
OH
OM
+
K L
M
Figure 5.15: Formation of 2- benzyl phenol via a carbanion
Chapter 5
115
This is what we had expected in accordance with previous investigations on hydrothermal
treatment of lignin model compounds. A study on benzyl phenyl ether (K), which represents
the most frequent bond type in lignin, the aryl-alkyl ether bond, had shown a maximum yield
of hydrolysis products between 300 and 320°C [25]. Beyond 320°C yields dropped vastly and
higher molecular compounds were formed due to polymerization reactions of the monomers.
In the case of benzyl phenyl ether (K), oligomerization was likewise initiated by a carbanion
(L) formed from the main hydrolysis product phenolate. Figure 5.15 shows the formation of
the two main side products 2-benzyl phenol (M) and 4-benzyl phenol. This confirms the
formation of carbon-carbon bonds initiated by a carbanion species.
Oligomerization and polymerization reactions are also confirmed by the fact that the material
regained after washing the filter cake with THF, (defined as “unconverted lignin”) shows a
different chemical composition (5.2 wt.% higher carbon content) than the original lignin and
yields only 2 wt.% additional product oil when used again as feed for hydrolysis.
.
Influence of reaction conditions on lignin depolymerization and sequential polymerization
The yield of product oil obtained from base catalyzed depolymerization of lignin goes
through a maximum with both residence time and temperature and decreases with pressure.
Oil yields peak at 300°C, a residence time of 4.2 min and 250 bar. The highest yield of 23.3
wt.% oil was obtained from a 10 wt.% lignin/ 4 wt.% NaOH aqueous solution under these
conditions. This is in agreement with Miller et al. [21], who found less insoluble products
(unconverted lignin) with decreasing lignin/NaOH ratios. The products in this oil have
molecular masses below 350 g/mol. As the estimated molecular mass of a syringol unit is
estimated to be 175 g/mol, the products consist primarily of monomers and dimers. When the
NaOH concentration was decreased to 2.5 wt.% the product oil contained oligomers up to the
weight of tetramers. As shown in Figure 5.6 monomer yield is proportional to the
concentration of available NaOH (Na+ cations). However, extrapolation of the monomer yield
reveals that approximately 1 wt.% NaOH is necessary to initiate hydrolytic conversion.
In part this “excess” NaOH is needed to convert the hydroxyl groups of phenolic and
catecholic compounds into the alcoholate. This process reduces internal hydrogen bonding
between the hydroxyl groups [27] and increases the solubility of lignin. The ratio of Na+ to
oxygen atoms in lignin corresponds to eight oxygen molecules per Na+ atom used, before
hydrolysis is being catalyzed in line with the average concentration of free Na+ cations. It can
Chapter 5
116
be speculated that the reduction of the internal hydrogen bonds enhances also the accessibility
of the ether bonds and facilitates the cleavage of phenolic monomers of lignin.
NaOH does not play an active role in the mechanism of oligomer formation. However,
oligomer formation depends on NaOH concentration in terms of solubility, as the formation
of a carbanion is only possible if the hydroxyl group is deprotonated. Figure 4 illustrates that
at a NaOH concentration of 2.5 wt.% oligomer yield reaches a plateau indicating that
oligomerization is not longer limited by the low solubility of reactants.
In Figure 5.8 is seen that monomer yields slightly increase with lignin dilution while oligomer
yields decrease simultaneously. This is what we expect for a consecutive reaction where
oligomers are secondary products. This becomes more clear when refering to monomer
concentrations. With an increase in initial lignin concentration, monomer concentration rises.
Consequently, the rate for oligomer formation is enhanced. This is in agreement with
Vigneault et al., who observed a decrease of monomer yield with increasing lignin
concentrations [15].
At present, the negative effect of pressure on lignin depolymerization is not clear. Yet, a
possible explanation for the decrease in monomer yield could be the solvent cage effect. With
increasing pressure the density of the solvent increases, intermolecular interactions are
enhanced and the influence of the cage effect becomes stronger [28]. According to the cage
effect theory the initially formed ion pair is trapped in the solvent cage [A++B
-]* and the
overall reaction from AB to A++B
- can only be realized if the initially formed ion pair is able
to diffuse apart. High densities increase the solvent cage strength, as intermolecular
interaction becomes stronger. Referring to the β-O-4-bond cleavage, this means that the
formed phenolate and the carbenium ion can not diffuse apart and are more likely to
recombine and regenerate the reactant. This effect is predominantly observed in super critical
water, but has been invoked for reactions in subcritical water to rationalize the change in the
reaction pathways with the change in the solvent or with increasing water density [29].
In the same way oligomer formation could be suppressed as the solvent cage would hinder the
natrium phenolate ion pair to diffuse and thus suppresses the formation of a carbanion.
5.5 Conclusions
We have shown that the depolymerization of lignin to monomeric compounds is
limited by consecutive addition and condensation reactions of the phenolic monomers to
oligomers. The formation of monomers from base catalyzed hydrolysis is proportional to the
Chapter 5
117
NaOH concentration in the aqueous solution. However, an excess of NaOH is necessary to
initiate hydrolysis. The “excess” NaOH is needed to convert the hydroxyl groups of phenolic
and catecholic compounds into the alcoholate. This process reduces internal hydrogen
bonding between the hydroxyl groups [27] and increases the solubility of lignin. It can be
speculated that the reduction of the internal hydrogen bonds enhances also the accessibility of
the ether bonds and facilitates the cleavage of phenolic monomers of lignin.
It is suggested that, during base catalyzed depolymerization of lignin, cleavage of the β-O-4
ether bond takes place heterolytically via the formation of a sodium phenolate derivative and
a carbenium ion like transition state, which is instantly neutralized by a hydroxide ion. The
sodium cations catalyze the reaction by forming cation adducts with lignin and, thus,
polarizing the ether bond. Syringol and its derivatives are preferentially formed due to the
stabilization of the carbenium ion transition state by the substituted methoxy groups.
5.6 References
1. Erickson, M.Larsson, S.Miksche, G.E., Acta Chem. Scand., 1973, 27 903.
2. Glasser, W.G. and Glasser, H.R., Paperi ja Puu, 1981, 63(2), 71-83.
3. Nimz, H., Angew. Chem., 1974, 86 336-44.
4. Yoshida, T. and Oshima, Y., Ind. Eng. Chem. Res., 2004, 43(15), 4097-104.
5. Osada, M.Sato, O.Watanabe, M.Arai, K.M., S., Energy Fuels, 2006, 20(3), 930-35.
6. Petrocelli, F.P. and Klein, M.T., Ind. Eng. Chem. Prod. Res. Dev., 1985, 24(4), 635-
41.
7. Amen-Chen, C.Pakdel, H.Roy, C., Bioresour. Technol., 2001, 79(3), 277-99.
8. Saisu, M.Sato, T.Watanabe, M.Adschiri, T.Arai, K., Energy Fuels, 2003, 17(4), 922-
28.
9. Kratzl, K. and Gratzl, J., Holzforschung, Holzverwertung, 1960, 1 8-14.
10. Dorrestijn, E.Laarhoven, L.J.J.Arends, I.Mulder, P., J. Anal. Appl. Pyrolysis, 2000,
54(1-2), 153-92.
11. Li, J.Henriksson, G.Gellerstedt, G., Bioresour. Technol., 2007, 98 3061-68.
12. McDonough, T.J., Tappi J., 1993, 76(8), 186-93.
13. Britt, P.F.Buchanan, A.C.Thomas, K.B.Lee, S.K., J. Anal. Appl. Pyrolysis, 1995, 33
1-19.
14. Man, X.Okuda, K.Ohara, S.Umetsu, M.Takami, S.Adschiri, T., Journal of Japan
Institute of Energy, 2005, 84 486-93.
Chapter 5
118
15. Vigneault A, J.D., Chornet E, Advance in the thermal depolymerization of lignin via
base-catalysis, in Science in Thermal and Chemical Biomass Conversion. 2006, CPL
Press.
16. Thring, R.W. and Breau, J., Fuel, 1996, 75(7), 795-800.
17. Sugita, Chem. Express, 1988, 3(8), 507-10.
18. Kruse, A. and Gawlik, A., Ind. Eng. Chem. Res., 2003, 42(2), 267-79.
19. Shabtai, J.S.Zmierczak, W.W.Chornet, E.Johnson, D., US2003/0100807 A1, 2003, 1-
19.
20. Shabtai, J.S.Zmierczak, W.W.Chornet, E.Johnson, D., US2003/0115792 A1, 2003.
21. Miller, J.E.Evans, L.R.Mudd, J.Brown, K., Sandia National Laboratories, SAND2002-
1318, 2002.
22. Miller, J.E.Evans, L.R.Littlewolf, A.Trudell, D.E., Fuel, 1999, 78(11), 1363-66.
23. Wooley, R., Biofuels Programm Semiannual Report, National Renewable Energy
Laboratory: Golden, Colorado, 2000.
24. Bergstrom, H.O.V. and Cederquist, K.N., US2,177,557, 1939.
25. Roberts, V.Fendt, S.Lercher, J.A., 2008.
26. Roberts, V. and Lercher, J., 2008.
27. Kubo, S. and Kadla, J.F., Biomacromolecules, 2005, 6 2815-21.
28. Wu, B.C.Klein, M.T.Sandler, S.I., Energy Fuels, 1991, 5(3), 453-58.
29. Akiya, N. and Savage, P.E., Chem. Rev., 2002, 102 (8), 2725-50.
Chapter 6
119
Chapter 6
Boric acid as a capping agent to suppress
oligomerization reactions during hydrothermal
lignin treatment
Abstract
The inhibition of concurrent oligomerization reactions during hydrothermal lignin
depolymerization is an important issue to enhance product yields. Applying boric acid as a
capping agent to suppress addition and condensation reactions of primarily formed products
significantly increases lignin depolymerization. Combination of base catalyzed lignin
hydrolysis with the addition of boric acid shifts the product distribution to lower molecular
weight and further increases products yields.
Chapter 6
120
6 Boric acid as an additive to suppress repolymerization
reactions during hydrothermal lignin treatment
6.1 Introduction
Lignin is a vastly abundant but underutilized polymer. Due to its composition of
phenyl propane units, it is a potentially rich source of phenolic compounds. If suitably
depolymerized, lignin has the potential to be a suitable gasoline additive or diesel fuel when
hydro treated. Literature research on lignin depolymerization however, shows that there are
limitations to the process. No matter to which condition lignin is exposed, each approach to
depolymerize its structure does not yield more than approximately 20-25 wt.% of a product
oil containing monomers and dimers. This boundary can be attributed to the repolymerization
of the highly reactive lignin cleavage products, forming coke and a lignin like material, which
is defined as unconverted lignin. Yet CHN analysis of the unconverted lignin shows a
different chemical composition (5.2 wt.% higher carbon content) than the original lignin and
yields only 2 wt.% additional product oil when retreated [1]. The mechanism of
repolymerization is so far unclear although assumptions have been made in literature [1-5].
To increase the yield of product oil from hydrothermal lignin treatment repolymerization has
to be limited. Many attempts have been made hereunto by stabilizing the intermediate
products, yet with little success.
In the following, we will give a general literature review, introducing the theory behind these
attempts, and will then introduce a new technique which inhibits repolymerization to such an
extent, that higher yields of product oil can be obtained.
Ionic and radical mechanisms have been proposed for repolymerization. Xin et al [2] consider
hydrolysis and dealkylation to occur, generating reactive low molecular weight fragments as
formaldehyde and phenolic compounds. Polymerization of these compounds then takes place
by cross-linking of the formaldehyde with the phenolic units. Others assume the formation of
stable C-C bonds by condensation of the reactive structures primarily formed by ether
hydrolysis [3-5].
Li et al. [6] propose depolymerization and repolymerization to take place simultaneously and
that both reaction pathways posses the same intermediate state, namely a carbenium ion,
generated at the α carbon atom.
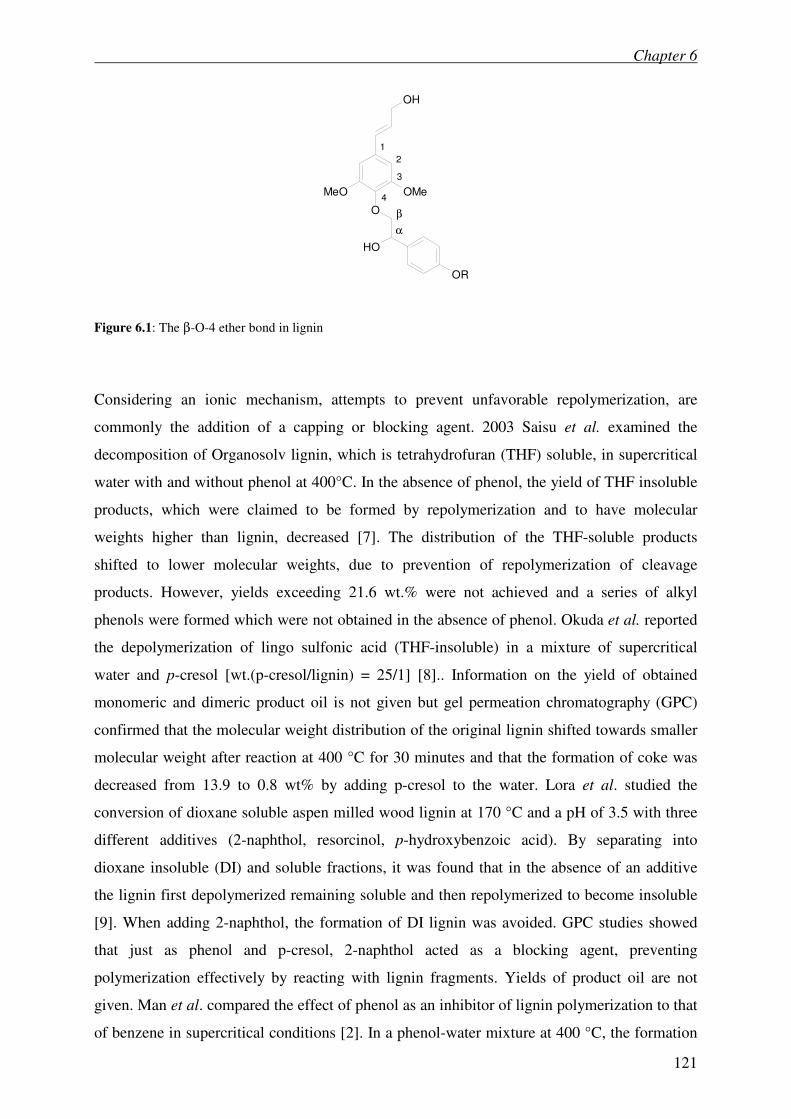
Chapter 6
121
OH
OMeMeO
OR
OH
O β
α
1
2
3
4
Figure 6.1: The β-O-4 ether bond in lignin
Considering an ionic mechanism, attempts to prevent unfavorable repolymerization, are
commonly the addition of a capping or blocking agent. 2003 Saisu et al. examined the
decomposition of Organosolv lignin, which is tetrahydrofuran (THF) soluble, in supercritical
water with and without phenol at 400°C. In the absence of phenol, the yield of THF insoluble
products, which were claimed to be formed by repolymerization and to have molecular
weights higher than lignin, decreased [7]. The distribution of the THF-soluble products
shifted to lower molecular weights, due to prevention of repolymerization of cleavage
products. However, yields exceeding 21.6 wt.% were not achieved and a series of alkyl
phenols were formed which were not obtained in the absence of phenol. Okuda et al. reported
the depolymerization of lingo sulfonic acid (THF-insoluble) in a mixture of supercritical
water and p-cresol [wt.(p-cresol/lignin) = 25/1] [8].. Information on the yield of obtained
monomeric and dimeric product oil is not given but gel permeation chromatography (GPC)
confirmed that the molecular weight distribution of the original lignin shifted towards smaller
molecular weight after reaction at 400 °C for 30 minutes and that the formation of coke was
decreased from 13.9 to 0.8 wt% by adding p-cresol to the water. Lora et al. studied the
conversion of dioxane soluble aspen milled wood lignin at 170 °C and a pH of 3.5 with three
different additives (2-naphthol, resorcinol, p-hydroxybenzoic acid). By separating into
dioxane insoluble (DI) and soluble fractions, it was found that in the absence of an additive
the lignin first depolymerized remaining soluble and then repolymerized to become insoluble
[9]. When adding 2-naphthol, the formation of DI lignin was avoided. GPC studies showed
that just as phenol and p-cresol, 2-naphthol acted as a blocking agent, preventing
polymerization effectively by reacting with lignin fragments. Yields of product oil are not
given. Man et al. compared the effect of phenol as an inhibitor of lignin polymerization to that
of benzene in supercritical conditions [2]. In a phenol-water mixture at 400 °C, the formation
Chapter 6
122
of coke was reduced to 12 wt.%, while a mixture of benzene and water did not block
polymerization. On examining steam treatment of aspen wood and lignin, Li et al.
investigated the competition between depolymerization and repolymerization of lignin in the
presence of blocking agents. Addition of 2-naphthol was revealed to inhibit the
polymerization most effectively [10].
Repolymerization of lignin cleavage products has also been claimed to follow a radical
pathway [11, 12]. Dorrestjin reports that weak phenoxylic bonds inside the lignin matrix start
to cleave and thereby initiate radical reactions. Subsequently, recombination of radical
moieties may lead to the formation of new carbon-carbon bonds [12]. Therefore, a further
attempt to suppress polymerization of lignin cleavage products is the application of an
external hydrogen-donor source to reduce the radical concentration by reacting the radical
moieties with hydrogen.
Dorrestjin et al. studied the depolymerisation of lignin to mono phenolic compounds in
mixtures of 9,10-dihydroanthracene and dioxane between 227 and 377°C [13]. The highest
yield of mono phenolic compounds (7 wt.%) was achieved applying Organosolv lignin in a
weight ratio of dioxane to 9,10-dihydroanthracene of 1:1 and 352°C. Tetralin was used as a
hydrogen donor solvent in studies on lignin hydrogenolysis conducted by Sugita [14] and
Thring [15]. In contrast to Dorrestijin these experiments were conducted in a hydrogen
atmosphere additionally to the hydrogen donor solvent. Thring summarizes the detected
monomeric products (phenol-, syringyl-, guaiacyl- and catechol derivatives as well as
aldehydes) and obtained a maximum yield of approx. 7 wt.% for a reaction time of 60 min at
390°C and with a nickel-tungsten catalyst. Sugita investigated the effect of FeCl3 and ZnCl2
and found a maximum total yield of 24 wt% products obtained from extraction of the acidic
fraction in a temperature range of 400-420°C and with FeCl3.
6.2 Experimental
The experiments were carried out in stainless steel autoclaves with a volume of 5.6
mL at 270°C to 360°C and reaction times from 20-60 min. Organosolv lignin purchased from
Sigma Aldrich was applied for all experiments. The reactors were filled with 0.1g lignin, 0.2g
boric acid and 3.7 mL bi distilled water. To determine the effect of boric acid concentration,
the weight ratio boric acid to lignin was varied from 0.5 to 2. For the experiments with NaOH,
weight ratios of NaOH to boric acid were varied from 0.5 to 1.25. Base catalyzed
depolymerisation experiments (BCD) were conducted under the same conditions with 5 mL
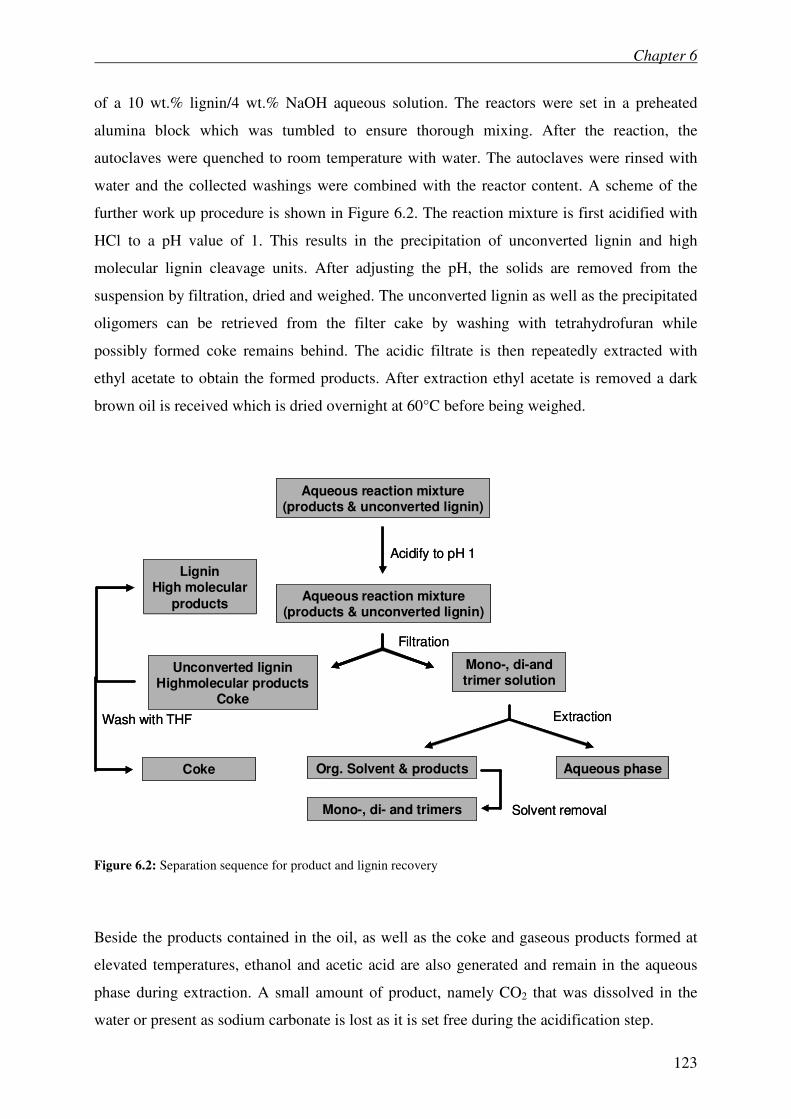
Chapter 6
123
of a 10 wt.% lignin/4 wt.% NaOH aqueous solution. The reactors were set in a preheated
alumina block which was tumbled to ensure thorough mixing. After the reaction, the
autoclaves were quenched to room temperature with water. The autoclaves were rinsed with
water and the collected washings were combined with the reactor content. A scheme of the
further work up procedure is shown in Figure 6.2. The reaction mixture is first acidified with
HCl to a pH value of 1. This results in the precipitation of unconverted lignin and high
molecular lignin cleavage units. After adjusting the pH, the solids are removed from the
suspension by filtration, dried and weighed. The unconverted lignin as well as the precipitated
oligomers can be retrieved from the filter cake by washing with tetrahydrofuran while
possibly formed coke remains behind. The acidic filtrate is then repeatedly extracted with
ethyl acetate to obtain the formed products. After extraction ethyl acetate is removed a dark
brown oil is received which is dried overnight at 60°C before being weighed.
Aqueous reaction mixture(products & unconverted lignin)
Acidify to pH 1
Aqueous reaction mixture(products & unconverted lignin)
Filtration
Unconverted ligninHighmolecular products
Coke
LigninHigh molecular
products
Coke
Mono-, di-and trimer solution
Extraction
Org. Solvent & products Aqueous phase
Mono-, di- and trimers Solvent removal
Wash with THF
Aqueous reaction mixture(products & unconverted lignin)
Acidify to pH 1
Aqueous reaction mixture(products & unconverted lignin)
Filtration
Unconverted ligninHighmolecular products
Coke
LigninHigh molecular
products
Coke
Mono-, di-and trimer solution
Extraction
Org. Solvent & products Aqueous phase
Mono-, di- and trimers Solvent removal
Wash with THF
Figure 6.2: Separation sequence for product and lignin recovery
Beside the products contained in the oil, as well as the coke and gaseous products formed at
elevated temperatures, ethanol and acetic acid are also generated and remain in the aqueous
phase during extraction. A small amount of product, namely CO2 that was dissolved in the
water or present as sodium carbonate is lost as it is set free during the acidification step.
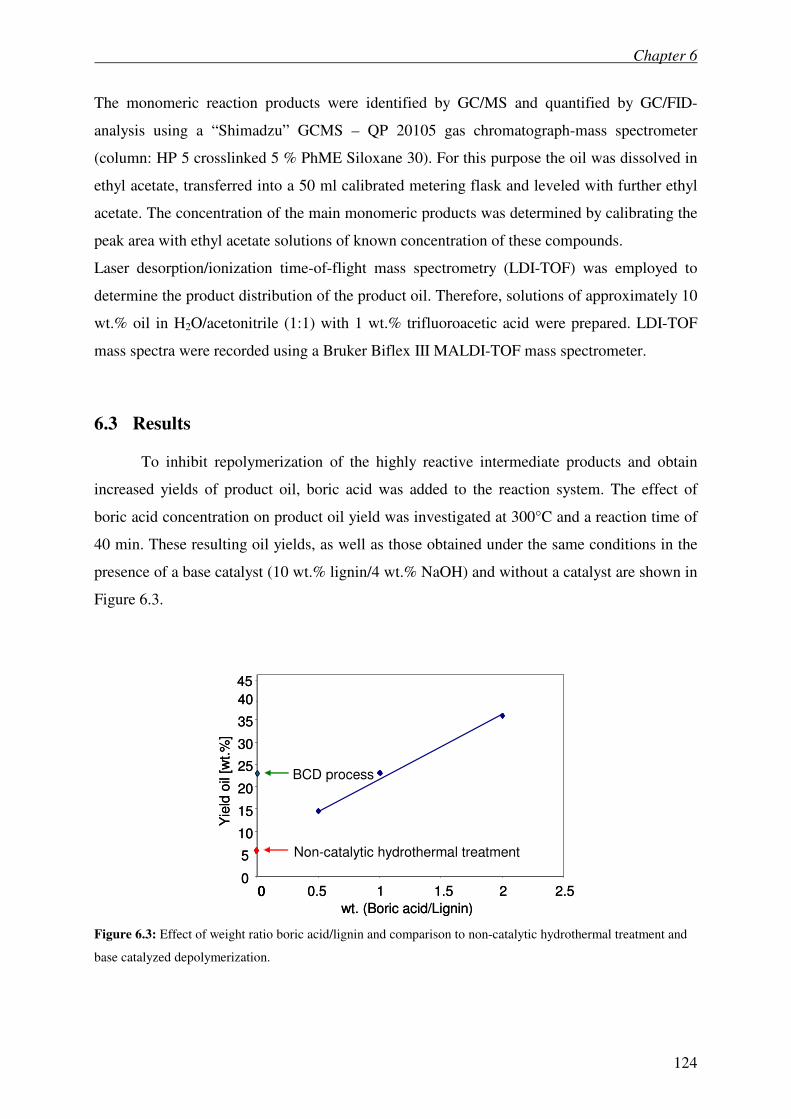
Chapter 6
124
The monomeric reaction products were identified by GC/MS and quantified by GC/FID-
analysis using a “Shimadzu” GCMS – QP 20105 gas chromatograph-mass spectrometer
(column: HP 5 crosslinked 5 % PhME Siloxane 30). For this purpose the oil was dissolved in
ethyl acetate, transferred into a 50 ml calibrated metering flask and leveled with further ethyl
acetate. The concentration of the main monomeric products was determined by calibrating the
peak area with ethyl acetate solutions of known concentration of these compounds.
Laser desorption/ionization time-of-flight mass spectrometry (LDI-TOF) was employed to
determine the product distribution of the product oil. Therefore, solutions of approximately 10
wt.% oil in H2O/acetonitrile (1:1) with 1 wt.% trifluoroacetic acid were prepared. LDI-TOF
mass spectra were recorded using a Bruker Biflex III MALDI-TOF mass spectrometer.
6.3 Results
To inhibit repolymerization of the highly reactive intermediate products and obtain
increased yields of product oil, boric acid was added to the reaction system. The effect of
boric acid concentration on product oil yield was investigated at 300°C and a reaction time of
40 min. These resulting oil yields, as well as those obtained under the same conditions in the
presence of a base catalyst (10 wt.% lignin/4 wt.% NaOH) and without a catalyst are shown in
Figure 6.3.
0
5
10
15
20
25
30
35
40
0 0.5 1 1.5 2 2.5
Yie
ld o
il [w
t.%
]
0
wt. (Boric acid/Lignin)
Non-catalytic hydrothermal treatment
BCD process
45
0
5
10
15
20
25
30
35
40
0 0.5 1 1.5 2 2.5
Yie
ld o
il [w
t.%
]
0
wt. (Boric acid/Lignin)
Non-catalytic hydrothermal treatment
BCD process
45
Figure 6.3: Effect of weight ratio boric acid/lignin and comparison to non-catalytic hydrothermal treatment and
base catalyzed depolymerization.
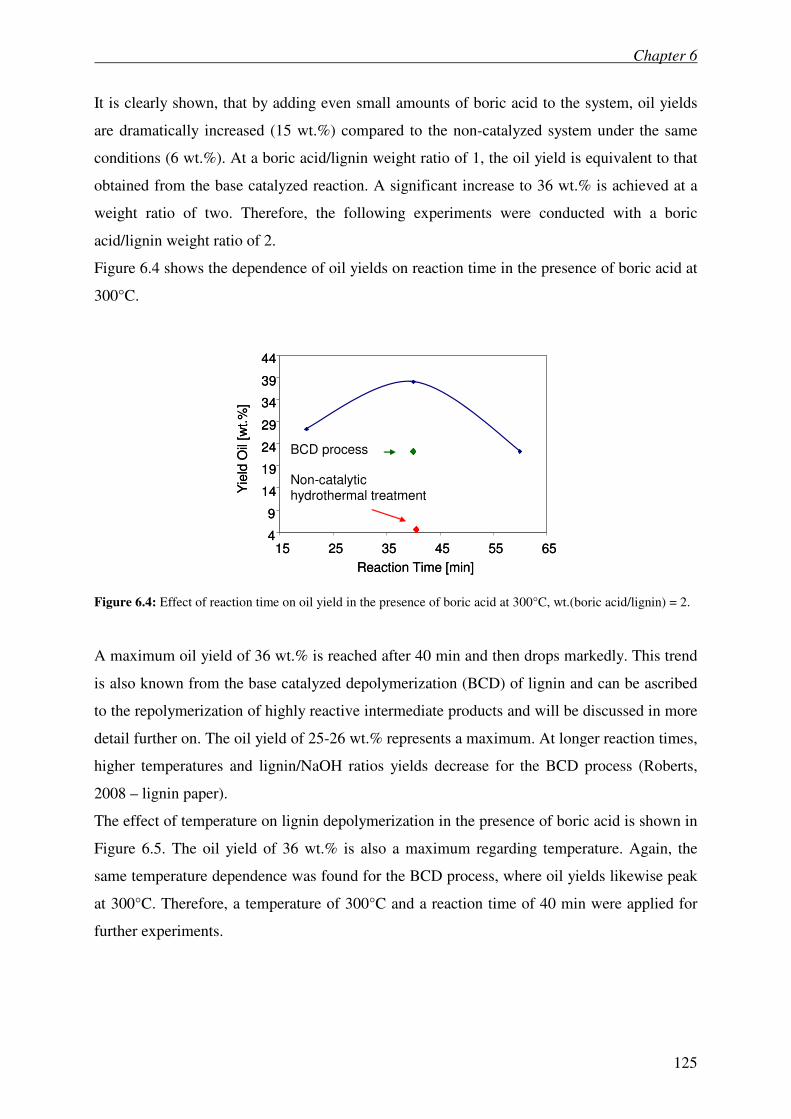
Chapter 6
125
It is clearly shown, that by adding even small amounts of boric acid to the system, oil yields
are dramatically increased (15 wt.%) compared to the non-catalyzed system under the same
conditions (6 wt.%). At a boric acid/lignin weight ratio of 1, the oil yield is equivalent to that
obtained from the base catalyzed reaction. A significant increase to 36 wt.% is achieved at a
weight ratio of two. Therefore, the following experiments were conducted with a boric
acid/lignin weight ratio of 2.
Figure 6.4 shows the dependence of oil yields on reaction time in the presence of boric acid at
300°C.
4
9
14
19
24
29
34
39
44
15 25 35 45 55 65
Reaction Time [min]
Yie
ld O
il [w
t.%
]
Non-catalytic hydrothermal treatment
BCD process
4
9
14
19
24
29
34
39
44
15 25 35 45 55 65
Reaction Time [min]
Yie
ld O
il [w
t.%
]
Non-catalytic hydrothermal treatment
BCD process
Figure 6.4: Effect of reaction time on oil yield in the presence of boric acid at 300°C, wt.(boric acid/lignin) = 2.
A maximum oil yield of 36 wt.% is reached after 40 min and then drops markedly. This trend
is also known from the base catalyzed depolymerization (BCD) of lignin and can be ascribed
to the repolymerization of highly reactive intermediate products and will be discussed in more
detail further on. The oil yield of 25-26 wt.% represents a maximum. At longer reaction times,
higher temperatures and lignin/NaOH ratios yields decrease for the BCD process (Roberts,
2008 – lignin paper).
The effect of temperature on lignin depolymerization in the presence of boric acid is shown in
Figure 6.5. The oil yield of 36 wt.% is also a maximum regarding temperature. Again, the
same temperature dependence was found for the BCD process, where oil yields likewise peak
at 300°C. Therefore, a temperature of 300°C and a reaction time of 40 min were applied for
further experiments.
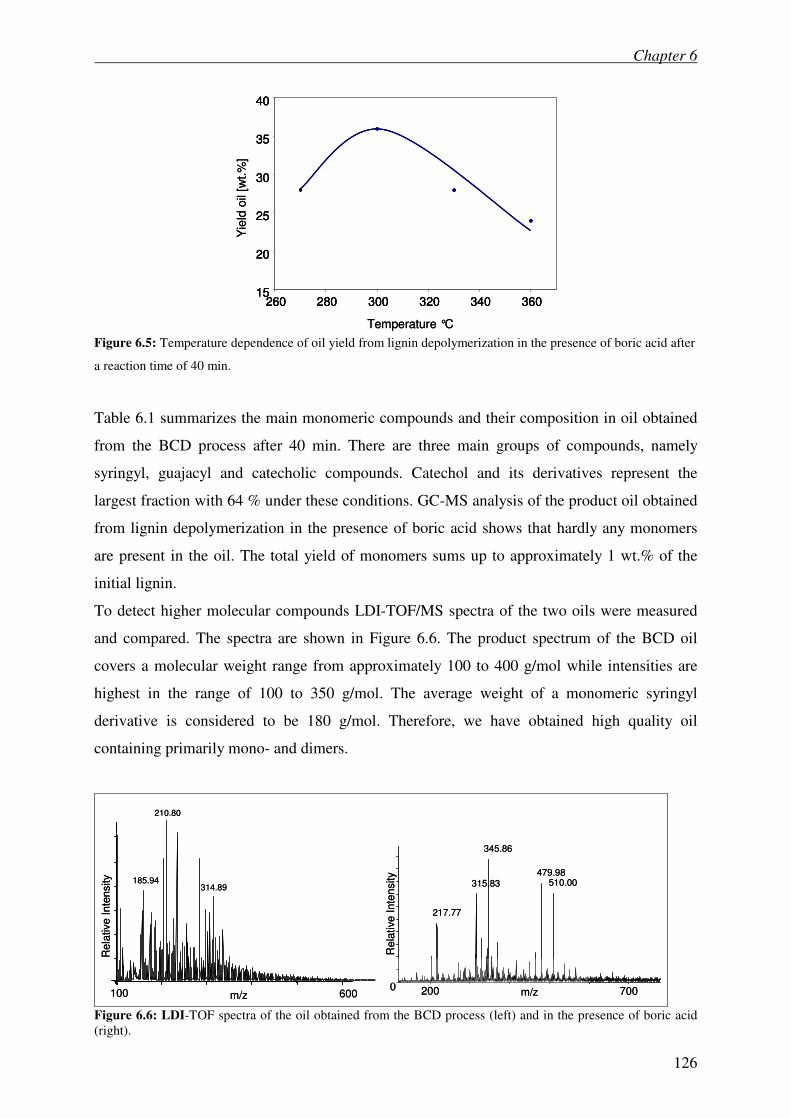
Chapter 6
126
15
20
25
30
35
40
260 280 300 320 340 360
Yie
ld o
il [w
t.%
]
Temperature °C
15
20
25
30
35
40
260 280 300 320 340 36015
20
25
30
35
40
260 280 300 320 340 360
Yie
ld o
il [w
t.%
]
Temperature °C Figure 6.5: Temperature dependence of oil yield from lignin depolymerization in the presence of boric acid after
a reaction time of 40 min.
Table 6.1 summarizes the main monomeric compounds and their composition in oil obtained
from the BCD process after 40 min. There are three main groups of compounds, namely
syringyl, guajacyl and catecholic compounds. Catechol and its derivatives represent the
largest fraction with 64 % under these conditions. GC-MS analysis of the product oil obtained
from lignin depolymerization in the presence of boric acid shows that hardly any monomers
are present in the oil. The total yield of monomers sums up to approximately 1 wt.% of the
initial lignin.
To detect higher molecular compounds LDI-TOF/MS spectra of the two oils were measured
and compared. The spectra are shown in Figure 6.6. The product spectrum of the BCD oil
covers a molecular weight range from approximately 100 to 400 g/mol while intensities are
highest in the range of 100 to 350 g/mol. The average weight of a monomeric syringyl
derivative is considered to be 180 g/mol. Therefore, we have obtained high quality oil
containing primarily mono- and dimers.
m/z100 600
185.94
210.80
314.89
m/z200 700
Rela
tive Inte
nsity
0
217.77
315.83
345.86
479.98510.00
Rela
tive Inte
nsity
m/z100 600
185.94
210.80
314.89
m/z200 700
Rela
tive Inte
nsity
0
217.77
315.83
345.86
479.98510.00
Rela
tive Inte
nsity
Figure 6.6: LDI-TOF spectra of the oil obtained from the BCD process (left) and in the presence of boric acid
(right).
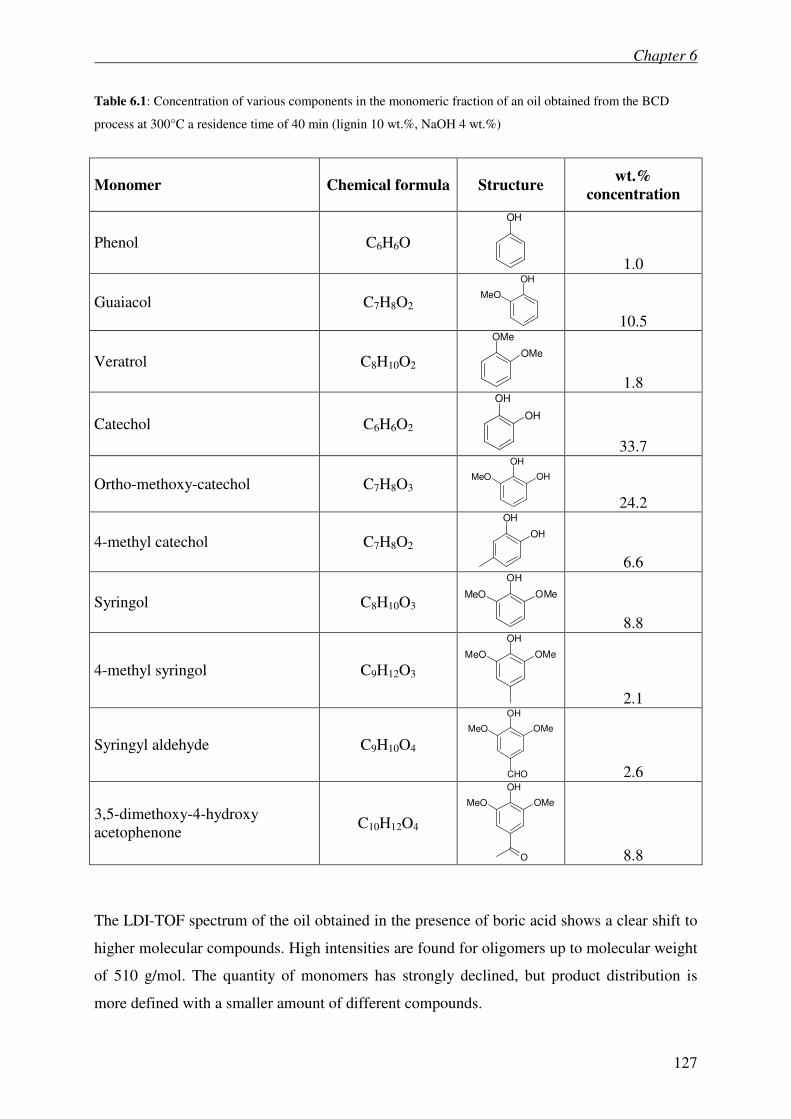
Chapter 6
127
Table 6.1: Concentration of various components in the monomeric fraction of an oil obtained from the BCD
process at 300°C a residence time of 40 min (lignin 10 wt.%, NaOH 4 wt.%)
Monomer Chemical formula Structure wt.%
concentration
Phenol C6H6O
OH
1.0
Guaiacol C7H8O2
OH
MeO
10.5
Veratrol C8H10O2
OMe
OMe
1.8
Catechol C6H6O2
OH
OH
33.7
Ortho-methoxy-catechol C7H8O3
OH
OHMeO
24.2
4-methyl catechol C7H8O2
OH
OH
6.6
Syringol C8H10O3
OH
OMeMeO
8.8
4-methyl syringol C9H12O3
OH
OMeMeO
2.1
Syringyl aldehyde C9H10O4
OH
OMeMeO
CHO 2.6
3,5-dimethoxy-4-hydroxy
acetophenone C10H12O4
OH
OMeMeO
O 8.8
The LDI-TOF spectrum of the oil obtained in the presence of boric acid shows a clear shift to
higher molecular compounds. High intensities are found for oligomers up to molecular weight
of 510 g/mol. The quantity of monomers has strongly declined, but product distribution is
more defined with a smaller amount of different compounds.
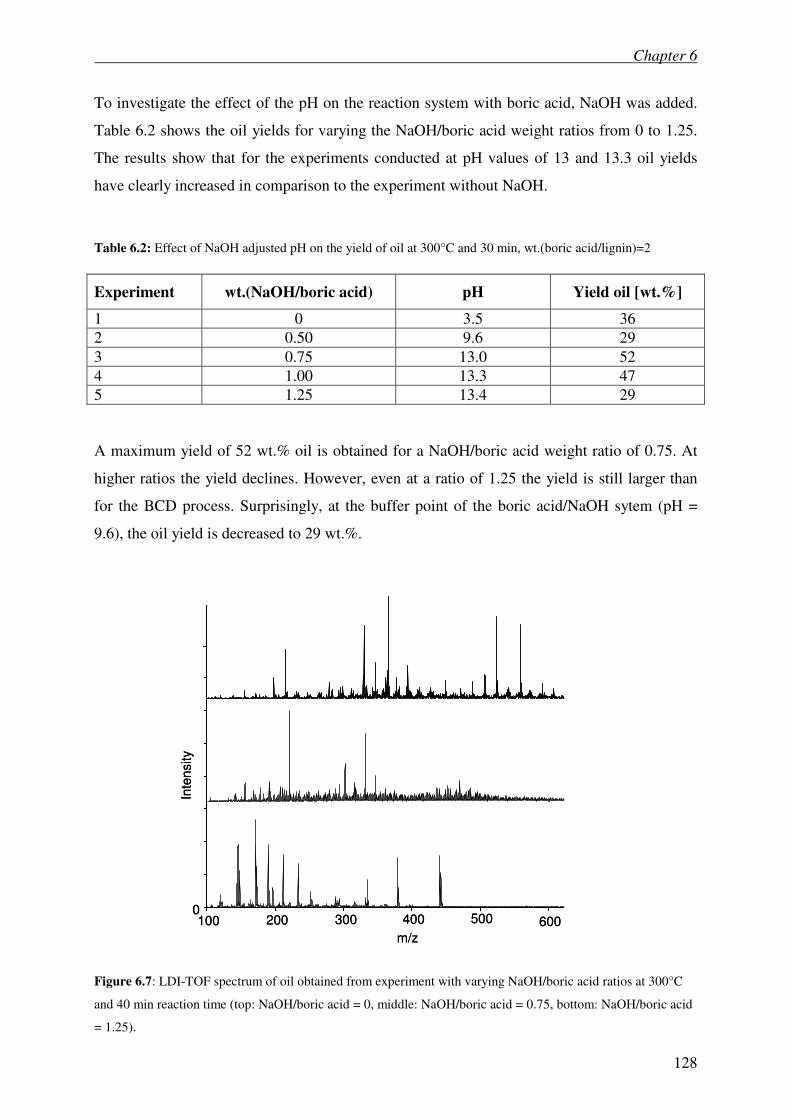
Chapter 6
128
To investigate the effect of the pH on the reaction system with boric acid, NaOH was added.
Table 6.2 shows the oil yields for varying the NaOH/boric acid weight ratios from 0 to 1.25.
The results show that for the experiments conducted at pH values of 13 and 13.3 oil yields
have clearly increased in comparison to the experiment without NaOH.
Table 6.2: Effect of NaOH adjusted pH on the yield of oil at 300°C and 30 min, wt.(boric acid/lignin)=2
Experiment wt.(NaOH/boric acid) pH Yield oil [wt.%]
1 0 3.5 36
2 0.50 9.6 29
3 0.75 13.0 52
4 1.00 13.3 47
5 1.25 13.4 29
A maximum yield of 52 wt.% oil is obtained for a NaOH/boric acid weight ratio of 0.75. At
higher ratios the yield declines. However, even at a ratio of 1.25 the yield is still larger than
for the BCD process. Surprisingly, at the buffer point of the boric acid/NaOH sytem (pH =
9.6), the oil yield is decreased to 29 wt.%.
Figure 6.7: LDI-TOF spectrum of oil obtained from experiment with varying NaOH/boric acid ratios at 300°C
and 40 min reaction time (top: NaOH/boric acid = 0, middle: NaOH/boric acid = 0.75, bottom: NaOH/boric acid
= 1.25).
m/z
100 600
Inte
nsity
0200 300 400 500
m/z
100 600
Inte
nsity
0200 300 400 500
Chapter 6
129
The LDI-TOF spectra of the oils obtained from the experiments with varying NaOH/boric
acid weight ratios (Table 6.2: experiments 1, 3 and 5) are shown in Figure 6.7. With
compounds in the range of 150 to 500 g/mol, the oil obtained with from experiment 3 has a
narrower molecular weight distribution than the oil obtained from the experiment with only
boric acid (experiment 1). Also, in comparison to the oil obtained in the presence of boric acid
the monomer fraction (up to 180 g/mol) in the oil has increased. This trend is even more
pronounced when the NaOH/boric acid ratio is increased to 1.25 (experiment 5). In this case,
the product distribution has become more defined and the monomeric fraction in the oil has
further increased. In general, it is observed that with an increasing amount of NaOH the
molecular weight distribution is shifted towards lower molecular products, increasing the
monomeric fraction of the oil.
It should be noted that only the relative intensities among peaks of one spectrum can be
compared but not of two different spectra.
6.4 Discussion
Lignin can be depolymerized via acid and base catalyzed hydrolysis of the ether
linkages abundant in its structure. The products of base catalyzed hydrolysis are compiled in
Table 6.1, indicating that the initial products formed are substituted derivatives of phenol and
catechol [1]. It has been indeed shown that in the early stages of reaction such monomers have
been found, which condense via an aldol addition route in the later stages of the reaction [1].
The monomer concentration is proportional to the concentration of NaOH in the aqueous
solution, i.e., it is proportional to the activity of the Na+ cations.
It is important to note at this point that an excess of NaOH is necessary to initiate hydrolytic
conversion. In part this “excess” lignin is needed to convert the hydroxyl groups of phenolic
and catecholic compounds into the alcoholate. This process reduces internal hydrogen
bonding between the hydroxyl groups [16] and increases the solubility of lignin. The ratio of
Na+ to oxygen atoms in lignin corresponds to eight oxygen molecules per Na
+ atom used,
before hydrolysis is being catalyzed in line with the average concentration of free Na+ cations.
It can be speculated that the reduction of the internal hydrogen bonds enhances also the
accessibility of the ether bonds and facilitates the cleavage of phenolic monomers of lignin.
In contrast to the basic, the acidic environment even enhances the degree of internal hydrogen
bonding. As a consequence, the possibility of the acid catalyzed cleavage of ether bonds is
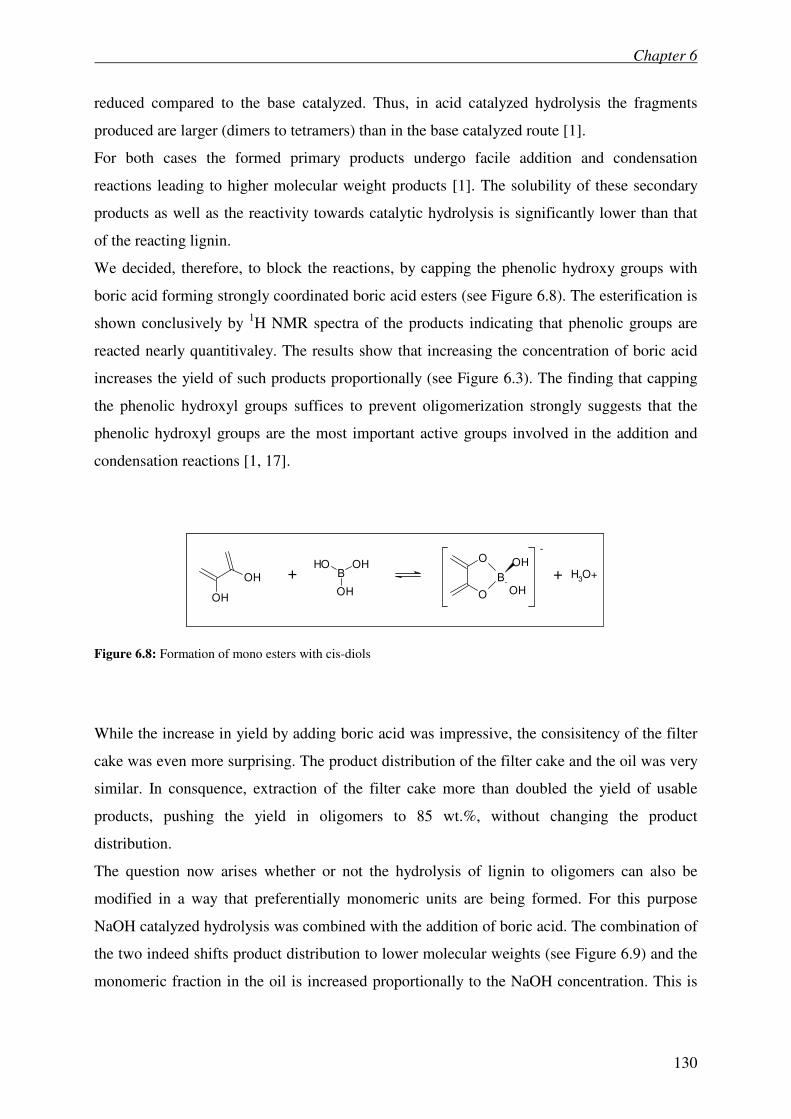
Chapter 6
130
reduced compared to the base catalyzed. Thus, in acid catalyzed hydrolysis the fragments
produced are larger (dimers to tetramers) than in the base catalyzed route [1].
For both cases the formed primary products undergo facile addition and condensation
reactions leading to higher molecular weight products [1]. The solubility of these secondary
products as well as the reactivity towards catalytic hydrolysis is significantly lower than that
of the reacting lignin.
We decided, therefore, to block the reactions, by capping the phenolic hydroxy groups with
boric acid forming strongly coordinated boric acid esters (see Figure 6.8). The esterification is
shown conclusively by 1H NMR spectra of the products indicating that phenolic groups are
reacted nearly quantitivaley. The results show that increasing the concentration of boric acid
increases the yield of such products proportionally (see Figure 6.3). The finding that capping
the phenolic hydroxyl groups suffices to prevent oligomerization strongly suggests that the
phenolic hydroxyl groups are the most important active groups involved in the addition and
condensation reactions [1, 17].
OH
OH
BOHOH
OH
O
O
BOH
OH
-
H3O++ +OH
OH
BOHOH
OH
O
O
BOH
OH
-
H3O++ +
Figure 6.8: Formation of mono esters with cis-diols
While the increase in yield by adding boric acid was impressive, the consisitency of the filter
cake was even more surprising. The product distribution of the filter cake and the oil was very
similar. In consquence, extraction of the filter cake more than doubled the yield of usable
products, pushing the yield in oligomers to 85 wt.%, without changing the product
distribution.
The question now arises whether or not the hydrolysis of lignin to oligomers can also be
modified in a way that preferentially monomeric units are being formed. For this purpose
NaOH catalyzed hydrolysis was combined with the addition of boric acid. The combination of
the two indeed shifts product distribution to lower molecular weights (see Figure 6.9) and the
monomeric fraction in the oil is increased proportionally to the NaOH concentration. This is
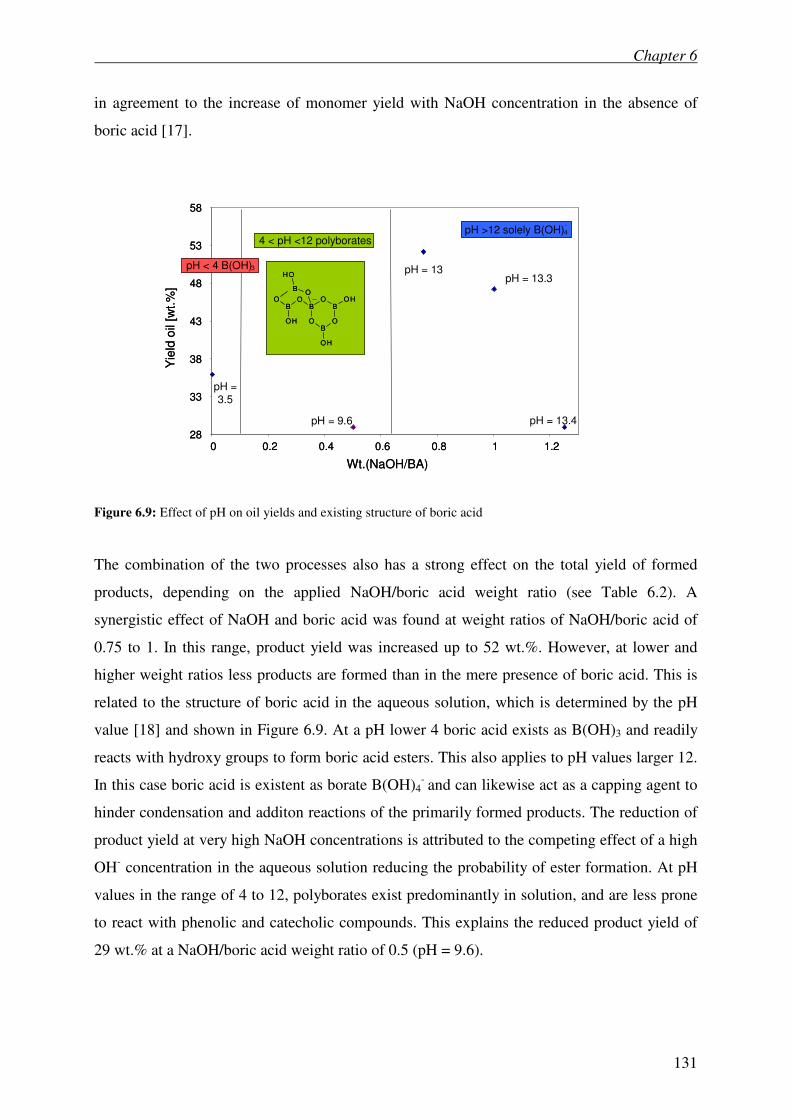
Chapter 6
131
in agreement to the increase of monomer yield with NaOH concentration in the absence of
boric acid [17].
pH = 9.6 pH = 13.4
28
33
38
43
48
53
58
0 0.2 0.4 0.6 0.8 1 1.2
Wt.(NaOH/BA)
Yie
ld o
il [w
t.%
]
pH =3.5
pH = 13pH = 13.3
pH >12 solely B(OH)4-
4 < pH <12 polyborates
pH < 4 B(OH)3
BO
O
O
B
B
B
OH
O
OHO
B
OH
OH
O
pH = 9.6 pH = 13.4
28
33
38
43
48
53
58
0 0.2 0.4 0.6 0.8 1 1.2
Wt.(NaOH/BA)
Yie
ld o
il [w
t.%
]
pH =3.5
pH = 13pH = 13.3
pH >12 solely B(OH)4-
4 < pH <12 polyborates
pH < 4 B(OH)3
BO
O
O
B
B
B
OH
O
OHO
B
OH
OH
OB
O
O
O
B
B
B
OH
O
OHO
B
OH
OH
O
Figure 6.9: Effect of pH on oil yields and existing structure of boric acid
The combination of the two processes also has a strong effect on the total yield of formed
products, depending on the applied NaOH/boric acid weight ratio (see Table 6.2). A
synergistic effect of NaOH and boric acid was found at weight ratios of NaOH/boric acid of
0.75 to 1. In this range, product yield was increased up to 52 wt.%. However, at lower and
higher weight ratios less products are formed than in the mere presence of boric acid. This is
related to the structure of boric acid in the aqueous solution, which is determined by the pH
value [18] and shown in Figure 6.9. At a pH lower 4 boric acid exists as B(OH)3 and readily
reacts with hydroxy groups to form boric acid esters. This also applies to pH values larger 12.
In this case boric acid is existent as borate B(OH)4- and can likewise act as a capping agent to
hinder condensation and additon reactions of the primarily formed products. The reduction of
product yield at very high NaOH concentrations is attributed to the competing effect of a high
OH- concentration in the aqueous solution reducing the probability of ester formation. At pH
values in the range of 4 to 12, polyborates exist predominantly in solution, and are less prone
to react with phenolic and catecholic compounds. This explains the reduced product yield of
29 wt.% at a NaOH/boric acid weight ratio of 0.5 (pH = 9.6).
Chapter 6
132
6.5 Conclusion
The inhibition of concurrent oligomerization reactions during hydrothermal lignin
depolymerization is important to enhance product yield from lignin depolymerization. Boric
acid has shown to be an excellent capping agent forming esters with phenolic OH groups.
Note that this indirectly also shows that the phenolic OH groups are key to these secondary
oligomerization rections. The acid catalyzed hydrolysis route is concluded to produce larger
fragments as primary products, because the stabilization of intermolecular hydrogen bonding
in lignin reduces the steric accessibility of ether groups for hydrolysis. In consequence, dimers
to tetramers are the most abundant products when boric acid is present as catalyst and capping
agent. With this approach 85% of lignin can be utilized in a single reaction step. The product
composition can be shifted to monomeric products by addition of appropriate concentration of
NaOH. The results indicate that lignin can be successfully converted into chemically viable
tailored phenolic building blocks.
6.6 References
1. Roberts, V. and Lercher, J., to be submitted, 2008.
2. Xin M., Journal of Japan Institute of Energy, 2005, 84 486-93.
3. Kratzl K, G.J., Holzforschung, Holzverwertung, 1960, 1 8-14.
4. Enkvist T., Tappi, 1952, 36 98.
5. Ishizu A., J. Japan Wood Res. Soc., 1958, 4 176.
6. Li J., Bioresource technology, 2007, 98(16), 3061-68.
7. Saisu, M.Sato, T.Watanabe, M.Adschiri, T.Arai, K., Energy Fuels, 2003, 17(4), 922-
28.
8. Okuda, K.Ohara, S.Umetsu, M.Takami, S.Adschiri, T., J. Phys.: Condens. Matter,
2004, 16 1325-30.
9. Lora, J.H. and Wayman, M., J. Appl. Polym. Sci., 1980, 25(4), 589-96.
10. Li J., 2007, 98, 3061, Bioresource Technology, 2007, 98 3061.
11. Britt, P.F.Buchanan, A.C.Thomas, K.B.Lee, S.K., J. Anal. Appl. Pyrolysis, 1995, 33
1-19.
12. Dorrestijn, E.Laarhoven, L.J.J.Arends, I.Mulder, P., J. Anal. Appl. Pyrolysis, 2000,
54(1-2), 153-92.
13. Dorrestijn, E.Kranenburg, M.Poinsot, D.Mulder, P., Holzforschung, 1999, 53(6), 611-
16.
Chapter 6
133
14. Sugita, Chem. Express, 1988, 3(8), 507-10.
15. Thring, R.W. and Breau, J., Fuel, 1996, 75(7), 795-800.
16. Kubo, S. and Kadla, J.F., Biomacromolecules, 2005, 6 2815-21.
17. Roberts, V.Fendt, S.Lercher, J.A., 2008.
18. Holleman, A.F. and Wiberg, E.N., Lehrbuch der Anorganischen Chemie. 102 ed.
2007: deGruyter.
Chapter 7
134
Chapter 7
Summary
Chapter 7
135
7.1 Summary
While the need for energy and raw materials is increasing world wide, environmental
problems, as a result of utilizing coal, crude oil and natural gas are gaining weight. The
decline of crude oil reservoirs and the associated fear of an energy crisis make renewable
resources more and more a topic of discussion. Due to its “CO2 neutrality”, biomass has a
high potential for the future and has to be considered as a regenerative resource for energy
and chemical production.
Lignin is a vastly abundant, but underutilized polymer. Due to its composition of phenyl
propane units, it is a potentially rich source of phenolic compounds for chemical production.
If suitably depolymerized, lignin further has the potential to be utilized as gasoline additive or
diesel fuel when hydro treated.
Three general routes for lignin conversion exist: (i) gasification to produce syngas, (ii)
production of biooil through pyrolysis or liquefaction and (iii) hydrolysis to produce
monomer and/or oligomer units. The first two routes demand severe conditions, while
hydrolysis is comparatively mild. Hydrolysis of lignin however, remains a great challenge due
to the extremely high thermal stability of the polymer, as well as in the difficulty of
controlling a selective bond cleavage into the phenolic monomers. The aim of this work was
therefore, to optimize reaction engineering and to develope a processing concept for
hydrothermal lignin conversion. Further, this work represents a fundamental investigation
towards characterization of the reaction products from catalytic hydrothermal lignin
depolymerization.
Due to the complexity and diversity of the lignin structure, model compounds were
applied to investigate the behaviour of lignin in sub-and supercritical water. Six compounds
were chosen, namely diphenyl ether, benzyl phenyl ether, diphenyl methan, eugenol, 4-
methoxy biphenyl und phthalan to represent the most frequent occuring bond types in lignin.
The results are summarized and discussed in chapter 3. It was shown that, in all model
compounds, the ether bond is cleaved both by pyrolysis and hydrolysis under the applied
conditions. Product distribution, however, can be influenced by adjusting the density of the
solvent. An increase in density shifts the reaction route towards an ionic pathway and the
formation of hydrolysis products is enhanced. For the very stable aryl-aryl ether bond in DPE,
a 100 % selectivity towards the hydrolysis product phenol is achieved at high densities in
supercritical water. By addition of alkali carbonates operation temperature for DPE
conversion is reduced from over 400°C to 350°C. Phenol yields are highest for K2CO3.
Chapter 7
136
However, when K2CO3 is supported on ZrO2 significant yields of phenol and a phenol
selectivity of 100% can be achieved with much smaller amounts of the carbonate. We ascribe
this to the increased amount of hydroxyl groups in the system, due to the dissociative
absorption of water on the metal oxide carrier. In contrast, alkali carbonates show an
inhibiting effect on BPE hydrolysis in subcritical water at low temperatures (270-300°C).
This is related to a change in solvent properties by addition of the carbonate. As the polarity
of water is increased in the presence of a salt, phase separation is enhanced and hydrolysis
reduced.
The C-C bonds in diphenyl methane and 4- methoxy biphenyl are not cleaved below 400°C
and in the presence of 10wt.% K2CO3/ZrO2. It was further shown that the application of
alcohols and alcohol/water solutions as solvents is unsuitable, as hydrolysis is inhibited and
the product spectrum broadens due to reaction of the model compounds with the solvent.
Relating these findings to the base catalyzed depolymerization of lignin, it is concluded that
among the bonds connecting the aromatic units, predominantly aryl-alkyl ether bonds,
specifically the β-O-4 ether bond, will be cleaved under the conditions applied. Consequently,
beside the phenolic monomers a large amount of oligomeric coumpounds are obtained upon
hydrothermal treatment. These compounds are dimers and trimers, but also higher molecular
oligomers.
Composition of the product oil differs strongly depending on the work up process, but
so far, a standard procedure has not been published. When lignin depolymerization aims
towards the production of chemicals, a high monomeric content of the product oil is desirable.
Therefore, a novel work up procedure for hydrothermal lignin depolymerization was
elaborated and is presented in chapter 4. The suggested work up yields a high value product
oil consisting predominantly of monomers and dimers. Furthermore, a variety of solvents
were investigated which allow tailoring the properties of the oil by selective extraction.
The products of base catalyzed liquid phase hydrolysis of lignin depend markedly on
the operation conditions. Varying temperature, pressure, catalyst concentration and residence
time the yield of monomers and oligomers from depolymerized lignin can be adjusted. These
results, as well as a concluded mechanism for the base catalyzed depolymerization are
presented in chapter 5. It is shown that the depolymerization of lignin to monomeric
compounds is limited by consecutive addition and condensation reactions of the phenolic
monomers to oligomers. The formation of monomers from base catalyzed hydrolysis is
proportional to the NaOH concentration in the aqueous solution. However, an excess of
NaOH is necessary to initiate hydrolysis. The “excess” NaOH is needed to convert the
Chapter 7
137
hydroxyl groups of phenolic and catecholic compounds into the alcoholate. This process
reduces internal hydrogen bonding between the hydroxyl groups and increases the solubility
of lignin. It can be speculated that the reduction of the internal hydrogen bonds enhances also
the accessibility of the ether bonds and facilitates the cleavage of phenolic monomers of
lignin.
It is suggested that, during base catalyzed depolymerization of lignin, cleavage of the β-O-4
ether bond takes place heterolytically via the formation of a sodium phenolate derivative and
a carbenium ion like transition state, which is instantly neutralized by a hydroxide ion. The
sodium cations catalyze the reaction by forming cation adducts with lignin and, thus,
polarizing the ether bond. Syringol and its derivatives are preferentially formed due to the
stabilization of the carbenium ion transition state by the substituted methoxy groups.
As mentioned above, the formed primary products from lignin hydrolysis undergo
facile addition and condensation reactions leading to higher molecular weight products. The
inhibition of concurrent oligomerization reactions during hydrothermal lignin
depolymerization is, thus, important to enhance product yield from lignin depolymerization.
We decided, therefore, to block the reactions, by capping the phenolic hydroxy groups with
boric acid forming strongly coordinated boric acid esters. The obtained results are presented
in chapter 6. Boric acid has shown to be an excellent capping agent forming esters with
phenolic OH groups. Note, that this indirectly also shows that the phenolic OH groups are key
to these secondary oligomerization rections. The acid catalyzed hydrolysis route is concluded
to produce larger fragments as primary products, because the stabilization of intermolecular
hydrogen bonding in lignin reduces the steric accessibility of ether groups for hydrolysis. In
consequence, dimers to tetramers are the most abundant products when boric acid is present
as catalyst and capping agent. With this approach 85% of lignin can be utilized in a single
reaction step. The product composition can be shifted to monomeric products by addition of
appropriate concentration of NaOH. These results indicate that lignin can be successfully
converted into chemically viable tailored phenolic building blocks.
Chapter 7
138
7.2 Zusammenfassung
Aufgrund des weltweit zunehmenden Verbrauchs an Energie und Rohstoffen wachsen
die aus der Nutzung von Kohle, Rohöl und Erdgas resultierenden Umweltprobleme. Die zur
Neige gehenden Erdölressourcen und die damit verbundene Angst einer drohenden
Energiekrise rücken erneuerbare Rohstoffe zunehmend in den Fokus des Interesses auf Seiten
von sowohl Energielieferanten als auch -verbrauchern. Aufgrund ihrer „CO2-Neutralität“,
besitzt Biomasse ein hohes Zukunftspotential und muß als Rohstoff für erneuerbare Energie
und die Herstellung von Feinchemikalien berücksichtigt werden.
Aufgrund seiner hohen Bioverfügbarkeit und gleichzeitig noch geringen Nutzung handelt es
sich bei Lignin um ein kommerziell interessantes Polymer. Seine Zusammensetzung aus
Phenylpropan-Untereinheiten macht Lignin zu einer potentiellen Ausgangsverbindung für die
Herstellung phenolischer Verbindungen in der chemischen Industrie.
Des Weiteren kann es, nach Depolymerisation und Hydrierung, als Grundstoff für die
Gewinnung von Benzinadditiven und Dieselbrennstoffen dienen. Hierbei können drei
verschiedene Varianten zur Behandlung des Rohmaterials unterschieden werden: (i)
Vergasung zur Synthesegas-Herstellung, (ii) Herstellung von Bioöl durch Pyrolyse respektive
Verflüssigung und (iii) Hydrolyse zur Gewinnung von Monomeren und niedermolekularen
Oligomeren.
Bei den ersten beiden Verfahren werden harsche Bedingungen benötigt, während die
Hydrolyse vergleichsweise mild ist. Durch die extrem hohe Strukturstabilität und die
Schwierigkeit einer selektiven Spaltung in Monomere stellt die Hydrolyse von Lignin jedoch
immer noch eine große Herausforderung dar.
Ziel dieser Arbeit war es daher, einerseits ein Verfahrenskonzept für die hydrothermale
Ligninumsetzung zu entwickeln und andererseits die Prozeßbedingungen zu optimieren.
Zusätzlich beinhaltet diese Arbeit eine umfassende Charakterisierung der gewonnen Produkte.
Lignin besitzt eine sehr komplexe und vielfältige Struktur. Es wurden daher
Modellverbindungen eingesetzt, um das Verhalten von Lignin in sub- und überkritischem
Wasser zu untersuchen. Sechs Verbindungen wurden gewählt, um die häufigsten
Bindungsarten im Lignin abzubilden: Diphenylether, Benzylphenylether, Diphenylmethan,
Eugenol, 4-Methoxybiphenyl und Phthalan. Die Ergebnisse sind in Kapitel 3 zusammen-
gefasst und diskutiert. Es wurde gezeigt, dass in allen Verbindungen die Etherbrücken sowohl
über einen radikalischen als auch einen ionischen Mechanismus umgesetzt werden. Die
Ausbeuten an Hydrolyseprodukten, die über einen ionischen Mechanismus gebildet werden,
lassen sich jedoch deutlich mit der Dichte erhöhen. Bei hohen Dichten wird für die DPE-
Chapter 7
139
Umsetzung in überkritischem Wasser sogar eine 100 %ige Selektivität zum Hydrolyseprodukt
Phenol erreicht. Ohne Katalysator findet unterhalb von 460°C keine DPE-Umsetzung statt.
Durch die Zugabe von Lithium-. Natrium- und Kalium-Carbonat erzielt man bereits ab 350°C
signifikante Ausbeuten an Phenol. Die Selektivität ist dabei für K2CO3 am höchsten.
Ebenfalls hohe Ausbeuten und Selektivitäten lassen sich mit weitaus kleineren Mengen an
K2CO3 erreichen, wenn dieses auf ZrO2 geträgert wurde. Dies wird auf die höhere
Konzentration von Hydroxylgruppen durch die dissoziative Absorption von Wasser auf dem
Metalloxidträger zurückgeführt.
Im Gegensatz dazu hemmt die Zugabe von Alkalicarbonaten die Hydrolyse von BPE in
subkritischem Wasser bei niedrigen Temperaturen (270-300°C). Diese Beobachtung wird mit
einer Veränderung der Lösungsmitteleigenschaften durch Zugabe der Salze in Verbindung
gebracht. Das Salz verursacht eine erhöhte Polarität des Wassers, wodurch eine
Phasentrennung begünstigt und somit die Hydrolyse gehemmt wird.
Die C-C-Bindung zwischen den aromatischen Einheiten im 4-Methoxybiphenyl sowie die
Methylenbrücke im Diphenylmethan lassen sich unter den verwendeten Bedingungen, auch
nicht bei Zugabe von ZrO2 geträgertem K2CO3, spalten. Es wurde weiterhin gezeigt, dass
Alkohole als Lösungsmittel ungeeignet sind. Gründe hierfür sind vor allem eine Hemmung
der Hydrolyse, aber auch ein Rückgang der Selektivität an Hydrolyseprodukten durch die
Formation einer weitaus breiteren Produktpalette. Zudem wird ein Großteil des Alkohols
vergast.
Aus den Experimenten mit Lignin-Modellverbindungen lässt sich folgern, dass bei der
basenkatalysierten Lignin-Hydrolyse vorwiegend die Aryl-Alkyl Etherbindungen,
insbesondere die β-O-4 Bindungen, gespalten, und neben Monomeren auch ein großer Anteil
Oligomere erhalten wird.
Die Zusammensetzung des gewonnen Produktöls hängt dabei stark von der
Aufarbeitung ab. Bisher publizierte Verfahren weichen stark voneinander ab und liefern Öle
mit hohem Oligomeranteil. Zielt die Lignin-Hydrolyse jedoch auf die Chemikaliengewinnung
ab, so ist ein hoher Anteil von Monomeren erforderlich. Eine Aufarbeitungsmethode, die ein
hochwertiges Öl liefert, bestehend aus vorwiegend Monomeren und Dimeren, konnte im
Rahmen dieser Arbeit erfolgreich entwickelt werden und wird in Kapitel 4 beschrieben.
Zudem wurde eine Reihe verschiedener Lösungsmittel untersucht, die durch selektive
Extraktion ein Abstimmen der Produkteigenschaften erlauben.
Die aus der basenkatalysierten Ligninhydrolyse gewonnen Produkte hängen stark von
den Reaktionsbedingungen ab. Monomer- und Oligomerausbeute lassen sich durch Variation
Chapter 7
140
der Temperatur, des Drucks, der Katalysatorkonzentration und der Verweilzeit einstellen. Die
Ergebnisse der hierzu durchgeführten Experimente sowie der daraus folgende
Reaktionsmechanismus für die basenkatalysierte Depolymerisierung finden sich in Kapitel 5.
Es konnte gezeigt werden, dass die Depolymerisierung zu monomeren Produkten durch
Folgereaktionen wie Additions – und Kondensationsreaktionen der Monomere limitiert ist.
Die Bildung der Monomere ist dabei proportional zur NaOH-Konzentration der wässrigen
Lösung. Ein Überschuß an NaOH ist jedoch nötig um die Hydroxylgruppen der Phenol- und
Catecholverbindungen in das entsprechende Alkoholat zu überführen und somit die
Monomerbildung zu initiieren. Dadurch wird die Anzahl intramolekularer
Wasserstoffbrückenbindungen (WBB) reduziert und die Löslichkeit des Moleküls erhöht. Es
wird angenommen, dass die Reduktion der intramolekularen WBB die Zugänglichkeit der
Etherbrücken erhöht und dadurch die Depolymerisierung in Monomere erleichtert wird.
Kinetische Untersuchen deuten auf eine heterolytische Spaltung der β-O-4 Etherbrücke hin.
Dabei wird ein Natriumphenolat und ein Carbeniumartiger Übergangszustand gebildet, der
sofort durch ein Hydroxidion neutralisiert wird. Na+ katalysiert dabei die Spaltung durch
Polarisierung der Lignin Etherbrücken. Syringolverbindungen werden bei der
basenkatalysierten Ligninhydrolyse bevorzugt gebildet, da im Übergangszustand das
Carbeniumion durch die erhöhte Anzahl der Methoxygruppen stabilisiert wird.
Wie bereits erwähnt, reagieren die Primärprodukte der Ligninhydrolyse durch
Addition und Kondensation zu Oligomeren weiter. Um die Ausbeute an Spaltprodukten zu
erhöhen, muß die Oligomerisierung folglich unterdrückt werden. Die Reaktion von Borsäure
mit Alkoholen zu Borsäureestern ist bekannt. Wir haben deshalb beschlossen,
Folgereaktionen der Primärprodukte durch Blockierung der phenolischen Hydroxygruppen
mit Borsäure zu verhindern. Die erhaltenen Ergebnisse werden in Kapitel 6 vorgestellt.
Borsäure hat sich durch ihre Fähigkeit zur Ausbildung von Estern mit phenolischen
Hydroxylgruppen, als hervorragendes Reagenz zur Unterdrückung der Oligomerisierung
erwiesen. Die Ergebnisse lassen darauf schließen, dass die säurekatalysierte Hydrolyse durch
Stabilisierung der intramolekularen WBB im Lignin die Zugänglichkeit der Ethergruppen
reduziert und deshalb zu höhermolekularen Produkten führt. Folglich erhält man in
Anwesenheit von Borsäure vorwiegend Dimere bis Tetramere. Mit diesem Verfahren erhält
man in einem einzigen Reaktionsschritt eine 85%ige Ausbeute an Hydrolyseprodukten. Durch
Zugabe geeigneter Mengen NaOH läßt sich die Produktzusammensetzung zu einem höheren
Monomeranteil verschieben.

Chapter 7
141
Im Rahmen dieser Arbeit konnte gezeigt werden, dass die Lignin Depolymerisierung zu
wertvollen, industriell nutzbaren phenolischen Verbindungen realisierbar ist.
Curriculum vitae
142
8 Curriculum vitae
Virginia Marie Roberts was born in Landstuhl, Germany on December 1st, 1978. She
visited the Gymnasium Wiesloch untill September 1993 and then moved with her parents to
Augsburg, where she visited the Holbein Gymnasium. 1998 she graduated and received her
Abitur (general qualification for university entrance). In the same year she took up chemistry
studies at the Technische Universität München, majoring in biochemistry. In 2004, Virginia
Roberts joined the group of Johannes Lercher (Chair for technical chemistry II) for her
Diploma thesis entitled “Mechanistic studies of SO2-adsorption on metal oxides incorporated
in porous networks”. After graduation as “Diplom-Chemiker” (master degree) in Mai 2004,
she stayed in the group of Johannes Lercher as a PhD student at the Tecnische Universität
München. Her work was focused on the catalytic hydrothermal conversion of lignin.
List of publications
143
9 List of publications
1. Roberts, V. M., Knapp, R., Lercher, J. A. „Catalytic conversion of diphenylether in
supercritical water as a model compound for lignin hydrolysis”, 2008, in preparation
2. Roberts, V. M., Fendt, S., Lercher, J. A. “The influence of alkali carbonates on
hydrolysis of benzyl phenyl ether in subcritical water”, 2008, in preparation
3. Roberts, V. M., Unkelbach, G., Schweppe, R., Lercher, J.L., 2008, “Elaboration of an
optimized work up procedure for the BCD process”, in preparation
4. Roberts, V. M., Lercher, J. A., 2008, “On the mechanism of base catalyzed
depolymerization of lignin“, ready for submission to J. Am. Chem. Soc.
5. Roberts, V. M., Stein, V., Lercher, J. A., 2008, “Boric acid as a capping agent to
suppress oligomerization reactions during hydrothermal lignin treatment”, ready for
submission to Angew. Chem. Int. Ed.
Oral and poster presentations
144
10 Oral and poster presentations
1. ERA Chemistry Workshop, “Ether hydrolysis as key reaction to utilize lignin”, April
2008 in Krakow, Poland
V. M. Roberts, J. A. Lercher, oral presentation
2. Europacat 8, “Catalytic conversion of diphenyl ether in supercritical water as a
model compound for lignin hydrolysis”, August 2007 in Turku, Finland
V. M. Roberts, R. T. Knapp, J. A. Lercher, poster presentation
3. Jahrestreffen Deutscher Katalytiker, “ZrO2 supported K2CO3 for the conversion of
diphenyl ether in supercritical water“, March 2007 in Weimar, Germany
V. M. Roberts, J. A. Lercher, poster presentation


![Almost transitive and almost homogeneous Separable Banach ... · in some separable almost transitive Banach space ([9]). A classical example of an almost homogeneous separable Banach](https://img.pdfslide.org/doc/110x75/60213e540d9f2439067866c2/almost-transitive-and-almost-homogeneous-separable-banach-in-some-separable.jpg)
![22. AFRIKANISTENTAG, 17.-18.06.2016, HU BERLIN · PDF fileWolff: Ideologie & Sprache ... Jonathan Pool (1972): [A] country that is linguistically highly heterogeneous is always underdeveloped](https://img.pdfslide.org/doc/110x75/5a78cc697f8b9a70648d0d7c/22-afrikanistentag-17-18062016-hu-berlin-ideologie-sprache-jonathan.jpg)