Embed Size (px)
Citation preview
Hydrazine Sensors Based on Nanostructured
TiO2 Films
Mohammed M. Rahman*1, Valero G. Alfonso2, Francisco Fabregat-Santiago*2, Juan
Bisquert1,2, Abdullah M. Asiri1, Abdelmohsen A. Alshehri1, Hassan A. Albar1
1Chemistry department, Faculty of Science, King Abdulaziz University, 21589 Jeddah, P.O. Box 80203, Saudi Arabia 2Institute of Advanced Materials, Universitat Jaume I, 12006 Castelló de la Plana, Spain. Abstract
In this work, we describe the response of a selective hydrazine sensor based on a film
of TiO2 nanoparticles faceted predominantly in 101 and 001 sides. The sensor was
fabricated depositing the nanoparticles plus 5% of nafion on a glassy carbon electrode.
Chemical sensing for hydrazine was performed through simple and reliable current-
voltage method. Hydrazine sensor exhibited a fast response and good selectivity. It also
displayed an excellent sensitivity, very low detection limit, long-term stability and
reproducibility. The sensor signal was found to depend linearly with the logarithm of
concentration providing a linear calibration plot (r2:0.997) in an aqueous hydrazine
solution ranging from 1.0 nM to 10.0 mM, with a sensitivity value of 35.04 µA cm-2.
Out of this linear region an extremely low detection limit as 28.8 pM (S/N = 3).
Analytical performance of TiO2 nanoparticles in terms of chemical sensing are also
discussed and analyses the real samples in detail in this work. This approach emerges as
an effective technique in developing efficient chemical sensors for the detection of
environmental pollutants in broad scales.
Keywords: Nanosensors; Titanium dioxide; Hydrazine sensor; Glassy carbon electrode; I-V method; Real sample
* Corresponding author information: [email protected] (MMR); Phone: +966-59-6421830; Fax: +966-026952292 [email protected] (FF-S); Phone: +34-964-387537; Fax: +34-964-729218
2
Introduction: Hydrazine (N2H4) is a molecule with applications in many different industrial sectors
that include photographic, dye, pharmaceutical, polymer, fuel (rockets, space craft’s)
explosive , agricultural (pesticides, and plant-growth regulators production), etc.1 Its
drawback is that it is a very toxic chemical and often considered as a cancer-causing,
poisonous, hazardous, cyanogenetic and nephrotoxic substance.2 Symptoms for severe
exposure of hydrazine includes: burning in eyes and nose, short-term loss of sight,
faintness, vomiting, respiratory edema and unconsciousness. Liver and kidney functions
may also be badly affected by long time exposure of hydrazine.3 Central nervous system
is also affected by hydrazine that sometimes leads to unconsciousness. When absorbed
through skin, it produces caustic-like burn and also interrupts the production of blood.4,5
Extreme toxicity and serious effects on health and environment requires the
immediate detection of hydrazine with a reliable method that may be easily adapted to
such wide industrial environments. Developed hydrazine detection methods include
spectrophotometric method, chromatography, titrimetric method, chemi-luminescence
etc6-11. Due to low-cost, rapid response and higher sensitivity, electrochemical sensors
are often more useful than any other methods for hydrazine detection and
quantification.12, 13 However, electrochemical oxidation of hydrazine at a bare electrode
is kinetically slow and associated with high over potential. Consequently, searching for
new materials for the modification of electrodes towards enhancing the rate of electron
transfer and reducing the over potential of the hydrazine oxidation is necessary. 14-17
Diffferent approaches such as the use of metal nanoparticles18, 19, metal oxides20, metal
complexes, hexacyanoferrate salts or organic mediators10, 11, have been tested up to now
with different levels of success.
In this work, we have analyzed sensitivity and specificity of a hydrazine sensor
fabricated with nanoparticles of TiO2 (7% rutile 93% anatase) with average size 50 nm
3
in which anatase faces were mainly oriented in 101 and 001 planes. Titanium dioxide is
a nontoxic and inexpensive material with very interesting applications, including its use
as photocatalyst21, 22 or electron selecting layer in solar cells.23, 24 The use of this
material is highly related with the structure and orientation of the crystalline planes,25
for instance, in catalytic applications the interaction between the molecule and the
surface of this material is essential to obtain the different selected properties.26 The main
crystalline forms of TiO2 are rutile and anatase. Anatase (101) forms structures
thermodynamically stable which are less reactive than (001).27 For example, anatase
(001) allows the dissociative adsorption of water, whereas (101) only accepts the
adsorption.28 In this scenario, TiO2 faceted, which contains (001), is more reactive than
normal TiO2.
In our approach a thin film of TiO2 nanoparticles mixed with nafion conductive
binders was deposited onto glassy carbon electrode (GCE) to build a hydrazine chemical
sensor. Detection of this carcinogenic agent was done using the simple and reliable
current-voltage (I-V) method at ambient conditions. We show that this hydrazine sensor
displays unique and excellent properties in terms of wide range of target concentration,
ultra-sensitive recognition and short response-time.
Experimental sections:
Disodium phosphate, 2-nitrophenol (2-NP), monosodium phosphate, 3-
methoxyphenol (3-MP), nafion (5% ethanolic solution), 4-aminophenol (4-AP),
ammonium hydroxide (NH4OH), 4-methoxyphenol (4-MP), acetone (Act),
benzaldehyde (BZD), chloroform (Chl), ethanol (EtOH), hydrazine, methanol (MeOH),
and xanthine (Xan) used in this present work were used without any further purification
and purchased from Sigma-Aldrich company. Crystallinity of TiO2 nanoparticles was
4
measured with XRD. TEM images were obtained from 42TEK. Fabrication of GCE was
carried out by mixing the faceted TiO2 nanoparticles using 5% ethanolic nafion solution
as conducting coating binder. It was then heated into an oven at 60.0 0C for 2 h to get
the dry fabricated-film onto GCE. In the electrochemical cell, TiO2 nanoparticles coated
GCE was used as working electrode (WE), Pd-wire was the counter electrode (CE), and
an aqueous 0.1 M phosphate solution (PBS, pH 7.0) used as electrolyte. To use as target
analytes, aqueous hydrazine solution (0.1 M) was diluted to different concentrations
(from 0.1 M to 0.1 nM) using deionized water. Electrical characterization of hydrazine
sensor based on TiO2 nanocrystals was carried out using current-voltage (I-V)
measurements with a Keithley, 6517A electrometer. All I-V measurements were carried
out missing the target element to 5.0 mL of PBS.
Results and Discussion
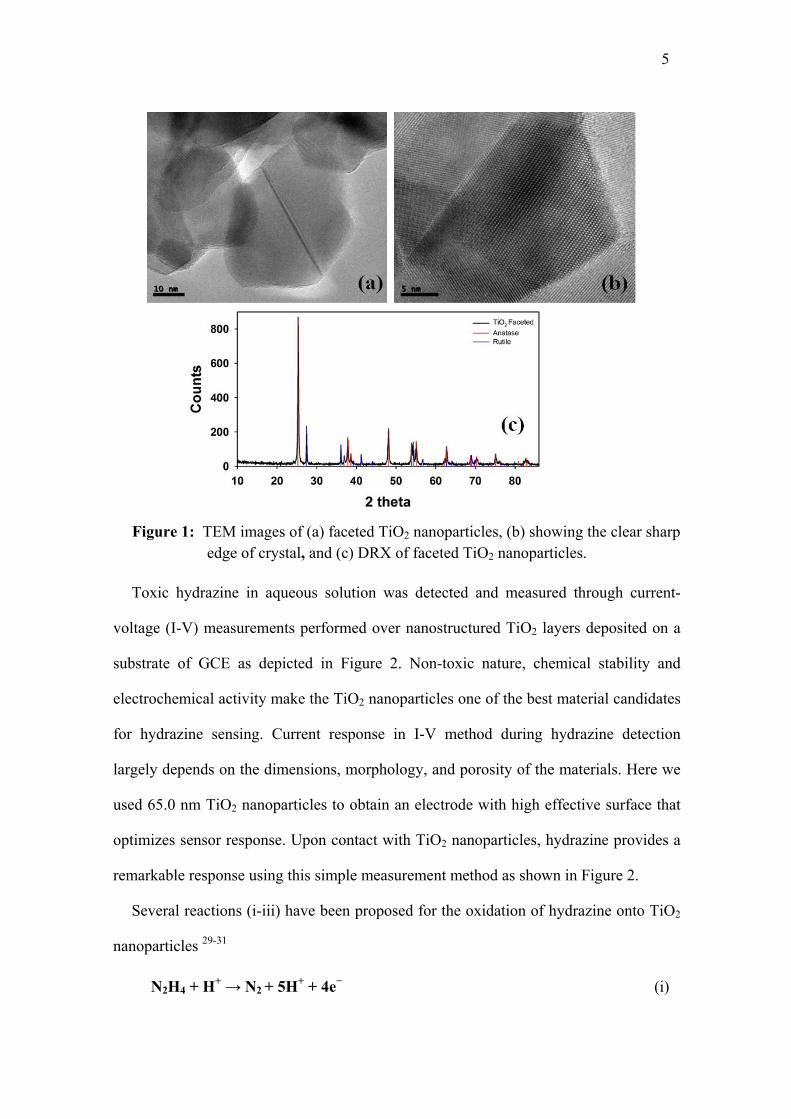
Faceted TiO2 nanoparticles, see Figure 1(a-b), with average particle size 65.0 nm
determined by TEM images were obtained from 42TEK. Exposed sides of anatase
nanoparticles are mainly (101) and (001). The nanoparticles contained both rutile and
anatase phases as plotted in Figure 1(c), with concentration ratio of 7%-93% given by
provider.
5
Figure 1: TEM images of (a) faceted TiO2 nanoparticles, (b) showing the clear sharp edge of crystal, and (c) DRX of faceted TiO2 nanoparticles.
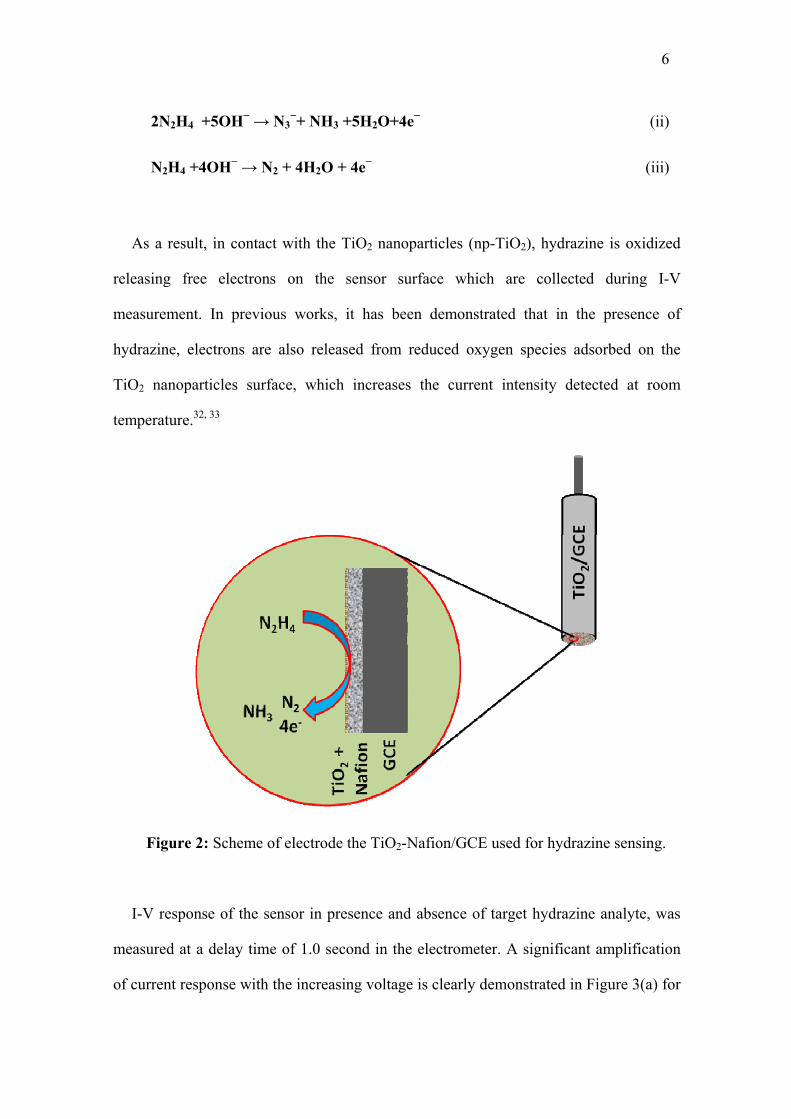
Toxic hydrazine in aqueous solution was detected and measured through current-
voltage (I-V) measurements performed over nanostructured TiO2 layers deposited on a
substrate of GCE as depicted in Figure 2. Non-toxic nature, chemical stability and
electrochemical activity make the TiO2 nanoparticles one of the best material candidates
for hydrazine sensing. Current response in I-V method during hydrazine detection
largely depends on the dimensions, morphology, and porosity of the materials. Here we
used 65.0 nm TiO2 nanoparticles to obtain an electrode with high effective surface that
optimizes sensor response. Upon contact with TiO2 nanoparticles, hydrazine provides a
remarkable response using this simple measurement method as shown in Figure 2.
Several reactions (i-iii) have been proposed for the oxidation of hydrazine onto TiO2
nanoparticles 29-31
N2H4 + H+ → N2 + 5H+ + 4e− (i)
6
2N2H4 +5OH− → N3−+ NH3 +5H2O+4e− (ii)
N2H4 +4OH− → N2 + 4H2O + 4e− (iii)
As a result, in contact with the TiO2 nanoparticles (np-TiO2), hydrazine is oxidized
releasing free electrons on the sensor surface which are collected during I-V
measurement. In previous works, it has been demonstrated that in the presence of
hydrazine, electrons are also released from reduced oxygen species adsorbed on the
TiO2 nanoparticles surface, which increases the current intensity detected at room
temperature.32, 33
Figure 2: Scheme of electrode the TiO2-Nafion/GCE used for hydrazine sensing.
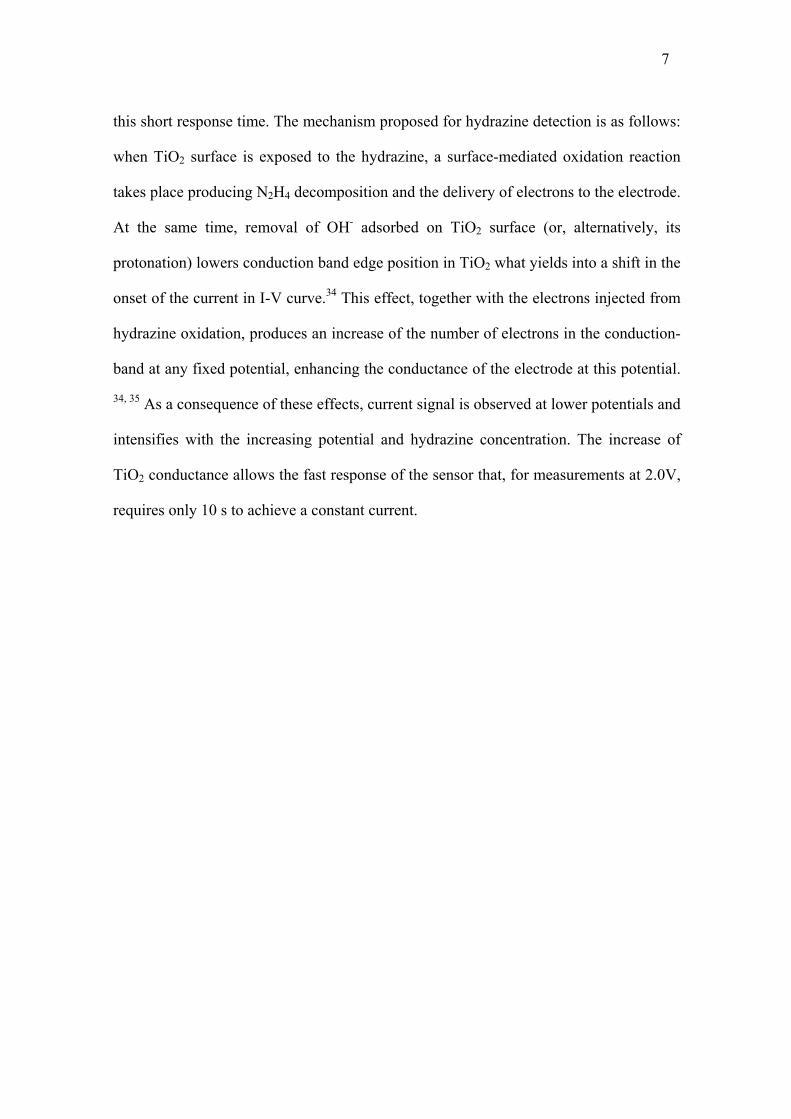
I-V response of the sensor in presence and absence of target hydrazine analyte, was
measured at a delay time of 1.0 second in the electrometer. A significant amplification
of current response with the increasing voltage is clearly demonstrated in Figure 3(a) for
7
this short response time. The mechanism proposed for hydrazine detection is as follows:
when TiO2 surface is exposed to the hydrazine, a surface-mediated oxidation reaction
takes place producing N2H4 decomposition and the delivery of electrons to the electrode.
At the same time, removal of OH- adsorbed on TiO2 surface (or, alternatively, its
protonation) lowers conduction band edge position in TiO2 what yields into a shift in the
onset of the current in I-V curve.34 This effect, together with the electrons injected from
hydrazine oxidation, produces an increase of the number of electrons in the conduction-
band at any fixed potential, enhancing the conductance of the electrode at this potential.
34, 35 As a consequence of these effects, current signal is observed at lower potentials and
intensifies with the increasing potential and hydrazine concentration. The increase of
TiO2 conductance allows the fast response of the sensor that, for measurements at 2.0V,
requires only 10 s to achieve a constant current.
8
Figure 3: (a) I-V response of TiO2 NPs/GCE electrode in absence (green) and
presence (red) of 1.0 nM hydrazine in the 0.1M PBS aqueous solution. Delay time
between measurements was 1s. (b) Repeatability study. (c) Current-voltage curve
indicating the selectivity of sensor. Inset: Magnified view of I-V response in 1.0~2.0V
potential window.
Figure 3(b) represents repeatability of the I-V responses with the TiO2 nanoparticles
coated GCE for 0.1 nM hydrazine solutions using 9 different working electrodes
(R1~R9) under identical conditions. Almost same current response was obtained for all
electrodes after repeating the experiments 7 times, confirming the excellent repeatability
of the sensor. This small change may be due to mass variation in TiO2 nanoparticles
9
during the coating of GCE working electrode. At the same hydrazine concentration
different electrodes show almost similar current responses.
Selectivity of sensor to hydrazine was studied in presence of different chemicals like
2-NP, 3-MP, 4-AP, 4-MP, Act, BZD, Chl, EtOH, Hyd, MeOH, Xan, and NH4OH using
the TiO2 nanoparticles/GCE, which is presented in Figure 3(c). In this response
comparison, the concentrations of all analytes were kept constant at 0.1 nM in PBS
under identical condition and the same fresh electrode was used in every observation. In
presence of hydrazine, the fabricated electrode shows higher current compared to all
other interferon’s, which demonstrated by the measurement of I-V technique in identical
conditions. Sensor is sensible to hydrazine while its response to different chemical is the
same as for reference electrolyte.
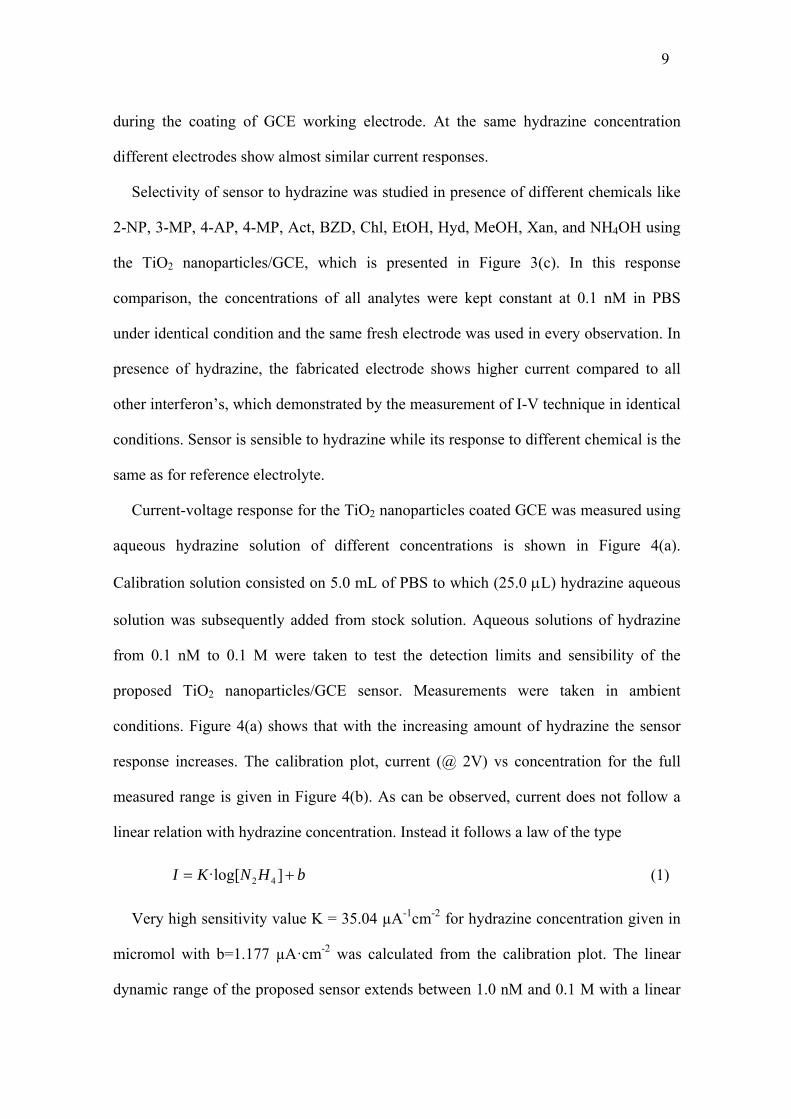
Current-voltage response for the TiO2 nanoparticles coated GCE was measured using
aqueous hydrazine solution of different concentrations is shown in Figure 4(a).
Calibration solution consisted on 5.0 mL of PBS to which (25.0 L) hydrazine aqueous
solution was subsequently added from stock solution. Aqueous solutions of hydrazine
from 0.1 nM to 0.1 M were taken to test the detection limits and sensibility of the
proposed TiO2 nanoparticles/GCE sensor. Measurements were taken in ambient
conditions. Figure 4(a) shows that with the increasing amount of hydrazine the sensor
response increases. The calibration plot, current (@ 2V) vs concentration for the full
measured range is given in Figure 4(b). As can be observed, current does not follow a
linear relation with hydrazine concentration. Instead it follows a law of the type
bHNKI ]·log[ 42 (1)
Very high sensitivity value K = 35.04 µA-1cm-2 for hydrazine concentration given in
micromol with b=1.177 µA·cm-2 was calculated from the calibration plot. The linear
dynamic range of the proposed sensor extends between 1.0 nM and 0.1 M with a linear
10
regression coefficient of 0.997. Below 1.0 nM, the sensor departed from behavior
described in Eq (4), but good response was still attained allowing a limit of detection as
low as 28.8 pM (3 × Noise/Slope ratio).
Figure 4. I-V curves of the sensor under hydrazine concentration changing from 0.1
nM to 0.1 M (a) taken to build sensor calibration curve (b). Data of current where taken
at 2.0V. Linear dynamic range in (b) extends from: 1.0 nM to 0.1 M
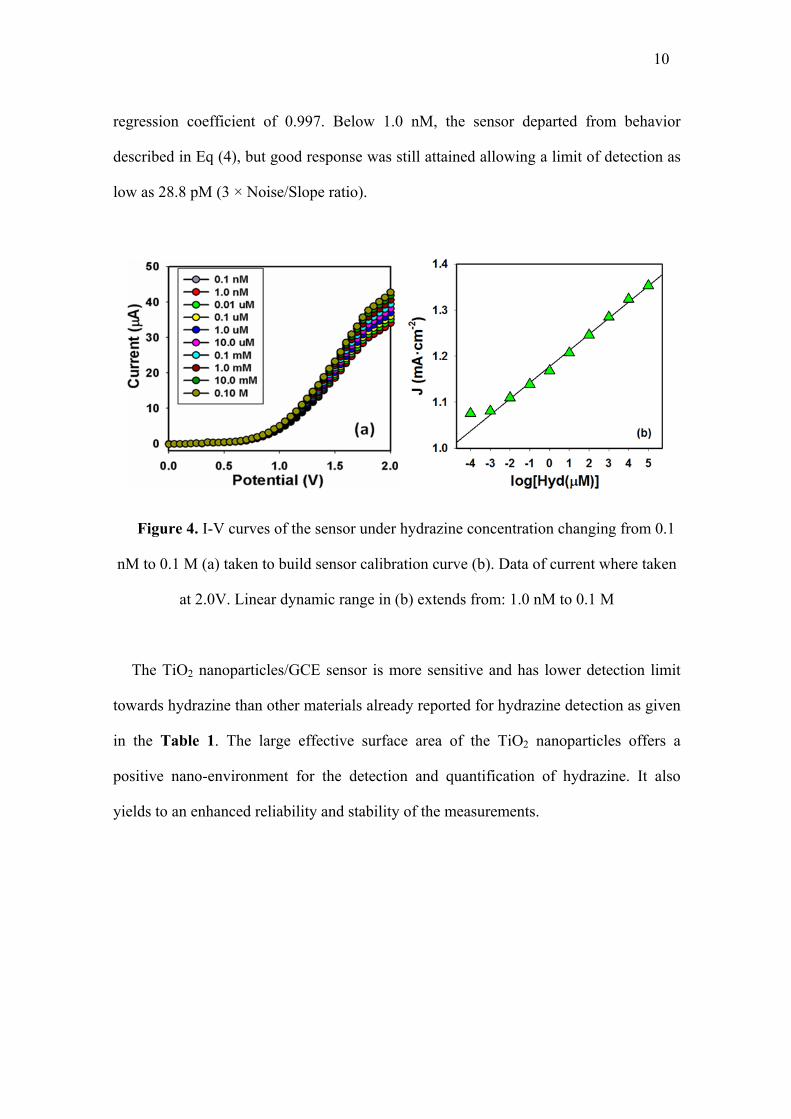
The TiO2 nanoparticles/GCE sensor is more sensitive and has lower detection limit
towards hydrazine than other materials already reported for hydrazine detection as given
in the Table 1. The large effective surface area of the TiO2 nanoparticles offers a
positive nano-environment for the detection and quantification of hydrazine. It also
yields to an enhanced reliability and stability of the measurements.
11
Table 1: Comparison of analytical performances of hydrazine detection using various
nanomaterials or nanocomposites by electrochemical approaches.
Electrode
materials Anlytes
Sensitivity
(µA·µM-1·cm-2)
Detection
limit (nM)
Linear
range
(µM)
Ref
CNT powder
microelectrode Hyd 0.9944 --- ---- 36
Ag-ZnO Nanoellipsoids Hyd 9.46 0.07 0.07-1.0 37
MWCNT/Chlorogenic
acid Hyd 0.0041 8 --- 3
Hierarchical
micro/nano
architectures/ZnO
Hyd 0.51 0.25 0.8-200 38
Pristine ZnO NRs
array Hyd 4.48 0.2 --- 39
ZnO-II/Au Hyd 1.6 0.066 0.066-425 40
ZnO/SWCNT Hyd 0.1 0.17 0.5-50 41
ZnO Nanoflowers Hyd 3.49 0.18 --- 42
Nano-Au ZnO-
MWCNT Hyd 0.0428 0.15 0.5–1800 43
PSS/Graphene/GCE Hyd --- 1000.0 3.0-300 44
TiO2 NPs/CGE Hyd 35.04* 0.0288 0.001-
10000
This
work * in µA·cm-2
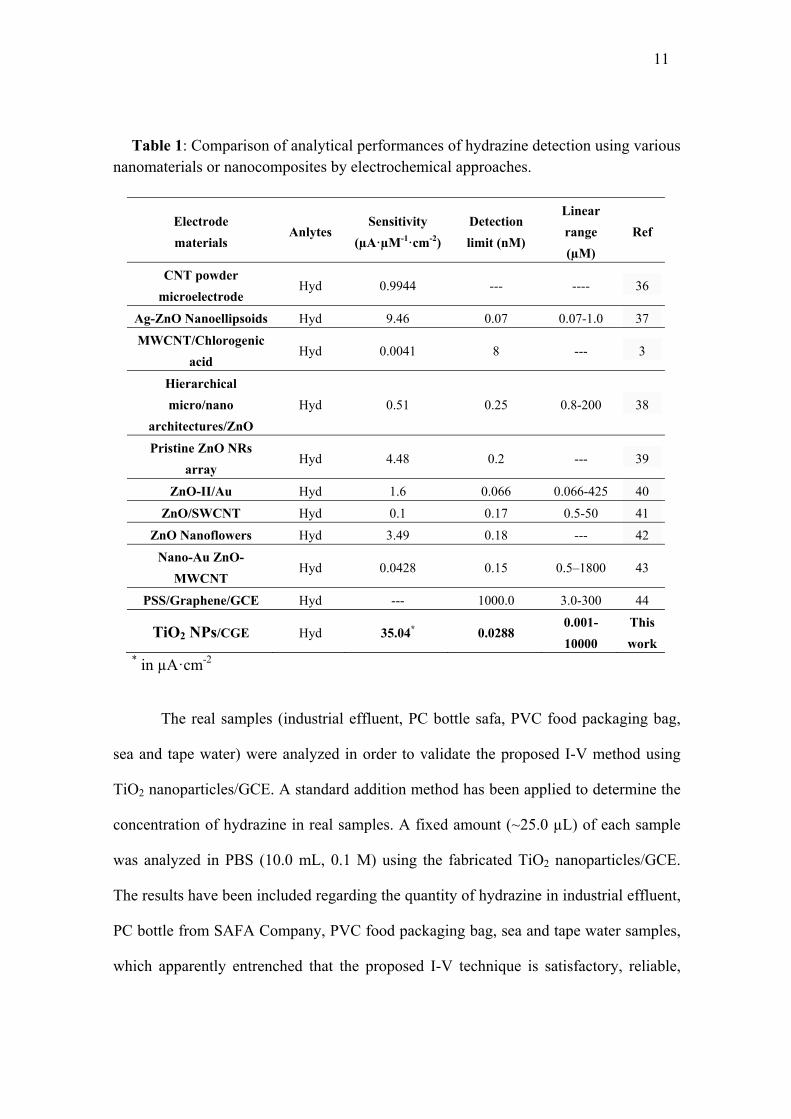
The real samples (industrial effluent, PC bottle safa, PVC food packaging bag,
sea and tape water) were analyzed in order to validate the proposed I-V method using
TiO2 nanoparticles/GCE. A standard addition method has been applied to determine the
concentration of hydrazine in real samples. A fixed amount (~25.0 µL) of each sample
was analyzed in PBS (10.0 mL, 0.1 M) using the fabricated TiO2 nanoparticles/GCE.
The results have been included regarding the quantity of hydrazine in industrial effluent,
PC bottle from SAFA Company, PVC food packaging bag, sea and tape water samples,
which apparently entrenched that the proposed I-V technique is satisfactory, reliable,
12
and suitable for analyzing real samples with assembled of TiO2 nanoparticles/GCE
(Table 2).
Table 2: Measured hydrazine concentration in different real samples.
Real samples Calibrated
concentration range
Measured current
(μA)
Respective concentration
(nM) Industrial
effluent 2.8 0.038 0.01
PC bottle Safa 2.5 0.021 0.01 PVC food
packaging bag 0.1 nM ~ 1.0
mM 1.9 0.017 0.01
Sea water 1.2 0.014 0.01
Tap water 0.5 0.009 0.01
Conclusions Development of a chemical sensor for hydrazine based on a nanoporous film of
faceted TiO2 nanoparticles deposited on flat-GCE electrode with conducting coating
binders is shown. The sensor displayed very high sensitivity and selectivity for
hydrazine sensing among various interfering chemicals. The sensor has demonstrated
very good linear behavior for a 9 orders of magnitude variation in hydrazine
concentration, ultra-low detection limit and very short response time (<10s). The
employed procedure for the measurement emerges as an effective technique in
developing efficient hazardous chemical sensors for the detection of environmental
pollutants in broad scales.
Acknowledgements This project was funded by the Deanship of Scientific Research (DSR) at King
Abdulaziz University, under grant No HiCi/2-130-36. The authors, therefore, acknowledge with thanks DSR for technical and financial support. We wish to thank the 42TEK S.L. (www.42tek.es ) for furnishing us with the relevant titanium dioxide samples needed for this analysis. This work was supported by Generalitat Valenciana
13
project PROMETEO/2014/020. VGA ackkowledges project NASCENT, ENE2014-56237-C4-3-R, from MINECO of Spain for finantial support. Serveis Centrals d’Instrumentació Científica from Universitat Jaume is acknowledged for TEM and DRX measurements. References
1. I. G. Casella, M. R. Guascito, A. M. Salvi and E. Desimoni, Analytica Chimica
Acta, 1997, 354, 333-341.
2. M. B. Gholivand and A. Azadbakht, Electrochimica Acta, 2011, 56, 10044–
10054.
3. A. Salimi, L. Miranzadeh and R. Hallaj, Talanta, 2008, 75, 147-156.
4. P. K. Rastogi, V. Ganesan and S. Krishnamoorthi, Electrochimica Acta, 2014,
125, 593-600.
5. J. C. Ballesteros, E. Chaînet, P. Ozil, G. Trejo and Y. Meas, Electrochimica
Acta, 2011, 56, 5443-5451.
6. A. Safavi and M. R. Baezzat, Analytica Chimica Acta, 1998, 358, 121-125.
7. Y. A. Gawargious and A. Besada, Talanta, 1975, 22, 757-760.
8. W. McBride, R. Henry and S. Skolnik, Analytical Chemistry, 1951, 23, 890-893.
9. S. Ikeda, H. Satake and Y. Kohri, Chemistry Letters, 1984, 873-876.
10. A. Safavi and A. A. Ensafi, Analytica Chimica Acta, 1995, 300, 307-311.
11. S. M. Golabi, H. R. Zare and M. Hamzehloo, Microchemical Journal, 2001, 69,
13-23.
12. N. Maleki, A. Safavi, E. Farjami and F. Tajabadi, Analytica Chimica Acta, 2008,
611, 151.
13. U. P. Azad and V. Ganesan, Electrochimica Acta, 2011, 56, 5766.
14. S. Ivanov, U. Lange, V. Tsakova and V. M. Mirsky, Sensors and Actuators B:
Chemical, 2010, 150, 271-278.
15. D. Jayasri and S. S. Narayanan, Journal of Hazardous Materials, 2007, 144,
348-354.
16. J. Li and X. Lin, Sensors and Actuators B: Chemical, 2007, 126, 527-535.
17. F. Li, B. Zhang, S. Dong and E. Wang, Electrochimica Acta, 1997, 42, 2563-
2568.
18. B. Haghighi, H. Hamidi and S. Bozorgzadeh, Analytical and Bioanalytical
Chemistry, 2010, 398, 1411-1416.
19. C. Batchelor-McAuley, C. E. Banks, A. O. Simm, T. G. J. Jones and R. G.
Compton, Analyst, 2006, 131, 106-110.
20. B. Šljukić, C. E. Banks, A. Crossley and R. G. Compton, Electroanalysis, 2006,
14
18, 1757-1762.
21. H. Chen, C. E. Nanayakkara and V. H. Grassian, Chemical Reviews, 2012, 112,
5919-5948.
22. A. L. Linsebigler, G. Lu and J. T. Yates, Chemical Reviews, 1995, 95, 735-758.
23. B. O'Regan and M. Gratzel, Nature, 1991, 353, 737-740.
24. L. Etgar, P. Gao, Z. Xue, Q. Peng, A. K. Chandiran, B. Liu, M. K. Nazeeruddin
and M. Grätzel, Journal of the American Chemical Society, 2012, 134, 17396-17399.
25. U. Diebold, Surface Science Reports, 2003, 48, 53-229.
26. G. Liu, H. G. Yang, J. Pan, Y. Q. Yang, G. Q. Lu and H.-M. Cheng, Chemical
Reviews, 2014, 114, 9559-9612.
27. B. Wu, C. Guo, N. Zheng, Z. Xie and G. D. Stucky, Journal of the American
Chemical Society, 2008, 130, 17563-17567.
28. A. Vittadini, A. Selloni, F. P. Rotzinger and M. Grätzel, Physical Review Letters,
1998, 81, 2954-2957.
29. C. G. Hu, W. L. Wang, S. X. Wang, W. Zhu and Y. Li, Diamond and Related
Materials, 2003, 12, 1295-1299.
30. B. Dong, B.-L. He, J. Huang, G.-Y. Gao, Z. Yang and H.-L. Li, Journal of
Power Sources, 2008, 175, 266-271.
31. T. O. Pavela, Suomen Kemistilehti, 1957, 30B.
32. X. Chen, Z. Wang, X. Wang, J. Wan, J. Liu and Y. Qian, Inorganic Chemistry,
2005, 44, 951-954.
33. M. Zhang, B. Chen, H. Tang, G. Tang, C. Li, L. Chen, H. Zhang and Q. Zhang,
RSC Advances, 2015, 5, 1417-1423.
34. F. Fabregat-Santiago, I. Mora-Sero, G. Garcia-Belmonte and J. Bisquert, Journal
of Physical Chemistry B, 2003, 107, 758-768.
35. J. Wu, T. Zhou, Q. Wang and A. Umar, Sensors and Actuators B: Chemical,
2016, 224, 878-884.
36. Y.-D. Zhao, W.-D. Zhang, H. Chen and Q.-M. Luo, Talanta, 2002, 58, 529-534.
37. R. Kumar, D. Rana, A. Umar, P. Sharma, S. Chauhan and M. S. Chauhan,
Talanta, 2015, 137, 204-213.
38. Y. Ni, J. Zhu, L. Zhang and J. Hong, CrystEngComm, 2010, 12, 2213-2218.
39. J. Liu, Y. Li, J. Jiang and X. Huang, Dalton Transactions, 2010, 39, 8693-8697.
40. W. Sultana, S. Ghosh and B. Eraiah, Electroanalysis, 2012, 24, 1869-1877.
41. K. N. Han, C. A. Li, M.-P. N. Bui, X.-H. Pham and G. H. Seong, Chemical
Communications, 2011, 47, 938-940.
42. B. Fang, C. Zhang, W. Zhang and G. Wang, Electrochimica Acta, 2009, 55, 178-
182.

15
43. C. Zhang, G. Wang, Y. Ji, M. Liu, Y. Feng, Z. Zhang and B. Fang, Sensors and
Actuators B: Chemical, 2010, 150, 247-253.
44. C. Wang, L. Zhang, Z. Guo, J. Xu, H. Wang, K. Zhai and X. Zhuo,
Microchimica Acta, 2010, 169, 1-6.


![[Benchmark Aco]Sensors 09 00909](https://img.pdfslide.org/doc/110x75/577d20ad1a28ab4e1e937e2c/benchmark-acosensors-09-00909.jpg)