Embed Size (px)
Citation preview
Identification and Recognition ofRemote-Controlled Malware
Inauguraldissertationzur Erlangung des akademischen Gradeseines Doktors der Naturwissenschaften
der Universität Mannheim
vorgelegt von
Christian Jörn Dietrichaus Düsseldorf, Deutschland
Mannheim, 2012

Dekan: Prof. Dr. Heinz Jürgen Müller, Universität MannheimReferent: Prof. Dr. Felix Christoph Freiling, Universität Erlangen-NürnbergKorreferent: Prof. Dr. Christopher Kruegel, University of California, Santa Barbara
Tag der mündlichen Prüfung: 28. März 2013
2
Abstract
Remote-controlled malware, organized in so-called botnets, have emerged as oneof the most prolific kinds of malicious software. Although numbers vary, in ex-treme cases such as Conficker, Bredolab and Mariposa, one botnet can span up toseveral million infected computers. This way, attackers draw substantial revenueby monetizing their bot-infected computers.This thesis encapsulates research on the detection of botnets – a required step
towards the mitigation of botnets. First, we design and implement Sandnet,an observation and monitoring infrastructure to study the botnet phenomenon.Using the results of Sandnet, we evaluate detection approaches based on trafficanalysis and rogue visual monetization.While traditionally, malware authors designed their botnet command and con-
trol channels to be based on plaintext protocols such as IRC, nowadays, botnetsleverage obfuscation and encryption of their C&C messages. This renders meth-ods which use characteristic recurring payload bytes ineffective. In addition, weobserve a trend towards distributed C&C architectures and nomadic behavior ofC&C servers in botnets with a centralized C&C architecture, rendering blacklistsinfeasible. Therefore, we identify and recognize botnet C&C channels by help oftraffic analysis. To a large degree, our clustering and classification leverage thesequence of message lengths per flow. As a result, our implementation, calledCoCoSpot, proves to reliably detect active C&C communication of a variety ofbotnet families, even in face of fully encrypted C&C messages.Furthermore, we observe that botmasters design their C&C channels in a more
stealthy manner so that the identification of C&C channels becomes even moredifficult. Indeed, with Feederbot we found a botnet that uses DNS as carrierprotocol for its command and control channel. By help of statistical entropy aswell as behavioral features, we design and implement a classifier that detects DNS-based C&C, even in mixed network traffic of benign users. Using our classifier,we even detect another botnet family which uses DNS as carrier protocol for itscommand and control.Finally, we show that a recent trend of botnets consists in rogue visual mon-
etization. Perceptual clustering of Sandnet screenshots enables us to groupmalware into rogue visual monetization campaigns and study their localizationas well as monetization properties.
i

Zusammenfassung
Fernsteuerbare Schadsoftware, zusammengeschaltet in sog. Botnetzen, hat sichmittlerweile zu einer sehr verbreiteten Art an Schadsoftware entwickelt. Obwohldie genauen Zahlen mitunter schwanken, so zeigt sich in Extremfällen wie etwabei Conficker, Bredolab und Mariposa, dass ein einzelnes Botnetz aus infiziertenComputern mit bis zu zweistelliger Millionenanzahl besteht. Die Angreifer er-wirtschaften somit erhebliche Einkommen, indem sie die infizierten Computermonetarisieren.Diese Arbeit umfasst Forschungsarbeiten zur Erkennung von Botnetzen – ein
notwendiger Schritt, um Botnetze zu entschärfen. Zunächst entwerfen und imple-mentieren wir die Beobachtungsumgebung Sandnet, um das Botnetz-Phänomendetailliert untersuchen zu können. Mit Hilfe der Ergebnisse des Sandnet ent-werfen und bewerten wir Erkennungsmechanismen, die sowohl auf Verkehrsflus-sanalyse des Netzwerkverkehrs als auch auf dem visuellen Eindruck der bösartigenBenutzerschnittstelle basieren.Während Schadsoftware-Autoren in der Vergangenheit die Steuerkanäle (C&C)
ihrer Botnetze häufig unter Verwendung von Klartext-Protokollen wie etwa IRCentworfen haben, so werden neuerdings fast ausschließlich verschleierte oder ver-schlüsselte C&C-Nachrichten verwendet. Dies verhindert Erkennungsmechanis-men, die auf charakteristischen, wiederkehrenden Nutzdaten-Mustern basieren.Darüber hinaus lässt sich ein Trend hin zu verteilten C&C-Architekturen sowieein nomadisches Umzugsverhalten der C&C-Server im Falle von Botnetzen mitzentralisierter C&C-Architektur erkennen. Auf diese Weise werden Blacklists vonC&C-Endpunkten umgangen. Wir entwickeln daher einen Ansatz zur Identifika-tion und Wiedererkennung von Botnetz-C&C-Kanälen mit Hilfe von Verkehrs-flussanalyse. Unser Ansatz basiert dabei in erster Linie auf der Sequenz vonNachrichtenlängen einer Netzwerkverbindung. In der Evaluation beweist un-sere Implementierung CoCoSpot, dass sie auf verlässliche Art und Weise C&C-Kommunikation einer Vielzahl an verschiedenen Botnetz-Familien erkennen kann,selbst wenn die C&C-Nachrichten vollständig verschlüsselt sind.Ferner beobachten wir, dass Botmaster ihre C&C-Kanäle unter erheblicher
Berücksichtigung der Tarnung im Netzwerkverkehr entwerfen. Mit Feederbotzeigen wir, dass mittlerweile Botnetze existieren, die DNS als Trägerprotokollfür ihren C&C-Kanal verwenden. Mit Hilfe der statistischen Entropie sowie Ver-
iii
Zusammenfassung
haltenseigenheiten wird ein Klassifizierer entworfen und implementiert, der DNS-basierte C&C-Kanäle erkennen kann – selbst in gemischtem Netzwerkverkehr vonlegitimen Benutzern. Unter Verwendung unseres Klassifizierers entdecken wirsogar eine weitere Botnet-Familie, die DNS als Trägerprotokoll für ihren C&Cbenutzt.Schließlich zeigen wir, dass ein aktueller Trend in der sog. rogue visual moneti-
zation liegt. Ein wahrnehmungsbasiertes Clustering von Screenshots des Sand-net ermöglicht es uns, Schadsoftware in Kampagnen der rogue visual monetiza-tion zu gruppieren und die Eigenschaften ihrer Lokalisierung und Monetarisierungzu studieren.
iv
Acknowledgements
This thesis would have hardly been possible without the help and support ofothers. First of all, I would like to thank my supervisor Felix C. Freiling who byhis guidance has significantly encouraged me and fostered my research. I havealways enjoyed our inspiring discussions and appreciated your kind advice. Yourpositive outlook and kindness inspired me and gave me confidence.I am deeply grateful to my colleague and friend Christian Rossow. Christian,
you are — by far — the most remarkable, sharp-minded, humble and encouragingperson I have ever worked with. It has been a great pleasure working with you.Furthermore, I am thankful to Norbert Pohlmann, for supporting me over
many years and giving me the opportunity to work in the inspiring environmentat his Institute. I appreciate to have learned quite some lessons not limited toacademic matters.Moreover, I thank the team at the Institute for Internet Security at the Univer-
sity of Applied Sciences Gelsenkirchen, in particular Christian Nordlohne, whosupported me with the analysis that influenced the C&C flow fingerprinting inthis thesis.Many thanks also to my second supervisor Christopher Kruegel. I really en-
joyed to work with you and the people in UCSB’s seclab. I am especially thankfulto — alphabetically ordered — Adam Doupé, Yanick Fratantonio, AlexandrosKapravelos, Gianluca Stringhini and Ali Zand. Furthermore, I would like tothank everyone at Lastline.A big thank you to my friend Philipp von Cube who bore with me for many
discussions and always supported me in times of decision-making.To conclude, I wish to extend a huge thank you to my parents and my brother
for their help and support all the way. You always supported all the decisions Imade, without asking for anything in return. Without your care and disciplineas well as the ways you have paved, I would simply not be the person I am today.Thank you very much for this.Last but not least I would like to thank my dear Julia. You have always been
(and will always be) the one to make my day. I am deeply grateful not only foryour inspiration and advice, but also for your love. This dissertation is dedicatedto you.
v

Contents
Abstract i
Zusammenfassung iii
Acknowledgements v
1 Introduction 11.1 Motivation . . . . . . . . . . . . . . . . . . . . . . . . . . . . . . . 11.2 Contributions: Countering Deviance . . . . . . . . . . . . . . . . . 2
1.2.1 Detection := Identification + Recognition . . . . . . . . . 41.2.2 List of Contributions . . . . . . . . . . . . . . . . . . . . . 5
1.3 Thesis Outline . . . . . . . . . . . . . . . . . . . . . . . . . . . . . 71.4 List of Publications . . . . . . . . . . . . . . . . . . . . . . . . . . 8
2 Background 112.1 Remote-Controlled Malware . . . . . . . . . . . . . . . . . . . . . 112.2 Machine Learning for Malware Detection . . . . . . . . . . . . . . 14
2.2.1 Clustering Evaluation . . . . . . . . . . . . . . . . . . . . . 182.2.2 Classification Evaluation . . . . . . . . . . . . . . . . . . . 20
2.3 Summary . . . . . . . . . . . . . . . . . . . . . . . . . . . . . . . 21
3 Malware Analysis using Sandnet 233.1 Introduction . . . . . . . . . . . . . . . . . . . . . . . . . . . . . . 233.2 Sandnet Architecture . . . . . . . . . . . . . . . . . . . . . . . . 243.3 Segmentation and Dissection of Network Traffic . . . . . . . . . . 263.4 Visualization . . . . . . . . . . . . . . . . . . . . . . . . . . . . . 293.5 Dataset Overview and Evaluation . . . . . . . . . . . . . . . . . . 313.6 Conclusion . . . . . . . . . . . . . . . . . . . . . . . . . . . . . . . 38
4 Recognition of Command and Control Flows 414.1 Introduction and Problem Statement . . . . . . . . . . . . . . . . 41
vii
Contents
4.2 Related Work . . . . . . . . . . . . . . . . . . . . . . . . . . . . . 474.3 Methodology . . . . . . . . . . . . . . . . . . . . . . . . . . . . . 49
4.3.1 Traffic Analysis Features of Botnet C&C . . . . . . . . . . 504.4 Clustering Analysis of Known C&C Flows . . . . . . . . . . . . . 51
4.4.1 Definition of the Distance Function . . . . . . . . . . . . . 514.4.2 Dataset Overview . . . . . . . . . . . . . . . . . . . . . . . 534.4.3 Hierarchical Clustering . . . . . . . . . . . . . . . . . . . . 544.4.4 Cluster Evaluation . . . . . . . . . . . . . . . . . . . . . . 554.4.5 Clustering results . . . . . . . . . . . . . . . . . . . . . . . 56
4.5 Designing the C&C Flow Classifier . . . . . . . . . . . . . . . . . 574.5.1 Cluster Centroids as C&C Channel Fingerprints . . . . . . 574.5.2 Classification Algorithm . . . . . . . . . . . . . . . . . . . 60
4.6 Evaluation of the C&C Flow Recognition . . . . . . . . . . . . . . 614.7 Discussion . . . . . . . . . . . . . . . . . . . . . . . . . . . . . . . 64
4.7.1 Reasoning and Evasion . . . . . . . . . . . . . . . . . . . . 654.7.2 C&C Blacklist Peculiarities and Delusion . . . . . . . . . . 66
4.8 Conclusion . . . . . . . . . . . . . . . . . . . . . . . . . . . . . . . 68
5 Detecting Botnets with DNS as Command and Control 695.1 Introduction . . . . . . . . . . . . . . . . . . . . . . . . . . . . . . 695.2 Case Study: DNS as Botnet C&C . . . . . . . . . . . . . . . . . . 70
5.2.1 DNS as Carrier for Botnet C&C . . . . . . . . . . . . . . . 715.2.2 Segmentation and Encryption . . . . . . . . . . . . . . . . 72
5.3 Detecting DNS-based Botnet C&C . . . . . . . . . . . . . . . . . 735.3.1 Classification Features . . . . . . . . . . . . . . . . . . . . 735.3.2 Clustering DNS traffic . . . . . . . . . . . . . . . . . . . . 775.3.3 Detecting Bots that use DNS C&C . . . . . . . . . . . . . 785.3.4 Detecting DNS C&C in mixed traffic . . . . . . . . . . . . 79
5.4 Discussion . . . . . . . . . . . . . . . . . . . . . . . . . . . . . . . 815.5 Related Work . . . . . . . . . . . . . . . . . . . . . . . . . . . . . 825.6 Conclusion . . . . . . . . . . . . . . . . . . . . . . . . . . . . . . . 83
6 Detecting Rogue Visual Malware 856.1 Introduction . . . . . . . . . . . . . . . . . . . . . . . . . . . . . . 856.2 Methodology . . . . . . . . . . . . . . . . . . . . . . . . . . . . . 87
6.2.1 Dataset . . . . . . . . . . . . . . . . . . . . . . . . . . . . 886.2.2 Malware User Interfaces . . . . . . . . . . . . . . . . . . . 896.2.3 Perceptual Hash Functions . . . . . . . . . . . . . . . . . . 906.2.4 Intra-Fingerprint Coherence . . . . . . . . . . . . . . . . . 916.2.5 Distance Computation and Clustering . . . . . . . . . . . 93
6.3 Evaluation . . . . . . . . . . . . . . . . . . . . . . . . . . . . . . . 936.3.1 Clustering evaluation . . . . . . . . . . . . . . . . . . . . . 946.3.2 Antivirus Detection . . . . . . . . . . . . . . . . . . . . . . 96
viii
Contents
6.3.3 Performance . . . . . . . . . . . . . . . . . . . . . . . . . . 996.4 Monetization and Localization . . . . . . . . . . . . . . . . . . . . 100
6.4.1 Ransomware Campaigns . . . . . . . . . . . . . . . . . . . 1006.4.2 Fake A/V Campaigns . . . . . . . . . . . . . . . . . . . . . 101
6.5 Limitations . . . . . . . . . . . . . . . . . . . . . . . . . . . . . . 1026.6 Related Work . . . . . . . . . . . . . . . . . . . . . . . . . . . . . 1046.7 Conclusion . . . . . . . . . . . . . . . . . . . . . . . . . . . . . . . 105
7 Conclusion 1077.1 Sandnet . . . . . . . . . . . . . . . . . . . . . . . . . . . . . . . 1077.2 CoCoSpot – Recognition of C&C flows . . . . . . . . . . . . . . . 1087.3 Botnets with DNS-based C&C . . . . . . . . . . . . . . . . . . . . 1097.4 Detection of rogue visual malware . . . . . . . . . . . . . . . . . . 113
List of Figures 115
List of Tables 117
Bibliography 119
ix

Chapter1Introduction
1.1 MotivationMalicious software, often referred to as malware, poses a severe problem to to-day’s information technology. While computer viruses have been around for morethan 25 years, nowadays, a prevalent subset of malware is organized in a remote-controllable fashion. An attacker merely infects computers, or more generally,IT systems of innocent victims in order to remotely execute arbitrary software.Thus, the change towards remote-controlled malware enables attackers to havemaximum flexibility concerning their monetization. Typically, an attacker aggre-gates her infected computers in a network. Such a network of computers infectedwith remote-controlled malware is referred to as a botnet.Adversaries monetize botnets in a variety of ways, e.g., by sending large amounts
of unsolicited commercial email (spam), ad fraud, stealing banking credentials ofthe infected computers’ users in order to mislead financial transactions or by lur-ing users into buying rogue software. Some botmasters build on extortion, and ifthe victim does not pay, the botnet performs a distributed denial of service attack,effectively knocking the victim offline. Recent studies on the underground econ-omy reveal potential revenues as well as the damage induced by remote-controlledmalware. Botnets such as Koobface [Vil10, TN10] focus solely on pay-per-clickor pay-per-install fraud, while still earning more than two million US dollars peryear. Similarly, the Storm botnet is expected to have produced a yearly revenueof 3.5 million US dollars [KKL+09]. Other botnets have specialized in distribut-ing rogue software, e.g., fake antivirus software and drew combined revenues ofover 130 million US dollars a year [SGAK+11]. In November 2011, operationGhost Click addressed the takedown and prosecution of DNSChanger, a botnetthat generated more than 14 million US dollars in fraudulent advertising revenueby help of hijacked DNS resolution of the victim computers [Gal11].But neither are botnets a problem of isolated spots, nor is it always necessarily
the monetization technique alone that causes damage. For example, the Mariposa
1
1 Introduction
botnet has comprised more than 13 million infected computers in more than 190countries [SBBD10]. Even worse, the Conficker botnet variants A-D are believedto have infected between 9 and 15 million computer systems worldwide [Onl09,UPI09], some even report up to 25 million infections [SGRL12]. In addition,without ever exposing a monetization technique at all, Conficker variants A-Dcaused severe problems in several institutions just by collateral damage of theinfections. Fighter planes of the French military were unable to take off dueto Conficker infections of related computer systems [Tel09]. Likewise, Britishwarships suffered from outages caused by Conficker infections [Reg09]. Theseincidents are examples of the severity of malicious, remote-controllable software.Clearly, the damage caused by botnets has reached a substantial extent, pos-
sibly even endangering society. As a first step, we need to design accurate andreliable detection methods for botnets. Being able to detect and measure theimpact of botnets on a large scale serves as a basis for subsequent actions, even-tually – if legal frameworks allow – leading to disinfections or takedowns.A key characteristic of malicious remote-controlled software lies in its ever-
changing appearance. This can be observed in a variety of ways. For example,in case of malicious remote-controlled software binaries, this property is often re-alized by so-called packing, which refers to the process of re-coding the softwarebinary while adding random elements, applying encryption or obfuscation. Thesame observation holds for a certain type of network traffic emitted by maliciousremote-controlled software, namely its command and control traffic. Typically,botnet command and control channels employ some kind of encryption or ob-fuscation technique in order to avoid characteristic payload substring patterns,which would serve as identification and recognition attribute. As a third ex-ample, let us refer to the user interfaces of rogue visual malware, such as fakeantivirus software. Although adhering to a similar user interface structure, theirvisual appearance employs slight variations in the details of their user interfaceelements.In summary, motivated by the need to evade detection, malicious software
strives for an ever-varying appearance. Even several samples of one kind ofmalicious remote-controlled software, e.g., what can naively be considered one botfamily, expose different appearances. As a result, the classification of malicioussoftware and its network traffic is rendered a challenge.
1.2 Contributions: Countering DevianceThis ever-changing appearance hinders the detection of both, malicious remote-controlled software as well as its network traffic. However, this thesis aimsat identifying and exploiting properties of remote-controlled malicious softwarethat – despite evasion techniques of malware – may serve for detection. Thismethodology builds upon two main observations.
2
1.2 Contributions: Countering Deviance
First, the variation of malware properties is hardly ever complete. While mal-ware authors typically address some properties specifically, such as the encodingof C&C messages by help of encryption, there is still room for detection ap-proaches in more subtle ways. In other words, we try to identify those propertiesthat are less frequently affected by variation, e.g., traffic analysis on botnet com-mand and control communication. As an example, the traffic analysis approachused in CoCoSpot as described in Chapter 4 leverages the sequence of messagelengths in botnet command and control channels. While encrypting C&C mes-sages results in varying payloads and thus avoids to recognize botnet C&C chan-nels by payload patterns, the traffic analysis properties still reveal characteristicrecognition attributes.
Second, the variation of malware sample properties is bounded. Using anappropriate feature space, even though samples may vary, this variation is typ-ically of limited scope, so that a large set of samples exhibits clusters of similarsample instances. From these clusters, characteristic structural templates canbe extracted and used as recognition attributes. For example, this approach isused in this thesis to infer user interface templates of rogue visual software, suchas fake antivirus software, by help of perceptual screenshot clustering. In thiscase, the variation of the user interface is bounded in the sense that only veryslight changes are made to the user interface elements, while the overall percep-tion remains the same. Using our perceptual clustering approach, we reveal theunderlying structure of the user interface which can be used as a recognitionfeature.
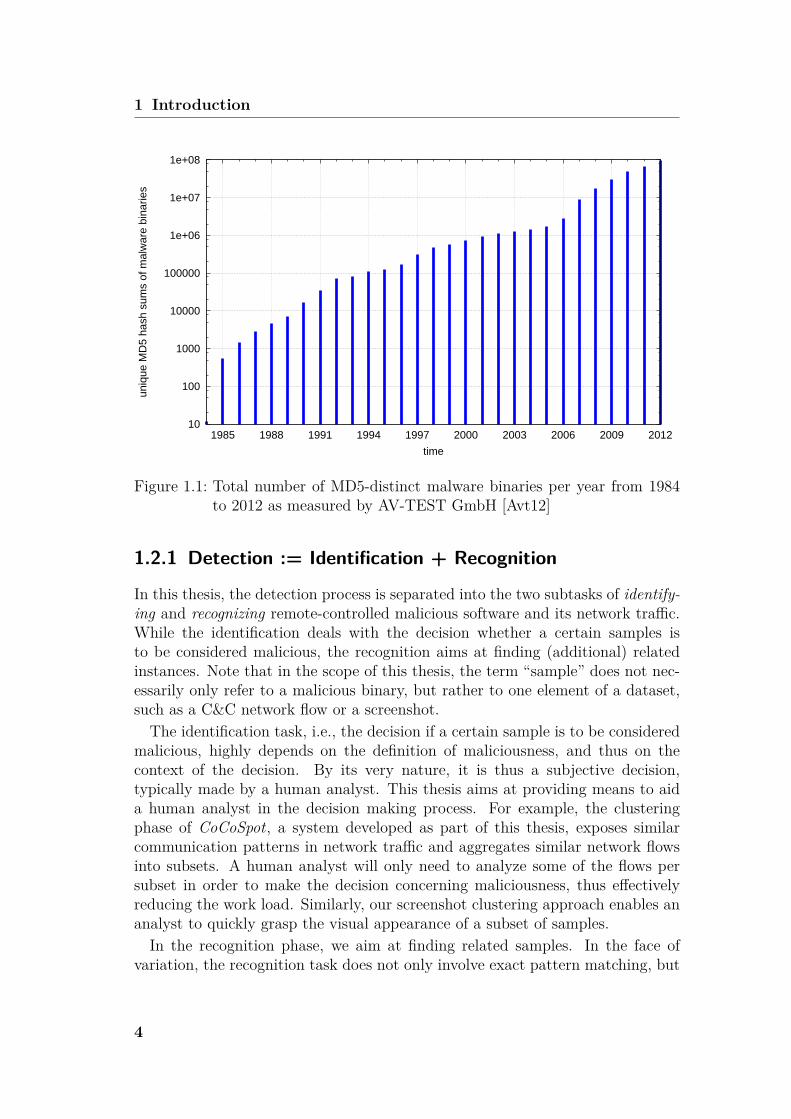
Telling from the facts, the number of observed MD5-distinct malware binarieshave increased for years [CDKL09]. Figure 1.1 shows the total number of MD5-distinct malware binaries per year from 1984 to 2012 as measure by AV-TESTGmbH. On the one hand, it is difficult – if at all possible – to measure whetherthis increase in unique malware binary hash sums relates to an increase in distinctmalware families. Nevertheless, on the other hand, this trend might also be aresult of the variations of malicious software binaries, such as packing. In thiscase, it is difficult to judge, whether the number of distinct families increases, too.However, it is desirable to understand and extract detection attributes on a per-family basis – instead of for each sample individually. Therefore, we also providea perspective on malware families. In the scope of this thesis, we define the termfamily in each specific context where it is used. For example, in the contextof CoCoSpot, we consider a family as the subset of malicious remote-controlledsoftware executions which share the same command and control protocol. Usingthe techniques proposed in this thesis, even though no general definition of amalware family can be concluded, the notion of a malware family depending onthe context will be fostered.
3
1 Introduction
10
100
1000
10000
100000
1e+06
1e+07
1e+08
1985 1988 1991 1994 1997 2000 2003 2006 2009 2012
uniq
ue M
D5
hash
sum
s of
mal
war
e bi
narie
s
time
Figure 1.1: Total number of MD5-distinct malware binaries per year from 1984to 2012 as measured by AV-TEST GmbH [Avt12]
1.2.1 Detection := Identification + Recognition
In this thesis, the detection process is separated into the two subtasks of identify-ing and recognizing remote-controlled malicious software and its network traffic.While the identification deals with the decision whether a certain samples isto be considered malicious, the recognition aims at finding (additional) relatedinstances. Note that in the scope of this thesis, the term “sample” does not nec-essarily only refer to a malicious binary, but rather to one element of a dataset,such as a C&C network flow or a screenshot.The identification task, i.e., the decision if a certain sample is to be considered
malicious, highly depends on the definition of maliciousness, and thus on thecontext of the decision. By its very nature, it is thus a subjective decision,typically made by a human analyst. This thesis aims at providing means to aida human analyst in the decision making process. For example, the clusteringphase of CoCoSpot, a system developed as part of this thesis, exposes similarcommunication patterns in network traffic and aggregates similar network flowsinto subsets. A human analyst will only need to analyze some of the flows persubset in order to make the decision concerning maliciousness, thus effectivelyreducing the work load. Similarly, our screenshot clustering approach enables ananalyst to quickly grasp the visual appearance of a subset of samples.In the recognition phase, we aim at finding related samples. In the face of
variation, the recognition task does not only involve exact pattern matching, but
4
1.2 Contributions: Countering Deviance
requires fuzzy pattern matching. While the recognition features are usually ex-tracted from a subset of samples, for example, the training samples compiled inthe identification phase, this set does not represent all possible values, i.e., thetraining sample set is not guaranteed to be complete. As an example, the mes-sage length sequences for a subset of similar network traffic samples for the Virutfamily’s command and control channels might expose a characteristic detectionattribute. However, we will hardly ever be able to compile a complete set of train-ing samples for Virut C&C traffic, due to variation. In other words, compared tothe training samples, another instance of a Virut command and control channel,e.g., found in the wild, will most certainly again vary slightly concerning the mes-sage length sequence and thus differ from all of the training samples. As a result,not only the identification phase needs to be aware of this variation, but also therecognition phase must be designed with regard to a certain level of fuzziness.To sum up, it is exactly this deviance which renders the detection of malicioussoftware a challenge. Thus, our separation of identification and recognition allowsus to develop specifically tailored methods for each of the subtasks.
1.2.2 List of ContributionsThis thesis aggregates work on the identification and recognition of maliciousremote-controlled software in terms of the following contributions.
Sandnet – A contained environment for dynamic malware analysis
Before we can apply machine learning, we need to collect data to be used inour experiments. While nowadays, malware is apparently ubiquitous, gatheringmalicious datasets from different parties might not seem to be a challenge. How-ever, using datasets from different sources raises concerns because they mightnot be comparable. In order to strive for correct and sound experiments, weaim to avoid artifacts in datasets, such as those induced by different source en-vironments, as much as possible. Therefore, we need a dataset where a largenumber of diverse malware has been executed under very similar conditions andwithin the same environment. We solve this problem by designing Sandnet,our contained dynamic malware analysis environment. In addition, we imple-ment an extensive post-processing chain which extracts and transforms the rawexecution results into structured and easily processable form and enriches themby correlating with external sources, such as origin AS and routing paths fromBGP feeds, geolocalization of IP addresses as well as reverse DNS information.Using Sandnet, we are able to compile a dataset of samples stemming from thesame environment, for a given experiment. Chapter 3 describes the design, usageand workflow of Sandnet. Sandnet has been developed in joint work withChristian Rossow.
5
1 Introduction
Recognition of command and control plane communication
Earlier work on detecting botnets developed means to automatically infer charac-teristic payload substring patterns of botnet C&C. Those substrings could thenbe used as payload signatures in the recognition phase. Albeit, over the lastfew years, botnets have evolved and nowadays the majority of botnets employobfuscated or encrypted command and control protocols. In addition, botnetsexhibit more and more nomadic C&C servers, i.e., migrate their C&C servers ona regular basis from one domain, IP address range or Autonomous System toanother. As a consequence thereof, detecting C&C flows of these modern botnetsis truly rendered a challenge, especially since encryption defeats payload patternmatching and a frequent migration of C&C servers turns blacklists inefficient.It may seem unlikely to still be able to detect such C&C channels. However,
in Chapter 4, we address the problem of recognizing command and control flowsof botnets and show that, using traffic analysis features, we can infer a model tocorrectly classify C&C channels of more than 35 distinct prevalent bot familiesamong network traffic of contained malware analysis environments. A key featureof our traffic analysis approach lies in the sequence of message lengths of C&Cflows.
Detecting botnets with DNS as carrier for command and control
Traditionally, botnets designed their C&C protocols to be based on IRC and lateron HTTP. Similarly, a body of related work exists on the detection of IRC- andHTTP-based command and control protocols. However, taking disguise of botnetcommand and control channels to the next level, we have discovered Feederbot, abotnet that uses the DNS protocol as carrier for its command and control. Beingthe first of this kind, we reverse engineered and investigated this botnet in detail,disclosing the techniques employed to hide their encrypted C&C traffic in regularDNS requests and responses.Additionally, we face the challenge to design a detection approach. Although
the botmasters employ DNS tunneling techniques, we show in this thesis thatour specifically tailored method can still detect botnets that use DNS as carrierprotocol for its C&C. Using our classifier, we have even discovered an independentsecond botnet that, too, builds its C&C upon the DNS protocol. Furthermore, weevaluate our approach on mixed network traffic with benign users’ network trafficin order to show that this approach can even be used in real-world environmentsto detect DNS-based botnets.
Detection of visual monetization plane activities
Given the fact that remote-controlled malware depends on network communica-tion, aiming to detect malware based on command and control traffic features, asdescribed in Chapters 4 and 5, seems natural. Complementary to the command
6
1.3 Thesis Outline
and control plane, we can try to detect malicious software by its monetizationtechnique. Recently, one important monetization technique has consisted in akind of malicious software termed rogue visual malware, which aims at luringthe innocent user into spending money on a rogue software product. Prevalentexamples of rogue visual malware are fake antivirus software (Fake A/V) andransomware.In this thesis, we study essential properties of rogue visual malware and propose
a method to recognize malware based on its graphical user interface. Especiallyin face of very low antivirus detection rates of rogue visual malware binaries –ranging as low as 10% of all binaries per campaign – our methodology pointstowards a new approach of detecting malware by exploiting its visual perception.In addition, our approach supports a human analyst in identifying rogue visualmalware campaigns. Furthermore, using the results of our approach, we provideinsights into the monetization and localization habits of rogue visual malwarecampaigns, based on data of more than two years.
1.3 Thesis OutlineThis thesis is structured as follows. Since this work combines techniques from ma-chine learning with the task of detecting malware, Chapter 2 provides backgroundinformation on properties of malicious software as well as recurring concepts ofmachine learning. We will cover the general process on how to apply unsupervisedand supervised machine learning to a given malware detection approach, startingwith the compilation of a dataset and concluding with evaluation methods.Subsequently, motivated to compile a correct and sound dataset, Chapter 3
describes our approach of building a contained environment for dynamic malwareanalysis. In addition, we provide examples on how to inspect the results of abinary execution in order to assign ground truth labels to samples of the dataset.For subsequent experiments throughout this thesis, we will always refer to theSandnet dataset.Recently, botnets have evolved and many bot families now employ obfuscated
or encrypted command and control channels. This renders previous approachesof recognizing botnet C&C channels ineffective. For example, payload patternmatching is defeated by C&C message encryption. Furthermore, the nomadiccharacter of modern centralized botnets, where the C&C server is migrated fromone domain, Autonomous System and IP address range to another, avoids black-list approaches. The same holds true for botnets with a distributed C&C archi-tecture. Despite the countermeasures taken by botmasters, we will address theproblem of recognizing command and control flows in Chapter 4. We will showthat our methodology of exploiting traffic analysis features successfully recognizeseven encrypted botnet C&C channels.Having identified a new kind of botnet C&C, namely botnets that use DNS
7
1 Introduction
as carrier for its command and control protocol, in Chapter 5, we provide a casestudy on such a botnet and design a detection approach. Again, we show thatour classifier successfully detects DNS-based botnets, effectively revealing anotherbotnet which uses DNS as C&C carrier protocol. Furthermore, our approach iseven able to detect DNS-based botnets in network traffic mixed with that ofbenign users.Chapter 6 focuses on a complementary detection approach for remote-controlled
malware by exploiting the monetization visibility. Rogue visual malware is a classof malware that builds on graphical user interfaces, a key property that we ex-ploit in our detection methodology. We show that the similarity among graphicaluser interfaces of one family is reflected in our perceptual clustering approach,effectively structuring a set of more than 200,000 executions of malware bina-ries. Concluding our work on rogue visual malware, we provide insights intoand compare monetization and localization means of Fake A/V and ransomwarecampaigns.Finally, Chapter 7 concludes this thesis by providing a summary and outlining
directions of future research.
1.4 List of PublicationsThis thesis aggregates research on the detection of malicious remote-controlledsoftware. While containing unpublished work, in large part, it consists of thefollowing publications:
• “Sandnet: Network Traffic Analysis of Malicious Software” (co-authoredwith Christian Rossow) [RDB+11]
• “On Botnets that use DNS for Command and Control” [DRF+11]
• “CoCoSpot: Clustering and Recognizing Botnet Command and ControlChannels using Traffic Analysis” [DRP12a]
• “Exploiting Visual Appearance to Cluster and Detect Rogue Software”[DRP13]
The part concerning the design and implementation of Sandnet in Chapter 3is joint work with Rossow and has not been published before. Subsequent resultshave been published together with Rossow, Bos, Cavallaro, van Steen, Freilingand Pohlmann [RDB+11].The identification and recognition of botnet command and control channels as
proposed in Chapter 4 are based on a journal article together with Rossow andPohlmann [DRP12a]. Additionally, this work has been refined and re-evaluatedon a larger dataset in August 2012.
8
1.4 List of Publications
Chapter 5 provides our insights on botnets using DNS as carrier protocol forcommand and control. This work has been published in a paper together withRossow, Freiling, Bos, van Steen and Pohlmann [DRF+11].Furthermore, we contributed to the following publications, but they have not
been included in this thesis:
• “eID Online Authentication Network Threat Model, Attacks and Implica-tions” [DRP12b]
• “Large-Scale Analysis of Malware Downloaders” [RDB12]
• “Prudent Practices for Designing Malware Experiments: Status Quo andOutlook” [RDK+12]
• “Manufacturing Compromise: The Emergence of Exploit-as-a-Service” [GBC+12]
9

Chapter2Background
Before digging into the technical approaches of detecting remote-controlled mal-ware, this chapter provides background information on recurring terms and con-cepts throughout this thesis. The methodologies that were developed as partof this thesis combine techniques from the domain of machine learning with thefield of malware detection. Therefore, we will discuss basic aspects of both areas.First, we provide a definition and an overview over botnets or more formally,remote-controlled malware. Subsequently, we introduce machine learning tech-niques used throughout the remaining experiments of this thesis.
2.1 Remote-Controlled MalwareIncreasingly, malware depends on network communication. To a great degree,current malicious software is programmed in a remote-controllable manner. Itreceives instructions over the Internet and sends back information. The prop-erty of being remote-controlled enables an attacker – in this context referred toas botmaster – to change the functionality of the malware after having infectedcomputers in the wild. Whenever the bot master faces countermeasures, the botscan thus be updated in order to circumvent the countermeasures. Furthermore,there is a variety of ways how malware monetizes infected computers, most ofwhich heavily depend on Internet communication. Consequently, network com-munication is inevitable for most modern malware.
Definition. For the scope of this thesis, remote-controlled malicious software isdefined as software which fulfills the following two conditions:
• The software is remote-controlled by means of network communication.
• The software employs malicious monetization, i.e., it monetizes informationor resources from or via the victim user or his/her computer.
11
2 Background
Thus, remote-controlled malicious software requires a network-based commandand control (C&C) plane. The C&C plane is used to instruct the bots and toreport back to the controlling unit. For example, the C&C plane is used for thebotmaster to instruct a bot to send spam and, vice versa, to report on the mailsubmission back to the C&C peer. In addition, the monetization plane coversthe techniques to monetize on the victim. For example, such monetization mightinclude the actual sending of spam messages, performing click fraud, denial-of-service attacks as well as to steal personal information such as online bankingcredentials.
Command and Control Plane
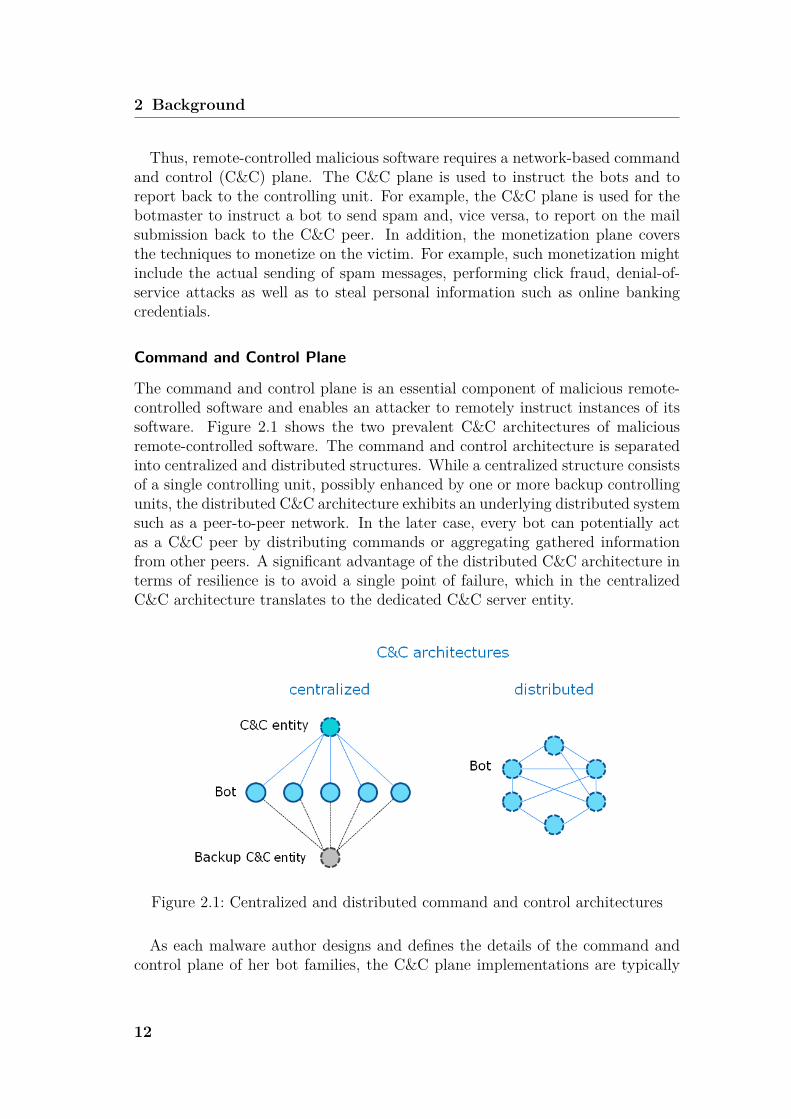
The command and control plane is an essential component of malicious remote-controlled software and enables an attacker to remotely instruct instances of itssoftware. Figure 2.1 shows the two prevalent C&C architectures of maliciousremote-controlled software. The command and control architecture is separatedinto centralized and distributed structures. While a centralized structure consistsof a single controlling unit, possibly enhanced by one or more backup controllingunits, the distributed C&C architecture exhibits an underlying distributed systemsuch as a peer-to-peer network. In the later case, every bot can potentially actas a C&C peer by distributing commands or aggregating gathered informationfrom other peers. A significant advantage of the distributed C&C architecture interms of resilience is to avoid a single point of failure, which in the centralizedC&C architecture translates to the dedicated C&C server entity.
Figure 2.1: Centralized and distributed command and control architectures
As each malware author designs and defines the details of the command andcontrol plane of her bot families, the C&C plane implementations are typically
12
2.1 Remote-Controlled Malware
very diverse in nature. This means that, on the one hand, the unique characterof a bot family’s C&C plane implementation – once grasped – might serve wellas a recognition property. On the other hand, the lack of general constraintson the C&C plane allows the attacker to define the C&C plane techniques in aflexible and volatile way. Botmasters are free to change the C&C plane techniquefrequently, or, with steganography in mind, design it in a very similar fashion aswell-known legitimate communication means.We will use the following definition of the term C&C protocol.
Definition. A C&C protocol is the protocol that is used to communicate instruc-tions and reports, signal a bot’s state and availability as well as transmit botprogram updates between one or more bots and the controlling entity, the bot-master.
In face of the detection of command and control plane communication, weobserve that once the C&C plane communication is identified, it serves as areliable recognition attribute. However, as the C&C plane communication maybe encrypted or obfuscated, the identification itself can be a challenging task.
Monetization Plane
Malware authors target financial gain. Thus, the monetization plane grasps thosetechniques (and preparations thereof) that the attacker employs in order to havemoney transferred to her benefit. Malicious remote-controlled software can beseparated concerning the visibility of monetization techniques on an infected com-puter. Sending spam email messages or logging keystrokes usually takes place inthe background without the victim user noticing. Similarly, click fraud is typi-cally performed as a background job without any interface elements noticeable tothe user. This kind of monetization is thus considered covert. However, certainmonetization techniques require the user to interact. For example, a recent mon-etization technique consists in fake antivirus software luring the user into buyinga fake software product. Likewise, ransomware extorts users to pay in order tounlock their computers. In the latter cases, the malware is forced to display auser interface and its monetization technique can thus be classified as exposed.In contrast to the C&C plane, to a certain degree, the techniques in the mon-
etization plane have to obey outer constraints. For example, a spam bot has tocomply with the general email delivery process, e.g., speaking the SMTP protocoland addressing well-defined mail servers. Similarly, a fake antivirus software hasto expose a certain user interface which lures the victim into spending money.These constraints may help in the detection process, because the malware
authors are restricted, e.g., in the network protocols and their usage. Thus,the obfuscation of the monetization plane activities becomes much more limited.More precisely, with regard to detection, we observe that monetization planeactivities form monetization-dependent recognition attributes. However, when
13
2 Background
compared to C&C plane recognition, monetization plane recognition attributescan be more volatile because the duration of monetization campaigns may beshorter than the C&C plane design and not all monetization techniques exposerecognizable attributes.
2.2 Machine Learning for Malware DetectionOne way of addressing and possibly mitigating the ever-changing appearance ofmalicious software is to infer structures and dependencies among malware whichare not obvious at first sight. These structures may only be discovered whenanalyzing a diverse set of malware and in comparison with benign counterparts.For example, even though the malware binaries of a certain bot family employan encrypted communication channel for command and control, we might still beable to model the communication behavior that is characteristic for this malwarefamily. Such a model could only be inferred after having analyzed lots of differentsamples of the malware family in question in addition to a diverse set of otherfamilies’ communication. Finally, if a model can be inferred, this communicationmodel will serve as a means to detect further instances of the same malwarefamily.In order to programmatically follow this approach, we turn to machine learn-
ing. Machine learning techniques deal with the modeling of relationships anddependencies among sets of data. In this thesis, we apply machine learning tothe domain of malware detection. The overall process of applying a machinelearning technique consists of several steps. In the following, we will provide ageneral overview, partly enriched with recommendations based on the guidelinesdeveloped by Rossow et al. [RDK+12].
Dataset compilation. First, a dataset covering instances of the data in ques-tion must be compiled. In general, the more diversity the dataset covers, themore likely it is to also cover the difficult and challenging cases for the chosenapproach. It is exactly those challenging cases, that help to judge if the derivedmodel can reliably be used for detection in an application context. In practice,the size of the dataset and its diversity are typically limited by outer constraintssuch as limited time and a limited number of sensors where to acquire instances.For the experiments in this thesis, we often turn to the Sandnet dataset. Inorder to maximize diversity, for example, we distribute instances over severaldistinct malware families and points in time. Furthermore, we maximize thenumber of instances to be used for the experiment. Care should be taken toavoid artifacts in the dataset, as they might influence the learning process in anundesired fashion – especially when combining datasets of distinct sources whichmight exhibit different artifacts. If available, the instances of the dataset shouldbe labeled using ground truth, because these labels allow for evaluation of sub-
14
2.2 Machine Learning for Malware Detection
sequently developed models. Based on the labels the dataset can be subdividedinto classes. In addition, when labeled datasets are available, we try to avoid askewed training set, i.e., we make sure that each class is represented with roughlythe same number of instances in the training dataset.
Feature Extraction. Second, features need to be defined and extracted fromthe dataset. The design and choice of the features depends largely on the specificgoal of an experiment and its application. We will therefore provide the featuredefinitions in each of the subsequent chapters containing machine learning ex-periments. In general, having a certain experiment’s goal in mind, the featuresshould be able to express the distinction between any of the classes in the datasetinvolved.Kinds of features for network traffic can be distinguished into numerical fea-
tures, sequential features and syntactical features as proposed by Rieck [Rie09].In addition, depending on the learning algorithm, features may need to be scaledand normalized. Features can be combined into a multidimensional vector. Theaggregation of multiple features is referred to as a feature vector, spanning a fea-ture space. For some learning algorithms, redundancy in the features of a featurevector may bias the learning result. As a precaution, we take care during thefeature extraction process to be aware of dependencies or redundancies amongfeatures.
Dissimilarity or distance measure. Based on the feature space, the dissimi-larity between any two instances is measured using a dissimilarity or distancefunction. Again, the specific distance function depends on the feature space,the context and the semantics of a certain experiment, and is thus defined ineach experiment of this thesis individually. In general, a distance function is afunction d(u, v), which, given two feature vectors u and v, returns a value inthe range R+
0 . Similar feature vectors exhibit a low distance while dissimilar in-stances have a higher distance. Examples for distance functions are the Euclideandistance, the Hamming distance or the Levenshtein distance.Furthermore, the distance function can be a function composed of several dis-
tance functions for each feature dimension. Assume a feature vector of two di-mensions with one string feature and one set-of-bigram feature. While the stringfeature might fit the Levenshtein distance [Lev65], the bigram dimension requiresa different distance function, such as the Jaccard distance [LW71].
Unsupervised learning. Machine learning techniques are divided into unsuper-vised and supervised learning. While unsupervised learning strives to structurea given dataset into subclasses, supervised learning targets the classification orprediction of previously unseen instances. Clustering is a prevalent example forunsupervised learning and it is particularly useful to find yet unknown properties
15
2 Background
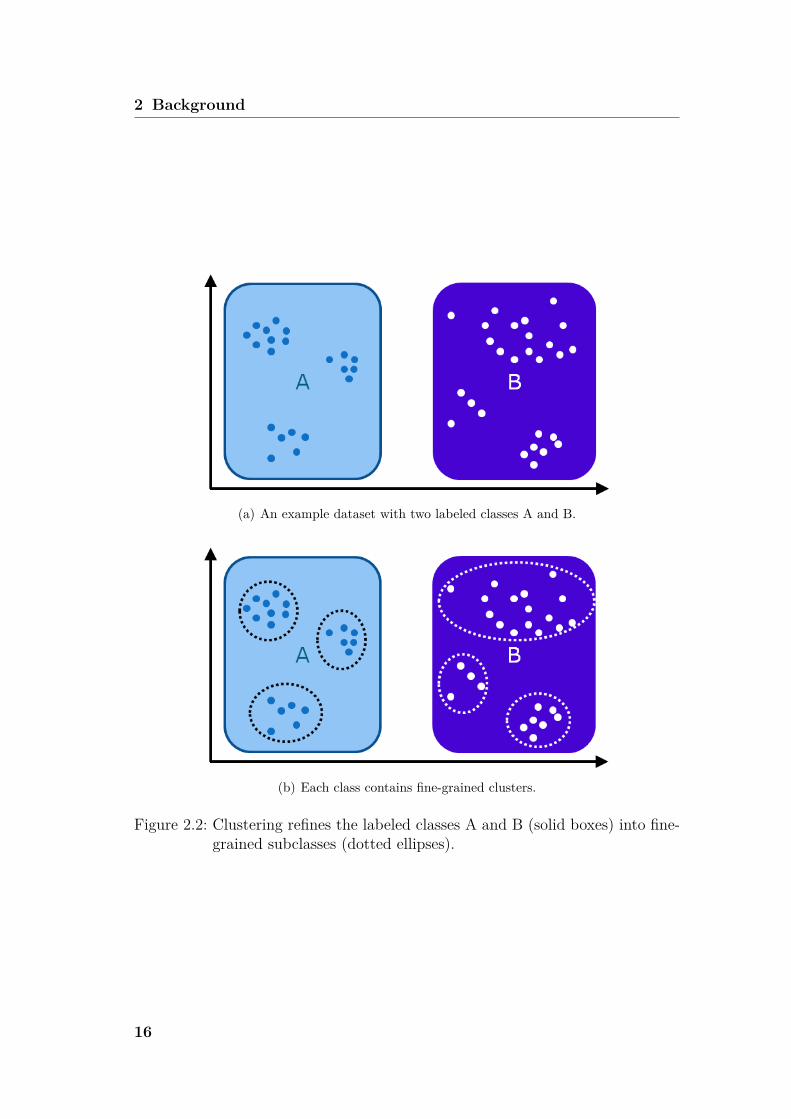
(a) An example dataset with two labeled classes A and B.
(b) Each class contains fine-grained clusters.
Figure 2.2: Clustering refines the labeled classes A and B (solid boxes) into fine-grained subclasses (dotted ellipses).
16
2.2 Machine Learning for Malware Detection
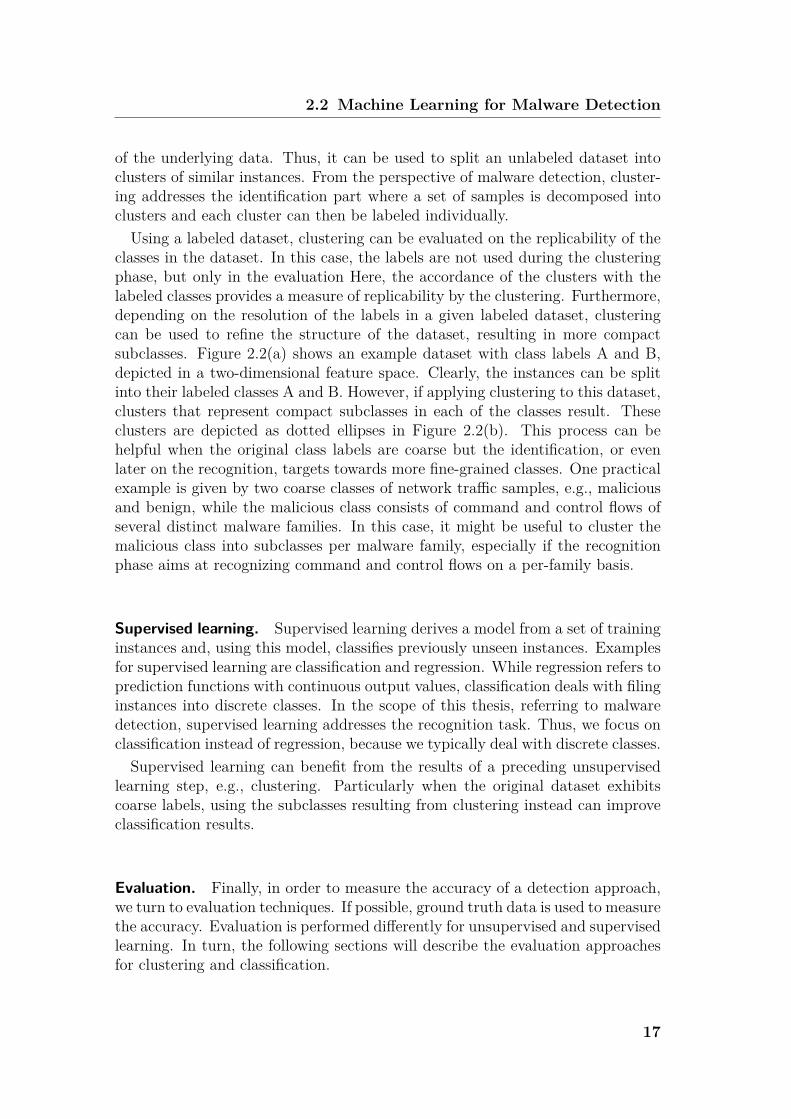
of the underlying data. Thus, it can be used to split an unlabeled dataset intoclusters of similar instances. From the perspective of malware detection, cluster-ing addresses the identification part where a set of samples is decomposed intoclusters and each cluster can then be labeled individually.Using a labeled dataset, clustering can be evaluated on the replicability of the
classes in the dataset. In this case, the labels are not used during the clusteringphase, but only in the evaluation Here, the accordance of the clusters with thelabeled classes provides a measure of replicability by the clustering. Furthermore,depending on the resolution of the labels in a given labeled dataset, clusteringcan be used to refine the structure of the dataset, resulting in more compactsubclasses. Figure 2.2(a) shows an example dataset with class labels A and B,depicted in a two-dimensional feature space. Clearly, the instances can be splitinto their labeled classes A and B. However, if applying clustering to this dataset,clusters that represent compact subclasses in each of the classes result. Theseclusters are depicted as dotted ellipses in Figure 2.2(b). This process can behelpful when the original class labels are coarse but the identification, or evenlater on the recognition, targets towards more fine-grained classes. One practicalexample is given by two coarse classes of network traffic samples, e.g., maliciousand benign, while the malicious class consists of command and control flows ofseveral distinct malware families. In this case, it might be useful to cluster themalicious class into subclasses per malware family, especially if the recognitionphase aims at recognizing command and control flows on a per-family basis.
Supervised learning. Supervised learning derives a model from a set of traininginstances and, using this model, classifies previously unseen instances. Examplesfor supervised learning are classification and regression. While regression refers toprediction functions with continuous output values, classification deals with filinginstances into discrete classes. In the scope of this thesis, referring to malwaredetection, supervised learning addresses the recognition task. Thus, we focus onclassification instead of regression, because we typically deal with discrete classes.Supervised learning can benefit from the results of a preceding unsupervised
learning step, e.g., clustering. Particularly when the original dataset exhibitscoarse labels, using the subclasses resulting from clustering instead can improveclassification results.
Evaluation. Finally, in order to measure the accuracy of a detection approach,we turn to evaluation techniques. If possible, ground truth data is used to measurethe accuracy. Evaluation is performed differently for unsupervised and supervisedlearning. In turn, the following sections will describe the evaluation approachesfor clustering and classification.
17
2 Background
2.2.1 Clustering EvaluationSince hierarchical clustering is used in several experiments of this thesis, its evalu-ation methodology is described in a general fashion in this section. Nevertheless,we will provide a detailed evaluation procedure for each experiment. In general,clustering aims to structure a given dataset into clusters or subclasses of simi-lar instances. Given a specific context, the clustering results can be evaluatedby measuring the correspondence of clusters to previously assigned class labels,i.e., ground truth.To evaluate how well a clustering represents the labeled dataset, we use two
measures from the area of unsupervised learning and originally defined in thecontext of information retrieval [vR79]. First, we measure the precision, whichrepresents how well our clustering separates instances of different classes into dis-joint clusters. Second, we compute the recall, which measures if similar instancesare grouped into the same cluster. Formally, let T be the set of ground truthclasses in the labeled dataset, C the set of created clusters, m = |T |, n = |C|and the total number of instances to be clustered is s = ∑n
i=1 |Ci|. We defineprecision P as
P = 1s
n∑i=1
Pi = 1s
n∑i=1
max(|Ci ∩ T1|, |Ci ∩ T2|, ..., |Ci ∩ Tm|) (2.1)
and recall R as
R = 1s
m∑i=1
Ri = 1s
m∑i=1
max(|C1 ∩ Ti|, |C2 ∩ Ti|, ..., |Cn ∩ Ti|) (2.2)
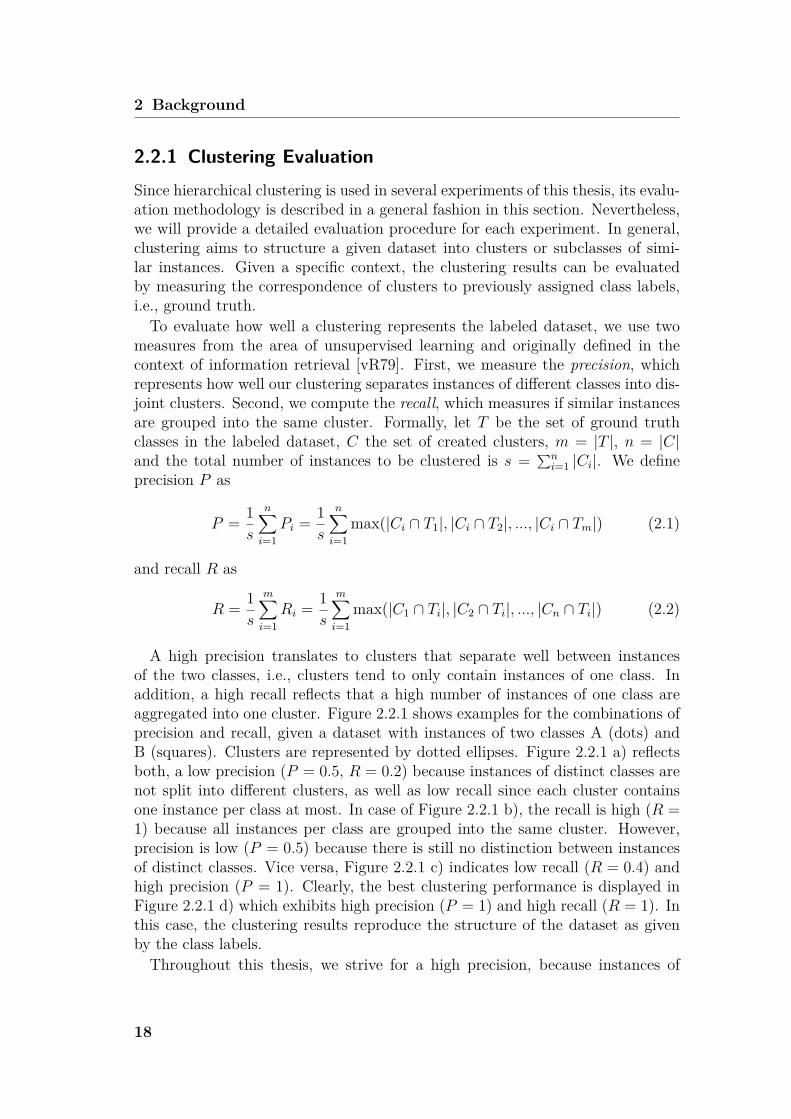
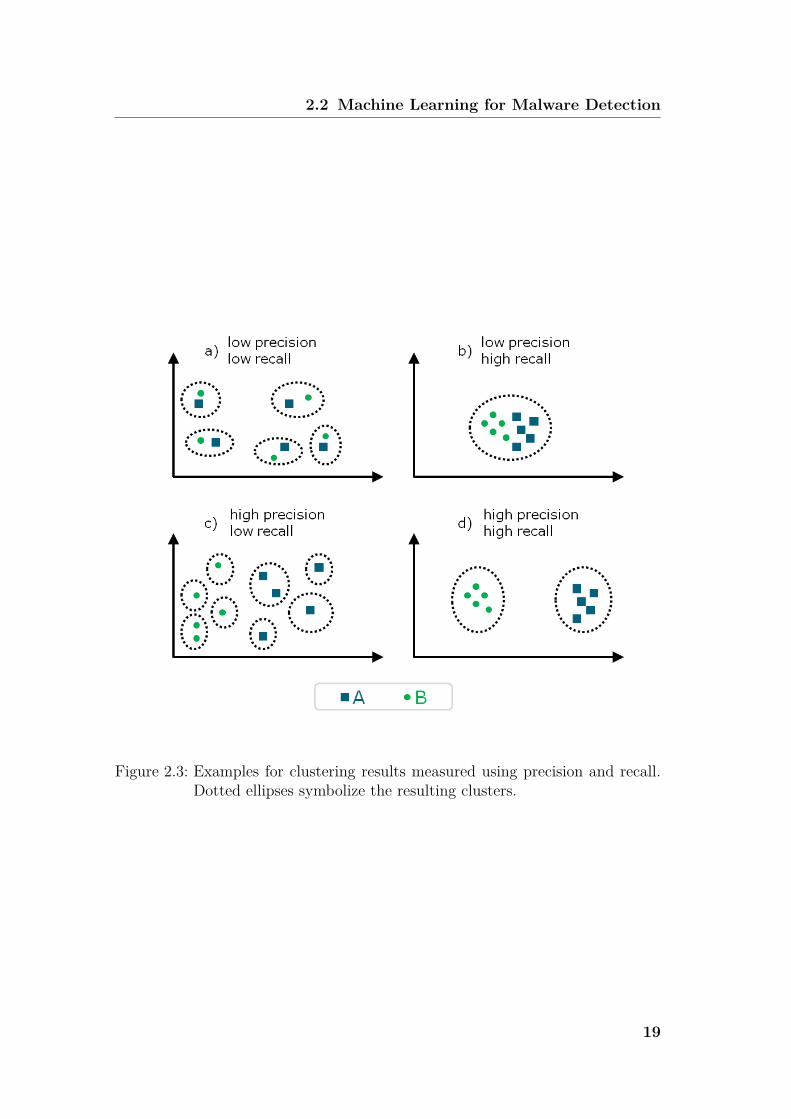
A high precision translates to clusters that separate well between instancesof the two classes, i.e., clusters tend to only contain instances of one class. Inaddition, a high recall reflects that a high number of instances of one class areaggregated into one cluster. Figure 2.2.1 shows examples for the combinations ofprecision and recall, given a dataset with instances of two classes A (dots) andB (squares). Clusters are represented by dotted ellipses. Figure 2.2.1 a) reflectsboth, a low precision (P = 0.5, R = 0.2) because instances of distinct classes arenot split into different clusters, as well as low recall since each cluster containsone instance per class at most. In case of Figure 2.2.1 b), the recall is high (R =1) because all instances per class are grouped into the same cluster. However,precision is low (P = 0.5) because there is still no distinction between instancesof distinct classes. Vice versa, Figure 2.2.1 c) indicates low recall (R = 0.4) andhigh precision (P = 1). Clearly, the best clustering performance is displayed inFigure 2.2.1 d) which exhibits high precision (P = 1) and high recall (R = 1). Inthis case, the clustering results reproduce the structure of the dataset as givenby the class labels.Throughout this thesis, we strive for a high precision, because instances of
18
2.2 Machine Learning for Malware Detection
Figure 2.3: Examples for clustering results measured using precision and recall.Dotted ellipses symbolize the resulting clusters.
19
2 Background
distinct families should be filed into different clusters. However, in practice,precision and recall form a trade-off. With higher precision, recall decreases andvice versa. In this case, we slightly favor a high precision over a high recall. Inother words, under certain circumstances, it is tolerable, if the instances of oneclass spread over more than one cluster. One such exemplary reason could bethat the clustering results in more fine-grained clusters than the resolution of theclass labels reveal. For example, imagine to cluster a dataset of fruit, coveringapples and citrus fruit. While the class labels may only provide the two fruitspecies apples and citrus fruit, the clustering might even distinguish the sortof fruit among each of the classes, e.g., lime, orange and lemon among citrusfruit as well as Granny Smith and Cox Orange among apples.In face of clustering evaluation, we need to be able to tolerate multiple clusters
for one class, but have to avoid too generic clusters by mixing different classes intothe same cluster. One way to deal with this requirement is to combine precisionand recall in a weighted score and prioritize precision over recall. Formally, we usethe F-measure [vR79] to evaluate the performance of a clustering with thresholdth and a weighting parameter β, with β < 1 reflecting higher weight on precisionover recall:
F-measureth = (1 + β2) · Pth · Rth
β2 · Pth +Rth
(2.3)
We will refer to F-measure in each of the subsequent chapters when dealingwith clustering evaluation and provide a reasonable value for the parameter βdepending on the context.
2.2.2 Classification EvaluationWhile for clustering evaluation we apply precision and recall, for classification,we evaluate using false negative and false positive rates. An instance which byground truth is assigned to class A but where the classifier erroneously predictsit not to be of class A is considered a false negative. Vice versa, a false positiveoccurs if an instance is not considered to be of class A (by ground truth), butthe classifier incorrectly assigns it to class A.Especially for supervised machine learning approaches, there is a general trade-
off between memorization and generalization. Whereas memorization will per-fectly reproduce the classification results on instances that were used duringtraining, it will fail for yet unknown instances. In the machine learning con-text, this pitfall is called overfitting. In contrast, too broad of a generalizationwill result in less accuracy of the classification – a phenomenon typically referredto as underfitting. Ideally, we strive for the right balance between underfittingand overfitting. This methodology is called structural risk minimization and hasinitially been proposed by Vapnik [Vap95].One way of measuring the fitness of a derived model and estimate its accu-
racy on an independent dataset is provided by cross-validation. Cross-validation
20
2.3 Summary
deals with a repeated classification and evaluation on different subsets of a givendataset. In this thesis, we turn to k-fold cross-validation [Sto74] which worksas follows. The training and validation datasets are split into k subsets. Then,k − 1 subsets are used for the training phase, while the remaining subset is usedfor the validation. This process is repeated until each subset has been used onceas validation subset. The mean of the resulting false positive and false negativesrates can help to estimate the performance of a given classifier on an independentdataset.
2.3 SummaryIn this chapter, we introduced the foundations of machine learning techniquesas well as the required concepts and definitions on malicious remote-controlledmalware. Used throughout the remainder of this thesis, these concepts form basicblocks for our detection methodologies.In the following chapters, we will design and implement detection approaches
in order to identify and recognize botnet command and control channels as wellas visual monetization techniques.
21

Chapter3Malware Analysis using Sandnet
3.1 IntroductionOften, analyzing malicious software is not a straight-forward process. Since mal-ware authors strive to evade detection, they employ a variety of means to hin-der the analysis and the detection of their malicious binaries. As an example,the static analysis of PE binaries is typically hindered by custom compressionand obfuscation techniques of the PE binary, an approach referred to as pack-ing [GFC08, MCJ07, DRSL08]. Only during runtime, the PE binary unpacks it-self in memory. As understanding the (un)packing algorithm of a certain malwarebinary is tedious, researchers turned towards executing the binary and analyzingthe binary during its execution. This approach is typically referred to as dynamicmalware analysis [WHF07].In order to study the malware phenomenon, we designed a contained dynamic
malware analysis environment, called Sandnet [RDB+11]. The name Sandnetis derived from “sandbox”, referring to a contained execution environment formalware without harming the outside world, and “network” due to our specialregard to malicious network traffic. Sandnet focuses on dynamic malware analy-sis, i.e., the automated execution of Windows PE binaries. Therefore, Sandnetcaptures the network traffic emitted during the malware binary execution andrecords the graphics output by taking screenshots. Furthermore, we enhancedSandnet by means of static analysis of PE binaries as well as an extensivepost-processing analysis, including payload-based protocol detection and parsersfor well-known application layer protocols. The output of the post-processing isstored in a PostgreSQL database.As a result, the Sandnet database constitutes a dataset of malicious PE bina-
ries as well as their execution results including the network traffic and screenshots.This dataset serves as the basis for our subsequent research on detecting maliciousremote-controlled software. Depending on the dedicated goal of an experiment, itis usually required to compile a subset of certain kinds of samples. For example,
23
3 Malware Analysis using Sandnet
as some binaries are acquired from public submission, it is not guaranteed that allbinaries are indeed malicious. We have observed cases where legitimate software,such as the default Windows Notepad program have been submitted. Thus, wewill discuss how the dataset for each experiment is compiled before performingthe actual clustering or classification experiment. One possible way of compilinga reliable dataset for an experiment is achieved by manually inspecting (a ran-dom subset of) the samples to be included. In order to make the manual reviewof samples as efficient and comfortable as possible for a human analyst, we ex-tended Sandnet with a web interface. Section 3.4 describes one example of howwe designed a web interface view on the network traffic emitted by an executedbinary. Throughout this chapter, we will describe the design of Sandnet and,where appropriate, provide statistics based on the resulting Sandnet data.
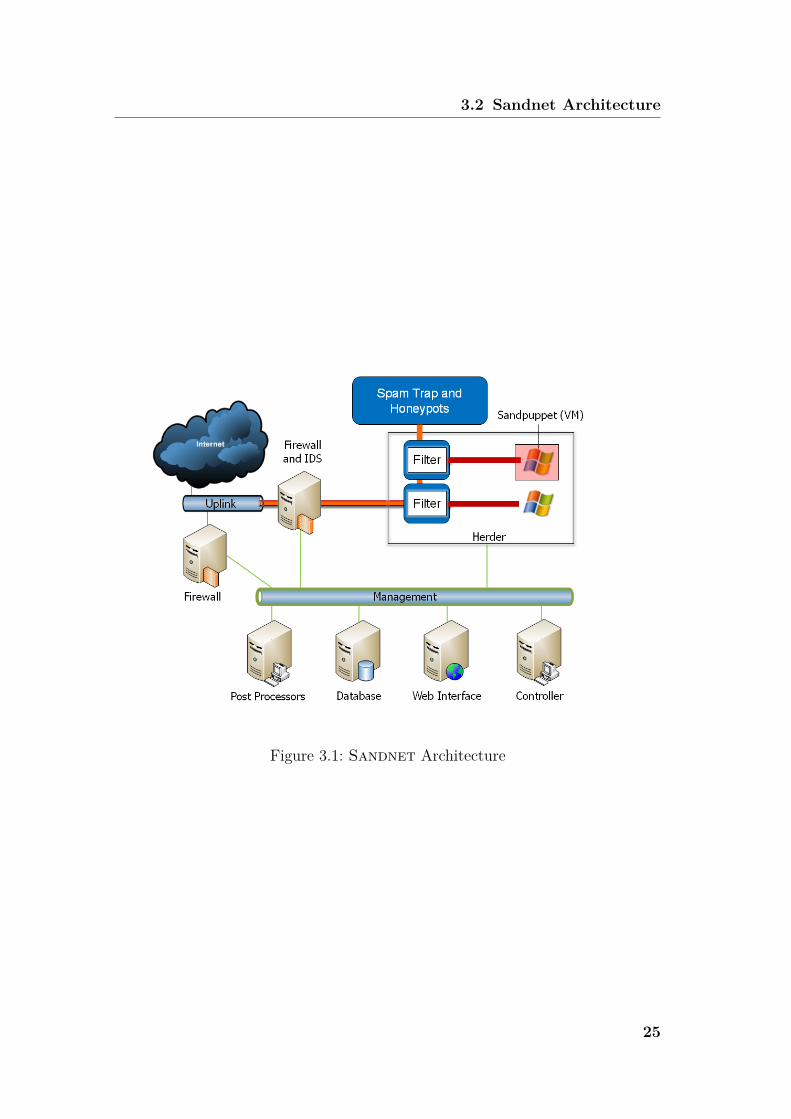
3.2 Sandnet ArchitectureEvery day, thousands of malware binaries hit the collection sensors of researchersand antivirus companies. To a certain degree, the amount of malware samplesmakes dynamic malware analysis a scalability problem. Thus, we designed Sand-net in a distributed, scalable manner. Figure 3.1 shows the overall Sandnetarchitecture.Each binary is executed in a pre-configured virtual machine, called Sandpuppet,
running Windows XP 32bit with Service Pack 3. Additionally, a sandpuppet hastypical applications installed, such as browsers, Flash plugins, PDF readers andmedia players as well as language packs for foreign languages including Chinese,Japanese and Russian. Having these additional language packs installed allows usto run malware which requires support for foreign languages. The host computersfor the virtual machines are termed herders. In this thesis, all experiments arebased on malware execution using the Windows XP SP3 32bit sandpuppet.In order to limit potential harm to others while running malware, we take care
in filtering out harmful traffic. Therefore, we deploy containment policies thatredirect harmful traffic, e.g., spam and infections, to local honeypots. Further-more, we limit the number of concurrent connections and the network bandwidthto mitigate denial of service activities. An in-path network intrusion detectionsystem (honeywall) watches for security breaches during our experiments. Thefiltering component operates on a per-sandpuppet basis and transparently seg-ments the sandpuppet-local network on the data link layer. By this means, thecommunication between two sandpuppets can be regulated. Since malware strivesto propagate, it often spreads autonomously. If communication between sand-puppets was not regulated, the binary executed in one sandpuppet might infectanother sandpuppet, influencing the results of both executions. By containmentpolicy, we can still allow communication among sandpuppets, if required in anexperiment. However, usually we prevent such communication among sandpup-
24
3.2 Sandnet Architecture
Figure 3.1: Sandnet Architecture
25
3 Malware Analysis using Sandnet
pets. We consider the separation of network segments per sandpuppet a veryimportant property in order to prevent unwanted influence on execution results.Furthermore, the fact that filtering the network traffic takes place on each
herder, instead of a single entity, allows for better scalability. Each herder pro-vides its sandpuppets with filtering instances. Thus, given enough uplink ca-pacity, in order to increase the processing throughput of Sandnet, herders canbe added. While in practice, several herders use the same spam trap and hon-eypots, the Sandnet architecture also allows for several spam traps and hon-eypots, e.g., for load balancing. However, during our Sandnet operation wenever saturated the capacity of the service simulation, spam trap or honeypotfarm. Similarly, the uplink capacity was never saturated because we force eachsandpuppet to the maximum bandwidth and packet rate of a typical dialup DSLline.Apart from the execution environment which consists of a set of herders, Sand-
net provides management components that take care of acquiring new binaries,scheduling binary executions and post-processing the raw results of the binaryexecutions. Based on the set of malware binaries, the Sandnet controller sched-ules binaries for execution in the execution queue which then serves as source forthe sandpuppets. Usually, scheduling considers the age of a sample, making surethat recent binaries are executed. This is an important aspect in order to compilea set of active remote-controlled malware executions, because the older a binary,the less likely it is to be able to reach its command and control peers. Further-more, we acquire antivirus labels for the binaries by help of VirusTotal. For thefive antivirus vendors Microsoft, Symantec, Kaspersky, Avira and Eset, we parsethe returned labels into type, platform, family name and variant. This way, forexample, we can measure the diversity of binaries in terms of distinct familiesand – if needed for an experiment – schedule a diverse set of binaries. Especiallyin face of polymorphism, we can mitigate the prevalence of a few families by helpof distributing scheduled binaries over several distinct antivirus family labels.Once a binary has been executed, the post-processors dissect the network traffic
of the execution, extract and transform the raw execution results into structuredand easily processable form by storing the results in an object-relational Post-greSQL database. In addition, the results are enriched by correlating with exter-nal sources, such as origin AS and routing paths from BGP feeds, geolocalizationof involved IP addresses as well as reverse DNS information. For subsequentanalyses, the Sandnet database is thus the primary source of input data.
3.3 Segmentation and Dissection of Network TrafficIn order to extract features from network traffic, it is essential to develop datastructures which provide access to the syntactic fields of the involved networkprotocols. However, it is often difficult to determine the level of detail required to
26
3.3 Segmentation and Dissection of Network Traffic
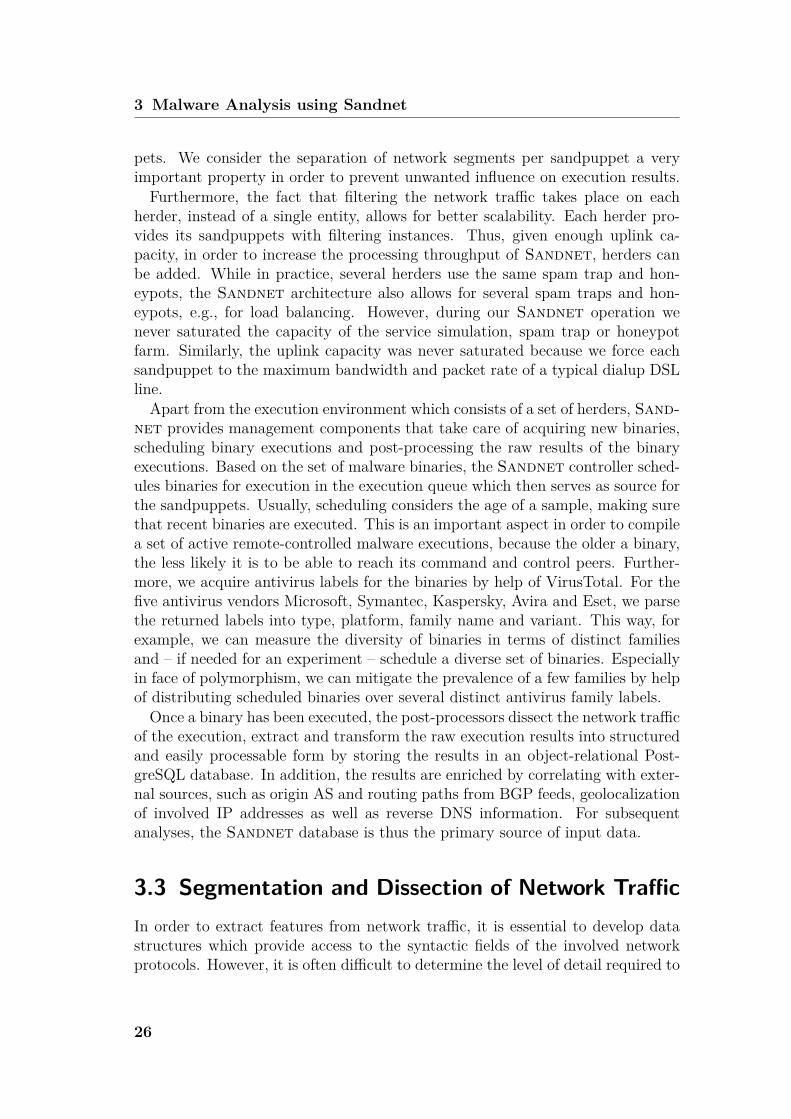
Figure 3.2: Abstract representations of network traffic as superflows, flows, mes-sages and frames
achieve the goal of an experiment in advance. On the one hand, a high resolutionin the parsed data structures provides a fine-grained access to all fields of a specificnetwork protocol. On the other hand, today’s networks have high bandwidthsand large data volumes which makes analyzing network traffic as a whole insuch environments infeasible. As a result, we are forced to restrict ourselvesto data structures that provide an abstract view on the network traffic. Thus,with performance and efficiency in mind, it is advantageous to parse only as fewstructures as required. Where applicable, we therefore focus intentionally on arepresentation of network traffic where only a very small fraction of the wholetraffic is distilled.For Sandnet network traffic, we decided to reassemble TCP and UDP streams.
Moreover, we developed parsers for the application layer protocols DNS, HTTP,SMTP, IRC, FTP and TLS. The parsers have intentionally been developed byhand so that syntax errors can be detected in detail and handled in a customfashion. The DNS parsing results are fed to a passive DNS database. For allstreams other than DNS, we assign the domain name that was used to resolvethe destination IP address to the stream. This is useful in order to compare thedomain name, for example, to the Host-Header in HTTP or the server name ofthe Server Name Indication extension in TLS.Furthermore, we develop heuristics for the segmentation of unknown applica-
tion layer protocols into messages. In general, we designed a data model for TCP-and UDP-based network traffic and its dissected protocol information, providingthree layers of abstraction, namely superflows, flows and messages. Figure 3.2shows the relationship between the different levels of abstraction of network traf-fic.A flow represents the notion of a communication channel between two entities
in terms of one network connection. It is uniquely identified by the 5-tuple:
27
3 Malware Analysis using Sandnet
transport layer protocol l4p (TCP or UDP), source sip and destination IP addressdip as well as source port sp and destination port dp. Additionally, a flow containscontextual information such as start ts and end times te and comprises the listof computed flow properties, such as the number of messages and the results ofpayload-based protocol determination. Formally, we define a flow f
f := 〈 l4p, sip, dip, sp, dp, ts, te 〈properties 〉 〉
Flows directed to the same destination can be aggregated into superflows. Inthis case, we do not include the source port in the unique identifier of a superflow,because in this context, we want a flow to be able to span multiple streams tothe same destination IP address and port with different source ports. As anexample, several HTTP connections between the same source and destination canhave varying source ports whereas the transport layer protocol, the source anddestination addresses as well as the destination port stay the same. A superflow isuniquely identified by the following 4-tuple (neglecting the source port): transportlayer protocol l4p (TCP or UDP), source sip and destination IP address dip aswell as destination port dp. Formally, we define a superflow fs
fs := 〈 l4p, sip, dip, dp, ts, te 〈properties 〉 〉
Just as a flow, a superflow is enhanced by a list of properties, depending on theexact experiment’s use case.Inspired by the fact that lots of application layer network protocols are designed
in a dialogue-like fashion, e.g., pairs of request and response such as HTTP,SMTP and DNS, we heuristically split the packet payload of a flow into mes-sages as follows. We define a message to be composed of all consecutive flowpayload transmitted in one direction until the direction of the payload trans-mission changes, an inactivity timeout of t minutes is hit (typically with t = 5)or a new stream is opened. The 5-minute-timeout stems from the fact that thenetwork egress router of the contained environment has a stream idle timeoutof 5 minutes. Frames without payload, especially those carrying only signalinginformation such as TCP acknowledgements are ignored because they do notcontribute to the message payload. Additionally, we encountered flows which donot follow the request-response rhythm, mostly because several requests are sentbefore a response is received. We treat such cases depending on whether theapplication layer protocol is known or not. If the application layer protocol isknown, we try to detect if duplicate messages were sent and if so, remove theduplicates. However, if no duplicates were detected, but the protocol consistsof request-response cycles and requests and responses are interleaved, we restorethe request-response-cycle based on the parsed protocol information. For exam-ple, if an HTTP flow consists of two subsequent requests before any of the tworesponses is transmitted, we re-order the messages so that two request-response
28
3.4 Visualization
cycles emerge. If the application layer protocol is unknown, we keep multiplesubsequent messages going in the same direction.Formally, a message mf of the flow f is thus defined as
mf := 〈 dir, len, ts, te, payload, 〈properties 〉 〉
where dir denotes the direction in which the message was transmitted, e.g., sourceto destination or vice versa, len is the length of the message in bytes, ts and te aretimestamps of the message start and end, and payload comprises the message’spayload. In case of HTTP, a message is extended by dissected protocol-specificfields, namely the request URI and the request and response bodies. We use ourcustom HTTP parser to extract these fields for all streams recognized as HTTPby OpenDPI [ipo11].Analogously, a message mfs of a superflow fs is thus defined as
mfs := 〈 dir, len, ts, te, payload, 〈properties 〉 〉
In order to apply machine learning to network traffic, we need to define andextract features. The definition of the feature extraction process is presentedin each of the subsequent chapters, depending on the goal of the experiment.However, the data structures for network traffic, defined in this chapter play animportant in subsequent work.
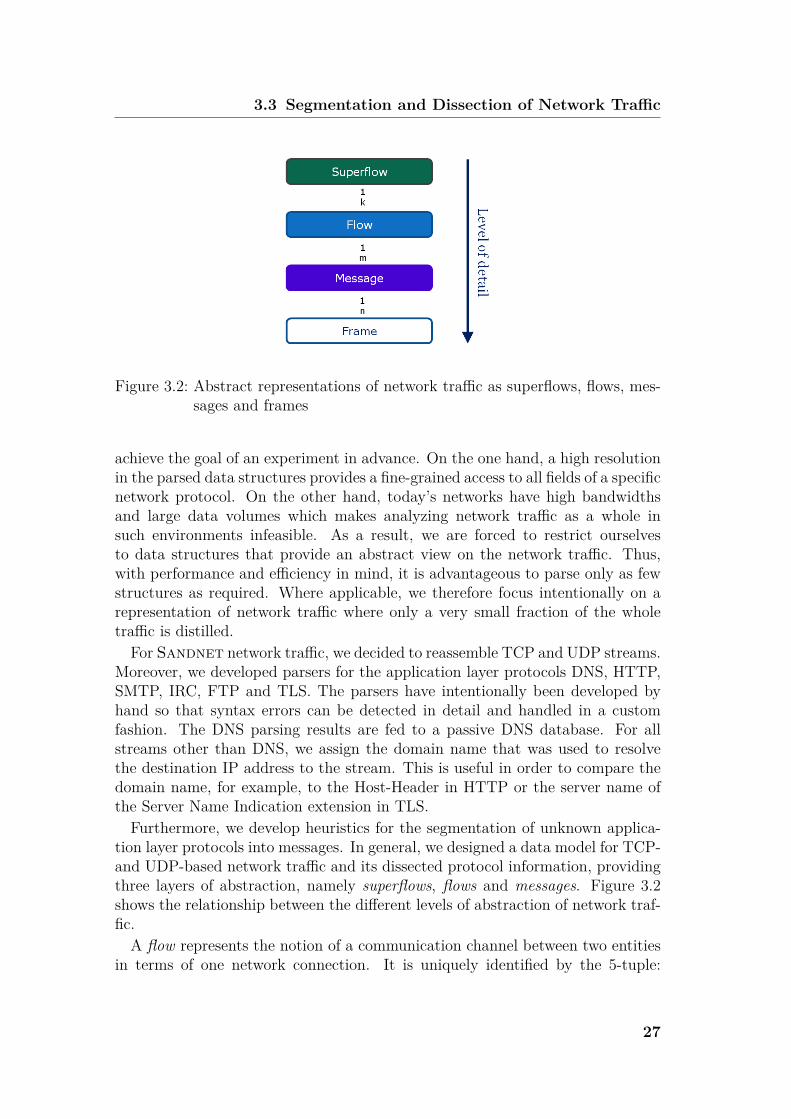
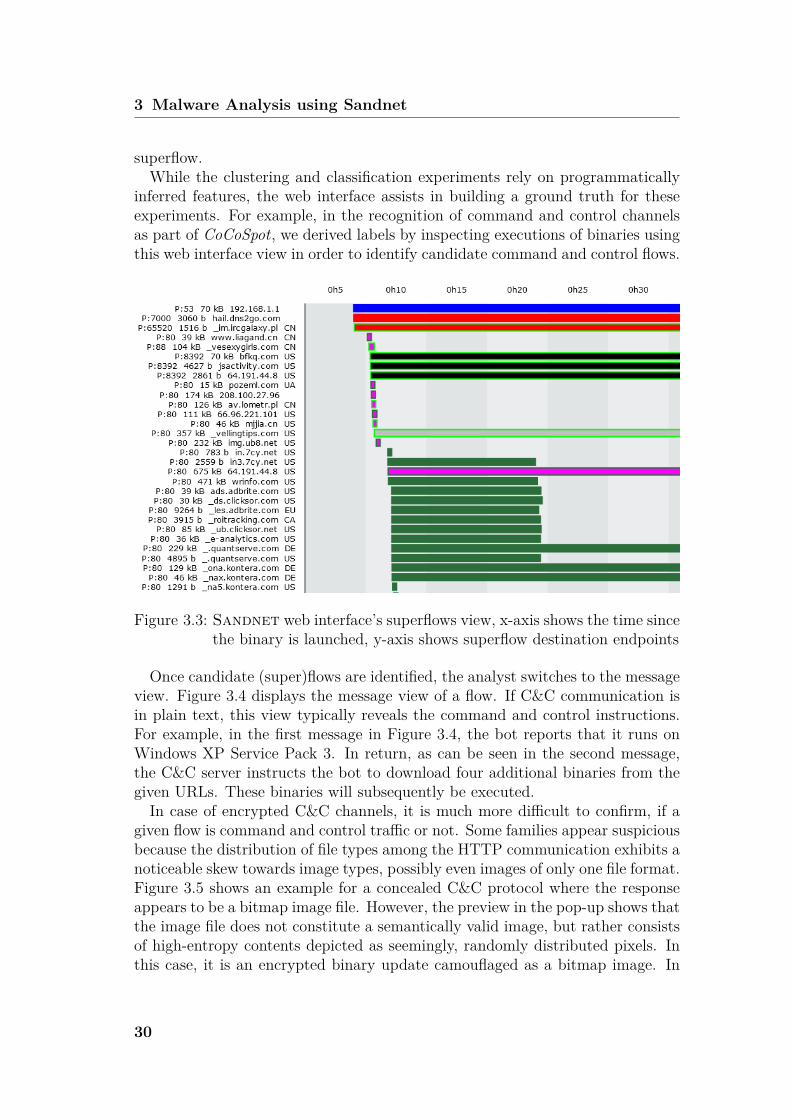
3.4 VisualizationIn order to evaluate our experiments, ground truth labels need to be assignedto the instances of a given dataset. Therefore, to inspect the execution resultsof a binary, we designed a web interface on the execution results of Sandnet.This section shows two important views of the web interface which were usedthroughout the subsequent experiments in this thesis.Figure 3.3 shows the network flows over time per execution. The x-axis corre-
lates to the relative time since the start of the execution of the binary with alter-nating background column coloring every five minutes. On the y-axis, startingfrom the top, the destinations of a superflow (or flow, respectively) are displayedin terms of IP address or domain name, destination port as well as the countrycode of the geolocalization result of the destination IP address. Additionally theamount of traffic transmitted in this superflow is shown. Colored bars symbol-ize superflows with colors denoting the application layer protocol as given bypayload-based protocol detection. For example, the red bars in Figure 3.3 corre-late to two IRC superflows, blue denotes superflows with DNS, green symbolizesHTTP traffic and fuchsia relates to HTTP traffic where an executable binaryhas been downloaded. The border color of the bars provide additional informa-tion such as whether a known C&C protocol was detected and labeled in the
29
3 Malware Analysis using Sandnet
superflow.While the clustering and classification experiments rely on programmatically
inferred features, the web interface assists in building a ground truth for theseexperiments. For example, in the recognition of command and control channelsas part of CoCoSpot, we derived labels by inspecting executions of binaries usingthis web interface view in order to identify candidate command and control flows.
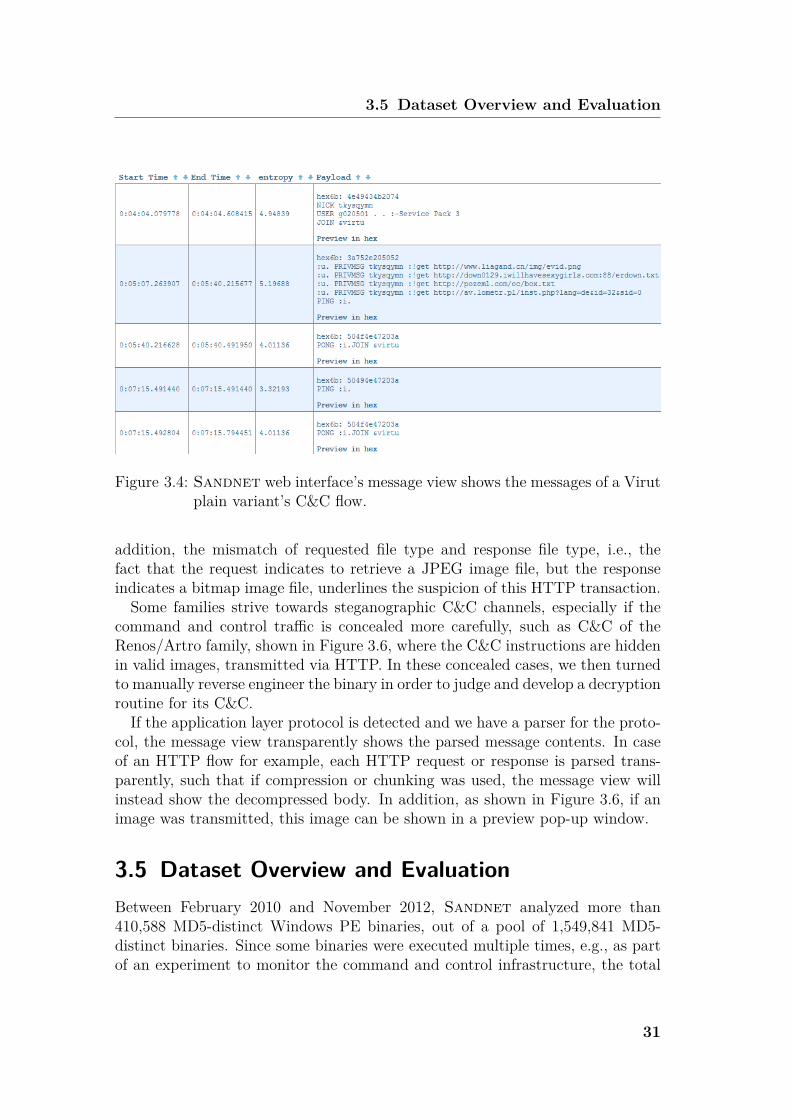
Figure 3.3: Sandnet web interface’s superflows view, x-axis shows the time sincethe binary is launched, y-axis shows superflow destination endpoints
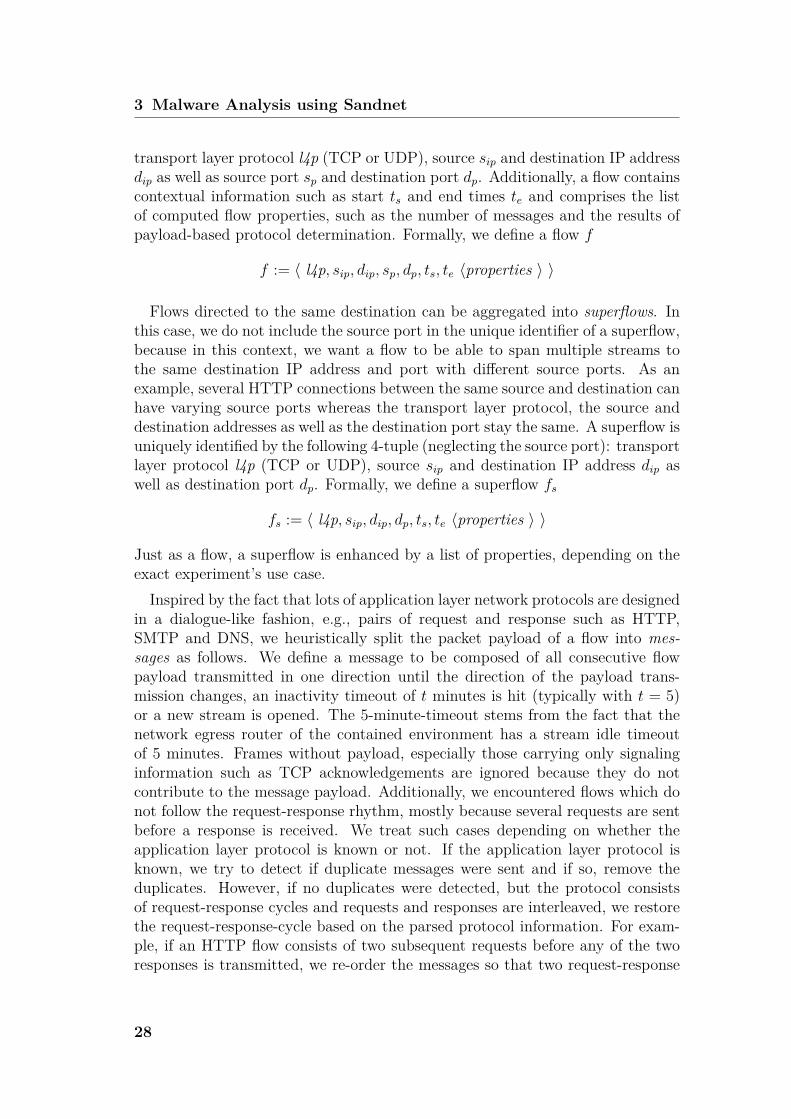
Once candidate (super)flows are identified, the analyst switches to the messageview. Figure 3.4 displays the message view of a flow. If C&C communication isin plain text, this view typically reveals the command and control instructions.For example, in the first message in Figure 3.4, the bot reports that it runs onWindows XP Service Pack 3. In return, as can be seen in the second message,the C&C server instructs the bot to download four additional binaries from thegiven URLs. These binaries will subsequently be executed.In case of encrypted C&C channels, it is much more difficult to confirm, if a
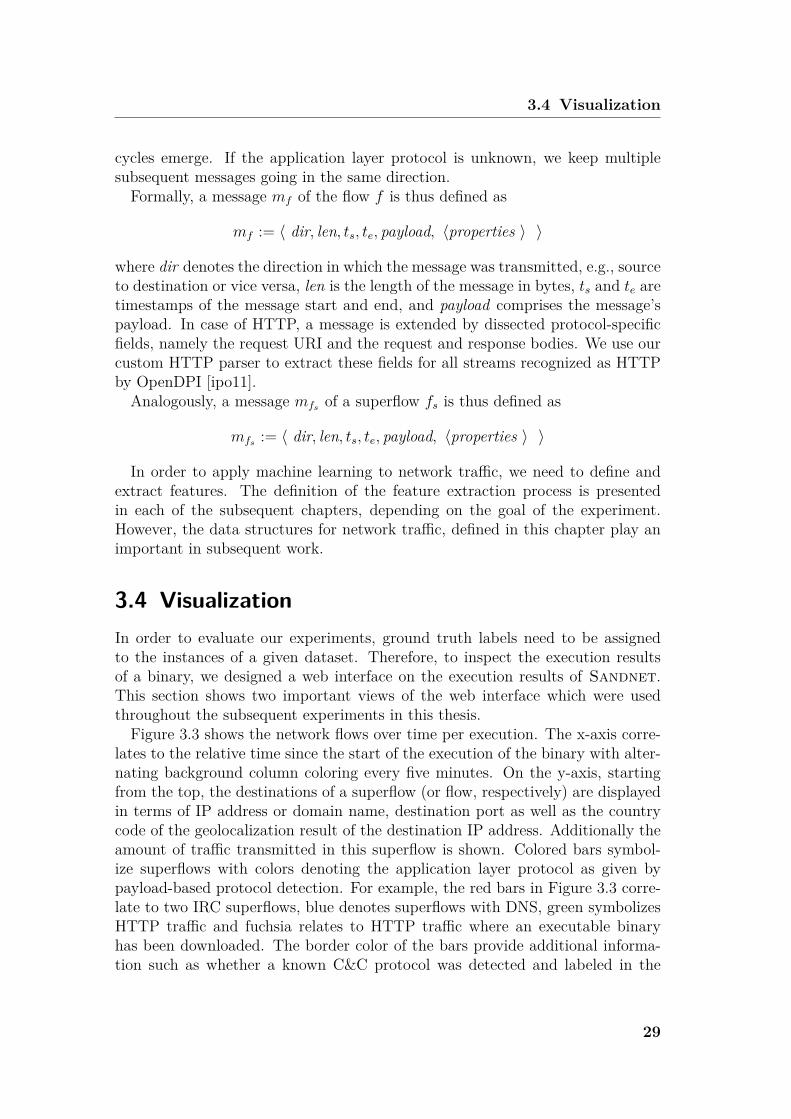
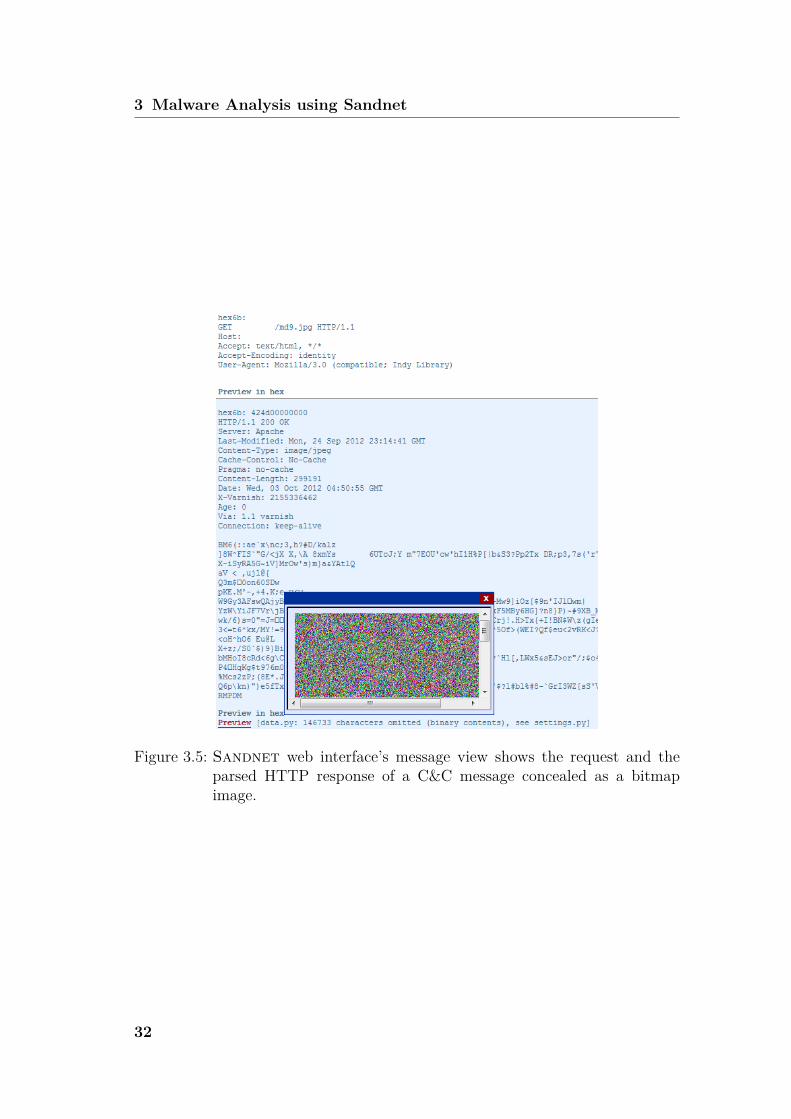
given flow is command and control traffic or not. Some families appear suspiciousbecause the distribution of file types among the HTTP communication exhibits anoticeable skew towards image types, possibly even images of only one file format.Figure 3.5 shows an example for a concealed C&C protocol where the responseappears to be a bitmap image file. However, the preview in the pop-up shows thatthe image file does not constitute a semantically valid image, but rather consistsof high-entropy contents depicted as seemingly, randomly distributed pixels. Inthis case, it is an encrypted binary update camouflaged as a bitmap image. In
30
3.5 Dataset Overview and Evaluation
Figure 3.4: Sandnet web interface’s message view shows the messages of a Virutplain variant’s C&C flow.
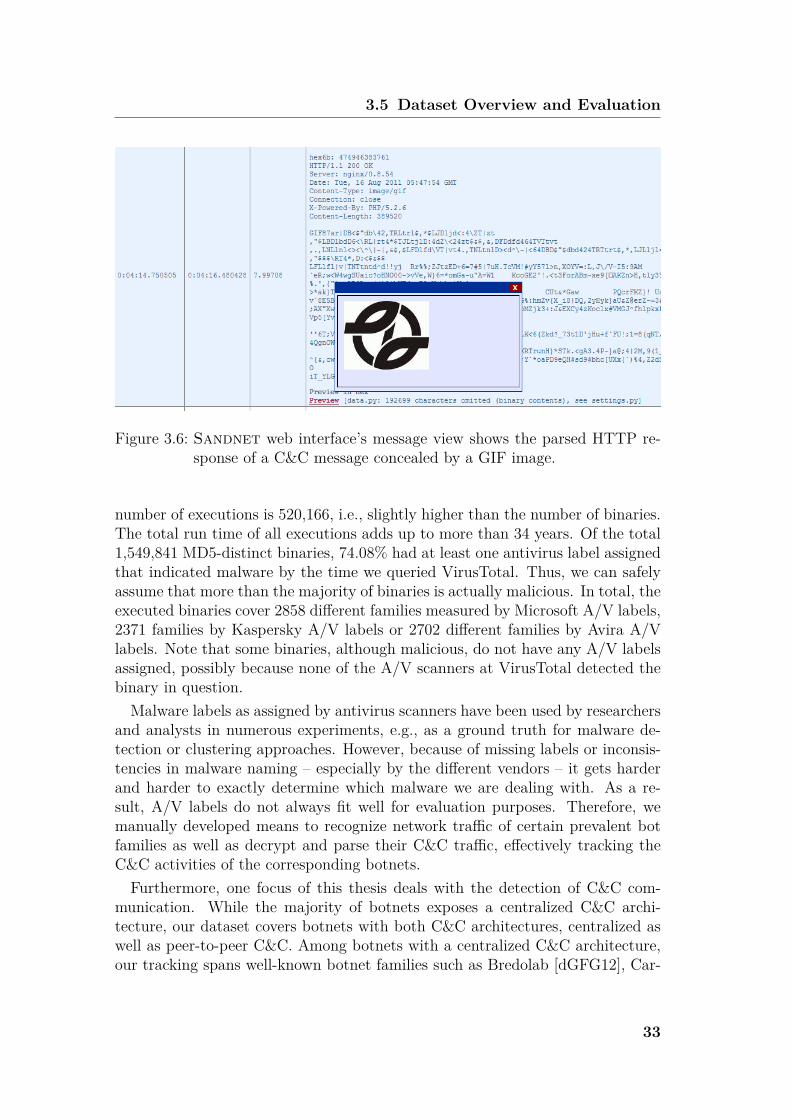
addition, the mismatch of requested file type and response file type, i.e., thefact that the request indicates to retrieve a JPEG image file, but the responseindicates a bitmap image file, underlines the suspicion of this HTTP transaction.Some families strive towards steganographic C&C channels, especially if the
command and control traffic is concealed more carefully, such as C&C of theRenos/Artro family, shown in Figure 3.6, where the C&C instructions are hiddenin valid images, transmitted via HTTP. In these concealed cases, we then turnedto manually reverse engineer the binary in order to judge and develop a decryptionroutine for its C&C.If the application layer protocol is detected and we have a parser for the proto-
col, the message view transparently shows the parsed message contents. In caseof an HTTP flow for example, each HTTP request or response is parsed trans-parently, such that if compression or chunking was used, the message view willinstead show the decompressed body. In addition, as shown in Figure 3.6, if animage was transmitted, this image can be shown in a preview pop-up window.
3.5 Dataset Overview and EvaluationBetween February 2010 and November 2012, Sandnet analyzed more than410,588 MD5-distinct Windows PE binaries, out of a pool of 1,549,841 MD5-distinct binaries. Since some binaries were executed multiple times, e.g., as partof an experiment to monitor the command and control infrastructure, the total
31
3 Malware Analysis using Sandnet
Figure 3.5: Sandnet web interface’s message view shows the request and theparsed HTTP response of a C&C message concealed as a bitmapimage.
32
3.5 Dataset Overview and Evaluation
Figure 3.6: Sandnet web interface’s message view shows the parsed HTTP re-sponse of a C&C message concealed by a GIF image.
number of executions is 520,166, i.e., slightly higher than the number of binaries.The total run time of all executions adds up to more than 34 years. Of the total1,549,841 MD5-distinct binaries, 74.08% had at least one antivirus label assignedthat indicated malware by the time we queried VirusTotal. Thus, we can safelyassume that more than the majority of binaries is actually malicious. In total, theexecuted binaries cover 2858 different families measured by Microsoft A/V labels,2371 families by Kaspersky A/V labels or 2702 different families by Avira A/Vlabels. Note that some binaries, although malicious, do not have any A/V labelsassigned, possibly because none of the A/V scanners at VirusTotal detected thebinary in question.Malware labels as assigned by antivirus scanners have been used by researchers
and analysts in numerous experiments, e.g., as a ground truth for malware de-tection or clustering approaches. However, because of missing labels or inconsis-tencies in malware naming – especially by the different vendors – it gets harderand harder to exactly determine which malware we are dealing with. As a re-sult, A/V labels do not always fit well for evaluation purposes. Therefore, wemanually developed means to recognize network traffic of certain prevalent botfamilies as well as decrypt and parse their C&C traffic, effectively tracking theC&C activities of the corresponding botnets.Furthermore, one focus of this thesis deals with the detection of C&C com-
munication. While the majority of botnets exposes a centralized C&C archi-tecture, our dataset covers botnets with both C&C architectures, centralized aswell as peer-to-peer C&C. Among botnets with a centralized C&C architecture,our tracking spans well-known botnet families such as Bredolab [dGFG12], Car-
33
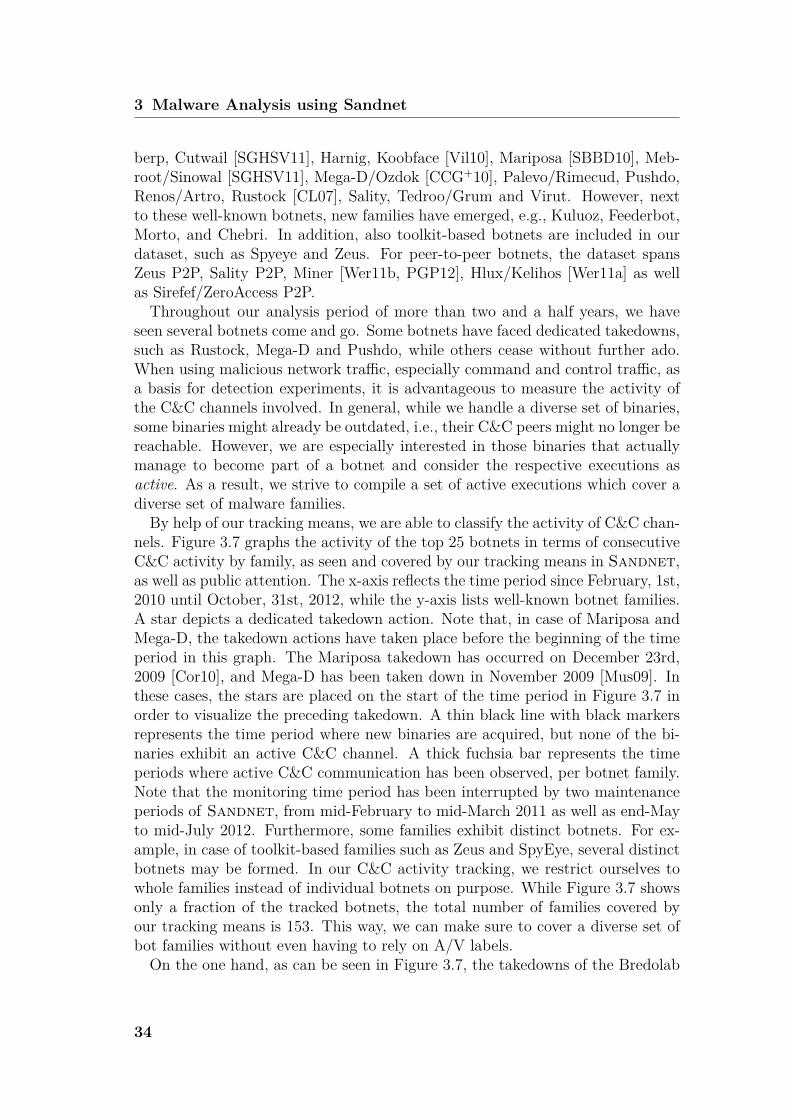
3 Malware Analysis using Sandnet
berp, Cutwail [SGHSV11], Harnig, Koobface [Vil10], Mariposa [SBBD10], Meb-root/Sinowal [SGHSV11], Mega-D/Ozdok [CCG+10], Palevo/Rimecud, Pushdo,Renos/Artro, Rustock [CL07], Sality, Tedroo/Grum and Virut. However, nextto these well-known botnets, new families have emerged, e.g., Kuluoz, Feederbot,Morto, and Chebri. In addition, also toolkit-based botnets are included in ourdataset, such as Spyeye and Zeus. For peer-to-peer botnets, the dataset spansZeus P2P, Sality P2P, Miner [Wer11b, PGP12], Hlux/Kelihos [Wer11a] as wellas Sirefef/ZeroAccess P2P.Throughout our analysis period of more than two and a half years, we have
seen several botnets come and go. Some botnets have faced dedicated takedowns,such as Rustock, Mega-D and Pushdo, while others cease without further ado.When using malicious network traffic, especially command and control traffic, asa basis for detection experiments, it is advantageous to measure the activity ofthe C&C channels involved. In general, while we handle a diverse set of binaries,some binaries might already be outdated, i.e., their C&C peers might no longer bereachable. However, we are especially interested in those binaries that actuallymanage to become part of a botnet and consider the respective executions asactive. As a result, we strive to compile a set of active executions which cover adiverse set of malware families.By help of our tracking means, we are able to classify the activity of C&C chan-
nels. Figure 3.7 graphs the activity of the top 25 botnets in terms of consecutiveC&C activity by family, as seen and covered by our tracking means in Sandnet,as well as public attention. The x-axis reflects the time period since February, 1st,2010 until October, 31st, 2012, while the y-axis lists well-known botnet families.A star depicts a dedicated takedown action. Note that, in case of Mariposa andMega-D, the takedown actions have taken place before the beginning of the timeperiod in this graph. The Mariposa takedown has occurred on December 23rd,2009 [Cor10], and Mega-D has been taken down in November 2009 [Mus09]. Inthese cases, the stars are placed on the start of the time period in Figure 3.7 inorder to visualize the preceding takedown. A thin black line with black markersrepresents the time period where new binaries are acquired, but none of the bi-naries exhibit an active C&C channel. A thick fuchsia bar represents the timeperiods where active C&C communication has been observed, per botnet family.Note that the monitoring time period has been interrupted by two maintenanceperiods of Sandnet, from mid-February to mid-March 2011 as well as end-Mayto mid-July 2012. Furthermore, some families exhibit distinct botnets. For ex-ample, in case of toolkit-based families such as Zeus and SpyEye, several distinctbotnets may be formed. In our C&C activity tracking, we restrict ourselves towhole families instead of individual botnets on purpose. While Figure 3.7 showsonly a fraction of the tracked botnets, the total number of families covered byour tracking means is 153. This way, we can make sure to cover a diverse set ofbot families without even having to rely on A/V labels.On the one hand, as can be seen in Figure 3.7, the takedowns of the Bredolab
34
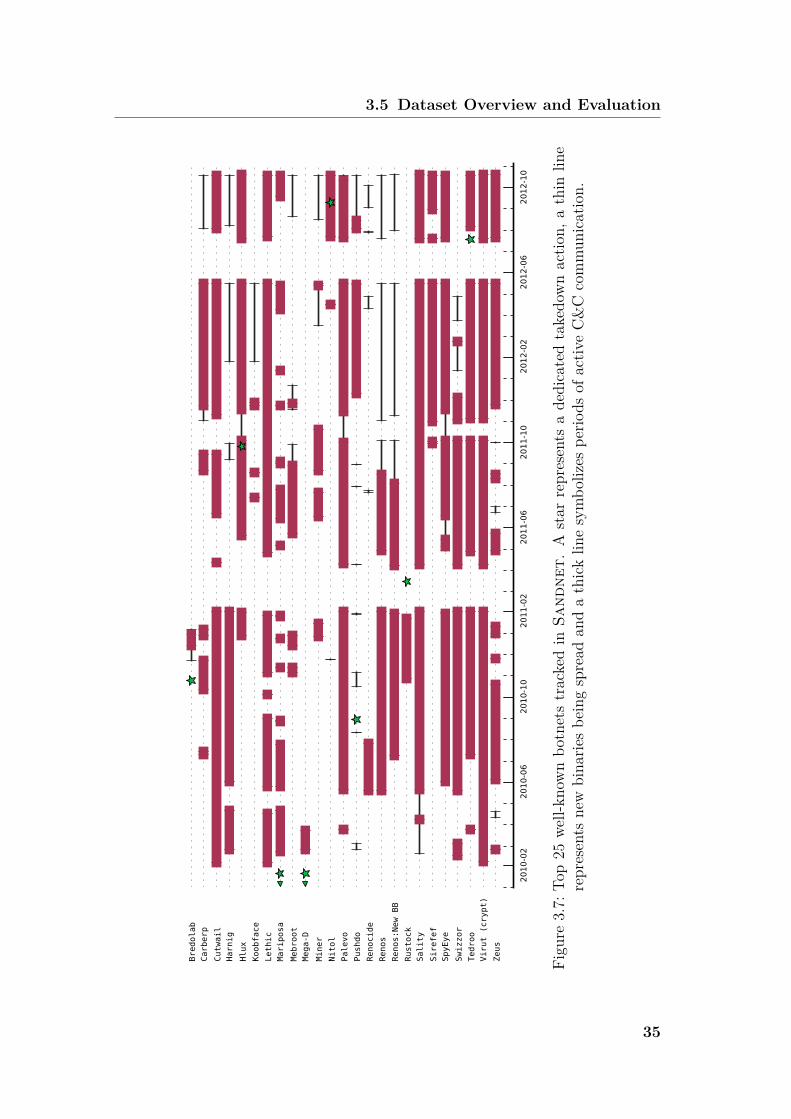
3.5 Dataset Overview and Evaluation
2010-0
22010-0
62010-1
02011-0
22011-0
62011-1
02012-0
22012-0
62012-1
0
Bredolab
Carberp
Cutwail
Harnig
Hlux
Koobface
Lethic
Mariposa
Mebroot
Mega-D
Miner
Nitol
Palevo
Pushdo
Renocide
Renos
Renos:New BB
Rustock
Sality
Sirefef
SpyEye
Swizzor
Tedroo
Virut (crypt)
Zeus
Figu
re3.7:
Top25
well-kn
ownbo
tnetstrackedin
Sand
net.
Astar
represents
adedicatedtakedo
wnactio
n,athin
line
represents
new
bina
riesbe
ingspread
andathick
linesymbo
lizes
perio
dsof
activ
eC&C
commun
ication.
35
3 Malware Analysis using Sandnet
[Wil10], Mega-D [Mus09] as well as the Rustock botnet [Wil11] have a long-lastingeffect. Although for Bredolab and Mega-D we witness active C&C during up toseveral months after the takedowns, none of these botnets manage to achieveactive C&C communication in the long run. On the other hand, we have seenquite a few botnet families resurrect from takedowns. For example, researchersinitiated a takedown of the Pushdo botnet in August 2010. However, even twoyears after the takedown, we still observe active executions of Pushdo. The Mari-posa botnet is believed to have been taken down in December 2009 [Cor10], butwe have seen active Mariposa command and control traffic ever since. Similarly,although the Nitol botnets have been taken down in September 2012 [Bos12],many Nitol binaries manage to successfully bootstrap and reach a viable C&Cserver. In addition, the Tedroo botnet has been addressed in a takedown actionon July, 19th, 2012 [Mus12]. However, again, we observed active C&C communi-cation of the same botnet family just within days after the takedown, continuingfor at least three months. From an observational point of view, the challenge ofbotnet family takedowns lies in their sustain.Some botnets even cease without a dedicated takedown of the C&C infras-
tructure. For example, the Miner botnet has not been addressed in a dedicatedoperation of its peer-to-peer-based C&C, but its activity diminished significantlyafter October 2011. Similarly, the Renos botnet has ceased its operation, possiblyafter removal signatures addressing the Renos binaries have been distributed byMicrosoft as part of its Removal Tool MSRT [Rad11].Figure 3.8 shows the C&C activity of botnets that expose Fake A/V or Ran-
somware as monetization technique. Over time, the diversity of rogue visualmalware families has increased in prevalence throughout 2011. Of the botnetfamilies shown in Figure 3.8, Ransom and Urausy demand ransom for monetiza-tion, while all other families focus on Scareware and Fake A/V. The prevalenceof active bot families using rogue visual monetization techniques underlines theimportance of this trend. Thus, we will specifically deal with this kind of mone-tization in Chapter 6.An interesting question is to what degree the executable binaries per botnet
family manage to evade antivirus detection. Therefore, we turn to our C&Ctracking means and measure the antivirus detection rates of malware binaries perbotnet family. We consider all executions of binaries where the C&C trackingmeans trigger in the first flow of that execution. We apply this constraint inorder to make sure that the binary being executed actually relates to the C&Ccommunication observed. If this constraint had been omitted, and the C&Ctracking had triggered on a subsequent flow, it would not have been guaranteedthat the C&C communication stems from the executed binary, because additionalmalware could have been downloaded. The observed C&C communication couldthen have originated in the additional malware instead of the originally executedbinary. In fact, we have observed this behavior, i.e., the downloading of additionalmalware, in at least 23 distinct bot families. We conclude that these 23 families
36
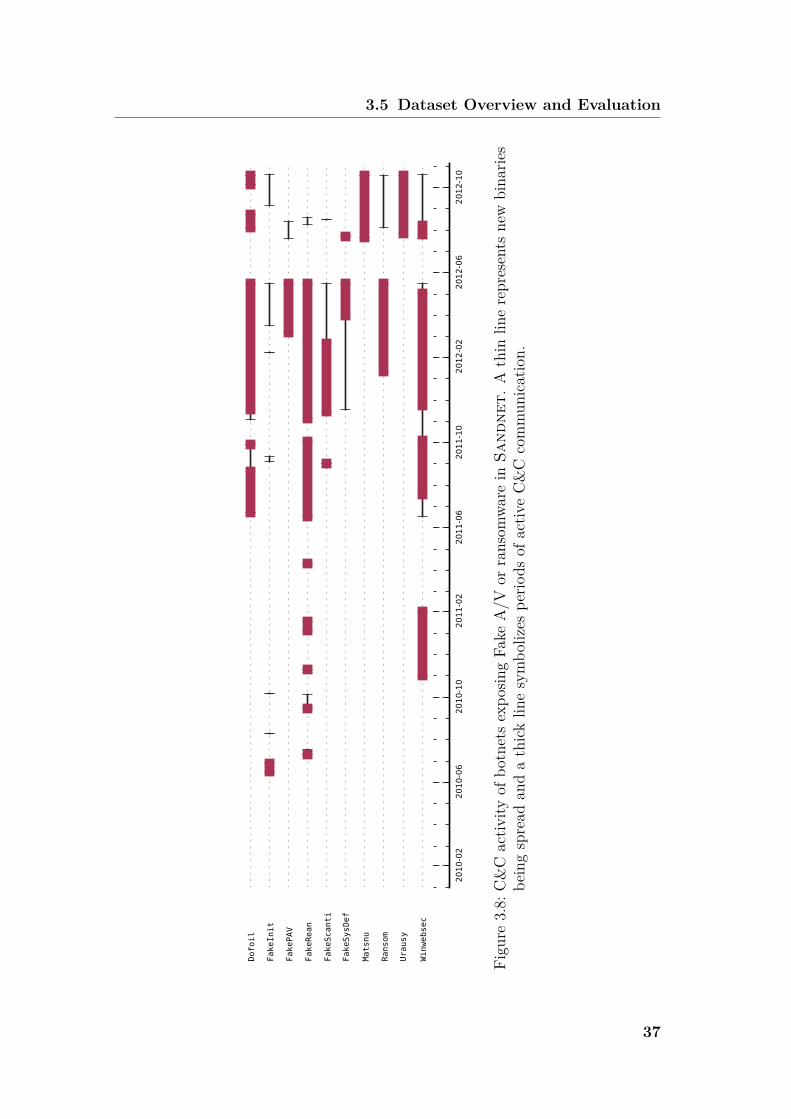
3.5 Dataset Overview and Evaluation
2010-0
22010-0
62010-1
02011-0
22011-0
62011-1
02012-0
22012-0
62012-1
0
Dofoil
FakeInit
FakePAV
FakeRean
FakeScanti
FakeSysDef
Matsnu
Ransom
Urausy
Winwebsec
Figu
re3.8:
C&C
activ
ityof
botnetsexpo
singFa
keA/V
orransom
ware
inSa
ndne
t.A
thin
linerepresents
new
bina
ries
beingspread
andathick
linesymbo
lizes
perio
dsof
activ
eC&C
commun
ication.
37
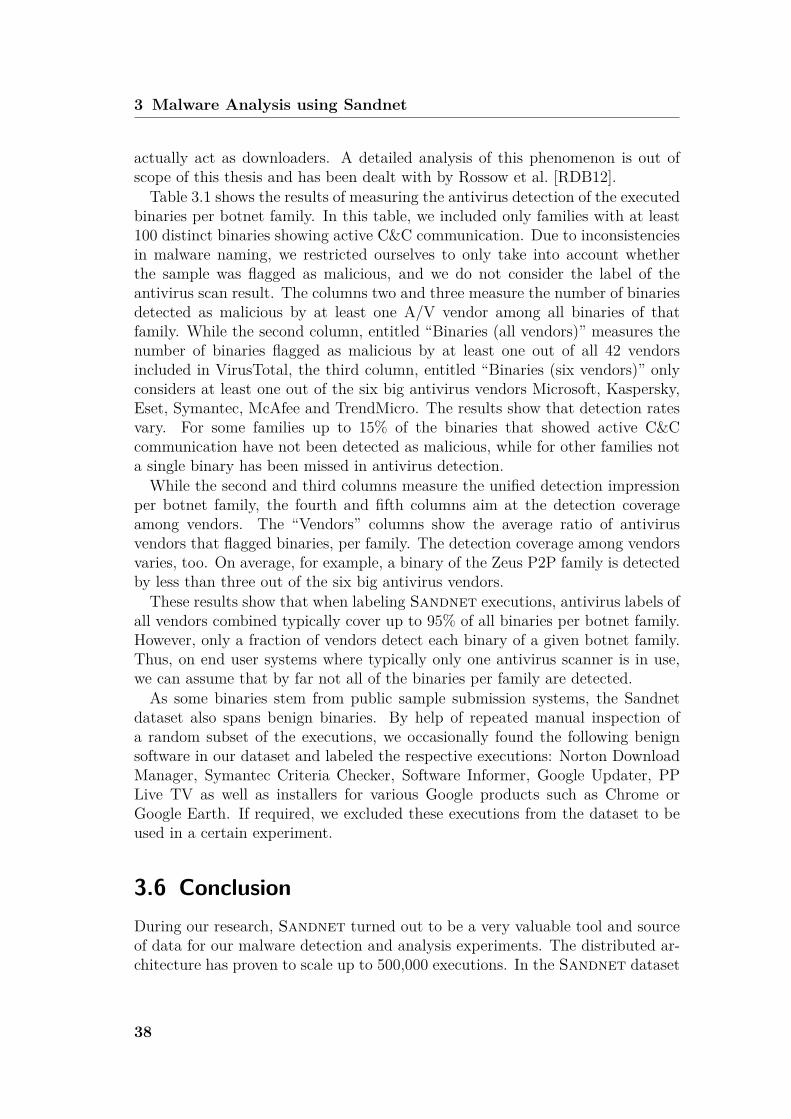
3 Malware Analysis using Sandnet
actually act as downloaders. A detailed analysis of this phenomenon is out ofscope of this thesis and has been dealt with by Rossow et al. [RDB12].Table 3.1 shows the results of measuring the antivirus detection of the executed
binaries per botnet family. In this table, we included only families with at least100 distinct binaries showing active C&C communication. Due to inconsistenciesin malware naming, we restricted ourselves to only take into account whetherthe sample was flagged as malicious, and we do not consider the label of theantivirus scan result. The columns two and three measure the number of binariesdetected as malicious by at least one A/V vendor among all binaries of thatfamily. While the second column, entitled “Binaries (all vendors)” measures thenumber of binaries flagged as malicious by at least one out of all 42 vendorsincluded in VirusTotal, the third column, entitled “Binaries (six vendors)” onlyconsiders at least one out of the six big antivirus vendors Microsoft, Kaspersky,Eset, Symantec, McAfee and TrendMicro. The results show that detection ratesvary. For some families up to 15% of the binaries that showed active C&Ccommunication have not been detected as malicious, while for other families nota single binary has been missed in antivirus detection.While the second and third columns measure the unified detection impression
per botnet family, the fourth and fifth columns aim at the detection coverageamong vendors. The “Vendors” columns show the average ratio of antivirusvendors that flagged binaries, per family. The detection coverage among vendorsvaries, too. On average, for example, a binary of the Zeus P2P family is detectedby less than three out of the six big antivirus vendors.These results show that when labeling Sandnet executions, antivirus labels of
all vendors combined typically cover up to 95% of all binaries per botnet family.However, only a fraction of vendors detect each binary of a given botnet family.Thus, on end user systems where typically only one antivirus scanner is in use,we can assume that by far not all of the binaries per family are detected.As some binaries stem from public sample submission systems, the Sandnet
dataset also spans benign binaries. By help of repeated manual inspection ofa random subset of the executions, we occasionally found the following benignsoftware in our dataset and labeled the respective executions: Norton DownloadManager, Symantec Criteria Checker, Software Informer, Google Updater, PPLive TV as well as installers for various Google products such as Chrome orGoogle Earth. If required, we excluded these executions from the dataset to beused in a certain experiment.
3.6 ConclusionDuring our research, Sandnet turned out to be a very valuable tool and sourceof data for our malware detection and analysis experiments. The distributed ar-chitecture has proven to scale up to 500,000 executions. In the Sandnet dataset
38
3.6 Conclusion
Binaries (%) Vendors (%)Botnet all vendors six vendors all vendors six vendorsCarberp 97.02 91.49 47.48 51.13Cutwail 97.96 93.88 62.39 59.86Harnig 97.54 99.65 54.78 61.29Hlux 92.04 87.08 39.07 47.88Lethic 92.60 97.45 63.43 66.16Mariposa 100.00 100.00 88.71 79.78Mebroot 100.00 93.85 53.30 58.21Palevo 98.75 98.42 73.96 73.41Pushdo 100.00 85.71 68.37 64.29Renocide 100.00 92.77 59.44 53.61Renos 99.93 97.99 87.91 77.48Renos:New BB 99.84 100.00 93.27 82.22Sality 98.78 99.78 84.85 80.22Sirefef 97.69 90.95 41.80 48.30SpyEye 98.79 93.77 55.19 59.52Swizzor 100.00 98.53 62.07 56.33Tedroo 100.00 94.74 53.48 51.97Virut (crypt) 98.21 100.00 83.10 80.82Zeus 91.27 93.01 45.00 52.33Zeus P2P 88.55 91.67 33.39 44.92
Table 3.1: Antivirus detection of PE binaries per botnet family for families withmore than 100 MD5-distinct binaries. All values in percent, eitherusing all 42 scanners or only the top six.
39
3 Malware Analysis using Sandnet
evaluation we have shown how we made sure that the resulting dataset satisfiesour requirements of spanning diverse and active remote-controlled malware. Wemaximize sample diversity by pooling binaries from several distinct malware fam-ilies, while, at the same time, considering the C&C activity in order to guaranteethat our dataset reflects well-functioning malware.As a result, all of the subsequent experiments in this thesis are based on sub-
sets of data acquired by means of Sandnet. In addition, Sandnet provides ahuman analyst with detailed information on the execution of a PE binary, en-abling both, quickly gathering a first impression of a binary as well as deeplyanalyzing all network communication. However, in many cases, manual effortswere additionally involved in order to get an understanding of what a certainmalware execution actually aims at, for example in terms of monetization.To sum up, in this chapter we provide an overview of Sandnet, our contained
dynamic malware analysis environment, which is used to compile a dataset ofmalware executions. In the following chapters, we will show how we developmalware detection approaches and evaluate using the Sandnet data.
40
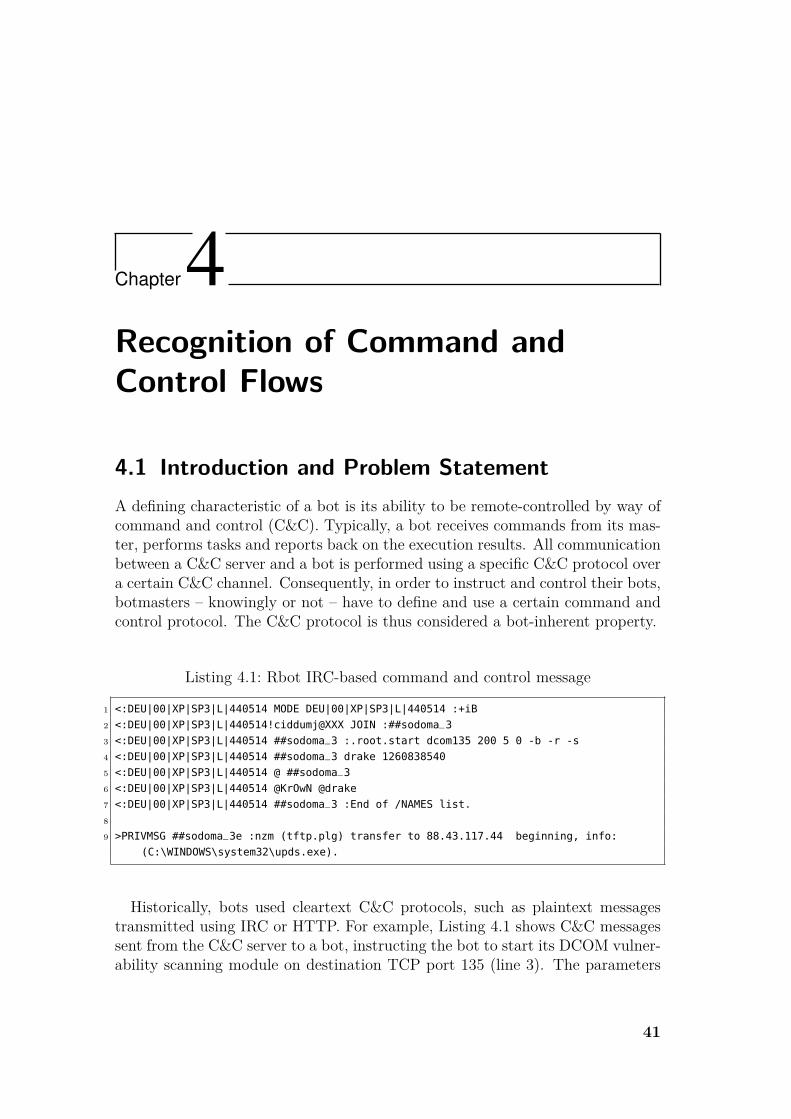
Chapter4Recognition of Command andControl Flows
4.1 Introduction and Problem StatementA defining characteristic of a bot is its ability to be remote-controlled by way ofcommand and control (C&C). Typically, a bot receives commands from its mas-ter, performs tasks and reports back on the execution results. All communicationbetween a C&C server and a bot is performed using a specific C&C protocol overa certain C&C channel. Consequently, in order to instruct and control their bots,botmasters – knowingly or not – have to define and use a certain command andcontrol protocol. The C&C protocol is thus considered a bot-inherent property.
Listing 4.1: Rbot IRC-based command and control message
1 <:DEU|00|XP|SP3|L|440514 MODE DEU|00|XP|SP3|L|440514 :+iB
2 <:DEU|00|XP|SP3|L|440514!ciddumj@XXX JOIN :##sodoma_3
3 <:DEU|00|XP|SP3|L|440514 ##sodoma_3 :.root.start dcom135 200 5 0 -b -r -s
4 <:DEU|00|XP|SP3|L|440514 ##sodoma_3 drake 1260838540
5 <:DEU|00|XP|SP3|L|440514 @ ##sodoma_3
6 <:DEU|00|XP|SP3|L|440514 @KrOwN @drake
7 <:DEU|00|XP|SP3|L|440514 ##sodoma_3 :End of /NAMES list.
8
9 >PRIVMSG ##sodoma_3e :nzm (tftp.plg) transfer to 88.43.117.44 beginning, info:
(C:\WINDOWS\system32\upds.exe).
Historically, bots used cleartext C&C protocols, such as plaintext messagestransmitted using IRC or HTTP. For example, Listing 4.1 shows C&C messagessent from the C&C server to a bot, instructing the bot to start its DCOM vulner-ability scanning module on destination TCP port 135 (line 3). The parameters
41
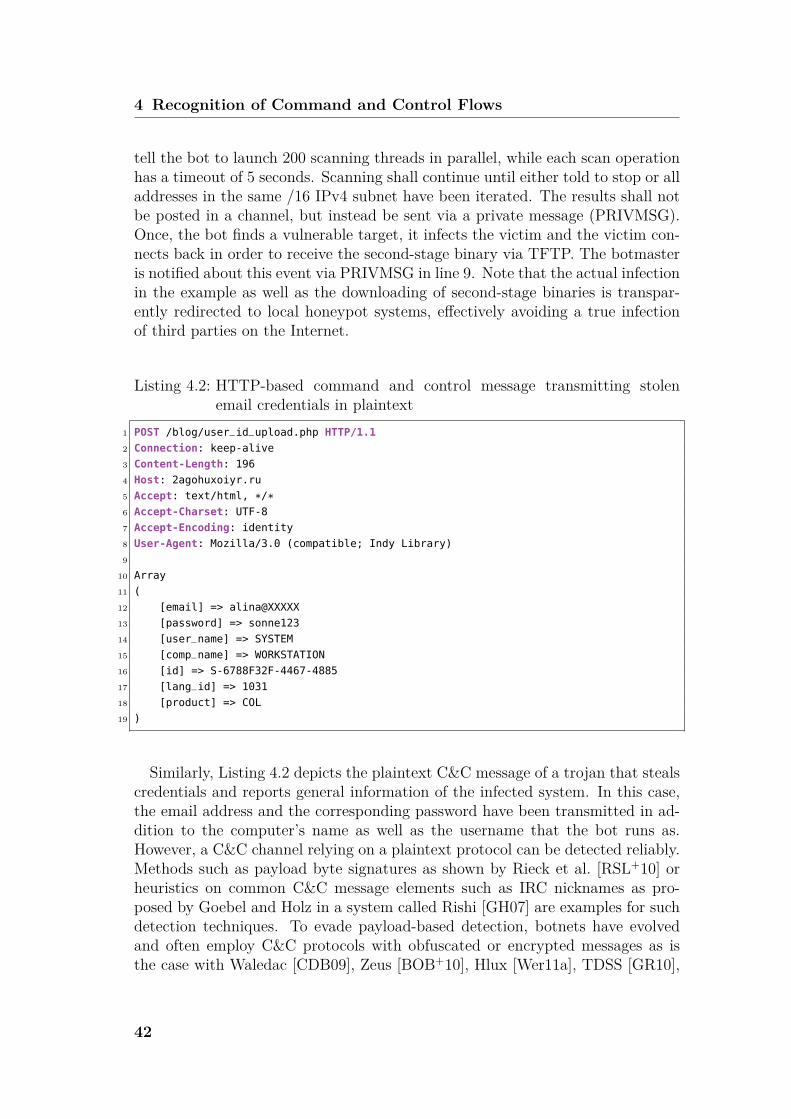
4 Recognition of Command and Control Flows
tell the bot to launch 200 scanning threads in parallel, while each scan operationhas a timeout of 5 seconds. Scanning shall continue until either told to stop or alladdresses in the same /16 IPv4 subnet have been iterated. The results shall notbe posted in a channel, but instead be sent via a private message (PRIVMSG).Once, the bot finds a vulnerable target, it infects the victim and the victim con-nects back in order to receive the second-stage binary via TFTP. The botmasteris notified about this event via PRIVMSG in line 9. Note that the actual infectionin the example as well as the downloading of second-stage binaries is transpar-ently redirected to local honeypot systems, effectively avoiding a true infectionof third parties on the Internet.
Listing 4.2: HTTP-based command and control message transmitting stolenemail credentials in plaintext
1 POST /blog/user_id_upload.php HTTP/1.1
2 Connection: keep-alive
3 Content-Length: 196
4 Host: 2agohuxoiyr.ru
5 Accept: text/html, */*6 Accept-Charset: UTF-8
7 Accept-Encoding: identity
8 User-Agent: Mozilla/3.0 (compatible; Indy Library)
9
10 Array
11 (
12 [email] => alina@XXXXX
13 [password] => sonne123
14 [user_name] => SYSTEM
15 [comp_name] => WORKSTATION
16 [id] => S-6788F32F-4467-4885
17 [lang_id] => 1031
18 [product] => COL
19 )
Similarly, Listing 4.2 depicts the plaintext C&C message of a trojan that stealscredentials and reports general information of the infected system. In this case,the email address and the corresponding password have been transmitted in ad-dition to the computer’s name as well as the username that the bot runs as.However, a C&C channel relying on a plaintext protocol can be detected reliably.Methods such as payload byte signatures as shown by Rieck et al. [RSL+10] orheuristics on common C&C message elements such as IRC nicknames as pro-posed by Goebel and Holz in a system called Rishi [GH07] are examples for suchdetection techniques. To evade payload-based detection, botnets have evolvedand often employ C&C protocols with obfuscated or encrypted messages as isthe case with Waledac [CDB09], Zeus [BOB+10], Hlux [Wer11a], TDSS [GR10],
42
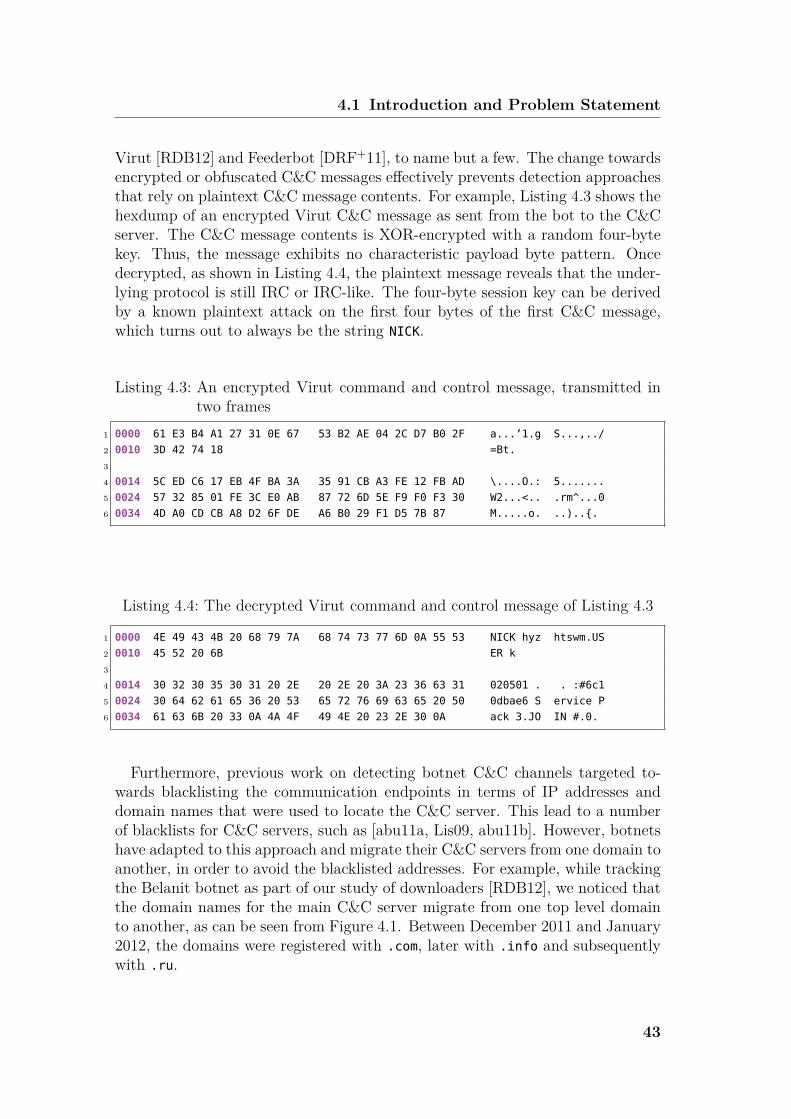
4.1 Introduction and Problem Statement
Virut [RDB12] and Feederbot [DRF+11], to name but a few. The change towardsencrypted or obfuscated C&C messages effectively prevents detection approachesthat rely on plaintext C&C message contents. For example, Listing 4.3 shows thehexdump of an encrypted Virut C&C message as sent from the bot to the C&Cserver. The C&C message contents is XOR-encrypted with a random four-bytekey. Thus, the message exhibits no characteristic payload byte pattern. Oncedecrypted, as shown in Listing 4.4, the plaintext message reveals that the under-lying protocol is still IRC or IRC-like. The four-byte session key can be derivedby a known plaintext attack on the first four bytes of the first C&C message,which turns out to always be the string NICK.
Listing 4.3: An encrypted Virut command and control message, transmitted intwo frames
1 0000 61 E3 B4 A1 27 31 0E 67 53 B2 AE 04 2C D7 B0 2F a...’1.g S...,../
2 0010 3D 42 74 18 =Bt.
3
4 0014 5C ED C6 17 EB 4F BA 3A 35 91 CB A3 FE 12 FB AD \....O.: 5.......
5 0024 57 32 85 01 FE 3C E0 AB 87 72 6D 5E F9 F0 F3 30 W2...<.. .rm^...0
6 0034 4D A0 CD CB A8 D2 6F DE A6 B0 29 F1 D5 7B 87 M.....o. ..)..{.
Listing 4.4: The decrypted Virut command and control message of Listing 4.3
1 0000 4E 49 43 4B 20 68 79 7A 68 74 73 77 6D 0A 55 53 NICK hyz htswm.US
2 0010 45 52 20 6B ER k
3
4 0014 30 32 30 35 30 31 20 2E 20 2E 20 3A 23 36 63 31 020501 . . :#6c1
5 0024 30 64 62 61 65 36 20 53 65 72 76 69 63 65 20 50 0dbae6 S ervice P
6 0034 61 63 6B 20 33 0A 4A 4F 49 4E 20 23 2E 30 0A ack 3.JO IN #.0.
Furthermore, previous work on detecting botnet C&C channels targeted to-wards blacklisting the communication endpoints in terms of IP addresses anddomain names that were used to locate the C&C server. This lead to a numberof blacklists for C&C servers, such as [abu11a, Lis09, abu11b]. However, botnetshave adapted to this approach and migrate their C&C servers from one domain toanother, in order to avoid the blacklisted addresses. For example, while trackingthe Belanit botnet as part of our study of downloaders [RDB12], we noticed thatthe domain names for the main C&C server migrate from one top level domainto another, as can be seen from Figure 4.1. Between December 2011 and January2012, the domains were registered with .com, later with .info and subsequentlywith .ru.
43
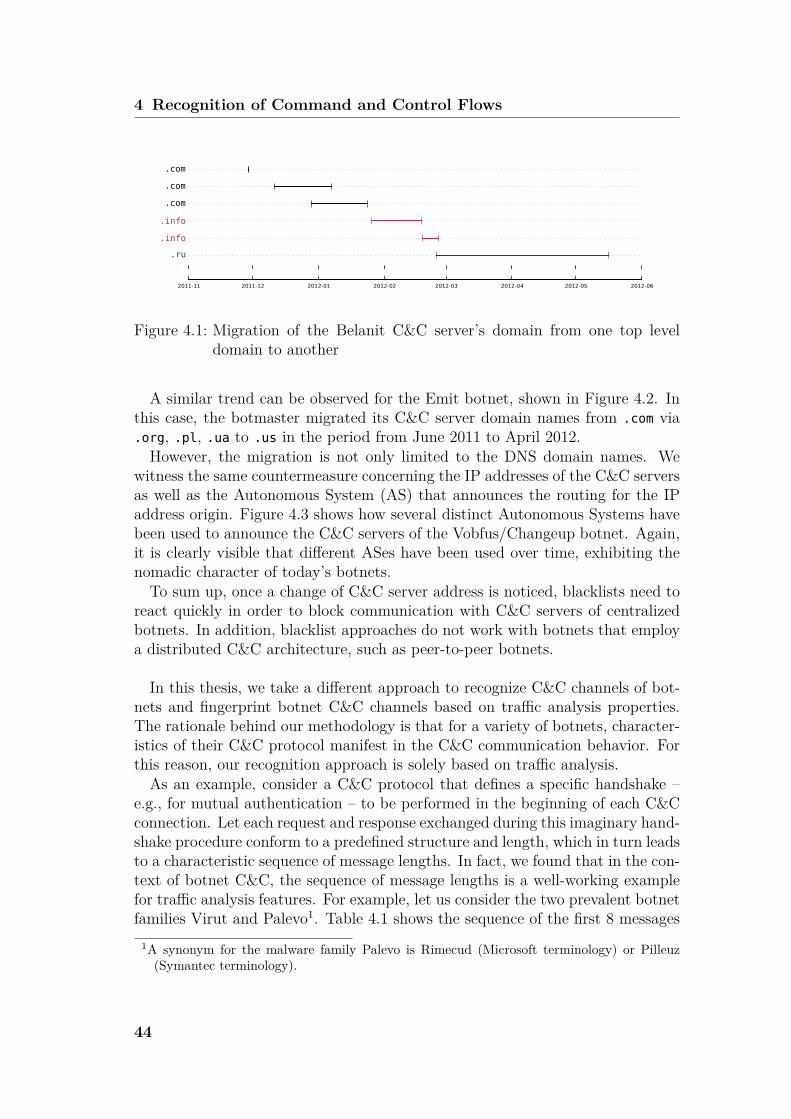
4 Recognition of Command and Control Flows
2011-11 2011-12 2012-01 2012-02 2012-03 2012-04 2012-05 2012-06
.com
.com
.com
.info
.info
.ru
Figure 4.1: Migration of the Belanit C&C server’s domain from one top leveldomain to another
A similar trend can be observed for the Emit botnet, shown in Figure 4.2. Inthis case, the botmaster migrated its C&C server domain names from .com via.org, .pl, .ua to .us in the period from June 2011 to April 2012.However, the migration is not only limited to the DNS domain names. We
witness the same countermeasure concerning the IP addresses of the C&C serversas well as the Autonomous System (AS) that announces the routing for the IPaddress origin. Figure 4.3 shows how several distinct Autonomous Systems havebeen used to announce the C&C servers of the Vobfus/Changeup botnet. Again,it is clearly visible that different ASes have been used over time, exhibiting thenomadic character of today’s botnets.To sum up, once a change of C&C server address is noticed, blacklists need to
react quickly in order to block communication with C&C servers of centralizedbotnets. In addition, blacklist approaches do not work with botnets that employa distributed C&C architecture, such as peer-to-peer botnets.
In this thesis, we take a different approach to recognize C&C channels of bot-nets and fingerprint botnet C&C channels based on traffic analysis properties.The rationale behind our methodology is that for a variety of botnets, character-istics of their C&C protocol manifest in the C&C communication behavior. Forthis reason, our recognition approach is solely based on traffic analysis.As an example, consider a C&C protocol that defines a specific handshake –
e.g., for mutual authentication – to be performed in the beginning of each C&Cconnection. Let each request and response exchanged during this imaginary hand-shake procedure conform to a predefined structure and length, which in turn leadsto a characteristic sequence of message lengths. In fact, we found that in the con-text of botnet C&C, the sequence of message lengths is a well-working examplefor traffic analysis features. For example, let us consider the two prevalent botnetfamilies Virut and Palevo1. Table 4.1 shows the sequence of the first 8 messages
1A synonym for the malware family Palevo is Rimecud (Microsoft terminology) or Pilleuz(Symantec terminology).
44
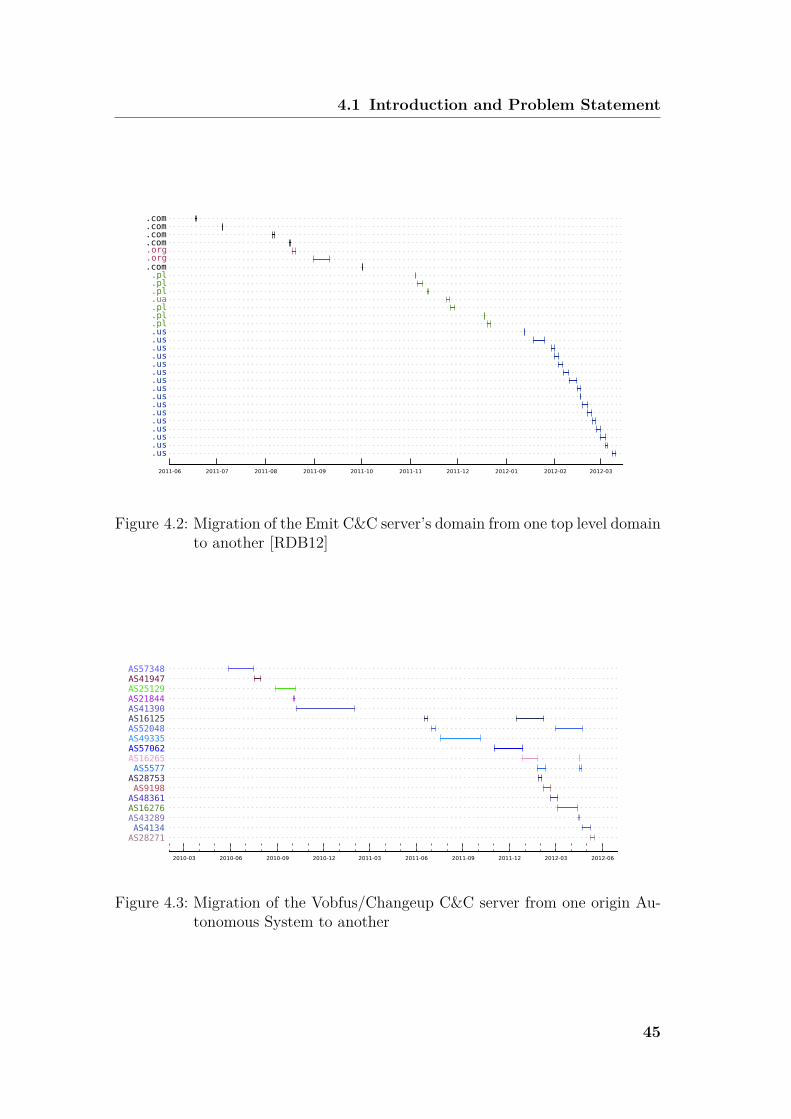
4.1 Introduction and Problem Statement
2011-06 2011-07 2011-08 2011-09 2011-10 2011-11 2011-12 2012-01 2012-02 2012-03
.com
.com
.com
.com
.org
.org
.com.pl.pl.pl.ua.pl.pl.pl.us.us.us.us.us.us.us.us.us.us.us.us.us.us.us.us
Figure 4.2: Migration of the Emit C&C server’s domain from one top level domainto another [RDB12]
2010-03 2010-06 2010-09 2010-12 2011-03 2011-06 2011-09 2011-12 2012-03 2012-06
AS57348AS41947AS25129AS21844AS41390AS16125AS52048AS49335AS57062AS16265AS5577AS28753AS9198AS48361AS16276AS43289AS4134AS28271
Figure 4.3: Migration of the Vobfus/Changeup C&C server from one origin Au-tonomous System to another
45
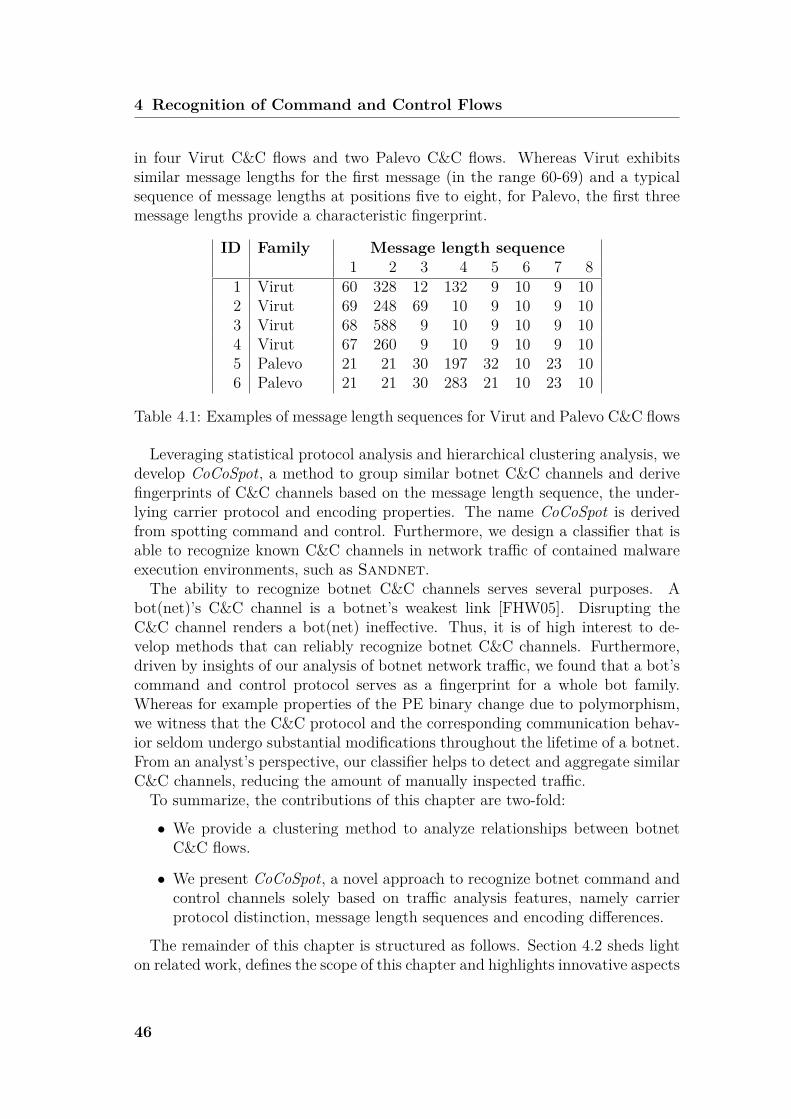
4 Recognition of Command and Control Flows
in four Virut C&C flows and two Palevo C&C flows. Whereas Virut exhibitssimilar message lengths for the first message (in the range 60-69) and a typicalsequence of message lengths at positions five to eight, for Palevo, the first threemessage lengths provide a characteristic fingerprint.
ID Family Message length sequence1 2 3 4 5 6 7 8
1 Virut 60 328 12 132 9 10 9 102 Virut 69 248 69 10 9 10 9 103 Virut 68 588 9 10 9 10 9 104 Virut 67 260 9 10 9 10 9 105 Palevo 21 21 30 197 32 10 23 106 Palevo 21 21 30 283 21 10 23 10
Table 4.1: Examples of message length sequences for Virut and Palevo C&C flows
Leveraging statistical protocol analysis and hierarchical clustering analysis, wedevelop CoCoSpot, a method to group similar botnet C&C channels and derivefingerprints of C&C channels based on the message length sequence, the under-lying carrier protocol and encoding properties. The name CoCoSpot is derivedfrom spotting command and control. Furthermore, we design a classifier that isable to recognize known C&C channels in network traffic of contained malwareexecution environments, such as Sandnet.The ability to recognize botnet C&C channels serves several purposes. A
bot(net)’s C&C channel is a botnet’s weakest link [FHW05]. Disrupting theC&C channel renders a bot(net) ineffective. Thus, it is of high interest to de-velop methods that can reliably recognize botnet C&C channels. Furthermore,driven by insights of our analysis of botnet network traffic, we found that a bot’scommand and control protocol serves as a fingerprint for a whole bot family.Whereas for example properties of the PE binary change due to polymorphism,we witness that the C&C protocol and the corresponding communication behav-ior seldom undergo substantial modifications throughout the lifetime of a botnet.From an analyst’s perspective, our classifier helps to detect and aggregate similarC&C channels, reducing the amount of manually inspected traffic.To summarize, the contributions of this chapter are two-fold:
• We provide a clustering method to analyze relationships between botnetC&C flows.
• We present CoCoSpot, a novel approach to recognize botnet command andcontrol channels solely based on traffic analysis features, namely carrierprotocol distinction, message length sequences and encoding differences.
The remainder of this chapter is structured as follows. Section 4.2 sheds lighton related work, defines the scope of this chapter and highlights innovative aspects
46
4.2 Related Work
of our approach. Subsequently, in Section 4.3, the general methodology as well asthe feature space is described. While Section 4.4 deals with the clustering phaseof C&C flows, Section 4.5 outlines the classifier which is then used to classifyunknown flows. In order to evaluate our approach, as described in Section 4.6,we classified arbitrary network flows emitted from our dynamic malware analysisenvironment Sandnet as either C&C or Non-C&C and verified the results usingtwo datasets. Finally, we discuss limitations of our approach in Section 4.7 andconclude in Section 4.8.
4.2 Related WorkTraditionally, botnet C&C channels have mainly been identified in two ways.First, publicly available blacklists [abu11a, Spa11, Goo11, Phi11] provide listsof known botnet servers by IP addresses or domain names. The drawback ofblacklists is that properties like IP addresses or domains are volatile. Botmasterscan and do change these often, rendering detection methods based on blacklistsinfeasible. In addition, botnets that rely on a peer-to-peer C&C architectureexhibit quickly changing sets of rendez-vous points. Some botmasters designtheir bot’s bootstrap process even more resilient by avoiding any static rendez-vous coordinates, e.g., by using domain generation algorithms where the currentrendez-vous point is valid for a very limited time span such as a few hours.These volatile communication endpoints can hardly be grasped by blacklists.Second, botnet C&C channels can be detected by checking for characteristicpayload substrings. For example, Botzilla [RSL+10], Rishi [GH07] and rules forthe Snort IDS [Thr11] identify C&C channels in network traffic using payloadbyte signatures for a small set of known botnets. However, most encrypted orobfuscated C&C protocols do not exhibit characteristic payload patterns andundermine existing payload byte signatures.Consequently, the traditional techniques are unsatisfying and have motivated
research for automated and more reliable processes. In that trail of research,BotMiner [GPZL08] and BotGrep [NMH+10] provide approaches to use trafficanalysis in order to find botnet C&C channels. However, while BotMiner requiresdetectable so-called A-plane activity such as spam, DDoS or scanning, CoCoSpotdoes not require any a priori or accompanying malicious actions and aims atthe recognition of C&C channels. For CoCoSpot, in order to detect a bot, itis enough to just exhibit C&C communication. The graph-based approach ofBotGrep requires botnets with distributed C&C architectures in order to detectthem. However, CoCoSpot not only works with peer-to-peer-based botnets, butalso with botnets exhibiting a centralized C&C architecture.Jacob et al. present JACKSTRAWS [JHKH11], which exploits that certain
C&C channels show recognizable system-level behavior in terms of system calltraces of Anubis [BKK06]. Particularly, JACKSTRAWS dynamically analyzes
47
4 Recognition of Command and Control Flows
malware binaries (e.g., with Anubis) and models system call graphs for knownC&C connections. New C&C channels are detected by matching unknown net-work connections against these graphs. As opposed to JACKSTRAWS, CoCoSpotdoes not depend on host-level analyses such as tainting, which enables our systemto be applied without host access. In addition, we will show that CoCoSpot candetect C&C flows of numerous different bot families, while Jacob et al. do not pro-vide insight into the diversity of the C&C channels detected by JACKSTRAWS.For example, while pure download-and-execute C&C channels follow strict sys-tem call patterns, more complex C&C channels spanning multiple TCP/UDPconnections (e.g., typical for most modern P2P- or HTTP-based botnets) maynot be detected by JACKSTRAWS. In contrast, CoCoSpot detects different ar-chitectural and many semantic types of C&C channels.Concurrent to our work, Bilge proposed DISCLOSURE [BBR+12], a system
to detect C&C servers in unknown network traffic based on NetFlow data. Bilgeframes a number of features that characterize botnet C&C servers, which arepartially similar to ours, but are applied in a different context. While we useperiodicity of messages to select C&C candidates, Bilge uses periodicity of net-work connections towards a server as an indicator for C&C channels. Similarly,we rely on the sequence of C&C message lengths, while DISCLOSURE bases onsequences of C&C stream size lengths. In both scenarios, these features seemto work well, while the constraints are different: DISCLOSURE is bound to thestrict NetFlow format, while we can rely on much finer granularity (messagesvs. connections) in our setting and deploy a wider flow format. Another advan-tage of CoCoSpot over DISCLOSURE is that we have fewer assumptions thatnarrow the type of C&C channels. For example, DISCLOSURE models networktraffic in a client-server fashion and favors centralized C&C channel architecturesand thus it will presumably fail for P2P-based botnets. Moreover, CoCoSpotdoes not require a priori knowledge on reputation of autonomous systems, sothat CoCoSpot even recognizes C&C servers in well-reputable networks.In general, our approach complements existing C&C detection systems, in that
we propose a technique to also recognize the nature (i.e., malware family) of C&Cchannels. While the difference may sound subtle, we see a major contributionhere. In many cases, it is desirable to know which type of botnet accounts for adetected C&C channel, e.g., to automate classification of malware [SGKA+09].In addition, especially compared to IP address (and domain) blacklists CoCoSpotprovides a finer granularity in that it restricts the detection to specific flows, whichturns out useful if legitimate and malicious activity appear on the same IP address(or domain). Moreover, our system is able to produce human-readable reports fordetected C&C channels, making an analysis easy. Currently, CoCoSpot reportsback the type of C&C channel found and provides the security analyst withexamples of similar C&C channels in the training dataset.In summary, the automatic recognition of C&C channels is a challenge and
demands for a different approach. We fill this gap by designing a method to
48
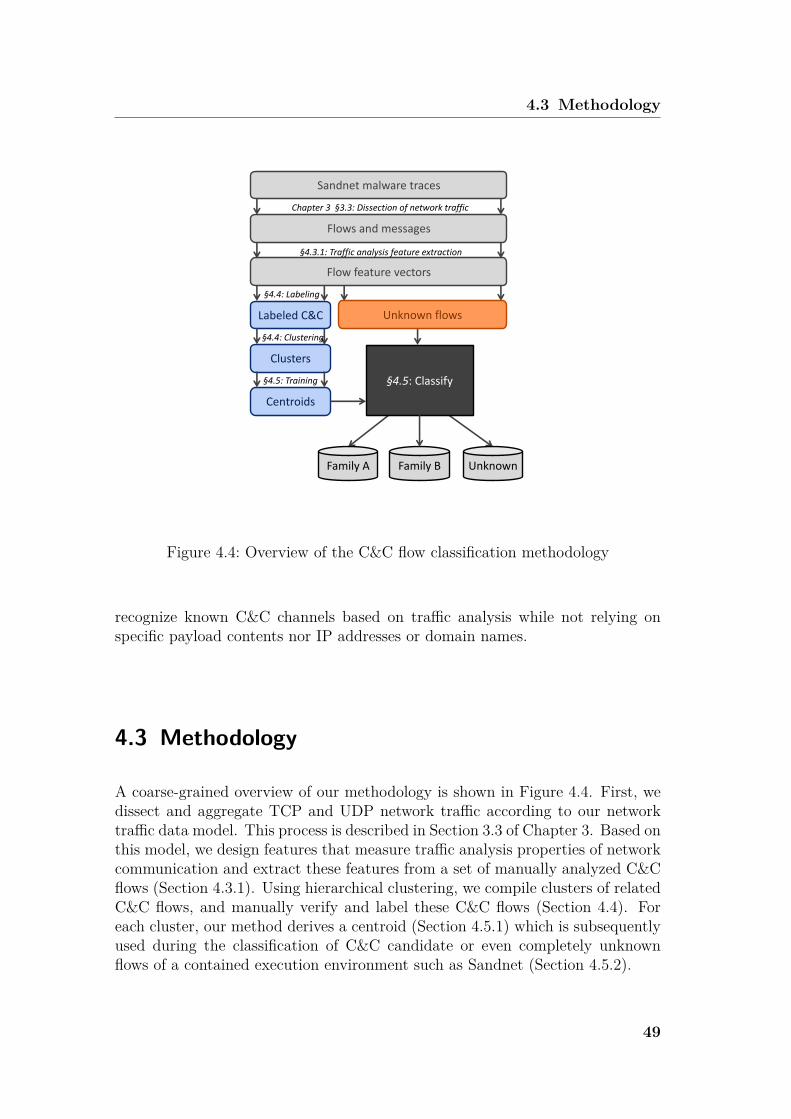
4.3 Methodology
Flows and messages
Sandnet malware traces
Labeled C&C
Clusters
Centroids
Unknown flows
Flow feature vectors
§4.5: Classify
Family A Family B Unknown
§4.4: Clustering
§4.5: Training
§4.4: Labeling
Chapter 3 §3.3: Dissection of network traffic
§4.3.1: Traffic analysis feature extraction
Figure 4.4: Overview of the C&C flow classification methodology
recognize known C&C channels based on traffic analysis while not relying onspecific payload contents nor IP addresses or domain names.
4.3 Methodology
A coarse-grained overview of our methodology is shown in Figure 4.4. First, wedissect and aggregate TCP and UDP network traffic according to our networktraffic data model. This process is described in Section 3.3 of Chapter 3. Based onthis model, we design features that measure traffic analysis properties of networkcommunication and extract these features from a set of manually analyzed C&Cflows (Section 4.3.1). Using hierarchical clustering, we compile clusters of relatedC&C flows, and manually verify and label these C&C flows (Section 4.4). Foreach cluster, our method derives a centroid (Section 4.5.1) which is subsequentlyused during the classification of C&C candidate or even completely unknownflows of a contained execution environment such as Sandnet (Section 4.5.2).
49
4 Recognition of Command and Control Flows
4.3.1 Traffic Analysis Features of Botnet C&CBased on our data model, we define features aiming to measure traffic analysisproperties of network communication, especially in the context of botnets. Thesefeatures will be used for the clustering analysis and the subsequent classificationof flows.Our feature space consists of three features. First, we consider the carrier pro-
tocol to be the underlying protocol of the C&C protocol and distinguish betweenTCP, UDP and HTTP. We assume that a C&C protocol is either designed tobe used with TCP, UDP or HTTP. In fact, we have not witnessed a change ofcarrier protocol during the lifetime of a botnet in our analysis of botnet traffic.As the second feature, we define the sequence of message lengths in a flow.
This feature is motivated by the observation that most C&C protocols exhibit acharacteristic sequence of message lengths. More precisely, we exploit the char-acteristic message length sequence during the beginning of a flow. We assumethat the first few messages of a flow cover what could be regarded a handshakephase of the C&C protocol. In addition, we observed that C&C flows exhibitcharacteristic message lengths during idle phases, i.e., when only keep-alive-likemessages are transmitted. We decide to take up to the first eight messages intoconsideration because on the one hand they cover the initial handshake and – ifthere is an early idle phase – the first few messages of an idle phase, too. Onthe other hand, eight messages is reasonably small in order to keep the compu-tational overhead low. We evaluated different numbers of messages in a flow andwhile smaller numbers make the computational performance decrease, we did notexperience huge improvement with longer message length sequences.In case of TCP and UDP as carrier protocol, the length of a message is defined
as the total length of the carrier protocol’s payload in bytes. For HTTP, we definethe message length of an HTTP request to be the sum of the body length as wellas the URI query section, and for a response the body length. We omit HTTPheaders because they do not contain relevant information for our method.The third feature is specific to HTTP and counts the number of distinct byte
values in the query section of the HTTP request URI, aggregated over up to thefirst four HTTP requests’ URIs of a flow. We observed that malware authors de-cide for different encoding schemes such as Base64, Hex or ASCII when designingan HTTP-based C&C protocol. To a certain degree, the number of distinct bytesreflect the encoding scheme of the URI’s query section. For example, for a Base64encoded query section of the URI, the number of distinct bytes does not exceed64. Note that we restrict ourselves to the query section of the request URIs forall requests.Throughout one botnet family, it is possible that there are multiple C&C pro-
tocols with possibly even different C&C architectures in place, for several reasons.Malware authors might allow for a backup C&C protocol that is only activated ifthe primary C&C protocol fails, several variants of one bot family might operate
50
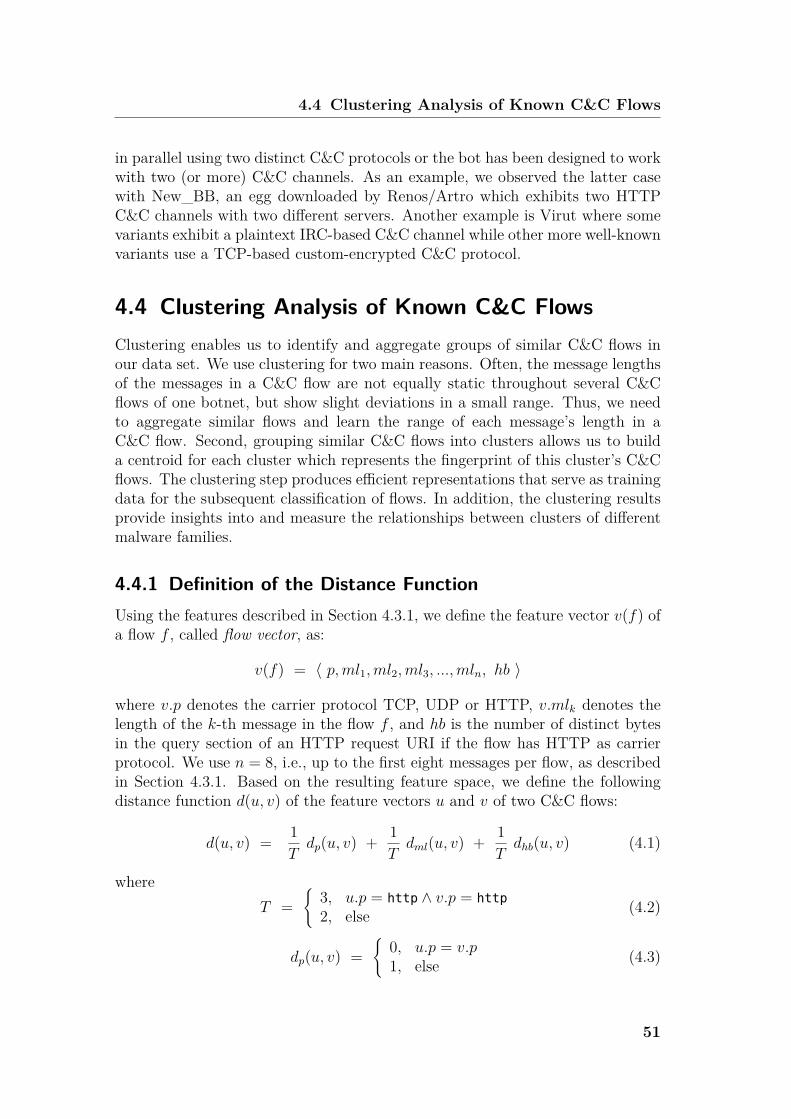
4.4 Clustering Analysis of Known C&C Flows
in parallel using two distinct C&C protocols or the bot has been designed to workwith two (or more) C&C channels. As an example, we observed the latter casewith New_BB, an egg downloaded by Renos/Artro which exhibits two HTTPC&C channels with two different servers. Another example is Virut where somevariants exhibit a plaintext IRC-based C&C channel while other more well-knownvariants use a TCP-based custom-encrypted C&C protocol.
4.4 Clustering Analysis of Known C&C FlowsClustering enables us to identify and aggregate groups of similar C&C flows inour data set. We use clustering for two main reasons. Often, the message lengthsof the messages in a C&C flow are not equally static throughout several C&Cflows of one botnet, but show slight deviations in a small range. Thus, we needto aggregate similar flows and learn the range of each message’s length in aC&C flow. Second, grouping similar C&C flows into clusters allows us to builda centroid for each cluster which represents the fingerprint of this cluster’s C&Cflows. The clustering step produces efficient representations that serve as trainingdata for the subsequent classification of flows. In addition, the clustering resultsprovide insights into and measure the relationships between clusters of differentmalware families.
4.4.1 Definition of the Distance FunctionUsing the features described in Section 4.3.1, we define the feature vector v(f) ofa flow f , called flow vector, as:
v(f) = 〈 p,ml1,ml2,ml3, ...,mln, hb 〉
where v.p denotes the carrier protocol TCP, UDP or HTTP, v.mlk denotes thelength of the k-th message in the flow f , and hb is the number of distinct bytesin the query section of an HTTP request URI if the flow has HTTP as carrierprotocol. We use n = 8, i.e., up to the first eight messages per flow, as describedin Section 4.3.1. Based on the resulting feature space, we define the followingdistance function d(u, v) of the feature vectors u and v of two C&C flows:
d(u, v) = 1Tdp(u, v) + 1
Tdml(u, v) + 1
Tdhb(u, v) (4.1)
whereT =
{3, u.p = http ∧ v.p = http
2, else (4.2)
dp(u, v) ={
0, u.p = v.p1, else (4.3)
51
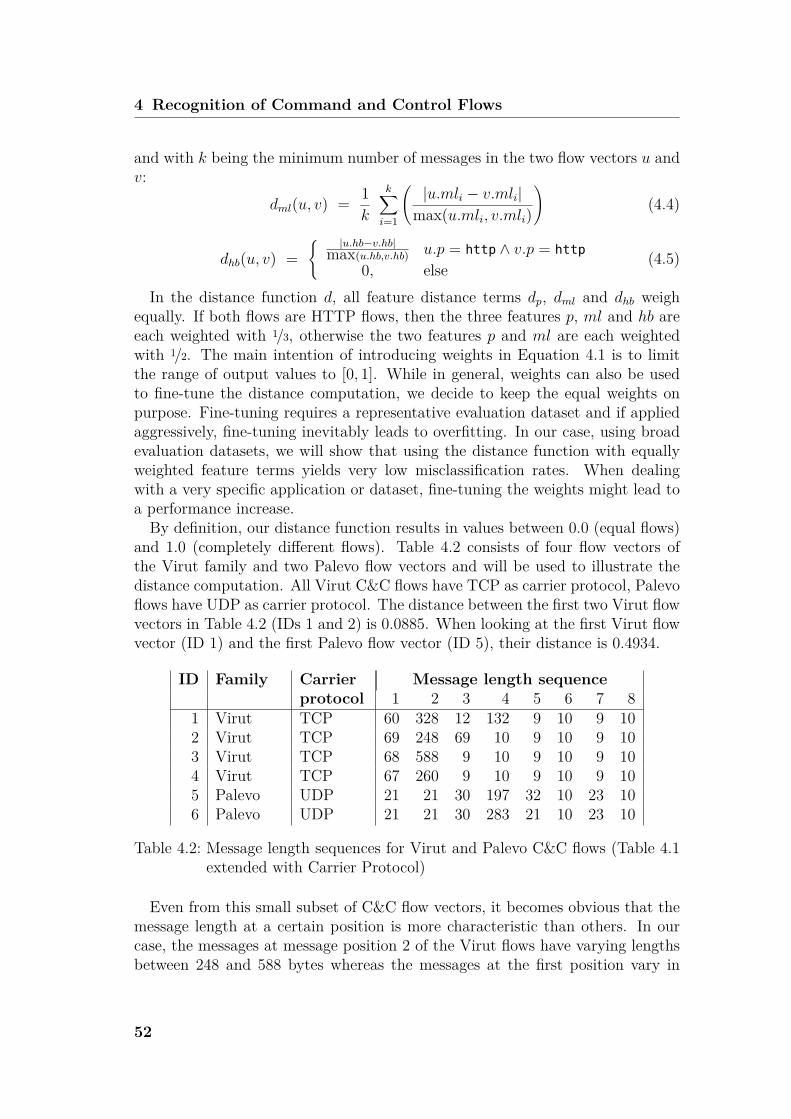
4 Recognition of Command and Control Flows
and with k being the minimum number of messages in the two flow vectors u andv:
dml(u, v) = 1k
k∑i=1
(|u.mli − v.mli|
max(u.mli, v.mli)
)(4.4)
dhb(u, v) ={ |u.hb−v.hb|
max(u.hb,v.hb) u.p = http ∧ v.p = http
0, else(4.5)
In the distance function d, all feature distance terms dp, dml and dhb weighequally. If both flows are HTTP flows, then the three features p, ml and hb areeach weighted with 1/3, otherwise the two features p and ml are each weightedwith 1/2. The main intention of introducing weights in Equation 4.1 is to limitthe range of output values to [0, 1]. While in general, weights can also be usedto fine-tune the distance computation, we decide to keep the equal weights onpurpose. Fine-tuning requires a representative evaluation dataset and if appliedaggressively, fine-tuning inevitably leads to overfitting. In our case, using broadevaluation datasets, we will show that using the distance function with equallyweighted feature terms yields very low misclassification rates. When dealingwith a very specific application or dataset, fine-tuning the weights might lead toa performance increase.By definition, our distance function results in values between 0.0 (equal flows)
and 1.0 (completely different flows). Table 4.2 consists of four flow vectors ofthe Virut family and two Palevo flow vectors and will be used to illustrate thedistance computation. All Virut C&C flows have TCP as carrier protocol, Palevoflows have UDP as carrier protocol. The distance between the first two Virut flowvectors in Table 4.2 (IDs 1 and 2) is 0.0885. When looking at the first Virut flowvector (ID 1) and the first Palevo flow vector (ID 5), their distance is 0.4934.
ID Family Carrier Message length sequenceprotocol 1 2 3 4 5 6 7 8
1 Virut TCP 60 328 12 132 9 10 9 102 Virut TCP 69 248 69 10 9 10 9 103 Virut TCP 68 588 9 10 9 10 9 104 Virut TCP 67 260 9 10 9 10 9 105 Palevo UDP 21 21 30 197 32 10 23 106 Palevo UDP 21 21 30 283 21 10 23 10
Table 4.2: Message length sequences for Virut and Palevo C&C flows (Table 4.1extended with Carrier Protocol)
Even from this small subset of C&C flow vectors, it becomes obvious that themessage length at a certain position is more characteristic than others. In ourcase, the messages at message position 2 of the Virut flows have varying lengthsbetween 248 and 588 bytes whereas the messages at the first position vary in
52
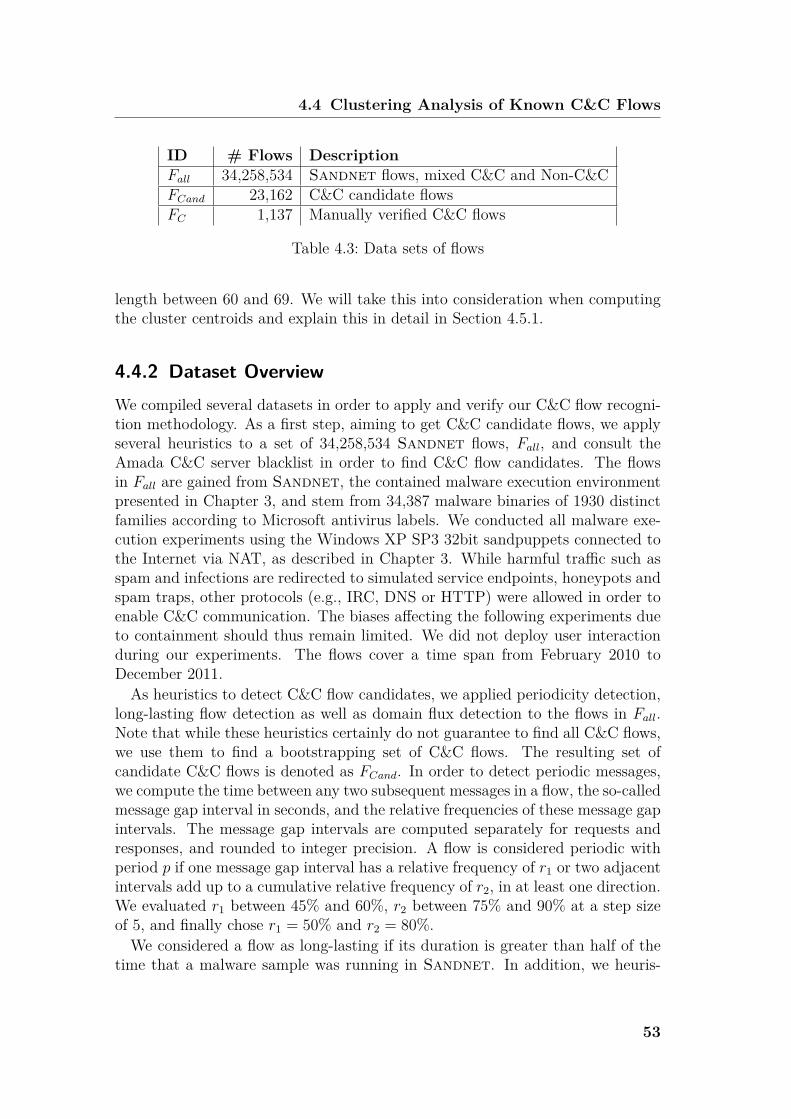
4.4 Clustering Analysis of Known C&C Flows
ID # Flows DescriptionFall 34,258,534 Sandnet flows, mixed C&C and Non-C&CFCand 23,162 C&C candidate flowsFC 1,137 Manually verified C&C flows
Table 4.3: Data sets of flows
length between 60 and 69. We will take this into consideration when computingthe cluster centroids and explain this in detail in Section 4.5.1.
4.4.2 Dataset OverviewWe compiled several datasets in order to apply and verify our C&C flow recogni-tion methodology. As a first step, aiming to get C&C candidate flows, we applyseveral heuristics to a set of 34,258,534 Sandnet flows, Fall, and consult theAmada C&C server blacklist in order to find C&C flow candidates. The flowsin Fall are gained from Sandnet, the contained malware execution environmentpresented in Chapter 3, and stem from 34,387 malware binaries of 1930 distinctfamilies according to Microsoft antivirus labels. We conducted all malware exe-cution experiments using the Windows XP SP3 32bit sandpuppets connected tothe Internet via NAT, as described in Chapter 3. While harmful traffic such asspam and infections are redirected to simulated service endpoints, honeypots andspam traps, other protocols (e.g., IRC, DNS or HTTP) were allowed in order toenable C&C communication. The biases affecting the following experiments dueto containment should thus remain limited. We did not deploy user interactionduring our experiments. The flows cover a time span from February 2010 toDecember 2011.As heuristics to detect C&C flow candidates, we applied periodicity detection,
long-lasting flow detection as well as domain flux detection to the flows in Fall.Note that while these heuristics certainly do not guarantee to find all C&C flows,we use them to find a bootstrapping set of C&C flows. The resulting set ofcandidate C&C flows is denoted as FCand. In order to detect periodic messages,we compute the time between any two subsequent messages in a flow, the so-calledmessage gap interval in seconds, and the relative frequencies of these message gapintervals. The message gap intervals are computed separately for requests andresponses, and rounded to integer precision. A flow is considered periodic withperiod p if one message gap interval has a relative frequency of r1 or two adjacentintervals add up to a cumulative relative frequency of r2, in at least one direction.We evaluated r1 between 45% and 60%, r2 between 75% and 90% at a step sizeof 5, and finally chose r1 = 50% and r2 = 80%.We considered a flow as long-lasting if its duration is greater than half of the
time that a malware sample was running in Sandnet. In addition, we heuris-
53
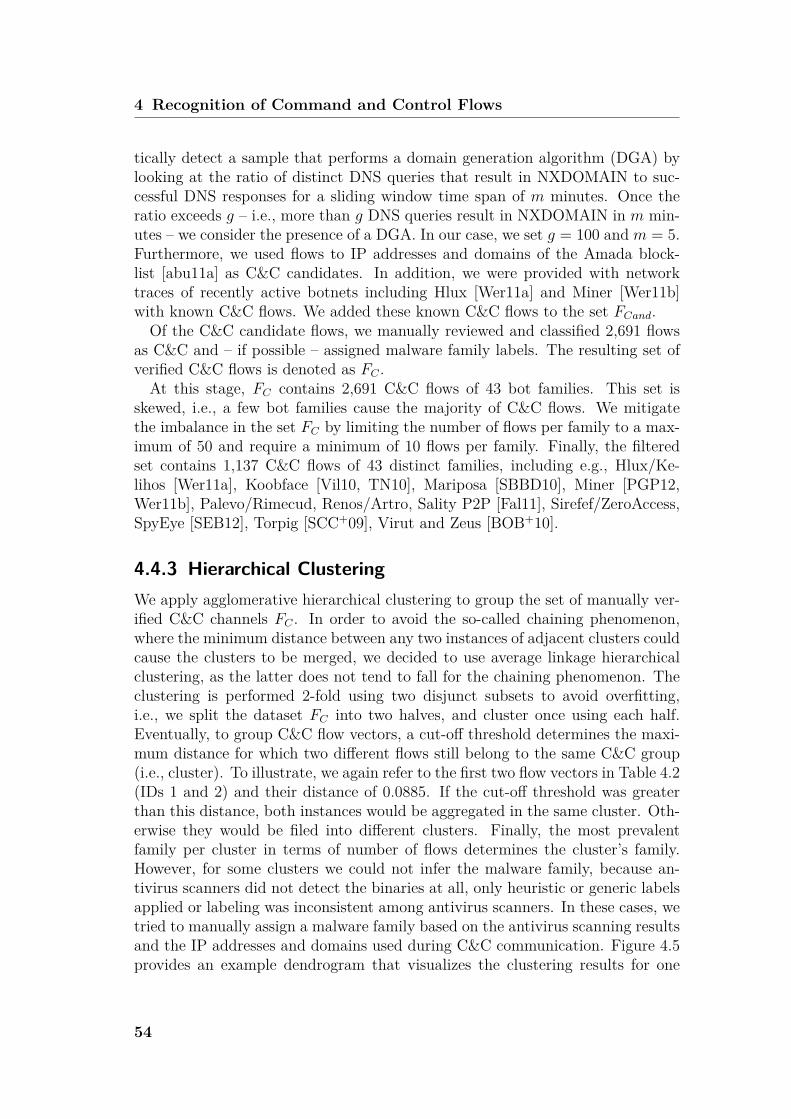
4 Recognition of Command and Control Flows
tically detect a sample that performs a domain generation algorithm (DGA) bylooking at the ratio of distinct DNS queries that result in NXDOMAIN to suc-cessful DNS responses for a sliding window time span of m minutes. Once theratio exceeds g – i.e., more than g DNS queries result in NXDOMAIN in m min-utes – we consider the presence of a DGA. In our case, we set g = 100 and m = 5.Furthermore, we used flows to IP addresses and domains of the Amada block-list [abu11a] as C&C candidates. In addition, we were provided with networktraces of recently active botnets including Hlux [Wer11a] and Miner [Wer11b]with known C&C flows. We added these known C&C flows to the set FCand.Of the C&C candidate flows, we manually reviewed and classified 2,691 flows
as C&C and – if possible – assigned malware family labels. The resulting set ofverified C&C flows is denoted as FC .At this stage, FC contains 2,691 C&C flows of 43 bot families. This set is
skewed, i.e., a few bot families cause the majority of C&C flows. We mitigatethe imbalance in the set FC by limiting the number of flows per family to a max-imum of 50 and require a minimum of 10 flows per family. Finally, the filteredset contains 1,137 C&C flows of 43 distinct families, including e.g., Hlux/Ke-lihos [Wer11a], Koobface [Vil10, TN10], Mariposa [SBBD10], Miner [PGP12,Wer11b], Palevo/Rimecud, Renos/Artro, Sality P2P [Fal11], Sirefef/ZeroAccess,SpyEye [SEB12], Torpig [SCC+09], Virut and Zeus [BOB+10].
4.4.3 Hierarchical ClusteringWe apply agglomerative hierarchical clustering to group the set of manually ver-ified C&C channels FC . In order to avoid the so-called chaining phenomenon,where the minimum distance between any two instances of adjacent clusters couldcause the clusters to be merged, we decided to use average linkage hierarchicalclustering, as the latter does not tend to fall for the chaining phenomenon. Theclustering is performed 2-fold using two disjunct subsets to avoid overfitting,i.e., we split the dataset FC into two halves, and cluster once using each half.Eventually, to group C&C flow vectors, a cut-off threshold determines the maxi-mum distance for which two different flows still belong to the same C&C group(i.e., cluster). To illustrate, we again refer to the first two flow vectors in Table 4.2(IDs 1 and 2) and their distance of 0.0885. If the cut-off threshold was greaterthan this distance, both instances would be aggregated in the same cluster. Oth-erwise they would be filed into different clusters. Finally, the most prevalentfamily per cluster in terms of number of flows determines the cluster’s family.However, for some clusters we could not infer the malware family, because an-tivirus scanners did not detect the binaries at all, only heuristic or generic labelsapplied or labeling was inconsistent among antivirus scanners. In these cases, wetried to manually assign a malware family based on the antivirus scanning resultsand the IP addresses and domains used during C&C communication. Figure 4.5provides an example dendrogram that visualizes the clustering results for one
54
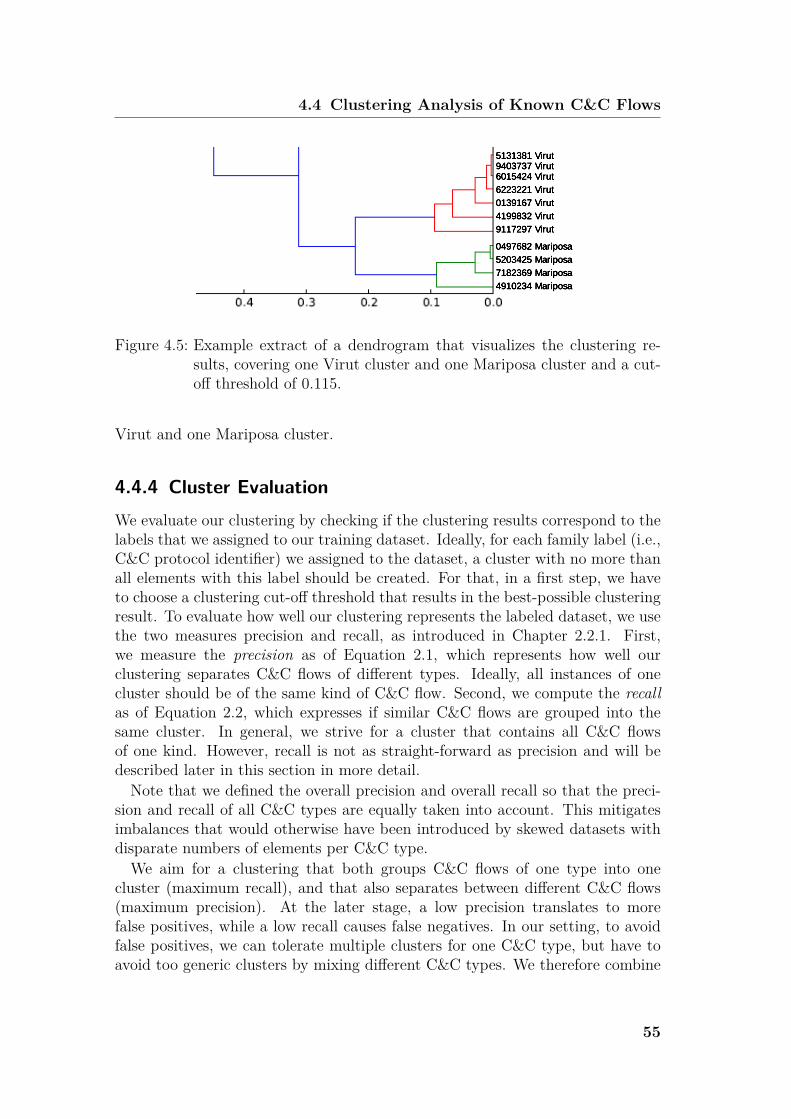
4.4 Clustering Analysis of Known C&C Flows
0497682 Mariposa5203425 Mariposa7182369 Mariposa4910234 Mariposa
5131381 Virut9403737 Virut6015424 Virut6223221 Virut0139167 Virut4199832 Virut9117297 Virut
Figure 4.5: Example extract of a dendrogram that visualizes the clustering re-sults, covering one Virut cluster and one Mariposa cluster and a cut-off threshold of 0.115.
Virut and one Mariposa cluster.
4.4.4 Cluster EvaluationWe evaluate our clustering by checking if the clustering results correspond to thelabels that we assigned to our training dataset. Ideally, for each family label (i.e.,C&C protocol identifier) we assigned to the dataset, a cluster with no more thanall elements with this label should be created. For that, in a first step, we haveto choose a clustering cut-off threshold that results in the best-possible clusteringresult. To evaluate how well our clustering represents the labeled dataset, we usethe two measures precision and recall, as introduced in Chapter 2.2.1. First,we measure the precision as of Equation 2.1, which represents how well ourclustering separates C&C flows of different types. Ideally, all instances of onecluster should be of the same kind of C&C flow. Second, we compute the recallas of Equation 2.2, which expresses if similar C&C flows are grouped into thesame cluster. In general, we strive for a cluster that contains all C&C flowsof one kind. However, recall is not as straight-forward as precision and will bedescribed later in this section in more detail.Note that we defined the overall precision and overall recall so that the preci-
sion and recall of all C&C types are equally taken into account. This mitigatesimbalances that would otherwise have been introduced by skewed datasets withdisparate numbers of elements per C&C type.We aim for a clustering that both groups C&C flows of one type into one
cluster (maximum recall), and that also separates between different C&C flows(maximum precision). At the later stage, a low precision translates to morefalse positives, while a low recall causes false negatives. In our setting, to avoidfalse positives, we can tolerate multiple clusters for one C&C type, but have toavoid too generic clusters by mixing different C&C types. We therefore combine
55
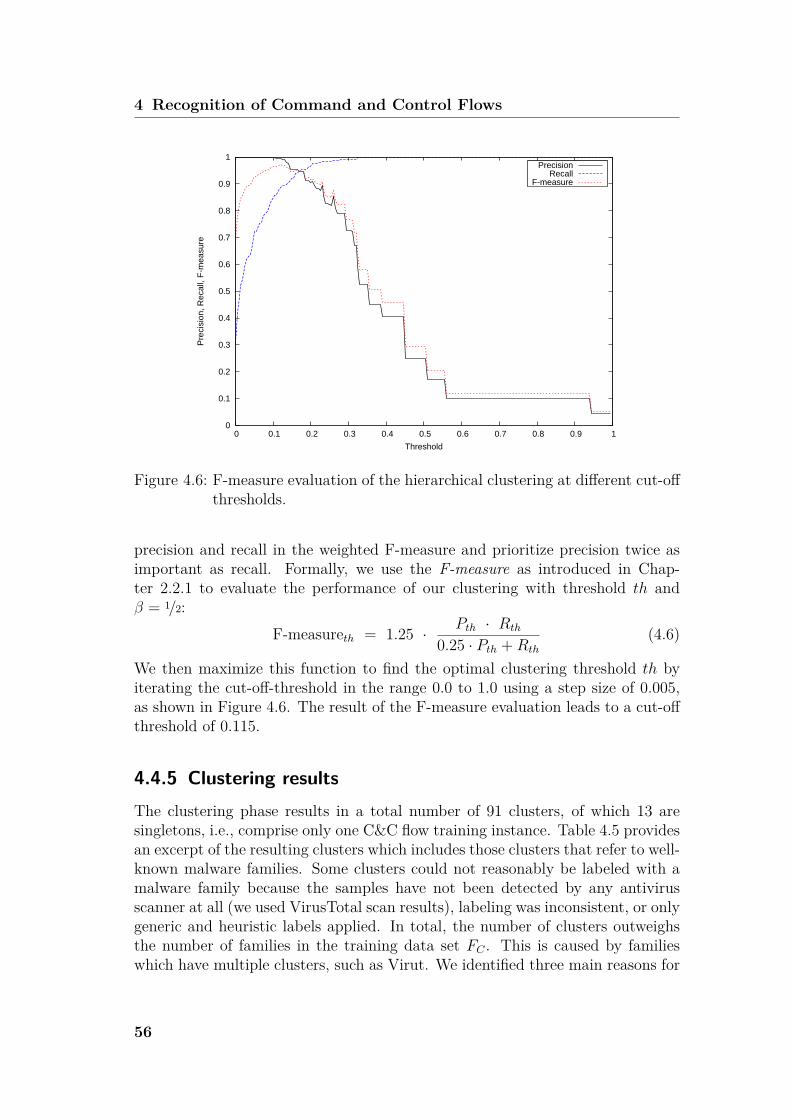
4 Recognition of Command and Control Flows
0
0.1
0.2
0.3
0.4
0.5
0.6
0.7
0.8
0.9
1
0 0.1 0.2 0.3 0.4 0.5 0.6 0.7 0.8 0.9 1
Pre
cisi
on, R
ecal
l, F
-mea
sure
Threshold
PrecisionRecall
F-measure
Figure 4.6: F-measure evaluation of the hierarchical clustering at different cut-offthresholds.
precision and recall in the weighted F-measure and prioritize precision twice asimportant as recall. Formally, we use the F-measure as introduced in Chap-ter 2.2.1 to evaluate the performance of our clustering with threshold th andβ = 1/2:
F-measureth = 1.25 · Pth · Rth
0.25 · Pth +Rth
(4.6)
We then maximize this function to find the optimal clustering threshold th byiterating the cut-off-threshold in the range 0.0 to 1.0 using a step size of 0.005,as shown in Figure 4.6. The result of the F-measure evaluation leads to a cut-offthreshold of 0.115.
4.4.5 Clustering resultsThe clustering phase results in a total number of 91 clusters, of which 13 aresingletons, i.e., comprise only one C&C flow training instance. Table 4.5 providesan excerpt of the resulting clusters which includes those clusters that refer to well-known malware families. Some clusters could not reasonably be labeled with amalware family because the samples have not been detected by any antivirusscanner at all (we used VirusTotal scan results), labeling was inconsistent, or onlygeneric and heuristic labels applied. In total, the number of clusters outweighsthe number of families in the training data set FC . This is caused by familieswhich have multiple clusters, such as Virut. We identified three main reasons for
56
4.5 Designing the C&C Flow Classifier
this. First, the bots of a certain malware family evolve over time. For Virut,two kinds of bots circulate in the wild. One variant is based on a plaintext IRCC&C channel, and another variant employs a TCP-based C&C channel whichprovides an intermediate layer of custom encryption. These two variants exhibitdifferent message length sequences (and message encodings) which is reflected intwo distinct Virut clusters. Second, different clusters might represent differentactivity states. Idle bots, i.e., where the botmaster does not have instructionsfor the bots, typically exhibit smaller messages (e.g., only keep-alive messages)compared to when orders (e.g., spam templates and address lists) are transmitted.Third, families that do not exhibit characteristic message lengths at all will resultin a high number of clusters.
4.5 Designing the C&C Flow ClassifierDuring the clustering phase, we have built groups of similar C&C flows. Inorder to extract fingerprints, we now compute a centroid for each cluster anddesign a nearest-cluster classifier that can classify unknown flows based on thesecentroids. Finally, we evaluate our classifier on two data sets and give upperbounds of classification errors.
4.5.1 Cluster Centroids as C&C Channel FingerprintsIn the training phase, we compute a centroid z for each cluster C.The data structure z of a centroid is based on the structure of a flow vector
v as defined in Section 4.4, extended by a sequence of weights and a maximumdistance. It consists of the following attributes:
z = < p, ml1,ml2, . . . ,mln, w1, w2, . . . , wn, maxdist, hb >
• z.p: The carrier protocol.
• z.mli: The sequence of the average length of the messages at index i of allflows in C.
• z.wi: The sequence of weights for each position i in the average messagelength sequence z.ml.
• z.maxdist: The maximum distance between the centroid and all of the flowvectors in the cluster in order to limit the cluster’s scope.
• z.hb: In case of a centroid for a cluster with at least one HTTP C&C flow:the average number of distinct bytes in the query section of HTTP requests.
57
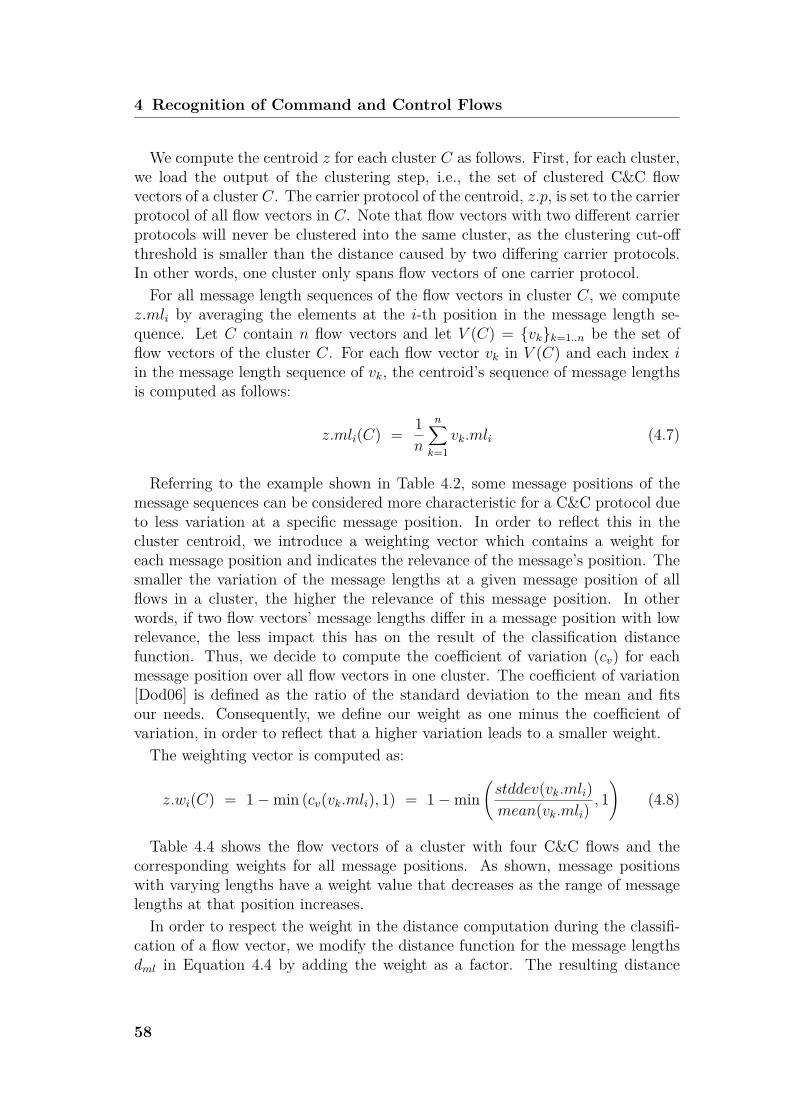
4 Recognition of Command and Control Flows
We compute the centroid z for each cluster C as follows. First, for each cluster,we load the output of the clustering step, i.e., the set of clustered C&C flowvectors of a cluster C. The carrier protocol of the centroid, z.p, is set to the carrierprotocol of all flow vectors in C. Note that flow vectors with two different carrierprotocols will never be clustered into the same cluster, as the clustering cut-offthreshold is smaller than the distance caused by two differing carrier protocols.In other words, one cluster only spans flow vectors of one carrier protocol.For all message length sequences of the flow vectors in cluster C, we compute
z.mli by averaging the elements at the i-th position in the message length se-quence. Let C contain n flow vectors and let V (C) = {vk}k=1..n be the set offlow vectors of the cluster C. For each flow vector vk in V (C) and each index iin the message length sequence of vk, the centroid’s sequence of message lengthsis computed as follows:
z.mli(C) = 1n
n∑k=1
vk.mli (4.7)
Referring to the example shown in Table 4.2, some message positions of themessage sequences can be considered more characteristic for a C&C protocol dueto less variation at a specific message position. In order to reflect this in thecluster centroid, we introduce a weighting vector which contains a weight foreach message position and indicates the relevance of the message’s position. Thesmaller the variation of the message lengths at a given message position of allflows in a cluster, the higher the relevance of this message position. In otherwords, if two flow vectors’ message lengths differ in a message position with lowrelevance, the less impact this has on the result of the classification distancefunction. Thus, we decide to compute the coefficient of variation (cv) for eachmessage position over all flow vectors in one cluster. The coefficient of variation[Dod06] is defined as the ratio of the standard deviation to the mean and fitsour needs. Consequently, we define our weight as one minus the coefficient ofvariation, in order to reflect that a higher variation leads to a smaller weight.The weighting vector is computed as:
z.wi(C) = 1−min (cv(vk.mli), 1) = 1−min(stddev(vk.mli)mean(vk.mli)
, 1)
(4.8)
Table 4.4 shows the flow vectors of a cluster with four C&C flows and thecorresponding weights for all message positions. As shown, message positionswith varying lengths have a weight value that decreases as the range of messagelengths at that position increases.In order to respect the weight in the distance computation during the classifi-
cation of a flow vector, we modify the distance function for the message lengthsdml in Equation 4.4 by adding the weight as a factor. The resulting distance
58
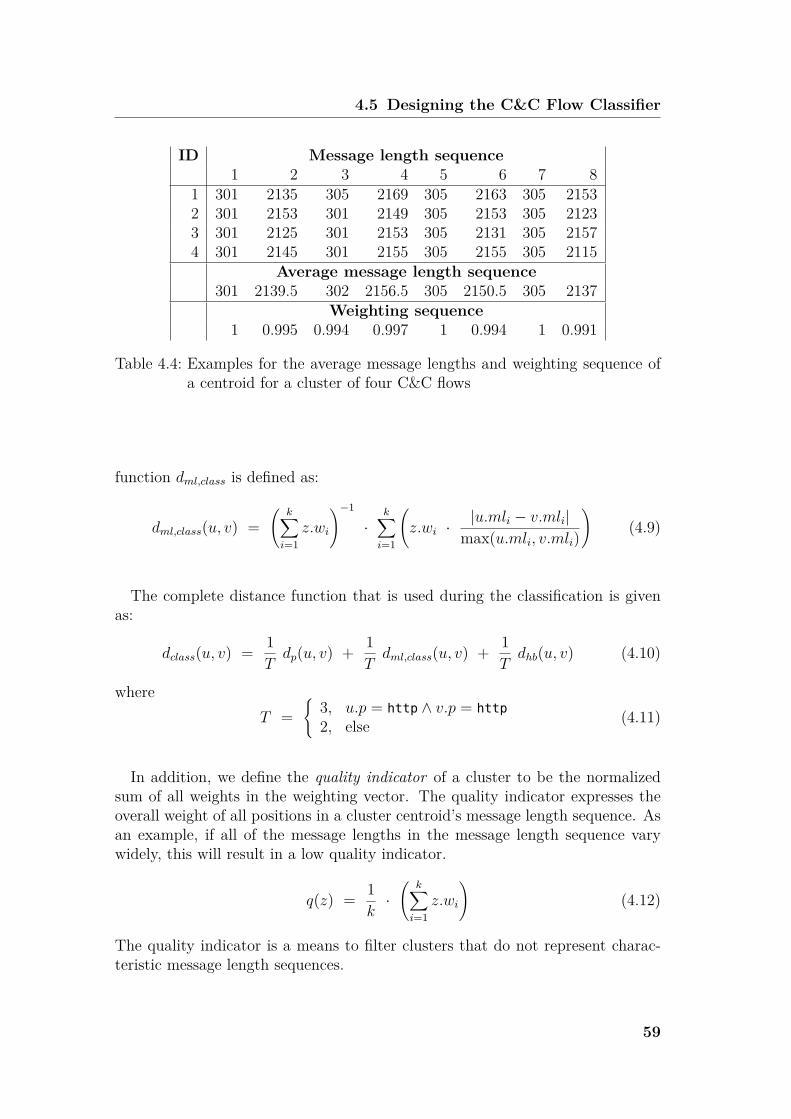
4.5 Designing the C&C Flow Classifier
ID Message length sequence1 2 3 4 5 6 7 8
1 301 2135 305 2169 305 2163 305 21532 301 2153 301 2149 305 2153 305 21233 301 2125 301 2153 305 2131 305 21574 301 2145 301 2155 305 2155 305 2115
Average message length sequence301 2139.5 302 2156.5 305 2150.5 305 2137
Weighting sequence1 0.995 0.994 0.997 1 0.994 1 0.991
Table 4.4: Examples for the average message lengths and weighting sequence ofa centroid for a cluster of four C&C flows
function dml,class is defined as:
dml,class(u, v) =(
k∑i=1
z.wi
)−1
·k∑
i=1
(z.wi ·
|u.mli − v.mli|max(u.mli, v.mli)
)(4.9)
The complete distance function that is used during the classification is givenas:
dclass(u, v) = 1Tdp(u, v) + 1
Tdml,class(u, v) + 1
Tdhb(u, v) (4.10)
whereT =
{3, u.p = http ∧ v.p = http
2, else (4.11)
In addition, we define the quality indicator of a cluster to be the normalizedsum of all weights in the weighting vector. The quality indicator expresses theoverall weight of all positions in a cluster centroid’s message length sequence. Asan example, if all of the message lengths in the message length sequence varywidely, this will result in a low quality indicator.
q(z) = 1k·(
k∑i=1
z.wi
)(4.12)
The quality indicator is a means to filter clusters that do not represent charac-teristic message length sequences.
59
4 Recognition of Command and Control Flows
Family Label #C #S C&C Arch CP Plain Avg QIBifrose 4 1 centralized TCP no 90.48BlackEnergy 3 0 centralized HTTP no 92.71Cycbot 6 0 centralized HTTP no 31.28Delf 2 1 centralized HTTP no 95.33Koobface 2 1 centralized HTTP no 88.89Mariposa 6 1 centralized UDP no 86.41Mebroot 6 2 centralized HTTP no 66.50Miner 1 0 P2P HTTP yes 97.35Nimnul/Ramnit 1 0 centralized TCP no 67.47Palevo 2 1 centralized UDP no 86.28Renos/Artro 2 0 centralized HTTP no 99.87Renos/Katusha 1 0 centralized HTTP no 100.00Renos:New BB 5 1 centralized HTTP yes 84.42Sality P2P 6 2 P2P UDP no 74.31Sirefef/ZeroAccess 3 0 P2P TCP no 80.51Small 2 1 centralized HTTP no 44.50Spatet/Llac 1 0 centralized TCP no 92.59TDSS/Alureon 1 0 centralized TCP no 81.82Tedroo 1 0 centralized TCP no 97.95Torpig 5 0 centralized TCP no 71.55Virut 3 0 centralized TCP mixed 82.01
Table 4.5: Clustering results of some well-known botnet families. #C: number ofclusters, #S: number of singleton clusters, C&C Arch denotes the C&Carchitecture (P2P=peer to peer), CP is the Carrier Protocol, Plaindenotes whether the family uses a plaintext C&C protocol encoding;Avg QI is the average quality indicator.
4.5.2 Classification AlgorithmSo far, we have developed a data structure for the cluster centroid and a distancefunction for the classification. The complete algorithm to classify a flow f is asfollows. First, we build the corresponding feature vector vf and compute thedistance between all cluster centroids and vf using the distance function dclass inEquation 4.10.Naively, we could be tempted to assign the closest cluster to the flow f , i.e.,
the cluster with the minimum distance to vf . However, the closest cluster is notnecessarily correct. Especially in case f is not a C&C flow at all, our classifierrequires a means to find out that f lies outside the scope of all clusters. Thus, weadditionally store the maximum distance between the centroid and all trainingflow vectors of a corresponding cluster, computed using the distance function dof Equation 4.1. The maximum distance limits the scope of the cluster, and flows
60
4.6 Evaluation of the C&C Flow Recognition
outside of this scope are discarded by the classifier.The label of the nearest cluster, i.e., the cluster with the minimum distance
between vf and the cluster centroid, is assigned to f , as long as the distance isbelow the maximum distance for the centroid. If none of the cluster centroidsare in range of f , the flow is considered not to be a known C&C flow. Listing 4.5contains the simplified Python code involved in the classification of a flow vector,given a set of centroids. For improved readability, error handling code has beenomitted.
4.6 Evaluation of the C&C Flow RecognitionIn this section we use our classifier to recognize C&C channels among arbitrarynetwork traffic emitted from Sandnet, our contained malware execution envi-ronment. Due to the sheer amount of flows to be classified and the absence ofrock-solid ground truth for C&C flows, validating the result of the classification isa difficult task. Therefore, we try to estimate upper bounds for the classificationerrors in order to provide an impression of the performance of our classificationapproach. We verify our classifier by help of two evaluation datasets, shown inTable 4.6.In order to estimate the false negative rate, we compiled a set of C&C peers.
For each of the 43 families in the training set FC , we build sets of C&C serverIP addresses or domain names based on manually verified C&C flows as well aspublicly available C&C server blacklists [abu11d, abu11c, abu11b]. We assumeall flows heading for any of the IP addresses or domains in our list of C&C peersas C&C flows. Using these C&C peer lists, we extract all matching flows fromSandnet traffic Fall, except those in the training set FC . For five families, ourheuristic did not find additional C&C flows, i.e., all flows of that specific familyhave already been used in the training phase and are thus excluded from theclassification set FF N .For an initial set of centroids for classification, we discard centroids of four C&C
families, as these do not show sufficiently characteristic message lengths. Amongthese families are SpyEye, Hlux, Zeus P2P and Carberp. Particularly, we discardfamilies with only singleton clusters, or centroids whose average message lengthweights is smaller than 30%. Our idea of finding a C&C protocol’s handshakecould be extended to search for representative message length sequences past ourcurrent limit of eight messages per flow to mitigate these cases. The resultingdata set is denoted as FF N and contains C&C flows for 34 out of 43 families.In order to estimate the false positive rate, we build a subset of all Sandnet flows
Fall, balanced by A/V label family so that the subset contains no more than fivemalware samples of a certain family, determined by Kaspersky antivirus labels.
61
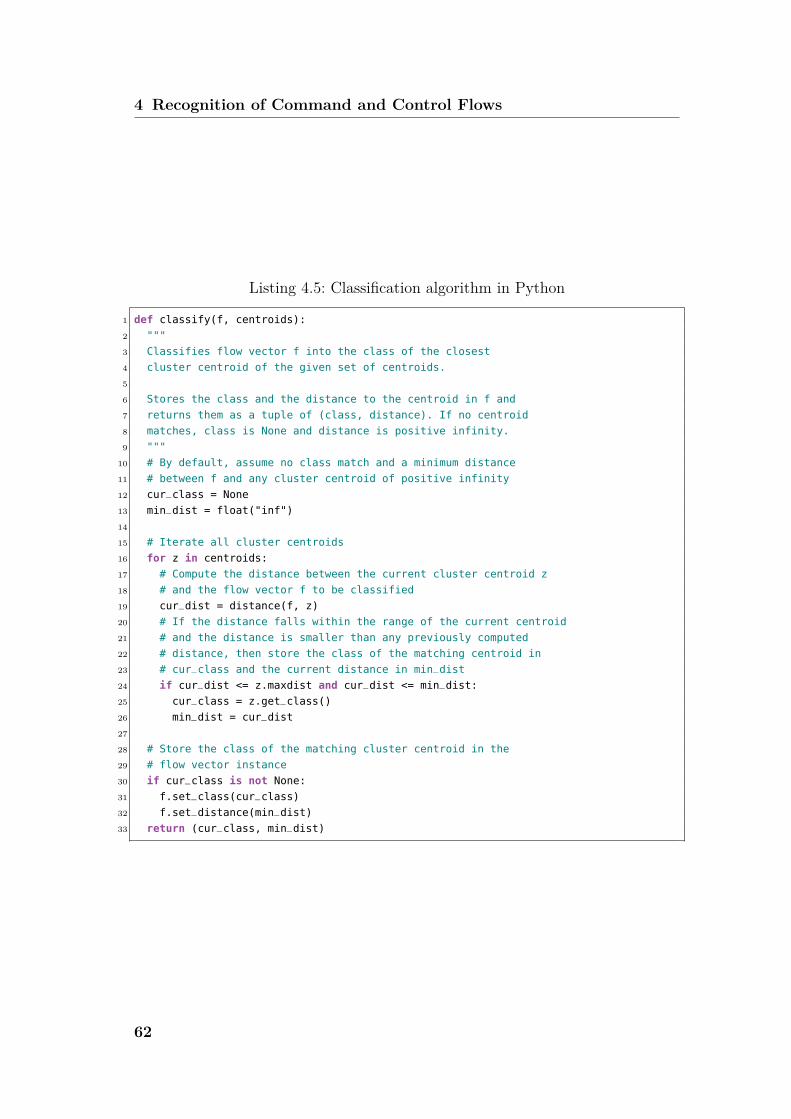
4 Recognition of Command and Control Flows
Listing 4.5: Classification algorithm in Python
1 def classify(f, centroids):
2 """
3 Classifies flow vector f into the class of the closest
4 cluster centroid of the given set of centroids.
5
6 Stores the class and the distance to the centroid in f and
7 returns them as a tuple of (class, distance). If no centroid
8 matches, class is None and distance is positive infinity.
9 """
10 # By default, assume no class match and a minimum distance
11 # between f and any cluster centroid of positive infinity
12 cur_class = None
13 min_dist = float("inf")
14
15 # Iterate all cluster centroids
16 for z in centroids:
17 # Compute the distance between the current cluster centroid z
18 # and the flow vector f to be classified
19 cur_dist = distance(f, z)
20 # If the distance falls within the range of the current centroid
21 # and the distance is smaller than any previously computed
22 # distance, then store the class of the matching centroid in
23 # cur_class and the current distance in min_dist
24 if cur_dist <= z.maxdist and cur_dist <= min_dist:
25 cur_class = z.get_class()
26 min_dist = cur_dist
27
28 # Store the class of the matching cluster centroid in the
29 # flow vector instance
30 if cur_class is not None:
31 f.set_class(cur_class)
32 f.set_distance(min_dist)
33 return (cur_class, min_dist)
62
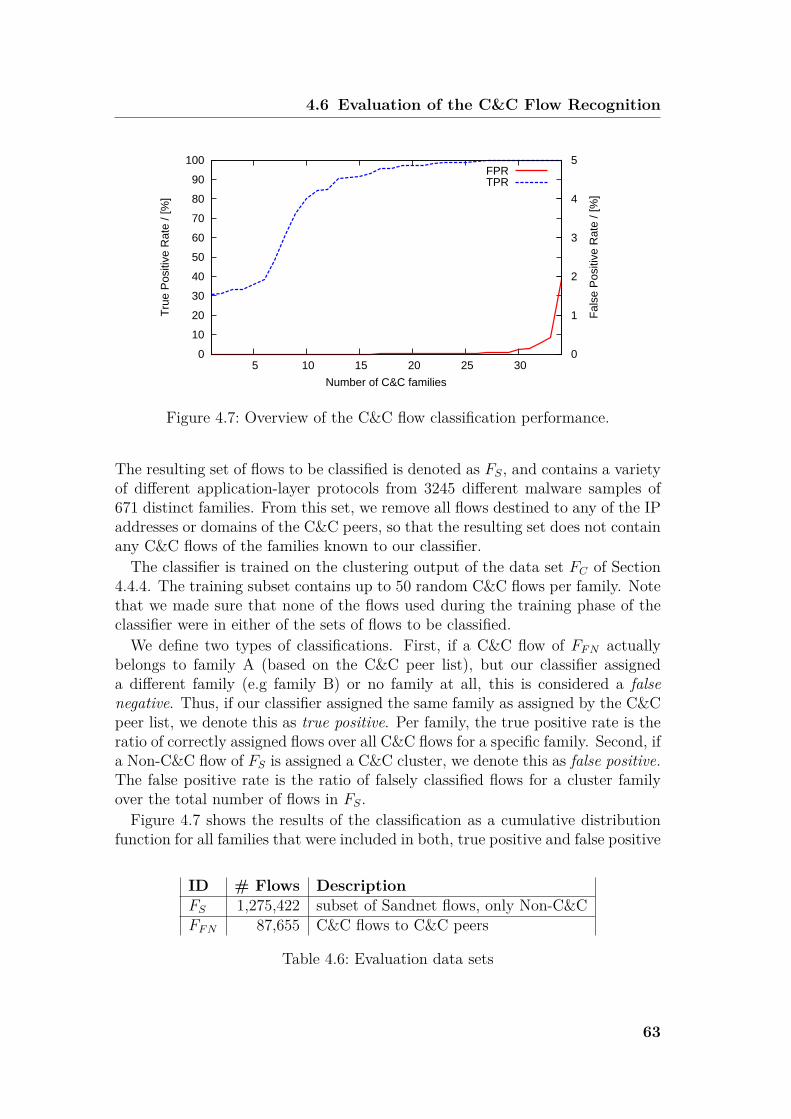
4.6 Evaluation of the C&C Flow Recognition
0
10
20
30
40
50
60
70
80
90
100
5 10 15 20 25 30 0
1
2
3
4
5T
rue
Pos
itive
Rat
e / [
%]
Fal
se P
ositi
ve R
ate
/ [%
]
Number of C&C families
FPRTPR
Figure 4.7: Overview of the C&C flow classification performance.
The resulting set of flows to be classified is denoted as FS, and contains a varietyof different application-layer protocols from 3245 different malware samples of671 distinct families. From this set, we remove all flows destined to any of the IPaddresses or domains of the C&C peers, so that the resulting set does not containany C&C flows of the families known to our classifier.The classifier is trained on the clustering output of the data set FC of Section
4.4.4. The training subset contains up to 50 random C&C flows per family. Notethat we made sure that none of the flows used during the training phase of theclassifier were in either of the sets of flows to be classified.We define two types of classifications. First, if a C&C flow of FF N actually
belongs to family A (based on the C&C peer list), but our classifier assigneda different family (e.g family B) or no family at all, this is considered a falsenegative. Thus, if our classifier assigned the same family as assigned by the C&Cpeer list, we denote this as true positive. Per family, the true positive rate is theratio of correctly assigned flows over all C&C flows for a specific family. Second, ifa Non-C&C flow of FS is assigned a C&C cluster, we denote this as false positive.The false positive rate is the ratio of falsely classified flows for a cluster familyover the total number of flows in FS.Figure 4.7 shows the results of the classification as a cumulative distribution
function for all families that were included in both, true positive and false positive
ID # Flows DescriptionFS 1,275,422 subset of Sandnet flows, only Non-C&CFF N 87,655 C&C flows to C&C peers
Table 4.6: Evaluation data sets
63
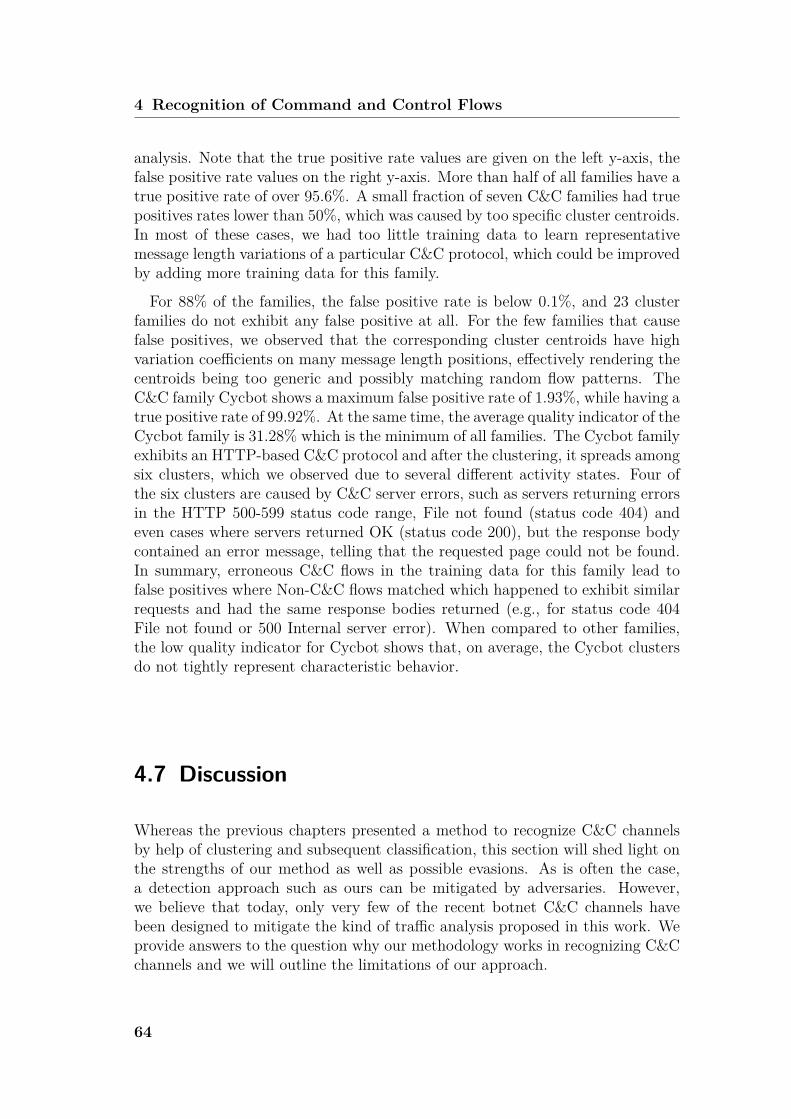
4 Recognition of Command and Control Flows
analysis. Note that the true positive rate values are given on the left y-axis, thefalse positive rate values on the right y-axis. More than half of all families have atrue positive rate of over 95.6%. A small fraction of seven C&C families had truepositives rates lower than 50%, which was caused by too specific cluster centroids.In most of these cases, we had too little training data to learn representativemessage length variations of a particular C&C protocol, which could be improvedby adding more training data for this family.
For 88% of the families, the false positive rate is below 0.1%, and 23 clusterfamilies do not exhibit any false positive at all. For the few families that causefalse positives, we observed that the corresponding cluster centroids have highvariation coefficients on many message length positions, effectively rendering thecentroids being too generic and possibly matching random flow patterns. TheC&C family Cycbot shows a maximum false positive rate of 1.93%, while having atrue positive rate of 99.92%. At the same time, the average quality indicator of theCycbot family is 31.28% which is the minimum of all families. The Cycbot familyexhibits an HTTP-based C&C protocol and after the clustering, it spreads amongsix clusters, which we observed due to several different activity states. Four ofthe six clusters are caused by C&C server errors, such as servers returning errorsin the HTTP 500-599 status code range, File not found (status code 404) andeven cases where servers returned OK (status code 200), but the response bodycontained an error message, telling that the requested page could not be found.In summary, erroneous C&C flows in the training data for this family lead tofalse positives where Non-C&C flows matched which happened to exhibit similarrequests and had the same response bodies returned (e.g., for status code 404File not found or 500 Internal server error). When compared to other families,the low quality indicator for Cycbot shows that, on average, the Cycbot clustersdo not tightly represent characteristic behavior.
4.7 Discussion
Whereas the previous chapters presented a method to recognize C&C channelsby help of clustering and subsequent classification, this section will shed light onthe strengths of our method as well as possible evasions. As is often the case,a detection approach such as ours can be mitigated by adversaries. However,we believe that today, only very few of the recent botnet C&C channels havebeen designed to mitigate the kind of traffic analysis proposed in this work. Weprovide answers to the question why our methodology works in recognizing C&Cchannels and we will outline the limitations of our approach.
64
4.7 Discussion
4.7.1 Reasoning and Evasion
Why does our methodology work? We assume that, driven by the practicalneed to evade payload byte signatures, botnet C&C protocols have evolved fromplaintext to obfuscated and encrypted message encodings. However, we speculatethat in practice, it has so far hardly ever been required to address the evasion oftraffic analysis from a botmaster’s point of view.The fact that our approach relies on message length sequences sets a limitation
if messages would no longer exhibit characteristic lengths. During the clusteringphase, we had to remove four families from the dataset because they do not havecharacteristic message lengths. These families include Hlux, SpyEye, Zeus P2Pand Carberp. However, it is difficult to tell whether the C&C protocols of thesefamilies are designed to evade traffic analysis approaches or whether CoCoSpotjust failed to derive centroids due to the kind of data that was transmitted overthe labeled C&C flows. We manually inspected the families where our approachhas failed, in order to clarify whether the message lengths are altered on pur-pose or by coincidence. Only in case of Zeus P2P, using reverse engineering, wefound proof in that it adds random message padding to most of its C&C mes-sages before encryption, possibly to evade message-length-based approaches suchas CoCoSpot. Interestingly, in case of Sality P2P, while message lengths vary,certain C&C messages are not padded at all and do exhibit characteristic mes-sage lengths. Thus, even if a subset of the C&C messages exhibits characteristicmessage lengths, CoCoSpot can effectively detect and classify this family. Fur-thermore, telling from the evaluation results, 34 of the 43 malware families weanalyzed, can successfully be detected using CoCoSpot. We see our approach asan innovative, additional means of classifying malicious traffic.In addition, our methodology has some limitations concerning details of the
practical implementation. As described in Section 3.3 of Chapter 3, we heuris-tically split messages of a flow if the direction of transmission changes or a newconnection is opened. If several messages are sent in the same direction over thesame connection, i.e., the C&C protocol does not follow a dialogue-like pattern,our approach will fail to correctly separate these. Indeed, after manual inspec-tion, we found such cases to cause false negatives, especially with unreliable C&Cservers that did not respond to an unusually high number of requests. For exam-ple, if a C&C server only responds to every fifth request, five subsequent requestsmight be aggregated into one request message until a response is received. Thus,the resulting message length sequence differs significantly from what has beenlearned during the training phase (where the C&C server responded to every re-quest), exhibiting higher values for the request message lengths. However, if thecarrier protocol is known, e.g., in case of HTTP, it can be parsed and does notneed to be split heuristically. Retransmissions of requests without response couldthen be ignored and messages can be separated at well-defined boundaries. Thiscould further reduce the possible false classification.
65
4 Recognition of Command and Control Flows
Additionally, care has to be taken during the training phase in order to makesure that representative C&C flows are considered. As the classification results ofthe Cycbot family show, erroneous C&C flows in the training data might result inhigh false positive rates. As such, it is important to make sure that the trainingset is compiled of active C&C channels.
4.7.2 C&C Blacklist Peculiarities and DelusionIn a separate experiment, we evaluated the Kuluoz malware family against a setof C&C signatures of a network intrusion detection system. When inspectingapparent false negatives of our classification results for the Kuluoz botnet C&Cin comparison to those signature matches, we stumbled upon a delusion techniqueof that specific botnet. We observed bots directing requests with the same URIpattern as their C&C to popular legitimate destinations, such as bing.com andtwitter.com, probably aiming to trigger signatures on purpose. Listing 4.6 showsthree HTTP requests, where the first stems from an active C&C channel andthe last two are delusion requests. Those servers have not been C&C serversand thus responded with an error message. However, the signature matcheswere based only on the URI request pattern and – erroneously – indicated C&Ccommunication with the respective destinations. Instead, our method performedcorrectly and did not classify this communication as C&C because the errorresponses differed significantly from what was derived from the active C&C inthe training phase. In fact, this revealed a false positive of the signature. Thisexperience elucidates that our method is able to distinguish active C&C frominactive C&C. Furthermore, automatically compiled blacklists from signaturematches will suffer from false positives, if delusions like those employed by Kuluozoccur. In this case, bing.com and twitter.com could have mistakenly been addedto a blacklist due to the signature hits.
We observed a similar delusion with the domain facebook.com. In this case,a SpyEye version 1.3 bot directed requests with a very similar pattern as itsregular C&C towards facebook.com, possibly to poison automatically compiledC&C server blacklists. While we have not found facebook.com in any of the C&Cserver blacklists that were used and monitored throughout our experiments, itshows the potential danger of mistreating legitimate domains as C&C servers.Especially for lesser-known benign domain names, it might not be as obviousas in the above mentioned cases, whether the respective domain acts as a C&Cserver.Even worse, we have witnessed botnets that use C&C servers which are located
in typical benign environments. We have observed C&C servers that were hostedon Amazon Elastic Compute Cloud EC2 [Ama12]. Blacklisting the IP address ofthe respective C&C server will inevitably block a variety of other services, which
66

4.7 Discussion
Listing 4.6: Delusion of Kuluoz C&C communication
1 // This is active C&C communication with a C&C server
2 GET /forum/index.php?r=gate&id=6c..ae&group=2507rcm&debug=0&ips=192.168.X.Y HTTP/1.1
3 User-Agent: Mozilla/5.0 (Windows; U; MSIE 9.0; Windows NT 9.0; en-US)
4 Host: XXXXXXXXXXXXXX.ru
5
6
7 // This is a delusion request towards twitter.com
8 GET /nygul/index.php?r=gate&ac=6c..ae&group=2507rcm&debug=0&ips=192.168.X.Y HTTP/1.1
9 User-Agent: Mozilla/5.0 (Windows; U; MSIE 9.0; Windows NT 9.0; en-US)
10 Host: twitter.com
11
12
13 // This is another delusion request towards bing.com
14 GET /afyu/index.php?r=gate&gh=6c..ae&group=2507rcm&debug=0&ips=192.168.X.Y HTTP/1.1
15 User-Agent: Mozilla/5.0 (Windows; U; MSIE 9.0; Windows NT 9.0; en-US)
16 Host: www.bing.com
17 Connection: Keep-Alive
Listing 4.7: Delusion of SpyEye C&C communication
1 // This is active C&C communication with a C&C server
2 GET /folder/gate.php?guid=Admin!COMPNAME!18273645&ver=10133&stat=ONLINE&ie=8.0.6001.18702
&os=5.1.2600&ut=Admin&cpu=4&ccrc=F8..BF&md5=e1..b1 HTTP/1.0
3 User-Agent: Microsoft Internet Explorer
4 Host: XXXXXXXXXXXX.com
56 // This is the delusion request towards facebook.com
7 GET /login.php?guid=5.1.2600!COMPNAME!18273645&ver=10325&stat=online&ie=8.0.6001.18702
&os=5.1.2600&ut=Admin&ccrc=36..45&md5=0f..af&plg=customconnector HTTP/1.1
8 User-Agent: Mozilla/4.0 (compatible; MSIE 8.0; Windows NT 5.1; Trident/4.0)
9 Host: facebook.com
are hosted on EC2, too, because EC2’s IP addresses are pooled. Furthermore,we found that the Bancos botnet distributes bot configuration updates by help ofdropbox.com. While dropbox.com is also being used for sharing benign contents,it is hardly possible to blacklist its domain or IP addresses without interferingwith benign usage. In such cases, a detection approach such as CoCoSpot helpsto fill the gap between a blacklist approach and more fine-grained filtering basedon active C&C channels.
67
4 Recognition of Command and Control Flows
4.8 ConclusionWith CoCoSpot, we have shown that for a variety of recent botnets, C&C pro-tocols can be detected using traffic analysis features, namely the message lengthsequence of the first 8 messages of a flow, the carrier protocol as well as differencesin the encoding scheme of the URI’s query section in case of HTTP messages. Thehuge benefit of our approach is to be independent from payload byte signatureswhich enables the detection of C&C protocols with obfuscated and encryptedmessage contents, as used by the majority of modern botnets. In addition, ourC&C flow fingerprints complement existing detection approaches while allowingfor finer granularity compared to IP address or domain blacklists. Especially theinherent distinction between active and inactive C&C channels renders CoCoSpotless prone to delusion, as shown in case of the Kuluoz botnet.As a side-effect, our C&C flow clustering can be used to discover relationships
between malware families, based on the distance of their C&C protocols. Exper-iments with more than 87,000 C&C flows as well as over 1.2 million Non-C&Cflows have shown that our classification method can reliably detect C&C flowsfor a variety of recent botnets with very few false positives.The technique presented in this chapter has focussed on the recognition of
C&C channels. In order to evade detection, botmasters could design their C&Cchannels in a more stealthy manner so that the identification of C&C channelsbecomes even more difficult. As such, C&C could be performed over less com-mon protocols for botnet C&C. For example, while most botnet C&C channelsexhibit HTTP as carrier protocol, botnets could instead build on DNS. From abotmasters point of view, the DNS protocol has the advantage that most net-worked environments require DNS as part of the regular operation, since thedomain resolution via DNS is a service protocol to most other application layerprotocols. Thus, the following chapter will deal with DNS as carrier protocol forbotnet command and control.
68
Chapter5Detecting Botnets with DNS asCommand and Control
5.1 IntroductionBotnets, i.e., sets of computers that are infected with a specific malicious soft-ware that allows these computers to be remote controlled, have become one ofthe biggest security issues on the Internet imposing a variety of threats to In-ternet users. Therefore, organizations have keen interest to keep the number ofbot infections low. Since the remote command and control channel (C&C) is adefining characteristic of botnets, techniques have been developed to detect botinfections by identifying the C&C network traffic.Advances in malware research have challenged botnet operators to improve the
resilience of their C&C traffic. Partly, this has been achieved by moving towardsdecentralized structures (like P2P) or by otherwise obfuscating and even encrypt-ing communication [SGE+09, SCC+09, HSD+08, BHB+09, CL07, GYP+09]. Thismakes it harder for researchers to distinguish malicious from benign traffic, albeitnot impossible.In the previous chapter, we proposed our method of identifying and recognizing
botnet C&C channels, even for encrypted C&C communication. It was only aquestion of time when botnet C&C channels would be designed in a way thatC&C messages are hidden in common application layer protocols, striving forcovert communication.Recently, we observed a specific type of malware termed Feederbot that showed
strange behavior in the sense that it seemingly did not use any obvious C&C chan-nel. A significant amount of traffic generated by the malware were messages forthe Domain Name System (DNS). By reverse engineering the particular sample,we found out that the bot (ab)used DNS as a communication channel for C&Ctraffic. Apart from this insight, we were interested in the difficulties to detect thistype of seemingly “covert” and “hard to detect” traffic. Since DNS has not been
69
5 Detecting Botnets with DNS as Command and Control
documented so far as a C&C protocol in botnets1, such botnets benefit from thefact that currently there is no specifically tailored detection mechanism, which inturn raises the probability for the botnet to remain undetected. We achieved todetect this particular type of C&C traffic using machine learning techniques andtraffic analysis.For example, we applied the resulting method on purely malicious traffic pro-
duced using our dynamic malware analysis network Sandnet and found thatin over 14 million DNS transactions of over 42,000 malware binaries we did notproduce any false positive. In fact, in addition to Feederbot, we were able toidentify a second class of malware that also used DNS as C&C channel.One reason for our good results was the way in which DNS was used for com-
munication: the botnet was using the technique of DNS tunneling to evade detec-tion. DNS tunneling refers to the technique in which data is transmitted withinresource record fields of a DNS message. As a bottom line, our results underlinethat covert communication must not necessarily be harder to detect than non-covert communication. On the contrary, the covert communication we analyzedintroduced anomalies to DNS traffic that can be identified. So the difficulty wasnot only to detect the presence of C&C information in DNS, it was also to identifythe carrier (i.e., DNS) over which covert communication takes place.In summary, the contributions of this chapter are threefold:
• To our knowledge, we are the first to document DNS-based botnet C&Ctraffic.
• We present a technique that distinguishes between DNS-based C&C andregular DNS communication in real-world DNS traffic. In other words, weprovide a technique for the detection of this particular class of malware.
• We present a classifier that can distinguish purely malicious communicationinto DNS-based C&C and regular DNS communication. In other words, weprovide a technique for the classification of malware samples based on theirbehavior.
The remainder of this chapter is structured as follows: We present the casestudy of Feederbot in Section 5.2. We then describe our detection and classi-fication approach in Section 5.3. We give a brief discussion of our findings inSection 5.4 and describe related work in Section 5.5.
5.2 Case Study: DNS as Botnet C&CFrom the point of view of a botmaster, a trade-off between C&C communicationvisibility and the bot-inherent need to communicate arises. On the one hand, bots
1There is only anecdotal evidence for DNS as botnet C&C [Bro11].
70
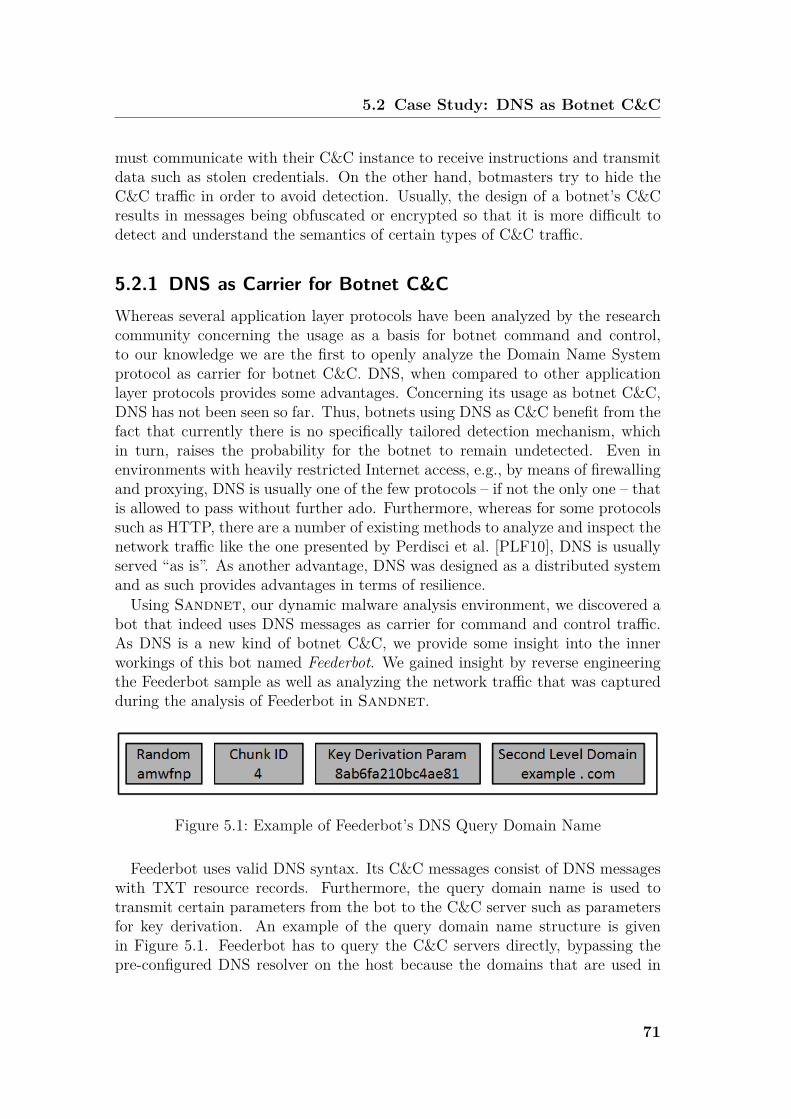
5.2 Case Study: DNS as Botnet C&C
must communicate with their C&C instance to receive instructions and transmitdata such as stolen credentials. On the other hand, botmasters try to hide theC&C traffic in order to avoid detection. Usually, the design of a botnet’s C&Cresults in messages being obfuscated or encrypted so that it is more difficult todetect and understand the semantics of certain types of C&C traffic.
5.2.1 DNS as Carrier for Botnet C&CWhereas several application layer protocols have been analyzed by the researchcommunity concerning the usage as a basis for botnet command and control,to our knowledge we are the first to openly analyze the Domain Name Systemprotocol as carrier for botnet C&C. DNS, when compared to other applicationlayer protocols provides some advantages. Concerning its usage as botnet C&C,DNS has not been seen so far. Thus, botnets using DNS as C&C benefit from thefact that currently there is no specifically tailored detection mechanism, whichin turn, raises the probability for the botnet to remain undetected. Even inenvironments with heavily restricted Internet access, e.g., by means of firewallingand proxying, DNS is usually one of the few protocols – if not the only one – thatis allowed to pass without further ado. Furthermore, whereas for some protocolssuch as HTTP, there are a number of existing methods to analyze and inspect thenetwork traffic like the one presented by Perdisci et al. [PLF10], DNS is usuallyserved “as is”. As another advantage, DNS was designed as a distributed systemand as such provides advantages in terms of resilience.Using Sandnet, our dynamic malware analysis environment, we discovered a
bot that indeed uses DNS messages as carrier for command and control traffic.As DNS is a new kind of botnet C&C, we provide some insight into the innerworkings of this bot named Feederbot. We gained insight by reverse engineeringthe Feederbot sample as well as analyzing the network traffic that was capturedduring the analysis of Feederbot in Sandnet.
Figure 5.1: Example of Feederbot’s DNS Query Domain Name
Feederbot uses valid DNS syntax. Its C&C messages consist of DNS messageswith TXT resource records. Furthermore, the query domain name is used totransmit certain parameters from the bot to the C&C server such as parametersfor key derivation. An example of the query domain name structure is givenin Figure 5.1. Feederbot has to query the C&C servers directly, bypassing thepre-configured DNS resolver on the host because the domains that are used in
71
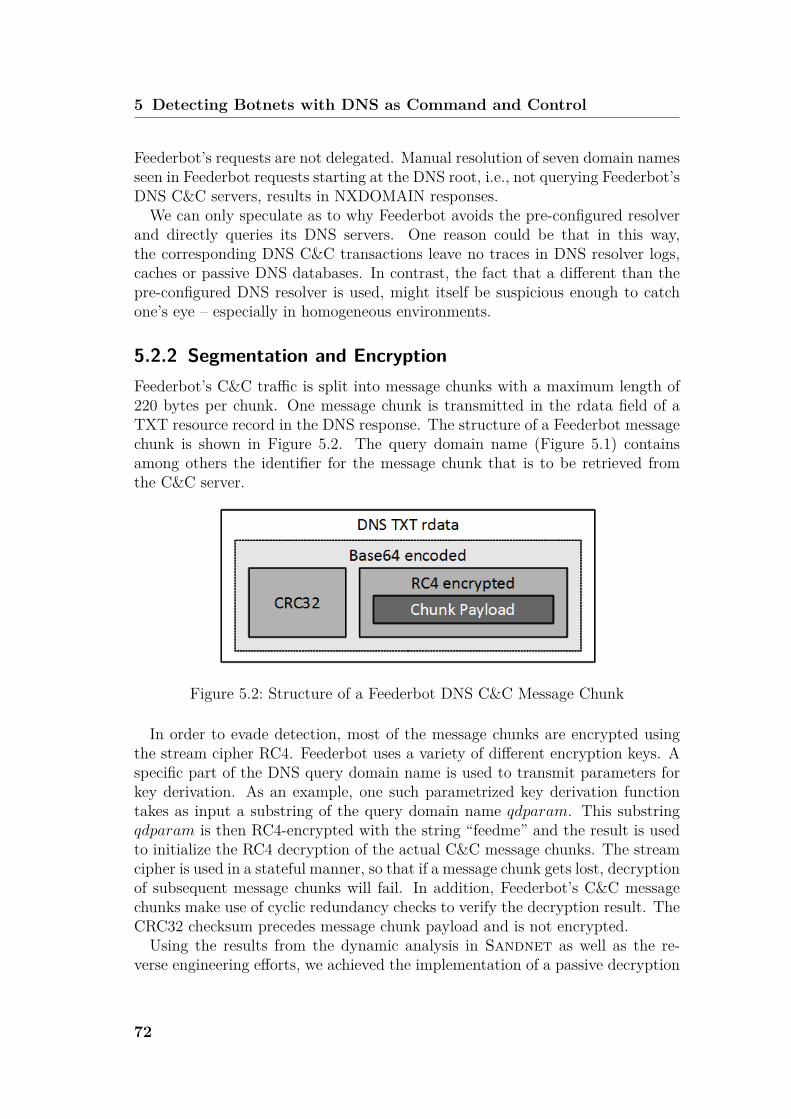
5 Detecting Botnets with DNS as Command and Control
Feederbot’s requests are not delegated. Manual resolution of seven domain namesseen in Feederbot requests starting at the DNS root, i.e., not querying Feederbot’sDNS C&C servers, results in NXDOMAIN responses.We can only speculate as to why Feederbot avoids the pre-configured resolver
and directly queries its DNS servers. One reason could be that in this way,the corresponding DNS C&C transactions leave no traces in DNS resolver logs,caches or passive DNS databases. In contrast, the fact that a different than thepre-configured DNS resolver is used, might itself be suspicious enough to catchone’s eye – especially in homogeneous environments.
5.2.2 Segmentation and EncryptionFeederbot’s C&C traffic is split into message chunks with a maximum length of220 bytes per chunk. One message chunk is transmitted in the rdata field of aTXT resource record in the DNS response. The structure of a Feederbot messagechunk is shown in Figure 5.2. The query domain name (Figure 5.1) containsamong others the identifier for the message chunk that is to be retrieved fromthe C&C server.
Figure 5.2: Structure of a Feederbot DNS C&C Message Chunk
In order to evade detection, most of the message chunks are encrypted usingthe stream cipher RC4. Feederbot uses a variety of different encryption keys. Aspecific part of the DNS query domain name is used to transmit parameters forkey derivation. As an example, one such parametrized key derivation functiontakes as input a substring of the query domain name qdparam. This substringqdparam is then RC4-encrypted with the string “feedme” and the result is usedto initialize the RC4 decryption of the actual C&C message chunks. The streamcipher is used in a stateful manner, so that if a message chunk gets lost, decryptionof subsequent message chunks will fail. In addition, Feederbot’s C&C messagechunks make use of cyclic redundancy checks to verify the decryption result. TheCRC32 checksum precedes message chunk payload and is not encrypted.Using the results from the dynamic analysis in Sandnet as well as the re-
verse engineering efforts, we achieved the implementation of a passive decryption
72
5.3 Detecting DNS-based Botnet C&C
utility in order to decrypt Feederbot’s DNS C&C messages. Additionally, weimplemented a low interaction clone of Feederbot to actively analyze its C&C.Feederbot receives instructions from several DNS C&C servers. Initially, when
Feederbot is launched, a request is sent to a very small subset of C&C servers.These servers seem to serve as bootstrapping C&C servers. During our monitoringperiod of nine months, we have seen only two such DNS servers (in terms of IPaddresses) acting as bootstrapping C&C servers. The response to this initialbootstrapping request message is not encrypted and only Base64 encoded. Itcontains a pointer to at least one other C&C server as well as another domainname. Subsequent communication is encrypted.
5.3 Detecting DNS-based Botnet C&CWhen facing a new kind of botnet C&C as with Feederbot, it is of concern howsuch a communication can be detected. Inspired by the results of the Feederbotanalysis, we developed machine learning features for a DNS C&C classificationmethod.Our classification approach is based on several prerequisites. First, we as-
sume that DNS-based C&C channels typically carry dense information, such ascompressed or encrypted data. As botmasters strive for resilience, encryptionis becoming more prevalent among botnet C&C. In addition, due to the mes-sage length limits of DNS, botmasters need to fit their commands into relativelysmall messages. Second, we assume that to a certain degree there is a continuous“downstream” flow of information, i.e., from the C&C server to the bot. Admit-tedly, this second condition may not be met for bots with certain monetizationfunctionalities, e.g., low profile trojans. However, we believe that lots of botsactually fulfill this requirement, especially spam-sending bots or click fraudsters.In these cases, the C&C server is required to continuously provide the bot withinput data, such as spam target email addresses, templates and text blocks orURLs to feed the click fraud module.
5.3.1 Classification FeaturesKey to our detection method are certain differences between regular DNS usageand DNS C&C, which we divide in two categories. The first category deals withdifferences concerning the use of the rdata field whereas the second categoryaddresses differences concerning the communication behavior.
Rdata Features
The basic unit for these entropy-based features is the rdata field of all resourcerecords of one DNS response. For brevity, this unit is referred to as rdata message
73
5 Detecting Botnets with DNS as Command and Control
in the following. As an example, in the context of Feederbot this corresponds toone message chunk. Note that we do not restrict the features to certain resourcerecord types or sections.Shannon entropy is a measure of randomness in a string of data. Given a finite
alphabet Σ = {0, 1..255}, the entropy estimates how randomly the characters inword w are distributed. We use the maximum likelihood estimator to calculatethe sample entropy of a message w ∈ Σ∗, fi denotes the frequency of character i:
H(w) = −255∑i=0
fi · log2(fi) (5.1)
Then, the word w1 = 001101 has a lower sample entropy than the word w2 =012345. We exploit the fact that encrypted or compressed messages have a highentropy. As we assume encrypted C&C, the C&Cmessages exhibit a high entropy.Encrypted data composed of characters of the full 8-bit-per-byte alphabet willconverge towards the theoretical maximum entropy of 8 bits per byte. In thiscase, entropy is typically referred to as byte entropy. In fact, when using DNSas C&C, certain fields of the DNS protocol such as TXT or CNAME resourcerecords’ rdata do not allow the full 8 bits to be used per byte. Thus, botmastershave to “downsample” their C&C messages to the destined alphabet, e.g., bymeans of Base64 or Base32 encoding. This implies that the resulting messageexhibits a comparatively low byte entropy. We overcome this issue by estimatingthe destined alphabet size by counting the number of distinct characters in agiven field. After that, we calculate the expected sample entropy for randomdata based on the estimated alphabet size.Another issue is posed by the fact that short strings of data – even when
composed of random characters – rarely reach the theoretical maximum entropy.For example, a string of 64 bytes length, based on the 8-bit per byte alphabet Σhas a theoretical maximum byte entropy of 6 bits. However, considering a stringr of 64 bytes length with randomly distributed bytes of the alphabet Σ, the byteentropy is typically lower than 6 bits, e.g., around 5.8 bits. This finding is basedon the birthday paradox. Basically, encrypted data is randomly distributed, butrandomness does not imply a uniform distribution. Thus, if a string r is short(e.g., 64 bytes), the expected byte entropy is significantly below 8 bits, althoughr might be purely random.We overcome this issue by calculating the statistical byte entropy for a string
of a given length. This is done as follows. Empirically, we compute the averagebyte entropy of a set of x = 1, 000 random words for every length 1 < N < 210.For any word w1, . . . , wx, we compose a random byte distribution and calculatethe byte entropy. Since x was chosen sufficiently large, calculating the mean overall x byte entropies of words with length N estimates the expected statistical byteentropy of random data of length N . Figure 5.3 shows the maximum theoreticalentropy and the expected statistical random entropy for the full 8-bit per byte
74
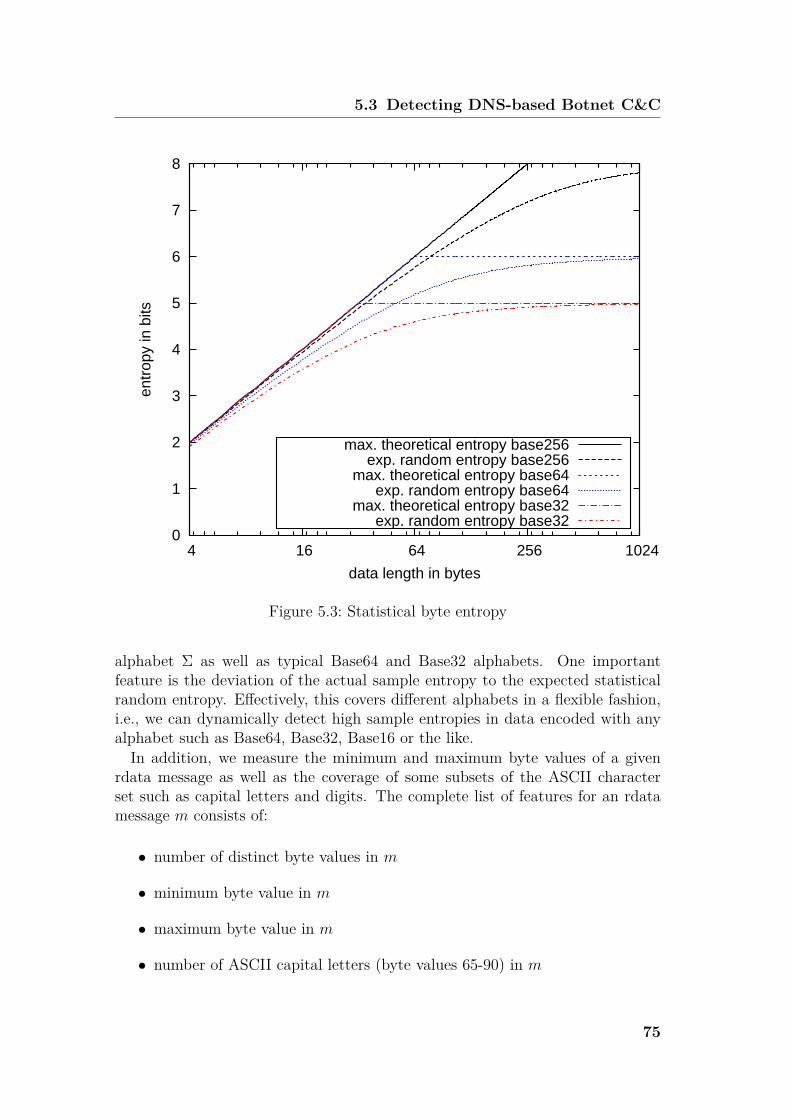
5.3 Detecting DNS-based Botnet C&C
0
1
2
3
4
5
6
7
8
4 16 64 256 1024
entr
opy
in b
its
data length in bytes
max. theoretical entropy base256exp. random entropy base256
max. theoretical entropy base64exp. random entropy base64
max. theoretical entropy base32exp. random entropy base32
Figure 5.3: Statistical byte entropy
alphabet Σ as well as typical Base64 and Base32 alphabets. One importantfeature is the deviation of the actual sample entropy to the expected statisticalrandom entropy. Effectively, this covers different alphabets in a flexible fashion,i.e., we can dynamically detect high sample entropies in data encoded with anyalphabet such as Base64, Base32, Base16 or the like.In addition, we measure the minimum and maximum byte values of a given
rdata message as well as the coverage of some subsets of the ASCII characterset such as capital letters and digits. The complete list of features for an rdatamessage m consists of:
• number of distinct byte values in m
• minimum byte value in m
• maximum byte value in m
• number of ASCII capital letters (byte values 65-90) in m
75
5 Detecting Botnets with DNS as Command and Control
• number of ASCII digits (byte values 48-57) in m
• length of m in bytes
• absolute difference of the statistical byte entropy at given length of m andthe entropy of m
Aggregated Behavioral Communication Features
Furthermore, we exploit behavioral properties of DNS C&C bots. These featuresaddress the fact that a certain amount of information has to be transmitted viathe DNS C&C channel, e.g., spam templates, email addresses or click fraud URLs,and that the C&C channel exhibits a certain level of persistence. In contrast tothe rdata features, the behavioral communication features do not operate on indi-vidual DNS response resource records. Instead, they operate on aggregated data.Thus, for the behavioral communication features to be computed, we need todefine aggregation criteria, so that communication properties can be aggregatedover time before calculating the features. When analyzing Feederbot, we observedthat the DNS C&C servers were contacted directly, avoiding the pre-configuredDNS resolver. In this case, in order to compute behavioral communication fea-tures (e.g., bandwidth), the requester’s IP address as well as the IP address ofthe DNS server serve as aggregation criteria. In contrast, if DNS requests aredirected towards pre-configured DNS resolvers, the requester’s IP address andthe query domain name (and parts thereof such as the second-level domain) areused as aggregation criteria. In both cases, we assume that the requester’s IPaddress represents one host, i.e., no network address translation has been per-formed. Note that even if network address translation was performed, detectingthat DNS C&C was used might still be possible. However, in such a case, itwould be impossible to identify the infected host.We define the following behavioral communication features. First, we measure
the size of all rdata messages (i.e., rdata fields of DNS response resource records)and compute the corresponding aggregated bandwidth over time. We expectthat the data volume transmitted between the DNS C&C server and the bot willtend to be significantly larger when compared to regular DNS usage, as DNS istypically not used for data transmission. This observation results in either largermessages and/or in an increased bandwidth consumption between the bot andthe C&C server.Second, the information flow between one bot instance and the C&C server is
expected to appear more persistent. We measure the persistence as the maximumof the time between two DNS responses, as well as the communication durationcalculated as the time between the first and the last message exchanged with aC&C server. Yet simple, we expect these behavioral communication features tobe effective enough in order to extend a classifier based on the rdata features.
76
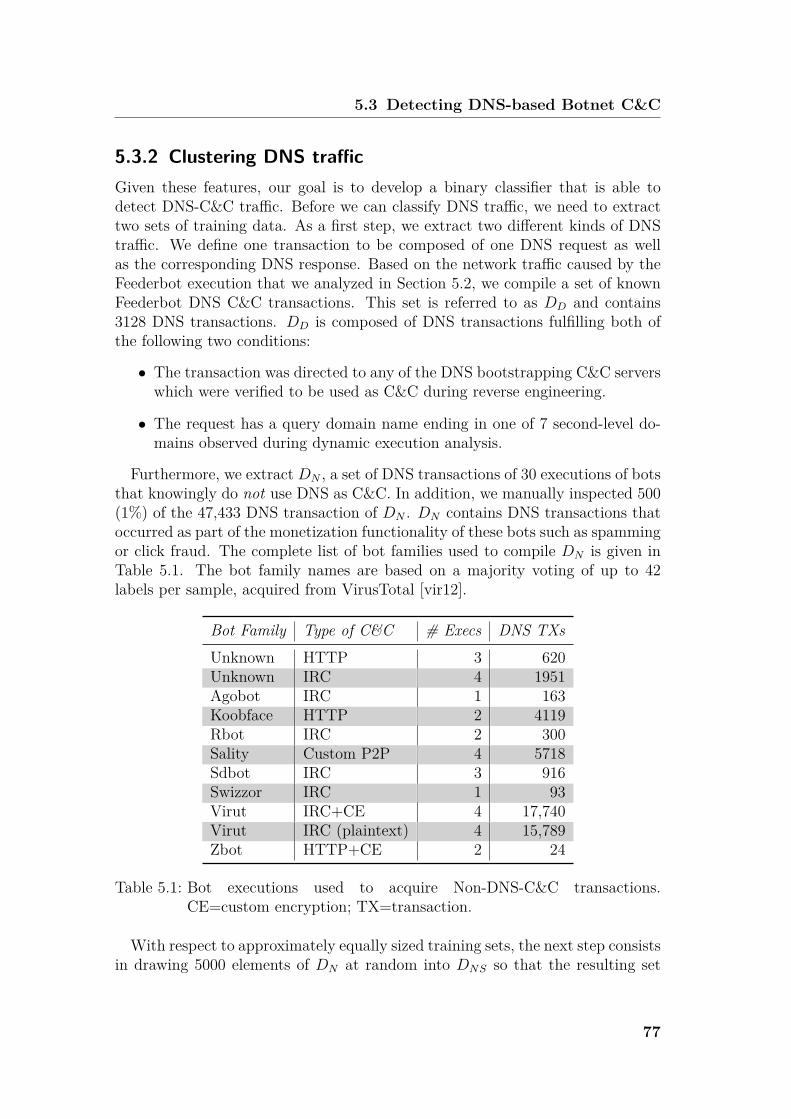
5.3 Detecting DNS-based Botnet C&C
5.3.2 Clustering DNS trafficGiven these features, our goal is to develop a binary classifier that is able todetect DNS-C&C traffic. Before we can classify DNS traffic, we need to extracttwo sets of training data. As a first step, we extract two different kinds of DNStraffic. We define one transaction to be composed of one DNS request as wellas the corresponding DNS response. Based on the network traffic caused by theFeederbot execution that we analyzed in Section 5.2, we compile a set of knownFeederbot DNS C&C transactions. This set is referred to as DD and contains3128 DNS transactions. DD is composed of DNS transactions fulfilling both ofthe following two conditions:
• The transaction was directed to any of the DNS bootstrapping C&C serverswhich were verified to be used as C&C during reverse engineering.
• The request has a query domain name ending in one of 7 second-level do-mains observed during dynamic execution analysis.
Furthermore, we extract DN , a set of DNS transactions of 30 executions of botsthat knowingly do not use DNS as C&C. In addition, we manually inspected 500(1%) of the 47,433 DNS transaction of DN . DN contains DNS transactions thatoccurred as part of the monetization functionality of these bots such as spammingor click fraud. The complete list of bot families used to compile DN is given inTable 5.1. The bot family names are based on a majority voting of up to 42labels per sample, acquired from VirusTotal [vir12].
Bot Family Type of C&C # Execs DNS TXsUnknown HTTP 3 620Unknown IRC 4 1951Agobot IRC 1 163Koobface HTTP 2 4119Rbot IRC 2 300Sality Custom P2P 4 5718Sdbot IRC 3 916Swizzor IRC 1 93Virut IRC+CE 4 17,740Virut IRC (plaintext) 4 15,789Zbot HTTP+CE 2 24
Table 5.1: Bot executions used to acquire Non-DNS-C&C transactions.CE=custom encryption; TX=transaction.
With respect to approximately equally sized training sets, the next step consistsin drawing 5000 elements of DN at random into DNS so that the resulting set
77
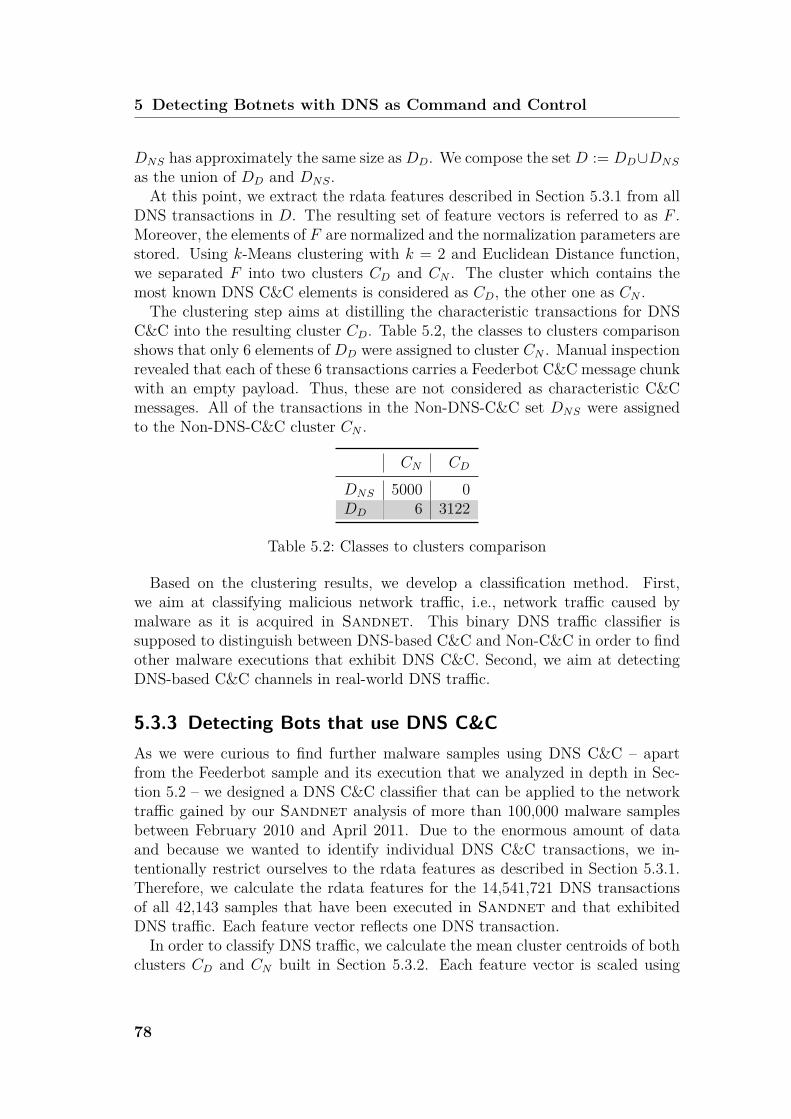
5 Detecting Botnets with DNS as Command and Control
DNS has approximately the same size asDD. We compose the setD := DD∪DNS
as the union of DD and DNS.At this point, we extract the rdata features described in Section 5.3.1 from all
DNS transactions in D. The resulting set of feature vectors is referred to as F .Moreover, the elements of F are normalized and the normalization parameters arestored. Using k-Means clustering with k = 2 and Euclidean Distance function,we separated F into two clusters CD and CN . The cluster which contains themost known DNS C&C elements is considered as CD, the other one as CN .The clustering step aims at distilling the characteristic transactions for DNS
C&C into the resulting cluster CD. Table 5.2, the classes to clusters comparisonshows that only 6 elements of DD were assigned to cluster CN . Manual inspectionrevealed that each of these 6 transactions carries a Feederbot C&C message chunkwith an empty payload. Thus, these are not considered as characteristic C&Cmessages. All of the transactions in the Non-DNS-C&C set DNS were assignedto the Non-DNS-C&C cluster CN .
CN CD
DNS 5000 0DD 6 3122
Table 5.2: Classes to clusters comparison
Based on the clustering results, we develop a classification method. First,we aim at classifying malicious network traffic, i.e., network traffic caused bymalware as it is acquired in Sandnet. This binary DNS traffic classifier issupposed to distinguish between DNS-based C&C and Non-C&C in order to findother malware executions that exhibit DNS C&C. Second, we aim at detectingDNS-based C&C channels in real-world DNS traffic.
5.3.3 Detecting Bots that use DNS C&CAs we were curious to find further malware samples using DNS C&C – apartfrom the Feederbot sample and its execution that we analyzed in depth in Sec-tion 5.2 – we designed a DNS C&C classifier that can be applied to the networktraffic gained by our Sandnet analysis of more than 100,000 malware samplesbetween February 2010 and April 2011. Due to the enormous amount of dataand because we wanted to identify individual DNS C&C transactions, we in-tentionally restrict ourselves to the rdata features as described in Section 5.3.1.Therefore, we calculate the rdata features for the 14,541,721 DNS transactionsof all 42,143 samples that have been executed in Sandnet and that exhibitedDNS traffic. Each feature vector reflects one DNS transaction.In order to classify DNS traffic, we calculate the mean cluster centroids of both
clusters CD and CN built in Section 5.3.2. Each feature vector is scaled using
78
5.3 Detecting DNS-based Botnet C&C
the normalization parameters from the training phase. Finally, as classificationmethod, we implemented a Euclidean Distance based classifier which assigns theclass of the closest cluster to the given feature vector.All in all, 109,412 DNS transactions of Sandnet traffic are classified as DNS
C&C. This procedure reveals 103 further executions of Feederbot samples. Sur-prisingly, our classification even discovers another bot family that uses DNS-basedC&C. We term this newly found bot Timestamper due to the fact that it usesthe Unix timestamp of the current date and time in the query domain name.Timestamper, in contrast to Feederbot, uses the pre-configured DNS resolver.Our classifier detects 53 executions of Timestamper in Sandnet data. Man-ual inspection verifies that all of the 156 executions which have associated DNStransactions classified as DNS C&C are either Feederbot or Timestamper execu-tions. Thus, at this point, we draw the conclusion that, in terms of Sandnetexecutions, our classifier does not produce any false positive.As part of an effort to estimate the false negative rate, we compile a regular
expression for Timestamper’s DNS C&C requests that matches the Unix times-tamp in the query domain name. 1679 transactions where the regular expressionmatches the query domain name are considered as Timestamper’s DNS C&C re-quests, the remaining 1851 DNS transactions are considered as Non-C&C DNS.Our classifier correctly classifies all of the 1679 transactions as being DNS C&Ctransactions, i.e., showing no false negatives among Timestamper’s DNS C&Ctraffic.In addition, we evaluate our classifier against 1851 Timestamper DNS transac-
tions which are not part of its DNS C&C in order to estimate the false positiverate on the transaction level. Once more, our classifier correctly considers allof these 1851 transactions as not being DNS C&C transactions, i.e., showing nofalse positive among the Timestamper DNS transactions.To summarize, our binary DNS C&C transaction classifier successfully reveals
103 further executions of Feederbot and discloses 53 executions of Timestamper,the newly disclosed bot that also uses DNS C&C. In addition, the results showthat even though we trained only on known Feederbot DNS C&C of one execution,our classifier was able to correctly classify DNS C&C transactions of another,completely unrelated type of malware.
5.3.4 Detecting DNS C&C in mixed trafficFurthermore, we evaluate our classifier on mixed workstation DNS traffic. There-fore, we recorded DNS network traffic at our Institute at the network router andNATting point where all traffic from workstations towards internal servers as wellas arbitrary Internet destinations passes. Traffic from the internal servers headingfor Internet destinations was excluded in order for recursive DNS queries causedby the DNS resolver to be avoided. All DNS traffic was recorded before sourcenetwork address translation (NAT) on the router was applied. In this manner,
79
5 Detecting Botnets with DNS as Command and Control
we are able to capture DNS traffic destined for the pre-configured DNS resolverand for remote DNS resolvers on the Internet.Additionally, we executed one Feederbot sample and one Timestamper sample
from inside the workstation net, each for one hour. Both samples were executedin virtual machines on workstation computers that were used for regular opera-tion throughout the whole measuring period. The network access of the virtualmachines was configured to use NAT on the workstation hosts. Thus, the trafficoriginating in each infected virtual machine and the corresponding workstationhost traffic cannot be distinguished by source IP address and regarding our aggre-gation they represent one entity. Additionally, all network traffic caused by thevirtual machines was recorded individually on the workstation host. Our goalis to detect those workstations that executed the Feederbot and Timestampersamples.The captured network traffic contains a total of 69,820 successful DNS transac-
tions from 49 distinct workstation IP addresses of our Institute, captured between7 a.m. and 8 p.m. on a regular weekday. This dataset is referred to as Tall. TheFeederbot VM caused a total of 2814 DNS transactions (TF ) among which 1092were DNS C&C transactions (TF CnC). Additionally, we observed 4334 HTTPflows during its click fraud activity. The network trace of the VM executing theTimestamp bot showed a total of 181 DNS transactions (TT ) with 102 DNS C&Ctransactions (TT CnC). Consequently, the traffic capture contains 66,825 DNStransactions caused by the legitimate workstations during regular operation.In order to make use of the aggregated behavioral communication features, we
extended our classification method. Based on the results in Section 5.3.3, wecompiled a set of 10 Feederbot executions revealed in Section 5.3.3. For theseexecutions, we calculated the following three thresholds:
1. tb the mean bandwidth per aggregate
2. tmi the mean of the maxima of the gaps between two consecutive C&Cmessages for DNS C&C flows
3. tsi the standard deviation of the maxima of the gaps between two consec-utive C&C messages for DNS C&C flows
As a first step, we applied the classifier presented in Section 5.3.3 to all ofthe DNS transactions in Tall. This results in the set of candidate DNS C&Ctransactions Tcand. Furthermore, in order to apply the behavioral communicationfeatures, we computed two kinds of aggregates for the candidate transactions inTcand. First, we aggregate by each pair of source and destination IP addresses.Second, we aggregate by each pair of source IP address and second level domainof the query domain name.Subsequently, the set of aggregates is filtered, eliminating all aggregates that
do not fulfill the behavioral properties. We exclude aggregates with a computed
80
5.4 Discussion
bandwidth smaller than tb and a maximum time between two C&C messagesgreater than d · tsi + tmi with d = 3. This filtering step makes sure that onlythose channels with persistence be considered as C&C channels. None of theaggregates were excluded in the filtering step.Based on the resulting set of aggregates, we consider each source IP address to
be infected with malware using DNS C&C. Indeed, only the two IP addresses ofthe workstations that hosted the Feederbot and Timestamper bots were classifiedas DNS C&C infected hosts. To sum up, we showed that our classifier can evendetect DNS C&C transactions in mixed network traffic of regular workstations.
5.4 DiscussionThough achieving high true positive rates, there are certain limitations that botscould exploit to evade our detection. One such limitation is posed by the fact thatbotmasters could restrict their C&C messages to very small sizes. In practice,message contents could be stored in e.g., 4 bytes of an A resource record’s rdata.In this case, our rdata features alone, which are currently applied to individualC&C messages, would not be able to detect these C&C messages as high entropymessages because the statistical byte entropy of such really short messages is verylow and our estimate of the alphabet size by counting the number of distinct bytesis inaccurate for short messages.In this case, a countermeasure could be to aggregate several messages and
compute aggregated rdata features. Furthermore, for each aggregate, the changeof entropy among subsequent messages can be measured. Additionally, for certainresource records one could compare the distribution of byte values against theexpected distribution. For example, the rdata of an A resource record containsIPv4 addresses. However, the IPv4 address space is not uniformly distributed.Instead, certain IPv4 address ranges remain reserved, e.g., for private use such as10.0.0.0/8 (RFC1918) or 224.0.0.0/4 for multicast. These might rarely show upin Internet DNS traffic whereas other addresses, e.g., popular web sites, mightappear more often in DNS query results.When looking at Feederbot, it becomes obvious that the query domain name
can be chosen completely at random. In general, this is true for botnets where theDNS C&C servers are contacted directly. In order to avoid raising suspicion, thebotmasters could have chosen e.g., random or even popular second-level domains.This would become a problem for our detection mechanism if only the querydomain name was used for aggregation alone. However, as we also aggregate bythe DNS server’s IP address, our classifier can still detect this kind of DNS C&C.As a result, we suggest to aggregate by at least both, the DNS server’s IP addressand the query domain name, because the botmaster can only arbitrarily changeone of them.Another limitation is posed by the fact that our behavioral communication fea-
81
5 Detecting Botnets with DNS as Command and Control
tures aim at botnets with a central C&C architecture using a limited set of C&Cservers. Botmasters might exploit this by spreading the communication withC&C servers over lots of different C&C destinations so that even the aggregatedbehavioral features such as the aggregated bandwidth remain subliminal. Effec-tively, a further step in this direction would be to change for a peer-to-peer C&Carchitecture where each bot is part of the peer-to-peer network. However, thisopens the door for a whole variety of techniques addressing peer-to-peer networkssuch as eclipse attacks.
5.5 Related WorkRelated work can be grouped in three categories. First, several C&C techniques ofbotnets have been analyzed in depth [HSD+08, SGE+09, CDB09, CL07, SCC+09].For example, Holz et al. [HSD+08] provide insights into botnets with peer-to-peerC&C architecture in a case study on the storm worm. Stock et al. and Calvet etal. [SGE+09, CDB09] analyze the Waledac peer-to-peer botnet in detail. How-ever, to our knowledge, we are the first to analyze DNS as carrier for botnet C&C.Our work depicts how C&C messages are structured, encrypted and encoded inregular DNS syntax as is the case with Feederbot, a bot using DNS C&C wediscovered during this work. Additionally, we discuss general architectural issuesand limitations of DNS botnet C&C. The second group of related work containsapproaches to detect botnets in network traffic. This kind of related work can beseparated into application protocol specific approaches and protocol independentapproaches. As HTTP is used as botnet C&C, some work has been done to de-velop specifically tailored detection methods for HTTP-based botnet C&C, suchas Perdisci et al. [PLF10]. Goebel and Holz [GH07] present methods in order todetect IRC-based botnets. However, due to their protocol-dependent orientation,none of these approaches are able to detect DNS C&C.Independent of the application layer protocol, Gu [GPZL08] and Strayer [SLWL08]
propose botnet detection methods based on network flow characteristics. How-ever, protocol-independent approaches will likely fail to detect DNS C&C as theyexpose neither chat-style characteristics nor necessarily spatial-temporal corre-lated behavior. For example, Feederbot does neither exhibit periodicity nor syn-chronized transactions among different bot executions – effectively exploiting thegap of existing detection approaches. Therefore, we provide a detection methodspecifically tailored to DNS C&C based on rdata and behavioral communicationfeatures – successfully filling this gap.A special case is the work of Choi et al. [CLLK07], which – though not specif-
ically targeting DNS C&C – addresses group activities in DNS. The authorsdefine differences between DNS query behavior typical to any kind of botnetand legitimate DNS resolution. According to Choi et al., key features for bot-typical behavior include simultaneous DNS queries, quickly changing C&C server
82
5.6 Conclusion
addresses as well as transient domains. However, as our analysis of Feederbotdiscovers, none of these assumptions hold. Feederbot’s C&C servers stayed up forthe whole monitoring period of nine months and DNS queries are not synchro-nized between different bots. Instead, we exploit rdata features and persistentcommunication behavior to detect DNS C&C.The third group of related work covers DNS covert communication. Bernat
[Ber08] analyzed DNS as covert storage and communication medium. Born andGustafson [BG] employ character frequency analysis in order to detect DNS tun-nels. However, both approaches do not specifically address the detectability ofDNS as botnet C&C. In addition, we significantly improve entropy-based featuresand combine them with behavioral features to target botnets.
5.6 ConclusionInspired by anomalous DNS behavior, we stepped into a whole new kind of botnetC&C. This shows that even though many bot families use IRC or HTTP as carrierprotocol for their C&C, malware authors still find new ways of instructing theirbots. It is obvious that DNS C&C moves botnet C&C one step further intothe direction of covert communication. However, as shown in this chapter, thedetection of such botnet C&C, even when covert, remains possible.We combine protocol-aware information theoretical features with aggregated
behavioral communication features and apply them at different levels of networktraffic abstraction, i.e., DNS transactions and hosts. In this way, we detect DNSC&C in real-world DNS traffic. Furthermore, we provide means to classify mal-ware concerning DNS C&C usage based on network traffic.To summarize, to the best of our knowledge we are the first to not only describe
a real-world botnet using DNS C&C, but also provide a mechanism to detect DNSC&C in network traffic.Thus, the previous chapter, presenting our C&C recognition method based
on traffic analysis, as well as this chapter which proposes a dedicated detectionapproach for covert DNS-based C&C round up our work on the detection ofbotnet command and control channels. The remainder of this thesis deals withthe detection of one of the most prevalent monetization techniques, namely roguevisual malware.
83

Chapter6Detecting Rogue Visual Malware
6.1 IntroductionWhile the previous chapters deal with the detection of botnet command and con-trol channels, in this chapter, we focus on the detection of visual monetizationtechniques of remote-controlled malware. Given the fact that botnets are free todesign their C&C protocols in a subtle and covert way, we have observed in a fewcases that botnets such as Zeus P2P even evade traffic analysis means. At thatpoint, one way to detect such malware lies in its monetization. While malwarecomes in many different flavors, e.g., spam bots [SHSG+11, CL07, SGHSV11],banking trojans [ROL+10, BOB+10] or denial-of-service bots [Naz], one impor-tant monetization technique of recent years is rogue software, such as fake an-tivirus software (Fake A/V) [RBM+10, Mic]. In this case, the user is tricked intospending money for a rogue software which, in fact, does not aim at fulfilling thepromised task. Instead, the rogue software is malicious, might not even have anylegitimate functionality at all, and entices the user to pay. However, all roguesoftware has in common to provide a user interface, e.g., be it to scare the user,or in order to ask for banking credentials, or to carry out the payment process.Figures 6.1(a) and 6.1(b) show example screenshots of two typical rogue soft-
ware flavors. The first displays a Fake A/V user interface, mimicking a benignantivirus application, while the second exhibits a ransom screen (in German),asking the user to pay before the computer is unlocked. Especially the later cate-gory, ransomware, is considered an increasing threat with more than 120,000 newransomware binaries in the second quarter of 2012 [McA12]. In addition, whenreferring to the C&C tracking of Fake A/V and ransomware botnets, we observea significant increase in activity since June 2011, as can be seen in Figure 3.8in Chapter 3. We conclude that, today, rogue visual software is thus one of themost prevalent techniques for the monetization of remote-controlled malware andaddress means to detect this kind of threat in this chapter.As rogue software is required to provide a user interface, we aim at exploiting
85
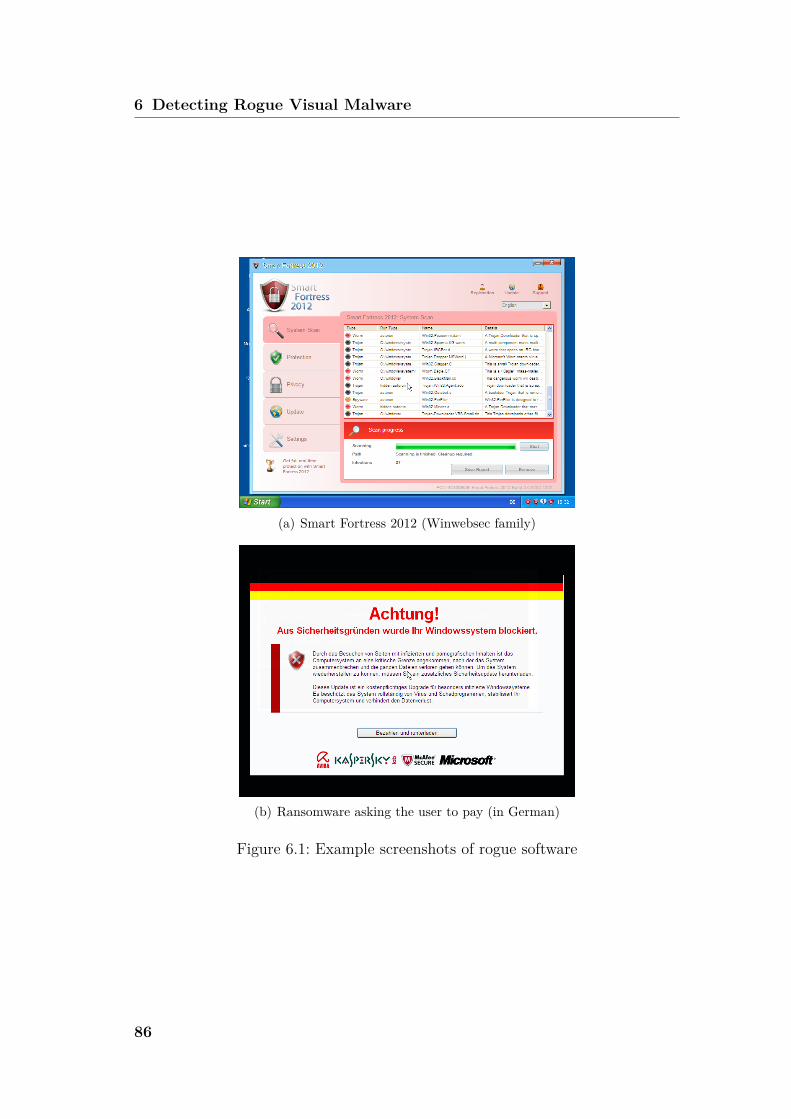
6 Detecting Rogue Visual Malware
(a) Smart Fortress 2012 (Winwebsec family)
(b) Ransomware asking the user to pay (in German)
Figure 6.1: Example screenshots of rogue software
86
6.2 Methodology
its visual appearance in order to cluster and classify rogue software. We motivateour efforts by the relatively low A/V detection rates of such rogue software, andwe aim to complement existing techniques to strive for better detection rates. Inparticular, we observed that the structure of the user interfaces of rogue softwareremains constant and can be used to recognize a rogue software family or cam-paign. Using a perceptual hash function and a hierarchical clustering approach,we propose a scalable and effective approach to cluster associated screenshotimages of malware samples.In short, the main contributions of this chapter are threefold:
• We provide a scalable method to cluster and classify rogue software basedon its user interface, an inherent property of rogue visual malware.
• We applied our method to a corpus of more than 187,560 malware samplesof more than 2,000 distinct families (based on Microsoft A/V labels) andrevealed 25 distinct types of rogue software user interfaces. Our methodsuccessfully reduces the amount of more than 187,560 malware samples andtheir associated screenshot images down to a set of human-manageable size,which assists a human analyst in understanding and combating Fake A/Vand ransomware.
• We provide insights into Fake A/V and ransomware campaigns as well astheir payment means. More specifically, we show a clear distinction ofpayment methods between Fake A/V and ransomware campaigns.
The remainder of this chapter is structured as follows. In Section 6.2, wewill describe the dataset our analysis is based on and outline our methodology.Subsequently, we will evaluate our method in Section 6.3. Using the clusteringresults, we will provide insights into the monetization and localization of roguesoftware, with a focus on four ransomware campaigns in Section 6.4. Section 6.5will discuss the limitations and evasion of our approach. Finally, we will describerelated work in Section 6.6 and conclude in Section 6.7.
6.2 MethodologyA coarse-grained overview of our methodology is shown in Figure 6.2. Our ap-proach consists of three steps. First, we execute malware samples and capturethe screen. Furthermore, we compute a perceptual hash of the resulting imageand finally, we cluster screenshots into subsets of similar appearance. Our goalis to find subsets of images that – although slightly different in detail – exhibit asimilar structure and a similar user perception.We found that the user interfaces of Fake A/V campaigns vary concerning
details such as the number of supposedly dangerous files as well as the roguesoftware name and logo. However, the position of the logo and the sizes of user
87
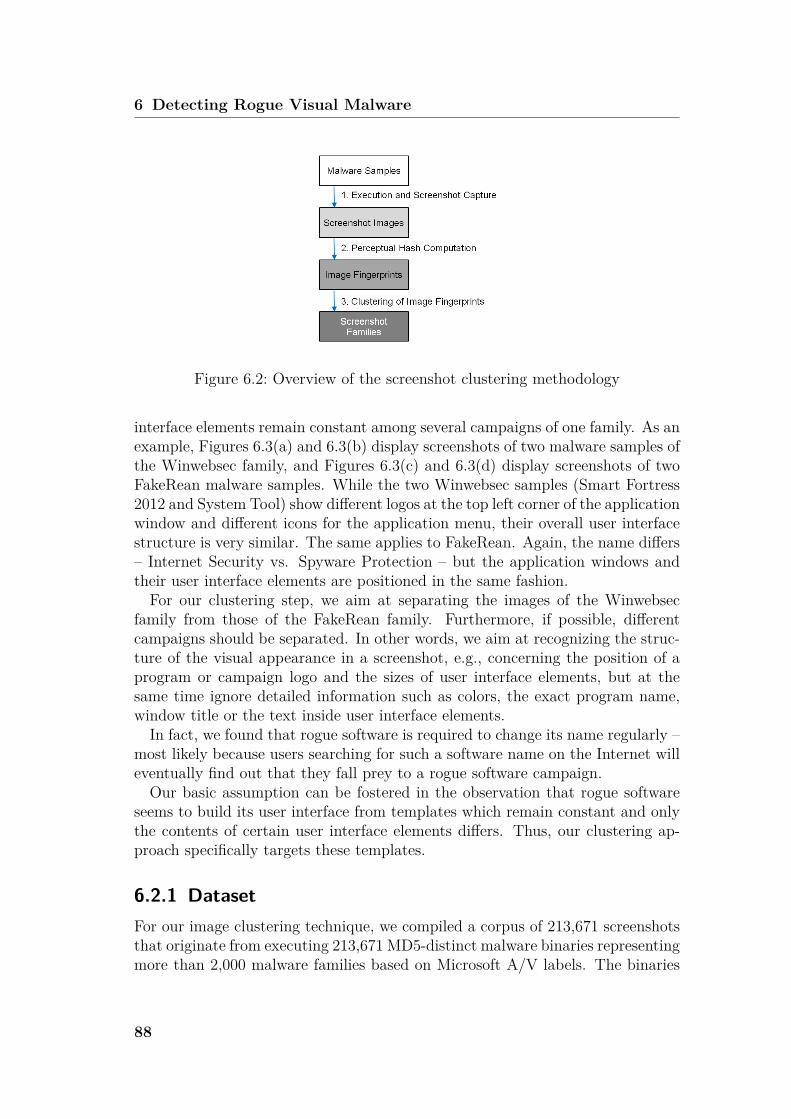
6 Detecting Rogue Visual Malware
Figure 6.2: Overview of the screenshot clustering methodology
interface elements remain constant among several campaigns of one family. As anexample, Figures 6.3(a) and 6.3(b) display screenshots of two malware samples ofthe Winwebsec family, and Figures 6.3(c) and 6.3(d) display screenshots of twoFakeRean malware samples. While the two Winwebsec samples (Smart Fortress2012 and System Tool) show different logos at the top left corner of the applicationwindow and different icons for the application menu, their overall user interfacestructure is very similar. The same applies to FakeRean. Again, the name differs– Internet Security vs. Spyware Protection – but the application windows andtheir user interface elements are positioned in the same fashion.For our clustering step, we aim at separating the images of the Winwebsec
family from those of the FakeRean family. Furthermore, if possible, differentcampaigns should be separated. In other words, we aim at recognizing the struc-ture of the visual appearance in a screenshot, e.g., concerning the position of aprogram or campaign logo and the sizes of user interface elements, but at thesame time ignore detailed information such as colors, the exact program name,window title or the text inside user interface elements.In fact, we found that rogue software is required to change its name regularly –
most likely because users searching for such a software name on the Internet willeventually find out that they fall prey to a rogue software campaign.Our basic assumption can be fostered in the observation that rogue software
seems to build its user interface from templates which remain constant and onlythe contents of certain user interface elements differs. Thus, our clustering ap-proach specifically targets these templates.
6.2.1 DatasetFor our image clustering technique, we compiled a corpus of 213,671 screenshotsthat originate from executing 213,671 MD5-distinct malware binaries representingmore than 2,000 malware families based on Microsoft A/V labels. The binaries
88
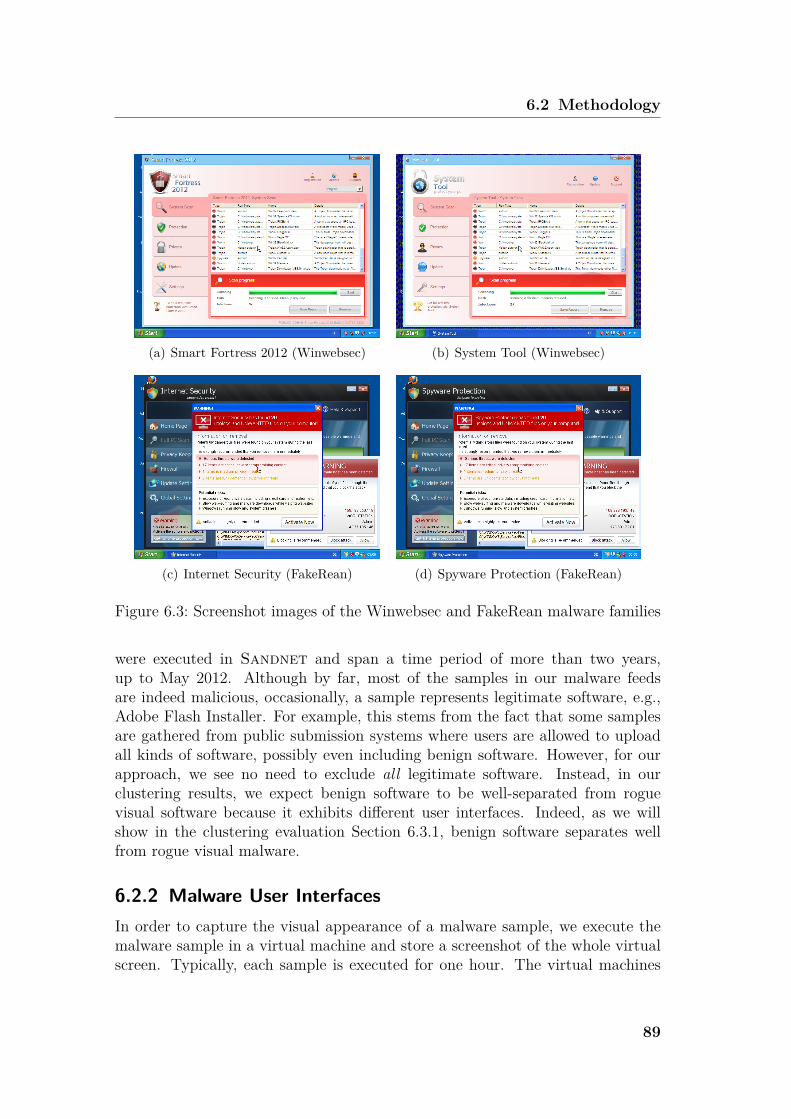
6.2 Methodology
(a) Smart Fortress 2012 (Winwebsec) (b) System Tool (Winwebsec)
(c) Internet Security (FakeRean) (d) Spyware Protection (FakeRean)
Figure 6.3: Screenshot images of the Winwebsec and FakeRean malware families
were executed in Sandnet and span a time period of more than two years,up to May 2012. Although by far, most of the samples in our malware feedsare indeed malicious, occasionally, a sample represents legitimate software, e.g.,Adobe Flash Installer. For example, this stems from the fact that some samplesare gathered from public submission systems where users are allowed to uploadall kinds of software, possibly even including benign software. However, for ourapproach, we see no need to exclude all legitimate software. Instead, in ourclustering results, we expect benign software to be well-separated from roguevisual software because it exhibits different user interfaces. Indeed, as we willshow in the clustering evaluation Section 6.3.1, benign software separates wellfrom rogue visual malware.
6.2.2 Malware User InterfacesIn order to capture the visual appearance of a malware sample, we execute themalware sample in a virtual machine and store a screenshot of the whole virtualscreen. Typically, each sample is executed for one hour. The virtual machines
89
6 Detecting Rogue Visual Malware
use Windows XP 32bit SP3 as operating system and have limited Internet access.SMTP as well as typical infection vector ports were transparently redirected tolocal spam traps and honeypots. During the execution of a sample, no userinteraction was performed. In order to prevent harming others and to mitigatedenial-of-service attacks, we restricted outgoing traffic to the protocols IRC, DNSand HTTP and throttled outgoing traffic. As the set of executed samples coversall kinds of malware, some of the screenshot images do not show any graphicaluser interface at all, e.g., malware operating completely in the background, ordisplay an error message. We will deal with the fact that not all screenshotsreflect rogue visual software in subsequent sections.
6.2.3 Perceptual Hash Functions
In our case, one screenshot image consists of 800x600 pixels of 24 bit color depth,resulting in ca. 11 MB of uncompressed data per image. To reduce the amountof data, we extract a fingerprint of the visual appearance, for each image. Thisfingerprint is then used in the clustering phase. As we are mainly interested in theperception, we turn to so-called perceptual hash functions. While cryptographichash functions aim at resulting in two different hash values upon the slightestdifference between two input values, perceptual hash functions aim at graspingsemantic differences of a certain context.We use the perceptual hash function p based on the discrete cosine transform
(DCT) as proposed by Zauner [Zau10]. First, an image is converted to grey scaleand a smoothing for each 7x7 pixel subarea is performed. Furthermore, the imageis resized to 32x32 pixels and the two-dimensional type-II DCT coefficients arecalculated. As high frequencies might not sustain compression, 64 low-frequencycoordinates (8x8) are considered – similar to the JPEG compression standard –to build up an 8-byte bitstring fingerprint. Effectively, this fingerprint providesa structural context-sensitive feature vector of the screenshot image.An advantage of this perceptual hash function is its robustness against minor
modifications to the visual appearance such as a change in color, certain levelsof distortion and non-uniform scaling. Thus, even if certain elements of a roguesoftware user interface are changed, distorted or blurred – for example in orderto result in different cryptographic hash values – the perceptual hash functionwill resist (to a certain degree). During the manual classification, which will bedescribed in more detail in Section 6.2.4, we found samples that changed thedesktop wallpaper and their perceptual hash value is close to the ones with theregular wallpaper. Also we found user interfaces where the colors of some userinterface elements were changed, which also produced nearby perceptual hashvalues.
90
6.2 Methodology
6.2.4 Intra-Fingerprint Coherence
For all of the 213,671 screenshot images, we applied the perceptual hash function,which results in a set of 17,767 distinct perceptual hash fingerprint values. Wedenote the full set of perceptual hash fingerprints as F . Note that not all ofthese fingerprints refer to user interfaces of rogue software, but also include errormessages – e.g., cases where the sample to be executed was corrupt – or a blankscreen, i.e., the sample did not exhibit a visual appearance at all.
Using a perceptual hash function, two images with a very high degree of struc-tural similarity might result in the same hash value. While in general, this factis desired, in the worst case, two images with the same hash value might notreflect the structural and perceptual similarity we aim at. In this case, we wouldneed to extend the fingerprint either by increasing the fingerprint length or bytaking additional features into account. We define the term Intra-Fingerprint co-herence to reflect that images with the same fingerprint indeed provide the samestructural and perceptual properties and thus likely reflect images of the samemalware family or campaign.
In order to test our fingerprints for Intra-Fingerprint coherence, we randomlyselected 345 fingerprint values (ca. 2% of 17,767) with at least 35 associatedscreenshot images per fingerprint, and for each fingerprint we inspected at leastthree random images manually. We checked whether the positions of user inter-face elements remain constant, especially the positions of logos, progress bars andtext area, list or table elements. In all cases, the images provided the requiredsimilarity in structure.
At the same time, we classified the fingerprints and assigned a campaign labelor – in case the screenshot does not show rogue software – a state label suchas whether an error message, a blank screen or a browser window is displayedor describe the application window. For example, a blank screen occurs if themalware operates completely in the background, e.g., in case of Zeus, a popularbanking trojan [BOB+10]. A prevalent group of fingerprints is caused by theHotbar/Clickpotato downloader which masks as installers for various softwaresuch as VLC or xvid. Other examples for malware which show neither FakeA/V nor ransomware include Adware causing the web browser to open a specificwebsite, cracks or serial key generator programs andWindows Explorer displayingthe contents of a certain folder.
The labeled set of 345 fingerprints covers 18 different fake A/V campaigns andtwo ransomware campaigns, shown in Table 6.1. The second column of Table 6.1denotes the Microsoft A/V family label, if at least one of the associated sampleswas detected by Microsoft.
91
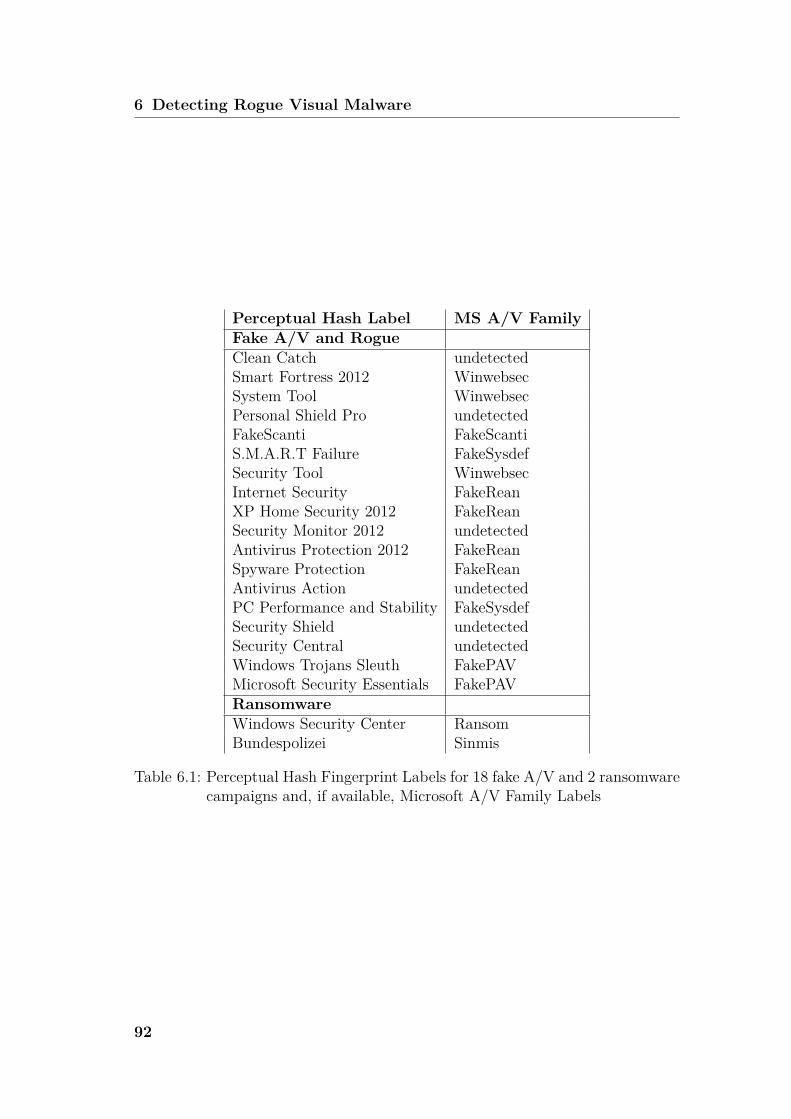
6 Detecting Rogue Visual Malware
Perceptual Hash Label MS A/V FamilyFake A/V and RogueClean Catch undetectedSmart Fortress 2012 WinwebsecSystem Tool WinwebsecPersonal Shield Pro undetectedFakeScanti FakeScantiS.M.A.R.T Failure FakeSysdefSecurity Tool WinwebsecInternet Security FakeReanXP Home Security 2012 FakeReanSecurity Monitor 2012 undetectedAntivirus Protection 2012 FakeReanSpyware Protection FakeReanAntivirus Action undetectedPC Performance and Stability FakeSysdefSecurity Shield undetectedSecurity Central undetectedWindows Trojans Sleuth FakePAVMicrosoft Security Essentials FakePAVRansomwareWindows Security Center RansomBundespolizei Sinmis
Table 6.1: Perceptual Hash Fingerprint Labels for 18 fake A/V and 2 ransomwarecampaigns and, if available, Microsoft A/V Family Labels
92
6.3 Evaluation
6.2.5 Distance Computation and ClusteringWhile the perceptual hash computation relaxes near-duplicates, i.e., it aggregatesvery similar images into one fingerprint value, a malware family or campaign typ-ically spans multiple different fingerprint values. In other words, one fingerprintis too specific to reflect a campaign or even a whole malware family. We foundseveral reasons for this. First, the application window might not always be atthe same position on the screen or other foreground application windows mightobscure parts of the rogue software’s window(s). This could result in differentperceptual hash values. Second, rogue software interfaces can provide severaldifferent views. For example, a fake A/V program might provide one view of ascan in progress (Figure 6.3(a)) and another one when the scan is finished andthe user is prompted for action, e.g., as shown in Figure 6.3(c).Thus, in order to aggregate several closely related fingerprints into subsets of
campaigns or malware families, we add a clustering step. In this clustering phase,we use the normalized bit-wise hamming distance as distance function betweentwo perceptual hash fingerprints. As the perceptual hashes have a fixed lengthof 8 bytes, the hamming distance returns the number of differing bits, with amaximum of 64. We normalize the hamming distance to the range 0.0 to 1.0 bydividing it by 64.Since the perceptual hash is a locality-sensitive hash [KG09], we can rely on
the hamming distance as a simple and fast distance function. Similar imageswill result in a low hamming distance (towards 0.0), while different images willexhibit higher distance values (towards 1.0). Another advantage of the hammingdistance is its high performance (XOR arithmetic). The combination of theperceptual hash function and the normalized hamming distance allows us to useagglomerative hierarchical clustering despite its worst-case complexity of O(n3).Thus, we apply agglomerative hierarchical clustering to the set of fingerprint
values. Furthermore, we decided to use average linkage clustering to avoid thechaining phenomenon. Finally, to aggregate similar fingerprints into one cluster,a cut-off threshold determines the maximum distance between any two differentfingerprint clusters. If the distance of any two distinct fingerprint clusters is lessthan the cut-off threshold, the associated screenshot fingerprints will be filed inthe same cluster, otherwise they would be filed into different clusters.
6.3 EvaluationOur clustering evaluation can be divided into two parts, Intra-Fingerprint Co-herence as well as Cluster Generalization. In addition, we evaluate the true A/Vdetection rate of Fake A/V campaigns identified by means of our clustering. Asdescribed in Section 6.2.4, we performed the Intra-Fingerprint evaluation by man-ually inspecting at least 3 random screenshot images for 345 random fingerprints
93
6 Detecting Rogue Visual Malware
and assigned a campaign description to each fingerprint. This way, we madesure that there is no collision of fingerprint hashes which breaks our similarityassumptions and we achieve Intra-Fingerprint Coherence.
6.3.1 Clustering evaluationIn the next step, we aim at evaluating how well our approach generalizes. Webuild a subset Fm consisting of the 345 labeled fingerprints plus 700 most preva-lent non-labeled fingerprints (measured by number of screenshot images per fin-gerprint) and clustered this subset. The subset Fm represents 187,560 screenshotsand samples, respectively. Our goal is to verify the clustering by checking if thenon-labeled fingerprints correspond to the labeled fingerprints of the same cluster.Therefore, for each resulting cluster, we inspect at least three of the correspond-ing screenshot images manually, to see if they relate to the assigned cluster’scampaign.However, before evaluation, the optimum cut-off threshold has to be deter-
mined. We use the metrics precision and recall, widely used for unsupervisedmachine learning techniques, to measure the clustering accuracy. More precisely,precision represents how well our clustering separates fingerprints of differentcampaigns. Recall denotes whether all fingerprints of a certain campaign or fam-ily are grouped into the same cluster. In our case, precision is more importantthan recall, i.e., it is more important to separate fingerprints of two campaignsthan to have all fingerprints of one campaign in only one single cluster. In otherwords, for example, we prefer to have two clusters for one family (or campaign)over aggregating multiple families (or campaigns) into one cluster. For the rea-sons mentioned in Section 6.2.5, such as different views of the rogue software’suser interface, we tolerate multiple clusters per campaign.Precision and recall are combined into F-measure, as defined in Chapter 2,
Section 2.2.1. We place twice as much emphasis on precision over recall for thereasons outlined above and thus use the following F-measure to evaluate ourclustering with threshold th and β = 1/2:
F-measureth = (1 + β2) · Pth · Rth
β2 · Pth +Rth
= 1.25 · Pth · Rth
0.25 · Pth +Rth
(6.1)
Using the labeled fingerprints, we estimate the optimum cut-off threshold byclustering with cut-off thresholds in the range 0.1 to 1.0 and a step size of 0.025.As a result, the best cut-off threshold is determined as 0.375 at a weighted F-measure of 93.32%. Figure 6.4 shows the precision, recall and F-measure (β = 1/2)over the range of evaluated thresholds.The clustering of the set Fm with cut-off threshold 0.375 results in 51 clusters.
10 of these 51 clusters did not have any labeled fingerprints in the same clusterand were manually inspected. Of the 10 unlabeled clusters, 5 clusters represent
94
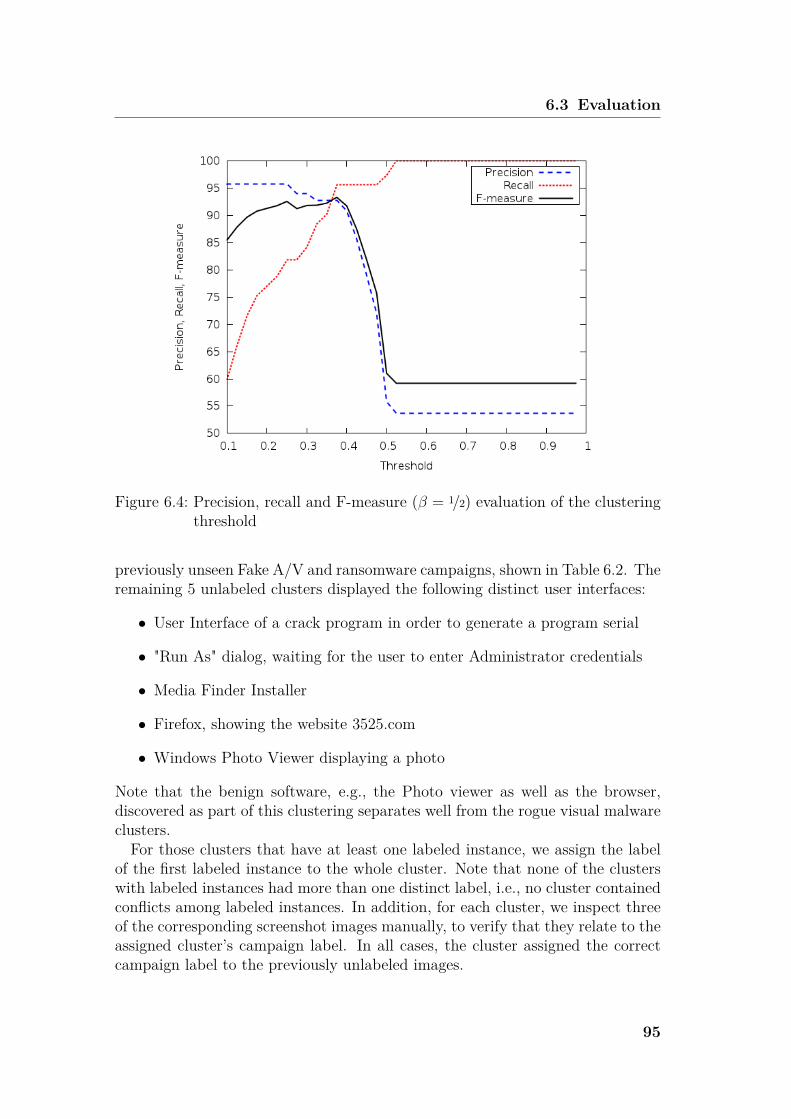
6.3 Evaluation
Figure 6.4: Precision, recall and F-measure (β = 1/2) evaluation of the clusteringthreshold
previously unseen Fake A/V and ransomware campaigns, shown in Table 6.2. Theremaining 5 unlabeled clusters displayed the following distinct user interfaces:
• User Interface of a crack program in order to generate a program serial
• "Run As" dialog, waiting for the user to enter Administrator credentials
• Media Finder Installer
• Firefox, showing the website 3525.com
• Windows Photo Viewer displaying a photo
Note that the benign software, e.g., the Photo viewer as well as the browser,discovered as part of this clustering separates well from the rogue visual malwareclusters.For those clusters that have at least one labeled instance, we assign the label
of the first labeled instance to the whole cluster. Note that none of the clusterswith labeled instances had more than one distinct label, i.e., no cluster containedconflicts among labeled instances. In addition, for each cluster, we inspect threeof the corresponding screenshot images manually, to verify that they relate to theassigned cluster’s campaign label. In all cases, the cluster assigned the correctcampaign label to the previously unlabeled images.
95
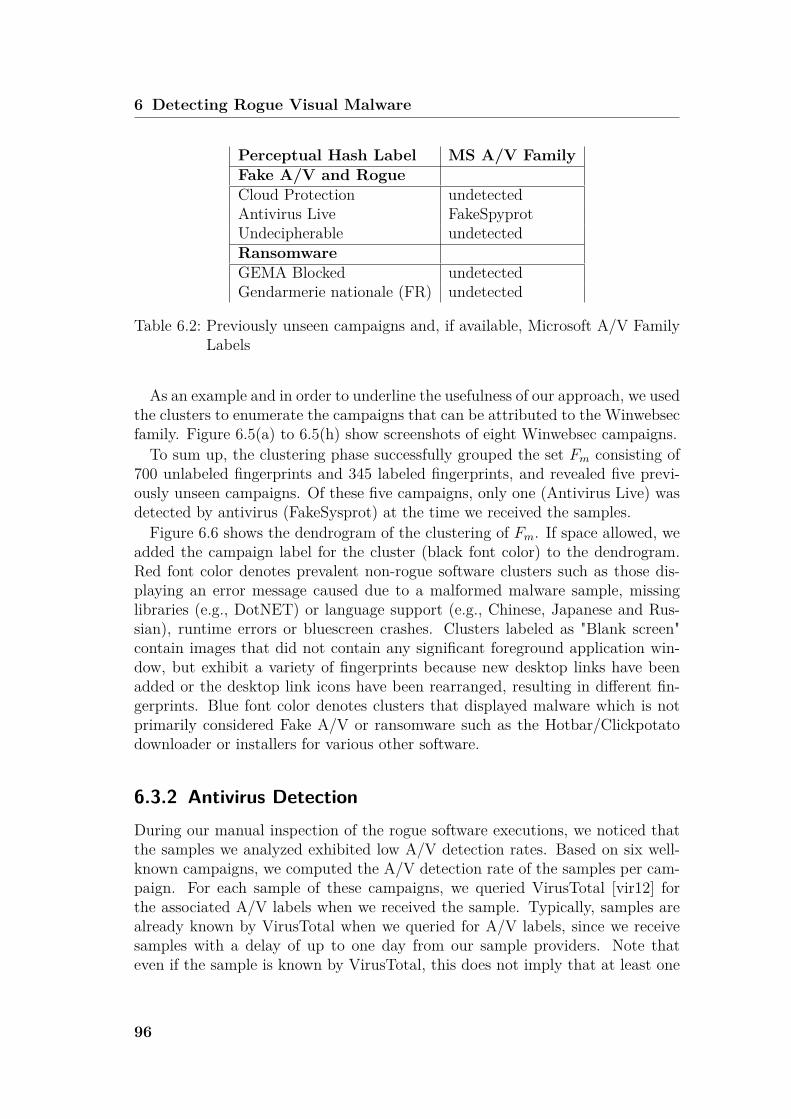
6 Detecting Rogue Visual Malware
Perceptual Hash Label MS A/V FamilyFake A/V and RogueCloud Protection undetectedAntivirus Live FakeSpyprotUndecipherable undetectedRansomwareGEMA Blocked undetectedGendarmerie nationale (FR) undetected
Table 6.2: Previously unseen campaigns and, if available, Microsoft A/V FamilyLabels
As an example and in order to underline the usefulness of our approach, we usedthe clusters to enumerate the campaigns that can be attributed to the Winwebsecfamily. Figure 6.5(a) to 6.5(h) show screenshots of eight Winwebsec campaigns.To sum up, the clustering phase successfully grouped the set Fm consisting of
700 unlabeled fingerprints and 345 labeled fingerprints, and revealed five previ-ously unseen campaigns. Of these five campaigns, only one (Antivirus Live) wasdetected by antivirus (FakeSysprot) at the time we received the samples.Figure 6.6 shows the dendrogram of the clustering of Fm. If space allowed, we
added the campaign label for the cluster (black font color) to the dendrogram.Red font color denotes prevalent non-rogue software clusters such as those dis-playing an error message caused due to a malformed malware sample, missinglibraries (e.g., DotNET) or language support (e.g., Chinese, Japanese and Rus-sian), runtime errors or bluescreen crashes. Clusters labeled as "Blank screen"contain images that did not contain any significant foreground application win-dow, but exhibit a variety of fingerprints because new desktop links have beenadded or the desktop link icons have been rearranged, resulting in different fin-gerprints. Blue font color denotes clusters that displayed malware which is notprimarily considered Fake A/V or ransomware such as the Hotbar/Clickpotatodownloader or installers for various other software.
6.3.2 Antivirus DetectionDuring our manual inspection of the rogue software executions, we noticed thatthe samples we analyzed exhibited low A/V detection rates. Based on six well-known campaigns, we computed the A/V detection rate of the samples per cam-paign. For each sample of these campaigns, we queried VirusTotal [vir12] forthe associated A/V labels when we received the sample. Typically, samples arealready known by VirusTotal when we queried for A/V labels, since we receivesamples with a delay of up to one day from our sample providers. Note thateven if the sample is known by VirusTotal, this does not imply that at least one
96
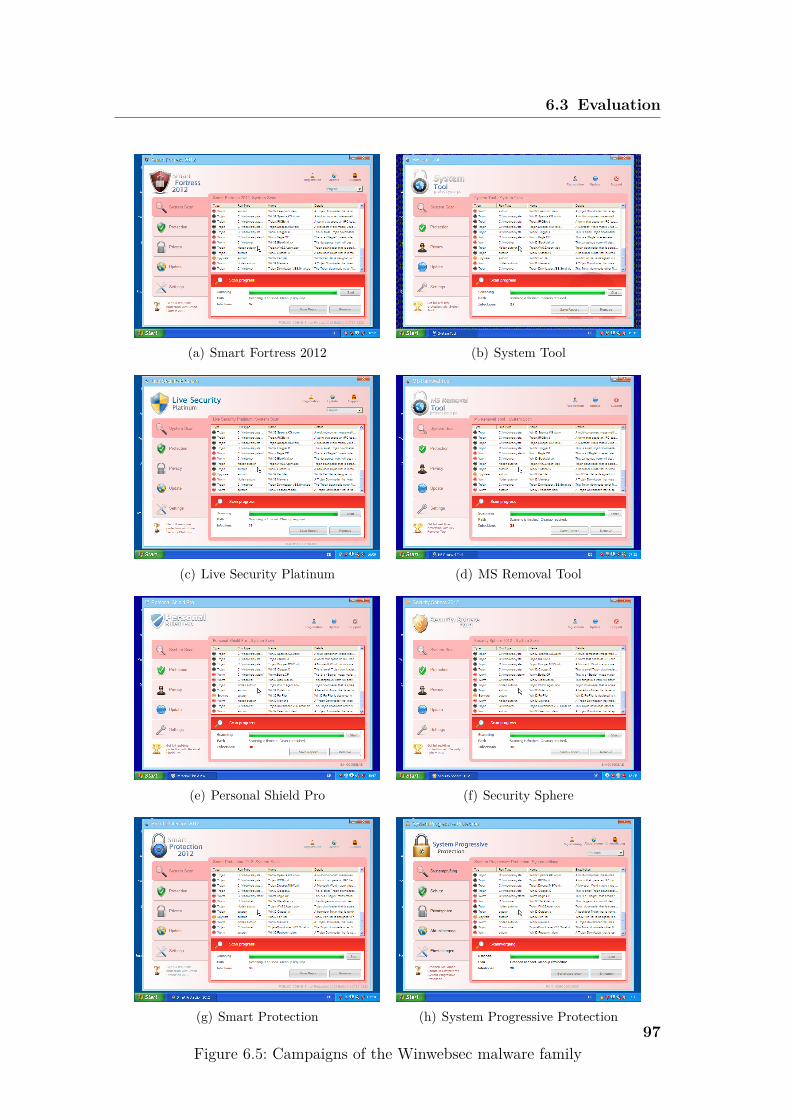
6.3 Evaluation
(a) Smart Fortress 2012 (b) System Tool
(c) Live Security Platinum (d) MS Removal Tool
(e) Personal Shield Pro (f) Security Sphere
(g) Smart Protection (h) System Progressive Protection
Figure 6.5: Campaigns of the Winwebsec malware family97
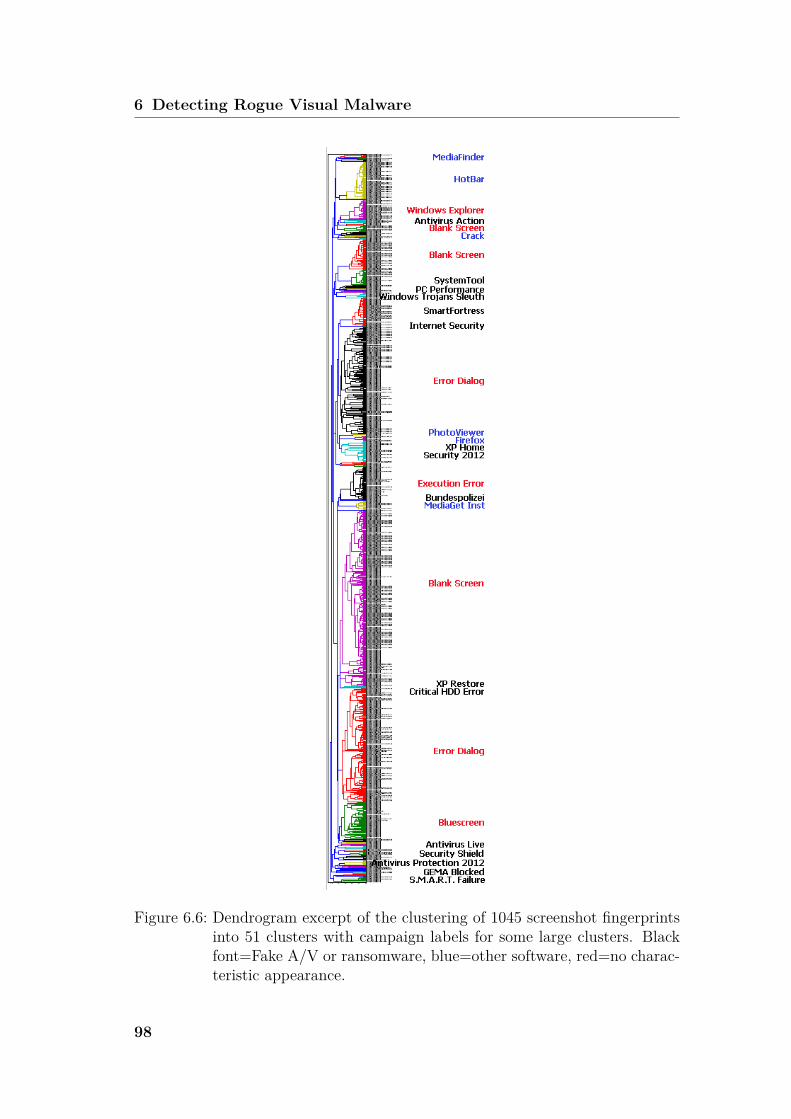
6 Detecting Rogue Visual Malware
Figure 6.6: Dendrogram excerpt of the clustering of 1045 screenshot fingerprintsinto 51 clusters with campaign labels for some large clusters. Blackfont=Fake A/V or ransomware, blue=other software, red=no charac-teristic appearance.
98
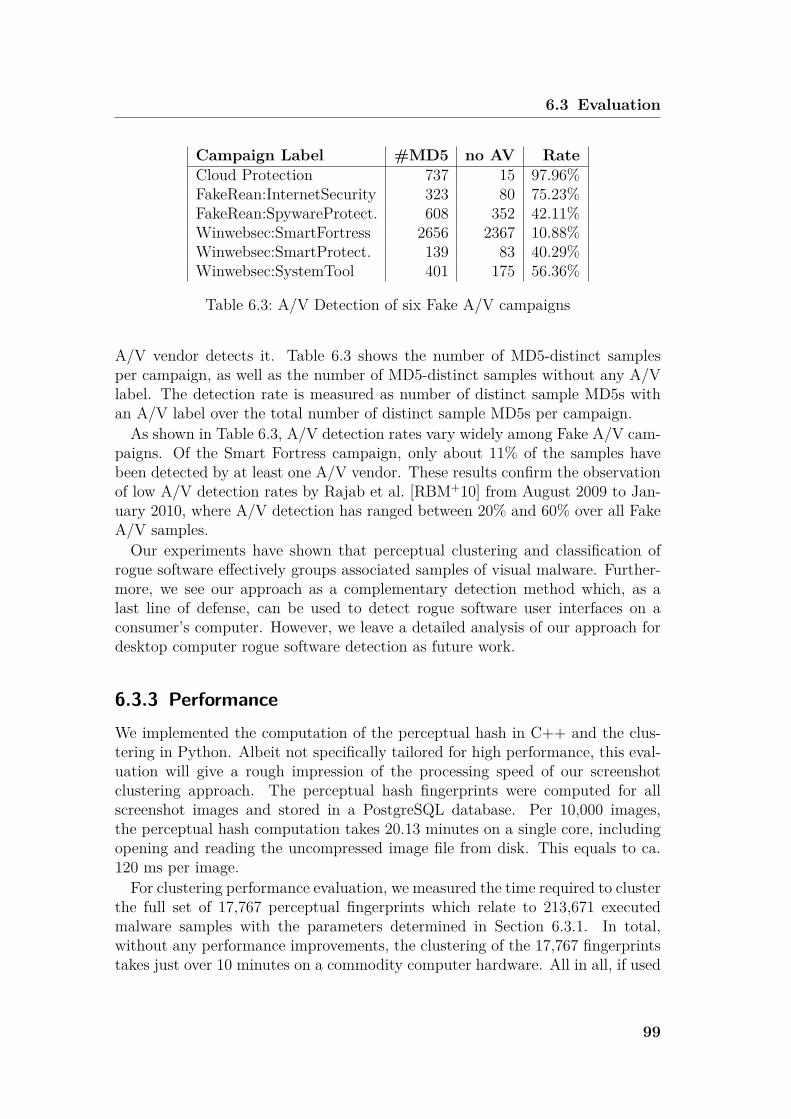
6.3 Evaluation
Campaign Label #MD5 no AV RateCloud Protection 737 15 97.96%FakeRean:InternetSecurity 323 80 75.23%FakeRean:SpywareProtect. 608 352 42.11%Winwebsec:SmartFortress 2656 2367 10.88%Winwebsec:SmartProtect. 139 83 40.29%Winwebsec:SystemTool 401 175 56.36%
Table 6.3: A/V Detection of six Fake A/V campaigns
A/V vendor detects it. Table 6.3 shows the number of MD5-distinct samplesper campaign, as well as the number of MD5-distinct samples without any A/Vlabel. The detection rate is measured as number of distinct sample MD5s withan A/V label over the total number of distinct sample MD5s per campaign.As shown in Table 6.3, A/V detection rates vary widely among Fake A/V cam-
paigns. Of the Smart Fortress campaign, only about 11% of the samples havebeen detected by at least one A/V vendor. These results confirm the observationof low A/V detection rates by Rajab et al. [RBM+10] from August 2009 to Jan-uary 2010, where A/V detection has ranged between 20% and 60% over all FakeA/V samples.Our experiments have shown that perceptual clustering and classification of
rogue software effectively groups associated samples of visual malware. Further-more, we see our approach as a complementary detection method which, as alast line of defense, can be used to detect rogue software user interfaces on aconsumer’s computer. However, we leave a detailed analysis of our approach fordesktop computer rogue software detection as future work.
6.3.3 PerformanceWe implemented the computation of the perceptual hash in C++ and the clus-tering in Python. Albeit not specifically tailored for high performance, this eval-uation will give a rough impression of the processing speed of our screenshotclustering approach. The perceptual hash fingerprints were computed for allscreenshot images and stored in a PostgreSQL database. Per 10,000 images,the perceptual hash computation takes 20.13 minutes on a single core, includingopening and reading the uncompressed image file from disk. This equals to ca.120 ms per image.For clustering performance evaluation, we measured the time required to cluster
the full set of 17,767 perceptual fingerprints which relate to 213,671 executedmalware samples with the parameters determined in Section 6.3.1. In total,without any performance improvements, the clustering of the 17,767 fingerprintstakes just over 10 minutes on a commodity computer hardware. All in all, if used
99
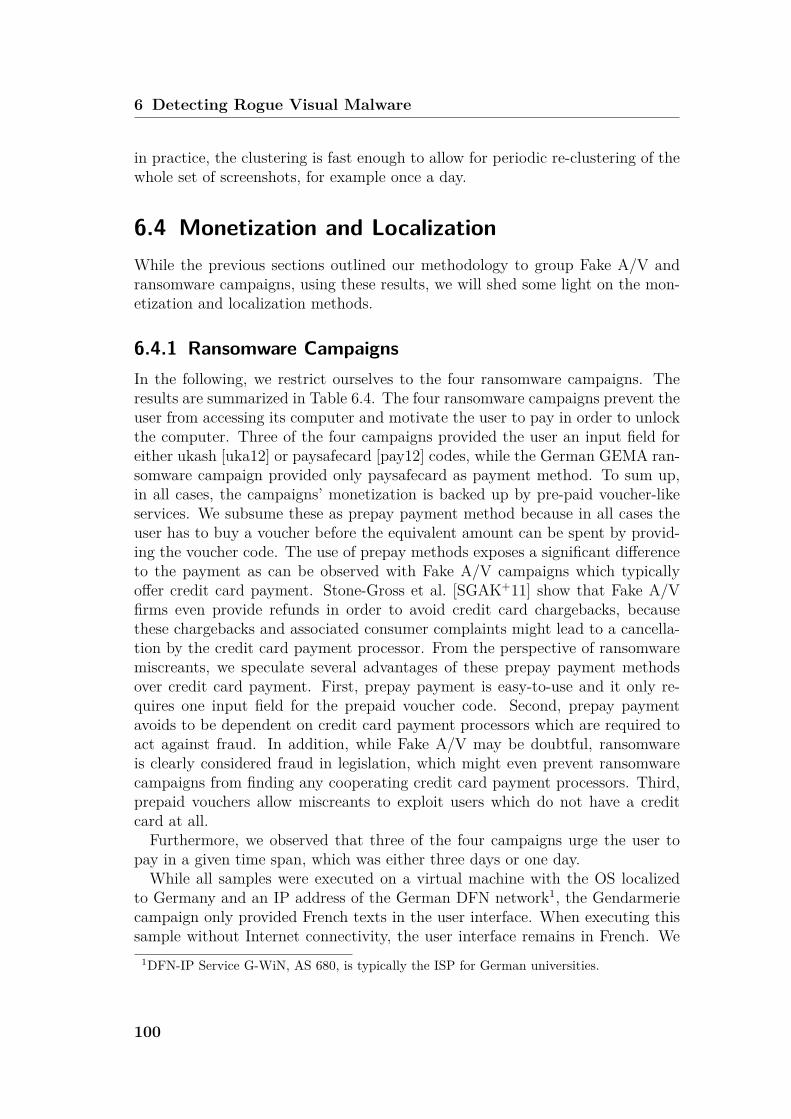
6 Detecting Rogue Visual Malware
in practice, the clustering is fast enough to allow for periodic re-clustering of thewhole set of screenshots, for example once a day.
6.4 Monetization and LocalizationWhile the previous sections outlined our methodology to group Fake A/V andransomware campaigns, using these results, we will shed some light on the mon-etization and localization methods.
6.4.1 Ransomware CampaignsIn the following, we restrict ourselves to the four ransomware campaigns. Theresults are summarized in Table 6.4. The four ransomware campaigns prevent theuser from accessing its computer and motivate the user to pay in order to unlockthe computer. Three of the four campaigns provided the user an input field foreither ukash [uka12] or paysafecard [pay12] codes, while the German GEMA ran-somware campaign provided only paysafecard as payment method. To sum up,in all cases, the campaigns’ monetization is backed up by pre-paid voucher-likeservices. We subsume these as prepay payment method because in all cases theuser has to buy a voucher before the equivalent amount can be spent by provid-ing the voucher code. The use of prepay methods exposes a significant differenceto the payment as can be observed with Fake A/V campaigns which typicallyoffer credit card payment. Stone-Gross et al. [SGAK+11] show that Fake A/Vfirms even provide refunds in order to avoid credit card chargebacks, becausethese chargebacks and associated consumer complaints might lead to a cancella-tion by the credit card payment processor. From the perspective of ransomwaremiscreants, we speculate several advantages of these prepay payment methodsover credit card payment. First, prepay payment is easy-to-use and it only re-quires one input field for the prepaid voucher code. Second, prepay paymentavoids to be dependent on credit card payment processors which are required toact against fraud. In addition, while Fake A/V may be doubtful, ransomwareis clearly considered fraud in legislation, which might even prevent ransomwarecampaigns from finding any cooperating credit card payment processors. Third,prepaid vouchers allow miscreants to exploit users which do not have a creditcard at all.Furthermore, we observed that three of the four campaigns urge the user to
pay in a given time span, which was either three days or one day.While all samples were executed on a virtual machine with the OS localized
to Germany and an IP address of the German DFN network1, the Gendarmeriecampaign only provided French texts in the user interface. When executing thissample without Internet connectivity, the user interface remains in French. We
1DFN-IP Service G-WiN, AS 680, is typically the ISP for German universities.
100
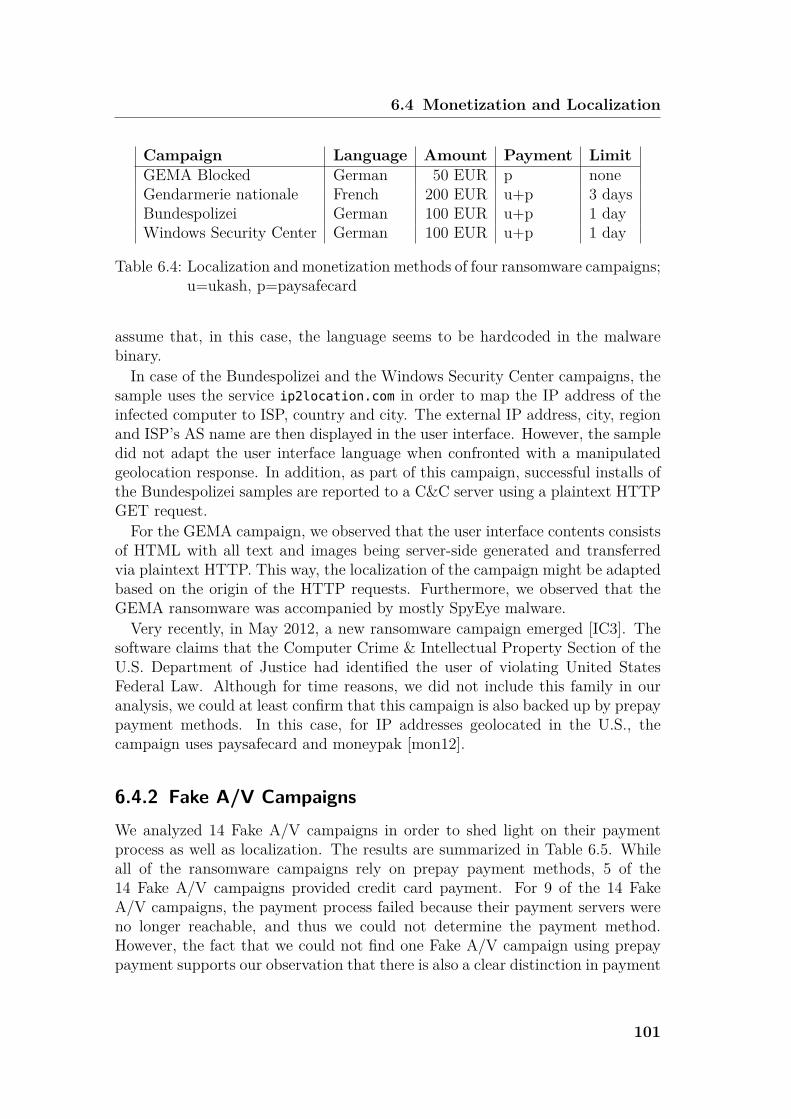
6.4 Monetization and Localization
Campaign Language Amount Payment LimitGEMA Blocked German 50 EUR p noneGendarmerie nationale French 200 EUR u+p 3 daysBundespolizei German 100 EUR u+p 1 dayWindows Security Center German 100 EUR u+p 1 day
Table 6.4: Localization and monetization methods of four ransomware campaigns;u=ukash, p=paysafecard
assume that, in this case, the language seems to be hardcoded in the malwarebinary.In case of the Bundespolizei and the Windows Security Center campaigns, the
sample uses the service ip2location.com in order to map the IP address of theinfected computer to ISP, country and city. The external IP address, city, regionand ISP’s AS name are then displayed in the user interface. However, the sampledid not adapt the user interface language when confronted with a manipulatedgeolocation response. In addition, as part of this campaign, successful installs ofthe Bundespolizei samples are reported to a C&C server using a plaintext HTTPGET request.For the GEMA campaign, we observed that the user interface contents consists
of HTML with all text and images being server-side generated and transferredvia plaintext HTTP. This way, the localization of the campaign might be adaptedbased on the origin of the HTTP requests. Furthermore, we observed that theGEMA ransomware was accompanied by mostly SpyEye malware.Very recently, in May 2012, a new ransomware campaign emerged [IC3]. The
software claims that the Computer Crime & Intellectual Property Section of theU.S. Department of Justice had identified the user of violating United StatesFederal Law. Although for time reasons, we did not include this family in ouranalysis, we could at least confirm that this campaign is also backed up by prepaypayment methods. In this case, for IP addresses geolocated in the U.S., thecampaign uses paysafecard and moneypak [mon12].
6.4.2 Fake A/V CampaignsWe analyzed 14 Fake A/V campaigns in order to shed light on their paymentprocess as well as localization. The results are summarized in Table 6.5. Whileall of the ransomware campaigns rely on prepay payment methods, 5 of the14 Fake A/V campaigns provided credit card payment. For 9 of the 14 FakeA/V campaigns, the payment process failed because their payment servers wereno longer reachable, and thus we could not determine the payment method.However, the fact that we could not find one Fake A/V campaign using prepaypayment supports our observation that there is also a clear distinction in payment
101
6 Detecting Rogue Visual Malware
methods between ransomware and Fake A/V software. Note that, for ethicalreasons, we did not perform any payments ourselves and judged on the acceptedcredit cards only based on the user interfaces.When turning to the amounts of the Fake A/V programs, values range from
$50 to $90 USD, depending on supposedly different versions of the program. Thefact that some campaigns exhibit the same amount scheme suggests that thesecampaigns might be related. Indeed, in case of the SmartFortress as well asthe SmartProtection campaigns, we found that both belong to the Winwebsecmalware family. However, we could not find proof that the same organization isbehind both campaigns.Interestingly, while the ransomware campaigns had user interface texts trans-
lated to the locale’s language, only one of the 14 Fake A/V campaigns of Table 6.5exhibits user interface texts matching the locale of the OS (German), all othersof the Fake A/V campaigns were only in English. In addition, all amounts weregiven in US dollars for the Fake A/V campaigns. In contrast, all ransomwarecampaigns had their amounts adapted to the locale’s currency (Euro).
6.5 LimitationsAlthough our approach is based on the inherent property of rogue software to dis-play a user interface, as always, there are some limitations and room for evasion.Targeting the image processing part, i.e., the computation of the perceptual hashfunction, malware authors could add random noise to the user interface, so thatthe resulting screenshots differ widely among samples of one campaign. How-ever, since our perceptual hash function depends on low-frequency coordinates,random noise which results in a change in high frequencies will not significantlychange the perceptual hash value. In order to modify the perceptual hash valuesignificantly, user interface elements would need to be positioned randomly.Another line of evasion lies in the resemblance of rogue software user interface
with that of legitimate software. So far, as long as user interfaces of rogue softwarediffer from those interfaces of legitimate software, our approach can possiblydetect and exploit exactly this difference. If user interfaces no longer visuallydiffer, e.g., because Fake A/V appearance exhibited the same user interface asone of the legitimate antivirus programs, our approach would fail. However,at some point, Fake A/V will always have to provide some kind of paymentinstruction and processing user interfaces which could still be used to separatefrom legitimate software.In addition, when executing the malware samples, none of them was confronted
with user interaction. We might have missed some samples which require theuser to interact with the system before displaying their Fake A/V or ransomwareuser interface. However, based on current research on environment-sensitive mal-ware [LKC11], we consider the amount of possibly missed samples to be negligible
102
6.5 Limitations
Cam
paign
Lang
uage
Amou
nts
Payment
Antiviru
sAction
English
$60
n/a
Antiviru
sLive
English
n/a
n/a
Antiviru
sPr
otectio
nEn
glish
3M:$
49.45,
6M:$
59.95,
LL:$
69.95
n/a
Internet
Securit
yEn
glish
n/a
n/a
Cloud
Protectio
nEn
glish
$52
VISA
/MC
MSSecurit
yEs
sentials
English
$50
n/a
PCPe
rform
ance
English
$74.95
(ligh
t),$
84.95(P
rof)
VISA
/MC
Person
alSh
ield
English
$1.50activ
ation+
1Y:$
59.90,
2Y:$
69.95,
LL:$
83VISA
/MC
SmartFo
rtress
English
1Y:$
59.95,
2Y:$
69.95,
LL:$
89.95
VISA
/MC
SmartPr
otectio
nEn
glish
1Y:$
59.95,
2Y:$
69.95,
LL:$
89.95
VISA
/MC
SmartRepair
English
$84.50
VISA
/MC
Spyw
arePr
otectio
nEn
glish
$60
n/a
XP
Antisp
yware
German
1Y:$
59.95,
2Y:$
69.95,
LL:$
79.95+
$19.95
Phon
eSu
pport24/7
n/a
XP
Hom
eSecurit
yEn
glish
1Y:$
59.95,
2Y:$
69.95,
LL:$
79.95
n/a
Table6.5:
Localization
and
mon
etization
metho
dsof
14Fa
keA/V
campa
igns;M=mon
ths,
Y=years,
LL=lifelon
g;MC=MasterC
ard;
Allam
ountsin
USD
103
6 Detecting Rogue Visual Malware
for the evaluation of our approach’s feasibility.
6.6 Related WorkWhile Fake A/V software has been studied before, e.g., in [RBM+10, KZRB11,SGAK+11, CLT+10], to the best of our knowledge, we are the first to propose aclustering and classification approach that targets the visual appearance of roguesoftware user interfaces. Thus, we not only cover Fake A/V, but provide a muchbroader approach of visual malware, including ransomware. Furthermore, our ap-proach serves as a means of classifying malware executions of a dynamic malwareanalysis environment and allows to identify and classify failed executions such asbluescreen crashes, error dialogs or lack of visual appearance (silent backgroundmalware).Related work can be grouped into three trails of research. The technical as-
pects, such as the distribution and infrastructure of Fake A/V malware has beenanalyzed by Cova et al. [CLT+10], Rajab et al. [RBM+10] as well as Komili etal. [KZRB11], e.g., by measuring the lifetime and distribution of domains involvedin Fake A/V software or analyzing the corresponding server geolocation, DNS andAS information. Especially two results of [RBM+10] inspired the development ofour visual clustering approach. First, the infrastructure of Fake A/V software isvolatile. Throughout the measurement period of one year, the median lifetimeof Fake A/V domains dropped to below one hour [RBM+10]. Thus, relying onnetwork properties such as domains and IP addresses in order to detect FakeA/V software becomes a tremendous effort. Second, Fake A/V malware suffersfrom decreasing A/V detection rates, even as low as 20% [RBM+10]. Our mea-surement confirms this, showing that in case of the SmartFortress campaign evenonly ca. 11% of the samples were detected by A/V (Table 6.3). This demands fora different detection approach such as ours by exploiting the visual appearanceof rogue software.Gazet has analyzed malware programming aspects of early ransomware virii
and the use of cryptographic algorithms that were used when encrypting files[Gaz10] on the user’s computer. However, the payment process of ransomware hasnot been addressed before. In addition, we observed that some of the ransomwareprograms included in our study no longer actually cryptographically encrypt files,but only block users from accessing the computer, typically be means of visually“locking” the full screen.The second trail of research deals with economical aspects of Fake A/V soft-
ware. Stone-Gross et al. [SGAK+11] show that more than 130 million dollarshave been earned in three monitored Fake A/V businesses. Furthermore, theydisclose that Fake A/V villains provide refunds in order to avoid credit cardchargebacks and possibly consumer complaints which could result in terminationby the credit card payment processor. We complement existing research by our
104
6.7 Conclusion
analysis of ransomware payment properties and by discovering a shift towardsprepay payment methods, such as ukash and paysafecard, in all four monitoredransomware campaigns.The third area of research covers clustering approaches using behavioral fea-
tures of executed malware samples. Perdisci et al. [PLF10] develop signatures forcharacteristic pattern elements in HTTP requests by means of clustering. Sim-ilarly, Rieck et al. [RSL+10] propose a system to detect malware by models ofrecurring network traffic payload invariants. Bayer et al. [BMCH+09] provide abroad overview over malware behavior using clustering to avoid skew by aggres-sively polymorphic malware. Our approach complements existing approaches bymapping visual appearance of rogue software to campaign and malware familyclusters. Especially if none of the existing approaches apply, e.g., if a sample doesnot exhibit network traffic at all, our screenshot clustering approach can still beused. Furthermore, complementary to the existing clustering methods as well asclassic A/V, our approach might help in detecting Fake A/V and ransomware.
6.7 ConclusionIn recent years, rogue software has become one of the most prevalent means ofmonetization for malware. We propose a new approach to cluster and detect roguesoftware based on its inherent need to display a user interface. Using a perceptualhash function and a hierarchical clustering on a set of 187,560 screenshot images,we successfully identified 25 campaigns, spanning Fake A/V and ransomware. Weobserved that especially rogue software suffers from very low antivirus detectionrates. Four of the five previously unseen campaigns have not been detected asmalware by the time we received the samples. While malware authors seemto succeed in evading classic antivirus signatures, our approach helps to avoidundetected rogue software. Furthermore, we have shown that our approach scalesto a large set of samples, effectively analyzing 213,671 screenshot images.Using the results of our clustering approach, we show that the two prevalent
classes of visual malware, Fake A/V and ransomware, exhibit distinct paymentmethods. While Fake A/V campaigns favor credit card payment, ransomwareprograms use prepay methods. From the perspective of ransomware miscreants,prepay payment methods provide a number of advantages. First, the prepaymethods enable ransomware campaigns to avoid cooperation with any other pay-ment companies, such as a credit card payment processor. We speculate thatsuch a dependency on payment processor companies would constitute an unpre-dictable risk. Second, prepay payment methods are easy to use and to process asthey only require one input field for the voucher code and cannot be associated toa person. Some ransomware campaigns even include detailed instructions on howand where to buy the prepay cards. Third, prepay payment allows miscreants toexploit users which do not own a credit card at all, thereby possible reaching a
105
6 Detecting Rogue Visual Malware
larger set of victims.To sum up, we have designed and implemented a large-scale clustering method
for rogue visual malware. At the same time, we provide insights into the mone-tization and localization properties of current rogue visual malware campaigns.Finally, we propose to convey our detection approach to end-user systems in orderto complement existing antivirus solutions.
106
Chapter7Conclusion
This thesis addresses the problem of identifying and recognizing remote-controlledmalware. First, in Chapter 3 we proposed Sandnet, our dynamic malware analy-sis environment, which is subsequently used to generate datasets for identificationand recognition experiments. Second, we designed and implemented a recognitionapproach of botnet C&C channels based on traffic analysis features in Chapter 4.Third, in Chapter 5, our case study on Feederbot, a bot with DNS as carrier forits C&C protocol, sheds light on a whole new class of botnets with covert C&C.Yet, our classifier of DNS traffic has proven to detect DNS-based C&C, even inmixed user traffic. Finally, in Chapter 6, we have designed and implemented adetection framework for rogue visual malware, exploiting the malware’s need toexpose a visual user interface for monetization.In the following, we will briefly summarize the results of this thesis and outline
future work on each of the topics.
7.1 SandnetWith Sandnet in Chapter 3, we have shown the importance of designing ascalable and reliable contained environment in order to study the behavior ofmalicious remote-controlled software. Based on Sandnet, we are able to compilesound datasets representing active and diverse remote-controlled malware. Thesedatasets enable us to design and evaluate malware detection methods.While contained environments like Sandnet provide the basis to understand
malware, the enormous growth in terms of MD5-distinct malware binaries risesconcerns how researchers can deal with malware in the forthcoming years. Inthe future, we also expect the diversity of malware to increase which makes itmuch more important to respect the diversity in the analysis of malware. Onetrail of research directs towards a pre-selection of representative instances perfamily, in order to avoid the re-execution of already known malware. With Fore-
107
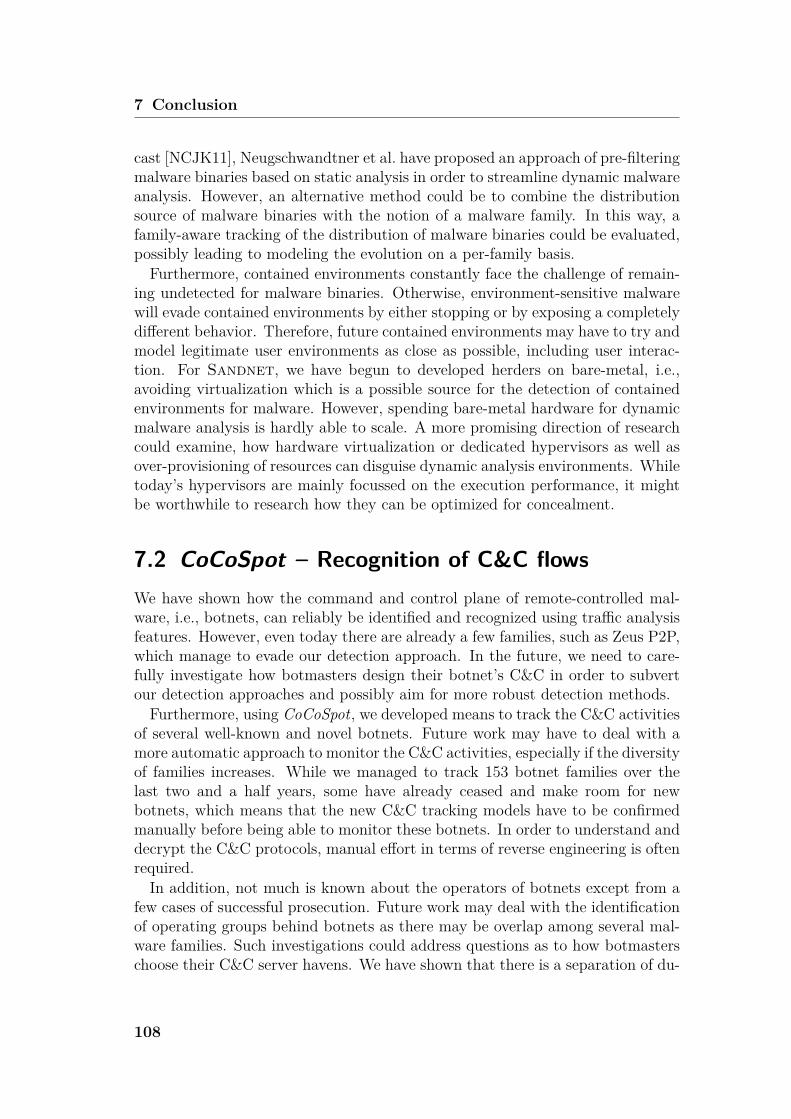
7 Conclusion
cast [NCJK11], Neugschwandtner et al. have proposed an approach of pre-filteringmalware binaries based on static analysis in order to streamline dynamic malwareanalysis. However, an alternative method could be to combine the distributionsource of malware binaries with the notion of a malware family. In this way, afamily-aware tracking of the distribution of malware binaries could be evaluated,possibly leading to modeling the evolution on a per-family basis.Furthermore, contained environments constantly face the challenge of remain-
ing undetected for malware binaries. Otherwise, environment-sensitive malwarewill evade contained environments by either stopping or by exposing a completelydifferent behavior. Therefore, future contained environments may have to try andmodel legitimate user environments as close as possible, including user interac-tion. For Sandnet, we have begun to developed herders on bare-metal, i.e.,avoiding virtualization which is a possible source for the detection of containedenvironments for malware. However, spending bare-metal hardware for dynamicmalware analysis is hardly able to scale. A more promising direction of researchcould examine, how hardware virtualization or dedicated hypervisors as well asover-provisioning of resources can disguise dynamic analysis environments. Whiletoday’s hypervisors are mainly focussed on the execution performance, it mightbe worthwhile to research how they can be optimized for concealment.
7.2 CoCoSpot – Recognition of C&C flowsWe have shown how the command and control plane of remote-controlled mal-ware, i.e., botnets, can reliably be identified and recognized using traffic analysisfeatures. However, even today there are already a few families, such as Zeus P2P,which manage to evade our detection approach. In the future, we need to care-fully investigate how botmasters design their botnet’s C&C in order to subvertour detection approaches and possibly aim for more robust detection methods.Furthermore, using CoCoSpot, we developed means to track the C&C activities
of several well-known and novel botnets. Future work may have to deal with amore automatic approach to monitor the C&C activities, especially if the diversityof families increases. While we managed to track 153 botnet families over thelast two and a half years, some have already ceased and make room for newbotnets, which means that the new C&C tracking models have to be confirmedmanually before being able to monitor these botnets. In order to understand anddecrypt the C&C protocols, manual effort in terms of reverse engineering is oftenrequired.In addition, not much is known about the operators of botnets except from a
few cases of successful prosecution. Future work may deal with the identificationof operating groups behind botnets as there may be overlap among several mal-ware families. Such investigations could address questions as to how botmasterschoose their C&C server havens. We have shown that there is a separation of du-
108
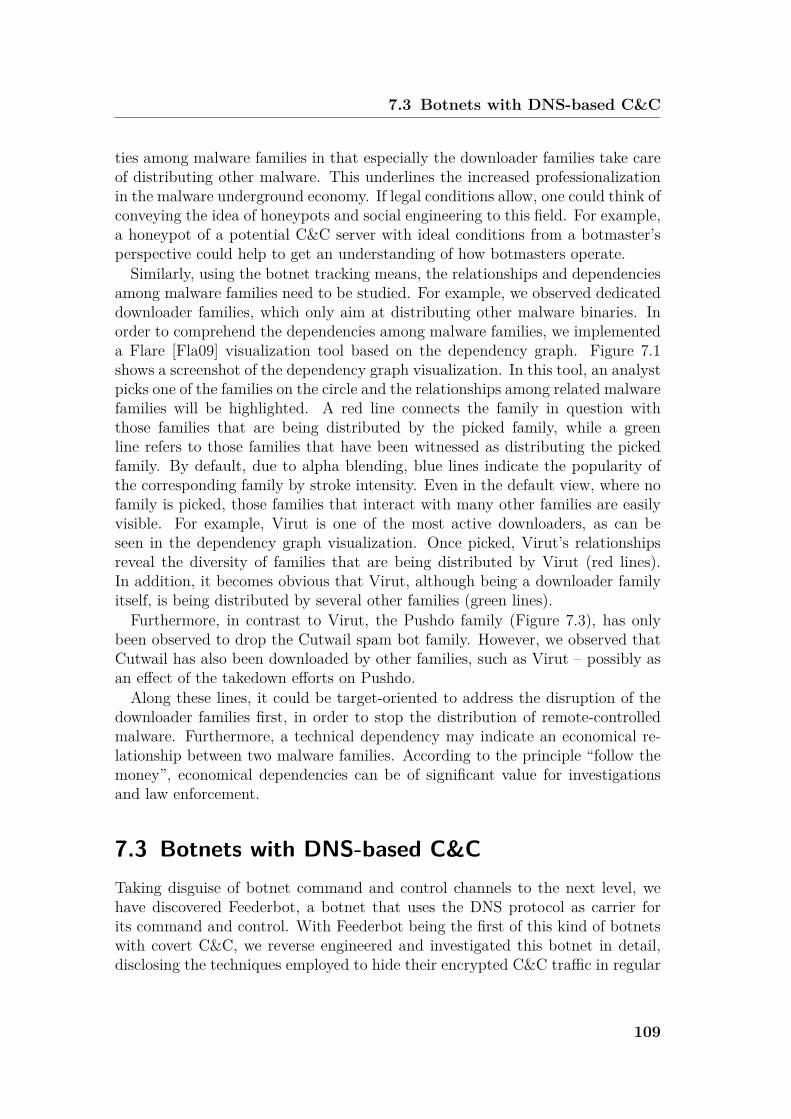
7.3 Botnets with DNS-based C&C
ties among malware families in that especially the downloader families take careof distributing other malware. This underlines the increased professionalizationin the malware underground economy. If legal conditions allow, one could think ofconveying the idea of honeypots and social engineering to this field. For example,a honeypot of a potential C&C server with ideal conditions from a botmaster’sperspective could help to get an understanding of how botmasters operate.Similarly, using the botnet tracking means, the relationships and dependencies
among malware families need to be studied. For example, we observed dedicateddownloader families, which only aim at distributing other malware binaries. Inorder to comprehend the dependencies among malware families, we implementeda Flare [Fla09] visualization tool based on the dependency graph. Figure 7.1shows a screenshot of the dependency graph visualization. In this tool, an analystpicks one of the families on the circle and the relationships among related malwarefamilies will be highlighted. A red line connects the family in question withthose families that are being distributed by the picked family, while a greenline refers to those families that have been witnessed as distributing the pickedfamily. By default, due to alpha blending, blue lines indicate the popularity ofthe corresponding family by stroke intensity. Even in the default view, where nofamily is picked, those families that interact with many other families are easilyvisible. For example, Virut is one of the most active downloaders, as can beseen in the dependency graph visualization. Once picked, Virut’s relationshipsreveal the diversity of families that are being distributed by Virut (red lines).In addition, it becomes obvious that Virut, although being a downloader familyitself, is being distributed by several other families (green lines).Furthermore, in contrast to Virut, the Pushdo family (Figure 7.3), has only
been observed to drop the Cutwail spam bot family. However, we observed thatCutwail has also been downloaded by other families, such as Virut – possibly asan effect of the takedown efforts on Pushdo.Along these lines, it could be target-oriented to address the disruption of the
downloader families first, in order to stop the distribution of remote-controlledmalware. Furthermore, a technical dependency may indicate an economical re-lationship between two malware families. According to the principle “follow themoney”, economical dependencies can be of significant value for investigationsand law enforcement.
7.3 Botnets with DNS-based C&CTaking disguise of botnet command and control channels to the next level, wehave discovered Feederbot, a botnet that uses the DNS protocol as carrier forits command and control. With Feederbot being the first of this kind of botnetswith covert C&C, we reverse engineered and investigated this botnet in detail,disclosing the techniques employed to hide their encrypted C&C traffic in regular
109

7 Conclusion
Figure 7.1: Visualization of the botnet family dependency graph
110
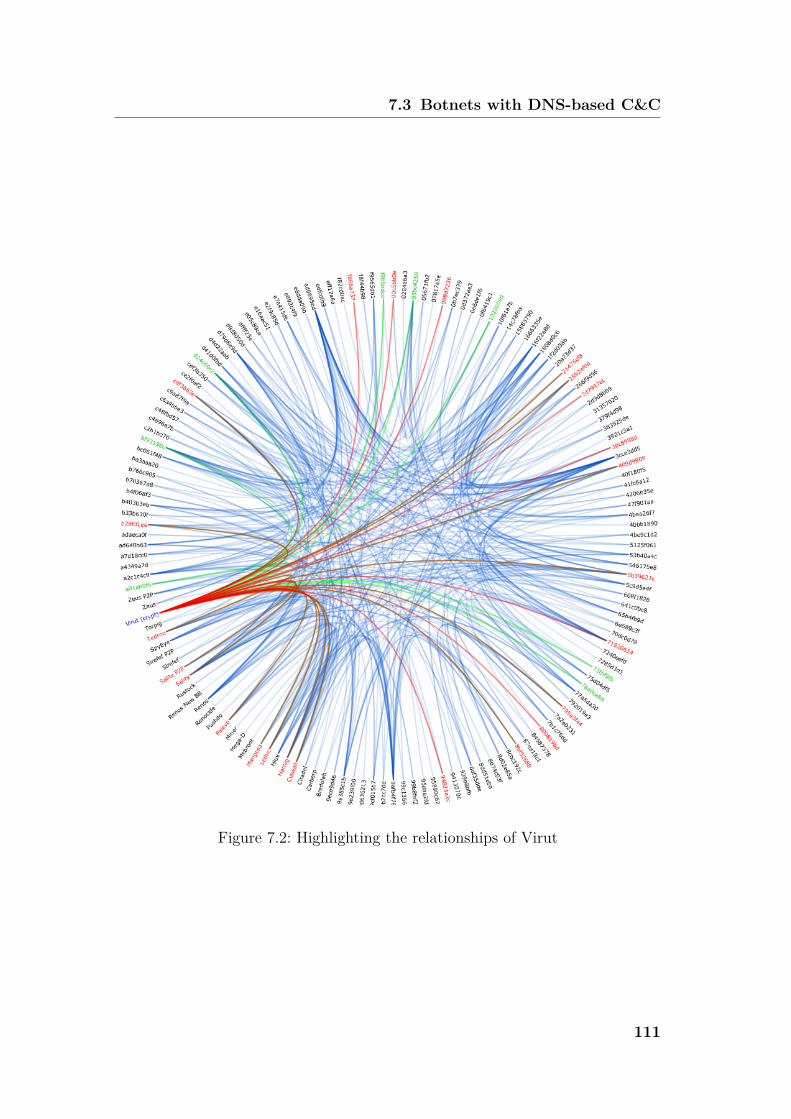
7.3 Botnets with DNS-based C&C
Figure 7.2: Highlighting the relationships of Virut
111
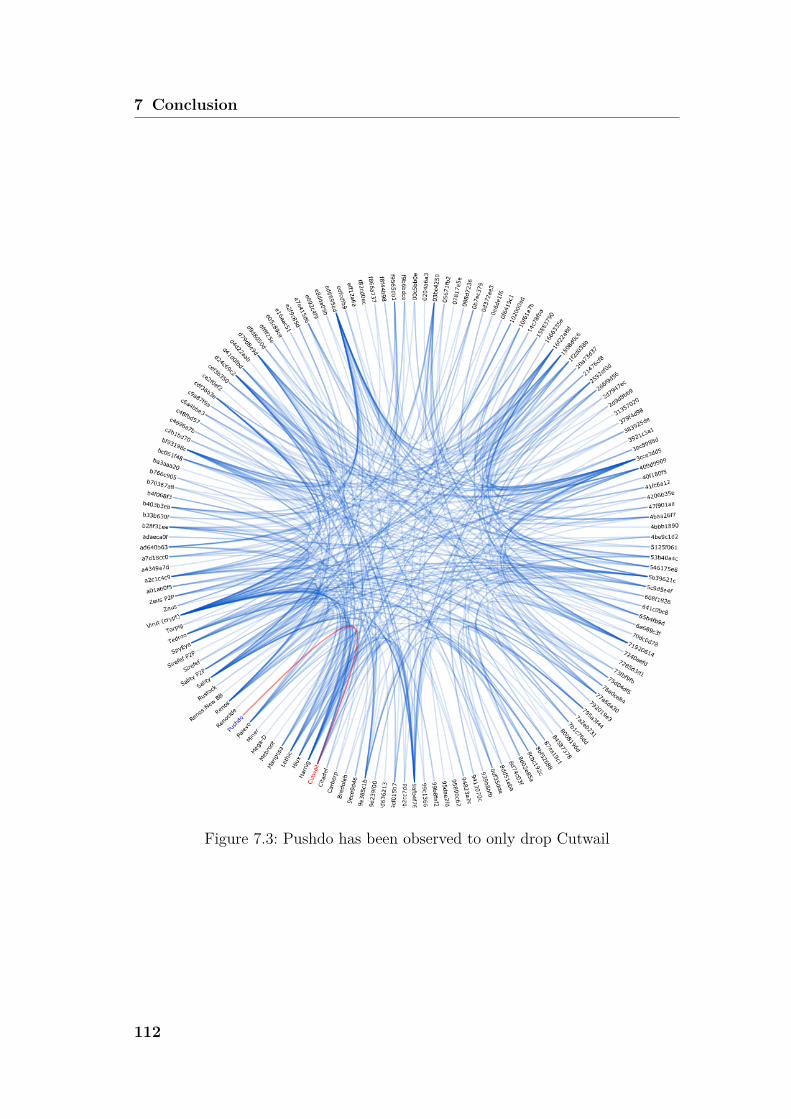
7 Conclusion
Figure 7.3: Pushdo has been observed to only drop Cutwail
112
7.4 Detection of rogue visual malware
DNS requests and responses.Furthermore, we designed and implemented a detection approach for botnets
with DNS as carrier for their command and control. Based on Sandnet data ofa time period of more than 18 months, we show in Chapter 5 that our specificallytailored method can still detect botnets that use DNS as carrier protocol forits C&C. Using our classifier, we have even discovered an independent secondbotnet that, too, builds its C&C upon the DNS protocol. Finally, we evaluateour detection methodology on mixed network traffic with benign users’ networktraffic and prove that our classifier can even be used in real-world environmentsto detect DNS-based botnets.While a whole body of research exists on detecting botnets with IRC and HTTP
as carrier for its command and control, to our knowledge, we are the first todiscover DNS-based botnets. In the future, we expect botmasters to increasinglydesign their C&C protocols to be based on different carrier protocols, in orderto evade detection. Future work could examine protocols like NTP or mediastreaming protocols for Flash as carrier protocols for botnet C&C. Similarly, asdescribed with Renos in Chapter 3, botnets could proceed in the direction ofhiding C&C messages in benign-looking contents like images or media content ingeneral.While purely network-based approaches may have reached their limits con-
cerning the detection of covert C&C channels, one approach for future work mayconsist in examining and modeling the data processing of media contents re-trieved over the network on the system level. Possibly, benign media processingsoftware exhibits a different behavior compared to malicious remote-controlledsoftware. For example, from a high-level perspective, by its very nature, visualmedia is supposed to be displayed, i.e., destined for the graphical output. How-ever, a software that downloads images, but never displays any of the retrievedimage data, may raise suspicion.
7.4 Detection of rogue visual malwareSince botnets have turned to rogue visual monetization techniques by means ofFake A/V or ransomware, this allows for a perceptual recognition. In Chapter 6,we have shown how rogue visual malware can be clustered and recognized by helpof perceptual hashing. Especially in face of the very low antivirus detection ratesof the respective malware binaries, sometimes even as low as 11% per campaign,our detection methodology may complement existing antivirus detection. As partof future work, we plan to evaluate our visual detection approach in the wild inorder to evaluate the detection performance on user systems.
113

List of Figures
1.1 Total number of MD5-distinct malware binaries per year from 1984to 2012 as measured by AV-TEST GmbH [Avt12] . . . . . . . . . 4
2.1 Centralized and distributed command and control architectures . 122.2 Clustering refines the labeled classes A and B (solid boxes) into
fine-grained subclasses (dotted ellipses). . . . . . . . . . . . . . . . 162.3 Examples for clustering results measured using precision and re-
call. Dotted ellipses symbolize the resulting clusters. . . . . . . . . 19
3.1 Sandnet Architecture . . . . . . . . . . . . . . . . . . . . . . . . 253.2 Abstract representations of network traffic as superflows, flows,
messages and frames . . . . . . . . . . . . . . . . . . . . . . . . . 273.3 Sandnet web interface’s superflows view, x-axis shows the time
since the binary is launched, y-axis shows superflow destinationendpoints . . . . . . . . . . . . . . . . . . . . . . . . . . . . . . . 30
3.4 Sandnet web interface’s message view shows the messages of aVirut plain variant’s C&C flow. . . . . . . . . . . . . . . . . . . . 31
3.5 Sandnet web interface’s message view shows the request and theparsed HTTP response of a C&C message concealed as a bitmapimage. . . . . . . . . . . . . . . . . . . . . . . . . . . . . . . . . . 32
3.6 Sandnet web interface’s message view shows the parsed HTTPresponse of a C&C message concealed by a GIF image. . . . . . . 33
3.7 Top 25 well-known botnets tracked in Sandnet. A star representsa dedicated takedown action, a thin line represents new binariesbeing spread and a thick line symbolizes periods of active C&Ccommunication. . . . . . . . . . . . . . . . . . . . . . . . . . . . . 35
3.8 C&C activity of botnets exposing Fake A/V or ransomware inSandnet. A thin line represents new binaries being spread and athick line symbolizes periods of active C&C communication. . . . 37
115
List of Figures
4.1 Migration of the Belanit C&C server’s domain from one top leveldomain to another . . . . . . . . . . . . . . . . . . . . . . . . . . 44
4.2 Migration of the Emit C&C server’s domain from one top leveldomain to another [RDB12] . . . . . . . . . . . . . . . . . . . . . 45
4.3 Migration of the Vobfus/Changeup C&C server from one originAutonomous System to another . . . . . . . . . . . . . . . . . . . 45
4.4 Overview of the C&C flow classification methodology . . . . . . . 494.5 Example extract of a dendrogram that visualizes the clustering
results, covering one Virut cluster and one Mariposa cluster and acut-off threshold of 0.115. . . . . . . . . . . . . . . . . . . . . . . 55
4.6 F-measure evaluation of the hierarchical clustering at different cut-off thresholds. . . . . . . . . . . . . . . . . . . . . . . . . . . . . . 56
4.7 Overview of the C&C flow classification performance. . . . . . . . 63
5.1 Example of Feederbot’s DNS Query Domain Name . . . . . . . . 715.2 Structure of a Feederbot DNS C&C Message Chunk . . . . . . . . 725.3 Statistical byte entropy . . . . . . . . . . . . . . . . . . . . . . . . 75
6.1 Example screenshots of rogue software . . . . . . . . . . . . . . . 866.2 Overview of the screenshot clustering methodology . . . . . . . . 886.3 Screenshot images of the Winwebsec and FakeRean malware families 896.4 Precision, recall and F-measure (β = 1/2) evaluation of the clus-
tering threshold . . . . . . . . . . . . . . . . . . . . . . . . . . . . 956.5 Campaigns of the Winwebsec malware family . . . . . . . . . . . 976.6 Dendrogram excerpt of the clustering of 1045 screenshot finger-
prints into 51 clusters with campaign labels for some large clus-ters. Black font=Fake A/V or ransomware, blue=other software,red=no characteristic appearance. . . . . . . . . . . . . . . . . . . 98
7.1 Visualization of the botnet family dependency graph . . . . . . . 1107.2 Highlighting the relationships of Virut . . . . . . . . . . . . . . . 1117.3 Pushdo has been observed to only drop Cutwail . . . . . . . . . . 112
116
List of Tables
3.1 Antivirus detection of PE binaries per botnet family for familieswith more than 100 MD5-distinct binaries. All values in percent,either using all 42 scanners or only the top six. . . . . . . . . . . . 39
4.1 Examples of message length sequences for Virut and Palevo C&Cflows . . . . . . . . . . . . . . . . . . . . . . . . . . . . . . . . . . 46
4.2 Message length sequences for Virut and Palevo C&C flows (Table4.1 extended with Carrier Protocol) . . . . . . . . . . . . . . . . . 52
4.3 Data sets of flows . . . . . . . . . . . . . . . . . . . . . . . . . . . 534.4 Examples for the average message lengths and weighting sequence
of a centroid for a cluster of four C&C flows . . . . . . . . . . . . 594.5 Clustering results of some well-known botnet families. #C: num-
ber of clusters, #S: number of singleton clusters, C&C Arch de-notes the C&C architecture (P2P=peer to peer), CP is the CarrierProtocol, Plain denotes whether the family uses a plaintext C&Cprotocol encoding; Avg QI is the average quality indicator. . . . . 60
4.6 Evaluation data sets . . . . . . . . . . . . . . . . . . . . . . . . . 63
5.1 Bot executions used to acquire Non-DNS-C&C transactions. CE=customencryption; TX=transaction. . . . . . . . . . . . . . . . . . . . . . 77
5.2 Classes to clusters comparison . . . . . . . . . . . . . . . . . . . . 78
6.1 Perceptual Hash Fingerprint Labels for 18 fake A/V and 2 ran-somware campaigns and, if available, Microsoft A/V Family Labels 92
6.2 Previously unseen campaigns and, if available, Microsoft A/V Fam-ily Labels . . . . . . . . . . . . . . . . . . . . . . . . . . . . . . . 96
6.3 A/V Detection of six Fake A/V campaigns . . . . . . . . . . . . . 996.4 Localization and monetization methods of four ransomware cam-
paigns; u=ukash, p=paysafecard . . . . . . . . . . . . . . . . . . . 101
117
List of Tables
6.5 Localization and monetization methods of 14 Fake A/V campaigns;M=months, Y=years, LL=lifelong; MC=MasterCard; All amountsin USD . . . . . . . . . . . . . . . . . . . . . . . . . . . . . . . . . 103
118
Bibliography
[abu11a] abuse.ch. AMaDa Blocklist. http://amada.abuse.ch/blocklist.php,2011.
[abu11b] abuse.ch. Palevo Tracker IP Address and Domain Blocklist. http://
amada.abuse.ch/palevotracker.php, 2011.
[abu11c] abuse.ch. SpyEye Tracker IP Address and Domain Blocklist. https:
//spyeyetracker.abuse.ch/blocklist.php, 2011.
[abu11d] abuse.ch. Zeus Tracker IP Address and Domain Blocklist. https:
//zeustracker.abuse.ch/blocklist.php, 2011.
[Ama12] Amazon Elastic Compute Cloud EC2. http://aws.amazon.com/ec2/,2012.
[Avt12] AV-Test GmbH: Total Malware per Year. http://www.av-test.org/
statistiken/malware/, 2012. Accessed: Nov 11th, 2012.
[BBR+12] Leyla Bilge, Davide Balzarotti, William Robertson, Engin Kirda, andChristopher Kruegel. DISCLOSURE: Detecting Botnet Command andControl Servers Through Large-Scale NetFlow Analysis. In Annual Com-puter Security Applications Conference, 2012.
[Ber08] Dusan Bernát. Domain name system as a memory and communicationmedium. In International Conference on Current Trends in Theory andPractice of Computer Science (SOFSEM), 2008.
[BG] Kenton Born and David Gustafson. Detecting DNS Tunnels Using Char-acter Frequency Analysis. http://arxiv.org/ftp/arxiv/papers/1004/
1004.4358.pdf.
[BHB+09] Ulrich Bayer, Imam Habibi, Davide Balzarotti, Engin Kirda, and Christo-pher Kruegel. A View on Current Malware Behaviors. In USENIX Work-shop on Large-Scale Exploits and Emergent Threats (LEET), 2009.
119
Bibliography
[BKK06] Ulrich Bayer, Christopher Kruegel, and Engin Kirda. TTAnalyze: A Toolfor Analyzing Malware. In 16th Annual EICAR Conference, Hamburg,Germany, April 2006.
[BMCH+09] Ulrich Bayer, Paolo Milani Comparetti, Clemens Hlauschek, ChristopherKruegel, and Engin Kirda. Scalable, Behavior-Based Malware Clustering.In Network and Distributed System Security Symposium (NDSS), 2009.
[BOB+10] Hamad Binsalleeh, Thomas Ormerod, Amine Boukhtouta, ProsenjitSinha, Amr M. Youssef, Mourad Debbabi, and Lingyu Wang. On theanalysis of the zeus botnet crimeware toolkit. In Conference on Privacy,Security and Trust, 2010.
[Bos12] Richard Domingues Boscovich. Microsoft Disrupts the EmergingNitol Botnet Being Spread through an Unsecure Supply Chain.http://blogs.technet.com/b/microsoft_blog/archive/2012/09/13/
microsoft-disrupts-the-emerging-nitol-botnet-being-spread-
through-an-unsecure-supply-chain.aspx, 2012.
[Bro11] Seth Bromberger. DNS as a Covert Channel Within Protected Networks,2011. http://www.oe.energy.gov/DocumentsandMedia/DNS_Exfiltration_
2011-01-01_v1.1.pdf.
[CCG+10] Chia Yuan Cho, Juan Caballero, Chris Grier, Vern Paxson, and DawnSong. Insights from the Inside: A View of Botnet Management fromInfiltration. In USENIX Workshop on Large-Scale Exploits and EmergentThreats (LEET), 2010.
[CDB09] Joan Calvet, Carlton R. Davis, and Pierre-Marc Bureau. Malware authorsdon’t learn, and that’s good! In International Conference on Maliciousand Unwanted Software (MALWARE), 2009.
[CDKL09] Julio Canto, Marc Dacier, Engin Kirda, and Corrado Leita. Large scalemalware collection: lessons learned. https://www.seclab.tuwien.ac.at/
papers/srds.pdf, 2009.
[CL07] Ken Chiang and Levi Lloyd. A case study of the rustock rootkit and spambot. In Workshop on Hot Topics in Understanding Botnets (HotBots),HotBots ’07, Berkeley, CA, USA, 2007. USENIX Association.
[CLLK07] Hyunsang Choi, Hanwoo Lee, Heejo Lee, and Hyogon Kim. Botnet De-tection by Monitoring Group Activities in DNS Traffic. In IEEE Interna-tional Conference on Computer and Information Technology (CIT), 2007.
[CLT+10] Marco Cova, Corrado Leita, Olivier Thonnard, Angelos D. Keromytis,and Marc Dacier. An Analysis of Rogue AV Campaigns. In Recent Ad-vances in Intrusion Detection, 2010.
[Cor10] Luis Corrons. Mariposa botnet. http://pandalabs.pandasecurity.com/
mariposa-botnet/, 2010.
120
Bibliography
[dGFG12] Daan de Graaf, Ahmed F.Shosha, and Pavel Gladyshev. BREDOLAB:Shopping in the Cybercrime Underworld. http://digitalfire.ucd.ie/
wp-content/uploads/2012/10/BREDOLAB-Shopping-in-the-Cybercrime-
Underworld.pdf, 2012.
[Dod06] Yadolah Dodge. The Oxford Dictionary of Statistical Terms. 2006.
[DRF+11] Christian J. Dietrich, Christian Rossow, Felix C. Freiling, Herbert Bos,Maarten van Steen, and Norbert Pohlmann. On Botnets that use DNSfor Command and Control. In Proceedings of European Conference onComputer Network Defense, 2011.
[DRP12a] Christian J. Dietrich, Christian Rossow, and Norbert Pohlmann. Co-CoSpot: Clustering and recognizing botnet command and control chan-nels using traffic analysis. In A Special Issue of Computer Networks OnBotnet Activity: Analysis, Detection and Shutdown, 2012.
[DRP12b] Christian J. Dietrich, Christian Rossow, and Norbert Pohlmann. eIDOnline Authentication Network Threat Model, Attacks and Implications.In 19th DFN Workshop 2012, 2012.
[DRP13] Christian J. Dietrich, Christian Rossow, and Norbert Pohlmann. Exploit-ing Visual Appearance to Cluster and Detect Rogue Software. In ACMSymposium On Applied Computing, 2013.
[DRSL08] Artem Dinaburg, Paul Royal, Monirul I. Sharif, and Wenke Lee. Ether:malware analysis via hardware virtualization extensions. In Peng Ning,Paul F. Syverson, and Somesh Jha, editors, ACM Conference on Com-puter and Communications Security, pages 51–62. ACM, 2008.
[Fal11] Nicolas Falliere. Sality: Story of a Peer-to-Peer Viral Network.http://www.symantec.com/content/en/us/enterprise/media/security_
response/whitepapers/sality_peer_to_peer_viral_network.pdf, 2011.
[FHW05] Felix C. Freiling, Thorsten Holz, and Georg Wicherski. Botnet track-ing: Exploring a root-cause methodology to prevent distributed denial-of-service attacks. In Sabrina De Capitani di Vimercati, Paul F. Syverson,and Dieter Gollmann, editors, European Symposium on Research in Com-puter Security (ESORICS), volume 3679 of Lecture Notes in ComputerScience, pages 319–335. Springer, 2005.
[Fla09] Flare. http://flare.prefuse.org, 2009.
[Gal11] Sean Gallagher. How the most massive botnet scam ever made millions forEstonian hackers. http://arstechnica.com/tech-policy/2011/11/how-
the-most-massive-botnet-scam-ever-made-millions-for-estonian-
hackers/, 2011.
[Gaz10] Alexandre Gazet. Comparative analysis of various ransomware virii. Jour-nal in Computer Virology, 6(1):77–90, 2010.
121
Bibliography
[GBC+12] Chris Grier, Lucas Ballard, Juan Caballero, Neha Chachra, Christian J.Dietrich, Kirill Levchenko, Panayiotis Mavrommatis, Damon McCoy, An-tonio Nappa, Andreas Pitsillidis, Niels Provos, M. Zubair Rafique, Mo-heeb Abu Rajab, Christian Rossow, Kurt Thomas, Vern Paxson, Ste-fan Savage, and Geoffrey M. Voelker. Manufacturing Compromise: TheEmergence of Exploit-as-a-Service. In Proceedings of the 19th ACM Con-ference on Computer and Communication Security, Raleigh, NC, October2012.
[GFC08] Fanglu Guo, Peter Ferrie, and Tzi-Cker Chiueh. A Study of thePacker Problem and Its Solutions. In Richard Lippmann, Engin Kirda,and Ari Trachtenberg, editors, Recent Advances in Intrusion Detection(RAID), volume 5230 of Lecture Notes in Computer Science, pages 98–115. Springer, 2008.
[GH07] Jan Goebel and Thorsten Holz. Rishi: Identify Bot Contaminated Hostsby IRC Nickname Evaluation. In USENIX Workshop on Hot Topics inUnderstanding Botnets (HotBots), 2007.
[Goo11] Google. Safe Browsing API. http://code.google.com/apis/
safebrowsing/, 2011.
[GPZL08] Guofei Gu, Roberto Perdisci, Junjie Zhang, and Wenke Lee. BotMiner:Clustering Analysis of Network Traffic for Protocol- and Structure-Independent Botnet Detection. In 17th USENIX Security Symposium,San Jose, CA, August 2008.
[GR10] Sergey Golovanov and Vyacheslav Rusakov. TDSS. http://www.
securelist.com/en/analysis/204792131/TDSS, 2010.
[GYP+09] Guofei Gu, Vinod Yegneswaran, Phillip A. Porras, Jennifer Stoll, andWenke Lee. Active botnet probing to identify obscure command andcontrol channels. In Annual Computer Security Applications Conference(ACSAC). IEEE Computer Society, 2009.
[HSD+08] Thorsten Holz, Moritz Steiner, Frederic Dahl, Ernst Biersack, and FelixFreiling. Measurements and Mitigation of Peer-to-Peer-based Botnets:A Case Study on Storm Worm. In USENIX Workshop on Large-ScaleExploits and Emergent Threats (LEET), 2008.
[IC3] Internet Crime Complaint Center IC3. Citadel Malware Delivers RevetonRansomware in Attempts to Extort Money. http://www.ic3.gov/media/
2012/120530.aspx.
[ipo11] ipoque.com. OpenDPI. http://www.opendpi.org/, 2011.
[JHKH11] Gregoire Jacob, Ralf Hund, Christopher Kruegel, and Thorsten Holz.JACKSTRAWS: Picking Command and Control Connections from BotTraffic. In USENIX Security Symposium 2011, 2011.
122
Bibliography
[KG09] Brian Kulis and Kristen Grauman. Kernelized locality-sensitive hash-ing for scalable image search. In International Conference on ComputerVision (ICCV). IEEE, 2009.
[KKL+09] Chris Kanich, Christian Kreibich, Kirill Levchenko, Brandon Enright,Geoffrey M. Voelker, Vern Paxson, and Stefan Savage. Spamalytics: anempirical analysis of spam marketing conversion. Communications of theACM, 52(9):99–107, 2009.
[KZRB11] Onur Komili, Kyle Zeeuwen, Matei Ripeanu, and Konstantin Beznosov.Stragegies for Monitoring Fake AV Distribution Networks. In Virus Bul-letin, 2011.
[Lev65] Vladimir I. Levenshtein. Binary codes capable of correcting deletions,insertions, and reversals. Doklady Akademii Nauk SSSR, 163, 1965.
[Lis09] Malware Domain List. www.malwaredomainlist.com, 2009.
[LKC11] Martina Lindorfer, Clemens Kolbitsch, and Paolo Milani Comparetti. De-tecting environment-sensitive malware. In Recent Advances in IntrusionDetection (RAID), 2011.
[LW71] Michael Levandowsky and David Winter. Distance between sets. Nature,234, 1971.
[McA12] McAfee. Threats report: Second quarter 2012. http://www.mcafee.com/
us/resources/reports/rp-quarterly-threat-q2-2012.pdf, 2012.
[MCJ07] Lorenzo Martignoni, Mihai Christodorescu, and Somesh Jha. Omniun-pack: Fast, generic, and safe unpacking of malware. In Annual ComputerSecurity Applications Conference (ACSAC), pages 431–441. IEEE Com-puter Society, 2007.
[Mic] Microsoft Security - Watch out for fake virus alerts. http://www.
microsoft.com/security/pc-security/antivirus-rogue.aspx.
[mon12] Green Dot Corporation - MoneyPak, 2012. https://www.moneypak.com.
[Mus09] Atif Mushtaq. Smashing the Mega-D/Ozdok botnet in 24 hours. http:
//blog.fireeye.com/research/2009/11/smashing-the-ozdok.html, 2009.
[Mus12] Atif Mushtaq. Grum, world’s third-largest botnet, knockeddown. http://blog.fireeye.com/research/2012/07/grum-botnet-no-
longer-safe-havens.html, 2012.
[Naz] Jose Nazario. BlackEnergy DDoS Bot Analysis. http://sites.google.
com/site/evelynnjou/BlackEnergyDDoSBotAnalysis.pdf.
[NCJK11] Matthias Neugschwandtner, Paolo Milani Comparetti, Grégoire Jacob,and Christopher Kruegel. Forecast: skimming off the malware cream. InAnnual Computer Security Applications Conference, pages 11–20, 2011.
123
Bibliography
[NMH+10] Shishir Nagaraja, Prateek Mittal, Chi-Yao Hong, Matthew Caesar, andNikita Borisov. Botgrep: Finding p2p bots with structured graph analysis.In USENIX Security Symposium, pages 95–110. USENIX Association,2010.
[Onl09] BBC News Online. Clock ticking on worm attack code. http://news.bbc.co.uk/2/hi/technology/7832652.stm, 2009.
[pay12] paysafecard, 2012. http://www.paysafecard.com.
[PGP12] Daniel Plohmann and Elmar Gerhards-Padilla. A Case Study on theMiner Botnet. In 4th International Conference on Cyber Conflict (Cy-Con’2012), Tallinn, Estonia, 2012.
[Phi11] PhishTank. Phish Archive. http://www.phishtank.com/, 2011.
[PLF10] Roberto Perdisci, Wenke Lee, and Nick Feamster. Behavioral Clusteringof HTTP-Based Malware and Signature Generation Using Malicious Net-work Traces. In USENIX Symposium on Networked Systems Design andImplementation (NSDI), 2010.
[Rad11] Marian Radu. Win32/Renocide, the aftermath. http://blogs.technet.
com/b/mmpc/archive/2011/03/16/win32-renocide-the-aftermath.aspx,2011.
[RBM+10] Moheeb Abu Rajab, Lucas Ballard, Panayiotis Mavrommatis, NielsProvos, and Xin Zhao. The Nocebo Effect on theWeb: An Analysisof Fake Anti-Virus Distribution. In USENIX Workshop on Large-ScaleExploits and Emergent Threats (LEET), 2010.
[RDB+11] Christian Rossow, Christian J. Dietrich, Herbert Bos, Lorenzo Cavallaro,Maarten van Steen, Felix C. Freiling, and Norbert Pohlmann. Sand-net: Network traffic analysis of malicious software. In Building AnalysisDatasets and Gathering Experience Returns for Security, 2011.
[RDB12] Christian Rossow, Christian J. Dietrich, and Herbert Bos. Large-ScaleAnalysis of Malware Downloaders . In Proceedings of the 9th Confer-ence on Detection of Intrusions and Malware & Vulnerability Assessment(DIMVA ’12) , Heraklion, Greece, July 2012.
[RDK+12] Christian Rossow, Christian J. Dietrich, Christian Kreibich, Chris Grier,Vern Paxson, Norbert Pohlmann, Herbert Bos, and Maarten van Steen.Prudent Practices for Designing Malware Experiments: Status Quo andOutlook. In Proceedings of the 33rd IEEE Symposium on Security andPrivacy (S&P), San Francisco, CA, May 2012.
[Reg09] The Register. Royal Navy warships lose email in virus in-fection. http://www.theregister.co.uk/2009/01/15/royal_navy_email_
virus_outage/, 2009.
124
Bibliography
[Rie09] Konrad Rieck. Machine learning for application-layer intrusion detection.PhD thesis, 2009.
[ROL+10] Marco Riccardi, David Oro, Jesus Luna, Marco Cremonini, and MarcVilanova. A Framework For Financial Botnet Analysis. In eCrime Re-searchers Summit, 2010.
[RSL+10] Konrad Rieck, Guido Schwenk, Tobias Limmer, Thorsten Holz, and PavelLaskov. Botzilla: Detecting the “Phoning Home” of Malicious Software.In ACM Symposium On Applied Computing, 2010.
[SBBD10] Prosenjit Sinha, Amine Boukhtouta, Victor Heber Belarde, and MouradDebbabi. Insights from the analysis of the mariposa botnet. In CRiSIS,pages 1–9. IEEE, 2010.
[SCC+09] Brett Stone-Gross, Marco Cova, Lorenzo Cavallaro, Bob Gilbert, MartinSzydlowski, Richard Kemmerer, Christopher Kruegel, and Giovanni Vi-gna. Your Botnet is My Botnet: Analysis of a Botnet Takeover. In ACMConference on Computer and Communications Security, 2009.
[SEB12] Aditya K. Sooda, Richard J. Enbodya, and Rohit Bansal. Dissecting Spy-Eye – Understanding the design of third generation botnets. In A SpecialIssue of Computer Networks On Botnet Activity: Analysis, Detection andShutdown, 2012.
[SGAK+11] Brett Stone-Gross, Ryan Abman, Richard A. Kemmerer, ChristopherKruegel, Douglas G. Steigerwald, and Giovanni Vigna. The UndergroundEconomy of Fake Antivirus Software. In 10th Workshop on Economics ofInformation Security (WEIS), 2011.
[SGE+09] Ben Stock, Jan Göbel, Markus Engelberth, Felix C. Freiling, and ThorstenHolz. Walowdac – Analysis of a Peer-to-Peer Botnet. In European Con-ference on Computer Network Defense (EC2ND), pages 13–20, November2009.
[SGHSV11] Brett Stone-Gross, Thorsten Holz, Gianluca Stringhini, and Giovanni Vi-gna. The Underground Economy of Spam: A Botmaster’s Perspective ofCoordinating Large-Scale Spam Campaigns. In USENIX Workshop onLarge-Scale Exploits and Emergent Threats (LEET), 2011.
[SGKA+09] Brett Stone-Gross, Christopher Kruegel, Kevin Almeroth, AndreasMoser, and Engin Kirda. FIRE: FInding Rogue nEtworks. In AnnualComputer Security Applications Conference (ACSAC), 2009.
[SGRL12] Seungwon Shin, Guofei Gu, Narasimha Reddy, and Christopher P. Lee.A large-scale empirical study of conficker. IEEE Transactions on Infor-mation Forensics and Security, 7(2):676–690, 2012.
125
Bibliography
[SHSG+11] Gianluca Stringhini, Thorsten Holz, Brett Stone-Gross, ChristopherKruegel, and Giovanni Vigna. BOTMAGNIFIER: Locating Spambotson the Internet. In USENIX Security Symposium. USENIX Association,2011.
[SLWL08] W. Timothy Strayer, David E. Lapsley, Robert Walsh, and Carl Livadas.Botnet detection based on network behavior. In Advances in InformationSecurity: Botnet Detection, pages 1–24. 2008.
[Spa11] Spamhaus. XBL. http://www.spamhaus.org/xbl/, 2011.
[Sto74] M. Stone. Cross-Validatory Choice and Assessment of Statistical Predic-tions. Journal of the Royal Statistical Society. Series B (Methodological),36(2):111–147, 1974.
[Tel09] The Telegraph. French fighter planes grounded by computer virus.http://www.telegraph.co.uk/news/worldnews/europe/france/4547649/
French-fighter-planes-grounded-by-computer-virus.html, 2009.
[Thr11] Emerging Threats. Snort Ruleset. http://www.emergingthreats.net/,2011.
[TN10] Kurt Thomas and David M. Nicol. The Koobface Botnet and the Riseof Social Malware. In 5th International Conference on Malicious andUnwanted Software (MALWARE) 2010, 2010.
[uka12] uKash, 2012. http://www.ukash.com.
[UPI09] UPI. Virus strikes 19 million PCs. http://www.upi.com/Top_News/2009/
01/25/Virus_strikes_15_million_PCs/UPI-19421232924206, 2009.
[Vap95] Vladimir N. Vapnik. The nature of statistical learning theory. Springer-Verlag New York, Inc., New York, NY, USA, 1995.
[Vil10] Nart Villeneuve. Koobface: Inside a crimeware network, 2010.
[vir12] Hispasec Sistemas - VirusTotal, 2012. http://www.virustotal.com/.
[vR79] C. J. van Rijsbergen. Information Retrieval. Butterworth, London, 1979.
[Wer11a] Tillmann Werner. Botnet Shutdown Success Story: How Kaspersky LabDisabled the Hlux/Kelihos Botnet. http://goo.gl/SznzF, 2011.
[Wer11b] Tillmann Werner. The Miner Botnet: Bitcoin Mining Goes Peer-To-Peer.http://goo.gl/NSXnl, 2011.
[WHF07] Carsten Willems, Thorsten Holz, and Felix C. Freiling. Toward Auto-mated Dynamic Malware Analysis Using CWSandbox. IEEE Security &Privacy, 5(2):32–39, 2007.
126
Bibliography
[Wil10] Jeff Williams. Bredolab Takedown, Another Win for Collabora-tion. http://blogs.technet.com/b/mmpc/archive/2010/10/26/bredolab-
takedown-another-win-for-collaboration.aspx, 2010.
[Wil11] Jeff Williams. Operation b107 – Rustock Botnet Takedown.http://blogs.technet.com/b/mmpc/archive/2011/03/18/operation-
b107-rustock-botnet-takedown.aspx, 2011.
[Zau10] Christoph Zauner. Implementation and Benchmarking of Perceptual HashFunctions. Master’s thesis, Upper Austria University of Applied Sciences,Hagenberg Campus, 2010.
127


![Blind Source Separation for Speaker Recognition Systemsmediatum.ub.tum.de/doc/1206598/266299.pdf · Christoph Kozielski, Online speaker recognition for teleconferencing systems [14]:](https://img.pdfslide.org/doc/110x75/602f905ec0c8f973e32a8714/blind-source-separation-for-speaker-recognition-christoph-kozielski-online-speaker.jpg)