Embed Size (px)
Citation preview
© 2013 WILEY-VCH Verlag GmbH & Co. KGaA, Weinheim
www.pss-rapid.com
ps
s
Phys. Status Solidi RRL 7, No. 12, 1084–1088 (2013) / DOI 10.1002/pssr.201308085
Impact of molecular tilt angle
on the absorption spectra
of pentacene:perfluoropentacene blends
K. Broch1, C. Bürker
1, J. Dieterle
1, S. Krause
2, A. Gerlach
*, 1, and F. Schreiber
1
1 Universität Tübingen, Institut für Angewandte Physik und LISA +, Auf der Morgenstelle 10, 72076 Tübingen, Germany 2 BESSY II, Albert-Einstein-Str. 15, 12489 Berlin, Germany
Received 18 July 2013, revised 4 September 2013, accepted 4 September 2013
Published online 13 September 2013
Keywords pentacene, perfluoropentacene, blends, optical spectroscopy, NEXAFS, dielectric function
* Corresponding author: e-mail [email protected], Phone: +49 70712973362
© 2013 WILEY-VCH Verlag GmbH & Co. KGaA, Weinheim
1 Introduction The optical properties of organic semiconductor (OSC) thin films are crucial for many de-vice applications [1–3]. However, for complex systems such as blends consisting of donor-acceptor pairs with strong intermolecular interactions, they are not yet under-stood. Apart from possible charge-transfer processes, the short and long range order within the film and the molecu-lar arrangement (including the molecular tilt angle) are known to affect the optical properties [3–10]. For a better understanding of these effects, experiments elucidating the molecular arrangement within the film are mandatory, such as near-edge X-ray absorption fine-structure spectroscopy (NEXAFS) [11–14], which is a well-established technique to investigate the ensemble averaged molecular tilt angle in thin films. Blends of the prototypical organic semiconduc-tor pentacene (PEN, C22H14) [15–18] and its perfluorinated counterpart perfluoropentacene (PFP, C22F14) [18–24] are a model system for a donor-acceptor complex [25–27] and exhibit strong intermolecular interactions, including charge-transfer upon excitation [9, 10]. For an equimolar mixing ratio, these two compounds mix on a molecular level and form a crystal structure with different unit cell parameters [23, 27]. Using X-ray diffraction it was found that there are domains with two orientations observable in
PFP:PEN blends, one with molecules standing nearly up-right on the substrate surface (σ-orientation) and one with molecules lying nearly parallel on the substrate (λ-orientation). The amount of molecules in these two ori-entations changes with the preparation temperature [27]. So far, no quantitative value for the tilt angle of the mole-cules in the two different orientations was determined, which is of interest not only for a detailed understanding of the optical properties and intermolecular interactions, but may also contribute to attempts to solve the full crystal structure of this complex system, including the orientation of the molecules in the unit cell, as well as to rationalise the optical anisotropy.
In this Letter, we determine the average molecular tilt angle in equimolar blends of PFP and PEN using NEXAFS. The uniaxial anisotropic optical properties of the mixed thin films are investigated using variable angle spectro-scopic ellipsometry (VASE) and differential reflectance spectroscopy (DRS) post growth and in real-time during growth. With the results of our NEXAFS experiments we are able to assign peaks in specific spectral regions of the absorption spectra in the visible range to the response of molecules in lying down (λ) and standing up (σ) orien-tation. Furthermore, following the film growth in real-
We investigate the relation between the optical properties and
the average molecular tilt angle for blends of pentacene and
perfluoropentacene, which can be considered as a prototypi-
cal donor–acceptor complex. Combining near-edge X-ray ab-
sorption fine-structure spectroscopy and optical spectroscopy
we study thin films of these compounds prepared at three dif-
ferent substrate temperatures sub.T For sub 180 KT = we ob-
serve a larger average tilt angle than for blends prepared at
higher substrate temperatures. This orientational change has
significant impact on the uniaxial anisotropic optical proper-
ties of the mixed films which we measure post growth as well
as in real-time during growth.
Phys. Status Solidi RRL 7, No. 12 (2013) 1085
www.pss-rapid.com © 2013 WILEY-VCH Verlag GmbH & Co. KGaA, Weinheim
Rapid
Research Letter
time using optical spectroscopy we observe pronounced changes in the relative intensity of specific peaks in the absorption spectra of the equimolar blends indicating thickness dependent changes in the average molecular tilt angle.
2 Experimental Equimolar mixtures of PEN (pur-
chased from Sigma Aldrich, 99.9% purity) and PFP (pur-chased from Kanto Denka Kogyo Co., 99% purity) in thin films with thicknesses 20 25 nmd = - were prepared by organic molecular beam deposition (OMBD) similar to Refs. [10, 27] at a base pressure of 102 10 mbar-¥ on a sili-con substrate covered with a native oxide layer (NativeSi,
xSiO 2 nm).d = Three different substrate temperatures subT (180 K, 300 K, and 330 K) were chosen, as the nucleation of the λ-orientation is expected to be most pronounced for low substrate temperatures, while with increasing prepara-tion temperature more molecules in σ-orientation and fewer molecules in λ-orientation are found [27]. On the different samples the average molecular tilt angle was de-termined by measuring NEXAFS around the K-egdes of carbon and fluorine, respectively, at the Optics beamline PM4 using the SurICat endstation at BESSY II (HZB, Germany). Four angles of incidence (AOI) Θ relative to the substrate surface were chosen (30°, 50°, 70° and 90°). As reference a Au(111) single crystal was measured and the mirror current was recorded to correct for fluctuations in the beam intensity. A comparable set of samples was prepared simultaneously on two silicon substrates covered with oxide layers of different thickness
xSiOd (ThermSi,
xSiO 147 nmd = and NativeSi) and the optical properties were investigated post growth by variable angle spectro-scopic ellipsometry (VASE) in the energy range from 1.4 eV to 3 eV performing a multi-sample analysis [28]. In the visible spectral range the samples exhibit uniaxial opti-cal anisotropy [10], i.e. their optical properties can be de-scribed by two dielectric functions 1 2j j ji, ,= +ε ε ε ( ),j xy z= , where xy (z) denotes the direction parallel (per-pendicular) to the substrate surface. During the NEXAFS and VASE measurements the sample temperature was kept constant at 300 K. Finally, on a third set of samples grown on glass substrates, 2 ( )xy E,ε was studied in real-time during growth using differential reflectance spectroscopy (DRS) [29–31] in the energy range from 1.4 eV to 3 eV.
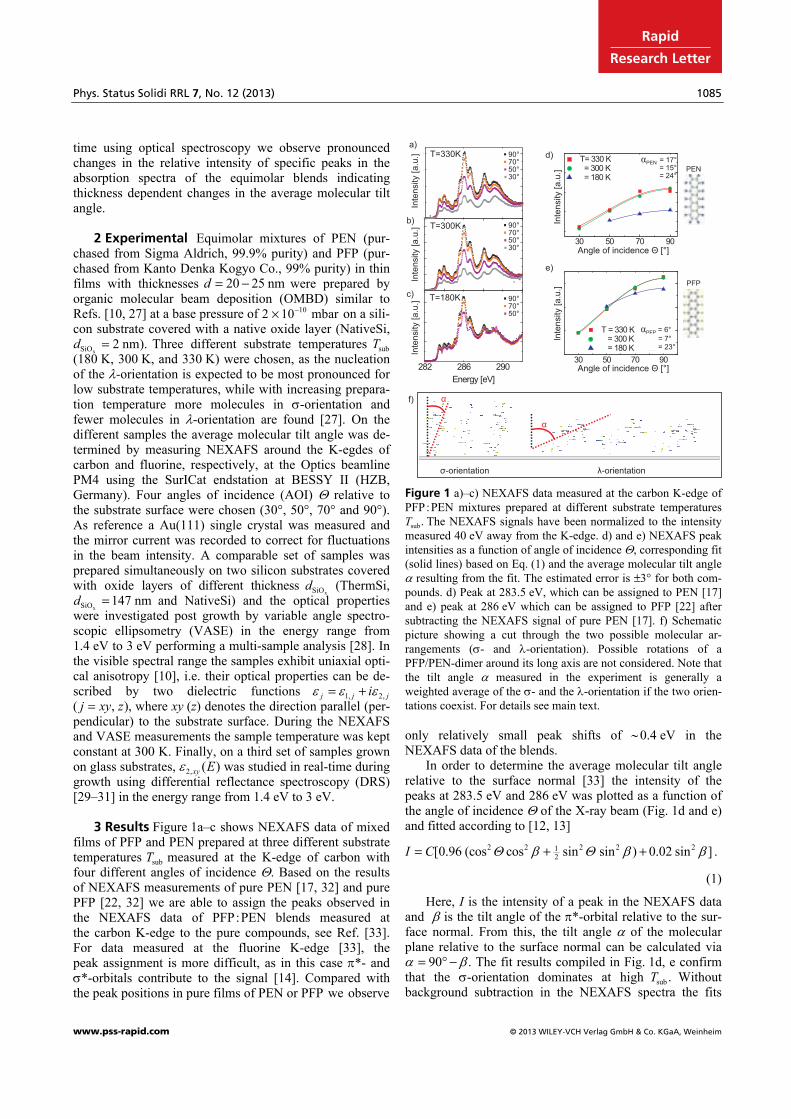
3 Results Figure 1a–c shows NEXAFS data of mixed
films of PFP and PEN prepared at three different substrate temperatures subT measured at the K-edge of carbon with four different angles of incidence Θ. Based on the results of NEXAFS measurements of pure PEN [17, 32] and pure PFP [22, 32] we are able to assign the peaks observed in the NEXAFS data of PFP:PEN blends measured at the carbon K-edge to the pure compounds, see Ref. [33]. For data measured at the fluorine K-edge [33], the peak assignment is more difficult, as in this case π*- and σ*-orbitals contribute to the signal [14]. Compared with the peak positions in pure films of PEN or PFP we observe
0.0
0.5
1.0
1.5
2.0
Intensity[a.u.]
0.0
0.5
1.0
1.5
2.0
Intensity[a.u.]
282 286 290
0.5
1.0
1.5
Intensity[a.u.]
Energy [eV]
a)
b)
c)
Intensity[a.u.]
Intensity[a.u.]
Intensity[a.u.]
T=300K
T=330K
T=180K
90°70°50°30°
90°70°50°30°
90°70°50°
d)
PEN
PFP
e)
f)
30 50 70 90
T= 330 K= 300 K= 180 K
Intensity[a.u.]
Intensity[a.u.]
Angle of incidence [°]Θ
αPEN = 17°αPEN = 15°αPEN = 24°
αPFP = 6°αPFP = 7°αPFP = 23°
Angle of incidence [°]Θ
σ-orientation λ-orientation
α
α
30 50 70 90
T = 330 K= 300 K= 180 K
Figure 1 a)–c) NEXAFS data measured at the carbon K-edge of
PFP:PEN mixtures prepared at different substrate temperatures
sub.T The NEXAFS signals have been normalized to the intensity
measured 40 eV away from the K-edge. d) and e) NEXAFS peak
intensities as a function of angle of incidence Θ, corresponding fit
(solid lines) based on Eq. (1) and the average molecular tilt angle α resulting from the fit. The estimated error is 3± ∞ for both com-
pounds. d) Peak at 283.5 eV, which can be assigned to PEN [17]
and e) peak at 286 eV which can be assigned to PFP [22] after
subtracting the NEXAFS signal of pure PEN [17]. f) Schematic
picture showing a cut through the two possible molecular ar-
rangements (σ- and λ-orientation). Possible rotations of a
PFP/PEN-dimer around its long axis are not considered. Note that
the tilt angle α measured in the experiment is generally a
weighted average of the σ- and the λ-orientation if the two orien-
tations coexist. For details see main text.
only relatively small peak shifts of ∼0.4 eV in the NEXAFS data of the blends.
In order to determine the average molecular tilt angle relative to the surface normal [33] the intensity of the peaks at 283.5 eV and 286 eV was plotted as a function of the angle of incidence Θ of the X-ray beam (Fig. 1d and e) and fitted according to [12, 13]
2 2 2 2 212
[0 96 (cos cos sin sin ) 0 02 sin ] .I C= . + + .Θ β Θ β β
(1)
Here, I is the intensity of a peak in the NEXAFS data and β is the tilt angle of the π*-orbital relative to the sur-face normal. From this, the tilt angle α of the molecular plane relative to the surface normal can be calculated via
90 .α β= ∞ - The fit results compiled in Fig. 1d, e confirm that the σ-orientation dominates at high sub .T Without background subtraction in the NEXAFS spectra the fits
1086 K. Broch et al.: Tilt angle dependent absorption spectra of PFP:PEN blends
© 2013 WILEY-VCH Verlag GmbH & Co. KGaA, Weinheim www.pss-rapid.com
statu
s
solid
i
ph
ysi
ca rrl
would yield for a given temperature subT similar values of the average tilt angle for both compounds. For PFP, a sub-traction of the NEXAFS signal of pure PEN [17, 33] re-sults in a quantitative change for the values of the average tilt angle in the samples prepared at 300 K and 330 K, see Fig. 1e. We note that a more elaborate analysis, taking pos-sible effects of intermolecular interactions on the NEXAFS signal of the blend into account, would require detailed theoretical calculations and is beyond the scope of this work. For the sample prepared at 180 K we find 24α ª ∞ for both compounds, which is significantly larger than the value for higher substrate temperatures. This confirms that in films prepared at low substrate temperatures more mole-cules are in the λ-orientation, which is consistent with the trend observed in X-ray diffraction experiments [27]. In Ref. [27] the out-of-plane lattice spacing d^ for the σ- and the λ-orientation was determined, which allows to estimate a minimum molecular tilt angle relative to the surface normal of ∼17° for the σ-orientation, in good agreement with the results of our NEXAFS experiments, and ∼66° for the λ-orientation. Based on these values an upper limit for the fraction λx of molecules in the λ-orientation in the sample prepared at sub 180 KT = can be calculated. For sim-plicity, we use for the average tilt angle σα the average of the results obtained for PEN and PFP, i.e. σ 12 .ª ∞α As-suming further that the average tilt angle of the molecules in the λ-orientation is 66°, the fraction λx can be estimated according to σ λ λ λ(1 ) ,x x= - +α α α with α being the aver-age molecular tilt angle. This rough estimate yields
λ 20%.x ª Since the actual tilt angle λα in the sample may be larger than 66°, 20% is an upper limit for λx in the sam-ple prepared at sub 180 K.T =
We investigated the influence of the molecular tilt an-gle on the optical properties of the mixtures by performing a multi-sample analysis [28] on a comparable set of sam-ples. For a complete characterisation of the temperature dependent optical properties of PFP:PEN blends we de-termined the optical anisotropy of the samples in the visi-ble spectral range. In agreement with the results of struc-tural investigations [27] we found uniaxial anisotropic op-tical properties, which can be described by two complex dielectric functions ( )j Eε with j xy= ( )j z= describing the optical properties parallel (perpendicular) to the sub-strate surface. In the following we will concentrate on
a)
CTε,xy
2
1.4 1.8 2.2 2.6 3.00.0
0.2
0.4
0.6
Energy [eV]
T=330KT=300KT=180K
σ
λ
1.4 1.8 2.2 2.6 3.00.0
0.4
0.8
1.2
1.6T=330KT=300KT=180K
b)
ε,z
2
λ
σ
Energy [eV]
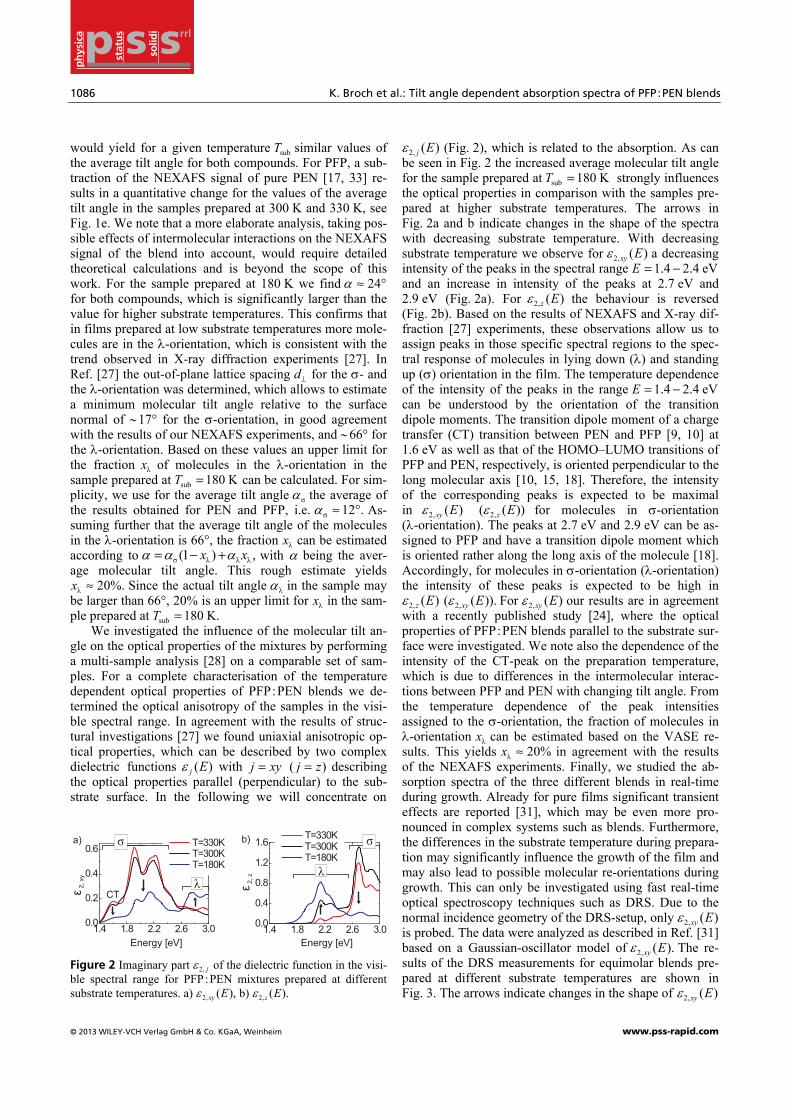
Figure 2 Imaginary part 2 jε , of the dielectric function in the visi-
ble spectral range for PFP:PEN mixtures prepared at different
substrate temperatures. a) 2 ( ),xy E,ε b) 2 ( ).z Eε ,
2 ( )j E,ε (Fig. 2), which is related to the absorption. As can be seen in Fig. 2 the increased average molecular tilt angle for the sample prepared at sub 180 KT = strongly influences the optical properties in comparison with the samples pre-pared at higher substrate temperatures. The arrows in Fig. 2a and b indicate changes in the shape of the spectra with decreasing substrate temperature. With decreasing substrate temperature we observe for 2 ( )xy E,ε a decreasing intensity of the peaks in the spectral range 1 4 2 4 eVE = . - . and an increase in intensity of the peaks at 2.7 eV and 2.9 eV (Fig. 2a). For 2 ( )z E,ε the behaviour is reversed (Fig. 2b). Based on the results of NEXAFS and X-ray dif-fraction [27] experiments, these observations allow us to assign peaks in those specific spectral regions to the spec-tral response of molecules in lying down (λ) and standing up (σ) orientation in the film. The temperature dependence of the intensity of the peaks in the range 1 4 2 4 eVE = . - . can be understood by the orientation of the transition dipole moments. The transition dipole moment of a charge transfer (CT) transition between PEN and PFP [9, 10] at 1.6 eV as well as that of the HOMO–LUMO transitions of PFP and PEN, respectively, is oriented perpendicular to the long molecular axis [10, 15, 18]. Therefore, the intensity of the corresponding peaks is expected to be maximal in 2 ( )xy E,ε 2( ( ))z Eε , for molecules in σ-orientation (λ-orientation). The peaks at 2.7 eV and 2.9 eV can be as-signed to PFP and have a transition dipole moment which is oriented rather along the long axis of the molecule [18]. Accordingly, for molecules in σ-orientation (λ-orientation) the intensity of these peaks is expected to be high in
2 ( )z E,ε 2( ( )).xy Eε , For 2 ( )xy E,ε our results are in agreement with a recently published study [24], where the optical properties of PFP:PEN blends parallel to the substrate sur-face were investigated. We note also the dependence of the intensity of the CT-peak on the preparation temperature, which is due to differences in the intermolecular interac-tions between PFP and PEN with changing tilt angle. From the temperature dependence of the peak intensities assigned to the σ-orientation, the fraction of molecules in λ-orientation λx can be estimated based on the VASE re-sults. This yields λ 20%x ª in agreement with the results of the NEXAFS experiments. Finally, we studied the ab-sorption spectra of the three different blends in real-time during growth. Already for pure films significant transient effects are reported [31], which may be even more pro-nounced in complex systems such as blends. Furthermore, the differences in the substrate temperature during prepara-tion may significantly influence the growth of the film and may also lead to possible molecular re-orientations during growth. This can only be investigated using fast real-time optical spectroscopy techniques such as DRS. Due to the normal incidence geometry of the DRS-setup, only 2 ( )xy E,ε is probed. The data were analyzed as described in Ref. [31] based on a Gaussian-oscillator model of 2 ( ).xy Eε , The re-sults of the DRS measurements for equimolar blends pre-pared at different substrate temperatures are shown in Fig. 3. The arrows indicate changes in the shape of 2 ( )xy E,ε
Phys. Status Solidi RRL 7, No. 12 (2013) 1087
www.pss-rapid.com © 2013 WILEY-VCH Verlag GmbH & Co. KGaA, Weinheim
Rapid
Research Letter
a)
1.4 1.8 2.2 2.6 3.00.0
0.2
0.4
0.6
Energy [eV]
d=1.6 nm+1.6nm / spectrum
d=19.2 nm
T=330 K
1.4 1.8 2.2 2.6 3.00.0
0.2
0.4
0.6
Energy [eV]
d=1.6 nm+1.6nm / spectrum
d=19.2 nm
T=300 Kb)
#8
#4
Film thickness [nm]
I[a.u.]
I[a.u.]
0 4 8 1 2 1 6 2 0
c)
ε2,xy
T=180 K
1.4 1.8 2.2 2.6 3.00.0
0.2
0.4
0.6
Energy [eV]
d=1.6 nm+1.6nm / spectrum
d=19.2 nm
c1)
1.4 2.2 3.00.0
0.2
0.4
0.6
Intensity
Energy [eV]
2.2 3.0
Energy [eV]
#4#8#8
#4d=1.6nm
I
d=19.2nmc2)
Energy [eV] Energy [eV]
ε2,xy
ε2,xy
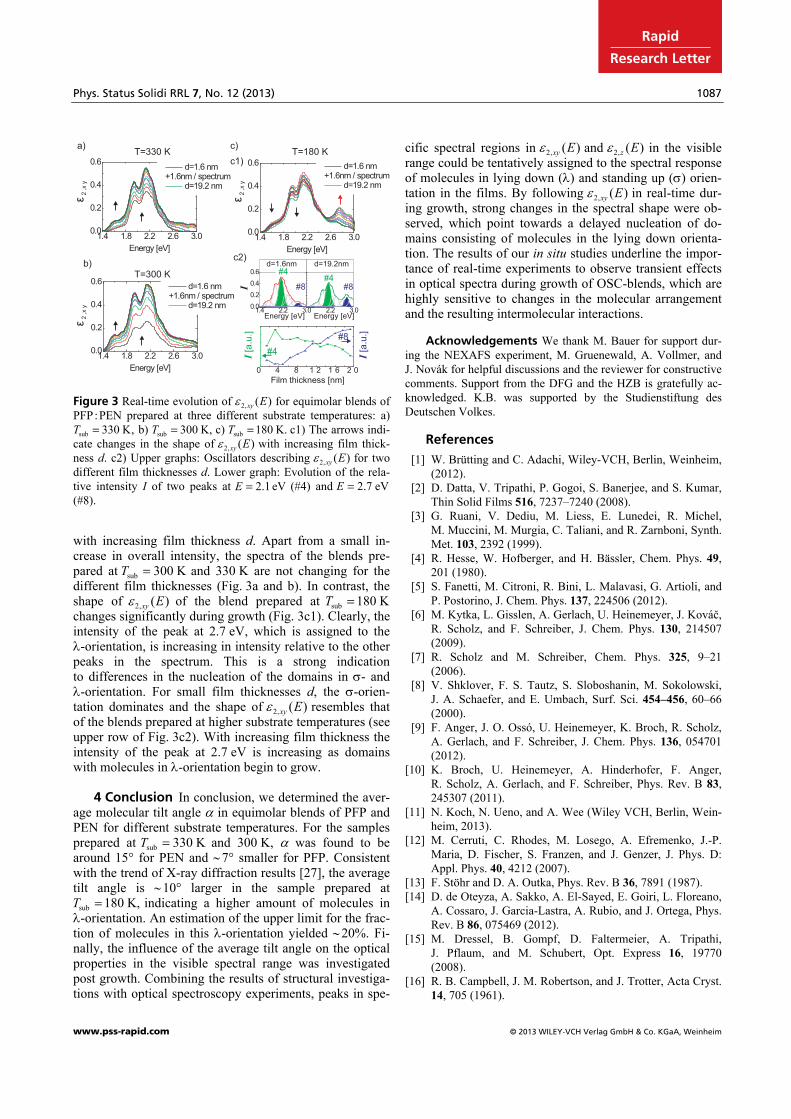
Figure 3 Real-time evolution of 2 ( )xy Eε , for equimolar blends of
PFP:PEN prepared at three different substrate temperatures: a)
sub 330 K,T = b) sub 300 K,T = c) sub 180 K.T = c1) The arrows indi-
cate changes in the shape of 2 ( )xy Eε , with increasing film thick-
ness d. c2) Upper graphs: Oscillators describing 2 ( )xy Eε , for two
different film thicknesses d. Lower graph: Evolution of the rela-
tive intensity I of two peaks at 2 1 eVE = . (#4) and 2 7 eVE = .
(#8).
with increasing film thickness d. Apart from a small in-crease in overall intensity, the spectra of the blends pre-pared at sub 300 KT = and 330 K are not changing for the different film thicknesses (Fig. 3a and b). In contrast, the shape of 2 ( )xy E,ε of the blend prepared at sub 180 KT = changes significantly during growth (Fig. 3c1). Clearly, the intensity of the peak at 2.7 eV, which is assigned to the λ-orientation, is increasing in intensity relative to the other peaks in the spectrum. This is a strong indication to differences in the nucleation of the domains in σ- and λ-orientation. For small film thicknesses d, the σ-orien-tation dominates and the shape of 2 ( )xy Eε , resembles that of the blends prepared at higher substrate temperatures (see upper row of Fig. 3c2). With increasing film thickness the intensity of the peak at 2.7 eV is increasing as domains with molecules in λ-orientation begin to grow.
4 Conclusion In conclusion, we determined the aver-
age molecular tilt angle α in equimolar blends of PFP and PEN for different substrate temperatures. For the samples prepared at sub 330 KT = and 300 K, α was found to be around 15° for PEN and ∼7° smaller for PFP. Consistent with the trend of X-ray diffraction results [27], the average tilt angle is ∼10° larger in the sample prepared at
sub 180 K,T = indicating a higher amount of molecules in λ-orientation. An estimation of the upper limit for the frac-tion of molecules in this λ-orientation yielded ∼20%. Fi-nally, the influence of the average tilt angle on the optical properties in the visible spectral range was investigated post growth. Combining the results of structural investiga-tions with optical spectroscopy experiments, peaks in spe-
cific spectral regions in 2 ( )xy E,ε and 2 ( )z E,ε in the visible range could be tentatively assigned to the spectral response of molecules in lying down (λ) and standing up (σ) orien-tation in the films. By following 2 ( )xy E,ε in real-time dur-ing growth, strong changes in the spectral shape were ob-served, which point towards a delayed nucleation of do-mains consisting of molecules in the lying down orienta-tion. The results of our in situ studies underline the impor-tance of real-time experiments to observe transient effects in optical spectra during growth of OSC-blends, which are highly sensitive to changes in the molecular arrangement and the resulting intermolecular interactions.
Acknowledgements We thank M. Bauer for support dur-
ing the NEXAFS experiment, M. Gruenewald, A. Vollmer, and
J. Novák for helpful discussions and the reviewer for constructive
comments. Support from the DFG and the HZB is gratefully ac-
knowledged. K.B. was supported by the Studienstiftung des
Deutschen Volkes.
References [1] W. Brütting and C. Adachi, Wiley-VCH, Berlin, Weinheim,
(2012).
[2] D. Datta, V. Tripathi, P. Gogoi, S. Banerjee, and S. Kumar,
Thin Solid Films 516, 7237–7240 (2008).
[3] G. Ruani, V. Dediu, M. Liess, E. Lunedei, R. Michel,
M. Muccini, M. Murgia, C. Taliani, and R. Zarnboni, Synth.
Met. 103, 2392 (1999).
[4] R. Hesse, W. Hofberger, and H. Bässler, Chem. Phys. 49,
201 (1980).
[5] S. Fanetti, M. Citroni, R. Bini, L. Malavasi, G. Artioli, and
P. Postorino, J. Chem. Phys. 137, 224506 (2012).
[6] M. Kytka, L. Gisslen, A. Gerlach, U. Heinemeyer, J. Kováč, R. Scholz, and F. Schreiber, J. Chem. Phys. 130, 214507
(2009).
[7] R. Scholz and M. Schreiber, Chem. Phys. 325, 9–21
(2006).
[8] V. Shklover, F. S. Tautz, S. Sloboshanin, M. Sokolowski,
J. A. Schaefer, and E. Umbach, Surf. Sci. 454–456, 60–66
(2000).
[9] F. Anger, J. O. Ossó, U. Heinemeyer, K. Broch, R. Scholz,
A. Gerlach, and F. Schreiber, J. Chem. Phys. 136, 054701
(2012).
[10] K. Broch, U. Heinemeyer, A. Hinderhofer, F. Anger,
R. Scholz, A. Gerlach, and F. Schreiber, Phys. Rev. B 83,
245307 (2011).
[11] N. Koch, N. Ueno, and A. Wee (Wiley VCH, Berlin, Wein-
heim, 2013).
[12] M. Cerruti, C. Rhodes, M. Losego, A. Efremenko, J.-P.
Maria, D. Fischer, S. Franzen, and J. Genzer, J. Phys. D:
Appl. Phys. 40, 4212 (2007).
[13] F. Stöhr and D. A. Outka, Phys. Rev. B 36, 7891 (1987).
[14] D. de Oteyza, A. Sakko, A. El-Sayed, E. Goiri, L. Floreano,
A. Cossaro, J. Garcia-Lastra, A. Rubio, and J. Ortega, Phys.
Rev. B 86, 075469 (2012).
[15] M. Dressel, B. Gompf, D. Faltermeier, A. Tripathi,
J. Pflaum, and M. Schubert, Opt. Express 16, 19770
(2008).
[16] R. B. Campbell, J. M. Robertson, and J. Trotter, Acta Cryst.
14, 705 (1961).
1088 K. Broch et al.: Tilt angle dependent absorption spectra of PFP:PEN blends
© 2013 WILEY-VCH Verlag GmbH & Co. KGaA, Weinheim www.pss-rapid.com
statu
s
solid
i
ph
ysi
ca rrl
[17] F. Zheng, B.-N. Park, S. Seo, P. G. Evans, and F. J. Himp-
sel, J. Chem. Phys. 126, 154702 (2007).
[18] A. Hinderhofer, U. Heinemeyer, A. Gerlach, S. Kowarik,
R. M. L. Jacobs, Y. Sakamoto, T. Suzuki, and F. Schreiber,
J. Chem. Phys. 127, 194705 (2007).
[19] T. Breuer and G. Witte, Phys. Rev. B 83, 155428 (2011).
[20] J. Götzen, C. H. Schwalb, C. Schmidt, M. Marks, U. Höfer,
and G. Witte, Langmuir 27, 993–999 (2011).
[21] T. Breuer, M. A. Celik, P. Jakob, R. Tonner, and G. Witte,
J. Phys. Chem. C 116, 14491–14503 (2012).
[22] C. Schmidt, T. Breuer, S. Wippermann, W. G. Schmidt, and
G. Witte, J. Phys. Chem. C 116, 24098–24106 (2012).
[23] I. Salzmann, S. Duhm, G. Heimel, J. P. Rabe, N. Koch,
M. Oehzelt, Y. Sakamoto, and T. Suzuki, Langmuir 24,
7294–7298 (2008).
[24] T. Breuer and G. Witte, J. Chem. Phys. 138, 114901 (2013).
[25] Y. Sakamoto, T. Suzuki, M. Kobayashi, Y. Gao, Y. Fukai,
Y. Inoue, F. Sato, and S. Tokito, J. Am. Chem. Soc. 126,
8138–8140 (2004).
[26] A. Hinderhofer and F. Schreiber, Chem. Phys. Chem. 13,
628 (2012).
[27] A. Hinderhofer, C. Frank, T. Hosokai, A. Resta, A. Gerlach,
and F. Schreiber, J. Chem. Phys. 134, 104702 (2011).
[28] U. Heinemeyer, R. Scholz, L. Gisslén, M. I. Alonso, J. O.
Ossó, M. Garriga, A. Hinderhofer, M. Kytka, S. Kowarik,
A. Gerlach, and F. Schreiber, Phys. Rev. B 78, 085210
(2008).
[29] R. Forker and T. Fritz, Phys. Chem. Chem. Phys. 11, 2142
(2009).
[30] R. Forker, M. Gruenewald, and T. Fritz, Annu. Rep. Prog.
Chem., Sect. C, Phys. Chem. 108, 34 (2012).
[31] U. Heinemeyer, K. Broch, A. Hinderhofer, M. Kytka,
R. Scholz, A. Gerlach, and F. Schreiber, Phys. Rev. Lett.
104, 257401 (2010).
[32] S. Kowarik, K. Broch, A. Hinderhofer, A. Schwartzberg,
J. O. Ossó, D. Kilcoyne, F. Schreiber, and S. R. Leone,
J. Phys. Chem. C 114, 13061 (2010).
[33] Details of the NEXAFS data analysis, a table of the NEXAFS
peak assignment and NEXAFS data measured at the fluo-
rine K-edge can be found in the Supporting Information.