Embed Size (px)
Citation preview
INAUGURAL-DISSERTATION
zurErlangung der Doktorwurde
derNaturwisschenschaftlich-Mathematischen
Gesamtfakultatder
Ruprecht-Karls-UniversitatHeidelberg
Vorgelegt von
M.Sc. Chem. Eng. Trupti Kathrotia
aus
Visavadar, India
Tag der mundlichen Prufung:
19. 05. 2011

Reaction Kinetics Modeling of OH*,CH*, and C2* Chemiluminescence
Gutachter: Prof. Dr. Uwe Riedel
Prof.(apl.) Dr. Hans-Robert Volpp

Abstract
In the combustion processes, spontaneous emission of chemiluminescence species respon-
sible for ultra-violet and visible light is in abundance. Due to its natural occurrence,
it offers an inexpensive diagnostic tool for flames and other combustion processes. It is
non-intrusive in nature and gives the facility to avoid expensive laser instrumentation.
In hydrocarbon oxidation most common electronically excited species are OH*, CH*,
C2*, and CO2*, where * represents the electronically excited state of a given radical
or molecule. In the early 1970s chemiluminescence has been identified as a marker for
heat release, reaction zone, and equivalence ratio, thereby providing a relatively easy
diagnostics alternative for online measurement of these features in practical combustion
applications. However, the quantitative relationship between chemiluminescence, heat
release, and equivalence ratio is mostly unknown except for a few correlations available
in literature over small range of conditions. Therefore a reaction kinetic model predicting
these species is necessary for the fundamental understanding of the chemiluminescence.
This mechanism then can be provided for predicting excited species in simulations of
various combustion devices.
A detailed reaction mechanism of chemiluminescence is not well studied. Therefore, the
objective of this work is to develop a reaction mechanism of chemiluminescent species
which can predict their concentrations in shock-tube and one-dimensional laminar flame
experiments.
The mechanism developed in this thesis is validated against various experimental con-
ditions in shock-tube experiments where it reproduces the ignition delay time very well.
In addition, the species profiles which provide a more stringent test on the mechanism
validation are calculated to reproduce the measured excited species concentrations in
laminar premixed and non-premixed flames. The comparison proves accuracy of the
mechanism.

The mechanism presented provides therefore a first step to quantitative understanding
of the excited species and can be further used in the simulation of practical combustion
systems.
Zusammenfassung
In Verbrennungsprozessen, ist Chemilumineszenz verantwortlich fur einen großen Teil des
ultravioletten und sichtbaren Lichts. Aufgrund ihres naturlichen Auftretens, bietet die
spektroskopische Untersuchung der Strahlung ein kostengunstiges Diagnose Verfahren
fur Flammen und andere Verbrennungsprozesse: Das Messverfahren ist beruhrungslos,
wodurch eine Beeinflussung der Flamme durch die Messmethode vermieden wird. Daruber
hinaus erfordert die messtechnische Erfassung der Chemilumineszenz keine teure Instru-
mentierung wie etwa im Falle laserdiagnostischer Messmethoden.
In der Kohlenwasserstoffoxidation sind die haufigsten, elektronisch angeregten Spezies
OH*, CH*, C2* und CO2*, wobei * den elektronisch angeregten Zustand eines bestimm-
ten Radikals oder eines Molekules bezeichnet. In den fruhen 1970er Jahren wurde die
Chemilumineszenz als Marker fur Warmefreisetzung, Reaktionszone und Aquivalenz-
verhaltnis identifiziert, wodurch heute ein relativ einfaches Messverfahren zur Online-
Messung dieser Großen in praktischen Verbrennungsprozessen gegeben ist. Allerdings ist
die quantitative Beziehung zwischen Chemilumineszenz, Warmefreisetzung und Aquivalenz-
verhaltnis bis auf einige Angaben aus der Literatur, die einen begrenzten Gultigkeitsbereich
haben, unbekannt. Die Voraussetzung fur die vollstandige, quantitative Beschreibung ist
das Verstandnis der reaktionskinetischen Vorgange, die zur Bildung angeregter Spezi-
es fuhren. Mechanismen, die in der Lage sind diese Vorgange darzustellen, konnen in
Simulationen von verbrennungstechnischen Apparaten eingesetzt werden.
Jedoch ist der reaktionskinetische Mechanismus, der Bildung und Verbrauch dieser an-
geregten Spezies darstellen kann, nicht vollstandig verstanden. Daher ist das Ziel dieser
Arbeit die Entwicklung eines Reaktionsmechanismus, der die zu erwartenden Mengen
angeregter Spezies vorherzusagen vermag.
Der in dieser Arbeit dargestellte Mechanismus wird zunachst unter unterschiedlichen Be-
dingungen mit experimentellen Daten aus Stoßwellenrohrversuchen validiert. Es wird ei-
ne sehr gute Ubereinstimmung zwischen gemessenen und berechneten Zundverzugszeiten
erzielt. Daruber hinaus werden eindimensionale vorgemischte und nichtvorgemischte la-
minare Flammen mit Hilfe dieses Mechanismus berechnet. Der Vergleich gemessener und

berechnter raumlicher Konzentrationsprofile in diesen Flammen stellt ein sehr strenges
Kriterium fur die Validierung des Mechanismus dar. Es zeigt sich beim Vergleich zwi-
schen Rechnung und Versuch, dass der Mechanismus in der Lage ist angeregte Spezies
mit hoher Genauigkeit unter Flammenbedingungen vorherzusagen.
Somit stellt der Mechanismus einen ersten Schritt fur die quantitative Berechnung an-
geregter Spezies dar und kann in der Simulation realer Verbrennungssysteme eingesetzt
werden.

Acknowledgement
It is my great pleasure to acknowledge all the people who helped me directly or indirectly
to accomplish this dissertation.
First and foremost, I express my sincere gratitude towards late Prof. Jurgen Warnatz for
giving me opportunity to work for my dissertation in his group. I thank my supervisor
Prof. Uwe Riedel for his constant inspiration and support towards the work and giving
me have independence in my work.
I gratefully acknowledge Prof. Ulrich Maas, Universitat Karlsruhe, for providing his code
INSFLA and Deutsche Forschungsgemeinschaft (DFG) for financial support through out
this work.
My sincere thanks to Ingrid Hellwig for organising administration related hurdles. I
thank all my coworkers at IWR and DLR-Stuttgart for making a cheerful work atmo-
sphere. Helpful meeting and discussion with ChemLum-project members will always be
a pleasant memory.
Last but not least, I am thankful to my family for their constant encouragement and
support. I dedicate this thesis to my parents.
Trupti Kathrotia
Heidelberg, March 2011

Contents
1 Introduction 1
1.1 Flame spectra . . . . . . . . . . . . . . . . . . . . . . . . . . . . . . . . . 1
1.2 Motivation . . . . . . . . . . . . . . . . . . . . . . . . . . . . . . . . . . . 4
1.3 Research goals . . . . . . . . . . . . . . . . . . . . . . . . . . . . . . . . . 5
2 Physical Chemistry Background 7
2.1 Homogeneous reacting system . . . . . . . . . . . . . . . . . . . . . . . . 7
2.2 One-dimensional laminar flames . . . . . . . . . . . . . . . . . . . . . . . 8
2.2.1 The structure of laminar premixed flames . . . . . . . . . . . . . 8
2.2.2 The structure of laminar non-premixed flames . . . . . . . . . . . 11
2.3 Transport parameters and thermodynamic data . . . . . . . . . . . . . . 13
2.4 Reaction kinetics . . . . . . . . . . . . . . . . . . . . . . . . . . . . . . . 15
2.5 Chemiluminescent kinetics . . . . . . . . . . . . . . . . . . . . . . . . . . 19
2.6 Analysis of the reaction kinetics . . . . . . . . . . . . . . . . . . . . . . . 22
3 Kinetics Mechanism of C1 to C4 Hydrocarbon Oxidation 24
3.1 H2-O2 oxidation . . . . . . . . . . . . . . . . . . . . . . . . . . . . . . . . 25
3.2 C1-C2 oxidation . . . . . . . . . . . . . . . . . . . . . . . . . . . . . . . . 28
3.2.1 C1 chemistry . . . . . . . . . . . . . . . . . . . . . . . . . . . . . 29
3.2.2 C2 chemistry . . . . . . . . . . . . . . . . . . . . . . . . . . . . . 32
3.2.3 C2H2 chemistry . . . . . . . . . . . . . . . . . . . . . . . . . . . . 33
3.2.4 Modifying important intermediate concentration . . . . . . . . . . 38
3.3 C3-C4 oxidation . . . . . . . . . . . . . . . . . . . . . . . . . . . . . . . . 44
4 Chemiluminescence Mechanism 45
4.1 Formation of OH* . . . . . . . . . . . . . . . . . . . . . . . . . . . . . . . 46
4.2 Formation of CH* . . . . . . . . . . . . . . . . . . . . . . . . . . . . . . . 50
4.3 Formation of C2* . . . . . . . . . . . . . . . . . . . . . . . . . . . . . . . 53
I
II Contents
4.4 Additional sub-mechanism of C, C2, C3, C2O, C3H and C3H2 . . . . . . . 54
4.4.1 Reactions of C . . . . . . . . . . . . . . . . . . . . . . . . . . . . 54
4.4.2 Reactions of C2 . . . . . . . . . . . . . . . . . . . . . . . . . . . . 54
4.4.3 Reactions of C3 . . . . . . . . . . . . . . . . . . . . . . . . . . . . 55
4.4.4 Reactions of C2O, C3H, and C3H2 . . . . . . . . . . . . . . . . . . 55
4.5 Validation of the C2 chemistry . . . . . . . . . . . . . . . . . . . . . . . . 56
5 Validation of the Chemiluminescence Mechanism 61
5.1 Simulations of shock-tube measurements . . . . . . . . . . . . . . . . . . 61
5.1.1 H2/O2/Ar/N2 mixtures . . . . . . . . . . . . . . . . . . . . . . . . 62
5.1.2 H2/CO/air mixtures . . . . . . . . . . . . . . . . . . . . . . . . . 65
5.1.3 H2/CH4/O2/Ar mixtures . . . . . . . . . . . . . . . . . . . . . . . 67
5.1.4 C2H2/O2/Ar and C2H2/N2O/Ar mixtures . . . . . . . . . . . . . 69
5.2 Simulations of laminar one-dimensional flame . . . . . . . . . . . . . . . 73
5.2.1 Simulations of laminar premixed flame . . . . . . . . . . . . . . . 73
5.2.2 Chemiluminescence as a heat release marker . . . . . . . . . . . . 91
5.2.3 Simulations of laminar non-premixed flames . . . . . . . . . . . . 93
6 Conclusion 95
References 98
Appendix 107
A Reaction Mechanism 108
1 Introduction
1.1 Flame spectra
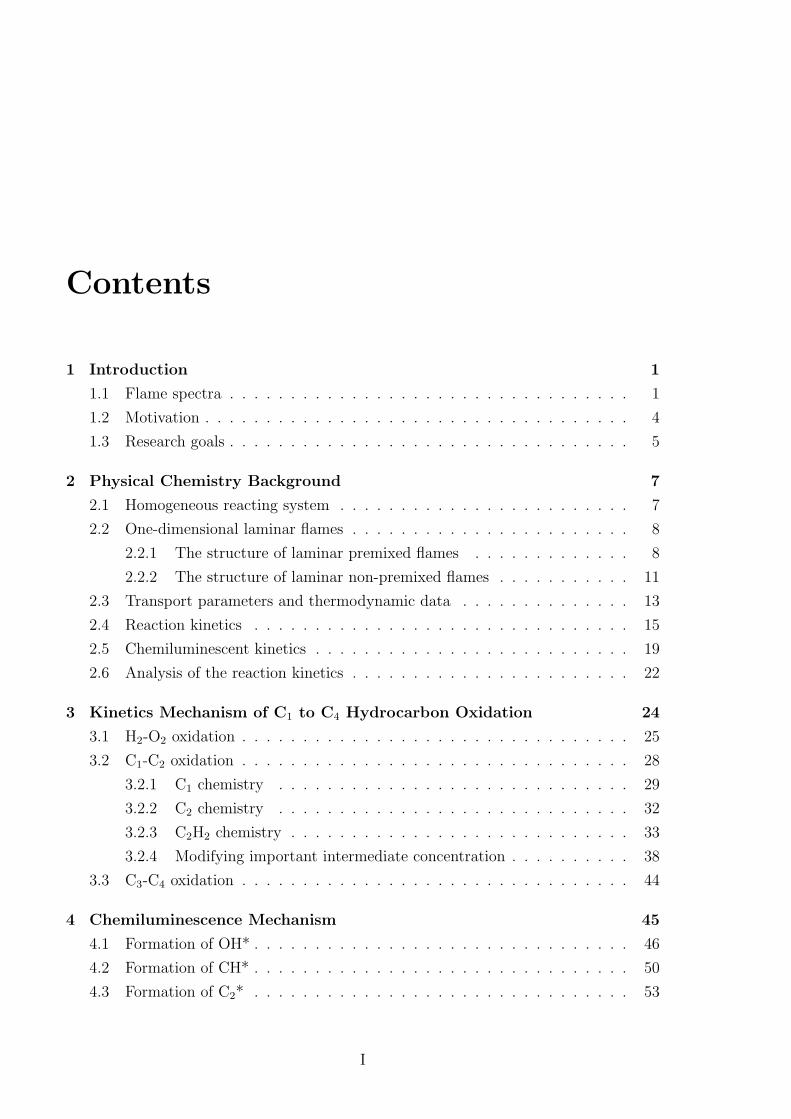
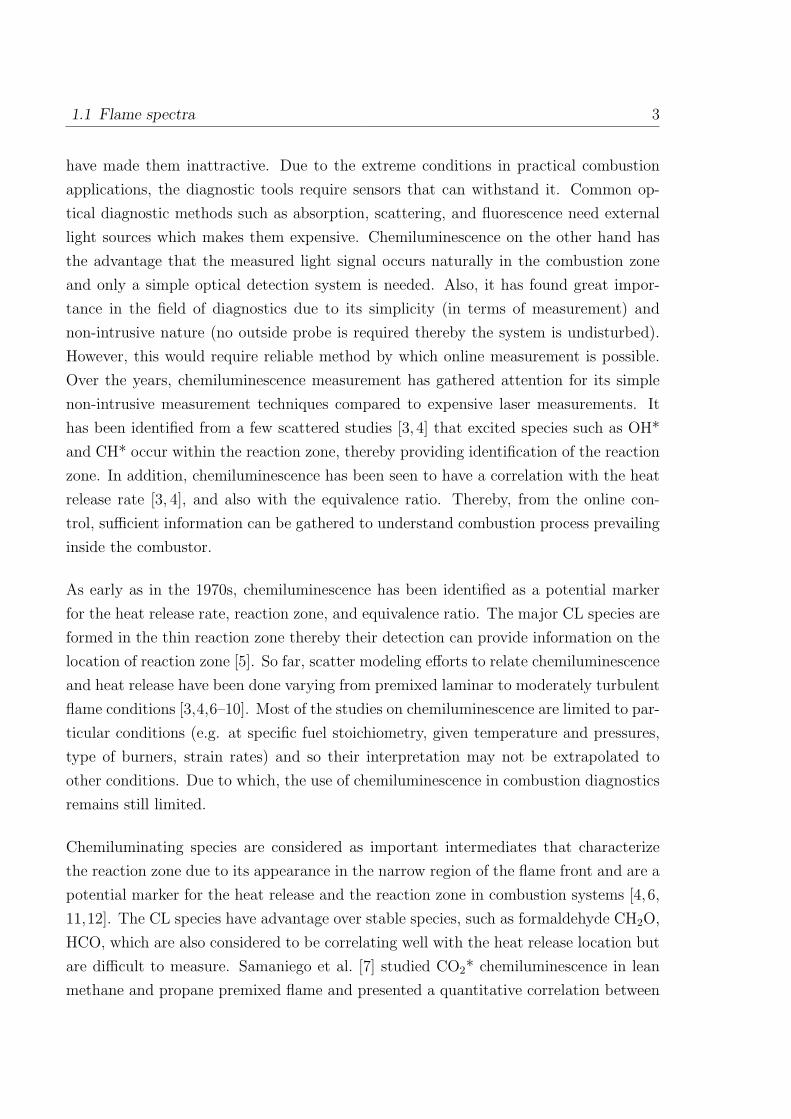
Luminescence occurring due to chemical excitation, referred to as Chemiluminescence
(CL), is found in the visible and ultra-violet band of flame spectra. In hydrocarbon
flames the four major emitters found are OH*, CH*, C2*, and CO2* [1], here star (*)
refers to electronically excited molecules. The study of CL dates back to 1960s where
Gaydon published his pioneering works on the flame spectroscopy. The flame spectra
Figure 1.1: Flame spectrum of a hydrocarbon flame showing the appearance of variousexcited species at different wavelengths [2].
in the visible and ultra-violet (UV) regions occur generally due to the transition of
electrons in molecules from one configuration to another configuration. A typical flame
spectrum obtained from hydrocarbon combustion is shown in Fig. 1.1. In this figure,
the detected chemiluminescence is corrected from background emission. Most of the
stable product of combustion does not give strong emission spectra in the visible or UV
1
2 1 Introduction
region. However, the OH* radical gives a strong spectrum with peak intensity at about
309 nm. In the flame zone, other unstable species that give emission in the visible and
near ultraviolet region are CH*, C2*, and CO2*. The OH* emission in hydrogen and
nitrous oxide-hydrogen flames is weak compared to the one found in hydrocarbon flame
and the spectra of hydrocarbon flames are more complex. The emission of CO2* appears
as a continuum which extends from 300 nm to 600 nm seen as blue color. In the primary
combustion zone, the emission of CH at about 387 nm and at 432 nm are seen. In
addition to CH*, the bands of C2* between 436 nm and 564 nm called Swan bands are
found in the visible region of flame spectra. The Swan bands of C2* are visible mainly
in the fuel rich gas mixtures.
The lower state of OH* is the ground state which is an inverted doublet state (X2 Π).
The higher state is the normal doublet Σ state OH(A2 Σ+). In addition to this there
exists excited OH(B2 Σ+) state from 420 nm to 600 nm in the visible region and another
OH(C2 Σ+) in the ultraviolet region from 225 to 260 nm. As these two bands are not
identified in flames and they are not studied in combustion diagnostics. In present work
only OH(A2 Σ+) is considered for the OH* chemiluminescence.
In the CH* spectrum, three major bands are emitted by the CH molecule. The one
seen at a wavelength of 431 nm (CH(A2∆)) is the strongest of the three bands (accounts
for about 80% of total CH*) and appears violet in the visible region. The other two
low populated states are CH(B2Σ−) and CH(C2∆). The present work considers mainly
CH(A2∆) state. With a very recent availability of CH(B2Σ−) measurement this CH*
state is also discussed.
Online measurement and control of the heat release rate and local equivalence ratio
in practical combustion devices are of great importance in industrial applications. A
precise control of combustion processes in practical applications is needed to avoid pol-
lutants and to save limited resources of the existing hydrocarbon fuels. The online
measurement of combustion processes would help to reduce pollutant emission, increase
the efficiency and to control instabilities inside the devices. This requires measurement
of equivalence ratio and flame temperature during the operation. In practical combus-
tion applications, a harsh environment (e.g. high temperature, soot, turbulence) exists
which makes the combustion diagnostics difficult. Many optical measurement techniques
have been considered for the diagnostic applications due to their compatibility at ex-
treme conditions in combustors. However, cost inefficiency, time, and other limitations
1.1 Flame spectra 3
have made them inattractive. Due to the extreme conditions in practical combustion
applications, the diagnostic tools require sensors that can withstand it. Common op-
tical diagnostic methods such as absorption, scattering, and fluorescence need external
light sources which makes them expensive. Chemiluminescence on the other hand has
the advantage that the measured light signal occurs naturally in the combustion zone
and only a simple optical detection system is needed. Also, it has found great impor-
tance in the field of diagnostics due to its simplicity (in terms of measurement) and
non-intrusive nature (no outside probe is required thereby the system is undisturbed).
However, this would require reliable method by which online measurement is possible.
Over the years, chemiluminescence measurement has gathered attention for its simple
non-intrusive measurement techniques compared to expensive laser measurements. It
has been identified from a few scattered studies [3, 4] that excited species such as OH*
and CH* occur within the reaction zone, thereby providing identification of the reaction
zone. In addition, chemiluminescence has been seen to have a correlation with the heat
release rate [3, 4], and also with the equivalence ratio. Thereby, from the online con-
trol, sufficient information can be gathered to understand combustion process prevailing
inside the combustor.
As early as in the 1970s, chemiluminescence has been identified as a potential marker
for the heat release rate, reaction zone, and equivalence ratio. The major CL species are
formed in the thin reaction zone thereby their detection can provide information on the
location of reaction zone [5]. So far, scatter modeling efforts to relate chemiluminescence
and heat release have been done varying from premixed laminar to moderately turbulent
flame conditions [3,4,6–10]. Most of the studies on chemiluminescence are limited to par-
ticular conditions (e.g. at specific fuel stoichiometry, given temperature and pressures,
type of burners, strain rates) and so their interpretation may not be extrapolated to
other conditions. Due to which, the use of chemiluminescence in combustion diagnostics
remains still limited.
Chemiluminating species are considered as important intermediates that characterize
the reaction zone due to its appearance in the narrow region of the flame front and are a
potential marker for the heat release and the reaction zone in combustion systems [4,6,
11,12]. The CL species have advantage over stable species, such as formaldehyde CH2O,
HCO, which are also considered to be correlating well with the heat release location but
are difficult to measure. Samaniego et al. [7] studied CO2* chemiluminescence in lean
methane and propane premixed flame and presented a quantitative correlation between
4 1 Introduction
CO2* emission and heat release rate. They investigated CO2* in laminar and turbulent
premixed flames. Najm and coworkers [6] studied several flame observables such as
the concentrations of OH, CH, CO, CH3, and CH2O; various concentration products
such as [OH][CH2O], [OH][CH4], and [OH][CO] in premixed methane flames with a two-
dimensional counter-rotating vortex pair. They also studied the concentration product
of [CH][O2], [C2H][O], and [CO][O] related to OH*, CH*, and C2* formation respectively.
They found that the concentration product of precursors of the OH* and CO2* were well
correlating with the peak heat release rate. Haber et al. [8] examined the relationship
between OH* and CH* light emissions and heat release in Bunsen Burner flames. They
suggested OH* as a good indicator of heat release whereas CH* as not an adequate
indicator of the heat release in methane combustion. Among recent studies Hardalupas
et al. [3] and Panoutsos and coworkers [4] studied OH*, CH*, C2*, and CO2* emission
in natural gas-air, methane-air premixed counter-flow flames. They studied the effect of
strain rate and equivalence ratio on chemiluminescence intensity and its applicability as
a heat release indicator. They found mainly OH*, CH* and CO2* as good indicators of
the heat release but not C2*. The intensity ratio of OH*/CH* was found to be a good
measure of the local equivalence ratio. They also explained a potential technique to
utilize chemiluminescence in practical burners for measuring the time-dependent local
equivalence ratio. In [5] a numerical study in premixed laminar flame condition was
aimed to investigate the potential of excited species as a heat release marker. The
usefulness of chemiluminescence for sensing the equivalence ratio in a combustion system
has been studied by Nori et al. [9,10]. They found the ratio of CH* to OH* correlating
with the fuel stoichiometry in a lean methane system. However, they were unable to
hold the correlation beyond certain limits of temperature and pressure. The intensities
from CH*, C2*, OH*, and CO2* have been used to determine the location of the reaction
zone as well. Their experimental-modeling study also showed the utility of CH*, under
certain temperature and pressure condition, for sensing the heat release rate.
1.2 Motivation
Experiments for a wide range of conditions of temperature, pressure, strain rate, equiv-
alence ratio, and types of combustors are restricted due to their limitations on time and
cost. Modeling studies, on the other hand provide an alternative flexible approach with
1.3 Research goals 5
all above advantages over experiments. An understanding of the chemiluminescence in
combustors requires detailed studies of formation and consumption of the excited species.
The aim of the present work is to provide such detailed chemical kinetics reaction mecha-
nism which can give information on the occurrence of the chemiluminating species in the
reaction zone and their concentrations that can be validated with the measured inten-
sities in various shock-tube and laminar flame measurements. The chemiluminescence
mechanism developed will provide a basis for studies of chemiluminescence and its rela-
tion to heat release rate, equivalence ratios, marker of the reaction zone in combustion
applications.
1.3 Research goals
The concentration of excited species in flames is much lower (atleast four to five orders
of magnitude) compared to the important intermediate species (CH, OH, H2O). There-
fore, the incorporation of the chemiluminescence sub-mechanism into basic hydrocarbon
oxidation mechanism does not affect global properties like ignition delay times and flame
speeds. However, some of the intermediate products of combustion such as CH, H, O,
C2H, and C2 provide the basis for the formation of chemiluminating chemistry. The con-
centration of these species is not important for the validation of the global parameters
(flame velocity, ignition delay times) of basic hydrocarbon chemistry. However, these
species are important in formation of excited species. Therefore, for the development
of chemiluminescence mechanism, it is very important to validate first the intermediate
species chemistry, keeping the global parameter unvaried. In addition, ground state C2
and C3 are important precursors in the formation of excited CH* and C2*. The reaction
kinetics of these species is not yet a part of hydrocarbon chemistry and therefore its
incorporation and validation is also important part of present work. So, in order to
provide validated chemiluminescence reaction mechanism, the objective of the present
work is threefold
(i) Modification of the basic hydrocarbon chemistry with respect to its important
intermediates concentrations (CH, C2H).
(ii) Addition of C-, C2-, and C3-species reactions.

6 1 Introduction
(iii) Development and validation of a reaction kinetic scheme to describe chemilumi-
nescence.
2 Physical Chemistry Background
A chemically reacting flow system can be characterized by specifying its properties such
as pressure, density, temperature, flow velocity, and concentration of species at each
point in space and time. These properties can vary with time and space. Some of these
properties such as the mass, energy, and momentum are conserved and their change
is described by conservation equations. This equations are the starting point of the
mathematical description of reacting flows. The different systems vary from each other
by boundary conditions and physicochemical conditions.
2.1 Homogeneous reacting system
The ignition delay times measured in a shock-tube are modeled by treating the reaction
system as a homogeneous mixture heated up by the shock wave. Therefore, the general
conservation equations are reduced to ordinary differential equations [13].
Conservation of mass:
The equation for conservation of total mass is also called continuity equation which
explains that the change of total mass with respect to time is zero,
∂m
∂t=
∂(ρV )
∂t= 0 (2.1)
Here m is the total mass and V is the volume of the system, ρ is the density of the
mixture, and t is the time.
Conservation of species mass:
∂ρi
∂t= Miωi (2.2)
7
8 2 Physical Chemistry Background
with ρi = ρwi. Here ρi is the partial density of the species i, wi is the mass fraction of
species i, ωi is the chemical rate of production of species i (molar scale), and Mi is the
molar mass of species i. With ρ being constant we obtain
∂wi
∂t=
Mi
ρωi. (2.3)
Conservation of energy:
∂T
∂t− 1
ρcp
∂p
∂t+
1
ρcp
ns∑i=1
ωihiMi = 0 (2.4)
where p = pressure, T = temperature, cp is the specific heat capacity at constant pres-
sure, ns = number of species, and hi is the specific enthalpy of species i.
The system is closed by the Ideal Gas Law :
pV = nRT. (2.5)
The equation system is solved numerically by the software packages DASSL (using the
backward differentiation formula) [14] or LIMEX (using extrapolation method) [15].
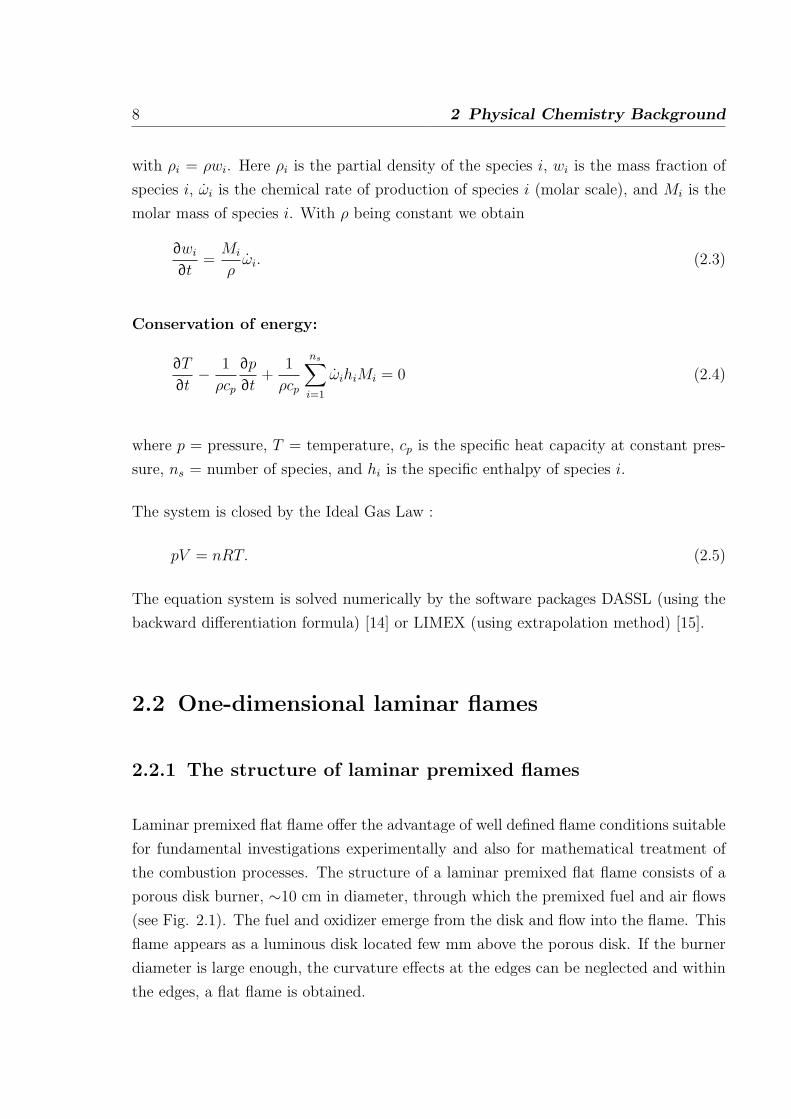
2.2 One-dimensional laminar flames
2.2.1 The structure of laminar premixed flames
Laminar premixed flat flame offer the advantage of well defined flame conditions suitable
for fundamental investigations experimentally and also for mathematical treatment of
the combustion processes. The structure of a laminar premixed flat flame consists of a
porous disk burner, ∼10 cm in diameter, through which the premixed fuel and air flows
(see Fig. 2.1). The fuel and oxidizer emerge from the disk and flow into the flame. This
flame appears as a luminous disk located few mm above the porous disk. If the burner
diameter is large enough, the curvature effects at the edges can be neglected and within
the edges, a flat flame is obtained.
2.2 One-dimensional laminar flames 9
J
z
dz
Area F
z
Burnt gases
Unburnt gases
Burner
Flame front
Figure 2.1: Schematic sketch of a laminar premixed flat flame.
The one-dimensional treatment is further simplified by the following assumptions [13]:
(i) the flame is stationary.
(ii) the perfect gas law is valid.
(iii) external forces such as gravitation are negligible.
(iv) the system is continuous as the mean free path of the molecules is small compared
to the flame thickness.
(v) the pressure is constant.
(vi) the kinetic energy of the gas flow is negligible compared to other terms in the
energy conservation equation.
(vii) the Dufour-effect (thermal diffusion) can be neglected.
(viii) heat flux due to the radiation of gases and particles is negligible (acceptable for
non-sooting flames).
(ix) the system is in local thermal equilibrium.
For any conserved variable E(z, t) in a one-dimensional system, the general relation is
∂W
∂t+
∂J
∂z= Q (2.6)
where W is density of conserved variable (E per volume), J is flux of the conserved
variable (E per surface·time), Q is source (or sink) of the conserved variable (E per
volume·time).
10 2 Physical Chemistry Background
Conservation of overall mass:
The density W in the conservation equation is given by the total mass density ρ. The
flux describes the movement of mass and is given by J = ρv. Here v is mean mass
velocity. The source term of the mass conservation equation (2.6) is zero (Q = 0) since
chemical reactions neither create nor destroy mass:
∂ρ
∂t+
∂(ρv)
∂z= 0. (2.7)
Conservation of species mass:
The density velocity W is given by partial density of species i which is ρi = mi/V = wiρ.
The flux J is given by J = ρivi. In addition, it has a source term which describes the
formation or consumption of the species i in chemical reactions. Therefore Q = Miωi
and the conservation equation reads
∂ρwi
∂t+
∂ρwivi
∂z= Miωi = ri, (2.8)
where ri = chemical rate of production (mass scale). The mass velocity vi of species
i is composed of the mean mass velocity v of the center of mass of the mixture and
a diffusion velocity Vi (relative to the center of mass), which is caused by molecular
transport due to concentration gradients of the species i, vi = v + Vi.
with ρi = ρwi, vi = v + Vi, and ji = ρwiVi,
∂ρwi
∂t+
∂ρvwi
∂z+
∂ji
∂z= Miωi. (2.9)
Conservation of energy:
The W term in equation (2.6) is given by∑
i ρihi =∑
i ρwihi. Here hi is the specific
enthalpy of species i. The flux J =∑
i ρivihi + jq =∑
i ρviwihi + jq, in which jq is the
heat flux corresponding to the diffusion flux introduced in the species mass equation
(ji). No source term is considered (Q = 0).
n∑i=1
∂ρwihi
∂t+
n∑i=1
∂ρvwihi
∂z+
n∑i=1
∂
∂z(ρViwihi) +
∂jq
∂z= 0. (2.10)
2.2 One-dimensional laminar flames 11
Inserting a few relations such as vi = v + Vi, and the diffusion flux ji yields the relation,
ρv
n∑i=1
wi∂hi
∂z+ ρ
n∑i=1
wi∂hi
∂t+
n∑i=1
hiMiωi +n∑
i=1
ji∂hi
∂z+
∂jq
∂z= 0. (2.11)
The temperature is calculated by solving this energy equation (2.11). After inserting
the heat flux jq and using the relation cp,idT = dhi and cp =∑
wicpi yields,
ρcp∂T
∂t=
∂
∂t(λ
∂T
∂z)− (ρvcp +
n∑i=1
jicp,i)∂T
∂z−
n∑i=1
hiωi (2.12)
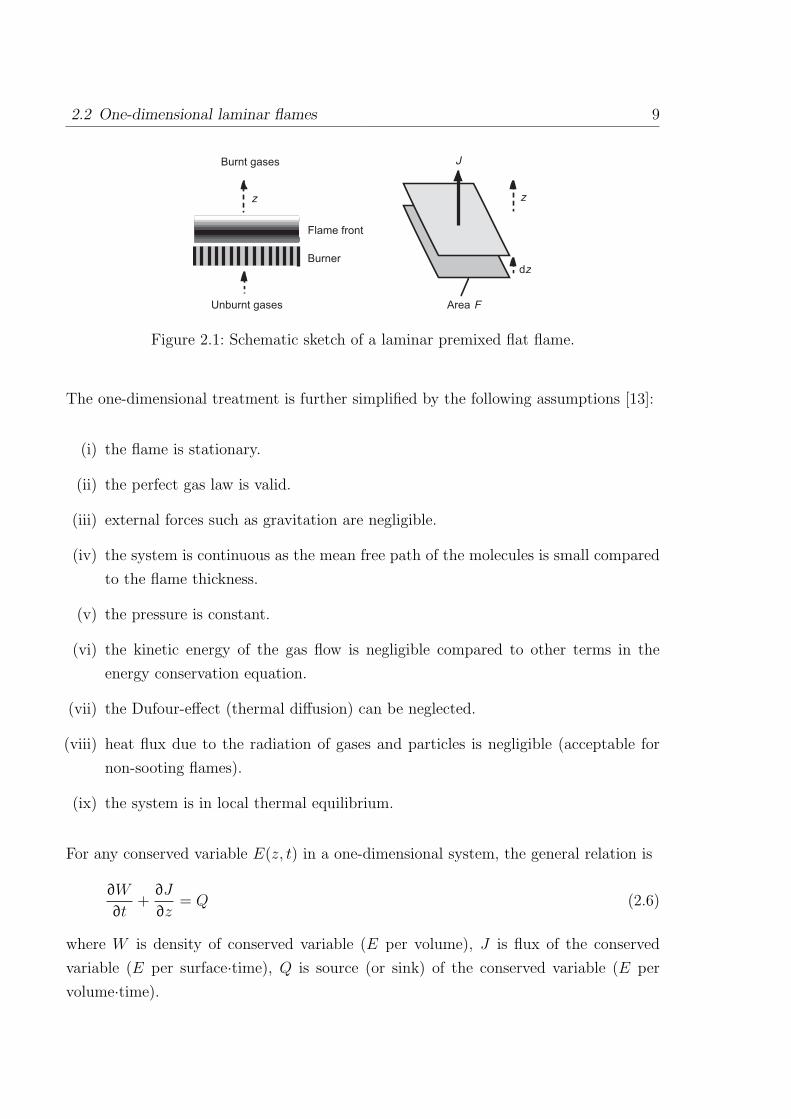
2.2.2 The structure of laminar non-premixed flames
The flame structure of non-premixed flames would require to solve the three-dimensional
conservation equations for overall mass, momentum, enthalpy and mass of species i.
However, the problem can be reduced spatially to one dimension by applying the bound-
ary layer assumption (i.e. neglecting the diffusion in the direction orthogonal to stream-
line). As shown in Fig. 2.2, examples of burners providing one-dimensional configu-
rations are the Tsuji burner [16] (it has a cylinder in cross flow) and the opposed-jet
flow burner (where a laminar fuel flow leaves one duct to stagnate against the laminar
oxidizer flow emerging from the opposite duct).
Flame frontStagnation line
Fuel Porous cylinder
y, vy
(a)
x, vx
Air
Flamefront
Air Porous plate
Burntgases
Fuel(b) Porous plate
Figure 2.2: Schematic example of counterflow nonpremixed flame burner (a) Tsuji burner(b) opposed flow burner.
The following assumptions lead to an equation system which has only the time t and
12 2 Physical Chemistry Background
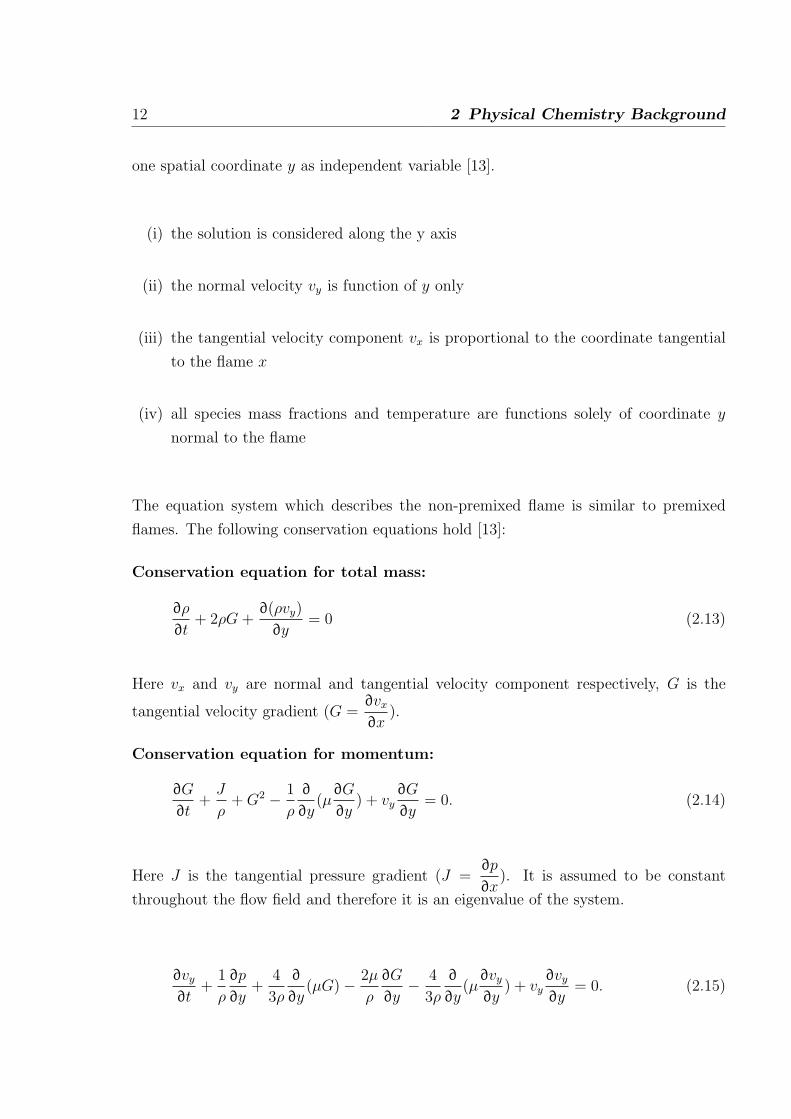
one spatial coordinate y as independent variable [13].
(i) the solution is considered along the y axis
(ii) the normal velocity vy is function of y only
(iii) the tangential velocity component vx is proportional to the coordinate tangential
to the flame x
(iv) all species mass fractions and temperature are functions solely of coordinate y
normal to the flame
The equation system which describes the non-premixed flame is similar to premixed
flames. The following conservation equations hold [13]:
Conservation equation for total mass:
∂ρ
∂t+ 2ρG +
∂(ρvy)
∂y= 0 (2.13)
Here vx and vy are normal and tangential velocity component respectively, G is the
tangential velocity gradient (G =∂vx
∂x).
Conservation equation for momentum:
∂G
∂t+
J
ρ+ G2 − 1
ρ
∂
∂y(µ
∂G
∂y) + vy
∂G
∂y= 0. (2.14)
Here J is the tangential pressure gradient (J =∂p
∂x). It is assumed to be constant
throughout the flow field and therefore it is an eigenvalue of the system.
∂vy
∂t+
1
ρ
∂p
∂y+
4
3ρ
∂
∂y(µG)− 2µ
ρ
∂G
∂y− 4
3ρ
∂
∂y(µ
∂vy
∂y) + vy
∂vy
∂y= 0. (2.15)
2.3 Transport parameters and thermodynamic data 13
Conservation equation for total enthalpy:
∂T
∂t− 1
ρ
∂p
∂t+ vy(
∂T
∂y)− 1
ρcp
∂
∂y(λ
∂T
∂y) +
1
ρcp
∑i
cp,iji,y∂T
∂y+
1
ρcp
∑i
hiωi = 0. (2.16)
Conservation equation for species mass:
∂wi
∂t+ vy
∂wi
∂y− 1
ρ
∂
∂yji,y =
ωi
ρ. (2.17)
The equations are similar to the premixed flame except that the mass flux ρvy is not
constant due to the mass flux in tangential direction. With appropriate boundary con-
ditions, the solution of the above equations provides the flow variables (temperature,
concentration, velocity profiles) which can be compared to experimental data.
2.3 Transport parameters and thermodynamic data
It is known from empirical observations that the concentration gradients cause mass
transport called diffusion and that temperature gradients causes heat transport called
heat conduction. The heat flux is proportional to the temperature gradient given by the
Fourier law of heat conduction,
jq = −λ∂T
∂z, (2.18)
here λ is the heat conductivity of the mixture. The heat conductivity in the above
equation is calculated from the mixture rule,
λ =1
2
[∑i
xiλi + (∑
i
xi
λi
)−1
], (2.19)
where xi is the mole fraction of the species i and λi is the heat conductivity of the species
i.
14 2 Physical Chemistry Background
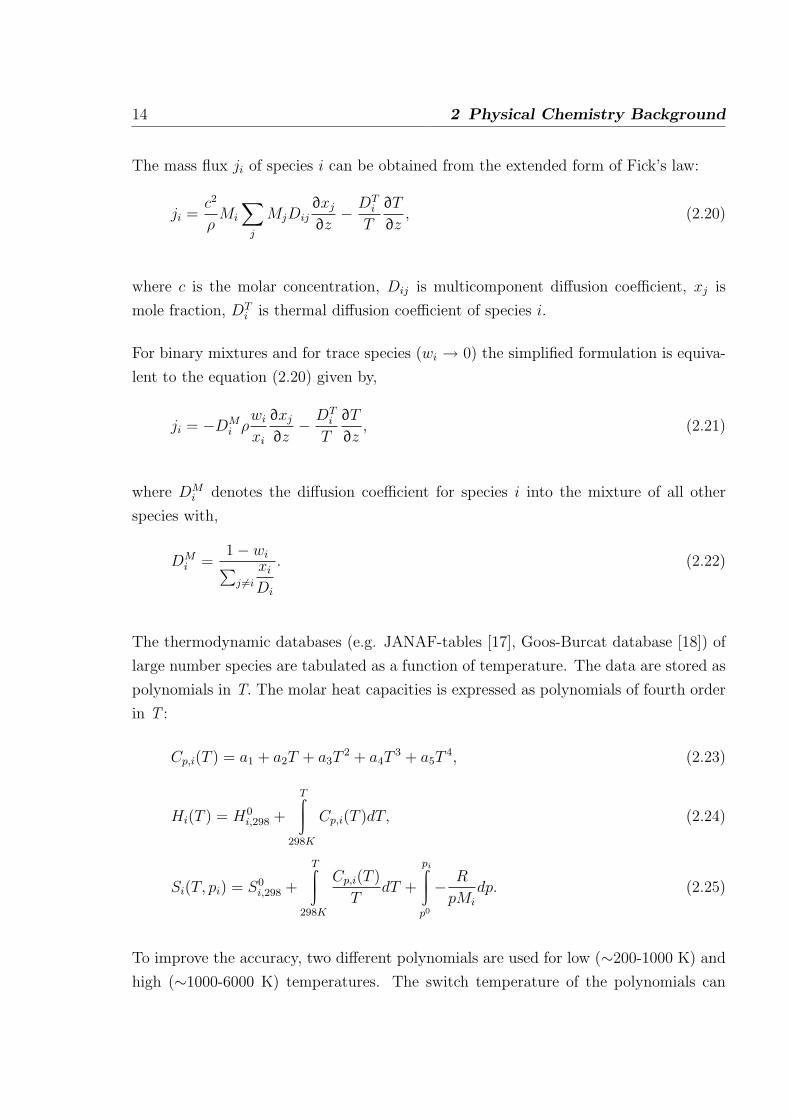
The mass flux ji of species i can be obtained from the extended form of Fick’s law:
ji =c2
ρMi
∑j
MjDij∂xj
∂z− DT
i
T
∂T
∂z, (2.20)
where c is the molar concentration, Dij is multicomponent diffusion coefficient, xj is
mole fraction, DTi is thermal diffusion coefficient of species i.
For binary mixtures and for trace species (wi → 0) the simplified formulation is equiva-
lent to the equation (2.20) given by,
ji = −DMi ρ
wi
xi
∂xj
∂z− DT
i
T
∂T
∂z, (2.21)
where DMi denotes the diffusion coefficient for species i into the mixture of all other
species with,
DMi =
1− wi∑j 6=i
xi
Di
. (2.22)
The thermodynamic databases (e.g. JANAF-tables [17], Goos-Burcat database [18]) of
large number species are tabulated as a function of temperature. The data are stored as
polynomials in T. The molar heat capacities is expressed as polynomials of fourth order
in T :
Cp,i(T ) = a1 + a2T + a3T2 + a4T
3 + a5T4, (2.23)
Hi(T ) = H0i,298 +
T∫
298K
Cp,i(T )dT, (2.24)
Si(T, pi) = S0i,298 +
T∫
298K
Cp,i(T )
TdT +
pi∫
p0
− R
pMi
dp. (2.25)
To improve the accuracy, two different polynomials are used for low (∼200-1000 K) and
high (∼1000-6000 K) temperatures. The switch temperature of the polynomials can
2.4 Reaction kinetics 15
vary with different format of the databases.
2.4 Reaction kinetics
Temperature dependent rate coefficients
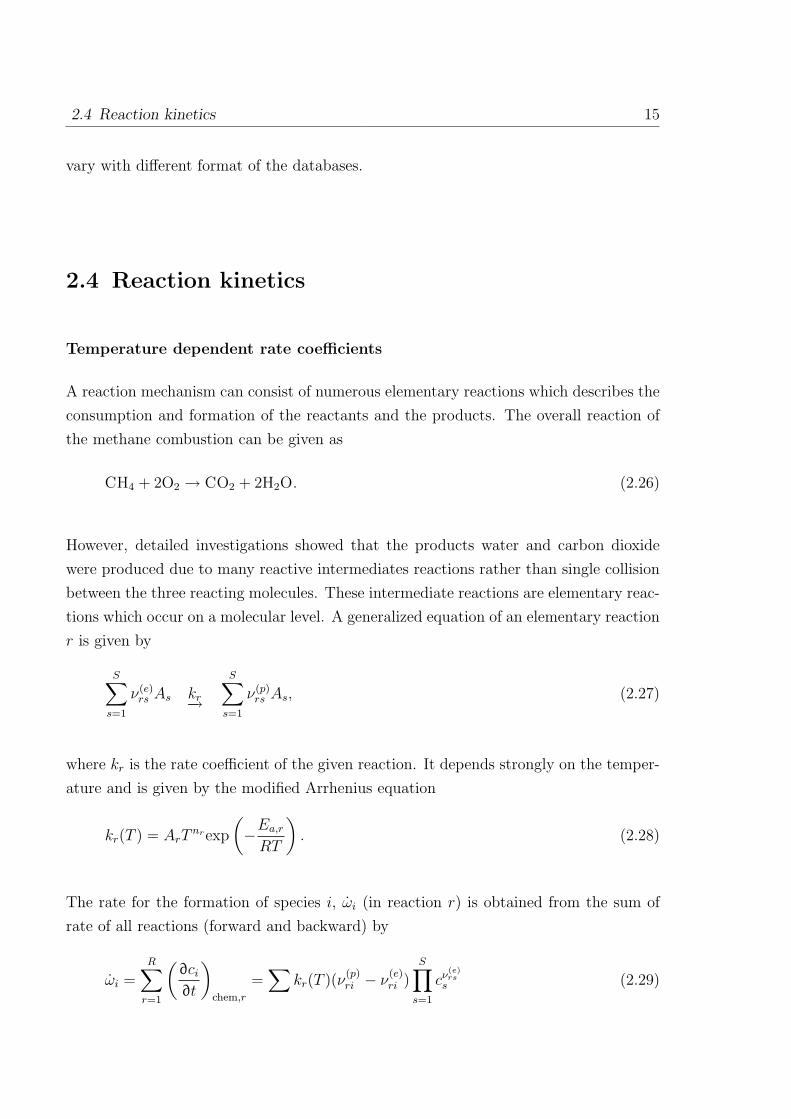
A reaction mechanism can consist of numerous elementary reactions which describes the
consumption and formation of the reactants and the products. The overall reaction of
the methane combustion can be given as
CH4 + 2O2 → CO2 + 2H2O. (2.26)
However, detailed investigations showed that the products water and carbon dioxide
were produced due to many reactive intermediates reactions rather than single collision
between the three reacting molecules. These intermediate reactions are elementary reac-
tions which occur on a molecular level. A generalized equation of an elementary reaction
r is given by
S∑s=1
ν(e)rs As kr−→
S∑s=1
ν(p)rs As, (2.27)
where kr is the rate coefficient of the given reaction. It depends strongly on the temper-
ature and is given by the modified Arrhenius equation
kr(T ) = ArTnrexp
(−Ea,r
RT
). (2.28)
The rate for the formation of species i, ωi (in reaction r) is obtained from the sum of
rate of all reactions (forward and backward) by
ωi =R∑
r=1
(∂ci
∂t
)
chem,r
=∑
kr(T )(ν(p)ri − ν
(e)ri )
S∏s=1
cν(e)rs
s (2.29)
16 2 Physical Chemistry Background
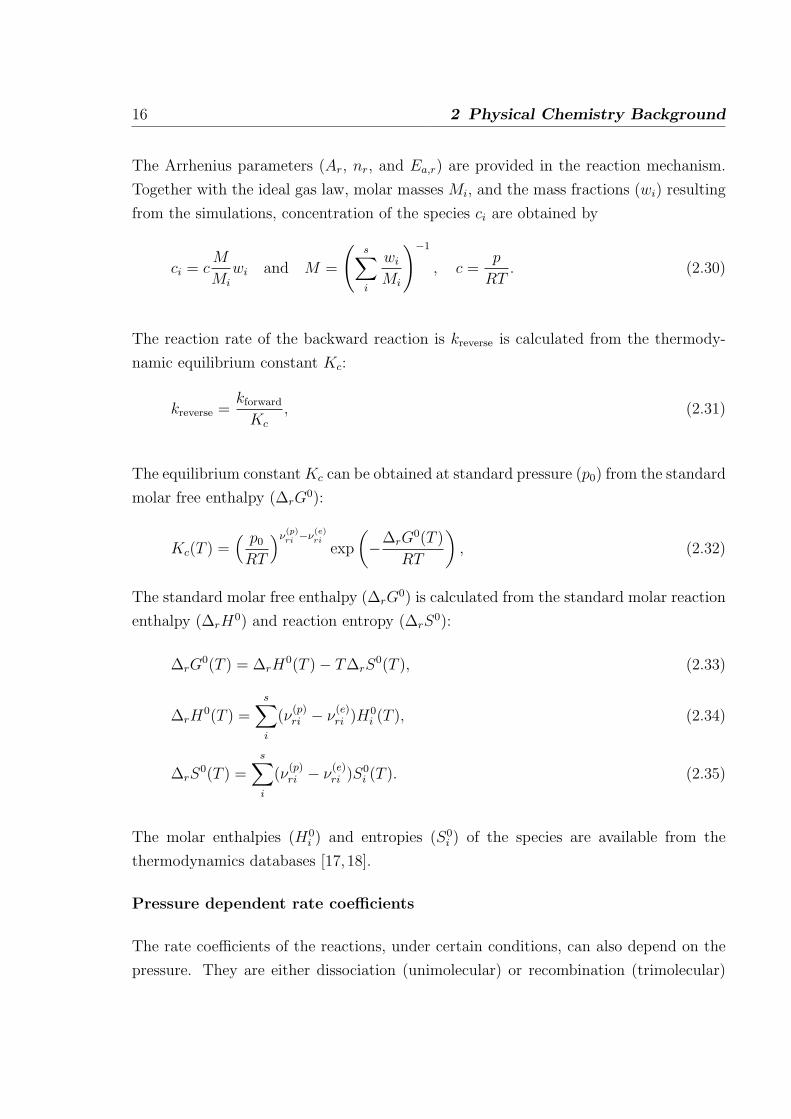
The Arrhenius parameters (Ar, nr, and Ea,r) are provided in the reaction mechanism.
Together with the ideal gas law, molar masses Mi, and the mass fractions (wi) resulting
from the simulations, concentration of the species ci are obtained by
ci = cM
Mi
wi and M =
(s∑i
wi
Mi
)−1
, c =p
RT. (2.30)
The reaction rate of the backward reaction is kreverse is calculated from the thermody-
namic equilibrium constant Kc:
kreverse =kforward
Kc
, (2.31)
The equilibrium constant Kc can be obtained at standard pressure (p0) from the standard
molar free enthalpy (∆rG0):
Kc(T ) =( p0
RT
)ν(p)ri −ν
(e)ri
exp
(−∆rG
0(T )
RT
), (2.32)
The standard molar free enthalpy (∆rG0) is calculated from the standard molar reaction
enthalpy (∆rH0) and reaction entropy (∆rS
0):
∆rG0(T ) = ∆rH
0(T )− T∆rS0(T ), (2.33)
∆rH0(T ) =
s∑i
(ν(p)ri − ν
(e)ri )H0
i (T ), (2.34)
∆rS0(T ) =
s∑i
(ν(p)ri − ν
(e)ri )S0
i (T ). (2.35)
The molar enthalpies (H0i ) and entropies (S0
i ) of the species are available from the
thermodynamics databases [17,18].
Pressure dependent rate coefficients
The rate coefficients of the reactions, under certain conditions, can also depend on the
pressure. They are either dissociation (unimolecular) or recombination (trimolecular)
2.4 Reaction kinetics 17
reactions whose rate increases with increasing pressure. The pressure dependence of the
reaction rate can be understood in principle by the Lindemann model [19]. According
to this model, such reactions are not elementary, rather they are a sequence of reactions.
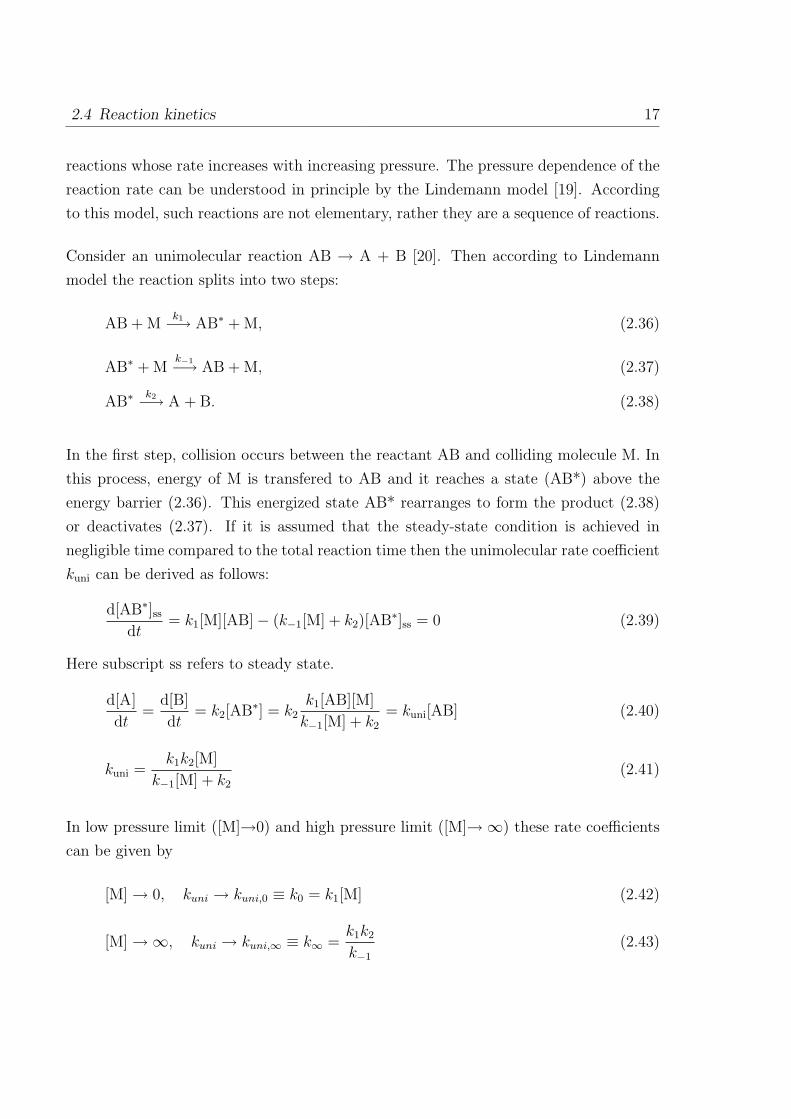
Consider an unimolecular reaction AB → A + B [20]. Then according to Lindemann
model the reaction splits into two steps:
AB + Mk1−→ AB∗ + M, (2.36)
AB∗ + Mk−1−→ AB + M, (2.37)
AB∗k2−→ A + B. (2.38)
In the first step, collision occurs between the reactant AB and colliding molecule M. In
this process, energy of M is transfered to AB and it reaches a state (AB*) above the
energy barrier (2.36). This energized state AB* rearranges to form the product (2.38)
or deactivates (2.37). If it is assumed that the steady-state condition is achieved in
negligible time compared to the total reaction time then the unimolecular rate coefficient
kuni can be derived as follows:
d[AB∗]ssdt
= k1[M][AB]− (k−1[M] + k2)[AB∗]ss = 0 (2.39)
Here subscript ss refers to steady state.
d[A]
dt=
d[B]
dt= k2[AB∗] = k2
k1[AB][M]
k−1[M] + k2
= kuni[AB] (2.40)
kuni =k1k2[M]
k−1[M] + k2
(2.41)
In low pressure limit ([M]→0) and high pressure limit ([M]→∞) these rate coefficients
can be given by
[M] → 0, kuni → kuni,0 ≡ k0 = k1[M] (2.42)
[M] →∞, kuni → kuni,∞ ≡ k∞ =k1k2
k−1
(2.43)
18 2 Physical Chemistry Background
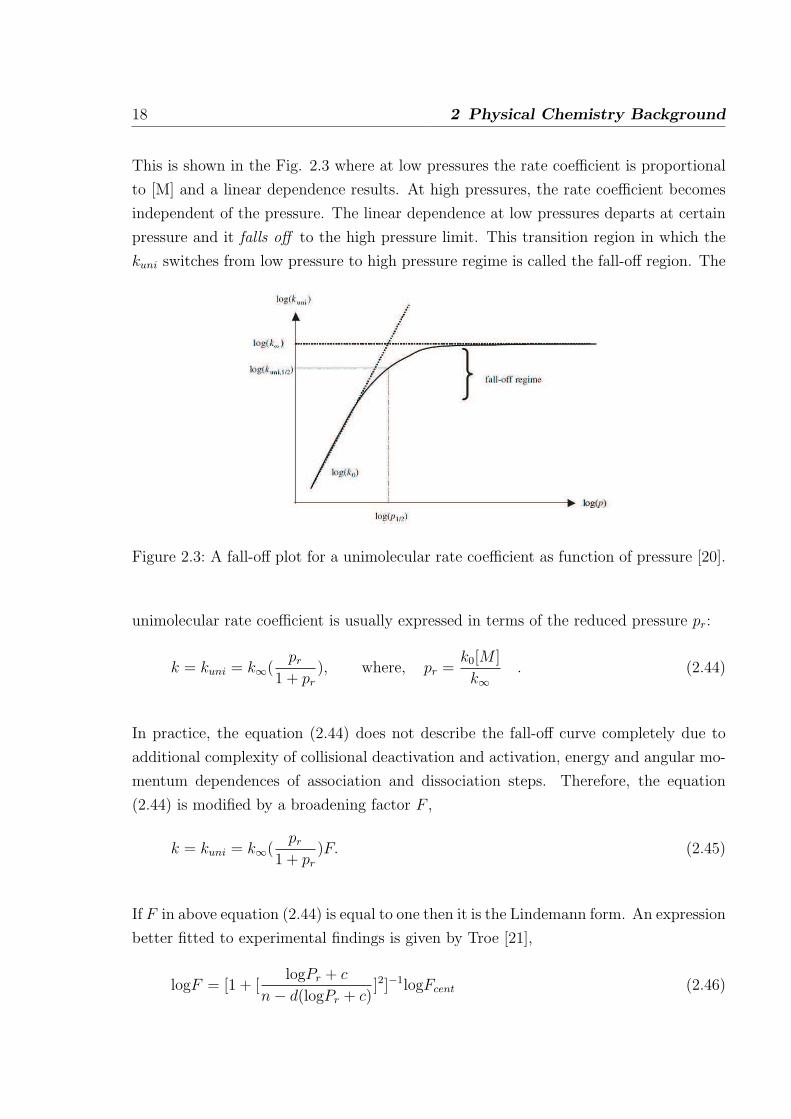
This is shown in the Fig. 2.3 where at low pressures the rate coefficient is proportional
to [M] and a linear dependence results. At high pressures, the rate coefficient becomes
independent of the pressure. The linear dependence at low pressures departs at certain
pressure and it falls off to the high pressure limit. This transition region in which the
kuni switches from low pressure to high pressure regime is called the fall-off region. The
Figure 2.3: A fall-off plot for a unimolecular rate coefficient as function of pressure [20].
unimolecular rate coefficient is usually expressed in terms of the reduced pressure pr:
k = kuni = k∞(pr
1 + pr
), where, pr =k0[M ]
k∞. (2.44)
In practice, the equation (2.44) does not describe the fall-off curve completely due to
additional complexity of collisional deactivation and activation, energy and angular mo-
mentum dependences of association and dissociation steps. Therefore, the equation
(2.44) is modified by a broadening factor F ,
k = kuni = k∞(pr
1 + pr
)F. (2.45)
If F in above equation (2.44) is equal to one then it is the Lindemann form. An expression
better fitted to experimental findings is given by Troe [21],
logF = [1 + [logPr + c
n− d(logPr + c)]2]−1logFcent (2.46)
2.5 Chemiluminescent kinetics 19
with c = −0.4− 0.67logFcent, n = 0.75− 1.27logFcent, d = 0.14, and
Fcent = (1− α)exp(−T/T ∗∗∗) + αexp(−T/T ∗) + exp(−T ∗∗/T ). (2.47)
In the Troe pressure-dependent reaction [21], in addition to the k∞ and k0 rate param-
eters, these four parameters α, T ∗∗∗, T ∗∗, T ∗ are provided as input.
2.5 Chemiluminescent kinetics
In the combustion zone, the electronically excited species are formed from the ener-
getic intermediate ground state species. These species formed are highly reactive. The
lifetime of the formed excited species is short and they return to the ground state by
emitting their energy which is immediately removed by passing into lower state (i.e. its
ground state or a lower excited state). This emitted radiation in form of light (hv) is
called luminescence. The luminescence arising from chemical excitation is called chemi-
luminescence.
In chemiluminescence, light is emitted by molecules returning to the ground state which
were excited chemically rather than thermally. The chemiluminescence signal shows
strong dependence on the chemical composition and weak dependence on the temper-
ature [22]. The strongest chemiluminescent intensities in hydrocarbon flames are from
OH* and CH* whereas C2* has a relatively weak intensity. The OH* emission is found at
309 nm, CH* emission is found at 431 nm CH(A2∆−X2Π), 390 nm CH(B2Σ−−X2Π),
and at 314 nm CH(C2∆ −X2Π) in flame spectra. Among the three available states in
CH*, the first two are the strongest. The Swan bands of C2* are found between 436 -
564 nm. Since in chemiluminescence the excited species are due to chemical excitation,
their formation does not depend on their ground state (which is the case for thermal
excitation).
In addition to this, the excited molecules can undergo collisional quenching. In col-
lisions with other molecules the electronically excited molecule may pass into a lower
electronic state - which is often the ground state. This radiationless decay process is
more common where the excess energy is transferred into the vibration, rotation, and
20 2 Physical Chemistry Background
translation of surrounding molecules. This thermal degradation converts the excitation
energy completely into thermal motion of particles, molecules or atoms i.e. to heat.
Collisional quenching is either reactive or non-reactive in nature. When the excited
species transfers its energy to the colliding molecule and comes to its ground state, this
is called non-reactive collisional quenching. An excited molecule may also take part in
chemical reactions [23]. When the energy transfer to the collider results in two different
products (due to chemical reaction), this is called reactive collisional quenching. The
spatial distribution of spontaneous emission depends on the orientation of the excited
molecules and on the symmetry properties of the excited state. Since this processes
involve collisions, their rates depend on the frequency of collisions and therefore on the
availability of the colliding molecules. In the gas phase this process may occur within
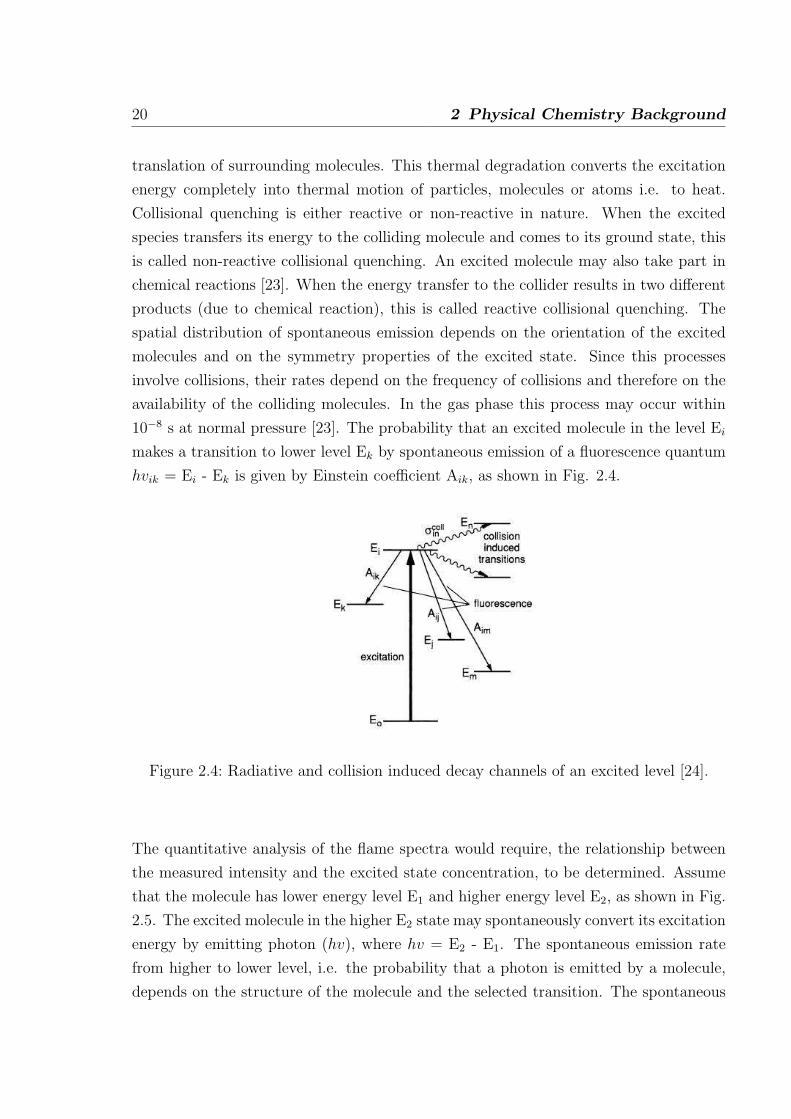
10−8 s at normal pressure [23]. The probability that an excited molecule in the level Ei
makes a transition to lower level Ek by spontaneous emission of a fluorescence quantum
hvik = Ei - Ek is given by Einstein coefficient Aik, as shown in Fig. 2.4.
Figure 2.4: Radiative and collision induced decay channels of an excited level [24].
The quantitative analysis of the flame spectra would require, the relationship between
the measured intensity and the excited state concentration, to be determined. Assume
that the molecule has lower energy level E1 and higher energy level E2, as shown in Fig.
2.5. The excited molecule in the higher E2 state may spontaneously convert its excitation
energy by emitting photon (hv), where hv = E2 - E1. The spontaneous emission rate
from higher to lower level, i.e. the probability that a photon is emitted by a molecule,
depends on the structure of the molecule and the selected transition. The spontaneous
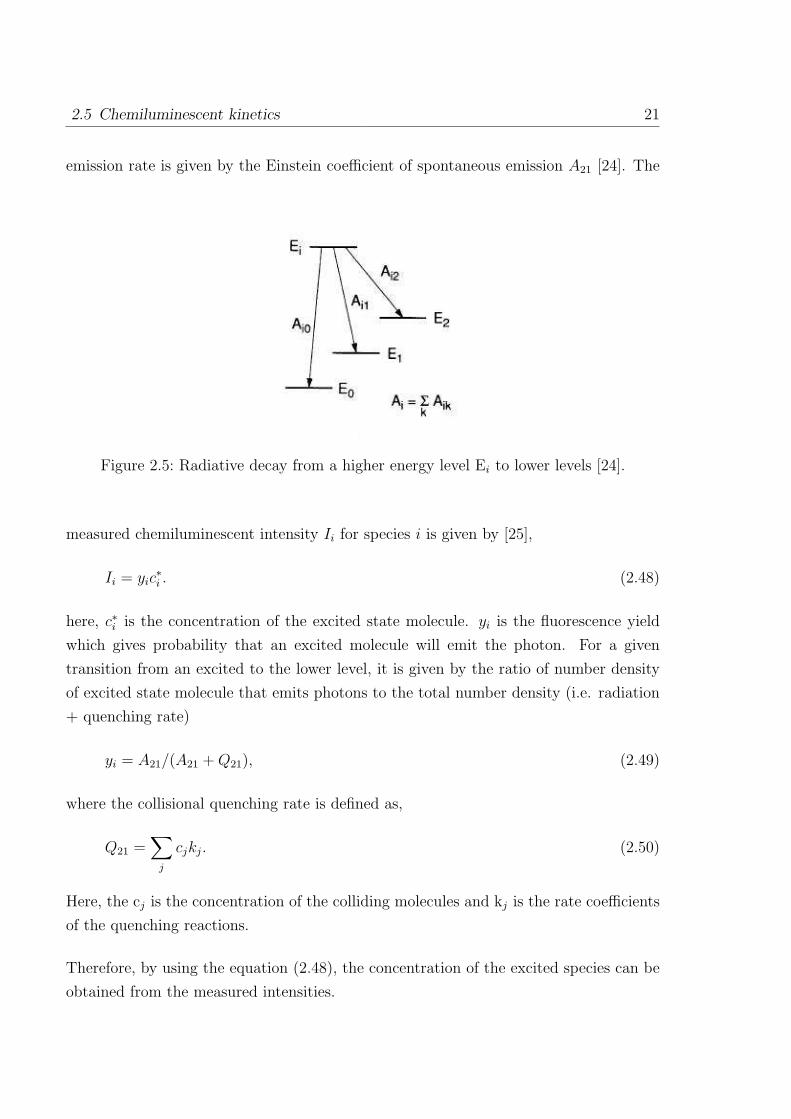
2.5 Chemiluminescent kinetics 21
emission rate is given by the Einstein coefficient of spontaneous emission A21 [24]. The
Figure 2.5: Radiative decay from a higher energy level Ei to lower levels [24].
measured chemiluminescent intensity Ii for species i is given by [25],
Ii = yic∗i . (2.48)
here, c∗i is the concentration of the excited state molecule. yi is the fluorescence yield
which gives probability that an excited molecule will emit the photon. For a given
transition from an excited to the lower level, it is given by the ratio of number density
of excited state molecule that emits photons to the total number density (i.e. radiation
+ quenching rate)
yi = A21/(A21 + Q21), (2.49)
where the collisional quenching rate is defined as,
Q21 =∑
j
cjkj. (2.50)
Here, the cj is the concentration of the colliding molecules and kj is the rate coefficients
of the quenching reactions.
Therefore, by using the equation (2.48), the concentration of the excited species can be
obtained from the measured intensities.
22 2 Physical Chemistry Background
2.6 Analysis of the reaction kinetics
It is well-known that the reaction kinetics mechanism of the smallest hydrocarbon fuel
(CH4) would require the mechanism consisting of about 11 species and 58 elementary
reactions. For higher hydrocarbons, several thousands of reaction would be required.
The interaction of these reactions governs the combustion process. However, among
them there are only few reactions which determine the rate of the overall process (called
rate-limiting reactions). Therefore it is advantageous to know the set of reactions whose
knowledge is sufficient to governs the entire combustion process.
The two major mechanism analysis methods performed are sensitivity analysis and re-
action flow analysis. Through the sensitivity analysis it is possible to determine whether
the reaction is rate limiting or not. This helps in understanding the relative importance
of reaction as one requires a highly accurate rate data for the rate limiting reaction. On
other hand, the accuracy of the rate data does not affect the simulation results of the
non sensitive reactions. The reaction flow analysis determines the characteristic reaction
paths thereby providing information on the formation and consumption pathways of a
given species.
In a sensitivity analysis, the rate coefficients of the chemical reactions are considered as
parameters. In a system with R reactions and S species, the change in concentration of
species i is written as,
dci
dt= Fi(c1, . . . , cs; k1, . . . , kr), (2.51)
where, i = 1, 2, . . . , S and ci(t = t0) = c0i .
Here, ci (concentration of species i) is the dependent variable and the time t is indepen-
dent variable. c0i is the initial condition at time t0. The dependence of the solution ci
on the parameter kr is called sensitivity. The absolute sensitivity is given by,
Ei,r =∂ci
∂kr
(2.52)
and the relative sensitivity is given by
E(rel)i,r =
kr
ci
∂ci
∂kr
=∂lnci
∂lnkr
. (2.53)
2.6 Analysis of the reaction kinetics 23
For given ±x% change in kr, the sensitivity analysis gives information on changes in
concentration of the given species. A high sensitivity indicates that the reaction is rate
limiting. The analysis can be performed either globally or locally. The global sensitivity
analysis considers the overall formation and consumption during the combustion process.
The resulting analysis is integrated over the whole reaction time (for homogeneous time
dependent system) and the results for stationary flames are integrated over the reaction
zone. The local reaction flow analysis considers the formation and consumption of species
locally, i.e. at specific times in time-dependent problem (ignition processes) or at specific
locations in steady state processes (flat flame).
The reaction flow analysis gives information on the relative rate of formation and con-
sumption of a species. From this analysis, one can draw the entire reaction pathway
for the consumption and formation of a given species. The integral reaction flow anal-
ysis considers the overall formation and consumption during the combustion process.
In homogeneous systems the results are integrated over the reaction time whereas in
stationary flames they are integrated over the reaction zone. The local reaction flow
analysis considers the formation and consumption of species at specific times (in homo-
geneous process) or at specific locations (flat flames). The reaction is considered to be
unimportant if the formation (or consumption) of given species is below certain limit
(e.g., 1%).
3 Kinetics Mechanism of C1 to C4
Hydrocarbon Oxidation
The concentration of chemiluminating species is low compared to the concentration of
ground state species. Therefore, it is seen that their prediction depends on the species
that are the direct precursors responsible for their formation. These intermediates such
as CH, C2H, C2, and 1CH2 are not directly important for the global validation (such
as ignition delay time, flame velocity) of the basic hydrocarbon oxidation mechanism.
Therefore, before developing the mechanism for the excited species, it is important to
have a good prediction of such chemiluminescence precursor species.
The underlying mechanism originates from the dissertation of Heghes [26]. The C1 to C4
hydrocarbon mechanism in [26] is derived to model basic fuels at non-sooting conditions.
This mechanism is modified in the present work with focus on the intermediates such
as CH, C2H, C2 and is discussed in this chapter. The complete description of oxidation
of hydrocarbons in the low and high temperature range requires incorporation of RO2,
RO2H, aldehyde species, and radicals along with single, double and triple bond RH.
Initially H, O, OH radicals are produced by chain branching steps of O2-H2-reactions
(oxy-hydrogen reactions). The hydrocarbon fuel molecules are attached by these radi-
cals to form alkyl radicals (Fig. 3.1). These alkyls further decompose to smaller alkyls.
In addition to the CH3 decomposition path there is a competing recombination path
which forms C2H6. This recombination path is important in the rich flame condition.
The CH3/C2H5 oxidation is rate limiting step. Similarly, the C3/C4 hydrocarbons de-
composes to CH4 and C2H5 and follows the C1/C2 chemistry pathways as shown in Fig.
3.1
24
3.1 H2-O2 oxidation 25
C1/C
2
CH4
C3/C
4
CH4
C2H5
CH3
CH2O
CHO
CO
C2H6
C2H5
C2H4
C2H3
CO2
C2H2
CH2
CH
C1/C
2
CH4
C3/C
4
CH4
C2H5
CH3
CH2O
CHO
CO
C2H6
C2H5
C2H4
C2H3
CO2
C2H2
CH2
CH
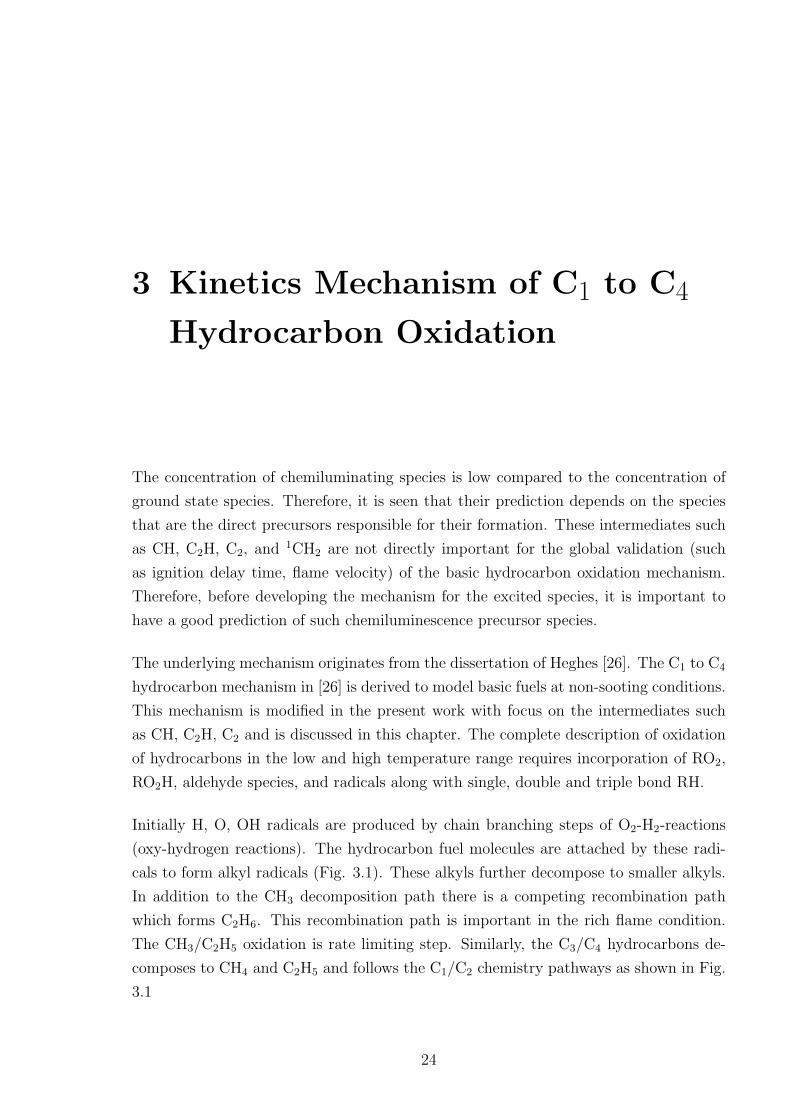
Figure 3.1: C1 to C4 hydrocarbon decomposition scheme.
3.1 H2-O2 oxidation
The mechanism of H2-O2 involves important chain branching steps forming H, O, and OH
radicals. The reaction H + O2 → OH + O (R1) is the most important chain branching
reaction at high temperature and low pressures. Here, the number (R1) refers to the
reaction number presented in mechanism in Appendix. A pressure- and temperature-
dependent reaction H + O2 + M → OH + O + M (R8) is competing with reaction (R1)
and has chain terminating character, due to the relatively nonreactive nature of the
HO2 radical formed. At low pressures the main branching reactions H+O2 (R1), O+H2
(R2) and OH+H2 (R3) are important. However, as the pressure increases leading to the
second explosion limit region, the reaction rate is controlled by the reactions involving
HO2.
The kinetics scheme discussed in [26] has been modified in the current work, which
is presented in Appendix. The underlying mechanism originating from Heghes 2007
[26] has considered reaction rate of H + O2 + M = HO2 + M (R8) as a sum of two
Arrhenius expression. The present study considers only one reaction rate (R8) as shown
in Appendix. The reaction H + O2 = OH + O (R1) is the basic chain branching
reaction at high temperature and flame propagation is highly sensitive to this reaction.
Reaction (R8), thus, competes with reaction (R1) at the given temperature and pressure
conditions. The ignition delay time measured from the onset of OH* profile is presented
26 3 Kinetics Mechanism of C1 to C4 Hydrocarbon Oxidation
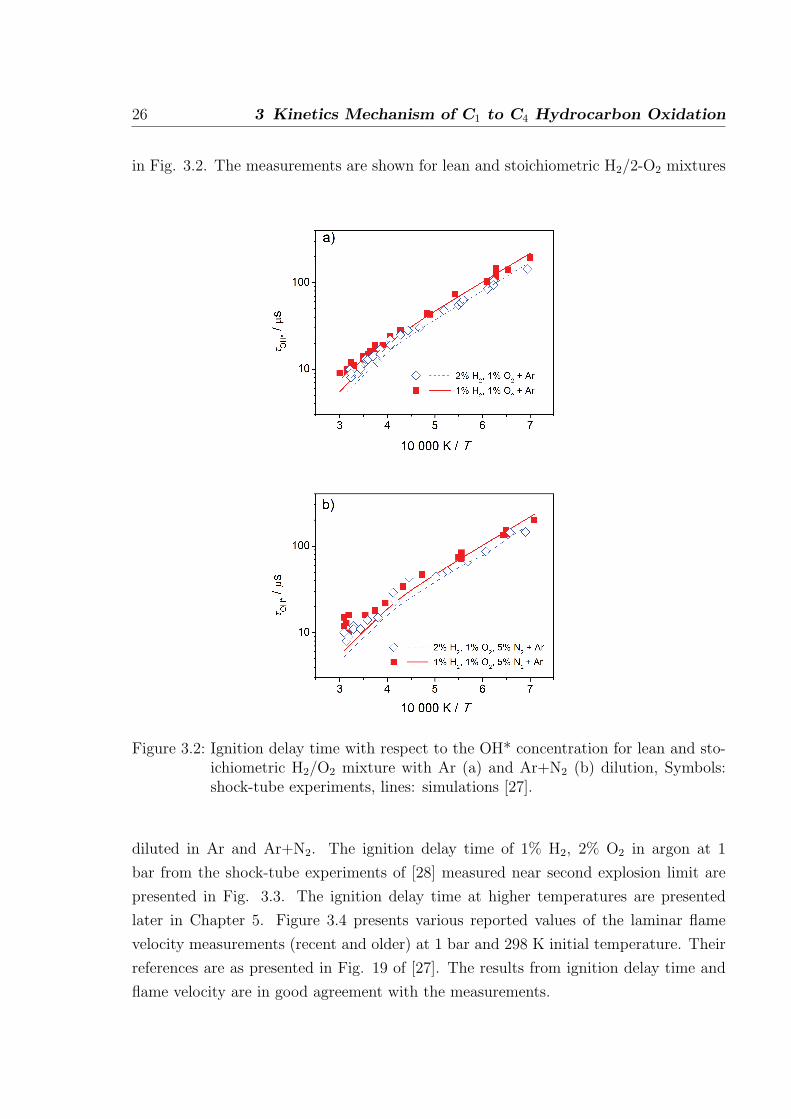
in Fig. 3.2. The measurements are shown for lean and stoichiometric H2/2-O2 mixtures
Figure 3.2: Ignition delay time with respect to the OH* concentration for lean and sto-ichiometric H2/O2 mixture with Ar (a) and Ar+N2 (b) dilution, Symbols:shock-tube experiments, lines: simulations [27].
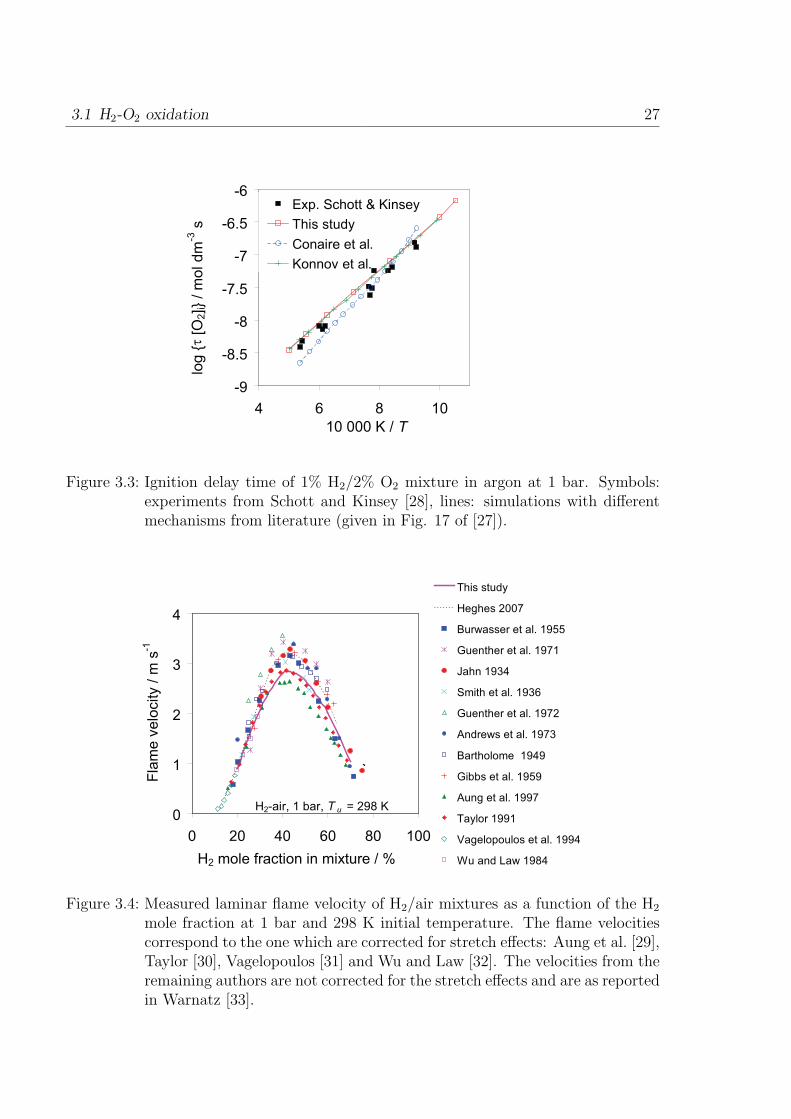
diluted in Ar and Ar+N2. The ignition delay time of 1% H2, 2% O2 in argon at 1
bar from the shock-tube experiments of [28] measured near second explosion limit are
presented in Fig. 3.3. The ignition delay time at higher temperatures are presented
later in Chapter 5. Figure 3.4 presents various reported values of the laminar flame
velocity measurements (recent and older) at 1 bar and 298 K initial temperature. Their
references are as presented in Fig. 19 of [27]. The results from ignition delay time and
flame velocity are in good agreement with the measurements.
3.1 H2-O2 oxidation 27
-9
-8.5
-8
-7.5
-7
-6.5
-6
4 6 8 10
10 000 K / T
log
{τ [O
2] i}
/ m
ol d
m-3
sExp. Schott & Kinsey
This study
Conaire et al.
Konnov et al.
Figure 3.3: Ignition delay time of 1% H2/2% O2 mixture in argon at 1 bar. Symbols:experiments from Schott and Kinsey [28], lines: simulations with differentmechanisms from literature (given in Fig. 17 of [27]).
H2-air, 1 bar, T u = 298 K0
1
2
3
4
0 20 40 60 80 100
H2 mole fraction in mixture / %
Fla
me
ve
locity / m
s-1
This study
Heghes 2007
Burwasser et al. 1955
Guenther et al. 1971
Jahn 1934
Smith et al. 1936
Guenther et al. 1972
Andrews et al. 1973
Bartholome 1949
Gibbs et al. 1959
Aung et al. 1997
Taylor 1991
Vagelopoulos et al. 1994
Wu and Law 1984
`
Figure 3.4: Measured laminar flame velocity of H2/air mixtures as a function of the H2
mole fraction at 1 bar and 298 K initial temperature. The flame velocitiescorrespond to the one which are corrected for stretch effects: Aung et al. [29],Taylor [30], Vagelopoulos [31] and Wu and Law [32]. The velocities from theremaining authors are not corrected for the stretch effects and are as reportedin Warnatz [33].
28 3 Kinetics Mechanism of C1 to C4 Hydrocarbon Oxidation
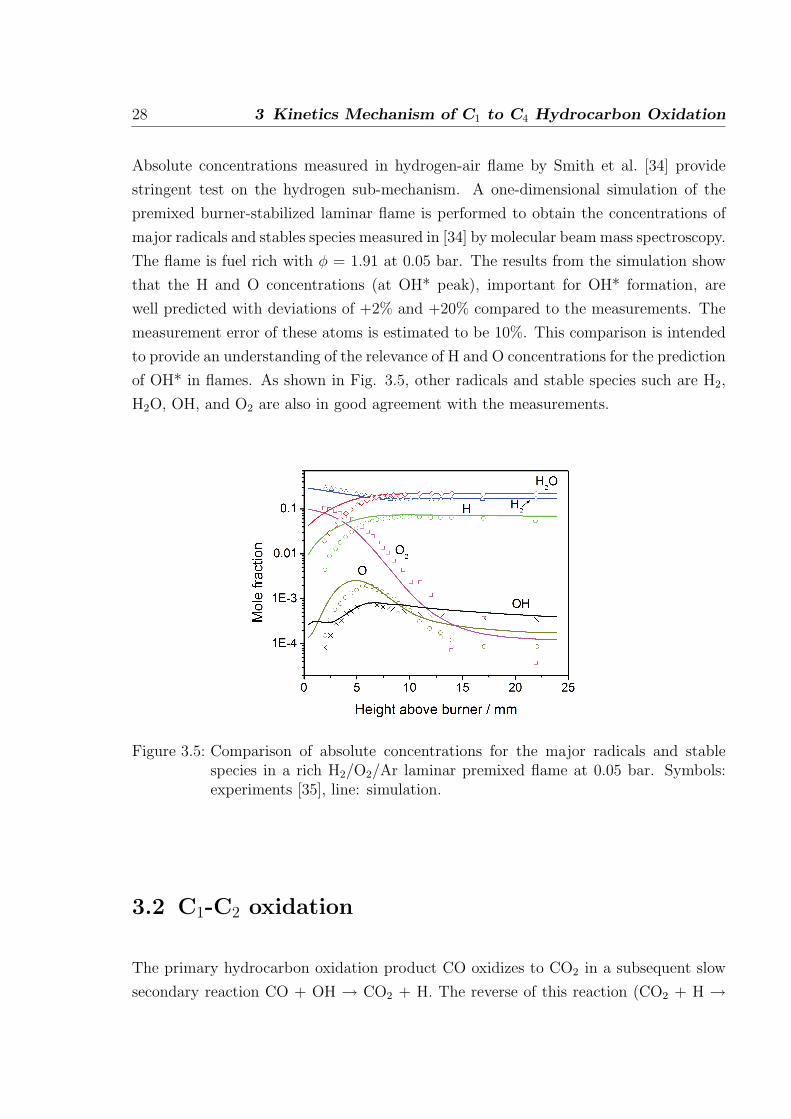
Absolute concentrations measured in hydrogen-air flame by Smith et al. [34] provide
stringent test on the hydrogen sub-mechanism. A one-dimensional simulation of the
premixed burner-stabilized laminar flame is performed to obtain the concentrations of
major radicals and stables species measured in [34] by molecular beam mass spectroscopy.
The flame is fuel rich with φ = 1.91 at 0.05 bar. The results from the simulation show
that the H and O concentrations (at OH* peak), important for OH* formation, are
well predicted with deviations of +2% and +20% compared to the measurements. The
measurement error of these atoms is estimated to be 10%. This comparison is intended
to provide an understanding of the relevance of H and O concentrations for the prediction
of OH* in flames. As shown in Fig. 3.5, other radicals and stable species such are H2,
H2O, OH, and O2 are also in good agreement with the measurements.
Figure 3.5: Comparison of absolute concentrations for the major radicals and stablespecies in a rich H2/O2/Ar laminar premixed flame at 0.05 bar. Symbols:experiments [35], line: simulation.
3.2 C1-C2 oxidation
The primary hydrocarbon oxidation product CO oxidizes to CO2 in a subsequent slow
secondary reaction CO + OH → CO2 + H. The reverse of this reaction (CO2 + H →
3.2 C1-C2 oxidation 29
CO + OH) is important to establish water gas equilibrium [36]. CO is mainly formed
in the reaction CHO + M → CO + H + M.
3.2.1 C1 chemistry
The smallest hydrocarbon fuel methane is widely studied in combustion as it is an im-
portant fuel itself but is also produced during the oxidation of most of the hydrocarbons.
In the oxidation of CH4, the fuel is attacked by H, O, OH radicals which forms CH3.
The reaction CH4 + M → CH3 + H + M initiates the thermal decomposition at high
temperature ignition forming CH3:
(R94) : CH4 + H → CH3 + H2,
(R95) : CH4 + O → CH3 + OH,
(R96) : CH4 + OH → CH3 + H2O.
The CH3 thus formed reacts with O to form formaldehyde (CH2O) which further reacts
rapidly to generate CHO:
(R66) : CH3 + O → CH2O + H,
(R54) : CH2O + H → CHO + H2,
(R55) : CH2O + O → CHO + OH,
(R56) : CH2O + OH → CHO + H2O.
The CHO is thermally decomposed to CO. The methane oxidation is completed by the
oxidation of CO to CO2:
(R34) : CHO + M → H + CO + M,
(R35) : CHO + H → H2 + CO.
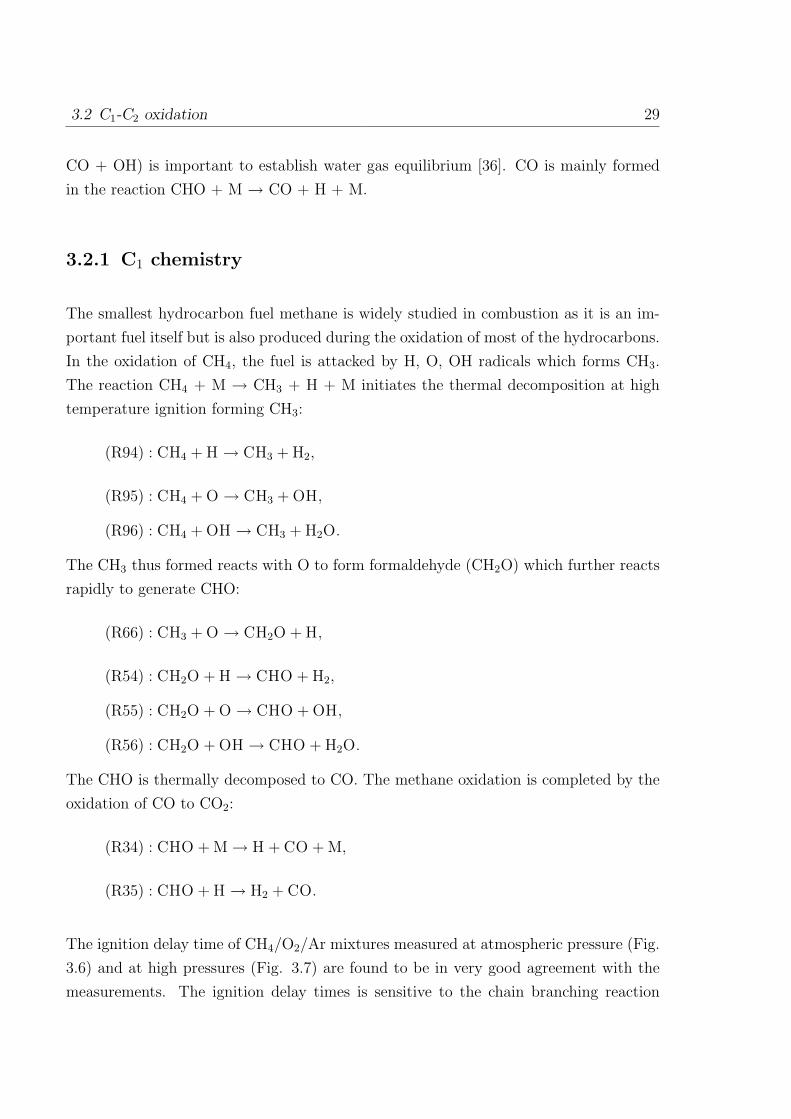
The ignition delay time of CH4/O2/Ar mixtures measured at atmospheric pressure (Fig.
3.6) and at high pressures (Fig. 3.7) are found to be in very good agreement with the
measurements. The ignition delay times is sensitive to the chain branching reaction
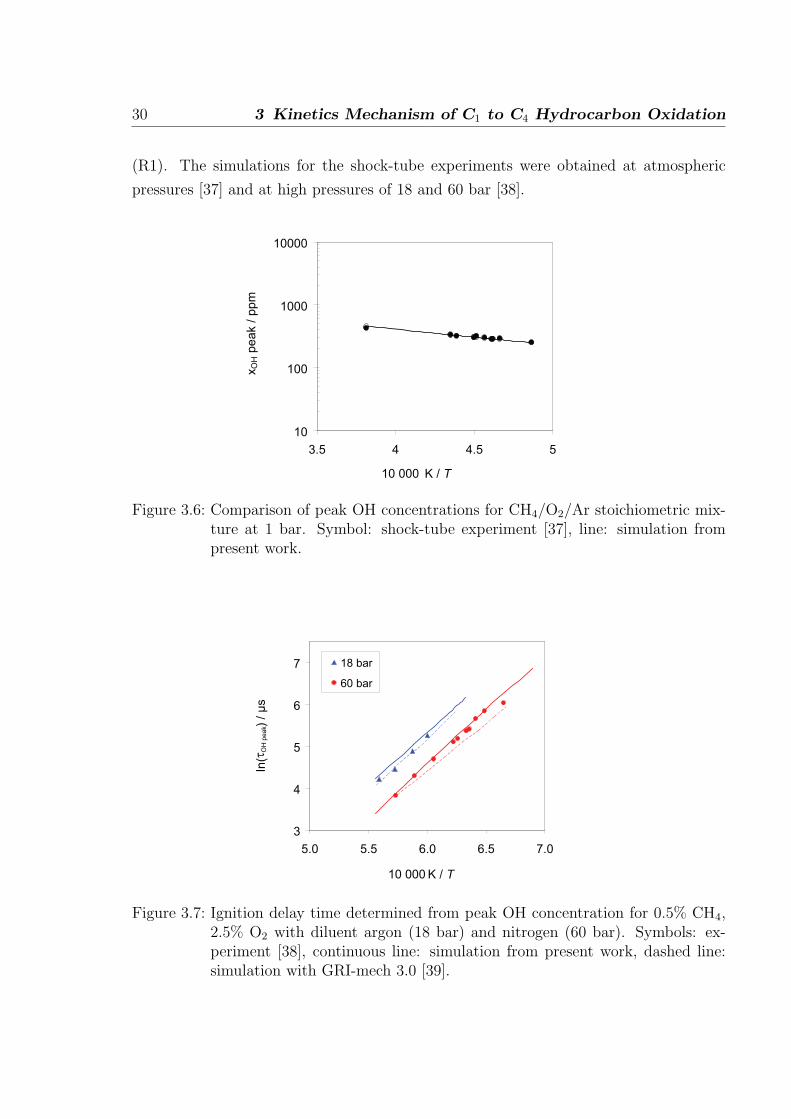
30 3 Kinetics Mechanism of C1 to C4 Hydrocarbon Oxidation
(R1). The simulations for the shock-tube experiments were obtained at atmospheric
pressures [37] and at high pressures of 18 and 60 bar [38].
10
100
1000
10000
3.5 4 4.5 5
10 000 K / T
xO
H p
ea
k / p
pm
Figure 3.6: Comparison of peak OH concentrations for CH4/O2/Ar stoichiometric mix-ture at 1 bar. Symbol: shock-tube experiment [37], line: simulation frompresent work.
3
4
5
6
7
5.0 5.5 6.0 6.5 7.0
10 000 K / T
In(τ
OH
peak)
/ µ
s
18 bar
60 bar
Figure 3.7: Ignition delay time determined from peak OH concentration for 0.5% CH4,2.5% O2 with diluent argon (18 bar) and nitrogen (60 bar). Symbols: ex-periment [38], continuous line: simulation from present work, dashed line:simulation with GRI-mech 3.0 [39].
3.2 C1-C2 oxidation 31
The measurement of peak OH concentrations for CH4/O2/Ar stoichiometric mixture at
1 bar pressure is obtained in shock-tube experiment [37]. As shown in Fig. 3.6 the
simulated OH peak concentrations are in very good agreement with the measurements.
At high pressures (Fig. 3.7), Petersen et al. [38] measured ignition delay time based
on the OH peak time for the mixture of 0.5% CH4-2.5% O2 with argon (18 bar) and
nitrogen (60 bar) as diluent. The simulated ignition delay times, as shown in Fig. 3.7,
are in very good agreement with the measurements at both pressures. The ignition delay
time obtained by using the GRI-mech 3.0 [39] slightly underpredicts the measurement
at 60 bar.
0
0.1
0.2
0.3
0.4
0.5
0.2 0.6 1 1.4 1.8
Equivalence ratio
Fla
me
ve
locity / m
s-1
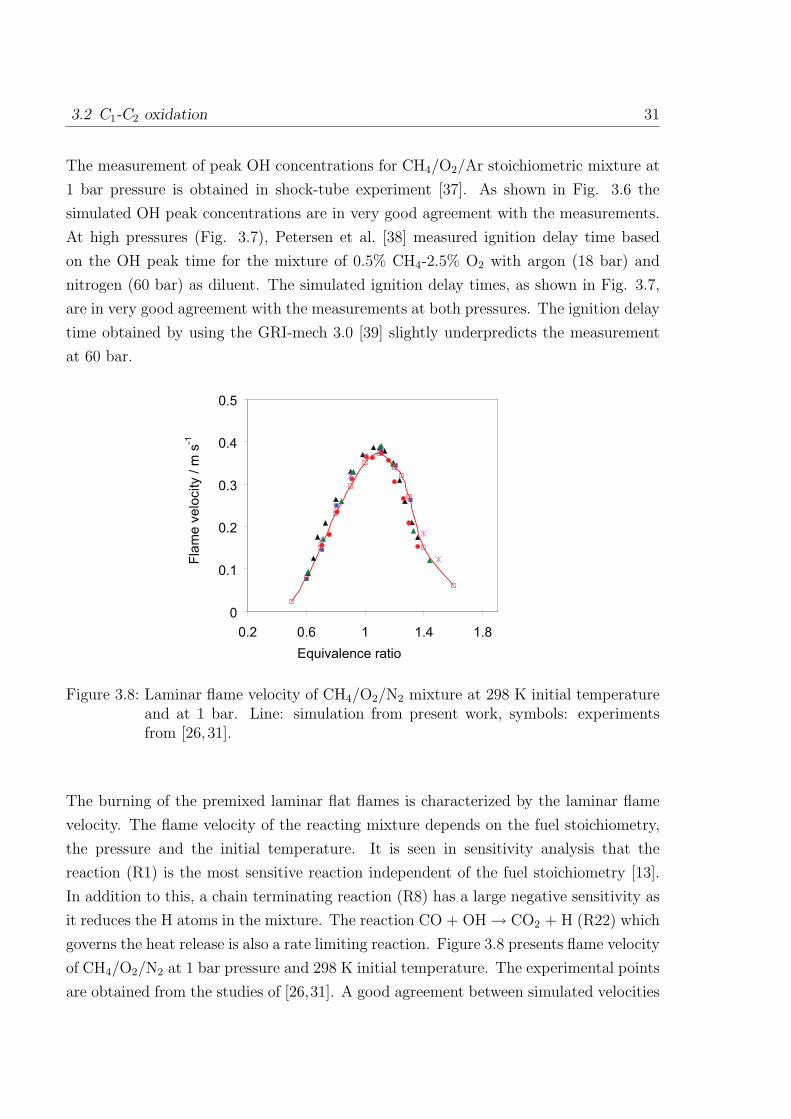
Figure 3.8: Laminar flame velocity of CH4/O2/N2 mixture at 298 K initial temperatureand at 1 bar. Line: simulation from present work, symbols: experimentsfrom [26,31].
The burning of the premixed laminar flat flames is characterized by the laminar flame
velocity. The flame velocity of the reacting mixture depends on the fuel stoichiometry,
the pressure and the initial temperature. It is seen in sensitivity analysis that the
reaction (R1) is the most sensitive reaction independent of the fuel stoichiometry [13].
In addition to this, a chain terminating reaction (R8) has a large negative sensitivity as
it reduces the H atoms in the mixture. The reaction CO + OH → CO2 + H (R22) which
governs the heat release is also a rate limiting reaction. Figure 3.8 presents flame velocity
of CH4/O2/N2 at 1 bar pressure and 298 K initial temperature. The experimental points
are obtained from the studies of [26,31]. A good agreement between simulated velocities
32 3 Kinetics Mechanism of C1 to C4 Hydrocarbon Oxidation
and experimental velocities is obtained at different equivalence ratios.
3.2.2 C2 chemistry
The simple scheme of decomposition of CH4 is complicated by the recombination of CH3
in the reaction
(R173) : CH3 + CH3 → C2H5 + H.
This recombination path consumes about 30% CH3 in stoichiometric CH4-air flames
which increases to 80% in rich flame. Thus from stoichiometric to rich conditions,
knowledge on the combustion of C2-hydrocarbons is getting more and more important
in addition to the C1-hydrocarbons chemistry.
The recombination path is dominated by reaction,
(R76) : CH3 + CH3 + M → C2H6 + M,
where the C2H6 formed is further attacked by H, O, and OH radicals to form C2H5.
There are many competing reactions consuming C2H5. In one channel it oxidizes to
CH2CHO and CH2CO, and finally forms CH3. The major channel is the reaction of
C2H5 with O2 and thermal decomposition forming C2H4:
(R176) : C2H5 + O2 → C2H4 + HO2,
(R172) : C2H5 + M → C2H4 + H + M.
In a less important channel, C2H5 reacts with H atoms to form CH3 again:
(R173) : C2H5 + H → CH3 + CH3.
The C2H4 formed in above channel oxidizes with H, OH and forms mainly CH3 and
CHO:
(R157) : C2H4 + OH → C2H3 + H2O,
(R155) : C2H4 + O → CH3 + CHO.
3.2 C1-C2 oxidation 33
In addition, C2H4 reacts back to C2H5 and another channel forms C2H3 (about 55% in
stoichiometric CH4 flames).
(R152) : C2H4 + H + M → C2H5 + M,
(R153) : C2H4 + H → C2H3 + H2.
The C2H3 formed from C2H4 is converted mainly to C2H2 by thermal decomposition
and by reaction with H atoms:
(R139) : C2H3 + M → C2H2 + H + M,
(R140) : C2H3 + H → C2H2 + H2.
3.2.3 C2H2 chemistry
The C2H2 plays an important role under fuel rich conditions. It is an important precursor
for the formation and growth of soot. In addition to this, the acetylene chemistry is also
important for the present work as the direct precursors to the excited species formation
(e.g. CH, C2H, C2) are formed from acetylene. The C2H2 formed in the recombination
channel is consumed by the attack of O and OH atoms:
(R129) : C2H2 + OH → C2H + H2O.
(R128) : C2H2 + O → HCCO + H,
(R127) : C2H2 + O → 3CH2 + CO,
As discussed in [26], the channel forming C2H is the dominant reaction (65% lean-,
70% rich- methane/air flame) followed by reaction forming HCCO (27% lean-, 22% rich-
methane/air flame) whereas the third channel which forms CH2 in the triplet state is a
minor channel (less than 10%). Among these C2H2 consumption reactions, the reaction
of C2H2 + O2 → HCCO + OH (R128) is found very important for the ignition delay
time of acetylene mixtures. Whereas the flame speed of such mixtures is sensitive to the
rate of C2H2 + OH → C2H + H2O (R129).
The mechanism presented in [26] is referred to hereafter as original mechanism whereas
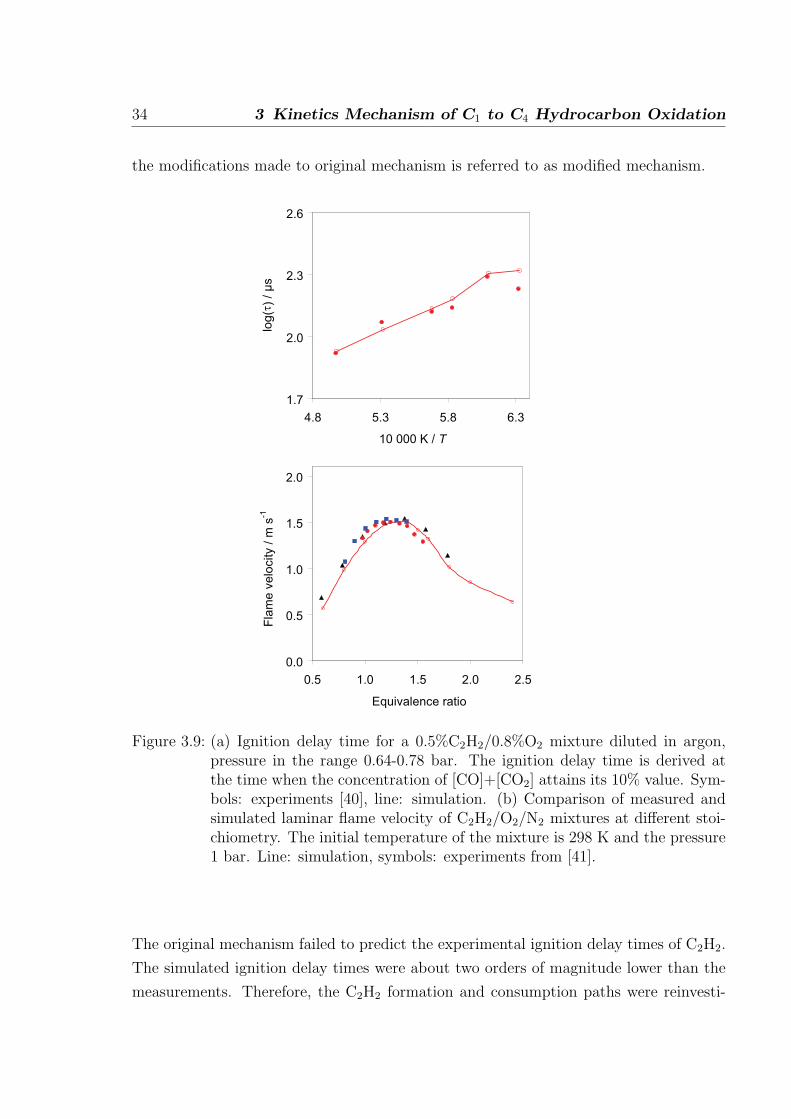
34 3 Kinetics Mechanism of C1 to C4 Hydrocarbon Oxidation
the modifications made to original mechanism is referred to as modified mechanism.
1.7
2.0
2.3
2.6
4.8 5.3 5.8 6.3
10 000 K / T
log
(τ)
/ µ
s
0.0
0.5
1.0
1.5
2.0
0.5 1.0 1.5 2.0 2.5
Equivalence ratio
Fla
me
ve
locity / m
s-1
Figure 3.9: (a) Ignition delay time for a 0.5%C2H2/0.8%O2 mixture diluted in argon,pressure in the range 0.64-0.78 bar. The ignition delay time is derived atthe time when the concentration of [CO]+[CO2] attains its 10% value. Sym-bols: experiments [40], line: simulation. (b) Comparison of measured andsimulated laminar flame velocity of C2H2/O2/N2 mixtures at different stoi-chiometry. The initial temperature of the mixture is 298 K and the pressure1 bar. Line: simulation, symbols: experiments from [41].
The original mechanism failed to predict the experimental ignition delay times of C2H2.
The simulated ignition delay times were about two orders of magnitude lower than the
measurements. Therefore, the C2H2 formation and consumption paths were reinvesti-
3.2 C1-C2 oxidation 35
gated. While modifying the mechanism one has to be careful as the reaction which
influences the ignition delay time has also influence on the flame velocity. In order to
match the measured ignition delay time it would require to decrease the rate of reaction
(R128). The rate of this reaction is not well studied and no recommendation is made in
the database by Baulch et al. [42]. Therefore a factor of 4 slower rate recommended by
Miller et al. [43] which is equal to k(R128) = 5.0×10⁷T 1.5exp(-126 kJ mol−1/RT ) cm−3
mol−1 s−1 is taken into account. Also the reaction rate of (R129) has been modified
within the available limit of k given in [42]. Based on these changes, the ignition delay
time is decreased compared to the earlier predictions in [26] and excellent agreement is
seen with the measurement as is shown in Fig. 3.9a. The flame velocities of acetylene-air
mixtures are also well reproduced as given in Fig. 3.9b.
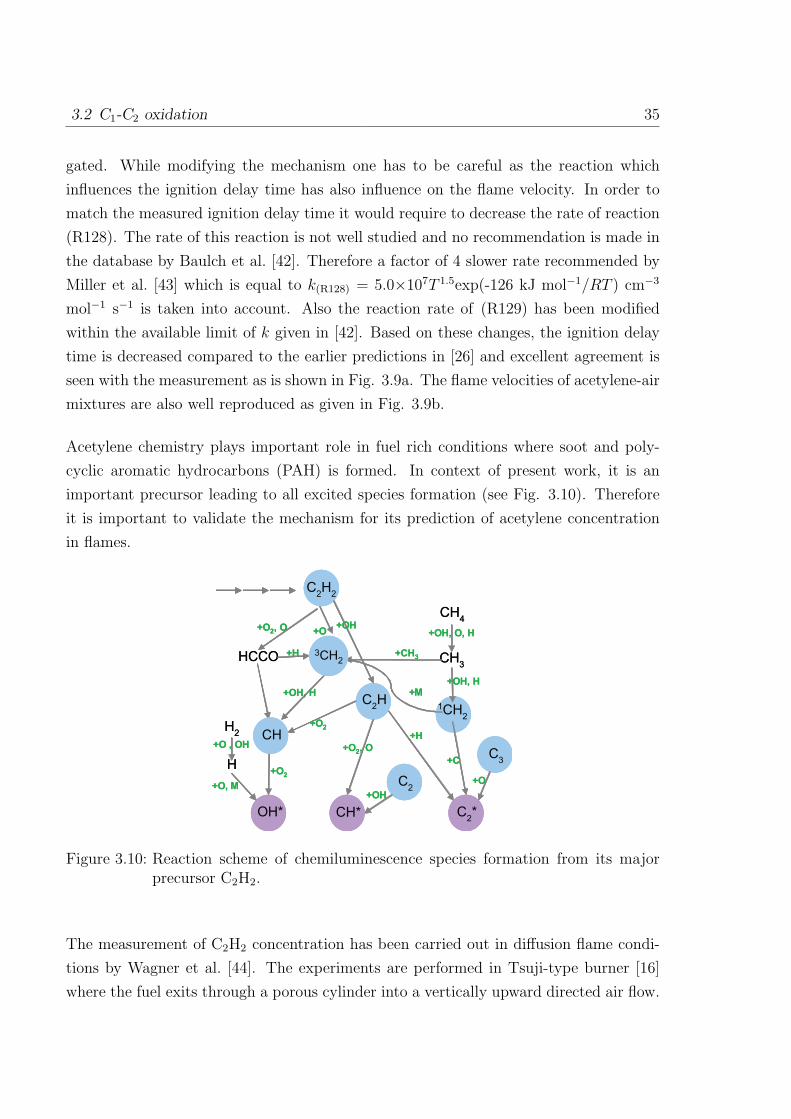
Acetylene chemistry plays important role in fuel rich conditions where soot and poly-
cyclic aromatic hydrocarbons (PAH) is formed. In context of present work, it is an
important precursor leading to all excited species formation (see Fig. 3.10). Therefore
it is important to validate the mechanism for its prediction of acetylene concentration
in flames.
C2H2
HCCO
C2H
CH
OH* C2*
+O2, O
+O2
+O2
+OH, H
+H
+OH+O
CH3
+OH, H
H
+O, M
CH4
+OH, O, H
H2
+O , OH
+O2, O
+H
+CH3
+M
+OH
C2
+C
3CH2
1CH2
CH*
C3
+O
CH
3CH2
C2H2
C2H2
HCCO
C2H
CH
OH*OH* C2*C2*
+O2, O
+O2
+O2
+OH, H
+H
+OH+O
CH3
+OH, H
H
+O, M
CH4
+OH, O, H
H2
+O , OH
+O2, O
+H
+CH3
+M
+OH
C2C2
+C
3CH2
1CH2
CH*CH*
C3C3
+O
CHCH
3CH2
3CH2
Figure 3.10: Reaction scheme of chemiluminescence species formation from its majorprecursor C2H2.
The measurement of C2H2 concentration has been carried out in diffusion flame condi-
tions by Wagner et al. [44]. The experiments are performed in Tsuji-type burner [16]
where the fuel exits through a porous cylinder into a vertically upward directed air flow.
36 3 Kinetics Mechanism of C1 to C4 Hydrocarbon Oxidation
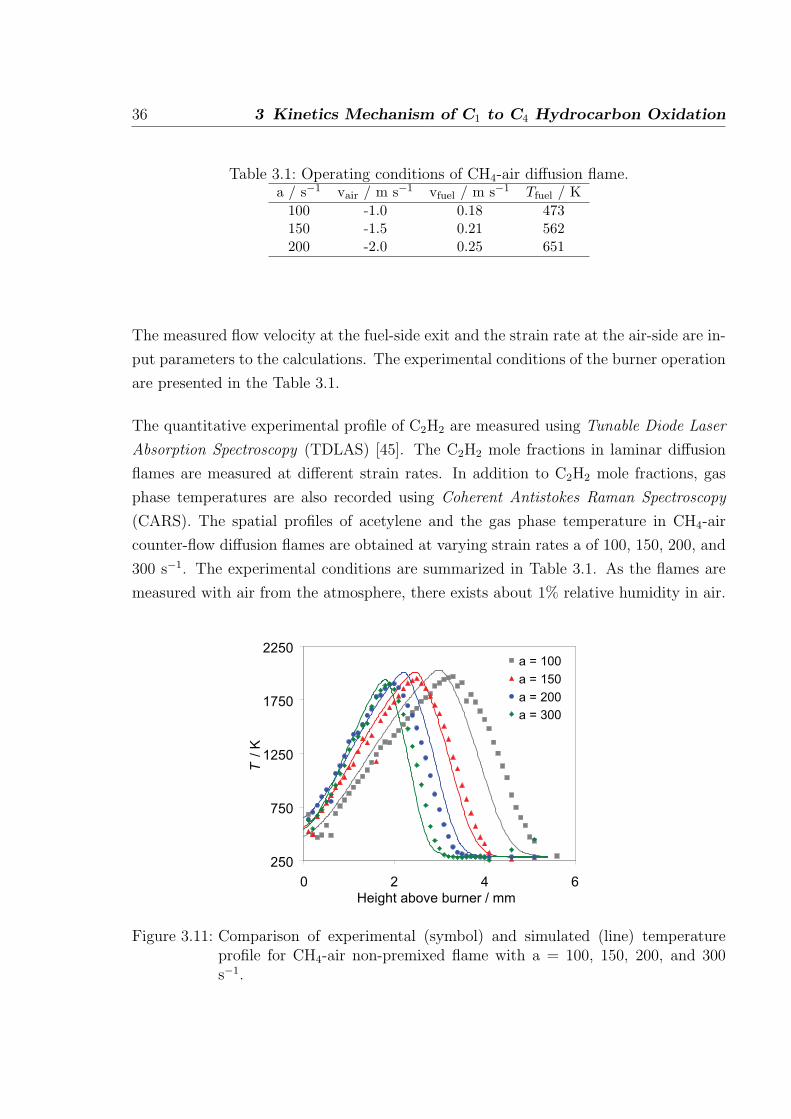
Table 3.1: Operating conditions of CH4-air diffusion flame.a / s−1 vair / m s−1 vfuel / m s−1 Tfuel / K
100 -1.0 0.18 473150 -1.5 0.21 562200 -2.0 0.25 651
The measured flow velocity at the fuel-side exit and the strain rate at the air-side are in-
put parameters to the calculations. The experimental conditions of the burner operation
are presented in the Table 3.1.
The quantitative experimental profile of C2H2 are measured using Tunable Diode Laser
Absorption Spectroscopy (TDLAS) [45]. The C2H2 mole fractions in laminar diffusion
flames are measured at different strain rates. In addition to C2H2 mole fractions, gas
phase temperatures are also recorded using Coherent Antistokes Raman Spectroscopy
(CARS). The spatial profiles of acetylene and the gas phase temperature in CH4-air
counter-flow diffusion flames are obtained at varying strain rates a of 100, 150, 200, and
300 s−1. The experimental conditions are summarized in Table 3.1. As the flames are
measured with air from the atmosphere, there exists about 1% relative humidity in air.
250
750
1250
1750
2250
0 2 4 6
Height above burner / mm
T / K
a = 100
a = 150
a = 200
a = 300
Figure 3.11: Comparison of experimental (symbol) and simulated (line) temperatureprofile for CH4-air non-premixed flame with a = 100, 150, 200, and 300s−1.
3.2 C1-C2 oxidation 37
The presence of humidity has a small influence, e.g. when the calculations are performed
with 1% relative humidity in air, the peak temperatures are about 18 K (at 100 s−1
strain rate) lower than those calculated with dry air. The temperature calculated with
1% relative humidity in air are closer to the measurements. Also, the calculations do
not account for the heat losses to the surroundings and therefore there is about 60 K
difference in measured and calculated peak temperature.
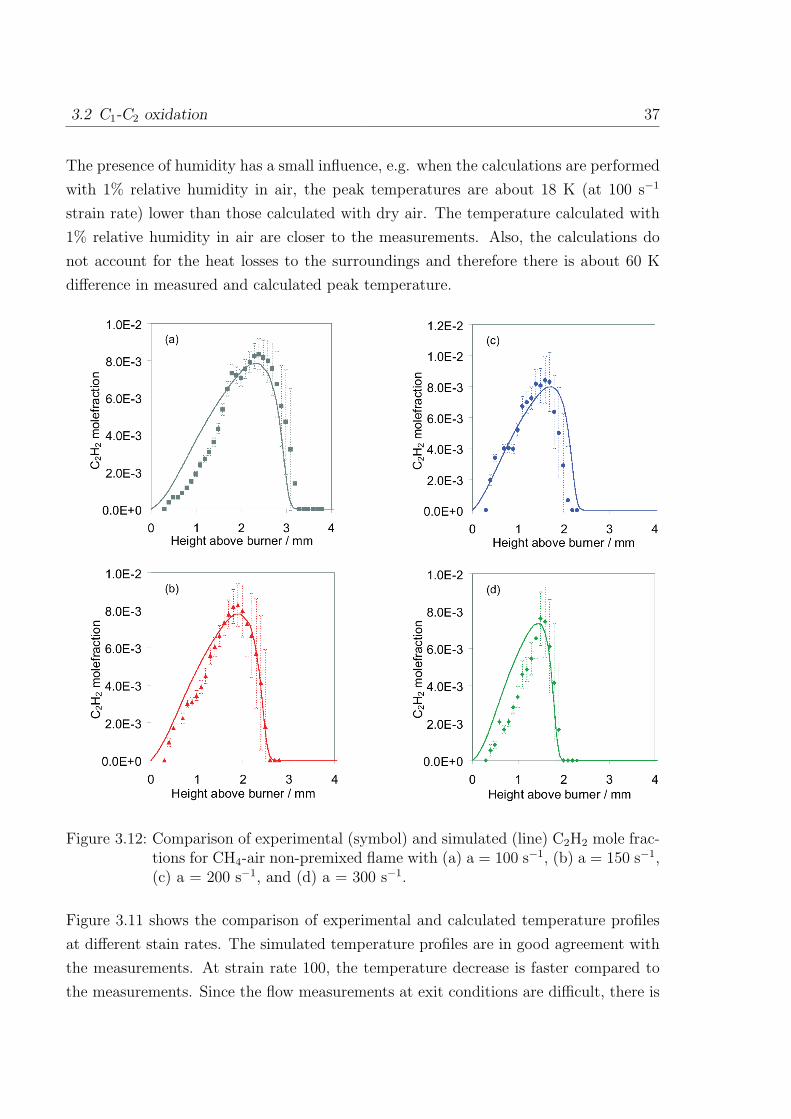
Figure 3.12: Comparison of experimental (symbol) and simulated (line) C2H2 mole frac-tions for CH4-air non-premixed flame with (a) a = 100 s−1, (b) a = 150 s−1,(c) a = 200 s−1, and (d) a = 300 s−1.
Figure 3.11 shows the comparison of experimental and calculated temperature profiles
at different stain rates. The simulated temperature profiles are in good agreement with
the measurements. At strain rate 100, the temperature decrease is faster compared to
the measurements. Since the flow measurements at exit conditions are difficult, there is
38 3 Kinetics Mechanism of C1 to C4 Hydrocarbon Oxidation
an error of about ±0.5% for the fuel flows and about a ±2.0% (a = 100) to ±0.7% (a =
300) error in air velocity measurement. This errors leads to a change in position of the
flame by which the discrepancy in the position of the measured and calculated profiles
is reduced. The temperatures at other strain rates are in very good agreement with the
measurements.
The measured and calculated C2H2 mole fractions are compared in the Fig. 3.12. The
error bars on measured C2H2 profile accounts for the uncertainty of the absorption line
fit. Therefore the resulting mole fraction is divided by the signal to noise ratio (SNR)
between the extracted absorption line area and residual noise on the signal [45]. The
measured and simulated C2H2 mole fractions are in excellent agreement at all three
strain rates.
3.2.4 Modifying important intermediate concentration
In addition to this, for the development of chemiluminescence mechanism, it is impor-
tant to have better prediction of certain intermediate species such as CH, C2H which are
direct precursors of the excited states formation. The prediction of these species is not a
criterion for the mechanism validations presented in [26], but it is important in the con-
text of the present work and therefore a further modification of the original mechanism
is carried out. The absolute CH concentrations in their ground states are studied in a
series of hydrocarbon (methane-, ethane-, and ethylene- air) premixed laminar flames
by Smith et al. [46]. Among other recent works, Thoman and McIlroy [47] measure
absolute CH concentration in stoichiometric and rich methane/oxygen/argon-flame via
cavity ringdown spectroscopy. The mechanism discussed in [26] predicts the CH con-
centrations about 4 times higher than the measurements. Therefore, it is necessary to
investigate the CH formation and consumption pathways that lead to such overpredic-
tion. The main channel to CH formation is via C2H or HCCO decomposition whereas
the 3CH2 is the minor channel to CH formation as shown in Fig. 3.13. The simulated
concentration of C2H is in good agreement with the measurement in Bastin et al. [48].
The following changes are made to the mechanism from [26] to achieve better prediction
of C2H2 ignition delay time and better prediction of CH concentrations in flames.
3.2 C1-C2 oxidation 39
3CH2HCCO
CH
C2H
C2H2
original mechanism
modified mechanism
Important CH formation path,
3CH2HCCO
CH
C2H
C2H2
original mechanism
modified mechanism
Important CH formation path,
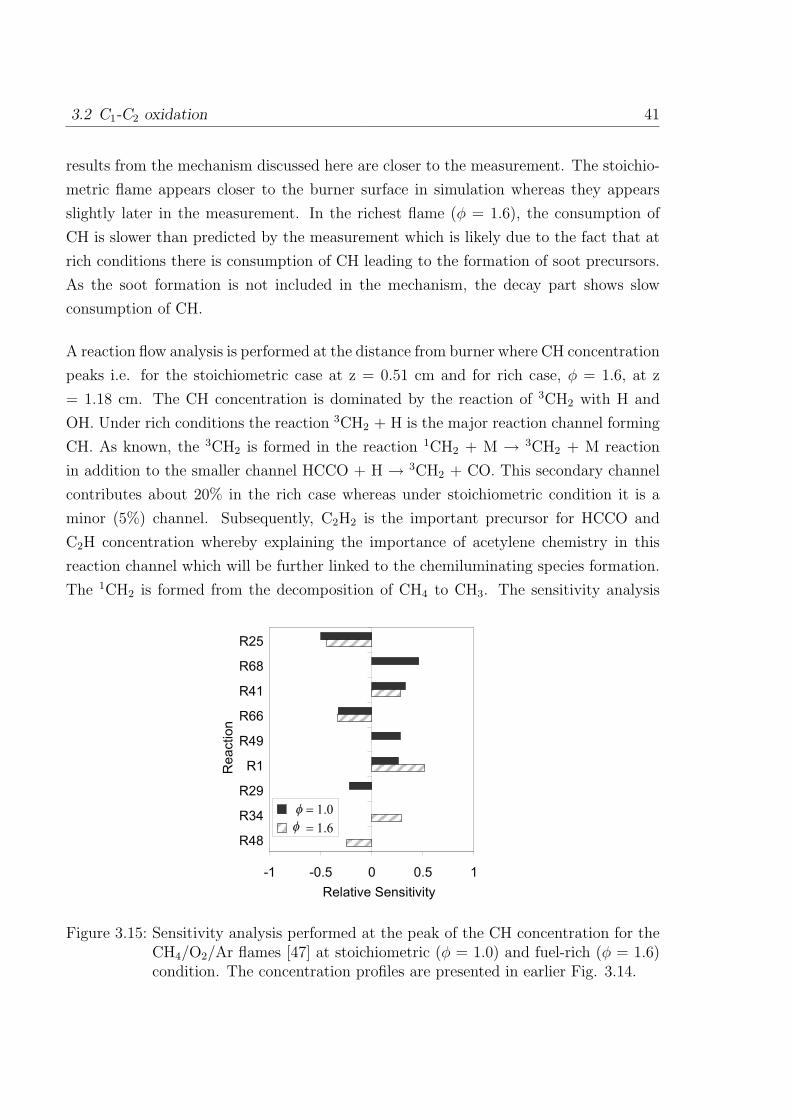
Figure 3.13: Schematic of the formation pathways of CH. Dotted line: in mechanismfrom [26], continuous line: modified path in present work.
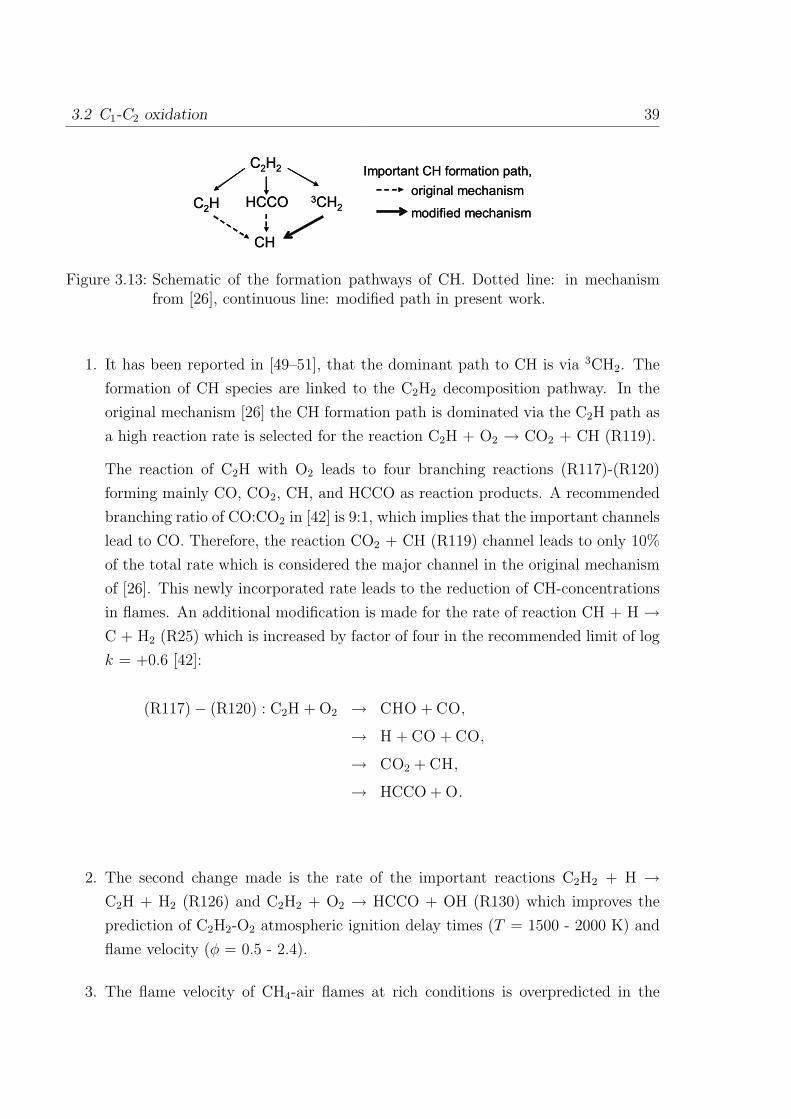
1. It has been reported in [49–51], that the dominant path to CH is via 3CH2. The
formation of CH species are linked to the C2H2 decomposition pathway. In the
original mechanism [26] the CH formation path is dominated via the C2H path as
a high reaction rate is selected for the reaction C2H + O2 → CO2 + CH (R119).
The reaction of C2H with O2 leads to four branching reactions (R117)-(R120)
forming mainly CO, CO2, CH, and HCCO as reaction products. A recommended
branching ratio of CO:CO2 in [42] is 9:1, which implies that the important channels
lead to CO. Therefore, the reaction CO2 + CH (R119) channel leads to only 10%
of the total rate which is considered the major channel in the original mechanism
of [26]. This newly incorporated rate leads to the reduction of CH-concentrations
in flames. An additional modification is made for the rate of reaction CH + H →C + H2 (R25) which is increased by factor of four in the recommended limit of log
k = +0.6 [42]:
(R117)− (R120) : C2H + O2 → CHO + CO,
→ H + CO + CO,
→ CO2 + CH,
→ HCCO + O.
2. The second change made is the rate of the important reactions C2H2 + H →C2H + H2 (R126) and C2H2 + O2 → HCCO + OH (R130) which improves the
prediction of C2H2-O2 atmospheric ignition delay times (T = 1500 - 2000 K) and
flame velocity (φ = 0.5 - 2.4).
3. The flame velocity of CH4-air flames at rich conditions is overpredicted in the
40 3 Kinetics Mechanism of C1 to C4 Hydrocarbon Oxidation
original mechanism [26]. An error in the k∞ of the pressure dependent reaction
CH4 + M→ CH3 + H + M (R93) found in the original mechanism is corrected. The
reaction of CH3 with O2 is an important propagation step in methane combustion.
The rate of CH3 + O2 → O + CH3O (R72) is taken from the recommendation of
Tsang et al. [52]. This change improves the prediction of CH4-O2 ignition delay
time prediction at high pressures (see Fig. 3.7).
0.0E+00
1.0E-05
2.0E-05
3.0E-05
4.0E-05
5.0E-05
2 7 12 17
Height above burner / mm
CH
mo
le fra
ctio
n
= 1.0
= 1.2
= 1.4
= 1.6
φ
φ
φ
φ
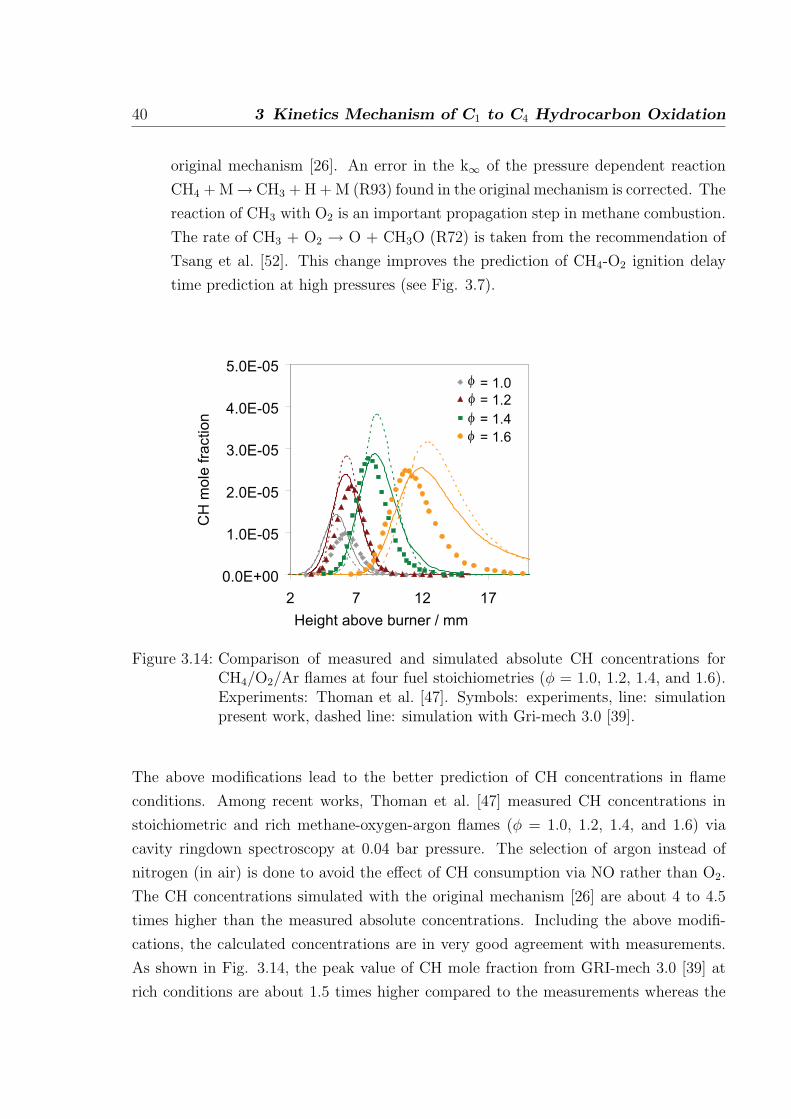
Figure 3.14: Comparison of measured and simulated absolute CH concentrations forCH4/O2/Ar flames at four fuel stoichiometries (φ = 1.0, 1.2, 1.4, and 1.6).Experiments: Thoman et al. [47]. Symbols: experiments, line: simulationpresent work, dashed line: simulation with Gri-mech 3.0 [39].
The above modifications lead to the better prediction of CH concentrations in flame
conditions. Among recent works, Thoman et al. [47] measured CH concentrations in
stoichiometric and rich methane-oxygen-argon flames (φ = 1.0, 1.2, 1.4, and 1.6) via
cavity ringdown spectroscopy at 0.04 bar pressure. The selection of argon instead of
nitrogen (in air) is done to avoid the effect of CH consumption via NO rather than O2.
The CH concentrations simulated with the original mechanism [26] are about 4 to 4.5
times higher than the measured absolute concentrations. Including the above modifi-
cations, the calculated concentrations are in very good agreement with measurements.
As shown in Fig. 3.14, the peak value of CH mole fraction from GRI-mech 3.0 [39] at
rich conditions are about 1.5 times higher compared to the measurements whereas the
3.2 C1-C2 oxidation 41
results from the mechanism discussed here are closer to the measurement. The stoichio-
metric flame appears closer to the burner surface in simulation whereas they appears
slightly later in the measurement. In the richest flame (φ = 1.6), the consumption of
CH is slower than predicted by the measurement which is likely due to the fact that at
rich conditions there is consumption of CH leading to the formation of soot precursors.
As the soot formation is not included in the mechanism, the decay part shows slow
consumption of CH.
A reaction flow analysis is performed at the distance from burner where CH concentration
peaks i.e. for the stoichiometric case at z = 0.51 cm and for rich case, φ = 1.6, at z
= 1.18 cm. The CH concentration is dominated by the reaction of 3CH2 with H and
OH. Under rich conditions the reaction 3CH2 + H is the major reaction channel forming
CH. As known, the 3CH2 is formed in the reaction 1CH2 + M → 3CH2 + M reaction
in addition to the smaller channel HCCO + H → 3CH2 + CO. This secondary channel
contributes about 20% in the rich case whereas under stoichiometric condition it is a
minor (5%) channel. Subsequently, C2H2 is the important precursor for HCCO and
C2H concentration whereby explaining the importance of acetylene chemistry in this
reaction channel which will be further linked to the chemiluminating species formation.
The 1CH2 is formed from the decomposition of CH4 to CH3. The sensitivity analysis
-1 -0.5 0 0.5 1
R25
R68
R41
R66
R49
R1
R29
R34
R48
Re
actio
n
Relative Sensitivity
= 1.0
= 1.6
φ
φ
Figure 3.15: Sensitivity analysis performed at the peak of the CH concentration for theCH4/O2/Ar flames [47] at stoichiometric (φ = 1.0) and fuel-rich (φ = 1.6)condition. The concentration profiles are presented in earlier Fig. 3.14.
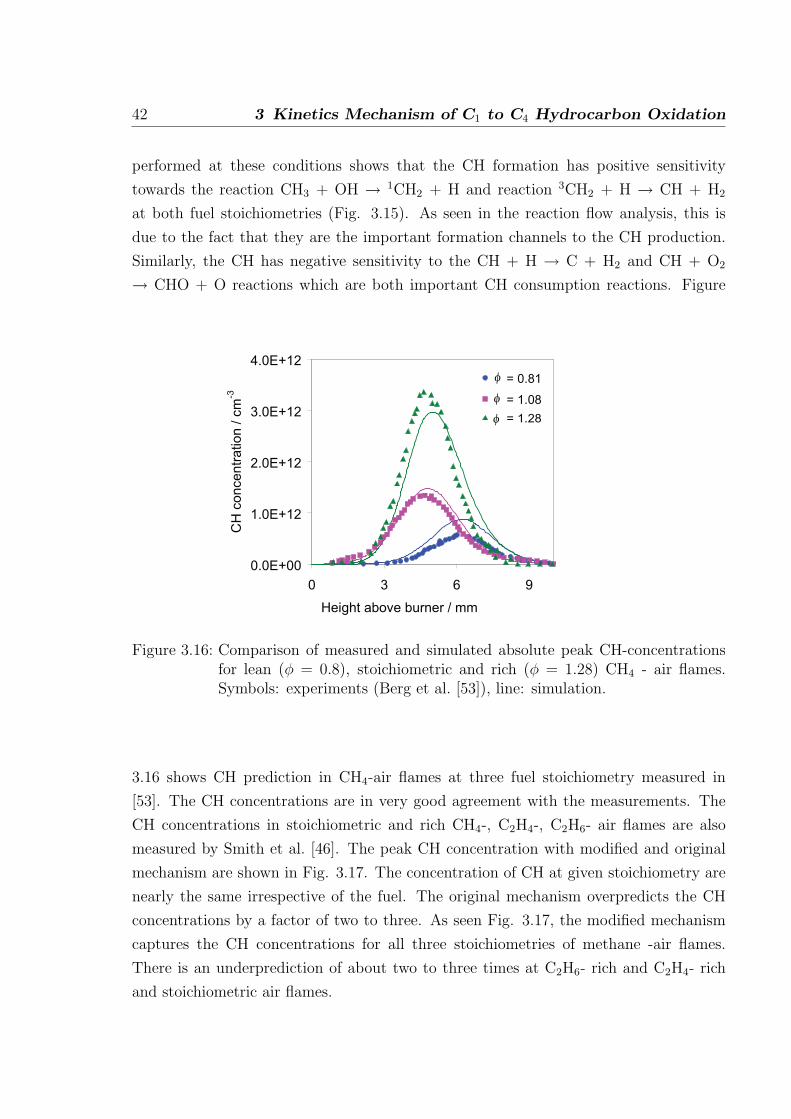
42 3 Kinetics Mechanism of C1 to C4 Hydrocarbon Oxidation
performed at these conditions shows that the CH formation has positive sensitivity
towards the reaction CH3 + OH → 1CH2 + H and reaction 3CH2 + H → CH + H2
at both fuel stoichiometries (Fig. 3.15). As seen in the reaction flow analysis, this is
due to the fact that they are the important formation channels to the CH production.
Similarly, the CH has negative sensitivity to the CH + H → C + H2 and CH + O2
→ CHO + O reactions which are both important CH consumption reactions. Figure
0.0E+00
1.0E+12
2.0E+12
3.0E+12
4.0E+12
0 3 6 9
Height above burner / mm
CH
co
nce
ntr
atio
n / c
m-3
= 0.81
= 1.08
= 1.28φ
φ
φ
Figure 3.16: Comparison of measured and simulated absolute peak CH-concentrationsfor lean (φ = 0.8), stoichiometric and rich (φ = 1.28) CH4 - air flames.Symbols: experiments (Berg et al. [53]), line: simulation.
3.16 shows CH prediction in CH4-air flames at three fuel stoichiometry measured in
[53]. The CH concentrations are in very good agreement with the measurements. The
CH concentrations in stoichiometric and rich CH4-, C2H4-, C2H6- air flames are also
measured by Smith et al. [46]. The peak CH concentration with modified and original
mechanism are shown in Fig. 3.17. The concentration of CH at given stoichiometry are
nearly the same irrespective of the fuel. The original mechanism overpredicts the CH
concentrations by a factor of two to three. As seen Fig. 3.17, the modified mechanism
captures the CH concentrations for all three stoichiometries of methane -air flames.
There is an underprediction of about two to three times at C2H6- rich and C2H4- rich
and stoichiometric air flames.
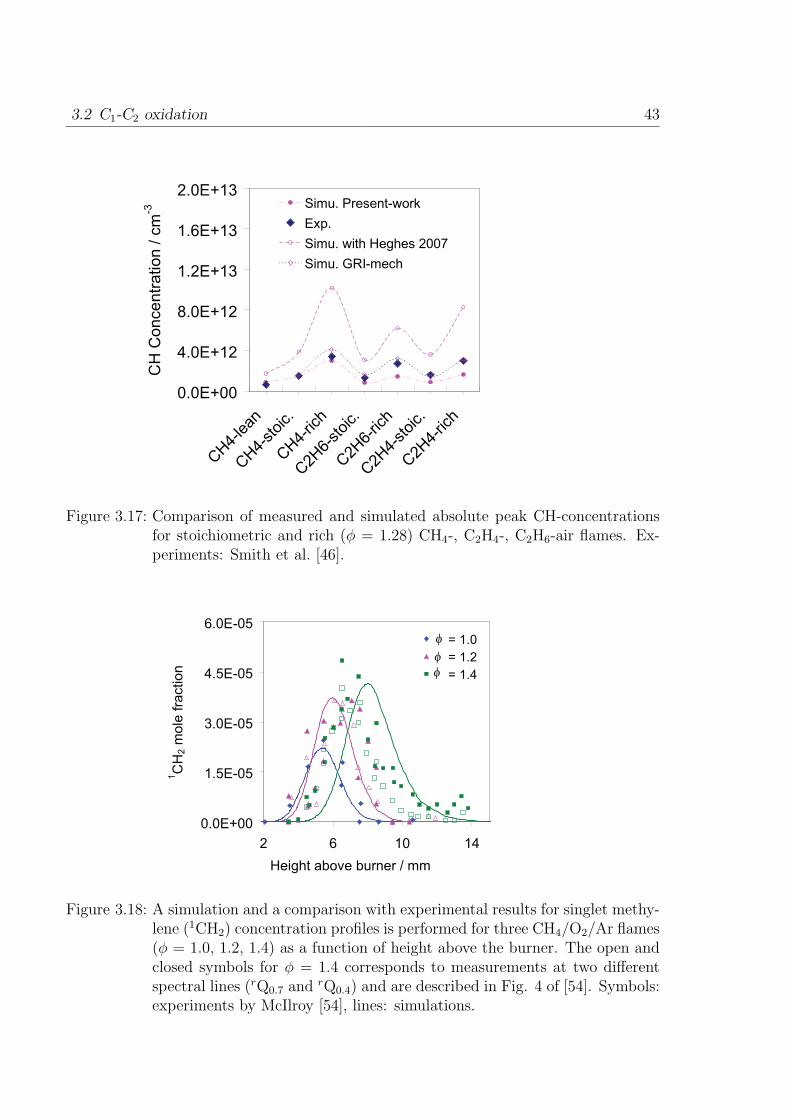
3.2 C1-C2 oxidation 43
0.0E+00
4.0E+12
8.0E+12
1.2E+13
1.6E+13
2.0E+13
CH4-
lean
CH4-
stoic.
CH4-
rich
C2H
6-stoic.
C2H
6-ric
h
C2H
4-stoic.
C2H
4-ric
h
CH
Co
nce
ntr
atio
n / c
m-3
Simu. Present-work
Exp.
Simu. with Heghes 2007
Simu. GRI-mech
Figure 3.17: Comparison of measured and simulated absolute peak CH-concentrationsfor stoichiometric and rich (φ = 1.28) CH4-, C2H4-, C2H6-air flames. Ex-periments: Smith et al. [46].
0.0E+00
1.5E-05
3.0E-05
4.5E-05
6.0E-05
2 6 10 14
Height above burner / mm
1C
H2 m
ole
fra
ctio
n
= 1.0
= 1.2
= 1.4
φ
φ
φ
Figure 3.18: A simulation and a comparison with experimental results for singlet methy-lene (1CH2) concentration profiles is performed for three CH4/O2/Ar flames(φ = 1.0, 1.2, 1.4) as a function of height above the burner. The open andclosed symbols for φ = 1.4 corresponds to measurements at two differentspectral lines (rQ0.7 and rQ0.4) and are described in Fig. 4 of [54]. Symbols:experiments by McIlroy [54], lines: simulations.
44 3 Kinetics Mechanism of C1 to C4 Hydrocarbon Oxidation
As seen earlier, the ground state species CH and C2H are important for the description
of OH*, CH* chemiluminescence. Similarly, the 1CH2, C, and C3 are important for the
C2* concentrations. The C2* formation reactions suggested in literature are 1CH2 +
C and C3 + O [1]. There are no measurements available for ground state C- and C3-
concentrations at flame conditions, however 1CH2 is measured by McIlroy (1998) [54].
The concentrations of 1CH2 are measured for four different fuel stoichiometries (φ =
1.0, 1.2, 1.4, and 1.6) of CH4/O2/Ar mixtures. A comparison with simulations is shown
in Fig. 3.18. All the four 1CH2 concentrations are in excellent agreement with the
measurement.
3.3 C3-C4 oxidation
The consumption of C3 and C4 species is observed by thermal decomposition reactions
and by attack of H, O, and OH radicals where smaller alkyl radicals are formed. Higher
alkanes are not formed and so the mechanism of smaller alkanes is relevant for the
description of the C3-C4 oxidation which is discussed in the previous section.
(R256) : C3H8 → CH3 + C2H5,
(R396)− (R398) : C4H10 → CH3 + C3H7,
→ tC4H9 + H,
→ iC4H9 + H,
(R257)− (R262) : C3H8 + H(/ + O/ + OH) → nC3H7 + H2(/ + OH + /H2O),
(R399)− (R404) : C4H10 + H(/ + O/ + OH) → iC4H9 + H2(/ + OH + /H2O),
→ tC4H9 + H2(/ + OH + /H2O).
The decomposition reactions of fuels such as C3H8 and C4H10 are given by reactions
(R256), (R396)-(R398). In these reactions smaller alkyls (CH3, C2H5, and i-C3H7) are
formed. The C3H8 fuel is attacked by H, O, and OH radicals forming alkyls (n-C3H7) as
shown in reactions (R257)-(R262). Similarly in the reactions of C4H10 with H, O, and
OH forms i-C4H9 (and t-C4H9) given by reactions (R399)-(R404). The results of higher
hydrocarbons are not presented here as they are similar to the one presented in [26].
4 Chemiluminescence Mechanism
The chemiluminescence reaction kinetics requires the knowledge of important reactions
for the formation and consumption of excited species and their reaction rates. Different
studies are dedicated to the identification of the formation pathways of excited species.
The rate of consumption can be obtained from the lifetime of these species and are rela-
tively known [55] compared to the formation rates. The first measurement and detailed
kinetics studies were done in the 1970s by Gaydon [1] since then significant progress
has been made in this field. However, the fundamental understanding on the relation
between the measured intensity and the simulated concentrations of the chemilumines-
cent species is still lacking. Therefore, there exists still uncertainty about the important
formation reactions forming these species, specifically for CH* and C2* formation. In
addition, very few studies have been done in N2O environment, where there are addi-
tional channels for the formation of these excited species. The concentration of these
excited species is much lower compared to the important ground state species (more
than five orders of magnitude) and therefore their presence has nearly no impact on the
overall oxidation process. Due to their low production rates and rapid removal rates,
they are often assumed to be in quasi-steady state [10].
The reaction kinetics of excited species can be described by three different types of
reactions. The formation reaction (4.1) and its subsequent consumption by radiative
decay (4.2) and non-reactive collisional quenching reactions (4.3). The excited state X*
formed is short lived and returns to the ground state via two channels. In the first
channel, it emits its excess energy in form of light in a radiative decay reaction (4.2). In
second channel, the excess energy of X* is transferred to the colliding molecule (4.3).
A + B → C + X∗, (4.1)
X∗ → X + hν, (4.2)
45
46 4 Chemiluminescence Mechanism
X∗ + M → X + M. (4.3)
4.1 Formation of OH*
The main formation reaction of OH* in hydrocarbon mixtures is:
(R414) : CH + O2 → CO + OH∗.
This reaction is initially proposed by Krishnamachari and Broida [56] who studied the
emission spectra of oxygen-acetylene flames at low pressures. Becker et al. (1977) [57]
find that the formation pathway suggested by Krishnamachari et al. does not explain
all the OH* formed and distinguish between hot and cold OH* emission. The formation
of OH* from the reaction of CH radical with molecular oxygen only accounts for the
dominating hot chemiluminescence. However, they are unable to identify the reaction(s)
responsible for the additional cold OH* emissions.
The rate of this reaction is found to be temperature independent in most literature
studies (or very small dependence). The rate coefficient is first derived by Porter et
al. (1967) [58] by correlating measured CH-, O2-, and OH*-profiles in methane and
acetylene flames between 800 and 2000 K. A rate of 6×1010 cm3mol−1s−1 is proposed.
Messing et al. [59] and Lichtin et al. [60] determine the reaction rate at room temperature
via chemiluminescence detection. Berman et al. [61] study the temperature dependence
of CH with O2 in the temperature range from 297 to 679 K using two-laser photolysis
techniques. They find very little temperature dependence of OH*. The rate given is
3.25×1013 cm3mol−1s−1. This rate is two orders of magnitude higher than that obtained
by Porter et al. [58]. Grebe and Homann [62] use a flow-reactor to study the C2H2/O/H-
system at room temperature and calculate a rate coefficient of 4.8×1010 cm3mol−1s−1,
which is similar to the high temperature value of Porter et al. [58]. Among the recent
studies, reaction rate data are available from Smith et al. [63], Carl et al. [64], and
Hall et al. [65]. Smith and co-workers [63] study low pressure methane flames. The
experimentally measured flame species profiles are compared with simulated profiles and
a reaction rate of 1.8×1011 cm3mol−1s−1 at flame temperature is indirectly recommended
by providing a fit of the simulated OH* profile with experiments. This reaction rate is
suggested by, Carl et al. [64], who investigate C2H2/O/H/O2 atomic flames. A low
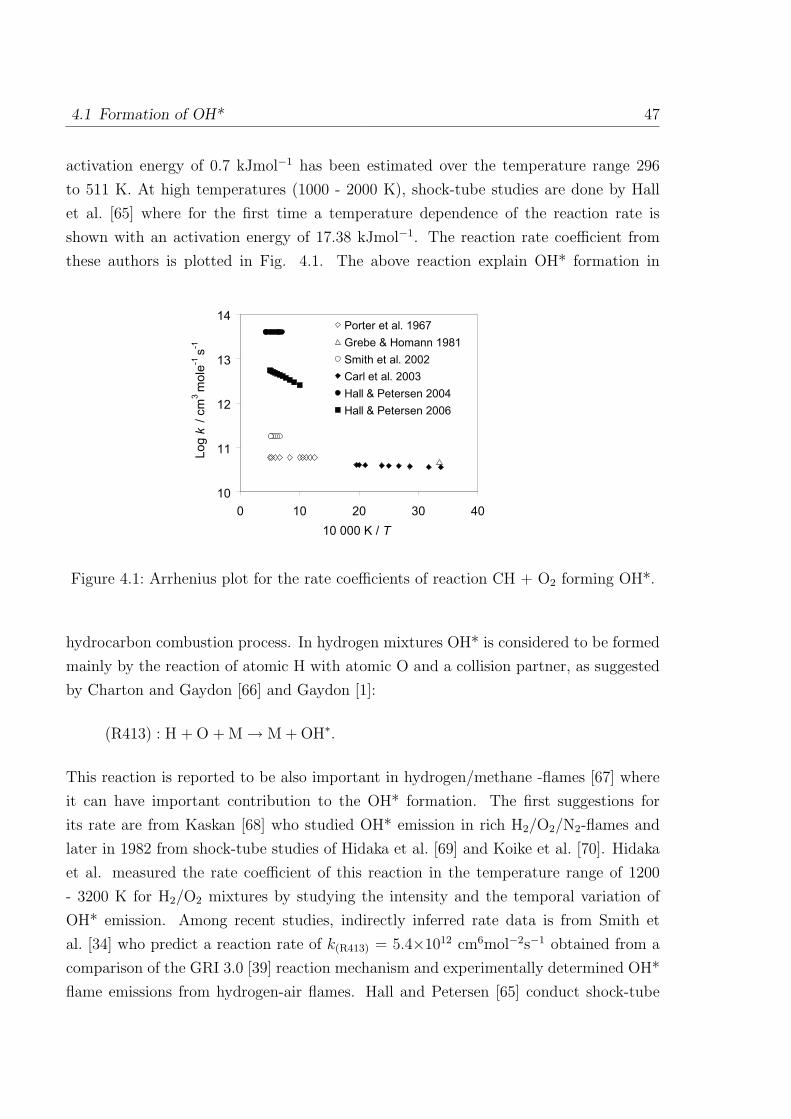
4.1 Formation of OH* 47
activation energy of 0.7 kJmol−1 has been estimated over the temperature range 296
to 511 K. At high temperatures (1000 - 2000 K), shock-tube studies are done by Hall
et al. [65] where for the first time a temperature dependence of the reaction rate is
shown with an activation energy of 17.38 kJmol−1. The reaction rate coefficient from
these authors is plotted in Fig. 4.1. The above reaction explain OH* formation in
10
11
12
13
14
0 10 20 30 40
10 000 K / T
Lo
g k
/ c
m3
mo
le-1
s-1
Porter et al. 1967
Grebe & Homann 1981
Smith et al. 2002
Carl et al. 2003
Hall & Petersen 2004
Hall & Petersen 2006
Figure 4.1: Arrhenius plot for the rate coefficients of reaction CH + O2 forming OH*.
hydrocarbon combustion process. In hydrogen mixtures OH* is considered to be formed
mainly by the reaction of atomic H with atomic O and a collision partner, as suggested
by Charton and Gaydon [66] and Gaydon [1]:
(R413) : H + O + M → M + OH∗.
This reaction is reported to be also important in hydrogen/methane -flames [67] where
it can have important contribution to the OH* formation. The first suggestions for
its rate are from Kaskan [68] who studied OH* emission in rich H2/O2/N2-flames and
later in 1982 from shock-tube studies of Hidaka et al. [69] and Koike et al. [70]. Hidaka
et al. measured the rate coefficient of this reaction in the temperature range of 1200
- 3200 K for H2/O2 mixtures by studying the intensity and the temporal variation of
OH* emission. Among recent studies, indirectly inferred rate data is from Smith et
al. [34] who predict a reaction rate of k(R413) = 5.4×1012 cm6mol−2s−1 obtained from a
comparison of the GRI 3.0 [39] reaction mechanism and experimentally determined OH*
flame emissions from hydrogen-air flames. Hall and Petersen [65] conduct shock-tube
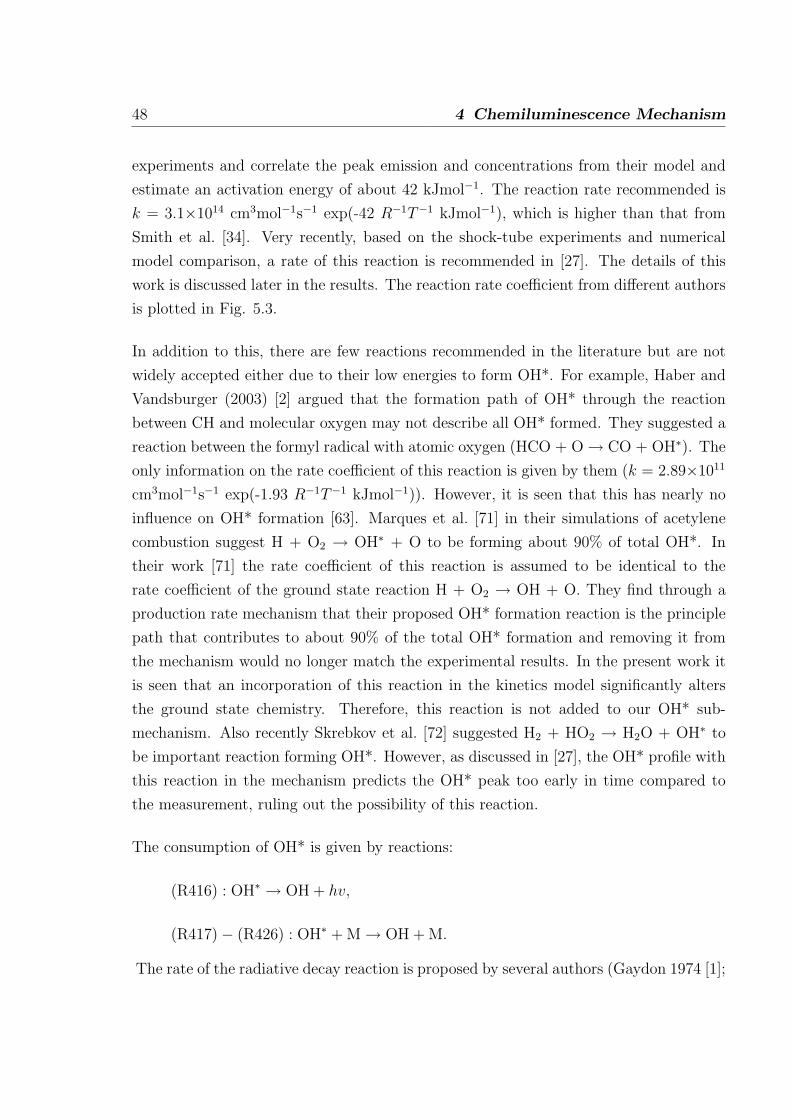
48 4 Chemiluminescence Mechanism
experiments and correlate the peak emission and concentrations from their model and
estimate an activation energy of about 42 kJmol−1. The reaction rate recommended is
k = 3.1×1014 cm3mol−1s−1 exp(-42 R−1T−1 kJmol−1), which is higher than that from
Smith et al. [34]. Very recently, based on the shock-tube experiments and numerical
model comparison, a rate of this reaction is recommended in [27]. The details of this
work is discussed later in the results. The reaction rate coefficient from different authors
is plotted in Fig. 5.3.
In addition to this, there are few reactions recommended in the literature but are not
widely accepted either due to their low energies to form OH*. For example, Haber and
Vandsburger (2003) [2] argued that the formation path of OH* through the reaction
between CH and molecular oxygen may not describe all OH* formed. They suggested a
reaction between the formyl radical with atomic oxygen (HCO + O → CO + OH∗). The
only information on the rate coefficient of this reaction is given by them (k = 2.89×10¹¹
cm3mol−1s−1 exp(-1.93 R−1T−1 kJmol−1)). However, it is seen that this has nearly no
influence on OH* formation [63]. Marques et al. [71] in their simulations of acetylene
combustion suggest H + O2 → OH∗ + O to be forming about 90% of total OH*. In
their work [71] the rate coefficient of this reaction is assumed to be identical to the
rate coefficient of the ground state reaction H + O2 → OH + O. They find through a
production rate mechanism that their proposed OH* formation reaction is the principle
path that contributes to about 90% of the total OH* formation and removing it from
the mechanism would no longer match the experimental results. In the present work it
is seen that an incorporation of this reaction in the kinetics model significantly alters
the ground state chemistry. Therefore, this reaction is not added to our OH* sub-
mechanism. Also recently Skrebkov et al. [72] suggested H2 + HO2 → H2O + OH∗ to
be important reaction forming OH*. However, as discussed in [27], the OH* profile with
this reaction in the mechanism predicts the OH* peak too early in time compared to
the measurement, ruling out the possibility of this reaction.
The consumption of OH* is given by reactions:
(R416) : OH∗ → OH + hv,
(R417)− (R426) : OH∗ + M → OH + M.
The rate of the radiative decay reaction is proposed by several authors (Gaydon 1974 [1];
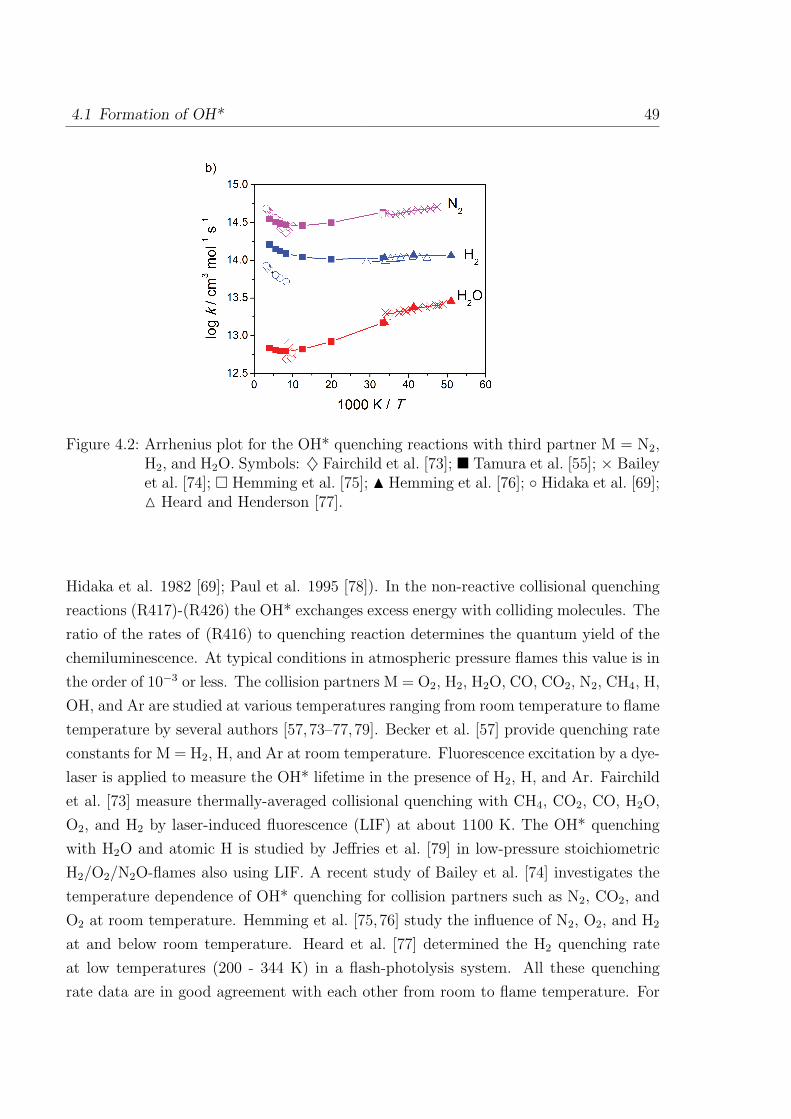
4.1 Formation of OH* 49
Figure 4.2: Arrhenius plot for the OH* quenching reactions with third partner M = N2,H2, and H2O. Symbols: ♦ Fairchild et al. [73]; ¥ Tamura et al. [55]; × Baileyet al. [74]; ¤ Hemming et al. [75]; N Hemming et al. [76]; ◦ Hidaka et al. [69];M Heard and Henderson [77].
Hidaka et al. 1982 [69]; Paul et al. 1995 [78]). In the non-reactive collisional quenching
reactions (R417)-(R426) the OH* exchanges excess energy with colliding molecules. The
ratio of the rates of (R416) to quenching reaction determines the quantum yield of the
chemiluminescence. At typical conditions in atmospheric pressure flames this value is in
the order of 10−3 or less. The collision partners M = O2, H2, H2O, CO, CO2, N2, CH4, H,
OH, and Ar are studied at various temperatures ranging from room temperature to flame
temperature by several authors [57,73–77,79]. Becker et al. [57] provide quenching rate
constants for M = H2, H, and Ar at room temperature. Fluorescence excitation by a dye-
laser is applied to measure the OH* lifetime in the presence of H2, H, and Ar. Fairchild
et al. [73] measure thermally-averaged collisional quenching with CH4, CO2, CO, H2O,
O2, and H2 by laser-induced fluorescence (LIF) at about 1100 K. The OH* quenching
with H2O and atomic H is studied by Jeffries et al. [79] in low-pressure stoichiometric
H2/O2/N2O-flames also using LIF. A recent study of Bailey et al. [74] investigates the
temperature dependence of OH* quenching for collision partners such as N2, CO2, and
O2 at room temperature. Hemming et al. [75,76] study the influence of N2, O2, and H2
at and below room temperature. Heard et al. [77] determined the H2 quenching rate
at low temperatures (200 - 344 K) in a flash-photolysis system. All these quenching
rate data are in good agreement with each other from room to flame temperature. For
50 4 Chemiluminescence Mechanism
collision partners such as M = H, O, and OH few information is available due to the
complexity of their measurement. The compilation of all such published data of major
colliding partners is given by Tamura et al. [55] and the recommendations are for the
range of 300 - 2500 K. Fig. 4.2 provides information on the major OH* quenching rates
in an Arrhenius plot.
4.2 Formation of CH*
CH* chemiluminescence is seen at 431 nm CH(A-X), 390 nm CH(B-X) and at 314 nm
CH(C-X) in flame spectra. About 80% of CH* seen in flames is from the CH(A-X)
transition whereas only 20% from the other two transitions, mainly from CH(B-X) [63].
Since the CH(C-X) transitions are very weak, they are not studied. Although all the
three states can be measured, due to lack of any rate data for CH(B) and CH(C) states,
total CH is modeled in present work. Three different reactions forming CH* are proposed
in the literature. CH* emission in hydrocarbon flame is first proposed by Gaydon [1]
from the reaction of C2 with OH, and is also supported by Bulewicz [80]:
(R429) : C2 + OH → CO2 + CH∗.
However, this hypothesis is later rejected by Brenig [81] who finds no CH* in systems
containing C2-, CH-, and OH- radicals in absence of oxygen atoms. Hand and Kisti-
akowsky (1962) [82] study acetylene-oxygen reactions in shock waves and propose the
reactions of C2H with molecular and atomic oxygen:
(R427) : C2H + O2 → CO2 + CH∗,
(R428) : C2H + O → CO + CH∗.
Bowman [83] studied the high temperature oxidation of methane in a shock-tube and
proposes that only reactions (R429) and (R427) are sufficiently exothermic to form CH*.
Matsuda [84] supports the reaction (R427) and proposes this reaction to be responsible
for the emission of CH* in all its three states (A2∆, B2Σ−, C2Σ+).
However, different experimental and modeling work supports one or the other reaction
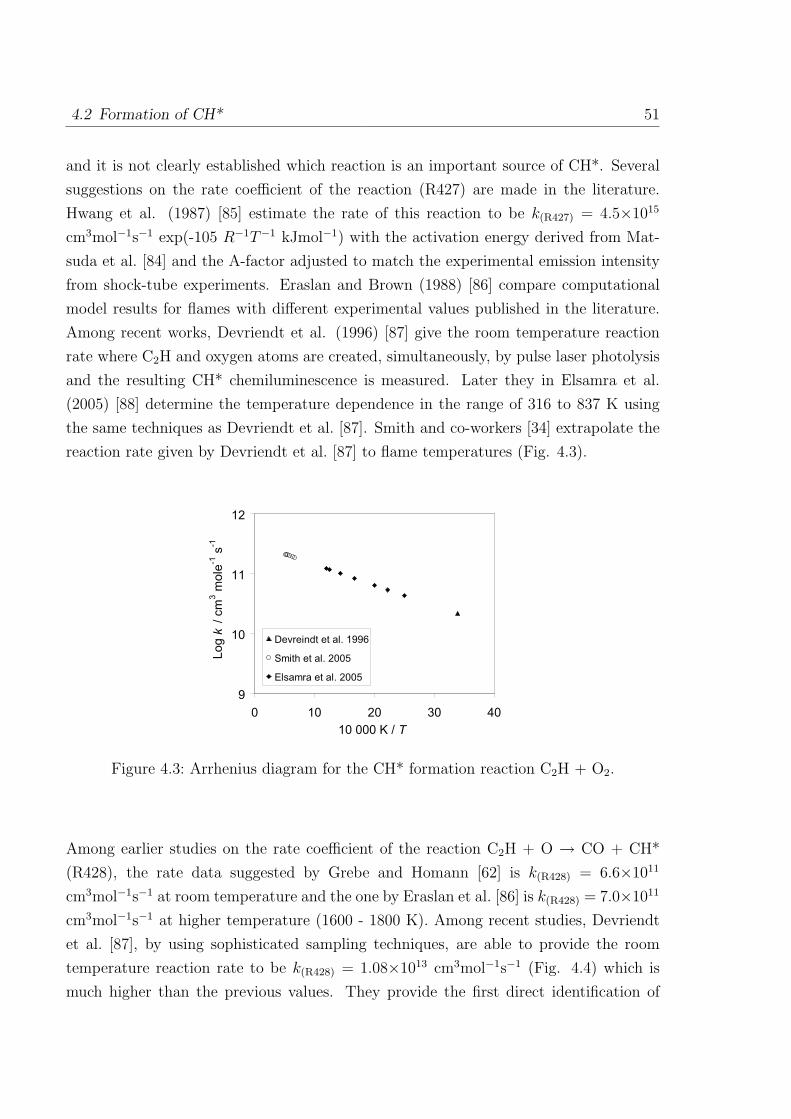
4.2 Formation of CH* 51
and it is not clearly established which reaction is an important source of CH*. Several
suggestions on the rate coefficient of the reaction (R427) are made in the literature.
Hwang et al. (1987) [85] estimate the rate of this reaction to be k(R427) = 4.5×10¹⁵
cm3mol−1s−1 exp(-105 R−1T−1 kJmol−1) with the activation energy derived from Mat-
suda et al. [84] and the A-factor adjusted to match the experimental emission intensity
from shock-tube experiments. Eraslan and Brown (1988) [86] compare computational
model results for flames with different experimental values published in the literature.
Among recent works, Devriendt et al. (1996) [87] give the room temperature reaction
rate where C2H and oxygen atoms are created, simultaneously, by pulse laser photolysis
and the resulting CH* chemiluminescence is measured. Later they in Elsamra et al.
(2005) [88] determine the temperature dependence in the range of 316 to 837 K using
the same techniques as Devriendt et al. [87]. Smith and co-workers [34] extrapolate the
reaction rate given by Devriendt et al. [87] to flame temperatures (Fig. 4.3).
9
10
11
12
0 10 20 30 40
10 000 K / T
Lo
g k
/ c
m3 m
ole
-1 s
-1
Devreindt et al. 1996
Smith et al. 2005
Elsamra et al. 2005
Figure 4.3: Arrhenius diagram for the CH* formation reaction C2H + O2.
Among earlier studies on the rate coefficient of the reaction C2H + O → CO + CH*
(R428), the rate data suggested by Grebe and Homann [62] is k(R428) = 6.6×10¹¹
cm3mol−1s−1 at room temperature and the one by Eraslan et al. [86] is k(R428) = 7.0×10¹¹
cm3mol−1s−1 at higher temperature (1600 - 1800 K). Among recent studies, Devriendt
et al. [87], by using sophisticated sampling techniques, are able to provide the room
temperature reaction rate to be k(R428) = 1.08×1013 cm3mol−1s−1 (Fig. 4.4) which is
much higher than the previous values. They provide the first direct identification of
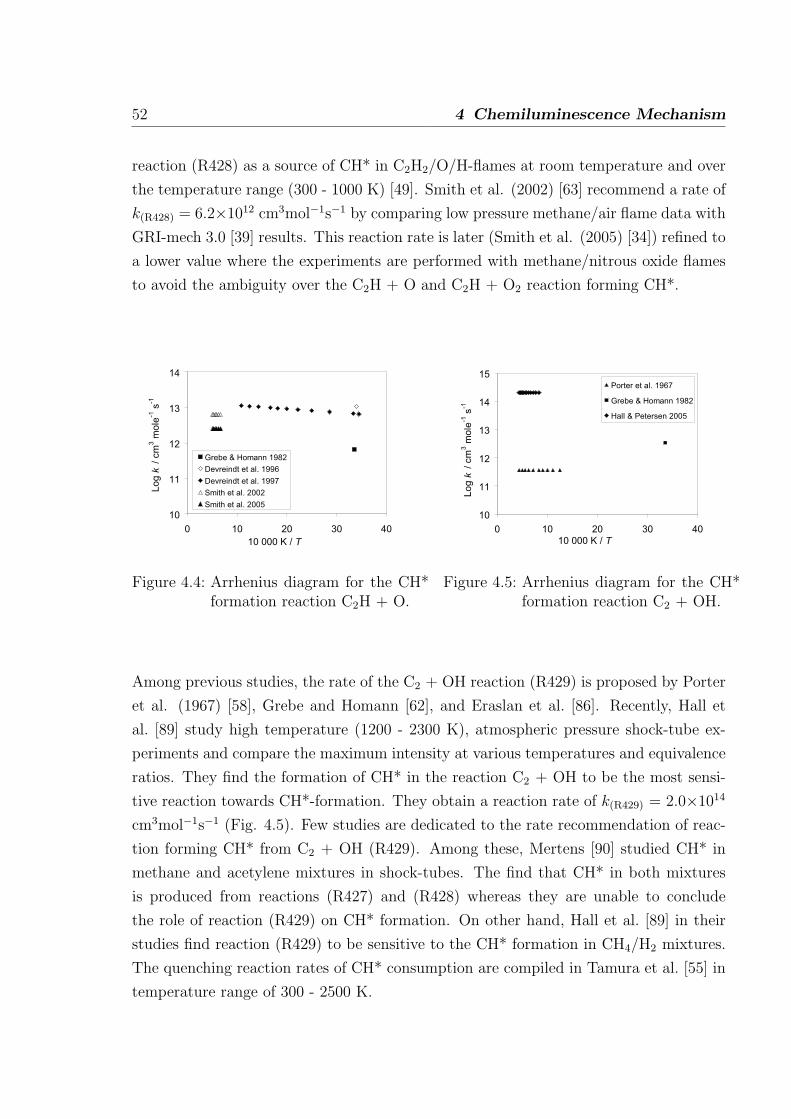
52 4 Chemiluminescence Mechanism
reaction (R428) as a source of CH* in C2H2/O/H-flames at room temperature and over
the temperature range (300 - 1000 K) [49]. Smith et al. (2002) [63] recommend a rate of
k(R428) = 6.2×1012 cm3mol−1s−1 by comparing low pressure methane/air flame data with
GRI-mech 3.0 [39] results. This reaction rate is later (Smith et al. (2005) [34]) refined to
a lower value where the experiments are performed with methane/nitrous oxide flames
to avoid the ambiguity over the C2H + O and C2H + O2 reaction forming CH*.
10
11
12
13
14
0 10 20 30 40
10 000 K / T
Lo
g k
/ c
m3 m
ole
-1 s
-1
Grebe & Homann 1982
Devreindt et al. 1996
Devreindt et al. 1997
Smith et al. 2002
Smith et al. 2005
Figure 4.4: Arrhenius diagram for the CH*formation reaction C2H + O.
10
11
12
13
14
15
0 10 20 30 40
10 000 K / T
Lo
g k
/ c
m3 m
ole
-1 s
-1
Porter et al. 1967
Grebe & Homann 1982
Hall & Petersen 2005
Figure 4.5: Arrhenius diagram for the CH*formation reaction C2 + OH.
Among previous studies, the rate of the C2 + OH reaction (R429) is proposed by Porter
et al. (1967) [58], Grebe and Homann [62], and Eraslan et al. [86]. Recently, Hall et
al. [89] study high temperature (1200 - 2300 K), atmospheric pressure shock-tube ex-
periments and compare the maximum intensity at various temperatures and equivalence
ratios. They find the formation of CH* in the reaction C2 + OH to be the most sensi-
tive reaction towards CH*-formation. They obtain a reaction rate of k(R429) = 2.0×10¹⁴
cm3mol−1s−1 (Fig. 4.5). Few studies are dedicated to the rate recommendation of reac-
tion forming CH* from C2 + OH (R429). Among these, Mertens [90] studied CH* in
methane and acetylene mixtures in shock-tubes. The find that CH* in both mixtures
is produced from reactions (R427) and (R428) whereas they are unable to conclude
the role of reaction (R429) on CH* formation. On other hand, Hall et al. [89] in their
studies find reaction (R429) to be sensitive to the CH* formation in CH4/H2 mixtures.
The quenching reaction rates of CH* consumption are compiled in Tamura et al. [55] in
temperature range of 300 - 2500 K.
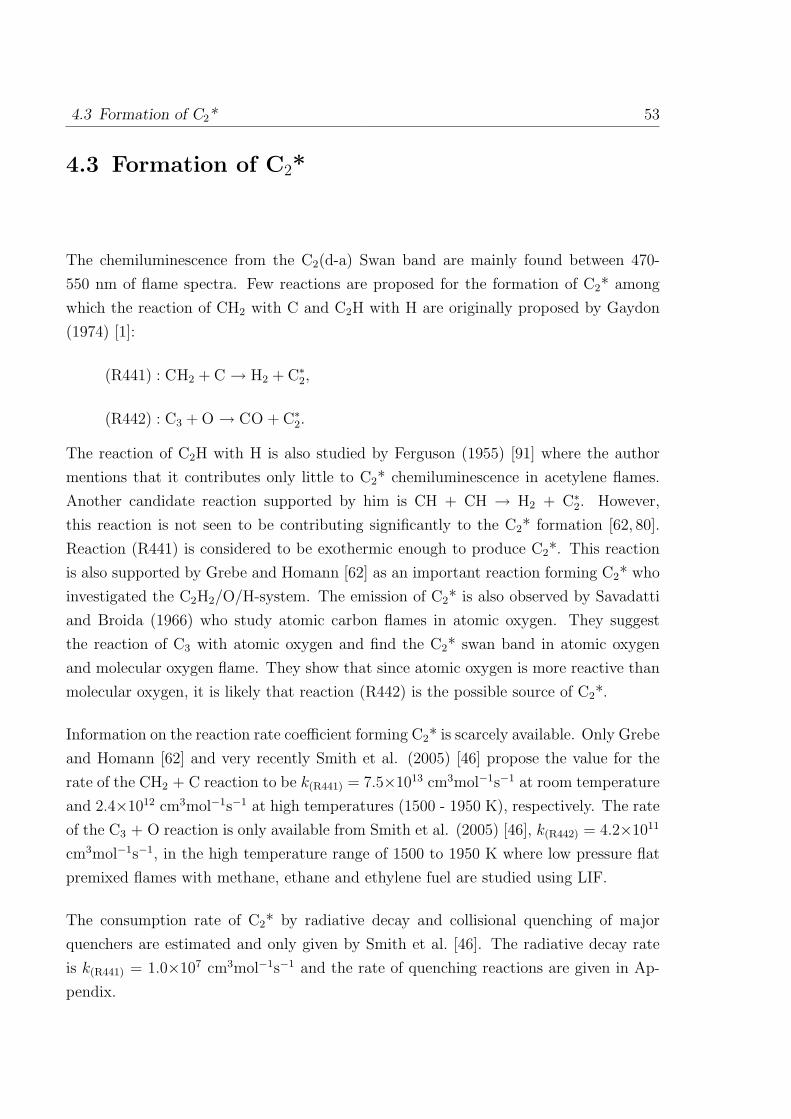
4.3 Formation of C2* 53
4.3 Formation of C2*
The chemiluminescence from the C2(d-a) Swan band are mainly found between 470-
550 nm of flame spectra. Few reactions are proposed for the formation of C2* among
which the reaction of CH2 with C and C2H with H are originally proposed by Gaydon
(1974) [1]:
(R441) : CH2 + C → H2 + C∗2,
(R442) : C3 + O → CO + C∗2.
The reaction of C2H with H is also studied by Ferguson (1955) [91] where the author
mentions that it contributes only little to C2* chemiluminescence in acetylene flames.
Another candidate reaction supported by him is CH + CH → H2 + C∗2. However,
this reaction is not seen to be contributing significantly to the C2* formation [62, 80].
Reaction (R441) is considered to be exothermic enough to produce C2*. This reaction
is also supported by Grebe and Homann [62] as an important reaction forming C2* who
investigated the C2H2/O/H-system. The emission of C2* is also observed by Savadatti
and Broida (1966) who study atomic carbon flames in atomic oxygen. They suggest
the reaction of C3 with atomic oxygen and find the C2* swan band in atomic oxygen
and molecular oxygen flame. They show that since atomic oxygen is more reactive than
molecular oxygen, it is likely that reaction (R442) is the possible source of C2*.
Information on the reaction rate coefficient forming C2* is scarcely available. Only Grebe
and Homann [62] and very recently Smith et al. (2005) [46] propose the value for the
rate of the CH2 + C reaction to be k(R441) = 7.5×1013 cm3mol−1s−1 at room temperature
and 2.4×1012 cm3mol−1s−1 at high temperatures (1500 - 1950 K), respectively. The rate
of the C3 + O reaction is only available from Smith et al. (2005) [46], k(R442) = 4.2×10¹¹
cm3mol−1s−1, in the high temperature range of 1500 to 1950 K where low pressure flat
premixed flames with methane, ethane and ethylene fuel are studied using LIF.
The consumption rate of C2* by radiative decay and collisional quenching of major
quenchers are estimated and only given by Smith et al. [46]. The radiative decay rate
is k(R441) = 1.0×107 cm3mol−1s−1 and the rate of quenching reactions are given in Ap-
pendix.
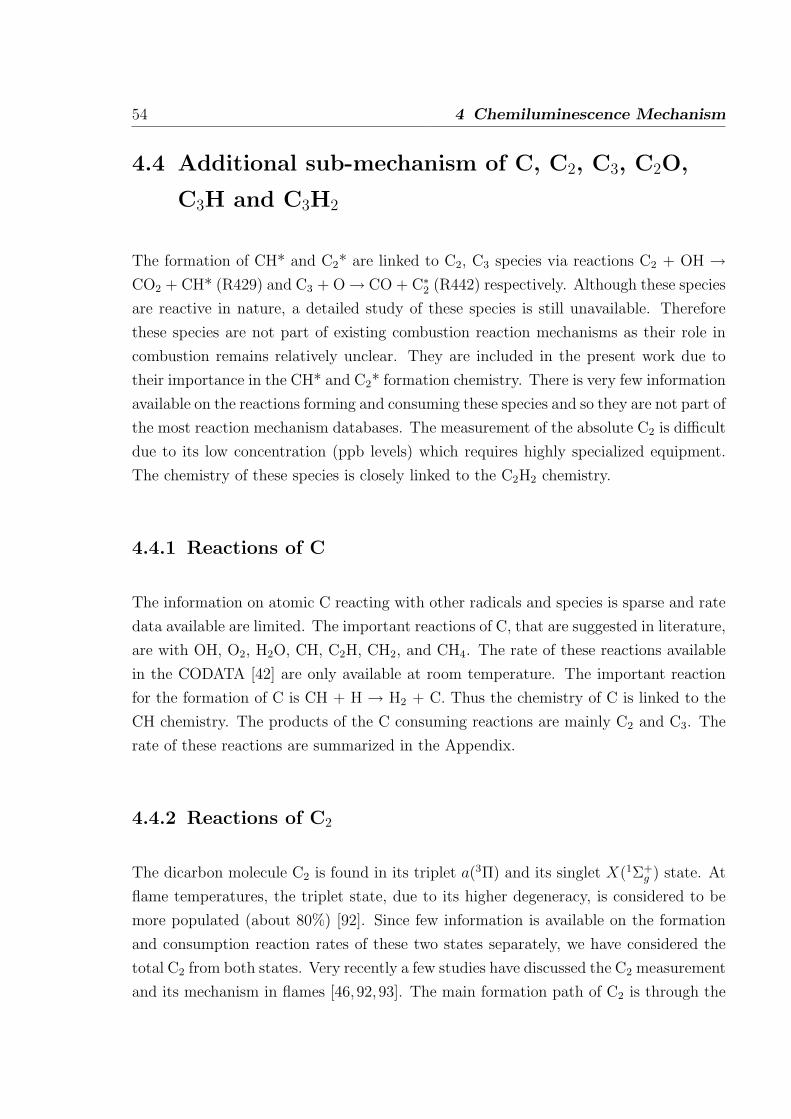
54 4 Chemiluminescence Mechanism
4.4 Additional sub-mechanism of C, C2, C3, C2O,
C3H and C3H2
The formation of CH* and C2* are linked to C2, C3 species via reactions C2 + OH →CO2 + CH* (R429) and C3 + O→ CO + C∗
2 (R442) respectively. Although these species
are reactive in nature, a detailed study of these species is still unavailable. Therefore
these species are not part of existing combustion reaction mechanisms as their role in
combustion remains relatively unclear. They are included in the present work due to
their importance in the CH* and C2* formation chemistry. There is very few information
available on the reactions forming and consuming these species and so they are not part of
the most reaction mechanism databases. The measurement of the absolute C2 is difficult
due to its low concentration (ppb levels) which requires highly specialized equipment.
The chemistry of these species is closely linked to the C2H2 chemistry.
4.4.1 Reactions of C
The information on atomic C reacting with other radicals and species is sparse and rate
data available are limited. The important reactions of C, that are suggested in literature,
are with OH, O2, H2O, CH, C2H, CH2, and CH4. The rate of these reactions available
in the CODATA [42] are only available at room temperature. The important reaction
for the formation of C is CH + H → H2 + C. Thus the chemistry of C is linked to the
CH chemistry. The products of the C consuming reactions are mainly C2 and C3. The
rate of these reactions are summarized in the Appendix.
4.4.2 Reactions of C2
The dicarbon molecule C2 is found in its triplet a(3Π) and its singlet X(1Σ+g ) state. At
flame temperatures, the triplet state, due to its higher degeneracy, is considered to be
more populated (about 80%) [92]. Since few information is available on the formation
and consumption reaction rates of these two states separately, we have considered the
total C2 from both states. Very recently a few studies have discussed the C2 measurement
and its mechanism in flames [46, 92, 93]. The main formation path of C2 is through the
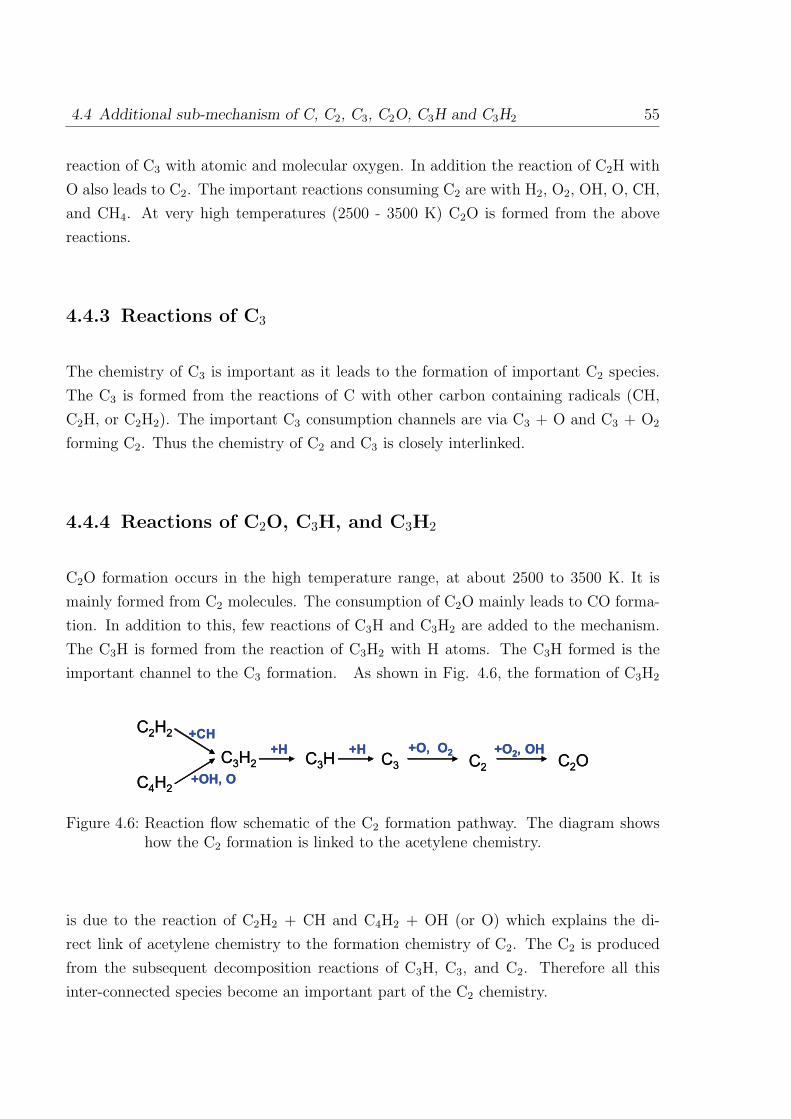
4.4 Additional sub-mechanism of C, C2, C3, C2O, C3H and C3H2 55
reaction of C3 with atomic and molecular oxygen. In addition the reaction of C2H with
O also leads to C2. The important reactions consuming C2 are with H2, O2, OH, O, CH,
and CH4. At very high temperatures (2500 - 3500 K) C2O is formed from the above
reactions.
4.4.3 Reactions of C3
The chemistry of C3 is important as it leads to the formation of important C2 species.
The C3 is formed from the reactions of C with other carbon containing radicals (CH,
C2H, or C2H2). The important C3 consumption channels are via C3 + O and C3 + O2
forming C2. Thus the chemistry of C2 and C3 is closely interlinked.
4.4.4 Reactions of C2O, C3H, and C3H2
C2O formation occurs in the high temperature range, at about 2500 to 3500 K. It is
mainly formed from C2 molecules. The consumption of C2O mainly leads to CO forma-
tion. In addition to this, few reactions of C3H and C3H2 are added to the mechanism.
The C3H is formed from the reaction of C3H2 with H atoms. The C3H formed is the
important channel to the C3 formation. As shown in Fig. 4.6, the formation of C3H2
C2H2
C4H2
C3H2 C
3H C
3 C2
+CH
+OH, O
+H +H +O, O2
C2O
+O2, OH
C2H2
C4H2
C3H2 C
3H C
3 C2
+CH
+OH, O
+H +H +O, O2
C2O
+O2, OH
Figure 4.6: Reaction flow schematic of the C2 formation pathway. The diagram showshow the C2 formation is linked to the acetylene chemistry.
is due to the reaction of C2H2 + CH and C4H2 + OH (or O) which explains the di-
rect link of acetylene chemistry to the formation chemistry of C2. The C2 is produced
from the subsequent decomposition reactions of C3H, C3, and C2. Therefore all this
inter-connected species become an important part of the C2 chemistry.
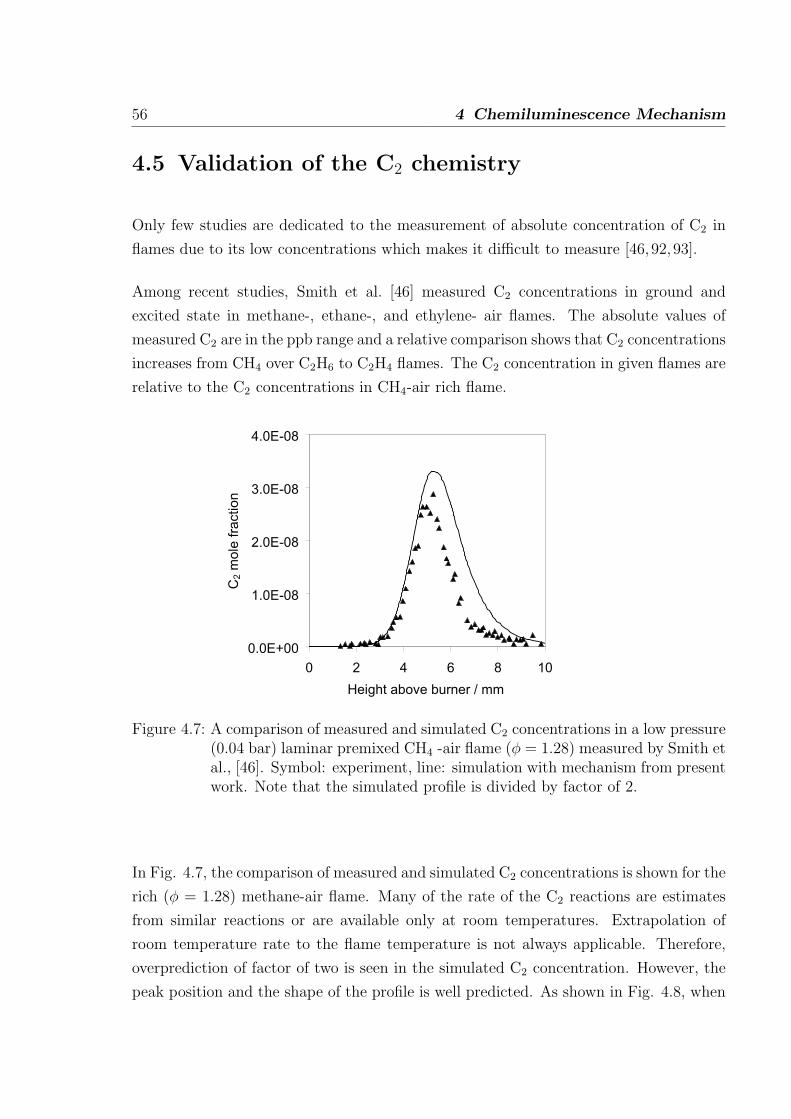
56 4 Chemiluminescence Mechanism
4.5 Validation of the C2 chemistry
Only few studies are dedicated to the measurement of absolute concentration of C2 in
flames due to its low concentrations which makes it difficult to measure [46,92,93].
Among recent studies, Smith et al. [46] measured C2 concentrations in ground and
excited state in methane-, ethane-, and ethylene- air flames. The absolute values of
measured C2 are in the ppb range and a relative comparison shows that C2 concentrations
increases from CH4 over C2H6 to C2H4 flames. The C2 concentration in given flames are
relative to the C2 concentrations in CH4-air rich flame.
0.0E+00
1.0E-08
2.0E-08
3.0E-08
4.0E-08
0 2 4 6 8 10
Height above burner / mm
C2 m
ole
fra
ctio
n
Figure 4.7: A comparison of measured and simulated C2 concentrations in a low pressure(0.04 bar) laminar premixed CH4 -air flame (φ = 1.28) measured by Smith etal., [46]. Symbol: experiment, line: simulation with mechanism from presentwork. Note that the simulated profile is divided by factor of 2.
In Fig. 4.7, the comparison of measured and simulated C2 concentrations is shown for the
rich (φ = 1.28) methane-air flame. Many of the rate of the C2 reactions are estimates
from similar reactions or are available only at room temperatures. Extrapolation of
room temperature rate to the flame temperature is not always applicable. Therefore,
overprediction of factor of two is seen in the simulated C2 concentration. However, the
peak position and the shape of the profile is well predicted. As shown in Fig. 4.8, when
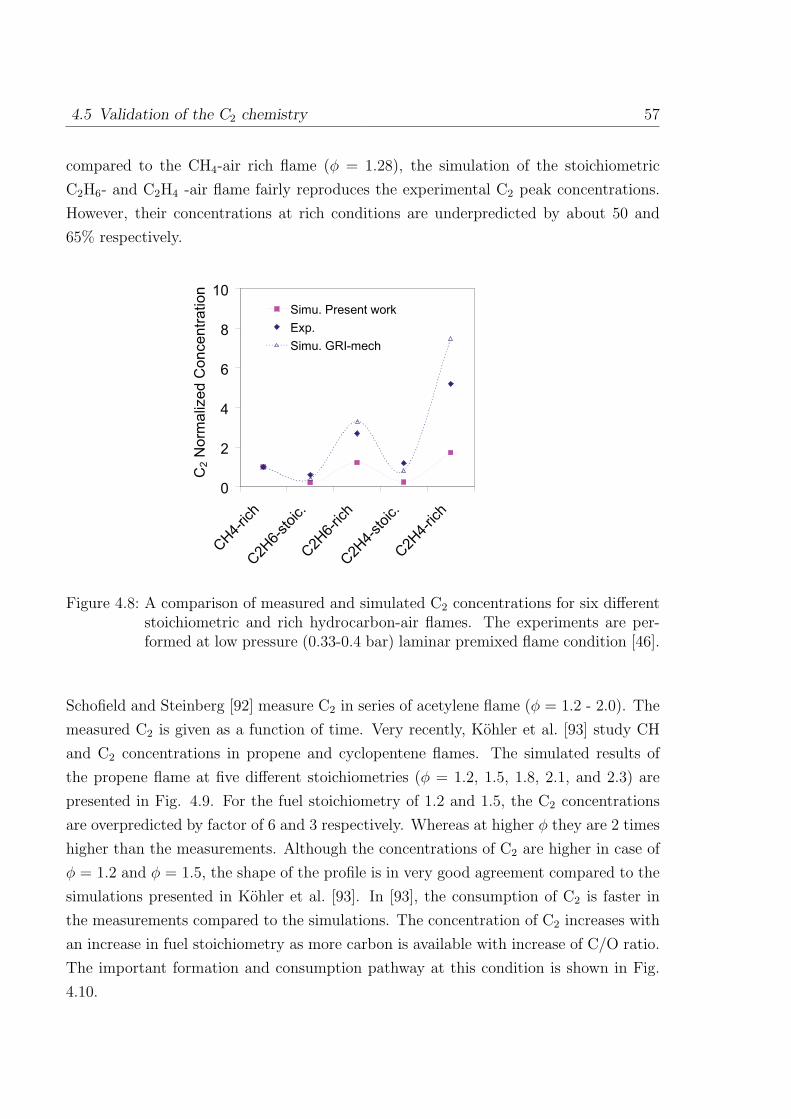
4.5 Validation of the C2 chemistry 57
compared to the CH4-air rich flame (φ = 1.28), the simulation of the stoichiometric
C2H6- and C2H4 -air flame fairly reproduces the experimental C2 peak concentrations.
However, their concentrations at rich conditions are underpredicted by about 50 and
65% respectively.
0
2
4
6
8
10
CH4-
rich
C2H
6-st
oic.
C2H
6-ric
hC2H
4-st
oic.
C2H
4-ric
h
C2 N
orm
aliz
ed
Co
nce
ntr
atio
n
Simu. Present work
Exp.
Simu. GRI-mech
Figure 4.8: A comparison of measured and simulated C2 concentrations for six differentstoichiometric and rich hydrocarbon-air flames. The experiments are per-formed at low pressure (0.33-0.4 bar) laminar premixed flame condition [46].
Schofield and Steinberg [92] measure C2 in series of acetylene flame (φ = 1.2 - 2.0). The
measured C2 is given as a function of time. Very recently, Kohler et al. [93] study CH
and C2 concentrations in propene and cyclopentene flames. The simulated results of
the propene flame at five different stoichiometries (φ = 1.2, 1.5, 1.8, 2.1, and 2.3) are
presented in Fig. 4.9. For the fuel stoichiometry of 1.2 and 1.5, the C2 concentrations
are overpredicted by factor of 6 and 3 respectively. Whereas at higher φ they are 2 times
higher than the measurements. Although the concentrations of C2 are higher in case of
φ = 1.2 and φ = 1.5, the shape of the profile is in very good agreement compared to the
simulations presented in Kohler et al. [93]. In [93], the consumption of C2 is faster in
the measurements compared to the simulations. The concentration of C2 increases with
an increase in fuel stoichiometry as more carbon is available with increase of C/O ratio.
The important formation and consumption pathway at this condition is shown in Fig.
4.10.
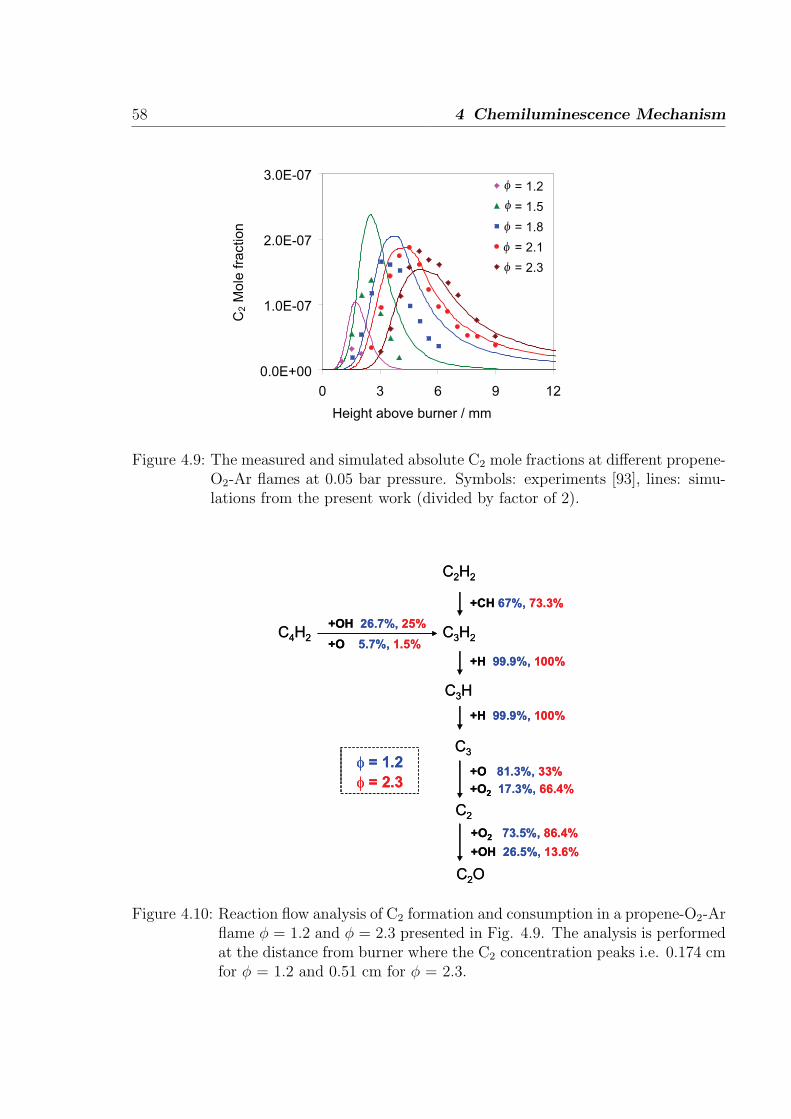
58 4 Chemiluminescence Mechanism
0.0E+00
1.0E-07
2.0E-07
3.0E-07
0 3 6 9 12
Height above burner / mm
C2 M
ole
fra
ctio
n
= 1.2
= 1.5
= 1.8
= 2.1
= 2.3
φ
φ
φ
φ
φ
Figure 4.9: The measured and simulated absolute C2 mole fractions at different propene-O2-Ar flames at 0.05 bar pressure. Symbols: experiments [93], lines: simu-lations from the present work (divided by factor of 2).
C2H2
C4H2
C3H2
C3H
C3
C2
+CH 67%, 73.3%
+OH 26.7%, 25%
+O 5.7%, 1.5%
+H 99.9%, 100%
+H 99.9%, 100%
+O 81.3%, 33%
+O2 17.3%, 66.4%
C2O
+O2 73.5%, 86.4%
+OH 26.5%, 13.6%
φ = 1.2
φ = 2.3
C2H2
C4H2
C3H2
C3H
C3
C2
+CH 67%, 73.3%
+OH 26.7%, 25%
+O 5.7%, 1.5%
+H 99.9%, 100%
+H 99.9%, 100%
+O 81.3%, 33%
+O2 17.3%, 66.4%
C2O
+O2 73.5%, 86.4%
+OH 26.5%, 13.6%
φ = 1.2
φ = 2.3
Figure 4.10: Reaction flow analysis of C2 formation and consumption in a propene-O2-Arflame φ = 1.2 and φ = 2.3 presented in Fig. 4.9. The analysis is performedat the distance from burner where the C2 concentration peaks i.e. 0.174 cmfor φ = 1.2 and 0.51 cm for φ = 2.3.
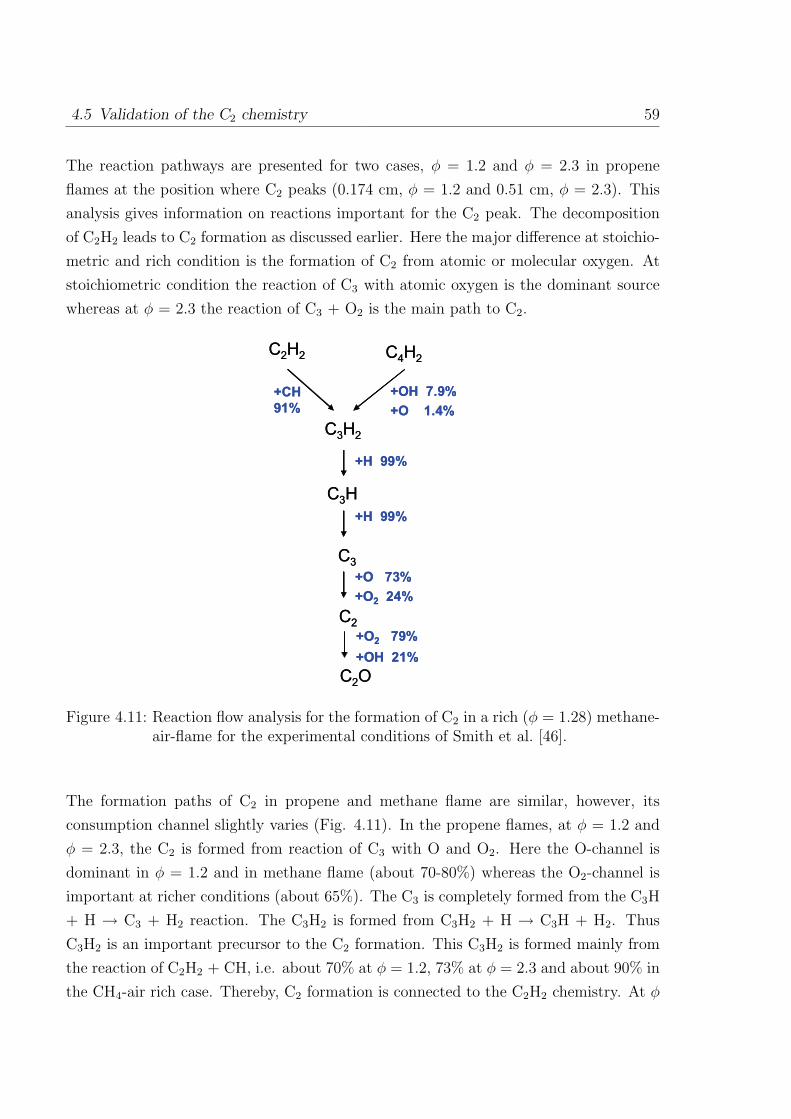
4.5 Validation of the C2 chemistry 59
The reaction pathways are presented for two cases, φ = 1.2 and φ = 2.3 in propene
flames at the position where C2 peaks (0.174 cm, φ = 1.2 and 0.51 cm, φ = 2.3). This
analysis gives information on reactions important for the C2 peak. The decomposition
of C2H2 leads to C2 formation as discussed earlier. Here the major difference at stoichio-
metric and rich condition is the formation of C2 from atomic or molecular oxygen. At
stoichiometric condition the reaction of C3 with atomic oxygen is the dominant source
whereas at φ = 2.3 the reaction of C3 + O2 is the main path to C2.
C2H2 C
4H2
C3H2
C3H
C3
C2
+CH
91%
+OH 7.9%
+O 1.4%
+H 99%
+H 99%
+O 73%
+O2 24%
C2O
+O2 79%
+OH 21%
C2H2 C
4H2
C3H2
C3H
C3
C2
+CH
91%
+OH 7.9%
+O 1.4%
+H 99%
+H 99%
+O 73%
+O2 24%
C2O
+O2 79%
+OH 21%
Figure 4.11: Reaction flow analysis for the formation of C2 in a rich (φ = 1.28) methane-air-flame for the experimental conditions of Smith et al. [46].
The formation paths of C2 in propene and methane flame are similar, however, its
consumption channel slightly varies (Fig. 4.11). In the propene flames, at φ = 1.2 and
φ = 2.3, the C2 is formed from reaction of C3 with O and O2. Here the O-channel is
dominant in φ = 1.2 and in methane flame (about 70-80%) whereas the O2-channel is
important at richer conditions (about 65%). The C3 is completely formed from the C3H
+ H → C3 + H2 reaction. The C3H2 is formed from C3H2 + H → C3H + H2. Thus
C3H2 is an important precursor to the C2 formation. This C3H2 is formed mainly from
the reaction of C2H2 + CH, i.e. about 70% at φ = 1.2, 73% at φ = 2.3 and about 90% in
the CH4-air rich case. Thereby, C2 formation is connected to the C2H2 chemistry. At φ
60 4 Chemiluminescence Mechanism
= 1.2 about 20% of C2 is consumed by C2O via its reaction with OH and O2. In addition
60% of it is consumed to form C2H. A small channel (8%) forms CH in the reaction C2
+ OH. But at richer case (φ = 2.3), only 4% forms C2O. A larger channel (90%) forms
C2H through its reaction with H2 and C2H2. The consumption of C3H is dominated by
its reaction with O2 and H to form HCCO and C3 respectively. Therefore the chemistry
of C2 is linked with the C2H2 chemistry. However the influence of C2 chemistry on C2H2
is very small as the concentration of C2 is in ppb-range which is about two to three
orders of magnitude lower than the important species in the C2H2 channel.
In present work and all the above reported studies of C2 ( [46], [93]), the addition of the
C2 sub-mechanism does not alter the validation of the ground state chemistry.
5 Validation of the
Chemiluminescence Mechanism
The validation of the chemiluminescence mechanism is a challenging task as it involves
the validation of its ground state formation chemistry and in addition it requires the
validation of its very low concentration species. There are certain experimental difficul-
ties in measurement of such species which leads to an only small number of available
experimental data for validation. In this chapter, the validation of CL mechanism is
presented where the simulated results are compared to the measurements obtained for
shock-heated mixtures and for one-dimensional laminar flame systems. The similations
are performed with program HOMREA [94] and INSFLA [94,95] respectively.
5.1 Simulations of shock-tube measurements
Different groups in literature have discussed the measurement of ignition delay time
by following the appearance of electronically excited species. Although due to its low
concentrations, the ignition delay times of excited species profile are not dependent
on the formation kinetics of these species itself but they provide information on the
ground state chemistry. Thereby, it helps in giving an extra check on ground state
chemistry. However, following the concentration of excited species as a function of
temperature, mixture stoichiometry shall give information on the formation kinetics of
the excited species. So far only OH* and CH* are measured at shock-tube conditions.
The measurement of C2* is unavailable in the literature as the shock-heated mixtures
are studied mainly in lean conditions where its formation is less likely.
61
62 5 Validation of the Chemiluminescence Mechanism
5.1.1 H2/O2/Ar/N2 mixtures
OH* formation in hydrogen oxygen mixtures is due to the three body reaction of
H+O+M. The temporal variation of OH* in hydrogen mixture is studied in a shock-
tube at temperatures of 1400 - 3300 K and at a pressure of 1 bar [27]. The results
of the prediction of OH* in the mechanism is validated with the measurements. The
OH* intensity measured under the shock-tube conditions cannot be directly related to
the computed concentrations as the link between the intensity and concentration is not
known. Its comparison requires a calibration factor which can convert the measured
intensity to the calculated concentrations. The role of thermal excitation in high tem-
perature chemistry is well-known. In hydrogen-oxygen mixtures, Hidaka et al. [69] and
Koike et al. [70] mentioned that the OH* above 2800 K is formed due to the thermal
excitation reaction (reverse quenching) and is independent of the formation reactions
(H+O+M). This information is used to derive the calibration factor by comparing the
measured intensity to the computed concentration. However, before relying on this
strategy, three important points need to be clarified [27]:
(i) Additional reactions (example, collisional induced decomposition of OH*) should
have a negligible effect only. As discussed in [27] the dissociation of OH* from
the reverse reaction −(R413) is thermodynamically accessible and the sensitivity
analysis shows that it contributes 5% to the OH* peak concentration compared to
the 95% due to the quenching reaction. Therefore it can be neglected.
(ii) The measured peak intensity should not suffer from insufficient temporal resolution
of the detectors. It is seen that the time resolution of experiments is short enough
to not influence the signal traces
(iii) The influence of radiation trapping due to ground state OH must be negligible.
The signal emitted from OH* chemiluminescence is partially trapped by ground
state OH which is abundant in gases after ignition. It is deduced, from simple
analytical approach to quantify signal trapping [27], that this effect is covered by
the calibration. The error caused by signal trapping due to the slight variations
between calibration and measurement and due to variations in the time profile is
estimated to be within the ±3% range.
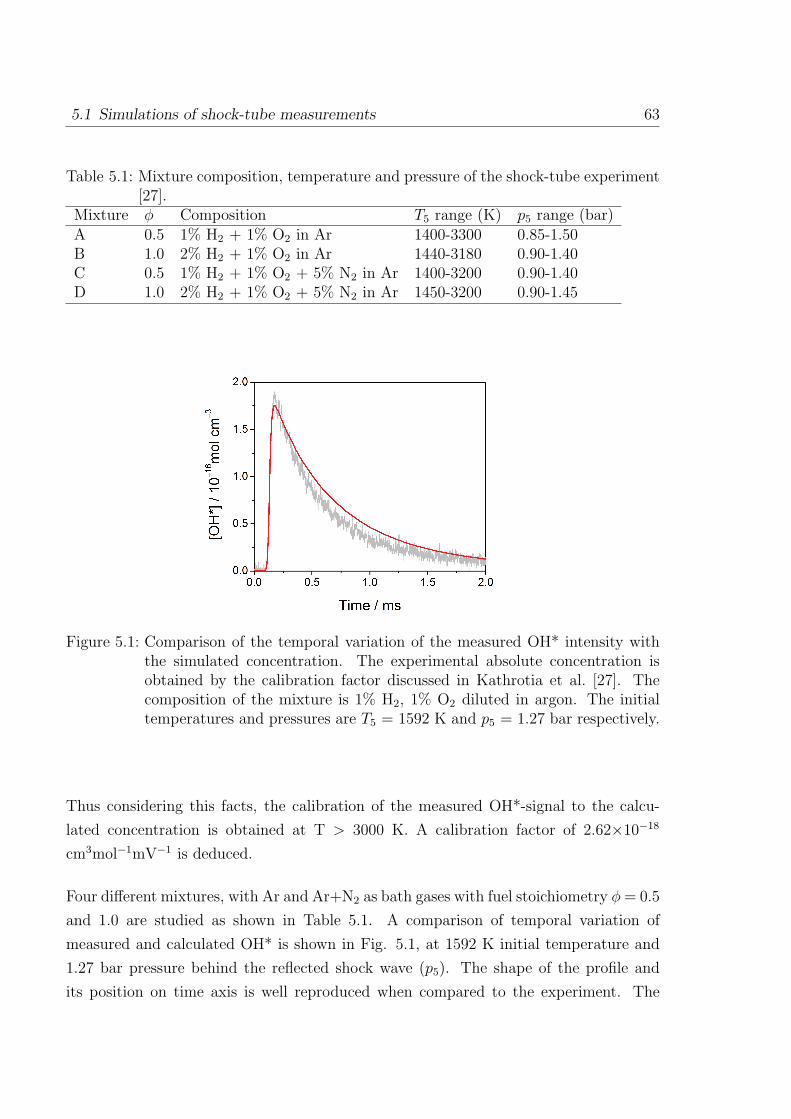
5.1 Simulations of shock-tube measurements 63
Table 5.1: Mixture composition, temperature and pressure of the shock-tube experiment[27].
Mixture φ Composition T5 range (K) p5 range (bar)A 0.5 1% H2 + 1% O2 in Ar 1400-3300 0.85-1.50B 1.0 2% H2 + 1% O2 in Ar 1440-3180 0.90-1.40C 0.5 1% H2 + 1% O2 + 5% N2 in Ar 1400-3200 0.90-1.40D 1.0 2% H2 + 1% O2 + 5% N2 in Ar 1450-3200 0.90-1.45
Figure 5.1: Comparison of the temporal variation of the measured OH* intensity withthe simulated concentration. The experimental absolute concentration isobtained by the calibration factor discussed in Kathrotia et al. [27]. Thecomposition of the mixture is 1% H2, 1% O2 diluted in argon. The initialtemperatures and pressures are T5 = 1592 K and p5 = 1.27 bar respectively.
Thus considering this facts, the calibration of the measured OH*-signal to the calcu-
lated concentration is obtained at T > 3000 K. A calibration factor of 2.62×10⁻¹⁸
cm3mol−1mV−1 is deduced.
Four different mixtures, with Ar and Ar+N2 as bath gases with fuel stoichiometry φ = 0.5
and 1.0 are studied as shown in Table 5.1. A comparison of temporal variation of
measured and calculated OH* is shown in Fig. 5.1, at 1592 K initial temperature and
1.27 bar pressure behind the reflected shock wave (p5). The shape of the profile and
its position on time axis is well reproduced when compared to the experiment. The
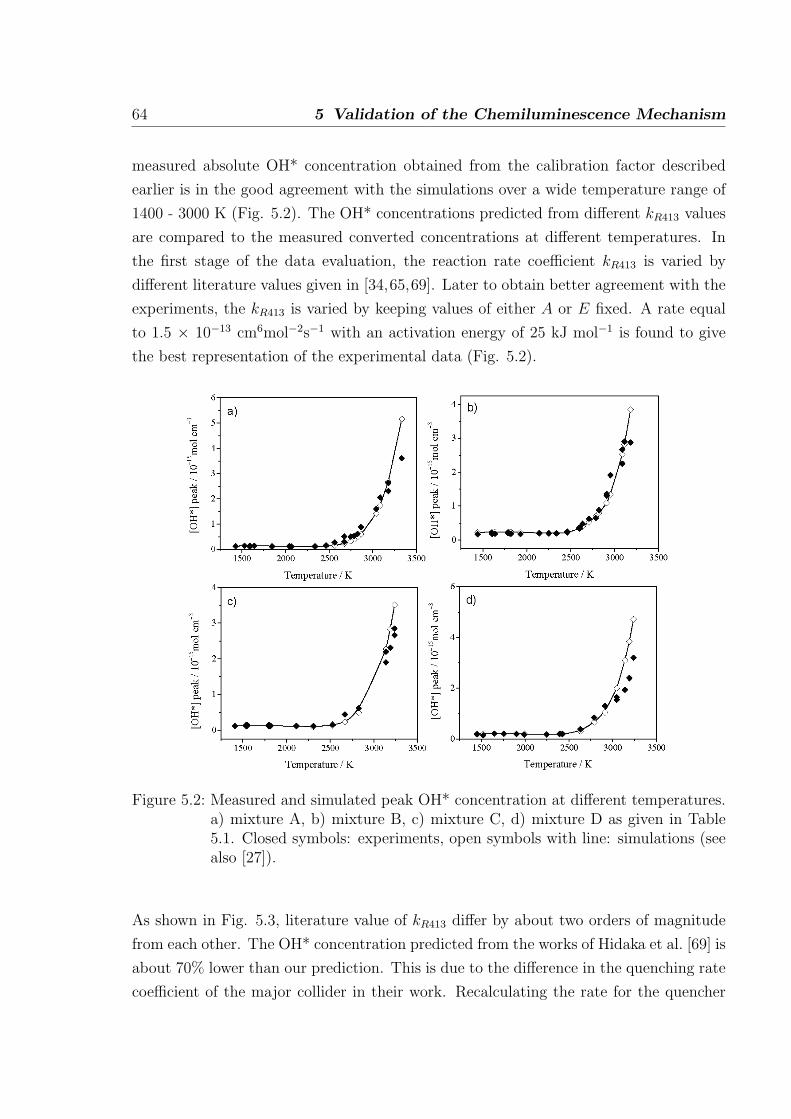
64 5 Validation of the Chemiluminescence Mechanism
measured absolute OH* concentration obtained from the calibration factor described
earlier is in the good agreement with the simulations over a wide temperature range of
1400 - 3000 K (Fig. 5.2). The OH* concentrations predicted from different kR413 values
are compared to the measured converted concentrations at different temperatures. In
the first stage of the data evaluation, the reaction rate coefficient kR413 is varied by
different literature values given in [34,65,69]. Later to obtain better agreement with the
experiments, the kR413 is varied by keeping values of either A or E fixed. A rate equal
to 1.5 × 10⁻¹³ cm6mol−2s−1 with an activation energy of 25 kJ mol−1 is found to give
the best representation of the experimental data (Fig. 5.2).
Figure 5.2: Measured and simulated peak OH* concentration at different temperatures.a) mixture A, b) mixture B, c) mixture C, d) mixture D as given in Table5.1. Closed symbols: experiments, open symbols with line: simulations (seealso [27]).
As shown in Fig. 5.3, literature value of kR413 differ by about two orders of magnitude
from each other. The OH* concentration predicted from the works of Hidaka et al. [69] is
about 70% lower than our prediction. This is due to the difference in the quenching rate
coefficient of the major collider in their work. Recalculating the rate for the quencher
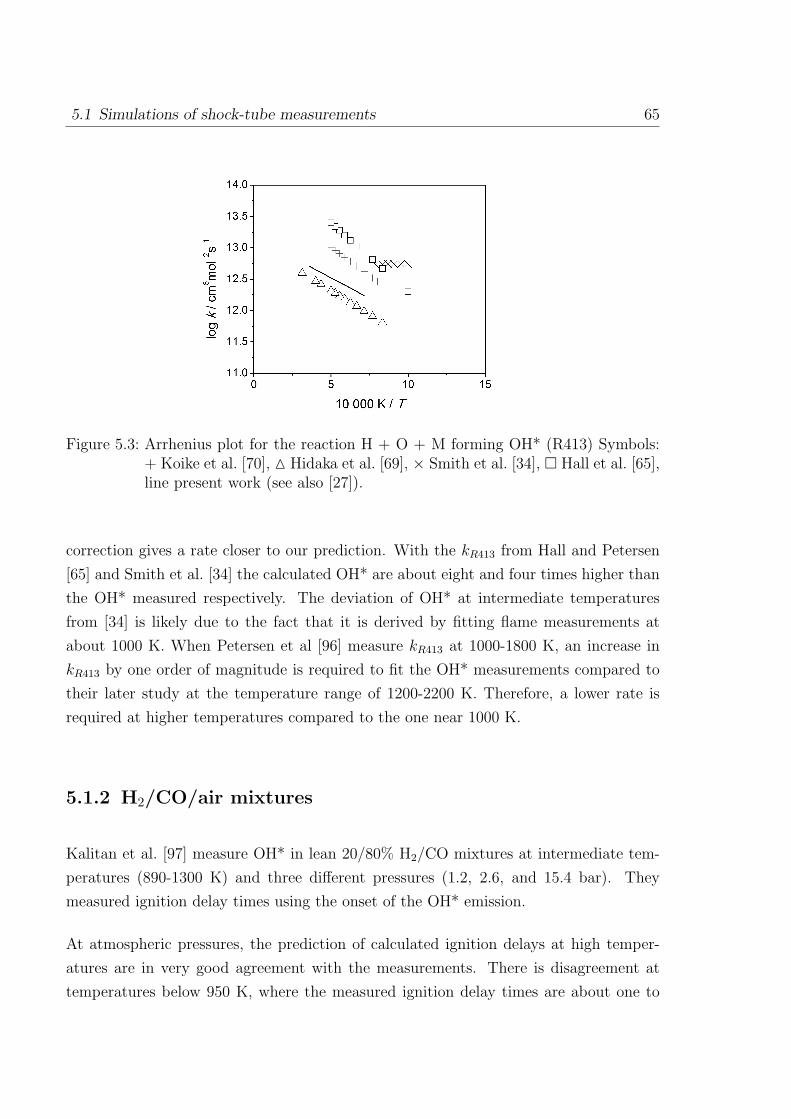
5.1 Simulations of shock-tube measurements 65
Figure 5.3: Arrhenius plot for the reaction H + O + M forming OH* (R413) Symbols:+ Koike et al. [70], M Hidaka et al. [69], × Smith et al. [34], ¤ Hall et al. [65],line present work (see also [27]).
correction gives a rate closer to our prediction. With the kR413 from Hall and Petersen
[65] and Smith et al. [34] the calculated OH* are about eight and four times higher than
the OH* measured respectively. The deviation of OH* at intermediate temperatures
from [34] is likely due to the fact that it is derived by fitting flame measurements at
about 1000 K. When Petersen et al [96] measure kR413 at 1000-1800 K, an increase in
kR413 by one order of magnitude is required to fit the OH* measurements compared to
their later study at the temperature range of 1200-2200 K. Therefore, a lower rate is
required at higher temperatures compared to the one near 1000 K.
5.1.2 H2/CO/air mixtures
Kalitan et al. [97] measure OH* in lean 20/80% H2/CO mixtures at intermediate tem-
peratures (890-1300 K) and three different pressures (1.2, 2.6, and 15.4 bar). They
measured ignition delay times using the onset of the OH* emission.
At atmospheric pressures, the prediction of calculated ignition delays at high temper-
atures are in very good agreement with the measurements. There is disagreement at
temperatures below 950 K, where the measured ignition delay times are about one to
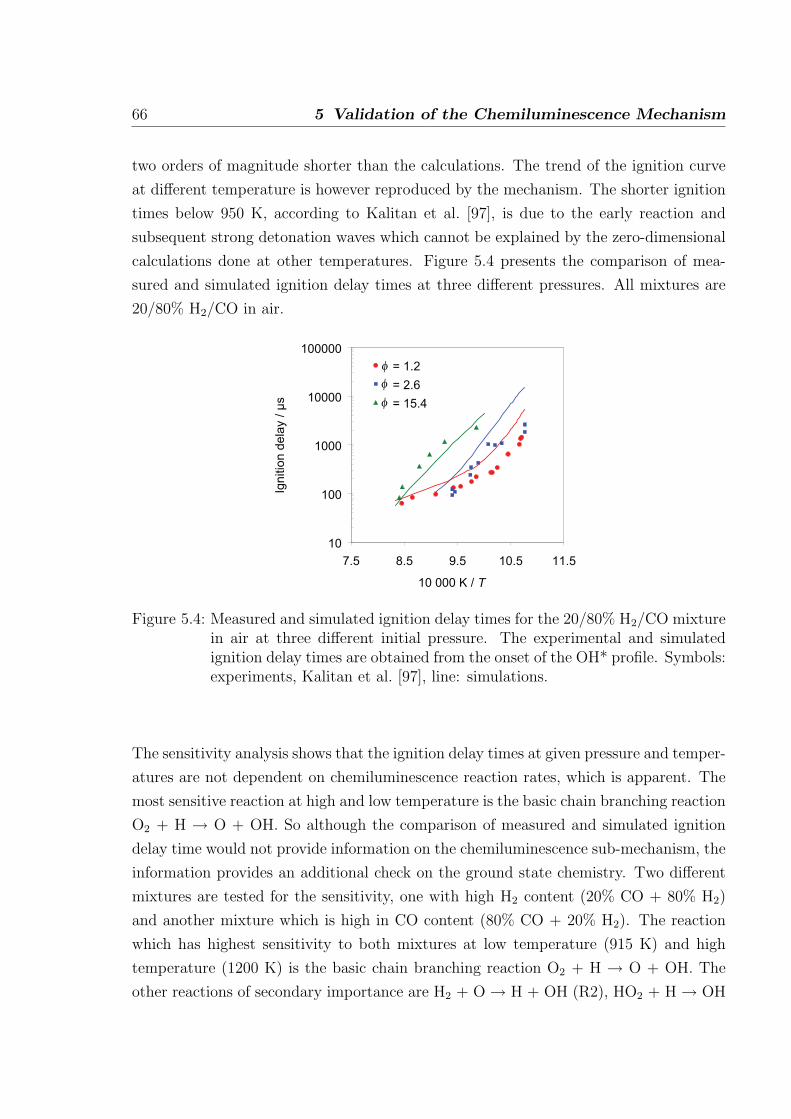
66 5 Validation of the Chemiluminescence Mechanism
two orders of magnitude shorter than the calculations. The trend of the ignition curve
at different temperature is however reproduced by the mechanism. The shorter ignition
times below 950 K, according to Kalitan et al. [97], is due to the early reaction and
subsequent strong detonation waves which cannot be explained by the zero-dimensional
calculations done at other temperatures. Figure 5.4 presents the comparison of mea-
sured and simulated ignition delay times at three different pressures. All mixtures are
20/80% H2/CO in air.
10
100
1000
10000
100000
7.5 8.5 9.5 10.5 11.5
10 000 K / T
Ign
itio
n d
ela
y / µ
s
= 1.2
= 2.6
= 15.4φ
φ
φ
Figure 5.4: Measured and simulated ignition delay times for the 20/80% H2/CO mixturein air at three different initial pressure. The experimental and simulatedignition delay times are obtained from the onset of the OH* profile. Symbols:experiments, Kalitan et al. [97], line: simulations.
The sensitivity analysis shows that the ignition delay times at given pressure and temper-
atures are not dependent on chemiluminescence reaction rates, which is apparent. The
most sensitive reaction at high and low temperature is the basic chain branching reaction
O2 + H → O + OH. So although the comparison of measured and simulated ignition
delay time would not provide information on the chemiluminescence sub-mechanism, the
information provides an additional check on the ground state chemistry. Two different
mixtures are tested for the sensitivity, one with high H2 content (20% CO + 80% H2)
and another mixture which is high in CO content (80% CO + 20% H2). The reaction
which has highest sensitivity to both mixtures at low temperature (915 K) and high
temperature (1200 K) is the basic chain branching reaction O2 + H → O + OH. The
other reactions of secondary importance are H2 + O → H + OH (R2), HO2 + H → OH
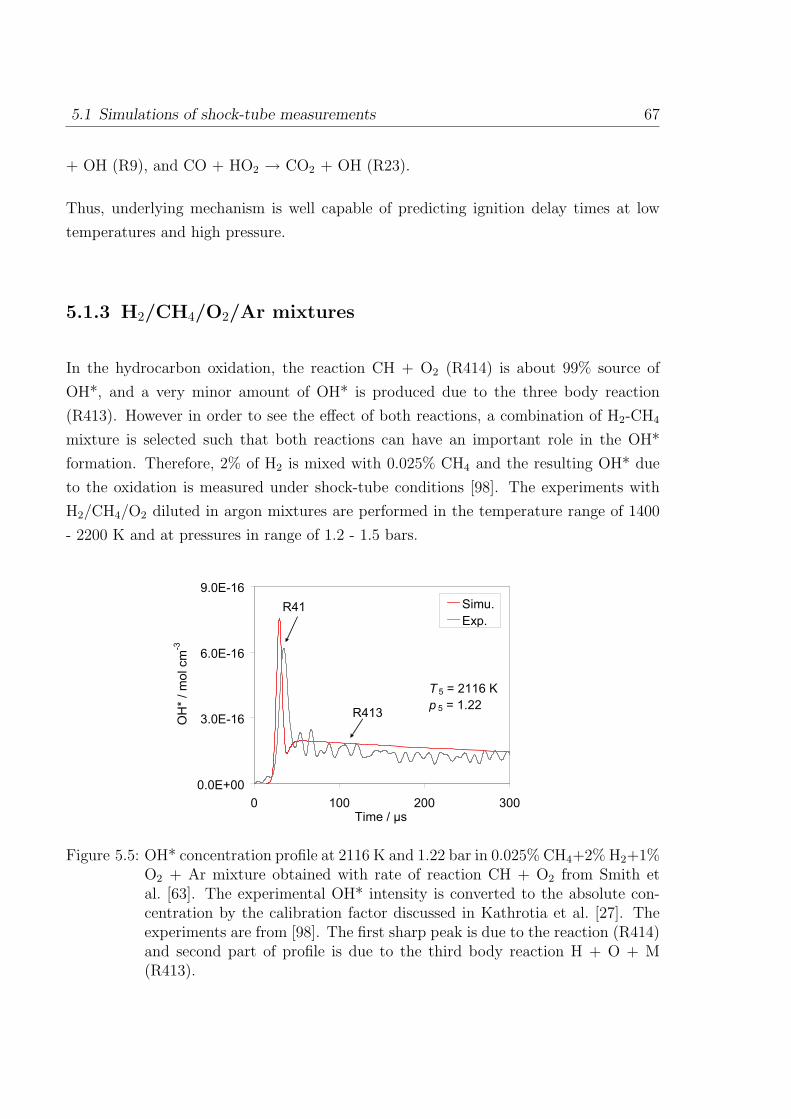
5.1 Simulations of shock-tube measurements 67
+ OH (R9), and CO + HO2 → CO2 + OH (R23).
Thus, underlying mechanism is well capable of predicting ignition delay times at low
temperatures and high pressure.
5.1.3 H2/CH4/O2/Ar mixtures
In the hydrocarbon oxidation, the reaction CH + O2 (R414) is about 99% source of
OH*, and a very minor amount of OH* is produced due to the three body reaction
(R413). However in order to see the effect of both reactions, a combination of H2-CH4
mixture is selected such that both reactions can have an important role in the OH*
formation. Therefore, 2% of H2 is mixed with 0.025% CH4 and the resulting OH* due
to the oxidation is measured under shock-tube conditions [98]. The experiments with
H2/CH4/O2 diluted in argon mixtures are performed in the temperature range of 1400
- 2200 K and at pressures in range of 1.2 - 1.5 bars.
0.0E+00
3.0E-16
6.0E-16
9.0E-16
0 100 200 300Time / µs
OH
* / m
ol cm
-3
Simu.
Exp.
T 5 = 2116 K
p 5 = 1.22
barR413
R41
4
Figure 5.5: OH* concentration profile at 2116 K and 1.22 bar in 0.025% CH4+2% H2+1%O2 + Ar mixture obtained with rate of reaction CH + O2 from Smith etal. [63]. The experimental OH* intensity is converted to the absolute con-centration by the calibration factor discussed in Kathrotia et al. [27]. Theexperiments are from [98]. The first sharp peak is due to the reaction (R414)and second part of profile is due to the third body reaction H + O + M(R413).
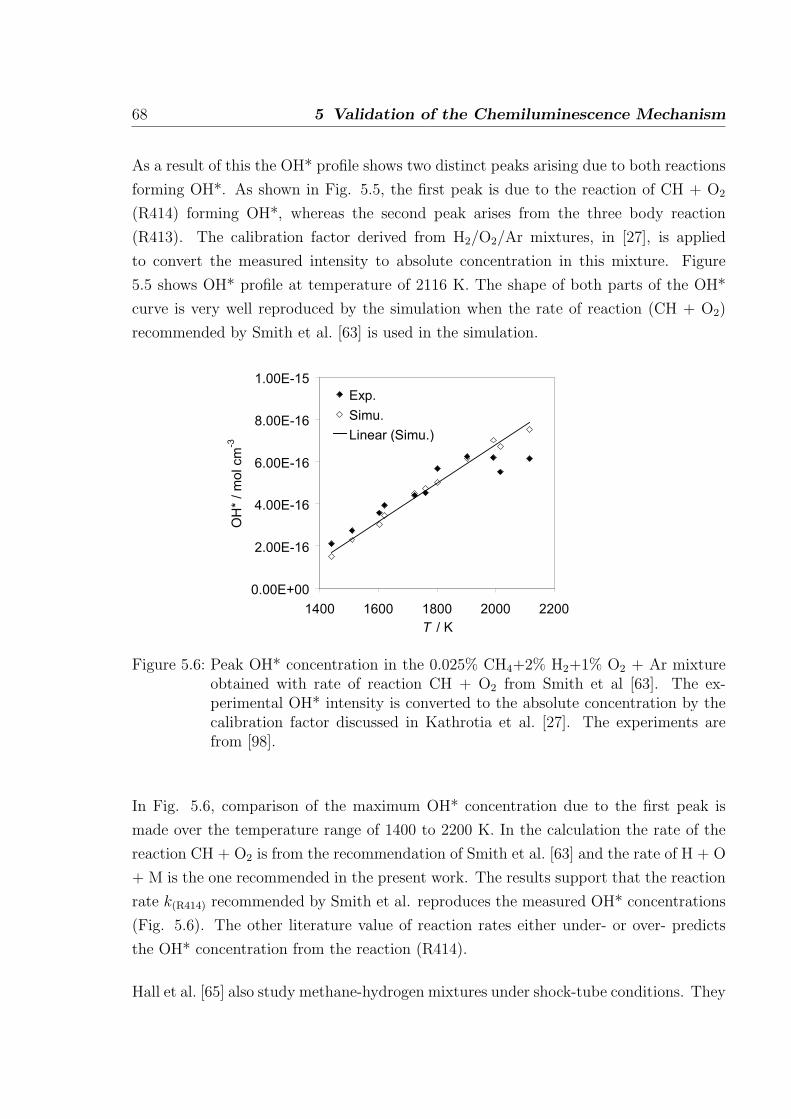
68 5 Validation of the Chemiluminescence Mechanism
As a result of this the OH* profile shows two distinct peaks arising due to both reactions
forming OH*. As shown in Fig. 5.5, the first peak is due to the reaction of CH + O2
(R414) forming OH*, whereas the second peak arises from the three body reaction
(R413). The calibration factor derived from H2/O2/Ar mixtures, in [27], is applied
to convert the measured intensity to absolute concentration in this mixture. Figure
5.5 shows OH* profile at temperature of 2116 K. The shape of both parts of the OH*
curve is very well reproduced by the simulation when the rate of reaction (CH + O2)
recommended by Smith et al. [63] is used in the simulation.
0.00E+00
2.00E-16
4.00E-16
6.00E-16
8.00E-16
1.00E-15
1400 1600 1800 2000 2200
T / K
OH
* / m
ol cm
-3
Exp.
Simu.
Linear (Simu.)
Figure 5.6: Peak OH* concentration in the 0.025% CH4+2% H2+1% O2 + Ar mixtureobtained with rate of reaction CH + O2 from Smith et al [63]. The ex-perimental OH* intensity is converted to the absolute concentration by thecalibration factor discussed in Kathrotia et al. [27]. The experiments arefrom [98].
In Fig. 5.6, comparison of the maximum OH* concentration due to the first peak is
made over the temperature range of 1400 to 2200 K. In the calculation the rate of the
reaction CH + O2 is from the recommendation of Smith et al. [63] and the rate of H + O
+ M is the one recommended in the present work. The results support that the reaction
rate k(R414) recommended by Smith et al. reproduces the measured OH* concentrations
(Fig. 5.6). The other literature value of reaction rates either under- or over- predicts
the OH* concentration from the reaction (R414).
Hall et al. [65] also study methane-hydrogen mixtures under shock-tube conditions. They
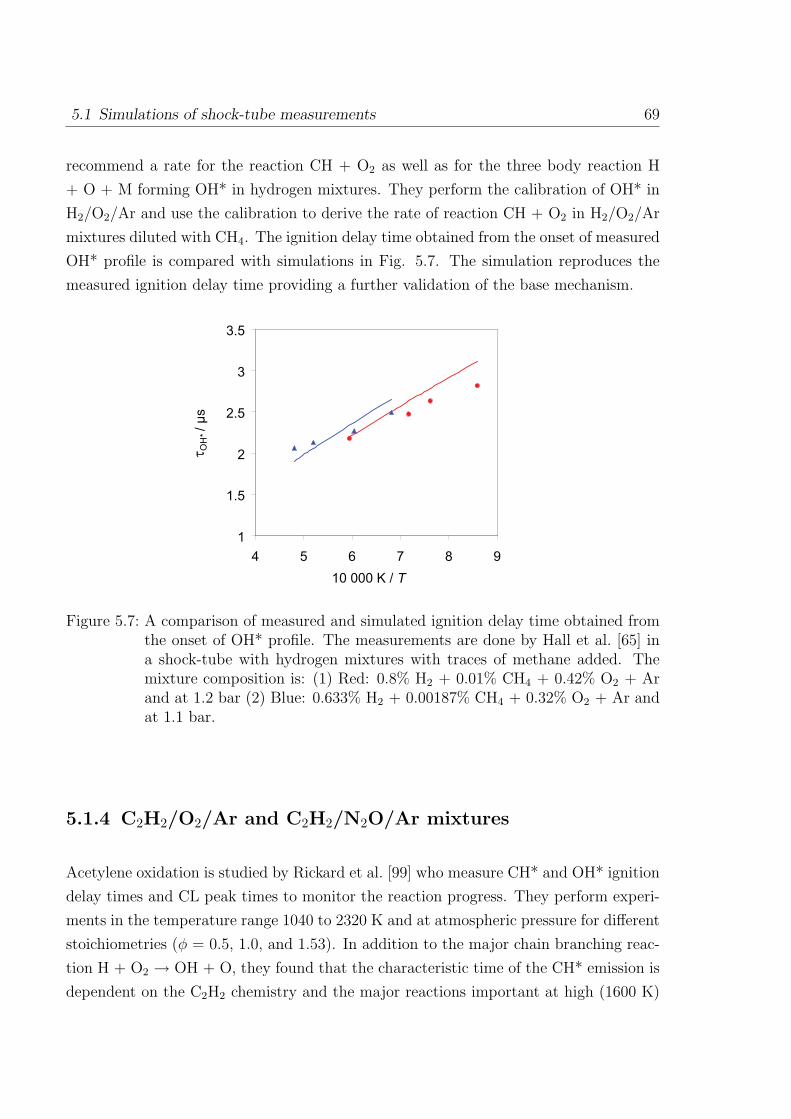
5.1 Simulations of shock-tube measurements 69
recommend a rate for the reaction CH + O2 as well as for the three body reaction H
+ O + M forming OH* in hydrogen mixtures. They perform the calibration of OH* in
H2/O2/Ar and use the calibration to derive the rate of reaction CH + O2 in H2/O2/Ar
mixtures diluted with CH4. The ignition delay time obtained from the onset of measured
OH* profile is compared with simulations in Fig. 5.7. The simulation reproduces the
measured ignition delay time providing a further validation of the base mechanism.
1
1.5
2
2.5
3
3.5
4 5 6 7 8 9
10 000 K / T
τO
H* / µ
s
Figure 5.7: A comparison of measured and simulated ignition delay time obtained fromthe onset of OH* profile. The measurements are done by Hall et al. [65] ina shock-tube with hydrogen mixtures with traces of methane added. Themixture composition is: (1) Red: 0.8% H2 + 0.01% CH4 + 0.42% O2 + Arand at 1.2 bar (2) Blue: 0.633% H2 + 0.00187% CH4 + 0.32% O2 + Ar andat 1.1 bar.
5.1.4 C2H2/O2/Ar and C2H2/N2O/Ar mixtures
Acetylene oxidation is studied by Rickard et al. [99] who measure CH* and OH* ignition
delay times and CL peak times to monitor the reaction progress. They perform experi-
ments in the temperature range 1040 to 2320 K and at atmospheric pressure for different
stoichiometries (φ = 0.5, 1.0, and 1.53). In addition to the major chain branching reac-
tion H + O2 → OH + O, they found that the characteristic time of the CH* emission is
dependent on the C2H2 chemistry and the major reactions important at high (1600 K)
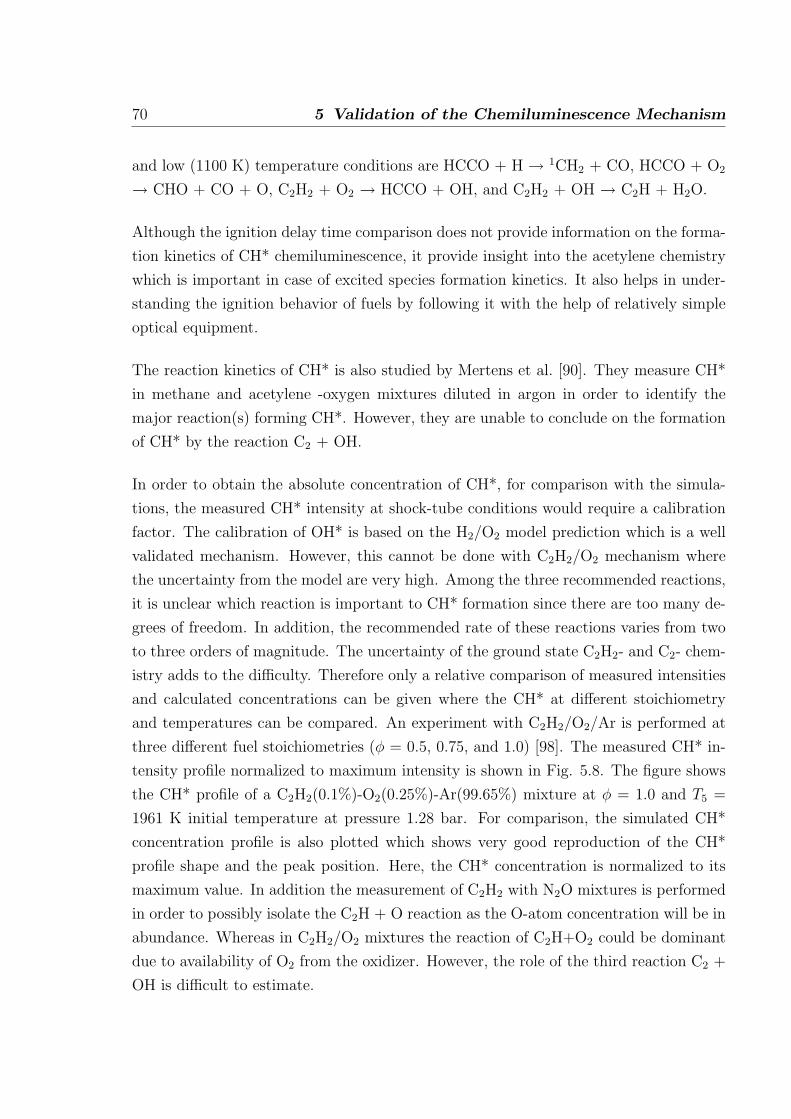
70 5 Validation of the Chemiluminescence Mechanism
and low (1100 K) temperature conditions are HCCO + H → 1CH2 + CO, HCCO + O2
→ CHO + CO + O, C2H2 + O2 → HCCO + OH, and C2H2 + OH → C2H + H2O.
Although the ignition delay time comparison does not provide information on the forma-
tion kinetics of CH* chemiluminescence, it provide insight into the acetylene chemistry
which is important in case of excited species formation kinetics. It also helps in under-
standing the ignition behavior of fuels by following it with the help of relatively simple
optical equipment.
The reaction kinetics of CH* is also studied by Mertens et al. [90]. They measure CH*
in methane and acetylene -oxygen mixtures diluted in argon in order to identify the
major reaction(s) forming CH*. However, they are unable to conclude on the formation
of CH* by the reaction C2 + OH.
In order to obtain the absolute concentration of CH*, for comparison with the simula-
tions, the measured CH* intensity at shock-tube conditions would require a calibration
factor. The calibration of OH* is based on the H2/O2 model prediction which is a well
validated mechanism. However, this cannot be done with C2H2/O2 mechanism where
the uncertainty from the model are very high. Among the three recommended reactions,
it is unclear which reaction is important to CH* formation since there are too many de-
grees of freedom. In addition, the recommended rate of these reactions varies from two
to three orders of magnitude. The uncertainty of the ground state C2H2- and C2- chem-
istry adds to the difficulty. Therefore only a relative comparison of measured intensities
and calculated concentrations can be given where the CH* at different stoichiometry
and temperatures can be compared. An experiment with C2H2/O2/Ar is performed at
three different fuel stoichiometries (φ = 0.5, 0.75, and 1.0) [98]. The measured CH* in-
tensity profile normalized to maximum intensity is shown in Fig. 5.8. The figure shows
the CH* profile of a C2H2(0.1%)-O2(0.25%)-Ar(99.65%) mixture at φ = 1.0 and T5 =
1961 K initial temperature at pressure 1.28 bar. For comparison, the simulated CH*
concentration profile is also plotted which shows very good reproduction of the CH*
profile shape and the peak position. Here, the CH* concentration is normalized to its
maximum value. In addition the measurement of C2H2 with N2O mixtures is performed
in order to possibly isolate the C2H + O reaction as the O-atom concentration will be in
abundance. Whereas in C2H2/O2 mixtures the reaction of C2H+O2 could be dominant
due to availability of O2 from the oxidizer. However, the role of the third reaction C2 +
OH is difficult to estimate.
5.1 Simulations of shock-tube measurements 71
0
0.3
0.6
0.9
1.2
0 150 300 450Time / µs
No
rma
lize
d C
H*
Simu.
Exp.
Figure 5.8: A comparison of the measured CH* intensity profile with the calculatedconcentration profile normalized at its respective maximum value (75 mV,6.6×10−14 mol cm−3). The mixture composition is C2H2(0.1%)-O2(0.25%)-Ar(99.65%) for the fuel stoichiometry of φ = 1.0. The initial mixture is atT5 = 1961 K and at pressure of 1.28 bar.
In lean mixtures and in lower hydrocarbon fuels the amount of ground state C2 is much
less compared to fuel-rich mixtures. Therefore it is possible that the existence of the
reaction (R429) is more visible in fuel-rich mixtures where C2 is in abundance. In the
present work, based on the shock-tube experiments performed by [98] in C2H2/O2/Ar
and C2H2/N2O/Ar mixtures at different stoichiometries, it is found that the ratio of
peak O/O2 at peak C2H is low and nearly constant (∼0.01) at different temperatures
for the O2 containing mixtures (Fig. 5.9). Therefore, the possibility of CH* formation
from C2H with O2 reaction (R427) is likely due to presence of the high amount of O2
compared to the O-atom concentration at the C2H peak. However, in N2O containing
mixtures the ratio is much higher (as much as 15) which implies the presence of high
amount of O-atoms compared to O2 at the C2H peak (Fig. 5.10). Therefore, in this case
it is possible to isolate the reaction (R428) from reaction (R427). The peak O/O2 ratio
in C2H2/N2O/Ar mixture has a temperature dependence.
It is possible that in N2O- containing mixture some more reactions may be responsible
for CH* formation e.g. reaction of NH with CO leading to CH* cannot be ruled out.
However, no such recommendations have been made so far in the literature. This study,
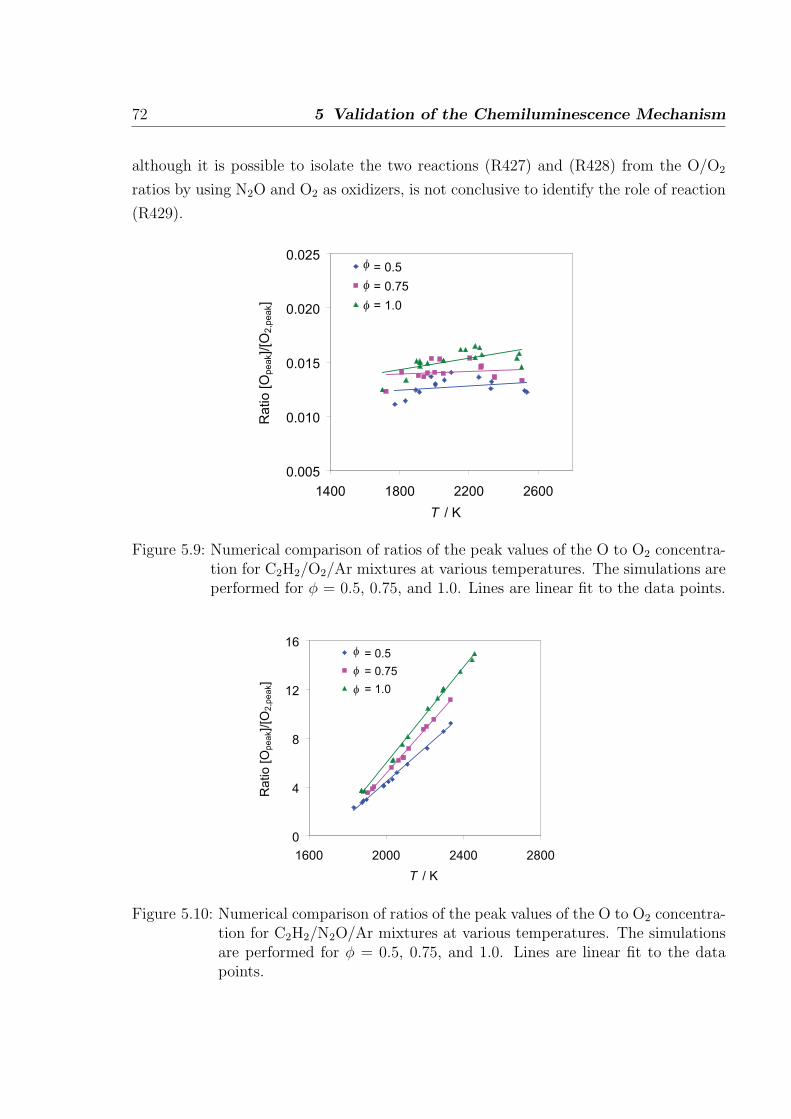
72 5 Validation of the Chemiluminescence Mechanism
although it is possible to isolate the two reactions (R427) and (R428) from the O/O2
ratios by using N2O and O2 as oxidizers, is not conclusive to identify the role of reaction
(R429).
0.005
0.010
0.015
0.020
0.025
1400 1800 2200 2600
T / K
Ra
tio
[O
pe
ak]/[O
2,p
ea
k]
= 0.5
= 0.75
= 1.0
φ
φ
φ
Figure 5.9: Numerical comparison of ratios of the peak values of the O to O2 concentra-tion for C2H2/O2/Ar mixtures at various temperatures. The simulations areperformed for φ = 0.5, 0.75, and 1.0. Lines are linear fit to the data points.
0
4
8
12
16
1600 2000 2400 2800
T / K
Ra
tio
[O
pe
ak]/[O
2,p
ea
k]
= 0.5
= 0.75
= 1.0
φ
φ
φ
Figure 5.10: Numerical comparison of ratios of the peak values of the O to O2 concentra-tion for C2H2/N2O/Ar mixtures at various temperatures. The simulationsare performed for φ = 0.5, 0.75, and 1.0. Lines are linear fit to the datapoints.
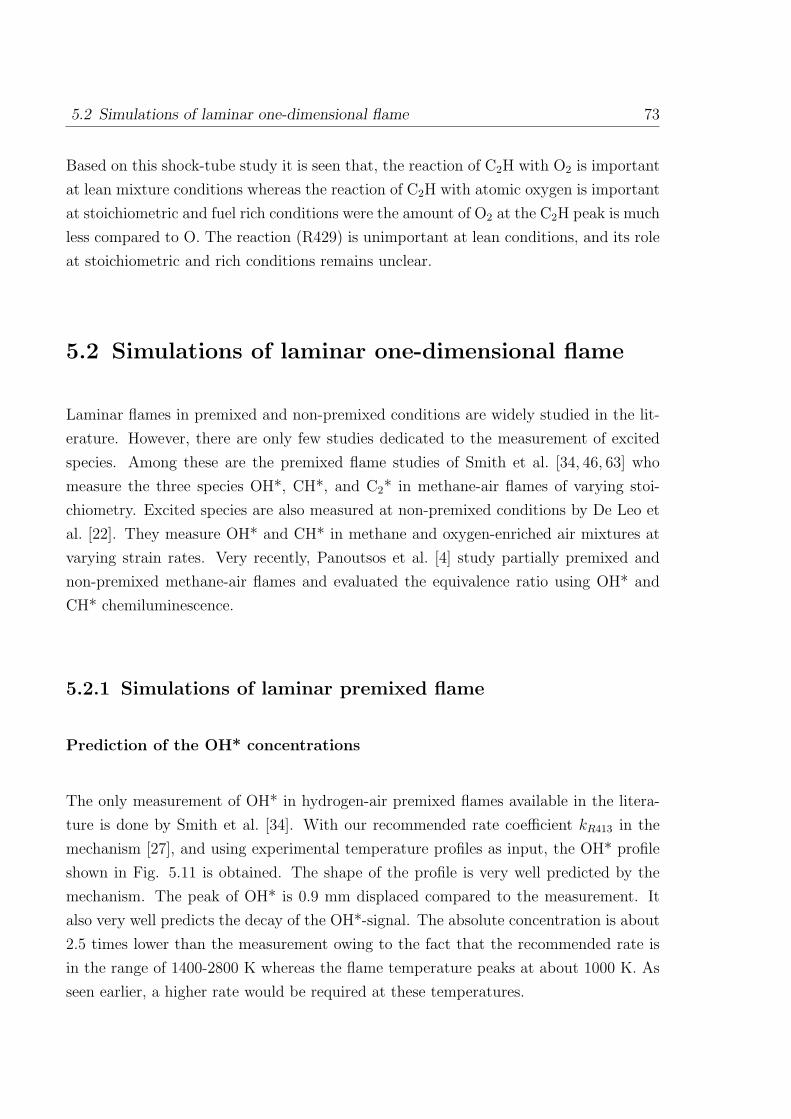
5.2 Simulations of laminar one-dimensional flame 73
Based on this shock-tube study it is seen that, the reaction of C2H with O2 is important
at lean mixture conditions whereas the reaction of C2H with atomic oxygen is important
at stoichiometric and fuel rich conditions were the amount of O2 at the C2H peak is much
less compared to O. The reaction (R429) is unimportant at lean conditions, and its role
at stoichiometric and rich conditions remains unclear.
5.2 Simulations of laminar one-dimensional flame
Laminar flames in premixed and non-premixed conditions are widely studied in the lit-
erature. However, there are only few studies dedicated to the measurement of excited
species. Among these are the premixed flame studies of Smith et al. [34, 46, 63] who
measure the three species OH*, CH*, and C2* in methane-air flames of varying stoi-
chiometry. Excited species are also measured at non-premixed conditions by De Leo et
al. [22]. They measure OH* and CH* in methane and oxygen-enriched air mixtures at
varying strain rates. Very recently, Panoutsos et al. [4] study partially premixed and
non-premixed methane-air flames and evaluated the equivalence ratio using OH* and
CH* chemiluminescence.
5.2.1 Simulations of laminar premixed flame
Prediction of the OH* concentrations
The only measurement of OH* in hydrogen-air premixed flames available in the litera-
ture is done by Smith et al. [34]. With our recommended rate coefficient kR413 in the
mechanism [27], and using experimental temperature profiles as input, the OH* profile
shown in Fig. 5.11 is obtained. The shape of the profile is very well predicted by the
mechanism. The peak of OH* is 0.9 mm displaced compared to the measurement. It
also very well predicts the decay of the OH*-signal. The absolute concentration is about
2.5 times lower than the measurement owing to the fact that the recommended rate is
in the range of 1400-2800 K whereas the flame temperature peaks at about 1000 K. As
seen earlier, a higher rate would be required at these temperatures.
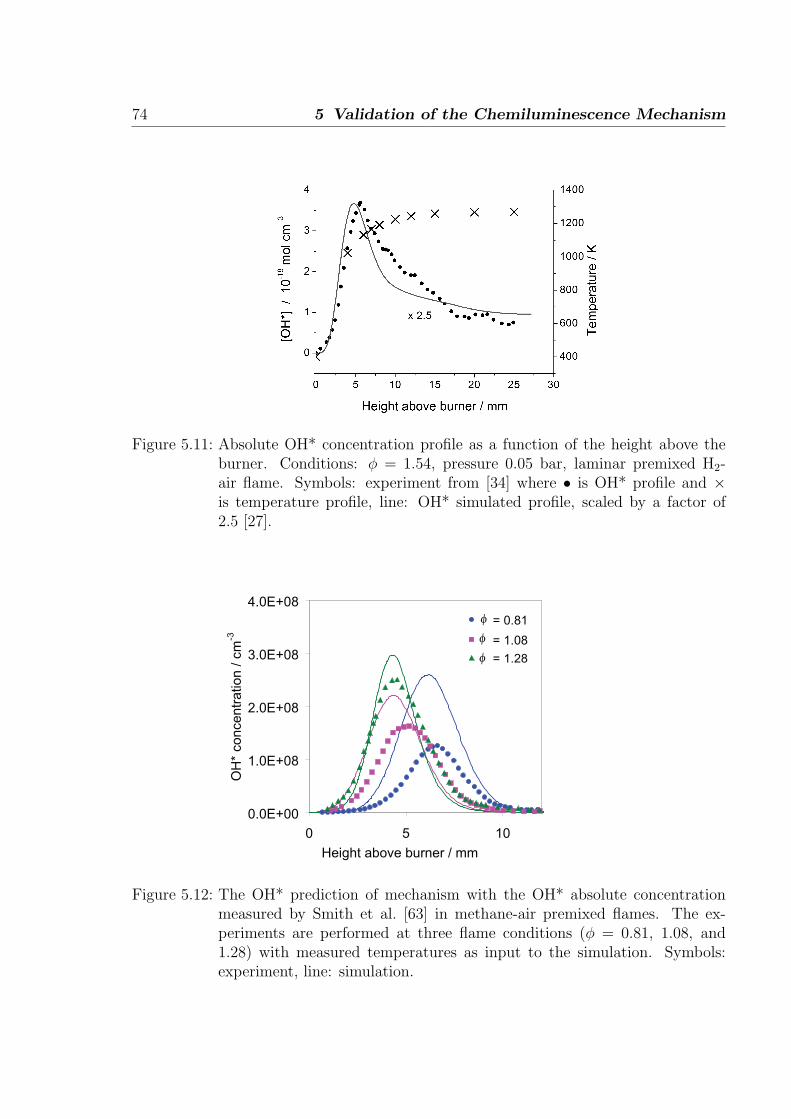
74 5 Validation of the Chemiluminescence Mechanism
Figure 5.11: Absolute OH* concentration profile as a function of the height above theburner. Conditions: φ = 1.54, pressure 0.05 bar, laminar premixed H2-air flame. Symbols: experiment from [34] where • is OH* profile and ×is temperature profile, line: OH* simulated profile, scaled by a factor of2.5 [27].
0.0E+00
1.0E+08
2.0E+08
3.0E+08
4.0E+08
0 5 10
Height above burner / mm
OH
* co
nce
ntr
atio
n / c
m-3
= 0.81
= 1.08
= 1.28
φ
φ
φ
Figure 5.12: The OH* prediction of mechanism with the OH* absolute concentrationmeasured by Smith et al. [63] in methane-air premixed flames. The ex-periments are performed at three flame conditions (φ = 0.81, 1.08, and1.28) with measured temperatures as input to the simulation. Symbols:experiment, line: simulation.
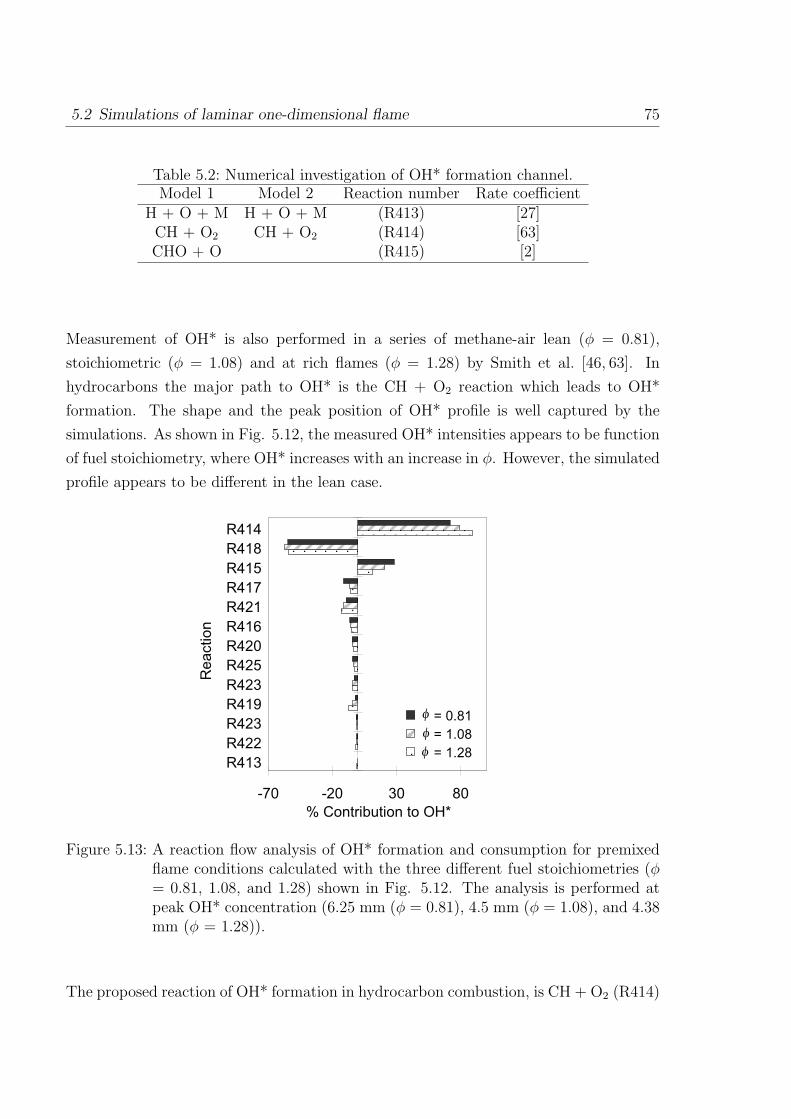
5.2 Simulations of laminar one-dimensional flame 75
Table 5.2: Numerical investigation of OH* formation channel.Model 1 Model 2 Reaction number Rate coefficient
H + O + M H + O + M (R413) [27]CH + O2 CH + O2 (R414) [63]CHO + O (R415) [2]
Measurement of OH* is also performed in a series of methane-air lean (φ = 0.81),
stoichiometric (φ = 1.08) and at rich flames (φ = 1.28) by Smith et al. [46, 63]. In
hydrocarbons the major path to OH* is the CH + O2 reaction which leads to OH*
formation. The shape and the peak position of OH* profile is well captured by the
simulations. As shown in Fig. 5.12, the measured OH* intensities appears to be function
of fuel stoichiometry, where OH* increases with an increase in φ. However, the simulated
profile appears to be different in the lean case.
-70 -20 30 80
R414
R418
R415
R417
R421
R416
R420
R425
R423
R419
R423
R422
R413
Re
actio
n
% Contribution to OH*
= 0.81
= 1.08
= 1.28
φ
φ
φ
Figure 5.13: A reaction flow analysis of OH* formation and consumption for premixedflame conditions calculated with the three different fuel stoichiometries (φ= 0.81, 1.08, and 1.28) shown in Fig. 5.12. The analysis is performed atpeak OH* concentration (6.25 mm (φ = 0.81), 4.5 mm (φ = 1.08), and 4.38mm (φ = 1.28)).
The proposed reaction of OH* formation in hydrocarbon combustion, is CH + O2 (R414)
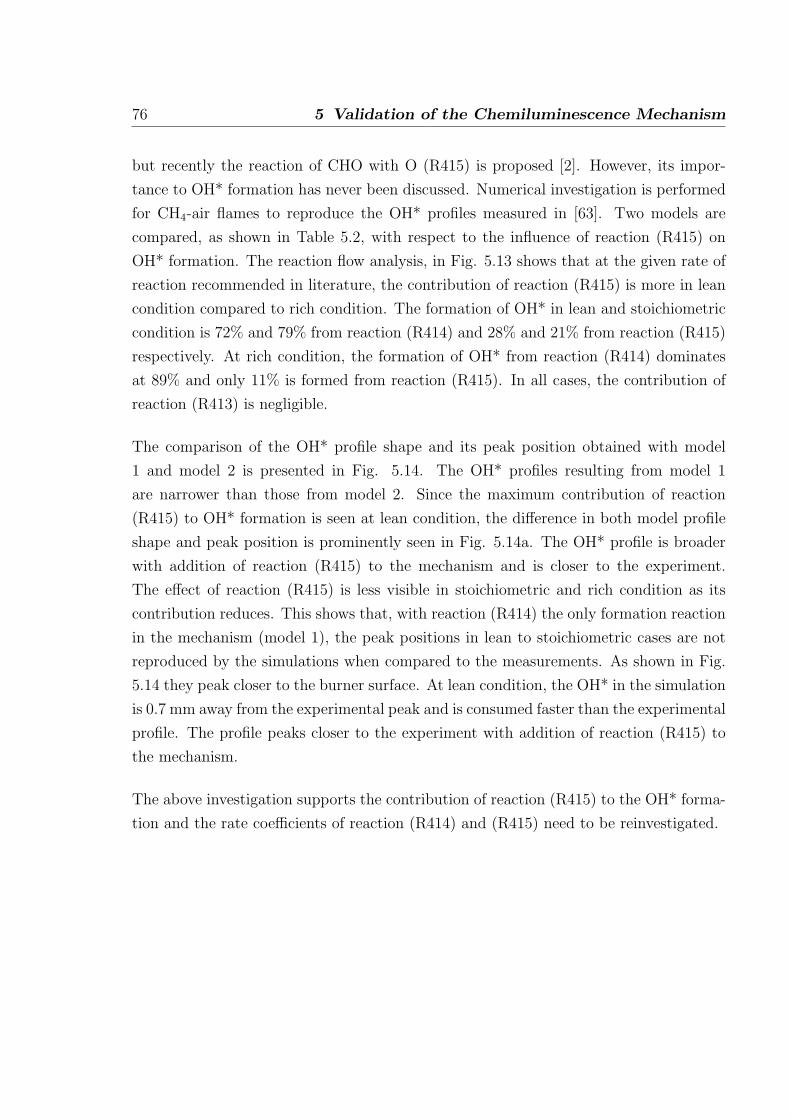
76 5 Validation of the Chemiluminescence Mechanism
but recently the reaction of CHO with O (R415) is proposed [2]. However, its impor-
tance to OH* formation has never been discussed. Numerical investigation is performed
for CH4-air flames to reproduce the OH* profiles measured in [63]. Two models are
compared, as shown in Table 5.2, with respect to the influence of reaction (R415) on
OH* formation. The reaction flow analysis, in Fig. 5.13 shows that at the given rate of
reaction recommended in literature, the contribution of reaction (R415) is more in lean
condition compared to rich condition. The formation of OH* in lean and stoichiometric
condition is 72% and 79% from reaction (R414) and 28% and 21% from reaction (R415)
respectively. At rich condition, the formation of OH* from reaction (R414) dominates
at 89% and only 11% is formed from reaction (R415). In all cases, the contribution of
reaction (R413) is negligible.
The comparison of the OH* profile shape and its peak position obtained with model
1 and model 2 is presented in Fig. 5.14. The OH* profiles resulting from model 1
are narrower than those from model 2. Since the maximum contribution of reaction
(R415) to OH* formation is seen at lean condition, the difference in both model profile
shape and peak position is prominently seen in Fig. 5.14a. The OH* profile is broader
with addition of reaction (R415) to the mechanism and is closer to the experiment.
The effect of reaction (R415) is less visible in stoichiometric and rich condition as its
contribution reduces. This shows that, with reaction (R414) the only formation reaction
in the mechanism (model 1), the peak positions in lean to stoichiometric cases are not
reproduced by the simulations when compared to the measurements. As shown in Fig.
5.14 they peak closer to the burner surface. At lean condition, the OH* in the simulation
is 0.7 mm away from the experimental peak and is consumed faster than the experimental
profile. The profile peaks closer to the experiment with addition of reaction (R415) to
the mechanism.
The above investigation supports the contribution of reaction (R415) to the OH* forma-
tion and the rate coefficients of reaction (R414) and (R415) need to be reinvestigated.
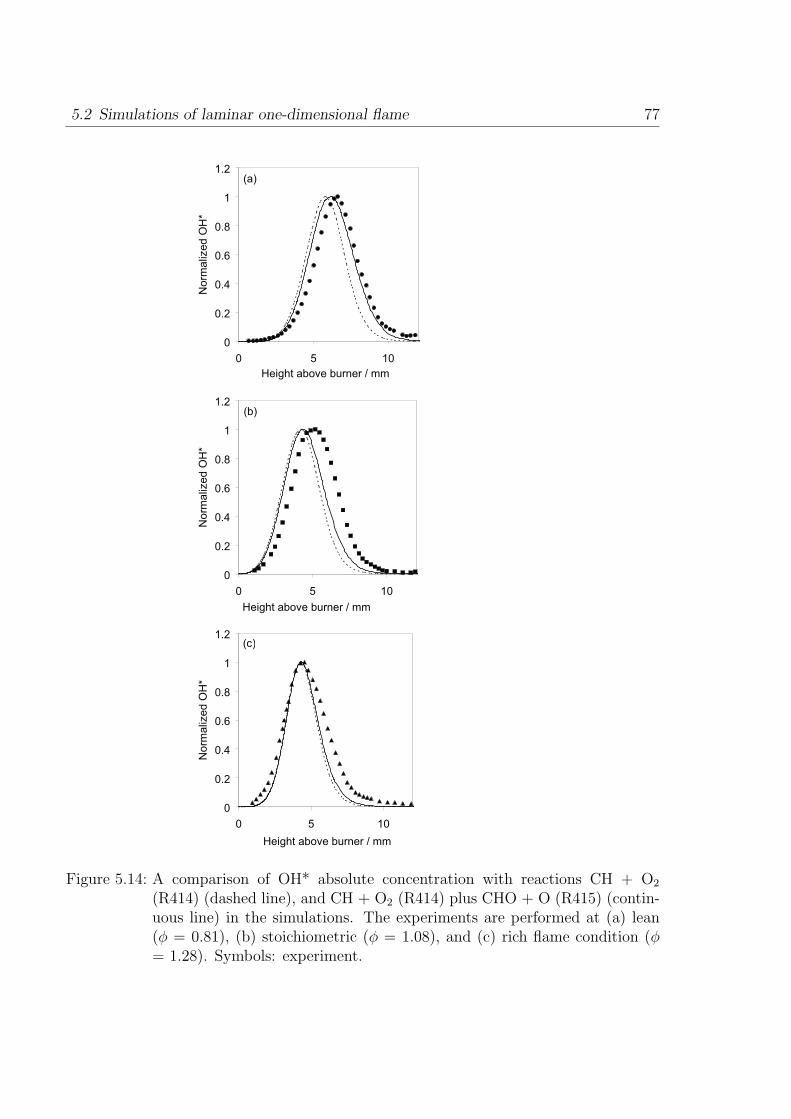
5.2 Simulations of laminar one-dimensional flame 77
0
0.2
0.4
0.6
0.8
1
1.2
0 5 10
Height above burner / mm
No
rma
lize
d O
H*
(a)
0
0.2
0.4
0.6
0.8
1
1.2
0 5 10
Height above burner / mm
No
rma
lize
d O
H*
(b)
0
0.2
0.4
0.6
0.8
1
1.2
0 5 10
Height above burner / mm
No
rma
lize
d O
H*
(c)
Figure 5.14: A comparison of OH* absolute concentration with reactions CH + O2
(R414) (dashed line), and CH + O2 (R414) plus CHO + O (R415) (contin-uous line) in the simulations. The experiments are performed at (a) lean(φ = 0.81), (b) stoichiometric (φ = 1.08), and (c) rich flame condition (φ= 1.28). Symbols: experiment.
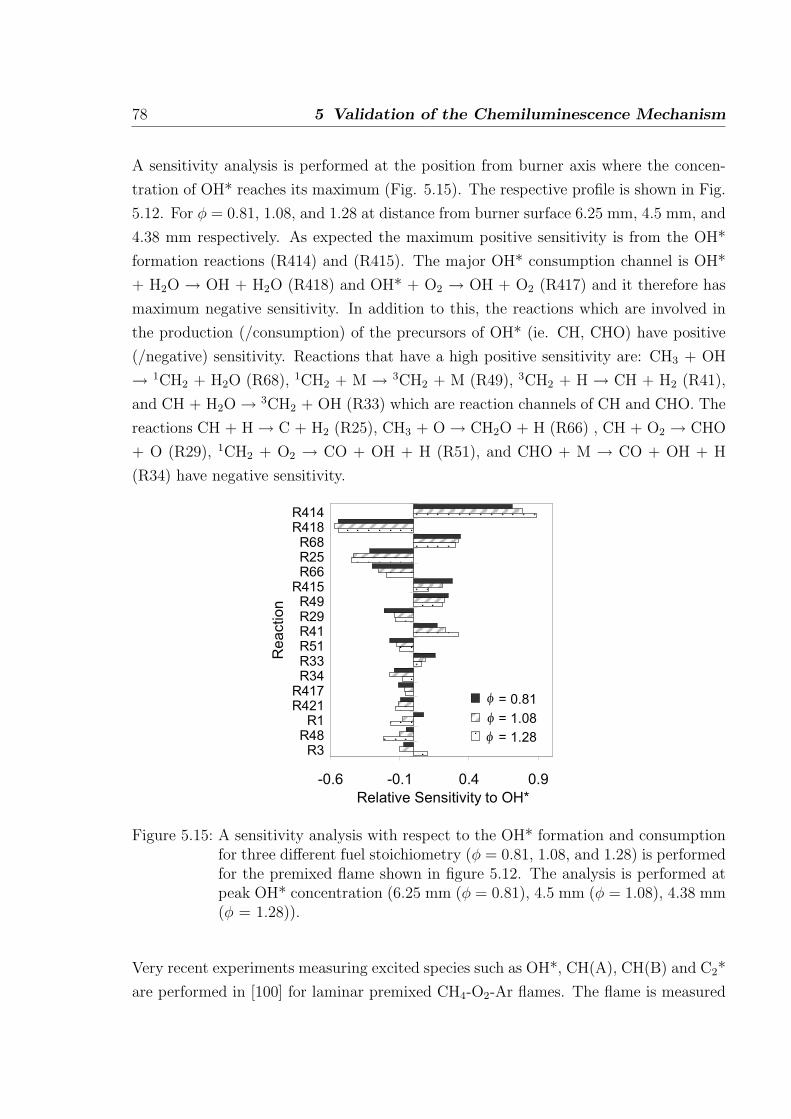
78 5 Validation of the Chemiluminescence Mechanism
A sensitivity analysis is performed at the position from burner axis where the concen-
tration of OH* reaches its maximum (Fig. 5.15). The respective profile is shown in Fig.
5.12. For φ = 0.81, 1.08, and 1.28 at distance from burner surface 6.25 mm, 4.5 mm, and
4.38 mm respectively. As expected the maximum positive sensitivity is from the OH*
formation reactions (R414) and (R415). The major OH* consumption channel is OH*
+ H2O → OH + H2O (R418) and OH* + O2 → OH + O2 (R417) and it therefore has
maximum negative sensitivity. In addition to this, the reactions which are involved in
the production (/consumption) of the precursors of OH* (ie. CH, CHO) have positive
(/negative) sensitivity. Reactions that have a high positive sensitivity are: CH3 + OH
→ 1CH2 + H2O (R68), 1CH2 + M → 3CH2 + M (R49), 3CH2 + H → CH + H2 (R41),
and CH + H2O → 3CH2 + OH (R33) which are reaction channels of CH and CHO. The
reactions CH + H → C + H2 (R25), CH3 + O → CH2O + H (R66) , CH + O2 → CHO
+ O (R29), 1CH2 + O2 → CO + OH + H (R51), and CHO + M → CO + OH + H
(R34) have negative sensitivity.
-0.6 -0.1 0.4 0.9
R414R418R68R25R66
R415R49R29R41R51R33R34
R417R421
R1R48R3
Re
actio
n
Relative Sensitivity to OH*
= 0.81
= 1.08
= 1.28
φ
φ
φ
Figure 5.15: A sensitivity analysis with respect to the OH* formation and consumptionfor three different fuel stoichiometry (φ = 0.81, 1.08, and 1.28) is performedfor the premixed flame shown in figure 5.12. The analysis is performed atpeak OH* concentration (6.25 mm (φ = 0.81), 4.5 mm (φ = 1.08), 4.38 mm(φ = 1.28)).
Very recent experiments measuring excited species such as OH*, CH(A), CH(B) and C2*
are performed in [100] for laminar premixed CH4-O2-Ar flames. The flame is measured
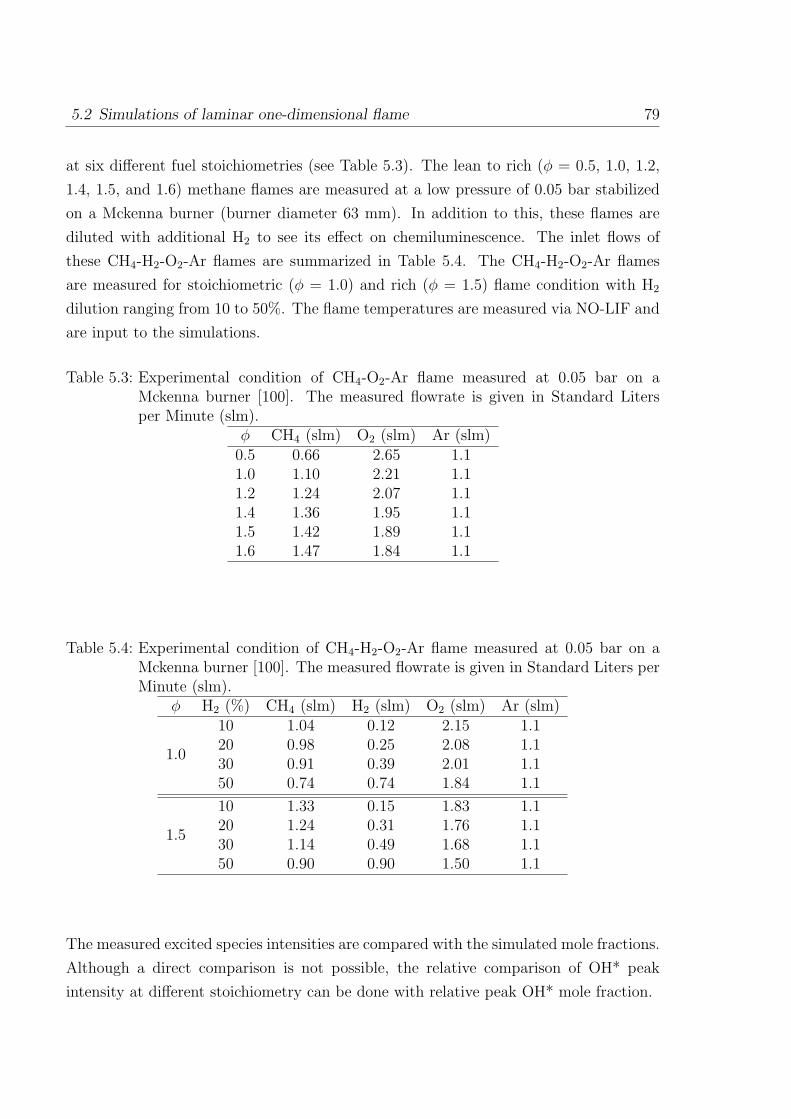
5.2 Simulations of laminar one-dimensional flame 79
at six different fuel stoichiometries (see Table 5.3). The lean to rich (φ = 0.5, 1.0, 1.2,
1.4, 1.5, and 1.6) methane flames are measured at a low pressure of 0.05 bar stabilized
on a Mckenna burner (burner diameter 63 mm). In addition to this, these flames are
diluted with additional H2 to see its effect on chemiluminescence. The inlet flows of
these CH4-H2-O2-Ar flames are summarized in Table 5.4. The CH4-H2-O2-Ar flames
are measured for stoichiometric (φ = 1.0) and rich (φ = 1.5) flame condition with H2
dilution ranging from 10 to 50%. The flame temperatures are measured via NO-LIF and
are input to the simulations.
Table 5.3: Experimental condition of CH4-O2-Ar flame measured at 0.05 bar on aMckenna burner [100]. The measured flowrate is given in Standard Litersper Minute (slm).
φ CH4 (slm) O2 (slm) Ar (slm)0.5 0.66 2.65 1.11.0 1.10 2.21 1.11.2 1.24 2.07 1.11.4 1.36 1.95 1.11.5 1.42 1.89 1.11.6 1.47 1.84 1.1
Table 5.4: Experimental condition of CH4-H2-O2-Ar flame measured at 0.05 bar on aMckenna burner [100]. The measured flowrate is given in Standard Liters perMinute (slm).
φ H2 (%) CH4 (slm) H2 (slm) O2 (slm) Ar (slm)
1.0
10 1.04 0.12 2.15 1.120 0.98 0.25 2.08 1.130 0.91 0.39 2.01 1.150 0.74 0.74 1.84 1.1
1.5
10 1.33 0.15 1.83 1.120 1.24 0.31 1.76 1.130 1.14 0.49 1.68 1.150 0.90 0.90 1.50 1.1
The measured excited species intensities are compared with the simulated mole fractions.
Although a direct comparison is not possible, the relative comparison of OH* peak
intensity at different stoichiometry can be done with relative peak OH* mole fraction.
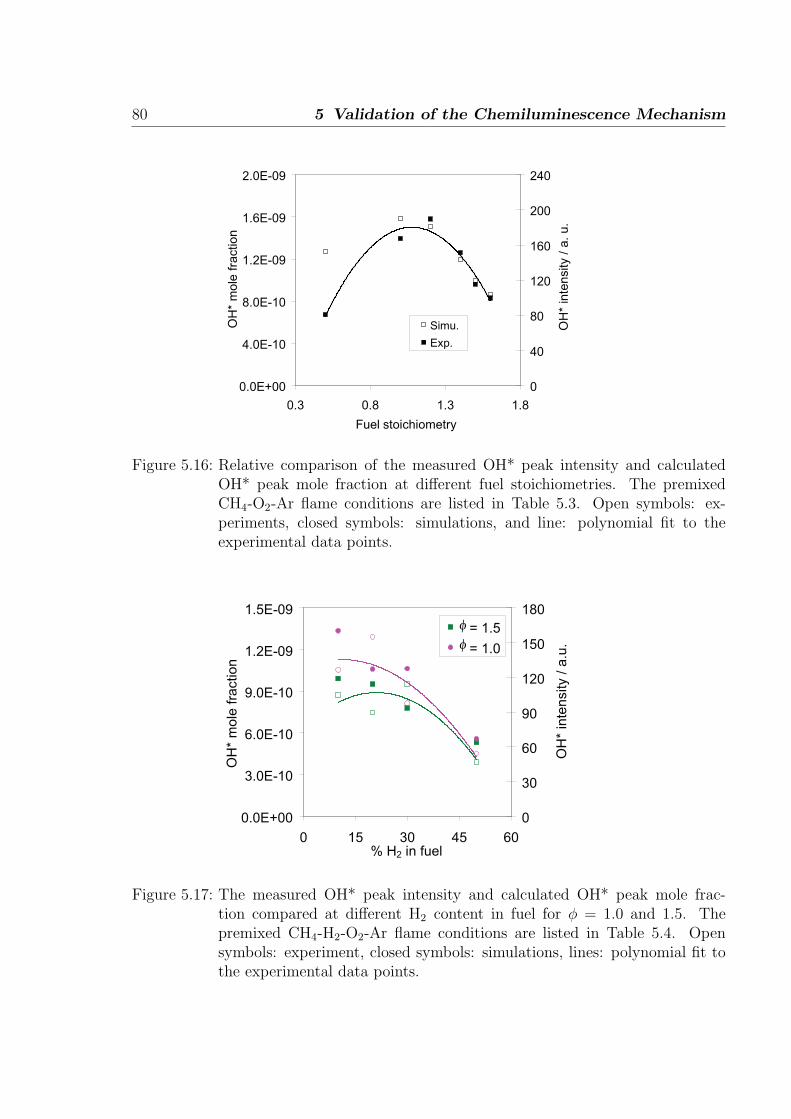
80 5 Validation of the Chemiluminescence Mechanism
0.0E+00
4.0E-10
8.0E-10
1.2E-09
1.6E-09
2.0E-09
0.3 0.8 1.3 1.8
Fuel stoichiometry
OH
* m
ole
fra
ction
0
40
80
120
160
200
240
OH
* in
tensity /
a.
u.
Simu.
Exp.
Figure 5.16: Relative comparison of the measured OH* peak intensity and calculatedOH* peak mole fraction at different fuel stoichiometries. The premixedCH4-O2-Ar flame conditions are listed in Table 5.3. Open symbols: ex-periments, closed symbols: simulations, and line: polynomial fit to theexperimental data points.
0.0E+00
3.0E-10
6.0E-10
9.0E-10
1.2E-09
1.5E-09
0 15 30 45 60% H2 in fuel
OH
* m
ole
fra
ctio
n
0
30
60
90
120
150
180
OH
* in
ten
sity / a
.u.
= 1.5
= 1.0φ
φ
Figure 5.17: The measured OH* peak intensity and calculated OH* peak mole frac-tion compared at different H2 content in fuel for φ = 1.0 and 1.5. Thepremixed CH4-H2-O2-Ar flame conditions are listed in Table 5.4. Opensymbols: experiment, closed symbols: simulations, lines: polynomial fit tothe experimental data points.
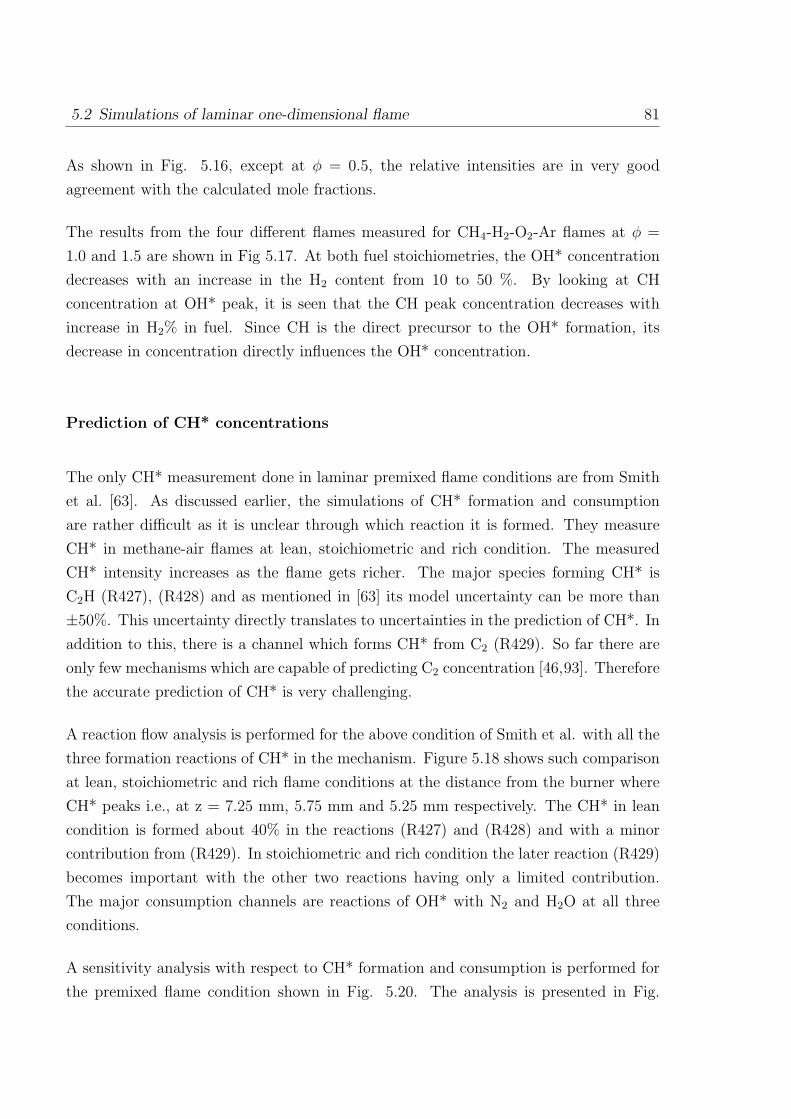
5.2 Simulations of laminar one-dimensional flame 81
As shown in Fig. 5.16, except at φ = 0.5, the relative intensities are in very good
agreement with the calculated mole fractions.
The results from the four different flames measured for CH4-H2-O2-Ar flames at φ =
1.0 and 1.5 are shown in Fig 5.17. At both fuel stoichiometries, the OH* concentration
decreases with an increase in the H2 content from 10 to 50 %. By looking at CH
concentration at OH* peak, it is seen that the CH peak concentration decreases with
increase in H2% in fuel. Since CH is the direct precursor to the OH* formation, its
decrease in concentration directly influences the OH* concentration.
Prediction of CH* concentrations
The only CH* measurement done in laminar premixed flame conditions are from Smith
et al. [63]. As discussed earlier, the simulations of CH* formation and consumption
are rather difficult as it is unclear through which reaction it is formed. They measure
CH* in methane-air flames at lean, stoichiometric and rich condition. The measured
CH* intensity increases as the flame gets richer. The major species forming CH* is
C2H (R427), (R428) and as mentioned in [63] its model uncertainty can be more than
±50%. This uncertainty directly translates to uncertainties in the prediction of CH*. In
addition to this, there is a channel which forms CH* from C2 (R429). So far there are
only few mechanisms which are capable of predicting C2 concentration [46,93]. Therefore
the accurate prediction of CH* is very challenging.
A reaction flow analysis is performed for the above condition of Smith et al. with all the
three formation reactions of CH* in the mechanism. Figure 5.18 shows such comparison
at lean, stoichiometric and rich flame conditions at the distance from the burner where
CH* peaks i.e., at z = 7.25 mm, 5.75 mm and 5.25 mm respectively. The CH* in lean
condition is formed about 40% in the reactions (R427) and (R428) and with a minor
contribution from (R429). In stoichiometric and rich condition the later reaction (R429)
becomes important with the other two reactions having only a limited contribution.
The major consumption channels are reactions of OH* with N2 and H2O at all three
conditions.
A sensitivity analysis with respect to CH* formation and consumption is performed for
the premixed flame condition shown in Fig. 5.20. The analysis is presented in Fig.
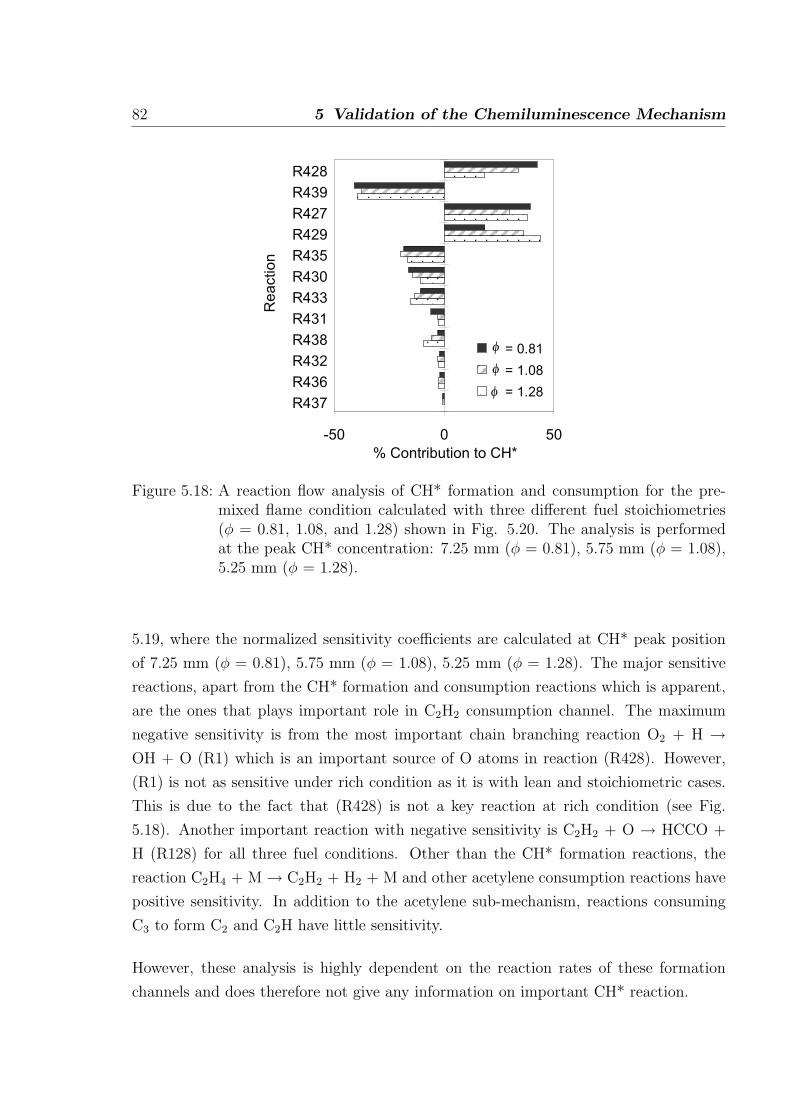
82 5 Validation of the Chemiluminescence Mechanism
-50 0 50
R428
R439
R427
R429
R435
R430
R433
R431
R438
R432
R436
R437
Re
actio
n
% Contribution to CH*
= 0.81
= 1.08
= 1.28
φ
φ
φ
Figure 5.18: A reaction flow analysis of CH* formation and consumption for the pre-mixed flame condition calculated with three different fuel stoichiometries(φ = 0.81, 1.08, and 1.28) shown in Fig. 5.20. The analysis is performedat the peak CH* concentration: 7.25 mm (φ = 0.81), 5.75 mm (φ = 1.08),5.25 mm (φ = 1.28).
5.19, where the normalized sensitivity coefficients are calculated at CH* peak position
of 7.25 mm (φ = 0.81), 5.75 mm (φ = 1.08), 5.25 mm (φ = 1.28). The major sensitive
reactions, apart from the CH* formation and consumption reactions which is apparent,
are the ones that plays important role in C2H2 consumption channel. The maximum
negative sensitivity is from the most important chain branching reaction O2 + H →OH + O (R1) which is an important source of O atoms in reaction (R428). However,
(R1) is not as sensitive under rich condition as it is with lean and stoichiometric cases.
This is due to the fact that (R428) is not a key reaction at rich condition (see Fig.
5.18). Another important reaction with negative sensitivity is C2H2 + O → HCCO +
H (R128) for all three fuel conditions. Other than the CH* formation reactions, the
reaction C2H4 + M → C2H2 + H2 + M and other acetylene consumption reactions have
positive sensitivity. In addition to the acetylene sub-mechanism, reactions consuming
C3 to form C2 and C2H have little sensitivity.
However, these analysis is highly dependent on the reaction rates of these formation
channels and does therefore not give any information on important CH* reaction.
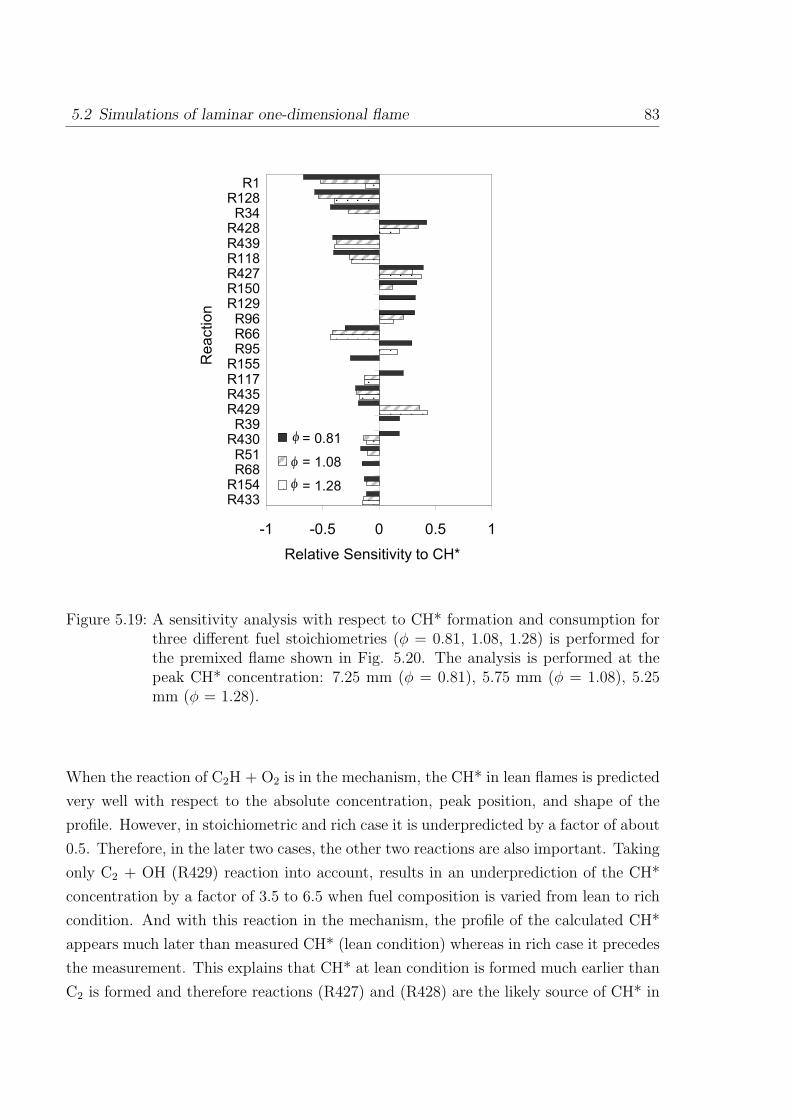
5.2 Simulations of laminar one-dimensional flame 83
-1 -0.5 0 0.5 1
R1R128R34
R428R439R118R427R150R129R96R66R95
R155R117R435R429R39
R430R51R68
R154R433
Re
actio
n
Relative Sensitivity to CH*
= 0.81
= 1.08
= 1.28
φ
φ
φ
Figure 5.19: A sensitivity analysis with respect to CH* formation and consumption forthree different fuel stoichiometries (φ = 0.81, 1.08, 1.28) is performed forthe premixed flame shown in Fig. 5.20. The analysis is performed at thepeak CH* concentration: 7.25 mm (φ = 0.81), 5.75 mm (φ = 1.08), 5.25mm (φ = 1.28).
When the reaction of C2H + O2 is in the mechanism, the CH* in lean flames is predicted
very well with respect to the absolute concentration, peak position, and shape of the
profile. However, in stoichiometric and rich case it is underpredicted by a factor of about
0.5. Therefore, in the later two cases, the other two reactions are also important. Taking
only C2 + OH (R429) reaction into account, results in an underprediction of the CH*
concentration by a factor of 3.5 to 6.5 when fuel composition is varied from lean to rich
condition. And with this reaction in the mechanism, the profile of the calculated CH*
appears much later than measured CH* (lean condition) whereas in rich case it precedes
the measurement. This explains that CH* at lean condition is formed much earlier than
C2 is formed and therefore reactions (R427) and (R428) are the likely source of CH* in
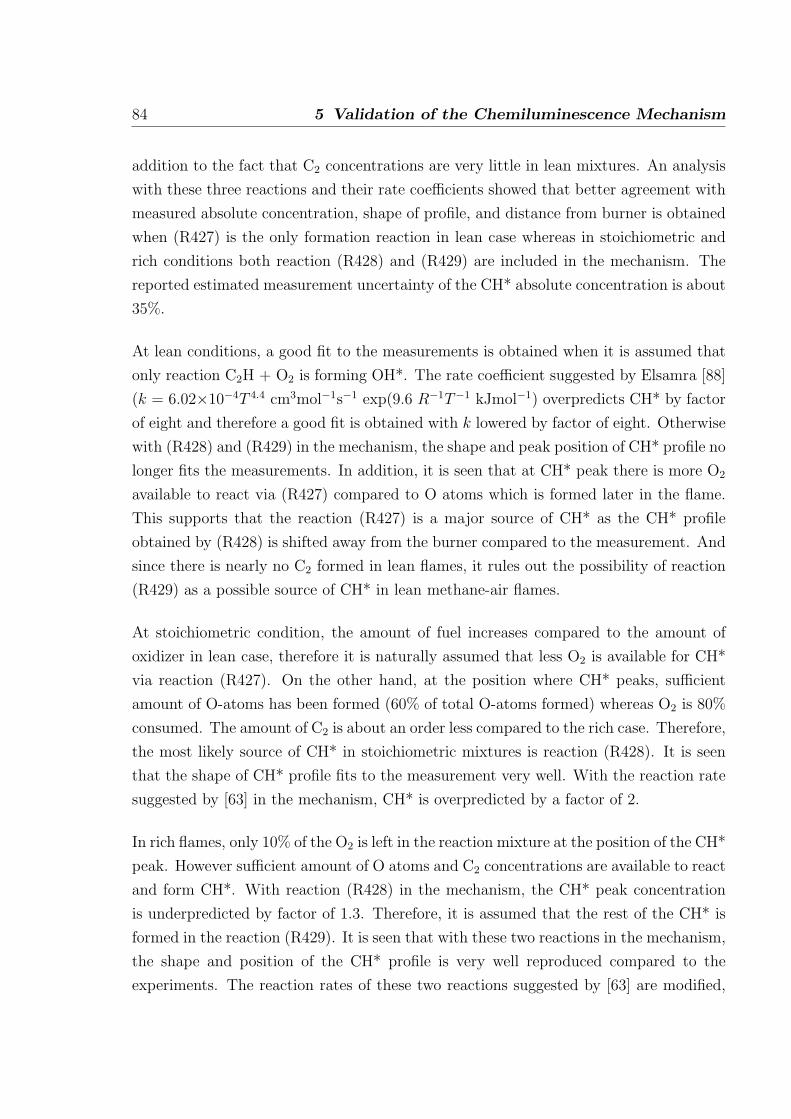
84 5 Validation of the Chemiluminescence Mechanism
addition to the fact that C2 concentrations are very little in lean mixtures. An analysis
with these three reactions and their rate coefficients showed that better agreement with
measured absolute concentration, shape of profile, and distance from burner is obtained
when (R427) is the only formation reaction in lean case whereas in stoichiometric and
rich conditions both reaction (R428) and (R429) are included in the mechanism. The
reported estimated measurement uncertainty of the CH* absolute concentration is about
35%.
At lean conditions, a good fit to the measurements is obtained when it is assumed that
only reaction C2H + O2 is forming OH*. The rate coefficient suggested by Elsamra [88]
(k = 6.02×10⁻⁴T 4.4 cm3mol−1s−1 exp(9.6 R−1T−1 kJmol−1) overpredicts CH* by factor
of eight and therefore a good fit is obtained with k lowered by factor of eight. Otherwise
with (R428) and (R429) in the mechanism, the shape and peak position of CH* profile no
longer fits the measurements. In addition, it is seen that at CH* peak there is more O2
available to react via (R427) compared to O atoms which is formed later in the flame.
This supports that the reaction (R427) is a major source of CH* as the CH* profile
obtained by (R428) is shifted away from the burner compared to the measurement. And
since there is nearly no C2 formed in lean flames, it rules out the possibility of reaction
(R429) as a possible source of CH* in lean methane-air flames.
At stoichiometric condition, the amount of fuel increases compared to the amount of
oxidizer in lean case, therefore it is naturally assumed that less O2 is available for CH*
via reaction (R427). On the other hand, at the position where CH* peaks, sufficient
amount of O-atoms has been formed (60% of total O-atoms formed) whereas O2 is 80%
consumed. The amount of C2 is about an order less compared to the rich case. Therefore,
the most likely source of CH* in stoichiometric mixtures is reaction (R428). It is seen
that the shape of CH* profile fits to the measurement very well. With the reaction rate
suggested by [63] in the mechanism, CH* is overpredicted by a factor of 2.
In rich flames, only 10% of the O2 is left in the reaction mixture at the position of the CH*
peak. However sufficient amount of O atoms and C2 concentrations are available to react
and form CH*. With reaction (R428) in the mechanism, the CH* peak concentration
is underpredicted by factor of 1.3. Therefore, it is assumed that the rest of the CH* is
formed in the reaction (R429). It is seen that with these two reactions in the mechanism,
the shape and position of the CH* profile is very well reproduced compared to the
experiments. The reaction rates of these two reactions suggested by [63] are modified,
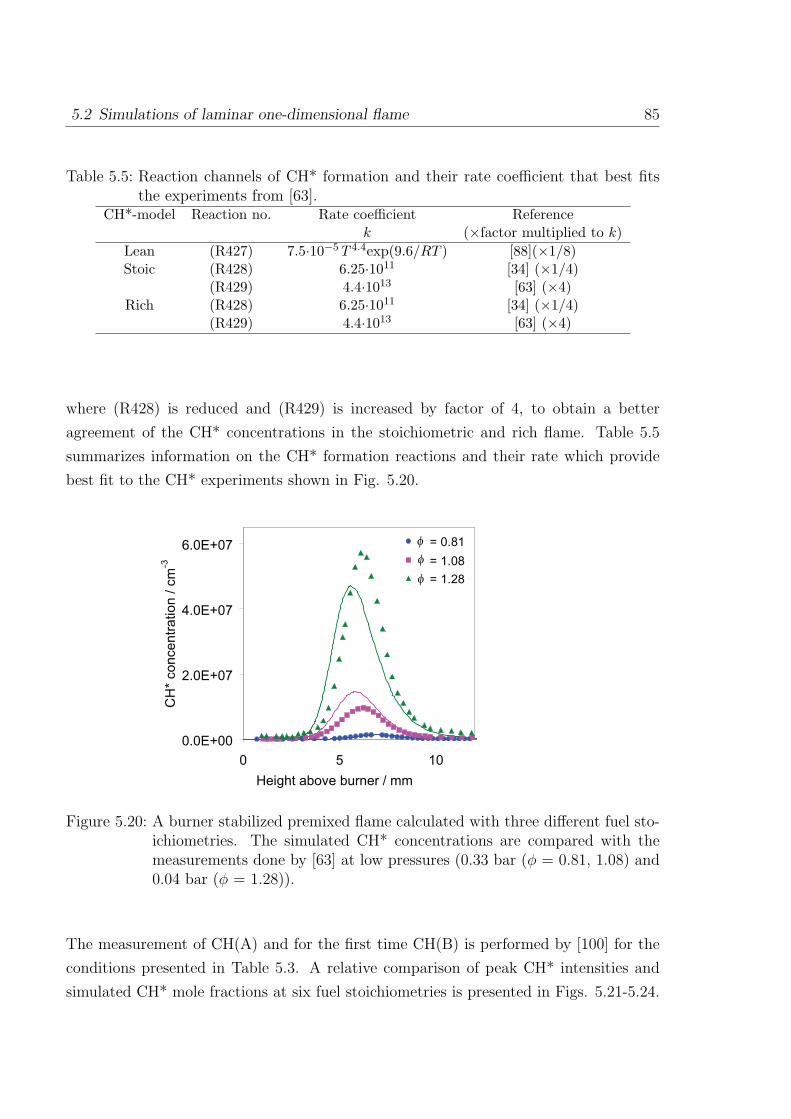
5.2 Simulations of laminar one-dimensional flame 85
Table 5.5: Reaction channels of CH* formation and their rate coefficient that best fitsthe experiments from [63].
CH*-model Reaction no. Rate coefficient Referencek (×factor multiplied to k)
Lean (R427) 7.5·10−5T 4.4exp(9.6/RT ) [88](×1/8)Stoic (R428) 6.25·1011 [34] (×1/4)
(R429) 4.4·1013 [63] (×4)Rich (R428) 6.25·1011 [34] (×1/4)
(R429) 4.4·1013 [63] (×4)
where (R428) is reduced and (R429) is increased by factor of 4, to obtain a better
agreement of the CH* concentrations in the stoichiometric and rich flame. Table 5.5
summarizes information on the CH* formation reactions and their rate which provide
best fit to the CH* experiments shown in Fig. 5.20.
0.0E+00
2.0E+07
4.0E+07
6.0E+07
0 5 10
Height above burner / mm
CH
* co
nce
ntr
atio
n / c
m-3
= 0.81
= 1.08
= 1.28φ
φ
φ
Figure 5.20: A burner stabilized premixed flame calculated with three different fuel sto-ichiometries. The simulated CH* concentrations are compared with themeasurements done by [63] at low pressures (0.33 bar (φ = 0.81, 1.08) and0.04 bar (φ = 1.28)).
The measurement of CH(A) and for the first time CH(B) is performed by [100] for the
conditions presented in Table 5.3. A relative comparison of peak CH* intensities and
simulated CH* mole fractions at six fuel stoichiometries is presented in Figs. 5.21-5.24.
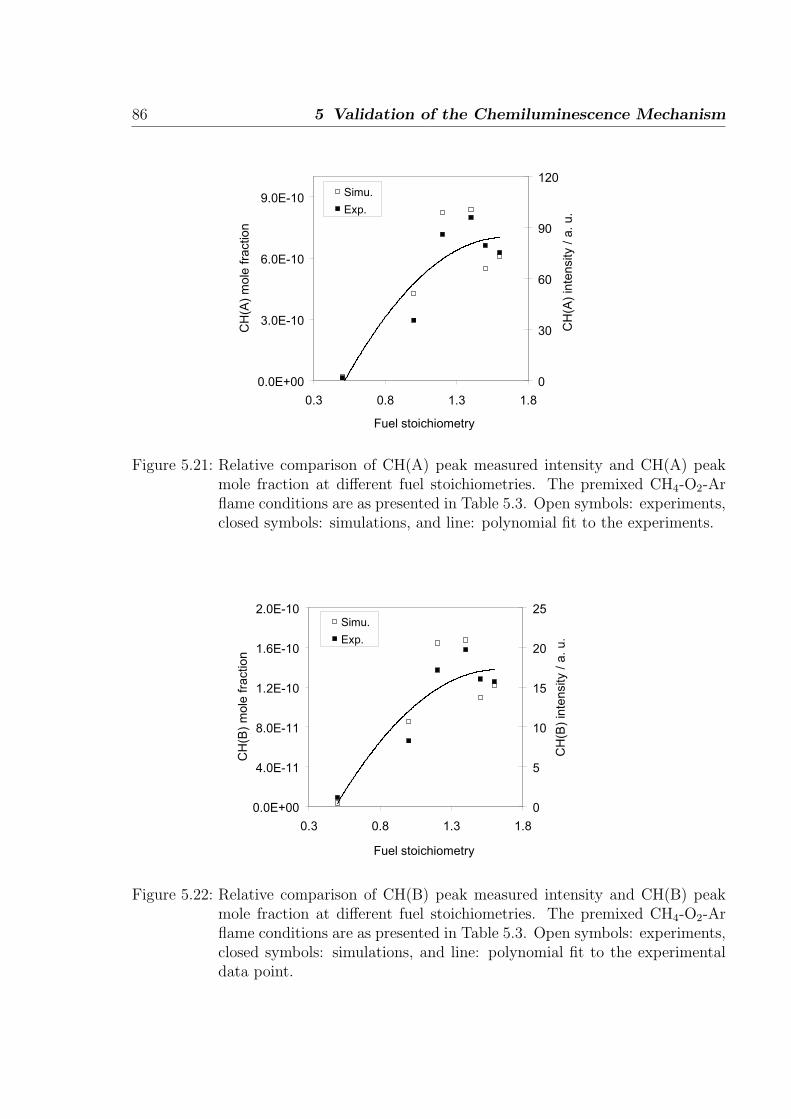
86 5 Validation of the Chemiluminescence Mechanism
0.0E+00
3.0E-10
6.0E-10
9.0E-10
0.3 0.8 1.3 1.8
Fuel stoichiometry
CH
(A)
mole
fra
ction
0
30
60
90
120
CH
(A)
inte
nsity /
a.
u.
Simu.
Exp.
Figure 5.21: Relative comparison of CH(A) peak measured intensity and CH(A) peakmole fraction at different fuel stoichiometries. The premixed CH4-O2-Arflame conditions are as presented in Table 5.3. Open symbols: experiments,closed symbols: simulations, and line: polynomial fit to the experiments.
0.0E+00
4.0E-11
8.0E-11
1.2E-10
1.6E-10
2.0E-10
0.3 0.8 1.3 1.8
Fuel stoichiometry
CH
(B)
mole
fra
ction
0
5
10
15
20
25
CH
(B)
inte
nsity /
a.
u.
Simu.
Exp.
Figure 5.22: Relative comparison of CH(B) peak measured intensity and CH(B) peakmole fraction at different fuel stoichiometries. The premixed CH4-O2-Arflame conditions are as presented in Table 5.3. Open symbols: experiments,closed symbols: simulations, and line: polynomial fit to the experimentaldata point.
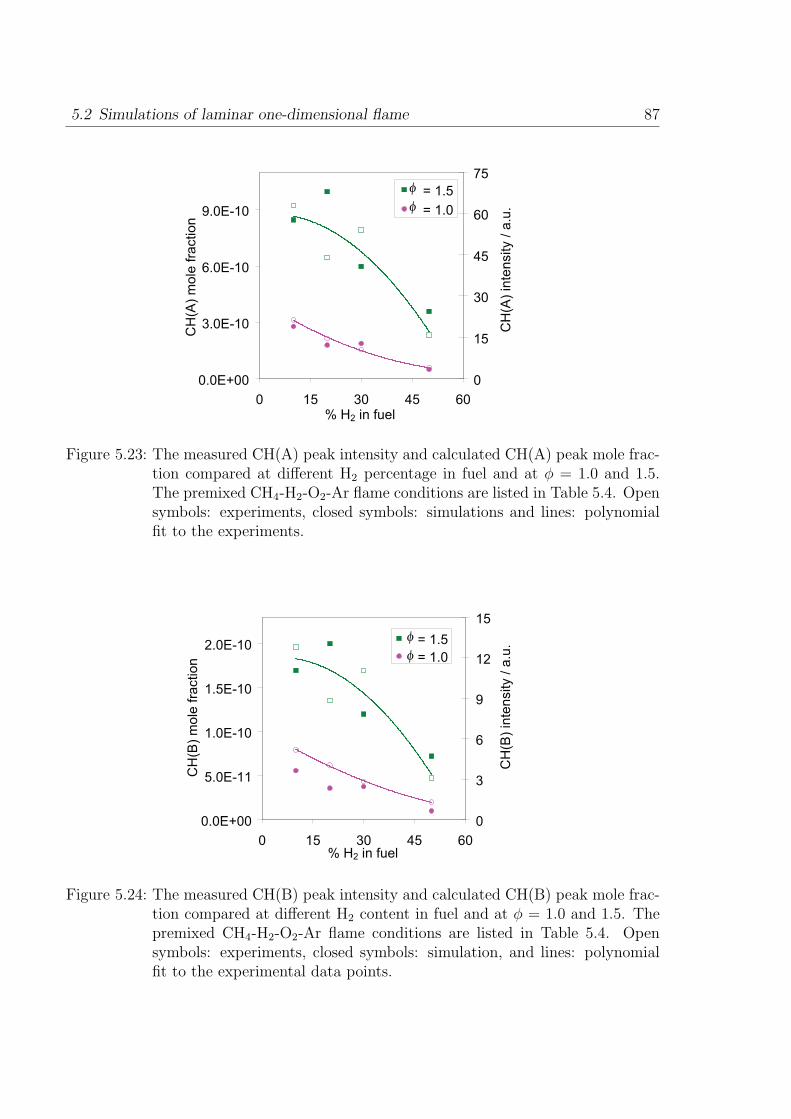
5.2 Simulations of laminar one-dimensional flame 87
0.0E+00
3.0E-10
6.0E-10
9.0E-10
0 15 30 45 60% H2 in fuel
CH
(A)
mo
le fra
ctio
n
0
15
30
45
60
75
CH
(A)
inte
nsity / a
.u.
= 1.5
= 1.0φ
φ
Figure 5.23: The measured CH(A) peak intensity and calculated CH(A) peak mole frac-tion compared at different H2 percentage in fuel and at φ = 1.0 and 1.5.The premixed CH4-H2-O2-Ar flame conditions are listed in Table 5.4. Opensymbols: experiments, closed symbols: simulations and lines: polynomialfit to the experiments.
0.0E+00
5.0E-11
1.0E-10
1.5E-10
2.0E-10
0 15 30 45 60% H2 in fuel
CH
(B)
mo
le fra
ctio
n
0
3
6
9
12
15
CH
(B)
inte
nsity / a
.u. = 1.5
= 1.0φ
φ
Figure 5.24: The measured CH(B) peak intensity and calculated CH(B) peak mole frac-tion compared at different H2 content in fuel and at φ = 1.0 and 1.5. Thepremixed CH4-H2-O2-Ar flame conditions are listed in Table 5.4. Opensymbols: experiments, closed symbols: simulation, and lines: polynomialfit to the experimental data points.
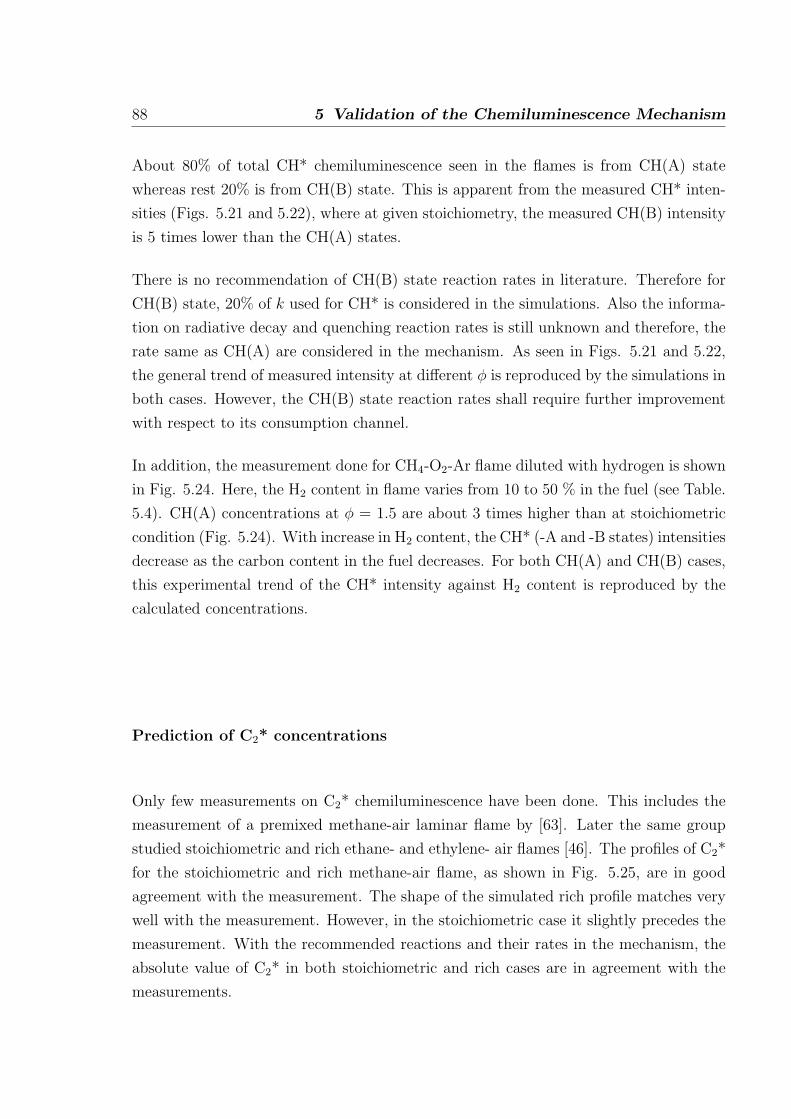
88 5 Validation of the Chemiluminescence Mechanism
About 80% of total CH* chemiluminescence seen in the flames is from CH(A) state
whereas rest 20% is from CH(B) state. This is apparent from the measured CH* inten-
sities (Figs. 5.21 and 5.22), where at given stoichiometry, the measured CH(B) intensity
is 5 times lower than the CH(A) states.
There is no recommendation of CH(B) state reaction rates in literature. Therefore for
CH(B) state, 20% of k used for CH* is considered in the simulations. Also the informa-
tion on radiative decay and quenching reaction rates is still unknown and therefore, the
rate same as CH(A) are considered in the mechanism. As seen in Figs. 5.21 and 5.22,
the general trend of measured intensity at different φ is reproduced by the simulations in
both cases. However, the CH(B) state reaction rates shall require further improvement
with respect to its consumption channel.
In addition, the measurement done for CH4-O2-Ar flame diluted with hydrogen is shown
in Fig. 5.24. Here, the H2 content in flame varies from 10 to 50 % in the fuel (see Table.
5.4). CH(A) concentrations at φ = 1.5 are about 3 times higher than at stoichiometric
condition (Fig. 5.24). With increase in H2 content, the CH* (-A and -B states) intensities
decrease as the carbon content in the fuel decreases. For both CH(A) and CH(B) cases,
this experimental trend of the CH* intensity against H2 content is reproduced by the
calculated concentrations.
Prediction of C2* concentrations
Only few measurements on C2* chemiluminescence have been done. This includes the
measurement of a premixed methane-air laminar flame by [63]. Later the same group
studied stoichiometric and rich ethane- and ethylene- air flames [46]. The profiles of C2*
for the stoichiometric and rich methane-air flame, as shown in Fig. 5.25, are in good
agreement with the measurement. The shape of the simulated rich profile matches very
well with the measurement. However, in the stoichiometric case it slightly precedes the
measurement. With the recommended reactions and their rates in the mechanism, the
absolute value of C2* in both stoichiometric and rich cases are in agreement with the
measurements.
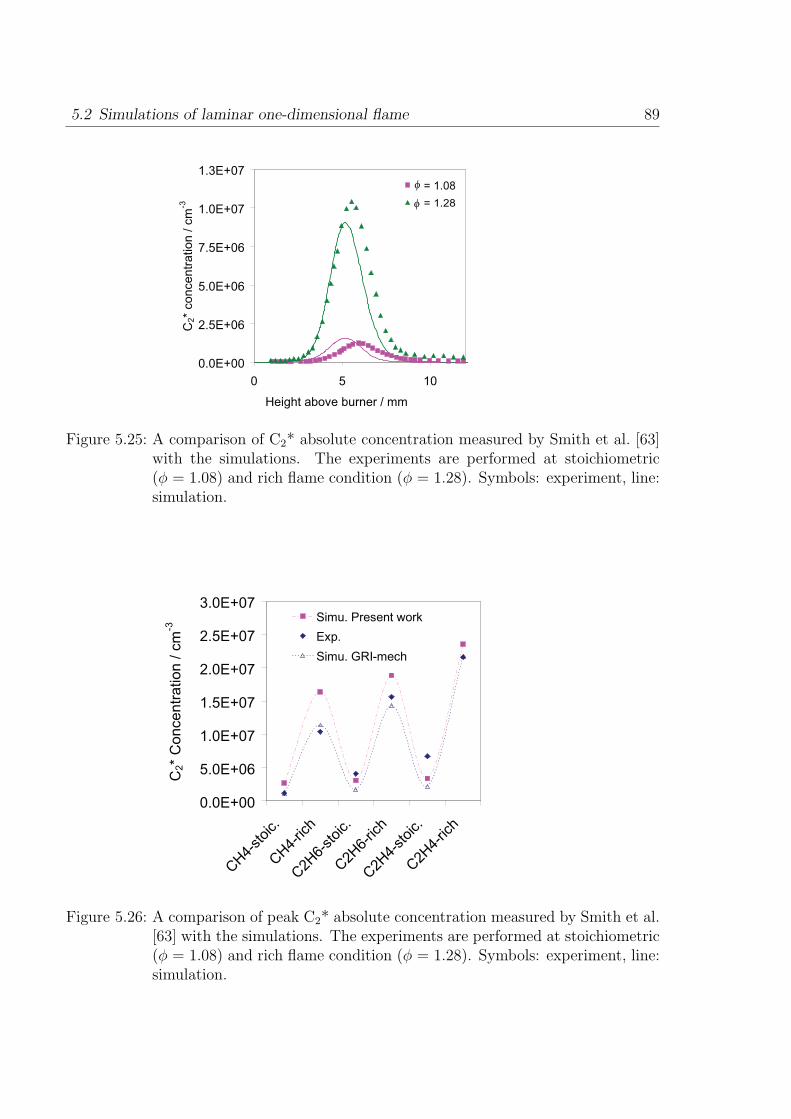
5.2 Simulations of laminar one-dimensional flame 89
0.0E+00
2.5E+06
5.0E+06
7.5E+06
1.0E+07
1.3E+07
0 5 10
Height above burner / mm
C2*
co
nce
ntr
atio
n / c
m-3
= 1.08
= 1.28φ
φ
Figure 5.25: A comparison of C2* absolute concentration measured by Smith et al. [63]with the simulations. The experiments are performed at stoichiometric(φ = 1.08) and rich flame condition (φ = 1.28). Symbols: experiment, line:simulation.
0.0E+00
5.0E+06
1.0E+07
1.5E+07
2.0E+07
2.5E+07
3.0E+07
CH4-
stoic.
CH4-
rich
C2H
6-stoic.
C2H
6-ric
h
C2H
4-stoic.
C2H
4-ric
h
C2*
Co
nce
ntr
atio
n / c
m-3
Simu. Present work
Exp.
Simu. GRI-mech
Figure 5.26: A comparison of peak C2* absolute concentration measured by Smith et al.[63] with the simulations. The experiments are performed at stoichiometric(φ = 1.08) and rich flame condition (φ = 1.28). Symbols: experiment, line:simulation.
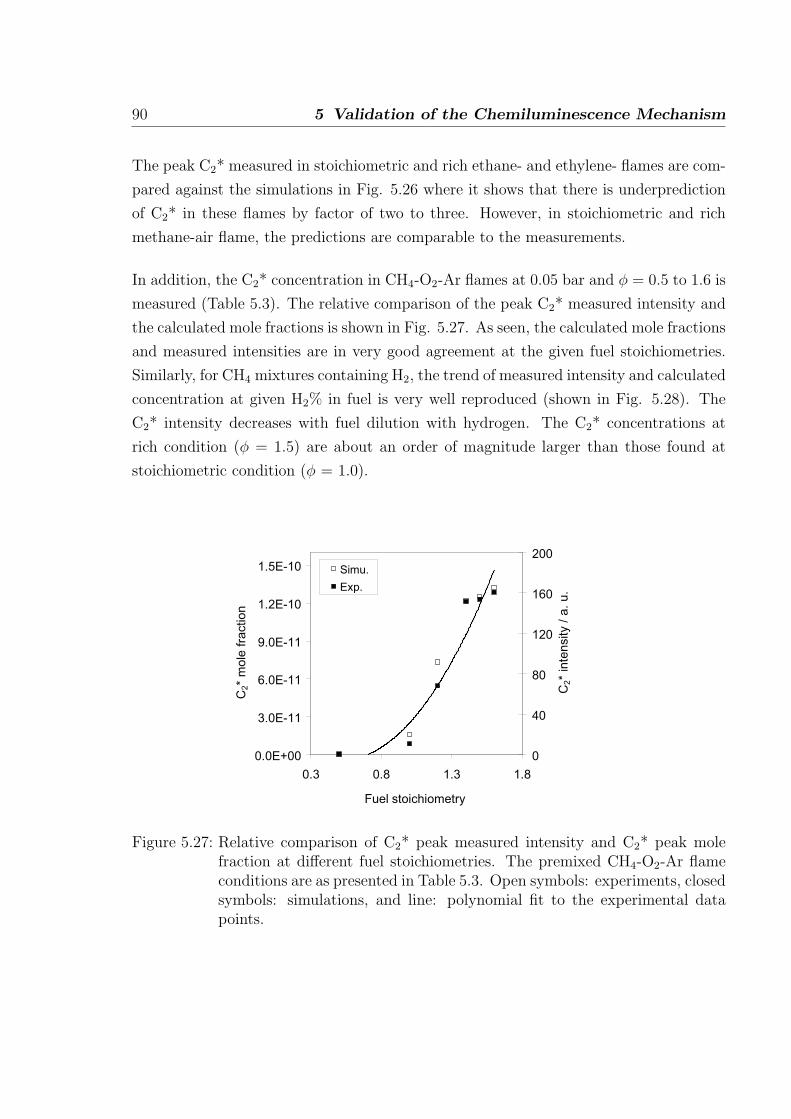
90 5 Validation of the Chemiluminescence Mechanism
The peak C2* measured in stoichiometric and rich ethane- and ethylene- flames are com-
pared against the simulations in Fig. 5.26 where it shows that there is underprediction
of C2* in these flames by factor of two to three. However, in stoichiometric and rich
methane-air flame, the predictions are comparable to the measurements.
In addition, the C2* concentration in CH4-O2-Ar flames at 0.05 bar and φ = 0.5 to 1.6 is
measured (Table 5.3). The relative comparison of the peak C2* measured intensity and
the calculated mole fractions is shown in Fig. 5.27. As seen, the calculated mole fractions
and measured intensities are in very good agreement at the given fuel stoichiometries.
Similarly, for CH4 mixtures containing H2, the trend of measured intensity and calculated
concentration at given H2% in fuel is very well reproduced (shown in Fig. 5.28). The
C2* intensity decreases with fuel dilution with hydrogen. The C2* concentrations at
rich condition (φ = 1.5) are about an order of magnitude larger than those found at
stoichiometric condition (φ = 1.0).
0.0E+00
3.0E-11
6.0E-11
9.0E-11
1.2E-10
1.5E-10
0.3 0.8 1.3 1.8
Fuel stoichiometry
C2*
mole
fra
ction
0
40
80
120
160
200C
2*
inte
nsity /
a.
u.
Simu.
Exp.
Figure 5.27: Relative comparison of C2* peak measured intensity and C2* peak molefraction at different fuel stoichiometries. The premixed CH4-O2-Ar flameconditions are as presented in Table 5.3. Open symbols: experiments, closedsymbols: simulations, and line: polynomial fit to the experimental datapoints.
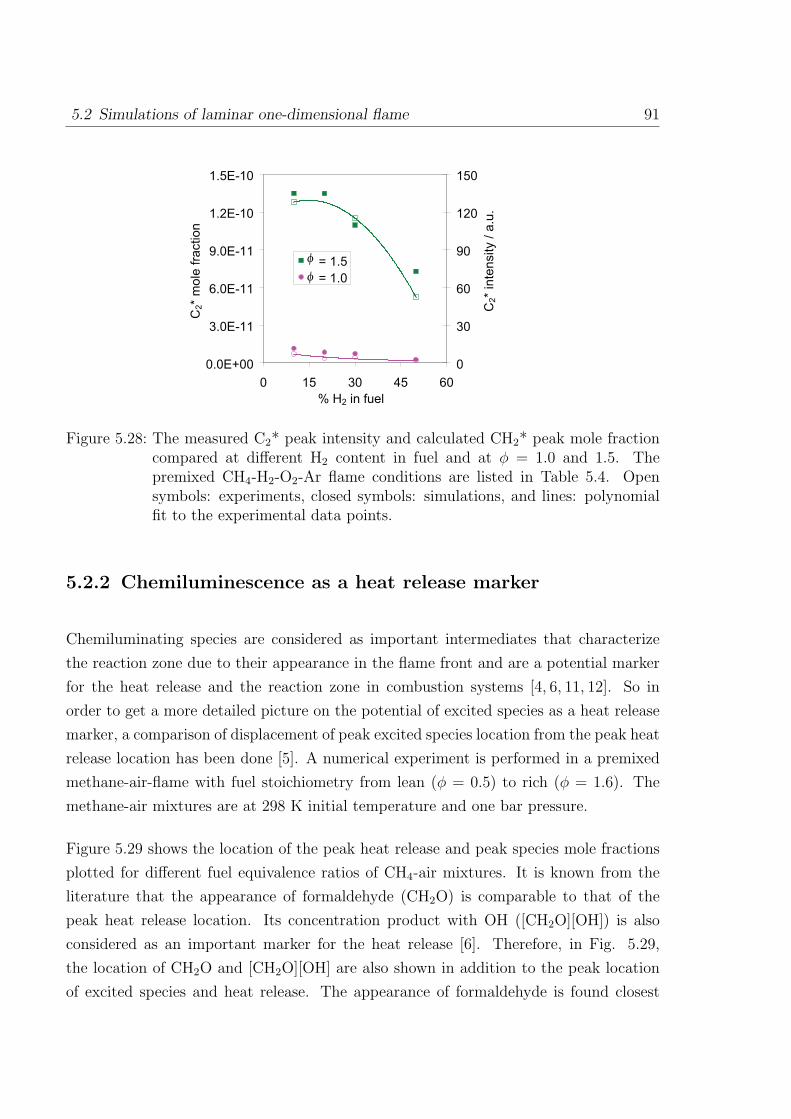
5.2 Simulations of laminar one-dimensional flame 91
0.0E+00
3.0E-11
6.0E-11
9.0E-11
1.2E-10
1.5E-10
0 15 30 45 60
% H2 in fuel
C2*
mo
le fra
ctio
n
0
30
60
90
120
150
C2*
inte
nsity / a
.u.
= 1.5
= 1.0φ
φ
Figure 5.28: The measured C2* peak intensity and calculated CH2* peak mole fractioncompared at different H2 content in fuel and at φ = 1.0 and 1.5. Thepremixed CH4-H2-O2-Ar flame conditions are listed in Table 5.4. Opensymbols: experiments, closed symbols: simulations, and lines: polynomialfit to the experimental data points.
5.2.2 Chemiluminescence as a heat release marker
Chemiluminating species are considered as important intermediates that characterize
the reaction zone due to their appearance in the flame front and are a potential marker
for the heat release and the reaction zone in combustion systems [4, 6, 11, 12]. So in
order to get a more detailed picture on the potential of excited species as a heat release
marker, a comparison of displacement of peak excited species location from the peak heat
release location has been done [5]. A numerical experiment is performed in a premixed
methane-air-flame with fuel stoichiometry from lean (φ = 0.5) to rich (φ = 1.6). The
methane-air mixtures are at 298 K initial temperature and one bar pressure.
Figure 5.29 shows the location of the peak heat release and peak species mole fractions
plotted for different fuel equivalence ratios of CH4-air mixtures. It is known from the
literature that the appearance of formaldehyde (CH2O) is comparable to that of the
peak heat release location. Its concentration product with OH ([CH2O][OH]) is also
considered as an important marker for the heat release [6]. Therefore, in Fig. 5.29,
the location of CH2O and [CH2O][OH] are also shown in addition to the peak location
of excited species and heat release. The appearance of formaldehyde is found closest
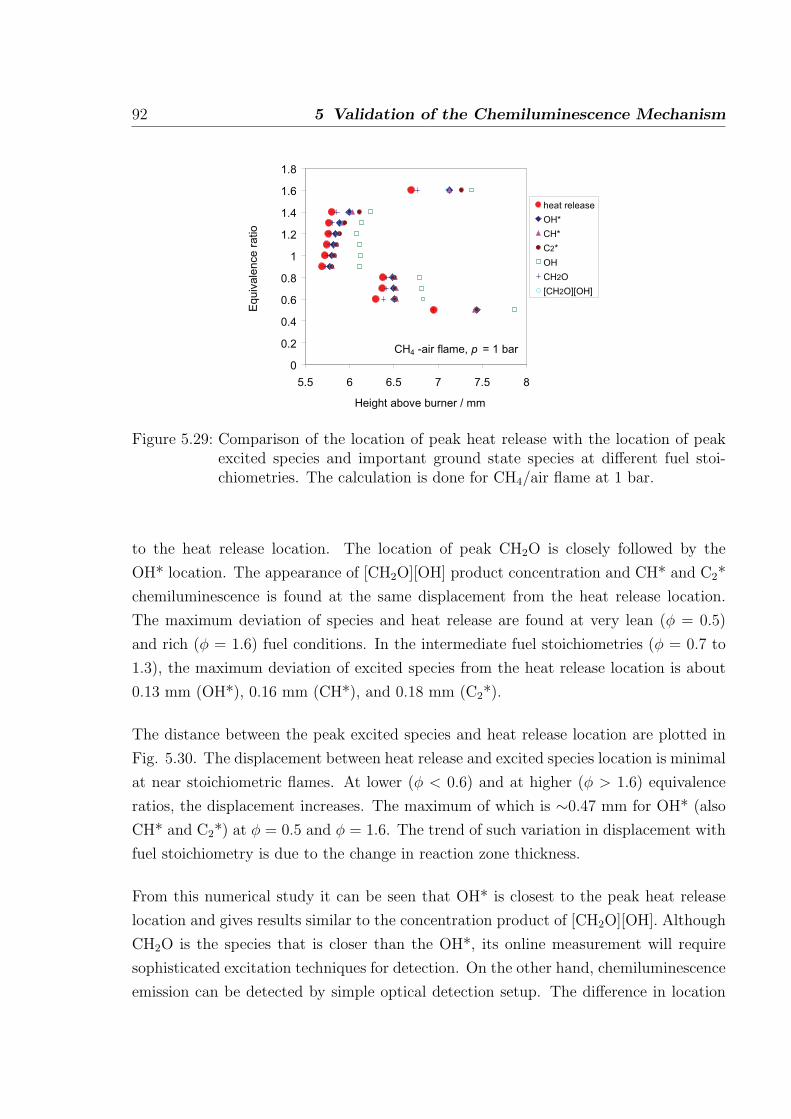
92 5 Validation of the Chemiluminescence Mechanism
CH4 -air flame, p = 1 bar
0
0.2
0.4
0.6
0.8
1
1.2
1.4
1.6
1.8
5.5 6 6.5 7 7.5 8
Height above burner / mm
Equiv
ale
nce r
atio
heat release
OH*
CH*
C2*
OH
CH2O
[CH2O][OH]
Figure 5.29: Comparison of the location of peak heat release with the location of peakexcited species and important ground state species at different fuel stoi-chiometries. The calculation is done for CH4/air flame at 1 bar.
to the heat release location. The location of peak CH2O is closely followed by the
OH* location. The appearance of [CH2O][OH] product concentration and CH* and C2*
chemiluminescence is found at the same displacement from the heat release location.
The maximum deviation of species and heat release are found at very lean (φ = 0.5)
and rich (φ = 1.6) fuel conditions. In the intermediate fuel stoichiometries (φ = 0.7 to
1.3), the maximum deviation of excited species from the heat release location is about
0.13 mm (OH*), 0.16 mm (CH*), and 0.18 mm (C2*).
The distance between the peak excited species and heat release location are plotted in
Fig. 5.30. The displacement between heat release and excited species location is minimal
at near stoichiometric flames. At lower (φ < 0.6) and at higher (φ > 1.6) equivalence
ratios, the displacement increases. The maximum of which is ∼0.47 mm for OH* (also
CH* and C2*) at φ = 0.5 and φ = 1.6. The trend of such variation in displacement with
fuel stoichiometry is due to the change in reaction zone thickness.
From this numerical study it can be seen that OH* is closest to the peak heat release
location and gives results similar to the concentration product of [CH2O][OH]. Although
CH2O is the species that is closer than the OH*, its online measurement will require
sophisticated excitation techniques for detection. On the other hand, chemiluminescence
emission can be detected by simple optical detection setup. The difference in location
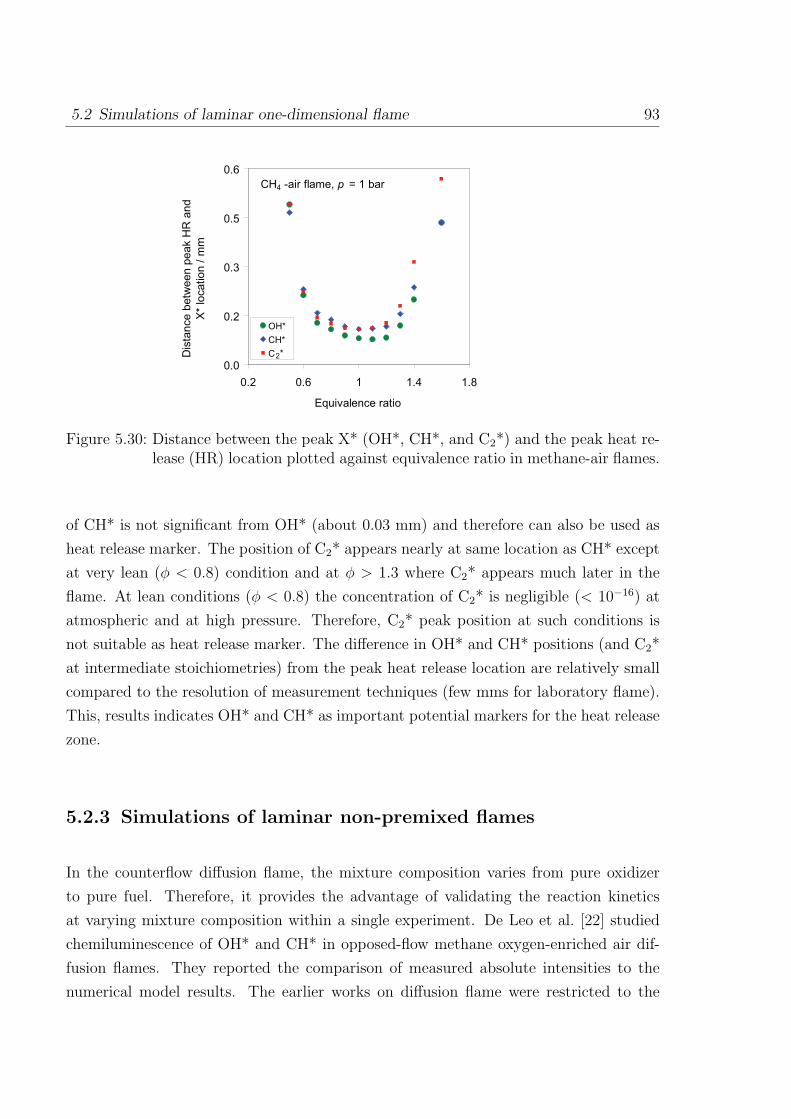
5.2 Simulations of laminar one-dimensional flame 93
CH4 -air flame, p = 1 bar
0.0
0.2
0.3
0.5
0.6
0.2 0.6 1 1.4 1.8
Equivalence ratio
Dis
tance b
etw
een p
eak H
R a
nd
X*
location /
mm
OH*
CH*
C2*
Figure 5.30: Distance between the peak X* (OH*, CH*, and C2*) and the peak heat re-lease (HR) location plotted against equivalence ratio in methane-air flames.
of CH* is not significant from OH* (about 0.03 mm) and therefore can also be used as
heat release marker. The position of C2* appears nearly at same location as CH* except
at very lean (φ < 0.8) condition and at φ > 1.3 where C2* appears much later in the
flame. At lean conditions (φ < 0.8) the concentration of C2* is negligible (< 10−16) at
atmospheric and at high pressure. Therefore, C2* peak position at such conditions is
not suitable as heat release marker. The difference in OH* and CH* positions (and C2*
at intermediate stoichiometries) from the peak heat release location are relatively small
compared to the resolution of measurement techniques (few mms for laboratory flame).
This, results indicates OH* and CH* as important potential markers for the heat release
zone.
5.2.3 Simulations of laminar non-premixed flames
In the counterflow diffusion flame, the mixture composition varies from pure oxidizer
to pure fuel. Therefore, it provides the advantage of validating the reaction kinetics
at varying mixture composition within a single experiment. De Leo et al. [22] studied
chemiluminescence of OH* and CH* in opposed-flow methane oxygen-enriched air dif-
fusion flames. They reported the comparison of measured absolute intensities to the
numerical model results. The earlier works on diffusion flame were restricted to the
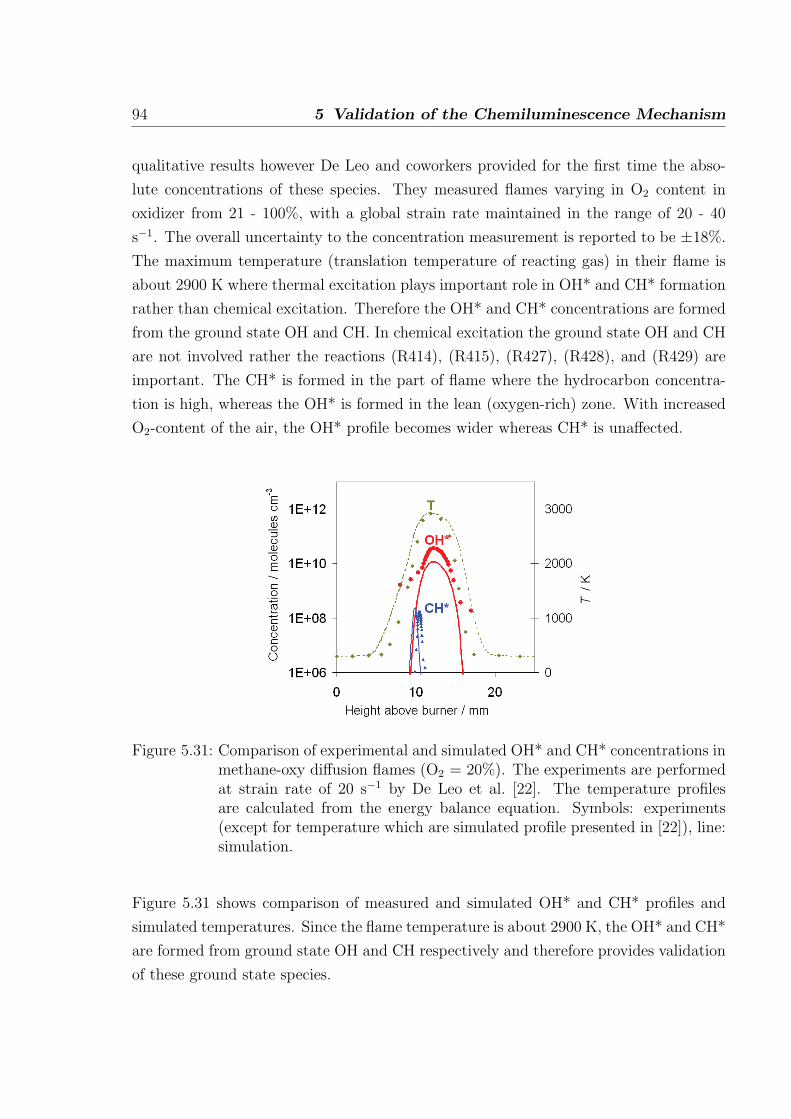
94 5 Validation of the Chemiluminescence Mechanism
qualitative results however De Leo and coworkers provided for the first time the abso-
lute concentrations of these species. They measured flames varying in O2 content in
oxidizer from 21 - 100%, with a global strain rate maintained in the range of 20 - 40
s−1. The overall uncertainty to the concentration measurement is reported to be ±18%.
The maximum temperature (translation temperature of reacting gas) in their flame is
about 2900 K where thermal excitation plays important role in OH* and CH* formation
rather than chemical excitation. Therefore the OH* and CH* concentrations are formed
from the ground state OH and CH. In chemical excitation the ground state OH and CH
are not involved rather the reactions (R414), (R415), (R427), (R428), and (R429) are
important. The CH* is formed in the part of flame where the hydrocarbon concentra-
tion is high, whereas the OH* is formed in the lean (oxygen-rich) zone. With increased
O2-content of the air, the OH* profile becomes wider whereas CH* is unaffected.
Figure 5.31: Comparison of experimental and simulated OH* and CH* concentrations inmethane-oxy diffusion flames (O2 = 20%). The experiments are performedat strain rate of 20 s−1 by De Leo et al. [22]. The temperature profilesare calculated from the energy balance equation. Symbols: experiments(except for temperature which are simulated profile presented in [22]), line:simulation.
Figure 5.31 shows comparison of measured and simulated OH* and CH* profiles and
simulated temperatures. Since the flame temperature is about 2900 K, the OH* and CH*
are formed from ground state OH and CH respectively and therefore provides validation
of these ground state species.
6 Conclusion
In this work, a reaction mechanism to predict chemiluminescent species by modeling
and numerical simulation has been developed. The developed mechanism is validated
against experimental species profiles. Numerical simulations of chemiluminescent species
concentrations in shock-tubes and in laminar flame conditions have been presented and
compared to experiments.
This work is comprised of three parts. (1) Modification of a basic hydrocarbon mech-
anism, with respect to acetylene chemistry and important ground state species concen-
tration (e.g. CH, and C2H), (2) Addition of a sub-mechanism predicting ground state
C2, and (3) Addition of a chemiluminescence sub-mechanism.
A hydrocarbon reaction mechanism developed earlier that simulates the oxidation of C1-
C4 hydrocarbon fuels is the starting point of this work. The major limitation of the base
mechanism is its prediction of acetylene ignition delay times that are about two orders of
magnitude lower than measurements. Acetylene is the main precursor to the formation
of all chemiluminescent species. Therefore, the base mechanism is reinvestigated for its
prediction of acetylene chemistry. The reactions sensitive to the C2H2 ignition delay time
and flame velocity are identified and their rate coefficients are modified within the limits
of rate data available in literature. In addition to this, it is seen that the prediction of the
chemiluminescent species depends strongly on the species that are direct precursors to
its formation (i.e. CH, C2H, and 1CH2). These species are not important for the global
validation (e.g. ignition delay time, flame velocity) of the base mechanism, however they
are important for chemiluminescence sub-model in the mechanism. Therefore necessary
modifications in the base mechanism are done to achieve correct prediction of such
precursors. Sufficient amount of experimental flame concentration measurement of CH,
C2H, and 1CH2 is available in the literature. Validation of these species concentrations is
done at different fuel stoichiometries and good agreement with measurements is found.
95
96 6 Conclusion
The formation of chemiluminescent species also depends on additional species such as
C2, C3 which are not part of any existing reaction mechanisms predicting fuel oxida-
tion. Therefore, a sub-mechanism predicting such C-containing species is added to the
base mechanism in the second part. These species, due to their low concentration,
are difficult to measure experimentally. For their validation not many experiments are
available in literature until recently measured C2 in methane and propene flames. This
sub-mechanism is validated for its prediction of C2 in methane and other hydrocar-
bon flames where the C2 concentrations are about twice overpredicted compared to the
measurements. The rate coefficients of most of reactions forming and consuming these
species are estimates based on similar reactions. Therefore, the twice overprediction of
C2 is likely. However, a good agreement of simulated C2 concentration with respect to
peak position and profile shape is found compared to the measurements.
A chemiluminescence (CL) sub-mechanism is added to the validated base mechanism.
The CL sub-mechanism consists of reactions leading to the formation and the consump-
tion of the excited species. The mechanism of chemiluminescent species is based on
an extensive literature review of reactions and rate coefficients responsible for their for-
mation and consumption. The literature value of major formation reactions vary from
two to four orders of magniture from each other and so selection of reaction rates is
difficult. In addition, the major CL formation reactions are not clearly understood. The
validation of the CL mechanism is done for shock-tube and for laminar flame conditions.
There is no direct relation available between the CL intensities measured in shock-tube
and calculated CL concentrations. Therefore, a calibration factor is required for the
conversion of the measured intensity to concentrations. In H2/O2 mixtures it is found
that above 3000 K initial temperature, the OH* is formed due to thermal excitation
rather than chemical excitation and so the OH* intensities are independent of rate of
reactions forming OH*. So based on the simulated OH* concentrations, the measured
intensities are converted to the concentrations. A rate coefficient of the reaction H + O
+ M → OH* + M is recommended in the present work. This is relatively easy with OH*
measurements where the H2 oxidation mechanism is relatively well known. However, the
CH* formation is more complicated with three different reactions and many degrees of
freedom arising from acetylene and C2 chemistry. And therefore, a direct comparison of
measured CH* intensities with simulated concentrations is not possible with shock-tube
measurements. The absolute concentrations measured in flames provide a more stringent
test for mechanism validation. The absolute species concentration of OH*, CH*, and C2*
97
measured in laminar premixed flames is available in the literature and the mechanism
prediction is validated against these measurements. For the very first time, the CH(B)
state is measured in the literature and so a relative comparison of measured intensity
and simulated concentration at different fuel stoichiometries is done. A good agreement
with respect to peak concentration, position of flame along the burner axis and the
profile shape are found for the OH*, CH*, and C2* for lean to rich stoichiometry.
An attempt is made to investigate the potential of chemiluminescence as a heat release
marker. It is seen that the peak of the OH* and CH* concentration is found close to the
location of the heat release. The differences between the peak heat release and excited
species location are relatively small compared to the resolution of most measurement
techniques (few milimeters for laboratory flame). Therefore, OH* and CH* can be
considered as potential heat release markers for heat release zone.
In the future, research can be extended to focus on identifying main formation path-
ways of CH*, as soon as new experiments become available. The chemiluminescence of
CO2* is also considered as a potential heat release marker. However, no absolute flame
concentration measurements are available for the validation of the mechanism. Further-
more, the CL mechanism can be extended for such and other excited species. The CL
mechanism can be further used to simulate larger combustion devices and investigate
the relation of chemiluminescence as heat release and reaction zone marker not only for
laminar but also for turbulent conditions.
Bibliography
[1] A. G. Gaydon. The spectroscopy of flames. Wiley: New York, 1974.
[2] L. C. Haber and U. Vandsburger. A global reaction model for OH* chemilumines-
cence applied to a laminar flat-flame burner. Combustion Science and Technology,
175:1859, 2003.
[3] Y. Hardalupas and M. Orain. Local measurement of the time-dependent heat
release rate and equivalence ratio using chemiluminescent emission from a flame.
Combustion and Flame, 139:188, 2004.
[4] C. S. Panoutsos, Y. Hardalupas, and A. M. K. P. Taylor. Numerical evalua-
tion of equivalence ratio measurement using OH* and CH* chemiluminescence in
premixed and non-premixed methane-air flames. Combustion and Flame, 156:273–
291, 2009.
[5] T. Kathrotia, U. Riedel, and J. Warnatz. A numerical study on the relation of
OH*, CH*, C2* chemiluminescence and heat release in premixed methane flame.
Proceedings of the European Combustion Meeting, 2009.
[6] H. Najm, O. Knio, P. Paul, and P. Wyckoff. A study of flame observables in
premixed methane-air flames. Combustion Science and Technology, 140:369, 1998.
[7] J. M. Samaniego, F. N. Egolfopoulos, and C. T. Bowman. CO2* chemiluminescence
in premixed flames. Combustion Science and Technology, 109:183, 1995.
[8] L. C. Haber, U. Vandsburger, W. R. Saunders, and V. K. Khanna. An experimen-
tal examination of the relationship between chemiluminescent light emissions and
heat release rate under non-adiabatic conditions. Proceedings of International gas
turbine institute, 2000-GT-0121, 2000.
98
Bibliography 99
[9] V. Nori and J. M. Seitzman. Chemiluminescence measurements and modeling in
Syngas, methane and Jet-A fueled Combustors. 45th AIAA Aerospace Sciences
Meeting and Exhibit, AIAA 2007-0466, 2007.
[10] V. N. Nori and J. M. Seitzman. CH* chemiluminescence modeling for combustion
diagnostics. Proceedings of the Combustion Institute, 32:895, 2009.
[11] J. Kojima, Y. Ikeda, and T. Nakajima. Spatially resolved measurement of OH*,
CH* and C2* chemiluminescence in the reaction zone of laminar methane/air
premixed flames. Proceedings Combustion Institute, 28:1757, 2000.
[12] H. Najm, P. Paul, C. Mueller, and P. Wyckoff. On the adequacy of certain ex-
perimental observables as measurements of flame burning rate. Combustion and
Flame, 113:312, 1998.
[13] J. Warnatz, U. Maas, and R. Dibble. Combustion - Physical and chemical fun-
damentals, modeling and simulation, experiments, pollutant formation. Springer,
4th edition.
[14] L. Petzold. A description of DASSL. Report SAND, 82-8637, 1982.
[15] P. Deuflhard and U. Nowak. Extrapolation integrators for quasilinear implicit
ODEs. DFG-SFB-123: Tech. Rep., Heidelberg University, 1985.
[16] H. Tsuji and I. Yamaoka. Structure analysis of counterflow diffusion flames in the
forward stagnation region of a porous cylinder. Proceedings of the Combustion
Institute, 13:723, 1971.
[17] M. W. Chase, C. A. Davies Jr., J. R. Downey, D. J. Frurip Jr., R. A. McDonald,
and A. N. Syverud. JANAF thermochemical tables third edition. Journal of
Physical and Chemical Reference Data, Supplement No. 1, page 14, 1985.
[18] E. Goos, A. Burcat, and B. Ruscic. New NASA Thermodynamic Polynomials
Database With Active Thermochemical Tables updates, 2011.
[19] F. A. Lindemann. Discussion on the radiation theory of chemical action. Trans-
actions of Faraday Society, 17:598, 1922.
[20] H. Carstensen and Dean A. M. Chapter 4: The kinetics of pressure-dependent
reactions. Comprehensive Chemical Kinetics, 42:101, 2007.
100 Bibliography
[21] R. G. Gilbert, K. Luther, and J. Troe. Theory of thermal unimolecular reactions in
the fall-off range. II. Weak collision rate constants. Ber. Bunsenges. Phys. Chem.,
87:169, 1983.
[22] M. De Leo, A. Saveliev, L. A. Kennedy, and S. A. Zelepouga. OH and CH lumi-
nescence in opposed flow methane oxy-flames. Combustion and Flame, 149:435,
2007.
[23] P. Atkins and J. Paula. Physical Chemistry. 8th edition.
[24] W. Demtroeder. Laser Spectroscopy. Springer Verlag, 3rd edition.
[25] J. Kojima, Y. Ikeda, and T. Nakajima. Basic aspects of OH(A), CH(A), and C2(d)
chemiluminescence in the reaction zone of laminar methane-air premixed flames.
Combustion and Flame, 140:34, 2005.
[26] C. Heghes. C1 to C4 hydrocarbon oxidation mechanism. PhD Thesis, Heidelberg,
2007.
[27] T. Kathrotia, M. Fikri, M. Bozkurt, M. Hartmann, U. Riedel, and C. Schulz.
Study of the H+O+M reaction forming OH*: Kinetics of OH* chemiluminescence
in hydrgen combustion systems. Combustion and Flame, 157:1261, 2010.
[28] G. L. Schott and J. L. Kinsey. Kinetic studies of hydroxyl radicals in shock waves.
II. Induction times in the hydrogen-oxygen reactions. The Journal of Chemical
Physics, 29:1177, 1958.
[29] K. T. Aung, M. I. Hassen, and G. M. Faeth. Flame Stretch Interaction of Laminar
Premixed Hydrogen/Air Flames at Normal Temperature and Pressure. Combus-
tion and Flame, 109:1, 1997.
[30] S. C. Taylor. PhD Thesis, University of Leeds, 1991.
[31] C. M. Vagelopoulos, F. N. Egolfopoulos, and C. K. Law. Further considerations
on the determination of laminar flame speeds with the counterflow twin-flame
technique. Proceedings of the Combustion Institute, 25:1341, 1994.
[32] C. K. Wu and C. K. Law. On the determination of laminar flame speeds from
stretched flames. Proceedings of the Combustion Institute, 20:1941, 1985.
Bibliography 101
[33] J. Warnatz. Calculation of the structure of laminar flat flames I: Flame velocity
of freely propagating ozone decomposition flames. Ber. Bunsenges. Phys. Chem.,
82:193, 1978.
[34] G. P. Smith, C. Park, and J. Luque. A note on chemiluminescence in low-pressure
hydrogen and methane-nitrous oxide flames. Combustion and Flame, 140:385,
2005.
[35] T. Vandooren and J. Bian. Validation of H2/O2 reaction mechanisms by compari-
son with the experimental structure of a rich hydrogen-oxygen flame. Proceedings
of the Combustion Institute, 23:341, 1991.
[36] J. Warnatz. The structure of freely propagating and burner-stabilized flames in
the H2-CO-O2 system. Ber. Bunsenges. Phys. Chem., 83:950, 1979.
[37] D. F. Davidson and R. K. Hanson. Fundamental kinetics database utilizing shock-
tube measurements. Volume 1: Ignition delay time measurements, page 12, 2005.
[38] E. L. Petersen, M. Rohrig, D. F. Davidson, R. K. Hanson, and C. T. Bowman.
High-pressure methane oxidation behind reflected shock waves. Proceedings of the
Combustion Institute, 26:799, 1996.
[39] G. P. Smith, D. M. Golden, M. Frenklach, N. W. Moriarty, B. Eiteneer, M. Golden-
berg, C. T. Bowmann, R. K. Hanson, S. Song, W. C. Gardiner Jr., V. V. Lissianski,
and Z. Qin. GRI-mech 3.0, University of California, Berkeley, CA., 1999.
[40] J. B. Homer and G. B. Kistiakowsky. Oxidation and pyrolysis of ethylene in shock
waves. The Journal of Chemical Physics, 47:5290, 1967.
[41] R. P. Lindstedt and G. Skevis. Chemistry of acetylene flames. Combustion Science
and Technology, 125:73, 1997.
[42] D. L. Baulch, C. T. Bowman, C. J. Cobos, R. A. Cox, Th. Just, J. A. Kerr, M. J.
Pilling, D. Stocker, J. Troe, W. Tsang, R. W. Walker, and J. Warnatz. Evalu-
ated kinetic data for combustion modelling: Supplement II. Journal of Physical
Chemistry Reference Data, 34:757, 2005.
[43] Miller J. A., Mitchell R. E., Smooke M. D., and Kee R. J. Toward a comprehensive
chemical kinetic mechanism for the oxidation of acetylene: Comparison of model
predictions with results from flame and shock tube experiments. Proceedings of
the Combustion Institute, 19:181, 1982.
102 Bibliography
[44] S. Wagner and V. Ebert. Personal communication, 2010.
[45] S. Wagner, B. T. Fisher, J. W. Fleming, and V. Ebert. TDLAS-based in situ
measurement of absolute acetylene concentrations in laminar 2D diffusion flames.
Proceedings Combustion Institute, 32:839, 2009.
[46] G. P. Smith, C. Park, J. Schneiderman, and J. Luque. C2 Swan band laser-
induced fluorescence and chemiluminescence in low-pressure hydrocarbon flames.
Combustion and Flame, 141:66, 2005.
[47] J. W. Thoman Jr. and A. McIlroy. Absolute CH radical concentrations in rich
low-pressure methane-oxygen-argon flames via cavity ringdown spectroscopy of
the A2∆-X2Π transition. Journal of Physical Chemistry A, 104:4953, 2000.
[48] E. Bastin, J. L. Delfau, M. Reuillon, C. Vovelle, and J. Warnatz. Experimental
and computational investigation of the structure of a sooting C2H2-O2-Ar flame.
Proceedings Combustion Institute, 22:313, 1988.
[49] K. Devriendt and J. Peeters. Direct identificationof the C2H(X2Σ+) + O(3P) →CH(A2∆) + CO as the source of the CH(A2∆→X2Π) chemiluminescence in the
C2H2/O/H atomic flames. Journal of Physical Chemistry A, 101:2546, 1997.
[50] C. Gibaud, J. Snyder, V. Sick, and R. P. Lindstedt. Laser-induced fluorescence
measurements and modeling of absolute CH concentrations in strained laminar
methane/air diffusion flames. Proceedings of the Combustion Institute, 30:455,
2005.
[51] S. V. Naik and N. M. Laurendeau. Measurements of absolute CH concentrations
by cavity ring-down spectroscopy and linear laser-induced fluorescence in laminar,
counterflow partially premixed and nonpremixed flames at atmospheric pressure.
Applied Optics, 43:5116, 2004.
[52] W. Tsang and R. F. Hampson. Chemical kinetic data base for combustion chem-
istry. Part I. Methane and related compounds. Journal of Physical Chemistry
Reference Data, 15:1087, 1986.
[53] P. A. Berg, D. A. Hill, A. R. Noble, G. P. Smith, J. B. Jeffries, and D. R. Crosley.
Absolute CH concentration measurements in low-pressure methane flames: Com-
parisons with model results. Combustion and Flame, 121:223, 2000.
Bibliography 103
[54] A. McIlroy. Direct measurement of 1CH2 in flames by cavity ringdown laser ab-
sorption spectroscopy. Chemical Physics Letters, 296:151, 1998.
[55] M. Tamura, P. A. Berg, J. E. Harrington, J. Luque, J. B. Jeffries, G. P. Smith,
and D. R. Crosley. Collisional quenching of CH(A), OH(A) and NO(A) in low
pressure hydrocarbon flames. Combustion and Flame, 114:502, 1998.
[56] S. L. N. G. Krishnamachari and H. P. Broida. Effect of molecular Oxygen on
the emission spectra of atomic oxygen-acetylene flames. The Journal of Chemical
Physics, 34:1709, 1961.
[57] K. Becker, D. Haaks, and T. Tatarczyk. The natural lifetime of OH (2Σ+, v=0,
N=2, J=3/2) and its quenching by atomic hydrogen. Chemical Physics Letters,
25:564, 1974.
[58] R. Porter, A. Clark, W. Kaskan, and W. Browne. A study of hydrocarbon flames.
Proceedings Combustion Institute, 11:907, 1967.
[59] I. Messing, C. Sadowski, and S. Filseth. Absolute rate constant for the reaction
of CH with O2. Chemical Physics Letters, 66:95, 1979.
[60] D. A. Lichtin, M. R. Berman, and M. C. Lin. NH(A3Π → X3Σ−) chemilumines-
cence from the CH(2Π) + NO reaction. Chemical Physics Letters, 108:18, 1984.
[61] M. R. Berman, J. W. Fleming, A. B. Harvey, and M. C. Lin. Temperature depen-
dence of CH radical reactions with O2, NO, CO and CO2. Proceedings Combustion
Institute, 19:73, 1982.
[62] J. Grebe and K. H. Homann. Blue-green chemiluminescence in the system
C2H2/O/H. Formation of the emitters CH(A2∆), C2(d3Πg) and C2H*. Ber. Bun-
senges. Phys. Chem, 86:587, 1982.
[63] G. P. Smith, J. Luque, C. Park, J. B. Jeffries, and D. R. Crosley. Low pressure
flame determinations of rate constants for OH(A) and CH(A) chemiluminescence.
Combustion and Flame, 131:59, 2002.
[64] S. A. Carl, M. V. Poppel, and J. Peeters. Identification of the CH + O2 → OH(A)
+ CO reaction as the source of OH(A-X) chemiluminescence in C2H2/O/H/O2
atomic flames and determination of its absolute rate constant over the range T =
296 to 511 K. Journal of Physical Chemistry, 107:11001, 2003.
104 Bibliography
[65] J. M. Hall and E. L. Petersen. An optimized kinetics model for OH chemilumi-
nescence at high temperatures and atmospheric pressures. International Journal
of Chemical Kinetics, 38:714, 2006.
[66] M. Charton and A. G. Gaydon. Excitation of spectra of OH in hydrogen flames
and its relation to excess concentrations of free atoms. Proceedings of the Royal
Society of London A, 245:84, 1958.
[67] S. W. Yoo, C. K. Law, and S. D. Tse. Chemiluminescent OH* and CH* flame
structure and aerodynamic scaling of weakly buoyant, nearly spherical diffusion
flames. Proceedings of the Combusion Institute, 29:1663, 2002.
[68] Kaskan W. E. Abnormal excitation of OH in H2/O2/N2 flames. The Journal of
Chemical Physics, 31:944, 1959.
[69] Y. Hidaka, S. Takahashi, H. Kawano, M. Suga, and W. C. Gardiner Jr. Shock-
tube measurement of the rate constant for excited OH(A2Σ+) formation in the
hydrogen-oxygen reaction. Journal of Physical Chemistry, 86:1429, 1982.
[70] Koike T. and Morinaga K. Further studies of the rate constant for chemical
excitation of OH in shock waves. Bull. Chem. Soc. Jpn., 55:52, 1982.
[71] C. S. T. Marques, L. H. Benvenutti, and C. A. Bertran. Kinetic modeling for
chemiluminescent radicals in acetylene combustion. J. Braz. Chem. Soc., 17:302,
2006.
[72] O. V. Skrebkov, Yu. P. Myagkov, S. P. Karkach, V. M. Vasilev, and A. L. Smirnov.
Formation mechanism of the excited OH(2Σ+) radical during the ignition of the
diluted H2-O2 mixture by shock waves. Doklady Physical Chemistry, 383:93, 2002.
[73] P. W. Fairchild, G. P. Smith, and D. R. Crosley. Collisional quenching of A2Σ+
OH at elevated temperatures. The Journal of Chemical Physics, 79:1795, 1983.
[74] A. E. Bailey, D. E. Heard, P. H. Paul, and M. J. Pilling. Collisional quenching of
OH(A) by N2, O2 and CO2 between 204 and 294 K. Implications for atmospheric
measurements of OH by laser-induced fluorescence. J. Chem. Soc., Faraday Trans.,
93:2915, 1997.
[75] B. L. Hemming, D. R. Crosley, J. E. Harrington, and V. Sick. Collisional quenching
of high rotational levels in OH(A2Σ+). Journal of Chemical Physics, 115:3099,
2001.
Bibliography 105
[76] B. L. Hemming and D. R. Crosley. Rotational level dependence of OH(A2Σ+)
quenching at 242 and 196 K . Journal of Physical Chemistry A, 106:8992, 2002.
[77] D. E. Heard and D. A. Henderson. Quenching of OH (A2Σ+, v′=0) by several
collision partners between 200 and 344 K. Cross-section measurements and model
comparisons. Physical Chemistry Chemical Physics, 2:67, 2000.
[78] P. Paul, J. Durant, and J. Gray. Collisional electronic quenching of OH(A2Σ)
measured at high temperature in a shock tube. The Journal of Chemical Physics,
102:8378, 1995.
[79] J. Jeffries, K. Kohse-Hoeinghaus, G. Smith, R. Copeland, and D. Crosley.
Rotational-level-dependent quenching of OH(A2Σ+) at flame temperatures. Chem-
ical Physics Letters, 152:160, 1988.
[80] E. M. Bulewicz, P. J. Padley, and R. E. Smith. Spectroscopy studies of C2, CH and
OH radicals in low pressure acetylene+oxygen flames. Proceedings of the Royal
Society of London A, 315:129, 1970.
[81] H. H. Brenig. PhD Thesis, Wuppertal, 1981.
[82] C. Hand and G. Kistiakowsky. Ionization cccompanying the ccetylene-oxygen
reaction in shock waves. The Journal of Chemical Physics, 37:1239, 1962.
[83] C. T. Bowman and D. J. Seery. Chemiluminescence in the high-temperature oxi-
dation of methane. Combustion and Flame, 12:611, 1968.
[84] S. Matsuda, I. Slagle, D. Fife, J. Marquart, and D. Gutman. Shock-tube study
of acetylene-oxygen reaction. IV. Kinetic study of CH, C2, and continuum chemi-
luminescence during the induction period. Journal of Chemical Physics, 57:5277,
1972.
[85] S. Hwang, W. C. Gardiner Jr., M. Frenklach, and Y. Hidaka. Induction zone
exothermicity of acetylene ignition. Combustion and Flame, 67:65, 1987.
[86] A. N. Eraslan and R. C. Brown. Chemiionization and ion-molecule reactions in
fuel-rich acetylene flames. Combustion and Flame, 74:19, 1988.
[87] K. Devriendt, H. Look, B. Ceursters, and J. Peeters. Kinetics of formation of
chemiluminescent CH(A2∆) by the elementary reactions of C2H(X2Σ+) with O(3P)
106 Bibliography
and O2(X3Σg
−): A pulse laser photolysis study. Chemical Physics Letters, 261:450,
1996.
[88] R. Elsamra, S. Vranckx, and S. Carl. CH(A2∆) formation in hydrocarbon com-
bustion: The temperature dependence of the rate constant of the reaction C2H +
O2 → CH(A2∆) + CO2. Journal of Physical Chemistry A, 109:10287, 2005.
[89] J. M. Hall, J. Vries, A. Amadio, and E. L. Petersen. Towards a kinetics model of
CH chemiluminescence. Aerospace Sciences Meeting and Exhibit, 43:AIAA 2005–
1318, 2005.
[90] J. Mertens. A shock tube study of CH* reaction kinetics in CH4 and C2H2 oxida-
tion. 22nd International Symposium on Shock Waves, 22:171, 1999.
[91] R. E. Ferguson. On the origin of the electronically excited C2* radical in hydro-
carbon flames. The Journal of Chemical Physics, 23:2085, 1955.
[92] K. Schofield and M. Steinberg. CH and C2 measurements imply a radical pool
within a pool in acetylene flames. Journal of Physical Chemistry A, 111:2098,
2007.
[93] M. Koehler, A. Brockhinke, M. Braun-Unkhoff, and K. Kohse-Hoeinghaus. Quanti-
tative laser diagnostic and modeling study of C2 and CH chemistry in combustion.
Journal of Physical Chemistry A, 114:4719, 2010.
[94] U. Maas and J. Warnatz. Ignition processes in hydrogen-oxygen mixtures. Com-
bustion and Flame, 74:53, 1988.
[95] U. Maas. Coupling of chemical reaction with flow and molecular transport. Ap-
plications of Mathematics, 40:249, 1995.
[96] E. Petersen, D. Kalitan, and M. Rickard. Calibration and chemical kinetics mod-
eling of an OH chemiluminescence diagnostic. AIAA Joint Propulsion Conference
and Exhibit, 2003.
[97] D. M. Kalitan, J. D. Mertens, M. W. Crofton, and E. L. Petersen. Ignition and
oxidation of lean CO/H2 fuel blends in air. Journal of Propulsion and Power,
23:1291, 2007.
[98] M. Bozkurt, M. Fikri, and C. Schulz. Personal communication, 2010.

Bibliography 107
[99] M. J. Rickard, J. M. Hall, and E. L. Petersen. Effect of silane addition on acetylene
ignition behind reflected shock waves. Proceedings of the Combustion Institute,
30:1915, 2005.
[100] A. Seipel, A. Brokhinke, and K. Kohse-Hoeinghaus. Personal communication,
2010.
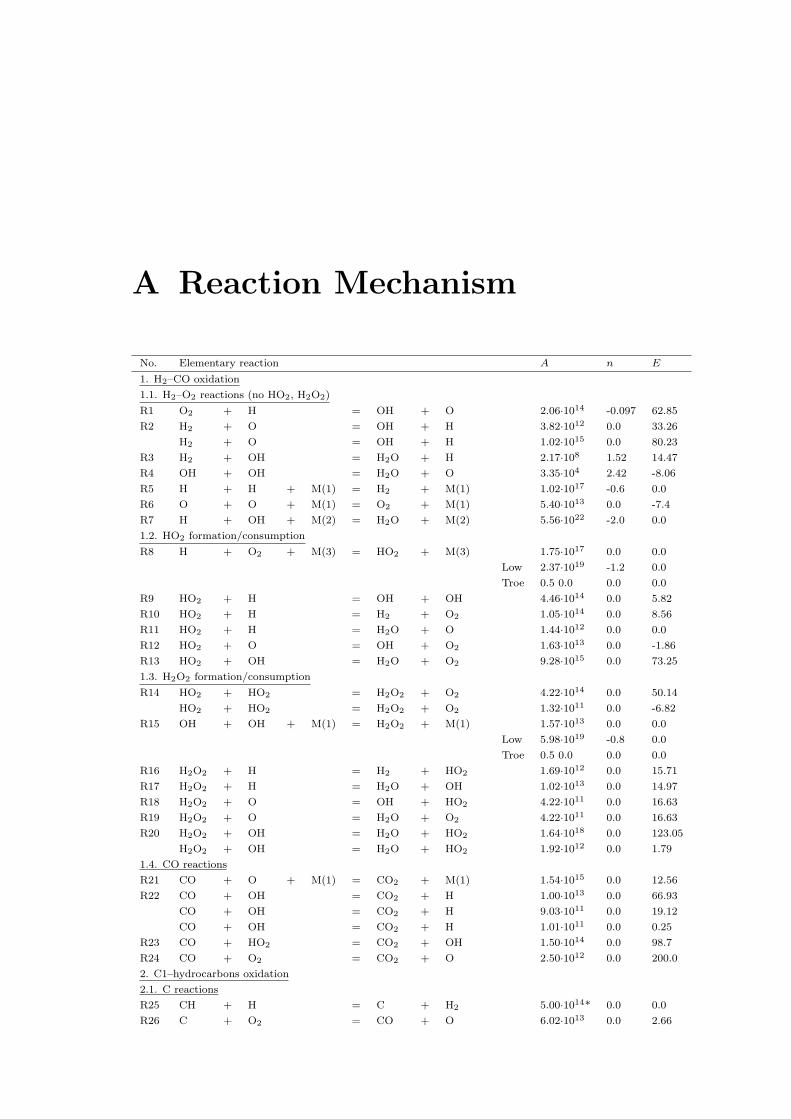
A Reaction Mechanism
No. Elementary reaction A n E
1. H2–CO oxidation
1.1. H2–O2 reactions (no HO2, H2O2)
R1 O2 + H = OH + O 2.06·1014 -0.097 62.85
R2 H2 + O = OH + H 3.82·1012 0.0 33.26
H2 + O = OH + H 1.02·1015 0.0 80.23
R3 H2 + OH = H2O + H 2.17·108 1.52 14.47
R4 OH + OH = H2O + O 3.35·104 2.42 -8.06
R5 H + H + M(1) = H2 + M(1) 1.02·1017 -0.6 0.0
R6 O + O + M(1) = O2 + M(1) 5.40·1013 0.0 -7.4
R7 H + OH + M(2) = H2O + M(2) 5.56·1022 -2.0 0.0
1.2. HO2 formation/consumption
R8 H + O2 + M(3) = HO2 + M(3) 1.75·1017 0.0 0.0
Low 2.37·1019 -1.2 0.0
Troe 0.5 0.0 0.0 0.0
R9 HO2 + H = OH + OH 4.46·1014 0.0 5.82
R10 HO2 + H = H2 + O2 1.05·1014 0.0 8.56
R11 HO2 + H = H2O + O 1.44·1012 0.0 0.0
R12 HO2 + O = OH + O2 1.63·1013 0.0 -1.86
R13 HO2 + OH = H2O + O2 9.28·1015 0.0 73.25
1.3. H2O2 formation/consumption
R14 HO2 + HO2 = H2O2 + O2 4.22·1014 0.0 50.14
HO2 + HO2 = H2O2 + O2 1.32·1011 0.0 -6.82
R15 OH + OH + M(1) = H2O2 + M(1) 1.57·1013 0.0 0.0
Low 5.98·1019 -0.8 0.0
Troe 0.5 0.0 0.0 0.0
R16 H2O2 + H = H2 + HO2 1.69·1012 0.0 15.71
R17 H2O2 + H = H2O + OH 1.02·1013 0.0 14.97
R18 H2O2 + O = OH + HO2 4.22·1011 0.0 16.63
R19 H2O2 + O = H2O + O2 4.22·1011 0.0 16.63
R20 H2O2 + OH = H2O + HO2 1.64·1018 0.0 123.05
H2O2 + OH = H2O + HO2 1.92·1012 0.0 1.79
1.4. CO reactions
R21 CO + O + M(1) = CO2 + M(1) 1.54·1015 0.0 12.56
R22 CO + OH = CO2 + H 1.00·1013 0.0 66.93
CO + OH = CO2 + H 9.03·1011 0.0 19.12
CO + OH = CO2 + H 1.01·1011 0.0 0.25
R23 CO + HO2 = CO2 + OH 1.50·1014 0.0 98.7
R24 CO + O2 = CO2 + O 2.50·1012 0.0 200.0
2. C1–hydrocarbons oxidation
2.1. C reactions
R25 CH + H = C + H2 5.00·1014* 0.0 0.0
R26 C + O2 = CO + O 6.02·1013 0.0 2.66
108
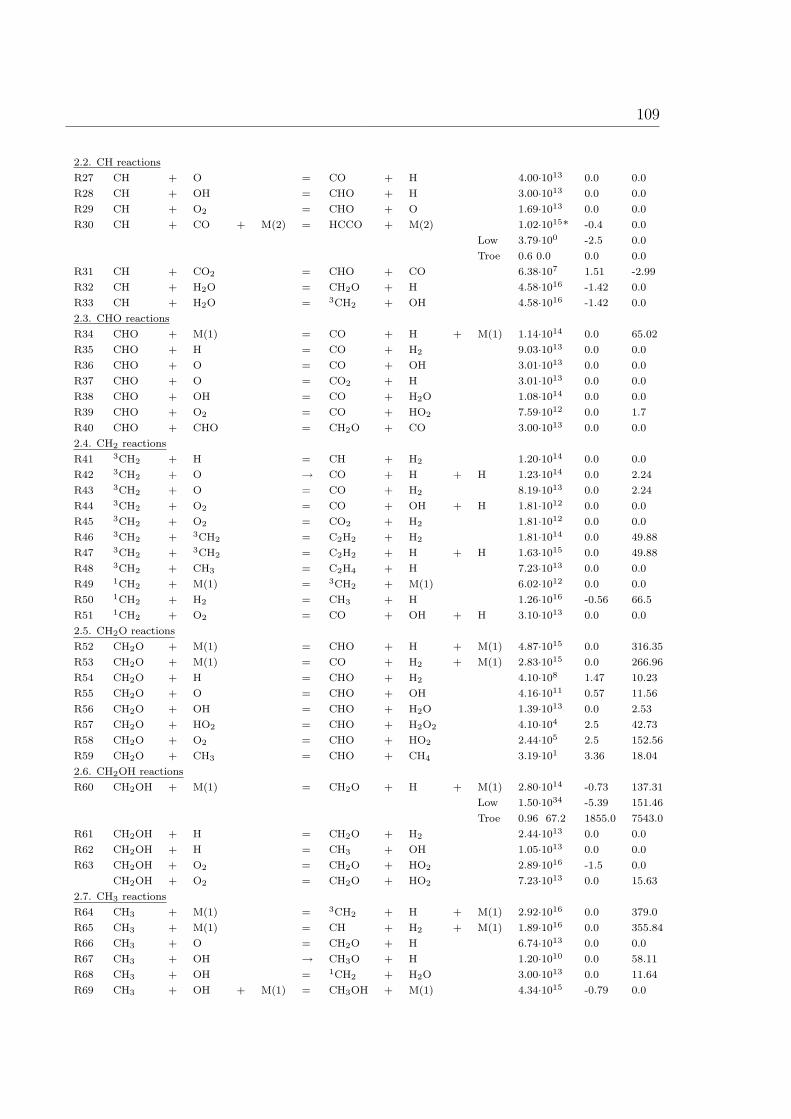
109
2.2. CH reactions
R27 CH + O = CO + H 4.00·1013 0.0 0.0
R28 CH + OH = CHO + H 3.00·1013 0.0 0.0
R29 CH + O2 = CHO + O 1.69·1013 0.0 0.0
R30 CH + CO + M(2) = HCCO + M(2) 1.02·1015* -0.4 0.0
Low 3.79·100 -2.5 0.0
Troe 0.6 0.0 0.0 0.0
R31 CH + CO2 = CHO + CO 6.38·107 1.51 -2.99
R32 CH + H2O = CH2O + H 4.58·1016 -1.42 0.0
R33 CH + H2O = 3CH2 + OH 4.58·1016 -1.42 0.0
2.3. CHO reactions
R34 CHO + M(1) = CO + H + M(1) 1.14·1014 0.0 65.02
R35 CHO + H = CO + H2 9.03·1013 0.0 0.0
R36 CHO + O = CO + OH 3.01·1013 0.0 0.0
R37 CHO + O = CO2 + H 3.01·1013 0.0 0.0
R38 CHO + OH = CO + H2O 1.08·1014 0.0 0.0
R39 CHO + O2 = CO + HO2 7.59·1012 0.0 1.7
R40 CHO + CHO = CH2O + CO 3.00·1013 0.0 0.0
2.4. CH2 reactions
R41 3CH2 + H = CH + H2 1.20·1014 0.0 0.0
R42 3CH2 + O → CO + H + H 1.23·1014 0.0 2.24
R43 3CH2 + O = CO + H2 8.19·1013 0.0 2.24
R44 3CH2 + O2 = CO + OH + H 1.81·1012 0.0 0.0
R45 3CH2 + O2 = CO2 + H2 1.81·1012 0.0 0.0
R46 3CH2 + 3CH2 = C2H2 + H2 1.81·1014 0.0 49.88
R47 3CH2 + 3CH2 = C2H2 + H + H 1.63·1015 0.0 49.88
R48 3CH2 + CH3 = C2H4 + H 7.23·1013 0.0 0.0
R49 1CH2 + M(1) = 3CH2 + M(1) 6.02·1012 0.0 0.0
R50 1CH2 + H2 = CH3 + H 1.26·1016 -0.56 66.5
R51 1CH2 + O2 = CO + OH + H 3.10·1013 0.0 0.0
2.5. CH2O reactions
R52 CH2O + M(1) = CHO + H + M(1) 4.87·1015 0.0 316.35
R53 CH2O + M(1) = CO + H2 + M(1) 2.83·1015 0.0 266.96
R54 CH2O + H = CHO + H2 4.10·108 1.47 10.23
R55 CH2O + O = CHO + OH 4.16·1011 0.57 11.56
R56 CH2O + OH = CHO + H2O 1.39·1013 0.0 2.53
R57 CH2O + HO2 = CHO + H2O2 4.10·104 2.5 42.73
R58 CH2O + O2 = CHO + HO2 2.44·105 2.5 152.56
R59 CH2O + CH3 = CHO + CH4 3.19·101 3.36 18.04
2.6. CH2OH reactions
R60 CH2OH + M(1) = CH2O + H + M(1) 2.80·1014 -0.73 137.31
Low 1.50·1034 -5.39 151.46
Troe 0.96 67.2 1855.0 7543.0
R61 CH2OH + H = CH2O + H2 2.44·1013 0.0 0.0
R62 CH2OH + H = CH3 + OH 1.05·1013 0.0 0.0
R63 CH2OH + O2 = CH2O + HO2 2.89·1016 -1.5 0.0
CH2OH + O2 = CH2O + HO2 7.23·1013 0.0 15.63
2.7. CH3 reactions
R64 CH3 + M(1) = 3CH2 + H + M(1) 2.92·1016 0.0 379.0
R65 CH3 + M(1) = CH + H2 + M(1) 1.89·1016 0.0 355.84
R66 CH3 + O = CH2O + H 6.74·1013 0.0 0.0
R67 CH3 + OH → CH3O + H 1.20·1010 0.0 58.11
R68 CH3 + OH = 1CH2 + H2O 3.00·1013 0.0 11.64
R69 CH3 + OH + M(1) = CH3OH + M(1) 4.34·1015 -0.79 0.0
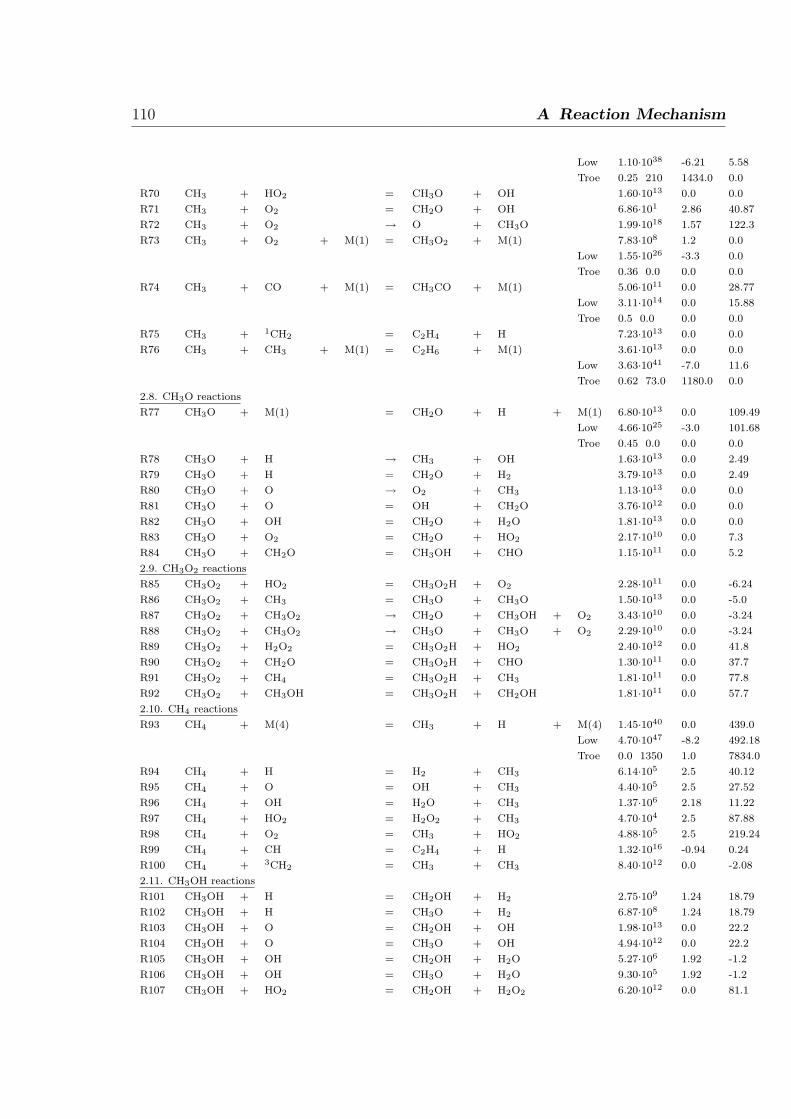
110 A Reaction Mechanism
Low 1.10·1038 -6.21 5.58
Troe 0.25 210 1434.0 0.0
R70 CH3 + HO2 = CH3O + OH 1.60·1013 0.0 0.0
R71 CH3 + O2 = CH2O + OH 6.86·101 2.86 40.87
R72 CH3 + O2 → O + CH3O 1.99·1018 1.57 122.3
R73 CH3 + O2 + M(1) = CH3O2 + M(1) 7.83·108 1.2 0.0
Low 1.55·1026 -3.3 0.0
Troe 0.36 0.0 0.0 0.0
R74 CH3 + CO + M(1) = CH3CO + M(1) 5.06·1011 0.0 28.77
Low 3.11·1014 0.0 15.88
Troe 0.5 0.0 0.0 0.0
R75 CH3 + 1CH2 = C2H4 + H 7.23·1013 0.0 0.0
R76 CH3 + CH3 + M(1) = C2H6 + M(1) 3.61·1013 0.0 0.0
Low 3.63·1041 -7.0 11.6
Troe 0.62 73.0 1180.0 0.0
2.8. CH3O reactions
R77 CH3O + M(1) = CH2O + H + M(1) 6.80·1013 0.0 109.49
Low 4.66·1025 -3.0 101.68
Troe 0.45 0.0 0.0 0.0
R78 CH3O + H → CH3 + OH 1.63·1013 0.0 2.49
R79 CH3O + H = CH2O + H2 3.79·1013 0.0 2.49
R80 CH3O + O → O2 + CH3 1.13·1013 0.0 0.0
R81 CH3O + O = OH + CH2O 3.76·1012 0.0 0.0
R82 CH3O + OH = CH2O + H2O 1.81·1013 0.0 0.0
R83 CH3O + O2 = CH2O + HO2 2.17·1010 0.0 7.3
R84 CH3O + CH2O = CH3OH + CHO 1.15·1011 0.0 5.2
2.9. CH3O2 reactions
R85 CH3O2 + HO2 = CH3O2H + O2 2.28·1011 0.0 -6.24
R86 CH3O2 + CH3 = CH3O + CH3O 1.50·1013 0.0 -5.0
R87 CH3O2 + CH3O2 → CH2O + CH3OH + O2 3.43·1010 0.0 -3.24
R88 CH3O2 + CH3O2 → CH3O + CH3O + O2 2.29·1010 0.0 -3.24
R89 CH3O2 + H2O2 = CH3O2H + HO2 2.40·1012 0.0 41.8
R90 CH3O2 + CH2O = CH3O2H + CHO 1.30·1011 0.0 37.7
R91 CH3O2 + CH4 = CH3O2H + CH3 1.81·1011 0.0 77.8
R92 CH3O2 + CH3OH = CH3O2H + CH2OH 1.81·1011 0.0 57.7
2.10. CH4 reactions
R93 CH4 + M(4) = CH3 + H + M(4) 1.45·1040 0.0 439.0
Low 4.70·1047 -8.2 492.18
Troe 0.0 1350 1.0 7834.0
R94 CH4 + H = H2 + CH3 6.14·105 2.5 40.12
R95 CH4 + O = OH + CH3 4.40·105 2.5 27.52
R96 CH4 + OH = H2O + CH3 1.37·106 2.18 11.22
R97 CH4 + HO2 = H2O2 + CH3 4.70·104 2.5 87.88
R98 CH4 + O2 = CH3 + HO2 4.88·105 2.5 219.24
R99 CH4 + CH = C2H4 + H 1.32·1016 -0.94 0.24
R100 CH4 + 3CH2 = CH3 + CH3 8.40·1012 0.0 -2.08
2.11. CH3OH reactions
R101 CH3OH + H = CH2OH + H2 2.75·109 1.24 18.79
R102 CH3OH + H = CH3O + H2 6.87·108 1.24 18.79
R103 CH3OH + O = CH2OH + OH 1.98·1013 0.0 22.2
R104 CH3OH + O = CH3O + OH 4.94·1012 0.0 22.2
R105 CH3OH + OH = CH2OH + H2O 5.27·106 1.92 -1.2
R106 CH3OH + OH = CH3O + H2O 9.30·105 1.92 -1.2
R107 CH3OH + HO2 = CH2OH + H2O2 6.20·1012 0.0 81.1
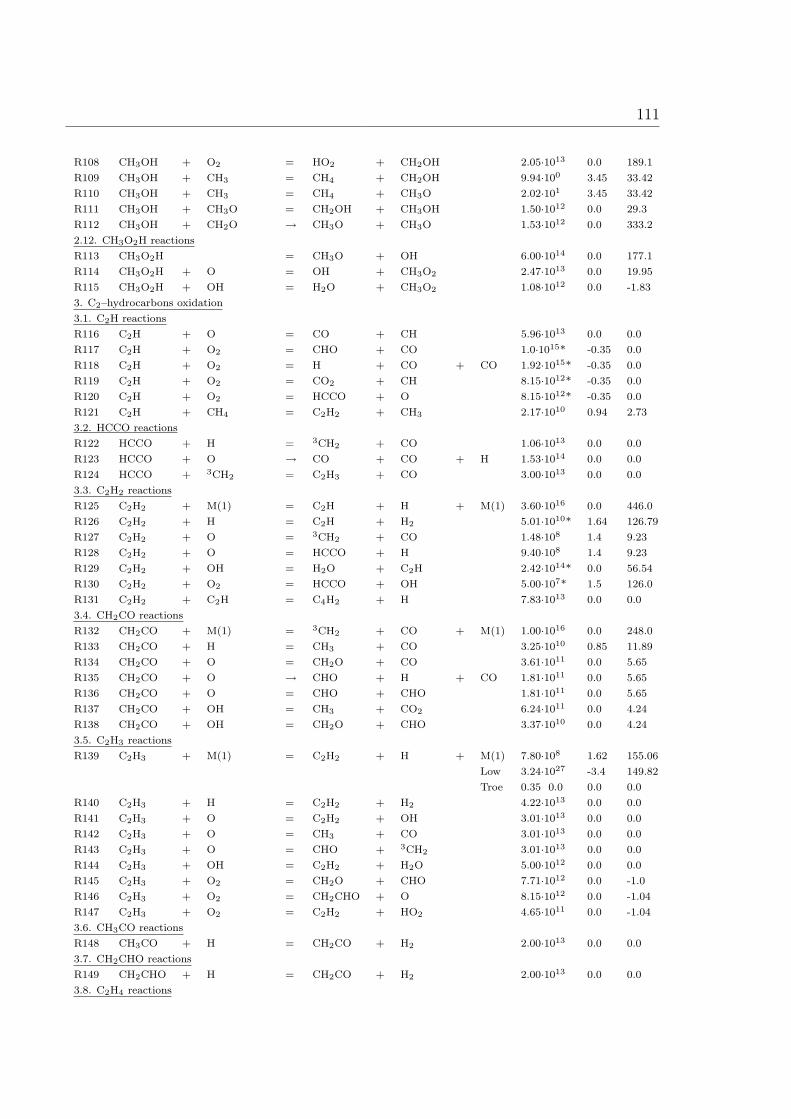
111
R108 CH3OH + O2 = HO2 + CH2OH 2.05·1013 0.0 189.1
R109 CH3OH + CH3 = CH4 + CH2OH 9.94·100 3.45 33.42
R110 CH3OH + CH3 = CH4 + CH3O 2.02·101 3.45 33.42
R111 CH3OH + CH3O = CH2OH + CH3OH 1.50·1012 0.0 29.3
R112 CH3OH + CH2O → CH3O + CH3O 1.53·1012 0.0 333.2
2.12. CH3O2H reactions
R113 CH3O2H = CH3O + OH 6.00·1014 0.0 177.1
R114 CH3O2H + O = OH + CH3O2 2.47·1013 0.0 19.95
R115 CH3O2H + OH = H2O + CH3O2 1.08·1012 0.0 -1.83
3. C2–hydrocarbons oxidation
3.1. C2H reactions
R116 C2H + O = CO + CH 5.96·1013 0.0 0.0
R117 C2H + O2 = CHO + CO 1.0·1015* -0.35 0.0
R118 C2H + O2 = H + CO + CO 1.92·1015* -0.35 0.0
R119 C2H + O2 = CO2 + CH 8.15·1012* -0.35 0.0
R120 C2H + O2 = HCCO + O 8.15·1012* -0.35 0.0
R121 C2H + CH4 = C2H2 + CH3 2.17·1010 0.94 2.73
3.2. HCCO reactions
R122 HCCO + H = 3CH2 + CO 1.06·1013 0.0 0.0
R123 HCCO + O → CO + CO + H 1.53·1014 0.0 0.0
R124 HCCO + 3CH2 = C2H3 + CO 3.00·1013 0.0 0.0
3.3. C2H2 reactions
R125 C2H2 + M(1) = C2H + H + M(1) 3.60·1016 0.0 446.0
R126 C2H2 + H = C2H + H2 5.01·1010* 1.64 126.79
R127 C2H2 + O = 3CH2 + CO 1.48·108 1.4 9.23
R128 C2H2 + O = HCCO + H 9.40·108 1.4 9.23
R129 C2H2 + OH = H2O + C2H 2.42·1014* 0.0 56.54
R130 C2H2 + O2 = HCCO + OH 5.00·107* 1.5 126.0
R131 C2H2 + C2H = C4H2 + H 7.83·1013 0.0 0.0
3.4. CH2CO reactions
R132 CH2CO + M(1) = 3CH2 + CO + M(1) 1.00·1016 0.0 248.0
R133 CH2CO + H = CH3 + CO 3.25·1010 0.85 11.89
R134 CH2CO + O = CH2O + CO 3.61·1011 0.0 5.65
R135 CH2CO + O → CHO + H + CO 1.81·1011 0.0 5.65
R136 CH2CO + O = CHO + CHO 1.81·1011 0.0 5.65
R137 CH2CO + OH = CH3 + CO2 6.24·1011 0.0 4.24
R138 CH2CO + OH = CH2O + CHO 3.37·1010 0.0 4.24
3.5. C2H3 reactions
R139 C2H3 + M(1) = C2H2 + H + M(1) 7.80·108 1.62 155.06
Low 3.24·1027 -3.4 149.82
Troe 0.35 0.0 0.0 0.0
R140 C2H3 + H = C2H2 + H2 4.22·1013 0.0 0.0
R141 C2H3 + O = C2H2 + OH 3.01·1013 0.0 0.0
R142 C2H3 + O = CH3 + CO 3.01·1013 0.0 0.0
R143 C2H3 + O = CHO + 3CH2 3.01·1013 0.0 0.0
R144 C2H3 + OH = C2H2 + H2O 5.00·1012 0.0 0.0
R145 C2H3 + O2 = CH2O + CHO 7.71·1012 0.0 -1.0
R146 C2H3 + O2 = CH2CHO + O 8.15·1012 0.0 -1.04
R147 C2H3 + O2 = C2H2 + HO2 4.65·1011 0.0 -1.04
3.6. CH3CO reactions
R148 CH3CO + H = CH2CO + H2 2.00·1013 0.0 0.0
3.7. CH2CHO reactions
R149 CH2CHO + H = CH2CO + H2 2.00·1013 0.0 0.0
3.8. C2H4 reactions
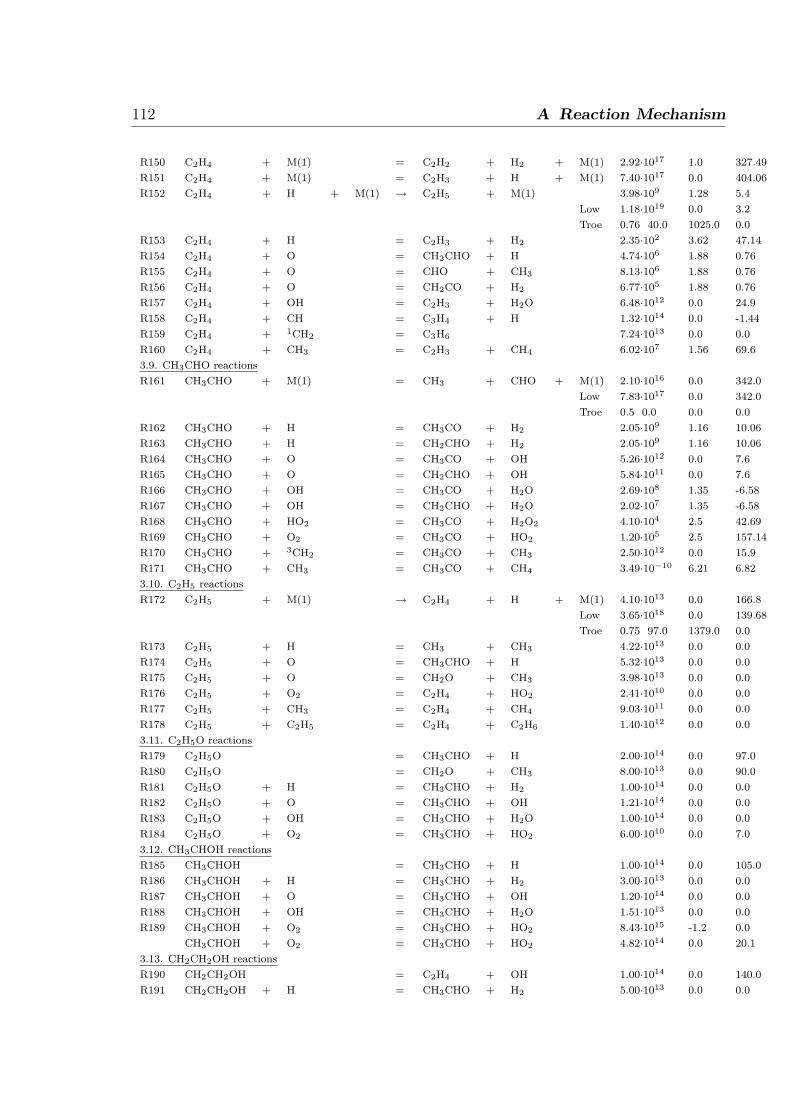
112 A Reaction Mechanism
R150 C2H4 + M(1) = C2H2 + H2 + M(1) 2.92·1017 1.0 327.49
R151 C2H4 + M(1) = C2H3 + H + M(1) 7.40·1017 0.0 404.06
R152 C2H4 + H + M(1) → C2H5 + M(1) 3.98·109 1.28 5.4
Low 1.18·1019 0.0 3.2
Troe 0.76 40.0 1025.0 0.0
R153 C2H4 + H = C2H3 + H2 2.35·102 3.62 47.14
R154 C2H4 + O = CH2CHO + H 4.74·106 1.88 0.76
R155 C2H4 + O = CHO + CH3 8.13·106 1.88 0.76
R156 C2H4 + O = CH2CO + H2 6.77·105 1.88 0.76
R157 C2H4 + OH = C2H3 + H2O 6.48·1012 0.0 24.9
R158 C2H4 + CH = C3H4 + H 1.32·1014 0.0 -1.44
R159 C2H4 + 1CH2 = C3H6 7.24·1013 0.0 0.0
R160 C2H4 + CH3 = C2H3 + CH4 6.02·107 1.56 69.6
3.9. CH3CHO reactions
R161 CH3CHO + M(1) = CH3 + CHO + M(1) 2.10·1016 0.0 342.0
Low 7.83·1017 0.0 342.0
Troe 0.5 0.0 0.0 0.0
R162 CH3CHO + H = CH3CO + H2 2.05·109 1.16 10.06
R163 CH3CHO + H = CH2CHO + H2 2.05·109 1.16 10.06
R164 CH3CHO + O = CH3CO + OH 5.26·1012 0.0 7.6
R165 CH3CHO + O = CH2CHO + OH 5.84·1011 0.0 7.6
R166 CH3CHO + OH = CH3CO + H2O 2.69·108 1.35 -6.58
R167 CH3CHO + OH = CH2CHO + H2O 2.02·107 1.35 -6.58
R168 CH3CHO + HO2 = CH3CO + H2O2 4.10·104 2.5 42.69
R169 CH3CHO + O2 = CH3CO + HO2 1.20·105 2.5 157.14
R170 CH3CHO + 3CH2 = CH3CO + CH3 2.50·1012 0.0 15.9
R171 CH3CHO + CH3 = CH3CO + CH4 3.49·10−10 6.21 6.82
3.10. C2H5 reactions
R172 C2H5 + M(1) → C2H4 + H + M(1) 4.10·1013 0.0 166.8
Low 3.65·1018 0.0 139.68
Troe 0.75 97.0 1379.0 0.0
R173 C2H5 + H = CH3 + CH3 4.22·1013 0.0 0.0
R174 C2H5 + O = CH3CHO + H 5.32·1013 0.0 0.0
R175 C2H5 + O = CH2O + CH3 3.98·1013 0.0 0.0
R176 C2H5 + O2 = C2H4 + HO2 2.41·1010 0.0 0.0
R177 C2H5 + CH3 = C2H4 + CH4 9.03·1011 0.0 0.0
R178 C2H5 + C2H5 = C2H4 + C2H6 1.40·1012 0.0 0.0
3.11. C2H5O reactions
R179 C2H5O = CH3CHO + H 2.00·1014 0.0 97.0
R180 C2H5O = CH2O + CH3 8.00·1013 0.0 90.0
R181 C2H5O + H = CH3CHO + H2 1.00·1014 0.0 0.0
R182 C2H5O + O = CH3CHO + OH 1.21·1014 0.0 0.0
R183 C2H5O + OH = CH3CHO + H2O 1.00·1014 0.0 0.0
R184 C2H5O + O2 = CH3CHO + HO2 6.00·1010 0.0 7.0
3.12. CH3CHOH reactions
R185 CH3CHOH = CH3CHO + H 1.00·1014 0.0 105.0
R186 CH3CHOH + H = CH3CHO + H2 3.00·1013 0.0 0.0
R187 CH3CHOH + O = CH3CHO + OH 1.20·1014 0.0 0.0
R188 CH3CHOH + OH = CH3CHO + H2O 1.51·1013 0.0 0.0
R189 CH3CHOH + O2 = CH3CHO + HO2 8.43·1015 -1.2 0.0
CH3CHOH + O2 = CH3CHO + HO2 4.82·1014 0.0 20.1
3.13. CH2CH2OH reactions
R190 CH2CH2OH = C2H4 + OH 1.00·1014 0.0 140.0
R191 CH2CH2OH + H = CH3CHO + H2 5.00·1013 0.0 0.0
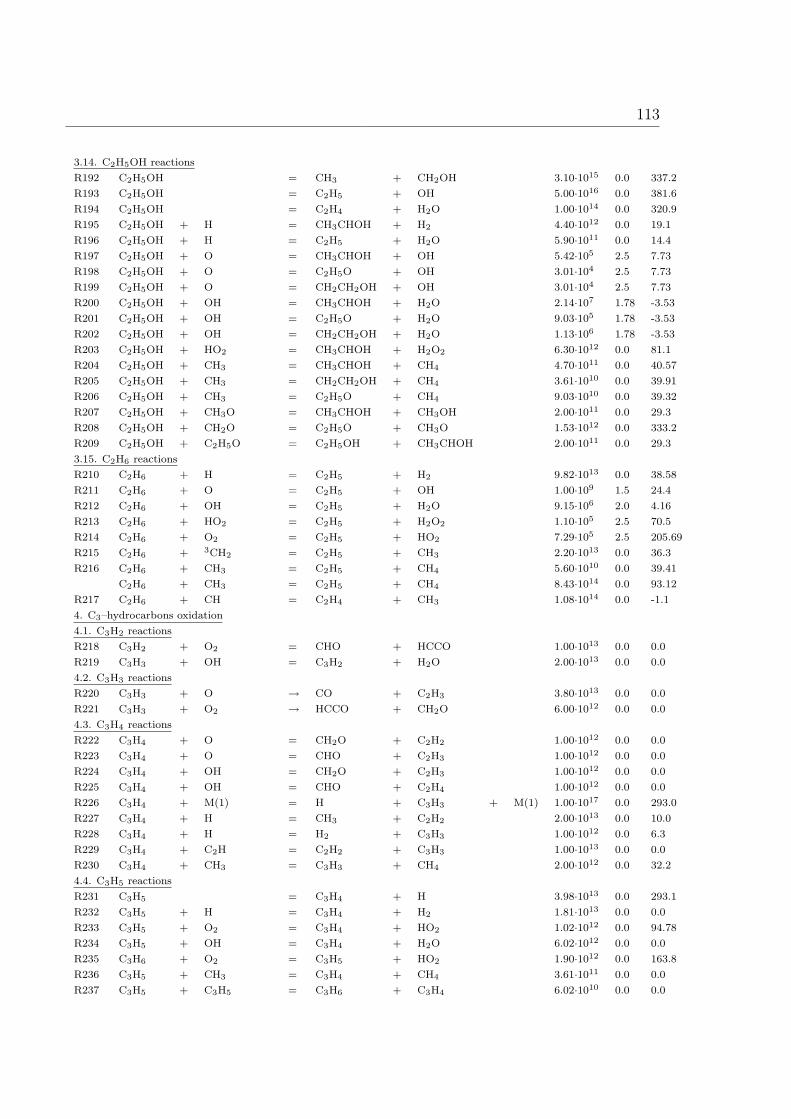
113
3.14. C2H5OH reactions
R192 C2H5OH = CH3 + CH2OH 3.10·1015 0.0 337.2
R193 C2H5OH = C2H5 + OH 5.00·1016 0.0 381.6
R194 C2H5OH = C2H4 + H2O 1.00·1014 0.0 320.9
R195 C2H5OH + H = CH3CHOH + H2 4.40·1012 0.0 19.1
R196 C2H5OH + H = C2H5 + H2O 5.90·1011 0.0 14.4
R197 C2H5OH + O = CH3CHOH + OH 5.42·105 2.5 7.73
R198 C2H5OH + O = C2H5O + OH 3.01·104 2.5 7.73
R199 C2H5OH + O = CH2CH2OH + OH 3.01·104 2.5 7.73
R200 C2H5OH + OH = CH3CHOH + H2O 2.14·107 1.78 -3.53
R201 C2H5OH + OH = C2H5O + H2O 9.03·105 1.78 -3.53
R202 C2H5OH + OH = CH2CH2OH + H2O 1.13·106 1.78 -3.53
R203 C2H5OH + HO2 = CH3CHOH + H2O2 6.30·1012 0.0 81.1
R204 C2H5OH + CH3 = CH3CHOH + CH4 4.70·1011 0.0 40.57
R205 C2H5OH + CH3 = CH2CH2OH + CH4 3.61·1010 0.0 39.91
R206 C2H5OH + CH3 = C2H5O + CH4 9.03·1010 0.0 39.32
R207 C2H5OH + CH3O = CH3CHOH + CH3OH 2.00·1011 0.0 29.3
R208 C2H5OH + CH2O = C2H5O + CH3O 1.53·1012 0.0 333.2
R209 C2H5OH + C2H5O = C2H5OH + CH3CHOH 2.00·1011 0.0 29.3
3.15. C2H6 reactions
R210 C2H6 + H = C2H5 + H2 9.82·1013 0.0 38.58
R211 C2H6 + O = C2H5 + OH 1.00·109 1.5 24.4
R212 C2H6 + OH = C2H5 + H2O 9.15·106 2.0 4.16
R213 C2H6 + HO2 = C2H5 + H2O2 1.10·105 2.5 70.5
R214 C2H6 + O2 = C2H5 + HO2 7.29·105 2.5 205.69
R215 C2H6 + 3CH2 = C2H5 + CH3 2.20·1013 0.0 36.3
R216 C2H6 + CH3 = C2H5 + CH4 5.60·1010 0.0 39.41
C2H6 + CH3 = C2H5 + CH4 8.43·1014 0.0 93.12
R217 C2H6 + CH = C2H4 + CH3 1.08·1014 0.0 -1.1
4. C3–hydrocarbons oxidation
4.1. C3H2 reactions
R218 C3H2 + O2 = CHO + HCCO 1.00·1013 0.0 0.0
R219 C3H3 + OH = C3H2 + H2O 2.00·1013 0.0 0.0
4.2. C3H3 reactions
R220 C3H3 + O → CO + C2H3 3.80·1013 0.0 0.0
R221 C3H3 + O2 → HCCO + CH2O 6.00·1012 0.0 0.0
4.3. C3H4 reactions
R222 C3H4 + O = CH2O + C2H2 1.00·1012 0.0 0.0
R223 C3H4 + O = CHO + C2H3 1.00·1012 0.0 0.0
R224 C3H4 + OH = CH2O + C2H3 1.00·1012 0.0 0.0
R225 C3H4 + OH = CHO + C2H4 1.00·1012 0.0 0.0
R226 C3H4 + M(1) = H + C3H3 + M(1) 1.00·1017 0.0 293.0
R227 C3H4 + H = CH3 + C2H2 2.00·1013 0.0 10.0
R228 C3H4 + H = H2 + C3H3 1.00·1012 0.0 6.3
R229 C3H4 + C2H = C2H2 + C3H3 1.00·1013 0.0 0.0
R230 C3H4 + CH3 = C3H3 + CH4 2.00·1012 0.0 32.2
4.4. C3H5 reactions
R231 C3H5 = C3H4 + H 3.98·1013 0.0 293.1
R232 C3H5 + H = C3H4 + H2 1.81·1013 0.0 0.0
R233 C3H5 + O2 = C3H4 + HO2 1.02·1012 0.0 94.78
R234 C3H5 + OH = C3H4 + H2O 6.02·1012 0.0 0.0
R235 C3H6 + O2 = C3H5 + HO2 1.90·1012 0.0 163.8
R236 C3H5 + CH3 = C3H4 + CH4 3.61·1011 0.0 0.0
R237 C3H5 + C3H5 = C3H6 + C3H4 6.02·1010 0.0 0.0
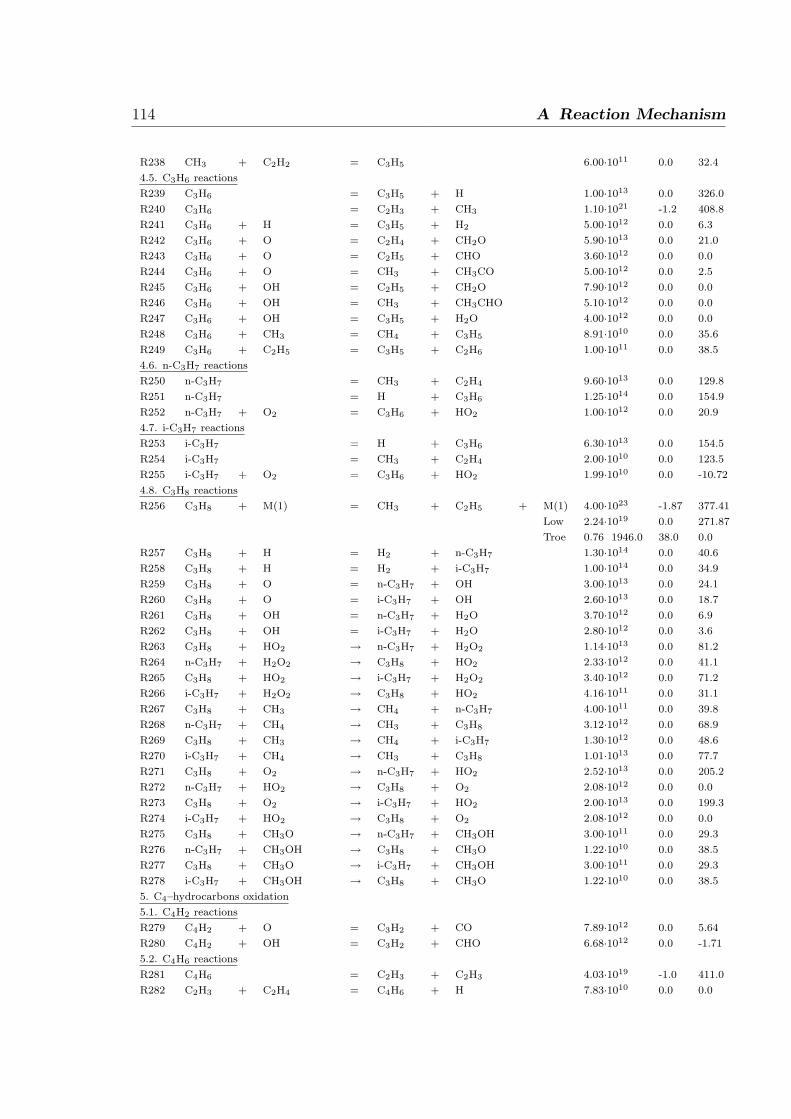
114 A Reaction Mechanism
R238 CH3 + C2H2 = C3H5 6.00·1011 0.0 32.4
4.5. C3H6 reactions
R239 C3H6 = C3H5 + H 1.00·1013 0.0 326.0
R240 C3H6 = C2H3 + CH3 1.10·1021 -1.2 408.8
R241 C3H6 + H = C3H5 + H2 5.00·1012 0.0 6.3
R242 C3H6 + O = C2H4 + CH2O 5.90·1013 0.0 21.0
R243 C3H6 + O = C2H5 + CHO 3.60·1012 0.0 0.0
R244 C3H6 + O = CH3 + CH3CO 5.00·1012 0.0 2.5
R245 C3H6 + OH = C2H5 + CH2O 7.90·1012 0.0 0.0
R246 C3H6 + OH = CH3 + CH3CHO 5.10·1012 0.0 0.0
R247 C3H6 + OH = C3H5 + H2O 4.00·1012 0.0 0.0
R248 C3H6 + CH3 = CH4 + C3H5 8.91·1010 0.0 35.6
R249 C3H6 + C2H5 = C3H5 + C2H6 1.00·1011 0.0 38.5
4.6. n-C3H7 reactions
R250 n-C3H7 = CH3 + C2H4 9.60·1013 0.0 129.8
R251 n-C3H7 = H + C3H6 1.25·1014 0.0 154.9
R252 n-C3H7 + O2 = C3H6 + HO2 1.00·1012 0.0 20.9
4.7. i-C3H7 reactions
R253 i-C3H7 = H + C3H6 6.30·1013 0.0 154.5
R254 i-C3H7 = CH3 + C2H4 2.00·1010 0.0 123.5
R255 i-C3H7 + O2 = C3H6 + HO2 1.99·1010 0.0 -10.72
4.8. C3H8 reactions
R256 C3H8 + M(1) = CH3 + C2H5 + M(1) 4.00·1023 -1.87 377.41
Low 2.24·1019 0.0 271.87
Troe 0.76 1946.0 38.0 0.0
R257 C3H8 + H = H2 + n-C3H7 1.30·1014 0.0 40.6
R258 C3H8 + H = H2 + i-C3H7 1.00·1014 0.0 34.9
R259 C3H8 + O = n-C3H7 + OH 3.00·1013 0.0 24.1
R260 C3H8 + O = i-C3H7 + OH 2.60·1013 0.0 18.7
R261 C3H8 + OH = n-C3H7 + H2O 3.70·1012 0.0 6.9
R262 C3H8 + OH = i-C3H7 + H2O 2.80·1012 0.0 3.6
R263 C3H8 + HO2 → n-C3H7 + H2O2 1.14·1013 0.0 81.2
R264 n-C3H7 + H2O2 → C3H8 + HO2 2.33·1012 0.0 41.1
R265 C3H8 + HO2 → i-C3H7 + H2O2 3.40·1012 0.0 71.2
R266 i-C3H7 + H2O2 → C3H8 + HO2 4.16·1011 0.0 31.1
R267 C3H8 + CH3 → CH4 + n-C3H7 4.00·1011 0.0 39.8
R268 n-C3H7 + CH4 → CH3 + C3H8 3.12·1012 0.0 68.9
R269 C3H8 + CH3 → CH4 + i-C3H7 1.30·1012 0.0 48.6
R270 i-C3H7 + CH4 → CH3 + C3H8 1.01·1013 0.0 77.7
R271 C3H8 + O2 → n-C3H7 + HO2 2.52·1013 0.0 205.2
R272 n-C3H7 + HO2 → C3H8 + O2 2.08·1012 0.0 0.0
R273 C3H8 + O2 → i-C3H7 + HO2 2.00·1013 0.0 199.3
R274 i-C3H7 + HO2 → C3H8 + O2 2.08·1012 0.0 0.0
R275 C3H8 + CH3O → n-C3H7 + CH3OH 3.00·1011 0.0 29.3
R276 n-C3H7 + CH3OH → C3H8 + CH3O 1.22·1010 0.0 38.5
R277 C3H8 + CH3O → i-C3H7 + CH3OH 3.00·1011 0.0 29.3
R278 i-C3H7 + CH3OH → C3H8 + CH3O 1.22·1010 0.0 38.5
5. C4–hydrocarbons oxidation
5.1. C4H2 reactions
R279 C4H2 + O = C3H2 + CO 7.89·1012 0.0 5.64
R280 C4H2 + OH = C3H2 + CHO 6.68·1012 0.0 -1.71
5.2. C4H6 reactions
R281 C4H6 = C2H3 + C2H3 4.03·1019 -1.0 411.0
R282 C2H3 + C2H4 = C4H6 + H 7.83·1010 0.0 0.0
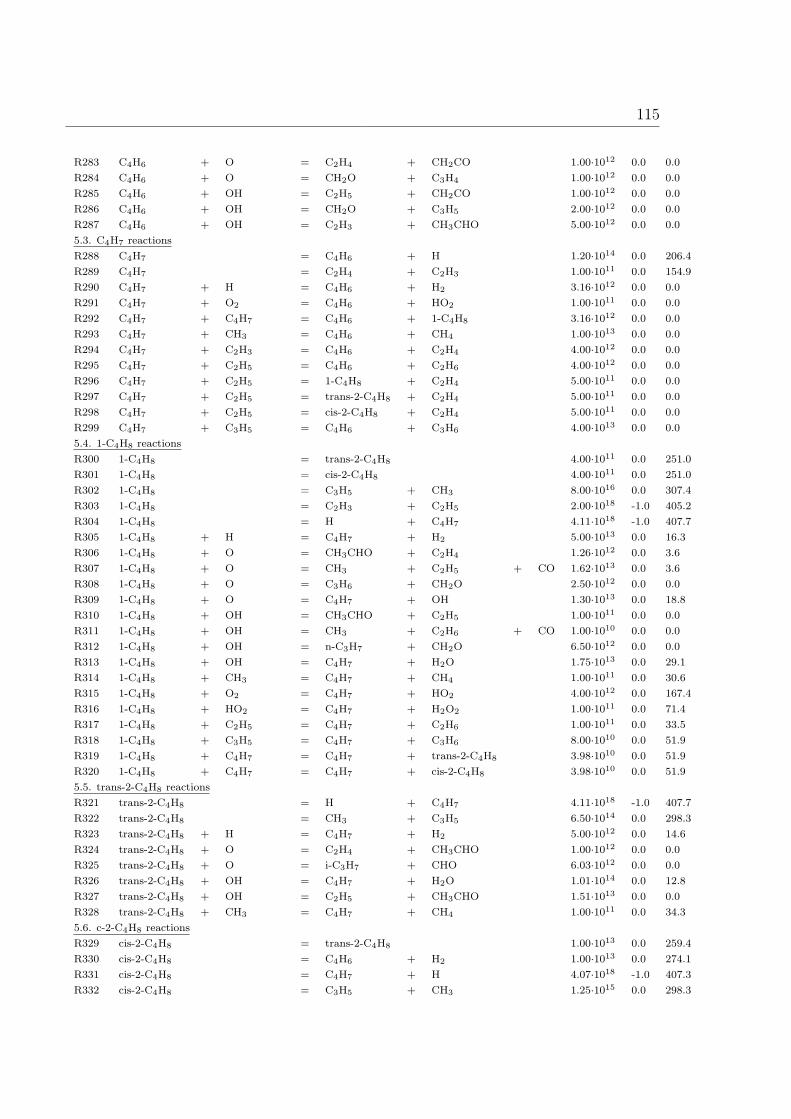
115
R283 C4H6 + O = C2H4 + CH2CO 1.00·1012 0.0 0.0
R284 C4H6 + O = CH2O + C3H4 1.00·1012 0.0 0.0
R285 C4H6 + OH = C2H5 + CH2CO 1.00·1012 0.0 0.0
R286 C4H6 + OH = CH2O + C3H5 2.00·1012 0.0 0.0
R287 C4H6 + OH = C2H3 + CH3CHO 5.00·1012 0.0 0.0
5.3. C4H7 reactions
R288 C4H7 = C4H6 + H 1.20·1014 0.0 206.4
R289 C4H7 = C2H4 + C2H3 1.00·1011 0.0 154.9
R290 C4H7 + H = C4H6 + H2 3.16·1012 0.0 0.0
R291 C4H7 + O2 = C4H6 + HO2 1.00·1011 0.0 0.0
R292 C4H7 + C4H7 = C4H6 + 1-C4H8 3.16·1012 0.0 0.0
R293 C4H7 + CH3 = C4H6 + CH4 1.00·1013 0.0 0.0
R294 C4H7 + C2H3 = C4H6 + C2H4 4.00·1012 0.0 0.0
R295 C4H7 + C2H5 = C4H6 + C2H6 4.00·1012 0.0 0.0
R296 C4H7 + C2H5 = 1-C4H8 + C2H4 5.00·1011 0.0 0.0
R297 C4H7 + C2H5 = trans-2-C4H8 + C2H4 5.00·1011 0.0 0.0
R298 C4H7 + C2H5 = cis-2-C4H8 + C2H4 5.00·1011 0.0 0.0
R299 C4H7 + C3H5 = C4H6 + C3H6 4.00·1013 0.0 0.0
5.4. 1-C4H8 reactions
R300 1-C4H8 = trans-2-C4H8 4.00·1011 0.0 251.0
R301 1-C4H8 = cis-2-C4H8 4.00·1011 0.0 251.0
R302 1-C4H8 = C3H5 + CH3 8.00·1016 0.0 307.4
R303 1-C4H8 = C2H3 + C2H5 2.00·1018 -1.0 405.2
R304 1-C4H8 = H + C4H7 4.11·1018 -1.0 407.7
R305 1-C4H8 + H = C4H7 + H2 5.00·1013 0.0 16.3
R306 1-C4H8 + O = CH3CHO + C2H4 1.26·1012 0.0 3.6
R307 1-C4H8 + O = CH3 + C2H5 + CO 1.62·1013 0.0 3.6
R308 1-C4H8 + O = C3H6 + CH2O 2.50·1012 0.0 0.0
R309 1-C4H8 + O = C4H7 + OH 1.30·1013 0.0 18.8
R310 1-C4H8 + OH = CH3CHO + C2H5 1.00·1011 0.0 0.0
R311 1-C4H8 + OH = CH3 + C2H6 + CO 1.00·1010 0.0 0.0
R312 1-C4H8 + OH = n-C3H7 + CH2O 6.50·1012 0.0 0.0
R313 1-C4H8 + OH = C4H7 + H2O 1.75·1013 0.0 29.1
R314 1-C4H8 + CH3 = C4H7 + CH4 1.00·1011 0.0 30.6
R315 1-C4H8 + O2 = C4H7 + HO2 4.00·1012 0.0 167.4
R316 1-C4H8 + HO2 = C4H7 + H2O2 1.00·1011 0.0 71.4
R317 1-C4H8 + C2H5 = C4H7 + C2H6 1.00·1011 0.0 33.5
R318 1-C4H8 + C3H5 = C4H7 + C3H6 8.00·1010 0.0 51.9
R319 1-C4H8 + C4H7 = C4H7 + trans-2-C4H8 3.98·1010 0.0 51.9
R320 1-C4H8 + C4H7 = C4H7 + cis-2-C4H8 3.98·1010 0.0 51.9
5.5. trans-2-C4H8 reactions
R321 trans-2-C4H8 = H + C4H7 4.11·1018 -1.0 407.7
R322 trans-2-C4H8 = CH3 + C3H5 6.50·1014 0.0 298.3
R323 trans-2-C4H8 + H = C4H7 + H2 5.00·1012 0.0 14.6
R324 trans-2-C4H8 + O = C2H4 + CH3CHO 1.00·1012 0.0 0.0
R325 trans-2-C4H8 + O = i-C3H7 + CHO 6.03·1012 0.0 0.0
R326 trans-2-C4H8 + OH = C4H7 + H2O 1.01·1014 0.0 12.8
R327 trans-2-C4H8 + OH = C2H5 + CH3CHO 1.51·1013 0.0 0.0
R328 trans-2-C4H8 + CH3 = C4H7 + CH4 1.00·1011 0.0 34.3
5.6. c-2-C4H8 reactions
R329 cis-2-C4H8 = trans-2-C4H8 1.00·1013 0.0 259.4
R330 cis-2-C4H8 = C4H6 + H2 1.00·1013 0.0 274.1
R331 cis-2-C4H8 = C4H7 + H 4.07·1018 -1.0 407.3
R332 cis-2-C4H8 = C3H5 + CH3 1.25·1015 0.0 298.3
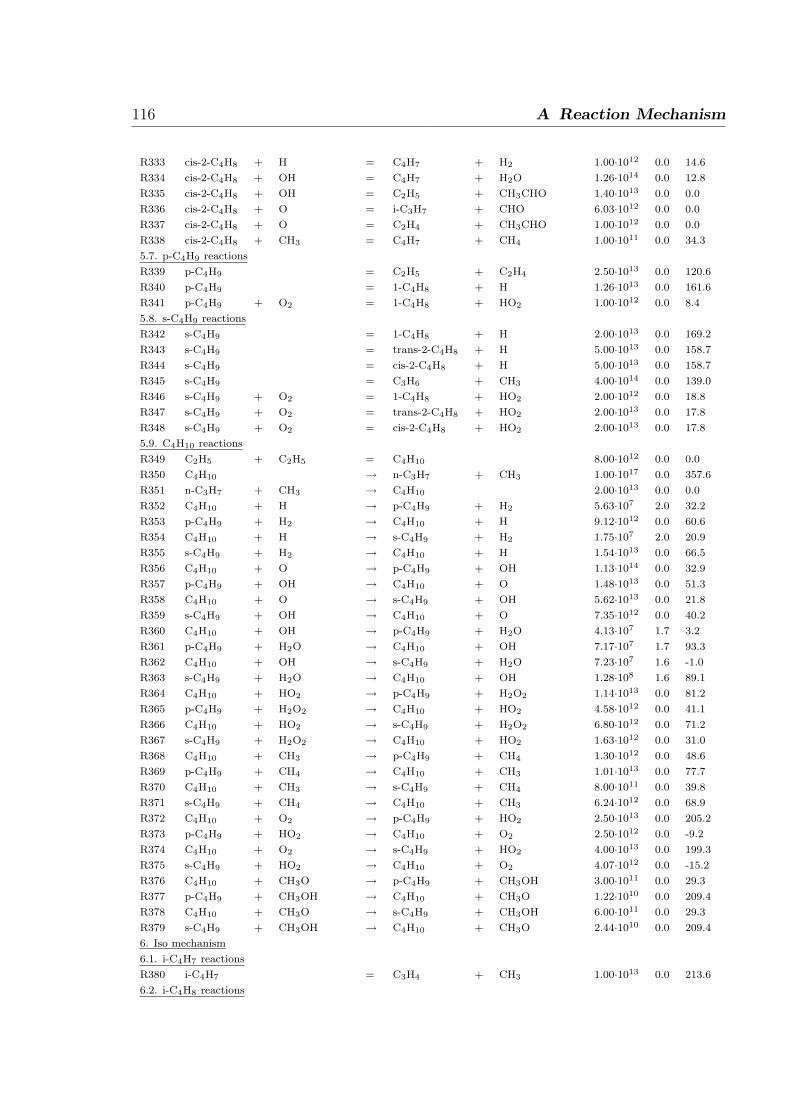
116 A Reaction Mechanism
R333 cis-2-C4H8 + H = C4H7 + H2 1.00·1012 0.0 14.6
R334 cis-2-C4H8 + OH = C4H7 + H2O 1.26·1014 0.0 12.8
R335 cis-2-C4H8 + OH = C2H5 + CH3CHO 1.40·1013 0.0 0.0
R336 cis-2-C4H8 + O = i-C3H7 + CHO 6.03·1012 0.0 0.0
R337 cis-2-C4H8 + O = C2H4 + CH3CHO 1.00·1012 0.0 0.0
R338 cis-2-C4H8 + CH3 = C4H7 + CH4 1.00·1011 0.0 34.3
5.7. p-C4H9 reactions
R339 p-C4H9 = C2H5 + C2H4 2.50·1013 0.0 120.6
R340 p-C4H9 = 1-C4H8 + H 1.26·1013 0.0 161.6
R341 p-C4H9 + O2 = 1-C4H8 + HO2 1.00·1012 0.0 8.4
5.8. s-C4H9 reactions
R342 s-C4H9 = 1-C4H8 + H 2.00·1013 0.0 169.2
R343 s-C4H9 = trans-2-C4H8 + H 5.00·1013 0.0 158.7
R344 s-C4H9 = cis-2-C4H8 + H 5.00·1013 0.0 158.7
R345 s-C4H9 = C3H6 + CH3 4.00·1014 0.0 139.0
R346 s-C4H9 + O2 = 1-C4H8 + HO2 2.00·1012 0.0 18.8
R347 s-C4H9 + O2 = trans-2-C4H8 + HO2 2.00·1013 0.0 17.8
R348 s-C4H9 + O2 = cis-2-C4H8 + HO2 2.00·1013 0.0 17.8
5.9. C4H10 reactions
R349 C2H5 + C2H5 = C4H10 8.00·1012 0.0 0.0
R350 C4H10 → n-C3H7 + CH3 1.00·1017 0.0 357.6
R351 n-C3H7 + CH3 → C4H10 2.00·1013 0.0 0.0
R352 C4H10 + H → p-C4H9 + H2 5.63·107 2.0 32.2
R353 p-C4H9 + H2 → C4H10 + H 9.12·1012 0.0 60.6
R354 C4H10 + H → s-C4H9 + H2 1.75·107 2.0 20.9
R355 s-C4H9 + H2 → C4H10 + H 1.54·1013 0.0 66.5
R356 C4H10 + O → p-C4H9 + OH 1.13·1014 0.0 32.9
R357 p-C4H9 + OH → C4H10 + O 1.48·1013 0.0 51.3
R358 C4H10 + O → s-C4H9 + OH 5.62·1013 0.0 21.8
R359 s-C4H9 + OH → C4H10 + O 7.35·1012 0.0 40.2
R360 C4H10 + OH → p-C4H9 + H2O 4.13·107 1.7 3.2
R361 p-C4H9 + H2O → C4H10 + OH 7.17·107 1.7 93.3
R362 C4H10 + OH → s-C4H9 + H2O 7.23·107 1.6 -1.0
R363 s-C4H9 + H2O → C4H10 + OH 1.28·108 1.6 89.1
R364 C4H10 + HO2 → p-C4H9 + H2O2 1.14·1013 0.0 81.2
R365 p-C4H9 + H2O2 → C4H10 + HO2 4.58·1012 0.0 41.1
R366 C4H10 + HO2 → s-C4H9 + H2O2 6.80·1012 0.0 71.2
R367 s-C4H9 + H2O2 → C4H10 + HO2 1.63·1012 0.0 31.0
R368 C4H10 + CH3 → p-C4H9 + CH4 1.30·1012 0.0 48.6
R369 p-C4H9 + CH4 → C4H10 + CH3 1.01·1013 0.0 77.7
R370 C4H10 + CH3 → s-C4H9 + CH4 8.00·1011 0.0 39.8
R371 s-C4H9 + CH4 → C4H10 + CH3 6.24·1012 0.0 68.9
R372 C4H10 + O2 → p-C4H9 + HO2 2.50·1013 0.0 205.2
R373 p-C4H9 + HO2 → C4H10 + O2 2.50·1012 0.0 -9.2
R374 C4H10 + O2 → s-C4H9 + HO2 4.00·1013 0.0 199.3
R375 s-C4H9 + HO2 → C4H10 + O2 4.07·1012 0.0 -15.2
R376 C4H10 + CH3O → p-C4H9 + CH3OH 3.00·1011 0.0 29.3
R377 p-C4H9 + CH3OH → C4H10 + CH3O 1.22·1010 0.0 209.4
R378 C4H10 + CH3O → s-C4H9 + CH3OH 6.00·1011 0.0 29.3
R379 s-C4H9 + CH3OH → C4H10 + CH3O 2.44·1010 0.0 209.4
6. Iso mechanism
6.1. i-C4H7 reactions
R380 i-C4H7 = C3H4 + CH3 1.00·1013 0.0 213.6
6.2. i-C4H8 reactions
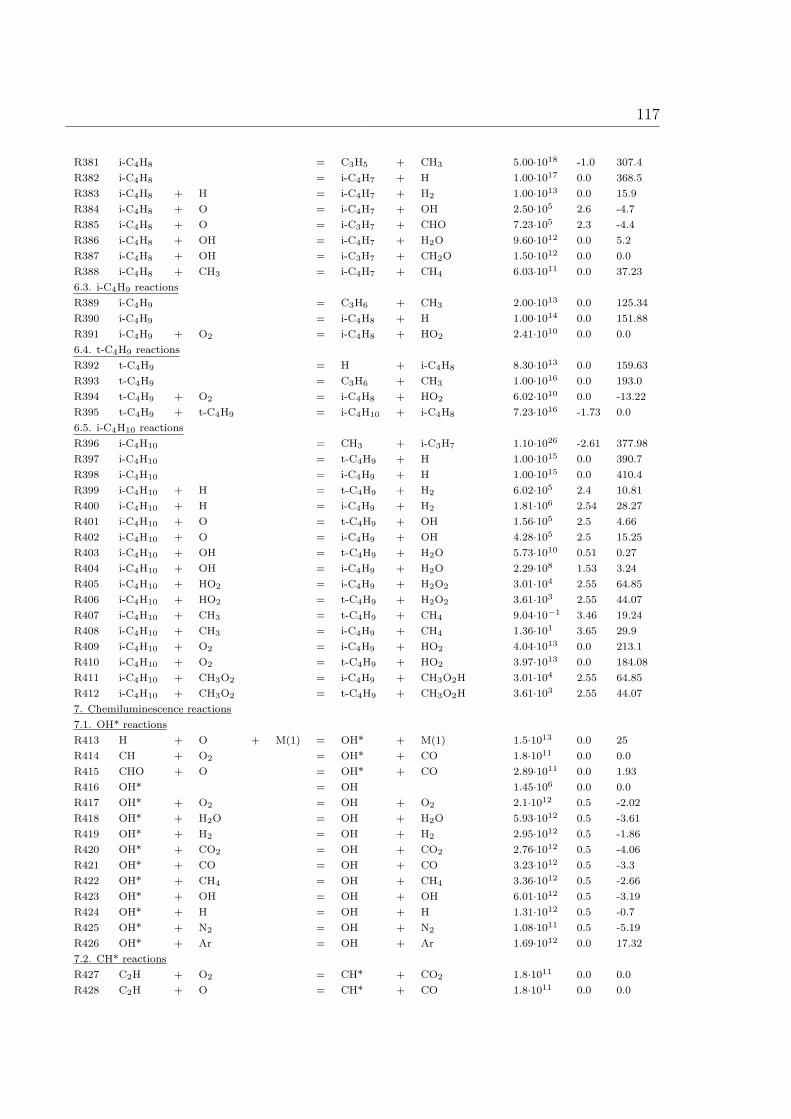
117
R381 i-C4H8 = C3H5 + CH3 5.00·1018 -1.0 307.4
R382 i-C4H8 = i-C4H7 + H 1.00·1017 0.0 368.5
R383 i-C4H8 + H = i-C4H7 + H2 1.00·1013 0.0 15.9
R384 i-C4H8 + O = i-C4H7 + OH 2.50·105 2.6 -4.7
R385 i-C4H8 + O = i-C3H7 + CHO 7.23·105 2.3 -4.4
R386 i-C4H8 + OH = i-C4H7 + H2O 9.60·1012 0.0 5.2
R387 i-C4H8 + OH = i-C3H7 + CH2O 1.50·1012 0.0 0.0
R388 i-C4H8 + CH3 = i-C4H7 + CH4 6.03·1011 0.0 37.23
6.3. i-C4H9 reactions
R389 i-C4H9 = C3H6 + CH3 2.00·1013 0.0 125.34
R390 i-C4H9 = i-C4H8 + H 1.00·1014 0.0 151.88
R391 i-C4H9 + O2 = i-C4H8 + HO2 2.41·1010 0.0 0.0
6.4. t-C4H9 reactions
R392 t-C4H9 = H + i-C4H8 8.30·1013 0.0 159.63
R393 t-C4H9 = C3H6 + CH3 1.00·1016 0.0 193.0
R394 t-C4H9 + O2 = i-C4H8 + HO2 6.02·1010 0.0 -13.22
R395 t-C4H9 + t-C4H9 = i-C4H10 + i-C4H8 7.23·1016 -1.73 0.0
6.5. i-C4H10 reactions
R396 i-C4H10 = CH3 + i-C3H7 1.10·1026 -2.61 377.98
R397 i-C4H10 = t-C4H9 + H 1.00·1015 0.0 390.7
R398 i-C4H10 = i-C4H9 + H 1.00·1015 0.0 410.4
R399 i-C4H10 + H = t-C4H9 + H2 6.02·105 2.4 10.81
R400 i-C4H10 + H = i-C4H9 + H2 1.81·106 2.54 28.27
R401 i-C4H10 + O = t-C4H9 + OH 1.56·105 2.5 4.66
R402 i-C4H10 + O = i-C4H9 + OH 4.28·105 2.5 15.25
R403 i-C4H10 + OH = t-C4H9 + H2O 5.73·1010 0.51 0.27
R404 i-C4H10 + OH = i-C4H9 + H2O 2.29·108 1.53 3.24
R405 i-C4H10 + HO2 = i-C4H9 + H2O2 3.01·104 2.55 64.85
R406 i-C4H10 + HO2 = t-C4H9 + H2O2 3.61·103 2.55 44.07
R407 i-C4H10 + CH3 = t-C4H9 + CH4 9.04·10−1 3.46 19.24
R408 i-C4H10 + CH3 = i-C4H9 + CH4 1.36·101 3.65 29.9
R409 i-C4H10 + O2 = i-C4H9 + HO2 4.04·1013 0.0 213.1
R410 i-C4H10 + O2 = t-C4H9 + HO2 3.97·1013 0.0 184.08
R411 i-C4H10 + CH3O2 = i-C4H9 + CH3O2H 3.01·104 2.55 64.85
R412 i-C4H10 + CH3O2 = t-C4H9 + CH3O2H 3.61·103 2.55 44.07
7. Chemiluminescence reactions
7.1. OH* reactions
R413 H + O + M(1) = OH* + M(1) 1.5·1013 0.0 25
R414 CH + O2 = OH* + CO 1.8·1011 0.0 0.0
R415 CHO + O = OH* + CO 2.89·1011 0.0 1.93
R416 OH* = OH 1.45·106 0.0 0.0
R417 OH* + O2 = OH + O2 2.1·1012 0.5 -2.02
R418 OH* + H2O = OH + H2O 5.93·1012 0.5 -3.61
R419 OH* + H2 = OH + H2 2.95·1012 0.5 -1.86
R420 OH* + CO2 = OH + CO2 2.76·1012 0.5 -4.06
R421 OH* + CO = OH + CO 3.23·1012 0.5 -3.3
R422 OH* + CH4 = OH + CH4 3.36·1012 0.5 -2.66
R423 OH* + OH = OH + OH 6.01·1012 0.5 -3.19
R424 OH* + H = OH + H 1.31·1012 0.5 -0.7
R425 OH* + N2 = OH + N2 1.08·1011 0.5 -5.19
R426 OH* + Ar = OH + Ar 1.69·1012 0.0 17.32
7.2. CH* reactions
R427 C2H + O2 = CH* + CO2 1.8·1011 0.0 0.0
R428 C2H + O = CH* + CO 1.8·1011 0.0 0.0
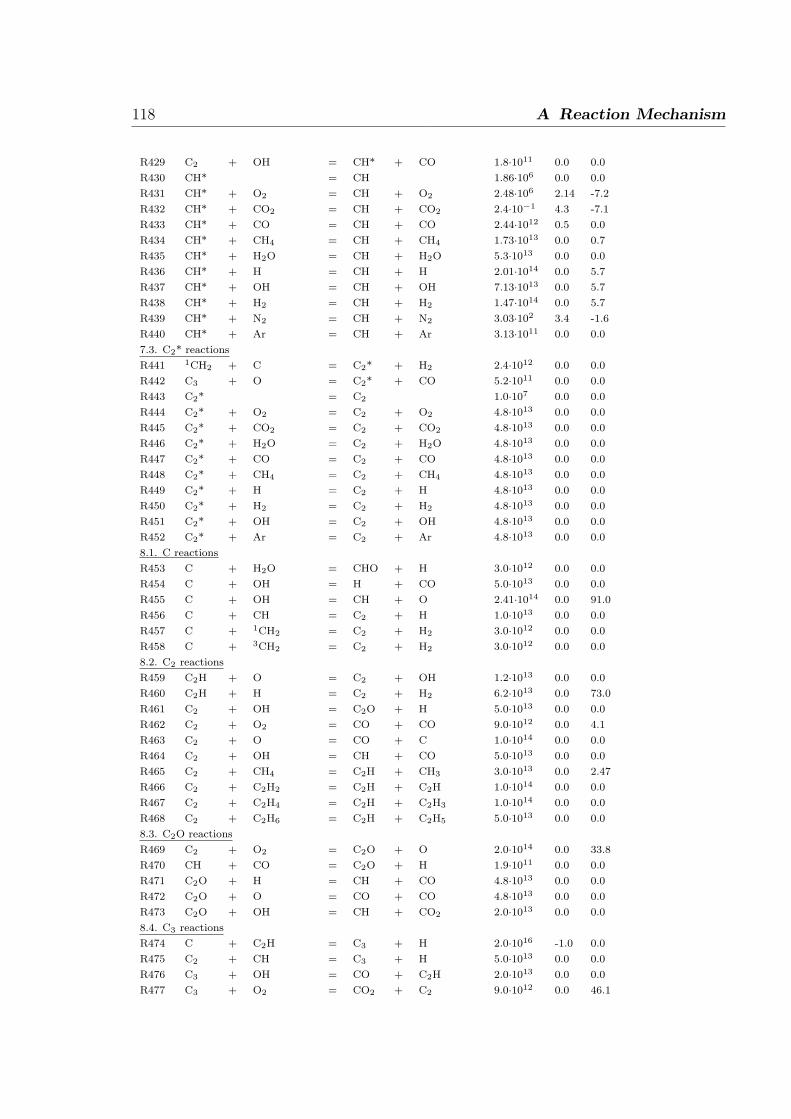
118 A Reaction Mechanism
R429 C2 + OH = CH* + CO 1.8·1011 0.0 0.0
R430 CH* = CH 1.86·106 0.0 0.0
R431 CH* + O2 = CH + O2 2.48·106 2.14 -7.2
R432 CH* + CO2 = CH + CO2 2.4·10−1 4.3 -7.1
R433 CH* + CO = CH + CO 2.44·1012 0.5 0.0
R434 CH* + CH4 = CH + CH4 1.73·1013 0.0 0.7
R435 CH* + H2O = CH + H2O 5.3·1013 0.0 0.0
R436 CH* + H = CH + H 2.01·1014 0.0 5.7
R437 CH* + OH = CH + OH 7.13·1013 0.0 5.7
R438 CH* + H2 = CH + H2 1.47·1014 0.0 5.7
R439 CH* + N2 = CH + N2 3.03·102 3.4 -1.6
R440 CH* + Ar = CH + Ar 3.13·1011 0.0 0.0
7.3. C2* reactions
R441 1CH2 + C = C2* + H2 2.4·1012 0.0 0.0
R442 C3 + O = C2* + CO 5.2·1011 0.0 0.0
R443 C2* = C2 1.0·107 0.0 0.0
R444 C2* + O2 = C2 + O2 4.8·1013 0.0 0.0
R445 C2* + CO2 = C2 + CO2 4.8·1013 0.0 0.0
R446 C2* + H2O = C2 + H2O 4.8·1013 0.0 0.0
R447 C2* + CO = C2 + CO 4.8·1013 0.0 0.0
R448 C2* + CH4 = C2 + CH4 4.8·1013 0.0 0.0
R449 C2* + H = C2 + H 4.8·1013 0.0 0.0
R450 C2* + H2 = C2 + H2 4.8·1013 0.0 0.0
R451 C2* + OH = C2 + OH 4.8·1013 0.0 0.0
R452 C2* + Ar = C2 + Ar 4.8·1013 0.0 0.0
8.1. C reactions
R453 C + H2O = CHO + H 3.0·1012 0.0 0.0
R454 C + OH = H + CO 5.0·1013 0.0 0.0
R455 C + OH = CH + O 2.41·1014 0.0 91.0
R456 C + CH = C2 + H 1.0·1013 0.0 0.0
R457 C + 1CH2 = C2 + H2 3.0·1012 0.0 0.0
R458 C + 3CH2 = C2 + H2 3.0·1012 0.0 0.0
8.2. C2 reactions
R459 C2H + O = C2 + OH 1.2·1013 0.0 0.0
R460 C2H + H = C2 + H2 6.2·1013 0.0 73.0
R461 C2 + OH = C2O + H 5.0·1013 0.0 0.0
R462 C2 + O2 = CO + CO 9.0·1012 0.0 4.1
R463 C2 + O = CO + C 1.0·1014 0.0 0.0
R464 C2 + OH = CH + CO 5.0·1013 0.0 0.0
R465 C2 + CH4 = C2H + CH3 3.0·1013 0.0 2.47
R466 C2 + C2H2 = C2H + C2H 1.0·1014 0.0 0.0
R467 C2 + C2H4 = C2H + C2H3 1.0·1014 0.0 0.0
R468 C2 + C2H6 = C2H + C2H5 5.0·1013 0.0 0.0
8.3. C2O reactions
R469 C2 + O2 = C2O + O 2.0·1014 0.0 33.8
R470 CH + CO = C2O + H 1.9·1011 0.0 0.0
R471 C2O + H = CH + CO 4.8·1013 0.0 0.0
R472 C2O + O = CO + CO 4.8·1013 0.0 0.0
R473 C2O + OH = CH + CO2 2.0·1013 0.0 0.0
8.4. C3 reactions
R474 C + C2H = C3 + H 2.0·1016 -1.0 0.0
R475 C2 + CH = C3 + H 5.0·1013 0.0 0.0
R476 C3 + OH = CO + C2H 2.0·1013 0.0 0.0
R477 C3 + O2 = CO2 + C2 9.0·1012 0.0 46.1
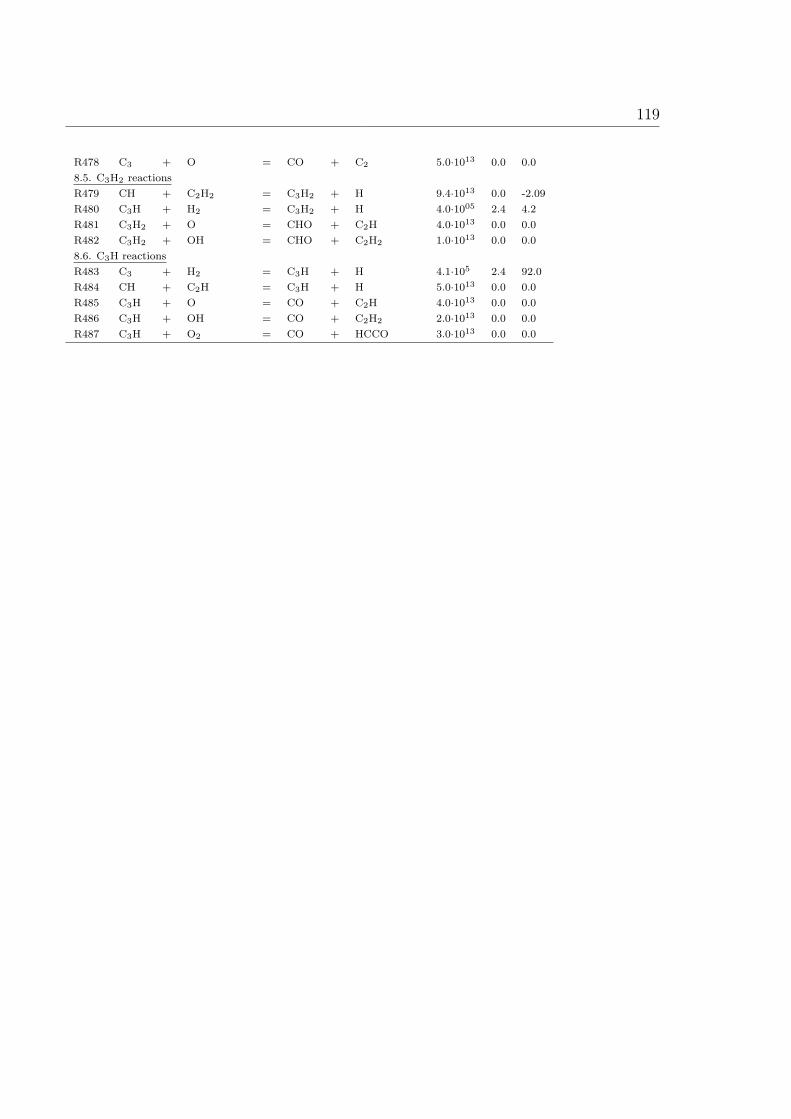
119
R478 C3 + O = CO + C2 5.0·1013 0.0 0.0
8.5. C3H2 reactions
R479 CH + C2H2 = C3H2 + H 9.4·1013 0.0 -2.09
R480 C3H + H2 = C3H2 + H 4.0·1005 2.4 4.2
R481 C3H2 + O = CHO + C2H 4.0·1013 0.0 0.0
R482 C3H2 + OH = CHO + C2H2 1.0·1013 0.0 0.0
8.6. C3H reactions
R483 C3 + H2 = C3H + H 4.1·105 2.4 92.0
R484 CH + C2H = C3H + H 5.0·1013 0.0 0.0
R485 C3H + O = CO + C2H 4.0·1013 0.0 0.0
R486 C3H + OH = CO + C2H2 2.0·1013 0.0 0.0
R487 C3H + O2 = CO + HCCO 3.0·1013 0.0 0.0
Erklarung
Hiermit versichere ich, daß ich die Arbeit selbstandig verfaßt und keine anderen als die
angegebenen Quellen und Hilfsmittel verwendet habe.
Heidelberg, den 29.03.2011
Trupti Kathrotia


![Herzlich Willkommen zur [0.2em] Mathematischen ... · 4 1240 Yahya Yardim, Bastian Spreckelsen Title Herzlich Willkommen zur [0.2em] Mathematischen Modellierungswoche [0.2em] für](https://img.pdfslide.org/doc/110x75/5d66f57988c993c54d8b5299/herzlich-willkommen-zur-02em-mathematischen-4-1240-yahya-yardim-bastian.jpg)