Embed Size (px)
Citation preview
Inference of pathways from metabolic networksby subgraph extraction
Karoline Faust1, Jerome Callut2, Pierre Dupont3, and Jacques van Helden4
1,4Laboratoire de Bioinformatique des Genomes et des Reseaux (BiGRe),Universite Libre de Bruxelles, Campus Plaine - CP263, Boulevard du Triomphe, 1050
Bruxelles, Belgium.2,3UCL Machine Learning Group, Universite catholique de Louvain,
B-1348 Louvain-la-Neuve, Belgium.{kfaust,jacques.van.helden}@ulb.ac.be
Abstract. In this work, we present different algorithmic approaches tothe inference of metabolic pathways from metabolic networks. Metabolicpathway inference can be applied to uncover the biological function ofsets of co-expressed, enzyme-coding genes.We compare the kWalks algorithm based on random walks and an alter-native approach relying on k-shortest paths. We study the influence ofvarious parameters on the pathway inference accuracy, which we measureon a set of 71 reference metabolic pathways. The results illustrate thatkWalks is significantly faster and has a higher sensitivity but the posi-tive predictive value is better for the pair-wise k-shortest path algorithm.This finding motivated the design of a hybrid approach, which reachesan average accuracy of 72% for the given set of reference pathways.
Key words: metabolic pathway inference, kWalks, k-shortest paths
1 Introduction
The products of co-expressed genes are often involved in a common biologicalfunction. In particular, the metabolic response to nutrients is generally regu-lated at multiple levels, including transcriptional. One approach to understandthe function of co-expressed enzymes is to uncover the biological pathways inwhich they participate. This is usually achieved by mapping reactions associatedto enzyme-coding genes on pre-defined metabolic pathways, i.e. [5, 11]. However,this approach does not deal well with transverse pathways (a set of reactionsmapping to several pathways) and it fails if reactions belong to a pathway notyet included in the pre-defined set of reference pathways. Another strategy hasbeen to infer metabolic pathways by finding the shortest paths between two reac-tions (e.g. those catalyzed by two co-expressed enzymes). One problem with thisapproach is the presence of compounds involved in a large number of reactions(co-factors and side-compounds like H2O, ATP, NADPH), which tend to be used
2 Inference of pathways from metabolic networks
as shortcuts to connect any pair of nodes. Thus, a naive path finding approachresults in biochemically invalid pathways, which contain co-factors or side com-pounds as intermediates. In our previous work, we tested different strategies toovercome this problem. First, we excluded a selected subset of highly connectedcompounds from the network [12, 13]. However, the choice of the compoundsto be excluded is an issue, since some among the highly connected compoundsparticipate in pathways as valid intermediate (e.g. purine nucleotide biosyn-thesis). We therefore introduced weighted networks [3, 4], in order to penalizehighly connected compounds without excluding them from the graph. This ap-proach yielded satisfactory results for the two-end linear path finding. In thepresent work, we extend the approach to multiple-end pathway inference: takingas input a set of seed reactions, we extract a subgraph that connects ”at best”those seed nodes, according to some relevance criteria. The resulting pathwaycan correspond to an already known pathway, but it can also be a variant or acombination of known pathways, or even a novel pathway.Pathway inference is as a more flexible alternative to pathway mapping. Forinstance, it can be used to infer pathways from operons, co-expressed genes orgene fusion events. It may also be applied in metabolic reconstruction in orderto suggest possible pathways from genomic data for organisms with unknownmetabolism.We thoroughly evaluated the pathway inference performance of three algorithms:the pair-wise k-shortest paths algorithm, the kWalks algorithm [1, 6] and a hybridalgorithm that combines the former two.
2 Materials and Methods
2.1 Metabolic graph
In order to infer metabolic pathways, we need to represent metabolic data as agraph. We selected MetaCyc [10], the well-curated tier of BioCyc [2], as our datasource, and constructed a bipartite, directed graph from all small molecule entriesand their associated reactions contained in the OWL file of MetaCyc (Release11.0). The resulting graph consists of 4,891 compound nodes and 5,358 reactionnodes. As discussed in [3], the direction of a reaction depends on physiologicalconditions in an organism (substrate and product concentrations, temperature).Since our graph is composed of data obtained from several hundred organisms,we considered that each reaction can be traversed either in forward or in reversedirection. Consequently, each reaction was represented as a pair of nodes, forthe forward and the reverse directions, respectively. To prevent the k-shortestpaths algorithm to cross the same reaction twice, forward and reverse directionare mutually exclusive. After this duplication of reaction nodes, we obtain adirected graph with 15,607 nodes and 43,938 edges. From now on, we will referto this graph as the MetaCyc graph.
Inference of pathways from metabolic networks 3
2.2 Reference pathways
We obtained a selected set of 71 known S. cerevisiae pathways from BioCyc(Release 11.0). All pathways in this reference set consist of at least 5 nodesand are included in the largest connected component of the MetaCyc graph. Onaverage, the pathways are composed of 13 nodes and in addition, more than halfof them are branched and/or cyclic.
2.3 Algorithms
All algorithms tested here take as input the nodes of interest (termed seed nodesor seeds) as well as a weighted input graph, and return a subgraph that connectsthe seeds.
Pair-wise k-shortest paths This approach relies on repetitively calling ak-shortest paths algorithm. K-shortest paths algorithms enumerate all simplepaths (paths containing each node only once) between a start and an end nodein the order of their length. In a weighted graph, paths are listed in the order oftheir weight.In the first step of pair-wise k-shortest paths, a k-shortest paths algorithm [7] iscalled successively on each pair of seed nodes. A k-shortest instead of a shortestpaths algorithm is employed to ensure that all lightest paths between a seednode pair are collected. The resulting path sets are stored in a path matrix.The minimal weight between each node pair is stored in a distance matrix. Forthe undirected MetaCyc graph, these matrices are symmetric. For the directedMetaCyc graph, the reverse paths between two seeds can be obtained by revers-ing the order of path nodes and their reaction directions.In the second step of the algorithm, the subgraph is constructed from the pathsets, starting with the lightest path set. Step-wise, more path sets are mergedwith the subgraph in increasing order of their weight. The process stops if eitherall seeds belong to one connected component of the subgraph or all path setshave been merged with the subgraph. The resulting subgraph represents the in-ferred pathway.This algorithm is time-consuming, since the number of calls to the k-shortestpaths algorithm increases quadratically with the seed node number.
kWalks The key idea of kWalks is that some edges in the input graph aremore relevant than others to connect the seed nodes. The relevance of an edgeis measured as the expected number of times it is visited along random walksconnecting seed nodes. These expected passage times can be obtained usingbasic Markov chain theory [8]. A transition probability matrix P is derived fromthe adjacency matrix of the graph using simple edge weight normalization. Foreach seed node x, the submatrix xP is defined by considering only the linesand columns of P corresponding to x and all non-seed nodes. The fundamentalmatrix xN = (I− xP )−1 contains useful information for computing the desired
4 Inference of pathways from metabolic networks
expectation. The entry xNxi gives the number of times node i has been visitedduring walks starting in node x and ending when any seed node (except x) isreached. The expected number of passage time xE(i, j) on an edge i → j isobtained by multiplying xNxi by the probability Pij of transiting from node ito node j. Finally, the relevance of an edge i → j is given by averaging xE(i, j)over all seed nodes x. This technique is time-consuming since it relies on matrixinversions, which are generally performed with a cubic time complexity in thenumber of nodes in the graph.An alternative approach considers random walks of a bounded length, i.e. onlywalks up to a prescribed length are allowed. The passage time expectationsduring such walks can be computed in linear time with respect to the number ofgraph edges and the maximum walk length using forward-backward recurrences[1, 6]. Moreover, bounding the walk length controls the level of locality whileconnecting seed nodes, which can be useful for pathway recovery.Once the edge relevance has been obtained, a subgraph can be extracted byadding edges in the order of their relevance with respect to seed nodes, untileither all seed nodes are connected or all edges have been added.The output of kWalks is a list of edge relevance values. We can replace theoriginal edge weights by these relevances and iterate kWalks by re-launching iton the input graph with updated weights.In contrast to pair-wise k-shortest paths, the pathways inferred by kWalks maycontain branches ending in non-seed nodes. We remove these branches in a post-processing step.
Hybrid approach The hybrid approach combines kWalks with the pair-wisek-shortest paths algorithm. First, kWalks is launched to extract a fixed percent-age of the input graph. The final pathway is then extracted from the kWalkssubgraph using the pair-wise k-shortest paths algorithm.
2.4 Parameter combinations
The performance of kWalks, pair-wise k-shortest paths and the hybrid approachwas evaluated with a number of different parameter values.
Iteration number For the kWalks and hybrid algorithm, we ran 1, 3 or 6iterations of the kWalk algorithm.
Graph weight We weight the metabolic graph to avoid highly connected com-pounds. As in our previous work [3, 4], we assign to each compound node itsdegree as weight (compound degree weight) or use an un-weighted graph forcomparison (unit weight). In addition, we test a weighting scheme where com-pound node weights are taken to the power of two (inflated compound degreeweight). Since the pair-wise k-shortest paths and kWalks assume weights onedges rather than nodes, the initial degree-based node weights are transformed

Inference of pathways from metabolic networks 5
into edge weights by taking the mean of the weights of the nodes adjacent to anedge.
Re-use of kWalks edge relevances In the hybrid approach, we may eitheruse the weights from the input graph or the edge relevances computed by kWalksto weight the extracted subgraph. In addition, when iterating kWalks, we maymodify the edge relevances by inflating them (taking them to the power of apositive integer) to increase the difference between relevances. We tested allcombinations resulting from these options.
Directionality In order to support reaction reversibility, we represent eachreaction by two nodes, one for the direct and one for the reverse direction. Inaddition, we also constructed an undirected version of the MetaCyc graph, whereeach reaction is represented by only one node, which is connected to compoundnodes by undirected edges.
Fixed subgraph extraction In the hybrid approach, after the last kWalksiteration we extract a subgraph of fixed size from the input graph. The size ofthis subgraph has been varied from 0.1% to 10% of the edges ranked by relevance.The subgraph obtained by fixed size extraction may consist of more than onecomponent.The subgraph size optimization has been performed in the directed, compound-weighted MetaCyc graph without iterating kWalks or inflating edge relevances.The input graph weights rather than the edge relevances were fed into the secondstep of the hybrid algorithm.
2.5 Evaluation procedure
For each pathway, several inferences are tested, with increasing seed node num-ber, in order to test the impact of the seed number on the accuracy of the result.For each of the 71 reference pathways, we first select the terminal reactions asseeds, we infer a pathway that interconnects them, and we compare the nodesof the inferred pathways with those of the annotated pathway. Then, we pro-gressively increase the number of seed reactions by adding randomly selectednodes of the reference pathway, and re-do the inference and evaluation, until allreactions of the pathway are selected as seeds.We define as one experiment the set of all the pathway inferences performed fora given parameter value combination (e.g. pair-wise k-shortest paths on directedgraph with compound node weights). We did 82 such experiments to find theoptimal parameter value combination for each algorithm.
Scores The accuracy of an inferred pathway is calculated based on the corre-spondence between its non-seed nodes and those of the reference pathway. Wedefine as true positive (TP) a non-seed node that is present in the reference as
6 Inference of pathways from metabolic networks
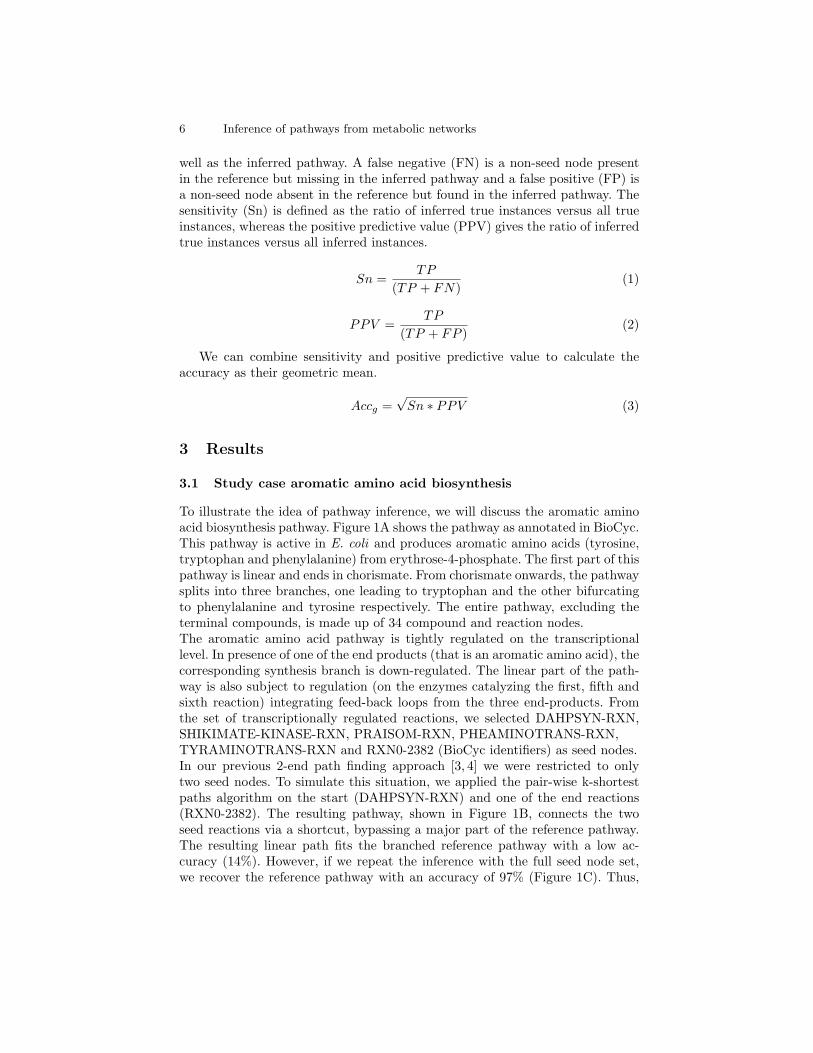
well as the inferred pathway. A false negative (FN) is a non-seed node presentin the reference but missing in the inferred pathway and a false positive (FP) isa non-seed node absent in the reference but found in the inferred pathway. Thesensitivity (Sn) is defined as the ratio of inferred true instances versus all trueinstances, whereas the positive predictive value (PPV) gives the ratio of inferredtrue instances versus all inferred instances.
Sn =TP
(TP + FN)(1)
PPV =TP
(TP + FP )(2)
We can combine sensitivity and positive predictive value to calculate theaccuracy as their geometric mean.
Accg =√
Sn ∗ PPV (3)
3 Results
3.1 Study case aromatic amino acid biosynthesis
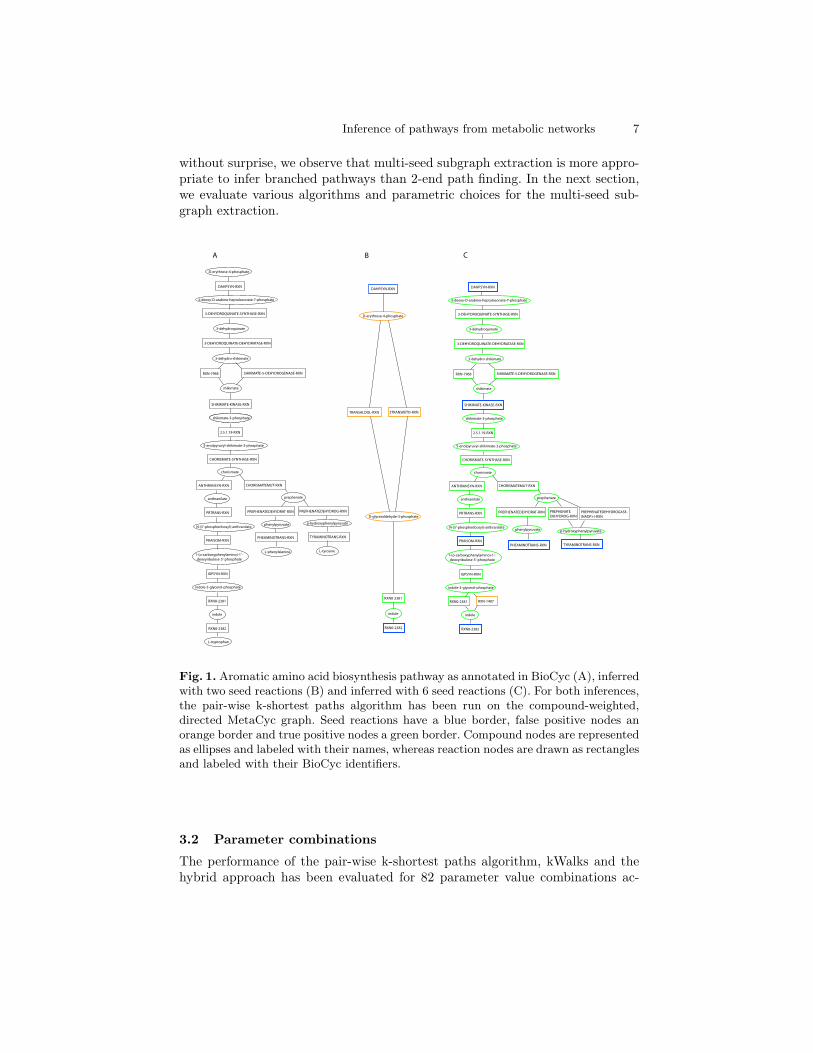
To illustrate the idea of pathway inference, we will discuss the aromatic aminoacid biosynthesis pathway. Figure 1A shows the pathway as annotated in BioCyc.This pathway is active in E. coli and produces aromatic amino acids (tyrosine,tryptophan and phenylalanine) from erythrose-4-phosphate. The first part of thispathway is linear and ends in chorismate. From chorismate onwards, the pathwaysplits into three branches, one leading to tryptophan and the other bifurcatingto phenylalanine and tyrosine respectively. The entire pathway, excluding theterminal compounds, is made up of 34 compound and reaction nodes.The aromatic amino acid pathway is tightly regulated on the transcriptionallevel. In presence of one of the end products (that is an aromatic amino acid), thecorresponding synthesis branch is down-regulated. The linear part of the path-way is also subject to regulation (on the enzymes catalyzing the first, fifth andsixth reaction) integrating feed-back loops from the three end-products. Fromthe set of transcriptionally regulated reactions, we selected DAHPSYN-RXN,SHIKIMATE-KINASE-RXN, PRAISOM-RXN, PHEAMINOTRANS-RXN,TYRAMINOTRANS-RXN and RXN0-2382 (BioCyc identifiers) as seed nodes.In our previous 2-end path finding approach [3, 4] we were restricted to onlytwo seed nodes. To simulate this situation, we applied the pair-wise k-shortestpaths algorithm on the start (DAHPSYN-RXN) and one of the end reactions(RXN0-2382). The resulting pathway, shown in Figure 1B, connects the twoseed reactions via a shortcut, bypassing a major part of the reference pathway.The resulting linear path fits the branched reference pathway with a low ac-curacy (14%). However, if we repeat the inference with the full seed node set,we recover the reference pathway with an accuracy of 97% (Figure 1C). Thus,
Inference of pathways from metabolic networks 7
without surprise, we observe that multi-seed subgraph extraction is more appro-priate to infer branched pathways than 2-end path finding. In the next section,we evaluate various algorithms and parametric choices for the multi-seed sub-graph extraction.
DAHPSYN-RXN
D-erythrose-4-phosphate
3-DEHYDROQUINATE-SYNTHASE-RXN
3-DEHYDROQUINATE-DEHYDRATASE-RXN
3-dehydroquinate
3-deoxy-D-arabino-heptulosonate-7-phosphate
3-dehydro-shikimate
RXN-7968 SHIKIMATE-5-DEHYDROGENASE-RXN
SHIKIMATE-KINASE-RXN
shikimate
shikimate-3-phosphateshikimate-3-phosphate
2.5.1.19-RXN
ANTHRANSYN-RXN
CHORISMATE-SYNTHASE-RXN
5-enolpyruvyl-shikimate-3-phosphate
CHORISMATEMUT-RXN
chorismate
PRTRANS-RXN
PRAISOM-RXN
IGPSYN-RXN
RXN0-2381
RXN0-2382
anthranilate
N-(5'-phosphoribosyl)-anthranilate
1-(o-carboxyphenylamino)-1'- deoxyribulose-5'-phosphate
indole-3-glycerol-phosphate
indole
L-tryptophan
PREPHENATEDEHYDRAT-RXN
PHEAMINOTRANS-RXN
PREPHENATEDEHYDROG-RXN
TYRAMINOTRANS-RXN
p-hydroxyphenylpyruvatephenylpyruvate
L-tyrosineL-phenylalanine
prephenate
DAHPSYN-RXN
3-DEHYDROQUINATE-SYNTHASE-RXN
3-DEHYDROQUINATE-DEHYDRATASE-RXN
3-dehydroquinate
3-deoxy-D-arabino-heptulosonate-7-phosphate
3-dehydro-shikimate
RXN-7968 SHIKIMATE-5-DEHYDROGENASE-RXN
SHIKIMATE-KINASE-RXN
shikimate
shikimate-3-phosphate
2.5.1.19-RXN
ANTHRANSYN-RXN
CHORISMATE-SYNTHASE-RXN
5-enolpyruvyl-shikimate-3-phosphate
CHORISMATEMUT-RXN
chorismate
PRTRANS-RXN
PRAISOM-RXN
IGPSYN-RXN
RXN0-2381
RXN0-2382
anthranilate
N-(5'-phosphoribosyl)-anthranilate
1-(o-carboxyphenylamino)-1'- deoxyribulose-5'-phosphate
indole-3-glycerol-phosphate
indole
PREPHENATEDEHYDRAT-RXN
PHEAMINOTRANS-RXN
PREPHENATEDEHYDROG-RXN
TYRAMINOTRANS-RXN
p-hydroxyphenylpyruvatephenylpyruvate
prephenate
PREPHENATEDEHYDROGASE-(NADP+)-RXN
RXN-1407
DAHPSYN-RXN
RXN0-2381
RXN0-2382
indole
TRANSALDOL-RXN 2TRANSKETO-RXN
D-glyceraldehyde-3-phosphate
D-erythrose-4-phosphate
A B C
Fig. 1. Aromatic amino acid biosynthesis pathway as annotated in BioCyc (A), inferredwith two seed reactions (B) and inferred with 6 seed reactions (C). For both inferences,the pair-wise k-shortest paths algorithm has been run on the compound-weighted,directed MetaCyc graph. Seed reactions have a blue border, false positive nodes anorange border and true positive nodes a green border. Compound nodes are representedas ellipses and labeled with their names, whereas reaction nodes are drawn as rectanglesand labeled with their BioCyc identifiers.
3.2 Parameter combinations
The performance of the pair-wise k-shortest paths algorithm, kWalks and thehybrid approach has been evaluated for 82 parameter value combinations ac-
8 Inference of pathways from metabolic networks
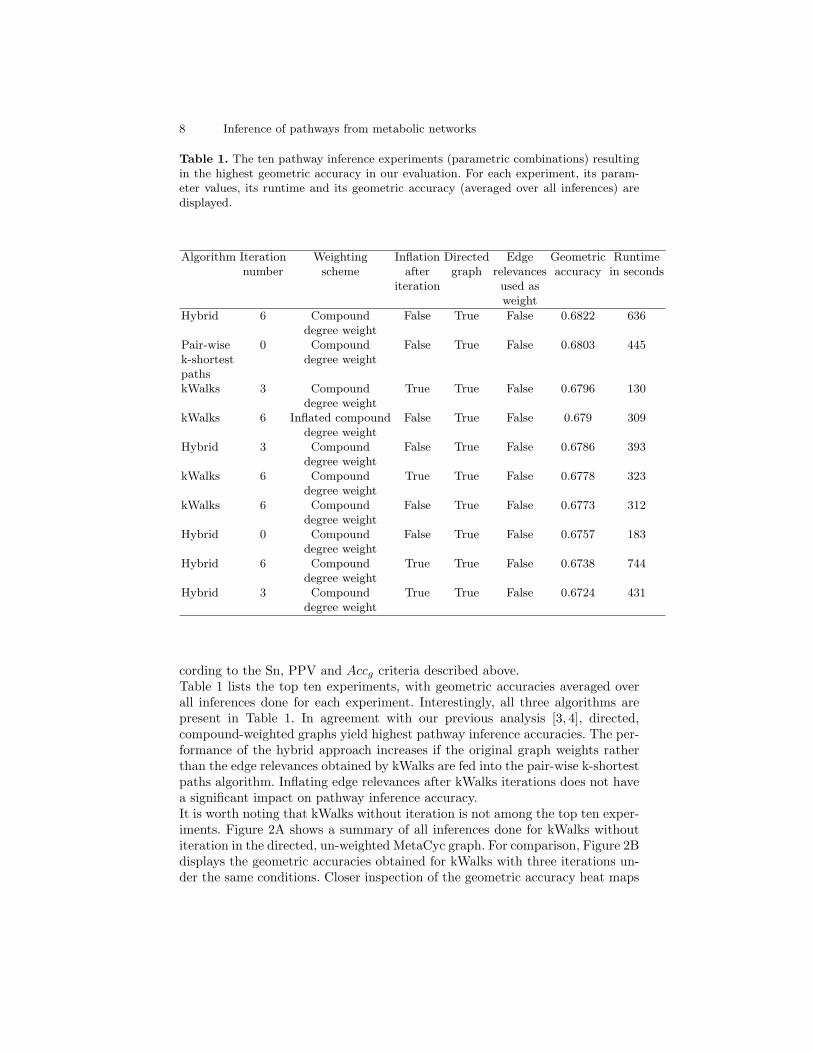
Table 1. The ten pathway inference experiments (parametric combinations) resultingin the highest geometric accuracy in our evaluation. For each experiment, its param-eter values, its runtime and its geometric accuracy (averaged over all inferences) aredisplayed.
Algorithm Iteration Weighting Inflation Directed Edge Geometric Runtimenumber scheme after graph relevances accuracy in seconds
iteration used asweight
Hybrid 6 Compound False True False 0.6822 636degree weight
Pair-wise 0 Compound False True False 0.6803 445k-shortest degree weightpathskWalks 3 Compound True True False 0.6796 130
degree weightkWalks 6 Inflated compound False True False 0.679 309
degree weightHybrid 3 Compound False True False 0.6786 393
degree weightkWalks 6 Compound True True False 0.6778 323
degree weightkWalks 6 Compound False True False 0.6773 312
degree weightHybrid 0 Compound False True False 0.6757 183
degree weightHybrid 6 Compound True True False 0.6738 744
degree weightHybrid 3 Compound True True False 0.6724 431
degree weight
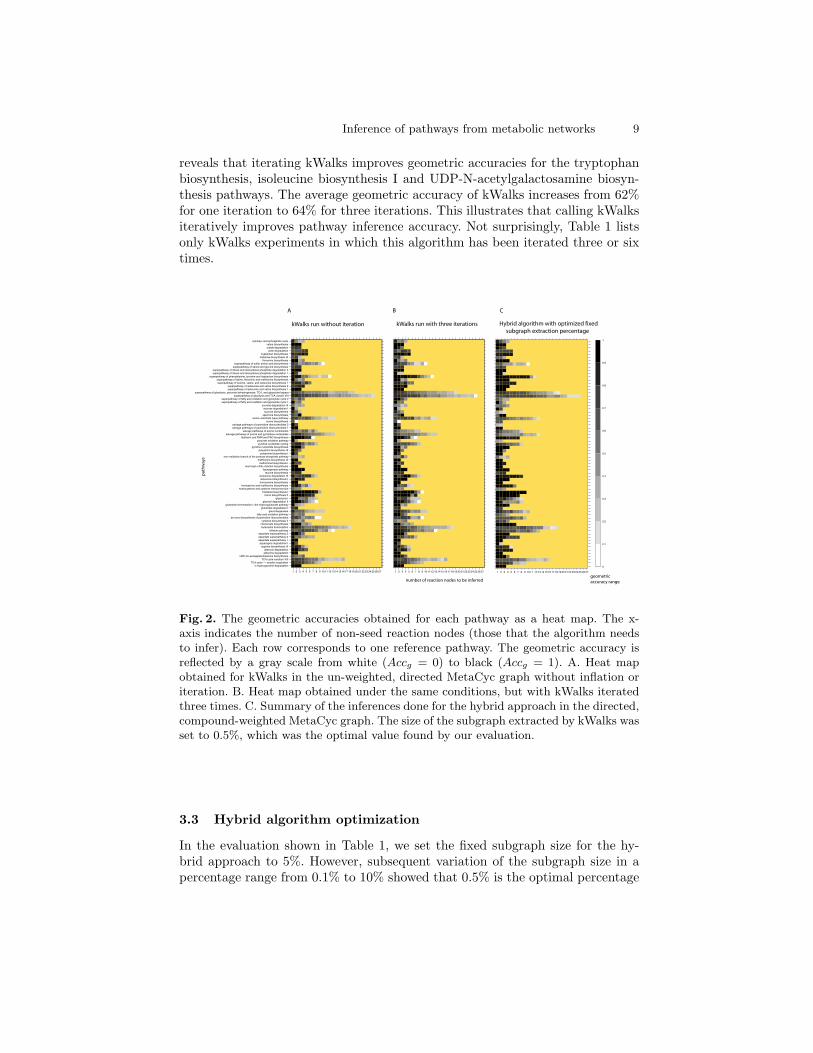
cording to the Sn, PPV and Accg criteria described above.Table 1 lists the top ten experiments, with geometric accuracies averaged overall inferences done for each experiment. Interestingly, all three algorithms arepresent in Table 1. In agreement with our previous analysis [3, 4], directed,compound-weighted graphs yield highest pathway inference accuracies. The per-formance of the hybrid approach increases if the original graph weights ratherthan the edge relevances obtained by kWalks are fed into the pair-wise k-shortestpaths algorithm. Inflating edge relevances after kWalks iterations does not havea significant impact on pathway inference accuracy.It is worth noting that kWalks without iteration is not among the top ten exper-iments. Figure 2A shows a summary of all inferences done for kWalks withoutiteration in the directed, un-weighted MetaCyc graph. For comparison, Figure 2Bdisplays the geometric accuracies obtained for kWalks with three iterations un-der the same conditions. Closer inspection of the geometric accuracy heat maps
Inference of pathways from metabolic networks 9
reveals that iterating kWalks improves geometric accuracies for the tryptophanbiosynthesis, isoleucine biosynthesis I and UDP-N-acetylgalactosamine biosyn-thesis pathways. The average geometric accuracy of kWalks increases from 62%for one iteration to 64% for three iterations. This illustrates that calling kWalksiteratively improves pathway inference accuracy. Not surprisingly, Table 1 listsonly kWalks experiments in which this algorithm has been iterated three or sixtimes.
1 2 3 4 5 6 7 8 9 10 11 12 13 14 15 16 17 18 19 20 21 22 23 24 25 26 27
4!hydroxyproline degradation
TCA cycle !! aerobic respiration
TCA cycle variation VIII
UDP!N!acetylgalactosamine biosynthesis
aldoxime degradation
allantoin degradation
arginine biosynthesis III
asparagine degradation I
aspartate superpathway 1
aspartate superpathway 2
aspartate superpathway 3
bifidum pathway
butanediol fermentation
chorismate biosynthesis
cysteine biosynthesis II
de novo biosynthesis of pyrimidine ribonucleotides
fatty acid oxidation pathway
gluconeogenesis
glutamate degradation I
glutamate fermentation I!the hydroxyglutarate pathway
glycerol degradation II
glycolysis I
heme biosynthesis II
histidine biosynthesis I
homocysteine and cysteine interconversion
homoserine and methionine biosynthesis
homoserine biosynthesis
isoleucine biosynthesis I
isoleucine degradation III
leucine biosynthesis
lipoxygenase pathway
mannosyl!chito!dolichol biosynthesis
methionine biosynthesis I
methionine biosynthesis III
non!oxidative branch of the pentose phosphate pathway
polyamine biosynthesis I
polyamine biosynthesis III
pyridine nucleotide biosynthesis
pyridine nucleotide cycling
pyruvate oxidation pathway
riboflavin and FMN and FAD biosynthesis
salvage pathways of purine and pyrimidine nucleotides
salvage pathways of purine nucleosides
salvage pathways of pyrimidine ribonucleotides 1
salvage pathways of pyrimidine ribonucleotides 2
serine biosynthesis
serine!isocitrate lyase pathway
spermine biosynthesis
sucrose biosynthesis
sucrose degradation I
sucrose degradation III
superpathway of fatty acid oxidation and glyoxylate cycle 1
superpathway of fatty acid oxidation and glyoxylate cycle 2
superpathway of glycolysis and TCA variant VIII
superpathway of glycolysis, pyruvate dehydrogenase, TCA, and glyoxylate bypass
superpathway of isoleucine and valine biosynthesis 1
superpathway of isoleucine and valine biosynthesis 2
superpathway of leucine, valine, and isoleucine biosynthesis 1
superpathway of lysine, threonine and methionine biosynthesis
superpathway of phenylalanine, tyrosine and tryptophan biosynthesis
superpathway of ribose and deoxyribose phosphate degradation 1
superpathway of ribose and deoxyribose phosphate degradation 2
superpathway of serine and glycine biosynthesis
superpathway of sulfur amino acid biosynthesis
threonine biosynthesis
trehalose biosynthesis III
tryptophan biosynthesis
urate degradation
ureide degradation
valine biosynthesis
xylulose!monophosphate cycle
1 2 3 4 5 6 7 8 9 10 11 12 13 14 15 16 17 18 19 20 21 22 23 24 25 26 27 1 2 3 4 5 6 7 8 9 10 11 12 13 14 15 16 17 18 19 20 21 22 23 24 25 26 27
0
0.1
0.2
0.3
0.4
0.5
0.6
0.7
0.8
0.9
1
Fig. 2. The geometric accuracies obtained for each pathway as a heat map. The x-axis indicates the number of non-seed reaction nodes (those that the algorithm needsto infer). Each row corresponds to one reference pathway. The geometric accuracy isreflected by a gray scale from white (Accg = 0) to black (Accg = 1). A. Heat mapobtained for kWalks in the un-weighted, directed MetaCyc graph without inflation oriteration. B. Heat map obtained under the same conditions, but with kWalks iteratedthree times. C. Summary of the inferences done for the hybrid approach in the directed,compound-weighted MetaCyc graph. The size of the subgraph extracted by kWalks wasset to 0.5%, which was the optimal value found by our evaluation.
3.3 Hybrid algorithm optimization
In the evaluation shown in Table 1, we set the fixed subgraph size for the hy-brid approach to 5%. However, subsequent variation of the subgraph size in apercentage range from 0.1% to 10% showed that 0.5% is the optimal percentage
10 Inference of pathways from metabolic networks
for subgraph extraction in the hybrid approach. When the subgraph extractionpercentage is set to 0.5%, the average geometric accuracy of the hybrid approachreaches 72%, which is the highest percentage obtained for any experiment. Figure2C shows the geometric accuracy of each inference in a heat map.
4 Discussion
4.1 Parameters
Graph directionality The directed MetaCyc graph yields higher geometric ac-curacies than the undirected one. In the undirected MetaCyc graph, it is possibleto traverse the graph from substrate to substrate or from product to product,which is prevented in the directed graph.
Compound weighting In our previous studies [3, 4], we showed that the weightis the most determinant parameter for inferring relevant pathways by 2-endpath finding. As expected, node weighting also exerts a strong impact on theperformances of multi-seed pathway inference, but this impact depends on thealgorithm used. The pair-wise k-shortest paths performed best in the compound-weighted MetaCyc graph. But surprisingly, kWalks without iteration resulted inhigher accuracies when applied to the un-weighted rather than to the weightedMetaCyc graph. Interestingly, kWalks automatically induces weights that favorrelevant compounds. Actually, the kWalks relevance score can be interpreted as acontext-specific betweenness index, and we can thus understand that it penalizeshighly connected compounds, thereby explaining the good results obtained byrelevance weighting. In the hybrid approach, the resulting average geometricaccuracy for the un-weighted graph is higher when we pass the kWalks inducedweights (edge relevances) rather than the original weights to the second step ofthe algorithm. However, if we run the hybrid approach on the weighted graph, thekWalks induced weights decrease the accuracy compared to the original weights.Inflation of kWalks induced weights does not improve results significantly.For most parameters, we determined optimal values and their combination (withrespect to the reference pathways) by an exhaustive search. However, compoundweights were chosen heuristically and may be optimized in future by a machinelearning approach.
4.2 Algorithms
Although the pair-wise k-shortest paths algorithm is slow (7 minutes per path-way inference in average), its average geometric accuracy figures among the topten. In contrast, kWalks without iteration runs in seconds, but yields unsatisfac-tory accuracies. Upon closer inspection, it became apparent that kWalks resultsin high sensitivities and low positive predictive values. The positive predictivevalue of the kWalks algorithm can be increased by invoking it iteratively orby combining it with pair-wise k-shortest paths in the hybrid algorithm. Both
Inference of pathways from metabolic networks 11
strategies are paid with a longer runtime.The highest average geometric accuracy was obtained with the optimized hybridapproach. This shows that pair-wise k-shortest paths and kWalks are comple-mentary. The focus of kWalks is to capture the part of the input graph mostrelevant for connecting the seeds, reducing the number of false negatives at thecost of increasing the number of false positives. Pair-wise k-shortest paths canthen discard false positives introduced by kWalks.
4.3 Similar approach to subgraph extraction
Recently, Koren and co-workers [9] designed a proximity measure that avoidsdead-end nodes and takes node degree and multiple paths between seeds intoaccount. Based on this measure, they describe a subgraph extraction approachthat relies on finding the k shortest paths between seed nodes. The resultingpaths are combined in such a way that proximity between seeds is maximizedwhile minimizing the subgraph size.This extraction procedure aims at capturing the paths that contribute to theproximity of nodes. It is worth noting that two nodes with many paths betweenthem are considered closer than two nodes connected by a few paths. Therefore,this algorithm will likely return more alternative paths between seeds than ouralgorithms do. This is very interesting when one wants to explore the metabolicneighborhood of a set of seed nodes, but less desirable when a metabolic pathwayshould be predicted.
5 Conclusion
We have presented three different algorithmic approaches to infer metabolicpathways from metabolic graphs: kWalks, pair-wise k-shortest paths, and a hy-brid that combines both.The former two algorithms have complementary strengths and weaknesses. Ourevaluation on 71 yeast pathways has shown that their combination in the hybridapproach yields the highest geometric accuracies.
In future, we will apply these algorithms to microarray data to infer metabolicpathways from co-expressed enzyme-coding genes.
Acknowledgments
KF is supported by Actions de Recherches Concertes de la Communaut Franaisede Belgique (ARC grant number 04/09-307). The BiGRe laboratory is a mem-ber of the BioSapiens Network of Excellence funded under the sixth Frameworkprogram of the European Communities (LSHG-CT-2003-503265). The work wassupported by the Belgian Program on Interuniversity Attraction Poles, initiatedby the Belgian Federal Science Policy Office, project P6/25 (BioMaGNet).
12 Inference of pathways from metabolic networks
We would like to thank the referees for their helpful comments, in particularfor pointing to the article of Koren and co-workers.
References
1. Callut, J.: First Passage Times Dynamics in Markov Models with Applications toHMM Induction, Sequence Classification, and Graph Mining. PhD Thesis Disserta-tion, Universite catholique de Louvain (2007)
2. Caspi, R. et al.: The MetaCyc Database of metabolic pathways and enzymes andthe BioCyc collection of Pathway/Genome Databases. Nucleic Acids Research 36,D623–D631 (2008)
3. Croes, D., Couche, F., Wodak, S., van Helden, J.: Metabolic PathFinding: inferringrelevant pathways in biochemical networks. Nucleic Acids Research 33, W326–W330(2005)
4. Croes, D., Couche, F., Wodak, S., van Helden, J.: Inferring Meaningful Pathwaysin Weighted Metabolic Networks. J. Mol. Biol. 356, 222–236 (2006)
5. Dahlquist, K.D., Salomonis, N., Vranizan, K., Lawlor, S.C., Conklin, B.R.: Gen-MAPP, a new tool for viewing and analyzing microarray data on biological path-ways. Nature Genetics 31, 19–20 (2002)
6. Dupont, P., Callut, J., Dooms, G., Monette, J.-N., Deville, Y.: Relevant subgraphextraction from random walks in a graph. Research Report UCL/FSA/INGI RR2006-07 (2006-07)
7. Jimenez, V.M., Marzal, A.: Computing the K-shortest Paths: a New Algorithm andan Experimental Comparison. In: Proc. 3rd Int. Worksh. Algorithm Engineering(WAE 1999) 1668, pp. 15–29 (1999)
8. Kemeny, J.G., Snell, J.L.: Finite Markov Chains. Springer-Verlag (1983)9. Koren, Y., North, S.C., Volinsky, C.: Measuring and extracting proximity in net-
works, In: Proceedings of the 12th ACM SIGKDD international conference onKnowledge discovery and data mining, pp. 245–255 (2006)
10. Krieger, C.J. et al.: MetaCyc: a multiorganism database of metabolic pathwaysand enzymes. Nucleic Acids Research 32, D438–D442 (2004)
11. Paley, S.M., Karp, P.D.: The Pathway Tools cellular overview diagram and OmicsViewer. Nucleic Acids Research 34, 3771–3778 (2006)
12. van Helden, J., Gilbert, D., Wernisch, L., Schroeder, M., Wodak, S.: Applicationsof regulatory sequence analysis and metabolic network analysis to the interpretationof gene expression data. In: Lecture Notes in Computer Science 2066, pp. 155–172(2001)
13. van Helden, J., Wernisch, L., Gilbert, D., Wodak, S.: Graph-based analysis ofmetabolic networks. In: Ernst Schering Res Found Workshop, pp. 245-74. Springer-Verlag (2002)