Embed Size (px)
Citation preview

Institut für Höhere Studien (IHS), Wien Institute for Advanced Studies, Vienna
Reihe Ökonomie / Economics Series No. 80
Public Debt and Generational Balance in Austria
Christian Keuschnigg, Mirela Keuschnigg, Reinhard Koman, Erik Lüth, Bernd Raffelhüschen
Public Debt and Generational Balance in Austria
Christian Keuschnigg, Mirela Keuschnigg, Reinhard Koman, Erik Lüth, Bernd Raffelhüschen
Reihe Ökonomie / Economics Series No. 80
March 2000
Institut für Höhere Studien Stumpergasse 56, A-1060 Wien Fax: +43/1/599 91-163 Christian Keuschnigg Institute of Public Finance, FB2 University of Saarland P.O. Box 151 150 D-66041 Saarbruecken CEPR and CESifo Mirela Keuschnigg Saarbrücken Reinhard Koman Phone: +43/1/599 91-252 E-mail: [email protected] Erik Lüth University of Freiburg Bernd Raffelhüschen Universities of Freiburg and Bergen
Institut für Höhere Studien (IHS), Wien Institute for Advanced Studies, Vienna

The Institute for Advanced Studies in Vienna is an independent center of postgraduate training and
research in the social sciences. The Economics Series presents research carried out at the
Department of Economics and Finance of the Institute. Department members, guests, visitors, and
other researchers are invited to submit manuscripts for possible inclusion in the series. The
submissions are subjected to an internal refereeing process.
Editorial Board
Editor:
Robert M. Kunst (Econometrics)
Associate Editors:
Walter Fisher (Macroeconomics)
Klaus Ritzberger (Microeconomics)
Abstract
Based on Austria’s fiscal stance in 1995, we compute the generational accounts for currently
living as well as future generations. The results reveal the existence of an enormous
intergenerational imbalance in favor of currently living generations. Total public sector
liabilities may be more than five times as high as the officially recorded level of public debt.
Without any action, future generations would face life-time net taxes that are about 65
percent higher than the tax burden of a current newborn. If the government could fully and
permanently retain the expenditure cutting and revenue raising effects of the 1996 fiscal
consolidation package and the 1997 pension reform, then it might be able to significantly
reduce the intergenerational liabilities. However, enacting both the recent tax reform 2000
and the reform of the family support scheme would increase again the fiscal imbalance and
intergenerational inequity of fiscal policy in Austria.
Keywords Fiscal policy, social security, public debt, generational accounting
JEL Classifications E6, H5, H6

Comments
Helpful comments by B. Böhm, H. Bonin, and seminar participants at the Austrian National Bank are
gratefully acknowledged. Furthermore, we like to thank L. Giorgi, K. Kreiter, U. Obermayr, H. Stefanits,
E. Fleischmann, and A. Rainer for providing us with particularly useful data and comments on Austrian
fiscal policy.
Contents
I Introduction 1
II Generational Accounting: The Method 2
III Generational Accounting For Austria 5 III.1 Recent Fiscal Policy 5 III.2 Tax Benefit Profiles 10 III.3 Baseline Results 11 III.4 Sensitivity Analysis 17
IV Restoring Fiscal Balance 19 IV.1 Recent Policy Initiatives 19 IV.1.1 The 1996 Fiscal Consolidation Package 19 IV.1.2 The 1997 Pension Reform 20 IV.1.3 Tax Reform 2000 21 IV.2 Results 23 IV.2.1 Consolidation Package 23 IV.2.2 Pension Reform 25 IV.2.3 Tax Reform 2000 26
V Conclusions 27
References 28
I H S — Keuschnigg, Keuschnigg, Koman, Lüth, Raffelhüschen / Public Debt & Generational Balance — 1
I Introduction
Public debt was once a mere 19 percent of GDP in 1970. During more than two decades,
however, fiscal policy allowed for a secular increase in government debt. Since 1975 the
budget has been permanently in deficit. Accordingly, debt grew at an accelerating pace from
37 percent in 1980 to 69.2 percent of GDP in 1995. On top of cyclical effects, expenditure
growth was mainly driven by an expanding welfare state and lately by increasing interest
payments. Pension obligations and the demand for cost intensive health care increase
progressively as a larger share of the population grows old. In addition to numerous new
entitlements and generous eligibility rules, social expenditures were inflated also by the
upward trend in unemployment (though much lower in Austria than in most other EU
countries). With a net deficit in excess of 5 percent of GDP, the situation appeared seemingly
unstable in 1995. In the absence of any drastic action, Austria’s participation in EMU was
threatened. The government finally pushed through a rather courageous consolidation
package in 1996 followed by a sizeable pension reform in 1997 and, thereby, was able to
improve sustainability in public finance. Government debt as a percentage of GDP is now
starting to decline.
The officially recorded level of debt, however, is a rather illusory concept that does not offer
much information regarding the sustainability of public finances and the true burden imposed
on future generations [cf. Auerbach et al. (1991) and (1994)]. If the government is to remain
solvent, it must satisfy its intertemporal budget constraint rather than any static net deficit
criterion. Intertemporal solvency requires that the present value of spending must not exceed
the present value of taxes plus current assets. Based on this concept, one may compute a
“total” level of debt reflecting the present value of the excess of upcoming spending
obligations over tax receipts that would obtain if current fiscal policy rules were continued
forever. Such a measure offers much more meaningful information on the sustainability of
public finances, and it may deviate considerably from the officially recorded level of debt.
Apart from the mere fact that consolidation measures may be successful in restoring
sustainability, they also involve intergenerational redistribution. For any given path of public
consumption, taxes may be collected now or later, and the burden will correspondingly fall on
current or future generations. The method of generational accounting records how the public
sector, under existing rules of spending and taxing, gives and takes from each generation
over the entire life-cycle. Calculating the difference of the present value of tax payments over
the present value of benefits over the rest of the life-time gives a single informative indicator
that identifies the net fiscal burden of each generation. Such long-term considerations,
however, are absent in conventional public sector accounting which usually rests on annual
budgets and fails to come forth with projections that go beyond one or two periods.
Consequently, not much is known about total government debt as well as the
intergenerational effects of actual fiscal policy. We employ the standardized approach to
2 — Keuschnigg, Keuschnigg, Koman, Lüth, Raffelhüschen / Public Debt & Generational Balance — I H S
generational accounting as proposed by Auerbach (1997) and Raffelhüschen (1998) in order
to gauge the total level of Austria’s public debt and to evaluate the intergenerational impact
of its fiscal policy.
We proceed by briefly presenting the generational accounting methodology.1 After shortly
discussing recent developments in the public sector, we turn to the baseline results
regarding the intergenerational stance of Austrian fiscal policy in 1995. Finally, we evaluate
the intergenerational consequences of the consolidation package of 1996 and the pension
reform of 1997. We then calculate the effects from the recently adopted tax reform 2000
including the family support package. In the concluding section, we reflect on the main
findings of the study and their policy implications.
II Generational Accounting: The Method
Traditional public sector accounting rests on a budget constraint that relates the
accumulation of debt tB to the size of the primary surplus tT according to
))(1(1 ttt TBrB −+=+ . This equation can be solved forward to obtain
.0)1(lim,)1( =+=++= −
∞→
∞
=
−∑ sst
stt
ts
stst BrNPGNPGrTB (1)
To remain solvent with a given level of historical debt, the government must run future
surpluses that are sufficiently large such that (1) is satisfied together with the No-Ponzi-
Game condition 0=tNPG . If it fails to generate the required surpluses, government
finances are not sustainable in the sense that the NPG condition, and thereby the
intertemporal budget constraint, will be violated. Debt will accumulate at an ever faster rate
until government becomes insolvent. Quite intuitively, one may therefore compute a
sustainability gap that is implied by current fiscal policy. Maintaining base year tax and
spending rules, we project future primary surpluses and compare their present value with the
current level of debt. The resulting gap reflects the degree to which current policies violate
the government’s solvency condition and are therefore unsustainable in base year t,
.)1(∑∞
=
−+−=ts
ststt rTBNPG (2)
We measure “total debt”, or wealth, by tNPG . If negative, government spending doesn’t
exhaust its revenues in present value terms, and fiscal policy may relax without violating
1 A critical survey on the analytical concept and empirical issues is found in Haveman (1994), CBO (1995) and
Diamond (1996). The method employed in this paper follows the standards developed in the European Commission’s project Generational Accounting in Europe [cf. Raffelhüschen (1999a, b, c)].
I H S — Keuschnigg, Keuschnigg, Koman, Lüth, Raffelhüschen / Public Debt & Generational Balance — 3
solvency. If positive, total expenditure commitments exceed prospective tax revenues under
status quo conditions, and current fiscal policy is unsustainable. Eventually, net taxes must
be increased at some future date to restore solvency. Total government debt, thus, provides
a clear indication of the overall extent of future fiscal adjustment that is dictated to keep the
government solvent. This measure accurately reflects the burden to future generations
induced by currently living cohorts. It makes explicit the government liabilities which are not
included in the official debt figures. Such liabilities, for example, include entitlements to
pension benefits that young people obtain in a pay-as-you-go system in exchange for their
contributions.
Apart from measuring total public debt based on the intertemporal budget constraint, the
generational accounting method also disaggregates in equation (1) the present value of net
taxes, or primary surpluses, across generations. Net taxes are understood as the excess of
taxes paid over benefits received. The latter include not only explicit transfer payments, in
cash and in kind, but also projected future government purchases of goods and services,
which are allocated to individual generations on a per-capita basis,
t t t ss
D
t t ss
B N N= +−=
+=
∞
∑ ∑, ,0 1
, (3)
where sttN −, stands for the present value of the net tax payments over the remaining life-
time, discounted to period t, by all members of a generation born in year t-s. Future values
are discounted with a constant pre-tax real interest rate r, and the life-cycle extends over a
maximum of D years. The first term on the right-hand-side then equals the present value of
net taxes summed over all generations alive in base-year t. The last term stands for the sum
of the present values of net tax payments made by future generations, that are those born in
year t+1 and later. The life-time tax burden of a particular generation is, thus, given by
t k t k
m
t k
f
s km
s t
k D
s km t s
s kf
s t
k D
s kf t s
N N N T P r T P r, , , , , , ,( ) ( )= + = +=
+−
=
+−∑ + ∑ +1 1 . (4)
In equation (4), ksT , refers to the net payment made in period s by a representative member
of the cohort born in year k<t, while ksP , stands for the fraction of agents born at date k who
survive until period s, or the size of generation k. Hence, the respective products represent
the net taxes paid by all members of generation k in period s. For all generations born prior
to the base-year, the summation begins in period t and extends only over the remaining life-
time. For future generations, born in period k > t, summation begins in period k and extends
over the full life-cycle. Irrespective of the date of birth, discounting is always back to period t.
In order to calculate net tax payments, the demographic structure ksP , must be specified.
Using population projections based on official statistics, the survival rates incorporate
assumptions concerning future fertility, mortality and net migration. A second step calculates
4 — Keuschnigg, Keuschnigg, Koman, Lüth, Raffelhüschen / Public Debt & Generational Balance — I H S
net tax payments ksT , relating to any present or future generation. Let i indicate a particular
tax or benefit item. Then we can simply sum over all types of payments in order to derive
s km
s k i s
m
iT h, , ,= −∑ , (5)
where )(, ih ks indicates the average transfer received or tax paid in period s by agents born
in k. Equations (4) and (5) take a life-cycle perspective over different periods while microdata
are available only for a particular base period across age groups. This difficulty is solved by
identifying agents in (5) according to their age and writing )(, ih as . This notation identifies the
date of birth as ask −= . It is generally assumed that both average payments and receipts
grow in line with overall productivity at a constant rate g. Then, the average tax/benefit
position in period s>t of a person aged a is related to the net tax liability of the same age
group in period t according to
tsatas gihih −+= )1)(()( ,, . (6)
Equations (4)-(6) are sufficient to calculate the net tax payments of any living or future
generation. For individuals of age 0 to D in the base-year, we retrieve average net tax liability
from micro-data on a broad range of tax and transfer payments. We thus obtain age-specific
tax/benefit profiles which are additionally differentiated according to gender. Note that taxes
include all forms of statutory payments to government while transfers reflect both in-cash
and in-kind benefits. In some instances, profiles may not vary according to age and gender.
This is the case whenever the assumed incidence corresponds to this uniformly distributed
profile or whenever sufficient information is not available. The cross-section profiles are
extrapolated into the future according to equation (6). They are taken as being
representative of the unobserved longitudinal data. With this extrapolation, one derives the
present value of net tax payments of the respective current generation as outlined in
equation (4). For future generations, we apply the same set of relative tax and transfer
profiles as illustrated in equation (6). Given that the status quo policies are preserved, future
generations face the same tax benefit rules as currently living agents do, and are thus
treated identically. Dividing the present value of future net taxes of a generation born in
period k by the respective base-year population of that cohort yields their generational
account:
ktktkt PNGA ,,, /= . (7)
The generational accounts measure the present value of the net tax burden, i.e. taxes net of
transfers, that individuals of a given age, rather than the entire cohort, must expect to pay
over their remaining life-cycle. The life-time net tax burden depends on survival probabilities
and net tax payments which fiscal policy allocates to members of specific age cohorts.
I H S — Keuschnigg, Keuschnigg, Koman, Lüth, Raffelhüschen / Public Debt & Generational Balance — 5
To restore sustainability in public finances, it may be necessary to increase the aggregate
present value of net taxes. According to (3), the government may raise the life-time net tax
burden of either present or future generations. To avoid an intergenerational imbalance of
fiscal policy, and for a “fair” treatment of present and future generations, government may
preferably impose equal life-cycle net tax rates (in terms of present value life-cycle income)
on both present and all future cohorts. An alternative hypothetical scenario that reveals the
potential for intergenerational redistribution induced by current fiscal policy, would raise tax
burden only on future generations born in period t+1 or subsequently while keeping the life-
time tax burden of currently living generations constant. Under this scenario, the tax increase
on future generations, necessary to restore sustainability and to eliminate total debt, will be
much higher, of course. To implement a specific scenario, we adjust scaling constants )(ikθ
which relate to types of payment i and to generation k, and compute net payments ksT , by
∑=i
kskks ihiT )()( ,, θ . (8)
As above, )(, ih ks stands for the transfer received or taxes paid by agents of age ksa −=
in period s>t. The scaling constants )(ikθ are chosen to eliminate total debt, 0=tNPG ,
and thereby to restore sustainability of fiscal policy, see equation (2). For example, the vector
)(ikθ might apply only to future generations who are born after the base year, or it might
include currently living old generations as well. It might reflect a decrease in all transfers or a
proportional increase in all taxes, depending on the specific scenario to be implemented.
III Generational Accounting For Austria
This section estimates total public sector debt and generational imbalance of Austrian fiscal
policy in 1995. Before reporting our baseline results, we briefly discuss some recent trends in
fiscal policy that led to the public sector budget in base-year 1995.
III.1 Recent Fiscal Policy
Debt Dynamics: Besides EU membership, the greatest political difficulties in the mid 90s
have been created by the fiscal problems encountered in preparing for EMU [cf. Genser and
Holzmann (1995) for a discussion]. Since 1975, the budget was permanently in deficit.
Already in 1987, the situation became seemingly unsustainable when the deficit exceeded 4
percent of GDP. The 1994 tax reform delivered significant tax cuts and further aggravated
the situation. In addition, weak economic growth caused social security spending to
accelerate. A deficit in the social security system, mostly determined by accelerated early
retirement, required large federal transfers that where in large part unexpected [see OECD
(1998)]. On top of that, contribution payments to the EU had to be financed for the first time.
6 — Keuschnigg, Keuschnigg, Koman, Lüth, Raffelhüschen / Public Debt & Generational Balance — I H S
The public deficit hit the 5.1 percent mark in 1995 which seemingly threatened Austrian
qualification for EMU.
Clearly, the Maastricht Treaty imposed a precise timing in fiscal consolidation and forced the
government to take prompter and more drastic action than would have been politically
opportune otherwise. At the end of 1995, the new coalition government finally delivered a
rather drastic fiscal consolidation package amounting to 4.5 percent of GDP over a two year
period [see Kramer and Lehner (1996), Lehner (1997), EC (1998)], one third to be covered
by higher revenues and two thirds by lower spending. On the revenue side, the government
relied predominantly on wage and personal income taxes, and to a lesser extent on
corporate and interest income taxes, an energy tax as well as a variety of indirect taxes.
Spending cuts mainly targeted compensation and employment of civil servants, and general
administration. Additional savings came from stricter eligibility criteria for unemployment
benefits and tightening of other social transfers. Transfers to the public pension scheme
were restricted, especially by limiting early retirement. In view of the long-run non-
sustainability of the current pension system, exacerbated by an aging population and
increasing life expectancy, an additional and more extensive pension reform was agreed
upon by the end of 1997.
According to the latest numbers, the objectives of the consolidation package have been
more than achieved. The net deficit of the entire public sector now stabilized at 2.5 percent
of GDP, well below the envisaged 3 percent mark, and is expected to remain at that level for
the next few years [cf Lehner (1998), IAS (1998)]. The primary surplus is approaching 1
percent of GDP. Public sector debt finally started to decline in 1997 to 66.1 percent of GDP,
down from 69.5 percent in 1996.
Public Expenditures: Over the last three decades, public expenditure increased from 41
percent of GDP in 1970 to 57.5 percent in 1995. Most of expenditure growth materialized in
the 1970s. Both larger purchases of goods and services as well as more and better paid
government personnel contributed to increasing public consumption. In 1995, public
consumption absorbed about 19 percent of GDP, 4.6 percent higher than in 1970. As
compared to the increase in transfers, the growth in public consumption was still moderate.
The share of transfers in GDP amounted to almost 30 percent in 1995, 12 percentage points
higher than in 1970. Pension expenditures increased from about 10 percent of GDP in 1970
to almost 14 percent in 1995. Demographic change, including longer life-expectancy as well
as excessive use of early retirement and disability pensions, is responsible for an ever larger
number of pensioners. In the presence of slower growth, the larger number of claimants and
the past generosity in the benefit levels resulted in a heavy pension burden as of 1995. New
benefits introduced during the 1970s and again in the 1990s together with a large rise in
early retirement inflated social security benefits and assistance grants in these periods. Last
but not least, transfer spending is importantly driven by higher interest payments which
I H S — Keuschnigg, Keuschnigg, Koman, Lüth, Raffelhüschen / Public Debt & Generational Balance — 7
quadrupled over the period, an unavoidable consequence of the rapid accumulation of public
debt.
Public Revenues: Starting from a level of 35.3 percent in 1970, taxes and social security
contributions amounted to 43 percent of GDP in 1995. The composition of revenues shifted
towards social security charges (from 9 percent of GDP in 1970 to 15.4 percent in 1995),
which are now about a third of total tax revenues. The last decades saw a cut in nominal tax
rates together with elimination of exemptions and a broadening of the tax base. The
importance of capital income taxes declined since the 1970s while an increasing part of the
tax burden was shifted to labor. Recently, the debate focused much on the proper balance
between business and labor taxation. Even by international comparison, Austria’s current tax
system is characterized by a high tax burden on labor.
In terms of revenues, the value added tax is the single most important tax in Austria. It
contributes two thirds of all revenues from indirect taxes. With a standard rate of 20% and a
reduced rate of 10%, Austria seems to have exhausted its potential VAT revenues.
Neighboring Germany levies considerably lower rates (16 percent and 7 percent,
respectively). Also, Austria’s standard rate is very close to the EU average which is 19.4
percent in 1998.
Social Insurance System: Austria has steadily built its welfare system over a long time and
runs now one of the more generous and complete systems in Europe. Social expenditures
accelerated rapidly in the 1970s and again in the early 90s. In addition to new entitlements
and generous eligibility rules, expenditure growth was nurtured by an aging population and,
lately, by an upward trend in unemployment. Compared to the EU12 average in 1994,
Austria affords a slightly higher percentage of GDP for social welfare. Furthermore, Austria is
more generous with family and old age support but spends markedly less for unemployment,
housing and other social purposes. A problem of the social insurance system is that lately an
ever larger part of expenditures must be covered out of general taxes rather than
contributions. In 1980, about 78 percent of social insurance benefits were still covered by
contributions, while in 1995, contributions covered no more than 72 percent of benefits.
The pension system in Austria is a very generous PAYG (pay-as-you-go) one [see Koch and
Thimann (1999), Rürup and Schröter (1997) and Stefanits (1998)]. The maximum
replacement rate is 80 percent, among the highest in Europe. As for 1995, pension
assessment is based on the best 15 years of salary, and benefits are indexed to net wages.
One of the distinctive features of the Austrian pension system is the large share of disability
and early retirement pensions. Given the increasing tendency to grant early retirement, the
share of regular old-age pensions declined from 25 percent for men (62 percent for women)
in 1970 to 13 percent (28 percent) in 1994. At the same time, both the life-expectancy and
the average duration of pensions increased. For these reasons, the old-age dependency
8 — Keuschnigg, Keuschnigg, Koman, Lüth, Raffelhüschen / Public Debt & Generational Balance — I H S
ratio2 reached 22.6 percent in 1995, being similar to that in Germany, the UK, France and
Italy. According to population projections, it is expected to grow to 41.4 percent until year
2030.
Contributions from the workforce are the main source of revenues. Contribution rates are
among the highest in Europe and amount to 22.8 percent of gross income. They are almost
double those in the 1960s. For the past 20 years, however, contributions have not fully
covered pension outlays. In 1995, contributions funded only 80 percent of total pension
expenditures. The rest is paid by transfers out of the government budget.
Population aging, increasing life-expectancy and very generous benefit levels make the
Austrian pension system unsustainable in the long-run. By international comparison, Austria
affords a rather high level of public spending on pensions. In 1995, pension expenditures
claimed 13.7 percent of GDP as compared to 9.9 percent in 1970. By way of contrast, the
OECD average is only 10 percent. Given the unfunded nature of the pension system, the
expected increasing dependency ratio will put an immense pressure on public budgets.
According to Koch and Thimann (1999), the fiscal pressure from the pension system is
expected to increase significantly until year 2020 and to accelerate afterwards, with a peak in
year 2035 when pension expenditures are estimated to reach 16.25 percent of GDP.3
Health expenditures have been one of the most rapidly growing items of public spending. An
aging population raises the demand for medical services and increasingly complex
treatments inflate costs. In addition, there are particular features of the Austrian health care
system which impair efficiency. Spending on health care is now among the highest in
Europe, see OECD (1997). Austria also affords a generous system of family assistance.
Currently, the main elements of family support are income-tax credits, free social security
coverage for dependents, free compulsory education and monthly cash benefits for children
up to working age, lump-sum post-birth payments, maternity leave, etc. In 1990, family
benefits amounted to 10 percent of GDP, which is among the highest within the OECD [see
OECD (1994)].
Consolidated Budget 1995: Table I reports the consolidated budget in Austria for the base-
year 1995. Macroeconomic data were retrieved from data bases of the Austrian Economic
Research Institutes IAS and WIFO as well as various years of OECD and ÖSTAT National
Accounts publications. Compilation of revenue figures was helped by revenue statistics of
Eurostat and OECD, various years, and wage tax statistics of ÖSTAT (1994) and (1995). For
the purpose of this study, some budget items had to be regrouped and netted out, but the
numbers in table I are reconciled with official statistics after some adjustments. For example,
filed income taxes have been distributed to wage and capital income taxes. Government
2 Defined as the ratio of the population 65 years or older to the population aged 15-64 years.
3 They analyse only the employee and self-employed pension schemes.
I H S — Keuschnigg, Keuschnigg, Koman, Lüth, Raffelhüschen / Public Debt & Generational Balance — 9
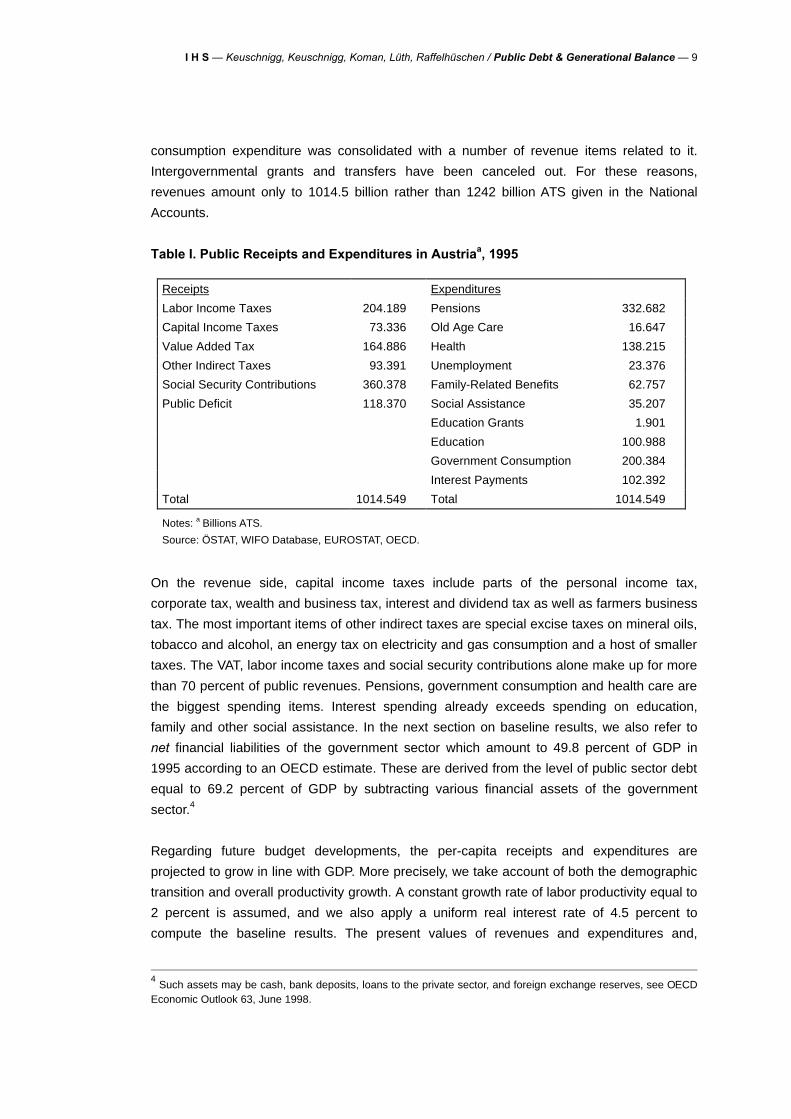
consumption expenditure was consolidated with a number of revenue items related to it.
Intergovernmental grants and transfers have been canceled out. For these reasons,
revenues amount only to 1014.5 billion rather than 1242 billion ATS given in the National
Accounts.
Table I. Public Receipts and Expenditures in Austriaa, 1995
Receipts Expenditures
Labor Income Taxes 204.189 Pensions 332.682
Capital Income Taxes 73.336 Old Age Care 16.647
Value Added Tax 164.886 Health 138.215
Other Indirect Taxes 93.391 Unemployment 23.376
Social Security Contributions 360.378 Family-Related Benefits 62.757
Public Deficit 118.370 Social Assistance 35.207
Education Grants 1.901
Education 100.988
Government Consumption 200.384
Interest Payments 102.392
Total 1014.549 Total 1014.549
Notes: a Billions ATS.
Source: ÖSTAT, WIFO Database, EUROSTAT, OECD.
On the revenue side, capital income taxes include parts of the personal income tax,
corporate tax, wealth and business tax, interest and dividend tax as well as farmers business
tax. The most important items of other indirect taxes are special excise taxes on mineral oils,
tobacco and alcohol, an energy tax on electricity and gas consumption and a host of smaller
taxes. The VAT, labor income taxes and social security contributions alone make up for more
than 70 percent of public revenues. Pensions, government consumption and health care are
the biggest spending items. Interest spending already exceeds spending on education,
family and other social assistance. In the next section on baseline results, we also refer to
net financial liabilities of the government sector which amount to 49.8 percent of GDP in
1995 according to an OECD estimate. These are derived from the level of public sector debt
equal to 69.2 percent of GDP by subtracting various financial assets of the government
sector.4
Regarding future budget developments, the per-capita receipts and expenditures are
projected to grow in line with GDP. More precisely, we take account of both the demographic
transition and overall productivity growth. A constant growth rate of labor productivity equal to
2 percent is assumed, and we also apply a uniform real interest rate of 4.5 percent to
compute the baseline results. The present values of revenues and expenditures and,
4 Such assets may be cash, bank deposits, loans to the private sector, and foreign exchange reserves, see OECD
Economic Outlook 63, June 1998.
10 — Keuschnigg, Keuschnigg, Koman, Lüth, Raffelhüschen / Public Debt & Generational Balance — I H S
therefore, the size of total debt as derived from the intertemporal budget constraint in (2) will
importantly depend on these two parameters. We thus report some sensitivity analysis in
subsection III.4.
III.2 Tax Benefit Profiles
For each person, fiscal legislation defines specific claims and liabilities against the public
sector. The benefit entitlements and tax liabilities of a 60 year old female pensioner are very
different from those of a 30 year old male wage earner. To quantify the inter- and intra-
generational impact of fiscal policy, generational accounting must keep track of the
distribution of taxes and benefits across various population groups. Breaking down
aggregate budget figures according to their age-gender distribution amounts to formidable
empirical work, yet the quality of the results depends very essentially on such effort. The
demographic decomposition of the budget is all the more difficult in our case since Austria
was not yet the subject of such a study before. We now describe in detail our empirical work
and the assumptions that were required to arrive at a consistent data base compiled from
different sources.
Current demographic developments determine the future age structure of the population
which, in turn, exerts an extremely important influence on future budgets. Regarding
mortality and fertility rates as well as migration, we closely follow the projections of the
Austrian Statistical Office [Demographic and Statistical Yearbooks, ÖSTAT (1996), (1997)]
which forecasts a slight rise in fertility and life-expectancy. The fertility rate increases from
1.4 in the base-year to 1.5 in 2010 and is assumed to remain constant thereafter. Life
expectancy at birth rises linearly from 72.5 in 1995 to 75.3 in 2010 for males and from 79.0
to 81.6 for females, and subsequently remains constant at that level. The Statistical Office
instead assumes that life-expectancy increases further after 2010. Given the long horizon of
our projection, we choose to be somewhat more conservative. Finally, net immigration
expands the labor force by a constant rate of 17,000, that is 0.21 percent of the population
per year.
A critical part of generational accounting concerns the construction of age-gender profiles
that keep track of the age distribution of tax payments and benefit entitlements. Following the
methodology described in Raffelhüschen (1998, section 3), we implemented separate
profiles for all major tax and spending categories. The distribution of labor taxes was
retrieved from ÖSTAT (Lohnsteuerstatistik, 1995), data on social security contributions were
directly provided by the Association of the Austrian Social Insurance Institutions
(Hauptverband der Österreichischen Sozialversicherungsträger). We allocated capital
income taxes across age and gender relying on capital income profiles that were available in
the European Union Household Panel compiled by Eurostat (1995). Finally, we allocated
payments of VAT and other indirect taxes on the basis of the consumer expenditure survey in
ÖSTAT (1984).
I H S — Keuschnigg, Keuschnigg, Koman, Lüth, Raffelhüschen / Public Debt & Generational Balance — 11
On the expenditure side, government consumption is determined residually by subtracting
from total expenditure all age-specifically distributed taxes and transfers as well as interest
payments. Since there is no clear evidence for an age specific demand pattern for
government consumption services such as defense, general administration and the like,
these expenditures were made flat across age groups. By way of contrast, age-gender
profiles are quite uneven for many social expenditure categories. Pension income of all sorts
and benefits from old age care can be tracked over life-time according to the household
panel. Eurostat (1995) similarly provides necessary information on age-specific transfer
income from family allowances, social assistance and unemployment benefits including
unemployment insurance.
Spending on education and health care was attributed to household groups based on
Eurostat (1995), ÖSTAT (1995/96) and ÖSTAT (1996/97a,b). This way we obtained the tax
benefit position for a representative member of each group. Next, one explicitly aggregates
by multiplying each group with its population weight and adding up. To reconcile the implied
aggregate revenue and spending volumes with actual budget figures, some adjustments
were required at various stages which is inevitable due to mutual inconsistencies of different
data sources. Decomposing government activity in this way and finding the age-gender
profiles of taxes and benefits is at the heart of generational accounting and eventually results
in generational tax benefit accounts such as those listed in tables II-IV below.
III.3 Baseline Results
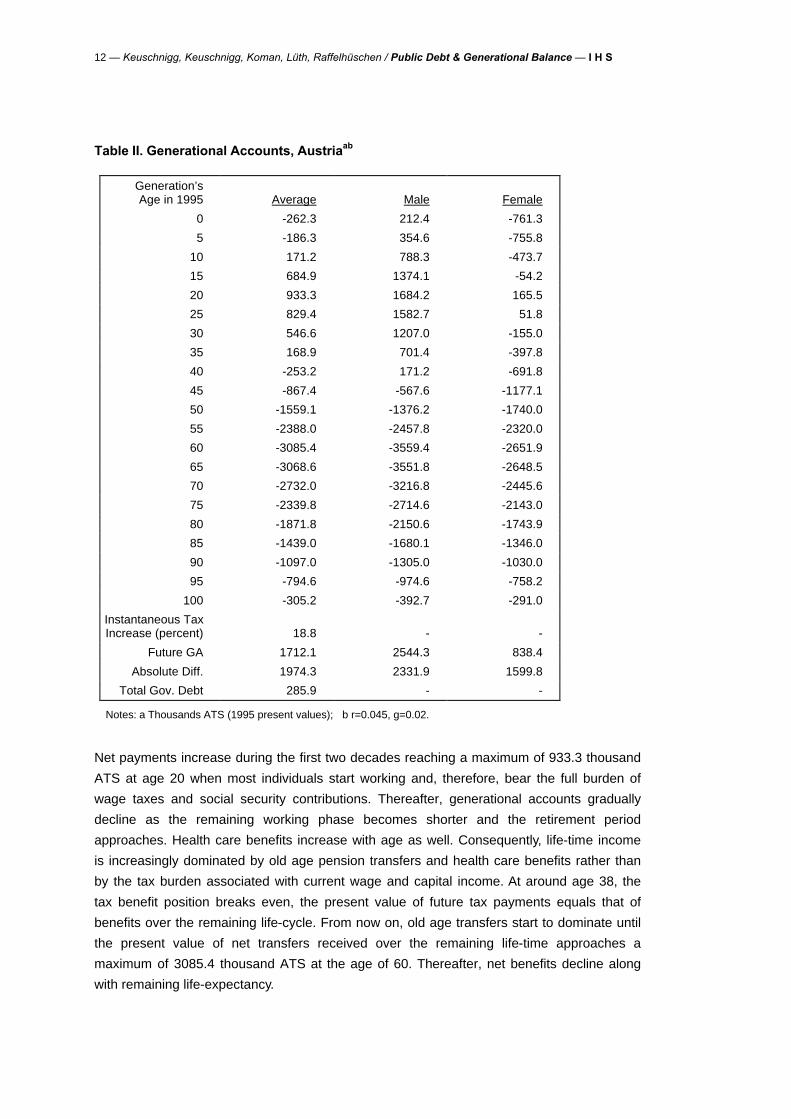
Table II displays the age-specific net payments to the government, in present value terms, of
all current and future generations. The figures reflect the structure of public revenues and
expenditure in Austria in 1995 under the baseline scenario, assuming that the status quo of
current legal provisions is continued forever. For a new born average citizen, the present
value of benefits received over the entire life-time exceeds the present value of taxes paid by
262.3 thousand ATS. The negative net transfer payments during the first seven years of life
may readily be explained by the fact that benefits relating to family support, education and
social assistance are received early in life and weigh much more than the present value of
income taxes that are paid only later in life.
12 — Keuschnigg, Keuschnigg, Koman, Lüth, Raffelhüschen / Public Debt & Generational Balance — I H S
Table II. Generational Accounts, Austriaab
Generation’s Age in 1995
Average
Male
Female
0 -262.3 212.4 -761.3
5 -186.3 354.6 -755.8
10 171.2 788.3 -473.7
15 684.9 1374.1 -54.2
20 933.3 1684.2 165.5
25 829.4 1582.7 51.8
30 546.6 1207.0 -155.0
35 168.9 701.4 -397.8
40 -253.2 171.2 -691.8
45 -867.4 -567.6 -1177.1
50 -1559.1 -1376.2 -1740.0
55 -2388.0 -2457.8 -2320.0
60 -3085.4 -3559.4 -2651.9
65 -3068.6 -3551.8 -2648.5
70 -2732.0 -3216.8 -2445.6
75 -2339.8 -2714.6 -2143.0
80 -1871.8 -2150.6 -1743.9
85 -1439.0 -1680.1 -1346.0
90 -1097.0 -1305.0 -1030.0
95 -794.6 -974.6 -758.2
100 -305.2 -392.7 -291.0
Instantaneous Tax Increase (percent)
18.8
-
-
Future GA 1712.1 2544.3 838.4
Absolute Diff. 1974.3 2331.9 1599.8
Total Gov. Debt 285.9 - -
Notes: a Thousands ATS (1995 present values); b r=0.045, g=0.02.
Net payments increase during the first two decades reaching a maximum of 933.3 thousand
ATS at age 20 when most individuals start working and, therefore, bear the full burden of
wage taxes and social security contributions. Thereafter, generational accounts gradually
decline as the remaining working phase becomes shorter and the retirement period
approaches. Health care benefits increase with age as well. Consequently, life-time income
is increasingly dominated by old age pension transfers and health care benefits rather than
by the tax burden associated with current wage and capital income. At around age 38, the
tax benefit position breaks even, the present value of future tax payments equals that of
benefits over the remaining life-cycle. From now on, old age transfers start to dominate until
the present value of net transfers received over the remaining life-time approaches a
maximum of 3085.4 thousand ATS at the age of 60. Thereafter, net benefits decline along
with remaining life-expectancy.
I H S — Keuschnigg, Keuschnigg, Koman, Lüth, Raffelhüschen / Public Debt & Generational Balance — 13
Table II also shows the age-specific generational accounts separately for males and females.
The Austrian fiscal system implies a large amount of redistribution between genders. Males
face high net payments for at least four decades, while females only for one. Furthermore,
the maximum present value of net payments by females at age 20 represents a mere 10
percent of the burden faced by males. However, females’ maximum net benefit position at
age 60 makes up for three quarters of the males’ account.
Tables III and IV split up the overall net liability of males and females into various tax and
transfer components and, thereby, provides more information with respect to the implied
redistribution between generations and genders in Austria. Among transfers, government
consumption is spread rather evenly across life-time, and the present values decline evenly
along with remaining life-expectancy. Pensions and health care benefits are received later in
life and mainly benefit the old. The other social transfers, in particular education and family
related transfers, are targeted towards the young. On the tax side, VAT and excise taxes
tend to be distributed more evenly over life compared to the other components and,
therefore, tend to be rather neutral in terms of intergenerational redistribution. The present
value of social insurance payments and of labor income taxes weighs more heavily for
younger generations. By way of contrast, capital income accrues later in life, reflecting life-
cycle savings patterns. That’s why the present value of capital income taxes stays rather
constant for many cohorts even though remaining life-time becomes shorter with aging.
Tables III and IV also provide evidence for significant intra-generational redistribution across
genders. Indirect taxes do not differentiate very much across genders. Transfers such as
social assistance, education and government consumption are rather evenly distributed as
well. By way of contrast, health and family related benefits are much larger for women,
especially during their first three decades of living. Given lower female labor force
participation, labor income taxes of females are much lower. They are only between 20 to 41
percent of taxes for males. A similar pattern holds for unemployment benefits. Capital income
taxes paid by females represent only 36 percent to 71 percent of their male counterparts.
Reflecting past wage incomes, pensions are again higher for males than for females.
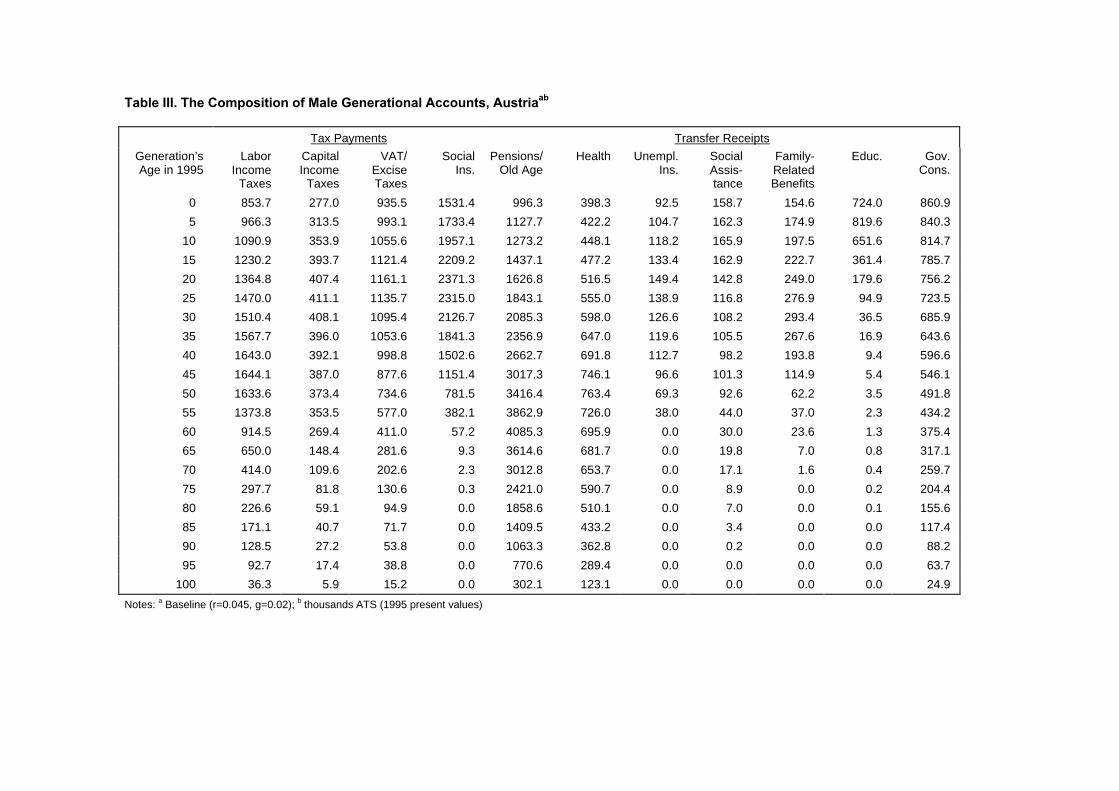
Table III. The Composition of Male Generational Accounts, Austriaab
Tax Payments Transfer Receipts
Generation’s Age in 1995
Labor Income
Taxes
Capital Income
Taxes
VAT/ Excise Taxes
Social Ins.
Pensions/ Old Age
Health Unempl. Ins.
Social Assis- tance
Family- Related Benefits
Educ. Gov. Cons.
0 853.7 277.0 935.5 1531.4 996.3 398.3 92.5 158.7 154.6 724.0 860.9
5 966.3 313.5 993.1 1733.4 1127.7 422.2 104.7 162.3 174.9 819.6 840.3
10 1090.9 353.9 1055.6 1957.1 1273.2 448.1 118.2 165.9 197.5 651.6 814.7
15 1230.2 393.7 1121.4 2209.2 1437.1 477.2 133.4 162.9 222.7 361.4 785.7
20 1364.8 407.4 1161.1 2371.3 1626.8 516.5 149.4 142.8 249.0 179.6 756.2
25 1470.0 411.1 1135.7 2315.0 1843.1 555.0 138.9 116.8 276.9 94.9 723.5
30 1510.4 408.1 1095.4 2126.7 2085.3 598.0 126.6 108.2 293.4 36.5 685.9
35 1567.7 396.0 1053.6 1841.3 2356.9 647.0 119.6 105.5 267.6 16.9 643.6
40 1643.0 392.1 998.8 1502.6 2662.7 691.8 112.7 98.2 193.8 9.4 596.6
45 1644.1 387.0 877.6 1151.4 3017.3 746.1 96.6 101.3 114.9 5.4 546.1
50 1633.6 373.4 734.6 781.5 3416.4 763.4 69.3 92.6 62.2 3.5 491.8
55 1373.8 353.5 577.0 382.1 3862.9 726.0 38.0 44.0 37.0 2.3 434.2
60 914.5 269.4 411.0 57.2 4085.3 695.9 0.0 30.0 23.6 1.3 375.4
65 650.0 148.4 281.6 9.3 3614.6 681.7 0.0 19.8 7.0 0.8 317.1
70 414.0 109.6 202.6 2.3 3012.8 653.7 0.0 17.1 1.6 0.4 259.7
75 297.7 81.8 130.6 0.3 2421.0 590.7 0.0 8.9 0.0 0.2 204.4
80 226.6 59.1 94.9 0.0 1858.6 510.1 0.0 7.0 0.0 0.1 155.6
85 171.1 40.7 71.7 0.0 1409.5 433.2 0.0 3.4 0.0 0.0 117.4
90 128.5 27.2 53.8 0.0 1063.3 362.8 0.0 0.2 0.0 0.0 88.2
95 92.7 17.4 38.8 0.0 770.6 289.4 0.0 0.0 0.0 0.0 63.7
100 36.3 5.9 15.2 0.0 302.1 123.1 0.0 0.0 0.0 0.0 24.9
Notes: a Baseline (r=0.045, g=0.02); b thousands ATS (1995 present values)
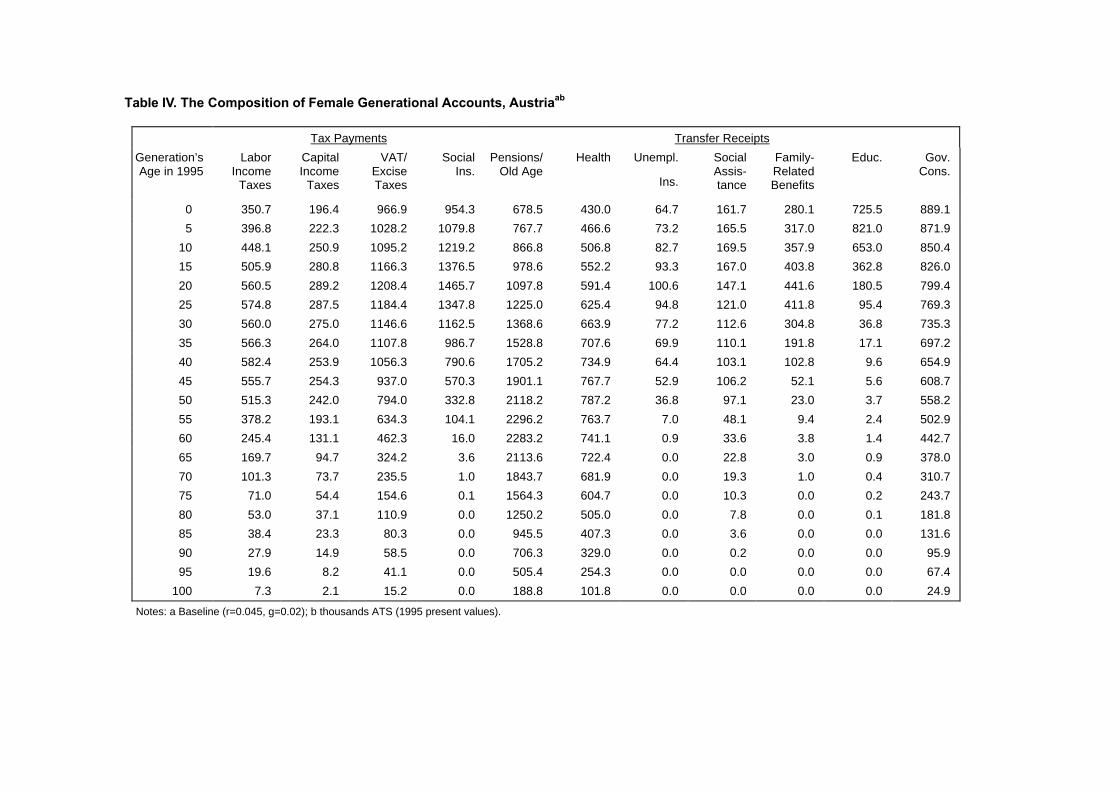
Table IV. The Composition of Female Generational Accounts, Austriaab
Tax Payments Transfer Receipts
Generation’s Age in 1995
Labor Income
Taxes
Capital Income
Taxes
VAT/ Excise Taxes
Social Ins.
Pensions/ Old Age
Health Unempl.
Ins.
Social Assis- tance
Family- Related Benefits
Educ. Gov. Cons.
0 350.7 196.4 966.9 954.3 678.5 430.0 64.7 161.7 280.1 725.5 889.1
5 396.8 222.3 1028.2 1079.8 767.7 466.6 73.2 165.5 317.0 821.0 871.9
10 448.1 250.9 1095.2 1219.2 866.8 506.8 82.7 169.5 357.9 653.0 850.4
15 505.9 280.8 1166.3 1376.5 978.6 552.2 93.3 167.0 403.8 362.8 826.0
20 560.5 289.2 1208.4 1465.7 1097.8 591.4 100.6 147.1 441.6 180.5 799.4
25 574.8 287.5 1184.4 1347.8 1225.0 625.4 94.8 121.0 411.8 95.4 769.3
30 560.0 275.0 1146.6 1162.5 1368.6 663.9 77.2 112.6 304.8 36.8 735.3
35 566.3 264.0 1107.8 986.7 1528.8 707.6 69.9 110.1 191.8 17.1 697.2
40 582.4 253.9 1056.3 790.6 1705.2 734.9 64.4 103.1 102.8 9.6 654.9
45 555.7 254.3 937.0 570.3 1901.1 767.7 52.9 106.2 52.1 5.6 608.7
50 515.3 242.0 794.0 332.8 2118.2 787.2 36.8 97.1 23.0 3.7 558.2
55 378.2 193.1 634.3 104.1 2296.2 763.7 7.0 48.1 9.4 2.4 502.9
60 245.4 131.1 462.3 16.0 2283.2 741.1 0.9 33.6 3.8 1.4 442.7
65 169.7 94.7 324.2 3.6 2113.6 722.4 0.0 22.8 3.0 0.9 378.0
70 101.3 73.7 235.5 1.0 1843.7 681.9 0.0 19.3 1.0 0.4 310.7
75 71.0 54.4 154.6 0.1 1564.3 604.7 0.0 10.3 0.0 0.2 243.7
80 53.0 37.1 110.9 0.0 1250.2 505.0 0.0 7.8 0.0 0.1 181.8
85 38.4 23.3 80.3 0.0 945.5 407.3 0.0 3.6 0.0 0.0 131.6
90 27.9 14.9 58.5 0.0 706.3 329.0 0.0 0.2 0.0 0.0 95.9
95 19.6 8.2 41.1 0.0 505.4 254.3 0.0 0.0 0.0 0.0 67.4
100 7.3 2.1 15.2 0.0 188.8 101.8 0.0 0.0 0.0 0.0 24.9
Notes: a Baseline (r=0.045, g=0.02); b thousands ATS (1995 present values).
16 — Keuschnigg, Keuschnigg, Koman, Lüth, Raffelhüschen / Public Debt & Generational Balance — I H S
What is the true size of Austria’s public debt in 1995? Clearly, the officially recorded net
financial liabilities equal to 49.8 percent of GDP are part of it, see equation (2). But total
public debt may be much higher. Economically, there is no difference between the claims of
those who have acquired government bonds, and the pension claims that today’s pensioners
have acquired in the past during their years of contributions. After all, the PAYG system is
built on a “contract between generations” where workers pay contributions today in
exchange for the promise that they will receive a pension when retired. Consequently,
pension rights accumulated under the PAYG system are as much a government liability as
previously issued government bonds. Turning to table II, a 65 year old Austrian receives
pensions and other transfers over the rest of life equal to a net present value of ATS 3068.6
thousand. Clearly, these are previously accumulated government liabilities which must be
serviced by future generations. By way of contrast, a person 20 years old in 1995 pays taxes
net of transfers received equal to a present value of ATS 933.3 thousand. This asset offsets
today’s government liability and, therefore, reduces the burden on future generations.
Multiplying the per capita numbers in table II by the size of the age group and adding up over
all cohorts, we obtain an implicit public debt imposed by currently living generations on future
generations amounting to 236.1 percent of GDP. Adding the officially recorded public debt
equal to 49.8 percent, Austria’s total public debt in 1995 amounts to 285.9 percent of GDP.5
Clearly, this is a huge burden imposed by currently living generations on future ones under
the current law. In order to service these liabilities, future generations will have to pay higher
taxes or to forego social benefits. The burden on each future generation (the cohorts born in
1996 or later) is uniquely measured by the present value of net taxes at the beginning of
their life. Assuming that all future cohorts, born in 1996 or later, start their life with the same
net present value of taxes, we ask the following hypothetical question: By how much do we
have to deteriorate the tax benefit position of future generations in order to enable the
government to service its true debt and to fulfill its intertemporal budget constraint? Table II
reports a required net payment equal to ATS 1712.1 thousand which is higher by 1974.3
thousand than the net (negative) liability of the 1995 cohort! The higher net payment could
be brought about, for example, by increasing the life-time tax burden of future generations by
64.8 percent. The two genders share quite unequally in this burden. Future born males
would face net payments of ATS 2544.3 thousand as compared to only 212.4 thousand for
1995 born males. By way of contrast, future females would face net payments of ATS 838.4
thousand at the beginning of their life as compared to the 761.3 thousand net benefit position
5 The latest international cross-country comparison, based on an interest rate of 5 percent and a growth rate of 1.5
percent, can be found in Gokhale and Raffelhüschen (2000). According to their parameterization, Austria has a total public indebtedness of 193 percent of GDP. Only Sweden and Finland display even higher debt-to-GDP ratios of 237 and 253 percent, respectively. For the UK (185), Spain (152), Germany (136), and Italy (107), the numbers range below Austrias but amount to still more than 100 percent of GDP. Debt-to-GDP ratios below the 100 percent figure can be found in the US (87), France (81), the Netherlands (76), Denmark (71), Belgium (19), and Norway (10). Only in Ireland, the intertemporal redistribution is to the advantage of future cohorts, indicated by a negative debt-to-GDP ratio of –4 percent.
I H S — Keuschnigg, Keuschnigg, Koman, Lüth, Raffelhüschen / Public Debt & Generational Balance — 17
of a current newborn female. Again, this highlights the stark tendency of current Austrian
policy to redistribute in both the inter- and intra-generational dimension.
The current state of affairs implies a beneficial position of present generations at the
expense of a huge burden on future ones. For an alternative way to characterize the
intergenerational imbalance, we ask: in order to eliminate total debt and to restore
sustainability of public finances, by how much must we increase taxes once and for all such
that the life-time tax burden of a current newborn and a future newborn are exactly the
same? Relative to the baseline scenario, this method of satisfying the intertemporal budget
constraint relieves future generations and puts a higher burden on current generations. In
this case, a permanent increase of all taxes by 18.8 percent (see table II) would be
necessary to equalize the accounts of the current and future newborns who would then face
a net life-time tax payment of ATS 309.2 thousand each. As a result, taxes would increase
from 38.4 percent6 to 45.6 percent of GDP. Alternatively, the fiscal imbalance could be
removed by permanently cutting transfers by 16.2 percent, thus equalizing life-time net
payments faced both by current and future newborns at ATS 275.1 thousand. Consequently,
transfer payments would decline from currently 39 percent of GDP to 32.7 percent.
A major source of intergenerational imbalance is that current fiscal policy fails to respond to
population aging. To see this, we run a hypothetical experiment that prevents aging by
keeping the base-year population structure constant. Under this scenario, total government
debt amounts to only 78.4 percent of GDP which means that the implicit debt reduces to
28.6 percent. Consequently, a comparatively moderate increase in life-time taxes for future
generations equal to 12.9 percent (instead of 64.8 percent in the baseline) would be enough
to restore sustainability, i.e. to satisfy the government’s intertemporal budget constraint. A tax
increase of only 4.9 percent (as compared to 18.8 percent in the baseline) would suffice if it
were extended to all generations. Similarly, the instantaneous and permanent cut in transfers
that would be required to restore intergenerational balance, is no more than 4.8 percent (as
compared to 16.2 percent in the baseline). To conclude, the unfavorable demographic
developments are a major source of fiscal imbalance.
III.4 Sensitivity Analysis
Like any estimate that derives from present value computations, our results are sensitive
with respect to variations in the interest and productivity growth rates as well as population
projections. Table V shows how low discount rates and high growth rates tend to inflate the
figures for total public debt. Within a reasonable range of parameter values, our estimate for
6 These figures for revenues and expenditures as percent of GDP do not correspond to those found elsewhere in
the paper, because contributions of public sector employees have been netted out. See the discussion of table I.
18 — Keuschnigg, Keuschnigg, Koman, Lüth, Raffelhüschen / Public Debt & Generational Balance — I H S
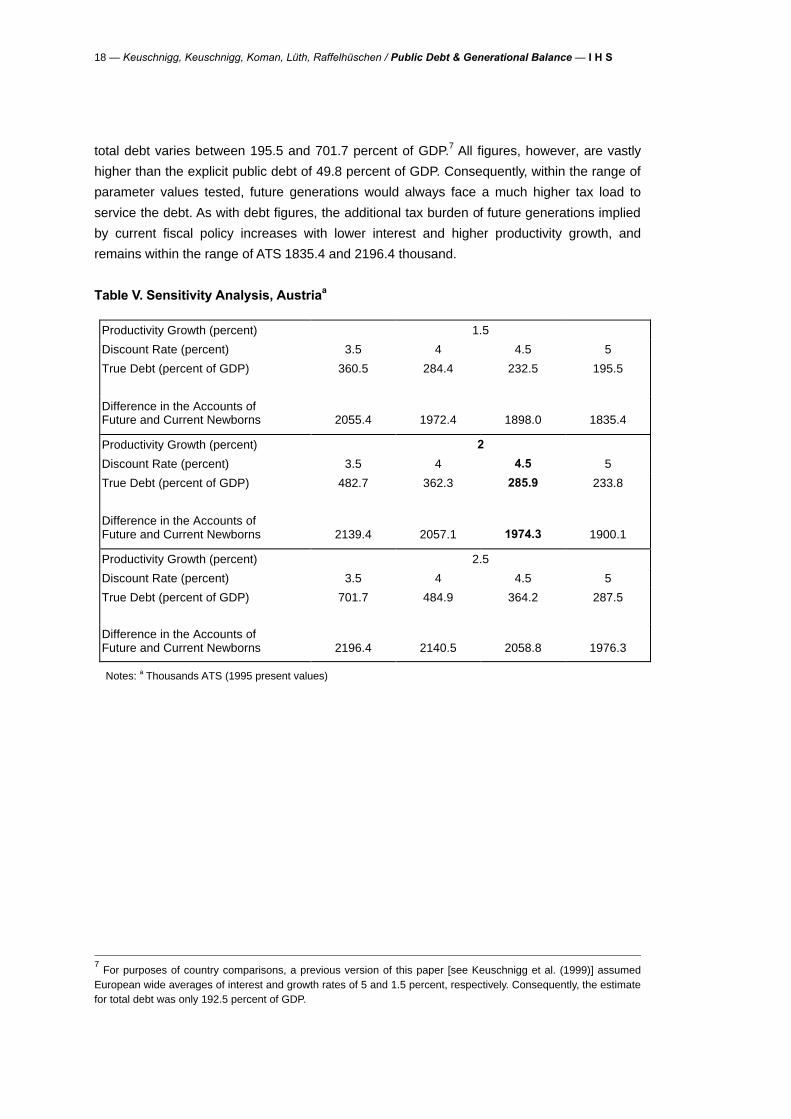
total debt varies between 195.5 and 701.7 percent of GDP.7 All figures, however, are vastly
higher than the explicit public debt of 49.8 percent of GDP. Consequently, within the range of
parameter values tested, future generations would always face a much higher tax load to
service the debt. As with debt figures, the additional tax burden of future generations implied
by current fiscal policy increases with lower interest and higher productivity growth, and
remains within the range of ATS 1835.4 and 2196.4 thousand.
Table V. Sensitivity Analysis, Austriaa
Productivity Growth (percent) 1.5
Discount Rate (percent) 3.5 4 4.5 5
True Debt (percent of GDP) 360.5 284.4 232.5 195.5
Difference in the Accounts of Future and Current Newborns
2055.4
1972.4
1898.0
1835.4
Productivity Growth (percent) 2
Discount Rate (percent) 3.5 4 4.5 5
True Debt (percent of GDP) 482.7 362.3 285.9 233.8
Difference in the Accounts of Future and Current Newborns
2139.4
2057.1
1974.3
1900.1
Productivity Growth (percent) 2.5
Discount Rate (percent) 3.5 4 4.5 5
True Debt (percent of GDP) 701.7 484.9 364.2 287.5
Difference in the Accounts of Future and Current Newborns
2196.4
2140.5
2058.8
1976.3
Notes: a Thousands ATS (1995 present values)
7 For purposes of country comparisons, a previous version of this paper [see Keuschnigg et al. (1999)] assumed
European wide averages of interest and growth rates of 5 and 1.5 percent, respectively. Consequently, the estimate for total debt was only 192.5 percent of GDP.
I H S — Keuschnigg, Keuschnigg, Koman, Lüth, Raffelhüschen / Public Debt & Generational Balance — 19
IV Restoring Fiscal Balance
IV.1 Recent Policy Initiatives
IV.1.1 The 1996 Fiscal Consolidation Package
The net public deficit in 1995 was 5.1 percent of GDP. At that time, the net deficit of the
entire public sector was forecast to be a full 8 percent of GDP in 1997 [cf. Lehner (1996)]. In
the absence of any drastic action, this perspective threatened Austria’s participation in EMU.
To reverse the trend, the government finally pushed through a consolidation package in 1996
and presented a two year budget. The objective was to reduce the net deficit to 3 percent in
1997 to meet the Maastricht deficit criterion. A quota of 2.7 percent was set for the central
government and 0.3 percent for the state and local governments. The original budget
projections indicated the need for a huge savings volume. 8
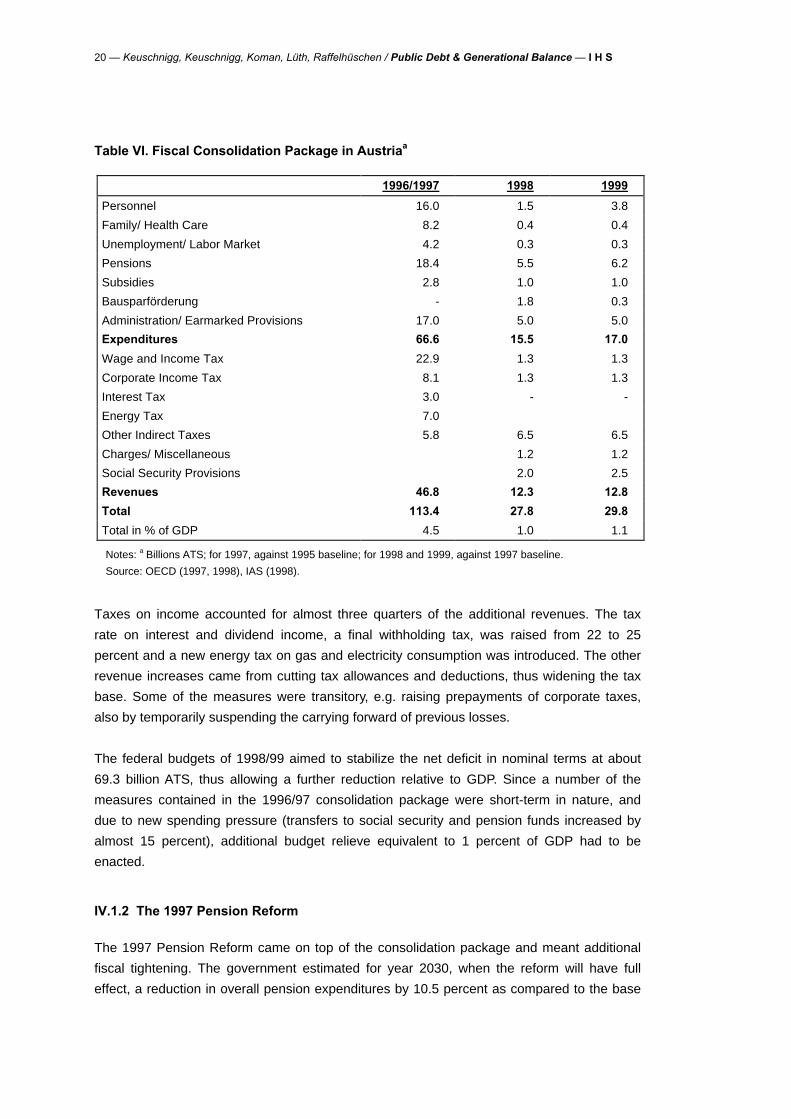
Table VI summarizes the main components of the consolidation package for the entire public
sector. Reducing the number of public sector employees and effectively freezing wage
increases restrained spending on personnel. Savings in general administration were to be
achieved by raising efficiency, stabilizing federal transfers to railways and cutting housing
subsidies. Some of these savings were actually revenue raising such as higher license
income from telecommunications and increased prepayments of corporate tax. Important
savings came from measures addressed to the pension system, mainly by discouraging
early retirement which was made financially less attractive. Required contribution periods
were extended from 35 to 37.5 years, and full pensions were made available only after the
60th year. Freezing benefits and restricting eligibility squeezed costs for nursing care. Family
allowances including maternity leave, payments for newborns, free transport to schools and
subsidies on school books were restricted or cut altogether. Savings in unemployment
insurance stemmed from stricter eligibility rules, lower benefits and tighter controls against
abuse. The government froze labor market funds at 1995 levels and cut subsidies to
business and earmarked transfers to off-budget funds. Over the 1996-1997 period,
expenditure savings amounted to almost 105 billion ATS. For 1998-1999, additional
expenditure cuts of 15.5 and 17 billion were budgeted.
8 The original projections were too pessimistic since later statistics showed a much smaller deficit for 1995.
20 — Keuschnigg, Keuschnigg, Koman, Lüth, Raffelhüschen / Public Debt & Generational Balance — I H S
Table VI. Fiscal Consolidation Package in Austriaa
1996/1997 1998 1999
Personnel 16.0 1.5 3.8
Family/ Health Care 8.2 0.4 0.4
Unemployment/ Labor Market 4.2 0.3 0.3
Pensions 18.4 5.5 6.2
Subsidies 2.8 1.0 1.0
Bausparförderung - 1.8 0.3
Administration/ Earmarked Provisions 17.0 5.0 5.0
Expenditures 66.6 15.5 17.0
Wage and Income Tax 22.9 1.3 1.3
Corporate Income Tax 8.1 1.3 1.3
Interest Tax 3.0 - -
Energy Tax 7.0
Other Indirect Taxes 5.8 6.5 6.5
Charges/ Miscellaneous 1.2 1.2
Social Security Provisions 2.0 2.5
Revenues 46.8 12.3 12.8
Total 113.4 27.8 29.8
Total in % of GDP 4.5 1.0 1.1
Notes: a Billions ATS; for 1997, against 1995 baseline; for 1998 and 1999, against 1997 baseline.
Source: OECD (1997, 1998), IAS (1998).
Taxes on income accounted for almost three quarters of the additional revenues. The tax
rate on interest and dividend income, a final withholding tax, was raised from 22 to 25
percent and a new energy tax on gas and electricity consumption was introduced. The other
revenue increases came from cutting tax allowances and deductions, thus widening the tax
base. Some of the measures were transitory, e.g. raising prepayments of corporate taxes,
also by temporarily suspending the carrying forward of previous losses.
The federal budgets of 1998/99 aimed to stabilize the net deficit in nominal terms at about
69.3 billion ATS, thus allowing a further reduction relative to GDP. Since a number of the
measures contained in the 1996/97 consolidation package were short-term in nature, and
due to new spending pressure (transfers to social security and pension funds increased by
almost 15 percent), additional budget relieve equivalent to 1 percent of GDP had to be
enacted.
IV.1.2 The 1997 Pension Reform
The 1997 Pension Reform came on top of the consolidation package and meant additional
fiscal tightening. The government estimated for year 2030, when the reform will have full
effect, a reduction in overall pension expenditures by 10.5 percent as compared to the base
I H S — Keuschnigg, Keuschnigg, Koman, Lüth, Raffelhüschen / Public Debt & Generational Balance — 21
case of no reform being implemented which roughly amounts to a savings of 1.5 percent of
GDP by 2030. A series of measures addressed strengthening of the link between benefits
and contributions paid, made early retirement less attractive, and harmonized the eligibility
criteria and benefit rules for different occupational pension schemes. The pension base for
assessing early retirement benefits is now calculated over an extended period of the best 15
to 18 years, which puts downward pressure on pension levels (to be phased in between
2003 and 2020). Pension rights are accumulated by 2 percentage points for each year of
contribution. To discourage early retirement, the accumulated percentage points are reduced
by 2 for each year of early retirement prior to the statutory retirement age, up to a maximum
deduction of 10 percentage points or 15 percent (starting with 2000).
Eligibility for early retirement on account of reduced capability to work was tightened. To
qualify for the pension, a claimant must have contributed at least 5 years (instead of 3 years
up to now) within the previous 15 years and must have been disabled for at least 20 weeks
(valid from 1998). Contribution rates of certain groups of the self-employed will be increased
from 15 percent to 20.25 percent until 2009. Another important element of the 1997 reform
was that pensions of civil servants are harmonized with the general system. Starting with
year 2003, their early retirement benefits are also assessed on the basis of the best 15 to 18
years instead of the last salary. Starting with year 2000, the adjustment factor of the general
pension system is applied to the pensions of civil servants as well. Finally, the reform also
incurred some new expenditure by raising pension claims from child rearing from year 2000
on. The reform additionally included some other, less important elements, see BMAGS
(1997).
IV.1.3 Tax Reform 2000
The fiscal consolidation program adopted in 1996 was fully implemented, and the 1997
pension reform further helped to restore fiscal stability. These measures brought an
important “breathing space” before further reforms are attacked and the deficit is brought
close to balance. The primary surplus is approaching 1 percent of GDP, and public debt
finally started to decline in 1997 to 66.1 percent of GDP, down from 69.5 percent in 1996.
Recently, the discussion focused on restructuring taxes. The increased burden from social
security contributions added to the relative price of labor with adverse effects on employment
creation [OECD (1999)]. As a major further step in fiscal reform, the Austrian Parliament
adopted in June 1999 the tax reform 2000 package to be enacted at the beginning of year
2000. By addressing the wage and income tax as well as enterprise taxation, it will reduce
the tax burden by ATS 32.5 billion in total, corresponding to about 1 percent of GDP.
Obviously, the new tax reform will act against budget consolidation.
22 — Keuschnigg, Keuschnigg, Koman, Lüth, Raffelhüschen / Public Debt & Generational Balance — I H S
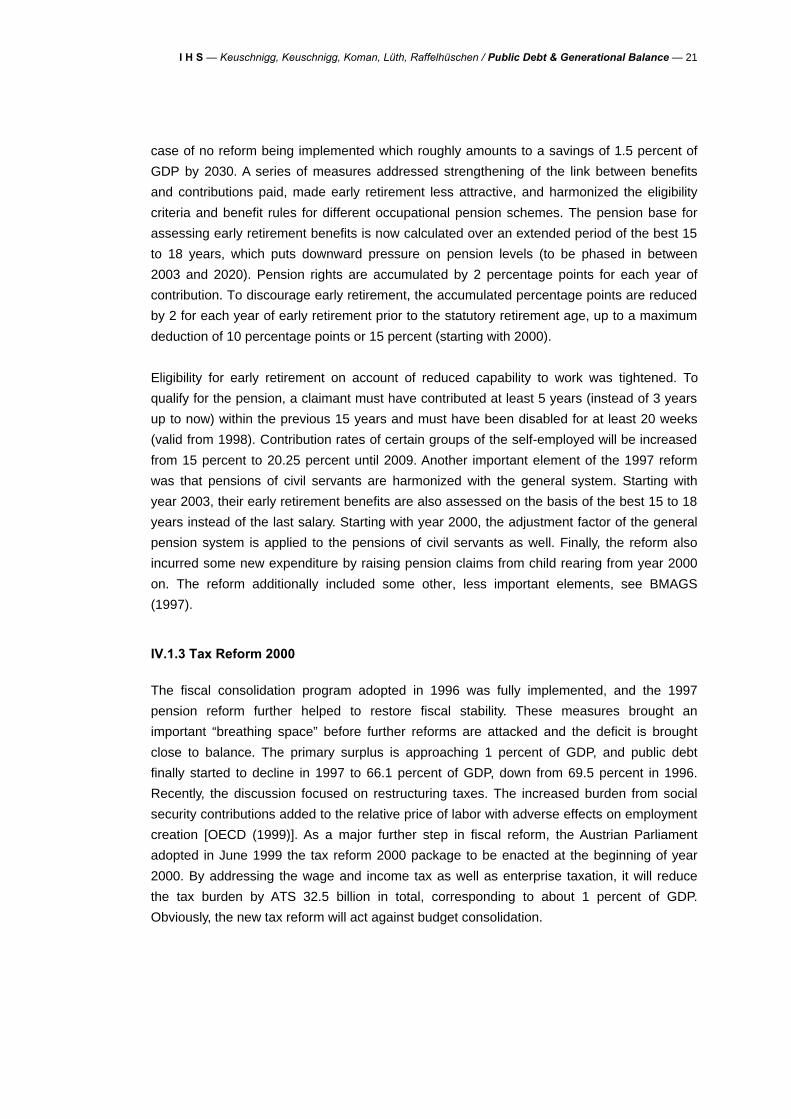
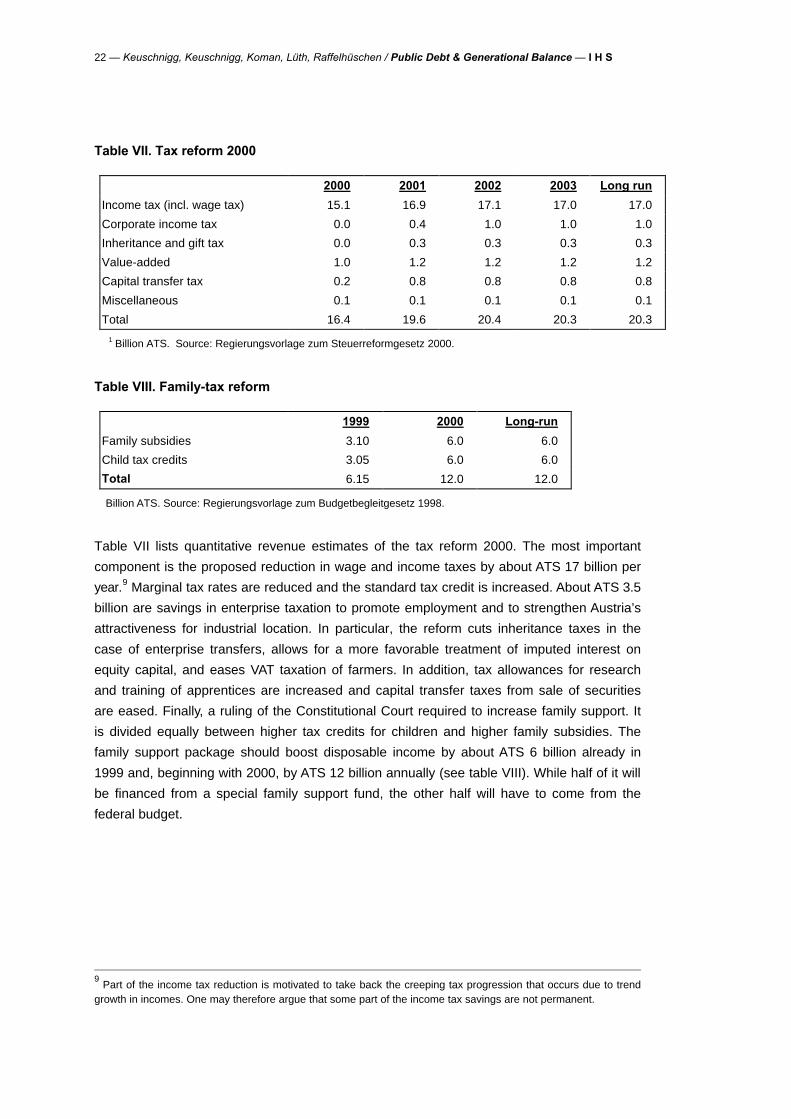
Table VII. Tax reform 2000
2000 2001 2002 2003 Long run
Income tax (incl. wage tax) 15.1 16.9 17.1 17.0 17.0
Corporate income tax 0.0 0.4 1.0 1.0 1.0
Inheritance and gift tax 0.0 0.3 0.3 0.3 0.3
Value-added 1.0 1.2 1.2 1.2 1.2
Capital transfer tax 0.2 0.8 0.8 0.8 0.8
Miscellaneous 0.1 0.1 0.1 0.1 0.1
Total 16.4 19.6 20.4 20.3 20.3
1 Billion ATS. Source: Regierungsvorlage zum Steuerreformgesetz 2000.
Table VIII. Family-tax reform
1999 2000 Long-run
Family subsidies 3.10 6.0 6.0
Child tax credits 3.05 6.0 6.0
Total 6.15 12.0 12.0
Billion ATS. Source: Regierungsvorlage zum Budgetbegleitgesetz 1998.
Table VII lists quantitative revenue estimates of the tax reform 2000. The most important
component is the proposed reduction in wage and income taxes by about ATS 17 billion per
year.9 Marginal tax rates are reduced and the standard tax credit is increased. About ATS 3.5
billion are savings in enterprise taxation to promote employment and to strengthen Austria’s
attractiveness for industrial location. In particular, the reform cuts inheritance taxes in the
case of enterprise transfers, allows for a more favorable treatment of imputed interest on
equity capital, and eases VAT taxation of farmers. In addition, tax allowances for research
and training of apprentices are increased and capital transfer taxes from sale of securities
are eased. Finally, a ruling of the Constitutional Court required to increase family support. It
is divided equally between higher tax credits for children and higher family subsidies. The
family support package should boost disposable income by about ATS 6 billion already in
1999 and, beginning with 2000, by ATS 12 billion annually (see table VIII). While half of it will
be financed from a special family support fund, the other half will have to come from the
federal budget.
9 Part of the income tax reduction is motivated to take back the creeping tax progression that occurs due to trend
growth in incomes. One may therefore argue that some part of the income tax savings are not permanent.
I H S — Keuschnigg, Keuschnigg, Koman, Lüth, Raffelhüschen / Public Debt & Generational Balance — 23
IV.2 Results
IV.2.1 Consolidation Package
The premature national elections in 1995 were largely due to the political difficulties in
arranging for the budget choices. To satisfy the Maastricht debt and deficit criteria and to
qualify for EMU required to consolidate public sector budgets faster and deeper than would
probably have been politically acceptable otherwise. The latest consolidation package
testifies to this necessity and is an impressive achievement on the way to fiscal
sustainability. The consolidation volume amounted to 4.5 percent of GDP but was stretched
over the two year period of 1996/97. As summarized in table VI, further consolidation in 1998
and 1999 worth 1 percent of GDP in each period helped to sustain the budgetary
improvements. The consolidation package had immediate effects that can already be read
from the statistics. The government debt ratio in 1997 fell by 3.4 percentage points against
1996.
Having discussed details in section IV.1.1, we turn now to the numerical evaluation of this
scenario in table IX. It should be emphasized that our scenario does not treat all budget cuts
as permanently affecting expenditures and revenues, but takes account of the fact that part
of the measures had only a one-off effect (for example, administration and earmarked
provisions on the expenditure side; wage and income tax, and corporate income tax on the
revenue side). However, the bulk of the consolidation measures are supposed to have long-
term effects.
24 — Keuschnigg, Keuschnigg, Koman, Lüth, Raffelhüschen / Public Debt & Generational Balance — I H S
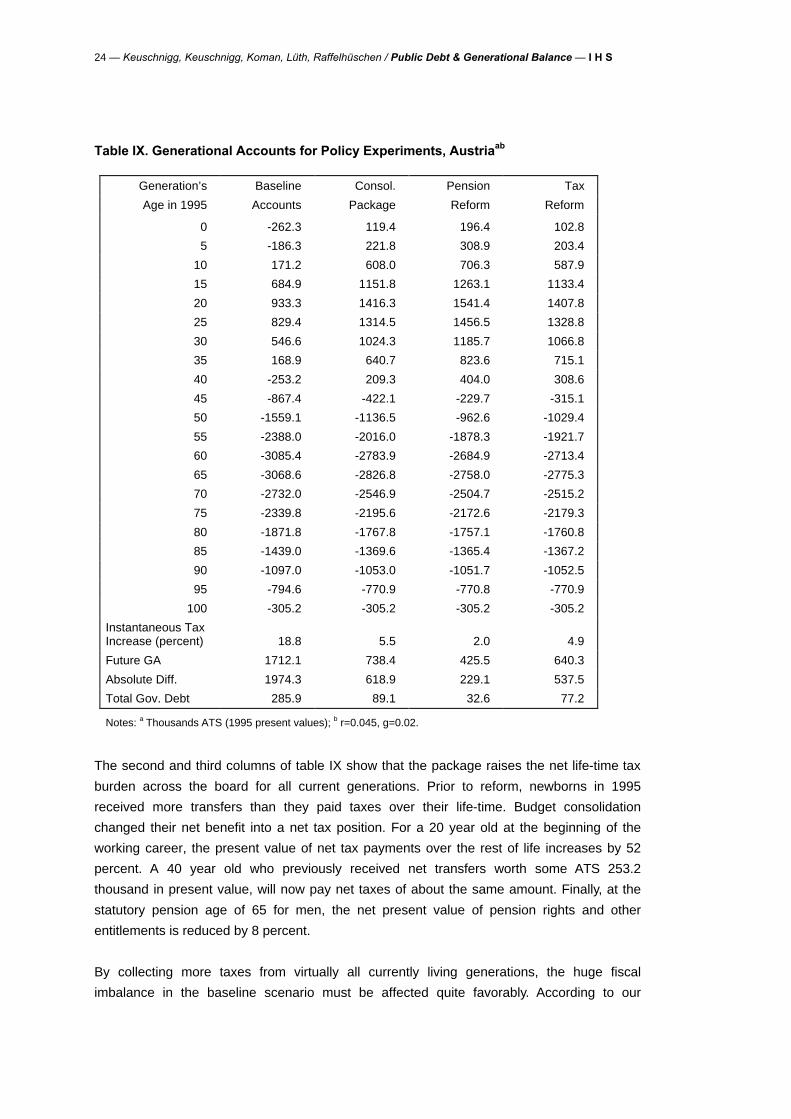
Table IX. Generational Accounts for Policy Experiments, Austriaab
Generation’s Baseline Consol. Pension Tax
Age in 1995 Accounts Package Reform Reform
0 -262.3 119.4 196.4 102.8
5 -186.3 221.8 308.9 203.4
10 171.2 608.0 706.3 587.9
15 684.9 1151.8 1263.1 1133.4
20 933.3 1416.3 1541.4 1407.8
25 829.4 1314.5 1456.5 1328.8
30 546.6 1024.3 1185.7 1066.8
35 168.9 640.7 823.6 715.1
40 -253.2 209.3 404.0 308.6
45 -867.4 -422.1 -229.7 -315.1
50 -1559.1 -1136.5 -962.6 -1029.4
55 -2388.0 -2016.0 -1878.3 -1921.7
60 -3085.4 -2783.9 -2684.9 -2713.4
65 -3068.6 -2826.8 -2758.0 -2775.3
70 -2732.0 -2546.9 -2504.7 -2515.2
75 -2339.8 -2195.6 -2172.6 -2179.3
80 -1871.8 -1767.8 -1757.1 -1760.8
85 -1439.0 -1369.6 -1365.4 -1367.2
90 -1097.0 -1053.0 -1051.7 -1052.5
95 -794.6 -770.9 -770.8 -770.9
100 -305.2 -305.2 -305.2 -305.2
Instantaneous Tax Increase (percent)
18.8
5.5
2.0
4.9
Future GA 1712.1 738.4 425.5 640.3
Absolute Diff. 1974.3 618.9 229.1 537.5
Total Gov. Debt 285.9 89.1 32.6 77.2
Notes: a Thousands ATS (1995 present values); b r=0.045, g=0.02.
The second and third columns of table IX show that the package raises the net life-time tax
burden across the board for all current generations. Prior to reform, newborns in 1995
received more transfers than they paid taxes over their life-time. Budget consolidation
changed their net benefit into a net tax position. For a 20 year old at the beginning of the
working career, the present value of net tax payments over the rest of life increases by 52
percent. A 40 year old who previously received net transfers worth some ATS 253.2
thousand in present value, will now pay net taxes of about the same amount. Finally, at the
statutory pension age of 65 for men, the net present value of pension rights and other
entitlements is reduced by 8 percent.
By collecting more taxes from virtually all currently living generations, the huge fiscal
imbalance in the baseline scenario must be affected quite favorably. According to our
I H S — Keuschnigg, Keuschnigg, Koman, Lüth, Raffelhüschen / Public Debt & Generational Balance — 25
estimates, total government debt is now reduced to 89.1 percent of GDP, down from more
than triple the amount prior to the reform. If the permanent nature of the budget cuts is
sustained indeed, this constitutes a huge step towards fiscal balance.10
Still, further action is required to restore long-term solvency. The remaining total debt
imposes an additional tax burden of ATS 618.9 thousand on future generations to restore
complete fiscal balance. That is equivalent to increasing taxes on future generations by 19.1
percent. At the start of their life, they would face a present value of taxes net of transfers
equal to ATS 738.4 thousand. An instantaneous, 5.5 percent increase in all taxes would
suffice if it would include present generations as well. Compared to the base case, these
figures are much smaller. We may conclude that the 1996/97 consolidation package largely,
but by no means completely, corrected a major intergenerational imbalance existing in 1995.
IV.2.2 Pension Reform
The 1997 Pension Reform comes on top of the consolidation package. Details are given in
section IV.1.2. According to estimates of the Ministry for Labor, Health, and Social Affairs the
reform would eventually reduce pension outlays of the employee and self-employed
schemes by 1.5 percent of GDP by 2030. Two thirds of the expected savings stem from the
assumed gradual reduction of the replacement rate by one half of the increase in life
expectancy. Such a reduction is in principle agreed upon but must still be implemented.
Without the inclusion of the demographic factor, however, the total reduction in expenditures
would not exceed 0.5 percent of GDP by 2030.
With respect to our simulation methodology, we proceed as follows. The pension reform
contains a number of measures which can not all be modeled in every detail. As a starting
point, we consider the effect on the projected aggregate expenses of the pension system in
2030 when the reform is fully effective. Then we adjust the life cycle pension profiles in order
to generate exactly the aggregate pension expenditure in 2030. Starting with year 2000, the
adjustment is phased in over twenty years implying that a person retiring in 2020 is the first
to experience a fully decreased pension over her retirement.
Our simulations use the projections by the Austrian government. When the 1997 pension
reform will have full effect in 2030, overall pension outlays are estimated to be 10.5 percent
lower than in the base case of no reform being implemented. A reduction of 2.5 percent
would be the result of changes in the benefit assessment rules, while a further reduction of 8
percent would be caused by the modification of the annual adjustment formula to reflect
increased life expectancy. In the base case, pension benefits (excluding civil servants) are
10
The induced general equilibrium effects of fiscal policy will also affect to some extent the intergenerational incidence of fiscal policy and the required increase in net taxes to satisfy the government budget constraint, see Keuschnigg (1992, 1994). As with most generational accounting studies, we keep the interest and growth rates constant and do not take into account potential feedback effects on the government budget.
26 — Keuschnigg, Keuschnigg, Koman, Lüth, Raffelhüschen / Public Debt & Generational Balance — I H S
projected to rise from 10.4 percent in 2000 to 14.2 percent of GDP in 2030. Under the reform
scenario, this figure is changed to 13.8 percent and 12.7 percent in 2030, in response to
changes in the benefit assessment rules and modification of the annual adjustment formula,
respectively.
The results are shown in table IX under the heading Pension Reform. Since it comes on top
of the fiscal consolidation package, we now compare with the third column to obtain the
differential effects of the pension reform. All currently living generations see their net benefit
position declining. Consider a newborn in 1995. Because she/he will receive a less generous
pension when old, the present value of taxes net of transfers rises by ATS 77 thousands.
This is an increase by 64 percent relative to the position after the consolidation package. In
absolute terms, a 40 year old in 1995 will face the highest increase in net taxes among
current generations equal to ATS 194.7 thousand. Because of the long phasing in, the reform
then rapidly looses its importance among current generations with still higher age. A 65 year
old, for example, who retires at the statutory age in 2015, will see her pension only
moderately reduced because her retirement still falls into the phasing in period. Finally,
current pensioners are spared part of the burden because about a third of the measures
apply only to new pensioners.
The pension reform is expected to reduce total public debt to 32.6 percent of GDP, down
from 89.1 percent. While the effect on fiscal sustainability is important, the pension reform is
rather less impressive if compared with the consolidation package. Unfortunately, our results
for the consolidated public sector hide the fact that the pension system quite probably is
responsible for a major part, if not most of total public debt in 1995, equal to 285.9 percent of
GDP. We thus conclude that the rest of the public sector may possibly be in surplus by now
while the pension system, if viewed in isolation, is still left with a major fiscal imbalance.
IV.2.3 Tax Reform 2000
Column five in table IX shows the results of the tax reform 2000 on top of budget
consolidation and pension reform. As tables VII and VIII witness, the tax reform implies a
decrease in wage and income taxes as well as an increase in family and child allowances.
Our scenario, however, does not include any of the latest policy proposals such as an across
the board reduction of discretionary spending by about 20 percent, amounting to
approximately ATS 20 billion in year 2000. Since a new government has not yet been formed
after the elections in fall 1999, the final outcome regarding the type of budgetary savings is
still highly uncertain. Taking the tax cuts as permanent, the tax reform 2000 again worsens
fiscal imbalance in Austria. Comparing with the fourth column of table IX (pension reform on
top of consolidation package), this policy scenario cuts the net life-time tax burden for all
presently living generations. Given that the tax cuts are targeted mainly on wage incomes
and families with children, the reduction in life-time tax burden is much larger for younger
I H S — Keuschnigg, Keuschnigg, Koman, Lüth, Raffelhüschen / Public Debt & Generational Balance — 27
generations than for, say, pensioners. A twenty year old average citizen will see his life-time
tax burden reduced by ATS 133.6 thousand which is almost 9 percent of his life-time liability
prior to reform.
While the previous consolidation measures including the pension reform succeeded to
squeeze total debt to 32.6 percent, the tax reform 2000 increases it again to 77.2 percent of
GDP. To eliminate this fiscal imbalance and to restore long-run solvency, the government
would have to increase taxes on future generations by 16.8 percent (while an instantaneous
tax increase of 4.9 percent would suffice if it included all current generations as well). The tax
reform, thus, significantly sharpens intergenerational inequity. The absolute difference in the
accounts of the 1995 new born and future generations increases to 537.5 thousand ATS
(from 229.1 in the pension reform experiment).
V Conclusions
Based on a generational accounting exercise, this paper computed the intergenerational
incidence of Austrian fiscal policy as of 1995. For this purpose, we calculated the present
value of life-time tax payments net of transfers both for currently living as well as future
generations. According to our results, Austrian fiscal stance in 1995 was characterized by a
tremendous intergenerational inequity in favor of currently living generations. Clearly, public
finances were unsustainable in the long-run. We found that overall public debt was more
than five times higher than officially recorded net debt. To eliminate this debt and restore
sustainability in public finances, an instantaneous increase in all taxes on both current and
future generations by 18.8 percent would be required. If the burden of consolidating public
finances were imposed only on future generations, they would face a life-time tax burden
that exceeds life-time taxes of a current new born by a full 65 percent.
Motivated in large part by the requirements of the Maastricht criteria and the need to qualify
for EMU, the government enacted a consolidation package in 1996 and a pension reform in
1997. We found that full implementation of the consolidation package alone should eliminate
more than two thirds of total government debt in 1995 equal to 286 percent, leaving a debt of
90 percent of GDP for further consolidation. If it were fully implemented, the 1997 pension
reform would further contribute to sustainability and reduce total debt. The combined
reforms, however, would still leave a consolidation requirement of about 33 percent of GDP.
Without any accompanying measures to pay for expected revenue losses, the recent tax
reform 2000 including the family support package, however, again raises total public debt
and is a step backwards in achieving long-run fiscal sustainability and generational balance
in Austria.
28 — Keuschnigg, Keuschnigg, Koman, Lüth, Raffelhüschen / Public Debt & Generational Balance — I H S
References
Auerbach, A. (1997), Quantifying the Current U.S. Fiscal Imbalance, National Tax Journal 50,
387–398.
Auerbach, A., J. Gokhale and L. Kotlikoff (1994), Generational Accounts: A Meaningful Way
to Evaluate Fiscal Policy, Journal of Economic Perspectives 8, 73–94.
Auerbach, A., J. Gokhale and L. Kotlikoff (1991), Generational Accounts: A Meaningful
Alternative to Deficit Accounting, in: D. Bradford (ed.), Tax Policy and the Economy, Vol.
5, Cambridge, Mass., 55–110.
BMAGS (1997), Pensionskonzept 2000 – Nationalratsbeschluß, Bundesministerium für
Arbeit, Gesundheit und Soziales, Wien.
CBO - Congressional Budget Office (1995), Who Pays and When? An Assessment of
Generational Accounting, Washington D.C.
Diamond, P. (1996), Generational Accounts and Generational Balance: An Assessment,
National Tax Journal 49, 597–607.
European Commission (1998), The Economic and Financial Situation in Austria, Brussels:
Directorate General II, Economic and Financial Affairs, II/271/97–EN (FINAL).
Eurostat (1995), European Community Household Panel, Wave 2.
Genser, B and R. Holzmann (1995), Die Österreichische Finanzpolitik vor dem EU-Beitritt,
Finanzarchiv 52, 71–110.
Gokhale, J. und B. Raffelhüschen (2000), Population Aging and Fiscal Policy in Europe and
the United States, Economic Review, Vol. 36 No. 1, Federal Reserve Bank of
Cleveland, forth.
Haveman, R. (1994), Should Generational Accounts Replace Public Budgets and Deficits?
Journal of Economic Perspectives 8, 95–111.
IAS (1998), Prognose der Österreichischen Wirtschaft 1998/99, Vienna: Institute for
Advanced Studies.

I H S — Keuschnigg, Keuschnigg, Koman, Lüth, Raffelhüschen / Public Debt & Generational Balance — 29
Keuschnigg, C., M. Keuschnigg, R. Koman, E. Lüth and B. Raffelhüschen (1999), Restoring
Generational Balance in Austria, in: European Commission (ed.), Generational
Accounting in Europe, Brussels, forth.
Keuschnigg, C. (1994), Dynamic Tax Incidence and Intergenerationally Neutral Reform,
European Economic Review 38, 343–366.
Keuschnigg, C. (1992), Intergenerationally Neutral Taxation, Public Finance / Finances
Publiques 47, 446–461.
Koch, M. and C. Thimann (1999), From Generosity to Sustainability: The Austrian Pension
System and Options for its Reform, Empirica 26, 21–38.
Kramer, H. and G. Lehner (1996), Die wirtschaftspolitischen Maßnahmen der neuen
Bundesregierung, WIFO Monatsberichte 3/1996, 163–169.
Lehner, G. (1998), Bund setzt Konsolidierung fort, WIFO Monatsberichte 5/1998, 349–363.
Lehner, G. (1997), Bundeshaushalt 1996 spiegelt Konsolidierungsmaßnahmen wider, WIFO
Monatsberichte 5/1997, 287–299.
Lehner, G. (1996), Budgetkonsolidierung prägt Bundesvoranschlag 1996 und 1997, WIFO
Monatsberichte 5/1996, 373–386.
OECD (1999), OECD Economic Surveys. Austria, OECD: Paris.
OECD (1998), OECD Economic Surveys. Austria, OECD: Paris.
OECD (1997), OECD Economic Surveys. Austria, OECD: Paris.
OECD (1994), OECD Economic Surveys. Austria, OECD: Paris.
ÖSTAT (1997), Statistical Yearbook, Vienna: Austrian Statistical Office.
ÖSTAT (1996/97a), Das Schulwesen in Österreich, Schuljahr 1996/97, Vienna: Austrian
Statistical Office, Beiträge zur Österreichischen Statistik, Heft 1262.
ÖSTAT (1996/97b), Österreichische Hochschulstatistik – Studienjahr 1996/1997, Vienna:
Austrian Statistical Office, Beiträge zur Österreichischen Statistik, Heft 1249.
ÖSTAT (1996), Demographic Yearbook, Vienna: Austrian Statistical Office.

30 — Keuschnigg, Keuschnigg, Koman, Lüth, Raffelhüschen / Public Debt & Generational Balance — I H S
ÖSTAT (1995/96), Gesundheitsstatistisches Jahrbuch, Vienna: Austrian Statistical Office,
Beiträge zur Österreichischen Statistik, Heft 1254.
ÖSTAT (1995), Lohnsteuerstatistik 1995, Vienna: Austrian Statistical Office, Beiträge zur
Österreichischen Statistik, Heft 1232.
ÖSTAT (1994), Lohnsteuerstatistik 1994, Vienna: Austrian Statistical Office, Beiträge zur
Österreichischen Statistik, Heft 1203.
ÖSTAT (1984), Konsumerhebung 1984, Vienna: Austrian Statistical Office, ISIS Database.
Raffelhüschen, B. (1999a), Generational Accounting in Europe, American Economic Review
89, 167–170.
Raffelhüschen, B. (1999b), Aging, Fiscal Policy and Social Insurance: A European
Perspective, in: A. Auerbach and R. Lee (ed.), Demographic Change and Fiscal Policy,
Cambridge: Cambridge University Press, forth.
Raffelhüschen, B. (1999c), Generational Accounting: Method, Data and Limitations, in:
European Commission (ed.), Generational Accounting in Europe, Brussels, forth.
Raffelhüschen, B. (1998), Generational Accounting in Europe, Study undertaken for the
European Commission, DG XXI, mimeo, Brussels.
Rürup, B. and I. Schröter (1997), Perspektiven der Pensionsversicherung in Österreich,
Gutachten im Auftrag des BM für Arbeit, Gesundheit und Soziales, Darmstadt.
Stefanits, H. (1998), Aktuelle Entwicklungen in der gesetzlichen Pensionsversicherung, BM
für Arbeit, Gesundheit und Soziales, Vortragsmanuskript.

Institut für Höhere Studien
Institute for Advanced Studies Stumpergasse 56
A-1060 Vienna
Austria
Phone:+43-1-599 91-145
Fax: +43-1-599 91-163


![Start. IHS/IMS EWG - Planungsgruppe Abschlussbesprechung Mai 2001 [mf]](https://img.pdfslide.org/doc/110x75/570491c91a28ab14218dcd47/start-ihsims-ewg-planungsgruppe-abschlussbesprechung-mai-2001-mf.jpg)