Embed Size (px)
Citation preview

INTERNATIONAL ANALYSES OF NATURAL RESOURCE CURSE AND KAZAKHSTAN’S
RELATED ECONOMIC PERFORMANCE WITH SPECIAL ATTENTION TO ITS WHEAT
AND ENERGY SECTORS
Inaugural Dissertation
zur
Erlangung des Grades
Doktor der Agrarwissenschaften
(Dr.agr.)
der
Hohen Landwirtschaftlichen Fakultät
der
Rheinischen Friedrich-Wilhelms-Universität
zu Bonn
von
Yessengali Oskenbayev
aus
Almaty, Kasachstan

ii
Gedruckt mit Unterstützung des Deutschen Akademischen
Austauschdienstes (DAAD)
Erstgutachter: Prof. Dr. Joachim von Braun
Zweitgutachter: Prof. Dr. Thomas Heckelei
Tag der mündlichen Prüfung: 17.04.2015
Erscheinungsjahr: 2015
iii
ABSTRACT
The bottom line of this study is to examine the role of natural resource endowments for
economic growth and institutional quality with special focus on Kazakhstan and CIS countries. It
is documented that resource rents share in income has a negative effect on institutional quality
and thus undermines economic growth. Comparing two subsamples, during 1990-2000 and
2001-2010, we find evidence that direct resource curse impact may disappear while indirect one
(through institutional quality) is persistent for all subsamples implying that resource curse via
institutions provides a much more important link between natural resources and economic
growth. Our findings suggest that the impact of the resource abundance deteriorates institutional
quality, which in turn hampers economic growth.
The other objective of the study is to show that the natural resource abundance is a nonlinear
function of the institutional quality. Above a certain threshold the natural resource abundance
affects institutional quality adversely implying that excessive or overabundant production of
resources are crucial in explaining the resources curse. Interestingly, for instance, diffuse
resources such as agricultural resources bear positive externalities at higher levels of production,
while at lower levels of production it could have negative impact on institutional quality.This
significant adverse impact of the agricultural sector on institutional quality is in contrast to other
studies. In addition, analysis of institutional arrangement reveals that the total effect of
agricultural value added had a negative impact on institutional quality and economic growth,
despite the squared term of agricultural value added exhibiting a positive impact on institutional
quality and economic growth. Indeed, this has also been documented in analyses from
Kazakhstan and other CIS countries. This is an implication that the agricultural sectors are
dominated by state or large agricultural enterprises in these countries, and in this sense the sector
can be regarded as a point-source resource sector. The dominance of large agricultural
enterprises or state companies has negatively influenced the progress of reforms; for instance,
land property rights are not enacted or established in almost all of the CIS countries.

iv
KURZFASSUNG
Die Grundfrage der vorliegenden Studie besteht darin herauszufinden, ob der negative Einfluss des
Reichtums an natürlichen Ressourcen auf wirtschaftliches Wachstum über institutionelle Qualität wirkt
und nicht über den direkten Ressourceneffekt, den frühere Studien dokumentieren. Es wird belegt, dass
der Anteil der Ressourcennutzung am Gesamteinkommen einen negativen Effekt auf institutionelle
Qualität hat und dadurch wirtschaftliches Wachstum hemmt. Durch Vergleich der Perioden 1990-2000
und 2001-2012 zeigen wir, dass der direkte Einfluss des Ressourcenfluchs verschwindet während der
indirekte (über die Institutionenqualität) Bestand hat für alle untersuchten Untergruppen, was die
Bedeutung von Institutionen als wichtiges Verbindungsstück zwischen natürlichen Ressourcen und
Wirtschaftswachstum hervorhebt.
Desweiteren ist es Ziel dieser Studie zu zeigen, dass institutionelle Qualität eine nicht-lineare Funktion
des Vorkommens natürlicher Ressourcen ist. Der Einfluss verschiedener Arten von Ressourcenreichtum
hat einen Schwellenwert, d.h. dass die exzessive bzw. überreiche Produktion der Ressourcen entscheidend
zur Erklärung den Ressourcenfluchs beiträgt. Interessanterweise birgt die Produktion diffuser, wie etwa
landwirtschaftlicher, Ressourcen positive Externalitäten bei hohem Produktionsniveau, während sie auf
niedrigem Niveau nachteilige Wirkungen auf institutionelle Qualität haben kann. Im Gegensatz zu
anderen Studien zeigen die Ergebnisse des Modells einen signifikant negativen Effekt des
landwirtschaftlichen Sektors auf Institutionenqualität. Sein Einfluss auf die institutionelle Qualität ist
dabei größer als der Anteil der Ressourcenrendite am Gesamteinkommen, was dadurch erklärt werden
kann, dass der landwirtschaftliche Sektor einen Punktquellenressourcen-Sektor und keinen Sektor diffuser
Ressourcenquellen darstellt, da er in GUS-Staaten von landwirtschaftlichen Großproduzenten kontrolliert
wird.
Darüber hinaus zeigt die Analyse der institutionellen Ausgestaltung einen negativen Gesamteffekt der
landwirtschaftlichen Wertschöpfung auf institutionelle Qualität und Wirtschaftswachstum, wenngleich
der quadrierte Term der landwirtschaftlichen Wertschöpfung positiv auf institutionelle Qualität und
Wirtschaftswachstum wirkt. Dies wurde auch in Analysen aus Kasachstan und anderen GUS-Staaten
dokumentiert und ist eine Folge daraus, dass die landwirtschaftliche Sektoren in diesen Ländern von
staatlichen oder Großbetrieben dominiert werden, weswegen diese Sektoren als Punktquellenressourcen-
Sektoren verstanden werden können. Die Dominanz landwirtschaftlicher Staats- oder Großbetriebe hat
dabei Reformen gebremst; so gibt es etwa in nahezu keinem GUS-Staat beschlossene oder in Kraft
getretene Landbesitzrechte.
v
ACKNOWLEDGEMENTS
Primarily, I would like to convey special gratitude and appreciation to German Academic and
Exchange Service (DAAD) for scholarship provided to conduct doctoral study and dissertation.
Without the support provided by DAAD, the thesis would not have been successfully
accomplished. I also would like to acknowledge the Center for Development Research and the
University of Bonn who supported and facilitated my doctoral research.
Successful completion of the dissertation was possible with the help and assistance of several
people. First and foremost, I am extremely grateful to my advisor, Prof. Dr. Joachim von Braun,
for his valuable guidance and consistent encouragement I have received during the research. I
consider it as a great chance to conduct my doctoral research under his guidance and to learn
from his expertise to overcome challenges despite his busy schedules. I do also hereby
acknowledge my doctoral dissertation tutor Dr. Matthias Kalkuhl, for he has given me additional
inspiration to work harder and consulting. Without his valuable advices and valuable
supervision, it would be impossible to finalize doctoral dissertation. Thanks so much to Prof. Dr.
Thomas Heckelei for his co-supervision of doctoral research.
Furthermore, I would like to thank Dr. Gunther Manske, Mrs. Zabel and Maike Retat-Amin for
their precious help and support during my stay and study in Germany. In the meantime, I would
like to acknowledge my friends and colleagues at ZEF, especially batch 2009for their
unconditional support. I am very much indebted to my family, my parents, wife and children,
sisters who supported me in every possible way to see the completion of this work.

vi
Table of Contents List of Tables ............................................................................................................................................. viii
List of Figures .............................................................................................................................................. ix
List of Abbreviations .................................................................................................................................... x
1 INTRODUCTION ................................................................................................................................ 1
1.1 Introduction ................................................................................................................................... 1
1.2 Background and Research Problem .............................................................................................. 2
1.3 Recent Institutional Arrangements in Kazakhstan ........................................................................ 7
1.4 Research Questions and Thesis Structure..................................................................................... 7
2 THE NATURAL RESOURCE CURSE, INSTITUTIONAL QUALITY, AND ECONOMIC
GROWTH IN EMERGING ECONOMIES ............................................................................................... 11
2.1 Introduction ................................................................................................................................. 11
2.2 Research Hypothesis and Data .................................................................................................... 15
2.3 Main Results of the Resource Rents and Income Per Capita Link ............................................. 20
2.3.1 Model Results ..................................................................................................................... 20
2.3.2 Instrumenting Institutional Quality ..................................................................................... 23
2.3.3 The Dutch Disease and the Manufacturing Sector .............................................................. 26
2.4 Conclusion .................................................................................................................................. 29
3 LINKAGES BETWEEN INSTITUTIONAL QUALITY AND DUTCH DISEASE IMPACT IN CIS
COUNTRIES .............................................................................................................................................. 31
3.1 Introduction ................................................................................................................................. 31
3.2 Research Hypothesis and Data .................................................................................................... 34
3.3 Contract-Intensive Money and Selected CIS Country Case Studies........................................... 37
3.3.1 Azerbaijan ........................................................................................................................... 37
3.3.2 Kazakhstan .......................................................................................................................... 40
3.3.3 Russian Federation .............................................................................................................. 42
3.4 Linkages Between Resource Abundance and Economic Growth in CIS Countries ................... 44
3.5 Linkages Between Institutional Quality and Resource Abundance in CIS Countries ................ 48
3.6 Dutch Disease Explanation of the Natural Resource Curse ........................................................ 57
3.7 Conclusion .................................................................................................................................. 59
4 ORGANIZATION AND INSTITUTIONAL EFFICIENCY OF THE WHEAT AND ENERGY
SECTORS IN KAZAKHSTAN.................................................................................................................. 61

vii
4.1 Introduction: General Overview of the Wheat and Energy Sectors ............................................ 61
4.2 Data Sources and Major Players of the Wheat Sector in Kazakhstan ......................................... 66
4.2.1 Vertically Integrated Holding Companies .......................................................................... 69
4.2.2 Institutional Arrangements and the Dominance of Vertically Integrated Agro-holding
Companies ........................................................................................................................................... 74
4.2.3 Commodity Stock Exchange ............................................................................................... 77
4.2.4 Farmers ............................................................................................................................... 77
4.2.5 The National Management Holding Company ‘KazAgro’ ................................................. 80
4.3 State Procurement and Price Control Policies in the Wheat Sector ............................................ 82
4.3.1 Government Support and Subsidies to the Wheat Sector of Kazakhstan............................ 82
4.3.2 Government Response to Food Price Volatility .................................................................. 84
4.3.3 The Wheat Export Ban in Kazakhstan and its Consequences ............................................. 86
4.4 Institutional Arrangements in the Energy Sector of Kazakhstan ................................................ 89
4.4.1 Overview of the major actors in the energy sector.............................................................. 89
4.4.2 Laws Concerning Subsurface Resource Users .................................................................... 93
4.4.3 Local Content ...................................................................................................................... 93
4.4.4 The Tax Regime in Kazakhstan .......................................................................................... 98
4.5 Policy Failures and the Role of Institutions in Wheat and Energy Markets of Kazakhstan ..... 101
4.5.1 Wheat Market Issues in Kazakhstan ................................................................................. 101
4.5.2 Policy Challenges .............................................................................................................. 104
5 REGIONAL DIMENSIONS OF NATURAL RESOURCE ABUNDANCE AND ECONOMIC
GROWTH WITHIN KAZAKHSTAN ..................................................................................................... 109
5.1 Introduction ............................................................................................................................... 109
5.2 Literature Review ...................................................................................................................... 111
5.3 Estimation Methodology ........................................................................................................... 114
5.4 Data and Descriptive Statistics ................................................................................................. 116
5.5 Empirical Investigation Results of Resource Abundance Impacts on Economic Performance in
Kazakhstan ............................................................................................................................................ 123
5.6 Concluding Remarks ................................................................................................................. 129
6 CONCLUSIONS AND RECOMMENDATIONS ........................................................................... 132
7 APPENDICES .................................................................................................................................. 138
8 REFERENCES ................................................................................................................................. 146

viii
List of Tables
Table 1.1: Sectoral composition of growth rates by major sectors of economy .......................................... 4
Table 1.2: Share of major sectors’ production in GDP .................................................................................. 6
Table 2.1: Descriptive Statistics of the Main Variables Used in Regression Models .................................. 18
Table 2.2: Correlation between CIM, Kaufmann et al. Institutional Quality Indicators and Macroeconomic
indicators, averages of 2001-2010 .............................................................................................................. 19
Table 2.3: Regression Results, 1991-2000 .................................................................................................. 21
Table 2.4: Regression Results, 2001-2010 .................................................................................................. 22
Table 2.5: Marginal effects of the resource rent share in income on economic growth (for two different
subsamples: 1991-2000 and 2001-2005) .................................................................................................... 23
Table 2.6: Instrumental Variable GMM Results (Robust std. err.).............................................................. 25
Table 2.7: The relationship between resource abundance and manufacturing sector growth ................. 27
Table 3.1: Results of the unit root tests for the full sample ....................................................................... 45
Table 3.2: Regression of Economic Growth on Resource Abundance and Institutions, 1993-2010 .......... 46
Table 3.3: Institutional Quality (CIM) and Resource Abundance ............................................................... 55
Table 3.4: Short-run and Long-run coefficients estimates from Table 4. ................................................... 56
Table 3.5: Crowding out effect of resource rents on agricultural production and wheat production
growth contribution to GDP, 1992-2010 .................................................................................................... 58
Table 3.6: Basic data on resource rents and economic growth, 8 CIS countries ........................................ 59
Table 4.1: Harvested Area of Wheat per Business Unit (Ha/Business Entity) ............................................ 71
Table 4.2: Wheat Harvesting Yield (Quintals per Hectare = Q/Ha) ............................................................ 72
Table 4.3: Average Annual Wheat Production Costs in Kazakhstan, 2010 ................................................. 75
Table 4.4: Wheat Production Profitability in Kazakhstan ........................................................................... 78
Table 4.5: Wheat Value Added Chain in Kazakhstan (Domestic Market) ................................................... 79
Table 4.6: Planned Governmental Agricultural Subsidies in 2010 (Total = approximately 122,300,000,000
tenge or 7.5 % of the Agriculture Sector GDP) ........................................................................................... 83
Table 4.7: Wheat Transportation Costs, 2010 ............................................................................................ 84
Table 4.8: Government Policy Responses to food price volatility, 2007-2008 ........................................... 85
Table 4.9: Local Content Law Comparative Analysis of Oil Producing Countries ....................................... 94
Table 4.10: The local content trend in Oil and Gas industry companies’ procurement ............................. 96
Table 4.11: Production, export, and import of major categories of goods (2009) ..................................... 96
Table 4.12: Tax Regime in Kazakhstan: 1991-2001 versus 2001-2011 period .......................................... 100
Table 4.13: Wheat exports share, by groups of countries ........................................................................ 104
Table 5.1: Regional Gross Regional Product, percent of total GRP for Kazakhstan .................................. 117
Table 5.2: GRP per capita growth rate by regions of Kazakhstan, in percentage ..................................... 118
Table 5.3: Correlation Matrix Inst (median of 14 provinces) and Worldwide Governance Indicators
(Kaufmann et al., 2009), 2003-2009 ......................................................................................................... 122
Table 5.4: Dynamic Panel Data IV/GMM Regression ................................................................................ 125
Table 5.5: First Stage Estimates ................................................................................................................ 128
ix
List of Figures
Figure 1.1: Energy Production Growth in Kazakhstan, in Millions of metric tons of oil equivalent (Mtoe) . 3
Figure 1.2: Sectoral Composition of Real GDP per Capita Growth Rates in Kazakhstan, 2001–2011 .......... 5
Figure 1.3: Employment Growth by Sector in Kazakhstan, in Percentage Change From the Previous Year 6
Figure 2.1: Smoothed Median Economic Growth Rates for 87 Developing and Emerging Economies,
1991–2010 .................................................................................................................................................. 12
Figure 2.2: GDP Per Capita Growth and the Log of Resource Rents % in GDP Among Emerging Economies
(1991–2001 Versus 2001–2010) ................................................................................................................. 13
Figure 2.3: GDP Per Capita Growth and Log of Resource Rents % in GDP Among Emerging Economies
(High Versus Low Quality Institutions, 2001–2010) .................................................................................... 14
Figure 2.4: The Link Between Income Per Capita Growth and Manufacturing Sector Growth Among
Emerging Economies ................................................................................................................................... 29
Figure 2.5: The link between the resource rent share of income and manufacturing sector growth ....... 29
Figure 3.1: Growth and Resource Rents (% of GDP), Average Values for 1991–2010................................ 33
Figure 3.2: Growth and Terms of Trade, Average Values for1991–2010 ................................................... 34
Figure 3.3: Conceptual Framework of the Study ........................................................................................ 35
Figure 3.4: CIM Over Time in Azerbaijan, 1993–2010 ................................................................................ 38
Figure 3.5: CIM Over Time in Kazakhstan, 1993–2010 ............................................................................... 41
Figure 3.6: CIM Over Time in the Russian Federation, 1993–2010 ............................................................ 43
Figure 3.7: Institutional Quality and Resource Abundance in Eight CIS Countries, 1993–2010 ................. 50
Figure 4.1: Wheat Production and Exports of Kazakhstan (thousands of metric tons).............................. 62
Figure 4.2: Wheat Exports and Domestic Prices in Kazakhstan (USD per metric ton) ............................... 64
Figure 4.3: Real Production of Energy Resources in Kazakhstan, 1992–2010 (logarithm values) .............. 65
Figure 4.4: Energy Resource Export Prices in Kazakhstan (monthly averages) .......................................... 66
Figure 4.5: Wheat Sector Value Added Chain ............................................................................................. 67
Figure 4.6: Wheat Production Value Chain in Kazakhstan, 2010 ................................................................ 69
Figure 4.7: Agricultural Production by Farm Type in 2010 (%) ................................................................... 71
Figure 4.8: Wheat Production Costs for Large-and Small-Scale Farms, 2010 (USD/MT) ............................ 76
Figure 4.9: Domestic Farm-gate Wheat Prices in Kazakhstan Versus Global Wheat Prices (USD/MT) ...... 87
Figure 4.10: Value Added Framework of the Kazakhstan Economy ........................................................... 91
Figure 4.11: Results of a SWOT Analysis of Local Content Regulations in Kazakhstan’s Oil Industry ........ 97
Figure 4.12: Relative Output/Input Prices and Gross Margins of Wheat Producers in Kazakhstan, 1995–
2011 (%) .................................................................................................................................................... 102
Figure 4.13: Transport Costs of Wheat Exports Versus Imports in Kazakhstan ........................................ 103
Figure 4.14: Annual Cumulative Bank Loan in Kazakhstan, 2003–2011 (in USD billions)......................... 105
Figure 4.15: The Shares of Bank Loans for SME in the Agricultural Sector of Kazakhstan Over Time* ... 106
Figure 4.16: State Purchase of Wheat by the Food Contract Corporation in Kazakhstan, 1998–2010 (in
millions of metric tons) ............................................................................................................................. 107
Figure 5.1: Real GDP Per Capita Growth Rates in Kazakhstan, 2001–2011 .............................................. 110
Figure 5.2: Natural Resource Production and Institutional Quality, 2003–2009 (among Kazakhstan
provinces) .................................................................................................................................................. 111

x
List of Abbreviations
BG - British Gas
CIS – Commonwealth of Independent States
COGS – Cost of Goods Sold
CPT – Corporate Income Tax
ETS – Eurasian Trading System, Commodity Exchange of Kazakhstan
FAO – Food and Agricultural Organization
FAPRI – Food and Agricultural Policy Research Institute
FDI – Foreign Direct Investment
FCC – Food Contract Corporation
FE GMM – Fixed-effects General Method of Moments
GRP – Gross Regional Product
GMM – General Method of Moments
IV – Instrumental Variable
KASE – Kazakhstan Stock Exchange
KCA – Kazakh Contract Agency
KMG – National Holding Company KazMunaiGas
KMG EP – KazMunaiGas Exploration Production, subsidiary company of KMG
KTZ – Kazak TemirZholdar (Kazakhstan Railways)
MINT - Ministry of Industry and New Technology
MOG – Ministry of Oil and Gas
NADLoC - National Agency for Development of Local Content
NCOC - North Caspian Operator Company
OPEC - Organization of the Petroleum Exporting Countries
OGI – Oil and Gas Industry
SARK – Statistical Agency of Republic of Kazakhstan
SOE – State Owned Enterprises
PIT – Personal Income tax
PMG – The Pooled Mean Group
USD – United States Dollar
Two-SLS – Two-Stage Least Squares
VAT - Value Added Tax

1 INTRODUCTION
1.1 Introduction
The natural resource curse, the premise that economies with vast natural resources are associated
with slow growth, has been empirically investigated and analyzed in many recent studies. Initial
studies (e.g. Sachs and Warner 1995, 1999)1 of this phenomenon concentrated on the direct
impact of natural resource abundance on economic growth. By contrast, more recent studies have
emphasized the importance of the quality of institutional channels to the natural resource curse
(e.g. Knack and Keefer, 1995; Acemoglu et al., 2002).
However, a number of recent studies (e.g. Stijns, 2005; Brunnschweiler, 2008; Alexeev and
Conrad, 2009) have raised some doubts about the resource curse hypothesis, emphasizing the
need to reconsider its impact on economic growth. Indeed, not all resource rich countries have
failed to make efficient use of those resources and achieved meaningful levels of development;
for instance, Norway has proved itself capable of escaping the “Dutch Disease” problem,
becoming one of the most developed countries in the world (Gylfason, 2001). Norway invests oil
industry funds into foreign securities, thus saving those funds for the next generation. Moreover,
Norway invests heavily in education and maintains sound economic policies. However, the
country is also notorious for its highly protectionist agricultural policies that are poorly targeted
and inefficient (IFPRI, 2008).
“Dutch Disease” explains economic decay associated with resource booms through the combined
effect of two factors: first, the real exchange rate appreciation triggered by commodity export
booms; and second, the nature of the expanding energy sector to crowd out labor force and
capital from the agricultural and manufacturing sectors, thus increasing their production costs
(Ross, 1999). Therefore, the overall effects of the resource concentration booms are the
contraction of export volumes from the agricultural and manufacturing sectors and increases in
the costs of non-tradable goods and services (Corden and Neary, 1982). Thus, the Dutch Disease
problem can be summarized as the change in relative prices of non-traded (services and
construction) to traded goods, leading to the crowding out of the traded goods sector by the non-
1 Some earlier studies (Gelb et al., 1988; Auty, 1990) have also revealed that misallocation of resources in resource
rich countries might harm economic progress, based upon the experience of countries such as Nigeria and Zambia.

2
traded goods sector; therefore, real exchange rate appreciation undermines the competitiveness
of the traded goods sector.
1.2 Background and Research Problem
Kazakhstan is a source-rich country, particularly in terms of energy resources such as oil, coal,
and natural gas. It was a leading energy-producing country among the Soviet Union Republics
and remains an important energy exporter. Fuel production comprised 23% of Kazakhstan’s GDP
in 1994 and the entire energy sector accounted for 42%. In Kazakhstan, 30% of the GDP and
over 50% of export revenues are from petroleum production. Kazakhstan’s natural gas reserves
are estimated to be in the 65–100 trillion cubic feet range (EIA, 2010). As a result of recent
global price increases for oil products, accompanied by an enormous increase in energy
production in Kazakhstan and particularly in the country’s oil sector since 1999 (Figure 1.1),
there have been windfall profits and high revenues from the energy sector. However, according
to the resource curse hypothesis this could potentially trigger rent-seeking activities and reduce
economic performance. Indeed, studies have found that such profits are not used to bring about
sound economic policy reforms and ‘better institutions,’ but rather lead to corruption and the
seizure of control over natural resources and their profits by an elite few, especially from
petroleum revenues that are the major point-source resource in the country (Auty, 2006).
To determine whether Kazakhstan suffers from a resource curse, it is essential to ascertain the
mechanisms that determine the circumstances under which energy resources, as point-source
resources, breed economic success rather than failure. The aspects of economic performance that
I analyzed are summarized in Table 1.1 and Figure 1.2. The sectoral composition of GDP per
capita growth rate averages are presented in Table 1.1. The contribution to the growth rates of
each sector was estimated by multiplying each sector’s production share of the GDP to their real
production per capita growth rates. The analysis results demonstrate that two sectors have
contributed most to GDP per capita growth rates: the energy and services sectors (including
banking and insurance). By contrast, agricultural growth remains lowest amongst the main
sectors of Kazakhstan’s economy. This reflects an important fact, because approximately 30% of
the labor force belongs to the agriculture sector as opposed to around 2.5% and 1% of the labor
force employed in the energy and service sectors, respectively.

3
Figure 1.1: Energy Production Growth in Kazakhstan, in Millions of metric tons of oil
equivalent (Mtoe)
Source: Based on British Petroleum Statistical Review of World Energy, 2010
The proportional energy sector growth is associated with declines in the agriculture sector and
expansion in the service sector, with the contributions to income per capita growth from the
energy and agriculture sectors moving in opposite directions. Agricultural sector decline largely
corresponds to energy sector growth and agricultural sector growth mirrored declines in the
energy sector, particularly in 2007 and 2009. Following growth in the energy sector, there were
immediate increases in the growth rates of the construction and other services sectors. It is
typical among resource-rich countries that the service and construction sectors experience booms
as a part of the non-traded goods sector. During boom periods oil revenues are typically spent on
education, housing, healthcare, and other services, which can be explained by the Dutch Disease
spending effect.2 Therefore, resource abundance and rental increases prompt price increases
among non-traded goods, including construction and other services. However, the services and
construction sectors contracted dramatically in 2008–2009.
2 Enormous foreign currency inflows to resource-rich economies, especially during oil booms, lead to relative price
increases of non-tradable goods such as services. Thus, relative price increases in non-tradable good sectors induces
real exchange rate appreciation, which in turn deteriorates the competitiveness of the economy.
0,0
20,0
40,0
60,0
80,0
100,0
120,0
140,0
160,0
180,0
19
91
19
92
19
93
19
94
19
95
19
96
19
97
19
98
19
99
20
00
20
01
20
02
20
03
20
04
20
05
20
06
20
07
20
08
20
09
20
10
20
11
20
12
Coal Production Natural Gas Oil Production

4
Table 1.1: Growth rate changes (in %) among major sectors of the Kazakhstan economy
2004 2005 2006 2007 2008 2009 2010 2011 2012
Energy 3.11 3.59 3.51 2.65 0.80 -0.47 1.97 2.18 1.18
Agriculture 0.63 0.56 0.52 0.43 0.11 -0.09 0.26 0.31 0.15
Construction 0.54 0.68 0.93 0.72 0.17 -0.11 0.45 0.39 0.22
Trade 1.10 1.03 1.09 0.95 0.25 -0.18 0.75 0.83 0.53
Transportation and
Communications 1.04 1.03 1.10 0.88 0.23 -0.16 0.64 0.57 0.36
Other Services 2.94 2.82 3.07 2.51 0.64 -0.46 1.28 1.47 0.85
GDP per capita growth rate 8.84 8.73 9.54 7.66 2.05 -1.44 5.79 5.97 3.51
Source: Based on data from the Statistical Database of the Republic of Kazakhstan, 2013
Figure 1.2 depicts trends in economic growth and the performance of the energy and agricultural
sectors. A smoothed series of sectoral composition growth rates (partly laid out in Table 1.1) are
shown in this graph. Surprisingly, energy sector growth was not significantly associated with
economy-wide growth, specifically during 2002–2011. The poor growth performance is
astonishing considering the modest growth of the energy sector in 2008. In contrast, overall
economic stagnation has coincided with stagnation in the agriculture sector since 2007. This
might reflect a Dutch Disease problem scenario, because either the agricultural or manufacturing
sector is typically squeezed out in resource-abundant countries. Moreover, economic growth
performance was volatile from 2007 to 2011, implying vulnerability of economic performance to
shocks despite rapid growth in the energy sector.

5
Figure 1.2: Sectoral Composition of Real GDP per Capita Growth Rates in Kazakhstan, 2001–
2011
Source: Based on data from the Statistical Database of the Republic of Kazakhstan, 2013
Furthermore, the service sector was as important as the energy sector in terms of GDP shares
(Table 1.2). The average GDP share of other services (banking and insurance) was 32.3% from
2004 to 2009, while the share of the energy sector was 30%. The GDP share of the agricultural
sector was minimal. The contraction of the agricultural sector share corresponds with the
expansion of the energy sector share, indicating an inverse relationship between the two sectors’
contributions to income per capita growth. In addition, the share of agricultural value added to
GDP gradually diminished from 2004 to 2009.
Economists have long discussed the tendency of countries with abundant natural resources,
particularly energy resources such as oil, to exhibit poor economic performance. Literature on
the ‘natural resource curse’ in Kazakhstan can be divided into two major categories. For
instance, Kutan and Wyzan (2005) considered this problem in Kazakhstan from the perspective
of the most obvious economic explanation, namely the Dutch Disease effect. Sharp oil price
increases were followed by real exchange rate appreciation, which thus had a devastating impact
on manufacturing. In contrast to the findings of that study, the latter suggests that exchange rate
appreciation occurred in other sectors, particularly among tradable goods.
-4%
-2%
0%
2%
4%
6%
8%
10%
12%
14%
16%
2001 2002 2003 2004 2005 2006 2007 2008 2009 2010 2011
Kazakhstan Agriculture Energy

6
Table 1.2: GDP Shares of Major Economy Sectors in Kazakhstan
2004 2005 2006 2007 2008 2009 2010 2011 2012
Energy 35.19% 41.12% 36.83% 34.60% 38.81% 32.35% 34.01% 36.56% 33.75%
Agriculture 7.12% 6.37% 5.50% 5.66% 5.32% 6.15% 4.51% 5.11% 4.38%
Construction 6.06% 7.84% 9.80% 9.44% 8.09% 7.89% 7.70% 6.59% 6.31%
Trade 12.46% 11.83% 11.40% 12.36% 12.25% 12.21% 12.99% 13.85% 15.24%
Transportation
and
Communications 11.78% 11.81% 11.54% 11.53% 11.02% 11.02% 11.12% 9.56% 10.23%
Other Services 33.29% 32.36% 32.20% 32.72% 31.17% 32.19% 22.14% 24.63% 24.28%
Source: Based on data from the Statistical Database of the Republic of Kazakhstan, 2013
Figure 1.3 depicts the trends in employment by sector. Employment in the agricultural sector
grew at a considerably slower rate than other sectors from 2002 to 2012, indicating a decline in
the total employment share of the agricultural sector. By contrast, employment growth rate in the
construction and other service sectors not only exceeded that of agriculture, but also that of the
energy sector in almost all years, revealing the relatively increased importance of construction
and other services. There was only one substantial decline in the other services sector in 2008.
Figure 1.3: Employment Growth by Sector in Kazakhstan, in Percentage Change From the
Previous Year
Source: Based on data from the Statistical Database of the Republic of Kazakhstan, 2013
-15
-10
-5
0
5
10
15
20
25
2002 2003 2004 2005 2006 2007 2008 2009 2010 2011 2012
Agriculture Energy Construction Services

7
1.3 Recent Institutional Arrangements in Kazakhstan
Kazakhstan is relatively large in terms of its land area, although it only has 16.6 million
inhabitants, and is heavily dependent on energy resources. The country has demonstrated high
economic growth since 2000. Although economic growth has been observed in all regions of
Kazakhstan, including non-oil producing regions, there is high variability in income per capita,
living standards, and poverty indicators (USAID, 2010). For instance, in 2010 the highest GRP
per capita documented in the Atyrau region was 5,401 thousand tenge (36,654 USD), while the
lowest GRP per capita reported in the Jambyl region was 429 thousand tenge (2,911 USD). The
Atyrau region is rich in oil resources, whereas the economy in Jambyl is predominantly
agricultural.
1.4 Research Questions and Thesis Structure
Although the observations and statistics provided above do not explicitly indicate that resource
abundance fails to sustain growth, they are consistent with a weak natural resource curse
hypothesis effect. In other words, the data suggest “relative de-industrialization,” which was also
found by Oomes and Kalcheva (2007). The increases in the other services and construction
sectors in both absolute (Table 1.1) and relative size (Figure 1.3), and the shrinkage of the
agricultural sector, reveal a mild case of Dutch Disease. This suggests that the spending effect is
crucial, rather than the resource movement effect, to explaining the Dutch Disease effect. Similar
findings were made by Westin (2004) and Omes and Kalcheva (2007) in Russia.
Furthermore, the inverse relationship between point source resource production and diffuse
resource production is indicated. Indeed, the link between energy and the other sectors of the
Kazakhstan economy is identified, particularly with respect to the agricultural and other services
sectors. Based on the facts and figures discussed in the previous sections, in this research I
investigated the following questions:
1. Is there evidence of the resource curse in modern emerging economies? If so, what

8
explains this association with natural resource-abundant economies? What are the
fundamental channels of the natural resource curse-institutional quality and Dutch
Disease?
2. Is there a negative link between resource abundance and income per capita growth? How
does the energy and the agricultural sector’s production influence on institutional quality?
3. How do institutional arrangements in the energy and agricultural sectors influence
development? Are point (e.g. energy) resources different from non-point (e.g.
agricultural) resources?
4. How does high energy production impact production in the agricultural sector? What are
the linkages between energy production and institutional performance?
The thesis is comprised of four chapters in which I addressed the aforementioned questions. To
this end, I evaluated the impact of natural resource endowment on economic growth and
potential ways to reap broad benefits from resource wealth. In recent years, there has been
revived and growing interest in the investigation of natural resources and their diverse
international, regional and intra-regional impacts. Only a handful of studies, however, have
considered both the economic and political channels of the resource curse for particular regions,
while few, if any, have been investigated within a country. Hence, my major aim in this study
was to fill this gap in economic literature. In addition, I sought to provide crucial insight for
policymakers concerning the resource wealth impact over the long-term, as well as to suggest
potential ways to reduce the negative impacts of resource abundance.
The key hypothesis in my research is that well managed resource endowments have enormous
positive potential, particularly within the Commonwealth of Independent States (CIS) region,
and thus could play an important role in boosting economic growth. The vast majority of studies
at the intra-regional level have concentrated on resource wealth impacts exclusively along
economic channels, while ignoring political economy dimensions. In this regard, I investigated
resource abundance impacts among the internal regions of Kazakhstan, examining both channels
of the potential resource curse problem. This country-specific approach including both channels

9
could be important for policymakers, because the various channels of resource curse might have
distinct impacts on economic growth and therefore greater understanding of such channels.
In Chapter 1 I present the introductory part of the thesis, including the background of the
research and the main facts about economic growth and its composites.
In Chapter 2 I present my evaluation of the existence of a natural resource curse in emerging
economies, including the fundamental channels of the potential resource curse.
In Chapter 3 I present my analysis of the linkages between resource abundance and economic
growth in CIS countries, particularly over the long-term. Furthermore, I also conducted an
empirical analysis of the energy sector’s impact on the agricultural sector and linkages to
institutional quality.
In Chapter 4 I present an analysis of the wheat sector in Kazakhstan, identifying the main actors
in the sector. The main objective of this part is to determine the effects of institutional
arrangements on the wheat sector development as one of the types of diffuse resources.
In Chapter 5 I discuss natural resource abundance and its causes in Kazakhstan. Following the
key actors in the wheat and energy sectors, I investigated the impacts of energy and agricultural
resources production, as well as their composition, on economic performance, either directly or
via institutional quality.
In Chapter 6 I provide the summary and research conclusions, and discuss further research topics
and other suggestions. I also provide bullet point recommendations for policymakers. References
and appendices are presented in the final section of the thesis.
My analyses of the resource curse shift from a global to a regional level, using data from CIS
countries, and are followed by an internal investigation of this phenomenon based on data from
within Kazakhstan. This is a logical sequence in that is consistent with the aforementioned
10
research. Initially, I investigated evidence of the resource curse worldwide and its pathways
using cross-national experiences to reveal the permanent channels of the resource curse effect.
Subsequently, I used panel data econometrics to review regional data from CIS countries and for
regions within Kazakhstan to gauge the impacts of resource wealth on institutional quality and
thus economic performance.

11
2 THE NATURAL RESOURCE CURSE, INSTITUTIONAL QUALITY,
AND ECONOMIC GROWTH IN EMERGING ECONOMIES
2.1 Introduction
Explaining the variability in economic growth among countries has been a recurrent research
question in economics. Differential growth rates are typically explained by investment in
physical or human capital, endogenous technological progress, geographical conditions, or
institutional factors (Barro and Sala-i-Martin, 2003; Acemoglu and Robinson, 2010). However,
recent developments in economic research have revealed that from 1960 to 1990, the economies
of resource-poor countries, on average, grew two or three times more than resource-abundant
countries (Sachs and Warner, 1995; Auty, 2001).3
This situation does not necessarily lead to the conclusion that all resource-abundant economies
are cursed by underdevelopment. Literature on the resource curse indicates that there are many
examples of strong economic growth among countries with abundant natural resources, such as
Australia, Canada, Norway, Botswana, Mauritius and Chile.4 Figure 2.1 describes the growth
performance of 87 developing and emerging economies. Averages of the median values of real
income per capita growth rates by groups from 1991 to 2010 for emerging economies were
plotted to reveal historic patterns. The data were grouped according to their export structure
(Appendix Table 2.1.A) according to the classification suggested by Woolcock et al. (2001) and
Isham et al. (2005). Economies were separated into four main categories according to their
predominant resource endowments (specifically their first and second most important exports):
manufacturing, point source, diffuse, and cacao/coffee based economies. This classification
rendered it possible to distinguish the distinct impacts of various resources. Although coffee and
cocoa are diffuse agricultural resources, economically they bear characteristics of point source
resources, as they are typically controlled by large-scale producers. Therefore, coffee and cocoa
are considered as a distinct type of resource, which might have a negative impact on economic
growth despite being diffuse resources.
3 See also Gelb (1988), Lane and Tornell (1996), and Gylfason et al. (1999). Probably the most recent literature
overview is provided by Ross (2013). 4 See Mehlum et al. (2006).

12
The trends depicted in Figure 2.1 demonstrate that countries that export manufactured goods had
the highest average income per capita growth relative to the other three categories, except during
economic crises (e.g., 1998, 2007–2009). It was also revealed that countries that concentrate on
point source and cacao/coffee products exhibited the slowest growth. The averaged median
growth rates during the 2000–2010 period were 4.10%, 2.95%, 2.33%, and 1.81% for countries
that concentrate on manufacturing, diffuse, point source, and coffee/cocoa goods, respectively.
However, since 2000 the data indicate that resource-rich economies are catching up to
manufacturing dominated countries. There was an upward sloping trend among resource-rich
countries, especially with respect to point source and diffuse resource based economies. This
result is consistent with a World Bank study (1994), which found that the five countries with the
most resources out of a total of 82 countries were also among the top 15 leading economies
according to income per capita. I examined whether this situation has changed since 2000.
Figure 2.1: Smoothed Median Economic Growth Rates for 87 Developing and Emerging
Economies, 1991–2010
Source: Based on IMF World Economic Outlook Database (2013)
To explain the disparity in economic growth according to export concentration, I focused on the
variation in economic growth for the period before and since 2000, especially with respect to
-4,00%
-2,00%
0,00%
2,00%
4,00%
6,00%
8,00%
10,00%
Point Source (43) Diffuse (17)
Manufacturing (9) Coffe/Cocoa (18)
13
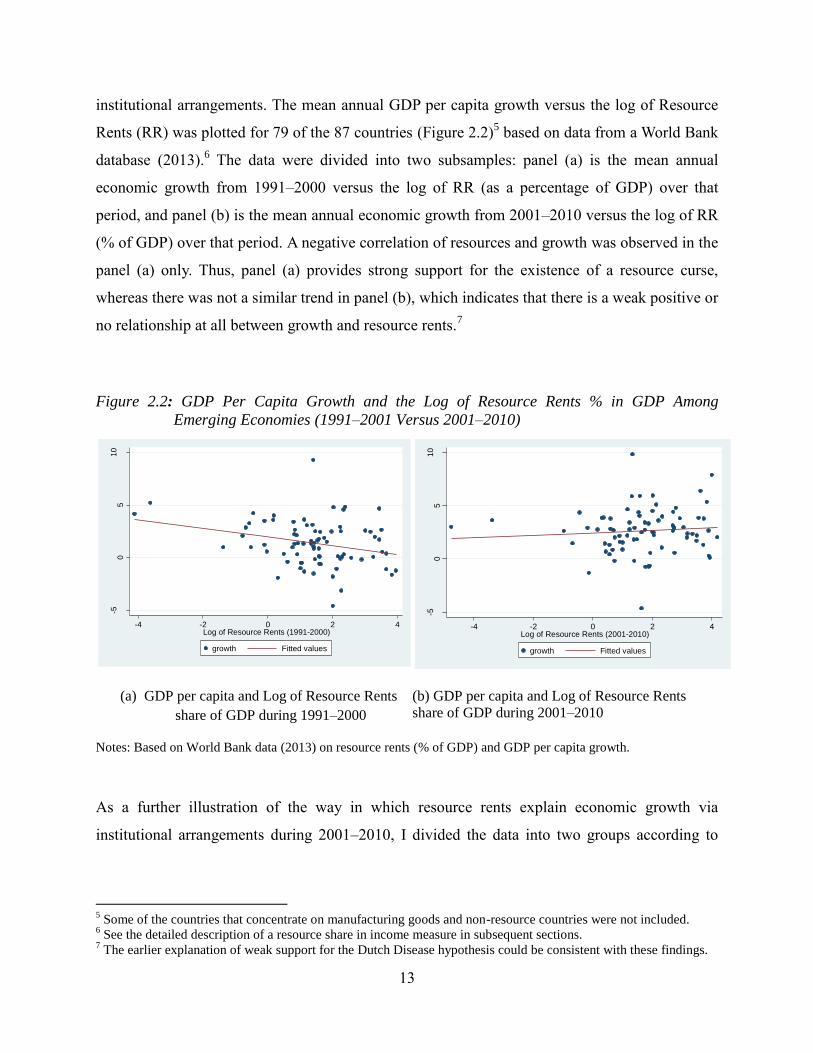
institutional arrangements. The mean annual GDP per capita growth versus the log of Resource
Rents (RR) was plotted for 79 of the 87 countries (Figure 2.2)5 based on data from a World Bank
database (2013).6 The data were divided into two subsamples: panel (a) is the mean annual
economic growth from 1991–2000 versus the log of RR (as a percentage of GDP) over that
period, and panel (b) is the mean annual economic growth from 2001–2010 versus the log of RR
(% of GDP) over that period. A negative correlation of resources and growth was observed in the
panel (a) only. Thus, panel (a) provides strong support for the existence of a resource curse,
whereas there was not a similar trend in panel (b), which indicates that there is a weak positive or
no relationship at all between growth and resource rents.7
Figure 2.2: GDP Per Capita Growth and the Log of Resource Rents % in GDP Among
Emerging Economies (1991–2001 Versus 2001–2010)
(a) GDP per capita and Log of Resource Rents
share of GDP during 1991–2000
(b) GDP per capita and Log of Resource Rents
share of GDP during 2001–2010
Notes: Based on World Bank data (2013) on resource rents (% of GDP) and GDP per capita growth.
As a further illustration of the way in which resource rents explain economic growth via
institutional arrangements during 2001–2010, I divided the data into two groups according to
5 Some of the countries that concentrate on manufacturing goods and non-resource countries were not included.
6 See the detailed description of a resource share in income measure in subsequent sections.
7 The earlier explanation of weak support for the Dutch Disease hypothesis could be consistent with these findings.
-50
510
GD
P p
er
cap
gro
wth
(1
99
1-2
00
0)
-4 -2 0 2 4Log of Resource Rents (1991-2000)
growth Fitted values
-50
510
GD
P p
er
cap
gro
wth
(2
00
1-2
01
0)
-4 -2 0 2 4Log of Resource Rents (2001-2010)
growth Fitted values

14
institutional quality (Figure 2.3).8 This dataset consists of 73 countries divided into two groups of
approximately equal size. Panel (a) consists of 36 countries with high quality institutions,
(measured by above-median values of contract-intensive money (CIM),9 and panel (b) consists
of the remaining 37 countries with ‘qualitatively ineffective’ institutions. The trends depicted in
Figure 2.3 demonstrate that the resource curse was evident in countries with low institutional
quality, whereas countries with substantial resources and effective institutions demonstrated
higher economic performance. However, there was a weak relationship between income per
capita and resource rents share of income associated with ‘bad’ or ‘good’ institutions. This might
be due to the fact that other growth factors are also essential. This relationship between
institutional quality and economic growth has also been observed in many earlier empirical and
theoretical studies.10
In particular, the distinction between grabber-friendly and producer-friendly
institutions is important because they impact economic growth in different ways. Grabber-
friendly institutions are particularly detrimental to economic growth because rent-seeking
absorbs entrepreneurial resources that are not available for growth promoting investments or
innovations.
Figure 2.3: GDP Per Capita Growth and Log of Resource Rents % in GDP Among Emerging
Economies (High Versus Low Quality Institutions, 2001–2010)
(a) With high institutional quality (CIM above
median)
(b) With low institutional quality (CIM equal or
below median) Note: Based on World Bank data (2013) of resource rent percentages of GDP and GDP per capita growth.
8 Following Auty (1997), Woolcock et al. (2001), and Isham et al. (2005) on the importance of natural resource
types in defining the quality of institutions. 9 The Contract-Intensive Money indicator is discussed in detail in the following sections.
10 See recent studies by Mehlum et al. (2006), Brunnschweiler (2007), and Boschini et al. (2007).
-20
24
68
GD
P p
er
cap
(2
00
1-2
01
0)
0 20 40 60Resource Rents (2001-2010)
y (with good institutions) Fitted values
0.1
.2.3
.4.5
GD
P p
er
cap
(2
00
1-2
01
0)
0 20 40 60 80Resource Rents
y (with bad institutions) Fitted values
15
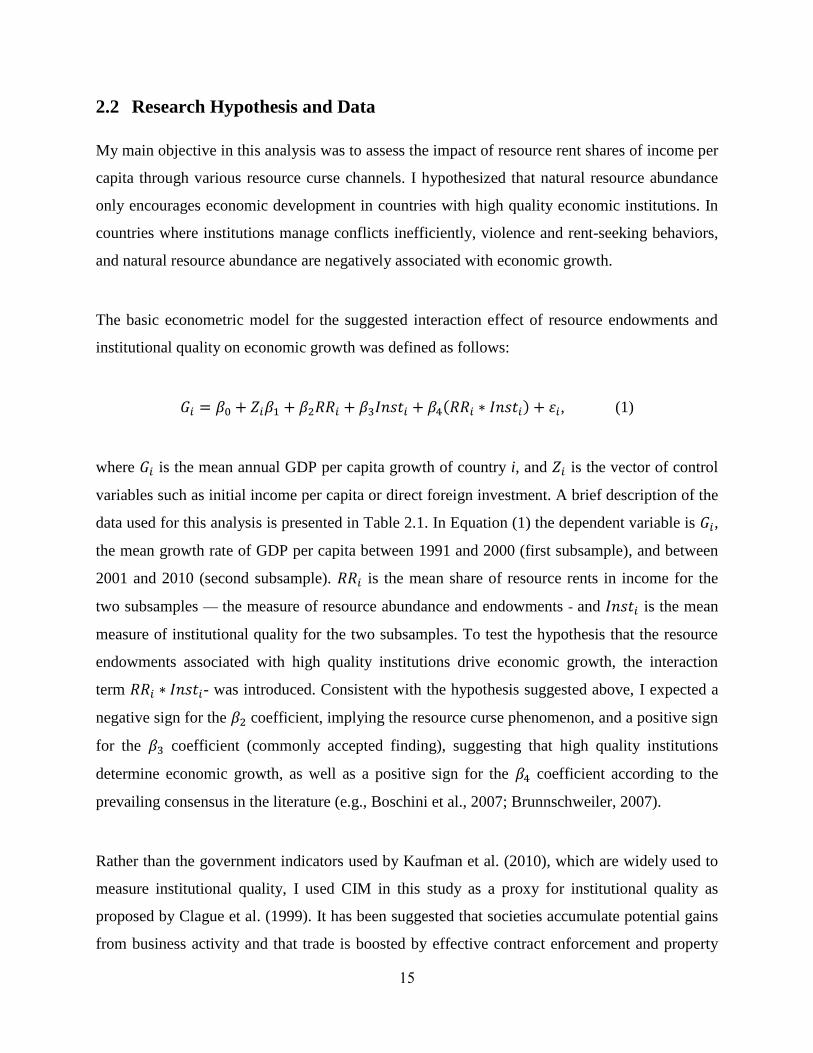
2.2 Research Hypothesis and Data
My main objective in this analysis was to assess the impact of resource rent shares of income per
capita through various resource curse channels. I hypothesized that natural resource abundance
only encourages economic development in countries with high quality economic institutions. In
countries where institutions manage conflicts inefficiently, violence and rent-seeking behaviors,
and natural resource abundance are negatively associated with economic growth.
The basic econometric model for the suggested interaction effect of resource endowments and
institutional quality on economic growth was defined as follows:
𝐺𝑖 = 𝛽0 + 𝑍𝑖𝛽1 + 𝛽2𝑅𝑅𝑖 + 𝛽3𝐼𝑛𝑠𝑡𝑖 + 𝛽4(𝑅𝑅𝑖 ∗ 𝐼𝑛𝑠𝑡𝑖) + 휀𝑖, (1)
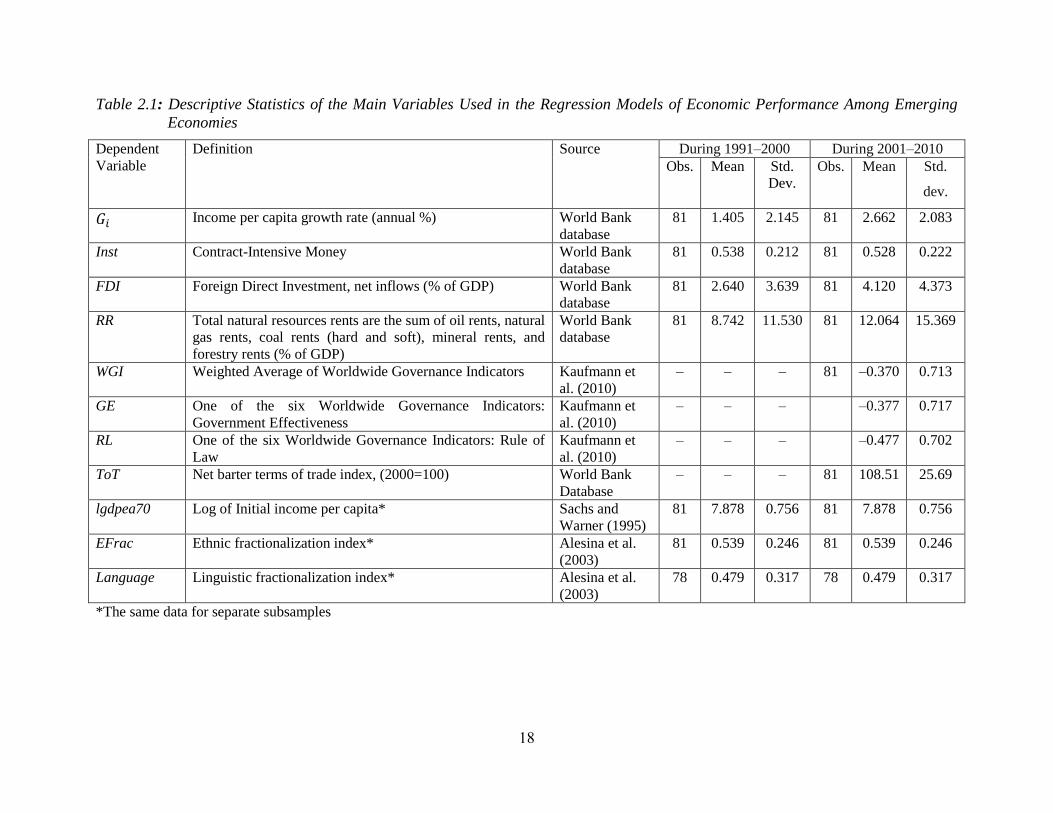
where 𝐺𝑖 is the mean annual GDP per capita growth of country i, and 𝑍𝑖 is the vector of control
variables such as initial income per capita or direct foreign investment. A brief description of the
data used for this analysis is presented in Table 2.1. In Equation (1) the dependent variable is 𝐺𝑖,
the mean growth rate of GDP per capita between 1991 and 2000 (first subsample), and between
2001 and 2010 (second subsample). 𝑅𝑅𝑖 is the mean share of resource rents in income for the
two subsamples — the measure of resource abundance and endowments - and 𝐼𝑛𝑠𝑡𝑖 is the mean
measure of institutional quality for the two subsamples. To test the hypothesis that the resource
endowments associated with high quality institutions drive economic growth, the interaction
term 𝑅𝑅𝑖 ∗ 𝐼𝑛𝑠𝑡𝑖- was introduced. Consistent with the hypothesis suggested above, I expected a
negative sign for the 𝛽2 coefficient, implying the resource curse phenomenon, and a positive sign
for the 𝛽3 coefficient (commonly accepted finding), suggesting that high quality institutions
determine economic growth, as well as a positive sign for the 𝛽4 coefficient according to the
prevailing consensus in the literature (e.g., Boschini et al., 2007; Brunnschweiler, 2007).
Rather than the government indicators used by Kaufman et al. (2010), which are widely used to
measure institutional quality, I used CIM in this study as a proxy for institutional quality as
proposed by Clague et al. (1999). It has been suggested that societies accumulate potential gains
from business activity and that trade is boosted by effective contract enforcement and property

16
rights. The level of the potential gains that a society can capture could be approximated by the
relative amount of money in use. CIM was defined in Clague et al. (1999) as follows:
Inst= (𝑀2−𝐶)
𝑀2, (2)
where 𝑀2 is the money supply including currency and deposits, and C is the amount of currency
in circulation. If Inst (CIM) is a good proxy for contract enforcement and property rights in a
broad sense, it should also be a good indicator of a government’s role in the economy in the
following ways: (a) as a third-party enforcer of transactions and trades that cannot be realized
otherwise; (b) as an intermediary institution that links breaches of contract; (c) as having the
capacity to establish rules and arrangements in a way that allows private actors to form formal
groups (e.g., trade associations); and (d) as a guarantor of civil behaviors among parties. The
approximation for institutional quality must be carefully chosen. The standard proxy variables
that are typically employed in the literature with respect to the resource curse are indices such as
ICRG, BERI, BI ratings (pioneered by Knack and Keefer, 1995; Mauro, 1995), and the
Worldwide Governance Indicators (WGI) suggested by Kaufmann et al. (2010). However, a
potential bias in these indicators may arise from the fact that they are based on the subjective
assessments of respondents.11
For instance, the evaluators may be more likely report that
governance in a country is good during times of strong economic performance. The use of CIM
also has potential risks if the measure is idiosyncratic and irrelevant to contract enforcement and
property rights. Clague et al. (1999) reviewed case studies from several countries and found that
CIM is a good measure of institutional quality, though some country examples demonstrate
idiosyncratic cases.
Table 2.1 presents descriptions of the relationships among institutional quality variables and
other economic indicators of the correlation matrix between Inst, the indicators of governance
used by Kaufmann et al. (2010), and other macroeconomic variables. All indicators and
measures are mean values for the period 2001–2010.12
The correlation of the WGI, estimated as
11
See Glaeser et al. (2004). 12
Almost identical correlation results were found for available data from 1996 to 2000.

17
a weighted average of its aggregate indicators, and its aggregate indicators of six broad
government dimensions—Voice and Accountability (VA), Political Stability and the Absence of
Violence (PA), Government Effectiveness (GE), Regulatory Quality (RQ), Rule of Law (RL),
and Control of Corruption (CC)—with CIM, was illustrated to examine the suitability of CIM as
an institutional quality variable. Among all indicators, CIM was most correlated with GE, RQ,
and RL. It was also highly correlated with other WGI aggregates such as VA, PA, and CC.
Finally, CIM also had a strong correlation with WGI. Table 2.2 demonstrates that CIM was
positively correlated with GDP per capita growth rate (Y). RR was not correlated with GDP per
capita and other macroeconomic indicators, however, RR was negatively correlated with all
institutional quality indicators. RR was not correlated with other macroeconomic indicators such
as foreign direct investment (FDI) and export share in GDP (Exp).
18
Table 2.1: Descriptive Statistics of the Main Variables Used in the Regression Models of Economic Performance Among Emerging
Economies
Dependent
Variable
Definition Source During 1991–2000 During 2001–2010
Obs. Mean Std.
Dev.
Obs. Mean Std.
dev.
𝐺𝑖 Income per capita growth rate (annual %) World Bank
database
81 1.405 2.145 81 2.662 2.083
Inst Contract-Intensive Money World Bank
database
81 0.538 0.212 81 0.528 0.222
FDI Foreign Direct Investment, net inflows (% of GDP) World Bank
database
81 2.640 3.639 81 4.120 4.373
RR Total natural resources rents are the sum of oil rents, natural
gas rents, coal rents (hard and soft), mineral rents, and
forestry rents (% of GDP)
World Bank
database
81 8.742 11.530 81 12.064 15.369
WGI Weighted Average of Worldwide Governance Indicators Kaufmann et
al. (2010)
– – – 81 –0.370 0.713
GE One of the six Worldwide Governance Indicators:
Government Effectiveness
Kaufmann et
al. (2010)
– – – –0.377 0.717
RL One of the six Worldwide Governance Indicators: Rule of
Law
Kaufmann et
al. (2010)
– – – –0.477 0.702
ToT Net barter terms of trade index, (2000=100) World Bank
Database
– – – 81 108.51 25.69
lgdpea70 Log of Initial income per capita* Sachs and
Warner (1995)
81 7.878 0.756 81 7.878 0.756
EFrac Ethnic fractionalization index* Alesina et al.
(2003)
81 0.539 0.246 81 0.539 0.246
Language Linguistic fractionalization index* Alesina et al.
(2003)
78 0.479 0.317 78 0.479 0.317
*The same data for separate subsamples

19
Table 2.2: Correlations Between CIM (Kaufmann et al. 2010) and International Institutional Quality Indicators and Macroeconomic
Indicators, Mean Values from 2001–2010
CIM VA PS GE RQ RL CC G RR FDI Exp WGI
CIM 1
VA 0.48*** 1.00
PS 0.28** 0.52*** 1.00
GE 0.67*** 0.57*** 0.63*** 1.00
RQ 0.64*** 0.62*** 0.65*** 0.92*** 1.00
RL 0.58*** 0.54*** 0.73*** 0.93*** 0.90*** 1.00
CC 0.51*** 0.54*** 0.70*** 0.91*** 0.88*** 0.93*** 1.00
G 0.23** 0.05 –0.01 0.21* 0.14 0.18 0.13 1.00
RR –0.25** –0.37*** –0.13 –0.24* –0.25** –0.23** –0.24** 0.11 1.00
FDI –0.07 0.04 0.18 0.14 0.17 0.17 0.29*** 0.23** 0.15 1.00
Exp 0.28** 0.13 0.42*** 0.56*** 0.51*** 0.50*** 0.55*** 0.06 0.14 0.52*** 1.00
WGI 0.40*** 0.51*** 0.53*** 0.65*** 0.69*** 0.67*** 0.71*** –0.02 –0.31*** 0.12 0.34*** 1.00
Note: Based on data from the World Bank (2013); *** denotes significance at the 1% level; ** at the 5% level; and * at the 10% level All
variables are average estimates of the indicators for the period 2001–2010; there were 81 observations CIM—Contract Intensive Money; VA—
Voice and Accountability; PA—Political Stability and Absence of Violence; GE—Government Effectiveness; RQ—Regulatory Quality; RL—
Rule of Law; CC—Control of Corruption; G-GDP per cap growth; RR-Resource Rents; FDI—Foreign Direct Investment; Exp—Export share in
GDP; WGI—Worldwide Governance Indicators Weighted Average Index of Institutional Quality.

20
2.3 Main Results of the Resource Rents and Income Per Capita Link
2.3.1 Model Results
To examine the hypothesis described in Equation (1) I used a regression model in which the
main explanatory variables of economic growth were resource rents, institutional quality, and
an interaction term. Additionally, to address the potential change in the resource curse
hypothesis before and since 2000, I divided the data into two subsamples for the periods
1991–2000 and 2001–2010. I estimated the regression of Equation (1) using the sample data
from 1991–2000 and is presented in Table 2.3. Columns (1) to (4) in Table 2.3 depict the
major outcomes of the model for the 1991–2000 period. All signs were consistent with the
hypothesis.
The relevant problem in estimating growth theories employing cross-country regressions
concerns functional form. In terms of assessing the regression of growth theories, the core
issue is that the specification (1) might be a misspecification of the growth process. Bernard
and Durlauf (1996) provides an example of a growth model with multiple steady states,
which suggests that countries exhibit convergence with similar steady states, thus indicating
local convergence. Therefore, a problem arises when some countries’ steady states differ and
other’s are associated with one another, as is evident from the R-squared outcomes presented
in Table 2.3. This means that using an OLS method could produce misleading or biased
results. Thus, employing an instrumental variable (IV) approach seems to be more
appropriate.
The results in columns (3) and (4) demonstrate that resource rent became individually
insignificant when the institutional quality variable was introduced into the model, whereas
the interaction term was individually insignificant in all cases. In cases where institutional
quality was not in the model, the resource rent share of GDP (RR) had a significant negative
impact on economic growth, supporting the resource curse hypothesis. RR and its interaction
with institutions term (RR*Inst) was not individually and jointly significant13
in the model
when all variables were present (see Column 4). However, they were jointly significant when
the institutional quality variable (Inst) was omitted from the model (see Column3).14
The
13
The joint significance statistic was 0.56 with a p-value of 0.58. 14
The joint significance statistic was 4.36 with a p-value of 0.02.

21
impact of the interaction on economic growth did not dominate the direct negative impact of
the resource rent share of GDP (RR).
Table 2.3: Regression Results for Economic Performance Indicators from Emerging
Economies, 1991–2000
Dependent Variable:
GDP per capita growth
(1) (2) (3) (4)
lgdpea70 0.602** –0.0505 0.507 –0.0405
(0.278) (0.357) (0.312) (0.356)
FDI 0.145** 0.0901 0.141** 0.0870
(0.0646) (0.0633) (0.0644) (0.0637)
RR –0.0494*** –0.0183 –0.0806** 0.0109
(0.0170) (0.0206) (0.0386) (0.0472)
Inst 4.257*** 4.709***
(1.228) (1.202)
RR*Inst 0.0776 –0.0645
(0.0885) (0.1000)
Constant –3.291 –0.568 –2.577 –0.871
(2.205) (2.408) (2.437) (2.488)
Observations 81 81 81 81
R-squared 0.152 0.254 0.160 0.259
F-stat
(p-value)
5.88
(0.001)
7.76
(0.000)
5,23
(0.000)
6.46
(0.000)
Note: Robust standard errors in parentheses; *** p<0.01, ** p<0.05, * p<0.1
The main results of the other subsample (mean 2001–2010 values) are presented in Table 2.4.
These results differed from the results of the first subsample in terms of the signs and the
significance of the variables in question in support of the hypothesis. Initial income had a
significant negative impact on economic growth, implying income per capita convergence.
Foreign direct investment (FDI) had a positive significant impact in all cases, which is
consistent with the working hypothesis. The resource rent share of income (RR) had a
significant positive association when the institution term was added to the model (Column 2).
Additionally, the resource rent share of income demonstrated a significant negative effect
when it was introduced into the model with the interaction term, inducing the relevant
specification of the model (Column 3). Both variables were individually and jointly

22
significant at the 5% level.15
The interaction term was significantly greater than the direct
negative effect of the resource rent share of income on income per capita growth in the other
subsample (1991–2000) results.16
The signs and significance of variables remained more or
less the same when all variables were included in the model (Column 4). It can be concluded
that resource rents can lead to economic expansion when institutional quality is high. Thus,
the model results confirmed the hypothesis that the role of institutions increases with the
appropriation of resources.
Table 2.4: Regression Results for Economic Performance Indicators from Emerging
Economies, 2001–2010
Dependent Variable:
GDP per capita
growth
(1) (2) (3) (4) (5)
lgdpea70 –0.386 –1.138*** –0.674** –1.144*** –1.188***
(0.292) (0.377) (0.298) (0.379) (0.374)
FDI 0.105*** 0.117*** 0.146*** 0.127*** 0.128***
(0.0329) (0.0335) (0.0375) (0.0317) (0.032)
RR 0.0158 0.0436** –0.0465* 0.0237 0.007
(0.0172) (0.0167) (0.0251) (0.0360) (0.035)
Inst 4.690*** 4.233*** 4.383***
(1.256) (1.419) (1.435)
RR*Inst 0.151*** 0.0416 0.041
ToT
(0.0527) (0.0621) (0.06)
0.015
(0.011)
Constant 5.081** 8.139*** 7.096*** 8.396*** 7.280***
(2.354) (2.478) (2.363) (2.489) (2.674)
Observations 81 81 81 81 81
R-squared
F-stat (p-value)
0.074
3.90
(0.01)
0.241
5.31
(0.000)
0.148
4.96
(0.001)
0.245
4.88
(0.000)
0.26
4.36
(0.000)
Note: Based on data from the World Bank (2013); robust standard errors in parentheses;***
p<0.01, ** p<0.05, * p<0.1
Though the magnitude of the interaction term exceeded the resource rent share of income
direct impact on growth, the simple comparison of magnitudes was not informative. Table 2.5
illustrates the results of the estimation of the different effects of the resource rent share of
15
Joint significance F-statistic was 4.86 with a p-value of 0.0103. 16
The results of the model are consistent with the results of Mehlum et al. (2006) and Boschini et al. (2007).

23
income on economic growth in two different subsamples and the marginal effects of the
resource rent share of income standard deviation change impact at various levels of
institutional quality.17
Table 2.5: Marginal Effects of the Resource Rent Share of Income on Economic Growth
Among Emerging Economies for 1991–2000 and 2001–2010
Note: Based on data from the World Bank (2013)
The interpretation of the resource rent share of income on economic growth at mean
institutions for the second subsample (2001–2010), is that, ceteris paribus, one standard
deviation increase in the resource rent share of income would increase income per capita by
0.476%, whereas one standard deviation increase would imply a –0.401% income per capita
decrease during 1991–2000. However, the results in both subsamples indicate that the
resource rent share of income per capita increase would further encourage economic
development with higher institutional quality.18
Thus, the marginal effects estimation results
support the hypothesis that the impact of resource abundance on economic growth is
determined by institutional quality. However, the interaction term lost significance in one of
the specifications, implying that the support for the hypothesis is rather weak and that the
interpretation of institutional quality must be made carefully. By contrast, the direct effect
was stable, indicating significance in all models. Thus, the interaction term was not
instrumented as it has been in earlier studies (e.g., Boschini et al., 2007).
2.3.2 Instrumenting Institutional Quality
One of the concerns in determining the relationship between economic growth and
institutional quality is that the institutional quality variable could be correlated with the error
17
The marginal effect was estimated as follows: ∆𝑦 = (𝛽2̂ + 𝛽4̂ ∗ 𝐼𝑛𝑠𝑡̅̅ ̅̅ ̅̅ ) ∗ 𝑠𝑡. 𝑑𝑒𝑣. 𝑅𝑅, where 𝐼𝑛𝑠𝑡̅̅ ̅̅ ̅̅ is the quality
level of institutions, 𝑠𝑡. 𝑑𝑒𝑣. 𝑅𝑅 is the standard deviation of the resource rent of income, using the coefficients
𝛽2̂𝑎𝑛𝑑𝛽4̂ from Column 3 in Table 2.4. For instance, the mean institutional quality value for the 2001–2010
subsample (0.513) was estimated as follows: (–0.0465+0.151*0.513)*15.369=0.476. 18
Though all signs were negative for the first subsample (1991–2000), the magnitudes were lower with higher
institutional quality.
1991–2000 2001–2010
Qualitatively Ineffective Institutions –0.880 –0.601
Mean Institutional Values –0.401 0.476
Values for Institutions One Std.
Dev. Above Mean –0.211 0.991
Qualitatively Effective Institutions –0.106 1.393

24
term in Equation (1).19
To test whether the institutional quality variable was endogenous in
the equation I performed a Hausman J Chi2
test for overidentifying restrictions and the results
are demonstrated in Table 2.6 along with additional institutional quality indicators that served
as robustness checks. With respect to the endogeneity test, the null hypothesis was not
rejected for the second decade, implying that the institutional quality and the resource rent
share of income variables were exogenous for that period. However, the null hypothesis was
rejected for the measure for 1991–2000 at the 5% level, indicating that both institutional
quality and the resource rent share of income are endogenous in this subsample. The
Hansen’s J values demonstrated in Table 2.6 imply that the suggested instrumental variables
are valid for the model because the null hypothesis was not rejected in all models.20
Institutional quality was instrumented and is displayed in Table 2.6. In both subsample
regression results shown in panels (1) and (2), the magnitudes of the institutional quality
variable, Inst, were high compared to those estimated using the OLS method. For instance,
the 2001–2010 magnitude of Inst was over threefold more than for 1991–2000, indicating a
potential bias problem related to measurement error in the OLS estimates.21
To examine the
validity of the institutional quality variable (CIM), Inst, I performed a IV GMM for the 2001–
2010 subsample using particular WGIs such as Government Effectiveness (GE), Rule of Law
(RL), Control of Corruption (CC), Regulatory Quality (RQ), Political Stability and Absence
of Violence (PS), and Voice and Accountability (VA) in panels (3) to (8) of Table 2.6. These
results are consistent with the CIM results, although CC, PS, and VA were not significant for
the second period.
Though the resource rents share of income (RR) might have a positive direct impact (e.g.,
during 2001–2010), it had a negative impact on economic growth through institutions in all
cases (before and after 2000). The results presented in Table 2.6 further indicate which
aspects of institutional quality were particularly associated with RR: while GE and the RL
were only slightly reduced, CC, RQ, PS, and VA can have strong negative relationships with
resource rent.
19
Concerning the endogeneity test for 𝐼𝑛𝑠𝑡𝑖, initially, the first regression model was performed as follows:
𝐼𝑛𝑠𝑡𝑖 = 𝛼0 + 𝑍𝑖𝛼1 + 𝛼2𝑅𝑅𝑖 + 𝑋𝑖𝛼3 + 𝜔𝑖, where 𝑋𝑖 is a set of instrumental variables. The set of instrumental
variables is from Alesina et al. (2003). Then, the residual 𝜔𝑖,, was included in the structural equation and tested
for joint significance to address endogeneity. 20
The null hypothesis is that the instrumental variables are exogenous and equations are identified. 21
See Ross (2001a, b) for discussions of the potential endogeneity problem of the institutional quality variable.

25
Table 2.6: Instrumental Variable GMM Results for the Economic Performance of Emerging
Economies (Robust Std. Err.)
Second Stage Regression Results Dependent
Variable:
GDP per
capita growth
rate
Instrumented Institutional Quality Indicators:
CIM GE RL CC RQ PS VA
1991–
2000
2001–
2010
2001–
2010
2001–
2010
2001–
2010
2001–
2010
2001–
2010
2001–
2010
(1) (2) (3) (4) (5) (6) (7) (8)
Inst 11.56*** 6.247** 2.057** 1.874* 2.272 3.256* –0.921 –32.967
(3.556) (2.670) (1.016) (1.116) (1.984) (1.913) (1.083) (212.16)
lgdpea70 –1.198* –1.378** –1.499** –1.129* –1.404 –1.982* 0.185 10.36
(0.653) (0.576) (0.644) (0.593) (0.987) (1.028) (0.535) (68.51)
FDI –0.00780 0.114*** 0.0434 0.0351 –0.0311 –0.005 0.143** 0.420
(0.0768) (0.0343) (0.0591) (0.0616) (0.1202) (0.1043) (0.063) (1.985)
RR 0.0332 0.0498** 0.0586** 0.0527* 0.064 0.0832* –0.001 –0.653
(0.0330) (0.0205) (0.0274) (0.0295) (0.0437) (0.0432) (0.024) (4.275)
Constant 4.392 9.194*** 14.37*** 11.67** 14.06 18.45** 0.090 –84.02
(3.499) (3.187) (5.274) (5.027) (8.585) (8.50) (4.731) (568.18)
Observations 78 78 78 78 78 78 78 78
Endog. test (p)
Hansen's J
chi2 (p)
0.02
0.92
0.58
0.57
0.21
0.75
0.27
0.37
0.41
0.36
0.10
0.78
0.42
0.14
0.32
0.98
First Stage Regression Results
CIM GE RL CC RQ PS VA
1991–2000 2001–2010 2001–2010 2001–2010 2001–2010 2001–2010 2001–2010 2001–2010
(1) (2) (3) (4) (5) (6) (7) (8)
lgdpea70 0.1176***
(0.0206)
0.1061***
(0.0313)
0.1176***
(0.0206)
0.1061***
(0.0313)
0.3856***
(0.0948)
0.4381***
(0.1038)
0.421***
(0.132)
0.327***
(0.093)
FDI 0.0084*
(0.0045)
–0.0016
(0.0029)
0.0084*
(0.0045)
–0.0016
(0.0029)
0.0516**
(0.0243)
0.0336
(0.0277)
0.040
(0.029)
0.009
(0.008)
RR –0.0047***
(0.0017)
–0.0036**
(0.0016)
–0.0047***
(0.0017)
–0.0036**
(0.0016)
–0.0168***
(0.0036)
–0.0172***
(0.0038)
–0.015***
(0.005)
–0.020***
(0.004)
EFrac –0.1232
(0.1129)
–0.0993
(0.1151)
–0.1232
(0.1129)
–0.0993
(0.1151)
–0.6834
(0.4194)
–0.4714
(0.3668)
–0.921*
(0.498)
–0.03
(0.357)
Language –0.0864
(0.0833)
–0.1486*
(0.0864)
–0.0864
(0.0833)
–0.1486*
(0.0864)
0.0932
(0.2817)
0.0055
(0.2650)
0.414
(0.399)
0.030
(0.242)
Asia&Oceania 0.1620***
(0.0484)
0.1958***
(0.0519)
0.1620***
(0.0484)
0.1958***
(0.0519)
0.0687
(0.1948)
0.2676
(0.1792)
–0.455**
(0.227)
–0.022
(0.174)
Constant –0.2935*
(0.1679)
–0.1723
(0.2586)
–0.2935*
(0.1679)
–0.1723
(0.2586)
–3.1566
(0.7966)
–3.5212***
(0.8612)
–3.429
(1.125)
–2.702
(0.801)
Observations 78 78 78 78 78 78 78 78
R-squared
Adj. R-squared
F-stat. (p)
0.56
0.53
18.40
(0.00)
0.52
0.47
16.75
(0.000)
0.52
0.48
12.64
(0.00)
0.41
0.35
8.52
(0.00)
0.45
0.40
7.49
(0.00)
0.43
0.38
10.36
(0.00)
026
0.19
5.42
(0.00)
0.32
0.26
9.17
(0.00)
Note: Based on data from the World Bank (2013); robust standard errors in parentheses; *** p<0.01, ** p<0.05,
* p<0.1
R-squared values for the second stage regressions are not reported. According to Sribney et al. (2003), this value
has no statistical meaning in the IV regression models and is therefore not reported in many studies.
To interpret the impact of a one standard deviation change (increase) in the resource rent
share of income per capita growth via institutions during 2001–2010, I initially estimated that
one standard deviation increase in resource rents (15.52) would lead to a decrease in
26
institutional quality by 0.25,22
the approximate difference between Chile (0.84) and Iran
(0.59). To translate this into RR impact on growth, a one standard deviation increase in RR,
ceteris paribus, would lower income per capita by 1.56%. In contrast, the direct RR effect on
economic growth, with a coefficient of 0.0498 indicates that a one standard deviation
increase in RR, ceteris paribus, would lead to a 0.376% increase in income per capita.23
Thus,
the indirect negative effect of RR via institutions far exceeds its direct positive impact on
economic growth. The net total effect of RR on economic growth was 1.19% (1.56–0.376),
implying that a one standard deviation increase in RR would lead to an income per capita
decrease of 1.19%.
2.3.3 The Dutch Disease and the Manufacturing Sector
In contrast to other studies on the resource curse, a direct positive relationship between
resource abundance and economic growth was detected for the second decade (2000–2010).
One explanation for this result could be the commodity boom that led to increasing
commodity prices from 2006 onwards. A positive link has also been observed in some earlier
studies (Sachs and Warner, 1999; Murphy et al., 1989) that attribute this to the fact that
economies with vast quantities of resources have the capacity to accumulate economic
infrastructure and human capital. If non-tradable sectors are characterized by increasing
returns to scale (IRS), a resource boom can indeed boost economic growth. However, if IRS
occurs in the manufacturing sector, resource concentration can be detrimental to economic
growth through the Dutch Disease effect. Thus, the relationship between resource abundance
and economic growth depends on whether IRS in production occurs within tradable or non-
tradable sectors.
To evaluate the Dutch Disease hypothesis, the link between the resource rent share of income
and manufacturing sector growth was examined separately for the two decades (Table 2.7).
Manufacturing value added (% of GDP) annual growth rate data were derived from the
World Bank database (2013).24
Resource abundance had a negative impact on economic
growth when resource abundance was included as an interaction variable with FDI for the
22
This figure was calculated as a product of the coefficient and the quotient of its standard deviation divided by
the standard deviation of the dependent variable: �̂�𝑅𝑅 ∗ (𝑠𝑡𝑑𝑒𝑣(𝑅𝑅)/𝑠𝑡𝑑𝑒𝑣(𝐼𝑛𝑠𝑡)). Standard deviations were
those of the regression based on 78 observations. Three countries were dropped from the OLS regression due to
missing data (𝑆𝑡𝑑𝑒𝑣(𝑅𝑅)=15.52, 𝑠𝑡𝑑𝑒𝑣(𝐼𝑛𝑠𝑡)=0.224 and �̂�𝑅𝑅=–0.0036) (Table 2.6, Column 2). 23
�̂�𝑅𝑅 ∗ (𝑠𝑡𝑑𝑒𝑣(𝑅𝑅)/𝑠𝑡𝑑𝑒𝑣(𝐺𝑟𝑜𝑤𝑡ℎ))=0.0498*(15.52/2.06) 24
Annual growth rate for manufacturing value added was based on local currency and in real terms.
Manufacturing includes industries determined by ISIC division 15–37.
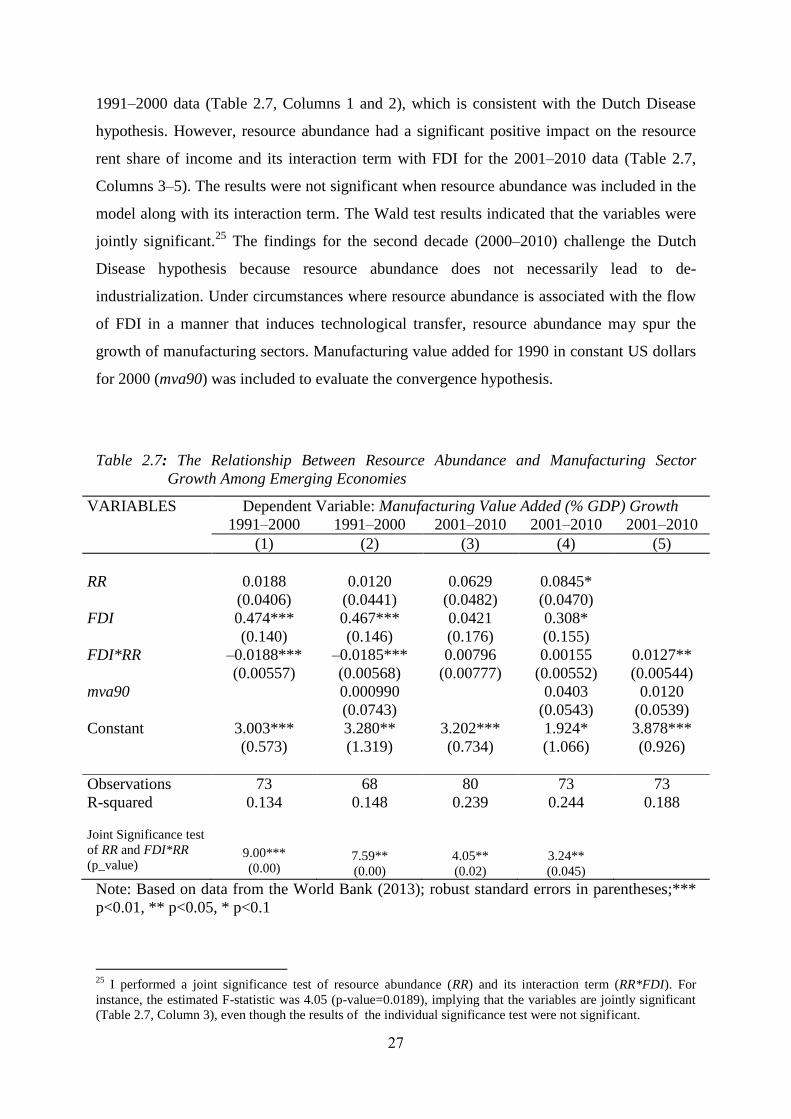
27
1991–2000 data (Table 2.7, Columns 1 and 2), which is consistent with the Dutch Disease
hypothesis. However, resource abundance had a significant positive impact on the resource
rent share of income and its interaction term with FDI for the 2001–2010 data (Table 2.7,
Columns 3–5). The results were not significant when resource abundance was included in the
model along with its interaction term. The Wald test results indicated that the variables were
jointly significant.25
The findings for the second decade (2000–2010) challenge the Dutch
Disease hypothesis because resource abundance does not necessarily lead to de-
industrialization. Under circumstances where resource abundance is associated with the flow
of FDI in a manner that induces technological transfer, resource abundance may spur the
growth of manufacturing sectors. Manufacturing value added for 1990 in constant US dollars
for 2000 (mva90) was included to evaluate the convergence hypothesis.
Table 2.7: The Relationship Between Resource Abundance and Manufacturing Sector
Growth Among Emerging Economies
VARIABLES Dependent Variable: Manufacturing Value Added (% GDP) Growth
1991–2000 1991–2000 2001–2010 2001–2010 2001–2010
(1) (2) (3) (4) (5)
RR 0.0188 0.0120 0.0629 0.0845*
(0.0406) (0.0441) (0.0482) (0.0470)
FDI 0.474*** 0.467*** 0.0421 0.308*
(0.140) (0.146) (0.176) (0.155)
FDI*RR –0.0188*** –0.0185*** 0.00796 0.00155 0.0127**
(0.00557) (0.00568) (0.00777) (0.00552) (0.00544)
mva90 0.000990 0.0403 0.0120
(0.0743) (0.0543) (0.0539)
Constant 3.003*** 3.280** 3.202*** 1.924* 3.878***
(0.573) (1.319) (0.734) (1.066) (0.926)
Observations 73 68 80 73 73
R-squared
Joint Significance test
of RR and FDI*RR
(p_value)
0.134
9.00***
(0.00)
0.148
7.59**
(0.00)
0.239
4.05**
(0.02)
0.244
3.24**
(0.045)
0.188
Note: Based on data from the World Bank (2013); robust standard errors in parentheses;***
p<0.01, ** p<0.05, * p<0.1
25
I performed a joint significance test of resource abundance (RR) and its interaction term (RR*FDI). For
instance, the estimated F-statistic was 4.05 (p-value=0.0189), implying that the variables are jointly significant
(Table 2.7, Column 3), even though the results of the individual significance test were not significant.

28
I also examined the resource abundance impact on real per capita manufacturing value added
growth to control for population growth (Appendix Table 2.7.A). A new measure of the
manufacturing per capita growth rate was estimated as the growth of the ratio of
manufacturing value added in real terms (constant US dollars for 2000) to the total population
size. The data were retrieved from the World Bank (2013) database. The results (Appendix
Table 2.7.A) indicate an identical relationship between resource abundance and
manufacturing sector growth (Table 2.7). The resource rent share of income associated with
the FDI concentrated in resource-abundant sectors had a negative association with growth in
manufacturing sectors during 1991–2000 (Table 2.7.A, Columns 1 and 2). However, the
relationship was positive for the second decade, implying that resource abundance may
contribute to manufacturing sector growth under certain conditions.
This result is consistent with the findings of certain studies of the link between economic
growth and FDI. For instance, Asiedu (2004) found that FDI in resource-rich countries is
typically concentrated in natural resource sectors and inhibits positive spillover such as
technological transfers and increases in employment that are often generated by the
manufacturing sector. Growth in the manufacturing sector had a significant positive
relationship with income per capita growth (Figure 2.4). This relationship could potentially
explain the negative relationship between resource abundance and manufacturing sector
growth for the first decade, 1991–2000 (Figure 2.5). Additionally, Asiedu (2006) found a
positive relationship between natural resource abundance and FDI. Following the
considerable commodities price increase, FDI has been concentrated in natural resource-
abundant sectors in Africa because foreign investors expanded activities in the mining, oil,
and gas industries (UNCTAD, 2006).
With respect to the positive link between resource abundance and manufacturing sector
growth, which is one of the key theories presented in this study, I conclude that FDI inflow
associated with abundant natural resources can be an advantage for resource-rich countries in
terms of boosting the manufacturing sector and encouraging economic growth. This idea is
borrowed from Borensztein et al. (1998), who found that FDI boosts economic growth when
the host country has sufficient human capital to benefit from technology transfer. The authors
also suggested that FDI may, in fact, ‘crowd out’ domestic investment. Thus, FDI may
adversely impact domestic savings and, in turn, undermine economic growth. This
observation may explain the negative impact of the interaction variable (RR*FDI) for the first
decade, 1991–2000 (Table 2.7, Column 2). Moreover, it explains the positive link indicating

29
that resource-rich countries can benefit from FDI flow if human capital surpasses a certain
threshold.
Figure 2.4: The Link Between Income Per Capita Growth and Manufacturing Sector Growth
Among Emerging Economies
(a) for the period 1991–2000 (b) for the period 2001–2010
Figure 2.5: The link between the resource rent share of income and manufacturing sector
growth
(a) for the period 1991–2000 (b) for the period 2001–2010 Note: Based on data from the World Bank (2013)
2.4 Conclusion
In this chapter I examined the relationships among natural resource endowments, economic
growth, and institutional quality.26
The results demonstrate that the resource share in income
has a negative relationship with institutional quality and thus undermines economic growth.
Comparing two temporal subsamples of economic indicator data from emerging economies, I
26
As observed in two influential papers by Sachs and Warner (1995, 1999)
-50
510
GD
P p
er
cap
ita g
row
th r
ate
-5 0 5 10 15Manufacturing Value Added (growth rate)
income per capita growth Fitted values
-50
510
GD
P p
er
cap
ita g
row
th r
ate
-5 0 5 10 15 20Manufacturing Value Added (growth rate)
income per cap. growth Fitted values
-50
510
15
Man
ufa
ctu
ring
Va
lue A
dd
ed g
row
th r
ate
0 10 20 30 40 50Resource Rents share in income, 1991-2000
Man1 Fitted values
-50
510
15
20
Man
ufa
ctu
ring
Va
lue A
dd
ed g
row
th r
ate
0 20 40 60 80Resource rents share in income, 2001-2010
Manufacturing value added growth rate Fitted values

30
found that a direct resource curse effect might have existed before 2001 but later disappeared
in the subsequent decade (from 2001 to 2010). While the direct effect of resource rents on
economic growth varied with volatile commodity prices that where high over the second half
of the last decade, the indirect resource curse impact (through institutional quality) was true
for all subsamples, implying that a resource curse as a result of institutional quality is a more
persistent link between natural resources and economic growth. The resource rents and the
ease to extract them, particularly for point-source resources, encourage different groups to
seize control of these resources and the subsequent revenues associated with their use. This
response, in turn, encourages inefficient institutional activity.
Thus, the relationship between resource abundance and economic growth is indirect as a
consequence of institutional quality. The level of resource concentration only undermines
growth through its impact on institutional quality. Heavy concentration of resource rents
generates ‘grabber-friendly’ institutions and in turn causes economic failure. Therefore,
transparency and political accountability in the management of specific point-source
resources (e.g., oil production) are key components and are the main policy recommendation
results of this investigation. The lack of transparency causes point-source resources to be
appropriable in rent-seeking activity and inefficient utilization. Additionally, complex rules
and regulations provide opportunities of certain groups to extract bribes. The lack of
transparency is a key issue to be tackled in the management of point-source resources.
Transparent business regulation regimes, however, are the key drivers of an economy in
which small businesses are motivated to be productive.
Another interesting finding of this study is that natural resource abundance that is associated
with resource-initiated FDI may boost growth in manufacturing sectors and, consequently,
may have contributed to the economic growth in the second decade of the study from 2001–
2010. Contrary to other studies (e.g., Asiedu, 2006), a positive link between natural resource
abundance and manufacturing sector growth was established for the second decade (2001–
2010). However, I argue that the findings are not completely contradictory to the findings of
other studies. The negative relationship between resource abundance and manufacturing
sector growth confirms the Dutch Disease theory. The results suggest that, under certain
circumstances (e.g., sufficient human capital and technological transfer, but also high
commodity prices), natural resources may be an advantage for an economy.
31
3 LINKAGES BETWEEN INSTITUTIONAL QUALITY AND DUTCH
DISEASE IMPACT IN CIS COUNTRIES
3.1 Introduction
Natural resources can be significant drivers of an economy, if they give it the ‘big push’
needed for development. Rosenstein-Rodan (1943, 1961) and Murphy et al. (1989) suggested
that a big-push approach is necessary to boost demand and expand the market, thus providing
better opportunities for entrepreneurs. This in turn is expected to boost economic
development. However, recent studies of the impacts of a natural resource on economic
growth emphasize the adverse links between natural resource abundance and economic
growth.27
Scientists have traditionally concentrated on total factor productivity, human and physical
capital accumulation, technological advancement and innovation, the knowledge creation
process and its spillovers, as well as global economic integration to explain the causality of
the growth of nations (Helpman, 2004). However, experts have emphasized the importance of
governance and institutions in the process of economic growth because they boost incentives
to create, accumulate, and accommodate change.28
In this context, many empirical studies
have focused on the political determinants of economic growth (Dellepiane-Avellaneda,
2010). North and Thomas (1973) highlight that the major factors upon which economists
have traditionally focused, such as innovation, economies of scale, education, and capital
accumulation, are not causes of economic growth but rather growth itself. Thus, they are
proximate factors of growth, whereas institutions reflect the fundamental factor of growth.
North (1990) characterizes institutions as “humanly devised constraints that shape human
interaction,” and suggests distinguishing between the rules of the game (institutions), the set
of organizations and individuals as key players of the game, and the way in which the game is
played. In this regard, growth economists considered ‘good governance’ as a pre-requisite for
sustained economic performance (Kaufmann et al., 2000; Knack, 2003). In contrast to other
studies, Olson (1997) attributes most of the variability in economic development to the
efficiency of resource use. In addition, he suggests that waste is commonly observed in
economies with a weak institutional framework, within which the rule of law and property
27
Sachs and Warner (1995, 1997) 28
Drazen (2000) presents a detailed discussion of the political economy of growth.

32
rights are underdeveloped. The behavior of organizations is very important for economic
growth and technological change. If transformations or technological changes are to be
achieved, government is needed to facilitate it because they bear features of public goods;
otherwise, a ‘free rider’ problem is encountered. Transformation cannot be achieved if a free
rider problem is widespread. In this regard, interest-group theory sheds light on the
importance of the interests of groups of individuals (Eggertsson, 1990). He suggests that the
size of the group is a primary factor in explaining the success of the group. In small groups,
the contribution of each individual is meaningful and thus is assumed to be important for
achieving common objectives, while in large groups the contribution of each individual does
not have the same relative impact, implying that free riding is more likely to harm the
common objective (Olson, 1965). In a subsequent study Olson (1982) argues that the so-
called distributional coalitions harm economic growth by distributing income among their
members, which is considered a rent seeking activity within economics.
The theory of interest groups has been applied to the investigation of centrally planned
economies since the collapse of the Soviet regime (Olson et al., 2000). They suggest that the
economic success of Soviet Union from 1950 until 1965 can be explained by the type of the
leadership. During this period the Soviet Union was governed by a relatively small group of
people. In fact, it is assumed that Stalin operated as the owner of the country. The Soviet
regime began to diminish in the Brezhnev era with the emergence of unbalanced structures.
Kasper et al. (2012) offer fresh insights into the failure of the Soviet regime, suggesting that
the principal-agent problem lies at the core of institutional economics in centrally planned
economies. Indeed, progressively structured groups pursuing their own interests flourished
during Brezhnev’s governance. Ministries and agencies have emerged as the main suppliers
of information to the central planning authorities. They acted like distributional coalitions or
‘rent-seeking groups’ in common economic literature, which triggered institutional decay. It
has also been suggested in earlier studies by Shleifer and Vishny (1998) that politicians “try
not to maximize social welfare, but rather aims their interests and goals” and in this respect
governance can be depicted as a ‘grabber hand.’ However, there are crucial differences
between socialism and capitalism. Under socialism, governments are richer and can dedicate
resources to inefficient activities. For instance, the Soviet government could exploit natural
resources to expand the militaristic economy.
On the other hand, Friedman (2008) emphasizes the importance of moral codes in the
existence of markets and the prosperity of economies. The theory explains market function in

33
the face of the debt crisis that occurred in Europe. This is a tale of moral hazard, when some
European countries pay the bills of other European Union countries, for actions in which they
played no role. However, Friedman (2008) suggests that not only is a weak moral code
harmful for economies, but also that too much moral code can be detrimental. The case of
Soviet Union is of particular interest here. In an attempt to divorce itself from the moral
outrages of the market, the Soviet Union appealed to communism and this utopian view of
cooperation became an obstacle to growth.
Resource-rich CIS countries can learn some lessons from the experiences of other countries
with abundant energy resources. The average per capita GDP growth rates and resource
rents29
of nine CIS countries are depicted in Figure 3.1, followed by their resource rent shares
of GDP in descending order (depicted as a red line). Figure 3.1 displays nonlinear
relationship (U-shaped pattern) between income per capita growth rate and resource rents
share in income. In this respect, it is important to focus on the explanation of resource curse
for countries with abundant resources, as well as deriving some lessons from other resource-
rich countries.
Figure 3.1: Growth and Resource Rents (% of GDP), Average Values for 1991–2010
Source: World Bank Database (2013)
29
Estimated as median GDP per capita growth rates (base year is 2000) and resource rent sharesof GDP for the
period from 1991 to 2010.
05101520253035404550
0123456789
10
Re
sou
rce
Re
nts
, % o
f G
DP
Gro
wth
Rat
e, %
Growth RR

34
In addition, the negative relationship between the terms of trade (real exchange rate) and
income per capita growth indicates that the real exchange rate could potentially be another
channel of the resource curse in CIS countries (Figure 3.2). The main contribution of this
analysis is to link the seemingly different channels of the negative effects of natural
resources, specifically the Dutch Disease effect, and the deterioration of institutional quality.
Thus, it is hypothesized that abundant resources limit agricultural sector production, which
might have a positive external effect on economic growth, either directly or indirectly
through institutional improvements rather than other types of resources. Isham et al. (2005)
found that the abundance of point source resources, as opposed to diffuse resources, is
detrimental to institutional quality. In the following analyses natural resource abundance
appears to undermine economic growth both directly and indirectly via its impact on
institutional quality by limiting agricultural production, which potentially entails positive
externalities for economic growth.
Figure 3.2: Growth and Terms of Trade, Average Values for1991–2010
Source: World Bank Database (2013)
Note: The terms of trade for most countries is from 2000 to 2010.
3.2 Research Hypothesis and Data
Unfortunately there is little consensus on natural resource curse theory. Most explanations
fall into one of two major groups. The first group concentrates on the institutional quality
0
1
2
3
4
5
6
7
8
9
10
0
20
40
60
80
100
120
140
160
180G
row
th R
ate
Term
s o
f tr
ade
ind
ex

35
dimension, suggesting that natural resources affect economic growth through institutional
quality30
or in association with institutional quality31
(see arrows 2(a) and 2 (b) in Figure 3.3).
The other group falls within the framework of the Dutch Disease phenomenon. The key
concept behind the Dutch Disease theory is that the concentration of natural resources crowds
out some other activity x (arrow 3 in Figure 3.3). This activity, in turn, boosts economic
growth. Sachs and Warner (1995, 1999, 2001) define x as activities in the manufacturing
sector.
Figure 3.3: Conceptual Framework of the Study
1
2 (a) 2 (b)
3
In this research I integrated two major channels of the effect of natural resources as a curse:
the impact on institutional quality and crowding-out due to the Dutch Disease effect. The
former is based on the hypothesis that natural resource abundance crowds out those sectors of
the economy whose positive externalities impact economic growth directly or indirectly via
institutional quality (arrow 3 in Figure 3.3). To examine this hypothesis I employed the panel
VAR method and defined the growth equation as follows:
𝑦𝑖,𝑡 = ∑ 𝛼𝑗𝑦𝑡−𝑗 + 𝛽′(𝐿)𝑅𝑅𝑖,𝑡𝑝𝑗=1 + 𝛾′(𝐿)𝐼𝑛𝑠𝑡𝑖,𝑡 + 𝛿′(𝐿)𝑅𝑅 ∗ 𝐼𝑛𝑠𝑡𝑖,𝑡 + 𝜃′(𝐿)𝑇𝑜𝑇𝑖,𝑡 + 𝜂𝑖 +
휀𝑖,𝑡 , (1)
30
See Isham et al. (2005) 31
See Mehlum et al. (2006), Boschini et al. (2007), and Brunnschweiler (2007)
Point-Source Resources
(Energy production)
Income Level
Institutional
Quality
Diffuse Resources
(Agricultural Resources)
Activity “x”
Point-Source Resources
(Energy production)

36
where 𝑦𝑖,𝑡 is real income per capita growth, 𝑅𝑅𝑖,𝑡 is a resource rents share in GDP, 𝐼𝑛𝑠𝑡𝑖,𝑡 is
an institutional quality variable, 𝑅𝑅 ∗ 𝐼𝑛𝑠𝑡𝑖,𝑡 is the interaction between resource abundance
and institutional quality (to examine the impact of resource abundance on the growth
associated with institutional quality), 𝑇𝑜𝑇𝑖,𝑡 represents the terms of trade, and 𝜂𝑖 represents
unobserved country-specific and time-invariant effects with E(𝜂𝑖)= 𝜂 and Var(𝜂𝑖)=𝜎𝜂2.
𝛽′(𝐿), 𝛾′(𝐿), 𝛿′(𝐿) as matrix polynomials in the lag operator L. In the same vein, the
equation for institutional quality, using panel VAR, was constructed as follows:
𝐼𝑛𝑠𝑡𝑖,𝑡 = ∑ 𝛼𝑗𝐼𝑛𝑠𝑡𝑡−𝑗 + 𝛽′(𝐿)𝑅𝑅𝑖,𝑡𝑝𝑗=1 + 𝛾′(𝐿)𝑅𝑅𝑖,𝑡
2 + 𝛿′(𝐿)𝐴𝑔𝑟𝑖𝑉𝐴𝑖,𝑡 + 𝜃′(𝐿)𝐴𝑔𝑟𝑖𝑉𝐴𝑖,𝑡2 +
𝜌𝑖 + 𝑣𝑖,𝑡 , (2)
where 𝐴𝑔𝑟𝑖𝑉𝐴𝑖,𝑡 is an agricultural resource production value added share of income and 𝜌𝑖
represents unobserved country-specific and time-invariant effects with 𝐸(𝜌𝑖) = 𝜌 and
Var(𝜌𝑖)=𝜎 𝜌2 . The resource abundance variables were split into two major groups, as follows:
𝑅𝑅𝑖,𝑡 represents point-source natural resource abundance and 𝐴𝑔𝑟𝑖𝑉𝐴𝑖,𝑡 represents the value
added share of income from producing agricultural goods, in order to examine whether the
composition of natural resources has a causal role in the resource curse for CIS countries.
Natural resource abundance variables were treated as a nonlinear function of institutional
quality. Thus, their squared terms are also included in Equation (2). In this regard,
examination of whether diffuse resources bear a positive impact on institutional quality is
crucial for better understanding of the major determinants of economic growth. The
coefficients for 𝛽′and 𝛾′ are expected to be negative because point-source resource
abundance, as opposed to diffuse resources, reduces institutional quality, while the
coefficients for 𝛿′ and 𝜃′are expected to be positive. Finally, the impact of resource rents on
the contribution to income from value-added agricultural growth was tested to observe
whether there is support for the main hypothesis defined above.
The major determinants of economic growth (human and physical capital, innovation and
spillover effects, and total factor productivity), are proximate determinants rather than

37
fundamental drivers of economy, such as institutions and governance. In addition, the
proximate determinants of economic growth were omitted due to the short-term nature of the
analyses. Lagged variables play an important role in the model. In particular, it has been
increasingly popular to use lagged variables in panel data models to predict long-term effects.
Thus, initial income bears the same characteristics of fixed effects, within which the lagged
dependent variable plays a crucial role through partially correcting growth according to
changes in the determinants of growth.
The analyses were conducted using data on growth, resource abundance, and institutional
quality for eight of the CIS: Armenia, Azerbaijan, Belarus, Georgia, Kazakhstan, Moldova,
Russia, and Ukraine. The panel dataset is a balanced panel followed over 18 years from 1993
to 2010. The panel data were chosen to include as many years as possible for a reasonable
sample of the CIS countries. A general description and the statistics of the data analyzed are
shown in Table 3.1.A. (see Appendix part). All of these data are available from the World
Bank World Development Indicators online database.
3.3 Contract-Intensive Money and Selected CIS Country Case Studies
I used Contract-Intensive Money (CIM) as a proxy for institutional quality, following Clague
et al. (1999). The authors suggest that contract enforcement and property rights boost
entrepreneurial activities and trade, which in turn increase the potential gains of society from
those activities and trade. They calculated CIM as follows:
CIM = (𝑀2−𝐶)
𝑀2
where 𝑀2 is money supply, including currency and deposits, and C is currency in circulation.
If CIM is a good proxy for institutional quality, and more specifically for contract
enforcement, property rights security, and political regime change, then it should immediately
react in response to these changes. The research focused on CIS countries with abundant
natural resources, specifically those with concentrated production of energy resources. The
CIM data were also retrieved from the World Bank World Development Indicators database
(see Table 3.1.A in the Appendix).
3.3.1 Azerbaijan
The Nagorno-Karabakh conflict between Azerbaijan and Armenia erupted in 1988 and
continued until 1991–1992. The war affected the entire Azerbaijani economy. A cease-fire

38
between Azerbaijan and Armenia was took effect in 1994 (Yalowitz and Cornell, 2004).
There was a substantial increase in CIM from 0.24 in 1993 to 0.64 in 1994 (Figure 3.4). Early
in Azerbaijan’s independence, strong capital inflows were common, as in many transitional
economies, particularly after the end of the war. The foreign investment was particularly
significant in its vast and promising natural resource sectors. A privatization law was passed
in 1993 and most of the national enterprises were privatized that same year. In 1994
Azerbaijan and a western consortium signed an oil contract worth $7.4 billion (BBC, 2012).32
Figure 3.4: CIM Over Time in Azerbaijan, 1993–2010
There were two early stages of reform in Azerbaijan. The first stage occurred from 1991 to
1995, and the second stage is from 1996 onwards. The first stage had some detrimental
effects on economic performance, most of which culminated in 1995. In fact, Azerbaijan’s
economy and social structure were on the verge of a substantial collapse in 1995 due to
events over the preceding years, such as coups and conflicts among government
representatives.33
After the presidential election of 1993 there were two attempted coups. In
32
BBC News Europe, (2012) 33
See the Government Accountability Project (GAP) Report (2008) for a full discussion of the reforms in the
early stages of independence.
Privatization
Cease-fire with Armenia
Finacial Crisis
State Oil Fund
1994
EITI Report
2003
2000
1997
1993
Redenomination of Domestic Currency
2006
Global Credit Crunch
2007
0,00
0,10
0,20
0,30
0,40
0,50
0,60
0,70
19
93
19
94
19
95
19
96
19
97
19
98
19
99
20
00
20
01
20
02
20
03
20
04
20
05
20
06
20
07
20
08
20
09
20
10
CIM of Azerbaijan
CIM of Azerbaijan

39
spite of political support for the building of a market economy, reforms were often
deliberately suspended by the president at the time (World Bank, 2000). The progress made
in governance and political reforms were very slow over this period and the increasing
burden of regulations and corruption impeded foreign investment and undermined economic
growth. The effects of these developments can be seen in Figure 3.4 as a dramatic decline in
CIM until 1996. In turn, these policies led to a sharp decrease in production and an increase
in unemployment in the country. In 1993 Heydar Aliyev seized power by means of a coup to
remove the democratically elected President, Abulfez Elchibey (GAP, 2008).
The second stage of reform from 1996 onwards is known as the period of macroeconomic
stability and dynamic development. In 1996 Azerbaijan adopted fiscal and monetary austerity
policies under a three-year agreement with the IMF. As a result of these policies the inflation
rate fell at the beginning of 1998. Azerbaijan’s fiscal and monetary policies in this period also
stabilized the currency (IMF, 1998). There was a sharp increase in CIM in 1993 followed by
a dramatic decline until 1996 (Figure 3.4). There was a slight recovery in 1997 followed by
an abrupt increase from 1999 to 2000. In addition, the State Oil Fund was established at the
end of 1999for the efficient management of oil revenues, which succeeded in improving
public trust from 1999 to 2000.
However, the National Bank of Azerbaijan declared that it would require all payments to be
made in domestic currency as of 2001. In addition, it introduced restrictive measures for the
importation of foreign currency, which was considered inappropriate by the IMF, since it was
expected to lead to divergent cash and non-cash exchange rates (IMF, 2002). In fact,
Azerbaijan did experience a high level of dollarization and a dramatic decline in CIM in 2001
(Feige, 2002).
In 2003 Azerbaijan joined the Extractive Industries Transparency Initiative (EITI) in London
by declaring its support for EITI and willingness to become a pilot country for the initiative’s
implementation. The EITI endeavors to improve governance in resource-rich countries
through the publication and verification of company payments and government revenues
from oil, gas, and mining. Azerbaijan became the first oil producing country in the world to
publish EITI reports that were audited by an independent firm in 2005. The Government of
Azerbaijan made substantial progress in economic development (Hasanov, 2011b) and the
economy experienced record growth in 2006. At the beginning of 2006 the government also

40
carried out a currency redenomination, introducing a new manat with a value equivalent to
5,000 of the former manat.
In 2008 the Central Bank of Azerbaijan pegged the value of the manat to the dollar, although
later, as a consequence of the depreciation of the dollar against the euro, it switched to the
euro-dollar basket. Following the peak of a financial crisis in October 2008 the Central Bank
of Azerbaijan effectively dropped the euro from the basket and again pegged its currency to
the dollar (BSTDB, 2011). The 2008 crisis indirectly affected the nation’s economy. After
government intervention by the Central Bank of Azerbaijan and the State Oil Fund reserves,
the financial situation of Azerbaijan became stable.CIM remained fairly constant from 2006
to 2009, followed by a slight decline in 2010.
3.3.2 Kazakhstan
Soon after its independence, economic reforms were implemented to develop a market
economy. Many reforms, such as privatization and other state reforms in the financial sector
were carried out at this time. The dramatic rise in CIM testifies to the efficiency of the
reforms that took place after 1995 (Figure3.5). The new currency of Kazakhstan that replaced
the Soviet ruble, the tenge, was introduced in 1993 by the National Bank of the Republic of
Kazakhstan (NBK). The monetary policy of the NBK is one of the factors that led to the
successful development of the Kazakh economy. Inflation reached 2265% in 1993, while
production output declined by nearly 50% from 1991 to 1995 (Akishev, 2008). CIM
remained stable from 1993 to 1996 (Figure 3.5). The NBK became independent in 1995 and
began to carry out policies independently from the central government. As a result of tight
monetary policy the NBK was able to combat inflation, which decreased from 2165% to 60%
1993–1995 (Akishev, 2008).
The NBK has pursued strict monetary and fiscal policies. Financial crises in Southeastern
Asia and Russia accelerated the depreciation of the tenge and triggered severe exchange rate
fluctuations in the foreign exchange market. The NBK has since changed the currency
regime, shifting to a free-floating foreign currency exchange rate in 1999. In addition, the
transition to a floating exchange rate regime was held in accordance with a financial
liberalization program launched at the same time (Oskenbayev, 2002). There was a
substantial increase in CIM between 1996 and 2001, followed by a slight decline in 2002 and
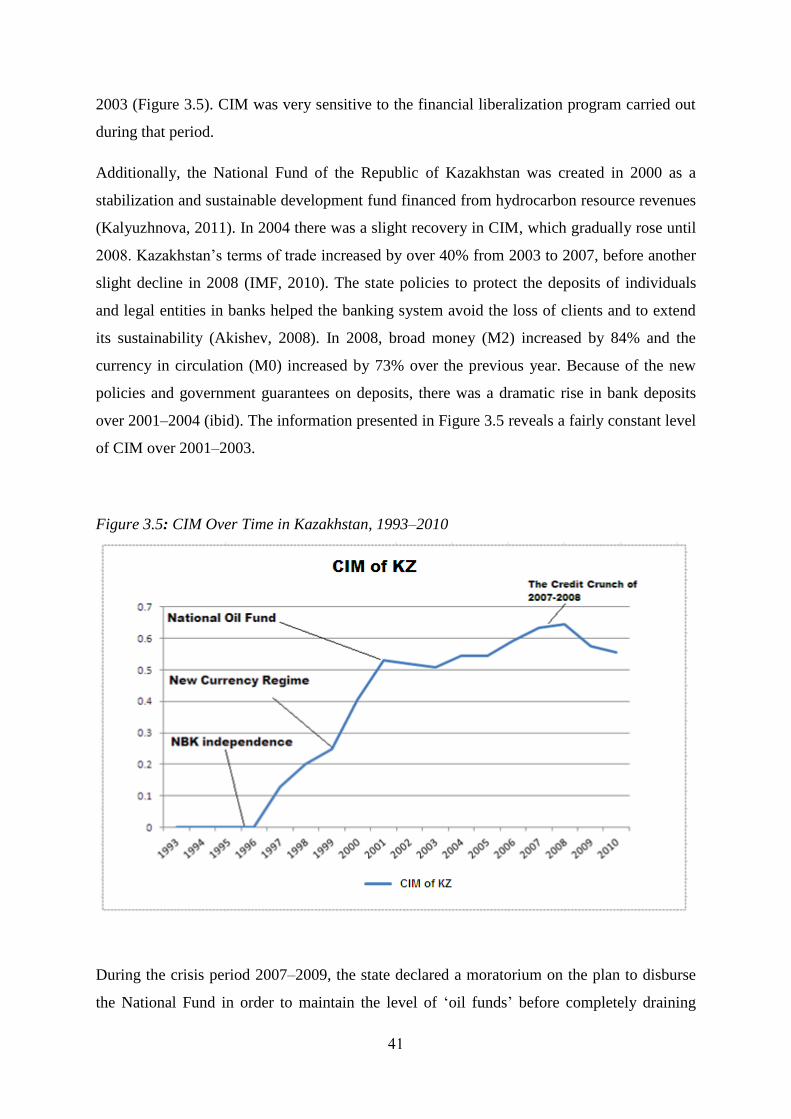
41
2003 (Figure 3.5). CIM was very sensitive to the financial liberalization program carried out
during that period.
Additionally, the National Fund of the Republic of Kazakhstan was created in 2000 as a
stabilization and sustainable development fund financed from hydrocarbon resource revenues
(Kalyuzhnova, 2011). In 2004 there was a slight recovery in CIM, which gradually rose until
2008. Kazakhstan’s terms of trade increased by over 40% from 2003 to 2007, before another
slight decline in 2008 (IMF, 2010). The state policies to protect the deposits of individuals
and legal entities in banks helped the banking system avoid the loss of clients and to extend
its sustainability (Akishev, 2008). In 2008, broad money (M2) increased by 84% and the
currency in circulation (M0) increased by 73% over the previous year. Because of the new
policies and government guarantees on deposits, there was a dramatic rise in bank deposits
over 2001–2004 (ibid). The information presented in Figure 3.5 reveals a fairly constant level
of CIM over 2001–2003.
Figure 3.5: CIM Over Time in Kazakhstan, 1993–2010
During the crisis period 2007–2009, the state declared a moratorium on the plan to disburse
the National Fund in order to maintain the level of ‘oil funds’ before completely draining

42
them. Thus, the government could not boost investment to the level needed to provide a
sustainable development target through application of the oil fund. Kazakhstan was one of the
leading transition economies in capital formation, which accounted for 27% of the GDP
before the crisis (Kalyuzhnova, 2011). As Figure 3.5 shows, there was a moderate decline in
CIM during 2009 and 2010. In addition, National Fund resources were shifted from a firm
level to portfolio assets and in the short term were directed to foreign assets rather than being
domestically oriented (ibid). As a result, Kazakhstan exhibited poor economic performance,
in particular in 2009 when there was negative growth.
3.3.3 Russian Federation
After the dissolution of the Soviet Union the government launched reforms lifting price
controls on consumer and intermediate goods (Vincent and Steven, 1993). To encourage the
development of the private sector, fundamental changes were made to the tax system. Large-
scale reforms, specifically tax reforms, were implemented to maintain economic stability
(Stepanyan, 2003). However, late 1993 until 1994 is considered a lost year for these reforms.
The dissolution of the parliament in October 1993 by Yeltsin after the breakup of the Soviet
Union seriously halted reform. President Yeltsin blamed the parliament for its “wrong
decisions,” in reference to the latest reforms in the budgetary system, privatization, and many
other areas (The Economist, 1993).34
The new elections were followed by the approval of a
new constitution as a result of a referendum (Gould-Davies and Woods, 1999). In
consequence of the delay in reforms and ignorance of monetary and budgetary policies, the
monthly rate of inflation skyrocketed from 4% to 15%, leading to a drop in the value of
domestic currency by 21% on ‘Black Tuesday’ in October 1994 (ibid). There was a sharp
decline in CIM from 1994 to 1995 (Figure 3.6).
The conflict between policymakers and oligarchs erupted in early 1997 (Gould-Davies and
Woods, 1999). In truth, this was a successful period for Russia in terms of economic
progress. However, the government established new strategies to encourage institutional
arrangements for sustainable long-term development in collaboration with IMF staff, because
the macroeconomic stabilization achieved at the time could not provide sustainable
development on its own. As the oligarchs in Russia became stronger, the state became
increasingly concerned about their avoidance of taxation following intense pressure on the
revenue side of the budget. To combat tax delinquency the newly appointed First Deputy
34
The Economist, 25 September 1993, p. 41.

43
Prime Minister of Russia Nemtsov, initiated a set of reform programs targeting oligarchs in
March 1997, which dealt with natural monopolists, the abolition of insider privatization, and
the punishment of tax evaders. In the end, political instability led to an extreme decline in
CIM in 1997 (Figure 3.6).
A new political scandal emerged during the financial crisis of 1998 and 1999 that affected
many countries, including Russia. The global recession of 1998, which started with the Asian
financial crisis in July 1997, exacerbated Russia's economic crisis. As a result of the crisis
and a huge budget deficit, the government implemented measures leading to an increase in
taxes in 1999, which increased tensions among the oligarchs as well. However, this decision
of parliament was sustained by a presidential decree, counteracting constitutional norms
(Gould-Davies and Woods, 1999). Although CIM did not decline as precipitously as it had in
1997, it fell during 2000 and 2001 from its 1999 level.
Figure 3.6: CIM Over Time in the Russian Federation, 1993–2010
There was not another significant change in CIM until 2006, even though the economic
growth of Russia in real terms reached almost 40% from 2001 to 2006 (Astrov, 2007). World
1994
Black Tuesday
1996
State DUMA and Presidential Election
1998
Currency Redenomination
Global Credit Crunch 2008
0,35
0,40
0,45
0,50
0,55
0,60
19
93
19
94
19
95
19
96
19
97
19
98
19
99
20
00
20
01
20
02
20
03
20
04
20
05
20
06
20
07
20
08
20
09
20
10
CIM of Russia
CIM of Russia
44
commodity price volatility, in particular for energy resource products, exposed fiscal
management to unexpected challenges. Thus, the government decided to establish an Oil
Stabilization Fund (OSF) in early 2004, which was essentially for economic stabilization,
accentuating the use of fiscal and monetary policies (e.g., a sterilization policy) in contrast to
other CIS countries (IMF, 2006).35
As a consequence, Russia achieved high budget surpluses
of in 2005 and 2006 of 7.5% and 8.6% respectively (Astrov, 2007). A strategic decision was
made to convert the OSF assets into foreign assets and corporate bonds in 2006 in order to
hedge against the risk of a decrease in oil prices and to diversify assets, grounded in the fact
that for some reason other countries would benefit from their domestic securities as a result
of oil price declines. This is consistent with Norway’s experience, which might have borne
fruit in the long term. CIM increased abruptly from 2006 onwards. The policies adopted at
the time also helped to achieve stable growth in spite of declining oil prices (Astrov, 2007:
172).
3.4 Linkages Between Resource Abundance and Economic Growth in CIS
Countries
I examined IPS (Im et al., 2003) and LLC (Levin et al., 2002) unit root tests, the results of
which are reported in Table 3.2. The null hypothesis was rejected for almost all variables,
with the sole exception of economic growth, G, which is non-stationary at levels with trend.
However, the null hypothesis was rejected for all variables on the basis of the LLC test
results. Most studies prefer LLC to IPS (Bowman, 1999; Breitung, 2000; Hlouskova and
Wagner, 2006) as a more powerful test, and the results indicated that the variables are
stationary.36
I used the Blundell-Bond system GMM (BBGMM) method to estimate the impact of the
main predictors of economic growth in CIS countries. The impacts of resource abundance,
institutional quality, and their interaction terms are demonstrated in Table 3.3. Coefficients of
the growth predictors in the BBGMM model had the expected signs and are consistent with
the findings of previous studies.37
The impacts of growth predictors over different time lags
35
For instance, Azerbaijan’s and Kazakhstan’s use of natural resources to target investment funds to foreign
assets. 36
See also Westerlund, 2010 and for a modified LLC panel unit root test see
http://www.nek.lu.se/NEKfng/westerlund.pdf 37
See Sachs and Warner (1999, 2001)
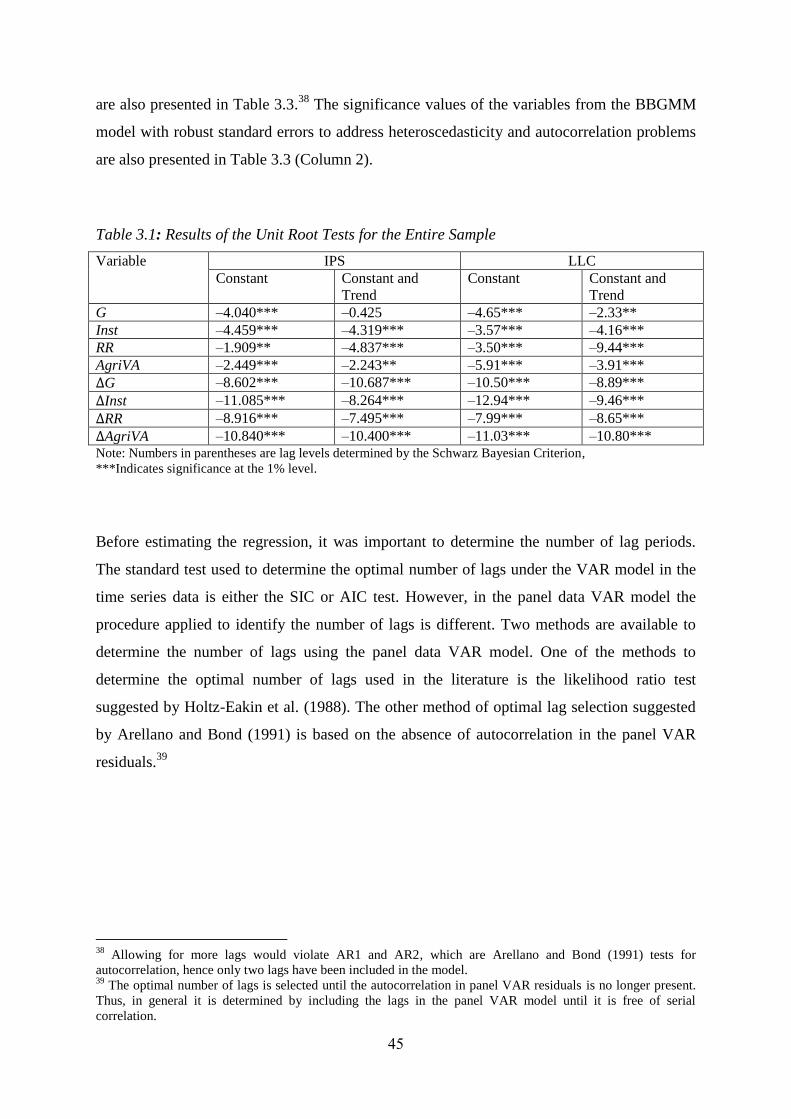
45
are also presented in Table 3.3.38
The significance values of the variables from the BBGMM
model with robust standard errors to address heteroscedasticity and autocorrelation problems
are also presented in Table 3.3 (Column 2).
Table 3.1: Results of the Unit Root Tests for the Entire Sample
Variable IPS LLC
Constant Constant and
Trend
Constant Constant and
Trend
G –4.040*** –0.425 –4.65*** –2.33**
Inst –4.459*** –4.319*** –3.57*** –4.16***
RR –1.909** –4.837*** –3.50*** –9.44***
AgriVA –2.449*** –2.243** –5.91*** –3.91***
∆G –8.602*** –10.687*** –10.50*** –8.89***
∆Inst –11.085*** –8.264*** –12.94*** –9.46***
∆RR –8.916*** –7.495*** –7.99*** –8.65***
∆AgriVA –10.840*** –10.400*** –11.03*** –10.80*** Note: Numbers in parentheses are lag levels determined by the Schwarz Bayesian Criterion,
***Indicates significance at the 1% level.
Before estimating the regression, it was important to determine the number of lag periods.
The standard test used to determine the optimal number of lags under the VAR model in the
time series data is either the SIC or AIC test. However, in the panel data VAR model the
procedure applied to identify the number of lags is different. Two methods are available to
determine the number of lags using the panel data VAR model. One of the methods to
determine the optimal number of lags used in the literature is the likelihood ratio test
suggested by Holtz-Eakin et al. (1988). The other method of optimal lag selection suggested
by Arellano and Bond (1991) is based on the absence of autocorrelation in the panel VAR
residuals.39
38
Allowing for more lags would violate AR1 and AR2, which are Arellano and Bond (1991) tests for
autocorrelation, hence only two lags have been included in the model. 39
The optimal number of lags is selected until the autocorrelation in panel VAR residuals is no longer present.
Thus, in general it is determined by including the lags in the panel VAR model until it is free of serial
correlation.

46
Table 3.2: Regression Results of Economic Growth on Resource Abundance and Institutions,
1993–2010
Variable Dependent Variable: Growth, G
(1) (2) (3) (4)
G(–1) 0.501***
(0.0826)
0.414***
(5.07)
0.411***
(0.0748)
0.112
(0.078)
RR
0.483***
(0.0960)
0.369
(0.041)
0.335***
(0.0739)
0.457**
(0.204)
RR(–1) –0.168*
(0.0929)
0.0715
(0.127)
–0.1789
(0.157)
RR(–2) –0.192**
(0.0902)
–0.187**
(0.0857)
Inst
–8.514 (6.083)
–8.657 (6.473)
–9.720 (7.618)
–11.607 (9.814)
Inst(–1) 9.922 (9.043) –0.628 (8.698) –13.131 (9.065)
Inst(–2) 10.964* (6.063) 12.66*** 4.448)
RR*Inst
–0.412* (0.212)
–0.214* (0.116)
–0.0741 (0.156)
–0.478 (0.322)
RR*Inst(–1) –0.213 (0.190) –0.257 (0.194) 0.285** (0.118)
RR*Inst(–2)
ToT
ToT(–1)
–0.070 (0.199) –0.0596 (0.157)
0.074** (0.034)
–0.121***(0.04)
Constant 1.486 (3.539) 2.135 (3.661) 2.206 (3.879) 19.260 (2.719)
Sargan test (p-
value)
96.07 (0.89) 119.10 (0.35) 118.16 (0.38) 79.35 (0.68)
AR1 (p-value) –2.2976 (0.022) –2.553 (0.01) –2.44 (0.01) –2.24 (0.03)
AR2 (p-value) 0.227 (0.82) –1.183 (0.24) –1.25 (0.21) –1.48 (0.14)
Observations 136 128 128 87
Number of id 8 8 8 8 Notes: Robust standard errors in parentheses. *** p<0.01, ** p<0.05, * p<0.1.
The regression coefficients were estimated using the Arellano and Bover (1995) and Blundell and Bond (1998)
system GMM approaches.40
AR1 and AR2 are Arellano and Bond (1991) tests for autocorrelation.
The p-value of the test statistics of serial correlation (for AR1 and AR2 processes) indicated
that there is no significant second-order autocorrelation in the BBGMM model, which is
crucial for establishing the validity of the instruments.41
The Sargan test (Arellano and Bond,
40
The estimation employed the xtdpdsys command in Stata. Standard instruments for the first differenced
equation include first differences of RR and Inst, an interaction term, and their lags. GMM-type instruments for
differenced and level equations are the lagged variable of Inst and lagged difference respectively. 41
The first differenced errors could be auto-correlated by construction when the regression errors are
independent and identically distributed. Thus, the GMM moment conditions may be invalid if autocorrelation
exists in the first differenced error greater than one.

47
1991) for over-identifying restrictions determines whether the residuals are correlated with
the instruments or not. The model or instruments may be misspecified in cases where the null
hypothesis is rejected. The p-value of the Sargan test statistic indicated that the null
hypothesis is valid—and subsequently the over-identifying restrictions were not rejected.
The direct effect of resource abundance on economic growth appeared to be positive in the
current year, while the direct negative impact of resource abundance was observed in past
values of resource abundance, either in RR(–1) or RR(–2), and in RR(–2) only if both lags
were included simultaneously (Column 3 in Table 3.3), implying that the direct impact
channel of the resource curse is not observed immediately. The significant positive impact of
past values of the institutional quality variable Inst(–2) can be interpreted similarly. This
implied that the positive effect of institutional quality on economic growth is long-term. High
quality institutions provide a certain degree of confidence regarding the enforceability of
contracts, an independent judiciary, and the rule of law. The higher the institutional quality,
the greater the incentive of a firms to save and increase capital, invest in business, and the
higher the economic growth rate. At the same time, the benefits of contract enforcement and
property rights are enjoyed in trade and specialization, and this process should be
implemented over the long term. This by no means implies that holding noncash assets leads
to better economic performance; the hypothesis is rather that the better institutions are, the
higher the quality of contract enforcement and property rights and the greater the subsequent
gains from trade and specialization. In addition, it should similarly stir up non-currency
holdings (Clague et al., 1999). Differences in institutional quality therefore, should imply
differences in productivity and economic performance. The estimated coefficient of lagged
institutional quality (12.66), Inst (–2), implies that a one standard deviation increase (0.14) in
this variable would lead to a 0.189% increase in income per capita growth rate after two years
in the eight CIS countries.42
The long-term coefficient of institutional quality impact was
21.49, implying that a one standard deviation increase in the logged institutional quality
variable, Inst(–2), would cause a 0.32% increase in economic growth rate over the long
term.43
42
Calculated as a product of the coefficient and standard deviation of the explanatory variable (stdev.Inst=0.14)
and then divided by the standard deviation of the dependent variable (st. dev. G = 9.48), so that the impact was
estimated as follows: 𝐶𝑜𝑒𝑓𝑓𝑖𝑐𝑖𝑒𝑛𝑡 ∗ (𝑠𝑡𝑑𝑒𝑣(𝐼𝑛𝑠𝑡)/𝑠𝑡𝑑𝑒𝑣(𝐺𝑟𝑜𝑤𝑡ℎ))= 12.66*(0.14/9.48). 43
The long-term coefficient was obtained by dividing the short-term coefficient (12.66) by one minus the lagged
variable of the dependent variable.

48
Although the lagged coefficients of the shares of resource rents of income and institutional
quality had the expected signs, the estimation results revealed the negative impact of the
interaction term of these variables (Columns 1 and 2 in Table 3.3). However, the sign was
reversed when the terms of trade variable was included (Column 4 in Table 3.3). The lagged
variable after one year showed a positive significant impact on economic growth, which is
consistent with economic theory and the findings of other empirical investigations. This
indicates that the resource abundance associated with better institutions and governance
improves economic performance. This implies that the ‘producer friendly’ institutions, in
contrast to ‘grabber friendly’ ones, boost income per capita growth. The significant lagged
interaction variable effect signifies that institutions are important in the long term in resource
abundant economies.
The next variable of interest is terms of trade (Column 4 in Table 3.3). The terms of trade
data for CIS countries are available for a shorter period (2000–2010). Terms of trade—the
variable that captures the Dutch Disease impact—indicates that the exchange rate had a
significant negative effect on income per capita growth after a lag time of one year. This
implies that it takes some time for the real exchange rate to deteriorate the competitiveness of
the economy. On the other hand, terms of trade had a significant positive effect on per capita
income growth at levels. This indicates that there is an immediate benefit from real exchange
appreciation due to price increases of exported goods and price decreases of imported goods.
In addition, with the inclusion of the terms of trade the resource abundance associated with
institutional quality was important for income per capita growth, implying that institutional
quality remains crucial for economic growth.
3.5 Linkages Between Institutional Quality and Resource Abundance in
CIS Countries
The relationships between resource abundance and institutional quality for eight CIS
countries from 1993 to 2010, including oil energy rich countries, are presented in Figure 3.7
(graphs a to h). Oil-rich countries, including: Azerbaijan, Kazakhstan, and Russia are shown
in Figure 1 (graphs f to h). The resource rent shares of income are presented on different
scales for different CIS countries to observe the links between institutions and resource
abundance.44
Armenia is among the CIS that depends least on natural resources. However,
44
The resource rents share of income as a percentage measure was used for Armenia, Belarus, Georgia and
Moldova as they have relatively small resource rents shares of their income. The log of the resource rents share

49
institutional quality is fairly sensitive to changes in resource concentration. It is clear that the
increase in the resource rents share of income is associated with a decline in institutional
quality from 2000 onward. This negative relationship between resource rents and institutions
was observed from 1993 to 2000, and from 1993 to 1995. The sharp increase in the resource
rents share of income is linked to low institutional quality. In the period from 1997 to 1999,
there was a decline in resource abundance accompanied by an increase in institutional
quality.
The downward sloping trend in resource rents is inversely associated with an upward slope in
institutional quality from 2000 onward in Belarus, and from 1999 onward in Moldova. From
1993 to 1997, the rapid rise in resource rents in Belarus was clearly related to declining
institutional quality. The sharp decline in resource abundance from 1997 to 1998 was
associated with rising institutional quality.
Georgia exhibited a sharp increase in resource abundance in 1999–2000, a decline in
institutional quality in the following year, and faced a huge decline in the resource rent share
of income immediately after institutional quality improved again. Although the resource rents
share of income is demonstrated in log form, its high volatility was clearly evident for the
Ukraine (graph e in Figure 3.7). The immediate increase of resource abundance from 1993 to
1997 was linked to the decline in institutional quality during that period. The same pattern of
relationships between the variables was observed for 1999–2000. From 2000 onward
resource rents declined, which coincides with the rising trend in institutional quality.
of income was taken for Ukraine and the resource rents share of income (as a percentage of GDP) of oil
resource rich countries (Azerbaijan, Kazakhstan, and Russia).
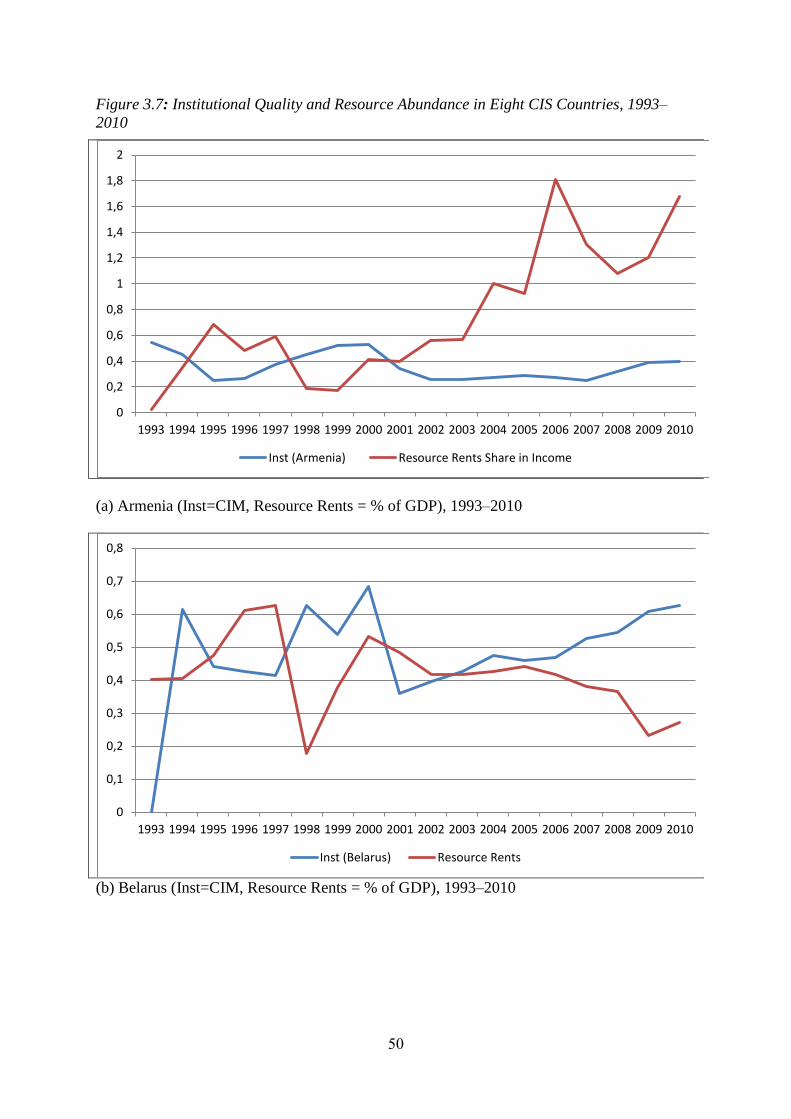
50
Figure 3.7: Institutional Quality and Resource Abundance in Eight CIS Countries, 1993–
2010
(a) Armenia (Inst=CIM, Resource Rents = % of GDP), 1993–2010
(b) Belarus (Inst=CIM, Resource Rents = % of GDP), 1993–2010
0
0,2
0,4
0,6
0,8
1
1,2
1,4
1,6
1,8
2
1993 1994 1995 1996 1997 1998 1999 2000 2001 2002 2003 2004 2005 2006 2007 2008 2009 2010
Inst (Armenia) Resource Rents Share in Income
0
0,1
0,2
0,3
0,4
0,5
0,6
0,7
0,8
1993 1994 1995 1996 1997 1998 1999 2000 2001 2002 2003 2004 2005 2006 2007 2008 2009 2010
Inst (Belarus) Resource Rents

51
(c) Georgia (Inst=CIM, Resource Rents = % of GDP), 1993–2010
(d) Moldova (Inst=CIM, Resource Rents = % of GDP), 1993–2010
0
0,2
0,4
0,6
0,8
1
1,2
1993 1994 1995 1996 1997 1998 1999 2000 2001 2002 2003 2004 2005 2006 2007 2008 2009 2010
Inst (Georgia) Resource Rents %GDP
0
0,1
0,2
0,3
0,4
0,5
0,6
0,7
1993 1994 1995 1996 1997 1998 1999 2000 2001 2002 2003 2004 2005 2006 2007 2008 2009 2010
Inst (Moldova) Resource Rents % GDP
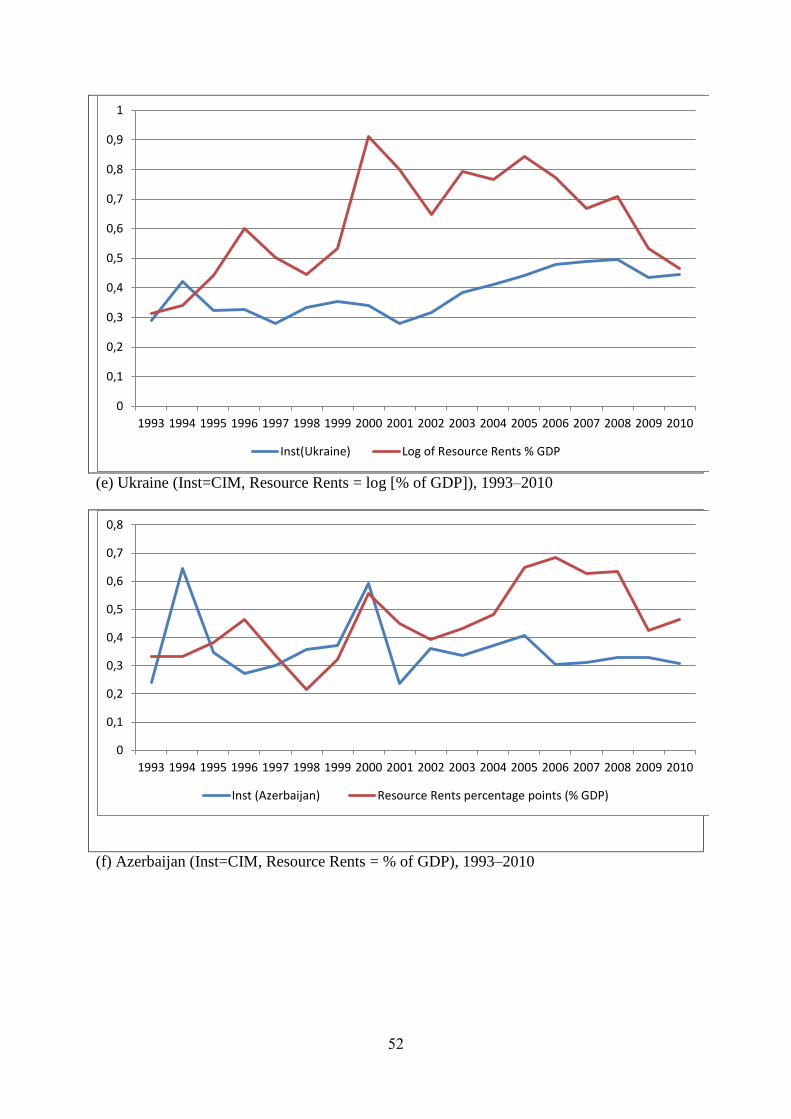
52
(e) Ukraine (Inst=CIM, Resource Rents = log [% of GDP]), 1993–2010
(f) Azerbaijan (Inst=CIM, Resource Rents = % of GDP), 1993–2010
0
0,1
0,2
0,3
0,4
0,5
0,6
0,7
0,8
0,9
1
1993 1994 1995 1996 1997 1998 1999 2000 2001 2002 2003 2004 2005 2006 2007 2008 2009 2010
Inst(Ukraine) Log of Resource Rents % GDP
0
0,1
0,2
0,3
0,4
0,5
0,6
0,7
0,8
1993 1994 1995 1996 1997 1998 1999 2000 2001 2002 2003 2004 2005 2006 2007 2008 2009 2010
Inst (Azerbaijan) Resource Rents percentage points (% GDP)
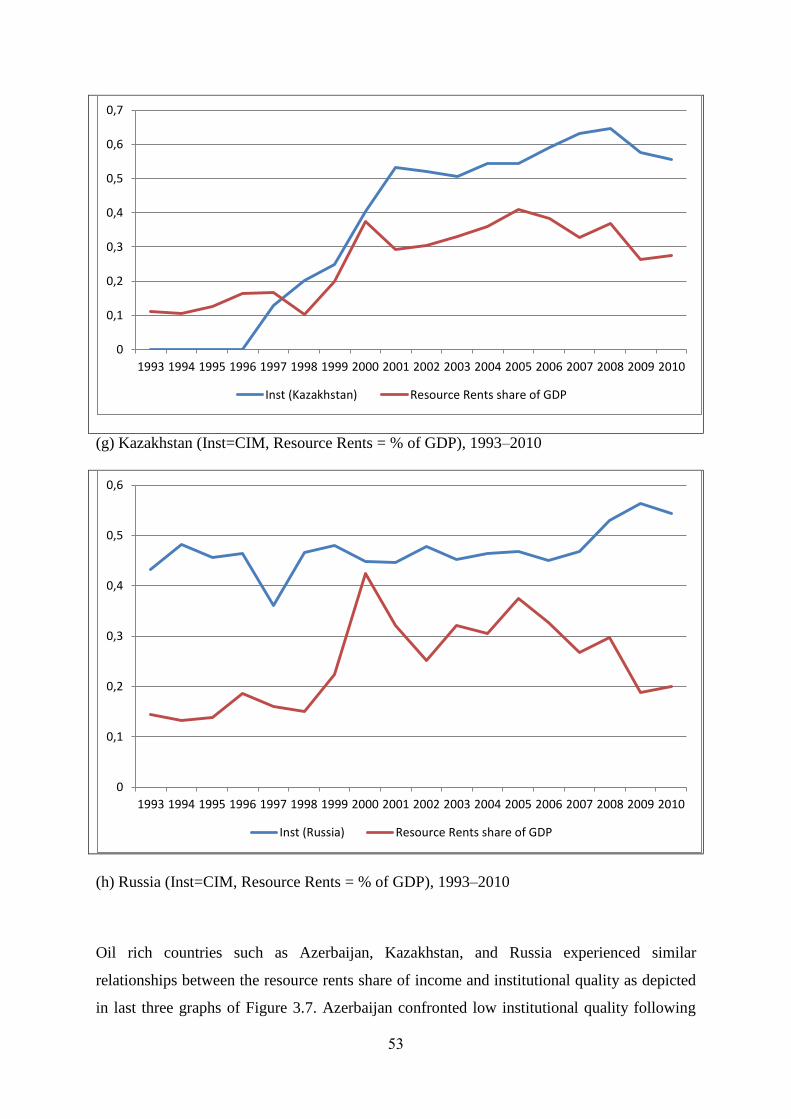
53
(g) Kazakhstan (Inst=CIM, Resource Rents = % of GDP), 1993–2010
(h) Russia (Inst=CIM, Resource Rents = % of GDP), 1993–2010
Oil rich countries such as Azerbaijan, Kazakhstan, and Russia experienced similar
relationships between the resource rents share of income and institutional quality as depicted
in last three graphs of Figure 3.7. Azerbaijan confronted low institutional quality following
0
0,1
0,2
0,3
0,4
0,5
0,6
0,7
1993 1994 1995 1996 1997 1998 1999 2000 2001 2002 2003 2004 2005 2006 2007 2008 2009 2010
Inst (Kazakhstan) Resource Rents share of GDP
0
0,1
0,2
0,3
0,4
0,5
0,6
1993 1994 1995 1996 1997 1998 1999 2000 2001 2002 2003 2004 2005 2006 2007 2008 2009 2010
Inst (Russia) Resource Rents share of GDP

54
sharp increases in resource rents in 1998 and 1999, and this rising trend continued from 2000
onwards. This inverse relationship was observed in preceding years as well. The resource
rents share of GDP increased from 33% to 47% over the period 1993–1996 and was
associated with a substantial decrease in institutional quality from 64 to 27, which represents
a 2.64 standard deviation from the mean. Institutional quality began to improve again as a
consequence of a decline in resource rents from 1996 to 1998.
The same pattern was observed in Kazakhstan and Russia, in particular from 2005 onwards in
Kazakhstan and from 2006 onwards in Russia, when declines in resource rents were
accompanied by improvements in institutional quality. Thus, the inverse link between the
resource rents share of and institutional quality was documented for eight CIS countries from
1993 to 2010, implying the potential existence of abundant energy resources (as a point
source resource), in particular oil extraction and exportation, and an adverse impact on
economic growth via institutions.
To reveal the link between institutional quality and resource abundance, I applied the
BBGMM dynamic panel data model using the panel data for the eight CIS countries from
1993 to 2010. The results of the regression model are presented in Table 3.4.45
The variables
used in the model are the institutional quality variable, Inst,46
and two explanatory variables
of institutional quality, such as the resource rents share of GDP and the agricultural value-
added share of GDP from 1993 to 2010. All data were retrieved from the World Bank World
Development indicators online database. Two types of natural resources, the resource rents
share of income representing point-source resources and the agricultural value-added share of
income representing diffuse resources,47
were included in the model to examine whether the
composition of resources is important for institutional quality in the CIS region. The results
of the Arellano and Bond (1991) tests for autocorrelation, AR1 and AR2, indicated an
optimal lag length in the panel VAR model of one.
There was a significant negative effect of the lagged variables of resource rents and
agricultural value-added shares of income, as well institutional quality, in both models,
including the agricultural value added from diffuse natural resources (Table 3.5). However,
45
The method applied to determine the optimal number of lags followed Arellano and Bond (1991), (i.e., the
same as was employed in the model in the previous section discussed above). 46
The proxy used for the institutional quality indicator, Contract-Intensive Money, was measured as follows:
CIM=(M2-M0)/M2, where M2 is broad money and M0 is currency in circulation. 47
Total natural resources rents are the sum of oil rents, natural gas rents, coal rents (hard and soft), mineral
rents, and forest rents.

55
the only difference in the second specification (Column 2 in Table 3.5) is that it included
squared terms and indicated that the lagged squared term of agricultural value-added share of
income had a positive impact on institutional quality. The model results indicated that the
composition of the resource is crucial for explaining the impact of natural resources on
institutional quality.48
Table 3.3: Institutional Quality (CIM) and Resource Abundance Among CIS Nations
Dependent Variable: Inst
VARIABLES (1) (2)
Inst(–1) 0.362*** (0.166) 0.330** (0.134)
RR(–1) –0.0024*** (0.0009) 0.00211 (0.00249)
RR_sq(–1) –6.88e–05** (2.84e–05)
AgriVA(–1) –0.0045** (0.0018) –0.0116*** (0.00304)
AgriVA_sq(–1) 0.000142*** (4.45e–05)
Constant 0.367*** (0.097) 0.416*** (0.0836)
Sargan test (p-value) 101.94
(0.80)
97.58
(0.88)
AR1 (p-value) –2.269
(0.023)
–1.97
(0.05)
AR2 (p-value) 1.183
(0.237)
1.39
(0.16)
Observations
Number of id
136
8
136
8 Notes: Robust standard errors in parentheses.*** p<0.01, ** p<0.05.
The regression coefficients were estimated using the Arellano and Bover (1995) and Blundell and Bond (1998)
system GMM approaches.
AR1 and AR2 are the Arellano and Bond (1991) tests for autocorrelation.
I obtained the short-term and long-term coefficients using the panel dynamic model outcomes
presented in Table 3.5. The lagged resource rents variable, RR(–1), the short-term coefficient
in specification (1) was –0.0024, implying that a one standard deviation increase in the
resource rents share of income (17.20) would lead to a reduction of institutional quality by
0.2949
after one year, which is relatively huge. The long-term coefficient (–0.0038) indicates
that a one standard deviation increase in the resource rents share of income would cause a
48
Following Auty (1997), Woolcock et al. (2001), and Isham et al. (2005). 49
Calculated as a product of the coefficient and standard deviation of the explanatory variable (stdev. RR=
17.20) and then divided by the standard deviation of the dependent variable (st. dev.Inst=0.14), so that the
impact was estimated as follows: 𝐶𝑜𝑒𝑓𝑓𝑖𝑐𝑖𝑒𝑛𝑡 ∗ (𝑠𝑡𝑑𝑒𝑣(𝐿𝑜𝑔𝑅𝑅)/𝑠𝑡𝑑𝑒𝑣(𝐼𝑛𝑠𝑡))= -0.0024*(17.20/0.14)=-0.29.

56
decline in institutional quality of 0.47. Thus, the impact of the long-term coefficient was
significantly greater than the short-term impact on institutional quality.
Table 3.4: Short-term and Long-term Coefficient Estimates from Table 3.4.50
Dependent Variable: Inst
VARIABLES (1) (2)
Short-term coefficients:
RR(–1) –0.0024 0.00211
RR_sq(–1) –0.0000688
AgriVA(–1) –0.0045 –0.0116
AgriVA_sq(–1) 0.000142
Long-term coefficients:
RR(–1) –0.0038 0.003
RR_sq(–1) –0.001
AgriVA(–1) –0.007 –0.017
AgriVA_sq(–1) 0.002
The lagged agricultural value added variable, AgriVA(–1) had a significant negative impact
on institutional quality, which in turn limits economic growth. This negative effect of
agricultural value added on institutional quality was almost double that of the resource rents
share of income in terms of magnitude. In reality, the agricultural sector was not typically
liberalized or reformed in CIS countries, particularly Central Asian countries. Land tenure
regulations prohibit private land ownership in Central Asian nations other than Kyrgyzstan
and Kazakhstan.51
In addition, agricultural sectors in the region are often highly subject to
government interventions, export bans, and restrictions.
Although land tenure laws in Kazakhstan permit private ownership of agricultural land, land
ownership transfer and property rights enforcement in the agricultural sector has been a slow
process in the country. The ‘On Land’ law states that land cultivated by agricultural
enterprises should be divided into “conditional land shares.” These shares are to be allocated
on a permanent tenure basis but are not land owned by the farmers that cultivate crops on
them (Dudwick et al., 2007). According to a presidential decree issued in 2003, farmers must
either operate their own business or invest their land shares in a larger agricultural enterprise,
or otherwise they will lose their conditional land share rights. As a result, small farmers
50
Short-term coefficients were obtained directly from the reported results in Table 3.4. The long-term
coefficient was obtained by dividing the short-term coefficients by one minus the lagged variable of the
dependent variable. 51
From the “Land Tenure and Property rights regional report volume 2.8 Central Asia,” USAID, July 2007.

57
possess a relatively small portion of arable land, while the share of arable land controlled by
large agricultural producers continues to grow. These land tenure and property right
constraints in Central Asia are serious barriers to agricultural investment and the expansion of
agricultural production (OECD, 2011).
In this respect, the agricultural sectors in CIS countries can be considered as point-source
resources rather than diffuse, which contradicts what has been suggested by Isham et al.
(2005). Thus, different economic development trajectories can be explained by the types of
natural resources concentrated within each country. In contrast to diffuse natural resources,
point-source natural resources are often more likely to negatively influence economic
development via institutional quality.52
3.6 Dutch Disease Explanation of the Natural Resource Curse
I examined whether the increased resource rents share of income affected the wheat yields of
CIS countries, since wheat is a major crop in many of them. I used wheat yield as the
dependent variable rather than agricultural value added for a couple of reasons. First, an
increase in agricultural added value might reflect commodities price changes rather than real
production growth. Second, agricultural value added and resource rents shares of income
move in opposite directions because both are estimated as GDP shares. In this respect, wheat
yield is a more direct and less ‘polluted’ measure of real agricultural sector growth.
To examine the linkages between resource abundance and agricultural sector growth, wheat
yield data—in hectograms/hectare (Hg/Ha)—were obtained from a FAO statistical database
(2013). I transformed the wheat production data into log form, and used the resource rents
share of GDP as a measure of resource abundance. To examine the impact of resource
abundance on economic growth via the Dutch Disease effect channel, I employed a dynamic
panel data model, the results of which are presented in Table 3.6. The regression results
support the resource curse hypothesis.53
The lagged variable of wheat production captured
partial effects of other determinants of real wheat production. The resource rents share of
income had a significant negative impact on the log value of wheat yields. In cases where the
agricultural sector is a crucial determinant of institutional quality, the impact of the Dutch
52
There are other channels through which agricultural production resources may be detrimental to economic
growth. For instance, Oskenbayev and Karimov (2013) documented that wheat price volatility associated with
appropriate institutional quality undermines economic growth. 53
The regression analysis covers the period from 1992 to 2010 because of wheat yield data availability.

58
Disease phenomenon explains the negative association of resource abundance with low
institutional quality, and thus with poor economic performance.
Table 3.5: Crowding-out Effect of Resource Rents on Agricultural Production and Wheat
Production Growth Contributions to GDP, 1992–2010
Log of Wheat Yield (Hg/Ha)
VARIABLES (1)
Log of Wheat Yield (–1) 0.208*** (0.065)
Resource Rents (% of GDP) –0.0058** (0.0024)
Constant 7.887*** (0.649)
Observations 144
Number of id 8
Sargan test (p-value) 117.52
(0.42)
AR1 (p-value) –2.29 (0.02)
0.20 (0.84) AR2 (p-value) Notes: Standard errors in parentheses.*** p<0.01, ** p<0.05, * p<0.1.
The regression coefficients in column one are estimated using Arellano and Bover (1995) and Blundell and
Bond (1998) system GMM approaches.
AR1 and AR2 are Arellano and Bond (1991) tests for autocorrelation.
As a further illustration of the importance of resource abundance in accounting for poor
economic performance among the eight CIS countries, the third column of Table 3.7 is a list
of the products of the coefficients estimated in the model specification described in Table 3.6
and the mean resource rents (median from 1991 to 2010), which was intended to capture any
crowding out effect of resource abundance. Two facts deserve close attention. One is that
countries producing energy resources, such as Azerbaijan, Kazakhstan and Russia, had the
highest crowding out effect from resource abundance. Second, the impacts of crowding out in
the oil rich countries mentioned above has increased substantially over the second decade,
from 2001 to 2010. For instance, the impact of crowding out more than doubled in
Kazakhstan and Russia, while it increased by 1.4 in Azerbaijan over the second decade.
Russia had the lowest average growth rate (6.13%) of the eight CIS countries covered in the
study over the period 2001–2010 (see Table 3.7). The results indicate that the wheat yield
was 17% lower due to a greater than twofold increase in natural resource rents share of

59
income, from 15.01% to 30.15%. Moreover, the same pattern was documented in the other
countries.
Table 3.6: Basic Information on Resource Rents and Economic Growth Among Eight CIS
Countries
Countries
Period from 1991 to 2000 Period from 2001 to 2010
Resource Rents:
average 1991 to
2000 (% of
GDP)
Real GDP per
capita growth
rates, average
1991 to 2000
(%)
Regression
estimates of
resource
rents effect1
Resource
Rents, (%
of GDP)
Real GDP
per capita
growth
rates,
average
2001 to
2010 (%)
Regression
estimates of
resource
rents effect,
average
2001 to
20101
(1) (2) (3) (4) (5) (6)
Armenia 0.27 5.48 –0.157 104 11.72 –0.603
Azerbaijan 33.19 –0.97 –19.25 47.36 9.51 –27.469
Belarus 2.77 0.95 –1.607 2.61 8.44 –1.514
Georgia 0.45 3.15 –0.261 0.88 6.15 –0.51
Kazakhstan 13.01 –2.71 –7.546 32.93 8.78 –19.099
Moldova 0.27 –4.13 –0.157 0.23 7.05 –0.133
Russia 15.01 –4.53 –8.706 30.15 6.13 –17.487
Ukraine 2.78 –8.90 –1.612 5.48 7.14 –3.178
Notes: The third column is a list of the products of resource abundance and the estimated regression coefficients
on the variables from specification presented in Table 3.6 (Column 3 =Column 1 *(–0.0058)*10054
for the first
decade, and Column 6 =Column 4*(–0.0058)*100 for the second decade), indicating the impacts of resource
abundance on agricultural resource production growth contribution by country. Afterwards, Columns 3 and 6
were multiplied by 100 to obtain percentage changes in wheat yields.
3.7 Conclusion
The literature on the resource curse has identified two channels for the impacts of abundant
natural resources on economic growth. Some evidence suggests that the impact of the
resource curse is determined by institutional quality, while other evidence suggests that the
natural resource curse effect undermines economic growth, crowding out sectors that would
otherwise have positive externalities on economic growth. However, most evidence is based
on results from analyses of cross-country surveys and thus need to be complemented with
time series or panel data to examine the impact of commodity booms on economic
performance. It is a potentially crucial point, because it is still undetermined whether the
observed negative impact of the resource curse occurs over the long term or is merely a short-
term phenomenon stemming from commodity booms and the uncertainties associated with it.
54
The coefficient was multiplied by 100 because the model is specified as a log-linear function. Thus, the
interpretation of the coefficient should be as follows: a one percent increase in the resource rents share of
income would lead to a -0.58% (�̂� ∗100 = (-0.0058)*100) change in wheat yield.
60
The lack of sufficient data on institutional quality has often constrained investigations that
would cover the impact on economic growth of the natural resource curse over the long term.
Finding the appropriate measure for institutional quality is a daunting task. The proxies used
in the literature that include the temporal dimension needed to conduct the appropriate
research are mostly unavailable. In this study I used a measure for institutional quality that
could be exploited to examine the resource curse, initially pioneered in an influential paper
by Clague et al. (1999). This measure has advantages over the others, not only in the
availability of the data, but also many other details discussed above.
The findings indicate that the type of resources is important in accounting for how the
resource curse occurs. That is to say, it is not all, but only some resources that are
problematic for economic growth. Thus, the greater the likelihood that the resource can be
controlled to capture the rents generated by producing it, the higher the possibility that this
will lead to rent-seeking and inefficiency. However, the abundance of natural resources and
their composition are nonlinear functions of institutional quality. It is believed that there is a
threshold point in the impact on institutional quality of different types or levels of abundance
of natural resources, implying that excessive or overabundant production of resources is
crucial for explaining the resources curse. Interestingly, agricultural resources typically have
positive externalities at higher levels of production, while at lower levels of production they
could have negative impacts on institutional quality.
In addition, the significant negative impact of the agricultural sector on institutional quality is
evident from the model results. Its impact on institutional quality was even greater than
resource rents share of income in terms of magnitude, explained by the fact that the
agricultural sector is more of a point-source resource rather than diffuse resource because it
can be controlled by large agricultural producers in CIS countries. Thus, when the
agricultural sector is represented largely by the state or certain groups it causes institutional
decay and consequently hinders economic growth. Another finding is that the impact of the
Dutch Disease phenomenon was observed through the channel of institutional quality. The
empirical results show that natural resource abundance had a significant negative impact on
the production growth in the agricultural sector. Therefore, the results suggest that the
production of abundant point-source natural resources—in the case of the CIS countries,
energy production—squeezes out agricultural sector production and potentially represents
another channel of the resource curse.

61
4 ORGANIZATION AND INSTITUTIONAL EFFICIENCY OF THE
WHEAT AND ENERGY SECTORS IN KAZAKHSTAN
4.1 Introduction: General Overview of the Wheat and Energy Sectors
The major objective of the analyses presented in this section was to differentiate between the
diverse effects of institutional arrangements among diffuse resource sectors, primarily wheat
production, versus point source resource sectors on agricultural sector development. One
hypothesis in economics is that the type or appropriateness of resources determines economic
performance, as discussed in previous sections. The mainstream view is that point source
resources, in contrast to diffuse resources such as wheat production, hinder economic growth
by deteriorating institutional quality (e.g., Isham et al., 2005).
The Central and Eastern European (CEE) and CIS countries followed divergent paths
regarding market reforms of their agriculture sectors, even though the countries started with a
common institutional heritage (Lerman et al. 2004). Indeed, the two groups of countries
diverged considerably with respect to land tenure, the transfer of land titles, privatization in
agriculture, and the restructuring of farms. Consequently, CEE countries are currently
outperforming their counterparts in terms of GDP, agricultural product growth, and the
productivity of agricultural labor (Lerman, 2000). In this regard, CIS countries can be
described as reluctant reformers, while CEE countries achieved more significant institutional
reforms in their agricultural sectors. This divergence in reform paths can largely be explained
by the cultural and social differences perpetuated during the Soviet period (Lerman et al.,
2004).
In addition, Lerman et al. (2004) suggest that the former socialist system economies inherited
a propensity for production maximization rather than profit maximization considerations.
Thus, the institutions established during Soviet rule have been persistent and continue to be
primarily focused on large-scale agricultural initiatives. Koester and Petrick (2010) found that
the emergence of large agricultural holding companies was due to the dominance of
patrimonial constitutions in society. As a result, the state inherited patrimonial characteristics
combined with power and resources, and subsequently the law was manipulated as a means
to lobby for the interests of those in power. Increasing lack of confidence in the state, legal
agencies, and institutions undermines the competitiveness of the environment. Consequently,
vertically integrated holding enterprises evolved, mirroring the debilities of the legal system.

62
The agricultural sector in Kazakhstan is a major component of the national economy,
employing 30% of the labor force despite the sector’s production accounting for only 10% of
the GDP. Kazakhstan is the world’s fifth largest wheat producer and tenth largest wheat
exporter. It is currently the third largest grain exporter among CIS countries after Russia and
Ukraine (Pomfret, 2013). Although dramatic decreases in grain and wheat production
occurred early in the post-Soviet period during the early 1990s, the wheat sector began to
recover in 1999 following the introduction of a price support system that prompted an
impressive increase in employment. By 2001 the number of workers employed in the
agricultural sector almost doubled from 1999 levels, reaching approximately two million
(IMF, 2003).
Figure 4.1: Wheat Production and Exports of Kazakhstan (thousands of metric tons)
Source: Based on data from the SARK database (2013)
The wheat sector is a major non-extractive production and export component of the
Kazakhstan economy, with production in recent years having returned to the record levels of
the 1980s. Indeed, for the first time since independence Kazakhstan documented exceptional
wheat harvests in 2009 and 2011 (Figure 4.1). Kazakhstan has a solid background and
significant experience producing, processing and exporting wheat, as well as the potential to
further develop this sector. In this regard Kazakhstan should confront challenges and mitigate
existing barriers in the wheat sector’s supply chain, with suggested approaches including
modern retail development, financial support for agribusiness, and building workforce skills
(OECD, 2011).
0
5000
10000
15000
20000
25000
19
87
19
88
19
89
19
90
19
91
19
92
19
93
19
94
19
95
19
96
19
97
19
98
19
99
20
00
20
01
20
02
20
03
20
04
20
05
20
06
20
07
20
08
20
09
20
10
20
11
20
12
Production Exports

63
Most wheat is produced in the northern region of Kazakhstan, with the North Kazakhstan,
Akmola and Kostanay provinces producing 75–80% of the national total. Wheat exports
largely depend on annual wheat production levels, as described in the summary presented in
Figure 4.1. However, considering that domestic demand for wheat is not increasing in parallel
with wheat production, it can also cause serious problems for the management of new stocks
of wheat. For instance, the difference between wheat production and exports in 2011 totaled
11.7 million metric tons, while domestic demand accounted for 2.5–3 million metric tons.
Wheat market has become volatile since 2006. Moreover, wheat production and export
volatility are associated with price volatility. For example, the decline of wheat production
and exports in 2008 was accompanied by high prices (Figure 4.2). The prolonged rise of
wheat prices peaked in 2008 and subsequent policies such as export restrictions and bans led
to a decline in wheat exports. Policymakers introduced export restriction measures in an
attempt to stabilize and isolate the domestic market from international food price volatility.
Access to financial resources by wheat producers is partly limited by the fact that financial
institutions do not accept real estate liens as collateral for loans (Gaisina, 2011). Furthermore
wheat production is highly variable, particularly in the provinces of Kostanay, Akmola, and
North Kazakhstan where climatic conditions can vary greatly between years. For example,
productivity in the early 1990s peaked at 12.2 quintals/ha, yet dropped to 5.0 quintals/ha by
1995 before subsequently rising again to 9.4 quintals/ha in 2000 and 9.7 quintals/ha in 2008
(ATF Bank, 2010). Owing to production variability, agribusiness and particularly the wheat
sector in Kazakhstan are considered high-risk investments by credit institutions, which have
failed to provide significant support for agricultural sector projects.
It has been suggested that the wheat sector could improve through integration with other
sectors of the economy (Meng et al., 2000). Other studies have concentrated on describing
the structure of demand, supply, and trade to highlight the competitiveness of specific sectors
of the economy (Ahmad and Braslavskaya, 2003). Brosig and Yahshilikov (2005) suggested
that openness to world market is a main factor that determines competitiveness, stemming
from the fact that transportation costs are very high for landlocked countries such as
Kazakhstan.
Many value chain analyses have been conducted to describe the roles of principal actors,
institutions, and intermediaries involved in the value added process. Initially suggested
theoretically and applied in development programs, the factors affecting value chain creation

64
have subsequently been made available for practitioners and scientists. Schmitz (2005)
introduced a new method of value chain analysis and demonstrated that the method can be
used by practitioners and policy makers. Value chain analysis methods have been employed
in many investigations of agricultural products (Fitter and Kaplinsky, 2001). Indeed, they
have recently been used to examine specific components of economies and widely employed
for case studies (Badiane et al., 2002; Larsen, 2003).
Figure 4.2: Wheat Exports and Domestic Prices in Kazakhstan (USD per metric ton)
Source: Based on data from the SARK data base (2013)
Kazakhstan’s crude oil production and exports were stable for nearly two decades until 2010
(Figure 4.3). Natural gas production and exports have also been stable, especially since 2003,
however, there was a huge gap between coal production and export volumes, reflecting that
the country is becoming more energy resource dependent, particularly with respect to oil and
natural gas. For instance, annually 73% of oil production, 70% of natural gas, and only 31%
of coal production were exported on average during the 1992–2010 period. Thus, energy
production relatively concentrated on oil and natural gas in contrast to coal exports. Oil
production accounted for 28% of the GDP, while the income shares of natural gas and coal
production were 0.29% and 2.58% respectively during the 2000–2010 period.
CIS countries are considered to have great growth potential in oil and gas production as
energy resource production in these countries is projected to increase at least twofold in the
0
50
100
150
200
250
300
350
2000 2001 2002 2003 2004 2005 2006 2007 2008 2009 2010 2011
Export Price Domestic Price
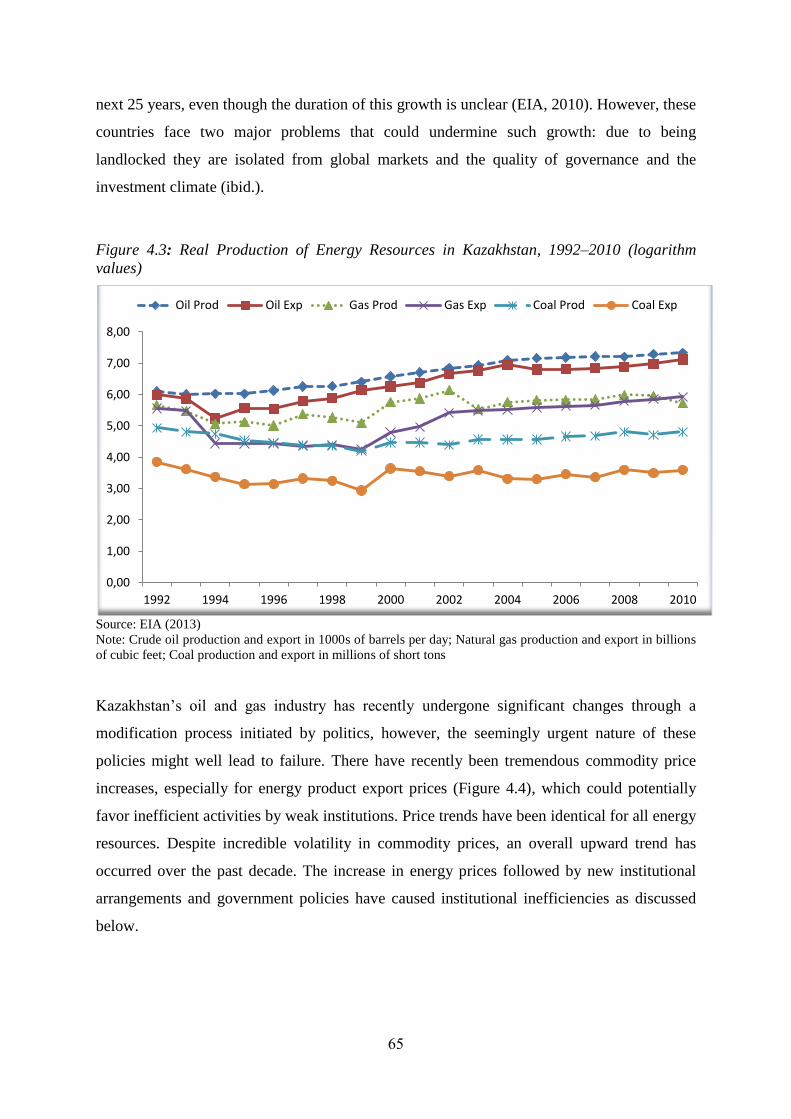
65
next 25 years, even though the duration of this growth is unclear (EIA, 2010). However, these
countries face two major problems that could undermine such growth: due to being
landlocked they are isolated from global markets and the quality of governance and the
investment climate (ibid.).
Figure 4.3: Real Production of Energy Resources in Kazakhstan, 1992–2010 (logarithm
values)
Source: EIA (2013)
Note: Crude oil production and export in 1000s of barrels per day; Natural gas production and export in billions
of cubic feet; Coal production and export in millions of short tons
Kazakhstan’s oil and gas industry has recently undergone significant changes through a
modification process initiated by politics, however, the seemingly urgent nature of these
policies might well lead to failure. There have recently been tremendous commodity price
increases, especially for energy product export prices (Figure 4.4), which could potentially
favor inefficient activities by weak institutions. Price trends have been identical for all energy
resources. Despite incredible volatility in commodity prices, an overall upward trend has
occurred over the past decade. The increase in energy prices followed by new institutional
arrangements and government policies have caused institutional inefficiencies as discussed
below.
0,00
1,00
2,00
3,00
4,00
5,00
6,00
7,00
8,00
1992 1994 1996 1998 2000 2002 2004 2006 2008 2010
Oil Prod Oil Exp Gas Prod Gas Exp Coal Prod Coal Exp

66
Figure 4.4: Energy Resource Export Prices in Kazakhstan (monthly averages)
Source: EIA (2013)
Notes: Crude Oil-CIS Urals MED. USD per bbl; Natural gas in USD per thousands of cubic meters; Coal in
USD per metric ton
4.2 Data Sources and Major Players of the Wheat Sector in Kazakhstan
This value chain study and empirical research effort was conducted throughout Kazakhstan.
Despite almost all regions of the country being involved in wheat production and post-harvest
processing, the major wheat producing areas are in northern Kazakhstan. An informal survey
was conducted to obtain preliminary information concerning institutions involved in the
value added process in the wheat supply chain, as well as their monetary values. Unstructured
interviews were conducted with representatives of three out of nine companies that produce
bakery and flour confectionary goods. Practitioners and scientists were interviewed to gain
insight on particular aspects of the sector. The principal research subjects included the Agro
Industry Institute Kazakhstan, various holding companies, wheat producers, scientists at the
Agrarian University of Almaty, and representatives of the Eurasian Trade Systems (ETS)
(i.e., a commodity exchange). The Statistical Agency of the Republic of Kazakhstan’s
(SARK) online database was used for the empirical analyses presented in the following
sections.
The wheat value chain in Kazakhstan includes producers, grain elevators, and mills. Holding
companies and the national holding company KazAgro are considered major actors, not only
0,00
50,00
100,00
150,00
200,00
250,00
300,00
350,00
400,00
450,00
500,00
1992 1994 1996 1998 2000 2002 2004 2006 2008 2010
Oil Price Gas Price Coal Price

67
in the wheat sector, but also in the broader agricultural sector of Kazakhstan (see Figure 4.5
and Figure 4.6). Most wheat is marketed to domestic holding companies and subsequently
exported. Grain is currently marketed through the following chain of main actors in the wheat
sector: producers, minor traders (small-scale intermediaries), wholesalers (private holding
companies), private or state mills and elevators (private holding companies or the
government food corporation), and exporters or domestic market outlets (domestic milling
companies, bread plants and bakeries). The fact that the value chain comprises numerous
intermediaries contributes to an increase of tradable and consumption goods from this sector
(Figure 4.5).
Figure 4.5: Wheat Sector Value Added Chain
Source: Based on interviews with representatives of the Agro Industry Institute Kazakhstan and ETS
The North Kazakhstan region’s share of grain exports accounts for 50%–55% of total grain
exports (Figure 4.6). There is an extensive network of grain elevators, mills, and storage
facilities in Kazakhstan with the capacity to handle up to 20,900,000 MT of grain. Of the
total amount of grain processed and stored, 8,900,000 MT (43%) are processed in elevators,
11,300,000 MT (54%) in mechanical grain warehouses, and the remaining 700,000 MT in
adapted non-mechanical warehouses and storage facilities. Statistics from 2007–2010 show
that small producers stored half of their grain with holding company warehouses, between
32.6% and 39.7% was held in granaries (granary enterprises) and the remaining 14.6% to
21.6% was sold directly by producers.
Additional grain processing in Kazakhstan is performed by 54 companies that concentrate on
the production of flour, cereals, and starch. These companies processed approximately
122,500,000,000 tenge ($816,666,667 USD) of grain products in 2008, including: 3,300,000
MT of whole wheat flour; 644,200 MT of bread; 132,000 MT of pasta, noodles, and other
products; 50,800 MT of buckwheat and graham flour; and 21,700 MT of bakery and
confectionery goods. Grain processing operations by these companies currently are at 35–
PRODUC
ERS
M
in
or
T
ra
d
er
s
(S
m
all
in
te
r
m
ed
ia
ri
es
)
Wholesal
ers
(Holding
companies)
E
le
v
at
or
s
(H
oldi
ng
Co
mpa
ni
es
)
E
x
p
o
rt
e
rs (H
oldi
ng
Co
m
pani
es
and
St
ate)
68
37% of capacity. Approximately 20,000,000 MT of grain were harvested in 2009, of which
the government only purchased 3,000,000 MT. Kazakhstan grain exporters have been
operating in a difficult environment due to the global financial crisis, increased grain exports
by principal competitors and neighbors (Russia and Ukraine), and other unfavorable
conditions. Traders practically ceased purchasing grain in 2009 due to dramatically low
prices and transportation shortages. The elevators and mills were already completely
overstocked and most small- and mid-scale enterprises that normally purchase and market
limited amounts of grain (50–100 MT) in neighboring regions of Russia suspended grain
trading due to market conditions and licensing terms.
As a result of local market conditions small producers are often compelled to sell grain at low
prices—from $53 to $67 USD per metric ton—for third-grade grain, which barely covered
production costs in 2009. This has led to significant increases in the debt burdens of
agricultural producers, which amount to an estimated total of $246,000,000 USD in Kostanay
alone. For instance, in 2009 small producer loans from second-tier banking institutions
accounted for $73,000,000 USD, and an additional $86,000,000 USD were borrowed from
KazAgro. Of the total agricultural producers’ debt, $53,000,000 USD were allocated to the
purchase of machines and tools and $38,000,000 USD to the purchase of fuel, herbicides and
spare parts. Due to the high costs of drying and storing grain in elevators, wheat milling
costs, lease and loan payments to banks and financial organizations (including penalty fees
and fines), most small producers have barely been capable of covering operating costs,
remaining on the verge of bankruptcy.

69
Figure 4.6: Wheat Production Value Chain in Kazakhstan, 2010
15% 59% 35%
>2,000,000 MT
38% 64%
Source: Based on interviews with representatives of the Agro Industry Institute of Kazakhstan
4.2.1 Vertically Integrated Holding Companies
The agricultural sector contribution to GDP in Kazakhstan has dramatically contracted since
the 1990s, having nearly collapsed during the first decade of independence due to the state’s
Agricultural Producers: 14,089,000 MT of
wheat produced
Households: 1,017,000 MT of
wheat (8%)
Small Producers: 4,143,000
MT of wheat (29%)
Agricultural Enterprises:
8,929,000 MT of wheat (63%)
Wheat Processing
and Flour Sales:
3,437,000 MT
Grain Storage and
Sale: 5,380,000 MT
Grain Reserves:
(187,000 MT), seed—78,000 MT, livestock
feed—109,000 MT
Groats, graham
flour, pellets, and
other grain products:
42,000 MT
Free Market
(Drying, Storage,
and
Standardization)
Holding Companies: 691,000
MT of wheat purchased from
the Food Corporation
State orders of wheat by national
holding company KazAgro
Further Drying, Storage,
Standardization, and Sale
Food Corporation purchased
5,200,000 MT of wheat in 2009
and 2,866,000 MT in 2010
Domestic
Market
Sales—1,700,000 MT
of wheat
State Wheat Reserves:
435,000 MT
(totalreserves accounted for
less than
6,000,000 MT)
Wheat Exports—6,000,000
MT
Wheat Exports—8,300,000in 2009 and
8,800,000 MT in 2010 respectively.
3,116,000 MT
of wheat
exported as
flour
5,084,000 MT of
wheat exported
as raw grain

70
concentration on the oil sector and neglect of the agricultural sector. The agricultural sector
share of income declined by 58% over 1992–1998 (World Bank, 2007) and has only begun to
revive since 1999, growing on average by 7% annually due to better economic conditions and
farm restructuring (World Bank, 2004; 2006). However, the decline of the agricultural sector
has not been completely reversed. With the enormous growth of the energy sector, the
agriculture sector’s share in GDP declined from 34% in 1990 to 5% in 2011 (OECD, 2013).
The Ministry of Agriculture launched its Agriculture and Food Program in 2002 in an effort
to diversify the economy. The program was motivated by the recovery of the agricultural
sector with the reforms and structural changes having led to an increase in the number of
farmers, while the driving force was the oil boom in Kazakhstan (Pomfret, 2013). According
to statistical database of Kazakhstan (SARK) there were 9,227 agricultural enterprises in
2010 that accounted for 61% of the nation’s arable land and 19.2% percent of national output,
192,611 family farms that accounted for 38% of the arable land and 24% of output, and
2,071,129 household plots that accounted for 1% percent of arable land and yet 56.8% of
output. The reforms almost doubled the number of farms from 104,621 in 2001 to 213,179 in
2011, of which 12,992 were agricultural enterprises and 200,187 were family farms.
Agricultural enterprises dominate the sector in the northern provinces of Kazakhstan,
particularly in wheat production.
Most agricultural enterprises were operated by state farm managers during the Soviet era,
especially in the wheat producing provinces. Agricultural enterprises account for 35% of the
total wheat output of the provinces of Akmola, Kostanay and North Kazakhstan, while family
farms produce only 12% (see graphs (a) and (b) in Figure 4.7). In contrast, family farms
dominate the producer composition of overall output for all of Kazakhstan. Furthermore,
there is considerable variability among the provinces that concentrate on wheat production
(Akmola, Kostanay and North Kazakhstan) where agricultural enterprises account for 73% of
arable land, versus southern provinces (Almaty, Zhambyl, Kyzylorda and South Kazakhstan),
where agricultural enterprises account for only 34% of the arable land (see graphs (c) and (d)
in Figure 4.7).

71
Figure 4.7: Agricultural Production by Farm Type in 2010 (%)
(a) The northern region includes three main
wheat producing provinces: Akmola,
Kostanai, and North Kazakhstan
(b) All regions of Kazakhstan
Arable Land Use by FarmType in Kazakhstan, 2010
(c) The northern region includes three main
wheat producing provinces: Akmola,
Kostanai, and North Kazakhstan
(d) The southern region includes four provinces:
Almaty, Zhambyl, South Kazakhstan, and
Kyzylorda
Source: Based on SARK data (2013)
Table 4.1: Mean Wheat Production Area by Farm Type, 2007–2011(hectares)
2007 2008 2009 2010 2011
Agricultural Enterprises 1160 1228.81 1306.11 962.17 710.72
Family Farms 21.72 21.30 23.97 22.10 22.24
Household Plots 0.0061 0.00185 0.00174 0.0018 0.00063
Source: Based on SARK data (2013)
Agricultural
Enterprises 35%
Family
Farms 12%
Household
plots 53%
Agricultural
Enterprises 19%
Family
Farms 24%
Household
plots 57%
Agricultural
Enterprises
73%
Family
Farms
26%
Household
plots 1%
Agricultural
Enterprises
34%
Family Farms
58%
Household
plots
8%

72
The mean size of wheat production areas for each producer category is shown in Table 4.1.
The wheat production area of agricultural enterprises is much greater than family farms and
household plots. Do the large-scale agricultural producers benefit from economies of scale
relative to mid- or small-scale farmers? Table 4.2 presents the average annual productivity of
each of the farm types from 2007 to 2011. Small- (household plots) and mid-scale farmers
(family arms) were as productive as large-scale farmers (agricultural enterprises). In 2010 the
wheat production shares of agricultural enterprises and family farms were relatively higher
than household plots, accounting for 35.4% and 45.1% respectively (Figure 4.2). Holding
companies play an important role in wheat production; the four largest agro-holding
companies control over 40% of the nation’s arable land and own 70% of the grain elevators,
while the top 20% of the largest companies control 80% of the arable land in North
Kazakhstan.
Table 4.2: Wheat Harvest Yields in Kazakhstan by Farm Type, 2007–2011 (quintals per
hectare)
2007 2008 2009 2010 2011
Kazakhstan (all producer categories) 13.0 9.7 11.9 7.3 16.6
Agricultural Enterprises(Selhozpredpriatya) 12.7 10.0 12.2 7.1 17.6
Family farms (Krestianskieilifermerskiehoziastva) 13.5 9.2 11.4 7.9 14.6
Households Plots (HoziastvaNaselenia) 16.0 5.6 13.9 11.6 20.0
Source: Based on SARK data (2013)
The large-scale or vertically integrated holding companies account for 15% of all companies
in wheat sector (Wandel, 2008), including: Agro-Sauda, Kazakexportastyk, Alibi, Batt, Dan,
Astyk, Bogvi, Karasu, and Zernovaya Industriya (Grain Industry). It is difficult to define the
exact number of agro-holding companies, however, for instance, Akimbekova (2006)
accounted for 40 holding companies in the wheat sector. Currently the large holding
companies operating in Kazakhstan, including foreign companies, are limited liability
partnerships such as: Agrocenter-Astana, Alibi, Ivolga-Holding, Wheat Pool Kazakhstan,
Kazexportastyk, Karasu, Tsesna-Astyk, KazGrainInspection, the Wheat Leasing Company,
Akzar-Trans, ALAN-AGRO, APK Kunaihlebprodukt, Agro-Star, AltynBiday 2000, SGS
Kazakhstan, Bayer CropScience A.G., the closed-type Stock Company BATT, the
International Kazakh Agroindustrial Stock Exchange, the Food Contract Corporation, Bisco,
JSC Dan, Sungrain S.A., GLENCORE International A.G., and Singenta Agro Services A.G.
73
The wheat supply chain is restrictive for small entities and individual traders from production
to export owing to the high costs of storage, transportation, and marketing. In order to
manage these financial challenges traders establish vertically integrated holdings to benefit
from economies of scale. The wheat sector in Kazakhstan is currently dominated by seven or
eight large-scale holding companies. Despite the lack of exact data the largest agro-holding
companies control approximately more than one million hectares of arable land, with the 10
largest agro-holding companies each possessing a minimum of 100,000 ha (OECD, 2013). In
addition, according to statistical data provided by the Agency of Statistics of the Republic of
Kazakhstan 62.8% of the grain produced in 2012 was from large-scale enterprises, 37% was
from family farms, and 0.2% was from household plots. Thus, approximately two-thirds of
the nation’s grain is produced by large-scale agricultural enterprises.55
One of these
companies, Zernovaya Industrya, exported more than one million metric tons of grain in
2008. While the company’s grain production capacity is limited to 100,000 ha, it also
maintains storage capacity for over one million metric tons of grain. The company also has
another trade advantage, it holds 70% of the stock of the Astrakhan Grain terminal, a
company that provides access to the international port of Astrakhan on the Caspian Sea, from
which it can export directly to the Middle East and Eastern Europe.
The second leading company is the APK-Invest Corporation, which owns an extensive
infrastructure network. Among Kazakhstani companies APK-Invest has the broadest
geographical influence in terms of grain exports and is the sole owner of the Azov port
elevator located on the Black Sea in Russia, which has storage capacity and facilities for up
to one million metric tons of grain. APK-Invest also holds 42% stock in the Ventspils Grain
terminal, a joint Kazakhstani-Latvian venture with a capacity of up to 2,500,000 MT of grain.
These facilities enable the corporation to export grain to Europe, Asia, and Africa. In contrast
with other wheat sector companies this corporation works exclusively in grain trading
operations and is not involved in production. Most of the corporation’s assets are held abroad
where it is mainly dedicated to grain logistics. The corporation marketed thirty eight billion
tenge (approximately $25,300,000 USD) of grain from Kazakhstan in 2007.
Another of the major large-scale holding companies in the wheat market is Ivolga-Holding,
which is also mostly involved with trading rather than production. This Kazakhstan-based
company is also a major actor in the wheat market of the Russian Federation and has the
55
This is true for all other years based on the statistics of the last decade. The data is available from the
Statistical Agency Database (Statistical Yearbook, 2012; page 299).
74
capacity to store one million metric tons of grain in Kazakhstan and an equal amount in
Russia, possessing 11 elevators in different regions of the Russian Federation alone.
Although the holding company is primarily a trader, it owns 500,000 ha of production area in
both Kazakhstan and Russia, exporting over one million metric tons of grain annually.
Compared to private infrastructure the state-owned facilities are relatively limited; there is
currently only one grain export terminal in the Caspian Sea controlled by the National
Management Holding Company (KazAgro). Thus, only some examples of large-scale
agriculture enterprises offer insights into the factors that enable them to benefit from
economies of scale.
4.2.2 Institutional Arrangements and the Dominance of Vertically
Integrated Agro-holding Companies
Financing and providing credit for wheat production is a major concern in Kazakhstan.
Wheat production costs in Kazakhstan are summarized in Table 4.3. Financing and
equipment leasing accounted for 20% of total production costs, representing the highest costs
of the Food Contract Corporation—National Holding Company in 2010. This fosters the
domination of the sector by large-scale producers (agro-holding companies) given their
relatively greater access to financial resources. The economic explanation of this fact is that
the credit worthiness of agro-holding companies is relatively better than that of smaller farms.
However, the institutional arrangements in favor of large producers have enabled their
prevalence in the wheat sector (Dudwick et al., 2007). The Land Code passed in 2003 allows
farms to use agricultural land as collateral. In contrast to smaller farms agro-holding
companies are also able to use other assets as collateral. Moreover, subleasing was outlawed
by the Land Code (article 170) implying that small-scale farmers could only obtain land by
purchasing it or integrating their production areas with large-scale farms. Article 170 of the
Land Code provided three options to those who lease or sublease land: 1) cultivation on land
leased from the government, 2) purchase of land, and 3) contributing a share of land to large-
scale enterprises. Producers that failed to select one of these options by the deadline of
January 1st 2005 were to have their land ownership rights revoked and their plots
appropriated by a special state fund. Many farmers were forced to merge their lands with

75
large agricultural enterprises due to a lack of the financial resources required to purchase and
obtain land ownership.56
This state policy was intended to prevent the breakup of and support large-scale farms.
Therefore, small farmers had to integrate with large-scale agro-holding companies to ensure
their access to financial resources and credit. Financial-industrial groups and agro-holding
companies are considered identical institutions, given that financial institutions, especially in
the grain sector, are formed as holdings in Kazakhstan (Frangulidi, 2006; Ibraev, 2006).
Table 4.3: Mean Annual Wheat Production Costs in Kazakhstan, 2010
Cost categories Tenge per quintal Percentage of total cost
Field Preparation, Seeds, and
Planting
218.45 16.10%
Labor 175.45 13.00%
Replacement Parts and Maintenance
Facilities
138.8 10.30%
Services 89.75 6.75%
Machinery and Equipment 134.05 9.85%
Fertilizers and Chemicals 69.95 5.10%
Energy 8.85 0.65%
Fuel and Lubricants 247.2 18.20%
Irrigation 2.25 0.15%
Financing and Equipment Lease
Financing
265.65 19.95%
The wheat production and processing costs of large- (mean size 20,000 ha) and small-scale
(mean size 6,000 ha) farms are presented in the graphs in Figure 4.8. One cost that is not
included in Table 4.3 is land rental cost, which is one of the major costs of wheat production
(Figure 4.8). Land rental costs per metric ton of wheat for both large- and small-scale farms
were relatively small in comparison to other costs. In contrast with small-scale farms, large-
scale farms have lower rental costs, giving them an advantage over small-scale farms.
56
The major motivation of new the arrangements in Land Code of 2003 was to improve the efficiency of land
use in Kazakhstan. According to the old regulations land holders were not in fact land owners and were not
subject to taxes in spite of whether they leased or subleased the land.

76
Figure 4.8 (a): Wheat Production Costs for Large-and Small-Scale Farms, 2010 (USD/MT)
(b): Wheat Production Costs of Large-and Small-Scale Farms, 2010 (USD/MT)
Operating costs were relatively higher for large-scale farms, primarily due to the depreciation
of machines and tractors utilized for wheat production. The depreciation costs of large-scale
farms were higher than those of small-scale farms due to their greater use of machines and
tractors. Direct costs were predominantly for the purchase of seeds, fertilizers, and chemicals.
Large-scale farms typically have access to better quality seed than small-scale farms, and
0
50
100
150
200
250
Small Scale Farm Large Sacle Farm
Operating Costs Direct Costs Land Rental Cost
0
50
100
150
200
250
Small Scale Farm Large Scale Farm
Depreciation Cash Expenses Alternative Costs

77
therefore utilize relatively less fertilizers and chemicals, reflected in their lower direct costs.
Holding companies are also able to purchase production inputs (chemicals, fertilizers and
fuels) at greater volumes and relatively lower prices before re-selling them to subsidiary
farms. In addition, parent companies are able to purchase grain at low prices; whereas small-
scale farms barely cover their costs with only minimum profits.
4.2.3 Commodity Stock Exchange
During the mid-1990s the commodity stock exchange operated comparatively well and
according to the ‘Commodity Exchange Law of the Republic of Kazakhstan (1995)’ grain
products were included into stock exchanges by the state. However, grain trading through the
stock exchange has practically ceased, with only 505,000 MT of grain sold in Kazakhstan’s
stock exchange markets in 2008. The decline of the stock exchange is due to large companies
and black market traders in the agricultural sectors that do not share an interest in developing
the stock exchange, which would improve the transparency of trade terms such as volumes,
prices, and quotations.
The commodity exchange renewed operations again in April 2009 with some amendments
and corrections to the existing laws applicable to grain.57
Accordingly, producers are required
to present documentation proving the availability of their wheat (ETS, 2005). Only elevators
and mills owned by traders provide these documents to small producers, who must pay for
grain storage and drying in the elevators and mills of the large trading companies, which
essentially operate as oligopolies. In addition, small producers must pay insurance at 10% of
the grain’s trading price, therefore small producers are barely able to make a profit due to the
high costs of planting and harvesting. Consequently, large-scale agro-holding companies
dominate among the 200 companies involved in grain production and the wheat market in
Kazakhstan.58
4.2.4 Farmers
The Food Corporation reported the purchase of 3,000,000 MT of wheat at a price of $165
USD/MT in 2009. The purchase was completed with significant delay, which had a negative
57
Law on Grain (2001); Annex to the State’s Decree No. 140 of September 14th
2010. 58
According to EBRD and FAO (EBRD-FAO, 2008) large-scale agro-holding companies account for
approximately 80% of the nation’s total grain output.

78
impact on prices. Producers operating with limited financial resources were obliged to sell
grain immediately after harvesting at prices that were lower than costs.
According to SARK data (2013) 5,000,000 MT of grain could not be marketed domestically
in 2009 as a result of over-supply, which amounted to approximately 20,000,000 MT of grain
in total, of which 5,000,000 MT is usually consumed annually in the domestic market. In
addition, 1,800,000 MT of grain were stored in elevators and mills. Producers had no option
other than to sell grain stocks at prices of $70–$80 USD/MT, suffering huge losses as the
quality of grain declines over time. The domestic grain market collapsed in the autumn of
2009 with the grain industry particularly unprofitable for small businesses and producers. As
a result of input price increases the costs of grain production are consistently rising, causing a
sharp decrease in producer profitability (Table 4.4).
The cost of grain production increased by a factor of 1.8 in 2009 relative to mean cost levels
from 2004–2008. The mean rate of cost increase during the 2007–2008 period was 13.8%,
leading to lower yields. Grain farming was comparatively profitable for producers during the
2007–2008 period, generating a mean gross profit margin of 38% due to global price
increases. The gross profit margin was estimated as the difference between revenue and costs
over revenue. Annual gross profit margins have been low (15–25%) for all other years since
independence (SARK, 2010).
Table 4.4: Wheat Production Profitability in Kazakhstan Over Time
№
Mean 2004–
2006
Mean
2007–2008
2009 Ratio of 2009 values to
Mean2004–
2006
Mean2007–
2008
1. Industrial Products and Services
(Inputs) Price Index (%)
120.3 164.4 – – –
2. Planting Costs (tenge per
hectare)
9,953 16,093 18,31
0
184.0 113.8
3. Harvest Yields (quintiles per
hectare)
9.9 11.6 12.6 127.2 108.6
4. Production Cost (tenge per ton) 10,083 14,215 14,25
8
141.4 100.0
5. Grain Sale Price (tenge per ton) 11,870 23,000 17,0
30
143.5 74.0
6. Gross Profit Margin(%)
15
38
16
Source: Based on SARK data (2013)
Despite better market conditions for Kazakhstan grain producers in 2010 due to reduced
production in Russia and dramatic price increases, the situation did not significantly improve
for many producers. The domestic wheat market remains very volatile and entirely dependent

79
on international markets, especially the performance of Russia and Ukraine, resulting in
considerable losses for producers and increased consumer prices for bread, bakery products,
and livestock feed.
Table 4.5: Comparison of Wheat Prices to Value Added Products in Kazakhstan’s Domestic
Market
Production
Types
2006 2007 2008
Tenge*/kg Ratio to
Wheat
Price
Tenge*/kg Ratio to
Wheat
Price
Tenge*/kg Ratio to
Wheat
Price
1. Production (Retail Prices)
Wheat 13.0 1.0 21.7 1.0 27.2 1.0
Durum
Wheat
(high protein
content)
14.6 1.12 19.7 0.91 31.5 1.18
Soft Wheat
(high starch
content)
12.9 1.0 21.9 1.01 27.0 0.99
2. Wheat Product Manufacturing Enterprises (Wholesale Prices)
Fine Flour 24.3 1.98 31.4 1.86 51.8 1.90
Graham
Flour
36.3 2.95 42.0 2.5 71.6 263
Wheat Bread 41.1 3.34 50.7 3.02 75.0 2.76
Rye Bread 62.6 5.09 72.6 4.32 91.7 3.37
Bakery 78.9 6.41 97.1 5.78 135.0 4.96
Sweet
Cookies
138.5 11.26 154.4 9.34 206.7 7.6
SpiceCake 103.3 8.40 121.4 7.22 158.5 5.87
3. Trade Organizations (Retail Prices)
Wheat Flour,
Average
55
4.47
91
5.42
107
3.93
Wheat Bread
Average
First Grade
Wheat
73
51
5.93
4.15
111
74
6.61
4.40
123
78
4.52
2.87
Rye Bread
and Rye-
Wheat Bread
80
6.50
110
6.55
120
4.45
Noodles 88 7.15 122 7.26 151 5.55
Macaroni 85 6.91 119 7.08 145 5.33
Cookies 169 13.70 212 12.62 253 9.30
SpiceCake 136 11.06 180 10.71 228 8.38
Source: Based on interviews with Agro Industry Institute representatives and informal survey data Note: * The national currency of Kazakhstan
Despite grain price decreases by nearly half in 2009, consumer prices (both wholesale and
retail) for bread and bakery products in most regions of Kazakhstan remained at record high
2007 price levels. In 2007 third-grade wheat sold at prices between 30,000 and 32,000 tenge
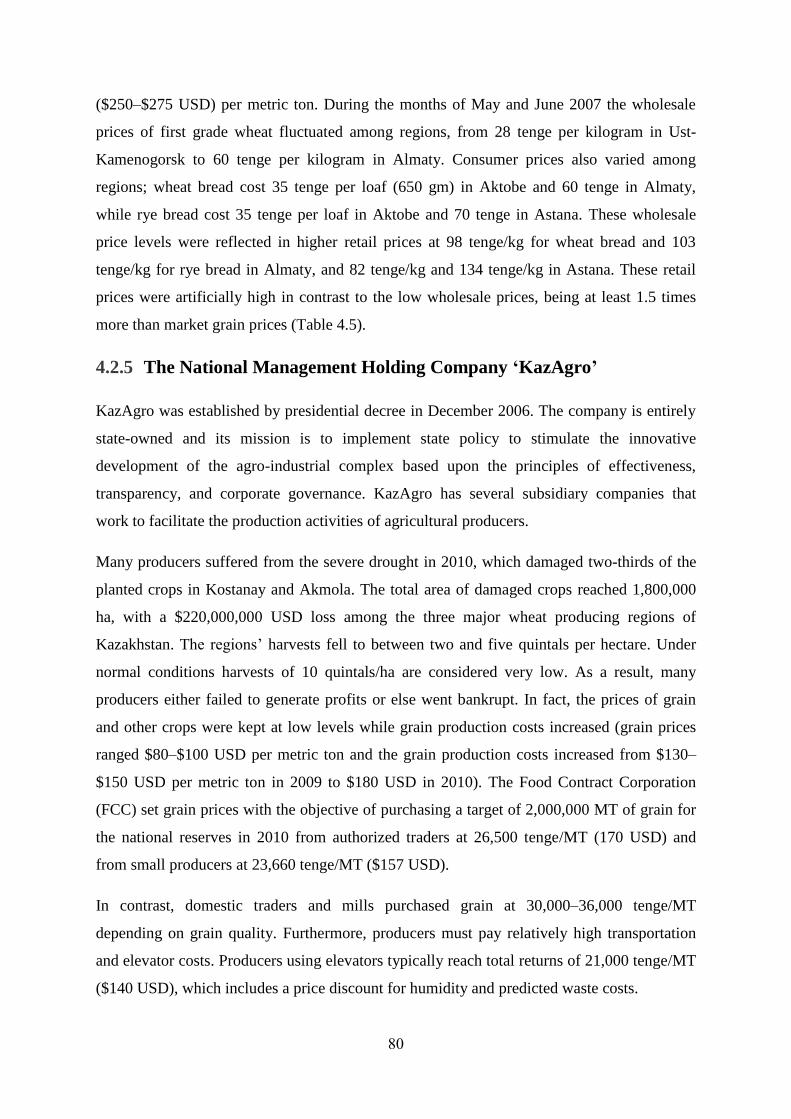
80
($250–$275 USD) per metric ton. During the months of May and June 2007 the wholesale
prices of first grade wheat fluctuated among regions, from 28 tenge per kilogram in Ust-
Kamenogorsk to 60 tenge per kilogram in Almaty. Consumer prices also varied among
regions; wheat bread cost 35 tenge per loaf (650 gm) in Aktobe and 60 tenge in Almaty,
while rye bread cost 35 tenge per loaf in Aktobe and 70 tenge in Astana. These wholesale
price levels were reflected in higher retail prices at 98 tenge/kg for wheat bread and 103
tenge/kg for rye bread in Almaty, and 82 tenge/kg and 134 tenge/kg in Astana. These retail
prices were artificially high in contrast to the low wholesale prices, being at least 1.5 times
more than market grain prices (Table 4.5).
4.2.5 The National Management Holding Company ‘KazAgro’
KazAgro was established by presidential decree in December 2006. The company is entirely
state-owned and its mission is to implement state policy to stimulate the innovative
development of the agro-industrial complex based upon the principles of effectiveness,
transparency, and corporate governance. KazAgro has several subsidiary companies that
work to facilitate the production activities of agricultural producers.
Many producers suffered from the severe drought in 2010, which damaged two-thirds of the
planted crops in Kostanay and Akmola. The total area of damaged crops reached 1,800,000
ha, with a $220,000,000 USD loss among the three major wheat producing regions of
Kazakhstan. The regions’ harvests fell to between two and five quintals per hectare. Under
normal conditions harvests of 10 quintals/ha are considered very low. As a result, many
producers either failed to generate profits or else went bankrupt. In fact, the prices of grain
and other crops were kept at low levels while grain production costs increased (grain prices
ranged $80–$100 USD per metric ton and the grain production costs increased from $130–
$150 USD per metric ton in 2009 to $180 USD in 2010). The Food Contract Corporation
(FCC) set grain prices with the objective of purchasing a target of 2,000,000 MT of grain for
the national reserves in 2010 from authorized traders at 26,500 tenge/MT (170 USD) and
from small producers at 23,660 tenge/MT ($157 USD).
In contrast, domestic traders and mills purchased grain at 30,000–36,000 tenge/MT
depending on grain quality. Furthermore, producers must pay relatively high transportation
and elevator costs. Producers using elevators typically reach total returns of 21,000 tenge/MT
($140 USD), which includes a price discount for humidity and predicted waste costs.

81
Although producers were well informed about the new Grain Law59
and its requirements,
many simply decided to ignore it based on the strong belief that it was not going to be
applied. The National Corporation had 5,300,000 MT of tradable grain stocks and a
maximum possible export level of 700,000 MT, thus 4,600,000 MT of grain were available as
a reserve. Furthermore, the National Corporation sold 1,000,000 MT of grain to the company
Alibi in 2010. According to the statistical agency of Kazakhstan the national grain reserves
rose from 6,100,000 MT at the beginning of August 2010 to 6,700,000 MT at the beginning
of September. The total amount of harvested grain was between 11,000,000–12,000,000 MT
in bunker weight, including bread grain, feed grain, seed stock, and carry-over grain stocks
exceeding 6,000,000 MT, with an estimated export potential of around 8,000,000 MT of
grain in 2010.
Despite calls from wheat producers for the government to help control domestic wheat
product prices, these prices are constantly increasing just as domestic gasoline prices are
rising every year. Wheat prices have risen in several regions of Kazakhstan, which in turn has
increased bread prices. The Ministry of Agriculture decided not to restrict grain exports in
2010, convincing the public and other trading partner countries that Kazakhstan had
sufficient grain to supply the domestic as well as export markets.
Producers that own more than 250 ha are obliged to sell some of their harvest to the National
Corporation according to the national law “on Grain.” They are also obliged to supply the
domestic market before marketing grain for export, with the specific amount of this
obligation depending on harvest quantity. For instance, due to low harvest levels in 2010
producers were required to sell 125–140 kg/ha of grain to FCC. The Parliament of
Kazakhstan defined the most socially important food products in March 2010, ranking wheat
and grain products as most important. According to these laws and regulations institutions
were required to set price ceilings in order to control the prices of food products.
In order to accomplish this task KazAgro, as representative of the national government,
should buy at least 4,000,000–5,000,000 MT of grain annually from producers rather than the
usual 1,000,000 MT. It is only possible to control prices if the government stores a significant
grain stock. Thus far, the government’s execution of interventions intended to reduce market
inefficiency remains only a promise. As a result, significant quantities of wheat harvested in
59
The Grain Law, introduced in 2001, was established to form “state reserves of grain.” According to this law
wheat producers with more than 250 ha of arable land are obliged to participate in the maintenance of grain
reserves.

82
2009 rotted in storage and under the best-case scenarios producers lost potential revenues due
to wheat being dramatically undervalued.
Currently, the government’s strategy seems impossible due to the fact that it does not possess
sufficient capacity to store the required amount of grain. During the Soviet era the country
operated 360 grain elevators, however, only 258 remain functional at present. Furthermore,
the government only owns five of the remaining 258 elevators. Aside from these elevators
there are granaries with the cumulative capacity to store 8,000,000 MT, however, currently
most of them are out of service and those that are operational have the capacity to store
1,000,000–2,000,000 MT at most.
4.3 State Procurement and Price Control Policies in the Wheat Sector
4.3.1 Government Support and Subsidies to the Wheat Sector of
Kazakhstan
The Kazakhstan national government implemented a differentiated subsidy system in 2010,
placing greater priority upon oil seed production rather than grains within the agricultural
sector. The policy implication is that the government is seeking to benefit from water
conservation (drought resistant) technologies. At the beginning of June 2010 the Ministry of
Agriculture planned to export an additional two to three million metric tons of grain. For this
purpose the ministry continued a strategy of subsidizing wheat transportation costs for grain
exporters. The ministry planned to allocate ten million tenge (approximately 66000 USD) to
subsidize grain transportation to Afganistan, Iran, China, and Central Asia (Table 4.6).
Furthermore, the ministry also intended to evaluate other grain export routes to the Middle
Eastern and East Asian countries. In 2010 the government’s subsidy program was to be
implemented by the company Tsentr Trasportnyh Uslug, via its subsidiary company
KazTemirTrans. Tsentr Trasportnyh Uslug representatives claim that the government did not
inform them of the subsidy program, which contradicts official statements and implies a
malfunction in the government.
In November 2009 the Kazakhstan national government decided to subsidize the
transportation costs of wheat exporters via the Russian Federation, providing the company
‘Center for Transportation Services, Kazakh Temir Zholdari (KTZ)’ with $5 billion USD to
cover transportation costs. The government offered $20 USD/MT for product transported via
the Russian Railways Company (RZD), which was expected to export of 1.7 million metric

83
tons of wheat. KTZ operates the Kazakhstan transportation campaign for wheat via the Azov,
Black, and Baltic Seas. In turn, the exporting company—KTZ—made contracts to further
export that grain to world markets with Russian transportation companies such as
Rusagrotrans, Technotrans, and LP Trans.
Table 4.6: Planned Agricultural Subsidies by the Kazakhstan National Government in 2010
Subsidy Type Tenge*
Interest payment coverage of financial leasing operations for the purchase of machines and
equipment
40
Wheat purchases for government reserves 11.25
Target current transfers to lower the costs of fuel, lubricants, and other production goods and
services in the cities of Astana and Almaty
16.59
Target current transfers to improve the quality and quantity of crop yields in the cities of
Astana and Almaty
50.04
Providing financing for all harvesting activities 80
Target current transfers to lower the costs of seed storage in different regions of the cities of
Kazakhstan, Astana, and Almaty
20.88
Transportation cost support $20 USD/MT
Other 72.93
Source: ATF Bank, Kazakhstan (2010)
Note: * in billions, the planned subsidies reached a total of 122,300,000,000 tenge, which was approximately
7.5% of the agricultural sector GDP
There were problems associated with the compensation of the campaign, with a majority of
wheat exporters claiming that the campaign actually created additional costs. Financial
support was only available to those companies that arranged for transportation through the
Center for Transportation Services. While other companies such as KazTransLimited charged
transportation costs via the Vladivostok port at a rate of $124 USD/MT the Center for
Transportation Services was charging $169 USD/MT for the same service (or $149 USD/MT
after the $20 USD/MT subsidy, see Table 4.7). Transportation costs from the port of Yeisk,
Russia to the port of Jedda, Saudi Arabia amounted to $141.3 USD/MT. Railroad
transportation costs for wheat within the territory of Kazakhstan are $25 USD/MT and $43
USD/MT within the territory of Russia (which together total $68 USD/MT). The final cost of
wheat price reached $265.3 USD/MT, including transportation and other costs such as
customs duties at the port of Djida. The overall cost of wheat placed in Saudi Arabia was
$266.7 USD/MT in 2010, however, traders could sell wheat at prices ranging between $270–
300 USD/MT and thus earn high profits from exporting wheat.
84
Table 4.7: Wheat Transportation and Export Costs from Kazakhstan in 2010
Wheat $ USD/MT
Third grade wheat value on train 124
Transportation Costs to the port of Eisk,Azov/Black Sea 68
Shipping Costs 17
Freight 55
Insurance (CIF) 1.3
Price of wheat at theport ofDjida, Saudi Arabia 265.3
Government compensation fortransportation costs 20 (since February 2010)
Total price of Kazakhstani wheat after compensation campaign 255.3
Final price of wheat at the port of Djida, Saudi Arabia (via Kazakh Railways) 245 (after compensation)
Source: Kazakh-Zerno (2010)
According to the FAO statistical database (2013), the producer price of wheat in China was
$279.5 USD/MT in 2010. Transportation from Kostanay (North Kazakhstan) to the town of
Dostyk near the Chinese border cost $46.32 USD/MT, and another $16.8 USD/MT from
Dostyk to the city of Alashankou in China. Finally, it cost an additional $67.4 USD/MT to
transport wheat from Alashankou to Tianjin or Lianyungang in China. Thus, wheat costs after
transportation and customs duties would amount to $254.52 USD/MT from Kazakhstan to the
interior of China. Export costs would be lower if state compensation was available.
4.3.2 Government Response to Food Price Volatility
European and Central Asian countries reacted in a variety of ways to the dramatic energy and
food price increases in 2007 and 2008. The majority of leading exporters (including
Argentina, India, Kazakhstan and Vietnam) launched export restriction policies by mid-2008
(World Bank, 2008). However, such policies had an adverse impact over the long-term
because they discouraged producers and exporters. Moreover, such restrictions can be
inefficient in the short-term if traders respond by increasing their margins and prices in
domestic markets. The predominant policy measures adopted during the 2007–2008 crisis
included: food export restrictions by producing countries, VAT rate reductions for food
imports, the implementation of government intervention mechanisms to control prices
(purchasing food and releasing food reserves), and the direct enforcement of price ceilings
and subsequent energy price adjustments. This set of policy measures was exercised again
over 2010–2011 (World Bank, 2011).
Price control efforts were unable to protect the poor from the combined negative effects of
food and oil price increases. In addition, VAT rate reductions dampen imported good prices
and increase budget deficits, whereas consumer prices usually remain unaffected. The

85
subsidization of energy resources as an input subsidy is driven by rent-seeking activities and
also leads to budget deficit increases. Export restrictions and price ceiling measures in the
agricultural and energy sectors of the economy also hinder integration with global markets.
Policy measures undertaken by the main CIS net exporters (Kazakhstan, Russia, and Ukraine)
in response to the food price increases in 2007–2008 are summarized in Table 4.8.
The responses to the food price volatility of Kazakhstan often matched those undertaken in
the Russian Federation, such as trade restrictions, consumer subsidies, and increased supply.
However, there was some divergence among these countries concerning trade liberalization
policy, social protection, and trade restriction. In contrast to Russia and Ukraine, Kazakhstan
did not consider a trade liberalization policy owing to its distinct trade patterns. Russian and
Ukrainian shares of wheat exports to CIS countries account for only 10% (2007) and 2%
(2009), while Kazakhstan exported 43% of its wheat and wheat flour to CIS countries in 2007
(FAO, 2011).
Table 4.8: Government Policy Responses to Food Price Volatility Among CIS Net Wheat
Exporters in 2007–2008
Country
Trade
restrictions
Trade
liberalization
Consumer
subsidies
Social
protections
Supply
increases
Kazakhstan + + + +
Russia + + + +
Ukraine + + + Source: IMF (2012), World Bank (2010), FAO (2010).
As a consequence of drought and fire in Russia and some regions of Kazakhstan, both
countries introduced export bans from 2010 until the end of the 2011 harvest. In addition, the
National Company of the Food Contract Corporation decided to export wheat by commercial
means to some partner countries (Homyak, 2010; USAID, 2010). Export restrictions had
adverse effects on producer income. The Single Commodity Transfer (SCT), a policy that
uses fiscal tools such as taxes or subsidies to dampen the negative impacts of export
restrictions on producers, resulted in negative income effects (–28% in 2007 and –24% in
2008), effectively imposing a tax on wheat producers as a result of fixing domestic prices for
wheat and wheat derived products significantly below the international prices (Figure 4.9). In
contrast to OECD countries, which subsidized their producers at rates ranging 34–55%,
86
Russia, Ukraine, and Kazakhstan imposed measures that increased taxes on their producers at
rates ranging 16–20% (FAO, 2011). The average annual inflation rate in Kazakhstan was
7.1% in 2010 and subsequently exceeded 8% in 2011 following food price increases,
gradually increasing as the country experienced severe weather conditions. In order to control
food prices, the government enacted laws imposing essential food item price ceilings (UN
ESCAP, 2011).
4.3.3 The Wheat Export Ban in Kazakhstan and its Consequences
The wheat export ban in Kazakhstan was imposed from April to September 2008 in response
to inflationary pressure stemming from skyrocketing global prices for wheat and other
agricultural products (Lillis, 2008). Several factors such as drought, increased bio-fuel
production, and increased food demand caused these price hikes. However, wheat importing
neighbors suffered from the export ban due to resulting price increases.
Moreover, wheat exporters were also adversely affected, as all existing contracts with foreign
partners were suspended. Such restrictions also harmed relations with international partners.
Exporters had to sell their wheat at the low government mandated prices rather than the
higher global market prices. Wheat traders earned respectable gains of $2.5 billion USD in
2008, which was 52% ($0.8 billion USD) higher than earnings in 2007 (Investkz, 2009).
Domestic farm-gate and global wheat price behavior from 2000 to 2010 is displayed in
Figure 4.9. The difference between global and domestic wheat prices declined dramatically
during the export ban, largely due to global price decreases. The export ban did not succeed
in reducing domestic wheat prices. Furthermore, the domestic wheat price gradually
increased as global wheat prices declined. The wheat price continued increasing and almost
reached global price levels by August 2009, when Kazakhstan recorded its highest harvest
yields since independence. The difference in prices peaked in March 2008 before
subsequently falling to its minimum level in September 2009.
The wheat export ban of 2007–2008 failed to bring domestic prices down in Kazakhstan.60
The dramatic domestic price increase can be explained by supplementary government
response policies. On top of the price-reducing policies, the government decided to increase
wheat reserves. The key intermediate actors in the value-added chain such as bakeries and
mills benefited from the measures to curb price volatility.
60
See Gotz et al. (2013), IAMO Policy Brief.

87
Figure 4.9: Domestic Farm-gate Wheat Prices in Kazakhstan Versus Global Wheat Prices
(USD/MT)
Source: Based on data from SARK (2013)
Kazakhstani officials clearly learned from the experiences of Ukraine during 1998–2000,
when it faced a deficit in domestic wheat supply while simultaneously enjoying good harvest
yields and being a net exporter, and consequently decided to take appropriate policy
measures. However, exporters pre-emptively sold wheat fearing that export bans and
licensing could take place, stimulating wheat price increases prior to the policies coming into
effect. Most wheat was exported, causing a deficit in the domestic market and eventually
pushing up the domestic price of wheat in 2008.
On one hand, the price increases provided opportunities for grain and wheat producers,
particularly for net wheat exporting countries and regions such as Kazakhstan. On the other
hand, the high prices imposed an additional burden on consumers. Since the export ban was
lifted wheat market conditions have been reversed. Globally wheat prices have decreased
sharply due to strong production. Wheat exports from Kazakhstan have shifted to the
southern countries of Central Asia and the Caspian Region. During the period from
September 2008 to February 2009, 96% of the wheat exported went to these countries, with
Afghanistan being the leading wheat importer (Investkz, 2009).
In August 2007 Kazakhstan introduced a new law regulating grain export licensing that
imposed a 10-day review period of all necessary documents before the authorities allow grain
0
50
100
150
200
250
300
350
400
450
500Ja
n.0
0
Jul.0
0
Jan
.01
Jul.0
1
Jan
.02
Jul.0
2
Jan
.03
Jul.0
3
Jan
.04
Jul.0
4
Jan
.05
Jul.0
5
Jan
.06
Jul.0
6
Jan
.07
Jul.0
7
Jan
.08
Jul.0
8
Jan
.09
Jul.0
9
Jan
.10
Jul.1
0
Wheat Price (USD per ton) World Wheat Price Difference

88
exports. However, grain export licensing was suspended in January 2012 due to pressure
from producers and exporters. The new law was introduced to control the prices of wheat and
other grains, which were increasing in 2007 despite good harvests and optimistic wheat
production forecasts (APK, 2007). The price increases and food security issues in Kazakhstan
prompted urgent measures.
The impact of the export licensing requirement has now been reversed. Grain storage
companies and refineries in Kazakhstan could barely process wheat and other crops because
the export licensing requirement generated overwhelming quantities of wheat and other
crops. Moreover, as a result of stricter rules regarding storage, drying, milling, and shipping
grain that accompanied the export licensing requirement, 70% of the grain buyers, small
businesses, and traders abandoned the market or merged with large-scale farms
(Agroacadem, 2012). The majority of the traders were exporting wheat to neighboring
regions of Russia in small amounts (50,000–100,000 MT).
This situation was worsened by the fact that most producers borrowed heavily to cover
harvest activities, while grain production generated huge losses because producers were
unable to export products. Interestingly, prices were relatively high when the export licensing
was introduced and for the period immediately thereafter (Zakonkz, 2009). In order to
improve food security in the face of the 2007–2008 global food price increases the price for
bread was administratively fixed at a moderate level. In the Kostanay region (oblast)—one of
three major wheat producing regions of Kazakhstan—a standard loaf of bread cost around 40
tenge, while its minimum production cost would have been closer to 47 tenge due to wheat
price increases that reached 72 tenge/kg (Lihogray, 2007).
Wheat prices continued rising as a result of global market price increases. The grain export
licensing policy ultimately fueled a spike in domestic wheat prices because exporters quickly
exported stocks to avoid the burdens associated with the licensing process. According to
officials, the main purpose of the export licensing requirement is to improve the transparency
of wheat exporting activities, which facilitates tax collection. However, it was clear in 2007
that exporters were selling almost all of their wheat abroad in anticipation of the new
requirements (identically to what had happened in response to similar measures in Russia
beforehand). Indeed, official statistics show that 1,000,000 MT of wheat were exported
before mid-September 2007, double the amount that had been exported over the same period
one year previously (Lihogray, 2007).

89
The grain stock stabilization fund was formed in 2007 in order to mitigate domestic wheat
price spikes. Although it played an important role in preventing bread prices from soaring, it
failed due to the absence of a transparent monitoring mechanism that guaranteed that wheat
price changes would not be fully passed on to flour prices. In addition, there are plenty of
consumer goods that use wheat as an input. Wheat accounts for 75–80% of the cost of pasta
production, 30% of bread, 60% of eggs, 20% of beef, and 60% of chicken production, so the
twofold increase of wheat prices was transmitted proportionally to many consumer goods.
4.4 Institutional Arrangements in the Energy Sector of Kazakhstan
4.4.1 Overview of the major actors in the energy sector
The major actors and participants in the energy sector value-added chain are described in
Figure 4.10. It is notable that the government has occupied an increasing role within this
chain. Regarding supporting institutions Kazakhstan has developed its banking sector, which
in turn has helped boost construction. In Kazakhstan the energy sector employs only 6% of
the labor force and oil production is concentrated within five oblasts (regions).
Approximately 68% of the country’s oil revenue is directed to the Oil Fund of Kazakhstan,
which is evidence of tight fiscal policy.
Kazakhstan has undergone substantial policy changes with regard to the restructuring of
institutions that regulate the energy sector, particularly the Ministry of Oil and Gas (MOG)
that was established for this purpose. The establishment of this ministry was the first sign
reform and served as an indicator of more rigid government policies rather than meaningful
reformation of the sector. First, the establishment of such an entity was not necessary from an
institutional point of view. Second, the enthusiastically created administrative unit has not
yielded any significant results, following the destiny of the ‘TaukenSamruk’ with high
ambitions yet insignificant results (Omarova, 2010). The Tauken-Samruk State Holding
Company is a complex for processing the mineral resources of Kazakhstan that has failed to
achieve the ambitious goals it was intended for (Abeni, 2010).
The Ministry of Energy and Mineral Resources was transformed into the MOG in March
2010 (Kazakhstanskaya Pravda, 2010). While the old ministry regulated the entire energy
sector, the new ministry is only responsible for the oil and gas sector, with other mineral
resources being regulated by the Ministry of Industry and New Technology (MINT). Some
experts claim that a separate ministry was in fact needed for the electricity and energy
90
industry given that it lacked a single administrative government agency (Sokolov, 2010).
Moreover, the oil and gas industry was already managed to some extent by the KazMunaiGaz
and the former Ministry of Energy and Mineral Resources.
The MOG (in cooperation with the MINT) established KazContract (KCA), an agency that
monitors local content regulations in Kazakhstan in 2010. KCA is responsible for local
content implementation and transparency, and in collaboration with both ministries it has
organized the Expert Council, an institution that seeks to guarantee the interests of domestic
suppliers and contractors. KCA was re-organized in 2011 as the National Agency for the
Development of Local Content (NADLoC) with expanded authority and functions. While the
KCA was only responsible for monitoring subsurface resource users, the new agency controls
all sectors within the economy, including government entities, national companies, and
holding companies that operate within the “Innovative Industrial Development Strategy of
Kazakhstan” program (Alibekova, 2010). However, this second step in the institutional
reform of the oil and gas industry has created significant challenges. For instance, the core
staff of the agency has relocated to the MINT, resulting in the significant loss of human
resources at NADLoC. As a new institution NADLoC had to hire additional staff while all
experienced personnel remained with the MINT.
The MOG adopted new institutional performance indicators in its 2010–2014 Strategic Plan.
Accordingly, the plan set the following objectives for the defined period: oil extraction of
85,000,000 MT (a 120.4% increase over 2008); crude gas production of 54,000,000,000 m3
(a 61.4% increase over 2008); oil exports of 75,000,000 MT (a 119.4% increase over 2008);
17,000,000 MT of oil refined in Kazakhstan (a 138% increase over 2008), with an additional
increase in the oil processing of 87% and achieving the necessary improvements to domestic
oil product quality to comply with Euro-3 and Euro-4 standards (Argynov, 2011).
Oil production generated $30,866.8 million USD in 2009 and the oil and gas sector’s share of
Kazakhstan’s GDP increased to 51%. Tax income from international trade and foreign
transactions increased by136.4% (100.6 bn tenge) due to changes in import tariffs stemming
from the introduction of Common External Tariffs and the re-evaluation of customs tariffs for
exported goods resulting from post-customs control of oil.

91
$18.3 billion
Exported $68 billion
$13.7 billion $4.6 billion
Goods and services supply of National Companies ($7.2 billion)
$15.3 bln.$1 bln.$4.9 bln
$3.9 bln. $10.4 billion
Figure 4.10: Value Added Framework of the Kazakhstan Economy
Note: Amounts in red are in USD
WORLD FINANCIAL MARKETS
EXTRACTIVE
RESOURCES
SECTOR
Accounts for 6% of
labor force
(including labor force
in oil sector working
on a contract basis—
500,000 employed
External Debt
International loans Second-tier
domestic bankloans
INDUSTRIAL SECTOR,
Accounts for 95% of labor force
(8.2 million employed)
Total
$12.1
billion
(22.5
billion
)
Taxes Budget
National Oil
Fund
92
Export tariffs have been re-introduced for oil and oil products at $99.71 USD/MT for light oil
products, $66.47 USD/MT for dark oil products, and $40 USD/MT for crude oil. There are plans
to boost budget revenues by 60 billion tenge (400 million USD) from new export tariffs in 2014,
and by up to 177 billion tenge (1180 million USD) in 2015. Dozens of oil producing companies
involved in Production Sharing Contracts are not subject to export taxes according to the Cabinet
of Ministers. Minister of Finance Bolat Zhamishev claimed that not all companies are subject to
an export duty, although TengizShevroil (one of the major companies operating in the
Karachaganak Field) is subject to this requirement (Sergeyeva, 2010). Statements concerning the
possibility of terminating contracts with 46 oil and gas companies followed and the MOG
subsequently terminated oil development contracts with Tolkynneftgaz and KazPolMunai ahead
of schedule. TengizShevroil paid 204 million tenge to settle environmental pollution claims
(186.1 m tenge plus an administrative penalty of 17.8 m tenge). Moreover, the inquiry committee
of the Agency for Fighting Economic Crimes and Corruption initiated criminal proceedings
against TengizShevroil executives. The head of the department for inquiry monitoring at the
Atyrau regional prosecutor’s office, Nurlan Kulbayev (Sokolov, 2010), reported that
TengizShevroil earned revenues of 212.3 million tenge from the Tengiz deposit from oil
extracted below the 5,100 m depth limit. This means that over the period from September 1,
2002 to June 1, 2010 TengizShevroil executives were complicit with illegal business activities in
breach of licensing terms that resulted in extremely high revenues for the company (Sokolov,
2010).
Taking into account that at least seven suits against TengizShevroil have been rejected over the
past decade the recent developments highlight the change in policy, although it is highly likely
that the government will reach a settlement with TengizShevroil and Karachganak. The
consortium developing the Karachaganak oil field has faced a similar series of lawsuits and
Timur Kulibayev (Omarova, 2010) claimed that Kazakhstan had achieved its goal of being
amongst the shareholders in the Karachaganak project (currently only 10% are under discussion).
Most likely, Italian Eni of BG will concede their shares owing to their plans to reduce
participation in the consortium. As has been evident in the past, tight control will probably
continue until additional shares are transferred to the Kazakhstan government.
93
In a similar respect, KazMunaiGaz has succeeded in increasing its share in the North Caspian
Project from 8.33% to 16.81% since 2009. This became possible when Agip KCO sold its shares
proportionally to each shareholder company. The operator of the consortium is the North
Caspian Operator Company (NCOC), which includes KMG Kashagan B.V., Exxon Mobil, and
Royal Dutch Shell, while Eni not only lost its single operator status, but also its membership in
the project (Paramonov and Strokov, 2011). The other oil field where BG Group PLC and Eni
SpA (ENI) operate, Karachaganak, is the only major project that is not under state control, with
its stake in the Karachaganak oil field increasing from 5% to 10% in 2011 (Antoncheva, 2011).
4.4.2 Laws Concerning Subsurface Resource Users
The development of legislation concerning subsurface resource use in Kazakhstan can be divided
into four phases. The first phase over the 1990–1996 period saw the development of legislation.
The 1996–1999 period was marked by enactment of the laws in question. During the 2005–2009
period new laws on the production of sharing contracts were introduced (Ward, 2007). Finally
over the period since 2009 or fourth phase the government has enacted new indirect forms of
taxation and local content regulations.
4.4.3 Local Content
A number of countries have imposed minimum local content requirements for energy producing
sectors. Oil and gas sectors are becoming particular targets of such regulations, including both
local content regulation and taxation policies (Hackenbruch and Pluess, 2011). A comparison of
policies from three countries is presented in Table 4.9. Brazil has enacted deregulation policies,
opening up its energy industry to foreign investment in 1990. Subsequently, foreign companies
have majority shares in projects such as Chevron’s operations in the Frade Field where minority
shares belong to the state-owned company Petrobras. Brazil has undertaken strict measures to
monitor foreign subsurface resource users. For instance, IBAMA (the environmental agency of
Brazil) fined Chevron 50 million reals ($28 million USD) and imposed further penalties for poor
contingency planning that resulted in an oil spill that occurred at the end of 2011 (Bertrand,
2011). Another government institution, the National Petroleum Agency of Brazil (ANP) which is
responsible for oil industry monitoring, has shut down one of Chevron’s wells and has
withdrawn the company’s drilling rights. There have been further fines and penalties aside from
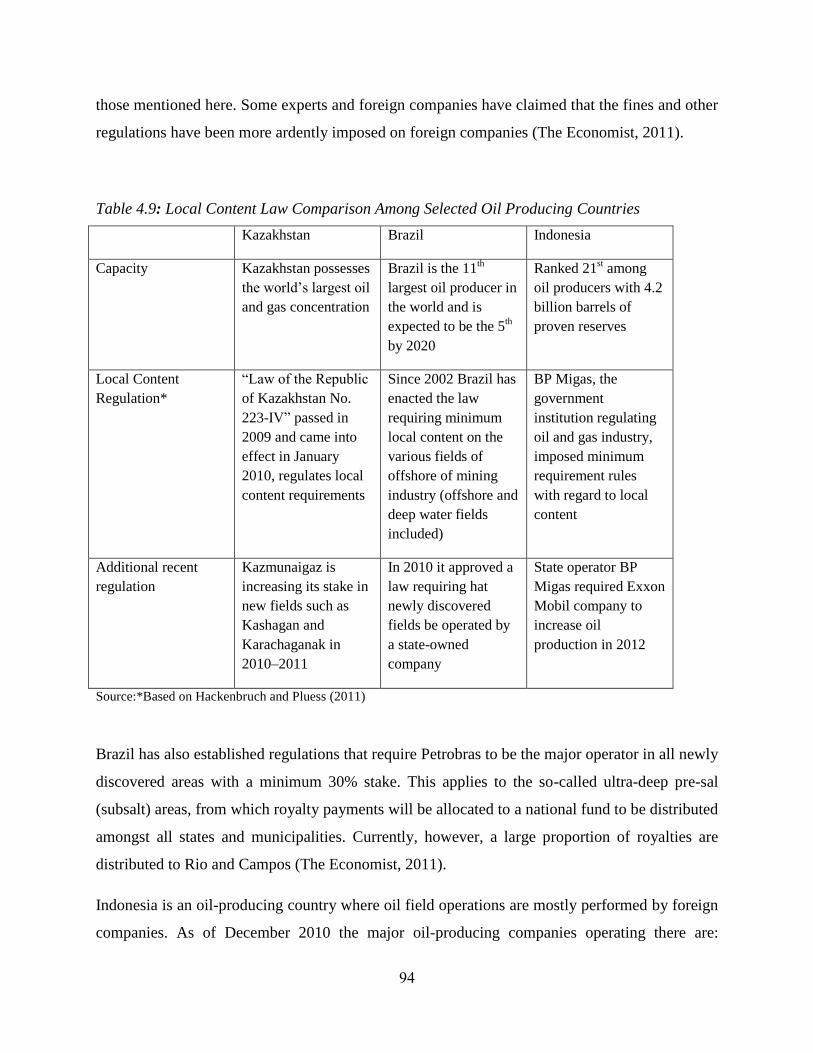
94
those mentioned here. Some experts and foreign companies have claimed that the fines and other
regulations have been more ardently imposed on foreign companies (The Economist, 2011).
Table 4.9: Local Content Law Comparison Among Selected Oil Producing Countries
Kazakhstan Brazil Indonesia
Capacity Kazakhstan possesses
the world’s largest oil
and gas concentration
Brazil is the 11th
largest oil producer in
the world and is
expected to be the 5th
by 2020
Ranked 21st among
oil producers with 4.2
billion barrels of
proven reserves
Local Content
Regulation*
“Law of the Republic
of Kazakhstan No.
223-IV” passed in
2009 and came into
effect in January
2010, regulates local
content requirements
Since 2002 Brazil has
enacted the law
requiring minimum
local content on the
various fields of
offshore of mining
industry (offshore and
deep water fields
included)
BP Migas, the
government
institution regulating
oil and gas industry,
imposed minimum
requirement rules
with regard to local
content
Additional recent
regulation
Kazmunaigaz is
increasing its stake in
new fields such as
Kashagan and
Karachaganak in
2010–2011
In 2010 it approved a
law requiring hat
newly discovered
fields be operated by
a state-owned
company
State operator BP
Migas required Exxon
Mobil company to
increase oil
production in 2012
Source:*Based on Hackenbruch and Pluess (2011)
Brazil has also established regulations that require Petrobras to be the major operator in all newly
discovered areas with a minimum 30% stake. This applies to the so-called ultra-deep pre-sal
(subsalt) areas, from which royalty payments will be allocated to a national fund to be distributed
amongst all states and municipalities. Currently, however, a large proportion of royalties are
distributed to Rio and Campos (The Economist, 2011).
Indonesia is an oil-producing country where oil field operations are mostly performed by foreign
companies. As of December 2010 the major oil-producing companies operating there are:

95
Chevron Pacific Indonesia (with a 43% stake), Pertamina (15%), and Petrochina International
(8%). The major gas-producing companies include: Total E&P Indonesie (with a 32% stake),
Conoco Phillips (15%), and Pertamina (14%). The oil and gas fields in Indonesia are operated
under Production Sharing Contracts (Oil and Gas in Indonesia: Investment and Taxation Guide,
page 10). A new law passed in 2009 introduced several changes. First, a license-based system
(which has been heavily criticized by foreign investors because it offers them less protection)
replaced the former contract-based system. Although foreign investors are eligible to hold 100%
of concession shares they should divest part of their shares to local companies within five years.
In addition, the production phase has been defined as 20 years and extraction areas have been
enlarged under the new law. Finally, foreign companies are obliged to use local rather than
foreign contractors, facing automatic suspension of their operations for incompliance (Divine,
2009).
A new law regarding the so-called ‘Kazakhstan content’ or Local Content Policy has been in
effect since January 2010. According to this law tender applicants are required to stipulate their
proposed obligations to engage with defined percentages of goods, labor, and services
originating in Kazakhstan that meet national and international standards. While definitions are
given to terms such as ‘Kazakhstan manufacturer,’ ‘of Kazakhstan origin,’ and ‘Kazakhstan
content,’ these are too general to resolve the issue of what truly constitutes local content. The
aim of the new law is to achieve a 90% supply of local content goods, labor, and services by
2014.
Unfortunately the current local content indicators are very low given that the production level
(and as the result the Kazakhstan shares of products and services procured by oil companies) is
very limited in comparison to those that are imported. There was an overall decrease in the local
content of commodities as of 2010, while there was a substantial increase for labor and services
supplied in that same year. Local content commodities accounted for 33.5 billion tenge (9.7%),
local content labor accounted for676 billion tenge, and services accounted for 775.4 billion tenge
(97.7%), while the overall value of local content was 1.49 trillion tenge (69.7%). Statistics from
the first six months of 2011 show that local content accounted for 3.66 trillion tenge, including
7.1% from commodities, 56.7% from labor, and 68.1% from services.

96
Table 4.10: Trends in Local Content of Oil and Gas Company Procurement in Kazakhstan,
2007–2010
Commodities Local Content in
%
Services Local Content in %
Total
production
Local
Content
Total
production
Local
Content
2010* 345.4 33.5 9.7 820.5 775.4 94.5
2009** 78.17 8.8 11.3 371.91 291.25 78.3
2008** 212.80 18.48 8.7 620.14 493.95 79.7
2007** 109.71 9.22 8.4 107.35 100.16 93.3 Source:* Melnik (2011), ** National Business(2010)
Note: Amounts in billions of tenge
The NADLoC targeted a level of at least 16% local content for commodities in its 2010–2014
strategy plan, although only 3% of oil industry equipment is supplied domestically (Melnik,
2011). NADLoC experts claim that the domestic processing industry has the capacity to provide
competitive products for the national market. The food and energy sectors have high potential
within the domestic market; however, other sectors are not competitive in both domestic and
foreign markets.
Table 4.11: Production, Exports and Imports of Major Categories of Goods in Kazakhstan, 2009
Production in
USD millions
Exports in
USD millions
Imports in
USD millions
Share of local
content on
domesticmarket
Machinery 1 915.2 399.7 11 225.2 11.9
Metallurgy 10 249.4 7 216.1 5 783.7 34.4
Chemicals 575 2 218.4 2 307.5 19.9
Light goods 172.9 333.9 363.6 32.21
Food goods 5 366.7 797.7 1 714.5 72.7
Energy 35 431.5 30 027.2 2 834.8 65.6
Source: Based on MINT (2010)
Figure 4.11 presents the results of a SWOT analysis of the local content policy in Kazakhstan,
based on responses by professionals in Kazakhstan’s oil industry to a questionnaire regarding the
industry’s strengths, weaknesses, opportunities and threats. A number of barriers are encountered
in implementing local content policies, including foreign oil companies’ tendency to prefer
global suppliers rather than local firms for cost-efficiency reasons (including the lack of suitable
infrastructure that limits their ability to conduct business with local firms). Additionally many

97
local firms do not meet international quality, safety and environmental standards, while the
divergence of national and international standards represents additional challenges, increasing
costs and decreasing the competitiveness of local companies. Finally, the lack of experience and
insufficient quantity of skilled workers and management staff increases labor costs due to
workers’ increased bargaining power (Domjan, 2004).
Figure 4.11: Results of a SWOT Analysis of Local Content Regulations in Kazakhstan’s Oil
Industry
Strengths Weaknesses
Legal framework that assures local
participation without compromising standards;
Government role as facilitator and
information database provider on local content;
Experience in local content policy
application at the state level
Lack of transparency;
Local content inconsistent with Profit
Sharing Contracts;
Oil companies resistance to local content
legislation;
The absence of a local engineering base
that complies with international standards;
Insufficiency of norms to monitor and
control local content development;
The unfriendly character of local content
with regards to investment climate Opportunities Threats
A transition period in the framework of
preferential trade agreements with the WTO;
Further development of legislative
framework;
Development of local content ideology;
Generating ‘technological leaders’ in the
sector
The exclusion of domestic goods from the
Preferential Trade Agreement in the framework
of the Customs Union and WTO;
The divergence of local standards from
international standards which undermines
competitiveness in global markets;
Discontinuity of government policy;
Technological advancement of leading
countries in renewable energy products and
resulting price decrease for particular
commodities
Source: * Based on Omarova (2010)
Investments totaling $7.4 billion USD were devoted to local content efforts in 2010, accounting
for 44% of all investments within the oil and gas sector. These efforts were conducted in oil
98
fields such as Tengiz, Kashagan and Karachaganak. The share of commodities procurement from
local firms, however, was less than 6% (Melnik, 2011). Naturally international oil companies are
unenthusiastic about local content regulations and often ignore such requirements. Thus, the
relatively higher prices of imported commodities are associated with greater production costs,
reducing the competitiveness of the oil production sector.
Investment in the hydrocarbon production sector accounts for 75% of the total mineral resources
investment in Kazakhstan (Djaturayeva, 2010). Furthermore, the majority of commodity
procurements are reported as oil production project investments to reduce the tax burden owed to
the government by these companies. Indeed, subsurface resource user investments are notable
because they are often in the form of sunk costs such as exploration costs or similar investments
(Yerkebulanov and Sagynova, 2011). In addition, local firms are not transparent about the value-
added process. Local firms apply to the government for contracts, obscuring the decision-making
process of the oil companies, which restricts their ability to learn from unsuccessful bidding
attempts (Domjan, 2004).
4.4.4 The Tax Regime in Kazakhstan
Based on a comparison of Russia and Kazakhstan, Weinthal and Luong (2001) explored the
hypothesis that privatization or state ownership determines the composition of taxes and
institutionalization. They found that privatization did not render the expected results in the
development of taxation in Kazakhstan. Whereas Kazakhstan has fully privatized its energy
sector, other CIS countries such as Azerbaijan, Turkmenistan, and Uzbekistan are examples of
the opposite extreme, having opted for full state ownership. On the other hand Russia has taken a
middle path by partly privatizing its energy sector. Domestic privatization of the energy sector
has prevailed in Russia, in contrast to Kazakhstan where foreign ownership dominates the energy
sector. The type of private ownership in these two countries has determined their divergence in
the development of taxation and institutionalization (Luong and Weinthal, 2006). I investigated
the hypothesis that majority foreign ownership in the energy sector (as in the case of
Kazakhstan) is a main factor in the establishment of the tax regime and institutionalization.
Since the establishment of the first tax code of 1995 a newer version was enacted in 2002 that
has since been amended in 2006 (Table 4.12). The 2002 tax code imposed new taxes on many

99
companies, whereas the 2006 amendment was intended to improve taxation for small businesses.
Kazakhstan introduced a new tax code in 2009 that took measures to simplify tax procedures for
small businesses and organizations. Additionally, the government launched a campaign to reduce
tax arrears by cancelling non-paid penalties and fines accrued in 2010. Tax arrears of almost 14.5
billion tenge ($ 98 million USD) were annulled and tax payments totaling almost 3 billion tenge
($20 million USD) were deferred (Caspionet, 2011). Under the new tax code an electronic tax
payment system was supposed to be introduced to eliminate tax collection problems and tax
arrears. The government of Kazakhstan lowered the social tax in2008 and income taxes in 2009
to improve the business climate by reducing tax burdens (World Bank, 2010). Based on its stated
objectives, however, the new tax code was intended to increase the tax burden on natural
resource extraction (Markov and Bissengaliyeva, 2009):
- To ease tax burdens, except for natural resource sectors;
- To increase the cash inflow from natural resource sectors;
- To improve the system of tax privileges; and
- To advance the tax administration system.
Under the new tax code corporate income tax was gradually reduced between 2009 and 2011,
with advance payments cancelled and tax loss carry-forward period increased from three to 10
years. The VAT regulations were also modified, gradually decreasing from 13% to 12%. VAT
payments were abolished for exported goods, internationally shipped goods, and goods produced
under subsurface resource use contracts. In contrast, personal income tax remained the same and
a flat tax rate was applied for social taxes (Table 4.12).
In addition, since January 2009 mineral resource extraction sector enterprises also pay a Mineral
Extraction Tax (MET), an Excess Profit Tax (EPT), signature bonuses, commercial discovery
bonuses, and historic costs. Royalty payments were replaced by the MET and Production
Sharing Contracts were discontinued (apart from pre-existing contracts as of January 2009).
Under the new regulations tax provisions were also cancelled for subsurface resource use
contracts originating after January 2009, while pre-existing contracts and PSAs are not subject to
this regulation. Kazakhstan introduced an export duty for exported oil, light oil, and dark oil
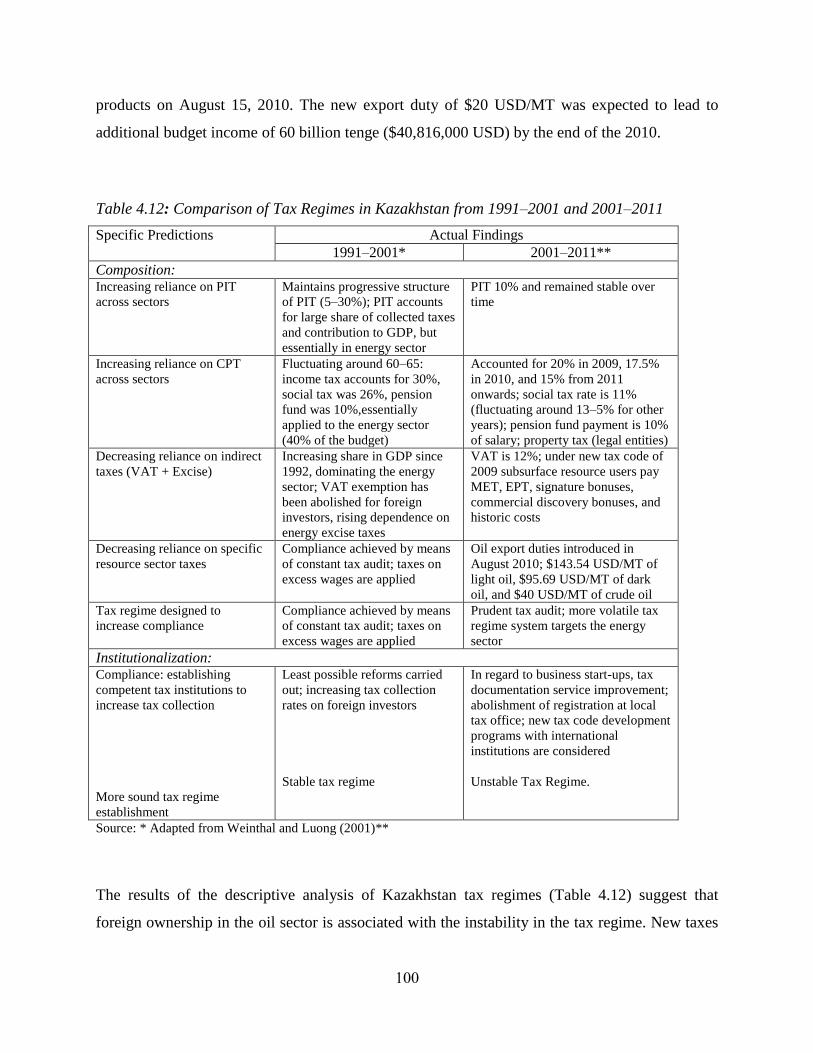
100
products on August 15, 2010. The new export duty of $20 USD/MT was expected to lead to
additional budget income of 60 billion tenge ($40,816,000 USD) by the end of the 2010.
Table 4.12: Comparison of Tax Regimes in Kazakhstan from 1991–2001 and 2001–2011
Specific Predictions Actual Findings 1991–2001* 2001–2011**
Composition: Increasing reliance on PIT
across sectors
Maintains progressive structure
of PIT (5–30%); PIT accounts
for large share of collected taxes
and contribution to GDP, but
essentially in energy sector
PIT 10% and remained stable over
time
Increasing reliance on CPT
across sectors
Fluctuating around 60–65:
income tax accounts for 30%,
social tax was 26%, pension
fund was 10%,essentially
applied to the energy sector
(40% of the budget)
Accounted for 20% in 2009, 17.5%
in 2010, and 15% from 2011
onwards; social tax rate is 11%
(fluctuating around 13–5% for other
years); pension fund payment is 10%
of salary; property tax (legal entities)
Decreasing reliance on indirect
taxes (VAT + Excise)
Increasing share in GDP since
1992, dominating the energy
sector; VAT exemption has
been abolished for foreign
investors, rising dependence on
energy excise taxes
VAT is 12%; under new tax code of
2009 subsurface resource users pay
MET, EPT, signature bonuses,
commercial discovery bonuses, and
historic costs
Decreasing reliance on specific
resource sector taxes
Compliance achieved by means
of constant tax audit; taxes on
excess wages are applied
Oil export duties introduced in
August 2010; $143.54 USD/MT of
light oil, $95.69 USD/MT of dark
oil, and $40 USD/MT of crude oil
Tax regime designed to
increase compliance
Compliance achieved by means
of constant tax audit; taxes on
excess wages are applied
Prudent tax audit; more volatile tax
regime system targets the energy
sector
Institutionalization: Compliance: establishing
competent tax institutions to
increase tax collection
More sound tax regime
establishment
Least possible reforms carried
out; increasing tax collection
rates on foreign investors
Stable tax regime
In regard to business start-ups, tax
documentation service improvement;
abolishment of registration at local
tax office; new tax code development
programs with international
institutions are considered
Unstable Tax Regime.
Source: * Adapted from Weinthal and Luong (2001)**
The results of the descriptive analysis of Kazakhstan tax regimes (Table 4.12) suggest that
foreign ownership in the oil sector is associated with the instability in the tax regime. New taxes
101
have recently been imposed that are largely concentrated on the extractive resource sectors. This
may be due to the fact that foreign owners generally have lower political power relative to
domestic owners. As a result of the predominance of foreign ownership the tax regime is less
stable in Kazakhstan than other CIS countries.
4.5 Policy Failures and the Role of Institutions in Wheat and Energy Markets
of Kazakhstan
4.5.1 Wheat Market Issues in Kazakhstan
The first decade of Kazakhstan’s independence was characterized by negligence of the
agricultural sector in favor of the energy sector (specifically oil production), which combined
with subsidy cuts and price liberalization in the agricultural sector has reduced agricultural
output by at least 20%. The situation of the agricultural sector only improved after 1998. First,
the devaluation of the domestic currency improved the competitiveness of the sector. Second, the
oil price increase and subsequent profits stimulated increased investment in the agricultural
sector (Swinnen et al., 2009). The agricultural sector became more lucrative as investments
facilitated vertical integration. Institutional arrangements and the government’s active role via its
holding companies under the auspices of the national holding company ‘Samruk-Kazyna’
stimulated the growth of vertically integrated holding companies. The difference between the
output and input prices of wheat production contracted significantly from 1995 to 1998 (Figure
4.12). Consequently, the gross margins of wheat production declined dramatically over this
period. Gross margins reached a minimum level of –31.4% in 1998. Even though gross margins
did not decline significantly in other years over the 1995–1998 period it was also negative in
1995 and 1997. The only increase was in 1996 with a moderate positive gross margin. This was
due to the fact that the policy enacted in the early years of independence made the input prices
for agricultural products skyrocket, while output prices were kept constant by monopsonistic
buyers or traders because the majority of the grain elevators and mills were sold to a small
number of enterprises that control the wheat market (Pomfret, 2009). As a result agricultural
enterprises and family farms have accrued huge losses that have led to an increase in barter based
commercial transactions (de Broeck and Kostial, 1998). In this respect, agricultural enterprises
and farms are ‘squeezed’ between upstream and downstream actors in the value chain.

102
Figure 4.12: Relative Output/Input Prices and Gross Margins of Wheat Producers in
Kazakhstan, 1995–2011 (%)
Source: Based on data from SARK (2013)
Countries with transitional economies following the break-up of centrally planned system are
often faced with ‘hold up’ problems, especially in agricultural sectors. Such hold-up problems
are associated with disruptions of the old exchange systems under planned economies. While the
old supply chains were regulated and controlled by authorities, the transitional economy
countries were in the stage of developing contract enforcement and rule of law mechanisms that
together cause hold-up problems, which usually stem from non-delivery, non-payment, long
delays, and discrepancies (Gow and Swinnen, 1998). Delayed payments in the agricultural sector
coupled with hold-up problems caused cash flow problems and reduced the gross margins of
wheat producers. Reputation can be an important factor in overcoming hold-up problems;
however, this does not play a significant role in monopolistic markets. Therefore, an effective
governmental role would be a key factor for third parties in enforcing contracts.
Kazakhstan is isolated from global markets by its landlocked location and poor infrastructure
(roads, communication, etc.), and this isolation is the major obstacle to the development of the
wheat market. Consequently, small-scale farmers (krestianskoe hoziastvo) are inadequately
assisted by the grain traders who dominate the wheat market in Kazakhstan, often leading to
-60
-40
-20
0
20
40
60
80
100
Relative Output/Input Prices Gross Margin

103
uncompetitive and incomplete markets, and to highly volatile market prices. Indeed, under these
circumstances prices decrease sharply during productive harvest seasons and rise dramatically
when supply abruptly decreases (e.g., during the drought in 2010). The oligopolistic nature of the
market and traders (wheat traders that buy from small-scale farmers), the large supply of wheat
that greatly exceeds domestic market needs, and high risks due to the seasonality and uncertainty
of wheat production all lower the bargaining power of small-scale farmers, forcing them to
accept very low prices for the wheat they produce.
Figure 4.13: Transport Costs of Wheat Exports Versus Imports in Kazakhstan
Source: Based on data from SARK (2013)
There is an asymmetry in the transportation costs of export and import goods. For instance,
shipment costs range between $8,500 and $10,500 USD from Europe to Central Asian
Republics, compared with $6,000 to $7,000 USD in the opposite direction. Furthermore,
transportation costs comprise 20% of the total value of exports and imports (ADB, 2006) due to
the fact that Central Asian countries largely export commodities and import manufactured goods.
A transportation cost index estimated as the percentage increase from the previous year is
presented in Figure 4.13. Indeed, transportation cost index values have been rising at an
accelerating rate since 2002, surpassing transportation cost index values for imports since 2004.
0
20
40
60
80
100
120
140
160
180
19
98
19
99
20
00
20
01
20
02
20
03
20
04
20
05
20
06
20
07
20
08
20
09
20
10
20
11
Exports Imports

104
The mean transportation price index value for exported goods was 26% from 2004 to 2011,
while the transportation price index value for imported goods was 14%. High oil prices largely
contributed to the increase in transportation costs (Mitchell, 2008).
Trade barriers have also had an adverse impact on transportation costs. Transportation costs
increase with time consuming and unpredictable transportation systems have impeded trade with
Europe and the Middle East in favor of CIS countries and East and South Asian countries. The
share of wheat exports to CIS countries from Kazakhstan has recently increased (Table 4.13).
Table 4.13: Kazakhstan Wheat Export Destination Composition, 2007–2011
2007 2008 2009 2010 2011
CIS Countries 63.99% 60.91% 63.15% 66.00% 74.73%
Other Countries 36.01% 39.09% 36.85% 34.00% 25.27%
Source: Based on data from the SARK database (2013)
Trade barriers have caused rent-seeking activities often associated with high transaction costs, in
turn creating obstacles for wheat production and investment. Transaction costs are high due to
unofficial payments at borders as well as burdensome and non-transparent customs procedures
(Kourmanova et al., 2008). Nevertheless, with active state intervention wheat producing CIS
countries such as Kazakhstan, Russia and Ukraine have adopted trade restriction policies
intended to promote sustainable development among agricultural producers.
4.5.2 Policy Challenges
After the worldwide crisis associated with disbelief in market mechanisms and growing state
intervention erupted in 2007, especially in natural resource-abundant countries, most countries
preferred to reorganize their economies rather than execute quality improving institutional
reforms. Following the crisis and failure of the banking system in Kazakhstan the state holding
company Samruk-Kazyna was established in October 2008. The major goals of this effort were
to diversify the economy and avoid negative Dutch Disease impacts on economic growth. The
policy efforts to improve the efficiency of energy (oil) resources were reflected in the
agricultural sector. The Ministry of Agriculture had combined institutions under its auspices and

105
established a state holding company, KazAgro, in December 2006 and consolidating it with its
several subsidiary companies to provide support for the agricultural sector. The budget of the
Ministry of Agriculture increased to $927 million USD in 2008, 45% of which belonged to
KazAgro (Pomfret, 2013). KazAgro not only monitors commodity prices, it also finances and
supports the agricultural sector and is responsible for promoting technical change and
improvement.
Figure 4.14: Annual Cumulative Bank Loan in Kazakhstan, 2003–2011 (in USD billions)
Source: Based on data from the National Bank of the Republic of Kazakhstan (2013)
Since 2009 the state has provided priority loans with low interest payments and enormous
subsidies through KazAgro for the production of major agricultural products such as grain, fruits
and vegetables, meat, milk, oil crops, poultry, sugar, and wool (Pomfret, 2013). However, the
central focus of the support for the agricultural sector was to increase production, while ignoring
the efficiency of production as well as socio-economic and environmental issues. KazAgro
subsidies and financial support for the agricultural sector (60.5% of total loans were made to
6,7 11,4
19,4
36,7
60,1 61,9 51,4 51,5
59,9
0,8 1
1,2
1,6
2,2 2,1
1,9 2
3,1
0,00%
2,00%
4,00%
6,00%
8,00%
10,00%
12,00%
0
10
20
30
40
50
60
70
2003 2004 2005 2006 2007 2008 2009 2010 2011
Loan
s to
Agr
ibu
sin
ess
, %
Ban
k Lo
ans,
in b
illio
n U
SD
Bank Loans to the rest of economy Bank Loans to Agribusiness
Share of loans to agribusiness
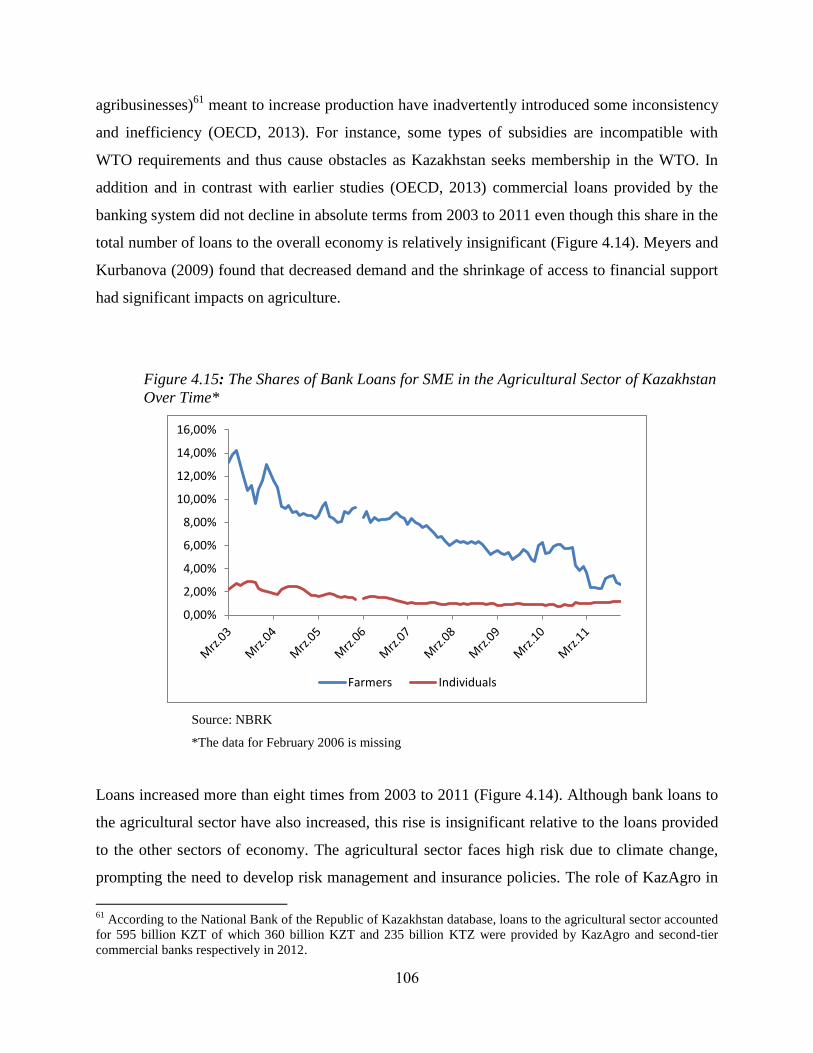
106
agribusinesses)61
meant to increase production have inadvertently introduced some inconsistency
and inefficiency (OECD, 2013). For instance, some types of subsidies are incompatible with
WTO requirements and thus cause obstacles as Kazakhstan seeks membership in the WTO. In
addition and in contrast with earlier studies (OECD, 2013) commercial loans provided by the
banking system did not decline in absolute terms from 2003 to 2011 even though this share in the
total number of loans to the overall economy is relatively insignificant (Figure 4.14). Meyers and
Kurbanova (2009) found that decreased demand and the shrinkage of access to financial support
had significant impacts on agriculture.
Figure 4.15: The Shares of Bank Loans for SME in the Agricultural Sector of Kazakhstan
Over Time*
Source: NBRK
*The data for February 2006 is missing
Loans increased more than eight times from 2003 to 2011 (Figure 4.14). Although bank loans to
the agricultural sector have also increased, this rise is insignificant relative to the loans provided
to the other sectors of economy. The agricultural sector faces high risk due to climate change,
prompting the need to develop risk management and insurance policies. The role of KazAgro in
61
According to the National Bank of the Republic of Kazakhstan database, loans to the agricultural sector accounted
for 595 billion KZT of which 360 billion KZT and 235 billion KTZ were provided by KazAgro and second-tier
commercial banks respectively in 2012.
0,00%
2,00%
4,00%
6,00%
8,00%
10,00%
12,00%
14,00%
16,00%
Farmers Individuals

107
financing the agricultural sector has increased during the years in question, which is why the
share of loans to the agricultural sector has sharply declined (shown as dashed line in Figure
4.14).
Bank loans for small businesses or small farmers in the agricultural sector have significantly
contracted since 2003. The share of loans for small enterprises with respect to loans for all
sectors62
over the period from March 2003 to December 2011 is displayed in Figure 4.15. The
share of bank loans for SMEs in the agricultural sector declined from 13.21% in March 2003 to
2.64% in 2011, largely due to the fact that the agricultural sector is high-risk owing to volatile
climate and price conditions. According to an OECD investigation (OECD, 2013), price
fluctuation and weather conditions hinder financial support of the agricultural sector, particularly
with respect to small and medium sized enterprises.
Figure 4.16: State Purchase of Wheat by the Food Contract Corporation in Kazakhstan,
1998–2010 (in millions of metric tons)
Source: Based on data from the SARK database (2013)
62
Sectors of economy in Kazakhstan are divided as follows: industrial, agricultural, construction, transportation,
communication, and trade.
0,00
0,50
1,00
1,50
2,00
2,50
3,00
3,50
4,00
4,50
5,00
1998 1999 2000 2001 2002 2003 2004 2005 2006 2007 2008 2009 2010
Volume of Commercial Purchase State Procurement

108
KazAgro also plays a key role in financing the agricultural sector by means of various credit
programs and concessional loans. For instance, credit, loans, direct market interventions, and
subsidies accounted for 60% of the company’s budget in 2008 (World Bank, 2010). The budget
is divided between subsidiaries of KazAgro such as the Food Contract Corporation,
KazAgroGarant, and KazAgroFinance. Thus, the efficient use of budget resources allocated to
the agricultural sector through KazAgro subsidiaries is a crucial issue requiring special focus.
Large agricultural producers are less dependent on financial support, given that they can access
commercial loans from second-tier banks with less effort than SMEs because they are considered
more reliable. Therefore, KazAgro investment and loans to SMEs could boost the efficiency of
financial support for agriculture. Moreover, concentration on SME lending in the agricultural
sector could enhance competition and the efficient and transparent allocation of financial
resources (OECD, 2013).
The state is increasingly becoming a major actor in the wheat market, having made commercial
wheat purchases since 2002. The FCC purchased almost 21% of the wheat in the market in
2009,63
when wheat production reached record high levels since the break-up of the Soviet
Union. Of the 21% of wheat purchased by the FCC, more than 18% was purchased for
commercial purposes and 3% for state grain stocks. Thus, the colossal FCC purchase of wheat
contributed to the relatively high profitability of wheat production in 2009. However, the
situation was reversed in 2010 when wheat producers faced severe drought and fire in some
regions of Russia and Kazakhstan. According to the new grain law that came into effect in 2010,
agricultural producers owning more than 250 ha of arable land are obliged to sell 20% of harvest
to FCC. The state purchases wheat at lower than market prices in order to minimize price
fluctuations, which in turn reduces the profitability of wheat producers (Figure 4.16).
63
According to the National Statistical Department of Kazakhstan, 22.7 million MT of wheat were produced in
2009. Out of that 22.7 million MT of wheat 4.7 million MT (approximately 4 million MT for commercial purposes
and 600 thousand MT of wheat for stock reserves) of wheat were purchased by the FCC.

109
5 REGIONAL DIMENSIONS OF NATURAL RESOURCE ABUNDANCE
AND ECONOMIC GROWTH WITHIN KAZAKHSTAN64
5.1 Introduction
Kazakhstan is one of the most resource-abundant countries in the world. It has concentrated
mineral resources, particularly abundant energy resources such as exportable oil, coal, and
natural gas. In 1994 its fossil fuel production accounted for 23% of the GDP. Indeed, the energy
sector comprises 42% of Kazakhstan’s total output. A significant proportion of investment is
spent on resource extraction: for instance, in 2009 investments into extractive resource
production accounted for 33% of the total annual fixed capital investment, while the
manufacturing sector accounted for only 8%. Only 2.3% of the labor force belonged to the
extractive resource sector in 2011, whereas the labor force of the agricultural and manufacturing
sectors accounted for 28% and 7% of the labor force respectively (SARK, 2013).
The average growth rates of point source resource abundant provinces (Aktobe, Atyrau,
Mangystau, Kyzylorda and West Kazakhstan) and diffuse resource abundant provinces (North
Kazakhstan, Kostanay and Akmola) versus general economic growth rates are presented in
Figure 5.1. Point source resource abundant provinces are largely concentrated on oil exportation,
while diffuse resource abundant provinces primarily focus on wheat production and exportation.
Surprisingly, the growth of energy producing provinces did not significantly contribute to
national economic growth over the 2002–2011 period. The downturn in economic performance
is even more surprising considering that the oil resource abundant provinces experienced
incredible growth in 2002, 2004 and 2010. In contrast, economic performance coincided more
strongly with the average growth rates of diffuse resource abundant provinces. Furthermore, the
diffuse resource abundant provinces have performed better than point source resource producing
provinces on multiple occasions since 2007. Despite the rapid growth of energy producing
provinces, the national economy’s vulnerability to shocks can be observed. Kazakhstan’s oil and
gas industry has recently undergone significant changes through a modification process imposed
by politics, however, the seemingly urgent nature of these policies might well lead to failure. For
64
The chapter was published in Economic Systems Journal in Volume 37 (Issue 2, 2013): 254-270, in cooperation
with Mesut Yilmaz and Kanat Abdulla and entitled as “Resource Concentration, Institutional Quality and the
Natural Resource Curse.”
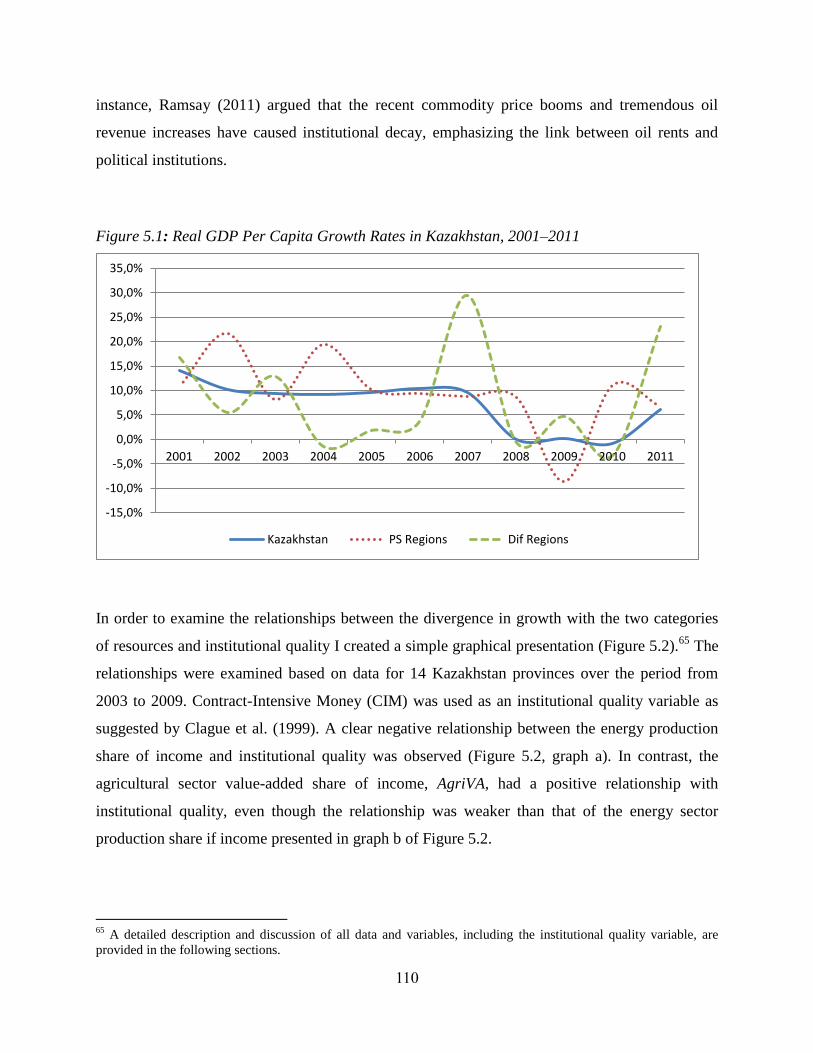
110
instance, Ramsay (2011) argued that the recent commodity price booms and tremendous oil
revenue increases have caused institutional decay, emphasizing the link between oil rents and
political institutions.
Figure 5.1: Real GDP Per Capita Growth Rates in Kazakhstan, 2001–2011
In order to examine the relationships between the divergence in growth with the two categories
of resources and institutional quality I created a simple graphical presentation (Figure 5.2).65
The
relationships were examined based on data for 14 Kazakhstan provinces over the period from
2003 to 2009. Contract-Intensive Money (CIM) was used as an institutional quality variable as
suggested by Clague et al. (1999). A clear negative relationship between the energy production
share of income and institutional quality was observed (Figure 5.2, graph a). In contrast, the
agricultural sector value-added share of income, AgriVA, had a positive relationship with
institutional quality, even though the relationship was weaker than that of the energy sector
production share if income presented in graph b of Figure 5.2.
65
A detailed description and discussion of all data and variables, including the institutional quality variable, are
provided in the following sections.
-15,0%
-10,0%
-5,0%
0,0%
5,0%
10,0%
15,0%
20,0%
25,0%
30,0%
35,0%
2001 2002 2003 2004 2005 2006 2007 2008 2009 2010 2011
Kazakhstan PS Regions Dif Regions
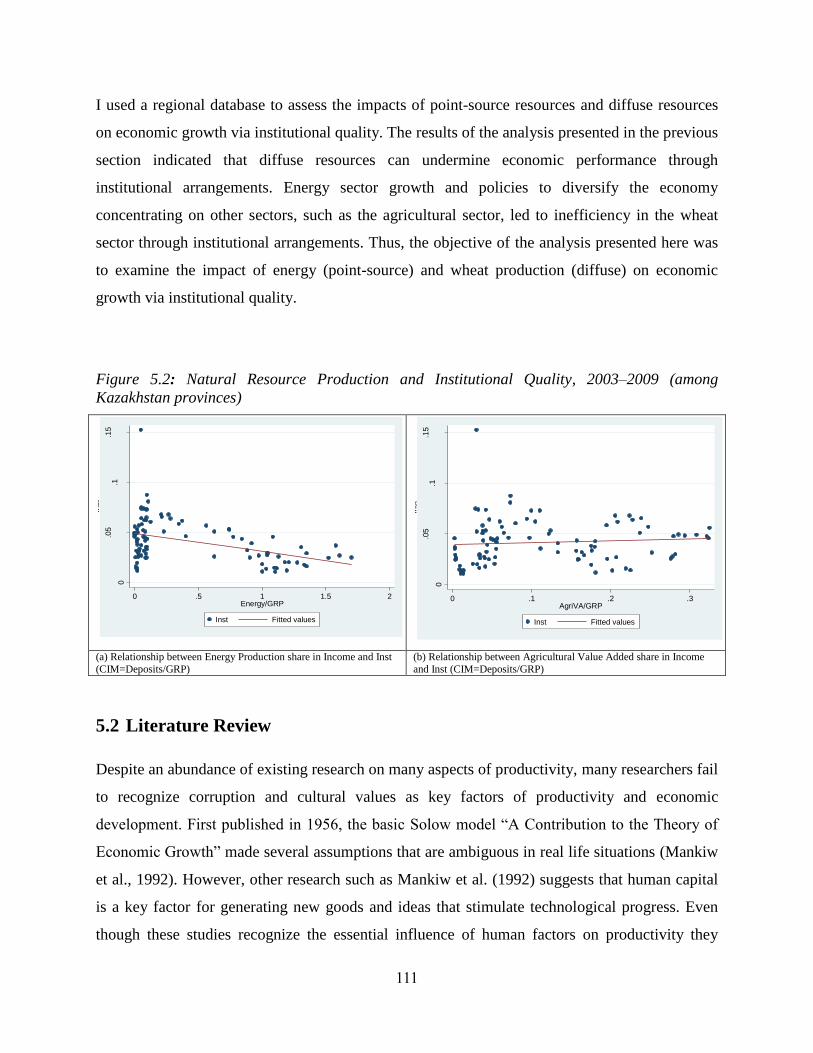
111
I used a regional database to assess the impacts of point-source resources and diffuse resources
on economic growth via institutional quality. The results of the analysis presented in the previous
section indicated that diffuse resources can undermine economic performance through
institutional arrangements. Energy sector growth and policies to diversify the economy
concentrating on other sectors, such as the agricultural sector, led to inefficiency in the wheat
sector through institutional arrangements. Thus, the objective of the analysis presented here was
to examine the impact of energy (point-source) and wheat production (diffuse) on economic
growth via institutional quality.
Figure 5.2: Natural Resource Production and Institutional Quality, 2003–2009 (among
Kazakhstan provinces)
(a) Relationship between Energy Production share in Income and Inst
(CIM=Deposits/GRP)
(b) Relationship between Agricultural Value Added share in Income
and Inst (CIM=Deposits/GRP)
5.2 Literature Review
Despite an abundance of existing research on many aspects of productivity, many researchers fail
to recognize corruption and cultural values as key factors of productivity and economic
development. First published in 1956, the basic Solow model “A Contribution to the Theory of
Economic Growth” made several assumptions that are ambiguous in real life situations (Mankiw
et al., 1992). However, other research such as Mankiw et al. (1992) suggests that human capital
is a key factor for generating new goods and ideas that stimulate technological progress. Even
though these studies recognize the essential influence of human factors on productivity they
0
.05
.1.1
5
Inst
0 .5 1 1.5 2Energy/GRP
Inst Fitted values
0
.05
.1.1
5
Inst
0 .1 .2 .3AgriVA/GRP
Inst Fitted values
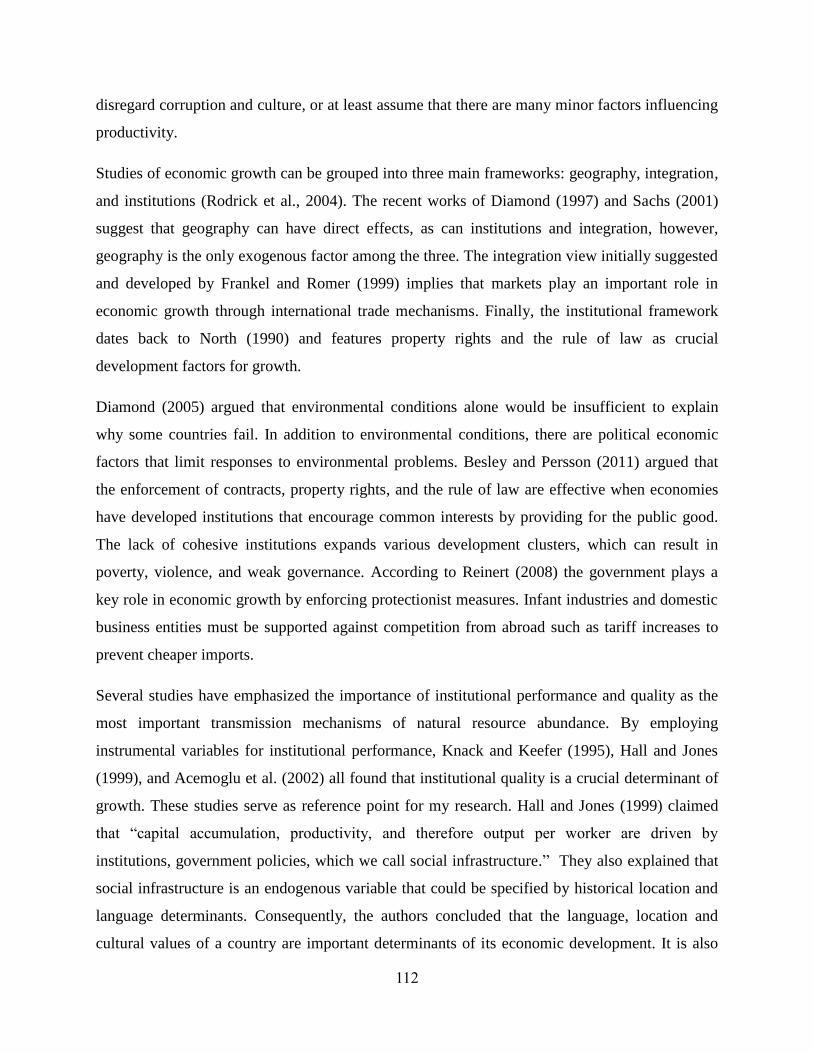
112
disregard corruption and culture, or at least assume that there are many minor factors influencing
productivity.
Studies of economic growth can be grouped into three main frameworks: geography, integration,
and institutions (Rodrick et al., 2004). The recent works of Diamond (1997) and Sachs (2001)
suggest that geography can have direct effects, as can institutions and integration, however,
geography is the only exogenous factor among the three. The integration view initially suggested
and developed by Frankel and Romer (1999) implies that markets play an important role in
economic growth through international trade mechanisms. Finally, the institutional framework
dates back to North (1990) and features property rights and the rule of law as crucial
development factors for growth.
Diamond (2005) argued that environmental conditions alone would be insufficient to explain
why some countries fail. In addition to environmental conditions, there are political economic
factors that limit responses to environmental problems. Besley and Persson (2011) argued that
the enforcement of contracts, property rights, and the rule of law are effective when economies
have developed institutions that encourage common interests by providing for the public good.
The lack of cohesive institutions expands various development clusters, which can result in
poverty, violence, and weak governance. According to Reinert (2008) the government plays a
key role in economic growth by enforcing protectionist measures. Infant industries and domestic
business entities must be supported against competition from abroad such as tariff increases to
prevent cheaper imports.
Several studies have emphasized the importance of institutional performance and quality as the
most important transmission mechanisms of natural resource abundance. By employing
instrumental variables for institutional performance, Knack and Keefer (1995), Hall and Jones
(1999), and Acemoglu et al. (2002) all found that institutional quality is a crucial determinant of
growth. These studies serve as reference point for my research. Hall and Jones (1999) claimed
that “capital accumulation, productivity, and therefore output per worker are driven by
institutions, government policies, which we call social infrastructure.” They also explained that
social infrastructure is an endogenous variable that could be specified by historical location and
language determinants. Consequently, the authors concluded that the language, location and
cultural values of a country are important determinants of its economic development. It is also
113
worth mentioning the studies conducted by Easterly and Levine (2003) and Rodrick et al. (2004)
that found that geographic variables can influence economic growth via institutional quality and
performance.
Political science (Isham, 2005) divides the mechanisms that impact institutional quality into
three channels: “rentier effects,” “delayed modernization,” and “entrenched quality,” with the
first being the most important among this group. Coined by and Robinson (2008), “rentier
effects” describes how the persistence of elites and thus economic institutions impact economic
outcomes. Economic institutions persist, even under de facto political power changes, as a result
of balancing investment by elites. Therefore, the authors concluded that the balance of power
over economic and political institutions between two groups—elites and citizens—determines
economic growth, with the balance depending on incentives. Therefore, the quality and
performance of institutions are crucial for determining economic outcomes. In addition,
Couttenier (2009) found a U-shaped relationship between the quantity of natural resources and
institutional performance, suggesting that there is a threshold of natural resource abundance
beyond which institutions perform poorly and are consequently detrimental to economic activity.
There are plenty of examples of transition economies failing to exploit natural resources for
economic growth as a result of the encouragement of rent-seeking activities and corruption, thus
failing to establish positive macroeconomic policies (Dolinskaya, 2001).
Finally, resource misallocation could be avoided by extending fiscal tools and instruments
(Acemoglu, 2007). The implication of direct fiscal tools and instruments for good governance
reduces the need for indirect fiscal tools and inefficient resource allocation (Besley and Persson,
2010). However, Acemoglu (2010) argues that the increase of a government’s fiscal capacity
should necessarily be followed by improving institutions, otherwise increasing fiscal capacity
causes a double-edged sword effect. On the one hand, fiscal strength implies better government
control; however, control could also induce political tension and clashes among distinct interests
within the country. The latter could outweigh any positive effects, creating a negative overall
impact on economic growth. Therefore, the author suggests that dynamic models that simulate
the relationships between government strength and political soundness are required in relevant
research efforts.

114
After examining natural resource abundance in Botswana, Acemoglu et al. (2002) concluded that
the country has successfully established effective institutions and achieved good governance.
They found that Botswana’s effective institutions, especially those dealing with private property,
evolved from its pre-colonial institutions. Botswana has established solid leadership (restricting
British authority) that was able to create incentives for institutional quality (Iimi, 2007). Norway
is another example of a point-source resource abundant country that was successful in
transforming it natural resource wealth into economic development and growth.
5.3 Estimation Methodology
There is a large body of models that consider government policy and institutional quality as
transmission mechanisms through which natural resources impact economic growth (Kormendi
and Meguire, 1985; Grier and Tullock, 1989; Barro, 1991). The seminal empirical model that
includes the share of primary goods on GDP and recognizes that primary good exports can
negatively affect growth was suggested by Sachs and Warner (1995). More recently, Papyrakis
and Gerlagh (2004) and Shao and Qi (2009) have improved the model in the following way:
(1) log(𝑦𝑖.𝑡) =∝0+∝1 𝐼𝑛𝑠𝑡𝑖,𝑡−1 +∝2 𝑍𝑖,𝑡−1 + 휀𝑖,𝑡,
where log (yi,t-1) is the log of per capita income, 𝐼𝑛𝑠𝑡𝑖.𝑡−1 represents institutional quality, and
𝑍𝑖,𝑡−1 is the vector of the lagged predictors66
of economic performance such as the Sachs-Warner
estimator of the terms of trade and the share of investments in GRP. The right hand side
variables, 𝐼𝑛𝑠𝑡𝑖.𝑡−1 and 𝑍𝑖.𝑡−1, represent the two major channels of the natural resource curse:
institutional quality and the Dutch Disease impact variables. Several features of this structural
model warrant mention. First, I considered the lagged right hand side variables in the equation,
assuming that institutional improvement (𝐼𝑛𝑠𝑡𝑖.𝑡−1) and investment (included in 𝑍𝑖,𝑡−1) impacts
on economic performance operate over the long term.67
Evidently the resource abundance
variable and institutional quality have possible feedback effect problems; therefore, the
endogeneity of the variable should be addressed carefully. Furthermore, resource abundance
determinants such as geography and culture variables (see Rodrick et al., 2004) have both direct
and indirect impacts on output per worker. The determinants of social infrastructure are valid
66
All predictors (independent variables) are lagged to control for potential endogeneity. 67
The same idea applies to the Terms of Trade (ToT), as the price is considered to be sticky in the short term.

115
instruments for the model. Subsequently, the authors (Rodrick et al., 2004) employed a very
powerful instrumental variable method in order to escape the endogeneity problem. Therefore,
regression of the geographic variables such as precipitation and temperature successfully created
the so-called new cleaned up social resource abundance, which does not suffer the causality
problem discussed above. Besides, applying instrumental variables to the model provides an
opportunity to avoid problems of measurement error. Thus, the authors found a simultaneous
solution for two problems and powerfully detected the crucial influence of resource abundance
or government policy on output per worker and consequently economic growth.
Alternatively, the specification for the instrumental variables technique suggested by Hall and
Jones (1999) can be applied using panel data with the following equation:
(2) 𝐼𝑛𝑠𝑡𝑖,𝑡̂ = 𝛽0 + 𝛽1𝑍𝑖,𝑡 + 𝛽2𝑁𝑅𝑖.𝑡 + 𝛽3𝑁𝑅𝑖.𝑡−1 + 𝛽4𝑁𝑅𝑖,𝑡
2 + 𝛽5𝑁𝑅𝑖,𝑡−12 + 𝜔𝑖,𝑡
where, 𝐼𝑛𝑠𝑡𝑖,𝑡 is expressed as a nonlinear function of natural resource abundance (the shares of
energy production and agricultural production in GRP) using𝑁𝑅𝑖,𝑡 and 𝑁𝑅𝑖,𝑡−1 . The resource
endowments square term, 𝑁𝑅𝑖,𝑡2 and its lagged variable 𝑁𝑅𝑖,𝑡−1
2 , are indicators of ‘excess
production’ or overabundance and the novelty of this study. The main hypothesis is that energy
production or more specifically excess energy production (squared term) is associated with
depressed agricultural resource production through poor institutions. Therefore, a negative sign
for 𝛽4,5 representing energy resource abundance was expected, whereby the signs of the
coefficients for resource production (𝛽2) and excess resource production (𝛽3) would depend on
the composition of resources. A negative sign for energy resource production (point source
resource) and a positive sign for commodities production (diffuse) were expected. The latter
hypothesis has been documented in previous studies,68
however, I also included squared terms in
an attempt to observe the potential impact of excess resource production on economic growth via
institutions. Lagged variables were included with the same idea discussed above for the variables
in Equation (1), based upon the assumption that the potential impacts of resource endowments on
institutional quality occur over the long term.
Although many studies have attempted to investigate the impact of institutional quality on
economic development empirically, the majority have conducted cross-country or cross-sectional
68
See Isham et al. (2005).
116
research. There are many drawbacks, however, in the empirical models undertaken through such
cross-country analyses. Aside from issues stemming from the model specification and
econometric procedure, several assumptions cast doubt on the validity of the results. The first
assumption is based on the ‘implicit homogeneity’ of the countries in question. Furthermore, the
quality and characteristics (nature) of the data from different countries is treated as the same,
producing problematic outcomes.
5.4 Data and Descriptive Statistics
The regional zones (oblasts) of the Kazakh Soviet Republic were initially conceived by the
Russian Federation according to their predominant economic activities. The oblasts were
subsequently subdivided internally into sub-regions according to their administrative
characteristics (Dvoskin, 1986). Kazakhstan can be divided into five regions according to
economic and geographic features: central, east, west, north, and south. Economical,
transportation, and administrative factors had crucial roles in shaping the boundaries of
Kazakhstan’s oblasts during the Soviet era. Most oblasts were established based on their
participation in energy and agricultural production. In fact, the current administrative centers of
all oblasts where the resource producing and refinery industries are located are the cities or
centers that were established during the Soviet period. Some oblasts boundaries were determined
due to their specific agriculture production or refinery activities. All administrative centers also
function as railroad junctions.
The largest region is West Kazakhstan, which includes four oblasts—Aktobe, Atyrau, West
Kazakhstan, and Mangistau (Table 5.1). Atyrau has the oldest oil and gas producing industries.
Aktobe has 10% of the proven and 30% of the potential hydrocarbon resources in Kazakhstan.
The North Kazakhstan region also includes four oblasts, Akmola, Pavlodar, North Kazakhstan
and Kostanay, all of which have economies concentrated on the production of grain, agriculture
machinery, and related equipment. The most densely populated region is South Kazakhstan,
including the oblasts of Almaty, Kyzylorda, Zhambyl, and South Kazakhstan, which produce a
wide variety of resources ranging from oil to agriculture products.
The oblasts can be grouped into the following regions based on production structure. The oil
extracting oblasts (Aktobe, Atyrau, WestKazakhstan, Kyzylorda and Mangistau) account for

117
99.97% of the country’s total oil production, with their individual oil extraction shares ranging
between 12% and 30% of total oil production. The oil producing oblasts are located in the region
of West Kazakhstan, while agricultural production oblasts are in the South Kazakhstan and North
Kazakhstan regions.
Table 5.1: Internal Gross Regional Product Shares of Total GRP for Kazakhstan (percentages)
2002 2009
Akmola 3.19 3.58
Aktobe 5.52 5.82
Almaty 2.45 2.26
Atyrau 17.79 17.95
WestKazakhstan 6.09 6.20
Zhambyl 1.74 1.80
Karagandy 5.68 5.64
Kostanay 4.10 4.05
Kyzylorda 3.50 4.62
Mangystau 12.31 11.87
SouthKazakhstan 2.41 1.90
Pavlodar 5.89 5.78
NorthKazakhstan 3.33 3.46
EastKazakhstan 4.09 3.34
Astana city 9.53 10.19
Almaty city 12.39 11.55 Source: Based on data from the Statistical Agency of Kazakhstan (2013)
Kazakhstan has achieved high rates of economic growth, largely due to a boom in its oil
industry. Therefore it is unsurprising that the related oblasts, especially Atyrau and Mangystau,
have increased their shares of gross regional product per capita in the country’s overall GRP per
capita (Table 5.2). Almaty and Astana administrative districts have also achieved high shares of
GRP per capita as a result of the strong performance of the construction sector and administrative
works.
Variability in GRP per capita among the different oblasts has risen due to the disparity of
economic growth between oil production and the agricultural sector. Non-oil producing oblasts
have also benefited from high oil revenues due to spillover effects occurring through different
channels such as increased overall demand and government distribution and redistribution

118
activities. The latter might be achieved though investment, transfers, and provisions to
economically lagging oblasts. Another potential channel is the movement of the labor force,
primarily from poorer to richer regions (USAID, 2006).
Table 5.2: Internal GRP Per Capita Growth Rate of Kazakhstan, (percentages)
2004 2005 2006 2007 2008 2009 S.d. across years
Akmola 6.54% 7.41% 10.93% 19.91% 4.82% 6.75% 0.06
Aktobe 8.83% 14.05% 9.31% 10.58% 8.34% –1.01% 0.05
Almaty 5.40% 8.10% 9.48% 11.78% 5.54% 6.99% 0.02
Atyrau 10.52% 9.45% 11.24% 4.73% 12.98% 0.60% 0.05
WestKazakhstan 24.69% 4.50% 9.69% 7.67% 9.64% –1.53% 0.09
Zhambyl 6.68% 8.09% 5.46% 12.45% 5.42% 7.84% 0.03
Karaganda 4.90% 12.43% 13.22% 8.79% 8.88% 2.66% 0.04
Kostanai 5.85% 7.42% 7.49% 15.86% 7.61% 3.09% 0.04
Kyzylorda 12.27% 12.18% 16.98% 12.57% 10.92% –4.67% 0.07
Mangistau 11.78% 15.23% 11.53% 7.96% 11.20% –1.53% 0.06
SouthKazakhstan –0.12% 4.85% 5.61% 13.43% 4.29% 11.79% 0.05
Pavlodar 9.38% 5.56% 8.01% 9.69% 13.48% 2.51% 0.04
NorthKazakhstan 3.68% 8.72% 10.49% 12.95% 7.70% 7.11% 0.03
EastKazakhstan 6.66% 7.57% 12.59% 10.46% 2.56% 4.62% 0.04
Kazakhstan (entire country) 11.22% 10.74% 11.58% 7.86% 7.84% 1.93% 0.07
S.D. across regions 0.06 0.04 0.03 0.04 0.04 0.04
Source: Based on data from the Statistical Agency of Kazakhstan (2013)
Considering the average GRP per capita growth rates during the 2001–2009 period, the
Kyzylorda and Mangistau oblasts (the main oil-producing oblasts) lead with respective average
annual growth of 10.04% and 9.36%. Conversely, oblasts in East Kazakhstan that are largely
concentrated on wheat production recorded the lowest average growth rates of real GRP per
capita at 7.41%. The standard deviations of the real GRP values are presented for all regions in
the final row of Table 5.2. Growth disparities among regions demonstrated a downward sloping
pattern during the 2004–2006 period as standard deviation in the growth rates per capita declined
from 0.06 to 0.03, although there was a slight increase during the crisis of 2007–2009. There was
a remarkably high standard deviation of growth rates per capita for all regions in 2004 due to the
difference between the West Kazakhstan region (oil-extracting region) which achieved a real
GRP growth rate of 24.69% and the slowest developing regions (South Kazakhstan and North
Kazakhstan) that are heavily involved in the agricultural sector. Institutions have not been able to
119
mitigate these regional disparities in economic performance (USAID, 2006). Thus, the oil boom
has exacerbated the regional disparities in growth rates per capita.
Panel data for the 14 oblasts of Kazakhstan covering the period between 2003 and 200969
were
obtained from the statistical database of the Statistical Agency of Republic of Kazakhstan or
‘SARK’ (2013). The descriptive statistics of all variables are presented in Table 5.3.A in the
Appendix. The mean and maximum log values of GRP per capita, Log(y), were 4.80 and 8.20
respectively, representing balanced growth rates across regions. The highest log values of GRP
per capita, Log(y), were for the oil- producing oblasts of Atyrau and Mangystau in 2008, one
year after the crisis of 2007. In contrast to the agricultural sector production share of income,
AgriVA, there was a high standard deviation for the energy production share of income,
EnergyProd, indicating volatility in the energy sector. The standard deviation of EnergyProd
was close to that of the log of GRP per capita, Log(y), yet it was more severe in case of
EnergyProd, with the highest value of 1.70 in Mangystau in 2005 and the lowest value of 0 in
the oblast of North Kazakhstan in 2003. The highest agricultural sector production share of
income, AgriVA, was 0.56 in the oblast of North Kazakhstan in 2004, while the lowest value of
0.004 was for Mangistau in 2009, reflecting the exact opposite trend of the energy production
shares of income.
Although growth was observed for all regions it was uneven across the regions mentioned. The
EnergyProd variable had values higher than one in most of the oblasts of the West Kazakhstan
region and the Kyzylorda oblast (situated in the southwest of Kazakhstan), all of which are oil
producing oblasts. The institutional quality variable, Inst, was more balanced than the resource
abundance variable, with a highest value of 1.10 (Kyzylorda in 2003) and lowest value of 0.21
(Almaty in 2008).
Several criticisms can be made of the natural resource measures used in academic research:
1. There is no differentiation among the types of natural resources used (Sachs and Warner,
1995; Isham et al., 2005);
2. There may be selection bias problems regarding the data (Fearon, 2005);
3. Important natural resources may be excluded (Fearon, 2005); and
69
Two administrative center cities, Astana and Almaty (formerly the capital city of Kazakhstan), were not included
in the dataset.
120
4. There are endogeneity problems (Rodrick et al., 2004; Brunnschweiler, 2008).
Nicolas Sarkozy suggested a new way of estimating national wealth, at the same time heavily
criticizing “GDP fetishism,” referring to a welfare measure that has served well since World War
II (Schwartz, 2010). This suggestion was initially proposed by Nobel Prize Winners Joseph
Stieglitz and Amartya Sen, as well as by Fitoussi (2009). Their argument is that GDP ignores key
economic indicators such as unemployment rates and food demand, which are also important
indicators of well-being. Furthermore, an appropriate index of a country’s well-being should
reflect education, health, material living standard, personal and social activity, environmental,
and security considerations. As an alternative to estimating national wealth, there is a consensus
among economists that a genuine savings indicator might be more appropriate than GDP (van
den Bergh, 2009). The ‘genuine savings’ are defined as the savings rate within the national
accounting framework, including resource depletion and degradation. Indeed, this indicator
better reflects national wealth (especially for resource-rich countries), given that it takes into
account capital investment, resource depletion, and pollution, thus representing an improved
wealth estimation option (Fereira and Vincent, 2005). This has been highlighted by
Dosmagambet (2010), who found evidence of negative genuine savings despite growth in gross
and net savings over the 1993–2006 period, which can be explained by energy and mineral
resource depletion.
The key estimator of national wealth used in this research is Gross Regional Product (GRP),
which is similar to GDP. The estimator used for regional national accounts, however, does not
include some items included in the GDP estimator, such as value added by the defense sector.
Therefore, GRP usually differs from GDP, including in its figures produced (USAID, 2006).
There are many studies that suggest that corruption has a negative impact on FDI inflow and thus
economic growth (Mauro, 1995). The implied effect stems from the fact that institutional quality
could establish a favorable climate for FDI inflow such as government efficiency, the security of
property rights, rule of law, and the efficiency of judicial law (Globerman and Shapiro, 2002;
Benassy-Quere, 2007). Recent empirical studies (i.e., Aidt, 2009) also suggest that the negative
impacts of corruption on sustainable development depend on institutional environments.

121
Given that the objective of this investigation was to evaluate the impact of natural resource
abundance through institutional quality, the ratio of registered economic crimes to population
(per thousand people) was used as a proxy for institutional performance. A number of studies
have investigated the causes and solutions to the natural resource curse in Kazakhstan. Initial
studies (Weinthal and Luong, 2001) associated the resource curse with tax volatility, claiming
that it was the result of the dominance of foreign over domestic investment, spurring higher
taxes. Tsalik and Ebel (2003) later emphasized the importance of good governance in
determining the quality of institutions. Furthermore, Kaiser and Pulsipher (2007) concluded that
the main obstacles to good governance in Kazakhstan are bureaucracy, unstable legislation on
energy resources, and corruption; reflecting business uncertainty and high levels of risk.
Clague et al. (1999) suggested the use of contract-intensive money as a proxy measure for
institutional quality.70
Following their approach, I estimated the approximate variable for
institutional quality as follows: Inst=(M2-M0)/GRP.71
The numerator is simply the difference
between M2 money supply and M0 currency in circulation outside of the banking system, or the
quantity of deposits in second-tier financial institutions. Proxies that are widely used in economic
literature as indices of institutional quality include; the Worldwide Governance Index
(Kaufmann et al., 2010), ICRG, BERI, and BI, however, they are not available for Kazakhstan at
the regional level. Moreover, there are other disadvantages of using these indices, such as the
risk of obtaining an incorrect measure of institutional quality based on incorrect information
provided by reporters who are misled by other characteristics of the economic situation.72
Indeed, one of the criteria for choosing the measure is that it should also represent the quality of
governance of both local and higher-level institutions.
The index suggested in this study was examined carefully in terms of its reliability as a proxy
indicator for institutions and governance. To this end, the correlations between this indicator of
institutional quality and WGI were tested. Table 5.4 presents the correlation values of the
70
Although the results are not shown here, I also used the number of registered economic crimes as a proxy for
institutional quality (see Oskenbayev et al., 2013). Initially, the idea was to employ crime rates, which have identical
results as a CIM indicator of institutional quality and reassures us of the validity of instruments used as a proxy for
institutional quality. 71
Clague et al. (1999) defined CIM in their original work as follows: CIM = (M2-M0)/M2, where M2 is the money
supply, including deposits and currency in circulation, while M0 is currency in circulation. The data for deposits in
second-tier banks was available while the data for currency in circulation was missing for the different provinces of
Kazakhstan. Thus, GRP was used as a denominator of the estimate. 72
See Clague et al. (1999) for a detailed discussion.

122
average73
institutional quality estimate, Inst, across regions of Kazakhstan and the Worldwide
Governance Indicators suggested by Kaufmann et al. (2010) from 2003 to 2009. The data was
obtained from the World Bank database, Worldwide Governance Index (WGI), which is an
aggregate index compiled by many individuals. This measure of institutional quality was highly
correlated with two World Governance Indicators (Government Effectiveness [GE] and Political
Stability and the Absence of Violence [PA]). The higher the World Governance Indicators value,
the better the institutional quality. The same is also true for the measure used to represent
institutional quality, Inst, indicating that it represents an adequate measure of institutional
quality.
Table 5.3: Correlation Matrix for the Institutional Quality Variable ‘Inst’ (median value of 14
provinces) and the Worldwide Governance Indicators (Kaufmann et al., 2010), 2003–2009
Inst VA PS GE RQ RL CC
Inst 1.00
VA 0.23 1.00
PA 0.77** –0.12 1.00
GE 0.74* –0.46 0.73* 1.00
RQ 0.33 –0.54 0.58 0.73* 1.00
RL 0.57 –0.46 0.76** 0.86** 0.85** 1.00
CC 0.58 –0.18 0.70* 0.67* 0.71* 0.51 1.00 Note: VA—Voice and Accountability; PA—Political Stability and Absence of Violence; GE—Government
Effectiveness; RQ—Regulatory Quality; RL—Rule of Law; CC—Control of Corruption; *** denotes significance
at the 1% level; ** at the 5% level; * at the 10% level
Source: Worldwide Governance Indicators (WGI) data available at www.govindicators.org
Another proxy variable used in this investigation was the terms of trade, ToT, estimated as the
ratio of the unit labor costs of the non-traded goods sector to that of the traded goods sector
following Oomes and Kalcheva (2007). In turn, the unit labor cost (in both the non-traded and
traded goods sector) was determined as the correspondence of wages in different sectors to their
respective productivity of labor, W/(Y/L), where W represents wages, and Y/L is the ratio of
output to labor (Hasanov, 2011a). High inflation and thus exchange rate overvaluation was
particularly high during the 2003–2006 period due to rapid inflows of foreign investment,
73
Median estimates for the 14 provinces of Kazakhstan.

123
particularly because of the construction industry boom. Conversely, real exchange rate
overvaluation in 2007–2009 was due to high oil prices (Bilyasheva and Bineau, 2011).
Regarding the measurement of resource abundance, which has been a keenly debated issue in the
literature of economic development and growth, the natural resource curse phenomenon is
sensitive to resource abundance measurements. The share of primary goods exports, either in
income or as a portion of total exports, is commonly employed in literature (Bond and Malik,
2009). Evidently, primary goods export is a proxy variable used for resource abundance
measurement, although it does not directly represent the resource richness of a country. A more
accurate measurement has recently been suggested by the World Bank (2005) based on the net
present value of wealth divided into three components: produced assets, human resources and
natural capital. However, this method heightens the identification problem in empirical studies
(e.g., Brunnschweiler, 2008). Another method used in the literature that has received broad
attention suggests two ways of estimating resource abundance based on the income share of the
particular resource (Bond and Malik, 2009). Given that investigation of resource abundance
measurement based on the latter method relies on the majority of natural resources being
consumed domestically, export shares might not offer an accurate estimate. I used resource
production data of energy and agriculture sector shares in GRP for this research. Economists are
concerned with two major problems in employing this type of estimate, the data quality and the
possibility of an endogeneity issue (Brunnschweiler, 2008). The endogeneity problem was
addressed using a two-stage least squares panel data model that is discussed in further detail in
the following section.
5.5 Empirical Investigation Results of Resource Abundance Impacts on
Economic Performance in Kazakhstan
Following the discussion above concerning the institutional quality endogeneity problem, an
IV/GMM fixed effects dynamic panel data model was used to combine fixed effect panel
estimates with instrumental variables. Natural resource endowments were used as instrumental
variables for the regression analysis, while institutional quality (Contract-Intensive Money), Inst,
was instrumented. The results of the instrument validity and exogeneity tests are presented in
Table 5.5 and Table 5.6. The fact that the geopolitical boundaries of the different provinces of

124
Kazakhstan were established according to economic factors implies that economic performance
could affect resource abundance among the regions. Consequently a feedback effect problem
arose, which usually can be dealt using an FE 2SLS model. Although the FE 2SLS method
addresses unobserved individual heterogeneity, it relies on the assumptions that there is no
autocorrelation and an absence of heteroscedasticity in the equation. However, when such
problems occurs the efficiency of the estimates is called into question. Therefore the dynamic
panel data IV/GMM method was applied to generate robust standard errors to address the
arbitrary heteroscedasticity and autocorrelation problems. In the case of a short time span, fixed
effects estimates are often inconsistent (Nickell, 1981) and IV and GMM (Arellano and Bond,
1991) methods are both regularly employed. A IV plus 2-way FE procedure was applied (based
on Driscoll and Kraay, 1998) and the results are presented in Table 5.5 and Table 5.6.74
This
method makes corrections to standard errors to address heteroscedasticity, serial correlation, and
cross-sectional dependence problems. I used a two-step GMM model instead of the System-
GMM, which is asymptotically efficient. The results of the tests of the validity of the instruments
utilized for institutional quality are presented in Table 5.5. As indicated by the results of the
Hansen J-statistic overidentification tests, orthogonality cannot be rejected in almost all of the
cases.75
Thus, orthogonality test results imply that the instruments are valid, with exogeneity
being confidently rejected. The Kleibergen-Paap Wald F, K-P LM statistics indicate that the null
hypothesis should be rejected for all cases. Therefore, the IV/GMM panel data dynamic method
was specified as being reliable in the specifications (2)–(4).
The relationships between public investment, private investment, and economic performance
have been an important issue in study of economic growth (Evans, 1985; Aschauer, 1989). Thus,
there is a general belief that these two types of investment can have divergent effects on
economic performance. For instance, public investment in human capital formation and
infrastructure can boost private investment. On the other hand, if public investments are raised
by means of borrowing and subsequently increasing interest rates they ‘crowds out’ private
investment (Khan and Kumar, 1997; Ghali, 1998; Ramirez, 2002). Thus, it is important for
policymakers in developing countries to define the difference between public and private
74
I used the xtivreg2 command in Stata, which yields robust standard errors (Schaffer, 2007). 75
It was only rejected when resource abundance variables were included in the model with one lag (Column 1,
Tables 5.5 and 5.6), verifying that the specification with two lags are crucial, as expected.
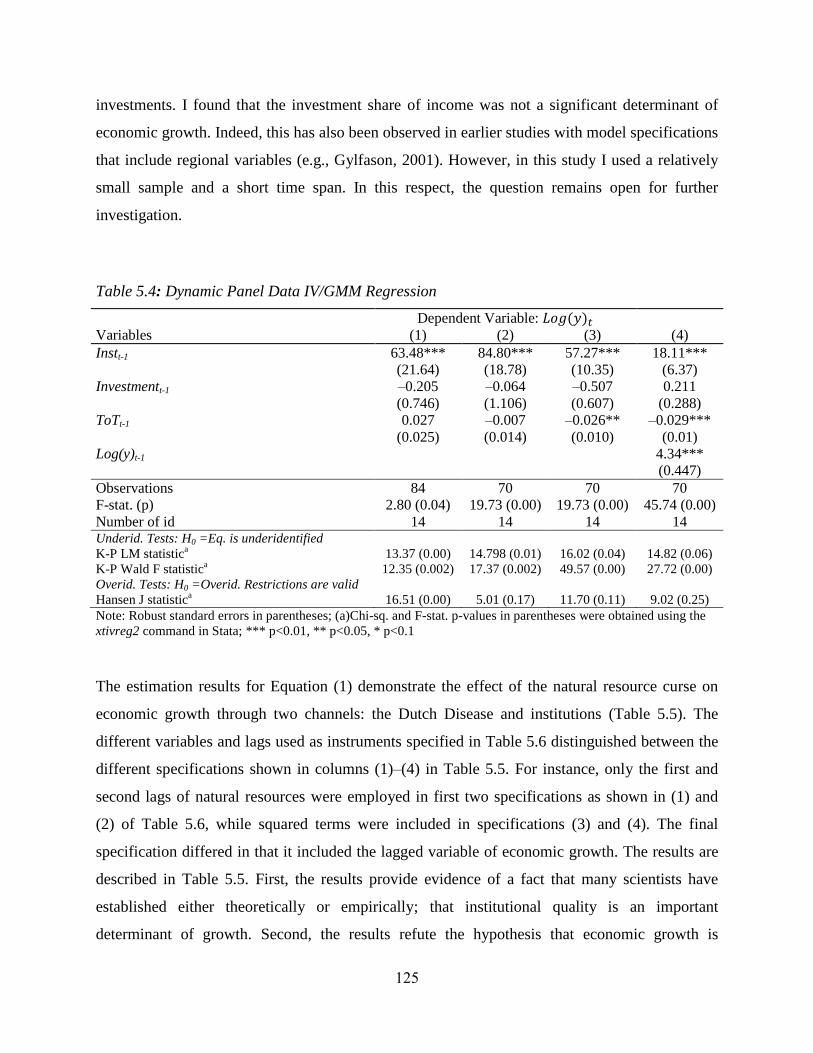
125
investments. I found that the investment share of income was not a significant determinant of
economic growth. Indeed, this has also been observed in earlier studies with model specifications
that include regional variables (e.g., Gylfason, 2001). However, in this study I used a relatively
small sample and a short time span. In this respect, the question remains open for further
investigation.
Table 5.4: Dynamic Panel Data IV/GMM Regression
Dependent Variable: 𝐿𝑜𝑔(𝑦)𝑡
Variables (1) (2) (3) (4)
Instt-1 63.48***
(21.64)
84.80***
(18.78)
57.27***
(10.35)
18.11***
(6.37)
Investmentt-1 –0.205 –0.064 –0.507 0.211
(0.746) (1.106) (0.607) (0.288)
ToTt-1 0.027 –0.007 –0.026** –0.029***
(0.025) (0.014) (0.010) (0.01)
Log(y)t-1 4.34***
(0.447)
Observations 84 70 70 70
F-stat. (p) 2.80 (0.04) 19.73 (0.00) 19.73 (0.00) 45.74 (0.00)
Number of id 14 14 14 14 Underid. Tests: H0 =Eq. is underidentified
K-P LM statistica
13.37 (0.00) 14.798 (0.01) 16.02 (0.04) 14.82 (0.06)
K-P Wald F statistica
12.35 (0.002) 17.37 (0.002) 49.57 (0.00) 27.72 (0.00)
Overid. Tests: H0 =Overid. Restrictions are valid
Hansen J statistica
16.51 (0.00) 5.01 (0.17) 11.70 (0.11) 9.02 (0.25)
Note: Robust standard errors in parentheses; (a)Chi-sq. and F-stat. p-values in parentheses were obtained using the
xtivreg2 command in Stata; *** p<0.01, ** p<0.05, * p<0.1
The estimation results for Equation (1) demonstrate the effect of the natural resource curse on
economic growth through two channels: the Dutch Disease and institutions (Table 5.5). The
different variables and lags used as instruments specified in Table 5.6 distinguished between the
different specifications shown in columns (1)–(4) in Table 5.5. For instance, only the first and
second lags of natural resources were employed in first two specifications as shown in (1) and
(2) of Table 5.6, while squared terms were included in specifications (3) and (4). The final
specification differed in that it included the lagged variable of economic growth. The results are
described in Table 5.5. First, the results provide evidence of a fact that many scientists have
established either theoretically or empirically; that institutional quality is an important
determinant of growth. Second, the results refute the hypothesis that economic growth is
126
determined solely by institutional quality and performance. Evidence of the Dutch Disease
impact is revealed by the results presented in columns (3) and (4), accompanying institutional
quality as another major channel of the natural resource curse effect. Thus, institutional quality
alone is not a strong predictor of growth.
The Dutch Disease effect variable reflecting the lagged variable of the relative per unit labor
costs of non-tradable goods sectors to that of tradable goods sectors, 𝑇𝑜𝑇𝑡−1, indicates a
significant negative impact on economic growth.76
Primary resource concentration and increased
returns trigger a spending effect. An increase in the relative price of non-tradable goods to
tradable goods occurs as a result of a spending boom, because the prices of non-tradable goods
are influenced by increased spending, unlike the prices of tradable goods. Subsequently real
wages soar, followed by relative price increases, raising overall domestic prices and thus
deteriorating competitiveness, particularly of the manufacturing sector.
An oil price increase and oil sector boom in oil resource-rich countries is likely to be
accompanied by a decrease in the risk premium of foreign funds to the country. This is followed
by an improvement in the terms of trade, causing the Dutch Disease problem (Kuralbayeva and
Vines, 2008). Indeed, in relying on their share of current and future oil revenues, the private
sector bases its consumption decisions accordingly. Thus, domestic spending increases
significantly as a result of private sector consumption behavior (Ploeg and Venables, 2011).
Indeed, this is evident in the case of Kazakhstan, with the recent oil price increase having fuelled
the spending behavior of the private sector, jeopardizing sustained economic growth and
institutional prudence.77
This relationship could be explained according to the Balassa-
Samuelson effect, implying that a productivity increase in the energy sector (especially oil
production) leads to relative price increases in non-tradable goods sectors. Thus, the real
exchange rate increase following relative price increases reduces the competitiveness of non-
tradable goods sectors.78
76
The significance is evident when the abundant resources production share of income (i.e., squared terms of
resources production), variables were included in the model. 77
See Esanov and Kuralbayeva (2010), a case study of the Natural Resource Curse and its potential channels in
Kazakhstan. The negative impact of ToT on institutional quality was documented in the first stage regression results
(see below).
78
See Kuralbayeva et al. (2001) and Algozhina (2006) on the Dutch Disease impact in Kazakhstan.
127
The results of the first stage regression disclosed in Table 5.6 are similar to the findings of
previous studies.79
Indeed, this confirms the suggestion made by other scientists that not all
natural resources deteriorate institutional quality, but rather specific ones, particularly point-
source natural resources.80
For instance, one standard deviation in the energy production value-
added share of income would lead to a 0.078 (7.8%) decrease in institutional quality.81
However,
the lagged variable of the energy production share of income and its squared term
EnergyProd_SQ, are weakly significant predictors of growth through institutional quality (Table
5.6). The energy production share of income negatively influences economic performance
through propagating ‘bad’ or inefficient institutions. Mehlum et al. (2006) argued that resource
concentration only undermines growth through its impacts on institutional quality. Heavy
concentration in energy production favors ‘grabber friendly’ institutions and worsens economic
performance, while resource reliance associated with ‘producer friendly’ institutions favors
economic growth. Thus, primary commodity production concentration also influences economic
growth through institutions.
In contrast with the findings of other studies, the agricultural value-added share of income did
not have a positive impact. The marginal effect of the agricultural value-added share of income
on institutional quality was estimated using specification (4) in Table 5.6, indicating that a
negative impact overwhelms the positive impact of overabundant resource production.82
For
instance, a one standard deviation (0.15) increase in agricultural value added leads to a 0.0227
(2.27%) decrease in institutional quality. Initially it seems that this negative impact contradicts
the findings observed in previous studies, because diffuse resources are supposed to have
positive impacts on institutional quality. However, taking into account that the agricultural
sectors in CIS countries, including Kazakhstan, are mainly controlled by state or large-scale
agricultural producers it can be considered as a point-source resource sector. Accordingly, this is
79
The Angrist-Pischke tests such as first-stage Chi2 and F-test for underidentification and weak identification test
results show that the endogenous variable is identified. 80
See Auty (1997), Woolcock et al. (2001), and Isham et al. (2005). 81
Only the squared term was considered because the energy production value-added term is insignificant. Therefore,
the marginal effect was estimated as follows: �̂�8 ∗ (𝑠𝑡𝑑𝑒𝑣(𝐸𝑛𝑒𝑟𝑔𝑦𝑃𝑟𝑜𝑑_𝑆𝑄)/𝑠𝑡𝑑𝑒𝑣(𝐼𝑛𝑠𝑡))= -0.0245*(0.7/0.22) =
–0.078. 82
The marginal effect was estimated as follows: ∆𝐼𝑛𝑠𝑡 = (𝛽6̂ + 2 ∗ 𝛽10̂ ∗ 𝐴𝑔𝑟𝑖𝑉𝐴̅̅ ̅̅ ̅̅ ̅̅ ̅̅ ) ∗ 𝑠𝑡. 𝑑𝑒𝑣. 𝐴𝑔𝑟𝑖𝑉𝐴, where 𝐼𝑛𝑠𝑡
is the level of institutions, 𝐴𝑔𝑟𝑖𝑉𝐴 is the agricultural value-added share of income, and 𝑠𝑡. 𝑑𝑒𝑣. 𝐴𝑔𝑟𝑖𝑉𝐴 is the
standard deviation of agricultural value added share in income. Thus the marginal effect estimation gives the
following result:∆𝐼𝑛𝑠𝑡 = (–0.264+2*0.313*0.18)*0.15=–0.0227, where the mean of agricultural value added is
0.18, its standard deviation is 0.15.
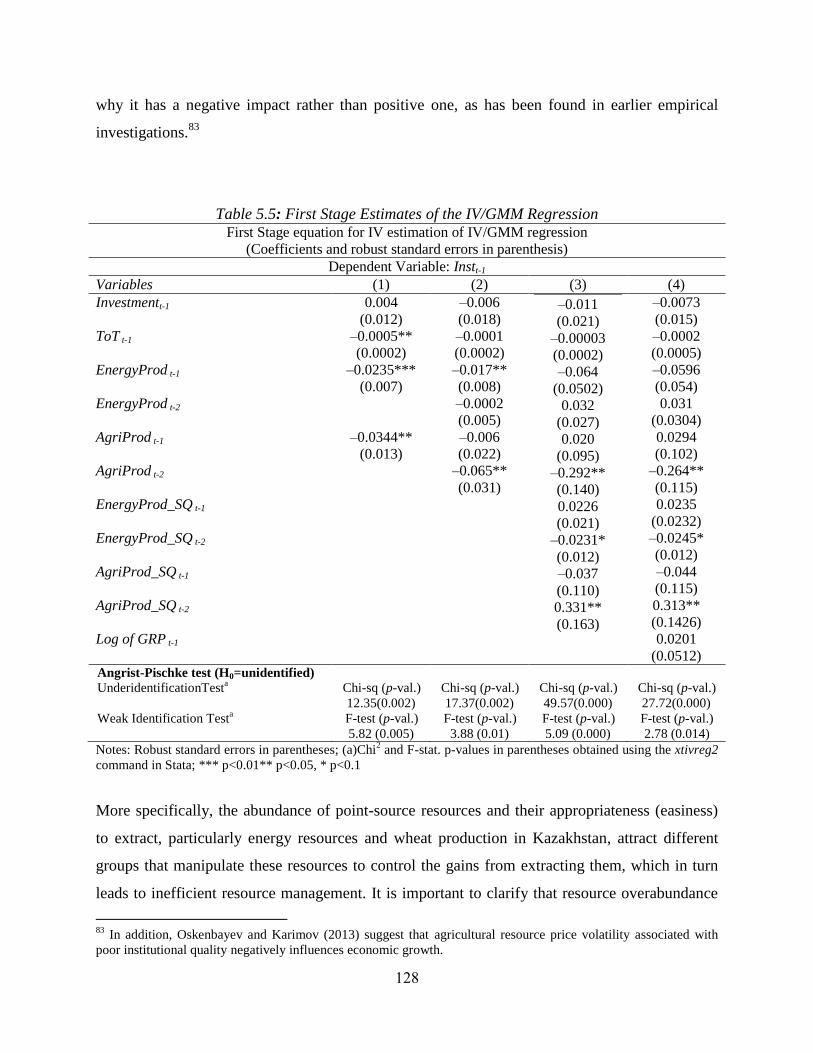
128
why it has a negative impact rather than positive one, as has been found in earlier empirical
investigations.83
Table 5.5: First Stage Estimates of the IV/GMM Regression First Stage equation for IV estimation of IV/GMM regression
(Coefficients and robust standard errors in parenthesis)
Dependent Variable: Instt-1
Variables (1) (2) (3) (4)
Investmentt-1
ToT t-1
EnergyProd t-1
EnergyProd t-2
AgriProd t-1
AgriProd t-2
EnergyProd_SQ t-1
EnergyProd_SQ t-2
AgriProd_SQ t-1
AgriProd_SQ t-2
Log of GRP t-1
0.004
(0.012)
–0.0005**
(0.0002)
–0.0235***
(0.007)
–0.0344**
(0.013)
–0.006
(0.018)
–0.0001
(0.0002)
–0.017**
(0.008)
–0.0002
(0.005)
–0.006
(0.022)
–0.065**
(0.031)
–0.011
(0.021)
–0.00003
(0.0002)
–0.064
(0.0502)
0.032
(0.027)
0.020
(0.095)
–0.292**
(0.140)
0.0226
(0.021)
–0.0231*
(0.012)
–0.037
(0.110)
0.331**
(0.163)
–0.0073
(0.015)
–0.0002
(0.0005)
–0.0596
(0.054)
0.031
(0.0304)
0.0294
(0.102)
–0.264**
(0.115)
0.0235
(0.0232)
–0.0245*
(0.012)
–0.044
(0.115)
0.313**
(0.1426)
0.0201
(0.0512) Angrist-Pischke test (H0=unidentified)
UnderidentificationTesta
Weak Identification Testa
Chi-sq (p-val.)
12.35(0.002)
F-test (p-val.)
5.82 (0.005)
Chi-sq (p-val.)
17.37(0.002)
F-test (p-val.)
3.88 (0.01)
Chi-sq (p-val.)
49.57(0.000)
F-test (p-val.)
5.09 (0.000)
Chi-sq (p-val.)
27.72(0.000)
F-test (p-val.)
2.78 (0.014)
Notes: Robust standard errors in parentheses; (a)Chi2 and F-stat. p-values in parentheses obtained using the xtivreg2
command in Stata; *** p<0.01** p<0.05, * p<0.1
More specifically, the abundance of point-source resources and their appropriateness (easiness)
to extract, particularly energy resources and wheat production in Kazakhstan, attract different
groups that manipulate these resources to control the gains from extracting them, which in turn
leads to inefficient resource management. It is important to clarify that resource overabundance
83
In addition, Oskenbayev and Karimov (2013) suggest that agricultural resource price volatility associated with
poor institutional quality negatively influences economic growth.
129
does not have a direct negative effect on economic growth; rather the effect is dependent on
institutional quality. Therefore, in cases where ‘producer friendly’ institutions are prevalent in
resource overabundant countries, point-source resources can contribute to economic growth. This
probably explains why some point-source resource rich countries (e.g., Norway, Botswana, Chile
and Mauritius) succeed more than others. The fact that overabundant resource production and
concentration is often accompanied by poor quality institutions, given that it can lead to
inefficient institutional activities when resource production is excessive and not in every case,
suggests that better (e.g., more transparent) management of point-source resources could derive
economic growth rather that have a detrimental effect on growth.
The ‘excess’ or overabundant resource production itself, EnergyProd_SQ and AgriVA_SQ (with
lags), suggests that institutional quality, Inst, is endogenously determined by natural resource
endowments and concentration, and that it is a significant estimator of growth (see columns 3
and 4 in Table 5.6). However, it rather shows that either the energy resource (EnergyProd)
production or its ‘excess’ production (EnergyProd_SQ) undermines the quality and performance
of institutions.84
Indeed, this is the major finding of this investigation. The interaction of a
squared term of the share of energy production of income (EnergyProd_SQt-2) has a weakly
significant negative impact on 𝐼𝑛𝑠𝑡𝑡−1, thus downgrading the institutional quality. The variable
is significant in terms of magnitude, as well as in comparison to other variables in the model. In
other words, ceteris paribus, energy production (of point-source resources) or its overabundant
level of production often favors poor or inefficient institutions.
5.6 Concluding Remarks
The results of this study are relatively interesting given that it is a case study. The most important
econometric finding of this study is that institutional quality is a function of point source and
diffuse natural resource endowments considered as a nonlinear function (squared terms), which
is an indicator of ‘overabundance’ or excess production. I found that the squared term of the
energy production share of income had a negative effect on institutional quality, implying that
excess production is detrimental to institutional quality. The overabundance or excess production
of point-source resources and their appropriateness (easiness) to extract, particularly in terms of
energy resources, attracts groups that seek to control these resources for their own benefit. In
84
See columns 1–4 in Table 5.6.

130
turn, this stimulates inefficient institutional activities. Resource overabundance does not have
direct negative effects on economic growth, rather it reduces institutional quality and causes poor
economic performance. Either energy or agricultural resource production can have negative
impacts on economic growth via adverse effects on institutional quality. Although overabundant
agricultural resource production has a positive influence on institutions and economic growth, a
negative overall effect of agricultural resources on economic growth was detected. One potential
explanation for this result is that agricultural resource production is manipulated and regulated
by large-scale agricultural enterprises in Kazakhstan. From this perspective agricultural resource
production is more similar to point-source than diffuse resources.
Therefore, the energy production share of GRP exhibits a negative impact on economic growth
via institutions. Excess or overabundant energy resource production share of income negatively
effects economic performance by favoring weak institutions. Either energy resource production
or the ‘excessive’ production share of income as well as the agricultural value-added share of
income have detrimental effects on institutional quality. Thus, it is the excess nature of energy
resource production associated with low levels of commodity production that is detrimental to
institutional quality, demonstrating the indirect effect of energy resource production. Indeed, this
was also observed with the inclusion of the energy production share of income.
Heavy concentration on energy production generates ‘grabber friendly’ institutions that are
detrimental to economic growth. Thus, primary commodity production can also positively
influence economic growth through institutions, as is documented with the inclusion of excess
agricultural resource production (squared term). In this respect greater transparency and political
accountability in the management of specific point-source resources (e.g., oil production) is the
most significant policy recommendation resulting from this investigation, given that a lack of
transparency makes point-source resource production appropriable by rent-seeking entities and
prone to inefficient utilization. In addition, overly complicated rules and regulations enhance
opportunities to extract bribes. Therefore, a lack of transparency as well as burdensome
regulations and rules reflect key issues to be addressed in managing point-source resource
industries. Excessive regulations and burdensome rules force small businesses to engage in
inefficient institutional practices. By contrast, under a transparent business regulation regime
small businesses are motivated to conduct business efficiently. A greater number of small- and
131
medium-sized enterprises would boost competition, especially in the agricultural sector,
consequently eliminating the domination of large-scale agricultural enterprises. In turn, this
would create an environment that is more amenable to reforms such as ensuring land property
rights, which would help undermine the position of elites and their resistance to democratic
reforms. Therefore, inclusion of more small and medium businesses would favor institutional
quality and improve the contribution of the agricultural sector to economic development.

132
6 CONCLUSIONS AND RECOMMENDATIONS
The first objective of the study was to assess the potential channels of the resource curse based
on data from developing countries. The study results indicate that resource abundance has
adverse and persistent effects on income per capita via institutional quality and governance. I
also examined the weak hypothesis that institutions and governance is the only channel of the
resource curse. In particular, the Dutch disease effect (the real exchange rate) was not observed
using terms of trade data. However, this may stem from the fact that the functional relationship
might differ between countries. Moreover, another drawback of the investigation is that the
available real exchange data is for a relatively short time span, from 2000 to 2010. An important
finding of this research study is that excess energy resource production or ‘overabundance’ is
associated with a decline in agricultural resource production based on research in CIS countries
(see the detailed discussion in Chapter 3). Furthermore, it was also observed that the total effect
of agricultural value added had a negative impact on institutional quality and economic growth,
despite the squared term of agricultural value added exhibiting a positive impact on institutional
quality and economic growth. Indeed, this has also been documented in analyses from
Kazakhstan and other CIS countries. This is an implication that the agricultural sectors are
dominated by state or large agricultural enterprises in these countries, and in this sense the sector
can be regarded as a point-source resource sector. The dominance of large agricultural
enterprises or state companies has negatively influenced the progress of reforms; for instance,
land property rights are not enacted or established in almost all of the CIS countries.
Another key finding of this study is that the wheat sector of Kazakhstan, often considered as a
diffuse resource sector in the literature, can be perverted by point source resource industries (e.g.,
energy production) owing to institutional arrangements. In contrast to other studies, I found that
diffuse resources such as wheat can be detrimental to governance. In 2007 Kazakhstan
designated 30 corporate leaders that would be the drivers of the economy in the international
arena. The Samruk-Kazyna state holding company is major actor that serves as the engine of
these corporate leaders. KazAgro, a subsidiary company of the national holding company,
announced the choice of clusters and large-scale agricultural producers. This reveals that the
government intentionally fostered and lobbied for large-scale agriculture enterprises. For
instance, agricultural land and transportation reforms reveal that large-scale farms are promoted
133
by the relevant institutions, especially with respect to financing activities and land distribution.
In particular, this explains the divergent paths of growth between the CIS and Central and
Eastern European (CEE) economies in their agricultural sectors. Although, energy resources are
more exposed to rent capture, it is possible to extract rents from agricultural resources through
transportation bottlenecks, export bans, and opaque licensing practices, as discussed in Chapter
4. Furthermore, the price volatility of agricultural resources can deteriorate institutional quality
by increasing rent-seeking activities. Thus, the combination of price volatility and weak
institutions can also undermine economic performance in the case of the agricultural sector. The
dramatic increase in wheat production in 2009 and the fires that affected Russia and some parts
of Kazakhstan in 2010 prompted the government of Kazakhstan to undertake several policy
actions, with financial assistance allocated to supporting grain transportation costs. In addition, a
law was introduced that requires producers to sell part of their wheat harvest to KazAgro in the
event that their harvests exceed the government-defined level. While these policies were
ostensibly intended to boost the competitiveness of the agriculture sector and support small
producers, they could also lead to rent-seeking behavior. Institutional reforms that discourage
rent-seeking behavior should be applied in this case, given that the government will have
increasing responsibility for the wheat market in future years.
The agricultural sector was ignored by the state during the early years of independence when it
confronted a substantial decline in food production. However, the state has reversed its policies
towards the development of the agricultural sector since 2000 as part of its economic
diversification strategy with the support of increased oil revenues. Indeed, statistics show that the
government has significantly increased subsidies and other types of financial support,
predominantly to large-scale producers. Isham et al. (2005) classified wheat as a diffuse resource
that is grown on relatively small family farms in North America, implying that cultivable land
was not occupied by elites. The fact that arable land was originally distributed among small
farmers in North America ensured innovative property rights earlier on than in many countries,
which in turn enabled sound institutions to develop. By contrast, institutional arrangements and
government policies such as state budget support, financial resources to cover transportation and
exporting costs, and land property rights have significantly contributed to the formation and
expansion of large-scale agricultural producers and state companies in Kazakhstan. As a result,
the process of enacting land and property rights reforms has been rather slow. On the other hand,

134
this in turn has induced a case of the Dutch Disease problem, deteriorating the agricultural
sector’s competitiveness. The food price decline in the first decade of independence has been
reversed, considerably reversing in favor of agricultural producers due to substantial state budget
support.
Kazakhstan’s economy has undergone substantial institutional arrangements in order to diversify
its economy. Most importantly, the state holding company Samruk-Kazyna was created in 2008,
with subsidiary companies in the major sectors of the Kazakhstan economy, including the
agricultural sector. The policy intended to use oil funds to benefit neglected sectors of the
economy, particularly to avoid the potential for a Dutch Disease problem. Consequently, the
state holding company KazAgro was established under the auspices of the Ministry of
Agriculture along with other subsidiary state companies of Samruk-Kazyna.
State intervention has had a substantial impact in the domestic wheat market. As shown in Figure
4.6, the state is becoming a key player in the wheat market of Kazakhstan. It is the de-facto
trader in the market, given that an enormous volume of wheat is purchased for commercial
purposes. On one hand, the state purchases helped farmers to avoid low profitability in 2009 due
to the record harvest levels and low wheat prices in the market. On the other hand, agricultural
producers and farmers often have to wait until the state announces the government-set wheat
prices, which creates some uncertainty for other traders within the market. For instance, if the
state sets the wheat price higher than the market price, other traders are unable to participate in
the wheat market and remain excluded until the state completes it purchases.
Due to the evolving nature of its institutional structure, Kazakhstan has been incapable of
developing comprehensive energy industry policies during the initial stage of attracting foreign
investments into the oil and gas industries. Despite recent positive signs the insignificant share of
Kazakhstan content, uncompetitive refinery production, and additional processing industries
might not be conducive to the expected sector improvements.
High resource concentration represents a typical problem of capital intensive sectors, which
leads to conflict among unbalanced interests. In countries with good governance over natural
resources industries governments pursue stakeholder interests by introducing step-by-step
development strategies. However, the recent price increase for oil products and the vast amount

135
of revenues were followed by an increase in state capacity. As the power of government
institutions became dominant the tax regime system became volatile. Rushed decision making
and crisis response policies since 2009 have harmed, or at least worsened, the investment
climate; moreover, indirect fiscal tools have led to the inefficient use of natural resources.
Further Research
While there is a broad range of literature concerning the natural resource curse, consideration of
natural capital depreciation using real GDP per capita growth rather than genuine income as the
main indicator of economic development is rare. Some research has taken into account genuine
income, strongly or weakly suggesting a natural resource curse in terms of genuine income
(Mikeseel, 1997; Neumayer, 2004), albeit without unanimous agreement on the existence of a
resource curse in terms of genuine savings and income. Genuine income is obtained by deducing
depreciation from GDP. Such research has found evidence of the natural resource curse when
correcting GDP per capita growth with genuine savings and income. The majority of supporters
of the use of genuine income advocate on the basis of the natural resource curse explanation,
particularly emphasizing unsustainable overconsumption, namely falsely indicating high income
levels and leading to unsustainable consumption. Thus, the erroneous perception of income
levels by policy-makers fuels overconsumption beyond sustainable levels. The revelation of the
existence of a natural resource curse by taking into account genuine income indicates that
overconsumption is crucial in explaining the resource curse. Therefore, it remains important to
conduct further investigation of the natural resource curse and its causes by employing a genuine
income estimate. From my perspective, future investigation focusing on the resource curse
should be carried out using panel data analyses to control for unobserved effects and avoid the
problem of estimate inconsistency. Moreover, future studies should take into account natural
capital stock and resource depletion rather than other traditional measures of economic
development such as GDP, which has been used in many empirical studies of the resource curse.
I did not find evidence that fixed capital formation has an impact on economic growth. Economic
theory suggests that the effects of the public and private investment nexus depend on several
factors. Public investment might boost economic growth if it enhances human capital formation
and infrastructure, while on the other hand it can crowd out private investment. Many studies are
limited due to the fact that they analyze small samples and data over short time spans. This study

136
shares these limitations. In addition, other determinants of growth such as human capital and
macroeconomic instability should be taken into consideration when evaluating the issue. The
volatility of energy resources reflects a central issue in economic development. External shocks
and energy price volatility associated with weak institutions in natural resource rich economies
can cause welfare losses (Loyaza et al., 2007). Therefore, how to overcome volatility and
manage risks associated with the volatility of energy and commodities prices deserve additional
investigation. Furthermore, emphasis should be placed on determining how to reduce the
negative effects of volatility on economic growth and poverty.
Some resource-rich countries (e.g., Norway, Chile) have exhibited relatively rapid growth, while
others (e.g., Venezuela, Papua New Guinea) have suffered from stagnation. By the same token,
some resource poor countries have experienced slow growth, while others such as some
Southeast Asian countries have experienced significant economic growth. The variability in the
expression of the natural resource effect is likely due to the fact that it can manifest through
different channels. Consequently, further investigations should focus on determining the impacts
of natural resource concentration or abundance on specific economies. A case study approach,
rather than cross-country investigation, can potentially provide specific explanations as to why
resource-rich countries experience divergent outcomes with respect to economic development.
One of the key channels of the negative impact of natural resources on economic growth is rent-
seeking activities, which deteriorate institutional quality. However, natural resources can
contribute to economic development under the tutelage of ‘producer friendly’ institutions. Thus,
further research should concentrate on the motives or channels through which natural resource
concentration fuels rent-seeking activities that ultimately undermine long-term economic growth.
Policies
The major policy strategy in the agricultural sector of Kazakhstan during the 1990s was
privatization. However, the manner of execution of this process led to the takeover of control
over production by the existing farm managers. Large-scale agricultural producers have become
increasingly dominant in crop production, whereas livestock production has been more
conducive to individual producers. Consequently, the disparity between large and small
enterprises has substantially increased. Large-scale enterprises prevail in North Kazakhstan

137
where wheat production dominates the sector. Policies have reversed since 1999 when the
government decided to support the agriculture sector and improve public finance availability.
Nevertheless, the key actors in the wheat sector remain influential and central government
policies are not implemented if they run counter to the interests of large agro-holding companies.
There are several factors contributing to the inefficient allocation of financial support to the
agricultural sector, including high transaction costs, the dominance of the state holding company
in the credit market, low returns on investment, and the risk involved in the agricultural sector
due to volatile weather conditions, especially in the wheat producing regions of Kazakhstan.
Evidently, the national holding company’s (KazAgro) presence in the market has compensated
for the lack of financial resources. However, the efficient allocation of public finances requires
careful assessment. Corporate governance and the transparent allocation of financial support by
KazAgro must be addressed for the sake of the efficient use of public financial resources. This
would enhance public financial support for agricultural producers, especially small and medium
enterprises. Moreover, it would also stimulate lending by second-tier banks, creating a more
competitive environment. Thus, transparency would mitigate the limited availability of
commercial bank loans to small and medium agricultural producers.
The policies and institutional arrangements to diversify the economy pursued in 2006–2007 have
revealed several weaknesses. These subsidy and financial assistance programs intended to
facilitate grain production were often accompanied by the inefficient use of public financial
resources. Thus, subsidy policies have fuelled corruption to some extent.
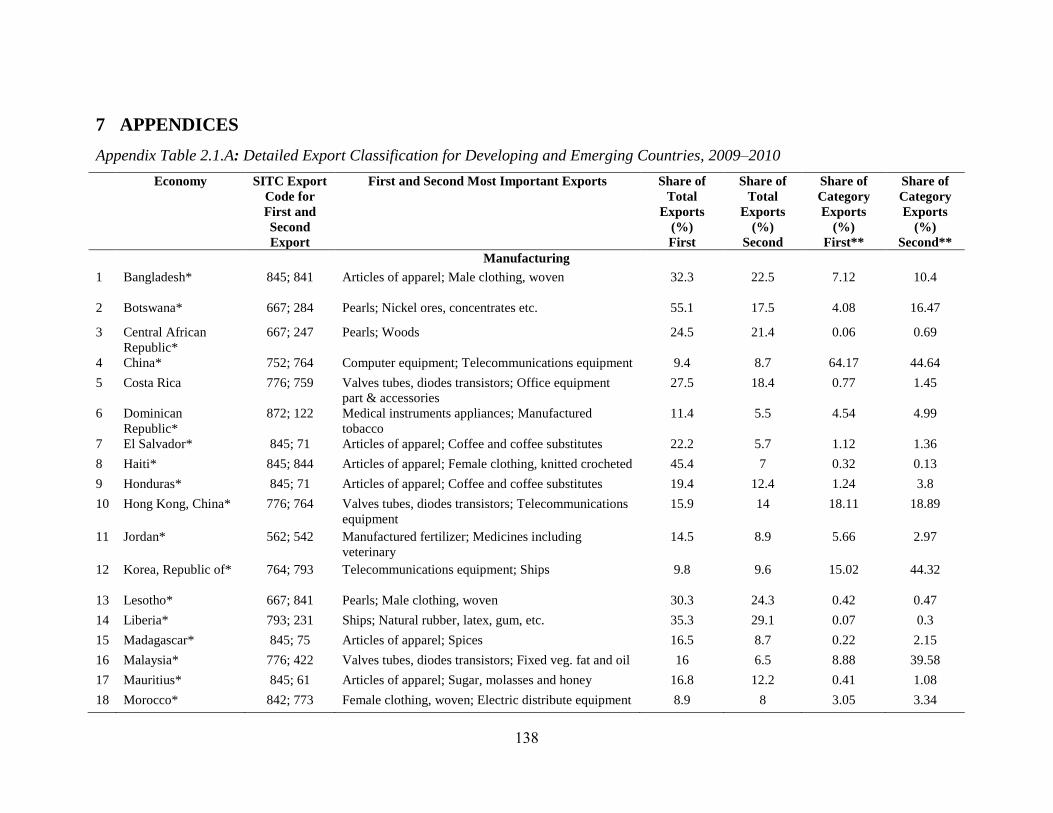
138
7 APPENDICES
Appendix Table 2.1.A: Detailed Export Classification for Developing and Emerging Countries, 2009–2010
Economy SITC Export
Code for
First and
Second
Export
First and Second Most Important Exports Share of
Total
Exports
(%)
First
Share of
Total
Exports
(%)
Second
Share of
Category
Exports
(%)
First**
Share of
Category
Exports
(%)
Second**
Manufacturing
1
Bangladesh* 845; 841 Articles of apparel; Male clothing, woven 32.3 22.5 7.12 10.4
2 Botswana* 667; 284 Pearls; Nickel ores, concentrates etc. 55.1 17.5 4.08 16.47
3 Central African
Republic*
667; 247 Pearls; Woods 24.5 21.4 0.06 0.69
4 China* 752; 764 Computer equipment; Telecommunications equipment 9.4 8.7 64.17 44.64
5 Costa Rica 776; 759 Valves tubes, diodes transistors; Office equipment
part & accessories
27.5 18.4 0.77 1.45
6 Dominican
Republic*
872; 122 Medical instruments appliances; Manufactured
tobacco
11.4 5.5 4.54 4.99
7 El Salvador* 845; 71 Articles of apparel; Coffee and coffee substitutes 22.2 5.7 1.12 1.36
8 Haiti* 845; 844 Articles of apparel; Female clothing, knitted crocheted 45.4 7 0.32 0.13
9 Honduras* 845; 71 Articles of apparel; Coffee and coffee substitutes 19.4 12.4 1.24 3.8
10 Hong Kong, China* 776; 764 Valves tubes, diodes transistors; Telecommunications
equipment
15.9 14 18.11 18.89
11 Jordan* 562; 542 Manufactured fertilizer; Medicines including
veterinary
14.5 8.9 5.66 2.97
12 Korea, Republic of* 764; 793 Telecommunications equipment; Ships
9.8 9.6 15.02 44.32
13 Lesotho* 667; 841 Pearls; Male clothing, woven 30.3 24.3 0.42 0.47
14 Liberia* 793; 231 Ships; Natural rubber, latex, gum, etc. 35.3 29.1 0.07 0.3
15 Madagascar* 845; 75 Articles of apparel; Spices 16.5 8.7 0.22 2.15
16 Malaysia* 776; 422 Valves tubes, diodes transistors; Fixed veg. fat and oil 16 6.5 8.88 39.58
17 Mauritius* 845; 61 Articles of apparel; Sugar, molasses and honey 16.8 12.2 0.41 1.08
18 Morocco* 842; 773 Female clothing, woven; Electric distribute equipment 8.9 8 3.05 3.34

139
Economy SITC Export
Code for
First and
Second
Export
First and Second Most Important Exports Share of
Total
Exports
(%)
First
Share of
Total
Exports
(%)
Second
Share of
Category
Exports
(%)
First**
Share of
Category
Exports
(%)
Second**
19 Nicaragua* 845; 71 Articles of apparel; Coffee and coffee substitutes 14.1 13.3 0.28 1.25
20 Pakistan* 658; 42 Made-up textile article; Rice 15.8 10.4 9.96 12.46
21 Panama 793; 541 Ships; Pharmaceuticals excluding medicines 13.2 9 0.13 0.54
22 Philippines* 776; 752 Valve tubes, diode transistors; Computer equipment 30.7 15.5 4.31 3.44
23 Singapore* 776; 334 Valve tubes, diode transistors; Heavy petroleum &
bituminous oil
23.8 15.3 23.13 18.46
24 Thailand* 752; 776 Computer equipment; Valve tubes, diode transistors 7 4.8 5.98 2.62
25 Turkey* 781; 676 Passenger cars and race cars; Iron steel bar rod section
piling
5.7 4.9 7.35 26.87
26 Sierra Leone* 667; 285 Pearls; Aluminum ore concentrate alumina 24.2 12.2 0.12 0.76
Diffuse
27 Argentina* 81; 421 Animal feed excluding unmilled cereal; Fixed veg. fat
and oil
14.1 7.3 35.33 49.6
28 Benin* 263; 334 Cotton; Heavy petroleum & bituminous oil 34.7 15.6 6.77 0.08
29 Burkina Faso* 263; 971 Cotton; Gold non-monetary excluding ores 40.9 32.5 6.67 0.47
30 Fiji* 61; 34 Sugar, molasses and honey; Fish 14.5 10.7 0.4 0.32
31 Gambia* 57; 421 Fruit nut; Fixed veg. fat and oil 34.9 9.8 0.02 0.02
32 Guatemala 61; 57 Sugar, molasses and honey; Fruit nut 9.3 9.1 3.2 2.2
33 Guinea-Bissau* 057 Fruit 89.5 0.33
34 Kenya* 74; 292 Tea and mate; Crude vegetable materials 17.8 12.9 16.57 6.66
35 Malawi* 121; 74 Tobacco and refuse; Tea and mate 58.3 7.1 8.67 1.56
36 Mali* 971; 263 Gold non-monetary excluding ores; Cotton 58.6 20.7 1.43 5.72
37 Mozambique* 684; 351 Aluminum; Electric current 38.9 10 2.94 5.58

140
Economy SITC Export
Code for
First and
Second
Export
First and Second Most Important Exports Share of
Total
Exports
(%)
First
Share of
Total
Exports
(%)
Second
Share of
Category
Exports
(%)
First**
Share of
Category
Exports
(%)
Second**
38 Namibia* 34, 667 Fish, fresh live chilled frozen; Pearls 14.8 14 2.55 0.92
39 Niger* 1; 525 Live animals; Radioactivity& associated materials 25.5 25.2 7.24 19.24
40 Paraguay* 222; 11 Oil seed, etc., for soft oil; Beef 33.2 18.6 6.47 7.77
41 Rwanda* 74; 287 Tea and mate; Base metal ores & concentrates 33.8 23.3 1.6 0.37
42 Somalia 1; 971 Live animals; Gold non-monetary excluding ores 31.5 28.9 3.83 0.17
43 Sri Lanka* 74; 845 Tea and mate; Articles of apparel 16.6 12.8 24.77 1.2
44 Uruguay* 11; 42 Beef, fresh chilled frozen; Rice 18.3 7.4 11.99 2.75
45 Zimbabwe* 121; 325 Unmanufactured tobacco and refuse; Coke, semi coke
retort carbon
13.9 9.1 4.37 12.19
Point Source
46 Algeria* 333; 343 Crude petroleum & bituminous oil; Natural gas 45.1 31.2 3.02 18.24
47 Angola* 333; 667 Crude petroleum & bituminous oil; Pearls 96.8 1.2 5.66 0.97
48 Bolivia* 343; 287 Natural gas; Base metal ores & concentrates 41.7 12.7 2.74 4.71
49 Brazil* 281; 333 Iron ore and concentrates; Crude petroleum &
bituminous oil
12 7.3 55.53 1.68
50 Cameroon* 333; 72 Crude petroleum & bituminous oil; Cocoa 33.6 16.8 0.16 4.98
51 Chad* 333; 334 Crude petroleum & bituminous oil; Heavy petroleum
& bituminous oil
84.5 7.5 0.33 0.09
52 Chile* 682; 283 Copper; Copper ores and concentrates 36.7 18.5 40.22 37.4
53 Colombia* 333; 321 Crude petroleum & bituminous oil; Coal excluding
non-agglomerated
29.5 14.8 1.4 16.41
54 Congo* 333; 334 Crude petroleum & bituminous oil; Heavy petroleum
& bituminous oil
77.4 4.5 0.72 0.13
55 Ecuador* 333; 57 Crude petroleum & bituminous oil; Fruit nut 48.8 13.4 1 6.44
56 Egypt* 334; 343 Heavy petroleum & bituminous oil; Natural gas 9.9 8.2 0.98 2.37

141
Economy SITC Export
Code for
First and
Second
Export
First and Second Most Important Exports Share of
Total
Exports
(%)
First
Share of
Total
Exports
(%)
Second
Share of
Category
Exports
(%)
First**
Share of
Category
Exports
(%)
Second**
57 Gabon* 333; 247 Crude petroleum & bituminous oil; Wood 73.8 9.2 0.66 15.67
58 Guinea* 285; 333 Aluminum ore concentrate alumina; Crude petroleum
& bituminous oil
48.1 14 14.61 0.02
59 Guyana* 971; 42 Gold non-monetary excluding ores; Rice 35.6 13.9 0.4 0.74
60 India* 334; 667 Heavy petroleum & bituminous oil; Pearls 14.2 9.5 11.43 35.72
61 Indonesia* 321; 422 Coal excluding non-agglomerated; Fixed veg. fat and
oil
11.6 10.1 48.66 47
62 Iran* 333; 334 Crude petroleum & bituminous oil; Heavy petroleum
& bituminous oil
77 2.5 9.06 0.88
63 Iraq 333; 334 Crude petroleum & bituminous oil; Heavy petroleum
& bituminous oil
97.2 0.8 5.81 0.14
64 Jamaica* 285; 334 Aluminum ore concentrate alumina; Heavy petroleum
& bituminous oil
37.1 18.8 11.1 0.1
65 Mauritania* 281; 34 Iron ore and concentrates; Fish, fresh live chilled
frozen
45.5 13.1 2.04 1.06
66 Mexico* 333; 764 Crude petroleum & bituminous oil;
Telecommunications equipment parts
11.7 7.4 4.03 7.09
67 Myanmar 343; 247 Natural gas; Wood 31.3 13.1 2.99 27
68 Nepal 674; 659 Steel; Floor Cover 9.0 7.7 0.46 1.14
69 Nigeria* 333; 334 Crude petroleum & bituminous oil; Heavy petroleum
& bituminous oil
80.2 5.2 6.32 1.22
70 Oman* 333; 343 Crude petroleum & bituminous oil; Natural gas 50.6 7.7 2.13 2.85
71 Papua New Guinea* 971; 283 Gold non-monetary excluding ores; Copper ores and
concentrates
28.3 21.9 2.01 3.82
72 Peru* 971; 283 Gold non-monetary excluding ores; Copper ores and
concentrates
23.4 16.3 9.53 16.27
73 Saudi Arabia* 333; 334 Crude petroleum & bituminous oil; Heavy petroleum
& bituminous oil
74.1 6.6 20.74 5.5
74 Senegal* 334; 522 Heavy petroleum & bituminous oil; Inorganic
chemical elem oxide salt
24.7 8.9 0.2 1.07
75 South Africa* 681; 321 Silver, platinum, platinum metals; Coal excluding
non-agglomerated
11.8 7.8 42.49 18.09
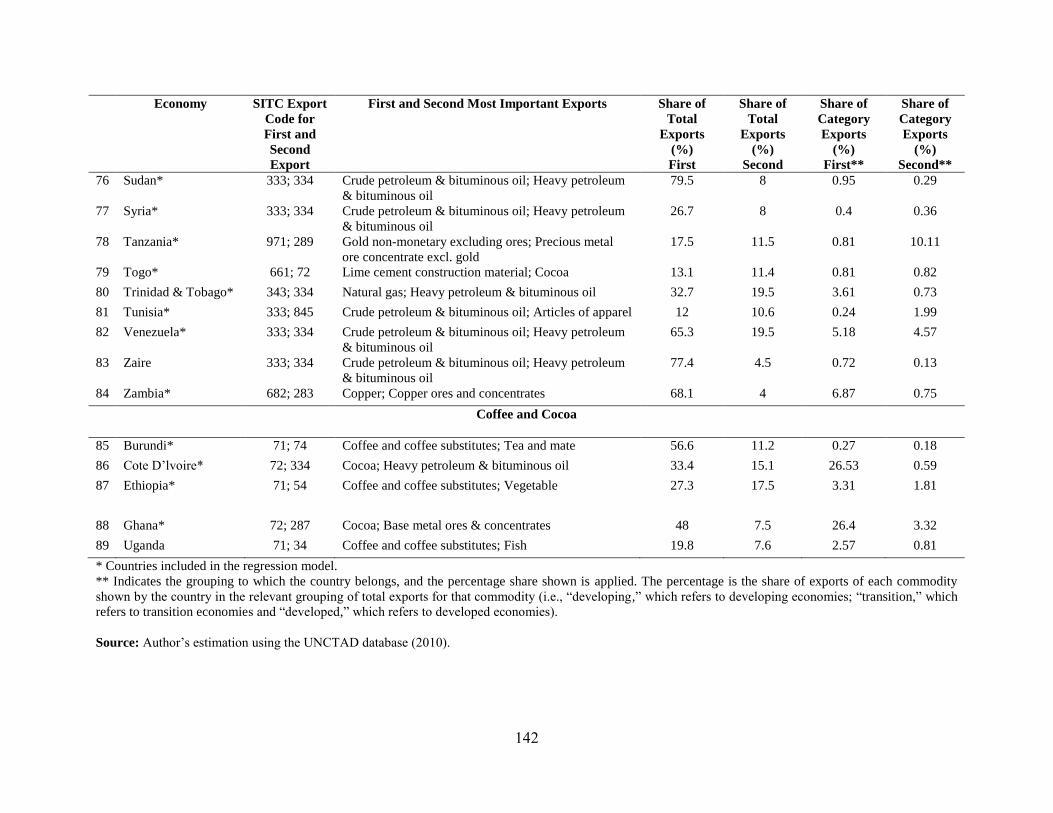
142
Economy SITC Export
Code for
First and
Second
Export
First and Second Most Important Exports Share of
Total
Exports
(%)
First
Share of
Total
Exports
(%)
Second
Share of
Category
Exports
(%)
First**
Share of
Category
Exports
(%)
Second**
76 Sudan* 333; 334 Crude petroleum & bituminous oil; Heavy petroleum
& bituminous oil
79.5 8 0.95 0.29
77 Syria* 333; 334 Crude petroleum & bituminous oil; Heavy petroleum
& bituminous oil
26.7 8 0.4 0.36
78 Tanzania* 971; 289 Gold non-monetary excluding ores; Precious metal
ore concentrate excl. gold
17.5 11.5 0.81 10.11
79 Togo* 661; 72 Lime cement construction material; Cocoa 13.1 11.4 0.81 0.82
80 Trinidad & Tobago* 343; 334 Natural gas; Heavy petroleum & bituminous oil 32.7 19.5 3.61 0.73
81 Tunisia* 333; 845 Crude petroleum & bituminous oil; Articles of apparel 12 10.6 0.24 1.99
82 Venezuela* 333; 334 Crude petroleum & bituminous oil; Heavy petroleum
& bituminous oil
65.3 19.5 5.18 4.57
83 Zaire 333; 334 Crude petroleum & bituminous oil; Heavy petroleum
& bituminous oil
77.4 4.5 0.72 0.13
84 Zambia* 682; 283 Copper; Copper ores and concentrates 68.1 4 6.87 0.75
Coffee and Cocoa
85 Burundi* 71; 74 Coffee and coffee substitutes; Tea and mate 56.6 11.2 0.27 0.18
86 Cote D’lvoire* 72; 334 Cocoa; Heavy petroleum & bituminous oil 33.4 15.1 26.53 0.59
87 Ethiopia* 71; 54 Coffee and coffee substitutes; Vegetable 27.3 17.5 3.31 1.81
88 Ghana* 72; 287 Cocoa; Base metal ores & concentrates 48 7.5 26.4 3.32
89 Uganda 71; 34 Coffee and coffee substitutes; Fish 19.8 7.6 2.57 0.81
* Countries included in the regression model.
** Indicates the grouping to which the country belongs, and the percentage share shown is applied. The percentage is the share of exports of each commodity
shown by the country in the relevant grouping of total exports for that commodity (i.e., “developing,” which refers to developing economies; “transition,” which
refers to transition economies and “developed,” which refers to developed economies).
Source: Author’s estimation using the UNCTAD database (2010).

143
Appendix Table 2.7.A: The relationship between resource abundance and manufacturing sector
growth (Robust std. err.)
VARIABLES Manufacturing value added per capita growth rate
1991–2000 1991–2000 2001–2010 2001–2010
(1) (2) (3) (4)
RR 0.0164 –1.10e–05 0.109** 0.141**
(0.0445) (0.0464) (0.0510) (0.0662)
FDI 0.538** 0.564** 0.287** 0.550*
(0.211) (0.232) (0.122) (0.305)
FDI*RR –0.0203*** –0.0206*** –0.00148 –0.00572
(0.00710) (0.00763) (0.00517) (0.00595)
mva90 –0.0485 0.125
(0.0670) (0.127)
Constant 0.756 1.768 –0.283 –3.259
(0.618) (1.209) (0.828) (3.166)
Observations 57 54 59 55
R-squared
Joint Significance test of
RR and FDI*RR
(p_value)
0.189
6.21***
(0.00)
0.224
5.63***
(0.00)
0.196
2.96*
(0.06)
0.209
2.54*
(0.09)
Robust standard errors in parentheses
*** p<0.01, ** p<0.05, * p<0.1

144
Table 3.1.A: Data and Descriptive Statistics
Variable Abbrev. Definition Mean Std.
Dev.
GDP per capita
growth (annual
%)
G Annual percentage growth rate of GDP per capita based on
constant local currency. GDP per capita is gross domestic
product divided by midyear population.
Indicator Code: NY.GDP.PCAP.KD.ZG
3.48
9.48
Total Natural
Resource Rents
(% GDP)
RR
Total natural resources rents are the sum of oil rents,
natural gas rents, coal rents (hard and soft), mineral rents,
and forest rents.
Indicator Code: NY.GDP.TOTL.RT.ZS
13.10
17.20
Agriculture,
Value Added (%
GDP)
AgriVA
Agriculture corresponds to ISIC divisions 1–5 and includes
forestry, hunting and fishing, as well as cultivation of crops
and livestock production. Value added is the net output of a
sector after adding up all outputs and subtracting
intermediate inputs. It is calculated without making
deductions for depreciation of fabricated assets or
depletion and degradation of natural resources. The origin
of value added is determined by the International Standard
Industrial Classification (ISIC), revision 3. Note: For VAB
countries, gross value added at factor cost is used as the
denominator.
Indicator Code: NV.AGR.TOTL.ZS
16.89
11.23
Terms of trade,
Net barter terms
of trade index
(2000 = 100)
Tot The terms of trade index is calculated as the percentage
ratio of the export unit value indexes to the import unit
value indexes, measured relative to the base year 2000.
Indicator Code: TT.PRI.MRCH.XD.WD
120.19 39.87
Institutional
Quality, CIM
Inst Contract-Intensive Money suggested by Clague et al.
(1999)
0.39
0.14
First component
of institutional
quality, CIM
M2 Money and quasi money comprise the sum of currency
outside banks, demand deposits other than those of the
central government, and the time, savings, and foreign
currency deposits of resident sectors other than the central
government.
Indicator Code: FM.LBL.MQMY.CN
Second
component of
institutional
quality, CIM
C Money is the sum of currency outside banks and demand
deposits other than those of central government. This
series, frequently referred to as M1, is a narrower
definition of money than M2. Data are in current local
currency.
Indicator Code: FM.LBL.MONY.CN

145
Table 5.3.A: Model Variables and Descriptive Statistics
Variable Abbreviation Definition Mean Std.
Dev.
Min. Max.
Log of Real Gross regional
product (GRP) per capita Log(y)
Log difference of current and
previous years’ Real (deflated by
CPI) GRP per capita
6.25 0.78 4.80 8.20
Energy Production
EnergyProd
Energy sector production
(including oil, gas and coal
production) share in GRP
0.43 0.51 0 1.70
Agriculture sector value
added share in income AgriVA
Agriculture sector value added
(including livestock and food
agriculture products) share in GRP
0.18 0.15 0.004 0.56
Investments share in
income Inv Share of regional fixed capital
investment in GRP
0.265 0.155 0.088 0.883
Institutional Quality or
Performance Inst The share of deposits in second-
tier banks in GRP
0.042 0.022 0.011 0.153
Proxy for real exchange
rates (Balassa-Samuelson
effect variable)
ToT Unit labor costs ratio of non-
traded goods sector to that of
traded goods sector
1.26 0.49 0.51 4.24
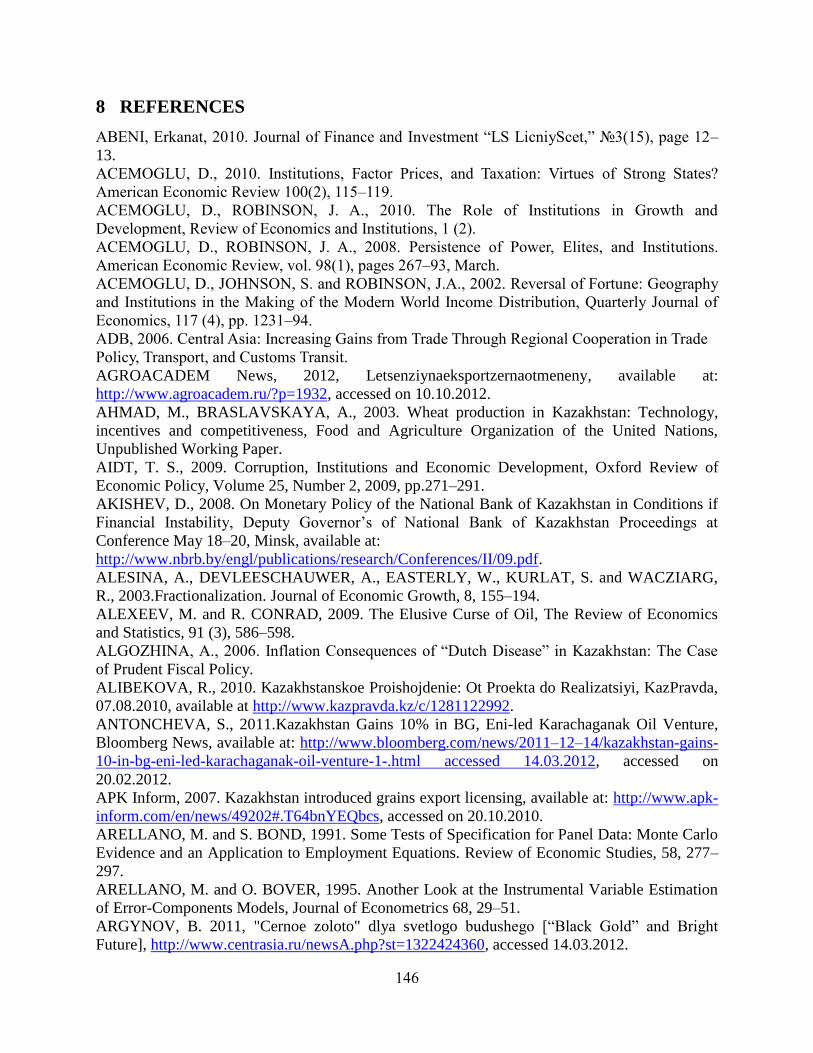
146
8 REFERENCES
ABENI, Erkanat, 2010. Journal of Finance and Investment “LS LicniyScet,” №3(15), page 12–
13.
ACEMOGLU, D., 2010. Institutions, Factor Prices, and Taxation: Virtues of Strong States?
American Economic Review 100(2), 115–119.
ACEMOGLU, D., ROBINSON, J. A., 2010. The Role of Institutions in Growth and
Development, Review of Economics and Institutions, 1 (2).
ACEMOGLU, D., ROBINSON, J. A., 2008. Persistence of Power, Elites, and Institutions.
American Economic Review, vol. 98(1), pages 267–93, March.
ACEMOGLU, D., JOHNSON, S. and ROBINSON, J.A., 2002. Reversal of Fortune: Geography
and Institutions in the Making of the Modern World Income Distribution, Quarterly Journal of
Economics, 117 (4), pp. 1231–94.
ADB, 2006. Central Asia: Increasing Gains from Trade Through Regional Cooperation in Trade
Policy, Transport, and Customs Transit.
AGROACADEM News, 2012, Letsenziynaeksportzernaotmeneny, available at:
http://www.agroacadem.ru/?p=1932, accessed on 10.10.2012.
AHMAD, M., BRASLAVSKAYA, A., 2003. Wheat production in Kazakhstan: Technology,
incentives and competitiveness, Food and Agriculture Organization of the United Nations,
Unpublished Working Paper.
AIDT, T. S., 2009. Corruption, Institutions and Economic Development, Oxford Review of
Economic Policy, Volume 25, Number 2, 2009, pp.271–291.
AKISHEV, D., 2008. On Monetary Policy of the National Bank of Kazakhstan in Conditions if
Financial Instability, Deputy Governor’s of National Bank of Kazakhstan Proceedings at
Conference May 18–20, Minsk, available at:
http://www.nbrb.by/engl/publications/research/Conferences/II/09.pdf.
ALESINA, A., DEVLEESCHAUWER, A., EASTERLY, W., KURLAT, S. and WACZIARG,
R., 2003.Fractionalization. Journal of Economic Growth, 8, 155–194.
ALEXEEV, M. and R. CONRAD, 2009. The Elusive Curse of Oil, The Review of Economics
and Statistics, 91 (3), 586–598.
ALGOZHINA, A., 2006. Inflation Consequences of “Dutch Disease” in Kazakhstan: The Case
of Prudent Fiscal Policy.
ALIBEKOVA, R., 2010. Kazakhstanskoe Proishojdenie: Ot Proekta do Realizatsiyi, KazPravda,
07.08.2010, available at http://www.kazpravda.kz/c/1281122992.
ANTONCHEVA, S., 2011.Kazakhstan Gains 10% in BG, Eni-led Karachaganak Oil Venture,
Bloomberg News, available at: http://www.bloomberg.com/news/2011–12–14/kazakhstan-gains-
10-in-bg-eni-led-karachaganak-oil-venture-1-.html accessed 14.03.2012, accessed on
20.02.2012.
APK Inform, 2007. Kazakhstan introduced grains export licensing, available at: http://www.apk-
inform.com/en/news/49202#.T64bnYEQbcs, accessed on 20.10.2010.
ARELLANO, M. and S. BOND, 1991. Some Tests of Specification for Panel Data: Monte Carlo
Evidence and an Application to Employment Equations. Review of Economic Studies, 58, 277–
297.
ARELLANO, M. and O. BOVER, 1995. Another Look at the Instrumental Variable Estimation
of Error-Components Models, Journal of Econometrics 68, 29–51.
ARGYNOV, B. 2011, "Cernoe zoloto" dlya svetlogo budushego [“Black Gold” and Bright
Future], http://www.centrasia.ru/newsA.php?st=1322424360, accessed 14.03.2012.
147
ASIEDU, E., 2006. Foreign Direct Investment in Africa, The World Economy, 29 (1), 63–78.
ASIEDU, E., 2004. The Determinants of Employment of Affiliates of US Multinational
Enterprises in Africa, Development Policy Review, 22, 4, 371–9.
ASCHAUER, D.A., 1989. Does Public Capital Crowd Out Private Capital, Journal of Monetary
Economics, 24, pp. 171–88.
ASTROV, V., 2007. The Russian Oil Fund as a Tool of Stabilization and Sterilization, Focus on
European Economic Integration No. 1, pp. 167–176.
ATF Bank, 2010. Pshenitsa Kazakhstan - Pogonyaza Liderami, ATF Bank Analysis Report.
AUTY, R., 1997. Natural Resource Endowment, the State and Development Strategy. Journal of
International Development 9(4), 651–663.
BADIANE, O., D. GHURA, L. GOREUX and P. MASSON. 2002. Cotton Sector Strategies in
West and Central Africa, World Bank Policy Research Working Paper No. 2867.
BARRO, R. J., 1991. Economic growth in a cross section of countries. Quarterly Journal of
Economics 106 (2), 407–441.
BARRO, R.J. and X. SALA-I-MARTIN, 2003. Economic Growth, 2nd
Edition, MIT Press.
BBC News Europe, 2012. Azerbaijan Profile, available at:
http://news.bbc.co.uk/1/hi/world/europe/country_profiles/1235976.stm, accessed on 10.12.2012
BENASSY-QUERE, A., COUPET, M., and MAYER, T., 2007. Institutional Determinants of
Foreign Direct Investment. World Economy 30, pp. 764–782.
BERNARD, A. and S.DURLAUF, 1996. Interpreting Tests of the Convergence Hypothesis,
Journal of Econometrics, 71, 161–172.
BERTRAND, P., 2011. Brazil Report Another Oil Spin Near Rio de Janeiro, International
Business News, available at http://www.ibtimes.com/articles/269743/20111219/brazil-oil-spill-
rio-janiero-chevron-petrobras.htm, accessed on 23.01.2012.
BESLEY, T. and T. PERSSON, 2011. The Pillars of Prosperity: The Political Economics of
Development Clusters, Princeton University Press.
BESLEY, T. and T. PERSSON, 2010. State Capacity, Conflict and Development. Econometrica,
78(1), 1–34.
BILYASHEVA, M. & Y. BINEAU, 2011. Kazakh real equilibrium exchange rate and crawling
peg policy: a response to global instability? Kazakh Economy Research Institute Research Paper.
BLUNDELL, R. and S. BOND, 1998. Initial Conditions and Moment Restrictions in Dynamic
Panel Data Models, Journal of Econometrics 87, 115–143.
BOND, S. R., MALIK, A, 2009. Natural Resources, Export Structure, and Investment. Oxford
Economic Papers, Vol. 61, Issue 4, pp. 675–702.
BORENSZTEIN, E., DE GREGORIO, J. and J.W. LEE, 1998. How Does Foreign Direct
Investment Affect Economic Growth, Journal of International Economic, 45, 115–135.
BOSCHINI, A. D., J. PETTERSON, and J. ROINE, 2007. Resource Curse or Not: A Question of
Appropriability. Scandinavian Journal of Economics 109(3), 593–617.
BOWMAN, D., 1999. Efficient Tests for Autoregressive Unit Roots in Panel Data. International
Finance Discussion Paper 646, Board of Governors of the Federal Reserve System.
BREITUNG, J., 2000. The Local Power of some Unit Root Tests for Panel Data, 161–177, in
Baltagi, B.H. (Ed.) Nonstationary Panels, Panel Cointegration, and Dynamic Panels.
BRITISH PETROLEUM, 2010. Statistical Review of World Energy. available at
http://www.bp.com/en/global/corporate/about-bp/energy-economics/statistical-review-of-world-
energy-2013.html

148
BROSIG, S. and Y. YAHSHILIKOV, 2005. Interregional Integration of Wheat Markets in
Kazakhstan, IAMO Discussion Paper No. 88.
BRUNNSCHWEILER, C. N., 2008. Cursing the Blessings? Natural Resource Abundance,
Institutions, and Economic Growth. World Development, 36(3), 399–419.
BSTDB, Black Sea Trade and Development Bank, 2011. Azerbaijan: Country Strategy, 2011–
2014.
CASPIONET, 2011. Kazakhstan tax regime becomes more liberal, available at
http://www.caspionet.kz/eng/business/Kazakhstans_tax_regime_becomes_more_liberal_131917
0486.html accessed on 15.01.2012, accessed on 23.10.2011.
CLAGUE, C.,KEEFER, P., KNACK, S. and M. OLSON, 1999. Contract Intensive Money.
Journal of Economic Growth , Vol. 4, No. 2 (June 1999): pp. 185–212.
CORDEN, W. Max, NEARY, J. Peter, 1982. Booming Sector and De-Industralisation in a Small
Open Economy, The Economic Journal, 92(368), 825–848.
COUTTENIER, M., 2009. Relationship Between Natural Resources and Institutions. ESNIE,
TEAM Conference Paper.
DELLEPIANE-AVELLANEDA, S., 2010. Review Article: Good Governance, Institutions and
Economic Development: Beyond the Conventional Wisdom. British Journal of Political Science,
40, pp 195–224.
De BROECK, M. and K. KOSTIAL, 1998. Output Decline in Transition: The case of
Kazakhstan, IMF Working Paper WP/98/45. International Monetary Fund: Washington DC.
OECD, 2013. Improving Access to Finance in Kazakhstan’s Agribusiness Sector, Private Sector
Development Policy Handbook.
DIAMOND, J., 2005. Collapse: How Societies Choose to Fail or Succeed, Penguin Group.
DIAMOND, J., 1997. Guns, Germs, and Steel, New York: W.W. Norton & Co.
DIVINE, Luke, 2009. Indonesia’s New Mining Law, available
at:http://www.asialaw.com/Article/2121729/Channel/22098/Indonesias-New-Mining-Law.html,
accessed on 23.10.2011.
DJATURAYEVA, Elvira, 2010. Oil and Gas of Kazakhstan. Reserves, Production and
Investment, Kazakhstan International Business Magazine №4
DOLINSKAYA, I., 2001. Explaining Russia’s Output Collapse: Aggregate Sources and
Regional Evidence. IMF Working Paper, №01/16, 1–33.
DOMJAN, P., 2004. Getting Competitive, Staying Competitive: The Challenge of Managing
Kazakhstan’s Oil Boom, Republic of Kazakhstan: Country Economic Memorandum,
Background Paper No. 5.
DOSMAGAMBET, Y., 2010. Calculating Genuine Saving for Kazakhstan. Journal of Economic
and Environmental Studies, Vol. 10, No. 2, pp. 271–282.
DVOSKIN, Beniamin J., 1986. Ekonomiko-Geograficheskoe Raionirovanie Kazakhstana,
Institute of Geography, Almaty Nauka, 245 (2).
DRAZEN, A., 2000. Political Economy in Macroeconomics, Princeton University Press.
DRISCOLL, J.S. and A.C. KRAAY, 1998. Consistent covariance matrix estimation with
spatially dependent panel data. Review of Economics and Statistics, 80 (1998), pp. 549–560.
DUDWICK, N., FOCK, K. and D. SEDIK, 2007. Land Reform and Farm Restructuring in
Transition Countries. The Experience of Bulgaria, Moldova, Azerbaijan, and Kazakhstan, World
Bank Working Paper No. 104, Washington, D.C.
EASTERLY, W. and R. LEVINE, 2003. Tropics, germs, and crops: how endowments influence
economic development. Journal of Monetary Economics 50(1), 3–39

149
EBRD-FAO, 2008. Grain production and export potential in CIS countries. Fighting food
inflation through sustainable investment. European Bank for Reconstruction and Development/
Food and Agriculture Organization, London, 8 p.
THE ECONOMIST, 25 September 1993, p. 41.EIA, 2010. EIA Country Profile: Kazakhstan
Energy Profile, can be viewed at:
http://tonto.eia.doe.gov/country/country_energy_data.cfm?fips=KZ, accessed 10.04.2010.
ETS, 2005. Stock Exchange Trade Rules, available at: http://www.ets.kz/a144, accessed on
December 2011.
ESANOV, A. and K. KURALBAYEVA, 2010. Managing boom-bust cycle in a resource rich
economy: the case of Kazakhstan 2000–2008, OxCarre Working Papers 043, Oxford Centre for
the Analysis of Resource Rich Economies, University of Oxford.
EVANS, P., 1985. Do Large Deficits Produce High Interest Rates? American Economic Review,
71, 1, pp. 68–87.
FAO, 2011. FAO Regional Policy Consultation on High Food Prices, Summary Proceedings of
FAO Regional Office for Europe and Central Asia Region.
FAOSTAT, 2013. FAO Statistical Database, available at http://faostat.fao.org/
FEARON, J.D., 2005. Primary Commodity Exports and Civil War. Journal of Conflict
Resolution, Vol. 49, No. 4, 483–507.
FEIGE, Edgar L., 2002. The Dynamics of Currency Substitution Asset Substitution and De Facto
Dollarization and Europization in Transition Countries.
FEREIRA, S., VINCENT, J., 2005. Genuine Savings: Leading Indicator of Sustainable
Development? Economic Development and Cultural Change, №53(3), pp. 737–754.
FITTER, R. and R. KAPLINSKY, 2001. Can an agricultural ‘commodity’ be decommodified,
and if so, who is to gain? IDS Discussion Paper 380, Institute of Development Studies, Brighton,
Sussex, England.
FRANKEL, J. and D. ROMER, 1999. Does Trade Cause Growth? American Economic Review,
89(3), 379–399.
GAP Report, 2008. Privatization and Corruption: The World Bank and Azerbaijan, Government
Accountability Project Report, Washington D.C. 20006.
GAISINA, S., 2011. Credit Through Rural Credit Partnership for Agricultural Producers in
Kazakhstan, Journal of Rural Cooperation, 39 (2), pp. 114–130.
GELB, A., 1988. Windfall Gains: Blessing or Curse? Oxford, Oxford University Press.
GHALI, K.H., 1998. Public Investment and Private Capital Formation in a Vector Error-
Correction Model of Growth, Applied Economics, 30, pp. 837–44.
GLAESER, E. L., LA PORTA, R., LOPEZ-DE-SILANEZ, F. and A. SHLEIFER, 2004. Do
Institutions Cause Growth? Journal of Economic Growth, 9 (3), 271–303.
GLOBERMAN, S., and D. SHAPIRO, 2002. Global Foreign Direct Investment Flow: The Role
of Governance Infrastructure. World Development 30, pp. 1899–1919.
GOTZ, L., DJURIC, I. and T. GLAUBEN, 2013. IAMO Policy Brief No. 10.
GOULD-DAVIES, N. and N. WOODS, 1999. Russia and the IMF, International Affairs, 75 (1).
GOW, H. and J. SWINNEN, 1998. Up- and Downstream Restructuring, Foreign Direct
Investment, and Hold-up Problems in Agricultural Transition, European Review of Agricultural
Economics 25: 331–350.
GRIER, K.B., TULLOCK, G., 1989. An empirical analysis of cross-national economic growth,
1951–80. Journal of Monetary Economics 24 (1), 259–276.
150
GYLFASON, T., HERBERTSSON, T.T. and G. ZOEGA, 1999. A Mixed Blessing: Natural
Resources and Economic Growth. Macroeconomic Dynamics 3. Pp. 204–225.
GYLFASON, T. 2001. Natural resources, education and economic development, European
Economic Review, 45(4), 847-859.
HACKENBRUCH, M., PLUESS, J.S., 2011. Commercial Value From Sustainable Local
Benefits in the Extractive Industries: Local Content, BSR Report.
HALL, R. E. and C. I. JONES, 1999. Why Do Some Countries Produce So Much More Output
Per Worker Than Others? The Quarterly Journal of Economics, Vol. 114, No. 1, pp. 83–116.
HASANOV, F., 2011a. Dutch Disease and Azerbaijan Economy, EERC Working Paper Series,
№11/03E.
HASANOV, F., 2011b. Relationship between inflation and economic growth in Azerbaijani
economy: Is there any threshold effect? MPRA Paper No. 33494.
HELPMAN, E., 2004. The Mystery of Economic Growth, Cambridge, MA: Harvard University
Press.
HLOUSKOVA, J. and WAGNER, M., 2006. The Performance of Panel Unit Root and
Stationarity Tests: Results from A Large Scale Simulation Study, Econometric Reviews, 25, p.
85–116.
HOLTZ-EAKIN, DOUGLAS, WHITNEY NEWEY, AND HARVEY S. ROSEN, 1988.
Estimating Vector Autoregressions with Panel Data, Econometrica 56, No. 6, November, pp.
1371 – 1395.
IIMI, A., 2007. Escaping from the Resource Curse: Evidence from Botswana and the Rest of the
World, IMF Staff Paper, Vol. 54, №4.
IM, K.S., PESARAN, M.H, and Y. SHIN, 2003. Testing for Unit Roots in Heterogeneous
Panels, Journal of Econometrics 115, pp. 53–74.
IMF Country Report, 2011. Republic of Kazakhstan: Selected Issues, IMF country Report
№11/151.
IMF, 2003. Republic of Kazakhstan: Selected issues and statistical appendix, IMF Country
Report No. 03/211, 2003, page 760.
IMF, 1998.Azerbaijan Republic: Recent Economic Developments, IMF Staff Country Report
No. 98/83
IMF Country report No.02/40, 2002. Azerbaijan Republic: Staff Report Article IV Consultation,
First Report Under the Poverty Reduction and Growth Facility, and Request for Waiver for
Performance Criteria.
IMF Country Report No. 06/430, 2006. Russian Federation: Selected Issues.
IMF Country Report No. 10/237, 2010. Republic of Kazakhstan: Selected Issues.
IMF Country Report No. 11/151, 2011. Republic of Kazakhstan: Selected Issues.
INVESTKZ, 2009, EksportZerna. Lutsche menshe, da lutsche! Kazakhstan’s International
Business Magazine, No.1
ISHAM, J., M. WOOLCOCK, L. PRITCHETT, and G. BUSBY, 2005. The Varieties of
Resource Experience: Natural Resource Export Structures and the Political Economy of
Economic Growth. World Bank Economic Review, 19(2), 141–174.
KAISER, J.M., PULSIPHER, A.G., 2006. A Review of the Oil and Gas Sector in Kazakhstan.
Energy Policy, 35, pp. 1300–1314.
KALYUZHNOVA, Y, 2011. The National Fund of the Republic of Kazakhstan (NFRK), From
accumulation to stress-test to global future, Energy Policy, 39 (10), pp. 6650–6657.
151
KASPER, W., STREIT, M.E., and P.J. BOETTKE, 2012. Institutional Economics: Property,
Competition, Policies. Edward Elgar Publishing Co. Ltd.
KAUFMANN, D., KRAAY, A. and M. MASTRUZZI, 2010. The Worldwide Governance
Indicators : A Summary of Methodology, Data and Analytical Issues. World Bank Policy
Research Working Paper № 5430.
KAUFMANN, D., KRAAY, A. and P. ZOIDO-LOBATON, 2000. Governance Matters: From
Measurement to Action, Finance and Development, 37 (2), Washington DC: International
Monetary Fund.
KAZAKHSTASKAYA PRAVDA, Ukaz Presidenta Respubliki Kazahstan ot 12 Marta 2010
goda № 936 [Republic of Kazakhstan Presidential Decree number 936], Newspaper
"Kazakhstanskaya Pravda" 13.03.2010, № 58–60 (26119–26121).
KHAN, M.S. and M.S. KUMAR, 1997. Public and Private Investment and the Growth Process
in Developing Countries, Oxford Bulletin of Economics and Statistics, 59 (1), pp. 69–88.
KNACK, S., 2003. Democracy, Governance and Growth, Ann Arbor: The University of
Michigan Press.
KNACK, S. and P. KEEFER, 1995. Institutions and Economic Performance: Cross-Section
Country Tests Using Alternative Institutional Measures. Economics and Politics 7, 207–227.
KORMENDI, Roger C., MEGUIRE, Philip G. (1985), Macroeconomic determinants of growth:
Cross-country evidence. Journal of Monetary Economics 16 (2), 141–163.
KOURMANOVA, A., DISSENOVA, M., BAKAS-UULY, B., KAIRAKBAY, B., ASHIGALI,
Z. and N. BISENOV, 2008. A Study on Mechanisms and Potential for Agricultural Commodities
Trade in Central Asia, accessed 15 June 2011, available at:
http://www.carecinstitute.org/uploads/docs/CAREC%20Research%202007-Agricultural-
Commodities-Trade.pdf
KURALBAYEVA, K. and D. VINES, 2008. Shocks to Terms of Trade and Risk-premium in an
Intertemporal Model: The Dutch Disease and a Dutch Party. Open Economic Review, 19: 277–
303
KURALBAYEVA, K., KUTAN, A.M., and WYZAN, M.L., 2001. Is Kazakhstan Vulnerable to
Dutch Disease, ZEI Working Paper B29–2001.
KUTAN, Ali M., WYZAN, M.L., 2005. Explaining the Real Exchange Rate in Kazakhstan
1996–2003: Is Kazakhstan Vulnerable to the Dutch Disease? Economic Systems, 29(2), pp. 242–
255.
IEA, 2011. Caspian Oil and Gas Exports are Poised for Take-off, can be viewed at:
http://www.iea.org/newsroomandevents/news/2011/march/name,19802,en.html, accessed
29.08.2012
LANE, P.R. and A. TORNELL, 1996. Power, Growth and the Voracity Effect. Journal of
Economic Growth, vol. 1, pp. 213–241.
LEVIN A., LIN, C.F, CHU, C.J., 2002. Unit root tests in panel data: asymptotic and finite
sample properties, Journal of Econometrics 108,1–24.
LARSEN, M. 2003. Quality Standard-Setting in the Global Cotton Chain and Cotton Sector
Reforms in Sub-Saharan Africa, Institute for International Studies, IIS/Gl. Kongevej Working
Paper 03.7.
LIHOGRAY, Olga, Sept. 27 2007, Pshenichnoe Zerno Razdora, Nasha Gazeta (Kostanay
Province Newspaper), available at:
http://www.ng.kz/modules/newspaper/article.php?numberid=46&storyid=2905, accessed on
10.08.2010.

152
LILLIS, J., 2008. Kazakhstan: Grain Export Ban Stokes Inflation Fears Elsewhere in Central
Asia, Eurasianet, April 2008.
MARKOV, V. and K. BISSENGALIYEVA, 2009. Taxation in Kazakhstan, available at:
http://www.hg.org/article.asp?id=6046, accessed on 16.01.2012.
MAURO, P., 1995. Corruption and Growth, The Quarterly Journal of Economics, Vol. 110, №3,
pp. 681–712.
MEHLUM, H., MOENE, K., TORVIK, R., 2006. Institutions and Resource Curse. The
Economic Journal, №116, 1–20.
MELNIK, Y., 2011. Kazakhstanskoe Soderzhanie. Kak Skazku Sdelat Bylu, International
Business Magazine “Kazakhstan” №5.
MENG, E., LONGMIRE, J. and MOLDASHEV, A., 2000. Kazakhstan’s wheat system:
priorities, constraints, and future prospects, Food Policy 2000(25) pp. 701–717.
MEYERS, W., and G. KURBANOVA, 2009. Impact of the Global and Financial Crisis on Food
Security in Eastern Europe and Central Asia. Background Paper for the Conference on Social
Impacts of the Economic Crisis in Eastern Europe, Turkey and Central Asia, 7–8 December
2009, Almaty, Kazakhstan.
MITCHELL, D., 2008. A Note on Rising Food Prices, Policy Research Working Paper 4682,
Development Prospects Group, The World Bank, July.
MURPHY, K., SCHLEIFER, A. and R.W., VISHNY, 1989. Industrialization and the big push,
Journal of Political Economy, 97 (5), pp. 1003–1026.
NICKELL, S., 1981. Biases in Dynamic Models with Fixed Effects. Econometrics 49, 1417–
1426.
NORTH, D.C., 1990. Institutions, Institutional Change and Economic Performance, Cambridge:
Cambridge University Press.
NORTH, D.C. and R.P. THOMAS, 1973. The Rise of the Western World: A New Economic
History. Cambridge University Press, Cambridge UK.
OECD, 2013, Review of Agricultural Policies: Kazakhstan
OECD, 2011. Competitiveness and Private Sector Development: Kazakhstan 2010, Sector
Competitiveness Strategy, OECD Publishing.
OECD, 2008. Rising Agricultural Prices: Causes, Consequences and Responses, Policy Brief,
OECD Observer.
OMAROVA, A., 2010. Determinatsya Bolshoi Nefti, National Business, 7 (77), pp. 16–22.
OOMES, N., and K.KALCHEVA , 2007. Diagnosing Dutch Disease: Does Russia Have the
Symptoms? BOFIT Discussion Paper No 6.
OSKENBAYEV, Y., 2002. Financial Openness in Developing Countries and the Scope of
Financial Liberalization in Kazakhstan, Bilig-Journal of Social Sciences of the Turkish World,
Spring, pp. 69–86, Ankara.
OSKENBAYEV, Y. and A. KARIMOV, 2013. Is Kazakhstan Vulnerable to Natural Resource
Curse, WIDER Working Paper No. 2013/130.
OSKENBAYEV, Y., YILMAZ, M. and K. ABDULLA, 2013. Resource Concentration,
Institutional Quality and the Natural Resource Curse, Economic Systems, 37 (2), 254-270 pp.
van der PLOEG, F. and A.J. VENABLES, 2011. Harnessing Windfall Revenues: Optimal
Policies for Resource-Rich Developing Economies. The Economic Journal, 121 (March), 1–30.
PARAMONOV, V. and STROKOV, A., 2011. Evropeiskoeprisutstviye v severo-
kaspiyskomproekteKazahstana: hronologiya, obemydobyci, marshritzypostavok,
perspektivyiriski, available athttp://easttime.ru/analitic/1/3/1000.html, accessed on 20.10.2011.

153
POMFRET, R., 2013. Kazakhstan’s Agriculture after Two Decades of Independence, Central
Asia Economic Paper № 6.
POMFRET, R., 2009. Using Energy Resources to Diversify the Economy: Agricultural Price
Distortions in Kazakhstan, Comparative Economic Studies, 181–212.
RAMIREZ, M.D., 2002. Public Capital Formation and Labor Productivity, Atlantic Economic
Journal, 30,4, pp. 366–79.
RAMSAY, K.W., 2011. Revisiting the Resource Curse: Natural Disasters, the Price for Oil, and
Democracy, International Organization, 65 (03), 507–529.
REINERT, E., 2008. How Rich Countries Got Rich and Why Poor Countries Stay Poor, Public
Affairs Press.
REVENUE WATCH, 2008. Kazakhstan: Transparency Snapshot
RODRICK, D., A. SUBRAMANIAN, and F. TREBBI, 2004. Institutions Rule: The Primacy of
Institutions over Geography and Integration in Economic Development. Journal of Economic
Growth 9(2), pp. 131–165.
ROSENSTEIN-RODAN, P., 1961. Notes on the Theory of the `Big Push'. In: Ellis, H.S.,
Wallich, H.C. (Eds.), Economic Development for Latin America. St. Martin's Press, New York.
ROSENSTEIN-RODAN, P., 1943. Problems of Industrialization of Eastern and Southeastern
Europe, Economic Journal 53(210–211) June-September: 202–211.
ROSS, M.L., 2013. The Politics of the Resource Curse: A Review, Available at SSRN:
http://ssrn.com/abstract=2342668 or http://dx.doi.org/10.2139/ssrn.2342668.
ROSS, M.L., 2001 a. Timber Booms and Institutional Breakdown in Southeast Asia, New York:
Cambridge University Press.
ROSS, M.L., 2001 b. Does Oil Hinder Democracy? World Politics, 53, pp. 325–361.
ROSS, M., L., 1999. The Political Economy of the Resource Curse. World Politics, 51 (02), pp.
297–322.
van den BERGH, J., 2009. The GDP Paradox. The Journal of Economic Psychology, №30, pp.
117–135.
SACHS, J.D., and A.M. WARNER, 1995. Natural Resource Abundance and Economic Growth,
Harvard Institute for International Development, Development Discussion Paper №517a.
SACHS, J.D., and A.M. WARNER, 1999. The Big Push, Natural Resource Booms, and Growth.
Journal of Economic Development Economics 59 (1), 43–76.
SALA-I-MARTIN, X., SUBRAMANIAN, A., 2003. Addressing the natural resource curse: an
illustration from Nigeria. NBER Working Paper №9804.
SCHAFFER, M. 2007. xtivreg2: Stata module to perform extended IV/2SLS, GMM and
AC/HAC, LIML and k-class regression for panel data models.
SCHMITZ, H., 2005. Value-chain Analysis for Policy-Makers and Practitioners. Geneva: ILO.
SCHWARTZ, J., 2010. Is GDP an Absolute Measure, Time Magazine, available at
http://www.time.com/time/business/article/0,8599,1957746,00.html, accessed 23.08.2011.
SHAO, S. and QI, Z., 2009. Energy exploitation and economic growth in Western China: An
empirical analysis based on the resource curse hypothesis. Frontiers of Economics in China 4 (1),
125–152.
SOKOLOV, A., 2010. Kompania “Tengizshevroil” zaplatila 204 mln. tenge v kacestve shtrafa i
vozmesheniya usherba za zagryznenia atmosfery, available athttp://invest-
market.kz/article.php?id=2249&type=news, accessed on 14.03.2012.
STEPANYAN, V., 2003. Reforming Tax Systems: Experience of Baltics, Russia, and Other
Countries of Former Soviet Union, IMF Working Paper WP/03/173

154
STIJNS, J-P S., 2005. Natural Resource Abundance and Economic Growth Revisited, Resources
Policy Journal, 30 (2), 107–130.
SWINNEN, J., Van HERCK, K. and L. VRANKEN, 2009. Agricultural Productivity in
Transition Economies, Choices 24(4), Accessed 15 August 2011, available at:
http://www.choicesmagazine.org/magazine/article.php?article=93.
THE ECONOMIST, “Oil, Water and Trouble”, December 31st 2011- January 6
th 2012, p. 37.
TSALIK, S., EBEL, R., 2003. Caspian Oil Windfalls: Who Will Benefit? Open Society Institute,
Central Eurasia Project.
UNCTAD, 2006. World Investment Report 2006: FDI from Developing and Transition
Economies: Implications for development (New York and Geneva: United Nations), United
Nations publication.
UN ESCAP, 2011. Kazakhstan: Briefing Notes. Economic and Social Survey of Asia and the
Pacific 2011.
WARD, Halina, 2007. Oil and Gas Contracts in Kazakhstan for Sustainable Development in
Kazakhstan, IIED Background Note on Context and Key Issues, London.
WEINTHAL, E., LUONG, P.J., 2001. Energy Wealth Tax Reform in Russia and Kazakhstan.
Resources Policy, 27, pp. 215–223.
WESTERLUND, J., 2010. A modified LLC Panel Unit Root Test, available at:
http://www.nek.lu.se/NEKfng/westerlund.pdf, accessed on 16.12.2012.
WESTIN, P., 2004. Dutch Disease: Diagnosing Russia. Moscow: ATON Capital.
WORLD BANK, 2007. Integrating Environment into Agriculture and Forestry Progress and
Prospects in Eastern Europe and Central Asia.
WORLD BANK, 2006. World Development Indicators, Washington, DC: World Bank.
WORLD BANK, 2005. World Development Report 2005: A Better Investment Climate for
Everyone. New York: Oxford University Press.
WORLD BANK Report No. 21459, 2000. Azerbaijan, Country Assistant Evaluation, World
Bank, Washington D.C.
WORLD BANK, 2004. Agricultural Post Privatization Assistance Project II, Environmental
Review, Washington, DC: World Bank.
WORLD BANK, 1994. Expanding the measure of wealth: Indicators of Environmentally
sustainable development. Environmentally sustainable development studies and monographs
series no. 7.
WORLD BANK Database, 2013 available at http://data.worldbank.org/indicator.
WOOLCOCK, M., PRITCHETT, L. and J.ISHAM, 2001. The Social Foundations of Poor
Economic Growth in Resource Rich Economies, in: AUTY, R.M. (editor), Resource Abundance
and Economic Development, New York, Oxford University Press.
YALOWITZ, K. and S.E. CORNELL, 2004. The Critical but Perilous Caucasus, ARTICLE,
Orbis, Volume 48, No. 1, pp. 105–116.
YERKEBULANOV, Y. & D. SAGYNOVA, 2011. Kazahstan skoesoderjanie v zakupkah
nedropolzovatelei, available at: http://www.gratanet.com/ru/publications/446, accessed on
14.03.2012.
ZAKONKZ, 2009, Pravitelstvo RK planiruet likvidirovat litsenzirovanie zerna, available
at:http://www.zakon.kz/152873-pravitelstvo-kazakhstana-planiruet.html, accessed on
20.10.2010.
155
I hereby declare, that I have produced this Dissertation just by myself, and all means for help and
all sources, as well as academic inputs are referenced in the manuscript.
29.08.2014
Yessengali Oskenbayev


![Untersuchungen zur Dimensionierung von Löschanlagen zur ... · VdS CEA-Richtlinie 4001 Die VdS CEA-Richtlinie 4001 [7] als „Richtlinie für Sprinkleranlagen - Planung und Einbau“](https://img.pdfslide.org/doc/110x75/611b427c79a8db4873683034/untersuchungen-zur-dimensionierung-von-lschanlagen-zur-vds-cea-richtlinie.jpg)