Embed Size (px)
Citation preview

Aus der Poliklinik für Zahnerhaltung, Parodontologie und Endodontologie
Westdeutsche Kieferklinik Heinrich-Heine-Universität Düsseldorf
Stellv. Direktor: Univ.-Prof. Dr. med Dr. med.dent Thomas Beikler
Investigation of the oral status and microorganisms in children with phenylketonuria
and type 1 diabetes
Dissertation
zur Erlangung des Grades eines Doktors der Zahnmedizin der Medizinischen Fakultät der Heinrich-Heine-Universität Düsseldorf
vorgelegt von
Preeti Singh-Hüsgen
2013
Als Inauguraldissertation gedruckt mit der Genehmigung der
Medizinischen Fakultät der Heinrich-Heine-Universität Düsseldorf
gez. Univ.-Prof. Dr. med. Joachim Windolf
Dekan
Referent: Univ.-Prof. Dr. W. H.-M Raab
Korreferent: Priv.-Doz. Dr. Thomas Meißner

This thesis is dedicated to my children,
Arjun and Agastya
--Unknowingly supportive in their love, daring to dream!
I
Abstract
The aim of this study was to investigate the oral parameters that influence the caries risk and risk of developing periodontal disease in children with phenylketonuria (PKU) and type 1 diabetes. The parameters to be assessed were the dental and oral hygiene status, gingival health and oral microorganisms in children with diabetes, PKU and healthy children.
Material and methods: Children between the ages of 3 and 18 years were recruited for each group in the study. The total sample consisted of 238 children. The PKU group had 38 children and both the diabetic and healthy control group comprised of 100 children each. Demographic data was collected with the help of a standard questionnaire. The dental status was assessed by the dmfs / DMFS Index and the gingival health and oral hygiene was evaluated using the Papillary Bleeding Index (PBI) and the Silness & Löe Index. For the microbiological examination of the bacteria, a sample was collected on a sterile paper point from the cervical region and gingival sulcus of the first deciduous molar or from the first permanent molar in the lower right quadrant. Quantitative real-time polymerase chain reaction was used for the detection of Streptococcus mutans (Sm), Lactobacillus casei (Lca), Lactobacillus species (Lac), Aggregatibacter actinomycetemcomitans (Aa), Porphyromonas gingivalis (Pg), and Tannerella forsythensis (Tf). The level of metabolic control of diabetes mellitus for the children with diabetes was determined by the glycosylated haemoglobin value.
Results: A statistically significant difference in the dmfs Index value was found between the three groups. The mean dmfs index value for the PKU children (4.18) was found to be relatively high as compared to the other two groups. No statistically significant difference was found in the mean DMFS values between the children and adolescents in the three groups. The diabetics showed statistically significant higher values for the Silness and Löe Index than the other two groups. The diabetic group also revealed a small statistically significant difference in the PBI score.
A comparison of all the bacteria between the three groups revealed a statistically significant difference between Lac, Lca and Pg. Counts of Lac were found to be the lowest in the PKU children. The diabetics showed the highest counts of Lca but lowest for Pg. The healthy children showed the lowest counts for Lca but highest counts for Lac and Pg.
Conclusions: Children with PKU possess a higher caries rate in their primary dentition. While diabetic children have a lower caries rate in their primary dentition, they show a higher risk of developing periodontal disease. It is, therefore, proposed that both groups of child patients, i.e. PKU and type 1 diabetics be encouraged to seek early dental advice and be incorporated in a meticulous prevention programme.

II
Abbreviations
µg Microgram
µl Microlitre
µmol Micromole
Aa Agregatibacter actinomycetemcomitans
ATCC American Type Culture Collection
BH4 Tetrahydrobiopterin
C Celsius
Ct Cycle threshold
DMFS Decayed, missing, filled surfaces for the dentition
dmfs Decayed, missing, filled surfaces for the primary dentition
DNA Desoxyribonucleic acid
DSMZ Deutsche Sammlung von Mikroorganismen und Zellkulturen
EDTA Ethylenediaminetetraacetic acid
GAPDH Glyceraldehyde 3-phosphate dehydrogenase
HbA1c Glycated hemoglobin
HLA Human leukocyte antigen
IDF International Diabetes Federation
IgA Immunoglobulin A
IL-1b Interleukin 1 beta
ISPAD International Society for Pediatric and Adolescent Diabetes
kb Kilobase
L Litre
Lac Lactobacillus species
LB-Amp Lysogeny Broth (LB) containing ampicillin
Lca Lactobacillus casei
min Minute
ml Millilitre
mM Millimol
mM Millimolar
III
mmol millimole
MMP-8 Matrix metalloproteinase-8
ng Nanogramm
nm Nanometre
nt Nucleotides
OD Optical Density
OPA One Phor All
PAH Phenylalanine hydroxylase
PBI Papillary Bleeding Index
PBS Phosphate buffered saline
PCR Polymerase chain reaction
Pg Prophyromonas gingivalis
Phe Phenylalanine
PKU Phenylketonuria
PMN Polymorphonuclear
RNA Ribonucleic acid
rpm Revolutions per minute
SD Standard deviation
SDS Sodium Dodecyl Sulfate
secs Seconds
Sm Streptococcus mutans
TBE Tris-Borate-EDTA
Tf Tannerella forsythensis
Tris Tris(hydroxymethyl)aminomethane
Tyr Tyrosine
WHO World Health Organisation

IV
Index
1 Introduction ................................................................................................. 1
2 Literature Review ........................................................................................ 3
2.1 Diabetes ................................................................................................ 3
2.2 Diagnosis of diabetes ............................................................................ 4
2.2.1 Epidemiology of diabetes ............................................................... 5
2.2.2 Complications of diabetes .............................................................. 6
2.3 Type 1 diabetes and oral health ............................................................ 6
2.4 Type 1 diabetes and dental caries ........................................................ 7
2.4.1 Type 1 diabetes and dietary factors .............................................. 12
2.4.2 Type 1 diabetes and periodontal disease ..................................... 13
2.5 Phenylketonuria .................................................................................. 19
2.5.1 Prevalence ................................................................................... 20
2.5.2 Treatment and dietary considerations .......................................... 20
2.5.3 PKU und oral health ..................................................................... 22
2.6 Detection of microorganisms using Polymerase Chain Reaction ........ 23
3 Aims and objectives of the study ............................................................... 26
4 Material and Methods ............................................................................... 27
4.1 The Questionnaire .............................................................................. 28
4.2 Clinical Examination ............................................................................ 28
4.2.1 DMFS/ dmfs Index ........................................................................ 28
4.2.2 Papillary Bleeding Index (PBI) ...................................................... 30
4.2.3 Silness & Löe Index ...................................................................... 30
4.3 Microbiological sample collection ........................................................ 31
4.4 Laboratory analysis of the bacteria- Materials ..................................... 32

V
4.4.1 Chemicals ..................................................................................... 32
4.4.2 Primers and Probes ...................................................................... 32
4.4.3 Master Mix .................................................................................... 34
4.4.4 Kits ............................................................................................... 34
4.4.5 Enzymes ....................................................................................... 34
4.4.6 Bacterial Strains ........................................................................... 35
4.4.7 Cloning Vector .............................................................................. 36
4.4.8 Equipment .................................................................................... 36
4.5 Laboratory analysis of the bacteria - Methods .................................... 36
4.5.1 DNA Extraction ............................................................................. 36
4.5.2 Cloning ......................................................................................... 39
4.5.3 Polymerase chain reaction (PCR) ................................................ 42
4.5.4 Quantification of the PCR ............................................................. 48
4.6 Statistical Analysis .............................................................................. 52
5 Results ...................................................................................................... 53
5.1 Results of the demographic data collected for the study ..................... 53
5.1.1 Age, socioeconomic status and ethnic origin ................................ 53
5.2 Dental status of the children and adolescents ..................................... 54
5.2.1 dmfs Index .................................................................................... 54
5.2.2 DMFS Index ................................................................................. 55
5.3 Oral hygiene and gingival health ......................................................... 55
5.3.1 Silness and Löe Index .................................................................. 55
5.3.2 Papillary bleeding Index ............................................................... 56
5.4 Microbiological results in the children and adolescents ...................... 57
6 Discussion ................................................................................................. 59

VI
6.1 Study design ....................................................................................... 59
6.2 Microbiological testing ......................................................................... 60
6.3 Results ................................................................................................ 62
6.3.1 Type 1 diabetes and dental caries ................................................ 62
6.3.2 Type 1 diabetes, oral hygiene and gingival health ........................ 64
6.3.3 Type 1 diabetes and oral microorganisms .................................... 67
6.3.4 PKU and dental caries .................................................................. 69
6.3.5 PKU, oral hygiene and gingival health .......................................... 70
6.3.6 PKU and oral microorganisms ...................................................... 70
7 Conclusions .............................................................................................. 72
8 References ................................................................................................ 74
9 Appendix ................................................................................................... 85
9.1 Chemicals ........................................................................................... 85
9.2 Questionaire ........................................................................................ 86
1
1 Introduction
It is often essential for children suffering from metabolic diseases to follow a
strict diet to keep the disorder under check and to be able to develop and
function normally. Phenylketonuria (PKU) is a metabolic disorder in which the
patients present with an absence or deficiency of the enzyme phenylalanine
hydroxylase which is essential to metabolise the amino acid phenylalanine into
the amino acid tyrosine. Uncontrolled, the disease can lead to the accumulation
of phenylalanine in the blood and brain causing disabilities. In order to keep the
ingestion of phenylalanine to a minimum, children with PKU follow a special low
protein diet. At the same time, their diet is rich in carbohydrates and the
phenylalanine -free formula drinks have a high pH (Kilpatrick et al., 1999). The
frequency of ingestion of these carbohydrates is high and therefore, the risk for
the development of caries in children suffering from PKU is considered to be
high.
Diabetes is another metabolic disorder, caused due to defective insulin
secretion and action resulting in abnormally high blood glucose levels. The
disease is principally classified into type 1 and type 2 diabetes. Traditionally,
children suffering from type 1 diabetes had to follow a diet restricted in
carbohydrates (Goteiner et al., 1986) in order to maintain normal blood sugar
levels. The intake of carbohydrates was aligned with the insulin regime.
Advancements in insulin therapy regimes have led to the relaxation of dietary
restrictions and type 1 diabetics are now able to follow a diet quite similar to
normal healthy individuals (Ciglar et al., 2002). Furthermore, due to alterations
in the polymorphonuclear (PMN) leucocyte function, collagen metabolism and a
possible alteration in the microbial flora, it has been found that type 1 diabetics
are more prone to infections than healthy individuals. Earlier studies have
shown that although children with type 1 diabetes possess a lower caries risk,
they have an increased risk of developing periodontal disease (Goteiner et al.,
1986; Firatli, 1997). Several studies have made diabetes and oral health their

2
subject to elucidate the impact of both on each other. A large portion of these
studies have, however been conducted on type 2 diabetic patients. Studies on
children have documented inconsistent results which may be due to the varying
susceptibility of the patients and the multifactorial nature of both diseases
(Karjalainen, 2000).
The present study aims to provide an insight into the oral status of children
suffering from two different metabolic diseases. At the same time it seeks to
answer questions on whether the dietary regulations of the children have an
effect on their dental health and whether there is an alteration in their oral
microflora, putting the children at a higher or lower risk for developing dental
caries and periodontal disease.

3
2 Literature Review
2.1 Diabetes
The ISPAD (International Society for Pediatric and Adolescent Diabetes) has
defined Diabetes as follows:
“Diabetes is a group of metabolic diseases characterized by chronic
hyperglycemia resulting from defects in insulin secretion, insulin action, or both.
The abnormalities in carbohydrate, fat, and protein metabolism that are found in
diabetes are due to deficient action of insulin on target tissues. If ketones are
present in blood or urine, treatment is urgent, because ketoacidosis can
develop rapidly.” (Craig et al., 2009)
Patients with hyperglycemia present with the symptoms of polyuria, polydipsia,
blurred vision and weight loss associated with polyphagia. Chronic
hyperglycemia may be accompanied by impairment of growth and susceptibility
to certain infections. Inadequacy due to impairment of insulin secretion and
defects in insulin action may exist in the same patient, making it difficult to
define which of the above is truly responsible for the hyperglycemia.
Diabetes can be mainly classified in type 1 and type 2 diabetes. Further
classification of diabetes includes cases of hyperglycemia due to genetic
defects of the β-cells or in insulin action, endocrinopathies, infections, induced
by drugs or chemicals, pancreatic diseases, associated with syndromes and
gestational diabetes.
Patients with type 1 diabetes (insulin dependent diabetes or juvenile-onset
diabetes) have an absolute deficiency of insulin secretion. This deficiency is
mainly due to T-cell mediated pancreatic islet β-cell destruction. It is believed
that environmental factors can also trigger pancreatic cell destruction. However,
these triggers, chemical or viral, are still unknown. The disease becomes
clinically evident after approximately 90% of the pancreatic β-cells have been
destroyed. Further, it has been found that a susceptibility to autoimmune type 1
diabetes can be transmitted by multiple genes, the chief gene being the Human
4
leukocyte antigen (HLA) gene. Individuals at risk of developing the disease can
be identified by an intravenous glucose tolerance test and measurement of
autoantibodies and genetic markers associated with type 1 diabetes.
Patients with type 2 diabetes (non–insulin dependent diabetes or adult-onset
diabetes) show a combination of resistance to insulin action, usually coupled
with a relative insulin deficiency. The specific etiology of the disease is unknown
but patients do not show an autoimmune destruction of β-cells or any other
cause of diabetes. These patients are usually obese and obesity itself leads to a
certain degree of insulin resistance. Others who are not obese usually exhibit
an increased percentage of body fat distributed primarily in the abdominal
region. Hyperglycemia develops gradually and remains undetected for a long
time as it is not severe enough to present the classic symptoms of diabetes.
Although undetected, this hyperglycemia is sufficient to cause pathologic and
functional changes in various target tissues (American Diabetes Association,
2010).
2.2 Diagnosis of diabetes
Diagnosis of diabetes is based on blood glucose measurements and the
presence or absence of symptoms and can be established by the following
criteria:
1. Symptoms of diabetes plus casual glucose concentration ≥ 11.1 mmol/L
(200 mg/ dl)
2. Fasting plasma glucose ≥ 7.0 mmol/L (≥ 126 mg/dl)
3. 2-hour post-load glucose ≥ 11.1 mmol/L ( 200 mg/ dl) during an oral
glucose tolerance test
4. HbA1C (glycated hemoglobin) ≥ 6.5
(Global IDF/ISPAD Guideline for Diabetes in Childhood and Adolescence,
2011)

5
2.2.1 Epidemiology of diabetes
Over 90% of child and adolescent diabetics, in most western countries, suffer
from type 1 diabetes. Less than half of these patients are diagnosed before the
age of 15 years. The incidence of type I diabetes varies considerably between
and even within countries and between different ethnic populations. The highest
incidence is found in Finland (64 per 100,000/ year) (Harjutsalo et al., 2008) and
the lowest in China (0.1 per 100,000/year) and Venezuela (The DIAMOND
Project Group, 2006). Environmental causes are believed to be the reason for
this great disparity. A rise of 2 to 5 percent per year has been noted in several
parts of the world. This amounts to an astonishing rise of 50% in 10 years
(British Medical Association, 2004). This rise shows a disproportionately greater
increase in diabetics under the age of 5 years. In Germany, the prevalence of
type I diabetes for children under 14 years is 10,000-15,000 children (Ehehalt et
al., 2008; Rosenbauer et al., 2002) and 21,000-24,000 (Rosenbauer et al.,
2002) for children under 19 years of age.
Gender differences in incidence have also been found in some populations. A
seasonal variation in the presentation of new cases is seen, with the peak being
observed in winter months.
Type 2 diabetes accounts for approximately 90% of all cases. Social and
behavioral changes are considered as the main factors responsible globally for
the sudden increase in type 2 diabetes. Type 2 diabetes is being more
frequently diagnosed in adolescents in recent years, mostly in the peri-pubertal
period (Global IDF/ISPAD Guideline for Diabetes in Childhood and
Adolescence, 2011).
In general, population growth, aging, urbanization, and an increasing
prevalence of obesity and physical inactivity are leading to an increase in
diabetes. An estimated 171 million people were suffering from diabetes in 2000
and this number is anticipated to rise to 366 million people in North America and
Europe by 2030 (Wild et al., 2004).
6
2.2.2 Complications of diabetes
Complications of diabetes can be classified as macrovascular and
microvascular. Macrovascular complications encompass atherosclerotic
cardiovascular diseases such as coronary heart disease, stroke and peripheral
vascular disease. Hyperglycaemia is the chief etiological factor of both these
complications. Chronic elevation of blood glucose level leads to the damage of
blood vessels due to the increased deposition of surface glycoproteins, which
then results in weakness of the basement membrane. The endothelium of the
retina, kidney and peripheral nervous system allow entry of glucose even in the
absence of insulin, subsequently initiating the microvascular complications
known as retinopathy, nephropathy and neuropathy.
One long term study, where patients were followed up for an average period of
6.5 years revealed that intensive therapy, keeping the blood glucose
concentrations close to the normal range, effectively delayed the onset,
decreased the frequency and severity, and at the same time slowed the
progression of diabetic retinopathy, nephropathy, and neuropathy in patients
with insulin dependent diabetes mellitus (The Diabetes Control and
Complications Trial Research Group., 1993). Some researchers, however,
refute the fact that hyperglycemia is the main cause of the diabetic
complications, supporting their hypothesis with examples of well controlled
diabetics also developing the complications in the course of time (Rich, 2006).
2.3 Type 1 diabetes and oral health
A number of studies have been dedicated to the investigation of oral health in
diabetics. The majority of these studies have been focused on the relationship
between periodontal disease and diabetes and fewer on dental caries and
diabetes. Although the risk of developing periodontal disease in diabetics is well
established, the association of dental caries and diabetes is still debated. It is,
however, difficult to interpret the significance of the results in relation to children
7
as a large amount of the studies regarding oral health in diabetics have been
carried out with type 2 diabetic adult patients.
2.4 Type 1 diabetes and dental caries
As mentioned above, the association between dental caries and diabetes type 1
has not been clearly established. Earlier studies have categorically shown that
children with diabetes had lesser dental caries as compared to healthy children,
the reason for this being stated as the restricted carbohydrate (sugar) intake of
diabetics. However, more recent studies have reported no difference in the
caries incidence of children with type 1 diabetes and their healthy counterparts
(Edblad et al. 2001; Moore et al., 2001b; Lalla et al., 2006a). It is believed that
the newer treatment regimens have led to a better control of the disease, thus
allowing the diabetic children to have a diet quite similar to that of normal
healthy children (Tonella et al., 2010). Therefore, recent studies investigating
the relationship between diabetes type 1 and dental caries are focusing on the
metabolic control of the disease. Longitudinal studies have been able to show a
positive correlation between the degree of metabolic control and the
development of dental caries (Twetman et al., 1992; Karjalainen et al., 1997;
Twetman et al., 2002). Interestingly, a more recent study has been able to
illustrate a positive relationship between caries risk and metabolic control, with a
sevenfold increased risk of impaired metabolic control after 3 years in those
assessed with high caries risk at onset (Twetman et al., 2005).
The multifactorial nature of dental caries makes it difficult to identify an exact
factor that could be responsible for an association between dental caries and
type 1 diabetes. In order to have a better understanding of this association a
brief account of the biological basis of the factors involved is necessary.
It has been postulated that impaired salivary secretion causes slow oral
clearance of sugar resulting in changes in the pH of dental plaque and thereby,
increasing the risk of caries development (Hase & Birkhed, 1988). Additionally,
type 1 diabetics show an alteration in the salivary glands (Reznick et al., 2006)

8
which causes a change in the composition of saliva and in the salivary flow rate
(Ben-Aryeh et al., 1988; Moore et al., 2001a; López et al., 2003; Mata et al.,
2004, Busato 2012), and this in turn has an effect on the oral microflora. These
changes have been found to remain over a period of 2 years (Siudikiene et al.,
2008). Another cross-sectional study confirmed that decreased unstimulated
salivary flow rates were associated with high caries levels in diabetic children
(Siudikiene et al., 2006).
a. Salivary composition
Glucose
Several studies have shown that type 1 diabetics with poor metabolic control
show an increase in the salivary and sulcular glucose levels due to the
hyperglycemia (Reuterving et al., 1987), reduced salivary glucose clearance
and a disruption in the neuroregulatory mechanism of the salivary glands
(Sampaio et al., 2011). Increase in the salivary glucose promotes bacterial
growth, decrease in the wound healing capacity and leads to an increase in
lactic acid production. This results in a decrease in the oral pH, thereby
simultaneously reducing the buffering capacity of saliva and altering the
bacterial colonization of the biofilm, in favour of Streptococcus mutans and
lactobacillus (Sampaio et al., 2011).
Proteins
Due to its known antimicrobial properties the role of IgA in the development of
dental caries has been investigated. However, its influence on caries
development has not as yet been substantiated. Siudikiene et al. (2008)
showed that children with diabetes had a significantly higher total
immunoglobulin A (IgA) and protein concentration over a study period of 2
years. López et al. (2003) found that the saliva of type 1 diabetics showed a
more acidic pH, reduced salivary flow rate, an increased level of total sugars,
glucose, urea and total proteins, whereas the calcium level was found to be
decreased. Other studies have shown no differences in the total concentration
of salivary proteins in type 1 diabetics and healthy controls (Edblad et al., 2001).

9
Isola et al. (2011) demonstrated that Statherin, a salivary protein involved in
regulation of calcium homeostasis and the formation of enamel pellicle was
found to be in a lower concentration in diabetics. The authors concluded that
this might account for the higher incidence of caries and infections in diabetics.
On the other hand, Engström and Kirstilä showed that patients with a total IgA
deficiency did not have a higher caries incidence than their control subjects
(Engström et al., 1992; Kirstilä et al., 1994).
Amylase
Long-chain carbohydrates are broken down by salivary amylase. The alpha-
amylases constitute a complex group of salivary digestive enzymes which
provide receptors on the tooth surface for the adherence of certain species of
Streptococcus thus promoting the formation of plaque and later dental caries. It
is, therefore, postulated that patients with uncontrolled type 1 diabetes and
elevated alpha-amylase levels, due to a carbohydrate-rich diet, may be more
prone to the development of dental caries (Sampaio et al., 2011).
Calcium
The concentration of calcium in saliva has also been investigated as a possible
cause in the development of caries. The process of remineralisation of carious
lesions can be promoted by increasing the concentration of calcium in saliva.
Some researchers have been able to demonstrate a higher concentration of
salivary calcium in diabetic individuals (Mata et al., 2004; Moreira et al., 2009),
whereas others have reported lower concentrations of salivary calcium in
diabetic patients (López et al., 2003). Other authors have found no difference
between normal and diabetic children in the concentrations of calcium in saliva
(Edblad et al., 2001).
b. Alterations in salivary microbiota
Streptococcus mutans and Lactobacillus are the two main microorganisms
involved in the development of dental caries. Streptococcus mutans play an
important role in the initiation of the carious lesion and Lactobacillus is
responsible for the progression of caries once the lesion has been formed or

10
demineralisation has taken place. As with healthy subjects, these two
microorganisms have been studied in type 1 diabetics. In 1989, Twetman
investigated the saliva of 94 children with type 1 diabetes and found that there
was no difference in the distribution or number of Streptococcus mutans in
healthy and type1 diabetes children, but the diabetic children showed
significantly lower levels of Lactobacilli. The number of Lactobacilli were found
to be positively correlated to the glucose concentration in saliva. They found no
difference in the caries incidence between healthy and diabetic children. The
authors attributed their findings to the dietary treatment of diabetic children
which gave rise to a reduction in the Lactobacilli count in saliva but did not
affect the Streptococcus mutans count (Twetman et al., 1989; Twetman et al.,
1992). Other studies have reported no difference in the Streptococcus mutans
and Lactobacillus counts or in the caries incidence between healthy and
diabetic children (Swanljung et al., 1992, Iughetti et al., 1999; Siudikiene et al.,
2008). Interestingly, in 2002 in a 3 year follow-up study Twetman et al. reported
that poor oral hygiene, previous caries experience and high levels of salivary
Lactobacilli were the significant single factors for the development of caries in
type 1 diabetics. The findings were rationalised by the theory that excess
glucose in saliva and gingival crevicular fluid enters into the oral cavity in
metabolically poorly controlled cases (Reuterving et al., 1987). This increased
the concentration of sugar in the biofilm thus enhancing plaque growth in
general and creating ecological conditions favouring aciduric bacteria such as
Lactobacilli (van Houte, 1994). Twetman suggested that this finding may reflect
the less restricted diet in today‟s diabetics (Twetman et al., 2002). Bolgül
showed an increase in the levels of salivary Streptococcus mutans and
Lactobacilli in poorly controlled diabetic children compared to well or moderately
controlled type 1 diabetics (Bolgül et al., 2004). Another study demonstrated
that the inheritance of some types of HLA-DR4, that are most prevalent in type
1 diabetics, was related to low salivary IgA activity against the streptococcus
mutans. This may possibly be caused by a weak bond between these alleles
and the antigenic peptides of Streptococcus mutans and may result in
increased colonization (Wallengren et al., 2005).
11
Thus it can be concluded, that studies on the levels of these bacteria in the
saliva of diabetic children are inconclusive, reporting decreased, increased or
similar levels in comparison to healthy children.
Siudikiene et al. did, however, show that although there were no differences in
the bacterial counts of diabetic and non-diabetic children, within the diabetic
group there was an inverse correlation of high salivary microbial counts and the
level of metabolic control of type 1 diabetes. Poorly controlled diabetics had
significantly higher counts of Streptococcus mutans and yeasts, as well as a
tendency for higher counts of Lactobacilli, as compared to the well-to-
moderately controlled diabetics (Siudikiene et al., 2006). This was also
supported by Syrjälä et al. (2003) who showed that among the diabetics with
HbA1c≥ 8.5, the presence of dental caries was more distinctly associated with
higher levels of Streptococcus mutans and Lactobacilli compared to those with
HbA1c ≤8.5. Similarly other studies have also deduced that poor glycemic
control strengthens the positive association of dental caries with Streptococcus
mutans and Lactobacilli (Karjalainen et al., 1997; Twetman et al., 1992;
Twetman et al., 2002).
c. Dental plaque
Dental plaque harbours bacteria that are essential for the development of caries
and periodontal disease. Thus the oral hygiene levels are positively related to
the levels of incidence of dental caries and periodontal disease in a given
population. Older as well as more recent studies have revealed that diabetics
had higher plaque indices than the healthy controls (Faulconbridge et al., 1981;
Goteiner et al., 1986). Siudikiene et al. have shown that in spite of similar oral
hygiene habits, the children with type 1 diabetes were more susceptible to the
accumulation of calculus than the healthy controls. Furthermore, the oral
hygiene index was found to be significantly higher in children with poor
metabolic control of diabetes compared to those with a well to moderate control
of the disease (Siudikiene et al., 2005). In a 2 year longitudinal study, the same
authors showed that type 1 diabetics demonstrated significantly higher dental
plaque levels than the controls. However, the diabetics and their non-diabetic
12
matched controls did not differ with respect to changes in dental plaque scores
over the two year period (Siudikiene et al., 2008). Similar results were found by
Lalla et al. (Lalla et al., 2006a). On the other hand, Saes Busato et al. (2010)
demonstrated no effect of the metabolic control on the oral health of
adolescents with type 1 diabetes.
2.4.1 Type 1 diabetes and dietary factors
Diet is another factor that executes an important function in the development of
dental caries. Concurrently, diet plays a significant role in the management of
diabetes. Thus common grounds have lead diet to be widely investigated in
diabetics in order to discover the implications of each factor in this triad
(diabetes, diet and dental caries).
Traditionally, studies focused on diabetics hypothesized that diabetics had a low
caries rate due to their sucrose-restricted diet. However, over the years the
dietary management of diabetics, especially type 1 diabetics has evolved and
their dietary plan does not differentiated much from that of a healthy individual.
Few current studies exhibit improvements in the therapy with insulin and oral
anti-diabetics, which have allowed a better control of the disease, without the
need for strict dietary restrictions (Tonella et al., 2010). Between 1992 and 1994
Moore et al. surveyed 406 patients with type 1 diabetes regarding their dietary
behavior. They found that the records of the diabetics varied extensively from
those of the controls. This was attributed to the counseling that the diabetics
received to maintain a healthy balanced diet. Dietary recommendations were
based on balancing the food intake to daily exercise activities and insulin
regimen in order to avoid dramatic variations in daily blood glucose levels and
prevent hypoglycemic episodes. The authors found that the diabetics, especially
females, had a higher frequency of food intake and snacked more frequently
between meals. This potential risk factor for dental caries was not significant in
the final regression model even when the gender variable was omitted.
Nonetheless, this finding did not indicate a significant association with a history
of caries for the entire population. It was concluded that the frequent intake of

13
carbohydrates (meals and multiple snacks) is likely to be an important risk
factor for caries in only a limited number of highly susceptible individuals.
Individuals with the most frequent food intakes (6.5/day) were found to have the
most severe caries experience. Neither dietary behaviours nor glycemic control
were found to contribute to caries in the participants (Moore et al., 2001b).
In 2005, Siudikiene et al. questioned 70 diabetic children and found no major
differences between them and non-diabetic children with respect to frequency of
meals or consumption of carbohydrates. They found that the diabetic children
had more frequent main meals and snacked less than the controls. In addition,
the diabetic children drank lesser sweet drinks than the controls.
In another study Ciglar et al. (2002) found that diabetics had a significantly
lower daily intake of carbohydrates as compared to the non-diabetics. On the
other hand, the diabetics had a considerably higher number of daily meals,
intake of dietary fibers, calcium and phosphorus. Additionally, they showed a
more frequent presence of low molecular carbohydrates in the daily meals thus
aiding the metabolism of cariogenic microorganisms. A significantly higher
incidence of caries was found in the diabetics, which the authors ascribed to the
more frequent daily intake of low molecular carbohydrates with an improper
calcium phosphorus ratio.
2.4.2 Type 1 diabetes and periodontal disease
A general consensus has long been reached that patients with diabetes have
an increased risk of developing periodontal disease. It is said to be twice as
prevalent in diabetics as in healthy individuals (Grossi, 2001). Most of the
studies that support this view have, however, been carried out on patients with
type 2 diabetes. Diabetes is considered as a predisposing or modifying factor
with regards to the intensity of the host response initiated by a local etiological
factor (Carranza & Newman, 1996).
14
Dental plaque and gingival inflammation
Plaque accumulation and colonization of microorganisms in the periodontal
pockets of diabetic patients has been found to be more rapid and to be of a
more severe nature than in healthy controls. Furthermore, it has been found
that patients with type 1 diabetes develop an earlier and higher inflammatory
response to a bacterial challenge than their healthy counterparts (Salvi et al.,
2005). Studies carried out on children and adolescents are not as many as
those carried out on type 2 diabetes populations, nevertheless, most of them
have come to a similar conclusion. Parameters for the analysis of periodontal
disease in investigations among children have usually been plaque indices,
gingival inflammation and bleeding on probing, as other parameters suggestive
of periodontal disease (pocket depth, bone loss) are rare in individuals less than
twenty years of age (Karjalainen, 2000). In 1982, Cianciola et al. demonstrated
a high incidence of periodontitis in diabetic children, starting at approximately 12
years of age. They reported that 9.8% of the diabetic children showed a
generalized periodontitis as compared to only 1.7% of the healthy children
(Cianciola et al., 1982). Firatli et al. also reported similar findings in 1996. They
measured the plaque index, gingival index, periodontal pocket depths and
clinical attachment levels in 77 children and adolescents with diabetes and
found the above parameters to be significantly higher than those of the controls.
They also found a positive correlation between the duration of diabetes and
clinical attachment loss (Firatli et al., 1996). In a 5 year follow-up study, one of
the authors in the above study was able to confirm the above results and they
concluded “that diabetes modifies the clinical status of the periodontal tissues
and increases clinical attachment loss” (Firatli, 1997). A more recent study by
Lalla et al. found that diabetes is highly significantly correlated with periodontitis,
especially in 12- to 18-year-old children. Children with diabetes had significantly
higher plaque and gingival inflammation levels and more number of teeth with
evidence of attachment loss than healthy children. The authors concluded that
in diabetic children periodontal destruction can start very early in life and
become predominant in adolescents (Lalla et al. 2006a). Barnett et al. studied a
sample of type 1 diabetics aged between 10 and 18 years and reported no
15
signs of periodontitis despite many of the subjects in the study having poorly
controlled diabetes for a long duration (Barnett et al., 1984).
Several studies have shown a significantly higher gingival index, suggesting
increased gingival inflammation in diabetic children and adolescents but no
difference in pocket depths/ periodontal status (Pinson et al., 1995; Sandholm
et al., 1989b; Novaes et al., 1991). In a group of 50 diabetic children Orbak et
al. found gingival inflammation in 69.7% of the 5-9 year-olds, and 83.7% of the
10-14 year-olds. The plaque indices, gingival indices and calculus indices
showed an increase with age in the diabetics children, with a significant
difference in all the above indices between the diabetic and the control children
for the 10-14 year-olds (Orbak et al., 2008).
Goteiner et al. on the other hand, reported gingival inflammation to be equal in
diabetic children and adolescents when compared to their controls (Goteiner et
al., 1986). In a 3 year longitudinal study, consisting of a group of diabetic
children and their healthy siblings, Sbordone et al. found no differences in
probing depth, attachment level, sulcus bleeding index or the plaque index
(Sbordone et al., 1998).
Therefore, the majority of studies on type 1 diabetic children, based on clinical
parameters reveal an increase in gingival inflammation in diabetic children as
compared to their controls, signaling an increased susceptibility to the
development of periodontal disease later in life. Not all studies have always
considered the same clinical parameters (bleeding on probing, plaque
accumulation and gingival inflammation) thus making it difficult to actually
assess the risk of development of periodontal disease in child diabetic patients.
Earlier studies have focused on the importance of metabolic control for oral
health among diabetics. Poor metabolic control has been linked to gingival
inflammation and periodontitis (Gusberti et al., 1983; Firatli et al., 1994). At the
same time, it has been suggested that an improvement in the periodontal
condition in turn has a positive effect on the metabolic control. This opinion is,
however, not supported by all studies. Several studies have reported the lack of

16
an association between gingival inflammation and metabolic control (Pinson et
al., 1995; Sandholm et al., 1989b; Sastrowijoto et al., 1989).
Microbial flora
The hypothesis that the composition of plaque differs in diabetic patients, in
terms of microbial flora has also been investigated by a number of studies.
McNamara et al. examined the microflora of the rat gingival crevice in
experimental diabetes model and noted that plaque accumulation was markedly
increased in the diabetic rats. A notable change was also found in the gingival
microflora which was attributed to diabetes-induced alterations in the sulcular
environment (increased level of glucose and urea, and decreased oxygen).
Moreover, the microbiological changes were found to precede the development
of the periodontal pocket (McNamara et al., 1982). Mashimo et al. investigated
the periodontal pockets in children with type 1 diabetes and found an increased
prevalence of Capnocytophaga. Actinobacillus actinomycetemcomitans was
also detected in some patients. This study, however had no controls (Mashimo
et al., 1983). Sandholm et al. also studied the morphotypes of the subgingival
microflora in 85 Finnish adolescents with type 1 diabetes. The microflora of the
diabetics showed significantly and higher proportions of gram-negative rods,
fusiforms, and total gram-negative bacteria. They justified their finding of
increased gingival inflammation in this group of patients than in the controls, by
the significantly higher proportion of the periodontally pathogenic bacteria
(Sandholm et al., 1989a). Other studies have found no significant differences in
the microbial species between the diabetics and healthy controls (Sbordone et
al., 1995; Sbordone et al., 1998; Christgau et al., 1998). In 2006, Lalla
investigated the levels of subgingival plaque bacteria and serum IgG responses
in patients with type 1 diabetes and non-diabetic controls with a similar
periodontal status. The analysis of 12 bacterial species was done by
checkerboard hybridization. The results demonstrated that among the
investigated species, only levels of Eubacterium nodatum were found to be
higher in diabetic patients, while none of the immunoglobulin G (IgG) titres
differed between the groups. The authors concluded that patients with type 1
17
diabetes and healthy controls showed comparable subgingival infection patterns
and serum antibody responses (Lalla et al., 2006b).
Porphyromonas gingivalis is considered as one of the microorganisms
responsible for periodontal disease. It has the capacity to invade endothelial
cells and is a potent signal for monocyte and macrophage activation. “Thus,
once established in the diabetic host, this chronic infection complicates diabetes
control and increases the occurrence and severity of microvascular and
macrovascular complications” (Grossi, 2001). In 1996, Smith et al. investigated
the presence of three periodontal pathogens viz. Porphyromonas gingivalis,
Bacteroides forsythus, and Actinobacillus actinomycetemcomitans and serum
antibody titers to these bacteria in patients with type 1 diabetes.
Porphyromonas gingivalis was detected in 12% of the patients, Bacteroides
forsythus in 50% of patients while A. actinomycetemcomitans remained
undetected. Positive associations were found between the presence of
Bacteroides forsythus and gingival index, probing depth, and attachment level.
The study further revealed a depressed humoral immune response among
diabetics with lower IgG antibody titres against Porphyromonas gingivalis and
Bacteroides forsythus in sera of these patients (Smith et al., 1996).
Thorstensson et al. conducted a study on adult type 1 diabetics and found that
significantly more diabetics harboured P. gingivalis than the controls. However,
the prevalence of P. gingivalis was associated with deepened periodontal
pockets among healthy controls but not among the diabetics. The serum
antibody titres for most antigens were found to be similar in both the diabetic
and non-diabetic group (Thorstensson et al., 1995). Similar findings were
supported by another study (Sastrowijoto et al., 1989). Mandell et al. examined
one periodontally-healthy and one periodontally-diseased site in each patient, in
a sample of poorly controlled type 1 diabetics. They found increased levels of
the periodontal pathogens Prevotella intermedia, P. melaninogenica spp.,
Bacteroides gracilis, Eikenella corrodens, Fusobacterium nucleatum and
Campylobacter rectus in the periodontally diseased sites. Sites associated with

18
deep pockets and attachment loss revealed higher levels of P. intermedia
(Mandell et al., 1992).
Studies investigating periodontally pathogenic microorganisms in type 2
diabetics have revealed a significant increase in the frequency of P. gingivalis,
Campylobacter spp., T. forsythensis and A. actinomycetemcomitans in the
subgingival plaque of diabetics compared with non-diabetics using polymerase
chain reaction (Ebersole et al., 2008; Campus et al., 2005). Using PCR and
targeting the 16S rRNA gene, Gafan demonstrated that the three periodontal
pathogens, viz. P. gingivalis, T. forsythensis and A. actinomycetemcomitans
can be detected in the dental plaque of healthy children and of those with
gingivitis. Interestingly, they also found that T. forsythensis was associated
more frequently with dental plaque at sites with no gingivitis (Gafan et al.,
2004). Similar results were observed by Sakai et al. in 2007. They examined 64
children in a 1 year longitudinal study and found that at least one of the putative
periodontal pathogens was detected in a high percentage of the children even
though the children depicted periodontally healthy conditions (Sakai et al.,
2007).
At present, it is difficult to estimate the real effect that diabetes has on the
composition of the subgingival plaque (microorganisms). Despite the fact that
certain microorganisms are more prevalent in diabetics, whether this is due to
direct alterations in the subgingival microenvironment or whether it takes place
indirectly by alterations to the host response, remains unclear. The subgingival
microenvironment of diabetic patients might be altered as a result of
hyperglycaemia, making it more habitable for periodontally pathogenic bacteria.
On the other hand, the host response to plaque may be altered in diabetics
leading to increased tissue destruction (Ohlrich et al., 2010).

19
2.5 Phenylketonuria
Phenylketonuria (PKU) is a rare metabolic genetic disorder. It is inherited as an
autosomal recessive trait and characterised by a wide range (over 400) of
mutations in the gene coding for the hepatic enzyme phenylalanine hydroxylase
(PAH). This leads to an absence or deficiency of the enzyme phenylalanine
hydroxylase which is essential to metabolise the amino acid phenylalanine
(Phe) into the amino acid tyrosine. Clinical manifestations of the disorder are
due to toxic accumulation of phenylalanine in the blood and brain.
Generally, PKU is diagnosed in a neonatal screening. However, if undiagnosed
at birth, symptoms start developing within a few months. They range from very
mild to severe and comprise of gradual developmental delay, stunted growth,
microcephaly, seizures, tremors, eczema, vomiting, and a musty odor.
Untreated patients, in time, develop intellectual disability, behavioral disorders
(hyperactivity) and motor disorders. Three forms of PKU have been described,
viz. classical (Phe > 20 mg/dl [1200 μmol/l]), mild (Phe between 10mg/dl [600
μmol/l] and 20 mg/dl [1200 μmol/l]) and mild hyperphenylalaninemia (Phe < 10
mg/dl, [600 μmol/l]).
The classical form is the most common form of PKU and manifests itself with
severe symptoms. Classic PKU is caused by a complete or near-complete
deficiency of PAH activity. Individuals with untreated classical PKU often
present with a musty body odor and dermatological conditions due to the
excretion of excessive phenylalanine and its metabolites. A decrease in skin
and hair pigmentation might also be observed due to the associated inhibition of
tyrosinase. Due to problems in the recycling of tetrahydrobiopterin (BH4), the
cofactor in the phenylalanine, tyrosine, and tryptophan hydroxylation reactions,
involved in catecholamine, serotonin, and nitric oxide biosynthesis, patients may
also show a decreased myelin formation and dopamine, norepinephrine, and
serotonin production. Additional problems, like exaggerated deep tendon
reflexes, tremor, and paraplegia or hemiplegia, can arise later in life (Williams,
1998; Pérez-Dueñas et al. 2005).

20
2.5.1 Prevalence
The prevalence of PKU is estimated to be 1 in 10,000 live births in Europe
(Steinfeld et al., 2004). The gene mutation frequency varies between different
ethnic groups, thus showing a higher rate in some countries like Ireland and
Italy. Prevalence is reported to be particularly high in Turkey with 1 in 4,000 live
births (Stuhrmann et al., 1989). In Germany an estimated 60 newborns are
diagnosed with PKU every year. PKU is found to be rarer in Finland, Africa and
Japan (Mitchell and Scriver, 2000).
2.5.2 Treatment and dietary considerations
There is no remedy for PKU. The objective in the management of PKU is to
prevent developmental delay and assist in normal growth of the patient. This is
accomplished by maintaining lower blood phenylalanine concentrations to the
recommended therapeutic levels. A low-protein diet in combination with a
protein (amino acids) Phe-free medical formula, which is free from or low in
phenylalanine is the mainstay of treatment. The aim is to achieve plasma Phe
concentrations of 2-5 mg/dL (120-300 µmol/L) in newborns and young children.
Patients tolerate less than 250-350 mg of dietary phenylalanine per day to keep
plasma concentration of Phe at a safe level of no more than 5 mg/dL (300
µmol/L). Controversy, however, remains over the plasma Phe concentration to
be attained for individuals older than twelve years of age. The overall
consensus is that the closer the Phe concentration is to the recommended
normal value, the better is the patient‟s general state of well-being. A diet which
is low in phenylalanine should be initiated as soon as possible after birth and
continued at least into adolescence and when necessary, for life. Children
under two years of age should maintain a total amino acid intake of at least 3
g/kg/day including 25 mg tyrosine/kg/day. In order to minimize fluctuations in
blood amino acid concentrations, the consumption of Phe-free medical formula
should be spread out equally over 24 hours. An adjuvant therapy with 6R-BH4
stereoisomer may benefit a large percentage of patients with PKU. In addition to
monitoring of the plasma Phe and Tyr concentrations, diet and cognitive

21
development of the patient, must be evaluated at regular intervals (Mitchell &
Scriver, 2000). Guidance regarding the use, dosage, and distribution of dosage
of the protein substitute over a 24-hour period is ambiguous, with a discrepancy
in recommendations between different treatment centres (Yi & Singh, 2008).
Medical Foods
As mentioned above, the treatment of PKU entails a strict diet which is low in
proteins and a Phe-free medical formula that substitutes the proteins (essential
amino acids) required by the patient for normal cognitive and physical
development. „Medical foods‟ is a term used to describe the Phe-free medical
formula and foods modified to be low in protein. In addition to the essential
amino acids the medical formula provides tyrosine, vitamins, minerals and trace
elements that a person without PKU would get from their normal diet. The
medical foods and more importantly the Phe-free formula is generally
prescribed by the physician. It is critical for patients with PKU to take the
prescribed amount of medical formula each day. The nutritional needs of each
patient are assessed by the dietitian and accordingly the formula is prescribed.
Formulas are available in a variety of forms and flavours, as a powdered drink
mix or as a ready-made drink in different flavours, bars and tablets to suit
diverse lifestyles and preferences. Formula is usually consumed approximately
three to four times a day, depending on individual requirements.
Additionally, low protein foods are modified by the manufacturer such that they
supply no more than one gram of protein per serving. They provide the
additional calories required by the patient without supplying additional
phenylalanine containing protein. In this manner, catabolism which in itself can
cause Phe levels to rise may be prevented.
A substantial amount of the protein required by the PKU patients is derived from
the medical formula, the rest, which includes the essential amount of Phe the
body needs for functioning and development, is derived from food. The PKU
diet primarily comprises of low protein foods such as fruits, vegetables, modified
low protein foods, fats and sugars.
22
Foods, high in protein such as red meat, chicken, fish, eggs, milk, yogurt,
cheese, nuts, soybeans and beans are excluded from a PKU diet, except when
the dietary restriction required is minimal. Foods such as regular pasta, bread,
rice and starchy vegetables (potatoes, peas, corn etc.) are also meant to be
consumed in a very limited amount. Unlimited quantities of low protein foods
should also be avoided. Fatty foods and foods with almost no proteins, such as
jams and conserves and sweets free from milk and gelatin need not be
restricted.
Aspartame
Aspartame avails a special mention in the diet of a patient suffering from PKU. It
is an artificial sweetener, used often in several „sugar-free‟ foods, beverages
and medications, that contains phenylalanine. Individuals with PKU should
avoid eating or drinking any food or drinks containing aspartame. Therefore,
generally most products containing aspartame are labeled with a warning:
„Contains Phenylalanine‟.
2.5.3 PKU und oral health
It has been suggested that patients with PKU are more likely to have dental
caries and or dental erosion as their diets tend to include more sugary foods
and acidic drinks. As mentioned above, children with PKU derive less protein
from foods; hence it is necessary for them to consume more carbohydrates and
fats to supplement their energy. For the same reasons, they may snack more
often over the course of the day. Furthermore, frequent ingestion of the Phe-
free medical formulas, which are sweetened and acidic, is detrimental for oral
health.
In 1999, Kilpatrick et al. evaluated the oral health of forty children with PKU and
the erosive potential of 5 amino acid supplements commonly prescribed in their
management. They found no significant difference in the level of dental caries
between the PKU children and the healthy children. The PKU children did,
however, show more signs of tooth wear. Supporting this finding, the study did
reveal that the titratable acidity of the flavoured supplements was significantly

23
higher than the control drinks (Kilpatrick et al., 1999). Another case report
published in 1992, describing the management of a child with PKU, tried to
provide a causal relationship between the chronic dietary acid load with dental
caries (Manz & Schmidt, 1992).
A search for studies and literature on children with PKU and dental health is
relatively fruitless. Very few studies have been conducted on the subject. Less
than a handful of studies, conducted in Europe in the early 70‟s and 80‟s have
focused on the oral health of children with PKU. For the purpose of the present
thesis these studies are, however, of little or no reference value as they have
been published in the local languages (Stavljenić et al., 1987; Oulis &
Kostopoulou, 1984; Velková & Podhradská 1976; Velková & Podhradská 1981;
Ogresta & Zaninović, 1975).
2.6 Detection of microorganisms using Polymerase Chain
Reaction
Traditionally, conventional culture methods have been widely used in studies to
distinguish the composition of oral microflora and are still considered the gold
standard when determining the utility of a new microbial diagnostic method in
oral microbiology. It is the only method able to properly describe new species
and to assess the antibiotic susceptibility of the grown bacteria. The
conventional culture methods do, however, have some drawbacks. Only viable
bacteria may be grown thus necessitating strict sampling and transport
conditions. Furthermore, culture of certain putative periodontal pathogens can
prove to be rather problematic. The sensitivity of this method can be slightly
low. Therefore, low numbers of a specific pathogen in a sample will remain
undetected and could falsify results. An additional drawback is that in this day
and age, culture methods are proving to be relatively time-consuming (Sanz et
al., 2004).
Over almost two decades Polymerase Chain Reaction has established itself as
a reliable DNA-based technique for detection of human oral microbial

24
pathogens. It has been found to be a rapid, accurate, highly sensitive and
specific method for the detection of periodontal pathogens as well as bacteria
associated with caries (Loesche, 1992; Lyons et al., 2000; Boutaga et al., 2006;
Rupf et al., 1999).
The advancements in molecular biology, designed for the detection of
microorganisms, have provided an improvement in the knowledge of microbial
genetics and has further boosted the development of enhanced diagnostic
techniques (Holt & Progulske, 1988; Gibbs, 1990; Saiki et al., 1988). Molecular
biology techniques are aimed at the analysis of DNA, RNA or the protein
structure or function (Dawson et al., 1996). The genetic material of a
microorganism constitutes transferring, ribosomal and messenger RNA and
chromosomal DNA. The principle of molecular biological diagnostic tests is
based on the recognition of specific (complementary) bacterial DNA sequences
from target microorganisms by specific DNA fragments. Therefore, it is essential
to extract bacterial DNA from the sample and amplify the specific DNA
sequence of the target bacteria. Different chemical, enzymatic or physical
methods are implemented to extract sufficient quantity of DNA for the
subsequent analysis by polymerase chain reaction (PCR). Organic chemicals or
detergents, such as hexadecyltrimethyl ammonium bromide or guanidine
hydrochloride are used for the lysis of the cells and precipitation of DNA is
carried out with isopropanol or ethanol (Smith et al., 1989). In another method,
lysozyme, an enzyme, is used to split the bacterial wall and the proteinic
components of the cell are destroyed with proteinase K. Heat is often used for
the disruption of the cell and denaturation of the proteins. Consequently, the
separation and purification of DNA is carried out using centrifugation and
chromatographic columns. Generally, extraction of DNA for periodontal testing
purposes is done using proteinase K or boiling and centrifugation (Ting & Slots,
1997; Umeda et al., 1998). Following the extraction and purification of DNA
from the sample polymerase chain reaction is used to specifically detect and
quantify the target pathogens.
25
PCR is an extremely sensitive diagnostic technique, capable of detecting even
one copy of the searched DNA fragment (Greenstein, 1988). However, just as
any other diagnostic technique it also has some limitations. A main drawback of
PCR is its vulnerability to contamination. The specificity of the polymerase chain
reaction depends on several complex, interrelated factors, such as
oligonucleotide primer size, annealing temperature and buffer salt
concentration. A small change or miscalculation of any of the ingredients can
lead to major errors in the result. Additionally, problems may arise when
studying small quantities of DNA, since the constituents of the reaction
(oligonucleotide primers, dNTPs, Taq polymerase) may be exhausted before
sufficient target is produced. On the other hand, PCR provides many
advantages in the diagnosis of oral microorganisms. Compared to conventional
lengthy and time consuming techniques, analysis of a great number of samples
can be carried out relatively easily and efficiently.
26
3 Aims and objectives of the study
The aim of this study was to investigate the oral parameters that influence the
caries risk and risk of developing periodontal disease in children with PKU and
type 1 diabetes. The parameters to be assessed were the dental and oral
hygiene status and oral microorganisms in children with diabetes, PKU and in
healthy children.
The null hypothesis of our study is that the children and adolescents suffering
from phenylketonuria do not possess a higher caries rate and more signs of
periodontal disease than their healthy or diabetic counterparts. On the other
hand, diabetic children do not have a lower caries rate and a higher risk of
developing periodontal disease.
The alternative hypothesis of our study is that the children suffering from
phenylketonuria possess a higher caries rate and show lesser signs of
periodontal disease than their healthy or diabetic counterparts. On the other
hand, diabetic children have a lower caries rate and a higher risk of developing
periodontal disease.

27
4 Material and Methods
This study, conducted at the Heinrich-Heine-University, Düsseldorf was a cross-
sectional study and involved the examination of patients from 3 groups. The
study was carried out from September 2005 till November 2006.
Children suffering from PKU (Group A) und type 1 diabetes (Group B) were
recruited from the Paediatric Department of the Children‟s Hospital at the
University Hospital in Düsseldorf. The control group (Group C) consisted of
healthy children who were recruited from the Department of Operative Dentistry,
Periodontology and Endodontology and from the Department of Orthodontics,
University Hospital, Düsseldorf. Children between the ages 3 and 18 years were
recruited for the study. The total sample consisted of 238 children. Both Group
B and C comprised of 100 children and Group A had 38 children. The patients
were matched for gender and age.
Parents of all the children gave their informed and written consent before
participating in the study. This study was approved by the Institutional Human
Subjects Ethics Committee of the Heinrich-Heine-University, Düsseldorf (Study
number: 2644).
Inclusion Criteria:
Children diagnosed with either type 1 diabetes or phenylketonuria (group
A & B)
Aged between 3 and 18 years
Informed consent given by the parents
Exclusion criteria:
Intake of antibiotics 2 weeks prior to the clinical examination
Systemic disease (group C)
An uncooperative child

28
4.1 The Questionnaire
Information regarding economic and social status, oral hygiene habits and
fluoride intake was collected with the help of a questionnaire (see Appendix).
The questionnaire was filled out by one of the parents or guardian in the waiting
room or while the child was being examined. The part of the questionnaire
collecting information on the socioeconomic status included questions regarding
the educational and professional status of both parents. Social status scores
were calculated from each of the three components. The child's social status
was defined by computing a total score for each parent. The higher of the two
scores was used. In the case of the parents being separated, the score of the
main care-provider was employed. Accordingly, the categories of social status
were defined as lower, middle and upper (Winkler& Stolzenberg, 1999).
4.2 Clinical Examination
All the participants were examined by a single dentist. Examination of the
patients was done under adequate lighting conditions, i.e. using a patient
examination light when the patient was not examined in a dental chair (at the
children‟s hospital). All the healthy control patients (group C) were examined in
a dental chair at the dental hospital. Two mirrors and a William‟s probe were
used for the dental examination. The dental status was assessed by the DMFS
Index and the oral hygiene and gingival health was evaluated by employing the
plaque index by Silness & Löe and the Papillary Bleeding Index (PBI),
respectively.
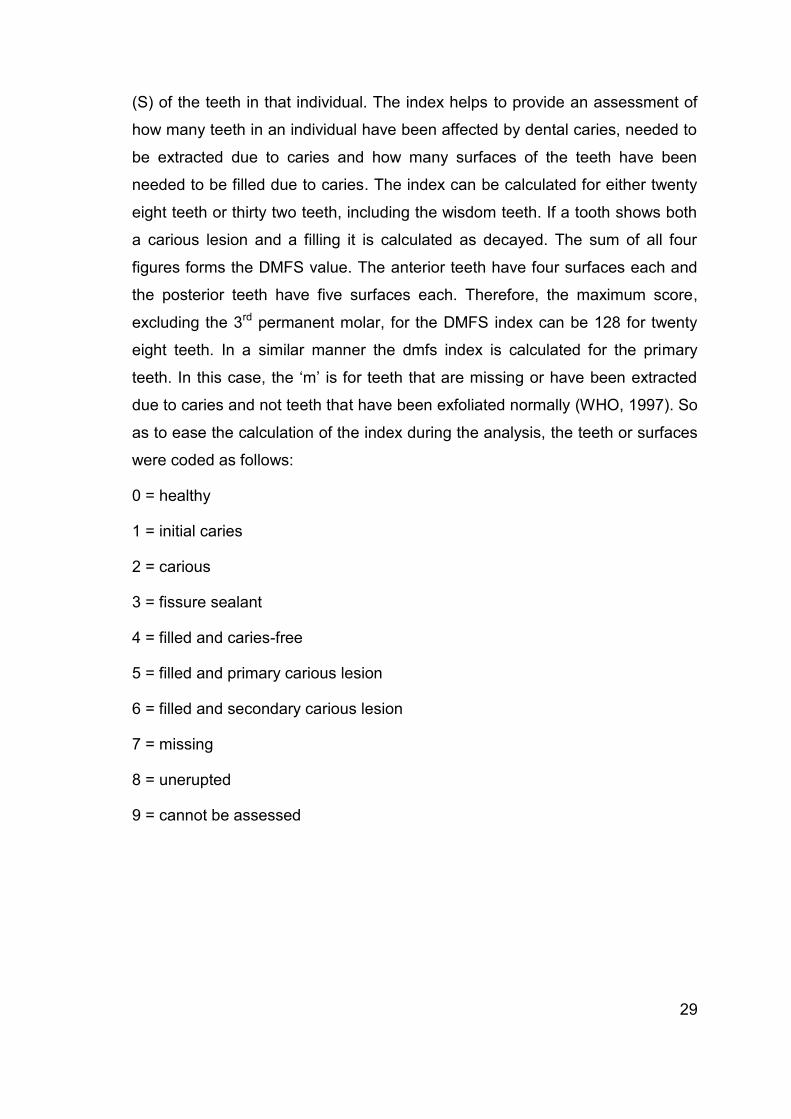
4.2.1 DMFS/ dmfs Index
The DMFS Index (decayed, missing, filled surfaces) was used for the secondary
(permanent teeth) and the dmfs Index for the primary dentition. The DMFS
numerically expresses the prevalence of dental caries in an individual by
calculating the number of decayed (D), missing (M), filled (F) teeth and surfaces
29
(S) of the teeth in that individual. The index helps to provide an assessment of
how many teeth in an individual have been affected by dental caries, needed to
be extracted due to caries and how many surfaces of the teeth have been
needed to be filled due to caries. The index can be calculated for either twenty
eight teeth or thirty two teeth, including the wisdom teeth. If a tooth shows both
a carious lesion and a filling it is calculated as decayed. The sum of all four
figures forms the DMFS value. The anterior teeth have four surfaces each and
the posterior teeth have five surfaces each. Therefore, the maximum score,
excluding the 3rd permanent molar, for the DMFS index can be 128 for twenty
eight teeth. In a similar manner the dmfs index is calculated for the primary
teeth. In this case, the „m‟ is for teeth that are missing or have been extracted
due to caries and not teeth that have been exfoliated normally (WHO, 1997). So
as to ease the calculation of the index during the analysis, the teeth or surfaces
were coded as follows:
0 = healthy
1 = initial caries
2 = carious
3 = fissure sealant
4 = filled and caries-free
5 = filled and primary carious lesion
6 = filled and secondary carious lesion
7 = missing
8 = unerupted
9 = cannot be assessed

30
4.2.2 Papillary Bleeding Index (PBI)
The Papillary Bleeding Index was first introduced by Saxer and Muhlemann in
1975. Bleeding is checked by inserting a periodontal probe into the gingival
sulcus at the base of the papilla on the mesial side, and then moved coronally
to the tip of the papilla. This is then immediately repeated on the distal side of
the papilla. The intensity of any bleeding is recorded as:
0 No bleeding
1 A single discreet bleeding point
2 Several isolated bleeding points or a single line of blood appear
3 The interdental triangle fills with blood shortly after probing
4 Profuse bleeding occurs after probing; blood flows immediately into the
marginal sulcus.
4.2.3 Silness & Löe Index
Plaque deposits were assessed using the Silness & Löe Index, which is based
on recording both soft debris and mineralised deposits on the teeth. Missing
teeth are not substituted.
The following scores are given from 0 to 3:
0 No plaque
1 A film of plaque adhering to the free gingival margin and adjacent area of
the tooth. The plaque may be seen in situ only using the probe on the
tooth surface.
2 Moderate accumulation of soft deposits within the gingival pocket, or the
tooth and gingival margin which can be seen with the naked eye.
3 Abundance of soft matter within the gingival pocket and/or on the tooth
and gingival margin.
31
The index score is achieved by calculating the sum of all the individual score
and dividing it by the number of teeth examined.
Metabolic control of diabetes:
The level of metabolic control of diabetes for the children in group B was
determined by the glycosylated haemoglobin value HbA1c. This reflects the
levels of glycaemia over the preceeding 6-12 weeks. According to the
guidelines for the management of type 1 diabetes, diabetics with HbA1c < 9%
are considered as well to moderately controlled patients and HbA1c ≥ 9% as
poorly controlled (Global IDF/ISPAD Guideline for Diabetes in Childhood and
Adolescence, 2011)
4.3 Microbiological sample collection
For the microbiological examination of the bacteria, a sample was collected on
a sterile paper point (ISO 35) from the cervical region and gingival sulcus of the
first deciduous molar or from the first permanent molar in the lower right
quadrant. In case the above mentioned teeth were missing, the sample was
taken from the gingival sulcus of the first deciduous molar or from the first
permanent molar in the lower left quadrant or the upper right quadrant.
The paper point was scraped along the cervical region of the tooth crown,
inserted into the gingival sulcus for a period of 30 seconds and then transferred
to a 1.5 ml microfuge tube (Eppendorf, Hamburg, Germany). This tube was
transported on ice to the laboratory, and frozen immediately, initially at -18° C
and then at -80° C, until later analysis.
32
4.4 Laboratory analysis of the bacteria- Materials
Quantitative real-time Polymerase Chain Reaction (PCR) was used for the
detection of the following bacteria:
1. Lactobacillus species (Lac)
2. Lactobacillus casei (Lca)
3. Streptococcus mutans (Sm)
4. Aggregatibacter actinomycetemcomitans (Aa)
5. Porphyromonas gingivalis (Pg)
6. Tannerella forsythensis (Tf)
4.4.1 Chemicals
The chemicals used in the laboratory were procured from the following
companies:
Gibco BRL Karlsruhe, Germany
Merck Darmstadt, Germany
Sigma-Aldrich Seelze, Germany
Biozym Hessisch Oldendorf, Germany
4.4.2 Primers and Probes
Primers and probes (Table 1) used for the PCR were synthesised by:
Metabion Martinsried, Germany
Eurogentec S.A. Seraing, Belgium (probe for Tf)

33
Species
Primer/Probe Sequence (5'-3') Size Literature
Sm Smu-AJ243965-F TGG GAC GCA AGG GAA CA 17 nt Price et
al.2007
Smu-AJ243965-R CCC GTT CGC GAC TCA AGA 18 nt
Smu-AJ243965-T(HEX-BHQ1) CTT GCA CAC CGT GTT T 16 nt
Lac Lacto- F2 TGG AAA CAG ATG CTA ATA CCG 21 nt Byun et
al.,2004
Lacto-R2 CGT CCA TTG TGG TAG ATT CCC T 22 nt
Lacto-S(FAM-BHQ1) CTG AGA CAC GGC CCA WAC TCC TAC GG 26 nt
Lca Lcase-62F TGC TTG CAC CGA GAT TCA AC 20 nt Self-
designed
Lcase-162R TTA GCA TCT GTT TCC AAA TGT TAT CC 26 nt
Lcas95T(HEX-BHQ1) CGG ACG GGT GAG TAA CAC GTG GGT AAC 27 nt
Aa Aa-U51862-F ACG CAG ACG ATT GAC TGA ATT TAA 24 nt Morillo et
al. 2004
Aa-U51862-R GAT CTT CAC AGC TAT ATG GCA GCT A 25 nt
Aa-U51862-S(FAM-BHQ1) TCA CCC TTC TAC CGT TGC CAT GGG 24 nt
Pg
Pg-D64081-F CCT ACG TGT ACG GAC AGA GCT ATA 24 nt Morillo et
al. 2004
Pg-D64081-R AGG ATC GCT CAG CGT AGC GAT T 22 nt
Pg-D64081-S(TEXRED-BHQ2) TCG CCC GGG AAG AAC TTG TCT TCA 24 nt
Tf Tf-AF054892-F TCC CAA AGA CGC GGA TAT CA 20 nt Morillo et
al. 2004
Tf-AF054892-R ACG GTC GCG ATG TCA TTG T 19 nt
Tf-AF054892-S(FAM-BHQ1) TCG CGA CGT GAA ATG GTA TTC CTC 24 nt
Table 1: Primers and probes for the investigated bacteria

34
4.4.3 Master Mix
qPCR Mastermix No ROX (Cat.-No: RT-QP2X-03NR)
Eurogentec Seraing, Belgium
4.4.4 Kits
Rapid DNA Ligation Kit
Roche Diagnostics Mannheim, Germany
High Pure PCR Product Purification Kit
Roche Diagnostics Mannheim,Germany
QiAamp DNA-Mini Kit
Qiagen Hilden, Deutschland
Gentra Puregene Kit
Qiagen Hilden, Germany
4.4.5 Enzymes
Proteinase K
Sigma-Aldrich Seelze, Germany
Taq DNA Polymerase
Invitrogen Carlsbad, USA
Restriction endonucleases Sph I und Sal I
Amersham Buckinghamshire, UK

35
4.4.6 Bacterial Strains
The bacterial strains used in this study were obtained from the German
Collection of Microorganisms and Cell Cultures (DSMZ) (Braunschweig,
Germany), American Type Culture Collection (ATCC) (LGC Standards, Wesel,
Germany) and from the reference cultures of the Institute for Medical
Microbiology and Hospital Hygiene, Heinrich-Heine University, Düsseldorf. They
were used to isolate genomic DNA for use in the Real-Time PCR and to set up
the PCR Standards.
Species
E.coli DH5α
Streptococcus mutans Reference culture
Lactobacillus casei Reference culture
Aggregatibacter
actinomycetemcomitans
DSMZ
Prophyromonas gingivalis DSMZ
Tannerella forsythensis ATCC
Table 2: Procurement of bacterial strains

36
4.4.7 Cloning Vector
Plasmid Size
(kb)
Resistance
gene
Character Company
pGEM-T 3 Amp LacZ' Gene, SP6- und T7
Promotor, f1-ori
Promega,
Mannheim,
Germany
Table 3: Cloning Vector
4.4.8 Equipment
iCycler iQ5
BioRad Munich, Germany
T-Gradient PCR thermalcycler
Whatman Biometra Göttingen, Germany
4.5 Laboratory analysis of the bacteria - Methods
4.5.1 DNA Extraction
a. Extraction of genomic DNA from patient samples
1. The paper point sample was inserted into a microfuge tube (Eppendorf,
Hamburg, Germany) with 70 µl 10M Tris HCl pH 8.0.
2. 140 µl Proteinase K was added to the microfuge tube and vortexed for
30 secs.
3. The microfuge tube was placed in a thermo-mixer at 56° C, set at 600
rpm for 1 hour. After 30 mins, the tube was removed and vortexed for 30
secs and reinserted.
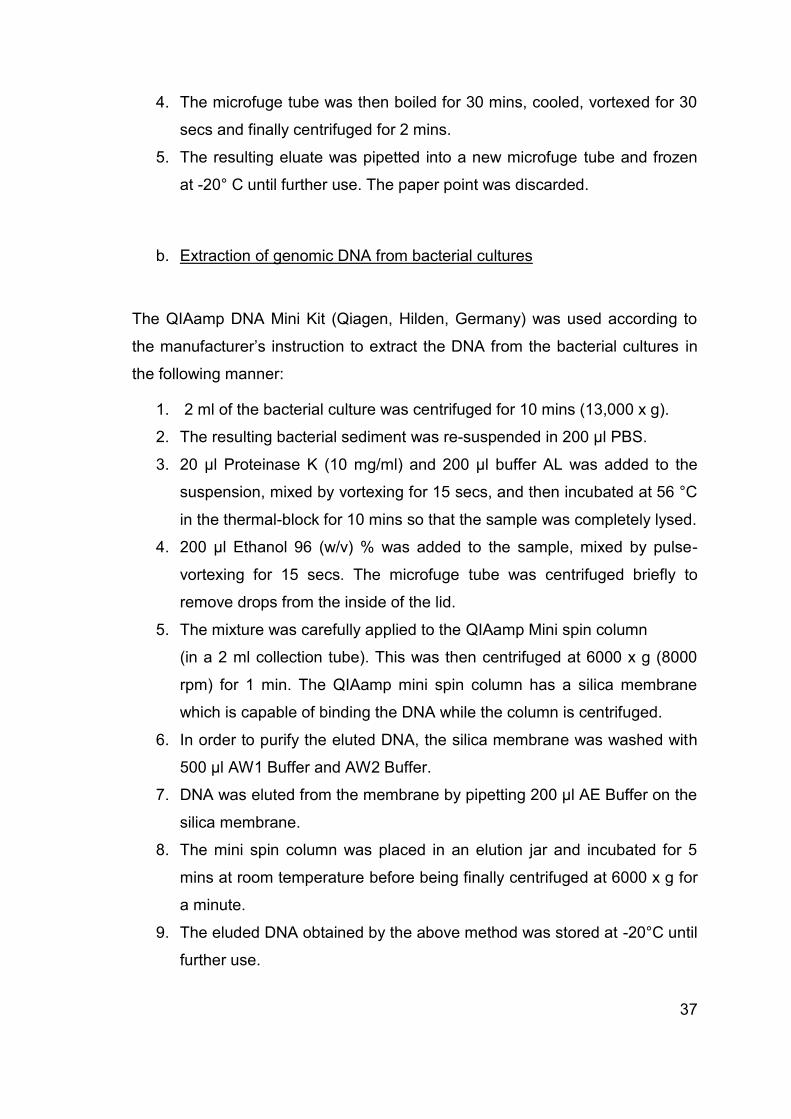
37
4. The microfuge tube was then boiled for 30 mins, cooled, vortexed for 30
secs and finally centrifuged for 2 mins.
5. The resulting eluate was pipetted into a new microfuge tube and frozen
at -20° C until further use. The paper point was discarded.
b. Extraction of genomic DNA from bacterial cultures
The QIAamp DNA Mini Kit (Qiagen, Hilden, Germany) was used according to
the manufacturer‟s instruction to extract the DNA from the bacterial cultures in
the following manner:
1. 2 ml of the bacterial culture was centrifuged for 10 mins (13,000 x g).
2. The resulting bacterial sediment was re-suspended in 200 µl PBS.
3. 20 µl Proteinase K (10 mg/ml) and 200 µl buffer AL was added to the
suspension, mixed by vortexing for 15 secs, and then incubated at 56 °C
in the thermal-block for 10 mins so that the sample was completely lysed.
4. 200 μl Ethanol 96 (w/v) % was added to the sample, mixed by pulse-
vortexing for 15 secs. The microfuge tube was centrifuged briefly to
remove drops from the inside of the lid.
5. The mixture was carefully applied to the QIAamp Mini spin column
(in a 2 ml collection tube). This was then centrifuged at 6000 x g (8000
rpm) for 1 min. The QIAamp mini spin column has a silica membrane
which is capable of binding the DNA while the column is centrifuged.
6. In order to purify the eluted DNA, the silica membrane was washed with
500 μl AW1 Buffer and AW2 Buffer.
7. DNA was eluted from the membrane by pipetting 200 μl AE Buffer on the
silica membrane.
8. The mini spin column was placed in an elution jar and incubated for 5
mins at room temperature before being finally centrifuged at 6000 x g for
a minute.
9. The eluded DNA obtained by the above method was stored at -20°C until
further use.

38
c. Isolation of Plasmid DNA from E.Coli
1. E. coli culture was inoculated with 3 ml of sterile LB-Amp Medium (1%
trypton, 0.5% yeast, 0.5% NaCl, 100 μg/μl Ampicillin, pH 7.5) and
incubated overnight at 37°C.
2. 1.5 ml of this culture was transfered to a microcentrifuge tube and
centrifuged at 13000 x g for 2 mins.
3. After dumping the supernatant 300 μl of Solution 1 (50 mM Tris/HCl pH
8.0, 10 mM EDTA) was added to the cell pellet, the cells were
resuspended and 12 μl RNAse 1 solution was added to them.
4. 300 μl of solution 2 (0.2 M NaOH, 1% SDS) was added. This solution
ruptures the cells.
5. 300 μl of solution 3 (2.55 M potassium acetate, pH 4.8) was added, the
tubes capped and shaken vigorously. This step precipitates the
chromosomal DNA and the proteins.
6. In order to separate the plasmid DNA from the chromosomal DNA and
the cellular debris in the pellet the tube was centrifuge at 13000 x g for
20 mins.
7. 800 μl of the white precipitate was mixed with 640 μl isopropanol and
centrifuged at 13000 x g for 15 mins. Isopropanol precipitates the
nucleic acids.
8. 500 μl of ice-cold 70% ethanol was added and the tube centrifuged
once again.
9. The tube was allowed to dry for approx. 5 mins and the resulting DNA
stored in 30 μl 10 mM Tris/ HCl, pH 8.0 at - 20°C.
The concentration of the plasmid DNA was determined with the help of a
spectrophotometer at 260 nm. The concentrations of the DNA ranged from 6.5 -
14.5 ng/ μl.

39
4.5.2 Cloning
a. Ligation
Approximately 2.5 ng amplicon was ligated into 0.25 ng pGEM-T-vector using
the Rapid DNA Ligation Kit (Roche Diagnostics, Mannheim, Germany). 1 μl
DNA 5X elution buffer, 5 μl T4 DNA 2X ligation buffer and 0.5 μl T4 DNA ligase
(5 U/ μl) were added to the vector and amplicon. This was carefully mixed with a
pipette and then incubated at room temperature for 30 mins.
b. Bacterial Transformation
1. 100ul of competent E. coli – DH5α cells were pipetted into the
above ligated vector. The tube was placed on ice for 30 min.
2. The tube was then kept in a waterbath at 42oC for exactly 2 mins
and immediately returned to ice for 1-2 mins.
3. 800 μl SOC medium( 2% Trypton, 0.5% yeast, 0.5% NaCl, pH 7.0,
2.5 mM KCl, 10 mM MgCl2, 20 mM glucose) was added to the
transformation mixture. This was incubated at 37°C for 1 hour with
shaking.
4. 1/10 and 9/10 of the mixture was spread on LB –Amp plates (1%
Trypton, 0.5% yeast, 0.5% NaCl, 1.5% agar, 100 μg ampicillin, pH
7.5) and placed overnight in the incubator at 37°C .
5. 4 clones were picked from each plate and cultivated in LB-Amp
medium (1% Trypton, 0.5% yeast, 0.5% NaCl, 1.5% agar, 100 μg/
μl ampicillin, pH 7.5).
6. The DNA was extracted from the bacteria as described earlier.
c. DNA restriction
4 μl of restriction enzymes Sph I and Sal I, 84 μl water in 48 μl OPA buffer were
added to 5 μl of plasmid DNA (approximately 2.5 ng DNA) and incubated at

40
37°C for 1 hour. The cloning process was analyzed by gel electrophoresis.
Figure 1 shows the pGEM®-T Vector (Promega, Mannhein, Germany) with
single 3´-T overhangs at the insertion site. The polymerases add a single
deoxyadenosine to the 3´-ends of the amplified fragments. The restriction
enzymes Sph I and Sal I cleave the insert clones at the respective cloning sites.
Figure 2 shows the respective cleavage sites.
Figure 1: pGEM®-T Vector Map and sequence reference points (Promega /t-vectors)
5`… ..GCATG ↑C… … … .G↑ TCGAC… ..3`
3`… ..C↓ GTACG… … … ..CAGCT↓ G… .5`
Sph I Sal I
Figure 2: Cleavage site on the restriction endonucleases Sph I and Sal I
d. Gel electrophoresis analysis of DNA
Gel electrophoresis was used to analyse the restricted or amplified DNA.
Depending on the size of the DNA fragment 1.5- 3% agarose gel was used for
this purpose. Higher concentrations of agarose facilitate separation of small
DNAs, while low agarose concentrations that of larger DNAs. 0.5x TBE was
41
used as the electrophoresis buffer (90mM Tris, 90mM Borate, 0.5 mM EDTA,
pH 8.0). DNA samples with loading buffer (0.25% Bromophenol blue, 0.25
Xylene cyanol, 15% Ficoll) were pipetted into the sample well and a current of
50 mA was applied. As a result of the current, the DNA strands migrate
resulting in bands of varying thickness. The gel was incubated in 0.1% ethidium
bromide solution in order to visualize the DNA bands. The 1-kb MassRuler DNA
Ladder (Fermentas, St. Leon-Rot, Germany) was used as the reference to
estimate the mass of the bands. The DNA bands were photographed under UV
light.
e. Bacterial storage
800 μl of each bacterial culture was stored in LB-Amp medium with 200 μl
glycerine (20 % concentration). These cultures were then stored at - 20°C until
further use.
f. Determination of the DNA concentration
Spectrophotometry was employed to determine the concentration of DNA. It
works by the principle of measuring the amount of ultraviolet irradiation
absorbed by the bases. 5 μl of the sample was added to 100 μl of water in the
quartz cuvette of the spectrophotometer.
Readings were taken at wavelengths of 260 nm and 280 nm. 260 nm is the
absorption maximum for DNA and 280 nm is the absorption maximum for
proteins. Therefore, the reading at 280 nm gives the amount of protein in the
sample and the reading at 260 nm allows calculation of the concentration of
nucleic acid in the sample.
1 O.D. (optical density) at 260 nm for double-stranded DNA = 50 ng/ul of DNA
Pure preparations of DNA have OD260/OD280 values of 1.8. If there is
contamination with protein or phenol, this ratio will be significantly less than the
values given above, and accurate quantification of the amount of nucleic acid
will not be possible.

42
The DNA concentration was determined as follows:
OD260 value/ OD280 value x dilution factor
The concentrations of the DNA (C) are shown in the table below:
Plasmid C (ng/μl) Molecules/μl
Lca 95 2.8 x 10¹⁰
Sm 74 2.2 x 10¹⁰
Aa 161 4.8 x 10¹⁰
Pg 175 5.2 x 10¹⁰
Tf 67 2.0 x 10¹⁰
Lac 80 2.26 x 10¹⁰
Table 4: DNA concentrations of the investigated bacteria
4.5.3 Polymerase chain reaction (PCR)
The PCR starts with denaturation of the target DNA strand (separation into a
single strand). For this purpose the DNA is heated for 1 to several mins to 94°
to 96° C. Following this, the temperature is lowered to approximately 50° C in
order to allow the forward and reverse primers to anneal to their complementary
sequences. The primers are designed to complement the DNA region to be
amplified. Subsequently, the temperature is raised to about 72° C. This allows
the Taq polymerase to attach to each priming site and produce a new DNA
strand. This is the end of the first cycle. The above mentioned steps of
denaturation, annealing and extension or elongation are repeated 40 times.

43
a. Conventional PCR
A T- Gradient thermalcycler (Whatman Biometra, Göttingen, Germany) was
used to perform the conventional PCR. The PCR mix consisted of the following:
Template 0.5 μl DNA solution (ca. 2.5 ng
DNA)
Buffer 5 μl 10 X PE Buffer (10 mM Tris/
HCl, pH 8.3, 50 mM KCl, 1.5mM
MgCl₂)
Deoxynucleoside triphosphate 8 μl NTP- Mix (each 1.3 mM GTP,
CTP, ATP, TTP)
Primer Each 0.5 μl Primer (0.1 mM)
Aqua dest. 34.5 μl
Taq DNA polymerase 1 μl Taq polymerase
Table 5: Conventional PCR Mix

44
The PCR run was as follows:
PCR step Temperature Time
1. Initialization 95 °C 5 min
2. Denaturation 95 °C 1 min
3. Annealing 52 °C 1 min
4. Elongation 72 °C 1 min
Table 6: Conventional PCR Run
A series of 40 cycles were repeated for Steps 2-4. The analysis of the PCR was
done with gel electrophoresis as described above.
b. Real-Time PCR
Real- time PCR enable one to measure the amount of PCR product at any point
of time. A cycle threshold (Ct) is defined during the exponential phase of the
PCR. This reflects the instant at which the fluorescence signal generated from a
sample is significantly greater than background fluorescence. In other words,
this is the point at which sufficient number of amplicons have accumulated
during the reaction. These Ct values are directly proportional to the amount of
starting template and represent the basis for calculating the DNA copy
numbers. Accurate quantitative results of the PCR product at specific cycle
numbers can be achieved by this method (Dorak, 2007a). In a real time PCR,
reporter molecules which are fluorescent dyes (SYBR Green) or sequence –
specific probes (TaqMan Probes) labeled with both a reporter fluorescent dye
and a quencher dye are bound to the double stranded DNA. These reporter
molecules produce fluorescence which increases with each amplification cycle
due to the accumulation of the PCR product. This fluorescence is detected and

45
monitored, thus enabling the quantification of even a relatively small amount of
PCR product.
TaqMan Probes:
TaqMan probes utilize the 5' exonuclease activity of the enzyme Taq
Polymerase for measuring the amount of target sequences in the samples.
These probes are oligonucleotides, with a reporter fluorophore at the 5' end and
a quencher fluorophore at the 3' end, are added to the PCR mixture. The
reporter and the quencher remain in close proximity to each other till the probe
is hydrolysed. The fluorescence of the reporter dye is not completely quenched
by the close proximity to the quencher thus producing background fluorescence.
During PCR, the probe anneals specifically between the forward and reverse
primer to a specific part of the PCR product. As extension of the primer is
carried on the template to which the TaqMan probe is bound, the probe is
cleaved and the reporter molecule pushed away from the quencher. This
increases the fluorescence intensity of the reporter dye. This increase in
fluorescence is quantitated as the reaction progresses.
The probes used in this study were marked with following reporter-quencher
combinations:
GAPDH FAM-BHQ1
Lca HEX- BHQ1
Sm HEX- BHQ1
Aa FAM-BHQ1
Pg Texas Red-BHQ1
Tf FAM-BHQ1
Lac FAM-BHQ1
46
Controls:
PCR is especially extremely sensitive to contamination by unwanted template
DNA. This poses a fundamental problem when the amount of template DNA is
limited. Practical measures are taken during preparation in the laboratory in
order to reduce contamination. However, one of the most significant measures
is to include control reactions in each PCR experiment. The negative control
reaction included exactly the same components as the experimental tubes and
water (H2O) instead of template DNA (patient sample). The human
glyceraldehyde-3-phosphate dehydrogenase (GAPDH) gene was added as the
positive control. GAPDH is an essential enzyme also known as a housekeeping
gene. Housekeeping genes are genes that are constitutively expressed
because they code for proteins that are continuously required by the cell to
perform basic functions necessary for the sustenance or maintenance of the
cell. GAPDH plays an important role in glycolysis. If GAPDH is not detected in
the patient sample it is an indication that either the amount of sample included
was insufficient or that the reaction was being inhibited by a contaminant
(Ellerbrock, 2010).
The iCycler IQ5 from Biorad (Munich, Germany) was used to perform the Real-
Time PCR. A template, comprising of 9 patient samples, 2 standards and a
negative control (H2O) was developed for the Real-Time PCR run (Figure 3).

47
Figure 3: Template for the microtitre plate used for the Real-Time PCR runs
The PCR Mix used for the Real-Time PCR consisted of the following in each
well:
2X Master Mix 12.5 μl
Forward Primer 2.5 μl
Reverse Primer 2.5 μl
Probe 2.5 μl
Aqua dest. 2.5 μl
Table 7: Real-Time PCR Mix

48
The above mix was prepared under sterile conditions in the „master mix room‟
which is free of DNA. A total of 22.5 μl was pipetted into each of the 96 wells.
The patient sample DNA was added to the above in a separate room. The
microtitre plate was sealed with a round cap mat and placed in the thermocycler
for the PCR run.
The PCR protocol was as follows:
Cycle Step Temperature Time
1 1 50°C 10 min
2 1 95°C 10 min
3-47 1 95°C 15 sec
2 60°C 1 min
Table 8: Real-Time PCR Run
PCR primers:
The alignment of 16S rDNA gene sequences by the software program MegAlign
(DNASTAR, Madison, USA) facilitated the identification of species-specific
regions useful as targets for the PCR. For the final design of specific TaqMan
primers and probes the Primer Express Software (Applied Biosystems, Foster
City, CA, USA) was used. All primers and probes were synthesised by Metabion
(Martinsried, Germany). Only the probe for Tf was synthesised by Eurogentec
S.A. (Seraing, Belgium).
4.5.4 Quantification of the PCR
Generation of the standards was essential to be able to quantitatively analyse
the bacterial DNA in the samples (Fehler! Verweisquelle konnte nicht
gefunden werden.). At the same time, the standard curves are a beneficial tool

49
to help determine the quality and efficiency (E) of an assay (Dorak, 2007b). The
standards were constructed by adding 5 µl of the successively diluted template
(107 to 101) to 495 µl of 10 mM Tris/ HCl, pH 7.5 – 8.0 and running this in a
conventional PCR. Sensitivity and the lower limits of the TaqMan PCR reactions
were measured using the pGemT-cloned amplicons as template DNA in 10-fold
dilutions (2.5x10⁵ to 2.5x101 copies/PCR). All values were measured in
duplicates and linearity was reproduced in a second run.
The specificity of each TaqMan PCR set was proven in silico by Blast homology
search (http://blast.ncbi.nlm.nih.gov/Blast.cgi) and using DNA from different oral
bacteria. Blast analysis revealed that in each TaqMan PCR only DNA of the
respective species which was homologous was amplified and testing of the
DNA templates of oral bacteria affirmed the specificity.
The efficiency of a PCR amplification is determined from the slope of the log-
linear portion the calibration curve (Bustin et al., 2009). In the calibration curve
the concentration of the initial template is plotted on the x axis and Ct is plotted
on the y axis. PCR efficiency is calculated as follows:
Efficiency = 10 -1/slope -1
The theoretical maximum of 100% of efficiency indicates that the amount of
product doubles with each cycle. At this point, the slope is -3.32. Another
indicator of the quality of the assay is the r2 or the coefficient of determination.
This is a measure of the precision of the dilutions and the accuracy in pipetting
during the preparation of the PCR. Ideally a perfect assay would have a slope of
-3.32 (100% efficiency) and a r2 of 1.00.

50
Lacto spp.
Lca
Smut
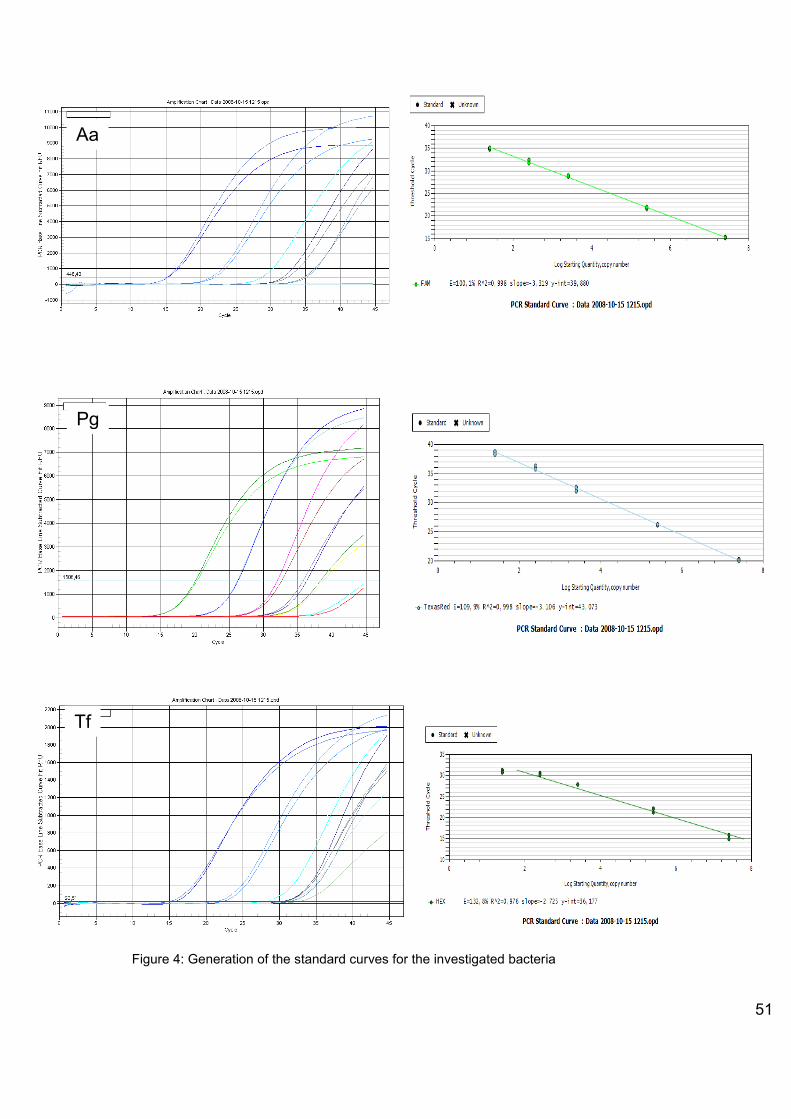
51
Figure 4: Generation of the standard curves for the investigated bacteria
Pg 5
Tf
Aa
Pg

52
4.6 Statistical Analysis
Raw data collected from the questionnaires and the clinical examination was
organised and categorised for appropriate analysis. All the analysis of the data
was done using SPSS 18 for Windows software.
Data was checked for normal distribution with the Kolmogorov-Smirnov-Test.
The data was then analysed using the Kruskal- Wallis and Mann-Whitney U
Test. The difference in the dental status i.e. the DMFS/dmfs Index, PBI and
Silness and Löe index between the 3 groups were evaluated. The counts of the
bacteria in the 3 groups were compared with Kruskal- Wallis and the Mann
Whitney U Test.
It was decided to have 100 children in each group in order to have 80/ 85%
chance of detecting a difference of 0.5 at the 5% level of significance.
Prior to commencement of the study, the examiner was calibrated on a series of
patients to ensure validity of the clinical measurements. Kappa was performed
to measure the intra-examiner reliability. A kappa value of 1 for the DMFS
Index, 0.975 for Silness and Löe index and 0.85 for the PBI was obtained
ensuring a high mean percentages agreement (80% - 100%).

53
5 Results
5.1 Results of the demographic data collected for the study
5.1.1 Age, socioeconomic status and ethnic origin
Children and adolescents from all the three groups were matched for age and
sex. The average age of the participants in the group A (PKU) was 8.5 years, in
group B (DM) was 11.5 years and in group C (control/ healthy) was 10.5 years.
In all three groups, A, B, and C, parents of the majority of the children and
adolescents belonged to the middle-class of society, followed by a lesser
percentage of the parents belonging to the upper-class and only a very small
percentage belonged to the lower class (Table 9). 1, 3 and 2 persons in groups
A, B and C respectively, failed to fill out the socio-economic part of the
questionnaire completely and therefore could not be included in the analysis. In
both groups B and C more than 70% of the children and adolescents were of
German origin with the rest of the sample population being of foreign origin. In
group C 90% of the participants were of German origin and the rest of foreign
origin (Table 10).
Group (N) Lower-class (%) Middle-class (%) Upper-class (%)
A (37) 13.2 57.9 26.3
B (97) 9 54 34
C (98) 4 49 45
Table 9: Percentage of the socioeconomic status of the parents of the children and adolescents in all three groups A, B, and C

54
Group (N) German origin (%) Foreign origin (%)
A (38) 71.1 28.9
B (100) 77 23
C (100) 90 10
Table 10: Percentage of the ethnic origin of the children and adolescents in all the three groups A, B and C
5.2 Dental status of the children and adolescents
5.2.1 dmfs Index
A comparison of the dmfs index for the primary dentition revealed that the
children in group A had an astonishingly high value as compared to the other
two groups. A statistically significant difference was found between the three
groups. Primary teeth of the children in group A showed a mean (± Standard
deviation) dmfs index value of 4.18 (±7.46) whereas those of group B and C
showed values of 1.38 (± 5.33) and 3.86 (±7.68), respectively. Thus the children
in group B demonstrated the lowest mean dmfs index values (Table 11).
Group N Minimum Maximum Mean Standard
Deviation
A 37 0 32 4.18* 7.46
B 100 0 50 1.38* 5.33
C 100 0 56 3.86* 7.68
Table 11: dmfs index values for groups A, B and C. * indicates statistically significant difference between the groups, p ≤ 0.05.

55
5.2.2 DMFS Index
A comparison of the DMFS index values for the secondary dentition revealed no
statistically significant difference between the children and adolescents in the
three groups. The participants in group A were found to have the highest mean
(± Standard deviation) DMFS index value of 3.16 (±8.92), closely followed by
the participants in group B with 3.08 (±11.38), and by those in group C with a
mean value of 2.57 (±7.11) (Table 12).
Group N Minimum Maximum Mean Standard
Deviation
A 37 0 51 3.16 8.92
B 100 0 88 3.08 11.38
C 100 0 61 2.57 7.11
Table 12: DMFS index values for groups A, B and C
5.3 Oral hygiene and gingival health
The oral health of the children was evaluated by determining the Silness and
Löe Index and the Papillary bleeding Index.
5.3.1 Silness and Löe Index
A comparison of the three groups for the Silness and Löe Index revealed a
small statistically significant difference between the groups, with participants of
group B showing higher values than those in group A and C (p=0.04) (Table
13). A comparison between groups B and C showed a more significant
statistical difference between the two groups (p=0.01).
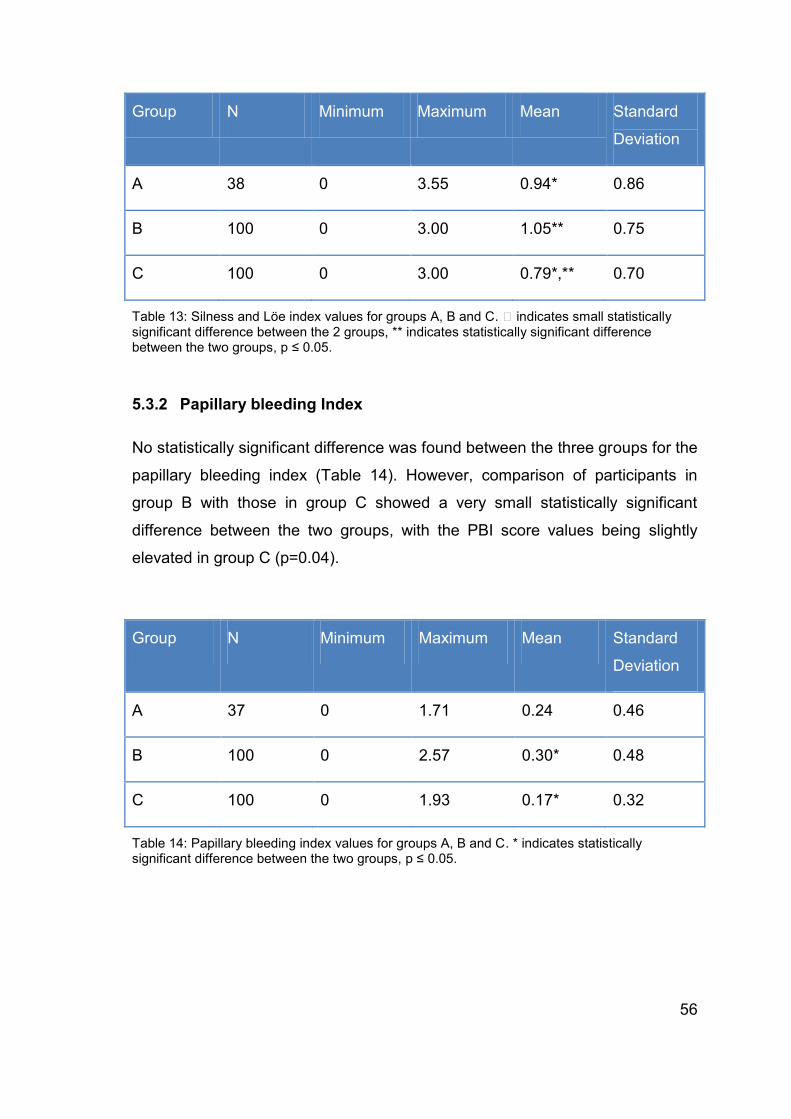
56
Group N Minimum Maximum Mean Standard
Deviation
A 38 0 3.55 0.94* 0.86
B 100 0 3.00 1.05** 0.75
C 100 0 3.00 0.79*,** 0.70
Table 13: Silness and Löe index values for groups A, B and C. indicates small statistically significant difference between the 2 groups, ** indicates statistically significant difference between the two groups, p ≤ 0.05.
5.3.2 Papillary bleeding Index
No statistically significant difference was found between the three groups for the
papillary bleeding index (Table 14). However, comparison of participants in
group B with those in group C showed a very small statistically significant
difference between the two groups, with the PBI score values being slightly
elevated in group C (p=0.04).
Group N Minimum Maximum Mean Standard
Deviation
A 37 0 1.71 0.24 0.46
B 100 0 2.57 0.30* 0.48
C 100 0 1.93 0.17* 0.32
Table 14: Papillary bleeding index values for groups A, B and C. * indicates statistically significant difference between the two groups, p ≤ 0.05.

57
5.4 Microbiological results in the children and adolescents
The oral microorganisms investigated in the study were Streptococcus mutans
(Sm), Lactobacillus species (Lac), Lactobacillus casei (Lca), Aggregatibacter
actinomycetemcomitans (Aa), Porphyromonas gingivalis (Pg) and Tannerella
forsythensis (Tg). A comparison of all the bacteria between the three groups
revealed a statistically significant difference between Lac, Lca and Pg (Table
15). Counts of Lac were found to be the lowest in the group A. Group B showed
the highest counts of Lca but lowest for Pg. Group C showed the lowest counts
for Lca and the highest counts for Lac and Pg.
Group Lac Lca Sm Aa Pg Tf
A 21.18*
(40.46)
1.38x 102*
(8.27x102)
3.18x10¹⁰
(1.96x10¹¹)
1.26
(3.27)
2.66x103*
(1.64x104)
5.41x10³
(2.14 x 10⁴)
B 1.04x102*
(3.70x102)
1.29x103*
(8.50x103)
1.27 x 10⁷
(1.26 x 10⁸)
1.22x10⁸
(1.22x10⁹)
54.64*
(1.30x102)
1.53 x 10⁵
(8.51x 10⁵)
C 3.11x103*
(3.00x104)
31.43*
(1.29x102)
6.20 x 10³
(4.34 x 10⁵)
3.67x10⁷
(2.68x10⁸)
6.76x104*
(6.55x105)
7.55 x 10⁵
(7.27x 10⁶)
Table 15: Mean (± Standard deviation) values of the copies/ mg of the sample for the microorganisms in groups A, B and C. * indicates statistically significant difference between the groups, p ≤ 0.05.
Comparison of the levels of the three bacteria between group A and B showed
that Pg was significantly lower and Lca was higher in the group B children (type
1 diabetes). Comparison of the levels of the three bacteria between group A
and C showed that levels of Lac and Pg were significantly lower in group A

58
children (PKU). Comparison of groups B and C showed that group B had lower
Lac and Pg levels but higher levels of Lca.

59
6 Discussion
6.1 Study design
This study was carried out with the aim of evaluating the oral status and the
microorganisms in patients with type 1 diabetes and PKU. It was proposed that
the two groups of patients have diets converse to each other and thus present
with a contrary risk for caries and periodontal disease. On the other hand,
according to newer disease management protocols for type 1 diabetes, dietary
restrictions for the patients have been relaxed. This is enabling them to lead a
more normal life in terms of the diet. Therefore, our secondary objective was to
determine whether the original proposition still holds true. This in mind, three
groups of patients were examined, viz. children with PKU, type 1 diabetes and
children with no systemic disease. The sample of PKU children was smaller, as
the disease is relatively rare. All other studies, assessing the oral health of
children with PKU had similar or smaller sample sizes. (Lucas et al., 2001;
Kilpatrick et al., 1999; Winter et al., 1974; Johnson et al., 1970)
Data regarding the socioeconomic status, and ethnic origin of parents and
children was collected with the help of a questionnaire designed by the Robert
Koch Institute (Berlin, Germany) and used for the German Health Interview and
Examination Survey for Children and Adolescents (KiGGS), 2003-2006. The
social status scaling index employed in the questionnaire is well established
and has been applied in German national health surveys (Winkler and
Stolzenberg, 1999). Therefore it was a valid and recognized questionnaire and
index, with a sure degree of reliability that was applied in our study.
The DMFT index is the most commonly employed index to assess the dental
status among a population. It is applied in studies worldwide and recommended
by the WHO for dental surveys (WHO, 1997). The gingival health and oral
hygiene were evaluated with the help of Papillary Bleeding Index and the
Silness and Löe plaque index. The PBI has the advantage of providing a
sufficiently precise picture of the gingival health with relatively little investment

60
of time. Although it is quick and accurate, it is slightly restricted as it only
assesses the health of the gingival papilla. The Silness and Löe plaque index
records the amount of plaque at the gingival margin, thus proving to be more
useful an index to determine the risk of development of caries and periodontal
disease than another index that records the extension of plaque over the
complete tooth surface. Concurrently, as it does not necessitate the use of a
disclosing agent it is a rapid and tidy means of assessing the oral hygien
a de Queiroz, 2011).
6.2 Microbiological testing
Several methods are used for the detection of oral microorganisms, viz.
traditional bacterial culture methods, immunological assays, enzymatic method
and since the late 90‟s molecular biological methods. Real-time PCR is fast
replacing traditional culture based methods as a qualitative and quantitative
diagnostic technique in microbiology. Direct counting of individual cells using
the microscope is probably the oldest method used for microbial quantification.
The above techniques were considered as the „gold standard‟ for the
identification and quantification of bacteria. However, a significant drawback in
these methods is the time required, often taking up to several days for a result.
Furthermore, these traditional methods also are considered to sometimes have
low sensitivity, be able to lowly or poorly grow viable organisms, have narrow
detection ranges, be complex to interpret and have high levels of background
and non-specific cross-reactions. These methods, on the other hand, supply
important data for new, uncharacterized or atypical organisms for further
research (Dorak, 2007a). The improvement in molecular biological techniques
over the past decades has led to revolutionary changes in diagnostic methods
in microbiology, initially with conventional PCR and now with the highly accurate
and specific real- time PCR. The sensitivity of real-time PCR enables the
detection of less than 10 cells with sensitive background regulations (Dorak,
2007a). Detection of the oral microorganisms in this study was conducted by
real-time TaqMan PCR. Due to their rapidity, sensitivity and specificity, PCR

61
based diagnostic methods have gained in popularity for the diagnosis and
detection of oral bacteria. Very minute quantities of DNA, which may even be
old or degraded, are sufficient to amplify and quantify the required DNA
accurately. However, the sensitivity of PCR is also one of its major drawbacks
as very minor amounts of foreign DNA can contaminate the sample and distort
the results (Suzuki et al., 2005). PCR methods are, however relatively
expensive as compared to traditional culturing methods. Nonetheless, when
considering the cost-benefit ratio, PCR methods definitely have the upper hand,
in terms of time and accuracy. Real-time PCR with highly specific primers and
TaqMan probes enables the continuous monitoring of DNA amplification,
eliminating the need for time consuming gel electrophoresis (Crockett &
Wittwer, 2001).
Another advantage of the TaqMan PCR is that multiple TaqMan probes and
primer sets can be used in different assays to differentiate between closely
related sequences. Moreover, probes can be labelled with different
fluorophores, thus developing a multiplex real-time PCR protocol allowing
different targets to be co-amplified and quantified within a single reaction.
16S rRNA sequences are usually used as primers in PCR based diagnostic
methods for the detection of oral microorganisms (Ashimoto et al., 1996;
Yoshida et al., 2003). Nevertheless, these primers may prove inadequate for
quantitative analysis as every microorganism may contain a certain amount of
these sequences and dental plaque has several closely related species. Hence,
primers based on a single copy gene sequence, which are more specific for a
target bacterium, are considered a better option for this purpose (Morillo et al.,
2004). However, isolation of specific nucleotide sequences from the genes of
organisms for which species-specific proteins have not already been
characterized proves to be challenging (Suzuki et al., 2004). Out of the five oral
microorganisms investigated in this study, only the species-specific TaqMan
probes and primers for Lactobacillus casei were self-designed. As the species
specific proteins for remaining bacteria had been previously characterized in
other studies it was possible to take the sequences for these from the literature
(Morillo et al., 2004; Byun et al., 2004; Price et al., 2007).

62
6.3 Results
6.3.1 Type 1 diabetes and dental caries
In the present study, it was found that the mean dmfs index value in the diabetic
children was statistically significantly lower than in the healthy children and the
children suffering from PKU. The mean DMFS index values, however, were
similar in the diabetic, PKU and healthy children. Comparable findings were
shown in a recent cross-sectional study, in a sample with a similar age range as
the present study (Tagelsir et al., 2011). Correspondingly, they found a notable
difference in the mean dmfs value between healthy children and type 1 diabetic
children, with the diabetic children showing lower values. Little or no difference
was found in the mean DMFS value. Interestingly, at the same time the study
also revealed a high level of untreated decay in diabetic children. The study
clearly outlined a high dental treatment need in diabetic children.
As mentioned earlier in the literature review, results for dental caries experience
have been particularly inconsistent. On one hand, older and newer studies have
been able to show a lower prevalence of caries in type 1 diabetic children than
in healthy controls (Orbak et al., 2008; Goteiner et al., 1986) and on the other, a
number of other studies (Twetman et al.,1989; Swanljung et al., 1992;
Siudikiene et al., 2008; Siudikiene et al., 2006; Lalla et al. 2006a; Edblad et al.,
2001) have found results analog to the present study where the diabetics have
a similar caries rate as the healthy controls. Most of these studies have,
however, been conducted on samples with an older age group. Thus the results
provided by the studies are mainly for adolescents. Many of them also discuss
this age group as one of emotional turmoil, with problems in compliance, not
only with oral hygiene, but also with diabetes therapy. This can lead to problems
with maintenance of metabolic control of the disease, which causes
physiological complications (Syrjälä et al., 2002). The same reasoning, coupled
with a diabetic diet which nowadays is almost similar to that of a healthy child,
may be found explicable to support the result in the present study of similar

63
caries rate in the permanent teeth of the diabetics and that of the healthy
controls or the children with PKU.
Some studies have been able to highlight a positive correlation between
metabolic control of the diabetes and dental caries, whereby poorly controlled
patients show higher levels of caries (Miko et al., 2010; Karjalainen et al., 1997;
Saes Busato et al., 2010; Bolgül et al., 2004; Canepari et al., 1994). Miko et al.
stated that the increase in caries levels in poorly controlled adolescents,
notwithstanding their sucrose-free diet, could be attributed to their faulty tooth
brushing habits or to their disregard for the proper metabolic control of their
disease. Poor control resulted in a decrease in the local oral pH and in the
cleansing effect of saliva. This, along with poor oral hygiene, resulted in the
development of dental caries (Miko et al., 2010). In a 3 year follow-up study,
Twetman et al. found that diabetic children and adolescents with poor metabolic
control developed 3 times more carious lesions compared to those with good
metabolic control (Twetman et al., 1992). They justified their findings by
explaining that elevated glucose concentrations, both in stimulated and resting
saliva, were found in poorly controlled metabolic diabetics. This released
excess glucose into the oral cavity via saliva and the gingival crevicular fluid,
which lead to the formation of a „sugar-rich‟ biofilm. This biofilm augments
plaque growth and establishes ecological conditions favourable for aciduric
bacteria, thus supporting the development of dental caries. The maintenance of
metabolic control is reliant on the patient‟s capability to perform self-care
procedures such as, regular insulin injections and adhering to the necessary
dietary restrictions. However, at times, it is possible that the maintenance of
good metabolic control might be affected by genetic factors (Karjalainen, 2000).
Similarly, self-care procedures are vital in the prevention of dental caries and
periodontal diseases. An interesting aspect was depicted by a group of Finnish
authors, who found that promotion of oral health in diabetics positively
influences diabetes adherence (Kneckt et al., 1999; Syrjälä et al., 2002).
Consequently, maintenance of oral health influences maintenance of diabetic
control, which in turn has an effect on the development of caries.

64
Contrary to the above, there are studies which have shown higher caries levels
in children and adolescents with diabetes irrespective of the metabolic control
(López et al., 2003). It should, however, be noted that the sample size in the
study conducted by López et al. was rather small. Hence, it would be prudent to
exercise caution while transferring these results to a larger population. The
majority of the patients (> 88%) included in the present study had a good to
moderate control of diabetes, with all patients having a HbA1 value of over 9%
being considered as poorly controlled. Therefore, it is unlikely that the results of
the present study have been influenced by the metabolic control of the disease.
6.3.2 Type 1 diabetes, oral hygiene and gingival health
In the present study, the oral or gingival health of the children and adolescents
with diabetes was found to be slightly worse than that of the healthy children
and that of the children with PKU. This finding is congruent with the results of
several other studies examining the gingival or periodontal health of children
with diabetes (Goteiner et al., 1986; Sandholm et al., 1989b; Pinson et al.,
1995; Novaes et al., 1991; Lopez et al., 2003; Lalla et al., 2006a; Saes Busato
et al., 2010; Tagelsir et al., 2011). Furthermore, some studies have been able to
show a significant worsening of the gingival health in patients with poor control
of diabetes (Karjalainen et al., 1997; Tervonen et al., 1986; Aren et al., 2003).
Karjalainen et al. examined newly diagnosed children in the hospital and
following discharge from the hospital. The authors were able to find an
improvement in the gingival bleeding after commencement of treatment,
therefore establishing a causal relationship between metabolic control of
diabetes and gingival health. In addition, they were able to show that poorly
controlled diabetic children and adolescents with a longer disease duration had
significantly more gingival bleeding than the moderately and well controlled
ones. Strictly seen, however, it must be stated that the value set for HbA1 for
well-controlled diabetics in the study was very high (HbA1 < 10%) and does not
correspond with the actual guidelines. In later and current studies this value
would also include patients with poor metabolic control of the disease.

65
Nevertheless, there are studies that have not been able to show any differences
in the plaque and gingival index or the gingival bleeding between diabetic
children and adolescents and non-diabetics (Firatli et al., 1996, Firatli, 1997;
Barnett et al., 1984; Siudikiene et al., 2006, 2008; Sbordone et al., 1998).
Siudikiene et al. found that the oral hygiene of both the healthy and diabetic
children worsened over a 2 year period. In a 5 year follow-up study, Firatli found
no differences between the plaque and gingival indices of the diabetic and non -
diabetic children and adolescents. Furthermore, they were unable to reveal a
positive correlation between the plaque index, gingival index and duration of
diabetes but were able to observe this between the clinical attachment level and
longer duration of diabetes. The authors stated that as diabetes is known to
modify the clinical status of periodontal tissues by its altered immunological
response, increased inflammatory response, altered collagen turnover and
predisposition to infections, the longer duration of diabetes could well increase
clinical attachment loss through periodontal complications. Barnett et al.
substantiated their findings of no differences between the diabetics and non -
diabetics with the explanation that there are differences in susceptibility to
periodontal disease among diabetic populations, with subpopulations of varying
sizes, that have an increased disease susceptibility. Furthermore, they
suggested that racial and sexual differences may also account for differences in
susceptibility. In the present study, however, this cannot be considered as one
of the influencing factors as the majority of the population was of the same
ethnic origin (German) and the division of gender was almost equal.
Studies regarding the gingival or periodontal health of diabetic patients are
abundant and therefore, it is an easy task to find studies with results that match
that of the present study and at the same time a number of studies that show
dissimilar results. In 2006, Khader et al. published a meta-analysis examining
the periodontal status of diabetics compared with non-diabetics. The meta-
analysis included all studies conducted with type 1 and 2 diabetics between the
years 1970 and 2003. The authors came to the conclusion that although
diabetics have a significantly worse oral hygiene, higher severity of gingival
disease and periodontal disease they present with a similar extent of gingival
66
and periodontal disease as the non-diabetics. This result was supported by the
observation that regular dental care and tooth brushing habits in diabetics may
be similar to that of non-diabetics (Khader et al. 2006).
Sepällä et al. took biopsies from gingival connective tissue of type 1 diabetics
and studied them for cellular and vascular changes that might be able to explain
the altered reaction of the gingival tissue in diabetics. They were unable to
detect vascular changes or specific characteristics of inflamed connective tissue
in well-controlled long-term diabetics under similar plaque conditions. Patients
with poor control of diabetes, however, often showed swollen and proliferated
endothelial cells. They found that patients with long-term poor control of
diabetes showed connective tissue changes, cellular and vascular, indicative of
increased catabolism rather than anabolism in the gingiva. The authors
provided an indefinite conclusion, stating that “one can speculate whether the
inflammatory response to a minor amount of plaque in long-term poorly
controlled diabetic subjects results in a plasma cell-dominated infiltrate with loss
of collagen and enlargement of vascular membranes” (Seppälä et al.,1997). In
an experimental gingivitis model, Salvi et al. found that both diabetics and non-
diabetics reacted equally with gingival inflammation to experimental plaque
accumulation. However, the type 1 diabetics, develop an quicker and greater
inflammatory response to a similar bacterial challenge (Salvi et al., 2005). A few
years later Salvi et al. reported that the gingival cervicular fluid biomarker levels
for IL-1b and MMP-8 were notably elevated in type 1 diabetics compared to
their healthy counterparts. This, however, did not arise due to differences in the
plaque index or the microbial composition of the two groups (Salvi et al., 2010).
As mentioned above (Firatli et al., 1997), several theories have been postulated
for altered periodontal tissue in diabetics. A consensus as to a definitive cause
for the increased severity of periodontal disease in these patients has, however,
till date not been reached. Research continues in the field with aims to cover all
aspects of both multifactorial diseases. One study suggests that periodontal
destruction can start very early in life in diabetics, becoming more pronounced
as children progress into adolescence (Lalla et al., 2006a). Despite the fact that
all cases of gingivitis do not lead to periodontitis, periodontitis is preceded by

67
gingivitis. Therefore, children and adolescent with type 1 diabetes should be
regularly examined for signs of gingivitis.
6.3.3 Type 1 diabetes and oral microorganisms
In the present study, children and adolescents with type 1 diabetes showed the
highest counts of Lactobacillus casei but lowest for Prophyromonas gingivalis.
The children with no systemic disease showed the highest counts of
Lactobacillus species and Prophyromonas gingivalis. The results of the present
study are in part comparable to results of other studies as no other study has
investigated the specific bacteria relevant to caries and periodontal disease
together, using PCR, in a group of type 1 diabetic children and adolescents, as
in this study. The advantages of molecular biological methods in investigating
the oral microflora have already been mentioned above. Some studies have
investigated solely Streptococcus mutans and Lactobacillus species (Siudikiene
et al., 2008; Siudikiene et al., 2006; Twetman et al., 1989; Twetman et al., 2002;
Karjalainen et al. 1997; Bolgül et al. 2004). Either traditional laboratory culture
methods or a commercial kit were used in these studies to determine the colony
forming units/ ml of bacteria. Moreover, all the studies used saliva as a sample
to determine the bacterial count. Saliva does provide a broad picture of the oral
bacterial load but is a weak tool to investigate bacteria that are potentially
periodontal pathogenic. Therefore, in the present study the sample for
determination of the microorganisms was taken from the cervical region
(supragingival plaque) and gingival sulcus. Karjalainen et al. and Siudikeine et
al. did not observe any differences in counts for Streptococcus mutans and
Lactobacillus species between the diabetic and non -diabetic children and
adolescents. In one of the studies they did, however, show an increase in the
counts for the above bacteria in patients with poor diabetic control (Siudikiene et
al., 2006). The same result could also be reported by Bolgül et al. (2004). In
1989, Twetman et al. reported low levels of Lactobacilli in diabetic patients. The
number of Lactobacilli were found to be positively correlated to concentration of
glucose in saliva. The authors suggested that it is essentially the dietary
68
treatment of diabetic children and adolescents which gives rise to a reduction of
lactobacilli in saliva but does not affect the Streptococcus mutans count.
Twetman et al., similar to the present study, reported high levels of lactobacilli in
the saliva of diabetic patients (Twetman et al., 2002). According to the study
group, this observation can be attributed to the less restricted diet of today‟s
diabetics. Likewise, our finding of no statistically significant difference in the
Streptococcus mutans and Lactobacillus species counts and increased counts
of Lactobacillus casei in the type 1 diabetics may be imputed to the relatively
similar dietary lifestyles of the diabetics and healthy children.
Very few studies can be found that investigate the periodontal pathogenic
bacteria in children and adolescents with type 1 diabetics (Sbordone et al.,
1995; Sbordone et al., 1998; Sandholm et al., 1989a; Mashimo et al., 1983).
Sbordone et al. were able to identify a cluster in their sample with high levels of
Porphyromonas gingivalis and Capnocytophaga species. P. gingivalis was
present in the patients at levels much higher than the reported critical level
(0.1%) that defines a periodontal site with non-progressing disease.
Nevertheless, none of the clusters exhibited any further periodontal breakdown
over the 3-year interval of the study. The authors suggested that the presence
of these microorganisms does not pose a risk for periodontal breakdown in
diabetic patients (Sbordone et al., 1998). Sandholm et al. found higher
proportions of gram-negative rods and total gram-negative bacteria in type 1
diabetic patients who presented with a higher degree of gingivitis, even though
they had similar plaque index scores to the non-diabetics (Sandholm et al.,
1989a). The results of the present study cannot be confirmed by any of the
above mentioned studies as the diabetic patients in this study were found to
have the lowest counts of Pg and no statistically significant difference was
found in the counts of Aa and Tf. Consequently, no microbiological reasoning
for the slightly raised level of gingivitis in the diabetics can be provided.
However, the study does provided proof that the oral microflora of the diabetics
does not differ much from that of healthy subjects.

69
6.3.4 PKU and dental caries
The results of the present research showed that the mean dmfs index value in
the group of children suffering from PKU was statistically significantly higher
than in the healthy children and the diabetic children. The mean DMFS index
values, however, were similar in all three groups. As mentioned earlier in the
literature review, studies investigating the dental status and oral health of
children with PKU are few and far between. The last study published on the
subject was over a decade ago in 2001 (Lucas et al., 2001). Similar to the
present study, this study examined forty-one children suffering from PKU for
dental caries, plaque and gingivitis indices and caries related oral flora. The
investigation was unable to reveal any significant difference in the mean dmfs or
DMFS values between the PKU children and the controls. An Australian group
of workers evaluated the oral health of PKU children and concurrently
investigated the erosive potential of 5 amino acid supplements regularly taken
by the children. Interestingly, the study group found that the titratable acidity of
the flavoured amino acid supplements was significantly higher than both their
unflavored counterparts and Coca Cola (Kilpatrick et al., 1999). They were able
to report a rather low caries rate but higher levels of tooth wear. In fact, the
study found that the whole sample showed a lower caries rate than that
reported overall for the Australian children. In both the above mentioned
studies, the authors attributed the reported caries related findings to the use of
fluoride supplements and water fluoridation. In an attempt to elucidate the low
caries prevalence in the presence of a highly cariogenic diet, Kilpatrick further
surmised the role of phenylalanine in limiting the growth of oral plaque
microorganisms, as suggested by Winter et al. (1974). Older studies have
likewise all revealed similar or lower caries experience in PKU children despite
their known use of highly acidic supplements and a diet rich in carbohydrates
and fat (King, 1969; Johnson et al., 1970; Winter et al., 1974). In the present
study, the children with PKU had an equal intake of fluoride supplements as the
healthy control children, which was considered to be a moderate to good intake
of fluorides (data not shown). Nevertheless, this does not provide an
explanation for the higher caries experience in the primary dentition of the

70
children with PKU compared to the healthy or the diabetic children. It may be
speculated that in the earlier years of the child‟s life, priorities of the parents of
children with PKU lie more in maintaining an optimal general health and daily
functioning of the child rather than focusing on prevention of oral disease.
6.3.5 PKU, oral hygiene and gingival health
In this study, the oral hygiene and gingival health, as estimated by the plaque
index by Silness and Löe and the papillary bleeding index, revealed no
differences between the children with PKU and the healthy children and
diabetics. Contrary to the results of the present study, Lucas et al. found greater
mean plaque score in children with PKU and no difference in the gingival
inflammation or spontaneous bleeding between PKU children and the controls
(Lucas et al., 2001). On the other hand, Kilpatrick et al. found exactly the
opposite viz., there was no difference in the plaque and oral debris between
PKU children and the controls but the PKU children exhibited significantly more
gingival inflammation than the controls (Kilpatrick et al., 1999). The authors,
however, did not justify this finding.
6.3.6 PKU and oral microorganisms
The results of the present study demonstrated significantly lower levels of
Lactobacillus species in children with PKU than in the healthy and diabetic
children but no difference in the any of the other investigated bacteria. These
results differ only slightly from those of Lucas et al., who examined the saliva
and plaque of their sample group for Streptococcus mutans and Lactobacilli by
traditional culture methods. They reported no differences between the bacterial
counts of the children with PKU and control subjects (Lucas et al., 2001). No
other study has documented the oral microflora in children suffering from PKU.
The results of this study can substantiate most of the findings on a
microbiological basis with no difference in the dental status, oral hygiene and

71
gingival health between the children with PKU and the diabetic and healthy
older children and adolescents.
72
7 Conclusions
The primary dentition in the PKU children revealed an astonishingly higher
prevalence of dental caries than that of the diabetic or healthy children. The
permanent dentition was, however, found to have the same prevalence of
caries as in the diabetic and healthy children and adolescents. At the same
time, oral hygiene and gingival health was found to be comparable to that of the
healthy children and adolescents.
The primary dentition of children with type 1 diabetes was found to have a
lesser prevalence of caries than the healthy or PKU children. The same positive
finding could not be confirmed regarding the permanent teeth of the diabetic
population in this study. The permanent teeth were found to have the same
prevalence of caries as the healthy and the PKU children. Noteworthy, was the
result that although the oral hygiene and gingival health was slightly worse in
the diabetic children and adolescents they did not harbor more periodontal
pathogenic bacteria than the healthy or PKU children, in fact the diabetic group
revealed the lowest levels of Prophyromonas gingivalis. The diabetic children
did, however, show higher levels of Lactobacilli casei than the children with
PKU and healthy children, which may suggest a relationship between a shift in
the oral microflora and the relatively unrestricted dietary habits of the diabetic
patients. The children suffering from PKU, on the other hand, revealed
significantly lower levels of Lactobacillus species compared to the healthy and
diabetic children and adolescents.
Thus the null hypothesis of our study can, only in part, be rejected and in part,
the alternative hypothesis that children (not adolescents) with PKU possess a
higher caries rate than their healthy or diabetic counterparts and that diabetic
children (not adolescents) have a lower caries rate and but a slightly higher risk
of developing periodontal disease, can be accepted.
The oral disease patterns observed in this study might possibly be ascribed to
the focus of parental attitudes towards the maintenance of normal general
health in view of the systemic disease, thus disregarding oral health in earlier

73
stages of the child‟s life. It is known that prevention of dental caries and
periodontal diseases is chiefly dependent on the patients‟ home care measures
and regular dental visits. Accordingly, in view of the higher risk for caries (PKU)
and periodontal disease (diabetes) at an earlier age for these children, it is
proposed that both groups of child patients, i.e. diabetics and PKU, be
encouraged to seek early dental advice and be provided with targeted dental
education.
The somewhat small sample size of the PKU children, the broad range in the
age of the participants and the cross-sectional design of this study may be seen
as the limitations of the study. These restricting factors prevent us from drawing
definitive conclusions regarding the impact of the systemic diseases, PKU and
type 1 diabetes, on the overall oral health of the child and adolescent patients.
Nonetheless, in light of the present findings, additional vital information is likely
to be attained by a planned longitudinal study, to help disclose assuredly the
relationship between the two metabolic illnesses and oral diseases.

74
8 References
1. American Diabetes Association. Position Statement, Diagnosis and
Classification of Diabetes Mellitus. Diabetes Care 2010; 33(Sup 1):
S62-69.
2. Aren G, Sepet E, Ozdemir D, Dinççağ N, Güvener B, Firatli E.
Periodontal health, salivary status, and metabolic control in children
with type 1 diabetes mellitus. J Periodontol. 2003 Dec;74(12):1789-
95.
3. Ashimoto, A., Chen, C., Bakker, I. & Slots, J. Polymerase chain
reaction detection of 8 putative periodontal pathogens in
subgingival plaque of gingivitis and advanced periodontitis lesions.
Oral Microbiology and Immunology. 1996: 11, 266–273.
4. Barnett ML, Baker RL, Yancey JM, MacMillan DR, Kotoyan
M.Absence of periodontitis in a population of insulin-dependent
diabetes mellitus (IDDM) patients. J Periodontol. 1984
Jul;55(7):402-5.
5. Ben-Aryeh H, Cohen M, Kanter Y, Szargel R, Laufer D. Salivary
composition in diabetic patients.J Diabet Complications. 1988 Apr-
Jun;2(2):96-9.
6. Bolgül BS, Celenk S, Ayna BE, Atakul F, Uysal E. Evaluation of
caries risk factors and effects of a fluoride-releasing adhesive
material in children with insulin-dependent diabetes mellitus
(IDDM): initial first-year results. Acta Odontol Scand. 2004
Oct;62(5):289-92.
7. Boutaga K, van Winkelhoff AJ, Vandenbroucke-Grauls CM,
Savelkoul PH. The additional value of real-time PCR in the
quantitative detection of periodontal pathogens. J Clin Periodontol.
2006 Jun;33(6):427-33.
8. British Medical Association (Board of Science and Education).
Diabetes mellitus – an update for healthcare professionals. 2004: 6.
9. Busato IM, Ignácio SA, Brancher JA, Moysés ST, Azevedo-Alanis
LR. Impact of clinical status and salivary conditions on xerostomia
and oral health-related quality of life of adolescents with type 1
diabetes mellitus.Community Dent Oral Epidemiol. 2012
Feb;40(1):62-9.
10. Bustin SA, Benes V, Garson JA, Hellemans J, Huggett J, Kubista
M, Mueller R, Nolan T, Pfaffl MW, Shipley GL, Vandesompele J,
Wittwer CT. The MIQE guidelines: minimum information for
publication of quantitative real-time PCR experiments. Clin Chem.
2009 Apr;55(4):611-22.

75
11. Byun R, Nadkarni MA, Chhour KL, Martin FE, Jacques NA, Hunter
N. Quantitative analysis of diverse Lactobacillus species present in
advanced dental caries. J Clin Microbiol. 2004 Jul;42(7):3128-36.
12. Campus G, Salem A, Uzzau S, Baldoni E, Tonolo G. Diabetes and
periodontal disease: a case-control study. J Periodontol 2005
Mar;76(3):418-25
13. Canepari P, Zerman N, Cavalleri G. Lack of correlation between
salivary Streptococcus mutans and lactobacilli counts and caries in
IDDM children. Minerva Stomatol. 1994 Nov;43(11):501-5.
14. Carranza FA, Newman MG; Irving Glickman‟s Clinical
Periodontology. Clinical periodontology. 8th ed. Philadelphia: WB
Saunders Co; 1996. p.281-9.
15. Christgau M, Palitzsch KD, Schmalz G, Kreiner U, Frenzel S.
Healing response to non-surgical periodontal therapy in patients
with diabetes mellitus: clinical, microbiological, and immunologic
results. J Clin Periodontol. 1998 Feb;25(2):112-24.
16. Cianciola LJ, Park BH, Bruck E, Mosovich L & Genco RJ.
Prevalence of periodontal disease in insulin-dependent diabetes
mellitus (juvenile diabetes). JADA 1982 May; 104(5): 653-660.
17. Ciglar L, Skaljac G, Sutalo J, Keros J, Janković B, Knezević A.
Influence of diet on dental caries in diabetics. Coll Antropol. 2002
Jun;26(1):311-7.
18. Craig ME, Hattersley A, Donaghue KC. Definition, epidemiology
and classification of diabetes in children and adolescents. Pediatric
Diabetes 2009: 10 (Suppl. 12): 3–12. ISPAD Clinical Practice
Consensus Guidelines 2009 Compendium.
19. Crockett AO, Wittwer CT. Fluorescein-labeled oligonucleotides for
real-time pcr: using the inherent quenching of deoxyguanosine
nucleotides. Anal Biochem. 2001 Mar 1;290(1):89-97.
20. Dawson M. T., Powell R. & Gannon, F. Gene Technology. Oxford:
BIOS Scientific Publishers 1996.
21. Dorak MT (ed.). Real-time PCR, Taylor & Francis Group, 2007a:
219-220.
22. Dorak MT (ed.). Real-Time PCR, Taylor & Francis Group,
2007b:41.
23. Ebersole JL, Holt SC, Hansard R, Novak MJ. Microbiologic and
immunologic characteristics of periodontal disease in Hispanic
Americans with type 2 diabetes. J Periodontol 2008 Apr;79(4):637-
46.
24. Edblad E, Lundin SÅ, Sjödin B, Åman J. Caries and salivary status
in young adults with type 1 diabetes. Swed Dent J 2001; 25: 53–60.

76
25. Ehehalt S, Blumenstock G, Willasch AM, Hub R, Ranke MK, Neu A.
Continuous rise in incidence of childhood Type 1 diabetes in
Germany. Diabet Med 2008; 25:755-7, EK III.
26. Ellerbrock B. Untersuchung kariogener Mikroorganismen auf den
freiliegenden Wurzeloberflächen bei Patienten mit chronischer
Parodontitis. Dissertation 2010:48.
27. Engström GN, Engström PE, Hammarström L, Smith CI. Oral
conditions in individuals with selective immunoglobulin A deficiency
and common variable immunodeficiency. J Periodontol. 1992
Dec;63(12):984-9.
28. Faulconbridge AR, Bradshaw WSL, Jenkins PA, Baum JD: The
dental status of a group of diabetic children. Br Dent J 1981; 151:
253–255.
29. Firatli E, Unal T, Saka N, Onan U, Sivas A, Oz H. Serum
fructosamine correlates with gingival index in children with insulin-
dependent diabetes mellitus (IDDM). J Clin Periodontol. 1994
Sep;21(8):565-8.
30. Firatli E, Yilmaz O, Onan U. The relationship between clinical
attachment loss and the duration of insulin-dependent diabetes
mellitus (IDDM) in children and adolescents. J Clin Periodontol.
1996 Apr;23(4):362-6.
31. Firatli E. The relationship between clinical periodontal status and
insulin-dependent diabetes mellitus. Results after 5 years. J
Periodontol. 1997 Feb;68(2):136-40.
32. Gafan GP, Lucas VS, Roberts GJ, Petrie A, Wilson M, Spratt DA.
Prevalence of periodontal pathogens in dental plaque of children. J
Clin Microbiol. 2004 Sep;42(9):4141-6.
33. Gibbs, R. A. DNA amplification by the polymerase chain reaction.
Analytical Chemistry.1990 62, 1202–1214.
34. Global IDF/ISPAD Guideline for Diabetes in Childhood and
Adolescence, 2011:54.
35. Goteiner D, Vogel R, Deasy M, Goteiner C: Periodontal and caries
experience in children with insulin-dependent diabetes mellitus. J
Am Dent Assoc 1986; 113: 277–279.
36. Greenstein G. Microbiologic assessments to enhance periodontal
diagnosis. J Periodontol. 1988 Aug;59(8):508-15
37. Grossi, S. Treatment of periodontal disease and control of diabetes:
An assessment of the evidence and need for future research.
Annals of Periodontology / The American Academy of
Periodontology. 2001;6: 138−145.
77
38. Gusberti FA, Syed SA, Bacon G, Grossman N & Loesche WJ.
Puberty gingivitis in insulin-dependent diabetic children. I. Cross-
sectional observations. J Periodontol 1983; 54: 714–720.
39. Harjutsalo V, Sjoberg L, Tuomilehto J. Time trends in the incidence
of type 1 diabetes in Finnish children: a cohort study. Lancet 2008;
371(9626): 1777-1782
40. Hase JC, Birkhed D: Salivary glucose clearance, dry mouth and pH
changes in dental plaque in man. Arch Oral Biol 1988; 33: 875–880
41. Holt, S. C. & Progulske, A. General microbiology, metabolism and
genetics. In: Oral Microbiology and Immunology, eds. Newman, M.
G. & Nisengard, R., 1988: 55–125. Philadelphia: WB Saunders Co.
42. Isola M, Solinas P, Proto E, Cossu M, Lantini MS. Reduced
statherin reactivity of human submandibular gland in diabetes. Oral
Dis. 2011 Mar;17(2):217-20.
43. Iughetti L, Marino R, Bertolani MF, Bernasconi S. Oral health in
children and adolescents with IDDM--a review. J Pediatr Endocrinol
Metab. 1999;12(5 Suppl 2):603-10.
44. Johnson R, Gardner R, Kozlowski R. Phenylketonuria--oral
manifestations. ASDC J Dent Child. 1970 Nov-Dec;37(6):515-8.
45. Karjalainen K. Periodontal diseases, dental caries and saliva in
relation to clinical characteristics of type 1 diabetes. Dissertation.
Acta Univ. Oul. D 587, 2000. ISBN 951-42-5639-5.
46. Karjalainen KM, Knuuttila ML, Kaar ML. Relationship between
caries and level of metabolic control in children and adolescents
with insulin-dependent diabetes mellitus. Caries Res 1997; 31: 13–
18.
47. Khader YS, Dauod AS, El-Qaderi SS, Alkafajei A, Batayha WQ.
Periodontal status of diabetics compared with non-diabetics: a
meta-analysis. J Diabetes Complications 2006; 20: 5968.
48. Kilpatrick NM, Awang H, Wilcken B, Christodoulou J. The
implication of phenylketonuria on oral health. Pediatr Dent. 1999
Nov-Dec;21(7):433-7
49. King WC. Oral characteristics of phenylketonuric children. ASDC J
Dent Child. 1969 Jan;36(1):61-7.
50. Kirstilä V, Tenovuo J, Ruuskanen O, Nikoskelainen J, Irjala K, Vilja
P. Salivary defense factors and oral health in patients with common
variable immunodeficiency. J Clin Immunol. 1994 Jul;14(4):229-36.
51. Kneckt MC, Syrjälä AM, Laukkanen P, Knuuttila ML Self-efficacy as
a common variable in oral health behavior and diabetes
adherence.Eur J Oral Sci. 1999 Apr;107(2):89-96.
52. Lalla E, Cheng B, Lal S, Tucker S, Greenberg E, Goland R,
Lamster IB. Periodontal changes in children and adolescents with

78
diabetes: a case-control study. Diabetes Care. 2006a
Feb;29(2):295-9.
53. Lalla E, Kaplan S, Chang SM, Roth GA, Celenti R, Hinckley K,
Greenberg E, Papapanou PN. Periodontal infection profiles in type
1 diabetes. J Clin Periodontol. 2006b Dec;33(12):855-62.
54. Loesche, W. J. DNA probe and enzyme analysis in periodontal
diagnostics. Journal of Periodontology. 1992 63, 1102–1109.
55. López ME, Colloca ME, Páez RG, Schallmach JN, Koss MA,
Chervonagura A. Salivary characteristics of diabetic children. Braz
Dent J. 2003;14(1):26-31. Epub 2003 Jul 31.
56. Lucas VS, Contreras A, Loukissa M, Roberts GJ. Dental disease
indices and caries related oral microflora in children with
phenylketonuria. ASDC J Dent Child. 2001 Jul-Aug;68(4):263-7,
229.;
57. Lyons, S. R., Griffen, A. L. & Leys, E. J. Quantitative real-time PCR
for Porphyromonas gingivalis and total bacteria. Journal of Clinical
Microbiology. 2000 38, 2362–2365.
58. Mandell RL, Dirienzo J, Kent R, Joshipura K, Haber J. Microbiology
of healthy and diseased periodontal sites in poorly controlled insulin
dependent diabetics. J Periodontol. 1992 Apr;63(4):274-9.
59. Manz F, Schmidt H. Retrospective approach to explain growth
retardation and urolithiasis in a child with long-term nutritional acid
loading. Z Ernahrungswiss. 1992 Jun;31(2):121-9.
60. Mashimo PA, Yamamoto Y, Slots J, Park BH, Genco RJ. The
periodontal microflora of juvenile diabetics. Culture,
immunofluorescence, and serum antibody studies.J Periodontol.
1983 Jul;54(7):420-30.
61. Mata A.D., Marques D., Rocha S. et al.: Eff ects of diabetes mellitus
on salivary secretion and its composition in the human. Mol. Cell.
Biochem. 2004, 261:137 -142.
62. McNamara TF, Ramamurthy NS, Mulvihill JE, Golub LM. The
development of an altered gingival crevicular microflora in the
alloxan-diabetic rat. Arch Oral Biol. 1982;27(3):217-23.
63. Miko S, Ambrus SJ, Sahafian S, Dinya E, Tamas G, Albrecht MG.
Dental caries and adolescents with type 1 diabetes. Br Dent J. 2010
Mar 27;208(6):E12
64. Mitchell JJ, Scriver CR. Phenylalanine Hydroxylase Deficiency.
2000 Jan 10 [Updated 2010 May 4]. In: Pagon RA, Bird TD, Dolan
CR, et al., editors. GeneReviews™ [Internet]. Seattle (WA):
University of Washington, Seattle; 1993.

79
65. Moore P.A., Guggenheimer J., Etzel K.R. et al.: Type 1 diabetes
mellitus, xerostomia, and salivary flow rates. Oral Surg. Oral Med.
Oral Pathol. Oral Radiol. Endod. 2001a, 92, 281 -291.
66. Moore PA, Weyant RJ, Etzel KR, Guggenheimer J, Mongelluzzo
MB, Myers DE et al. Type 1 diabetes mellitus and oral health:
assessment of coronal and root caries. Community Dent Oral
Epidemiol 2001b; 29: 183–194.
67. Moreira A.R., Passos I.A., Sampaio F.C. etal. Flow rate, pH and
calcium concentration of saliva of children and adolescents with
type 1 diabetes mellitus. Braz. J. Med. Biol. Res. 2009,42, 707 -
711.
68. Morillo JM, Lau L, Sanz M, Herrera D, Martín C, Silva A.
Quantitative real-time polymerase chain reaction based on single
copy gene sequence for detection of periodontal pathogens. J Clin
Periodontol. 2004 Dec;31(12):1054-60.
69. Novaes AB Jr, Pereira AL, de Moraes N, Novaes AB.
Manifestations of insulin-dependent diabetes mellitus in the
periodontium of young Brazilian patients. Periodontol. 1991
Feb;62(2):116-22.
70. Ogresta B, Zaninović M. Incidence of caries in children affected with
phenylketonuria. Acta Stomatol Croat. 1975;9(2):61-4.
71. Ohlrich EJ, Cullinan MP, Leichter JW. Diabetes, periodontitis, and
the subgingival microbiota. J Oral Microbiol. 2010 Dec 21;2.
72. Orbak R, Simsek S, Orbak Z, Kavrut F, Colak M. The influence of
type-1 diabetes mellitus on dentition and oral health in children and
adolescents. Yonsei Med J. 2008 Jun 30;49(3):357-65.
73. Oulis C, Kostopoulou M. Phenylketonuria in children: problems of
special interest to the dentist. Odontostomatol Proodos. 1984 Nov-
Dec;38(6):341-50.
74. Pérez-Dueñas B, Valls-Solé J, Fernández-Alvarez E, Conill J,
Vilaseca MA, Artuch R, Campistol J. Characterization of tremor in
phenylketonuric patients. J Neurol. 2005;252: 1328–34.
75. Pinson M, Hoffman WH, Garnick JJ, Litaker MS. Periodontal
disease and type I diabetes mellitus in children and adolescents. J
Clin Periodontol. 1995 Feb;22(2):118-23.
76. Price RR, Viscount HB, Stanley MC, Leung KP. Targeted profiling
of oral bacteria in human saliva and in vitro biofilms with
quantitative real-time PCR. Biofouling. 2007;23(3-4):203-13.
77. a de Queiroz A. Gingival Indices: State of Art.
Gingival Diseases - Their Aetiology, Prevention and Treatment.
Edited by Fotinos S. Panagakos and Robin M. Davies, ISBN 978-
80
953-307-376-7, Publisher: InTech, Published: September 22, 2011:
42-54
78. Reuterving CO, Reuterving G, Hägg E, Ericson T. Salivary flow rate
and salivary glucose concentration in patients with diabetes
mellitus: Influence of severity of diabetes. Diabetes Metab. 1987;13:
457–462.
79. Reznick AZ, Shehadeh N, Shafir Y, Nagler RM. Free radicals
related effects and antioxidants in saliva and serum of adolescents
with Type 1 diabetes mellitus. Arch Oral Biol. 2006 Aug;51(8):640-
8.
80. Rich SS. Genetics of diabetes and its complications. J Am Soc
Nephrol. 2006 Feb;17(2):353-60.
81. Rosenbauer J, Icks A, Giani G. Incidence and prevalence of
childhood type 1 diabetes mellitus in Germany-model-based
national estimates. J Pediatr Endocrinol Metab 2002;15:1497-504,
EK IIb
82. Rupf S, Merte K, Eschrich K. Quantification of bacteria in oral
samples by competitive polymerase chain reaction.J Dent Res.
1999 Apr;78(4):850-6.
83. Saes Busato IM, Bittencourt MS, Machado MA, Grégio AM,
Azevedo-Alanis LR. Association between metabolic control and oral
health in adolescents with type 1 diabetes mellitus. Oral Surg Oral
Med Oral Pathol Oral Radiol Endod. 2010 Mar;109(3):e51-6.
84. Saiki, R., Gelfand, D. H., Stoffel, S., Scharf, S.J., Higuchi, R., Horn,
G. T., Mullis, K. B. & Erlich, H. A. Primer-directed enzymatic
amplification of DNA with thermostable DNA polymerase. Science
1988 239, 487–491.
85. Sakai VT, Campos MR, Machado MA, Lauris JR, Greene AS,
Santos CF. Prevalence of four putative periodontopathic bacteria in
saliva of a group of Brazilian children with mixed dentition: 1-year
longitudinal study. Int J Paediatr Dent. 2007 May;17(3):192-9.
86. Salvi GE, Franco LM, Braun TM, Lee A, Rutger Persson G, Lang
NP, Giannobile WV. Pro-inflammatory biomarkers during
experimental gingivitis in patients with type 1 diabetes mellitus: a
proof-of-concept study. J Clin Periodontol. 2010 Jan;37(1):9-16.
87. Salvi GE, Kandylaki M, Troendle A, Persson GR, Lang NP.
Experimental gingivitis in type 1 diabetics: a controlled clinical and
microbiological study J Clin Periodontol. 2005 Mar;32(3):310-6.
88. Sampaio N, Mello S, Alves C. Dental caries-associated risk factors
and type 1 diabetes mellitus. Pediatric Endocrinology, Diabetes and
Metabolism. 2011, 17, 3: 152-157

81
89. Sandholm L, Swanljung O, Rytömaa I, Kaprio EA, Mäenpää J.
Morphotypes of the subgingival microflora in diabetic adolescents in
Finland. J Periodontol. 1989a Sep;60(9):526-8.
90. Sandholm L, Swanljung O, Rytömaa I, Kaprio EA, Mäenpää J.
Periodontal status of Finnish adolescents with insulin-dependent
diabetes mellitus. J Clin Periodontol. 1989b Nov;16(10):617-20.
91. Sanz M, Lau L, Herrera D, Morillo JM, Silva A. Methods of detection
of Actinobacillus actinomycetemcomitans, Porphyromonas
gingivalis and Tannerella forsythensis in periodontal microbiology,
with special emphasis on advanced molecular techniques: a review.
J Clin Periodontol. 2004 Dec;31(12):1034-47.
92. Sastrowijoto SH, Hillemans P, van Steenbergen TJ, Abraham-Inpijn
L, de Graaff J. Periodontal condition and microbiology of healthy
and diseased periodontal pockets in type 1 diabetes mellitus
patients. J Clin Periodontol. 1989 May;16(5):316-22
93. Sbordone L, Ramaglia L, Barone A, Ciaglia RN, Iacono VJ.
Periodontal status and subgingival microbiota of insulin-dependent
juvenile diabetics: a 3-year longitudinal study. J Periodontol. 1998
Feb;69(2):120-8.
94. Sbordone L, Ramaglia L, Barone A, Ciaglia RN, Tenore A, Iacono
VJ. Periodontal status and selected cultivable anaerobic microflora
of insulin-dependent juvenile diabetics. J Periodontol. 1995
Jun;66(6):452-61
95. Seppälä B, Sorsa T, and Ainamo J. Morphometric Analysis of
Cellular and Vascular Changes in Gingival Connective Tissue in
Long-Term Insulin-Dependent Diabetes. J Periodontol. 1997 Dec;
68 (12): 1237-124.
96. Siudikiene J, Machiulskiene V, Nyvad B, Tenovuo J, Nedzelskiene
I. Dental Caries Increments and Related Factors in Children with
Type 1 Diabetes Mellitus. Caries Res. 2008; 42:354–362
97. Siudikiene J, Machiulskiene V, Nyvad B, TenovuoJ, Nedzelskiene I:
Dental caries and salivary status in children with type 1 diabetes
mellitus, related to the metabolic control of the disease. Eur J Oral
Sci. 2006; 114: 8–14.
98. Siudikiene J., Machiulskiene V., Dobrovolskiené R., Nedzelskiene I.
Oral hygiene in children with type I diabetes mellitus. Stomatologiia,
2005, 7: 24 -27.
99. Smith GL, Sansone C, Socransky SS. Comparison of two methods
for the small-scale extraction of DNA from subgingival
microorganisms. Oral Microbiol Immunol. 1989 Sep;4(3):135-40.

82
100. Smith GT, Greenbaum CJ, Johnson BD, Persson GR. Short-term
responses to periodontal therapy in insulin-dependent diabetic
patients. J Periodontol. 1996 Aug;67(8):794-802.
101. Stavljenić LV, Rajić Z, Cvorisćec D, Granić P, Mardesić D,
Zaninović M, Devernay Z. Changes in the composition of salivary
amino acids, proteins and enzymes in children with
phenylketonuria. Acta Stomatol Croat. 1987;21(2):87-92.
102. Steinfeld, R., Kohlschutter, A., Ullrich, K., Lukacs, Z. Efficiency of
long-term tetrahydrobiopterin monotherapy in phenylketonuria. J.
Inherit. Metab. Dis. 2004,27: 449-453.
103. Stuhrmann M, Riess O, Mönch E, Kurdoglu G. Haplotype analysis
of the phenylalanine hydroxylase gene in Turkish phenylketonuria
families. Clin Genet. 1989 Aug;36(2):117-21.
104. Suzuki N, Nakano Y, Yoshida A, Yamashita Y, Kiyoura Y. Real-time
TaqMan PCR for quantifying oral bacteria during biofilm formation.
J Clin Microbiol. 2004 Aug;42(8):3827-30.
105. Suzuki N, Yoshida A, Nakano Y. Quantitative analysis of multi-
species oral biofilms by TaqMan Real-Time PCR. Clin Med Res.
2005 Aug;3(3):176-85.
106. Swanljung O, Meurman JH, Torkko H, Sandholm L, Kaprio E,
Mäenpää J. Caries and saliva in 12-18-year-old diabetics and
controls. Scand J Dent Res. 1992 Dec;100(6):310-3.
107. Syrjälä AM, Niskanen MC, Knuuttila ML. The theory of reasoned
action in describing tooth brushing, dental caries and diabetes
adherence among diabetic patients. J Clin Periodontol. 2002
May;29(5):427-32.
108. Syrjälä AM, Niskanen MC, Ylöstalo P, Knuuttila ML. Metabolic
control as a modifier of the association between salivary factors and
dental caries among diabetic patients. Caries Res. 2003. Mar-
Apr;37(2):142-7.
109. Tagelsir A, Cauwels R, van Aken S, Vanobbergen J, Martens LC.
Dental caries and dental care level (restorative index) in children
with diabetes mellitus type 1. Int J Paediatr Dent. 2011
Jan;21(1):13-22.
110. Tervonen, T. & Knuuttila, M. Relation of diabetes control to
periodontal pocketing and alveolar bone level. Oral Surgery, Oral
Medicine Oral Pathology. 1986 61, 346- 349.
111. The Diabetes Control and Complications Trial Research Group. The
effect of intensive treatment of diabetes on the development and
progression of long-term complications in insulin-dependent
diabetes mellitus. N Engl J Med. 1993 Sep 30; 329(14):977-8.

83
112. The DIAMOND Project Group. Incidence and trends of childhood
type 1 diabetes worldwide 1990-1999. Diabet Med 2006; 23(8):
857-866) (ISPAD 2011)
113. Thorstensson H, Dahlén G, Hugoson A. Some suspected
periodontopathogens and serum antibody response in adult long-
duration insulin-dependent diabetics.J Clin Periodontol. 1995
Jun;22(6):449-58.
114. Ting M, Slots J Microbiological diagnostics in periodontics.
Compend Contin Educ Dent. 1997 Sep;18(9):861-4, 866-7, 871-2
passim; quiz 87.
115. Tonella P, Flück CE, Mullis PE. Metabolic control of type 1 diabetic
patients followed at the University Children's Hospital in Berne:
have we reached the goal? Swiss Med Wkly. 2010 Jul
16;140:w13057.
116. Twetman S, Aronsson S, Björkman S. Mutans streptococci and
lactobacilli in saliva from children with insulin-dependent diabetes
mellitus. Oral Microbiol Immunol. 1989 Sep;4(3):165-8.
117. Twetman S, Johansson I, Birkhed D, Nederfors T. Caries incidence
in young type 1 diabetes mellitus patients in relation to metabolic
control. Caries Res. 2002 Jan-Feb;36(1):31-5.
118. Twetman S, Nederfors T, Ståhl B, Aronson S. Two-year longitudinal
observations of salivary status and dental caries in children with
insulin-dependent diabetes mellitus. Pediatr Dent 1992; 14: 184–
188.
119. Twetman S, Petersson GH, Bratthall D. Caries risk assessment as
a predictor of metabolic control in young Type 1 diabetics. Diabet
Med. 2005 Mar;22(3):312-5.
120. Umeda M, Contreras A, Chen C, Bakker I, Slots J. The utility of
whole saliva to detect the oral presence of periodontopathic
bacteria. . J Periodontol. 1998 Jul;69(7):828-33.
121. van Houte J: Role of microorganisms in caries etiology. J Dent Res.
1994;73:672–681.
122. Velková A, Podhrádská O. Dental findings in children with
phenylketonuria. Cesk Stomatol. 1976 Dec;76(6):441-8.
123. Velková A, Podhradská O. Stomatologic problems in children with
phenylketonuria. Cesk Stomatol. 1981 Jan;81(1):27-32.
124. Wallengren ML, Hamberg K, Ericson D, Nordberg J. Low salivary
IgA activity to cell-surface antigens of mutans streptococci related
to HLA-DRB1*04. Oral Microbiol Immunol. 2005 Apr;20(2):73-81.
125. WHO Oral health surveys: basic methods. Geneva: 1997

84
126. Wild S, Roglic G, Green A, Sicree R, and King H. Global prevalence
of diabetes: estimates for the year 2000 and projections for 2030.
Diabetes Care 2004; 27(5): 1047-1053
127. Williams K. Benefits of normalizing plasma phenylalanine: impact
on behaviour and health. A case report. J Inherit Metab Dis.
1998;21:785–90.
128. Winkler J., Stolzenberg H. Social Status Scaling in the German
National Health Interview and Examination Survey:
Gesundheitswesen 1999 61. Sonderheft 2:178–S183, Georg
Thieme Verlag.
129. Winter GB, Murray JJ, Goose DH. Prevalence of dental caries in
phenylketonuric children. Caries Res. 1974;8(3):256-66.
130. Yi SH, Singh RH. Protein substitute for children and adults with
phenylketonuria. Cochrane Database Syst Rev. 2008 Oct
8;(4):CD004731.
131. Yoshida A, Suzuki N, Nakano Y, Kawada M, Oho T, Koga T.
Development of a 5' nuclease-based real-time PCR assay for
quantitative detection of cariogenic dental pathogens Streptococcus
mutans and Streptococcus sobrinus. J Clin Microbiol. 2003
Sep;41(9):4438-41.

85
9 Appendix
9.1 Chemicals
Agarose Biozym Scientific GmbH, Hess. Oldendorf,
Germany
Bromophenol blue Merck, Darmstadt, Germany
Dinatriumhydrogenphosphate Merck, Darmstadt, Germany
EDTA Sigma-Aldrich Chemie GmbH, München, Germany
Ethanol Merck, Darmstadt, Germany
Ethidium bromide Sigma-Aldrich Chemie GmbH, München, Germany
Glucose Merck, Darmstadt, Germany
Glycerine Merck, Darmstadt, Germany
Yeast extract Gibco BRL, Invitrogen GmbH, Karlsruhe, Germany
Isopropanol Merck, Darmstadt, Germany
Kaliumacetate Merck, Darmstadt, Germany
Magnesiumchloride Merck, Darmstadt, Germany
Natriumchloride Merck, Darmstadt, Germany
Tris (hydroxymethylaminomethane) Merck, Darmstadt, Germany
TSB (Tryptic Soy Broth) Difco Laboratories GmbH, Augsburg,Germany
PBS (Phosphate buffered saline) Gibco BRL, Invitrogen GmbH, Karlsruhe,
Germany

86
9.2 Questionaire
Questionnaire used in the study to collect sociodemographic data and
information on oral hygiene habits and fluoride intake of the participants.
Sehr geehrte Eltern,
anbei erhalten Sie auf freiwilliger Basis einen Fragebogen, welcher für die
Analyse und Auswertung der Studie benötigt wird. Die Fragen zur
Soziodemografie orientieren sich am Fragebogen des Robert Koch Institutes,
der im Rahmen des Kinder- und Jugendgesundheitsurveys KiGGS eingesetzt
wird.
Soziodemografische Fragen
Ihre Adresse:
1. Welchen Schulabschluss haben Sie? Vater Mutter
(1) Hauptschulabschluss/ Volksschulabschluss
(2) Realschulabschluss (Mittlere Reife, Fachoberschulreife)
(3) Abschluss Politechnische Oberschule (POS)
(4) Fachhochschulreife, Abschluss Fachoberschule

87
(5) Abitur (Gymnasium, fachgebundene Hochschulreife)
(6) Anderer Schulabschluss
(7) Schule beendet ohne Schulabschluss/ kein Schulbesuch
(8) Noch keinen Schulabschluss
2. Welchen Berufsausbildungsabschluss haben Sie?
(1) Lehre (beruflich-betriebliche Ausbildung)
(2) Berufsschule, Handelsschule (beruflich-schulische Ausbildung)
(3) Fachschule (z.B. Meister- Technikerschule, Berufs- oder
Fachakademie
(4) Fachhochschule, Ingenieurschule
(5) Universität, Hochschule
(6) Anderer Ausbildungsabschluss
(7) Kein beruflicher Abschluss und auch nicht in Ausbildung
(8) Noch in beruflicher Ausbildung ( Auszubildender, Student)
3. Sind Sie zurzeit berufstätig?
Zurzeit
(1)...nicht berufstätig ( Hausfrau/-mann, Student, Rentner usw.)
(2)...arbeitslos - nicht beschäftigt
(3)...arbeitslos – Vollzeit beschäftigt ( z.B. ‚Ein-Euro-Job‟ bei
ALGII)
(4)...arbeitslos – Teilzeit oder stundenweise beschäftigt

88
(5)...vorübergehende Freistellung (z.B. Elternzeit)
(6)...Teilzeit oder stundenweise berufstätig
(7)...voll berufstätig
(8)...Auszubildender (z.B. Lehrling)
4. Wer kümmert sich um Ihr Kind, wenn Sie bei der Arbeit sind?
(1) Kindergarten/ Schule
(2) Großeltern
(3) Kindergarten, danach bei Großeltern
(4) Tagesmutter
(5) Au-Pair Mädchen
(6) Kinderhort
(7) Ehemann/-frau oder Partner
5. Bei wem lebt ihr Kind hauptsächlich?
(1) Leibliche Eltern
(2) Mutter und ihr Partner
(3) Vater und seine Partnerin
(4) Mutter
(5) Vater
(6) Großeltern oder andere Verwandte
(7) Pflegeeltern/ Adoptiveltern
(8) In einem Heim

89
6. Mit wie vielen Geschwistern lebt Ihr Kind zusammen?
(0) mehr als vier
(1) vier
(2) drei
(3) zwei
(4) ein
(5) kein
Fragen zur Mundgesundheit
1. Wie oft reinigt Ihr Kind sich die Zähne?
(0) nicht jeden Tag
(1) einmal am Tag
(2) zweimal am Tag
(3) mehr als zweimal täglich
2. Wann haben Sie angefangen die Zähne Ihres Kindes zu reinigen?
(0) nach drei Jahren

90
(1) mit zwei bis drei Jahren
(2) mit ein bis zwei Jahren
(3) mit dem ersten Zahndurchbruch
3. Wer reinigt die Zähne Ihres Kindes?
(0) das Kind selbst
(1) ich
(2) das Kind, ich reinige nach
4. Haben Sie gemerkt, dass Ihr Kind Zahnfleischblutung hat?
(0) ja, jeden Tag
(1) ja, manchmal
(2) nein
5. Wurde Ihr Kind schon einmal zahnärztlich untersucht?
(0) nein, noch nie
(1) ja, mindestens einmal
(2) ja, regelmäßig
6. Wann war Ihr Kind zum ersten Mal beim Zahnarzt?
(0) noch nie

91
(1) erst nach drei Jahren
(2) erst mit zwei bis drei Jahren
(3) erst mit ein bis zwei Jahren
(4) erst mit dem ersten Zahndurchbruch
7. Hat Ihr Kind schon einmal Zahnschmerzen gehabt (kein
Zahnungsbeschwerde)?
(0) ja, öfter
(1) ja, einmal
(2) nein
8. Hat Ihr Kind kranke Zähne („Loch im Zahn“)?
(0) ja
(1) nein (Frage 9 überspringen)
9. Wann hat Ihr Kind den ersten kariösen Zahn gehabt?
(0) vor einem Jahr
(1) mit ein bis zwei Jahren
(2) mit zwei bis drei Jahren
(3) später als drei Jahren

92
10. Benutzt Ihr Kind Zahnseide?
(0) nein
(1) ja
Fluoridanamnese
1. Benutzen Sie fluoridiertes Speisesalz?
(0) nein
(1) manchmal
(2) täglich, aber nicht zu allen Mahlzeiten
(3) immer
2. Bekommt Ihr Kind Fluoridtabletten?
(0) nein
(1) manchmal
(2) oft
(3) täglich
3. Benutzt Ihr Kind fluoridierte Zahnpasta?
(0) nein
(1) einmal täglich
(2) zweimal pro Tag oder öfter

93
4. Benutzt Ihr Kind Fluoridgel?
(0) nein
(1) manchmal
(2) einmal pro Woche
5. Benutzt Ihr Kind eine Fluoridmundspülung?
(0) nein
(1) manchmal
(2) täglich
Acknowledgements
This thesis has been my companion for the past few years, through births and
deaths. Both, have taught me that patience and perseverance pay off. The
mammoth effort involved in the accomplishment of a thesis had not dawned
upon me when I started. Life threw the time plan I had set up to achieve my
goals out of place! Several personal deadlines were pushed back. Despite my
past experience in writing a dissertation, it sometimes seemed difficult to see
light at the end of the tunnel. Had it not been for a number of helping hands and
supportive people the realisation of this thesis would not have been possible
and therefore I would like to express my gratitude to all who have contributed to
it in some way or the other.
I am sincerely and heartily grateful to my supervisor, Prof. Dr. W.H.-M. Raab for
the support and guidance he provided me throughout my thesis. He always
encouraged me to think independently, gave me the freedom to develop and
helped open doors for me, to bring my ideas to fruition.
One such door was PD Dr. Thomas Meissner, from the Department of General
Paediatrics. I am particularly thankful for his assistance during the data
collection for children with metabolic diseases. His friendly, enthusiastic and
helpful nature facilitated the swift examination of the children.
I would like to offer my special thanks to Prof. Dr. Birgit Henrich, from the
Institute of Medical Microbiology and Hospital Hygiene for her assistance. Her
expert, expeditious and unwearied efforts and guidance with the microbiological
analysis were indispensible for the completion of this research.
I am truly indebted and thankful to PD Dr. Mozhgan Bizhang, for her continuous
aid, not only in different aspects of this research, but essentially in the statistical
analysis of the data.
It is with immense gratitude that I acknowledge the help of Prof. Dr. Stefan
Zimmer. His valuable advice and useful recommendations during the initial
planning stages of the study were crucial in the commencement of this research
project.

At the same time, I am greatly obliged to many colleagues and other members
of staff at the University Hospital Düsseldorf, who supported me during various
stages of this research work. I also thank all the children and parents who
participated in this study.
Despite all the professional aid, this thesis would not have been possible
without the perpetual support, understanding and encouragement of my family. I
thank my parents, who have always been my pillar of strength, encouraging me
and building my confidence to reach for higher grounds. I cannot thank my
parents-in-law enough for continuously being there for me whenever I needed
them. Last but certainly not the least, I would like to thank my husband for his
undying moral support, motivation and insightful help at all times through to the
achievement of this work.