Embed Size (px)
Citation preview
WISSENSCHAFTSZENTRUM BERLIN FÜR SOZIALFORSCHUNG SOCIAL SCIENCE RESEARCH CENTER BERLIN
ISSN Nr. 0722 – 6748
Research Area Markets and Political Economy
Forschungsschwerpunkt Markt und politische Ökonomie
Jonathan Beck *
Fixed, Focal, Fair?
Book Prices Under Optional Resale Price Maintenance
* WZB - Wissenschaftszentrum Berlin
SP II 2004 – 15
December 2004
Research Unit Competitiveness and Industrial Change
Abteilung Wettbewerbsfähigkeit und industrieller Wandel
brought to you by COREView metadata, citation and similar papers at core.ac.uk
provided by Research Papers in Economics

Zitierweise/Citation: Jonathan Beck, Fixed, Focal, Fair? Book Prices Under Optional Resale Price Maintenance, Discussion Paper SP II 2004 – 15, Wissenschaftszentrum Berlin, 2004. Wissenschaftszentrum Berlin für Sozialforschung gGmbH, Reichpietschufer 50, 10785 Berlin, Germany, Tel. (030) 2 54 91 – 0 Internet: www.wz-berlin.de
ii
ABSTRACT
Fixed, Focal, Fair? Book Prices Under Optional Resale Price Maintenance
by Jonathan Beck*
In media markets, products are highly differentiated but prices are often bunched at apparent focal points. I use a comprehensive cross-section data set on the German book market to assess whether such focal points are a result of upstream coordination and whether the option to impose resale price maintenance (RPM) played a facilitating role. Therewith, I provide empirical evidence to a long-lasting policy debate. Results suggest that focal prices are used to coordinate competition rather than collusion. Focal prices are mostly lower than expected from hedonic projections. In cases where the decisions on focal pricing and RPM are positively correlated, controlling for endogeneity and a number of other factors, RPM does not seem to facilitate above average focal pricing in particular. Keywords: resale price maintenance; focal prices; vertical restraints; collusion;
simultaneous probit; book industry.
JEL Classification: D4, L11, L13, L42, L82.
* Thanks to Lars-Hendrik Röoller for guidance and comments, to Joe Clougherty, Ela Glowicka,
Michal Grajek, Peter Haan, Holger Stichnoth, Henning Weber and participants at the BDPEMS workshop and the WZB seminar for comments and helpful discussions, to MVB Marketing- und Verlagsservice des Buchhandels GmbH for its permission to use the data and in particular toWilfried Schinzel for his advice on data characteristics and extraction. Reinhard Kraasch provided me with a program to process the database’s output files. Financial support from the German Federal Ministry of Education and Research is gratefully acknowledged (project 01AK702A). All remaining errors are mine.
iii

ZUSAMMENFASSUNG
Fixiert, fokal, fair? Buchpreise bei optionaler Preisbindung
Produkte in Medienmärkten sind hochgradig differenziert, Preise sammeln sich jedoch häufig an augenscheinlich fokalen Punkten. Ich verwende einen umfassenden Satz von Querschnittsdaten aus dem deutschen Buchmarkt, um zu untersuchen, ob derartige Fokalpunkte das Ergebnis von Koordination auf der Verlagsseite sind und ob optionale Preisbindung eine begünstigende Rolle dabei spielte. Damit bereichere ich eine langlebige Politikdebatte mit empirischer Evidenz. Die Ergebnisse legen nahe, dass Fokalpreise eher der Koordination von Wettbewerb als Kollusion dienen. Fokalpreise sind meistens niedriger als von hedonischen Projektionen erwartet. In den Fällen, in welchen die Entscheidungen über fokale Preissetzung und Preisbindung positiv korreliert sind, unter Kontrolle des Einflusses von Endogenität und einer Reihe von anderen Faktoren, scheint optionale Preisbindung die Setzung von überdurchschnittlichen Fokalpreisen nicht insbesondere zu begünstigen.
iv
1 Focal pricing in media industries
Every month, book publishers introduce thousands of new titles to the market – titles
which differ greatly in various cost- and demand-specific aspects. Pricing, however, is
less heterogeneous. Certain prices, in particular those close to or at round numbers like
20 or 25, appear far more often than others. Some suspect that publishers could use such
prices as focal points – in the sense of Schelling (1963) – to coordinate competition to
the disadvantage of consumers. The music industry is another case in point. Reviewing
proposed mergers of major record companies, the European Commission found that at a
predominant share of record sales took place at a small set of distinct wholesale prices.1
The Commission’s concern was that these prices served as focal points for tacit collu-
sion among the majors. In addition, the majors publicly announce changes in pricing,
which can also be interpreted as a sign of collusion (Rotemberg and Saloner, 1990).2 In
Sony/BMG, however, the Commission concluded that the empirical evidence pointing
towards tacit collusion on focal prices was insufficient to prohibit the merger.
Making first-time use of comprehensive title-specific data on the German book market,
this paper has two objectives. First, I provide an empirical assessment whether coordi-
nated focal pricing occurs in the book industry and whether it harms consumers. Second,
I analyze the determinants of focal pricing: focussing in particular on the influence of re-
sale price maintenance (RPM) as an endogenous decision variable. Thereby, this paper
provides broad empirical evidence to a long-lasting policy debate on RPM for books.3
In many European countries, that debate began in the 19th century with the introduc-
tion of RPM schemes to the book market.4 It has been reoccurring regularly, in recent
years mostly because some of these RPM systems were subject to inquiry by the Euro-
1See Rabassa (2001) and the Commission’s documentation of the EMI/Time Warner and the Sony/BMGmerger cases (COMP/M.1852 and COMP/M.3333).
2For example, Universal Music recently announced to cut its wholesale prices “to $ 10.02 or $ 9.09 formany of the CDs it produces” and said that it expected competitors to follow (Financial Times, Sept. 4, 2003).
3To my knowledge, there is no other quantitative empirical study on the price effects of RPM for booksexcept for case studies involving a handful of titles (Stumpp, 1998; Liefmann, 1904). Bittlingmayer (1992) andClerides (2001, 2002) are empirical studies regarding other aspects of the industry. Ornstein and Hanssens(1987) study the effects of RPM in liquor dealing.
4For reviews of the national experiences, see Pohle (1895) and Picot (1991) for Germany, Guillebraud(1965) for the UK and Tosdal (1915) for a US perspective. The introduced scheme mostly took the form of asectoral contractual arrangement like the UK’s Net Book Agreement. While the latter was abolished in 1995,some other countries still maintain a comparable scheme. Alternatively, RPM for books is often allowed oreven enforced by a distinct law like France’s Loi Lang.
1
pean Commission. Although cross-border trade was the critical issue in all recent cases,
involved parties tended to debate the overall costs and benefits of RPM for books.5 The
ability of RPM to enable or facilitate collusion between publishers represents a major
concern, raised in the general economic literature on RPM as well as in these particular
debates.6 Another stream of theoretical literature emphasizes potential efficiency benefits
of RPM in the presence of upstream market power and demand uncertainty (Deneckere
et al., 1996, 1997; Wang, 2004). The welfare implications of these RPM theories are often
ambiguous, though. In conclusion, a case-by-case empirical analysis is frequently called
for (Martin, 1993; Butz, 1996, for example).
In this paper, I propose a formalization of focal pricing in media industries which leads
to an empirical method based on hedonic regression to identify its average effect on price
levels. Empirical results employing a comprehensive database of “books in print” sug-
gest that coordinated focal pricing is prevalent in a number of market segments. Since
my data were generated under an RPM system where publishers had the choice not to
fix a title’s retail price, I can use title-specific information on this choice to assess the level
effects of focal pricing under RPM. Results indicate that focal pricing under RPM rarely
damages consumer surplus: i.e., it most often does not lead to higher prices on average.
In a second step, I explicitly account for the simultaneity between the decisions to price
focally and to fix the retail price. I also assess the influence of other factors on both deci-
sions. Results regarding RPM reflect those from the first-stage analysis. I cannot confirm
the suspicion that RPM facilitates coordination on ‘unfair’ focal prices – prices that are
too high compared to otherwise similar but non-focally priced titles. In segments where
the decisions on RPM and focal pricing are positively correlated, this leads significantly
more often to ‘fair’ focal prices – prices with negative ‘focality markups’ over the (pre-
dicted) hedonic price. In segments with predominantly positive ‘focality markups’, the
two decisions are independent. Further results indicate that focal pricing is nevertheless
a result of publisher coordination. Alternative causes for observed focal prices points do
5Inquiries by the Commission concerned cross-border RPM arrangements covering the Nether-lands/Belgium, the UK/Ireland, France/Belgium and Germany/Austria, see Goyder (1998).
6See Mathewson and Winter (1998) for a survey, Jullien and Rey (2000) for the – to my knowledge – onlyformal attempt to formulate the suspicion, and OECD (1997, p. 7ff.) for its application to the book market.The seminal papers on this issue are Yamey (1954) and Telser (1960).
2
not appear relatively important. In combination, these results suggest that it is competi-
tors who ‘meet’ on a focal price point, not conspirators.
The rest of the paper is organized as follows: in the next section I give a description of the
data and motivate my analysis by a glance at the distribution of book prices in Germany.
In section 3 I review related theoretical literature and propose a theoretical framework
for the empirical analysis of focal pricing with differentiated products. In section 4 an
approach to first measure the price effects of focal pricing and then to assess the influence
of RPM, coordination incentives and other factors on focal pricing is presented together
with the corresponding results. I also discuss limitations and report on a number of
robustness checks. In section 5 I offer some final conclusions.
2 A first look at the data
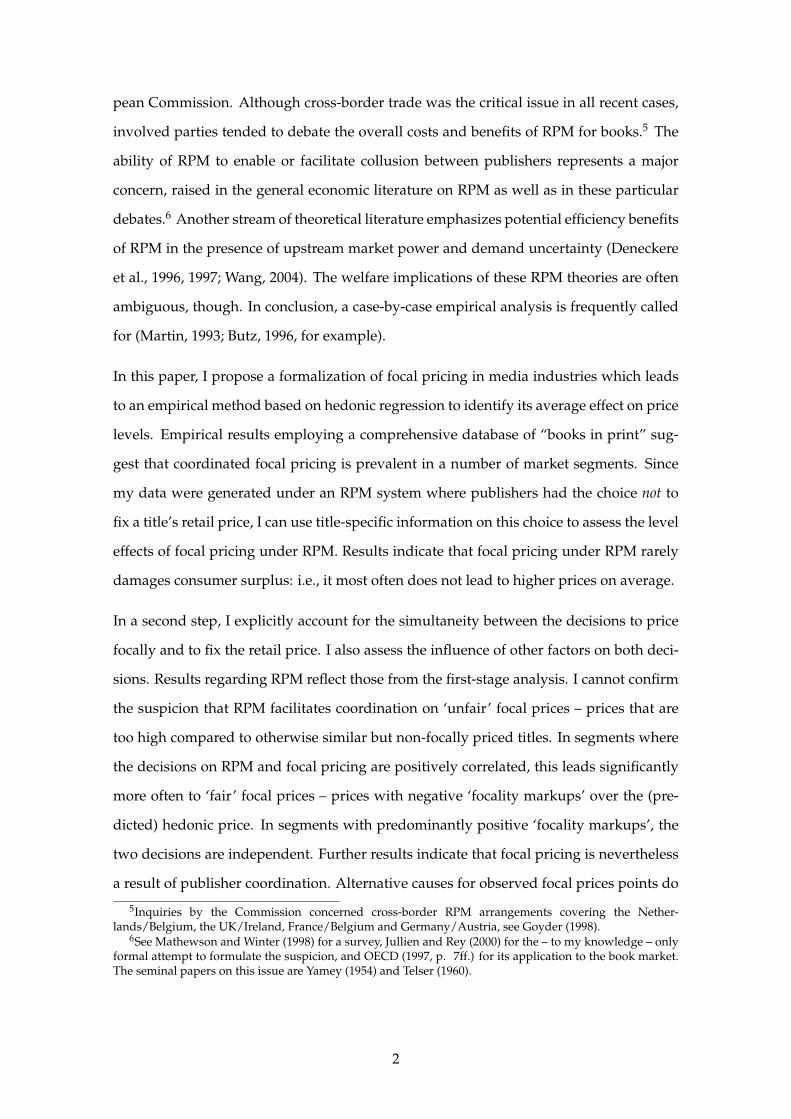
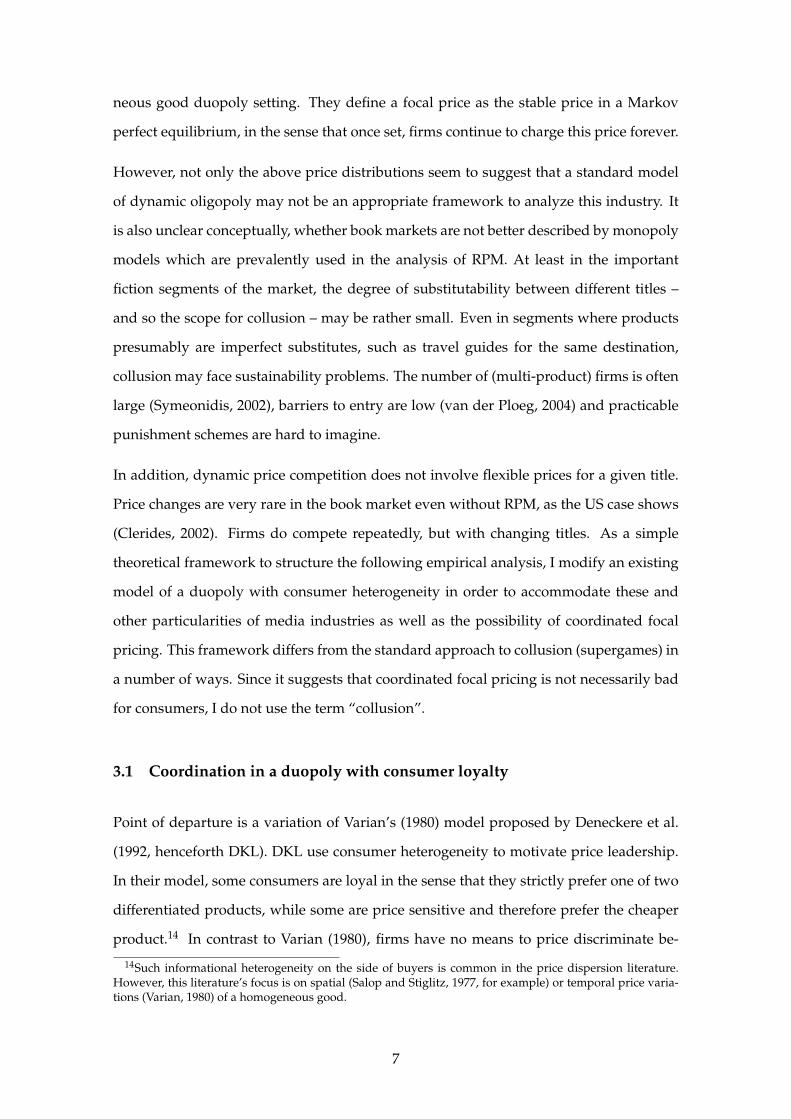
Figure 1: Prices in ‘popular’ segments by 1-digit level
Figures 1 and 2 show the distribution of German book prices below 50 DM (Deutsche
Mark),7 separately for hardcovers and paperbacks in eight thematic segments. To facili-
tate comparison, hardcover prices are given as kernel density estimates, while paperback7About 70.5% of all hardcovers and 98.2% of all paperbacks in the sample have a price in this range.
3
prices are given as histograms. Binwidth for both histograms and kernels is 1 DM. For
the histograms, the starting value is 0.5 DM. Effectively, this divides up the observed
price range into clusters of 1 DM centered around whole numbers.8
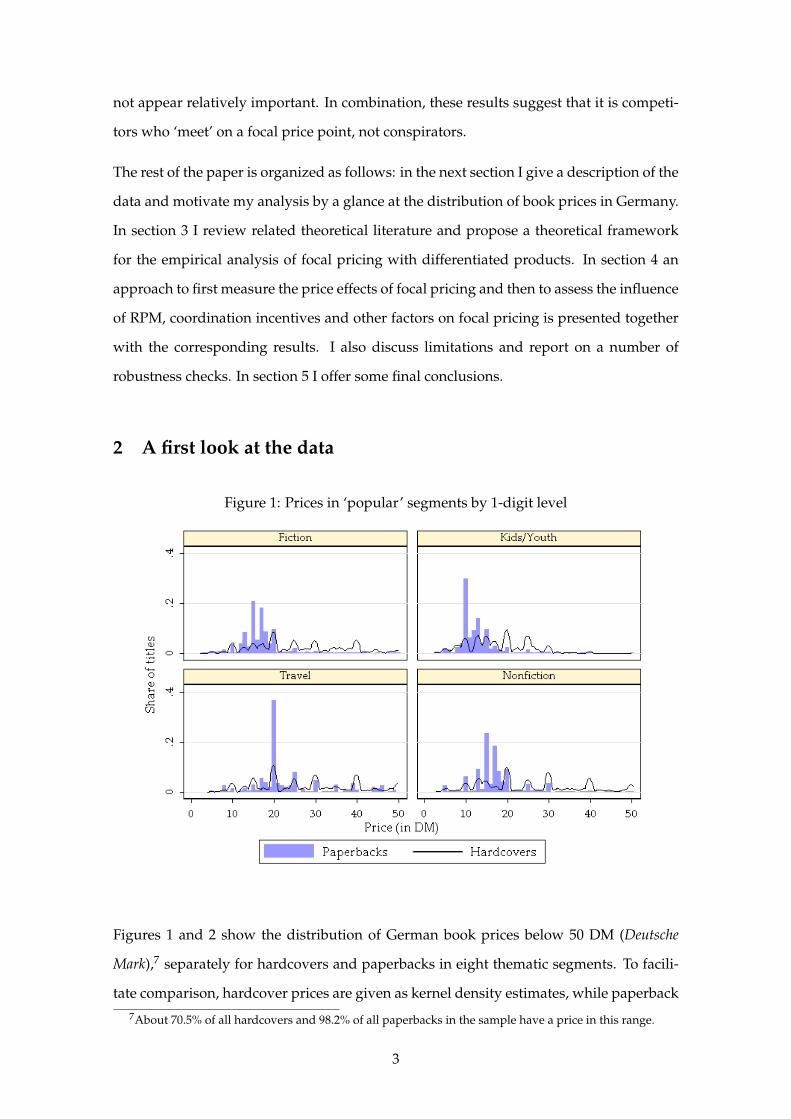
Figure 2: Prices in ‘professional’ segments by 1-digit level
Altogether, these figures confirm that the distribution of book prices exhibits significant
mass points at candidate focal points like 10, 15, 20 and so forth. In addition, pricing in
hardcover and paperback segments appears to be substantially different: the paperbacks’
distributions are by far more compressed. Paperback prices concentrate mostly in the 10-
20 DM interval, with remarkable bumps at 10, 13, 15, 18 and 20 DM. Hardcover prices are
higher and mostly concentrate at whole tenners. With relative frequencies around 30%,
paperback titles in the segments Travel and Kids/Youth seem to be most outstandingly
priced on the focal points 10 and 20 DM, respectively.
The data underlying these figures come from the database German books in print which
contains information on all titles available in Germany at a certain point in time. It is used8This paper is not concerned with the question why prices often end with a nine, although this is true
for many titles in the sample as well as for potentially focal prices like 19.90. This phenomenon has beenlabeled ‘the 9 fixation’ in the marketing literature, which proposed several explanations. Mostly, they usenotions of bounded rationality, where consumers are, for example, subject to rounding illusions, or like toget some change at the cashier. See Basu (1997), whose explanation rests on fully rational consumers, andthe references therein. Here, I assume that consumers round rationally and treat prices like 19.90 and 20.00as roughly equal.
4
primarily by retailers and librarians, e.g. for keyword searches for specific titles upon
consumer request. My sample should carry all titles that were commercially available
by about August 2001. I restrict attention to 112,662 titles produced from 1999 with non-
missing observations on price, number of pages, type of binding and market segment.9
Data on product characteristics also include dummies indicating whether a title has black
or colored images, whether it is published within a series, or whether it is a reprint. Prices
that are not subject to RPM are indicated as “free”. These are publishers’ list prices that
publishers demand for direct orders and suggest to retailers. Given the prevalence of
RPM, retailers are likely to implement publishers’ prices even when they are not subject
to RPM, and offer discounts only to sell off remnants.10
Market segments are classified in quite some detail through a 3-digit code of the form
xyz, where every digit stands for another dimension of segmentation:
• the first digit (x) distinguishes hardcover (x=1) from paperback (x=2) titles,
• the second digit (y) denotes one of eight main market segments (see table 1),
• the third digit (z) denotes further sub-segments for every main market.11
Thus, the first digit refers to a material characteristic which – as the empirical results
below show – also differentiates market segments. The other two digits refer to a the-
matic classification which applies to both hardcover and paperback titles. For example,
xyz=112 denotes the following segmentation: hardcover (x=1) fiction (y=1), subcategory
thriller (z=2). Table 1 gives some summary statistics for prices in the eight main market
segments. I refer to these segments, distinguished by y, as ‘1-digit segments’ and to the
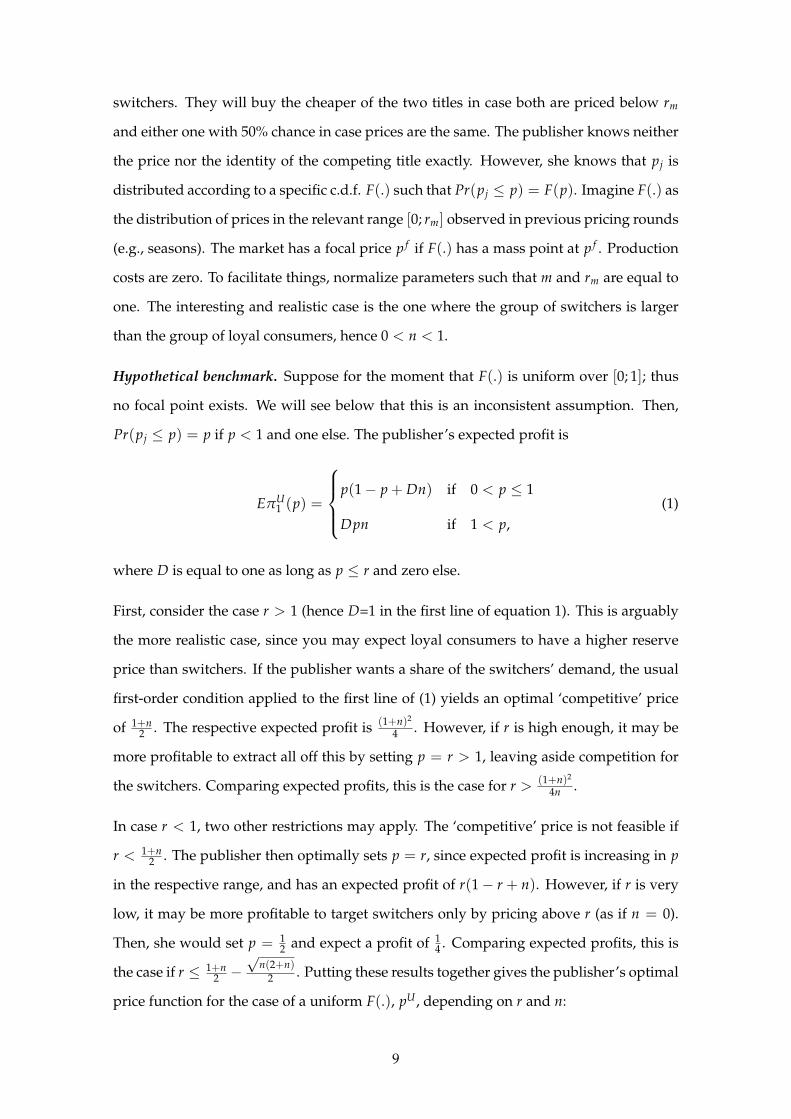
more detailed segments indicated by xyz as ‘3-digit’ segments. Mean hardcover prices in
the popular (mass market) segments 1 to 4 are considerably lower than in the professional
publications segments 5 to 8.12
9Some titles were indicated to include another medium such as a CD, CD-ROM or DVD. These titles wereexcluded from the sample, since it is unclear which of the bundled media was the main product and whichthe supplement. In addition, non-book market segments (e.g. maps), segments containing less than 5 titles,as well as titles from publishers producing less than 5 titles between 1999 and 2001 were excluded.
10While existent in the time period studied here, the possibility to set non-binding suggested retail priceshas been eliminated by a new law on RPM for books effective from October 2002, which generally requirespublishers to implement RPM.
11The original database contains a fourth digit, which allows for a deeper segmentation. I do not makeuse of this 4-digit segmentation, however, since segments on this level are defined only for a subset of all3-digit segments and because they often include a small number of titles (or none at all).
12The last segment (8) contains mainly schoolbooks and is thus exceptional, since those are usually notpurchased by individuals, but mostly in bulk by public institutions that at the same time define curricula,
5
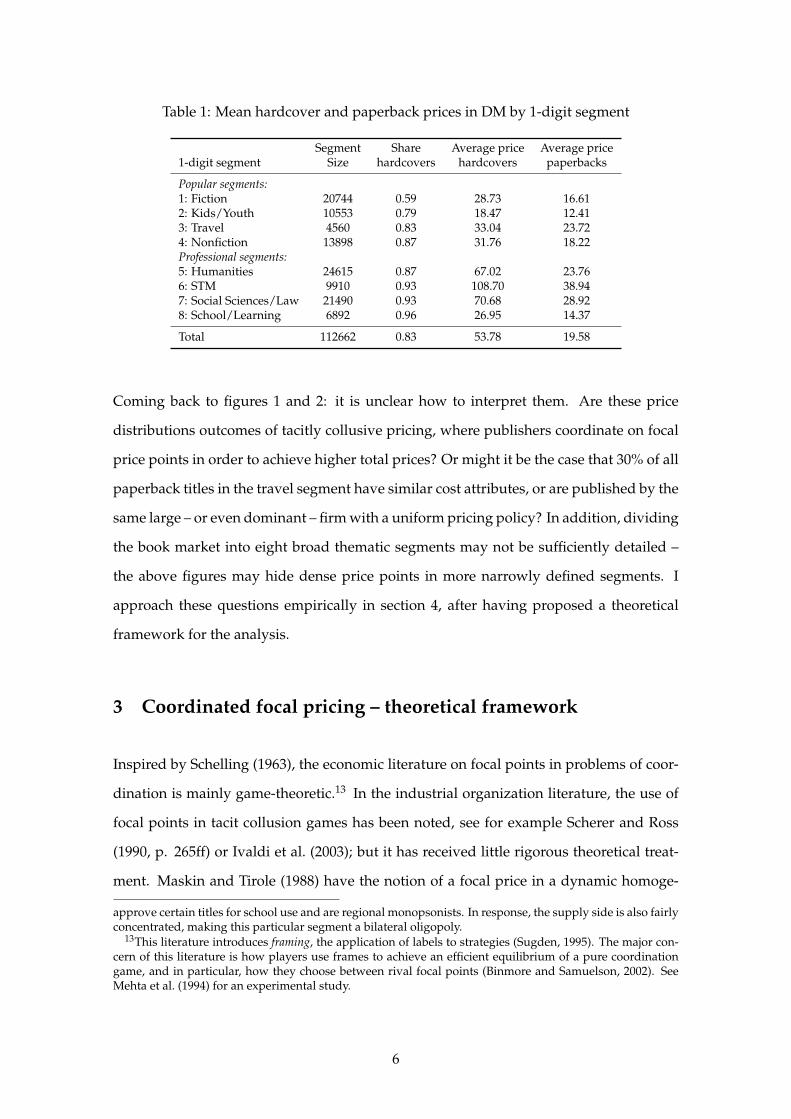
Table 1: Mean hardcover and paperback prices in DM by 1-digit segment
Segment Share Average price Average price1-digit segment Size hardcovers hardcovers paperbacks
Popular segments:1: Fiction 20744 0.59 28.73 16.612: Kids/Youth 10553 0.79 18.47 12.413: Travel 4560 0.83 33.04 23.724: Nonfiction 13898 0.87 31.76 18.22Professional segments:5: Humanities 24615 0.87 67.02 23.766: STM 9910 0.93 108.70 38.947: Social Sciences/Law 21490 0.93 70.68 28.928: School/Learning 6892 0.96 26.95 14.37
Total 112662 0.83 53.78 19.58
Coming back to figures 1 and 2: it is unclear how to interpret them. Are these price
distributions outcomes of tacitly collusive pricing, where publishers coordinate on focal
price points in order to achieve higher total prices? Or might it be the case that 30% of all
paperback titles in the travel segment have similar cost attributes, or are published by the
same large – or even dominant – firm with a uniform pricing policy? In addition, dividing
the book market into eight broad thematic segments may not be sufficiently detailed –
the above figures may hide dense price points in more narrowly defined segments. I
approach these questions empirically in section 4, after having proposed a theoretical
framework for the analysis.
3 Coordinated focal pricing – theoretical framework
Inspired by Schelling (1963), the economic literature on focal points in problems of coor-
dination is mainly game-theoretic.13 In the industrial organization literature, the use of
focal points in tacit collusion games has been noted, see for example Scherer and Ross
(1990, p. 265ff) or Ivaldi et al. (2003); but it has received little rigorous theoretical treat-
ment. Maskin and Tirole (1988) have the notion of a focal price in a dynamic homoge-
approve certain titles for school use and are regional monopsonists. In response, the supply side is also fairlyconcentrated, making this particular segment a bilateral oligopoly.
13This literature introduces framing, the application of labels to strategies (Sugden, 1995). The major con-cern of this literature is how players use frames to achieve an efficient equilibrium of a pure coordinationgame, and in particular, how they choose between rival focal points (Binmore and Samuelson, 2002). SeeMehta et al. (1994) for an experimental study.
6
neous good duopoly setting. They define a focal price as the stable price in a Markov
perfect equilibrium, in the sense that once set, firms continue to charge this price forever.
However, not only the above price distributions seem to suggest that a standard model
of dynamic oligopoly may not be an appropriate framework to analyze this industry. It
is also unclear conceptually, whether book markets are not better described by monopoly
models which are prevalently used in the analysis of RPM. At least in the important
fiction segments of the market, the degree of substitutability between different titles –
and so the scope for collusion – may be rather small. Even in segments where products
presumably are imperfect substitutes, such as travel guides for the same destination,
collusion may face sustainability problems. The number of (multi-product) firms is often
large (Symeonidis, 2002), barriers to entry are low (van der Ploeg, 2004) and practicable
punishment schemes are hard to imagine.
In addition, dynamic price competition does not involve flexible prices for a given title.
Price changes are very rare in the book market even without RPM, as the US case shows
(Clerides, 2002). Firms do compete repeatedly, but with changing titles. As a simple
theoretical framework to structure the following empirical analysis, I modify an existing
model of a duopoly with consumer heterogeneity in order to accommodate these and
other particularities of media industries as well as the possibility of coordinated focal
pricing. This framework differs from the standard approach to collusion (supergames) in
a number of ways. Since it suggests that coordinated focal pricing is not necessarily bad
for consumers, I do not use the term “collusion”.
3.1 Coordination in a duopoly with consumer loyalty
Point of departure is a variation of Varian’s (1980) model proposed by Deneckere et al.
(1992, henceforth DKL). DKL use consumer heterogeneity to motivate price leadership.
In their model, some consumers are loyal in the sense that they strictly prefer one of two
differentiated products, while some are price sensitive and therefore prefer the cheaper
product.14 In contrast to Varian (1980), firms have no means to price discriminate be-
14Such informational heterogeneity on the side of buyers is common in the price dispersion literature.However, this literature’s focus is on spatial (Salop and Stiglitz, 1977, for example) or temporal price varia-tions (Varian, 1980) of a homogeneous good.
7

tween consumers. Once decided upon and communicated, prices are ex post inflexible.
DKL show that with two asymmetrically popular firms, the firm with the larger group of
loyal consumers endogenously becomes a price leader, determining the uniform market
price.
This setup fits to some of the stylized characteristics of the book market. First, consumer
heterogeneity is certainly present. Some buyers are informed and want to buy a spe-
cific title, some come undecided and want to see what a particular retailer has to offer
(so-called ‘impulse buyers’). Second, publishers’ price decisions are usually irreversible.
Publishers decide on a price before the title is introduced to the market. Adjustments
seem to be infeasible during a title’s primary selling season – which in practice is at most
6 months – and are rare afterwards.15
On the other hand, market structure in this industry is quite fragmented – far from a
duopoly at least. Competition between available titles is limited additionally by the fact
that due to specialization or restrictions in shelf space, a retailer only has a small share of
all titles on stock. Presumably, every retailer’s selection of stocked titles is a different one.
While informed buyers will manage to get their favorite title, undecided buyers choose
between titles on stock at the retailer they happen to walk in. Unlike in DKL, a publisher
therefore cannot identify the specific titles that compete with his title for undecided buy-
ers. In fact, the set of competing titles is a different one for every retailer. Simple direct
price coordination, for example by means of a leader-follower scheme as in DKL, is not
feasible in this case.
3.2 Coordinated focal pricing in fragmented media markets
Consider the following formalization. A publisher has to decide on a price p for a title
to be introduced to the market. She knows there are n loyal consumers who will buy
the title definitely, if p is not larger than their reserve price r.16 Also, m consumers with
reserve price rm will be undecided between this title and a competing title j: call them the
15Price increases are extremely rare, while markdowns sometimes occur after the selling season to sell offremaining inventory. Presumably, publishers who choose not to fix prices via RPM want to provide retailerswith the opportunity of such remnant sales.
16Although the following reasoning will be applied to a large number of titles, title subscripts for p, n andr are omitted here for legibility.
8
switchers. They will buy the cheaper of the two titles in case both are priced below rm
and either one with 50% chance in case prices are the same. The publisher knows neither
the price nor the identity of the competing title exactly. However, she knows that pj is
distributed according to a specific c.d.f. F(.) such that Pr(pj ≤ p) = F(p). Imagine F(.) as
the distribution of prices in the relevant range [0; rm] observed in previous pricing rounds
(e.g., seasons). The market has a focal price p f if F(.) has a mass point at p f . Production
costs are zero. To facilitate things, normalize parameters such that m and rm are equal to
one. The interesting and realistic case is the one where the group of switchers is larger
than the group of loyal consumers, hence 0 < n < 1.
Hypothetical benchmark. Suppose for the moment that F(.) is uniform over [0; 1]; thus
no focal point exists. We will see below that this is an inconsistent assumption. Then,
Pr(pj ≤ p) = p if p < 1 and one else. The publisher’s expected profit is
EπU1 (p) =
p(1− p + Dn) if 0 < p ≤ 1
Dpn if 1 < p,(1)
where D is equal to one as long as p ≤ r and zero else.
First, consider the case r > 1 (hence D=1 in the first line of equation 1). This is arguably
the more realistic case, since you may expect loyal consumers to have a higher reserve
price than switchers. If the publisher wants a share of the switchers’ demand, the usual
first-order condition applied to the first line of (1) yields an optimal ‘competitive’ price
of 1+n2 . The respective expected profit is (1+n)2
4 . However, if r is high enough, it may be
more profitable to extract all off this by setting p = r > 1, leaving aside competition for
the switchers. Comparing expected profits, this is the case for r > (1+n)2
4n .
In case r < 1, two other restrictions may apply. The ‘competitive’ price is not feasible if
r < 1+n2 . The publisher then optimally sets p = r, since expected profit is increasing in p
in the respective range, and has an expected profit of r(1− r + n). However, if r is very
low, it may be more profitable to target switchers only by pricing above r (as if n = 0).
Then, she would set p = 12 and expect a profit of 1
4 . Comparing expected profits, this is
the case if r ≤ 1+n2 −
√n(2+n)
2 . Putting these results together gives the publisher’s optimal
price function for the case of a uniform F(.), pU , depending on r and n:
9
pU(r, n) =
12 if r ≤ 1+n
2 −√
n(2+n)2
r if 1+n2 −
√n(2+n)
2 < r < 1+n2
1+n2 if 1+n
2 ≤ r ≤ (1+n)2
4n
r else.
(2)
The function pU(r, n) is inconsistent with the initial assumption on F(.), though. If all
firms in the market use this pricing function (with different rj and nj entering), our pub-
lisher cannot believe that F(.) has no focal point. In other words, a uniform F(.) cannot be
the outcome of previous pricing rounds in this fashion. For example, if F(.) is the result
of prices of a large number of titles whose rj and nj are uniformly distributed on some
interval including [0; 1], it will have a mass point at 12 .17 See appendix A for a simulation.
Coordinated focal pricing. How would equation 2 change if there were a focal price?
Suppose the publisher believes that
pj
= p f with probability q (0 < q < 1)
is uniformly distributed (as before) with probability 1− q.
Say, q is the empirical share of all titles in the relevant range [0; 1] that were priced at p f in
the last season. Depending on whether p is higher, lower or equal to p f , the publisher’s
expected profit is
EπF1 (p) =
(1− q)p(1− p + Dn) + qp(1 + Dn) if p < p f < 1
(1− q)p f (1− p f + Dn) + qp f ( 12 + Dn) if p = p f < 1
(1− q)p(1− p + Dn) + qpDn if p f < p < 1
pDn if p f < 1 < p.
(3)
Obviously, it is very attractive to undercut p f by a small amount. But then, why should
a publisher expect p f to be a mass point of the price distribution in the first place? It
17Another puzzle appears to be that the resulting price distribution has an upper bound exceeding thatof F(.). More precisely, the publisher under consideration expects only competitors with prices below 1 butallows herself to price above 1. She can do so because titles with prices above 1 – although existent – areirrelevant for her decision. They are out of competition for the switchers’ demand.
10
is precisely for this reason that we suspect focal pricing to be a coordinated outcome.
Imagine there is a coordination authority (say, a trade association) that can observe all
parameter values after prices have been determined. It checks every undercutting firm i
for ri < p f and is able to severely punish those who set a price such that ri 6= pi < p f .
Only publishers who have to undercut p f in order to serve their loyal consumers are
allowed and able to do so.18
Even under such a coordination mechanism, there is room for title-specific optimization
similar to the above benchmark case. Sorting out the publisher’s price function is some-
what more involved, though, since you have to deal with two additional parameters (q
and p f ). The specific results depending on these parameters are secondary for the pur-
pose of this paper and therefore referred to the appendix. Here I only summarize the
procedure and the resulting price function. As before, for a very low r it is better to focus
on switchers only. Comparing the respective expected profit for p = r < p f with that
from focal pricing with n = 0 gives a lower bound on r depending on the other parame-
ters, rmin(n, q, p f ). For reserve prices above rmin yet still below p f , the publisher optimally
sets p = r.
When r > p f , the choice is between focal pricing and setting a price above p f . Con-
strained maximization of the third line of the above expected profit function gives a po-
tentially optimal price of p = 1+n−q2(1−q) , which is feasible (lying between p f and one) only
for intermediate n. It is optimal compared to focal pricing only for small q and not too
large r (with respective bounds nmin/max, q and r dependent on p f , n and q). In case these
conditions are met for n and q but r lies between p f and p, the optimal price is p = r
since the respective profit function is increasing in p. In case these conditions on n and q
are not met, it is more profitable to set either p = p f or p = r. Comparing the respective
expected profits yields an upper bound for r above which the publisher leaves the com-
petition for switchers: rmax(n, q, p f ). Assembling these results gives a publisher’s price
18The purpose of this paper is not to show whether or how coordinated focal pricing could work explicitlyin this setup. Given this particularly simple coordination mechanism, I only check whether the resulting pricefunction is a consistent one and derive an estimation strategy for the empirical analysis.
11
function under coordinated focal pricing:
pF(r, n, p f , q) =
p f if r ≤ rmin
r if rmin < r < p f
p f if p f ≤ r ≤ rmax and (n ≤ nmin or q > q)
r if p f ≤ r < p, nmin < n ≤ nmax and q ≤ q
p = 1+n−q2(1−q) if p ≤ r ≤ r, nmin < n ≤ nmax and q ≤ q
r else .
(4)
The precise expressions for rmin, rmax, nmin, nmax, q and r are given in appendix A. Com-
pared to the price function for pU , here p f replaces 12 as the price to target switchers only.
For a range of parameter values – i.e. the third case of equation 4 – it is profitable to do
focal pricing although loyal consumers are willing to pay more. An important feature of
this pricing function is the fact that the focal price contains no title-specific information
(through r or n), while all other prices do. This result is used as a central identification
assumption in the following empirical section.
For an outsider who treats n and r as uniformly distributed random variables, p f is the
only mass point in the price distribution. If all firms in the market use this pricing func-
tion (with different rj and nj entering), the initial assumption on p f is thus consistent.
In addition, stability of pF(.) and the corresponding coordination mechanism would re-
quire that q is a good estimate of the resulting share of focally priced titles in the relevant
range. In the appendix, I assess this by simulation and find for a number of candidate
focal points that there is a specific and reasonable q for which pF(.) is stable in this sense.
How does all this affect consumers? With a simulated distribution of (ri, ni) for 1000 titles,
the average price is about 0.9 in the hypothetical benchmark case of a uniform F(.), while
it is slightly lower (0.88) if pricing is according to equation 4 with p f = 12 (see appendix).
This is due to the fact that on the one hand, the coordination mechanism imposed does
not deter firms from undercutting the focal price when their loyal consumers are not
willing to pay p f , while on the other hand it induces at least some firms to cut their price
from r down to p f in order to ‘meet the competition’ for switchers. But the simulated
12
average price increases when the focal price increases. It becomes 0.9 for p f = 34 and
goes up to 0.99 for the largest possible p f = 1.
Therefore, the effects of coordinated focal pricing on average prices are unclear. An in-
crease in average prices through focal pricing – compared to the benchmark case – is
dependent on the ability of publishers to coordinate on a focal price close to one. This
ambiguity should be similar in markets with more than one focal price: expected average
prices should depend on the focal points’ level, the distance between them and the share
of titles priced on these points.
3.3 The role of RPM
Until now, I have assumed that publishers can determine the retail price. Which is true for
titles under RPM, but not for titles with flexible prices. The conjectures that RPM in gen-
eral facilitates collusive pricing and that collusive pricing is often coordinated via focal
points have yet received little formal foundation. This is particularly true for their com-
bination: the relationship between RPM and tacit collusion on focal prices. In either case,
progress on these grounds is beyond the scope of this paper. Let me just note, instead,
that there are several reasons why publishers may not be able to control retail prices ap-
propriately via non-linear wholesale contracts, if RPM is not an option; for instance, cost
heterogeneity of retailers, transaction costs due to the large number or retailers, or laws
that require equal wholesale conditions for all retailers (Kandel, 1996). The frequent use
of ‘Minimum Advertised Pricing’ programs in music publishing is another indicator of
the manufacturers’ desire to control retail prices in these industries (Wang, 2004).
In addition, even homogeneous retailers selling a homogeneous good will want to intro-
duce price dispersion when faced with informational imperfections on the side of buyers
(cf. the above cited literature on price dispersion). For the book industry, a number of
recent empirical studies of on- and offline book prices in the US confirm this assertion
(Chevalier and Goolsbee, 2003; Clay et al., 2001, for example). If retailers not subject to
RPM introduced additional price dispersion, coordination between publishers would be
complicated, since the resulting price distribution may not offer clear focal points.
13

3.4 Alternative explanations
Factors other than upstream coordination may account for the observed price distribu-
tions with perceived focal points. First of all, it may be the case that the distribution of
consumers’ reserve prices has mass points. If, say, 40% of all consumers loyal to distinct
titles have a reserve price equal to 20, that price will appear as focal even when the re-
spective publishers do not consider competition for switchers in their pricing decision.
Pricing patterns will then not differ empirically between titles on and off perceived focal
points since in either case title-specific parameters determine a title’s price.
Dominant-firm price leadership is an alternative explanation. As DKL show, a dominant
firm may emerge as price leader and effectively determine a uniform market price. In the
context of the book market with multi-product firms and various market segments, price
leadership may consist in the determination of a set of price points. Fringe firms would
follow, which in effect yields a price distribution with mass points chosen by the price
leader. I assess this possibility in section 4.3.
Firms’ uniform pricing policies may also lead to the observation of focal price points.
Eventually, firms prefer to set a uniform price for all or a subset of their titles, for example
when overhead costs are large but also for marketing-related reasons.19 In segments with
some large firms, such uniform pricing will lead to mass points in the price distribution
even without coordination efforts. This possibility is evaluated in section 4.3 as well.
4 Focal pricing with optional RPM – empirical approach
What do these theoretical considerations imply for an empirical analysis of book prices?
Suppose coordinated focal pricing as characterized by equation 4 is the data-generating
process for the observed distribution of prices shown in figures 1 and 2. The primary im-
plication for an empirical analysis is that focal prices contain no title-specific information
whatsoever. Conversely, non-focal prices are driven by title-specific parameters, i.e. the
number of loyal consumers and their reserve price. The same reasoning applies to cost
factors, which were not included in the above formalization for simplicity but most likely
19For example, travel guides appearing in a given publisher’s series often have a uniform price, althoughproduction costs and possibly consumers’ reserve prices differ between titles (destinations).
14
play an important role in pricing decisions. Given title-specific data on these factors, one
may estimate a hedonic pricing equation using only those titles with non-focal prices.
If observed focal pricing is due to publisher coordination, predicted hedonic prices for
focally priced titles should be different than actual prices. If focally priced titles are pre-
dominantly more expensive than their implied hedonic prices, such coordination can be
called detrimental to consumer surplus.
Knittel and Stango (2003, henceforth KS) propose a similar identification scheme. They
study collusion on focal prices – in terms of interest rates – between US credit card issuers
at the state-level during the 1980s. In their study, potentially collusive focal points are
directly observable in the form of state-imposed interest rate ceilings. In addition, KS
have a control group of states that did not impose a ceiling. They assume a reduced-
form pricing equation for off-ceiling interest rates and find that a significant portion of
credit card issuers set above-average prices at the ceiling. They interpret their result as
an indication of tacit collusion on focal prices.
A main difference between this paper and that of KS is that it is not manifest here when
a price qualifies as focal. I therefore experiment with various definitions. Another im-
portant difference to KS is the explicit consideration of the decision on RPM, which is
taken jointly with that on focal pricing. The influence of hedonic prices, pricing of po-
tential competitors as well as a number of other factors on these decisions is estimated in
section 4.3.
4.1 Hedonic non-focal prices
Looking at actual price distributions, you have seen in section 2 that in each market seg-
ment there is potentially not one, but a set of focal prices. Suppose for the moment that
this set is known for every segment. I have argued that offside focal points, observed
prices depend on the number of loyal consumers, their reserve prices, and costs. Sup-
pose that these title-specific values are functions of a title’s vector of product characteris-
tics (x) and of other unobservable factors. The resulting price, denoted by p∗, is therefore
15
hedonic and can be represented by the following reduced form:
p∗ = f (x, βk) + ε. (5)
In this equation, βk is a vector of coefficients capturing segment-specific cost- and demand-
effects of observable product characteristics. The error term ε captures effects unobserv-
able to the econometrician, e.g. from differences in unobserved product characteristics
such as author reputation or cover design. A standard assumption is that product char-
acteristics are exogenous to the pricing decision. I justify this assumption in more detail
in section 4.4.
In principle, f (.) can be estimated using the observations on titles with non-focal prices.
While using such a subsample of titles can induce selection bias in certain circumstances,
it does not seem to be critical here (see section 4.4 for more detail). Unfortunately, unlike
KS I have little a priori knowledge to be able to safely identify the set of focal prices within
a market segment. A working definition could do the trick, however. I experiment with
various definitions for focality and cross-check respective estimation results. Results are
qualitatively invariant across definitions.
A focal price: working definitions. As in section 2, I partition observed prices into clus-
ters (1-DM intervals around a whole number). Three versions of a ‘rational’ working
definition regard the one, three or five largest price clusters per segment as focal, where
size is in terms of the number of titles priced at the respective points. The definitions are
labeled Top1, Top3 and Top5.20 In order to avoid mistaking as focal, say, the fourth largest
yet comparatively insignificant price cluster in a segment with highly dispersed prices, a
second requirement for focality is that candidate clusters have to include at least 5% of a
segment’s titles.
I define focal prices on the 3-digit segment level, thus for 130 segments altogether. A
dummy variable dFOCAL is set to one for all titles that are priced in the clusters tagged fo-
cal by the respective definition. Segments can differ in the number of focal points found.
For example, consider definition Top3. When prices in a segment are highly dispersed,
20I also experimented with three analogous ‘psychological’ working definitions. They accept only thoseclusters as potentially focal, which fit to a broad version of the ‘9 fixation’: those around 5, 10, 15, 20 DM andso on. However, results obtained are fairly similar to the less restrictive ‘rational’ definition, and are thus notreported. See section 4.4 for more detail.
16
such that it has only one price cluster including more than 5% of its titles, only this one
cluster will be tagged focal. When prices in a segment concentrate on five clusters all
containing at least 5% of the titles, the three largest will be tagged focal.
Using definition Top3, the most frequent clusters found focal across segments are those
around 20, 15, 30, 17, 40, 25, 10, 13, 18, 50 and 19 DM (ordered by frequency). They
account for about 83% of all focal points found using this definition. Table 2 gives some
cross-segment summary statistics on size, active firms and the occurrence of focal prices
depending on the three definitions. Naturally, the average segment’s share of titles on the
focal point(s) is increasing in the number of points allowed by the definition. It more than
doubles for Top3 (40%), compared to Top1 (19%), but increases by much less if one goes
up to Top5 (49%). Regardless of the definition, a considerable share of firms do not price
focally. Note from the Min./Max. column that for every definition except Top1, there
are segments without focal points (focally pricing firms), as well as segments where all
titles are focally priced (all firms price focally). Table 3 gives cross-publisher summary
statistics on firm size (number of titles), diversification (number of segments a publisher
is active in) and focal pricing. For definition Top3, the average publisher has about 22%
of its titles priced focally.
Table 2: Cross-segment summary statistics on size, active firms and focal pricing
Variable Mean Std. deviation Min. / Max.
Segment size (No. of titles) 1020 1525 6 / 7641No. of active firms in segment 115 141 1 / 695Definition Top1:Focally priced titles (share) 0.19 0.13 0 / 0.73Focally pricing firms (share) 0.27 0.14 0 / 1Definition Top3:Focally priced titles (share) 0.40 0.20 0 / 1Focally pricing firms (share) 0.46 0.20 0 / 1Definition Top5:Focally priced titles (share) 0.49 0.24 0 / 1Focally pricing firms (share) 0.55 0.22 0 / 1
Observations: 130 3-digit segments.
17
Table 3: Cross-publisher summary statistics on size, diversification and focal pricing
Variable Mean Std. deviation Min. / Max.
Size (titles) 43 160 1 / 4205No. of segments in portfolio 5 7 1 / 77Focally priced titles (share, def. Top3) 0.22 0.30 0 / 1
Observations: 1643 publishers.
Estimating hedonic prices. Given a working definition of focal prices, I estimate the β-
parameters of the reduced-form pricing relationship (equation 5) using the subset of titles
with non-focal prices. In view of the evident differences between price distributions of
hardcovers and paperbacks in popular and professional segments (cf. figures 1 and 2),
this analysis is done separately for these four groups of market segments. A semi-log
specification is chosen as functional form for f (.), since it is standard in the estimation of
hedonic prices:21
ln(pijk) = x′i βk + λk + κj + ε i; i = 1, ..., N; j = 1, ..., J; k = 1, ..., K. (6)
Product characteristics in xi include title i’s number of pages and dummy variables indi-
cating the title’s type of binding, whether it has black or colored images, whether it is a
reprint, whether it is part of a series and the year of publication. Some interaction terms
are also included. See tables 9 to 11 in the appendix for a complete list, descriptions and
summary statistics of these variables. Fixed effects for K market segments and J publish-
ers are captured by λk and κj, respectively. Regarding the error term ε i, the standard OLS
assumptions are at play. The resulting regression coefficients are of secondary interest,
since their primary function is to serve as inputs in the analysis of focally priced titles.
Report and discussion of estimated coefficients is therefore referred to appendix B. Table
4 gives a digest, focussing on fixed effects and fit statistics. Most notably, fit of the re-
gression as measured by R2 is not strictly proportional to sample size and the number of
active publishers is considerably lower in paperback segments.
21In addition, fit is considerably better compared to the linear specification. In view of the large number ofdummy variables in the data, a double-log specification as well as Box-Cox transformations of the variablesdid not seem appropriate.
18
Table 4: Hedonic regression results: digest
Dependent variable: ln(price)
Popular Popular Professional ProfessionalSegment: hardcover paperback hardcover paperback
Coefficient estimates: reported in table 12 (appendix).
Fixed effects (number):Binding dummies 21 21 21 21Years of publication 3 3 3 32-digit segments 32 31 37 32Publishers 1196 189 1316 192
Observations 23312 6025 48609 3641R2 0.73 0.65 0.75 0.81Adjusted R2 0.71 0.64 0.74 0.79
Note: Based on OLS estimation results for focal price definition Top3.
4.2 Are fixed focal prices fair?
Estimates obtained for the coefficients in equation 6 are used to predict hedonic prices
for all titles in the sample.22 In order to answer the question whether fixed focal prices
are bad for consumers (‘unfair’), I compare actual (p) and predicted hedonic prices (p∗)
for focally priced RPM and non-RPM titles. To facilitate comparison and interpretation,
I analyze the log difference pDiff : ln(p)-ln( p∗). For non-focally priced titles, pDiff is just
the regression residual ε, which by construction should be zero on average. Not so for
focally priced titles, which were not included in the above estimation. If focal pricing is a
coordination device to implement above-hedonic prices, the prediction error pDiff should
be positive for these titles: a measure for the sustained ‘focality markup’. The four panels
in figure 3 compare the distribution of the regression residuals (kernel density, dashed
line) with the distribution of the prediction error for focally priced titles (histogram).23
Except for the group of popular paperback segments, the average prediction error for fo-
cally priced titles (indicated by a solid vertical line) is negative. In the exceptional group,
it is very close to zero. Nevertheless, there seems to be some evidence of opportunistic
focal pricing. In popular paperback segments, for example, we find density peaks at ‘fo-
22For a fairly small number of titles (between 53 and 215 depending on the group of segments), this is notfeasible because their publishers priced all their titles focally (cf. table 3). I cannot estimate the fixed effect(κj) for these publishers and hence cannot predict hedonic prices for their titles.
23Binwidth is 0.01, corresponding to a 1%-difference between pi and p∗.
19
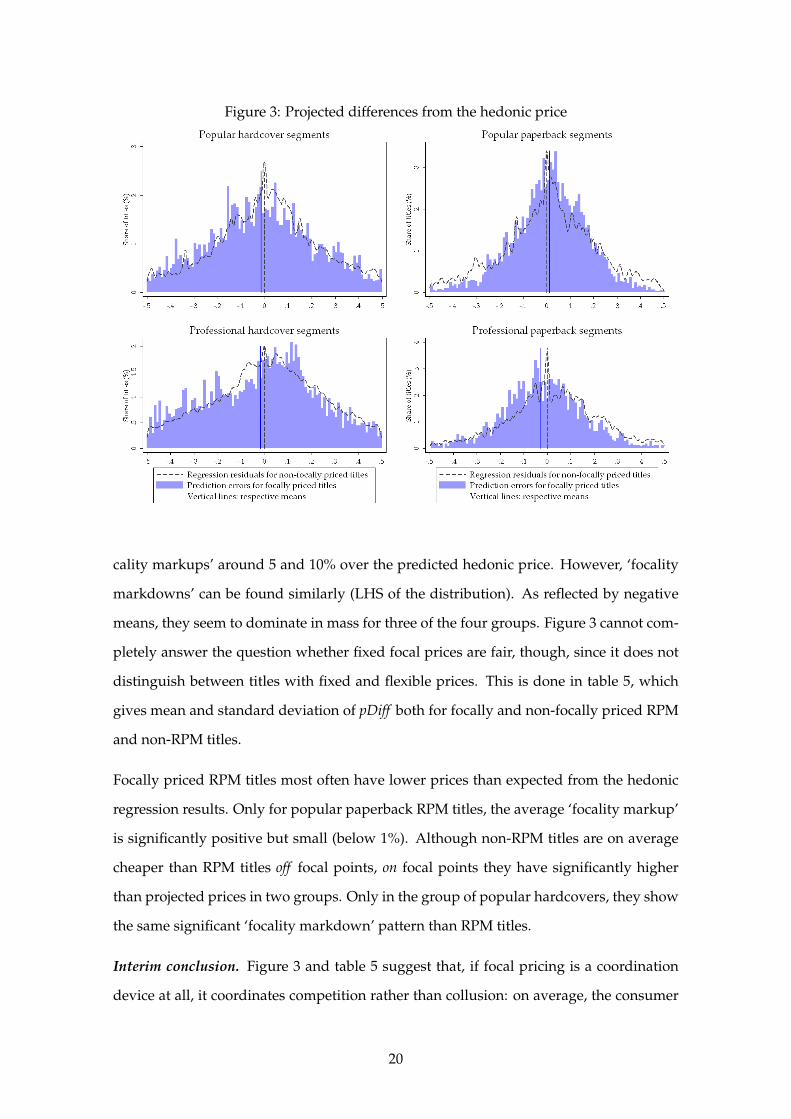
Figure 3: Projected differences from the hedonic price
cality markups’ around 5 and 10% over the predicted hedonic price. However, ‘focality
markdowns’ can be found similarly (LHS of the distribution). As reflected by negative
means, they seem to dominate in mass for three of the four groups. Figure 3 cannot com-
pletely answer the question whether fixed focal prices are fair, though, since it does not
distinguish between titles with fixed and flexible prices. This is done in table 5, which
gives mean and standard deviation of pDiff both for focally and non-focally priced RPM
and non-RPM titles.
Focally priced RPM titles most often have lower prices than expected from the hedonic
regression results. Only for popular paperback RPM titles, the average ‘focality markup’
is significantly positive but small (below 1%). Although non-RPM titles are on average
cheaper than RPM titles off focal points, on focal points they have significantly higher
than projected prices in two groups. Only in the group of popular hardcovers, they show
the same significant ‘focality markdown’ pattern than RPM titles.
Interim conclusion. Figure 3 and table 5 suggest that, if focal pricing is a coordination
device at all, it coordinates competition rather than collusion: on average, the consumer
20
Table 5: Differences between predicted and actual price
Popular hardcover Popular paperback
dRPM=0 dRPM=1 dRPM=0 dRPM=1dFOCAL=0Mean -0.040 (0.003) (-0.003) (0.000)Std. deviation 0.373 0.352 0.305 0.259Frequency 1,696 21,610 163 5,865dFOCAL=1Mean -0.070 -0.011 0.163 0.008Std. deviation 0.365 0.325 0.282 0.184Frequency 854 12,194 126 6,944
Professional hardcover Professional paperback
dRPM=0 dRPM=1 dRPM=0 dRPM=1dFOCAL=0Mean -0.018 (0.003) (-0.039) (0.001)Std. deviation 0.297 0.400 0.311 0.292Frequency 7,009 41,598 80 3,561dFOCAL=1Mean 0.028 -0.022 (-0.085) -0.027Std. deviation 0.296 0.351 0.449 0.216Frequency 1,094 7,391 12 1,998
Note: Group-wise means, standard deviation and frequency forpDiff =ln(p)-ln( p∗). dRPM=1 denotes titles sold under RPM,dFOCAL=1 denotes titles sold at a focal price (definition Top3).Means in brackets are not significantly different fromzero (5%-level, t-test).
surplus effect of focal pricing under RPM seems to be negligible, if not positive. Yet, there
is an important caveat. This conclusion stems from an analysis which gives equal weight
to every title in the sample. The data at hand do not include sold quantities, which would
be needed as proper weights to determine ‘real’ average prices.
While this straightforward analysis of price differences is nevertheless informative con-
cerning the effects of focal pricing with optional RPM, it is not very helpful for under-
standing the phenomenon. An attempt in that direction is presented in the following
section. For a number of reasons, this analysis concentrates on the two groups of popular
segments. First, the rationale for focal pricing presented in section 3 is fitted to retail-
oriented mass market segments. It seems less reasonable for titles targeted to specialized
readerships like scientific publications, let alone the exceptional schoolbook market. Fur-
thermore, any estimation method applied to these segments would have to rely on a very
low number of focally priced non-RPM titles (12, cf. table 5) in the group of professional
paperback segments.
21
4.3 Determinants of focal pricing under optional RPM
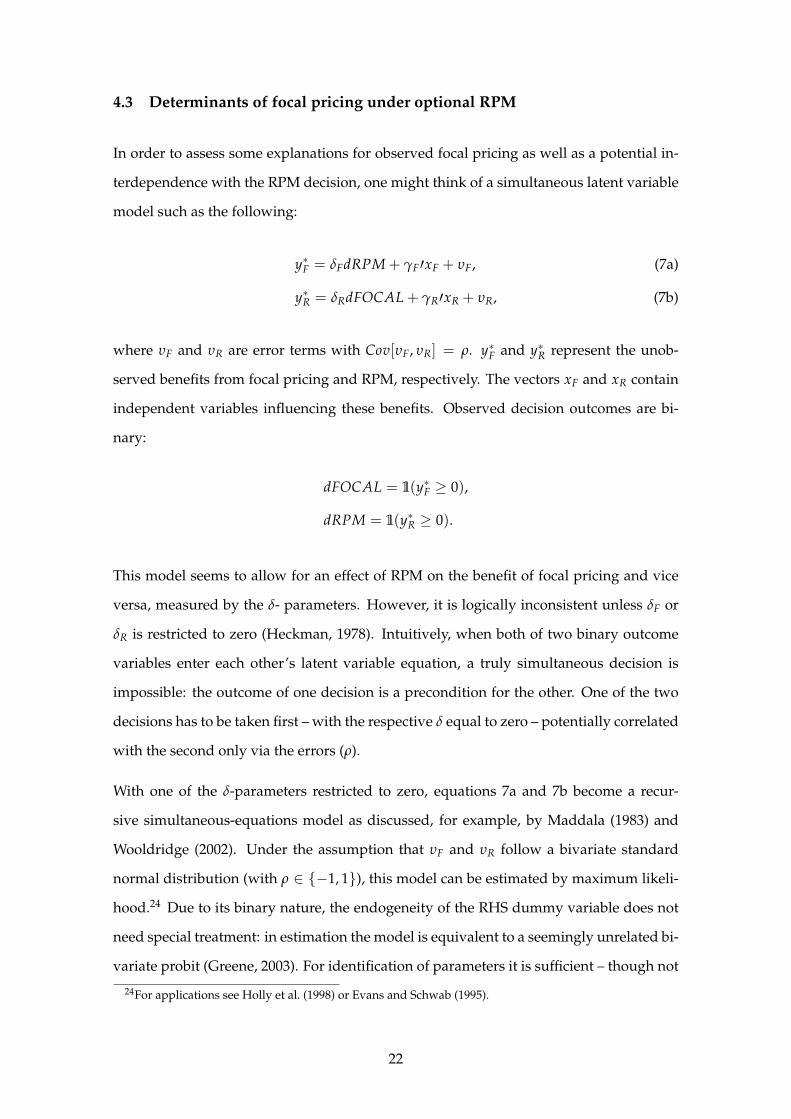
In order to assess some explanations for observed focal pricing as well as a potential in-
terdependence with the RPM decision, one might think of a simultaneous latent variable
model such as the following:
y∗F = δFdRPM + γF′xF + υF, (7a)
y∗R = δRdFOCAL + γR′xR + υR, (7b)
where υF and υR are error terms with Cov[υF, υR] = ρ. y∗F and y∗R represent the unob-
served benefits from focal pricing and RPM, respectively. The vectors xF and xR contain
independent variables influencing these benefits. Observed decision outcomes are bi-
nary:
dFOCAL = 1(y∗F ≥ 0),
dRPM = 1(y∗R ≥ 0).
This model seems to allow for an effect of RPM on the benefit of focal pricing and vice
versa, measured by the δ- parameters. However, it is logically inconsistent unless δF or
δR is restricted to zero (Heckman, 1978). Intuitively, when both of two binary outcome
variables enter each other’s latent variable equation, a truly simultaneous decision is
impossible: the outcome of one decision is a precondition for the other. One of the two
decisions has to be taken first – with the respective δ equal to zero – potentially correlated
with the second only via the errors (ρ).
With one of the δ-parameters restricted to zero, equations 7a and 7b become a recur-
sive simultaneous-equations model as discussed, for example, by Maddala (1983) and
Wooldridge (2002). Under the assumption that υF and υR follow a bivariate standard
normal distribution (with ρ ∈ {−1, 1}), this model can be estimated by maximum likeli-
hood.24 Due to its binary nature, the endogeneity of the RHS dummy variable does not
need special treatment: in estimation the model is equivalent to a seemingly unrelated bi-
variate probit (Greene, 2003). For identification of parameters it is sufficient – though not
24For applications see Holly et al. (1998) or Evans and Schwab (1995).
22
necessary (Wilde, 2000) – that xR includes at least one variable not included in xF. A Wald
test of H0: ρ=0 is an appropriate test for endogeneity, e.g. of dRPM in equation 7a for the
case δR=0 (Fabbri et al., 2004). Before I compare results for the two zero-restrictions on δ,
let me introduce the independent variables.
Independent variables: FOCAL equation. The publisher’s decision to deviate from the
hedonic to a focal price may be dependent on the distance between these price points
(pDiff ). In order to distinguish the effects of ‘focality markups’ from those of ‘focality
markdowns’, I separate pDiff into two variables: pDistNeg is the absolute value of pDiff
if pDiff is negative (‘focality markdowns’), and zero else; pDistPos is the absolute value of
pDiff given it is positive, and zero else. Hence, if pDistNeg>0, then pDistPos=0 (and vice
versa). If focal pricing is an instrument to implement above-hedonic prices, we expect a
title’s probability to be priced focally, Pr(dFOCAL=1), to increase in pDistPos. On the other
hand, if focal pricing is ‘competitive’, we expect Pr(dFOCAL=1) to increase in pDistNeg.
If the effect of pDiff on Pr(dFOCAL=1) is just one-way no matter whether pDiff is positive
or negative, the coefficients for pDistNeg and pDistPos should have opposite signs.
As discussed in section 3.4, observed focal pricing may be a result rather of firms’ uniform
pricing policies instead of coordination. The following two variables allow to disentan-
gle these effects. Denote by pci title i’s price cluster, by nj the size (number of titles) of
publisher j and by npci
j the number of j’s titles priced in this cluster.25 The title-specific
value of FipCatShare is then the firm’s share of titles priced on title i’s price cluster:n
pci
jnj
.
For example, consider a firm that publishes 10 titles, eventually in different segments, 6
of which at a price of 20 DM, three at 22 DM and one at 23 DM. For the titles priced at
20 DM, FipCatShare takes the value 0.6, and 0.3 or 0.1 for the other titles. If observed focal
pricing is caused by uniform pricing policies, Pr(dRPM=1) should increase in FipCatShare.
Further, denote by npci−j the number of titles by publisher j’s competitors priced on cluster
pci , by nk the size (number of titles) of segment k and by nk
j the number of titles offered in
k by publisher j. Then, the title-specific value of CompCatShare is the share of publisher
j’s competitors’ titles that are priced on title i’s price cluster:n
pci−j
nk−nkj. In the above example,
suppose the segment of the title with price 23 DM contains 20 titles altogether, of which
25As in the previous sections, I form clusters by division of observed prices into 1-DM-intervals aroundwhole numbers.
23
16 are published by other firms and 5 of these 16 have a price of 23 DM. For the one
title published by our example firm at a price of 23 DM, CompCatShare then takes on the
value .25 (4 over 16).
If Pr(dFOCAL=1) increases in CompCatShare, then observed focal pricing is a result of
publisher coordination: the presence of many competitors’ titles on a focal price attracts
others. Both FipCatShare and CompCatShare are scaled on 0/1, so calculating marginal
effects, we can also assess which effect is more important in determining focal prices. If
Pr(dFOCAL=1) increases in FipCatShare more strongly than in CompCatShare, then uni-
form pricing policies are more important in explaining focal points in the price distribu-
tion.
Finally, in segments found to be dominated by a firm at least twice as large as the second-
largest firm, a dummy dDomFi indicates titles published by the largest firm, while dFringeFi
indicates titles by all other firms in the respective segment.26 If observed focal pricing is
the result of price leadership of dominant firms, this should be reflected in a positive
effect of these variables on the probability of focal pricing.
Independent variables: RPM equation. The distance between a title’s hedonic and its
actual list price should also influence the publisher’s decision on RPM. If RPM is imple-
mented to prohibit retailers from realizing markups or markdowns over the list price,
these variables should have the respective (opposing) effects on Pr(dRPM=1). Given re-
tailers have incentives to deviate from the list price towards the hedonic price, in either
case these incentives – and hence the publisher’s interest in fixing the price – should
increase in the distance between hedonic and list price (pDistNeg/pDistPos).
Demand uncertainty is a central feature in a number of efficiency-oriented RPM theories.
Attempting to assess the influence of risk and demand uncertainty on the decision on
RPM, I include the size of a title’s publisher (PubSize) and a title’s segment (SgtSize) –
both in logs of the number of titles – as well as a dummy indicating whether the title is
published within a series (dSeries). Titles published by larger firms (in larger segments)
should be less (more) prone to risk than from smaller publishers (in smaller segments)
due to stronger marketing/financial potential (less visibility). If demand uncertainty is
2629 out of 130 3-digit segments where found to be dominated according to this criterion. See section 4.4for a discussion of results using an alternative dominance criterion.
24
important in explaining RPM, Pr(dRPM=1) should thus decrease in PubSize and increase
in SgtSize. Note, however, that this assertion holds for PubSize only as far as the number
of titles is a good proxy for a publisher’s financial potential. Demand for titles published
within a series should be less variant and more predictable, so the effect of dSeries on
Pr(dRPM=1) should be negative, if demand uncertainty plays a role. These measures of
demand uncertainty are of limited adequacy, however, since more important quantity
aspects of demand uncertainty like print size cannot be controlled for with this data.
Restriction on δ and estimation results. In order to determine whether one of the two δ-
coefficients can be safely restricted to zero, I compare estimation results for both logically
consistent versions of model 7. In the first version, the restriction is δF=0, in the second it
is δR=0. Although these two versions are non-nested, an encompassing approach offers
a clear decision for the two groups of popular segments studied here. Table 6 gives the
estimates for δ and ρ as well as log-likelihood values for the two versions.
Under both versions, only for popular hardcovers the hypothesis that dRPM/dFOCAL
is exogenous in equation 7a/7b is rejected by a Wald test of H0: ρ=0. δR, estimated un-
der the restriction δF=0, is rather close to and not significantly different from zero for
both segment groups.27 On the other hand, δF, estimated under the restriction δR=0, is
significantly different from zero in the joint estimation for popular hardcovers. It is not
significant for popular paperbacks. For δR=0 and both groups of segments, the value of
the log-likelihood increases in joint estimation compared to separate probit estimations.
Under δF=0, the log-likelihood barely improves with joint estimation for popular paper-
backs. For popular hardcovers, separate probit estimations under δR=0 yield a higher
log-likelihood value than joint estimation under δF=0.
Hence, while results obtained imposing δR=0 encompass results obtained imposing δF=0,
this is not true the other way around. In order to analyze the joint decision on focality and
RPM in this context, it is therefore appropriate to restrict δR to zero. As a first result, this
implies that we can think of the decision on RPM as taken before the decision on focal
pricing with the latter having no direct impact on the first. In the case of popular paper-
back segments, we additionally cannot reject the hypothesis that ρ=0, which implies that
27The same result is obtained in separate estimations of the two equations and even when standard errorsare not corrected for presumable within-publisher correlation of errors (not reported).
25

Table 6: Model comparison
Popular hardcovers Popular paperbacksCoefficient (p-value) Coefficient (p-value)
Restriction: δF = 0δR -0.0641 (0.3709) 0.0305 (0.8447)ρ 0.2894 (0.0003) 0.0221 (0.8307)Log-L, bivariate probit: -13153.97 -3021.25Log-L, single equations probit: -13191.01 -3021.32
Restriction: δR = 0δF 1.4461 (0.0004) -0.2328 (0.6844)ρ -0.4726 (0.0456) 0.0982 (0.3207)Log-L, bivariate probit: -13136.80 -3020.59Log-L, single equations probit: -13152.88 -3021.36
Note: p-values robust to within-cluster (publisher) correlation. Those reportedfor ρ are those calculated from standard errors of atanhρ = 1
2 ln( 1+ρ1−ρ ),
which instead of ρ is directly estimable.
dRPM is exogenous in equation 7a. The two equations can be estimated separately in this
case.
As a final remark on table 6, note a potential compensating effect between the estimated
signs of ρ and the respective δ-coefficient, e.g. comparing the two groups of segments
for δR=0. The estimated sign for δF only indicates the direction of the direct effect of RPM
on Pr(dFOCAL=1). As long as the estimated ρ has the opposite sign, the direction of
the overall effect is not obvious from these coefficient estimates and one has to resort to
marginal effects. This property of the model to frequently yield estimates for δ and ρ with
switched signs was also found in Monte Carlo studies by Fabbri et al. (2004).
Table 7 reports the coefficients estimated under δR=0, in the case of popular paperbacks
with the additional restriction ρ=0. Regarding the independent variables in the FOCAL
equation, the estimates for pDistNeg and pDistPos reflect our findings from the previous
section. In both groups, the direct effect of pDiff on Pr(dFOCAL=1) seems to be posi-
tive not only for titles with positive ‘focality markups’ (pDistPos), but also for titles with
below-hedonic prices. However, this effect is significant only with popular paperbacks
for pDistPos. This suggests that in paperback segments, focal pricing is an instrument
rather to implement above- than below-hedonic prices.
26
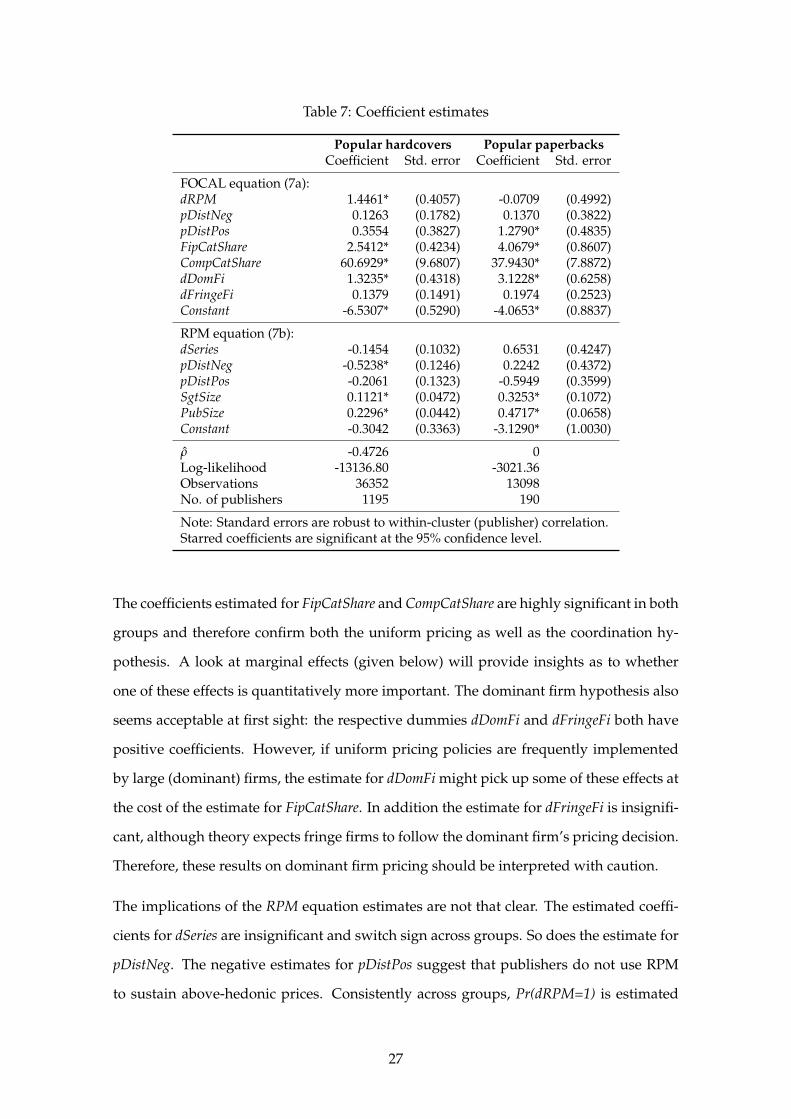
Table 7: Coefficient estimates
Popular hardcovers Popular paperbacksCoefficient Std. error Coefficient Std. error
FOCAL equation (7a):dRPM 1.4461* (0.4057) -0.0709 (0.4992)pDistNeg 0.1263 (0.1782) 0.1370 (0.3822)pDistPos 0.3554 (0.3827) 1.2790* (0.4835)FipCatShare 2.5412* (0.4234) 4.0679* (0.8607)CompCatShare 60.6929* (9.6807) 37.9430* (7.8872)dDomFi 1.3235* (0.4318) 3.1228* (0.6258)dFringeFi 0.1379 (0.1491) 0.1974 (0.2523)Constant -6.5307* (0.5290) -4.0653* (0.8837)
RPM equation (7b):dSeries -0.1454 (0.1032) 0.6531 (0.4247)pDistNeg -0.5238* (0.1246) 0.2242 (0.4372)pDistPos -0.2061 (0.1323) -0.5949 (0.3599)SgtSize 0.1121* (0.0472) 0.3253* (0.1072)PubSize 0.2296* (0.0442) 0.4717* (0.0658)Constant -0.3042 (0.3363) -3.1290* (1.0030)
ρ -0.4726 0Log-likelihood -13136.80 -3021.36Observations 36352 13098No. of publishers 1195 190
Note: Standard errors are robust to within-cluster (publisher) correlation.Starred coefficients are significant at the 95% confidence level.
The coefficients estimated for FipCatShare and CompCatShare are highly significant in both
groups and therefore confirm both the uniform pricing as well as the coordination hy-
pothesis. A look at marginal effects (given below) will provide insights as to whether
one of these effects is quantitatively more important. The dominant firm hypothesis also
seems acceptable at first sight: the respective dummies dDomFi and dFringeFi both have
positive coefficients. However, if uniform pricing policies are frequently implemented
by large (dominant) firms, the estimate for dDomFi might pick up some of these effects at
the cost of the estimate for FipCatShare. In addition the estimate for dFringeFi is insignifi-
cant, although theory expects fringe firms to follow the dominant firm’s pricing decision.
Therefore, these results on dominant firm pricing should be interpreted with caution.
The implications of the RPM equation estimates are not that clear. The estimated coeffi-
cients for dSeries are insignificant and switch sign across groups. So does the estimate for
pDistNeg. The negative estimates for pDistPos suggest that publishers do not use RPM
to sustain above-hedonic prices. Consistently across groups, Pr(dRPM=1) is estimated
27

to increase in segment size, a finding which seems to confirm the demand uncertainty
hypothesis. However, if our measure of firm size (PubSize) is adequate, this conclusion
has to be qualified since the estimated direction of its effect is contrary to respective ex-
pectations.
Marginal effects. Given the above coefficients, the variables’ marginal effects on the out-
come probabilities can be calculated, in principle for each of the four possible combina-
tions of dFOCAL and dRPM. I concentrate on
Pr(dFOCAL=1) = Pr(dFOCAL=1,dRPM=1) + Pr(dFOCAL=1,dRPM=0).
Marginal effects on Pr(dFOCAL=1) for variables which only enter the FOCAL equation
are calculated in the standard way. The marginal effect of dRPM on Pr(dFOCAL=1) is
d dPr(dFOCAL=1)d dRPM = Pr(dFOCAL=1|dRPM=1)
Pr(dRPM=1) − Pr(dFOCAL=1|dRPM=0)Pr(dRPM=0) .
The main interest in this number is not only whether it is positive or negative, but also
whether it is larger for titles with markups over the hedonic price than for titles with
markdowns. This marginal effect is therefore calculated both for a title with pDistPos>0
and for a title with pDistNeg>0, while all other variables are evaluated at their means.
See table 8 for the results.
Table 8: Marginal effects on Pr(dFOCAL = 1)
Popular hardcovers Popular paperbacks
x ∂Pr(dFOCAL=1)∂x mean(x) ∂Pr(dFOCAL=1)
∂x mean(x)
Independent:FipCatShare .735 .163 .855 .137CompCatShare 17.554 .063 7.973 .119dDomFi* .484 .036 .145 .024dFringeFi* .041 .357 .037 .037
Endogenous: dRPM*for pDistPos > 0 .127 .929 -.014 .978for pDistNeg > 0 .125 .929 -.016 .978
Note: Marginal effects evaluated at pDistNeg=0 (except in the last row, thereat pDistPos=0) and at sample means for the other variables.(*) Marginal effect a for discrete change from 0 to 1.
Comparing marginal effects for FipCatShare and CompCatShare, we find that focal pric-
ing is largely due to cross-publisher coordination instead of within-firm uniform pricing
policies. The probability of an average popular hardcover title to be priced focally in-
28
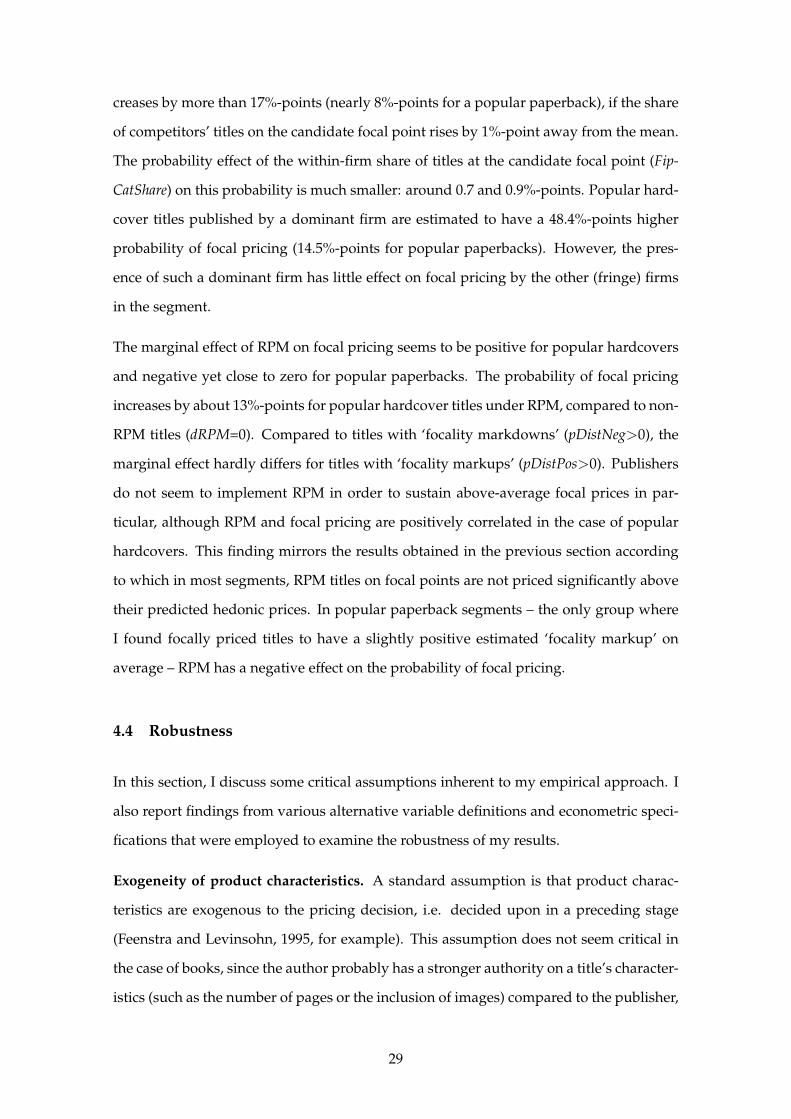
creases by more than 17%-points (nearly 8%-points for a popular paperback), if the share
of competitors’ titles on the candidate focal point rises by 1%-point away from the mean.
The probability effect of the within-firm share of titles at the candidate focal point (Fip-
CatShare) on this probability is much smaller: around 0.7 and 0.9%-points. Popular hard-
cover titles published by a dominant firm are estimated to have a 48.4%-points higher
probability of focal pricing (14.5%-points for popular paperbacks). However, the pres-
ence of such a dominant firm has little effect on focal pricing by the other (fringe) firms
in the segment.
The marginal effect of RPM on focal pricing seems to be positive for popular hardcovers
and negative yet close to zero for popular paperbacks. The probability of focal pricing
increases by about 13%-points for popular hardcover titles under RPM, compared to non-
RPM titles (dRPM=0). Compared to titles with ‘focality markdowns’ (pDistNeg>0), the
marginal effect hardly differs for titles with ‘focality markups’ (pDistPos>0). Publishers
do not seem to implement RPM in order to sustain above-average focal prices in par-
ticular, although RPM and focal pricing are positively correlated in the case of popular
hardcovers. This finding mirrors the results obtained in the previous section according
to which in most segments, RPM titles on focal points are not priced significantly above
their predicted hedonic prices. In popular paperback segments – the only group where
I found focally priced titles to have a slightly positive estimated ‘focality markup’ on
average – RPM has a negative effect on the probability of focal pricing.
4.4 Robustness
In this section, I discuss some critical assumptions inherent to my empirical approach. I
also report findings from various alternative variable definitions and econometric speci-
fications that were employed to examine the robustness of my results.
Exogeneity of product characteristics. A standard assumption is that product charac-
teristics are exogenous to the pricing decision, i.e. decided upon in a preceding stage
(Feenstra and Levinsohn, 1995, for example). This assumption does not seem critical in
the case of books, since the author probably has a stronger authority on a title’s character-
istics (such as the number of pages or the inclusion of images) compared to the publisher,
29
while the latter has authority with respect to pricing. Nevertheless, one may imagine a
situation where, for example, publishers influence product characteristics in order to be
able to price focally; or where, for some reason, titles with colored images are much more
inclined to be priced focally. In consequence, hedonic regression results would carry an
endogeneity bias.
In order to assess whether this is a probable scenario in the present context, a comparison
of the distribution of the variables in question for focally and non-focally priced titles
can be informative. Tables 10 and 11 in the appendix provide summary statistics, sep-
arately by 1-digit segment. The variables’ means differ somewhat between focally and
non-focally priced titles in a number of cases; yet, for all variables except one there is no
evident pattern. An apparent observation, however, is that in all segments, focally priced
titles have a – sometimes considerably – lower mean and variance of the number of pages.
Above all, this reflects the fact that most focal prices lie at the lower end (<50 DM) of a
price distribution which goes well into triple-digit prices at the upper end. However, the
differences between focally and non-focally priced titles are slightest in those segments
which exhibit the most apparent focal points: Kids/Youth and Travel paperbacks. I con-
clude that the assumption of exogenous product characteristics in the pricing decision is
not evidently violated.
No selection bias in hedonic regression. My empirical approach implicitly assumes that
excluding the focally priced titles from the hedonic regression does not trigger selection
bias. Selection bias is present when the errors in equations 6 and 7a are correlated; that
is, when there exists some correlation between the focal pricing decision and the hedonic
price function which is not accounted for by the variables in the model. For example,
suppose that titles by unknown authors are for some reason predominantly priced on
focal points. These titles presumably have a below-average hedonic price – an effect
which is unobserved to the econometrician and thus enters the error term in the hedonic
estimation. The correlation between the errors in the two equations is then negative: a
higher probability of focal pricing implies a lower hedonic price. Ignoring this correlation
would give upward-biased predictions of hedonic prices for focally-priced titles. Hence,
the predicted difference between a title’s actual focal and its hedonic price – the ‘focality
markup’ – would be too low.
30

In order to test for selection bias in my results, I performed the so-called Heckit two-step
estimation of equations 6 and 7a (Heckman, 1979; Wooldridge, 2002).28 The hypothesis
of no selection bias in results from an independent hedonic regression cannot be rejected
in the case of popular hardcover and professional paperback segments. The estimated
selection bias in the other two segment groups is significantly different from – but rather
close to – zero. In all cases, results regarding the level effects of focal pricing as well as
estimated coefficients for equation 7a do not change qualitatively compared to the results
reported here.29
Alternative focality definition. A ‘psychological’ definition of focal points was already
mentioned. It did not lead to different estimates in the hedonic price regression. By
definition, the number of focally priced titles is considerably lower according to this ap-
proach, since the prime criterion here is not only frequency but also ‘9 fixation’. Un-
fortunately, the MLE for the bivariate probit model did not converge for all groups and
versions (out of Top1, Top3 and Top5) of this definition of focality. Wherever obtained, ex-
ogeneity of dRPM in the FOCAL equation could not be rejected, though. Estimates from
single-equation probits were qualitatively similar to those resulting from the respective
‘rational’ focality definition. These findings may indicate the overall inappropriateness
of this ‘psychological’ definition of focality. In case this definition has some bite, they at
least do not disqualify results obtained using the less restrictive ‘rational’ approach.
Alternative econometric specifications. In comparison to standard studies of hedonic
pricing, fit in the hedonic regressions as measured by R2 seems to suggest that there
is room for improvement. However, an enlarged specification of the pricing equation,
including more interaction terms and more detailed segment effects, did neither improve
fit considerably, nor did it change the qualitative findings in consequent analyses.
Table 13 in appendix C gives coefficient estimates for a bivariate probit model with addi-
tional restrictions on the FOCAL equation. In particular, the coefficients for pDistNeg and
pDistPos, which were mostly insignificant in the unrestricted version, were restricted to
zero; analogously those for the questionable dominant-firm indicators. This allows for an
28The estimations were slightly modified in order to allow for an unrestricted estimation of the selectionbias: instead of the variables pDistPos/pDistNeg, all exogenous variables from the hedonic regression wereincluded in equation 7a. Since equation 7b was not included, the potential endogeneity of RPM is ignoredby this procedure.
29Results are made available upon request.
31
assessment of the robustness of estimates for pDistNeg and pDistPos in the RPM equation,
as well as the two variables found to be most important in explaining focal pricing: Fip-
catShare and CompcatShare. They are fairly robust: all estimates are very similar to those
obtained for the unrestricted model, including ρ. Table 14 in appendix C gives coefficient
estimates for a bivariate probit model with additional restrictions on the RPM equation;
here, the coefficients for pDistNeg and pDistPos are restricted to zero. Again, all remaining
parameters are very similar to their estimates from the unrestricted model.
Alternative dominance criterion. The dominance criterion implemented above – for
which a firm is dominant if its market share as measured by the number of titles is twice
as large as that of the market’s second-largest firm – may not be accurate. For another
popular criterion of dominance according to which a firm with a market share exceeding
40% is dominant, I find such dominant firms in 14 out of 130 3-digit segments (compared
to 29 for the above criterion). Estimates do not change qualitatively with this alternative
dominance criterion.
5 Conclusion
Highly differentiated media products like books or music recordings are frequently priced
at apparent focal points. Among the explanations for this phenomenon is the hypothesis
that manufacturers use focal pricing as an instrument of coordination, and that vertical
restraints such as RPM or minimum advertised prices play a facilitating role in this game.
In this paper, I propose a formal rationale for focal pricing in media industries and use a
comprehensive cross-section of title-specific data on the German book market in order to
assess these hypotheses empirically.
First of all, I find considerable differences in pricing between hardcover and paperback
segments. This confirms a recent merger decision by the German Federal Cartel Office,
which emphasized that paperback and hardcover segments constitute distinct markets
(merger case Random House/Heyne). It prohibited a proposed merger that would have
increased market concentration in the popular paperback segment substantially.
32
A comparison of predicted hedonic prices for focally and non-focally priced titles sug-
gests that focal pricing coordinates competition rather than collusion. Titles with focal
prices are on average cheaper than their predicted hedonic price. While this also holds
for titles sold under RPM, it does not always for titles with flexible prices. Results from a
simultaneous probit model suggest that focal pricing is nevertheless due to upstream co-
ordination rather than uniform pricing policies. A title’s probability to be priced focally
reacts much more strongly to the presence of potential competitors at a given price than
to within-firm prices.
RPM titles are more probable to be priced on a focal point only where this leads to below-
hedonic prices on average. For popular paperback segments, of which some appear to
have most blatant focal points in their distribution of prices, I cannot reject the hypoth-
esis that the decisions on RPM and focal pricing are independent. Altogether, these re-
sults suggest that publishers do not implement RPM in order to facilitate coordination
on above-hedonic focal prices.
Despite some significant results, any approach relying on cross-section data such as that
used here is limited in its ability to evaluate the welfare effects of RPM for books. Effects
on product variety and sold copies are critical in this evaluation and can only be studied
with quantity data. Fortunately, richer data collected from retailers’ scanner cashiers is
increasingly available, enabling further research into these questions.
33
References
Binmore, Ken and Larry Samuelson (2002), The evolution of focal points, mimeo.
Bittlingmayer, George (1992), The elasticity of demand for books, resale price mainte-
nance and the Lerner index, Journal of Institutional and Theoretical Economics, 148, pp.
588–606.
Butz, David A. (1996), Does the per se rule deter vertical price-fixing?, Economic Inquiry,
34 (4), pp. 770–780.
Chevalier, Judith and Austan Goolsbee (2003), Price competition online: Amazon versus
Barnes and Noble, Quantitative Marketing and Economics, 1 (2), pp. 203–222.
Clay, Karen B., Ramayya Krishnan and Eric D. Wolff (2001), Prices and price dispersion
on the web: evidence from the online book industry, Journal of Industrial Economics,
49 (4), pp. 521–539.
Clerides, Sofronis K. (2001), Product selection with multi-peaked preferences in book
publishing, mimeo.
— (2002), Book value: intertemporal pricing and quality discrimination in the U.S. mar-
ket for books, International Journal of Industrial Organization, 20 (10), pp. 1385–1408.
Deneckere, Raymond, Dan Kovenock and Robert Lee (1992), A model of price leadership
based on consumer loyalty, Journal of Industrial Economics, 40 (2), pp. 147–156.
Deneckere, Raymond, Howard P. Marvel and James Peck (1996), Demand uncertainty,
inventories, and resale price maintenance, Quarterly Journal of Economics, 111 (3), pp.
885–913.
— (1997), Demand uncertainty and price maintenance: markdowns as destructive com-
petition, American Economic Review, 87 (4), pp. 619–641.
Evans, William N. and Robert M. Schwab (1995), Finishing high school and starting col-
lege: do catholic schools make a difference?, Quarterly Journal of Economics, 110 (4), pp.
941–974.
34
Fabbri, Daniele, Chiara Monfardini and Rosalba Radice (2004), Testing exogeneity in the
bivariate probit model: Monte Carlo evidence and an application to health economics,
mimeo.
Feenstra, Robert C. and James Levinsohn (1995), Estimating markups and market con-
duct with multidimensional product attributes, Review of Economic Studies, 62, pp. 19–
52.
Goyder, Daniel G. (1998), EC Competition Law (Oxford University Press), 3rd edition.
Greene, William H. (2003), Econometric analysis (Prentice Hall, Upper Saddle River, NJ).
Guillebraud, C. W. (1965), The Marshall-Macmillan correspondence over the net book
system, Economic Journal, 75, pp. 518–538.
Heckman, James J. (1978), Dummy endogenous variables in a simultaneous equation
system, Econometrica, 46 (6), pp. 931–959.
— (1979), Sample selection bias as a specification error, Econometrica, 47 (1), pp. 153–161.
Holly, Alberto, Lucien Gardiol, Gianfranco Domenighetti and Brigitte Bisig (1998), An
econometric model of health care utilization and health insurance in Switzerland, Eu-
ropean Economic Review, 42, pp. 513–522.
Ivaldi, Marc, Bruno Jullien, Patrick Rey, Paul Seabright and Jean Tirole (2003), The eco-
nomics of tacit collusion, final report for DG competition, European Commission.
Jullien, Bruno and Patrick Rey (2000), Resale price maintenance and collusion, cEPR Dis-
cussion Paper, London.
Kandel, Eugene (1996), The right to return, Journal of Law & Economics, 39, pp. 329–356.
Knittel, Christopher R. and Victor Stango (2003), Price ceilings as focal points for tacit
collusion: evidence from credit cards, American Economic Review, 93 (5), pp. 1703–1729.
Liefmann, R. (1904), Der deutsche Buchhandel in der Kartellenquete, nebst Untersuchun-
gen uber seine Organisation und seine voraussichtliche Weiterbildung, Jahrbucher fur
Nationalokonomie und Statistik, 28 (3), pp. 200–237.
35
Maddala, G. S. (1983), Limited-Dependent and Qualitative Variables in Econometrics (Cam-
bridge University Press).
Martin, Stephen (1993), Advanced industrial economics (Blackwell Publishers).
Maskin, Eric and Jean Tirole (1988), A theory of dynamic oligopoly, II: price competition,
kinked demand curves, and edgeworth cycles, Econometrica, 56 (3), pp. 571–599.
Mathewson, Frank and Ralph Winter (1998), The law and economics of resale price main-
tenance, Review of Industrial Organization, 13, pp. 57–84.
Mehta, Judith, Chris Starmer and Robert Sugden (1994), The nature of salience: an ex-
perimental investigation of pure coordination games, American Economic Review, 84 (3),
pp. 658–673.
OECD (1997), Resale price maintenance (Proceedings, Roundtables on Competition Policy).
Ornstein, Stanley I. and Dominique M. Hanssens (1987), Resale price maintenance: out-
put increasing or restricting? The case of distilled spirits in the United States, Journal of
Industrial Economics, 36 (1), pp. 1–18.
Picot, Arnold (1991), Comment on W. Breit, Resale price maintenance: what do
economists know and when did they know it?, Journal of Institutional and Theoretical
Economics, 147, pp. 91–96.
Pohle, L. (1895), Das deutsche Buchhandlerkartell, Schriften des Vereins fur Socialpolitik, 61,
pp. 459–532.
Rabassa, Valerie (2001), The Commission’s review of the media merger wave, Competition
policy newsletter, 2001 (1), pp. 46–51.
Rotemberg, Julio J. and Garth Saloner (1990), Collusive price leadership, Journal of Indus-
trial Economics, 39 (1), pp. 93–111.
Salop, Steven and Joseph Stiglitz (1977), Bargains and ripoffs: a model of monopolisti-
cally competitive price dispersion, Review of Economic Studies, 44 (3), pp. 493–510.
Schelling, Thomas (1963), The strategy of conflict (Oxford University Press).
36
Scherer, Frederic M. and David Ross (1990), Industrial market structure an economic perfor-
mance (Houghton Mifflin), 3rd edition.
Stumpp, Henning (1998), Die Preisbindung fur Verlagserzeugnisse: Wettbewerbsbeschrankung
oder Regulierung zur Beseitigung von Marktunvollkommenheiten? (Nomos, Baden-Baden).
Sugden, Robert (1995), A theory of focal points, The Economic Journal, 105, pp. 533–550.
Symeonidis, George (2002), Cartel stability with multiproduct firms, International Journal
of Industrial Organization, 20, pp. 339–352.
Telser, Lester (1960), Why would manufacturers want fair trade?, Journal of Law & Eco-
nomics, 3, pp. 86–105.
Tosdal, Harry R. (1915), Price maintenance in the book trade, Quarterly Journal of Eco-
nomics, 30 (1), pp. 86–109.
van der Ploeg, Frederick (2004), Beyond the dogma of the fixed book price agreement,
Journal of Cultural Economics, 28, pp. 1–20.
Varian, Hal R. (1980), A model of sales, American Economic Review, 70 (4), pp. 651–659.
Wang, Hao (2004), Resale price maintenance in an oligopoly with uncertain demand,
International Journal of Industrial Organization, 22, pp. 389–411.
Wilde, Joachim (2000), Identification of multiple equation probit models with endoge-
nous regressors, Economics Letters, 69, pp. 309–312.
Wooldridge, Jeffrey M. (2002), Econometric Analysis of Cross Section and Panel Data (MIT
Press, Cambridge, MA).
Yamey, Basil S. (1954), The origins of resale price maintenance: A study of three branches
of retail trade, Economic Journal, 62 (247), pp. 522–545.
37
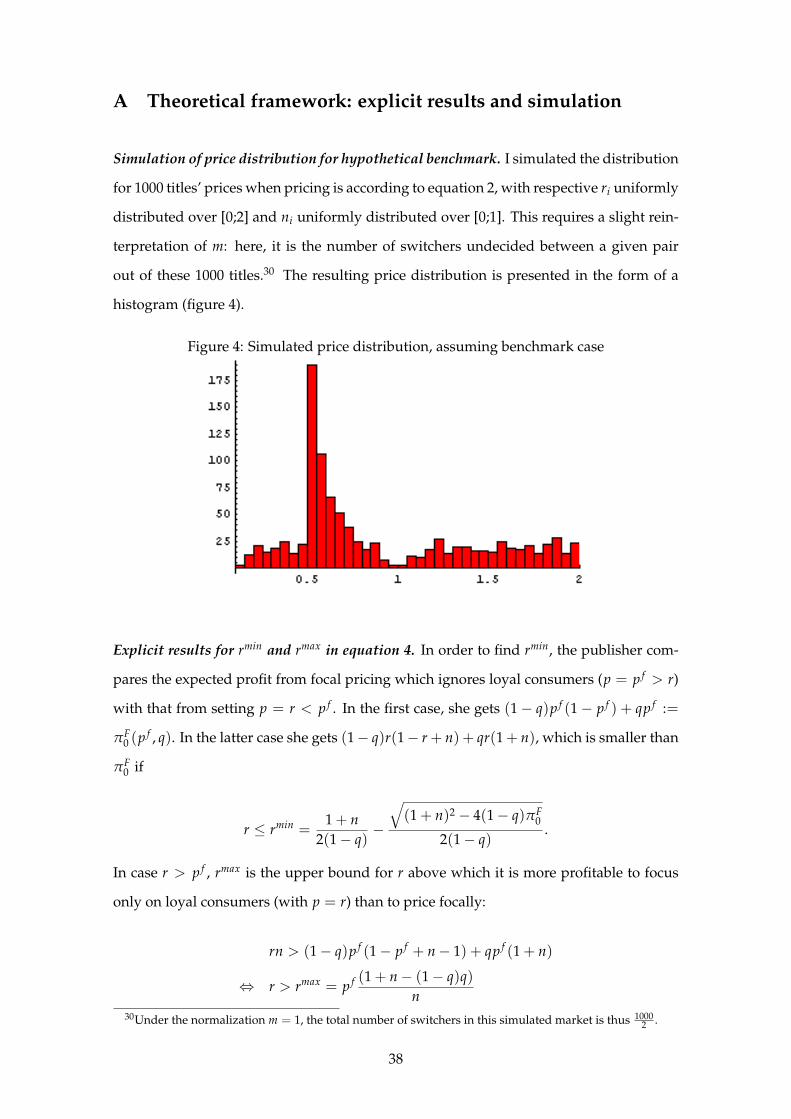
A Theoretical framework: explicit results and simulation
Simulation of price distribution for hypothetical benchmark. I simulated the distribution
for 1000 titles’ prices when pricing is according to equation 2, with respective ri uniformly
distributed over [0;2] and ni uniformly distributed over [0;1]. This requires a slight rein-
terpretation of m: here, it is the number of switchers undecided between a given pair
out of these 1000 titles.30 The resulting price distribution is presented in the form of a
histogram (figure 4).
Figure 4: Simulated price distribution, assuming benchmark case
Explicit results for rmin and rmax in equation 4. In order to find rmin, the publisher com-
pares the expected profit from focal pricing which ignores loyal consumers (p = p f > r)
with that from setting p = r < p f . In the first case, she gets (1− q)p f (1− p f ) + qp f :=
πF0 (p f , q). In the latter case she gets (1− q)r(1− r + n) + qr(1 + n), which is smaller than
πF0 if
r ≤ rmin =1 + n
2(1− q)−
√(1 + n)2 − 4(1− q)πF
0
2(1− q).
In case r > p f , rmax is the upper bound for r above which it is more profitable to focus
only on loyal consumers (with p = r) than to price focally:
rn > (1− q)p f (1− p f + n− 1) + qp f (1 + n)
⇔ r > rmax = p f (1 + n− (1− q)q)n
30Under the normalization m = 1, the total number of switchers in this simulated market is thus 10002 .
38
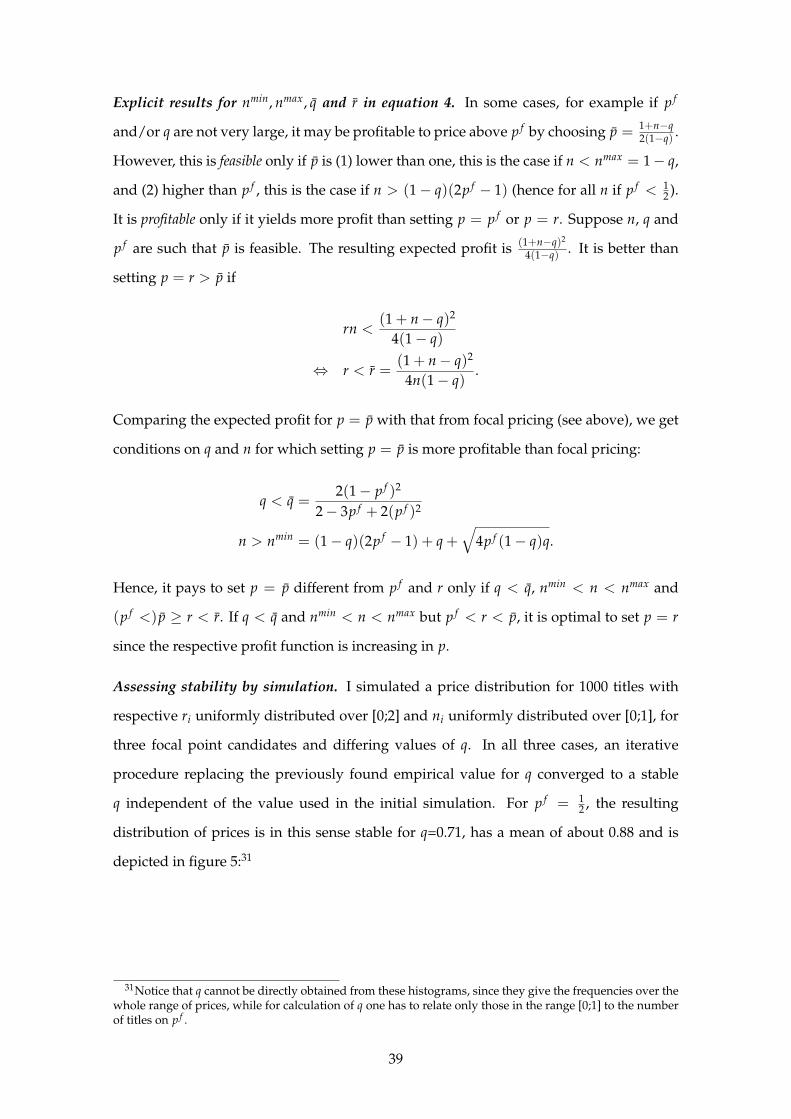
Explicit results for nmin, nmax, q and r in equation 4. In some cases, for example if p f
and/or q are not very large, it may be profitable to price above p f by choosing p = 1+n−q2(1−q) .
However, this is feasible only if p is (1) lower than one, this is the case if n < nmax = 1− q,
and (2) higher than p f , this is the case if n > (1− q)(2p f − 1) (hence for all n if p f < 12 ).
It is profitable only if it yields more profit than setting p = p f or p = r. Suppose n, q and
p f are such that p is feasible. The resulting expected profit is (1+n−q)2
4(1−q) . It is better than
setting p = r > p if
rn <(1 + n− q)2
4(1− q)
⇔ r < r =(1 + n− q)2
4n(1− q).
Comparing the expected profit for p = p with that from focal pricing (see above), we get
conditions on q and n for which setting p = p is more profitable than focal pricing:
q < q =2(1− p f )2
2− 3p f + 2(p f )2
n > nmin = (1− q)(2p f − 1) + q +√
4p f (1− q)q.
Hence, it pays to set p = p different from p f and r only if q < q, nmin < n < nmax and
(p f <) p ≥ r < r. If q < q and nmin < n < nmax but p f < r < p, it is optimal to set p = r
since the respective profit function is increasing in p.
Assessing stability by simulation. I simulated a price distribution for 1000 titles with
respective ri uniformly distributed over [0;2] and ni uniformly distributed over [0;1], for
three focal point candidates and differing values of q. In all three cases, an iterative
procedure replacing the previously found empirical value for q converged to a stable
q independent of the value used in the initial simulation. For p f = 12 , the resulting
distribution of prices is in this sense stable for q=0.71, has a mean of about 0.88 and is
depicted in figure 5:31
31Notice that q cannot be directly obtained from these histograms, since they give the frequencies over thewhole range of prices, while for calculation of q one has to relate only those in the range [0;1] to the numberof titles on p f .
39
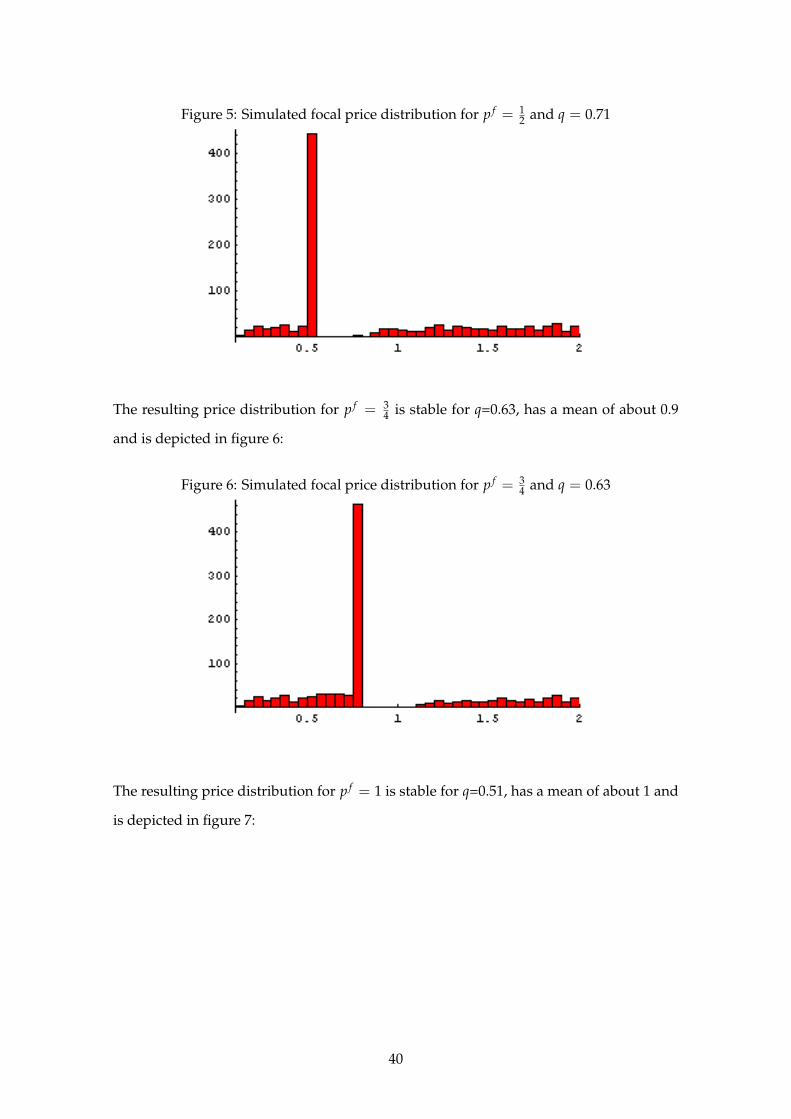
Figure 5: Simulated focal price distribution for p f = 12 and q = 0.71
The resulting price distribution for p f = 34 is stable for q=0.63, has a mean of about 0.9
and is depicted in figure 6:
Figure 6: Simulated focal price distribution for p f = 34 and q = 0.63
The resulting price distribution for p f = 1 is stable for q=0.51, has a mean of about 1 and
is depicted in figure 7:
40
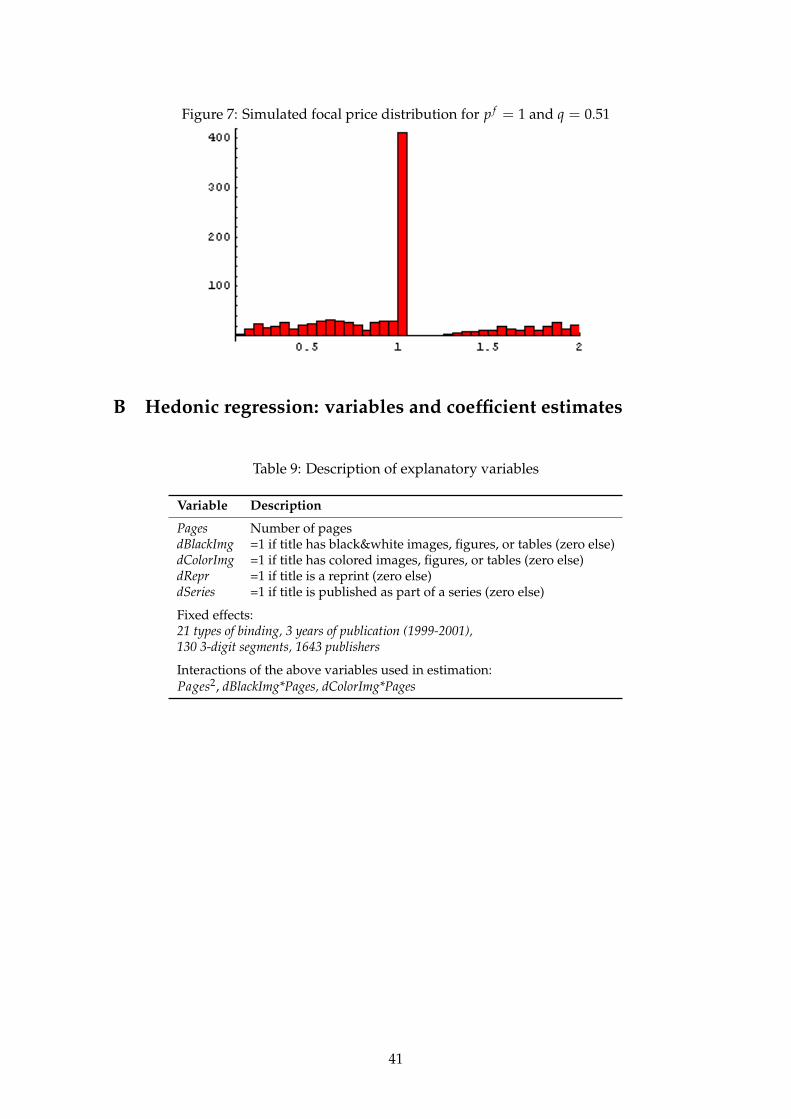
Figure 7: Simulated focal price distribution for p f = 1 and q = 0.51
B Hedonic regression: variables and coefficient estimates
Table 9: Description of explanatory variables
Variable Description
Pages Number of pagesdBlackImg =1 if title has black&white images, figures, or tables (zero else)dColorImg =1 if title has colored images, figures, or tables (zero else)dRepr =1 if title is a reprint (zero else)dSeries =1 if title is published as part of a series (zero else)
Fixed effects:21 types of binding, 3 years of publication (1999-2001),130 3-digit segments, 1643 publishers
Interactions of the above variables used in estimation:Pages2, dBlackImg*Pages, dColorImg*Pages
41
Table 10: Summary statistics on explanatory variables – popular segments
Segment/Variable Mean (std. dev.) by 1-digit segment and focality
Hardcover PaperbackdFOCAL=0 dFOCAL=1 dFOCAL=0 dFOCAL=1
FictionPages 323.10 320.60 231.60 183.52
(263.35) (149.97) (216.61) (135.99)dBlackImg 0.04 0.03 0.19 0.25dColorImg 0.01 0.02 0.10 0.14dRepr 0.12 0.11 0.09 0.11dSeries 0.91 0.90 0.27 0.26
Kids/YouthPages 178.15 145.32 92.29 87.12
(117.93) (71.98) (92.99) (73.50)dBlackImg 0.10 0.22 0.13 0.13dColorImg 0.12 0.09 0.40 0.42dRepr 0.09 0.11 0.13 0.13dSeries 0.67 0.59 0.27 0.39
TravelPages 331.64 253.25 213.83 201.93
(197.21) (111.88) (161.18) (129.33)dBlackImg 0.43 0.25 0.32 0.29dColorImg 0.34 0.58 0.54 0.56dRepr 0.39 0.47 0.25 0.27dSeries 0.80 0.88 0.42 0.49
NonfictionPages 282.46 217.03 210.13 152.47
(1231.34) (97.15) (370.17) (119.38)dBlackImg 0.17 0.09 0.29 0.27dColorImg 0.07 0.02 0.39 0.43dRepr 0.18 0.19 0.21 0.15dSeries 0.84 0.93 0.31 0.24
42
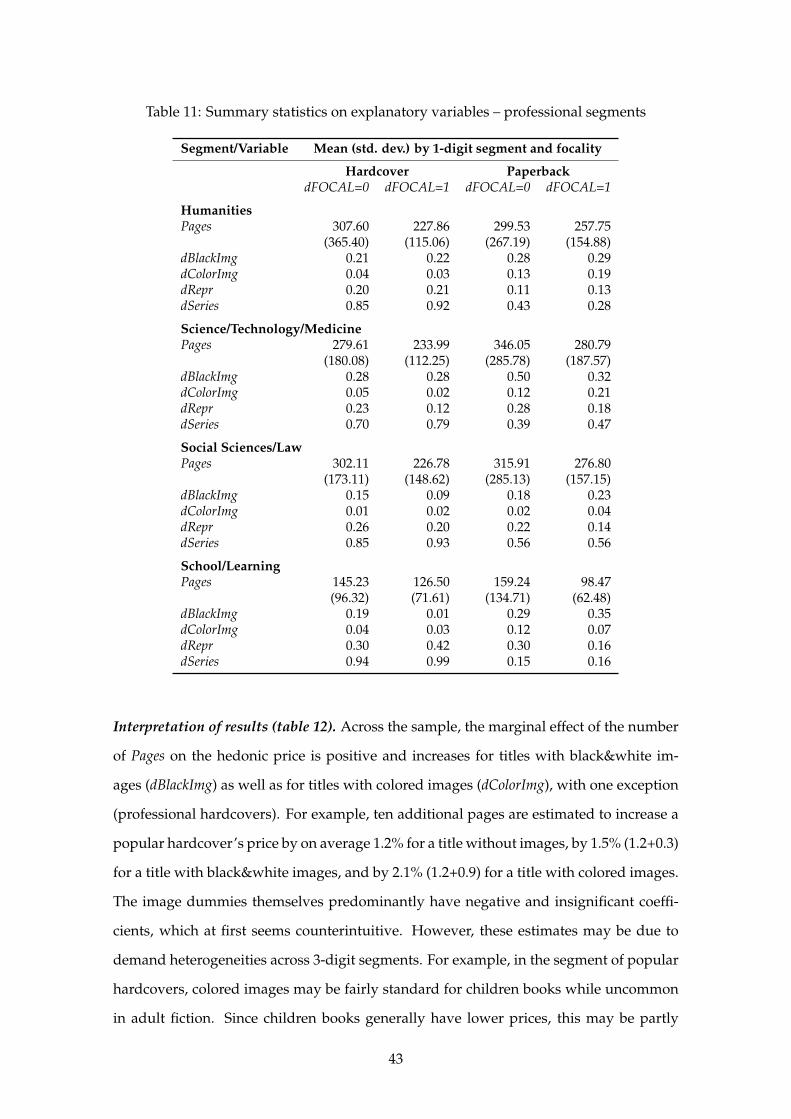
Table 11: Summary statistics on explanatory variables – professional segments
Segment/Variable Mean (std. dev.) by 1-digit segment and focality
Hardcover PaperbackdFOCAL=0 dFOCAL=1 dFOCAL=0 dFOCAL=1
HumanitiesPages 307.60 227.86 299.53 257.75
(365.40) (115.06) (267.19) (154.88)dBlackImg 0.21 0.22 0.28 0.29dColorImg 0.04 0.03 0.13 0.19dRepr 0.20 0.21 0.11 0.13dSeries 0.85 0.92 0.43 0.28
Science/Technology/MedicinePages 279.61 233.99 346.05 280.79
(180.08) (112.25) (285.78) (187.57)dBlackImg 0.28 0.28 0.50 0.32dColorImg 0.05 0.02 0.12 0.21dRepr 0.23 0.12 0.28 0.18dSeries 0.70 0.79 0.39 0.47
Social Sciences/LawPages 302.11 226.78 315.91 276.80
(173.11) (148.62) (285.13) (157.15)dBlackImg 0.15 0.09 0.18 0.23dColorImg 0.01 0.02 0.02 0.04dRepr 0.26 0.20 0.22 0.14dSeries 0.85 0.93 0.56 0.56
School/LearningPages 145.23 126.50 159.24 98.47
(96.32) (71.61) (134.71) (62.48)dBlackImg 0.19 0.01 0.29 0.35dColorImg 0.04 0.03 0.12 0.07dRepr 0.30 0.42 0.30 0.16dSeries 0.94 0.99 0.15 0.16
Interpretation of results (table 12). Across the sample, the marginal effect of the number
of Pages on the hedonic price is positive and increases for titles with black&white im-
ages (dBlackImg) as well as for titles with colored images (dColorImg), with one exception
(professional hardcovers). For example, ten additional pages are estimated to increase a
popular hardcover’s price by on average 1.2% for a title without images, by 1.5% (1.2+0.3)
for a title with black&white images, and by 2.1% (1.2+0.9) for a title with colored images.
The image dummies themselves predominantly have negative and insignificant coeffi-
cients, which at first seems counterintuitive. However, these estimates may be due to
demand heterogeneities across 3-digit segments. For example, in the segment of popular
hardcovers, colored images may be fairly standard for children books while uncommon
in adult fiction. Since children books generally have lower prices, this may be partly
43
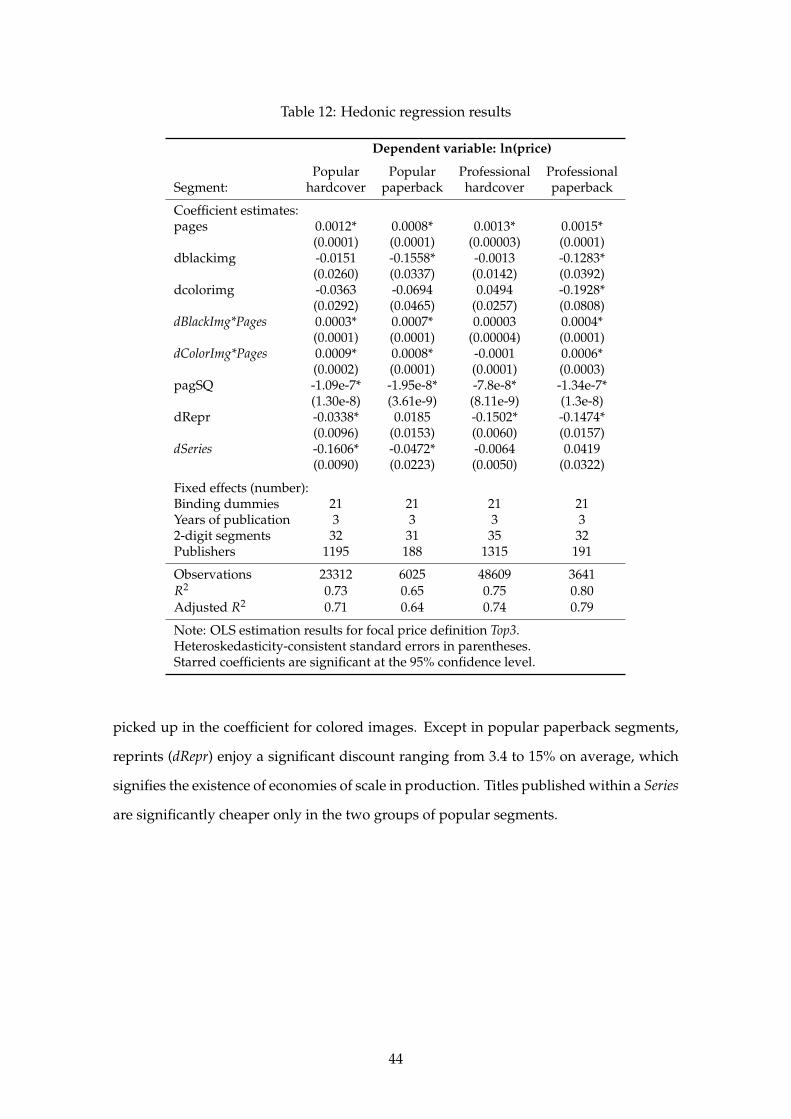
Table 12: Hedonic regression results
Dependent variable: ln(price)
Popular Popular Professional ProfessionalSegment: hardcover paperback hardcover paperback
Coefficient estimates:pages 0.0012* 0.0008* 0.0013* 0.0015*
(0.0001) (0.0001) (0.00003) (0.0001)dblackimg -0.0151 -0.1558* -0.0013 -0.1283*
(0.0260) (0.0337) (0.0142) (0.0392)dcolorimg -0.0363 -0.0694 0.0494 -0.1928*
(0.0292) (0.0465) (0.0257) (0.0808)dBlackImg*Pages 0.0003* 0.0007* 0.00003 0.0004*
(0.0001) (0.0001) (0.00004) (0.0001)dColorImg*Pages 0.0009* 0.0008* -0.0001 0.0006*
(0.0002) (0.0001) (0.0001) (0.0003)pagSQ -1.09e-7* -1.95e-8* -7.8e-8* -1.34e-7*
(1.30e-8) (3.61e-9) (8.11e-9) (1.3e-8)dRepr -0.0338* 0.0185 -0.1502* -0.1474*
(0.0096) (0.0153) (0.0060) (0.0157)dSeries -0.1606* -0.0472* -0.0064 0.0419
(0.0090) (0.0223) (0.0050) (0.0322)
Fixed effects (number):Binding dummies 21 21 21 21Years of publication 3 3 3 32-digit segments 32 31 35 32Publishers 1195 188 1315 191
Observations 23312 6025 48609 3641R2 0.73 0.65 0.75 0.80Adjusted R2 0.71 0.64 0.74 0.79
Note: OLS estimation results for focal price definition Top3.Heteroskedasticity-consistent standard errors in parentheses.Starred coefficients are significant at the 95% confidence level.
picked up in the coefficient for colored images. Except in popular paperback segments,
reprints (dRepr) enjoy a significant discount ranging from 3.4 to 15% on average, which
signifies the existence of economies of scale in production. Titles published within a Series
are significantly cheaper only in the two groups of popular segments.
44
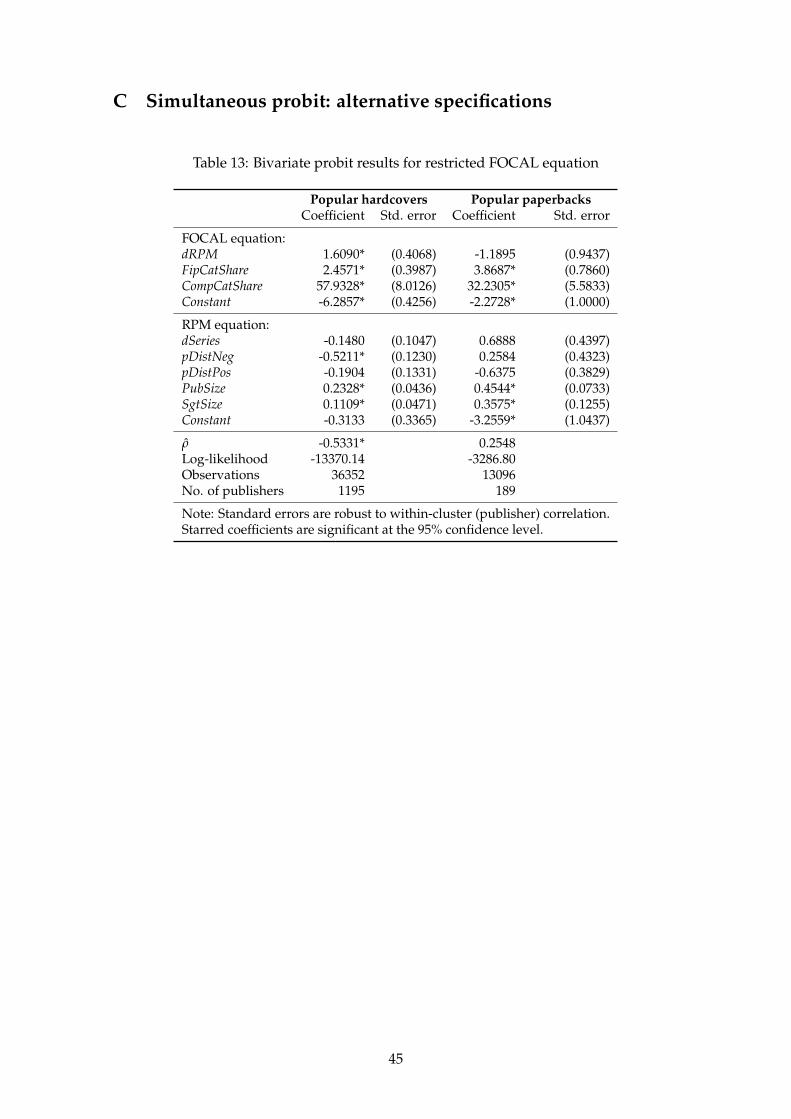
C Simultaneous probit: alternative specifications
Table 13: Bivariate probit results for restricted FOCAL equation
Popular hardcovers Popular paperbacksCoefficient Std. error Coefficient Std. error
FOCAL equation:dRPM 1.6090* (0.4068) -1.1895 (0.9437)FipCatShare 2.4571* (0.3987) 3.8687* (0.7860)CompCatShare 57.9328* (8.0126) 32.2305* (5.5833)Constant -6.2857* (0.4256) -2.2728* (1.0000)
RPM equation:dSeries -0.1480 (0.1047) 0.6888 (0.4397)pDistNeg -0.5211* (0.1230) 0.2584 (0.4323)pDistPos -0.1904 (0.1331) -0.6375 (0.3829)PubSize 0.2328* (0.0436) 0.4544* (0.0733)SgtSize 0.1109* (0.0471) 0.3575* (0.1255)Constant -0.3133 (0.3365) -3.2559* (1.0437)
ρ -0.5331* 0.2548Log-likelihood -13370.14 -3286.80Observations 36352 13096No. of publishers 1195 189
Note: Standard errors are robust to within-cluster (publisher) correlation.Starred coefficients are significant at the 95% confidence level.
45
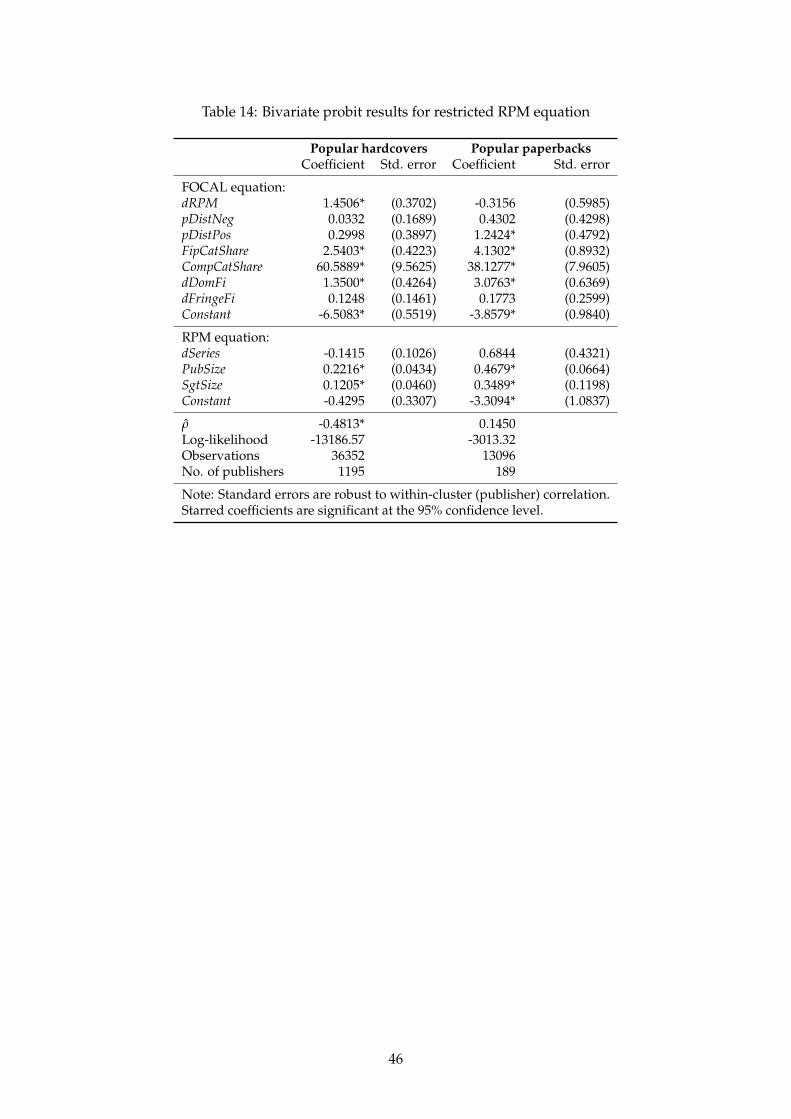
Table 14: Bivariate probit results for restricted RPM equation
Popular hardcovers Popular paperbacksCoefficient Std. error Coefficient Std. error
FOCAL equation:dRPM 1.4506* (0.3702) -0.3156 (0.5985)pDistNeg 0.0332 (0.1689) 0.4302 (0.4298)pDistPos 0.2998 (0.3897) 1.2424* (0.4792)FipCatShare 2.5403* (0.4223) 4.1302* (0.8932)CompCatShare 60.5889* (9.5625) 38.1277* (7.9605)dDomFi 1.3500* (0.4264) 3.0763* (0.6369)dFringeFi 0.1248 (0.1461) 0.1773 (0.2599)Constant -6.5083* (0.5519) -3.8579* (0.9840)
RPM equation:dSeries -0.1415 (0.1026) 0.6844 (0.4321)PubSize 0.2216* (0.0434) 0.4679* (0.0664)SgtSize 0.1205* (0.0460) 0.3489* (0.1198)Constant -0.4295 (0.3307) -3.3094* (1.0837)
ρ -0.4813* 0.1450Log-likelihood -13186.57 -3013.32Observations 36352 13096No. of publishers 1195 189
Note: Standard errors are robust to within-cluster (publisher) correlation.Starred coefficients are significant at the 95% confidence level.
46

Bücher des Forschungsschwerpunkts Markt und politische Ökonomie Books of the Research Area Markets and Political Economy
Pablo Beramendi Decentralization and Income Inequality 2003, Madrid: Juan March Institute
Thomas Cusack A National Challenge at the Local Level: Citizens, Elites and Institutions in Reunified Germany 2003, Ashgate
Sebastian Kessing Essays on Employment Protection 2003, Freie Universität Berlin, http://www.diss.fu-berlin.de/2003/202
Daniel Krähmer On Learning and Information in Markets and Organizations 2003, Shaker Verlag
Bob Hancké Large Firms and Institutional Change. Industrial Renewal and Economic Restructuring in France 2002, Oxford University Press
Andreas Stephan Essays on the Contribution of Public Infrastruc-ture to Private: Production and its Political Economy 2002, dissertation.de
Peter A. Hall, David Soskice (Eds.) Varieties of Capitalism 2001, Oxford University Press
Hans Mewis Essays on Herd Behavior and Strategic Delegation 2001, Shaker Verlag
Andreas Moerke Organisationslernen über Netzwerke – Die personellen Verflechtungen von Führungsgremien japanischer Aktiengesellschaften 2001, Deutscher Universitäts-Verlag
Silke Neubauer Multimarket Contact and Organizational Design 2001, Deutscher Universitäts-Verlag
Lars-Hendrik Röller, Christian Wey (Eds.) Die Soziale Marktwirtschaft in der neuen Weltwirtschaft, WZB Jahrbuch 2001 2001, edition sigma
Michael Tröge Competition in Credit Markets: A Theoretic Analysis 2001, Deutscher Universitäts-Verlag
Torben Iversen, Jonas Pontusson, David Soskice (Eds.) Unions, Employers, and Central Banks 2000, Cambridge University Press
Tobias Miarka Financial Intermediation and Deregulation: A Critical Analysis of Japanese Bank-Firm-Relationships 2000, Physica-Verlag
Rita Zobel Beschäftigungsveränderungen und organisationales Lernen in japanischen Industriengesellschaften 2000, Humboldt-Universität zu Berlin http://dochost.rz.hu-berlin.de/dissertationen/zobel-rita-2000-06-19
Jos Jansen Essays on Incentives in Regulation and Innovation 2000, Tilburg University
Ralph Siebert Innovation, Research Joint Ventures, and Multiproduct Competition 2000, Humboldt-Universität zu Berlin http://dochost.rz.hu-berlin.de/dissertationen/siebert-ralph-2000-03-23/
Damien J. Neven, Lars-Hendrik Röller (Eds.) The Political Economy of Industrial Policy in Europe and the Member States 2000, edition sigma
Jianping Yang Bankbeziehungen deutscher Unternehmen: Investitionsverhalten und Risikoanalyse 2000, Deutscher Universitäts-Verlag
Christoph Schenk Cooperation between Competitors – Subcontracting and the Influence of Information, Production and Capacity on Market Structure and Competition 1999, Humboldt-Universität zu Berlin http://dochost.rz.hu-berlin.de/dissertationen/schenk-christoph-1999-11-16
Horst Albach, Ulrike Görtzen, Rita Zobel (Eds.) Information Processing as a Competitive Advantage of Japanese Firms 1999, edition sigma
Dieter Köster Wettbewerb in Netzproduktmärkten 1999, Deutscher Universitäts-Verlag
Christian Wey Marktorganisation durch Standardisierung: Ein Beitrag zur Neuen Institutionenökonomik des Marktes 1999, edition sigma
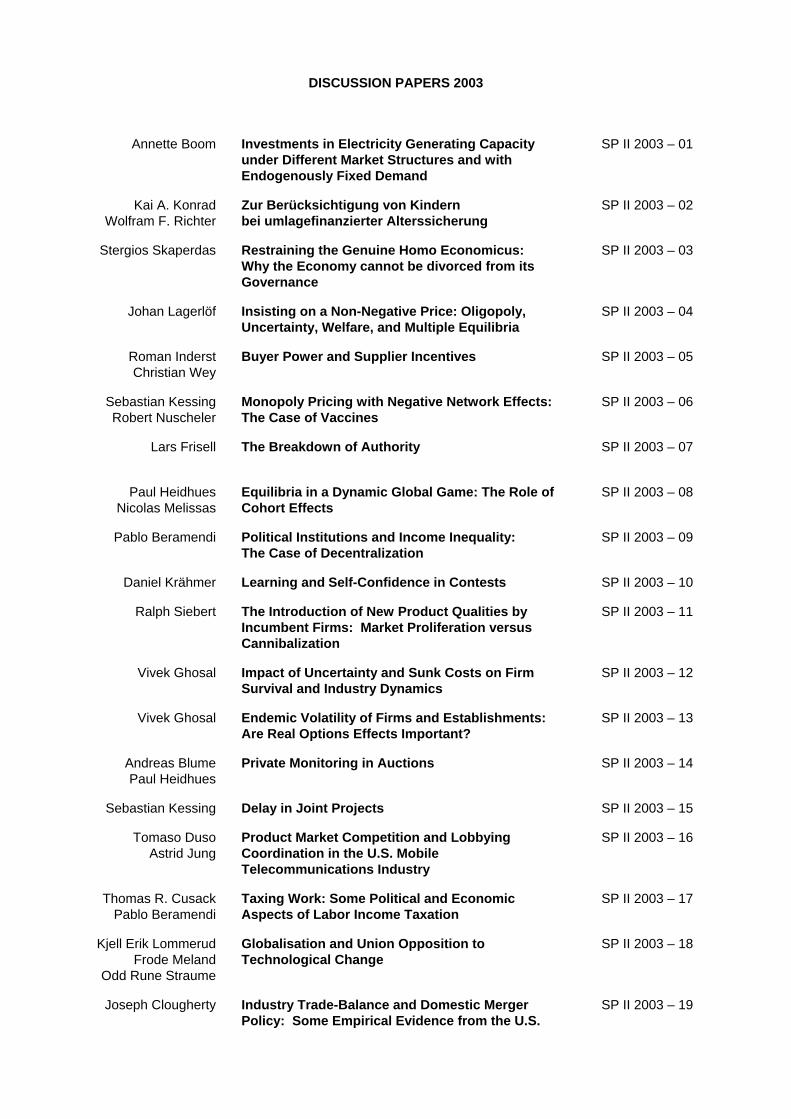
DISCUSSION PAPERS 2003
Annette Boom Investments in Electricity Generating Capacity under Different Market Structures and with Endogenously Fixed Demand
SP II 2003 – 01
Kai A. Konrad Wolfram F. Richter
Zur Berücksichtigung von Kindern bei umlagefinanzierter Alterssicherung
SP II 2003 – 02
Stergios Skaperdas Restraining the Genuine Homo Economicus: Why the Economy cannot be divorced from its Governance
SP II 2003 – 03
Johan Lagerlöf Insisting on a Non-Negative Price: Oligopoly, Uncertainty, Welfare, and Multiple Equilibria
SP II 2003 – 04
Roman Inderst Christian Wey
Buyer Power and Supplier Incentives SP II 2003 – 05
Sebastian Kessing Robert Nuscheler
Monopoly Pricing with Negative Network Effects: The Case of Vaccines
SP II 2003 – 06
Lars Frisell
The Breakdown of Authority SP II 2003 – 07
Paul Heidhues Nicolas Melissas
Equilibria in a Dynamic Global Game: The Role of Cohort Effects
SP II 2003 – 08
Pablo Beramendi Political Institutions and Income Inequality: The Case of Decentralization
SP II 2003 – 09
Daniel Krähmer Learning and Self-Confidence in Contests SP II 2003 – 10
Ralph Siebert The Introduction of New Product Qualities by Incumbent Firms: Market Proliferation versus Cannibalization
SP II 2003 – 11
Vivek Ghosal Impact of Uncertainty and Sunk Costs on Firm Survival and Industry Dynamics
SP II 2003 – 12
Vivek Ghosal Endemic Volatility of Firms and Establishments: Are Real Options Effects Important?
SP II 2003 – 13
Andreas Blume Paul Heidhues
Private Monitoring in Auctions SP II 2003 – 14
Sebastian Kessing Delay in Joint Projects SP II 2003 – 15
Tomaso Duso Astrid Jung
Product Market Competition and Lobbying Coordination in the U.S. Mobile Telecommunications Industry
SP II 2003 – 16
Thomas R. Cusack Pablo Beramendi
Taxing Work: Some Political and Economic Aspects of Labor Income Taxation
SP II 2003 – 17
Kjell Erik Lommerud Frode Meland
Odd Rune Straume
Globalisation and Union Opposition to Technological Change
SP II 2003 – 18
Joseph Clougherty Industry Trade-Balance and Domestic Merger Policy: Some Empirical Evidence from the U.S.
SP II 2003 – 19
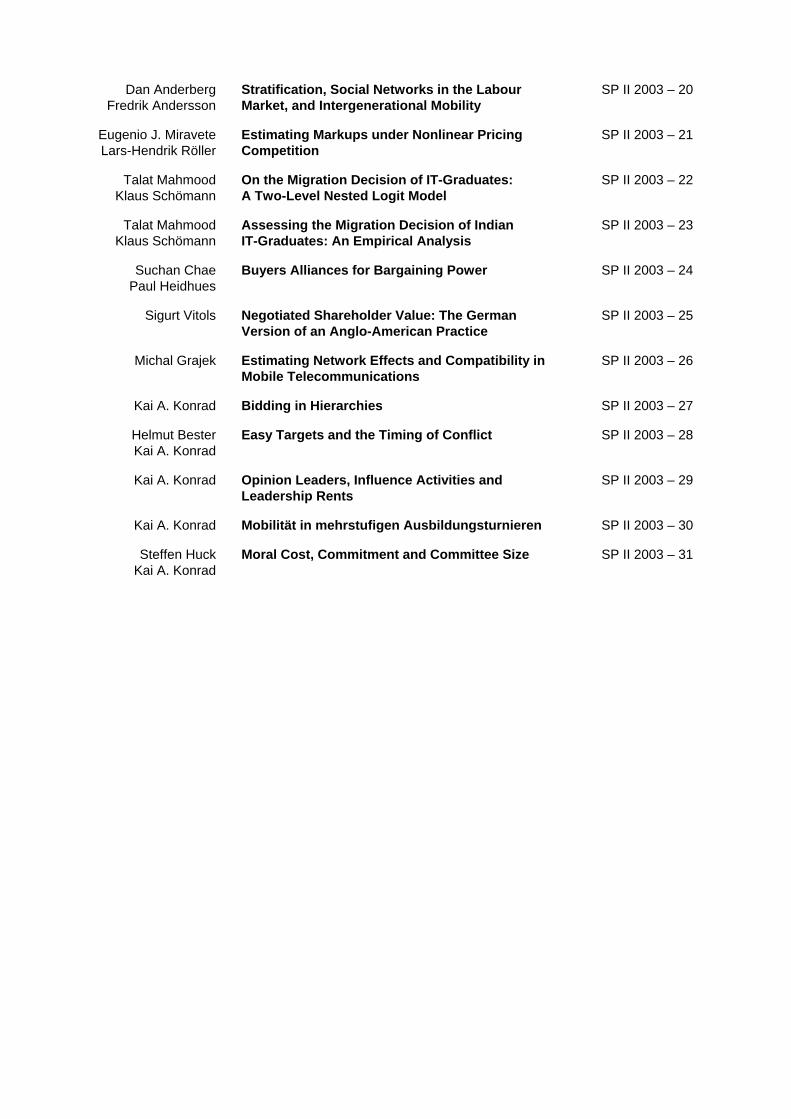
Dan Anderberg Fredrik Andersson
Stratification, Social Networks in the Labour Market, and Intergenerational Mobility
SP II 2003 – 20
Eugenio J. Miravete Lars-Hendrik Röller
Estimating Markups under Nonlinear Pricing Competition
SP II 2003 – 21
Talat Mahmood Klaus Schömann
On the Migration Decision of IT-Graduates: A Two-Level Nested Logit Model
SP II 2003 – 22
Talat Mahmood Klaus Schömann
Assessing the Migration Decision of Indian IT-Graduates: An Empirical Analysis
SP II 2003 – 23
Suchan Chae Paul Heidhues
Buyers Alliances for Bargaining Power SP II 2003 – 24
Sigurt Vitols Negotiated Shareholder Value: The German Version of an Anglo-American Practice
SP II 2003 – 25
Michal Grajek Estimating Network Effects and Compatibility in Mobile Telecommunications
SP II 2003 – 26
Kai A. Konrad Bidding in Hierarchies SP II 2003 – 27
Helmut Bester Kai A. Konrad
Easy Targets and the Timing of Conflict SP II 2003 – 28
Kai A. Konrad Opinion Leaders, Influence Activities and Leadership Rents
SP II 2003 – 29
Kai A. Konrad Mobilität in mehrstufigen Ausbildungsturnieren SP II 2003 – 30
Steffen Huck Kai A. Konrad
Moral Cost, Commitment and Committee Size SP II 2003 – 31
DISCUSSION PAPERS 2004
Jos Jansen Partial Information Sharing in Cournot Oligopoly SP II 2004 – 01
Johan Lagerlöf Lars Frisell
Lobbying, Information Transmission, and Unequal Representation
SP II 2004 – 02
Sigurt Vitols Changes in Germany’s Bank Based Financial System: A Varieties of Capitalism Perspective
SP II 2004 – 03
Lutz Engelhardt Entrepreneurial Business Models in the German Software Industry: Companies, Venture Capital, and Stock Market Based Growth Strategies of the ‚Neuer Markt’
SP II 2004 – 04
Antonio Guarino Steffen Huck
Thomas D. Jeitschko
Can Fear Cause Economic Collapse? Insights from an Experimental Study
SP II 2004 – 05
Thomas Plümper Vera E. Troeger
External Effects of Currency Unions SP II 2004 – 06
Ulrich Kaiser¤ An Estimated Model of the German Magazine Market
SP II 2004 – 07
Pablo Beramendi Thomas R. Cusack
Diverse Disparities: The Politics and Economics of Wage, Market and Disposable Income Inequalities
SP II 2004 – 08
Joseph Clougherty Antitrust Holdup Source, Cross-National Institutional Variation, and Corporate Political Strategy Implications for Domestic Mergers in a Global Context
SP II 2004 – 09
Joseph Clougherty Anming Zhang
Export Orientation and Domestic Merger Policy: Theory and Some Empirical Evidence
SP II 2004 – 10
Roel C.A. Oomen Modelling Realized Variance when Returns are Serially Correlated
SP II 2004 – 11
Robert J. Franzese,Jr. Jude C. Hays
Modeling International Diffusion: Inferential Benefits and Methodological Challenges, with an Application to International Tax Competition
SP II 2004 – 12
Albert Banal-Estañol Inés Macho-Stadler
Jo Seldeslachts
Mergers, Investment Decisions and Internal Organisation
SP II 2004 – 13
Oz Shy Rune Stenbacka
Price Competition, Business Hours, and Shopping Time Flexibility
SP II 2004 – 14
Jonathan Beck Fixed, Focal, Fair? Book Prices Under Optional Resale Price Maintenance
SP II 2004 – 15

Bei Ihren Bestellungen von WZB-Papers schicken Sie bitte unbedingt einen an Sie adressierten Auf-kleber mit sowie je paper eine Briefmarke im Wert von 0,51 Euro oder einen "Coupon Reponse Inter-national " (für Besteller aus dem Ausland)
Please send a self addressed label and postage stamps in the amount of 0.51 Euro or a "Coupon- Reponse International" (if you are ordering from outside Germany) for each WZB-paper requested
Bestellschein Order Form
Absender / Return Address:
Wissenschaftszentrum Berlin für Sozialforschung Presse- und informationsreferat Reichpietschufer 50 D-10785 Berlin-Tiergarten
Hiermit bestelle ich folgende(s) Discussion paper(s):
Please send me the following Discussion paper(s):
Bestell-Nr. / Order no. Autor/in, Kurztitel /Author(s) / Title(s) in brief