Embed Size (px)
Citation preview
Weierstraß-Institutfür Angewandte Analysis und StochastikLeibniz-Institut im Forschungsverbund Berlin e. V.
Preprint ISSN 2198-5855
Liquid-liquid dewetting: Morphologies and rates
Stefan Bommer 1, Ralf Seemann1, Sebastian Jachalski 2, Dirk Peschka2,
Barbara Wagner2
submitted: December 05, 2016
1 Experimental PhysicsSaarland University66123 SaarbrückenGermanyE-Mail: [email protected],
2 Weierstrass InstituteMohrenstr. 3910117 BerlinGermanyE-Mail: [email protected]
No. 2346
Berlin 2016
2010 Mathematics Subject Classification. 68.05.Cf, 02.60.Cb.
Key words and phrases. Free boundary problems, interface dynamics, experimental methods, numerical simula-tions.
This research was carried out in the framework of SPP5016 Transport processes at fluidic interfaces.
Edited byWeierstraß-Institut für Angewandte Analysis und Stochastik (WIAS)Leibniz-Institut im Forschungsverbund Berlin e. V.Mohrenstraße 3910117 BerlinGermany
Fax: +49 30 20372-303E-Mail: [email protected] Wide Web: http://www.wias-berlin.de/
Abstract
The dependence of the dissipation on the local details of the flow field of a liquid poly-mer film dewetting from a liquid polymer substrate is shown, solving the free boundaryproblem for a two-layer liquid system. As a key result we show that the dewetting ratesof such a liquid bi-layer system can not be described by a single power law but showstransient behaviour of the rates, changing from increasing to decreasing behaviour. Thetheoretical predictions on the evolution of morphology and rates of the free surfaces andfree interfaces are compared to measurements of the evolution of the polystyrene(PS)-air,the polymethyl methacrylate (PMMA)-air and the PS-PMMA interfaces using in situ atomicforce microscopy (AFM), and they show excellent agreement.
1 Introduction
Wetting and dewetting phenomena are omnipresent in nature and in technological applicationsand have been studied extensively for flows over flat solid substrates, e.g. [4, 16]. However,since liquid substrates are less influenced by substrate heterogeneities, it is surprising that thea similar in-depth understanding has not been reached yet for dewetting from liquid substrates.An equilibrium droplet resting on a liquid substrate deforms its support so that both componentsof the interfacial tension balance at the contact line and the Neumann triangle construction [15]leads to lens-shaped droplets. Away from equilibrium, a negative spreading parameter S = γs−(γ`+γ`,s) makes it energetically advantegeous for a liquid layer to retract from the substrate anddecrease its interfacial area with the underlying substrate. The resulting flow in the dewettingliquid couples to a flow in the liquid substrate and strongly influences the observed interfaceshapes, the flow fields and the overall dynamics of the process.
Pioneering works for the theory of liquid-liquid dewetting by Joanny [10] and Brochard-Wyartet al. [2] made predictions for small equilibrium contact angles and for the limiting regimes,where both viscosities differ by orders of magnitude. More recently the liquid-liquid dewettingwas also studied using thin-film models studying different modes of instability of dewetting us-ing simulations and stability analysis [6, 18] and also the approach of stationary states [3].Dewetting of different liquid-liquid model systems has been studied experimentally by the groupof Krausch [12, 21] for different film heights and substrate viscosities. Pan et al. [17] performedsimilar studies of dewetting rates and interface shapes for more viscous substrates and varioussubstrate thicknesses. Unfortunately, none of the above works performs a comparison of ex-perimental observed shapes with theoretical predicted ones. This seems highly relevant sincethe observed shapes differ considerably from the empirical predictions used to derive dewet-ting rates. Therefore, in this study we present a detailed comparison of experimentally obtainedrim shapes, their evolution, and their dewetting dynamics with those computed from thin-filmequations. Additionally, we examine the underlying mechanisms by discussing flow fields anddissipation mechanisms.
1
2 Experimental Methods
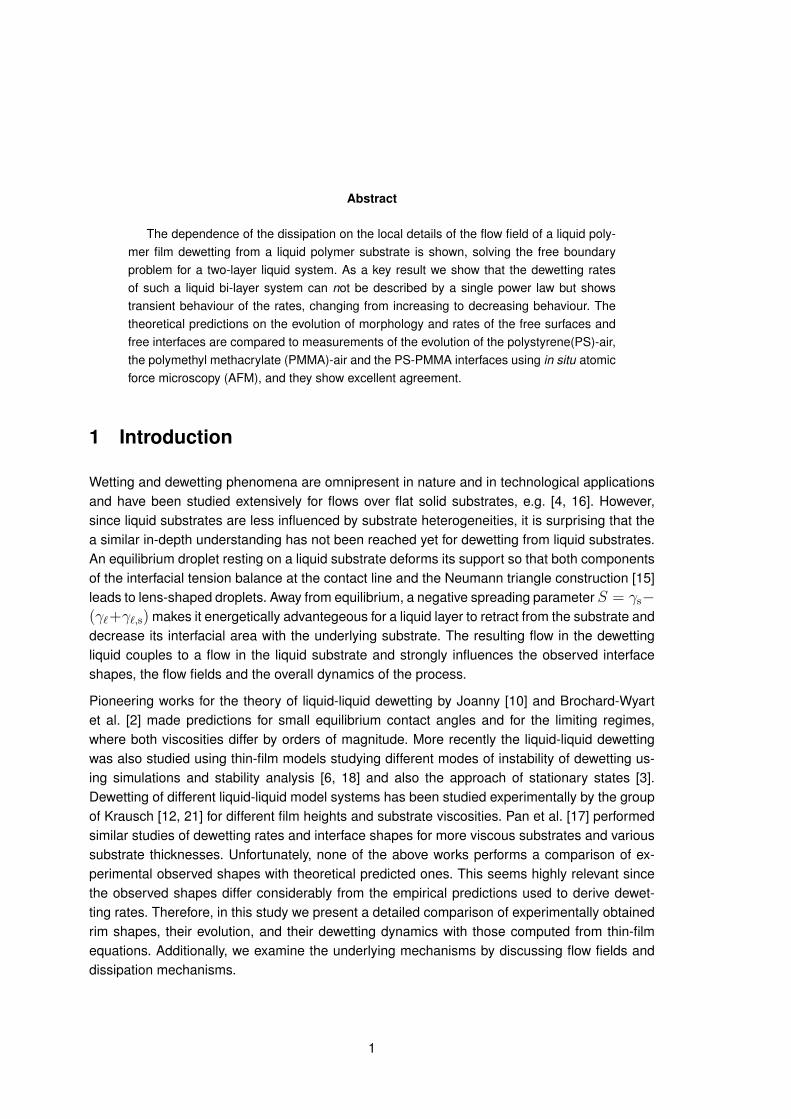
We consider the model system of short-chained liquid PS (`) and liquid substrate PMMA (s).For the liquid-liquid dewetting experiments, thin rectangular PS patches of constant thicknessh = h(t = 0, x, y) were prepared in their glassy state on top of thin glassy PMMA films ofconstant thickness h1 = h1(t = 0, x, y) supported by silicon wafers at z = 0. The process isstarted by heating the materials above the glass transition temperature and then monitored byin situ AFM (see Fig. 1).
Figure 1: Composed AFM scan for 1:1 dewetting after 24 h
Therefore, silicon rectangles of about 2cm2 were cut from 5′′-wafers with 〈100〉 orientation.These silicon rectangles were pre-cleaned by a fast CO2-stream (snow-jet, Tectra) and soni-cated in ethanol, acetone and toluene followed by a bath in peroxymonosulfuric acid (piranhaetch) and a careful rinse with hot MilliporeTM water. After this cleaning procedure PMMA filmswere spun from toluene solution on top of the silicon support with homogeneous thicknesses.The PS films can not be spun directly onto the PMMA and were, in a first step, spun from toluenesolution onto freshly cleaved mica sheets. In a second step, the glassy PS films were transferredfrom mica onto a MilliporeTM water surface and picked up from above with the PMMA coatedsilicon substrates. During this process the initially closed PS film ruptures into the aforemen-tioned rectangular patches, which are then transferred onto the PMMA substrate. The typicalfilm-thicknesses h, h1 used in our dewetting experiments range from 50 nm to 240 nm andexperiments with various ratios h:h1 were performed.
x
0 50 100 150 200
z
0
1
2
3
4
5
6
xc
a)
x
0 50 100 150 200
b)
x
0 100 200
c)
x
0 100 200
d) theoryexperiment
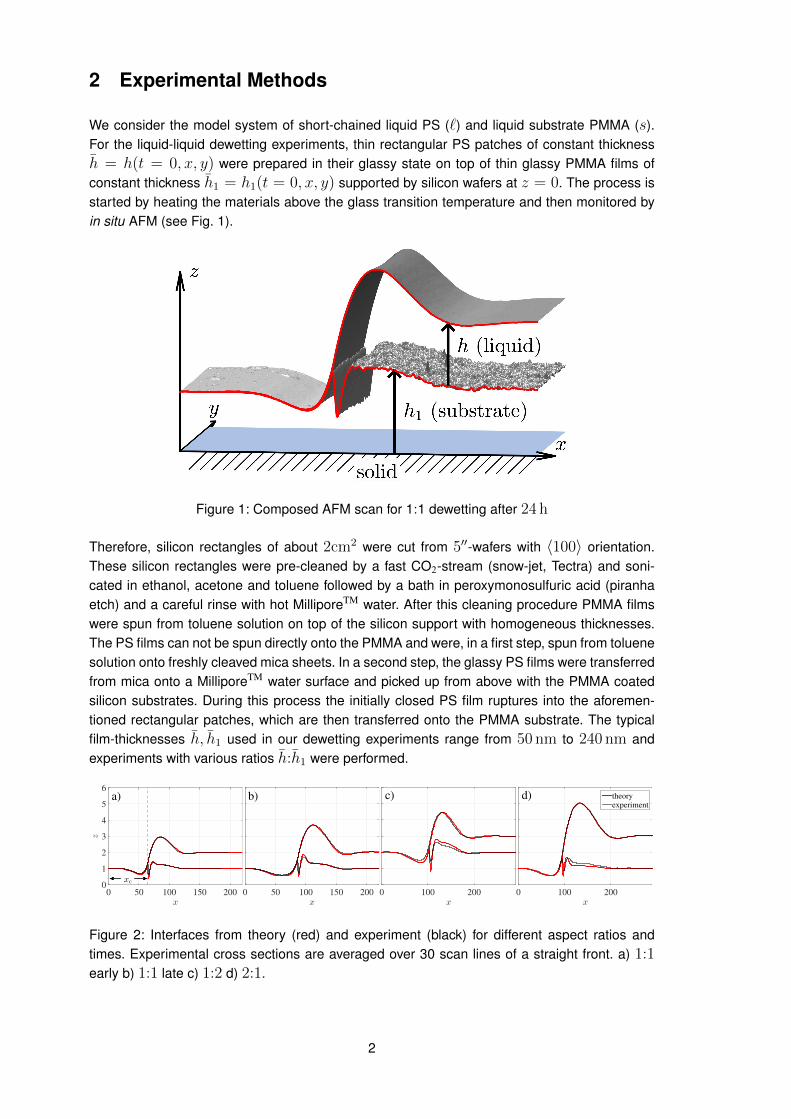
Figure 2: Interfaces from theory (red) and experiment (black) for different aspect ratios andtimes. Experimental cross sections are averaged over 30 scan lines of a straight front. a) 1:1early b) 1:1 late c) 1:2 d) 2:1.
2
Both polymers were purchased from Polymer Standard Service Mainz (PSS-Mainz,Germany)with polydispersity of Mw/Mn = 1.05 and molecular weights of Mw = 64 kg/mol andMw = 9.9 kg/mol for PS and PMMA, respectively. The dewetting experiments were con-ducted at a temperature of T = 140C resulting in viscosities of PS µ` ≈ 700 kPa s and PMMAµs = 675 kPa s. The viscosity values were measured using the self-similarity in stepped poly-mer films as presented in [14] and [20]. While errors of most experimental parameters lie within afew percent, the temperature and chain-length dependence of the polymer viscosity representsthe main source of uncertainty. It easily affects the timescale of experiments and simulationswithin several ten percent. When matching experimental and numerical timescales we foundthat setting µ` = 1100 kPa s and keeping the viscosity ratio fixed gives a very good agreementfor all the experiments considered. Combining the viscosities, literature values from [7, 13] andtypical shear rates we estimate the Weissenberg number of order 10−3, suggesting that PSand PMMA are not viscoelastic and can be considered Newtonian. Following the procedure de-scribed in [1] we experimentally determined the involved surface tensions to γ` = 32.3 mN/m,γs = 32 mN/m and γ`,s = 1.2 ± 0.1 mN/m, compatible with values reported in literature,e.g. [22]. To obtain the shape of the embedded liquid-liquid interface, the dewetting process isstopped by quenching the sample down to room temperature. The now glassy samples weredipped into a selective solvent (cyclohexane, Sigma Aldrich, Germany) to remove the PS fromthe underlying PMMA. After drying the sample, the formerly buried PS/PMMA interface can beimaged by AFM. The full final shape of the dewetting is obtained by composing the subsequentlyimaged polymer/air and PS/PMMA surfaces (see FIG. 1, 1).
3 Thin-film model
The flow describing the dewetting process is modelled by the Stokes equation ∇ · (−piI +µi(∇ui + ∇uTi )) = 0 and ∇ · ui = 0 solved in Ωi for i ∈ s, ` in the substrate and theliquid. Assuming translational invariance of the 3D flow in y-direction, one can parametrize thedomains
Ωs(t) = (x, z) ∈ R2 : 0 < z < h1, (3.1a)
Ω`(t) = (x, z) ∈ R2 : h1 < z < h1 + h, (3.1b)
using non-negative functions h1(t, x), h(t, x) as sketched in FIG. 1. The velocity, pressure,and viscosity in Ωi are denoted by ui, pi, µi. The equations in the two regions are coupled byinterface/boundary conditions, e.g. no-slip us = 0 at z = 0, continuity u` = us at z = h1
and the usual tangential and normal stress jump condition at the free interfaces z = h1 andz = h1 + h. Kinematic conditions relate the velocities of the flow to the velocities of surfacesand interfaces. At the contact line one needs to impose further conditions using the Neumanntriangle. The equations are rescaled using
[z] = [x] = H, [t] = Hµ`/γs, (3.2)
and replace the dimensional parameters by γs = 1, γ` = γ`/γs, γs,` = γs,`/γs, and S = S/γs2. Following the standard thin-film approximation we assume that the interfaces are shallow
1Note: The composition requires rotation, shift and possibly a tilt of upper and lower AFM scan for a perfectmatch. Cross sections are averaged over a few scan lines.
2Note: We consistently normalized all experimental and numerical lengths by setting H to the initial film heightso that in particular h = 1.
3
|∂xh1|, |∂xh| 1. Then a formal asymptotic calculation shows that h1, h are solutions ofa system of parabolic equations defined separately on the wetted region ω(t) = x ∈ R :h(t, x) > 0 and its complement. For x ∈ ω we have
∂th1 = ∂x (M11∂xπ1 +M12π2) , (3.3a)
∂th = ∂x (M21∂xπ1 +M22π2) , (3.3b)
with mobility matrix
M =1
µ
Ç13h3
112h2
1h12h2
1hµ3h3 + h1h
2
å, (3.3c)
pressures π1 = −(γ`,s + γ`)∂xxh1 − γ`∂xxh and π2 = −γ`∂xxh1 − γ`∂xxh, and viscosityratio µ = µs/µ`. On the complement of ω, only h1 is unknown and solves ∂th1 = ∂x (m∂xπ1)with m = 1
3µh3
1 and pressure π1 = −(γ`,s + γ`)∂xxh1. Additionally boundary conditions needto be imposed at the contact line xc = ∂ω. Note that once the solution is known, then from thethin-film approximation one can reconstruct the horizontal component of the velocity ui = ui · xusing
us =∂xπ1
2µz2 + cs,1z + cs,2, (3.4a)
u` =∂xπ2
2z2 + c`,1z + c`,2, (3.4b)
for x ∈ ω. The functions cs,1, cs,2, c`,1, c`,2 depend on (t, x) and are determined using theboundary conditions us = 0 at z = 0, us − u` = ∂z(us − µu`) = 0 at z = h1, ∂zu` = 0at z = h1 + h as before. The velocity in the complement is determined analogously. Thederivation of this model can be found in [9, 11, 19] and the corresponding novel numericalmethod is described in [8].
4 Comparison of interface morphology and rates
In Figs. 2a-d) we show the perfect alignment of the experimentally measured and theoreticallycomputed interface profiles. One can observe features, that to some extent have been reportedpreviously. The contact line is elevated by the flow, a dynamic feature not observed in stationarydroplets for sufficiently thick substrates [1]. The material of the dewetting liquid (PS) accumu-lates in a rim which, by conservation of mass, grows in time when the liquid retracts from thesubstrate. Also some material of the substrate (PMMA) is dragged along generating a depletionnear x < xc and an accumulation of substrate material near x > xc. Right next to the contactline, some part of the dewetting liquid extends deeply into the substrate and generates a trenchand thereby produces additional resistance against the dewetting motion. Note that the size ofthe trench does not or only depends weakly on size size of the dewetting rim. Compared to theaspect ratio 1:1 in Fig. 2a), switching aspect ratios has no influence on the qualitative behav-ior of solutions and the perfect match between experiment and simulation. The only influence isthat for thicker substrates 1:2 Fig. 2c) these features grow and for thinner substrates 2:1 Fig. 2d)these features shrink in size. Away from the rim the interfaces decay in an oscillatory fashioninto their prepared constant states h1(t, x), h(t, x)→ h1, h.
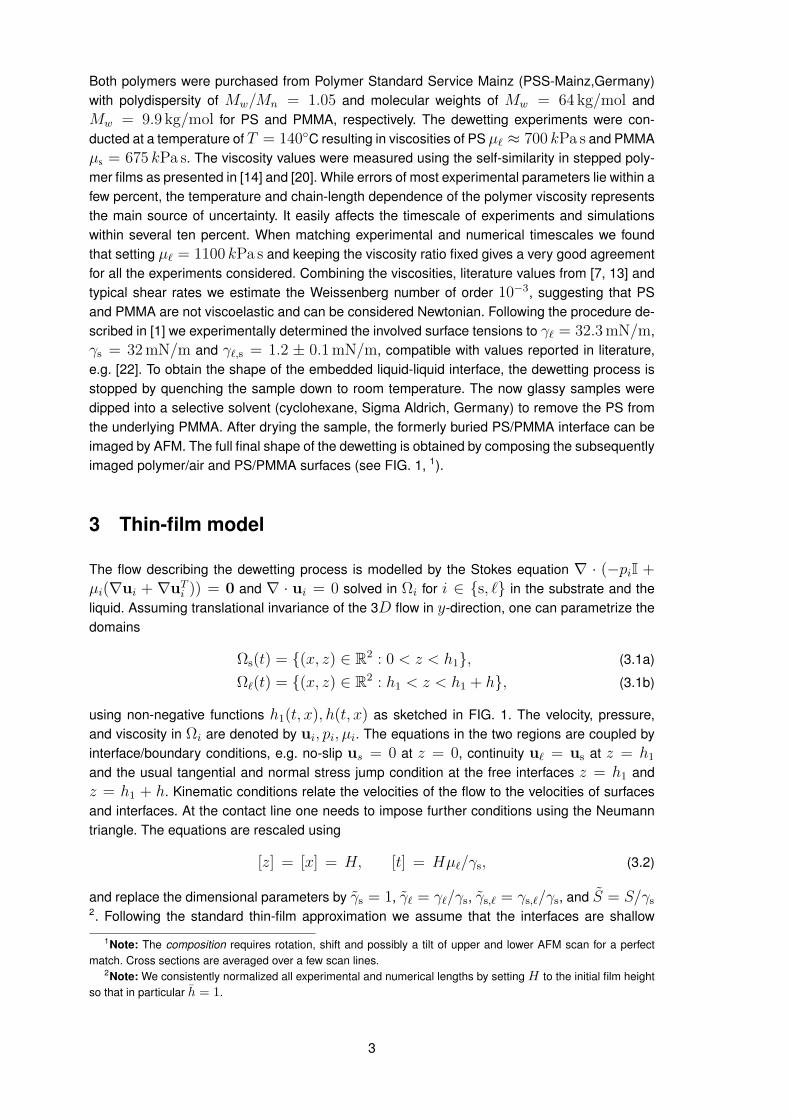
For a fixed aspect ratio (3.2) predicts that, due to the absence of additional intrinsic time andlength scales for Newtonian liquids, the influence of the absolute height is to scale time linearly
4
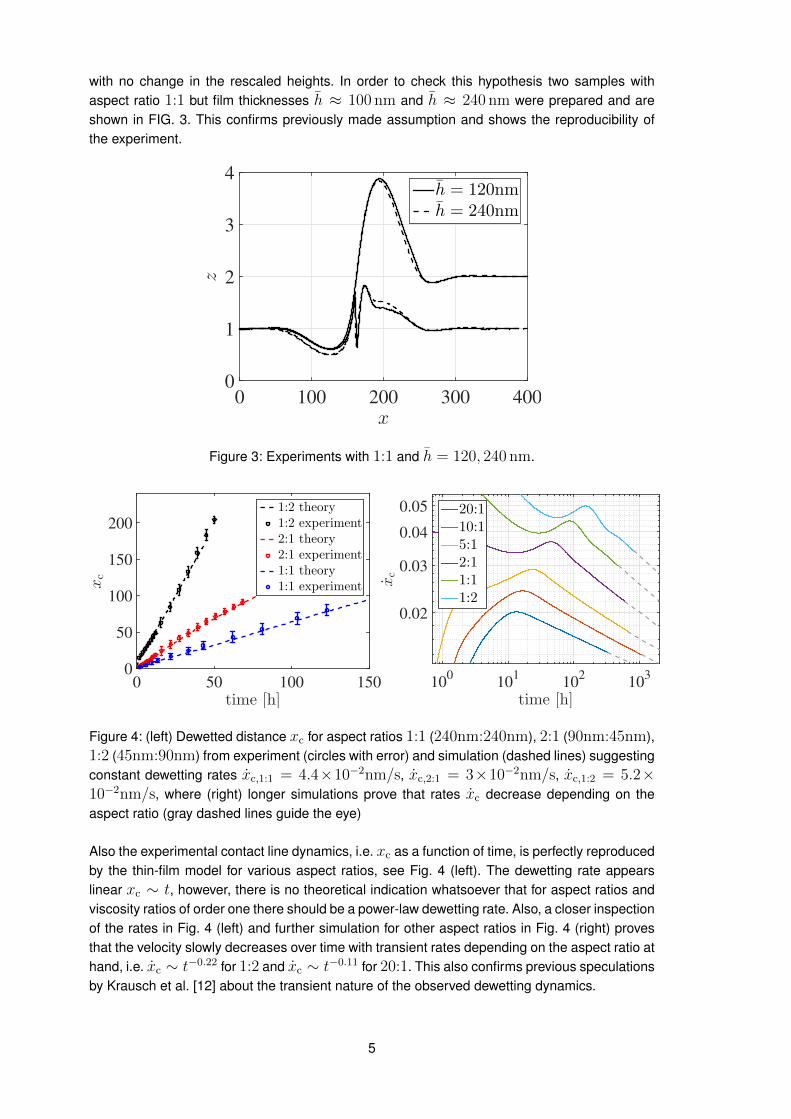
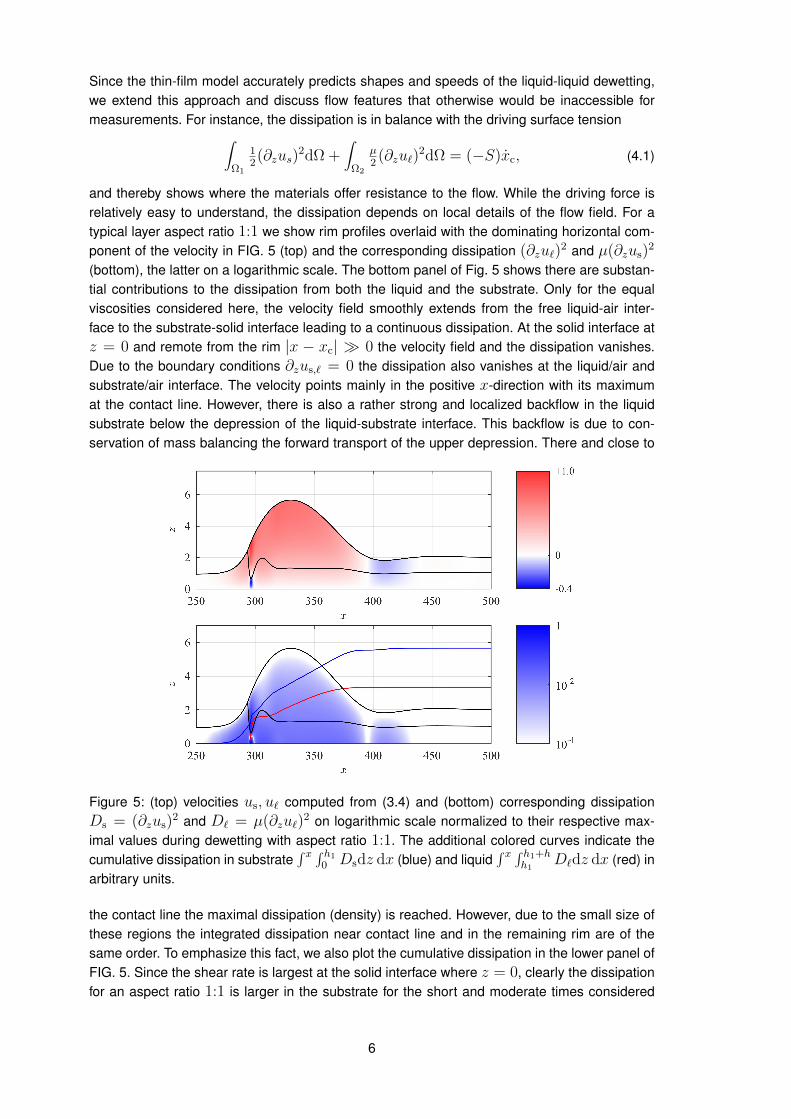
with no change in the rescaled heights. In order to check this hypothesis two samples withaspect ratio 1:1 but film thicknesses h ≈ 100 nm and h ≈ 240 nm were prepared and areshown in FIG. 3. This confirms previously made assumption and shows the reproducibility ofthe experiment.
x
0 100 200 300 400
z
0
1
2
3
4h = 120nm
h = 240nm
Figure 3: Experiments with 1:1 and h = 120, 240 nm.
time [h]0 50 100 150
xc
0
50
100
150
200
1:2 theory1:2 experiment2:1 theory2:1 experiment1:1 theory1:1 experiment
time [h]10
010
110
210
3
xc
0.02
0.03
0.04
0.05 20:110:15:12:11:11:2
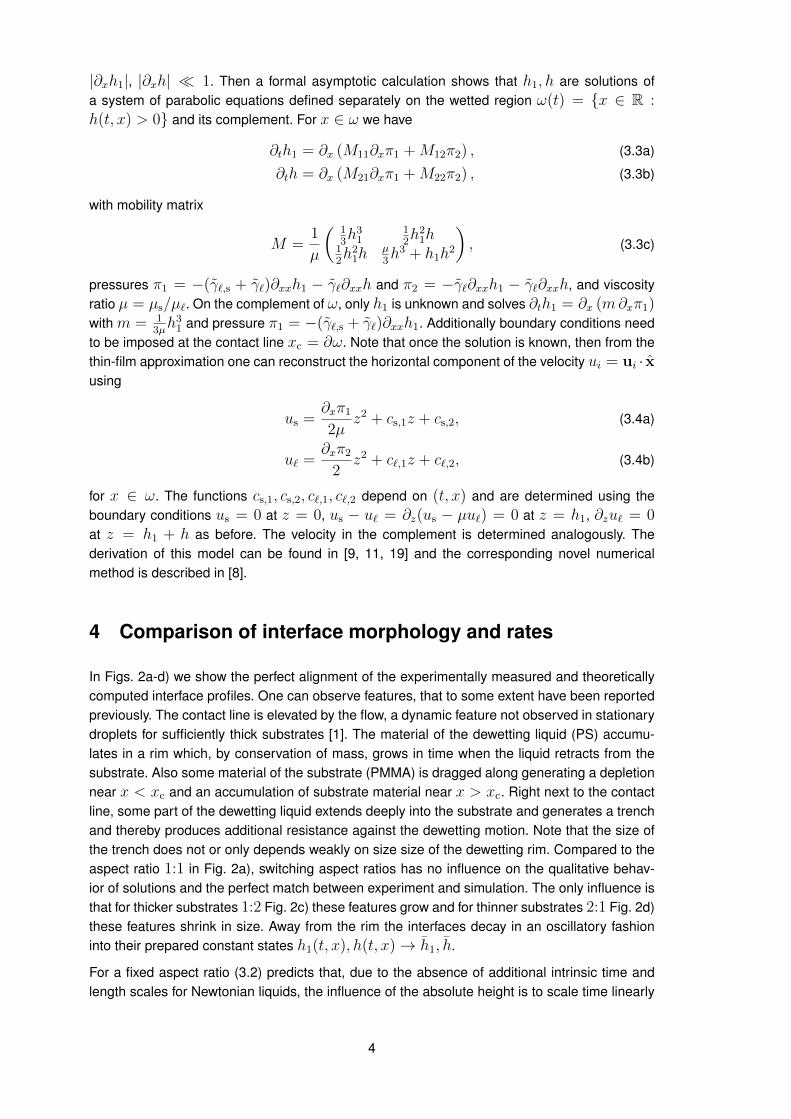
Figure 4: (left) Dewetted distance xc for aspect ratios 1:1 (240nm:240nm), 2:1 (90nm:45nm),1:2 (45nm:90nm) from experiment (circles with error) and simulation (dashed lines) suggestingconstant dewetting rates xc,1:1 = 4.4×10⁻²nm/s, xc,2:1 = 3×10⁻²nm/s, xc,1:2 = 5.2×10⁻²nm/s, where (right) longer simulations prove that rates xc decrease depending on theaspect ratio (gray dashed lines guide the eye)
Also the experimental contact line dynamics, i.e. xc as a function of time, is perfectly reproducedby the thin-film model for various aspect ratios, see Fig. 4 (left). The dewetting rate appearslinear xc ∼ t, however, there is no theoretical indication whatsoever that for aspect ratios andviscosity ratios of order one there should be a power-law dewetting rate. Also, a closer inspectionof the rates in Fig. 4 (left) and further simulation for other aspect ratios in Fig. 4 (right) provesthat the velocity slowly decreases over time with transient rates depending on the aspect ratio athand, i.e. xc ∼ t−0.22 for 1:2 and xc ∼ t−0.11 for 20:1. This also confirms previous speculationsby Krausch et al. [12] about the transient nature of the observed dewetting dynamics.
5
Since the thin-film model accurately predicts shapes and speeds of the liquid-liquid dewetting,we extend this approach and discuss flow features that otherwise would be inaccessible formeasurements. For instance, the dissipation is in balance with the driving surface tension∫
Ω1
12(∂zus)
2dΩ +∫
Ω2
µ2(∂zu`)
2dΩ = (−S)xc, (4.1)
and thereby shows where the materials offer resistance to the flow. While the driving force isrelatively easy to understand, the dissipation depends on local details of the flow field. For atypical layer aspect ratio 1:1 we show rim profiles overlaid with the dominating horizontal com-ponent of the velocity in FIG. 5 (top) and the corresponding dissipation (∂zu`)
2 and µ(∂zus)2
(bottom), the latter on a logarithmic scale. The bottom panel of Fig. 5 shows there are substan-tial contributions to the dissipation from both the liquid and the substrate. Only for the equalviscosities considered here, the velocity field smoothly extends from the free liquid-air inter-face to the substrate-solid interface leading to a continuous dissipation. At the solid interface atz = 0 and remote from the rim |x − xc| 0 the velocity field and the dissipation vanishes.Due to the boundary conditions ∂zus,` = 0 the dissipation also vanishes at the liquid/air andsubstrate/air interface. The velocity points mainly in the positive x-direction with its maximumat the contact line. However, there is also a rather strong and localized backflow in the liquidsubstrate below the depression of the liquid-substrate interface. This backflow is due to con-servation of mass balancing the forward transport of the upper depression. There and close to
Figure 5: (top) velocities us, u` computed from (3.4) and (bottom) corresponding dissipationDs = (∂zus)
2 and D` = µ(∂zu`)2 on logarithmic scale normalized to their respective max-
imal values during dewetting with aspect ratio 1:1. The additional colored curves indicate thecumulative dissipation in substrate
∫ x ∫ h10 Dsdz dx (blue) and liquid
∫ x ∫ h1+hh1
D`dz dx (red) inarbitrary units.
the contact line the maximal dissipation (density) is reached. However, due to the small size ofthese regions the integrated dissipation near contact line and in the remaining rim are of thesame order. To emphasize this fact, we also plot the cumulative dissipation in the lower panel ofFIG. 5. Since the shear rate is largest at the solid interface where z = 0, clearly the dissipationfor an aspect ratio 1:1 is larger in the substrate for the short and moderate times considered
6
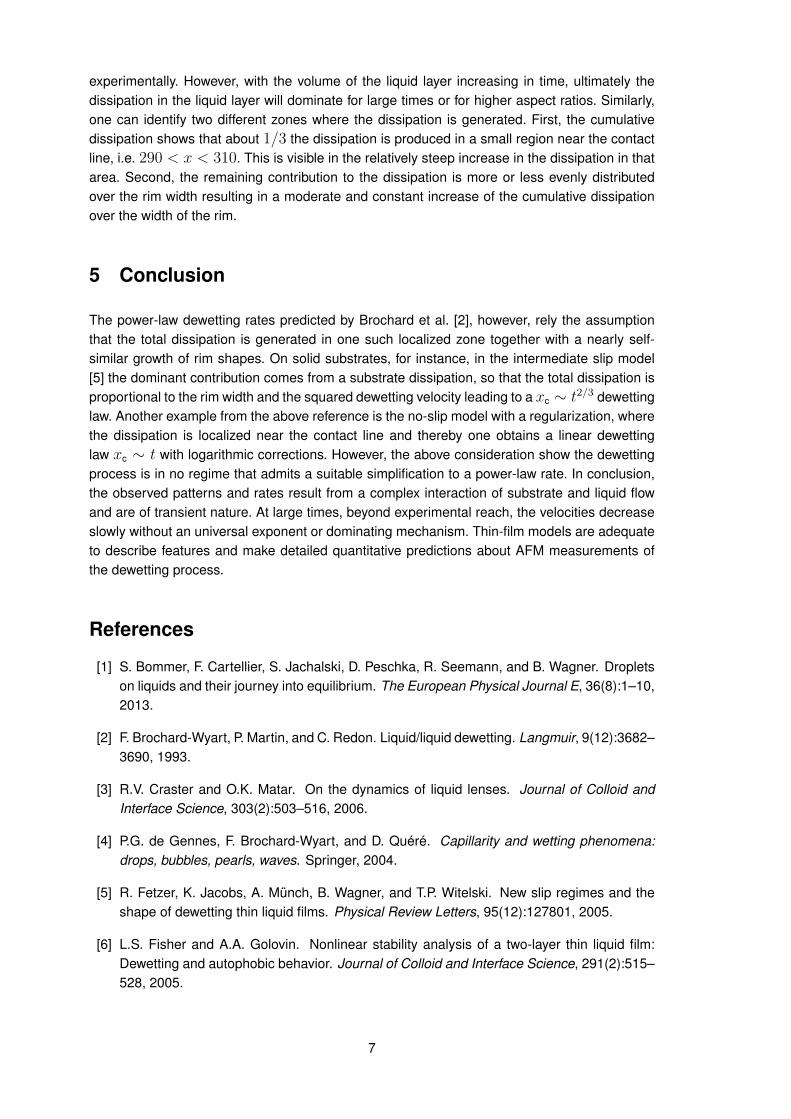
experimentally. However, with the volume of the liquid layer increasing in time, ultimately thedissipation in the liquid layer will dominate for large times or for higher aspect ratios. Similarly,one can identify two different zones where the dissipation is generated. First, the cumulativedissipation shows that about 1/3 the dissipation is produced in a small region near the contactline, i.e. 290 < x < 310. This is visible in the relatively steep increase in the dissipation in thatarea. Second, the remaining contribution to the dissipation is more or less evenly distributedover the rim width resulting in a moderate and constant increase of the cumulative dissipationover the width of the rim.
5 Conclusion
The power-law dewetting rates predicted by Brochard et al. [2], however, rely the assumptionthat the total dissipation is generated in one such localized zone together with a nearly self-similar growth of rim shapes. On solid substrates, for instance, in the intermediate slip model[5] the dominant contribution comes from a substrate dissipation, so that the total dissipation isproportional to the rim width and the squared dewetting velocity leading to a xc ∼ t2/3 dewettinglaw. Another example from the above reference is the no-slip model with a regularization, wherethe dissipation is localized near the contact line and thereby one obtains a linear dewettinglaw xc ∼ t with logarithmic corrections. However, the above consideration show the dewettingprocess is in no regime that admits a suitable simplification to a power-law rate. In conclusion,the observed patterns and rates result from a complex interaction of substrate and liquid flowand are of transient nature. At large times, beyond experimental reach, the velocities decreaseslowly without an universal exponent or dominating mechanism. Thin-film models are adequateto describe features and make detailed quantitative predictions about AFM measurements ofthe dewetting process.
References
[1] S. Bommer, F. Cartellier, S. Jachalski, D. Peschka, R. Seemann, and B. Wagner. Dropletson liquids and their journey into equilibrium. The European Physical Journal E, 36(8):1–10,2013.
[2] F. Brochard-Wyart, P. Martin, and C. Redon. Liquid/liquid dewetting. Langmuir, 9(12):3682–3690, 1993.
[3] R.V. Craster and O.K. Matar. On the dynamics of liquid lenses. Journal of Colloid andInterface Science, 303(2):503–516, 2006.
[4] P.G. de Gennes, F. Brochard-Wyart, and D. Quéré. Capillarity and wetting phenomena:drops, bubbles, pearls, waves. Springer, 2004.
[5] R. Fetzer, K. Jacobs, A. Münch, B. Wagner, and T.P. Witelski. New slip regimes and theshape of dewetting thin liquid films. Physical Review Letters, 95(12):127801, 2005.
[6] L.S. Fisher and A.A. Golovin. Nonlinear stability analysis of a two-layer thin liquid film:Dewetting and autophobic behavior. Journal of Colloid and Interface Science, 291(2):515–528, 2005.
7
[7] Y. Hirai, T. Yoshikawa, N. Takagi, S. Yoshida, and K. Yamamoto. Mechanical properties ofpoly-methyl methacrylate (PMMA) for nano imprint lithography. Journal of PhotopolymerScience and Technology, 16(4):615–620, 2003.
[8] R. Huth, S. Jachalski, G. Kitavtsev, and D. Peschka. Gradient flow perspective on thin-filmbilayer flows. Journal of Engineering Mathematics, 94(1):43–61, 2015.
[9] S. Jachalski, D. Peschka, A. Münch, and B. Wagner. Impact of interfacial slip on the stabilityof liquid two-layer polymer films. J. Engr. Math., 86(1):9–29, 2014.
[10] J.F. Joanny. Wetting of a liquid substrate. Physicochemical Hydrodynamics, 9(1-2):183–196, 1987.
[11] J.J. Kriegsmann and M.J. Miksis. Steady motion of a drop along a liquid interface. SIAMJournal on Applied Mathematics, 64(1):18–40, 2003.
[12] P. Lambooy, K.C. Phelan, O. Haugg, and G. Krausch. Dewetting at the liquid-liquid inter-face. Physical Review Letters, 76(7):1110, 1996.
[13] P. Lomellini. Effect of chain length on the network modulus and entanglement. Polymer,33(6):1255–1260, 1992.
[14] J.D. McGraw, T. Salez, O. Bäumchen, E. Raphaël, and K. Dalnoki-Veress. Self-similarityand energy dissipation in stepped polymer films. Physical Review Letters, 109(12):128303,2012.
[15] F.E. Neumann. Vorlesungen über mathematische Physik: Vorlesungen über die Theorieder Capillarität, volume 7. BG Teubner, 1894.
[16] A. Oron, S.H. Davis, and S.G. Bankoff. Long-scale evolution of thin liquid films. Reviewsof Modern Physics, 69(3):931, 1997.
[17] Q. Pan, K.I. Winey, H.H. Hu, and R.J. Composto. Unstable polymer bilayers. 2. The effectof film thickness. Langmuir, 13(6):1758–1766, 1997.
[18] A. Pototsky, M. Bestehorn, D. Merkt, and U. Thiele. Alternative pathways of dewetting fora thin liquid two-layer film. Physical Review E, 70(2):025201, 2004.
[19] A. Pototsky, M. Bestehorn, D. Merkt, and U. Thiele. Morphology changes in the evolutionof liquid two-layer films. The Journal of chemical physics, 122:224711, 2005.
[20] T. Salez, J.D. McGraw, S.L. Cormier, O. Bäumchen, K. Dalnoki-Veress, and E. Raphaël.Numerical solutions of thin-film equations for polymer flows. The European Physical Jour-nal E, 35(11):1–9, 2012.
[21] C. Wang, G. Krausch, and M. Geoghegan. Dewetting at a polymer-polymer interface: filmthickness dependence. Langmuir, 17(20):6269–6274, 2001.
[22] S. Wu. Surface and interfacial tensions of polymer melts. ii. poly (methyl methacrylate), poly(n-butyl methacrylate), and polystyrene. The Journal of Physical Chemistry, 74(3):632–638, 1970.
8