Embed Size (px)
Citation preview

Liquid-Jet Photoemission Studies of the Interface
between Metal-Oxide Nanoparticles and Aqueous
Solution
Im Fachbereich Physik der Freien Universität Berlin
eingereichte Dissertation
zur Erlangung des akademischen Grades
eines Doktors der Naturwissenschaften (Dr. rer. nat.)
vorgelegt von
Hebatallah Ali
Berlin
2019
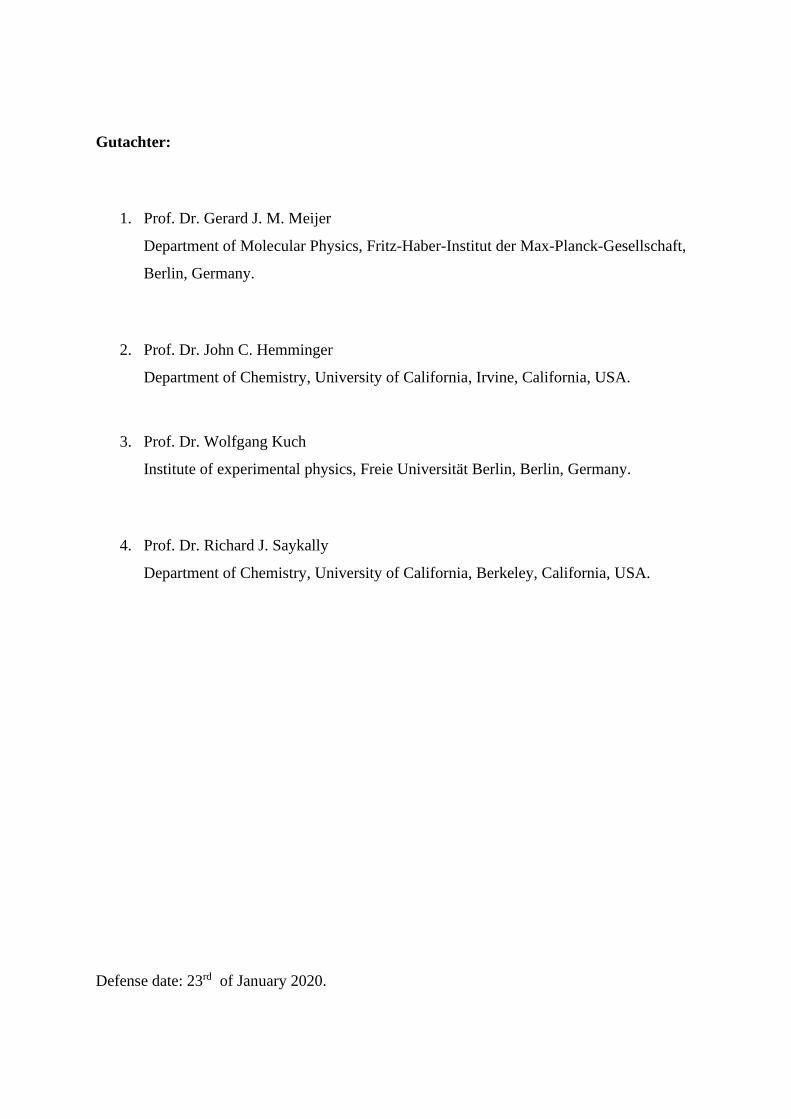
Gutachter:
1. Prof. Dr. Gerard J. M. Meijer
Department of Molecular Physics, Fritz-Haber-Institut der Max-Planck-Gesellschaft,
Berlin, Germany.
2. Prof. Dr. John C. Hemminger
Department of Chemistry, University of California, Irvine, California, USA.
3. Prof. Dr. Wolfgang Kuch
Institute of experimental physics, Freie Universität Berlin, Berlin, Germany.
4. Prof. Dr. Richard J. Saykally
Department of Chemistry, University of California, Berkeley, California, USA.
Defense date: 23rd of January 2020.

This Thesis was written under the supervision of
Prof. Dr. Gerard J. M. Meijer and Dr. Bernd Winter
at the Molecular Physics department- Fritz Haber
Institute of the Max Planck Society.
During this course, I was granted a PhD scholarship
from the Egyptian Ministry of Higher Education and
Ain Shams University, Cairo, Egypt.

i
Abstract
This thesis reports on the electronic structure of water adsorption on transition metal oxide
(TMO) nanoparticle (NP) surfaces using liquid jet photoelectron spectroscopy. My focus is to
determine the nature of water adsorption (associative/dissociative) on TMO surfaces from NPs fully
immersed in liquid water. Probing the electronic structure of this solid — liquid interface is crucial for
a variety of scientific and technological fields, such as material science, corrosion, electrochemistry,
and photocatalytic water splitting. Especially the latter is receiving ample interest due to the current
environmental pollution and energy shortage problems. In this context, I have studied the molecular
species forming at the NP — water interface for the arguably most efficient photocatalytic systems:
hematite iron oxide (α-Fe2O3) and anatase titanium dioxide (TiO2). Using soft X-ray photoelectron
spectroscopy (PES) from liquid microjets, I have detected valence and core-level photoelectrons, as
well as Auger electrons, from liquid water, NP – water interface, and the interior of the aqueous-phase
NPs. Such methods are shown to be highly sensitive to the adsorbed interfacial species on the NP
surfaces.
In the α-Fe2O3 NP aqueous solution, water has been found to be dissociatively adsorbed on the
surface, proven by the water-dissociation product hydroxide, detected by resonant and non-resonant
photoelectron spectroscopy (PES), as well as partial-electron-yield X-ray absorption spectroscopy
(PEY-XAS) at the oxygen K-edge. The iron L3-edge PEY-XAS measurements have proven to be
sensitive to the chemical environment of the Fe3+ ions at the NP surface. By comparing the pre-edge
peak intensities of local versus non-local autoionization signals, the ultrafast charge-transfer time from
interfacial Fe3+ into the aqueous environment can be estimated.
The TiO2 NP — water interface study has revealed that the nature of water interaction with a
defect-free TiO2 surface depends on the surrounding chemical environment. Water has been found to
be molecularly adsorbed at the surface in an acidic environment and dissociatively adsorbed at a pH
above neutral (slightly basic, pH 7.8). This is inferred from resonant and non-resonant PES and PEY-
XA spectra at the O K-edge, taken from the adsorbed oxygen interfacial species. Based on these
findings, combined with the previously reported ambient pressure photoelectron spectroscopic results
of similar systems at neutral pH, I have proposed a TiO2—water interaction mechanism which depends
on the aqueous solution pH and hence on the proton mobility in these environments. This mechanism
solves a long-standing question about the nature of water adsorption on TiO2 surfaces.
Furthermore, soft X-ray photoelectron spectroscopy (XPS) and PEY-XAS were carried out at
the nitrogen K-edge for TiO2 NPs dispersed in 0.3 M NH4OH aqueous solution (pH 7.8) to identify
the composition and thickness of the so-called Stern layer surrounding the TiO2 NPs. It was found to
be composed of NH4+ ions, with an approximately 0.35 nm thickness. Also, I observed a significant
amount of OH- molecules created upon water dissociation on the TiO2 surface and subsequently
trapped around the Stern layer, forming a diffuse layer, by comparing the XP spectra of hydroxide
signals from the NP aqueous solution with the reference samples (0.5 M NH4OH and 5 M NaOH
solutions). Complementary information is obtained from the bulk sensitive photon-emission
spectroscopic study (photon yield detection) at the oxygen K-edge which allows to quantify the total
amount of OH- in the TiO2 aqueous solution to be 0.6 M. Such a large OH- concentration can only be
explained when taking a source of OH- generation into account, which is water dissociation at the TiO2
NP surface. I also provide experimental evidence that almost all OH- ions in the TiO2 NP aqueous
solution coordinate with three water molecules, forming a tetrahedral hydration configuration, and
constitute > 0.44-nm-thick diffuse layers around TiO2 NPs. This diffuse layer, together with the NH4+
Stern layer, form a > 0.8-nm-thick electric double layer (EDL) around the dispersed TiO2 NPs. Lastly,
I proposed two models of charged-ion distributions in the EDL around TiO2 NPs, where the proton is
either anchored at the TiO2 surface or quickly diffusing away into the bulk solution. Both models are
preventing the unwanted H+ — OH- recombination, although the second model is more realistic as the
efficient H+ dynamics provides continuous freeing surface sites for further water dissociation.

ii
iii
Zusammenfassung
Diese Arbeit berichtet über die Aufklärung und Erforschung der elektronischen Struktur der Wasser-
Grenzschicht an Übergangsmetalloxid (TMO) Nanopartikel (NP) Oberflächen unter Verwendung der
Flüssigstrahl-Photoelektronen Spektroskopie. Mein Fokus liegt auf der Bestimmung der Art
(assoziativ/dissoziativ) der Wasseradsorption an TMO-Oberflächen aus vollständig eingetauchten
Nanopartikeln in flüssigem Wasser. Die Erforschung der elektronischen Struktur dieser Fest-Flüssig-
Grenzfläche ist entscheidend für eine Vielzahl von wissenschaftlichen und technologischen Bereichen in der
Materialwissenschaft, bei der Korrosion, in der Elektrochemie und bei der photokatalytischen Wasserspaltung.
Vor allem Letzteres stößt aufgrund der aktuellen Umweltverschmutzung und Energieknappheit auf großes
Interesse. In diesem Zusammenhang habe ich die Bildung molekularer Spezies an der NP-Wasser-Schnittstelle
für die effizientesten photokatalytischen Systeme untersucht: Hämatit-Eisenoxid (α-Fe2O3) und Anatase-
Titandioxid (TiO2). Mit Hilfe der Photoelektronen Spektroskopie (PES) im weichen Röntgenbereich an einem
Mikroflüssigkeitsstrahl habe ich Valenz- und Rumpf-Niveau-Photoelektronen sowie Auger-Elektronen von
flüssigem Wasser, aus der Nanopartikel-Wasser-Grenzfläche und aus dem Inneren der Nanopartikel in der
wässrigen Phase erfasst. Solche Verfahren erwiesen sich als sehr empfindlich gegenüber Änderungen in der
Zusammensetzung der Spezien an der NP-Oberfläche.
Für die Grenzfläche zwischen den α-Fe2O3 Nanopartikeln und Wasser wurde festgestellt, dass Wasser an
der Oberfläche dissoziativ adsorbiert wird. Dies wurde aus den Hydroxyl-Signalen geschlossen, die mit Hilfe
der resonanten, nicht-resonanten und den sogenannten partiellen Elektronen-Ausbeute-
Röntgenabsorptionsspektren (PEY-XA) an der Sauerstoff K-Kante gewonnen wurden. Entsprechend haben sich
die Eisen L3-Kanten PEY-XAS-Messungen als empfindlich gegenüber der chemischen Umgebung der Fe3+-
Ionen an der NP-Oberfläche erwiesen. Durch den Vergleich des Anteils der vor der Kante liegenden Peak-
Intensitäten an lokalen und nicht-lokalen Autoionisationssignalen wird eine sehr schnelle
Ladungsübertragungszeit von ~ 1fs von den Fe3+-Ionen in der Grenzfläche in die wässrige Umgebung
abgeschätzt.
Die TiO2-Nanopartikel-Wassergrenzflächenstudie hat gezeigt, dass die Art der Wasserwechselwirkung
mit einer defektfreien TiO2-Oberfläche von der chemischen Umgebung abhängt. Es wurde festgestellt, dass im
sauren pH-Bereich Wasser molekular an der Oberfläche adsorbiert und im neutralen bis leicht-basischem pH-
Bereich (pH 7,8) dissoziativ adsorbiert wird. Dies konnte anhand von Signalen der adsorbierten Sauerstoff-
Grenzflächenspezies, die von resonanten, nicht-resonanten und den PEY-XA-Spektren an der O-K-Kante
gewonnen wurden, geschlossen werden. Basierend auf diesen Erkenntnissen und aus den zuvor berichteten
Photoelektronen-spektroskopischen Ergebnissen eines ähnlichen Systems bei neutralem pH-Wert schlage ich
einen TiO2-Wasser-Interaktionsmechanismus vor, der von dem pH-Wert der wässrigen Lösung und damit von
der Protonenmobilität in diesen Umgebungen abhängt. Dieses Modell beantwortet eine seit langem bestehende
Frage nach der Art der Wasseraufnahme auf der TiO2-Oberfläche. Darüber hinaus wurden
Photoelektronenspektroskopie-Messungen im weichen Röntgenbereich und PEY-XAS Messungen an der
Stickstoff-K-Kante für TiO2-Nanopartikel durchgeführt, die in einer 0,3 M NH4OH-Wasserlösung (bei pH 7,8)
dispergiert sind, um die Zusammensetzung und Dicke der so genannten Stern-Schicht, die die TiO2-Nanopartikel
umgibt, zu identifizieren. Es wurde festgestellt, dass die Stern-Schicht aus NH4+-Ionen besteht und einer Dicke
von etwa 0,35 nm hat. Außerdem beobachtete ich eine signifikante Menge an OH- Molekülen, die bei der
Wasserdissoziation auf der TiO2-Oberfläche entstanden sind und anschließend ausserhalb der Stern-Schicht sich
ansammeln und eine diffuse Schicht bilden. Dies wurde anhand von Vergleichen der Hydroxidsignalen in den
Photoelektronen-Spektren aus der Nanopartikel-Wasserlösung mit den Referenzproben (0,5 M NH4OH- und 5
M NaOH-Lösungen) ermittelt. Weitere Erkenntnisse wurden aus den bulk-sensitiven
Röntgenemissionsspektroskopischen Studien (durch Photonenausbeutedetektion) an der Sauerstoff-K-Kante
gewonnen, die es ermöglichte, die Gesamtmenge an OH- in der wässrigen TiO2-Lösung auf 0,6 M zu
quantifizieren. Eine solch große OH- Konzentration kann nur unter Berücksichtigung einer Quelle der OH-
Erzeugung erklärt werden – diese kann nur die Wasserdissoziation an der TiO2-Nanopartikel-Oberfläche sein.
Ich stelle auch experimentelle Beweise zur Verfügung, dass fast alle OH- Ionen in der wässrigen TiO2
Nanopartikel-Lösung mit drei Wassermolekülen tetraedisch koordinieren, die damit eine ca. > 0,44 nm dicke
diffuse Schicht um die TiO2 Nanopartikel bilden. Diese diffuse Schicht bildet zusammen mit der NH4+ Stern-
Schicht eine > 0,8 nm dicke elektrische Doppelschicht (EDL) um die dispergierten TiO2 Nanopartikel.
Schließlich habe ich zwei Modelle der Verteilung geladener Ionen in der EDL um den TiO2 Nanopartikeln herum
vorgeschlagen, bei denen das Proton entweder an der TiO2-Oberfläche verankert ist oder schnell in den Bulk
diffundiert. Beide Modelle verhindern die unerwünschte H+ - OH- Rekombination, obwohl das zweite Modell
realistischer ist, da die effiziente H+ Dynamik eine kontinuierliche Freisetzung von Oberflächenstellen für die
weitere Wasserdissoziation ermöglicht.

iv

v
List of Abbreviations
AP-PES Ambient Pressure Photoelectron Spectroscopy
Aq Aqueous
Aq. sol. Aqueous solution
BE Binding Energy
CPMD Car-Parrinello Molecular Dynamics
CCD Charged Coupled Device
DFT Density Functional Theory
DPU Differential Pumping Unit
EAL Effective Attenuation Length
EDL Electric Double Layer
ETMD Electron Transfer Medicated Decay
Eg Energy gap
FEP Fluorinated Ethylene Propylene
Fs Femtosecond
HER H2 Evolution Reaction
HOMO Highest Occupied Molecular Orbital
HPLC High-Performance Liquid Chromatography
IC Interaction Chamber
ICD Intermolecular Coulombic Decay
IMFP Inelastic Mean Free Path
KE Kinetic Energy
LUMO Lowest Unoccupied Molecular Orbital
MCP Micro-Channel Plate
MD Molecular Dynamics
ML Monolayer
NP Nanoparticle
OER O2 Evolution Reaction
PCEY Partial Electron Yield spectrum integrated over the
relaxation channels involving solely core orbitals
PES Photoelectron Spectroscopy

vi
PEC Photoelectrochemical Cells
PEEK Poly-Ether Ether Ketone
PEY-XA Partial Electron Yield X-ray Absorption
PFY-XA Partial Fluorescence Yield X-ray Absorption
PVEY Partial Electron Yield spectrum integrated over the
relaxation channels involving solely valence
orbitals
PZC Point of Zero Charge
RIXS Resonant Inelastic X-ray Scattering
RPES Resonant Photoemission Spectrum
SEM Scanning Electron Microscopy
TEY Total Electron Yield
TMO Transition Metal Oxide
vdW van der Waals
VLS Variable Line Spacing
XA X-Ray Absorption
XANES X-Ray Absorption Near-Edge Structure
XMCD X-Ray Magnetic Circular Dichroism
XRD X-Ray Diffraction

vii
Contents
Abstract .................................................................................................................................... i
Zusammenfassung................................................................................................................. iii
List of Abbreviations ............................................................................................................. v
Chapter 1
Introduction and Motivation .................................................................................. 1
1.1 Thesis Outline ............................................................................................................ 6
Chapter 2
X-ray Spectroscopy .................................................................................................. 9
2.1 X-ray Radiation ......................................................................................................... 9
2.2 Photoionization .......................................................................................................... 9
2.3 Relaxation Processes via Electron Emission ........................................................... 12
2.3.1 Auger-Electron Spectroscopy and Resonant Photoelectron Spectroscopy ............. 14
2.4 Electron Scattering ................................................................................................... 15
2.5 Relaxation Processes via Photon-Emission ............................................................. 18
Chapter 3
Experimental Techniques ..................................................................................... 21
3.1 SOL3 PES Experimental Setup ................................................................................ 21
3.1.1 Interaction Chamber ................................................................................................ 21
3.1.2 Electron Analyzer .................................................................................................... 23
3.1.3 Differential Pumping Unit ....................................................................................... 25
3.2 LiXEdrom Experimental Setup ............................................................................... 26
3.3 Liquid Microjet Sample Introduction System ......................................................... 28
3.4 Synchrotron Radiation ............................................................................................. 30
3.4.1 U49-2/PGM-1 Beamline .......................................................................................... 32
viii
Chapter 4
Photoemission and Photon-Emission Spectra from Liquid Water ................... 35
4.1 Valence Band and O 1s Core-Level Photoelectron Spectra .................................... 35
4.2 O K-edge Partial Electron Yield X-ray Absorption Spectra ................................... 38
4.3 O K-edge Partial Fluorescence Yield X-ray Absorption Spectra ............................ 40
Chapter 5
Electronic Structure of the Hematite Fe2O3 Nanoparticle – Aqueous Interface
................................................................................................................................. 43
5.1 Introduction .............................................................................................................. 44
5.2 Methods and Materials ............................................................................................ 46
5.3 Results and Discussion ............................................................................................ 47
5.3.1 Valence Photoelectron Spectra ................................................................................ 47
5.3.2 O 1s Resonant Photoemission and Partial-Electron-Yield XA Spectra .................. 50
5.3.3 O 1s Core-Level Photoelectron Spectra .................................................................. 56
5.3.4 Fe 2p Photoemission and PEY-XA Spectra ............................................................ 58
5.4 Conclusions.............................................................................................................. 64
5.5 Appendix .................................................................................................................. 66
5.5.1 Lattice-Oxygen O 1s Absorption Spectra from α-Fe2O3 NP Aqueous Solution ..... 66
5.5.2 Nitrate and Hydroxide O 1s Absorption Spectra from Fe2O3 NP Aqueous Solutions
................................................................................................................................. 67
5.5.3 Adsorbed Nitrate and Hydroxide on the NP Surface Observed in the O 1s RPE
Spectra from Fe2O3 NP Aqueous Solutions ............................................................. 68
5.5.4 Valence Photoelectron Spectra from 1 M HNO3 Aqueous Solution ....................... 69
5.5.5 O 1s Photoelectron Spectra from Fe2O3 NP Aqueous Solution .............................. 70
Chapter 6
Electronic Structure of the Anatase TiO2 Nanoparticle— Aqueous Interface 73
6.1 Introduction .............................................................................................................. 74
6.2 Methods and Materials ............................................................................................ 77

ix
6.3 Results and Discussion ............................................................................................ 78
6.3.1 Ti L-edge PEY-XA Spectra ..................................................................................... 78
6.3.2 O 1s Off-resonant Photoemission Spectra ............................................................... 80
6.3.3 O K-edge Photoemission and PEY-XA Spectra ...................................................... 82
6.4 Conclusions.............................................................................................................. 91
6.5 Appendix .................................................................................................................. 92
6.5.1 Valence Band Photoelectron Spectra Measured On-resonant and Off-resonant at the
Ti L-edge for the [2:1]NH4+ NP(aq) Solution ............................................................ 92
6.5.2 The 10Dq Energy Splitting of the Ti 3d Orbital Detected from TiO2 NP Aqueous
Solutions .................................................................................................................. 93
Chapter 7
X-ray Spectroscopic Characterization of the Electric Double Layer (EDL)
around TiO2 Nanoparticles Stabilized in NH4OH Aqueous Solution ............... 95
7.1 Introduction .............................................................................................................. 96
7.2 Methods and Materials ............................................................................................ 98
7.3 Results and Discussion ............................................................................................ 99
7.3.1 N 1s Off-resonant Photoemission and PEY-XA Spectra ........................................ 99
7.3.2 O1s Off-resonant Photoemission Spectra .............................................................. 101
7.3.3 O K-edge PFY-XA Spectra ................................................................................... 104
7.4 Conclusion ............................................................................................................. 110
7.5 Appendix ................................................................................................................ 111
7.5.1 Fitting Parameter of O1s PE Spectra in Figure 7-3 ............................................... 111
7.5.2 PFY-XA Spectra of Neat Water and TiO2 NPs [1:1]Cl- Aqueous Solutions ......... 112
7.5.3 Fitting Parameter of O K-edge PFY-XA Spectra in Figure 7-4 and Figure A-7-1
............................................................................................................................... 113
7.5.4 Calculation Details of the OH- Molarity in the TiO2 NPs [2:1]NH4+ Aqueous Solution:
............................................................................................................................... 114

x
Chapter 8
Summary and Outlook ........................................................................................ 115
8.1 Summary of the Results ......................................................................................... 115
8.2 Other Projects ........................................................................................................ 116
8.3 Outlook .................................................................................................................. 118
References ........................................................................................................................... 125
Acknowledgements ............................................................................................................ 147
Short Curriculum Vitae .................................................................................................... 149
Publications ........................................................................................................................ 151

1
Chapter 1
Introduction and Motivation
The energy crisis, global warming, and environmental pollution are the most crucial problems
facing humankind.1 The fact that our societies are based on fossil fuel is feeding those problems. Also,
the continuous increase in human population, the expansion of the global economy and fast
development of industrial society have required a commensurate increase in energy sources to fulfill
the needs of the rapidly changing world civilization. Here, fossil fuels represent the consumable energy
source most heavily relied on.2 They cannot continue to play this role for long, as it fails to fulfill the
increasingly sophisticated needs of our worldwide civilization. Fossil fuels are essentially the product
of a natural hyper-slow carbon cycle3 that took millions of years. This makes it quantitatively limited,
and it will be consumed at a certain point in the future. On the other side, fossil fuel consumption is
accompanied by the emission of so-called “greenhouse gases” such as carbon dioxide, sulfur and
nitrogen oxides. These greenhouse gases are the main causes of environmental pollution, climate
change and global warming.4
Hence, an alternative energy source is urgently needed. However, it is also important to
maintain the beneficial factors of using fossil fuels such as their high energy density, ease of
transportation and convenience in energy release.5 This high energy density actually comes from the
sunlight which implies that another conversion method of this energy into chemical potential would
be the best candidate for clean and renewable energy in the future. Sunlight is an extremely high-
energy source: Half an hour of sunshine on Earth provides sufficient energy to cover all user needs
worldwide for a full year.6-7 Accordingly, research is dedicated to developing effective strategies for
conversion and harvesting the solar energy as well as storing it via solar cells, photovoltaic cells and
H2 fuel generation.5 The latter is the technology most-expected to replace fossil fuel due to its unique
advantages i.e. (i) its high energy density of 120-142 kJ/kg, (ii) the fact that it is extracted by splitting
liquid water molecules (the most abundant molecule on Earth) and (iii) its combustion product (H2O)g,
an environment-friendly gas.
The natural biological water splitting process is photosynthesis where the solar energy is
absorbed by plants and converted to split the water molecules, producing H2 and so-called biological
O2 molecules. This natural photosynthesis has inspired scientists for long time. In 1971 Fujishima and
Honda8 showed that water can decompose at the titanium dioxide surface under applied voltage
(photoelectrochemical (PEC) conditions), which has widely become known as artificial
photosynthesis8:
2
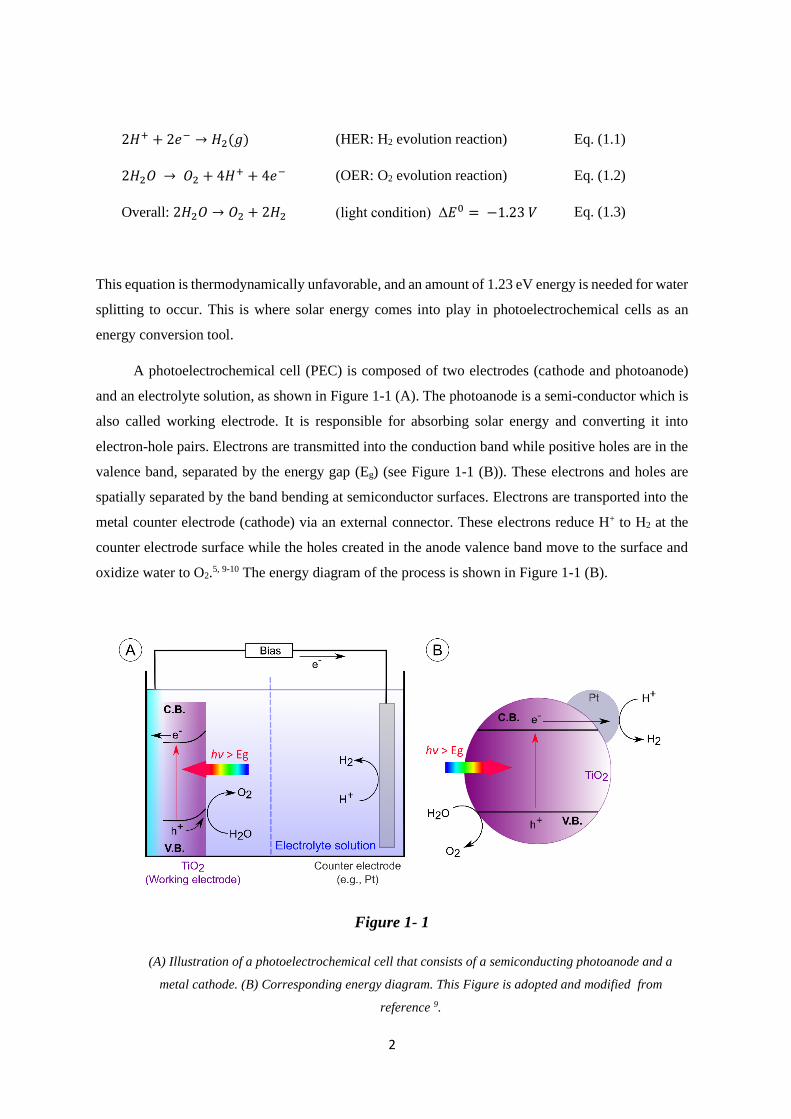
2𝐻+ + 2𝑒− → 𝐻2(𝑔) (HER: H2 evolution reaction) Eq. (1.1)
2𝐻2𝑂 → 𝑂2 + 4𝐻+ + 4𝑒− (OER: O2 evolution reaction) Eq. (1.2)
Overall: 2𝐻2𝑂 → 𝑂2 + 2𝐻2 (light condition) Δ𝐸0 = −1.23 𝑉 Eq. (1.3)
This equation is thermodynamically unfavorable, and an amount of 1.23 eV energy is needed for water
splitting to occur. This is where solar energy comes into play in photoelectrochemical cells as an
energy conversion tool.
A photoelectrochemical cell (PEC) is composed of two electrodes (cathode and photoanode)
and an electrolyte solution, as shown in Figure 1-1 (A). The photoanode is a semi-conductor which is
also called working electrode. It is responsible for absorbing solar energy and converting it into
electron-hole pairs. Electrons are transmitted into the conduction band while positive holes are in the
valence band, separated by the energy gap (Eg) (see Figure 1-1 (B)). These electrons and holes are
spatially separated by the band bending at semiconductor surfaces. Electrons are transported into the
metal counter electrode (cathode) via an external connector. These electrons reduce H+ to H2 at the
counter electrode surface while the holes created in the anode valence band move to the surface and
oxidize water to O2.5, 9-10 The energy diagram of the process is shown in Figure 1-1 (B).
Figure 1- 1
(A) Illustration of a photoelectrochemical cell that consists of a semiconducting photoanode and a
metal cathode. (B) Corresponding energy diagram. This Figure is adopted and modified from
reference 9.

3
There are continuous efforts towards enhancing the water-splitting efficiency, finding novel
catalyzer and increasing the reaction kinetics on the surfaces of both the photoanode and the cathode
to match the rates of charge generation and separation.5 However, some considerations should be taken
into account when choosing semiconductor materials as photoanode for an efficient solar water
splitting:
(i) Potential requirement: From the water splitting energetics, equation (1.3), it follows
that the band gap of the photoanode material should exceed 1.23 eV. Nonetheless, other
energy losses in the PEC are happening during operation (e.g. the overpotential loss at
the electrodes and the ionic loss in the electrolyte), and they should be considered. An
actual cell requires a potential difference between the two halves of the reactions of at
least 1.6 V.5
(ii) Band structure: The energy positions of band-edges of the conduction and valence band
(and not only the bandgap, i.e. the energy difference between them) need to be carefully
taken into consideration as they affect the reduction and oxidation reactions of water.
Also, these band-edge positions are affected by the adsorbed aqueous molecular species
(OH-, H+, H2O) on the electrode surface11. Such information on the band-edge positions
as well as the nature of the water adsorption (associative/ dissociative) on the surface, are
most directly revealed from photoelectron (PE) spectroscopic measurements for which
ultra-high vacuum is needed. Meanwhile, it is challenging to perform PE measurements
from solid surfaces in contact with an aqueous environment (due to the vapor pressure
equilibrium of the liquid water in vacuum, detailed in Section 3.3). I address this lack of
electronic structure information of the liquid—solid interface which is the central aspect
of this study. Also, I review the pervious technical efforts to overcome this apparent
incongruity of measuring PE (in ultra-high vacuum) from solid surface in contact with
liquid water. Finally, I explain my approach to enhance our capability to collect electrons
emitted from solid surfaces covered by bulk aqueous solution.
(iii) High crystallization and surface area: Both the oxidation and reduction reactions
happen at the electrode surfaces. For efficiency enhancement of these reactions, a highly
crystalline surface area is obviously favorable as it provides better charge transport and
higher surface activities for both the OER and the HER.5 Significant efforts have been
dedicated to design and study the efficiency of PEC equipped with nanoparticle (NP)
coated electrodes12-13 as their structures offer a larger surface area.
(iv) Stability: The electrode materials are desired to have long lifetimes as well as high
stability in both acidic and basic solutions to avoid degradation14 which would reduce the
efficiency of the solar water splitting.

4
(v) Low-cost material: For an economically competitive technology, the cost is a big issue.
The selected material should be highly abundant in the Earth’s crust and its exploitation
should be relatively cheap.
Within the context of these requirements, the transition-metal oxides (TMO) are the very fitting
candidates. Surprisingly, our knowledge about their electronic structure interactions with liquid water
is relatively poor. Only with a molecular-level understanding of the water adsorption nature
(molecularly or dissociatively) on the different transition metal oxide surfaces, it would be possible to
develop efficient and competitive photoelectrochemical cells for water splitting. This is the main
motivation of this thesis, which addresses two main aspects: (i) Demonstrate the applicability of PES
for measuring the electronic structure of the transition metal oxide in contact with bulk water
(mimicking the PEC conditions). (ii) Characterize the nature of water interaction with the hematite
iron oxide (Fe2O3) and with the anatase titanium dioxide (TiO2); The choice of these two TMOs is
elaborated next.
The following brief overview of the technical methodologies that have been applied, including
the one I used in this study, is meant to place my work into the context of existing studies:
(i) There is a large number of single-crystal solid surface studies in ultra-high vacuum
condition. The solid surfaces are exposed to liquid water for hours/days before
transferring them into the ultra-high vacuum chamber where the measurements take
place.15-17 Scientists using this ex-situ methodology were relying on the solid surface
being able to “remember” having been exposed to water and ultra-fines traces of the
aqueous adsorbed species remaining bonded on the surface. Although useful, this method
does not represent solids in contact with the liquid water.
(ii) The interactions of well-defined TMO surfaces with few water molecules were studied
under ultra-high vacuum condition. In this method, the H2O molecules are introduced
into the vacuum chamber as gas through a leak valve.18 This method enabled formation
of water “bilayer” at the TMO surfaces.19-21 Although the bilayer gives an indication of
the water adsorption nature, it is still dealing with single to few adsorbed water molecules.
(iii) The so-called “fast-frozen technique” examines TMO—water interaction by freezing
water layers on top of a single crystal surface.22-26 It is very likely that freezing the liquid
is reflected in the measured photoelectron spectra, especially that aqueous ion dynamics
and reactivities are reduced.
(iv) With the continuous development of the photoelectron spectroscopic technique, the so-
called ambient pressure measurements became possible. This refers to photoelectrons
measured from solid surfaces covered by few water layers stabilized by relative

5
humidity.27-29 These are yet model systems, barely representing the solid surface in
contact with bulk water.
(v) In addition, liquid cells are used to collect photoelectron signals across an ultra-thin
graphene membrane (the cell window).30-31 Both the membrane interaction with the water
molecules and its effect of strongly attenuating the photoelectron signal due to the small
inelastic mean free path of the emitted electron (as discussed in Section 2.4) need to be
carefully taken into account.
(vi) The liquid-microjet technique which I use in my studies, allows the introduction of a
laminar water surface of (5-50) μm diameter into the measurement chamber, while
maintaining the vacuum conditions for the detection of photoelectrons from the liquid
(described in detail in Section 3.3). This enables the detection of the electronic structure
of liquid water by coupling the liquid jet technique to photoelectron spectroscopy using
a suitable light source.32-33 In this study, I use synchrotron‐radiation‐based soft X‐ray
electron spectroscopy from a liquid microjet to characterize the electronic structure of the
transition metal oxides—water interface for nanoparticles (NP) dispersed in aqueous
solutions. These nanoparticles represent the solid surface interacting with bulk liquid
water. This approach not only allows the study of the TMO—water interfaces, it also
enables the desirable variation of pH. The results are presented in this thesis (Chapters 5,
6 and 7) for two selected transition metal oxides. It is important to mention that the
stability of the TMO nanoparticles in liquid water is not trivial. NPs tend to reduce their
surface energy by aggregation which leads to precipitation and sedimentation. Only by
adding stabilizer ions into the solution, these ions would be adsorbed at the NPs surface.
This charges the NP surfaces, and NPs repel each other and can thus be stabilized in
solutions without aggregation. On the other side the stabilizer ions would prevent water
molecules from interacting with the NP surface. To overcome this problem specific
procedures have been applied for each sample in order to reduce the number of stabilizer
ions relative to the NP available surface sites. These free NP surface sites can interact
with the surrounding water molecules. Details of the procedure adopted for each sample
are presented in the Section “Methods and Materials” in the corresponding Chapters 5, 6
and 7.
In this thesis, hematite iron oxide (α-Fe2O3) and anatase titanium dioxide (TiO2) interacting with
liquid water (in aqueous solution) are studied with a main focus on characterizing the
associative/dissociative nature of water adsorption. The choice of these systems is based on the
aforementioned requirements for selecting water splitting material. Hematite iron oxide has a band
gap of 2.2 eV while the band gap of anatase TiO2 is 3.2 eV. Accordingly, both materials absorb a
significant amount of the solar spectrum. Furthermore both are highly abundant in the Earth’s crust

6
and are easily extracted which translates in low costs of the PEC. In both cases the efficiency for solar
water splitting compared to other transition metal oxides is relatively high.5
The liquid-jet electronic structure measurements of the (hematite Fe2O3 , anatase TiO2)
nanoparticle—water interface are reported in Chapters 5 and 6 respectively. For the α-Fe2O3
nanoparticle, water is found to be dissociatively adsorbed at the surface in acidic solutions, while for
the TiO2 nanoparticle, water is molecularly adsorbed in the acidic chemical environment and it
interacts dissociatively with the surface at slightly basic pH. In latter case, a complementary study
using photon-emission spectroscopy (here we detect emitted X-ray photons) is performed and reported
in Chapter 7. Due to the large penetration depth of X-rays, this method is highly bulk sensitive and
assists in quantifying the water dissociation on the TiO2 surface. The results are combined with those
of the photoelectron to determine the composition of the Stern layer and of the diffuse layer around
the TiO2 nanoparticle in aqueous solution. In addition, I estimate the Debye length for this specific
sample.
1.1 Thesis Outline
This thesis consists of eight chapters:
Chapter 1: Introduction and Motivation: The problems of the energy crisis, environmental
pollution and global warming are caused by the reliance on fossil fuels as the essential
energy sources. We need to switch from this fuel to a clean and renewable energy source
based on sunlight. The promises and challenges of converting solar energy into H2 fuel
via photoelectrochemical cells are explained. One of those challenges is the lack of
knowledge about the transition metal oxide—water interface, which is the main
motivation of this study. Finally, I elaborate on the specific selection of the hematite iron
oxide and the anatase titanium dioxide, the materials examined in this thesis.
Chapter 2: X-ray Spectroscopy: In this chapter, I focus on describing the basic theories of
photoelectron spectroscopy which is the main technique used in this study. I differentiate
between the initiated X-ray photoionization and the photoexcitation processes and I
discuss the different non-radiative relaxation processes via Auger-electron emission.
After that, I comment on the inelastic mean free path of the electrons in aqueous solution
and its effect on the (limited) probing depth of the photoelectron spectroscopy
measurements. I also briefly introduce the photon-emission (photon-out) spectroscopy by
giving an overview on the different radiative relaxation processes upon
photoionization/photoexcitation by X-ray radiation.
7
Chapter 3: Experimental Techniques: This section focuses on the technical description of the
experimental techniques used in this thesis. I start by describing the SOL3 PES setup
which is used to collect the photoemission spectra shown in this study. Complementary
photon-emission measurements are conducted using the LiXEdrom experimental setup
which is briefly explained as well. Also, the liquid micro-jet technique, by which the
liquid samples are introduced into the vacuum chamber of the SOL3 PES and the
LiXEdrom, is discussed. Lastly, the benefit of using a tunable X-ray source from a
synchrotron radiation facility, like BESSY II, is elaborated. I specifically highlight the
technical parameters of the soft X-ray beam provided by the U49-2/PGM-1 beamline that
was used in this study.
Chapter 4: Photoemission and Photon-emission Spectroscopies from Liquid Water: This
chapter presents the photoemission and photon-emission measurements of liquid water.
These respective spectra serve as references for discussing the results presented in the
subsequent chapters.
N.B.: The term “photoemission” is used here to cover all the electron-out processes by
direct photoelectron emission as well as the secondary electron emission (i.e.: electron
emission by autoionization, such as Auger decay, and secondary electrons) resulting from
electronic relaxation. It should not be confused with the term “photon-emission”, which
is a photon-out process.
Chapter 5: Electronic Structure of the Hematite Fe2O3 Nanoparticle—Aqueous Solution
Interface: This chapter starts with an introduction reviewing the importance of hematite
Fe2O3 as a photocatalytic material, the challenges of investigating the Fe2O3 — water
interfacial electronic structure, the related reported literature and our approach to
measuring it. In the Methods and Materials section, the specific experimental parameters
used to collect the results shown are described and a detailed description of the
investigated samples is provided. The Results and Discussion section is divided into four
parts: (i) valence photoelectron spectra, (ii) O 1s resonant photoemission and partial-
electron-yield XA spectra, (iii) O 1s core-level photoelectron spectra, and (iv) Fe 2p
photoemission and PEY-XA spectra. In each part, the corresponding results are presented
and discussed. That is followed by the Conclusion section. The chapter closes with an
Appendix section.
Chapter 6: Electronic Structure of the Anatase TiO2 Nanoparticle—Aqueous Solution
Interface: Analogous to the pervious chapter, the introduction reviews the titanium
dioxide’s promising role as photocatalytic material, the debate about the nature of water
(molecular/dissociative) adsorption on this surface, the difficulties and attempts to probe

8
the TiO2—water interface by photoelectron spectroscopy, and our approach to measuring
this interfacial electronic structure using TiO2 nanoparticle colloidal aqueous solutions.
Also, the specific experimental parameters used, and a detailed description of the
investigated samples are mentioned in the Methods and Materials section. This is
followed by the results and discussion of the (i) Ti L-edge PEY-XA spectra, (ii) O 1s off-
resonant photoemission spectra, and (iii) O K-edge photoemission and PEY-XA spectra.
This chapter ends with the Conclusion section and an Appendix.
Chapter 7: X-ray Spectroscopic Characterization of the Electric Double Layer (EDL) around
TiO2 Nanoparticles Stabilized in NH4OH Aqueous Solution: This chapter is an
extension of the TiO2 –water interface study. Here I focus only on the dissociative water
interaction, described in Chapter 6, occurring for the above neutral pH ~ 7.8. The
introduction section motivates the importance of enhancing the water dissociation
efficiency by separating the produced (OH-) and (H+) species from each other through
diffusion into the surrounding aqueous environment. This section also explains the
possible parities of the composed electric double layer around a charged surface (TiO2
nanoparticle) in aqueous solution and its effect on the aqueous ion distribution. The
Methods and Materials section states the experimental parameters used during the
photoemission and the photon-emission measurements using the SOL3PES and the
LiXedrom, respectively, and provides a detailed description of the investigated samples.
In the Results and Discussion section, the measurements are presented and discussed,
divided into three parts: (i) N 1s Off-resonant Photoemission and PEY-XA Spectra, (ii)
O 1s Off-resonant Photoemission Spectra, and (iii) O K-edge PFY-XA Spectra. This
chapter ends with a Conclusion Section and an Appendix Section.
Chapter 8: Summary and Outlook: After summarizing the findings of this study, I propose a means
of harvesting the H+ generated from the water dissociative interaction with the TiO2
surface as a way to future applications. Then, I present selected completed side-projects
that I participated in during my PhD which are relevant to this study. Next, I present
selected results from my currently conducted studies of similar NP(aq) systems
(magnetite iron oxide—aqueous interface and cerium dioxide—aqueous interface) based
on the findings reported so far. Lastly, I give an outlook on future studies of the NP(aq)
systems using tender X-rays (1.5-12 KeV).
9
Chapter 2
X-ray Spectroscopy
In this chapter, I explain the main theoretical concepts that form the basis for the experimental
measurements presented in this thesis. Starting from the soft X-ray interaction with matter, I
differentiate between the photoionization and the photoexcitation of the sample upon interacting with
X-ray photons. I also discuss the different radiative and non-radiative relaxation processes. Firstly, I
focus on explaining the non-radiative relaxation processes via Auger-electron emission (the second
order photoemission), distinguishing between the normal, participator and spectator Auger decay
channels. Thereafter, I describe electron scattering and its effect on the photoemission spectroscopy
probing depth. Lastly, I briefly comment on the radiative relaxation processes in photoionized and
photoexcited matter.
2.1 X-ray Radiation
X-ray radiation, also known as Röntgen radiation, is a part of the electromagnetic spectrum that
was discovered in 1895 by Conrad Röntgen.34 It has a wavelength range of ��ngstroms up to
nanometers, shorter than UV photons and longer than gamma rays. Because of their short wavelengths
X-ray beams are ideally suited for the investigation of the structure of matter. The photon energy is
described by the Planck-Einstein relation.
𝐸 = ℎ𝜈 =ℎ𝑐
𝜆𝑝ℎ Eq. (2.1)
where 𝐸 is the photon energy, ℎ is Planck’s constant, 𝜈 is the frequency of the X-ray wave, 𝜆𝑝ℎ is the
wavelength and 𝑐 is the speed of light. X-ray photons can interact with matter either by absorption, or
scattering. I focus in the following section only on the absorption process, in which an X-ray photon
is absorbed and an electron is ejected from the atom or molecule of the material. In order to ionize the
molecule this X-ray photon must have an energy exceeding the binding energy of the electron in its
molecular orbital. The whole process is called photoelectric absorption or photoionization.
2.2 Photoionization
Photoionization is again a photon-in – electron-out process, where a sample is irradiated with
X-ray photons (ℎ𝜈), and electrons are ejected from the system. By measuring the kinetic energy (𝐸𝐾𝑖𝑛)
of the emitted electrons, one obtains the binding energy (𝐸𝐵) of the initial electronic state from the
following equation:
10
𝐸𝐵 = 𝐸𝐾𝑖𝑛 − ℎ𝜈 Eq.(2.2)
In this presentation, 𝐸𝐵 is relative to the vacuum level which is defined as the reference zero. 𝐸𝐵 and
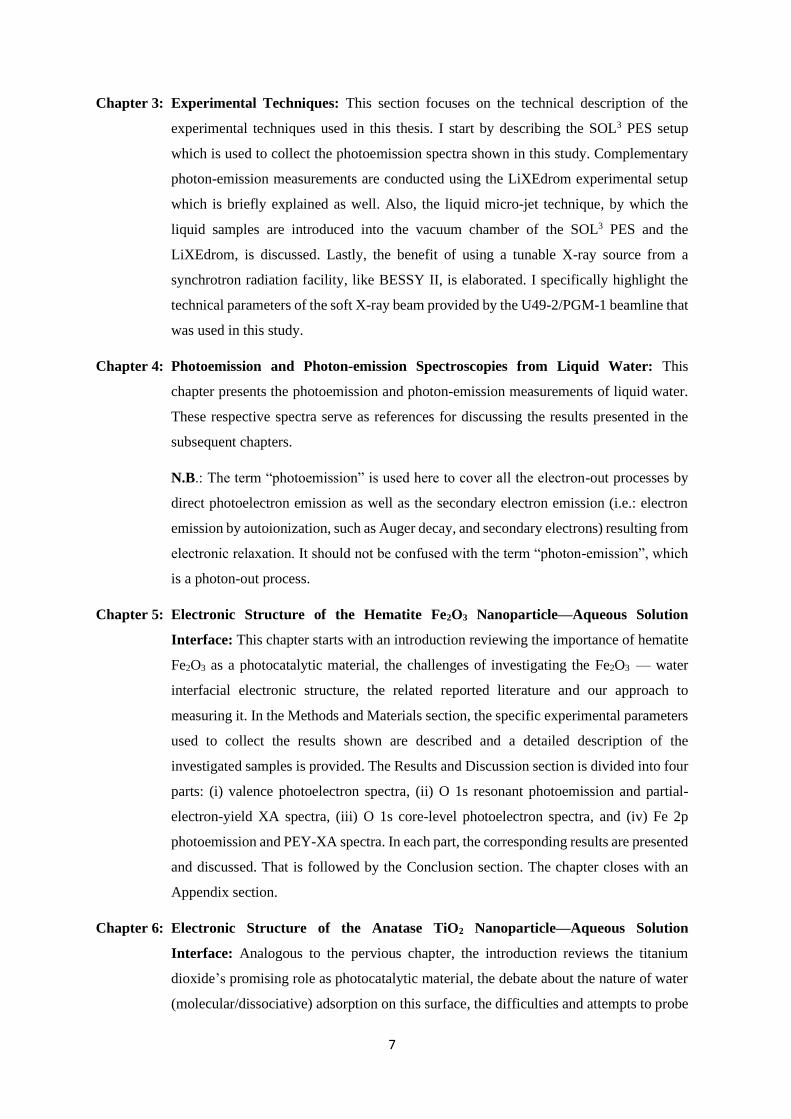
𝐸𝐾𝑖𝑛 are represented in Figure 2-1. Low-energy photons are capable to eject electrons from the valence
levels having binding energies below 40 eV. In contrast, a high energy X-ray photon can probe both,
valence and core electronic orbitals.
Figure 2- 1
Schematic energy diagram showing the photoionization process of an atom. The occupied energy
levels are shown in light blue color, the unoccupied energy levels are shown in red, and the
electrons are represented by dark blue balls. The binding energy and the kinetic energy are
presented on the right-hand side. A low energy photon can eject only valence electrons while a
high energy X-ray photon can ionize both core or valence electrons. This Figure is adapted and
modified from reference 35.
The photoionization process of a condensed material is typically described via a three-step
model. Here, the X-ray photon absorption and electron excitation into a final state inside the matter
are considered the first step. Then, in the second step, this electron is travelling through the sample.
Finally, it escapes from the surface into vacuum (third step). A more realistic approach is the one-step
model where the excited electron travels into a damped energy state. This damping state is taking into
account the limited inelastic mean free path of the electron.36 The latter is described in detail in Section
2.4.
11
For the theoretical interpretation of the photoelectron process several factors must be
considered: (1) the interaction of the incident photon with the emitted photoelectron, (2) the interaction
of the ejected photoelectron with the remaining electrons in the system and how they are reorganized
due to the creation of an electron vacancy, and (3) the continuous nuclear motion effect37-38. However,
such detailed treatment of the photoionization process is not subject of this thesis and it is sufficient
to explain the measurements presented in Chapters (5, 6 and 7) based on the following assumptions:
• The independent particle model: The photoelectron interaction with its surrounding
electrons in the system is completely neglected. The photoelectron is assumed to travel near
the electrons and nuclei in an electrostatic potential.39 This is accurate enough in a weakly
correlated system where no electron-electron interaction occurs, as in aqueous solutions.
• The sudden approximation: This approximation assumes that the photoelectron is fast
enough to leave the system without being affected by the valence shell reorganization. This
is true only for high kinetic-energy electrons which can escape within the core-hole lifetime
(few femtosecond time scale). This assumption is valid for photoelectrons with high kinetic
energies of hundreds of eV, i.e., for large photon energies40 used in this study.
• The Born-Oppenheimer approximation: Based on the Born-Oppenheimer approach,
atomic nuclei motion can be separated from the electron dynamics. As a direct photoelectron
emission process happens within attoseconds,41 which is at least two orders of magnitude
faster than the atomic movement,42 the whole process is happening in the ground-state
geometry.
Based on those assumptions, the electron—electron interaction and the effects of nuclear motion
on the photoionization process are completely neglected. Only the photon absorption and the emission
of one electron should be considered in the Hamiltonian (H0) of the process. We can therefore describe
the perturbated Hamiltonian (H’) as follows:
𝐻′ = 𝑒
𝑚𝑐 𝐴 . �� Eq.(2.3)
where 𝐴 is the vector potential of the photon, 𝑝 is the electron movement momentum operator (𝑝 =
𝔦ħ∇), c is the speed of light, e and m are the charge and mass of the electron, respectively.43-44 Another
expression of Eq.(2.3) would be:
𝐻′ = 𝔦ħ𝑒
𝑚𝑐 𝐴 . ∇ Eq.(2.4)
12
The intensity of the photoemission signal collected upon the photoionization process is directly
dependent on the transition probability of one electron in an (N) electrons system from an initial state
(𝔦 ) with wave function (Ψ𝔦 ) to a final state (f) with wavefunction (Ψf ). This transition probability is
given by Fermi’s Golden Rule:
W𝑡 =2π
ħ |⟨𝛹𝑓 |𝐻′|𝛹𝔦 ⟩|
2. 𝜕(𝐸𝑓 − 𝐸𝑖 − ħ𝜔) Eq.(2.5)
ħ is the reduced Planck constant and ħ𝝎 is the photon energy.43-44
Equations 2.3 – 2.5 are the essential basics of the photoionization process and they are sufficient
to interpret the direct valence band and core level photoelectron spectra presented in this thesis.
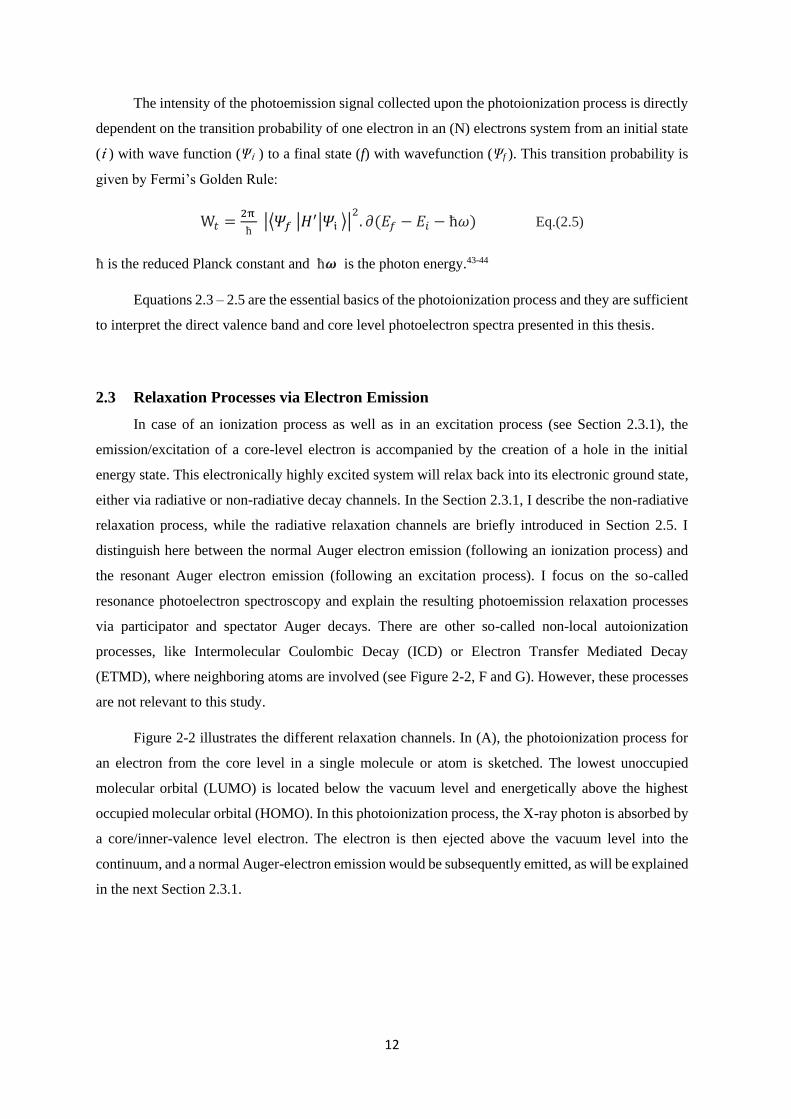
2.3 Relaxation Processes via Electron Emission
In case of an ionization process as well as in an excitation process (see Section 2.3.1), the
emission/excitation of a core-level electron is accompanied by the creation of a hole in the initial
energy state. This electronically highly excited system will relax back into its electronic ground state,
either via radiative or non-radiative decay channels. In the Section 2.3.1, I describe the non-radiative
relaxation process, while the radiative relaxation channels are briefly introduced in Section 2.5. I
distinguish here between the normal Auger electron emission (following an ionization process) and
the resonant Auger electron emission (following an excitation process). I focus on the so-called
resonance photoelectron spectroscopy and explain the resulting photoemission relaxation processes
via participator and spectator Auger decays. There are other so-called non-local autoionization
processes, like Intermolecular Coulombic Decay (ICD) or Electron Transfer Mediated Decay
(ETMD), where neighboring atoms are involved (see Figure 2-2, F and G). However, these processes
are not relevant to this study.
Figure 2-2 illustrates the different relaxation channels. In (A), the photoionization process for
an electron from the core level in a single molecule or atom is sketched. The lowest unoccupied
molecular orbital (LUMO) is located below the vacuum level and energetically above the highest
occupied molecular orbital (HOMO). In this photoionization process, the X-ray photon is absorbed by
a core/inner-valence level electron. The electron is then ejected above the vacuum level into the
continuum, and a normal Auger-electron emission would be subsequently emitted, as will be explained
in the next Section 2.3.1.

13
Figure 2- 2
Schematic representation of the photoionization, the photoexcitation and the non-radiative
relaxation processes. The photoionization of a single atom (presented in A) could relax via Auger
process (B), however an photoionized atom in a medium could relax via intermolecular
coulombic decay (F) or electron transfer mediated decay (G) channels. On the other side, a
photoexcited atom like (C), would relax via participator (D) or spectator (E) Auger decay.
Detailed explanation of these processes is described in the text.

14
2.3.1 Auger-Electron Spectroscopy and Resonant Photoelectron Spectroscopy
Auger spectroscopy is named after Pierre Auger, who explained this second order
photoelectron emission in 1926.45 In Figure 2-2 (B), a normal Auger electron emission process is
sketched. After an electron from a core level is ejected from the system, an electron from a higher
energy level refills the core hole, and transfers its energy to a third electron, which is ejected to the
continuum, leaving the atom behind with two holes. The kinetic energy of the emitted Auger electron
is determined by the energy difference between the electronic states involved in the process and is
completely independent from the excitation photon energy. i.e. an Auger emission line is very element
specific.
The whole Auger process is mediated by the Coulomb interaction between the primary core
hole and the valence shell electrons46-47 that makes it the most probably decay channel for light atoms,
where the Coulomb interaction is larger than the electrostatic potential of the atomic core.48 For a
heavy element, an X-ray emission relaxation process is more dominating as the electrostatic potential
exceeds the hole-electron Coulomb interaction.48
Likewise, in the photoionization process, the intensity of an Auger line is depending on the
Auger transition probability and it is given by equation 2.6:
W𝐴 =2π
ħ |∬ 𝑋𝑓
∗(𝒓𝟏) 𝛹𝑓∗(𝒓𝟐)
𝑒2
|𝒓𝟏−𝒓𝟐| 𝑋𝑖(𝒓𝟏) 𝛹𝑖(𝒓𝟐) 𝑑𝒓𝟏 𝑑𝒓𝟐 |
2
Eq.(2.6)
The two electrons involved in the Auger process have initial (i) and final (f) energy state wavefunctions
𝑋𝑖(𝒓𝟏) ,𝛹𝑖(𝒓𝟐), 𝑋𝑓∗(𝒓𝟏) and 𝛹𝑓
∗(𝒓𝟐). Please note that 𝑋𝑓∗(𝒓𝟏) is the formal hole energy state while
𝛹𝑓∗(𝒓𝟐) is a continuum energy state.49
The creation of a core hole is not necessarily the result of an electron ejection, it also could be
generated due to an excitation of core electron into a valence orbital, which is either unoccupied or
partially occupied as shown in Figure 2-2(C). This case is called “resonant excitation”, here the
excitation photon energy is matching the energy difference between the core level and a valence level
within the atom. At this resonance photon energy, the atom becomes excited, but not ionized and will
relax via radiative or non-radiative processes. The latter is of greater interest for interpreting the results
in this study and it has two types: participator and spectator Auger processes. For both cases, two holes
are created in the atom and one electron is emitted. In the participator process, (Figure 2-2 (D)) the
promoted electron relaxes back to its initial energy state (participate in the relaxation process) while
transferring its energy to a second electron, which escapes the system. For the spectator process shown
in Figure 2-2 (E), the promoted electron only spectates the relaxation of a second electron, transferring
its energy to a third electron, which is leaving the system. The spectator and the participator Auger
electrons are distinct from each other by their kinetic energy as shown experimentally in Section (4.2)
15
for liquid water. Note that the final states of participator resonant Auger-electrons are indistinguishable
from that of photoionization emission i.e., coherent superposition of outgoing electron waves of the
participator Auger emission and the photoionization emission; In the light of this, the process can also
be called a resonantly enhanced photoionization channel. The resonant photoemission spectroscopy
has proven to be a powerful tool for probing the ultrafast charge delocalization50 and in this thesis, it
is successful in highly enhancing the signal from the nanoparticle surface fully immersed in liquid
water and from the solid–liquid interface species, as will be presented in the result chapters 4 and 5.
There are also other important relaxation channels like the intermolecular Coulombic decay
(ICD) and the electron transfer medicated decay (ETMD),51 however, those processes are not studied
in this thesis. As the photoionized atom is not isolated, neighboring molecules can contribute in the
relaxation processes. For the ICD process shown in Figure 2-2 (F), after the photoionization of the
molecule, a second electron fills the core hole and its energy is transferred to a neighboring molecule,
followed by an electron ejection. In the final state every molecular site has one hole. In the ETMD
process presented in Figure 2-2 (G), an electron from a neighboring molecule fills the core hole. A
second electron is then emitted with the respective excess energy. In this process, both holes are on
the neighboring molecular site.
2.4 Electron Scattering
As described throughout in Chapter 2, soft X-ray photoemission is a very powerful technique
for material characterization, as it is highly element-specific with tunable surface sensitivity. In this
section, I explain how electron scattering affects the photoemission spectrum, and what information
we can obtain from solid surfaces covered by many layers of water as in the case of NPs dispersed in
aqueous solution.
A soft X-ray beam (e.g., from a synchrotron radiation source like BESSY II) has an attenuation
length of 1-10 μm when penetrating into the sample.52-53 However, the emitted electrons can only
escape from the most upper few nm below the sample surface. In general, electrons travelling in a
medium have a rather short inelastic mean free path (IMFP), which is highly dependent on their kinetic
energies. The IMFP is defined as the distance between two inelastic scattering events. The
experimentally accessible parameter is the electron effective attenuation length (EAL), which is the
distance after which the number of electrons with a certain kinetic energy drops to 1/e due to (in)elastic
scattering.54-55 This EAL quantity is representing a lower bound for the IMFP.35 IMFP and EAL are
related by the following equation (when ignoring the emission angle dependence):
EAL = (1 − 0.028√𝑧)[0.501 + 0.068 ln 𝐸𝐾𝑖𝑛] IMFP, Eq.(2.7)
Where Z is the atomic number and 𝐸𝐾𝑖𝑛 is the kinetic energy of the emitted electron in eV.56
These quantities are almost identical in the case of weak elastic scattering. However, it is
16
experimentally difficult to distinguish between the elastic and inelastic scattering contributions in the
total photoelectron signal. Theoretically, the EAL was reported 30% lower than the IMFP using
statistical path length simulation models 54, 56. For this study as well as for many other experiments,
determination of the EAL is fully sufficient.55
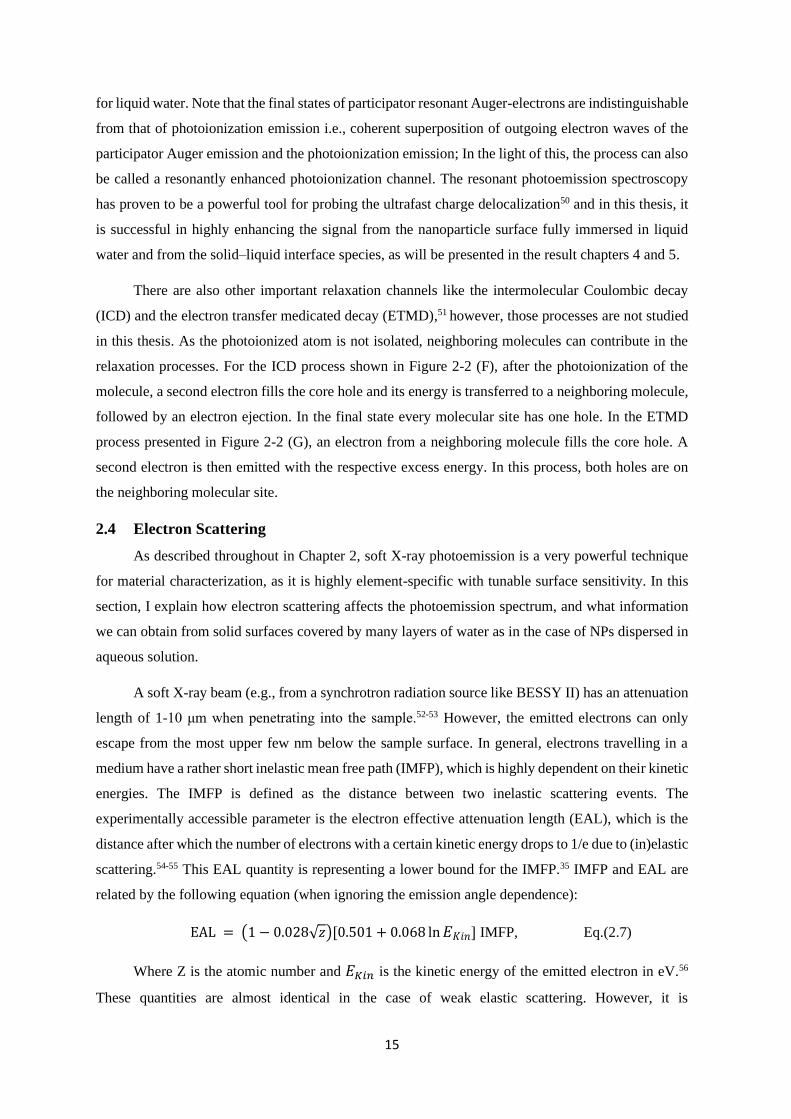
The left-hand side of Figure 2-3, schematically illustrates how electrons emitted in bulk water
and near the water–vacuum interface are affected by inelastic and elastic scattering for two different
kinetic energy regimes. Low-kinetic energy electrons (shown in green color) can only be detected if
they are emitted close to the liquid–vacuum boundary, the electrons generated in the bulk will scatter
away and will likely not reach the photoelectron detector. In red color, the high-kinetic energy
electrons can escape from the interface as well as from the bulk. The right-hand side of Figure 2-3
illustrates the steeper exponential decrease of the low-kinetic energy electrons (green curve) compared
to the high-kinetic energy electrons (red curve) as a function of the liquid water depth. As a result, the
ratio of the surface vs the bulk contribution is for low kinetic energies larger than for high kinetic
energies.
Figure 2- 3
Schematic illustration of the inelastic mean free path (IMFP) and the electron effective
attenuation length (EAL) of emitted photoelectrons in liquid water. Electrons are deflected by
elastic scattering and lose their kinetic energy via inelastic collisions. The PE signal gets
exponentially attenuated with depth as presented by the green and red curves for low and high
kinetic energy electrons, respectively. The area under the curves is shown on the right-hand side
as function of surface and bulk PE signal. This Figure is taken from reference57.
17
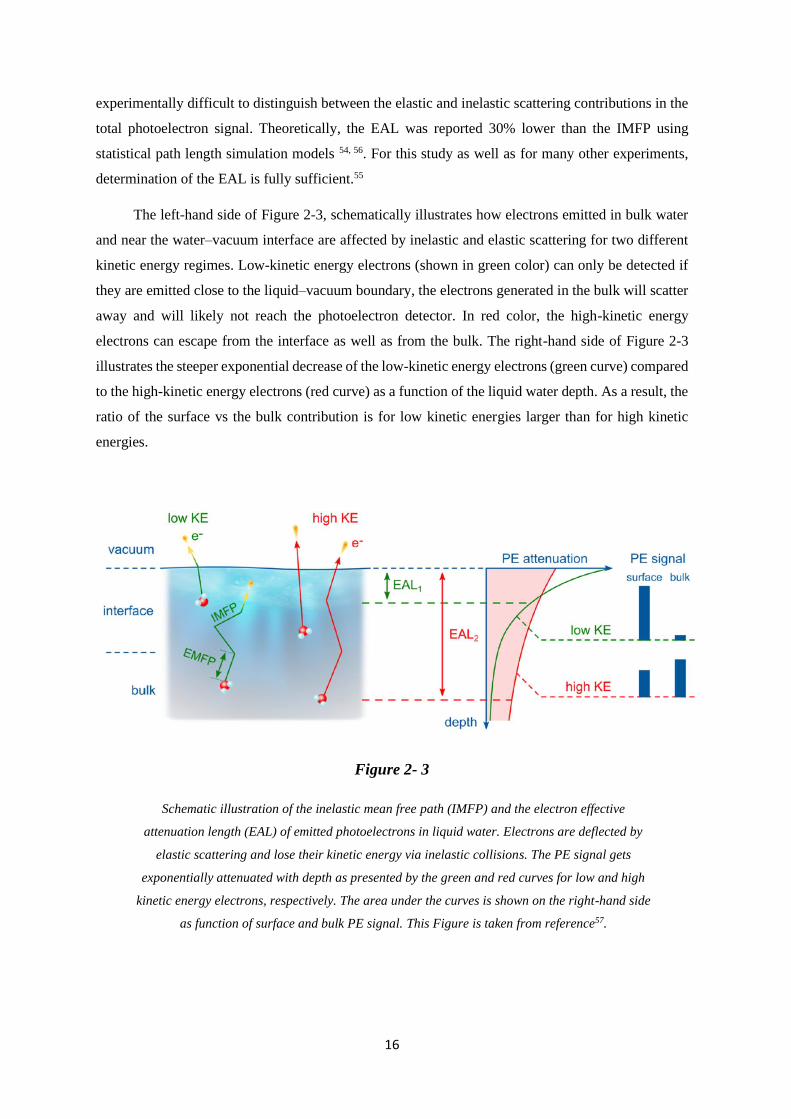
Several efforts have been made to spectroscopically estimate IMFP. Even though, it was
expected to be dependent on the sample nature, Seah and Dench in 1979 reported a “universal curve”
based on an extensive database measured for selected metals56, 58 (qualitatively similar to the grey
curve in Figure 2-4). However, the photoemission probing depth for liquid water is still unresolved.
Figure 2-4 is presenting different results for EAL and IMFP as a function of electron kinetic energy
for liquid water. The blue and green EAL curves used experimental measurement of the O 1s core
orbital photoelectron signal intensities of pure water, which were derived independently, all by liquid
PES, to estimate the probing depth for photoemission55, 59-60. The grey IMFP1 curve was obtained by
constructing a Bethe surface from liquid water inelastic X-ray scattering data (see reference60 for a
more detailed description), which reproduced the shape of the universal curve for solid samples. The
red dashed IMFP curve is estimated by comparing PE measurements from aqueous electrolyte and
molecular dynamics simulations of the depth profile of the solute ions.59 Despite this uncertainty of
the IMFP, it is sufficient for the present study to have a rough estimation of photoemission probing
depth in liquid water.
Figure 2- 4
Experimentally derived effective attenuation length (EAL) and simulated inelastic mean free path
(IMFP) curves for liquid water. Details are described in the main text. This Figure is taken from
reference35.

18
In this thesis, the main interest is in the (resonant) Auger decay channels when sweeping through
the oxygen K-edge, which results in roughly 500 eV kinetic energy electrons. This translates into an
inelastic mean free path of the electrons on the order of a few nanometer (3-5 nm) depending on which
reference curve in Figure 2-4 is considered. Such small IMFPs make it difficult to get reasonable signal
from nanoparticles fully immersed in liquid water: electrons now need to escape through the solution-
vacuum interface and through or from the NPs-solution interface.
However, for small enough size of the NPs (< 30 nm diameter), a relatively high density profile
of nanoparticles at the water—vapor boundary can be established, enabling the detection of emitted
photoelectrons from the nanoparticle surface. Currently, there is no other way to investigate the
nanoparticle–(bulk) water interface other than using the liquid jet technique.
2.5 Relaxation Processes via Photon-Emission
In this section, I briefly summarize the radiative relaxation process upon photoionization or
photoexcitation of an atom or molecule. Besides the normal Auger electron emission, the system can
also emit a photon via X-ray fluorescence while refilling the core-hole (see Figure 2-5 (B)). As
explained in Section 2.3, the resonant photoexcitation will also produce a core-hole (see Figure 2-
5(C)). It is followed by one of two probable radiative decay processes. The first is called resonant
elastic X-ray scattering and is characterized by the fallback of the initially promoted electron to the
core-orbital emitting the same amount of energy as it has received from the absorption (see Figure 2-
5(D)). The second case is called resonant inelastic X-ray scattering and describes the case that any
other electron refills the core hole, resulting in the emission of an X-ray photon with less energy than
the absorbed one (see figure 2-5 (E)).
In general, the quantum yield for fluorescence is much lower than for Auger emission for light
elements (i.e. low atomic numbers).61 On the other hand, the probing depth of photon-emission
spectroscopic techniques is much larger compared to photoelectron-based techniques. Accordingly,
photon-emission spectroscopy provides bulk sensitive measurements with reasonable signal intensity.
It is complementary to photoelectron spectroscopy and useful for the study of the nanoparticle–bulk
aqueous solution systems as shown in Chapter 7.

19
Figure 2- 5
Schematic representation of the photoionization, photoexcitation, and radiative relaxation
processes. The photoionized single atom (presented in A) can relax via a non-resonant X-ray
emission process (B). A photoexcited single atom (C) can either relax via resonant elastic X-ray
scattering (D), or via resonant inelastic X-ray scattering (E). See text for more details.

20

21
Chapter 3
Experimental Techniques
This thesis reports measurements that have been done with two different experimental setups
(SOL3 PES and LiXEdrom ) both at the beamline U49-PGM1 of the synchrotron radiation facility
BESSY II Berlin, Germany. The photoemission studies were performed with the SOL3 PES while the
photon-emission spectra were detected with the LiXEdrom setup. In this chapter, both experimental
setups are described, as well as the liquid sample introduction system (liquid micro-jet). I also provide
a short introduction into synchrotron radiation, which is used as an X-ray excitation and ionization
source in this study, with a special focus on the U49-PGM1 beamline parameters.
3.1 SOL3 PES Experimental Setup
SOL3 setup is an abbreviation of Solid, Solution, and Solar. This reflects our main research
goals, i.e., exploring the solid—solution interface using photons; optionally in the solar spectrum. My
very first measurements from the TiO2 nanoparticle—aqueous interface, performed during the
commissioning beamtime of the SOL3 setup in April 2016, are published as proof of concept
accompanied with the experimental setup description in ref.62 In brief, the SOL3 PES setup consists of
three main parts: (1) The interaction chamber, (2) the electron analyzer, and (3) the differential
pumping unit.
3.1.1 Interaction Chamber
Figure 3-1 represents schematically the interaction chamber (IC) of the SOL3 PES setup. It is
made of non-magnetic stainless-steel material with a dimension of 27x27x42 cm3. The hemispherical
electron analyzer is mounted perpendicularly to both the X-ray beam and the liquid jet axis. The IC is
equipped with a gate valve towards the entrance of the X-ray beam from the differential pumping unit,
while the liquid jet is housed on an X,Y,Z manipulator. The latter makes the alignment of the sample
easier under the electron analyzer pinhole and along the X-ray beam axis to achieve higher PE signals
during the measurements.
In addition, a three-pair Helmholtz coil assembly is surrounding the IC along the three main
axis (illustrated in left bottom of Figure 3-1), to compensate the earth magnetic field at the interaction
point (highlighted by a blue circle in Figure 3-1). The X-ray beam focal point meets the laminar liquid
jet in front of the electron analyzer orifice.
22
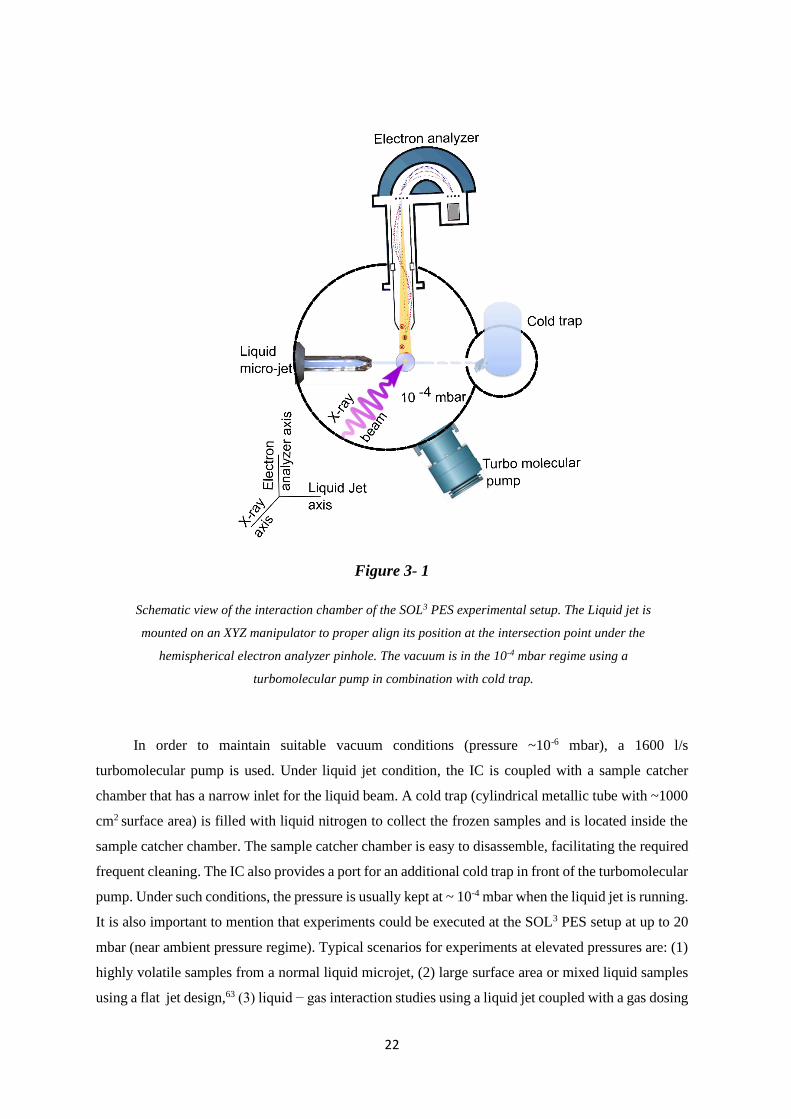
Figure 3- 1
Schematic view of the interaction chamber of the SOL3 PES experimental setup. The Liquid jet is
mounted on an XYZ manipulator to proper align its position at the intersection point under the
hemispherical electron analyzer pinhole. The vacuum is in the 10-4 mbar regime using a
turbomolecular pump in combination with cold trap.
In order to maintain suitable vacuum conditions (pressure ~10-6 mbar), a 1600 l/s
turbomolecular pump is used. Under liquid jet condition, the IC is coupled with a sample catcher
chamber that has a narrow inlet for the liquid beam. A cold trap (cylindrical metallic tube with ~1000
cm2 surface area) is filled with liquid nitrogen to collect the frozen samples and is located inside the
sample catcher chamber. The sample catcher chamber is easy to disassemble, facilitating the required
frequent cleaning. The IC also provides a port for an additional cold trap in front of the turbomolecular
pump. Under such conditions, the pressure is usually kept at ~ 10-4 mbar when the liquid jet is running.
It is also important to mention that experiments could be executed at the SOL3 PES setup at up to 20
mbar (near ambient pressure regime). Typical scenarios for experiments at elevated pressures are: (1)
highly volatile samples from a normal liquid microjet, (2) large surface area or mixed liquid samples
using a flat jet design,63 (3) liquid − gas interaction studies using a liquid jet coupled with a gas dosing

23
system,64 (4) or investigations at the liquid − solid crystalline interface as function of relative H2O
humidity.29
The whole IC can be rotated from 90° to zero° relative to the floor plane. This enables us to
detect electrons emitted at different angles with respect to the X-ray beam polarization plane to study
the electron angular distribution of different molecular orbitals. In this thesis photoelectron angular
distribution experiments were not performed.
3.1.2 Electron Analyzer
A hemispherical electron analyzer (EA) consists of three main parts: (1) an electrostatic lens
unit (the drift stage) that refocuses the electrons entering the analyzer; this unit also provides efficient
differential pumping, (2) two concentric outer and inner hemispheres with approximately 200 mm
radius (for the outer hemisphere)62 and an changeable inlet slit with widths ranging from 0.2 mm to 4
mm (controlling the energy resolution).62, 65 (3) Behind the exit slit, the detector unit is mounted. This
2-dimensional detector consists of a micro-channel plate (MCP) and a 40 mm-diameter phosphor
screen coupled to a charged coupled device (CCD) camera.62
SOL3 PES is equipped with a “ScientaOmicron R4000 HiPP-2” high-resolution hemispherical
electron energy analyzer designed to detect electron energies in the approximately 5 to 6000 eV range,
and capable to perform near-ambient-pressure measurements, up to tens of millibars.
The emitted electrons at the interaction point pass the skimmer orifice (entrance into the
analyzer), which acts as a first pinhole for the drift stage (see Figure 3-2 (A)). Inside the drift stage the
electrostatic lenses accelerate or retard the electrons before reaching the inlet slit of the hemispherical
analyzer, where the electrons are forced to follow a circular trajectory by the electrostatic field between
the two concentric hemispherical lenses. Only electrons with a specific kinetic energy (the so-called
pass energy, 𝐸𝑃) reach the exit slit and are counted by the electron detector. The pass energy in the
Scienta R4000 HiPP-2 electron analyzer can be chosen between the following values: 5, 10, 20, 50,
100, 200, and 500 eV. This pass energy is fixed during the measurements. A larger pass energy allows
a higher transmission, resulting in higher signal intensity in shorter time, however at the expense of
energy resolution. In contrast, a small pass energy allows measurement of high-energy resolution
spectra, but signal intensity is smaller. There are additional restrictions, e.g. pass energies must be
smaller than 1/3 of the kinetic energy of the electrons detected. In order to scan over a range of kinetic
energies, the drift stage de-/accelerate the electrons to reach the entrance aperture (AE) of the
hemispherical analyzer with a matching energy to the pass energy (±8% distribution66).
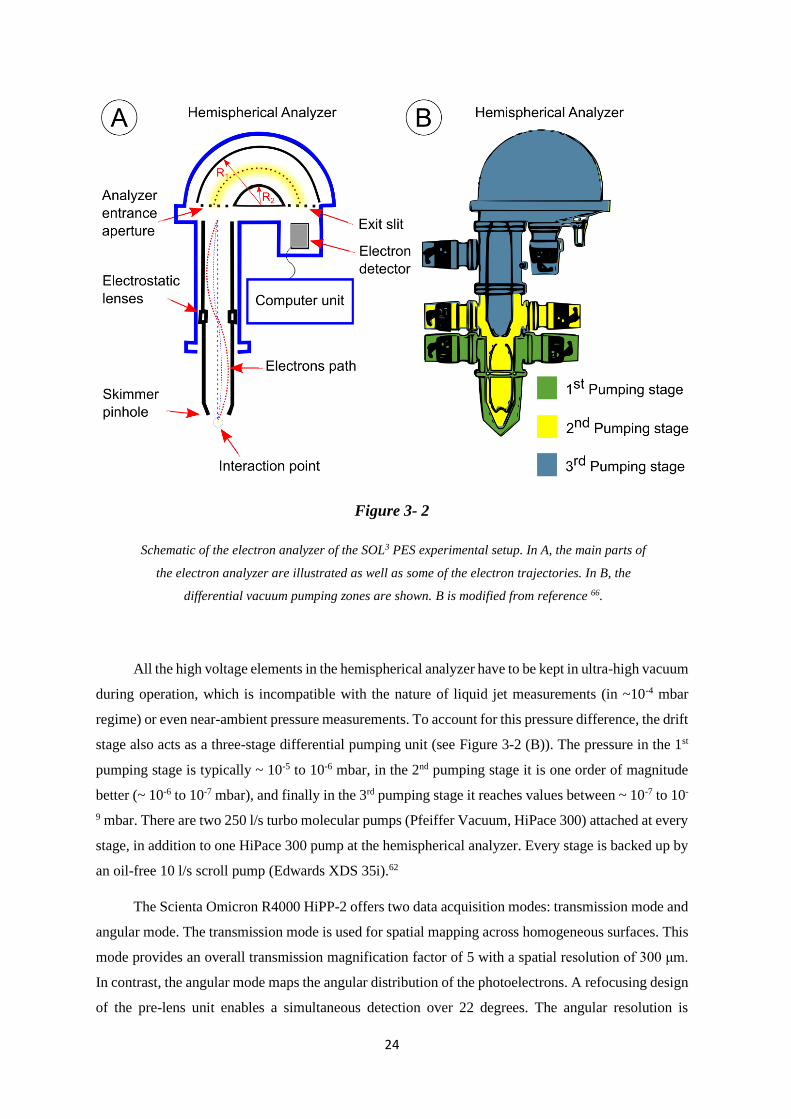
24
Figure 3- 2
Schematic of the electron analyzer of the SOL3 PES experimental setup. In A, the main parts of
the electron analyzer are illustrated as well as some of the electron trajectories. In B, the
differential vacuum pumping zones are shown. B is modified from reference 66.
All the high voltage elements in the hemispherical analyzer have to be kept in ultra-high vacuum
during operation, which is incompatible with the nature of liquid jet measurements (in ~10-4 mbar
regime) or even near-ambient pressure measurements. To account for this pressure difference, the drift
stage also acts as a three-stage differential pumping unit (see Figure 3-2 (B)). The pressure in the 1st
pumping stage is typically ~ 10-5 to 10-6 mbar, in the 2nd pumping stage it is one order of magnitude
better (~ 10-6 to 10-7 mbar), and finally in the 3rd pumping stage it reaches values between ~ 10-7 to 10-
9 mbar. There are two 250 l/s turbo molecular pumps (Pfeiffer Vacuum, HiPace 300) attached at every
stage, in addition to one HiPace 300 pump at the hemispherical analyzer. Every stage is backed up by
an oil-free 10 l/s scroll pump (Edwards XDS 35i).62
The Scienta Omicron R4000 HiPP-2 offers two data acquisition modes: transmission mode and
angular mode. The transmission mode is used for spatial mapping across homogeneous surfaces. This
mode provides an overall transmission magnification factor of 5 with a spatial resolution of 300 μm.
In contrast, the angular mode maps the angular distribution of the photoelectrons. A refocusing design
of the pre-lens unit enables a simultaneous detection over 22 degrees. The angular resolution is
25
dependent on the emission spot size, with smaller spot sizes giving the highest resolution. A 0.1 mm
spot yields better than 0.3° angular resolution.
The electron analyzer energy resolution (∆𝐸) of the Scienta Omicron R4000 HiPP-2,66 in a first
approximation, can be described by the following equation:
∆𝐸 =𝑆∗𝐸𝑃
2𝑟0 Eq.(3.1)
𝐸𝑃 is the pass energy (eV), 𝑟0 is the radius of the hemispherical analyzer (200 mm), and 𝑆 is the
entrance slit in mm in the energy dispersion direction.66 Equation 3.1 assumes a perfect analyzer and
does not take mechanical imperfection, surface potentials etc. into account. For this analyzer, 𝑆 can be
changed between nine different sizes, ranging from 0.2 to 4 mm.62 Usually, the slit is kept to 1.5 mm,
which provides a good compromise between energy resolution and electron transmission.
3.1.3 Differential Pumping Unit
The differential pumping unit (DPU) is located between the interaction chamber and the
refocusing chamber of the beamline (see Figure 3-3). Its function is to keep the vacuum at the beamline
side in good condition (10-9 mbar) during XPS experiments in the interaction chamber even at elevated
pressures of up to 20 mbar. It consists of three sections, which are pumped individually by one 250 l/s
turbo molecular pump in the first section and two 80 l/s turbo pumps in the other two sections. The
first section is also equipped with a liquid nitrogen cold trap. The sections are separated by 1, 2, and
3 mm concentric pinholes (from the IC to the beamline). To guide the X-ray beam through these
pinholes and at the same time hit the sample at the required imaging distance of 0.5 mm in front of the
analyzer aperture cone, the DP is adjustable in all three translation axes and also rotatable by +/-5°
with respect to the synchrotron-light axis. Passing the synchrotron light through the DP is assisted by
a fluorescence film, covering the areas around the pinholes, that gets illuminated when hit by X-ray.
The DP unit is separated from the IC by a gate valve, which is open during the measurements
and manually locked when breaking the vacuum in the IC is necessary. This is usually the case for
disassembling the sample catcher chamber and cleaning the IC (after liquid jet measurements),
inserting a sample holder (e.g., liquid jet manipulator, solid sample holder, electrochemical flow cell,
etc.), and also for rotating the IC relative to the X-ray beam polarization plane.

26
Figure 3- 3
The differential pumping unit is divided into three regions, which are connected with each other by
1-3 mm pinholes. It keeps the pressure at the beamline side in the 10-9 mbar regime – even at near-
ambient pressures conditions in the interaction chamber.
3.2 LiXEdrom Experimental Setup
The LiXEdrom experimental setup was used for the photon-emission measurements presented
in Chapter 7. A schematic of this experimental station is shown in Figure 3-4. It consists of three parts:
(i) The interaction chamber: A liquid jet is mounted on an XYZ manipulator normal to the X-ray
beam. The liquid shoots vertically down into an ISO-K 100 tube that resides in a liquid nitrogen bath.
Here, the liquid-jet freezes out when hitting the inner wall. The pressure inside the interaction chamber
is kept at 10-5 mbar using a 1500 l/s turbo-molecular pump and an additional cold trap. (ii) The
differential pumping section: This section is located behind the interaction chamber (not shown in
the figure). Analogous to the SOL3 PES differential pumping section, it serves to differentiate the
pressure between the interaction chamber and the first part of the beamline. A typical pressure in the
differential pumping section during experiments is 10-9 mbar. A gate valve between the interaction
chamber and the differential pumping section is kept open during the measurements and closed when
breaking the vacuum in the interaction chamber is needed (for insertion/removal of the sample holder
or clean-up of the sample cold trap). (iii) The detector: The LiXEdrom detector section is divided
into two parts: the dispersion element and the photon detector. It is separated from the interaction
chamber by a gate valve that can be closed during the insertion of the sample to preserve the vacuum
inside the detector section and opened during the measurements (in the 10-7 mbar regime for the

27
dispersion element and 10-9 mbar regime at the photon detector). The LiXEdrom is supplied by two
diffraction gratings, acting as light dispersion elements. They are spherical gratings with variable line
spacing (VLS) with line densities of 1200 l/mm and 2400 l/mm, respectively, mounted on a holder
inside a vacuum chamber, covering the photon energy ranges between 200-500 eV and 400-1200 eV.
In this study, I used the 2400 l/mm grating to record the photon emission from the oxygen K-edge (~
530 eV photon energy). The LiXEdrom photon detector consists of a micro-channel plate (MCP),
phosphor screen and a charge coupled device (CCD) camera as shown in Figure 3-5. Once the photons
hit the MCP surface, electrons are generated due to the photoelectric effect. The high electrical voltage
applied throughout the MCP tubes leads to an electron avalanche, i.e. every single generated electron
is accelerated and releases further electrons from the MCP walls, leading to a gain of 104 (see Figure
3-5 right hand side). By impinging on the phosphor screen, a fluorescence image is created that is
captured by the CCD camera.
Figure 3- 4
A schematic diagram of the LiXEdrom experimental station. The X-ray beam interacts with the
liquid sample in a point, which acts like an emission source for the grating, that disperse the light.
This dispersed light beam is then detected by a photon detector, which is placed in a Rowland
geometry with respect to the grating and the sample-beam interaction point.
The LiXEdrom components are arranged in a Roland circle geometry. Thus, the interaction
point between the X-ray beam and the liquid jet acts like a light source to the grating; and the photon
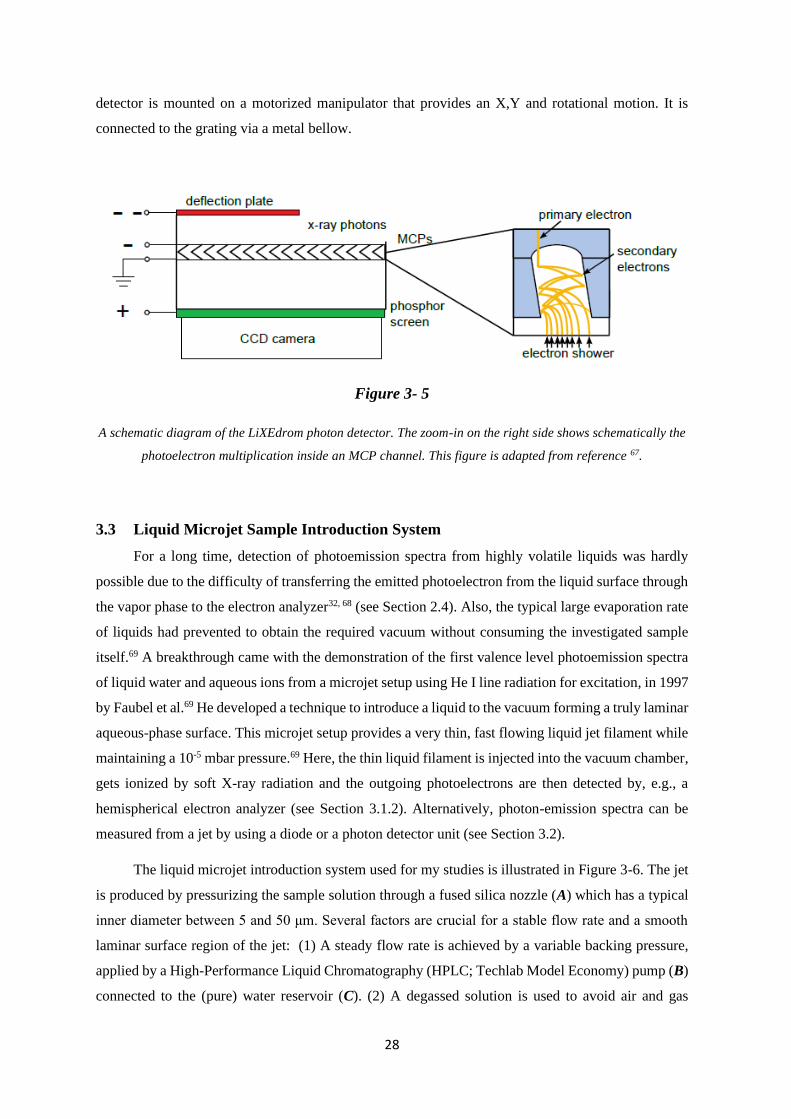
28
detector is mounted on a motorized manipulator that provides an X,Y and rotational motion. It is
connected to the grating via a metal bellow.
Figure 3- 5
A schematic diagram of the LiXEdrom photon detector. The zoom-in on the right side shows schematically the
photoelectron multiplication inside an MCP channel. This figure is adapted from reference 67.
3.3 Liquid Microjet Sample Introduction System
For a long time, detection of photoemission spectra from highly volatile liquids was hardly
possible due to the difficulty of transferring the emitted photoelectron from the liquid surface through
the vapor phase to the electron analyzer32, 68 (see Section 2.4). Also, the typical large evaporation rate
of liquids had prevented to obtain the required vacuum without consuming the investigated sample
itself.69 A breakthrough came with the demonstration of the first valence level photoemission spectra
of liquid water and aqueous ions from a microjet setup using He I line radiation for excitation, in 1997
by Faubel et al.69 He developed a technique to introduce a liquid to the vacuum forming a truly laminar
aqueous-phase surface. This microjet setup provides a very thin, fast flowing liquid jet filament while
maintaining a 10-5 mbar pressure.69 Here, the thin liquid filament is injected into the vacuum chamber,
gets ionized by soft X-ray radiation and the outgoing photoelectrons are then detected by, e.g., a
hemispherical electron analyzer (see Section 3.1.2). Alternatively, photon-emission spectra can be
measured from a jet by using a diode or a photon detector unit (see Section 3.2).
The liquid microjet introduction system used for my studies is illustrated in Figure 3-6. The jet
is produced by pressurizing the sample solution through a fused silica nozzle (A) which has a typical
inner diameter between 5 and 50 μm. Several factors are crucial for a stable flow rate and a smooth
laminar surface region of the jet: (1) A steady flow rate is achieved by a variable backing pressure,
applied by a High-Performance Liquid Chromatography (HPLC; Techlab Model Economy) pump (B)
connected to the (pure) water reservoir (C). (2) A degassed solution is used to avoid air and gas

29
bubbles, which could lead to flow interruptions of the jet and ultimately to a freezing tip of the nozzle
inside the vacuum chamber. (3) A very clear solution without any micro-suspended particles/
impurities will prevent nozzle clogging. This is done by filtrating the sample before reaching the
nozzle through an inline filter with 2 µm pore size. (D) An external filtration process should be applied
before inserting the liquid sample in the reservoir (C).
Figure 3- 6
Schematic of the liquid jet introduction system. The figure is adapted from reference 70.
In order to measure highly acidic, basic or salty samples without interaction with the stainless
steel parts of the HPLC pump, we implement a loop system (E) between the HPLC pump (B) and the
nozzle (A). The plastic tubes in the loop system, which are in direct contact with the solution being
investigated, are made of the chemically inert materials Fluorinated Ethylene Propylene (FEP) and

30
Poly-Ether Ether Ketone (PEEK). By switching a four-way switch (F), the loop capillary is loaded
from the sample reservoir (C) with the aid of an external peristaltic pump (not shown in Figure 3-6).
After loading and switching again the four-way switch (F) the water from the reservoir C, running
through the HPLC pump, goes to the loop system and pushes the sample solution to the nozzle (A).
An additional loop system can be connected to the switch (F) to reduce the measurement deadtime
during sample filling. Typically, the sample solution is cooled to (5 - 15°C) by a cooling device (Julabo
F12 ED chillor) (G). This leads to a reduced evaporation rate of the liquid sample and increases the
electron inelastic mean free path around the liquid jet at the interaction point.
3.4 Synchrotron Radiation
Synchrotron radiation is the electromagnetic radiation that is emitted tangentially along the
trajectory of charged particles travelling near the speed of light, when deflected from their straight
path, typically by (strong) magnetic fields. Synchrotron radiation can occur naturally, e.g. in
supernovae remnants like the Crab Nebula, or it can be generated artificially, e.g. in electron storage
rings. The first of its kind was a “betatron” built in the 1940th, for electron acceleration.71-72 Nowadays,
storage rings in the 3rd generation are world-wide in place, capable of producing ultra-high brilliance
synchrotron radiation thanks to the development of insertion devices like undulators and wigglers. A
schematic of an undulator is shown in Figure 3-7. It consists of an array of dipole magnets with
alternating polarity, where the electron beam travels along a sinusoidal trajectory.73 Electrons lose
energy by emitting radiation every time they change their direction.74-75 Due to relativistic effects and
the constructive interference of this radiation a highly collimated photon beam with a few energetic
narrow peaks, the so-called harmonics (see the inset of Figure 3-7) is generated. The distance between
the north and south poles of a magnet inside the undulator is called the undulator gap. By changing
the gap of the undulator, one can control the photon energy of the harmonic peaks. The odd harmonic
peaks are the ones used in the experiments.75 A quality parameter for an X-ray photon beam generated
from an undulator is the brilliance. This term reflects the number of photons per area of radiation, per
solid angle of the radiation cone, and per unit time.
BESSY II (Berliner Elektronenspeicherring-Gesellschaft für Synchrotronstrahlung) is one of
the 3rd generation synchrotron radiation facilities and it was used to carry out the experiments
presented in this thesis. It offers ultra-bright photon beams in the wavelength range of infrared up to
hard X-rays with the highest brilliance in the soft X-ray regime. Experiments at up to 46 beamlines
can be performed independently, and at 26 stations at the same time. There are two beamlines at
BESSY II (UE52-SGM-1, and U49/2-PGM-1) that provide the required high photon flux in the soft
X-ray regime and a small focal spot size for the liquid jet experiments (see 3.4.1). In Figure 3-8, the
electron trajectory inside the BESSY II accelerator and the storage ring is illustrated. Free electrons
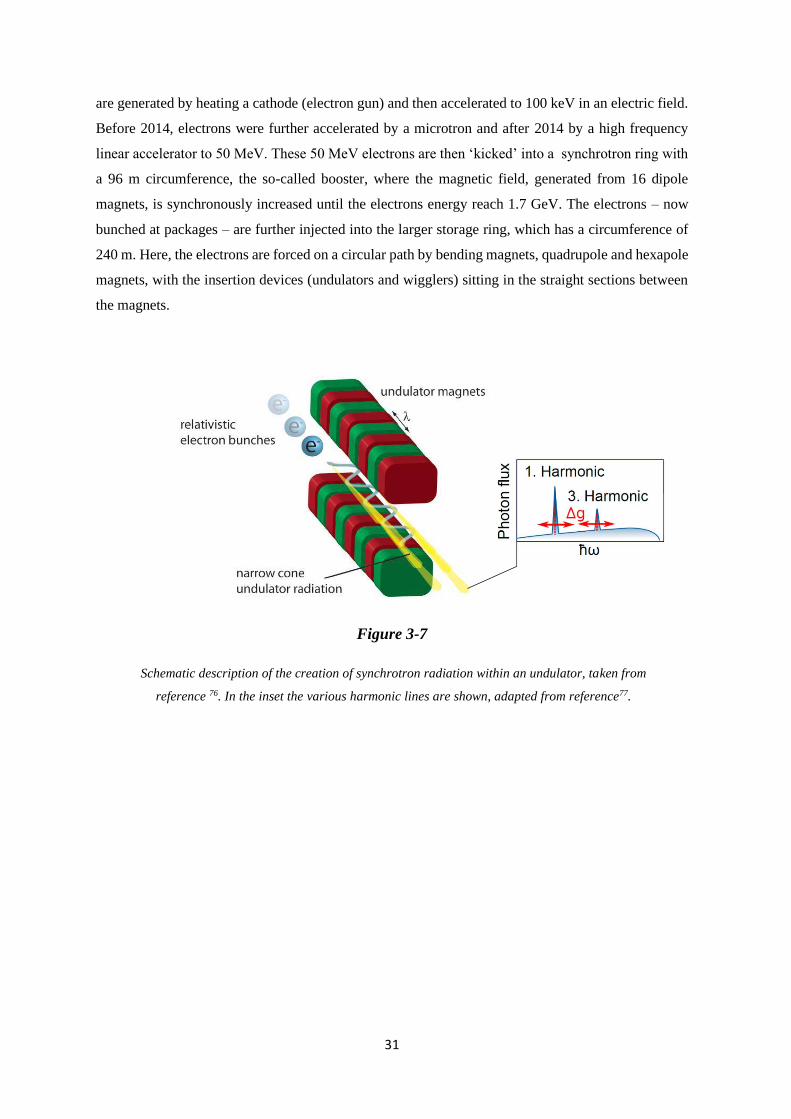
31
are generated by heating a cathode (electron gun) and then accelerated to 100 keV in an electric field.
Before 2014, electrons were further accelerated by a microtron and after 2014 by a high frequency
linear accelerator to 50 MeV. These 50 MeV electrons are then ‘kicked’ into a synchrotron ring with
a 96 m circumference, the so-called booster, where the magnetic field, generated from 16 dipole
magnets, is synchronously increased until the electrons energy reach 1.7 GeV. The electrons – now
bunched at packages – are further injected into the larger storage ring, which has a circumference of
240 m. Here, the electrons are forced on a circular path by bending magnets, quadrupole and hexapole
magnets, with the insertion devices (undulators and wigglers) sitting in the straight sections between
the magnets.
Figure 3-7
Schematic description of the creation of synchrotron radiation within an undulator, taken from
reference 76. In the inset the various harmonic lines are shown, adapted from reference77.

32
Figure 3- 8
A schematic diagram of the BESSY II synchrotron facility. Electrons are generated by an electron
gun and accelerated to reach 99.9% of the speed of light before being injected in the storage ring.
Figure is taken from reference78.
3.4.1 U49-2/PGM-1 Beamline
Liquid jet photoelectron measurements require specific X-ray beam parameters like a small
focal size, high photon flux, and variable soft X-ray energy. The U49-2/PGM-1 beamline meets those
requirements. Figure 3-9 presents a schematic side and top view of all optical elements of the beamline,
which are in an ultra-high vacuum environment. A brilliant, coherent, and pulsed X-ray beam with
possible energies between 80 and 1600 eV is generated inside the U49/2 undulator – an insertion
device consisting of multiple strong permanent magnets each 24.5 mm wide with periodic polarity.
From there the synchrotron light is guided towards the U49/2-PGM-1 beamline, where it passes a
series of collimating optical elements. The beam is then monochromatized by the pre-mirror M2
coupled to an exchangeable plane grating of 600 l/mm and 1200 l/mm before reaching the focusing
cylindrical mirror M3. The exit slit is adjustable from 5 μm up to 2 mm. As the energy resolution of
the beamline directly correlates with the exit slit size a good compromise between resolution and
photon flux is 50-100 µm. The mirror M4 refocuses the X-ray beam. The final focal size is under
optimal conditions ‘beamline exit slit’(vertical) times 100 µm (horizontal), with a lower value of 22
µm in the vertical direction.79 The technical parameters of the U49-2/PGM-1 beamline are summarized
in table 3-1.

33
Figure 3- 9
Optical layout of the U49-2/PGM-1 beamline, adapted from reference 79.
Energy range 85 - 1600 eV
Energy resolution 25,000 (85 - 500 eV)
15,000 (500 - 1,500 eV)
Flux 1013 ph/s (85 – 500 eV)
1012 ph/s (500- 1500 eV)
Polarization Horizontal
Divergence 2 mrad horizontal
2 mrad vertical
Focus size 100 μm x 22 μm
Focus distance 959 mm from the last valve
Focus height 1417 mm from the floor level
Fixed end station NO
Table 3- 1
The technical parameters of the U49-2/PGM-1 beamline.

34

35
Chapter 4
Photoemission and Photon-Emission Spectra from Liquid Water
Liquid water is the main solvent for all the samples measured in this thesis, and its spectral
features are used as energy references for all the measured spectra in Chapters 5, 6 and 7. This chapter
reviews photoemission and photon-emission spectra obtained from liquid water using the microjet
technique. First, I present and discuss the valence and O 1s core-level photoelectron spectra from
liquid and gas-phase water. Then, I show that these liquid water spectral features serve as an accurate
reference for binding energy determination. This requires reviewing the result from a recent study (to
which I contributed) on the effect of ion concentration in aqueous solution on the electronic structure
of the liquid water. Afterwards, I present a series of resonant valence PE spectra measured around the
O 1s resonance photon energies of H2O(l). In these spectra, I differentiate the photoemission resonance
signals (spectator, participator and normal Auger electrons) based on the earlier explained Auger
emissions in Section 2.3. Next, I introduce the so-called partial electron yield X-ray absorption (PEY-
XA) spectrum generated by integrating the aforementioned series of valence band spectra. Analogous
to the PEY-XA spectrum, I present the O K-edge partial fluorescence yield X-ray absorption (PFY-
XA) spectrum. This spectrum is generated by integrating the intensity of the photon-emission yield
upon the water electron’s relaxation from the valence to the O 1s core orbital. Using a contour-map
representation of the intensity of the emitted photons as the function of emitted photon energy and
excitation photon energy, I assign the observed spectral features to their corresponding radiative
relaxation channels explained in Section 2.5.
4.1 Valence Band and O 1s Core-Level Photoelectron Spectra
In this section, I present the valence and core-level PES spectra from liquid and gas-phase
water, assign the spectral peaks to their corresponding electronic states, and I discuss why the water
1b1 peak position is an accurate energy reference.
Figure 4-1, bottom, displays the valence and O 1s core-level photoelectron spectra from 0.05 M
NaI aqueous solution measured at 150 and 575 eV photon energy, respectively. The latter photon
energy is high enough to ionize the O 1s core-level. This low-concentration salt solution is needed to
avoid sample charging upon interacting with the X-ray photons which can produce peak shifts and
broadenings and to compensate for electronic charging80. Such a procedure is typically adopted in
liquid jet photoelectron measurements when solutions are non- or poorly conductive.
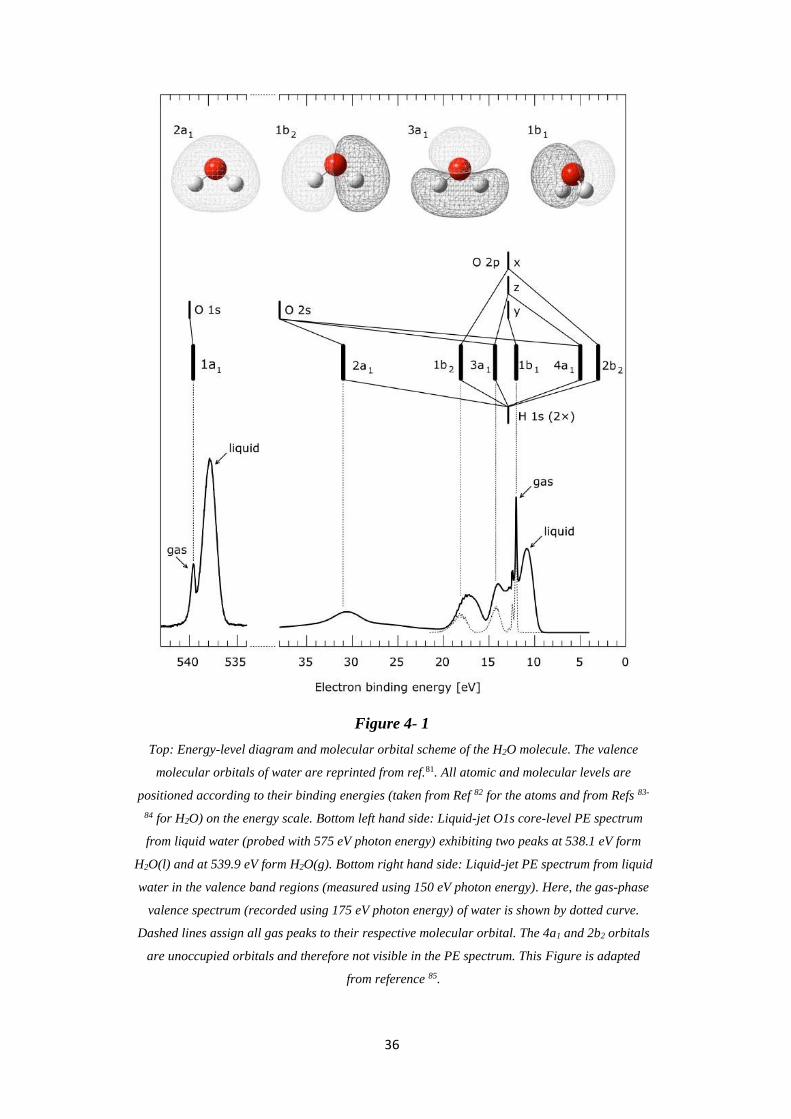
36
Figure 4- 1
Top: Energy-level diagram and molecular orbital scheme of the H2O molecule. The valence
molecular orbitals of water are reprinted from ref.81. All atomic and molecular levels are
positioned according to their binding energies (taken from Ref 82 for the atoms and from Refs 83-
84 for H2O) on the energy scale. Bottom left hand side: Liquid-jet O1s core-level PE spectrum
from liquid water (probed with 575 eV photon energy) exhibiting two peaks at 538.1 eV form
H2O(l) and at 539.9 eV form H2O(g). Bottom right hand side: Liquid-jet PE spectrum from liquid
water in the valence band regions (measured using 150 eV photon energy). Here, the gas-phase
valence spectrum (recorded using 175 eV photon energy) of water is shown by dotted curve.
Dashed lines assign all gas peaks to their respective molecular orbital. The 4a1 and 2b2 orbitals
are unoccupied orbitals and therefore not visible in the PE spectrum. This Figure is adapted
from reference 85.

37
Photoelectron spectra from a liquid water jet inevitably exhibit signal from both liquid and gas-
phase water. The relative intensity of the latter depends on focal size of the photon beam and can be
kept as low as 5% when the focal size is on the order of the jet diameter. In order to isolate the gas
contribution from liquid water, the jet position is typically moved away from the X-ray beam focus
(the interaction point, see Section 3.1.1). The resulting valence spectrum, obtained for 175 eV photon
energy is shown by a dotted line below the liquid water valence spectrum in Figure 4-1. For both liquid
and gas-phase valence spectra, peaks at the low binding energies are produced from the ionization of
the molecular valence orbitals of the H2O, 1b1, 3a1, 1b2, and 2a1. The respective peaks for the liquid
phase are shifted by approximately 1.4 eV toward lower energy and exhibit larger widths in
comparison to the gas-phase peaks due to water’s dielectric screening and a large distribution of
hydration configuration, respectively. A full energy-level diagram of gas-phase H2O is presented in
the middle of Figure 4-1, and at the top, the shapes and characters of the four occupied valence
molecular orbitals of an isolated water molecule are illustrated. Peaks at the high-binding energy side
in Figure 4-1 identify the O 1s core-level spectrum from the liquid water. It exhibits peaks at 538.1
eV form H2O(l) and at 539.9 eV form H2O(g). The liquid-phase peak is used for energy calibration
for all the O 1s core-level measurements of different samples in this thesis.
Our typical energy reference for all measured valence PES spectra using aqueous solution
microjets is the 1b1 liquid water peak. It is well separated from the corresponding gas-phase peak and
it has been reported at 11.16 eV binding energy.86 This value was taken from a spectrum recorded for
neat liquid water. This procedure is only valid if the solute has no effect on the water valence energies.
Recently, our group has combined liquid jet measurements with molecular dynamical and quantum
chemical calculations to answer these questions.80 Figure 4-2 shows valence PE spectra measured for
0.5 and 8 M NaI aqueous solutions to assess the electronic structure changes when going from liquid
water to the viscous, almost crystalline-like liquid phase.80 It is found that the solute peaks Na+ 2p, I-
4d and I- 5p and also the water 1b1 peak position stay aligned.80 The absence of any shift then implies
that the 1b1 peak of liquid water is a robust energy reference for photoemission measurements from
aqueous solution using microjet.80
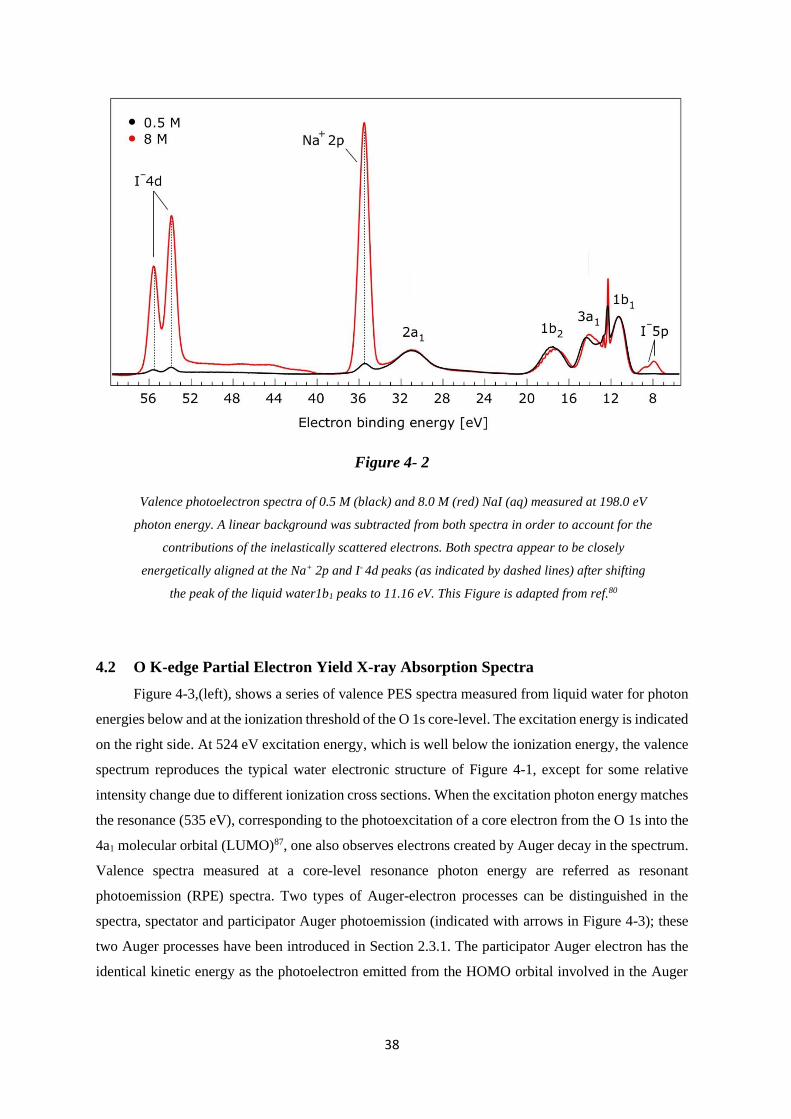
38
Figure 4- 2
Valence photoelectron spectra of 0.5 M (black) and 8.0 M (red) NaI (aq) measured at 198.0 eV
photon energy. A linear background was subtracted from both spectra in order to account for the
contributions of the inelastically scattered electrons. Both spectra appear to be closely
energetically aligned at the Na+ 2p and I- 4d peaks (as indicated by dashed lines) after shifting
the peak of the liquid water1b1 peaks to 11.16 eV. This Figure is adapted from ref.80
4.2 O K-edge Partial Electron Yield X-ray Absorption Spectra
Figure 4-3,(left), shows a series of valence PES spectra measured from liquid water for photon
energies below and at the ionization threshold of the O 1s core-level. The excitation energy is indicated
on the right side. At 524 eV excitation energy, which is well below the ionization energy, the valence
spectrum reproduces the typical water electronic structure of Figure 4-1, except for some relative
intensity change due to different ionization cross sections. When the excitation photon energy matches
the resonance (535 eV), corresponding to the photoexcitation of a core electron from the O 1s into the
4a1 molecular orbital (LUMO)87, one also observes electrons created by Auger decay in the spectrum.
Valence spectra measured at a core-level resonance photon energy are referred as resonant
photoemission (RPE) spectra. Two types of Auger-electron processes can be distinguished in the
spectra, spectator and participator Auger photoemission (indicated with arrows in Figure 4-3); these
two Auger processes have been introduced in Section 2.3.1. The participator Auger electron has the
identical kinetic energy as the photoelectron emitted from the HOMO orbital involved in the Auger

39
decay (a resonantly enhanced photoionization channel). In contrast, spectator Auger electrons have
lower kinetic energy (appearing at higher binding energy) than the emitted direct photoelectron.
Figure 4- 3
A Series of valence photoelectron spectra of 0.05 M NaCl aqueous solution measured below and
on resonance photon energies for the O 1s core orbital. All orbitals are labeled. The produced
partial electron yield-X-ray Absorption (PEY-XA) spectrum is shown on the right-hand side. At
resonant photon energy (535 eV), examples of the participator and spectator Auger electron
signals are indicated. These signals give rise to the pre-edge peak (red-shaded area) in the PEY-
XA spectrum. Above the ionization photon energy (537 eV) normal Auger electron signals are
producing the main edge peak (yellow-shaded area).
By further increasing the excitation photon energy above the water O 1s ionization threshold,
the system will relax via normal Auger emission (discussed in Section 2.3.1). This channel gives rise
to the large signal, indicated by the arrow labeled normal Auger.
XA measurements can be achieved by observing the second-order relaxation processes
(radiative or non-radiative) via photoemission or photon-emission over specific binding energy/
kinetic energy or photon energy window (partial yield) or over the whole energy range (total yield).
In the following, I discuss the partial electron yield XA spectrum obtained by recording the second-
40
order photoemission signal intensity (appearing in the valence-spectrum window) as a function of the
photon energy across the O K-edge. In the subsequent section, the spectrum recorded using the photon-
emission is presented and discussed.
The so-called partial electron yield X-ray absorption (PEY-XA) over the O K-edge is presented
on the right hand side of Figure 4-3. This spectrum is generated by integrating the signal intensity for
each RPE spectrum shown on the left as a function of its photon energy. It consists of two spectral
features which are called the pre-edge (red-shaded area) and the main edge (yellow-shaded area). The
identical valence spectra which have only direct photoelectron signals, produce a constant background;
while the various spectra exhibiting second order photoemission signals from the resonant Auger
emission generate the pre-edge at 535 eV photon energy (red-shaded area). Also, the main edge
(yellow-shaded area) is the result of the normal Auger electrons in the valence band region. As
aforementioned, this PEY-XA spectrum is observing the relaxation processes happening over the
valence band window. Other Auger relaxation channels could also be detected and would reproduce
the XA spectrum as well, which is adopted later in Chapter 5 for the Fe L-edge XA spectra where the
electron emission over the valence band region and the 3p core-orbital region are integrated separately
(Section 5.3.4). The comparison of these two differently-integrated XA spectra can reveal information
about the valence electron delocalization of the hematite iron oxide into the aqueous environment.
Analogous to the valence band spectrum in Figure 4.1, the vapor phase has a contribution in
all RPE spectra presented in Figure 4.3, including the PEY-XA spectrum. In the latter spectrum, the
vapor phase peaks appears at roughly 534.4 and 536.2 eV photon energy just below the water pre-
edge and main edge. A detailed explanation of the gas phase influence on the O K-edge PEY-XA
spectrum is shown later in Section 5.3.2. There, we compare the vapor phase and liquid phase spectra
with the hematite NP solution measurement and we also comment on the effect of the beamline focus
size. Our main interest for all the O K-edge PEY-XA spectra of the NP samples focuses on the 528-
533 eV photon energy range where we observe oxygen species of NP Lattice oxides, OH-, NO3
- and
this range is free from water signals.
4.3 O K-edge Partial Fluorescence Yield X-ray Absorption Spectra
Similar to the PEY-XA spectrum, I present and discuss here the partial fluorescence yield X-
ray absorption (PFY-XA) spectrum. This is obtained by observing the second order radiative
relaxation process (photon intensity) over the valence band energy region upon tuning the excitation
energy across the O 1s resonance. These radiative relaxation decay channels are also called resonant
inelastic X-ray scattering (RIXS) spectroscopy. Figure 4-4 left hand side shows a 2D contour map
where the emitted photon energy (on the X axis) and its intensity (following the color code shown in
the inset) are given as a function of the excitation photon energy (on the Y axis). Below 532 eV photon
41
energy, no fluorescence is emitted. At the photoexcitation energy of 535 eV, the O 1s electron is
promoted to the 4a1 (empty) valence orbital. The system then relaxes via resonant elastic X-ray
emission (marked by a white line on the map) and inelastic X-ray emission. Both signals are detected
and presented in Figure 4-4. The difference between those two relaxation processes is explained in
Section 2.5. Briefly, the elastic emission produces photons with identical energy as the excitation
photon energy, but the inelastically emitted photon is less in energy compared to the excitation photon
energy. By tuning the incident photon energy to the ionization threshold, the non-resonant X-ray
emission is observed. On the right hand side of Figure 4-4, the integrated fluorescence signal of the
emitted photon is presented as function of the excitation photon energy. Again, two main features are
highlighted: the pre-edge (red-shaded area) and the main edge (yellow-shaded area), similar to the
PEY-XA spectrum (Figure 4-3) except for the different peak intensity ratio that is due to the strong
saturation effect in photon yield detections. Usually the pre-edge at 535 eV is used for energy
calibration and intensity normalization of the spectra from different samples (as adopted in Chapter
7).
It is important to note that the vapor phase contribution in this PFY-XA spectrum is much
smaller, almost invisible compared to the partial electron yield. This is due to the much higher probing
depth of this technique and hence, the vapor signal is very minor with respect to the bulk water photon-
emission signals.

42
Figure 4- 4
A series of photon-emission spectra of liquid water measured below and on resonance photon
energies for the O 1s core orbital are presented as 2D contour map (the incident photon energy,
emitted photon energy vs the intensity in color code). The produced partial fluorescence yield X-
ray Absorption (PFY-XA) spectrum is shown on the right hand side. At photoexcitation energy
(535 eV), the resonant elastic and non-elastic X-ray emission produce the pre-edge peak (red-
shaded area). At higher photon energy, the water molecules are ionized and non-resonant photon
emission is reflected on the PFY-XA as the main edge peak (yellow-shaded area).

43
Chapter 5
Electronic Structure of the Hematite Fe2O3 Nanoparticle –
Aqueous Interface
This part of the thesis is taken from the following publication:
Molecular Species Forming at the α-Fe2O3 Nanoparticle–Aqueous Solution Interface
Hebatallah Ali, Robert Seidel, Marvin N. Pohl and Bernd Winter
Chemical Science 2018, 9, 4511-4523, DOI: 10.1039/C7SC05156E
This article is licensed under a Creative Commons Attribution 3.0 Unported Licence
Local electronic-structure interaction, dissociative water adsorption, and
electron-delocalization time at the α-Fe2O3 nanoparticle–aqueous solution
interface are revealed from liquid-jet photoelectron spectroscopy at the
oxygen-1s and iron-2p resonances.

44
5.1 Introduction
Iron oxides are highly abundant metal-oxide minerals on Earth15 and play a prominent role in
many environmental and technological processes,88-92 relevant for instance in mineralogy and
atmospheric science, including corrosion, catalysis, crystal growth and dissolution, as well as photo-
electrochemical water splitting. Particularly the latter is of large interest in current energy research,
and a central goal is to determine the atomic / molecular and electronic structure of the interface
between transition-metal oxide surface and liquid water. Here we focus on photoelectron (PE)
spectroscopy to determine the electronic structure.
Experimentally, photoelectron-spectroscopy investigations of the solution – solid interface
remain challenging, and so are any other electron-based imaging and spectroscopy techniques
routinely used in surface-science studies, requiring considerable adjustment for aqueous phase
applications. In recent years several experimental developments have been demonstrated. These are
(1) ambient pressure photoelectron (AP-PE) spectroscopy,93-97 (2) photoelectron spectroscopy from
liquid cells consisting of a few layers thick graphene (oxide) membrane with large transmission for
electrons in the < 500 eV kinetic energy (KE) range,31, 98-99 and (3) liquid-microjet PE spectroscopy.32-
33, 86, 100-105 AP-PE spectroscopy detects electrons ejected from the solid surface covered with a few-
layer water film, stabilized at approximately 20 mbar water atmosphere. Such near-ambient pressure
measurements require experimental conditions that enable collision-free travel of the electrons
escaping the solution to the electron analyzer; i.e., long enough electron mean free path must be
ensured. The same also applies to the liquid-jet experiments, which are however typically performed
at much lower pressure, ~10-4 mbar, and requirements for differential pumping are not as strict.
Application of PE spectroscopy, arguably the most important electronic-structure technique, with its
unique sensitivity to the atomic chemical environment, then enables detection of the molecular species
at the solution – solid interface. The species are identified by their respective electron binding energies
(BE), and in some cases by the electronic relaxation processes such as Auger decay or other
autoionization channels, which is a central aspect of the present study. One of the main scientific
challenges is to explore how exactly water interacts with a solid surface. This includes an
understanding of the possible rearrangements of the solid surface structure, connected with catalyzed
water dissociation, which would ultimately enable the control of surface properties.
This chapter reports on hematite, α-Fe2O3, nanoparticles (NPs) in aqueous solution. Hematite is
the thermodynamically most stable iron oxide, and its interaction with water is promising for
photocatalytic (cheap) solar H2 production.106-113 Several experimental 114-120 and theoretical 121-124
studies have been reported for single crystal surfaces. There are likely to exist six possible surface
terminations of hematite 121 which can be classified into two categories, oxygen and iron terminations.
Relative stabilities depend on temperature and oxygen pressure during the preparation process of the

45
crystalline surface.125 However, a detailed understanding of the hematite termination remains
unresolved.126-127 There is general consensus that gaseous H2O dissociates at the hematite surface at
both high18 and low128 vapor exposure. Note that almost all experimental studies have been performed
for gas-phase water adsorption in ultra-high vacuum15-18, 128 or at ambient pressure.129-130 Dissociative
water adsorption is also found in density functional theory 131-134 and molecular dynamics (MD)
simulations.135
The electronic structure of the hematite – liquid-water interface has been investigated rather
little. On the experimental side we are aware of one single but significant AP-PE spectroscopy
measurement from the hematite – liquid-water interface.136 It was concluded that H2O adsorption on
the α-Fe2O3(0001) surface at near ambient-pressure conditions leads to hydroxylation at very low
relative humidity (RH). With increasing RH, the OH coverage increases up to one monolayer, and
thereafter H2O adsorbs molecularly on top of the hydroxylated surface. Based on measured uptake
curves of OH and H2O as a function of RH the authors suggest cooperative effects among water
molecules that lead to water dissociation. The water-catalyzed dissociation is argued to result from the
stabilization of the dissociated state due to the strong hydrogen bond between H2O and OH which
lowers the kinetic barrier for water dissociation.136 Finally, observed small oxygen-1s binding energy
shifts of adsorbed OH as a function of water coverage are possible indications of the occurrence of
different OH species or α-Fe2O3(0001) surface reconstruction. We would also like to point out an MD
simulation of hematite NPs in water.137 Smaller NPs (1.6 nm) were observed to exhibit larger disorder
of the crystalline structure, and also the immediate two water layers are less ordered than for the larger
(2.7 nm) particles studied. These results are in accord with a combined vibrational spectroscopy and
MD simulations study.22
In the present study, I perform liquid-jet PE spectroscopy measurements in conjunction with
soft-X-rays from hematite NPs dispersed in aqueous solution. This is the all-in-solution approach to
investigate the electronic structure of the Fe2O3 – water interface, and no such attempt has been
reported previously. Although we expect that the actual O 1s photoelectron spectrum from dissociated
H2O at the NP surface will not provide consequential new information with regard to the
aforementioned AP-PE study from hematite crystal,136 there is however an interest in aqueous
suspension of hematite NPs for potential (photo)electrochemical applications. We also like to point
out that liquid jet studies have the advantage that photon beam damage or impurities (often carbon)
encountered in AP studies are essentially absent in flowing samples. Yet, NP (aq) studies remain
challenging and complicated for several reasons. One issue is the preparation of aqueous solutions in
which the NPs are prevented from aggregation. Another concern is the small electron escape depth in
aqueous solution 35, 59-60 which would suggest that detection of electrons with kinetic energies below
approximately 500-700 eV (approximately covering the energies of the Auger electrons considered in

46
this work), originating from the NPs in solution, is unfeasible. Regarding the first point, preparation
of stable NP (aq) suspension requires addition of a stabilizer, typically by pH variation. Only if the
surfaces are charged the particles will be electrostatically repelled from each other, and do not form
aggregates that sediment out. Inevitably, the adsorption of charged molecules at the NP surface implies
that the neat Fe2O3 NP–water interface would be difficult to explore; this also applies to previously
reported aqueous-phase NP studies.138-139 In the present case α-Fe2O3 NPs, 6 nm diameter, are
stabilized in 0.05 and 0.1 M HNO3 aqueous solution, yielding a positive zeta potential. At this acidic
pH the NP surface will interact with NO3- anions; at these low concentrations all HNO3 molecules in
the solution dissociate into NO3- and H+(H3O+).140 It is thus crucial to explore and establish
experimental conditions that reasonably balance the stabilizer concentration with a large enough
number of NP surface sites for interaction with H2O molecules. With respect to the second point, we
show here that liquid-jet PE spectroscopy is capable to detect the electronic structure of the hematite
NP–aqueous solution interface despite the small electron mean free path in solution.35 Specifically,
from a combination of core-level and resonant (oxygen 1s and the iron 2p edges) valence PE
measurements, and also from analysis of the derived partial-electron-yield X-ray absorption (PEY-
XA) spectra we observe the small signal from adsorbed OH species which can be distinguished from
the nitrate species, NO3- (aq) and NO3
- (ads). Furthermore, the interfacial electron signal can be
distinguished from the electrons emitted from the interior of the aqueous-phase NPs.
5.2 Methods and Materials
The photoemission measurements were conducted using the SOL3 liquid-jet PE spectroscopy
setup62 at the U49 PGM soft-X-ray beamline of the synchrotron-radiation facility BESSY II, Berlin.
Electrons were detected in a direction perpendicular to the polarization vector of the X-ray beam, with
the latter intersecting the horizontal liquid jet also at 90o angle. The liquid jet was produced by pushing
the aqueous solution at a flow rate of 1.2 ml/min and at approximately 25 bar through a 35-µm inner-
diameter quartz capillary into the vacuum chamber. This diameter is considerably larger compared to
the typically 15-20 μm in most of our previous liquid-jet PE spectroscopy studies,33, 100 but the larger
size was found here to deliver more stable jets in the case of NP solutions. The jet temperature at the
position of interaction with the X-rays (approximately 0.3 mm downstream of the glass capillary) was
approximately 2-5 °C. This is a crude estimate, accounting for the reservoir temperature of 10-15 °C
and the varying relative amount of measured water gas-phase signal intensity when ionizing the liquid
jet further downstream. An exact determination of the jet temperature has been reported for 10-μm
diameter based on a measurement of the velocity distribution of evaporating water molecules, yielding
a temperature of ∼6 °C. 141 Under liquid-jet operation conditions a pressure of 7.5x10⁻⁴ mbar was
maintained in the interaction chamber using a molecular turbo pump (1600 l/s) and two liquid-nitrogen
cold traps. Using an 80-µm exit slit of the beamline the energy resolution at 500 eV photon energy

47
(near the oxygen K-edge) was better than 130 meV, and at 700 eV photon energy (iron L-edge) the
resolution was better than 200 meV. The focal size of the X-ray beam was approximately 60 x 60 μm2.
Electrons were detected with a HiPP-2 (ScientaOmicron) hemispherical energy analyzer which is part
of SOL3. The 500-µm-diameter detector orifice was at 0.5 mm distance from the liquid jet. With the
analyzer pass-energy set to 100 eV the energy resolution was approximately 100 meV in our
experiments.
Iron oxide, α-hematite (Fe2O3), nanoparticles of 6 nm diameter dispersed in 0.05 and 0.1 M
HNO3 aqueous solutions, were purchased from PlasmaChem [http://www.plasmachem.com]. The
following three NP solutions were studied: 5 wt% NPs in 0.1 M HNO3 aqueous solutions (pH 1.55),
10 wt% NPs in 0.1 (pH 1.9) and 0.05 M (pH 2.0) HNO3 aqueous solutions. The 0.05 M stabilizer
concentration was found to correspond to the smallest amount of stabilizer, NO3-, at which the NPs
stay separated.
5.3 Results and Discussion
5.3.1 Valence Photoelectron Spectra
Figure 5-1(A) presents the valence PE spectra from a 6-nm hematite α-Fe2O3 NPs, 5 wt%,
aqueous solution with added HNO3 (0.1 M), measured at photon energies 710.5 (in black) and 704.5
(blue) eV. The former energy is resonant with the lowest-energy Fe 2p → valence excitation, and the
latter energy corresponds to off-resonant valence ionization. Spectra shown in the Figure are displayed
on the binding energy (BE) axis, with energies given relative to the vacuum level.33 Both spectra are
presented as measured but a Shirley background has been subtracted to remove signal from
inelastically scattered electrons. (Unless otherwise noted, the Shirley method is used throughout this
thesis; It assumes that the background intensity at a given kinetic energy is proportional to a ratio of
the integrated photoelectron signals at higher kinetic energies.142-143) Relative intensities of the two
spectra are displayed to yield the same height of the water 2a1 peak (near 32 eV BE) as this inner-
valence peak remains unaffected by the resonant excitation. The spectral energy positions
corresponding to ionization of water orbitals 1b1, 3a1, 1b2, and 2a1 are labeled.
The most striking observation in Figure 5-1(A) is the absence of the low-energy emission band
near 8.5 eV BE for the off-resonant ionization. This immediately illustrates the increased sensitivity
of resonant PE (RPE) spectroscopy to otherwise weak photoelectron signals. As shown in previous
studies on Fe3+ 139 and Ti3+ 144 aqueous solutions, the direct valence ionization and the (valence → 2p
participator) Auger decay produce the same final states. This leads to the coherent superposition of
the outgoing electron waves for the two different channels and causes the observed signal
enhancement.50 Hence the off-resonant PE spectrum in Figure 5-1(A) is essentially the spectrum of

48
neat water, and I can analyze the 710.5-eV RPE spectrum by eliminating the water contributions. For
that I first fit the 704.5-eV (off-resonant) spectrum with the known water photoelectron peak positions
and widths (determined for the much lower ionization energy of 180 eV 32); intensities are kept as free
parameters to account for unknown variations of ionization cross sections when increasing the photon
energy.
Figure 5- 1
(A) Valence photoelectron spectra from a 5 wt% α-Fe2O3 NP aqueous solution obtained at the
iron 2p resonant photon energy 710.5 eV (black) and at the off-resonant photon energy 704.5 eV
(blue). A Shirley background has been subtracted. Contributions from water ionization are
labelled. (B) Decomposition of the 710.5 eV spectrum of (A) into contributions from water (blue-
filled Gaussians) and iron (green Gaussians). The black-dotted line is the total fit. (C) The green
spectrum represents solute-only spectral contributions; it is the sum of the green Gaussians in
(B). The grey line is the photoelectron spectrum from solid α-Fe2O3 measured in ultrahigh
vacuum; from ref 145. The black sticks are calculated energy positions and weights from ref 146.
Both the grey spectrum and the calculated energies were shifted by the work function (5.4 ± 0.2
eV) 18 as to match the liquid-jet spectra which are presented with reference to the vacuum level.

49
The respective water contributions are presented by the blue Gaussians in Figure 5-1(B). The signal
arising from NP ionization is then accounted for by introducing five unique additional Gaussians
(green curves); the total fit in Figure 5-1(B), shown in red, accurately reproduces the 710-eV RPE
spectrum. In Figure 5-1(C), I present the spectrum resulting from summing up the Gaussians in Figure
5-1(B) that represent signal from NP ionization. A detailed interpretation will be provided below with
the help of PE spectra measured at the oxygen 1s edge. We note that the experimental NP valence
spectrum is in an overall fair agreement with a previously reported valence PE spectrum from
crystalline α-hematite 145 (in grey) measured in ultra-high vacuum. There are clearly distinct
differences though. Most noticeable is the occurrence of extra PE signal near 14.5 eV BE, which is
due to the effect of the aqueous solution on the Fe 3d – O 2p hybridization which causes a strong
ligand-to-iron charge transfer50 in this metal oxide.
The major conclusion from Figures 5-1(A) and 5-1(B) is that electron emission from the Fe2O3
NPs is definitely detectable in the present liquid-jet experiments. This is not self-evident because of
aforementioned small electron mean free paths in aqueous solutions at the present KEs;35, 59 this will
be detailed later. The lowest-ionization energy peak in Figure 5-1(B) (due to the highest-occupied
molecular orbital, HOMO, which is of metal 3d nature) of the solution cannot be fit by a single peak.
I assign the two Gaussians, at 8.2 eV and 9 eV BE, to the t2g (with 3-electron occupancy) and eg (2
electrons) levels which arise from the iron 3d5 high-spin levels in an octahedral ligand field.147 To
support this assignment, I need to collect more electronic structure information though, for instance
from the PEY-XA spectra which provide the 10Dq values. Moreover, I must explore whether the
observed energies are due to electrons emitted from the NP surface or the interior. It should be noted
that the 8.2 and 9 eV energy positions are smaller than the respective iron t2g and eg energies, 8.9 and
10.2 eV, reported for aqueous Fe3+ cation.50 On the other hand, a single peak at 10.3 eV BE was
observed in a later liquid-jet PE study.148 Such differences between the iron-oxide NP and the iron
hexa-aqua complex can be attributed to the different ligand fields arising from the specific local
environments. Previously reported valence PE spectra from the α-Fe2O3 (1012) crystalline surface in
ultra-high vacuum also exhibit a broad unresolved HOMO peak near 8.5 eV,145 similar to the spectrum
in Figure 5-1(A). Also, a very recent valence PE spectroscopy study from a powder of 7-nm diameter
iron-oxide NPs exhibits a single broad Fe 3d derived peak.149 Yet, theoretical calculations146 do
reproduce the split as shown by the sticks in Figure 5-1(C).

50
5.3.2 O 1s Resonant Photoemission and Partial-Electron-Yield XA Spectra
I now explore the photoemission spectra measured for photon energies near the oxygen 1s core-
level ionization threshold. These (valence) RPE spectra contain contributions from direct valence
photoionization and from non-radiative relaxation channels, associated with the oxygen 1s core-hole
refill. Results from 5 wt% α-Fe2O3 NPs of 6 nm diameter, dispersed in 0.1 M HNO3 aqueous solution
(same solution as in Figure 5-1), are presented in Figure 5-2(A). At photon energies < 528.0 eV one
essentially measures the valence PE spectra from neat water; compare the discussion on Figure 5-
1(A). All spectral changes occurring for increasing photon energies are then associated with the
oxygen 1s electron promotion into the partially occupied t2g, eg, and empty valence orbitals. The first
absorption peak of neat water (O 1s → 4a1; pre-peak) occurs at 535.0 eV photon energy,150-151 with an
absorption onset at approximately 533.0 eV. In order to accurately determine the full absorption
spectrum, I look at the respective O 1s PEY-XA spectrum, presented in Figure 5-2(B), which was
obtained by integrating the signal intensity of each RPE spectrum between 15 and 27 eV BE. The
steep water absorption onset at 533.0 eV is clearly visible. All other features, at 532.2 eV (peak a),
531.5 eV (small shoulder b), and 530 eV (peak c) must arise from oxygen-containing species other
than bulk-phase H2O, and these are of particular interest here.
The origin of the absorption peaks a-c can be explained by an analysis of the accompanying
changes among the respective RPE spectra. For convenience, I project the RPE spectra in Figure 5-
2(A) onto a color-coded 2-dimensional representation. The resulting photon-energy versus electron
BE map is shown in Figure 5-2(C). In addition, I present in Figure 5-2(D) the single RPE spectrum
measured at resonance c, as this helps to better visualize this small feature. Absorption peak a is caused
by an intensity increase near 17 eV BE, and also by a band of at least six overlapping peaks in the
21.0-24.5 eV BE range, as can be seen by the changing color at 532.2 eV excitation photon energy in
the encircled area. These energies correspond to spectator Auger electrons from aqueous-phase NO3-
as has been measured previously for HNO3 aqueous solutions.62 The PE spectrum at 532.2 eV
resonance (peak a) from a 0.5 M HNO3 aqueous solution will be shown later, when I determine the
spectral contributions from surface-adsorbed species.
Since the hematite-NP surface is positively charged, as inferred from the measured zeta
potential of +30 mV, NO3- molecules will inevitably bind at the surface. Evidence for that is indeed
found in the O 1s X-ray absorption spectrum, shown in Figure 5-3, where we present results from 10
wt% NP / 0.1 M HNO3, 0.5 M HNO3, 0.5 M NaOH aqueous solutions, and from neat liquid water; in
addition, the O 1s XA spectrum from gas-phase H2O is shown. The liquid water spectrum (blue line),
presented in the inset figure, is a PEY-XA spectrum which was previously measured in our laboratory
with a smaller capillary (15 μm diameter compared to 35 μm here) to form the liquid jet. Furthermore,
in that study a smaller (23 x 12 μm2 ) X-ray focus was available.
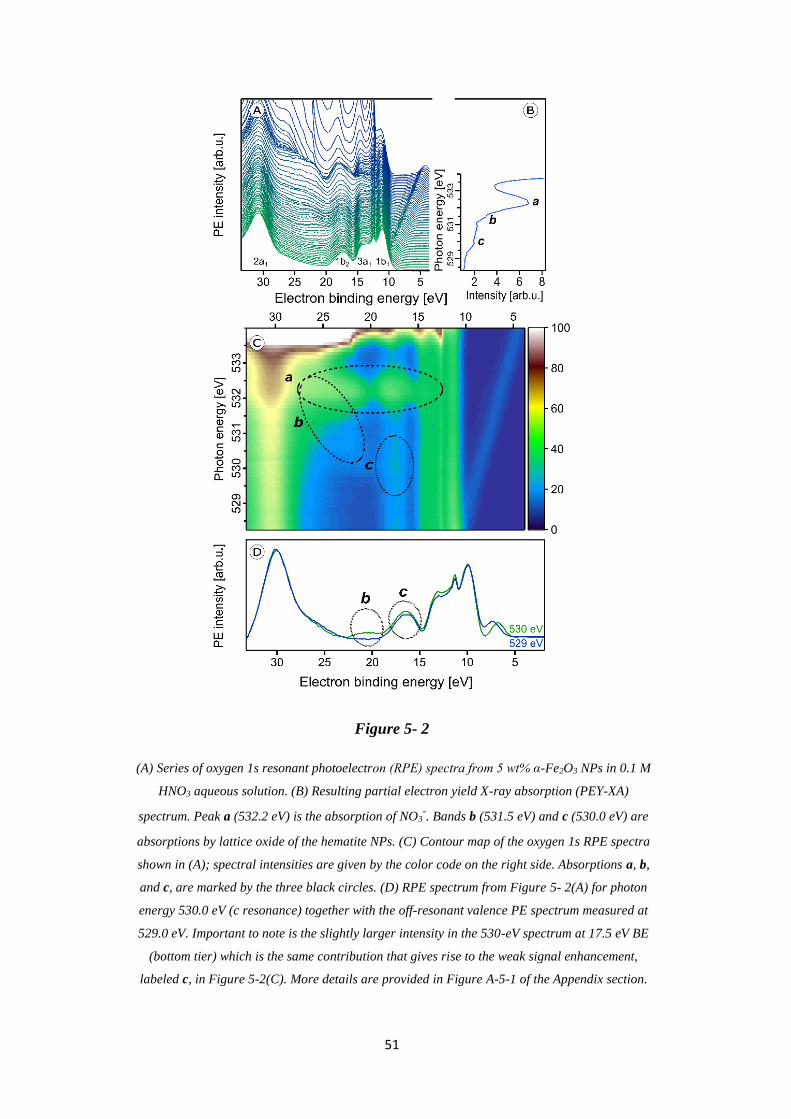
51
Figure 5- 2
(A) Series of oxygen 1s resonant photoelectron (RPE) spectra from 5 wt% α-Fe2O3 NPs in 0.1 M
HNO3 aqueous solution. (B) Resulting partial electron yield X-ray absorption (PEY-XA)
spectrum. Peak a (532.2 eV) is the absorption of NO3-. Bands b (531.5 eV) and c (530.0 eV) are
absorptions by lattice oxide of the hematite NPs. (C) Contour map of the oxygen 1s RPE spectra
shown in (A); spectral intensities are given by the color code on the right side. Absorptions a, b,
and c, are marked by the three black circles. (D) RPE spectrum from Figure 5- 2(A) for photon
energy 530.0 eV (c resonance) together with the off-resonant valence PE spectrum measured at
529.0 eV. Important to note is the slightly larger intensity in the 530-eV spectrum at 17.5 eV BE
(bottom tier) which is the same contribution that gives rise to the weak signal enhancement,
labeled c, in Figure 5-2(C). More details are provided in Figure A-5-1 of the Appendix section.

52
Figure 5- 3
(A) Oxygen 1s PEY-XA spectra from 10 wt% NP / 0.1 M HNO3 aqueous solution (in red) and
from neat water measured under conditions that considerably suppress the spectral contributions
from gas-phase water; see discussion in Experimental section. Spectral intensities are adjusted
to yield the same heights of the water pre-edge peak, at 535.0 eV. The grey-shaded peak is the
leading absorption of gas-phase water; the full spectrum is presented in the inset figure where
we also show an extended range of the liquid water spectrum. The latter was obtained from
signal integration of the leading Auger peak that overlaps with the valence PE band; the
procedure has been discussed in ref 152. (B) Oxygen 1s PEY-XA spectra from 0.5 M NaOH (light
blue), from 0.5 M HNO3 (pink), and from 10 wt% NP / 0.1 M HNO3 aqueous solutions. All
spectra in (B) were measured using the same large-diameter glass capillary. Note that under
these experimental conditions the absorption peak of hydroxide is not resolved (reported near
533 eV 153-154), and furthermore the small signal from hydroxide strongly overlaps with the large
water gas-phase absorption.

53
Both effects are the reason for a large contribution of gas-phase H2O to the aqueous solution XA
spectra in the present study, which is clearly seen in Figure 5-3(A) displaying the spectra from the NP
solution (in red) and from water (from inset figure), for both gas-phase (grey-shaded peak) and liquid
water (blue line) on top of each other. The large shoulder at 534.4 eV observed in Figure 5-3(A) is
thus the signal from gas-phase water, and from comparison with the XA spectrum from 0.5 M NaOH
(light blue line in Figure 5-3(B)) which exhibits small signal near 533 eV, I see that contributions from
gaseous water and OH- (aq) strongly overlap. Since the hydroxide concentration in the NP solutions
is so small, a meaningful quantification of its signal on the large water background thus seems
unreasonable. Yet, an attempt to single out OH signal based on subtraction of gas-phase signal from
the NP (aq) XA spectrum is presented in Figure A-5-2 of the (Appendix Section 5.5). It shows
measurements from three different NP solutions, each representing a different fraction of surface sites
available for H2O adsorption. The analysis indeed suggests a small signal from hydroxide at 533 eV,
and there is also an indication that the signal intensity may increase with the available surface sites.
More details on the data analysis are provided in the Appendix Section 5.5. Unlike the OH- X-ray
absorption, NO3- absorbs at considerable lower energies than water, near 532.3 eV, as can be seen
from the XA spectrum from 0.5 M HNO3 aqueous solution in Figure 5-3(B). Hence, NO3- can be
easily identified in the NP (aq) XA spectra.
In order to obtain a more significant spectroscopic signature from hydroxide adsorbed at the NP
– solution interface I next consider the RPE spectra measured at the X-ray absorption maximum, 532.2
eV (peak a; Figure 5-3). These spectra are barely affected by gas-phase water, and I can detect
adsorbed hydroxide and nitrate simultaneously. Results are shown in Figure 5-4 for the same solutions
briefly mentioned in the previous paragraph where I discussed the XA spectra. As introduced along
with Figure A-5-2 the NPs in the different solutions differ by the amount of adsorbed nitrate, and
hence the fraction of available adsorption sites for water varies, which is controlled by the
concentration of the NPs and the concentration of stabilizing HNO3. The nitrate-to-free surface sites
ratios studied here are approximately 1:1 (labeled [1:1] in Figure 5-4) for 5 wt% NP in 0.1 M HNO3,
1:2 ([1:2]) for 10 wt% NP in 0.1 M HNO3, and 1:4 ([1:4]) for 10 wt% NP in 0.05 M HNO3. For
reference, Figure 5- 4 also includes the spectra from 0.5 M HNO3 and 0.5 M NaOH aqueous solutions,
the latter is measured at 532.8 eV excitation energy (close to peak a). All spectra are displayed with
the corresponding off-resonant spectra subtracted which singles out the spectral features that get
enhanced. Note that subtraction of the large water signal is the reason for the rather poor signal
statistics. As-measured RPE spectra are shown in Figure A-5-3 of the Appendix Section 5.5. One
important observation from Figure 5-4 is that the RPE spectrum for highest NO3- (ads) concentration
(ratio 1:1) is almost the same as the one from bare HNO3 aqueous solution. In both cases four main
photoemission bands are observed, at approximately 16.0, 18.0, 22.5, and 24.5 eV BE (all within the

54
red-shaded area), arising from various Auger-electron decays upon O 1s → valence excitation at 532.2
eV photon energy.
Figure 5- 4
Photoelectron spectra at resonance a (532.2 eV) from three α-Fe2O3 NPs aqueous solutions, as
well as from 0.5 M HNO3 and 0.5 M NaOH (measured at 532.8 eV, near a) aqueous solutions. In
all cases the respective off-resonant photoelectron spectrum has been subtracted. Results for the
following NP solutions are shown: Purple: 0.5 M HNO3. Black: 5 wt% NP in 0.1 M HNO3 [1:1].
Red: 10 wt% NP in 0.1 M HNO3 [1:2]. Green: 10 wt% NP in 0.05 M HNO3 [1:4]. The additional
spectrum from 0.5 M NaOH is shown in blue. The shaded areas mark spectral regions which are
dominated by contributions from a single species: Blue region: OH-. Grey region: lattice oxide.
Red region: NO3-. In square brackets the ratios of number of adsorbed NO3
- to number of
available surface sites of the hematite NPs are shown. These ratios are estimates based on the
total surface of the NPs in a given volume, and assuming a density of adsorption sites of 5.6 nm-2
which is the value reported for crystalline hematite;130 see also description of Figure A-5-2
where I analyze the XA spectra from the same solutions.
The fact that the spectra present close resemblance indicates that the electronic structure of NO3- (aq)
changes little upon adsorption at the NP surface. The 4-peak structure of the HNO3 (aq) spectrum can
be qualitatively attributed to Auger processes that involve orbitals with NO3- character. These have

55
energies of approximately 9.5, 16.0, 19.5 eV BE, as determined from an (off-resonant; 200 eV photon
energy) valence PE spectrum from 1M HNO3 aqueous solution presented in Figure A-5-4 (in the
Appendix Section 5.5). The leading peak at 15.5 eV is due to a participator Auger decay. A more
accurate assignment of the NO3- Auger-electron spectrum would require quantification of screening
effects of the core hole, and also consideration of the nitrogen versus oxygen characters of the
orbitals.155
With increasing number of available H2O adsorption sites on the NP surface (ratio 1:4) the RPE
spectrum (green in Figure 5-4) still exhibits a similar overall shape as the one from NO3- (aq) but
relative peak intensities in the 15-20 eV BE range change, and peak energies tend to shift slightly. In
addition, peaks seem to broaden but this effect cannot be quantified due to insufficient signal statistics.
These changes are attributed to the occurrence of signal from adsorbed OH- which is concluded from
comparison with the 0.5 M NaOH aqueous solution. The respective RPE spectrum (in blue) exhibits
a rather similar overall shape as the one from the [1:4] NP solution (green). I particularly point out the
appearance of a 28.5 eV BE peak (blue-shaded area) for the latter solution which is an unequivocal
signature of OH- (compare blue spectrum). The differences of all spectral intensities are argued to arise
primarily from the varying relative ratios of adsorbed NO3- over OH
-. But I also expect small energy
differences between free and adsorbed hydroxide, and I also note that in the NP spectrum the 28.5-eV
OH- peak overlaps with the electron emission from NP lattice oxygen (23-28 eV BE region; grey-
shaded), although this signal has larger intensity at the slightly lower absorption energy corresponding
to peak b (531.5 eV) in Figure 5-2(C).
I return to Figure 5-2 to discuss X-ray absorption peaks b and c. Both oxygen-1s excitations
must arise from the Fe2O3 NPs (aq), and I now differentiate between the contributions from the NP –
solution interface versus those from the NP interior (bulk). As seen from Figure 5-2(C) absorption b
(see also Figure A-5-1) correlates with a signal increase in the RPE spectra near 23 eV BE, whereas c
correlates with a very small increase of the 17.5-eV BE peak. In an attempt to somewhat enhance the
visibility of absorption c, I display in Figure 5-2(D) the relevant single RPE spectrum, at 530.0 eV
excitation energy, selected from Figure 5-2(A). This spectrum is compared with the off-resonant PE
spectrum measured at 529.0 eV, and one notices a small signal increase at the 17.5 eV BE. In Figure
A-5-1 of the Appendix Section 5.5 I show that this increase vanishes when the photon energy is raised
slightly above the c resonance.
From comparison with L-edge X-ray absorption spectra from hematite crystal measured at ~10-
4 mbar water pressure,156 I assign absorptions b and c to the O 1s → t2g (at 530.0 eV) and O 1s → eg
(at 531.5 eV) transitions, respectively. The energy difference yields 10Dq = 1.5 eV. Previous XA

56
spectroscopy studies from α-Fe2O3 16 have reported very similar absorption energies of 530.2 and
531.6 eV, respectively, i.e., 10Dq = 1.4 eV.17, 157-162 Another study, of supported 8- and 30-nm hematite
NPs 163 finds absorption maxima at 530.4 (for O 2p – Fe t2g) and 531.8 eV (for O 2p – Fe eg) photon
energies. In the same work, also crystalline hematite has been investigated, and the authors observed
the identical 10Dq value of 1.38 eV, concluding that there is no evidence for a size-driven effect. The
slightly larger 10Dq (1.5 eV) in the present study is thus argued to result from the hematite NP’s
modified electronic structure in the presence of an aqueous solution. This conclusion will be
corroborated by RPE measurements at the iron 2p (L) edge. With above assignments to electron
promotion into t2g and eg states, which are separated by 1.5 eV, one would expect similar RPE spectra
for b and c excitations. But this is not observed experimentally. Referring to the computed electronic
states of (FeO6)9-, 16, 147 and considering solely involvement of t2g states the peak at 17.5 eV BE
(corresponding to ~512 eV kinetic energy) could be qualitatively understood as arising from O2- 1s-
1t2g1t2g spectator Auger decay. Here, excitation from the oxygen 1s core-level into the empty 2t2g (spin
down) level is followed by core-hole refill from the 1t2g level, and electron release from 1t2g. Similarly,
for the O2- 1s → 4eg excitation at 531.5 eV the peak at ~22.5 eV BE (corresponding to ~509 eV kinetic
energy) can be explained by O2- 1s-3eg3eg spectator Auger decay. I am unable though to provide a
more quantitative explanation based on the available data.
5.3.3 O 1s Core-Level Photoelectron Spectra
In the previous section surface bound NO3- and OH
- species were shown to give rise to
characteristic signals in the O 1s RPE valence spectra. I now explore the signature of these species in
the non-resonant O 1s PE spectra, shown in Figure 5-5(A). The spectra were obtained from the 6-nm
diameter Fe2O3 NPs (10 wt% aqueous solutions) for the two HNO3 concentrations 0.1 M (in red) and
0.05 M (in green). For comparison, the spectrum from 0.05 M NaCl aqueous solution containing no
NPs, and essentially representing neat water, is presented as well (in blue). The spectra are normalized
to their peak maxima, as shown in the inset of Figure 5-5(A). A photon energy of 1200 eV was used
to deliberately generate O 1s photoelectrons with approximately 650 eV KE, which is similar to the
electron energies detected in case of the Fe 2p RPE spectra shown in Figure 5-1. This assures a
comparable probing depth into the solution for both cases. And more important, the inelastic mean
free path of the ~700 eV photoelectrons is obviously large enough to detect electrons born at the NP
(aq) surface and even originating inside the NPs (aq). However, the exact probing depth into the
particles as well as the distance of the NPs from the solution surface cannot be quantified here. For
recent estimates of electron mean free paths in liquid water and aqueous solutions we refer to
references.59-60

57
Figure 5- 5
(A) Oxygen 1s photoelectron spectra from the 10 wt% hematite NPs in 0.1 M HNO3 aqueous
solution (corresponding to [1:2]; red curve), and in 0.05 M HNO3 aqueous solution
(corresponding to [1:4]; green curve). For reference, the spectrum from 0.05 M NaCl aqueous
solution (blue curve) is also shown. Photon energy was 1200 eV. In the main figure, the O 1s
peak has been cut at about 25% of its intensity. The full peaks, and the intensity normalization is
seen in the inset figure. (B), (C) Oxygen 1s photoelectron spectra in the 538-532 eV binding
energy region which covers the O 1s photoelectron peaks from OH- (536.1 eV) and lattice oxide
(534.7 eV). (B) shows results for the 10 wt% hematite NPs / 0.05 M HNO3 aqueous solution
(corresponding to [1:4]), and (C) for 10 wt% hematite NPs / 0.1 M HNO3 aqueous solution
(corresponding to [1:2]) after subtraction of the 0.05 M NaCl aqueous solution spectrum (red
dots). Black dots in (B) and (C) result from five-point-binning of the red dots, and the green line
results from additional smoothing. Error bars, representing the standard deviation from five-
point-binning, are still fairly large. They are too large to reveal the expected increase in the OH-
to-lattice oxide signal ratio when going from [1:2] to [1:4] solution. See also Figure A-5-5 for
the raw data.
PE spectra from the two NP solutions (Figure 5-5(A)) are seen to be by far dominated by
photoelectrons from liquid water, giving rise to the strong peak at 538.0 eV BE.164 A small shoulder
at 540.0 eV BE arises from ionization of gas-phase water. The photoelectron signal contributions from
oxygen species, primarily OH- bound to the NP (aq), appear at lower BE than water, and the intensity
is very small, slightly greater than the baseline signal. An enlarged view of the spectral region of
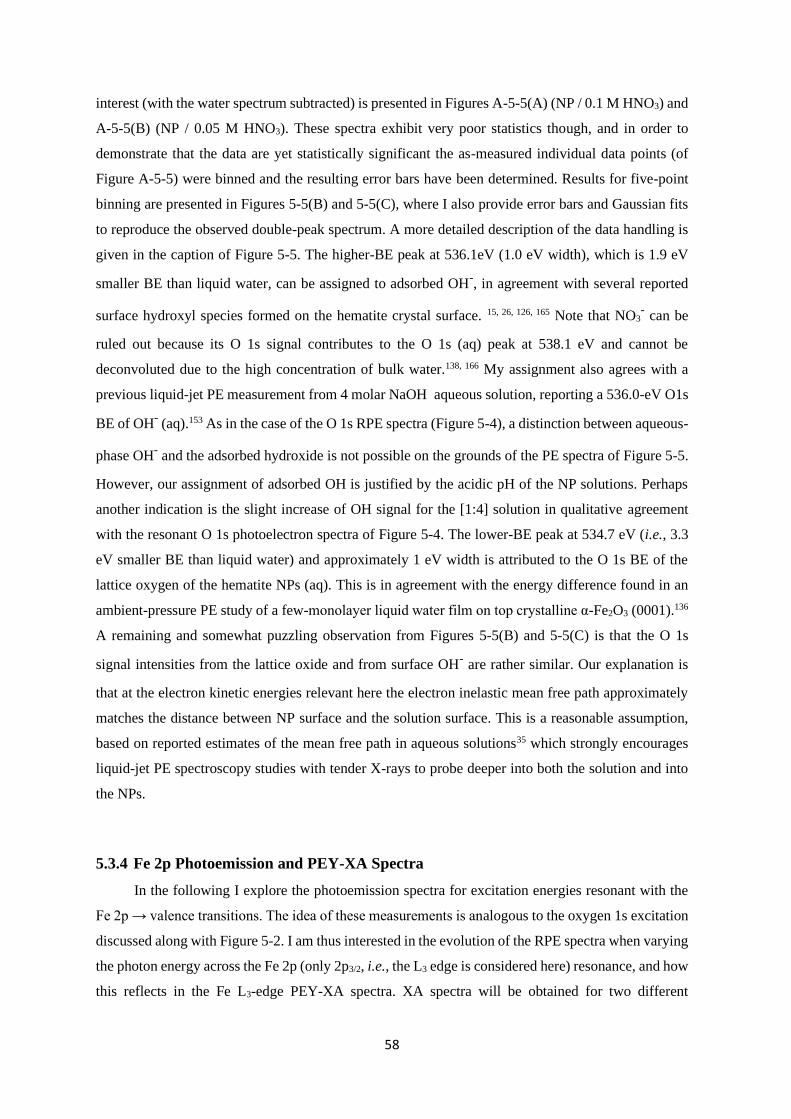
58
interest (with the water spectrum subtracted) is presented in Figures A-5-5(A) (NP / 0.1 M HNO3) and
A-5-5(B) (NP / 0.05 M HNO3). These spectra exhibit very poor statistics though, and in order to
demonstrate that the data are yet statistically significant the as-measured individual data points (of
Figure A-5-5) were binned and the resulting error bars have been determined. Results for five-point
binning are presented in Figures 5-5(B) and 5-5(C), where I also provide error bars and Gaussian fits
to reproduce the observed double-peak spectrum. A more detailed description of the data handling is
given in the caption of Figure 5-5. The higher-BE peak at 536.1eV (1.0 eV width), which is 1.9 eV
smaller BE than liquid water, can be assigned to adsorbed OH-, in agreement with several reported
surface hydroxyl species formed on the hematite crystal surface. 15, 26, 126, 165 Note that NO3- can be
ruled out because its O 1s signal contributes to the O 1s (aq) peak at 538.1 eV and cannot be
deconvoluted due to the high concentration of bulk water.138, 166 My assignment also agrees with a
previous liquid-jet PE measurement from 4 molar NaOH aqueous solution, reporting a 536.0-eV O1s
BE of OH- (aq).153 As in the case of the O 1s RPE spectra (Figure 5-4), a distinction between aqueous-
phase OH- and the adsorbed hydroxide is not possible on the grounds of the PE spectra of Figure 5-5.
However, our assignment of adsorbed OH is justified by the acidic pH of the NP solutions. Perhaps
another indication is the slight increase of OH signal for the [1:4] solution in qualitative agreement
with the resonant O 1s photoelectron spectra of Figure 5-4. The lower-BE peak at 534.7 eV (i.e., 3.3
eV smaller BE than liquid water) and approximately 1 eV width is attributed to the O 1s BE of the
lattice oxygen of the hematite NPs (aq). This is in agreement with the energy difference found in an
ambient-pressure PE study of a few-monolayer liquid water film on top crystalline α-Fe2O3 (0001).136
A remaining and somewhat puzzling observation from Figures 5-5(B) and 5-5(C) is that the O 1s
signal intensities from the lattice oxide and from surface OH- are rather similar. Our explanation is
that at the electron kinetic energies relevant here the electron inelastic mean free path approximately
matches the distance between NP surface and the solution surface. This is a reasonable assumption,
based on reported estimates of the mean free path in aqueous solutions35 which strongly encourages
liquid-jet PE spectroscopy studies with tender X-rays to probe deeper into both the solution and into
the NPs.
5.3.4 Fe 2p Photoemission and PEY-XA Spectra
In the following I explore the photoemission spectra for excitation energies resonant with the
Fe 2p → valence transitions. The idea of these measurements is analogous to the oxygen 1s excitation
discussed along with Figure 5-2. I am thus interested in the evolution of the RPE spectra when varying
the photon energy across the Fe 2p (only 2p3/2, i.e., the L3 edge is considered here) resonance, and how
this reflects in the Fe L3-edge PEY-XA spectra. XA spectra will be obtained for two different

59
relaxation channels, one corresponding to the refill of the 2p core-hole by a valence electron, and in
the other case the refill is by another core-level electron. The specific Auger decay channels are 2p-
3d3d and 2p-3p3p which lead to electron emission in the 672–715 eV and 560–600 eV kinetic energy
ranges, respectively. Hence, signal integration of the RPE spectra within these boundaries yields the
respective PEY-XA spectra. In (2p-3d3d) PEY the electron refilling the core hole originates from an
iron 3d valence orbital (spectra are denoted as PVEY). The 3d orbitals carry information on the mixing
with ligand-centered orbitals. On the other hand, in (2p-3p3p) PEY the core-hole is refilled by
electrons from the deeper Fe 3p orbitals which only weakly interact with the ligands (spectra are
denoted as PCEY). Here we use the same nomenclature as in our previous study from FeCl2 aqueous
solutions.167 Illustrations of the two Auger processes will be presented in Figure 5-6.
Figures 5-6(A) and 5-6(C) present Fe 2p RPE maps from 10 wt% α- Fe2O3 NPs in 0.1 M HNO3
aqueous solution, covering the 2p-3p3p and 2p-3d3d Auger decay channels; individual spectra were
recorded for photon energies between 707-717 eV. Figures 5-6(B) and 5-6(D) display the respective
PCEY- and PVEY-XA spectra. Note that Figure 5-6(A) displays data as KEs while Figure 5-6(C)
presents BEs in the 5-25 eV range energy, which corresponds to 682-712 eV KE. Valence spectra in
Figure 5-6(C) are dominated by an off-resonant water-signal background, appearing as vertical bands.
The spectra in Figure 5-6(A) have no off-resonant signal contribution, and solely exhibit resonant
signals from 2p-3p3p and in part from 2p-3s3d Auger emissions. Therefore, in the latter case the KE
axis is more appropriate since Auger electrons do not depend on the photon energy. Both PEY-XA
spectra exhibit a pre-peak at 709 eV photon energy, and a main peak at 710.5 eV. These are the Fe
2p3/2 → t2g and Fe 2p3/2 → eg resonances characteristic for Fe3+.
Figure 5-7 presents the PVEY- and PCEY-XA spectra on top of each other, and one observes a
considerably smaller pre-peak in the PVEY-XA spectrum; intensities are displayed such that the eg
peaks have the same height (to be discussed later). In addition to the different intensities of the pre-
peaks, one notices a somewhat smaller intensity in the post-edge region at 709–714 eV. The pre-peak
arises from the electronic interactions between the iron site and the local environment, i.e., with the
solvation-shell water molecules and the lattice oxygen atoms of the hematite NP. The excited electron
can thus engage in additional relaxation processes such as electron delocalization and energy
transfer.167-168 As a consequence, the PVEY-XA spectrum may differ considerably from the PCEY-XA
spectrum which is in fact a better representation of the true X-ray absorption spectrum that would be
obtained in a transmission measurement. The delocalized excited electron has a lower probability to
refill the Fe 2p hole within its lifetime (sub-10 fs), and hence the PEY is state-dependent, scaling with
the extent of delocalization. The observed differences between the PVEY- and PCEY-XA spectra
(Figure 5-7) thus correlate with the orbital extensions.168 Core-level 3p orbitals are strongly localized
and are not or barely involved in iron–ligand orbital mixing.

60
Figure 5- 6
Fe 2p3/2 resonant photoelectron spectra from 10 wt% α- Fe2O3 NPs in 0.1 M HNO3 aqueous
solution, covering the 2p-3p3p (A) and 2p-3d3d (C) Auger-electron emissions after Fe 2p3/2 →
t2g and 2p → eg excitation, respectively. Spectra were recorded for photon energies between 707-
716 eV. The respective PCEY- and PVEY-XA spectra, and illustrations of the relevant energies,
excitations and the relaxation channels are displayed in (B) and (D).

61
In contrast, 3d orbitals are large, and there is considerable mixing with water lone-pair orbitals as well
as with the NP lattice oxygen-2p orbitals which was already seen from Figure 5-1. Our interpretation
is corroborated by the changes that occur in the RPE spectra measured at the eg versus the t2g resonance.
These two RPE spectra are shown in Figure 5-8. In both cases the off-resonant valence PE spectrum,
measured at 707 eV (bottom tier in Figure 5-8), has been subtracted. To quantify the spectral changes
that occur for the two resonances we fit the spectra (center and top tiers in Figure 5-8) using the same
Gaussians as in Figure 5-1(B), i.e., energy positions and peak widths are kept constant, and the only
free fit parameter is the intensity. The most noticeable observation is the decrease of the t2g signal
intensity relative to the eg signal which is exactly what one expects. Due to the overlap of the metal t2g
levels with the O 2p levels of hematite (already seen in Figure 5-1(C)) the electron excited into t2g
appears to relax by a different path, thus quenching the 2p-3d3d Auger channel. On the other hand,
when populating the eg states, which have less overlap with the oxygen orbitals, the excited electron
promptly refills the Fe 2p hole via the 2p-3d3d Auger channel. These qualitative considerations are in
agreement with theoretical calculations, reporting for bulk hematite stronger hybridization between Fe
t2g and O 2p orbitals than between eg and O 2p, 48% versus 35% oxygen character.147
I can go a step further and quantify the observed electron delocalization to estimate the charge
transfer, or electron delocalization rate. Fast charge transfer, which inhibits the charge recombination
at the surface (for instance of a transition-metal-oxide electrode), is crucial for efficient device
performance under photoelectrochemical conditions. With the Fe 2p lifetime, τcore, assuming an
exponential Auger decay rate, and an exponential electron delocalization governed by the charge
transfer time, τCT, the latter can be expressed as τCT = τcore·(fAuger–1 -1).169-170 Here, fAuger is the fraction
of normal Auger-electron signal with respect to the signal from non-local decay processes, the charge-
transfer channels of autoionization. τcore = 1.6 fs (1.8 fs) as calculated from the natural line width of
Fe 2p, Γ = 0.41 eV 171 (0.36 eV 172). I determine the normal Auger fraction from the local and non-
local signal contributions. Disentangling these signals from Figure 5-8 is not straight-forward because
both eg and t2g mix with ligand orbitals, and hence there is no obvious way of scaling the relative
spectral intensities. Arguably, the more accurate procedure is to use the peak areas of the PCEY- and
PVEY-XA spectra of Figure 5-7.

62
Figure 5- 7
Comparison of the Fe L3-edge PCEY- and PVEY-XA spectra (in green and red) from 10 wt% α-
Fe2O3 NPs in 0.1 M HNO3 aqueous solution (of Figure 5-6) with the Fe L3-edge PVEY-XA
spectrum from 1 M FeCl3 aqueous solution (in blue), 50 and with the total-electron-yield
spectrum from solid hematite sample (in black).16 Spectra are displayed to yield the same height
of the most intense absorption band, at 710.5 eV photon energy.
In this case, assuming that the intensity normalization at the eg peak is reasonable, the difference in
the pre-peak intensity of the t2g absorption does scale quantitatively with the electron delocalization.
To be more accurate, I argue that the PCEY-XA spectrum is a very good representation of an actual
X-ray absorption spectrum.167-168 Any difference between PCEY- and PVEY-XA spectra must thus be
due to delocalization of the 3d electrons. From the areas of the t2g XA peaks we then find fAuger = 0.6
which yields τCT ~ 1 fs. We are not aware of a previous report of this quantity which would be very
difficult to access by other experimental techniques, requiring sub-femtosecond laser pulses.
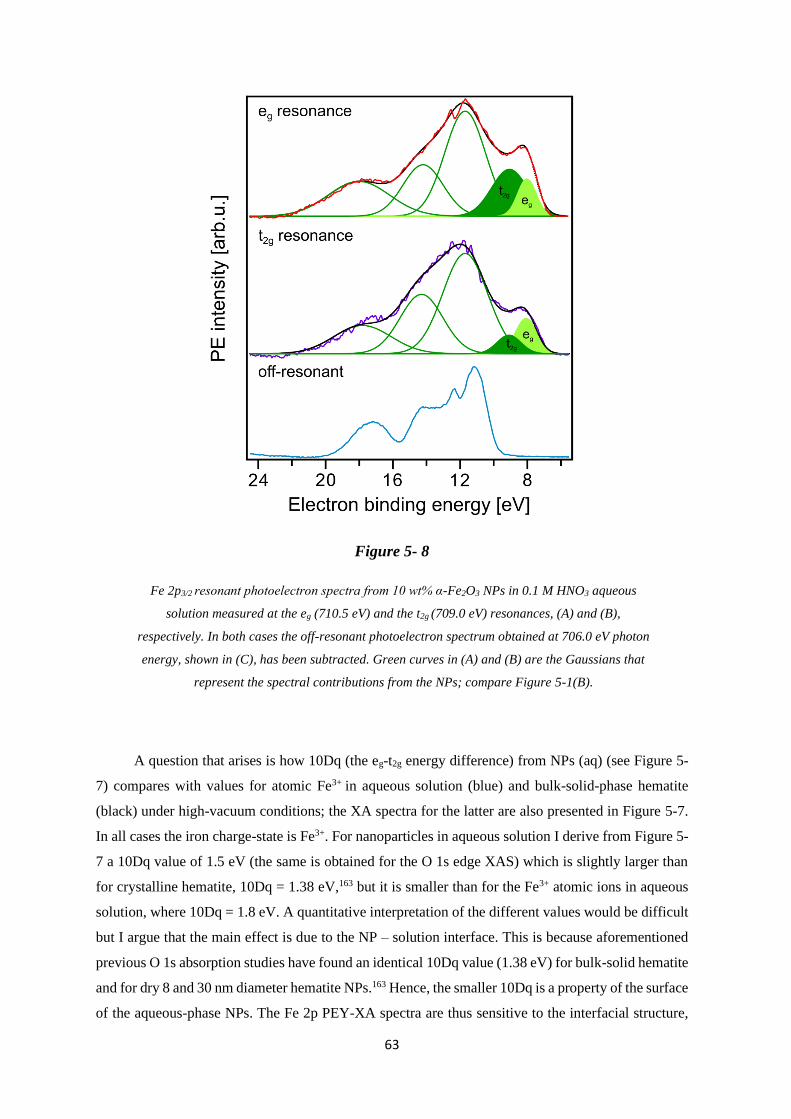
63
Figure 5- 8
Fe 2p3/2 resonant photoelectron spectra from 10 wt% α-Fe2O3 NPs in 0.1 M HNO3 aqueous
solution measured at the eg (710.5 eV) and the t2g (709.0 eV) resonances, (A) and (B),
respectively. In both cases the off-resonant photoelectron spectrum obtained at 706.0 eV photon
energy, shown in (C), has been subtracted. Green curves in (A) and (B) are the Gaussians that
represent the spectral contributions from the NPs; compare Figure 5-1(B).
A question that arises is how 10Dq (the eg-t2g energy difference) from NPs (aq) (see Figure 5-
7) compares with values for atomic Fe3+ in aqueous solution (blue) and bulk-solid-phase hematite
(black) under high-vacuum conditions; the XA spectra for the latter are also presented in Figure 5-7.
In all cases the iron charge-state is Fe3+. For nanoparticles in aqueous solution I derive from Figure 5-
7 a 10Dq value of 1.5 eV (the same is obtained for the O 1s edge XAS) which is slightly larger than
for crystalline hematite, 10Dq = 1.38 eV,163 but it is smaller than for the Fe3+ atomic ions in aqueous
solution, where 10Dq = 1.8 eV. A quantitative interpretation of the different values would be difficult
but I argue that the main effect is due to the NP – solution interface. This is because aforementioned
previous O 1s absorption studies have found an identical 10Dq value (1.38 eV) for bulk-solid hematite
and for dry 8 and 30 nm diameter hematite NPs.163 Hence, the smaller 10Dq is a property of the surface
of the aqueous-phase NPs. The Fe 2p PEY-XA spectra are thus sensitive to the interfacial structure,

64
and yet the quantitative characterization of the ligand field, without a good understanding of the
surface structure and the existing molecular species, is elusive. A similar qualitative argument
probably holds to explain the intensity variation in the 711-714 eV photon-energy region (Figure 5-7)
– the spectral fingerprint region of excited-state charge transfer.173 Intensities follow the same trend as
the t2g absorption intensity, although the effect is negligibly small when comparing PVEY compared
to PCEY. The latter would be expected if I assume that the ground-state iron t2g – oxygen 2p orbital
overlap is only little affected by the electron excited into a higher lying state. This assumption also
justifies aforementioned normalization of the spectra at the 2p → eg absorption in Figure 5-7. The
observed considerably larger intensity, near 712 eV absorption energy, for crystalline hematite
compared with the NP solutions, and even more so Fe3+ (aq), suggests that ground-state charge transfer
from the ligand to the iron cation is smaller in solution, implying less orbital overlap. Arguably, water
or hydroxide, either absorbed at the nanoparticle surface or located within the first hydration shell in
case of the Fe3+ (aq) monomer, have a smaller charge-transfer probability compared to O2- ligands in
the bulk hematite. To confirm this interpretation theoretical calculations are needed to quantify charge
transfer, including electron donation and back-donation between the different electronic ground-state
configurations.
5.4 Conclusions
I demonstrated that liquid-jet soft-X-ray PE spectroscopy is a powerful method that enables the
detailed investigation of the electronic-structure interaction of hematite nanoparticles with an aqueous
solution. This is a remarkable result because of the rather short probing depth of the emitted
(photo)electrons in aqueous solutions. An experimental challenge of the present work has been to
stabilize hematite NPs at sufficiently large concentration with an as small as possible number of
stabilizing molecules adsorbed at the NP surface. Using a combination of soft-X-ray photoemission
techniques (direct and resonant ionization, and autoionization) electrons from both the surface and the
interior of the aqueous-phase NPs can be detected. From the oxygen 1s PE spectra I obtain the electron
binding energy from dissociated water, at 536.1 eV, which is in good agreement with the energies of
hydroxyl species reported in an ambient-pressure PE-spectroscopy study of the Fe2O3(0001) hematite
– liquid water interface.136 However, the new spectroscopic information from our NP study is revealed
from resonant PE spectra at the oxygen 1s and iron 2p edges. The former spectra provide a
complementary and very sensitive electronic structure signature of oxygen-containing molecules
adsorbed at the NP surface. Performing photoemission measurements at the iron 2p edge we were able
to detect the lowest ionization energy of the solution, which corresponds to the ionization of the iron
3d-derived eg and t2g orbitals. This is an important quantity for understanding chemical reactions in
aqueous solution. I also determined the eg-t2g energy difference (10Dq value) from the partial-electron
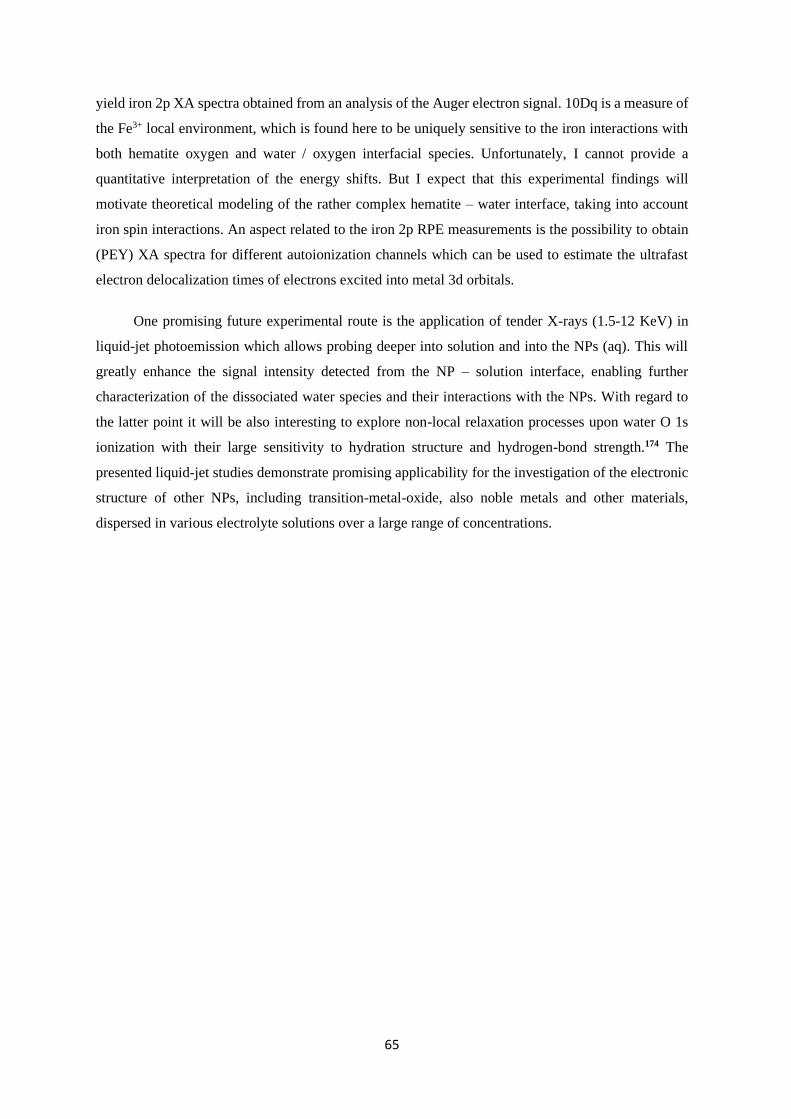
65
yield iron 2p XA spectra obtained from an analysis of the Auger electron signal. 10Dq is a measure of
the Fe3+ local environment, which is found here to be uniquely sensitive to the iron interactions with
both hematite oxygen and water / oxygen interfacial species. Unfortunately, I cannot provide a
quantitative interpretation of the energy shifts. But I expect that this experimental findings will
motivate theoretical modeling of the rather complex hematite – water interface, taking into account
iron spin interactions. An aspect related to the iron 2p RPE measurements is the possibility to obtain
(PEY) XA spectra for different autoionization channels which can be used to estimate the ultrafast
electron delocalization times of electrons excited into metal 3d orbitals.
One promising future experimental route is the application of tender X-rays (1.5-12 KeV) in
liquid-jet photoemission which allows probing deeper into solution and into the NPs (aq). This will
greatly enhance the signal intensity detected from the NP – solution interface, enabling further
characterization of the dissociated water species and their interactions with the NPs. With regard to
the latter point it will be also interesting to explore non-local relaxation processes upon water O 1s
ionization with their large sensitivity to hydration structure and hydrogen-bond strength.174 The
presented liquid-jet studies demonstrate promising applicability for the investigation of the electronic
structure of other NPs, including transition-metal-oxide, also noble metals and other materials,
dispersed in various electrolyte solutions over a large range of concentrations.

66
5.5 Appendix
5.5.1 Lattice-Oxygen O 1s Absorption Spectra from α-Fe2O3 NP Aqueous Solution
Figure A-5- 1
Selected RPE spectra from 5 wt% NP / 0.1 M HNO3 aqueous solution which are taken from
Figure 5-2(A) for photon energies 530.0 eV (c resonance) and 531.0 eV (energy between c and b
resonances). Each spectrum is presented together with the off-resonant valence PE spectrum
measured at 529.0 eV. Important to notice is the slightly larger intensity in the 530-eV spectrum
at 17.5 eV BE (bottom tier), which disappears shortly above the resonance (top tier). This is the
same contribution that gives rise to the weak signal enhancement, labeled c, in Figure 5-2(C).
All peaks appearing in the < 10 eV BE region result from water O 1s ionization by the second-
order light (2x hν) which is not blocked at the beamline.
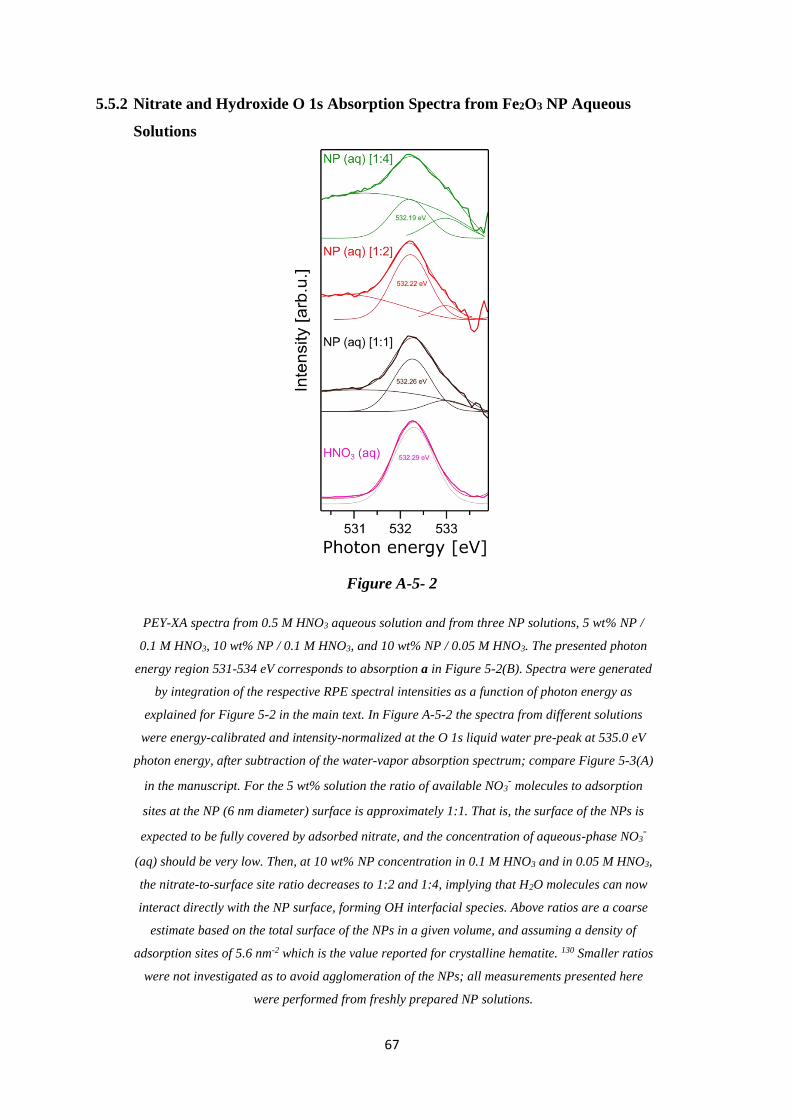
67
5.5.2 Nitrate and Hydroxide O 1s Absorption Spectra from Fe2O3 NP Aqueous
Solutions
Figure A-5- 2
PEY-XA spectra from 0.5 M HNO3 aqueous solution and from three NP solutions, 5 wt% NP /
0.1 M HNO3, 10 wt% NP / 0.1 M HNO3, and 10 wt% NP / 0.05 M HNO3. The presented photon
energy region 531-534 eV corresponds to absorption a in Figure 5-2(B). Spectra were generated
by integration of the respective RPE spectral intensities as a function of photon energy as
explained for Figure 5-2 in the main text. In Figure A-5-2 the spectra from different solutions
were energy-calibrated and intensity-normalized at the O 1s liquid water pre-peak at 535.0 eV
photon energy, after subtraction of the water-vapor absorption spectrum; compare Figure 5-3(A)
in the manuscript. For the 5 wt% solution the ratio of available NO3- molecules to adsorption
sites at the NP (6 nm diameter) surface is approximately 1:1. That is, the surface of the NPs is
expected to be fully covered by adsorbed nitrate, and the concentration of aqueous-phase NO3-
(aq) should be very low. Then, at 10 wt% NP concentration in 0.1 M HNO3 and in 0.05 M HNO3,
the nitrate-to-surface site ratio decreases to 1:2 and 1:4, implying that H2O molecules can now
interact directly with the NP surface, forming OH interfacial species. Above ratios are a coarse
estimate based on the total surface of the NPs in a given volume, and assuming a density of
adsorption sites of 5.6 nm-2 which is the value reported for crystalline hematite. 130 Smaller ratios
were not investigated as to avoid agglomeration of the NPs; all measurements presented here
were performed from freshly prepared NP solutions.

68
5.5.3 Adsorbed Nitrate and Hydroxide on the NP Surface Observed in the O 1s RPE
Spectra from Fe2O3 NP Aqueous Solutions
Figure A-5- 3
Photoelectron spectra at resonance a (532.2 eV) for the same three α-Fe2O3 NPs aqueous
solutions considered in Figure A-5-2. In addition, spectra from 0.5 M HNO3 and 0.5 M NaOH
(measured at near a) aqueous solution, are shown. Unlike in Figure 5-4 spectra are shown as
measured without the off-resonant photoelectron spectrum subtracted. Otherwise Figure A-5-3
and Figure 5-4 are identical.
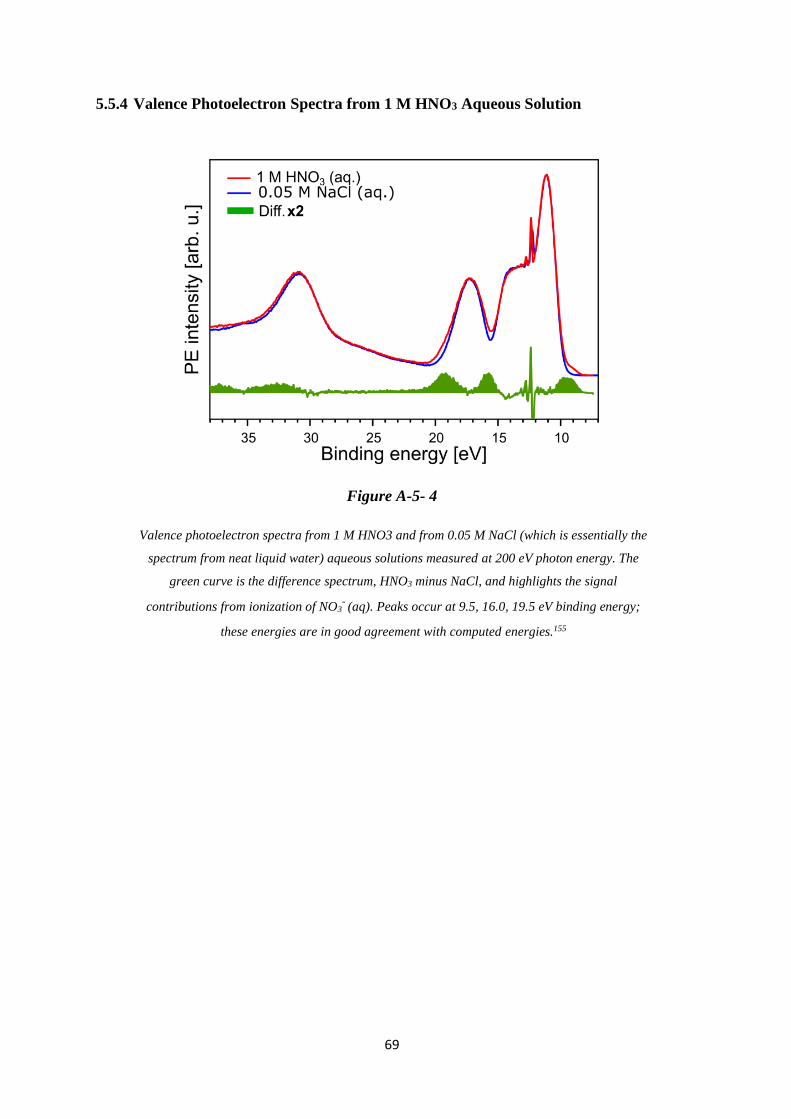
69
5.5.4 Valence Photoelectron Spectra from 1 M HNO3 Aqueous Solution
Figure A-5- 4
Valence photoelectron spectra from 1 M HNO3 and from 0.05 M NaCl (which is essentially the
spectrum from neat liquid water) aqueous solutions measured at 200 eV photon energy. The
green curve is the difference spectrum, HNO3 minus NaCl, and highlights the signal
contributions from ionization of NO3- (aq). Peaks occur at 9.5, 16.0, 19.5 eV binding energy;
these energies are in good agreement with computed energies.155
70
5.5.5 O 1s Photoelectron Spectra from Fe2O3 NP Aqueous Solution
Figure A-5- 5
Oxygen 1s photoelectron spectra from the 10 wt% hematite NPs in 0.1 M HNO3 aqueous solution
showing the 538-532 eV binding energy region which covers the O 1s photoelectron spectra from
OH- (536.1 eV) and lattice oxide (534.7 eV). Ionization photon energy was 1200 eV. In this
figure we present the raw data, whereas in Figures 5-5(B) and 5-5(C) we show the same data for
5-point binning. Each contribution is presented by a Gaussian, and the total fit is shown by the
dotted curve. (A) shows results for the 10 wt% hematite NPs / 0.1 M HNO3 aqueous solution
(corresponding to [1:2]), and (B) for 10 wt% hematite NPs / 0.05 M HNO3 aqueous solution
(corresponding to [1:4]) after subtraction of the 0.05 M NaCl aqueous solution spectrum.

71
The table below presents the positions and areas of both the hydroxide and lattice-oxide O1s
photoelectron peaks along with the respective error bars of the raw data.
NPs in 0.1 M HNO3 aq. solution Peak [eV] Area [arb. u.]
Lattice Oxide 534.8 ± 0.2 114.4 ± 32
OH- 536.2 ± 0.1 91.2 ± 29
NPs in 0.05M HNO3 aq. solution Peak [eV] Area [arb. u.]
Lattice Oxide 534.7 ± 0.2 139.2 ± 31
OH- 536.2 ± 0.1 140.2 ± 30

72
73
Chapter 6
Electronic Structure of the Anatase TiO2 Nanoparticle—
Aqueous Interface
This part of the thesis is taken from the following publication:
Electronic Structure of Aqueous-Phase Anatase Titanium Dioxide Nanoparticles
Probed by Liquid Jet Photoelectron Spectroscopy
Hebatallah Ali, Robert Seidel, Arno Bergmann and Bernd Winter
Journal of Materials Chemistry A 2019, 7, 6665-6675, DOI: 10.1039/C8TA09414D
This article is licensed under a Creative Commons Attribution 3.0 Unported Licence
This article was selected for the themed collection: 2019 Journal of Materials Chemistry A HOT Papers,
and appears as the front cover of the Issue 12, 2019.
Proposed pH-dependent mechanism of TiO2 – water interaction.

74
6.1 Introduction
Titanium dioxide, TiO2, with its three phases in nature, anatase, rutile and brookite, is one of
the most important transition metal oxides.175 It offers wide-range properties for science and industry
applications, and furthermore it is a chemically stable, abundant and cheap material.176 Exhibiting a
large bandgap of 3.2 eV TiO2 absorbs light in the UV region 177-178 which explains the extensive study
of this material in photoelectric and photochemical research.1, 179 In 1972, Fujishima and Honda
studied the water photolysis on the TiO2 electrode surface which can be described by the reaction H2O
+ 2hν → ½ O2 + H2.8 This photochemical reaction thus provides a clean and sustainable way for
hydrogen fuel production from solar energy. Many subsequent works have focused on the water
electrolysis to develop efficient photoelectrochemical cells (PEC) for solar hydrogen generation by
immersing two electrodes (TiO2 photoanode and a cathode). 177, 180-186 The challenge in these studies is
to minimize the unwanted back-reaction, i.e., the recombination or non-separation of hydrogen and
oxygen atoms which reduces the PEC’s efficiency. An ideally performing device, minimally suffering
from electric current losses, would assure that the initial charge separation is very fast (on the
femtosecond timescale) to slow down the back-reaction.187 Despite active research the conversion
efficiency from solar to electric power with current PECs is still low, reaching up to 17%,187-188 and
prevents this path for solar hydrogen generation from being economically and commercially viable.189-
190
As the TiO2 electrode is immersed in an aqueous environment it is essential to gain a detailed
understanding of the electronic properties of the TiO2 – water interface, and this has motivated many
investigations of the water adsorption behavior on single crystals, in rutile as well as in anatase phase.
93, 177, 191-196 Likewise, the present study aims at determining the electronic structure of this interfacial
layer. The novel approach here is to access the interface by soft X-ray photoelectron (PE) spectroscopy
which has not been accomplished previously for a TiO2 surface fully contained in liquid water. The
reason is that the detection of photoelectrons in a high-vapor pressure environment has only recently
become possible with the introduction of the liquid microjet technique 139, 197-199 and of ambient
pressure photoelectron spectroscopy (AP-PES). 27, 29, 93, 97, 136 Liquid jets are ideally suited to study NPs
dispersed in aqueous solutions 139, 197-199 while the latter technique typically refers to condensation of
few monolayers (ML) liquid water on a solid substrate at suitable relative humidity. 27, 29, 93, 97, 136 Also,
photoelectrons have been detected from liquid cells equipped with a few-nanometer thick graphene
membrane to separate the liquid from vacuum. 98-99, 200
The TiO2 anatase phase has been found to exhibit higher photocatalytic activity 201 and higher
efficiency in photo-electrochemistry applications,202-203 and is also more stable in the nanometer
regime.204-205 However, on macroscopic size scale, rutile is the most stable phase,175, 206 and has been
studied more intensively, both theoretically 177, 191 and experimentally.93, 207-208 Yet, the nature of the
water adsorption on the TiO2 surfaces remains unclear; depending on the specific study water has been

75
concluded to adsorb (1) dissociatively, (2) molecularly, or (3) mixed at the TiO2 interface.93, 177, 191-194,
209-213 Furthermore, the adsorption mechanisms for these different cases were proposed to depend on
whether or not the (vacuum) surface is defect-free. A defect surface site refers to a missing oxygen
atom in the crystal structure (oxygen vacancy), and is easily created by electron bombardment, ion
sputtering, or thermal annealing.214 In aqueous phase the situation is quite different; defects on the
titania surface will be healed upon interaction with the water molecules. 93, 138 Oxygen vacancies are
accompanied by a change of the titanium charge state (Ti4+ → Ti3+) and the occurrence of color centers,
214 which are the most active surface sites for water dissociation (mechanism (1)). 214-216 Defects on
the TiO2 surface are conveniently detected by Ti3+ signal,93, 192 a procedure also adapted here. For the
interpretation of the results obtained in the present work it is useful to briefly review the different
adsorption mechanisms.
Dissociative adsorption (mechanism (1)) of TiO2 – water interaction depends entirely on the
existence of surface defects; water molecules dissociate only at oxygen vacancy defects. The thus
generated hydroxyl species fills the oxygen vacancies (denoted OHt), leaving the hydrogen to bond to
a neighbor lattice oxygen atom (OHb) and forming what is termed paired hydroxyl groups.208 Ketteler
et al.93 observed this paired OH for 0.25 ML coverage on rutile (110) using AP-PES. In addition, the
authors detected an O 1s photoelectron signal from adsorbed molecular water at less than 1 ML
coverage, with an approximately 0.5 eV lower binding energy (BE) as compared to bulk water. This
PE peak could correspond to hydroxyl or to molecularly adsorbed water; also pseudo-dissociated water
has been suggested.93 In the latter process, the paired hydroxyl groups re-form a water molecule by
back-reaction. At higher coverage, water has been shown to adsorb molecularly, bonding to the OH
groups that act as hydrogen-donors.93 A similar conclusion has been drawn from PE spectroscopy
measurements from TiO2 nanoparticles (NP) exposed to water vapor; experiments were conducted
using an aerosol generator.217 Mechanism (1) can hence be represented as H2O + Ob ↔ OHb + OHt
.218-219 The interconversion energy of the dissociated hydroxyl pair relative to the water molecule
(back-reaction) has been estimated as ΔE = 0.035±0.003 eV, based on a combination of supersonic
molecular-beam experiments, scanning tunneling microscopy, and ab initio molecular dynamics.218
Given this very small energy difference between the two states, the re-formation of adsorbed water
molecule is slightly more likely over the paired hydroxyl configuration, but not dominating.219 In this
mechanism, OHt was assumed to form a covalent bond with the TiO2 surface.93 This interpretation is
based on the detected energy of the O 1s and Ti 2p peak positions, both being different for the hydrated
TiO2 rutile crystal surface compared to the bulk crystal.207
In the second proposed mechanism (2) of the TiO2 / water interaction, water is molecularly
adsorbed on the surface at very specific geometries where the water oxygen atom binds to Ti4+ sites
and its hydrogens bind to two neighboring lattice oxygen atoms.220 This raises the question whether
water dissociates exclusively at oxygen vacancies or whether dissociation can also occur at Ti4+ sites.
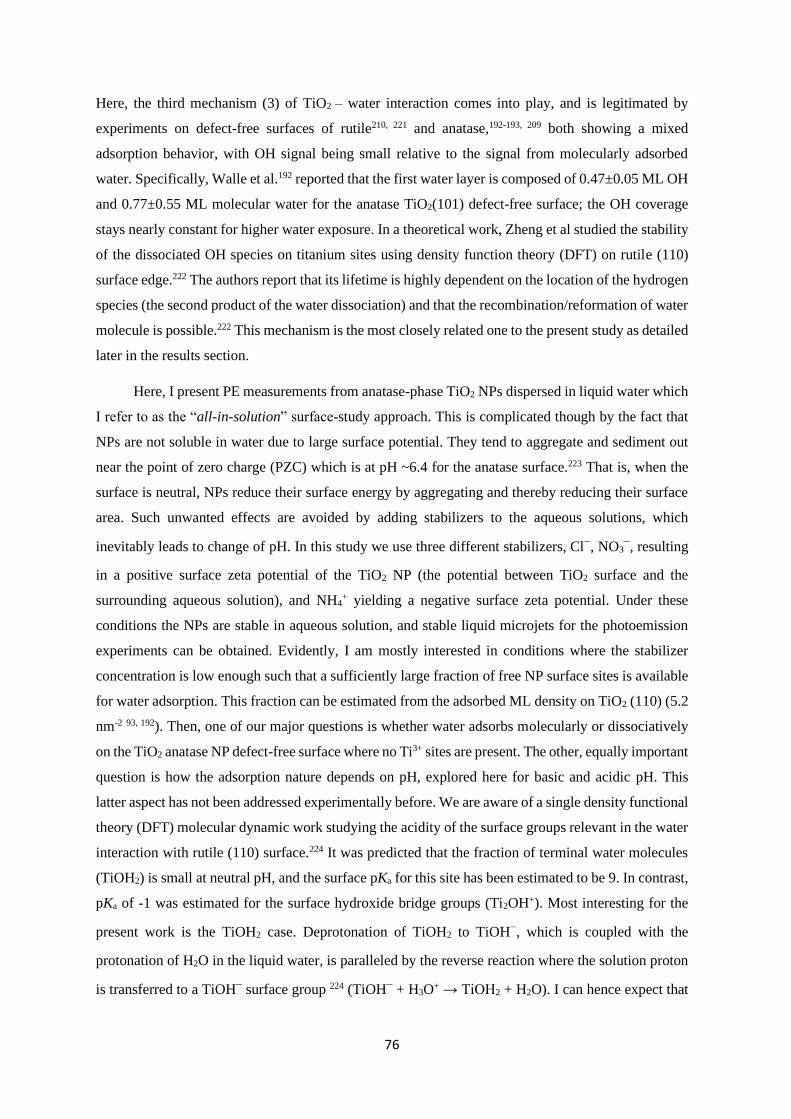
76
Here, the third mechanism (3) of TiO2 – water interaction comes into play, and is legitimated by
experiments on defect-free surfaces of rutile210, 221 and anatase,192-193, 209 both showing a mixed
adsorption behavior, with OH signal being small relative to the signal from molecularly adsorbed
water. Specifically, Walle et al.192 reported that the first water layer is composed of 0.47±0.05 ML OH
and 0.77±0.55 ML molecular water for the anatase TiO2(101) defect-free surface; the OH coverage
stays nearly constant for higher water exposure. In a theoretical work, Zheng et al studied the stability
of the dissociated OH species on titanium sites using density function theory (DFT) on rutile (110)
surface edge.222 The authors report that its lifetime is highly dependent on the location of the hydrogen
species (the second product of the water dissociation) and that the recombination/reformation of water
molecule is possible.222 This mechanism is the most closely related one to the present study as detailed
later in the results section.
Here, I present PE measurements from anatase-phase TiO2 NPs dispersed in liquid water which
I refer to as the “all-in-solution” surface-study approach. This is complicated though by the fact that
NPs are not soluble in water due to large surface potential. They tend to aggregate and sediment out
near the point of zero charge (PZC) which is at pH ~6.4 for the anatase surface.223 That is, when the
surface is neutral, NPs reduce their surface energy by aggregating and thereby reducing their surface
area. Such unwanted effects are avoided by adding stabilizers to the aqueous solutions, which
inevitably leads to change of pH. In this study we use three different stabilizers, Cl–, NO3
–, resulting
in a positive surface zeta potential of the TiO2 NP (the potential between TiO2 surface and the
surrounding aqueous solution), and NH4+ yielding a negative surface zeta potential. Under these
conditions the NPs are stable in aqueous solution, and stable liquid microjets for the photoemission
experiments can be obtained. Evidently, I am mostly interested in conditions where the stabilizer
concentration is low enough such that a sufficiently large fraction of free NP surface sites is available
for water adsorption. This fraction can be estimated from the adsorbed ML density on TiO2 (110) (5.2
nm-2 93, 192). Then, one of our major questions is whether water adsorbs molecularly or dissociatively
on the TiO2 anatase NP defect-free surface where no Ti3+ sites are present. The other, equally important
question is how the adsorption nature depends on pH, explored here for basic and acidic pH. This
latter aspect has not been addressed experimentally before. We are aware of a single density functional
theory (DFT) molecular dynamic work studying the acidity of the surface groups relevant in the water
interaction with rutile (110) surface.224 It was predicted that the fraction of terminal water molecules
(TiOH2) is small at neutral pH, and the surface pKa for this site has been estimated to be 9. In contrast,
pKa of -1 was estimated for the surface hydroxide bridge groups (Ti2OH+). Most interesting for the
present work is the TiOH2 case. Deprotonation of TiOH2 to TiOH–, which is coupled with the
protonation of H2O in the liquid water, is paralleled by the reverse reaction where the solution proton
is transferred to a TiOH– surface group 224 (TiOH
– + H3O+ → TiOH2 + H2O). I can hence expect that

77
in a basic solution environment this reverse reaction is insignificant. Qualitatively, such a behavior is
supported by our combined resonant and non-resonant PE spectroscopy, as well as partial-electron
yield X-ray absorption (PEY-XA) measurements from TiO2 NP (aq) at different pHs.
6.2 Methods and Materials
Photoelectron measurements of TiO2 NP solutions (i.e., colloidal dispersions) were conducted
using the SOL3 PES setup62 at the U49/2-PGM-1 soft X-ray beamline, at the synchrotron radiation
facility BESSY II, Berlin. Briefly, synchrotron light, liquid jet and the photoelectron detection are
orthogonal to each other. The X-ray light at this beamline is linearly polarized in the floor plane which
is the plane spanned by jet propagation and light propagation. Focal size is approximately 60 x 20
μm2. Solutions were injected into the interaction vacuum chamber through a 25 μm glass capillary.
Liquid flow rate was 0.7 ml/min using a backing pressure of 10 bars. The liquid jet hits the X-ray
beam at 0.5 mm distance from the capillary tip, and this interaction point is at 500 μm distance from
the detector orifice. The pressure in this chamber was kept at approximately 3.0 x 10⁻⁴ mbar by using
a turbo molecular pump (1600 l s-1) and two liquid nitrogen cold traps. At 500 eV photon energy, using
80 μm beamline exit slit, the energy resolution in our measurement is higher than 130 meV.
Four sets of anatase TiO2 NP solutions were studied. The NP sizes used in this study were given
by the samples that were commercially available. In addition to different NP sizes, the different
vendors also use different stabilizers as well as different stabilizer concentrations. Then, together with
the finding that anatase-phase TiO2 NPs, for 2-200 nm diameter, have been demonstrated to exhibit
no noticeable size effects on the electronic structure 225 it is possible to solely vary the ratio of free-to-
stabilizer covered surface sites as a single parameter.
Dry NPs: 20 nm diameter, 99.5% anatase TiO2 NP sample purchased from Io-Li-Tec, Germany.
This sample was used for the total electron yield measurements of the Ti L- edge XA and the O K-
edge XA spectra for examining the similarity between XA spectra the anatase-phase TiO2 NPs in dry
environment and TiO2 single crystal reported in literature.
TiO2 NPs in HCl aqueous solution: (acidic solutions without free surface sites) 10 nm, 99.9%
pure anatase TiO2 NPs coated with Cl–, purchased from Mknano, Canada, was used to prepare the 20
wt% TiO2 NP in 0.5 M HCl aqueous solution (yielding pH 1.2) and in 1 M HCl aqueous solution
(yielding pH 0.7). In both samples, the NPs are fully covered by Cl- ions with NP surface sites relative
to stabilizer ions ratio [1:1]Cl- and [1:2]Cl- respectively. In all these cases water cannot interact with the
actual TiO2 NP. Our measurements from the HCl-stabilized NP solutions thus provide valuable
reference O 1s non-resonant, resonant XPS and PEY-XAS spectra of the TiO2 NPs, in the absence of
interfacial oxygen species.

78
TiO2 NPs in HNO3 aqueous solution: (acidic solutions with free / no free surface sites) 20
wt%, 6 nm TiO2 NPs in 0.5 M HNO3 aqueous solution (yielding pH 1.2) and in 0.25 M HNO3 aqueous
solution (pH 0.9), purchased from PlasmaChem, Germany, which have TiO2 surface sites relative to
the stabilizer ratios of [1:1]NO3- and [2:1]NO3- , respectively. Furthermore, in order to increase the
[x:y]NO3- ratio, a 20 wt%, 3 nm TiO2 NP in 0.6 M HNO3 aqueous solution (pH 0.7) yielding [4:1]NO3-
was used; this ready-to-use solution was purchased from NYACOL, USA.
TiO2 NPs in NH4OH aqueous solution: (basic solutions with free surface sites) 20 wt%, 20
nm TiO2 NP in 0.3 M NH4OH aqueous solution (pH 7.8; slightly above the neutral water pH) was
obtained from NYACOL, USA. In addition, we added 0.5 M NH4OH to this NPs(aq) solution to obtain
20 wt%, 20 nm TiO2 NP in 0.8 M NH4OH aqueous solution (pH 9.8). This leads to ratios [2:1]NH4+
and [1:1.5]NH4+, respectively. The latter sample is used to support our proposed TiO2/water interaction
mechanism, as discussed in the results section. It is interesting to mention that the estimated
[2:1]NH4+ratio is in good agreement with measurements of the surface zeta potential. It is -16.9 mV for
the [2:1]NH4+ solution (measured with “Zetasizer Nano ZS” spectrometer) and can be compared with
a value of +30 mV 226 for fully covered anatase TiO2 NPs surface in aqueous solution.
6.3 Results and Discussion
6.3.1 Ti L-edge PEY-XA Spectra
I start by exploring the X-ray absorption (XA) spectra from aqueous-phase TiO2 NPs measured
at the Ti4+ 2p → valence 3d0 resonance. We note that an electron-yield absorption spectrum essentially
captures electrons that are emitted in an electronic relaxation process, which is mostly Auger decay.
One typically assumes that the Auger-electron yield is proportional to the actual XA. 167-168 In the
present work I detect the partial electron yield corresponding to the refill of a Ti 2p hole by a 3p
electron and subsequent ejection of another 3p electron (Ti LMM Auger channel); this (resonant)
Auger signal appears in the 360-420 eV kinetic energy range. More specifically, by integrating the
signal intensity over this energy range as a function of the excitation energy I obtain the so-called
partial electron yield XA (PEY-XA) spectrum. For the questions addressed here, the small difference
that may occur between PEY and total electron yield (TEY) detection 168 is irrelevant; the important
point here is that I can experimentally track the electronic structure changes that lead to the measured
XA spectra. Figure 6-1 shows the Ti L-edge PEY-XA spectra from several NP solutions, [1:1]Cl-,
[1:1]NO3-, [4:1]NO3- and [2:1]NH4+. I present one sample from each set described in the experimental
section. Only for the NO3- sample set, two samples provided from different companies, are shown
([4:1]NO3- and [1:1]NO3-). In addition, the dry NPs (shown in the bottom of Figure 6-1) XA spectrum
was measured by detecting the drain current while sweeping the photon energies over the Ti L-edge.
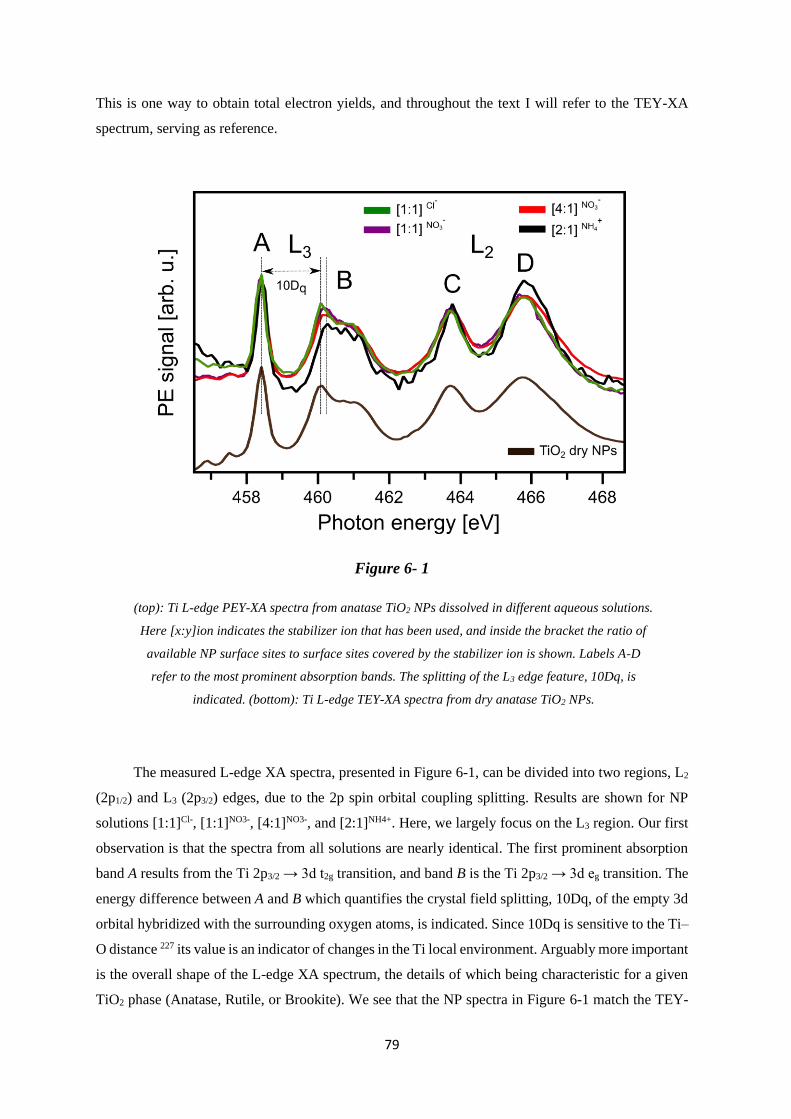
79
This is one way to obtain total electron yields, and throughout the text I will refer to the TEY-XA
spectrum, serving as reference.
Figure 6- 1
(top): Ti L-edge PEY-XA spectra from anatase TiO2 NPs dissolved in different aqueous solutions.
Here [x:y]ion indicates the stabilizer ion that has been used, and inside the bracket the ratio of
available NP surface sites to surface sites covered by the stabilizer ion is shown. Labels A-D
refer to the most prominent absorption bands. The splitting of the L3 edge feature, 10Dq, is
indicated. (bottom): Ti L-edge TEY-XA spectra from dry anatase TiO2 NPs.
The measured L-edge XA spectra, presented in Figure 6-1, can be divided into two regions, L2
(2p1/2) and L3 (2p3/2) edges, due to the 2p spin orbital coupling splitting. Results are shown for NP
solutions [1:1]Cl-, [1:1]NO3-, [4:1]NO3-, and [2:1]NH4+. Here, we largely focus on the L3 region. Our first
observation is that the spectra from all solutions are nearly identical. The first prominent absorption
band A results from the Ti 2p3/2 → 3d t2g transition, and band B is the Ti 2p3/2 → 3d eg transition. The
energy difference between A and B which quantifies the crystal field splitting, 10Dq, of the empty 3d
orbital hybridized with the surrounding oxygen atoms, is indicated. Since 10Dq is sensitive to the Ti–
O distance 227 its value is an indicator of changes in the Ti local environment. Arguably more important
is the overall shape of the L-edge XA spectrum, the details of which being characteristic for a given
TiO2 phase (Anatase, Rutile, or Brookite). We see that the NP spectra in Figure 6-1 match the TEY-

80
XA spectrum from dry 20 nm NPs which is also presented, at the bottom of Figure 6-1, rather well.
And the latter spectrum perfectly reproduces the XA spectrum from anatase-phase TiO2 crystal.228-230
I particularly point out that the broadening of the eg L2 (as well as the sub-splitting of the eg L3 edge),
which is very sensitive to the crystal phase, is the same in all spectra and reproduces the shape and
width reported in the literature.228-230 I can thus rule out any NP phase transition in the aqueous
solutions, and also oxygen defects are not detected which would manifest in contributions from Ti3+
signal.
To further confirm the non-existence of Ti3+ I have also recorded the valence spectra at the
various resonances, A, B, C, D identified in Figure 6-1. The results are exemplarily shown for the
[2:1]NH4+ solution in Figure A-6-1 of the Appendix Section 6.5 where I also present an off-resonant
spectrum measured slightly below the resonance, at 457 eV photon energy. In none of the spectra I
observe any signature of the 2p – 3d3d (LVV) Ti3+ Auger decay as judged from comparison with our
previous study of atomic Ti3+ in TiCl3 aqueous solution.144 Our conclusion is also supported by
reported valence spectra from pure crystalline anatase TiO2 (containing no Ti3+) and from Li+-doped
TiO2 in which case Ti3+ forms.231 Hence, the spectra in Figure A-6-1 prove that the Ti 3d orbital is
empty, and the aqueous-phase NPs are indeed purely anatase-phase TiO2. Adsorption mechanism (1),
described in the Introduction Section 6.1, is thus irrelevant for the TiO2 NP – aqueous solution
interface. One further observation from Figure 6-1 that is noteworthy to mention is that 10Dq appears
to be slightly larger for the [2:1]NH4+ solution than for all other solutions. In Figure A-6-2 of the
Appendix Section 6.5 I have averaged the [4:1]NO3–, [1:1]Cl–, and [1:1]NO3– solution spectra for better
visualization of this pH-dependent effect. Arguably, this is an indication that NH4+, unlike the other
stabilizing ions, has some specific effect on the interfacial structure. Indeed, a distinct adsorption
behavior of H2O occurs in the NH4+-stabilized NP solutions as we will show below.
6.3.2 O 1s Off-resonant Photoemission Spectra
Figure 6-2 presents the (regular) oxygen 1s core-level photoelectron spectra measured at 1200
eV photon energy for all our NPs solutions. Here I have included the reference spectrum from O 1s
spectrum from 0.05M NaCl aqueous solution, representative of neat liquid water. I find that all PE
spectra (Figure 6-2(A)), again with the one exception of NH4+ (Figure 6-2(B)) are almost identical,
exhibiting the main bulk water peak at 538.1 eV BE, 86 relative to the vacuum level, the water gas-
phase (a shoulder) at 540.0 eV, and an additional small peak at 534.9 eV BE from lattice oxygen of
the TiO2 NPs, in agreement with the reported value for the TiO2 rutile crystal with few layers of water
prepared at suitable relative humidity.93 Similar to our previous study of aqueous-phase hematite NPs
stabilized with NO3–, 197 the PE signal from the NO3
– cannot be observed (at 538.1 eV binding
energy166) at such a low concentration because of overlap with large signal intensity from bulk water.

81
138, 166 The OH–signal, on the other hand gives rise to a peak at 536.0 eV BE (determined in the
aforementioned ambient-pressure PE study from rutile TiO2 single crystal93) which is distinguishable
from NO3- and water. But there is no indication of adsorbed OH
– despite available free adsorption
sites for interaction with water, for instance in the case of the [4:1]NO3- and [2:1]NO3- . I thus conclude
(and will later corroborate) that water does not dissociate on the TiO2 NP surface but rather adsorbs
molecularly; yet, a small but negligible amount of dissociated water may exist at the NP surface. This
is opposite to α-Fe2O3 NPs, where water dissociates when the NPs are stabilized by NO3–.197 (See
Figure 5-5) Note that also adsorbed water, similar to NO3–, has a O 1s BE strongly overlapping with
bulk water (0.5 eV lower BE than bulk water93) which makes the detection of this contribution
impossible in a liquid-jet experiment.
Figure 6- 2
Oxygen 1s photoelectron spectra of the different anatase TiO2 NP aqueous solutions, measured
at 1200 eV photon energy. As in Figure 6-1, [x:y]ion indicates the stabilizer ion that has been
used, and inside the bracket the ratio of free NP surface sites to surface sites covered by the
stabilizer ion is shown. NP size is given in the experimental section. (A) Acidic NP solutions:
[1:1]Cl- (pH 1.2), [1:2]Cl
- (pH 0.7), [1:1]NO3
- (pH 1.2), [2:1]NO3
- (pH 0.9) and, [4:1]NO3
-
(pH 0.7). Also shown is the spectrum from 0.05 M NaCl. (B) Basic solution: [1:1]NH4+ (pH 7.8).
Also shown are the O 1s spectra from 0.05 M NaCl and 0.5 M NH4OH aqueous solutions.

82
I now turn to the [2:1]NH4+ NP solution (Figure 6-2(B)) where I observe a weak signal at 536.0
eV BE which identifies adsorbed OH– species. This energy is in agreement with the previously
reported value for adsorbed hydroxyl on a TiO2 surface under near ambient pressure conditions.29, 93,
213. Comparing with reference O 1s PE spectra from 0.5 M NH4OH aqueous solution (pH 11.7) and
0.05 M NaCl aqueous solution, containing no NPs, the OH– signal is seen to vanish. This implies that
it is not produced by the NH4+ interaction with bulk water. Note that the higher-concentration solution,
0.5M NH4OH (compared to 0.3 M NH4OH), does not even show the slightest evidence of OH– signal.
Hence, the 536.0-eV BE signal must result from water interaction with the TiO2 free surface sites.
Since the pH of the [2:1]NH4+ NP solution is 7.8, i.e., the concentration of free OH– in the solution is
roughly 10-7 mol/L, the detected OH– species must be immobilized within the TiO2 NP – solution
interface rather than being free in the solution. One also infers from Figure 6-2 that dissociation of
water on the TiO2 NP surface depends on solution pH, a hypothesis I will verify with the help of
oxygen K-edge PEY-XA spectra. In the present case of approximately 650 eV O 1s photoelectrons
the top-most layers of the NPs, including their adsorbed molecular layer, are probed. The relatively
large OH– signal intensity compared to the lattice oxide signal in Figure 6-2(B) is attributed to the
exponentially decreasing electron signal contribution as a function of distance from the (covered) NP
surface – aqueous solution interface.
6.3.3 O K-edge Photoemission and PEY-XA Spectra
Analogous to the Ti L-edge PEY-XA measurements, I also study the valence photoemission
signal (detected in the 510-525 eV kinetic energy range), sweeping the photon energy across the O 1s
resonance. Figure 6-3(A) presents the O 1s PEY-XA spectra from five selected NP solutions, [1:1]Cl-,
[1:2]Cl-, [4:1]NO3-, [2:1]NH4+, and [1:1.5]NH4+. In Figure 6-3(B) I show the respective spectra from four
relevant reference salt aqueous solutions, 0.5 M HNO3 (pH -0.2), 0.5 M NH4OH (pH 11.7), 0.5 M
NaOH (pH 13.7), and 0.05 M NaCl (pH 7). Figure 6-3(C) shows the TEY-XA spectrum from the dry
TiO2 NPs which was however recorded by measuring the resulting electric current through the sample.
In Figures 6-3(A) and 6-3(B), the large peak at 535 eV photon energy is due to the liquid water
absorption pre-peak (O 1s → 4a1 transition 150) which is used here for energy calibration and intensity
normalization. The shoulder at 534.5 eV photon energy is the respective H2O gas-phase absorption.
This contribution is seen to vary among different solutions, which is due to a combination of changing
vapor pressure upon pH variation and perhaps slight misalignment of the liquid jet when switching
solutions. In addition to the water absorption bands several smaller peaks, a (near 531.2 eV), b
(532.3eV), c (532.8), and d (533.8), can be seen in both Figures 6-3(A) and 6-3(B). More specifically,
and starting with the TEY-XA spectrum from dry NPs (Figure 6-3(C)), the two main bands, a (531.2

83
eV) and d (533.8 eV), are the absorptions O 1s → O 2p–Ti 3d (t2g and eg); these metal orbitals are
hybridized with lattice O 2p. 162, 225, 232-234 I next consider the solutions [1:1]Cl- and [1:2]Cl- for which
no free adsorption sites on the NP surfaces are available.
Figure 6- 3
(A) O 1s PEY-XA spectra from different anatase TiO2 NP aqueous solutions; compare caption of
Figure 6-2 for the solution labels. Intensities are normalized at the water pre-peak band at 535.0
eV. (B) O 1s PEY-XA spectra from reference solutions, as labeled. (C) TEY-XA spectra from dry
anatase TiO2 NPs. Assignment of absorption bands: a and d (TiO2 lattice oxide), b (NO3–), c (OH
–).

84
The respective spectra thus serve as reference, representative of an O 1s XA spectrum in the absence
of interfacial oxygen-containing species, and they are also useful to quantify the stabilizer ion and
concentration effects on the detected signal intensities. Not surprisingly, these spectra exhibit just
absorption a, corresponding to the TiO2 NP bulk, and band d stays undetected, hidden under the water
pre-edge peak. Small energy shift of band a with respect to the dry NPs is likely caused by the Cl–
decoration. Turning now to the [4:1]NO3- NP solution – I expect molecular water adsorption (as
concluded from Figure 6-2(A)) – an additional band b (at 532.3 eV photon energy) is observed. The
same band occurs in the XA spectrum from 0.5M HNO3 aqueous solution (Figure 6-3(B)), and I can
unequivocally assign band b to interfacial NO3- species. For the [2:1]NH4+ and [1:1.5]NH4+ NP solutions
I find an intense band c (at 532.8 eV photon energy), i.e., at slightly larger absorption than b, and the
intensity of band a is now very small. Comparing with the XA spectrum from 0.5M NaOH aqueous
solution (pH ~13.7) in Figure 6-3(B), where I also find an absorption band (although small) at position
c, shows that this band is due to free OH– (also in agreement with references 153-154). The comparison
with NaOH solution was necessary here because the OH– signal from 0.5M NH4OH solution (our
reference discussed along with Figure 6-2) is below our detection limit. Note that NaOH is a stronger
base than NH4OH. As a further remark, I point out that the intensities of interfacial OH– in the NP (aq)
solutions is so much larger than the signal of the free OH– in the reference solutions (particularly 0.5
M NaOH). This result would seem non-intuitive given the NP solution pH of 7.8. I attribute the large
OH signal to immobilized dissociated H2O at or near the TiO2 surface; alternatively, this effect might
be a consequence of the NPs position relative to the solution – vacuum interface to be detailed below.
Complementary resonant X-ray scattering (RIXS) studies are presented in Section 7. 3.3 to clarify the
origin of this large signal from TiO2 NPs in aqueous solution, at basic pH.
In order to explore the water–NP interaction mechanism, I performed O 1s RPE spectroscopy
measurements at three selected excitation energies, the t2g lattice oxide (absorption a), the interfacial
NO3– (b) and OH
– (c). My initial focus is to identify the spectral contributions from the lattice oxide
as this will guide me in singling out contributions from interfacial species. In Figure 6-4, I present the
RPE spectra from all our NP solutions measured at a (531.2 eV), and in addition I show the off-
resonance spectrum from [2:1]NH4+ NP solution. All spectra are displayed with a Shirley background
subtracted. The off-resonance spectrum reproduces the water valence spectrum (in blue), 32 and solute
signal is below our detection limit. The most relevant feature in this comparison is the electron signal
near 22.5 eV (grey-shaded) which results from Auger electron emission. It is specifically the spectator
Auger decay, O–2 1s-1t2g-1t2g, occurring at 508.7 eV kinetic energy (equivalent to 22.5 eV BE), and
has been assigned with the help of the TiO6-8 molecular orbital diagram from reference235. The other

85
spectral features at approximately 18.0 and 24.5 eV BE are also due to spectator Auger decay but are
not further considered here as their intensities are too small for a quantitative analysis of the interfacial
species.
Figure 6- 4
Valence resonant photoelectron (RPE) spectra from different anatase TiO2 NP aqueous solutions
measured at the O2– resonance, a (531.2 eV photon energy; compare Figure 6-3). Also presented
is the off resonance spectrum from [2:1]NH4+ NP solution, measured at 530.0 eV photon energy.
Solutions are labeled as explained in the caption of Figure 6-1. Here, we have added the NP
diameters. The grey-shaded area highlights the contributions from the spectator Auger electrons
originating from the TiO2 lattice oxide.
The next observation from Figure 6-4 is the considerable intensity variation of the lattice oxide
absorption band among the different solutions. At the applied 531.2-eV photon energy (resonance a
in Figure 6-3) the electron inelastic mean free path can be assumed to be less than 3 nm,35 implying
that the NPs are located within this range from the solution – vacuum interface. Arguably, there are
several parameters that have direct influence on the exact position of a nanoparticle in the measured
solutions, including particle size, stabilizer ion and concentration. The current experiment was not
designed to systematically study such effects since the different solutions in this work usually differ
by more than one parameter. However, the lattice signal contributions tend to be larger for the smaller

86
NPs, which might be an indication of smaller NPs having a larger affinity for the solution interface.
On the other hand, the comparison between the 10 nm [1:1]Cl- and the 6 nm [1:1]NO3- NP solutions
would suggest the opposite, indicating that the distance of the NPs from the solution surface depends
on the complex interplay between size, charge, and adsorbate, and specifically on the respective nature
of the so-called diffusive layer.236 It is reminded that electronic-structure size effects (see Methods and
Materials Section 6.2) in the NP size range considered here can be expected to be negligible.
Having analyzed the oxygen signal from the NPs, based on the O 1s RPE spectra at the lattice
oxide resonance, a, I now turn to explore the contribution from oxygen-containing molecular species
at the NP / water interface. I start with the acidic solution. Figure 6-5 shows RPE spectra measured at
the NO3- resonance, b, for the [1:1]NO3-, [2:1]NO3-, and [4:1]NO3- NP aqueous solutions. For comparison
I also include a spectrum from the 0.5 M HNO3 aqueous solution. All spectra are displayed with a
Shirley background subtracted. As in Figure 6-4 the signal near 30 eV (2a1) and 11 eV (1b1) is due to
water, 237 and the latter was used for signal intensity normalization. The interesting features are the
broad electron emissions in the 13-24 eV BE range due to NO3–. As in the previous work on hematite
NPs 197 (see Figure 5-4) the same four main photoemission bands are observed, at approximately 16.0,
18.0, 22.5, and 24.5 eV BE (all within the red-shaded area), assigned to various Auger-electron decays
upon O 1s → valence excitation at 532.2 eV photon energy.197 The 24.5-eV peak strongly overlaps
with the lattice oxide peak (black-shaded area); compare Figure 6-4. This peak can be most clearly
observed for the [4:1]NO3- NP solution, in which case NO3– contribution is the lowest; see experimental
section. On the other hand, the NO3– signal increasingly dominates when going from [4:1]NO3- to
[1:1]NO3- solutions. In fact, relative intensities (red-shaded area) almost quantitatively track our
estimated NP surface sites-to-stabilizer ratios. Most important for the present study are however the
[2:1]NO3- and [4:1]NO3- solutions which provide free surface sites for water to interact with the TiO2
surface. If this interaction were dissociative, Auger signal from adsorbed OH– should appear in the
25-32 eV binding energy finger-print region (blue-shaded area) analogue to the hematite NPs (aq)
study;197 this is because of the considerable spectral overlap between resonances b and c (of adsorbed
NO3– and OH
–, respectively), seen in Figure 6-3(A). Obviously no signal of adsorbed OH
– is observed
here, corroborating our above finding (from the O1s non-resonant spectra, Figure 6-2(A), and O K-
edge XAS, Figure 6-3) that water adsorbs molecularly on the surface of the TiO2 in acidic
environment. In the next paragraph I discuss the interaction in basic solution.

87
Figure 6- 5
Valence resonant photoelectron (RPE) spectra from different anatase TiO2 NP aqueous solutions
measured at the NO3– resonance, b (523.2 eV photon energy; compare Figure 6-3). Also
presented is the spectrum from 0.5 M HNO3 aqueous solution. Different shades indicate the
regions of Auger-electron emission from different species: NO3– (red-shaded), lattice oxide
(grey-shaded), OH– (blue-shaded).
Figure 6-6 shows the respective O 1s RPE spectra from the basic [2:1]NH4+ and [1:1.5]NH4+ NP
solutions. Measurements were performed right at the OH– resonance (peak c, 532.8 eV photon
energy), rather than at resonance b, which increases the spectral sensitivity to adsorbed OH-. The
figure also includes an off-resonance spectrum from the [2:1]NH4+ NP solution measured at 530 eV
photon energy as well as a reference spectrum from 0.5 M NaOH aqueous solution. All the spectra are
Shirley-background subtracted. Again, the off-resonance spectrum (in dark blue) reproduces the water
valence peaks.32 The NaOH spectrum (light blue) exhibits the resonantly enhanced OH– signal,
dominated by Auger-electron emission, in the 15-25 eV BE range (corresponding to 505-514 eV
kinetic energy range).153 This signal contribution is found to be much larger in the spectra from the
NP solutions, with an intensity being an order of magnitude larger than the signal from the water
valence band. I note though that near the 25-eV BE position (grey-shaded area) the OH– signal
considerably overlaps with the electron emission from lattice oxide (see also Figure 6-4 and 6-5). The
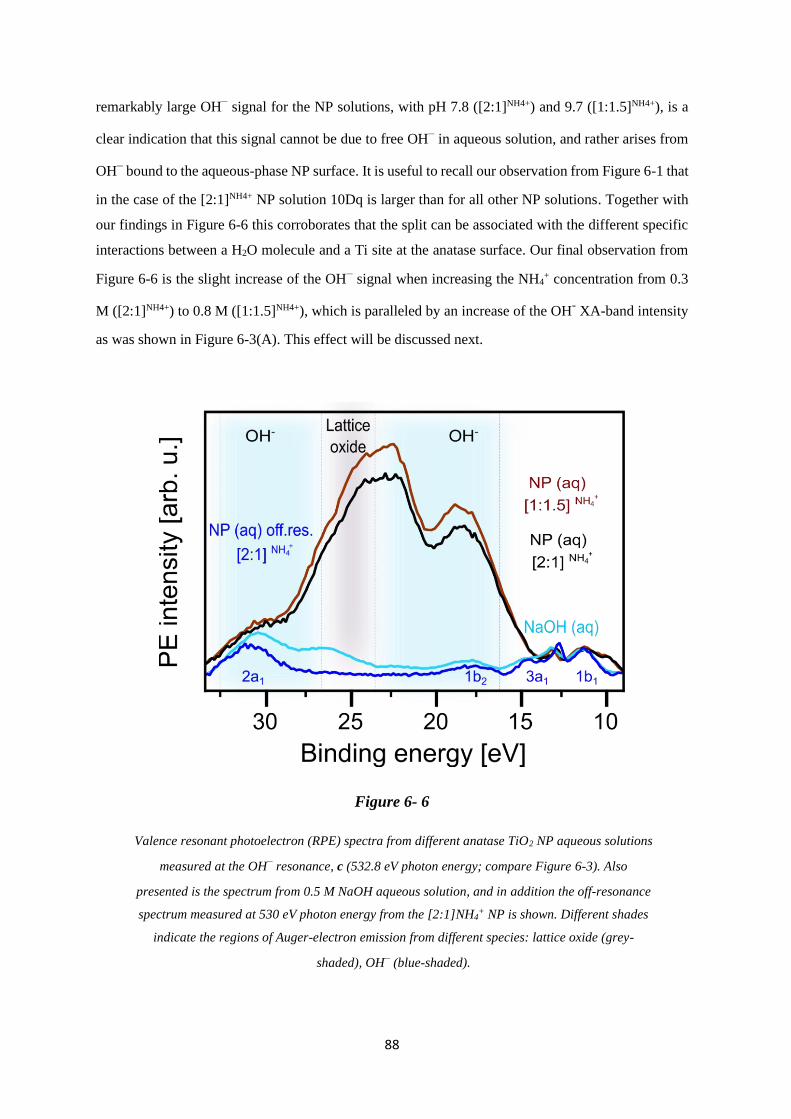
88
remarkably large OH– signal for the NP solutions, with pH 7.8 ([2:1]NH4+) and 9.7 ([1:1.5]NH4+), is a
clear indication that this signal cannot be due to free OH– in aqueous solution, and rather arises from
OH– bound to the aqueous-phase NP surface. It is useful to recall our observation from Figure 6-1 that
in the case of the [2:1]NH4+ NP solution 10Dq is larger than for all other NP solutions. Together with
our findings in Figure 6-6 this corroborates that the split can be associated with the different specific
interactions between a H2O molecule and a Ti site at the anatase surface. Our final observation from
Figure 6-6 is the slight increase of the OH– signal when increasing the NH4
+ concentration from 0.3
M ([2:1]NH4+) to 0.8 M ([1:1.5]NH4+), which is paralleled by an increase of the OH- XA-band intensity
as was shown in Figure 6-3(A). This effect will be discussed next.
Figure 6- 6
Valence resonant photoelectron (RPE) spectra from different anatase TiO2 NP aqueous solutions
measured at the OH– resonance, c (532.8 eV photon energy; compare Figure 6-3). Also
presented is the spectrum from 0.5 M NaOH aqueous solution, and in addition the off-resonance
spectrum measured at 530 eV photon energy from the [2:1]NH4+ NP is shown. Different shades
indicate the regions of Auger-electron emission from different species: lattice oxide (grey-
shaded), OH– (blue-shaded).

89
My observations, from Figures (6-1) to (6-6), lead me to propose the following pH-dependent
adsorption mechanisms for water on the anatase NP surface, illustrated in Figure 6-7. Here I depict
the interaction in the acidic environment in the top tier, and in basic solution in the bottom tier. My
starting point is the hypothetical (prepared) adsorption of a water molecule for both cases. This is
followed by the dissociation of H2O at the defect-free anatase surface, forming a hydroxyl / H+ pair
similar to the processes discussed in references, 192 and explained in the introduction. Above, I have
inferred from the changes of 10Dq that water dissociates at the Ti surface sites of the TiO2 NP. One
crucial difference between acidic and basic environments is then the probability to stabilize the
(paired) proton in the vicinity of OH- at the surface. In fact, aforementioned simulation of the
dissociative/ associative water adsorption on rutile TiO2 using DFT calculations222 concludes that the
stability of hydroxylated configuration is largely dependent on the locations of the H+ species, and the
recombination of water molecules from hydroxyls is observed in the fully hydroxylated condition. I
argue that this is what our data show. Under acidic conditions the free proton is locally rather confined
due to hydronium molecules, and recombination to form water is likely. This is illustrated in the acidic-
environment model (top tier of the second step), in Figure 6-7. Possibly, also the surrounding
hydronium in water may transfer a proton to a surface OH– molecule (center tier of the second step).
In any case, our experiments suggest that the lifetime of hydroxyl is very short, and this species can
thus not be detected here. In contrast, such recombination is less likely in basic solution where H+
quickly diffuses away from the surface, and the OH– lifetime is sufficiently large. This situation is
illustrated at the right side of the bottom tier of Figure 6-7. My model mechanism would also account
for the increase of OH– signal suggested by the spectrum of the [1:1.5]NH4+ NP solution in Figure 6-6.
Here, due to larger pH the proton delocalization is even larger, which leads to the stabilization of more
hydroxyl groups at the TiO2 surface.

90
Figure 6- 7
Illustration of the proposed TiO2 – water interaction in acidic (top tier) and basic (bottom tier)
aqueous solutions. TiO2 NPs are represented by the large white spheres. Water and hydronium
oxygens are shown in red, bonded hydrogen atoms in white, and a single free hydrogen (proton)
in solution is shown in light-grey. The hydroxyl stability on the NP surface depends on its
probability to form a water molecule by capture a free H+ or via proton transfer from a
surrounding hydronium. This probability is largest in acidic environment, either by
recombination of the dissociated H+ and OH– pairs (top panel in the acidic model second step)
or by proton transfer from the surrounding hydronium (bottom tier in the acidic model second
step). Such recombination and proton transfer processes do not occur in a basic or above neutral
chemical environment; the basic-pH interaction model is illustrated in the bottom-most tier of the
Figure.
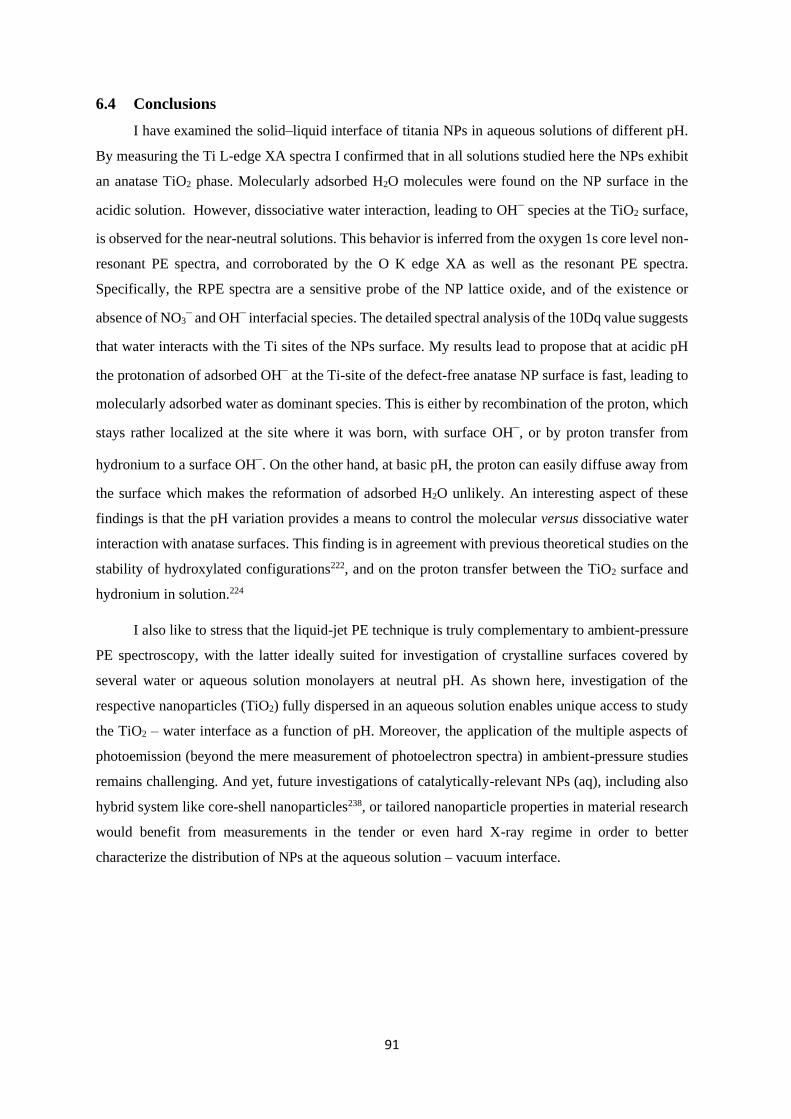
91
6.4 Conclusions
I have examined the solid–liquid interface of titania NPs in aqueous solutions of different pH.
By measuring the Ti L-edge XA spectra I confirmed that in all solutions studied here the NPs exhibit
an anatase TiO2 phase. Molecularly adsorbed H2O molecules were found on the NP surface in the
acidic solution. However, dissociative water interaction, leading to OH– species at the TiO2 surface,
is observed for the near-neutral solutions. This behavior is inferred from the oxygen 1s core level non-
resonant PE spectra, and corroborated by the O K edge XA as well as the resonant PE spectra.
Specifically, the RPE spectra are a sensitive probe of the NP lattice oxide, and of the existence or
absence of NO3– and OH
– interfacial species. The detailed spectral analysis of the 10Dq value suggests
that water interacts with the Ti sites of the NPs surface. My results lead to propose that at acidic pH
the protonation of adsorbed OH– at the Ti-site of the defect-free anatase NP surface is fast, leading to
molecularly adsorbed water as dominant species. This is either by recombination of the proton, which
stays rather localized at the site where it was born, with surface OH–, or by proton transfer from
hydronium to a surface OH–. On the other hand, at basic pH, the proton can easily diffuse away from
the surface which makes the reformation of adsorbed H2O unlikely. An interesting aspect of these
findings is that the pH variation provides a means to control the molecular versus dissociative water
interaction with anatase surfaces. This finding is in agreement with previous theoretical studies on the
stability of hydroxylated configurations222, and on the proton transfer between the TiO2 surface and
hydronium in solution.224
I also like to stress that the liquid-jet PE technique is truly complementary to ambient-pressure
PE spectroscopy, with the latter ideally suited for investigation of crystalline surfaces covered by
several water or aqueous solution monolayers at neutral pH. As shown here, investigation of the
respective nanoparticles (TiO2) fully dispersed in an aqueous solution enables unique access to study
the TiO2 – water interface as a function of pH. Moreover, the application of the multiple aspects of
photoemission (beyond the mere measurement of photoelectron spectra) in ambient-pressure studies
remains challenging. And yet, future investigations of catalytically-relevant NPs (aq), including also
hybrid system like core-shell nanoparticles238, or tailored nanoparticle properties in material research
would benefit from measurements in the tender or even hard X-ray regime in order to better
characterize the distribution of NPs at the aqueous solution – vacuum interface.

92
6.5 Appendix
6.5.1 Valence Band Photoelectron Spectra Measured On-resonant and Off-resonant at
the Ti L-edge for the [2:1]NH4+ NP(aq) Solution
Figure A-6- 1
Valence band photoelectron spectra measured at off-resonance and on-resonance (A, B, C and D
in Figure 6-1) photon energies for the [2:1]NH4+ sample. The off-resonance spectrum was
measured at 457 eV photon energy, while the on-resonance spectra were recorded at marked
peaks in Figure 6-1: A (L3t2g), B (L3eg at two positions due to the sub-splitting), C (L2t2g) and D
(L2eg). All spectra are almost identical, exhibiting no signal from Ti3+.
93
6.5.2 The 10Dq Energy Splitting of the Ti 3d Orbital Detected from TiO2 NP Aqueous
Solutions
Figure A-6- 2
Ti L-edge PEY-XA spectrum in black from anatase TiO2 NPs [2:1]NH4+ sample in comparison
with an average spectrum of the TiO2 NPs [4:1]NO3-, [1:1]Cl- and [1:1]NO3- solutions shown in
Figure 6-1. The 10Dq splitting is indicated by dashed lines.

94
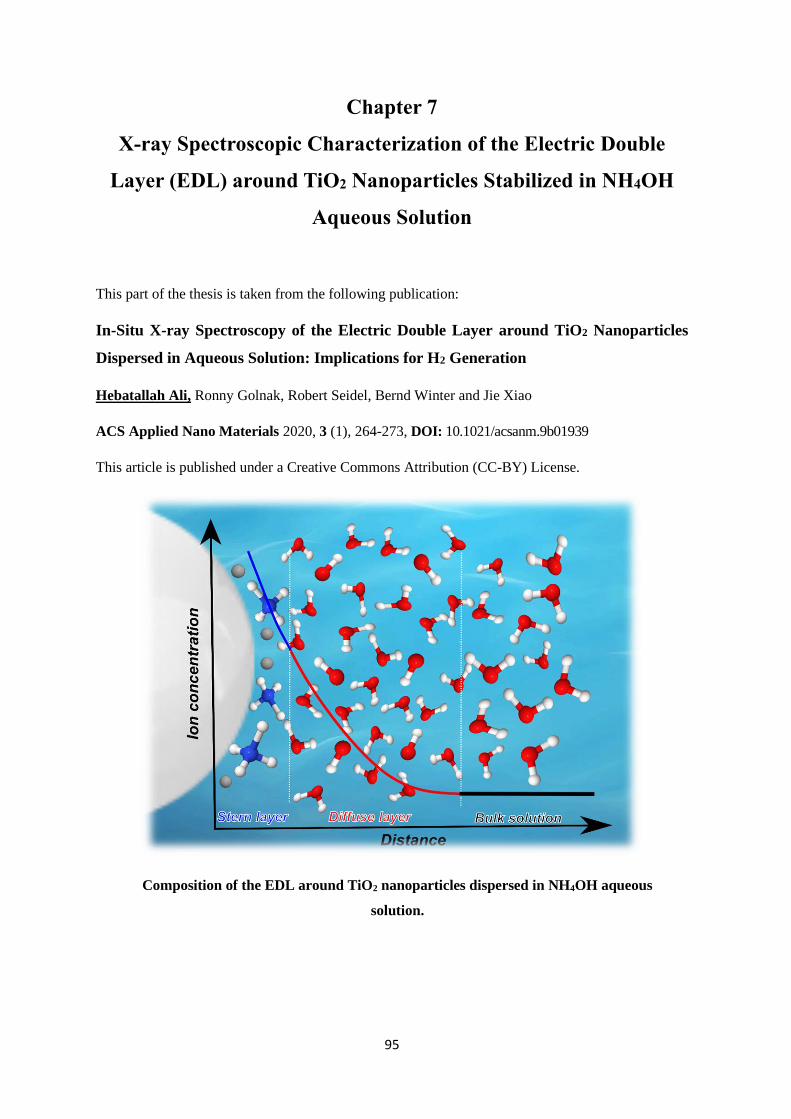
95
Chapter 7
X-ray Spectroscopic Characterization of the Electric Double
Layer (EDL) around TiO2 Nanoparticles Stabilized in NH4OH
Aqueous Solution
This part of the thesis is taken from the following publication:
In-Situ X-ray Spectroscopy of the Electric Double Layer around TiO2 Nanoparticles
Dispersed in Aqueous Solution: Implications for H2 Generation
Hebatallah Ali, Ronny Golnak, Robert Seidel, Bernd Winter and Jie Xiao
ACS Applied Nano Materials 2020, 3 (1), 264-273, DOI: 10.1021/acsanm.9b01939
This article is published under a Creative Commons Attribution (CC-BY) License.
Composition of the EDL around TiO2 nanoparticles dispersed in NH4OH aqueous
solution.

96
7.1 Introduction
Titanium dioxide (TiO2) is a promising material to catalyze water dissociation for the production
of H2 fuel as a clean and renewable energy source.177, 185, 189, 239-240 Among the three TiO2 phases,
brooktile, rutile and anatase, the latter phase exhibits the highest photocatalytic activity241-242 and
chemical stability in various aqueous environments.243 Many efforts have been made to improve the
TiO2-catalyzed energy conversion efficiency in water-splitting reactions.177, 180-186 However, the fast
back-reaction of proton (H+) and hydroxide (OH–) recombination into water molecules reduces the
efficiency significantly.189 Spatial separation of proton from hydroxide is therefore very critical for the
enhancement of the water dissociation efficiency and device performance. This separation of the
dissociation products, H+ and OH– ions, in the vicinity of the TiO2 – water interface requires a true
aqueous environment (rather than a few monolayers of water coverage) that enables ions to diffuse
away from the interface. In fact, the electric double layer (EDL) that forms at the TiO2 – water interface
will strongly influence ion distributions and mobilities. Several models have been proposed to describe
the EDL, including the Helmholtz model,244 the Gouy-Chapman model,245-246 and the Gouy-Chapman-
Stern model247. In the Helmholtz model, the EDL is treated analogously to a static electric capacitor248-
249 where all counter-ions are postulated to be confined to the TiO2 surface, and all co-ions are repelled.
Ion mobility in solution is completely ignored in this model.248-249 It is, however, taken into account in
the Gouy-Chapman model that postulates a diffuse layer located at the interface where the ion
concentration away from the interface follows the Boltzmann distribution.249 This model assumes that
ions are point charges, occupying no space, and this can lead to an overestimation of surface charge.249
The Gouy-Chapman-Stern model,247 based on the two previous models, which is also the model we
adopt in this study to discuss the acquired spectra, introduces an additional layer, the Stern layer, where
some or all counter-ions are confined at the TiO2 surface. The remaining counter-ions or co-ions,
depending on the electrolyte concentration, are mobile and form the diffuse layer.250 As in the Gouy-
Chapman model, ions are Boltzmann-distributed across the layer. The thickness of the EDL in the
Gouy-Chapman-Stern model is defined as the Debye length, which is strongly dependent on the
electrolyte concentration.248
Although the charge parity of the EDL at the TiO2 – water interface in dilute aqueous solution
has been extensively investigated by various methods,251-254 we still lack a quantitative molecular-level
experimental insight into the detailed EDL structure, including the Debye length (electrostatic
screening length). Soft X-ray spectroscopy studies that can directly reveal element-specific electronic
structure of interfacial species are still scarce for solid surfaces in contact with real (bulk) aqueous
solution. In recent years, the development of ambient pressure X-ray photoelectron spectroscopy (AP-
PES) has allowed for instance probing of the EDL for a thin electrolyte film on top of a polycrystalline
gold electrode created by the so-called “dip-and-pull method” by using tender X-ray radiation for
ionization.255 In the aforementioned study, the Debye length, measured as a function of the KOH
97
electrolyte concentration, has been reported to decrease monotonically from 30.4 nm at 0.1 mM to
approximately 1.9 nm near 80 mM concentration.255 Despite extensive experimental efforts, PES
studies seeking to reveal the EDL dimension have remained limited to nanometer-thick water
coverage, in which case ion mobility and ion adsorption/desorption at the TiO2 surface will be different
than in bulk solution.256 In-situ probing of the TiO2 surface fully contained in liquid water is therefore
of great importance, but experimentally challenging.
In this study, X-ray photoelectron spectroscopy (PES) and partial electron/fluorescence yield
X-ray absorption spectroscopy (PEY/PFY-XAS) measurements are conducted on anatase-phase TiO2
nanoparticles (NPs) dispersed in NH4OH aqueous solution. Our system represents a TiO2 surface fully
immersed in aqueous solution at slightly basic pH (~7.8), for which we recently demonstrated
dissociative water adsorption at the NP – solution interface.257 Here, we report complementary
electron-yield and photon-yield detections to quantify the amount of water dissociation at the TiO2 –
water interface, and estimate the Debye length. The NP solution has a concentration of 20 wt%
corresponding to an average separation distance between the dispersed NPs of approximately 80 μm
resulting from van der Waals (vdW) interaction between the NPs. In this case of high NP
concentration, the Stern layer is composed of stabilizer NH4+ ions (discussed later along with Figure
7-2), and NP aggregation and the lack of it can be well described by the Derjaguin, Landau, Verwey
and Overbeek (DLVO) theory.248-249 Accordingly, at high electrolyte concentration, the NP interaction
potential barrier is lowered and a minimum (secondary energy barrier with oppositely charged ions)
in the potential curve can lead to a slow NP aggregation.249 For electrolyte concentrations above the
so-called critical coagulation value, the energy barrier reduces to below zero and triggers NPs to
aggregate rapidly.249 The TiO2 NP colloidal solution in the present study falls into the category of
relatively high concentration, but still being below the critical value. We briefly review the expected
nature of the EDL, and how it depends on electrolyte concentration. As illustrated in the cartoon of
Figure 7-1(A), at low electrolyte concentration positive charge (these are the NH4+ cations)
accommodates at the NP surface to establish charge neutrality of the NP + EDL entity. In a simplified
picture, Figure 7-1(B), of high electrolyte concentrations negative charge from the electrolyte (OH–
in our case) will approach the NPs more closely, and stay associated with the NPs within the EDL.
The primary goal of the present study is to use PES together with the more bulk-sensitive PFY-XA
spectroscopy to identify the molecular nature of the EDL, including composition of oppositely charged
ions, and to even estimate the thickness of the EDL and infer hydration structure details.

98
Figure 7-1
Potential curves of the EDL surrounding the nanoparticle: (A) low electrolyte concentration, and
(B) high electrolyte concentration (adsorbing counter-ions) leading to charge reversal. The figure
is partially adapted from reference 250.
7.2 Methods and Materials
Both the PES and PEY-XAS measurements were conducted with the SOL3PES setup,62 and
PFY-XAS studies were performed with the LiXedrom setup,258 at the synchrotron-radiation facility
BESSY II, Berlin. For all measurements we used the soft X-ray beamline U49/2-PGM1. A 20 wt%
colloidal solution of 20 nm diameter anatase-phase TiO2 NPs dispersed in 0.3 M NH4OH aqueous
solution was acquired from NYACOL, USA, and introduced into the experimental vacuum chambers
by applying liquid microjet technique.86 I also investigated 0.5 and 2 M NH4OH, and 5 M NaOH
aqueous solutions, as well as a 20 wt% colloidal solution of 10 nm diameter anatase-phase TiO2 NPs
dispersed in 0.5 M HCl aqueous solution purchased from MK Nano, Canada, which all served as
references for spectral comparisons. Note that the NP surface in 0.5 M HCl aqueous solution is fully
covered by adsorbed Cl– ions, and water cannot interact with the TiO2 NP. This provides a useful
spectroscopic reference, and has been applied in several previous liquid microjet PES studies.62, 138-139,
197-198, 259 According to the concentrations of the TiO2 NP (20 wt%) and NH4OH (0.3 M) aqueous
solutions, the NP diameter (20 nm), and with the reported adsorption density of approximately 5.2
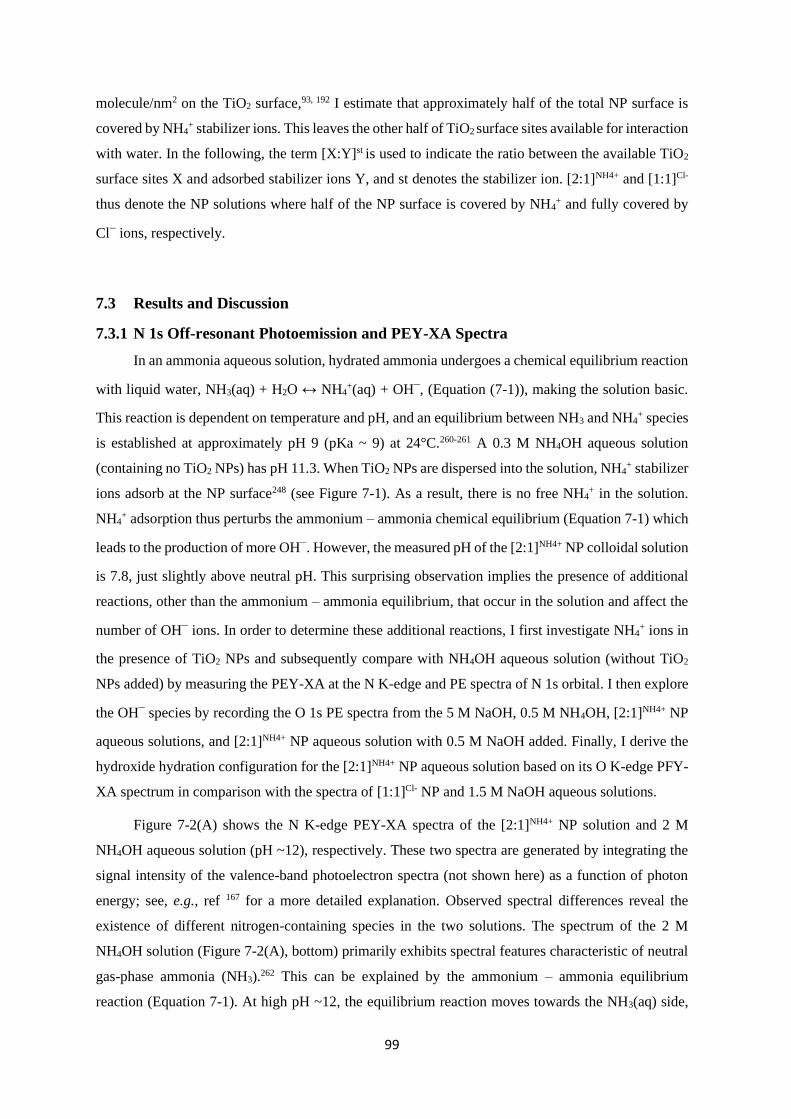
99
molecule/nm2 on the TiO2 surface,93, 192 I estimate that approximately half of the total NP surface is
covered by NH4+ stabilizer ions. This leaves the other half of TiO2 surface sites available for interaction
with water. In the following, the term [X:Y]st is used to indicate the ratio between the available TiO2
surface sites X and adsorbed stabilizer ions Y, and st denotes the stabilizer ion. [2:1]NH4+ and [1:1]Cl-
thus denote the NP solutions where half of the NP surface is covered by NH4+ and fully covered by
Cl– ions, respectively.
7.3 Results and Discussion
7.3.1 N 1s Off-resonant Photoemission and PEY-XA Spectra
In an ammonia aqueous solution, hydrated ammonia undergoes a chemical equilibrium reaction
with liquid water, NH3(aq) + H2O ↔ NH4+(aq) + OH
–, (Equation (7-1)), making the solution basic.
This reaction is dependent on temperature and pH, and an equilibrium between NH3 and NH4+ species
is established at approximately pH 9 (pKa ~ 9) at 24°C.260-261 A 0.3 M NH4OH aqueous solution
(containing no TiO2 NPs) has pH 11.3. When TiO2 NPs are dispersed into the solution, NH4+ stabilizer
ions adsorb at the NP surface248 (see Figure 7-1). As a result, there is no free NH4+ in the solution.
NH4+ adsorption thus perturbs the ammonium – ammonia chemical equilibrium (Equation 7-1) which
leads to the production of more OH–. However, the measured pH of the [2:1]NH4+ NP colloidal solution
is 7.8, just slightly above neutral pH. This surprising observation implies the presence of additional
reactions, other than the ammonium – ammonia equilibrium, that occur in the solution and affect the
number of OH– ions. In order to determine these additional reactions, I first investigate NH4
+ ions in
the presence of TiO2 NPs and subsequently compare with NH4OH aqueous solution (without TiO2
NPs added) by measuring the PEY-XA at the N K-edge and PE spectra of N 1s orbital. I then explore
the OH– species by recording the O 1s PE spectra from the 5 M NaOH, 0.5 M NH4OH, [2:1]NH4+ NP
aqueous solutions, and [2:1]NH4+ NP aqueous solution with 0.5 M NaOH added. Finally, I derive the
hydroxide hydration configuration for the [2:1]NH4+ NP aqueous solution based on its O K-edge PFY-
XA spectrum in comparison with the spectra of [1:1]Cl- NP and 1.5 M NaOH aqueous solutions.
Figure 7-2(A) shows the N K-edge PEY-XA spectra of the [2:1]NH4+ NP solution and 2 M
NH4OH aqueous solution (pH ~12), respectively. These two spectra are generated by integrating the
signal intensity of the valence-band photoelectron spectra (not shown here) as a function of photon
energy; see, e.g., ref 167 for a more detailed explanation. Observed spectral differences reveal the
existence of different nitrogen-containing species in the two solutions. The spectrum of the 2 M
NH4OH solution (Figure 7-2(A), bottom) primarily exhibits spectral features characteristic of neutral
gas-phase ammonia (NH3).262 This can be explained by the ammonium – ammonia equilibrium
reaction (Equation 7-1). At high pH ~12, the equilibrium reaction moves towards the NH3(aq) side,
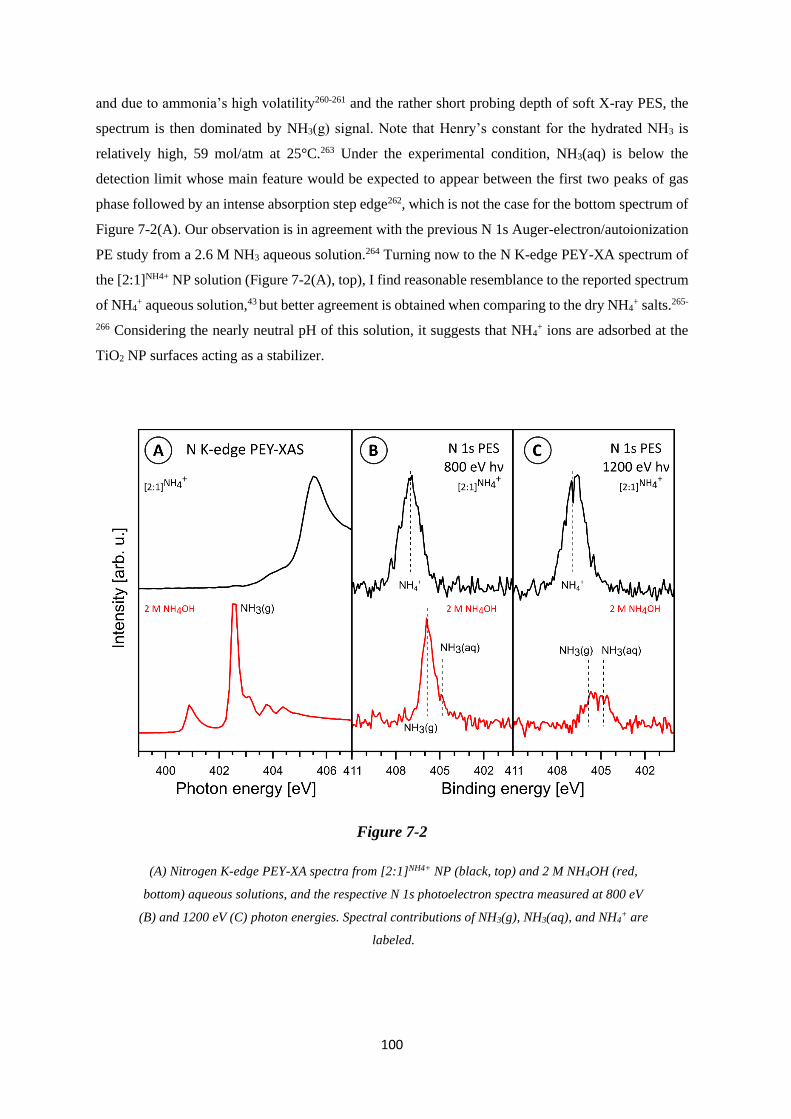
100
and due to ammonia’s high volatility260-261 and the rather short probing depth of soft X-ray PES, the
spectrum is then dominated by NH3(g) signal. Note that Henry’s constant for the hydrated NH3 is
relatively high, 59 mol/atm at 25°C.263 Under the experimental condition, NH3(aq) is below the
detection limit whose main feature would be expected to appear between the first two peaks of gas
phase followed by an intense absorption step edge262, which is not the case for the bottom spectrum of
Figure 7-2(A). Our observation is in agreement with the previous N 1s Auger-electron/autoionization
PE study from a 2.6 M NH3 aqueous solution.264 Turning now to the N K-edge PEY-XA spectrum of
the [2:1]NH4+ NP solution (Figure 7-2(A), top), I find reasonable resemblance to the reported spectrum
of NH4+ aqueous solution,43 but better agreement is obtained when comparing to the dry NH4
+ salts.265-
266 Considering the nearly neutral pH of this solution, it suggests that NH4+ ions are adsorbed at the
TiO2 NP surfaces acting as a stabilizer.
Figure 7-2
(A) Nitrogen K-edge PEY-XA spectra from [2:1]NH4+ NP (black, top) and 2 M NH4OH (red,
bottom) aqueous solutions, and the respective N 1s photoelectron spectra measured at 800 eV
(B) and 1200 eV (C) photon energies. Spectral contributions of NH3(g), NH3(aq), and NH4+ are
labeled.

101
Our conclusion on the nature of the nitrogen-containing species is corroborated by the N 1s PE
spectra from the same two solutions which are also presented in Figure 7-2. Measurements were
performed at two photon energies, 800 eV (Figure 7-2(B)) and 1200 eV (Figure 7-2(C)). The latter
energy probes deeper into the solutions due to the larger kinetic energies of the photoelectrons
resulting in a larger electron inelastic mean free path (IMFP).35 Beginning with the 800-eV spectrum
taken from the 2 M NH4OH solution (Figure 7-2(B), bottom), one observes a large peak at 405.9 eV
binding energy (BE) which arises from N 1s ionization of gas-phase ammonia, NH3(g). Signal from
NH3(aq) is weak, giving rise to a small shoulder at 404.8 eV BE. In contrast, the 800-eV PE spectrum
of the [2:1]NH4+ NP solution (Figure 7-2(B), top) exhibits a single peak at larger BE of 407.0 eV which
originates from N 1s ionization of adsorbed ammonium stabilizer, NH4+. This is exactly what one
would expect based on Figure 7-2(A), top. Note also that in both cases the energies of the detected
electrons are rather similar. That is, the kinetic energy (KE) of the N 1s photoelectrons (excited by
800 eV photon energy) and of the N 1s Auger electrons (from which the PEY-XA spectrum in Figure
7-2(A), bottom, has been obtained) are approximately 400 eV. At this energy the electron probing
depth is thus too small to detect a noticeable signal from NH3(aq). Increasing the photon energy from
800 to 1200 eV has a minor effect on the PE spectrum of [2:1]NH4+ solution (Figure 7-2(C), top), but
one observes a drastic change of the spectrum from the 2 M NH4OH solution (Figure 7-2(C), bottom).
Due to the increased probing depth, the spectrum of the 2 M NH4OH solution now exhibits, in addition
to the NH3(g) signal at 405.9 eV, a second peak at 404.8 eV of similar intensity arising from NH3(aq).
This implies that the majority of NH4+ in the [2:1]NH4+ NP solution cannot be assigned to species
solvated in bulk solution. If this were the case, a significant amount of NH3(g) (and some NH3(aq) at
1200 eV excitation energy) signal would be detected due to the ammonia – ammonium equilibrium
(Equation 7-1). Therefore, Figure 7-2 reveals that almost all NH4+ ions in the [2:1]NH4+ NP solution
are adsorbed on the TiO2 NP surface, covering about half of the available surface area, as mentioned
above. The adsorbed NH4+ ions constitute a positively charged Stern layer of the EDL. The thickness
of this Stern layer is on the order of the diameter of the NH4+ ion which is approximately 0.35 nm,
assuming a 0.175 nm NH4+ ionic radius.267
7.3.2 O1s Off-resonant Photoemission Spectra
I next focus on the nature of the oxygen-containing species, and I am particularly interested in
identifying dissociated water and estimating the amount of OH– anions, from which an approximate
length of the diffuse layer can be inferred. For that I have measured the oxygen 1s PE (Figure 7-3) and
oxygen K-edge PFY-XA (Figure 7-4) spectra from the same [2:1]NH4+ NP solution. In addition, I
present the respective spectra from two reference aqueous solutions, 5 M NaOH and 0.5 M NH4OH.
5 M NaOH solution is used to establish the OH– PES peak position, and to identify the effect of OH
–
102
on the water structure through changes of the water O 1s PE peak. Note that 0.5 M concentration is
reasonably close to the 0.3 M NH4OH concentration which is used to stabilize the aqueous-phase TiO2
NPs. All PE spectra were measured at 1200 eV photon energy, i.e., at the same energy which we have
applied to increase the probing depth into the solution in the case of the N 1s PE measurements (Figure
7-2(C)). Spectra are displayed to yield the same heights of the strongest peak. Figure 7-3(A) shows
the O 1s PE spectrum from the 5 M NaOH aqueous solution. Three major oxygen features can be
observed, the dominating liquid-water peak at 538.1 eV BE,86 the water-vapor contribution at 539.9
eV,164, 268 and hydrated OH– giving rise to a shoulder at 535.8 eV.269 These contributions are
highlighted by the respective Gaussian fits shown in different colors; see figure caption for details.
The O 1s PE spectrum from the other reference solution, 0.5 M NH4OH, shown in Figure 7-3(B)
exhibits no OH– signal at this low OH
– concentration; this is also true for a NaOH aqueous solution
of the same concentration.269 Another important difference between the spectra of lower (0.5 M) and
higher (5 M) OH– concentrations is the change of the water O 1s peak width. The full width at half
maximum (FWHM) of the low-concentration spectrum is approximately 1.6 eV (which is almost the
same as for neat liquid water164), and increases by 12.5 % (0.2 eV wider) for the higher concentration.
Qualitatively, such a broadening is in accord with a theoretical finding that hydration of hydroxide
affects the electronic structure of water,270 and it also agrees with previous experimental and
computational PFY-XA study of hydroxide aqueous solution154 which will be detailed below along
with the discussion of Figure 7-4.
The O 1s PE spectrum of the [2:1]NH4+ NP solution, shown in Figure 7-3(C), is rather similar to
the spectrum of the 5 M NaOH aqueous solution. However, there is an additional small peak from the
TiO2 lattice oxygen at 534.8 eV BE, and furthermore the following subtle but important spectral
differences can be observed. (1) The OH– signal intensity from the NP solution amounts to almost
70% of that from the 5 M NaOH solution. According to the spectrum of 0.5 M NH4OH (Figure 7-
3(B)), which corresponds to an even higher OH– concentration than the [2:1]NH4+ NP solution, one
would expect to observe no OH– signal, let alone to exhibit an intensity comparable to the 5 M NaOH
aqueous solution. (2) The FWHM of the water O 1s PE peak is very similar to the one from neat water,
and the peak is not broadened unlike in the case of the 5 M NaOH aqueous solution. (3) The OH– peak
position is at slightly smaller (by 0.5 eV) BE compared to the PE spectrum from 5 M NaOH aqueous
solution (Figure 7-3(A)). All relevant BEs, FWHMs, and peak areas are provided in Table A-7-1 of
the Appendix Section 7.5.

103
Figure 7-3
O 1s PE spectra of 5 M NaOH (A), 0.5 M NH4OH (taken from ref. 257) (B), [2:1]NH4+ NP (taken
from ref. 257) (C), and [2:1]NH4+ NP + 0.5 M NaOH (D) aqueous solutions measured at 1200 eV
photon energy. Note that solution in (D) has pH of only 9.8 whereas the pure 0.5 M NaOH
solution has pH 13.7. All spectra are fitted with multiple Gaussian functions that each represent
the different oxygen species: liquid water (H2O(l)), gas-phase water (H2O(g)), OH–, TiO2. Spectra
are presented on the binding energy scale, and intensities of the different spectra are displayed to
yield the same peak height of the liquid-water peak. Dots are the measured data, and the solid red
lines are the total fits. The detailed fitting parameters are presented in Table A-1 in the Appendix
(Section 7.5).
Observation (1) indicates that in the NP solution the number of OH– significantly exceeds the
number that would be provided from 0.3 M concentration, and yet the pH of the [2:1]NH4+ NP solution
is only 7.8. Observations (2) and (3) imply that OH– species in the NP solution are accommodated in
a different chemical environment than the hydrated OH– in water at basic pH. In the previous work,

104
on the same [2:1]NH4+ NP aqueous solution,257 I have reported that water dissociates at the TiO2 NP
surface (Chapter 6) which can qualitatively explain the increase of OH– signals (observation (1)) in
the spectrum. Note though that observation (1) is at odds with the fact that the pH of the [2:1]NH4+ NP
solution is only 7.8. It thus implies that most of the OH– molecules in the NP solution must be trapped
around the TiO2 NPs by the positive Stern layer, forming the diffuse layer of the EDL; these confined
OH– species make no contribution to the pH measurement. Analogous to my previous photoemission
study of aqueous-phase TiO2 NPs,257 I have also measured the [2:1]NH4+ NP solution with 0.5 M NaOH
added (Figure 7-3(D)) to show that the intensity of the OH– peak at 536.3 eV continues to increase,
becoming as large as for the 5 M NaOH solution. However, the pH is ~ 9.8 and the added amount of
hydroxide could not produce such signal enhancement. This further corroborates our conclusion that
a large amount of OH– is indeed produced by additional water dissociation at the TiO2 surface. The
implications of observations (2) and (3) together with the findings of Figure 7-3(D) will be detailed in
the following paragraphs, where I acquire additional support from PFY-XA measurements. The latter
is indispensable here as it is a bulk-sensitive method, enabling a realistic estimate of the amount of
OH– present in the NP solution.
7.3.3 O K-edge PFY-XA Spectra
The O K-edge PFY-XA spectrum of the [2:1]NH4+ NP solution, with the assistance of the
reference PFY-XA spectra of [1:1]Cl- NP solution, neat water, and 1.5 M NaOH aqueous solution,
allow for a quantitative estimation of the OH– amount in the NP solution. All PFY-XA spectra, shown
in Figure 7-4, were generated by integrating the X-ray emission intensities resulting from valence band
to core transitions (O 2p → 1s) following resonant excitation at the O K-edge. Note that the PFY-XA
spectrum of 1.5 M NaOH aqueous solution, shown in Figures 7-4(B) and 7-4(D) has been adapted
from ref.271. This spectrum helps to quantify the amount of OH– in the NP solutions, which will be
explained later. Figure 7-4(A) shows the spectra from the [2:1]NH4+ NP solution and the [1:1]Cl– NP
solution. Since the latter solution corresponds to the fully Cl–-covered NP surface, water cannot
interact with TiO2. Hence, the difference spectrum (dotted curve), [2:1]NH4+ NP minus [1:1]Cl- NP,
reveals the signal solely due to OH–. I label this signal contribution OH
–(i*). Then in Figure 7-4(B), I
compare OH–(i*) with the OH
– signal obtained from the neat 1.5 M NaOH aqueous solution (no NPs
contained). For that I subtract the PFY-XA spectrum of neat water (shown in blue) from the one of
the NaOH solution (in brown). This difference spectrum is presented at the bottom of Figure 7-4(B).
Unlike in Figure 7-4(A), one now observes two contributions, centered at 532.8 and 534.1 eV photon
energy, labeled OH–(i) and OH
–(ii), respectively. These two OH
– contributions have been previously
105
reported for 4 and 6 M KOH aqueous solutions, and were attributed, based on computations, to the
hydroxide hydration complexes in tri-coordinated (tetrahedral-coordinated) OH–(H2O)3 and in planar
4-fold coordinated (hyper-coordinated) OH–(H2O)4 configurations, respectively.154 The tetrahedral
configuration produces a single pre-edge peak at 532.5 eV photon energy (matching the OH–(i) peak
position in Figure 7-4(B)), whereas the hyper-coordinated configuration gives rise to a pre-edge peak
at 534.5 eV (coinciding with OH–(ii) in Figure 7-4(B)), as well as to OH
–(i).154 The good agreement
between the computed energies for OH–(i) with the experimental energy of OH
–(i*) strongly suggests
that not only is the OH– hydration configuration near the NP surface different than in bulk water, but
the tri-coordinated structure dominates. Note that the occurrence of different OH– configurations
would be qualitatively consistent with the different O1s BEs found in the NP solution compared to the
5 M NaOH solution (Figure 7-3(A) and 7-3(C)). Our suggested hydroxide hydration configuration
within the EDL is corroborated by a Car-Parrinello molecular dynamics (CPMD) simulation, finding
that the fraction of 3- and 4-coordinated structures depends strongly on the OH– concentration. At low
concentration, OH– ions are surrounded by abundant water molecules and the OH
–(H2O)4 hyper-
coordinated configuration is preferred; the tetrahedral complex OH–(H2O)3 quickly (within 2-3 ps)
interconverts to OH–(H2O)4.272-273 At high concentration, fewer water molecules are available to
coordinate OH–, making the OH
–(H2O)3 configuration more favorable.274 I argue that the OH
–
concentration in the diffuse layer is high, although I have yet to quantify the concentration, and the 3-
coordinated structure thus dominates. This interpretation is supported by a nuclear magnetic resonance
study of the water molecule distribution around TiO2 NPs, showing strong confinement of water
molecules with low mobility and reactivity within the first few layers above the TiO2 surface.275
Having characterized the OH– hydration configurations and their contributions to the PFY-XA
spectra, I now quantify the amount of OH– within the EDL. The O K-edge PFY-XA spectra of
[2:1]NH4+ NP (Figure 7-4(A)) and 1.5 M NaOH solutions (Figure 7-4(B)) solutions are then fitted with
Gaussians, each representing the respective oxygen component, as shown in Figure 7-4(C) and (D).
In both cases, the well-known water pre-edge peak at 535.0 eV87 is presented in blue (no filling) and
is used for intensity normalization; the relative intensity of this signal will be used to estimate the OH–
concentration. In Figure 7-4(C) the two TiO2 oxygen features at 531.1 and 533.3 eV (green Gaussians),
resulting from O 2p orbital hybridization with Ti t2g and eg orbitals,162, 225, 232-234 are fitted under the
constraints of the same peak positions, widths, and intensity ratio that are obtained from the fitting
parameters of the reference PFY-XA spectrum of the [1:1]Cl- NP solution (no OH– signal) shown in
Figure A-7-1 and Table A-7-2 in the Appendix Section 7.5.
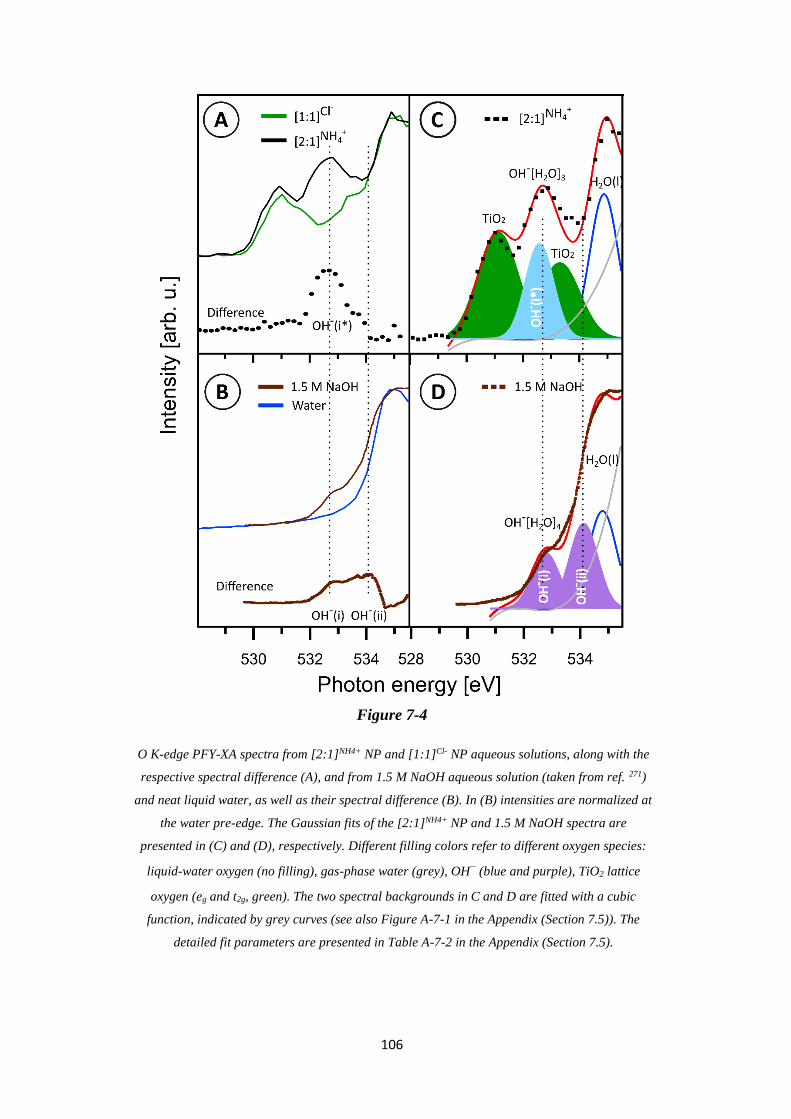
106
Figure 7-4
O K-edge PFY-XA spectra from [2:1]NH4+ NP and [1:1]Cl- NP aqueous solutions, along with the
respective spectral difference (A), and from 1.5 M NaOH aqueous solution (taken from ref. 271)
and neat liquid water, as well as their spectral difference (B). In (B) intensities are normalized at
the water pre-edge. The Gaussian fits of the [2:1]NH4+ NP and 1.5 M NaOH spectra are
presented in (C) and (D), respectively. Different filling colors refer to different oxygen species:
liquid-water oxygen (no filling), gas-phase water (grey), OH– (blue and purple), TiO2 lattice
oxygen (eg and t2g, green). The two spectral backgrounds in C and D are fitted with a cubic
function, indicated by grey curves (see also Figure A-7-1 in the Appendix (Section 7.5)). The
detailed fit parameters are presented in Table A-7-2 in the Appendix (Section 7.5).

107
It is clear that the fitted Gaussian at 532.6 eV (light blue; Figure 7-4(C)), which accounts for
OH– signal, is needed to yield a good total fit (red line) of the overall spectrum. The 532.6-eV peak
position perfectly matches the position of the computed tetrahedral species OH–(H2O)3 (feature OH
–
(i) at 532.5 eV photon energy),154 in agreement with our above, more qualitative analysis. I notice that
in my previous O 1s PE spectroscopy study of TiO2 NP aqueous solution,257 the obtained PEY-XA
spectra exhibit somewhat smaller OH– signal with respect to the water pre-edge intensity. Also, the
TiO2 signal is considerably smaller in the electron-yield measurements. It is this signal-intensity
discrimination intrinsic to the (rather surface-sensitive) PES study that did not allow for a quantitative
estimate of the relative concentration of the (oxygen) species of interest. In contrast, the signals
obtained with bulk-sensitive PFY are argued to quantitatively reflect the total TiO2 lattice and OH–
concentrations in solutions.
In Figure 7-4(D) I present the individual contributions of OH–(i) and OH
–(ii) to the PFY-XA
spectrum from 1.5 M NaOH aqueous solution (of Figure 7-4(B)), where I am guided by the analysis
of ref 154. I first fit the water pre-edge peak (see Figure A-7-1 and its caption), and then include two
Gaussian peaks, representing OH–(i) and OH
–(ii). The obtained peak positions (532.8 and 534.1 eV
photon energy) are in very good agreement with the energies computed for the hyper-coordinated
hydroxide.154 For estimating the OH– amount in the NP solution, I then compare the Gaussian peak
area of tetrahedral (light blue peak in Figure 7-4(C)) with the area of hyper-coordinated (light violet
peaks in Figure 7-4(D)) OH– species, from which an approximately 0.6 M OH
– concentration for the
[2:1]NH4+ NP aqueous solution is derived. Here, I have used the OH–-to-H2O (pre-peak) intensity ratio
of Figure 7-4(D) as a calibration point; see the fitting parameters in Table A-7-2 and related calculation
details in the Appendix Section 7.5.
I recall that the 0.3 M NH4OH aqueous solution has the pH 11.3, whereas the pH of [2:1]NH4+
NP solution (prepared in 0.3 M NH4OH aqueous solution) is only 7.8. Despite this near-neutral pH,
the OH– concentration in the NP solution estimated to be 0.6 M, and almost all these anions are
confined within the EDL. Given that at 0.3 M NH4+ concentration about half the TiO2 NP surface sites
are covered (estimated from 5.2 ions adsorbed/nm2),93, 192 0.6 M OH–(H2O)3 would be enough to
exceed one monolayer coverage, forming the diffuse layer. This raises several questions: (1) How
thick is the diffuse layer, (2) what is the origin of the 0.6 M OH– concentration, and (3) what role does
the produced H+ (from water dissociation) play in this interfacial system? To answer these questions I
propose two scenarios, as schematically presented in Figure 7-5.

108
Scenario A (Figure 7-5(A)) proposes that 0.3 M NH4OH solution contributes maximum 0.3 M
OH– concentration to the diffuse layer (bulk OH
– drawn toward the NPs by Coulombic attraction of
the Stern layer), and the other 0.3 M OH– is provided by water dissociation at the TiO2 NP surface.
Indeed, our previous liquid microjet PES study of the same [2:1]NH4+ TiO2 NP colloidal solution has
already shown that OH– can be produced in basic solution from water dissociation,257 and subsequent
OH– liberation (into the diffuse layer) allows for further dissociation. The amount of OH
– that can be
accommodated in the diffuse layer depends on the effective charge of the Stern layer, and one crucial
question is whether H+ (from water dissociation) is part of the Stern layer. As discussed in the
Introduction Section 7.1, fast H+ – OH– recombination is one of the major obstacles limiting the
efficiency of water dissociation reactions. In the present case, this problem is by-passed, when we
assume that H+ is bound at the TiO2 surface. This confinement of H+ increases the Stern layer charge
and keeps the extra negative OH– species stay close, within the diffuse layer. Such a mechanism would
be consistent with a previous scanning tunneling microscopy study finding that H+ bonds to the oxygen
sites of TiO2 surfaces.211
In Scenario B (Figure 7-5(B)), the 0.6 M OH– concentration is assumed to be fully produced by
water dissociation at the TiO2 NP surfaces. Due to the limited number of anchoring oxygen sites for
water on the TiO2 surface, the excess amount of OH– can be rationalized when assuming that some
fraction of H+ ions produced at the interface migrates through the diffuse layer, and recombines to
form water in the bulk solution. This latter neutralization would explain the observed relatively low
pH 9.8 when adding NaOH to the NP solution (see Figure 7-3(D), and respective figure caption). Note
that some fraction of H+ will inevitably recombine with OH– in the diffuse layer, and the resulting loss
of OH– molecules can be replenished because H+ release from the TiO2 surface vacates adsorption
sites for further water dissociation reaction, which in turn generates additional OH– in the diffuse
layer. Even if we do not understand the detailed mechanism of such efficient diffusion through the
diffuse layer (although very thin; discussed below), OH– in the bulk solution, as well as in the diffuse
layer, must play an important role in initiating the release of H+ from the TiO2 surface. This dynamical
cycle of continuous freeing surface sites for water adsorption, and the subsequent release of H+,
followed by recombination, will reach an equilibrium once the bulk solution is nearly neutralized.
Similar observations have been made from a photoelectrochemical cell (PEC) study under external
electric potential.5, 276-277 Water dissociation was found to occur at the TiO2 working electrode,
followed by H+ diffusion through an electrolyte solution to the counter electrode; the nature of the
EDL at the working electrode – electrolyte interface has not been addressed.

109
Figure 7-5
Schematic representation of the charge (NH4+, OH
–) distribution in the EDL around a TiO2 NP.
(A) In Scenario A, 0.3 M H2O have dissociated at the TiO2 surface producing H+ ions that
become part of the Stern layer as well as producing 0.3 M OH– in the diffuse layer. All other
OH–, also residing within the diffuse layer, originate from the bulk solution (from the 0.3 M
NH4OH stabilizer). (B) Scenario B assumes that 0.6 M H2O are dissociated and form 0.6 M OH–
ions in the diffuse layer. The corresponding 0.6 M H+ are divided into 0.3 M H+ that are bound
to the oxygen sites on the TiO2 surface, and the other 0.3 M H+ quickly diffuse into the bulk
solution and neutralize the solution.
Finally, the thickness of the diffuse layer is estimated based on the 0.22 nm O–O bond length
reported for the OH–(H2O)n complex.154 The 0.6 M tetrahedral OH
–(H2O)3 complex derived from the
quantitative analysis of the PFY-XA spectra in Figure 7-4 can then form an at least 0.44-nm-thick
diffuse layer, corresponding to one complete densely-packed monolayer (with 0.3 M NH4+ covering
half of the TiO2 NP surface). The actual thickness of the diffuse layer is, however, likely to extend
beyond 0.44 nm due to the mobility of OH–(H2O)3 ions. Hence, the Debye length should be > 0.8 nm;
this comprises the > 0.44 nm diffuse layer and ~ 0.35 nm Stern layer. Previous electrochemical studies
have investigated the interaction force between two electrodes immersed in ionic liquid and in NaCl
aqueous solution, and obtained a semi-parabolic relationship between the interaction force, from
which the Debye length can be inferred as a function of electrolyte concentration. The results of ref.
278 show that the Debye length reaches an undetectably small value at 0.1 M electrolyte concentration,

110
and then goes up to approximately 1.5 nm for ~2.0 M concentration in the case of NaCl aqueous
solution, and to approximately 6 nm for ~2.0 M concentration ionic liquid solution in propylene,
respectively.278 Our > 0.8 nm Debye length estimated for the [2:1]NH4+ colloidal solution agrees with
this reported Debye length vs. concentration relation,278 although we cannot precisely determine the
overall electrolyte concentration.
7.4 Conclusion
I have applied in-situ X-ray spectroscopy to characterize the electric double layer (EDL) around
20-nm TiO2 NPs dispersed and stabilized in NH4OH aqueous solution. My studies thus capture the
interaction of bulk electrolyte solution with a TiO2 surface. By combining PES, PEY-XAS and PFY-
XAS, I find that at low concentration of NH4+ stabilizer ions – but still assuring that NPs do not
aggregate – there remains sufficient NP surface area to interact with water. My PES and PEY-XAS
measurements at the N 1s and O 1s core levels, along with the measured pH, identify the Stern layer
to consist of NH4+ stabilizer ions, and the diffuse layer being composed of OH
–. Moreover, the PFY
measurements at the O K-edge reveal an unexpected large amount of OH– in the NP aqueous solution
(despite near-neutral pH) that can only be explained by water dissociation. These OH– species are
proposed to form an approximately > 0.44-nm-thick diffuse layer, charge-balanced by a ~ 0.35-nm
Stern layer of NH4+. The PFY measurements furthermore strongly suggest a prevailing 3-coordinated
OH– hydration structure, OH
–(H2O)3, within the diffuse layer which is not the case for OH
– hydration
in bulk-solution where the 4-coordinated structure, OH–(H2O)4, is more probable. I conclude by
proposing two models in which the dissociation product H+ is either anchored at the TiO2 – solution
interface (Scenario A), or it quickly escapes into the bulk solution (Scenario B), both consequently
preventing the unwanted H+ – OH– recombination. Scenario B is probably a more realistic description
of the dynamics of dissociative water adsorption / H+ release and recombination cycle, although
elements of both models are likely relevant. In addition, the present work marks an important advance
in the spectroscopic characterization of the EDL, including the molecular interactions of aqueous
solution with solid surfaces that are relevant for energy-material research. My method can be readily
applied to surfaces other than studied here.

111
7.5 Appendix
7.5.1 Fitting Parameter of O1s PE Spectra in Figure 7-3
0.5 M NH4OH 5 M NaOH
Position FWHM Area Position FWHM Area
H2O(l) 538.1 1.6 100 538.1 1.8 100
H2O(g) 539.9 1.0 4.9 539.9 1.0 7.0
TiO2 - - - - - -
OH- - - - 535.8 1.8 11.8
TiO2 [2:1]NH4+ TiO2 [2:1]NH4+ + NaOH
Position FWHM Area Position FWHM Area
H2O(l) 538.1 1.6 100 538.1 1.6 100
H2O(g) 539.9 1.0 6.7 539.9 1.0 8.5
TiO2 534.8 1.4 1.0 534.8 1.4 0.9
OH- 536.3 1.4 8.0 536.3 1.4 12.3
Table A-7-1
Fitting parameters of PE spectra in Figure 3. All fitted areas are normalized according to the
fitted area of H2O(l) peak at 538.1 eV which is set to 100.
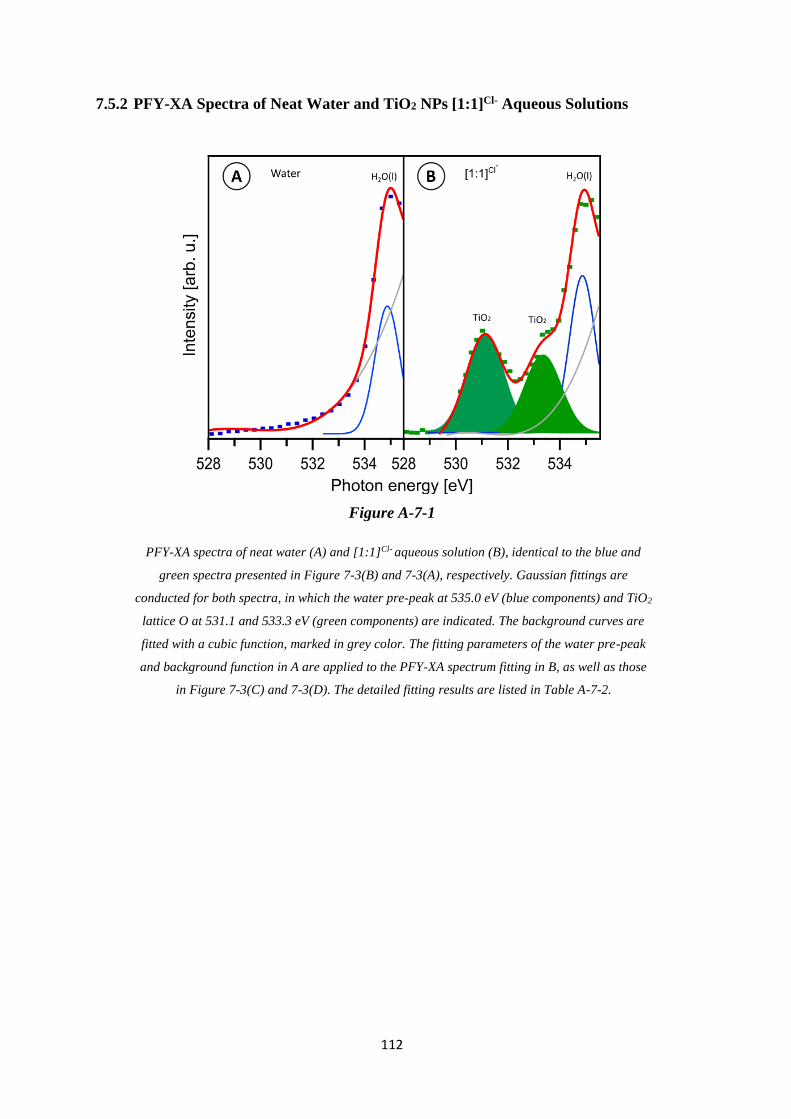
112
7.5.2 PFY-XA Spectra of Neat Water and TiO2 NPs [1:1]Cl- Aqueous Solutions
Figure A-7-1
PFY-XA spectra of neat water (A) and [1:1]Cl- aqueous solution (B), identical to the blue and
green spectra presented in Figure 7-3(B) and 7-3(A), respectively. Gaussian fittings are
conducted for both spectra, in which the water pre-peak at 535.0 eV (blue components) and TiO2
lattice O at 531.1 and 533.3 eV (green components) are indicated. The background curves are
fitted with a cubic function, marked in grey color. The fitting parameters of the water pre-peak
and background function in A are applied to the PFY-XA spectrum fitting in B, as well as those
in Figure 7-3(C) and 7-3(D). The detailed fitting results are listed in Table A-7-2.
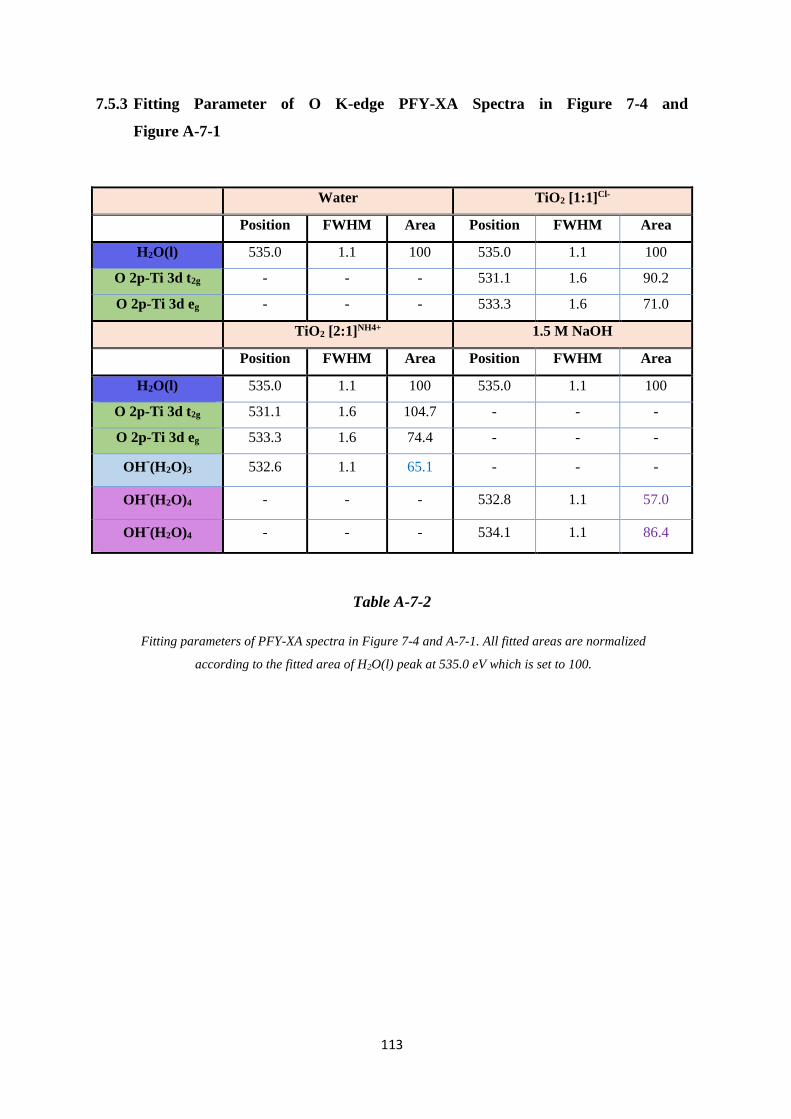
113
7.5.3 Fitting Parameter of O K-edge PFY-XA Spectra in Figure 7-4 and
Figure A-7-1
Water TiO2 [1:1]Cl-
Position FWHM Area Position FWHM Area
H2O(l) 535.0 1.1 100 535.0 1.1 100
O 2p-Ti 3d t2g - - - 531.1 1.6 90.2
O 2p-Ti 3d eg - - - 533.3 1.6 71.0
TiO2 [2:1]NH4+ 1.5 M NaOH
Position FWHM Area Position FWHM Area
H2O(l) 535.0 1.1 100 535.0 1.1 100
O 2p-Ti 3d t2g 531.1 1.6 104.7 - - -
O 2p-Ti 3d eg 533.3 1.6 74.4 - - -
OH-(H2O)3 532.6 1.1 65.1 - - -
OH-(H2O)4 - - - 532.8 1.1 57.0
OH-(H2O)4 - - - 534.1 1.1 86.4
Table A-7-2
Fitting parameters of PFY-XA spectra in Figure 7-4 and A-7-1. All fitted areas are normalized
according to the fitted area of H2O(l) peak at 535.0 eV which is set to 100.

114
7.5.4 Calculation Details of the OH- Molarity in the TiO2 NPs [2:1]NH4+ Aqueous
Solution:
According to the fitting results presented in Table A-7-2, the total area of the two fitted OH-
(H2O)4 components from the 1.5 M NaOH aqueous solution 57.0 + 86.4 = 143.4 is compared to the
corresponding OH-(H2O)3 area of the [2:1]NH4+ solution 65.1. As the water peaks in both solutions are
used as a common reference, a correction factor that considers the different water weights in each
solution is applied. Given that the mass density of the [2:1]NH4+ solution is 1100 g/l and weight
percentage of NP is 20wt%, the water weight in a given volume, say 1 liter, is calculated to be 1100 g
× 80% = 880 g (the weight of 0.3 M NH4OH is negligible). The water weight in one liter of 1.5 M
NaOH aqueous solution is 1000 g. Therefore, the molarity x of OH-(H2O)3 in the [2:1]NH4+ solution
can be estimated by x/1.5 M = (65.1 × 880 g)/(143.4 × 1000 g), which gives x = 0.6 M.

115
Chapter 8
Summary and Outlook
During the course of my PhD studies, I focused on characterizing the electronic structure of the
transition metal oxide – aqueous interface for hematite iron oxide (α-Fe2O3) and anatase titanium
dioxide (TiO2) nanoparticles. A key aspect was the nature of water adsorption at these interfaces. In
this chapter, I summarize the findings based on the measurements shown in chapters 5, 6 and 7, and I
propose a harvesting methodology of the H2 fuel from the dissociative TiO2 — water interaction. Then,
I briefly highlight the results from some other projects that I have been involved in. These projects are
not the main focus of this study, but the findings are of general relevance for liquid-jet PES. Then in
the outlook Section, I describe the current efforts to investigate other NP systems e.g., magnetite iron
oxide and cerium dioxide nanoparticle aqueous solutions, building on the experience accumulated
with α-Fe2O3 and TiO2 NPs. Also, the future perspectives for further characterization of the systems
studied in this thesis are presented.
8.1 Summary of the Results
The electronic structure of the interfacial layer between the (6 nm diameter) hematite iron oxide
nanoparticles and aqueous solution was reported in Chapter 5 using the liquid microjet technique
coupled to soft X-ray photoelectron spectroscopy. This method is sufficiently sensitive to detect the
adsorbed hydroxide species, resulting from the water dissociation at the nanoparticle surface in
aqueous solution (in acidic condition). The photoelectron signals of adsorbed OH- were obtained at
the O 1s resonant, non-resonant and from partial electron yield X-ray absorption. In addition, the Fe
2p3/2 resonant excitation was explored. This L3-edge detection is sensitive to the surrounding chemical
environment of the Fe3+ ions at the nanoparticle—aqueous interface which is manifested in the 10Dq
value, a measure of the ligand-field strength. By recording the L3 edge PEY-XA spectra from different
iron Auger-decay channels, the t2g (3d electrons) peak intensity variation was assigned to different
extents of electron delocalization. From the experimental fraction of local versus non-local
autoionization signals, the charge transfer time from the interfacial Fe3+ into the environment is found
to be approximately 1 fs.
Analogous to the hematite system, the nature of water interaction with the anatase TiO2
nanoparticles surfaces was reported in Chapter 6. The electronic structure of the nanoparticles of
different size (3, 6, 10 and 20 nm diameter), dispersed in different aqueous solutions (different pH)
was investigated in order to identify the molecular species adsorbed at the NP— aqueous solution

116
interface. From the Ti 2p resonant photoemission (PEY-XA) an anatase-phase transformation or the
occurrence of Ti3+ sites due to surface oxygen defects could be ruled out. The O 1s non-resonant and
on-resonant photoelectron spectra allow to distinguish the molecular and dissociative water adsorption
on the TiO2 NP (aq) surface. The latter measurements demonstrate that water is adsorbed molecularly
at low pH, and is interacting dissociatevely at the TiO2 NP (aq) surface for slightly basic solution.
Based on these findings, I propose an anatase TiO2—water interaction mechanism that explicitly takes
the local solution chemical environment into account.
Using in-situ X-ray spectroscopy, the electric double layer around 20-nm TiO2 NPs dispersed
and stabilized in NH4OH aqueous solution was characterized in Chapter 7. From a combination of PE
and PEY-XA spectra at the N 1s core level, the Stern layer was identified to consist of NH4+ stabilizer
ions. The concentration of NH4+ ions is low enough to cover only half of the TiO2 surface sites, which
allows water interaction with the NPs. This less than one monolayer thick Stern layer is approximately
~ 0.35-nm thick. Also, the combination of PE and PFY-XA measurements at the O K-edge revealed
an unexpected large OH- amount in the NP aqueous solution which is not consistent with the pH of
7.8. This large OH- concentration is attributed to the dissociative water interaction with the TiO2
surface in such a chemical environment (based on Chapter 6 findings). From the measured PFY-XA
spectra, I quantify the hydroxide amount in the NP aqueous solution ~ 0.6 M trapped in > 0.44-nm-
thick diffuse layer around the Stern layer. Also, I show that these hydroxide groups are forming a
tetrahedral hydrated configuration structure OH–(H2O)3 which is different from the hyper-coordinated
hydroxyl hydrated complexes OH–(H2O)4 forming in bulk hydroxide solutions. Lastly, I proposed two
structural models of the EDL around the TiO2 NPs, where the dissociated produced H+ is anchored at
the NP surface or diffuses into the bulk solution, respectively. Both models prevent H+ and OH- from
recombination. The second proposed mechanism is probably more favorable as it potentially provides
a means to produce more dissociation by adding an electric bias to the bulk solution. I have shown
that adding NH4OH or NaOH to the NPs (aq) solution (see Figure 6-7 and Figure 7-3) provides a
means to extract the H+ away from the NP surface in aqueous solution (Figure 7-5 (B)).279 The next
step is to provide an external negative potential equivalent to the OH-, attracting generated H+ to leave
the NP surface in order to free the catalytic sites for further water dissociation.
8.2 Other Projects
In parallel to the transition metal oxide NP—water interaction studies, I participated in other
projects, some of which have been published. Here, I briefly mention only those that are somewhat
related to my main topic.
117
• Advances in Liquid Phase Soft-X-ray Photoemission Spectroscopy: A New
Experimental Setup at BESSY II.
This work is describing the SOL3 PES experimental station, its technical features, and
reports some proof-of-concept measurements. I here cite the abstract of the article62, and
then briefly highlight the important role of this experimental setup for conducting my
NP(aq) studies ”A state-of-the-art experimental setup for soft X-ray photo- and Auger-
electron spectroscopy from liquid phase has been built for operation at the synchrotron-
light facility BESSY II, Berlin. The experimental station is named SOL3, which is derived
from solid, solution, and solar, and refers to the aim of studying solid–liquid interfaces,
optionally irradiated by photons in the solar spectrum. SOL3 is equipped with a high-
transmission hemispherical electron analyzer for detecting electrons emitted from small
molecular aggregates, nanoparticles, or biochemical molecules and their components in
(aqueous) solutions, either in vacuum or in an ambient pressure environment. In addition
to conventional energy-resolved electron detection, SOL3 enables detection of electron
angular distributions by the combination of a ±11° acceptance angle of the electron
analyzer and a rotation of the analyzer in the polarization plane of the incoming
synchrotron-light beam. The present manuscript describes the technical features of SOL3,
and we also report the very first measurements of soft-X-ray photoemission spectra from
a liquid microjet of neat liquid water and of TiO2-nanoparticle aqueous solution obtained
with this new setup, highlighting the necessity for state-of-the-art electron detection.”
The presented resonant photoelectron spectra (in Chapters 5 and 6) are the pioneer in
solid-liquid interface studies. This aspect is crucial for probing the electronic structure of
the adsorbed molecular species on the NP(aq) surfaces as a function of pH, which has not
been attempted before.
• Do water's electrons care about electrolytes?
This project investigated if the electrolyte ions have an effect on the electronic
structure of the surrounding water molecules and whether the photoelectron spectrum of
neat liquid water can be used as an energy reference to calibrate other aqueous solution
photoelectron spectra. I already mentioned this study briefly in Chapter 4. The main goal
of that work, as summarized in the abstract of ref.80, is: ”Ions have a profound effect on the
geometrical structure of liquid water and an aqueous environment is known to change the
electronic structure of ions. Here we combine photoelectron spectroscopy measurements from
liquid microjets with molecular dynamical and quantum chemical calculations to address the

118
reverse question, to what extent do ions affect the electronic structure of liquid water? We
study aqueous solutions of sodium iodide (NaI) over a wide concentration range, from nearly
pure water to 8 M solutions, recording spectra in the 5 to 60 eV binding energy range to
include all water valence and the solute Na+ 2p, I− 4d, and I− 5p orbital ionization peaks. We
observe that the electron binding energies of the solute ions change only slightly as a function
of electrolyte concentration, less than 150 ± 60 meV over an ∼8 M range. Furthermore, the
photoelectron spectrum of liquid water is surprisingly mildly affected as we transform the
sample from a dilute aqueous salt solution to a viscous, crystalline-like phase. The most
noticeable spectral changes are a negative binding energy shift of the water 1b2 ionizing
transition (up to −370 ± 60 meV) and a narrowing of the flat-top shape water 3a1 ionization
feature (up to 450 ± 90 meV). A novel computationally efficient technique is introduced to
calculate liquid-state photoemission spectra using small clusters from molecular dynamics
(MD) simulations embedded in dielectric continuum. This theoretical treatment captured the
characteristic positions and structures of the aqueous photoemission peaks, reproducing the
experimentally observed narrowing of the water 3a1 feature and weak sensitivity of the water
binding energies to electrolyte concentration. The calculations allowed us to attribute the
small binding energy shifts to ion-induced disruptions of intermolecular electronic
interactions. Furthermore, they demonstrate the importance of considering concentration-
dependent screening lengths for a correct description of the electronic structure of solvated
systems. Accounting for electronic screening, the calculations highlight the minimal effect of
electrolyte concentration on the 1b1 binding energy reference, in accord with the experiments.
This leads us to a key finding that the isolated, lowest-binding-energy, 1b1, photoemission
feature of liquid water is a robust energetic reference for aqueous liquid microjet
photoemission studies.”
With the water 1b1 binding energy being a confirmed robust energy reference, I was
able to accurately determine the binding energies of the NPs as well as of the adsorbed
interfacial molecular species.
8.3 Outlook
In this section, I present several perspectives and my thoughts of current and future experiments
and applications. First, I report on two ongoing studies of two other metal-oxide nanoparticle aqueous
systems. I conclude by elaborating on the advantage of applying tender X-rays, for the study of
aqueous-phase NPs.
With the hematite iron oxide and the titanium dioxide – aqueous interface studies I have
demonstrated that the liquid microjet technique combined with the soft X-ray photoelectron

119
spectroscopy is a powerful analytical technique to characterize the interfacial layer between
nanoparticles and aqueous solution. I have applied the same techniques to the Fe3O4 NPs and CeO2
NPs to probe their solid surface interaction with solvent and solute ions. The findings are summarized
below:
• Magnetite Iron Oxide Nanoparticle—Aqueous Solution Interface
Magnetite iron oxide (Fe3O4) exhibits strong magnetic properties (magnetic moment
of 4 μB per formula cell126) which makes it a promising electrode material for energy
storage application, such as supercapacitors280-281. Also, its nanoparticle structures are
being intensively exploited as ferrofluids in magnetic refrigeration282, and used in
magnetic resonance imaging283 and cancer therapy284-285. Iron (II, III) oxide (Fe3O4) has
an inverse spinel structure where the Fe2+ is octahedrally coordinated while the Fe3+
cations are divided between octahedral and tetrahedral coordination (accurate ratio of
every coordination is addressed in the following text). The total ratio of Fe2+/Fe3+ is 1:2.
When this value decreases, the Fe3O4 partially loses its magnetic properties. According
to Néel’s theory of ferrimagnetism, the magnetic moment of Fe3O4 uniquely arises from
the Fe2+ ions; The Fe3+ cation moments cancel each other on each sublattice (tetrahedral
and octahedral sublattice).126, 286 The Fe2+ cations are known to be easily oxidized to Fe3+,
by exposure to air, humidity, or in acidic aqueous solution. Therefore, magnetite
nanoparticles are not sustainable in aqueous solution, and they start losing their magnetic
properties. In fact, magnetite would transform into maghemite (γ-Fe2O3), where the
Fe2+/Fe3+ ratio drops to zero (magnetic moment of 2.5 μB per formula unit), then adapt to
the most stable form of iron oxide, hematite (α-Fe2O3).126 Such a transformation affects
almost all the magnetite iron oxide applications, especially the ones performed in aqueous
solution. This oxidation behavior of Fe2+, resulting in iron oxide phase transformation,
has been the motivation for several works 287-289 as well as for my NP study. Specifically,
I aim to quantify and compare the Fe2+/Fe3+ ratios for magnetite NPs under different Fe2+
oxidization conditions:
(i) NPs extensively exposed to Fe2+ oxidization condition: Magnetite NPs
dispersed in an acidic aqueous solution. Two Fe2+/Fe3+ ratios were obtained: (1)
At the NPs—aqueous interface (by preforming liquid jet PES measurements) as
well as (2) from the NP interior (by fully digestion of the NPs).
(ii) NPs shortly exposed to Fe2+ oxidization condition: Dried Fe3O4 NPs(aq) from
the aqueous solution in (i), and the dried NPs (aq) after distilled water washing.
(iii) NPs never exposed to Fe2+ oxidization condition: Dry NPs (this ratio is
reported in the literature290 by our collaborator Kevin M. Rosso (Pacific
Northwest National Laboratory, USA)).

120
First, characteristic measurements were performed for conditions (i) and (ii) to ensure
the same particle shape and size after chemical treatment, washing and drying.
Measurements included (1) X-ray diffraction (XRD) and Scanning electron microscopy
(SEM) from the dried Fe3O4 NPs(aq) after being dissolved in acidic aqueous solution
(NPs shortly exposed to Fe2+ oxidization condition (ii)), and (2) dynamic light
scattering (DLS)) for Fe3O4 NPs dispersed in HNO3 aqueous solution (NPs extensively
exposed to Fe2+ oxidization condition(i)). DLS measurements were performed twice for
the latter sample, since part of the experiment was done at BESSY II, Berlin, while
additional studies were done at the Pacific Northwest National Laboratory, USA, which
made a re-examination of the sample stability mandatory.
In the following, I present liquid jet photoemission spectra from magnetite NP
aqueous solution, aiming at determining the Fe2+/Fe3+ ratio. Figure 8-1 presents the Fe
L3-edge PEY-XA spectrum obtained by integrating the photoemission signals over the
2p-3p3p Auger decay channel (compare Figure 5-6) for 10 wt% (20 nm) Fe3O4
nanoparticles stabilized in HNO3 aqueous solution (black curve). In an attempt to
interpret the spectrum we consider the previously reported ab-initio based multireference
configuration interaction (MRCI) calculations for the Fe(II)O6 ,Fe(III)O6 and Fe(III)O4
clusters on the Fe L-edge290 (shown in green, blue and orange, respectively). We thus
compare the measured PEY-XA spectrum with the total fit of the three characteristic
individual spectra which represent the spectral contribution of the octahedral
configurated Fe2+, octahedral configurated Fe3+ and tetrahedral configurated Fe3+. The
fitting residual (linear combination fitting of theoretical component spectra) is presented
in red color. The fit yields a contribution of 25.9%, 37.0% and 37.1% of Fe(II)O6
,Fe(III)O6 and Fe(III)O4 respectively (for NPs highly exposed to Fe2+ oxidization
condition at the NPs—aqueous interface (i)). This can be compared with 37.21%,
29.37% and 33.42% reported for the dry magnetite NPs measured by bulk-sensitive
technique, total electron yield X-ray absorption290 (NPs never exposed to Fe2+
oxidization condition (iii)). Given the surface sensitivity of the liquid-jet PE
measurements, the large change of the Fe2+ contribution in the PEY-XA spectrum
suggests that these cations are slowly oxidized at the magnetite nanoparticles surface.
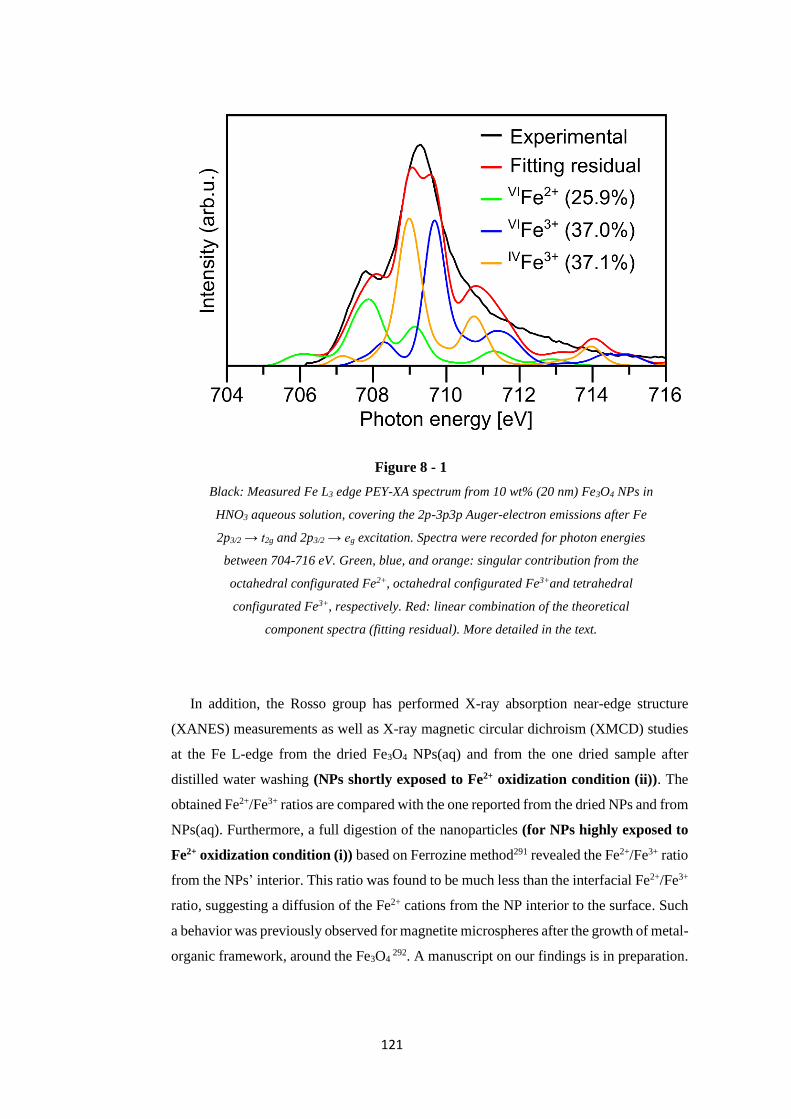
121
Figure 8 - 1
Black: Measured Fe L3 edge PEY-XA spectrum from 10 wt% (20 nm) Fe3O4 NPs in
HNO3 aqueous solution, covering the 2p-3p3p Auger-electron emissions after Fe
2p3/2 → t2g and 2p3/2 → eg excitation. Spectra were recorded for photon energies
between 704-716 eV. Green, blue, and orange: singular contribution from the
octahedral configurated Fe2+, octahedral configurated Fe3+and tetrahedral
configurated Fe3+, respectively. Red: linear combination of the theoretical
component spectra (fitting residual). More detailed in the text.
In addition, the Rosso group has performed X-ray absorption near-edge structure
(XANES) measurements as well as X-ray magnetic circular dichroism (XMCD) studies
at the Fe L-edge from the dried Fe3O4 NPs(aq) and from the one dried sample after
distilled water washing (NPs shortly exposed to Fe2+ oxidization condition (ii)). The
obtained Fe2+/Fe3+ ratios are compared with the one reported from the dried NPs and from
NPs(aq). Furthermore, a full digestion of the nanoparticles (for NPs highly exposed to
Fe2+ oxidization condition (i)) based on Ferrozine method291 revealed the Fe2+/Fe3+ ratio
from the NPs’ interior. This ratio was found to be much less than the interfacial Fe2+/Fe3+
ratio, suggesting a diffusion of the Fe2+ cations from the NP interior to the surface. Such
a behavior was previously observed for magnetite microspheres after the growth of metal-
organic framework, around the Fe3O4 292. A manuscript on our findings is in preparation.

122
• Cerium Dioxide Nanoparticle—Aqueous Solution Interface
The electronic and optical properties of cerium dioxide (CeO2) make this material
interesting for many applications, such as thermal barrier coating, ionic conductors, and
again for H2 fuel production293 and solar cells.294-295 Especially with regard to the latter,
the 3.2 eV band gap renders this materials of considerable interest for the thermochemical
splitting of liquid water.296 It is thus crucial to explore the electronic structure of the
CeO2—water interface. Many experimental and theoretical studies were indeed dedicated
to characterize the nature of water adsorption on the CeO2 surfaces.297-302 Yet, it remains
unclear whether water is molecularly, dissociatively, or mixed adsorbed at the surface.297
A better characterization of this CeO2—aqueous interface was the main motivation of
exploring aqueous-phase ceria NPs by liquid-jet photoelectron spectroscopy. Figure 8-2
presents the valence photoelectron spectra measured on- and off resonant (in red and blue
curves), respectively at the Ce4+ 3d5/2 transition to the valence orbital from a 20 wt% 3nm
CeO2 nanoparticle stabilized in HNO3 aqueous solution. The spectra are energy calibrated
with reference to the 1b1 peak of liquid water (11.16 eV binding energy32), and they are
presented after a Shirley background subtraction. The intensities are displayed to yield
the same heights of the 2a1 water peak as it represents an isolated peak which is not
affected at resonance. A similar procedure was adopted in the α-Fe2O3 NPs(aq) study (see
Section 5.3.1).
The most noticeable peak at the low binding energy side, at approximately 9 eV, is
attributed to two components, the Ce 5d – O 2p and Ce 4f- O 2p hybridizations, based on
the reported valence band spectra of cerium dioxide single crystal303. The broad electron
emission near 25 eV binding energy can be attributed to the contribution from Ce 5p, O
2s and Ce 5s, respectively303. This implies that liquid-jet PES is capable to detect
electrons emitted from the CeO2 NP (aq). Moreover, we have succeeded to detect signals
from interfacial oxygen species resulting from the adsorption of water. Analogous to the
α-Fe2O3 NPs (aq) O 1s RPE and PE measurements shown in Figures 5-4 and 5-5, CeO2
NPs (aq) solutions with reduced amount of NO3- stabilizer ions relative to the available
NPs surface sites were recently measured to investigate the nature of water adsorption on
the NPs surface. The data analysis is in process and manuscript on this work is in
preparation.
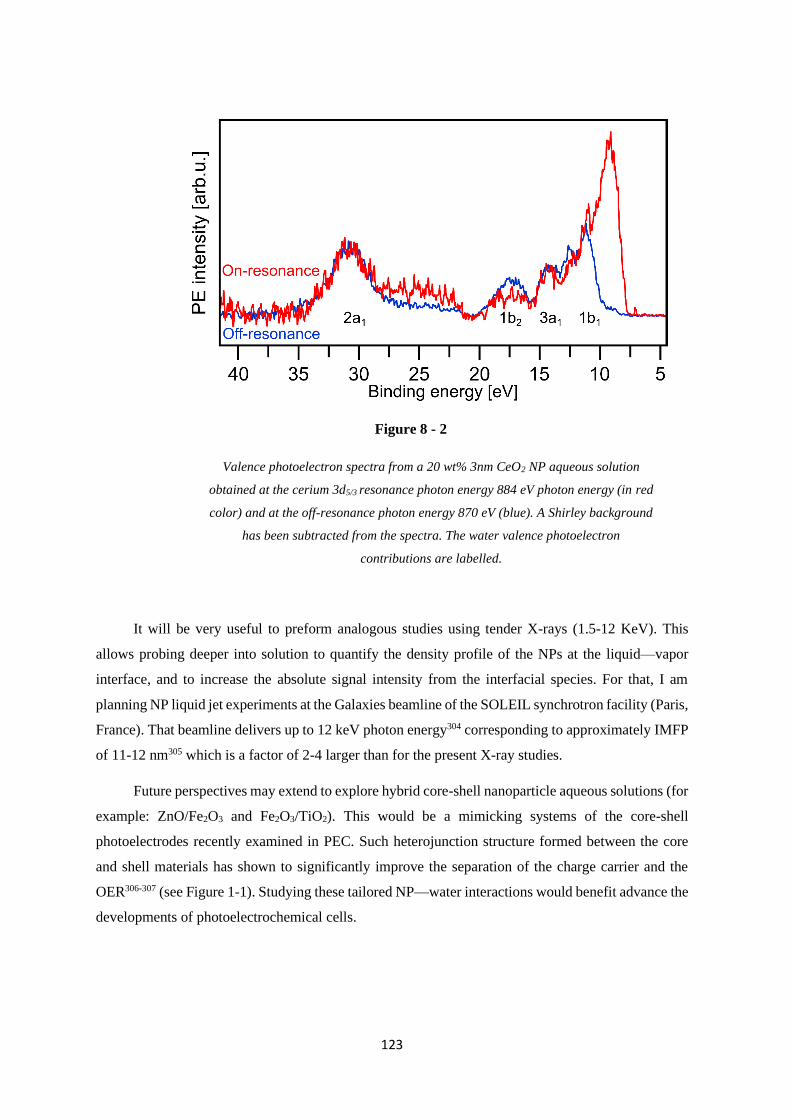
123
Figure 8 - 2
Valence photoelectron spectra from a 20 wt% 3nm CeO2 NP aqueous solution
obtained at the cerium 3d5/3 resonance photon energy 884 eV photon energy (in red
color) and at the off-resonance photon energy 870 eV (blue). A Shirley background
has been subtracted from the spectra. The water valence photoelectron
contributions are labelled.
It will be very useful to preform analogous studies using tender X-rays (1.5-12 KeV). This
allows probing deeper into solution to quantify the density profile of the NPs at the liquid—vapor
interface, and to increase the absolute signal intensity from the interfacial species. For that, I am
planning NP liquid jet experiments at the Galaxies beamline of the SOLEIL synchrotron facility (Paris,
France). That beamline delivers up to 12 keV photon energy304 corresponding to approximately IMFP
of 11-12 nm305 which is a factor of 2-4 larger than for the present X-ray studies.
Future perspectives may extend to explore hybrid core-shell nanoparticle aqueous solutions (for
example: ZnO/Fe2O3 and Fe2O3/TiO2). This would be a mimicking systems of the core-shell
photoelectrodes recently examined in PEC. Such heterojunction structure formed between the core
and shell materials has shown to significantly improve the separation of the charge carrier and the
OER306-307 (see Figure 1-1). Studying these tailored NP—water interactions would benefit advance the
developments of photoelectrochemical cells.

124
125
References
1. Schneider, J.; Matsuoka, M.; Takeuchi, M.; Zhang, J.; Horiuchi, Y.; Anpo, M.; Bahnemann, D.
W., Understanding TiO2 photocatalysis: mechanisms and materials. Chem. Rev. (Washington,
DC, U. S.) 2014, 114 (19), 9919-9986.
2. Nehring, R., Traversing the mountaintop: world fossil fuel production to 2050. Philosophical
Transactions of the Royal Society B: Biological Sciences 2009, 364 (1532), 3067-3079.
3. Berner, R. A., The long-term carbon cycle, fossil fuels and atmospheric composition. Nature
2003, 426 (6964), 323.
4. Wang, W.; Tadé, M. O.; Shao, Z., Research progress of perovskite materials in photocatalysis-
and photovoltaics-related energy conversion and environmental treatment. Chem. Soc. Rev.
2015, 44 (15), 5371-5408.
5. Wang, D. A. C., Guozhong, Nanomaterials for Energy Conversion and Storage. 2018.
6. Dincer, I.; Zamfirescu, C., Sustainable energy systems and applications. Springer Science &
Business Media: 2011.
7. Lewis, N. S., Toward cost-effective solar energy use. Science 2007, 315 (5813), 798-801.
8. Fujishima, A.; Honda, K., Electrochemical evidence for the mechanism of the primary stage of
photosynthesis. Bull. Chem. Soc. Jpn. 1971, 44 (4), 1148-1150.
9. Maeda, K., Photocatalytic water splitting using semiconductor particles: history and recent
developments. Journal of Photochemistry and Photobiology C: Photochemistry Reviews 2011,
12 (4), 237-268.
10. Van de Krol, R., Principles of photoelectrochemical cells. Photoelectrochemical Hydrogen
Production 2011, 102, 13.
11. Deák, P.; Kullgren, J.; Aradi, B.; Frauenheim, T.; Kavan, L., Water splitting and the band edge
positions of TiO2. Electrochim. Acta 2016, 199, 27-34.
12. Atabaev, T. S.; Hossain, M. A.; Lee, D.; Kim, H.-K.; Hwang, Y.-H., Pt-coated TiO2 nanorods
for photoelectrochemical water splitting applications. Results in Physics 2016, 6, 373-376.
13. Macdonald, T. J.; Ambroz, F.; Batmunkh, M.; Li, Y.; Kim, D.; Contini, C.; Poduval, R.; Liu,
H.; Shapter, J. G.; Papakonstantinou, I., TiO2 nanofiber photoelectrochemical cells loaded with
sub-12 nm AuNPs: Size dependent performance evaluation. Materials today energy 2018, 9,
254-263.
14. Bae, D.; Seger, B.; Vesborg, P. C.; Hansen, O.; Chorkendorff, I., Strategies for stable water
splitting via protected photoelectrodes. Chem. Soc. Rev. 2017, 46 (7), 1933-1954.
15. Junta-Rosso, J. L.; Hochella, M. F., The chemistry of hematite 001 surfaces. Geochim.
Cosmochim. Acta 1996, 60 (2), 305-314.

126
16. Todd, E.; Sherman, D.; Purton, J., Surface oxidation of chalcopyrite (CuFeS2) under ambient
atmospheric and aqueous (pH 2-10) conditions: Cu, Fe L-and O K-edge X-ray spectroscopy.
Geochim. Cosmochim. Acta 2003, 67 (12), 2137-2146.
17. Todd, E.; Sherman, D.; Purton, J., Surface oxidation of pyrite under ambient atmospheric and
aqueous (pH= 2 to 10) conditions: electronic structure and mineralogy from X-ray absorption
spectroscopy. Geochim. Cosmochim. Acta 2003, 67 (5), 881-893.
18. Kurtz, R. L.; Henrich, V. E., Surface electronic structure and chemisorption on corundum
transition-metal oxides: α-Fe2O3. Phys. Rev. B 1987, 36 (6), 3413.
19. Henderson, M. A., The interaction of water with solid surfaces: fundamental aspects revisited.
Surf. Sci. Rep. 2002, 46 (1-8), 1-308.
20. Thiel, P. A.; Madey, T. E., The interaction of water with solid surfaces: fundamental aspects.
Surf. Sci. Rep. 1987, 7 (6-8), 211-385.
21. Hodgson, A.; Haq, S., Water adsorption and the wetting of metal surfaces. Surf. Sci. Rep. 2009,
64 (9), 381-451.
22. Boily, J.-F. o.; Yesilbas, M.; Md. Musleh Uddin, M.; Baiqing, L.; Trushkina, Y.; Salazar-
Alvarez, G. n., Thin Water Films at Multifaceted Hematite Particle Surfaces. Langmuir 2015,
31 (48), 13127-13137.
23. Boily, J.-F.; Shchukarev, A., X-ray photoelectron spectroscopy of fast-frozen hematite colloids
in aqueous solutions. 2. Tracing the relationship between surface charge and electrolyte
adsorption. J. Phys. Chem. C 2010, 114 (6), 2613-2616.
24. Shimizu, K.; Shchukarev, A.; Boily, J.-F. o., X-ray photoelectron spectroscopy of fast-frozen
hematite colloids in aqueous solutions. 3. Stabilization of ammonium species by surface
(hydr)oxo groups. J. Phys. Chem. C 2011, 115 (14), 6796-6801.
25. Shimizu, K.; Shchukarev, A.; Kozin, P. A.; Boily, J.-F., X-ray photoelectron spectroscopy of
fast-frozen hematite colloids in aqueous solutions. 4. Coexistence of alkali metal (Na+, K+, Rb+,
Cs+) and chloride ions. Surf. Sci. 2012, 606 (13-14), 1005-1009.
26. Shimizu, K.; Shchukarev, A.; Kozin, P. A.; Boily, J.-F. o., X-ray Photoelectron Spectroscopy
of Fast-Frozen Hematite Colloids in Aqueous Solutions. 5. Halide Ion (F–, Cl–, Br–, I–)
Adsorption. Langmuir 2013, 29 (8), 2623-2630.
27. Andersson, K.; Ketteler, G.; Bluhm, H.; Yamamoto, S.; Ogasawara, H.; Pettersson, L. G.;
Salmeron, M.; Nilsson, A., Autocatalytic water dissociation on Cu(110) at near ambient
conditions. J. Am. Chem. Soc. 2008, 130 (9), 2793-2797.
28. Jürgensen, A.; Esser, N.; Hergenröder, R., Near ambient pressure XPS with a conventional X‐
ray source. Surf. Interface Anal. 2012, 44 (8), 1100-1103.
29. Yamamoto, S.; Bluhm, H.; Andersson, K.; Ketteler, G.; Ogasawara, H.; Salmeron, M.; Nilsson,
A., In situ X-ray photoelectron spectroscopy studies of water on metals and oxides at ambient
conditions. J. Phys.: Condens. Matter 2008, 20 (18), 184025.

127
30. Kerherve, G.; Regoutz, A.; Bentley, D.; Hood, C.; Feeley, K.; Knight, S.; Robson, A.; Turner,
C.; Singh, N.; Pontefract, J., Laboratory-based high pressure X-ray photoelectron spectroscopy:
A novel and flexible reaction cell approach. Rev. Sci. Instrum. 2017, 88 (3), 033102.
31. Velasco‐Velez, J. J.; Pfeifer, V.; Hävecker, M.; Weatherup, R. S.; Arrigo, R.; Chuang, C. H.;
Stotz, E.; Weinberg, G.; Salmeron, M.; Schlögl, R., Photoelectron spectroscopy at the
graphene–liquid interface reveals the electronic structure of an electrodeposited cobalt/graphene
electrocatalyst. Angewandte Chemie International Edition 2015, 54 (48), 14554-14558.
32. Winter, B.; Weber, R.; Widdra, W.; Dittmar, M.; Faubel, M.; Hertel, I., Full valence band
photoemission from liquid water using EUV synchrotron radiation. J. Phys. Chem. A 2004, 108
(14), 2625-2632.
33. Winter, B.; Faubel, M., Photoemission from liquid aqueous solutions. Chem. Rev. (Washington,
DC, U. S.) 2006, 106 (4), 1176-1211.
34. Siegbahn, K., From X-ray to electron spectroscopy and new trends. J. Electron Spectrosc. Relat.
Phenom. 1990, 51, 11-36.
35. Seidel, R.; Winter, B.; Bradforth, S. E., Valence electronic structure of aqueous solutions:
Insights from photoelectron spectroscopy. Annu. Rev. Phys. Chem. 2016, 67, 283-305.
36. Almbladh, C.-O. In Photoemission beyond the sudden approximation, J. Phys.: Conf. Ser., IOP
Publishing: 2006; p 127.
37. Dehmer, J.; Dill, D.; Wallace, S., Shape-resonance-enhanced nuclear-motion effects in
molecular photoionization. Phys. Rev. Lett. 1979, 43 (14), 1005.
38. Raseev, G.; Le Rouzo, H.; Lefebvre‐Brion, H., Partial photoionization cross section and
photoelectron angular distribution for the X2Σg+ state of N2
+ in the static‐exchange
approximation. J.Chem. Phys. 1980, 72 (10), 5701-5709.
39. Schaich, W., Theory of photoemission: Independent particle model. In Photoemission in Solids
I, Springer: 1978; pp 105-134.
40. Hedin, L.; Lee, J., Sudden approximation in photoemission and beyond. J. Electron Spectrosc.
Relat. Phenom. 2002, 124 (2-3), 289-315.
41. Schultze, M.; Fieß, M.; Karpowicz, N.; Gagnon, J.; Korbman, M.; Hofstetter, M.; Neppl, S.;
Cavalieri, A. L.; Komninos, Y.; Mercouris, T., Delay in photoemission. Science 2010, 328
(5986), 1658-1662.
42. Zewail, A. H., Femtochemistry: Atomic-scale dynamics of the chemical bond. J. Phys. Chem.
A 2000, 104 (24), 5660-5694.
43. Santana, J. A. C., Quantitative Core Level Photoelectron Spectroscopy. Morgan & Claypool
Publishers: 2016.
44. Hüfner, S., Photoelectron spectroscopy: principles and applications. Springer Science &
Business Media: 1995.
128
45. Barthés-Labrousse, M.-G., The Auger Effect. Microscopy Microanalysis Microstructures 1995,
6 (3), 253-262.
46. Rausch, R.; Potthoff, M., Pump-probe Auger-electron spectroscopy of Mott insulators. Phys.
Rev. B 2019, 99 (20), 205108.
47. Potthoff, M.; Braun, J.; Borstel, G.; Nolting, W., Theory of Auger electron and appearance-
potential spectroscopy from solids with partially filled valence bands: Effects of valence-band–
core interaction. Phys. Rev. B 1993, 47 (19), 12480.
48. Carley, A. F., Surface Analysis: X-ray Photoelectron Spectroscopy. In Encyclopedia of
Materials: Science and Technology, Buschow, K. H. J.; Cahn, R. W.; Flemings, M. C.; Ilschner,
B.; Kramer, E. J.; Mahajan, S.; Veyssière, P., Eds. Elsevier: Oxford, 2001; pp 8991-8996.
49. Carlson, T., Photoelectron and Auger spectroscopy. Springer Science & Business Media: 2013.
50. Thürmer, S.; Seidel, R.; Eberhardt, W.; Bradforth, S. E.; Winter, B., Ultrafast hybridization
screening in Fe3+ aqueous solution. J. Am. Chem. Soc. 2011, 133 (32), 12528-12535.
51. Hergenhahn, U., Interatomic and intermolecular coulombic decay: The early years. J. Electron
Spectrosc. Relat. Phenom. 2011, 184 (3-6), 78-90.
52. Kirz, J.; Jacobsen, C.; Howells, M., Soft X-ray microscopes and their biological applications.
Q. Rev. Biophys. 1995, 28 (1), 33-130.
53. Guttmann, P.; Bittencourt, C., Overview of nanoscale NEXAFS performed with soft X-ray
microscopes. Beilstein journal of nanotechnology 2015, 6 (1), 595-604.
54. Jablonski, A.; Powell, C. J., Relationships between electron inelastic mean free paths, effective
attenuation lengths, and mean escape depths. J. Electron Spectrosc. Relat. Phenom. 1999, 100
(1-3), 137-160.
55. Ottosson, N.; Faubel, M.; Bradforth, S. E.; Jungwirth, P.; Winter, B., Photoelectron
spectroscopy of liquid water and aqueous solution: Electron effective attenuation lengths and
emission-angle anisotropy. J. Electron Spectrosc. Relat. Phenom. 2010, 177 (2-3), 60-70.
56. Hofmann, S., Auger-and X-ray photoelectron spectroscopy in materials science: a user-
oriented guide. Springer Science & Business Media: 2012; Vol. 49.
57. Thürmer, S., Inquiring photoelectrons about the dynamics in liquid water. 2013.
58. Seah, M. P.; Dench, W., Quantitative electron spectroscopy of surfaces: A standard data base
for electron inelastic mean free paths in solids. Surf. Interface Anal. 1979, 1 (1), 2-11.
59. Thürmer, S.; Seidel, R.; Faubel, M.; Eberhardt, W.; Hemminger, J. C.; Bradforth, S. E.; Winter,
B., Photoelectron angular distributions from liquid water: Effects of electron scattering. Phys.
Rev. Lett. 2013, 111 (17), 173005.
60. Suzuki, Y.-I.; Nishizawa, K.; Kurahashi, N.; Suzuki, T., Effective attenuation length of an
electron in liquid water between 10 and 600 eV. Physical Review E 2014, 90 (1), 010302.
61. Smith, J. W.; Saykally, R. J., Soft x-ray absorption spectroscopy of liquids and solutions. Chem.
Rev. (Washington, DC, U. S.) 2017, 117 (23), 13909-13934.
129
62. Seidel, R.; Pohl, M. N.; Ali, H.; Winter, B.; Aziz, E. F., Advances in liquid phase soft-x-ray
photoemission spectroscopy: A new experimental setup at BESSY II. Rev. Sci. Instrum. 2017,
88 (7), 073107.
63. Ekimova, M.; Quevedo, W.; Faubel, M.; Wernet, P.; Nibbering, E. T., A liquid flatjet system
for solution phase soft-x-ray spectroscopy. Structural Dynamics 2015, 2 (5), 054301.
64. Artiglia, L.; Edebeli, J.; Orlando, F.; Chen, S.; Lee, M.-T.; Arroyo, P. C.; Gilgen, A.; Bartels-
Rausch, T.; Kleibert, A.; Vazdar, M., A surface-stabilized ozonide triggers bromide oxidation
at the aqueous solution-vapour interface. Nature Comm. 2017, 8 (1), 700.
65. Eriksson, S. K.; Hahlin, M.; Kahk, J. M.; Villar-Garcia, I. J.; Webb, M. J.; Grennberg, H.;
Yakimova, R.; Rensmo, H.; Edström, K.; Hagfeldt, A., A versatile photoelectron spectrometer
for pressures up to 30 mbar. Rev. Sci. Instrum. 2014, 85 (7), 075119.
66. Scienta Omicron, Data sheet: HiPP-2 Electron Spectrometer
67. Gotz, M. Electronic Structure in Solution. Soft X-ray Absorption and Emission for Fe2+ in
Water. Freie Universität Berlin, Germany, 2012.
68. Weber, R.; Winter, B.; Schmidt, P.; Widdra, W.; Hertel, I.; Dittmar, M.; Faubel, M.,
Photoemission from aqueous alkali-metal− iodide salt solutions using EUV synchrotron
radiation. J. Phys. Chem. B 2004, 108 (15), 4729-4736.
69. Faubel, M.; Steiner, B.; Toennies, J. P., Photoelectron spectroscopy of liquid water, some
alcohols, and pure nonane in free micro jets. J.Chem. Phys. 1997, 106 (22), 9013-9031.
70. Seidel, R. Electronic-Structure Interactions in Aqueous Solutions: A Liquid-Jet Photoelectron-
Spectroscopy Study. Technische Universität Berlin, 2011.
71. Scharf, W., Particle accelerators and their uses. CRC Press: 1991.
72. Kunz, C., Synchrotron radiation. 1974.
73. Brown, G.; Halbach, K.; Harris, J.; Winick, H., Wiggler and undulator magnets—A review.
Nuclear Instruments and Methods in Physics Research 1983, 208 (1-3), 65-77.
74. Chavanne, J.; Elleaume, P., Undulator and wiggler shimming. 1995.
75. Winick, H.; Brown, G.; Halbach, K.; Harris, J., Wiggler and undulator magnets. Physics Today
1981, 34 (5), 50-63.
76. Golnak, R. Investigation of the Electronic Structure of Transition Metal-Ions in Solution from
Aqua-Complexes to Porphyrins. Freie Universität Berlin, 2015.
77. Unger, I. Relaxation Processes in Aqueous Solutions upon X-ray Exposure: Entanglement of
Electronic and Nuclear Dynamics. Freie Universität Berlin, 2015.
78. Helmholtz-zentrum-Berlin BESSY II storage ring. https://www.helmholtz-
berlin.de/mediathek/info/beschleunigerphysik-fuer-anfaenger/der-speicherring_en.html.
79. Kachel, T., The plane grating monochromator beamline U49-2 PGM-1 at BESSY II. Journal of
large-scale research facilities JLSRF 2016, 2, 72.

130
80. Pohl, M. N.; Muchová, E.; Seidel, R.; Ali, H.; Sršeň, Š.; Wilkinson, I.; Winter, B.; Slavíček, P.,
Do water's electrons care about electrolytes? Chem. Sci. 2019, 10 (3), 848-865.
81. Madelung, O., Landolt-Bornstein: Numerical Data and Functional Relationships in Science and
Technology. New series group III 1987, 22, 63,117.
82. Thompson, A.; Vaughan, D., X-ray data booklet (center for X-ray optics and advanced light
source). Lawrence Berkeley National Laboratory 2001.
83. Banna, M.; McQuaide, B.; Malutzki, R.; Schmidt, V., The photoelectron spectrum of water in
the 30 to 140 eV photon energy range. J.Chem. Phys. 1986, 84 (9), 4739-4744.
84. Sankari, R.; Ehara, M.; Nakatsuji, H.; Senba, Y.; Hosokawa, K.; Yoshida, H.; De Fanis, A.;
Tamenori, Y.; Aksela, S.; Ueda, K., Vibrationally resolved O 1s photoelectron spectrum of
water. Chem. Phys. Lett. 2003, 380 (5-6), 647-653.
85. Pohl, M. N. Intermolecular Electronic Decay in Aqueous Solutions: A Liquid-Phase
Photoelectron Spectroscopy Study. 2018.
86. Winter, B., Liquid microjet for photoelectron spectroscopy. Nucl. Instrum. Methods Phys. Res.,
Sect. A 2009, 601 (1), 139-150.
87. Winter, B.; Hergenhahn, U.; Faubel, M.; Björneholm, O.; Hertel, I. V., Hydrogen bonding in
liquid water probed by resonant Auger-electron spectroscopy. J.Chem. Phys. 2007, 127 (9),
094501.
88. Wang, M.-Y.; Shen, T.; Wang, M.; Zhang, D.-E.; Tong, Z.-w.; Chen, J., One-pot synthesis of
α-Fe2O3 nanoparticles-decorated reduced graphene oxide for efficient nonenzymatic H2O2
biosensor. Sensors and Actuators B: Chemical 2014, 190, 645-650.
89. Reufer, M.; Dietsch, H.; Gasser, U.; Grobety, B.; Hirt, A.; Malik, V. K.; Schurtenberger, P.,
Magnetic properties of silica coated spindle-type hematite particles. J. Phys.: Condens. Matter
2011, 23 (6), 065102.
90. Azevedo, J.; Seipp, T.; Burfeind, J.; Sousa, C.; Bentien, A.; Araújo, J. P.; Mendes, A., Unbiased
solar energy storage: Photoelectrochemical redox flow battery. Nano Energy 2016, 22, 396-
405.
91. Ramasami, A. K.; Ravishankar, T. N.; Sureshkumar, K.; Reddy, M. V.; Chowdari, B. V. R.;
Ramakrishnappa, T.; Balakrishna, G. R., Synthesis, exploration of energy storage and
electrochemical sensing properties of hematite nanoparticles. J. Alloys Compd. 2016, 671, 552-
559.
92. Dias, P.; Vilanova, A.; Lopes, T.; Andrade, L.; Mendes, A., Extremely stable bare hematite
photoanode for solar water splitting. Nano Energy 2016, 23, 70-79.
93. Ketteler, G.; Yamamoto, S.; Bluhm, H.; Andersson, K.; Starr, D. E.; Ogletree, D. F.; Ogasawara,
H.; Nilsson, A.; Salmeron, M., The nature of water nucleation sites on TiO2 (110) surfaces
revealed by ambient pressure X-ray photoelectron spectroscopy. J. Phys. Chem. C 2007, 111
(23), 8278-8282.
131
94. Crumlin, E. J.; Bluhm, H.; Liu, Z., In situ investigation of electrochemical devices using
ambient pressure photoelectron spectroscopy. J. Electron Spectrosc. Relat. Phenom. 2013, 190,
84-92.
95. Karslıoğlu, O.; Nemšák, S.; Zegkinoglou, I.; Shavorskiy, A.; Hartl, M.; Salmassi, F.; Gullikson,
E.; Ng, M.; Rameshan, C.; Rude, B., Aqueous solution/metal interfaces investigated in operando
by photoelectron spectroscopy. Faraday Discuss. 2015, 180, 35-53.
96. Wu, C. H.; Weatherup, R. S.; Salmeron, M. B., Probing electrode/electrolyte interfaces in situ
by X-ray spectroscopies: old methods, new tricks. Phys. Chem. Chem. Phys. 2015, 17 (45),
30229-30239.
97. Axnanda, S.; Crumlin, E. J.; Mao, B.; Rani, S.; Chang, R.; Karlsson, P. G.; Edwards, M. O.;
Lundqvist, M.; Moberg, R.; Ross, P., Using “Tender” X-ray ambient pressure X-Ray
photoelectron spectroscopy as a direct probe of solid-liquid interface. Sci. Rep. 2015, 5, 9788.
98. Kolmakov, A.; Dikin, D. A.; Cote, L. J.; Huang, J.; Abyaneh, M. K.; Amati, M.; Gregoratti, L.;
Günther, S.; Kiskinova, M., Graphene oxide windows for in situ environmental cell
photoelectron spectroscopy. Nat. Nanotechnol. 2011, 6 (10), 651-657.
99. Kraus, J.; Reichelt, R.; Günther, S.; Gregoratti, L.; Amati, M.; Kiskinova, M.; Yulaev, A.;
Vlassiouk, I.; Kolmakov, A., Photoelectron spectroscopy of wet and gaseous samples through
graphene membranes. Nanoscale 2014, 6 (23), 14394-14403.
100. Seidel, R.; Thürmer, S.; Winter, B., Photoelectron spectroscopy meets aqueous solution: studies
from a vacuum liquid microjet. J. Phys. Chem. Lett. 2011, 2 (6), 633-641.
101. Faubel, M.; Steiner, B.; Toennies, J., Measurement of HeI photoelectron spectra of liquid water,
formamide and ethylene glycol in fast-flowing microjets. J. Electron Spectrosc. Relat. Phenom.
1998, 95 (2), 159-169.
102. Siefermann, K. R.; Liu, Y.; Lugovoy, E.; Link, O.; Faubel, M.; Buck, U.; Winter, B.; Abel, B.,
Binding energies, lifetimes and implications of bulk and interface solvated electrons in water.
Nature Chem. 2010, 2 (4), 274-279.
103. Tang, Y.; Shen, H.; Sekiguchi, K.; Kurahashi, N.; Mizuno, T.; Suzuki, Y.-I.; Suzuki, T., Direct
measurement of vertical binding energy of a hydrated electron. Phys. Chem. Chem. Phys. 2010,
12 (15), 3653-3655.
104. Shreve, A. T.; Yen, T. A.; Neumark, D. M., Photoelectron spectroscopy of hydrated electrons.
Chem. Phys. Lett. 2010, 493 (4), 216-219.
105. Lübcke, A.; Buchner, F.; Heine, N.; Hertel, I. V.; Schultz, T., Time-resolved photoelectron
spectroscopy of solvated electrons in aqueous NaI solution. Phys. Chem. Chem. Phys. 2010, 12
(43), 14629-14634.
106. Congiu, M.; De Marco, M. L.; Bonomo, M.; Nunes-Neto, O.; Dini, D.; Graeff, C. F., Pristine
and Al-doped hematite printed films as photoanodes of p-type dye-sensitized solar cells.
Journal of Nanoparticle Research 2017, 19 (1), 7.

132
107. Corbellini, L.; Lacroix, C.; Harnagea, C.; Korinek, A.; Botton, G. A.; Ménard, D.; Pignolet, A.,
Epitaxially stabilized thin films of ε-Fe2O3 (001) grown on YSZ (100). Sci. Rep. 2017, 7 (1),
3712.
108. Jubb, A. M.; Allen, H. C., Vibrational spectroscopic characterization of hematite, maghemite,
and magnetite thin films produced by vapor deposition. ACS Appl. Mater. Interfaces 2010, 2
(10), 2804-2812.
109. Liu, J.; Kim, Y.-T.; Kwon, Y.-U., Hematite Thin Films with Various Nanoscopic Morphologies
Through Control of Self-Assembly Structures. Nanoscale research letters 2015, 10 (1), 228.
110. Wang, W.; Liang, L.; Johs, A.; Gu, B., Thin films of uniform hematite nanoparticles: control of
surface hydrophobicity and self-assembly. J. Mater. Chem. 2008, 18 (47), 5770-5775.
111. Braun, A.; Sivula, K.; Bora, D. K.; Zhu, J.; Zhang, L.; Gratzel, M.; Guo, J.; Constable, E. C.,
Direct observation of two electron holes in a hematite photoanode during photoelectrochemical
water splitting. J. Phys. Chem. C 2012, 116 (32), 16870-16875.
112. Gajda-Schrantz, K.; Tymen, S.; Boudoire, F.; Toth, R.; Bora, D. K.; Calvet, W.; Grätzel, M.;
Constable, E. C.; Braun, A., Formation of an electron hole doped film in the α-Fe2O3 photoanode
upon electrochemical oxidation. Phys. Chem. Chem. Phys. 2013, 15 (5), 1443-1451.
113. Sivula, K.; Le Formal, F.; Grätzel, M., Solar water splitting: progress using hematite (α‐Fe2O3)
photoelectrodes. ChemSusChem 2011, 4 (4), 432-449.
114. Lemire, C.; Bertarione, S.; Zecchina, A.; Scarano, D.; Chaka, A.; Shaikhutdinov, S.; Freund,
H.-J., Ferryl (Fe=O) Termination of the Hematite α−Fe2O3 (0001) Surface. Phys. Rev. Lett.
2005, 94 (16), 166101.
115. Lad, R. J.; Henrich, V. E., Structure of α-Fe2O3 single crystal surfaces following Ar+ ion
bombardment and annealing in O2. Surf. Sci. 1988, 193 (1-2), 81-93.
116. Kurtz, R. L.; Henrich, V. E., Geometric structure of the α-Fe2O3 (001) surface: A LEED and
XPS study. Surf. Sci. 1983, 129 (2-3), 345-354.
117. Condon, N. G.; Murray, P. W.; Leibsle, F. M.; Thornton, G.; Lennie, A. R.; Vaughan, D. J.,
Fe3O4(111) termination of α-Fe2O3(0001). Surf. Sci. 1994, 310 (1-3), L609-L613.
118. Condon, N.; Leibsle, F.; Lennie, A.; Murray, P.; Parker, T.; Vaughan, D.; Thornton, G.,
Scanning tunnelling microscopy studies of α-Fe2O3 (0001). Surf. Sci. 1998, 397 (1-3), 278-287.
119. Tang, Y.; Qin, H.; Wu, K.; Guo, Q.; Guo, J., The reduction and oxidation of Fe2O3 (0001)
surface investigated by scanning tunneling microscopy. Surf. Sci. 2013, 609, 67-72.
120. Lanier, C. H.; Chiaramonti, A. N.; Marks, L. D.; Poeppelmeier, K. R., The Fe3O4 origin of the
“Biphase” reconstruction on α-Fe2O3 (0001). Surf. Sci. 2009, 603 (16), 2574-2579.
121. Kiejna, A.; Pabisiak, T., Mixed termination of hematite (α-Fe2O3)(0001) surface. J. Phys. Chem.
C 2013, 117 (46), 24339-24344.
122. Kiejna, A.; Pabisiak, T., Surface properties of clean and Au or Pd covered hematite (α-
Fe2O3)(0001). J. Phys.: Condens. Matter 2012, 24 (9), 095003.

133
123. Alvarez-Ramırez, F.; Martınez-Magadán, J.; Gomes, J.; Illas, F., On the geometric structure of
the (0001) hematite surface. Surf. Sci. 2004, 558 (1), 4-14.
124. Wang, X.-G.; Weiss, W.; Shaikhutdinov, S. K.; Ritter, M.; Petersen, M.; Wagner, F.; Schlögl,
R.; Scheffler, M., The hematite (α-Fe2O3)(0001) surface: evidence for domains of distinct
chemistry. Phys. Rev. Lett. 1998, 81 (5), 1038.
125. Barbier, A.; Stierle, A.; Kasper, N.; Guittet, M.-J.; Jupille, J., Surface termination of hematite
at environmental oxygen pressures: Experimental surface phase diagram. Phys. Rev. B 2007, 75
(23), 233406.
126. Parkinson, G. S., Iron oxide surfaces. Surf. Sci. Rep. 2016, 71 (1), 272-365.
127. Kuhlenbeck, H.; Shaikhutdinov, S.; Freund, H.-J., Well-ordered transition metal oxide layers in
model catalysis–a series of case studies. Chem. Rev. (Washington, DC, U. S.) 2013, 113 (6),
3986-4034.
128. Hendewerk, M.; Salmeron, M.; Somorjai, G. A., Water adsorption on the (001) plane of Fe2O3:
An XPS, UPS, Auger, and TPD study. Surf. Sci. 1986, 172 (3), 544-556.
129. Morimoto, T.; Nagao, M.; Tokuda, F., Relation between the amounts of chemisorbed and
physisorbed water on metal oxides. J. Phys. Chem. 1969, 73 (1), 243-248.
130. McCafferty, E.; Zettlemoyer, A., Adsorption of water vapour on α-Fe2O3. Discussions of the
Faraday Society 1971, 52, 239-254.
131. Nguyen, M.-T.; Seriani, N.; Gebauer, R., Water adsorption and dissociation on α-Fe2O3 (0001):
PBE+ U calculations. J.Chem. Phys. 2013, 138 (19), 194709.
132. Yin, S.; Ma, X.; Ellis, D., Initial stages of H2O adsorption and hydroxylation of Fe-terminated
α-Fe2O3 (0001) surface. Surf. Sci. 2007, 601 (12), 2426-2437.
133. Pan, H.; Meng, X.; Qin, G., Hydrogen generation by water splitting on hematite (0001) surfaces:
first-principles calculations. Phys. Chem. Chem. Phys. 2014, 16 (46), 25442-25448.
134. von Rudorff, G. F.; Jakobsen, R.; Rosso, K. M.; Blumberger, J., Fast Interconversion of
Hydrogen Bonding at the Hematite (001)–Liquid Water Interface. J. Phys. Chem. Lett. 2016, 7
(7), 1155-1160.
135. Kerisit, S., Water structure at hematite–water interfaces. Geochim. Cosmochim. Acta 2011, 75
(8), 2043-2061.
136. Yamamoto, S.; Kendelewicz, T.; Newberg, J. T.; Ketteler, G.; Starr, D. E.; Mysak, E. R.;
Andersson, K. J.; Ogasawara, H.; Bluhm, H.; Salmeron, M., Water adsorption on α-Fe2O3
(0001) at near ambient conditions. J. Phys. Chem. C 2010, 114 (5), 2256-2266.
137. Spagnoli, D.; Gilbert, B.; Waychunas, G. A.; Banfield, J. F., Prediction of the effects of size
and morphology on the structure of water around hematite nanoparticles. Geochim. Cosmochim.
Acta 2009, 73 (14), 4023-4033.
134
138. Makowski, M. J.; Galhenage, R. P.; Langford, J.; Hemminger, J. C., Liquid-Jet X-ray
Photoelectron Spectra of TiO2 Nanoparticles in an Aqueous Electrolyte Solution. J. Phys. Chem.
Lett. 2016, 7 (9), 1732-1735.
139. Brown, M. A.; Seidel, R.; Thürmer, S.; Faubel, M.; Hemminger, J. C.; van Bokhoven, J. A.;
Winter, B.; Sterrer, M., Electronic structure of sub-10 nm colloidal silica nanoparticles
measured by in situ photoelectron spectroscopy at the aqueous-solid interface. Phys. Chem.
Chem. Phys. 2011, 13 (28), 12720-12723.
140. Lewis, T.; Winter, B.; Stern, A. C.; Baer, M. D.; Mundy, C. J.; Tobias, D. J.; Hemminger, J. C.,
Does nitric acid dissociate at the aqueous solution surface? J. Phys. Chem. C 2011, 115 (43),
21183-21190.
141. Faubel, M.; Kisters, T., Non-equilibrium molecular evaporation of carboxylic acid dimers.
Nature 1989, 339 (6225), 527.
142. Jouaiti, A.; Mosser, A.; Romeo, M.; Shindo, S., Background calculation for X-ray photoelectron
spectra analysis. J. Electron Spectrosc. Relat. Phenom. 1992, 59 (4), 327-340.
143. Shirley, D. A., High-resolution X-ray photoemission spectrum of the valence bands of gold.
Phys. Rev. B 1972, 5 (12), 4709.
144. Seidel, R.; Atak, K.; Thürmer, S.; Aziz, E. F.; Winter, B., Ti3+ aqueous solution: hybridization
and electronic relaxation probed by state-dependent electron spectroscopy. J. Phys. Chem. B
2015, 119 (33), 10607-10615.
145. Lad, R. J.; Henrich, V. E., Photoemission study of the valence-band electronic structure in FexO,
Fe3O4, and α-Fe2O3 single crystals. Phys. Rev. B 1989, 39 (18), 13478.
146. Fujimori, A.; Saeki, M.; Kimizuka, N.; Taniguchi, M.; Suga, S., Photoemission satellites and
electronic structure of Fe2O3. Phys. Rev. B 1986, 34 (10), 7318.
147. Sherman, D. M., The electronic structures of Fe3+ coordination sites in iron oxides: Applications
to spectra, bonding, and magnetism. Phys. Chem. Miner. 1985, 12 (3), 161-175.
148. Yepes, D.; Seidel, R.; Winter, B.; Blumberger, J.; Jaque, P., Photoemission Spectra and Density
Functional Theory Calculations of 3d Transition Metal–Aqua Complexes (Ti–Cu) in Aqueous
Solution. J. Phys. Chem. B 2014, 118 (24), 6850-6863.
149. Radu, T.; Iacovita, C.; Benea, D.; Turcu, R., X-ray photoelectron spectroscopic characterization
of iron oxide nanoparticles. Appl. Surf. Sci. 2017, 405, 337-343.
150. Fransson, T.; Harada, Y.; Kosugi, N.; Besley, N. A.; Winter, B.; Rehr, J. J.; Pettersson, L. G.
M.; Nilsson, A., X-ray and Electron Spectroscopy of Water. Chem. Rev. (Washington, DC, U.
S.) 2016, 116 (13), 7551-7569.
151. Wernet, P.; Nordlund, D.; Bergmann, U.; Cavalleri, M.; Odelius, M.; Ogasawara, H.; Näslund,
L.; Hirsch, T.; Ojamäe, L.; Glatzel, P., The structure of the first coordination shell in liquid
water. Science 2004, 304 (5673), 995-999.
135
152. Thürmer, S.; Unger, I.; Slavíček, P.; Winter, B., Relaxation of Electronically Excited Hydrogen
Peroxide in Liquid Water: Insights from Auger-Electron Emission. J. Phys. Chem. C 2013, 117
(43), 22268-22275.
153. Aziz, E. F.; Ottosson, N.; Faubel, M.; Hertel, I. V.; Winter, B., Interaction between liquid water
and hydroxide revealed by core-hole de-excitation. Nature 2008, 455 (7209), 89-91.
154. Cappa, C. D.; Smith, J. D.; Messer, B. M.; Cohen, R. C.; Saykally, R. J., Nature of the aqueous
hydroxide ion probed by X-ray absorption spectroscopy. J. Phys. Chem. A 2007, 111 (22), 4776-
4785.
155. Poshusta, R.; Tseng, D.; Hess, A. C.; McCarthy, M. I., Periodic Hartree-Fock study of nitric
acid monohydrate crystal: bulk and clean surface. J. Phys. Chem. 1993, 97 (28), 7295-7303.
156. Cressey, G.; Henderson, C.; Van der Laan, G., Use of L-edge X-ray absorption spectroscopy to
characterize multiple valence states of 3d transition metals; a new probe for mineralogical and
geochemical research. Phys. Chem. Miner. 1993, 20 (2), 111-119.
157. Bora, D. K.; Braun, A.; Erat, S.; Ariffin, A. K.; Löhnert, R.; Sivula, K.; Töpfer, J. r.; Grätzel,
M.; Manzke, R.; Graule, T., Evolution of an oxygen near-edge X-ray absorption fine structure
transition in the upper Hubbard band in α-Fe2O3 upon electrochemical oxidation. J. Phys. Chem.
C 2011, 115 (13), 5619-5625.
158. Wu, Z.; Gota, S.; Jollet, F.; Pollak, M.; Gautier-Soyer, M.; Natoli, C., Characterization of iron
oxides by X-ray absorption at the oxygen K edge using a full multiple-scattering approach.
Phys. Rev. B 1997, 55 (4), 2570.
159. Pollak, M.; Gautier, M.; Thromat, N.; Gota, S.; Mackrodt, W.; Saunders, V., An in-situ study
of the surface phase transitions of α-Fe2O3 by X-ray absorption spectroscopy at the oxygen K
edge. Nuclear Instruments and Methods in Physics Research Section B: Beam Interactions with
Materials and Atoms 1995, 97 (1-4), 383-386.
160. Park, T.-J.; Sambasivan, S.; Fischer, D. A.; Yoon, W.-S.; Misewich, J. A.; Wong, S. S.,
Electronic structure and chemistry of iron-based metal oxide nanostructured materials: a
NEXAFS investigation of BiFeO3, Bi2Fe4O9, α-Fe2O3, γ-Fe2O3, and Fe/Fe3O4. J. Phys. Chem.
C 2008, 112 (28), 10359-10369.
161. Colliex, C.; Manoubi, T.; Ortiz, C., Electron-energy-loss-spectroscopy near-edge fine structures
in the iron-oxygen system. Phys. Rev. B 1991, 44 (20), 11402-11411.
162. De Groot, F. M. F.; Grioni, M.; Fuggle, J. C.; Ghijsen, J.; Sawatzky, G. A.; Petersen, H., Oxygen
1s x-ray-absorption edges of transition-metal oxides. Phys. Rev. B 1989, 40 (8), 5715-5723.
163. Gilbert, B.; Frandsen, C.; Maxey, E.; Sherman, D., Band-gap measurements of bulk and
nanoscale hematite by soft X-ray spectroscopy. Phys. Rev. B 2009, 79 (3), 035108.
164. Winter, B.; Aziz, E. F.; Hergenhahn, U.; Faubel, M.; Hertel, I. V., Hydrogen bonds in liquid
water studied by photoelectron spectroscopy. J.Chem. Phys. 2007, 126 (12), 124504.
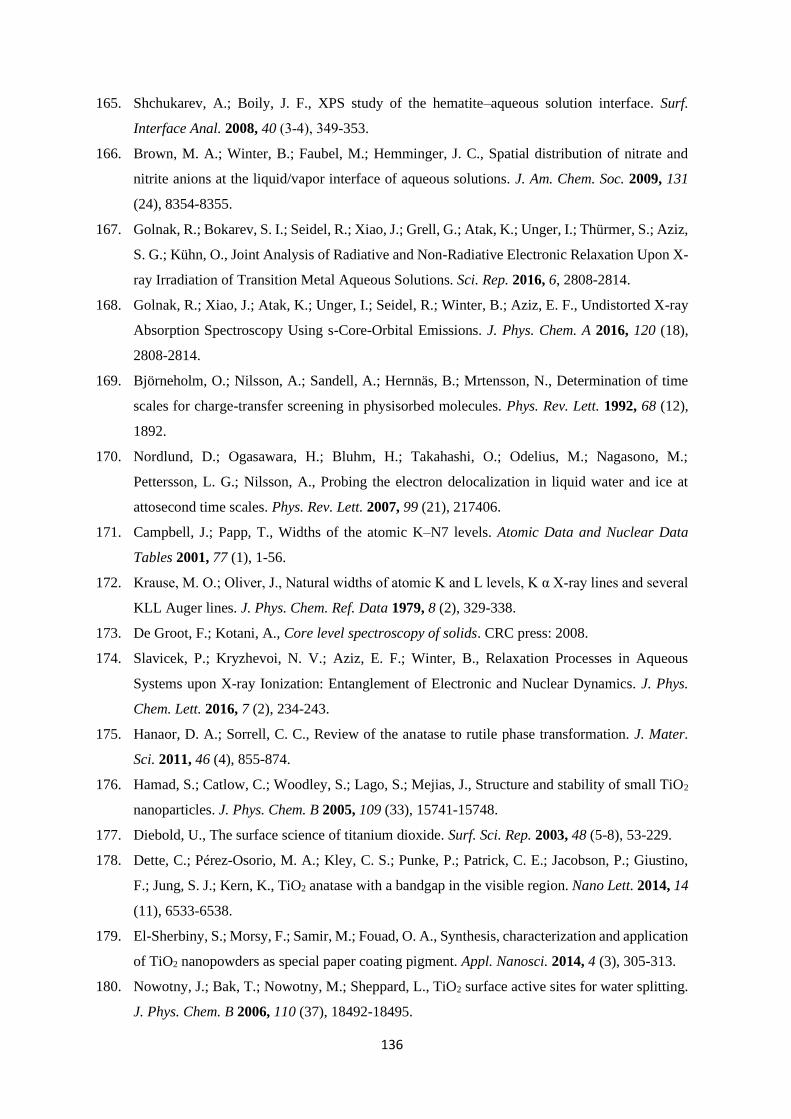
136
165. Shchukarev, A.; Boily, J. F., XPS study of the hematite–aqueous solution interface. Surf.
Interface Anal. 2008, 40 (3‐4), 349-353.
166. Brown, M. A.; Winter, B.; Faubel, M.; Hemminger, J. C., Spatial distribution of nitrate and
nitrite anions at the liquid/vapor interface of aqueous solutions. J. Am. Chem. Soc. 2009, 131
(24), 8354-8355.
167. Golnak, R.; Bokarev, S. I.; Seidel, R.; Xiao, J.; Grell, G.; Atak, K.; Unger, I.; Thürmer, S.; Aziz,
S. G.; Kühn, O., Joint Analysis of Radiative and Non-Radiative Electronic Relaxation Upon X-
ray Irradiation of Transition Metal Aqueous Solutions. Sci. Rep. 2016, 6, 2808-2814.
168. Golnak, R.; Xiao, J.; Atak, K.; Unger, I.; Seidel, R.; Winter, B.; Aziz, E. F., Undistorted X-ray
Absorption Spectroscopy Using s-Core-Orbital Emissions. J. Phys. Chem. A 2016, 120 (18),
2808-2814.
169. Björneholm, O.; Nilsson, A.; Sandell, A.; Hernnäs, B.; Mrtensson, N., Determination of time
scales for charge-transfer screening in physisorbed molecules. Phys. Rev. Lett. 1992, 68 (12),
1892.
170. Nordlund, D.; Ogasawara, H.; Bluhm, H.; Takahashi, O.; Odelius, M.; Nagasono, M.;
Pettersson, L. G.; Nilsson, A., Probing the electron delocalization in liquid water and ice at
attosecond time scales. Phys. Rev. Lett. 2007, 99 (21), 217406.
171. Campbell, J.; Papp, T., Widths of the atomic K–N7 levels. Atomic Data and Nuclear Data
Tables 2001, 77 (1), 1-56.
172. Krause, M. O.; Oliver, J., Natural widths of atomic K and L levels, K α X‐ray lines and several
KLL Auger lines. J. Phys. Chem. Ref. Data 1979, 8 (2), 329-338.
173. De Groot, F.; Kotani, A., Core level spectroscopy of solids. CRC press: 2008.
174. Slavicek, P.; Kryzhevoi, N. V.; Aziz, E. F.; Winter, B., Relaxation Processes in Aqueous
Systems upon X-ray Ionization: Entanglement of Electronic and Nuclear Dynamics. J. Phys.
Chem. Lett. 2016, 7 (2), 234-243.
175. Hanaor, D. A.; Sorrell, C. C., Review of the anatase to rutile phase transformation. J. Mater.
Sci. 2011, 46 (4), 855-874.
176. Hamad, S.; Catlow, C.; Woodley, S.; Lago, S.; Mejias, J., Structure and stability of small TiO2
nanoparticles. J. Phys. Chem. B 2005, 109 (33), 15741-15748.
177. Diebold, U., The surface science of titanium dioxide. Surf. Sci. Rep. 2003, 48 (5-8), 53-229.
178. Dette, C.; Pérez-Osorio, M. A.; Kley, C. S.; Punke, P.; Patrick, C. E.; Jacobson, P.; Giustino,
F.; Jung, S. J.; Kern, K., TiO2 anatase with a bandgap in the visible region. Nano Lett. 2014, 14
(11), 6533-6538.
179. El-Sherbiny, S.; Morsy, F.; Samir, M.; Fouad, O. A., Synthesis, characterization and application
of TiO2 nanopowders as special paper coating pigment. Appl. Nanosci. 2014, 4 (3), 305-313.
180. Nowotny, J.; Bak, T.; Nowotny, M.; Sheppard, L., TiO2 surface active sites for water splitting.
J. Phys. Chem. B 2006, 110 (37), 18492-18495.
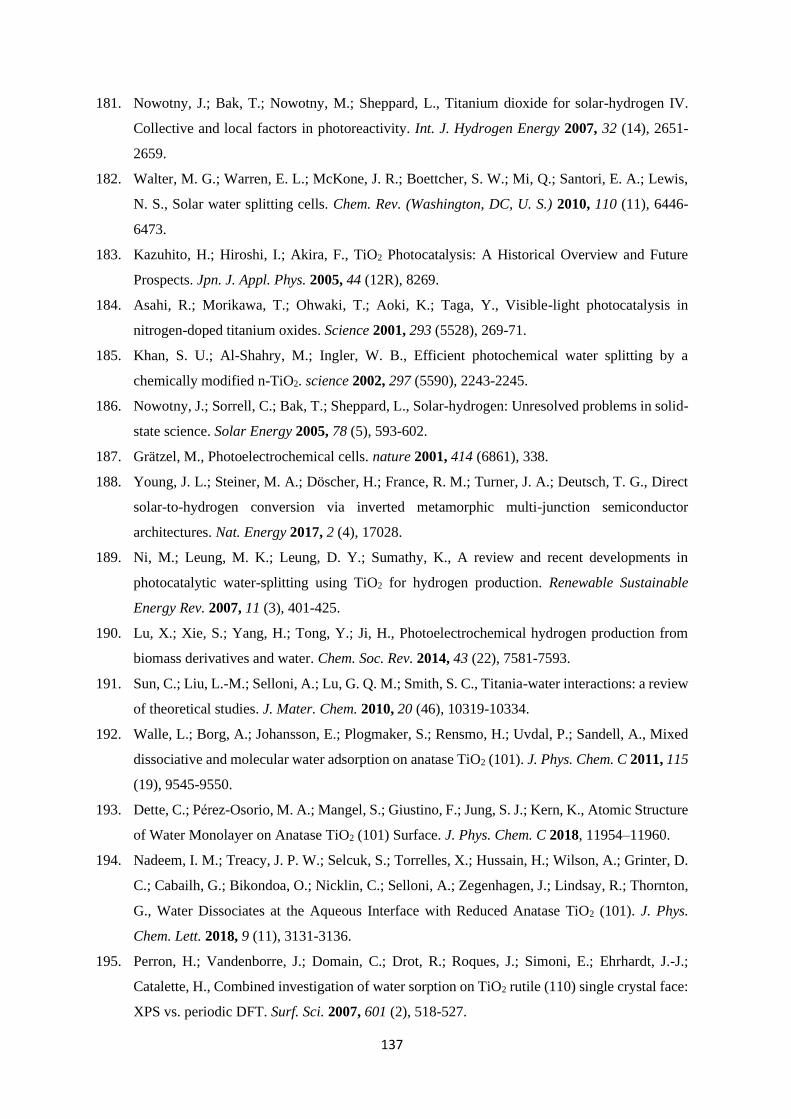
137
181. Nowotny, J.; Bak, T.; Nowotny, M.; Sheppard, L., Titanium dioxide for solar-hydrogen IV.
Collective and local factors in photoreactivity. Int. J. Hydrogen Energy 2007, 32 (14), 2651-
2659.
182. Walter, M. G.; Warren, E. L.; McKone, J. R.; Boettcher, S. W.; Mi, Q.; Santori, E. A.; Lewis,
N. S., Solar water splitting cells. Chem. Rev. (Washington, DC, U. S.) 2010, 110 (11), 6446-
6473.
183. Kazuhito, H.; Hiroshi, I.; Akira, F., TiO2 Photocatalysis: A Historical Overview and Future
Prospects. Jpn. J. Appl. Phys. 2005, 44 (12R), 8269.
184. Asahi, R.; Morikawa, T.; Ohwaki, T.; Aoki, K.; Taga, Y., Visible-light photocatalysis in
nitrogen-doped titanium oxides. Science 2001, 293 (5528), 269-71.
185. Khan, S. U.; Al-Shahry, M.; Ingler, W. B., Efficient photochemical water splitting by a
chemically modified n-TiO2. science 2002, 297 (5590), 2243-2245.
186. Nowotny, J.; Sorrell, C.; Bak, T.; Sheppard, L., Solar-hydrogen: Unresolved problems in solid-
state science. Solar Energy 2005, 78 (5), 593-602.
187. Grätzel, M., Photoelectrochemical cells. nature 2001, 414 (6861), 338.
188. Young, J. L.; Steiner, M. A.; Döscher, H.; France, R. M.; Turner, J. A.; Deutsch, T. G., Direct
solar-to-hydrogen conversion via inverted metamorphic multi-junction semiconductor
architectures. Nat. Energy 2017, 2 (4), 17028.
189. Ni, M.; Leung, M. K.; Leung, D. Y.; Sumathy, K., A review and recent developments in
photocatalytic water-splitting using TiO2 for hydrogen production. Renewable Sustainable
Energy Rev. 2007, 11 (3), 401-425.
190. Lu, X.; Xie, S.; Yang, H.; Tong, Y.; Ji, H., Photoelectrochemical hydrogen production from
biomass derivatives and water. Chem. Soc. Rev. 2014, 43 (22), 7581-7593.
191. Sun, C.; Liu, L.-M.; Selloni, A.; Lu, G. Q. M.; Smith, S. C., Titania-water interactions: a review
of theoretical studies. J. Mater. Chem. 2010, 20 (46), 10319-10334.
192. Walle, L.; Borg, A.; Johansson, E.; Plogmaker, S.; Rensmo, H.; Uvdal, P.; Sandell, A., Mixed
dissociative and molecular water adsorption on anatase TiO2 (101). J. Phys. Chem. C 2011, 115
(19), 9545-9550.
193. Dette, C.; Pérez-Osorio, M. A.; Mangel, S.; Giustino, F.; Jung, S. J.; Kern, K., Atomic Structure
of Water Monolayer on Anatase TiO2 (101) Surface. J. Phys. Chem. C 2018, 11954–11960.
194. Nadeem, I. M.; Treacy, J. P. W.; Selcuk, S.; Torrelles, X.; Hussain, H.; Wilson, A.; Grinter, D.
C.; Cabailh, G.; Bikondoa, O.; Nicklin, C.; Selloni, A.; Zegenhagen, J.; Lindsay, R.; Thornton,
G., Water Dissociates at the Aqueous Interface with Reduced Anatase TiO2 (101). J. Phys.
Chem. Lett. 2018, 9 (11), 3131-3136.
195. Perron, H.; Vandenborre, J.; Domain, C.; Drot, R.; Roques, J.; Simoni, E.; Ehrhardt, J.-J.;
Catalette, H., Combined investigation of water sorption on TiO2 rutile (110) single crystal face:
XPS vs. periodic DFT. Surf. Sci. 2007, 601 (2), 518-527.
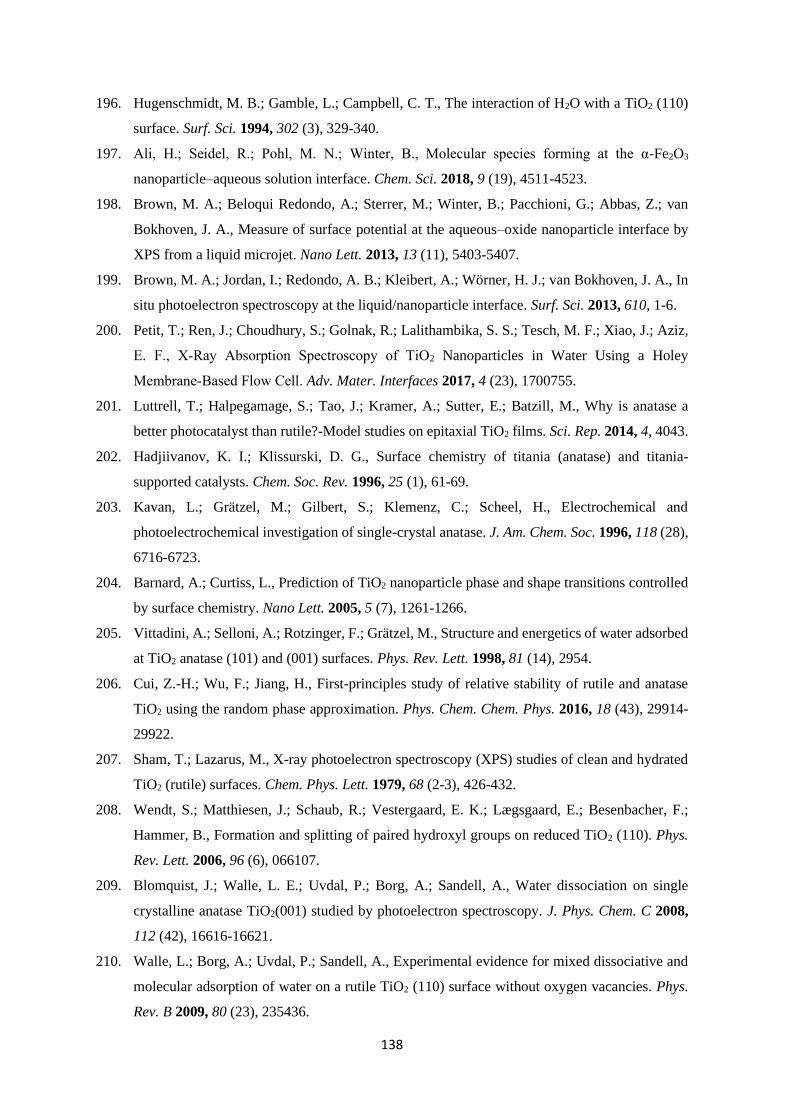
138
196. Hugenschmidt, M. B.; Gamble, L.; Campbell, C. T., The interaction of H2O with a TiO2 (110)
surface. Surf. Sci. 1994, 302 (3), 329-340.
197. Ali, H.; Seidel, R.; Pohl, M. N.; Winter, B., Molecular species forming at the α-Fe2O3
nanoparticle–aqueous solution interface. Chem. Sci. 2018, 9 (19), 4511-4523.
198. Brown, M. A.; Beloqui Redondo, A.; Sterrer, M.; Winter, B.; Pacchioni, G.; Abbas, Z.; van
Bokhoven, J. A., Measure of surface potential at the aqueous–oxide nanoparticle interface by
XPS from a liquid microjet. Nano Lett. 2013, 13 (11), 5403-5407.
199. Brown, M. A.; Jordan, I.; Redondo, A. B.; Kleibert, A.; Wörner, H. J.; van Bokhoven, J. A., In
situ photoelectron spectroscopy at the liquid/nanoparticle interface. Surf. Sci. 2013, 610, 1-6.
200. Petit, T.; Ren, J.; Choudhury, S.; Golnak, R.; Lalithambika, S. S.; Tesch, M. F.; Xiao, J.; Aziz,
E. F., X‐Ray Absorption Spectroscopy of TiO2 Nanoparticles in Water Using a Holey
Membrane‐Based Flow Cell. Adv. Mater. Interfaces 2017, 4 (23), 1700755.
201. Luttrell, T.; Halpegamage, S.; Tao, J.; Kramer, A.; Sutter, E.; Batzill, M., Why is anatase a
better photocatalyst than rutile?-Model studies on epitaxial TiO2 films. Sci. Rep. 2014, 4, 4043.
202. Hadjiivanov, K. I.; Klissurski, D. G., Surface chemistry of titania (anatase) and titania-
supported catalysts. Chem. Soc. Rev. 1996, 25 (1), 61-69.
203. Kavan, L.; Grätzel, M.; Gilbert, S.; Klemenz, C.; Scheel, H., Electrochemical and
photoelectrochemical investigation of single-crystal anatase. J. Am. Chem. Soc. 1996, 118 (28),
6716-6723.
204. Barnard, A.; Curtiss, L., Prediction of TiO2 nanoparticle phase and shape transitions controlled
by surface chemistry. Nano Lett. 2005, 5 (7), 1261-1266.
205. Vittadini, A.; Selloni, A.; Rotzinger, F.; Grätzel, M., Structure and energetics of water adsorbed
at TiO2 anatase (101) and (001) surfaces. Phys. Rev. Lett. 1998, 81 (14), 2954.
206. Cui, Z.-H.; Wu, F.; Jiang, H., First-principles study of relative stability of rutile and anatase
TiO2 using the random phase approximation. Phys. Chem. Chem. Phys. 2016, 18 (43), 29914-
29922.
207. Sham, T.; Lazarus, M., X-ray photoelectron spectroscopy (XPS) studies of clean and hydrated
TiO2 (rutile) surfaces. Chem. Phys. Lett. 1979, 68 (2-3), 426-432.
208. Wendt, S.; Matthiesen, J.; Schaub, R.; Vestergaard, E. K.; Lægsgaard, E.; Besenbacher, F.;
Hammer, B., Formation and splitting of paired hydroxyl groups on reduced TiO2 (110). Phys.
Rev. Lett. 2006, 96 (6), 066107.
209. Blomquist, J.; Walle, L. E.; Uvdal, P.; Borg, A.; Sandell, A., Water dissociation on single
crystalline anatase TiO2(001) studied by photoelectron spectroscopy. J. Phys. Chem. C 2008,
112 (42), 16616-16621.
210. Walle, L.; Borg, A.; Uvdal, P.; Sandell, A., Experimental evidence for mixed dissociative and
molecular adsorption of water on a rutile TiO2 (110) surface without oxygen vacancies. Phys.
Rev. B 2009, 80 (23), 235436.

139
211. Balajka, J.; Hines, M. A.; DeBenedetti, W. J.; Komora, M.; Pavelec, J.; Schmid, M.; Diebold,
U., High-affinity adsorption leads to molecularly ordered interfaces on TiO2 in air and solution.
Science 2018, 361 (6404), 786-789.
212. Balajka, J.; Aschauer, U.; Mertens, S. F.; Selloni, A.; Schmid, M.; Diebold, U., Surface
Structure of TiO2 Rutile (011) Exposed to Liquid Water. J. Phys. Chem. C 2017, 121 (47),
26424-26431.
213. Jackman, M. J.; Thomas, A. G.; Muryn, C., Photoelectron spectroscopy study of stoichiometric
and reduced anatase TiO2 (101) surfaces: the effect of subsurface defects on water adsorption
at near-ambient pressures. J. Phys. Chem. C 2015, 119 (24), 13682-13690.
214. Thompson, T. L.; Yates, J. T., TiO2-based photocatalysis: surface defects, oxygen and charge
transfer. Top. Catal. 2005, 35 (3-4), 197-210.
215. Hossain, F.; Murch, G.; Sheppard, L.; Nowotny, J., Reactivity of ideal and defected rutile TiO2
(110) surface with oxygen. Adv. Appl. Ceram. 2007, 106 (1-2), 95-100.
216. Zhao, H.; Pan, F.; Li, Y., A review on the effects of TiO2 surface point defects on CO2
photoreduction with H2O. Journal of Materiomics 2017, 3 (1), 17-32.
217. Benkoula, S.; Sublemontier, O.; Patanen, M.; Nicolas, C.; Sirotti, F.; Naitabdi, A.; Gaie-Levrel,
F.; Antonsson, E.; Aureau, D.; Ouf, F.-X., Water adsorption on TiO2 surfaces probed by soft X-
ray spectroscopies: bulk materials vs. isolated nanoparticles. Sci. Rep. 2015, 5, 15088.
218. Wang, Z.-T.; Wang, Y.-G.; Mu, R.; Yoon, Y.; Dahal, A.; Schenter, G. K.; Glezakou, V.-A.;
Rousseau, R.; Lyubinetsky, I.; Dohnálek, Z., Probing equilibrium of molecular and
deprotonated water on TiO2 (110). Proceedings of the National Academy of Sciences 2017, 114
(8), 1801-1805.
219. Diebold, U., Perspective: A controversial benchmark system for water-oxide interfaces:
H2O/TiO2 (110). J.Chem. Phys. 2017, 147 (4), 040901.
220. He, Y.; Tilocca, A.; Dulub, O.; Selloni, A.; Diebold, U., Local ordering and electronic
signatures of submonolayer water on anatase TiO2 (101). Nat. Mater. 2009, 8 (7), 585.
221. Duncan, D.; Allegretti, F.; Woodruff, D., Water does partially dissociate on the perfect TiO2
(110) surface: a quantitative structure determination. Phys. Rev. B 2012, 86 (4), 045411.
222. Zheng, T.; Wu, C.; Chen, M.; Zhang, Y.; Cummings, P. T., A DFT study of water adsorption
on rutile TiO2 (110) surface: The effects of surface steps. J.Chem. Phys. 2016, 145 (4), 044702.
223. Schindler, P.; Gamsjäger, H., Acid—base reactions of the TiO2 (Anatase)—water interface and
the point of zero charge of TiO2 suspensions. Kolloid-Zeitschrift und Zeitschrift für Polymere
1972, 250 (7), 759-763.
224. Cheng, J.; Sprik, M., Acidity of the aqueous rutile TiO2 (110) surface from density functional
theory based molecular dynamics. J. Chem. Theory Comput. 2010, 6 (3), 880-889.
225. Vayssieres, L.; Persson, C.; Guo, J.-H., Size effect on the conduction band orbital character of
anatase TiO2 nanocrystals. Appl. Phys. Lett. 2011, 99 (18), 183101.
140
226. Sentein, C.; Guizard, B.; Giraud, S.; Yé, C.; Ténégal, F., Dispersion and stability of TiO2
nanoparticles synthesized by laser pyrolysis in aqueous suspensions. J. Phys.: Conf. Ser. 2009,
170 (1), 012013.
227. Burns, R. G.; Burns, R. G., Mineralogical applications of crystal field theory. Cambridge
University Press: 1993; Vol. 5.
228. Crocombette, J.; Jollet, F., Ti 2p X-ray absorption in titanium dioxides (TiO2): the influence of
the cation site environment. J. Phys.: Condens. Matter 1994, 6 (49), 10811.
229. De Groot, F.; Figueiredo, M.; Basto, M.; Abbate, M.; Petersen, H.; Fuggle, J., 2p X-ray
absorption of titanium in minerals. Phys. Chem. Miner. 1992, 19 (3), 140-147.
230. Henderson, G. S.; De Groot, F. M.; Moulton, B. J., X-ray absorption near-edge structure
(XANES) spectroscopy. Rev. Mineral. Geochem. 2014, 78 (1), 75-138.
231. Henningsson, A.; Rensmo, H.; Sandell, A.; Siegbahn, H.; Södergren, S.; Lindström, H.;
Hagfeldt, A., Electronic structure of electrochemically Li-inserted TiO2 studied with
synchrotron radiation electron spectroscopies. J.Chem. Phys. 2003, 118 (12), 5607-5612.
232. Thomas, A.; Flavell, W.; Mallick, A.; Kumarasinghe, A.; Tsoutsou, D.; Khan, N.; Chatwin, C.;
Rayner, S.; Smith, G.; Stockbauer, R., Comparison of the electronic structure of anatase and
rutile TiO2 single-crystal surfaces using resonant photoemission and X-ray absorption
spectroscopy. Phys. Rev. B 2007, 75 (3), 035105.
233. Mosquera, A. A.; Endrino, J. L.; Albella, J. M., XANES observations of the inhibition and
promotion of anatase and rutile phases in silver containing films. J. Anal. At. Spectrom. 2014,
29 (4), 736-742.
234. Ruus, R.; Kikas, A.; Saar, A.; Ausmees, A.; Nommiste, E.; Aarik, J.; Aidla, A.; Uustare, T.;
Martinson, I., Ti 2p and O 1s X-ray absorption of TiO2 polymorphs. Solid State Commun. 1997,
104 (4), 199-203.
235. Tossell, J.; Vaughan, D.; Johnson, K., Electronic-Structure of Rutile, Wustite, and Hematite
from Molecular-Orbital Calculations. Am. Mineral. 1974, 59 (3-4), 319-334.
236. Debye, P.; Hückel, E., De la theorie des electrolytes. L'abaissement du point de congelation et
phenomenes associes. Physikalische Zeitschrift 1923, 24 (9), 185-206.
237. Kurahashi, N.; Karashima, S.; Tang, Y.; Horio, T.; Abulimiti, B.; Suzuki, Y.-I.; Ogi, Y.; Oura,
M.; Suzuki, T., Photoelectron spectroscopy of aqueous solutions: Streaming potentials of NaX
(X= Cl, Br, and I) solutions and electron binding energies of liquid water and X−. J.Chem. Phys.
2014, 140 (17), 174506.
238. Moustakas, N.; Kontos, A.; Likodimos, V.; Katsaros, F.; Boukos, N.; Tsoutsou, D.; Dimoulas,
A.; Romanos, G. E.; Dionysiou, D.; Falaras, P., Inorganic–organic core–shell titania
nanoparticles for efficient visible light activated photocatalysis. Appl. Catal., B 2013, 130, 14-
24.
141
239. Sato, S.; White, J., Photodecomposition of water over Pt/TiO2 catalysts. Chem. Phys. Lett. 1980,
72 (1), 83-86.
240. Serpone, N.; Lawless, D.; Disdier, J.; Herrmann, J.-M., Spectroscopic, photoconductivity, and
photocatalytic studies of TiO2 colloids: naked and with the lattice doped with Cr3+, Fe3+, and
V5+ cations. Langmuir 1994, 10 (3), 643-652.
241. Di Paola, A.; Bellardita, M.; Palmisano, L., Brookite, the least known TiO2 photocatalyst.
Catalysts 2013, 3 (1), 36-73.
242. Grätzel, M.; Rotzinger, F. P., The influence of the crystal lattice structure on the conduction
band energy of oxides of titanium (IV). Chem. Phys. Lett. 1985, 118 (5), 474-477.
243. Ola, O.; Maroto-Valer, M. M., Review of material design and reactor engineering on TiO2
photocatalysis for CO2 reduction. Journal of Photochemistry and Photobiology C:
Photochemistry Reviews 2015, 24, 16-42.
244. Helmholtz, H. v., Ueber einige Gesetze der Vertheilung elektrischer Ströme in körperlichen
Leitern, mit Anwendung auf die thierisch‐elektrischen Versuche (Schluss.). Annalen der Physik
1853, 165 (7), 353-377.
245. Chapman, D. L., LI. A contribution to the theory of electrocapillarity. The London, Edinburgh,
and Dublin philosophical magazine and journal of science 1913, 25 (148), 475-481.
246. Gouy, M., Sur la constitution de la charge électrique à la surface d'un électrolyte. J. Phys. Theor.
Appl. 1910, 9 (1), 457-468.
247. Stern, O., The theory of the electrolytic double-layer. Z. Elektrochem 1924, 30 (508), 1014-
1020.
248. Polte, J., Fundamental growth principles of colloidal metal nanoparticles–a new perspective.
CrystEngComm 2015, 17 (36), 6809-6830.
249. Guo, D.; Xie, G.; Luo, J., Mechanical properties of nanoparticles: basics and applications. J.
Phys. D: Appl. Phys. 2013, 47 (1), 013001.
250. Elimelech, M.; Gregory, J.; Jia, X., Particle deposition and aggregation: measurement,
modelling and simulation. Butterworth-Heinemann: 2013.
251. Zhao, Z.; Li, Z.; Zou, Z., Structure and properties of water on the anatase TiO2 (101) surface:
from single-molecule adsorption to interface formation. J. Phys. Chem. C 2012, 116 (20),
11054-11061.
252. Fenter, P.; Cheng, L.; Rihs, S.; Machesky, M.; Bedzyk, M. J.; Sturchio, N., Electrical double-
layer structure at the rutile–water interface as observed in situ with small-period X-ray standing
waves. J. Colloid Interface Sci. 2000, 225 (1), 154-165.
253. Předota, M.; Bandura, A.; Cummings, P.; Kubicki, J.; Wesolowski, D.; Chialvo, A.; Machesky,
M., Electric double layer at the rutile (110) surface. 1. Structure of surfaces and interfacial water
from molecular dynamics by use of ab initio potentials. J. Phys. Chem. B 2004, 108 (32), 12049-
12060.

142
254. Cheng, J.; Sprik, M., The electric double layer at a rutile TiO2 water interface modelled using
density functional theory based molecular dynamics simulation. J. Phys.: Condens. Matter
2014, 26 (24), 244108.
255. Favaro, M.; Jeong, B.; Ross, P. N.; Yano, J.; Hussain, Z.; Liu, Z.; Crumlin, E. J., Unravelling
the electrochemical double layer by direct probing of the solid/liquid interface. Nature Comm.
2016, 7, 12695.
256. Rubasinghege, G.; Grassian, V. H., Role(s) of adsorbed water in the surface chemistry of
environmental interfaces. Chem. Commun. (Cambridge, U. K.) 2013, 49 (30), 3071-3094.
257. Ali, H.; Seidel, R.; Bergmann, A.; Winter, B., Electronic structure of aqueous-phase anatase
titanium dioxide nanoparticles probed by liquid jet photoelectron spectroscopy. Journal of
Materials Chemistry A 2019, 7, 6665-6675.
258. Helmholtz-zentrum-Berlin, LiXEdrom: High Energy Resolution RIXS Station dedicated to
Liquid Investigation at BESSY II. Journal of large-scale research facilities JLSRF 2016, 2, 80.
259. Jordan, I.; Redondo, A. B.; Brown, M. A.; Fodor, D.; Staniuk, M.; Kleibert, A.; Wörner, H. J.;
Giorgi, J. B.; van Bokhoven, J. A., Non-uniform spatial distribution of tin oxide (SnO2)
nanoparticles at the air–water interface. Chem. Commun. (Cambridge, U. K.) 2014, 50 (32),
4242-4244.
260. Emerson, K.; Russo, R. C.; Lund, R. E.; Thurston, R. V., Aqueous ammonia equilibrium
calculations: effect of pH and temperature. Journal of the Fisheries Board of Canada 1975, 32
(12), 2379-2383.
261. Bates, R. G.; Pinching, G., Acidic dissociation constant of ammonium ion at 0 to 50 C, and the
base strength of ammonia. Journal of Research of the National Bureau of Standards 1949, 42,
419-430.
262. Weinhardt, L.; Ertan, E.; Iannuzzi, M.; Weigand, M.; Fuchs, O.; Bär, M.; Blum, M.; Denlinger,
J. D.; Yang, W.; Umbach, E., Probing hydrogen bonding orbitals: resonant inelastic soft X-ray
scattering of aqueous NH3. Phys. Chem. Chem. Phys. 2015, 17 (40), 27145-27153.
263. Perry, R.; Chilton, C., Chemical Engineers' Handbook. Section 3. McGraw Hill. New York
1973, 1, 973.
264. Unger, I.; Hollas, D.; Seidel, R.; Thürmer, S.; Aziz, E. F.; Slavicek, P.; Winter, B., Control of
X-ray induced electron and nuclear dynamics in ammonia and glycine aqueous solution via
hydrogen bonding. J. Phys. Chem. B 2015, 119 (33), 10750-10759.
265. Ogunremi, T.; Cutler, J.; Christensen, C.; Sparks, C. In X-ray Absorption Spectroscopic analysis
of raw and processed hog manure, Soils and Crops Workshop, 2007.
266. Leinweber, P.; Kruse, J.; Walley, F. L.; Gillespie, A.; Eckhardt, K.-U.; Blyth, R. I.; Regier, T.,
Nitrogen K-edge XANES–an overview of reference compounds used to identify
unknown'organic nitrogen in environmental samples. Journal of synchrotron radiation 2007,
14 (6), 500-511.

143
267. Sidey, V., On the effective ionic radii for ammonium. Acta Crystallographica Section B:
Structural Science, Crystal Engineering and Materials 2016, 72 (4), 626-633.
268. Brown, M. A.; Faubel, M.; Winter, B., X-ray photo-and resonant Auger-electron spectroscopy
studies of liquid water and aqueous solutions. Annual Reports Section" C"(Physical Chemistry)
2009, 105, 174-212.
269. Winter, B.; Faubel, M.; Vácha, R.; Jungwirth, P., Behavior of hydroxide at the water/vapor
interface. Chem. Phys. Lett. 2009, 474 (4-6), 241-247.
270. Tuckerman, M. E.; Chandra, A.; Marx, D., Structure and dynamics of OH-(aq). Acc. Chem. Res.
2006, 39 (2), 151-158.
271. Blum, M. Electronic and Chemical Properties of Liquids and Solutions. Universität Würzburg,
2009.
272. Tuckerman, M.; Laasonen, K.; Sprik, M.; Parrinello, M., Ab initio molecular dynamics
simulation of the solvation and transport of hydronium and hydroxyl ions in water. J.Chem.
Phys. 1995, 103 (1), 150-161.
273. Asthagiri, D.; Pratt, L. R.; Kress, J. D.; Gomez, M. A., Hydration and mobility of HO-(aq).
Proceedings of the National Academy of Sciences 2004, 101 (19), 7229-7233.
274. Chen, B.; Park, J. M.; Ivanov, I.; Tabacchi, G.; Klein, M. L.; Parrinello, M., First-principles
study of aqueous hydroxide solutions. J. Am. Chem. Soc. 2002, 124 (29), 8534-8535.
275. Zhu, L.; Gu, Q.; Sun, P.; Chen, W.; Wang, X.; Xue, G., Characterization of the mobility and
reactivity of water molecules on TiO2 nanoparticles by 1H solid-state nuclear magnetic
resonance. ACS Appl. Mater. Interfaces 2013, 5 (20), 10352-10356.
276. Zaleska-Medynska, A., Metal Oxide-based Photocatalysis: Fundamentals and Prospects for
Application. Elsevier: 2018.
277. Minggu, L. J.; Daud, W. R. W.; Kassim, M. B., An overview of photocells and photoreactors
for photoelectrochemical water splitting. Int. J. Hydrogen Energy 2010, 35 (11), 5233-5244.
278. Smith, A. M.; Lee, A. A.; Perkin, S., The electrostatic screening length in concentrated
electrolytes increases with concentration. J. Phys. Chem. Lett. 2016, 7 (12), 2157-2163.
279. Ali, H.; Golnak, R.; Seidel, R.; Winter, B.; Xiao, J., In-Situ X-ray Spectroscopy of the Electric
Double Layer around TiO2 Nanoparticles Dispersed in Aqueous Solution: Implications for H2
Generation. ACS Applied Nano Materials 2020, 3 (1), 264-273.
280. Wang, Q.; Jiao, L.; Du, H.; Wang, Y.; Yuan, H., Fe3O4 nanoparticles grown on graphene as
advanced electrode materials for supercapacitors. J. Power Sources 2014, 245, 101-106.
281. Nithya, V.; Arul, N. S., Progress and development of Fe3O4 electrodes for supercapacitors.
Journal of Materials Chemistry A 2016, 4 (28), 10767-10778.
282. Barclay, J., Use of a ferrofluid as the heat‐exchange fluid in a magnetic refrigerator. J. Appl.
Phys. 1982, 53 (4), 2887-2894.
144
283. Kim, E. H.; Lee, H. S.; Kwak, B. K.; Kim, B.-K., Synthesis of ferrofluid with magnetic
nanoparticles by sonochemical method for MRI contrast agent. J. Magn. Magn. Mater. 2005,
289, 328-330.
284. Giustini, A. J.; Petryk, A. A.; Cassim, S. M.; Tate, J. A.; Baker, I.; Hoopes, P. J., Magnetic
nanoparticle hyperthermia in cancer treatment. Nano Life 2010, 1 (01n02), 17-32.
285. Dilnawaz, F.; Singh, A.; Mohanty, C.; Sahoo, S. K., Dual drug loaded superparamagnetic iron
oxide nanoparticles for targeted cancer therapy. Biomaterials 2010, 31 (13), 3694-3706.
286. Néel, M. L. In Propriétés magnétiques des ferrites; ferrimagnétisme et antiferromagnétisme,
Annales de Physique, 1948; pp 137-198.
287. Alibeigi, S.; Vaezi, M. R., Phase transformation of iron oxide nanoparticles by varying the
molar ratio of Fe2+: Fe3+. Chemical Engineering & Technology: Industrial Chemistry‐Plant
Equipment‐Process Engineering‐Biotechnology 2008, 31 (11), 1591-1596.
288. Gorski, C. A.; Handler, R. M.; Beard, B. L.; Pasakarnis, T.; Johnson, C. M.; Scherer, M. M., Fe
atom exchange between aqueous Fe2+ and magnetite. Environ. Sci. Technol. 2012, 46 (22),
12399-12407.
289. Fock, J.; Bogart, L. K.; González-Alonso, D.; Espeso, J. I.; Hansen, M. F.; Varón, M.; Frandsen,
C.; Pankhurst, Q. A., On the ‘centre of gravity’method for measuring the composition of
magnetite/maghemite mixtures, or the stoichiometry of magnetite-maghemite solid solutions,
via 57Fe Mössbauer spectroscopy. J. Phys. D: Appl. Phys. 2017, 50 (26), 265005.
290. Sassi, M.; Pearce, C. I.; Bagus, P. S.; Arenholz, E.; Rosso, K. M., First-Principles Fe L2,3 -Edge
and O K-Edge XANES and XMCD Spectra for Iron Oxides. J. Phys. Chem. A 2017, 121 (40),
7613-7618.
291. Stookey, L. L., Ferrozinea—A new spectrophotometric reagent for iron. Anal. Chem. 1970, 42
(7), 779-781.
292. Elsaidi, S. K.; Sinnwell, M. A.; Banerjee, D.; Devaraj, A.; Kukkadapu, R. K.; Droubay, T. C.;
Nie, Z.; Kovarik, L.; Vijayakumar, M.; Manandhar, S.; Nandasiri, M.; McGrail, B. P.;
Thallapally, P. K., Reduced Magnetism in Core–Shell Magnetite@MOF Composites. Nano
Lett. 2017, 17 (11), 6968-6973.
293. Abanades, S.; Legal, A.; Cordier, A.; Peraudeau, G.; Flamant, G.; Julbe, A., Investigation of
reactive cerium-based oxides for H2 production by thermochemical two-step water-splitting. J.
Mater. Sci. 2010, 45 (15), 4163-4173.
294. El Khalifi, M.; Picaud, F.; Bizi, M., Electronic and optical properties of CeO2 from first
principles calculations. Analytical Methods 2016, 8 (25), 5045-5052.
295. Montini, T.; Melchionna, M.; Monai, M.; Fornasiero, P., Fundamentals and catalytic
applications of CeO2-based materials. Chem. Rev. (Washington, DC, U. S.) 2016, 116 (10),
5987-6041.
145
296. Abanades, S.; Flamant, G., Thermochemical hydrogen production from a two-step solar-driven
water-splitting cycle based on cerium oxides. Solar energy 2006, 80 (12), 1611-1623.
297. Mullins, D. R., The surface chemistry of cerium oxide. Surf. Sci. Rep. 2015, 70 (1), 42-85.
298. Fernández-Torre, D.; Kośmider, K.; Carrasco, J.; Ganduglia-Pirovano, M. V.; Pérez, R., Insight
into the Adsorption of Water on the Clean CeO2(111) Surface with van der Waals and Hybrid
Density Functionals. J. Phys. Chem. C 2012, 116 (25), 13584-13593.
299. Fronzi, M.; Piccinin, S.; Delley, B.; Traversa, E.; Stampfl, C., Water adsorption on the
stoichiometric and reduced CeO2 (111) surface: a first-principles investigation. Phys. Chem.
Chem. Phys. 2009, 11 (40), 9188-9199.
300. Han, Z. K.; Gao, Y., Water Adsorption and Dissociation on Ceria‐Supported Single‐Atom
Catalysts: A First‐Principles DFT+ U Investigation. Chemistry–A European Journal 2016, 22
(6), 2092-2099.
301. Henderson, M. A.; Perkins, C.; Engelhard, M. H.; Thevuthasan, S.; Peden, C. H., Redox
properties of water on the oxidized and reduced surfaces of CeO2 (111). Surf. Sci. 2003, 526 (1-
2), 1-18.
302. Kropp, T.; Paier, J.; Sauer, J., Interactions of Water with the (111) and (100) Surfaces of Ceria.
J. Phys. Chem. C 2017, 121 (39), 21571-21578.
303. Maslakov, K. I.; Teterin, Y. A.; Ryzhkov, M. V.; Popel, A. J.; Teterin, A. Y.; Ivanov, K. E.;
Kalmykov, S. N.; Petrov, V. G.; Petrov, P. K.; Farnan, I., The electronic structure and the nature
of the chemical bond in CeO2. Phys. Chem. Chem. Phys. 2018, 20 (23), 16167-16175.
304. Ablett, J.; Prieur, D.; Céolin, D.; Lassalle-Kaiser, B.; Lebert, B.; Sauvage, M.; Moreno, T.; Bac,
S.; Balédent, V.; Ovono, A., The GALAXIES inelastic hard X-ray scattering end-station at
Synchrotron SOLEIL. Journal of synchrotron radiation 2019, 26 (1).
305. Shinotsuka, H.; Da, B.; Tanuma, S.; Yoshikawa, H.; Powell, C.; Penn, D. R., Calculations of
electron inelastic mean free paths. XI. Data for liquid water for energies from 50 eV to 30 keV.
Surf. Interface Anal. 2017, 49 (4), 238-252.
306. Wang, M.; Pyeon, M.; Gönüllü, Y.; Kaouk, A.; Shen, S.; Guo, L.; Mathur, S., Constructing
Fe2O3/TiO2 core–shell photoelectrodes for efficient photoelectrochemical water splitting.
Nanoscale 2015, 7 (22), 10094-10100.
307. Hsu, Y.-K.; Chen, Y.-C.; Lin, Y.-G., Novel ZnO/Fe2O3 core–shell nanowires for
photoelectrochemical water splitting. ACS Appl. Mater. Interfaces 2015, 7 (25), 14157-14162.

146

147
Acknowledgements
My PhD has been an amazing experience on both the scientific and social level. Many people
have contributed to this experience, and I am very grateful to have met them in this period of my life
and for their impact in this work. No words can express how much I am thankful to all of you.
First of all, Prof. Dr. Gerard J. M. Meijer, thank you for being my supervisor and allowing me
to work in this awesome molecular physics department; I really like this place with its very motivated
and friendly environment. You are always a strong supporter and advisor, who allowed me to
individually conduct my projects and related research with large degree of freedom and trust. I learnt
so much from you especially on the academic level. I also would like to thank Prof. Dr. John C.
Hemminger, my second supervisor, for his kind support and motivation.
Foremost I thank Dr. Bernd Winter, my PhD mentor from day one, the expert in liquid-jet
photoelectron spectroscopy. I still remember our first meeting to discuss the nanoparticles project and
its challenges. Thank you for all your support, scientific knowledge, guidance and discussions. These
are the main reasons I have become “The Queen of nanoparticles ” as you usually call me. I could not
have imagined having a better advisor and mentor for my PhD study.
My sincere thanks also go to Dr. Robert Seidel. You are always more than a mentor. I appreciate
so much your continuous help and advice through the whole period of my PhD. You are an excellent
teacher, who gave me my very first tour in the BESSY hall and all the support during my experiments
and research. Thanks for your highly motivated, helpful and funny personality. “Correct! Life is boring
when it is so serious”. “One last thing”, thanks for introducing me to all the chocolate kinds and brands
around the world, even the Japanese green KitKat.
I would also like to express my special appreciation and thanks to Dr. Ronny Golnak for his
support and for sharing with me many beamtime shifts on the Lixedrom as well as the SOL3 PES
setups. It was always trustworthy to talk to you and getting your advice. I am also very grateful to Dr.
Jie Xiao for the long discussions about the photon-emission measurements, as well as for his patience
and guidance. It was a pleasure to collaborate with you on the TiO2 project.
Also, I would like to thank again Dr. Robert Seidel, Dr. Jie Xiao, Dr. Uwe Hergenhahn, Dr.
Bernd Winter and Prof. Dr. Gerard Meijer for their corrections, comments and reviews of this
dissertation.
I am very grateful for many colleagues who shared with me many fruitful beamtime shifts
either during conducting my PhD project or other research projects: Marvin N. Pohl, Dr. Arno
Bergmann, Dr. Anne Stephansen, Sebastian Malerz, Dr. Hanns Christian Schewe, Dr. Florian Trinter,
Garlef Wartner and Dennis Hein. I am also thankful to many colleagues who became good friends:

148
Karen Mudryk, Dawei Cao, and Nicole Walter. Also to all my colleagues in the molecular physics
department, FHI; I thank you for the very friendly working environment. I enjoyed a lot with all of
you organizing and celebrating the “Sommer Fest 2018”, “Lange Nacht der Wissenschaft 2019” as
well as many summer grills and ceremonies.
A big thank to my home university colleagues and friends especially, Haiam Adel and Nadia
ElKady for all their support; also, the Egyptian Ministry of Higher Education and Scientific Research
as well as Ain Shams University for my PhD grant.
Last, I am very grateful to the most precious people in my life, my family. Thanks for all the
unconditional support.
149
Short Curriculum Vitae
Hebatallah Ali
2009- Now
Assistant Lecturer of Spectroscopic Physics,
Ain Shams University, Cairo, Egypt
Education
2004-2008
Ain Shams University, Cairo, Egypt
B.Sc. of Physics and Pure Mathematics
(with general grade “Very Good”, in the 1st rank)
Honored by the excellence award for Bachelor graduate from
the “Egyptian Association of Scientific Professions”
2008-2009
Ain Shams University, Cairo, Egypt
Preliminary year of Master Courses
(with general grade “Excellent”, in the 1st rank)
2010-2013
Ain Shams University and Egyptian Atomic Energy Authority,
Cairo, Egypt
M.Sc. of Spectroscopic Physics
Thesis title: “Elemental analysis inductively coupled plasma
mass spectrometry and other spectroscopic methods of Beryl”
Honored by the excellence award for young scientists from
“The Egyptian Society of Nuclear Sciences and Applications”
2016-2017
Freie Universität Berlin and Helmholtz-Zentrum Berlin,
Germany
PhD Candidate: “Liquid-Jet Photoemission Studies of the
Interface between Metal-Oxide Nanoparticles and Aqueous
Solution”
Mentors: Dr. Bernd Winter and Dr. Robert Seidel,
in the institute of Methods for Material Development under the
Supervision of Prof. Dr. Emad F. Aziz.
Funded by a Scholarship from the Egyptian Ministry of Higher
Education and by Ain Shams University

150
2017-2019
Freie Universität Berlin and Fritz-Haber-Institut der Max-
Planck-Gesellschaft, Berlin, Germany
Continued PhD studies on: “Liquid-Jet Photoemission Studies
of the Interface between Metal-Oxide Nanoparticles and
Aqueous Solution”
Mentors: Dr. Bernd Winter and Dr. Robert Seidel
Supervisors: Prof. Dr. Gerard J. M. Meijer and Prof. Dr. John
C. Hemminger.
Funded by a Scholarship from the Egyptian Ministry of Higher
Education and by Ain Shams University

151
Publications
Publications covered in this thesis:
• Molecular species forming at the α-Fe2O3 nanoparticle–aqueous solution interface
Hebatallah Ali, Robert Seidel, Marvin N. Pohl and Bernd Winter
Chemical Science 2018, 9, 4511-4523, DOI: 10.1039/C7SC05156E
• Electronic Structure of Aqueous-Phase Anatase Titanium Dioxide Nanoparticles Probed
by Liquid Jet Photoelectron Spectroscopy
Hebatallah Ali, Robert Seidel, Arno Bergmann and Bernd Winter
Journal of Materials Chemistry A 2019, 7, 6665-6675, DOI: 10.1039/C8TA09414D
• In-situ probe of the electric double layer around the TiO2 nanoparticles dispersed in
aqueous solution
Hebatallah Ali, Ronny Golnak, Robert Seidel, Bernd Winter, and Jie Xiao
ACS Applied Nano Materials 2020, 3 (1), 264-273, DOI: 10.1021/acsanm.9b01939
Publications not covered in this thesis:
• Advances in Liquid Phase Soft-X-ray Photoemission Spectroscopy: A New Experimental
Setup at BESSY II
Robert Seidel, Marvin N. Pohl, Hebatallah Ali, Bernd Winter, and Emad F. Aziz
Review of Scientific Instruments 2017, 88 (7), 073107, DOI: 10.1063/1.4990797
• Do water's electrons care about electrolytes?
Marvin N. Pohl, Eva Muchová, Robert Seidel, Hebatallah Ali, Štěpán Sršeň, Iain Wilkinson,
Bernd Winter and Petr Slavíček
Chemical Science 2019, 10, 848-865, DOI: 10.1039/C8SC03381A
• Valence and Core-Level X-ray Photoelectron Spectroscopy of a Liquid Ammonia
Microjet
Tillmann Buttersack, Philip E. Mason, Ryan S. McMullen, Tomas Martinek, Krystof Brezina,
Dennis Hein, Hebatallah Ali, Claudia Kolbeck, Christian Schewe, Sebastian Malerz, Bernd
Winter, Robert Seidel, Ondrej Marsalek, Pavel Jungwirth, and Stephen E. Bradforth
Journal of the American Chemical Society 2019, 141 (5), 1838–1841,
DOI:10.1021/jacs.8b10942

152

153
Selbstständigkeitserklärung
Hiermit erkläre ich, dass ich die vorliegende Dissertation selbstständig und nur mit Hilfe der
angegebenen Quellen angefertigt habe. Ich versichere, dass diese Arbeit nicht in einem
vorhergehenden Promotionsverfahren angenommen wurde oder als ungenugend beurteilt wurde.
Hebatallah Ali
Berlin, den 1.10.2019