Embed Size (px)
Citation preview
Institut für Organischen Landbau
Occasional direct-seeding of grain legumes
in Organic Agriculture in Germany and Brazilfertilisation with P and S
&weed control with natural herbicides
Dissertationzur Erlangung des Grades
Doktor der Agrarwissenscha�en
(Dr. agr.)
der Landwirtscha�lichen Fakultät
der Rheinischen-Friedrich-Wilhelms-Universität Bonn
von
Michael Giepenaus
Mülheim a.d. Ruhr
Bonn 2018
Gutachter:
Prof. Dr. Ulrich Köpke
Prof. Dr. Heinrich Scherer
Prof. Dr. Matthias Becker
Tag der mündlichen Prüfung: 20.11.2017
Angefertigt mit Genehmigung der Landwirtschaftlichen Fakultät der Universität Bonn.

AcknowledgementsFirst I would like to thank my supervisor Prof. Dr. Köpke for providing me with an interesting andchallenging research topic.
I am particularly grateful to the IAPAR research institute in Paraná state, Brazil, for inviting me as aguest researcher. The institute provided me with excellent infrastructure, working materials, and mostimportantly, competent and friendly sta� to realise my experiments. I would like to o�er my specialthanks to my friends Dr. Francisco Skora Neto and Antonio Campos for our dedicated and fruitfulresearch partnership at IAPAR Ponta Grossa and to Telma Passini for helping me enormously with theorganisation of my works at IAPAR Londrina. The two years of research in Brazil would not have beenpossible without the generous and highly appreciated funding by DAAD.
Furthermore, I would like to thank all sta� of the IOL laboratory for the hard work of analysing thehuge amount of samples collected in numerous �eld trials in Germany and Brazil. Also I am grateful toIOL technicians and student assistants for the help in setting up, conducting and evaluating the �eldtrials.
Thank you Yao for always cheering me up and giving me good advice during all this hard time. Muchasgracias Carmen for receiving me in Spain and enabling me to �nish my PhD in a positive atmospherewith never ending sunshine. Last but not least I thank my parents for always supporting me with mystudies and my PhD.
Für dich Papa.
3
AbstractThe aim of this work was to test strategies, which improve nutrient supply and weed control in occasionaldirect-seeded (DS) grain legumes in Organic Agriculture. The e�ect of intra-row fertilisation of rockphosphate (RP) and several sulphur fertilisers on crop growth, yield and nutrient uptake was studied in�eld trials with faba bean (Vicia faba) in Germany (two sites in NRW, 2011 and 2012) and with soybean(Glycine max) in Brazil (three sites in Paraná, 2012 and 2013). The second part of this work investigatedweed control with natural herbicides (NH). Therefore, eighteen screening trials in the �eld and �ve �eldtrials with soybean and common bean (Phaseolus vulgaris) were conducted in Brazil. Additionally, thee�ect of di�erent amounts of oats straw residue on faba bean and weed shoot growth were examinedas a second trial factor within the 2012 fertiliser trials in Germany.
Soils at all fertiliser trials in Germany exhibited su�cient P-contents (LUFA C) and the intra-rowfertilisation of RP (50 kg ha−1 P) did not have any e�ect on faba bean growth and P-uptake, neither alonenor in combination with elemental sulphur, which by way of in situ acid formation can enhance RPsolubility. On the contrary, the sulphur fertilisers potassium sulphate, gypsum and elemental sulphur didresult in a markedly increased S-uptake in both trial years, while faba bean growth and yield were onlya�ected positively and in part signi�cantly in the second trial year. The clear e�ect was assumed to bedue to low soil sulphate contents during initial crop development, caused by low sulphate adsorption andhence high leaching rates during winter and also due to low soil organic matter (SOM) mineralisationrates under DS management. However in Brazil, soybean did not react to S-fertilisation with increasedcrop growth, yield or S-uptake in any trial. The su�cient S-supply was explained with the high contentsof adsorbed sulphate in soil and high SOM mineralisation rates under tropical climate. P-fertiliserapplication was also ine�ective at most sites due to su�cient to high soil P-contents. Only on a �eldwith low P-contents at site Ponta Grossa P-fertilisation had a positive e�ect on P-uptake, crop growthand yield. In both years this positive e�ect was increased by simultaneous application of elementalsulphur, which presumably increased solubility of RP.
In screening trials with natural herbicides pine oil and acidic acid were found to be the most potentactive ingredients with a cell membrane disrupting (CMD) e�ect. While the sole spray application of highamounts of NaCl resulted in relatively weak plant damage, it was found that the combination of CMDand NaCl resulted in a strongly enhanced weed control. Additionally, a meristem damaging systemice�ect of NaCl was identi�ed, which was particularly strong for dicot weed species. In consequence,CMD amounts and hence application costs could be reduced drastically. Furthermore, it was determinedrepeatedly that emulsi�ers in�uence formulation e�cacy strongly at the rates commonly applied in NHand therefore these inert ingredients have to be considered as active ones in NH formulations. In theDS soybean �eld trial in Londrina it was determined that at a �xed total amount of AI (90 L ha−1 pineoil or limonene and 90 kg ha−1 NaCl) two concentrated applications resulted in a higher weed controlthan the three diluted ones. Weed control in this trial was not satisfactory, though, and crop growth aswell as yield were markedly reduced compared to the clean control treatment. In the DS soybean trialin Ponta Grossa 50 L ha−1 pine oil or limonene and 50 kg ha−1 NaCl were applied once, twice and threetimes. Even after three applications weed drymass remained relatively high compared to the weedycontrol. Nevertheless, soybean shoot drymass was not a�ected strongly by weed infestation and withthree applications grain yield was close to the clean control. Nevertheless, results in this trial werein�uenced by crop damage due to contact with NH spray, because no working protective screen wasavailable during application. In two �eld trials with conventionally tilled common bean, weed controlwas satisfactory in all spray treatments. Crop growth and yield were comparable to those of the weedfree control.
4
KurzzusammenfassungDie vorliegende Arbeit erforschte Strategien zur Verbesserung der Nährsto�versorgung und der Un-krautregulierung bei temporärer Direktsaat (DS) von Körnerleguminosen im Ökologischen Landbau. InFeldversuchen wurde die Wirkung der Unterfußdüngung von Rohphosphat und verschiedenen Schwe-feldüngern auf P�anzenwachstum, Ertrag und die Nährsto�aufnahme von Ackerbohne (Vicia faba) inDeutschland (zwei Standorte, 2011 und 2012) und von Sojabohne (Glycine max) in Brasilien (drei Stan-dorte in Paraná, 2012 und 2013) untersucht. Der zweite Teil der Arbeit behandelte die Unkrautregulierungmit natürlichen Herbiziden (NH). Hierzu wurden achtzehn Screeningversuche im Feld und fünf Feld-versuchen mit Soja- und Gartenbohne (Phaseolus vulgaris) in Brasilien realisiert. Weiterhin wurde derEin�uss verschiedener Mulchmengen von Haferstroh auf das Ackerbohnen- und das Unkrautwachstumuntersucht.
In den Düngungsversuchen in Deutschland waren die P-Bodengehalte ausreichend (LUFA C), undes wurde kein Ein�uss der Rohphosphat Unterfußdüngung (50 kg ha−1 P) auf das Wachstum und dieP-Aufnahme der Ackerbohne gefunden, auch nicht bei gemeinsamer Gabe mit elementarem Schwefel(40 kg ha−1 S), der die Löslichkeit des Rohphoshates durch in situ Schwefelsäurebildung im Boden er-höhen kann. Die Schwefeldünger Kaliumsulfat, Gips, und elementarer Schwefel (alle 40 kg ha−1 S) führtenin beiden Versuchsjahren zu signi�kant erhöhter S-Aufnahme in Sproß und Korn. Im zweiten Versuchs-jahr wurde auch das Ackerbohnenwachstum und die Kornernte positiv und teilweise signi�kant beein-�usst. Die deutliche Düngerwirkung wurde darauf zurückgeführt, dass an beiden Versuchsstandortendie Sulfatgehalte zu Vegetationsbeginn aufgrund starker Auswaschung im Winter gering waren, unddie Nachlieferung von Sulfat durch Mineralisierung der organischen Bodensubstanz unter Direktsaatnicht ausreichten. Die Sojabohne reagierte hingegen in keinem der Versuche mit erhöhter S-Aufnahmeoder gesteigertem P�anzenwachstum. Die ausreichende S-Versorgung wurde mit den hohen Mengensorbierten Sulfats im Boden und der schnellen S-Nachlieferung aus der organischen Bodensubstanzerklärt. Die P-Düngung war aufgrund ausreichender bis hoher Bodengehalte von P ebenfalls an fastallen Standorten wirkungslos. Nur auf einem Feld mit niedrigen P-Gehalten (Ponta Grossa) wirkte sichdie P-Düngung positiv auf P-Gehalte, P�anzenwachstum und Ertrag aus. Die Wirkung der P-Düngungauf die gleichen P�anzenparameter wurde durch Mischung mit elementarem Schwefel in beiden Ver-suchsjahren aufgrund dessen positiven Ein�usses auf die Löslichkeit von Rohphosphat verstärkt.
In Versuchen mit natürlichen Herbiziden (NH) wurden in Screeningversuchen Pinienöl und Es-sigsäure als e�ektivste Wirksto�e mit Cuticula und Zellmembran schädigender Wirkung (cell membranedisruptors, CMD) identi�ziert. Während die alleinige Applikation hoher Mengen von NaCl nur einerelativ geringe Wirkung zeigte, wurde festgestellt, dass dessen Kombination mit CMD die Wirksamkeitpotenzierte und zusätzlich Meristeme durch eine systemische Wirkung stark geschädigt wurden, ins-besondere bei dikotylen Unkräutern. Die Menge von CMD und somit die Applikationskosten konntenin der Folge durch NaCl Beimischung deutlich reduziert werden. Es konnte wiederholt nachgewiesenwerden, dass die häu�g hohen Emulgatormengen in NH eine eigene herbizide Wirkung aufweisen undfolglich Emulgatoren nicht als inerte Inhaltssto�e von NH Formulierungen gelten können. Im Feld-versuch mit DS Sojabohne in Londrina ergab bei gleicher Gesamtmenge Wirksto� (90 L ha−1 Limonenoder Pinienöl und 90 kg ha−1 NaCl) die konzentrierte zweimalige Anwendung eine bessere Unkrautreg-ulierung als drei verdünnte Anwendungen. Die Unkrautregulierung war jedoch nicht ausreichend undP�anzenwachstum und Ertrag waren deutlich geringer als in der unkrautfreihen Kontrolle. Im DS So-jabohnenversuch in Ponta Grossa wurden 50 L ha−1 Limonen oder Pinienöl sowie 50 kg ha−1 NaCl ein,zwei und drei Mal appliziert. Obwohl nach drei Applikation die Unkrauttrockenmasse noch relativ hochim Vergleich zur verunkrauteten Kontrolle war, war die Sproßtrockenmasse der Sojabohne nicht starknegativ beein�usst, und die Kornernte war mit drei Applikationen sogar vergleichbar mit der unkraut-freien Kontrolle. Die Versuchsergebnisse waren aber insbesondere bei wiederholter Applikation durchKulturschäden beein�usst, da bei der Applikation der NH kein zuverlässiger Sprühschutz vorhandenwar. In Feldversuchen mit Gartenbohne (konventionelle Bodenbearbeitung) war die Unkrautregulierungin allen Behandlungen ausreichend, und sowohl P�anzenwachstum als auch Erträge waren vergleichbarmit der unkrautfreien Kontrolle.
5
Contents
1 Introduction 131.1 Nutrient supply in direct-seeding . . . . . . . . . . . . . . . . . . . . . . . . . . . . . . . . . 14
1.1.1 Phosphorus de�ciency . . . . . . . . . . . . . . . . . . . . . . . . . . . . . . . . . . . 151.1.2 Sulphur de�ciency . . . . . . . . . . . . . . . . . . . . . . . . . . . . . . . . . . . . . 161.1.3 Research approach and hypotheses . . . . . . . . . . . . . . . . . . . . . . . . . . . 17
1.2 Weed control with mulch and natural herbicides in direct-seeding . . . . . . . . . . . . . 181.2.1 Mulch from harvest residues . . . . . . . . . . . . . . . . . . . . . . . . . . . . . . . 181.2.2 Natural herbicides . . . . . . . . . . . . . . . . . . . . . . . . . . . . . . . . . . . . . . 181.2.3 Research approach and hypotheses . . . . . . . . . . . . . . . . . . . . . . . . . . . 21
2 Materials and Methods 232.1 Trial sites . . . . . . . . . . . . . . . . . . . . . . . . . . . . . . . . . . . . . . . . . . . . . . . . 23
2.1.1 Germany . . . . . . . . . . . . . . . . . . . . . . . . . . . . . . . . . . . . . . . . . . . 232.1.2 Brazil . . . . . . . . . . . . . . . . . . . . . . . . . . . . . . . . . . . . . . . . . . . . . 24
2.2 Fertiliser trials (Germany and Brazil) . . . . . . . . . . . . . . . . . . . . . . . . . . . . . . . 272.2.1 Phosphorus and sulphur fertiliser trials (Germany and Brazil) . . . . . . . . . . . 272.2.2 Fertiliser and oats straw residue trials Wiesengut (Germany) . . . . . . . . . . . . 282.2.3 Evaluation dates . . . . . . . . . . . . . . . . . . . . . . . . . . . . . . . . . . . . . . . 29
2.3 Natural herbicide trials (Brazil) . . . . . . . . . . . . . . . . . . . . . . . . . . . . . . . . . . . 302.3.1 Natural herbicide formulation and application . . . . . . . . . . . . . . . . . . . . . 302.3.2 Design screening trials . . . . . . . . . . . . . . . . . . . . . . . . . . . . . . . . . . . 322.3.3 Design �eld trials . . . . . . . . . . . . . . . . . . . . . . . . . . . . . . . . . . . . . . 41
2.4 Evaluations . . . . . . . . . . . . . . . . . . . . . . . . . . . . . . . . . . . . . . . . . . . . . . . 452.4.1 Shoot dry mass, grain yield and thousand kernel weight . . . . . . . . . . . . . . . 462.4.2 Visual weed injury ratings and weed cover . . . . . . . . . . . . . . . . . . . . . . . 462.4.3 Soil sampling . . . . . . . . . . . . . . . . . . . . . . . . . . . . . . . . . . . . . . . . . 46
2.5 Laboratory analysis . . . . . . . . . . . . . . . . . . . . . . . . . . . . . . . . . . . . . . . . . . 472.6 Statistical analysis . . . . . . . . . . . . . . . . . . . . . . . . . . . . . . . . . . . . . . . . . . 48
3 Results A: faba bean trials (Germany) 493.1 Soil conditions . . . . . . . . . . . . . . . . . . . . . . . . . . . . . . . . . . . . . . . . . . . . . 493.2 Fertiliser e�ect on crop growth and grain yield . . . . . . . . . . . . . . . . . . . . . . . . . 493.3 Fertiliser e�ect on nutrient uptake and nutrient concentrations . . . . . . . . . . . . . . . 53
3.3.1 Phosphorus . . . . . . . . . . . . . . . . . . . . . . . . . . . . . . . . . . . . . . . . . . 533.3.2 Nitrogen . . . . . . . . . . . . . . . . . . . . . . . . . . . . . . . . . . . . . . . . . . . 533.3.3 Sulphur and N:S ratio . . . . . . . . . . . . . . . . . . . . . . . . . . . . . . . . . . . . 533.3.4 Potassium . . . . . . . . . . . . . . . . . . . . . . . . . . . . . . . . . . . . . . . . . . . 57
3.4 Summary results fertiliser application . . . . . . . . . . . . . . . . . . . . . . . . . . . . . . . 583.5 Oats straw residue . . . . . . . . . . . . . . . . . . . . . . . . . . . . . . . . . . . . . . . . . . 59
3.5.1 E�ects of straw residue mass on crop and weed growth . . . . . . . . . . . . . . . 593.5.2 E�ects of cutting height on crop and weed growth . . . . . . . . . . . . . . . . . . 60
3.6 Summary results oats straw residue . . . . . . . . . . . . . . . . . . . . . . . . . . . . . . . . 61
4 Discussion A: faba bean trials (Germany) 624.1 Phosphorus . . . . . . . . . . . . . . . . . . . . . . . . . . . . . . . . . . . . . . . . . . . . . . 62
4.1.1 Rock phosphate and elemental sulphur . . . . . . . . . . . . . . . . . . . . . . . . . 624.1.2 E�ects on sulphur availability . . . . . . . . . . . . . . . . . . . . . . . . . . . . . . . 63
4.2 Sulphur . . . . . . . . . . . . . . . . . . . . . . . . . . . . . . . . . . . . . . . . . . . . . . . . . 634.2.1 E�ect of sulphur fertiliser application . . . . . . . . . . . . . . . . . . . . . . . . . . 634.2.2 Experimental sites and susceptibility to S-de�ciency . . . . . . . . . . . . . . . . . 64
4.2.3 E�ect of sulphur fertiliser form . . . . . . . . . . . . . . . . . . . . . . . . . . . . . . 664.3 Oats straw residue . . . . . . . . . . . . . . . . . . . . . . . . . . . . . . . . . . . . . . . . . . 66
5 Results B: soybean fertiliser trials (Brazil) 685.1 Soil conditions . . . . . . . . . . . . . . . . . . . . . . . . . . . . . . . . . . . . . . . . . . . . . 685.2 Fertiliser e�ect on crop growth and grain yield . . . . . . . . . . . . . . . . . . . . . . . . . 68
5.2.1 Crop density and weed infestation . . . . . . . . . . . . . . . . . . . . . . . . . . . . 685.2.2 Site Londrina . . . . . . . . . . . . . . . . . . . . . . . . . . . . . . . . . . . . . . . . . 695.2.3 Site Ponta Grossa . . . . . . . . . . . . . . . . . . . . . . . . . . . . . . . . . . . . . . 715.2.4 Site Umuarama . . . . . . . . . . . . . . . . . . . . . . . . . . . . . . . . . . . . . . . . 71
5.3 Fertiliser e�ect on nutrient uptake and nutrient concentrations . . . . . . . . . . . . . . . 715.3.1 Phosphorus . . . . . . . . . . . . . . . . . . . . . . . . . . . . . . . . . . . . . . . . . . 725.3.2 Nitrogen . . . . . . . . . . . . . . . . . . . . . . . . . . . . . . . . . . . . . . . . . . . 725.3.3 Sulphur and N:S ratio . . . . . . . . . . . . . . . . . . . . . . . . . . . . . . . . . . . . 745.3.4 Potassium . . . . . . . . . . . . . . . . . . . . . . . . . . . . . . . . . . . . . . . . . . . 76
5.4 Summary results soybean fertiliser trials . . . . . . . . . . . . . . . . . . . . . . . . . . . . . 79
6 Discussion B: soybean trials (Brazil) 806.1 Phosphorus . . . . . . . . . . . . . . . . . . . . . . . . . . . . . . . . . . . . . . . . . . . . . . 80
6.1.1 Londrina (LO), Ponta Grossa (PG-High) and Umuarama (UM) . . . . . . . . . . . . 806.1.2 Ponta Grossa: Low P content site (PG-Low) . . . . . . . . . . . . . . . . . . . . . . . 80
6.2 Sulphur . . . . . . . . . . . . . . . . . . . . . . . . . . . . . . . . . . . . . . . . . . . . . . . . . 816.2.1 E�ect of sulphur fertiliser application . . . . . . . . . . . . . . . . . . . . . . . . . . 816.2.2 Experimental sites and susceptibility to S-de�ciency . . . . . . . . . . . . . . . . . 826.2.3 Balance of sulphur �uxes . . . . . . . . . . . . . . . . . . . . . . . . . . . . . . . . . 83
7 Results C: natural herbicide trials (Brazil) 857.1 Screening trials . . . . . . . . . . . . . . . . . . . . . . . . . . . . . . . . . . . . . . . . . . . . 85
7.1.1 Essential oils and acetic acid . . . . . . . . . . . . . . . . . . . . . . . . . . . . . . . . 857.1.2 Vegetable oil applied alone and in combination with essential oils . . . . . . . . . 887.1.3 NaCl applied alone and in combination with CMD . . . . . . . . . . . . . . . . . . 887.1.4 E�ect of emulsi�ers . . . . . . . . . . . . . . . . . . . . . . . . . . . . . . . . . . . . . 917.1.5 Weed species susceptibility . . . . . . . . . . . . . . . . . . . . . . . . . . . . . . . . 94
7.2 Summary results screening trials . . . . . . . . . . . . . . . . . . . . . . . . . . . . . . . . . . 967.3 Field trials . . . . . . . . . . . . . . . . . . . . . . . . . . . . . . . . . . . . . . . . . . . . . . . 97
7.3.1 Soybean trial Londrina (LO-NH) . . . . . . . . . . . . . . . . . . . . . . . . . . . . . . 977.3.2 Soybean trial Ponta Grossa (PG-NH) . . . . . . . . . . . . . . . . . . . . . . . . . . . 997.3.3 Common bean trials Ponta Grossa (PG-Lim, PG-Pin, PG-NaCl) . . . . . . . . . . 101
7.4 Summary results �eld trials . . . . . . . . . . . . . . . . . . . . . . . . . . . . . . . . . . . . . 104
8 Discussion C: natural herbicide trials (Brazil) 1058.1 Active ingredients and their formulations . . . . . . . . . . . . . . . . . . . . . . . . . . . . 105
8.1.1 Cell membrane disruptors . . . . . . . . . . . . . . . . . . . . . . . . . . . . . . . . . 1058.1.2 NaCl formulations . . . . . . . . . . . . . . . . . . . . . . . . . . . . . . . . . . . . . . 1078.1.3 E�ect of concentration, dilution and volume . . . . . . . . . . . . . . . . . . . . . . 108
8.2 Weed control and susceptibility to natural herbicide application . . . . . . . . . . . . . . . 1098.3 Environmental conditions and natural herbicide e�cacy . . . . . . . . . . . . . . . . . . . 1118.4 Agronomic aspects of natural herbicides . . . . . . . . . . . . . . . . . . . . . . . . . . . . . 112
8.4.1 Straw residue cover . . . . . . . . . . . . . . . . . . . . . . . . . . . . . . . . . . . . . 1128.4.2 Application intervals and repetitions . . . . . . . . . . . . . . . . . . . . . . . . . . 1128.4.3 Requirements for spraying equipment . . . . . . . . . . . . . . . . . . . . . . . . . . 1128.4.4 Application costs . . . . . . . . . . . . . . . . . . . . . . . . . . . . . . . . . . . . . . 1138.4.5 Summary: ideal conditions for NH application . . . . . . . . . . . . . . . . . . . . . 114
7
8.5 Emulsi�ers - ’inert’ ingredients in natural herbicides . . . . . . . . . . . . . . . . . . . . . . 115
9 Summary 1189.1 P and S fertilisation in direct-seeding in temperate climate (Germany) . . . . . . . . . . . 1189.2 P and S fertilisation in direct-seeding in tropical climate (Brazil) . . . . . . . . . . . . . . . 1199.3 Natural herbicides . . . . . . . . . . . . . . . . . . . . . . . . . . . . . . . . . . . . . . . . . . 120
10 Outlook: natural herbicides in OA direct-seeding 12310.1 Improvement of formulations . . . . . . . . . . . . . . . . . . . . . . . . . . . . . . . . . . . . 123
10.1.1 Substitution of cell membrane disruptors . . . . . . . . . . . . . . . . . . . . . . . . 12310.1.2 Phytotoxic salts . . . . . . . . . . . . . . . . . . . . . . . . . . . . . . . . . . . . . . . 12410.1.3 Active ingredients with systemic e�ect . . . . . . . . . . . . . . . . . . . . . . . . . 124
10.2 Potentials of natural herbicide use in temperate climate . . . . . . . . . . . . . . . . . . . . 12510.3 Spraying equipment and precision farming . . . . . . . . . . . . . . . . . . . . . . . . . . . 12510.4 Certi�cation . . . . . . . . . . . . . . . . . . . . . . . . . . . . . . . . . . . . . . . . . . . . . . 125
Appendices 127
A Faba bean trials (Germany) 127
B Soybean fertiliser trials (Brazil) 130
List of Figures2.1 Climate diagrams Germany . . . . . . . . . . . . . . . . . . . . . . . . . . . . . . . . . . . . . 242.3 Climate diagrams Brazil . . . . . . . . . . . . . . . . . . . . . . . . . . . . . . . . . . . . . . . 263.1 Fertiliser e�ect on faba bean shoot dry mass and grain yield . . . . . . . . . . . . . . . . . 503.2 Fertiliser e�ect on faba bean shoot height, shoot diameter and LAI . . . . . . . . . . . . . 513.4 Fertiliser e�ect on faba bean yield components . . . . . . . . . . . . . . . . . . . . . . . . . 523.5 Fertiliser e�ect on faba bean phosphorus uptake and concentration . . . . . . . . . . . . . 543.7 Fertiliser e�ect on faba bean nitrogen uptake and concentration . . . . . . . . . . . . . . . 553.9 Fertiliser e�ect on faba bean sulphur uptake and concentration . . . . . . . . . . . . . . . 563.11 Fertiliser e�ect on faba bean N:S ratio in shoot and grain . . . . . . . . . . . . . . . . . . . 573.12 E�ect of straw residue on faba bean shoot dry mass and grain yield . . . . . . . . . . . . 593.14 E�ect of oats cutting height on weed and faba bean shoot growth, grain yield . . . . . . 605.1 Fertiliser e�ect on soybean shoot dry mass and grain yield . . . . . . . . . . . . . . . . . . 705.3 Fertiliser e�ect on soybean phosphorus uptake and concentration . . . . . . . . . . . . . 735.5 Fertiliser e�ect on soybean leaf nutrient concentrations . . . . . . . . . . . . . . . . . . . . 745.6 Fertiliser e�ect on soybean nitrogen uptake and concentration . . . . . . . . . . . . . . . 755.8 Fertiliser e�ect on soybean sulphur uptake and concentration . . . . . . . . . . . . . . . . 775.10 Fertiliser e�ect on soybean N:S ratio . . . . . . . . . . . . . . . . . . . . . . . . . . . . . . . 787.1 Screening S-L1, S-PG1, S-PG2, S-PG3, S-PG16: formulations containing only one CMD 867.2 Screening S-PG2 and S-PG3: essential oils and AA alone and their combinations . . . . 877.4 Screening S-L2 and S-PG4: vegetable oil alone and in combination with essential oil . . 887.5 Screening S-PG4, S-PG5, S-PG12 and S-PG13: AA and NaCl alone and their combination 897.6 Photos: e�ects of CMD-NaCl formulation on monocot and dicot species . . . . . . . . . . 897.8 Screening S-PG6, S-PG7 and S-PG8: dose reduction of AA and essential oils . . . . . . . 907.9 Screening: S-PG9: AA and NaCl dose . . . . . . . . . . . . . . . . . . . . . . . . . . . . . . . 917.10 Screening S-L2, S-PG14 and S-PG15: emulsi�ers applied alone . . . . . . . . . . . . . . . 927.11 Photo: emulsi�er e�ect on weeds . . . . . . . . . . . . . . . . . . . . . . . . . . . . . . . . . 927.13 Screening S-PG11 and S-PG12: dose e�ect of NPE and terpene . . . . . . . . . . . . . . . 937.14 Screening: S-PG13: NaCl dose, emulsi�er dose and type . . . . . . . . . . . . . . . . . . . . 937.15 Screening: S-PG14: SA, MSO and NaCl . . . . . . . . . . . . . . . . . . . . . . . . . . . . . . 947.16 Screening: summary plot emulsi�er e�ect . . . . . . . . . . . . . . . . . . . . . . . . . . . . 95
8
7.18 Trial LO-NH: e�ect of NH on Weed cover . . . . . . . . . . . . . . . . . . . . . . . . . . . . . 977.19 Trial LO-NH: Weed and soybean shoot dry mass and grain yield . . . . . . . . . . . . . . . 987.20 Trial LO-NH: Thousand kernel weight, green and damaged grains . . . . . . . . . . . . . . 987.22 Trial PG-NH: e�ect of NH on weed injury rating . . . . . . . . . . . . . . . . . . . . . . . . . 997.23 Trial PG-NH: e�ect of weed density on weed injury ratings . . . . . . . . . . . . . . . . . . 1007.24 Trial PG-NH: e�ect of NH on weed and soybean shoot dry mass and grain yield . . . . . 1007.25 Trial PG-NH: e�ect of weed density on weed and soybean shoot dry mass and grain yield 1017.26 Trials PG-Lim, PG-Pin: e�ect of NH on weed injury ratings . . . . . . . . . . . . . . . . . 1027.27 Trials PG-Lim, PG-Pin: e�ect of NH on weed dry mass, separated by species . . . . . . . 1027.28 Trials PG-Lim, PG-Pin, PG-NaCl: e�ect of NH on shoot dry mass and grain yield . . . . 1038.1 Photos: Banded application . . . . . . . . . . . . . . . . . . . . . . . . . . . . . . . . . . . . . 113A.1 Fertiliser e�ect on potassium parameters - Germany . . . . . . . . . . . . . . . . . . . . . . 127A.3 E�ect of straw residue on faba bean shoot height and diameter . . . . . . . . . . . . . . . 128A.5 E�ect of straw residue on faba bean yield components . . . . . . . . . . . . . . . . . . . . . 129A.6 E�ect of oats cutting height on weed and faba bean shoot growth as well as grain yield 129B.1 Shoot height soybean . . . . . . . . . . . . . . . . . . . . . . . . . . . . . . . . . . . . . . . . . 130B.3 Thousand kernel weight soybean trials Brazil . . . . . . . . . . . . . . . . . . . . . . . . . . 130B.5 K-uptake and concentration soybean . . . . . . . . . . . . . . . . . . . . . . . . . . . . . . . 131B.7 First shoot dry mass evaluation LO1: shoot drymass, shoot height and shoot diameter . 132B.8 Nutrient uptake trial LO1 at �rst shoot dry mass evaluation . . . . . . . . . . . . . . . . . 132B.9 Yield components trial LO1 . . . . . . . . . . . . . . . . . . . . . . . . . . . . . . . . . . . . . 133B.10 Plant components trial PG1 . . . . . . . . . . . . . . . . . . . . . . . . . . . . . . . . . . . . . 134
List of Tables2.1 Site descriptions Germany . . . . . . . . . . . . . . . . . . . . . . . . . . . . . . . . . . . . . . 232.2 Site descriptions Brazil . . . . . . . . . . . . . . . . . . . . . . . . . . . . . . . . . . . . . . . . 252.3 Sowing, evaluation and harvest dates Germany . . . . . . . . . . . . . . . . . . . . . . . . . 292.4 Sowing, evaluation and harvest dates Brazil . . . . . . . . . . . . . . . . . . . . . . . . . . . 292.5 Soil physics and chemistry natural herbicide trials Brazil . . . . . . . . . . . . . . . . . . . 422.6 Visual weed injury rating scale . . . . . . . . . . . . . . . . . . . . . . . . . . . . . . . . . . . 473.1 Soil physics and chemistry Germany . . . . . . . . . . . . . . . . . . . . . . . . . . . . . . . 493.2 Reference nutrient concentrations faba bean . . . . . . . . . . . . . . . . . . . . . . . . . . . 535.1 Soil granulometry, cation exchange capacity Brazil . . . . . . . . . . . . . . . . . . . . . . . 685.2 Soil nutrient contents Brazil . . . . . . . . . . . . . . . . . . . . . . . . . . . . . . . . . . . . . 698.1 Summary table: weed species susceptibility . . . . . . . . . . . . . . . . . . . . . . . . . . . 1108.2 Natural herbicides: commercial products and costs . . . . . . . . . . . . . . . . . . . . . . . 1148.3 Natural herbicides: Non-formulated AI and costs . . . . . . . . . . . . . . . . . . . . . . . . 1148.4 δ-limonene formulation described in product patent . . . . . . . . . . . . . . . . . . . . . . 1168.5 Emulsi�er amount in natural and conventional herbicide formulations . . . . . . . . . . . 116
List of BoxesBox 1.1 Hypotheses: P and S fertiliser trials . . . . . . . . . . . . . . . . . . . . . . . . . . . . . . 17Box 1.2 Hypotheses: oats straw residues . . . . . . . . . . . . . . . . . . . . . . . . . . . . . . . . 21Box 1.3 Research objectives screening trials . . . . . . . . . . . . . . . . . . . . . . . . . . . . . 22Box 1.4 Hypotheses: natural herbicide �eld trials . . . . . . . . . . . . . . . . . . . . . . . . . . 22Box 2.1 Design P-trial and S-trial (Germany and Brazil) . . . . . . . . . . . . . . . . . . . 27Box 2.2 Design WG-PS trial (Germany) . . . . . . . . . . . . . . . . . . . . . . . . . . . . . . . . . 28Box 2.3 Design WG-G, WG-K, WG-M trials - Germany . . . . . . . . . . . . . . . . . . . . . . . 29Box 2.4 Abbreviations: natural herbicide ingredients and weed species . . . . . . . . . . . . . 32Box 2.5 Codi�ed description of natural herbicide formulations . . . . . . . . . . . . . . . . . . 32Box 2.6 Screening trial Londrina 1 - S-L1 . . . . . . . . . . . . . . . . . . . . . . . . . . . . . . . 33
9
Box 2.7 Screening trial Londrina 2 - S-L2 . . . . . . . . . . . . . . . . . . . . . . . . . . . . . . . 33Box 2.8 Screening trial Ponta Grossa 1 - S-PG1 . . . . . . . . . . . . . . . . . . . . . . . . . . . 34Box 2.9 Screening trial Ponta Grossa 2 - S-PG2 . . . . . . . . . . . . . . . . . . . . . . . . . . . 34Box 2.10 Screening trial Ponta Grossa 3 - S-PG3 . . . . . . . . . . . . . . . . . . . . . . . . . . . 35Box 2.11 Screening trial Ponta Grossa 4 - S-PG4 . . . . . . . . . . . . . . . . . . . . . . . . . . . 35Box 2.12 Screening trial Ponta Grossa 5 - S-PG5 . . . . . . . . . . . . . . . . . . . . . . . . . . . 36Box 2.13 Screening trial Ponta Grossa 6 - S-PG6 . . . . . . . . . . . . . . . . . . . . . . . . . . . 36Box 2.14 Screening trial Ponta Grossa 7 - S-PG7 . . . . . . . . . . . . . . . . . . . . . . . . . . . 36Box 2.15 Screening trial Ponta Grossa 8 - S-PG8 . . . . . . . . . . . . . . . . . . . . . . . . . . . 37Box 2.16 Screening trial Ponta Grossa 9 - S-PG9 . . . . . . . . . . . . . . . . . . . . . . . . . . . 37Box 2.17 Screening trial Ponta Grossa 10 - S-PG10 . . . . . . . . . . . . . . . . . . . . . . . . . 37Box 2.18 Screening trial Ponta Grossa 11 - S-PG11 . . . . . . . . . . . . . . . . . . . . . . . . . 38Box 2.19 Screening trial Ponta Grossa 12 - S-PG12 . . . . . . . . . . . . . . . . . . . . . . . . . 38Box 2.20 Screening trial Ponta Grossa 13 - S-PG13 . . . . . . . . . . . . . . . . . . . . . . . . . 39Box 2.21 Screening trial Ponta Grossa 14 - S-PG14 . . . . . . . . . . . . . . . . . . . . . . . . . 40Box 2.22 Screening trial Ponta Grossa 15 - S-PG15 . . . . . . . . . . . . . . . . . . . . . . . . . 40Box 2.23 Screening trial Ponta Grossa 16 - S-PG16 . . . . . . . . . . . . . . . . . . . . . . . . . 41Box 2.24 Screening trial Ponta Grossa 17 - S-PG17 . . . . . . . . . . . . . . . . . . . . . . . . . 41Box 2.25 Screening trial Ponta Grossa 18 - S-PG18 . . . . . . . . . . . . . . . . . . . . . . . . . 41Box 2.26 Soybean direct-seeding NH trial Ponta Grossa (PG-NH) . . . . . . . . . . . . . . . . . 43Box 2.27 Soybean direct-seeding NH trial Londrina (LO-NH) . . . . . . . . . . . . . . . . . . . . 44Box 2.28 Common bean tillage NH trials Ponta Grossa (PG-Lim, PG-Pin & PG-NaCl) . . . . 45Box 3.1 Summary faba bean fertiliser trials . . . . . . . . . . . . . . . . . . . . . . . . . . . . . . 58Box 3.2 Summary e�ect oats straw biomass . . . . . . . . . . . . . . . . . . . . . . . . . . . . . . 61Box 5.1 Summary soybean fertiliser trials . . . . . . . . . . . . . . . . . . . . . . . . . . . . . . . 79Box 7.1 Abbreviations: 5-letter Bayer code of weed species . . . . . . . . . . . . . . . . . . . . 85Box 7.2 Summary: e�ect of essential oils and acetic acid . . . . . . . . . . . . . . . . . . . . . . 88Box 7.3 Summary: NaCl applied alone and in combination with CMD . . . . . . . . . . . . . . 91Box 7.4 Summary: emulsi�ers e�ect . . . . . . . . . . . . . . . . . . . . . . . . . . . . . . . . . . 94Box 7.5 Summary: weed susceptibility . . . . . . . . . . . . . . . . . . . . . . . . . . . . . . . . . 95Box 7.6 Research questions screening trials . . . . . . . . . . . . . . . . . . . . . . . . . . . . . . 96Box 7.7 Summary results LO-NH . . . . . . . . . . . . . . . . . . . . . . . . . . . . . . . . . . . . . 99Box 7.8 Summary results PG-NH . . . . . . . . . . . . . . . . . . . . . . . . . . . . . . . . . . . . . 101Box 7.9 Summary results PG-Lim, PG-Pin, and PG-NaCl . . . . . . . . . . . . . . . . . . . . . 103Box 7.10 Summary of results NH �eld trials . . . . . . . . . . . . . . . . . . . . . . . . . . . . . 104Box 8.1 Summary: ideal conditions for NH application . . . . . . . . . . . . . . . . . . . . . . . 115
10
List of abbreviationsAA acetic acidAAS atomic absorption spectroscopyADP adenosine diphosphateAEC anion exchange capacityAI active ingredientAMP adenosine monophosphateANOVA analysis of varianceATP adenosine triphosphateBBCH Biologische Bundesanstalt, Bundessortenamt und CHemische IndustrieCA conservation agricultureCEC cation exchange capacityCMD cell membrane disruptorsCT conventional tillageDAE days after emergenceDBG Deutsche Bodenkundliche GesellschaftDL double lactateDNA desoxyribonucleic acidDS direct seedingEPA US Environmental Protection AgencyEU European UnionFFA free fatty acidsIAPAR Instituto Agronômico do ParanáICP Inductively Coupled PlasmaIOL Institute of Organic Agriculture, Bonn UniversityLAI leaf area indexMSO methylated soybean seed oilNH natural herbicideNPE nonylphenol ethoxylateNT no-tillageOA Organic AgricultureOADS Organic Agriculture Direct SeedingoDS occasional direct seedingOMRI Organic Materials Review InstituteP phosphorusPA pelargonic acidPEG polyethylene glycolPET polyethylene terephthalatePPG polypropylene glycolPRE pre-emergencePVC polyvinylchlorideRBD randomised block designRNA ribonucleic acidROS reactive oxygen speciesRP rock phosphateS sulphur

SA sulphonic acidSE standard error of the meanSiBCS Sistema Brasileiro de Classi�cação de SolosSOM soil organic matterSSP super single phosphateT80 Tween 80®TKW thousand kernel weightVDLUFA Verband Deutscher Landwirtschaftlicher Untersuchungs- und ForschungsanstaltenWRB FAO World Reference Base for soils
12
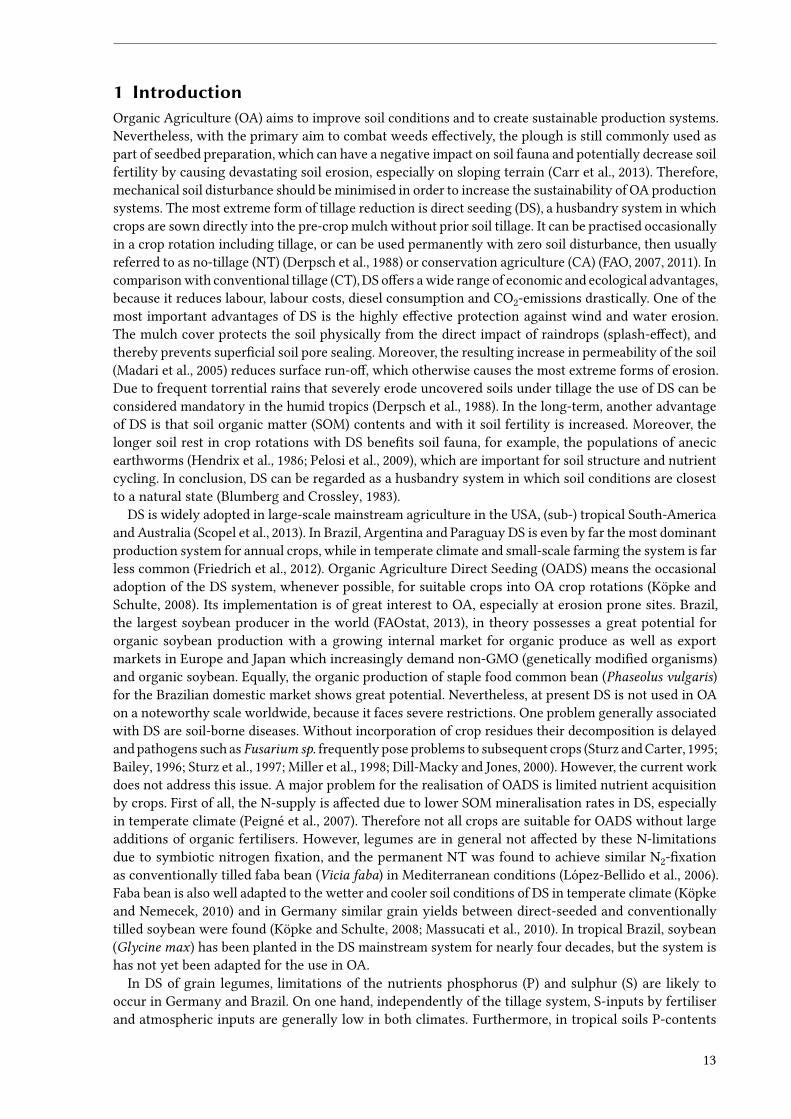
1 IntroductionOrganic Agriculture (OA) aims to improve soil conditions and to create sustainable production systems.Nevertheless, with the primary aim to combat weeds e�ectively, the plough is still commonly used aspart of seedbed preparation, which can have a negative impact on soil fauna and potentially decrease soilfertility by causing devastating soil erosion, especially on sloping terrain (Carr et al., 2013). Therefore,mechanical soil disturbance should be minimised in order to increase the sustainability of OA productionsystems. The most extreme form of tillage reduction is direct seeding (DS), a husbandry system in whichcrops are sown directly into the pre-crop mulch without prior soil tillage. It can be practised occasionallyin a crop rotation including tillage, or can be used permanently with zero soil disturbance, then usuallyreferred to as no-tillage (NT) (Derpsch et al., 1988) or conservation agriculture (CA) (FAO, 2007, 2011). Incomparison with conventional tillage (CT), DS o�ers a wide range of economic and ecological advantages,because it reduces labour, labour costs, diesel consumption and CO2-emissions drastically. One of themost important advantages of DS is the highly e�ective protection against wind and water erosion.The mulch cover protects the soil physically from the direct impact of raindrops (splash-e�ect), andthereby prevents super�cial soil pore sealing. Moreover, the resulting increase in permeability of the soil(Madari et al., 2005) reduces surface run-o�, which otherwise causes the most extreme forms of erosion.Due to frequent torrential rains that severely erode uncovered soils under tillage the use of DS can beconsidered mandatory in the humid tropics (Derpsch et al., 1988). In the long-term, another advantageof DS is that soil organic matter (SOM) contents and with it soil fertility is increased. Moreover, thelonger soil rest in crop rotations with DS bene�ts soil fauna, for example, the populations of anecicearthworms (Hendrix et al., 1986; Pelosi et al., 2009), which are important for soil structure and nutrientcycling. In conclusion, DS can be regarded as a husbandry system in which soil conditions are closestto a natural state (Blumberg and Crossley, 1983).
DS is widely adopted in large-scale mainstream agriculture in the USA, (sub-) tropical South-Americaand Australia (Scopel et al., 2013). In Brazil, Argentina and Paraguay DS is even by far the most dominantproduction system for annual crops, while in temperate climate and small-scale farming the system is farless common (Friedrich et al., 2012). Organic Agriculture Direct Seeding (OADS) means the occasionaladoption of the DS system, whenever possible, for suitable crops into OA crop rotations (Köpke andSchulte, 2008). Its implementation is of great interest to OA, especially at erosion prone sites. Brazil,the largest soybean producer in the world (FAOstat, 2013), in theory possesses a great potential fororganic soybean production with a growing internal market for organic produce as well as exportmarkets in Europe and Japan which increasingly demand non-GMO (genetically modi�ed organisms)and organic soybean. Equally, the organic production of staple food common bean (Phaseolus vulgaris)for the Brazilian domestic market shows great potential. Nevertheless, at present DS is not used in OAon a noteworthy scale worldwide, because it faces severe restrictions. One problem generally associatedwith DS are soil-borne diseases. Without incorporation of crop residues their decomposition is delayedand pathogens such as Fusarium sp. frequently pose problems to subsequent crops (Sturz and Carter, 1995;Bailey, 1996; Sturz et al., 1997; Miller et al., 1998; Dill-Macky and Jones, 2000). However, the current workdoes not address this issue. A major problem for the realisation of OADS is limited nutrient acquisitionby crops. First of all, the N-supply is a�ected due to lower SOM mineralisation rates in DS, especiallyin temperate climate (Peigné et al., 2007). Therefore not all crops are suitable for OADS without largeadditions of organic fertilisers. However, legumes are in general not a�ected by these N-limitationsdue to symbiotic nitrogen �xation, and the permanent NT was found to achieve similar N2-�xationas conventionally tilled faba bean (Vicia faba) in Mediterranean conditions (López-Bellido et al., 2006).Faba bean is also well adapted to the wetter and cooler soil conditions of DS in temperate climate (Köpkeand Nemecek, 2010) and in Germany similar grain yields between direct-seeded and conventionallytilled soybean were found (Köpke and Schulte, 2008; Massucati et al., 2010). In tropical Brazil, soybean(Glycine max) has been planted in the DS mainstream system for nearly four decades, but the system ishas not yet been adapted for the use in OA.
In DS of grain legumes, limitations of the nutrients phosphorus (P) and sulphur (S) are likely tooccur in Germany and Brazil. On one hand, independently of the tillage system, S-inputs by fertiliserand atmospheric inputs are generally low in both climates. Furthermore, in tropical soils P-contents
13
1 Introduction
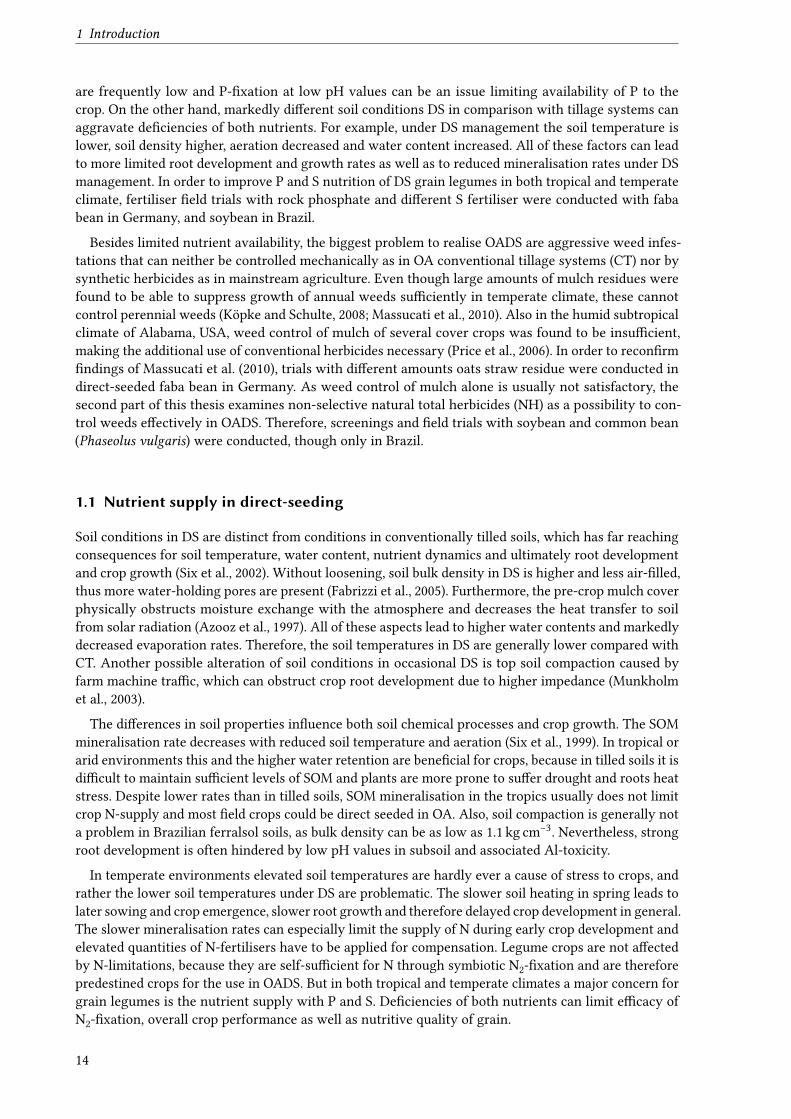
are frequently low and P-�xation at low pH values can be an issue limiting availability of P to thecrop. On the other hand, markedly di�erent soil conditions DS in comparison with tillage systems canaggravate de�ciencies of both nutrients. For example, under DS management the soil temperature islower, soil density higher, aeration decreased and water content increased. All of these factors can leadto more limited root development and growth rates as well as to reduced mineralisation rates under DSmanagement. In order to improve P and S nutrition of DS grain legumes in both tropical and temperateclimate, fertiliser �eld trials with rock phosphate and di�erent S fertiliser were conducted with fababean in Germany, and soybean in Brazil.
Besides limited nutrient availability, the biggest problem to realise OADS are aggressive weed infes-tations that can neither be controlled mechanically as in OA conventional tillage systems (CT) nor bysynthetic herbicides as in mainstream agriculture. Even though large amounts of mulch residues werefound to be able to suppress growth of annual weeds su�ciently in temperate climate, these cannotcontrol perennial weeds (Köpke and Schulte, 2008; Massucati et al., 2010). Also in the humid subtropicalclimate of Alabama, USA, weed control of mulch of several cover crops was found to be insu�cient,making the additional use of conventional herbicides necessary (Price et al., 2006). In order to recon�rm�ndings of Massucati et al. (2010), trials with di�erent amounts oats straw residue were conducted indirect-seeded faba bean in Germany. As weed control of mulch alone is usually not satisfactory, thesecond part of this thesis examines non-selective natural total herbicides (NH) as a possibility to con-trol weeds e�ectively in OADS. Therefore, screenings and �eld trials with soybean and common bean(Phaseolus vulgaris) were conducted, though only in Brazil.
1.1 Nutrient supply in direct-seeding
Soil conditions in DS are distinct from conditions in conventionally tilled soils, which has far reachingconsequences for soil temperature, water content, nutrient dynamics and ultimately root developmentand crop growth (Six et al., 2002). Without loosening, soil bulk density in DS is higher and less air-�lled,thus more water-holding pores are present (Fabrizzi et al., 2005). Furthermore, the pre-crop mulch coverphysically obstructs moisture exchange with the atmosphere and decreases the heat transfer to soilfrom solar radiation (Azooz et al., 1997). All of these aspects lead to higher water contents and markedlydecreased evaporation rates. Therefore, the soil temperatures in DS are generally lower compared withCT. Another possible alteration of soil conditions in occasional DS is top soil compaction caused byfarm machine tra�c, which can obstruct crop root development due to higher impedance (Munkholmet al., 2003).
The di�erences in soil properties in�uence both soil chemical processes and crop growth. The SOMmineralisation rate decreases with reduced soil temperature and aeration (Six et al., 1999). In tropical orarid environments this and the higher water retention are bene�cial for crops, because in tilled soils it isdi�cult to maintain su�cient levels of SOM and plants are more prone to su�er drought and roots heatstress. Despite lower rates than in tilled soils, SOM mineralisation in the tropics usually does not limitcrop N-supply and most �eld crops could be direct seeded in OA. Also, soil compaction is generally nota problem in Brazilian ferralsol soils, as bulk density can be as low as 1.1 kg cm−3. Nevertheless, strongroot development is often hindered by low pH values in subsoil and associated Al-toxicity.
In temperate environments elevated soil temperatures are hardly ever a cause of stress to crops, andrather the lower soil temperatures under DS are problematic. The slower soil heating in spring leads tolater sowing and crop emergence, slower root growth and therefore delayed crop development in general.The slower mineralisation rates can especially limit the supply of N during early crop development andelevated quantities of N-fertilisers have to be applied for compensation. Legume crops are not a�ectedby N-limitations, because they are self-su�cient for N through symbiotic N2-�xation and are thereforepredestined crops for the use in OADS. But in both tropical and temperate climates a major concern forgrain legumes is the nutrient supply with P and S. De�ciencies of both nutrients can limit e�cacy ofN2-�xation, overall crop performance as well as nutritive quality of grain.
14
1.1.1 Phosphorus deficiency
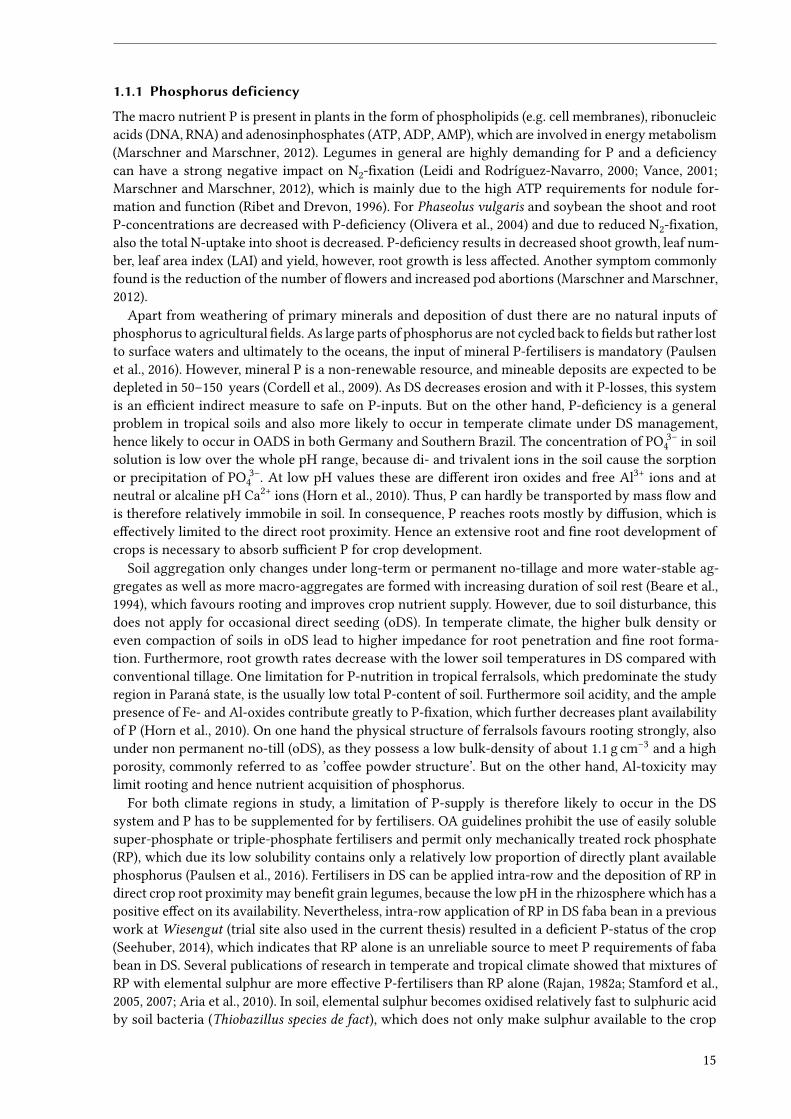
The macro nutrient P is present in plants in the form of phospholipids (e.g. cell membranes), ribonucleicacids (DNA, RNA) and adenosinphosphates (ATP, ADP, AMP), which are involved in energy metabolism(Marschner and Marschner, 2012). Legumes in general are highly demanding for P and a de�ciencycan have a strong negative impact on N2-�xation (Leidi and Rodríguez-Navarro, 2000; Vance, 2001;Marschner and Marschner, 2012), which is mainly due to the high ATP requirements for nodule for-mation and function (Ribet and Drevon, 1996). For Phaseolus vulgaris and soybean the shoot and rootP-concentrations are decreased with P-de�ciency (Olivera et al., 2004) and due to reduced N2-�xation,also the total N-uptake into shoot is decreased. P-de�ciency results in decreased shoot growth, leaf num-ber, leaf area index (LAI) and yield, however, root growth is less a�ected. Another symptom commonlyfound is the reduction of the number of �owers and increased pod abortions (Marschner and Marschner,2012).
Apart from weathering of primary minerals and deposition of dust there are no natural inputs ofphosphorus to agricultural �elds. As large parts of phosphorus are not cycled back to �elds but rather lostto surface waters and ultimately to the oceans, the input of mineral P-fertilisers is mandatory (Paulsenet al., 2016). However, mineral P is a non-renewable resource, and mineable deposits are expected to bedepleted in 50–150 years (Cordell et al., 2009). As DS decreases erosion and with it P-losses, this systemis an e�cient indirect measure to safe on P-inputs. But on the other hand, P-de�ciency is a generalproblem in tropical soils and also more likely to occur in temperate climate under DS management,hence likely to occur in OADS in both Germany and Southern Brazil. The concentration of PO 3–
4 in soilsolution is low over the whole pH range, because di- and trivalent ions in the soil cause the sorptionor precipitation of PO 3–
4 . At low pH values these are di�erent iron oxides and free Al3+ ions and atneutral or alcaline pH Ca2+ ions (Horn et al., 2010). Thus, P can hardly be transported by mass �ow andis therefore relatively immobile in soil. In consequence, P reaches roots mostly by di�usion, which ise�ectively limited to the direct root proximity. Hence an extensive root and �ne root development ofcrops is necessary to absorb su�cient P for crop development.
Soil aggregation only changes under long-term or permanent no-tillage and more water-stable ag-gregates as well as more macro-aggregates are formed with increasing duration of soil rest (Beare et al.,1994), which favours rooting and improves crop nutrient supply. However, due to soil disturbance, thisdoes not apply for occasional direct seeding (oDS). In temperate climate, the higher bulk density oreven compaction of soils in oDS lead to higher impedance for root penetration and �ne root forma-tion. Furthermore, root growth rates decrease with the lower soil temperatures in DS compared withconventional tillage. One limitation for P-nutrition in tropical ferralsols, which predominate the studyregion in Paraná state, is the usually low total P-content of soil. Furthermore soil acidity, and the amplepresence of Fe- and Al-oxides contribute greatly to P-�xation, which further decreases plant availabilityof P (Horn et al., 2010). On one hand the physical structure of ferralsols favours rooting strongly, alsounder non permanent no-till (oDS), as they possess a low bulk-density of about 1.1 g cm−3 and a highporosity, commonly referred to as ’co�ee powder structure’. But on the other hand, Al-toxicity maylimit rooting and hence nutrient acquisition of phosphorus.
For both climate regions in study, a limitation of P-supply is therefore likely to occur in the DSsystem and P has to be supplemented for by fertilisers. OA guidelines prohibit the use of easily solublesuper-phosphate or triple-phosphate fertilisers and permit only mechanically treated rock phosphate(RP), which due its low solubility contains only a relatively low proportion of directly plant availablephosphorus (Paulsen et al., 2016). Fertilisers in DS can be applied intra-row and the deposition of RP indirect crop root proximity may bene�t grain legumes, because the low pH in the rhizosphere which has apositive e�ect on its availability. Nevertheless, intra-row application of RP in DS faba bean in a previouswork at Wiesengut (trial site also used in the current thesis) resulted in a de�cient P-status of the crop(Seehuber, 2014), which indicates that RP alone is an unreliable source to meet P requirements of fababean in DS. Several publications of research in temperate and tropical climate showed that mixtures ofRP with elemental sulphur are more e�ective P-fertilisers than RP alone (Rajan, 1982a; Stamford et al.,2005, 2007; Aria et al., 2010). In soil, elemental sulphur becomes oxidised relatively fast to sulphuric acidby soil bacteria (Thiobazillus species de fact), which does not only make sulphur available to the crop
15
1 Introduction
(SO 2–4 ), but also leads to a sharp decline of pH in proximity to elemental sulphur. The acid formed can
help to solubilise simultaneously applied RP in situ and may thereby increase P availability to crops.
1.1.2 Sulphur deficiency
Sulphur is an essential macro nutrient, which is mostly taken up in the form of sulphate (SO 2–4 ), yet
uptake is also possible as SO2 gas through leaf stomata. In plants sulphur can be found in the pro-teinogenic amino-acids cysthein, cysthin and methionin and is therefore part of proteins in general.It is a key element in functional groups of co-enzymes and vitamins and forms part of iron-sulphurproteins involved in oxidation-reduction reactions (ferredoxin), energy metabolism and nitrogen �xa-tion (nitrogenase). Furthermore, sulphate esters are components of sulpholipids and as such structuralcomponents of biological membranes. Another large fraction of S-containing substances are formedin plant secondary metabolism, e.g. glycosinolates in Brassicaceae or alliins in Alliaeae (Scherer, 2001;Marschner and Marschner, 2012).
When S-de�ciency occurs the S-concentrations in shoots, roots and nodules can be drastically de-creased (Pacyna et al., 2006). The shortage of S-containing amino acids cysteine and methionine inhibitsprotein synthesis and decreases chlorophyll and protein contents in leafs and reduces shoot growth andleaf area (Marschner and Marschner, 2012). Also, the lower contents of the these amino-acids, whichare essential in the nutrition of non-ruminants, in�uence the protein quality and hence the nutritionalvalue of grain negatively (Kim et al., 1999; Gayler and Sykes, 1985). This change in nutritive qualitymay occur without necessarily decreasing grain yield or protein content: when S is de�cient, the graincontent of S-rich storage protein glycinin decreases, and is compensated for by β-conglycinins, whichare practically void of S-containing amino-acids (Gayler and Sykes, 1985; Sexton et al., 1998). Further-more, under conditions of S-de�ciency levels of ferredoxin, ATP and leghemoglobin decrease (Schereret al., 2008), which causes an obstruction of energy metabolism. With sulphur de�ciency nodule weightis usually lower (Scherer and Lange, 1996) and even moderate S-de�ciency leads to a sharp decline innitrogenase-activity (Scherer and Lange, 1996; Scherer et al., 2008), which can induce N-de�ciency inlegume crops (Pacyna et al., 2006).
To be sustainable, OA strongly depends on e�cient symbiotic N2-�xation by legume crops, which incomparison with other crop families have a relatively high demand for sulphur (Brassicaceae > Legumi-nosae > Gramineae). For both German and Brazilian sites S-de�ciency is likely to occur direct-seededgrain legumes. In highly industrialised European countries like Germany, atmospheric sulphur depo-sitions were as high as 33 kg ha−1 a−1 S in the 1980’s (Prechtel et al., 2001), which apart from causingnegative e�ects such as acid rains, delivered sulphur to crops in su�cient quantities. However, sul-phur gas emission to the atmosphere could be decreased strongly by obligatory �ue-gas desulfurisation(Srivastava and Jozewicz, 2001) and the use of low S-containing fuels (Scherer, 2009). Hence, currentatmospheric inputs only amount to about 10 kg ha−1 a−1 S (Horn et al., 2010; Umweltbundesamt, 2014).For this reason, the problem of sulphur de�ciency in agriculture has gained great importance over thelast 20 years. Additionally to low inputs, the leaching potential for sulphate is usually high in Germany,because most soils have a neutral pH, which limits SO 2–
4 sorption to exchange sites and hence favoursleaching strongly (Bolan et al., 1988). Another factor favouring S-de�ciency speci�cally in DS in tem-perate climate is the limitation of S-supply from SOM mineralisation due to lower soil temperaturesand aeration. Also in Brazil sulphur de�ciency is suspected to occur. Fertiliser inputs of sulphur aregenerally low, for OA and mainstream agriculture alike. Widely used in Brazilian mainstream agricul-ture are high grade P- and N-fertilisers lacking sulphur, for example triple phosphate. Application ofgypsum (CaSO4 ·2 H2O) is not a wide-spread practice or only realised sporadically. Also, mixed farmingis rather the exception in Paraná state and generally no sulphur is applied in the form of farm manureor slurry. As a consequence atmospheric immissions are presumably the only relevant input of sulphurto soils. However, the soybean cultivation regions in Paraná state are generally in rural areas withlow industrialisation, and so are the experimental sites. In rural sites in Brazil sulphur wet-depositionwas measured ranging from 0.2 kg ha−1 a−1 S (Dias et al., 2012) to 2.1 kg ha−1 a−1 S (Pelicho et al., 2006).Even considering that dry deposition rates are of the same magnitude as wet-deposition (Garland, 1978),the total sulphur immission rate expected for experimental sites in Paraná state is unlikely to exceed
16
5 kg ha−1 a−1 S, which cannot balance the harvest exports of most crops, e.g. 10–15 kg ha−1 for soybean.Losses of sulphate by leaching may also be considerable. On one hand permeable clayey and sandyferralsols dominate in Paraná state. The high rainfall incidence and intensity might lead to an elevatedleaching potential of SO 2–
4 ions in these soils. On the other hand, the low pH of soils brings about a highanion exchange capacity (AEC) and SO 2–
4 can be adsorbed to soil particles (e.g. Fe-, Al-oxides), therebyrestricting leaching losses (Horn et al., 2010). Another argument against a high leaching potential is thatbare fallows hardly exist in Paraná state and cereals or green manure crops are grown in winter. Alsoin contrast to temperate climate, SOM mineralisation kinetics are not considered to be a limiting factorfor plant availability of S. In the tropics rather low SOM contents caused by rapid mineralisation maybe problematic, especially in soils with a sandy texture. Overall, there is evidence for S-de�ciency inagricultural soils in Paraná state, and if not acute, de�ciency can be expected to occur in the long-termdue to a negative nutrient balance. This problem is not assumed to be limited to OADS, but relevant forBrazilian mainstream soybean cultivation as well.
Prior works in Germany found that fertilisation with K2SO4 (35 kg ha−1 S) increased S-content from0.25 % to 0.36 % in shoot dry mass compared with control treatment and slightly increase in N-content,indicating a positive e�ect on symbiotic N2-�xation (Seehuber, 2014). Also in several regions of Brazil(including Paraná state), sulphur fertilisation has proven e�cient to increase soybean grain yields (Sfredoand Lantmann, 2007).
1.1.3 Research approach and hypotheses
From the current state of the art it is assumed that at German and Brazilian trial sites nutrient de�cienciesof phosphorus and sulphur are likely to occur in direct-seeded grain legumes in OA. Therefore, the aimof the thesis at hand is to improve the P and S nutrition of grain legumes in DS in both tropical andtemperate climate, with intra-row applied, OA permitted rock phosphate and sulphur fertilisers. In�eld trials, the e�ects on crop growth and yield as well as nutrient concentrations in shoot and grainare examined. Aiming to improve P-supply of grain legumes, rock-phosphate is applied intra-row in�eld trials, alone and in combination with elemental sulphur. When elemental sulphur is oxidised bysoil bacteria, sulphuric acid is formed and is assumed to solubilise RP in situ and increase the cropavailability of RP. The mixture, also known as ’biosuper’, has knowingly not been studied extensivelyas intra-row application in DS. In order to determine whether S-de�ciencies are in fact present and iffertiliser application can improve sulphur supply of DS grain legumes, the S-fertilisers gypsum, K2SO4,and elemental sulphur, which all possess a di�ering solubility, were applied intra-row. In North-Rhine-Westfalia (NRW) Germany, a total of six trials at two experimental sites were conducted with faba bean,Vicia faba (L.), in Hennef (2011) and Rheinbach (2012). In Paraná state, southern Brazil, a total of eightfertiliser trials were realised with DS soybean, Glycine max (L.), at the three experimental sites Londrina,Ponta Grossa and Umuarama. For fertiliser trials in Germany and Brazil the following hypothesis arepostulated:
Box 1.1 Hypotheses: P and S fertiliser trials
1. Rock phosphate (RP) application increases shoot P-uptake and -contents.2. RP increases crop growth and yield.3. Joint application of RP and elemental S further increases uptake and contents of P and S.4. Joint application of RP and elemental S further enhances crop growth and yield.5. S fertiliser increases S-uptake and contents.6. S fertiliser increases crop growth and yield.7. Soluble sulphur forms K2SO4 and gypsum are most e�ective.
17
1 Introduction
1.2 Weed control with mulch and natural herbicides in direct-seeding
1.2.1 Mulch from harvest residues
Compared to conventional tillage the mulch layer in DS can in�uence weed populations physically,chemically and biologically. Important physical factors of mulch are that less direct sunlight reachesthe soil surface and that diurnal soil temperature variation is reduced, which both inhibits weed seedgermination. Furthermore, weed emergence is obstructed physically (Christo�oleti et al., 2007). Chemicalchanges occur in the C:N ratio of topsoil which has an in�uence on nitrate contents. Depending onresidue type, either higher nitrate contents may occur at the soil surface, which enhance weed seedgermination and growth (Christo�oleti et al., 2007), or the reverse e�ect of N-immobilisation (Rice andSmith, 1984), which does not favour weed germination. Nevertheless, the most important chemical weedsuppression e�ect of mulch residue is the release of allelopathic substances, which obstruct weed seedgermination and weed growth (Bhowmik et al., 2003; Singh et al., 2003; Weir et al., 2004; Belz et al., 2007).Biological e�ects of mulch are enhanced parasitism and predation of weed seeds by microorganisms,insects and small mammals (Christo�oleti et al., 2007). Overall, weed control may be improved in DS:life-time of weed seeds, weed number and occurrence of grassy weeds is reduced. In order to takeadvantage of weed control e�ect of mulch for the realisation of occasional OADS a large mulch biomassis considered essential as a base to implement the system. In tropical Brazil, Vidal et al. (1998) andTheisen et al. (2000) found that increasing amounts of black oats or wheat decreased weed growth,especially that of Brachiaria grasses, and increased soybean yields. Works of Massucati et al. (2010) andMassucati and Köepke (2011) in Germany showed that with an oats straw biomass of at least 4 t ha−1
acceptable faba bean grain yields can be accomplished, but with the restriction that weed pressure ofperennials such as Cirsium spp. and Rumex spp. has to be low. In these experiments, perennial weedswere removed manually. In general mulches do not control perennials su�ciently and even organicmulches in combination with a polypropylene cover did not yield satisfactory results (Skroch et al.,1992). But also independent of perennials, mulch cover alone is apparently not always able to grantacceptable weed control. A work by Price et al. (2006) in Alabama state, USA, found that mulch of ryeand oats granted e�cient weed control, but only in combination with a soybean pre-emergence (PRE)herbicide application. Thus, the authors concluded that mulches allow for herbicide reductions, but thatnone of the cover crops granted e�ective weed control without the use of any herbicide.
1.2.2 Natural herbicides
As pre-crop mulch is not able to control weeds e�ectively, and due to the prohibition of syntheticherbicides in OA by self-imposed guidelines, manual weeding is currently the only applicable weedcontrol measure in DS after crop emergence. However, costs for this measure are prohibitive. Due to thelack of e�ective weed control strategies OADS is currently not practised in Germany and Brazil. Whilefaba bean is commonly planted using CT in temperate climate OA, organic soybean is rarely cultivatedin OA in Brazil due to the low e�ciency of erosion control in the CT system. In fact, the low proportionof OA in Brazilian husbandry systems in general may largely be attributed to the fact that DS cannotbe realised. For both regions in study the key to enable grain legume OADS is the development of ane�ective weed control strategy involving the use of natural herbicide (NH). Their temporary use couldenable more organic farmers to perform judicious tillage coupled with soil structure improvement ofoccasional DS at least for grain legumes (Köpke and Nemecek, 2010), as well as o�ering the broad-scalebene�cial environmental e�ects of OA that have been documented by Hole et al. (2005).
Active ingredients: cell membrane disruptors (CMD) Commercial NH formulations, which arecerti�ed for use in OA in certain countries (USA, Oceania), contain as active ingredient (AI) the essentialplant oils citronella oil (e.g. Barrier H® 1 or GreenMatchEX®), pine oil (Organic Interceptor®), cloveoil (e.g. BurnOut II®, EcoExempt HC®, Matran 2®) or δ-limonene (NaturesAvenger®), as well as onorganic acids, such as pelargonic (Finalsan®) or acetic acid (AllDown®). These AI, on which most NHresearch has been focused on, posses a similar mode of action: they penetrate the leaf cuticle and change
1Barrier H® contains 22.9 % wt/wt citronella oil java type, extracted from Cymbopogon winterianus.
18
its permeability. Within the leafs they damage cell and organelle membranes, which is why they canbe referred to as cell membrane disruptors (CMD). Ultimately cell contents leak out and cells die ofuncontrolled water loss, resulting in non-selective damage to plants (Tworkoski, 2002; Bakkali et al.,2008). The e�ect of CMD is not systemic. Thus, non-contacted meristems can resprout and plant recoverymay happen quickly. This also means that application volumes need to be large to assure good coverage.As NH are generally not selective, their application can only occur broadcast before crop emergence orafter crop emergence as a banded application with the use of a protective screen. In agricultural practicethe use of this AI class is therefore limited to row crops such as faba bean, soybean, common bean ormaize.
Most essential oils, including citronella oil, clove oil, eucalypt oil and natural pine oil, are obtainedby way of steam distillation. This process is energy-intensive, costly and oil yields are generally low,resulting in elevated prices of these AI. For example, the annual oil yields of Cymbopogon winterianus inIndia are in the range of 200–250 kg ha−1 are under favourable conditions 2. For Cymbopogon nardus (L.)Rendle, reported annual oil yields are as low as 76 kg ha−1 (Mahalwal and Ali, 2003). The situation forclove oil, the most potent CMD of a wide range of essential oils tested by Tworkoski (2002) is similar. Notonly is the production and harvest process laborious (cloves are handpicked), but the annual productionof buds is only about 250 kg ha−1 on average, and up to 850 kg ha−1 under good management 2. Witha clove oil content of 14–21 % 3 annual oil yields are in the range of 35–170 kg ha−1. Besides low yield,alternative uses for both clove and citronella oil are numerous, for example in cosmetics, food, andpharmaceutical industry. Natural pine oil is used in fragrances, inhalants or disinfectants 4 and theprice is also highly elevated: for example, oil from Pinus ponderosa costs approximately 250 € per litre(Kelkar et al., 2006). Nevertheless, most pine oil available commercially is a semi-synthetic productbased on the oxidation of pine resin distillate containing α-pinene, which is oxidised in presence of anacetic acid catalyst (Budiman et al., 2015). This reaction yields a mixture consisting of 65 % α-terpineoland original α-pinene, which is a pine oil far lower in price (about 4 € per litre) and of a di�erentchemical composition than the steam distilled product. δ-limonene is most abundant monoterpene innature and is obtained as a byproduct of orange juice production as it is present in juice and citrus peel.Currently, São Paulo state, Brazil is the worlds largest producer of orange juice and δ-limonene. Withmultiple uses, in cosmetics, food industry, solvents and cleaning products the demand for δ-limoneneis high, yet it is still one of the cheapest essential oils, with a price in a range of 2–6 € per litre (oralcommunication Citrovita, 2013). Several middle chain fatty acids from C9-C11, especially pelargonicacid (PA) (C9), cause rapid electrolyte leakage and non-selective damage to plants (Lederer et al., 2004).One AI of this class that is widely used in commercial NH formulations is PA, also called nonoanicacid (e.g. in Finalsan® or Scythe®). Its advantages are its ideal environmental and toxicological pro�le(Opdyke, 1978). Even though PA is a substance present in nature, for example in Pelargonium species,the extraction of su�cient quantities is not feasible and the commercialised products all use synthesisedPA in its soluble ammonium salt form. Another common in AI is acetic acid (AA), which is contained inthe OMRI 5 certi�ed AllDown® or in WeedPharm®. AA is a naturally occurring chemical with a simplestructure, and a very positive environmental pro�le (Webber et al., 2006), yet AA as a weed controlagent possesses several disadvantages considering safety and transportation.
Emulsifiers Practically all pesticidal, including NH formulations contain emulsi�ers, which are alsocommonly referred to surfactants (surface active ingredients). AI, which are not miscible with waterrequire the use of emulsi�ers, and spreaders are used in order to improve leaf coverage and therebyguarantee product e�cacy. Emulsi�ers do not belong to a de�ned chemical family and can be classi�edby their action as emulsi�ers, penetrants, spreader, stickers and activators or grouped into ionic andnon-ionic emulsi�ers (Hazen, 2009). However, there is no strict separation between these actions: e.g. anemulsi�er allows mixing of oils and water, but also in�uences the spreading of the mixture on the leaf
2www.horticulture.kar.nic.in, accessed on 29.10.2016.3www.essentialoil.com, accessed on 14.11.2016.4www.fao.org, accessed on 09.10.2016.5OMRI: Organic Materials Review Institute, USA
19
1 Introduction
surface. The preference in mainstream herbicide formulation is mostly given to non-ionic emulsi�ers(Young, 2008), because these do not interact with salts present in herbicides or water (e.g. Ca +
2 in hardwater). On product labels of conventional and natural herbicide formulations the identity of emulsi�ersis not disclosed and are referred to as inert ingredients.
Application rates and costs Typically AI concentrations of commercial products are about 20 % foressential oils, 10–20 % for AA, and about 5 % for PA containing products. For e�ective weed control theleaf surface needs to be covered thoroughly. To achieve full coverage all commercial products recommendapplication rates of 1000 L ha−1, which results in AI amounts of 50–200 L ha−1. For the application of NHformulations containing citronella or clove oil this means that the agricultural area needed to producethe amount of AI for a single application would exceed the area that can be treated. Due to high AIrates, the application costs are extremely elevated for most products. For example, the cost of a singlecitronella oil application would be as high as 9000 € per hectare. Also the application cost of the currentlycheapest formulation based on pelargonic acid (Finalsan®) is elevated with about 750 € per hectare andapplication. OA certi�ed products are at present only available in the USA (e.g. AllDown®) and Oceania(e.g. Organic Weedfree Rapid® in New Zealand), but neither in Europe nor in Brazil. However, no knownexamples of actual use of the currently available commercial NH formulations in agricultural practiceexist, at least not in annual �eld crops. Their application appears to be limited to urban gardening, whichis re�ected in the generally small container sizes for areas of only up to 100 m2.
State of the art of natural herbicide research Most scienti�c literature on CMD is based on re-sults from laboratory experiments such as germination tests or leaf disk essays (Tworkoski, 2002; Vaidet al., 2010; Bainard et al., 2006; Batish et al., 2004; Singh et al., 2009; Setia et al., 2007). However, thesestudies do not possess any explanatory power for potential uses in agricultural practice and can at mostevaluate substances for their comparative cytotoxicity or ability to disrupt cell membranes. Some paperswith more practical relevance deal with application of substances on weed plants in greenhouses, e.g.Abouziena et al. (2009), but scienti�c literature on e�cacy and potentials of NH under �eld conditionsis scarce. In an outdoor pot trial Boyd and Brennan (2006) showed that rates of clove oil for e�ectivecontrol of dicot weeds are about 12–60 L ha−1, while control of the monocot rye was not possible. Thecosts for one application calculated in this study were prohibitive with about 750 € per hectare. Young(2004) examined the use of pine oil and AA for weed control along roadsides and found that even re-peated applications of 50–70 kg ha−1 pine oil at an interval of two weeks yielded unsatisfying results.Further work by Barker and Prostak (2014) on weed control on roadsides found that various applicationsof formulations containing CMD were necessary to control weeds season-long, because resproutingof weeds was an issue. James et al. (2002) found applications of 50–100 kg ha−1 of pine oil on newlyemerged weeds to be as e�ective as commercial glyphosate and glufosinate formulations, nevertheless,established weeds needed higher rates for good control. Evans et al. (2009) compared di�erent con-centrations of vinegar and clove oil for the control of redroot pigweed (Amaranthus retro�exus) andvelvetleaf (Abutilon theophrasti). In this study it was found that plant morphology has an in�uenceon weed susceptibility, and that good control is only possible at early growth stages. At present, onlya limited number of peer-reviewed papers on NH use in annual crops exists, such as works of Evansand Bellinder (2009); Evans et al. (2011) with vinegar and clove oil application in the vegetable cropsbell pepper and broccoli in CT. These works found that e�cient weed control can be achieved at highapplication volumes (e.g. 15 % AA at a rate of 640 L ha−1), and that application timing and growth stageof weeds in�uenced control strongly. Both works advert that crop injury may cause signi�cant yieldreductions if not shielded appropriately.
Due to limited weed control e�cacy and extremely elevated application costs the use of any of NHformulations which only contain CMD as AI do not need further consideration for the use in OADS. Eventhough all commercial NH formulations and most recent research is based on CMD, other AI optionsdo exist. Historically, NaCl has been used for weed control and was applied in quantities of several tonsper hectare in winter cereals (Smith and Secoy, 1976; Timmons, 2005). Large amounts of NaCl in soilscause osmotic stress to roots, ion toxicity, and nutrient imbalances in plants (Marschner and Marschner,
20
2012). Similar e�ects can be assumed for NaCl spray application on aerial plant parts. Recent works onweed control with seawater in a seashore paspalum lawn found that e�ective broad-leaf control andlittle damage to lawn can be achieved (Zulkaliph et al., 2011; Uddin et al., 2013). In a work of Lukashyket al. (2008) spray applications of 250 kg ha−1 kainit fertiliser 6 with an NaCl equivalent of 140 kg ha−1
were found to have potential for weed control of Vicia hirsuta in winter wheat and winter rye. NaCl ischeap, abundant in nature and possesses a predictable behaviour in the environment, and therefore itspotential as an AI in NH formulations is examined in this work.
1.2.3 Research approach and hypotheses
To improve weed control in OADS (grain legume) row crops, an integrated weed control strategy isproposed as a solution: the �rst aspect of the strategy is the use of allelopathic pre-crop mulches suchas oats straw or rye, which control weeds physically and through the release of allelopathic substances.The second aspect of the control strategy is the use of NH.
Oats straw residue Mulch is the base for OADS, but in the current work it is only a secondaryresearch topic. One aim was to recon�rm �ndings of Schulte (2007), Massucati (2013) and Köpke andSchulte (2008) on the e�ect of di�erent amounts of oats mulch residue on weed growth and faba beandevelopment in Germany. For this purpose the straw mulch biomass treatments (0, 4 and 6 t ha−1) wereincluded into the fertiliser trial design in the second trial year at organically managed experimentalfarm Wiesengut, Hennef (WG), with the following hypotheses:
Box 1.2 Hypotheses: oats straw residues
With increasing amount of mulch from oats straw residues8. Weed biomass decreases.9. Faba bean growth and yield increases.
Natural herbicides For NH to become a relevant weed control tool in OA the e�ciency of formula-tions needs improvement and the costs have to be reduced. Importantly, formulations have to be studiedat �eld level and in crop stands to investigate agronomic aspects under realistic conditions. With scarcescienti�c literature on trials in crop stands, the NH research project was started with limited experienceon behaviour of AI and formulations under �eld conditions, which is why the character of this researchpart is exploratory to a large extent. NH research was only conducted in Brazil and originally, the aimwas to evaluate e�ciency of commercial NH in DS �eld trials. As these products did not have a regis-tration in Brazil the import even for experimental purposes was not approved by the Brazilian ministryof agriculture. Consequently the research goal in 2011/12 was to identify e�ective AI and formulationsand to study the susceptibility of a range of weed species in screening trials on previously tilled �elds.To elaborate formulations, AI used in commercial formulations or described in literature were used incombination with a range of emulsi�ers.
Screening trials focused on one hand on di�erent CMD, including several essential oils, acidic acid(AA) and pelargonic acid (PA) and on the other hand on phytotoxic salts, such as NaCl. Mixtures ofdi�erent AI seemed promising, and a special focus was given to combinations of CMD with NaCl. Theresearch goal of the screenings was to develop e�cient, yet - as far as possible - cost-e�ective NHformulations. In the course of screening trials the formulations containing the AI pine oil, δ-limonene,AA and NaCl proved to be most e�ective and other AI were discarted either due too ine�ciency or highcost. In the second year �ve �eld trials were conducted at two Brazilian sites with the purpose to study
6Kainit mineral is a hydrated potassium-magnesium sulphate-chloride (KMg(SO4)Cl·3 H2O). However, mined kainit fertiliser(e.g. Magnesia-Kainit®) does not consist only of the pure kainit mineral, but contains about 56 % NaCl. The fertilisercomposition of Magnesia-Kainit® is as follows: K: 9.1 %, Mg: 3.0 %, S: 4 %, Cl: 43 %, Na: 20 % (K+S Kali GmbH, 2015).
21
1 Introduction
the e�ect of e�ective formulations on weed control and crop growth under �eld conditions. Parallel to�eld trials the screening trials were continued in 2012/13.
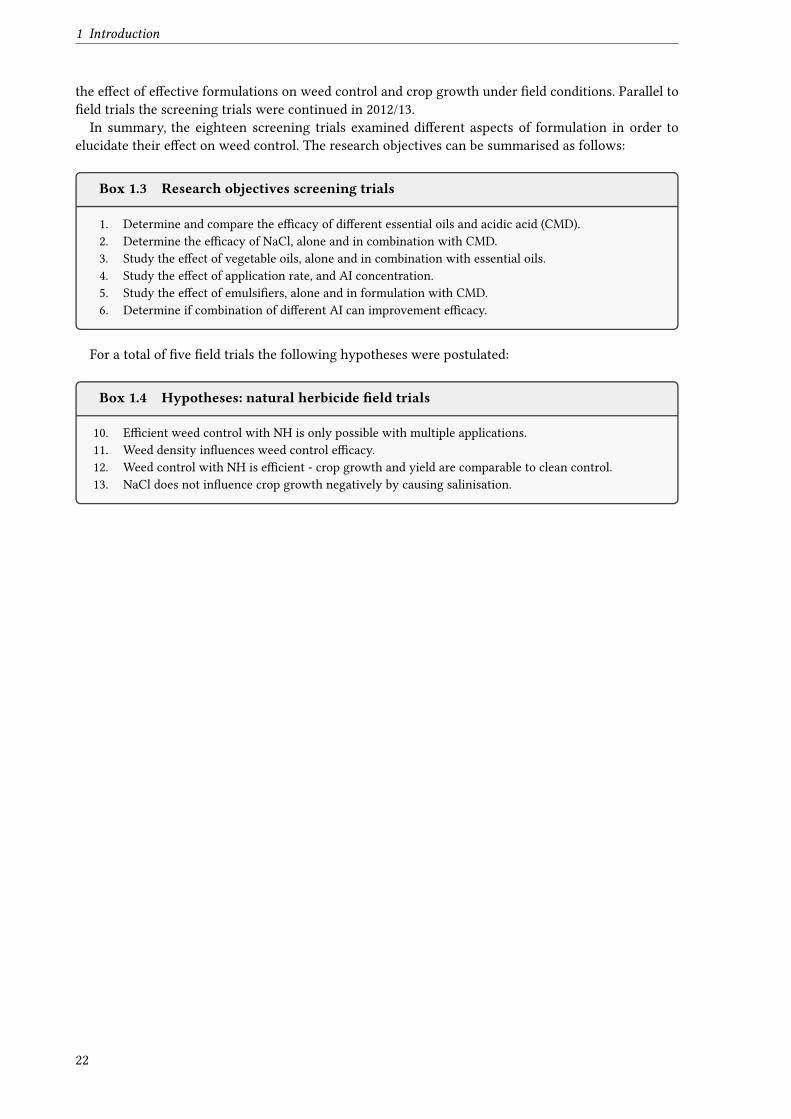
In summary, the eighteen screening trials examined di�erent aspects of formulation in order toelucidate their e�ect on weed control. The research objectives can be summarised as follows:
Box 1.3 Research objectives screening trials
1. Determine and compare the e�cacy of di�erent essential oils and acidic acid (CMD).2. Determine the e�cacy of NaCl, alone and in combination with CMD.3. Study the e�ect of vegetable oils, alone and in combination with essential oils.4. Study the e�ect of application rate, and AI concentration.5. Study the e�ect of emulsi�ers, alone and in formulation with CMD.6. Determine if combination of di�erent AI can improvement e�cacy.
For a total of �ve �eld trials the following hypotheses were postulated:
Box 1.4 Hypotheses: natural herbicide �eld trials
10. E�cient weed control with NH is only possible with multiple applications.11. Weed density in�uences weed control e�cacy.12. Weed control with NH is e�cient - crop growth and yield are comparable to clean control.13. NaCl does not in�uence crop growth negatively by causing salinisation.
22
2 Materials and MethodsResearch was conducted in two climate zones - Germany (temperate) and Brazil (tropical) and on twodi�erent topics. In order to avoid redundancies, descriptions of materials and methods are summarisedwhenever there are similarities between the experiments conducted.
2.1 Trial sites
2.1.1 Germany
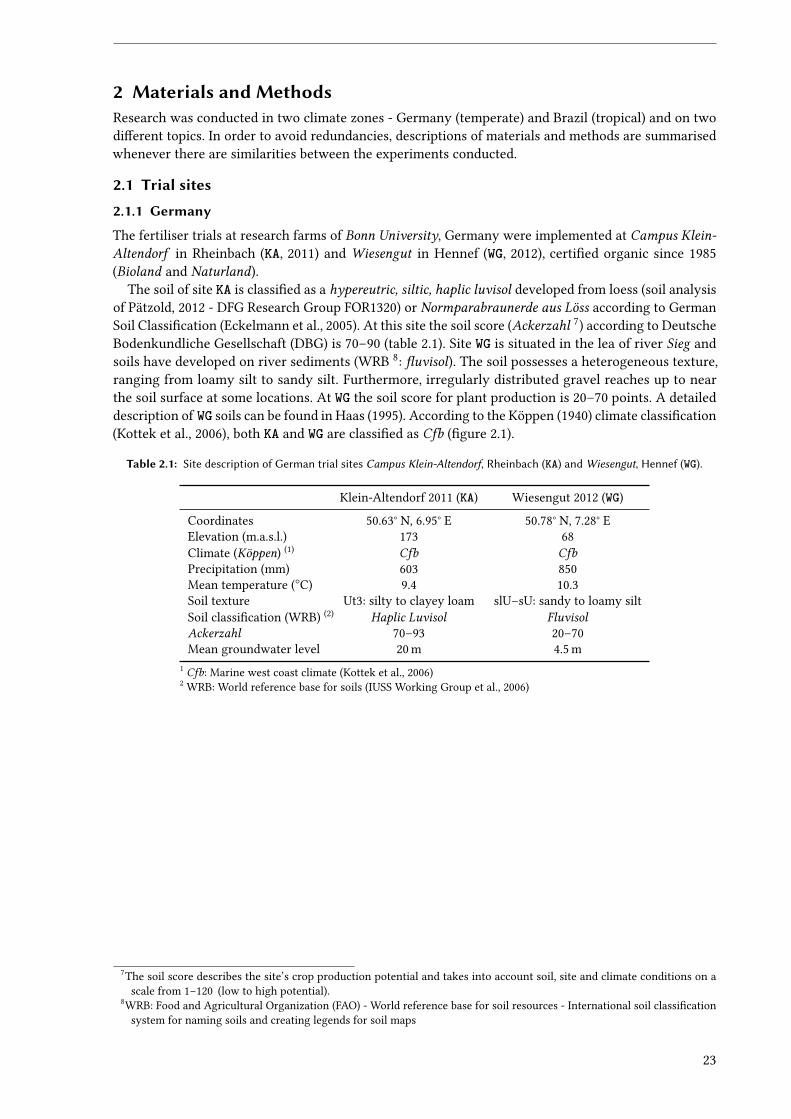
The fertiliser trials at research farms of Bonn University, Germany were implemented at Campus Klein-Altendorf in Rheinbach (KA, 2011) and Wiesengut in Hennef (WG, 2012), certi�ed organic since 1985(Bioland and Naturland).
The soil of site KA is classi�ed as a hypereutric, siltic, haplic luvisol developed from loess (soil analysisof Pätzold, 2012 - DFG Research Group FOR1320) or Normparabraunerde aus Löss according to GermanSoil Classi�cation (Eckelmann et al., 2005). At this site the soil score (Ackerzahl 7) according to DeutscheBodenkundliche Gesellschaft (DBG) is 70–90 (table 2.1). Site WG is situated in the lea of river Sieg andsoils have developed on river sediments (WRB 8: �uvisol). The soil possesses a heterogeneous texture,ranging from loamy silt to sandy silt. Furthermore, irregularly distributed gravel reaches up to nearthe soil surface at some locations. At WG the soil score for plant production is 20–70 points. A detaileddescription of WG soils can be found in Haas (1995). According to the Köppen (1940) climate classi�cation(Kottek et al., 2006), both KA and WG are classi�ed as Cfb (�gure 2.1).
Table 2.1: Site description of German trial sites Campus Klein-Altendorf, Rheinbach (KA) and Wiesengut, Hennef (WG).
Klein-Altendorf 2011 (KA) Wiesengut 2012 (WG)
Coordinates 50.63° N, 6.95° E 50.78° N, 7.28° EElevation (m.a.s.l.) 173 68Climate (Köppen) (1) Cfb CfbPrecipitation (mm) 603 850Mean temperature (○C) 9.4 10.3Soil texture Ut3: silty to clayey loam slU–sU: sandy to loamy siltSoil classi�cation (WRB) (2) Haplic Luvisol FluvisolAckerzahl 70–93 20–70Mean groundwater level 20 m 4.5 m
1 Cfb: Marine west coast climate (Kottek et al., 2006)2 WRB: World reference base for soils (IUSS Working Group et al., 2006)
7The soil score describes the site’s crop production potential and takes into account soil, site and climate conditions on ascale from 1–120 (low to high potential).
8WRB: Food and Agricultural Organization (FAO) - World reference base for soil resources - International soil classi�cationsystem for naming soils and creating legends for soil maps
23
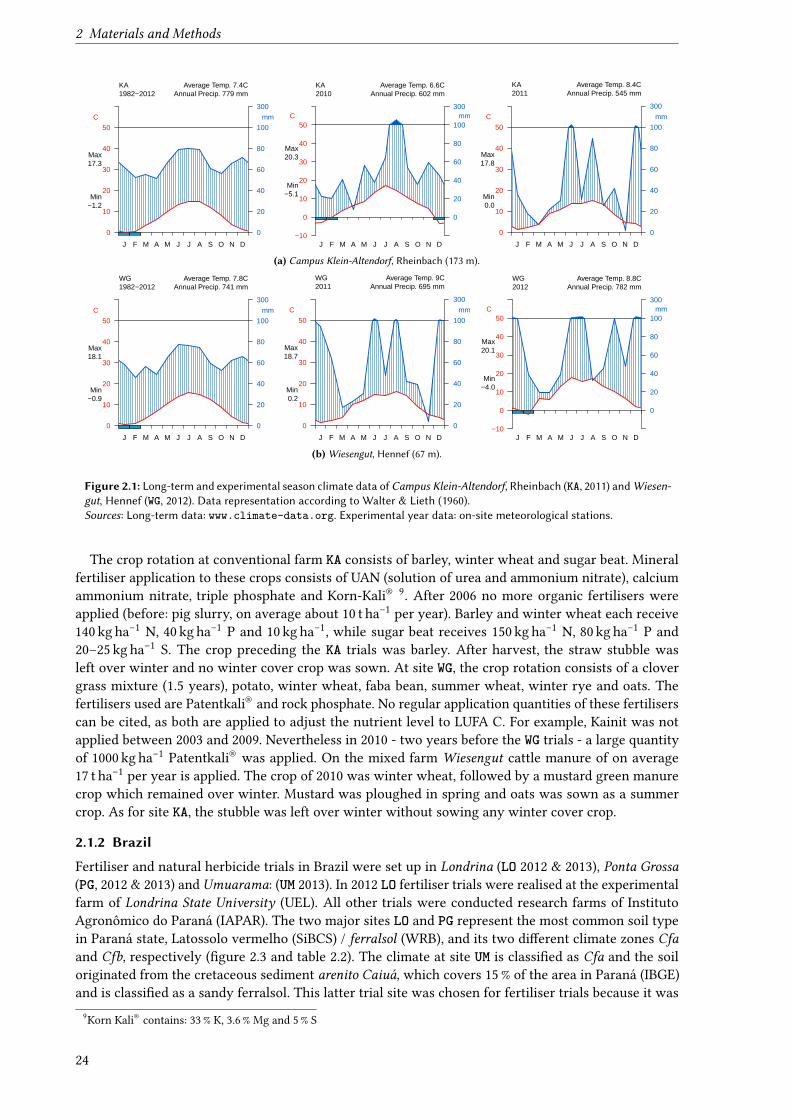
2 Materials and Methods
0
10
20
30
40
50
0
20
40
60
80
100
300
C mm
KA1982−2012
Average Temp. 7.4C Annual Precip. 779 mm
Max 17.3
Min −1.2
J F M A M J J A S O N D−10
0
10
20
30
40
50
0
20
40
60
80
100
300C mm
KA2010
Average Temp. 6.6C Annual Precip. 602 mm
Max 20.3
Min −5.1
J F M A M J J A S O N D
0
10
20
30
40
50
0
20
40
60
80
100
300
C mm
KA2011
Average Temp. 8.4C Annual Precip. 545 mm
Max 17.8
Min 0.0
J F M A M J J A S O N D
(a) Campus Klein-Altendorf, Rheinbach (173 m).
0
10
20
30
40
50
0
20
40
60
80
100
300
C mm
WG1982−2012
Average Temp. 7.8C Annual Precip. 741 mm
Max 18.1
Min −0.9
J F M A M J J A S O N D
0
10
20
30
40
50
0
20
40
60
80
100
300
C mm
WG2011
Average Temp. 9C Annual Precip. 695 mm
Max 18.7
Min 0.2
J F M A M J J A S O N D−10
0
10
20
30
40
50
0
20
40
60
80
100
300C mm
WG2012
Average Temp. 8.8C Annual Precip. 782 mm
Max 20.1
Min −4.0
J F M A M J J A S O N D
(b) Wiesengut, Hennef (67 m).
Figure 2.1: Long-term and experimental season climate data of Campus Klein-Altendorf, Rheinbach (KA, 2011) and Wiesen-gut, Hennef (WG, 2012). Data representation according to Walter & Lieth (1960).Sources: Long-term data: www.climate-data.org. Experimental year data: on-site meteorological stations.
The crop rotation at conventional farm KA consists of barley, winter wheat and sugar beat. Mineralfertiliser application to these crops consists of UAN (solution of urea and ammonium nitrate), calciumammonium nitrate, triple phosphate and Korn-Kali® 9. After 2006 no more organic fertilisers wereapplied (before: pig slurry, on average about 10 t ha−1 per year). Barley and winter wheat each receive140 kg ha−1 N, 40 kg ha−1 P and 10 kg ha−1, while sugar beat receives 150 kg ha−1 N, 80 kg ha−1 P and20–25 kg ha−1 S. The crop preceding the KA trials was barley. After harvest, the straw stubble wasleft over winter and no winter cover crop was sown. At site WG, the crop rotation consists of a clovergrass mixture (1.5 years), potato, winter wheat, faba bean, summer wheat, winter rye and oats. Thefertilisers used are Patentkali® and rock phosphate. No regular application quantities of these fertiliserscan be cited, as both are applied to adjust the nutrient level to LUFA C. For example, Kainit was notapplied between 2003 and 2009. Nevertheless in 2010 - two years before the WG trials - a large quantityof 1000 kg ha−1 Patentkali® was applied. On the mixed farm Wiesengut cattle manure of on average17 t ha−1 per year is applied. The crop of 2010 was winter wheat, followed by a mustard green manurecrop which remained over winter. Mustard was ploughed in spring and oats was sown as a summercrop. As for site KA, the stubble was left over winter without sowing any winter cover crop.
2.1.2 Brazil
Fertiliser and natural herbicide trials in Brazil were set up in Londrina (LO 2012 & 2013), Ponta Grossa(PG, 2012 & 2013) and Umuarama: (UM 2013). In 2012 LO fertiliser trials were realised at the experimentalfarm of Londrina State University (UEL). All other trials were conducted research farms of InstitutoAgronômico do Paraná (IAPAR). The two major sites LO and PG represent the most common soil typein Paraná state, Latossolo vermelho (SiBCS) / ferralsol (WRB), and its two di�erent climate zones Cfaand Cfb, respectively (�gure 2.3 and table 2.2). The climate at site UM is classi�ed as Cfa and the soiloriginated from the cretaceous sediment arenito Caiuá, which covers 15 % of the area in Paraná (IBGE)and is classi�ed as a sandy ferralsol. This latter trial site was chosen for fertiliser trials because it was
9Korn Kali® contains: 33 % K, 3.6 % Mg and 5 % S
24
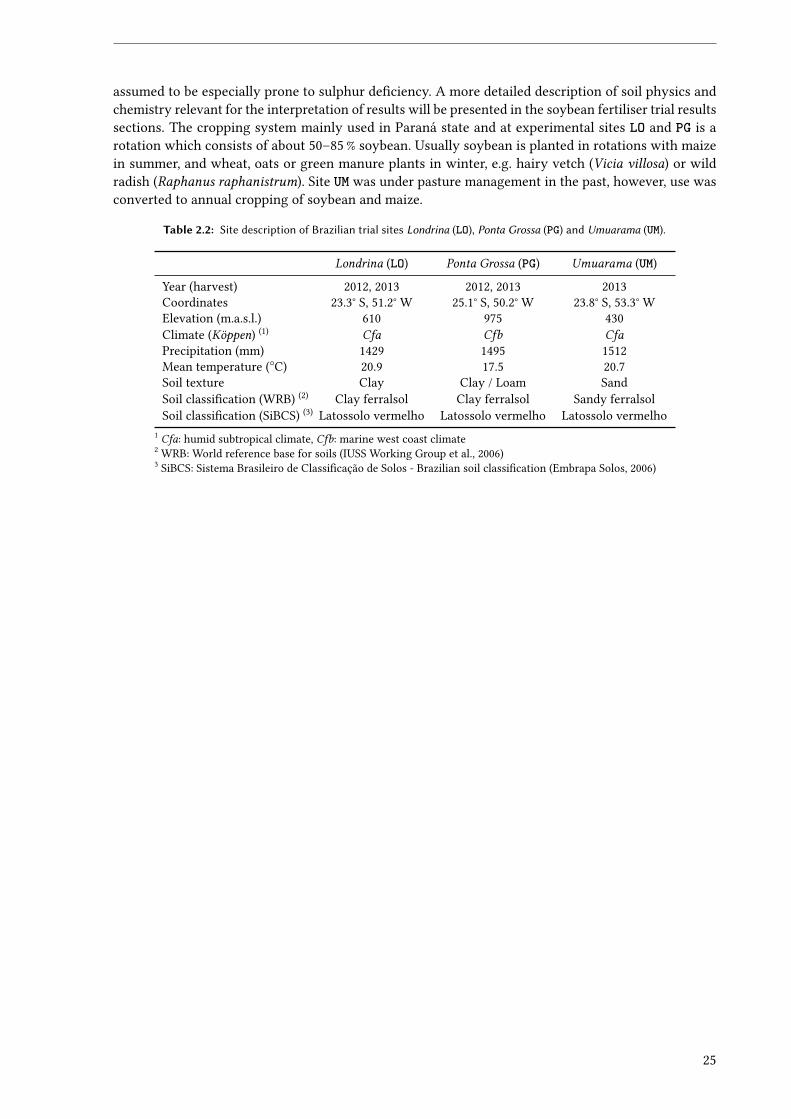
assumed to be especially prone to sulphur de�ciency. A more detailed description of soil physics andchemistry relevant for the interpretation of results will be presented in the soybean fertiliser trial resultssections. The cropping system mainly used in Paraná state and at experimental sites LO and PG is arotation which consists of about 50–85 % soybean. Usually soybean is planted in rotations with maizein summer, and wheat, oats or green manure plants in winter, e.g. hairy vetch (Vicia villosa) or wildradish (Raphanus raphanistrum). Site UM was under pasture management in the past, however, use wasconverted to annual cropping of soybean and maize.
Table 2.2: Site description of Brazilian trial sites Londrina (LO), Ponta Grossa (PG) and Umuarama (UM).
Londrina (LO) Ponta Grossa (PG) Umuarama (UM)
Year (harvest) 2012, 2013 2012, 2013 2013Coordinates 23.3° S, 51.2° W 25.1° S, 50.2° W 23.8° S, 53.3° WElevation (m.a.s.l.) 610 975 430Climate (Köppen) (1) Cfa Cfb CfaPrecipitation (mm) 1429 1495 1512Mean temperature (○C) 20.9 17.5 20.7Soil texture Clay Clay / Loam SandSoil classi�cation (WRB) (2) Clay ferralsol Clay ferralsol Sandy ferralsolSoil classi�cation (SiBCS) (3) Latossolo vermelho Latossolo vermelho Latossolo vermelho
1 Cfa: humid subtropical climate, Cfb: marine west coast climate2 WRB: World reference base for soils (IUSS Working Group et al., 2006)3 SiBCS: Sistema Brasileiro de Classi�cação de Solos - Brazilian soil classi�cation (Embrapa Solos, 2006)
25
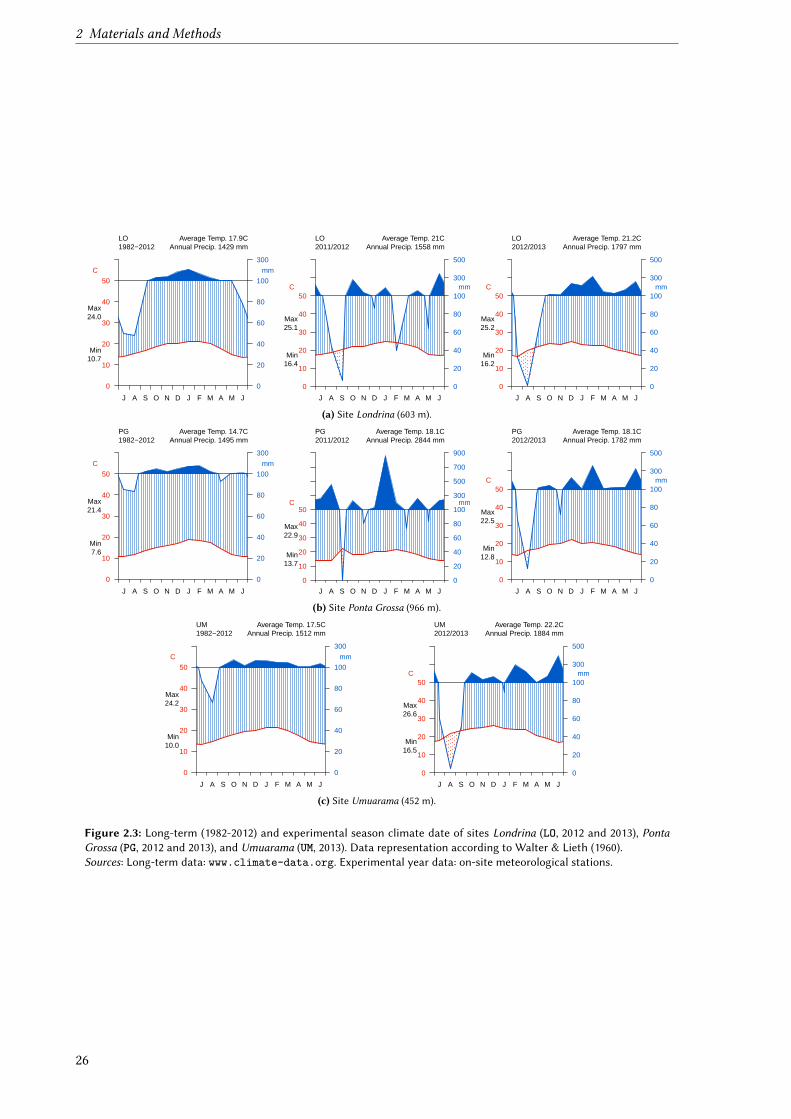
2 Materials and Methods
0
10
20
30
40
50
0
20
40
60
80
100
300
C mm
LO1982−2012
Average Temp. 17.9C Annual Precip. 1429 mm
Max 24.0
Min 10.7
J A S O N D J F M A M J
0
10
20
30
40
50
0
20
40
60
80
100
300
500
C mm
LO2011/2012
Average Temp. 21C Annual Precip. 1558 mm
Max 25.1
Min 16.4
J A S O N D J F M A M J
0
10
20
30
40
50
0
20
40
60
80
100
300
500
C mm
LO2012/2013
Average Temp. 21.2C Annual Precip. 1797 mm
Max 25.2
Min 16.2
J A S O N D J F M A M J
(a) Site Londrina (603 m).
0
10
20
30
40
50
0
20
40
60
80
100
300
C mm
PG1982−2012
Average Temp. 14.7C Annual Precip. 1495 mm
Max 21.4
Min 7.6
J A S O N D J F M A M J
0
10
20
30
40
50
0
20
40
60
80
100
300
500
700
900
C mm
PG2011/2012
Average Temp. 18.1C Annual Precip. 2844 mm
Max 22.9
Min 13.7
J A S O N D J F M A M J
0
10
20
30
40
50
0
20
40
60
80
100
300
500
C mm
PG2012/2013
Average Temp. 18.1C Annual Precip. 1782 mm
Max 22.5
Min 12.8
J A S O N D J F M A M J
(b) Site Ponta Grossa (966 m).
0
10
20
30
40
50
0
20
40
60
80
100
300
C mm
UM1982−2012
Average Temp. 17.5C Annual Precip. 1512 mm
Max 24.2
Min 10.0
J A S O N D J F M A M J
0
10
20
30
40
50
0
20
40
60
80
100
300
500
C mm
UM2012/2013
Average Temp. 22.2C Annual Precip. 1884 mm
Max 26.6
Min 16.5
J A S O N D J F M A M J
(c) Site Umuarama (452 m).
Figure 2.3: Long-term (1982-2012) and experimental season climate date of sites Londrina (LO, 2012 and 2013), PontaGrossa (PG, 2012 and 2013), and Umuarama (UM, 2013). Data representation according to Walter & Lieth (1960).Sources: Long-term data: www.climate-data.org. Experimental year data: on-site meteorological stations.
26
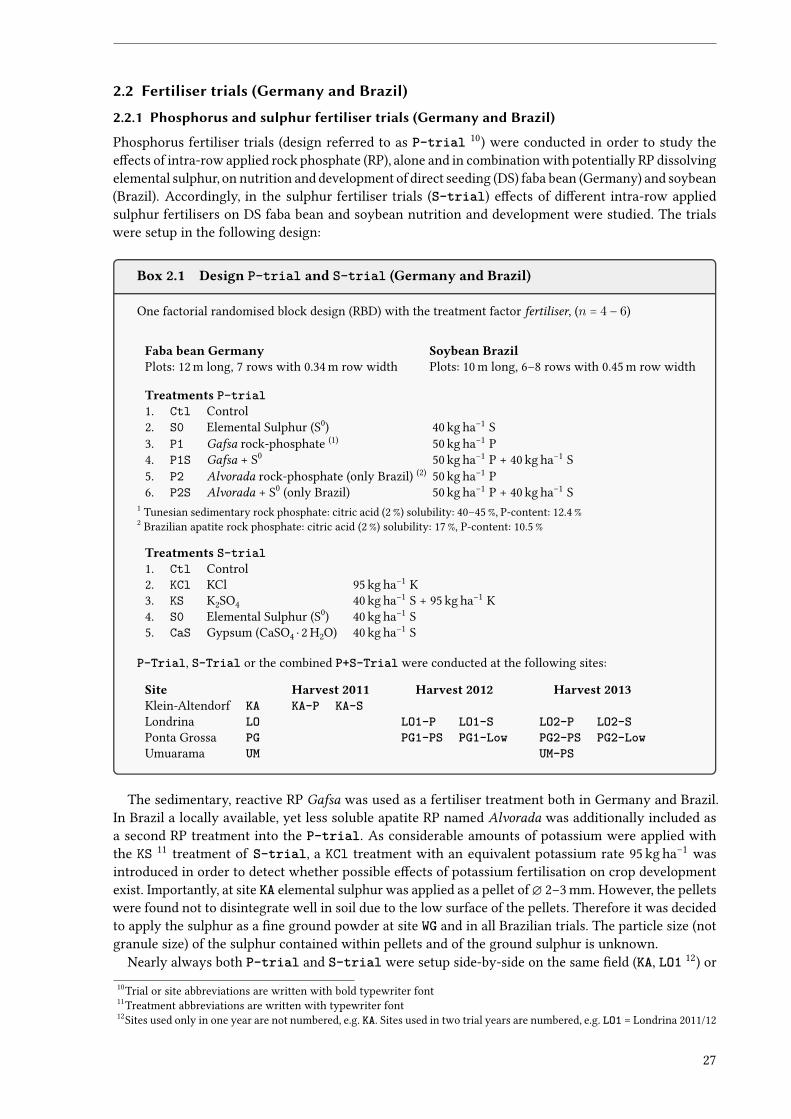
2.2 Fertiliser trials (Germany and Brazil)
2.2.1 Phosphorus and sulphur fertiliser trials (Germany and Brazil)
Phosphorus fertiliser trials (design referred to as P-trial 10) were conducted in order to study thee�ects of intra-row applied rock phosphate (RP), alone and in combination with potentially RP dissolvingelemental sulphur, on nutrition and development of direct seeding (DS) faba bean (Germany) and soybean(Brazil). Accordingly, in the sulphur fertiliser trials (S-trial) e�ects of di�erent intra-row appliedsulphur fertilisers on DS faba bean and soybean nutrition and development were studied. The trialswere setup in the following design:
Box 2.1 Design P-trial and S-trial (Germany and Brazil)
One factorial randomised block design (RBD) with the treatment factor fertiliser, (n = 4 − 6)
Faba bean Germany Soybean BrazilPlots: 12 m long, 7 rows with 0.34 m row width Plots: 10 m long, 6–8 rows with 0.45 m row width
Treatments P-trial1. Ctl Control2. S0 Elemental Sulphur (S0) 40 kg ha−1 S3. P1 Gafsa rock-phosphate (1) 50 kg ha−1 P4. P1S Gafsa + S0 50 kg ha−1 P + 40 kg ha−1 S5. P2 Alvorada rock-phosphate (only Brazil) (2) 50 kg ha−1 P6. P2S Alvorada + S0 (only Brazil) 50 kg ha−1 P + 40 kg ha−1 S
1 Tunesian sedimentary rock phosphate: citric acid (2 %) solubility: 40–45 %, P-content: 12.4 %2 Brazilian apatite rock phosphate: citric acid (2 %) solubility: 17 %, P-content: 10.5 %
Treatments S-trial1. Ctl Control2. KCl KCl 95 kg ha−1 K3. KS K2SO4 40 kg ha−1 S + 95 kg ha−1 K4. S0 Elemental Sulphur (S0) 40 kg ha−1 S5. CaS Gypsum (CaSO4 · 2 H2O) 40 kg ha−1 S
P-Trial, S-Trial or the combined P+S-Trial were conducted at the following sites:
Site Harvest 2011 Harvest 2012 Harvest 2013Klein-Altendorf KA KA-P KA-SLondrina LO LO1-P LO1-S LO2-P LO2-SPonta Grossa PG PG1-PS PG1-Low PG2-PS PG2-LowUmuarama UM UM-PS
The sedimentary, reactive RP Gafsa was used as a fertiliser treatment both in Germany and Brazil.In Brazil a locally available, yet less soluble apatite RP named Alvorada was additionally included asa second RP treatment into the P-trial. As considerable amounts of potassium were applied withthe KS 11 treatment of S-trial, a KCl treatment with an equivalent potassium rate 95 kg ha−1 wasintroduced in order to detect whether possible e�ects of potassium fertilisation on crop developmentexist. Importantly, at site KA elemental sulphur was applied as a pellet of∅ 2–3 mm. However, the pelletswere found not to disintegrate well in soil due to the low surface of the pellets. Therefore it was decidedto apply the sulphur as a �ne ground powder at site WG and in all Brazilian trials. The particle size (notgranule size) of the sulphur contained within pellets and of the ground sulphur is unknown.
Nearly always both P-trial and S-trial were setup side-by-side on the same �eld (KA, LO1 12) or10Trial or site abbreviations are written with bold typewriter font11Treatment abbreviations are written with typewriter font12Sites used only in one year are not numbered, e.g. KA. Sites used in two trial years are numbered, e.g. LO1 = Londrina 2011/12
27
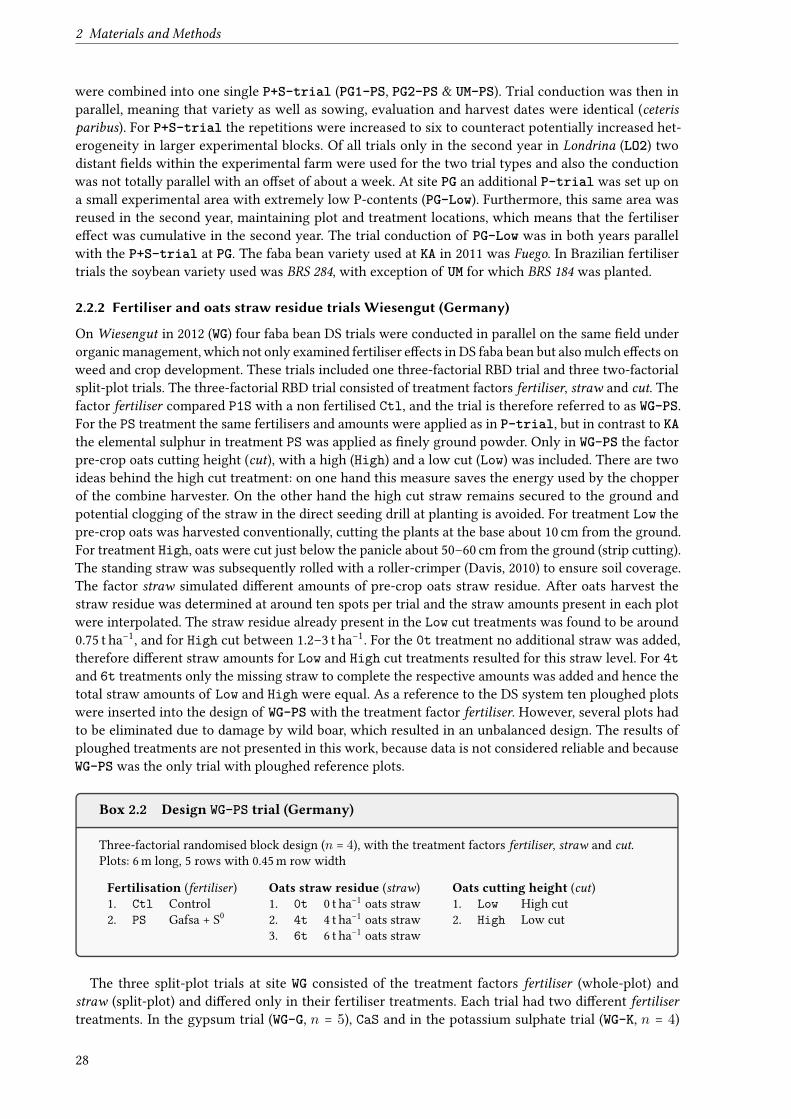
2 Materials and Methods
were combined into one single P+S-trial (PG1-PS, PG2-PS & UM-PS). Trial conduction was then inparallel, meaning that variety as well as sowing, evaluation and harvest dates were identical (ceterisparibus). For P+S-trial the repetitions were increased to six to counteract potentially increased het-erogeneity in larger experimental blocks. Of all trials only in the second year in Londrina (LO2) twodistant �elds within the experimental farm were used for the two trial types and also the conductionwas not totally parallel with an o�set of about a week. At site PG an additional P-trial was set up ona small experimental area with extremely low P-contents (PG-Low). Furthermore, this same area wasreused in the second year, maintaining plot and treatment locations, which means that the fertilisere�ect was cumulative in the second year. The trial conduction of PG-Low was in both years parallelwith the P+S-trial at PG. The faba bean variety used at KA in 2011 was Fuego. In Brazilian fertilisertrials the soybean variety used was BRS 284, with exception of UM for which BRS 184 was planted.
2.2.2 Fertiliser and oats straw residue trials Wiesengut (Germany)
On Wiesengut in 2012 (WG) four faba bean DS trials were conducted in parallel on the same �eld underorganic management, which not only examined fertiliser e�ects in DS faba bean but also mulch e�ects onweed and crop development. These trials included one three-factorial RBD trial and three two-factorialsplit-plot trials. The three-factorial RBD trial consisted of treatment factors fertiliser, straw and cut. Thefactor fertiliser compared P1S with a non fertilised Ctl, and the trial is therefore referred to as WG-PS.For the PS treatment the same fertilisers and amounts were applied as in P-trial, but in contrast to KAthe elemental sulphur in treatment PS was applied as �nely ground powder. Only in WG-PS the factorpre-crop oats cutting height (cut), with a high (High) and a low cut (Low) was included. There are twoideas behind the high cut treatment: on one hand this measure saves the energy used by the chopperof the combine harvester. On the other hand the high cut straw remains secured to the ground andpotential clogging of the straw in the direct seeding drill at planting is avoided. For treatment Low thepre-crop oats was harvested conventionally, cutting the plants at the base about 10 cm from the ground.For treatment High, oats were cut just below the panicle about 50–60 cm from the ground (strip cutting).The standing straw was subsequently rolled with a roller-crimper (Davis, 2010) to ensure soil coverage.The factor straw simulated di�erent amounts of pre-crop oats straw residue. After oats harvest thestraw residue was determined at around ten spots per trial and the straw amounts present in each plotwere interpolated. The straw residue already present in the Low cut treatments was found to be around0.75 t ha−1, and for High cut between 1.2–3 t ha−1. For the 0t treatment no additional straw was added,therefore di�erent straw amounts for Low and High cut treatments resulted for this straw level. For 4tand 6t treatments only the missing straw to complete the respective amounts was added and hence thetotal straw amounts of Low and High were equal. As a reference to the DS system ten ploughed plotswere inserted into the design of WG-PS with the treatment factor fertiliser. However, several plots hadto be eliminated due to damage by wild boar, which resulted in an unbalanced design. The results ofploughed treatments are not presented in this work, because data is not considered reliable and becauseWG-PS was the only trial with ploughed reference plots.
Box 2.2 Design WG-PS trial (Germany)
Three-factorial randomised block design (n = 4), with the treatment factors fertiliser, straw and cut.Plots: 6 m long, 5 rows with 0.45 m row width
Fertilisation (fertiliser) Oats straw residue (straw) Oats cutting height (cut)1. Ctl Control 1. 0t 0 t ha−1 oats straw 1. Low High cut2. PS Gafsa + S0 2. 4t 4 t ha−1 oats straw 2. High Low cut
3. 6t 6 t ha−1 oats straw
The three split-plot trials at site WG consisted of the treatment factors fertiliser (whole-plot) andstraw (split-plot) and di�ered only in their fertiliser treatments. Each trial had two di�erent fertilisertreatments. In the gypsum trial (WG-G, n = 5), CaS and in the potassium sulphate trial (WG-K, n = 4)
28
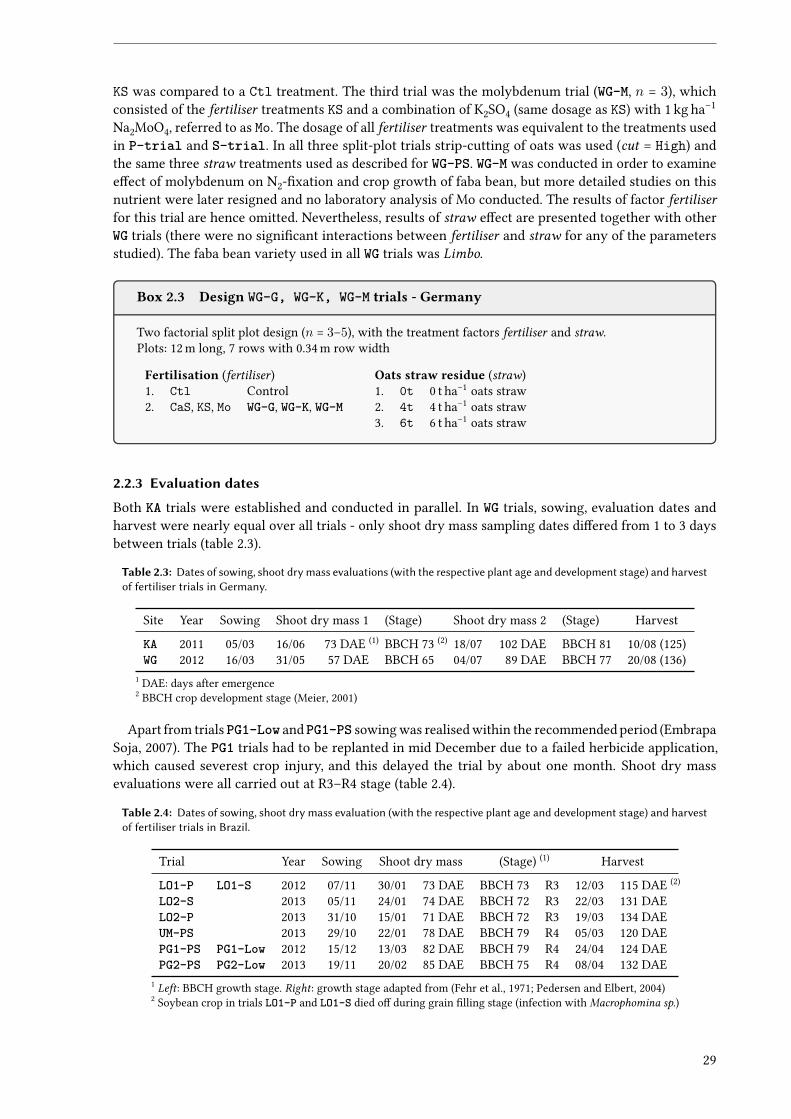
KS was compared to a Ctl treatment. The third trial was the molybdenum trial (WG-M, n = 3), whichconsisted of the fertiliser treatments KS and a combination of K2SO4 (same dosage as KS) with 1 kg ha−1
Na2MoO4, referred to as Mo. The dosage of all fertiliser treatments was equivalent to the treatments usedin P-trial and S-trial. In all three split-plot trials strip-cutting of oats was used (cut = High) andthe same three straw treatments used as described for WG-PS. WG-M was conducted in order to examinee�ect of molybdenum on N2-�xation and crop growth of faba bean, but more detailed studies on thisnutrient were later resigned and no laboratory analysis of Mo conducted. The results of factor fertiliserfor this trial are hence omitted. Nevertheless, results of straw e�ect are presented together with otherWG trials (there were no signi�cant interactions between fertiliser and straw for any of the parametersstudied). The faba bean variety used in all WG trials was Limbo.
Box 2.3 Design WG-G, WG-K, WG-M trials - Germany
Two factorial split plot design (n = 3–5), with the treatment factors fertiliser and straw.Plots: 12 m long, 7 rows with 0.34 m row width
Fertilisation (fertiliser) Oats straw residue (straw)1. Ctl Control 1. 0t 0 t ha−1 oats straw2. CaS, KS, Mo WG-G, WG-K, WG-M 2. 4t 4 t ha−1 oats straw
3. 6t 6 t ha−1 oats straw
2.2.3 Evaluation dates
Both KA trials were established and conducted in parallel. In WG trials, sowing, evaluation dates andharvest were nearly equal over all trials - only shoot dry mass sampling dates di�ered from 1 to 3 daysbetween trials (table 2.3).
Table 2.3: Dates of sowing, shoot dry mass evaluations (with the respective plant age and development stage) and harvestof fertiliser trials in Germany.
Site Year Sowing Shoot dry mass 1 (Stage) Shoot dry mass 2 (Stage) Harvest
KA 2011 05/03 16/06 73 DAE (1) BBCH 73 (2) 18/07 102 DAE BBCH 81 10/08 (125)WG 2012 16/03 31/05 57 DAE BBCH 65 04/07 89 DAE BBCH 77 20/08 (136)
1 DAE: days after emergence2 BBCH crop development stage (Meier, 2001)
Apart from trials PG1-Low and PG1-PS sowing was realised within the recommended period (EmbrapaSoja, 2007). The PG1 trials had to be replanted in mid December due to a failed herbicide application,which caused severest crop injury, and this delayed the trial by about one month. Shoot dry massevaluations were all carried out at R3–R4 stage (table 2.4).
Table 2.4: Dates of sowing, shoot dry mass evaluation (with the respective plant age and development stage) and harvestof fertiliser trials in Brazil.
Trial Year Sowing Shoot dry mass (Stage) (1) Harvest
LO1-P LO1-S 2012 07/11 30/01 73 DAE BBCH 73 R3 12/03 115 DAE (2)
LO2-S 2013 05/11 24/01 74 DAE BBCH 72 R3 22/03 131 DAELO2-P 2013 31/10 15/01 71 DAE BBCH 72 R3 19/03 134 DAEUM-PS 2013 29/10 22/01 78 DAE BBCH 79 R4 05/03 120 DAEPG1-PS PG1-Low 2012 15/12 13/03 82 DAE BBCH 79 R4 24/04 124 DAEPG2-PS PG2-Low 2013 19/11 20/02 85 DAE BBCH 75 R4 08/04 132 DAE
1 Left: BBCH growth stage. Right: growth stage adapted from (Fehr et al., 1971; Pedersen and Elbert, 2004)2 Soybean crop in trials LO1-P and LO1-S died o� during grain �lling stage (infection with Macrophomina sp.)
29
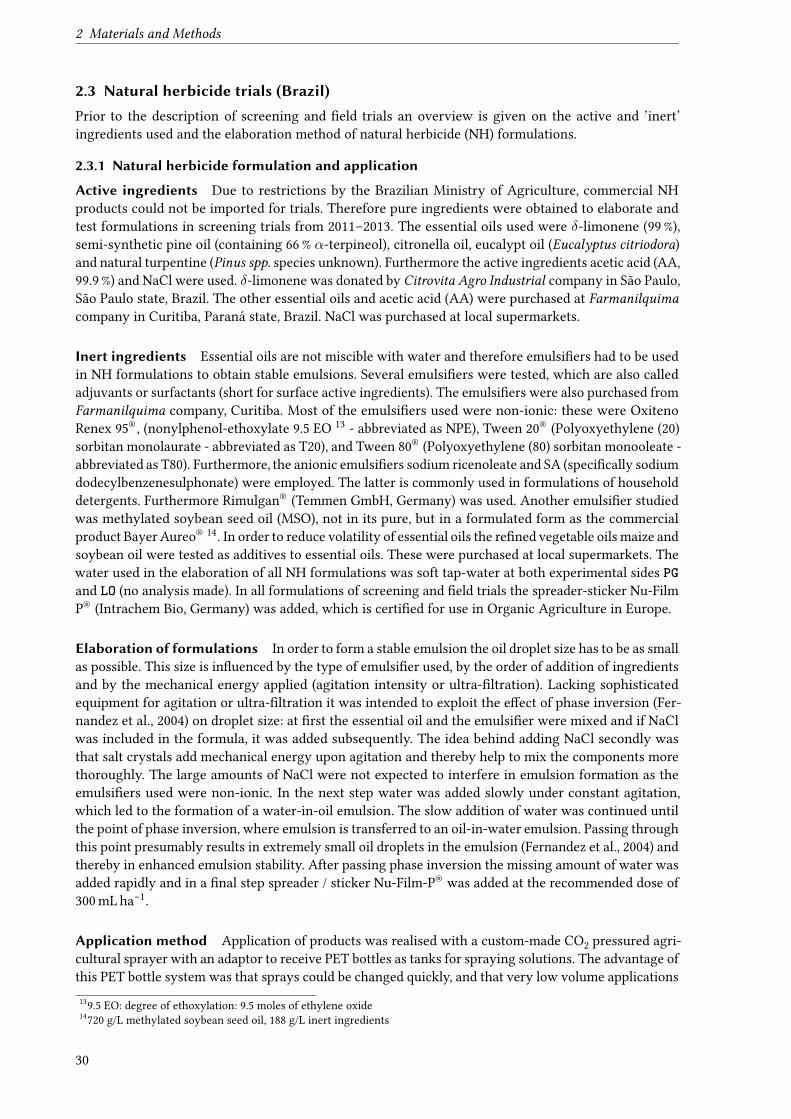
2 Materials and Methods
2.3 Natural herbicide trials (Brazil)Prior to the description of screening and �eld trials an overview is given on the active and ’inert’ingredients used and the elaboration method of natural herbicide (NH) formulations.
2.3.1 Natural herbicide formulation and application
Active ingredients Due to restrictions by the Brazilian Ministry of Agriculture, commercial NHproducts could not be imported for trials. Therefore pure ingredients were obtained to elaborate andtest formulations in screening trials from 2011–2013. The essential oils used were δ-limonene (99 %),semi-synthetic pine oil (containing 66 % α-terpineol), citronella oil, eucalypt oil (Eucalyptus citriodora)and natural turpentine (Pinus spp. species unknown). Furthermore the active ingredients acetic acid (AA,99.9 %) and NaCl were used. δ-limonene was donated by Citrovita Agro Industrial company in São Paulo,São Paulo state, Brazil. The other essential oils and acetic acid (AA) were purchased at Farmanilquimacompany in Curitiba, Paraná state, Brazil. NaCl was purchased at local supermarkets.
Inert ingredients Essential oils are not miscible with water and therefore emulsi�ers had to be usedin NH formulations to obtain stable emulsions. Several emulsi�ers were tested, which are also calledadjuvants or surfactants (short for surface active ingredients). The emulsi�ers were also purchased fromFarmanilquima company, Curitiba. Most of the emulsi�ers used were non-ionic: these were OxitenoRenex 95®, (nonylphenol-ethoxylate 9.5 EO 13 - abbreviated as NPE), Tween 20® (Polyoxyethylene (20)sorbitan monolaurate - abbreviated as T20), and Tween 80® (Polyoxyethylene (80) sorbitan monooleate -abbreviated as T80). Furthermore, the anionic emulsi�ers sodium ricenoleate and SA (speci�cally sodiumdodecylbenzenesulphonate) were employed. The latter is commonly used in formulations of householddetergents. Furthermore Rimulgan® (Temmen GmbH, Germany) was used. Another emulsi�er studiedwas methylated soybean seed oil (MSO), not in its pure, but in a formulated form as the commercialproduct Bayer Aureo® 14. In order to reduce volatility of essential oils the re�ned vegetable oils maize andsoybean oil were tested as additives to essential oils. These were purchased at local supermarkets. Thewater used in the elaboration of all NH formulations was soft tap-water at both experimental sides PGand LO (no analysis made). In all formulations of screening and �eld trials the spreader-sticker Nu-FilmP® (Intrachem Bio, Germany) was added, which is certi�ed for use in Organic Agriculture in Europe.
Elaboration of formulations In order to form a stable emulsion the oil droplet size has to be as smallas possible. This size is in�uenced by the type of emulsi�er used, by the order of addition of ingredientsand by the mechanical energy applied (agitation intensity or ultra-�ltration). Lacking sophisticatedequipment for agitation or ultra-�ltration it was intended to exploit the e�ect of phase inversion (Fer-nandez et al., 2004) on droplet size: at �rst the essential oil and the emulsi�er were mixed and if NaClwas included in the formula, it was added subsequently. The idea behind adding NaCl secondly wasthat salt crystals add mechanical energy upon agitation and thereby help to mix the components morethoroughly. The large amounts of NaCl were not expected to interfere in emulsion formation as theemulsi�ers used were non-ionic. In the next step water was added slowly under constant agitation,which led to the formation of a water-in-oil emulsion. The slow addition of water was continued untilthe point of phase inversion, where emulsion is transferred to an oil-in-water emulsion. Passing throughthis point presumably results in extremely small oil droplets in the emulsion (Fernandez et al., 2004) andthereby in enhanced emulsion stability. After passing phase inversion the missing amount of water wasadded rapidly and in a �nal step spreader / sticker Nu-Film-P® was added at the recommended dose of300 mL ha−1.
Application method Application of products was realised with a custom-made CO2 pressured agri-cultural sprayer with an adaptor to receive PET bottles as tanks for spraying solutions. The advantage ofthis PET bottle system was that sprays could be changed quickly, and that very low volume applications139.5 EO: degree of ethoxylation: 9.5 moles of ethylene oxide14720 g/L methylated soybean seed oil, 188 g/L inert ingredients
30
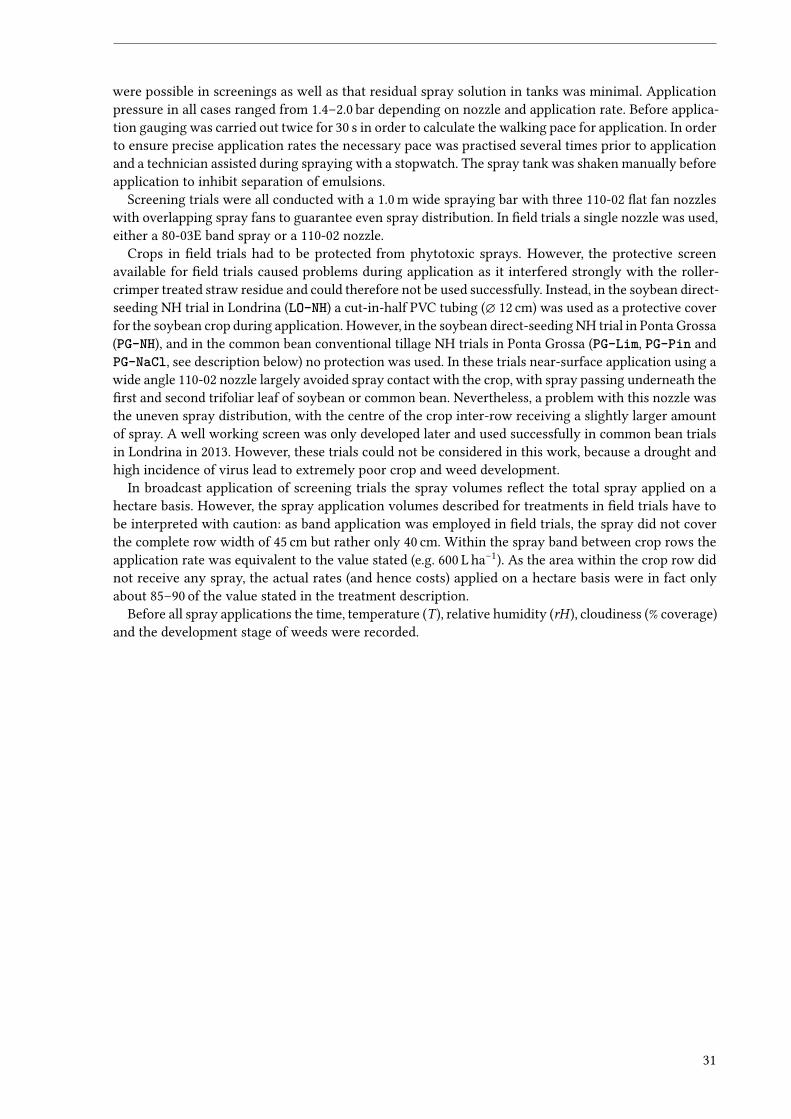
were possible in screenings as well as that residual spray solution in tanks was minimal. Applicationpressure in all cases ranged from 1.4–2.0 bar depending on nozzle and application rate. Before applica-tion gauging was carried out twice for 30 s in order to calculate the walking pace for application. In orderto ensure precise application rates the necessary pace was practised several times prior to applicationand a technician assisted during spraying with a stopwatch. The spray tank was shaken manually beforeapplication to inhibit separation of emulsions.
Screening trials were all conducted with a 1.0 m wide spraying bar with three 110-02 �at fan nozzleswith overlapping spray fans to guarantee even spray distribution. In �eld trials a single nozzle was used,either a 80-03E band spray or a 110-02 nozzle.
Crops in �eld trials had to be protected from phytotoxic sprays. However, the protective screenavailable for �eld trials caused problems during application as it interfered strongly with the roller-crimper treated straw residue and could therefore not be used successfully. Instead, in the soybean direct-seeding NH trial in Londrina (LO-NH) a cut-in-half PVC tubing (∅ 12 cm) was used as a protective coverfor the soybean crop during application. However, in the soybean direct-seeding NH trial in Ponta Grossa(PG-NH), and in the common bean conventional tillage NH trials in Ponta Grossa (PG-Lim, PG-Pin andPG-NaCl, see description below) no protection was used. In these trials near-surface application using awide angle 110-02 nozzle largely avoided spray contact with the crop, with spray passing underneath the�rst and second trifoliar leaf of soybean or common bean. Nevertheless, a problem with this nozzle wasthe uneven spray distribution, with the centre of the crop inter-row receiving a slightly larger amountof spray. A well working screen was only developed later and used successfully in common bean trialsin Londrina in 2013. However, these trials could not be considered in this work, because a drought andhigh incidence of virus lead to extremely poor crop and weed development.
In broadcast application of screening trials the spray volumes re�ect the total spray applied on ahectare basis. However, the spray application volumes described for treatments in �eld trials have tobe interpreted with caution: as band application was employed in �eld trials, the spray did not coverthe complete row width of 45 cm but rather only 40 cm. Within the spray band between crop rows theapplication rate was equivalent to the value stated (e.g. 600 L ha−1). As the area within the crop row didnot receive any spray, the actual rates (and hence costs) applied on a hectare basis were in fact onlyabout 85–90 of the value stated in the treatment description.
Before all spray applications the time, temperature (T ), relative humidity (rH ), cloudiness (% coverage)and the development stage of weeds were recorded.
31
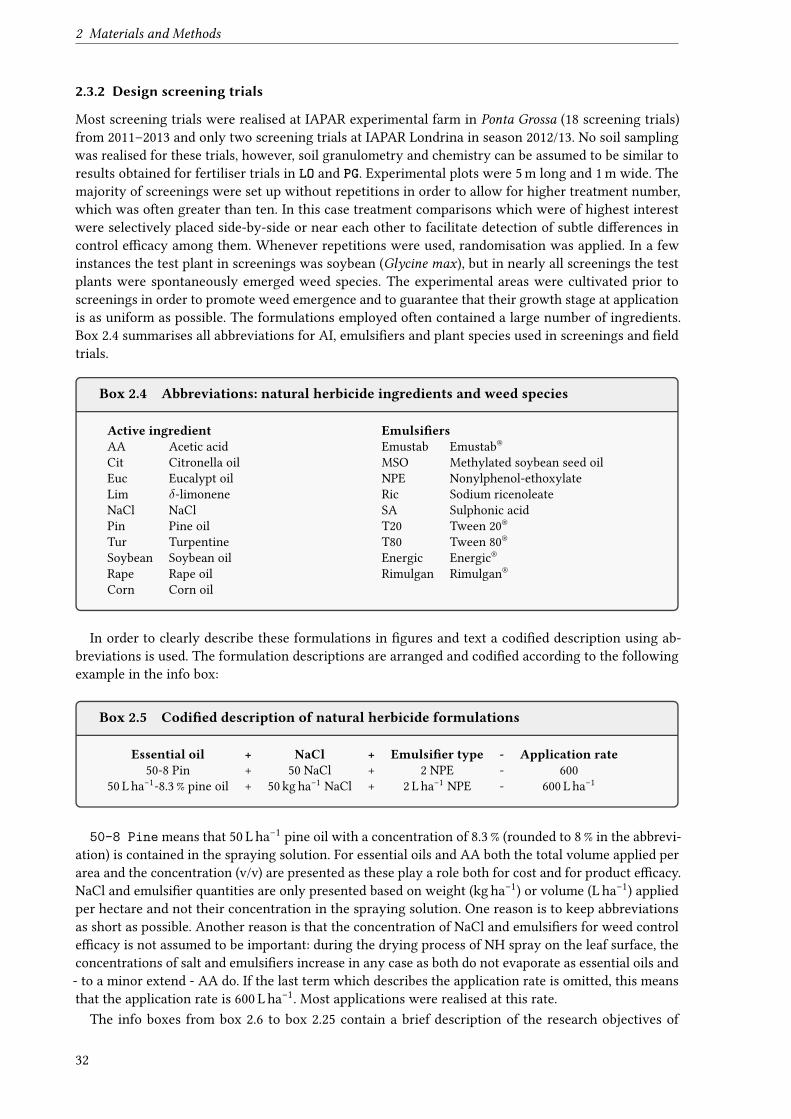
2 Materials and Methods
2.3.2 Design screening trials
Most screening trials were realised at IAPAR experimental farm in Ponta Grossa (18 screening trials)from 2011–2013 and only two screening trials at IAPAR Londrina in season 2012/13. No soil samplingwas realised for these trials, however, soil granulometry and chemistry can be assumed to be similar toresults obtained for fertiliser trials in LO and PG. Experimental plots were 5 m long and 1 m wide. Themajority of screenings were set up without repetitions in order to allow for higher treatment number,which was often greater than ten. In this case treatment comparisons which were of highest interestwere selectively placed side-by-side or near each other to facilitate detection of subtle di�erences incontrol e�cacy among them. Whenever repetitions were used, randomisation was applied. In a fewinstances the test plant in screenings was soybean (Glycine max), but in nearly all screenings the testplants were spontaneously emerged weed species. The experimental areas were cultivated prior toscreenings in order to promote weed emergence and to guarantee that their growth stage at applicationis as uniform as possible. The formulations employed often contained a large number of ingredients.Box 2.4 summarises all abbreviations for AI, emulsi�ers and plant species used in screenings and �eldtrials.
Box 2.4 Abbreviations: natural herbicide ingredients and weed species
Active ingredient Emulsi�ersAA Acetic acid Emustab Emustab®Cit Citronella oil MSO Methylated soybean seed oilEuc Eucalypt oil NPE Nonylphenol-ethoxylateLim δ-limonene Ric Sodium ricenoleateNaCl NaCl SA Sulphonic acidPin Pine oil T20 Tween 20®Tur Turpentine T80 Tween 80®Soybean Soybean oil Energic Energic®Rape Rape oil Rimulgan Rimulgan®
Corn Corn oil
In order to clearly describe these formulations in �gures and text a codi�ed description using ab-breviations is used. The formulation descriptions are arranged and codi�ed according to the followingexample in the info box:
Box 2.5 Codi�ed description of natural herbicide formulations
Essential oil + NaCl + Emulsi�er type - Application rate50-8 Pin + 50 NaCl + 2 NPE - 600
50 L ha−1-8.3 % pine oil + 50 kg ha−1 NaCl + 2 L ha−1 NPE - 600 L ha−1
50-8 Pine means that 50 L ha−1 pine oil with a concentration of 8.3 % (rounded to 8 % in the abbrevi-ation) is contained in the spraying solution. For essential oils and AA both the total volume applied perarea and the concentration (v/v) are presented as these play a role both for cost and for product e�cacy.NaCl and emulsi�er quantities are only presented based on weight (kg ha−1) or volume (L ha−1) appliedper hectare and not their concentration in the spraying solution. One reason is to keep abbreviationsas short as possible. Another reason is that the concentration of NaCl and emulsi�ers for weed controle�cacy is not assumed to be important: during the drying process of NH spray on the leaf surface, theconcentrations of salt and emulsi�ers increase in any case as both do not evaporate as essential oils and- to a minor extend - AA do. If the last term which describes the application rate is omitted, this meansthat the application rate is 600 L ha−1. Most applications were realised at this rate.
The info boxes from box 2.6 to box 2.25 contain a brief description of the research objectives of
32
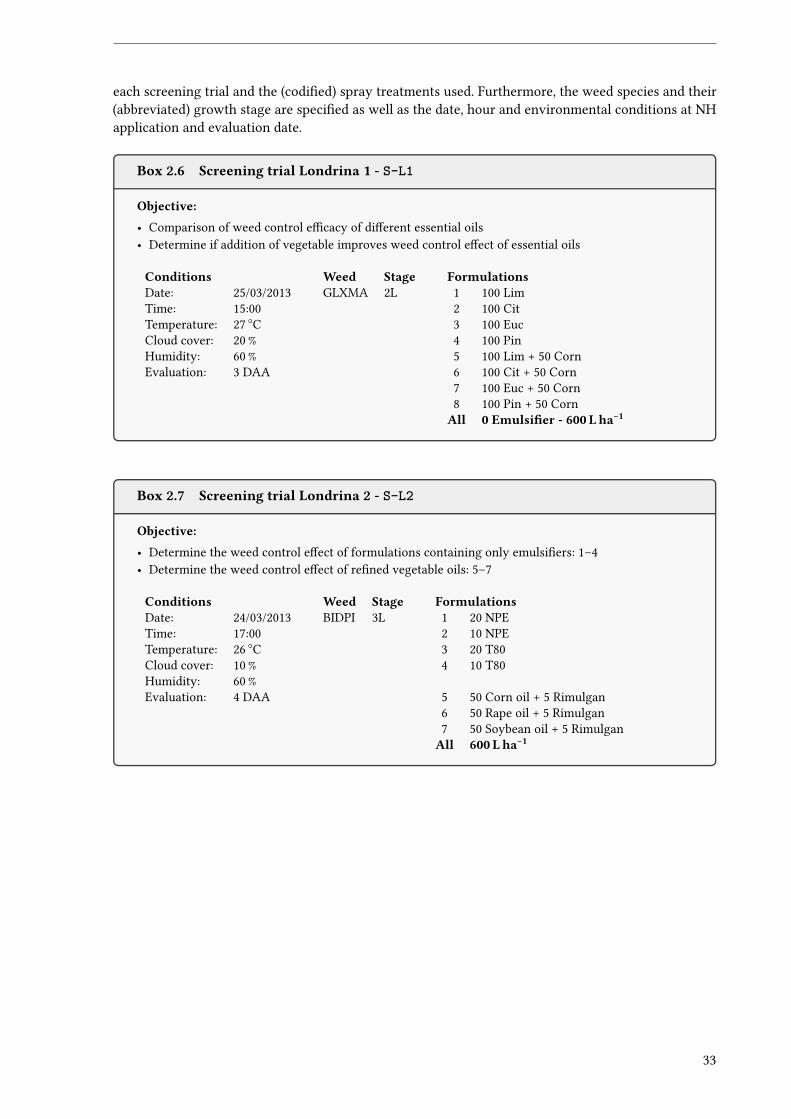
each screening trial and the (codi�ed) spray treatments used. Furthermore, the weed species and their(abbreviated) growth stage are speci�ed as well as the date, hour and environmental conditions at NHapplication and evaluation date.
Box 2.6 Screening trial Londrina 1 - S-L1
Objective:• Comparison of weed control e�cacy of di�erent essential oils• Determine if addition of vegetable improves weed control e�ect of essential oils
Conditions Weed Stage FormulationsDate: 25/03/2013 GLXMA 2L 1 100 LimTime: 15:00 2 100 CitTemperature: 27 ○C 3 100 EucCloud cover: 20 % 4 100 PinHumidity: 60 % 5 100 Lim + 50 CornEvaluation: 3 DAA 6 100 Cit + 50 Corn
7 100 Euc + 50 Corn8 100 Pin + 50 CornAll 0 Emulsi�er - 600 Lha−1
Box 2.7 Screening trial Londrina 2 - S-L2
Objective:• Determine the weed control e�ect of formulations containing only emulsi�ers: 1–4• Determine the weed control e�ect of re�ned vegetable oils: 5–7
Conditions Weed Stage FormulationsDate: 24/03/2013 BIDPI 3L 1 20 NPETime: 17:00 2 10 NPETemperature: 26 ○C 3 20 T80Cloud cover: 10 % 4 10 T80Humidity: 60 %Evaluation: 4 DAA 5 50 Corn oil + 5 Rimulgan
6 50 Rape oil + 5 Rimulgan7 50 Soybean oil + 5 RimulganAll 600 Lha−1
33
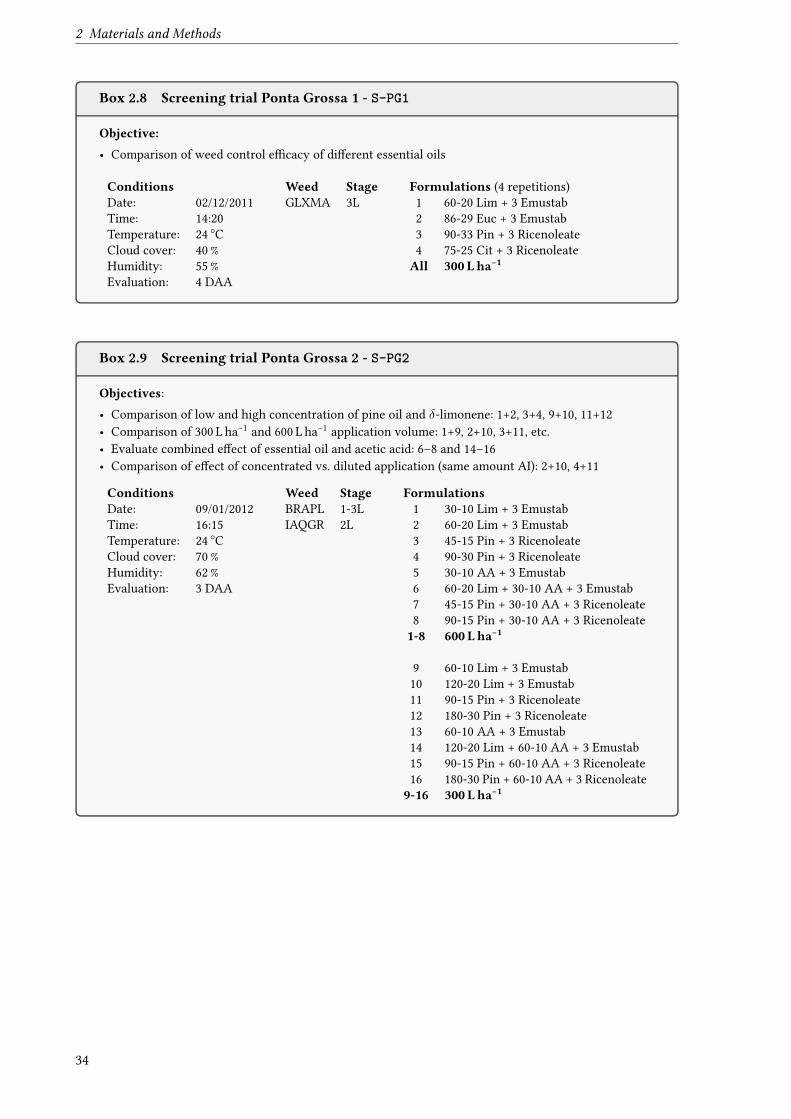
2 Materials and Methods
Box 2.8 Screening trial Ponta Grossa 1 - S-PG1
Objective:• Comparison of weed control e�cacy of di�erent essential oils
Conditions Weed Stage Formulations (4 repetitions)Date: 02/12/2011 GLXMA 3L 1 60-20 Lim + 3 EmustabTime: 14:20 2 86-29 Euc + 3 EmustabTemperature: 24 ○C 3 90-33 Pin + 3 RicenoleateCloud cover: 40 % 4 75-25 Cit + 3 RicenoleateHumidity: 55 % All 300 Lha−1Evaluation: 4 DAA
Box 2.9 Screening trial Ponta Grossa 2 - S-PG2
Objectives:• Comparison of low and high concentration of pine oil and δ-limonene: 1+2, 3+4, 9+10, 11+12• Comparison of 300 L ha−1 and 600 L ha−1 application volume: 1+9, 2+10, 3+11, etc.• Evaluate combined e�ect of essential oil and acetic acid: 6–8 and 14–16• Comparison of e�ect of concentrated vs. diluted application (same amount AI): 2+10, 4+11
Conditions Weed Stage FormulationsDate: 09/01/2012 BRAPL 1-3L 1 30-10 Lim + 3 EmustabTime: 16:15 IAQGR 2L 2 60-20 Lim + 3 EmustabTemperature: 24 ○C 3 45-15 Pin + 3 RicenoleateCloud cover: 70 % 4 90-30 Pin + 3 RicenoleateHumidity: 62 % 5 30-10 AA + 3 EmustabEvaluation: 3 DAA 6 60-20 Lim + 30-10 AA + 3 Emustab
7 45-15 Pin + 30-10 AA + 3 Ricenoleate8 90-15 Pin + 30-10 AA + 3 Ricenoleate1-8 600 Lha−1
9 60-10 Lim + 3 Emustab10 120-20 Lim + 3 Emustab11 90-15 Pin + 3 Ricenoleate12 180-30 Pin + 3 Ricenoleate13 60-10 AA + 3 Emustab14 120-20 Lim + 60-10 AA + 3 Emustab15 90-15 Pin + 60-10 AA + 3 Ricenoleate16 180-30 Pin + 60-10 AA + 3 Ricenoleate9-16 300 Lha−1
34
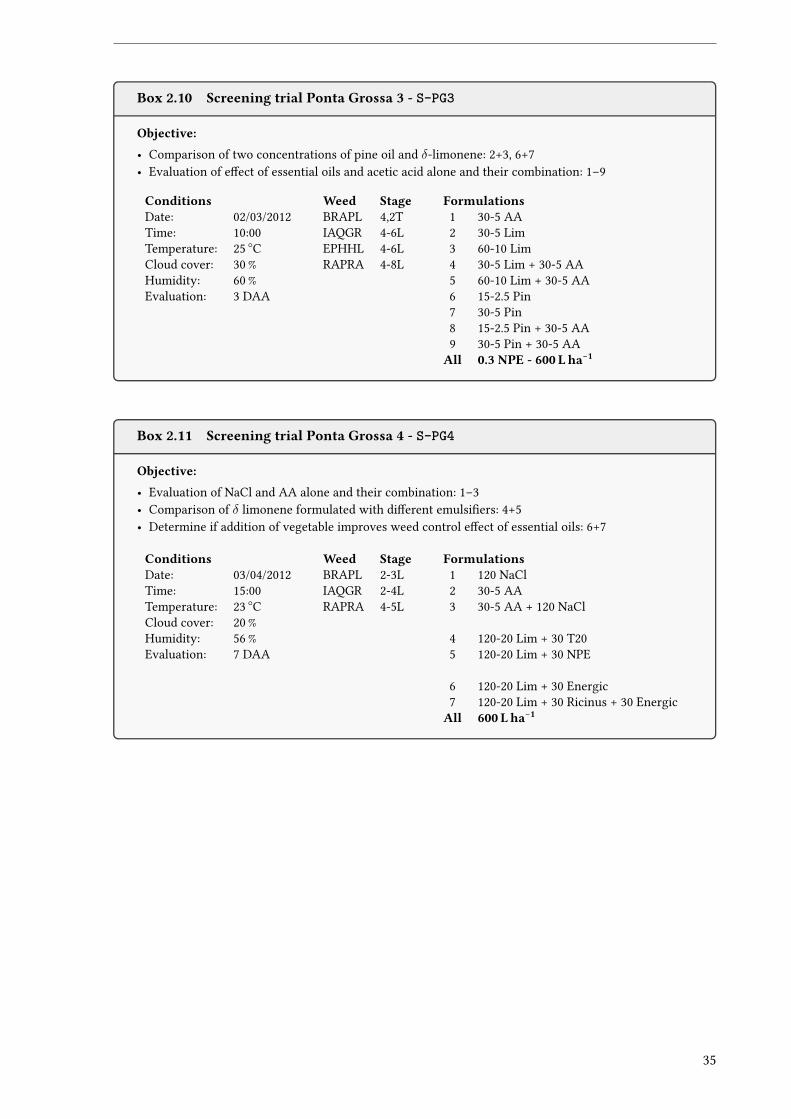
Box 2.10 Screening trial Ponta Grossa 3 - S-PG3
Objective:• Comparison of two concentrations of pine oil and δ-limonene: 2+3, 6+7• Evaluation of e�ect of essential oils and acetic acid alone and their combination: 1–9
Conditions Weed Stage FormulationsDate: 02/03/2012 BRAPL 4,2T 1 30-5 AATime: 10:00 IAQGR 4-6L 2 30-5 LimTemperature: 25 ○C EPHHL 4-6L 3 60-10 LimCloud cover: 30 % RAPRA 4-8L 4 30-5 Lim + 30-5 AAHumidity: 60 % 5 60-10 Lim + 30-5 AAEvaluation: 3 DAA 6 15-2.5 Pin
7 30-5 Pin8 15-2.5 Pin + 30-5 AA9 30-5 Pin + 30-5 AAAll 0.3 NPE - 600 Lha−1
Box 2.11 Screening trial Ponta Grossa 4 - S-PG4
Objective:• Evaluation of NaCl and AA alone and their combination: 1–3• Comparison of δ limonene formulated with di�erent emulsi�ers: 4+5• Determine if addition of vegetable improves weed control e�ect of essential oils: 6+7
Conditions Weed Stage FormulationsDate: 03/04/2012 BRAPL 2-3L 1 120 NaClTime: 15:00 IAQGR 2-4L 2 30-5 AATemperature: 23 ○C RAPRA 4-5L 3 30-5 AA + 120 NaClCloud cover: 20 %Humidity: 56 % 4 120-20 Lim + 30 T20Evaluation: 7 DAA 5 120-20 Lim + 30 NPE
6 120-20 Lim + 30 Energic7 120-20 Lim + 30 Ricinus + 30 EnergicAll 600 Lha−1
35
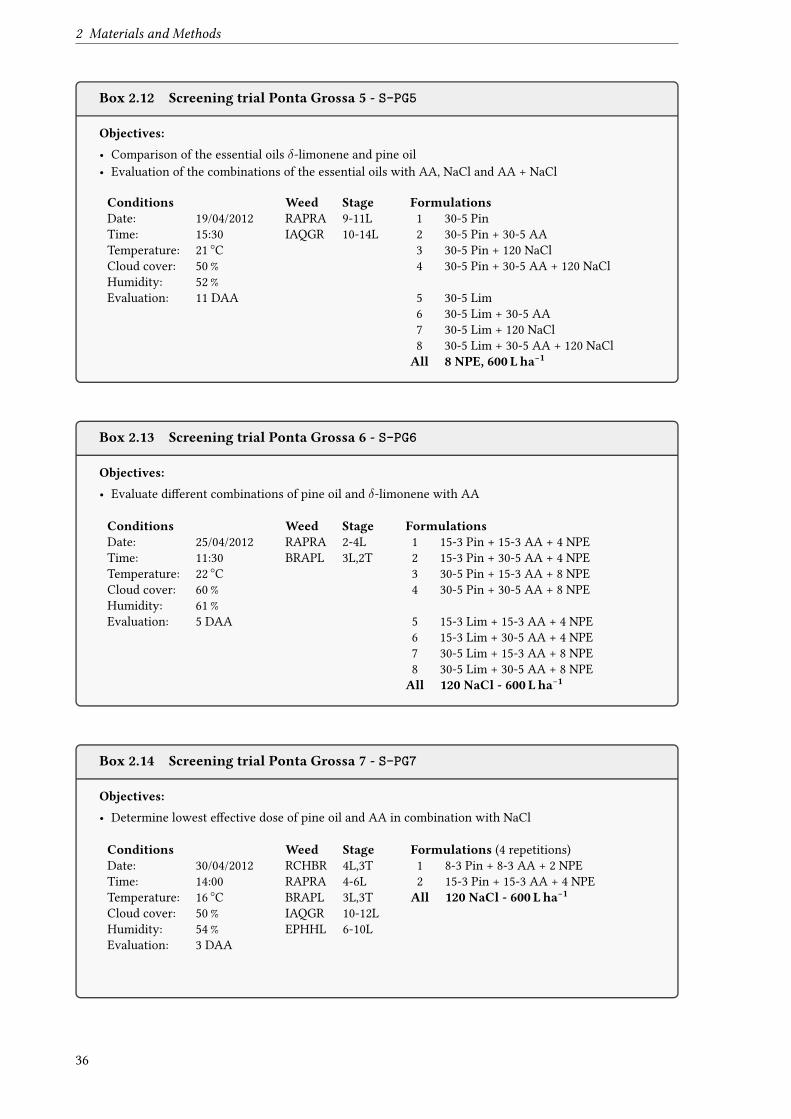
2 Materials and Methods
Box 2.12 Screening trial Ponta Grossa 5 - S-PG5
Objectives:• Comparison of the essential oils δ-limonene and pine oil• Evaluation of the combinations of the essential oils with AA, NaCl and AA + NaCl
Conditions Weed Stage FormulationsDate: 19/04/2012 RAPRA 9-11L 1 30-5 PinTime: 15:30 IAQGR 10-14L 2 30-5 Pin + 30-5 AATemperature: 21 ○C 3 30-5 Pin + 120 NaClCloud cover: 50 % 4 30-5 Pin + 30-5 AA + 120 NaClHumidity: 52 %Evaluation: 11 DAA 5 30-5 Lim
6 30-5 Lim + 30-5 AA7 30-5 Lim + 120 NaCl8 30-5 Lim + 30-5 AA + 120 NaClAll 8 NPE, 600 Lha−1
Box 2.13 Screening trial Ponta Grossa 6 - S-PG6
Objectives:• Evaluate di�erent combinations of pine oil and δ-limonene with AA
Conditions Weed Stage FormulationsDate: 25/04/2012 RAPRA 2-4L 1 15-3 Pin + 15-3 AA + 4 NPETime: 11:30 BRAPL 3L,2T 2 15-3 Pin + 30-5 AA + 4 NPETemperature: 22 ○C 3 30-5 Pin + 15-3 AA + 8 NPECloud cover: 60 % 4 30-5 Pin + 30-5 AA + 8 NPEHumidity: 61 %Evaluation: 5 DAA 5 15-3 Lim + 15-3 AA + 4 NPE
6 15-3 Lim + 30-5 AA + 4 NPE7 30-5 Lim + 15-3 AA + 8 NPE8 30-5 Lim + 30-5 AA + 8 NPEAll 120 NaCl - 600 Lha−1
Box 2.14 Screening trial Ponta Grossa 7 - S-PG7
Objectives:• Determine lowest e�ective dose of pine oil and AA in combination with NaCl
Conditions Weed Stage Formulations (4 repetitions)Date: 30/04/2012 RCHBR 4L,3T 1 8-3 Pin + 8-3 AA + 2 NPETime: 14:00 RAPRA 4-6L 2 15-3 Pin + 15-3 AA + 4 NPETemperature: 16 ○C BRAPL 3L,3T All 120 NaCl - 600 Lha−1Cloud cover: 50 % IAQGR 10-12LHumidity: 54 % EPHHL 6-10LEvaluation: 3 DAA
36
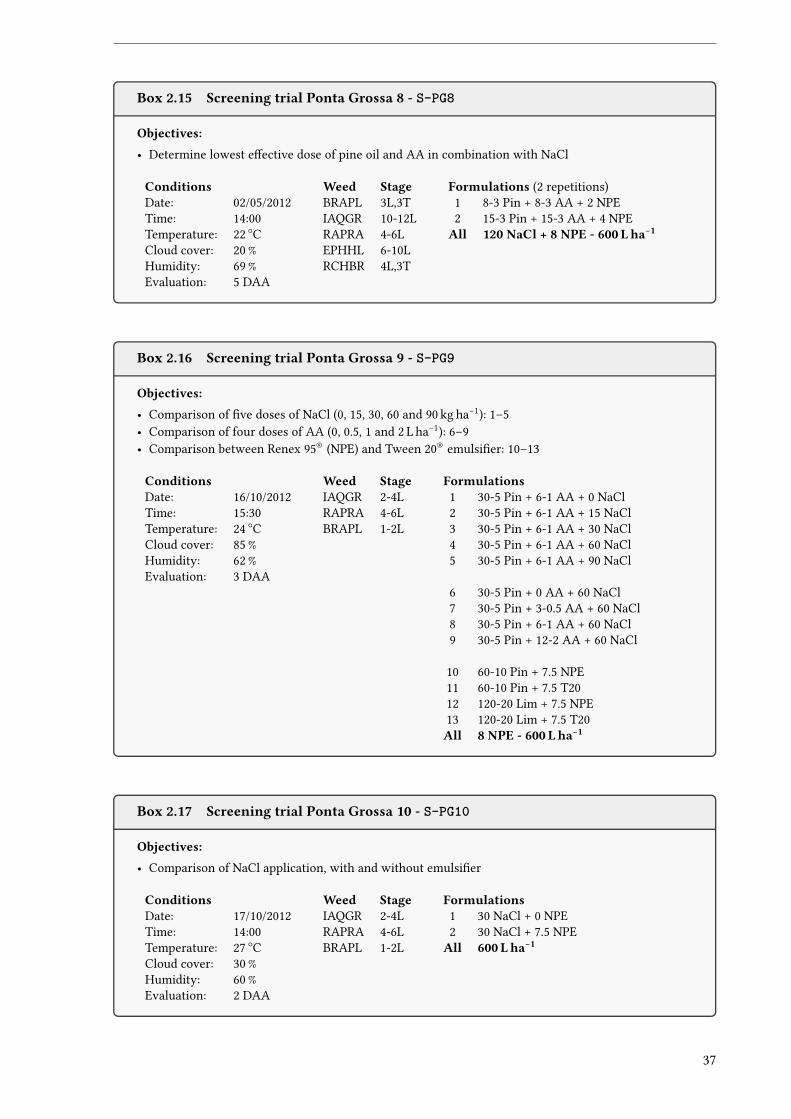
Box 2.15 Screening trial Ponta Grossa 8 - S-PG8
Objectives:• Determine lowest e�ective dose of pine oil and AA in combination with NaCl
Conditions Weed Stage Formulations (2 repetitions)Date: 02/05/2012 BRAPL 3L,3T 1 8-3 Pin + 8-3 AA + 2 NPETime: 14:00 IAQGR 10-12L 2 15-3 Pin + 15-3 AA + 4 NPETemperature: 22 ○C RAPRA 4-6L All 120 NaCl + 8 NPE - 600 Lha−1Cloud cover: 20 % EPHHL 6-10LHumidity: 69 % RCHBR 4L,3TEvaluation: 5 DAA
Box 2.16 Screening trial Ponta Grossa 9 - S-PG9
Objectives:• Comparison of �ve doses of NaCl (0, 15, 30, 60 and 90 kg ha−1): 1–5• Comparison of four doses of AA (0, 0.5, 1 and 2 L ha−1): 6–9• Comparison between Renex 95® (NPE) and Tween 20® emulsi�er: 10–13
Conditions Weed Stage FormulationsDate: 16/10/2012 IAQGR 2-4L 1 30-5 Pin + 6-1 AA + 0 NaClTime: 15:30 RAPRA 4-6L 2 30-5 Pin + 6-1 AA + 15 NaClTemperature: 24 ○C BRAPL 1-2L 3 30-5 Pin + 6-1 AA + 30 NaClCloud cover: 85 % 4 30-5 Pin + 6-1 AA + 60 NaClHumidity: 62 % 5 30-5 Pin + 6-1 AA + 90 NaClEvaluation: 3 DAA
6 30-5 Pin + 0 AA + 60 NaCl7 30-5 Pin + 3-0.5 AA + 60 NaCl8 30-5 Pin + 6-1 AA + 60 NaCl9 30-5 Pin + 12-2 AA + 60 NaCl
10 60-10 Pin + 7.5 NPE11 60-10 Pin + 7.5 T2012 120-20 Lim + 7.5 NPE13 120-20 Lim + 7.5 T20All 8 NPE - 600 Lha−1
Box 2.17 Screening trial Ponta Grossa 10 - S-PG10
Objectives:• Comparison of NaCl application, with and without emulsi�er
Conditions Weed Stage FormulationsDate: 17/10/2012 IAQGR 2-4L 1 30 NaCl + 0 NPETime: 14:00 RAPRA 4-6L 2 30 NaCl + 7.5 NPETemperature: 27 ○C BRAPL 1-2L All 600 Lha−1Cloud cover: 30 %Humidity: 60 %Evaluation: 2 DAA
37
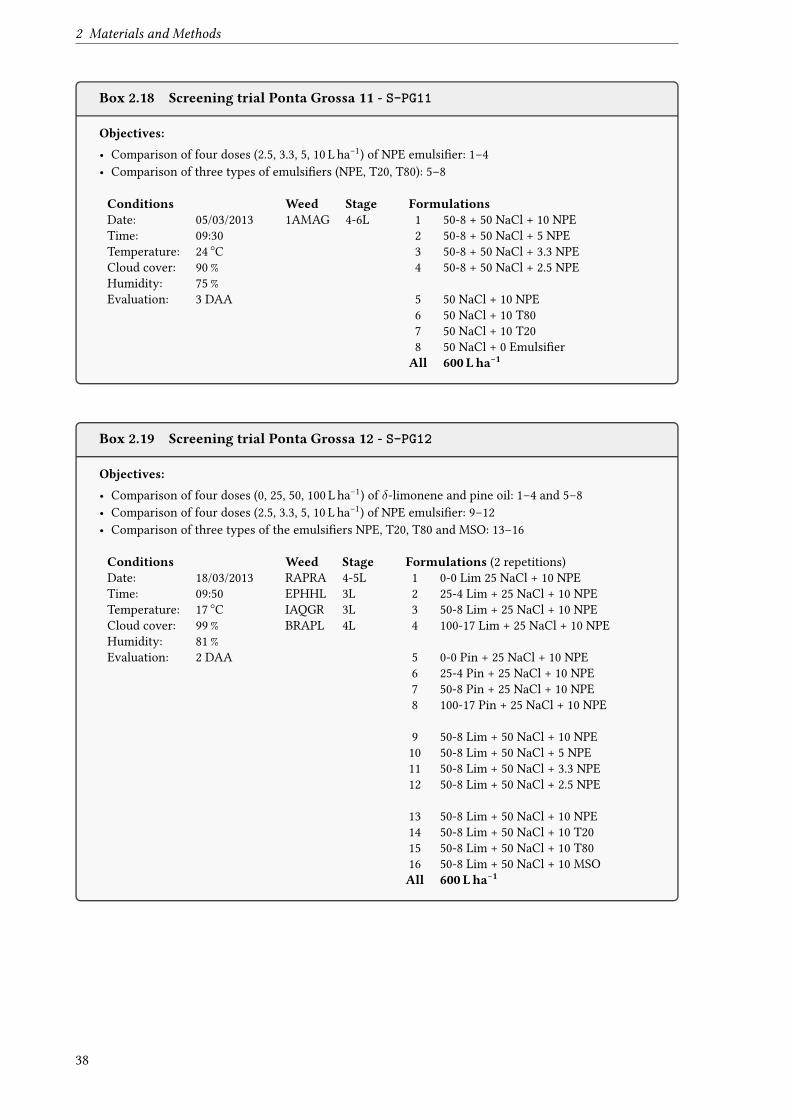
2 Materials and Methods
Box 2.18 Screening trial Ponta Grossa 11 - S-PG11
Objectives:• Comparison of four doses (2.5, 3.3, 5, 10 L ha−1) of NPE emulsi�er: 1–4• Comparison of three types of emulsi�ers (NPE, T20, T80): 5–8
Conditions Weed Stage FormulationsDate: 05/03/2013 1AMAG 4-6L 1 50-8 + 50 NaCl + 10 NPETime: 09:30 2 50-8 + 50 NaCl + 5 NPETemperature: 24 ○C 3 50-8 + 50 NaCl + 3.3 NPECloud cover: 90 % 4 50-8 + 50 NaCl + 2.5 NPEHumidity: 75 %Evaluation: 3 DAA 5 50 NaCl + 10 NPE
6 50 NaCl + 10 T807 50 NaCl + 10 T208 50 NaCl + 0 Emulsi�erAll 600 Lha−1
Box 2.19 Screening trial Ponta Grossa 12 - S-PG12
Objectives:• Comparison of four doses (0, 25, 50, 100 L ha−1) of δ-limonene and pine oil: 1–4 and 5–8• Comparison of four doses (2.5, 3.3, 5, 10 L ha−1) of NPE emulsi�er: 9–12• Comparison of three types of the emulsi�ers NPE, T20, T80 and MSO: 13–16
Conditions Weed Stage Formulations (2 repetitions)Date: 18/03/2013 RAPRA 4-5L 1 0-0 Lim 25 NaCl + 10 NPETime: 09:50 EPHHL 3L 2 25-4 Lim + 25 NaCl + 10 NPETemperature: 17 ○C IAQGR 3L 3 50-8 Lim + 25 NaCl + 10 NPECloud cover: 99 % BRAPL 4L 4 100-17 Lim + 25 NaCl + 10 NPEHumidity: 81 %Evaluation: 2 DAA 5 0-0 Pin + 25 NaCl + 10 NPE
6 25-4 Pin + 25 NaCl + 10 NPE7 50-8 Pin + 25 NaCl + 10 NPE8 100-17 Pin + 25 NaCl + 10 NPE
9 50-8 Lim + 50 NaCl + 10 NPE10 50-8 Lim + 50 NaCl + 5 NPE11 50-8 Lim + 50 NaCl + 3.3 NPE12 50-8 Lim + 50 NaCl + 2.5 NPE
13 50-8 Lim + 50 NaCl + 10 NPE14 50-8 Lim + 50 NaCl + 10 T2015 50-8 Lim + 50 NaCl + 10 T8016 50-8 Lim + 50 NaCl + 10 MSOAll 600 Lha−1
38
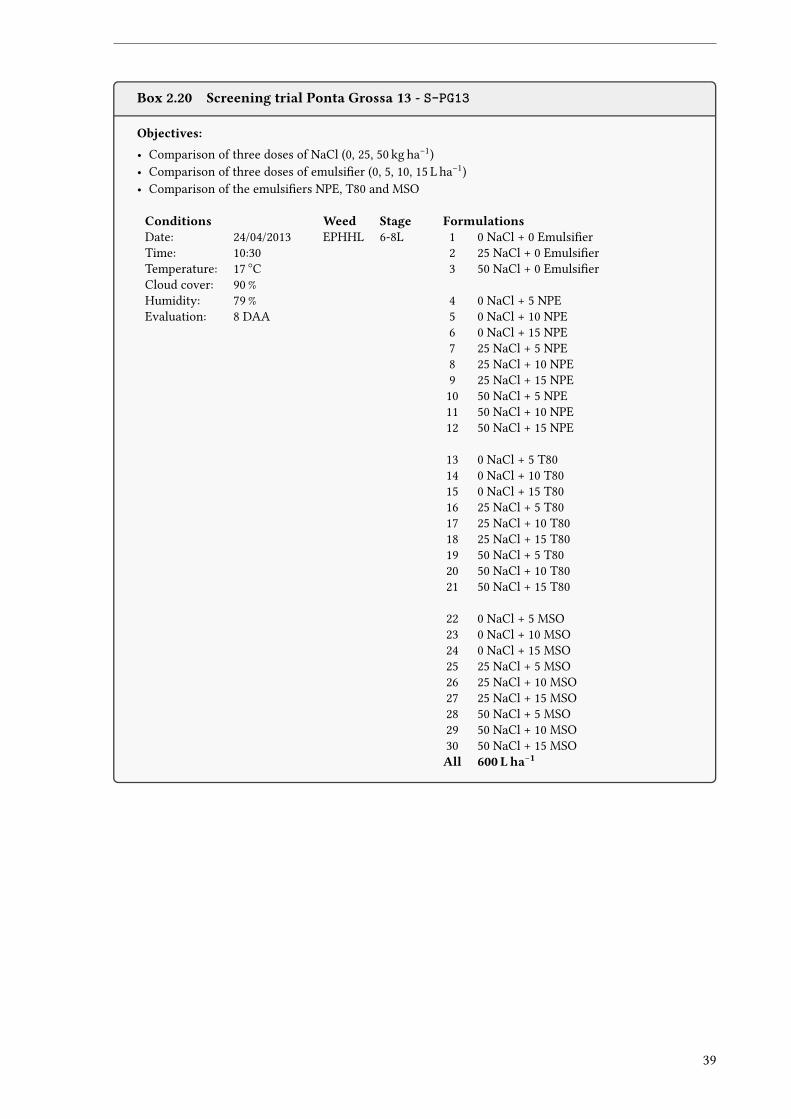
Box 2.20 Screening trial Ponta Grossa 13 - S-PG13
Objectives:• Comparison of three doses of NaCl (0, 25, 50 kg ha−1)• Comparison of three doses of emulsi�er (0, 5, 10, 15 L ha−1)• Comparison of the emulsi�ers NPE, T80 and MSO
Conditions Weed Stage FormulationsDate: 24/04/2013 EPHHL 6-8L 1 0 NaCl + 0 Emulsi�erTime: 10:30 2 25 NaCl + 0 Emulsi�erTemperature: 17 ○C 3 50 NaCl + 0 Emulsi�erCloud cover: 90 %Humidity: 79 % 4 0 NaCl + 5 NPEEvaluation: 8 DAA 5 0 NaCl + 10 NPE
6 0 NaCl + 15 NPE7 25 NaCl + 5 NPE8 25 NaCl + 10 NPE9 25 NaCl + 15 NPE10 50 NaCl + 5 NPE11 50 NaCl + 10 NPE12 50 NaCl + 15 NPE
13 0 NaCl + 5 T8014 0 NaCl + 10 T8015 0 NaCl + 15 T8016 25 NaCl + 5 T8017 25 NaCl + 10 T8018 25 NaCl + 15 T8019 50 NaCl + 5 T8020 50 NaCl + 10 T8021 50 NaCl + 15 T80
22 0 NaCl + 5 MSO23 0 NaCl + 10 MSO24 0 NaCl + 15 MSO25 25 NaCl + 5 MSO26 25 NaCl + 10 MSO27 25 NaCl + 15 MSO28 50 NaCl + 5 MSO29 50 NaCl + 10 MSO30 50 NaCl + 15 MSOAll 600 Lha−1
39
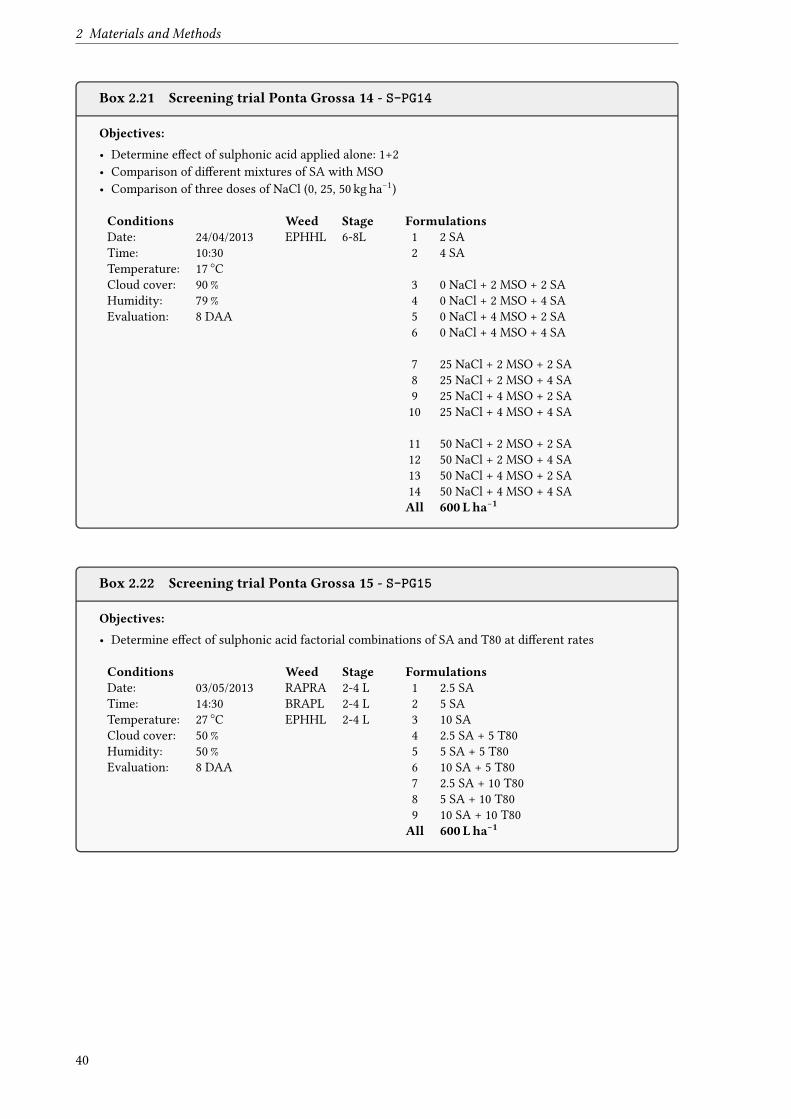
2 Materials and Methods
Box 2.21 Screening trial Ponta Grossa 14 - S-PG14
Objectives:• Determine e�ect of sulphonic acid applied alone: 1+2• Comparison of di�erent mixtures of SA with MSO• Comparison of three doses of NaCl (0, 25, 50 kg ha−1)
Conditions Weed Stage FormulationsDate: 24/04/2013 EPHHL 6-8L 1 2 SATime: 10:30 2 4 SATemperature: 17 ○CCloud cover: 90 % 3 0 NaCl + 2 MSO + 2 SAHumidity: 79 % 4 0 NaCl + 2 MSO + 4 SAEvaluation: 8 DAA 5 0 NaCl + 4 MSO + 2 SA
6 0 NaCl + 4 MSO + 4 SA
7 25 NaCl + 2 MSO + 2 SA8 25 NaCl + 2 MSO + 4 SA9 25 NaCl + 4 MSO + 2 SA10 25 NaCl + 4 MSO + 4 SA
11 50 NaCl + 2 MSO + 2 SA12 50 NaCl + 2 MSO + 4 SA13 50 NaCl + 4 MSO + 2 SA14 50 NaCl + 4 MSO + 4 SAAll 600 Lha−1
Box 2.22 Screening trial Ponta Grossa 15 - S-PG15
Objectives:• Determine e�ect of sulphonic acid factorial combinations of SA and T80 at di�erent rates
Conditions Weed Stage FormulationsDate: 03/05/2013 RAPRA 2-4 L 1 2.5 SATime: 14:30 BRAPL 2-4 L 2 5 SATemperature: 27 ○C EPHHL 2-4 L 3 10 SACloud cover: 50 % 4 2.5 SA + 5 T80Humidity: 50 % 5 5 SA + 5 T80Evaluation: 8 DAA 6 10 SA + 5 T80
7 2.5 SA + 10 T808 5 SA + 10 T809 10 SA + 10 T80All 600 Lha−1
40
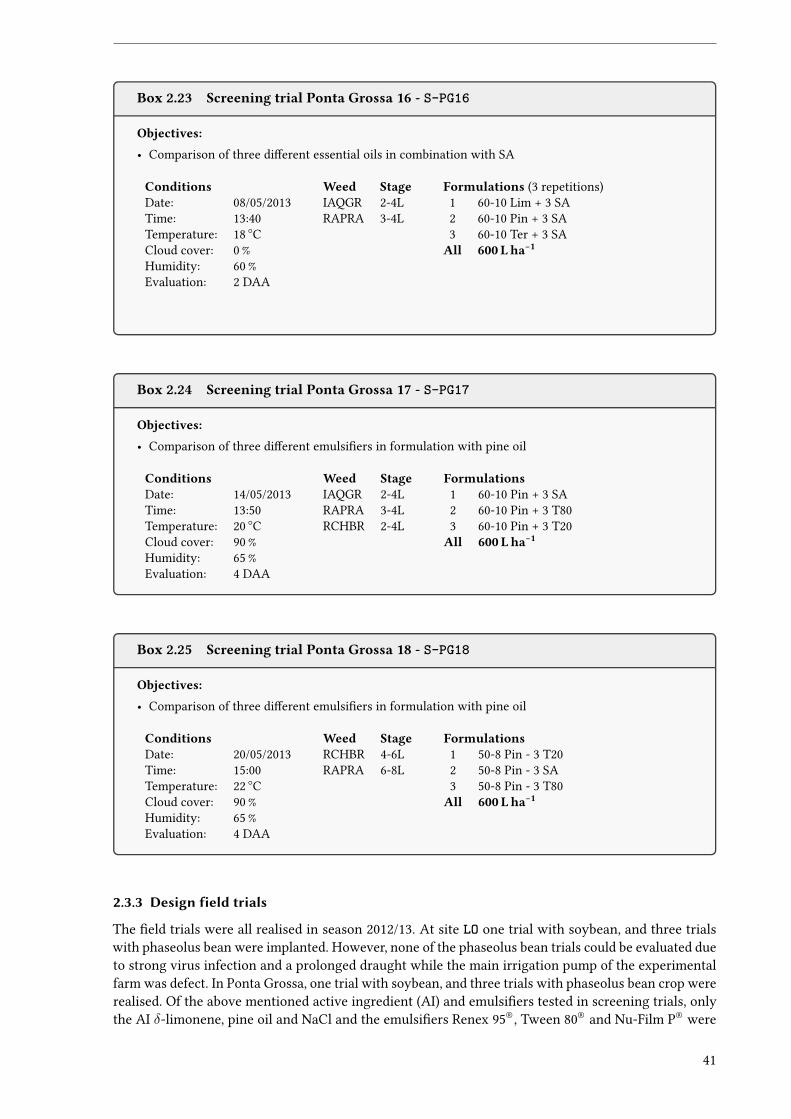
Box 2.23 Screening trial Ponta Grossa 16 - S-PG16
Objectives:• Comparison of three di�erent essential oils in combination with SA
Conditions Weed Stage Formulations (3 repetitions)Date: 08/05/2013 IAQGR 2-4L 1 60-10 Lim + 3 SATime: 13:40 RAPRA 3-4L 2 60-10 Pin + 3 SATemperature: 18 ○C 3 60-10 Ter + 3 SACloud cover: 0 % All 600 Lha−1Humidity: 60 %Evaluation: 2 DAA
Box 2.24 Screening trial Ponta Grossa 17 - S-PG17
Objectives:• Comparison of three di�erent emulsi�ers in formulation with pine oil
Conditions Weed Stage FormulationsDate: 14/05/2013 IAQGR 2-4L 1 60-10 Pin + 3 SATime: 13:50 RAPRA 3-4L 2 60-10 Pin + 3 T80Temperature: 20 ○C RCHBR 2-4L 3 60-10 Pin + 3 T20Cloud cover: 90 % All 600 Lha−1Humidity: 65 %Evaluation: 4 DAA
Box 2.25 Screening trial Ponta Grossa 18 - S-PG18
Objectives:• Comparison of three di�erent emulsi�ers in formulation with pine oil
Conditions Weed Stage FormulationsDate: 20/05/2013 RCHBR 4-6L 1 50-8 Pin - 3 T20Time: 15:00 RAPRA 6-8L 2 50-8 Pin - 3 SATemperature: 22 ○C 3 50-8 Pin - 3 T80Cloud cover: 90 % All 600 Lha−1Humidity: 65 %Evaluation: 4 DAA
2.3.3 Design field trials
The �eld trials were all realised in season 2012/13. At site LO one trial with soybean, and three trialswith phaseolus bean were implanted. However, none of the phaseolus bean trials could be evaluated dueto strong virus infection and a prolonged draught while the main irrigation pump of the experimentalfarm was defect. In Ponta Grossa, one trial with soybean, and three trials with phaseolus bean crop wererealised. Of the above mentioned active ingredient (AI) and emulsi�ers tested in screening trials, onlythe AI δ-limonene, pine oil and NaCl and the emulsi�ers Renex 95®, Tween 80® and Nu-Film P® were
41
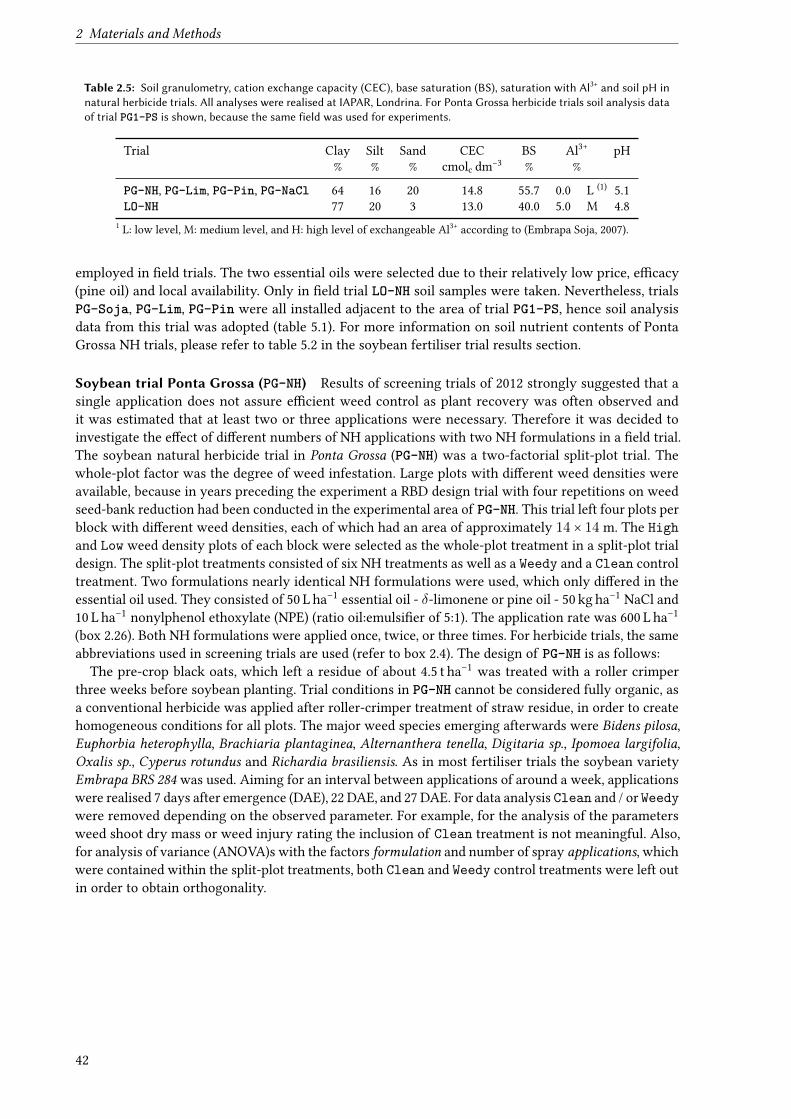
2 Materials and Methods
Table 2.5: Soil granulometry, cation exchange capacity (CEC), base saturation (BS), saturation with Al3+ and soil pH innatural herbicide trials. All analyses were realised at IAPAR, Londrina. For Ponta Grossa herbicide trials soil analysis dataof trial PG1-PS is shown, because the same field was used for experiments.
Trial Clay Silt Sand CEC BS Al3+ pH% % % cmolc dm−3 % %
PG-NH, PG-Lim, PG-Pin, PG-NaCl 64 16 20 14.8 55.7 0.0 L (1) 5.1LO-NH 77 20 3 13.0 40.0 5.0 M 4.8
1 L: low level, M: medium level, and H: high level of exchangeable Al3+ according to (Embrapa Soja, 2007).
employed in �eld trials. The two essential oils were selected due to their relatively low price, e�cacy(pine oil) and local availability. Only in �eld trial LO-NH soil samples were taken. Nevertheless, trialsPG-Soja, PG-Lim, PG-Pin were all installed adjacent to the area of trial PG1-PS, hence soil analysisdata from this trial was adopted (table 5.1). For more information on soil nutrient contents of PontaGrossa NH trials, please refer to table 5.2 in the soybean fertiliser trial results section.
Soybean trial Ponta Grossa (PG-NH) Results of screening trials of 2012 strongly suggested that asingle application does not assure e�cient weed control as plant recovery was often observed andit was estimated that at least two or three applications were necessary. Therefore it was decided toinvestigate the e�ect of di�erent numbers of NH applications with two NH formulations in a �eld trial.The soybean natural herbicide trial in Ponta Grossa (PG-NH) was a two-factorial split-plot trial. Thewhole-plot factor was the degree of weed infestation. Large plots with di�erent weed densities wereavailable, because in years preceding the experiment a RBD design trial with four repetitions on weedseed-bank reduction had been conducted in the experimental area of PG-NH. This trial left four plots perblock with di�erent weed densities, each of which had an area of approximately 14 × 14 m. The Highand Low weed density plots of each block were selected as the whole-plot treatment in a split-plot trialdesign. The split-plot treatments consisted of six NH treatments as well as a Weedy and a Clean controltreatment. Two formulations nearly identical NH formulations were used, which only di�ered in theessential oil used. They consisted of 50 L ha−1 essential oil - δ-limonene or pine oil - 50 kg ha−1 NaCl and10 L ha−1 nonylphenol ethoxylate (NPE) (ratio oil:emulsi�er of 5:1). The application rate was 600 L ha−1
(box 2.26). Both NH formulations were applied once, twice, or three times. For herbicide trials, the sameabbreviations used in screening trials are used (refer to box 2.4). The design of PG-NH is as follows:
The pre-crop black oats, which left a residue of about 4.5 t ha−1 was treated with a roller crimperthree weeks before soybean planting. Trial conditions in PG-NH cannot be considered fully organic, asa conventional herbicide was applied after roller-crimper treatment of straw residue, in order to createhomogeneous conditions for all plots. The major weed species emerging afterwards were Bidens pilosa,Euphorbia heterophylla, Brachiaria plantaginea, Alternanthera tenella, Digitaria sp., Ipomoea largifolia,Oxalis sp., Cyperus rotundus and Richardia brasiliensis. As in most fertiliser trials the soybean varietyEmbrapa BRS 284 was used. Aiming for an interval between applications of around a week, applicationswere realised 7 days after emergence (DAE), 22 DAE, and 27 DAE. For data analysis Clean and / or Weedywere removed depending on the observed parameter. For example, for the analysis of the parametersweed shoot dry mass or weed injury rating the inclusion of Clean treatment is not meaningful. Also,for analysis of variance (ANOVA)s with the factors formulation and number of spray applications, whichwere contained within the split-plot treatments, both Clean and Weedy control treatments were left outin order to obtain orthogonality.
42
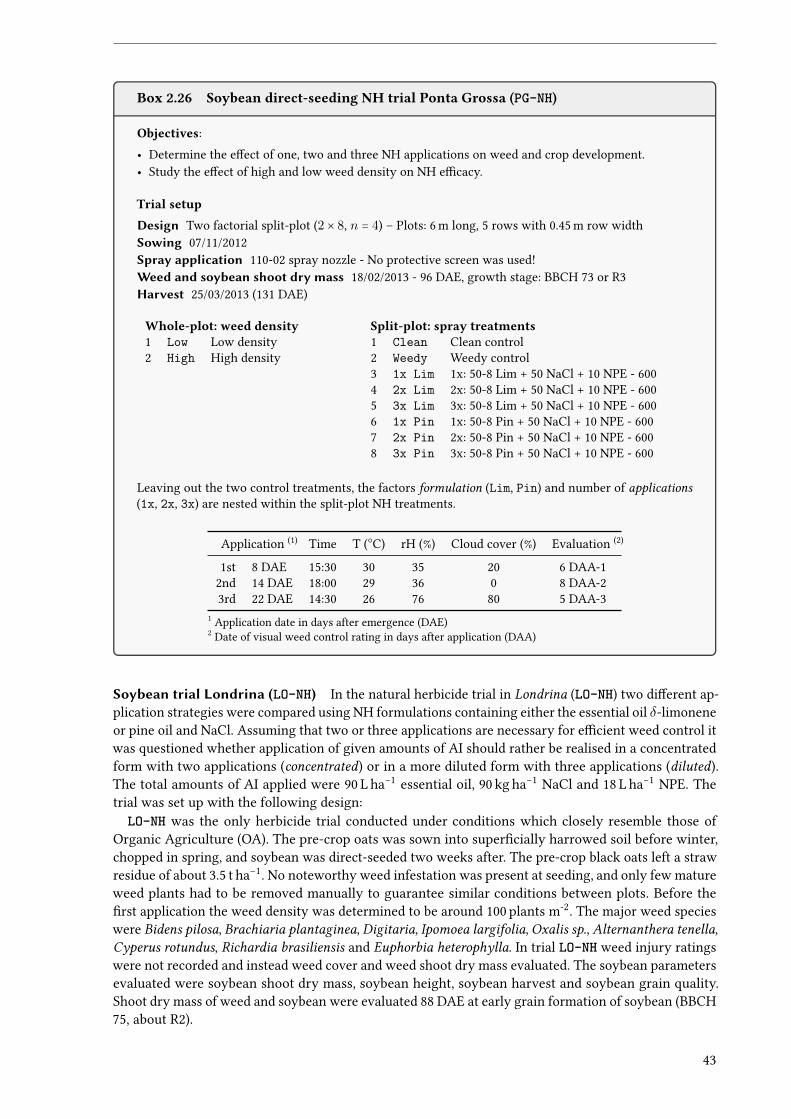
Box 2.26 Soybean direct-seeding NH trial Ponta Grossa (PG-NH)
Objectives:• Determine the e�ect of one, two and three NH applications on weed and crop development.• Study the e�ect of high and low weed density on NH e�cacy.
Trial setupDesign Two factorial split-plot (2 × 8, n = 4) – Plots: 6 m long, 5 rows with 0.45 m row widthSowing 07/11/2012Spray application 110-02 spray nozzle - No protective screen was used!Weed and soybean shoot dry mass 18/02/2013 - 96 DAE, growth stage: BBCH 73 or R3Harvest 25/03/2013 (131 DAE)
Whole-plot: weed density Split-plot: spray treatments1 Low Low density 1 Clean Clean control2 High High density 2 Weedy Weedy control
3 1x Lim 1x: 50-8 Lim + 50 NaCl + 10 NPE - 6004 2x Lim 2x: 50-8 Lim + 50 NaCl + 10 NPE - 6005 3x Lim 3x: 50-8 Lim + 50 NaCl + 10 NPE - 6006 1x Pin 1x: 50-8 Pin + 50 NaCl + 10 NPE - 6007 2x Pin 2x: 50-8 Pin + 50 NaCl + 10 NPE - 6008 3x Pin 3x: 50-8 Pin + 50 NaCl + 10 NPE - 600
Leaving out the two control treatments, the factors formulation (Lim, Pin) and number of applications(1x, 2x, 3x) are nested within the split-plot NH treatments.
Application (1) Time T (○C) rH (%) Cloud cover (%) Evaluation (2)
1st 8 DAE 15:30 30 35 20 6 DAA-12nd 14 DAE 18:00 29 36 0 8 DAA-23rd 22 DAE 14:30 26 76 80 5 DAA-3
1 Application date in days after emergence (DAE)2 Date of visual weed control rating in days after application (DAA)
Soybean trial Londrina (LO-NH) In the natural herbicide trial in Londrina (LO-NH) two di�erent ap-plication strategies were compared using NH formulations containing either the essential oil δ-limoneneor pine oil and NaCl. Assuming that two or three applications are necessary for e�cient weed control itwas questioned whether application of given amounts of AI should rather be realised in a concentratedform with two applications (concentrated) or in a more diluted form with three applications (diluted).The total amounts of AI applied were 90 L ha−1 essential oil, 90 kg ha−1 NaCl and 18 L ha−1 NPE. Thetrial was set up with the following design:
LO-NH was the only herbicide trial conducted under conditions which closely resemble those ofOrganic Agriculture (OA). The pre-crop oats was sown into super�cially harrowed soil before winter,chopped in spring, and soybean was direct-seeded two weeks after. The pre-crop black oats left a strawresidue of about 3.5 t ha−1. No noteworthy weed infestation was present at seeding, and only few matureweed plants had to be removed manually to guarantee similar conditions between plots. Before the�rst application the weed density was determined to be around 100 plants m-2. The major weed specieswere Bidens pilosa, Brachiaria plantaginea, Digitaria, Ipomoea largifolia, Oxalis sp., Alternanthera tenella,Cyperus rotundus, Richardia brasiliensis and Euphorbia heterophylla. In trial LO-NH weed injury ratingswere not recorded and instead weed cover and weed shoot dry mass evaluated. The soybean parametersevaluated were soybean shoot dry mass, soybean height, soybean harvest and soybean grain quality.Shoot dry mass of weed and soybean were evaluated 88 DAE at early grain formation of soybean (BBCH75, about R2).
43
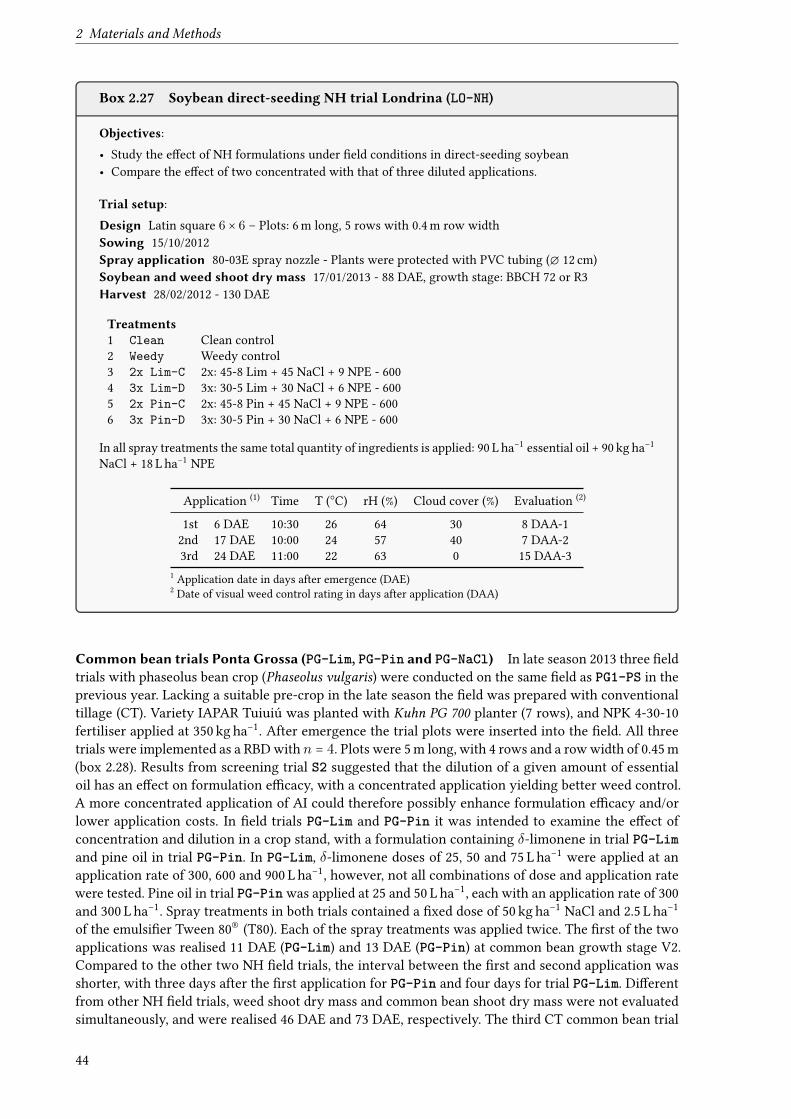
2 Materials and Methods
Box 2.27 Soybean direct-seeding NH trial Londrina (LO-NH)
Objectives:• Study the e�ect of NH formulations under �eld conditions in direct-seeding soybean• Compare the e�ect of two concentrated with that of three diluted applications.
Trial setup:Design Latin square 6 × 6 – Plots: 6 m long, 5 rows with 0.4 m row widthSowing 15/10/2012Spray application 80-03E spray nozzle - Plants were protected with PVC tubing (∅ 12 cm)Soybean and weed shoot dry mass 17/01/2013 - 88 DAE, growth stage: BBCH 72 or R3Harvest 28/02/2012 - 130 DAE
Treatments1 Clean Clean control2 Weedy Weedy control3 2x Lim-C 2x: 45-8 Lim + 45 NaCl + 9 NPE - 6004 3x Lim-D 3x: 30-5 Lim + 30 NaCl + 6 NPE - 6005 2x Pin-C 2x: 45-8 Pin + 45 NaCl + 9 NPE - 6006 3x Pin-D 3x: 30-5 Pin + 30 NaCl + 6 NPE - 600
In all spray treatments the same total quantity of ingredients is applied: 90 L ha−1 essential oil + 90 kg ha−1
NaCl + 18 L ha−1 NPE
Application (1) Time T (○C) rH (%) Cloud cover (%) Evaluation (2)
1st 6 DAE 10:30 26 64 30 8 DAA-12nd 17 DAE 10:00 24 57 40 7 DAA-23rd 24 DAE 11:00 22 63 0 15 DAA-3
1 Application date in days after emergence (DAE)2 Date of visual weed control rating in days after application (DAA)
Common bean trials Ponta Grossa (PG-Lim, PG-Pin and PG-NaCl) In late season 2013 three �eldtrials with phaseolus bean crop (Phaseolus vulgaris) were conducted on the same �eld as PG1-PS in theprevious year. Lacking a suitable pre-crop in the late season the �eld was prepared with conventionaltillage (CT). Variety IAPAR Tuiuiú was planted with Kuhn PG 700 planter (7 rows), and NPK 4-30-10fertiliser applied at 350 kg ha−1. After emergence the trial plots were inserted into the �eld. All threetrials were implemented as a RBD with n = 4. Plots were 5 m long, with 4 rows and a row width of 0.45 m(box 2.28). Results from screening trial S2 suggested that the dilution of a given amount of essentialoil has an e�ect on formulation e�cacy, with a concentrated application yielding better weed control.A more concentrated application of AI could therefore possibly enhance formulation e�cacy and/orlower application costs. In �eld trials PG-Lim and PG-Pin it was intended to examine the e�ect ofconcentration and dilution in a crop stand, with a formulation containing δ-limonene in trial PG-Limand pine oil in trial PG-Pin. In PG-Lim, δ-limonene doses of 25, 50 and 75 L ha−1 were applied at anapplication rate of 300, 600 and 900 L ha−1, however, not all combinations of dose and application ratewere tested. Pine oil in trial PG-Pin was applied at 25 and 50 L ha−1, each with an application rate of 300and 300 L ha−1. Spray treatments in both trials contained a �xed dose of 50 kg ha−1 NaCl and 2.5 L ha−1
of the emulsi�er Tween 80® (T80). Each of the spray treatments was applied twice. The �rst of the twoapplications was realised 11 DAE (PG-Lim) and 13 DAE (PG-Pin) at common bean growth stage V2.Compared to the other two NH �eld trials, the interval between the �rst and second application wasshorter, with three days after the �rst application for PG-Pin and four days for trial PG-Lim. Di�erentfrom other NH �eld trials, weed shoot dry mass and common bean shoot dry mass were not evaluatedsimultaneously, and were realised 46 DAE and 73 DAE, respectively. The third CT common bean trial
44
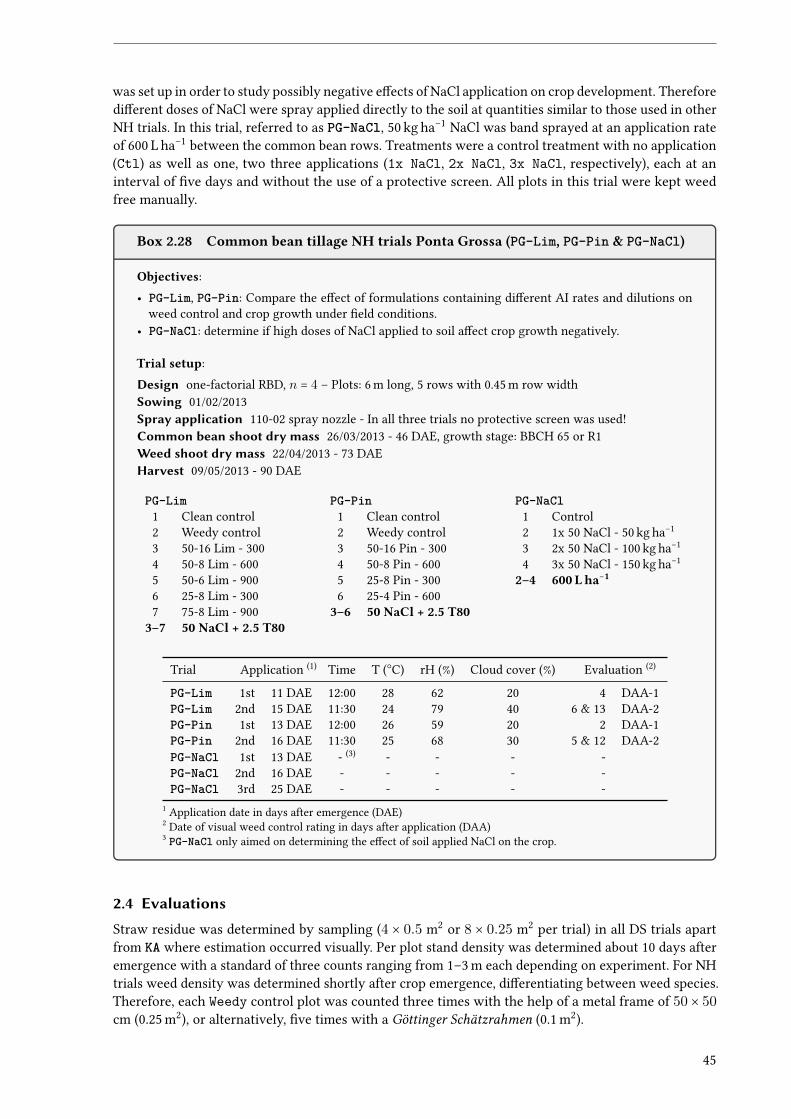
was set up in order to study possibly negative e�ects of NaCl application on crop development. Thereforedi�erent doses of NaCl were spray applied directly to the soil at quantities similar to those used in otherNH trials. In this trial, referred to as PG-NaCl, 50 kg ha−1 NaCl was band sprayed at an application rateof 600 L ha−1 between the common bean rows. Treatments were a control treatment with no application(Ctl) as well as one, two three applications (1x NaCl, 2x NaCl, 3x NaCl, respectively), each at aninterval of �ve days and without the use of a protective screen. All plots in this trial were kept weedfree manually.
Box 2.28 Common bean tillage NH trials Ponta Grossa (PG-Lim, PG-Pin & PG-NaCl)
Objectives:• PG-Lim, PG-Pin: Compare the e�ect of formulations containing di�erent AI rates and dilutions on
weed control and crop growth under �eld conditions.• PG-NaCl: determine if high doses of NaCl applied to soil a�ect crop growth negatively.
Trial setup:Design one-factorial RBD, n = 4 – Plots: 6 m long, 5 rows with 0.45 m row widthSowing 01/02/2013Spray application 110-02 spray nozzle - In all three trials no protective screen was used!Common bean shoot dry mass 26/03/2013 - 46 DAE, growth stage: BBCH 65 or R1Weed shoot dry mass 22/04/2013 - 73 DAEHarvest 09/05/2013 - 90 DAE
PG-Lim PG-Pin PG-NaCl1 Clean control 1 Clean control 1 Control2 Weedy control 2 Weedy control 2 1x 50 NaCl - 50 kg ha−1
3 50-16 Lim - 300 3 50-16 Pin - 300 3 2x 50 NaCl - 100 kg ha−1
4 50-8 Lim - 600 4 50-8 Pin - 600 4 3x 50 NaCl - 150 kg ha−1
5 50-6 Lim - 900 5 25-8 Pin - 300 2–4 600 Lha−16 25-8 Lim - 300 6 25-4 Pin - 6007 75-8 Lim - 900 3–6 50 NaCl + 2.5 T80
3–7 50 NaCl + 2.5 T80
Trial Application (1) Time T (○C) rH (%) Cloud cover (%) Evaluation (2)
PG-Lim 1st 11 DAE 12:00 28 62 20 4 DAA-1PG-Lim 2nd 15 DAE 11:30 24 79 40 6 & 13 DAA-2PG-Pin 1st 13 DAE 12:00 26 59 20 2 DAA-1PG-Pin 2nd 16 DAE 11:30 25 68 30 5 & 12 DAA-2PG-NaCl 1st 13 DAE - (3) - - - -PG-NaCl 2nd 16 DAE - - - - -PG-NaCl 3rd 25 DAE - - - - -
1 Application date in days after emergence (DAE)2 Date of visual weed control rating in days after application (DAA)3 PG-NaCl only aimed on determining the e�ect of soil applied NaCl on the crop.
2.4 EvaluationsStraw residue was determined by sampling (4 × 0.5 m2 or 8 × 0.25 m2 per trial) in all DS trials apartfrom KA where estimation occurred visually. Per plot stand density was determined about 10 days afteremergence with a standard of three counts ranging from 1–3 m each depending on experiment. For NHtrials weed density was determined shortly after crop emergence, di�erentiating between weed species.Therefore, each Weedy control plot was counted three times with the help of a metal frame of 50 × 50cm (0.25 m2), or alternatively, �ve times with a Göttinger Schätzrahmen (0.1 m2).
45
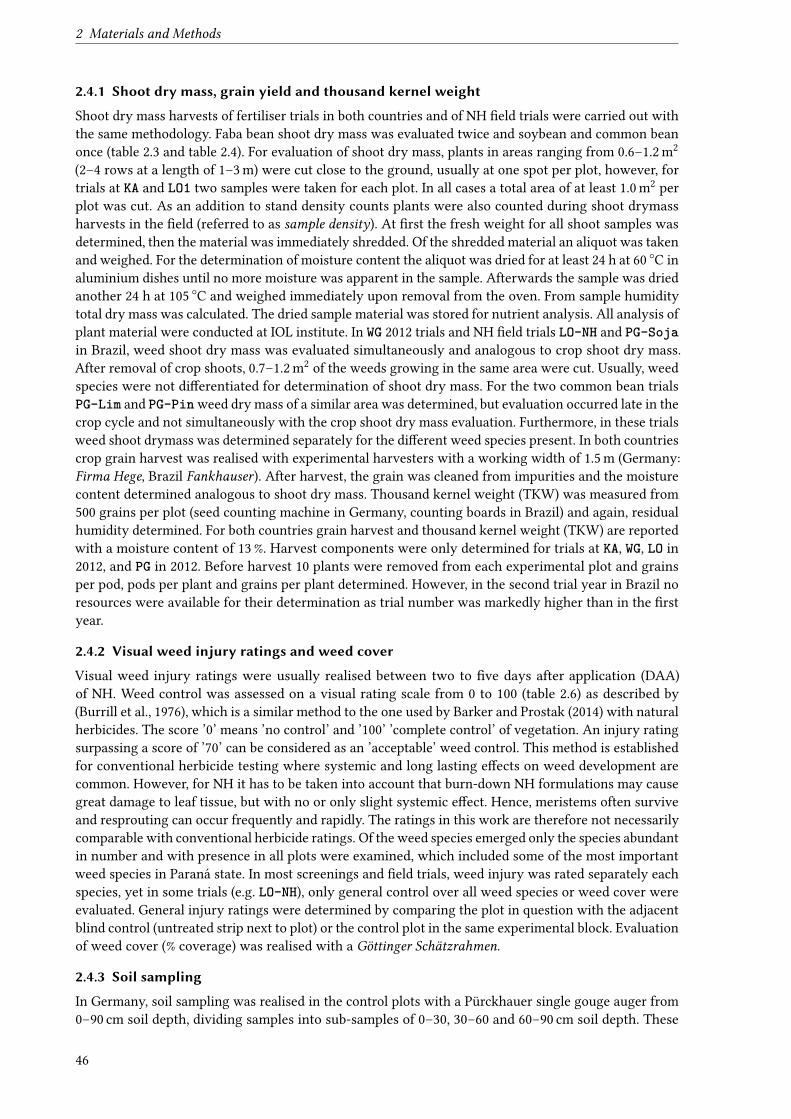
2 Materials and Methods
2.4.1 Shoot dry mass, grain yield and thousand kernel weight
Shoot dry mass harvests of fertiliser trials in both countries and of NH �eld trials were carried out withthe same methodology. Faba bean shoot dry mass was evaluated twice and soybean and common beanonce (table 2.3 and table 2.4). For evaluation of shoot dry mass, plants in areas ranging from 0.6–1.2 m2
(2–4 rows at a length of 1–3 m) were cut close to the ground, usually at one spot per plot, however, fortrials at KA and LO1 two samples were taken for each plot. In all cases a total area of at least 1.0 m2 perplot was cut. As an addition to stand density counts plants were also counted during shoot drymassharvests in the �eld (referred to as sample density). At �rst the fresh weight for all shoot samples wasdetermined, then the material was immediately shredded. Of the shredded material an aliquot was takenand weighed. For the determination of moisture content the aliquot was dried for at least 24 h at 60 ○C inaluminium dishes until no more moisture was apparent in the sample. Afterwards the sample was driedanother 24 h at 105 ○C and weighed immediately upon removal from the oven. From sample humiditytotal dry mass was calculated. The dried sample material was stored for nutrient analysis. All analysis ofplant material were conducted at IOL institute. In WG 2012 trials and NH �eld trials LO-NH and PG-Sojain Brazil, weed shoot dry mass was evaluated simultaneously and analogous to crop shoot dry mass.After removal of crop shoots, 0.7–1.2 m2 of the weeds growing in the same area were cut. Usually, weedspecies were not di�erentiated for determination of shoot dry mass. For the two common bean trialsPG-Lim and PG-Pin weed dry mass of a similar area was determined, but evaluation occurred late in thecrop cycle and not simultaneously with the crop shoot dry mass evaluation. Furthermore, in these trialsweed shoot drymass was determined separately for the di�erent weed species present. In both countriescrop grain harvest was realised with experimental harvesters with a working width of 1.5 m (Germany:Firma Hege, Brazil Fankhauser). After harvest, the grain was cleaned from impurities and the moisturecontent determined analogous to shoot dry mass. Thousand kernel weight (TKW) was measured from500 grains per plot (seed counting machine in Germany, counting boards in Brazil) and again, residualhumidity determined. For both countries grain harvest and thousand kernel weight (TKW) are reportedwith a moisture content of 13 %. Harvest components were only determined for trials at KA, WG, LO in2012, and PG in 2012. Before harvest 10 plants were removed from each experimental plot and grainsper pod, pods per plant and grains per plant determined. However, in the second trial year in Brazil noresources were available for their determination as trial number was markedly higher than in the �rstyear.
2.4.2 Visual weed injury ratings and weed cover
Visual weed injury ratings were usually realised between two to �ve days after application (DAA)of NH. Weed control was assessed on a visual rating scale from 0 to 100 (table 2.6) as described by(Burrill et al., 1976), which is a similar method to the one used by Barker and Prostak (2014) with naturalherbicides. The score ’0’ means ’no control’ and ’100’ ’complete control’ of vegetation. An injury ratingsurpassing a score of ’70’ can be considered as an ’acceptable’ weed control. This method is establishedfor conventional herbicide testing where systemic and long lasting e�ects on weed development arecommon. However, for NH it has to be taken into account that burn-down NH formulations may causegreat damage to leaf tissue, but with no or only slight systemic e�ect. Hence, meristems often surviveand resprouting can occur frequently and rapidly. The ratings in this work are therefore not necessarilycomparable with conventional herbicide ratings. Of the weed species emerged only the species abundantin number and with presence in all plots were examined, which included some of the most importantweed species in Paraná state. In most screenings and �eld trials, weed injury was rated separately eachspecies, yet in some trials (e.g. LO-NH), only general control over all weed species or weed cover wereevaluated. General injury ratings were determined by comparing the plot in question with the adjacentblind control (untreated strip next to plot) or the control plot in the same experimental block. Evaluationof weed cover (% coverage) was realised with a Göttinger Schätzrahmen.
2.4.3 Soil sampling
In Germany, soil sampling was realised in the control plots with a Pürckhauer single gouge auger from0–90 cm soil depth, dividing samples into sub-samples of 0–30, 30–60 and 60–90 cm soil depth. These
46
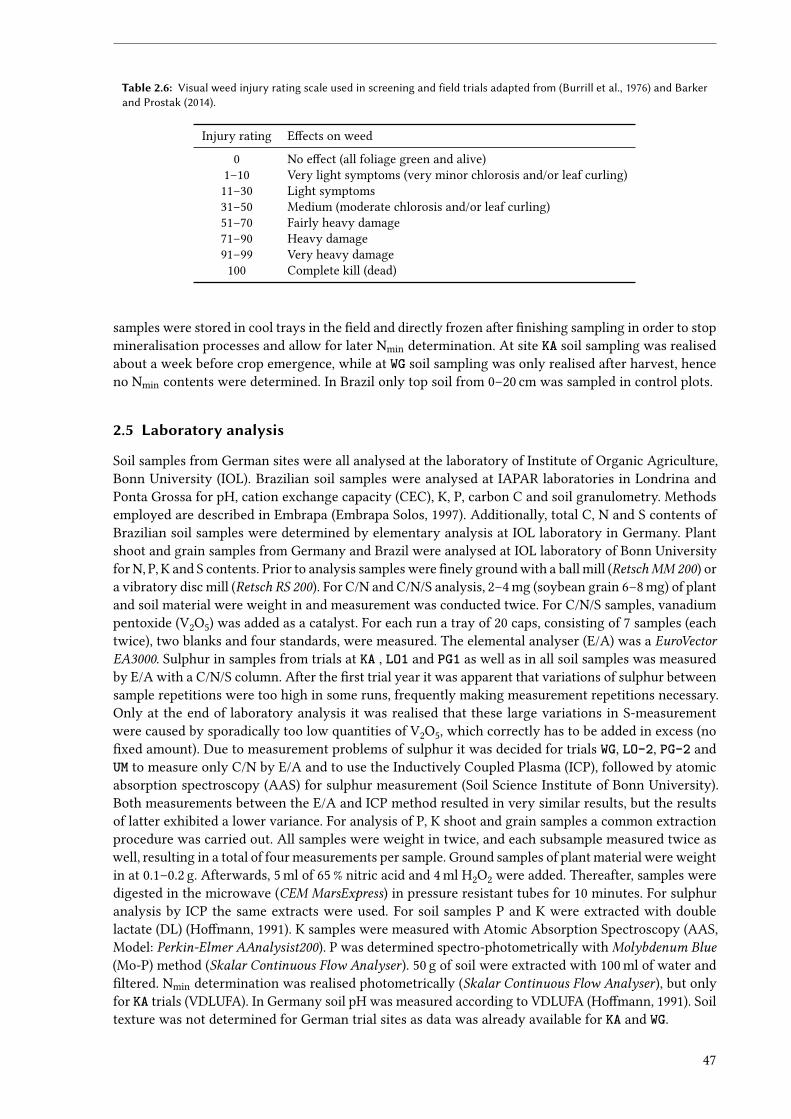
Table 2.6: Visual weed injury rating scale used in screening and field trials adapted from (Burrill et al., 1976) and Barkerand Prostak (2014).
Injury rating E�ects on weed
0 No e�ect (all foliage green and alive)1–10 Very light symptoms (very minor chlorosis and/or leaf curling)11–30 Light symptoms31–50 Medium (moderate chlorosis and/or leaf curling)51–70 Fairly heavy damage71–90 Heavy damage91–99 Very heavy damage
100 Complete kill (dead)
samples were stored in cool trays in the �eld and directly frozen after �nishing sampling in order to stopmineralisation processes and allow for later Nmin determination. At site KA soil sampling was realisedabout a week before crop emergence, while at WG soil sampling was only realised after harvest, henceno Nmin contents were determined. In Brazil only top soil from 0–20 cm was sampled in control plots.
2.5 Laboratory analysis
Soil samples from German sites were all analysed at the laboratory of Institute of Organic Agriculture,Bonn University (IOL). Brazilian soil samples were analysed at IAPAR laboratories in Londrina andPonta Grossa for pH, cation exchange capacity (CEC), K, P, carbon C and soil granulometry. Methodsemployed are described in Embrapa (Embrapa Solos, 1997). Additionally, total C, N and S contents ofBrazilian soil samples were determined by elementary analysis at IOL laboratory in Germany. Plantshoot and grain samples from Germany and Brazil were analysed at IOL laboratory of Bonn Universityfor N, P, K and S contents. Prior to analysis samples were �nely ground with a ball mill (RetschMM 200) ora vibratory disc mill (Retsch RS 200). For C/N and C/N/S analysis, 2–4 mg (soybean grain 6–8 mg) of plantand soil material were weight in and measurement was conducted twice. For C/N/S samples, vanadiumpentoxide (V2O5) was added as a catalyst. For each run a tray of 20 caps, consisting of 7 samples (eachtwice), two blanks and four standards, were measured. The elemental analyser (E/A) was a EuroVectorEA3000. Sulphur in samples from trials at KA , LO1 and PG1 as well as in all soil samples was measuredby E/A with a C/N/S column. After the �rst trial year it was apparent that variations of sulphur betweensample repetitions were too high in some runs, frequently making measurement repetitions necessary.Only at the end of laboratory analysis it was realised that these large variations in S-measurementwere caused by sporadically too low quantities of V2O5, which correctly has to be added in excess (no�xed amount). Due to measurement problems of sulphur it was decided for trials WG, LO-2, PG-2 andUM to measure only C/N by E/A and to use the Inductively Coupled Plasma (ICP), followed by atomicabsorption spectroscopy (AAS) for sulphur measurement (Soil Science Institute of Bonn University).Both measurements between the E/A and ICP method resulted in very similar results, but the resultsof latter exhibited a lower variance. For analysis of P, K shoot and grain samples a common extractionprocedure was carried out. All samples were weight in twice, and each subsample measured twice aswell, resulting in a total of four measurements per sample. Ground samples of plant material were weightin at 0.1–0.2 g. Afterwards, 5 ml of 65 % nitric acid and 4 ml H2O2 were added. Thereafter, samples weredigested in the microwave (CEM MarsExpress) in pressure resistant tubes for 10 minutes. For sulphuranalysis by ICP the same extracts were used. For soil samples P and K were extracted with doublelactate (DL) (Ho�mann, 1991). K samples were measured with Atomic Absorption Spectroscopy (AAS,Model: Perkin-Elmer AAnalysist200). P was determined spectro-photometrically with Molybdenum Blue(Mo-P) method (Skalar Continuous Flow Analyser). 50 g of soil were extracted with 100 ml of water and�ltered. Nmin determination was realised photometrically (Skalar Continuous Flow Analyser), but onlyfor KA trials (VDLUFA). In Germany soil pH was measured according to VDLUFA (Ho�mann, 1991). Soiltexture was not determined for German trial sites as data was already available for KA and WG.
47
2 Materials and Methods
2.6 Statistical analysisFor statistical analysis and plotting R statistical package was used (R Core Team, 2015). Prior to ANOVA,data was tested for normality with the Shapiro Wilk test (Shapiro and Wilk, 1965) and for homogeneityof variance (homoescacidicity) with the Levene test (Levene, 1960). Transformations were not necessary.
Whenever the prerequesites of normality or homoescacidity were not ful�lled non-parametric Kruskal-Wallis test (Kruskal and Wallis, 1952) of agricolae package was used for analysis (de Mendiburu, 2015).In the case that prerequesites were met, mixed model ANOVAs were carried out with lme functionof nlme package (Pinheiro et al., 2015). For latin square design the lmer function from lmer package(Bates et al., 2015) was employed. If signi�cant e�ects were found in ANOVA (p < 0.05), post-hoc TukeyHonest Signi�cant Di�erence (TukeyHSD) (Tukey, 1949) (α = 0.05) were carried out using the multcomppackage (Graves et al., 2015). All results plots in this work were created with the ggplot2 package(Wickham, 2009).
48
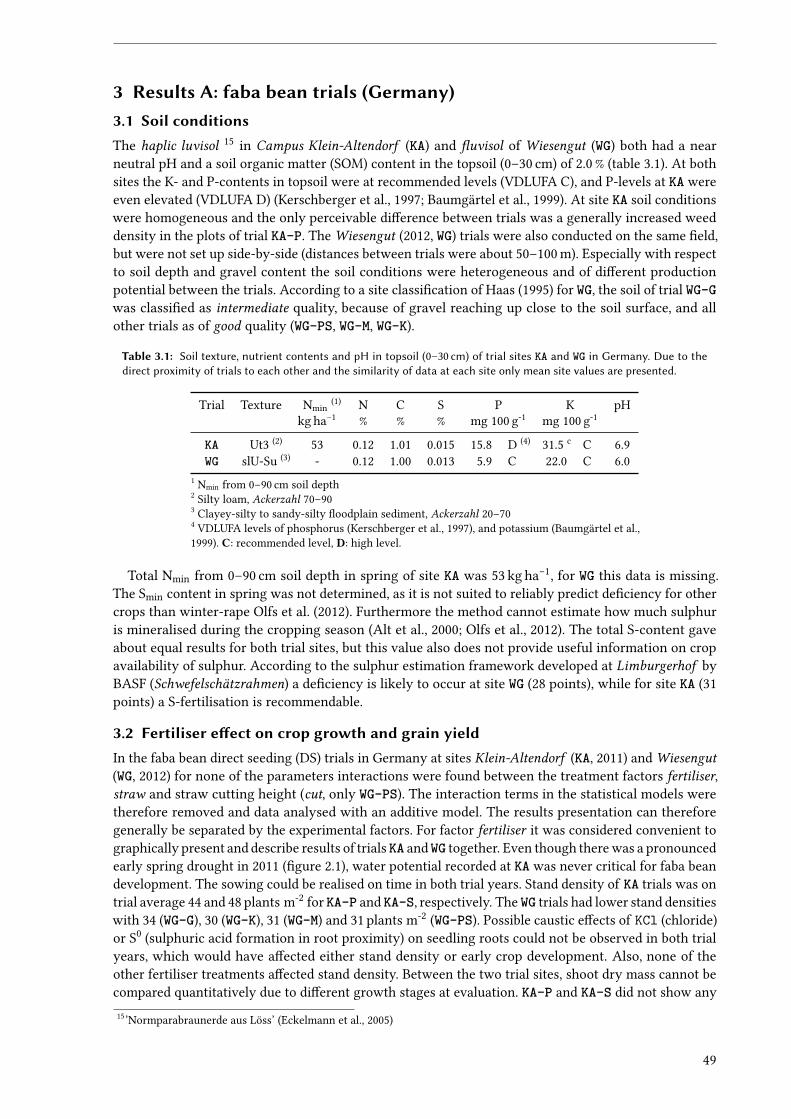
3 Results A: faba bean trials (Germany)3.1 Soil conditionsThe haplic luvisol 15 in Campus Klein-Altendorf (KA) and �uvisol of Wiesengut (WG) both had a nearneutral pH and a soil organic matter (SOM) content in the topsoil (0–30 cm) of 2.0 % (table 3.1). At bothsites the K- and P-contents in topsoil were at recommended levels (VDLUFA C), and P-levels at KA wereeven elevated (VDLUFA D) (Kerschberger et al., 1997; Baumgärtel et al., 1999). At site KA soil conditionswere homogeneous and the only perceivable di�erence between trials was a generally increased weeddensity in the plots of trial KA-P. The Wiesengut (2012, WG) trials were also conducted on the same �eld,but were not set up side-by-side (distances between trials were about 50–100 m). Especially with respectto soil depth and gravel content the soil conditions were heterogeneous and of di�erent productionpotential between the trials. According to a site classi�cation of Haas (1995) for WG, the soil of trial WG-Gwas classi�ed as intermediate quality, because of gravel reaching up close to the soil surface, and allother trials as of good quality (WG-PS, WG-M, WG-K).
Table 3.1: Soil texture, nutrient contents and pH in topsoil (0–30 cm) of trial sites KA and WG in Germany. Due to thedirect proximity of trials to each other and the similarity of data at each site only mean site values are presented.
Trial Texture Nmin(1) N C S P K pH
kg ha−1 % % % mg 100 g-1 mg 100 g-1
KA Ut3 (2) 53 0.12 1.01 0.015 15.8 D (4) 31.5 c C 6.9WG slU-Su (3) - 0.12 1.00 0.013 5.9 C 22.0 C 6.0
1 Nmin from 0–90 cm soil depth2 Silty loam, Ackerzahl 70–903 Clayey-silty to sandy-silty �oodplain sediment, Ackerzahl 20–704 VDLUFA levels of phosphorus (Kerschberger et al., 1997), and potassium (Baumgärtel et al.,1999). C: recommended level, D: high level.
Total Nmin from 0–90 cm soil depth in spring of site KA was 53 kg ha−1, for WG this data is missing.The Smin content in spring was not determined, as it is not suited to reliably predict de�ciency for othercrops than winter-rape Olfs et al. (2012). Furthermore the method cannot estimate how much sulphuris mineralised during the cropping season (Alt et al., 2000; Olfs et al., 2012). The total S-content gaveabout equal results for both trial sites, but this value also does not provide useful information on cropavailability of sulphur. According to the sulphur estimation framework developed at Limburgerhof byBASF (Schwefelschätzrahmen) a de�ciency is likely to occur at site WG (28 points), while for site KA (31points) a S-fertilisation is recommendable.
3.2 Fertiliser e�ect on crop growth and grain yieldIn the faba bean direct seeding (DS) trials in Germany at sites Klein-Altendorf (KA, 2011) and Wiesengut(WG, 2012) for none of the parameters interactions were found between the treatment factors fertiliser,straw and straw cutting height (cut, only WG-PS). The interaction terms in the statistical models weretherefore removed and data analysed with an additive model. The results presentation can thereforegenerally be separated by the experimental factors. For factor fertiliser it was considered convenient tographically present and describe results of trials KA and WG together. Even though there was a pronouncedearly spring drought in 2011 (�gure 2.1), water potential recorded at KA was never critical for faba beandevelopment. The sowing could be realised on time in both trial years. Stand density of KA trials was ontrial average 44 and 48 plants m-2 for KA-P and KA-S, respectively. The WG trials had lower stand densitieswith 34 (WG-G), 30 (WG-K), 31 (WG-M) and 31 plants m-2 (WG-PS). Possible caustic e�ects of KCl (chloride)or S0 (sulphuric acid formation in root proximity) on seedling roots could not be observed in both trialyears, which would have a�ected either stand density or early crop development. Also, none of theother fertiliser treatments a�ected stand density. Between the two trial sites, shoot dry mass cannot becompared quantitatively due to di�erent growth stages at evaluation. KA-P and KA-S did not show any15’Normparabraunerde aus Löss’ (Eckelmann et al., 2005)
49
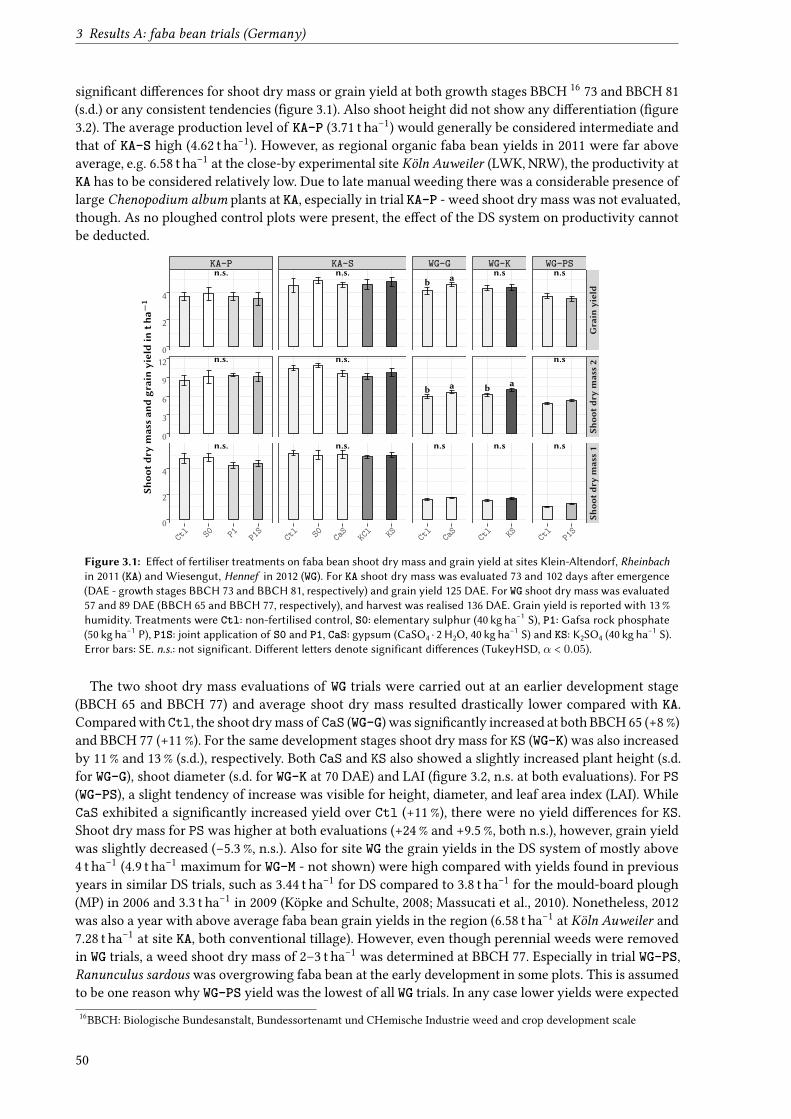
3 Results A: faba bean trials (Germany)
signi�cant di�erences for shoot dry mass or grain yield at both growth stages BBCH 16 73 and BBCH 81(s.d.) or any consistent tendencies (�gure 3.1). Also shoot height did not show any di�erentiation (�gure3.2). The average production level of KA-P (3.71 t ha−1) would generally be considered intermediate andthat of KA-S high (4.62 t ha−1). However, as regional organic faba bean yields in 2011 were far aboveaverage, e.g. 6.58 t ha−1 at the close-by experimental site Köln Auweiler (LWK, NRW), the productivity atKA has to be considered relatively low. Due to late manual weeding there was a considerable presence oflarge Chenopodium album plants at KA, especially in trial KA-P - weed shoot dry mass was not evaluated,though. As no ploughed control plots were present, the e�ect of the DS system on productivity cannotbe deducted.
n.s.
n.s.
n.s.
n.s.
n.s.
n.s.
ab
ab
n.s
n.s
b a
n.s
n.s
n.s
n.s
KA-P KA-S WG-G WG-K WG-PS
Grain
yield
Shoo
tdry
mass2
Shoo
tdry
mass1
Ctl S0 P1 P1
SCt
l S0 KCl KSCa
SCt
lCa
SCt
l KS Ctl
P1S
0
2
4
0
3
6
9
12
0
2
4
Shoo
tdry
massan
dgrainyieldin
tha−
1
Figure 3.1: E�ect of fertiliser treatments on faba bean shoot dry mass and grain yield at sites Klein-Altendorf, Rheinbachin 2011 (KA) and Wiesengut, Hennef in 2012 (WG). For KA shoot dry mass was evaluated 73 and 102 days a�er emergence(DAE - growth stages BBCH 73 and BBCH 81, respectively) and grain yield 125 DAE. For WG shoot dry mass was evaluated57 and 89 DAE (BBCH 65 and BBCH 77, respectively), and harvest was realised 136 DAE. Grain yield is reported with 13 %humidity. Treatments were Ctl: non-fertilised control, S0: elementary sulphur (40 kg ha−1 S), P1: Gafsa rock phosphate(50 kg ha−1 P), P1S: joint application of S0 and P1, CaS: gypsum (CaSO4 · 2 H2O, 40 kg ha−1 S) and KS: K2SO4 (40 kg ha−1 S).Error bars: SE. n.s.: not significant. Di�erent le�ers denote significant di�erences (TukeyHSD, α < 0.05).
The two shoot dry mass evaluations of WG trials were carried out at an earlier development stage(BBCH 65 and BBCH 77) and average shoot dry mass resulted drastically lower compared with KA.Compared with Ctl, the shoot dry mass of CaS (WG-G) was signi�cantly increased at both BBCH 65 (+8 %)and BBCH 77 (+11 %). For the same development stages shoot dry mass for KS (WG-K) was also increasedby 11 % and 13 % (s.d.), respectively. Both CaS and KS also showed a slightly increased plant height (s.d.for WG-G), shoot diameter (s.d. for WG-K at 70 DAE) and LAI (�gure 3.2, n.s. at both evaluations). For PS(WG-PS), a slight tendency of increase was visible for height, diameter, and leaf area index (LAI). WhileCaS exhibited a signi�cantly increased yield over Ctl (+11 %), there were no yield di�erences for KS.Shoot dry mass for PS was higher at both evaluations (+24 % and +9.5 %, both n.s.), however, grain yieldwas slightly decreased (−5.3 %, n.s.). Also for site WG the grain yields in the DS system of mostly above4 t ha−1 (4.9 t ha−1 maximum for WG-M - not shown) were high compared with yields found in previousyears in similar DS trials, such as 3.44 t ha−1 for DS compared to 3.8 t ha−1 for the mould-board plough(MP) in 2006 and 3.3 t ha−1 in 2009 (Köpke and Schulte, 2008; Massucati et al., 2010). Nonetheless, 2012was also a year with above average faba bean grain yields in the region (6.58 t ha−1 at Köln Auweiler and7.28 t ha−1 at site KA, both conventional tillage). However, even though perennial weeds were removedin WG trials, a weed shoot dry mass of 2–3 t ha−1 was determined at BBCH 77. Especially in trial WG-PS,Ranunculus sardous was overgrowing faba bean at the early development in some plots. This is assumedto be one reason why WG-PS yield was the lowest of all WG trials. In any case lower yields were expected16BBCH: Biologische Bundesanstalt, Bundessortenamt und CHemische Industrie weed and crop development scale
50
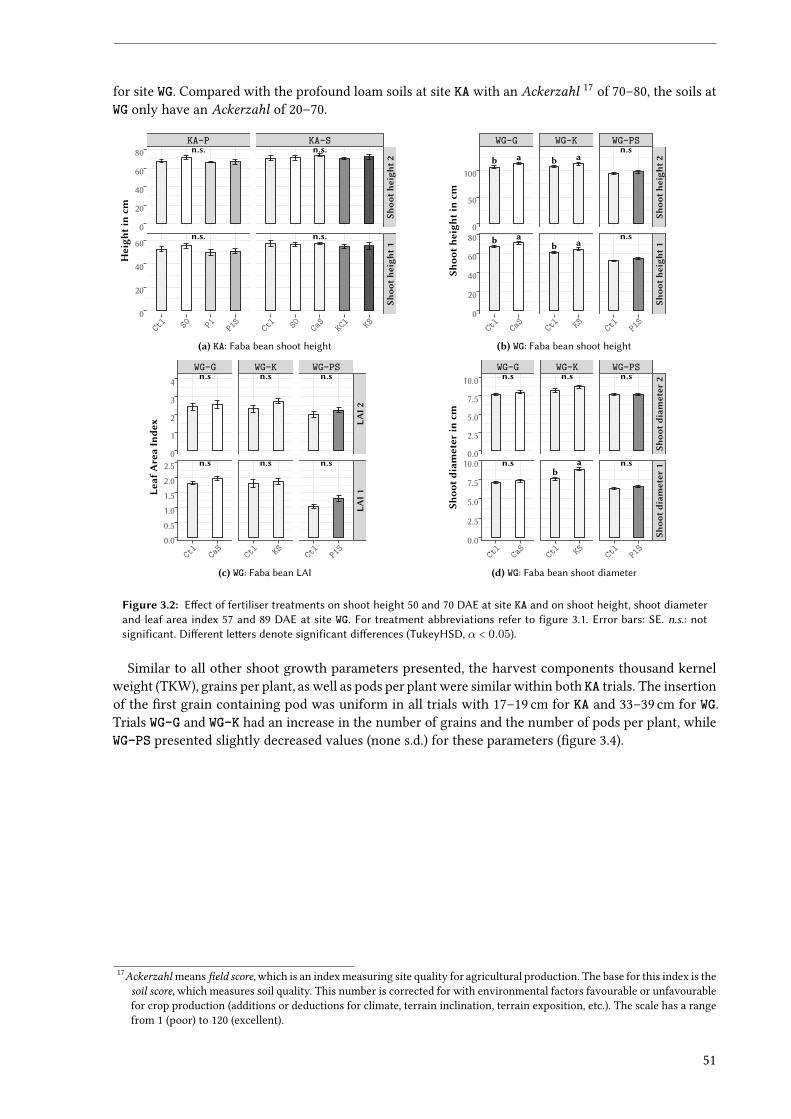
for site WG. Compared with the profound loam soils at site KA with an Ackerzahl 17 of 70–80, the soils atWG only have an Ackerzahl of 20–70.
n.s.
n.s.
n.s.
n.s.
KA-P KA-S
Shoo
theigh
t2Sh
ooth
eigh
t1
Ctl S0 P1 P1
SCt
l S0 KCl KSCa
S
0
20
40
60
80
0
20
40
60
Heigh
tincm
(a) KA: Faba bean shoot height
ab
ab
b a
b a
n.s
n.s
WG-G WG-K WG-PS
Shoo
theigh
t2Sh
ooth
eigh
t1
Ctl
CaS
Ctl KS Ct
lP1
S
0
50
100
0
20
40
60
80
Shoo
theigh
tincm
(b) WG: Faba bean shoot height
n.s
n.s
n.s
n.s
n.s
n.s
WG-G WG-K WG-PSLA
I2LA
I1
Ctl
CaS
Ctl KS Ct
lP1
S
0
1
2
3
4
0.0
0.5
1.0
1.5
2.0
2.5
Leaf
AreaInde
x
(c) WG: Faba bean LAI
n.s
n.s
n.s
ba
n.s
n.s
WG-G WG-K WG-PS
Shoo
tdiameter
2Sh
ootd
iameter
1
Ctl
CaS
Ctl KS Ct
lP1
S
0.0
2.5
5.0
7.5
10.0
0.0
2.5
5.0
7.5
10.0Sh
ootd
iameter
incm
(d) WG: Faba bean shoot diameter
Figure 3.2: E�ect of fertiliser treatments on shoot height 50 and 70 DAE at site KA and on shoot height, shoot diameterand leaf area index 57 and 89 DAE at site WG. For treatment abbreviations refer to figure 3.1. Error bars: SE. n.s.: notsignificant. Di�erent le�ers denote significant di�erences (TukeyHSD, α < 0.05).
Similar to all other shoot growth parameters presented, the harvest components thousand kernelweight (TKW), grains per plant, as well as pods per plant were similar within both KA trials. The insertionof the �rst grain containing pod was uniform in all trials with 17–19 cm for KA and 33–39 cm for WG.Trials WG-G and WG-K had an increase in the number of grains and the number of pods per plant, whileWG-PS presented slightly decreased values (none s.d.) for these parameters (�gure 3.4).
17Ackerzahl means �eld score, which is an index measuring site quality for agricultural production. The base for this index is thesoil score, which measures soil quality. This number is corrected for with environmental factors favourable or unfavourablefor crop production (additions or deductions for climate, terrain inclination, terrain exposition, etc.). The scale has a rangefrom 1 (poor) to 120 (excellent).
51
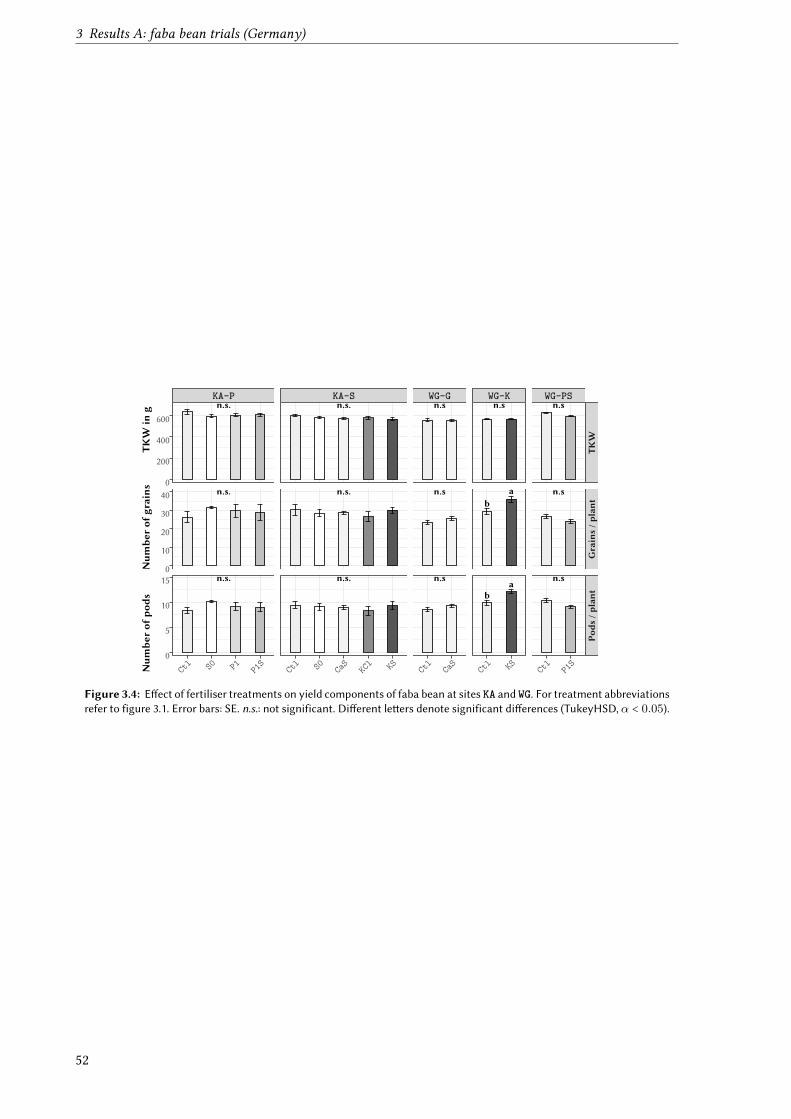
3 Results A: faba bean trials (Germany)
n.s.
n.s.
n.s.
n.s.
n.s.
n.s.
n.s
n.s
n.s
n.s
ba
ba
n.s
n.s
n.s
KA-P KA-S WG-G WG-K WG-PS
TKW
Grains/p
lant
Pods
/plant
Ctl S0 P1 P1
SCt
l S0 KCl KSCa
SCt
lCa
SCt
l KS Ctl
P1S
0
200
400
600
0
10
20
30
40
0
5
10
15
Num
berof
pods
Num
berof
grains
TKW
ing
Figure 3.4: E�ect of fertiliser treatments on yield components of faba bean at sites KA and WG. For treatment abbreviationsrefer to figure 3.1. Error bars: SE. n.s.: not significant. Di�erent le�ers denote significant di�erences (TukeyHSD,α < 0.05).
52
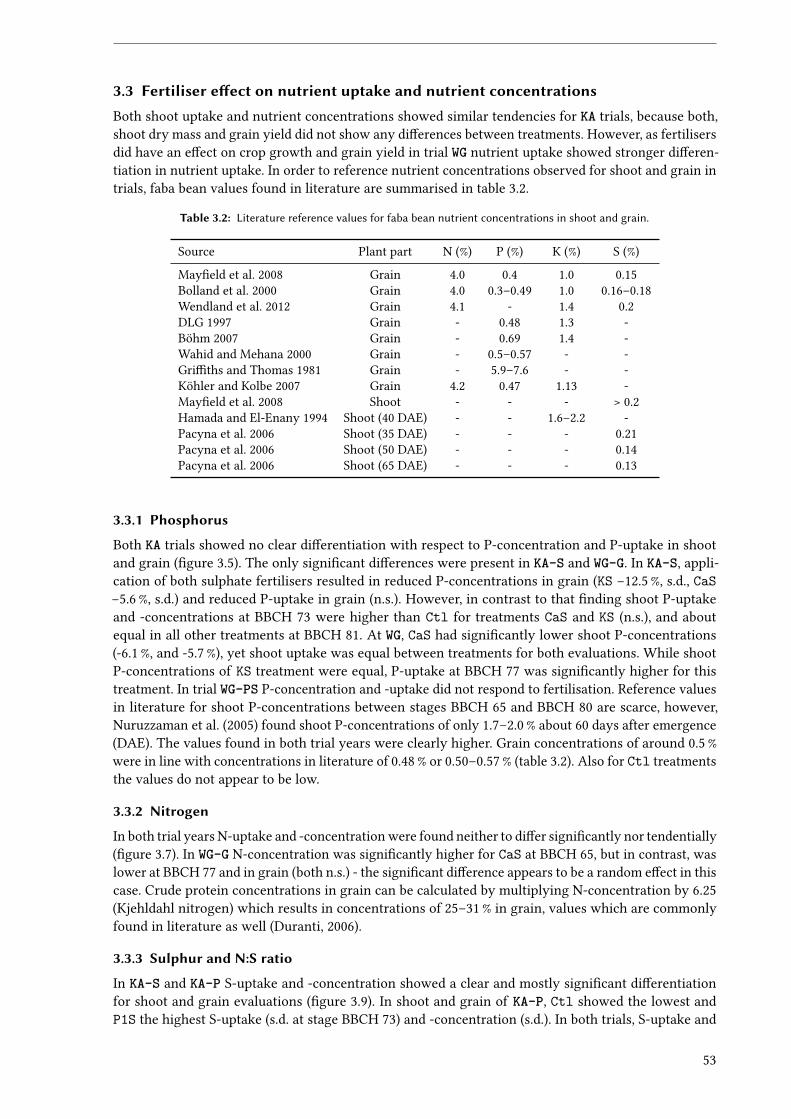
3.3 Fertiliser e�ect on nutrient uptake and nutrient concentrationsBoth shoot uptake and nutrient concentrations showed similar tendencies for KA trials, because both,shoot dry mass and grain yield did not show any di�erences between treatments. However, as fertilisersdid have an e�ect on crop growth and grain yield in trial WG nutrient uptake showed stronger di�eren-tiation in nutrient uptake. In order to reference nutrient concentrations observed for shoot and grain intrials, faba bean values found in literature are summarised in table 3.2.
Table 3.2: Literature reference values for faba bean nutrient concentrations in shoot and grain.
Source Plant part N (%) P (%) K (%) S (%)
May�eld et al. 2008 Grain 4.0 0.4 1.0 0.15Bolland et al. 2000 Grain 4.0 0.3–0.49 1.0 0.16–0.18Wendland et al. 2012 Grain 4.1 - 1.4 0.2DLG 1997 Grain - 0.48 1.3 -Böhm 2007 Grain - 0.69 1.4 -Wahid and Mehana 2000 Grain - 0.5–0.57 - -Gri�ths and Thomas 1981 Grain - 5.9–7.6 - -Köhler and Kolbe 2007 Grain 4.2 0.47 1.13 -May�eld et al. 2008 Shoot - - - > 0.2Hamada and El-Enany 1994 Shoot (40 DAE) - - 1.6–2.2 -Pacyna et al. 2006 Shoot (35 DAE) - - - 0.21Pacyna et al. 2006 Shoot (50 DAE) - - - 0.14Pacyna et al. 2006 Shoot (65 DAE) - - - 0.13
3.3.1 Phosphorus
Both KA trials showed no clear di�erentiation with respect to P-concentration and P-uptake in shootand grain (�gure 3.5). The only signi�cant di�erences were present in KA-S and WG-G. In KA-S, appli-cation of both sulphate fertilisers resulted in reduced P-concentrations in grain (KS −12.5 %, s.d., CaS−5.6 %, s.d.) and reduced P-uptake in grain (n.s.). However, in contrast to that �nding shoot P-uptakeand -concentrations at BBCH 73 were higher than Ctl for treatments CaS and KS (n.s.), and aboutequal in all other treatments at BBCH 81. At WG, CaS had signi�cantly lower shoot P-concentrations(-6.1 %, and -5.7 %), yet shoot uptake was equal between treatments for both evaluations. While shootP-concentrations of KS treatment were equal, P-uptake at BBCH 77 was signi�cantly higher for thistreatment. In trial WG-PS P-concentration and -uptake did not respond to fertilisation. Reference valuesin literature for shoot P-concentrations between stages BBCH 65 and BBCH 80 are scarce, however,Nuruzzaman et al. (2005) found shoot P-concentrations of only 1.7–2.0 % about 60 days after emergence(DAE). The values found in both trial years were clearly higher. Grain concentrations of around 0.5 %were in line with concentrations in literature of 0.48 % or 0.50–0.57 % (table 3.2). Also for Ctl treatmentsthe values do not appear to be low.
3.3.2 Nitrogen
In both trial years N-uptake and -concentration were found neither to di�er signi�cantly nor tendentially(�gure 3.7). In WG-G N-concentration was signi�cantly higher for CaS at BBCH 65, but in contrast, waslower at BBCH 77 and in grain (both n.s.) - the signi�cant di�erence appears to be a random e�ect in thiscase. Crude protein concentrations in grain can be calculated by multiplying N-concentration by 6.25(Kjehldahl nitrogen) which results in concentrations of 25–31 % in grain, values which are commonlyfound in literature as well (Duranti, 2006).
3.3.3 Sulphur and N:S ratio
In KA-S and KA-P S-uptake and -concentration showed a clear and mostly signi�cant di�erentiationfor shoot and grain evaluations (�gure 3.9). In shoot and grain of KA-P, Ctl showed the lowest andP1S the highest S-uptake (s.d. at stage BBCH 73) and -concentration (s.d.). In both trials, S-uptake and
53
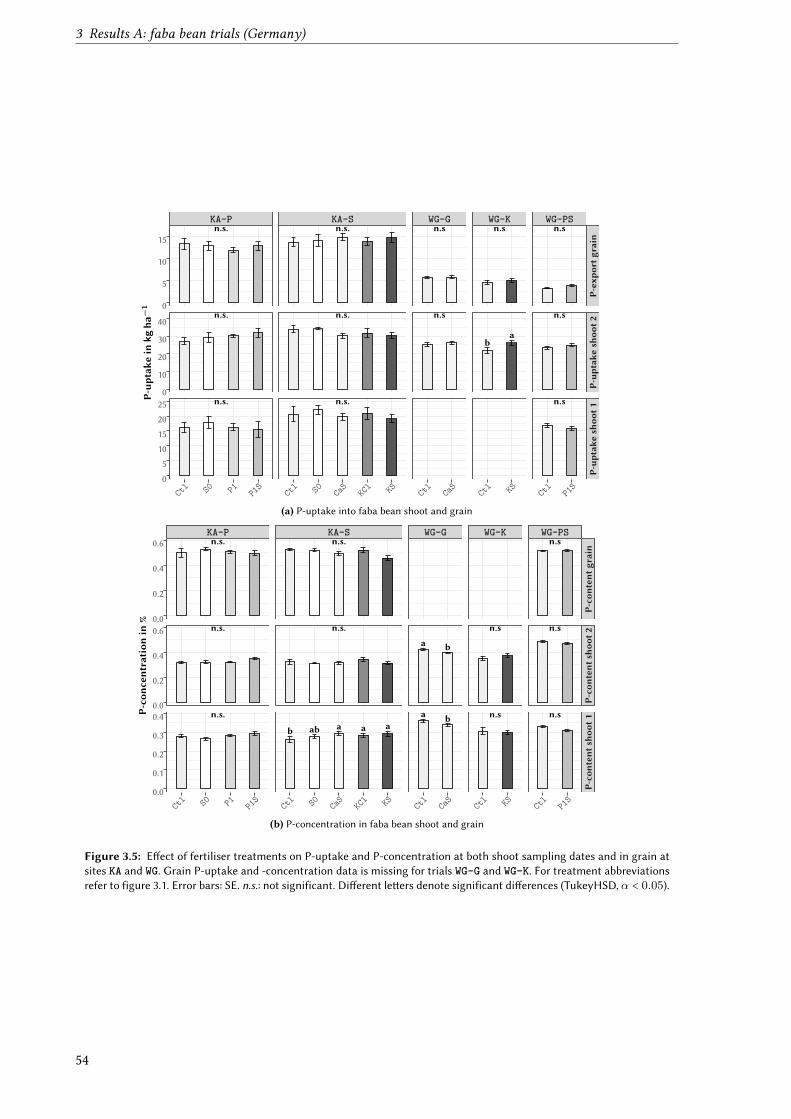
3 Results A: faba bean trials (Germany)
n.s.
n.s.
n.s.
n.s.
n.s.
n.s.
n.s
n.s
n.s
ba
n.s
n.s
n.s
KA-P KA-S WG-G WG-K WG-PS
P-ex
port
grain
P-up
take
shoo
t2P-up
take
shoo
t1
Ctl S0 P1 P1
SCt
l S0 KCl KSCa
SCt
lCa
SCt
l KS Ctl
P1S
0
5
10
15
0
10
20
30
40
0
5
10
15
20
25
P-up
take
inkgha−
1
(a) P-uptake into faba bean shoot and grain
n.s.
n.s.
n.s.
n.s.
n.s.
b ab a a a
ba
ba
n.s
n.s
n.s
n.s
n.s
KA-P KA-S WG-G WG-K WG-PS
P-co
nten
tgrain
P-co
nten
tsho
ot2
P-co
nten
tsho
ot1
Ctl S0 P1 P1
SCt
l S0 KCl KSCa
SCt
lCa
SCt
l KS Ctl
P1S
0.0
0.2
0.4
0.6
0.0
0.2
0.4
0.6
0.0
0.1
0.2
0.3
0.4P-co
ncen
trationin
%
(b) P-concentration in faba bean shoot and grain
Figure 3.5: E�ect of fertiliser treatments on P-uptake and P-concentration at both shoot sampling dates and in grain atsites KA and WG. Grain P-uptake and -concentration data is missing for trials WG-G and WG-K. For treatment abbreviationsrefer to figure 3.1. Error bars: SE. n.s.: not significant. Di�erent le�ers denote significant di�erences (TukeyHSD,α < 0.05).
54
n.s.
n.s.
n.s.
n.s.
n.s.
n.s.
ab
n.s
n.s
n.s
n.s
n.s
n.s
n.s
n.s
KA-P KA-S WG-G WG-K WG-PS
N-exp
ortg
rain
N-uptak
esh
oot2
N-uptak
esh
oot1
Ctl S0 P1 P1
SCt
l S0 KCl KSCa
SCt
lCa
SCt
l KS Ctl
P1S
0
50
100
150
0
100
200
300
0
50
100
150
200
N-uptak
ein
kgha−
1
(a) N-uptake into faba bean shoot and grain
n.s.
n.s.
n.s.
n.s.
n.s.
n.s.
ba
ba
ab
n.s
n.s
b a
n.s
n.s
n.s
KA-P KA-S WG-G WG-K WG-PS
N-con
tent
grain
N-con
tent
shoo
t2N-con
tent
shoo
t1
Ctl S0 P1 P1
SCt
l S0 KCl KSCa
SCt
lCa
SCt
l KS Ctl
P1S
0
2
4
0
1
2
3
4
0
1
2
3
4
N-con
centration
in%
(b) N-concentration in faba bean shoot and grain
Figure 3.7: E�ect of fertiliser treatments on N-uptake and N-concentration at both shoot sampling dates and in grain atsites KA and WG. For treatment abbreviations refer to figure 3.1. Error bars: SE. n.s.: not significant. Di�erent le�ers denotesignificant di�erences (TukeyHSD, α < 0.05).
55
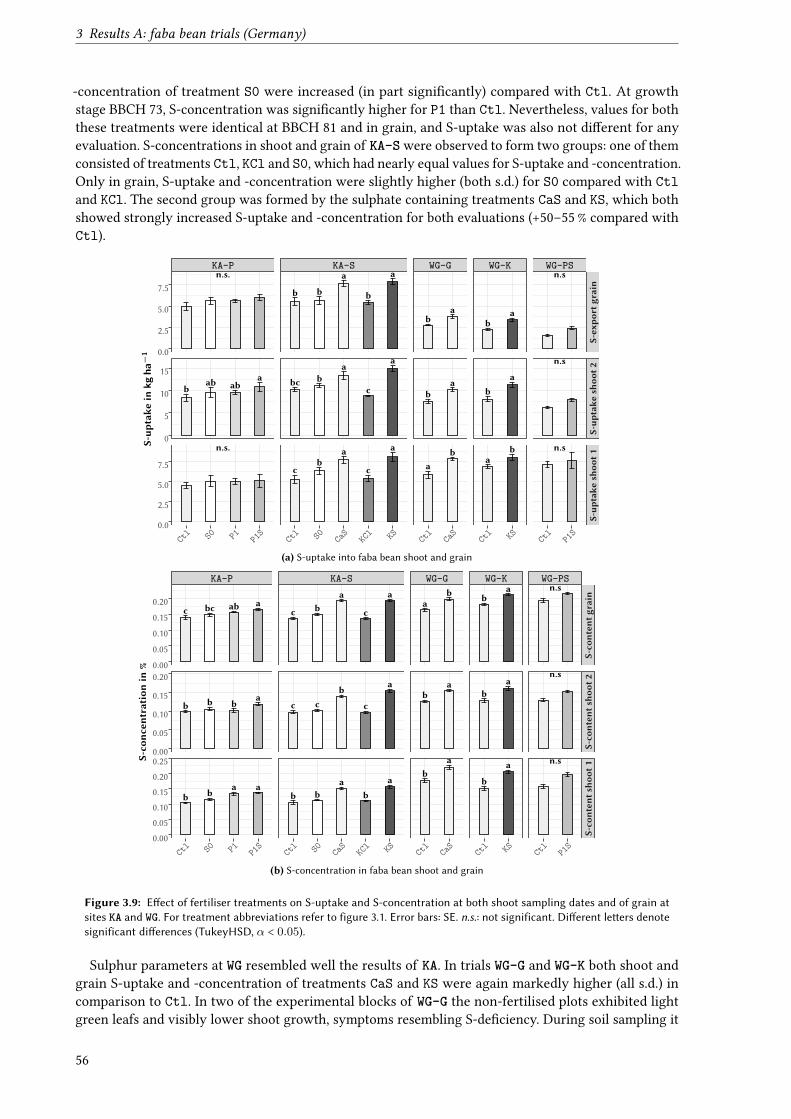
3 Results A: faba bean trials (Germany)
-concentration of treatment S0 were increased (in part signi�cantly) compared with Ctl. At growthstage BBCH 73, S-concentration was signi�cantly higher for P1 than Ctl. Nevertheless, values for boththese treatments were identical at BBCH 81 and in grain, and S-uptake was also not di�erent for anyevaluation. S-concentrations in shoot and grain of KA-S were observed to form two groups: one of themconsisted of treatments Ctl, KCl and S0, which had nearly equal values for S-uptake and -concentration.Only in grain, S-uptake and -concentration were slightly higher (both s.d.) for S0 compared with Ctland KCl. The second group was formed by the sulphate containing treatments CaS and KS, which bothshowed strongly increased S-uptake and -concentration for both evaluations (+50–55 % compared withCtl).
n.s.
bab ab
a
n.s.
b b
a
b
a
bc ba
c
a
cb
a
c
a
ab
ab
ba
ba
ba
ab
n.s
n.s
n.s
KA-P KA-S WG-G WG-K WG-PS
S-ex
port
grain
S-up
take
shoo
t2S-up
take
shoo
t1
Ctl S0 P1 P1
SCt
l S0 KCl KSCa
SCt
lCa
SCt
l KS Ctl
P1S
0.0
2.5
5.0
7.5
0
5
10
15
0.0
2.5
5.0
7.5
S-up
take
inkgha−
1
(a) S-uptake into faba bean shoot and grain
c bc ab a
b b ba
b b a a
c ba
c
a
c cb
c
a
b ba
b
a
ba
ab
ab
ba
ba
b
a
n.s
n.s
n.s
KA-P KA-S WG-G WG-K WG-PSS-co
nten
tgrain
S-co
nten
tsho
ot2
S-co
nten
tsho
ot1
Ctl S0 P1 P1
SCt
l S0 KCl KSCa
SCt
lCa
SCt
l KS Ctl
P1S
0.00
0.05
0.10
0.15
0.20
0.00
0.05
0.10
0.15
0.20
0.00
0.05
0.10
0.15
0.20
0.25S-co
ncen
trationin
%
(b) S-concentration in faba bean shoot and grain
Figure 3.9: E�ect of fertiliser treatments on S-uptake and S-concentration at both shoot sampling dates and of grain atsites KA and WG. For treatment abbreviations refer to figure 3.1. Error bars: SE. n.s.: not significant. Di�erent le�ers denotesignificant di�erences (TukeyHSD, α < 0.05).
Sulphur parameters at WG resembled well the results of KA. In trials WG-G and WG-K both shoot andgrain S-uptake and -concentration of treatments CaS and KS were again markedly higher (all s.d.) incomparison to Ctl. In two of the experimental blocks of WG-G the non-fertilised plots exhibited lightgreen leafs and visibly lower shoot growth, symptoms resembling S-de�ciency. During soil sampling it
56
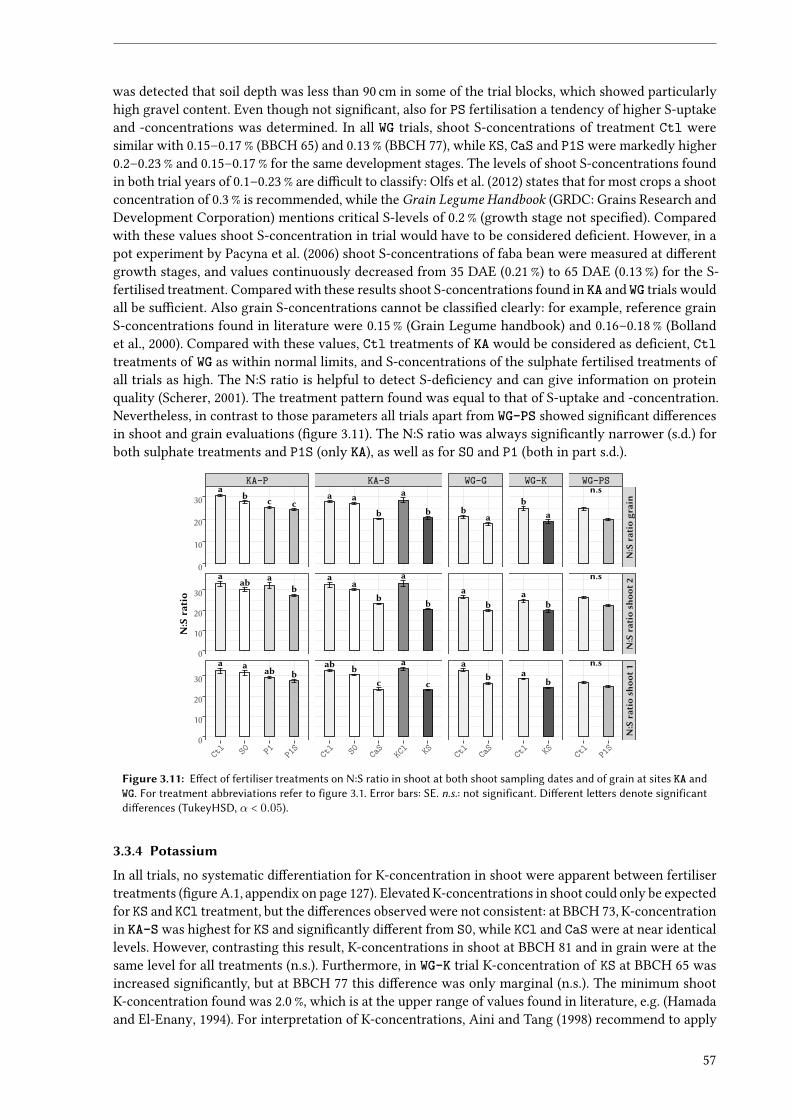
was detected that soil depth was less than 90 cm in some of the trial blocks, which showed particularlyhigh gravel content. Even though not signi�cant, also for PS fertilisation a tendency of higher S-uptakeand -concentrations was determined. In all WG trials, shoot S-concentrations of treatment Ctl weresimilar with 0.15–0.17 % (BBCH 65) and 0.13 % (BBCH 77), while KS, CaS and P1S were markedly higher0.2–0.23 % and 0.15–0.17 % for the same development stages. The levels of shoot S-concentrations foundin both trial years of 0.1–0.23 % are di�cult to classify: Olfs et al. (2012) states that for most crops a shootconcentration of 0.3 % is recommended, while the Grain Legume Handbook (GRDC: Grains Research andDevelopment Corporation) mentions critical S-levels of 0.2 % (growth stage not speci�ed). Comparedwith these values shoot S-concentration in trial would have to be considered de�cient. However, in apot experiment by Pacyna et al. (2006) shoot S-concentrations of faba bean were measured at di�erentgrowth stages, and values continuously decreased from 35 DAE (0.21 %) to 65 DAE (0.13 %) for the S-fertilised treatment. Compared with these results shoot S-concentrations found in KA and WG trials wouldall be su�cient. Also grain S-concentrations cannot be classi�ed clearly: for example, reference grainS-concentrations found in literature were 0.15 % (Grain Legume handbook) and 0.16–0.18 % (Bollandet al., 2000). Compared with these values, Ctl treatments of KA would be considered as de�cient, Ctltreatments of WG as within normal limits, and S-concentrations of the sulphate fertilised treatments ofall trials as high. The N:S ratio is helpful to detect S-de�ciency and can give information on proteinquality (Scherer, 2001). The treatment pattern found was equal to that of S-uptake and -concentration.Nevertheless, in contrast to those parameters all trials apart from WG-PS showed signi�cant di�erencesin shoot and grain evaluations (�gure 3.11). The N:S ratio was always signi�cantly narrower (s.d.) forboth sulphate treatments and P1S (only KA), as well as for SO and P1 (both in part s.d.).
ab c c
aab a
b
a a ab b
a a
b
a
b
aa
b
a
b
ab bc
a
c
ab
ba
ba
ba
ab
ab
n.s
n.s
n.s
KA-P KA-S WG-G WG-K WG-PS
N:S
ratiograin
N:S
ratiosh
oot2
N:S
ratiosh
oot1
Ctl S0 P1 P1
SCt
l S0 KCl KSCa
SCt
lCa
SCt
l KS Ctl
P1S
0
10
20
30
0
10
20
30
0
10
20
30
N:S
ratio
Figure 3.11: E�ect of fertiliser treatments on N:S ratio in shoot at both shoot sampling dates and of grain at sites KA andWG. For treatment abbreviations refer to figure 3.1. Error bars: SE. n.s.: not significant. Di�erent le�ers denote significantdi�erences (TukeyHSD, α < 0.05).
3.3.4 Potassium
In all trials, no systematic di�erentiation for K-concentration in shoot were apparent between fertilisertreatments (�gure A.1, appendix on page 127). Elevated K-concentrations in shoot could only be expectedfor KS and KCl treatment, but the di�erences observed were not consistent: at BBCH 73, K-concentrationin KA-S was highest for KS and signi�cantly di�erent from S0, while KCl and CaS were at near identicallevels. However, contrasting this result, K-concentrations in shoot at BBCH 81 and in grain were at thesame level for all treatments (n.s.). Furthermore, in WG-K trial K-concentration of KS at BBCH 65 wasincreased signi�cantly, but at BBCH 77 this di�erence was only marginal (n.s.). The minimum shootK-concentration found was 2.0 %, which is at the upper range of values found in literature, e.g. (Hamadaand El-Enany, 1994). For interpretation of K-concentrations, Aini and Tang (1998) recommend to apply
57
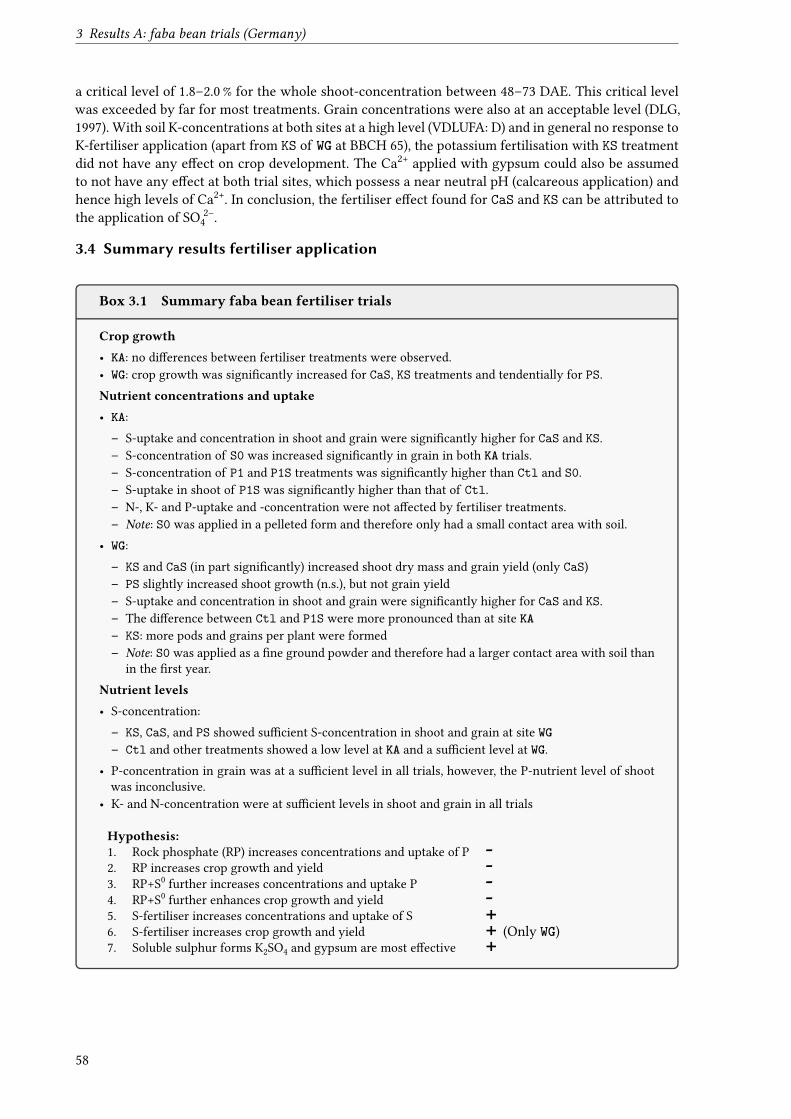
3 Results A: faba bean trials (Germany)
a critical level of 1.8–2.0 % for the whole shoot-concentration between 48–73 DAE. This critical levelwas exceeded by far for most treatments. Grain concentrations were also at an acceptable level (DLG,1997). With soil K-concentrations at both sites at a high level (VDLUFA: D) and in general no response toK-fertiliser application (apart from KS of WG at BBCH 65), the potassium fertilisation with KS treatmentdid not have any e�ect on crop development. The Ca2+ applied with gypsum could also be assumedto not have any e�ect at both trial sites, which possess a near neutral pH (calcareous application) andhence high levels of Ca2+. In conclusion, the fertiliser e�ect found for CaS and KS can be attributed tothe application of SO 2–
4 .
3.4 Summary results fertiliser application
Box 3.1 Summary faba bean fertiliser trials
Crop growth• KA: no di�erences between fertiliser treatments were observed.• WG: crop growth was signi�cantly increased for CaS, KS treatments and tendentially for PS.Nutrient concentrations and uptake• KA:– S-uptake and concentration in shoot and grain were signi�cantly higher for CaS and KS.– S-concentration of S0 was increased signi�cantly in grain in both KA trials.– S-concentration of P1 and P1S treatments was signi�cantly higher than Ctl and S0.– S-uptake in shoot of P1S was signi�cantly higher than that of Ctl.– N-, K- and P-uptake and -concentration were not a�ected by fertiliser treatments.– Note: S0 was applied in a pelleted form and therefore only had a small contact area with soil.
• WG:– KS and CaS (in part signi�cantly) increased shoot dry mass and grain yield (only CaS)– PS slightly increased shoot growth (n.s.), but not grain yield– S-uptake and concentration in shoot and grain were signi�cantly higher for CaS and KS.– The di�erence between Ctl and P1S were more pronounced than at site KA– KS: more pods and grains per plant were formed– Note: S0 was applied as a �ne ground powder and therefore had a larger contact area with soil than
in the �rst year.Nutrient levels• S-concentration:– KS, CaS, and PS showed su�cient S-concentration in shoot and grain at site WG– Ctl and other treatments showed a low level at KA and a su�cient level at WG.
• P-concentration in grain was at a su�cient level in all trials, however, the P-nutrient level of shootwas inconclusive.
• K- and N-concentration were at su�cient levels in shoot and grain in all trials
Hypothesis:1. Rock phosphate (RP) increases concentrations and uptake of P -2. RP increases crop growth and yield -3. RP+S0 further increases concentrations and uptake P -4. RP+S0 further enhances crop growth and yield -5. S-fertiliser increases concentrations and uptake of S +6. S-fertiliser increases crop growth and yield + (Only WG)7. Soluble sulphur forms K2SO4 and gypsum are most e�ective +
58
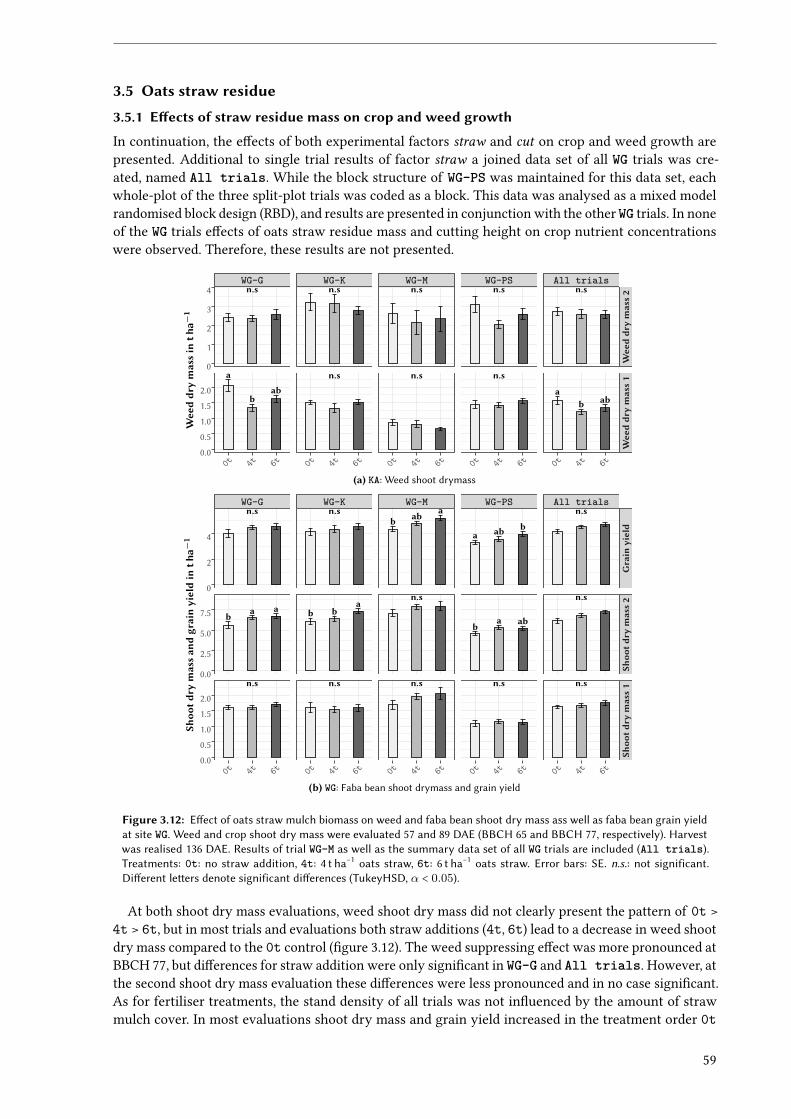
3.5 Oats straw residue
3.5.1 E�ects of straw residue mass on crop and weed growth
In continuation, the e�ects of both experimental factors straw and cut on crop and weed growth arepresented. Additional to single trial results of factor straw a joined data set of all WG trials was cre-ated, named All trials. While the block structure of WG-PS was maintained for this data set, eachwhole-plot of the three split-plot trials was coded as a block. This data was analysed as a mixed modelrandomised block design (RBD), and results are presented in conjunction with the other WG trials. In noneof the WG trials e�ects of oats straw residue mass and cutting height on crop nutrient concentrationswere observed. Therefore, these results are not presented.
n.s
a
bab
n.s
n.s
n.s
n.s
n.s
n.s
n.s
ab ab
WG-G WG-K WG-M WG-PS All trials
Wee
ddr
ymass2
Wee
ddr
ymass1
0t 4t 6t 0t 4t 6t 0t 4t 6t 0t 4t 6t 0t 4t 6t
0
1
2
3
4
0.0
0.5
1.0
1.5
2.0
Wee
ddr
ymassin
tha−
1
(a) KA: Weed shoot drymass
n.s
b a a
n.s
n.s
b ba
n.s
b ab a
n.s
n.s
a ab b
ba ab
n.s
n.s
n.s
n.s
WG-G WG-K WG-M WG-PS All trials
Grain
yield
Shoo
tdry
mass2
Shoo
tdry
mass1
0t 4t 6t 0t 4t 6t 0t 4t 6t 0t 4t 6t 0t 4t 6t
0
2
4
0.0
2.5
5.0
7.5
0.0
0.5
1.0
1.5
2.0
Shoo
tdry
massan
dgrainyieldin
tha−
1
(b) WG: Faba bean shoot drymass and grain yield
Figure 3.12: E�ect of oats straw mulch biomass on weed and faba bean shoot dry mass ass well as faba bean grain yieldat site WG. Weed and crop shoot dry mass were evaluated 57 and 89 DAE (BBCH 65 and BBCH 77, respectively). Harvestwas realised 136 DAE. Results of trial WG-M as well as the summary data set of all WG trials are included (All trials).Treatments: 0t: no straw addition, 4t: 4 t ha−1 oats straw, 6t: 6 t ha−1 oats straw. Error bars: SE. n.s.: not significant.Di�erent le�ers denote significant di�erences (TukeyHSD, α < 0.05).
At both shoot dry mass evaluations, weed shoot dry mass did not clearly present the pattern of 0t >4t > 6t, but in most trials and evaluations both straw additions (4t, 6t) lead to a decrease in weed shootdry mass compared to the 0t control (�gure 3.12). The weed suppressing e�ect was more pronounced atBBCH 77, but di�erences for straw addition were only signi�cant in WG-G and All trials. However, atthe second shoot dry mass evaluation these di�erences were less pronounced and in no case signi�cant.As for fertiliser treatments, the stand density of all trials was not in�uenced by the amount of strawmulch cover. In most evaluations shoot dry mass and grain yield increased in the treatment order 0t
59

3 Results A: faba bean trials (Germany)
< 4t < 6t. While at the �rst shoot dry mass evaluation this pattern was only apparent for WG-G, WG-M,and for the joined data set All trials, it was universal at the time of the second evaluation, only withexception of WG-PS (�gure 3.12 b), with often signi�cant di�erences between control and straw additiontreatments. In all trials grain yield exhibited the pattern 0t < 4t < 6t, however, di�erences were onlysigni�cant in WG-M and WG-PS.
Furthermore, crop height and diameter were tendentially increased in nearly all trials with increas-ing amounts of mulch (�gure A.3 on page 128 in the annex), and in many cases the di�erences werestatistically signi�cant between 0t and 4t or 6t treatments. Straw mulch biomass e�ects on LAI werenot consistent at the �rst evaluation, and only in WG-M and All trials the common 0t < 4t < 6tpattern was apparent. For the second evaluation only the LAI of treatments 0t and 6t was determined:in all trials the LAI was 15–25 % higher for 6t than 0t, though di�erences were not signi�cant. Further-more, there were no signi�cant e�ects and no apparent tendencies over all trials between straw mulchtreatments on yield components (�gure A.5 on page 129 in the annex).
3.5.2 E�ects of cu�ing height on crop and weed growth
The stand density was not in�uenced by oats straw cutting height. However, High cutting of oats straw atharvest a�ected crop growth negatively: even though there were no di�erences between crop and weedshoot dry mass at the �rst shoot dry mass evaluation (BBCH 65), at the second evaluation weed growthof treatment High was more elevated (n.s.) while faba bean shoot growth was decreased (n.s., �gure3.14), which resulted in signi�cantly lower grain yield was (about −0.5 t ha−1 or −13 %). No di�erenceswere observed for shoot height and diameter at both evaluations. Even though not signi�cant, LAI wasalso decreased for High (−17.1 %). Yield components were mostly not a�ected by the cutting height andno signi�cant di�erences were present for the number of pods and grains per plant. However, TKW wassigni�cantly lower for High, even though absolute di�erences were marginal. Results of shoot height,shoot diameter, LAI and yield components are presented in �gure A.6 on page 129 in the annex.
n.s n.s
Weeddry mass 1
Weeddry mass 2
Low
High Lo
wHi
gh0
1
2
3
tha−
1
(a) Weed shoot dry mass
n.s n.s
ba
Faba beandry mass 1
Faba beandry mass 2
Faba beangrain yield
Low
High Lo
wHi
gh Low
High
0
2
4
tha−
1
(b) Faba bean shoot dry mass
Figure 3.14: E�ect of oats cu�ing height on weed and faba bean shoot growth as well as faba bean grain yield at siteWG. Both weed and shoot growth were evaluated 57 and 89 DAE (BBCH 65 and BBCH 77 of faba bean, respectively).Treatments were Low: low cut at oats harvest at the base of the plant, and High: high cut at oats harvest beneath thepanicle. Error bars: SE. n.s.: not significant. Di�erent le�ers denote significant di�erences (TukeyHSD, α < 0.05).
60
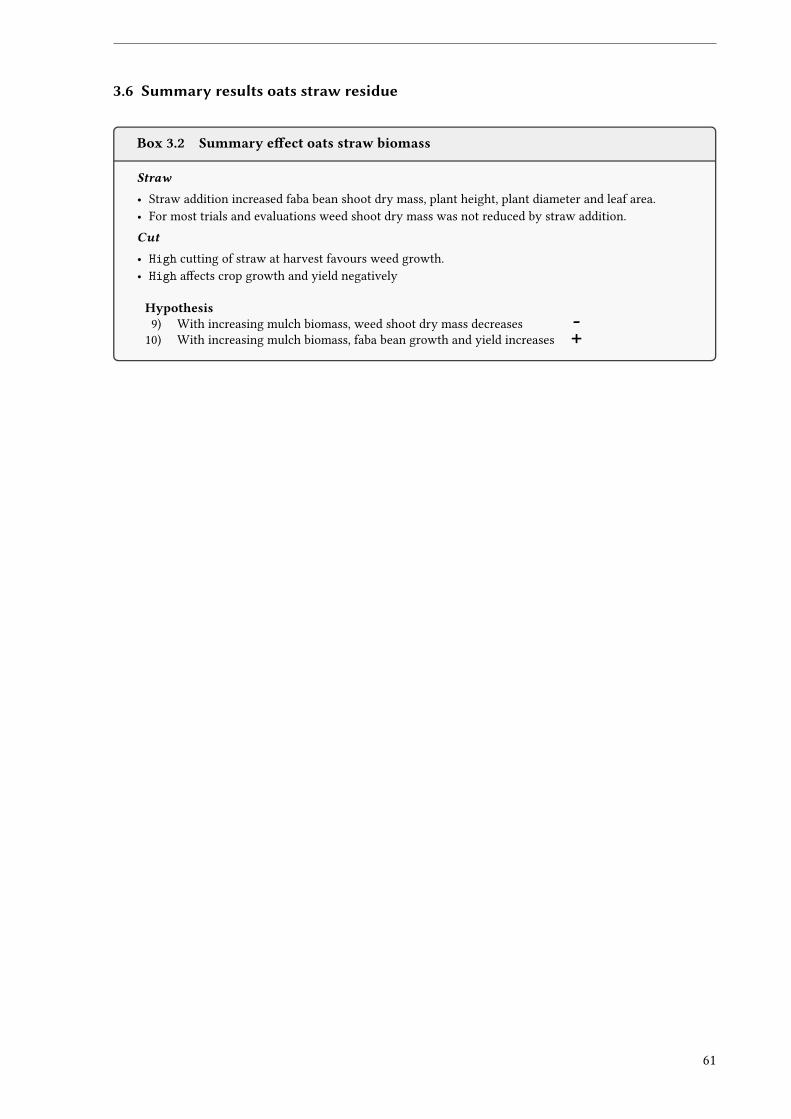
3.6 Summary results oats straw residue
Box 3.2 Summary e�ect oats straw biomass
Straw
• Straw addition increased faba bean shoot dry mass, plant height, plant diameter and leaf area.• For most trials and evaluations weed shoot dry mass was not reduced by straw addition.Cut
• High cutting of straw at harvest favours weed growth.• High a�ects crop growth and yield negatively
Hypothesis9) With increasing mulch biomass, weed shoot dry mass decreases -
10) With increasing mulch biomass, faba bean growth and yield increases +
61
4 Discussion A: faba bean trials (Germany)
4 Discussion A: faba bean trials (Germany)In both trial years sulphur fertilisation resulted in a marked increase in sulphur uptake and contents.Nevertheless only at site WG plant growth was a�ected slightly positive. None of the parameters mea-suring crop growth of faba beans responded to the applied P- and S-fertiliser treatments. Only in thesecond year at WG, positive fertiliser e�ects on crop growth were observed. At both experimental sites,crop growth was obviously restricted by weed infestation. Under totally weed free growth conditionsnutrient demands for P and S would have been higher and may have allowed for nutrient de�cienciesto show up clearer and for a better di�erentiation between fertiliser treatments.
4.1 Phosphorus
When P-de�ciency occurs, shoot P-concentration is decreased (Olivera et al., 2004). The energy metabolismis a�ected strongly, and nitrogen �xation in grain legumes decreases and with it N-uptake into shoot,even though N-concentrations may be equal between de�cient and su�cient conditions (Leidi andRodríguez-Navarro, 2000; Marschner and Marschner, 2012). When de�cient in P, shoot growth and LAI,as well as number of pods and decreased yield are common symptoms (Marschner and Marschner, 2012).Only after many years of permanent direct seeding (no-till) a soil structure which is favourable to root-ing can be formed. However, most notable under occasional direct seeding is that the soil has a higherdensity due to lack of loosening through tillage, which apart from lower soil temperatures hinders rootformation and the di�usion of P. Therefore it was hypothesised, that phosphorus acquisition in theDS system is obstructed and that P-de�ciencies are likely to occur. However, no signs of P-de�ciencywere observed in �eld trials and the shoot and grain P-concentrations were in line with values foundin literature for conditions of nutrient su�ciency. Furthermore, the application of RP, alone and incombination with elemental sulphur did not a�ect shoot growth, LAI, grain yield, yield componentsor P and N- nutrient uptake or concentration. It is therefore concluded, that independent of fertiliserapplication phosphate supply was not limited, even under conditions of occasional direct seeding (oDS)in temperate climate. This can be explained with the soil P-levels, which were high (VDLUFA D) at KAand at a recommended level (VDLUFA C) at WG. In similar DS faba bean trials at WG, RP application in awork of Seehuber (2014) also did not a�ect yield and P-concentrations in leaf.
4.1.1 Rock phosphate and elemental sulphur
Nevertheless, shoot growth, grain yield, and P-uptake of P1S treatment in WG-PS showed a positivetendency, but it cannot be concluded clearly if this increase was due to the application of RP or S0
or to the combined e�ect of the two. The hypothesised e�ect that combined application of RP andS0 could improve RP-availability to crops, which has been demonstrated in previous works (Rajan,1982a,b), could not be eluded with the experimental setup in Germany. One problem was that onlyat KA, all P-trial treatments were applied, while WG trial only included the P1S treatment. Secondly,the fertiliser application at KA of RP as a granule and S0 as pellets, both with about 3 mm diameter,was not ideal: the contact area between the two fertilisers and between their mixture and soil wasreduced in comparison with the application as a powder, and with it the oxidation rate of elementalsulphur and the dissolution of RP. Especially the oxidation rate of S0 in�uences e�ectiveness of the RP+ S0, which depends heavily on sulphur particle size (Rajan, 1982a,b; Germida and Janzen, 1993; Yanget al., 2010). Nevertheless, Olfs et al. (2012) adverts that not the pellet size, but the particle size of thesulphur contained within is important. For a rapid oxidisation, sulphur should ideally be of colloidalsize of about 1 µm (Germida and Janzen, 1993). However, it is unknown, which particle size was usedin the elaboration of the pellets used in trials. In any case the large pellets did e�ectively limit soil andmicrobe contact, as they did not disintegrate with humidity in soil. The pellets were found largely intactabout two months after planting. Therefore acidi�cation and dissolution of RP were presumably not asstrong as they could have been, a�ecting fertiliser performance negatively. In the P1S treatment at WG�ne ground elemental sulphur was used. This mixture did have a positive e�ect on faba bean growth,P-uptake and S-concentration, but due to missing S0 and P1 treatments the solubilisation e�ect couldnot be estimated. Nevertheless it is assumed, that the e�ect was rather brought about by the elemental
62
sulphur. As it was applied as a powder it became oxidised quicker than in the �rst year, and already atthe �rst shoot dry mass evaluation shoot S-concentration of S0 was similar to that of treatments KSand CaS.
4.1.2 E�ects on sulphur availability
Interestingly for KA-P, the RP fertilisation alone (P1) did also have a signi�cant e�ect on shoot and grainsulphur concentrations, which is interpreted as an interaction between P and S in soil. PO 3–
4 and SO 2–4
compete for binding sites in soil, e.g. on goethite surfaces. As the PO 3–4 ion has a stronger a�nity, the
presence of excess phosphate may have increased sulphate concentration in the soil solution as foundby Geelhoed et al. (1997a,b). A further study of Bolan et al. (1986, 1988) also a�rms this hypothesis,which found that both lime (CaCO3) and P-fertiliser additions strongly increase leaching of sulphatefrom soils. The displacement e�ect may therefore explain why P1 increased shoot S-concentration.
4.2 Sulphur
4.2.1 E�ect of sulphur fertiliser application
Sulphur de�ciency a�ects glucose and adenosine triphosphate (ATP)-concentrations in faba bean, re-duces nodule weight and a�ects nitrogen �xation negatively (Pacyna et al., 2006; Scherer et al., 2008).Also, the S-concentrations in shoots, roots and nodules can be drastically decreased (Pacyna et al., 2006).The shortage of S-containing amino acids cysteine and methionine inhibits protein synthesis. There-fore chlorophyll and protein contents in leafs are decreased and shoot growth and leaf area reduced(Marschner and Marschner, 2012). In faba bean �eld trials S-concentrations and -uptake were the pa-rameters a�ected strongest by fertilisation at both sites. As literature values are mostly only availablefor leafs, the ranges observed in shoot cannot be put in relation to values in literature and hence usedas an indicator for the presence of S-de�ciency. Even though large di�erences in S-concentration be-tween sulphur fertilised and non-fertilised plots, the S-supply in KA was not limiting crop growth andN-�xation, which indicates that not even a latent de�ciency was present. Another possible interpreta-tion could be that the low plant S-concentration was in fact limiting N-�xation (Scherer et al., 2008),but that this could be compensated for by native soil N, and that therefore N-de�ciency symptoms wereabsent. On the other hand, trials WG-G and WG-K were indicating the presence of S-de�ciency. While N-concentrations and -uptake were about equal between fertiliser and control treatments, CaS and KS leadto a strong increase in S-uptake. In some plots of WG-G even visible symptoms typical for S-de�ciencywere found. Also a slight, but partially signi�cant increase in crop shoot growth was found, with amaximum increase in faba bean shoot dry mass of +11 %. Under S-de�ciency the protein quality andhence the nutritional value of grain is known to change (Gayler and Sykes, 1985; Kim et al., 1999), dueto a lower amount of essential amino-acids methionine and cysteine (Sexton et al., 1998). Protein qualitywas not determined directly, but the strong increase of grain S-concentration, and the more narrow N:Sratio may indicate an improvement (Gayler and Sykes, 1985; Scherer, 2001). Studies with soybean haveshown that S-de�ciency does not necessarily lead to a decrease in grain protein content or yield, butrather to a change in the type of storage protein formed. About 70 % of the protein in soybean seedis present as glycinin (also termed 11S) and β-conglycinin (7S) (Thanh et al., 1975; Derbyshire et al.,1976). Under S-de�cient conditions the amount of 11S protein, which is rich in S-containing amino-acids(3–4 % S), decreases. Instead, more 7S protein is formed, which contains less than 1 % S (Sexton et al.,1998). A similar change in storage protein can be proposed for faba bean, and with about equal grainconcentration of crude protein (N-concentration x 6.25) for all treatments, in both years the increaseof about 50 % in grain S-content and a more narrow N:S ratio for KS and CaS compared with Ctl mayindicate an increase in S-containing amino-acids and hence an improvement of grain nutritive quality.Yet, depending on legume species great amounts can be present as sulphate in grain, which would notimprove its nutritional quality. While lupine grain contains 30 % sulphate, common bean hardly containsany, independent of S nutritional status (Tabe and Droux, 2001, 2002). As for faba bean no literature datawas found on sulphate contents in grain, no de�nite conclusion can be drawn if the higher S-contentsdo indeed indicate a higher nutritional value of the grain.
63
4 Discussion A: faba bean trials (Germany)
4.2.2 Experimental sites and susceptibility to S-deficiency
The site speci�c risk for the occurrence of S-de�ciency is a�ected by a range of factors. On one hand thecrop speci�c demand for S and the yield level are decisive. Site speci�c, the amount of SOM, soil texture,soil chemistry, atmospheric S-deposition, sulphate leaching rates and potential in�uence of groundwaterplay an important role. Furthermore, the farm management with respect to fertiliser application andpresence of life stock is important. For both German experimental sites these factors need to be observed.
Influence of groundwater on sulphur supply The experimental site KA is not in�uenced by ground-water (groundwater table approximately 20 m below soil surface), but the experimental �elds at site WGare located in the lea of river Sieg. Therefore it was suspected that groundwater may have an in�uenceon crop sulphur supply, as capillary rise of sulphate rich groundwater can largely meet crop demand,depending on sources up to 50–70 % (Bloem, 1998; Schnug and Haneklaus, 1998). However, the ground-water table at the drinking water protection zone located only about 150 m from the experimental �eldis on annual average 4–4.5 m below �eld level15. In the data set of 2016 the groundwater table reachedits maximum of 2.5 m below �eld level in January. Capillary rise of groundwater only occurs if the soilabove the groundwater table has dried o� su�ciently to form a pronounced moisture gradient, whichcan presumably not occur before late spring. But at this time the groundwater table has already droppedconsiderably, e.g. in the 2016 data to 4 m in April. In conclusion, any sulphur supply from groundwatercan also be ruled out for the WG experiments.
Sulphate leaching potential To determine the risk for sulphur de�ciency at both sites at �rst the soilsulphate content at the beginning of the experiments needs to be estimated. Similar to nitrate, sulphatecan easily be lost by leaching during winter. Soil chemistry at both experimental sites and in temperateclimate soils in general is favourable for high sulphate leaching rates. This is because soils in temperateclimate mostly possess a neutral pH value, which is due to low weathering state and common calcareousapplication. anion exchange capacity (AEC) and hence SO 2–
4 sorption is low under these conditionscompared with more acidic soil conditions (Bolan et al., 1988). Leaching is generally dependent on theexchange rate of soil water, which in turn is conditioned by precipitation and soil texture: a coarse soiltexture favours leaching strongly, while loam soils possess an intermediate and clay soils a low leachingpotential. Soil skeleton (> 2 mm) also increases leaching potential as the water absorbing soil volume isdecreased leading to faster saturation. Soil at site KA is a loam with a high clay content (Ut4 accordingto KA5) and does not posses any skeleton. From the perspective of soil texture the leaching potential isrelatively low. In comparison, leaching potential is higher for site WG, at which soil is a sandy loam withat places considerable presence of soil skeleton (highly heterogeneous). The symptoms interpreted assulphur de�ciencies in some of the unfertilised plots of trial WG-G could be explained with the reducedsoil volume, but also with higher sulphate leaching rates at this particular location as soil saturationoccurs quicker due to an elevated gravel content.
Studies from England have shown that most of the SO 2–4 in soil solution is leached in winter (Kopáček
et al., 2014). In Denmark, a work of Eriksen et al. (2002) identi�ed leaching as the quantitatively mostimportant item a�ecting sulphur balance. In Central Europe �elds without soil cover or growing vege-tation potentially have leaching rates of 20–120 kg ha−1 a−1 S, with a mean of 50–60 kg ha−1 a−1 S (Hornet al., 2010). Even though weeds formed limited biomass at WG it is assumed that this did not lower thesoil water content notably and therefore the soil was in a saturated state most of the winter. Catchcrops can take up NO –
3 and SO 2–4 in autumn and winter and may prevent most S-leaching (Eriksen and
Thorup-Kristensen, 2002), but after harvest of cereals (barley at KA and oats at WG) no catch crops wereplanted afterwards. The sulphur in harvest residues is liberated quickly and is susceptible to leachingin winter. Therefore, only a small proportion of approximately 10 % of sulphur in pre- or cover cropresidue is available to the subsequent crop (Schnug, 1988). Hence the sulphur contained in cereal harvestresidues at both experimental sites is thought to be of little relevance for the nutrition of faba bean.
For the region (Niederrheinische Bucht) in which both trial sites are located a groundwater rechargeof 160–250 mm has been determined (Bogena et al., 2003), which is a good approximation for seepagewater on a larger scale. For site WG seepage water amounts to 228 mm per year on average15, which
64
at places with higher gravel content is assumed to be considerably higher. The movement of nitrateand sulphate in soil have been determined to be higher than that of water in pH neutral soils, whichis explained by the fact that water can enter soil aggregates while nitrate is repelled by negativelycharged clay humus complexes (Körschens and Mahn, 2013). While nitrate is leached 4–4.5 mm per mmof seepage water (Körschens and Mahn, 2013), sulphate moves about 3.5 mm per mm seepage water insoils with a neutral pH (Seeger et al., 2005). Based on sulphate movement and seepage water rates, eventhe large amount of sulphate applied at WG in 2010 (Patentkali application of 1000 kg ha−1, equivalent to170 kg ha−1 sulphur) was presumably transferred to a soil depth greater than 70 cm and was hence notavailable to the crop early in the season. The mineral sulphate available to plants at the beginning ofthe season was not determined at both sites, but it can be assumed that these were extremely low dueto leaching losses in winter.
Mineral and organic fertiliser management At site KA sulphur is applied annually in the form ofKorn-Kali® at rates of 10 kg ha−1 S for wheat and barley and about 20–25 kg ha−1 S for sugar beet, whileno organic fertilisers are applied. At the organic mixed farm WG, Patentkali® 18 is used as a potassiumsource, which contains considerable amounts of sulphur. Nevertheless, Patentkali® application is notrealised on a regular basis (e.g. no application between 2003 and 2009) as its application has the objectiveto maintain soil contents of potassium within the boundaries of LUFA class C. With punctual applicationsof large amounts of Patentkali® no sulphur reserves are build up in soil and most sulphate is lost byleaching. Therefore, S applied in mineral fertilisers can hardly be taken into account for nutrition of fababean. Cattle manure is applied at an average rate of 17 t ha−1 per year, though not to the faba bean crop.It contains approximately 0.05 % (LWK North Rhine-Westphalia), which results in S-inputs of about9 kg ha−1 S per year. Nevertheless, sulphur from organic fertilisers to a large extent is not directly plantavailable and similar to SOM has to be mineralised �rst.
Balance of sulphur fluxes As 95 % of S in soil (Scherer, 2009) is bound organically, without mineralfertilisation and presumably low soil sulphate contents in spring, crop S-supply has to be met to a greatextent by mineralisation of SOM. In consequence, the biological and biochemical mineralisation kineticsplay a key role for S-supply to the crop, which in turn are strongly in�uenced by soil temperature. Underdirect-seeding management soil temperatures rise slower in spring than with conventional seedbedpreparation. Hence, also SOM mineralisation rates are lower, which may have caused the interpreted(latent) S-de�ciency in WG trials and the relatively low sulphur levels in shoot and grain in KA trials.However, it cannot be concluded if the DS management in the trials was indeed a cause for the S-de�ciency as control tillage plots were missing in the trials. Net annual mineralisation rates are about1.7–3.1 % of total sulphur in soil (Eriksen et al., 1995), which would correspond to 8–14 kg ha−1 and7–12 kg ha−1 according to the total S-contents determined in top soil (0–30 cm) for sites KA and WG,respectively. In DS, net mineralisation amounts can be assumed to be rather at the lower end of thesevalues. But even if total annual sulphur mineralisation rates were su�cient, slow mineralisation kineticscould cause S-de�ciency in spring in the absence of external inputs. Apart from mineralisation, onlyatmospheric depositions are available to the crop without additional fertilisation, which are about10 kg ha−1 a−1 (Horn et al., 2010; Umweltbundesamt, 2014). Nevertheless these depositions are onlypartially available to the crop (approximately 60–70 % according to annual rainfall distribution andassuming equal dry deposition rates throughout the year). With yields in a range of 3–5 t ha−1 for fababean and a grain concentration of 0.15–0.2 % the total harvest export is in the range of 7–10 kg ha−1 S.SOM mineralisation and atmospheric depositions are hardly able to meet the total crop S-demand atboth trial sites and due to the slower SOM onset of mineralisation especially in the early season sulphurde�ciency is likely to occur.
18Patentkali®: Potassium sulphate with magnesium: 24.9 % K, 6.0 % Mg, 17 % S
65
4 Discussion A: faba bean trials (Germany)
4.2.3 E�ect of sulphur fertiliser form
Due to the presence of a positive e�ect of sulphur fertiliser application it can be assumed that nutrientliberation kinetics and atmospheric inputs cannot ensure a su�cient S-nutrient supply to the faba beancrop under DS management. Additional S fertilisation can therefore be recommended. The sulphurpellets applied at KA did exhibit an e�ect on S-concentration, but this e�ect was low compared withKS and CaS. Apparently the grain concentrations were a�ected stronger than the shoot concentrationsfor S0. Likely this is due to the late onset of the fertiliser e�ect, because S0 had to be oxidised by soilbacteria (Thiobacillus sp.) to sulphate �rst to become plant available, which - as mentioned above - wasrestricted by the large pellet size. Therefore the impact of elemental sulphur remained small in the�rst year. The e�ect of CaS and KS on growth (only WG) and sulphur nutrient parameters was similar.Even though the P1S treatment in WG-PS did result in a weaker growth increase than CaS and KS, theS-concentrations in shoot and grain were also comparable to those treatments. This indicates that thepowder application of elemental sulphur in fact had a better e�ect than the pellets in the �rst year.Additionally, the RP in this treatment also have had a positive e�ect on sulphate concentration in soilsolution, as described above for P1 treatment. Again, due to missing P1 and S0 treatments, the singlee�ect of each of the two fertilisers cannot be separated. Even though plant availability of the sulphurform applied plays a role, the di�erent solubility of gypsum and K2SO4 did not matter, and both suppliedplants equally well with S. Possibly in practice, elemental sulphur is able to supply S just as e�ectiveas the more soluble sulphate forms, if applied as �ne ground powder, preferentially with particles ofcolloidal size. Micronised elemental sulphur was found to be oxidised to 50 % within 6–10 days at soiltemperatures of 20 ○C, 23–26 days at 7 ○C, and 36–42 days at 2 ○C (Chapman, 1989). Therefore, even therates at initially low soil temperatures in spring in the trials were apparently su�cient to meet cropdemand and increase sulphur uptake drastically.
4.3 Oats straw residueThe experimental data on oats straw cutting height was limited to trial WG-PS. Nevertheless, fromthe results of this trial it can be assumed that the High cut, which was used for all split-plot trials,had a negative impact on weed control of oats straw mulch, and was therefore unfavourable for cropdevelopment. The decreased weed control compared with Low cut is assumed to be due the reduced soilcover of rolled straw compared with chipped straw. Moreover, while chipped straw is evenly distributed,the rolled straw is only combed into one single direction, often points up slightly and is therefore not inclose contact with soil. Soil shading is reduced and more solar radiation can reach the soil surface, whichreduces the physical obstruction of weed germination and emergence considerably. Furthermore, thestanding straw dries faster after rainfall, which may retard or obstruct their decomposition and hencethe release of allelopathic substances and thereby decrease their associated weed control e�ect. Theresults from the factor oats straw residue (straw) con�rm the �nding of works at Wiesengut in previousyears (Schulte, 2007; Köpke and Schulte, 2008; Massucati et al., 2010, 2011; Massucati and Köepke, 2011;Massucati, 2013). Over all trials a similar pattern could be observed, even though results were notalways signi�cant. Oats mulch residue suppressed weeds at the initial development of faba bean, whichfavoured crop development. While at the �rst evaluation clear di�erences in weed dry mass were foundbetween straw residue treatments, this e�ect was only weak at the second evaluation. Apparently, atlater stages of faba bean development weed growth did not impede crop growth as strongly anymore:weed dry mass was similar over all straw treatments, but faba bean growth showed the same treatmentdi�erentiation as at the �rst evaluation. This con�rms �ndings of Massucati and Köepke (2011) that theearly suppression of weeds is decisive for the positive e�ect of mulch. Rather than season-long weedcontrol, the positive e�ect lays in the improvement of initial crop development.
Compared with trials of (Massucati et al., 2010) weed shoot dry mass was higher for all WG trials(evaluated at about equal growth stages). However, in Massucatis works even for the 0t treatment aweed shoot dry mass of only 0.75 t ha−1 was determined (88 DAE) and strong reductions were achieved,down to 0.51 t ha−1 for 4t and 0.27 t ha−1 for 6t oats straw treatment (Massucati et al., 2010). The 0t plotsin the cited work even had a lower weed shoot dry mass than the weed shoot dry mass found for the6t treatments of WG trials (BBCH 65 / 89 DAE). Weed pressure in WG trials therefore can be considered
66
distinctly higher. Despite the higher weed infestation yields were also higher at WG. Both increasesin weed shoot dry mass and faba bean yield can be explained by the excellent growing conditions in2012, with reference trials of Landwirtschaftskammer (LWK, NRW) achieving yields exceeding 6 t ha−1.Another reason for higher weed growth and smaller di�erentiation between treatments at WG trialswas the High cutting height used in all split-plot trials (see above). Furthermore, lower weed controlwas presumably due to the amount of oats straw biomass added in trials: in order to make Low andHigh cut treatments comparable both the stubble of Low and High treatments were determined andthe missing straw was added up to 4 t ha−1 and 6 t ha−1. The di�erence between 0t and 4t treatment inthe split-plot trials was therefore not as large as the treatment nomination alleges, because High cutstraw alone already left 2–3 t ha−1 of straw residue. Straw additions were therefore only in the rangeof 1–3 (4t) and to 3–5 t ha−1 (6t). The total mulch biomass used by Massucati (2013) was higher: inthese trials stubble was not quanti�ed (assumed to be 0 t ha−1) and hence 4 t ha−1 and 6 t ha−1 of strawwere added. Therefore, including the stubble weight of presumably 1–2 t ha−1 total amounts of 5–6 t ha−1
and 7–8 t ha−1 were actually present. Combined with a Low cutting of oats straw in these trials the soilcoverage was better, which is the most likely explanation for better weed control in comparison to thetrials conducted in the work of Massucati.
67
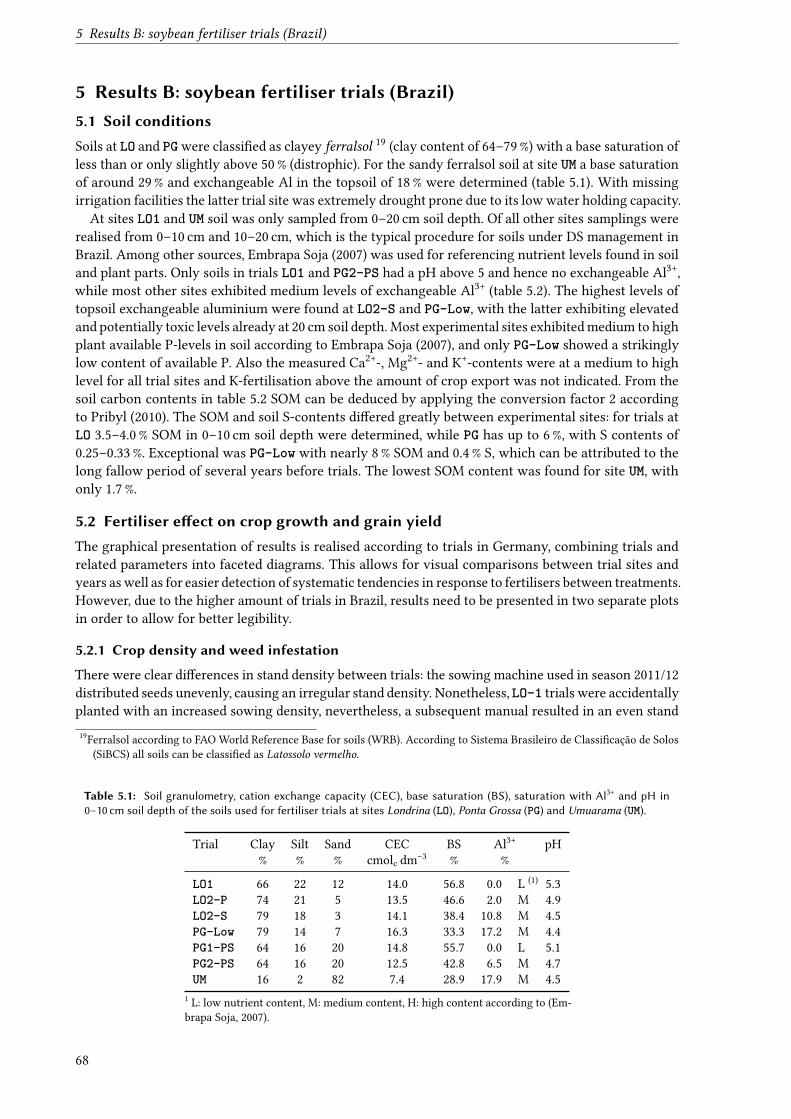
5 Results B: soybean fertiliser trials (Brazil)
5 Results B: soybean fertiliser trials (Brazil)5.1 Soil conditionsSoils at LO and PG were classi�ed as clayey ferralsol 19 (clay content of 64–79 %) with a base saturation ofless than or only slightly above 50 % (distrophic). For the sandy ferralsol soil at site UM a base saturationof around 29 % and exchangeable Al in the topsoil of 18 % were determined (table 5.1). With missingirrigation facilities the latter trial site was extremely drought prone due to its low water holding capacity.
At sites LO1 and UM soil was only sampled from 0–20 cm soil depth. Of all other sites samplings wererealised from 0–10 cm and 10–20 cm, which is the typical procedure for soils under DS management inBrazil. Among other sources, Embrapa Soja (2007) was used for referencing nutrient levels found in soiland plant parts. Only soils in trials LO1 and PG2-PS had a pH above 5 and hence no exchangeable Al3+,while most other sites exhibited medium levels of exchangeable Al3+ (table 5.2). The highest levels oftopsoil exchangeable aluminium were found at LO2-S and PG-Low, with the latter exhibiting elevatedand potentially toxic levels already at 20 cm soil depth. Most experimental sites exhibited medium to highplant available P-levels in soil according to Embrapa Soja (2007), and only PG-Low showed a strikinglylow content of available P. Also the measured Ca2+-, Mg2+- and K+-contents were at a medium to highlevel for all trial sites and K-fertilisation above the amount of crop export was not indicated. From thesoil carbon contents in table 5.2 SOM can be deduced by applying the conversion factor 2 accordingto Pribyl (2010). The SOM and soil S-contents di�ered greatly between experimental sites: for trials atLO 3.5–4.0 % SOM in 0–10 cm soil depth were determined, while PG has up to 6 %, with S contents of0.25–0.33 %. Exceptional was PG-Low with nearly 8 % SOM and 0.4 % S, which can be attributed to thelong fallow period of several years before trials. The lowest SOM content was found for site UM, withonly 1.7 %.
5.2 Fertiliser e�ect on crop growth and grain yieldThe graphical presentation of results is realised according to trials in Germany, combining trials andrelated parameters into faceted diagrams. This allows for visual comparisons between trial sites andyears as well as for easier detection of systematic tendencies in response to fertilisers between treatments.However, due to the higher amount of trials in Brazil, results need to be presented in two separate plotsin order to allow for better legibility.
5.2.1 Crop density and weed infestation
There were clear di�erences in stand density between trials: the sowing machine used in season 2011/12distributed seeds unevenly, causing an irregular stand density. Nonetheless, LO-1 trials were accidentallyplanted with an increased sowing density, nevertheless, a subsequent manual resulted in an even stand19Ferralsol according to FAO World Reference Base for soils (WRB). According to Sistema Brasileiro de Classi�cação de Solos
(SiBCS) all soils can be classi�ed as Latossolo vermelho.
Table 5.1: Soil granulometry, cation exchange capacity (CEC), base saturation (BS), saturation with Al3+ and pH in0–10 cm soil depth of the soils used for fertiliser trials at sites Londrina (LO), Ponta Grossa (PG) and Umuarama (UM).
Trial Clay Silt Sand CEC BS Al3+ pH% % % cmolc dm−3 % %
LO1 66 22 12 14.0 56.8 0.0 L (1) 5.3LO2-P 74 21 5 13.5 46.6 2.0 M 4.9LO2-S 79 18 3 14.1 38.4 10.8 M 4.5PG-Low 79 14 7 16.3 33.3 17.2 M 4.4PG1-PS 64 16 20 14.8 55.7 0.0 L 5.1PG2-PS 64 16 20 12.5 42.8 6.5 M 4.7UM 16 2 82 7.4 28.9 17.9 M 4.5
1 L: low nutrient content, M: medium content, H: high content according to (Em-brapa Soja, 2007).
68
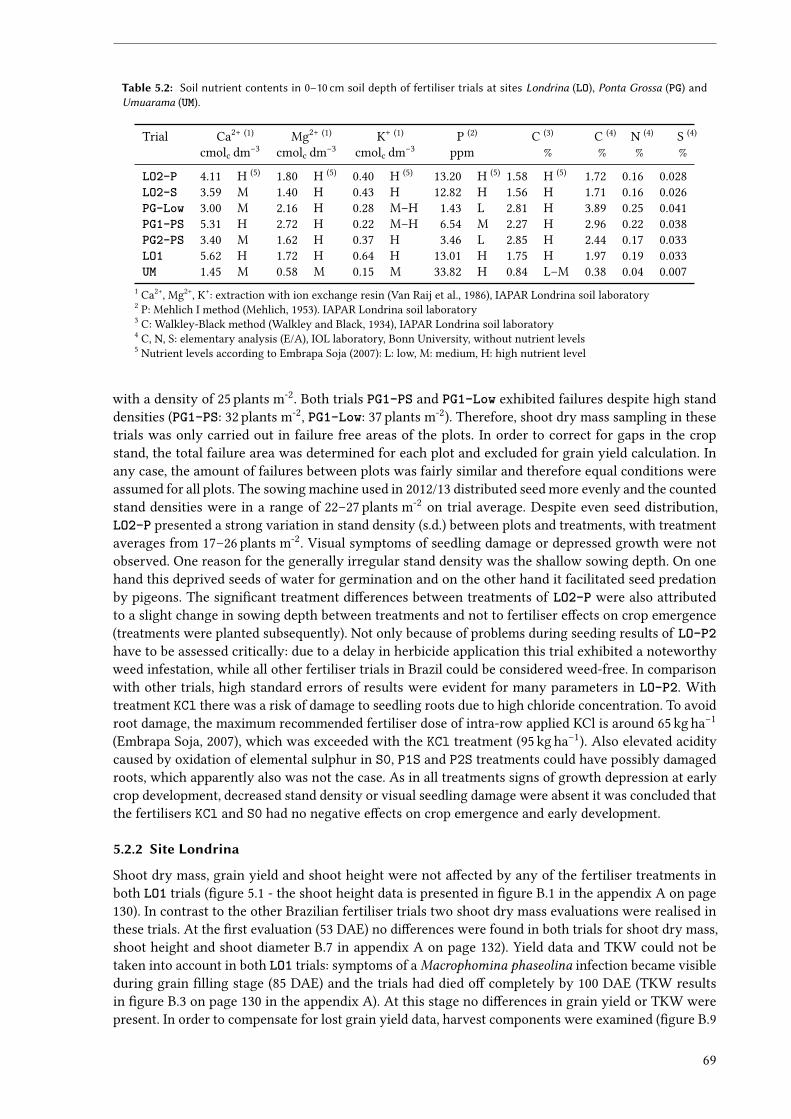
Table 5.2: Soil nutrient contents in 0–10 cm soil depth of fertiliser trials at sites Londrina (LO), Ponta Grossa (PG) andUmuarama (UM).
Trial Ca2+ (1) Mg2+ (1) K+ (1) P (2) C (3) C (4) N (4) S (4)
cmolc dm−3 cmolc dm−3 cmolc dm−3 ppm % % % %
LO2-P 4.11 H (5) 1.80 H (5) 0.40 H (5) 13.20 H (5) 1.58 H (5) 1.72 0.16 0.028LO2-S 3.59 M 1.40 H 0.43 H 12.82 H 1.56 H 1.71 0.16 0.026PG-Low 3.00 M 2.16 H 0.28 M–H 1.43 L 2.81 H 3.89 0.25 0.041PG1-PS 5.31 H 2.72 H 0.22 M–H 6.54 M 2.27 H 2.96 0.22 0.038PG2-PS 3.40 M 1.62 H 0.37 H 3.46 L 2.85 H 2.44 0.17 0.033LO1 5.62 H 1.72 H 0.64 H 13.01 H 1.75 H 1.97 0.19 0.033UM 1.45 M 0.58 M 0.15 M 33.82 H 0.84 L–M 0.38 0.04 0.007
1 Ca2+, Mg2+, K+: extraction with ion exchange resin (Van Raij et al., 1986), IAPAR Londrina soil laboratory2 P: Mehlich I method (Mehlich, 1953). IAPAR Londrina soil laboratory3 C: Walkley-Black method (Walkley and Black, 1934), IAPAR Londrina soil laboratory4 C, N, S: elementary analysis (E/A), IOL laboratory, Bonn University, without nutrient levels5 Nutrient levels according to Embrapa Soja (2007): L: low, M: medium, H: high nutrient level
with a density of 25 plants m-2. Both trials PG1-PS and PG1-Low exhibited failures despite high standdensities (PG1-PS: 32 plants m-2, PG1-Low: 37 plants m-2). Therefore, shoot dry mass sampling in thesetrials was only carried out in failure free areas of the plots. In order to correct for gaps in the cropstand, the total failure area was determined for each plot and excluded for grain yield calculation. Inany case, the amount of failures between plots was fairly similar and therefore equal conditions wereassumed for all plots. The sowing machine used in 2012/13 distributed seed more evenly and the countedstand densities were in a range of 22–27 plants m-2 on trial average. Despite even seed distribution,LO2-P presented a strong variation in stand density (s.d.) between plots and treatments, with treatmentaverages from 17–26 plants m-2. Visual symptoms of seedling damage or depressed growth were notobserved. One reason for the generally irregular stand density was the shallow sowing depth. On onehand this deprived seeds of water for germination and on the other hand it facilitated seed predationby pigeons. The signi�cant treatment di�erences between treatments of LO2-P were also attributedto a slight change in sowing depth between treatments and not to fertiliser e�ects on crop emergence(treatments were planted subsequently). Not only because of problems during seeding results of LO-P2have to be assessed critically: due to a delay in herbicide application this trial exhibited a noteworthyweed infestation, while all other fertiliser trials in Brazil could be considered weed-free. In comparisonwith other trials, high standard errors of results were evident for many parameters in LO-P2. Withtreatment KCl there was a risk of damage to seedling roots due to high chloride concentration. To avoidroot damage, the maximum recommended fertiliser dose of intra-row applied KCl is around 65 kg ha−1
(Embrapa Soja, 2007), which was exceeded with the KCl treatment (95 kg ha−1). Also elevated aciditycaused by oxidation of elemental sulphur in S0, P1S and P2S treatments could have possibly damagedroots, which apparently also was not the case. As in all treatments signs of growth depression at earlycrop development, decreased stand density or visual seedling damage were absent it was concluded thatthe fertilisers KCl and S0 had no negative e�ects on crop emergence and early development.
5.2.2 Site Londrina
Shoot dry mass, grain yield and shoot height were not a�ected by any of the fertiliser treatments inboth LO1 trials (�gure 5.1 - the shoot height data is presented in �gure B.1 in the appendix A on page130). In contrast to the other Brazilian fertiliser trials two shoot dry mass evaluations were realised inthese trials. At the �rst evaluation (53 DAE) no di�erences were found in both trials for shoot dry mass,shoot height and shoot diameter B.7 in appendix A on page 132). Yield data and TKW could not betaken into account in both LO1 trials: symptoms of a Macrophomina phaseolina infection became visibleduring grain �lling stage (85 DAE) and the trials had died o� completely by 100 DAE (TKW resultsin �gure B.3 on page 130 in the appendix A). At this stage no di�erences in grain yield or TKW werepresent. In order to compensate for lost grain yield data, harvest components were examined (�gure B.9
69
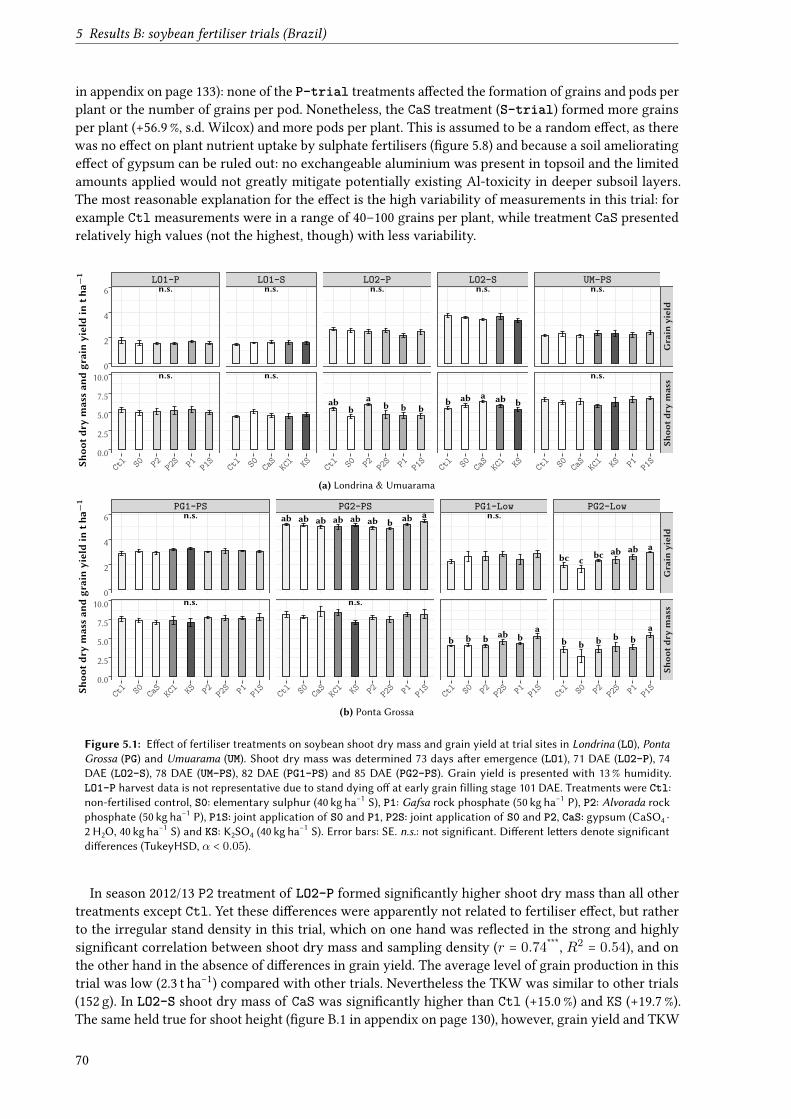
5 Results B: soybean fertiliser trials (Brazil)
in appendix on page 133): none of the P-trial treatments a�ected the formation of grains and pods perplant or the number of grains per pod. Nonetheless, the CaS treatment (S-trial) formed more grainsper plant (+56.9 %, s.d. Wilcox) and more pods per plant. This is assumed to be a random e�ect, as therewas no e�ect on plant nutrient uptake by sulphate fertilisers (�gure 5.8) and because a soil amelioratinge�ect of gypsum can be ruled out: no exchangeable aluminium was present in topsoil and the limitedamounts applied would not greatly mitigate potentially existing Al-toxicity in deeper subsoil layers.The most reasonable explanation for the e�ect is the high variability of measurements in this trial: forexample Ctl measurements were in a range of 40–100 grains per plant, while treatment CaS presentedrelatively high values (not the highest, though) with less variability.
n.s.
n.s.
n.s.
n.s.
n.s.
abb
ab b b
n.s.
b ab a ab b
n.s.
n.s.
LO1-P LO1-S LO2-P LO2-S UM-PS
Grain
yield
Shoo
tdry
mass
Ctl S0 P2 P2
S P1 P1S
Ctl S0 KC
l KSCaS
Ctl S0 P2 P2
S P1 P1S
Ctl S0 KC
l KSCaS
Ctl S0 KC
l KSCaS P1 P1
S
0
2
4
6
0.0
2.5
5.0
7.5
10.0
Shoo
tdry
massan
dgrainyieldin
tha−
1
(a) Londrina & Umuarama
n.s.
n.s.
ab ab ab ab ab ab b ab a
n.s.
n.s.
b b b ab ba
bc c bc ab ab a
b b b b ba
PG1-PS PG2-PS PG1-Low PG2-Low
Grain
yield
Shoo
tdry
mass
Ctl S0 KC
l KSCaS P2 P2
S P1 P1S
Ctl S0 KC
l KSCaS P2 P2
S P1 P1S
Ctl S0 P2 P2
S P1 P1S
Ctl S0 P2 P2
S P1 P1S
0
2
4
6
0.0
2.5
5.0
7.5
10.0
Shoo
tdry
massan
dgrainyieldin
tha−
1
(b) Ponta Grossa
Figure 5.1: E�ect of fertiliser treatments on soybean shoot dry mass and grain yield at trial sites in Londrina (LO), PontaGrossa (PG) and Umuarama (UM). Shoot dry mass was determined 73 days a�er emergence (LO1), 71 DAE (LO2-P), 74DAE (LO2-S), 78 DAE (UM-PS), 82 DAE (PG1-PS) and 85 DAE (PG2-PS). Grain yield is presented with 13 % humidity.LO1-P harvest data is not representative due to stand dying o� at early grain filling stage 101 DAE. Treatments were Ctl:non-fertilised control, S0: elementary sulphur (40 kg ha−1 S), P1: Gafsa rock phosphate (50 kg ha−1 P), P2: Alvorada rockphosphate (50 kg ha−1 P), P1S: joint application of S0 and P1, P2S: joint application of S0 and P2, CaS: gypsum (CaSO4 ·2 H2O, 40 kg ha−1 S) and KS: K2SO4 (40 kg ha−1 S). Error bars: SE. n.s.: not significant. Di�erent le�ers denote significantdi�erences (TukeyHSD, α < 0.05).
In season 2012/13 P2 treatment of LO2-P formed signi�cantly higher shoot dry mass than all othertreatments except Ctl. Yet these di�erences were apparently not related to fertiliser e�ect, but ratherto the irregular stand density in this trial, which on one hand was re�ected in the strong and highlysigni�cant correlation between shoot dry mass and sampling density (r = 0.74***, R2
= 0.54), and onthe other hand in the absence of di�erences in grain yield. The average level of grain production in thistrial was low (2.3 t ha−1) compared with other trials. Nevertheless the TKW was similar to other trials(152 g). In LO2-S shoot dry mass of CaS was signi�cantly higher than Ctl (+15.0 %) and KS (+19.7 %).The same held true for shoot height (�gure B.1 in appendix on page 130), however, grain yield and TKW
70
did not show any di�erentiation. The grain yield was at an intermediate level 20 with 3.8 t ha−1.
5.2.3 Site Ponta Grossa
Shoot dry mass was similar for most sites, and only both PG-High trials stood out with far higher shootdry mass production. This can be explained by the sites cooler temperate climate, which prolongs thecrop cycle and the vegetative growth period (Embrapa Soja, 2007). Shoot dry mass, shoot height andgrain yield of PG1-PS, were similar for all treatments. In season 2011/12 plant diameter, LAI, and weightof the plant parts stem, leaf and pods were determined during the evaluation of shoot dry mass. Mostof this component data showed a strong and highly signi�cant correlation to the sample density, whichmeans that the irregular stand interfered with the data quality. Therefore treatment comparisons arenot meaningful for these parameters (�gure B.10 in the appendix on page 134).
Curious about the results was that the yield level remained extremely low, only slightly higher thanPG1-Low, despite distinctly higher shoot dry mass weight in trial comparison. The reason for this canbe found in the ratio of pods (wt/wt) per plant, which was only 0.2 for PG1-PS and 0.31 in trial PG1-Low.The low yield of PG1-PS could therefore be attributed to the low number of pods formed. This wasassumed to be a consequence of the late reseeding (consequence of herbicide damage) of both PG1 trialsin mid-December 2011, which lead to a reduced period for �owering and pod-set, and ultimately tolower yields. Due to the generally lower production level PG1-Low was not a�ected as strongly by thelate sowing date. The PG2-PS trial had the highest production level of all trials with an average yield of5.1 t ha−1, and signi�cant treatment di�erences were apparent between P1S and P2S. Compared withCtl, the yield was decreased for P2S (−6.9 %) and marginally increased for P1S (+4.7 %). As no plausiblereason exists as to why P2S application would impact yield negatively a random e�ect was assumed.Compared with treatment Ctl, shoot height and shoot dry mass of PG1-Low were found to be increasedfor treatments P1S (+32 %, s.d.) and P2S (+13 %, n.s.), and both treatments also yielded most (n.s.). Onaverage, production was relatively low with only 2.6 t ha−1, but grain TKW was in a normal range withan trial average of 141 g. The treatment di�erentiation in 2012/13 of PG-Low was far stronger: shootgrowth of P1S was highest (+55 %, compared with Ctl, s.d.) while S0 exhibited a depression in shootdry mass with the lowest value of all treatments (−24 %), even though di�erences of S0 in comparisonwith Ctl were not signi�cant. The treatment pattern found for both shoot dry mass and grain yieldwas P1S > P1 > P2S > P2 > Ctl > S0. Grain yield of P1S was also together in a group with P1 and P2Streatment (all three s.d.). Even though TKW was notably higher in season 2012/2013 (162 g), productionlevel of PG2-Low remained low, with an average of only 2.3 t ha−1.
5.2.4 Site Umuarama
All fertilisation treatments in UM-PS resulted in about equal shoot dry mass (n.s.), shoot height, grainyield and TKW. Even though shoot dry mass was at similar levels as in most other trials, the meanproduction level remained low with only 2.3 t ha−1. The explanation for this is that a drought occurredduring the grain �lling stage (experimental site did not have irrigation facilities) which is the growthstage of soybean that has the highest demand for water (Embrapa Soja, 2007).
5.3 Fertiliser e�ect on nutrient uptake and nutrient concentrationsNutrient concentrations in soybean shoot were all determined at development stages R3 and R4 (BBCH73–74) and can therefore be compared within and between trials. No literature values for shoot nutrientconcentrations of the exact same growth stage (R2–R4) were available, therefore shoot concentrationvalues for soybean growth stage R4.5, found by Sexton et al. (1998), were used as a reference in Braziliantrials. Leaf concentrations, which were only determined in the second trial season at stage R3 werecompared with literature values, which are usually obtained at the earlier development stage R2. Theliterature sources used to reference grain and leaf concentrations determined in this work, and to qualifythem as de�cient, su�cient, or high were Nogueira and Melo (2003), Hitsuda et al. (2004), Urano et al.(2006), Sfredo and Lantmann (2007), Embrapa Soja (2007) and Marschner and Marschner (2012). Further-more, in the �rst of the two shoot dry mass evaluations of LO1 trials (53 DAE) nutrient concentrations20Source: Instituto Brasileiro de Geogra�a e Estatística (IBGE)
71
5 Results B: soybean fertiliser trials (Brazil)
and uptake were determined. The nutrient uptake of both trials, which presented no di�erences in P, SN and K uptake into shoot can be observed in �gure B.8 on page 132 in the appendix A.
5.3.1 Phosphorus
None of P- nor S-trial treatments had any e�ect on shoot and grain P-concentrations (�gure 5.3)and absolute values were similar for all trials. Di�erences in P-uptake were therefore only a function ofshoot growth and grain production. The only signi�cant, di�erences found for P-concentration werethose in grain of trial PG2-Low, which were negligible in absolute and relative terms. As Alvorada RP(P2) is less soluble than Gafsa RP (P1), di�erences would be expected to be the opposite between thetwo treatments, therefore this is concluded to be a random e�ect.
The signi�cant di�erences for leaf P-concentration observed in trial PG2-PS were also concluded tobe random (�gure 5.5), because it is not plausible that P2 treatment showed lower leaf P-concentrationsthan all other non P-fertilised treatments. While all other trials in 2012/2013 showed adequate P-concentrations in leafs, values of all PG2-Low treatments were de�cient for P. The same was also truefor grain P-concentration in both PG-Low trials, which also presented slightly de�cient levels (EmbrapaSoja, 2007; Marschner and Marschner, 2012). The signi�cant increase in grain P-concentration of only4.9 % in treatment P2 was again assumed to be a random e�ect: P1 (Gafsa) was the more soluble phos-phate, and hence would have to be expected to possess a greater e�ect on P-concentration. For shootconcentrations no reference values were found for the respective growth stage, but average values be-tween trials were mostly similar. Notably lower were concentrations in both PG-Low trials. Nonetheless,the exceptionally low concentrations found in PG1-Low may also be due to a measurement error duringlaboratory analysis.
5.3.2 Nitrogen
Both LO1 trials and UM-PS did not show di�erences in N-uptake and -concentration in shoot and grain(�gure 5.6). Shoot concentrations of LO2-P were also similar. Analogous to shoot dry mass, the signi�-cant di�erences observed for shoot N-uptake (s.d.) were presumably connected to the heterogeneouscrop stand. Compared with literature reference values the leaf N-concentration of this trial was rela-tively low for all treatments except P1 (n.s.). At the same time grain N-uptake and N-concentration weresimilar for all treatments and the N-concentrations at a rather elevated level. Shoot N-concentrationswere also equal over all treatments in trial LO2-S. Therefore di�erentiation of uptake was analogousto shoot dry mass, with a signi�cantly higher N-uptake for CaS compared with Ctl and KS treatments.The leaf N-concentrations were also nearly equal for all treatments and at a relatively low level. Eventhough signi�cant di�erences were present in grain N-concentrations, the values were all in a narrowrange from 6.77–6.98 %, and the relative di�erences of fertilised treatments compared with Ctl werenegligible (CaS: +4.34 %, KS: +3.1 %). The grain N-uptake was about equal for all treatments (n.s.).
All nitrogen parameters of PG1-PS were found not to di�er. For season 2012/2013 results were alsosimilar: there were no di�erences in N-concentrations of PG2-PS, however, analogous to grain yieldgrain, N-uptake did present signi�cant di�erences. The leaf N-concentration was found to be at su�cientlevels for all treatments and the grain concentration at a high level.
In the PG-Low trials di�erences were present in N-parameters in both trial years. Shoot N-concentrationof PG1-Low was similar between treatments despite the presence of signi�cant di�erences. Shoot N-uptake was distinguished more clearly: P1S and P2S showed higher values than all other treatments(s.d.). Grain concentration was practically equal for all treatments and moreover the lowest on averageof all trials, even though still above the critical concentration according to Embrapa Soja (2007). Therewas a slight tendency of higher grain yields for the treatments P1S and P2S, but the di�erences of thesecompared with P2, S0 and P1 were only small. Grain N-concentrations of PG2-Low were equal overall treatments, but for shoot and grain uptake a clear di�erentiation was apparent. In shoot only P1Swas signi�cantly higher than other treatments. It was also visible that S0 treatment showed decreasedgrowth, with all other treatments being nearly identical. Grain yield showed a similar, yet more di�er-entiated pattern, in the order S0 < Ctl = P2 < P2S < P1 < P1S. The leaf N-concentration in the secondtrial season was low for all treatments. For the N-parameters in UM-PS the results were similar for all
72
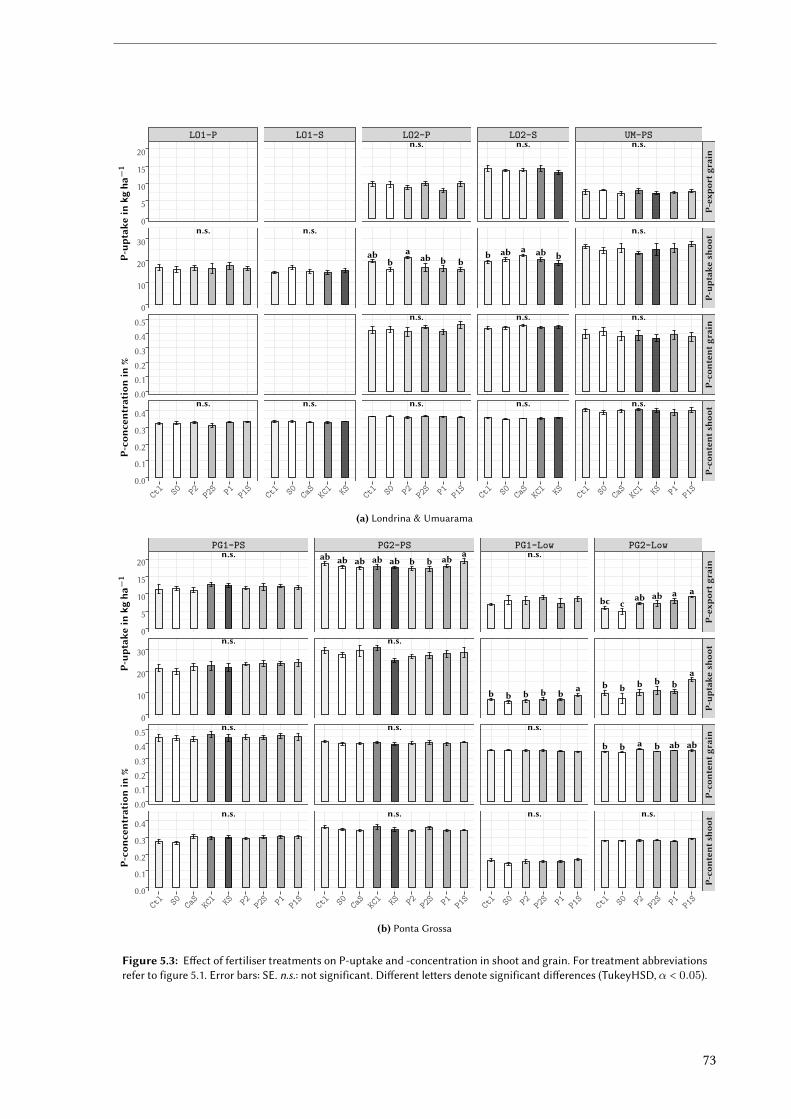
n.s.
n.s.
n.s.
n.s.
n.s.
abb
aab b b
n.s.
n.s.
n.s.
b ab a ab b
n.s.
n.s.
n.s.
n.s.
n.s.
n.s.
LO1-P LO1-S LO2-P LO2-S UM-PS
P-ex
port
grain
P-up
take
shoo
tP-co
nten
tgrain
P-co
nten
tsho
ot
Ctl S0 P2 P2
S P1 P1S
Ctl S0 KC
l KSCaS
Ctl S0 P2 P2
S P1 P1S
Ctl S0 KC
l KSCaS
Ctl S0 KC
l KSCaS P1 P1
S
0
5
10
15
20
0
10
20
30
0.0
0.1
0.2
0.3
0.4
0.5
0.0
0.1
0.2
0.3
0.4
P-co
ncen
trationin
%P-up
take
inkgha−
1
(a) Londrina & Umuarama
n.s.
n.s.
n.s.
n.s.
ab ab ab ab ab b b ab a
n.s.
n.s.
n.s.
n.s.
b b b b b a
n.s.
n.s.
bc cab ab a a
b b b b ba
b b a b ab ab
n.s.
PG1-PS PG2-PS PG1-Low PG2-Low
P-ex
port
grain
P-up
take
shoo
tP-co
nten
tgrain
P-co
nten
tsho
ot
Ctl S0 KC
l KSCaS P2 P2
S P1 P1S
Ctl S0 KC
l KSCaS P2 P2
S P1 P1S
Ctl S0 P2 P2
S P1 P1S
Ctl S0 P2 P2
S P1 P1S
0
5
10
15
20
0
10
20
30
0.0
0.1
0.2
0.3
0.4
0.5
0.0
0.1
0.2
0.3
0.4
P-co
ncen
trationin
%P-up
take
inkgha−
1
(b) Ponta Grossa
Figure 5.3: E�ect of fertiliser treatments on P-uptake and -concentration in shoot and grain. For treatment abbreviationsrefer to figure 5.1. Error bars: SE. n.s.: not significant. Di�erent le�ers denote significant di�erences (TukeyHSD,α < 0.05).
73
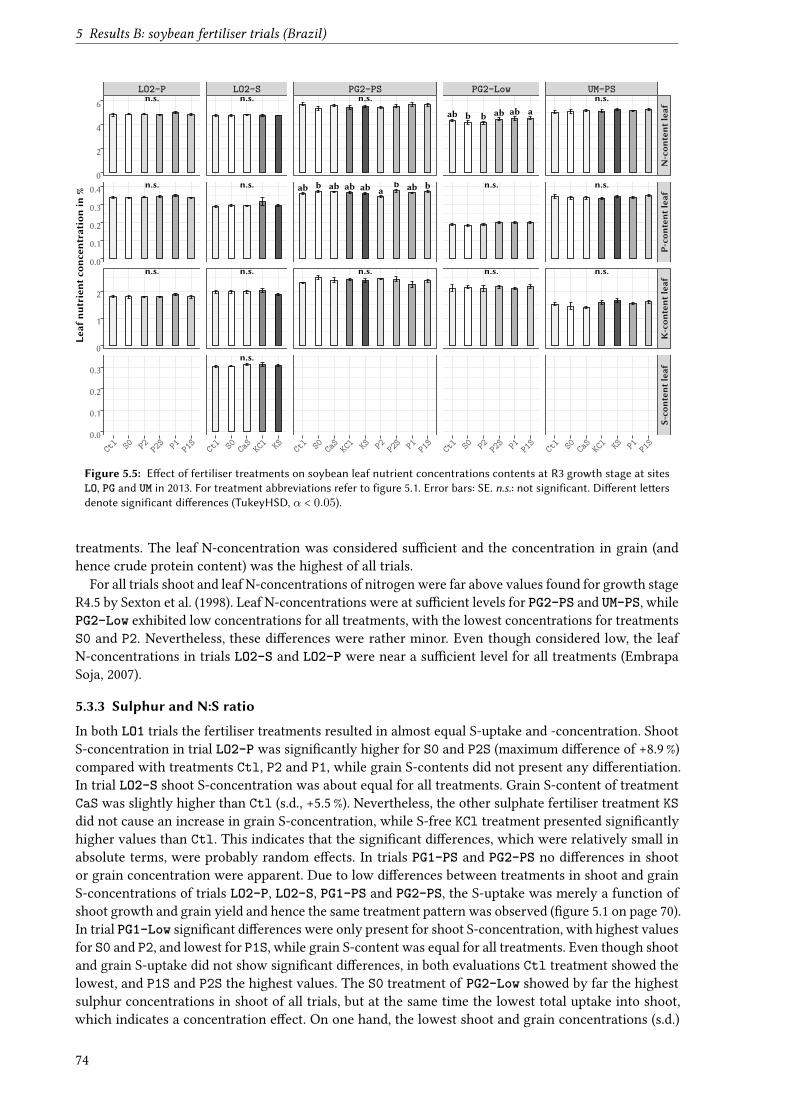
5 Results B: soybean fertiliser trials (Brazil)
n.s.
n.s.
n.s.
n.s.
n.s.
n.s.
n.s.
n.s.
ab b ab ab ab ab ab b
n.s.
ab b b ab ab a
n.s.
n.s.
n.s.
n.s.
n.s.
LO2-P LO2-S PG2-PS PG2-Low UM-PS
N-con
tent
leaf
P-co
nten
tlea
fK-con
tent
leaf
S-co
nten
tlea
f
Ctl S0 P2 P2
S P1 P1S
Ctl S0 KC
l KSCaS
Ctl S0 KC
l KSCaS P2 P2
S P1 P1S
Ctl S0 P2 P2
S P1 P1S
Ctl S0 KC
l KSCaS P1 P1
S
0
2
4
6
0.0
0.1
0.2
0.3
0.4
0
1
2
0.0
0.1
0.2
0.3
Leaf
nutrient
conc
entrationin
%
Figure 5.5: E�ect of fertiliser treatments on soybean leaf nutrient concentrations contents at R3 growth stage at sitesLO, PG and UM in 2013. For treatment abbreviations refer to figure 5.1. Error bars: SE. n.s.: not significant. Di�erent le�ersdenote significant di�erences (TukeyHSD, α < 0.05).
treatments. The leaf N-concentration was considered su�cient and the concentration in grain (andhence crude protein content) was the highest of all trials.
For all trials shoot and leaf N-concentrations of nitrogen were far above values found for growth stageR4.5 by Sexton et al. (1998). Leaf N-concentrations were at su�cient levels for PG2-PS and UM-PS, whilePG2-Low exhibited low concentrations for all treatments, with the lowest concentrations for treatmentsS0 and P2. Nevertheless, these di�erences were rather minor. Even though considered low, the leafN-concentrations in trials LO2-S and LO2-P were near a su�cient level for all treatments (EmbrapaSoja, 2007).
5.3.3 Sulphur and N:S ratio
In both LO1 trials the fertiliser treatments resulted in almost equal S-uptake and -concentration. ShootS-concentration in trial LO2-P was signi�cantly higher for S0 and P2S (maximum di�erence of +8.9 %)compared with treatments Ctl, P2 and P1, while grain S-contents did not present any di�erentiation.In trial LO2-S shoot S-concentration was about equal for all treatments. Grain S-content of treatmentCaS was slightly higher than Ctl (s.d., +5.5 %). Nevertheless, the other sulphate fertiliser treatment KSdid not cause an increase in grain S-concentration, while S-free KCl treatment presented signi�cantlyhigher values than Ctl. This indicates that the signi�cant di�erences, which were relatively small inabsolute terms, were probably random e�ects. In trials PG1-PS and PG2-PS no di�erences in shootor grain concentration were apparent. Due to low di�erences between treatments in shoot and grainS-concentrations of trials LO2-P, LO2-S, PG1-PS and PG2-PS, the S-uptake was merely a function ofshoot growth and grain yield and hence the same treatment pattern was observed (�gure 5.1 on page 70).In trial PG1-Low signi�cant di�erences were only present for shoot S-concentration, with highest valuesfor S0 and P2, and lowest for P1S, while grain S-content was equal for all treatments. Even though shootand grain S-uptake did not show signi�cant di�erences, in both evaluations Ctl treatment showed thelowest, and P1S and P2S the highest values. The S0 treatment of PG2-Low showed by far the highestsulphur concentrations in shoot of all trials, but at the same time the lowest total uptake into shoot,which indicates a concentration e�ect. On one hand, the lowest shoot and grain concentrations (s.d.)
74
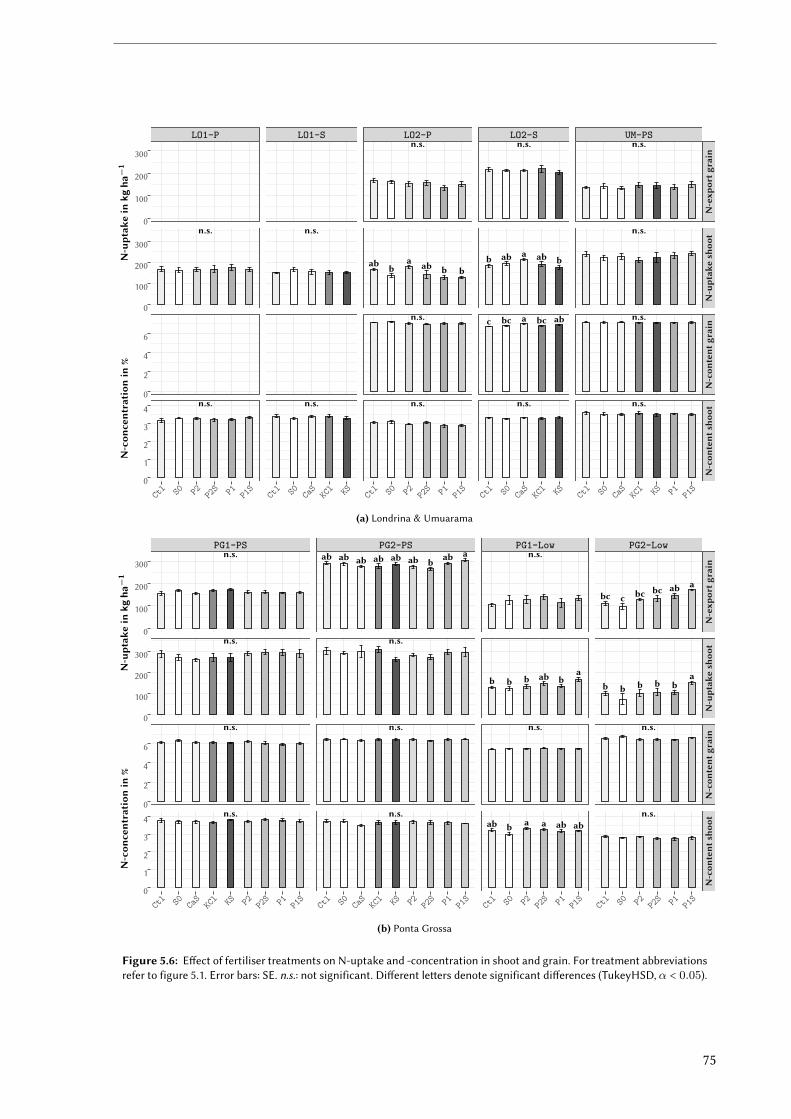
n.s.
n.s.
n.s.
n.s.
n.s.
ab ba ab b b
n.s.
n.s.
n.s.
b ab a ab b
c bc a bc ab
n.s.
n.s.
n.s.
n.s.
n.s.
LO1-P LO1-S LO2-P LO2-S UM-PS
N-exp
ortg
rain
N-uptak
esh
oot
N-con
tent
grain
N-con
tent
shoo
t
Ctl S0 P2 P2
S P1 P1S
Ctl S0 KC
l KSCaS
Ctl S0 P2 P2
S P1 P1S
Ctl S0 KC
l KSCaS
Ctl S0 KC
l KSCaS P1 P1
S
0
100
200
300
0
100
200
300
0
2
4
6
0
1
2
3
4
N-con
centration
in%
N-uptak
ein
kgha−
1
(a) Londrina & Umuarama
n.s.
n.s.
n.s.
n.s.
ab ab ab ab ab ab b ab a
n.s.
n.s.
n.s.
n.s.
b b b ab ba
n.s.
ab b a a ab ab
bc c bc bc ab a
b b b b ba
n.s.
n.s.
PG1-PS PG2-PS PG1-Low PG2-Low
N-exp
ortg
rain
N-uptak
esh
oot
N-con
tent
grain
N-con
tent
shoo
t
Ctl S0 KC
l KSCaS P2 P2
S P1 P1S
Ctl S0 KC
l KSCaS P2 P2
S P1 P1S
Ctl S0 P2 P2
S P1 P1S
Ctl S0 P2 P2
S P1 P1S
0
100
200
300
0
100
200
300
0
2
4
6
0
1
2
3
4
N-con
centration
in%
N-uptak
ein
kgha−
1
(b) Ponta Grossa
Figure 5.6: E�ect of fertiliser treatments on N-uptake and -concentration in shoot and grain. For treatment abbreviationsrefer to figure 5.1. Error bars: SE. n.s.: not significant. Di�erent le�ers denote significant di�erences (TukeyHSD,α < 0.05).
75
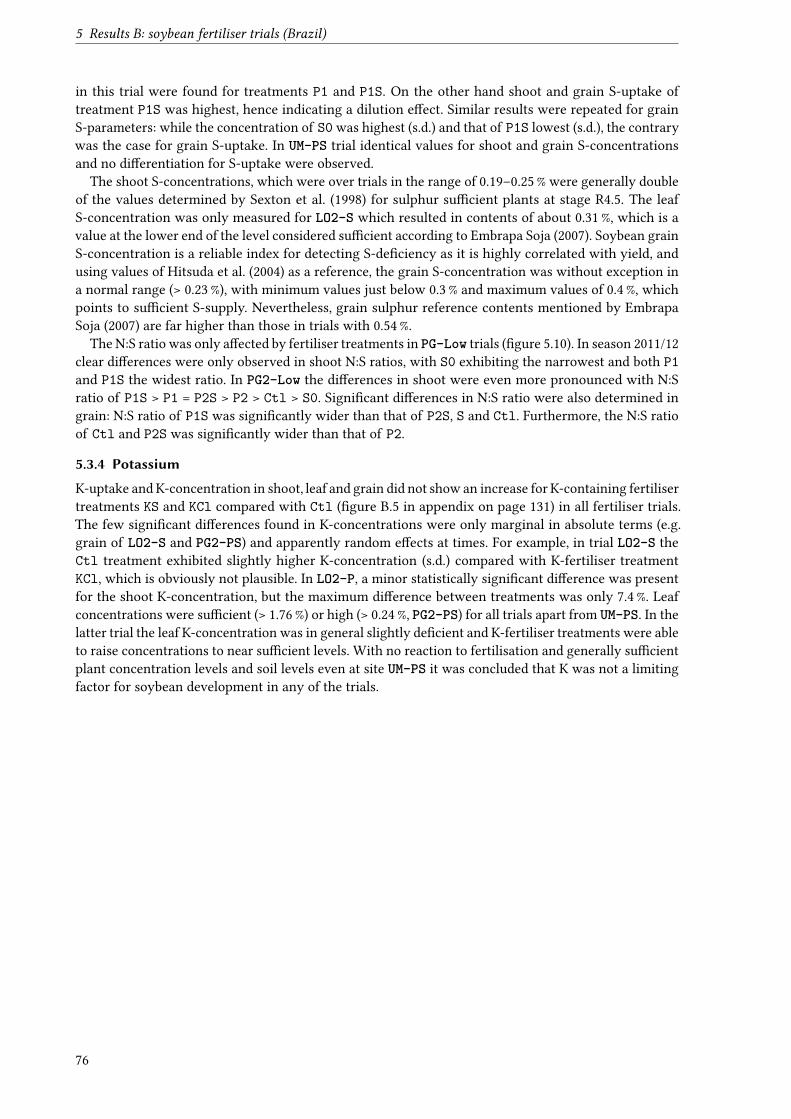
5 Results B: soybean fertiliser trials (Brazil)
in this trial were found for treatments P1 and P1S. On the other hand shoot and grain S-uptake oftreatment P1S was highest, hence indicating a dilution e�ect. Similar results were repeated for grainS-parameters: while the concentration of S0 was highest (s.d.) and that of P1S lowest (s.d.), the contrarywas the case for grain S-uptake. In UM-PS trial identical values for shoot and grain S-concentrationsand no di�erentiation for S-uptake were observed.
The shoot S-concentrations, which were over trials in the range of 0.19–0.25 % were generally doubleof the values determined by Sexton et al. (1998) for sulphur su�cient plants at stage R4.5. The leafS-concentration was only measured for LO2-S which resulted in contents of about 0.31 %, which is avalue at the lower end of the level considered su�cient according to Embrapa Soja (2007). Soybean grainS-concentration is a reliable index for detecting S-de�ciency as it is highly correlated with yield, andusing values of Hitsuda et al. (2004) as a reference, the grain S-concentration was without exception ina normal range (> 0.23 %), with minimum values just below 0.3 % and maximum values of 0.4 %, whichpoints to su�cient S-supply. Nevertheless, grain sulphur reference contents mentioned by EmbrapaSoja (2007) are far higher than those in trials with 0.54 %.
The N:S ratio was only a�ected by fertiliser treatments in PG-Low trials (�gure 5.10). In season 2011/12clear di�erences were only observed in shoot N:S ratios, with S0 exhibiting the narrowest and both P1and P1S the widest ratio. In PG2-Low the di�erences in shoot were even more pronounced with N:Sratio of P1S > P1 = P2S > P2 > Ctl > S0. Signi�cant di�erences in N:S ratio were also determined ingrain: N:S ratio of P1S was signi�cantly wider than that of P2S, S and Ctl. Furthermore, the N:S ratioof Ctl and P2S was signi�cantly wider than that of P2.
5.3.4 Potassium
K-uptake and K-concentration in shoot, leaf and grain did not show an increase for K-containing fertilisertreatments KS and KCl compared with Ctl (�gure B.5 in appendix on page 131) in all fertiliser trials.The few signi�cant di�erences found in K-concentrations were only marginal in absolute terms (e.g.grain of LO2-S and PG2-PS) and apparently random e�ects at times. For example, in trial LO2-S theCtl treatment exhibited slightly higher K-concentration (s.d.) compared with K-fertiliser treatmentKCl, which is obviously not plausible. In LO2-P, a minor statistically signi�cant di�erence was presentfor the shoot K-concentration, but the maximum di�erence between treatments was only 7.4 %. Leafconcentrations were su�cient (> 1.76 %) or high (> 0.24 %, PG2-PS) for all trials apart from UM-PS. In thelatter trial the leaf K-concentration was in general slightly de�cient and K-fertiliser treatments were ableto raise concentrations to near su�cient levels. With no reaction to fertilisation and generally su�cientplant concentration levels and soil levels even at site UM-PS it was concluded that K was not a limitingfactor for soybean development in any of the trials.
76
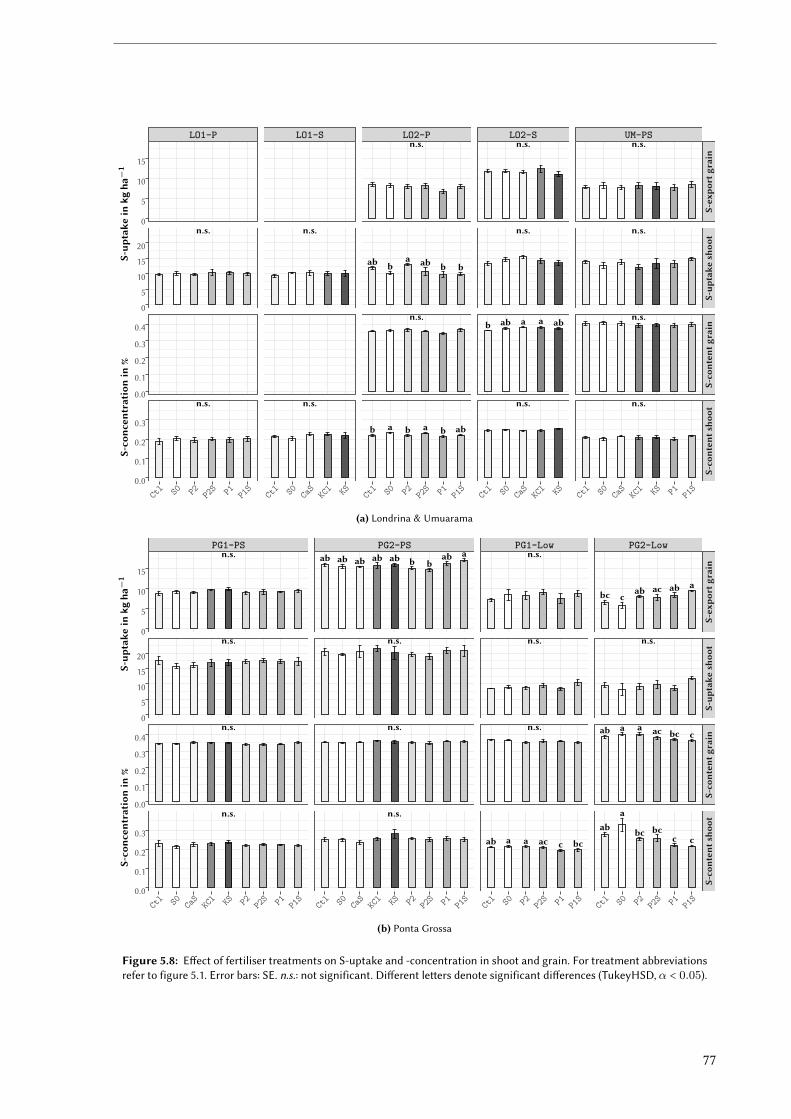
n.s.
n.s.
n.s.
n.s.
n.s.
ab ba ab b b
n.s.
b a b a b ab
n.s.
n.s.
b ab a a ab
n.s.
n.s.
n.s.
n.s.
n.s.
LO1-P LO1-S LO2-P LO2-S UM-PS
S-ex
port
grain
S-up
take
shoo
tS-co
nten
tgrain
S-co
nten
tsho
ot
Ctl S0 P2 P2
S P1 P1S
Ctl S0 KC
l KSCaS
Ctl S0 P2 P2
S P1 P1S
Ctl S0 KC
l KSCaS
Ctl S0 KC
l KSCaS P1 P1
S
0
5
10
15
0
5
10
15
20
0.0
0.1
0.2
0.3
0.4
0.0
0.1
0.2
0.3
S-co
ncen
trationin
%S-up
take
inkgha−
1
(a) Londrina & Umuarama
n.s.
n.s.
n.s.
n.s.
ab ab ab ab ab b bab a
n.s.
n.s.
n.s.
n.s.
n.s.
n.s.
ab a a ac c bc
bc cab ac ab a
n.s.
ab a a ac bc c
aba
bc bcc c
PG1-PS PG2-PS PG1-Low PG2-Low
S-ex
port
grain
S-up
take
shoo
tS-co
nten
tgrain
S-co
nten
tsho
ot
Ctl S0 KC
l KSCaS P2 P2
S P1 P1S
Ctl S0 KC
l KSCaS P2 P2
S P1 P1S
Ctl S0 P2 P2
S P1 P1S
Ctl S0 P2 P2
S P1 P1S
0
5
10
15
0
5
10
15
20
0.0
0.1
0.2
0.3
0.4
0.0
0.1
0.2
0.3
S-co
ncen
trationin
%S-up
take
inkgha−
1
(b) Ponta Grossa
Figure 5.8: E�ect of fertiliser treatments on S-uptake and -concentration in shoot and grain. For treatment abbreviationsrefer to figure 5.1. Error bars: SE. n.s.: not significant. Di�erent le�ers denote significant di�erences (TukeyHSD,α < 0.05).
77
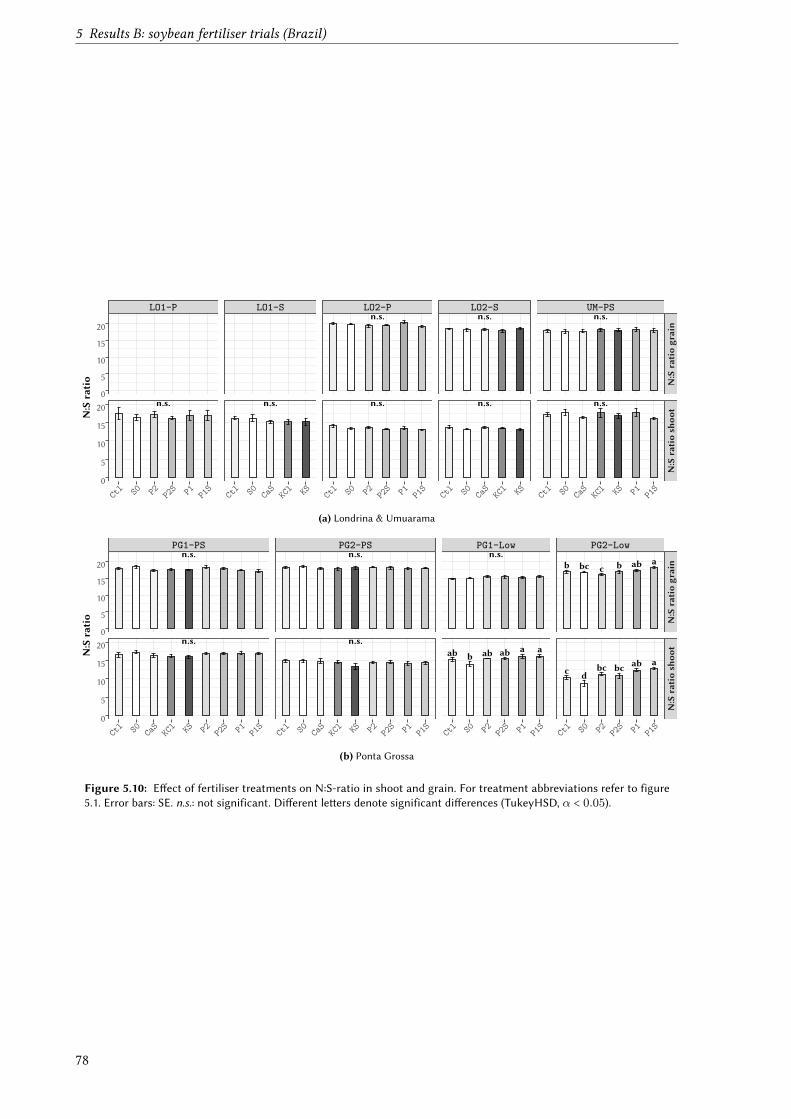
5 Results B: soybean fertiliser trials (Brazil)
n.s. n.s.
n.s.
n.s.
n.s.
n.s.
n.s.
n.s.
LO1-P LO1-S LO2-P LO2-S UM-PS
N:S
ratiograin
N:S
ratiosh
oot
Ctl S0 P2 P2
S P1 P1S
Ctl S0 KC
l KSCaS
Ctl S0 P2 P2
S P1 P1S
Ctl S0 KC
l KSCaS
Ctl S0 KC
l KSCaS P1 P1
S
0
5
10
15
20
0
5
10
15
20
N:S
ratio
(a) Londrina & Umuarama
n.s.
n.s.
n.s.
n.s.
n.s.
ab b ab ab a a
b bc c b ab a
c dbc bc ab a
PG1-PS PG2-PS PG1-Low PG2-Low
N:S
ratiograin
N:S
ratiosh
oot
Ctl S0 KC
l KSCaS P2 P2
S P1 P1S
Ctl S0 KC
l KSCaS P2 P2
S P1 P1S
Ctl S0 P2 P2
S P1 P1S
Ctl S0 P2 P2
S P1 P1S
0
5
10
15
20
0
5
10
15
20
N:S
ratio
(b) Ponta Grossa
Figure 5.10: E�ect of fertiliser treatments on N:S-ratio in shoot and grain. For treatment abbreviations refer to figure5.1. Error bars: SE. n.s.: not significant. Di�erent le�ers denote significant di�erences (TukeyHSD, α < 0.05).
78
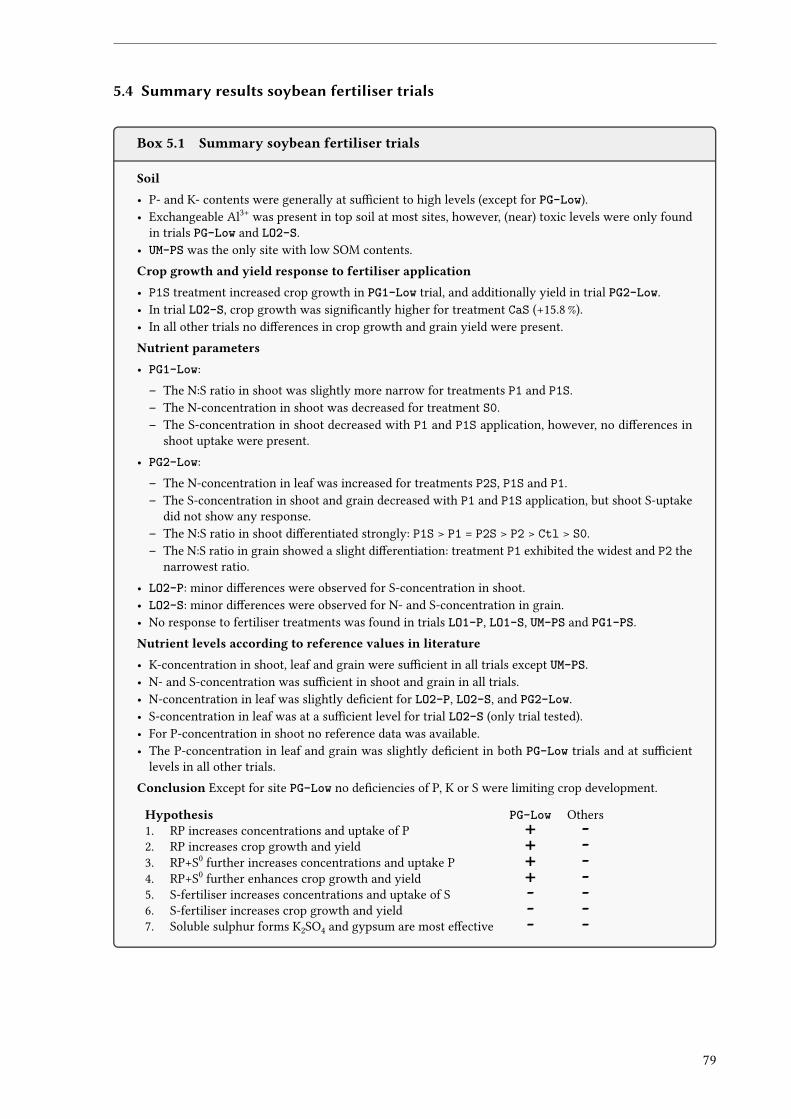
5.4 Summary results soybean fertiliser trials
Box 5.1 Summary soybean fertiliser trials
Soil• P- and K- contents were generally at su�cient to high levels (except for PG-Low).• Exchangeable Al3+ was present in top soil at most sites, however, (near) toxic levels were only found
in trials PG-Low and LO2-S.• UM-PS was the only site with low SOM contents.Crop growth and yield response to fertiliser application• P1S treatment increased crop growth in PG1-Low trial, and additionally yield in trial PG2-Low.• In trial LO2-S, crop growth was signi�cantly higher for treatment CaS (+15.8 %).• In all other trials no di�erences in crop growth and grain yield were present.Nutrient parameters• PG1-Low:– The N:S ratio in shoot was slightly more narrow for treatments P1 and P1S.– The N-concentration in shoot was decreased for treatment S0.– The S-concentration in shoot decreased with P1 and P1S application, however, no di�erences in
shoot uptake were present.• PG2-Low:– The N-concentration in leaf was increased for treatments P2S, P1S and P1.– The S-concentration in shoot and grain decreased with P1 and P1S application, but shoot S-uptake
did not show any response.– The N:S ratio in shoot di�erentiated strongly: P1S > P1 = P2S > P2 > Ctl > S0.– The N:S ratio in grain showed a slight di�erentiation: treatment P1 exhibited the widest and P2 the
narrowest ratio.• LO2-P: minor di�erences were observed for S-concentration in shoot.• LO2-S: minor di�erences were observed for N- and S-concentration in grain.• No response to fertiliser treatments was found in trials LO1-P, LO1-S, UM-PS and PG1-PS.Nutrient levels according to reference values in literature• K-concentration in shoot, leaf and grain were su�cient in all trials except UM-PS.• N- and S-concentration was su�cient in shoot and grain in all trials.• N-concentration in leaf was slightly de�cient for LO2-P, LO2-S, and PG2-Low.• S-concentration in leaf was at a su�cient level for trial LO2-S (only trial tested).• For P-concentration in shoot no reference data was available.• The P-concentration in leaf and grain was slightly de�cient in both PG-Low trials and at su�cient
levels in all other trials.Conclusion Except for site PG-Low no de�ciencies of P, K or S were limiting crop development.
Hypothesis PG-Low Others1. RP increases concentrations and uptake of P + -2. RP increases crop growth and yield + -3. RP+S0 further increases concentrations and uptake P + -4. RP+S0 further enhances crop growth and yield + -5. S-fertiliser increases concentrations and uptake of S - -6. S-fertiliser increases crop growth and yield - -7. Soluble sulphur forms K2SO4 and gypsum are most e�ective - -
79
6 Discussion B: soybean trials (Brazil)
6 Discussion B: soybean trials (Brazil)In several occasions relatively small, but statistically signi�cant di�erences between fertiliser treatmentswere found for crop growth and nutrient parameters. However, these di�erences often did not seemto be meaningful and were also not repeated over several trials. Furthermore, the relative di�erencesdetermined were mostly below 10 %, which for many parameters is only a subtle di�erence in the contextof �eld trial. Realising statistical testing with a total of nine trials which more than ten independentparameters each (i.e. not including the parameters nutrient uptake or export, which are calculatedfrom shoot dry mass, grain yield and their respective nutrient contents) a considerable number of falsepositives naturally arises by chance. Therefore statistical di�erences, which were not observed to beconsecutive over trials, which were relatively small or which showed �awed logic, were interpreted asrandom e�ects. In the results section these random e�ects have been identi�ed and the correspondingtreatment di�erences were assumed not to be directly related to fertiliser e�ects. They will hence beignored in the following discussion, which will merely focuses on the results that are directly related tothe e�ects of phosphorus and sulphur fertilisation.
6.1 Phosphorus
6.1.1 Londrina (LO), Ponta Grossa (PG-High) and Umuarama (UM)
At the clay rich ferralsol sites LO and PG-High and at sandy ferralsol site UM soil P-contents were mediumto high according to (Embrapa Soja, 2007), and no additional P fertiliser application was recommended.P-de�ciency symptoms (described in faba bean discussion on page 62) absent in the treatments withoutP-fertiliser application. Nutrient concentrations of P, and N in shoot, leaf and grain were generally atmedium to high levels Embrapa Soja (2007) and P-fertiliser application did not increase shoot dry mass,grain yield, and P- or N-uptake. No control treatments with phosphorus fertilisers more soluble thanRP, like super single phosphate (SSP) or triple phosphate (TP), were installed in the trials. Therefore it isnot possible to fully determine if the solubility of rock phosphates was in fact limiting crop productivity.Nevertheless growth limitation caused by limited phosphate solubility seems unlikely: not even intrial PG2-High, which showed the highest shoot growth and grain yields and hence demand for Pof all trials and at the same time one of the lowest soil P-contents (still considered medium), rock P-fertiliser application did not have any e�ect and it is assumed that more soluble P-fertilisers wouldnot have brought about an e�ect either. Apart from trials on �eld PG-Low, trial results �rmly indicateP-su�ciency. For most sites it can be assumed that there were no adverse e�ect on soybean crop rootingand hence for phosphorus acquisition. Di�erent from direct-seeding in temperate climate, the lower soiltemperatures compared to soils under conventional tillage do not limit root growth but rather maintainsoil temperatures at more optimal levels. Furthermore, ferralsol soils possess a low density and a goodporosity, also frequently referred to as co�ee powder structure, which facilitates di�usion processes androot penetration. The sandy ferralsol at site UM also possesses a great medium soil pore volume whichfavours rooting. Apart from trial LO2-S, Al-toxicity was not a serious constraint to crop developmentat these sites despite the low pH values, according to reference values in Embrapa Soja (2007),
6.1.2 Ponta Grossa: Low P content site (PG-Low)
The soil conditions of PG-Low were most distinct from the other ferralsol trial sites: the soil had by farthe lowest P-contents and Al-toxicity was strongest. It was the only site for which fertiliser applicationwas repeated in two consecutive trial years and also the only site at which fertiliser application had ane�ect on crop parameters.
Al-toxicity The soil P-contents of PG-Low were extremely low and limiting to crop development.However, soil acidity, which was the severest of all trials, probably even had a more negative impact oncrop growth, with exchangeable Al3+ reaching near-toxic concentrations already in the topsoil 0–20 cm.With presumably even more increased subsoil acidity and Al-toxicity, the rhizosphere was e�ectivelylimited to the topsoil and the acquisition of water and nutrients was compromised. Despite extremelylow soil contents, phosphorus was probably less of a limiting factor than the soil volume e�ectively
80
available for rooting. A possible explanation for the �nding that with treatment S0 shoot dry mass andgrain yield decreased strongly in season 2012/2013 could be the acidifying e�ect of elemental sulphur:upon oxidation by Thiobacillus bacteria in soil forms sulphuric acid (Yang et al., 2010). Over the twoyears of S0 application, the already present Al-toxicity was thereby intensi�ed in direct root proximity,which further deteriorated crop growth conditions. Nevertheless, the negative e�ect that S0 had appliedalone was not found when applied in combination with rock phosphates. This could be explained withRP bu�ering the acidity caused by S0 oxidation. Furthermore, calcium, which is liberated from RP ondissolution, plays a key role in protecting roots against low pH and Al-toxicity stress (Caires et al., 2002).
Phosphorus fertiliser e�ect The shoot P-concentration was lower in both years than in the otherBrazilian fertiliser trials. However, the drastic di�erence in shoot P-concentrations between seasons2011/12 and 2012/13 cannot be explained: the P-concentrations in the �rst trial season resulted extremelylow, and were possibly the result of a laboratory measurement error. The cumulative e�ect of repeatedfertiliser application in season 2012/13 lead to a more pronounced treatment di�erentiation. The e�ectof RP was apparently dependent on its solubility, which is assumed to be the reason for Gafsa RP givingbetter results than Alvorada (citric acid (2 %) solubility: 40–45 % vs. 17 %, respectively). Changes in tissueP-concentrations still remained relatively low between treatments, but crop growth and P-uptake wereclearly increased with rock-P fertiliser treatments. P-concentrations in leaf were found to be de�cientin the second trial season, making this the only Brazilian site where presence of P-de�ciency could becon�rmed. The only signi�cant increase in leaf-P was found for P1S, but concentrations remained in ade�cient range. The bu�ering e�ect of both RP indicated that the acid formed by oxidation of elementalS was indeed bu�ered by RP and helped in its solubilisation (Rajan, 1982a,b) and therefore liberation ofPO 3–
4 . As a result, a positive e�ect of the joint application of RP and elemental sulphur in treatmentsP1S and P2S can be concluded in trial PG-Low, which was not related to the fertiliser e�ect of elementalsulphur.
6.2 Sulphur
6.2.1 E�ect of sulphur fertiliser application
In the �eld trials conducted, sulphur was not a limiting factor for crop production and for none of thetrials a sulphur induced e�ect on soybean shoot dry mass, grain yield was found. Furthermore, neitherS-concentrations of shoot, leaf (only limited data) nor grain did react to fertilisation and also N-uptakeremained unchanged. Nutrient levels of S in shoot and grain were nearly always su�cient. Evidencefor a bene�cial e�ect on the grain protein quality could not be found either, as an increased contentof cysteine and methionin would have been indicated by a more narrow N:S ratio (Gayler and Sykes,1985). This con�rms results of Caires et al. (1998) and Caires et al. (2011), who in soybean direct-seedingtrials on a ferralsol in Ponta Grossa also did not �nd any e�ect for gypsum application on grain yield.However, in works of Sfredo and Lantmann (2007) in Londrina and Ponta Grossa gypsum and elementalsulphur application both resulted in yield increases for soybean crop.
The reaction to S-fertiliser application observed in trial PG2-Low with a signi�cantly higher S-uptakeinto grain in P1S treatment was attributed to the positive impact of elemental sulphur on P-availability,which in turn increased crop growth and yield and hence S-uptake. A further e�ect of application ofS-fertiliser CaS was observed in trial LO2-S where crop growth was increased signi�cantly. Nonethe-less, also in this trial S-concentrations of leaf, shoot and grain remained equal for all treatments. Theapplication of sulphur fertiliser cannot explain this di�erence as the more soluble fertiliser KS did nothave any e�ect on sulphur uptake. The cause for the e�ect of gypsum was rather thought to be dueto the presence of Al-toxicity. In an adjacent trial with Phaseolus vulgaris on the same �eld tap rootdeformations starting at about 15 soil depth were observed. Al-toxicity was the most likely cause forthese deformations as soil pH in the �eld of trial LO2-S was one of the lowest of all trials (only PG-Lowlower) and the level of exchangeable aluminium one of the highest determined in soil samples. Bothfactors presumably hindered the root development of the soybean crop (Marschner and Marschner,2012). With no response to KS treatment it can be concluded that the increased crop growth of CaS
81
6 Discussion B: soybean trials (Brazil)
was not caused by an improved supply of SO 2–4 , but can rather be attributed to the positive e�ect of
gypsum in the mitigation of Al-toxicity. Gypsum application has an direct e�ect on soil pH, as sulphateis exchanged with OH– ligands and increases the adsorption of cations (Curtin and Syers, 1990). Further-more, it enhances root growth by providing Ca2+, which is limited in acid soils and competes with Al3+
for exchange sites on the root surface (Marschner and Marschner, 2012) and can alleviate deleterious Ale�ects (Rengel, 1992). Furthermore, the SO 2–
4 provided with gypsum application is capable of decreasingAl-toxicity by the formation of non-toxic AlSO +
4 ions (Caires et al., 2002; Marschner and Marschner,2012). The total absence of fertiliser response in all trials clearly indicates that soybean S-demand couldfully be met by SOM mineralisation and with the sulphate that is adsorbed or free in the soil solution,even for the sites with average to high yields and accordingly relatively high S-demands (e.g. PG-High).
6.2.2 Experimental sites and susceptibility to S-deficiency
Sulphur in organic ma�er The largest S-pool at all ferralsol sites is the organically bound sulphur inSOM, which only in the topsoil (0–20 cm) with S-contents of 0.026–0.041 % (to the largest extent presentin SOM) at LO and PG amount to 570–902 kg ha−1 S. For the sandy ferralsol site UM these values werefar lower, with topsoil contents of 1.7 % SOM topsoil and an S-content of only about 150 kg ha−1 S andfurther yet presumably minor amounts (no data present) in subsoil. No data from �eld trials on annualsulphur mineralisation rates or quantities were found for tropical soils under direct seeding management.Taking the mineralisation rate of total organic sulphur found by Eriksen et al. (1995) for Danish soilsof 3 % of amounts mineralised in top soil would amount to 18–28 kg ha−1 S for the clayey and about5 kg ha−1 for the sandy ferralsol soils. In a laboratory pot experiment on sulphur mineralisation withBrazilian ferralsol soils with similar texture and SOM contents rates of about 11 kg ha−1 were foundboth for sandy and clayey textures (Silva et al., 1999). The higher SOM mineralisation rate (with respectto SOM content) for the soil with the sandy texture is plausible due to the high soil temperatures andthe excellent aeration of sandy soils. Additionally to SOM mineralisation, S contained in oats strawresidue of 4 t ha−1, with a S-content of about 0.23 % S (Plant Nutrition Institute, 2014), amounting toabout 9 kg ha−1 S can largely become available to the crop during the soybean growing season.
Sulphate adsorption In general about 95 % of S in soils is contained in SOM, while mineral sulphate,which is adsorbed or free in the soil solution forms only a minor fraction of the total S pool (Scherer,2009). However, this only holds true for moderately weathered soils with about neutral pH values. Incalcareous soils and in intensely weathered acid tropical soils adsorbed sulphate can form an importantpool for crop S-supply. With an ample presence of the variable charge sesquioxides hematite and goethiteand a low soil pH in the range of 4.5–5.5 the AEC and sulphate sorption are high in ferralsol soils (Alvesand Lavorenti, 2004). For example, Neptune et al. (1975) found a ratio of 8:11 soluble to adsorbed sulphurfor a Brazilian ferralsol, meaning that the amount of adsorbed sulphate may exceed that of free sulphateions in the soil solution.
According to data of Churka Blum et al. (2013), the maximum adsorption of SO 2–4 -S in the top-
soil (0–20 cm) of a loamy ferralsol in Ponta Grossa was 56.8 mg kg−1 and 217.4 mg kg−1 in the subsoil(180–200 cm) and in a clayey ferralsol in Guarapuava, Paraná 133.3 mg kg−1 and 384.6 mg kg−1, respec-tively. The reason for the lower values in topsoil is that sulphate adsorption is in�uenced negatively byhigh pH (Bolan et al., 1986), soil organic matter and phosphate ions (Couto et al., 1979; Bolan et al., 1988;Liu and Hue, 2001; Scherer, 2001). In another study of Alves and Lavorenti (2004) on representative soilsin São Paulo state, Brazil, a maximum SO 2–
4 -S adsorption capacity of clay in the subsoil of ferralsols(80–170 cm soil depth) was determined to be between 163–473 mg kg−1 of clay, which is equivalent to arange of 118–411 kg ha−1 maximum sulphate adsorption for a subsoil layer of 10 cm thickness. Given theclay content of the clayey ferralsols at experimental soils at LO and PG of 64–79 % maximum sulphate-Sadsorption of 118–411 kg ha−1 would be possible and 29–83 kg ha−1 for the sandy ferralsol at site UM(16 % clay).
Actual values of extractable sulphate found by Churka Blum et al. (2013) could be taken as a referencefor the magnitude of the amount of adsorbed sulphate potentially present in the clayey ferralsol soilsstudied in the work at hand: between 0–100 cm soil depth a total of 72 kg ha−1 adsorbed S was found in
82
Ponta Grossa, 13 years after gypsum application of 12 t ha−1, compared to 39 kg ha−1 for the non-fertilisedplots, and in Guarapuava, 3.5 years after application 297 kg ha−1 compared to 48 kg ha−1, respectively.Reference values for extractable sulphate in sandy ferralsols were not found in literature and it can onlybe assumed that the magnitude would be about 4–5 times lower according to the lower clay contents,hence about 10 kg ha−1, assuming no gypsum application. Therefore even without gypsum application,adsorbed mineral sulphur can be assumed to be an important S-pool in ferralsol soils, which shouldlargely be available to the crop. The total soybean S-demand for yields of 3–4 t ha−1 is in the range of45–60 kg ha−1 (Embrapa Soja, 2007). According to the values cited above, this demand can be met bysulphur mineralisation and soil mineral sulphur, which explains why S-fertiliser treatments did not haveany e�ect.
Sulphate leaching potential Both clayey and sandy ferralsols exhibit fast in�ltration rates, but onlythe clayey ones have a high water holding capacity. Therefore, the leaching potential of sandy ferralsolsis certainly higher. Up to a certain point, the high potential for sulphate adsorption can inhibit leaching.For example, in the experiment of Churka Blum et al. (2013), 13 years after application of 12 t ha−1 ofgypsum in Ponta Grossa, only 52 % had been leached below 200 cm soil depth and concentrations upto 100 cm were still higher than those for the non-fertilised treatment, while 3.5 years after gypsumapplication in the clayey ferralsol at Guarapuava, 100 % of the gypsum was still present up to samesoil depth, with highest concentration in the soil layer from 20–60 cm. For sandy ferralsols no data onleaching rates was found, but rates can be expected to be far higher due to the lower sulphate adsorptionpotential. An important fact to consider when discussing leaching potential is that bare fallows hardlyexist in crop rotations in Paraná state and for most of the year a growing vegetation cover can activelyremove SO 2–
4 from soil solution, which recycles sulphur back to topsoil (Eriksen and Thorup-Kristensen,2002) and eventually to SOM. While at site LO and PG annual cropping is practised, at site UM conversionhas only occurred recently. During the long-term pasture use, S-exports were minimal and leaching wasinhibited more e�ectively than with annual crops by the relatively extensive root system of pastures.In conclusion, the combination of SOM preservation in DS, near-permanent vegetation cover and highsulphate adsorption potential in acid soil conditions limit sulphate leaching and at least for the clayeyferralsol soils sulphate leaching rates can be assumed to be much lower than expected initially.
6.2.3 Balance of sulphur fluxes
Cropping system exports A typical cropping system used in mainstream agriculture in Paranástate is a rotation consisting of about 50–85 % soybean, which is planted in rotations with maize insummer, and wheat, oats or green manure plants in winter, e.g. hairy vetch (Vicia villosa), or wild radish(Raphanus raphanistrum). Soybean is the major sulphur exporting crop in Brazilian agriculture (Yamadaand Lopes, 1998), and in comparison with maize or wheat, the S-demand of soybean is highest (Sfredoand Lantmann, 2007). With average soybean grain yields of 3.4 t ha−1 in Paraná state (IBGE 2014 21)and a grain concentration of 0.3–0.54 % (Embrapa Soja, 2007), the total export of S is in the range of9–15 kg ha−1, which is similar to values found in this work (7–15 kg ha−1). With a grain concentrationsof maize and wheat of about 0.1 % and 0.15 % S typical yields result in S-exports of 7–9 kg ha−1 and3–6 kg ha−1 S, respectively. Annual S-exports are therefore in the range from about 8 kg ha−1, e.g. formaize cropping in summer plus a green manure winter crop, to 12–21 kg ha−1 S for a rotation of soybeanfollowed by wheat in winter. On average a minimum annual export of sulphur between 10–15 kg ha−1
can be assumed.
Sulphur fertilisation and atmospheric inputs Atmospheric immissions are the most relevant in-put of sulphur to agricultural soils. High resolution data on regional variations in S-immission in Brazilare not available but several studies on rain water chemistry have been conducted in metropolitan, near-industrial and rural areas. For the metropolitan areas of São Paulo and Rio de Janeiro, wet-depositionsof 8.2 kg ha−1 a−1 S (Rocha et al., 2003) and 7.2 kg ha−1 a−1 S (De Mello, 2001) have been determined,21IBGE: Instituto brasileiro de geogra�a e estatística - Brazilian institute for geography and statistics
83
6 Discussion B: soybean trials (Brazil)
respectively. Near coal power plants, which are one of the strongest S-emitters, wet depositions were13.3 kg ha−1 a−1 and 15 kg ha−1 S (Migliavacca et al., 2004; Flues et al., 2002). Nonetheless, the soybeancultivation sites in Paraná state are generally in rural areas with low industrialisation, and so are theexperimental sites. For Cuiaba, Mato Grosso state, a non-industrialised city in the interior of Brazil,sulphur wet deposition is as low as 0.2 kg ha−1 a−1 S (Dias et al., 2012). The trial site and second largestcity in Paraná state Londrina, has a low degree of industrialisation and the wet-deposition at this siteis only about 2.1 kg ha−1 a−1 S (Pelicho et al., 2006). Similar immissions are assumed for Ponta Grossaand even lower values for the trial site outside of the small town of Umuarama. Considering that drydeposition rates can be assumed to be of the same magnitude as wet-deposition (Garland, 1978), thetotal sulphur immission rate to be expected at experimental sites in Paraná state are unlikely to exceed5 kg ha−1 a−1 S.
Therefore an imbalance between harvest exports and atmospheric inputs is apparent in Paraná state,with a negative balance of at least 10 kg ha−1 a−1 S, because further amounts are removed by leaching,with presumably elevated rates for soils with a sandy texture. Hence, fertiliser inputs of sulphur becomenecessary to avoid S-de�ciency in the long term.
Mixed farming systems are not wide-spread and therefore no on-farm sulphur recycling with organicfertiliser application is practised in general. Cattle livestock farming is realised as grazing systems, andsheds that would enable manure collection are only used for pig and poultry production. Typically, itcan be assumed that harvested sulphur is entirely exported o�-farm. In most fertilisers sulphur is absentor contents are low, as more concentrated fertilisers are used preferentially (Schnug, 1988; Scherer, 2001).For example, the more concentrated P-fertiliser triple phosphate is preferred over the sulphur containingsuper-single-phosphate (SSP).
Nonetheless, amelioration of soils with a combination of limestone and gypsum is common practicein Brazil. The purpose of limestone application is to correct for acidity in the topsoil, but applied in thisform Ca2+ is not mobile enough to move to and mitigate low Ca2+ contents in the subsoil. The purposeof gypsum application is to e�ectively bring Ca2+ into the subsoil as it is far more mobile in soil. Thesupply of S as a plant nutrient is - if at all - only a secondary objective of soil amelioration. Apart fromforming less toxic Al-SO 2–
4 salts, the sulphate contained in gypsum also exhibits a self-liming e�ect, byexchange with OH– ligands upon adsorption. This combined e�ect of gypsum in the subsoil e�ectivelyameliorates Al-toxicity (Caires et al., 2011). Gypsum application is recommended when subsoil Ca2+
contents are below 0.5 cmolc dm−3 and saturation of Al3+ above 20 %.No soil analysis of subsoil layers is available for the experimental sites, yet the high saturation of Al3+
in the topsoil of PG-Low, UM and LO2-S makes the presence of Al-toxicity likely. In fact, for the latter sitesymptoms resembling Al-toxicity were found. Nevertheless, at none of the experimental sites gypsumapplication has been realised in the past. Rather than a intra-row application of sulphur fertilisers,broadcast gypsum application has to be recommended. Due to the relatively fast in�ltration into thesoil the broadcast application of gypsum is a much more e�ective way to supply sulphur to the crop,which furthermore helps to ameliorate a much larger soil volume than a intra-row application. Withtypical recommended rates of 700 kg ha−1 gypsum for sandy soils and up to 3200 kg ha−1 for clay soils(rule of thumb: 50 x % clay kg ha−1), large sulphur amounts of 110 kg ha−1 and 500 kg ha−1 S are applied,respectively, and due to the adsorption capacity of tropical variable charge soils, there is a residual e�ectof 5–15 years (de Sousa et al., 2005). Gypsum broadcast application can therefore avoid occurrence ofS-de�ciency in the long-term e�ectively. Nonetheless, excessive gypsum applications have to be avoidedas SO 2–
4 is known to move through the soil pro�le together with cations, which can result in leachinglosses of potassium and magnesium (Liu and Hue, 2001).
84
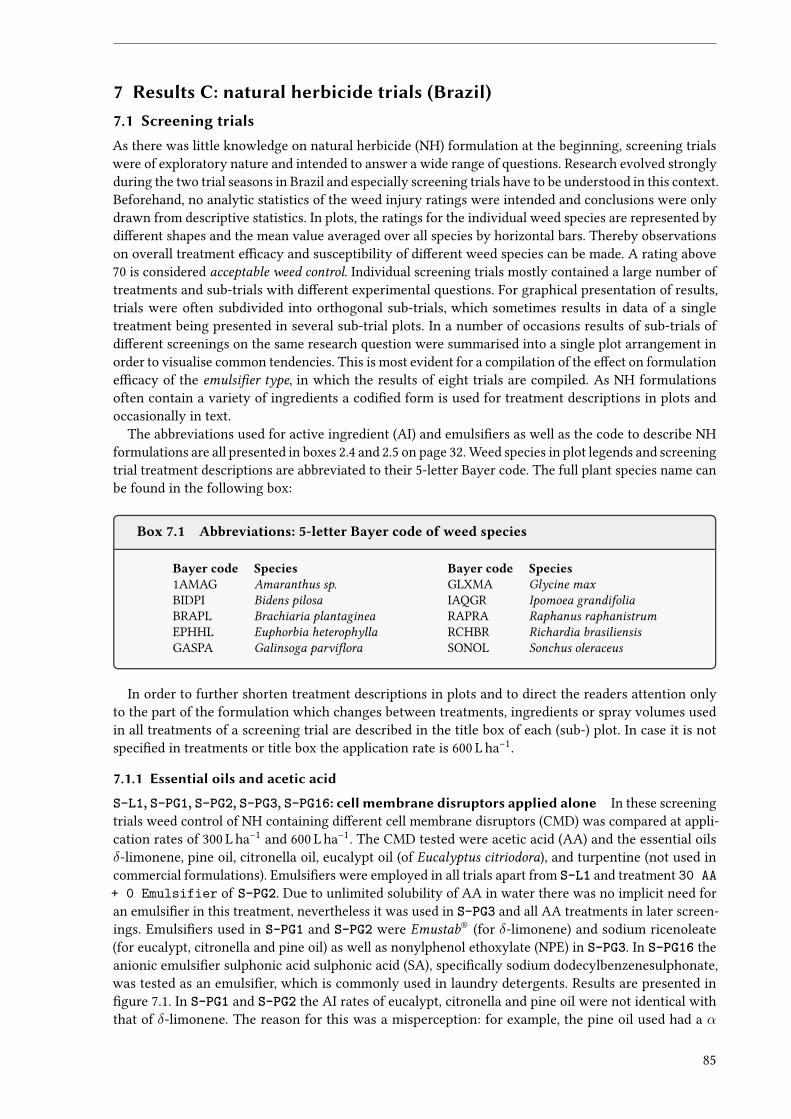
7 Results C: natural herbicide trials (Brazil)7.1 Screening trialsAs there was little knowledge on natural herbicide (NH) formulation at the beginning, screening trialswere of exploratory nature and intended to answer a wide range of questions. Research evolved stronglyduring the two trial seasons in Brazil and especially screening trials have to be understood in this context.Beforehand, no analytic statistics of the weed injury ratings were intended and conclusions were onlydrawn from descriptive statistics. In plots, the ratings for the individual weed species are represented bydi�erent shapes and the mean value averaged over all species by horizontal bars. Thereby observationson overall treatment e�cacy and susceptibility of di�erent weed species can be made. A rating above70 is considered acceptable weed control. Individual screening trials mostly contained a large number oftreatments and sub-trials with di�erent experimental questions. For graphical presentation of results,trials were often subdivided into orthogonal sub-trials, which sometimes results in data of a singletreatment being presented in several sub-trial plots. In a number of occasions results of sub-trials ofdi�erent screenings on the same research question were summarised into a single plot arrangement inorder to visualise common tendencies. This is most evident for a compilation of the e�ect on formulatione�cacy of the emulsi�er type, in which the results of eight trials are compiled. As NH formulationsoften contain a variety of ingredients a codi�ed form is used for treatment descriptions in plots andoccasionally in text.
The abbreviations used for active ingredient (AI) and emulsi�ers as well as the code to describe NHformulations are all presented in boxes 2.4 and 2.5 on page 32. Weed species in plot legends and screeningtrial treatment descriptions are abbreviated to their 5-letter Bayer code. The full plant species name canbe found in the following box:
Box 7.1 Abbreviations: 5-letter Bayer code of weed species
Bayer code Species Bayer code Species1AMAG Amaranthus sp. GLXMA Glycine maxBIDPI Bidens pilosa IAQGR Ipomoea grandifoliaBRAPL Brachiaria plantaginea RAPRA Raphanus raphanistrumEPHHL Euphorbia heterophylla RCHBR Richardia brasiliensisGASPA Galinsoga parvi�ora SONOL Sonchus oleraceus
In order to further shorten treatment descriptions in plots and to direct the readers attention onlyto the part of the formulation which changes between treatments, ingredients or spray volumes usedin all treatments of a screening trial are described in the title box of each (sub-) plot. In case it is notspeci�ed in treatments or title box the application rate is 600 L ha−1.
7.1.1 Essential oils and acetic acid
S-L1, S-PG1, S-PG2, S-PG3, S-PG16: cell membrane disruptors applied alone In these screeningtrials weed control of NH containing di�erent cell membrane disruptors (CMD) was compared at appli-cation rates of 300 L ha−1 and 600 L ha−1. The CMD tested were acetic acid (AA) and the essential oilsδ-limonene, pine oil, citronella oil, eucalypt oil (of Eucalyptus citriodora), and turpentine (not used incommercial formulations). Emulsi�ers were employed in all trials apart from S-L1 and treatment 30 AA+ 0 Emulsifier of S-PG2. Due to unlimited solubility of AA in water there was no implicit need foran emulsi�er in this treatment, nevertheless it was used in S-PG3 and all AA treatments in later screen-ings. Emulsi�ers used in S-PG1 and S-PG2 were Emustab® (for δ-limonene) and sodium ricenoleate(for eucalypt, citronella and pine oil) as well as nonylphenol ethoxylate (NPE) in S-PG3. In S-PG16 theanionic emulsi�er sulphonic acid sulphonic acid (SA), speci�cally sodium dodecylbenzenesulphonate,was tested as an emulsi�er, which is commonly used in laundry detergents. Results are presented in�gure 7.1. In S-PG1 and S-PG2 the AI rates of eucalypt, citronella and pine oil were not identical withthat of δ-limonene. The reason for this was a misperception: for example, the pine oil used had a α
85
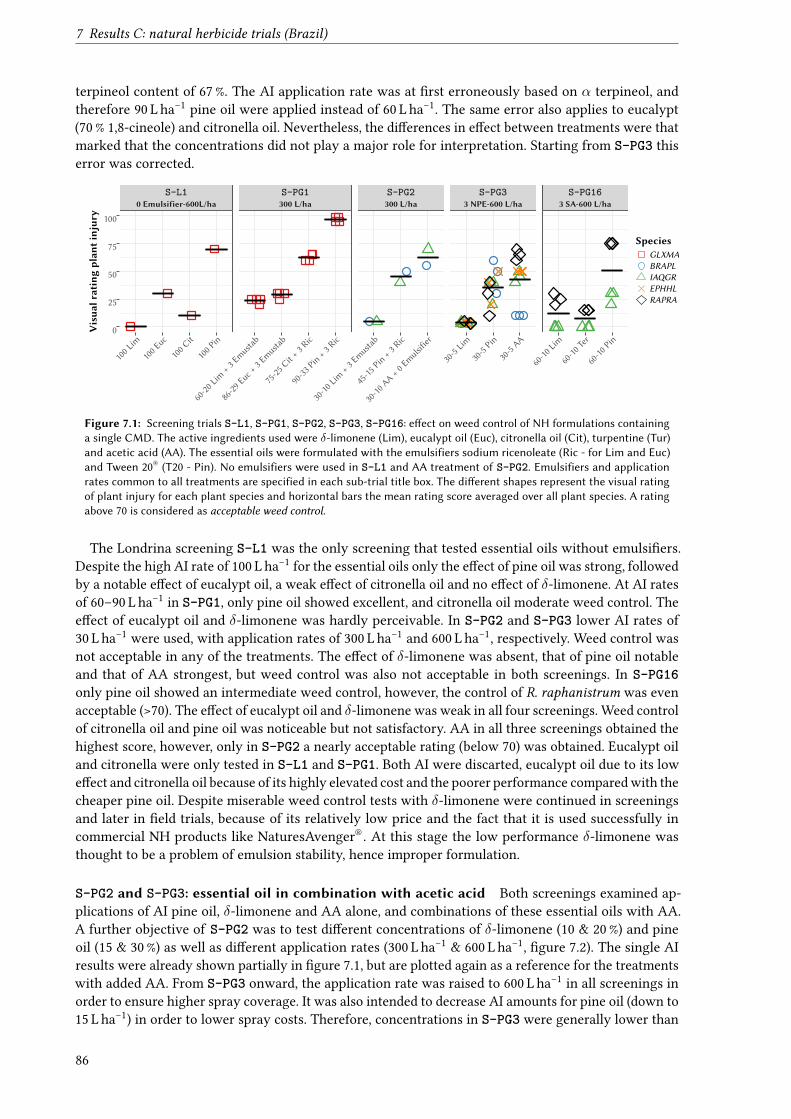
7 Results C: natural herbicide trials (Brazil)
terpineol content of 67 %. The AI application rate was at �rst erroneously based on α terpineol, andtherefore 90 L ha−1 pine oil were applied instead of 60 L ha−1. The same error also applies to eucalypt(70 % 1,8-cineole) and citronella oil. Nevertheless, the di�erences in e�ect between treatments were thatmarked that the concentrations did not play a major role for interpretation. Starting from S-PG3 thiserror was corrected.
S-L10 Emulsifier-600L/ha
S-PG1300 L/ha
S-PG2300 L/ha
S-PG33 NPE-600 L/ha
S-PG163 SA-600 L/ha
100 Lim
100 Euc
100 Cit
100 Pin
60-20
Lim+ 3
Emustab
86-29
Euc +
3 Emustab
75-25
Cit +3 Ric
90-33
Pin+ 3
Ric
30-10
Lim+ 3
Emustab
45-15
Pin+ 3
Ric
30-10
AA+ 0
Emulsifier
30-5Lim
30-5Pin
30-5AA
60-10
Lim
60-10
Ter
60-10
Pin0
25
50
75
100
Visua
lratingplan
tinjur
y
SpeciesGLXMABRAPLIAQGREPHHLRAPRA
Figure 7.1: Screening trials S-L1, S-PG1, S-PG2, S-PG3, S-PG16: e�ect on weed control of NH formulations containinga single CMD. The active ingredients used were δ-limonene (Lim), eucalypt oil (Euc), citronella oil (Cit), turpentine (Tur)and acetic acid (AA). The essential oils were formulated with the emulsifiers sodium ricenoleate (Ric - for Lim and Euc)and Tween 20® (T20 - Pin). No emulsifiers were used in S-L1 and AA treatment of S-PG2. Emulsifiers and applicationrates common to all treatments are specified in each sub-trial title box. The di�erent shapes represent the visual ratingof plant injury for each plant species and horizontal bars the mean rating score averaged over all plant species. A ratingabove 70 is considered as acceptable weed control.
The Londrina screening S-L1 was the only screening that tested essential oils without emulsi�ers.Despite the high AI rate of 100 L ha−1 for the essential oils only the e�ect of pine oil was strong, followedby a notable e�ect of eucalypt oil, a weak e�ect of citronella oil and no e�ect of δ-limonene. At AI ratesof 60–90 L ha−1 in S-PG1, only pine oil showed excellent, and citronella oil moderate weed control. Thee�ect of eucalypt oil and δ-limonene was hardly perceivable. In S-PG2 and S-PG3 lower AI rates of30 L ha−1 were used, with application rates of 300 L ha−1 and 600 L ha−1, respectively. Weed control wasnot acceptable in any of the treatments. The e�ect of δ-limonene was absent, that of pine oil notableand that of AA strongest, but weed control was also not acceptable in both screenings. In S-PG16only pine oil showed an intermediate weed control, however, the control of R. raphanistrum was evenacceptable (>70). The e�ect of eucalypt oil and δ-limonene was weak in all four screenings. Weed controlof citronella oil and pine oil was noticeable but not satisfactory. AA in all three screenings obtained thehighest score, however, only in S-PG2 a nearly acceptable rating (below 70) was obtained. Eucalypt oiland citronella were only tested in S-L1 and S-PG1. Both AI were discarted, eucalypt oil due to its lowe�ect and citronella oil because of its highly elevated cost and the poorer performance compared with thecheaper pine oil. Despite miserable weed control tests with δ-limonene were continued in screeningsand later in �eld trials, because of its relatively low price and the fact that it is used successfully incommercial NH products like NaturesAvenger®. At this stage the low performance δ-limonene wasthought to be a problem of emulsion stability, hence improper formulation.
S-PG2 and S-PG3: essential oil in combination with acetic acid Both screenings examined ap-plications of AI pine oil, δ-limonene and AA alone, and combinations of these essential oils with AA.A further objective of S-PG2 was to test di�erent concentrations of δ-limonene (10 & 20 %) and pineoil (15 & 30 %) as well as di�erent application rates (300 L ha−1 & 600 L ha−1, �gure 7.2). The single AIresults were already shown partially in �gure 7.1, but are plotted again as a reference for the treatmentswith added AA. From S-PG3 onward, the application rate was raised to 600 L ha−1 in all screenings inorder to ensure higher spray coverage. It was also intended to decrease AI amounts for pine oil (down to15 L ha−1) in order to lower spray costs. Therefore, concentrations in S-PG3 were generally lower than
86
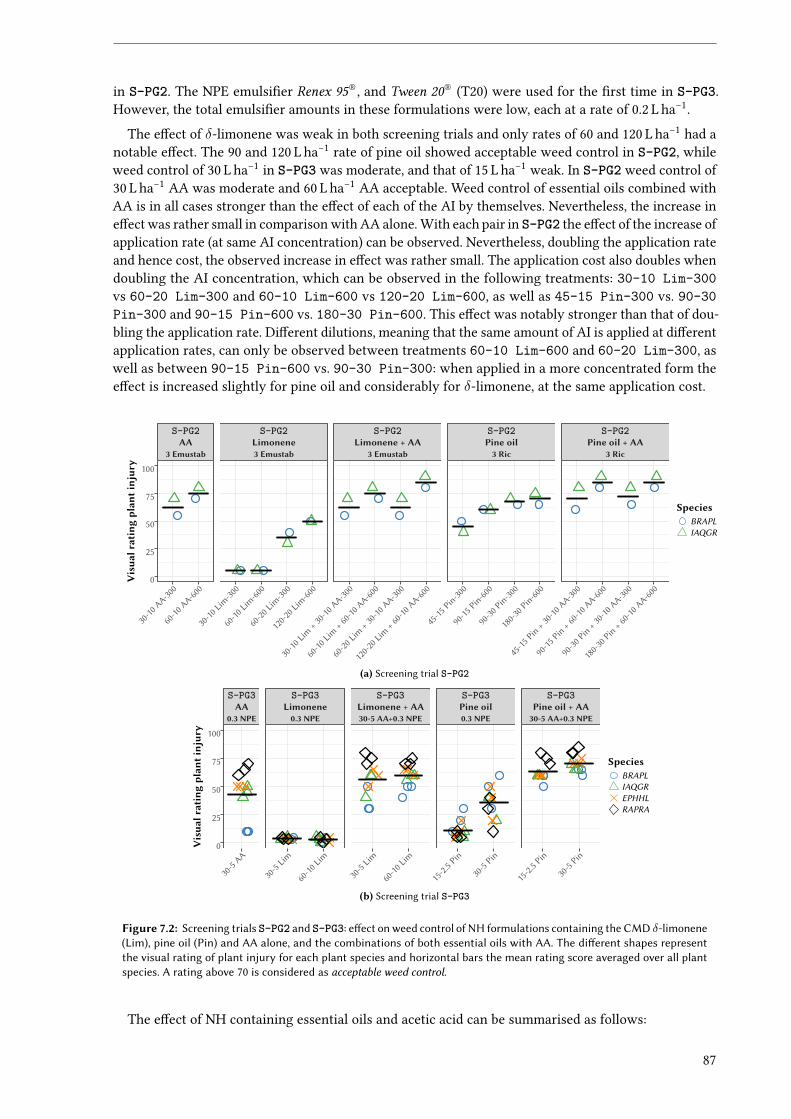
in S-PG2. The NPE emulsi�er Renex 95®, and Tween 20® (T20) were used for the �rst time in S-PG3.However, the total emulsi�er amounts in these formulations were low, each at a rate of 0.2 L ha−1.
The e�ect of δ-limonene was weak in both screening trials and only rates of 60 and 120 L ha−1 had anotable e�ect. The 90 and 120 L ha−1 rate of pine oil showed acceptable weed control in S-PG2, whileweed control of 30 L ha−1 in S-PG3 was moderate, and that of 15 L ha−1 weak. In S-PG2 weed control of30 L ha−1 AA was moderate and 60 L ha−1 AA acceptable. Weed control of essential oils combined withAA is in all cases stronger than the e�ect of each of the AI by themselves. Nevertheless, the increase ine�ect was rather small in comparison with AA alone. With each pair in S-PG2 the e�ect of the increase ofapplication rate (at same AI concentration) can be observed. Nevertheless, doubling the application rateand hence cost, the observed increase in e�ect was rather small. The application cost also doubles whendoubling the AI concentration, which can be observed in the following treatments: 30-10 Lim-300vs 60-20 Lim-300 and 60-10 Lim-600 vs 120-20 Lim-600, as well as 45-15 Pin-300 vs. 90-30Pin-300 and 90-15 Pin-600 vs. 180-30 Pin-600. This e�ect was notably stronger than that of dou-bling the application rate. Di�erent dilutions, meaning that the same amount of AI is applied at di�erentapplication rates, can only be observed between treatments 60-10 Lim-600 and 60-20 Lim-300, aswell as between 90-15 Pin-600 vs. 90-30 Pin-300: when applied in a more concentrated form thee�ect is increased slightly for pine oil and considerably for δ-limonene, at the same application cost.
S-PG2AA
3 Emustab
S-PG2Limonene3 Emustab
S-PG2Limonene + AA
3 Emustab
S-PG2Pine oil3 Ric
S-PG2Pine oil + AA
3 Ric
30-10
AA-300
60-10
AA-600
30-10
Lim-300
60-10
Lim-600
60-20
Lim-300
120-20 Lim-600
30-10
Lim+ 30-10 AA-300
60-10
Lim+ 60-10 AA-600
60-20
Lim+ 30-10 AA-300
120-20 Lim+ 60-10 AA-600
45-15
Pin-300
90-15
Pin-600
90-30
Pin-300
180-30 Pin-600
45-15
Pin+ 30-10 AA-300
90-15
Pin+ 60-10 AA-600
90-30
Pin+ 30-10 AA-300
180-30 Pin+ 60-10 AA-600
0
25
50
75
100
Visua
lratingplan
tinjur
y
SpeciesBRAPLIAQGR
(a) Screening trial S-PG2
S-PG3AA
0.3 NPE
S-PG3Limonene0.3 NPE
S-PG3Limonene + AA30-5 AA+0.3 NPE
S-PG3Pine oil0.3 NPE
S-PG3Pine oil + AA30-5 AA+0.3 NPE
30-5AA
30-5Lim
60-10
Lim
30-5Lim
60-10
Lim
15-2.5 Pin
30-5Pin
15-2.5 Pin
30-5Pin
0
25
50
75
100
Visua
lratingplan
tinjur
y
SpeciesBRAPLIAQGREPHHLRAPRA
(b) Screening trial S-PG3
Figure 7.2: Screening trials S-PG2 and S-PG3: e�ect on weed control of NH formulations containing the CMD δ-limonene(Lim), pine oil (Pin) and AA alone, and the combinations of both essential oils with AA. The di�erent shapes representthe visual rating of plant injury for each plant species and horizontal bars the mean rating score averaged over all plantspecies. A rating above 70 is considered as acceptable weed control.
The e�ect of NH containing essential oils and acetic acid can be summarised as follows:
87
7 Results C: natural herbicide trials (Brazil)
Box 7.2 Summary: e�ect of essential oils and acetic acid
• Comparison of AI e�ect: AA > pine oil > citronella oil > eucalypt oil > δ-limonene > turpentine.• Without addition of an emulsi�er only pine oil and acetic acid have any e�ect.• The absolute e�ect of δ-limonene was minimal, even at a high concentration of 20 %.• Weed control of the mixture of essential oils and AA was not largely improved compared to AA alone.• At a �xed AI rate, the concentrated application resulted in better control than the diluted one.
7.1.2 Vegetable oil applied alone and in combination with essential oils
Only in screening S-L2 the re�ned vegetable oils of corn, soybean and rape oil were applied at ratesof 50 L ha−1 in combination with the Organic Agriculture (OA) certi�ed emulsi�er Rimulgan®, but novisible phytotoxic e�ects on weeds were observed (�gure 7.4). Nevertheless, it was hypothesised thatthe volatilisation of the essential oils could be reduced when applied in mixture with vegetable oils,thereby prolonging and possibly increasing the phytotoxic e�ect on weeds. In screening S-L1 essentialoils were applied alone at a rate of 100 L ha−1 without the addition of an emulsi�er and in combinationwith 50 L ha−1 corn oil. In S-PG4, re�ned ricinus oil (30 L ha−1) was added to a formulation of 120 L ha−1
δ-limonene and 30 L ha−1 NPE emulsi�er. In both screenings the herbicidal e�ect of the essential oilformulations decreased clearly.
S-L1No emulsifier
S-L25 Rimulgan
S-PG43 Energic
100 Lim
100 Lim+ 50 Corn
100 Euc
100 Euc+ 50 Corn
100 Cit
100 Cit+ 50 Corn
100 Pin
100 Pin+ 50 Corn
50Cornoil
50Rapeoil
50Soybean oil
120 Lim
120 Lim+ 30 Ricinus
0
25
50
75
100
Visua
lratingplan
tinjur
y
SpeciesGLXMABRAPLIAQGRRAPRABIDPI
Figure 7.4: Screening trials S-L2 and S-PG4: e�ect on weed control of NH formulations containing vegetable oil appliedalone (S-L2) and in combination with the essential oils pine oil (Pin), δ-limonene (Lim) and eucalypt oil (S-L1 and S-PG4).Emulsifiers used were Rimulgan (S-L2), Energic (S-PG4) and no emulsifier (S-L1). The di�erent shapes represent thevisual rating of plant injury for each plant species and horizontal bars the mean rating score averaged over all species. Arating above 70 is considered as acceptable weed control.
7.1.3 NaCl applied alone and in combination with CMD
S-PG4, S-PG5, S-PG12 and S-PG13: NaCl alone and in combination with AA and essential oilsWorks of Lukashyk (2005); Lukashyk et al. (2008) had examined spray application of NaCl containingkainit fertiliser (50 % NaCl) as a weed control strategy. In �eld trials 350 kg ha−1 NaCl applied as powderand 150 kg ha−1 NaCl in spraying solution lead to acceptable control of Vicia hirsuta, which is a problemweed in temperate climate OA. Inspired by this work, the addition of a large amount of NaCl (120 kg ha−1)to formulations containing CMD was hypothesised to increase the herbicidal e�ect: as CMD damageand permeabilise leaf cuticle and cell membranes, NaCl could possibly be taken up into the leaf in greaterquantities and unfold an phytotoxic e�ect within the leaf tissue. Screenings S-PG12, S-PG13 and S-PG4contained treatments in which NaCl was applied alone without emulsi�ers (�gure 7.5). The e�ectvaried strongly between screenings and weed species. Ipomoea largifolia was controlled e�ectively with50 kg ha−1 NaCl in S-PG12, while the control e�ect for Euphorbia heterophylla was weak to moderatein S-PG13 with 25 and 50 kg ha−1 NaCl. The 120 kg ha−1 NaCl rate in S-PG4 even did not show any
88
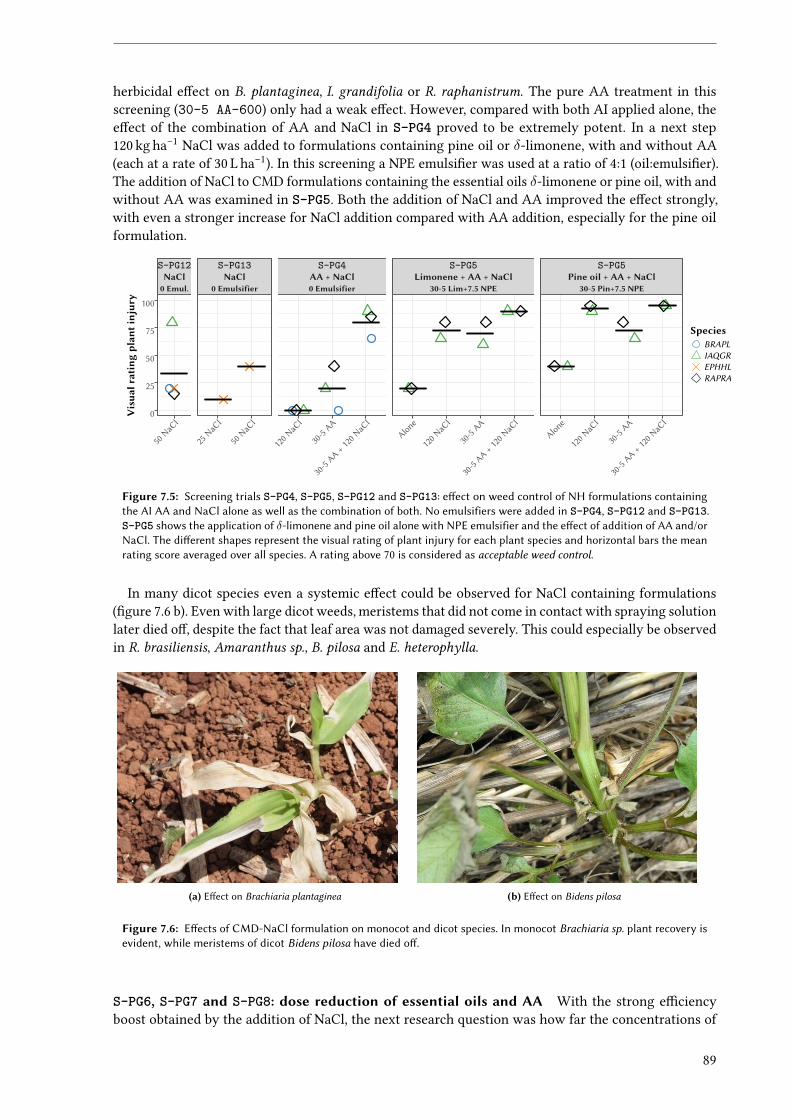
herbicidal e�ect on B. plantaginea, I. grandifolia or R. raphanistrum. The pure AA treatment in thisscreening (30-5 AA-600) only had a weak e�ect. However, compared with both AI applied alone, thee�ect of the combination of AA and NaCl in S-PG4 proved to be extremely potent. In a next step120 kg ha−1 NaCl was added to formulations containing pine oil or δ-limonene, with and without AA(each at a rate of 30 L ha−1). In this screening a NPE emulsi�er was used at a ratio of 4:1 (oil:emulsi�er).The addition of NaCl to CMD formulations containing the essential oils δ-limonene or pine oil, with andwithout AA was examined in S-PG5. Both the addition of NaCl and AA improved the e�ect strongly,with even a stronger increase for NaCl addition compared with AA addition, especially for the pine oilformulation.
S-PG12NaCl0 Emul.
S-PG13NaCl
0 Emulsifier
S-PG4AA + NaCl0 Emulsifier
S-PG5Limonene + AA + NaCl
30-5 Lim+7.5 NPE
S-PG5Pine oil + AA + NaCl
30-5 Pin+7.5 NPE
50NaCl
25NaCl
50NaCl
120 N
aCl
30-5AA
30-5AA
+ 120NaCl
Alone
120 N
aCl
30-5AA
30-5AA
+ 120NaCl
Alone
120 N
aCl
30-5AA
30-5AA
+ 120NaCl
0
25
50
75
100
Visua
lratingplan
tinjur
y
SpeciesBRAPLIAQGREPHHLRAPRA
Figure 7.5: Screening trials S-PG4, S-PG5, S-PG12 and S-PG13: e�ect on weed control of NH formulations containingthe AI AA and NaCl alone as well as the combination of both. No emulsifiers were added in S-PG4, S-PG12 and S-PG13.S-PG5 shows the application of δ-limonene and pine oil alone with NPE emulsifier and the e�ect of addition of AA and/orNaCl. The di�erent shapes represent the visual rating of plant injury for each plant species and horizontal bars the meanrating score averaged over all species. A rating above 70 is considered as acceptable weed control.
In many dicot species even a systemic e�ect could be observed for NaCl containing formulations(�gure 7.6 b). Even with large dicot weeds, meristems that did not come in contact with spraying solutionlater died o�, despite the fact that leaf area was not damaged severely. This could especially be observedin R. brasiliensis, Amaranthus sp., B. pilosa and E. heterophylla.
(a) E�ect on Brachiaria plantaginea (b) E�ect on Bidens pilosa
Figure 7.6: E�ects of CMD-NaCl formulation on monocot and dicot species. In monocot Brachiaria sp. plant recovery isevident, while meristems of dicot Bidens pilosa have died o�.
S-PG6, S-PG7 and S-PG8: dose reduction of essential oils and AA With the strong e�ciencyboost obtained by the addition of NaCl, the next research question was how far the concentrations of
89
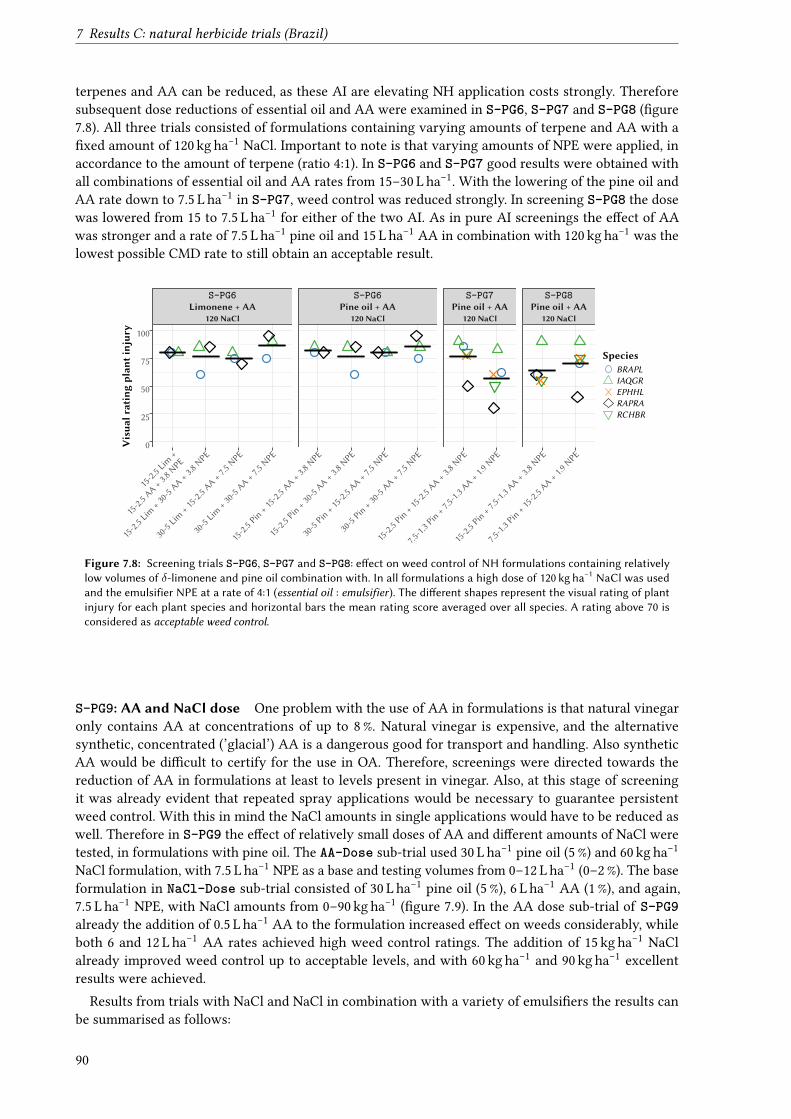
7 Results C: natural herbicide trials (Brazil)
terpenes and AA can be reduced, as these AI are elevating NH application costs strongly. Thereforesubsequent dose reductions of essential oil and AA were examined in S-PG6, S-PG7 and S-PG8 (�gure7.8). All three trials consisted of formulations containing varying amounts of terpene and AA with a�xed amount of 120 kg ha−1 NaCl. Important to note is that varying amounts of NPE were applied, inaccordance to the amount of terpene (ratio 4:1). In S-PG6 and S-PG7 good results were obtained withall combinations of essential oil and AA rates from 15–30 L ha−1. With the lowering of the pine oil andAA rate down to 7.5 L ha−1 in S-PG7, weed control was reduced strongly. In screening S-PG8 the dosewas lowered from 15 to 7.5 L ha−1 for either of the two AI. As in pure AI screenings the e�ect of AAwas stronger and a rate of 7.5 L ha−1 pine oil and 15 L ha−1 AA in combination with 120 kg ha−1 was thelowest possible CMD rate to still obtain an acceptable result.
S-PG6Limonene + AA
120 NaCl
S-PG6Pine oil + AA
120 NaCl
S-PG7Pine oil + AA
120 NaCl
S-PG8Pine oil + AA
120 NaCl
15-2.5 Lim+
15-2.5 AA+ 3.8NPE
15-2.5 Lim+ 30-5
AA+ 3.8NPE
30-5Lim
+ 15-2.5AA
+ 7.5NPE
30-5Lim
+ 30-5
AA+ 7.5NPE
15-2.5 Pin+ 15-2.5AA
+ 3.8NPE
15-2.5 Pin+ 30-5
AA+ 3.8NPE
30-5Pin
+ 15-2.5AA
+ 7.5NPE
30-5Pin
+ 30-5
AA+ 7.5NPE
15-2.5 Pin+ 15-2.5AA
+ 3.8NPE
7.5-1.3 Pin+ 7.5-1.3AA
+ 1.9NPE
15-2.5 Pin+ 7.5-1.3AA
+ 3.8NPE
7.5-1.3 Pin+ 15-2.5AA
+ 1.9NPE
0
25
50
75
100
Visua
lratingplan
tinjur
y
SpeciesBRAPLIAQGREPHHLRAPRARCHBR
Figure 7.8: Screening trials S-PG6, S-PG7 and S-PG8: e�ect on weed control of NH formulations containing relativelylow volumes of δ-limonene and pine oil combination with. In all formulations a high dose of 120 kg ha−1 NaCl was usedand the emulsifier NPE at a rate of 4:1 (essential oil : emulsifier). The di�erent shapes represent the visual rating of plantinjury for each plant species and horizontal bars the mean rating score averaged over all species. A rating above 70 isconsidered as acceptable weed control.
S-PG9: AA and NaCl dose One problem with the use of AA in formulations is that natural vinegaronly contains AA at concentrations of up to 8 %. Natural vinegar is expensive, and the alternativesynthetic, concentrated (’glacial’) AA is a dangerous good for transport and handling. Also syntheticAA would be di�cult to certify for the use in OA. Therefore, screenings were directed towards thereduction of AA in formulations at least to levels present in vinegar. Also, at this stage of screeningit was already evident that repeated spray applications would be necessary to guarantee persistentweed control. With this in mind the NaCl amounts in single applications would have to be reduced aswell. Therefore in S-PG9 the e�ect of relatively small doses of AA and di�erent amounts of NaCl weretested, in formulations with pine oil. The AA-Dose sub-trial used 30 L ha−1 pine oil (5 %) and 60 kg ha−1
NaCl formulation, with 7.5 L ha−1 NPE as a base and testing volumes from 0–12 L ha−1 (0–2 %). The baseformulation in NaCl-Dose sub-trial consisted of 30 L ha−1 pine oil (5 %), 6 L ha−1 AA (1 %), and again,7.5 L ha−1 NPE, with NaCl amounts from 0–90 kg ha−1 (�gure 7.9). In the AA dose sub-trial of S-PG9already the addition of 0.5 L ha−1 AA to the formulation increased e�ect on weeds considerably, whileboth 6 and 12 L ha−1 AA rates achieved high weed control ratings. The addition of 15 kg ha−1 NaClalready improved weed control up to acceptable levels, and with 60 kg ha−1 and 90 kg ha−1 excellentresults were achieved.
Results from trials with NaCl and NaCl in combination with a variety of emulsi�ers the results canbe summarised as follows:
90
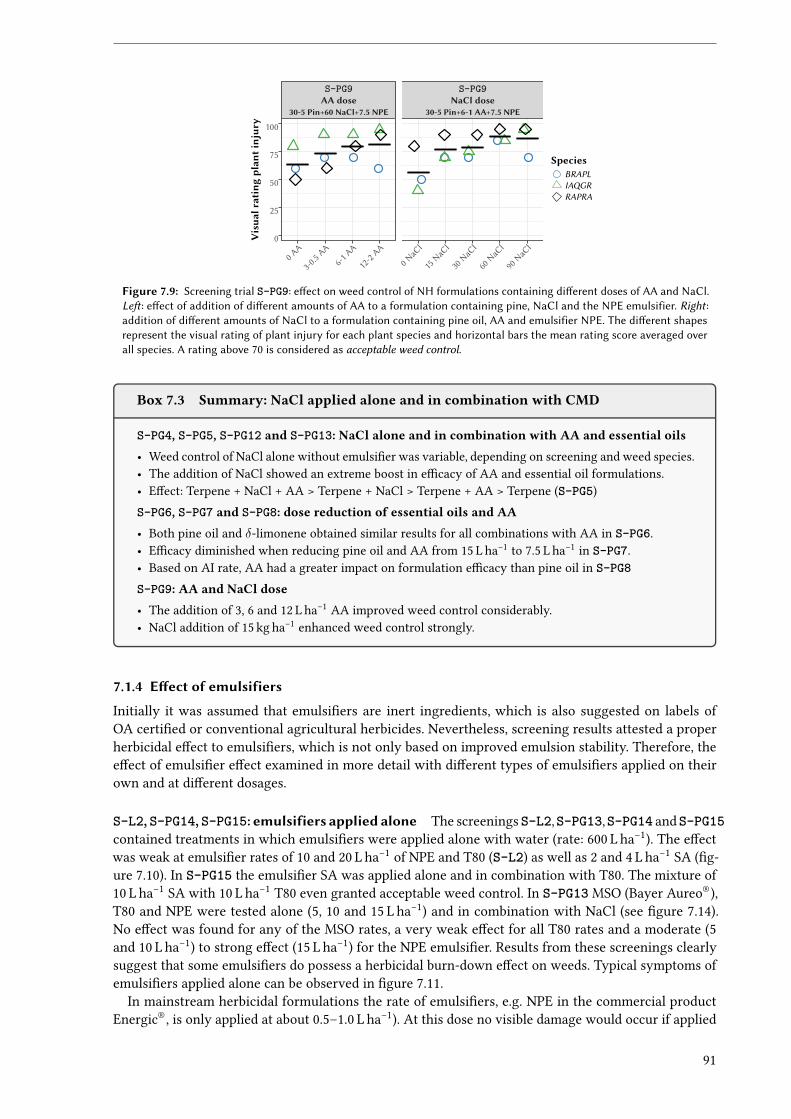
S-PG9AA dose
30-5 Pin+60 NaCl+7.5 NPE
S-PG9NaCl dose
30-5 Pin+6-1 AA+7.5 NPE
0 AA
3-0.5AA
6-1AA
12-2AA
0 NaCl
15NaCl
30NaCl
60NaCl
90NaCl
0
25
50
75
100
Visua
lratingplan
tinjur
y
SpeciesBRAPLIAQGRRAPRA
Figure 7.9: Screening trial S-PG9: e�ect on weed control of NH formulations containing di�erent doses of AA and NaCl.Le� : e�ect of addition of di�erent amounts of AA to a formulation containing pine, NaCl and the NPE emulsifier. Right :addition of di�erent amounts of NaCl to a formulation containing pine oil, AA and emulsifier NPE. The di�erent shapesrepresent the visual rating of plant injury for each plant species and horizontal bars the mean rating score averaged overall species. A rating above 70 is considered as acceptable weed control.
Box 7.3 Summary: NaCl applied alone and in combination with CMD
S-PG4, S-PG5, S-PG12 and S-PG13: NaCl alone and in combination with AA and essential oils• Weed control of NaCl alone without emulsi�er was variable, depending on screening and weed species.• The addition of NaCl showed an extreme boost in e�cacy of AA and essential oil formulations.• E�ect: Terpene + NaCl + AA > Terpene + NaCl > Terpene + AA > Terpene (S-PG5)S-PG6, S-PG7 and S-PG8: dose reduction of essential oils and AA• Both pine oil and δ-limonene obtained similar results for all combinations with AA in S-PG6.• E�cacy diminished when reducing pine oil and AA from 15 L ha−1 to 7.5 L ha−1 in S-PG7.• Based on AI rate, AA had a greater impact on formulation e�cacy than pine oil in S-PG8S-PG9: AA and NaCl dose• The addition of 3, 6 and 12 L ha−1 AA improved weed control considerably.• NaCl addition of 15 kg ha−1 enhanced weed control strongly.
7.1.4 E�ect of emulsifiers
Initially it was assumed that emulsi�ers are inert ingredients, which is also suggested on labels ofOA certi�ed or conventional agricultural herbicides. Nevertheless, screening results attested a properherbicidal e�ect to emulsi�ers, which is not only based on improved emulsion stability. Therefore, thee�ect of emulsi�er e�ect examined in more detail with di�erent types of emulsi�ers applied on theirown and at di�erent dosages.
S-L2, S-PG14, S-PG15: emulsifiers applied alone The screenings S-L2,S-PG13,S-PG14 and S-PG15contained treatments in which emulsi�ers were applied alone with water (rate: 600 L ha−1). The e�ectwas weak at emulsi�er rates of 10 and 20 L ha−1 of NPE and T80 (S-L2) as well as 2 and 4 L ha−1 SA (�g-ure 7.10). In S-PG15 the emulsi�er SA was applied alone and in combination with T80. The mixture of10 L ha−1 SA with 10 L ha−1 T80 even granted acceptable weed control. In S-PG13 MSO (Bayer Aureo®),T80 and NPE were tested alone (5, 10 and 15 L ha−1) and in combination with NaCl (see �gure 7.14).No e�ect was found for any of the MSO rates, a very weak e�ect for all T80 rates and a moderate (5and 10 L ha−1) to strong e�ect (15 L ha−1) for the NPE emulsi�er. Results from these screenings clearlysuggest that some emulsi�ers do possess a herbicidal burn-down e�ect on weeds. Typical symptoms ofemulsi�ers applied alone can be observed in �gure 7.11.
In mainstream herbicidal formulations the rate of emulsi�ers, e.g. NPE in the commercial productEnergic®, is only applied at about 0.5–1.0 L ha−1). At this dose no visible damage would occur if applied
91
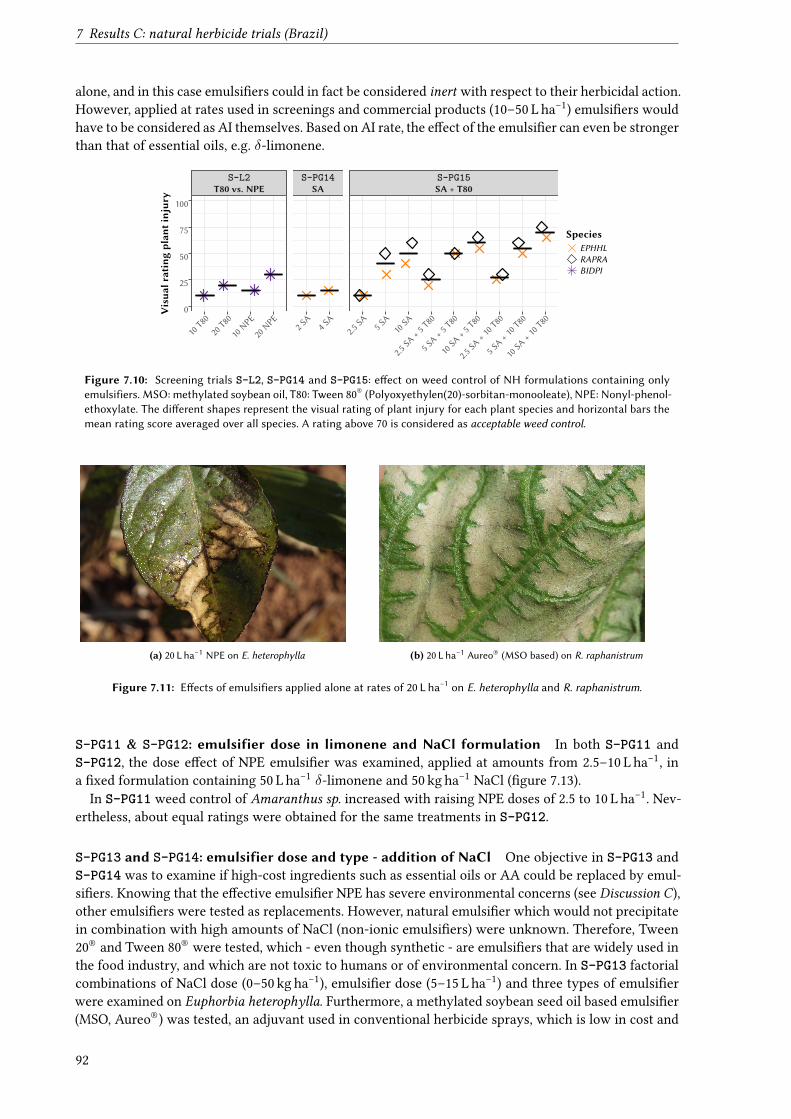
7 Results C: natural herbicide trials (Brazil)
alone, and in this case emulsi�ers could in fact be considered inert with respect to their herbicidal action.However, applied at rates used in screenings and commercial products (10–50 L ha−1) emulsi�ers wouldhave to be considered as AI themselves. Based on AI rate, the e�ect of the emulsi�er can even be strongerthan that of essential oils, e.g. δ-limonene.
S-L2T80 vs. NPE
S-PG14SA
S-PG15SA + T80
10T80
20T80
10NPE
20NPE
2 SA
4 SA
2.5SA 5 S
A10SA
2.5SA+ 5
T80
5 SA+ 5
T80
10SA+ 5
T80
2.5SA+ 10 T80
5 SA+ 10 T80
10SA+ 10 T80
0
25
50
75
100
Visua
lratingplan
tinjur
y
SpeciesEPHHLRAPRABIDPI
Figure 7.10: Screening trials S-L2, S-PG14 and S-PG15: e�ect on weed control of NH formulations containing onlyemulsifiers. MSO: methylated soybean oil, T80: Tween 80® (Polyoxyethylen(20)-sorbitan-monooleate), NPE: Nonyl-phenol-ethoxylate. The di�erent shapes represent the visual rating of plant injury for each plant species and horizontal bars themean rating score averaged over all species. A rating above 70 is considered as acceptable weed control.
(a) 20 L ha−1 NPE on E. heterophylla (b) 20 L ha−1 Aureo® (MSO based) on R. raphanistrum
Figure 7.11: E�ects of emulsifiers applied alone at rates of 20 L ha−1 on E. heterophylla and R. raphanistrum.
S-PG11 & S-PG12: emulsifier dose in limonene and NaCl formulation In both S-PG11 andS-PG12, the dose e�ect of NPE emulsi�er was examined, applied at amounts from 2.5–10 L ha−1, ina �xed formulation containing 50 L ha−1 δ-limonene and 50 kg ha−1 NaCl (�gure 7.13).
In S-PG11 weed control of Amaranthus sp. increased with raising NPE doses of 2.5 to 10 L ha−1. Nev-ertheless, about equal ratings were obtained for the same treatments in S-PG12.
S-PG13 and S-PG14: emulsifier dose and type - addition of NaCl One objective in S-PG13 andS-PG14 was to examine if high-cost ingredients such as essential oils or AA could be replaced by emul-si�ers. Knowing that the e�ective emulsi�er NPE has severe environmental concerns (see Discussion C),other emulsi�ers were tested as replacements. However, natural emulsi�er which would not precipitatein combination with high amounts of NaCl (non-ionic emulsi�ers) were unknown. Therefore, Tween20® and Tween 80® were tested, which - even though synthetic - are emulsi�ers that are widely used inthe food industry, and which are not toxic to humans or of environmental concern. In S-PG13 factorialcombinations of NaCl dose (0–50 kg ha−1), emulsi�er dose (5–15 L ha−1) and three types of emulsi�erwere examined on Euphorbia heterophylla. Furthermore, a methylated soybean seed oil based emulsi�er(MSO, Aureo®) was tested, an adjuvant used in conventional herbicide sprays, which is low in cost and
92
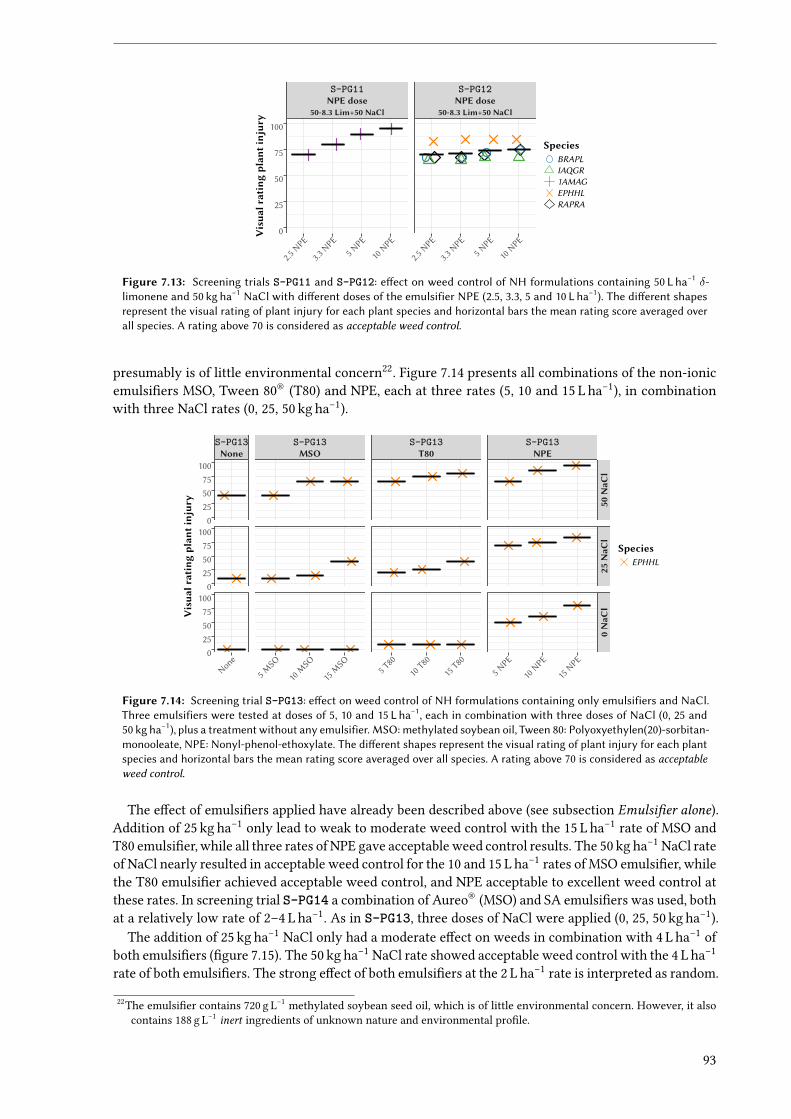
S-PG11NPE dose
50-8.3 Lim+50 NaCl
S-PG12NPE dose
50-8.3 Lim+50 NaCl
2.5NPE
3.3NPE
5 NPE
10NPE
2.5NPE
3.3NPE
5 NPE
10NPE
0
25
50
75
100
Visua
lratingplan
tinjur
y
SpeciesBRAPLIAQGR1AMAGEPHHLRAPRA
Figure 7.13: Screening trials S-PG11 and S-PG12: e�ect on weed control of NH formulations containing 50 L ha−1 δ-limonene and 50 kg ha−1 NaCl with di�erent doses of the emulsifier NPE (2.5, 3.3, 5 and 10 L ha−1). The di�erent shapesrepresent the visual rating of plant injury for each plant species and horizontal bars the mean rating score averaged overall species. A rating above 70 is considered as acceptable weed control.
presumably is of little environmental concern22. Figure 7.14 presents all combinations of the non-ionicemulsi�ers MSO, Tween 80® (T80) and NPE, each at three rates (5, 10 and 15 L ha−1), in combinationwith three NaCl rates (0, 25, 50 kg ha−1).
S-PG13None
S-PG13MSO
S-PG13T80
S-PG13NPE
50NaC
l25
NaC
l0NaC
l
None
5 MSO
10MSO
15MSO
5 T80
10T80
15T80
5 NPE
10NPE
15NPE
0255075100
0255075100
0255075100
Visua
lratingplan
tinjur
y
SpeciesEPHHL
Figure 7.14: Screening trial S-PG13: e�ect on weed control of NH formulations containing only emulsifiers and NaCl.Three emulsifiers were tested at doses of 5, 10 and 15 L ha−1, each in combination with three doses of NaCl (0, 25 and50 kg ha−1), plus a treatment without any emulsifier. MSO: methylated soybean oil, Tween 80: Polyoxyethylen(20)-sorbitan-monooleate, NPE: Nonyl-phenol-ethoxylate. The di�erent shapes represent the visual rating of plant injury for each plantspecies and horizontal bars the mean rating score averaged over all species. A rating above 70 is considered as acceptableweed control.
The e�ect of emulsi�ers applied have already been described above (see subsection Emulsi�er alone).Addition of 25 kg ha−1 only lead to weak to moderate weed control with the 15 L ha−1 rate of MSO andT80 emulsi�er, while all three rates of NPE gave acceptable weed control results. The 50 kg ha−1 NaCl rateof NaCl nearly resulted in acceptable weed control for the 10 and 15 L ha−1 rates of MSO emulsi�er, whilethe T80 emulsi�er achieved acceptable weed control, and NPE acceptable to excellent weed control atthese rates. In screening trial S-PG14 a combination of Aureo® (MSO) and SA emulsi�ers was used, bothat a relatively low rate of 2–4 L ha−1. As in S-PG13, three doses of NaCl were applied (0, 25, 50 kg ha−1).
The addition of 25 kg ha−1 NaCl only had a moderate e�ect on weeds in combination with 4 L ha−1 ofboth emulsi�ers (�gure 7.15). The 50 kg ha−1 NaCl rate showed acceptable weed control with the 4 L ha−1
rate of both emulsi�ers. The strong e�ect of both emulsi�ers at the 2 L ha−1 rate is interpreted as random.
22The emulsi�er contains 720 g L−1 methylated soybean seed oil, which is of little environmental concern. However, it alsocontains 188 g L−1 inert ingredients of unknown nature and environmental pro�le.
93
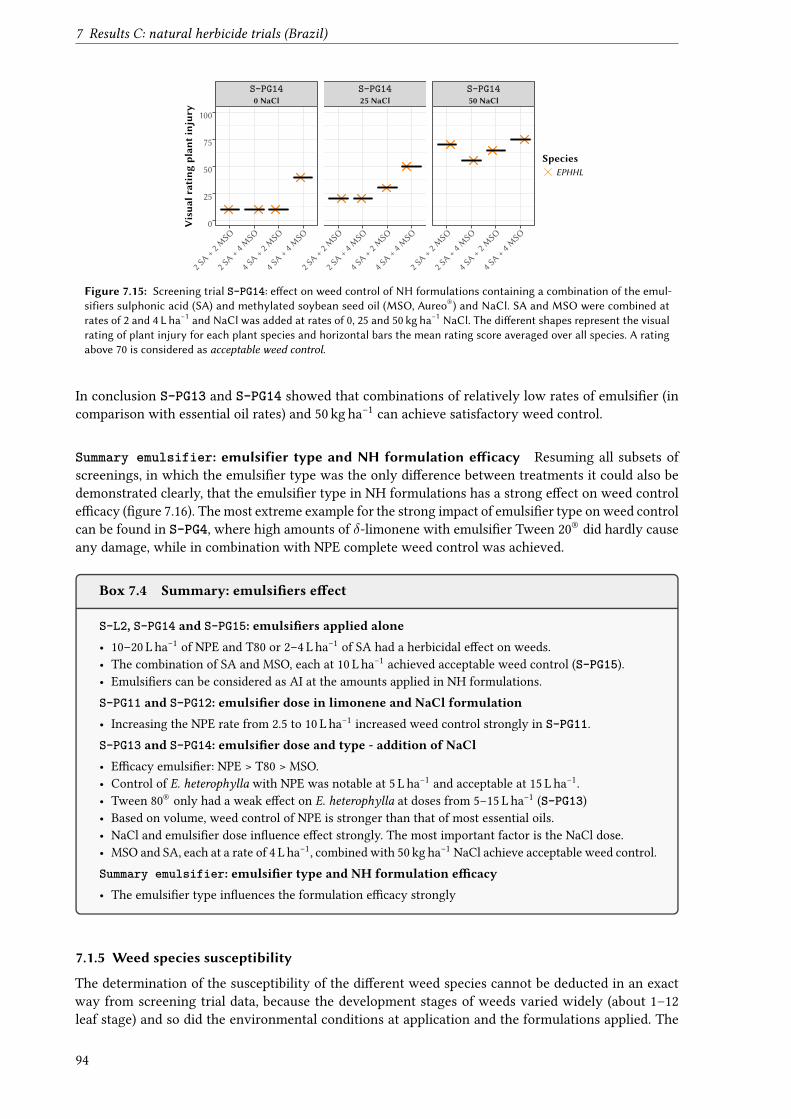
7 Results C: natural herbicide trials (Brazil)
S-PG140 NaCl
S-PG1425 NaCl
S-PG1450 NaCl
2 SA+ 2
MSO
2 SA+ 4
MSO
4 SA+ 2
MSO
4 SA+ 4
MSO
2 SA+ 2
MSO
2 SA+ 4
MSO
4 SA+ 2
MSO
4 SA+ 4
MSO
2 SA+ 2
MSO
2 SA+ 4
MSO
4 SA+ 2
MSO
4 SA+ 4
MSO
0
25
50
75
100
Visua
lratingplan
tinjur
y
SpeciesEPHHL
Figure 7.15: Screening trial S-PG14: e�ect on weed control of NH formulations containing a combination of the emul-sifiers sulphonic acid (SA) and methylated soybean seed oil (MSO, Aureo®) and NaCl. SA and MSO were combined atrates of 2 and 4 L ha−1 and NaCl was added at rates of 0, 25 and 50 kg ha−1 NaCl. The di�erent shapes represent the visualrating of plant injury for each plant species and horizontal bars the mean rating score averaged over all species. A ratingabove 70 is considered as acceptable weed control.
In conclusion S-PG13 and S-PG14 showed that combinations of relatively low rates of emulsi�er (incomparison with essential oil rates) and 50 kg ha−1 can achieve satisfactory weed control.
Summary emulsifier: emulsifier type and NH formulation e�icacy Resuming all subsets ofscreenings, in which the emulsi�er type was the only di�erence between treatments it could also bedemonstrated clearly, that the emulsi�er type in NH formulations has a strong e�ect on weed controle�cacy (�gure 7.16). The most extreme example for the strong impact of emulsi�er type on weed controlcan be found in S-PG4, where high amounts of δ-limonene with emulsi�er Tween 20® did hardly causeany damage, while in combination with NPE complete weed control was achieved.
Box 7.4 Summary: emulsi�ers e�ect
S-L2, S-PG14 and S-PG15: emulsi�ers applied alone• 10–20 L ha−1 of NPE and T80 or 2–4 L ha−1 of SA had a herbicidal e�ect on weeds.• The combination of SA and MSO, each at 10 L ha−1 achieved acceptable weed control (S-PG15).• Emulsi�ers can be considered as AI at the amounts applied in NH formulations.S-PG11 and S-PG12: emulsi�er dose in limonene and NaCl formulation• Increasing the NPE rate from 2.5 to 10 L ha−1 increased weed control strongly in S-PG11.S-PG13 and S-PG14: emulsi�er dose and type - addition of NaCl• E�cacy emulsi�er: NPE > T80 > MSO.• Control of E. heterophylla with NPE was notable at 5 L ha−1 and acceptable at 15 L ha−1.• Tween 80® only had a weak e�ect on E. heterophylla at doses from 5–15 L ha−1 (S-PG13)• Based on volume, weed control of NPE is stronger than that of most essential oils.• NaCl and emulsi�er dose in�uence e�ect strongly. The most important factor is the NaCl dose.• MSO and SA, each at a rate of 4 L ha−1, combined with 50 kg ha−1 NaCl achieve acceptable weed control.Summary emulsifier: emulsi�er type and NH formulation e�cacy• The emulsi�er type in�uences the formulation e�cacy strongly
7.1.5 Weed species susceptibility
The determination of the susceptibility of the di�erent weed species cannot be deducted in an exactway from screening trial data, because the development stages of weeds varied widely (about 1–12leaf stage) and so did the environmental conditions at application and the formulations applied. The
94
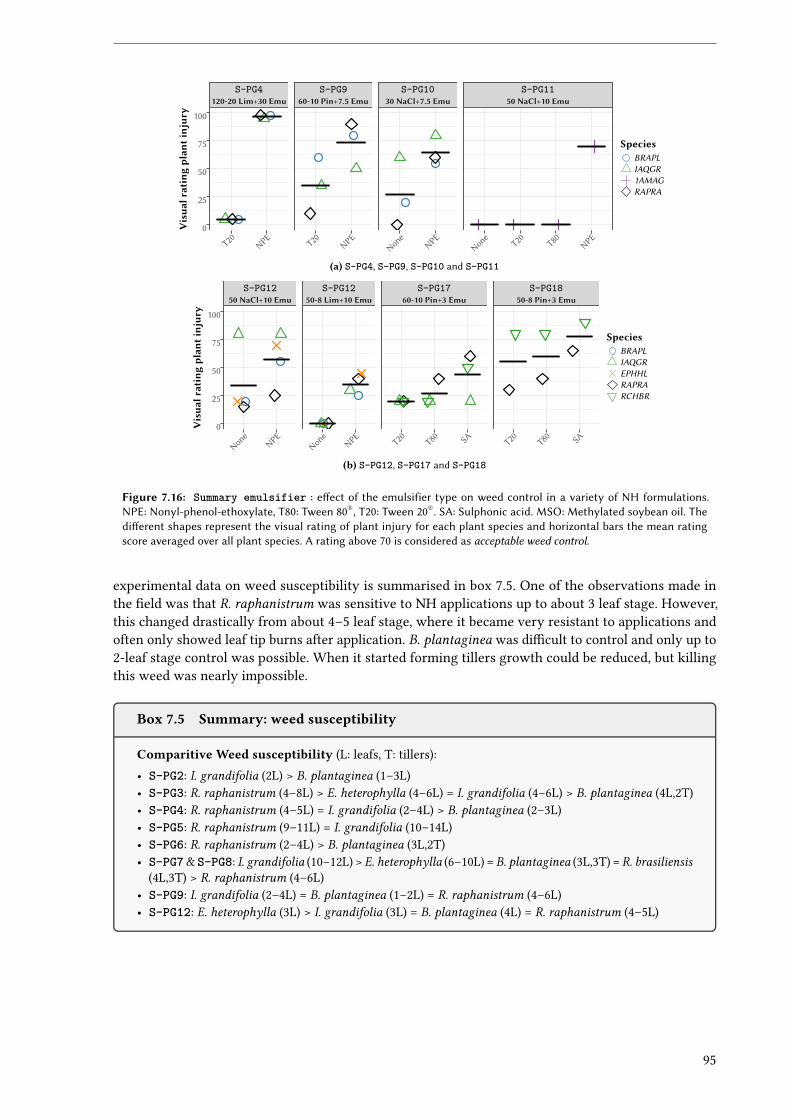
S-PG4120-20 Lim+30 Emu
S-PG960-10 Pin+7.5 Emu
S-PG1030 NaCl+7.5 Emu
S-PG1150 NaCl+10 Emu
T20
NPE
T20
NPE
None
NPE
None T2
0T80
NPE
0
25
50
75
100
Visua
lratingplan
tinjur
y
SpeciesBRAPLIAQGR1AMAGRAPRA
(a) S-PG4, S-PG9, S-PG10 and S-PG11
S-PG1250 NaCl+10 Emu
S-PG1250-8 Lim+10 Emu
S-PG1760-10 Pin+3 Emu
S-PG1850-8 Pin+3 Emu
None
NPE
None
NPE
T20
T80 SA T2
0T80 SA
0
25
50
75
100
Visua
lratingplan
tinjur
y
SpeciesBRAPLIAQGREPHHLRAPRARCHBR
(b) S-PG12, S-PG17 and S-PG18
Figure 7.16: Summary emulsifier : e�ect of the emulsifier type on weed control in a variety of NH formulations.NPE: Nonyl-phenol-ethoxylate, T80: Tween 80®, T20: Tween 20®. SA: Sulphonic acid. MSO: Methylated soybean oil. Thedi�erent shapes represent the visual rating of plant injury for each plant species and horizontal bars the mean ratingscore averaged over all plant species. A rating above 70 is considered as acceptable weed control.
experimental data on weed susceptibility is summarised in box 7.5. One of the observations made inthe �eld was that R. raphanistrum was sensitive to NH applications up to about 3 leaf stage. However,this changed drastically from about 4–5 leaf stage, where it became very resistant to applications andoften only showed leaf tip burns after application. B. plantaginea was di�cult to control and only up to2-leaf stage control was possible. When it started forming tillers growth could be reduced, but killingthis weed was nearly impossible.
Box 7.5 Summary: weed susceptibility
Comparitive Weed susceptibility (L: leafs, T: tillers):• S-PG2: I. grandifolia (2L) > B. plantaginea (1–3L)• S-PG3: R. raphanistrum (4–8L) > E. heterophylla (4–6L) = I. grandifolia (4–6L) > B. plantaginea (4L,2T)• S-PG4: R. raphanistrum (4–5L) = I. grandifolia (2–4L) > B. plantaginea (2–3L)• S-PG5: R. raphanistrum (9–11L) = I. grandifolia (10–14L)• S-PG6: R. raphanistrum (2–4L) > B. plantaginea (3L,2T)• S-PG7 & S-PG8: I. grandifolia (10–12L) > E. heterophylla (6–10L) = B. plantaginea (3L,3T) = R. brasiliensis
(4L,3T) > R. raphanistrum (4–6L)• S-PG9: I. grandifolia (2–4L) = B. plantaginea (1–2L) = R. raphanistrum (4–6L)• S-PG12: E. heterophylla (3L) > I. grandifolia (3L) = B. plantaginea (4L) = R. raphanistrum (4–5L)
95
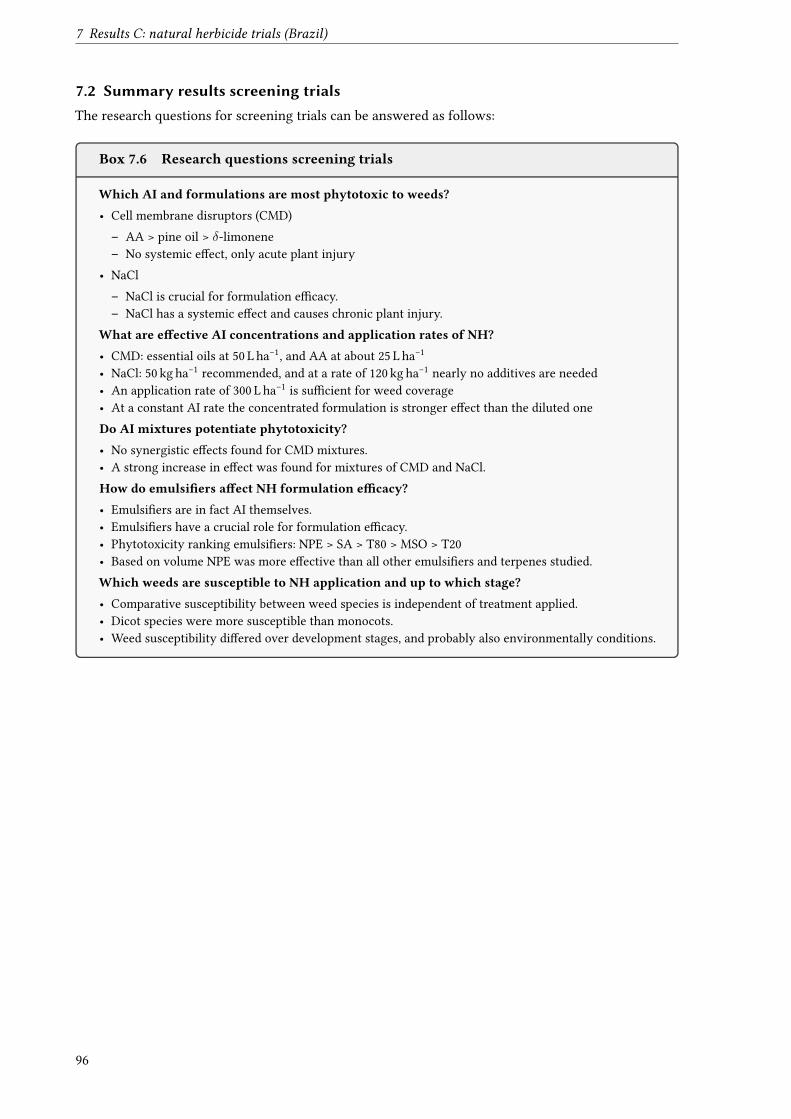
7 Results C: natural herbicide trials (Brazil)
7.2 Summary results screening trialsThe research questions for screening trials can be answered as follows:
Box 7.6 Research questions screening trials
Which AI and formulations are most phytotoxic to weeds?• Cell membrane disruptors (CMD)– AA > pine oil > δ-limonene– No systemic e�ect, only acute plant injury
• NaCl– NaCl is crucial for formulation e�cacy.– NaCl has a systemic e�ect and causes chronic plant injury.
What are e�ective AI concentrations and application rates of NH?• CMD: essential oils at 50 L ha−1, and AA at about 25 L ha−1
• NaCl: 50 kg ha−1 recommended, and at a rate of 120 kg ha−1 nearly no additives are needed• An application rate of 300 L ha−1 is su�cient for weed coverage• At a constant AI rate the concentrated formulation is stronger e�ect than the diluted oneDo AI mixtures potentiate phytotoxicity?• No synergistic e�ects found for CMD mixtures.• A strong increase in e�ect was found for mixtures of CMD and NaCl.How do emulsi�ers a�ect NH formulation e�cacy?• Emulsi�ers are in fact AI themselves.• Emulsi�ers have a crucial role for formulation e�cacy.• Phytotoxicity ranking emulsi�ers: NPE > SA > T80 > MSO > T20• Based on volume NPE was more e�ective than all other emulsi�ers and terpenes studied.Which weeds are susceptible to NH application and up to which stage?• Comparative susceptibility between weed species is independent of treatment applied.• Dicot species were more susceptible than monocots.• Weed susceptibility di�ered over development stages, and probably also environmentally conditions.
96
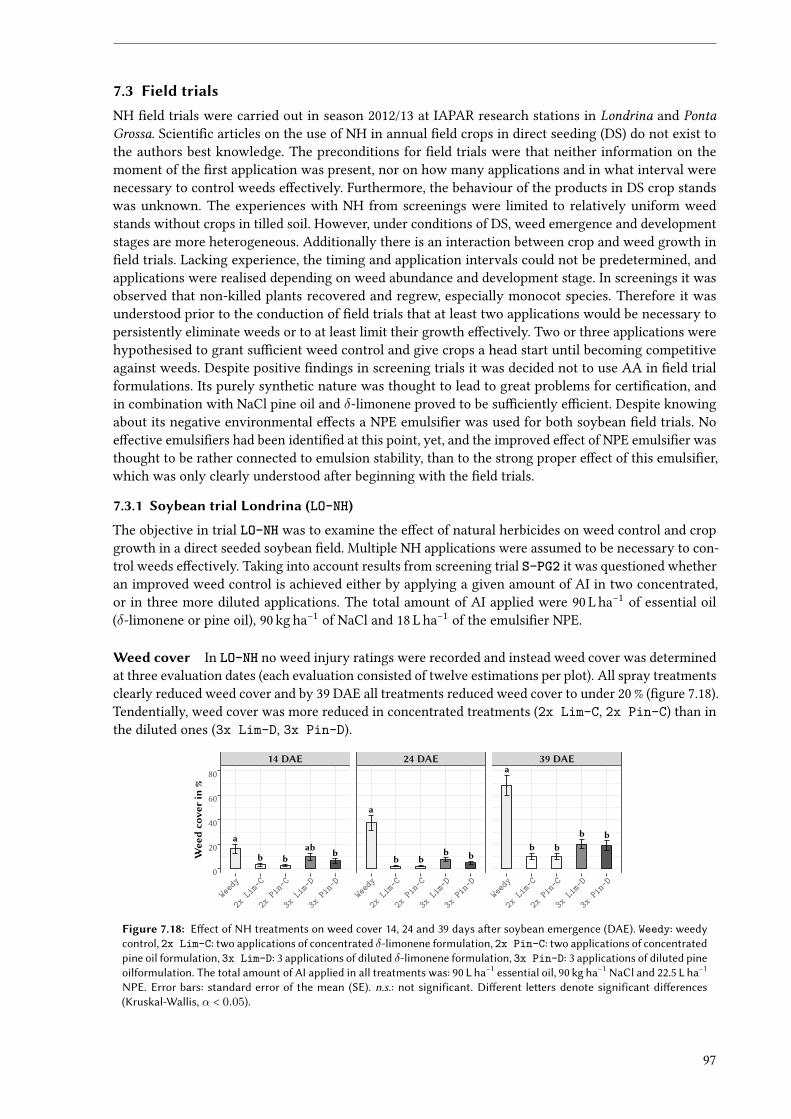
7.3 Field trialsNH �eld trials were carried out in season 2012/13 at IAPAR research stations in Londrina and PontaGrossa. Scienti�c articles on the use of NH in annual �eld crops in direct seeding (DS) do not exist tothe authors best knowledge. The preconditions for �eld trials were that neither information on themoment of the �rst application was present, nor on how many applications and in what interval werenecessary to control weeds e�ectively. Furthermore, the behaviour of the products in DS crop standswas unknown. The experiences with NH from screenings were limited to relatively uniform weedstands without crops in tilled soil. However, under conditions of DS, weed emergence and developmentstages are more heterogeneous. Additionally there is an interaction between crop and weed growth in�eld trials. Lacking experience, the timing and application intervals could not be predetermined, andapplications were realised depending on weed abundance and development stage. In screenings it wasobserved that non-killed plants recovered and regrew, especially monocot species. Therefore it wasunderstood prior to the conduction of �eld trials that at least two applications would be necessary topersistently eliminate weeds or to at least limit their growth e�ectively. Two or three applications werehypothesised to grant su�cient weed control and give crops a head start until becoming competitiveagainst weeds. Despite positive �ndings in screening trials it was decided not to use AA in �eld trialformulations. Its purely synthetic nature was thought to lead to great problems for certi�cation, andin combination with NaCl pine oil and δ-limonene proved to be su�ciently e�cient. Despite knowingabout its negative environmental e�ects a NPE emulsi�er was used for both soybean �eld trials. Noe�ective emulsi�ers had been identi�ed at this point, yet, and the improved e�ect of NPE emulsi�er wasthought to be rather connected to emulsion stability, than to the strong proper e�ect of this emulsi�er,which was only clearly understood after beginning with the �eld trials.
7.3.1 Soybean trial Londrina (LO-NH)
The objective in trial LO-NH was to examine the e�ect of natural herbicides on weed control and cropgrowth in a direct seeded soybean �eld. Multiple NH applications were assumed to be necessary to con-trol weeds e�ectively. Taking into account results from screening trial S-PG2 it was questioned whetheran improved weed control is achieved either by applying a given amount of AI in two concentrated,or in three more diluted applications. The total amount of AI applied were 90 L ha−1 of essential oil(δ-limonene or pine oil), 90 kg ha−1 of NaCl and 18 L ha−1 of the emulsi�er NPE.
Weed cover In LO-NH no weed injury ratings were recorded and instead weed cover was determinedat three evaluation dates (each evaluation consisted of twelve estimations per plot). All spray treatmentsclearly reduced weed cover and by 39 DAE all treatments reduced weed cover to under 20 % (�gure 7.18).Tendentially, weed cover was more reduced in concentrated treatments (2x Lim-C, 2x Pin-C) than inthe diluted ones (3x Lim-D, 3x Pin-D).
b bab b
a
b bb b
a
b bb b
a14 DAE 24 DAE 39 DAE
Weed
y
2xLi
m-C
2xPi
n-C
3xLi
m-D
3xPi
n-D
Weed
y
2xLi
m-C
2xPi
n-C
3xLi
m-D
3xPi
n-D
Weed
y
2xLi
m-C
2xPi
n-C
3xLi
m-D
3xPi
n-D
0
20
40
60
80
Wee
dco
verin
%
Figure 7.18: E�ect of NH treatments on weed cover 14, 24 and 39 days a�er soybean emergence (DAE). Weedy: weedycontrol, 2x Lim-C: two applications of concentrated δ-limonene formulation, 2x Pin-C: two applications of concentratedpine oil formulation, 3x Lim-D: 3 applications of diluted δ-limonene formulation, 3x Pin-D: 3 applications of diluted pineoilformulation. The total amount of AI applied in all treatments was: 90 L ha−1 essential oil, 90 kg ha−1 NaCl and 22.5 L ha−1
NPE. Error bars: standard error of the mean (SE). n.s.: not significant. Di�erent le�ers denote significant di�erences(Kruskal-Wallis, α < 0.05).
97
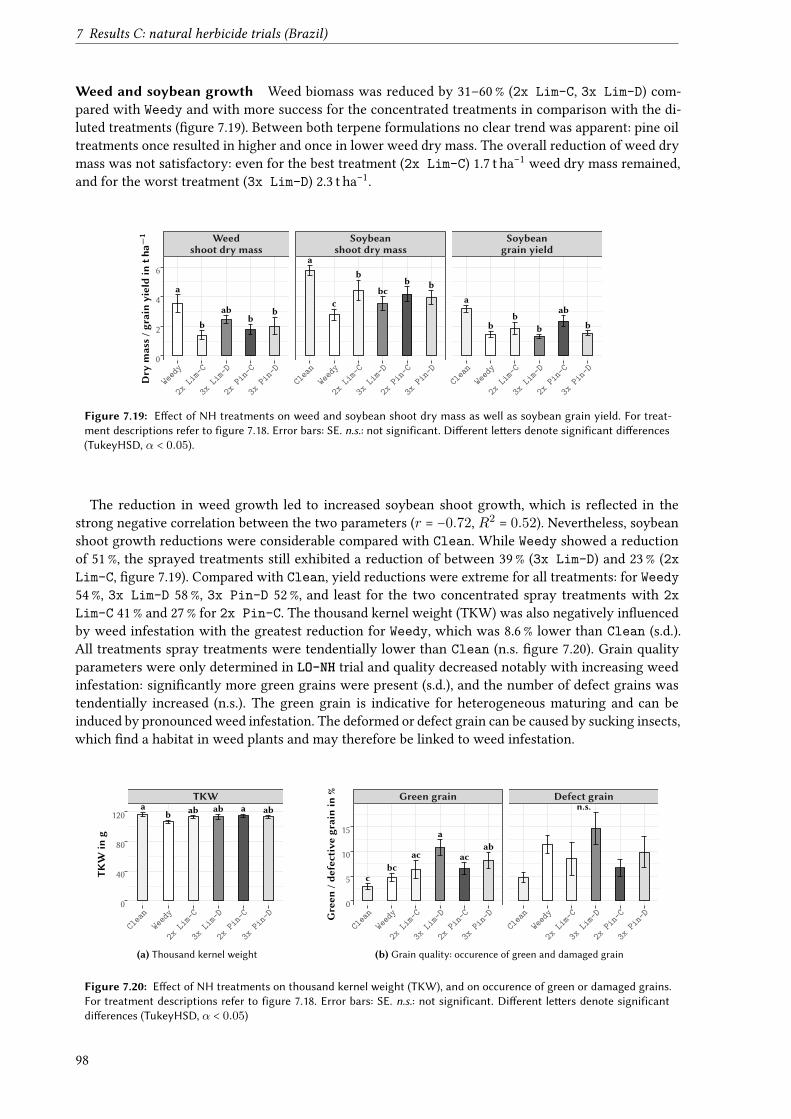
7 Results C: natural herbicide trials (Brazil)
Weed and soybean growth Weed biomass was reduced by 31–60 % (2x Lim-C, 3x Lim-D) com-pared with Weedy and with more success for the concentrated treatments in comparison with the di-luted treatments (�gure 7.19). Between both terpene formulations no clear trend was apparent: pine oiltreatments once resulted in higher and once in lower weed dry mass. The overall reduction of weed drymass was not satisfactory: even for the best treatment (2x Lim-C) 1.7 t ha−1 weed dry mass remained,and for the worst treatment (3x Lim-D) 2.3 t ha−1.
bb
ab b
ab
bbc
b
a
cb
ab
b b
a
b
Weedshoot dry mass
Soybeanshoot dry mass
Soybeangrain yield
Weed
y
2xLi
m-C
3xLi
m-D
2xPi
n-C
3xPi
n-D
Clea
nWe
edy
2xLi
m-C
3xLi
m-D
2xPi
n-C
3xPi
n-D
Clea
nWe
edy
2xLi
m-C
3xLi
m-D
2xPi
n-C
3xPi
n-D
0
2
4
6
Dry
mass/g
rain
yieldin
tha−
1
Figure 7.19: E�ect of NH treatments on weed and soybean shoot dry mass as well as soybean grain yield. For treat-ment descriptions refer to figure 7.18. Error bars: SE. n.s.: not significant. Di�erent le�ers denote significant di�erences(TukeyHSD, α < 0.05).
The reduction in weed growth led to increased soybean shoot growth, which is re�ected in thestrong negative correlation between the two parameters (r = −0.72, R2
= 0.52). Nevertheless, soybeanshoot growth reductions were considerable compared with Clean. While Weedy showed a reductionof 51 %, the sprayed treatments still exhibited a reduction of between 39 % (3x Lim-D) and 23 % (2xLim-C, �gure 7.19). Compared with Clean, yield reductions were extreme for all treatments: for Weedy54 %, 3x Lim-D 58 %, 3x Pin-D 52 %, and least for the two concentrated spray treatments with 2xLim-C 41 % and 27 % for 2x Pin-C. The thousand kernel weight (TKW) was also negatively in�uencedby weed infestation with the greatest reduction for Weedy, which was 8.6 % lower than Clean (s.d.).All treatments spray treatments were tendentially lower than Clean (n.s. �gure 7.20). Grain qualityparameters were only determined in LO-NH trial and quality decreased notably with increasing weedinfestation: signi�cantly more green grains were present (s.d.), and the number of defect grains wastendentially increased (n.s.). The green grain is indicative for heterogeneous maturing and can beinduced by pronounced weed infestation. The deformed or defect grain can be caused by sucking insects,which �nd a habitat in weed plants and may therefore be linked to weed infestation.
ab aab abab
TKW
Clea
nWe
edy
2xLi
m-C
3xLi
m-D
2xPi
n-C
3xPi
n-D
0
40
80
120
TKW
ing
(a) Thousand kernel weight
ac ac
aab
cbc
n.s.Green grain Defect grain
Clea
nWe
edy
2xLi
m-C
3xLi
m-D
2xPi
n-C
3xPi
n-D
Clea
nWe
edy
2xLi
m-C
3xLi
m-D
2xPi
n-C
3xPi
n-D
0
5
10
15
Green
/defective
grainin
%
(b) Grain quality: occurence of green and damaged grain
Figure 7.20: E�ect of NH treatments on thousand kernel weight (TKW), and on occurence of green or damaged grains.For treatment descriptions refer to figure 7.18. Error bars: SE. n.s.: not significant. Di�erent le�ers denote significantdi�erences (TukeyHSD, α < 0.05)
98
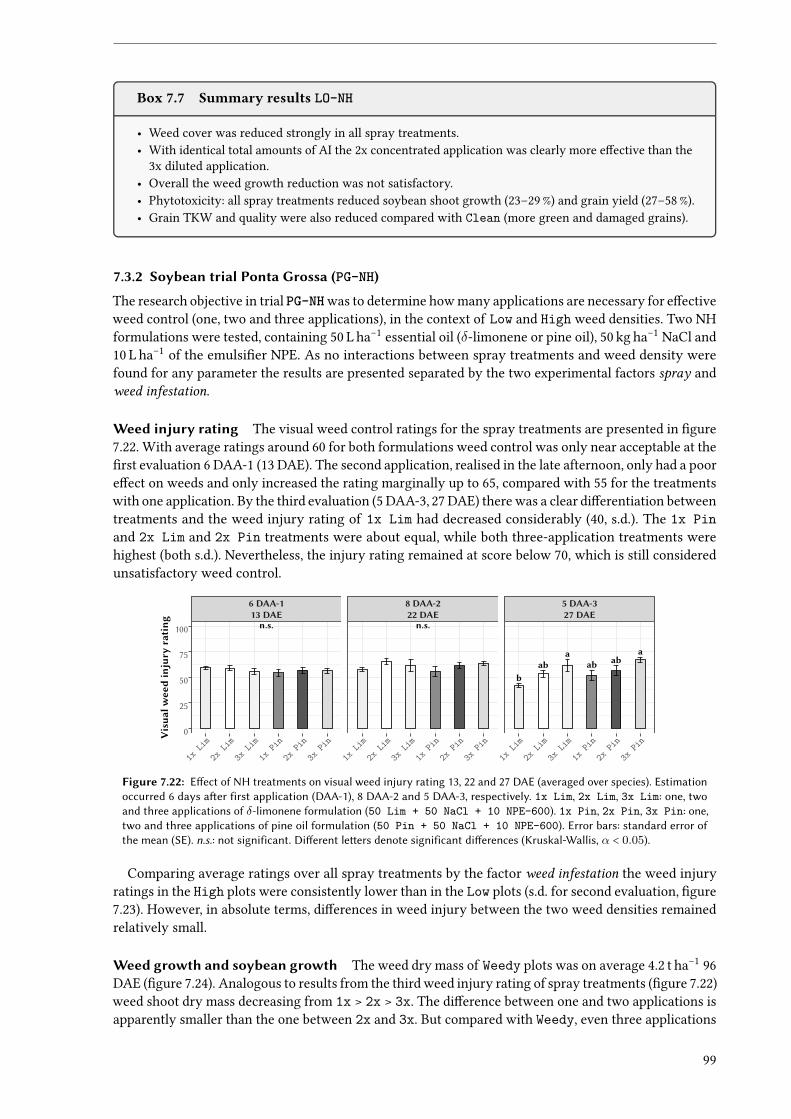
Box 7.7 Summary results LO-NH
• Weed cover was reduced strongly in all spray treatments.• With identical total amounts of AI the 2x concentrated application was clearly more e�ective than the
3x diluted application.• Overall the weed growth reduction was not satisfactory.• Phytotoxicity: all spray treatments reduced soybean shoot growth (23–29 %) and grain yield (27–58 %).• Grain TKW and quality were also reduced compared with Clean (more green and damaged grains).
7.3.2 Soybean trial Ponta Grossa (PG-NH)
The research objective in trial PG-NH was to determine how many applications are necessary for e�ectiveweed control (one, two and three applications), in the context of Low and High weed densities. Two NHformulations were tested, containing 50 L ha−1 essential oil (δ-limonene or pine oil), 50 kg ha−1 NaCl and10 L ha−1 of the emulsi�er NPE. As no interactions between spray treatments and weed density werefound for any parameter the results are presented separated by the two experimental factors spray andweed infestation.
Weed injury rating The visual weed control ratings for the spray treatments are presented in �gure7.22. With average ratings around 60 for both formulations weed control was only near acceptable at the�rst evaluation 6 DAA-1 (13 DAE). The second application, realised in the late afternoon, only had a poore�ect on weeds and only increased the rating marginally up to 65, compared with 55 for the treatmentswith one application. By the third evaluation (5 DAA-3, 27 DAE) there was a clear di�erentiation betweentreatments and the weed injury rating of 1x Lim had decreased considerably (40, s.d.). The 1x Pinand 2x Lim and 2x Pin treatments were about equal, while both three-application treatments werehighest (both s.d.). Nevertheless, the injury rating remained at score below 70, which is still consideredunsatisfactory weed control.
n.s. n.s.
babab ab
a a
6 DAA-113 DAE
8 DAA-222 DAE
5 DAA-327 DAE
1xLi
m
2xLi
m
3xLi
m
1xPi
n
2xPi
n
3xPi
n
1xLi
m
2xLi
m
3xLi
m
1xPi
n
2xPi
n
3xPi
n
1xLi
m
2xLi
m
3xLi
m
1xPi
n
2xPi
n
3xPi
n0
25
50
75
100
Visua
lwee
dinjury
rating
Figure 7.22: E�ect of NH treatments on visual weed injury rating 13, 22 and 27 DAE (averaged over species). Estimationoccurred 6 days a�er first application (DAA-1), 8 DAA-2 and 5 DAA-3, respectively. 1x Lim, 2x Lim, 3x Lim: one, twoand three applications of δ-limonene formulation (50 Lim + 50 NaCl + 10 NPE-600). 1x Pin, 2x Pin, 3x Pin: one,two and three applications of pine oil formulation (50 Pin + 50 NaCl + 10 NPE-600). Error bars: standard error ofthe mean (SE). n.s.: not significant. Di�erent le�ers denote significant di�erences (Kruskal-Wallis, α < 0.05).
Comparing average ratings over all spray treatments by the factor weed infestation the weed injuryratings in the High plots were consistently lower than in the Low plots (s.d. for second evaluation, �gure7.23). However, in absolute terms, di�erences in weed injury between the two weed densities remainedrelatively small.
Weed growth and soybean growth The weed dry mass of Weedy plots was on average 4.2 t ha−1 96DAE (�gure 7.24). Analogous to results from the third weed injury rating of spray treatments (�gure 7.22)weed shoot dry mass decreasing from 1x > 2x > 3x. The di�erence between one and two applications isapparently smaller than the one between 2x and 3x. But compared with Weedy, even three applications
99
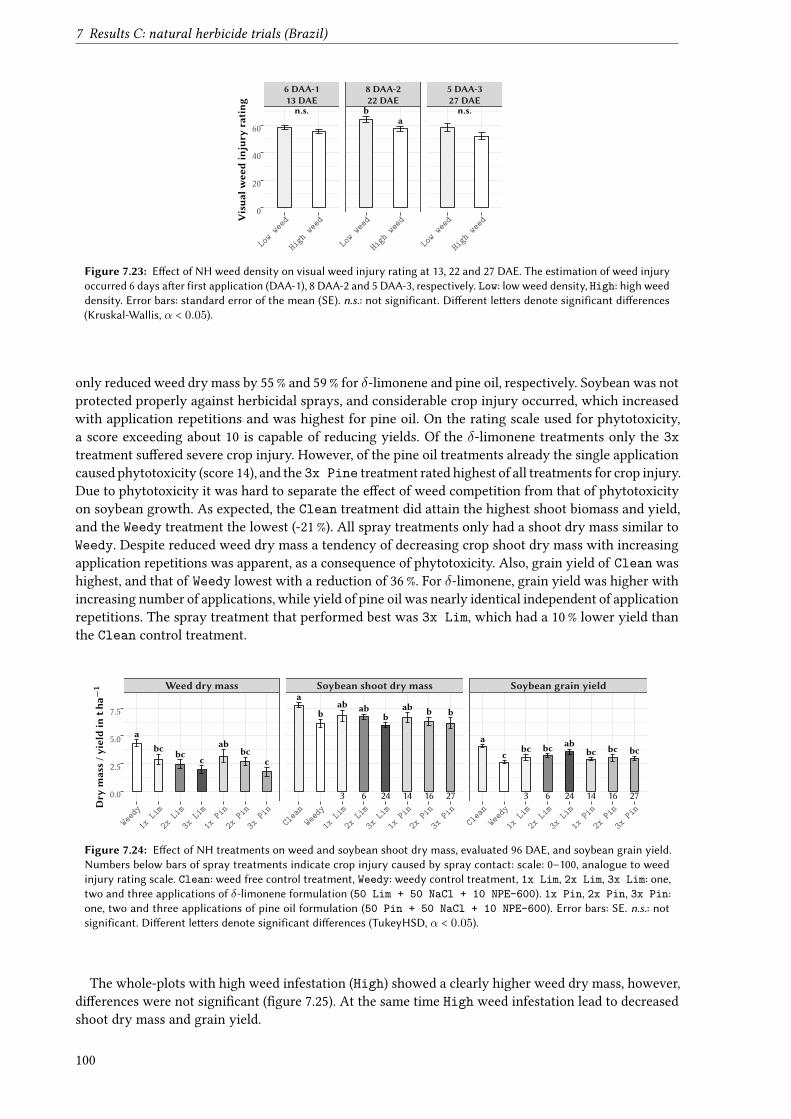
7 Results C: natural herbicide trials (Brazil)
n.s.a
b n.s.
6 DAA-113 DAE
8 DAA-222 DAE
5 DAA-327 DAE
Low
weed
High
weed
Low
weed
High
weed
Low
weed
High
weed
0
20
40
60
Visua
lwee
dinjury
rating
Figure 7.23: E�ect of NH weed density on visual weed injury rating at 13, 22 and 27 DAE. The estimation of weed injuryoccurred 6 days a�er first application (DAA-1), 8 DAA-2 and 5 DAA-3, respectively. Low: low weed density, High: high weeddensity. Error bars: standard error of the mean (SE). n.s.: not significant. Di�erent le�ers denote significant di�erences(Kruskal-Wallis, α < 0.05).
only reduced weed dry mass by 55 % and 59 % for δ-limonene and pine oil, respectively. Soybean was notprotected properly against herbicidal sprays, and considerable crop injury occurred, which increasedwith application repetitions and was highest for pine oil. On the rating scale used for phytotoxicity,a score exceeding about 10 is capable of reducing yields. Of the δ-limonene treatments only the 3xtreatment su�ered severe crop injury. However, of the pine oil treatments already the single applicationcaused phytotoxicity (score 14), and the 3x Pine treatment rated highest of all treatments for crop injury.Due to phytotoxicity it was hard to separate the e�ect of weed competition from that of phytotoxicityon soybean growth. As expected, the Clean treatment did attain the highest shoot biomass and yield,and the Weedy treatment the lowest (-21 %). All spray treatments only had a shoot dry mass similar toWeedy. Despite reduced weed dry mass a tendency of decreasing crop shoot dry mass with increasingapplication repetitions was apparent, as a consequence of phytotoxicity. Also, grain yield of Clean washighest, and that of Weedy lowest with a reduction of 36 %. For δ-limonene, grain yield was higher withincreasing number of applications, while yield of pine oil was nearly identical independent of applicationrepetitions. The spray treatment that performed best was 3x Lim, which had a 10 % lower yield thanthe Clean control treatment.
bc abbc bc
c c
a
ab abab bb b
a
b
3 146 1624 27
bc bcbc bcabbc
a
c
3 146 1624 27
Weed dry mass Soybean shoot dry mass Soybean grain yield
Weed
y
1xLi
m
2xLi
m
3xLi
m
1xPi
n
2xPi
n
3xPi
nCl
ean
Weed
y
1xLi
m
2xLi
m
3xLi
m
1xPi
n
2xPi
n
3xPi
nCl
ean
Weed
y
1xLi
m
2xLi
m
3xLi
m
1xPi
n
2xPi
n
3xPi
n
0.0
2.5
5.0
7.5
Dry
mass/y
ield
intha−
1
Figure 7.24: E�ect of NH treatments on weed and soybean shoot dry mass, evaluated 96 DAE, and soybean grain yield.Numbers below bars of spray treatments indicate crop injury caused by spray contact: scale: 0–100, analogue to weedinjury rating scale. Clean: weed free control treatment, Weedy: weedy control treatment, 1x Lim, 2x Lim, 3x Lim: one,two and three applications of δ-limonene formulation (50 Lim + 50 NaCl + 10 NPE-600). 1x Pin, 2x Pin, 3x Pin:one, two and three applications of pine oil formulation (50 Pin + 50 NaCl + 10 NPE-600). Error bars: SE. n.s.: notsignificant. Di�erent le�ers denote significant di�erences (TukeyHSD, α < 0.05).
The whole-plots with high weed infestation (High) showed a clearly higher weed dry mass, however,di�erences were not signi�cant (�gure 7.25). At the same time High weed infestation lead to decreasedshoot dry mass and grain yield.
100
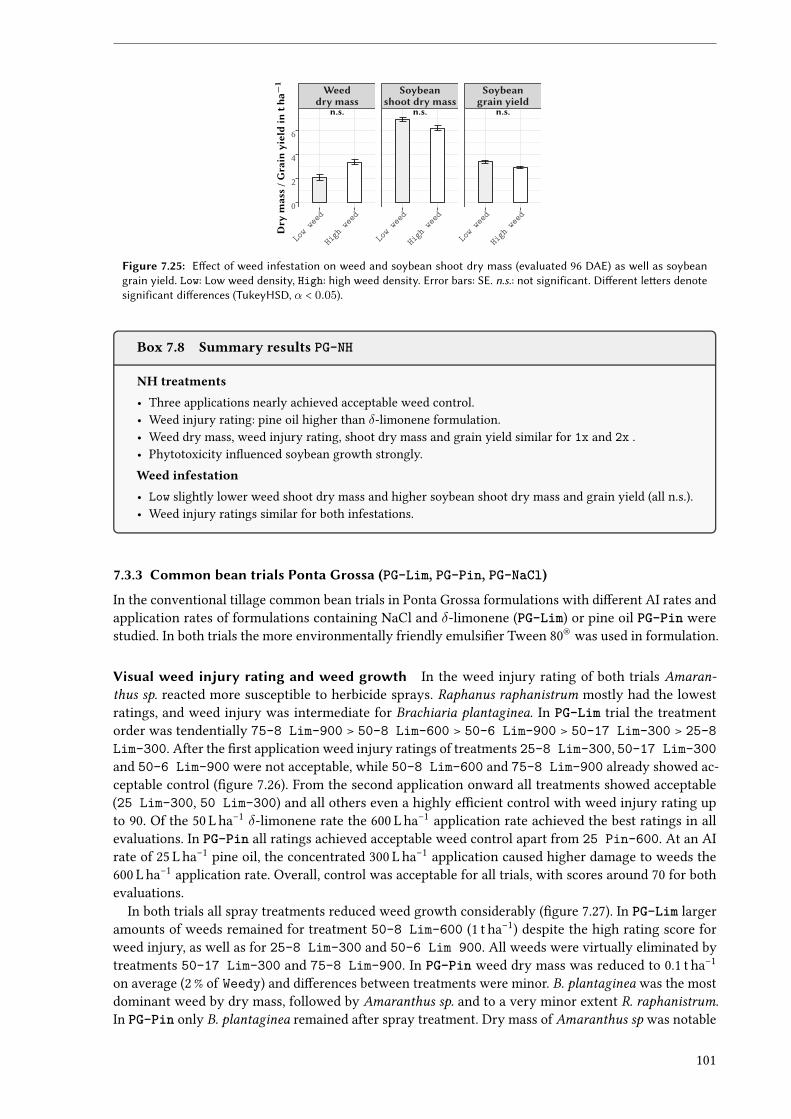
n.s. n.s. n.s.
Weeddry mass
Soybeanshoot dry mass
Soybeangrain yield
Low
weed
High
weed
Low
weed
High
weed
Low
weed
High
weed
0
2
4
6
Dry
mass/G
rain
yieldin
tha−
1Figure 7.25: E�ect of weed infestation on weed and soybean shoot dry mass (evaluated 96 DAE) as well as soybeangrain yield. Low: Low weed density, High: high weed density. Error bars: SE. n.s.: not significant. Di�erent le�ers denotesignificant di�erences (TukeyHSD, α < 0.05).
Box 7.8 Summary results PG-NH
NH treatments• Three applications nearly achieved acceptable weed control.• Weed injury rating: pine oil higher than δ-limonene formulation.• Weed dry mass, weed injury rating, shoot dry mass and grain yield similar for 1x and 2x .• Phytotoxicity in�uenced soybean growth strongly.Weed infestation• Low slightly lower weed shoot dry mass and higher soybean shoot dry mass and grain yield (all n.s.).• Weed injury ratings similar for both infestations.
7.3.3 Common bean trials Ponta Grossa (PG-Lim, PG-Pin, PG-NaCl)
In the conventional tillage common bean trials in Ponta Grossa formulations with di�erent AI rates andapplication rates of formulations containing NaCl and δ-limonene (PG-Lim) or pine oil PG-Pin werestudied. In both trials the more environmentally friendly emulsi�er Tween 80® was used in formulation.
Visual weed injury rating and weed growth In the weed injury rating of both trials Amaran-thus sp. reacted more susceptible to herbicide sprays. Raphanus raphanistrum mostly had the lowestratings, and weed injury was intermediate for Brachiaria plantaginea. In PG-Lim trial the treatmentorder was tendentially 75-8 Lim-900 > 50-8 Lim-600 > 50-6 Lim-900 > 50-17 Lim-300 > 25-8Lim-300. After the �rst application weed injury ratings of treatments 25-8 Lim-300, 50-17 Lim-300and 50-6 Lim-900 were not acceptable, while 50-8 Lim-600 and 75-8 Lim-900 already showed ac-ceptable control (�gure 7.26). From the second application onward all treatments showed acceptable(25 Lim-300, 50 Lim-300) and all others even a highly e�cient control with weed injury rating upto 90. Of the 50 L ha−1 δ-limonene rate the 600 L ha−1 application rate achieved the best ratings in allevaluations. In PG-Pin all ratings achieved acceptable weed control apart from 25 Pin-600. At an AIrate of 25 L ha−1 pine oil, the concentrated 300 L ha−1 application caused higher damage to weeds the600 L ha−1 application rate. Overall, control was acceptable for all trials, with scores around 70 for bothevaluations.
In both trials all spray treatments reduced weed growth considerably (�gure 7.27). In PG-Lim largeramounts of weeds remained for treatment 50-8 Lim-600 (1 t ha−1) despite the high rating score forweed injury, as well as for 25-8 Lim-300 and 50-6 Lim 900. All weeds were virtually eliminated bytreatments 50-17 Lim-300 and 75-8 Lim-900. In PG-Pin weed dry mass was reduced to 0.1 t ha−1
on average (2 % of Weedy) and di�erences between treatments were minor. B. plantaginea was the mostdominant weed by dry mass, followed by Amaranthus sp. and to a very minor extent R. raphanistrum.In PG-Pin only B. plantaginea remained after spray treatment. Dry mass of Amaranthus sp was notable
101
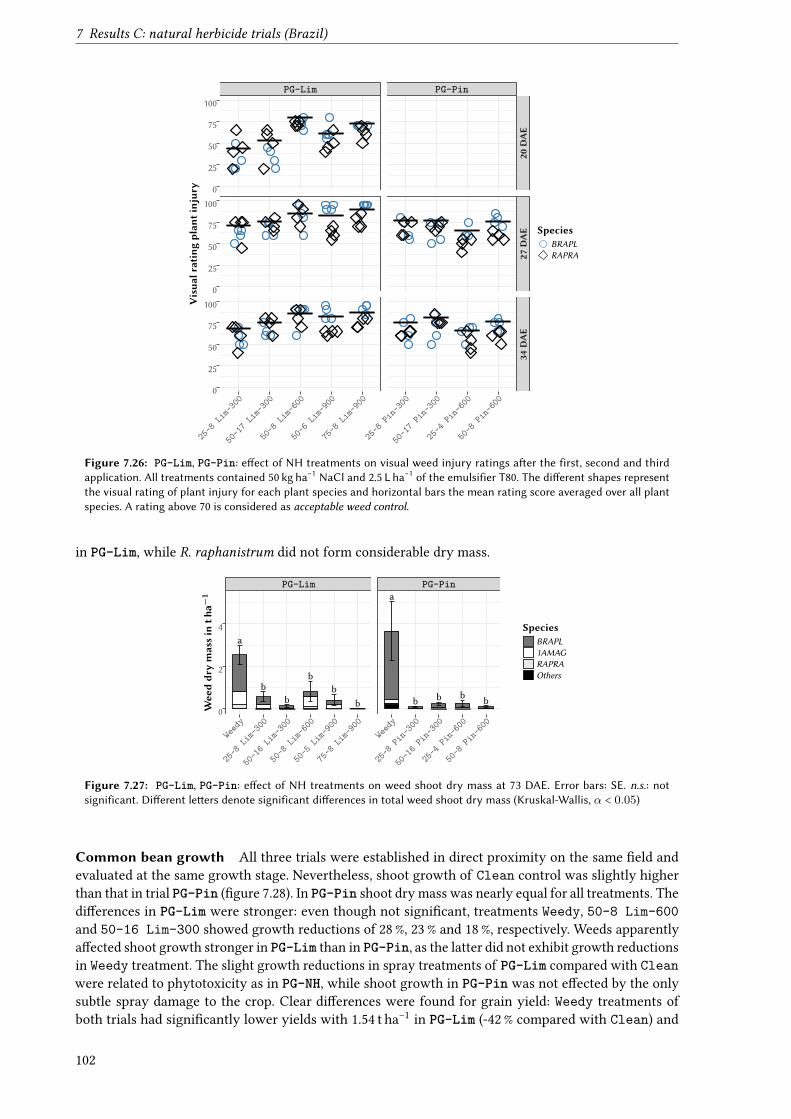
7 Results C: natural herbicide trials (Brazil)
PG-Lim PG-Pin
20DAE
27DAE
34DAE
25-8
Lim-
300
50-1
7Li
m-30
0
50-8
Lim-
600
50-6
Lim-
900
75-8
Lim-
900
25-8
Pin-
300
50-1
7Pi
n-30
0
25-4
Pin-
600
50-8
Pin-
600
0
25
50
75
100
0
25
50
75
100
0
25
50
75
100Visua
lratingplan
tinjur
y
SpeciesBRAPLRAPRA
Figure 7.26: PG-Lim, PG-Pin: e�ect of NH treatments on visual weed injury ratings a�er the first, second and thirdapplication. All treatments contained 50 kg ha−1 NaCl and 2.5 L ha−1 of the emulsifier T80. The di�erent shapes representthe visual rating of plant injury for each plant species and horizontal bars the mean rating score averaged over all plantspecies. A rating above 70 is considered as acceptable weed control.
in PG-Lim, while R. raphanistrum did not form considerable dry mass.
bb
bb
b
a
b b b b
aPG-Lim PG-Pin
Weed
y
25-8
Lim-
300
50-1
6Li
m-30
0
50-8
Lim-
600
50-5
Lim-
900
75-8
Lim-
900
Weed
y
25-8
Pin-
300
50-1
6Pi
n-30
0
25-4
Pin-
600
50-8
Pin-
600
0
2
4
Wee
ddr
ymassin
tha−
1
SpeciesBRAPL1AMAGRAPRAOthers
Figure 7.27: PG-Lim, PG-Pin: e�ect of NH treatments on weed shoot dry mass at 73 DAE. Error bars: SE. n.s.: notsignificant. Di�erent le�ers denote significant di�erences in total weed shoot dry mass (Kruskal-Wallis, α < 0.05)
Common bean growth All three trials were established in direct proximity on the same �eld andevaluated at the same growth stage. Nevertheless, shoot growth of Clean control was slightly higherthan that in trial PG-Pin (�gure 7.28). In PG-Pin shoot dry mass was nearly equal for all treatments. Thedi�erences in PG-Lim were stronger: even though not signi�cant, treatments Weedy, 50-8 Lim-600and 50-16 Lim-300 showed growth reductions of 28 %, 23 % and 18 %, respectively. Weeds apparentlya�ected shoot growth stronger in PG-Lim than in PG-Pin, as the latter did not exhibit growth reductionsin Weedy treatment. The slight growth reductions in spray treatments of PG-Lim compared with Cleanwere related to phytotoxicity as in PG-NH, while shoot growth in PG-Pin was not e�ected by the onlysubtle spray damage to the crop. Clear di�erences were found for grain yield: Weedy treatments ofboth trials had signi�cantly lower yields with 1.54 t ha−1 in PG-Lim (-42 % compared with Clean) and
102
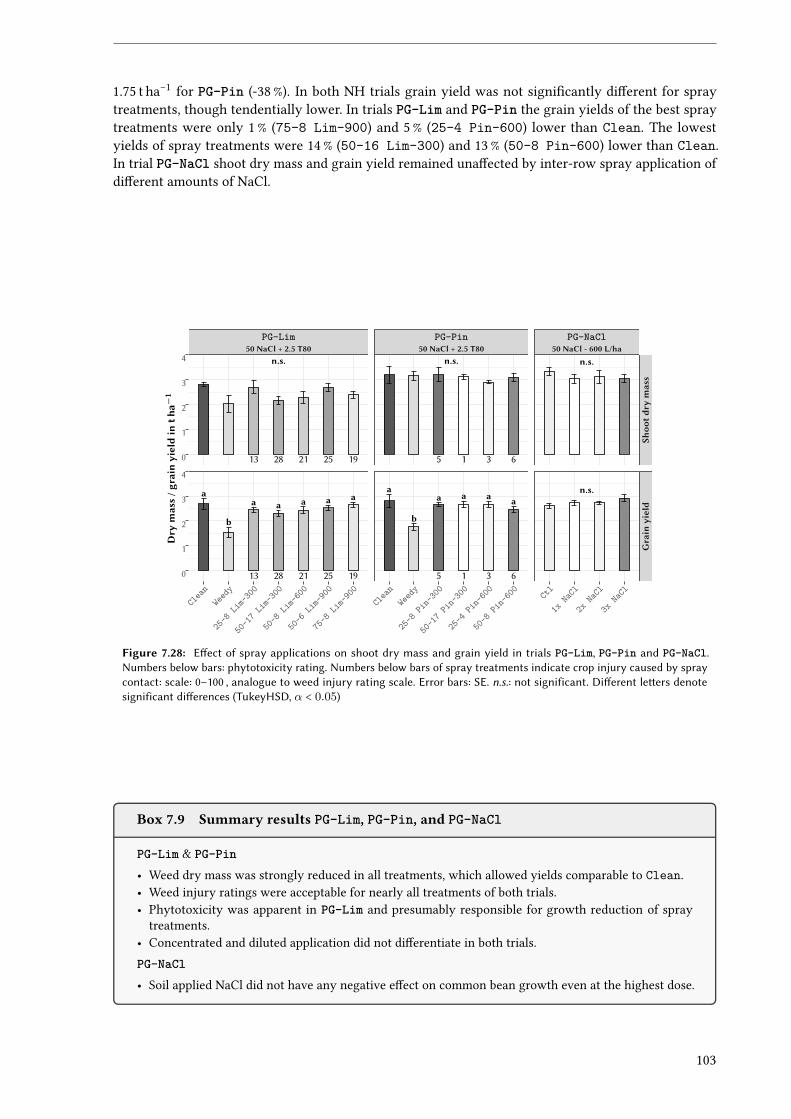
1.75 t ha−1 for PG-Pin (-38 %). In both NH trials grain yield was not signi�cantly di�erent for spraytreatments, though tendentially lower. In trials PG-Lim and PG-Pin the grain yields of the best spraytreatments were only 1 % (75-8 Lim-900) and 5 % (25-4 Pin-600) lower than Clean. The lowestyields of spray treatments were 14 % (50-16 Lim-300) and 13 % (50-8 Pin-600) lower than Clean.In trial PG-NaCl shoot dry mass and grain yield remained una�ected by inter-row spray application ofdi�erent amounts of NaCl.
n.s.
13 28 21 25 19
aa a a a a
b
13 28 21 25 19
n.s.
5 1 3 6
aa a a a
b
5 1 3 6
n.s.
n.s.
PG-Lim50 NaCl + 2.5 T80
PG-Pin50 NaCl + 2.5 T80
PG-NaCl50 NaCl - 600 L/ha
Shoo
tdry
mass
Grain
yield
Clea
nWe
edy
25-8
Lim-
300
50-1
7Li
m-30
0
50-8
Lim-
600
50-6
Lim-
900
75-8
Lim-
900
Clea
nWe
edy
25-8
Pin-
300
50-1
7Pi
n-30
0
25-4
Pin-
600
50-8
Pin-
600
Ctl
1xNa
Cl
2xNa
Cl
3xNa
Cl
0
1
2
3
4
0
1
2
3
4
Dry
mass/g
rain
yieldin
tha−
1
Figure 7.28: E�ect of spray applications on shoot dry mass and grain yield in trials PG-Lim, PG-Pin and PG-NaCl.Numbers below bars: phytotoxicity rating. Numbers below bars of spray treatments indicate crop injury caused by spraycontact: scale: 0–100 , analogue to weed injury rating scale. Error bars: SE. n.s.: not significant. Di�erent le�ers denotesignificant di�erences (TukeyHSD, α < 0.05)
Box 7.9 Summary results PG-Lim, PG-Pin, and PG-NaCl
PG-Lim & PG-Pin• Weed dry mass was strongly reduced in all treatments, which allowed yields comparable to Clean.• Weed injury ratings were acceptable for nearly all treatments of both trials.• Phytotoxicity was apparent in PG-Lim and presumably responsible for growth reduction of spray
treatments.• Concentrated and diluted application did not di�erentiate in both trials.PG-NaCl• Soil applied NaCl did not have any negative e�ect on common bean growth even at the highest dose.
103
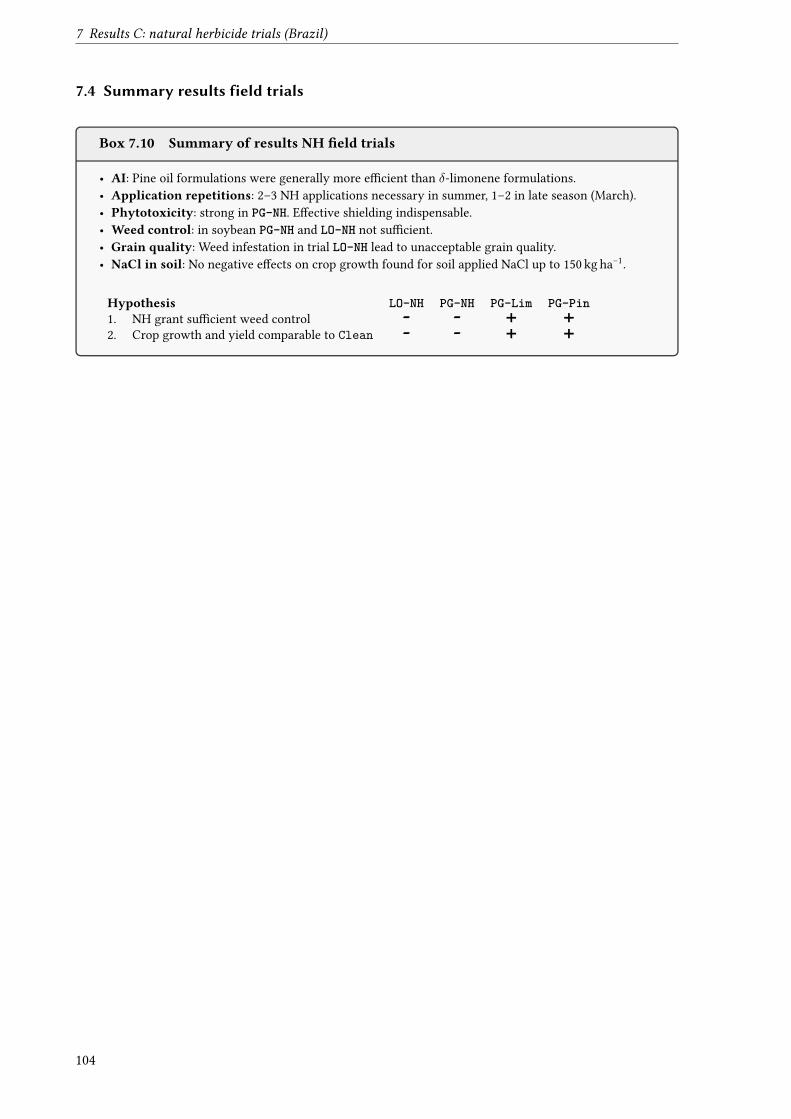
7 Results C: natural herbicide trials (Brazil)
7.4 Summary results field trials
Box 7.10 Summary of results NH �eld trials
• AI: Pine oil formulations were generally more e�cient than δ-limonene formulations.• Application repetitions: 2–3 NH applications necessary in summer, 1–2 in late season (March).• Phytotoxicity: strong in PG-NH. E�ective shielding indispensable.• Weed control: in soybean PG-NH and LO-NH not su�cient.• Grain quality: Weed infestation in trial LO-NH lead to unacceptable grain quality.• NaCl in soil: No negative e�ects on crop growth found for soil applied NaCl up to 150 kg ha−1.
Hypothesis LO-NH PG-NH PG-Lim PG-Pin1. NH grant su�cient weed control - - + +2. Crop growth and yield comparable to Clean - - + +
104
8 Discussion C: natural herbicide trials (Brazil)8.1 Active ingredients and their formulations
8.1.1 Cell membrane disruptors
Essential oils, AA, emulsi�ers and MSO caused very similar damage symptoms to weed plants in screen-ings. Many literature sources support this �nding: within the class of essential oils the mode of actionis the same and only the magnitude of their e�ect di�ers (Bakkali et al., 2008). All cell membrane dis-ruptors (CMD) penetrate the leaf cuticle and change its permeability. Inside the leaf they interact withand damage cell and organelle membranes which causes rapid electrolyte leakage and leads to universalinterference in most of cells metabolism (Tworkoski, 2002; Bakkali et al., 2008). Findings of Baker (1970)for mineral oil are similar: penetration of hydrocarbons causes cell membrane damage, a decrease ofmembrane potentials and consecutive formation of reactive oxygen species (ROS), which in turn leadsto further membrane damage. Another consequence of the membrane damage is described by Ledereret al. (2004): chlorophyll displaced from the thylakoids is sensitised in the light and generates radicals(ROS), which cause peroxidation and increase membrane damage further. Ultimately cell contents leakout and cells die of uncontrolled water loss (Tworkoski, 2002; Bakkali et al., 2008). Despite the samemode of action, Evans et al. (2009) found slight di�erences in damage symptoms between clove oil andAA. While damage symptoms of AA were found widespread throughout the leaf tissue, including upperand lower epidermal cells, the damage for clove oil treatment was mostly located in the mesophyll cells.Epidermal cells appeared less a�ected by clove oil than by AA in vinegar. Even though both destroycell membranes they are distinct in their ability to penetrate cuticle and leaf tissue. This is assumed tobe due to their di�erence in polarity and hence solubility in water. Due to their common general e�ecton cell membranes, essential oils, mineral oils, AA, pelargonic acid (PA) and also emulsi�ers can all begrouped into the same AI class, denominated CMD. The e�ect of all CMD is not systemic as no translo-cation within plants occurs. Remaining, non-contacted meristems may resprout and plant recovery canhappen quickly. Common to all CMD are the large concentrations and total amounts of AI needed toe�ectively kill or severely damage plants. Following, some of the presented ingredients are discussed inmore detail. Due to the large quantities of water insoluble (essential) oils in most NH formulations, alsolarge quantities of emulsi�ers are needed to elaborate stable emulsions. This deserves special attentionas it has far reaching consequences for the environmental pro�le of NH and their certi�cation and istherefore discussed separately in more detail.
Essential oils Essential oils usually consist of a wide range of chemical constituents, but mainly ofterpenes (mostly monoterpenes and sesquiterpenes) and volatile aromatics. The type and quantity ofconstituents vary between species of a genus, a variety within a species and the environmental conditionsof their respective production sites (Ioannou et al., 2014). Thus, essential oils are by no means de�nedsubstances, which may limit reproducibility of experimental �ndings due to di�erent oil qualities.δ-limonene was found to be an extremely ine�cient AI and cannot be considered for NH formulations.
Its e�ect is apparently more based on the accompanying emulsi�er than the δ-limonene itself. Pine oilproved to be e�ective, and even caused damage to weeds without the use of any emulsi�er. Nevertheless,also this ingredient performed better when combined with an e�ective emulsi�er, such as NPE. The otheressential oils tested were discarted in screenings due to insu�cient e�ect or high cost. One problem inthe use of essential oils as AI for weed control is their volatility. The cuticle and membrane dissolvinge�ect is therefore limited in time and a reason why they only cause acute and no chronic plant injury.The volatility of substances (vapour pressure high) is a�ected by its polarity. Pine oil (α-Terpineol)as an alcohol is more polar than δ-limonene and hence less volatile. Elaborating natural herbicideformulations it was observed that without any emulsi�er δ-limonene separated quickly when mixedwith water whereas synthetic pine oil (65 %α-terpineol) even showed a milky appearance for a very shorttime after agitation (not stable though). Weidenhamer et al. (1993) con�rmed that solubility of alcoholmonoterpenes are one to two magnitudes of order higher than that of pure hydrocarbons, and found asolubility of 13 mg L−1 for δ-limonene and 1360 mg L−1 for 4-Terpineol (similar to α-terpineol containedin pine oil). The natural turpentine (α-pinene) tested in screenings did not show any notable e�ect,
105
8 Discussion C: natural herbicide trials (Brazil)
which may be due to the low solubility (22 mg L−1) and high volatility as is the case for δ-limonene.The lower volatility and higher solubility in water associated with higher polarity may explain thehigher toxicity of pine oil to plants compared to δ-limonene (monoterpene-hydrocarbon): due to a lowervolatility the time to exert an e�ect on plant tissue is prolonged and due to a higher solubility alsohigher concentrations come in contact with target cells. In the case of heavy mineral oils Crafts andReiber (1948) and Baker (1970) found that the acute injury to plants was caused by volatile unsaturatesand volatile acidic compounds, while chronic injuries were caused by high boiling unsaturates. Gauvritand Cabanne (2006) con�rms these �ndings: inside the di�erent classes of constituents of mineral oilsthe order of phytotoxicity is aromatics > ole�ns > naphthenes > para�ns. The author concludes thatunsaturation and aromaticity generally appear to be the major factor for phytotoxicity of (mineral) oils,and attributes this �nding to their higher reactivity. These results may also explain why cinnamon andthyme oil, which respectively contain the aromatic essential oils eugenol and thymol, are among themost phytotoxic essential oils (Tworkoski, 2002).
There are reports of systemic action of constituents of some essential oils, e.g. eucalypt oil (Singhet al., 2005). However, these results were obtained in laboratory bioessays with seeds of Partheniumhysterophorus weed. It is assumed that due to their volatility, essential oils cannot come into contactwith seeds or seedlings in concentrations to cause any physiological response, but will evaporate on thesoil surface. This is even more true for DS management, as the mulch impedes spray contact with thesoil. In the few screenings with eucalypt oil (from Eucalyptus citriodora) symptoms indicating a systemice�ect, e.g. leaf yellowing, tissue necrosis (not acute damage) or growth reduction could not be observedat all, even at rates of 90 L ha−1. Based on the limited experimental data no de�nite conclusion can bedrawn, but a systemic e�ect under �eld conditions is assumed to be unlikely. Nevertheless, additions ofsmall volumes of essential oils with supposedly systemic action to NH formulations should be studiedfurther.
Acetic acid Acetic acid was the most e�ective CMD in screening trials based on concentration. De-spite being a very simple chemical with a very positive environmental pro�le (Webber et al., 2006), AAas a weed control agent possesses several disadvantages. First to mention is the high cost of naturalvinegar. AA concentrations in vinegar range from about 5–10 %, but concentrations used for an e�ec-tive burn-down e�ect in weeds is 15–20 %, concentrations which are not present in natural vinegar(Evans and Bellinder, 2009; Evans et al., 2009). Typical spray application volumes are 500–1000 L ha−1,or 50–200 L ha−1 of AA. Only the use of cheaper synthetic glacial AA can therefore be an option, whichdi�cults or impedes OA certi�cation. The second problem is that concentrations starting around 10 %are caustic, causing skin irritation and severe eye damage upon contact, as well as serious lung injuryupon inhalation. Another downside is that volumes needed for application are very large and hence onlytransport of concentrates would be feasible. But handling concentrates would aggravate the hazardsfor users even more. Likewise, concentrations exceeding 10 % are considered a dangerous good andspecial rules for transportation with consequently increased costs apply. Resuming, the use of AA as astandalone AI in natural herbicide formulations can be ruled out at this point. Nevertheless, AA can beused as an ingredient for pH regulation or as a formulation enhancer with concentrations from about1–3 %. In screening tests an improved weed control was observed with AA added to NaCl formulations.
Combinations of cell membrane disruptors From the results of mixtures of di�erent essentialoils or essential oils with AA no interaction or potentiating e�ects could be observed. However, thescreening trials were not suitable for a �ne detection of di�erences. In the case of essential oil - AAmixtures the e�ect of AA was dominant, which re�ects the e�ciency of AA as a single ingredient.
Vegetable oils Applied purely, no damage to plants was found in screenings, which is in line withresults from leaf disk essays of Tworkoski (2002) in which no electrolyte leakage was found for there�ned vegetable oils (rapeseed, canola, soybean). Addition of re�ned vegetable oils decreased the e�ectof essential oil formulations strongly, which is assumed to be due to the lower concentration of essentialoil that leaf tissue come in contact with. Even though re�ned vegetable oils are generally not phytotoxic,
106
application of crude ricinus (3 %) and cotton oils (5 %) to control insect pests was reported to result indevastating leaf burns on crops (oral communication Androcioli, IAPAR, Londrina 2013). This observede�ect may have been due to the fact that crude vegetable oils contain up to 10 % free fatty acids (FFA),which are in fact phytotoxic. Furthermore, non-saturated vegetable oils oxidise in presence of daylightand form additional FFA in the process (Carlsson et al., 1976). Applying non-re�ned vegetable oils witha high content of FFA and non-saturated fatty acids could therefore be examined for possible phytotoxice�ects on weeds.
Methylated soybean seed oil - Aureo® The product Aureo® tested in screenings in part showedpromising results. This product at large contains methylated soybean seed oil (MSO), which in essence issoybean biodiesel. However, apart from 72 % MSO the product also contains about 19 % inert ingredients,in which unknown ingredients are contained. The importance of these inert ingredients for the productse�ect remains unknown, and they may have been in�uencing the e�ect strongly. Nevertheless, Vaughnand Holser (2007) studied the phytotoxic e�ects of 1–2 % aqueous emulsions of di�erent biodiesel. Theirphytotoxic e�ect was found to be higher than that of commercial NH products based on essential oils orPA, at lower concentrations and also at a lower cost. Biodiesel may therefore be an AI in environmentallyfriendly contact herbicides and their potentials of biodiesel should be examined further.
Emulsifiers With the results found in screenings there is no doubt that emulsi�ers are in fact AIthemselves at the high concentrations applied in NH formulations. Damage symptoms are similar tothose of other CMD, as emulsi�er equally interact with the cuticle waxes and cell membranes lipids.Anionic emulsi�ers additionally interact with proteins and are considered more cytotoxic than non-ionicemulsi�ers (Bartnik, 1992), which can explain the relatively strong weed control e�ect of sulphonic acidin mixtures with other CMD and/or NaCl, as well as on its own. Nevertheless, toxicity of ionic emulsi-�ers is formulations containing the anionic emulsi�er sodium ricenoleate formed were relatively weakin action compared with those containing NPE. At the rates used in mainstream herbicidal formulationsof about 0.5–1.0 L ha−1, both NPE or Tween 80® (T80) emulsi�ers do not present any visible e�ect andcan in fact be considered inert with respect to their herbicidal action. However, in screening trials weeddamage started to occur at rates of 5–10 L ha−1 for NPE and 10–20 L ha−1 for Tween 80®. Using NPEemulsi�er for trials certainly alterated results. For example, a large proportion of damage caused byδ-limonene containing formulations could be attributed to the use of this emulsi�er. There is apparentlyno awareness of the herbicidal e�ect of emulsi�ers in natural herbicide formulations and no scienti�cliterature on the topic was found. The reason for this is assumed to be that commercial NH formulationsare the only known case in which such high quantities of emulsi�ers are used in agriculture. Further-more, these substances by law can be declared as ’inert’ ingredients without further de�nition. They arenot tested in the certi�cation process and without disclosure there is also no possibility to revise themin independent studies. Emulsi�ers are indispensable ingredients in NH formulations, which stronglyin�uence product e�cacy, and are one of the most complex issues for certi�cation and practical appli-cation of NH. Therefore the implications of emulsi�ers for the environmental pro�le and certi�cationof formulations is discussed separately in section 8.5 Emulsi�ers: ’inert’ ingredients in NH formulationson page 115.
8.1.2 NaCl formulations
The e�ect of spray applied NaCl alone varied strongly from moderate to no weed control. However theaddition of NaCl to CMD formulations potentiated weed control strongly. Subsequently essential oil ratecould be lowered considerably from about 200 L ha−1 to 25–50 L ha−1, maintaining the burn-down e�ectat a comparable level. In Germany Urtica sp. and Rumex sp. showed clear reaction of NaCl applicationwithout emulsi�ers though, but no representative trials were conducted. The observed susceptibilitymay be due to the relatively thin cuticle which permits penetration of NaCl into plants (Hull et al.,1975). NaCl application of up to 120 kg ha−1 NaCl without the use of any emulsi�er mostly did not causeserious, if any leaf damage on screened weed plants. A thick waxy cuticle and trichomes on leafs inhibitthe contact of NaCl solution with the permeable cell wall, which was found for mature Vicia hirsuta by
107
8 Discussion C: natural herbicide trials (Brazil)
(Lukashyk, 2005). However, NaCl in mixture with any CMD potentiated the herbicidal e�ect strongly.The main obstacle for NaCl penetration into leafs is the cuticle, and the dissolving and penetrating e�ectof CMD apparently opens an entry door for NaCl absorption into plant tissue. Plants can react to theacute osmotic stress by stomata closure, accumulation of NaCl in the apoplast or formation of organicsolutes to balance osmotic potential inside cells (Marschner and Marschner, 2012). However, leaf cuticleand cell membrane permeabilised by CMD render stomata closure ine�ective, while the high osmoticpotential of NaCl speeds up desiccation. In addition to acute damage some systemic e�ect was observedand NaCl is apparently transported to meristems, which was especially observed in dicot species. Evenlateral meristems that have not gotten into contact with spraying solution died o�, retarding or inhibitingresprouting (�gure 7.6 b). Furthermore, also advanced growth stages of the weeds Bidens pilosa andEuphorbia heterophylla could be controlled e�ectively with NaCl, despite the fact that full spray coveragewas not reached. Due to its strong acute and longer lasting e�ect NaCl is one of the most promisingingredients for NH formulations. Furthermore, NaCl is a cost neutral ingredient compared with CMD.Weed control can be improved further by increasing the application rate of NaCl, but it is not knownup to what dose a use is sensible, considering salinisation and impacts on crop (by root absorption). Inmost experiments the per-application-rate was limited to 50 kg ha−1, and the maximum total amountapplied in a cropping period was 150 kg ha−1. In trial PG-NaCl this high dose was applied directly to thesoil in the inter-row space, which did not result in any negative e�ect to crops, indicating that at leastwith occasional applications, no concentrations toxic to plants are reached in the soil. Nevertheless,it has to be pointed out that application must be limited to permeable soils in climates with verticaldownward water movement, which would allow for NaCl to be leached from topsoil. In Brazil, apartfrom the Caatinga biome, these conditions are generally met and salinisation problems are not expected.In screenings the combination of AA and NaCl appeared to be highly e�ective, which may be related toAA penetrating leaf tissue more profoundly than essential oils (Evans et al., 2009). Furthermore, it maybe possible that H+ ions in AA saturate negative binding sites, which are predominant in plant tissue.This could lead to higher presence of ’free’ Na+ ions in plant tissue.
8.1.3 E�ect of concentration, dilution and volume
Concerning concentrations of ingredients it is di�cult to determine exact values for an e�ective NHformulation, because emulsi�ers played a crucial role in the e�ect of practically all formulations tested.Independent of this fact, formulations that can achieve e�cient control, given benign environmentalconditions (see below) and applied at an early weed development stage could be proposed to containthe AI amounts presented in continuation. For cost reduction and improvement of herbicidal e�ectall formulations need to contain NaCl, or another phytotoxic mineral salt. Several times it was shownin screenings that NaCl amounts of 50 kg ha−1 per application were necessary for an acceptable e�ect,while 120 kg ha−1 gave excellent results. In mixed formulations of CMD and NaCl the damage causedby NaCl appears to be much larger than that of the CMD component. However, cuticle penetrationhas to be facilitated by CMD, which is supported by the �nding that pure applied NaCl gave extremelyvarying results, ranging from none to moderate weed control. δ-limonene can be discarted from the listof possible CMD ingredients, and of the tested essential oils only pine oil remains as a candidate for asuccessful NH formulation. In some cases 25 L ha−1 of this ingredient were su�cient for a strong e�ect.However, to guarantee acceptable weed control, pine oil needs to be formulated with at least 50 L ha−1
in combination with NaCl. For formulations containing only AA as AI the dosage can be lower thanthat of essential oils, with concentrations of about 10 %. Nevertheless, AA has been discarted from thelist of standalone ingredients for NH formulations due to the disadvantages discussed above, and onlymakes sense in combination with NaCl. In this case concentrations of 5 % AA with 50 kg ha−1 NaCl mayalready grant e�cient weed control, but data obtained is not su�cient to make a reasonable judgement.In oil-containing formulations emulsi�ers are necessary, and a minimum ratio of oil:/emulsi�er/ of 10:1can be proposed from screening and formulation testing. As emulsi�ers possess a proper e�ect theymay also be considered as the CMD component of a formulation containing NaCl. The formulationscontaining T80, SA or NPE in combination with NaCl achieved acceptable weed control in screeningsS-PG13 and S-PG14. The combination of NaCl and an e�ective emulsi�er could lead to tremendous
108
reductions in application costs. However, an environmentally friendly, or even natural emulsi�er withCMD action �rst has to be found. Estimating from �ndings with NPE and Tween 80® the necessary doseof a emulsi�er to penetrate or permeabilise the leaf cuticle would start from about 10 L ha−1. CommercialCMD formulations are recommended at application rates of 1000 L ha−1 presumably because completecoverage is necessary and because evaporation of essential oil has to be counteracted to prolong e�ect.However, the commercial products are also indicated for grown weeds, for which complete coverage canonly be achieved by such large volumes. Nevertheless, the elimination of grown weeds has repeatedlybeen shown not to be e�ective (Young, 2004; Barker and Prostak, 2014). As NH formulations based onlyon CMD will always fail to control large weeds the application at earlier growth stages is consideredmandatory. Under these circumstances a rate of 1000 L ha−1 is not necessary and would elevate costsunnecessarily. 600 L ha−1 gave su�cient coverage in all screenings and �eld trials conducted and even ata rate of 300 L ha−1 insu�cient spray coverage did not appear to be a problem. Testing di�erent volumesand concentrations of CMD formulations it was found in S-PG2 that the same amount of AI, applied in amore concentrated form with 300 L ha−1 resulted in higher weed control than its more diluted applicationwith 600 L ha−1. In this screening, the di�erence between the concentrated and diluted application wasmore pronounced than the e�ect of doubling the application rate (AI concentration �xed). Due tothe systemic e�ect of NaCl the improvement of e�ect by concentrated application may even be morepronounced in NaCl containing formulations. However, concentrated application of NaCl containingformulations was only tested in the �eld trials PG-Lim and PG-Pin. In these trials weed control was tooe�cient in all treatments to allow for a clear di�erentiation between the di�erent formulations tested.The concentrated 25 L ha−1 rate of pine oil (300 L ha−1) scored a higher weed injury rating than dilutedone (600 L ha−1), while in PG-Lim trial the results for the 50 L ha−1 rate are inconclusive: the 300 L ha−1
application scored worse than 600 L ha−1, but slightly higher than 900 L ha−1. Therefore, no de�niteconclusion can be drawn, and further studies would have to be conducted to con�rm if concentratedapplication can be recommended.
8.2 Weed control and susceptibility to natural herbicide applicationFor interpretation of trial results it needs consideration that none of the trials were conducted on �eldsunder permanent organic management. The �ora present was therefore typical for areas treated withconventional herbicides and densities were presumably lower than those found in �elds under permanentorganic management. Also, apart from Oxalis sp. and rare occurrence of Cyperacea sp., no perennialweed species were present, which could also be di�erent in OA. Resuming the results of screening trialswith di�erent CMD formulations, alone or combined with NaCl, the susceptibility of weed species wasobserved to be relatively constant independent of the formulations applied. Mostly the developmentstage of weeds in�uenced susceptibility.
Monocots compared with dicots Especially dicot species were found to be susceptible. Within thisgroup are some of the most common and problematic weeds in soybean DS, for example E. heterophylla,Amaranthus sp., Alternanthera tenella, Parthenium hysteropherus and B. pilosa (�gure 7.6 a). The sus-ceptible species Alternanthera tenella and Amaranthus sp. can even be controlled with NaCl solutionsonly with addition of small amounts of emulsi�er and without the need of addition of large amountsof essential oil. Therefore at least in theory, control of these species can be achieved at a low cost. Anintermediate susceptibility was observed for Ipomoea grandifolia, Richardia brasiliensis and Commelinabenghalensis, recently emerged B. plantaginea (< 2 leaf) and R. raphanistrum (< 4 leaf). Relatively in-sensitive to application were monocots with more than 2 leafs or with presence of �rst tillers such asBrachiaria plantaginea (�gure 7.6 b), Digitaria sp. or dicot Raphanus. raphanistrum (> 4 leafs). This isre�ected in the weed dry mass found in PG-Lim and PG-Pin which is made up almost exclusively ofB. plantaginea. Cyperacea species rarely occurred in experiments, however, �eld observations indicatedthat Cyperus rotundus is not susceptible to application at all: not even light leaf burns were observed.One explication for the low susceptibility of monocot species is the higher amount of wax formed onthe cuticle, which is for several cereal species 2–4 times that of dicot weeds (Stender, 1902). An excep-tion in screenings was Commelina benghalensis, a monocot which was fairly easy to control with NH
109
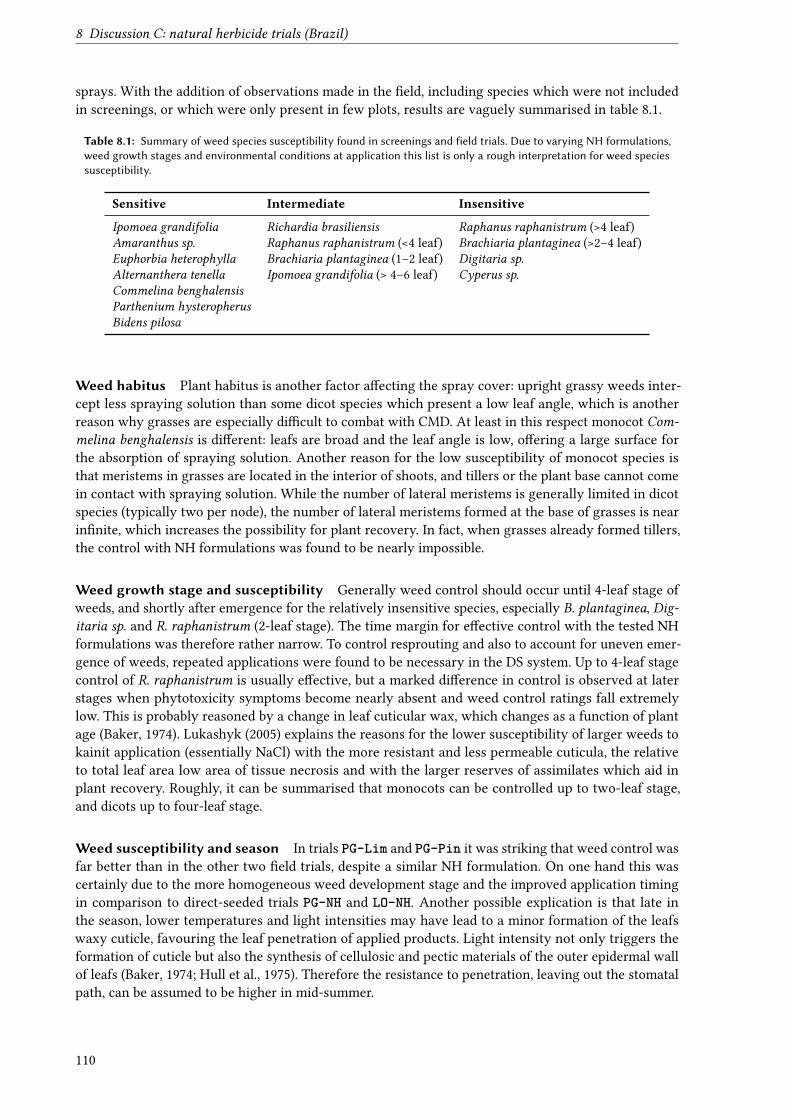
8 Discussion C: natural herbicide trials (Brazil)
sprays. With the addition of observations made in the �eld, including species which were not includedin screenings, or which were only present in few plots, results are vaguely summarised in table 8.1.
Table 8.1: Summary of weed species susceptibility found in screenings and field trials. Due to varying NH formulations,weed growth stages and environmental conditions at application this list is only a rough interpretation for weed speciessusceptibility.
Sensitive Intermediate Insensitive
Ipomoea grandifolia Richardia brasiliensis Raphanus raphanistrum (>4 leaf)Amaranthus sp. Raphanus raphanistrum (<4 leaf) Brachiaria plantaginea (>2–4 leaf)Euphorbia heterophylla Brachiaria plantaginea (1–2 leaf) Digitaria sp.Alternanthera tenella Ipomoea grandifolia (> 4–6 leaf) Cyperus sp.Commelina benghalensisParthenium hysteropherusBidens pilosa
Weed habitus Plant habitus is another factor a�ecting the spray cover: upright grassy weeds inter-cept less spraying solution than some dicot species which present a low leaf angle, which is anotherreason why grasses are especially di�cult to combat with CMD. At least in this respect monocot Com-melina benghalensis is di�erent: leafs are broad and the leaf angle is low, o�ering a large surface forthe absorption of spraying solution. Another reason for the low susceptibility of monocot species isthat meristems in grasses are located in the interior of shoots, and tillers or the plant base cannot comein contact with spraying solution. While the number of lateral meristems is generally limited in dicotspecies (typically two per node), the number of lateral meristems formed at the base of grasses is nearin�nite, which increases the possibility for plant recovery. In fact, when grasses already formed tillers,the control with NH formulations was found to be nearly impossible.
Weed growth stage and susceptibility Generally weed control should occur until 4-leaf stage ofweeds, and shortly after emergence for the relatively insensitive species, especially B. plantaginea, Dig-itaria sp. and R. raphanistrum (2-leaf stage). The time margin for e�ective control with the tested NHformulations was therefore rather narrow. To control resprouting and also to account for uneven emer-gence of weeds, repeated applications were found to be necessary in the DS system. Up to 4-leaf stagecontrol of R. raphanistrum is usually e�ective, but a marked di�erence in control is observed at laterstages when phytotoxicity symptoms become nearly absent and weed control ratings fall extremelylow. This is probably reasoned by a change in leaf cuticular wax, which changes as a function of plantage (Baker, 1974). Lukashyk (2005) explains the reasons for the lower susceptibility of larger weeds tokainit application (essentially NaCl) with the more resistant and less permeable cuticula, the relativeto total leaf area low area of tissue necrosis and with the larger reserves of assimilates which aid inplant recovery. Roughly, it can be summarised that monocots can be controlled up to two-leaf stage,and dicots up to four-leaf stage.
Weed susceptibility and season In trials PG-Lim and PG-Pin it was striking that weed control wasfar better than in the other two �eld trials, despite a similar NH formulation. On one hand this wascertainly due to the more homogeneous weed development stage and the improved application timingin comparison to direct-seeded trials PG-NH and LO-NH. Another possible explication is that late inthe season, lower temperatures and light intensities may have lead to a minor formation of the leafswaxy cuticle, favouring the leaf penetration of applied products. Light intensity not only triggers theformation of cuticle but also the synthesis of cellulosic and pectic materials of the outer epidermal wallof leafs (Baker, 1974; Hull et al., 1975). Therefore the resistance to penetration, leaving out the stomatalpath, can be assumed to be higher in mid-summer.
110
Cell membrane disruptors, NaCl and weed susceptibility The universal problem with formula-tions only containing CMD is that control can only occur up to a relatively young development stage(Bhowmik et al., 2003; Young, 2004; Batish et al., 2008). The e�ect of pure CMD formulations is �rmlylinked to a complete product coverage of the leaf area. With growing plant age the amount of over-lapping leafs and lateral meristems, as well as the energy reserves for recovery increase (Evans et al.,2009). Therefore, weed control with CMD becomes unfeasible at advanced development stages. Weedsusceptible in the case of pure CMD is a function of habitus, cuticle thickness, protection of meristems,and storage reserves for recovery. However, information on e�ects of NaCl applied to leafs is hardlyfound in literature (Lukashyk et al., 2008; Uddin et al., 2013) as research on weed species salt toleranceusually studies the e�ect of soil salinity. In this case weed tolerance is a function of the osmotic potentialat which plants are still able to absorb water, or a function of the NaCl concentration that plants cantolerate their tissue (Marschner and Marschner, 2012). The former mechanism for salt tolerance of plantscannot be expected to play a role for leaf applied products. Di�erences in weed susceptibilities to sprayapplication of NaCl can rather be explained by the second argument: weed susceptibility is probably afunction of resistance to acute osmotic stress, and tolerance of meristems to high NaCl concentrations.However, the experimental data is too limited to derive exact conclusions on how plants susceptibilityis working in this case. Monocot species appear to be more salt tolerant than dicots. Dying o� of tillerswas not observed as commonly as the dying o� of lateral buds in dicots. This is supported results ofUddin et al. (2013), who found that seawater application for weed control in turfgrass controlled dicotspecies, while leaving the grass undamaged.
8.3 Environmental conditions and natural herbicide e�icacy
In order to evaluate the optimal time of day for application one screening trial was conducted, inwhich spray treatments were applied either in the morning, midday or afternoon. Unfortunately, thescreening gave no results, which was due to the low dose of AI chosen. Nevertheless, observations madein screenings and �eld trials indicate that NH e�cacy does depend on environmental conditions andthe time of the day of application, at least for formulations containing NaCl. Applications in the lateafternoon were generally found not to be as e�ective as applications in the morning or midday. Thiscould for example be observed for the second application of trial PG-NH: the visual weed injury ratingsresulted in low scores for this application. Furthermore, the di�erence in weed dry mass comparedwith the single application treatments was only small. Another example are the results from screeningsS-PG11 and S-PG12: with the same NH formulation the midday-application in S-PG11 resulted in betterweed control than the late afternoon application in S-PG12. Labels of commercial NH formulation statethat application timing is irrelevant. However, compared with formulations only containing CMD, NaCladds osmotic stress to the acute toxicity of CMD. At midday with highest temperatures the osmoticshock caused to plant tissue is highest. In fact, wilting at midday was observed to start within secondsafter application. Stomata closure cannot protect plants as it may be possible in the early morning orlate afternoon and leaf tissue dies o� immediately. At lower temperatures in the afternoon the leaf donot dry out as quickly and may give more time to plants to adjust to the stress. Apart from stomatalclosure plants may be able to form osmotic solutes during nighttime to adjust to the NaCl absorbed(Marschner and Marschner, 2012). Brainard et al. (2013) found that cloud cover, hence reduced solarradiation, did not a�ect weed control of vinegar and clove oil formulations. Nevertheless, high relativehumidity was found to improve weed control. On one hand, this may be due to the slower evaporationrate of the spraying solution at high relative humidity, and hence a prolonged time for AI to act uponplant tissue. On the other hand more stomata are open in these conditions, which may increase theAI entry into the leaf. Supporting this argument, it was also found for mineral oils that in the light,when stomata are open, plants were killed more easily, while when closed at night, their e�ect was low.Nevertheless, for mineral oils that penetrate plant tissue easily, the environmental conditions were lessimportant. Resuming, phytotoxicity of mineral oils is greatest on sunny and very hot weather (Baker,1970). Another argument that can explain more e�ective weed control for midday-application is that themembrane leakage displaces chlorophyll from the thylakoids. In the light this chlorophyll is sensitisedand forms radicals, which then cause peroxidation and further damage to membranes (Lederer et al.,
111
8 Discussion C: natural herbicide trials (Brazil)
2004). Deducing from screenings and �eld trials the moment most unfavourable for weed control is thelate afternoon, and with low temperatures or/and cloudy conditions. In conclusion, NH applicationsshould be realised when temperatures and radiation are highest. Noon is usually avoided for herbicideapplication in mainstream practice, due to faster drying of spray and the drift caused by stronger windsdue to thermal activity. However, drift o� is not a problem in banded application close to the groundwith a protective screen and midday application would therefore not a problem for NH application inOA.
8.4 Agronomic aspects of natural herbicides
8.4.1 Straw residue cover
One precondition for using the DS system in OA is a dense pre-crop mulch cover to reduce weedinfestation e�ciently. The rolling of pre-crop straw brings about certain problems: on one hand the soilcoverage is worse, on the other hand the problem was encountered that the protective screen interferedwith the upstanding straw residue. Furthermore, standing straw absorbs spraying solution and acts asa protection to weeds. For NH application chipping the pre-crop or pre-crop residues can therefore berecommended: the weeds emerge directly through the mulch cover and are not shielded by any straw.At the same time the distribution of chipped straw is more homogeneous and less soil is exposed tosolar radiation, which would favour germination of weed seeds (Finch-Savage and Leubner-Metzger,2006). For soybean, an important consideration is an early seeding date, before weeds begin to emerge.Weeds that emerge prior to soybean could be controlled with NH, but due to high costs applicationsshould be concentrated after crop emergence to limit the number of applications. Of both soybean �eldtrials, only LO-NH was managed without prior herbicide application. Seeding occurred early, and mostweeds only started emerging after crop emergence.
8.4.2 Application intervals and repetitions
In �eld trials one single application did not give satisfactory results. Other studies also con�rm thatmultiple applications are necessary for sustainable weed control (Young, 2004; Barker and Prostak, 2014).For the summer crop soybean two to three applications were necessary, and for late season common beanone or two applications. The interval length between applications was observed to be crucial to obtainpositive results. With the choice of an application interval in mid-summer of about seven days, weedshad resprouted and had nearly regrown to their original size by the subsequent application, which leadto relatively low weed injury ratings and high weed biomass in PG-NH, LO-NH. It seems reasonable toassume that the second application has to be timed shortly after the beginning of resprouting of survivingweeds. In dicot weeds the apical dominance is usually broken due to damage to or destruction of theapical meristem. The resprouting of the remaining lateral meristems therefore occurs simultaneously.During resprouting weeds are not able accumulate photosynthates but are forced to consume theirenergy reserves and to expose sensitive meristems, which is why this is thought to be the ideal momentfor the subsequent NH application. Depending on temperature an estimate for the interval betweenapplications ranges from about four days in mid-summer (November / December) to six to eight daysfor late season crops (March / April).
8.4.3 Requirements for spraying equipment
The tested NH formulations all possess a non-selective burn-down e�ect on plants, hence crops needto be protected from NH spray. The protective screens available at both sides had the disadvantageof interfering with the rolled straw, which was pointing up frequently. In consequence in none of thePG trials a protective screen was used. In common bean conventional tillage (CT) trials the unshieldedapplication did not cause greater damage to crop, but in PG-NH damage was considerable, which stronglyaltered trial results. In contrast, in Londrina large PVC tubes were used to cover the small plantletsfrom spray, which allowed for su�cient crop protection. Even with a protective screen, post-emergenceapplication can be di�cult to realise immediately after crop emergence, and only the centre of therow can be band-sprayed without risking injury to sensitive crop seedlings. This requires specialised
112
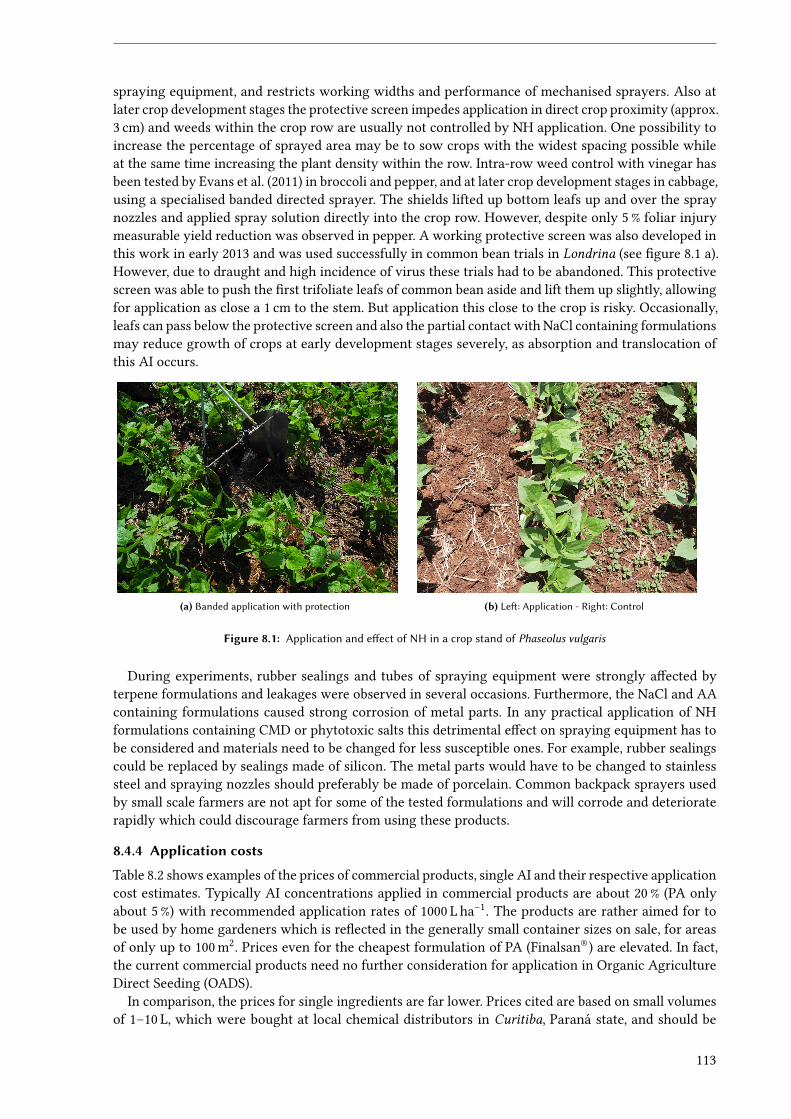
spraying equipment, and restricts working widths and performance of mechanised sprayers. Also atlater crop development stages the protective screen impedes application in direct crop proximity (approx.3 cm) and weeds within the crop row are usually not controlled by NH application. One possibility toincrease the percentage of sprayed area may be to sow crops with the widest spacing possible whileat the same time increasing the plant density within the row. Intra-row weed control with vinegar hasbeen tested by Evans et al. (2011) in broccoli and pepper, and at later crop development stages in cabbage,using a specialised banded directed sprayer. The shields lifted up bottom leafs up and over the spraynozzles and applied spray solution directly into the crop row. However, despite only 5 % foliar injurymeasurable yield reduction was observed in pepper. A working protective screen was also developed inthis work in early 2013 and was used successfully in common bean trials in Londrina (see �gure 8.1 a).However, due to draught and high incidence of virus these trials had to be abandoned. This protectivescreen was able to push the �rst trifoliate leafs of common bean aside and lift them up slightly, allowingfor application as close a 1 cm to the stem. But application this close to the crop is risky. Occasionally,leafs can pass below the protective screen and also the partial contact with NaCl containing formulationsmay reduce growth of crops at early development stages severely, as absorption and translocation ofthis AI occurs.
(a) Banded application with protection (b) Le�: Application - Right: Control
Figure 8.1: Application and e�ect of NH in a crop stand of Phaseolus vulgaris
During experiments, rubber sealings and tubes of spraying equipment were strongly a�ected byterpene formulations and leakages were observed in several occasions. Furthermore, the NaCl and AAcontaining formulations caused strong corrosion of metal parts. In any practical application of NHformulations containing CMD or phytotoxic salts this detrimental e�ect on spraying equipment has tobe considered and materials need to be changed for less susceptible ones. For example, rubber sealingscould be replaced by sealings made of silicon. The metal parts would have to be changed to stainlesssteel and spraying nozzles should preferably be made of porcelain. Common backpack sprayers usedby small scale farmers are not apt for some of the tested formulations and will corrode and deterioraterapidly which could discourage farmers from using these products.
8.4.4 Application costs
Table 8.2 shows examples of the prices of commercial products, single AI and their respective applicationcost estimates. Typically AI concentrations applied in commercial products are about 20 % (PA onlyabout 5 %) with recommended application rates of 1000 L ha−1. The products are rather aimed for tobe used by home gardeners which is re�ected in the generally small container sizes on sale, for areasof only up to 100 m2. Prices even for the cheapest formulation of PA (Finalsan®) are elevated. In fact,the current commercial products need no further consideration for application in Organic AgricultureDirect Seeding (OADS).
In comparison, the prices for single ingredients are far lower. Prices cited are based on small volumesof 1–10 L, which were bought at local chemical distributors in Curitiba, Paraná state, and should be
113
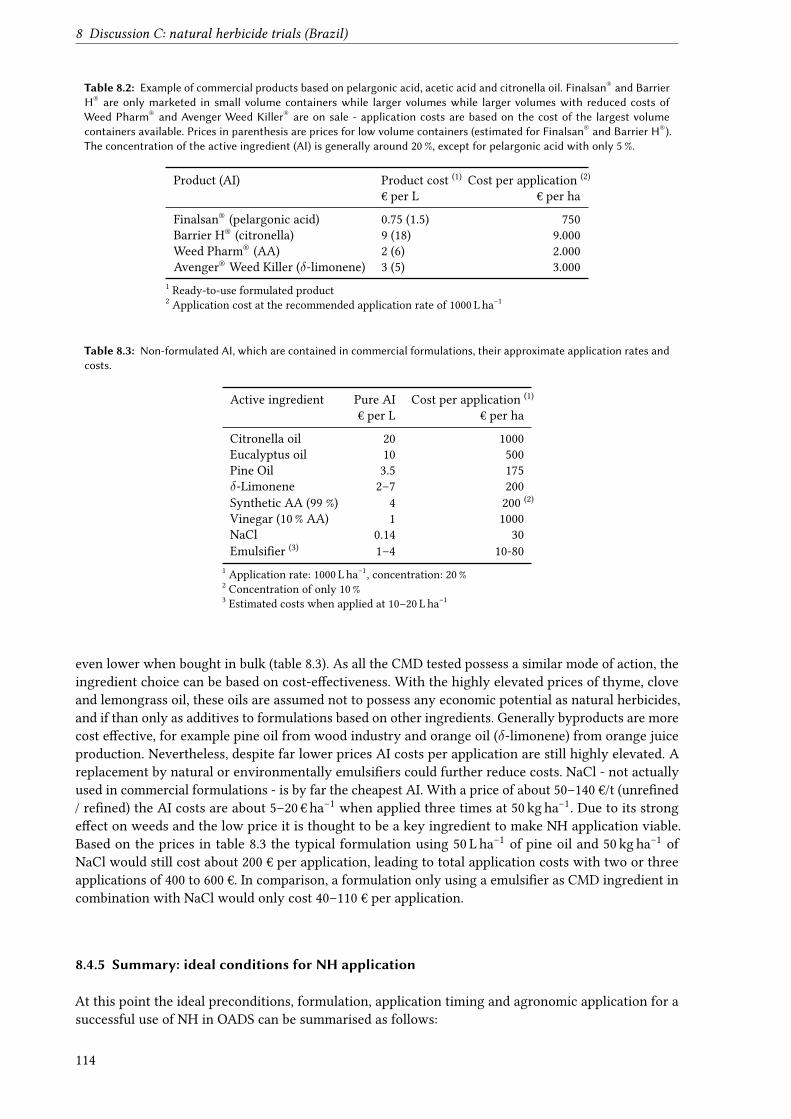
8 Discussion C: natural herbicide trials (Brazil)
Table 8.2: Example of commercial products based on pelargonic acid, acetic acid and citronella oil. Finalsan® and BarrierH® are only marketed in small volume containers while larger volumes while larger volumes with reduced costs ofWeed Pharm® and Avenger Weed Killer® are on sale - application costs are based on the cost of the largest volumecontainers available. Prices in parenthesis are prices for low volume containers (estimated for Finalsan® and Barrier H®).The concentration of the active ingredient (AI) is generally around 20 %, except for pelargonic acid with only 5 %.
Product (AI) Product cost (1) Cost per application (2)
€ per L € per ha
Finalsan® (pelargonic acid) 0.75 (1.5) 750Barrier H® (citronella) 9 (18) 9.000Weed Pharm® (AA) 2 (6) 2.000Avenger® Weed Killer (δ-limonene) 3 (5) 3.000
1 Ready-to-use formulated product2 Application cost at the recommended application rate of 1000 L ha−1
Table 8.3: Non-formulated AI, which are contained in commercial formulations, their approximate application rates andcosts.
Active ingredient Pure AI Cost per application (1)
€ per L € per ha
Citronella oil 20 1000Eucalyptus oil 10 500Pine Oil 3.5 175δ-Limonene 2–7 200Synthetic AA (99 %) 4 200 (2)
Vinegar (10 % AA) 1 1000NaCl 0.14 30Emulsi�er (3) 1–4 10-80
1 Application rate: 1000 L ha−1, concentration: 20 %2 Concentration of only 10 %3 Estimated costs when applied at 10–20 L ha−1
even lower when bought in bulk (table 8.3). As all the CMD tested possess a similar mode of action, theingredient choice can be based on cost-e�ectiveness. With the highly elevated prices of thyme, cloveand lemongrass oil, these oils are assumed not to possess any economic potential as natural herbicides,and if than only as additives to formulations based on other ingredients. Generally byproducts are morecost e�ective, for example pine oil from wood industry and orange oil (δ-limonene) from orange juiceproduction. Nevertheless, despite far lower prices AI costs per application are still highly elevated. Areplacement by natural or environmentally emulsi�ers could further reduce costs. NaCl - not actuallyused in commercial formulations - is by far the cheapest AI. With a price of about 50–140 €/t (unre�ned/ re�ned) the AI costs are about 5–20 € ha−1 when applied three times at 50 kg ha−1. Due to its stronge�ect on weeds and the low price it is thought to be a key ingredient to make NH application viable.Based on the prices in table 8.3 the typical formulation using 50 L ha−1 of pine oil and 50 kg ha−1 ofNaCl would still cost about 200 € per application, leading to total application costs with two or threeapplications of 400 to 600 €. In comparison, a formulation only using a emulsi�er as CMD ingredient incombination with NaCl would only cost 40–110 € per application.
8.4.5 Summary: ideal conditions for NH application
At this point the ideal preconditions, formulation, application timing and agronomic application for asuccessful use of NH in OADS can be summarised as follows:
114
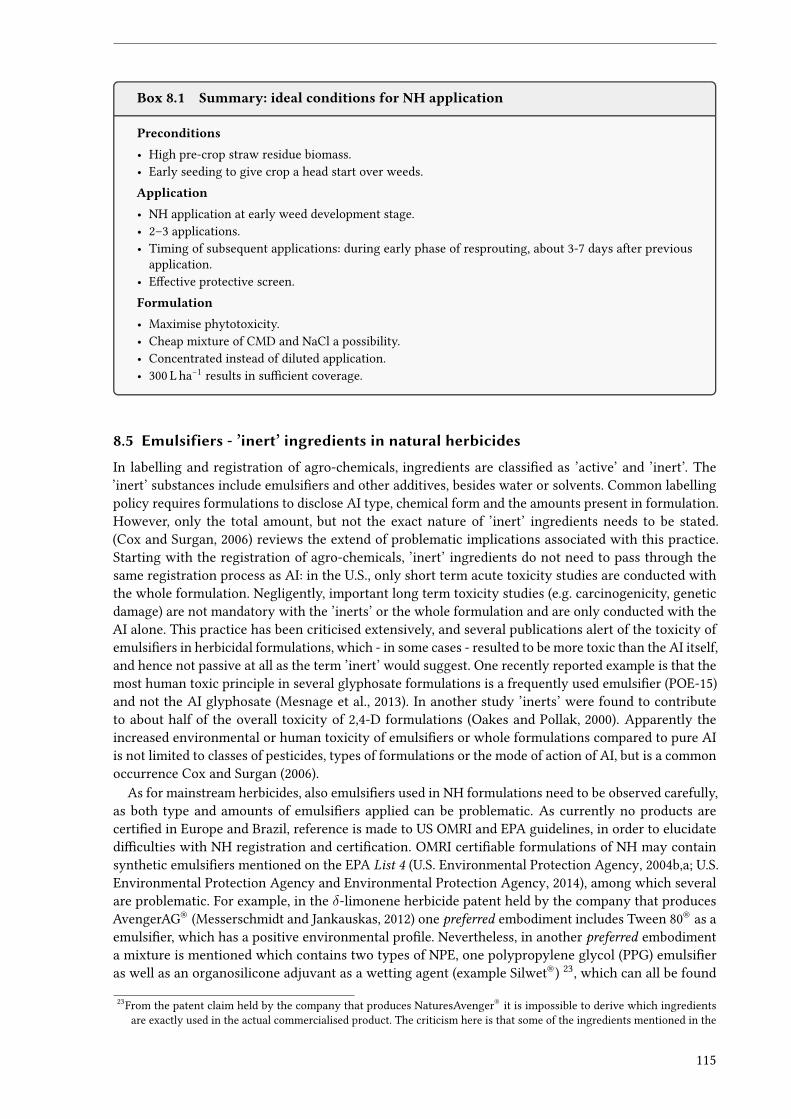
Box 8.1 Summary: ideal conditions for NH application
Preconditions• High pre-crop straw residue biomass.• Early seeding to give crop a head start over weeds.Application• NH application at early weed development stage.• 2–3 applications.• Timing of subsequent applications: during early phase of resprouting, about 3-7 days after previous
application.• E�ective protective screen.Formulation• Maximise phytotoxicity.• Cheap mixture of CMD and NaCl a possibility.• Concentrated instead of diluted application.• 300 L ha−1 results in su�cient coverage.
8.5 Emulsifiers - ’inert’ ingredients in natural herbicides
In labelling and registration of agro-chemicals, ingredients are classi�ed as ’active’ and ’inert’. The’inert’ substances include emulsi�ers and other additives, besides water or solvents. Common labellingpolicy requires formulations to disclose AI type, chemical form and the amounts present in formulation.However, only the total amount, but not the exact nature of ’inert’ ingredients needs to be stated.(Cox and Surgan, 2006) reviews the extend of problematic implications associated with this practice.Starting with the registration of agro-chemicals, ’inert’ ingredients do not need to pass through thesame registration process as AI: in the U.S., only short term acute toxicity studies are conducted withthe whole formulation. Negligently, important long term toxicity studies (e.g. carcinogenicity, geneticdamage) are not mandatory with the ’inerts’ or the whole formulation and are only conducted with theAI alone. This practice has been criticised extensively, and several publications alert of the toxicity ofemulsi�ers in herbicidal formulations, which - in some cases - resulted to be more toxic than the AI itself,and hence not passive at all as the term ’inert’ would suggest. One recently reported example is that themost human toxic principle in several glyphosate formulations is a frequently used emulsi�er (POE-15)and not the AI glyphosate (Mesnage et al., 2013). In another study ’inerts’ were found to contributeto about half of the overall toxicity of 2,4-D formulations (Oakes and Pollak, 2000). Apparently theincreased environmental or human toxicity of emulsi�ers or whole formulations compared to pure AIis not limited to classes of pesticides, types of formulations or the mode of action of AI, but is a commonoccurrence Cox and Surgan (2006).
As for mainstream herbicides, also emulsi�ers used in NH formulations need to be observed carefully,as both type and amounts of emulsi�ers applied can be problematic. As currently no products arecerti�ed in Europe and Brazil, reference is made to US OMRI and EPA guidelines, in order to elucidatedi�culties with NH registration and certi�cation. OMRI certi�able formulations of NH may containsynthetic emulsi�ers mentioned on the EPA List 4 (U.S. Environmental Protection Agency, 2004b,a; U.S.Environmental Protection Agency and Environmental Protection Agency, 2014), among which severalare problematic. For example, in the δ-limonene herbicide patent held by the company that producesAvengerAG® (Messerschmidt and Jankauskas, 2012) one preferred embodiment includes Tween 80® as aemulsi�er, which has a positive environmental pro�le. Nevertheless, in another preferred embodimenta mixture is mentioned which contains two types of NPE, one polypropylene glycol (PPG) emulsi�eras well as an organosilicone adjuvant as a wetting agent (example Silwet®) 23, which can all be found
23From the patent claim held by the company that produces NaturesAvenger® it is impossible to derive which ingredientsare exactly used in the actual commercialised product. The criticism here is that some of the ingredients mentioned in the
115
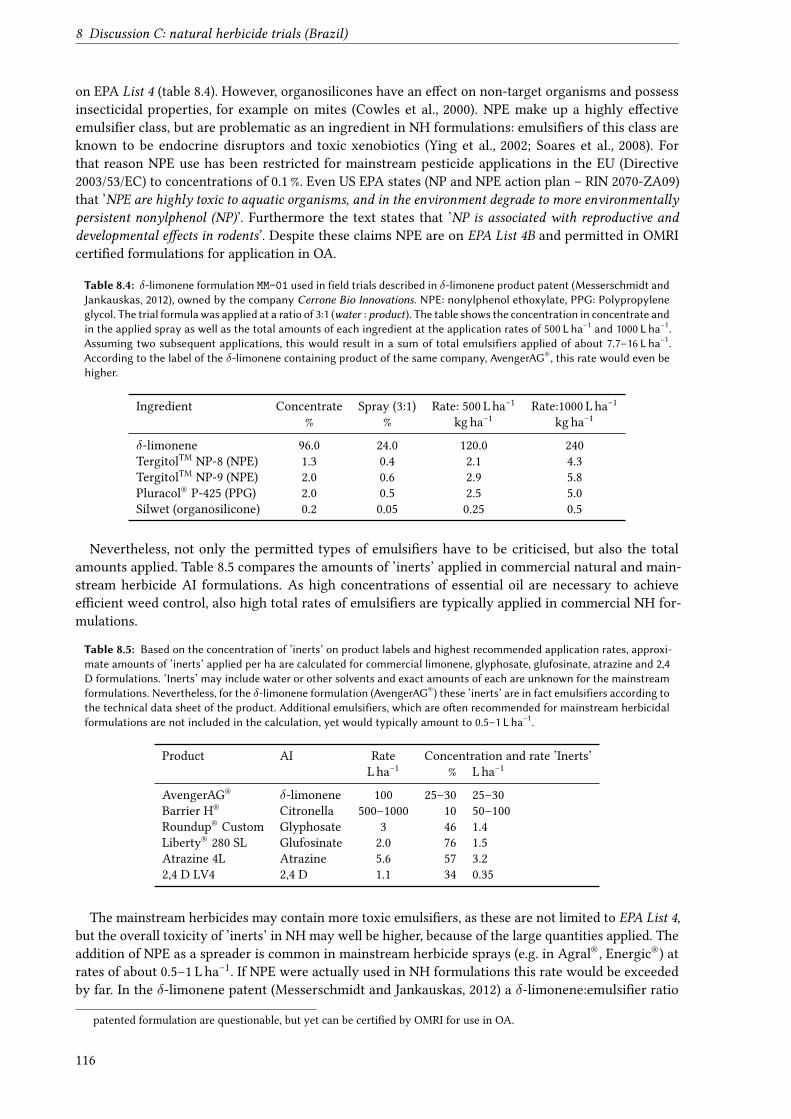
8 Discussion C: natural herbicide trials (Brazil)
on EPA List 4 (table 8.4). However, organosilicones have an e�ect on non-target organisms and possessinsecticidal properties, for example on mites (Cowles et al., 2000). NPE make up a highly e�ectiveemulsi�er class, but are problematic as an ingredient in NH formulations: emulsi�ers of this class areknown to be endocrine disruptors and toxic xenobiotics (Ying et al., 2002; Soares et al., 2008). Forthat reason NPE use has been restricted for mainstream pesticide applications in the EU (Directive2003/53/EC) to concentrations of 0.1 %. Even US EPA states (NP and NPE action plan – RIN 2070-ZA09)that ’NPE are highly toxic to aquatic organisms, and in the environment degrade to more environmentallypersistent nonylphenol (NP)’. Furthermore the text states that ’NP is associated with reproductive anddevelopmental e�ects in rodents’. Despite these claims NPE are on EPA List 4B and permitted in OMRIcerti�ed formulations for application in OA.
Table 8.4: δ-limonene formulation MM-01 used in field trials described in δ-limonene product patent (Messerschmidt andJankauskas, 2012), owned by the company Cerrone Bio Innovations. NPE: nonylphenol ethoxylate, PPG: Polypropyleneglycol. The trial formula was applied at a ratio of 3:1 (water : product). The table shows the concentration in concentrate andin the applied spray as well as the total amounts of each ingredient at the application rates of 500 L ha−1 and 1000 L ha−1.Assuming two subsequent applications, this would result in a sum of total emulsifiers applied of about 7.7–16 L ha−1.According to the label of the δ-limonene containing product of the same company, AvengerAG®, this rate would even behigher.
Ingredient Concentrate Spray (3:1) Rate: 500 L ha−1 Rate:1000 L ha−1
% % kg ha−1 kg ha−1
δ-limonene 96.0 24.0 120.0 240TergitolTM NP-8 (NPE) 1.3 0.4 2.1 4.3TergitolTM NP-9 (NPE) 2.0 0.6 2.9 5.8Pluracol® P-425 (PPG) 2.0 0.5 2.5 5.0Silwet (organosilicone) 0.2 0.05 0.25 0.5
Nevertheless, not only the permitted types of emulsi�ers have to be criticised, but also the totalamounts applied. Table 8.5 compares the amounts of ’inerts’ applied in commercial natural and main-stream herbicide AI formulations. As high concentrations of essential oil are necessary to achievee�cient weed control, also high total rates of emulsi�ers are typically applied in commercial NH for-mulations.
Table 8.5: Based on the concentration of ’inerts’ on product labels and highest recommended application rates, approxi-mate amounts of ’inerts’ applied per ha are calculated for commercial limonene, glyphosate, glufosinate, atrazine and 2,4D formulations. ’Inerts’ may include water or other solvents and exact amounts of each are unknown for the mainstreamformulations. Nevertheless, for the δ-limonene formulation (AvengerAG®) these ’inerts’ are in fact emulsifiers according tothe technical data sheet of the product. Additional emulsifiers, which are o�en recommended for mainstream herbicidalformulations are not included in the calculation, yet would typically amount to 0.5–1 L ha−1.
Product AI Rate Concentration and rate ’Inerts’L ha−1 % L ha−1
AvengerAG® δ-limonene 100 25–30 25–30Barrier H® Citronella 500–1000 10 50–100Roundup® Custom Glyphosate 3 46 1.4Liberty® 280 SL Glufosinate 2.0 76 1.5Atrazine 4L Atrazine 5.6 57 3.22,4 D LV4 2,4 D 1.1 34 0.35
The mainstream herbicides may contain more toxic emulsi�ers, as these are not limited to EPA List 4,but the overall toxicity of ’inerts’ in NH may well be higher, because of the large quantities applied. Theaddition of NPE as a spreader is common in mainstream herbicide sprays (e.g. in Agral®, Energic®) atrates of about 0.5–1 L ha−1. If NPE were actually used in NH formulations this rate would be exceededby far. In the δ-limonene patent (Messerschmidt and Jankauskas, 2012) a δ-limonene:emulsi�er ratio
patented formulation are questionable, but yet can be certi�ed by OMRI for use in OA.
116
of up to 4:1 is described, which at a recommended rate of 1000 L ha−1 and a concentration of 20 % δ-limonene would amount to about 50 L ha−1 emulsi�er per application. Independent of environmentale�ect, from the screenings conducted in this work it can be concluded that a wide range of emulsi�ershas a phytotoxic e�ect at doses near that magnitude, e.g. T80, MSO, SA or NPE. Furthermore, as δ-limonene e�ect was found to be extremely dependent on emulsi�er choice it can be assumed thatthe commercial product AvenverAG® also derives its herbicidal e�ect from the emulsi�ers contained,and not from the ingredient δ-limonene, which is declared as the AI on the product label. Thus, theexisting OMRI guidelines most certainly have to be reviewed critically with respect to the emulsi�erspermitted, especially for NH. Considering the synthetic nature, potential toxicity and the herbicidale�ect of emulsi�ers, certi�cations of some of the commercial NH products on the market may have tobe revoked.
117
9 Summary
9 SummaryDirect seeding (DS) is a cropping system, which compared with conventional tillage (CT) reduces labour,diesel consumption, and CO2-emissions drastically, and is highly e�ective in protecting soils againsterosion. In tropical climates torrential rains occur frequently, and the use of the direct-seeding systemhas to be considered mandatory for annual cropping, in order to avoid soil degradation by erosion and tothereby preserve soil fertility in the long-term. The same holds true for erosion prone soils on hillsides intemperate climate. Organic farming, which accepts soil fertility losses by strong erosion due to intensetillage management, cannot be considered sustainable. The implementation of occasional DS is of greatinterest to Organic Agriculture (OA) but the system faces severe restrictions.
Especially plant nutrition with sulphur and phosphorus is assumed to be limited under DS manage-ment. In temperate climate, the lower soil temperatures in DS and the higher top-soil density reducesoil organic matter (SOM) mineralisation rates, and crop �ne root formation in comparison to tillagesystems. In consequence, availability of phosphorus (P) and sulphur (S) is decreased. S-inputs by fertil-isation and atmospheric deposition are also generally low, which holds true for rural sites in tropicalclimate as well. In tropical soils P de�ciency is frequently caused by subsoil Al-toxicity, low P-contentsand P-�xation. The biggest constraint for the realisation of DS in OA are high weed pressures. Eventhough straw residues of cereal crops are able to suppress weeds up to a certain extent, weed control isine�cient without further measures. The research goal of the work at hand was to address both weedcontrol and plant nutrition restrictions in DS for grain legumes in OA of Germany and Brazil. In orderto improve nutrient supply with P and S, rock phosphate (RP) and di�erent sulphur fertilisers wereapplied intra-row. Field trials were conducted in seasons 2011/12 with DS faba bean in Germany and in2012/13 with DS soybean in Brazil.
The second research approach primarily studied weed control with natural herbicides. These werethoroughly examined in Brazil in screening trials with spontaneously emerged weeds, in �eld trials withdirect-seeded soybean, and with common bean under conventional tillage. As a second weed controlstrategy, results of previous works which studied weed control with straw residues in temperate climateDS were validated. Therefore, treatments with di�erent amounts of oats straw residue were includedinto the fertiliser trials in Germany in the second trial year.
9.1 P and S fertilisation in direct-seeding in temperate climate (Germany)
Fertiliser trials with direct-seeded faba bean were conducted on a luvisol soil formed on loess at CampusKlein Altendorf in 2011 (KA), and on a �uvisol at Wiesengut in 2012 (WG). In the S-Trial at KA, sulphurwas applied intra-row at a rate of 40 kg ha−1 in the forms of gypsum (CaSO4 ·2 H2O), potassium sulphate(K2SO4), and elemental sulphur (S0). An additional KCl treatment examined the e�ect of K-fertilisation ata rate of 97 kg ha−1 K, which is equivalent to the amount of K applied in K2SO4 treatment. In the P-Trial,the e�ects of intra-row appliedGafsa rock phosphate (RP) were studied. As the low solubility of RP limitsP-supply, it was intended to increase its dissolution by simultaneous application of elemental sulphur,which upon oxidation by Thiobacillus de fact bacteria liberates sulphuric acid in situ. The treatmentswere RP, applied at 50 kg ha−1 P, elemental sulphur at 40 kg ha−1 S, and the combination of the two. BothP- and S-Trial had a non-fertilised control.
At site WG in 2012, fertiliser treatments were examined in combination with mulch straw biomasstreatments under OA management. In the three-factorial trial WG-PS, the fertiliser treatment consistedof RP in combination with elemental sulphur, and a control treatment. The second treatment factor wasoats straw biomass, which consisted of the treatments 0, 4, and 6 t ha−1 oats straw. The third treatmentfactor was the oats cutting height at harvest, consisting of a conventional low cut at the plant base, anda high cut just below the panicle followed by rolling the straw with a roller-crimper. On the same �eldthree split-plot trials were conducted, in which oats was harvested with a high cut. The gypsum trial(WG-G) and the potassium sulphate trial (WG-K) each consisted of two whole-plot fertiliser treatments: acontrol, and a gypsum treatment for WG-G, and a control and a K2SO4 treatment for WG-K. Furthermore,each trial had the same oats straw biomass treatments as the WG-PS trial within the split-plots. Of a thirdsplit-plot trial with molybdenum application (WG-M), only the oats straw treatments were evaluated.
118
Phosphorus The soil at the trial sites in Germany contained phosphorus at a recommended level(LUFA C). RP fertiliser applications, alone and in combination with elemental sulphur, in both years didnot result in a positive e�ect on crop growth, P-uptake and -concentration. The lower soil temperaturesin the DS system, the higher top-soil density, and the reduced aeration compared to tilled soils, all did notlimit root development to the extent that P-uptake was compromised. Due to P-su�ciency, for Germantrial sites no conclusions can be drawn whether the combined application of RP and elemental sulphuris able to improve P-supply: in 2011 elemental sulphur was applied as pellets, which did not disintegratewell in soil, and in 2012 only the combined application of both treatments was examined. Trials wouldhave to be repeated on sites with lower P-content.
Sulphur In both years the sulphate fertiliser treatments had a strong and almost identical e�ect onS-uptake into shoot and grain, with an increase of up to 40 % compared with the control. The morenarrow N:S ratio in grain indicated that grain contained higher amounts of the S-containing amino-acidscysteine and methionin, which would mean an improvement in grain nutritional quality. Elementalsulphur showed a weaker e�ect, only apparent in grain. This could in part be attributed to the applicationof S0 as pellets. These only possessed a small surface in contact with the soil, resulting in delayed sulphateliberation. While in 2011 no impact on crop growth was found, in 2012 shoot growth and grain yieldwere in part signi�cantly increased.
The sulphur balance determined for the experimental sites in Germany was found to be negative,as atmospheric inputs did not balance harvest exports over the crop rotation. Also, lixiviation lossesin the neutral and relatively permeable soils are high. Nevertheless, the main reason for the presenceof S-de�ciency was attributed to the kinetic limitation of SOM mineralisation caused by lower soiltemperatures under DS management. Furthermore, the low SOM-mineralisation rates limit crop S-supplyindependent of nutrient balance. Therefore, the application of sulphur fertilisers to grain legumes isconsidered mandatory for occasional DS in temperate Germany. Generally, the S-fertilisers gypsum,K2SO4, and S0 are all able to guarantee su�cient S-supply to the faba bean crop. S0 has the advantage thatthe oxidation speed can be roughly controlled by the choice of sulphur particle size. While a long-terme�ect can be achieved with larger particle sizes, colloidal elemental sulphur has to be chosen to obtaina short-term fertiliser e�ect (Chapman, 1989; Germida and Janzen, 1993).
The work at hand cannot conclude if lower SOM mineralisation rates in direct-seeding were thecause for the lower S-uptake in non-fertilised plots. To better understand the implications of nutrientsupply of P and S in the DS system in comparison to CT, the trials should be repeated including fertilisertreatments in both the DS and the CT system.
Oats straw residue In WG trials, increasing the amount of oats straw showed a signi�cant positivee�ect, or at least a trend to increase crop growth and grain yield, which con�rms results of Massucatiet al. (2010). In trial WG-PS, the high cut at oats harvest had a negative impact on weed control, becausesoil coverage by mulch and shading was reduced, which lead to the formation of a higher weed shootdrymass and to lower crop growth.
9.2 P and S fertilisation in direct-seeding in tropical climate (Brazil)The same P-Trial and S-Trial as in Germany were conducted in Brazil with DS soybean, in 2012and 2013 (year of harvest) on clayey ferralsol soils in Londrina (LO) and Ponta Grossa (PG), and in 2013on a sandy ferralsol soil in Umuarama (UM). Additionally to Gafsa RP a less soluble Brazilian AlvoradaRP was applied, alone and combined with S0.
Phosphorus For Gafsa and Alvorada RP, applied alone and in combination with elemental sulphur,no crop response was determined at trial sites with medium to high soil P-contents. On a highly acidand P-poor ferralsol in PG, the P-Trial was repeated for two consecutive years with the exact sameplot treatments. In both trial years positive e�ects of P-fertilisation were apparent, with increased shootgrowth, grain yield, and P-uptake, especially in the second year. Furthermore, in these trials the additionof elemental sulphur further increased P-uptake and elevated shoot growth as well as yield for both
119
9 Summary
P-fertilisers, with a stronger e�ect for Gafsa treatments. The S0 application alone caused a distinctgrowth depression in 2013, presumably because sulphuric acid formation increased the already presentAl-toxicity, and thereby restricted crop root development. In combined applications of RP and S0, thisacidity was bu�ered by the dissolution of RP. On P-poor soils it should be examined if the e�ect ofthe combinations of RP and S0 can further be increased by inoculation of the fertiliser mixture withThiobacillus sp. bacteria, weeks prior to application (Aria et al., 2010).
Sulphur In a total of �ve trials and over two years no response in crop growth, grain yield, and nutrientuptake was found for sulphur fertilisation, not even at the S-de�ciency prone sandy ferralsol site UM.Only the gypsum application in Londrina 2013 had a positive e�ect on crop growth, but the e�ect wasinterpreted as a result of amelioration of Al-toxicity, and not attributed directly to sulphate application,because the even more soluble K2SO4 exhibited no response. In tropical soils mineralisation rates arerelatively high. Furthermore, large amounts of plant available SO 2–
4 are adsorbed to sesquioxides andkaolinite in acid tropical variable charge soils, which also restricts leaching losses despite high amountsof rainfall. In all trials both the combination of high SOM mineralisation rates and large pools of adsorbedsulphate were concluded to be able to fully meet crop S-supply. Sulphur �ows at experimental sites werenot balanced, and even without considering additional leaching losses, yield exports alone exceededatmospheric inputs. Therefore, sulphur de�ciency may become a problem in the long term. Nevertheless,intra-row application of S-fertilisers is not considered necessary. With low soil pH, Al-toxicity is one ofthe major limitations for crop productivity in ferralsol soils, and in some of the trials high saturationlevels of Al +
3 were present. Therefore, emphasis should rather be put on amelioration of Al-toxicity.Al-saturation and calcium contents in subsoil should be monitored and gypsum applied periodicallywhenever critical values are reached. Thereby su�cient quantities of S are supplied to soils and noS-de�ciency has to be expected. In conclusion, further research on intra-row application of sulphurfertilisers for Brazilian sites is not considered necessary.
9.3 Natural herbicidesThe screening trials were realised in previously cultivated �elds with recently emerged spontaneousvegetation. The active ingredient (AI) tested in screenings were mainly the essential oils δ-limoneneand pine oil, acetic acid (AA), and NaCl, apart from a variety of emulsi�ers. Other essential oils such ascitronella or eucalypt oil were discarded due to insu�cient e�ect or prohibitive costs. In all screenings,per-species visual weed injury ratings were estimated, with 0 indicating no weed damage, a ratingabove 70 acceptable, and 100 complete weed control. Furthermore, a total of �ve natural herbicide(NH) �eld trials were conducted, two with DS soybean, and three trials with late season CT commonbean, all including a weedy and a clean control plot. In a two factorial split-plot trial in Ponta Grossawith DS soybean (PG-NH), the whole-plot factor consisted of a high and a low weed density treatment(di�erent weed densities were the result of seed bank reduction trials in previous years). The two NH-formulations tested contained 50 L ha−1 δ-limonene or pine oil, 50 kg ha−1 NaCl, and 10 L ha−1 emulsi�er(Renex 95®). These formulations were band-sprayed between crop rows at a rate of 600 L ha−1. The split-plot treatments consisted of one, two and three applications of both formulations, with a week intervalbetween subsequent applications. In the Latin square soybean DS trial in Londrina (LO-NH), a totalamount of 90 L ha−1 essential oil (δ-limonene or pine oil), 90 kg ha−1 NaCl, and 20 L ha−1 emulsi�er Renex95® was applied, either concentrated in two applications (45 L ha−1 terpene, 45 kg ha−1 NaCl) or dilutedin three applications (30 L ha−1 terpene, 30 kg ha−1 NaCl), again with an interval of a week betweensubsequent applications. In the one factorial common bean trial PG-Lim, the spray treatments were 25Lim-300 (25 L ha−1 δ-limonene at a rate of 300 L ha−1), 50 Lim-300, 50 Lim-600, 50 Lim-900 and 75Lim-900. In the second one factorial common bean trial PG-Pine, the treatments were 25 Pin-300,25 Pin-600, 50 Pin-300 and 50 Pin-600. In both trials all spray treatments additionally contained50 kg ha−1 NaCl and 10 L ha−1 emulsi�er Tween 80®. Applications were realised twice at an interval offour days. In all NH �eld trials crop and weed shoot dry mass as well as grain yield were determined.Weed control was estimated with visual weed injury ratings per species (Ponta Grossa trials) or weedcover (Londrina). In a third CT common bean trial the e�ect of soil applied NaCl was studied to determine
120
if the total NaCl amounts applied have a negative impact on crop growth by root absorption (PG-NaCl).Treatments consisted of a control plot and three NaCl treatments in which 50 kg ha−1 NaCl were sprayapplied to the inter-row space once, twice and three times, at an interval from four to �ve days betweenapplications. Plots were kept weed free.
Results screening trials The screening trials con�rmed the �ndings of prior works, that applicationof formulations of cell membrane disruptors (CMD) alone, like AA, essential oils, or pelargonic acid(PA), are not viable for application in agricultural practice. Weeds readily resprout, and already the costof a single application is highly elevated. In most trials both the essential oils pine oil and δ-limonenewere used. However, δ-limonene proved to be extremely ine�cient, and most of the e�ect was relatedto the emulsi�ers contained within the formulation. In screenings it could be shown that at least forAA and essential oil formulations the concentration and dilution of ingredients plays a crucial role,more than the application rate. Applying a given amount of product in a concentrated form at a lowerapplication rate, resulted in better weed control than the diluted application. Spray applied NaCl atrates of 120 kg ha−1 caused weak or no weed damage only. However, in combination with CMD, NaClrates of 50–120 kg ha−1 strongly increased phytotoxicity. NaCl on one hand damages plants throughstrong osmotic stress, but also introduces a systemic e�ect to formulations as it is translocated to youngmeristems, which frequently die o�. Resprouting of weeds occurs less frequently and is both reducedand delayed. In combination with NaCl the concentrations of CMD ingredients used initially could bedecreased from rates of 150–200 L ha−1 to 50 L ha−1 for pine oil. Emulsi�ers were found to a�ect NHe�cacy strongly, not only because of their e�ect on emulsion stability, but because of a proper herbicidale�ect occurring at the large quantities applied in NH formulations, which is similar to that of CMDingredients.
Results field trials In trial PG-NH, weed control with one and two application repetitions was unsat-isfactory, while three repetitions of both formulations nearly achieved su�cient weed control. It wasconcluded that the application intervals were too long, as weeds had resprouted and regrown nearlyto their original size at the subsequent applications. Weed shoot dry mass was reduced for all spraytreatments compared with control (4.7 t ha−1), but even in the three application treatments about 2 t ha−1
weed shoot dry mass remained. As spray application was realised without the use of a protective screen,strong phytotoxicity and reduced crop growth and yield resulted. Despite of crop damage, three appli-cations of the δ-limonene formulation gave comparable yields to the control treatment. Weed densityalso in�uenced weed and crop growth: even though not signi�cant (n.s.), the average weed dry masswas 2.1 t ha−1 for the low and 3.4 t ha−1 for the high weed density. Also, reductions for shoot dry mass(7.0 t ha−1, 6.2 t ha−1) and grain yield (3.4 t ha−1, 2.9 t ha−1) were found for low and high weed density,respectively (both n.s.). In trial LO-NH weed cover was reduced strongly by all spray treatments, withconcentrated applications achieving improved results. At the last evaluation 39 days after emergence(DAE), weed cover was 68 % for the weedy control, 10 % for both concentrated and 20 % for both dilutedapplication treatments. Weed dry mass (88 DAE) was 3.5 t ha−1 for weedy control, 1.4 t ha−1 for 2xLim-C,1.8 t ha−1 for 2xPin-C, 2.4 t ha−1 for 3xLim-D and 2.0 t ha−1 for 3xPin-D. Shoot dry mass (also evaluated88 DAE) was 4.4 t ha−1 for clean control, 2.8 t ha−1 in weedy control, 4.4 t ha−1 in 2xLim-C, 4.1 t ha−1 in2xPin-C, 3.5 t ha−1 3xLim-D, 3.9 t ha−1 3xPin-D. Grain yield was 3.2 t ha−1 for clean control, 1.5 t ha−1
in weedy control, 1.9 t ha−1 in 2xLim-C, 2.3 t ha−1 in 2xPin-C, 1.3 t ha−1 3xLim-D, 1.5 t ha−1 3xPin-D.The concentrated applications clearly showed improved weed control and crop growth. However, cropgrowth and yield were strongly reduced in all spray treatments compared to control. Also grain qual-ity resulted low for all spray treatments and the weedy control, with a large proportion of green anddefect grain. In PG-Lim spray treatments achieved su�cient weed control with weed injury ratings fre-quently surpassing 75. Weed dry mass (73 DAE) was 2.5 t ha−1 in the weedy control, 0.6 t ha−1 in 25-8.3Lim-300, 0.1 t ha−1 in 50-16.7 Lim-300, 0.8 t ha−1 in 50-8.3 Lim-600, 0.4 t ha−1 50-5.6 Lim-900,and 0.0 t ha−1 in 75-8.3 Lim-900. Common bean shoot dry mass was only reduced in the weedy con-trol treatment with 2.0 t ha−1 compared with 2.8 t ha−1 in the clean control. Shoot dry mass in the spraytreatments was in the range of 2.2–2.7 t ha−1, however, this parameter was in part a�ected by phytotox-
121
9 Summary
icity. Grain yield was 2.7 t ha−1 for Clean and 1.5 t ha−1 for Weedy control, and spray treatments werein the range of 2.3–2.7 t ha−1. In PG-Pin weed injury ratings of spray treatments also often surpassed a75. While weed dry mass (73 DAE) in PG-Pin weedy control was 3.7 t ha−1, the best performing spraytreatment achieved near perfect weed control with only 0.2 t ha−1 remaining weed shoot dry mass. Alltreatments exhibited a similar common bean shoot dry mass, with 3.2 t ha−1 for the clean control and3.1 t ha−1 for the weedy control, which indicated a relatively low initial weed pressure in this trial. How-ever, a strong yield reduction was present for Weedy control with 1.8 t ha−1 compared with 2.8 t ha−1 forthe Clean control. Spray treatments had very similar yields compared with Clean control in a range of2.5–2.7 t ha−1. The intra-row application of NaCl in PG-NaCl did not have any negative e�ect on cropgrowth or yield even with three applications, totalling 150 kg ha−1 NaCl.
General conclusions NH trials In screening and �eld trials it was observed that most dicots couldbe controlled well until about the 4-leaf stage. Monocots were less sensitive. When grasses started toform tillers they were almost impossible to control, therefore application should occur up to 2-leaf stage.With CT common bean it was found that at least two applications were necessary to control weeds. InDS soybean rather three applications were necessary, due to higher weed growth rates in the summermonths. It was concluded that subsequent applications should occur when the weeds have started toresprout, and lateral bud meristems form enough area to intercept spray. Approximate recommendedintervals for soybean in tropical summer conditions are 3–5 days, and in late summer season commonbean crop about 7 days. Furthermore, the results suggest that in order to maximise the herbicidale�ect the application of NH formulations containing cell membrane disruptors (CMD) and NaCl shouldpreferably occur midday, when temperatures and irradiation are highest.
122
10 Outlook: natural herbicides in OA direct-seedingIn order to realise (occasional) direct-seeding successfully in OA, a dense mulch cover is a prerequisitein order to suppress weeds before crop emergence and during early crop development. High cutting ofstraw at harvest followed by a treatment with a roller-crimper, tested in the work at hand, is not a feasiblestrategy as it decreases mulch soil coverage, and because it presumably reduces the release of allelopathicsubstance by the straw. In order to guarantee an equal distribution and maximum soil coverage, the cerealpre-crop should be cut low and chipped at harvest. The biomass of allelopathic oats or rye straw shouldexceed 4 t ha−1. As weed control by mulches of annual weeds in tropical climate and of perennial weedsin temperate climate is insu�cient, the use of NH is thought to be indispensable for the implementationof successful Organic Agriculture Direct Seeding (OADS). NH containing cell membrane disruptors andNaCl could be the key to enable DS in OA. However, weed control is only su�cient if applied at earlyweed growth stages and if subsequent applications are timed correctly. Currently, the greatest problemare the highly elevated costs of NH formulations and their often unsatisfactory weed control, especiallywith respect to monocot species.
10.1 Improvement of formulations
NH formulations need to be improved and development should focus on non-selective total herbicides.These need be the most phytotoxic possible, while maintaining costs, human toxicity, and environmentalrisks at minimum. The primary scenario for the application NH is assumed to be in DS row crops, suchas grain legumes or maize, but products could also be applied in all other DS �eld crops prior to cropemergence. To decrease costs and improve NH e�ciency, expensive ingredients need to be substitutedby cheaper ones. In order to further improve e�cacy of NH, other phytotoxic mineral salts or AI withsystemic e�ects could be introduced to formulations.
10.1.1 Substitution of cell membrane disruptors
For the penetration of leaf cuticle and cell membranes CMD are assumed to be indispensable in NHformulations. Emulsi�ers by their e�ect are also CMD ingredients and could be another AI option forNH formulations: in screenings formulations containing only T80, SA, or NPE, in combination withNaCl gave moderate to acceptable results at a competitive cost. However, these are not of natural origin.Emulsi�ers of natural origin could be soaps made from vegetable oils. Nevertheless, a common problemwith these ionic emulsi�ers is that �occulation may occur when adding salts to the formulation. Allowingsynthetic emulsi�ers made of natural primary materials could be a reasonable exception for syntheticsubstances in NH certi�cation. For example, polyethylene glycol (PEG) emulsi�ers are a reaction productof sugar (or starch) and vegetable oil. They are proven to possess a low toxicity (Messinger et al., 2007),which is why they are widely used in cosmetics and food industry. Another toxicological safe syntheticsubstitute for the criticised nonylphenol ethoxylate (NPE) emulsi�er is Tween 80®, a synthetic emulsi�erused in food industry, which gave acceptable results in screenings.
It may also be possible to substitute expensive CMD by cheaper crude vegetable oils, which have canhave a weed control e�ect, presumably due their content of phytotoxic free fatty acids. Furthermore,biodiesel could be an AI in environmentally friendly contact herbicides, even though strictly speaking,biodiesel cannot fully be considered natural, as a simple transesteri�cation reaction is involved inproduction (saponi�cation of vegetable oil followed by esteri�cation of the resulting fatty acids withmethanol). Another potential candidate for replacement of CMD is fusel oil, a byproduct of ethanol fuelproduction from sugarcane, which has a similar mode of action. It is available in large quantities andat a low cost in Brazil. Doses of 375 L ha−1 and 500 L ha−1 fusel oil resulted in fast wilting followed byyellowing and drying of weed plants. The species Ipomoea hederifolia, Ipomoea quamoclit, Euphorbiaheterophylla, Digitaria spp., Cenchrus echinatus, and Panicum maximum were controlled e�ectively byfusel oil, when treated early after emergence (Azania et al., 2010, 2011). In another work e�cient (gradeB) control of monocots Digitaria insularis and Commelina benghalensis was achieved with rates of600–800 L ha−1 (Osipe et al., 2009). Promising about fusel oil is its low cost and that in contrast to CMDand NaCl formulations, an e�cient control of some monocot species is apparently possible.
123
10 Outlook: natural herbicides in OA direct-seeding
10.1.2 Phytotoxic salts
Combining CMD with NaCl was the most successful measure to improve formulation e�cacy, and todecrease NH application costs in this work. Further mineral salts with a predictive behaviour in theenvironment should be examined for their weed control potential in combination with CMD. Chlorideis responsible for most of NaCl toxicity, and at an equivalent chloride rate KCl application resultedin similar weed damage as NaCl Lukashyk (2005). Therefore, further chlorides such as MgCl2 ·6 H20or CaCl2 could also possess potential as AI in combination with CMD. Another phytotoxic mineralsalt for use in NH formulations might be iron-vitriol (FeSO4). It has already been used as a herbicidein the mid 19th century (Smith and Secoy, 1976; Timmons, 2005), and is still applied today as a mossherbicide or in lawn fertilisers. With a relatively high solubility of 256 g L−1, anhydrous FeSO4 couldbe spray applied at rates up to 100 kg ha−1 in NH formulations with relatively low costs: the price ofFeSO4 is currently in a range from 55–140 € per tonne. The substance exhibits acute toxicity to humansupon skin contact (skin resorption, caustic action), contact with mucus tissues, or upon swallowing.Nevertheless, the environmental pro�le is ideal and with careful handling it could be another AI optionfor NH formulations.
10.1.3 Active ingredients with systemic e�ect
As CMD enhance the permeability of the leaf cuticle, this port of entry should also be studied forallelopathic extracts or systemic AI. One option is manuka oil, the essential oil from the manuka treeLeptospermum scoparium, which shows pre- and post- herbicidal activity. It was successfully tested ina mixture with a commercial lemongrass oil herbicide (Dayan et al., 2011). In trials, monocotyledonousweeds exhibited lower chlorophyll and carotenoid contents in regrown leaf tissue as well as stuntedgrowth, apart from burn-down symptoms (Dayan et al., 2011). The β-triketones present in manuka oilhave the same molecular target site as the mainstream synthetic herbicides AI sulcotrione andmesotrione,namely the enzyme p-hydroxyphenylpyruvate dioxygenase (Dayan et al., 2007). Compared with all otheressential oils, the herbicidal activity of manuka oil is highest, and application volumes are relativelysmall with 0.5–3 L ha−1. With a systemic action and a pronounced e�ect on monocot weeds, manukaoil appears to be one of the most promising options to improve NH formulations or to base them uponthis oil.
A further possibility could be combining CMD with bialaphos 24, a tripeptide produced by Strep-tomyces viridichromogenes & hygroscopicus bacteria in soil. The substance is a pre-herbicide, whichis hydrolysed to 2-Alanin and L-phosphinotricin inside plant cells. Glufosinate, a racemate of L- andD-phosphinothricin, is its synthetic analogue, and a mainstream herbicide commercialised under thename Basta® or Liberty® (Copping and Duke, 2007; Duke and Dayan, 2011). The e�ects of bialaphos andglufosinate are identical, but the formulated product exhibits a weaker e�ect on weeds than glufosinatebased products. The substance is the only natural systemic AI that has ever been employed in a commer-cial product (Dayan et al., 2009). It was marketed as Herbiace® in Japan (Meiji Seika), yet the registrationexpired around 2010 and was not renewed. The market price per application was around 180 € (Infor-mation Meiji Seika), which, compared to current NH prices, can be considered low-priced. Bialaphosful�ls most criteria for an AI in NH: it is of natural origin and can be produced in biofermenters (Satohet al., 1993). Furthermore, its toxicological pro�le is acceptable, and the overall environmental pro�leappears to be positive. No long term e�ects such as carcinogenicity, teratogenicity, and mutagenicitywere found in studies with its synthetic analogue glufosinate ammonium (Ebert et al., 1990), and sus-pected reproductive toxicity of glufosinate has recently be refuted (Schulte-Hermann et al., 2006). Eventhough there is a notable toxicity of glufosinate on aquatic organisms (PAN Pesticides Database - Chem-icals), glufosinate is rarely found in the environment (Scribner et al., 2007), due to its fast decomposition.Therefore, glufosinate possesses a limited potential to pollute surface waters, which is assumed to besimilar for bialaphos. Apparently, bialaphos use in OA has never been considered. It should be testedand reviewed for certi�cation, alone and in formulation with other AI mentioned in this work.
Further substances with a systemic herbicidal action, that could be tested in CMD based formulations,24Bialaphos or bilanafos: tripeptide, which within the plant is hydrolysed to 2-Alanin and L-phosphinotricin
124
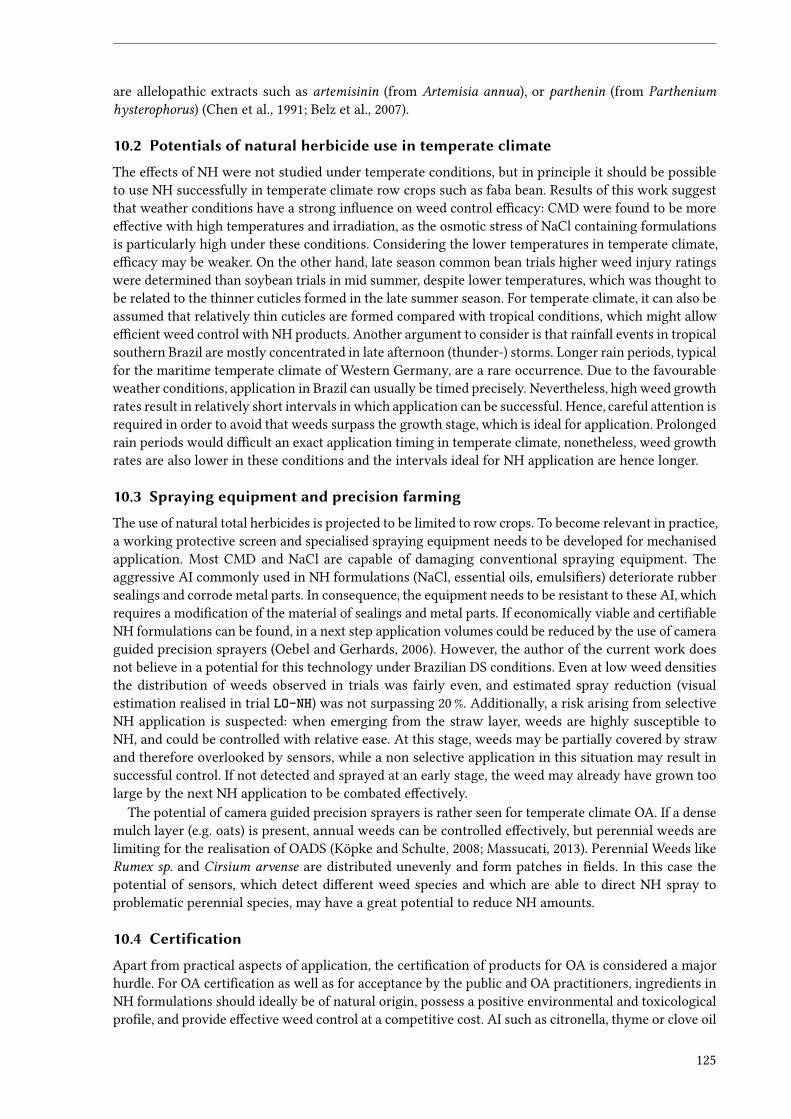
are allelopathic extracts such as artemisinin (from Artemisia annua), or parthenin (from Partheniumhysterophorus) (Chen et al., 1991; Belz et al., 2007).
10.2 Potentials of natural herbicide use in temperate climate
The e�ects of NH were not studied under temperate conditions, but in principle it should be possibleto use NH successfully in temperate climate row crops such as faba bean. Results of this work suggestthat weather conditions have a strong in�uence on weed control e�cacy: CMD were found to be moree�ective with high temperatures and irradiation, as the osmotic stress of NaCl containing formulationsis particularly high under these conditions. Considering the lower temperatures in temperate climate,e�cacy may be weaker. On the other hand, late season common bean trials higher weed injury ratingswere determined than soybean trials in mid summer, despite lower temperatures, which was thought tobe related to the thinner cuticles formed in the late summer season. For temperate climate, it can also beassumed that relatively thin cuticles are formed compared with tropical conditions, which might allowe�cient weed control with NH products. Another argument to consider is that rainfall events in tropicalsouthern Brazil are mostly concentrated in late afternoon (thunder-) storms. Longer rain periods, typicalfor the maritime temperate climate of Western Germany, are a rare occurrence. Due to the favourableweather conditions, application in Brazil can usually be timed precisely. Nevertheless, high weed growthrates result in relatively short intervals in which application can be successful. Hence, careful attention isrequired in order to avoid that weeds surpass the growth stage, which is ideal for application. Prolongedrain periods would di�cult an exact application timing in temperate climate, nonetheless, weed growthrates are also lower in these conditions and the intervals ideal for NH application are hence longer.
10.3 Spraying equipment and precision farming
The use of natural total herbicides is projected to be limited to row crops. To become relevant in practice,a working protective screen and specialised spraying equipment needs to be developed for mechanisedapplication. Most CMD and NaCl are capable of damaging conventional spraying equipment. Theaggressive AI commonly used in NH formulations (NaCl, essential oils, emulsi�ers) deteriorate rubbersealings and corrode metal parts. In consequence, the equipment needs to be resistant to these AI, whichrequires a modi�cation of the material of sealings and metal parts. If economically viable and certi�ableNH formulations can be found, in a next step application volumes could be reduced by the use of cameraguided precision sprayers (Oebel and Gerhards, 2006). However, the author of the current work doesnot believe in a potential for this technology under Brazilian DS conditions. Even at low weed densitiesthe distribution of weeds observed in trials was fairly even, and estimated spray reduction (visualestimation realised in trial LO-NH) was not surpassing 20 %. Additionally, a risk arising from selectiveNH application is suspected: when emerging from the straw layer, weeds are highly susceptible toNH, and could be controlled with relative ease. At this stage, weeds may be partially covered by strawand therefore overlooked by sensors, while a non selective application in this situation may result insuccessful control. If not detected and sprayed at an early stage, the weed may already have grown toolarge by the next NH application to be combated e�ectively.
The potential of camera guided precision sprayers is rather seen for temperate climate OA. If a densemulch layer (e.g. oats) is present, annual weeds can be controlled e�ectively, but perennial weeds arelimiting for the realisation of OADS (Köpke and Schulte, 2008; Massucati, 2013). Perennial Weeds likeRumex sp. and Cirsium arvense are distributed unevenly and form patches in �elds. In this case thepotential of sensors, which detect di�erent weed species and which are able to direct NH spray toproblematic perennial species, may have a great potential to reduce NH amounts.
10.4 Certification
Apart from practical aspects of application, the certi�cation of products for OA is considered a majorhurdle. For OA certi�cation as well as for acceptance by the public and OA practitioners, ingredients inNH formulations should ideally be of natural origin, possess a positive environmental and toxicologicalpro�le, and provide e�ective weed control at a competitive cost. AI such as citronella, thyme or clove oil
125
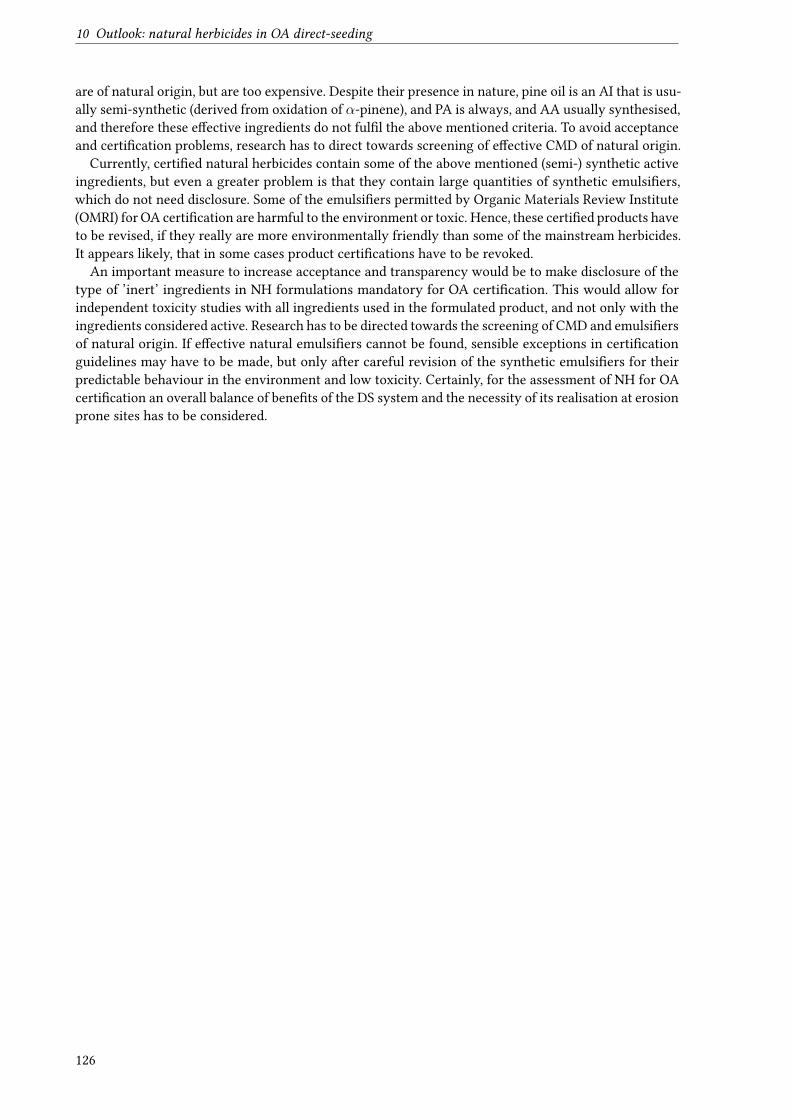
10 Outlook: natural herbicides in OA direct-seeding
are of natural origin, but are too expensive. Despite their presence in nature, pine oil is an AI that is usu-ally semi-synthetic (derived from oxidation of α-pinene), and PA is always, and AA usually synthesised,and therefore these e�ective ingredients do not ful�l the above mentioned criteria. To avoid acceptanceand certi�cation problems, research has to direct towards screening of e�ective CMD of natural origin.
Currently, certi�ed natural herbicides contain some of the above mentioned (semi-) synthetic activeingredients, but even a greater problem is that they contain large quantities of synthetic emulsi�ers,which do not need disclosure. Some of the emulsi�ers permitted by Organic Materials Review Institute(OMRI) for OA certi�cation are harmful to the environment or toxic. Hence, these certi�ed products haveto be revised, if they really are more environmentally friendly than some of the mainstream herbicides.It appears likely, that in some cases product certi�cations have to be revoked.
An important measure to increase acceptance and transparency would be to make disclosure of thetype of ’inert’ ingredients in NH formulations mandatory for OA certi�cation. This would allow forindependent toxicity studies with all ingredients used in the formulated product, and not only with theingredients considered active. Research has to be directed towards the screening of CMD and emulsi�ersof natural origin. If e�ective natural emulsi�ers cannot be found, sensible exceptions in certi�cationguidelines may have to be made, but only after careful revision of the synthetic emulsi�ers for theirpredictable behaviour in the environment and low toxicity. Certainly, for the assessment of NH for OAcerti�cation an overall balance of bene�ts of the DS system and the necessity of its realisation at erosionprone sites has to be considered.
126
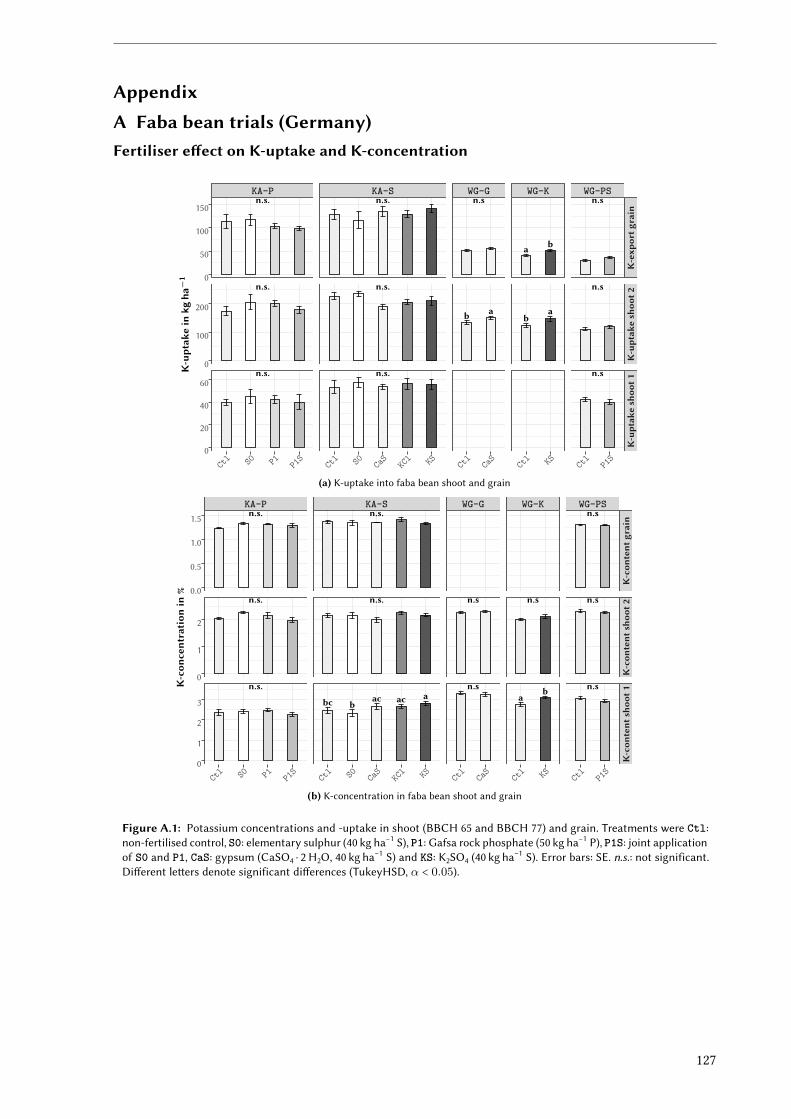
AppendixA Faba bean trials (Germany)Fertiliser e�ect on K-uptake and K-concentration
n.s.
n.s.
n.s.
n.s.
n.s.
n.s.
n.s
ab
a b
ba
n.s
n.s
n.s
KA-P KA-S WG-G WG-K WG-PS
K-exp
ortg
rain
K-uptak
esh
oot2
K-uptak
esh
oot1
Ctl S0 P1 P1
SCt
l S0 KCl KSCa
SCt
lCa
SCt
l KS Ctl
P1S
0
50
100
150
0
100
200
0
20
40
60
K-uptak
ein
kgha−
1
(a) K-uptake into faba bean shoot and grain
n.s.
n.s.
n.s.
n.s.
n.s.
bc bac ac a
n.s
n.s
n.s
ab
n.s
n.s
n.s
KA-P KA-S WG-G WG-K WG-PS
K-con
tent
grain
K-con
tent
shoo
t2K-con
tent
shoo
t1
Ctl S0 P1 P1
SCt
l S0 KCl KSCa
SCt
lCa
SCt
l KS Ctl
P1S
0.0
0.5
1.0
1.5
0
1
2
0
1
2
3
K-con
centration
in%
(b) K-concentration in faba bean shoot and grain
Figure A.1: Potassium concentrations and -uptake in shoot (BBCH 65 and BBCH 77) and grain. Treatments were Ctl:non-fertilised control, S0: elementary sulphur (40 kg ha−1 S), P1: Gafsa rock phosphate (50 kg ha−1 P), P1S: joint applicationof S0 and P1, CaS: gypsum (CaSO4 · 2 H2O, 40 kg ha−1 S) and KS: K2SO4 (40 kg ha−1 S). Error bars: SE. n.s.: not significant.Di�erent le�ers denote significant di�erences (TukeyHSD, α < 0.05).
127
A Faba bean trials (Germany)
Oats straw e�ect on shoot height, diameter and LAI
b ab a
c a b
b ab a
n.s
n.s
b ab a
n.s
n.s
n.s
b ab a
WG-G WG-K WG-M WG-PS All trials
Shoo
theigh
t2Sh
ooth
eigh
t1
0t 4t 6t 0t 4t 6t 0t 4t 6t 0t 4t 6t 0t 4t 6t
0
50
100
0
20
40
60
80
Shoo
theigh
tincm
(a) WG: Faba bean shoot height
n.s
b ab a
ab ba
n.s
n.s
n.s
n.s
n.s
n.s
b ab a
WG-G WG-K WG-M WG-PS All trials
Shoo
tdiameter
2Sh
ootd
iameter
1
0t 4t 6t 0t 4t 6t 0t 4t 6t 0t 4t 6t 0t 4t 6t
0.0
2.5
5.0
7.5
10.0
0.0
2.5
5.0
7.5
Shoo
tdiameter
inmm
(b) WG: Faba bean shoot diameter
n.s
n.s
n.s
n.s
n.s
n.s
n.s
n.s
n.s
n.s
WG-G WG-K WG-M WG-PS All trialsLA
I2LA
I1
0t 4t 6t 0t 4t 6t 0t 4t 6t 0t 4t 6t 0t 4t 6t
0
1
2
3
0
1
2
Leaf
AreaInde
x
(c) WG: Faba bean LAI
Figure A.3: E�ect of oats straw mulch biomass on faba bean shoot height and diameter as well as leaf area index at siteWG, evaluated 57 and 89 DAE (BBCH 65 and BBCH 77, respectively). Treatments: 0t: no straw addition, 4t: 4 t ha−1 oatsstraw, 6t: 6 t ha−1 oats straw. Error bars: SE. n.s.: not significant. Di�erent le�ers denote significant di�erences (TukeyHSD,α < 0.05).
128
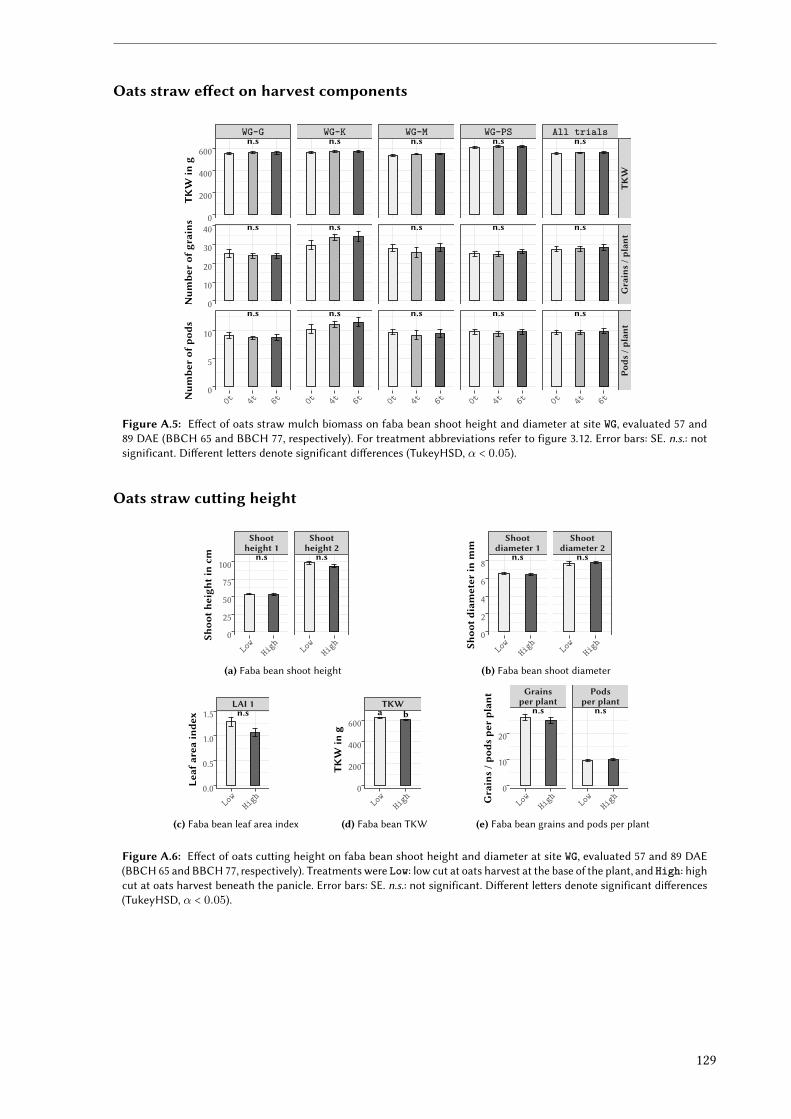
Oats straw e�ect on harvest components
n.s
n.s
n.s
n.s
n.s
n.s
n.s
n.s
n.s
n.s
n.s
n.s
n.s
n.s
n.s
WG-G WG-K WG-M WG-PS All trials
TKW
Grains/p
lant
Pods
/plant
0t 4t 6t 0t 4t 6t 0t 4t 6t 0t 4t 6t 0t 4t 6t
0
200
400
600
0
10
20
30
40
0
5
10
Num
berof
pods
Num
berof
grains
TKW
ing
Figure A.5: E�ect of oats straw mulch biomass on faba bean shoot height and diameter at site WG, evaluated 57 and89 DAE (BBCH 65 and BBCH 77, respectively). For treatment abbreviations refer to figure 3.12. Error bars: SE. n.s.: notsignificant. Di�erent le�ers denote significant di�erences (TukeyHSD, α < 0.05).
Oats straw cu�ing height
n.s n.s
Shootheight 1
Shootheight 2
Low
High Lo
wHi
gh0
25
50
75
100
Shoo
theigh
tincm
(a) Faba bean shoot height
n.s n.s
Shootdiameter 1
Shootdiameter 2
Low
High Lo
wHi
gh0
2
4
6
8
Shoo
tdiameter
inmm
(b) Faba bean shoot diameter
n.sLAI 1
Low
High
0.0
0.5
1.0
1.5
Leaf
area
inde
x
(c) Faba bean leaf area index
baTKW
Low
High
0
200
400
600
TKW
ing
(d) Faba bean TKW
n.s n.s
Grainsper plant
Podsper plant
Low
High Lo
wHi
gh0
10
20
Grains/p
odspe
rplan
t
(e) Faba bean grains and pods per plant
Figure A.6: E�ect of oats cu�ing height on faba bean shoot height and diameter at site WG, evaluated 57 and 89 DAE(BBCH 65 and BBCH 77, respectively). Treatments were Low: low cut at oats harvest at the base of the plant, and High: highcut at oats harvest beneath the panicle. Error bars: SE. n.s.: not significant. Di�erent le�ers denote significant di�erences(TukeyHSD, α < 0.05).
129
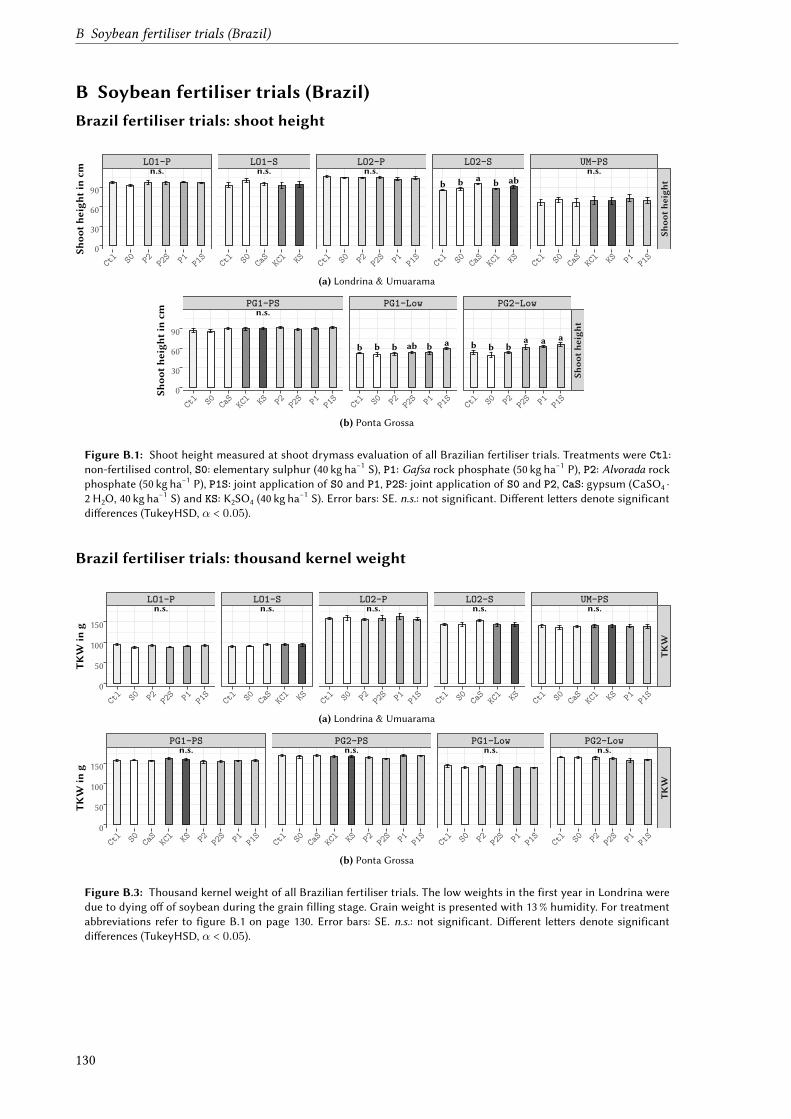
B Soybean fertiliser trials (Brazil)
B Soybean fertiliser trials (Brazil)Brazil fertiliser trials: shoot height
n.s. n.s. n.s.b b a b ab
n.s.LO1-P LO1-S LO2-P LO2-S UM-PS
Shoo
theigh
t
Ctl S0 P2 P2
S P1 P1S
Ctl S0 KC
l KSCaS
Ctl S0 P2 P2
S P1 P1S
Ctl S0 KC
l KSCaS
Ctl S0 KC
l KSCaS P1 P1
S0
30
60
90
Shoo
theigh
tincm
(a) Londrina & Umuarama
n.s.
b b b ab b a b b ba a a
PG1-PS PG1-Low PG2-Low
Shoo
theigh
t
Ctl S0 KC
l KSCaS P2 P2
S P1 P1S
Ctl S0 P2 P2
S P1 P1S
Ctl S0 P2 P2
S P1 P1S
0
30
60
90
Shoo
theigh
tincm
(b) Ponta Grossa
Figure B.1: Shoot height measured at shoot drymass evaluation of all Brazilian fertiliser trials. Treatments were Ctl:non-fertilised control, S0: elementary sulphur (40 kg ha−1 S), P1: Gafsa rock phosphate (50 kg ha−1 P), P2: Alvorada rockphosphate (50 kg ha−1 P), P1S: joint application of S0 and P1, P2S: joint application of S0 and P2, CaS: gypsum (CaSO4 ·2 H2O, 40 kg ha−1 S) and KS: K2SO4 (40 kg ha−1 S). Error bars: SE. n.s.: not significant. Di�erent le�ers denote significantdi�erences (TukeyHSD, α < 0.05).
Brazil fertiliser trials: thousand kernel weight
n.s. n.s. n.s. n.s. n.s.LO1-P LO1-S LO2-P LO2-S UM-PS
TKW
Ctl S0 P2 P2
S P1 P1S
Ctl S0 KC
l KSCaS
Ctl S0 P2 P2
S P1 P1S
Ctl S0 KC
l KSCaS
Ctl S0 KC
l KSCaS P1 P1
S0
50
100
150
TKW
ing
(a) Londrina & Umuarama
n.s. n.s. n.s. n.s.PG1-PS PG2-PS PG1-Low PG2-Low
TKW
Ctl S0 KC
l KSCaS P2 P2
S P1 P1S
Ctl S0 KC
l KSCaS P2 P2
S P1 P1S
Ctl S0 P2 P2
S P1 P1S
Ctl S0 P2 P2
S P1 P1S
0
50
100
150
TKW
ing
(b) Ponta Grossa
Figure B.3: Thousand kernel weight of all Brazilian fertiliser trials. The low weights in the first year in Londrina weredue to dying o� of soybean during the grain filling stage. Grain weight is presented with 13 % humidity. For treatmentabbreviations refer to figure B.1 on page 130. Error bars: SE. n.s.: not significant. Di�erent le�ers denote significantdi�erences (TukeyHSD, α < 0.05).
130
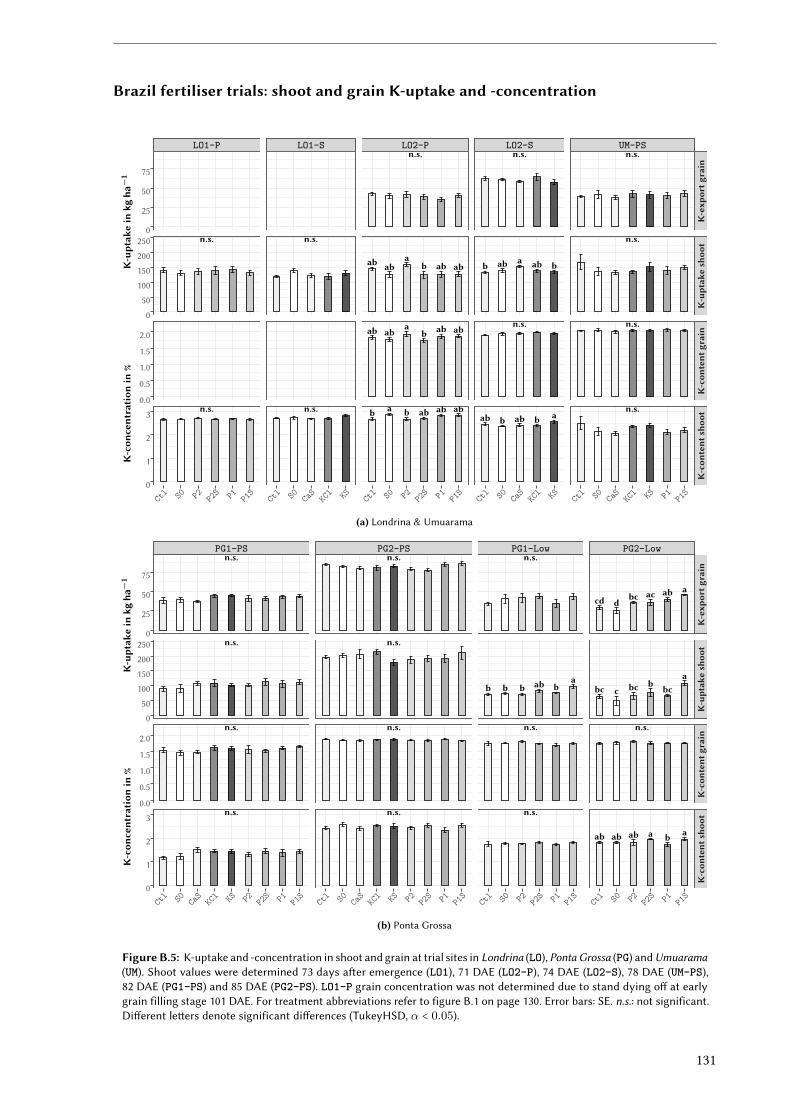
Brazil fertiliser trials: shoot and grain K-uptake and -concentration
n.s.
n.s.
n.s.
n.s.
n.s.
ab aba
b ab ab
ab aba
b ab ab
b a b ab ab ab
n.s.
b ab a ab b
n.s.
ab b ab b a
n.s.
n.s.
n.s.
n.s.
LO1-P LO1-S LO2-P LO2-S UM-PS
K-exp
ortg
rain
K-uptak
esh
oot
K-con
tent
grain
K-con
tent
shoo
t
Ctl S0 P2 P2
S P1 P1S
Ctl S0 KC
l KSCaS
Ctl S0 P2 P2
S P1 P1S
Ctl S0 KC
l KSCaS
Ctl S0 KC
l KSCaS P1 P1
S
0
25
50
75
0
50
100
150
200
250
0.0
0.5
1.0
1.5
2.0
0
1
2
3
K-con
centration
in%
K-uptak
ein
kgha−
1
(a) Londrina & Umuarama
n.s.
n.s.
n.s.
n.s.
n.s.
n.s.
n.s.
n.s.
n.s.
b b b ab ba
n.s.
n.s.
cd dbc ac ab a
bc c bc b bca
n.s.
ab ab ab a b a
PG1-PS PG2-PS PG1-Low PG2-Low
K-exp
ortg
rain
K-uptak
esh
oot
K-con
tent
grain
K-con
tent
shoo
t
Ctl S0 KC
l KSCaS P2 P2
S P1 P1S
Ctl S0 KC
l KSCaS P2 P2
S P1 P1S
Ctl S0 P2 P2
S P1 P1S
Ctl S0 P2 P2
S P1 P1S
0
25
50
75
0
50
100
150
200
250
0.0
0.5
1.0
1.5
2.0
0
1
2
3
K-con
centration
in%
K-uptak
ein
kgha−
1
(b) Ponta Grossa
Figure B.5: K-uptake and -concentration in shoot and grain at trial sites in Londrina (LO), Ponta Grossa (PG) and Umuarama(UM). Shoot values were determined 73 days a�er emergence (LO1), 71 DAE (LO2-P), 74 DAE (LO2-S), 78 DAE (UM-PS),82 DAE (PG1-PS) and 85 DAE (PG2-PS). LO1-P grain concentration was not determined due to stand dying o� at earlygrain filling stage 101 DAE. For treatment abbreviations refer to figure B.1 on page 130. Error bars: SE. n.s.: not significant.Di�erent le�ers denote significant di�erences (TukeyHSD, α < 0.05).
131
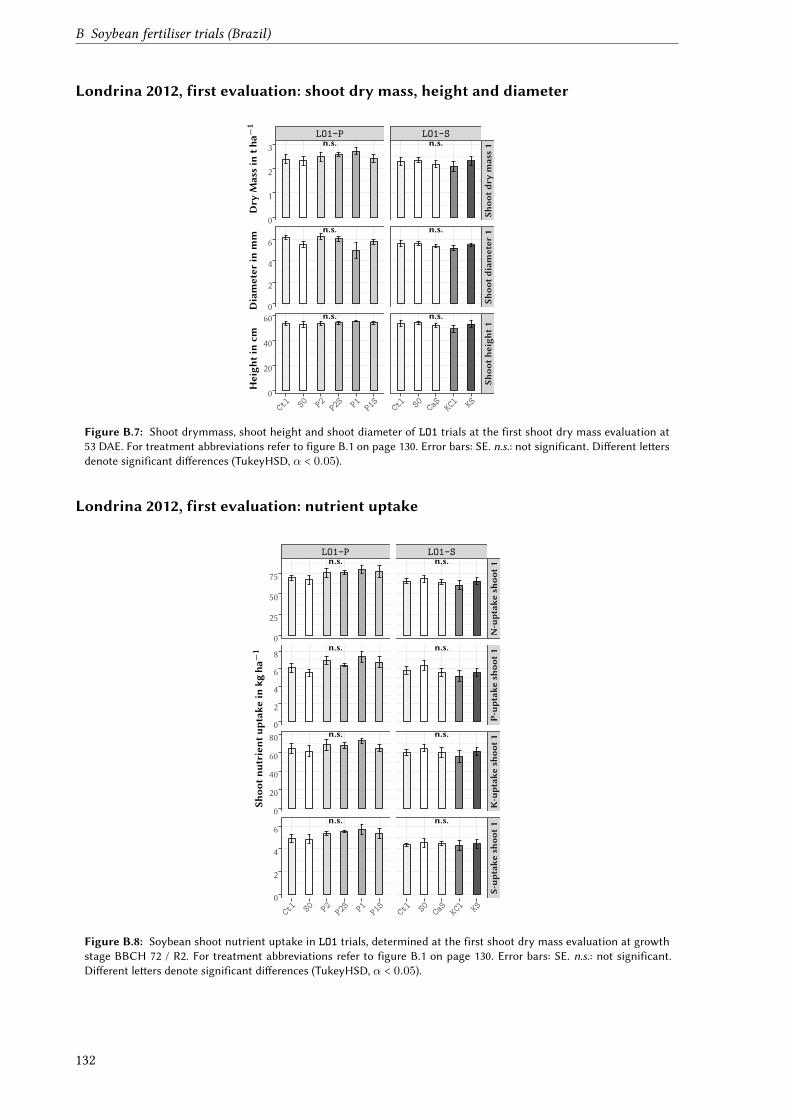
B Soybean fertiliser trials (Brazil)
Londrina 2012, first evaluation: shoot dry mass, height and diameter
n.s.
n.s.
n.s.
n.s.
n.s.
n.s.
LO1-P LO1-S
Shoo
tdry
mass1
Shoo
tdiameter
1Sh
ooth
eigh
t1
Ctl S0 P2 P2
S P1 P1S
Ctl S0 KC
l KSCaS
0
1
2
3
0
2
4
6
0
20
40
60
Heigh
tincm
Diameter
inmm
Dry
Massin
tha−
1
Figure B.7: Shoot drymmass, shoot height and shoot diameter of LO1 trials at the first shoot dry mass evaluation at53 DAE. For treatment abbreviations refer to figure B.1 on page 130. Error bars: SE. n.s.: not significant. Di�erent le�ersdenote significant di�erences (TukeyHSD, α < 0.05).
Londrina 2012, first evaluation: nutrient uptake
n.s.
n.s.
n.s.
n.s.
n.s.
n.s.
n.s.
n.s.
LO1-P LO1-S
N-uptak
esh
oot1
P-up
take
shoo
t1K-uptak
esh
oot1
S-up
take
shoo
t1
Ctl S0 P2 P2
S P1 P1S
Ctl S0 KC
l KSCaS
0
25
50
75
0
2
4
6
8
0
20
40
60
80
0
2
4
6
Shoo
tnutrien
tuptak
ein
kgha−
1
Figure B.8: Soybean shoot nutrient uptake in LO1 trials, determined at the first shoot dry mass evaluation at growthstage BBCH 72 / R2. For treatment abbreviations refer to figure B.1 on page 130. Error bars: SE. n.s.: not significant.Di�erent le�ers denote significant di�erences (TukeyHSD, α < 0.05).
132
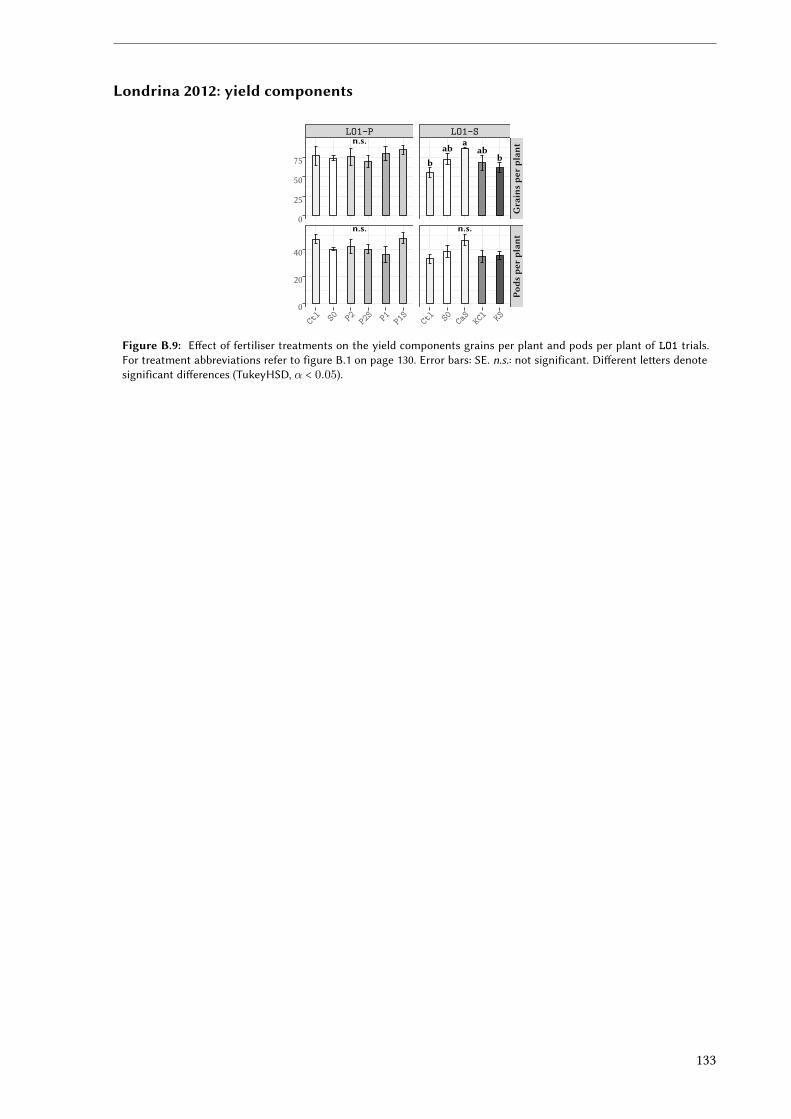
Londrina 2012: yield components
n.s.
n.s.
bab a
abb
n.s.
LO1-P LO1-S
Grainspe
rplan
tPo
dspe
rplan
t
Ctl S0 P2 P2
S P1 P1S
Ctl S0 KC
l KSCaS
0
25
50
75
0
20
40
Figure B.9: E�ect of fertiliser treatments on the yield components grains per plant and pods per plant of LO1 trials.For treatment abbreviations refer to figure B.1 on page 130. Error bars: SE. n.s.: not significant. Di�erent le�ers denotesignificant di�erences (TukeyHSD, α < 0.05).
133
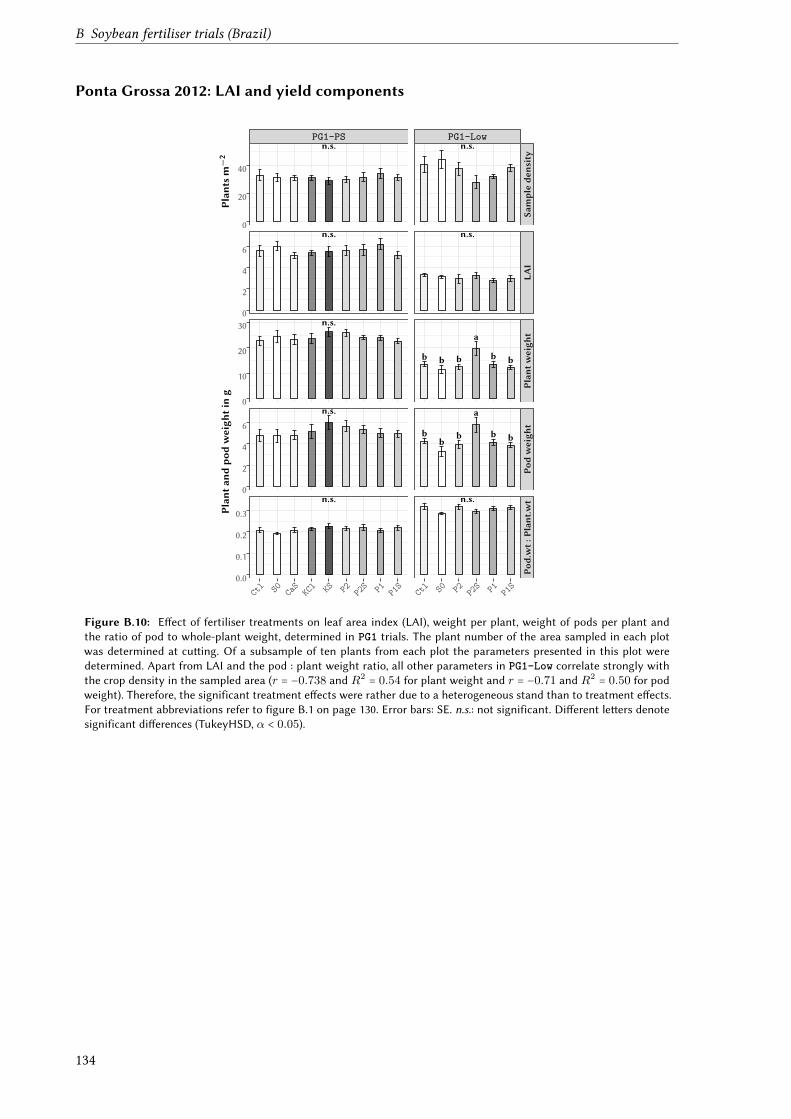
B Soybean fertiliser trials (Brazil)
Ponta Grossa 2012: LAI and yield components
n.s.
n.s.
n.s.
n.s.
n.s.
n.s.
n.s.
b b b
a
b b
bb
b
a
b b
n.s.
PG1-PS PG1-Low
Samplede
nsity
LAI
Plan
tweigh
tPo
dweigh
tPo
d.wt:
Plan
t.wt
Ctl S0 KC
l KSCaS P2 P2
S P1 P1S
Ctl S0 P2 P2
S P1 P1S
0
20
40
0
2
4
6
0
10
20
30
0
2
4
6
0.0
0.1
0.2
0.3Plan
tand
podweigh
ting
Plan
tsm
−2
Figure B.10: E�ect of fertiliser treatments on leaf area index (LAI), weight per plant, weight of pods per plant andthe ratio of pod to whole-plant weight, determined in PG1 trials. The plant number of the area sampled in each plotwas determined at cu�ing. Of a subsample of ten plants from each plot the parameters presented in this plot weredetermined. Apart from LAI and the pod : plant weight ratio, all other parameters in PG1-Low correlate strongly withthe crop density in the sampled area (r = −0.738 and R2
= 0.54 for plant weight and r = −0.71 and R2= 0.50 for pod
weight). Therefore, the significant treatment e�ects were rather due to a heterogeneous stand than to treatment e�ects.For treatment abbreviations refer to figure B.1 on page 130. Error bars: SE. n.s.: not significant. Di�erent le�ers denotesignificant di�erences (TukeyHSD, α < 0.05).
134
ReferencesAbouziena, H. F.; Omar, A. A.; Sharma, S. D.; and Singh, M., 2009: E�cacy comparison of some new
natural-product herbicides for weed control at two growth stages. Weed Technology, 23(3):431–437.
Aini, N. and Tang, C., 1998: Diagnosis of potassium de�ciency in faba bean and chickpea by plantanalysis. Animal Production Science, 38(5):503–509.
Alt; Appel; Bihler; Bischo�, R.; and Boysen, R., 2000: Schwefelversorgung von Kulturp�anzen -Bedarfsprognose und Düngung. VDLUFA Standpunkt.
Alves, M. and Lavorenti, A., 2004: Sulfate adsorption and its relationships with properties of repre-sentative soils of the São Paulo State, Brazil. Geoderma, 118(1):89–99.
Aria, M. M.; Lakzian, A.; Haghnia, G. H.; Berenji, A. R.; Besharati, H.; and Fotovat, A., 2010:E�ect of Thiobacillus, sulphur, and vermicompost on the water-soluble phosphorus of hard rock phos-phate. Bioresource Technology, 101(2):551–554.
Azania, A. A. d. P. M.; Azania, C. A. M.; Marques, M. O.; and Pavani, M. d. C. M. D., 2011: Herbi-cidal Potentiality of Fusel Oil, chapter 36, pages 735–746. InTech.
Azania, C.; Azania, A.; Pizzo, I.; and Schiavetto, A., 2010: Resposta de plantas daninhas ao óleo fúselaplicado em pós-emergência inicial e tardia. Planta Daninha, 28:541 – 549.
Azooz, R.; Lowery, B.; Daniel, T.; and Arshad, M., 1997: Impact of tillage and residue managementon soil heat �ux. Agricultural and forest meteorology, 84(3):207–222.
Bailey, K., 1996: Diseases under conservation tillage systems. Canadian journal of plant science,76(4):635–639.
Bainard, L.; Isman, M.; and Upadhyaya, M., 2006: Phytotoxicity of clove oil and its primary con-stituent eugenol and the role of leaf epicuticular wax in the susceptibility to these essential oils. Weedscience, 54(5):833–837.
Baker, E., 1974: The in�uence of environment on leaf wax development in Brassica oleracea var. gem-mifera. New Phytologist, 73(5):955–966.
Baker, J., 1970: The e�ects of oils on plants. Environmental Pollution (1970), 1(1):27–44.
Bakkali, F.; Averbeck, S.; Averbeck, D.; and Idaomar, M., 2008: Biological e�ects of essential oils –a review. Food and chemical toxicology, 46(2):446–475.
Barker, A. V. and Prostak, R. G., 2014: Management of vegetation by alternative practices in �eldsand roadsides. International Journal of Agronomy, 2014.
Bartnik, F., 1992: Anionic surfactants: biochemistry, toxicology, dermatology, volume 43, chapter In-teraction of anionic surfactants with proteins, enzymes, and membranes, pages 1–42. CRC Press.
Bates, D.; Mächler, M.; Bolker, B.; and Walker, S., 2015: Fitting Linear Mixed-E�ects Models Usinglme4. Journal of Statistical Software, 67(1):1–48.
Batish, D. R.; Setia, N.; Singh, H. P.; and Kohli, R. K., 2004: Phytotoxicity of lemon-scented eucalyptoil and its potential use as a bioherbicide. Crop Protection, 23(12):1209–1214.
Batish, D. R.; Singh, H. P.; Kohli, R. K.; and Kaur, S., 2008: Eucalyptus essential oil as a naturalpesticide. Forest Ecology and Management, 256(12):2166–2174.
Baumgärtel, G.; Früchtenicht, K.; Hege, U.; Heyn, J.; and Orlovius, K., 1999: Kaliumdüngung nachBodenuntersuchung und P�anzenbedarf – Richtwerte für die Gehaltsklasse C. VDLUFA Standpunkt,Verband Deutscher Landwirtschaftlicher Untersuchungs-und Forschungsanstalten, Darmstadt.
135
References
Beare, M.; Hendrix, P.; and Coleman, D., 1994: Water-stable aggregates and organic matter fractionsin conventional-and no-tillage soils. Soil Science Society of America Journal, 58(3):777–786.
Belz, R.; Reinhardt, C.; Foxcroft, L.; and Hurle, K., 2007: Residue allelopathy in Parthenium hys-terophorus L. - Does parthenin play a leading role? Crop Protection, 26(3):237–245.
Bhowmik, P. C. et al., 2003: Challenges and opportunities in implementing allelopathy for naturalweed management. Crop Protection, 22(4):661–671.
Bloem, E. M., 1998: Schwefel-Bilanz von Agrarökosystemen unter besonderer Berücksichtigung hy-drologischer und bodenphysikalischer Standorteigenschaften. Braunschweig.
Blumberg, A. and Crossley, D., 1983: Comparison of soil surface arthropod populations in conven-tional tillage, no-tillage and old �eld systems. Agro-ecosystems, 8(3):247–253.
Bogena, H.; Kunkel, R.; Schöbel, T.; Schrey, H. P.; and Wendland, F., 2003: Die Grundwasserneu-bildung in Nordrhein-Westfalen.
Böhm, H., 2007: Mineralsto�gehalte in Körnerleguminosen und Sommergetreide.
Bolan, N.; Syers, J.; and Tillman, R., 1986: Ionic strength e�ects on surface charge and adsorption ofphosphate and sulphate by soils. Journal of Soil Science, 37(3):379–388.
Bolan, N.; Syers, J.; Tillman, R.; and Scotter, D., 1988: E�ect of liming and phosphate additions onsulphate leaching in soils. Journal of soil science, 39(4):493–504.
Bolland, M.; Siddique, K.; and Brennan, R., 2000: Grain yield responses of faba bean (Vicia faba L.)to applications of fertiliser phosphorus and zinc. Animal Production Science, 40(6):849–857.
Boyd, N. and Brennan, E., 2006: Burning nettle, common purslane, and rye response to a clove oilherbicide. Weed Technology, 20:646–650.
Brainard, D. C.; Curran, W. S.; Bellinder, R. R.; Ngouajio, M.; VanGessel, M. J.; Haar, M. J.;Lanini, W. T.; and Masiunas, J. B., 2013: Temperature and relative humidity a�ect weed responseto vinegar and clove oil. Weed Technology, 27(1):156–164.
Budiman, A.; Arifta, T. I.; Diana, D.; and Sutijan, S., 2015: Continuous production of α-terpineolfrom α-pinene isolated from Indonesian crude turpentine. Modern Applied Science, 9(4).
Burrill, L.; Cárdenas, J.; and Locatelli, E., 1976: Field manual for weed control research. AIDPublication-US Agency for International Development (USA).
Caires, E.; Chueiri, W.; MADRUGA, E.; and Figueiredo, A., 1998: Alterações de característicasquímicas do solo e resposta da soja ao calcário e gesso aplicados na superfície em sistema de cultivosem preparo do solo. Revista Brasileira de Ciência do Solo, 22(1):27–34.
Caires, E.; Joris, H.; and Churka, S., 2011: Long-term e�ects of lime and gypsum additions on no-tillcorn and soybean yield and soil chemical properties in southern Brazil. Soil use and management,27(1):45–53.
Caires, E. F.; Feldhaus, I. C.; Barth, G.; and Garbuio, F. J., 2002: Lime and gypsum application onthe wheat crop. Scientia Agricola, 59(2):357–364.
Carlsson, D.; Suprunchuk, T.; and Wiles, D., 1976: Photooxidation of unsaturated oils: e�ects ofsinglet oxygen quenchers. Journal of the American Oil Chemists’ Society, 53(10):656–660.
Carr, P. M.; Gramig, G. G.; and Liebig, M. A., 2013: Impacts of organic zero tillage systems on crops,weeds, and soil quality. Sustainability, 5(7):3172–3201.
136
References
Chapman, S., 1989: Oxidation of micronized elemental sulphur in soil. Plant and soil, 116(1):69–76.
Chen, P.; Polatnick, M.; and Leather, G., 1991: Comparative study on artemisinin, 2, 4-D andglyphosate. Journal of Agricultural and Food Chemistry, 39(5):991–994.
Christo�oleti, P. J.; de Carvalho, S. J. P.; Lopez-Ovejero, R. F.; Nicolai, M.; Hidalgo, E.; andda Silva, J. E., 2007: Conservation of natural resources in Brazilian agriculture – Implications onweed biology and management. Crop Protection, 26(3):383–389. Weed Science in Time of Transition.
Churka Blum, S.; Caires, E.; and Alleoni, L., 2013: Lime and phosphogypsum application and sulfateretention in subtropical soils under no-till system. Journal of soil science and plant nutrition, 13(2):279–300.
Copping, L. and Duke, S., 2007: Natural products that have been used commercially as crop protectionagents. Pest Management Science, 63(6):524–554.
Cordell, D.; Drangert, J.-O.; and White, S., 2009: The story of phosphorus: Global food security andfood for thought. Global Environmental Change, 19(2):292–305.
Couto, W.; Lathwell, D.; and Bouldin, D., 1979: Sulfate sorption by two oxisols and an al�sol of thetropics. Soil Science, 127(2):108–116.
Cowles, R.; Cowles, E.; McDermott, A.; and Ramoutar, D., 2000: Inert formulation ingredients withactivity: toxicity of trisiloxane surfactant solutions to twospotted spider mites (Acari: Tetranychidae).Journal of economic entomology, 93(2):180–188.
Cox, C. and Surgan, M., 2006: Unidenti�ed inert ingredients in pesticides: implications for human andenvironmental health. Environmental health perspectives, pages 1803–1806.
Crafts, A. S. and Reiber, H. G., 1948: Herbicidal properties of oils. University of California.
Curtin, D. and Syers, J., 1990: Mechanism of sulphate adsorption by two tropical soils. EuropeanJournal of Soil Science, 41(2):295–304.
Davis, A. S., 2010: Cover-crop roller-crimper contributes to weed management in no-till soybean. Weedscience, 58(3):300–309.
Dayan, F.; Howell, J.; Marais, J.; Ferreira, D.; and Koivunen, M., 2011: Manuka Oil, A NaturalHerbicide with Preemergence Activity. Weed Science, 59(4):464–469.
Dayan, F. E.; Cantrell, C. L.; and Duke, S. O., 2009: Natural products in crop protection. Bioorganic& Medicinal Chemistry, 17(12):4022–4034.
Dayan, F. E.; Duke, S. O.; Sauldubois, A.; Singh, N.; McCurdy, C.; and Cantrell, C., 2007: p-Hydroxyphenylpyruvate dioxygenase is a herbicidal target site for β-triketones from Leptospermumscoparium. Phytochemistry, 68(14):2004–2014.
De Mello, W., 2001: Precipitation chemistry in the coast of the Metropolitan Region of Rio de Janeiro,Brazil. Environmental Pollution, 114(2):235–242.
de Mendiburu, F., 2015: agricolae: Statistical Procedures for Agricultural Research. R package version1.2-3.
de Sousa, D.; Lobato, E.; and Rein, T. A., 2005: Uso do gesso agrícola nos solos do cerrado. EmbrapaCerrados. Circular Técnica.
Derbyshire, E.; Wright, D.; and Boulter, D., 1976: Legumin and vicilin, storage proteins of legumeseeds. Phytochemistry, 15(1):3–24.
137
References
Derpsch, R.; Roth, C.; Sidiras, N.; Köpke, U. et al., 1988: Erosion control in Paraná, Brazil: mulchingsystems, direct sowing, and conservation tillage. Schriftenreihe der GTZ, (205).
Dias, V. R. d.M.; Sanches, L.; Alves,M. d. C.; andNogueira, J. d. S., 2012: Spatio-temporal variabilityof anions in wet precipitation of Cuiabá, Brazil. Atmospheric Research, 107:9–19.
Dill-Macky, R. and Jones, R., 2000: The e�ect of previous crop residues and tillage on Fusarium headblight of wheat. Plant disease, 84(1):71–76.
DLG, 1997: DLG-Futterwerttabelle für Wiederkäuer, 7. Au�age.
Duke, S. O. and Dayan, F. E., 2011: Modes of action of microbially-produced phytotoxins. Toxins,3(8):1038–1064.
Duranti, M., 2006: Grain legume proteins and nutraceutical properties. Fitoterapia, 77(2):67–82.
Ebert, E.; Leist, K.-H.; and Mayer, D., 1990: Summary of safety evaluation toxicity studies of glufosi-nate ammonium. Food and Chemical Toxicology, 28(5):339–349.
Eckelmann, W.; Sponagel, H.; Grottenthaler, W. et al., 2005: Bodenkundliche Kartieranleitung - 5.verbesserte und erweiterte Au�age.
Embrapa Soja, 2007: Sistemas de Produção 10 - Tecnologias de Produção de Soja - Paraná 2007. Tech-nical report, Embrapa Soja.
Embrapa Solos, 1997: Manual de métodos de análise de solo. Rio de Janeiro: Embrapa Solos.
Embrapa Solos, 2006: Sistema brasileiro de classi�cação de solos. Centro Nacional de Pesquisa de Solos:Rio de Janeiro.
Eriksen, J.; Mortensen, J. V.; Nielsen, J. D.; and Nielsen, N. E., 1995: Sulphur mineralisation in �veDanish soils as measured by plant uptake in a pot experiment. Agriculture, ecosystems & environment,56(1):43–51.
Eriksen, J.; Olesen, J. E.; and Askegaard, M., 2002: Sulphate leaching and sulphur balances of anorganic cereal crop rotation on three Danish soils. European journal of agronomy, 17(1):1–9.
Eriksen, J. and Thorup-Kristensen, K., 2002: The e�ect of catch crops on sulphate leaching andavailability of S in the succeeding crop on sandy loam soil in Denmark. Agriculture, ecosystems &environment, 90(3):247–254.
Evans, G. and Bellinder, R., 2009: The potential use of vinegar and a clove oil herbicide for weedcontrol in sweet corn, potato, and onion. 23:120–128.
Evans, G.; Bellinder, R.; and Go�net, M., 2009: Herbicidal e�ects of vinegar and a clove oil producton redroot pigweed (Amaranthus retro�exus) and velvetleaf (Abutilon theophrasti). Weed Technology,23(2):292–299.
Evans, G.; Bellinder, R.; and Hahn, R., 2011: Integration of vinegar for in-row weed control in trans-planted bell pepper and broccoli. Weed Technology, 25(3):459–465.
Fabrizzi, K.; Garcıa, F.; Costa, J.; and Picone, L., 2005: Soil water dynamics, physical properties andcorn and wheat responses to minimum and no-tillage systems in the southern Pampas of Argentina.Soil and Tillage Research, 81(1):57–69.
FAO, 2007: Tropical Crop-Livestock Systems in Conservation Agriculture: The Brazilian Experience(Integrated Crop Management). FAO. ISBN 9251056927.
138
References
FAO, 2011: Green Manure / Cover Crops and Crop Rotation in Conservation Agriculture on Small Farms(Integrated Crop Management). FAO. ISBN 9251068569.
FAOstat, 2013: Food and agriculture Organization of the United Nations (2013). FAO, Retrieved 25/05/2015from http://faostat3. fao. org/faostat-gateway/go/to/download/Q/QC/S, 20.
Fehr, W.; Caviness, C.; Burmood, D.; and Pennington, J., 1971: Stage of development descriptionsfor soybeans, Glycine max (L.) Merrill. Crop science, 11(6):929–931.
Fernandez, P.; André, V.; Rieger, J.; and Kühnle, A., 2004: Nano-emulsion formation by emulsionphase inversion. Colloids and Surfaces A: Physicochemical and Engineering Aspects, 251(1):53–58.
Finch-Savage, W. and Leubner-Metzger, G., 2006: Seed dormancy and the control of germination.New Phytologist, 171(3):501–523.
Flues, M.; Hama, P.; Lemes, M.; Dantas, E.; and Fornaro, A., 2002: Evaluation of the rainwater acid-ity of a rural region due to a coal-�red power plant in Brazil. Atmospheric Environment, 36(14):2397–2404.
Friedrich, T.; Derpsch, R.; and Kassam, A., 2012: Overview of the global spread of conservationagriculture. Field Actions Science Reports. The journal of �eld actions, (Special Issue 6).
Garland, J., 1978: Dry and wet removal of sulphur from the atmosphere. Atmospheric Environment(1967), 12(1):349–362.
Gauvrit, C. and Cabanne, F., 2006: Oils for weed control: uses and mode of action. Pesticide science,37(2):147–153.
Gayler, K. R. and Sykes, G. E., 1985: E�ects of nutritional stress on the storage proteins of soybeans.Plant physiology, 78(3):582–585.
Geelhoed, J. S.; Hiemstra, T.; and Van Riemsdijk, W. H., 1997a: Phosphate and sulfate adsorptionon goethite: single anion and competitive adsorption. Geochimica et cosmochimica acta, 61(12):2389–2396.
Geelhoed, J. S.; Van Riemsdijk, W. H.; and Findenegg, G. R., 1997b: E�ects of sulphate and pH onthe plant-availability of phosphate adsorbed on goethite. Plant and soil, 197(2):241–249.
Germida, J. and Janzen, H., 1993: Factors a�ecting the oxidation of elemental sulfur in soils. Fertilizerresearch, 35(1-2):101–114.
Graves, S.; Piepho, H.-P.; and with help from Sundar Dorai-Raj, L. S., 2015: multcompView: Vi-sualizations of Paired Comparisons. R package version 0.1-7.
Gri�ths, D. W. and Thomas, T. A., 1981: Phytate and total phosphorus content of �eld beans (Viciafaba L.). Journal of the Science of Food and Agriculture, 32(2):187–192.
Haas, G., 1995: Selection of �eld trial plots at the research station Wiesengut using a location speci�ccatalogue of criteria. Mitteilungen der Gesellschaft für P�anzenbauwissenschaften (Germany).
Hamada, A. and El-Enany, A., 1994: E�ect of NaCl salinity on growth, pigment and mineral elementcontents, and gas exchange of broad bean and pea plants. Biologia Plantarum, 36(1):75–81.
Hazen, J. L., 2009: Adjuvants – Terminology, Classi�cation, and Chemistry.
Hendrix, P. F.; Parmelee, R.W.; Crossley, D.; Coleman, D. C.; Odum, E. P.; and Gro�man, P. M.,1986: Detritus food webs in conventional and no-tillage agroecosystems. Bioscience, pages 374–380.
139
References
Hitsuda, K.; Sfredo, G. J.; and Klepker, D., 2004: Diagnosis of sulfur de�ciency in soybean usingseeds. Soil Science Society of America Journal, 68(4):1445–1451.
Ho�mann, G., 1991: Handbuch der landwirtschaftlichen Versuchs- und Untersuchungsanstalten (Me-thodenhandbuch) Band 1: Die Untersuchung von Böden. VDLUFA-Verlag, Darmstadt, page 1740.
Hole, D.; Perkins, A.; Wilson, J.; Alexander, I.; Grice, P.; and Evans, A. D., 2005: Does organicfarming bene�t biodiversity? Biological conservation, 122(1):113–130.
Horn, R.; Brümmer, G. W.; Kandeler, E.; Kögel-Knabner, I.; Kretzschmar, R.; Stahr, K.; andWilke, B.-M., 2010: Sche�er / Schachtschabel: Lehrbuch der Bodenkunde. Springer-Verlag.
Hull, H.; Morton, H.; and Wharrie, J., 1975: Environmental in�uences on cuticle development andresultant foliar penetration. The Botanical Review, 41(4):421–452.
Ioannou, E.; Koutsaviti, A.; Tzakou, O.; and Roussis, V., 2014: The genus Pinus: a comparative studyon the needle essential oil composition of 46 pine species. Phytochemistry Reviews, 13(4):741–768.
IUSS Working Group, W. et al., 2006: World reference base for soil resources. World Soil ResourcesReport, 103.
James, T.; Rahman, A.; Trolove, M.; and Frith, H., 2002: E�cacy of a certi�ed organic herbicidebased on pine essence. New Zealand Plant Protection, 55:207–212.
Kelkar, V. M.; Geils, B. W.; Becker, D. R.; Overby, S. T.; and Neary, D. G., 2006: How to recovermore value from small pine trees: Essential oils and resins. Biomass and Bioenergy, 30(4):316–320.
Kerschberger, M.; Hege, U.; and Jungk, A., 1997: VDLUFA-Standpunkt: Phosphordüngung nachBodenuntersuchung und P�anzenbedarf. VDLUFA, Darmstadt.
Kim, H.; Hirai, M. Y.; Hayashi, H.; Chino, M.; Naito, S.; and Fujiwara, T., 1999: Role of O-acetyl-L-serine in the coordinated regulation of the expression of a soybean seed storage-protein gene bysulfur and nitrogen nutrition. Planta, 209(3):282–289.
Köhler, B. and Kolbe, H., 2007: Nährsto�gehalte der Fruchtarten im ökologischen Landbau. Schriften-reihe der Sächsischen Landesanstalt für Landwirtschaft, (9):1–21.
Kopáček, J.; Hejzlar, J.; Porcal, P.; and Posch, M., 2014: Sulphate leaching from di�use agriculturaland forest sources in a large central European catchment during 1900–2010. Science of The TotalEnvironment, 470:543–550.
Köpke, U. and Nemecek, T., 2010: Ecological services of faba bean. Field Crops Research, 115(3):217–233.
Köpke, U. and Schulte, H., 2008: Direct seeding of faba beans in Organic Agriculture. 16th IFOAMOrganic World Congress, Modena, Italy, June 16-20, 2008.
Körschens, M. and Mahn, E.-G., 2013: Strategien zur Regeneration belasteter Agrarökosysteme desmitteldeutschen Schwarzerdegebietes. Springer-Verlag.
Kottek, M.; Grieser, J.; Beck, C.; Rudolf, B.; and Rubel, F., 2006: World map of the Köppen-Geigerclimate classi�cation updated. Meteorologische Zeitschrift, 15(3):259–263.
Kruskal, W. H. and Wallis, W. A., 1952: Use of ranks in one-criterion variance analysis. Journal ofthe American statistical Association, 47(260):583–621.
K+S Kali GmbH, 2015: Technical data sheet Magnesia-Kainit®.
140
References
Lederer, B.; Fujimori, T.; Tsujino, Y.; Wakabayashi, K.; and Böger, P., 2004: Phytotoxic activity ofmiddle-chain fatty acids II: peroxidation and membrane e�ects. Pesticide biochemistry and physiology,80(3):151–156.
Leidi, E. and Rodríguez-Navarro, D., 2000: Nitrogen and phosphorus availability limit N2-�xation inbean. New phytologist, 147(2):337–346.
Levene, H., 1960: Robust tests for equality of variances. Contributions to probability and statistics: Essaysin honor of Harold Hotelling, 2:278–292.
Liu, J. and Hue, N., 2001: Amending subsoil acidity by surface applications of gypsum, lime, andcomposts. Communications in soil science and plant analysis, 32(13-14):2117–2132.
López-Bellido, L.; López-Bellido, R. J.; Redondo, R.; and Benítez, J., 2006: Faba bean nitrogen�xation in a wheat-based rotation under rainfed Mediterranean conditions: e�ect of tillage system.Field crops research, 98(2):253–260.
Lukashyk, P., 2005: Problemunkräuter im Organischen Landbau: Entwicklung von Strategien zurnachhaltigen Regulierung von Ackerkratzdistel Cirsium arvense (L.) Scop. und Rauhhaarige WickeVicia hirsuta (L.) S. F. Gray. Ph.D. thesis, Universität Bonn.
Lukashyk, P.; Berg, M.; and Köpke, U., 2008: Nutzung von Kainit zur Regulierung von Vicia hirsuta(L.) S. F. Gray im ökologischen Landbau. Journal of Plant Diseases and Protection, Special IssueXXI:419–424.
Madari, B.; Machado, P. L. O. A.; Torres, E.; de Andrade, A. G.; and Valencia, L. I. O., 2005: Notillage and crop rotation e�ects on soil aggregation and organic carbon in a rhodic ferralsol fromsouthern Brazil. Soil and Tillage Research, 80:185–200.
Mahalwal, V. S. and Ali, M., 2003: Volatile constituents of Cymbopogon nardus (Linn.) Rendle. Flavourand fragrance journal, 18(1):73–76.
Marschner, H. and Marschner, P., 2012: Marschner’s mineral nutrition of higher plants. Academicpress.
Massucati, L.; Geib, B.; and Köpke, U., 2011: E�ekte temporärer Direktsaat von Ackerbohnen (Viciafaba sp.) auf die Segetal�ora im Ökologischen Landbau.
Massucati, L. F., 2013: Temporäre Direktsaat von Ackerbohnen (Vicia faba L.) im Ökologischen Land-bau. Ph.D. thesis, Universität Bonn.
Massucati, P. and Köepke, U., 2011: Faba bean (Vicia faba l.): Response to occasional direct seedinginto straw residues under temperate climate conditions. In Proceedings of the 3rd Scienti�c Conferenceof ISOFAR, volume 28, pages 198–201.
Massucati, P.; Luiz, F.; and Köpke, U., 2010: Weed control with straw residues in occasional directseeding of faba bean (Vicia faba sp.) in Organic Agriculture. Towards Agro-Environmental Climateand Energetic Sustainability, pages 575–584.
May�eld, A.; Bull, B.; Day, T.; Day, H.; Ward, I.; Klitcher, D.; and Hawthorne, W., 2008: GrainLegume Handbook. The Grain Legume Handbook Committee, Riverton, South Australia.
Mehlich, A., 1953: Determination of P, Ca, Mg, K, Na, and NH4. North Carolina Soil Test Division, Publ,pages 1–53.
Meier, U., 2001: Entwicklungsstadien mono- und dikotyler P�anzen - BBCH Monographie. BiologischeBundesanstalt für Land- und Forstwirtschaft.
141
References
Mesnage, R.; Bernay, B.; and Séralini, G.-E., 2013: Ethoxylated adjuvants of glyphosate-based her-bicides are active principles of human cell toxicity. Toxicology, 313(2):122–128.
Messerschmidt, O. and Jankauskas, J., 2012: Limonene-containing herbicide compositions, herbicideconcentrate formulations and methods for making and using same for organic production. US Patent8,153,561.
Messinger, H.; Aulmann, W.; Kleber, M.; and Koehl, W., 2007: Investigations on the e�ects of alkylpolyglucosides on development and fertility. Food and chemical toxicology, 45(8):1375–1382.
Migliavacca, D.; Teixeira, E.; Pires, M.; and Fachel, J., 2004: Study of chemical elements in atmo-spheric precipitation in South Brazil. Atmospheric Environment, 38(11):1641–1656.
Miller, D.; Culley, J.; Fraser, K.; Hubbard, S.; Meloche, F.; Ouellet, T.; Lloyd Seaman,W.; Seifert,K. A.; Turkington, K.; and Voldeng, H., 1998: E�ect of tillage practice on fusarium head blight ofwheat. Canadian Journal of Plant Pathology, 20(1):95–103.
Munkholm, L. J.; Schjønning, P.; Rasmussen, K. J.; and Tanderup, K., 2003: Spatial and temporale�ects of direct drilling on soil structure in the seedling environment. Soil and Tillage Research,71(2):163–173.
Neptune, A.; Tabatabai, M.; and Hanway, J., 1975: Sulfur fractions and carbon-nitrogen-phosphorus-sulfur relationships in some Brazilian and Iowa soils. Soil Science Society of America Journal, 39(1):51–55.
Nogueira, M. and Melo, W., 2003: Enxofre disponível para a soja e atividade de arilsulfatase em solotratado com gesso agrícola. Revista Brasileira de Ciência do Solo, 27:655–663.
Nuruzzaman, M.; Lambers, H.; Bolland, M. D.; and Veneklaas, E. J., 2005: Phosphorus uptake bygrain legumes and subsequently grown wheat at di�erent levels of residual phosphorus fertiliser.Crop and Pasture Science, 56(10):1041–1047.
Oakes, D. and Pollak, J., 2000: The in vitro evaluation of the toxicities of three related herbicideformulations containing ester derivatives of 2, 4, 5-T and 2, 4-D using sub-mitochondrial particles.Toxicology, 151(1):1–9.
Oebel, H. and Gerhards, R., 2006: Kameragesteuerte Unkrautbekämpfung - eine Verfahrenstechnikfür die Praxis. Zeitschrift für P�anzenkranheiten und P�anzenschutz, Sonderheft, 20:181–187.
Olfs, H.; Fuchs, M.; Ortseifen, U.; von Schintling-Horny, L.; von Chappuis, A.; Zerulla, W.; andErdle, K., 2012: Schwefel-Düngung e�zient gestalten. Fachzentrum Land-und Ernährungswirtschaft.DLG-Merkblatt, 373:4–26.
Olivera, M.; Tejera, N.; Iribarne, C.; Ocana, A.; and Lluch, C., 2004: Growth, nitrogen �xation andammonium assimilation in common bean (Phaseolus vulgaris): e�ect of phosphorus. PhysiologiaPlantarum, 121(3):498–505.
Opdyke, D., 1978: Pelargonic acid. Food and Cosmetics Toxicology, 16:839–841.
Osipe, R.; Braido, A.; Baldini, V.; and Gandolfo, M. A., 2009: Avaliação da e�ciência de diferentesdoses de óleo fúsel no controle de Digitaria insularis (capim-amargoso) e Commelina benghalensis(trapoeraba). Revista Brasileira de Agroecologia, 4(2).
Pacyna, S.; Schulz, M.; and Scherer, H., 2006: In�uence of sulphur supply on glucose and ATP concen-trations of inoculated broad beans (Vicia faba minor L.). Biology and Fertility of Soils, 42(4):324–329.
Paulsen, H. M.; Köpke, U.; Oberson, A.; and Rahmann, G., 2016: Phosphorus – the predicament oforganic farming. In Phosphorus in Agriculture: 100% Zero, pages 195–213. Springer.
142
References
Pedersen, P. and Elbert, B., 2004: Soybean growth and development. Iowa State University, UniversityExtension Ames, IA.
Peigné, J.; Ball, B. C.; Roger-Estrade, J.; and David, C., 2007: Is conservation tillage suitable fororganic farming? A review. Soil Use and Management, 23(2):129–144.
Pelicho, A. F.; Martins, L. D.; Nomi, S. N.; and Solci, M. C., 2006: Integrated and sequential bulk andwet-only samplings of atmospheric precipitation in Londrina, South Brazil (1998–2002). AtmosphericEnvironment, 40(35):6827–6835.
Pelosi, C.; Bertrand, M.; and Roger-Estrade, J., 2009: Earthworm community in conventional, or-ganic and direct seeding with living mulch cropping systems. Agronomy for Sustainable Development,29(2):287–295.
Pinheiro, J.; Bates, D.; DebRoy, S.; Sarkar, D.; and R Core Team, 2015: nlme: Linear and NonlinearMixed E�ects Models. R package version 3.1-122.
Plant Nutrition Institute, I., 2014: IPNI Estimates of Nutrient Uptake and Removal.
Prechtel, A.; Alewell, C.; Armbruster, M.; Bittersohl, J.; Cullen, J.; Evans, C.; Helliwell, R.;Kopácek, J.; Marchetto, A.; Matzner, E. et al., 2001: Response of sulphur dynamics in Europeancatchments to decreasing sulphate deposition. Hydrology and Earth System Sciences Discussions,5(3):311–326.
Pribyl, D. W., 2010: A critical review of the conventional SOC to SOM conversion factor. Geoderma,156(3):75–83.
Price, A. J.; Wayne Reeves, D.; and Patterson, M. G., 2006: Evaluation of weed control providedby three winter cereals in conservation-tillage soybean. Renewable Agriculture and Food Systems,21(03):159–164.
R Core Team, 2015: R: A Language and Environment for Statistical Computing. R Foundation forStatistical Computing, Vienna, Austria.
Rajan, S., 1982a: Availability to plants of phosphate from ’biosupers’ and partially acidulated phosphaterock. New Zealand journal of agricultural research, 25(3):355–361.
Rajan, S., 1982b: In�uence of phosphate rock reactivity and granule size on the e�ectiveness of ’biosu-per’. Fertilizer research, 3(1):3–12.
Rengel, Z., 1992: Role of calcium in aluminium toxicity. New Phytologist, 121(4):499–513.
Ribet, J. and Drevon, J., 1996: The phosphorus requirement of N2-�xing and urea-fed Acacia mangium.New Phytologist, 132(3):383–390.
Rice, C. W. and Smith, M. S., 1984: Short-term immobilization of fertilizer nitrogen at the surface ofno-till and plowed soils. Soil Science Society of America Journal, 48(2):295–297.
Rocha, F. R.; Fracassi da Silva, J. A.; Lago, C. L.; Fornaro, A.; and Gutz, I. G., 2003: Wet deposi-tion and related atmospheric chemistry in the São Paulo metropolis, Brazil: Part 1. Major inorganicions in rainwater as evaluated by capillary electrophoresis with contactless conductivity detection.Atmospheric Environment, 37(1):105–115.
Satoh, A.; Murakami, T.; Takebe, H.; Imai, S.; and Seto, H., 1993: Industrial Development ofBialaphos, a Herbicide from the Metabolites of Streptomyces hygroscopicus SF 1293. 7(2):128–132.
Scherer, H., 2001: Sulphur in crop production – invited paper. European Journal of agronomy, 14(2):81–111.
143
References
Scherer, H. and Lange, A., 1996: N2-�xation and growth of legumes as a�ected by sulphur fertilization.Biology and fertility of soils, 23(4):449–453.
Scherer, H.; Pacyna, S.; Spoth, K.; and Schulz, M., 2008: Low levels of ferredoxin, ATP and leghe-moglobin contribute to limited N2-�xation of peas (Pisum sativum L.) and alfalfa (Medicago sativa L.)under S de�ciency conditions. Biology and Fertility of Soils, 44(7):909–916.
Scherer, W., 2009: Sulfur in soils. Journal of Plant Nutrition and Soil Science, 172(3):326–335.
Schnug, E., 1988: Quantitative und qualitative Aspekte der Diagnose und Therapie der Schwefelver-sorgung von Raps (Brassica napus L.) unter besonderer Berücksichtigung glucosinolatarmer Sorten.Ph.D. thesis.
Schnug, E. and Haneklaus, S., 1998: Diagnosis of sulphur nutrition. In Sulphur in agroecosystems,pages 1–38. Springer.
Schulte, H., 2007: Ackerbohnen - Direktsaat in Hafermulch unter den Bedingungen des OrganischenLandbaus. Master’s thesis, Landwirtschaftliche Fakultät der Universität Bonn.
Schulte-Hermann, R.; Wogan, G. N.; Berry, S. C.; Brown, N. A.; Czeizel, A.; Giavini, E.; Holmes,L. B.; Kroes, R.; Nau,H.; Neubert, D. et al., 2006: Analysis of reproductive toxicity and classi�cationof glufosinate-ammonium. Regulatory toxicology and pharmacology, 44(3):1–76.
Scopel, E.; Triomphe, B.; A�holder, F.; Da Silva, F. A. M.; Corbeels, M.; Xavier, J. H. V.; Lahmar,R.; Recous, S.; Bernoux, M.; Blanchart, E. et al., 2013: Conservation agriculture cropping systemsin temperate and tropical conditions, performances and impacts. A review. Agronomy for sustainabledevelopment, 33(1):113–130.
Scribner, E. A.; Battaglin, W. A.; Gilliom, R. J.; and Meyer, M. T., 2007: Concentrations ofglyphosate, its degradation product, aminomethylphosphonic acid, and glufosinate in ground-andsurface-water, rainfall, and soil samples collected in the United States, 2001-06. US Geological Survey.
Seeger, J.; Meissner, R.; and Richter, G., 2005: Austragungsverhalten und Wanderungs-geschwindigkeit von Sulfat in der ungesättigten Bodenzone - Lysimeter- und Freilandergebnisse.In 11. Gumsteiner Lysimetertagung.
Seehuber, C., 2014: Nährsto�versorgung zur Optimierung der N2-Fixierung und Produktivität vonKörnerleguminosen. Ph.D. thesis, Universitäts-und Landesbibliothek Bonn.
Setia, N.; Batish, D.; Singh, H.; and Kohli, R., 2007: Phytotoxicity of volatile oil from Eucalyptuscitriodora against some weedy species. Journal of Environmental Biology, 28(1):63–67.
Sexton, P. J.; Paek, N. C.; and Shibles, R. M., 1998: E�ects of nitrogen source and timing of sulfurde�ciency on seed yield and expression of 11S and 7S seed storage proteins of soybean. Field cropsresearch, 59(1):1–8.
Sfredo, G. and Lantmann, A., 2007: Enxofre: nutriente necessário para maiores rendimentos da soja.Embrapa Soja.
Shapiro, S. and Wilk, M., 1965: An analysis of variance test for normality (complete samples).Biometrika, 52(3/4):591–611.
Silva, C. A.; VALE, F. d.; Anderson, S. J.; and Kobal, A. R., 1999: Mineralização de nitrogênio eenxofre em solos brasileiros sob in�uência da calagem e fósforo. Pesquisa Agropecuária Brasileira,34(9):1679–1689.
Singh, H.; Batish, D.; and Kohli, R., 2003: Allelopathic interactions and allelochemicals - New possi-bilities for sustainable weed management. Critical reviews in plant sciences, 22(3):239–311.
144
References
Singh, H. P.; Batish, D. R.; Setia, N.; and Kohli, R. K., 2005: Herbicidal activity of volatile oils fromEucalyptus citriodora against Parthenium hysterophorus. Annals of Applied Biology, 146(1):89–94.
Singh, H. P.; Kaur, S.; Mittal, S.; Batish, D. R.; and Kohli, R. K., 2009: Essential oil of Artemisiascoparia inhibits plant growth by generating reactive oxygen species and causing oxidative damage.Journal of chemical ecology, 35(2):154–162.
Six, J.; Elliott, E.; and Paustian, K., 1999: Aggregate and soil organic matter dynamics under conven-tional and no-tillage systems. Soil Science Society of America Journal, 63(5):1350–1358.
Six, J.; Feller, C.; Denef, K.; Ogle, S.; de Moraes Sa, J. C.; Albrecht, A. et al., 2002: Soil organicmatter, biota and aggregation in temperate and tropical soils - E�ects of no-tillage. Agronomie, 22(7-8):755–775.
Skroch, W.; Powell, M.; Bilderback, T.; and Henry, P., 1992: Mulches: Durability, aesthetic value,weed control, and temperature. J. Environ. Hort, 10(1):43–45.
Smith, A. E. and Secoy, D., 1976: Early chemical control of weeds in Europe. Weed Science, pages594–597.
Soares, A.; Guieysse, B.; Je�erson, B.; Cartmell, E.; and Lester, J., 2008: Nonylphenol in the envi-ronment: a critical review on occurrence, fate, toxicity and treatment in wastewaters. Environmentinternational, 34(7):1033–1049.
Srivastava, R. K. and Jozewicz, W., 2001: Flue gas desulfurization: the state of the art. Journal of theAir & Waste Management Association, 51(12):1676–1688.
Stamford,N.; Santos, C.; Santos, P.; Santos, K.; andMontenegro, A., 2005: E�ects of rock phosphate,sulphur with and without Acidithiobacillus and organic by-products on mimosa (Mimosa caesalpini-ifolia) grown in a Brazilian tableland soil. Tropical Grasslands, 39(04):54–61.
Stamford, N.; Santos, P.; Santos, C.; Freitas, A.; Dias, S.; and Lira,M., 2007: Agronomic e�ectivenessof biofertilizers with phosphate rock, sulphur and Acidithiobacillus for yam bean grown on a Braziliantableland acidic soil. Bioresource Technology, 98(6):1311–1318.
Stender, A., 1902: Untersuchungen über die Unkrautvertilgung durch Düngesalze. Ph.D. thesis.
Sturz, A. and Carter, M., 1995: Conservation tillage systems, fungal complexes and disease develop-ment in soybean and barley rhizospheres in Prince Edward Island. Soil and Tillage Research, 34(4):225–238.
Sturz, A.; Carter, M.; and Johnston, H., 1997: A review of plant disease, pathogen interactions andmicrobial antagonism under conservation tillage in temperate humid agriculture. Soil and TillageResearch, 41(3):169–189.
Tabe, L. M. and Droux, M., 2001: Sulfur assimilation in developing lupin cotyledons could contributesigni�cantly to the accumulation of organic sulfur reserves in the seed. Plant Physiology, 126(1):176–187.
Tabe, L. M. and Droux, M., 2002: Limits to sulfur accumulation in transgenic lupin seeds expressinga foreign sulfur-rich protein. Plant Physiology, 128(3):1137–1148.
Thanh, V. H.; Okubo, K.; and Shibasaki, K., 1975: The heterogeneity of the 7S soybean protein bysepharose gel chromatography and disc gel electrophoresis. Agricultural and Biological Chemistry,39(7):1501–1503.
Theisen, G.; Vidal, R.; and Fleck, N., 2000: Redução da infestação de Brachiaria plantaginea em sojapela cobertura do solo com palha de aveia-preta. Pesquisa Agropecuária Brasileira, 35(4):753–756.
145
References
Timmons, F., 2005: A History of Weed Control in the United States and Canada. Weed Science, 53:748–761.
Tukey, J. W., 1949: Comparing individual means in the analysis of variance. Biometrics, pages 99–114.
Tworkoski, T., 2002: Herbicide e�ects of essential oils. Weed Science, 50(4):425–431.
Uddin, M. K.; Juraimi, A. S.; Ismail, M. R.; Othman, R.; and Rahim, A. A., 2013: E�cacy of seawater application for broadleaf weed control in seashore paspalum. Journal of Food, Agriculture &Environment, 11(2):836–840.
Umweltbundesamt, 2014: Modellierung und Kartierung atmosphärischer Sto�einträge und kritischerBelastungsschwellen zur kontinuierlichen Bewertung der ökosystemspezi�schen Gefährdung derBiodiversität in Deutschland PINeti (Pollutant INput and EcosysTem Impact). 62.
Urano, E.; Kurihara, C.; and Maeda, S., 2006: Avaliação do estado nutricional da soja. Pesq. agropec.bras., Brasília, 41(9):1421–1428.
U.S. Environmental Protection Agency, 2004a: List of Inert Pesticide Ingredients - 4A - Minimal RiskInert Ingredients. O�ce of Pesticide Programs.
U.S. Environmental Protection Agency, 2004b: List of Inert Pesticide Ingredients - 4B. O�ce ofPesticide Programs.
U.S. Environmental Protection Agency and Environmental Protection Agency, U., 2014: InertIngredients Eligible for FIFRA 25(b) Pesticide Products. O�ce of chemical safety and pollution preven-tion.
Vaid, S.; Batish, D. R.; Singh, H. P.; and Kohli, R. K., 2010: Phytotoxic e�ect of eugenol towards twoweedy species. The Bioscan, 5(3):339–341.
Van Raij, B.; Quaggio, J.; and Da Silva, N., 1986: Extraction of phosphorus, potassium, calcium, andmagnesium from soils by an ion-exchange resin procedure. Communications in Soil Science & PlantAnalysis, 17(5):547–566.
Vance, C. P., 2001: Symbiotic nitrogen �xation and phosphorus acquisition. plant nutrition in a worldof declining renewable resources. Plant physiology, 127(2):390–397.
Vaughn, S. F. and Holser, R. A., 2007: Evaluation of biodiesels from several oilseed sources as envi-ronmental friendly contact herbicides. Industrial Crops and Products, 26(1):63–68.
Vidal, R.; Theisen, G.; Fleck, N.; and Bauman, T., 1998: Palha no sistema de semeadura direta reduza infestação de gramíneas anuais e aumenta a produtividade da soja. Ciência Rural, Santa Maria,28(3):373–377.
Wahid, O. A. A. and Mehana, T. A., 2000: Impact of phosphate-solubilizing fungi on the yield andphosphorus-uptake by wheat and faba bean plants. Microbiological research, 155(3):221–227.
Walkley, A. and Black, I. A., 1934: An examination of the Degtjare� method for determining soilorganic matter, and a proposed modi�cation of the chromic acid titration method. Soil science, 37(1):29–38.
Webber, C.; Shre�er, J.-O.; and LANE, O., 2006: Vinegar as a burn-down herbicide: acetic acid con-centrations, application volumes, and adjuvants. 2005 Vegetable weed control studies. Oklahoma StateUniversity, Division of Agricultural Sciences and Natural Resources, pages 29–30.
Weidenhamer, J. D.; Macias, F. A.; Fischer, N. H.; andWilliamson, G. B., 1993: Just how insolubleare monoterpenes? Journal of Chemical Ecology, 19:1799–1807.
146
References
Weir, T.; Park, S.-W.; and Vivanco, J., 2004: Biochemical and physiological mechanisms mediated byallelochemicals. Current Opinion in Plant Biology, 7(4):472–479.
Wendland, M.; Diepolder, M.; and Capriel, P., 2012: Leitfaden für die Düngung von Acker-undGrünland - Gelbes Heft. 10. unveränderte Au�age.
Wickham, H., 2009: ggplot2: Elegant Graphics for Data Analysis. Springer-Verlag New York Inc.
Yamada, T. and Lopes, A. S., 1998: Balanço de nutrientes na agricultura brasileira. Informaçõesagronômicas, (84):1–8.
Yang, Z.-H.; Stöven, K.; Haneklaus, S.; and Singh, E., B.R.and Schnug, 2010: Elemental sulfur oxida-tion by Thiobacillus spp. and aerobic heterotrophic sulfur-oxidizing bacteria. Pedosphere, 20(1):71–79.
Ying,G.-G.;Williams, B.; andKookana,R., 2002: Environmental fate of alkylphenols and alkylphenolethoxylates – a review. Environment International, 28(3):215–226.
Young, B. G., 2008: A Compendium of Herbicide Adjuvants. Southern Illinois University.
Young, S., 2004: Natural product herbicides for control of annual vegetation along roadsides. Weedtechnology, 18:580–587.
Zulkaliph, N. A.; Juraimi, A. S.; Uddin, M. K.; Begum, M.; Mustapha, M. S.; Amrizal, S. M.;Samsuddin, N.H. et al., 2011: Use of Saline Water for Weed Control in Seashore Paspalum (Paspalumvaginatum).
147

This thesis, containing 52 �gures, 15 tables, and 46 boxes, was typeset with LATEX using Linux Libertineserif and sans-serif as well as Computer Modern typewriter type faces. Walter & Lieth climatic diagramswere created with R package iki.dataclim and all other diagrams with the ggplot2 plotting systemfor R.©2018 by Michael Giepen