Embed Size (px)
Citation preview
Leibniz Institute for Farm Animal Biology (FBN) Dummerstorf
In cooperation with the Christian Albrechts University Kiel
Oral Bioavailability of Flavonoids
and Their Effects on the Metabolic and
Antioxidative Status in Neonatal Calves
[Orale Bioverfuumlgbarkeit von Flavonoiden
sowie deren Effekte auf den Stoffwechsel und
den antioxidativen Status beim neugeborenen Kalb]
Dissertation
submitted for the Doctoral Degree
awarded by the Faculty of Agricultural and Nutritional Sciences
of the Christian Albrechts University Kiel
submitted by
MSc Josefine Maciej
from Kuumlhlungsborn
Kiel 2015
Dean Prof Dr sc agr Eberhard Hartung
1 Examiner PD Dr med vet habil Harald M Hammon
2 Examiner Prof Dr med vet Siegfried Wolffram
Day of oral examination July 08 2015
Printed with the approval of the Faculty for Agricultural and Nutritional Sciences of the
Christian Albrechts University Kiel
This dissertation was written at the
Leibniz Institute for Farm Animal Biology (FBN) Dummerstorf (Head Prof Dr rer
nat habil Manfred Schwerin) at the Institute of Nutritional Physiology ʻOskar Kellnerʼ
(Head PD Dr rer nat habil Cornelia C Metges) in the Division of Endocrine
Metabolic Regulation (Head PD Dr med vet habil Harald M Hammon)
This study was kindly supported by the
Federal Ministry of Education and Research Germany (BMFT grant no 0315538B)
Oral Bioavailability of Flavonoids
and Their Effects on the Metabolic and
Antioxidative Status in Neonatal Calves
[Orale Bioverfuumlgbarkeit von Flavonoiden
sowie deren Effekte auf den Stoffwechsel und
den antioxidativen Status beim neugeborenen Kalb]
Faber est quisque fortunae suae
(Appius Claudius Caecus)
CONTENT
I
Content
Abbreviations IV
General Introduction 1
References 4
Chapter 1
Literature Overview 5
11 An introduction in flavonoids 6
111 Chemical structure and natural occurrence 6
112 Biological effects of flavonoids in plants 10
113 Biological effects of flavonoids in humans and animals 10
12 Bioavailability of flavonoids 12
121 General aspects of bioavailability with focus on ruminants 12
122 Absorption and distribution of flavonoids in the organism 14
123 Metabolism and excretion of flavonoids 17
124 Factors influencing bioavailability of flavonoids 19
125 Studies on bioavailability of quercetin and catechins 20
13 Metabolic and health status in neonatal calves 24
131 Metabolic status in calves at birth and postnatal changes 24
132 Health status in calves and development of the immune system 25
133 Oxidative stress and antioxidative capacity in neonatal calves 26
134 Effects of flavonoid administration on development and health status in
neonatal calves 29
14 Conclusive remarks and need for further research 31
References 32
CONTENT
II
Chapter 2
Bioavailability of the flavonol quercetin in neonatal calves after oral
administration of quercetin aglycone or rutin 51
Abstract 52
21 Introduction 53
22 Materials and Methods 54
221 Animals and feeding 54
222 Treatment and blood sampling 55
223 Analytical methods 57
224 Calculations and statistical analyses 59
23 Results 60
231 Body weight and feed intake 60
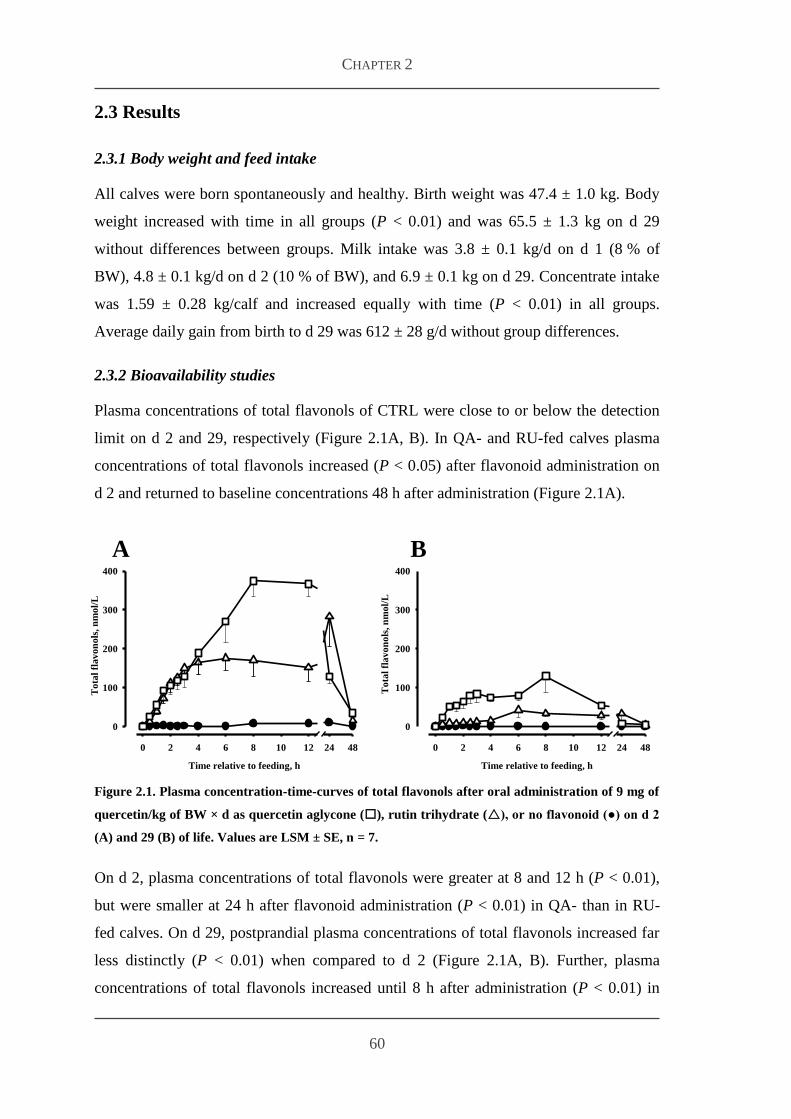
232 Bioavailability studies 60
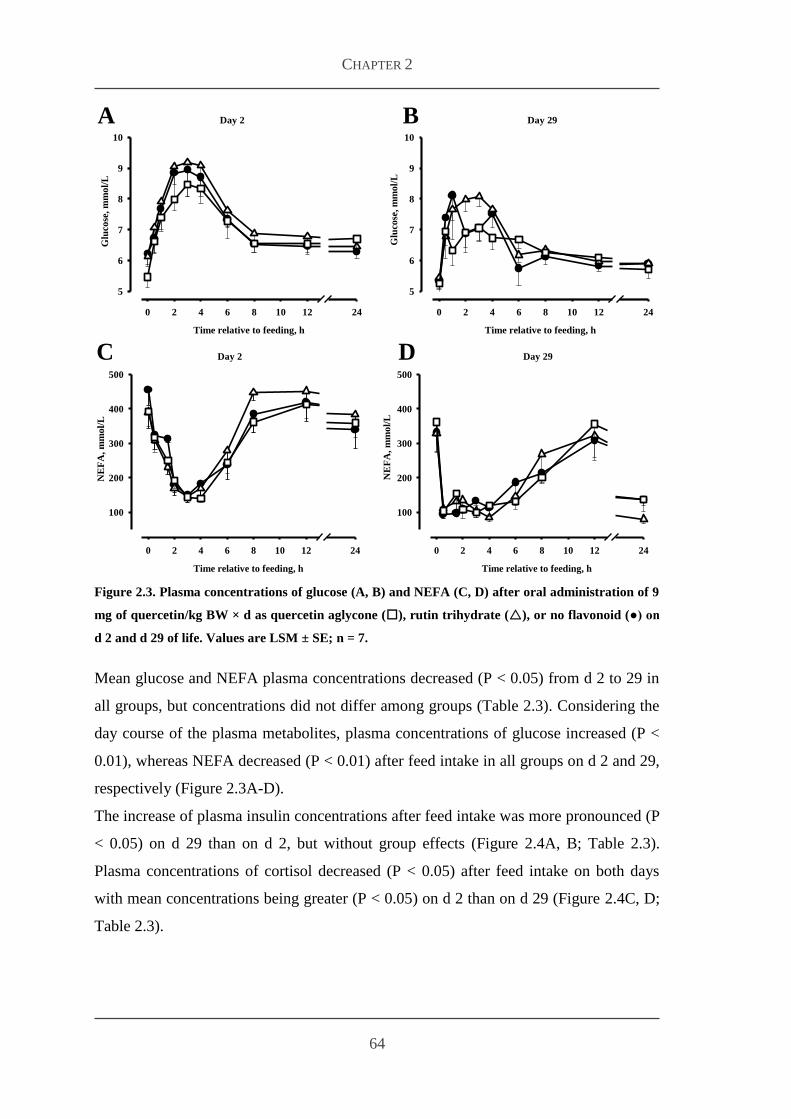
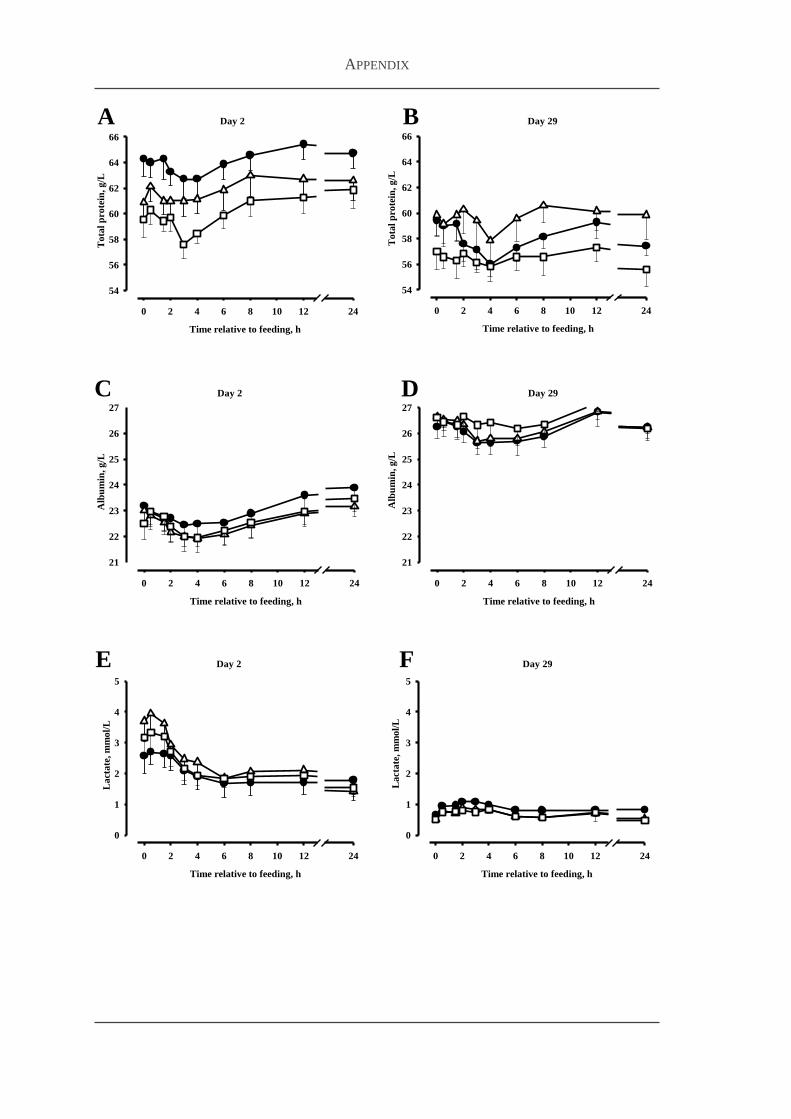
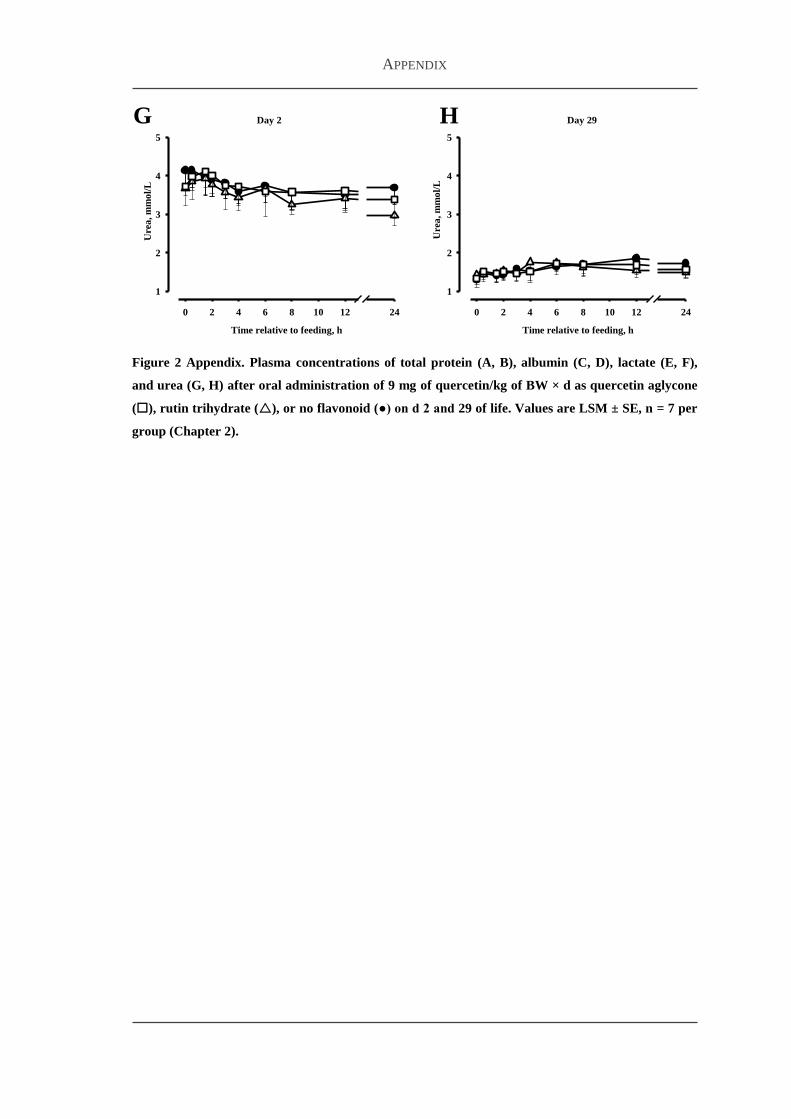
233 Plasma concentrations of metabolites and hormones 63
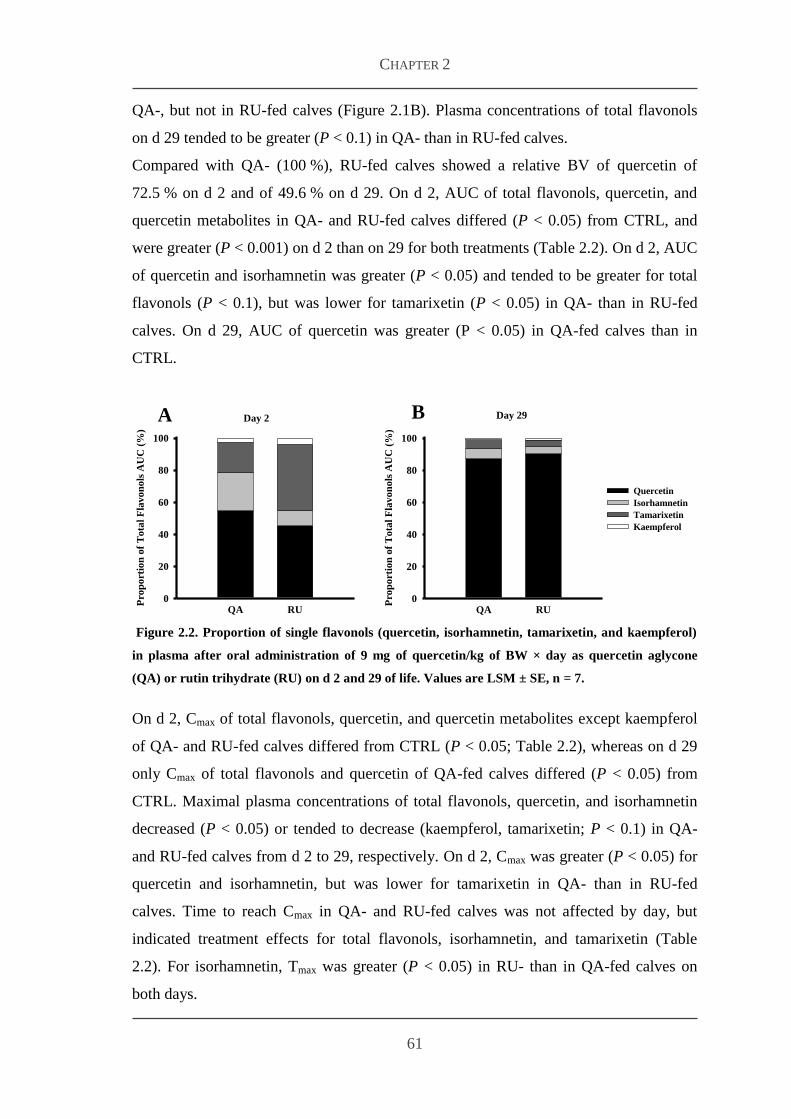
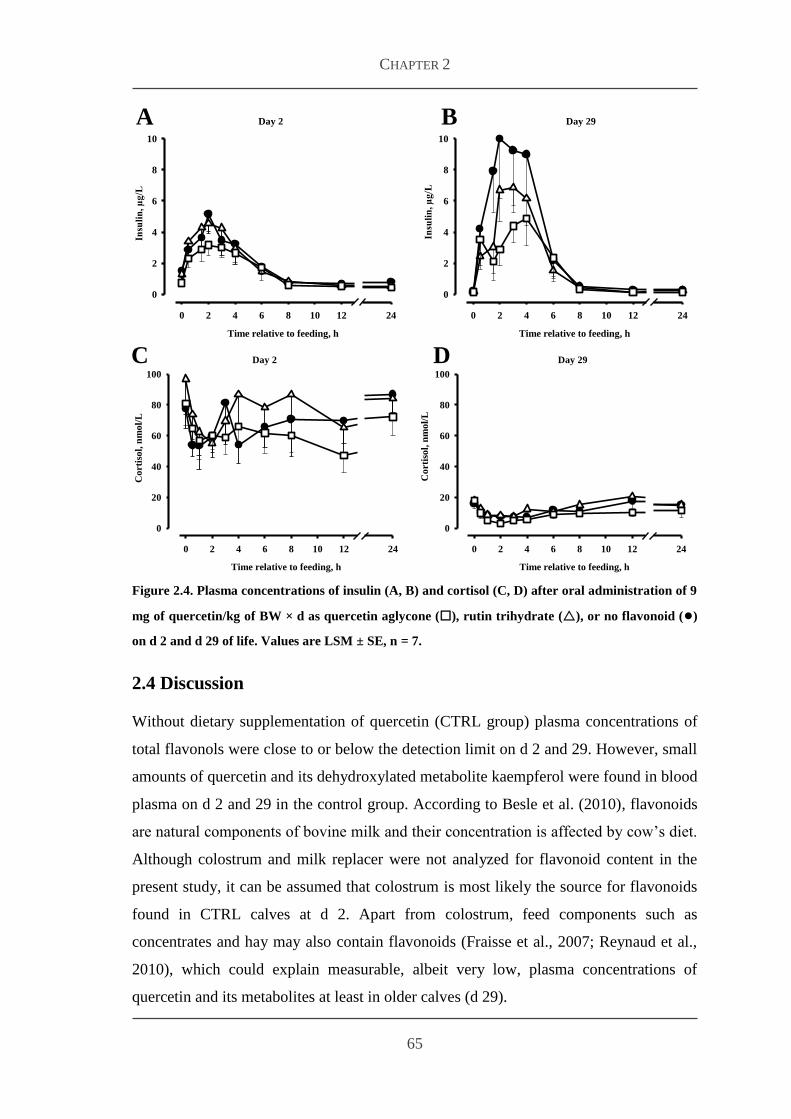
24 Discussion 65
References 69
Chapter 3
Effects of oral flavonoid supplementation on metabolic and antioxidative status
in newborn dairy calves 77
Abstract 77
31 Introduction 78
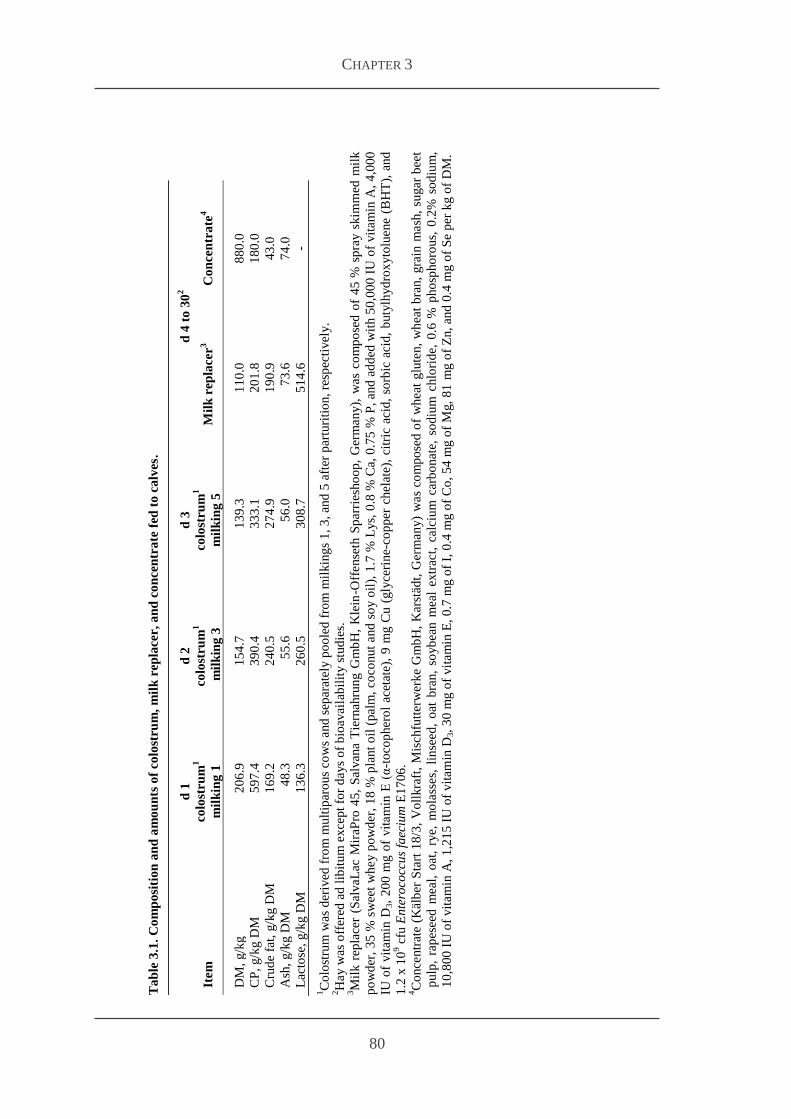
32 Materials and Methods 80
321 Animals and feeding 79
322 Treatment and blood sampling 81
323 Analytical methods 81
324 Statistical analyses 82
33 Results 84
331 Body weight feed intake and health status 85
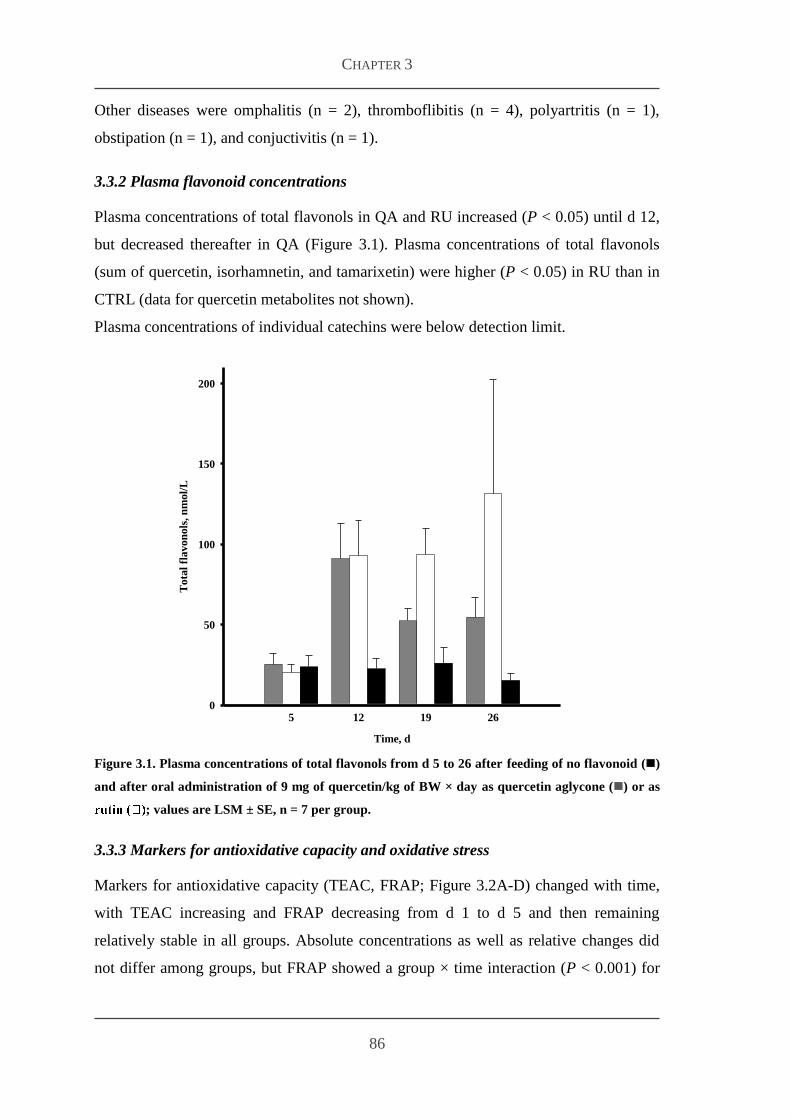
332 Plasma flavonoid concentrations 86
CONTENT
III
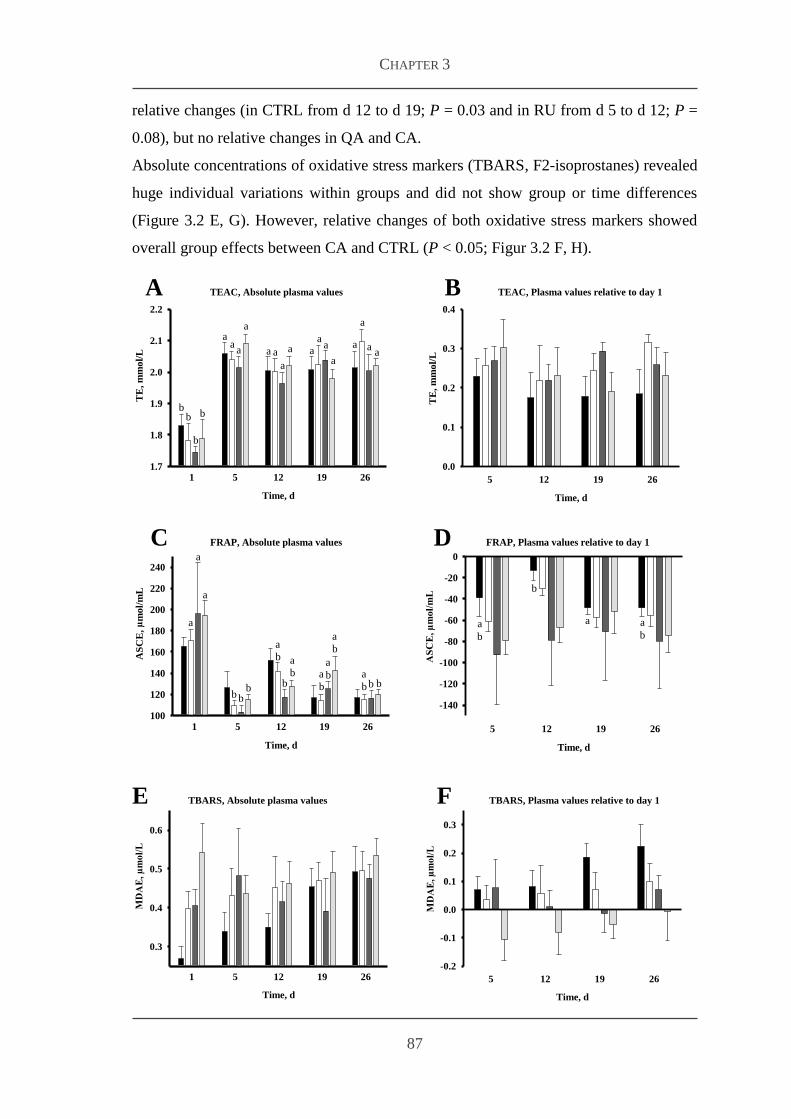
333 Markers for antioxidative capacity and oxidative stress 86
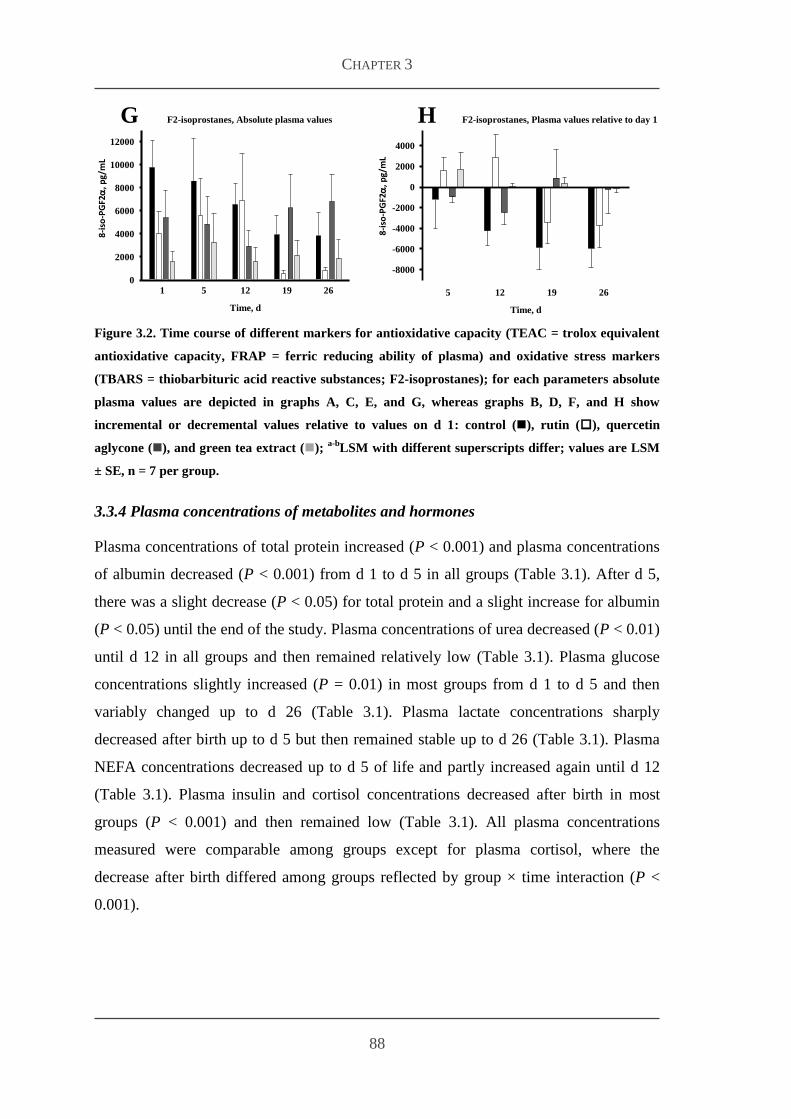
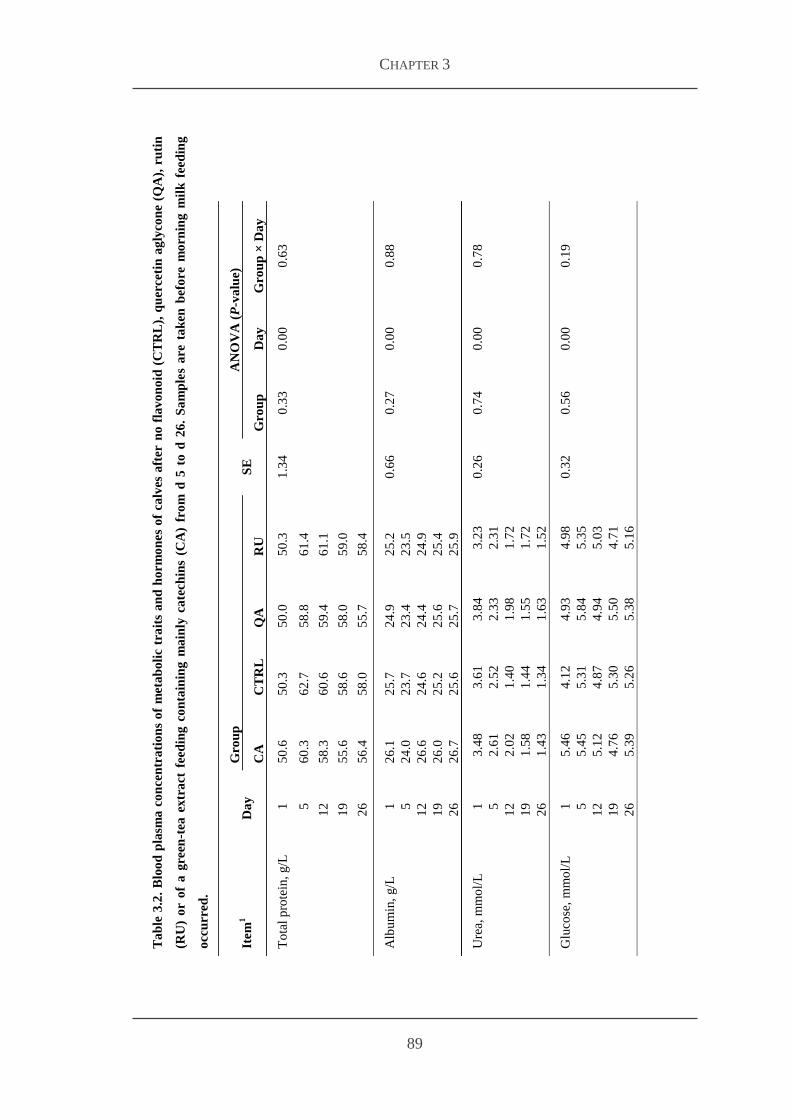
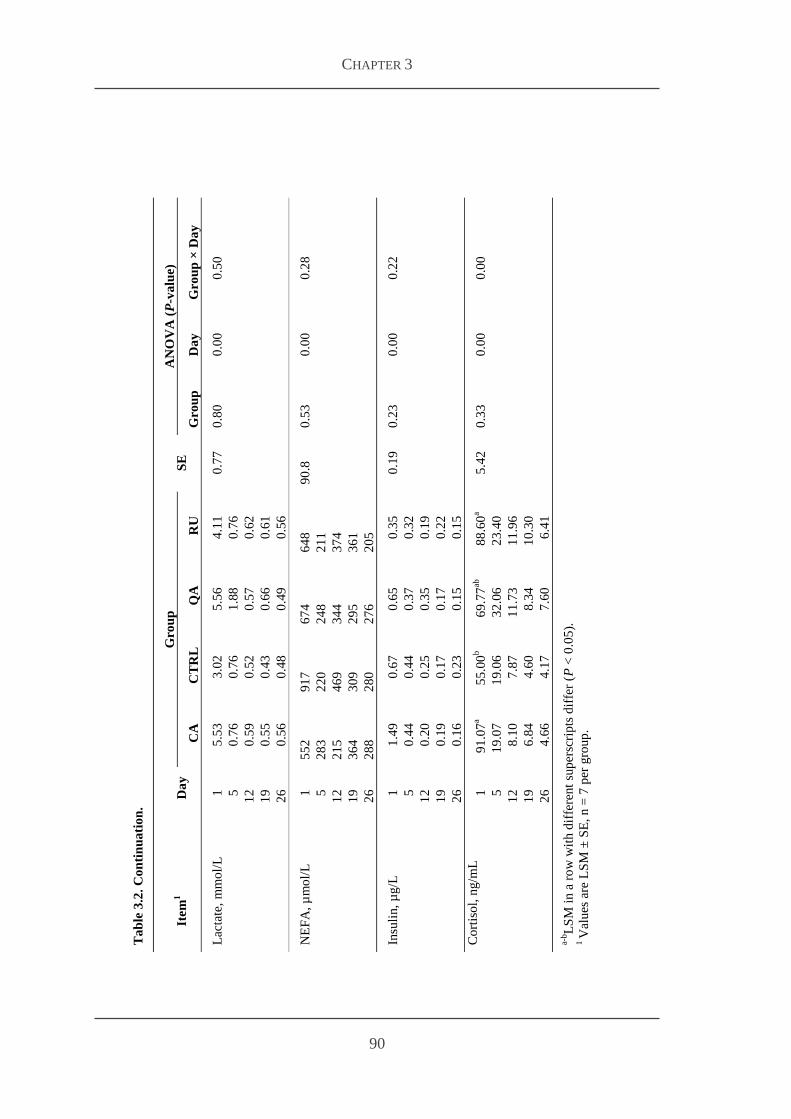
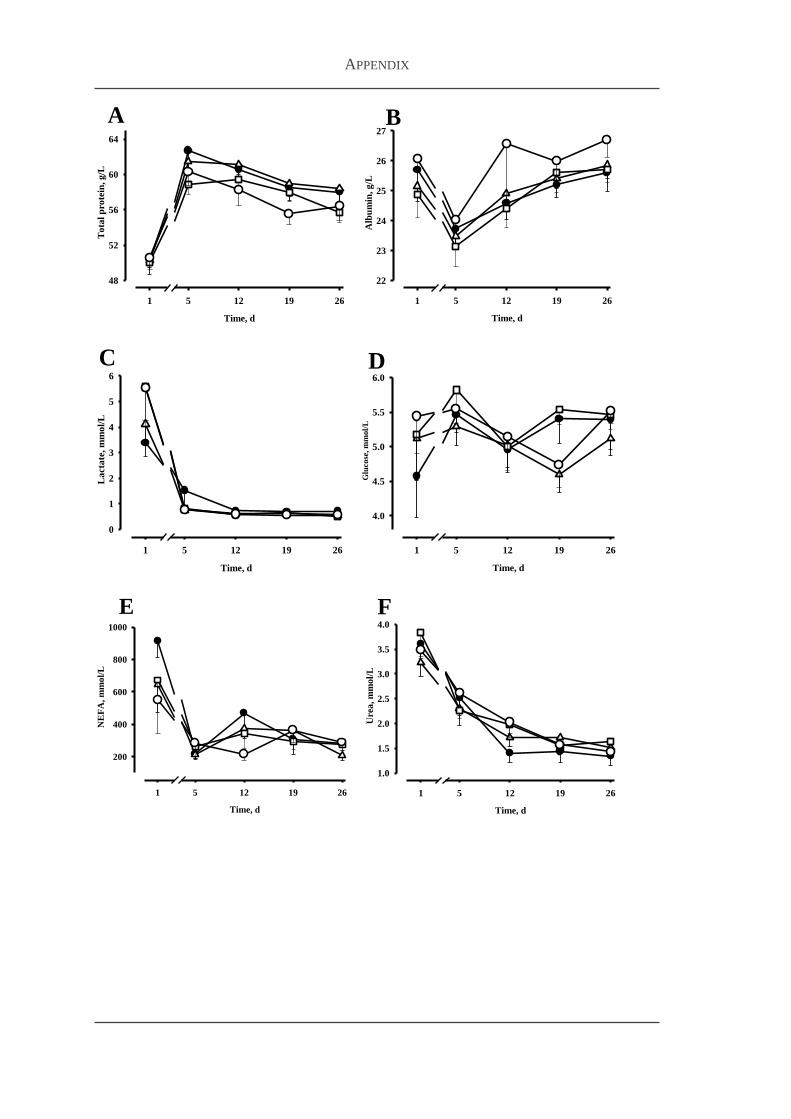
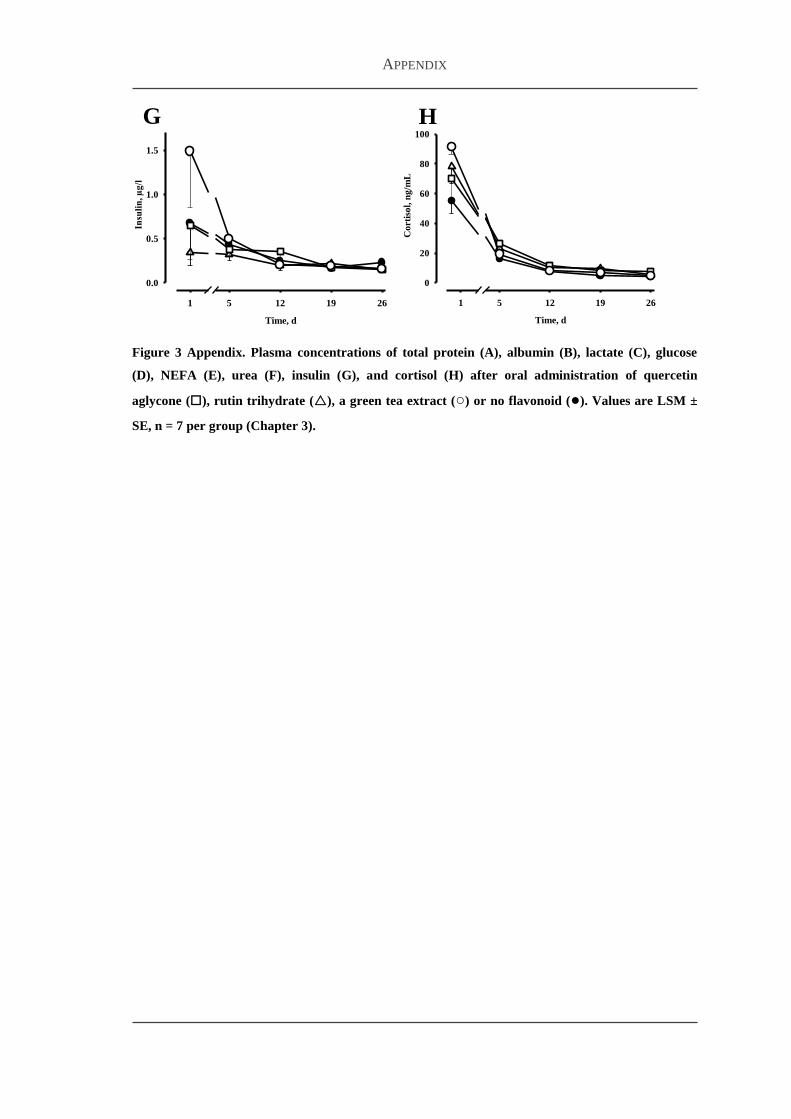
334 Plasma concentrations of metabolites and hormones 88
34 Discussion 91
References 94
Chapter 4
General Discussion 99
References 106
Summary 109
Zusammenfassung 112
Appendix
ABBREVIATIONS
IV
Abbreviations
ASCE Ascorbic acid equivalent(s)
AUC Area under the curve
BW Body weight
BHT Butylhydroxytoluene
BV Bioavailability
CA Catechins
cfu Colony forming units
Cmax Maximal reached plasma concentration
CP Crude protein
CTRL Control group fed no flavonoid
d Day(s)
DM Dry matter
DNA Deoxyribonucleic acid
EDTA Ethylenediaminetetraacetic acid
8-iso-PGF2α 8-iso-prostaglandin F2α
ELISA Enzyme-linked immunosorbent assay
FRAP Ferric reducing ability of plasma
GH Growth hormone
GLUT Glucose transporter
GTE Green tea extract
h Hour(s)time of day
HPLC High-performance liquid chromatography
Ig Immunoglobulin(s)
IGF Insulin-like growth factor
IU International units
LDL Low-density lipoprotein
LPH Lactase phlorizin hydrolase
MDAE Malondialdehyde equivalent
n Number
NEFA Non-esterified fatty acids
QA Quercetin aglycone
ABBREVIATIONS
V
QE Quercetin equivalents
RIA Radioimmunoassay
ROS Reactive oxygen species
RU Quercetin glucorhamnoside rutin
SE Standard error
SEM Standard error of the mean
SGLT Sodium-dependent glucose co-transporter
TE Trolox equivalents
TEAC Trolox equivalent antioxidative capacity
TBARS Thiobarbituric acid reactive substances
Tmax time until maximal plasma concentration is reached
U Unit(s)
wk week(s)
1
General Introduction
GENERAL INTRODUCTION
2
General Introduction
After birth calves undergo huge immunological and metabolic changes Though
relatively mature when born they must adapt to various morphological and functional
changes after birth (Blum and Hammon 2000 Hammon et al 2012) Because of
impaired neonatal management like colostrum management calf losses are highest in
the first weeks of life mainly due to respiratory and digestive diseases In the United
States 23 million calf losses were counted in 2010 (USDA 2011)
Oxidative stress is assumed to play a key role in numerous diseases as almost any
disease is somehow related to an increased formation of reactive oxygen species
(Halliwell 1991) In calves increased levels of markers for oxidative stress were found
during the first days of life (Stohrer et al 2003 Alexandrovich and Antonovna 2009)
and during sickness (Ahmed and Hassan 2007 Al-Qudah 2009) Furthermore the
nutrient status highly affects the antioxidant system (Schwerin et al 2002 Sies et al
2005) and often is impaired in newborn calves due to the change from intrauterine
continuous energy and nutrient supply via placenta to discontinuous oral supply after
birth Thus improvement of the antioxidant status in newborn calves may contribute to
the development of an own defence against environmental threats which helps to
reduce calf losses and to improve health status during the neonatal development
Because flavonoids as phenolic compounds are claimed to be strong antioxidants and to
have countless other health-promoting effects they are claimed and marketed as health-
promoting substances by the feeding industry Especially since the ban of antibiotic
growth promoters in the European Union in 2006 these ʻgreenrsquo feed additives gained
enormous popularity all over the world However any in vivo biological effect of a
substance requires its bioavailability (BV) In contrast to several monogastric species
where BV of flavonoids is extensively investigated knowledge on BV of flavonoids in
neonatal calves is still lacking Thus the aim of this study was to investigate the oral
BV of the flavonol quercetin one of the most abundant flavonoids in nature fed either
as aglycone or as its glycoside rutin in neonatal calves Studies were carried out on days
2 and 29 of life to show possible differences in absorption distribution and metabolism
of quercetin during ontogenetic development of newborn calves Furthermore oral
supplementation with quercetin and catechins for a three-wk period provides
GENERAL INTRODUCTION
3
information of flavonoid effects on metabolic and antioxidative status in neonatal
calves
This thesis is structured in 4 major chapters At first chapter 1 shows an overview of
flavonoids and their BV and introduces major aspects of the antioxidative system and
metabolic status in neonatal calves Chapter 2 deals with the relative oral bioavailability
of quercetin fed as quercetin aglycone or as its glucorhamnoside rutin in neonatal
calves Chapter 3 focusses on the effects on the metabolic and antioxidative status in
neonatal calves during oral supplementation of quercetin aglycone rutin and catechins
Finally chapter 4 presents a general discussion of the results of chapter 2 and 3 in
consideration of present knowledge in the literature
GENERAL INTRODUCTION
4
References
Ahmed W M and S E Hassan 2007 Applied studies on coccidiosis in growing
buffalo-calves with special reference to oxidantantioxidant status World J Zool
240ndash48
Alexandrovich K N and S E Antonovna 2009 Age-dependent level of antioxidant
defence system and lipid metabolism state in calves Int J Appl Res Vet Med
773ndash75
Al-Qudah K M 2009 Oxidative stress in calves with acute or chronic
bronchopneumonia Rev Med Vet 160231ndash236
Blum J W and H Hammon 2000 Colostrum effects on the gastrointestinal tract and
on nutritional endocrine and metabolic parameters in neonatal calves Livest
Prod Sci 66151ndash159
Halliwell B 1991 Reactive oxygen species in living systems Source biochemistry
and role in human disease Am J Med Suppl 91S14ndashS22
Hammon H M J Steinhoff-Wagner U Schoumlnhusen C C Metges and J W Blum
2012 Energy metabolism in the newborn farm animal with emphasis on the calf
endocrine changes and responses to milk-born and systemic hormones Domest
Anim Endocrinol 43171ndash185
Schwerin M U Dorroch M Beyer H Swalve C C Metges and P Junghans 2002
Dietary protein modifies hepatic gene expression associated with oxidative stress
responsiveness in growing pigs FASEB J 161322ndash1324
Sies H W Stahl and A Sevanian 2005 Nutritional dietary and postprandial
oxidative stress J Nutr 135969ndash972
Stohrer M S Lutz and M Stangassinger 2003 Antioxidant status of calves and foals
declines after birth Acta Vet Scand Suppl 44P38
USDA (US Department of Agriculture) Animal and Plant Health Inspection Service
2011 Cattle and calves nonpredator death loss in the United States 2010
httpwwwaphisusdagovanimal_healthnahmsgeneraldownloadscattle_calves
_nonpred_2010pdf (Accessed May 2013)
5
Chapter 1
Literature Overview
LITERATURE OVERVIEW
6
1 Literature Overview
11 An introduction in flavonoids
111 Chemical structure and natural occurrence
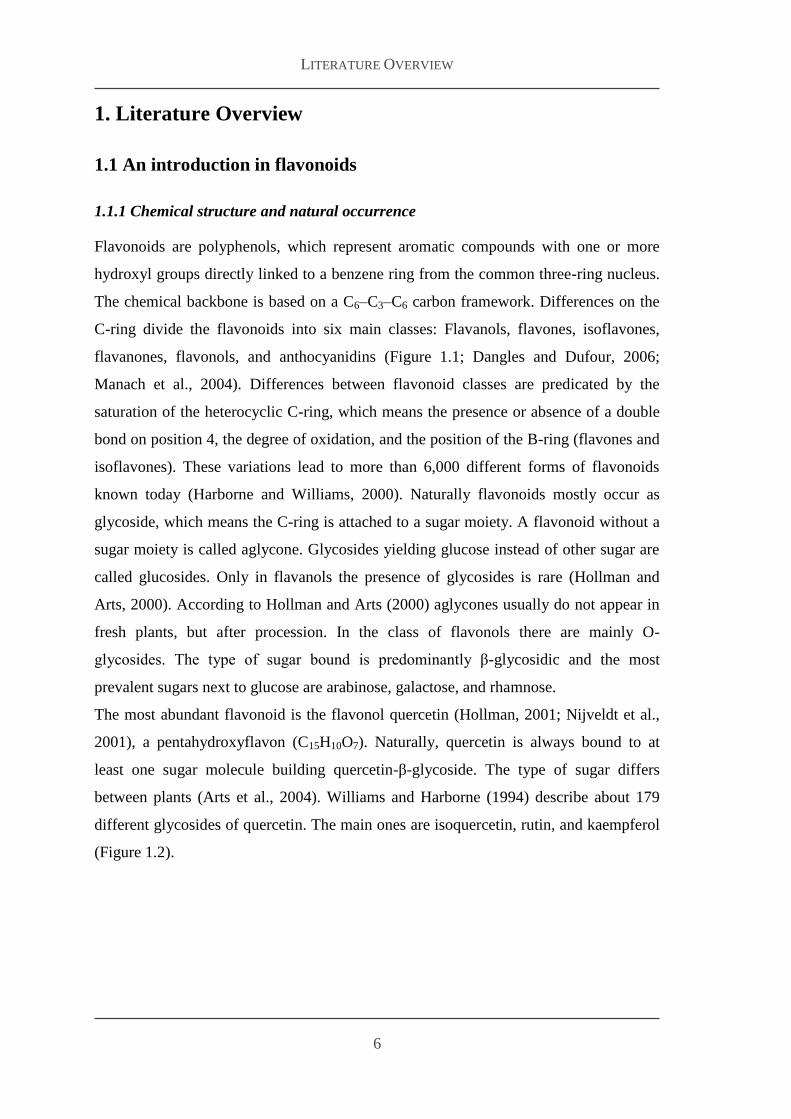
Flavonoids are polyphenols which represent aromatic compounds with one or more
hydroxyl groups directly linked to a benzene ring from the common three-ring nucleus
The chemical backbone is based on a C6ndashC3ndashC6 carbon framework Differences on the
C-ring divide the flavonoids into six main classes Flavanols flavones isoflavones
flavanones flavonols and anthocyanidins (Figure 11 Dangles and Dufour 2006
Manach et al 2004) Differences between flavonoid classes are predicated by the
saturation of the heterocyclic C-ring which means the presence or absence of a double
bond on position 4 the degree of oxidation and the position of the B-ring (flavones and
isoflavones) These variations lead to more than 6000 different forms of flavonoids
known today (Harborne and Williams 2000) Naturally flavonoids mostly occur as
glycoside which means the C-ring is attached to a sugar moiety A flavonoid without a
sugar moiety is called aglycone Glycosides yielding glucose instead of other sugar are
called glucosides Only in flavanols the presence of glycosides is rare (Hollman and
Arts 2000) According to Hollman and Arts (2000) aglycones usually do not appear in
fresh plants but after procession In the class of flavonols there are mainly O-
glycosides The type of sugar bound is predominantly β-glycosidic and the most
prevalent sugars next to glucose are arabinose galactose and rhamnose
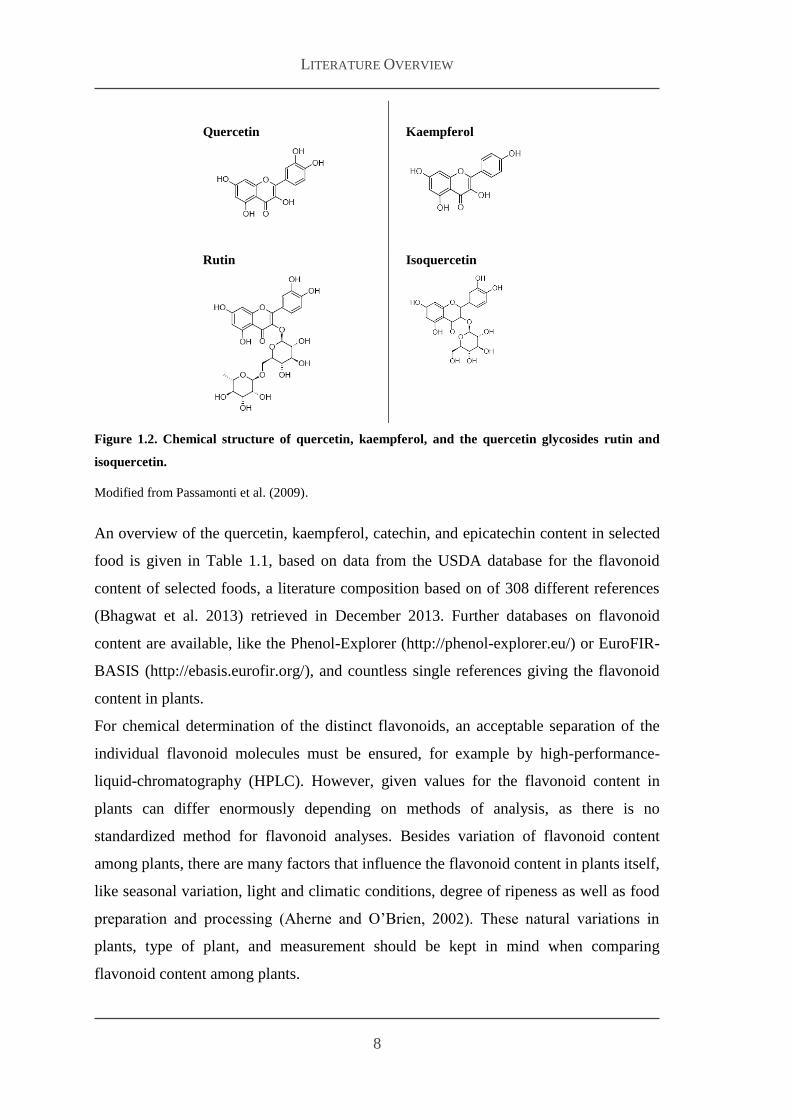
The most abundant flavonoid is the flavonol quercetin (Hollman 2001 Nijveldt et al
2001) a pentahydroxyflavon (C15H10O7) Naturally quercetin is always bound to at
least one sugar molecule building quercetin-β-glycoside The type of sugar differs
between plants (Arts et al 2004) Williams and Harborne (1994) describe about 179
different glycosides of quercetin The main ones are isoquercetin rutin and kaempferol
(Figure 12)
LITERATURE OVERVIEW
7
Flavanol
Flavanone
Catechin
Epicatechin
Epigallocatechin gallate
Hesperitin
Naringenin
Eriodictyol
Flavone
Flavonol
Luteolin
Apigenin
Quercetin
Kaempferol
Myricetin
Isorhamnetin
Isoflavone
Anthocyanidin
Genistein
Daidzein
Biochanin A
Pelargonidin
Cyanidin
Delphinidin
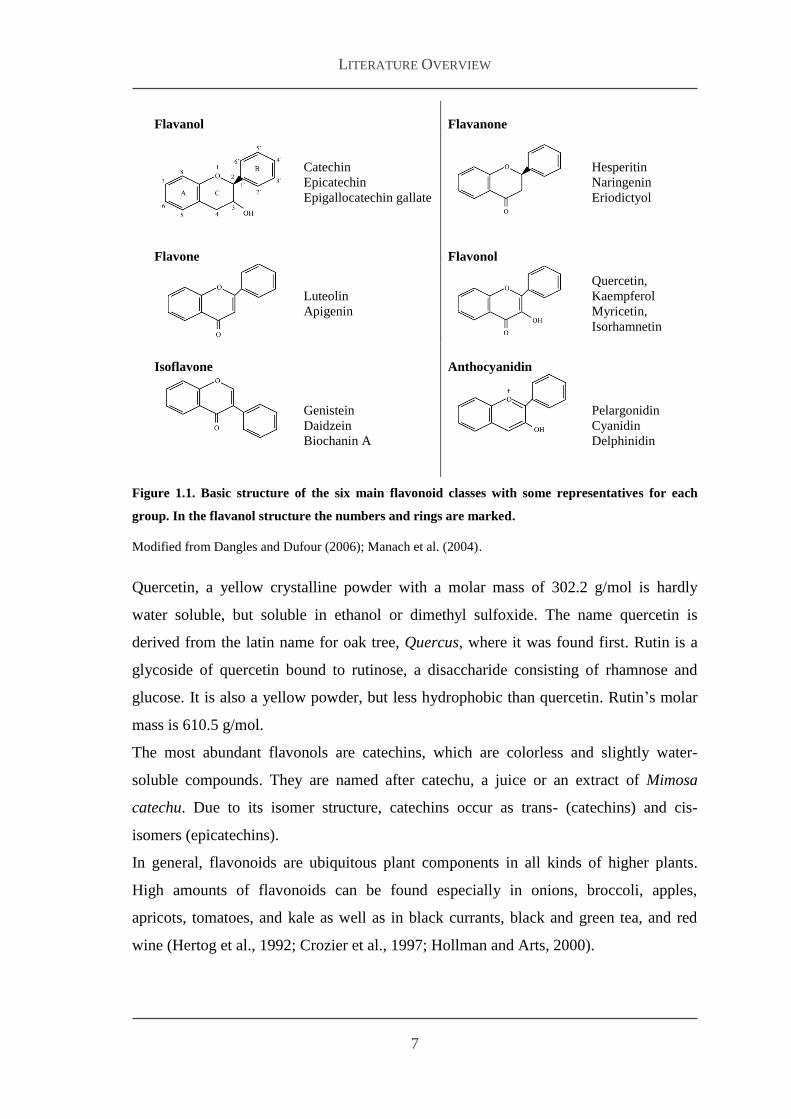
Figure 11 Basic structure of the six main flavonoid classes with some representatives for each
group In the flavanol structure the numbers and rings are marked
Modified from Dangles and Dufour (2006) Manach et al (2004)
Quercetin a yellow crystalline powder with a molar mass of 3022 gmol is hardly
water soluble but soluble in ethanol or dimethyl sulfoxide The name quercetin is
derived from the latin name for oak tree Quercus where it was found first Rutin is a
glycoside of quercetin bound to rutinose a disaccharide consisting of rhamnose and
glucose It is also a yellow powder but less hydrophobic than quercetin Rutinʼs molar
mass is 6105 gmol
The most abundant flavonols are catechins which are colorless and slightly water-
soluble compounds They are named after catechu a juice or an extract of Mimosa
catechu Due to its isomer structure catechins occur as trans- (catechins) and cis-
isomers (epicatechins)
In general flavonoids are ubiquitous plant components in all kinds of higher plants
High amounts of flavonoids can be found especially in onions broccoli apples
apricots tomatoes and kale as well as in black currants black and green tea and red
wine (Hertog et al 1992 Crozier et al 1997 Hollman and Arts 2000)
LITERATURE OVERVIEW
8
Quercetin
Kaempferol
Rutin
Isoquercetin
Figure 12 Chemical structure of quercetin kaempferol and the quercetin glycosides rutin and
isoquercetin
Modified from Passamonti et al (2009)
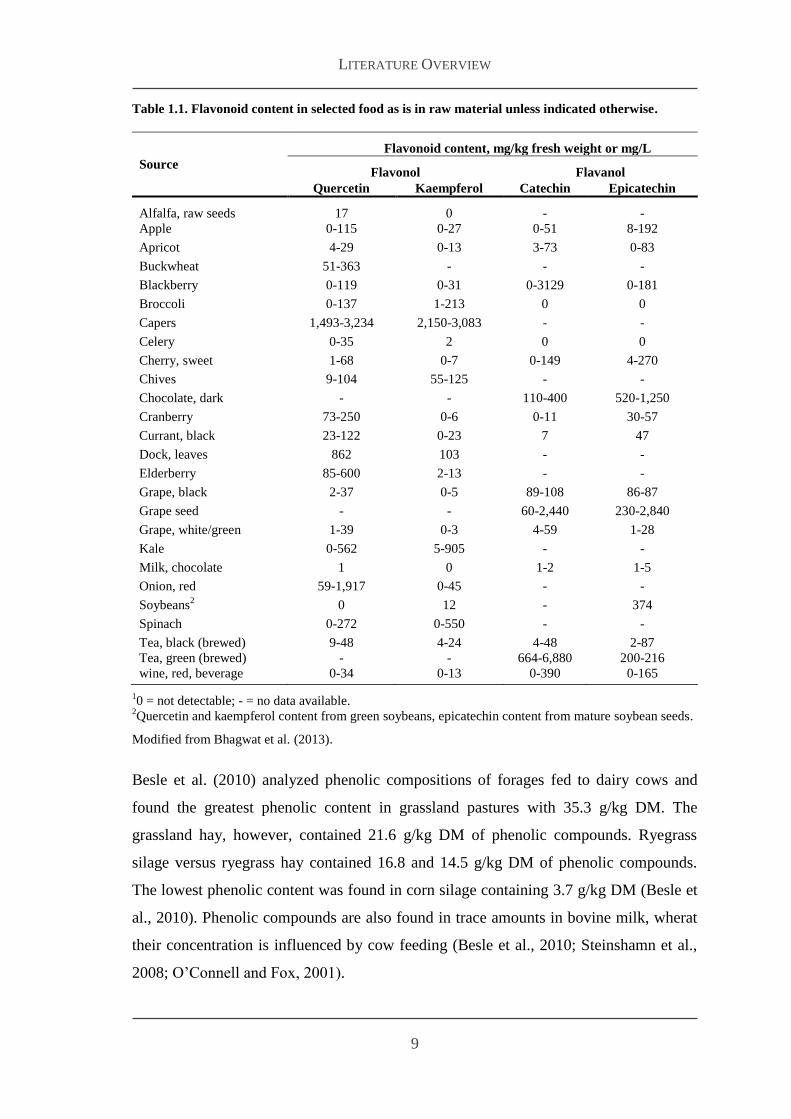
An overview of the quercetin kaempferol catechin and epicatechin content in selected
food is given in Table 11 based on data from the USDA database for the flavonoid
content of selected foods a literature composition based on of 308 different references
(Bhagwat et al 2013) retrieved in December 2013 Further databases on flavonoid
content are available like the Phenol-Explorer (httpphenol-explorereu) or EuroFIR-
BASIS (httpebasiseurofirorg) and countless single references giving the flavonoid
content in plants
For chemical determination of the distinct flavonoids an acceptable separation of the
individual flavonoid molecules must be ensured for example by high-performance-
liquid-chromatography (HPLC) However given values for the flavonoid content in
plants can differ enormously depending on methods of analysis as there is no
standardized method for flavonoid analyses Besides variation of flavonoid content
among plants there are many factors that influence the flavonoid content in plants itself
like seasonal variation light and climatic conditions degree of ripeness as well as food
preparation and processing (Aherne and OrsquoBrien 2002) These natural variations in
plants type of plant and measurement should be kept in mind when comparing
flavonoid content among plants
LITERATURE OVERVIEW
9
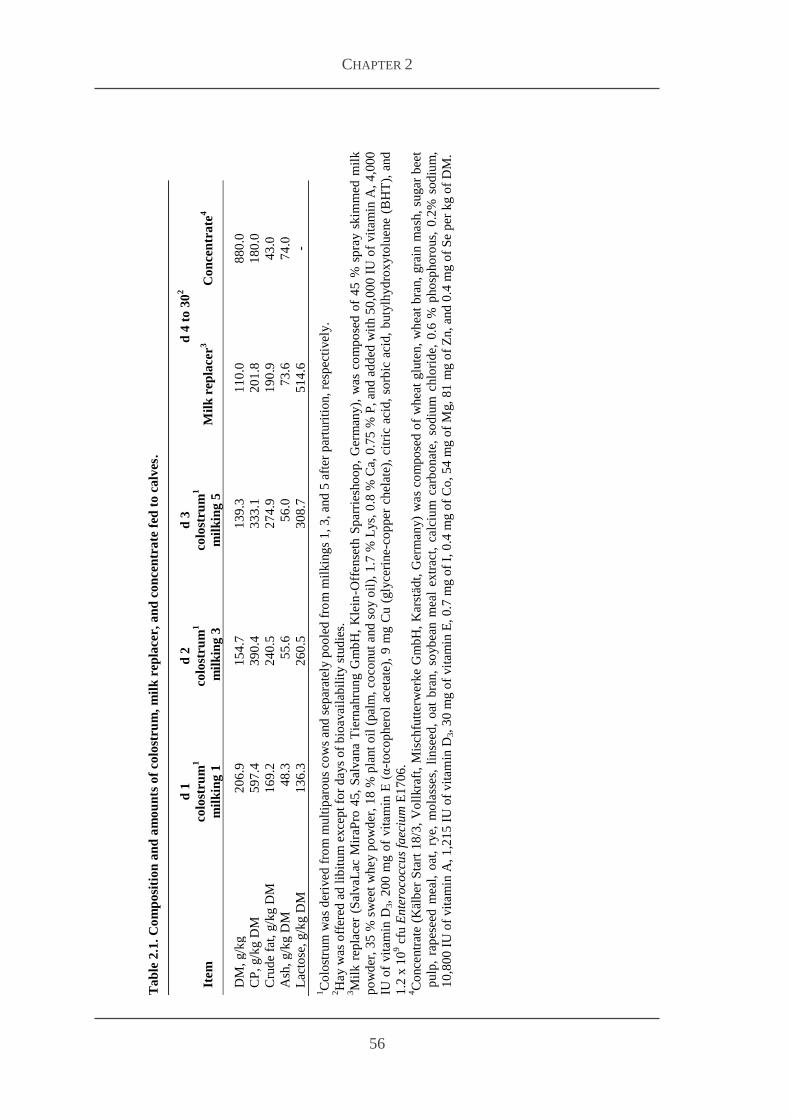
Table 11 Flavonoid content in selected food as is in raw material unless indicated otherwise
Source
Flavonoid content mgkg fresh weight or mgL
Flavonol Flavanol
Quercetin Kaempferol Catechin Epicatechin
Alfalfa raw seeds 17 0 - -
Apple 0-115 0-27 0-51 8-192
Apricot 4-29 0-13 3-73 0-83
Buckwheat 51-363 - - -
Blackberry 0-119 0-31 0-3129 0-181
Broccoli 0-137 1-213 0 0
Capers 1493-3234 2150-3083 - -
Celery 0-35 2 0 0
Cherry sweet 1-68 0-7 0-149 4-270
Chives 9-104 55-125 - -
Chocolate dark - - 110-400 520-1250
Cranberry 73-250 0-6 0-11 30-57
Currant black 23-122 0-23 7 47
Dock leaves 862 103 - -
Elderberry 85-600 2-13 - -
Grape black 2-37 0-5 89-108 86-87
Grape seed - - 60-2440 230-2840
Grape whitegreen 1-39 0-3 4-59 1-28
Kale 0-562 5-905 - -
Milk chocolate 1 0 1-2 1-5
Onion red 59-1917 0-45 - -
Soybeans2 0 12 - 374
Spinach 0-272 0-550 - -
Tea black (brewed) 9-48 4-24 4-48 2-87
Tea green (brewed) - - 664-6880 200-216
wine red beverage 0-34 0-13 0-390 0-165
10 = not detectable - = no data available
2Quercetin and kaempferol content from green soybeans epicatechin content from mature soybean seeds
Modified from Bhagwat et al (2013)
Besle et al (2010) analyzed phenolic compositions of forages fed to dairy cows and
found the greatest phenolic content in grassland pastures with 353 gkg DM The
grassland hay however contained 216 gkg DM of phenolic compounds Ryegrass
silage versus ryegrass hay contained 168 and 145 gkg DM of phenolic compounds
The lowest phenolic content was found in corn silage containing 37 gkg DM (Besle et
al 2010) Phenolic compounds are also found in trace amounts in bovine milk wherat
their concentration is influenced by cow feeding (Besle et al 2010 Steinshamn et al
2008 OrsquoConnell and Fox 2001)
LITERATURE OVERVIEW
10
112 Biological effects of flavonoids in plants
Flavonoids have multifarious and important functions in plant biochemistry and
physiology like protecting deoxyribonucleic acid (DNA) from ultraviolet-induced
damage (Kootstra 1994) Flavonoids further affect photosynthesis by catalysing
electron transport processes (Das 1994) In leaves flavonoid pigments protect the
underlying photosynthetic cells by absorbing radiation Most flavonoids accumulate in
the epidermal cell layer of leaves (Winkel-Shirley 2002) and in the skin of fruits
(Manach et al 2004) The diversity of colors in plants is mainly caused by flavonoids
thus flavonoids play a crucial role in attracting pollinators and seed dispersers (Winkel-
Shirley 2002) Furthermore flavonoids protect plants against microbial invasion by
acting as phytoalexins (Harborne and Williams 2000) increasing tolerance against
abiotic stressors or defend other herbivory for example by bitter tasting (Gould and
Lister 2006 Harborne and Williams 2000) The signal transfer between plants and
microorganisms is also triggered by flavonoids as seen in the stimulation of the
Rhizobium bacteria for nitrogen fixation (Gould and Lister 2006) Flavonoids are stored
in plant vacuoles Cell death causes flavonoids to disperse into different fluid
components of the plants like waxes and resins (Das 1994) which are often considered
as enriched with flavonoids
113 Biological effects of flavonoids in humans and animals
The effects of flavonoids in humans and animals are seen ambiguous On the one hand
flavonoids are discussed as anti-nutritive factors whereat on the other hand flavonoids
are claimed health and performance promoting Negative aspects of flavonoids are seen
in tannins where diminishing BV of proteins and minerals or an inhibition of digestive
enzymes can occur (Chung et al 1998) Phytoestrogens are attributed to have adverse
health effects in infant development (Zung et al 2001) However todayʼs research is
mainly focussed on the positive aspects of flavonoids especially their antioxidative
activity and protective capacity against oxidative stress Flavonoids were found to
inhibit oxidation of low-density lipoproteins (LDL) in vitro (Harborne and Williams
2000) Low-density lipoproteins transport lipophilic substances like cholesterol and
plasma cholesterol esters Elevated plasma concentrations of LDL are associated with
vascular diseases like atherosclerosis (Aviram and Fuhrman 2003) and related problems
like coronary heart disease and stroke (Denny and Buttriss 2005) Therefore a large
LITERATURE OVERVIEW
11
body of research deals with the influence of a flavonoid-rich diet on reducing coronary
heart and vascular diseases (Hertog et al 1993 Knekt et al 1996 Rimm et al 1996
Yochum et al 1999 Hirvonen et al 2001 Mennen et al 2004) In spite of all these
investigations Loke et al (2010) postulated the detailed mechanisms of how flavonoids
may protect against cardiovascular diseases as still unknown Besides influencing
cardiovascular diseases flavonoids are involved in cancer control (Lamartiniere et al
1995 Knekt et al 1997 Hirvonen et al 2001) Birt et al (2001) postulated estrogenic
and antiestrogenic activity antiproliferation cell cycle arrest and apoptosis as well as
induction of detoxification enzymes regulation of host immune function and other
mechanisms of flavonoid actions as responsible for tumor growth restriction
Furthermore flavonoids are claimed to be involved in modulation of
neurodegeneration especially age-related cognitive and motoric decline in protection
against cerebral ischemiaperfusion injuries or other brain abnormalities (Youdim and
Joseph 2003) Other neurodegenerative disorders in this context are Alzheimerʼs
disease Parkinsonʼs disease seizures trauma and neuroinflammation (Varadarajan et
al 2001 Schroeter and Spencer 2003 Miller et al 2009) In addition flavonoid
treatment may alleviate infection by human immunodeficiency virus because
flavonoids are capable to inhibit several critical enzymes involved in life cycle of
human immunodeficiency virus (Cos et al 2008)
Effects of flavonoids and their metabolites on the metabolism in organisms are
manifold Especially those on carbohydrate metabolism are well studied and an impact
on glucose homeostasis was found in several studies Hanhineva et al (2010) reviewed
the impact of dietary polyphenols on the carbohydrate metabolism and summarized the
inhibition of carbohydrate digestion and glucose absorption in the intestine the
stimulation of insulin secretion from pancreatic β-cells the modulation of glucose
release from the liver the activation of insulin receptors and glucose uptake in insulin-
sensitive tissues as well as the modulation of intracellular signalling pathways and gene
expression as possible mechanisms of how flavonoids influence carbohydrate
metabolism More in detail flavonoids are capable to inhibit α-amylase and α-
glucosidase activity (Tadera et al 2006) inhibit the sodium-dependent glucose co-
transporter (SGLT) 1 (Kobayashi et al 2000) or glucose transporters itself (Johnston et
al 2005) In rat insulinoma pancreatic cells polyphenols like quercetin apigenin and
luteolin inhibited cytotoxicity and attenuated the decrease of glucose-stimulated insulin
LITERATURE OVERVIEW
12
secretion (Kim et al 2007) However insulin secretion is affected by a wide range of
different plant compounds and extracts Glucose uptake can be stimulated by flavonoids
in both insulin-sensitive and non-insulin sensitive tissue mostly dose-dependent
(Hanhineva et al 2010) Glucose transporter (GLUT) 1 widely distributed in fetal
tissues and GLUT 4 expressed by muscle are supposed to mainly trigger flavonoid
mediated glucose uptake (Hanhineva et al 2010)
However the influence of polyphenols on liver function to maintain glucose
homeostasis may also play a key role in neonates Endogenous glucose production as
important pathway to ensure glucose homeostasis in the neonate (Girard et al 1992)
originates from glycogenolysis and gluconeogenesis both taking place in the liver An
improved hepatic glucose and lipid metabolism was indicated in diabetic rats feeding a
polyphenol-rich diet (Roghani and Baluchnejadmojarad 2010 Bose et al 2008
Wolfram et al 2006) In non-diabetic rats quercetin stimulated glycogenolysis and
inhibited glycolysis and gluconeogenesis (Gasparin et al 2003a b) ex vivo by infusing
the liver with 50 to 300 micromolL quercetin However these concentrations are not
achievable with standard diets for in vivo experiments (Gasparin et al 2003a b)
Furthermore Kobayashi et al (2010) and Seiva et al (2012) showed positive effects of
a flavonoid-rich diet on lipid metabolism in rats fed a high-fat diet as plasma
concentrations of triglycerides non-esterified fatty acids (NEFA) insulin and leptin as
well as lipogenesis were reduced
12 Bioavailability of flavonoids
121 General aspects of bioavailability with focus on ruminants
In general BV can be defined as the rate and extent to which the active ingredient of a
substance is absorbed in the blood compartment or becomes available at the site of
action The European Agency for the Evaluation of Medicinal Products (2000) defines
BV as the extent and rate to which a substance or its active moiety is delivered from a
pharmaceutical form and becomes available in circulation However the effect of a
substance is usually determined by its concentration at the place of action
All postabsorptive biological effects of given substances depend on their BV
Parameters determining BV are liberation absorption distribution metabolism and
excretion abbreviated with their first letters as LADME-system Liberation the first
LITERATURE OVERVIEW
13
step for an effect of a drug or an active compound means drug release or drug delivery
and can be seen as a complex process The drug must disaggregate in smaller particles
dissolve in the present fluid and disperse which is more difficult for water insoluble
substances like flavonoids In the next step the absorption the active compound must
enter the blood or lymph vessels when given orally Absorption of orally given
ingredients is determined by solution rate as well as gut and stomach contentfilling
(Frey 2007) Bioavailability was shown to be influenced by technological (galenical)
factors of the substance the form of application local factors like diarrhea or contact
with other substances and first-pass effects These first-pass effects occur when an
active compound is metabolized very fast and thus inactivated or transformed before
entering the systemic circulation for example in the gut mucosa or liver After
absorption into the bloodstream the active compound is distributed by passive diffusion
or by convective transport from the blood capillaries into neighboring tissues The
metabolism of an active compound means its biotransformation mainly increasing its
hydrophilic properties (Pfeiffer et al 1995) The main organ for biotransformation is
the liver but it also takes place in the mucosa cells of the gastrointestinal tract lung
and kidney Most enzymes involved in this process are located in the endoplasmic
reticulum (Frey 2007) Biotransformation is two-phased Phase-I-reaction is a
transformation where functional groups are built into non-polar molecules mostly by
oxidation reduction or hydrolysis Absorption to water soluble molecules in phase-II-
reaction enables excretion The most important ways of excretion or elimination are
renal biliary and intestinal
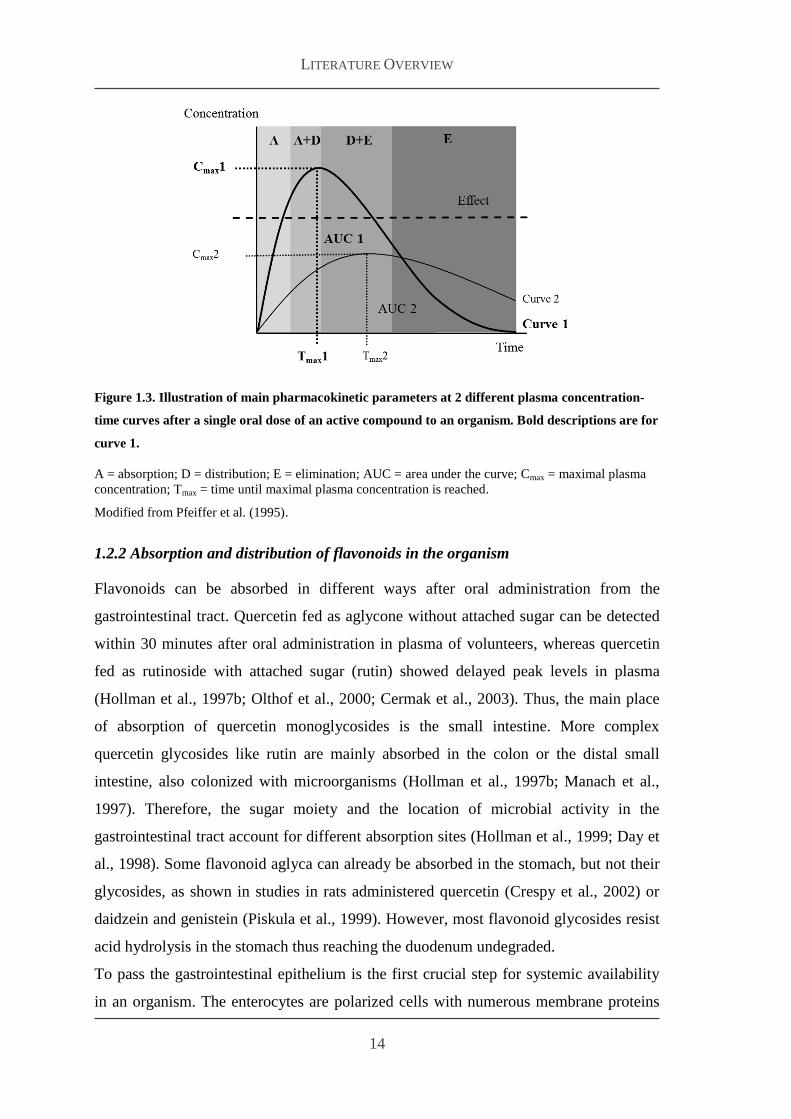
To determine BV the concentration of an active ingredient is measured over time in
blood samples collected from the systemic circulation and as plasma concentration-
time curves are specified only by absorption distribution and elimination To calculate
BV area under the curve (AUC) maximal plasma concentration (Cmax) and time until
the maximal plasma concentration is reached (Tmax) are used as pharmacokinetic
parameters (see Figure 13)
Bioavailability is either relative or absolute For determination of the absolute oral BV
of a substance the AUC after oral intake is compared to the AUC after intravenous
injection In contrast to this relative oral BV compares two different drugs containing
the same active principle after oral application As time interval of sampling mainly
determines accuracy sampling frequency should be as high as possible
LITERATURE OVERVIEW
14
Figure 13 Illustration of main pharmacokinetic parameters at 2 different plasma concentration-
time curves after a single oral dose of an active compound to an organism Bold descriptions are for
curve 1
A = absorption D = distribution E = elimination AUC = area under the curve Cmax = maximal plasma
concentration Tmax = time until maximal plasma concentration is reached
Modified from Pfeiffer et al (1995)
122 Absorption and distribution of flavonoids in the organism
Flavonoids can be absorbed in different ways after oral administration from the
gastrointestinal tract Quercetin fed as aglycone without attached sugar can be detected
within 30 minutes after oral administration in plasma of volunteers whereas quercetin
fed as rutinoside with attached sugar (rutin) showed delayed peak levels in plasma
(Hollman et al 1997b Olthof et al 2000 Cermak et al 2003) Thus the main place
of absorption of quercetin monoglycosides is the small intestine More complex
quercetin glycosides like rutin are mainly absorbed in the colon or the distal small
intestine also colonized with microorganisms (Hollman et al 1997b Manach et al
1997) Therefore the sugar moiety and the location of microbial activity in the
gastrointestinal tract account for different absorption sites (Hollman et al 1999 Day et
al 1998) Some flavonoid aglyca can already be absorbed in the stomach but not their
glycosides as shown in studies in rats administered quercetin (Crespy et al 2002) or
daidzein and genistein (Piskula et al 1999) However most flavonoid glycosides resist
acid hydrolysis in the stomach thus reaching the duodenum undegraded
To pass the gastrointestinal epithelium is the first crucial step for systemic availability
in an organism The enterocytes are polarized cells with numerous membrane proteins
LITERATURE OVERVIEW
15
that enable the transport of dietary compounds from the lumen into the blood stream via
channels or active transporters (Figure 14) Lipophilic and small nonpolar substances
can pass the plasma membrane via diffusion following a concentration gradient As
flavonoids are polar and thus hydrophilic substances the passive diffusion of flavonoids
however barely occurs in the gastrointestinal tract (Day et al 2000 Manach et al
2004 Crespy et al 2003) Only for the aglyca a passive absorption is discussed (Day et
al 2000 Cermak et al 2003 Wolffram 2010) Acidic conditions in the stomach
inhibit hydrolysis (Day et al 2000) and pancreatic enzymes are also not able to
hydrolyze β-glycosidic bounds (Arts et al 2004) On the contrary Walle et al (2005)
found hydrolysis of dietary flavonoids already in the oral cavity by both bacteria and
shed epithelial cells but with a large interindividual variability between volunteers
Furthermore Kahle et al (2011) found degradation of polyphenols varying after
incubation with human saliva Different glucosidases like lactase phlorizin hydrolase
(LPH) are known to hydrolyze flavonoids (Day et al 2000 Sesink et al 2002 Neacutemeth
et al 2003) Lactase phlorizin hydrolase is an extracellular enzyme from the brush
border membrane of intestinal mammalian cells and was shown to be important for
intestinal absorption of quercetin glycosides (Figure 14 Sesink et al 2002)
Extracellular glucosidases cleave the sugar from the flavonoid glucosides and the
aglycone can be absorbed Hydrolysis by lactase phlorizin hydrolase might be reduced
in rats and sheep due to their higher microbial population in the stomach than in humans
(Day et al 2000) In human small intestine and liver an intracellular cytosolic β-
glucosidase was described that hydrolyze various flavonoid glycosides (Day et al
1998) Further enzymes hydrolyzing flavonoids in the gut are glucocerebrosidase (Day
et al 1998) and other cytosolic β-glucosidases (McMahon 1997) More complex
glycosides like rhamnosides are hydrolyzed by enzymes of microorganism in the distal
small intestine or in the colon (Crespy et al 1999 Scholz and Williamson 2007)
Besides that active transport systems are prevalently used for flavonoid transport into
the cell (Figure 14) Several studies suggest that quercetin glucosides could be
absorbed in the small intestine via SGLT 1 (Gee et al 1998 Walgren et al 2000a
Wolffram et al 2002) Also GLUT like GLUT 2 (Chen et al 2007) are discussed to
transport quercetin glucosides across the cell membranes Since the membrane transport
of xenobiotics chemical compounds like antibiotics that are neither produced in an
organism nor are part of the regular diet is a key factor in medical treatment and
LITERATURE OVERVIEW
16
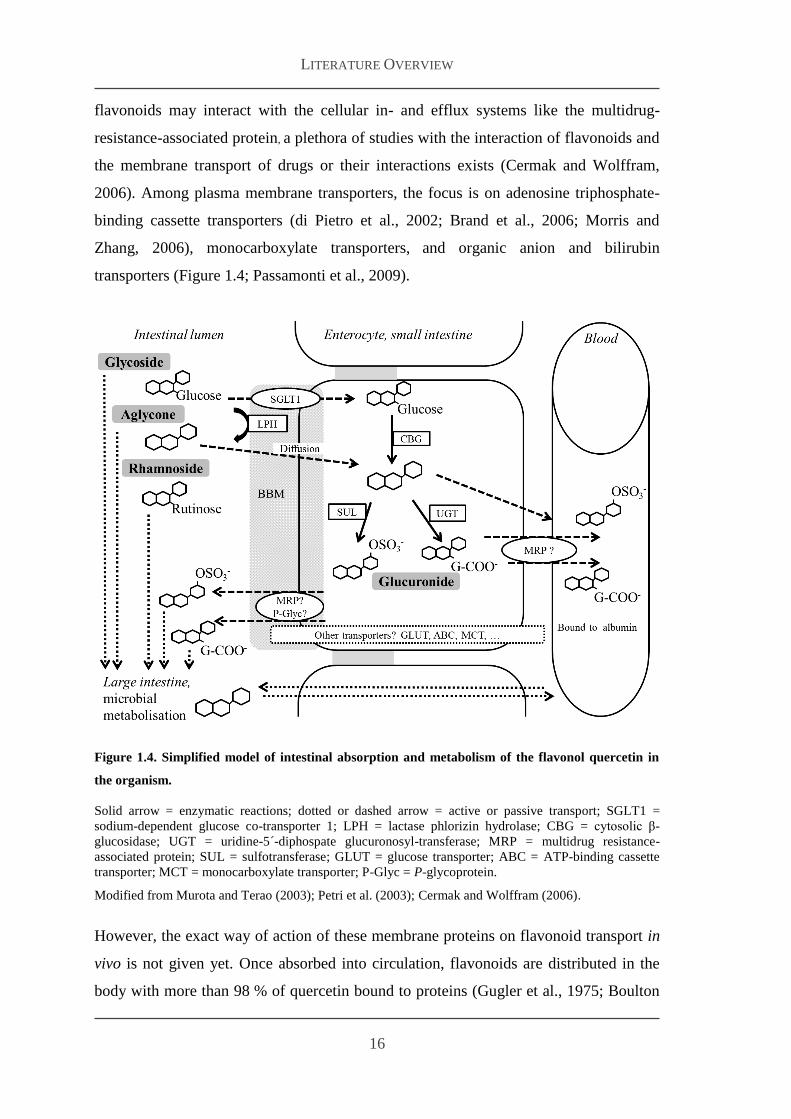
flavonoids may interact with the cellular in- and efflux systems like the multidrug-
resistance-associated protein a plethora of studies with the interaction of flavonoids and
the membrane transport of drugs or their interactions exists (Cermak and Wolffram
2006) Among plasma membrane transporters the focus is on adenosine triphosphate-
binding cassette transporters (di Pietro et al 2002 Brand et al 2006 Morris and
Zhang 2006) monocarboxylate transporters and organic anion and bilirubin
transporters (Figure 14 Passamonti et al 2009)
Figure 14 Simplified model of intestinal absorption and metabolism of the flavonol quercetin in
the organism
Solid arrow = enzymatic reactions dotted or dashed arrow = active or passive transport SGLT1 =
sodium-dependent glucose co-transporter 1 LPH = lactase phlorizin hydrolase CBG = cytosolic β-
glucosidase UGT = uridine-5acute-diphospate glucuronosyl-transferase MRP = multidrug resistance-
associated protein SUL = sulfotransferase GLUT = glucose transporter ABC = ATP-binding cassette
transporter MCT = monocarboxylate transporter P-Glyc = P-glycoprotein
Modified from Murota and Terao (2003) Petri et al (2003) Cermak and Wolffram (2006)
However the exact way of action of these membrane proteins on flavonoid transport in
vivo is not given yet Once absorbed into circulation flavonoids are distributed in the
body with more than 98 of quercetin bound to proteins (Gugler et al 1975 Boulton
LITERATURE OVERVIEW
17
et al 1998 Janisch et al 2004) mainly albumin as the most prevalent protein in
plasma Further quercetin is also bound to glycoproteins and LDL (Boulton et al
1998) Depending on their conjugation the affinity of quercetin to bind on serum
albumin differs (Janisch et al 2004) contributing to the huge variation in BV (Dufour
and Dangles 2005) However as it is known that binding of the polyphenol to proteins
alter their biological activity the biological effect of this binding needs still to be
evaluated (Manach et al 2004)
The pattern of metabolites in tissues may be different from the one in the blood stream
due to its cellular uptake or intracellular metabolism (Manach et al 2004)
Furthermore Manach et al (2004) consider that plasma concentrations do not
necessarily correlate with the concentration in tissue Thus plasma concentration of
flavonoids may not be an accurate biomarker of exposure to body tissue
123 Metabolism and excretion of flavonoids
First-pass effect during intestinal absorption is crucial for availability of orally
administered flavonoids as described in chapter 121 Hydrolyzation of some
flavonoids already occurs by passing the enterocytes via the membrane-bound lactase
phlorizin hydrolase Other flavonoids are hydrolyzed in the enterocyte by cytosolic β-
glucosidase before entering the systemic circulation (Day et al 2000 1998 Sesink et
al 2002) and being transported to the liver Flavonoids reaching the colon are
hydrolyzed by microorganisms before absorption In human intestine the presence of
the bacteria species Eubacterium Clostridium and Bacterioides indicated metabolism
of flavonoids Various simple aromatic acids are produced in this process and the
released aglycone is often degraded by colonic microorganisms (Manach et al 2004)
These aglycones are further degraded by splitting the heterocyclic ring thus flavonols
mainly produce hydroxyphenylacetic acids Different flavonoid classes lead to different
acids like flavones and flavanones are mainly metabolized to hydroxyphenylpropionic
acids All breakdown products are further metabolized to derivatives of benzoic acid
microbial metabolites are absorbed in the colon and conjugated with glycine glucuronic
acid or sulfate (Manach et al 2004) Due to the different composition of the colonic
microflora in different species the variations in microbial metabolism of flavonoids are
enormous
LITERATURE OVERVIEW
18
The main site of flavonol metabolism besides the gastrointestinal tract is the liver
(Hollman and Katan 1997 Aherne and OrsquoBrien 2002) Flavonoids are transported to
the liver via the portal vein During absorption in the intestine and later in the liver
flavonoids are conjugated by phase-II-reactions mainly glucuronidation methylation
and sulfation Phase-I-reactions like oxidation by enzymes of the cytochrome P450
system are of minor importance in flavonoid metabolism (Otake et al 2002) The
reactions of phase-II mainly are detoxificating processes in the body like metabolism of
xenobiotics (Manach et al 2004) When methylated a methyl group of quercetin is
transferred catalyzed by the catechol-O-methyl transferase (Manach et al 2004) which
is found in many tissues with highest activity in liver and kidneys (Piskula and Terao
1998) Glucuronidation occurs in the liver but also to a great extent in the intestine
(Spencer et al 1999) This process is catalyzed by the Uridine diphosphate-
glucuronosyltransferase which is located in the endoplasmatic reticulum Here
glucuronic acid from Uridine diphosphate-glucuronic acid is transferred to the
polyphenol Sulfation also mainly occurs in the liver (Piskula and Terao 1998) The
transfer of a sulfate moiety from 3acute-phosphoadenosine-5acute-phosphosulfate to the
hydroxyl group of polyphenols is catalyzed by sulfotransferases According to the kind
of the substance and the ingested dose the importance of glucuronidation methylation
and sulfation varies (Manach et al 2004) A higher ingested dose causes a shift from
sulfation to glucuronidation (Koster et al 1981) However the pattern of conjugation is
further influenced by species sex or food deprivation (Piskula 2000)
Flavonoids formed in the gut mucosa only partially enter circulation and a significant
amount will be secreted back into the gut lumen (Crespy et al 1999) This so called
apical efflux out of the enterocytes is probably triggered by adenosine triphosphate-
binding cassette transporter like the multidrug resistance associated protein 2 (Walle et
al 1999 Walgren et al 2000b) the breast cancer resistance protein 1 (Sesink et al
2005) or the P-glycoprotein (Ofer et al 2005)
However flavonoids often undergo an intensive enterohepatic circulation Due to their
biliary excretion back into the duodenum flavonoids may be further metabolized by
intestinal microorganisms or reabsorbed from the intestine (Hackett 1986) This
recycling may enhance availability of flavonoids in the body (Manach et al 2004) or
cause a second plasma peak (Setchell et al 2001 Manach et al 2003) According to
the site of absorption flavonoids may undergo different metabolic fates thus the liver
LITERATURE OVERVIEW
19
might be more important for flavonoids absorbed in the small intestine than for the ones
absorbed in the colon (Heim et al 2002)
Flavonoids and their metabolites usually are excreted by bile or urine The smaller
conjugates prefer urinary excretion whereas the larger and extensively conjugated
metabolites prefer the biliary one (Manach et al 2004) Flavonoid glucuronides and
sulphates are readily excreted with the urine due to their polarity and water solubility
(Hackett 1986) However though various flavonoids are excreted by urine (Aherne and
OʼBrien 2002 Scalbert and Williamson 2000 Manach et al 2004) this route seems to
be of minor importance (Hollman et al 1995) Due to partially long elimination half-
life flavonoids may be accumulated in blood plasma because of repeated absorption
(Aherne and OrsquoBrien 2002)
124 Factors influencing bioavailability of flavonoids
Bioavailability of flavonoids may be influenced at all states of the described LADME-
system on both pre- as well as post-absorptive by species differences and individual
factors like state of development and nutrition (Heaney 2001) enzyme activities or
secretion other regulatory mechanisms and interindividual differences (Egert et al
2008) Plasma peak concentrations of epigallocatechin gallate increased 35-fold when
catechins were given to fasted compared to non-fasted volunteers (Chow et al 2005)
Further mucosal mass intestinal transit time rate of gastric emptying as well as the up-
and down-regulation of absorption by physiological control because of habituation
influenced flavonoid BV (Heaney 2001) Summarized by Scholz and Williamson
(2007) the most important criterion influencing BV is the attached sugar followed by
the food matrix the added flavonoids the given dose and the adaption to it and the
inhibition of flavonoids by chemical changes after absorption or processing in the
gastrointestinal tract or due to interactions with other feed components
The effects of the food matrix the physical form in which flavonoids are administered
and solubility on BV seem to be more complex Quercetin is slightly soluble in water
but addition of organic solvents such as lipids emulsifiers (Azuma et al 2002) or
propylene glycol (Shimoi et al 1998) may enhance solubility The benefit of alcohol on
BV of flavonoids is discussed ambiguous as some found appreciable improvements
(Azuma et al 2002 Dragoni et al 2006) others not (Donovan et al 1999 Goldberg
et al 2003) However Azuma et al (2002) only enhanced BV of flavonoids using
LITERATURE OVERVIEW
20
alcohol concentrations of more than 30 in the diet Overall composition of the meal
and the source of flavonoids have the main impact on BV Quercetin from onions had a
higher BV than quercetin from apples or pure rutin (Hollman et al 1997b) Food
preparation and processing like cooking also affect BV since it can cause a reduction in
flavonoid content or cause chemical transformation (Manach et al 2004) Furthermore
flavonoid absorption is affected by the fat content in the diet (Lesser et al 2004)
Interestingly interactions of polyphenols with milk proteins partly inhibited positive
aspects of flavonoids or led to differences in absorption or reduced AUC values of
flavonoid plasma concentrations (Serafini et al 2003 Reddy et al 2005 Egert et al
2013) Nevertheless other studies in humans showed no effect of milk on BV of
flavonoids (van Het Hof et al 1998 Hollman et al 2001)
125 Studies on bioavailability of quercetin and catechins
In cattle the companion studies of Berger et al (2012) and Gohlke et al (2013) where
quercetin aglycone and rutin were given intraruminal (10 and 50 mgkg body weight
(BW) Berger et al 2012) and intraduodenal (9 18 or 27 mgkg BW Gohlke et al
2013) to dairy cows showed maximal plasma concentrations of flavonols ranging from
about 20 to 1000 nmolL at 30 min to 2 h after administration Interestingly rutin was
much better available than quercetin aglycone after intraruminal (Berger et al 2012)
than after intraduodenal administration (Gohlke et al 2013) Manach et al (2005)
reported a range from 0 to 4 micromolL plasma concentration of total flavonols after intake
of 50 mg aglycone equivalents in humans whereas an older study of Gugler et al
(1975) found no effect of oral administration on quercetin plasma concentration in
humans and therefore suggested oral administration of quercetin as ineffective
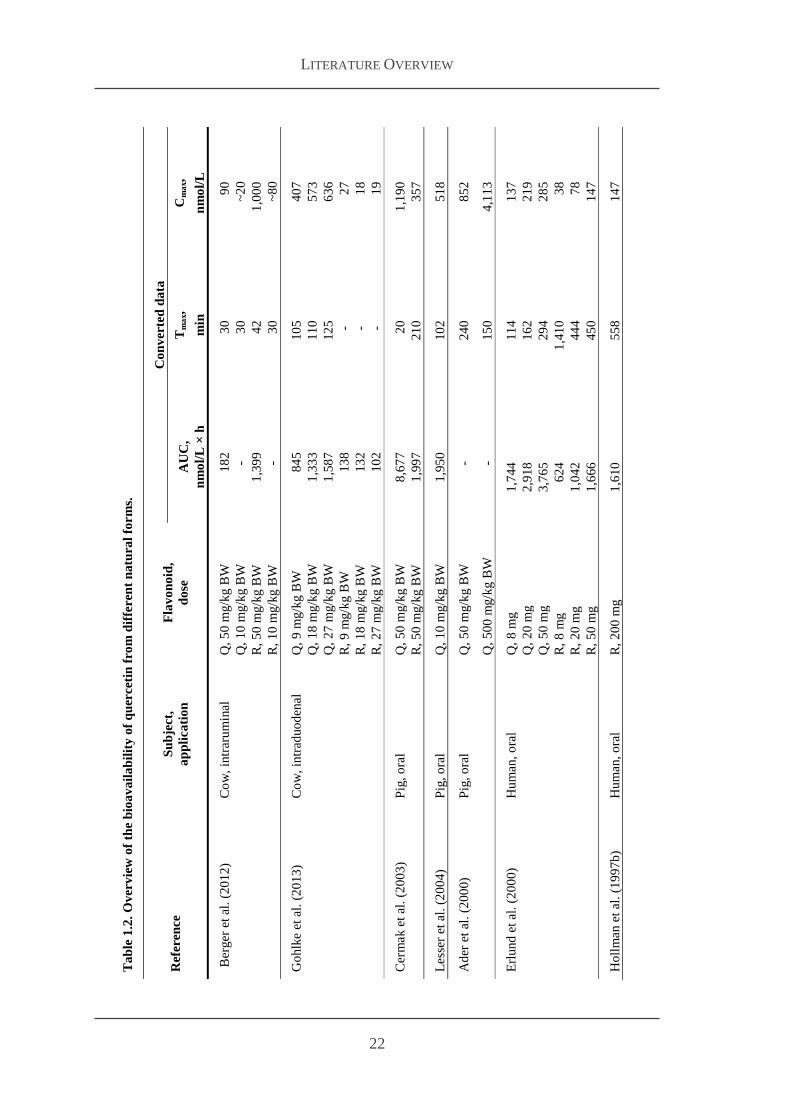
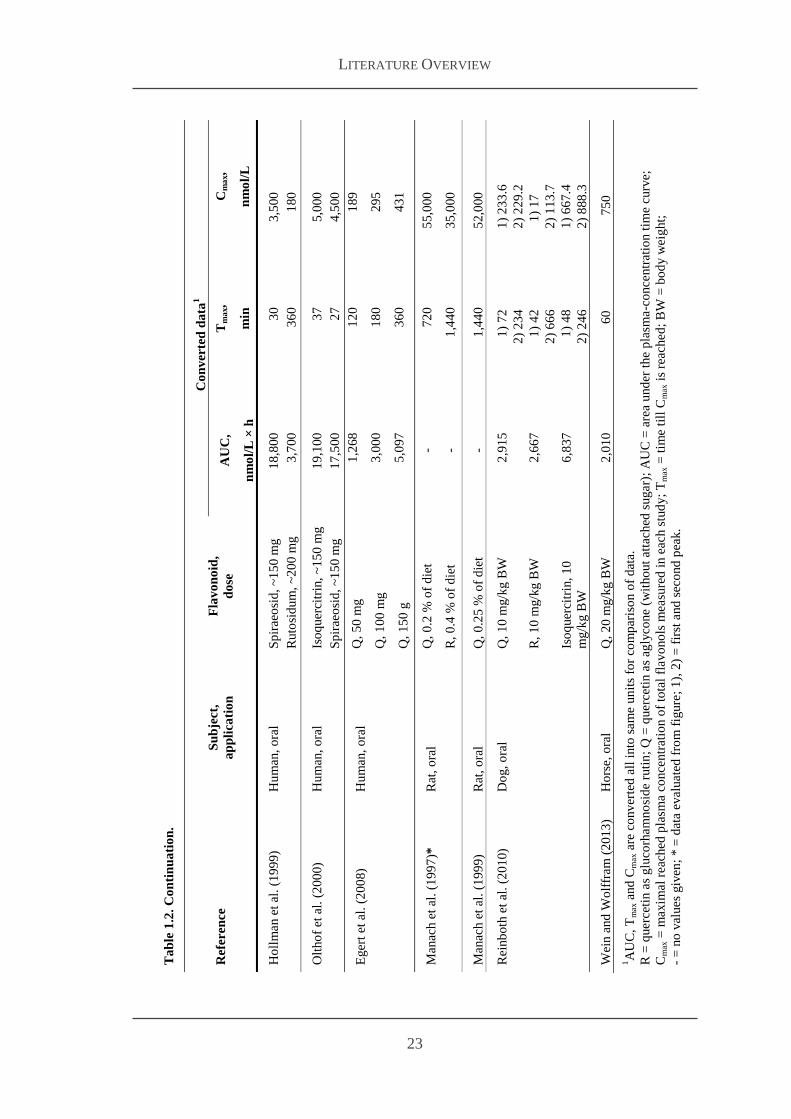
However more recent studies revealed detectable plasma concentrations of quercetin
after oral flavonol administration as shown in Table 12 In this overview only studies
were listed in which pure quercetin substances were administered and plasma
concentrations were measured Though lots of BV studies are conducted with food
containing high contents of flavonoids like apples wine or onions interactions with
other food components or matrix effects cannot be excluded Therefore it is more
reliable using pure substances for comparing BV studies
Studies on the BV of catechins with pure substances are rare as mostly tea extracts
were used According to Manach et al (1999) in rats the catechin metabolites (catechin
LITERATURE OVERVIEW
21
and methylcatechin) reached similar plasma concentrations after oral supplementation
of catechin than the quercetin metabolites quercetin isorhamnetin and tamarixetin after
quercetin administration in comparable doses However metabolites of catechin showed
a faster decline in plasma concentration than those of quercetin possibly due to lesser
binding to plasma albumin or higher urinary excretion (Manach et al 1999) Hollman
et al (1997a) too postulated a good absorption of catechin and its microbial
degradation products after oral administration of radioactively labelled (+)-catechin to
rodents monkeys and humans in different studies Nevertheless BV of catechins
widely depends on species on the administered compound and on the chemically
structure of the distinct catechin isomers such as epicatechin epigallocatechin and
epigallocatechin gallate In rats fed 200 mgkg BW of a green tea extract (GTE) Chen
et al (1997) found a systemic availability of 312 for epicatechin and of 14 for
epigallocatechin but only of 01 for epigallocatechin gallate whereas in dogs after
oral and intravenous administration of 25 mgkg BW of epigallocatechin gallate
absolute BV was about 20 (Swezey et al 2003) However systemic available
epicatechin epigallocatechin and epigallocatechin gallate was very low after oral
administration of 20 mgkg BW of green tea to humans (Lee et al 2002) or after oral
administration of 500 mgkg BW and intravenous administration of 50 mgkg BW
catechin fractions containing 5 epicatechin 13 epicatechin gallate and 50
epigallocatechin gallate to rats (Zhu et al 2000) The consumption of a green tea
beverage by humans resulted in maximal plasma concentrations of total catechins of
4618 plusmn 274 nmolL at 90 min after drinking (Egert et al 2013) Major catechins in this
study detected in plasma samples after consumption of various test drinks were
epigallocatechin gallate (1799 nmolL) epicatechin gallate (1473 nmolL)
epigallocatechin (865 nmolL) epicatechin (482 nmolL) and small amounts of
catechin and gallocatechin (Egert et al 2013)
LITERATURE OVERVIEW
22
Ta
ble
12
O
ver
vie
w o
f th
e b
ioa
va
ila
bil
ity
of
qu
erce
tin
fro
m d
iffe
ren
t n
atu
ral
form
s
Ref
eren
ce
Su
bje
ct
ap
pli
cati
on
Fla
vo
no
id
do
se
Co
nv
erte
d d
ata
AU
C
Tm
ax
Cm
ax
nm
ol
L times
h
min
n
mo
lL
Ber
ger
et
al
(20
12
)
Co
w
intr
aru
min
al
Q
50
mgk
g B
W
18
2
3
0
9
0
Q
1
0 m
gk
g B
W
-
3
0
~
20
R
5
0 m
gk
g B
W
1
39
9
4
2
10
00
R
1
0 m
gk
g B
W
-
3
0
~
80
Go
hlk
e et
al
(2
01
3)
Co
w
intr
aduo
den
al
Q
9 m
gk
g B
W
84
5
10
5
4
07
Q
1
8 m
gk
g B
W
1
33
3
11
0
5
73
Q
2
7 m
gk
g B
W
1
58
7
12
5
6
36
R
9
mgk
g B
W
13
8
-
2
7
R
1
8 m
gk
g B
W
13
2
-
1
8
R
2
7 m
gk
g B
W
10
2
-
1
9
Cer
mak e
t al
(2
00
3)
Pig
o
ral
Q
50
mgk
g B
W
8
67
7
2
0
11
90
R
5
0 m
gk
g B
W
1
99
7
21
0
3
57
Les
ser
et a
l (
20
04)
Pig
o
ral
Q
10
mgk
g B
W
1
95
0
10
2
5
18
Ad
er e
t al
(2
00
0)
Pig
o
ral
Q
50
mgk
g B
W
-
24
0
8
52
Q
50
0 m
gk
g B
W
-
15
0
41
13
Erl
und
et
al
(20
00
) H
um
an
ora
l Q
8
mg
17
44
11
4
1
37
Q
2
0 m
g
2
918
16
2
2
19
Q
5
0 m
g
3
765
29
4
2
85
R
8
mg
6
24
1
41
0
3
8
R
2
0 m
g
1
042
44
4
7
8
R
5
0 m
g
1
666
45
0
1
47
Ho
llm
an e
t al
(1
99
7b
) H
um
an
ora
l R
2
00
mg
16
10
55
8
1
47
LITERATURE OVERVIEW
23
T
ab
le 1
2
Co
nti
nu
ati
on
Ref
eren
ce
Su
bje
ct
ap
pli
cati
on
Fla
vo
no
id
do
se
Co
nv
erte
d d
ata
1
AU
C
Tm
ax
Cm
ax
nm
ol
L times
h
min
n
mo
lL
Ho
llm
an e
t al
(1
99
9)
Hu
man
o
ral
Sp
irae
osi
d
~1
50 m
g
18
800
3
0
3
500
R
uto
sid
um
~
20
0 m
g
3
700
3
60
1
80
Olt
ho
f et
al
(2
00
0)
Hu
man
o
ral
Iso
quer
citr
in
~1
50
mg
19
100
3
7
5
000
S
pir
aeo
sid
~
15
0 m
g
17
500
2
7
4
500
Eger
t et
al
(2
00
8)
Hu
man
o
ral
Q
50
mg
1
268
1
20
1
89
Q
10
0 m
g
3
000
1
80
2
95
Q
15
0 g
5
097
3
60
4
31
Man
ach e
t al
(1
99
7)
R
at
ora
l Q
0
2
of
die
t
-
7
20
550
00
R
04
o
f d
iet
-
14
40
350
00
Man
ach e
t al
(1
99
9)
Rat
o
ral
Q
02
5
of
die
t
-
14
40
520
00
Rei
nb
oth
et
al
(20
10)
Do
g
ora
l Q
1
0 m
gk
g B
W
2
915
1)
72
1)
233
6
2
) 2
34
2)
229
2
R
1
0 m
gk
g B
W
2
667
1)
42
1
) 17
2
) 6
66
2)
113
7
Is
oq
uer
citr
in
10
mg
kg B
W
6
837
1)
48
1)
667
4
2
) 2
46
2)
888
3
Wei
n a
nd
Wo
lffr
am
(2
01
3)
Ho
rse
ora
l Q
2
0 m
gk
g B
W
2
010
6
0
75
0
1A
UC
T
max
and
Cm
ax a
re c
onv
erte
d a
ll i
nto
sam
e un
its
for
com
par
iso
n o
f d
ata
R =
quer
ceti
n a
s glu
corh
am
no
sid
e ru
tin
Q
= q
uer
ceti
n a
s ag
lyco
ne
(wit
ho
ut
atta
ched
sugar)
A
UC
= a
rea
und
er t
he
pla
sma-c
once
ntr
atio
n t
ime
curv
e
Cm
ax =
maxim
al r
each
ed p
lasm
a co
nce
ntr
atio
n o
f to
tal
flav
ono
ls m
easu
red
in e
ach s
tud
y
Tm
ax =
tim
e ti
ll C
max
is
reac
hed
B
W =
bo
dy w
eig
ht
- =
no
val
ues
giv
en
=
dat
a ev
aluate
d f
rom
fig
ure
1
) 2
) =
fir
st a
nd
sec
ond
pea
k
LITERATURE OVERVIEW
24
13 Metabolic and health status in neonatal calves
131 Metabolic status in calves at birth and postnatal changes
Although calves are precocial animals and thus relatively mature when born they still
must adapt to various morphological and functional changes after birth (Blum and
Hammon 2000) During gestation energy supply is continuously via placenta with
glucose as main energy substrate With birth this changes to a discontinuously oral
supply by colostrum and milk intake with lactose and fat as main energy source
(Hammon et al 2013) Prenatal glucocorticoids and catecholamines as well as thyroid
hormones in the fetal blood lead to an increased gluconeogenic activity and hepatic
glycogen storage ensuring coverage of the energy demand of the newborn calf
(Hammon et al 2012) However calves are often hypoglycemic after birth as they
need to adapt to the usage of other fuels than glucose taken up with liquid feeding
Thus endogenous glucose production is an important pathway to ensure glucose
homeostasis in the calf and increases with maturation (Steinhoff-Wagner et al 2011)
Important regulators for endogenous glucose production are hormones like insulin
glucagon catecholamines growth hormone and glucocorticoids The peptide hormone
insulin is built in the pancreatic β-cells Plasma concentrations are reduced at birth and
increase after first feed intake indicating that especially glucose intake stimulates insulin
secretion (Hadorn et al 1997 Hammon and Blum 1998 Rauprich et al 2000) The
peptide hormone glucagon is built in the pancreatic α-cells and acts as antagonist to
insulin Plasma glucagon concentrations also increase after first feed intake in calves
(Hammon et al 2012) Endogenous glucose production is in addition stimulated by
catecholamines glucocorticoids and probably growth hormone (GH) Around birth all
these hormones showed elevated plasma concentrations in calves and catecholamines
and glucocorticoids are known for their promoting effects on metabolic maturation in
the neonate (Hammon et al 2012 2013) Plasma concentrations of cortisol are high at
birth and decrease thereafter (Hadorn et al 1997 Hammon et al 2012 Schiessler et
al 2002) In addition cortisol next to other regulators is a major player for initiating
birth (Liggins 1994) Furthermore thyroid hormones play an important role for
endogenous glucose production during late gestation and after birth (Fowden et al
2001) Plasma concentrations of thyroid hormones are high at birth and decrease
LITERATURE OVERVIEW
25
thereafter in mature calves but not in preterm born calves (Steinhoff-Wagner et al
2011)
In neonatal calves colostrum feeding affects the GH ndash insulin-like growth factor (IGF)
system which most likely is a response to energy supply and improved glucose status in
calves after colostrum feeding (Hammon et al 2012) Amount time point and
frequency of feeding influence plasma IGF-1 concentrations (Hadorn et al 1997
Nussbaum et al 2002) which are lower during the first wk of life in restricted (Hadorn
et al 1997) or formula fed calves (Rauprich et al 2000) indicating the huge
importance of early and sufficient colostrum feeding to newborn calves for their
development and maturation
132 Health status in calves and development of the immune system
Immune defence of newborn calves depends on uptake of immunoglobulins (Ig) with
colostrum as there is no placental transfer of Ig and endogenous production of Ig is
negligible (Chase et al 2008) The ingestion of sufficient colostrum is thus essential for
immunological protection during the first 2 to 4 weeks of life until calves develop an
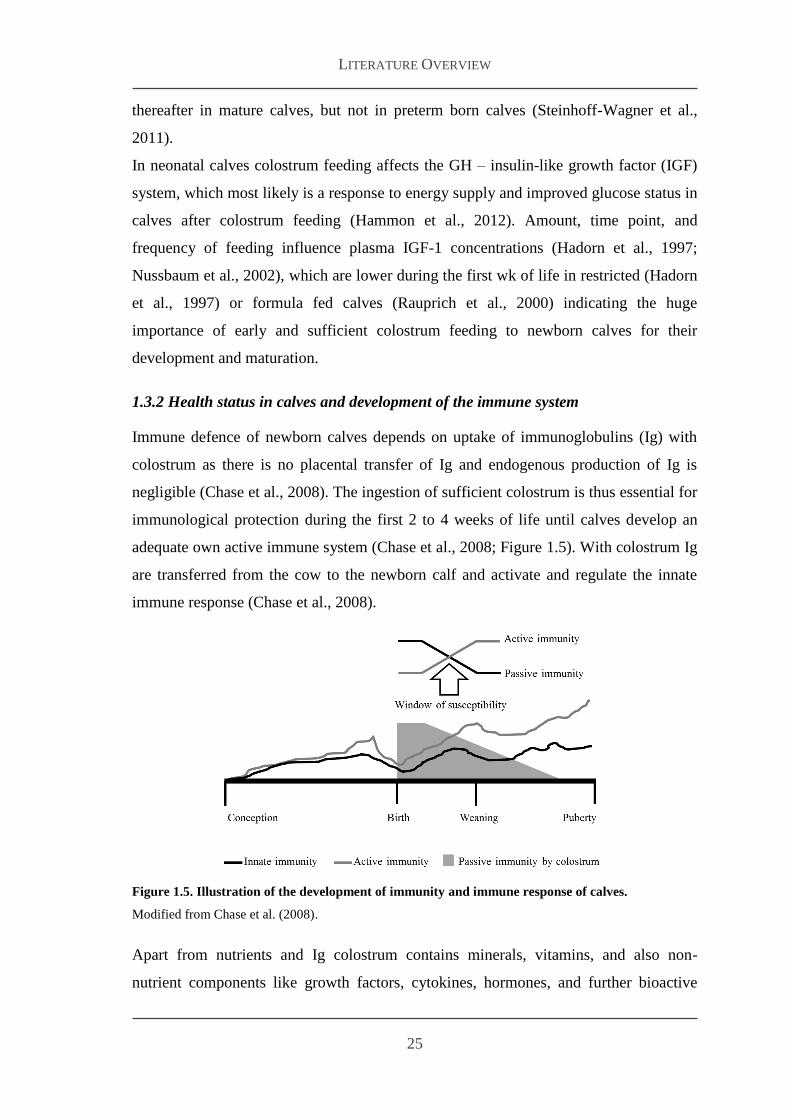
adequate own active immune system (Chase et al 2008 Figure 15) With colostrum Ig
are transferred from the cow to the newborn calf and activate and regulate the innate
immune response (Chase et al 2008)
Figure 15 Illustration of the development of immunity and immune response of calves
Modified from Chase et al (2008)
Apart from nutrients and Ig colostrum contains minerals vitamins and also non-
nutrient components like growth factors cytokines hormones and further bioactive
LITERATURE OVERVIEW
26
substances (Blum 2006) Most of these non-nutrient factors and bioactive compounds
are derived from blood of dams but some are produced in the mammary gland (Blum
2006) The average Ig concentrations in bovine colostrum varies greatly depending
mainly on breed age of dam nutrition in the preparturient period season or amount of
produced colostrum (Godden 2008) As colostrogenesis ends abruptly at parturition the
greatest concentration of the beneficial compounds is in first colostrum and in further
milkings concentrations are decreasing because of dilution effects (Godden 2008) The
small intestine as the site of digestion and absorption of Ig mainly IgG is permeable for
up to 12 to 48 h after birth (Stott et al 1979 Baintner 2007) Feeding the calf leads to
a faster closure of the gut permeability for great Ig independent from the amount fed
(Stott et al 1979) Small intestinal epithelium includes vacuoles that allow intracellular
digestion at birth but soon after colostrum ingestion vacuoles disappear (Blum 2005)
Therefore colostrum influences the gastrointestinal tract as seen among others in
changes in microbial population epithelial cell proliferation protein synthesis and
digestion (Blum 2006) Furthermore colostrum also exerts long-lasting systemic
effects on metabolism and endocrine traits by effecting systemic growth activity and
behavior (Blum 2006)
Endogenous Ig production and thus active immunity in calves is delayed (Chase 2008)
With passive immunity decreasing and active immunity still being insufficient
susceptibility to diseases is highest in the first wk of life (Figure 15) and notable calf
losses occur with pneumonia and diarrhea being the main reasons for it (USDA 2011)
Pneumonia in pre-weaned calves is a multi-factorial disease caused by a number of
viruses and some calf- and environmental related risk factors (Lorenz et al 2011)
Diarrhea is one of the most serious problems in calf rearing worldwide often leading to
other diseases like pneumonia in enfeebled calves Furthermore those calves show
reduced growth So calves suffering from diseases in newborn age may show long-
lasting impaired performance
133 Oxidative stress and antioxidative capacity in neonatal calves
Oxygen is essential for all aerobic living organisms It is part of several chemical
compounds like hydrogen peroxide hypochlorus acid peroxinitrite singlet oxygen and
ozone Importantly oxygen has the potential to destroy cell integrity when building up
reactive oxygen species (ROS) These ROS can be divided in free radicals and non-
LITERATURE OVERVIEW
27
radicals In general a free radical is an atom or molecule with one or more unpaired
electrons (Halliwell 1991) marked by the radical dot (middot) The most reactive ones are
hydroxyl radical superoxide anion nitric oxide and peroxyl radical All these ROS are
naturally produced in the body during energy production and unspecific immune
defense mainly to neutralize bacteria and viruses and thus protecting the body against
pathogens External influences like ionizing radiation toxins drugs and chemicals or
environmental pollutants can considerably increase the generation of ROS (Sies 1991)
resulting in cell toxic conditions
The organism has a pool of reducing systems to neutralize these free radicals called
antioxidants These are substances that when present at low concentrations compared
with those of an oxidizable substrate significantly delay or prevent oxidation of that
substrate (Halliwell 1991) Antioxidants are divided into enzymatic antioxidants like
superoxide-dismutase catalase or glutathion-peroxidase and non-enzymatic
antioxidants including albumin carotenoids bilirubin uric acid glutathion vitamins
A C and E as well as flavonoids Every aerobe living system is aligned to have a
balance between these oxidants and antioxidants but due to inadequate antioxidant
defense or external influences an imbalance between the generation of prooxidants and
the activity of the antioxidant defenses in favor for the prooxidants can occur and is
called oxidative stress (Sies 1985 1991) Oxidative stress is related to numerous
diseases the so called free radical diseases According to Halliwell (1991) for most
human diseases oxidative stress might be secondary to the primary disease process
Next to maturation of the organism (Robles et al 2001 Saugstad 2005 Mutinati et al
2014) nutrient status and nutrition in general plays a major role in the antioxidant
system (Schwerin et al 2002 Sies et al 2005) However neonates have a greater
susceptibility to oxidative stress than adults or juvenile subjects (Saugstad 2005
Mutinati et al 2014) Main reason therefor is the change from the hypoxic intrauterine
environment to extrauterine conditions after birth and the start of regular breathing
(Robles et al 2001 Albera and Kankofer 2011) Especially premature neonates are
prone to oxidative stress (Robles et al 2001)
There are several approaches to measure antioxidative capacity oxidative stress or free
radicals Alam et al (2013) reviewed 29 different in vivo and in vitro methods for
evaluating antioxidant activity and oxidative stress In general common methods range
from quantification of (free) radicals quantification of markers for oxidative stress like
LITERATURE OVERVIEW
28
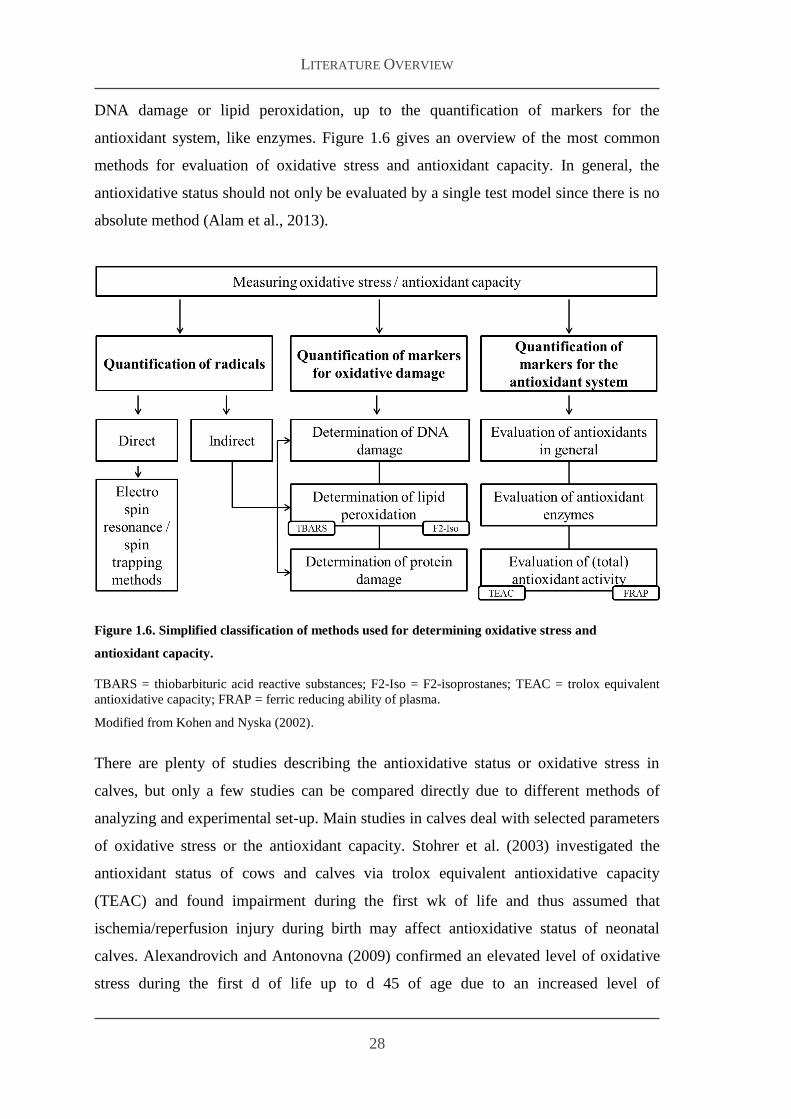
DNA damage or lipid peroxidation up to the quantification of markers for the
antioxidant system like enzymes Figure 16 gives an overview of the most common
methods for evaluation of oxidative stress and antioxidant capacity In general the
antioxidative status should not only be evaluated by a single test model since there is no
absolute method (Alam et al 2013)
Figure 16 Simplified classification of methods used for determining oxidative stress and
antioxidant capacity
TBARS = thiobarbituric acid reactive substances F2-Iso = F2-isoprostanes TEAC = trolox equivalent
antioxidative capacity FRAP = ferric reducing ability of plasma
Modified from Kohen and Nyska (2002)
There are plenty of studies describing the antioxidative status or oxidative stress in
calves but only a few studies can be compared directly due to different methods of
analyzing and experimental set-up Main studies in calves deal with selected parameters
of oxidative stress or the antioxidant capacity Stohrer et al (2003) investigated the
antioxidant status of cows and calves via trolox equivalent antioxidative capacity
(TEAC) and found impairment during the first wk of life and thus assumed that
ischemiareperfusion injury during birth may affect antioxidative status of neonatal
calves Alexandrovich and Antonovna (2009) confirmed an elevated level of oxidative
stress during the first d of life up to d 45 of age due to an increased level of
LITERATURE OVERVIEW
29
thiobarbituric acid active products and glutathione when calves were less than 15 d old
and reduced values when calves were 50 to 60 d old The authors assume that the
transition period in feeding of calves was the reason for that Also transportation of
calves leads to an increase of markers for oxidative stress Wernicki et al (2006) found
significantly elevated thiobarbituric acid reactive substances (TBARS) plasma
concentration in calves that were transported for 2 h The season did not significantly
change TBARS levels in calves but glutathione peroxidase and superoxide dismutase
were higher in calves born in summer than in calves born in fall (Chigerwe et al 2013)
However in this study no correlation between TBARS and the age of calves was found
but there was an obvious correlation between increased oxidative stress or a reduced
antioxidative capacity and health status of calves These findings confirmed a study by
Ahmed and Hassan (2007) who investigated several parameters of calves infected with
Eimeria species Malondialdehyde and nitric oxide as markers for oxidative stress were
elevated in infected calves Catalase superoxide-dismutase ascorbic acid glutathione
and the total antioxidant capacity were significantly reduced in infected calves
compared to control calves Bronchopneumonia as a major calf disease similarly
showed elevated markers of oxidative stress in calves (Al-Qudah 2009) Also the way
of delivery seems to influence the antioxidative status since higher malondialdehyde
and glutathione concentrations in blood showed an exposure to higher oxidative stress
in calves delivered by caesarian section (Erisir et al 2013) Retskii et al (2010)
lsquocorrectedrsquo the antioxidant status of newborn calves to form higher colostral immunity
due to treatment with glucose ascorbic acid solution and unithiol and thus reduced the
incidence and severity of neonatal diseases
134 Effects of flavonoid administration on development and health status in
neonatal calves
Countless flavonoid-rich feed additives are marketed claiming improvements in animal
health and productivity in cattle nutrition These additives are used in calvesʼ milk
replacer and in feed for heifers lactating cows and fattening cattle
(httpsanogoldeunews2008flavonoidephp httpwwwpultedeAntioxidantien_
Botanische_Wirkstoffeamplang=en httpwwwschaumanndecpsrdeSID-18 120AAB
B3-717B45schaumann-dehsxsl4736html httpwwwprovimicomgrmediagrape_
pp_concentrate_-_engpdf httpwww gainfeedscomruminant goldgrain-calf-nut)
LITERATURE OVERVIEW
30
In general lots of feed additives are supposed to reduce or replace antibiotics thus
terms like phytobiotics phototherapeutic or nutraceutical are commonly used Since
flavonoids are present in all kinds of higher plants young ruminants may have
evolutionary depended on flavonoids (Yaghoubi et al 2008) However results of
studies on feeding flavonoids to young calves are ambiguous As mentioned the
metabolism of calves mainly is influenced by nutrition hence Yaghoubi et al (2008)
postulated an improved growth of calves by feeding flavonoids extracted from propolis
Enhancing growth in ruminants by flavonoid feeding is discussed due to possible effects
on microbial population in the rumen (Aerts et al 1999 Greathead 2003) and
especially in the developing reticulorumen (Yaghoubi et al 2008 Costa Jr et al
2012) According to Aerts et al (1999) the degradation of dietary protein to ammonia
by microorganisms in the rumen of sheep is slowed down by proanthocyanidins which
are polymere forms of catechins and thus increasing the absorption of amino acids in
the small intestine Durmic and Blache (2012) also reviewed beneficial effects of
secondary plant compounds on rumen fermentation focused on the protection of dietary
proteins combined with a reduced microbial proteolysis and release into the duodenum
However mainly tannins are building complexes with proteins (Aerts et al 1999) In
general secondary plant metabolites may exert prebiotic effects due to stimulation of
certain bacteria in the rumen (Greathead 2003) and affect the immune system as
hypothesized by Yaghoubi et al (2008) though the authors found an ambiguous blood
IgG concentrations after feeding flavonoids to calves Metwally et al (2013) reported a
numeric increase in blood IgM concentrations after feeding propolis extract to buffalo
calves considering a non-specific immunostimulating effect Also Oliveira et al (2010)
postulated an improved immune response of calves when feeding a flavonoid-rich
pomegranate extract due to an enhanced total IgG response after ovalbumin vaccination
and increased synthesis of interferon-γ and interleukin-4 On the other hand neutrophil
phagocytic and killing activities of neutrophils against Escherichia coli did not differ
when feeding pomegranate extract to young calves (Oliveira et al 2010) Besides that
some flavonoids have hormone-like structures and activities and therefore are called
phyto-oestrogens (Greathead 2003) probably exerting anabolic effects in calves Such
effects were seen in other species like mice (Sokolova et al 1978) Furthermore it is
noteworthy that quercetin is a major component of several plants used as antidiarrheal
remedies (Middleton et al 2000) Di Carlo et al (1994) showed quercetin feeding
LITERATURE OVERVIEW
31
ameliorating diarrhea in mice by 92 in a dose-related manner as did Gaacutelvez et al
(1995) in quercitrin (3-rhamnosylquercetin)-treated rats and Nielsen (2008) in piglets
Rao et al (1997) pointed out a possible antidiarrheal effect of the flavonoid ternatin
However propolis or pomegranate extract feeding did not ameliorate diarrhea in calves
(Yaghoubi et al 2008 Oliveira et al 2010) but feeding a GTE decreased frequency
and degree of non-pathogenic diarrhea remarkably (Ishihara et al 2001)
14 Conclusive remarks and need for further research
Green feed additives like flavonoids have a considerably role in human and animal
nutrition Numerous feed supplements containing flavonoids are marketed in the dairy
industry to improve health growth and thus productivity
These antioxidative anti-inflammatory and antimicrobial secondary plant metabolites
may especially be used in the neonatal period when calves are just developing their
immune system However little is known about the systemic BV of flavonoids and their
effects in vivo especially in calves Thus the aim of this study is to investigate the BV
of the most abundant flavonoids quercetin and catechin in newborn calves and to
examine their effects on selected aspects of the antioxidative status and metabolism
Therefore dairy calves were fed quercetin as aglycone its glucorhamnoside rutin and
catechins for the first 3 wk of life Parameters of the antioxidative status oxidative
stress and metabolism were determined and studies on BV of quercetin aglycone and
rutin were performed on d 2 and 29 of life representing a different ontogenetic status in
calves
LITERATURE OVERVIEW
32
References
Ader P A Wessmann and S Wolffram 2000 Bioavailability and metabolism of the
flavonol quercetin in the pig Free Radic Biol Med 281056ndash1067
Aerts R J T N Barry and W C McNabb 1999 Polyphenols and agriculture
Beneficial effects of proanthocyanidins in forages Agric Ecosyst Environ 751ndash
12
Aherne S A and N M OrsquoBrien 2002 Dietary flavonols Chemistry food content
and metabolism Nutrition 1875ndash81
Ahmed W M and S E Hassan 2007 Applied studies on coccidiosis in growing
buffalo-calves with special reference to oxidantantioxidant status World J Zool
240ndash48
Alam M N N J Bristi and M Rafiquzzaman 2013 Review on in vivo and in vitro
methods evaluation of antioxidant activity Saudi Pharm J 21143ndash152
Albera E and M Kankofer 2011 The comparison of antioxidativeoxidative profile in
blood colostrum and milk of early post-partum cows and their newborns Reprod
Domest Anim 46763ndash769
Alexandrovich K N and S E Antonovna 2009 Age-dependent level of antioxidant
defence system and lipid metabolism state in calves Int J Appl Res Vet Med
773ndash75
Al-Qudah K M 2009 Oxidative stress in calves with acute or chronic
bronchopneumonia Rev Med Vet 160231ndash236
Arts I C W A L A Sesink M Faassen-Peters and P C H Hollman 2004 The
type of sugar moiety is a major determinant of the small intestinal uptake and
subsequent biliary excretion of dietary quercetin glycosides Br J Nutr 91841ndash
847
Aviram M and B Fuhrman 2003 Effects of flavonoids on the oxidation of low-
density lipoprotein and atherosclerosis Pages 165ndash203 in Flavonoids in Health
and Disease Second Edition C A Rice-Evans and L Packer eds Marcel
Dekker Inc New York USA
LITERATURE OVERVIEW
33
Azuma K K Ippoushi H Ito H Higashio and J Terao 2002 Combination of lipids
and emulsifiers enhances the absorption of orally administered quercetin in rats J
Agr Food Chem 501706ndash1712
Baintner K 2007 Transmission of antibodies from mother to young Evolutionary
strategies in a proteolytic environment Vet Immunol Immunopathol 117153ndash
161
Berger L M S Wein R Blank C C Metges and S Wolffram 2012 Bioavailability
of the flavonol quercetin in cows after intraruminal application of quercetin
aglycone and rutin J Dairy Sci 955047ndash5055
Besle J M D Viala B Martin P Pradel B Meunier J L Berdagueacute D Fraisse J L
Lamaison and J B Coulon 2010 Ultraviolet-absorbing compounds in milk are
related to forage polyphenols J Dairy Sci 932846ndash2856
Bhagwat S D B Haytowitz J M Holden (Ret) 2013 USDA database for the
flavonoid content of selected foods Release 31 US Department of Agriculture
(USDA) Agricultural Research Service
httpwwwarsusdagovSP2UserFilesPlace12354500DataFlavFlav3-1pdf
(Accessed April 2014)
Birt D F S Hendrich and W Wang 2001 Dietary agents in cancer prevention
Flavonoids and isoflavonoids Pharmacol Ther 90157ndash177
Blum J W 2005 Bovine gut development Pages 31ndash52 in Calf and heifer rearing
P C Garnsworthy ed Nottingham University Press Nottingham UK
Blum J W 2006 Nutritional physiology of neonatal calves J Anim Physiol Anim
Nutr 901ndash11
Blum J W and H Hammon 2000 Colostrum effects on the gastrointestinal tract and
on nutritional endocrine and metabolic parameters in neonatal calves Livest
Prod Sci 66151ndash159
Brand W M E Schutte G Williamson J J van Zanden N H P Cnubben J P
Groten P J van Bladeren and I M C M Rietjens 2006 Flavonoid-mediated
inhibition of intestinal ABC transporters may affect the oral bioavailability of
drugs food-borne toxic compounds and bioactive ingredients Biomed
Pharmacother 60508ndash519
LITERATURE OVERVIEW
34
Bose M J D Lambert J Ju K R Reuhl S A Shapses and C S Yang 2008 The
major green tea polyphenol (ndash)-epigallocatechin-3-gallate inhibits obesity
metabolic syndrome and fatty liver disease in high-fat-fed mice J Nutr
138167ndash1683
Boulton D W U K Walle and T Walle 1998 Extensive binding of the bioflavonoid
quercetin to human plasma proteins J Pharm Pharmacol 50243ndash249
Cermak R S Landgraf and S Wolffram 2003 The bioavailability of quercetin in
pigs depends on the glycoside moiety and on dietary factors J Nutr 1332802ndash
2807
Cermak R and S Wolffram 2006 The potential of flavonoids to influence drug
metabolism and pharmacokinetics by local gastrointestinal mechanisms Curr
Drug Metab 7729ndash744
Chase C C L D J Hurley and A J Reber 2008 Neonatal immune development in
the calf and its impact on vaccine response Vet Clin North Am Food Anim
Pract 2487ndash104
Chen C-H H-J Hsu Y-J Huang and C-J Lin 2007 Interaction of flavonoids and
intestinal facilitated glucose transporters Planta Med 73348ndash354
Chen L M-J Lee and C S Yang 1997 Absorption distribution and elimination of
tea polyohenols in rats Drug Metab Dispos 251045ndash1050
Chigerwe M A D Beck S S Kim and D M Coons 2013 Comparison of plasma
oxidative status biomarkers in neonatal dairy calves during summer and fall
seasons J Veterinar Sci Technolo S111ndash4
Chow H-H S I A Hakim D R Vining J A Crowell J Ranger-Moore W M
Chew C A Celaya S R Rodney Y Hara and D S Alberts 2005 Effects of
dosing condition on the oral bioavailability of green tea catechins after single-
dose administration of Polyphenon E in healthy individuals Clin Cancer Res
114627ndash4633
Chung K T C-I Wei and M G Johnson 1998 Are tannins a double-edged sword in
biology and health Trends Food Sci Technol 9168ndash175
LITERATURE OVERVIEW
35
Cos P L Maes A Vlietinck and L Pieters 2008 Plant-derived leading compounds
for chemotherapy of human immunodeficiency virus (HIV) infection - an update
(1998 - 2007) Planta Med 741323ndash1337
Costa Jr J B G L M Zeoula S L Franco L P P de Moura M V Valero F L
Simiono E M da Paula and R B Samensari 2012 Effect of propolis product
on digestibility and ruminal parameters in buffaloes consuming a forage-based
diet Ital J Anim Sci 11e78
Crespy V C Morand C Besson N Cotelle H Veacutezin C Demigneacute and C Reacutemeacutesy
2003 The splanchnic metabolism of flavonoids highly differed according to the
nature of the compound Am J Physiol Gastrointest Liver Physiol 284G980ndash
G988
Crespy V C Morand C Besson C Manach C Demigne and C Remesy 2002
Quercetin but not its glycosides is absorbed from the rat stomach J Agr Food
Chem 50618ndash621
Crespy V C Morand C Manach C Besson C Demigne and C Remesy 1999 Part
of quercetin absorbed in the small intestine is conjugated and further secreted in
the intestinal lumen Part of quercetin absorbed in the small intestine is conjugated
and further secreted in the intestinal lumen Am J Physiol Gastrointest Liver
Physiol 277G120ndashG126
Crozier A M E J Lean M S McDonald and C Black 1997 Quantitative analysis
of the flavonoid content of commercial tomatoes onions lettuce and celery J
Agr Food Chem 45590ndash595
Dangles O and C Dufour 2006 Flavonoid-Protein Interactions Pages 443ndash469 in
Flavonoids Chemistry Biochemistry and Applications O M Andersen and
K R Markham ed Taylor amp Francis Group Boca Raton USA
Das D K 1994 Naturally occurring flavonoids Structure chemistry and high-
performance liquid chromatography methods for separation and characterization
Methods Enzymol 234410ndash420
LITERATURE OVERVIEW
36
Day A J F J Cantildeada J C Diacuteaz P A Kroon R Mclauchlan C B Faulds G W
Plumb M R Morgan and G Williamson 2000 Dietary flavonoid and
isoflavone glycosides are hydrolysed by the lactase site of lactase phlorizin
hydrolase FEBS Lett 468166ndash170
Day A J M S DuPont S Ridley M Rhodes M J Rhodes M R Morgan and G
Williamson 1998 Deglycosylation of flavonoid and isoflavonoid glycosides by
human small intestine and liver beta-glucosidase activity FEBS Lett 43671ndash75
Denny A and J Buttriss 2005 Synthesis Report No 4 Plant Foods and Health Focus
on Plant Bioactives British Nutrition Foundation Norfolk UK
di Carlo G D N Mascolo A A Izzo and F Capasso 1994 Effects of quercetin on
the gastrointestinal tract in rats and mice Phytother Res 842ndash45
di Pietro A G Conseil J M Peacuterez-Victoria G Dayan H Baubichon-Cortay D
Trompier E Steinfels J-M Jault H de Wet M Maitrejean G Comte A
Boumendjel A-M Mariotte C Dumontet D B McIntosh A Goffeau S
Castanys F Gamarro and D Barron 2002 Modulation by flavonoids of cell
multidrug resistance mediated by P-glycoprotein and related ABC transporters
Cell Mol Life Sci 59307ndash322
Donovan J L J R Bell S Kasim-Karakas J B German R L Walzem R J
Hansen and A L Waterhouse 1999 Catechin is present as metabolites in human
plasma after consumption of red wine J Nutr 1291662ndash1668
Dragoni S J Gee R Bennett M Valoti and G Sgaragli 2006 Red wine alcohol
promotes quercetin absorption and directs its metabolism towards isorhamnetin
and tamarixetin in rat intestine in vitro Br J Pharmacol 147765ndash771
Dufour C and O Dangles 2005 Flavonoid-serum albumin complexation
Determination of binding constants and binding sites by fluorescence
spectroscopy Biochim Biophys Acta 1721164ndash173
Durmic Z and D Blache 2012 Bioactive plants and plant products Effects on animal
function health and welfare Anim Feed Sci Technol 176150ndash162
LITERATURE OVERVIEW
37
Egert S J Tereszczuk S Wein M J Muumlller J Frank G Rimbach and S Wolffram
2013 Simultaneous ingestion of dietary proteins reduces the bioavailability of
galloylated catechins from green tea in humans Eur J Nutr 52281ndash288
Egert S S Wolffram A Bosy-Westphal C Boesch-Saadatmandi A E Wagner J
Frank G Rimbach and M J Mueller 2008 Daily quercetin supplementation
dose-dependently increases plasma quercetin concentrations in healthy humans
J Nutr 1381615ndash1621
Erlund I T Kosonen G Alfthan J Maumlenpaumlauml K Perttunen J Kenraali J
Parantainen and A Aro 2000 Pharmacokinetics of quercetin from quercetin
aglycone and rutin in healthy volunteers Eur J Clin Pharmacol 56545ndash553
Erisir M F M Kandemir and M Yuumlksel 2013 The effects of caesarean section on
lipid peroxidation and some antioxidants in the blood of newborn calves Vet
Archiv 83153ndash159
European Agency for the Evaluation of Medicinal Products 2000 Note for guidance on
the investigation of bioavailability and bioequivalence Committee for proprietary
medicinal products London UK
Frey H-H 2007 Allgemeine Pharmakologie Pages 1ndash32 in Lehrbuch der
Pharmakologie und Toxikologie fuumlr die Veterinaumlrmedizin H-H Frey and W
Loumlscher ed Enke Verlag Stuttgart Germany
Fowden A L J Mapstone and A J Forhead 2001 Regulation of glucogenesis by
thyroid hormones in fetal sheep during late gestation J Endocrinol 170461ndash469
Gaacutelvez J F Saacutenchez de Medina J Jimeacutenez M I Torres M I Fernaacutendez M C
Nuacutentildeez A Riacuteos A Gil and A Zarzuelo 1995 Effect of quercitrin on lactose-
induced chronic diarrhoea in rats Planta Med 61302ndash306
Gasparin F R S C L Salgueiro-Pagadigorria L Bracht E L Ishii-Iwamoto A
Bracht and J Constantin 2003a Action of quercetin on glycogen catabolism in
the rat liver Xenobiotica 33587ndash602
Gasparin F R S F L Spitzner E L Ishii-Iwamoto A Bracht and J Constantin
2003b Actions of quercetin on gluconeogenesis and glycolysis in rat liver
Xenobiotica 33903ndash911
LITERATURE OVERVIEW
38
Gee J M M S DuPont M J C Rhodes and I T Johnson 1998 Quercetin
glucosides interact with the intestinal glucose transport pathway Free Radic Biol
Med 2519ndash25
Girard J P Ferreacute J-P Pegorier and P-H Dueacutee 1992 Adaptations of glucose and
fatty acid metabolism during perinatal period and suckling-weaning transition
Physiol Rev 72507ndash562
Gohlke A C J Ingelmann G Nuumlrnberg A Starke S Wolffram and C C Metges
2013 Bioavailability of quercetin from its aglycone and its glucorhamnoside rutin
in lactating dairy cows after intraduodenal administration J Dairy Sci 962303ndash
2313
Goldberg D M J Yan and G J Soleas 2003 Absorption of three wine-related
polyphenols in three different matrices by healthy subjects Clin Biochem 3679ndash
87
Godden S 2008 Colostrum management for dairy calves Vet Clin Food Anim
2419ndash39
Gould K S and C Lister 2006 Flavonoid Functions in Plants Pages 397ndash441 in
Flavonoids Chemistry Biochemistry and Applications O M Andersen and K
R Markham ed Taylor amp Francis Group Boca Raton USA
Greathead H 2003 Plants and plant extracts for improving animal productivity Proc
Nutr Soc 62279ndash290
Gugler R M Leschik and H J Dengler 1975 Disposition of quercetin in man after
single oral and intravenous doses Eur J Clin Pharmacol 9229ndash234
Hackett A M 1986 The metabolism of flavonoid compounds in mammals Pages
177ndash194 in Plant Flavonoids in Biology and Medicine Biochemical
pharmacological and structure-activity relationship V Cody E J Middleton
and J B Harborne ed Alan R Liss Inc New York USA
Hadorn U H Hammon R M Bruckmaier and J W Blum 1997 Delaying colostrum
intake by one day has important effects on metabolic traits and on gastrointestinal
and metabolic hormones in neonatal calves J Nutr 1272011ndash2023
LITERATURE OVERVIEW
39
Halliwell B 1991 Reactive oxygen species in living systems Source biochemistry
and role in human disease Am J Med 91S14ndashS22
Hammon H M and J W Blum 1998 Metabolic and endocrine traits of neonatal
calves are influenced by feeding colostrum for different durations or only milk
replacer J Nutr 128624ndash632
Hammon H M J Steinhoff-Wagner J Flor U Schoumlnhusen and C C Metges 2013
Lactation Biology Symposium Role of colostrum and colostrum components on
glucose metabolism in neonatal calves J Anim Sci 91685ndash695
Hammon H M J Steinhoff-Wagner U Schoumlnhusen C C Metges and J W Blum
2012 Energy metabolism in the newborn farm animal with emphasis on the calf
Endocrine changes and responses to milk-born and systemic hormones Domest
Anim Endocrinol 43171ndash185
Hanhineva K R Toumlrroumlnen I Bondia-Pons J Pekkinen M Kolehmainen H
Mykkaumlnen and K Poutanen 2010 Impact of dietary polyphenols on
carbohydrate metabolism Int J Mol Sci 111365ndash1402
Harborne J B and C A Williams 2000 Advances in flavonoid research since 1992
Phytochemistry 55481ndash504
Heaney R P 2001 Factors influencing the measurement of bioavalability taking
calcium as a model J Nutr 1311344Sndash1348S
Heim K E A R Tagliaferro and D J Bobilya 2002 Flavonoid antioxidants
Chemistry metabolism and structure-activity relationships J Nutr Biochem
13572ndash584
Hertog M G L E J M Feskens P C H Hollman M B Katan and D Kromhout
1993 Dietary antioxidant flavonoids and risk of coronary heart disease The
Zutphen Elderly Study Lancet 3421007ndash1011
Hertog M G L P C H Hollman and M B Katan 1992 Content of potentially
anticarcinogenic flavonoids of 28 vegetables and 9 fruits commonly consumed in
the Netherlands Proc Nutr Soc 402379ndash2383
LITERATURE OVERVIEW
40
Hollman P C H 2001 Determination of flavonols in body fluids Pages 97ndash102 in
Flavonoids and other Polyphenols Methods in Enzymology L Packer ed
Academic Press San Diego USA
Hollman P C H and I C W Arts 2000 Flavonols flavones and flavanols ndash nature
occurrence and dietary burden J Sci Food Agric 801081ndash1093
Hollman P C H M N C P Bijsman Y van Gameren E P J Cnossen J H M de
Vries and M B Katan 1999 The sugar moiety is a major determinant of the
absorption of dietary flavonoid glycosides in man Free Radic Res 31569ndash573
Hollman P C H J H M de Vries S D van Leeuwen M J Mengelers and M B
Katan 1995 Absorption of dietary quercetin glycosides and quercetin in healthy
ileostomy volunteers Am J Clin Nutr 621276ndash1282
Hollman P C H and M B Katan 1997 Absorption metabolism and health effects of
dietary flavonoids in man Biomed Pharmacother 51305ndash310
Hollman P C H L B M Tijburg and C S Yang 1997a Bioavailability of
flavonoids from tea Crit Rev Food Sci Nutr 37719ndash738
Hollman P C H K H van het Hof L B Tijburg and M B Katan 2001 Addition of
milk does not affect the absorption of flavonols from tea in man Free Radic Res
34297ndash300
Hollman P C H J M P van Trijp M N C P Buysman M S vd Gaag M J B
Mengelers J H M de Vries and M B Katan 1997b Relative bioavailability of
the antioxidant flavonoid quercetin from various foods in man FEBS Lett
418152ndash156
Hirvonen T P Pietinen M Virtanen M L Ovaskainen S Haumlkkinen D Albanes
and J Virtamo 2001 Intake of flavonols and flavones and risk of coronary heart
disease in male smokers Epidemiology 1262ndash67
Ishihara N D-C Chu S Akachi and L R Juneja 2001 Improvement of intestinal
microflora balance and prevention of digestive and respiratory organ diseases in
calves by green tea extracts Livest Prod Sci 68217ndash229
LITERATURE OVERVIEW
41
Janisch K M G Williamson P Needs and G W Plumb 2004 Properties of
quercetin conjugates Modulation of LDL oxidation and binding to human serum
albumin Free Radic Res 38877ndash884
Johnston K P Sharp M Clifford and L Morgan 2005 Dietary polyphenols decrease
glucose uptake by human intestinal Caco-2 cells FEBS Lett 5791653ndash1657
Kahle K M Kempf P Schreier W Scheppach D Schrenk T Kautenburger D
Hecker W Huemmer M Ackermann and E Richling 2011 Intestinal transit
and systemic metabolism of apple polyphenols Eur J Nutr 50507ndash22
Kim E-K K-B Kwon M-Y Song M-J Han J-H Lee Y-R Lee D-G Ryu B-
H Park J-W Park 2007 Flavonoids protect against cytokine-induced pancreatic
β-cell damage through suppression of nuclear factor κβ activation Pancreas
35e1ndash9
Knekt P R Jaumlrvinen A Reunanen and J Maatela 1996 Flavonoid intake and
coronary mortality in Finland A cohort study Br Med J 312478ndash482
Knekt P R Jaumlrvinen R Seppaumlnen M Helioumlvaara L Teppo E Pukkala and A
Aromaa 1997 Dietary flavonoids and the risk of lung cancer and other malignant
neoplasms Am J Epidemiol 146223ndash230
Kobayashi Y M Miyazawa A Kamei K Abe and T Kojima 2010 Ameliorative
effects of mulberry (Morus alba L) leaves on hyperlipidemia in rats fed a high-fat
diet Induction of fatty acid oxidation inhibition of lipogenesis and suppression
of oxidative stress Biosci Biotechnol Biochem 742385ndash2395
Kobayashi Y M Suzuki H Satsu S Arai Y Hara K Suzuki Y Miyamoto and M
Shimizu 2000 Green tea polyphenols inhibit the sodium-dependent glucose
transporter of intestinal epithelial cells by a competitive mechanism J Agr Food
Chem 485618ndash5623
Kohen R and A Nyska 2002 Oxidation of biological systems Oxidative stress
phenomena antioxidants redox reactions and methods for their quantification
Toxicol Pathol 30620ndash650
Kootstra A 1994 Protection from UV-B-induced DNA damage by flavonoids Plant
Mol Biol 26771ndash774
LITERATURE OVERVIEW
42
Koster H I Halsema E Scholtens M Knippers and G J Mulder 1981 Dose-
dependent shifts in the sulfation and glucuronidation of phenolic compounds in
the rat in vivo and in isolated hepatocytes Biochem Pharmacol 302569ndash2575
Lamartiniere C A J Moore M Holland and S Barnes 1995 Neonatal genistein
chemoprevents mammary cancer Proc Soc Exp Biol Med 208120ndash123
Lee M-L P Maliakal L Chen X Meng F Y Bondoc S Prabhu G Lambert S
Mohr and C S Yang 2002 Pharmacokinetics of tea catechins after ingestion of
green tea and (ndash)-epigallocatechin-3-gallate by humans Formation of different
metabolites and individual variability Cancer Epidemiol Biomarkers Prev
111025ndash1032
Lesser S R Cermak and S Wolffram 2004 Bioavailability of quercetin in pigs is
influenced by the dietary fat content J Nutr 1431508ndash1511
Liggins G C 1994 The role of cortisol in preparing the fetus for birth Reprod Fertil
Dev 6141ndash50
Loke W M J M Hodgson and K D Croft 2010 The biochemistry behind the
potential cardiovascular protection by dietary flavonoids Pages 91ndash106 in Plant
Phenolics and Human Health Biochemistry Nutrition and Pharmacology C G
Fraga ed J Wiley amp Sons Inc Hoboken USA
Lorenz I B Earley J Gilmore I Hogan E Kennedy and S J More 2011 Calf
health from birth to weaning III Housing and management of calf pneumonia Ir
Vet J 641ndash14
Manach C C Morand C Demigneacute O Texier F Reacutegeacuterat and C Reacutemeacutesy 1997
Bioavailability of rutin and quercetin in rats FEBS Lett 40912ndash16
Manach C C Morand A Gil-Izquierdo C Bouteloup-Demange and C Reacutemeacutesy
2003 Bioavailability in humans of the flavanones hesperidin and narirutin after
the ingestion of two doses of orange juice Eur J Clin Nutr 57235ndash42
Manach C A Scalbert C Morand C Reacutemeacutesy and L Jimeacutenez 2004 Polyphenols
Food sources and bioavailability Am J Clin Nutr 79727ndash747
LITERATURE OVERVIEW
43
Manach C O Texier C Morand V Crespy F Reacutegeacuterat C Demigneacute and C Reacutemeacutesy
1999 Comparison of the bioavailability of quercetin and catechin in rats Free
Radic Biol Med 271259ndash1266
Manach C G Williamson C Morand A Scalbert and C Reacutemeacutesy 2005
Bioavailability and bioefficacy of polyphenols in humans I Review of 97
bioavailability studies Am J Clin Nutr 81230Sndash242S
McMahon L G 1997 Cytosolic pyridoxine-β-D-glucoside hydrolase from porcine
jejunal mucosa Purification properties and comparison with broad specifity β-
glucosidase J Biol Chem 27232025ndash32033
Mennen L I D Sapinho A De Bree N Arnault S Bertrais P Galan and S
Hercberg 2004 Consumption of foods rich in flavonoids is related to a decreased
cardiovascular risk in apparently healthy french women J Nutr 134923ndash926
Metwally M T A A R Khafagy H I Eid and A M Algammal 2013 Studies on
the immunostimulatory effect of propolis in diarrheic buffalo calves J Adv Vet
Res 3114ndash117
Middleton E C Kandaswami and T C Theoharides 2000 The effects of plant
flavonoids on mammalian cells Implications for inflammation heart disease and
cancer Pharmacol Rev 52673ndash751
Miller R L M James-Kracke G Y Sun and A Y Sun 2009 Oxidative and
inflammatory pathways in Parkinsonrsquos disease Neurochem Res 3455ndash65
Morris M E and S Zhang 2006 Flavonoid-drug interactions Effects of flavonoids
on ABC transporters Live Sci 782116ndash2130
Murota K and J Terao 2003 Antioxidative flavonoid quercetin Implication of its
intestinal absorption and metabolism Arch Biochem Biophys 41712ndash17
Mutinati M M Pantaleo M Roncetti M Piccinno A Rizzo and R L Sciorsci
2014 Oxidative stress in neonatology A review Reprod Domest Anim 497ndash
16
LITERATURE OVERVIEW
44
Neacutemeth K G W Plumb J-G Berrin N Juge R Jacob H Y Naim G Williamson
D M Swallow and P A Kroon 2003 Deglycosylation by small intestinal
epithelial cell beta-glucosidases is a critical step in the absorption and metabolism
of dietary flavonoid glycosides in humans Eur J Nutr 4229ndash42
Nielsen B K 2008 Botanicals as feed additives to improve health and production in
pig breeding Res Pig Breed 212ndash18
Nijveldt R J E van Nood D E C van Hoorn P G Boelens K van Norren and P
A M van Leeuwen 2001 Flavonoids A review of probable mechanisms of
action and potential applications Am J Clin Nutr 74418ndash425
Nussbaum A G Schiessler H M Hammon and J W Blum 2002 Growth
performance and metabolic and endocrine traits in calves pair-fed by bucket or by
automate starting in the neonatal period J Anim Sci 801545ndash1555
OrsquoConnell J E and P F Fox 2001 Significance and applications of phenolic
compounds in the production and quality of milk and dairy products A review
Int Dairy J 11103ndash120
Ofer M S Wolffram A Koggel H Spahn-Langguth and P Langguth 2005
Modulation of drug transport by selected flavonoids Involvement of P-gp and
OCT Eur J Pharm Sci 25263ndash271
Oliveira R A C D Narciso R S Bisinotto M C Perdomo M A Ballou M Dreher
and J E P Santos 2010 Effects of feeding polyphenols from pomegranate
extract on health growth nutrient digestion and immunocompetence of calves J
Dairy Sci 934280ndash4291
Olthof M R P C H Hollman T B Vree and M B Katan 2000 Bioavailabilities of
quercetin-3-glucoside and quercetin-4`-glucoside do not differ in humans J Nutr
21200ndash1203
Otake Y F Hsieh and T Walle 2002 Glucuronidation versus oxidation of the
flavonoid galangin by human liver microsomes and hepatocytes Drug Metab
Dispos 30576ndash581
LITERATURE OVERVIEW
45
Passamonti S M Terdoslavich R Franca A Vanzo F Tramer E Braidot E
Petrussa and A Vianello 2009 Bioavailability of flavonoids A review of their
membrane transport and the function of bilitranslocase in animal and plant
organisms Curr Drug Metab 10369ndash394
Petri N C Tannergren B Holst F A Mellon Y Bao G W Plumb J I M Bacon
K A O Leary P A Kroon L Knutson P Forsell T Eriksson H Lennernas
and G Williamson 2003 Absorptionmetabolism of sulforaphane and quercetin
and regulation of phase II enzymes in human jejenum in vivo Drug Metab
Dispos 31805ndash813
Pfeiffer S P Pflegel and H-H Borchert 1995 Grundlagen der Biopharmazie
Pharmakokinetik Bioverfuumlgbarkeit Biotransformation VEB Verlag Volk und
Gesundheit Berlin Germany
Piskula M K 2000 Soy isoflavone conjugation differs in fed and food-deprived rats J
Nutr 1301766ndash1771
Piskula M K and J Terao 1998 Accumulation of (ndash)-epicatechin metabolites in rat
plasma after oral administration and distribution of conjugation enzymes in rat
tissues J Nutr 1281172ndash1178
Piskula M K J Yamakoshi and Y Iwai 1999 Daidzein and genistein but not their
glucosides are absorbed from the rat stomach FEBS Lett 447287ndash291
Rauprich A B E H M Hammon and J W Blum 2000 Effects of feeding colostrum
and a formula with nutrient contents as colostrum on metabolic and endocrine
traits in neonatal calves Biol Neonate 7853ndash64
Rao V S F A Santos T T Sobreira M F Souza C L Melo and E R Silveira
1997 Investigations on the gastroprotective and antidiarrhoeal properties of
ternatin a tetramethoxyflavone from Egletes viscosa Planta Med 63146ndash149
Reddy V C G V Vidya Sagar D Sreeramulu L Venu and M Raghunath 2005
Addition of milk does not alter the antioxidant activity of black tea Ann Nutr
Metab 49189ndash195
LITERATURE OVERVIEW
46
Reinboth M S Wolffram G Abraham F R Ungemach and R Cermak 2010 Oral
bioavailability of quercetin from different quercetin glycosides in dogs Br J
Nutr 104198ndash203
Retskii M I A G Shakhov D V Chusov A I Zolotarev M I Lebedev T G
Ermolova and G N Bliznetsova 2010 Correcting the antioxidant status of
newborn calves for forming higher colostral immunity Russ Agric Sci 36127ndash
Rimm E B M B Katan A Ascherio M J Stampfer and W C Willett 1996
Relation between intake of flavonoids and risk for coronary heart disease in male
health professionals Ann Intern Med 125384ndash389
Robles R N Palomino and A Robles 2001 Oxidative stress in the neonate Early
Hum Dev 65S75ndashS81
Roghani M and T Baluchnejadmojarad 2010 Hypoglycemic and hypolipidemic
effect and antioxidant activity of chronic epigallocatechin-gallate in
streptozotocin-diabetic rats Pathophysiology 1755ndash59
Saugstad O D 2005 Oxidative stress in the newborn A 30-year perspective Biol
Neonate 88228ndash236
Scalbert A and G Williamson 2000 Dietary intake and bioavailability of
polyphenols J Nutr 1302073ndash2085
Schiessler G A Nussbaum H M Hammon and J W Blum 2002 Calves sucking
colostrum and milk from their dams or from an automatic feeding station starting
in the neonatal period metabolic and endocrine traits and growth performance
Anim Sci 74431ndash444
Scholz S and G Williamson 2007 Interactions affecting the bioavailability of dietary
polyphenols in vivo Int J Vitam Nutr Res 77224ndash235
Schwerin M U Dorroch M Beyer H Swalve C C Metges and P Junghans 2002
Dietary protein modifies hepatic gene expression associated with oxidative stress
responsiveness in growing pigs FASEB J 161322ndash1324
LITERATURE OVERVIEW
47
Schroeter H and J P E Spencer 2003 Flavonoids Neurodegenerative agents
Modulation of oxidative stress-induced map kinase signal transduction Pages
233ndash272 in Flavonoids in Health and Disease C A Rice-Evans and L Packer
ed Marcel Dekker Inc New York USA
Seiva F R F L G A Chuffa C P Braga J P A Amorim and A A H Fernandes
2012 Quercetin ameliorates glucose and lipid metabolism and improves
antioxidant status in postnatally monosodium glutamate-induced metabolic
alterations Food Chem Toxicol 503556ndash3561
Serafini M R Bugianesi G Maiani S Valtuena S De Santis and A Crozier 2003
Plasma antioxidants from chocolate Nature 4241013
Sesink A L A I C W Arts V C J de Boer P Breedveld J H M Schellens P C
H Hollman and F G M Russel 2005 Breast cancer resistance protein
(Bcrp1Abcg2) limits net intestinal uptake of quercetin in rats by facilitating
apical efflux of glucuronides Mol Pharmacol 671999ndash2006
Sesink A L A I C W Arts M Faassen-Peters and P C H Hollman 2002
Intestinal uptake of quercetin-3-glucoside in rats involves hydrolysis by lactase
phlorizin hydrolase J Nutr 133773ndash776
Setchell K D R N M Brown P Desai L Zimmer-Nechemias B E Wolfe W T
Brashear A S Kirschner A Cassidy and J E Heubi 2001 Bioavailability of
pure isoflavones in healthy humans and analysis of commercial soy isoflavone
supplements J Nutr 1311362Sndash1375
Shimoi K H Okada M Furugori T Goda S Takase M Suzuki Y Hara H
Yamamoto and N Kinae 1998 Intestinal absorption of luteolin and luteolin 7-O-
β-glucoside in rats and humans FEBS Lett 438220ndash224
Sies H 1985 Oxidative Stress Introductory Remarks Pages 1ndash8 in Oxidative Stress
H Sies ed Academic Press Inc London UK
Sies H 1991 Role of reactive oxygen species in biological processes Klin
Wochenschr 69965ndash968
Sies H W Stahl and A Sevanian 2005 Nutritional dietary and postprandial
oxidative stress J Nutr 135969ndash972
LITERATURE OVERVIEW
48
Sokolova V E E A Vasilrsquochenko and I K Izmaĭlova 1978 Anabolic action of
flavonoids Famakol Toksikol 41323ndash327
Spencer J P G Chowrimootoo R Choudhury E S Debnam S K Srai and C Rice-
Evans 1999 The small intestine can both absorb and glucuronidate luminal
flavonoids FEBS Lett 458224ndash230
Steinhoff-Wagner J S Goumlrs P Junghans R M Bruckmaier E Kanitz C C Metges
and H M Hammon 2011 Maturation of endogenous glucose production in
preterm and term calves J Dairy Sci 945111ndash5123
Steinshamn H S Purup E Thuen and J Hansen-Moslashller 2008 Effects of clover-
grass silages and concentrate supplementation on the content of phytoestrogens in
dairy cow milk J Dairy Sci 912715ndash2725
Stohrer M S Lutz and M Stangassinger 2003 Antioxidant status of calves and foals
declines after birth Acta Vet Scand Suppl 44P38
Stott G H D B Marx B E Menefee and G T Nightengale 1979 Colostral
immunoglobulin transfer in calves I Period of absorption J Dairy Sci 621632ndash
1638
Swezey R R D E Aldridge S E Le Valley J A Crowell Y Hara and C E Green
2003 Absorption tissue distribution and elimination of 4-[3H]-epigallocatechin
gallate in beagle dogs Int J Toxicol 22187ndash193
Tadera K Y Minami K Takamatsu and T Matsuoka 2006 Inhibition of α-
glucosidase and α-amylase by flavonoids J Nutr Sci Vitaminol 52149ndash153
USDA (United States Department of Agriculture) Animal and Plant Health Inspection
Service 2011 Cattle and calves nonpredator death loss in the United States 2010
httpwwwaphisusdagovanimal_healthnahmsgeneraldownloadscattle_calves
_nonpred_2010pdf (Accessed May 2013)
van Het Hof K H G A A Kivits J A Weststrate and L B M Tijburg 1998
Bioavailability of catechins from tea The effect of milk Eur J Clin Nutr
52356ndash359
LITERATURE OVERVIEW
49
Varadarajan S J Kanski M Aksenova C Lauderback and D A Butterfield 2001
Different mechanisms of oxidative stress and neurotoxicity for Alzheimerlsquos
Aβ(1minus42) and Aβ(25minus35) J Am Chem Soc 1235625ndash5631
Walgren R A J Lin R K Kinne and T Walle 2000a Cellular Uptake of dietary
flavonoid quercetin 4`-szlig-glucoside by sodium-dependent glucose transporter
SGLT1 J Pharmacol Exp Ther 294837ndash843
Walgren R A G E Lindenmayer and T Walle 2000b Efflux of dietary flavonoid
quercetin 4`beta-glucoside across human intestinal Caco-2 cell monolayers by
apical multidrug resistance-associated protein-2 J Pharmacol Exp Ther
294830ndash836
Walle T A M Browning L L Steed S G Reed and U K Walle 2005 Human
nutrition and metabolism flavonoid glucosides are hydrolyzed and thus activated
in the oral cavity J Nutr 13548ndash52
Walle U K A Galijatovic and T Walle 1999 Transport of the flavonoid chrysin and
its conjugated metabolites by the human intestinal cell line caco-2 Biochem
Pharmacol 58431ndash438
Wein S and S Wolffram 2013 Oral bioavailability of quercetin in horses J Equine
Vet Sci 33441ndash445
Wernicki A M Kankofer P Mikucki and A Puchalski 2006 Evaluation of plasma
cortisol and TBARS levels in calves after short-term transportation Rev Med
Vet 15730ndash34
Williams C A and J B Harborne 1994 Flavone and flavonol glycosides Pages 337ndash
385 in The Flavonoids Advances in research since 1986 JB Harborne ed
Chapman and Hall London UK
Winkel-Shirley B 2002 Biosynthesis of flavonoids and effects of stress Curr Opin
Plant Biol 5218ndash223
LITERATURE OVERVIEW
50
Wolffram S 2010 Wie viel kommt an Die Bioverfuumlgbarkeit sekundaumlrer
Pflanzenstoffe am Beispiel des Quercetins Pages 10ndash14 in Aktuelle
Ernaumlhrungsmedizin Georg Thieme Verlag KG Stuttgart Germany - New York
USA httpwwwinstitut-danonedeernaehrungsaufklaerungunsere-materialien
(Accessed April 2013)
Wolffram S M Bloeck and P Ader 2002 Quercetin-3-glucoside is transported by
the glucose carrier SGLT1 across the brush border membrane of rat small
intestine J Nutr 132630ndash635
Wolfram S D Raederstorff M Preller Y Wang S R Teixeira C Riegger and P
Weber 2006 Epigallocatechin gallate supplementation alleviates diabetes in
rodents J Nutr 1362512ndash2518
Yaghoubi S M J G R Ghorbani H R Rahmani and A Nikkhah 2008 Growth
weaning performance and blood indicators of humoral immunity in Holstein
calves fed supplemental flavonoids Anim Physiol Anim Nutr 92456ndash462
Yochum L L H Kushi K Meyer and A R Folsom 1999 Dietary flavonoid intake
and risk of cardiovascular disease in postmenopausal women Am J Epidemiol
149943ndash949
Youdim K A and J A Joseph 2003 Phytochemicals and brain aging A multiplicity
of effects Pages 205ndash347 in Flavonoids in Health and Disease C A Rice-Evans
and L Packer ed Marcel Dekker Inc New York USA
Zhu M Y Chen and R C Li 2000 Oral absorption and bioavailability of tea
catechins Planta Med 66444ndash447
Zung A R Reifen Z Keem and Z Zadik 2001 Phytoestrogens The pediatric
perspective J Pediatr Gastroenterol Nutr 33112ndash118
51
Chapter 2
Bioavailability of the flavonol quercetin in neonatal calves
after oral administration of quercetin aglycone or rutin
J Maciej C T Schaumlff E Kanitzdagger A TuchschererDagger R M Bruckmaiersect
S Wolffram and H M Hammon1
Institute of Nutritional Physiology ldquoOskar Kellnerrdquo
daggerInstitute of Behavioural Physiology and
DaggerInstitute of Genetics and Biometry Leibniz Institute for Farm Animal Biology (FBN)
Wilhelm-Stahl-Allee 2 18196 Dummerstorf Germany
sectVeterinary Physiology Vetsuisse Faculty University of Bern 3001 Bern Switzerland
Institute of Animal Nutrition and Physiology Christian Albrechts University Kiel
24118 Kiel Germany
Received January 20 2015
Accepted February 6 2015
1Corresponding author hammonfbn-dummerstorfde
Used by permission of the Journal of Dairy Science
Published in Journal of Dairy Science 2015 983906ndash3917
httpdxdoiorg103168jds2015-9361
CHAPTER 2
52
2 Bioavailability of the flavonol quercetin in neonatal calves
after oral administration of quercetin aglycone or rutin
Abstract
Polyphenols such as flavonoids are secondary plant metabolites with potentially
health-promoting properties In newborn calves flavonoids may improve health status
but little is known about the systemically availability of flavonoids in calves to exert
biological effects The aim of this study was to investigate the oral bioavailability of the
flavonol quercetin applied either as quercetin aglycone (QA) or as its glucorhamnoside
rutin (RU) in newborn dairy calves Twenty-one male newborn German Holstein calves
were fed equal amounts of colostrum and milk replacer according to body weight On d
2 and 29 of life 9 mg of quercetin equivalentskg of body weight either fed as QA or as
RU or no quercetin (control group) were fed together with the morning meal Blood
samples were taken before and 05 1 15 2 25 3 4 5 6 12 24 and 48 h after feed
intake Quercetin and quercetin metabolites with an intact flavonol structure
(isorhamnetin tamarixetin and kaempferol) were analyzed in blood plasma after
treatment with glucuronidasesulfatase by HPLC with fluorescence detection Maximum
individual plasma concentration was depicted from the concentration-time-curve on d 2
and 29 respectively Additional blood samples were taken to measure basal plasma
concentrations of total protein albumin urea and lactate as well as pre- and
postprandial plasma concentrations of glucose non-esterified fatty acids insulin and
cortisol Plasma concentrations of quercetin and its metabolites were significantly
higher on d 2 than on d 29 of life and administration of QA resulted in higher plasma
concentrations of quercetin and its metabolites than RU The relative bioavailability of
total flavonols (sum of quercetin and its metabolites isorhamnetin tamarixetin and
kaempferol) from RU was 725 on d 2 and 496 on d 29 when compared with QA
(100 ) Calves fed QA reached maximum plasma concentrations of total flavonols
much earlier than did RU-fed calves Plasma metabolites and hormones were barely
affected by QA and RU feeding in this experiment Taken together orally administrated
QA resulted in a greater bioavailability of quercetin than RU on d 2 and 29
respectively and differed markedly between calves aged 2 and 29 d
Key Words bioavailability calf flavonoid quercetin rutin
CHAPTER 2
53
21 Introduction
Flavonoids are secondary plant metabolites occurring ubiquitously in all higher plants
(Manach et al 2004 Besle et al 2010) They are known for their health-promoting
properties (eg antioxidative and anti-inflammatory Middleton et al 2000 Nijveldt et
al 2001 Williams et al 2004) Quercetin is one of the most abundant flavonoids and
is present in high concentrations in onions apples and kale (Hertog et al 1992
Nijveldt et al 2001) and in low concentrations also in milk (Besle et al 2010
Bhagwat et al 2013) In addition to their health-promoting properties quercetin and its
metabolites modulate the expression and activity of several metabolic key enzymes and
therefore might be involved in regulation of lipid and carbohydrate metabolism
(Middleton et al 2000 Gasparin et al 2003 Kobayashi et al 2010)
Newborn calves undergo tremendous immunological and metabolic changes after birth
to adapt for extra-uterine life (Blum 2006 Chase et al 2008 Hammon et al 2012)
and colostrum management is one of the most important factors to support neonatal
health and development (Godden 2008 Hammon et al 2012) Nevertheless morbidity
and mortality rates are still high during first weeks of life and calves often suffer from
diarrhea and respiratory disease (McGuirk 2008 Mee 2008 Uetake 2013) as well as
from high levels of oxidative stress (Inanami et al 1999 Gaaacutel et al 2006) Frequent
problems on farms are the lack of high-quality colostrum availability and the
insufficient colostrum supply (Quickley and Drewry 1998 Godden 2008) Colostrum
and mature milk contain antioxidant agents to protect neonatal calves from oxidative
stress (Lindmark-Maringnsson and Aringkesson 2000 Besle et al 2010) Poor quality of
colostrum is reflected by low concentrations of antioxidative substances Thus
supplementing colostrum and milk at beginning of lactation with the natural antioxidant
agent quercetin may improve neonatal oxidative status However there is no
information about the bioavailability (BV) of orally applied quercetin with colostrum
and milk in newborn calves although feeding industry already offers flavonoid-
supplemented feed for dairy calves
Studies on BV of quercetin from quercetin aglycone (QA) or its glucorhamnoside rutin
(RU) in different monogastric species such as rats (Manach et al 1997) pigs (Ader et
al 2000 Cermak et al 2003 Lesser et al 2004) dogs (Reinboth et al 2010) and
humans (Erlund et al 2000 Egert et al 2008) showed marked differences to ruminant
CHAPTER 2
54
species (eg cows with intraruminal QA and RU application Berger et al 2012) These
differences may be due to differnces in gastrointestinal anatomy and physiology (Arts et
al 2004 Berger et al 2012 Gohlke et al 2013) Conversely in newborn calves the
forestomach system is just developing thus newborn calves are functionally
monogastrics (Drackley et al 2008) The aim of the present study was to investigate the
relative BV of quercetin after oral administration of QA or RU in calves during first
month of life We hypothesized that BV in calves depends on the form of application
(QA and RU) and changes with age due to ontogenetic development and maturation of
the gastrointestinal tract during first month of life We further tested the hypothesis that
quercetin application might affect metabolic and endocrine traits especially concerning
glucose metabolism in neonatal calves because findings in literature pointed to impair
carbohydrate digestion and glucose absorption after flavonoid intake (Cermak et al
2004 Tadera et al 2006)
22 Materials and Methods
221 Animals and feeding
The experimental procedures were carried out according to the animal care guidelines
and were approved by the relevant authorities of the State Mecklenburg-West
Pomerania Germany (LVL M-VTSD72213-21-01910) Twenty-one male German
Holstein calves were examined on d 2 and 29 of life All calves were spontaneously
born from multiparous cows on neighboring farms and transported directly after birth to
the experimental barn Calves were kept in single boxes with straw bedding and had
free access to water Calves were fed twice daily (0700 and 1500 h) with a nipple bottle
or nipple bucket On the first 3 d of life calves received pooled colostrum obtained from
milkings 1 3 and 5 (d 1 2 and 3 after parturition respectively Table 21) at amounts
of 8 of BW on d 1 and 10 of BW on d 2 and 3 (Steinhoff-Wagner et al 2011)
From d 4 until d 29 calves received milk replacer (150 gL SalvaLac MiraPro 45
Salvana Tiernahrung GmbH Klein-Offenseth Sparrieshoop Germany) at 12 of
BWd (Table 21) To ensure uptake of equal amounts of feed refused amounts of
colostrum or milk were tube-fed to calves Milk intake was adapted to BW data once a
week
CHAPTER 2
55
Colostrum or milk replacer was supplemented with chicken egg-derived
immunoglobulins (Globigen Life Start 25 EW Nutrition GmbH Visbek Germany)
composed of 75 dextrose and 25 whole egg powder (1075 CP 1050 crude
fat 010 crude fiber and 250 ash) with high antibody titer against Eschericha coli
type K 99 Salmonella Tymphimurium and Salmonella Dublin bovine rotavirus type
G6 and G10 bovine coronavirus Cryptosporidium parvum and Clostridium
perfringens serotype C Immunoglobulins were added from d 2 till d 6 Respective
amounts of immunoglobulins fed twice daily were 40 32 24 16 and 8 gd
From d 4 on calves had free access to pelleted concentrate (Kaumllber Start 183 pell
Vollkraft Mischfutterwerke GmbH Karstaumldt Germany Table 21) and hay
Concentrate intake was measured daily after morning milk feeding To avoid iron
deficiency calves received 600 mg iron dextran subcutaneously (Ursoferran
Serumwerk Bernburg Germany) on their first day of life Navel disinfection was
performed with 10 iodine solution (vet sept Loumlsung Albrecht GmbH Aulendorf
Germany) immediately after birth Health status of calves was determined daily by
measuring rectal temperature heart rate and respiratory rate by evaluation of
behavioral abnormalities nasal discharge respiratory sounds fecal consistence and by
navel inspection
222 Treatment and blood sampling
Calves were randomly assigned to 1 of 3 feeding groups (n = 7 per group) receiving
either no flavonoids (control group CTRL) 9 mg of QAkg of BW (quercetin aglycone
dihydrate Carl Roth GmbH Karlsruhe Germany) or 18 mg of RUkg of BW (rutin
trihydrate Carl Roth GmbH) each resulting in a dose of 9 mg of quercetin equivalents
(QE)kg of BW on d 2 and d 29 of life Calves received the whole dose of QA or RU
during morning feeding applying the QE suspension with a 10-ml syringe directly into
the mouth
CHAPTER 2
56
Ta
ble
21
C
om
po
siti
on
an
d a
mo
un
ts o
f co
lost
rum
m
ilk
rep
lace
r a
nd
co
nce
ntr
ate
fed
to
ca
lves
d
1
d 2
d
3
d 4
to
30
2
Item
co
lost
rum
1
mil
kin
g 1
colo
stru
m1
mil
kin
g 3
colo
stru
m1
mil
kin
g 5
M
ilk
rep
lace
r3
Co
nce
ntr
ate
4
DM
gk
g
20
69
1
54
7
13
93
1
10
0
88
00
CP
gk
g D
M
59
74
3
90
4
33
31
2
01
8
18
00
Cru
de
fat
gk
g D
M
16
92
2
40
5
27
49
1
90
9
43
0
Ash
gk
g D
M
48
3
55
6
56
0
73
6
74
0
Lac
tose
g
kg D
M
13
63
2
60
5
30
87
5
14
6
-
1C
olo
stru
m w
as d
eriv
ed f
rom
mu
ltip
aro
us
cow
s and
sep
arat
ely p
oo
led
fro
m m
ilkin
gs
1
3
and
5 a
fter
par
turi
tio
n
resp
ecti
vel
y
2H
ay w
as o
ffer
ed a
d l
ibit
um
exce
pt
for
days
of
bio
avai
lab
ilit
y s
tud
ies
3M
ilk
rep
lace
r (S
alvaL
ac M
iraP
ro 4
5
Sal
vana
Tie
rnah
run
g G
mb
H
Kle
in-O
ffense
th S
parr
iesh
oo
p
Ger
man
y)
was
com
po
sed
of
45
s
pra
y s
kim
med
mil
k
po
wd
er
35
s
wee
t w
hey p
ow
der
1
8
pla
nt
oil
(p
alm
co
conut
and
so
y o
il)
17
L
ys
08
C
a 0
75
P
an
d a
dd
ed w
ith 5
00
00
IU
of
vit
am
in A
4
000
IU o
f vit
am
in D
3
20
0 m
g o
f vit
am
in E
(α
-to
cop
her
ol
acet
ate)
9
mg C
u (
gly
ceri
ne-
cop
per
chel
ate)
ci
tric
aci
d
sorb
ic a
cid
b
uty
lhyd
rox
yto
luene (
BH
T)
and
12
x 1
09 c
fu E
nte
roco
ccu
s fa
eciu
m E
17
06
4C
once
ntr
ate
(Kaumll
ber
Sta
rt 1
83
V
oll
kra
ft
Mis
ch
futt
erw
erk
e G
mb
H
Kar
staumld
t G
erm
an
y)
was
com
po
sed
of
wh
eat
glu
ten
wh
eat
bra
n
gra
in m
ash
su
gar
bee
t
pulp
ra
pes
eed
mea
l o
at
rye
mo
lass
es
lin
seed
o
at b
ran
soyb
ean m
eal
extr
act
cal
ciu
m c
arb
onat
e s
od
ium
chlo
rid
e 0
6
pho
spho
rous
02
s
od
ium
10
800
IU
of
vit
am
in A
1
21
5 I
U o
f vit
am
in D
3
30
mg o
f vit
am
in E
0
7 m
g o
f I
04
mg o
f C
o
54
mg o
f M
g
81
mg o
f Z
n
and
04
mg o
f S
e p
er k
g o
f D
M
CHAPTER 2
57
The day before the study started a catheter (Certofix Mono 340 Braun Melsungen AG
Melsungen Germany) was inserted into the calvesrsquo right jugular vein and blood
samples were taken before (time point 0) and 05 1 15 2 25 3 4 6 8 12 24 and
48 h after feeding using S-Monovette tubes (Sarstedt AG amp Co Nuumlmbrecht Germany)
containing lithium heparin (16 IUmL blood) for analysis of plasma flavonols
Additional blood samples except on 15 25 and 48 h were taken for measurement of
plasma concentrations of total protein albumin glucose NEFA urea and lactate using
tubes containing sodium fluoride and K3EDTA (10 mgmL fluoride and 12 mgmL
EDTA) Blood sampled into tubes containing dipotassium EDTA (18 mgmL) was used
for determination of insulin and cortisol plasma concentrations Catheters were flushed
with 10 mL sodium chloride solution (09 sodium chloride Braun Melsungen AG)
after each blood sampling Blood was immediately put on ice centrifuged for 20 min at
1500 times g at 4deg C and plasma was stored at -80deg C for flavonol analysis and at -20deg C
for analyses of metabolites and hormones
223 Analytical methods
Flavonols were extracted from plasma as described by Egert et al (2008) and
concentrations of quercetin aglycone and its methylated (isorhamnetin tamarixetin) and
dehydroxylated (kaempferol) derivatives were analyzed by HPLC with fluorescence
detection as previously described (Ader et al 2000 Berger et al 2012 Gohlke et al
2013) Briefly plasma samples were thawed in a 40deg C water bath Then 980 μL of
plasma was acidified with 130 μL of acetic acid (0583 molL) spiked with 20 μL of
methanolic rhamnetin solution (internal standard 1 mg20 mL in methanol Rotichrom
HPLC Carl Roth GmbH) and treated with a mixture of β-glucuronidase and sulfatase
(from Helix pomatia Type H-1 with final activities of 7300 and 130 UmL for
glucuronidase and sulfatase respectively Sigma-Aldrich Chemie GmbH Dreieich
Germany) to cleave the ester bonds of glucuronides and sulfates After incubation at
37deg C for 1 h 3 mL of acetone was added and the samples were centrifuged at 3700 times g
for 45 min at 4deg C) The supernatant was evaporated until dryness Residues were
resolved in 200 μL methanol and after 15 min in an ultrasonic bath 775 μL of
nanopure water and 225 μL of hydrochloric acid (10 molL) were added For flavonol
analyses by HPLC 30 μL of the final solution was injected by a cooled (4deg C)
autosampler (AS-2057 Plus Jasco Deutschland GmbH Groszlig-Umstadt Germany) onto
CHAPTER 2
58
a C-18 Kromasil 100 column (250 times 4 mm particle size = 5 μm Jasco Deutschland
GmbH) guarded by a pre-column (C-18 Inertsil ODS-2 10 times 4 mm particle size = 5
μm Jasco Deutschland GmbH) The eluent (flow rate 1 mLmin) was composed of
0025 molL sodium dihydrogen phosphate (pH 24) acetonitrile and methanol
(68275 volvolvol) In a postcolumn reactor the effluent was mixed with aluminum
nitrate [flow rate = 04 mLmin 1 mmolL in methanol containing 75 [volvol] acetic
acid] for derivatization and fluorescence of the flavonol-aluminum complex was
measured using a fluorescence detector (excitation wavelength = 422 nm emission
wavelength = 485 nm FP920 Jasco Deutschland GmbH) Identification of peaks
obtained was performed using the retention times of the standards which were prepared
with pure flavonols and treated in the same way as samples The detection limit of
flavonols was le10 nmolL and the recovery rate was 92 plusmn 2 (mean plusmn SE) Inter- and
intraassay variances for quercetin were 72 and 05 The sum of plasma
concentrations of quercetin and its metabolites in plasma is referred to as total
flavonols
Plasma metabolites were analyzed spectrophotometrically (ABX Penta 400 Horiba
ABX SAS Montpellier Cedex France) by the Clinic for Cattle (University of
Veterinary Medicine Foundation Hanover Germany) using the respective kits
Albumin (no A11A01664) and lactate (no A11A01721 Horiba Europe GmbH
Hannover Germany) NEFA (no 434-91795 Wako Chemicals GmbH Neuss
Germany) glucose (no 553-230) and total protein (no 553-412 MTI Diagnostics
GmbH Idstein Germany) and urea (no LT-UR 0050 Labor + Technik E Lehmann
GmbH Berlin Germany)
Plasma insulin concentrations were determined using an RIA as previously described
(Vicari et al 2008) Plasma cortisol concentrations were analyzed using a commercial
ELISA kit validated for bovine plasma (EIA-1887 DRG Instruments GmbH Marburg
Germany Weber et al 2013) Cross reactivities of the monoclonal antibody against
corticosteron and progesterone were 45 and 9 respectively and to any further plasma
steroids lower than 2 Test sensitivity was 34 ngmL inter- and intraassay variations
were 53 and 121 respectively
Colostrum was analyzed for DM CP crude fat and ash content (Qualitaumltspruumlfungs- und
Dienstleistungsgesellschaft Mecklenburg-Vorpommern mbH Guumlstrow Germany)
according to the Weender standard procedure (Naumann and Bassler 2004) as shown
CHAPTER 2
59
in Table 21 Chemical composition of milk replacer and concentrates were according to
the manufacturersrsquo declarations (Table 21)
224 Calculations and statistical analyses
Quercetin measurements were corrected by baseline concentration (first blood sample
before QA or RU administration) then area under the curve (AUC) was calculated for
quercetin and its metabolites (isorhamnetin tamarixetin and kaempferol) according to
the trapeziodale rule between 0 and 24 h using GraphPad Prism 3 (GraphPad Software
Inc San Diego CA version 303) For single quercetin metabolites AUC proportion
relative to AUC of total flavonols (sum of quercetin isorhamnetin tamarixetin and
kaempferol) was calculated in addition Maximum plasma flavonol concentrations
(Cmax) and time after intake until Cmax was reached (Tmax) were determined from
individual plasma concentration-time curves Relative BV of quercetin from RU was
calculated as
Relative BV = AUCRUAUCQA times 100
Statistical analyses were performed using SASSTAT software (SAS Institute 2010)
All data are presented as LSM plusmn SE Body weight concentrate intake and
pharmacokinetic parameters (AUC Cmax Tmax) as well as proportions of single
metabolites on d 2 and 29 were analyzed by repeated measurement ANOVA using the
Mixed procedure with group (levels CTRL QA RU for proportional calculations only
QA and RU) repeated variable day (levels d 2 29) and group times day interaction as
fixed effects in the model Repeated measures on each calf were taken into account by
using the repeated statement of the Mixed procedure with an autoregressive residual
covariance structure Plasma concentration of total flavonols as well as metabolite and
hormone data were analyzed by repeated measurement ANOVA using the Mixed
procedure as described previously with group (levels CTRL QA RU) day (levels d
2 29) time changes within d 2 and 29 (several time points before and after feed intake
on d 2 and 29 respectively) and respective interactions as fixed effects Pairwise
differences among treatments and time changes were tested by the Tukey-Kramer-test
Effects were considered significant if P lt 005
CHAPTER 2
60
23 Results
231 Body weight and feed intake
All calves were born spontaneously and healthy Birth weight was 474 plusmn 10 kg Body
weight increased with time in all groups (P lt 001) and was 655 plusmn 13 kg on d 29
without differences between groups Milk intake was 38 plusmn 01 kgd on d 1 (8 of
BW) 48 plusmn 01 kgd on d 2 (10 of BW) and 69 plusmn 01 kg on d 29 Concentrate intake
was 159 plusmn 028 kgcalf and increased equally with time (P lt 001) in all groups
Average daily gain from birth to d 29 was 612 plusmn 28 gd without group differences
232 Bioavailability studies
Plasma concentrations of total flavonols of CTRL were close to or below the detection
limit on d 2 and 29 respectively (Figure 21A B) In QA- and RU-fed calves plasma
concentrations of total flavonols increased (P lt 005) after flavonoid administration on
d 2 and returned to baseline concentrations 48 h after administration (Figure 21A)
Figure 21 Plasma concentration-time-curves of total flavonols after oral administration of 9 mg of
quercetinkg of BW times d as quercetin aglycone () rutin trihydrate () or no flavonoid () on d 2
(A) and 29 (B) of life Values are LSM plusmn SE n = 7
On d 2 plasma concentrations of total flavonols were greater at 8 and 12 h (P lt 001)
but were smaller at 24 h after flavonoid administration (P lt 001) in QA- than in RU-
fed calves On d 29 postprandial plasma concentrations of total flavonols increased far
less distinctly (P lt 001) when compared to d 2 (Figure 21A B) Further plasma
concentrations of total flavonols increased until 8 h after administration (P lt 001) in
A B
Time relative to feeding h
0 2 4 6 8 10 12 24 48
To
tal
fla
vo
no
ls n
mo
lL
0
100
200
300
400
Time relative to feeding h
0 2 4 6 8 10 12 24 48
To
tal
fla
vo
no
ls n
mo
lL
0
100
200
300
400
CHAPTER 2
61
QA- but not in RU-fed calves (Figure 21B) Plasma concentrations of total flavonols
on d 29 tended to be greater (P lt 01) in QA- than in RU-fed calves
Compared with QA- (100 ) RU-fed calves showed a relative BV of quercetin of
725 on d 2 and of 496 on d 29 On d 2 AUC of total flavonols quercetin and
quercetin metabolites in QA- and RU-fed calves differed (P lt 005) from CTRL and
were greater (P lt 0001) on d 2 than on 29 for both treatments (Table 22) On d 2 AUC
of quercetin and isorhamnetin was greater (P lt 005) and tended to be greater for total
flavonols (P lt 01) but was lower for tamarixetin (P lt 005) in QA- than in RU-fed
calves On d 29 AUC of quercetin was greater (P lt 005) in QA-fed calves than in
CTRL
A Day 2
QA RU
Pro
po
rtio
n o
f T
ota
l F
lav
on
ols
AU
C (
)
0
20
40
60
80
100
Quercetin
Isorhamnetin
Tamarixetin
Kaempferol
B Day 29
QA RU
Pro
po
rtio
n o
f T
ota
l F
lav
on
ols
AU
C (
)
0
20
40
60
80
100
Figure 22 Proportion of single flavonols (quercetin isorhamnetin tamarixetin and kaempferol)
in plasma after oral administration of 9 mg of quercetinkg of BW times day as quercetin aglycone
(QA) or rutin trihydrate (RU) on d 2 and 29 of life Values are LSM plusmn SE n = 7
On d 2 Cmax of total flavonols quercetin and quercetin metabolites except kaempferol
of QA- and RU-fed calves differed from CTRL (P lt 005 Table 22) whereas on d 29
only Cmax of total flavonols and quercetin of QA-fed calves differed (P lt 005) from
CTRL Maximal plasma concentrations of total flavonols quercetin and isorhamnetin
decreased (P lt 005) or tended to decrease (kaempferol tamarixetin P lt 01) in QA-
and RU-fed calves from d 2 to 29 respectively On d 2 Cmax was greater (P lt 005) for
quercetin and isorhamnetin but was lower for tamarixetin in QA- than in RU-fed
calves Time to reach Cmax in QA- and RU-fed calves was not affected by day but
indicated treatment effects for total flavonols isorhamnetin and tamarixetin (Table
22) For isorhamnetin Tmax was greater (P lt 005) in RU- than in QA-fed calves on
both days
CHAPTER 2
62
Table 22 Pharmacokinetic parameters after oral administration of quercetin as quercetin
aglycone (QA) or rutin trihydrate (RU) on d 2 and 29 of life calves of the control group (CTRL)
received no flavonoids
Item1 Day
Group2
SE
ANOVA (P-value)
CTRL QA RU Group Day Group
times day
AUC 3 nmolL times h
AUCTotal 2 154c 5947
a 4312
ab 395 0001 0001 0001
29 770 1336 662
AUCQ 2 102c 3413
a 1967
b 228 0001 0001 0001
29 267b 1090
a 535
ab
AUCK 2 319b 152
a 159
a 244 002 0001 005
29 000 111 639
AUCI 2 000c 1390
a 447
b 701 0001 0001 0001
29 000 675 239
AUCT 2 000c 1070
b 1768
a 154 0001 0001 0001
29 000 583 196
Cmax4 nmolL
Cmax Total 2 139b 407
a 330
a 359 0001 0001 0001
29 224b 168
a 747
ab
Cmax Q 2 107c 238
a 129
b 193 0001 0001 003
29 628b 137
a 603
ab
Cmax K 2 196b 124
a 109
ab 207 001 0001 016
29 000 386 212
Cmax I 2 000c 945
a 396
b 585 0001 0001 0001
29 000 155 399
Cmax T 2 000c 771
b 163
a 156 0001 0001 0001
29 000 945 327
Tmax5 h
Tmax Total 2 950 106 164 284 005 012 090
29 649 621 104
Tmax Q 2 665 886 117 277 031 047 076
29 644 593 111
Tmax K 2 100 967 123 401 093 049 076
29 ND6 800 800
Tmax I 2 ND 114b 193
a 256 0001 088 009
29 ND 590b 240
a
Tmax T 2 ND 111 166 357 001 063 018
29 ND 763 240
a-cLSM in a row with different superscripts differ (P lt 005)
1Values are LSM with SE n = 7 per group
2Group QA = 30 micromol(kg BW times d) quercetin aglycone RU = 30 micromol(kg BW times d) rutin trihydrate
CTRL = no flavonol fed 3AUC = area under the plasma concentration-time curve of flavonols from 0 to 24 h calculated by
subtracting baseline values (time point 0) from all other time points according to the trapezoidale rule
AUCTotal AUCQ AUCK AUCI AUCT = AUC of total flavonols (Total) or of the respective quercetin
metabolites quercetin (Q) kaempferol (K) isorhamnetin (I) and tamarixetin (T) respectively 4Cmax = maximum plasma concentration of flavonols subtracted by basal plasma concentration before feed
intake Cmax Total Cmax Q Cmax K Cmax I Cmax T = maximum plasma concentration of total flavonols
(Total) quercetin aglycone (Q) kaempferol (K) isorhamnetin (I) and tamarixetin (T) respectively 5Tmax = time until Cmax was reached Tmax Total Tmax Q Tmax K Tmax I Tmax T = time until Cmax Total Cmax Q
Cmax K Cmax I Cmax T was reached respectively 6ND = Not definable
CHAPTER 2
63
Relative distribution of single flavonols (quercetin isorhamnetin tamarixetin and
kaempferol) proportionately to total flavonols in plasma showed highest values for
quercetin on both days and in both groups (QA and RU) Proportion of single flavonols
changed with time namely increased for quercetin (P lt 005) but decreased for
isorhamnetin and tamarixetin (P lt 005) from d 2 to 29 (Figure 22A B) On d 2
proportion of isorhamnetin was greater (P lt 005) and proportion of tamarixetin was
smaller (P lt 005) in QA- than in RU-fed calves (Figure 22A)
233 Plasma concentrations of metabolites and hormones
Plasma concentrations of total protein decreased (P lt 005) from d 2 to 29 in CTRL and
were greater on d 2 in CTRL than in QA-fed calves (P lt 005 Table 23) Plasma
concentrations of albumin increased (P lt 001) and plasma concentrations of lactate and
urea decreased (P lt 001) from d 2 to 29 without any group effect (Table 23)
Table 23 Blood plasma concentrations of metabolites and hormones of calves after oral
administration of quercetin as quercetin aglycone (QA) rutin trihydrate (RU) or no flavonoid
(CTRL) on d 2 and d 29
Item1 Day
Group2
SE
ANOVA (P-value)
CTRL QA RU Group Day Group
times day
Total
protein gL
2 640a 599
b 617
ab 098 003 0001 007
29 580 565 596
Albumin
gL
2 229 226 225 037 095 0001 042
29 261 265 263
Lactate
mmolL
2 168 237 265 027 031 0001 004
29 063 068 069
Glucose
mmolL
2 737 714 761 028 035 0001 099
29 658 640 679
NEFA
micromolL
2 298 281 298 13 087 0001 065
29 172 177 173
Urea
mmolL
2 380 375 355 026 091 0001 082
29 155 156 155
Insulin
microgL
2 238 179 241 065 012 008 029
29 438 209 277
Cortisol 2 672 629 779 70 043 0001 067
nmolL 29 111 86 130
a-bLSM in a row with different superscripts differ (P lt 005)
1Values are LSM based on plasma concentrations in blood samples taken before and until 24 h after
morning feeding on d 2 and 29 respectively n = 7 per group
2Group QA = 30 micromol(kg BW times d) quercetin aglycone RU = 30 micromol(kg BW times d) rutin trihydrate
CTRL = no flavonol fed
CHAPTER 2
64
A Day 2 B Day 29
Time relative to feeding h
0 2 4 6 8 10 12 24
Glu
cose
m
mo
lL
5
6
7
8
9
10
Time relative to feeding h
0 2 4 6 8 10 12 24
Glu
cose
m
mo
lL
5
6
7
8
9
10
C Day 2 D Day 29
Time relative to feeding h
0 2 4 6 8 10 12 24
NE
FA
m
mo
lL
100
200
300
400
500
Time relative to feeding h
0 2 4 6 8 10 12 24
NE
FA
m
mo
lL
100
200
300
400
500
Figure 23 Plasma concentrations of glucose (A B) and NEFA (C D) after oral administration of 9
mg of quercetinkg BW times d as quercetin aglycone () rutin trihydrate () or no flavonoid () on
d 2 and d 29 of life Values are LSM plusmn SE n = 7
Mean glucose and NEFA plasma concentrations decreased (P lt 005) from d 2 to 29 in
all groups but concentrations did not differ among groups (Table 23) Considering the
day course of the plasma metabolites plasma concentrations of glucose increased (P lt
001) whereas NEFA decreased (P lt 001) after feed intake in all groups on d 2 and 29
respectively (Figure 23A-D)
The increase of plasma insulin concentrations after feed intake was more pronounced (P
lt 005) on d 29 than on d 2 but without group effects (Figure 24A B Table 23)
Plasma concentrations of cortisol decreased (P lt 005) after feed intake on both days
with mean concentrations being greater (P lt 005) on d 2 than on d 29 (Figure 24C D
Table 23)
CHAPTER 2
65
A Day 2 B Day 29
Time relative to feeding h
0 2 4 6 8 10 12 24
Insu
lin
micro
gL
0
2
4
6
8
10
Time relative to feeding h
0 2 4 6 8 10 12 24
Insu
lin
micro
gL
0
2
4
6
8
10
C Day 2 D Day 29
Time relative to feeding h
0 2 4 6 8 10 12 24
Co
rtis
ol
nm
ol
L
0
20
40
60
80
100
Time relative to feeding h
0 2 4 6 8 10 12 24
Co
rtis
ol
nm
ol
L
0
20
40
60
80
100
Figure 24 Plasma concentrations of insulin (A B) and cortisol (C D) after oral administration of 9
mg of quercetinkg of BW times d as quercetin aglycone () rutin trihydrate () or no flavonoid ()
on d 2 and d 29 of life Values are LSM plusmn SE n = 7
24 Discussion
Without dietary supplementation of quercetin (CTRL group) plasma concentrations of
total flavonols were close to or below the detection limit on d 2 and 29 However small
amounts of quercetin and its dehydroxylated metabolite kaempferol were found in blood
plasma on d 2 and 29 in the control group According to Besle et al (2010) flavonoids
are natural components of bovine milk and their concentration is affected by cowrsquos diet
Although colostrum and milk replacer were not analyzed for flavonoid content in the
present study it can be assumed that colostrum is most likely the source for flavonoids
found in CTRL calves at d 2 Apart from colostrum feed components such as
concentrates and hay may also contain flavonoids (Fraisse et al 2007 Reynaud et al
2010) which could explain measurable albeit very low plasma concentrations of
quercetin and its metabolites at least in older calves (d 29)
CHAPTER 2
66
In calves quercetin was systemically available from both supplements QA as well as
RU Interestingly plasma values obtained for quercetin and its metabolites with an
intact flavonol structure were greater on d 2 than on d 29 indicating better absorption or
less excretion in younger animals This may be explained by a different degree of
gastrointestinal maturation and intestinal permeability on d 2 and 29 respectively
(Blum 2006) Thus the epithelium in newborn animals is characterized by vacuolated
epithelial cells which are not present in older animals (Bainter 2002 Blum 2006) This
has possibly contributed to a greater absorption of quercetin from both sources (QA and
RU) on d 2 compared with d 29 in calves Furthermore the reticulorumen and microbial
activities might be already more developed in 29- than in 2-d-old calves resulting in
partial ruminal degradation of the flavonoids applied (Heinrichs and Jones 2003
Guilloteau et al 2009 Berger et al 2012 Li et al 2012) The BV of quercetin from
both QA and RU especially on d 29 could probably be improved when encapsulated
quercetin preparations will be used (Ding et al 2014)
On both days investigated feeding of QA resulted in greater plasma concentrations of
total flavonols quercetin and its metabolites than feeding of RU indicating QA as a
better source of quercetin than RU with respect to the BV of quercetin Markedly lower
plasma concentrations of total flavonols were also seen in monogastric species after
feeding of RU instead of QA at dosages comparable to the current study (Manach et al
1997 Cermak et al 2003 Reinboth et al 2010) Thus the present results obtained in
calves are in principal accordance with studies on the BV of quercetin in monogastric
species such as rats (Manach et al 1997) dogs (Reinboth et al 2010) pigs (Cermak et
al 2003 Lesser et al 2004) and humans (Erlund et al 2000 Egert et al 2008) As
the newborn calf is considered as a functionally monogastric animal (Drackley 2008)
these findings are not surprising
Concerning RU application studies in monogastric species often indicate a delayed
increase of quercetin and its metabolites in blood plasma (Erlund et al 2000 Cermak et
al 2003 Reinboth et al 2010) In the present study maximal plasma concentrations of
quercetin and its metabolites were measured much later after RU than after QA feeding
indicating different intestinal sites for absorption (Erlund et al 2000) In RU-fed
calves quercetin and its metabolites at least on d 2 most likely derive from absorption
in both the small and the large intestine In addition we found the same slow increase of
quercetin and its metabolites in blood plasma after QA and RU feeding but the increase
CHAPTER 2
67
stopped much earlier in RU- than in QA-fed calves In general the sugar moiety in
flavonol molecules determines the absorption of flavonoids in organisms (Day et al
1998 Hollman et al 1999) and QA is supposed to be already absorbed in the small
intestine More complex glycosides such as the glucorhamnoside RU are absorbed in
distal parts of the small intestine or in the colon of monogastric animals where flavonol
molecules are hydrolyzed by microorganisms Thus the lack of rhamnosidase activity
in the small intestine can be considered as one reason for delayed and lower absorption
of RU than of QA (Erlund et al 2000 Cermak et al 2003) Our pattern of relative BV
of total flavonols after RU feeding fits to relative BV of total flavonols in blood plasma
after duodenal but not after ruminal application in dairy cows (Berger et al 2012
Gohlke et al 2013) indicating a low ruminal function in our calves during first month
of life
Interestingly pharmacokinetics of quercetin absorption after QA feeding markedly
differed between calves and adult cattle (Berger et al 2012 Gohlke et al 2013) or
monogastric animals (Erlund et al 2000 Cermak et al 2003 Reinboth et al 2010)
The typical peak of total flavonol plasma concentrations some minutes after QA
administration was not seen in newborn calves As a consequence time for reaching
Cmax was much greater in calves than in adult ruminants and monogastrics Comparable
slow increases of quercetin and its metabolites as in newborn calvesrsquo blood plasma were
only seen in rats (Manach et al 1997) These differences in pharmacokinetics after QA
feeding are difficult to explain but a probable reason is the low release of milk protein
into the duodenum due to abomasal casein clotting (Heinrichs and Jones 2003
Guilloteau et al 2009) and the potential binding of flavonoids to milk proteins (Gugler
et al 1975 Boulton et al 1998 Janisch et al 2004)
All measured metabolites and hormones were in physiological ranges and most of these
findings were in accordance with previous results indicating postnatal growth
especially protein accretion and development in breeding as well as suckling calves
(Egli and Blum 1998 Nussbaum et al 2002 Schiessler et al 2002) Conversely
except for total protein concentrations on d 2 we found no treatment effects by QA or
RU feeding in these calves Plasma protein concentrations were lower in QA-fed than in
CTRL calves a finding that was hard to explain because all calves received the same
pooled colostrum with identical IgG content at first days of life Postprandial changes of
metabolites and hormones have been reported previously (Hadorn et al 1997 Hammon
CHAPTER 2
68
and Blum 1998) but systemic glucose metabolism was not affected by QA or RU
feeding as we have assumed from literature (Cermak et al 2004 Tadera et al 2006)
In conclusion BV of quercetin and its metabolites in newborn calves is more
pronounced when quercetin is fed as QA than as RU These findings go along with data
on BV of quercetin in lactating cows with duodenal application (Gohlke et al 2013)
and in monogastric species like rats dogs and pigs (Manach et al 1997 Cermak et al
2003 Reinboth et al 2010) Greater BV of quercetin on d 2 than on d 29 of life was
probably due to reduced maturation status of the gastrointestinal tract in 2-d old calves
However effects of quercetin feeding on the antioxidative status should be investigated
to validate health-protecting effects of quercetin in neonatal calves
Acknowledgements
We gratefully thank Petra Schulz and Maike Gosse (Christian Albrechts University
Kiel Germany) for excellent laboratory assistance as well as Annette Zeyner Kirsten
Buumlsing (University of Rostock Rostock Germany) and Bernd Stabenow (FBN
Dummerstorf Dummerstorf Germany) for providing experimental facilities Chicken-
egg derived immunoglobulins (Globigen Life Start 25 ) were generously provided by
EW Nutrition GmbH (Visbek Germany) This work is part of the joint research project
Food Chain Plus (FoCus) and was financially supported by the Federal Ministry of
Education and Research Bonn Germany (BMFT grant no 0315538B)
CHAPTER 2
69
References
Ader P A Wessmann and S Wolffram 2000 Bioavailability and metabolism of the
flavonol quercetin in the pig Free Radic Biol Med 281056ndash1067 http
dxdoiorg 101016S0891-5849(00)00195-7
Arts I C W A L A Sesink M Faassen-Peters and P C H Hollman 2004 The
type of sugar moiety is a major determinant of the small intestinal uptake and
subsequent biliary excretion of dietary quercetin glycosides Br J Nutr 91841ndash
847 httpdxdoiorg101079BJN20041123
Bainter K 2002 Vacuolation in the young Pages 55-110 in Biology of the intestine in
Growing Animals R Zabielski P C Gregory and B Westrom ed Elsevier
Amsterdam the Netherlands
Berger L M S Wein R Blank C C Metges and S Wolffram 2012 Bioavailability
of the flavonol quercetin in cows after intraruminal application of quercetin
aglycone and rutin J Dairy Sci 955047ndash5055 httpdxdoiorg103168jds
2012-5439
Besle J M D Viala B Martin P Pradel B Meunier J L Berdagueacute D Fraisse J L
Lamaison and J B Coulon 2010 Ultraviolet-absorbing compounds in milk are
related to forage polyphenols J Dairy Sci 932846ndash2856 httpdxdoiorg
103168jds2009-2939
Bhagwat S D B Haytowitz J M Holden 2013 USDA database for the flavonoid
content of selected foods Release 31 US Department of Agriculture (USDA)
Agricultural Research Service Accessed April 15 2014 httpwwwarsusdagov
SP2UserFilesPlace12354500DataFlavFlav3-1pdf
Blum J W 2006 Nutritional physiology of neonatal calves J Anim Physiol Anim
Nutr (Berl) 901ndash11 httpdxdoiorg101111j1439-0396200500614x
Boulton D W U K Walle and T Walle 1998 Extensive binding of the bioflavonoid
quercetin to human plasma proteins J Pharm Pharmacol 50243ndash249
httpdxdoiorg101111j2042-71581998tb06183x
CHAPTER 2
70
Cermak R S Landgraf and S Wolffram 2003 The bioavailability of quercetin in
pigs depends on the glycoside moiety and on dietary factors J Nutr 1332802ndash
2807
Cermak R S Landgraf and S Wolffram 2004 Quercetin glucosides inhibit glucose
uptake into brush-border-membrane vesicles of porcine jejunum Br J Nutr
91849ndash855 httpdxdoiorg101079BJN20041128
Chase C C D J Hurley and A J Reber 2008 Neonatal immune development in the
calf and its impact on vaccine response Vet Clin North Am Food Anim Pract
2487ndash104
Day A J M S DuPont S Ridley M Rhodes M J Rhodes M R Morgan and G
Williamson 1998 Deglycosylation of flavonoid and isoflavonoid glycosides by
human small intestine and liver beta-glucosidase activity FEBS Lett 43671ndash75
httpdxdoiorg101016S0014-5793(98)01101-6
Ding B P Chen Y Kong Y Zhai X Pang J Dou and G Zhai 2014 Preparation
and evaluation of folate-modified lipid nanocapsules for quercetin delivery J
Drug Target 2267ndash75
Drackley J K 2008 Calf nutrition from birth to breeding Vet Clin North Am Food
Anim Pract 2455ndash86 httpdxdoiorg101016jcvfa200801001
Egert S S Wolffram A Bosy-Westphal C Boesch-Saadatmandi A E Wagner J
Frank G Rimbach and M J Mueller 2008 Daily quercetin supplementation
dose-dependently increases plasma quercetin concentrations in healthy humans J
Nutr 1381615ndash1621
Egli C P and J W Blum 1998 Clinical haematological metabolic and endocrine
traits during the first three months of life of suckling simmentaler calves held in a
cow-calf operation Zentralbl Veterinarmed A 4599ndash118
Erlund I T Kosonen G Alfthan J Maumlenpaumlauml K Perttunen J Kenraali J
Parantainen and A Aro 2000 Pharmacokinetics of quercetin from quercetin
aglycone and rutin in healthy volunteers Eur J Clin Pharmacol 56545ndash553
httpdxdoiorg101007s002280000197
CHAPTER 2
71
Fraisse D A Carnat D Viala P Pradel J-M Besle J-B Coulon C Felgines and
J-L Lamaison 2007 Polyphenolic composition of a permanent pasture
Variations related to the period of harvesting J Sci Food Agric 872427ndash2435
httpdxdoiorg101002jsfa2918
Gaaacutel T R Ribiczeyne-Szabo K Stadler J Jakus J Reiczigel P Kover M Mezes
and L Sumeghy 2006 Free radicals lipid peroxidation and antioxidant system in
the blood of cows and newborn calves around calving Comp Biochem Physiol
B Biochem Mol Biol 143391ndash396
Gasparin F R S C L Salgueiro-Pagadigorria L Bracht E L Ishii-Iwamoto A
Bracht and J Constantin 2003 Action of quercetin on glycogen catabolism in
the rat liver Xenobiotica 33587ndash602 httpdxdoiorg10108000498250310
00089100
Godden S 2008 Colostrum management for dairy calves Vet Clin North Am Food
Anim Pract 2419ndash39
Gohlke A C J Ingelmann G Nuumlrnberg A Starke S Wolffram and C C Metges
2013 Bioavailability of quercetin from its aglycone and its glucorhamnoside rutin
in lactating dairy cows after intraduodenal administration J Dairy Sci 962303ndash
2313 httpdxdoiorg103168jds2012-6234
Gugler R M Leschik and H J Dengler 1975 Disposition of quercetin in man after
single oral and intravenous doses Eur J Clin Pharmacol 9229ndash234
Guilloteau P R Zabielski J W Blum 2009 Gastrointestinal tract and digestion in
the young ruminant Ontogenesis adaptations consequences and manipulations
J Physiol Pharmacol 60(Suppl 3)37ndash46
Hadorn U H Hammon R M Bruckmaier and J W Blum 1997 Delaying colostrum
intake by one day has important effects on metabolic traits and on gastrointestinal
and metabolic hormones in neonatal calves J Nutr 1272011ndash2023
Hammon H M and J W Blum 1998 Metabolic and endocrine traits of neonatal
calves are influenced by feeding colostrum for different durations or only milk
replacer J Nutr 128624ndash632
CHAPTER 2
72
Hammon H M J Steinhoff-Wagner U Schoumlnhusen C C Metges and J W Blum
2012 Energy metabolism in the newborn farm animal with emphasis on the calf
Endocrine changes and responses to milk-born and systemic hormones Domest
Anim Endocrinol 43171ndash185
Heinrichs A J and C M Jones 2003 Feeding the newborn calf College of
Agricultural Sciences Agricultural Research and Cooperative Extension
Pennsylvania State University University Park PA
Hertog M G L P C H Hollman and M B Katan 1992 Content of potentially
anticarcinogenic flavonoids of 28 vegetables and 9 fruits commonly consumed in
the Netherlands Proc Nutr Soc 402379ndash2383 httpdxdoiorg101021
jf00024a011
Hollman P C H M N C P Bijsman Y van Gameren E P J Cnossen J H M de
Vries and M B Katan 1999 The sugar moiety is a major determinant of the
absorption of dietary flavonoid glycosides in man Free Radic Res 31569ndash573
httpdxdoiorg10108010715769900301141
Inanami O A Shiga K J Okada R Sato Y Miyake and M Kuwabara 1999 Lipid
peroxides and antioxidants in serum of neonatal calves Am J Vet Res 60452ndash
457
Janisch K M G Williamson P Needs and G W Plumb 2004 Properties of
quercetin conjugates Modulation of LDL oxidation and binding to human serum
albumin Free Radic Res 38877ndash884 httpdxdoiorg1010801071576041000
1728415
Kobayashi Y M Miyazawa A Kamei K Abe and T Kojima 2010 Ameliorative
effects of mulberry (Morus alba L) leaves on hyperlipidemia in rats fed a high-fat
diet Induction of fatty acid oxidation inhibition of lipogenesis and suppression
of oxidative stress Biosci Biotechnol Biochem 742385ndash2395
Lesser S R Cermak and S Wolffram 2004 Bioavailability of quercetin in pigs is
influenced by the dietary fat content J Nutr 1431508ndash1511
CHAPTER 2
73
Li R W E E Connor C Li R L Baldwin VI and M E Sparks 2012
Characterization of the rumen microbiota of pre-ruminant calves using
metagenomic tools Environ Microbiol 14129ndash139 httpdxdoiorg
101111j1462-2920201102543x
Lindmark-Maringnsson H and B Aringkesson 2000 Antioxidative factors in milk Br J
Nutr 84S103ndashS110
Manach C C Morand C Demigneacute O Texier F Reacutegeacuterat and C Reacutemeacutesy 1997
Bioavailability of rutin and quercetin in rats FEBS Lett 40912ndash16
httpdxdoiorg101016S0014-5793(97)00467-5
Manach C A Scalbert C Morand C Reacutemeacutesy and L Jimeacutenez 2004 Polyphenols
Food sources and bioavailability Am J Clin Nutr 79727ndash747
McGuirk S M 2008 Disease management of dairy calves and heifers Vet Clin North
Am Food Anim Pract 24139ndash153
Mee J F 2008 Newborn dairy calf management Vet Clin North Am Food Anim
Pract 241ndash17
Middleton E C Kandaswami and T C Theoharides 2000 The effects of plant
flavonoids on mammalian cells Implications for inflammation heart disease and
cancer Pharmacol Rev 52673ndash751
Naumann C and R Basler 2004 Die chemische Untersuchung von Futtermitteln
VDLUFA-Verlag Darmstadt Germany
Nijveldt R J E van Nood D E C van Hoorn P G Boelens K van Norren and P
A M van Leeuwen 2001 Flavonoids A review of probable mechanisms of
action and potential applications Am J Clin Nutr 74418ndash425
Nussbaum A G Schiessler H M Hammon and J W Blum 2002 Growth
performance and metabolic and endocrine traits in calves pair-fed by bucket or by
automate starting in the neonatal period J Anim Sci 801545ndash1555
Quigley J D III and J J Drewry 1998 Nutrient and immunity transfer from cow to
calf pre- and postcalving J Dairy Sci 812779ndash2790
CHAPTER 2
74
Reinboth M S Wolffram G Abraham F R Ungemach and R Cermak 2010 Oral
bioavailability of quercetin from different quercetin glycosides in dogs Br J
Nutr 104198ndash203 httpdxdoiorg101017S000711451000053X
Reynaud A D Fraisse A Cornu A Farruggia E Pujos-Guillot J-M Besle B
Martin J-L Lamaison D Paquet M Doreau and B Graulet 2010 Variation in
content and composition of phenolic compounds in permanent pastures according
to botanical variation J Agr Food Chem 585485ndash5494 httpdxdoiorg
101021jf1000293
SAS Institute Inc 2010 SASQC 92 Userrsquos Guide Second Edition Cary NC SAS
Institute Inc
Schiessler G A Nussbaum H M Hammon and J W Blum 2002 Calves sucking
colostrum and milk from their dams or from an automatic feeding station starting
in the neonatal period Metabolic and endocrine traits and growth performance
Anim Sci 74431ndash444
Steinhoff-Wagner J S Goumlrs P Junghans R M Bruckmaier E Kanitz C C Metges
and H M Hammon 2011 Maturation of endogenous glucose production in
preterm and term calves J Dairy Sci 945111ndash5123 httpdxdoiorg
103168jds2011-4355
Tadera K Y Minami K Takamatsu and T Matsuoka 2006 Inhibition of alpha-
glucosidase and alpha-amylase by flavonoids J Nutr Sci Vitaminol (Tokyo)
52149ndash153
Uetake K 2013 Newborn calf welfare A review focusing on mortality rates Anim
Sci J 84101ndash105
Vicari T J J G C van den Borne W J J Gerrits Y Zbinden and J W Blum 2008
Postprandial blood hormone and metabolite concentrations influenced by feeding
frequency and feeding level in veal calves Domest Anim Endocrinol 3474ndash88
httpdxdoiorg101016jdomaniend200611002
CHAPTER 2
75
Weber C C Hametner A Tuchscherer B Losand E Kanitz W Otten S P Singh
R M Bruckmaier F Becker W Kanitz and H M Hammon 2013 Variation in fat
mobilization during early lactation differently affects feed intake body condition
and lipid and glucose metabolism in high-yielding dairy cows J Dairy Sci 96165ndash
180 httpdxdoiorg103168jds2012-5574
Williams R J J P Spencer and C Rice-Evans 2004 Flavonoids Antioxidants or
signalling molecules Free Radic Biol Med 36838ndash849
76
Chapter 3
Effects of oral flavonoid supplementation on metabolic and
antioxidative status in newborn dairy calves
J Maciej C T Schaumlff E Kanitzdagger A TuchschererDagger R M Bruckmaiersect
S Wolffram and H M Hammon1
Institute of Nutritional Physiology ldquoOskar Kellnerrdquo
daggerInstitute of Behavioural Physiology and
DaggerInstitute of Genetics and Biometry Leibniz Institute for Farm Animal Biology (FBN)
Wilhelm-Stahl-Allee 2 18196 Dummerstorf Germany
sectDepartment of Clinical Research and Veterinary Public Health Veterinary Physiology
Vetsuisse Faculty University of Bern 3001 Bern Switzerland
Institute of Animal Nutrition and Physiology Christian Albrechts University Kiel
24118 Kiel Germany
1Corresponding author H M Hammon Leibniz Institute for Farm Animal Biology
(FBN) Institute of Nutritional Physiology ldquoOskar Kellnerrdquo Wilhelm-Stahl-Allee 2
18196 Dummerstorf Germany phone +49-38208-68670 fax +49-38208-68652
e-mail hammonfbn-dummerstorfde
Used by permission of the Journal of Dairy Scince
Manuscript submitted to Journal of Dairy Science
Manuscript ID JDS-15-9906
CHAPTER 3
77
3 Effects of oral flavonoid supplementation on metabolic and
antioxidative status in newborn dairy calves
Abstract
Many studies investigated effects of natural feed additives like flavonoids and verified
their antioxidative or antiinflammatory properties but scientific proof for flavonoids as
health and performance-promoting tool in calf nutrition is weak Thus we investigated
the effects of the most abundant flavonoid quercetin and of a green tea extract (GTE)
containing various catechins on metabolic and antioxidative traits in dairy calves to
further clarify potential health-promoting effects Male newborn German Holstein
calves (n=7 per group) either received no flavonoid (control group) 10 mg of quercetin
equivalents as quercetin aglycone or as rutinkg of body weight (BW) and d or 10
mgkg BW and d of a GTE from d 5 to d 26 of life with morning and evening feeding
All calves were fed equal amounts of colostrum and milk replacer according to BW
Body Weight feed intake and health status were evaluated daily Blood samples were
collected from the jugular vein on d 1 5 12 19 and 26 before morning feeding to
investigate flavonoid metabolic and antioxidative status in calves During the
experiment growth performance data and health status remained unchanged but GTE-
fed calves had less loose feces than controls and calves fed quercetin aglycone required
less medical treatment than other groups Concentrations of quercetin changed over
time and were higher in rutin-fed than control group whereas catechins were below
detection limit Plasma trolox equivalent antioxidative capacity (TEAC) and ferric
reducing ability of plasma (FRAP) were measured as markers for plasma antioxidative
capacity Concentrations of TEAC increased whereas FRAP decreased after the first d
of life in all groups least in controls Oxidative stress markers in plasma were measured
as thiobarbituric acid reactive substances (TBARS) and F2-isoprostances
Concentrations of TBARS were highest during first month of life in the control group
but decreased at the same time in the GTE group F2-isoprostane concentrations
decreased in control group only Plasma concentrations of total protein albumin urea
lactate glucose and non-esterified fatty acids as well as of insulin and cortisol varied in
time but there were no group differences caused by flavavonoid supplementation
Taken together orally administrated quercetin and catechins at dosages used in the
CHAPTER 3
78
present study resulted in no or only weak effects on health metabolic and antioxidative
status in newborn dairy calves
Key Words antioxidative status calf flavonoid quercetin rutin
31 Introduction
After birth calves undergo huge immunological and metabolic changes Though
relatively mature at birth they need to adapt to various morphological and functional
changes after birth (Blum and Hammon 2000) Calf losses mainly occur during first wk
of life mostly because of respiratory and digestive problems (USDA 2011) Good
management like early and sufficient colostrum supply is essential In addition fed
supplements are daily practice in modern dairy Particularly since the ban of antibiotic
growth promoters in the European Union in 2006 the call for ʻnaturalʼ feed additives
gained enormous popularity In this respect flavonoids as secondary plant metabolites
ubiquitous in all higher plants are of interest Their health-promoting properties are
mainly thought to be due to their strong antioxidant activity in vitro associated with
effects on several metabolic key enzymes and inflammatory cells (Middleton et al
2000) glucose and lipid metabolism (Shetty et al 2004 Kobayashi et al 2010) or
incidence of diarrhea (di Carlo et al 1994 Gaacutelvez et al 1995) One of the most
abundant flavonoids is the flavonol quercetin a pentahydroxyflavon mostly bound β-
glycosidic manner to at least one sugar molecule and present in high concentrations in
apples and onions Quercetin bound to rutinose is called rutin and is the major glycoside
of quercetin The predominant flavanol another subgroup of flavonoids is catechin
which is mainly found in high concentrations in green tea
Almost any disease is associated with increased formation of reactive oxygen species
thus causing oxidative stress (Halliwell 1991) In calves enhanced oxidative stress was
seen on the first d of life (Alexandrovich and Antonovna 2009) and especially if sick
(Ahmed and Hassan 2007 Al-Qudah 2009) Because the nutrient status often is
impaired in newborn calves this possibly affects the antioxidant system (Schwerin et
al 2002 Sies et al 2005) Thus improvement of the antioxidant status in newborn
calves may accelerate maturation of the own immune system improve health status and
thus reduce calf losses The bioavailability of quercetin in newborn calves as
prerequisite for biological effects was recently shown (Maciej et al 2015) Based on
these findings we have tested the hypothesis that quercetin and catechin
CHAPTER 3
79
supplementation affect metabolism and the antioxidative and health status during the
first 3 wk of life in dairy calves
32 Materials and Methods
321 Animals and feeding
Procedures performed in this study were in accordance with the German animal
protection law and approved by the relevant authorities (Landesamt fuumlr Landwirtschaft
Lebensmittelsicherheit und Fischerei Mecklenburg-Vorpommern Germany
permission no LVL M-VTSD72213-21-01910) Twenty-eight male German
Holstein calves were examined from d 1 to d 26 of life All calves were spontaneously
born from multiparous cows on neighboring farms and transported directly after birth to
the experimental barn of the University of Rostock where they were kept in single
boxes with straw bedding Calves had free access to water and were fed twice daily by
nipple bottle or nipple bucket On the first 3 d of life calves received pooled colostrum
obtained from milkings 1 3 and 5 (d 1 2 and 3 after parturition respectively) in
amounts of 8 of BW on d 1 and 10 of BW on d 2 and 3 (Table 1) From d 4 until d
26 calves received a commercial milk replacer (150 gL SalvaLac MiraPro 45 Salvana
Tiernahrung GmbH Klein-Offenseth Sparrieshoop Germany) in amounts of 12 of
BWd To ensure equal feed uptake in all groups refused amounts of colostrum or milk
replacer were tub- fed Milk replacer amounts were adapted to BW once a wk
From d 2 to d 6 colostrum or milk replacer was supplemented with chicken-egg derived
immunoglobulins (Globigen Life Start 25 EW Nutrition GmbH Visbek Germany)
fed twice daily in amounts of 40 32 24 16 and 8 gd respectively (Maciej et al
2015)
Calves had free access to pelleted concentrate (Kaumllber Start 183 pell Vollkraft
Mischfutterwerke GmbH Karstaumldt Germany) and hay from d 4 on Concentrate intake
was measured daily after the morning milk feeding (Maciej et al 2015)
CHAPTER 3
80
Ta
ble
31
C
om
po
siti
on
an
d a
mo
un
ts o
f co
lost
rum
m
ilk
rep
lace
r a
nd
co
nce
ntr
ate
fed
to
ca
lves
d
1
d 2
d
3
d 4
to
30
2
Item
co
lost
rum
1
mil
kin
g 1
colo
stru
m1
mil
kin
g 3
colo
stru
m1
mil
kin
g 5
M
ilk
rep
lace
r3
Co
nce
ntr
ate
4
DM
gk
g
20
69
1
54
7
13
93
1
10
0
88
00
CP
gk
g D
M
59
74
3
90
4
33
31
2
01
8
18
00
Cru
de
fat
gk
g D
M
16
92
2
40
5
27
49
1
90
9
43
0
Ash
gk
g D
M
48
3
55
6
56
0
73
6
74
0
Lac
tose
g
kg D
M
13
63
2
60
5
30
87
5
14
6
-
1C
olo
stru
m w
as d
eriv
ed f
rom
mu
ltip
aro
us
cow
s and
sep
arat
ely p
oo
led
fro
m m
ilkin
gs
1
3
and
5 a
fter
par
turi
tio
n
resp
ecti
vel
y
2H
ay w
as o
ffer
ed a
d l
ibit
um
exce
pt
for
days
of
bio
avai
lab
ilit
y s
tud
ies
3M
ilk r
epla
cer
(Sal
vaL
ac M
iraP
ro 4
5
Sal
van
a T
iern
ahru
ng
Gm
bH
K
lein
-Off
ense
th S
parr
iesh
oo
p
Ger
man
y)
was
com
po
sed
of
45
s
pra
y s
kim
med
mil
k
po
wd
er
35
s
wee
t w
hey p
ow
der
1
8
pla
nt
oil
(p
alm
co
conut
and
so
y o
il)
17
L
ys
08
C
a 0
75
P
an
d a
dd
ed w
ith 5
00
00
IU
of
vit
am
in A
4
000
IU o
f vit
am
in D
3
20
0 m
g o
f vit
am
in E
(α
-to
cop
her
ol
acet
ate)
9
mg C
u (
gly
ceri
ne-
cop
per
chel
ate)
ci
tric
aci
d
sorb
ic a
cid
b
uty
lhyd
rox
yto
luene (
BH
T)
and
12
x 1
09 c
fu E
nte
roco
ccu
s fa
eciu
m E
17
06
4C
once
ntr
ate
(Kaumll
ber
Sta
rt 1
83
V
oll
kra
ft
Mis
ch
futt
erw
erk
e G
mb
H
Kar
staumld
t G
erm
an
y)
was
com
po
sed
of
wh
eat
glu
ten
wh
eat
bra
n
gra
in m
ash
su
gar
bee
t
pulp
ra
pes
eed
mea
l o
at
rye
mo
lass
es
lin
seed
o
at b
ran
soyb
ean m
eal
extr
act
cal
ciu
m c
arb
onat
e s
od
ium
chlo
rid
e 0
6
pho
spho
rous
02
s
od
ium
10
800
IU
of
vit
am
in A
1
21
5 I
U o
f vit
am
in D
3
30
mg o
f vit
am
in E
0
7 m
g o
f I
04
mg o
f C
o
54
mg o
f M
g
81
mg o
f Z
n
and
04
mg o
f S
e p
er k
g o
f D
M
CHAPTER 3
81
Health status of calves was determined daily by measuring rectal temperature heart and
respiratory rate by evaluation of behavioral abnormalities nasal discharge respiratory
sounds and by navel inspection Fecal consistence was assessed daily by fecal
consistence score according to Larson et al (1977) normal (1) soft (2) runny (3) or
watery (4) Sick calves were treated by a veterinarian for statistical analysis each calf
was counted as treated for a disease independent from how many times an animal was
treated
322 Treatment and blood sampling
Calves were randomly assigned to one of four feeding groups (n = 7) Control (CTRL)
received no flavonoids QA received 10 mgkg BW times d quercetin aglycone (quercetin
dihydrate Carl Roth GmbH amp Co KG Karlsruhe Germany) RU received 20 mgkg
BW times d quercetin as glucorhamnoside rutin (rutin trihydrate Carl Roth GmbH amp Co
KG) and CA received 10 mgkg BW times d of a green tea extract (GTE) containing
various catechins (Polyphenon 60 Sigma-Aldrich Chemie GmbH Steinheim
Germany) For QA and RU daily dose of quercetin equivalents was 10 mgkg of BW
(30 micromolkg BW) The GTE (703 total catechins) fed in CA was composed of 14
catechin 03 catechin gallate 52 gallocatechin 21 gallocatechin gallate (all as
trans-isomers) and 64 epicatechin 70 epicatechin gallate 190
epigallocatechin 288 epigallocatechin gallate (all as cis-isomers) Amounts of
flavonoid fed to calves in this study were based on previous studies in pigs and dogs
(Lesser et al 2004 Reinboth et al 2010 Luumlhring et al 2011) Due to studies on
bioavailability of flavonoids all calves received their respective daily dose with the
morning feeding on d 2 and no flavonoids were fed on d 3 and 4 From d 5 on the daily
dose was equally split with morning and evening meal since d 26 On d 1 3 and 4 no
flavonoids were fed Flavonoids were suspended in water and administered with a
disposable 10-ml syringe directly into the mouth during milk feeding
Jugular blood samples were taken immediately after birth and on d 5 12 19 and 26
before morning feeding using evacuated tubes (Vacuette Greiner Bio-One GmbH
Frickenhausen Germany) Tubes containing 15 IUmL lithium heparinate were used
for the determination of the plasma concentrations of flavonols catechins and the
markers for antioxidative capacity and oxidative stress tubes containing 25 gL sodium
fluoride and 18 gL potassium EDTA were used for the determination of plasma
CHAPTER 3
82
protein albumin glucose NEFA urea and lactate and tubes containing 18 gL
potassium-EDTA were used for the determination of plasma insulin and cortisol
concentrations The blood samples were immediately put on ice and centrifuged (1500
times g 4degC 20 min) To measure the catechins 1 mL of plasma was mixed with 20 microL of
an ascorbate-EDTA solution (04 molL NaH2PO4 Carl Roth GmbH amp Co KG)
containing 20 ascorbic acid (Merck KGaA Darmstadt Germany) and 01 EDTA
(Carl Roth GmbH amp Co KG) at pH 36 To measure F2-Isoprostanes a 0005
ethanolic butylhydroxytoluene (BHT) solution (0005 BHT in ethanol wv) was
added in one percent proportion for stabilization The plasma samples were stored until
analyzed at -20degC for metabolites and hormones and at -80degC for flavonoid and
(anti)oxidative parameters until analyzed
323 Analytical methods
Plasma concentrations of quercetin aglycone and its methylated (isorhamnetin and
tamarixetin) and dehydroxylated (kaempferol) derivatives were analyzed by HPLC with
fluorescence detection as described previously (Berger et al 2012) The detection limit
of flavonol was le 10 nmolL and the recovery rate of flavonols was 92 plusmn 2 (mean plusmn
SEM) Inter- and intraassay coefficients of variability for quercetin were 72 and 05
respectively The sum of quercetin and its metabolites in plasma is referred to as total
flavonols
Plasma concentrations of individual catechins (gallocatechin epigallocatechin
epigallocatechin gallate epicatechin gallate and epicatechin) were determined by
HPLC (Lee et al 1995) with some modifications (Egert et al 2013) In brief 500 microL
of thawed plasma were mixed with 375 microL of β-glucuronidasesulfatase (final activities
of 7300 and 130 UmL for glucuronidase and sulfatase respectively Sigma Aldrich
Chemie GmbH) and incubated at 37degC for 45 min Hydrolyzation was stopped by
adding 1 mL methylene chloride Samples were mixed for 4 min and centrifuged (3220
times g 4degC 15 min) The supernatant was transferred into another tube mixed with 1 mL
ethyl acetate for 4 min and centrifuged (3220 times g 4degC 20 min) and 800 microL of the
supernatant were transferred into a glass tube with glass pearls and ethyl acetate
extraction was repeated twice Supernatants were combined mixed with 10 microL of 1
aqueous ascorbic acid and dried by vacuum centrifugation (SPD2010 SpeedVac
System Thermo Fischer Scientific GmbH Dreieich Germany) The dried sample was
CHAPTER 3
83
dissolved in 150 microL of the mobile phase A by vortex mixing and ultrasonic bath for 15
min After centrifugation 30 microL of the supernatant were used for HPLC analyses For
catechin analyses by HPLC (Jasco Deutschland GmbH Groszlig-Umstadt Germany pump
model PU-2080 plus) the supernatant was injected into the fully automated autosampler
(AS-2057 Plus Jasco Deutschland GmbH) Separation occurred on a reverse-phase C-
18 Kromasil 100 column (25 times 46 mm 5 microm Jasco Deutschland GmbH) protected by
a pre-column (C-18 Inertsil ODS-2 10 times 4 mm particle size 5 μm Jasco Deutschland
GmbH) at 30degC Mobile phase A and B were composed of water acetonitrile and
trifluoroacetic acid (92801 and 653501 vvv) with a pH of 25 At a flow rate of 09
mLmin the eluent was monitored by electrochemical detection with potential settings
at 0 120 240 and 360 mV in a 4-channel colometric electrochemical detector (Coul
Array 5600A ESA Inc Chelmsford MA) Dominant signals used for quantification of
catechins were 120 mV for epigallocatechin and epicatechin gallate and 240 mV for
catechin gallocatechin epicatechin and epigallocatechin gallate respectively
Quantification of individual plasma catechins were carried out using external standards
which were generated by simultaneously adding catechin gallocatechin
epigallocatechin epigallocatechin gallate epicatechin gallate and epicatechin (Carl
Roth GmbH amp Co KG) to untreated plasma at final concentrations of each catechin of
0125 025 05 1 25 5 75 and 10 micromolL Calibration samples were treated in the
same way as experimental samples The coefficient of determination was r ge 099
detection limit of catechins was le 10 nmolL and the intra-assay coefficient of variation
was 24 plusmn 26 to 65 plusmn 47
Antioxidative capacity and oxidative stress markers were analyzed in repeated
measurements The trolox equivalent antioxidative capacity (TEAC) is defined as
amount of the water-soluble vitamin E derivate trolox (in mmol) needed to show the
same antioxidant capacity at a defined time point as 1 mmol of plasma and is expressed
as trolox equivalents (TE) in mmolL plasma The TEAC was measured according to
the modified protocol of Re et al (1999) by measuring spectrophotometrically the
decolorization of 22-azinobis(3-ethylbenzothiazoline-6-sulphonic acid) radical cation
(ABTS+) caused by binding to antioxidants at a wavelength of 734 nm Ferric reducing
ability of plasma (FRAP) was determined according to Benzie and Strain (1996) and is
given in ascorbic acid equivalents (ASCE) in micromolmL plasma Reduction of Fe3+
-
tripyridyltriazin by antioxidants from plasma results in a color change that is directly
CHAPTER 3
84
proportional to antioxidative capacity Absorbance was measured at a wavelength of
595 nm and compared to the one of ascorbic acid Thiobarbituric acid reactive
substances (TBARS) concentration in plasma was measured according to Yagi (1998)
with modifications and is given as malondialdehyde equivalents (MDAE) in micromolL
plasma Adding thiobarbituric acid to the sample results in formation of a red complex
whose optical density was measured photometrically at a wavelength of 532 nm F2-
isoprostanes especially their main representative 8-iso-prostaglandin F2α are produced
in vivo by peroxidation of the cell membrane lipid component arachidonic acid and is
considered as a reliable marker for lipid peroxidation Detection of 8-iso-prostaglandin
F2α was carried out with an enzymatic immune assay (Direct 8-iso-prostaglandin F2α
Assay Designs MI) and values are expressed in pgmL
Plasma metabolites were analyzed by the Clinic for Cattle (University of Veterinary
Medicine Hannover Foundation Germany) spectrophotometrically on an ABX Pentra
400 (Horiba ABX SAS Montpellier Cedex France) using the respective kits Albumin
(no A11A01664) and lactate (no A11A01721 Horiba Europe GmbH Hannover
Germany) NEFA (no 434-91795 Wako Chemicals GmbH Neuss Germany) glucose
(no 553-230) and total protein (biuret reaction no 553-412 MTI Diagnostics GmbH
Idstein Germany) and urea (no LT-UR 0050 Labor + Technik E Lehmann GmbH
Berlin Germany) Plasma insulin and cortisol concentrations were measured either by
radioimmunoassay or by ELISA respectively as previously described (Maciej et al
2015)
Colostrum was analyzed for DM CP crude fat and ash content (were measured by
MQD Qualitaumltspruumlfungs- und Dienstleistungsgesellschaft Mecklenburg-Vorpommern
Guumlstrow Germany) using standard procedures according to Weende (Naumann and
Bassler 2004) Chemical components and contents of the milk replacer were provided
by the manufacturer according to Weender analysis (Naumann and Bassler 2004 Table
31)
324 Statistical analyses
Statistical analyses were performed using SAS software Version 94 for Windows
Copyright SAS Institute Inc Cary NC USA Data on health performance and from
plasma measurements are presented as least squares means (LSM) plusmn standard error (SE)
and were analyzed by repeated measurement ANOVA using the Mixed procedure of
CHAPTER 3
85
SASSTAT software with a model containing the fixed effects treatment group (levels
CTRL QA RU CA for plasma flavonol concentrations only CTRL QA RU) day
(levels 1 5 12 19 26) and group times day interaction Repeated measures on the same
animal were taken into account by the REPEATED statement of the MIXED procedure
and an autoregressive type for the block diagonal residual covariance matrix Pairwise
differences among treatment groups and days were tested by the Tukey-Kramer-test
Data on fecal score and medical treatment were analyzed with the NPAR1WAY
procedure of SASSTAT software across the one-way classification treatment group
(levels CTRL QA RU CA) using Wilcoxon scores (for each wk seperately) Effects
and differences were considered significant if P lt 005
33 Results
331 Body weight feed intake and health status
All calves were born spontaneously and were evidently healthy Body weight was 473
plusmn 10 kg at birth and did not differ among groups
Average daily gain (616 gd plusmn 25 g n = 28) and final BW (582 kg plusmn 042 kg n = 28)
was not different between groups
Milk intake increased with time (wk 1 = 51 kgd wk 2 = 61 kgd wk 3 = 64 kgd wk
4 = 70 kgd P lt 0001) equally in all groups Concentrate intake also increased with
time (P lt 0001) equally in all groups During the first wk concentrate intake was very
low (4 gd) but increased to 27 gd during the second wk and to 117 gd in wk 4
Average fecal score for all groups was 14 and each calf had on average 2 d of strong
diarrhea indicated by fecal score 4 Severe diarrhea occurred between d 3 and d 20 and
fecal score was highest in wk 2 (fecal score 162) and wk 3 (fecal score 154) During
the first wk of life fecal score differed among groups being lower (P lt 005) in CA
group (fecal score 101) than in CTRL group (fecal score 146) and in group QA (fecal
score 131)
Treatments of diseases showed no significant group differences However group CA
had 3 treated calves (total 7 treatments 2 diarrhea 4 pneumonia 1 other disease) and
other groups 6 treated calves each [CTRL in total 9 treatments (4 diarrhea 2
pneumonia 3 other diseases) RU in total 10 treatments (1 diarrhea 7 pneumonia 2
other diseases) QA in total 10 treatments (1 diarrhea 5 pneumonia 4 other diseases)]
CHAPTER 3
86
Other diseases were omphalitis (n = 2) thromboflibitis (n = 4) polyartritis (n = 1)
obstipation (n = 1) and conjuctivitis (n = 1)
332 Plasma flavonoid concentrations
Plasma concentrations of total flavonols in QA and RU increased (P lt 005) until d 12
but decreased thereafter in QA (Figure 31) Plasma concentrations of total flavonols
(sum of quercetin isorhamnetin and tamarixetin) were higher (P lt 005) in RU than in
CTRL (data for quercetin metabolites not shown)
Plasma concentrations of individual catechins were below detection limit
Time d
5 12 19 26
Tota
l fl
avon
ols
n
mol
L
0
50
100
150
200
Figure 31 Plasma concentrations of total flavonols from d 5 to 26 after feeding of no flavonoid ()
and after oral administration of 9 mg of quercetinkg of BW times day as quercetin aglycone () or as
values are LSM plusmn SE n = 7 per group
333 Markers for antioxidative capacity and oxidative stress
Markers for antioxidative capacity (TEAC FRAP Figure 32A-D) changed with time
with TEAC increasing and FRAP decreasing from d 1 to d 5 and then remaining
relatively stable in all groups Absolute concentrations as well as relative changes did
not differ among groups but FRAP showed a group times time interaction (P lt 0001) for
CHAPTER 3
87
relative changes (in CTRL from d 12 to d 19 P = 003 and in RU from d 5 to d 12 P =
008) but no relative changes in QA and CA
Absolute concentrations of oxidative stress markers (TBARS F2-isoprostanes) revealed
huge individual variations within groups and did not show group or time differences
(Figure 32 E G) However relative changes of both oxidative stress markers showed
overall group effects between CA and CTRL (P lt 005 Figur 32 F H)
A TEAC Absolute plasma values B TEAC Plasma values relative to day 1
Time d
1 5 12 19 26
TE
m
mo
lL
17
18
19
20
21
22
Time d
5 12 19 26
TE
m
mo
lL
00
01
02
03
04
C FRAP Absolute plasma values D FRAP Plasma values relative to day 1
Time d
1 5 12 19 26
AS
CE
micro
mo
lm
L
100
120
140
160
180
200
220
240
Time d
5 12 19 26
AS
CE
micro
mo
lm
L
-140
-120
-100
-80
-60
-40
-20
0
E TBARS Absolute plasma values F TBARS Plasma values relative to day 1
Time d
1 5 12 19 26
MD
AE
micro
mo
lL
03
04
05
06
Time d
5 12 19 26
MD
AE
micro
mo
lL
-02
-01
00
01
02
03
b b
b
b
a a
a
a
a a
a a
a a
a a
a a
a a
a a
a a
a a
a a
a a
a a
a a
a a
b a
b a
b a
a
b
a
b a
b a
b a
b a
a a
a
b
a
a
b
a
a
b
a
a
b
a
a
b
a
a
b
a
a
b
a
CHAPTER 3
88
G F2-isoprostanes Absolute plasma values H F2-isoprostanes Plasma values relative to day 1
Time d
1 5 12 19 260
2000
4000
6000
8000
10000
12000
Time d
5 12 19 26
8-i
so-P
GF2
pg
mL
-8000
-6000
-4000
-2000
0
2000
4000
8-i
so-P
GF2
pg
mL
Figure 32 Time course of different markers for antioxidative capacity (TEAC = trolox equivalent
antioxidative capacity FRAP = ferric reducing ability of plasma) and oxidative stress markers
(TBARS = thiobarbituric acid reactive substances F2-isoprostanes) for each parameters absolute
plasma values are depicted in graphs A C E and G whereas graphs B D F and H show
incremental or decremental values relative to values on d 1 control () rutin () quercetin
aglycone () and green tea extract () a-b
LSM with different superscripts differ values are LSM
plusmn SE n = 7 per group
334 Plasma concentrations of metabolites and hormones
Plasma concentrations of total protein increased (P lt 0001) and plasma concentrations
of albumin decreased (P lt 0001) from d 1 to d 5 in all groups (Table 31) After d 5
there was a slight decrease (P lt 005) for total protein and a slight increase for albumin
(P lt 005) until the end of the study Plasma concentrations of urea decreased (P lt 001)
until d 12 in all groups and then remained relatively low (Table 31) Plasma glucose
concentrations slightly increased (P = 001) in most groups from d 1 to d 5 and then
variably changed up to d 26 (Table 31) Plasma lactate concentrations sharply
decreased after birth up to d 5 but then remained stable up to d 26 (Table 31) Plasma
NEFA concentrations decreased up to d 5 of life and partly increased again until d 12
(Table 31) Plasma insulin and cortisol concentrations decreased after birth in most
groups (P lt 0001) and then remained low (Table 31) All plasma concentrations
measured were comparable among groups except for plasma cortisol where the
decrease after birth differed among groups reflected by group times time interaction (P lt
0001)
CHAPTER 3
89
Ta
ble
32
B
loo
d p
lasm
a c
on
cen
tra
tio
ns
of
met
ab
oli
c tr
ait
s a
nd
ho
rm
on
es
of
calv
es a
fter
no
fla
vo
no
id (
CT
RL
) q
uer
ceti
n a
gly
con
e (Q
A)
ru
tin
(RU
) o
r o
f a
gre
en-t
ea e
xtr
act
fee
din
g c
on
tain
ing
ma
inly
ca
tech
ins
(CA
) fr
om
d 5
to
d 2
6
Sa
mp
les
are
ta
ken
bef
ore
mo
rnin
g m
ilk
fee
din
g
occ
urr
ed
Item
1
Da
y
Gro
up
S
E
AN
OV
A (
P-v
alu
e)
CA
C
TR
L
QA
R
U
Gro
up
D
ay
G
rou
p times
Da
y
To
tal
pro
tein
gL
1
50
6
50
3
50
0
50
3
13
4
03
3
00
0
06
3
5
6
03
6
27
5
88
6
14
12
58
3
60
6
59
4
61
1
19
55
6
58
6
58
0
59
0
26
56
4
58
0
55
7
58
4
Alb
um
in
gL
1
26
1
25
7
24
9
25
2
06
6
02
7
00
0
08
8
5
2
40
2
37
2
34
2
35
12
26
6
24
6
24
4
24
9
19
26
0
25
2
25
6
25
4
26
26
7
25
6
25
7
25
9
Ure
a m
mo
lL
1
3
48
3
61
3
84
3
23
02
6
07
4
00
0
07
8
5
26
1
2
52
2
33
2
31
12
2
02
1
40
1
98
1
72
19
1
58
1
44
1
55
1
72
26
1
43
1
34
1
63
1
52
Glu
cose
m
mo
lL
1
5
46
4
12
4
93
4
98
03
2
05
6
00
0
01
9
5
54
5
5
31
5
84
5
35
12
5
12
4
87
4
94
5
03
19
4
76
5
30
5
50
4
71
26
5
39
5
26
5
38
5
16
CHAPTER 3
90
Ta
ble
32
C
on
tin
ua
tio
n
Item
1
Da
y
Gro
up
S
E
AN
OV
A (
P-v
alu
e)
CA
C
TR
L
QA
R
U
Gro
up
D
ay
G
rou
p times
Da
y
Lac
tate
m
mo
lL
1
55
3
30
2
55
6
41
1
0
77
08
0
00
0
0
50
5
07
6
07
6
18
8
07
6
12
05
9
05
2
05
7
06
2
19
05
5
04
3
06
6
06
1
26
05
6
04
8
04
9
05
6
NE
FA
micro
mo
lL
1
55
2
91
7
67
4
64
8
90
8
05
3
00
0
0
28
5
28
3
22
0
24
8
21
1
12
21
5
46
9
34
4
37
4
19
36
4
30
9
29
5
36
1
26
28
8
28
0
27
6
20
5
Insu
lin
microgL
1
14
9
06
7
06
5
03
5
0
19
02
3
00
0
0
22
5
04
4
04
4
03
7
03
2
12
02
0
02
5
03
5
01
9
19
01
9
01
7
01
7
02
2
26
01
6
02
3
01
5
01
5
Co
rtis
ol
ngm
L
1
9
10
7a
5
50
0b
6
97
7ab
88
60
a
54
2
03
3
00
0
0
00
5
1
90
7
1
90
6
3
20
6
2
34
0
12
81
0
78
7
1
17
3
1
19
6
19
68
4
46
0
83
4
1
03
0
26
46
6
41
7
76
0
64
1
a-bL
SM
in a
ro
w w
ith d
iffe
rent
sup
ersc
rip
ts d
iffe
r (P
lt 0
05
)
1 V
alues
are
LS
M plusmn
SE
n =
7 p
er g
roup
CHAPTER 3
91
34 Discussion
At birth BW was not different among groups as planned and postnatal growth
performance was not affected by treatment The lack of differences in feed intake and
ADG during flavonoid administration is in line with findings of Oliveira et al (2010)
after feeding a flavonoid-rich pomegranate extract to calves for the first 30 d of life
Because concentrate intake did not differ among groups rumen development during
first month of life was unlikely changed by flavonoid administration as supported by
low plasma concentrations of β-hydroxybutyrate that did not increase in flavonoid-
treated calves during the experimental period (Maciej and Hammon unpublished
observations) Nevertheless plant extracts have the potential to affect rumen
development but may be only effective in older calves (Greathead 2003)
The impact of flavonoids on health status is discussed controversially Nielsen (2008)
found fewer diarrhea in weaned piglets after feeding natural feed additives containing a
high amount of flavonoids In contrast Oliveira et al (2010) reported no effects on
health parameters like incidence of diarrhea by feeding a polyphenol-rich feed to
newborn calves Interestingly we found an improved fecal score in CA compared to
CTRL calves In recent studies GTE were shown to inhibit diarrhea in newborn calves
(Ishihara et al 2001) In addition the number of treatments was markedly reduced in
the study of Ishihara et al (2001) confirming our results of numerically less treated
calves because of diarrhea in CA
Plasma antioxidant capacity of calves based on TEAC and FRAP measurements was
not influenced by flavonoid feeding in this study However the sharp changes of both
markers from d 1 to d 5 again highlights the role of colostrum feeding (Blum and
Hammon 2000 Hammon et al 2013) Measurement of TEAC is dependent on the
vitamin E analogue trolox Because vitamin E is provided by colostrum feeding (Blum
et al 1997 Lindmark-Maringnsson and Aringkesson 2000 Zanker et al 2000) and plasma
TEAC also increased rapidly after first colostrum intake in calves Our findings on
FRAP agree with those of Gaaacutel et al (2006) that also showed a decline of this parameter
after first colostrum intake Urea is a major factor influencing FRAP (Benzie and Strain
1996) and albumin and urea are factors influencing TEAC (Miller et al 1993) but
these metabolites only changed in time and were similar among groups Although
plasma metabolites were not affected by treatment decremental changes of FRAP
CHAPTER 3
92
values from d 12 to d 19 in CTRL and from d 5 to d 12 in RU reflect changes of
antioxidative capacity with time
Oxidative stress markers (TBARS and F2-Isoprostanes) did not follow a clear time-
dependent trend as seen for TEAC and FRAP Nevertheless TBARS increased in time
in CTRL and decreased in CA suggesting less oxidative stress in calves fed GTE On
the other hand F2-isoprostane concentrations in plasma decreased only in CTRL
indicating more oxidative stress In previous studies on calves plasma concentrations of
oxidative stress markers distinctly increased when calves were sick or stressed (Erisir et
al 2013 Ahmed and Hassan 2007 Al-Qudah 2009) This suggests that flavonoid
feeding to healthy calves as in the present study may not change oxidative stress
markers A polyphenol-rich diet in humans (Nieman et al 2013) lactating cows
(Gohlke et al 2013) pigs (Luumlhring et al 2011) or rats (Igarashi and Ohmuma 1995)
also led only to slight or no changes of markers of antioxidant activity or oxidative
stress
In general methods for determination of TBARS and F2-isoprostanes were discussed to
be inappropriate because of too low specificity and concomitantly too high inter-assay
variation (Rimbach et al 1999 Halliwell and Whiteman 2004 Celi 2011)
Furthermore antioxidative status tremendously differs between individuals and depends
on medical treatment (Farombi 2001) and season (Bernabucci et al 2002) In addition
plasma flavonol concentrations were relatively low since blood sampling occurred in
the pre-prandial stage and postprandial plasma flavonol concentration in calves
decreased rapidly with age (Maciej et al 2015) Therefore variable results concerning
antioxidative status or oxidative stress markers can be expected Also the amount of
flavonoid used in this study was based on previous studies in pigs and dogs (Lesser et
al 2004 Reinboth et al 2010 Luumlhring et al 2011) which may not be adequate for
colostrum- and milk-fed calves The determination of other parameters such as of
protein damage determination of vitamins E and C or of enzymatic antioxidants might
be more appropriate
We assumed that quercetin feeding may affect metabolic status in calves as some
authors postulate effects of flavonoids on glucose metabolism (Cermak et al 2004
Shetty et al 2004 Gohlke et al 2013) However we found no effects on pre-prandial
plasma glucose concentrations by flavonoid feeding in this study The increase of
plasma glucose concentrations after birth reflects lactose intake by colostrum and milk
CHAPTER 3
93
feeding as well as an increasing endogenous glucose production with age (Hammon et
al 2013) Because plasma glucose is highly regulated with the goal to maintain
euglycemia concentrations were relatively stable throughout the study and
corresponded to earlier presented data measured in young milk-fed calves (Hadorn et
al 1997 Rauprich et al 2000 Nussbaum et al 2002) Plasma concentrations of other
metabolites and insulin were also not affected by flavonoid feeding and simply reflected
physiological changes during first month of life (Nussbaum et al 2002 Schiessler et
al 2002 Hammon et al 2012) Differences in plasma cortisol concentrations among
groups on d 1 were independent of flavonoid administration as blood was sampled
before flavonoid supplementation
In conclusion effects of flavonoid treatment were much less than hoped or expected
However reduced medical treatment fewer incidences of diarrhea and a slight effect
on oxidative stress markers may indicate a potential health-promoting effect of
catechins in this study Nevertheless evidence for biological effects of flavonoid-
containing supplements is not available for young calves Feeding higher doses of
flavonoids than in this study may possibly cause more distinct changes of the metabolic
or antioxidative status in neonatal calves In addition use of more specific markers of
anti-oxidative capacity or stress may be helpful in future studies
Acknowledgements
We gratefully thank Petra Schulz and Maike Gosse (Christian Albrechts University
Kiel) for excellent laboratory assistance as well as Annette Zeyner Kirsten Buumlsing
(University of Rostock) and Bernd Stabenow (Leibniz Institute for Farm Animal
Biology) for providing the experimental facilities Chicken-egg derived
immunoglobulins (Globigen Life Start 25 ) were generously provided by EW
Nutrition GmbH Visbek Germany This work is part of the joint research project Food
Chain Plus (FoCus) and was financially supported by the Federal Ministry of Education
and Research Germany (BMFT grant no 0315538B)
CHAPTER 3
94
References
Ahmed W M and S E Hassan 2007 Applied studies on coccidiosis in growing
Buffalo-calves with special reference to oxidantantioxidant status World J Zool
240ndash48
Alexandrovich K N and S E Antonovna 2009 Age-dependent level of antioxidant
defence system and lipid metabolism state in calves Int J Appl Res Vet Med
773ndash75
Al-Qudah K M 2009 Oxidative stress in calves with acute or chronic
bronchopneumonia Rev Meacuted Veacutet 160231ndash236
Benzie I F and J J Strain 1996 The ferric reducing ability of plasma (FRAP) as a
measure of ldquoantioxidant powerrdquo The FRAP assay Anal Biochem 23970ndash76
Berger L M S Wein R Blank C C Metges and S Wolffram 2012 Bioavailability
of the flavonol quercetin in cows after intraruminal application of quercetin
aglycone and rutin J Dairy Sci 955047ndash5055
Bernabucci U B Ronchi N Lacetera and A Nardone 2002 Markers of oxidative
status in plasma and erythrocytes of transition dairy cows during hot season J
Dairy Sci 852173ndash2179
Blum J W U Hadorn H P Sallmann and W Schuep 1997 Delaying colostrum
intake by one day impairs plasma lipid essential fatty acid carotene retinol and
α-tocopherol status in neonatal calves J Nutr 1272024ndash2029
Blum J and H Hammon 2000 Colostrum effects on the gastrointestinal tract and on
nutritional endocrine and metabolic parameters in neonatal calves Livest Prod
Sci 66151ndash159
Celi P 2011 Biomarkers of oxidative stress in ruminant medicine Immunopharmacol
Immunotoxicol 33233ndash240
Cermak R S Landgraf and S Wolffram 2004 Quercetin glucosides inhibit glucose
uptake into brush-border-membrane vesicles of porcine jejunum Br J Nutr
91849ndash55
di Carlo G D N Mascolo A A Izzo and F Capasso 1994 Effects of quercetin on
the gastrointestinal tract in rats and mice Phytother Res 842ndash45
CHAPTER 3
95
Egert S J Tereszczuk S Wein M J Muumlller J Frank G Rimbach and S Wolffram
2013 Simultaneous ingestion of dietary proteins reduces the bioavailability of
galloylated catechins from green tea in humans Eur J Nutr 52281ndash288
Erisir M F M Kandemir and M Yuumlksel 2013 The effects of Caesarean section on
lipid peroxidation and some antioxidants in the blood of newborn calves Vet
Arch 83153ndash159
Farombi E O 2001 Antioxidant status and hepatic lipid peroxidation in
chloramphenicol-treated rats Tohoku J Exp Med 19491ndash98
Gaaacutel T P Ribiczeyneacute-Szaboacute K Stadler J Jakus J Reiczigel P Koumlveacuter M Meacutezes
and L Suumlmeghy 2006 Free radicals lipid peroxidation and the antioxidant
system in the blood of cows and newborn calves around calving Comp Biochem
Physiol B Biochem Mol Biol 143391ndash396
Gaacutelvez J F Saacutenchez de Medina J Jimeacutenez M I Torres M I Fernaacutendez M C
Nuacutentildeez A Riacuteos A Gil and A Zarzuelo 1995 Effect of quercitrin on lactose-
induced chronic diarrhoea in rats Planta Med 61302ndash306
Gohlke A C J Ingelmann G Nuumlrnberg J M Weitzel H M Hammon S Goumlrs A
Starke S Wolffram and C C Metges 2013 Influence of 4-week intraduodenal
supplementation of quercetin on performance glucose metabolism and mRNA
abundance of genes related to glucose metabolism and antioxidative status in
dairy cows J Dairy Sci 966986-7000
Greathead H 2003 Plants and plant extracts for improving animal productivity Proc
Nutr Soc 62279ndash290
Hadorn U H Hammon R M Bruckmaier and J W Blum 1997 Delaying colostrum
intake by one day has important effects on metabolic traits and on gastrointestinal
and metabolic hormones in neonatal calves J Nutr 1272011ndash2023
Halliwell B 1991 Reactive oxygen species in living systems source biochemistry
and role in human disease Am J Med 9114Sndash22S
Halliwell B and M Whiteman 2004 Measuring reactive species and oxidative
damage in vivo and in cell culture how should you do it and what do the results
mean Br J Pharmacol 142231ndash255
Hammon H M J Steinhoff-Wagner J Flor U Schoumlnhusen and C C Metges 2013
Lactation Biology Symposium role of colostrum and colostrum components on
glucose metabolism in neonatal calves J Anim Sci 91685ndash695
CHAPTER 3
96
Hammon H M J Steinhoff-Wagner U Schoumlnhusen C C Metges and J W Blum
2012 Energy metabolism in the newborn farm animal with emphasis on the calf
endocrine changes and responses to milk-born and systemic hormones Domest
Anim Endocrinol 43171ndash185
Igarashi K and M Ohmuma 1995 Effects of isorhamnetin rhamnetin and quercetin
on the concentrations of cholesterol and lipoperoxide in the serum and liver and
on the blood and liver antioxidative enzyme activities of rats Biosci Biotechnol
Biochem 59595ndash601
Ishihara N D-C Chu S Akachi and L R Juneja 2001 Improvement of intestinal
microflora balance and prevention of digestive and respiratory organ diseases in
calves by green tea extracts Livest Prod Sci 68217ndash229
Kobayashi Y M Miyazawa A Kamei K Abe and T Kojima 2010 Ameliorative
effects of mulberry (Morus alba L) leaves on hyperlipidemia in rats fed a high-fat
diet Induction of fatty acid oxidation inhibition of lipogenesis and suppression
of oxidative stress Biosci Biotechnol Biochem 742385ndash2395
Larson L L F G Owen J L Albright R D Appleman R C Lamb and L D
Muller 1977 Guidelines toward more uniformity in measuring and reporting calf
experimental data J Dairy Sci 60989ndash991
Lee M J Z Y Wang H Li L Chen Y Sun S Gobbo D A Balentine and C S
Yang 1995 Analysis of plasma and urinary tea polyphenols in human subjects
Cancer Epidemiol Biomarkers Prev 4393ndash399
Lesser S R Cermak and S Wolffram 2004 Bioavailability of quercetin in pigs is
influenced by the dietary fat content J Nutr 1431508ndash1511
Lindmark-Maringnsson H and B Aringkesson 2000 Antioxidative factors in milk Br J
Nutr 84103ndash110
Luumlhring M R Blank S Wolffram 2011 Vitamin E-sparing and vitamin E-
independent antioxidative effects of the flavonol quercetin in growing pigs Anim
Feed Sci Technol 169199ndash207
Maciej J C T Schaumlff E Kanitz A Tuchscherer R M Bruckmaier S Wolffram
H M Hammon 2015 Bioavailability of the flavonol quercetin in neonatal calves
after oral administration of quercetin aglycone or rutin J Dairy Sci 98 3906ndash
3917
CHAPTER 3
97
Middleton E C Kandaswami and T C Theoharides 2000 The effects of plant
flavonoids on mammalian cells Implications for inflammation heart disease and
cancer Pharmacol Rev 52673ndash751
Miller J K E Brzezinska-Slebodzinska and F C Madsen 1993 Oxidative stress
antioxidants and animal function J Dairy Sci 762812ndash2823
Naumann C and R Basler 2004 Die chemische Untersuchung von Futtermitteln
VDLUFA-Verlag Darmstadt Germany
Nielsen B K 2008 Botanicals as feed additives to improve health and production in
pig breeding Res Pig Breed 212ndash18
Nieman D C N D Gillitt A M Knab R A Shanely K L Pappan F Jin and M
A Lila 2013 Influence of a polyphenol-enriched protein powder on exercise-
induced inflammation and oxidative stress in athletes a randomized trial using a
metabolomics approach PLoS One 8e72215
Nussbaum A G Schiessler H M Hammon and J W Blum 2002 Growth
performance and metabolic and endocrine traits in calves pair-fed by bucket or by
automate starting in the neonatal period J Anim Sci 801545ndash1555
Oliveira R A C D Narciso R S Bisinotto M C Perdomo M A Ballou M
Dreher and J E P Santos 2010 Effects of feeding polyphenols from
pomegranate extract on health growth nutrient digestion and
immunocompetence of calves J Dairy Sci 934280ndash91
Rauprich A B E H M Hammon and J W Blum 2000 Effects of feeding colostrum
and a formula with nutrient contents as colostrum on metabolic and endocrine
traits in neonatal calves Biol Neonate 7853ndash64
Re R N Pellegrini A Proteggente A Pannala M Yang and C Rice-Evans 1999
Antioxidant activity applying an improved ABTS radical cation decolorization
assay Free Radic Biol Med 261231ndash1237
Reinboth M S Wolffram G Abraham F R Ungemach and R Cermak 2010 Oral
bioavailability of quercetin from different quercetin glycosides in dogs Br J
Nutr 104198ndash203
Rimbach G D Houmlhler A Fischer S Roy F Virgili J Pallauf and L Packer 1999
Methods to assess free radicals and oxidative stress in biological systems Arch
Anim Nutr 52203ndash222
CHAPTER 3
98
Schiessler G A Nussbaum H M Hammon and J W Blum 2002 Calves sucking
colostrum and milk from their dams or from an automatic feeding station starting
in the neonatal period metabolic and endocrine traits and growth performance
Anim Sci 74431ndash444
Schwerin M U Dorroch M Beyer H Swalve C C Metges and P Junghans 2002
Dietary protein modifies hepatic gene expression associated with oxidative stress
responsiveness in growing pigs FASEB J 161322ndash1324
Shetty A K R Rashmi M G R Rajan K Sambaiah and P V Salimath 2004
Antidiabetic influence of quercetin in streptozotocin-induced diabetic rats Nutr
Res 24373ndash381
Sies H W Stahl and A Sevanian 2005 Nutritional dietary and postprandial
oxidative stress J Nutr 135969ndash972
USDA 2011 Cattle and calves nonpredator death loss in the United States 2010
USDAndashAPHISndashVSndashCEAH Fort Collins CO 6311111
Yagi K 1998 Simple assay for the level of total lipid peroxides in serum or plasma
Pages 101ndash106 in Free Radical and Antioxidant Protocols D Armstrong ed
Humana Press New York Buffalo USA
Zanker I A H M Hammon and J W Blum 2000 -Carotene retinol and -
tocopherol status in calves fed colostrum at 0-2 6-7 12-13 or 24-25 hours after
birth Int J Vitam Nutr Res 70305ndash310
99
Chapter 4
General Discussion
CHAPTER 4
100
General Discussion
Rearing neonatal calves healthy and economically is still a major challenge in todayʼs
dairy farming Feed supplements are often claimed to provide an effective and easy way
to improve performance of animals but the actual use of such supplements marketed is
manifold Since flavonoids are ingredients in all higher plants with numerous health-
promoting properties like acting antioxidative antiviral or anti-inflammatory and
beneficial effects on metabolic key enzymes and even antidiarrheal remedies (Chapter
1 Gaacutelvez et al 1995 Rao et al 1997 Middleton et al 2000) their use in dairy
nutrition is comprehensible However biological effects in vivo require systemic BV
Bioavailability in particular means the absorption distribution metabolism and at least
the excretion from the organism For calves systemic BV is widely unknown so far
Therefore this study was performed to examine BV and the biological effects of the
most abundant flavonoids quercetin and catechin in neonatal calves
In the first study of this thesis (Chapter 2) the systemically availability of quercetin
either applied as quercetin aglycone or applied as quercetin glucorhamnoside rutin
linked to the sugar rutinose was evaluated in newborn calves on d 2 and on d 29 of life
to investigate two different ontogenetic states In the second study (Chapter 3) possible
influences of quercetin as aglycone or as rutin and furthermore of catechin on the
metabolic and antioxidative status in calves were examined during a 3-wk feeding from
d 5 to 26 of life
In both studies of this thesis quercetin aglycone and rutin were supplemented at an
amount of 30 micromolkg of BW per d This dosage based results from companion studies
in dairy cows (Berger et al 2012 Gohlke et al 2013) Both quercetin sources were fed
as pure substances suspended in 10 mL of water to enable oral apply of flavonoids
during milk feeding Therefore possible effects can be deduced exclusively from
flavonoid feeding what would not be the case when feeding plant extracts with mixed
compositions or other natural products like propolis as seen in a number of other
studies in calves (Yaghoubi et al 2008 Oliveira et al 2010) In contrast to quercetin
feeding catechin could not be fed as pure substance but was fed by a GTE on a level of
10 mgkg of BW per d of original substance containing 703 catechins Dosage of
catechins was aligned to quercetin dosage and is shown in Table 1 of the appendix of
CHAPTER 4
101
this thesis However plasma catechin concentrations were below the detection limit
(data not shown) thus in further studies higher dosages should be applied
Studies on BV of flavonoids are conducted for a wide variety of species including
humans (Erlund et al 2000 Egert et al 2008) pigs (Ader et al 2000 Lesser et al
2004 Cermak et al 2003) rats (Manach et al 1997 1999) dogs (Reinboth et al
2010) horses (Wein and Wolffram 2013) and cows (Berger et al 2012 Gohlke et al
2013) The enormous differences among the species and ages impeded a transfer of
findings to neonatal calves (Chapter 1 section 225) Hence this thesis shall be a basis
for further more specific investigations on flavonoid feeding in calves Next to
differences among species as mentioned above great inter-individual differences among
calves were found in these experiments confirming previous studies for plasma
flavonol concentrations attributed to individual enzyme expression or differences in
intestinal bacterial colonization (Neacutemeth et al 2003 Manach et al 2005) Calves for
these studies originated from two distinct neighboring farms thus genetic background
feeding of dams and further external influences may partly account for differences
found Such impacts could be avoided by selecting calves from just one dairy operation
with a common pedigree
In the first study of this thesis (Chapter 2) quercetin was systemically available
reflected by increased concentrations of total flavonols quercetin and the quercetin
metabolites tamarixetin isorhamnetin and kaempferol in blood plasma of neonatal
calves both after administration of quercetin as aglycone and as glucorhamnoside rutin
Neonatal calves are regarded as functional monogastrics until development of the
reticulorumen allows rumination (Drackley 2008) Therefore BV in neonatal calves is
more comparable to monogastric but not to ruminant species as quercetin aglycone was
better absorbed than rutin This is in line with a decreasing BV of quercetin with
ontogenesis as on d 29 a higher microbial fermentation thus lower BV due to partial
ruminal degradation of quercetin was expected (Heinrichs and Jones 2003 Guilloteau
et al 2009 Berger et al 2012)
However absorption of quercetin occurred slowly reflected in delayed and lower
maximal reached plasma concentrations than found in monogastrics (Lesser et al 2004
Reinboth et al 2010 Chapter 2) or in adult cattle (Berger et al 2012 Gohlke et al
2013 Chapter 2) although applying comparable amounts of quercetin This once more
underpins that results from studies on BV of other species or adult cattle cannot be
CHAPTER 4
102
deduced to young calves Furthermore a delayed absorption of quercetin as
glucorhamnoside rutin but not as its aglycone was seen as result of different absorption
sites in monogastrics (Hollman et al 1997 Manach et al 1997 Chapter 1) On the
contrary in neonatal calves quercetin aglycone and rutin administration showed the
same slow increase in plasma concentrations indicating similar absorption sites as well
as a special feature in milk-fed calves because of abomasal milk clotting (Chapter 2) To
exclude interactions with milk fed flavonoids may be administered with water only
instead of milk which should result in a faster increase of plasma flavonol
concentrations Anyway to determine the exact place of absorption and metabolism of
flavonoids in calves further studies are required like intraruminal or intraduodenal
application of flavonoids or in vitro absorption tests of flavonoids with different bovine
gastrointestinal tissues
Aside from this the slow absorption of flavonols during BV studies (Chapter 2) seems
to be associated with the accumulation of quercetin in plasma during long-term
administration (Chapter 3) When elimination half-lives of flavonoids are long repeated
absorption of flavonoids can cause accumulation in blood plasma (Aherne and OʼBrien
2002 Chapter 1) Again calves showed differences to other monogastrics like pigs
where long-term quercetin feeding did not lead to an accumulation in plasma mainly
due to much faster absorption of quercetin (Bieger et al 2008) In calves accumulation
of flavonols in plasma during long-term administration was especially seen for rutin
(Chapter 3) what is in line with findings from BV studies of a delayed peak in plasma
flavonol concentrations after rutin feeding especially on d 2 (Chapter 2)
Interestingly even without dietary flavonoid supplementation calves showed
measurable plasma flavonol concentrations during BV studies (Chapter 2) and during
long-term administration (data not shown Chapter 3) This was particularly seen on day
2 when colostrum was fed (Chapter 2) indicating once more the outstanding role of
colostrum for health and welfare of calves (Hammon et al 2013) In addition to further
clarify the source of flavonols analysis of the respective composition of colostrum or
calf feed is required In the superordinate context of these studies bovine milk or
colostrum are probable flavonoid sources in human nutrition as well as veal rich in
flavonoids as so called functional food Precondition for this would be further studies
examining the distribution of flavonoids in calves and distinct tissue analyses after
flavonoid absorption (Chapter 1)
CHAPTER 4
103
However concentrations of metabolites and hormones measured postprandial during
BV studies (Chapter 2) or basal during long-term flavonoid treatment (Chapter 3) were
in line with previous studies on calves without dietary flavonoid supplementation
indicating physiological conditions and an unaffected metabolic status of calves by
flavonoid feeding Results of basal blood samples during long-term flavonoid
administration (Chapter 3) confirmed the findings of unaffected metabolic parameters
found in BV studies (Chapter 2) Flavonoid administration at higher dosage and a more
distinct focus on glucose metabolism during the experimental design putatively may
reveal effects as found in companion studies on calves (Gruse et al 2014) or in
monogastric animals showing an inhibited glucose uptake in intestinal cells after
quercetin feeding (Cermak et al 2004) Nevertheless all data indicated the use of
flavonoids in sensitive neonatal calves is harmless This is noteworthy as secondary
plant metabolites in the past mainly counted as anti-nutritive factors (Durmic and
Blache 2012)
Markers of oxidative stress and of the antioxidative capacity in calves during long-term
administration of quercetin and catechin were barely influenced by feeding regime but
influenced by time reflected by physiological changes during maturation (Chapter 3)
Colostrum as source for antioxidants like vitamins and enzymes (Lindmark-Maringnsson
and Aringkesson 2000) was assumed to induce at least most of the time effects of the
antioxidative status in this study The distinct increase of TE (unit for TEAC) and the
decrease of ASCE (as unit for FRAP) from shortly after birth to d 5 of life demonstrated
the important role of feed intake This was the first study proofing this outstanding
influence of feed intake However similar changes in plasma concentrations were not
seen for TBARS or F2-isoprostanes as oxidative stress markers Therefore relative
changes from d 1 to other d were evaluated which pointed out a possible role of
catechin feeding Taken together reduced medical treatment better fecal scores and a
slight impact on oxidative stress markers possibly indicate health-promoting effects of
catechins in calves This is especially interesting und should be further examined in
regard to the low plasma catechin concentrations found
Nevertheless in this study changes in oxidative stress markers by flavonoid feeding
were weak (Chapter 3) when compared to other studies showing more distinct
differences in oxidative stress markers mainly in obviously impaired calves (Wernicki
et al 2006 Ahmed and Hassan 2007 Al-Qudah 2009) This was not true in the
CHAPTER 4
104
studies of this thesis where all calves were kept under similar conditions Furthermore
in contrast to plasma metabolites like glucose or protein there is a lack of basic
information like data for physiological ranges concerning markers for antioxidative
capacity and oxidative stress Anyway this may be explained by the huge variation
found in the distinct studies and the different methods of analysis (Chapter 1 3) raising
the question whether there are more appropriate markers to determine the antioxidative
status of calves or if additional parameters should be used As presented previously
(Chapter 1 section 233) conceivable suggestions are the determination of vitamins E
and C carotenoids bilirubin or glutathione as well as enzymatic antioxidants like
superoxide-dismutase catalase or glutathione-peroxidase Moreover a more closely
setting of sample collection over longer time periods would allow a deeper insight in
kinetics of flavonoid action Additionally in these studies only 7 calves per group were
investigated Using more animals per group would let findings become more
conclusive
On the other hand dietary flavonoid supplementation namely catechin feeding seemed
to improve health status reflected in fewer sick calves and less diarrhea although
plasma catechin concentrations were below the detection limit (Chapter 3) However
biological effects not only depended on absolute plasma concentrations but also on
concentrations in target tissues which is needed to be examined in further studies A
possible approach is comparing directly the effects of flavonoid supplementation from d
of birth to a control group without flavonoid supplementation or treating sick calves
with flavonoids compared to sick calves without flavonoid treatment with both
approaches using an adequate number of animals Furthermore the chemical form or
the galenical form in general in which the flavonoid is applied greatly influences BV
and thus the biological effects (Chapter 1) as may be seen in studies that compare
quercetin aglycone or rutin administration to natural plant extracts containing quercetin
In previous studies on V urine and feces collection were the appropriate methods used
as due to urine and feces analyses the excretion of the investigated substance can be
verified Since this thesis focused on the more fundamental question if flavonoids were
absorbed at all no excrement was analyzed
In conclusion these studies clearly showed for the first time that quercetin is
systemically available in newborn calves This is a requirement for biological effects in
the organism which already are claimed by feed producers in practical dairy nutrition
CHAPTER 4
105
The great influence of maturation and ontogenetic stage of young calves on BV of
flavonoids was demonstrated just as the influence of the chemical form of the
administered flavonoids It was evaluated to what extend flavonoids affect the
metabolic and antioxidative status in neonatal calves shown in slight changes of the
respective markers This all contributes to a better understanding of the usage the mode
of action and the benefit of flavonoids as ʽnaturalʼ health-promoting feed supplements
CHAPTER 4
106
References
Ader P A Wessmann and S Wolffram 2000 Bioavailability and metabolism of the
flavonol quercetin in the pig Free Radic Biol Med 281056ndash1067
Aherne S A and N M OrsquoBrien 2002 Dietary flavonols Chemistry food content
and metabolism Nutrition 1875ndash81
Ahmed W M and S E Hassan 2007 Applied studies on coccidiosis in growing
Buffalo-calves with special reference to oxidantantioxidant status World J Zool
240ndash48
Al-Qudah K M 2009 Oxidative stress in calves with acute or chronic
bronchopneumonia Rev Meacuted Veacutet 160231ndash236
Berger L M S Wein R Blank C C Metges and S Wolffram 2012 Bioavailability
of the flavonol quercetin in cows after intraruminal application of quercetin
aglycone and rutin J Dairy Sci 955047ndash5055
Bieger J R Cermak R Blank V C J de Boer P C H Hollman J Kamphues and
S Wolffram 2008 Tissue distribution of quercetin in pigs after long-term dietary
supplementation J Nutr 1381417ndash1420
Cermak R S Landgraf and S Wolffram 2003 The bioavailability of quercetin in
pigs depends on the glycoside moiety and on dietary factors J Nutr 1332802ndash
2807
Cermak R S Landgraf and S Wolffram 2004 Quercetin glucosides inhibit glucose
uptake into brush-border-membrane vesicles of porcine jejunum Br J Nutr
91849ndash55
Drackley J K 2008 Calf nutrition from birth to breeding Vet Clin North Am Food
Anim Pract 2455ndash86
Durmic Z and D Blache 2012 Bioactive plants and plant products Effects on animal
function health and welfare Anim Feed Sci Technol 176150ndash162
Egert S S Wolffram A Bosy-Westphal C Boesch-Saadatmandi A E Wagner J
Frank G Rimbach and M J Mueller 2008 Daily quercetin supplementation
dose-dependently increases plasma quercetin concentrations in healthy humans J
Nutr 1381615ndash1621
CHAPTER 4
107
Erlund I T Kosonen G Alfthan J Maumlenpaumlauml K Perttunen J Kenraali J
Parantainen and A Aro 2000 Pharmacokinetics of quercetin from quercetin
aglycone and rutin in healthy volunteers Eur J Clin Pharmacol 56545ndash553
Gaacutelvez J F Saacutenchez de Medina J Jimeacutenez M I Torres M I Fernaacutendez M C
Nuacutentildeez A Riacuteos A Gil and A Zarzuelo 1995 Effect of quercitrin on lactose-
induced chronic diarrhoea in rats Planta Med 61302ndash306
Gohlke A C J Ingelmann G Nuumlrnberg A Starke S Wolffram and C C Metges
2013 Bioavailability of quercetin from its aglycone and its glucorhamnoside rutin
in lactating dairy cows after intraduodenal administration J Dairy Sci 962303ndash
2313
Gruse J S Goumlrs W Otten J Weitzel S Wolffram C C Metges and H M
Hammon 2014 Effects of different milk diets and oral quercetin supplementation
on postprandial glucose metabolism in neonatal calves Proc Soc Nutr Physiol
23114
Guilloteau P R Zabielski J W Blum 2009 Gastrointestinal tract and digestion in
the young ruminant Ontogenesis adaptations consequences and manipulations
J Physiol Pharmacol 60 Suppl 237ndash46
Hammon H M J Steinhoff-Wagner J Flor U Schoumlnhusen and C C Metges 2013
Lactation Biology Symposium Role of colostrum and colostrum components on
glucose metabolism in neonatal calves J Anim Sci 91685ndash695
Hollman P C H J M P van Trijp M N C P Buysman M S vd Gaag M J B
Mengelers J H M de Vries and M B Katan 1997 Relative bioavailability of
the antioxidant flavonoid quercetin from various foods in man FEBS Lett
418152ndash156
Heinrichs A J and C M Jones 2003 Feeding the newborn calf College of
Agricultural Sciences Agricultural Research and Cooperative Extension
Pennsylvania State University University Park PA
Lesser S R Cermak and S Wolffram 2004 Bioavailability of quercetin in pigs is
influenced by the dietary fat content J Nutr 1431508ndash1511
Lindmark-Maringnsson H and B Aringkesson 2000 Antioxidative factors in milk Br J
Nutr 84103ndash110
Manach C C Morand C Demigneacute O Texier F Reacutegeacuterat and C Reacutemeacutesy 1997
Bioavailability of rutin and quercetin in rats FEBS Lett 40912ndash16
CHAPTER 4
108
Manach C O Texier C Morand V Crespy F Reacutegeacuterat C Demigneacute and C Reacutemeacutesy
1999 Comparison of the bioavailability of quercetin and catechin in rats Free
Radic Biol Med 271259ndash1266
Manach C G Williamson C Morand A Scalbert and C Reacutemeacutesy 2005
Bioavailability and bioefficacy of polyphenols in humans I Review of 97
bioavailability studies Am J Clin Nutr 81230Sndash242S
Middleton E C Kandaswami and T C Theoharides 2000 The effects of plant
flavonoids on mammalian cells Implications for inflammation heart disease and
cancer Pharmacol Rev 52673ndash751
Neacutemeth K G W Plumb J-G Berrin N Juge R Jacob H Y Naim G Williamson
D M Swallow and P A Kroon 2003 Deglycosylation by small intestinal
epithelial cell beta-glucosidases is a critical step in the absorption and metabolism
of dietary flavonoid glycosides in humans Eur J Nutr 4229ndash42
Oliveira R A C D Narciso R S Bisinotto M C Perdomo M A Ballou M Dreher
and J E P Santos 2010 Effects of feeding polyphenols from pomegranate
extract on health growth nutrient digestion and immunocompetence of calves J
Dairy Sci 934280ndash4291
Rao V S F A Santos T T Sobreira M F Souza C L Melo and E R Silveira
1997 Investigations on the gastroprotective and antidiarrhoeal properties of
ternatin a tetramethoxyflavone from Egletes viscosa Planta Med 63146ndash149
Reinboth M S Wolffram G Abraham F R Ungemach and R Cermak 2010 Oral
bioavailability of quercetin from different quercetin glycosides in dogs Br J
Nutr 104198ndash203
Wein S and S Wolffram 2013 Oral bioavailability of quercetin in horses J Equine
Vet Sci 33441ndash445
Wernicki A M Kankofer P Mikucki and A Puchalski 2006 Evaluation of plasma
cortisol and TBARS levels in calves after short-term transportation Rev Meacuted
Veacutet 15730ndash34
Yaghoubi S M J G R Ghorbani H R Rahmani and A Nikkhah 2008 Growth
weaning performance and blood indicators of humoral immunity in Holstein
calves fed supplemental flavonoids Anim Physiol Anim Nutr 92456ndash462
109
Summary
SUMMARY
110
Summary
Flavonoids are secondary plant metabolites with numerous health-promoting properties
The feeding industry widely use flavonoids as ʽgreenʼ feed supplements even scientific
evidence of their value are often hypothetical Due to their high susceptibility to
diseases the use of flavonoids in neonatal calves might be especially useful However
to determine biological effects in vivo flavonoids must be systemically available in
calves but this is not known yet Therefore the aim of this study was to determine BV
and their biological effects of the most abundant flavonoids quercetin and catechin in
neonatal calves
In part one of the study calves (n = 7 per group) were fed quercetin as aglycone or as
glucorhamnoside rutin or no flavonoid (control group) on d 2 and 29 of life Blood
samples were taken in defined time intervals before and until 48 h after flavonoid
administration via jugular vein catheters Quercetin and its methylated (isorhamnetin
tamarixetin) and dehydroxylated (kaempferol) metabolites were analyzed in blood
plasma using HPLC with subsequent fluorescence detection It was shown that
quercetin is systemically available both as aglycone and as rutin in neonatal calves but
BV of quercetin aglycone was higher than BV of rutin as previously shown in
monogastric species Furthermore BV of quercetin and its metabolites was greater on d
2 than on d 29 of life and the proportion of quercetin metabolites differed greatly
between the two d which possibly can deduced to maturation of the gastrointestinal
tract
In part two of the study effects of a three-wk administration of quercetin aglycone rutin
or a green tea extract containing mainly catechins on performance health and the
antioxidative capacity and oxidative stress in neonatal calves were evaluated A fourth
group was used as control group (n = 7 calves per group) and did not receive any
flavonoid sopplementation No group differences were found for zootechnical
parameters but a slight benefit in health status when catechins were fed Effects of
flavonoid feeding on metabolic status were not seen in this study but total protein
albumin urea lactate glucose NEFA insulin and cortisol reflected typical time
changes during postnatal calf development Markers of the antioxidative capacity in
blood plasma (TEAC FRAP) showed incisive differences in time seen in a sharp
increase of TEAC and in a decrease of FRAP plasma concentrations postpartum
SUMMARY
111
However oxidative stress markers (TBARS F2-isoprostanes) did not illustrate distinct
group and time effects due to great interindividual variances
Taken together this study clearly demonstrated that the bioavailability of quercetin is
determined by its chemical form and depends to a major extent on physiological
processes of digestion and gastrointestinal maturation in calves In contrast the
influence of flavonoids on the antioxidative status did not show clear results thus an
improvement of the antioxidative status in neonatal calves by flavonoid administration
cannot be confirmed by this study
SUMMARY
112
Zusammenfassung
Flavonoide sind sekundaumlre Pflanzeninhaltsstoffe denen zahlreiche gesundheits-
foumlrdernde Eigenschaften zugesprochen werden In der Futtermittelindustrie haben
Flavonoide deshalb als bdquogruumlneldquo Zusatzstoffe bereits weitreichend Einzug erhalten auch
wenn wissenschaftlich fundierte Nachweise bezuumlglich ihrer Wirkung im Nutztier
oftmals hypothetisch sind Besonders fuumlr neugeborene Kaumllber scheint aufgrund ihrer
erhoumlhten Krankheitsanfaumllligkeit der Einsatz von pflanzlichen Zusatzstoffen sinnvoll
Allerdings muumlssten Flavonoide fuumlr biologische Effekte systemisch im Kalb verfuumlgbar
sein wofuumlr es bis jetzt noch keine Belege gibt Somit war es Ziel dieser Arbeit die
Bioverfuumlgbarkeit und die biologischen Effekte der weit verbreiteten Flavonoide
Quercetin und Catechin beim neugeborenen Kalb zu untersuchen
Dazu erfolgte im ersten Teil dieser Studie die Fuumltterung von Quercetin als reines
Aglykon oder mit entsprechendem Zuckerrest als Glukorhamnosid Rutin am 2 und 29
Lebenstag der Kaumllber (n = 7 pro Gruppe) Vor sowie bis zu 48 Stunden nach der
Flavonoidapplikation wurden in definierten Zeitabstaumlnden Blutproben gewonnen und
der Gehalt an Quercetin sowie der jeweiligen methylierten (Isorhamnetin Tamarixetin)
und dehydroxylierten (Kaempferol) Metaboliten mittels Hochleistungsfluumlssigkeits-
chromatographie mit anschlieszligender Fluoreszenzdetektion analysiert Es konnte gezeigt
werden dass Quercetin sowohl als Aglykon als auch als Rutin systemisch im Kalb
verfuumlgbar war wobei die systemische Verfuumlgbarkeit von Quercetin nach Fuumltterung des
Aglycons houmlher war als nach Fuumltterung von Rutin Weiterhin wurde am 2 Lebenstag
eine deutlich houmlhere Bioverfuumlgbarkeit von Quercetin und seinen Metaboliten festgestellt
als am 29 Lebenstag Auch war der Anteil der einzelnen Quercetinmetabolite an der
Gesamtflavanolkonzentration im Blutplasma stark veraumlndert was moumlglicherweise auf
den unterschiedlichen Grad der Darmentwicklung am 2 und 29 Lebenstag
zuruumlckgefuumlhrt werden kann
Im zweiten Teil der Studie wurde die Leistungsentwicklung der Gesundheitsstatus
sowie die antioxidative Kapazitaumlt und der oxidative Stress bei Kaumllbern untersucht
denen uumlber einen Zeitraum von drei Wochen entweder Quercetin in Form des Aglycons
oder als Rutin oder ein Gruumlnteeextrakt der hauptsaumlchlich Catechine enthielt verabreicht
wurde Eine vierte Kaumllbergruppe bekam keine Flavonoide zugefuumlttert und diente als
Kontrollgruppe (n = 7 pro Gruppe) Hierbei konnten in den erhobenen zootechnischen
SUMMARY
113
Parametern keine Gruppenunterschiede jedoch ein leichter Vorteil durch die Fuumltterung
von Catechin im Gesundheitsstatus festgestellt werden Effekte der Flavonoidfuumltterung
auf den Stoffwechsel der Kaumllber ausgedruumlckt durch Gesamtprotein Albumin
Harnstoff Laktat Glukose nicht-veresterte Fettsaumluren Insulin und Cortisol konnten in
dieser Studie nicht dargelegt werden jedoch wiesen diese Parameter
entwicklungsphysiologische Zeitveraumlnderungen auf Marker der antioxidativen
Kapazitaumlt im Blutplasma (TEAC FRAP) zeigten praumlgnante Zeitunterschiede
ausgedruumlckt durch einen deutlichen Anstieg der TEAC und einen ausgepraumlgten Abfall
der FRAP nach der Geburt Marker fuumlr den oxidativen Stress (TBARS F2-Isoprostane)
hingegen zeigten im Blutplasma aufgrund der starken individuellen Streuung keine
eindeutigen Behandlungs- und Zeiteffekte
Zusammenfassend konnte mit dieser Studie gezeigt werden dass die Bioverfuumlgbarkeit
von Quercetin durch dessen chemische Form determiniert ist und zum groumlszligtenteils von
verdauungsphysiologischen Vorgaumlngen und der Darmreifung des Kalbes abhaumlngig ist
Dagegen zeigten die hier durchgefuumlhrten Untersuchungen zum Einfluss der Flavonoide
auf den antioxidativen Status der Kaumllber keine eindeutigen Ergebnisse so dass eine
Verbesserung des antioxidativen Status nach Flavonoidgabe bei neugeborenen Kaumllbern
mit dieser Studie nicht bestaumltigt werden konnte
APPENDIX
Appendix
APPENDIX
Table 1 Appendix Calculation of flavonoid dosage
Item Formula Molar mass
gmol
Flavonoid dosage
mgkg
BW
micromolkg
BW
Rutintrihydrate (group RU) C27H30O16 3 H2O 6646 20 30
Quercetindihydrate (group QA) C15H10O7 2 H2O 3383 10 30
Water H2O 180
Rutinose C12H22O16 3263
Rutin minus water 6105
Rutin QE1 minus water and
rutinose
2842
30222
9 30
Quercetin QE minus water 3022 9 30
Polyphenon 60 (group CA) 10
Catechin content 703 7
Epigallocatechin C15H14O7 306267 190 620
Epicatechin C15H14O6 290260 064 220
Epigallocatechin gallate C22H18O11 458370 288 628
Epicatechin gallate C22H18O10 442370 070 158
Gallocatechin gallate C22H18O11 458370 021 046
Catechin gallate C22H18O10 442370 003 007
Gallocatechin C15H14O7 306267 052 170
Catechin C15H14O6 290260 014 048
Sum CA 7 19
1 QE = Quercetin equivalents
2 Only theoretically due to binding of 2 H and 1 O from crystalline water
APPENDIX
A Day 2 B Day 29
Time relative to feeding h
0 2 4 6 8 10 12 24 48
Qu
erce
tin
n
mo
lL
0
50
100
150
200
Time relative to feeding h
0 2 4 6 8 10 12 24 48
Qu
erce
tin
n
mo
lL
0
50
100
150
200
C Day 2 D Day 29
Time relative to feeding h
0 2 4 6 8 10 12 24 48
Iso
rha
mn
etin
n
mo
lL
0
20
40
60
80
100
Time relative to feeding h
0 2 4 6 8 10 12 24 48
Iso
rha
mn
etin
n
mo
lL
0
20
40
60
80
100
E Day 2 F Day 29
Time relative to feeding h
0 2 4 6 8 10 12 24 48
Ta
ma
rix
etin
n
mo
lL
0
25
50
75
100
125
150
Time relative to feeding h
0 2 4 6 8 10 12 24 48
Ta
ma
rix
etin
n
mo
lL
0
25
50
75
100
125
150
APPENDIX
G Day 2 H Day 29
Time relative to feeding h
0 2 4 6 8 10 12 24 48
Ka
emp
fero
l n
mo
lL
0
2
4
6
8
10
12
Time relative to feeding h
0 2 4 6 8 10 12 24 48
Ka
emp
fero
l n
mo
lL
0
2
4
6
8
10
12
Figure 1 Appendix Plasma concentration-time curves of quercetin (A B) isorhamnetin (C D)
tamarixetin (E F) and kaempferol (G H) after oral administration of 9 mg of quercetinkg of BW
times d as quercetin aglycone () rutin trihydrate () or no flavonoid () on d 2 and 29 of life Values
are LSM plusmn SE n = 7 per group (Chapter 2)
APPENDIX
A Day 2 B Day 29
Time relative to feeding h
0 2 4 6 8 10 12 24
To
tal
pro
tein
g
L
54
56
58
60
62
64
66
Time relative to feeding h
0 2 4 6 8 10 12 24
To
tal
pro
tein
g
L
54
56
58
60
62
64
66
C Day 2 D Day 29
Time relative to feeding h
0 2 4 6 8 10 12 24
Alb
um
in g
L
21
22
23
24
25
26
27
Time relative to feeding h
0 2 4 6 8 10 12 24
Alb
um
in g
L
21
22
23
24
25
26
27
E Day 2 F Day 29
Time relative to feeding h
0 2 4 6 8 10 12 24
La
cta
te m
mo
lL
0
1
2
3
4
5
Time relative to feeding h
0 2 4 6 8 10 12 24
La
cta
te m
mo
lL
0
1
2
3
4
5
APPENDIX
G Day 2 H Day 29
Time relative to feeding h
0 2 4 6 8 10 12 24
Ure
a m
mo
lL
1
2
3
4
5
Time relative to feeding h
0 2 4 6 8 10 12 24
Ure
a m
mo
lL
1
2
3
4
5
Figure 2 Appendix Plasma concentrations of total protein (A B) albumin (C D) lactate (E F)
and urea (G H) after oral administration of 9 mg of quercetinkg of BW times d as quercetin aglycone
() rutin trihydrate () or no flavonoid () on d 2 and 29 of life Values are LSM plusmn SE n = 7 per
group (Chapter 2)
APPENDIX
A
Time d
1 5 12 19 26
To
tal
pro
tein
g
L
48
52
56
60
64
B
Time d
1 5 12 19 26
Alb
um
in g
L
22
23
24
25
26
27
C
Time d
1 5 12 19 26
La
cta
te m
mo
lL
0
1
2
3
4
5
6
D
Time d
1 5 12 19 26
Glu
cose
m
mo
lL
40
45
50
55
60
E
Time d
1 5 12 19 26
NE
FA
m
mo
lL
200
400
600
800
1000
F
Time d
1 5 12 19 26
Ure
a m
mo
lL
10
15
20
25
30
35
40
APPENDIX
G
Time d
1 5 12 19 26
Insu
lin
micro
gl
00
05
10
15
H
Time d
1 5 12 19 26
Co
rtis
ol
ng
mL
0
20
40
60
80
100
Figure 3 Appendix Plasma concentrations of total protein (A) albumin (B) lactate (C) glucose
(D) NEFA (E) urea (F) insulin (G) and cortisol (H) after oral administration of quercetin
aglycone () rutin trihydrate () a green tea extract () or no flavonoid () Values are LSM plusmn
SE n = 7 per group (Chapter 3)
APPENDIX
Herzlichen Dankhellip
PD Dr Harald M Hammon fuumlr die Uumlberlassung des Themas und die Betreuung dieser
Arbeit sowie fuumlr die Unterstuumltzung bei Fragen und Problemen Prof Dr Siegfried
Wolffram fuumlr die freundliche Uumlbernahme des Zweitgutachtens und fuumlr die konstruktive
Kritik zu den Manuskripten Familie Klodt sowie Ralf Kocher und Ronny Koumllpin
fuumlr die Bereitstellung der Versuchskaumllber Den Mitarbeitern der Tierarztpraxis Dr
Linke fuumlr die medizinische Betreuung der Kaumllber die leider viel zu oft noumltig war Dr
Bernd Linke und Dr Peter Sanftleben da durch ihre exzellente Betreuung waumlhrend
der Masterarbeit erst das Interesse fuumlr das Anfertigen einer Doktorarbeit geweckt
wurde Klaus-Dieter Witt dem Herdenmanager des FBN fuumlr die schnelle
unkomplizierte Hilfe in praktischen und organisatorischen Belangen waumlhrend des
Kaumllberversuches den Handwerkern des FBN fuumlr die tatkraumlftige Unterstuumltzung beim
Kaumllberstall-Bauen bei den Kaumllbertransporten und fuumlr alle weiteren baulich-technischen
Hilfestellungen Petra Schulz und Maike Gosse vom Institut fuumlr Tierernaumlhrung und
Stoffwechselphysiologie der CAU Kiel fuumlr die hervorragenden Laboranalysen und
diesbezuumlglichen Erklaumlrungen Allen Kollegen des Instituts fuumlr Ernaumlhrungsphysiologie
bdquoOskar Kellnerldquo fuumlr die gute Zusammenarbeit Dr Julia Steinhoff-Wagner fuumlr die
dynamische Einfuumlhrung ins FBN und somit fuumlr meine schoumlne Anfangszeit dort sowie
fuumlr die fortwaumlhrende Beratung auch uumlber den groszligen Teich hinweg allen
Doktoranden-Kollegen fuumlr die tolle lehrreiche gemeinsame Zeit am FBN Jeannine
Gruse (vom ersten Tag anhellip ) und Dr Christine Schaumlff fuumlr das Korrekturlesen die
Motivation und sonstige Hilfe vor allem in der Endphase dieser Arbeit Meiner
Mitstreiterin und besten Kollegin der Welt Annika Gohlke fuumlr unzaumlhlige Tierarzt-
Einsaumltze zu jeder Tages- und Nachtzeit fuumlr viele gemeinsame Stunden im Stall und im
Buumlro sowie fuumlr die direkte unkomplizierte Art die Dinge anzupacken
Der groumlszligte Dank allerdings gilt meiner Familie
Meinem Mann meinen Kindern meinen Eltern und Groszligeltern sowie meiner Schwester
danke ich von ganzem Herzen
fuumlr die bedingungslose Unterstuumltzung Liebe Zuversicht
Krasse Herdehellip
APPENDIX
Curriculum Vitae
Josefine Maciej (neacutee Flor) born on October 02 1984 in Kuumlhlungsborn
Nationality German Civil Status Married 2 children
Education
Since 102011 Doctoral student Agricultural Sciences Christian Albrechts
University Kiel Faculty of Agricultural and Nutritional Sciences
102007 ndash 022010 Master of Science Agriculture Ecology University of Rostock
Master program Livestock Sciences Master Thesis The use of
computer tomography for the evaluation of stomach development in
milk-fed calves (Grade 10)
102004 ndash 092007 Bachelor of Science Agriculture Ecology University of Rostock
062004 Abitur Gymnasium Sanitz
WorkProfessional Experience
062010 ndash 062014 Scientific assistantdoctoral student Leibniz Institute for Farm
Animal Biology (FBN) Institute of Nutritional Physiology (ʽOskar-
Kellnerʼ) Dummerstorf
052009 ndash 072009 Student research assistant University of Goumlttingen Research Unit
Agriculture and Environment
092008 ndash 022009 Agricultural journey through the USA Internship at the weekly
dairy farm family magazine ʽFarmshineʼ Brownstown PA
022008 ndash 042008 Internship Landwirtschaftsberatung Mecklenburg-Vorpommern
Schleswig-Holstein (LMS) Bad Doberan
112004 ndash 122005 Student research assistant University of Rostock Faculty of
Agricultural and Environmental Sciences Institute of Animal
Nutrition
082004 ndash 012008 InternshipPractical work Landwirtschaftsgesellschaft Prisannewitz
Personal Engagement
122011 ndash 092012 Representative of public relations for doctoral students Leibniz
Institute for Farm Animal Biology (FBN) Dummerstorf
Since 052010 Member of volunteer fire department Kavelstorf
Kiel May 04 2015
Printed with the approval of the Faculty for Agricultural and Nutritional Sciences of the
Christian Albrechts University Kiel
This dissertation was written at the
Leibniz Institute for Farm Animal Biology (FBN) Dummerstorf (Head Prof Dr rer
nat habil Manfred Schwerin) at the Institute of Nutritional Physiology ʻOskar Kellnerʼ
(Head PD Dr rer nat habil Cornelia C Metges) in the Division of Endocrine
Metabolic Regulation (Head PD Dr med vet habil Harald M Hammon)
This study was kindly supported by the
Federal Ministry of Education and Research Germany (BMFT grant no 0315538B)
Oral Bioavailability of Flavonoids
and Their Effects on the Metabolic and
Antioxidative Status in Neonatal Calves
[Orale Bioverfuumlgbarkeit von Flavonoiden
sowie deren Effekte auf den Stoffwechsel und
den antioxidativen Status beim neugeborenen Kalb]
Faber est quisque fortunae suae
(Appius Claudius Caecus)
CONTENT
I
Content
Abbreviations IV
General Introduction 1
References 4
Chapter 1
Literature Overview 5
11 An introduction in flavonoids 6
111 Chemical structure and natural occurrence 6
112 Biological effects of flavonoids in plants 10
113 Biological effects of flavonoids in humans and animals 10
12 Bioavailability of flavonoids 12
121 General aspects of bioavailability with focus on ruminants 12
122 Absorption and distribution of flavonoids in the organism 14
123 Metabolism and excretion of flavonoids 17
124 Factors influencing bioavailability of flavonoids 19
125 Studies on bioavailability of quercetin and catechins 20
13 Metabolic and health status in neonatal calves 24
131 Metabolic status in calves at birth and postnatal changes 24
132 Health status in calves and development of the immune system 25
133 Oxidative stress and antioxidative capacity in neonatal calves 26
134 Effects of flavonoid administration on development and health status in
neonatal calves 29
14 Conclusive remarks and need for further research 31
References 32
CONTENT
II
Chapter 2
Bioavailability of the flavonol quercetin in neonatal calves after oral
administration of quercetin aglycone or rutin 51
Abstract 52
21 Introduction 53
22 Materials and Methods 54
221 Animals and feeding 54
222 Treatment and blood sampling 55
223 Analytical methods 57
224 Calculations and statistical analyses 59
23 Results 60
231 Body weight and feed intake 60
232 Bioavailability studies 60
233 Plasma concentrations of metabolites and hormones 63
24 Discussion 65
References 69
Chapter 3
Effects of oral flavonoid supplementation on metabolic and antioxidative status
in newborn dairy calves 77
Abstract 77
31 Introduction 78
32 Materials and Methods 80
321 Animals and feeding 79
322 Treatment and blood sampling 81
323 Analytical methods 81
324 Statistical analyses 82
33 Results 84
331 Body weight feed intake and health status 85
332 Plasma flavonoid concentrations 86
CONTENT
III
333 Markers for antioxidative capacity and oxidative stress 86
334 Plasma concentrations of metabolites and hormones 88
34 Discussion 91
References 94
Chapter 4
General Discussion 99
References 106
Summary 109
Zusammenfassung 112
Appendix
ABBREVIATIONS
IV
Abbreviations
ASCE Ascorbic acid equivalent(s)
AUC Area under the curve
BW Body weight
BHT Butylhydroxytoluene
BV Bioavailability
CA Catechins
cfu Colony forming units
Cmax Maximal reached plasma concentration
CP Crude protein
CTRL Control group fed no flavonoid
d Day(s)
DM Dry matter
DNA Deoxyribonucleic acid
EDTA Ethylenediaminetetraacetic acid
8-iso-PGF2α 8-iso-prostaglandin F2α
ELISA Enzyme-linked immunosorbent assay
FRAP Ferric reducing ability of plasma
GH Growth hormone
GLUT Glucose transporter
GTE Green tea extract
h Hour(s)time of day
HPLC High-performance liquid chromatography
Ig Immunoglobulin(s)
IGF Insulin-like growth factor
IU International units
LDL Low-density lipoprotein
LPH Lactase phlorizin hydrolase
MDAE Malondialdehyde equivalent
n Number
NEFA Non-esterified fatty acids
QA Quercetin aglycone
ABBREVIATIONS
V
QE Quercetin equivalents
RIA Radioimmunoassay
ROS Reactive oxygen species
RU Quercetin glucorhamnoside rutin
SE Standard error
SEM Standard error of the mean
SGLT Sodium-dependent glucose co-transporter
TE Trolox equivalents
TEAC Trolox equivalent antioxidative capacity
TBARS Thiobarbituric acid reactive substances
Tmax time until maximal plasma concentration is reached
U Unit(s)
wk week(s)
1
General Introduction
GENERAL INTRODUCTION
2
General Introduction
After birth calves undergo huge immunological and metabolic changes Though
relatively mature when born they must adapt to various morphological and functional
changes after birth (Blum and Hammon 2000 Hammon et al 2012) Because of
impaired neonatal management like colostrum management calf losses are highest in
the first weeks of life mainly due to respiratory and digestive diseases In the United
States 23 million calf losses were counted in 2010 (USDA 2011)
Oxidative stress is assumed to play a key role in numerous diseases as almost any
disease is somehow related to an increased formation of reactive oxygen species
(Halliwell 1991) In calves increased levels of markers for oxidative stress were found
during the first days of life (Stohrer et al 2003 Alexandrovich and Antonovna 2009)
and during sickness (Ahmed and Hassan 2007 Al-Qudah 2009) Furthermore the
nutrient status highly affects the antioxidant system (Schwerin et al 2002 Sies et al
2005) and often is impaired in newborn calves due to the change from intrauterine
continuous energy and nutrient supply via placenta to discontinuous oral supply after
birth Thus improvement of the antioxidant status in newborn calves may contribute to
the development of an own defence against environmental threats which helps to
reduce calf losses and to improve health status during the neonatal development
Because flavonoids as phenolic compounds are claimed to be strong antioxidants and to
have countless other health-promoting effects they are claimed and marketed as health-
promoting substances by the feeding industry Especially since the ban of antibiotic
growth promoters in the European Union in 2006 these ʻgreenrsquo feed additives gained
enormous popularity all over the world However any in vivo biological effect of a
substance requires its bioavailability (BV) In contrast to several monogastric species
where BV of flavonoids is extensively investigated knowledge on BV of flavonoids in
neonatal calves is still lacking Thus the aim of this study was to investigate the oral
BV of the flavonol quercetin one of the most abundant flavonoids in nature fed either
as aglycone or as its glycoside rutin in neonatal calves Studies were carried out on days
2 and 29 of life to show possible differences in absorption distribution and metabolism
of quercetin during ontogenetic development of newborn calves Furthermore oral
supplementation with quercetin and catechins for a three-wk period provides
GENERAL INTRODUCTION
3
information of flavonoid effects on metabolic and antioxidative status in neonatal
calves
This thesis is structured in 4 major chapters At first chapter 1 shows an overview of
flavonoids and their BV and introduces major aspects of the antioxidative system and
metabolic status in neonatal calves Chapter 2 deals with the relative oral bioavailability
of quercetin fed as quercetin aglycone or as its glucorhamnoside rutin in neonatal
calves Chapter 3 focusses on the effects on the metabolic and antioxidative status in
neonatal calves during oral supplementation of quercetin aglycone rutin and catechins
Finally chapter 4 presents a general discussion of the results of chapter 2 and 3 in
consideration of present knowledge in the literature
GENERAL INTRODUCTION
4
References
Ahmed W M and S E Hassan 2007 Applied studies on coccidiosis in growing
buffalo-calves with special reference to oxidantantioxidant status World J Zool
240ndash48
Alexandrovich K N and S E Antonovna 2009 Age-dependent level of antioxidant
defence system and lipid metabolism state in calves Int J Appl Res Vet Med
773ndash75
Al-Qudah K M 2009 Oxidative stress in calves with acute or chronic
bronchopneumonia Rev Med Vet 160231ndash236
Blum J W and H Hammon 2000 Colostrum effects on the gastrointestinal tract and
on nutritional endocrine and metabolic parameters in neonatal calves Livest
Prod Sci 66151ndash159
Halliwell B 1991 Reactive oxygen species in living systems Source biochemistry
and role in human disease Am J Med Suppl 91S14ndashS22
Hammon H M J Steinhoff-Wagner U Schoumlnhusen C C Metges and J W Blum
2012 Energy metabolism in the newborn farm animal with emphasis on the calf
endocrine changes and responses to milk-born and systemic hormones Domest
Anim Endocrinol 43171ndash185
Schwerin M U Dorroch M Beyer H Swalve C C Metges and P Junghans 2002
Dietary protein modifies hepatic gene expression associated with oxidative stress
responsiveness in growing pigs FASEB J 161322ndash1324
Sies H W Stahl and A Sevanian 2005 Nutritional dietary and postprandial
oxidative stress J Nutr 135969ndash972
Stohrer M S Lutz and M Stangassinger 2003 Antioxidant status of calves and foals
declines after birth Acta Vet Scand Suppl 44P38
USDA (US Department of Agriculture) Animal and Plant Health Inspection Service
2011 Cattle and calves nonpredator death loss in the United States 2010
httpwwwaphisusdagovanimal_healthnahmsgeneraldownloadscattle_calves
_nonpred_2010pdf (Accessed May 2013)
5
Chapter 1
Literature Overview
LITERATURE OVERVIEW
6
1 Literature Overview
11 An introduction in flavonoids
111 Chemical structure and natural occurrence
Flavonoids are polyphenols which represent aromatic compounds with one or more
hydroxyl groups directly linked to a benzene ring from the common three-ring nucleus
The chemical backbone is based on a C6ndashC3ndashC6 carbon framework Differences on the
C-ring divide the flavonoids into six main classes Flavanols flavones isoflavones
flavanones flavonols and anthocyanidins (Figure 11 Dangles and Dufour 2006
Manach et al 2004) Differences between flavonoid classes are predicated by the
saturation of the heterocyclic C-ring which means the presence or absence of a double
bond on position 4 the degree of oxidation and the position of the B-ring (flavones and
isoflavones) These variations lead to more than 6000 different forms of flavonoids
known today (Harborne and Williams 2000) Naturally flavonoids mostly occur as
glycoside which means the C-ring is attached to a sugar moiety A flavonoid without a
sugar moiety is called aglycone Glycosides yielding glucose instead of other sugar are
called glucosides Only in flavanols the presence of glycosides is rare (Hollman and
Arts 2000) According to Hollman and Arts (2000) aglycones usually do not appear in
fresh plants but after procession In the class of flavonols there are mainly O-
glycosides The type of sugar bound is predominantly β-glycosidic and the most
prevalent sugars next to glucose are arabinose galactose and rhamnose
The most abundant flavonoid is the flavonol quercetin (Hollman 2001 Nijveldt et al
2001) a pentahydroxyflavon (C15H10O7) Naturally quercetin is always bound to at
least one sugar molecule building quercetin-β-glycoside The type of sugar differs
between plants (Arts et al 2004) Williams and Harborne (1994) describe about 179
different glycosides of quercetin The main ones are isoquercetin rutin and kaempferol
(Figure 12)
LITERATURE OVERVIEW
7
Flavanol
Flavanone
Catechin
Epicatechin
Epigallocatechin gallate
Hesperitin
Naringenin
Eriodictyol
Flavone
Flavonol
Luteolin
Apigenin
Quercetin
Kaempferol
Myricetin
Isorhamnetin
Isoflavone
Anthocyanidin
Genistein
Daidzein
Biochanin A
Pelargonidin
Cyanidin
Delphinidin
Figure 11 Basic structure of the six main flavonoid classes with some representatives for each
group In the flavanol structure the numbers and rings are marked
Modified from Dangles and Dufour (2006) Manach et al (2004)
Quercetin a yellow crystalline powder with a molar mass of 3022 gmol is hardly
water soluble but soluble in ethanol or dimethyl sulfoxide The name quercetin is
derived from the latin name for oak tree Quercus where it was found first Rutin is a
glycoside of quercetin bound to rutinose a disaccharide consisting of rhamnose and
glucose It is also a yellow powder but less hydrophobic than quercetin Rutinʼs molar
mass is 6105 gmol
The most abundant flavonols are catechins which are colorless and slightly water-
soluble compounds They are named after catechu a juice or an extract of Mimosa
catechu Due to its isomer structure catechins occur as trans- (catechins) and cis-
isomers (epicatechins)
In general flavonoids are ubiquitous plant components in all kinds of higher plants
High amounts of flavonoids can be found especially in onions broccoli apples
apricots tomatoes and kale as well as in black currants black and green tea and red
wine (Hertog et al 1992 Crozier et al 1997 Hollman and Arts 2000)
LITERATURE OVERVIEW
8
Quercetin
Kaempferol
Rutin
Isoquercetin
Figure 12 Chemical structure of quercetin kaempferol and the quercetin glycosides rutin and
isoquercetin
Modified from Passamonti et al (2009)
An overview of the quercetin kaempferol catechin and epicatechin content in selected
food is given in Table 11 based on data from the USDA database for the flavonoid
content of selected foods a literature composition based on of 308 different references
(Bhagwat et al 2013) retrieved in December 2013 Further databases on flavonoid
content are available like the Phenol-Explorer (httpphenol-explorereu) or EuroFIR-
BASIS (httpebasiseurofirorg) and countless single references giving the flavonoid
content in plants
For chemical determination of the distinct flavonoids an acceptable separation of the
individual flavonoid molecules must be ensured for example by high-performance-
liquid-chromatography (HPLC) However given values for the flavonoid content in
plants can differ enormously depending on methods of analysis as there is no
standardized method for flavonoid analyses Besides variation of flavonoid content
among plants there are many factors that influence the flavonoid content in plants itself
like seasonal variation light and climatic conditions degree of ripeness as well as food
preparation and processing (Aherne and OrsquoBrien 2002) These natural variations in
plants type of plant and measurement should be kept in mind when comparing
flavonoid content among plants
LITERATURE OVERVIEW
9
Table 11 Flavonoid content in selected food as is in raw material unless indicated otherwise
Source
Flavonoid content mgkg fresh weight or mgL
Flavonol Flavanol
Quercetin Kaempferol Catechin Epicatechin
Alfalfa raw seeds 17 0 - -
Apple 0-115 0-27 0-51 8-192
Apricot 4-29 0-13 3-73 0-83
Buckwheat 51-363 - - -
Blackberry 0-119 0-31 0-3129 0-181
Broccoli 0-137 1-213 0 0
Capers 1493-3234 2150-3083 - -
Celery 0-35 2 0 0
Cherry sweet 1-68 0-7 0-149 4-270
Chives 9-104 55-125 - -
Chocolate dark - - 110-400 520-1250
Cranberry 73-250 0-6 0-11 30-57
Currant black 23-122 0-23 7 47
Dock leaves 862 103 - -
Elderberry 85-600 2-13 - -
Grape black 2-37 0-5 89-108 86-87
Grape seed - - 60-2440 230-2840
Grape whitegreen 1-39 0-3 4-59 1-28
Kale 0-562 5-905 - -
Milk chocolate 1 0 1-2 1-5
Onion red 59-1917 0-45 - -
Soybeans2 0 12 - 374
Spinach 0-272 0-550 - -
Tea black (brewed) 9-48 4-24 4-48 2-87
Tea green (brewed) - - 664-6880 200-216
wine red beverage 0-34 0-13 0-390 0-165
10 = not detectable - = no data available
2Quercetin and kaempferol content from green soybeans epicatechin content from mature soybean seeds
Modified from Bhagwat et al (2013)
Besle et al (2010) analyzed phenolic compositions of forages fed to dairy cows and
found the greatest phenolic content in grassland pastures with 353 gkg DM The
grassland hay however contained 216 gkg DM of phenolic compounds Ryegrass
silage versus ryegrass hay contained 168 and 145 gkg DM of phenolic compounds
The lowest phenolic content was found in corn silage containing 37 gkg DM (Besle et
al 2010) Phenolic compounds are also found in trace amounts in bovine milk wherat
their concentration is influenced by cow feeding (Besle et al 2010 Steinshamn et al
2008 OrsquoConnell and Fox 2001)
LITERATURE OVERVIEW
10
112 Biological effects of flavonoids in plants
Flavonoids have multifarious and important functions in plant biochemistry and
physiology like protecting deoxyribonucleic acid (DNA) from ultraviolet-induced
damage (Kootstra 1994) Flavonoids further affect photosynthesis by catalysing
electron transport processes (Das 1994) In leaves flavonoid pigments protect the
underlying photosynthetic cells by absorbing radiation Most flavonoids accumulate in
the epidermal cell layer of leaves (Winkel-Shirley 2002) and in the skin of fruits
(Manach et al 2004) The diversity of colors in plants is mainly caused by flavonoids
thus flavonoids play a crucial role in attracting pollinators and seed dispersers (Winkel-
Shirley 2002) Furthermore flavonoids protect plants against microbial invasion by
acting as phytoalexins (Harborne and Williams 2000) increasing tolerance against
abiotic stressors or defend other herbivory for example by bitter tasting (Gould and
Lister 2006 Harborne and Williams 2000) The signal transfer between plants and
microorganisms is also triggered by flavonoids as seen in the stimulation of the
Rhizobium bacteria for nitrogen fixation (Gould and Lister 2006) Flavonoids are stored
in plant vacuoles Cell death causes flavonoids to disperse into different fluid
components of the plants like waxes and resins (Das 1994) which are often considered
as enriched with flavonoids
113 Biological effects of flavonoids in humans and animals
The effects of flavonoids in humans and animals are seen ambiguous On the one hand
flavonoids are discussed as anti-nutritive factors whereat on the other hand flavonoids
are claimed health and performance promoting Negative aspects of flavonoids are seen
in tannins where diminishing BV of proteins and minerals or an inhibition of digestive
enzymes can occur (Chung et al 1998) Phytoestrogens are attributed to have adverse
health effects in infant development (Zung et al 2001) However todayʼs research is
mainly focussed on the positive aspects of flavonoids especially their antioxidative
activity and protective capacity against oxidative stress Flavonoids were found to
inhibit oxidation of low-density lipoproteins (LDL) in vitro (Harborne and Williams
2000) Low-density lipoproteins transport lipophilic substances like cholesterol and
plasma cholesterol esters Elevated plasma concentrations of LDL are associated with
vascular diseases like atherosclerosis (Aviram and Fuhrman 2003) and related problems
like coronary heart disease and stroke (Denny and Buttriss 2005) Therefore a large
LITERATURE OVERVIEW
11
body of research deals with the influence of a flavonoid-rich diet on reducing coronary
heart and vascular diseases (Hertog et al 1993 Knekt et al 1996 Rimm et al 1996
Yochum et al 1999 Hirvonen et al 2001 Mennen et al 2004) In spite of all these
investigations Loke et al (2010) postulated the detailed mechanisms of how flavonoids
may protect against cardiovascular diseases as still unknown Besides influencing
cardiovascular diseases flavonoids are involved in cancer control (Lamartiniere et al
1995 Knekt et al 1997 Hirvonen et al 2001) Birt et al (2001) postulated estrogenic
and antiestrogenic activity antiproliferation cell cycle arrest and apoptosis as well as
induction of detoxification enzymes regulation of host immune function and other
mechanisms of flavonoid actions as responsible for tumor growth restriction
Furthermore flavonoids are claimed to be involved in modulation of
neurodegeneration especially age-related cognitive and motoric decline in protection
against cerebral ischemiaperfusion injuries or other brain abnormalities (Youdim and
Joseph 2003) Other neurodegenerative disorders in this context are Alzheimerʼs
disease Parkinsonʼs disease seizures trauma and neuroinflammation (Varadarajan et
al 2001 Schroeter and Spencer 2003 Miller et al 2009) In addition flavonoid
treatment may alleviate infection by human immunodeficiency virus because
flavonoids are capable to inhibit several critical enzymes involved in life cycle of
human immunodeficiency virus (Cos et al 2008)
Effects of flavonoids and their metabolites on the metabolism in organisms are
manifold Especially those on carbohydrate metabolism are well studied and an impact
on glucose homeostasis was found in several studies Hanhineva et al (2010) reviewed
the impact of dietary polyphenols on the carbohydrate metabolism and summarized the
inhibition of carbohydrate digestion and glucose absorption in the intestine the
stimulation of insulin secretion from pancreatic β-cells the modulation of glucose
release from the liver the activation of insulin receptors and glucose uptake in insulin-
sensitive tissues as well as the modulation of intracellular signalling pathways and gene
expression as possible mechanisms of how flavonoids influence carbohydrate
metabolism More in detail flavonoids are capable to inhibit α-amylase and α-
glucosidase activity (Tadera et al 2006) inhibit the sodium-dependent glucose co-
transporter (SGLT) 1 (Kobayashi et al 2000) or glucose transporters itself (Johnston et
al 2005) In rat insulinoma pancreatic cells polyphenols like quercetin apigenin and
luteolin inhibited cytotoxicity and attenuated the decrease of glucose-stimulated insulin
LITERATURE OVERVIEW
12
secretion (Kim et al 2007) However insulin secretion is affected by a wide range of
different plant compounds and extracts Glucose uptake can be stimulated by flavonoids
in both insulin-sensitive and non-insulin sensitive tissue mostly dose-dependent
(Hanhineva et al 2010) Glucose transporter (GLUT) 1 widely distributed in fetal
tissues and GLUT 4 expressed by muscle are supposed to mainly trigger flavonoid
mediated glucose uptake (Hanhineva et al 2010)
However the influence of polyphenols on liver function to maintain glucose
homeostasis may also play a key role in neonates Endogenous glucose production as
important pathway to ensure glucose homeostasis in the neonate (Girard et al 1992)
originates from glycogenolysis and gluconeogenesis both taking place in the liver An
improved hepatic glucose and lipid metabolism was indicated in diabetic rats feeding a
polyphenol-rich diet (Roghani and Baluchnejadmojarad 2010 Bose et al 2008
Wolfram et al 2006) In non-diabetic rats quercetin stimulated glycogenolysis and
inhibited glycolysis and gluconeogenesis (Gasparin et al 2003a b) ex vivo by infusing
the liver with 50 to 300 micromolL quercetin However these concentrations are not
achievable with standard diets for in vivo experiments (Gasparin et al 2003a b)
Furthermore Kobayashi et al (2010) and Seiva et al (2012) showed positive effects of
a flavonoid-rich diet on lipid metabolism in rats fed a high-fat diet as plasma
concentrations of triglycerides non-esterified fatty acids (NEFA) insulin and leptin as
well as lipogenesis were reduced
12 Bioavailability of flavonoids
121 General aspects of bioavailability with focus on ruminants
In general BV can be defined as the rate and extent to which the active ingredient of a
substance is absorbed in the blood compartment or becomes available at the site of
action The European Agency for the Evaluation of Medicinal Products (2000) defines
BV as the extent and rate to which a substance or its active moiety is delivered from a
pharmaceutical form and becomes available in circulation However the effect of a
substance is usually determined by its concentration at the place of action
All postabsorptive biological effects of given substances depend on their BV
Parameters determining BV are liberation absorption distribution metabolism and
excretion abbreviated with their first letters as LADME-system Liberation the first
LITERATURE OVERVIEW
13
step for an effect of a drug or an active compound means drug release or drug delivery
and can be seen as a complex process The drug must disaggregate in smaller particles
dissolve in the present fluid and disperse which is more difficult for water insoluble
substances like flavonoids In the next step the absorption the active compound must
enter the blood or lymph vessels when given orally Absorption of orally given
ingredients is determined by solution rate as well as gut and stomach contentfilling
(Frey 2007) Bioavailability was shown to be influenced by technological (galenical)
factors of the substance the form of application local factors like diarrhea or contact
with other substances and first-pass effects These first-pass effects occur when an
active compound is metabolized very fast and thus inactivated or transformed before
entering the systemic circulation for example in the gut mucosa or liver After
absorption into the bloodstream the active compound is distributed by passive diffusion
or by convective transport from the blood capillaries into neighboring tissues The
metabolism of an active compound means its biotransformation mainly increasing its
hydrophilic properties (Pfeiffer et al 1995) The main organ for biotransformation is
the liver but it also takes place in the mucosa cells of the gastrointestinal tract lung
and kidney Most enzymes involved in this process are located in the endoplasmic
reticulum (Frey 2007) Biotransformation is two-phased Phase-I-reaction is a
transformation where functional groups are built into non-polar molecules mostly by
oxidation reduction or hydrolysis Absorption to water soluble molecules in phase-II-
reaction enables excretion The most important ways of excretion or elimination are
renal biliary and intestinal
To determine BV the concentration of an active ingredient is measured over time in
blood samples collected from the systemic circulation and as plasma concentration-
time curves are specified only by absorption distribution and elimination To calculate
BV area under the curve (AUC) maximal plasma concentration (Cmax) and time until
the maximal plasma concentration is reached (Tmax) are used as pharmacokinetic
parameters (see Figure 13)
Bioavailability is either relative or absolute For determination of the absolute oral BV
of a substance the AUC after oral intake is compared to the AUC after intravenous
injection In contrast to this relative oral BV compares two different drugs containing
the same active principle after oral application As time interval of sampling mainly
determines accuracy sampling frequency should be as high as possible
LITERATURE OVERVIEW
14
Figure 13 Illustration of main pharmacokinetic parameters at 2 different plasma concentration-
time curves after a single oral dose of an active compound to an organism Bold descriptions are for
curve 1
A = absorption D = distribution E = elimination AUC = area under the curve Cmax = maximal plasma
concentration Tmax = time until maximal plasma concentration is reached
Modified from Pfeiffer et al (1995)
122 Absorption and distribution of flavonoids in the organism
Flavonoids can be absorbed in different ways after oral administration from the
gastrointestinal tract Quercetin fed as aglycone without attached sugar can be detected
within 30 minutes after oral administration in plasma of volunteers whereas quercetin
fed as rutinoside with attached sugar (rutin) showed delayed peak levels in plasma
(Hollman et al 1997b Olthof et al 2000 Cermak et al 2003) Thus the main place
of absorption of quercetin monoglycosides is the small intestine More complex
quercetin glycosides like rutin are mainly absorbed in the colon or the distal small
intestine also colonized with microorganisms (Hollman et al 1997b Manach et al
1997) Therefore the sugar moiety and the location of microbial activity in the
gastrointestinal tract account for different absorption sites (Hollman et al 1999 Day et
al 1998) Some flavonoid aglyca can already be absorbed in the stomach but not their
glycosides as shown in studies in rats administered quercetin (Crespy et al 2002) or
daidzein and genistein (Piskula et al 1999) However most flavonoid glycosides resist
acid hydrolysis in the stomach thus reaching the duodenum undegraded
To pass the gastrointestinal epithelium is the first crucial step for systemic availability
in an organism The enterocytes are polarized cells with numerous membrane proteins
LITERATURE OVERVIEW
15
that enable the transport of dietary compounds from the lumen into the blood stream via
channels or active transporters (Figure 14) Lipophilic and small nonpolar substances
can pass the plasma membrane via diffusion following a concentration gradient As
flavonoids are polar and thus hydrophilic substances the passive diffusion of flavonoids
however barely occurs in the gastrointestinal tract (Day et al 2000 Manach et al
2004 Crespy et al 2003) Only for the aglyca a passive absorption is discussed (Day et
al 2000 Cermak et al 2003 Wolffram 2010) Acidic conditions in the stomach
inhibit hydrolysis (Day et al 2000) and pancreatic enzymes are also not able to
hydrolyze β-glycosidic bounds (Arts et al 2004) On the contrary Walle et al (2005)
found hydrolysis of dietary flavonoids already in the oral cavity by both bacteria and
shed epithelial cells but with a large interindividual variability between volunteers
Furthermore Kahle et al (2011) found degradation of polyphenols varying after
incubation with human saliva Different glucosidases like lactase phlorizin hydrolase
(LPH) are known to hydrolyze flavonoids (Day et al 2000 Sesink et al 2002 Neacutemeth
et al 2003) Lactase phlorizin hydrolase is an extracellular enzyme from the brush
border membrane of intestinal mammalian cells and was shown to be important for
intestinal absorption of quercetin glycosides (Figure 14 Sesink et al 2002)
Extracellular glucosidases cleave the sugar from the flavonoid glucosides and the
aglycone can be absorbed Hydrolysis by lactase phlorizin hydrolase might be reduced
in rats and sheep due to their higher microbial population in the stomach than in humans
(Day et al 2000) In human small intestine and liver an intracellular cytosolic β-
glucosidase was described that hydrolyze various flavonoid glycosides (Day et al
1998) Further enzymes hydrolyzing flavonoids in the gut are glucocerebrosidase (Day
et al 1998) and other cytosolic β-glucosidases (McMahon 1997) More complex
glycosides like rhamnosides are hydrolyzed by enzymes of microorganism in the distal
small intestine or in the colon (Crespy et al 1999 Scholz and Williamson 2007)
Besides that active transport systems are prevalently used for flavonoid transport into
the cell (Figure 14) Several studies suggest that quercetin glucosides could be
absorbed in the small intestine via SGLT 1 (Gee et al 1998 Walgren et al 2000a
Wolffram et al 2002) Also GLUT like GLUT 2 (Chen et al 2007) are discussed to
transport quercetin glucosides across the cell membranes Since the membrane transport
of xenobiotics chemical compounds like antibiotics that are neither produced in an
organism nor are part of the regular diet is a key factor in medical treatment and
LITERATURE OVERVIEW
16
flavonoids may interact with the cellular in- and efflux systems like the multidrug-
resistance-associated protein a plethora of studies with the interaction of flavonoids and
the membrane transport of drugs or their interactions exists (Cermak and Wolffram
2006) Among plasma membrane transporters the focus is on adenosine triphosphate-
binding cassette transporters (di Pietro et al 2002 Brand et al 2006 Morris and
Zhang 2006) monocarboxylate transporters and organic anion and bilirubin
transporters (Figure 14 Passamonti et al 2009)
Figure 14 Simplified model of intestinal absorption and metabolism of the flavonol quercetin in
the organism
Solid arrow = enzymatic reactions dotted or dashed arrow = active or passive transport SGLT1 =
sodium-dependent glucose co-transporter 1 LPH = lactase phlorizin hydrolase CBG = cytosolic β-
glucosidase UGT = uridine-5acute-diphospate glucuronosyl-transferase MRP = multidrug resistance-
associated protein SUL = sulfotransferase GLUT = glucose transporter ABC = ATP-binding cassette
transporter MCT = monocarboxylate transporter P-Glyc = P-glycoprotein
Modified from Murota and Terao (2003) Petri et al (2003) Cermak and Wolffram (2006)
However the exact way of action of these membrane proteins on flavonoid transport in
vivo is not given yet Once absorbed into circulation flavonoids are distributed in the
body with more than 98 of quercetin bound to proteins (Gugler et al 1975 Boulton
LITERATURE OVERVIEW
17
et al 1998 Janisch et al 2004) mainly albumin as the most prevalent protein in
plasma Further quercetin is also bound to glycoproteins and LDL (Boulton et al
1998) Depending on their conjugation the affinity of quercetin to bind on serum
albumin differs (Janisch et al 2004) contributing to the huge variation in BV (Dufour
and Dangles 2005) However as it is known that binding of the polyphenol to proteins
alter their biological activity the biological effect of this binding needs still to be
evaluated (Manach et al 2004)
The pattern of metabolites in tissues may be different from the one in the blood stream
due to its cellular uptake or intracellular metabolism (Manach et al 2004)
Furthermore Manach et al (2004) consider that plasma concentrations do not
necessarily correlate with the concentration in tissue Thus plasma concentration of
flavonoids may not be an accurate biomarker of exposure to body tissue
123 Metabolism and excretion of flavonoids
First-pass effect during intestinal absorption is crucial for availability of orally
administered flavonoids as described in chapter 121 Hydrolyzation of some
flavonoids already occurs by passing the enterocytes via the membrane-bound lactase
phlorizin hydrolase Other flavonoids are hydrolyzed in the enterocyte by cytosolic β-
glucosidase before entering the systemic circulation (Day et al 2000 1998 Sesink et
al 2002) and being transported to the liver Flavonoids reaching the colon are
hydrolyzed by microorganisms before absorption In human intestine the presence of
the bacteria species Eubacterium Clostridium and Bacterioides indicated metabolism
of flavonoids Various simple aromatic acids are produced in this process and the
released aglycone is often degraded by colonic microorganisms (Manach et al 2004)
These aglycones are further degraded by splitting the heterocyclic ring thus flavonols
mainly produce hydroxyphenylacetic acids Different flavonoid classes lead to different
acids like flavones and flavanones are mainly metabolized to hydroxyphenylpropionic
acids All breakdown products are further metabolized to derivatives of benzoic acid
microbial metabolites are absorbed in the colon and conjugated with glycine glucuronic
acid or sulfate (Manach et al 2004) Due to the different composition of the colonic
microflora in different species the variations in microbial metabolism of flavonoids are
enormous
LITERATURE OVERVIEW
18
The main site of flavonol metabolism besides the gastrointestinal tract is the liver
(Hollman and Katan 1997 Aherne and OrsquoBrien 2002) Flavonoids are transported to
the liver via the portal vein During absorption in the intestine and later in the liver
flavonoids are conjugated by phase-II-reactions mainly glucuronidation methylation
and sulfation Phase-I-reactions like oxidation by enzymes of the cytochrome P450
system are of minor importance in flavonoid metabolism (Otake et al 2002) The
reactions of phase-II mainly are detoxificating processes in the body like metabolism of
xenobiotics (Manach et al 2004) When methylated a methyl group of quercetin is
transferred catalyzed by the catechol-O-methyl transferase (Manach et al 2004) which
is found in many tissues with highest activity in liver and kidneys (Piskula and Terao
1998) Glucuronidation occurs in the liver but also to a great extent in the intestine
(Spencer et al 1999) This process is catalyzed by the Uridine diphosphate-
glucuronosyltransferase which is located in the endoplasmatic reticulum Here
glucuronic acid from Uridine diphosphate-glucuronic acid is transferred to the
polyphenol Sulfation also mainly occurs in the liver (Piskula and Terao 1998) The
transfer of a sulfate moiety from 3acute-phosphoadenosine-5acute-phosphosulfate to the
hydroxyl group of polyphenols is catalyzed by sulfotransferases According to the kind
of the substance and the ingested dose the importance of glucuronidation methylation
and sulfation varies (Manach et al 2004) A higher ingested dose causes a shift from
sulfation to glucuronidation (Koster et al 1981) However the pattern of conjugation is
further influenced by species sex or food deprivation (Piskula 2000)
Flavonoids formed in the gut mucosa only partially enter circulation and a significant
amount will be secreted back into the gut lumen (Crespy et al 1999) This so called
apical efflux out of the enterocytes is probably triggered by adenosine triphosphate-
binding cassette transporter like the multidrug resistance associated protein 2 (Walle et
al 1999 Walgren et al 2000b) the breast cancer resistance protein 1 (Sesink et al
2005) or the P-glycoprotein (Ofer et al 2005)
However flavonoids often undergo an intensive enterohepatic circulation Due to their
biliary excretion back into the duodenum flavonoids may be further metabolized by
intestinal microorganisms or reabsorbed from the intestine (Hackett 1986) This
recycling may enhance availability of flavonoids in the body (Manach et al 2004) or
cause a second plasma peak (Setchell et al 2001 Manach et al 2003) According to
the site of absorption flavonoids may undergo different metabolic fates thus the liver
LITERATURE OVERVIEW
19
might be more important for flavonoids absorbed in the small intestine than for the ones
absorbed in the colon (Heim et al 2002)
Flavonoids and their metabolites usually are excreted by bile or urine The smaller
conjugates prefer urinary excretion whereas the larger and extensively conjugated
metabolites prefer the biliary one (Manach et al 2004) Flavonoid glucuronides and
sulphates are readily excreted with the urine due to their polarity and water solubility
(Hackett 1986) However though various flavonoids are excreted by urine (Aherne and
OʼBrien 2002 Scalbert and Williamson 2000 Manach et al 2004) this route seems to
be of minor importance (Hollman et al 1995) Due to partially long elimination half-
life flavonoids may be accumulated in blood plasma because of repeated absorption
(Aherne and OrsquoBrien 2002)
124 Factors influencing bioavailability of flavonoids
Bioavailability of flavonoids may be influenced at all states of the described LADME-
system on both pre- as well as post-absorptive by species differences and individual
factors like state of development and nutrition (Heaney 2001) enzyme activities or
secretion other regulatory mechanisms and interindividual differences (Egert et al
2008) Plasma peak concentrations of epigallocatechin gallate increased 35-fold when
catechins were given to fasted compared to non-fasted volunteers (Chow et al 2005)
Further mucosal mass intestinal transit time rate of gastric emptying as well as the up-
and down-regulation of absorption by physiological control because of habituation
influenced flavonoid BV (Heaney 2001) Summarized by Scholz and Williamson
(2007) the most important criterion influencing BV is the attached sugar followed by
the food matrix the added flavonoids the given dose and the adaption to it and the
inhibition of flavonoids by chemical changes after absorption or processing in the
gastrointestinal tract or due to interactions with other feed components
The effects of the food matrix the physical form in which flavonoids are administered
and solubility on BV seem to be more complex Quercetin is slightly soluble in water
but addition of organic solvents such as lipids emulsifiers (Azuma et al 2002) or
propylene glycol (Shimoi et al 1998) may enhance solubility The benefit of alcohol on
BV of flavonoids is discussed ambiguous as some found appreciable improvements
(Azuma et al 2002 Dragoni et al 2006) others not (Donovan et al 1999 Goldberg
et al 2003) However Azuma et al (2002) only enhanced BV of flavonoids using
LITERATURE OVERVIEW
20
alcohol concentrations of more than 30 in the diet Overall composition of the meal
and the source of flavonoids have the main impact on BV Quercetin from onions had a
higher BV than quercetin from apples or pure rutin (Hollman et al 1997b) Food
preparation and processing like cooking also affect BV since it can cause a reduction in
flavonoid content or cause chemical transformation (Manach et al 2004) Furthermore
flavonoid absorption is affected by the fat content in the diet (Lesser et al 2004)
Interestingly interactions of polyphenols with milk proteins partly inhibited positive
aspects of flavonoids or led to differences in absorption or reduced AUC values of
flavonoid plasma concentrations (Serafini et al 2003 Reddy et al 2005 Egert et al
2013) Nevertheless other studies in humans showed no effect of milk on BV of
flavonoids (van Het Hof et al 1998 Hollman et al 2001)
125 Studies on bioavailability of quercetin and catechins
In cattle the companion studies of Berger et al (2012) and Gohlke et al (2013) where
quercetin aglycone and rutin were given intraruminal (10 and 50 mgkg body weight
(BW) Berger et al 2012) and intraduodenal (9 18 or 27 mgkg BW Gohlke et al
2013) to dairy cows showed maximal plasma concentrations of flavonols ranging from
about 20 to 1000 nmolL at 30 min to 2 h after administration Interestingly rutin was
much better available than quercetin aglycone after intraruminal (Berger et al 2012)
than after intraduodenal administration (Gohlke et al 2013) Manach et al (2005)
reported a range from 0 to 4 micromolL plasma concentration of total flavonols after intake
of 50 mg aglycone equivalents in humans whereas an older study of Gugler et al
(1975) found no effect of oral administration on quercetin plasma concentration in
humans and therefore suggested oral administration of quercetin as ineffective
However more recent studies revealed detectable plasma concentrations of quercetin
after oral flavonol administration as shown in Table 12 In this overview only studies
were listed in which pure quercetin substances were administered and plasma
concentrations were measured Though lots of BV studies are conducted with food
containing high contents of flavonoids like apples wine or onions interactions with
other food components or matrix effects cannot be excluded Therefore it is more
reliable using pure substances for comparing BV studies
Studies on the BV of catechins with pure substances are rare as mostly tea extracts
were used According to Manach et al (1999) in rats the catechin metabolites (catechin
LITERATURE OVERVIEW
21
and methylcatechin) reached similar plasma concentrations after oral supplementation
of catechin than the quercetin metabolites quercetin isorhamnetin and tamarixetin after
quercetin administration in comparable doses However metabolites of catechin showed
a faster decline in plasma concentration than those of quercetin possibly due to lesser
binding to plasma albumin or higher urinary excretion (Manach et al 1999) Hollman
et al (1997a) too postulated a good absorption of catechin and its microbial
degradation products after oral administration of radioactively labelled (+)-catechin to
rodents monkeys and humans in different studies Nevertheless BV of catechins
widely depends on species on the administered compound and on the chemically
structure of the distinct catechin isomers such as epicatechin epigallocatechin and
epigallocatechin gallate In rats fed 200 mgkg BW of a green tea extract (GTE) Chen
et al (1997) found a systemic availability of 312 for epicatechin and of 14 for
epigallocatechin but only of 01 for epigallocatechin gallate whereas in dogs after
oral and intravenous administration of 25 mgkg BW of epigallocatechin gallate
absolute BV was about 20 (Swezey et al 2003) However systemic available
epicatechin epigallocatechin and epigallocatechin gallate was very low after oral
administration of 20 mgkg BW of green tea to humans (Lee et al 2002) or after oral
administration of 500 mgkg BW and intravenous administration of 50 mgkg BW
catechin fractions containing 5 epicatechin 13 epicatechin gallate and 50
epigallocatechin gallate to rats (Zhu et al 2000) The consumption of a green tea
beverage by humans resulted in maximal plasma concentrations of total catechins of
4618 plusmn 274 nmolL at 90 min after drinking (Egert et al 2013) Major catechins in this
study detected in plasma samples after consumption of various test drinks were
epigallocatechin gallate (1799 nmolL) epicatechin gallate (1473 nmolL)
epigallocatechin (865 nmolL) epicatechin (482 nmolL) and small amounts of
catechin and gallocatechin (Egert et al 2013)
LITERATURE OVERVIEW
22
Ta
ble
12
O
ver
vie
w o
f th
e b
ioa
va
ila
bil
ity
of
qu
erce
tin
fro
m d
iffe
ren
t n
atu
ral
form
s
Ref
eren
ce
Su
bje
ct
ap
pli
cati
on
Fla
vo
no
id
do
se
Co
nv
erte
d d
ata
AU
C
Tm
ax
Cm
ax
nm
ol
L times
h
min
n
mo
lL
Ber
ger
et
al
(20
12
)
Co
w
intr
aru
min
al
Q
50
mgk
g B
W
18
2
3
0
9
0
Q
1
0 m
gk
g B
W
-
3
0
~
20
R
5
0 m
gk
g B
W
1
39
9
4
2
10
00
R
1
0 m
gk
g B
W
-
3
0
~
80
Go
hlk
e et
al
(2
01
3)
Co
w
intr
aduo
den
al
Q
9 m
gk
g B
W
84
5
10
5
4
07
Q
1
8 m
gk
g B
W
1
33
3
11
0
5
73
Q
2
7 m
gk
g B
W
1
58
7
12
5
6
36
R
9
mgk
g B
W
13
8
-
2
7
R
1
8 m
gk
g B
W
13
2
-
1
8
R
2
7 m
gk
g B
W
10
2
-
1
9
Cer
mak e
t al
(2
00
3)
Pig
o
ral
Q
50
mgk
g B
W
8
67
7
2
0
11
90
R
5
0 m
gk
g B
W
1
99
7
21
0
3
57
Les
ser
et a
l (
20
04)
Pig
o
ral
Q
10
mgk
g B
W
1
95
0
10
2
5
18
Ad
er e
t al
(2
00
0)
Pig
o
ral
Q
50
mgk
g B
W
-
24
0
8
52
Q
50
0 m
gk
g B
W
-
15
0
41
13
Erl
und
et
al
(20
00
) H
um
an
ora
l Q
8
mg
17
44
11
4
1
37
Q
2
0 m
g
2
918
16
2
2
19
Q
5
0 m
g
3
765
29
4
2
85
R
8
mg
6
24
1
41
0
3
8
R
2
0 m
g
1
042
44
4
7
8
R
5
0 m
g
1
666
45
0
1
47
Ho
llm
an e
t al
(1
99
7b
) H
um
an
ora
l R
2
00
mg
16
10
55
8
1
47
LITERATURE OVERVIEW
23
T
ab
le 1
2
Co
nti
nu
ati
on
Ref
eren
ce
Su
bje
ct
ap
pli
cati
on
Fla
vo
no
id
do
se
Co
nv
erte
d d
ata
1
AU
C
Tm
ax
Cm
ax
nm
ol
L times
h
min
n
mo
lL
Ho
llm
an e
t al
(1
99
9)
Hu
man
o
ral
Sp
irae
osi
d
~1
50 m
g
18
800
3
0
3
500
R
uto
sid
um
~
20
0 m
g
3
700
3
60
1
80
Olt
ho
f et
al
(2
00
0)
Hu
man
o
ral
Iso
quer
citr
in
~1
50
mg
19
100
3
7
5
000
S
pir
aeo
sid
~
15
0 m
g
17
500
2
7
4
500
Eger
t et
al
(2
00
8)
Hu
man
o
ral
Q
50
mg
1
268
1
20
1
89
Q
10
0 m
g
3
000
1
80
2
95
Q
15
0 g
5
097
3
60
4
31
Man
ach e
t al
(1
99
7)
R
at
ora
l Q
0
2
of
die
t
-
7
20
550
00
R
04
o
f d
iet
-
14
40
350
00
Man
ach e
t al
(1
99
9)
Rat
o
ral
Q
02
5
of
die
t
-
14
40
520
00
Rei
nb
oth
et
al
(20
10)
Do
g
ora
l Q
1
0 m
gk
g B
W
2
915
1)
72
1)
233
6
2
) 2
34
2)
229
2
R
1
0 m
gk
g B
W
2
667
1)
42
1
) 17
2
) 6
66
2)
113
7
Is
oq
uer
citr
in
10
mg
kg B
W
6
837
1)
48
1)
667
4
2
) 2
46
2)
888
3
Wei
n a
nd
Wo
lffr
am
(2
01
3)
Ho
rse
ora
l Q
2
0 m
gk
g B
W
2
010
6
0
75
0
1A
UC
T
max
and
Cm
ax a
re c
onv
erte
d a
ll i
nto
sam
e un
its
for
com
par
iso
n o
f d
ata
R =
quer
ceti
n a
s glu
corh
am
no
sid
e ru
tin
Q
= q
uer
ceti
n a
s ag
lyco
ne
(wit
ho
ut
atta
ched
sugar)
A
UC
= a
rea
und
er t
he
pla
sma-c
once
ntr
atio
n t
ime
curv
e
Cm
ax =
maxim
al r
each
ed p
lasm
a co
nce
ntr
atio
n o
f to
tal
flav
ono
ls m
easu
red
in e
ach s
tud
y
Tm
ax =
tim
e ti
ll C
max
is
reac
hed
B
W =
bo
dy w
eig
ht
- =
no
val
ues
giv
en
=
dat
a ev
aluate
d f
rom
fig
ure
1
) 2
) =
fir
st a
nd
sec
ond
pea
k
LITERATURE OVERVIEW
24
13 Metabolic and health status in neonatal calves
131 Metabolic status in calves at birth and postnatal changes
Although calves are precocial animals and thus relatively mature when born they still
must adapt to various morphological and functional changes after birth (Blum and
Hammon 2000) During gestation energy supply is continuously via placenta with
glucose as main energy substrate With birth this changes to a discontinuously oral
supply by colostrum and milk intake with lactose and fat as main energy source
(Hammon et al 2013) Prenatal glucocorticoids and catecholamines as well as thyroid
hormones in the fetal blood lead to an increased gluconeogenic activity and hepatic
glycogen storage ensuring coverage of the energy demand of the newborn calf
(Hammon et al 2012) However calves are often hypoglycemic after birth as they
need to adapt to the usage of other fuels than glucose taken up with liquid feeding
Thus endogenous glucose production is an important pathway to ensure glucose
homeostasis in the calf and increases with maturation (Steinhoff-Wagner et al 2011)
Important regulators for endogenous glucose production are hormones like insulin
glucagon catecholamines growth hormone and glucocorticoids The peptide hormone
insulin is built in the pancreatic β-cells Plasma concentrations are reduced at birth and
increase after first feed intake indicating that especially glucose intake stimulates insulin
secretion (Hadorn et al 1997 Hammon and Blum 1998 Rauprich et al 2000) The
peptide hormone glucagon is built in the pancreatic α-cells and acts as antagonist to
insulin Plasma glucagon concentrations also increase after first feed intake in calves
(Hammon et al 2012) Endogenous glucose production is in addition stimulated by
catecholamines glucocorticoids and probably growth hormone (GH) Around birth all
these hormones showed elevated plasma concentrations in calves and catecholamines
and glucocorticoids are known for their promoting effects on metabolic maturation in
the neonate (Hammon et al 2012 2013) Plasma concentrations of cortisol are high at
birth and decrease thereafter (Hadorn et al 1997 Hammon et al 2012 Schiessler et
al 2002) In addition cortisol next to other regulators is a major player for initiating
birth (Liggins 1994) Furthermore thyroid hormones play an important role for
endogenous glucose production during late gestation and after birth (Fowden et al
2001) Plasma concentrations of thyroid hormones are high at birth and decrease
LITERATURE OVERVIEW
25
thereafter in mature calves but not in preterm born calves (Steinhoff-Wagner et al
2011)
In neonatal calves colostrum feeding affects the GH ndash insulin-like growth factor (IGF)
system which most likely is a response to energy supply and improved glucose status in
calves after colostrum feeding (Hammon et al 2012) Amount time point and
frequency of feeding influence plasma IGF-1 concentrations (Hadorn et al 1997
Nussbaum et al 2002) which are lower during the first wk of life in restricted (Hadorn
et al 1997) or formula fed calves (Rauprich et al 2000) indicating the huge
importance of early and sufficient colostrum feeding to newborn calves for their
development and maturation
132 Health status in calves and development of the immune system
Immune defence of newborn calves depends on uptake of immunoglobulins (Ig) with
colostrum as there is no placental transfer of Ig and endogenous production of Ig is
negligible (Chase et al 2008) The ingestion of sufficient colostrum is thus essential for
immunological protection during the first 2 to 4 weeks of life until calves develop an
adequate own active immune system (Chase et al 2008 Figure 15) With colostrum Ig
are transferred from the cow to the newborn calf and activate and regulate the innate
immune response (Chase et al 2008)
Figure 15 Illustration of the development of immunity and immune response of calves
Modified from Chase et al (2008)
Apart from nutrients and Ig colostrum contains minerals vitamins and also non-
nutrient components like growth factors cytokines hormones and further bioactive
LITERATURE OVERVIEW
26
substances (Blum 2006) Most of these non-nutrient factors and bioactive compounds
are derived from blood of dams but some are produced in the mammary gland (Blum
2006) The average Ig concentrations in bovine colostrum varies greatly depending
mainly on breed age of dam nutrition in the preparturient period season or amount of
produced colostrum (Godden 2008) As colostrogenesis ends abruptly at parturition the
greatest concentration of the beneficial compounds is in first colostrum and in further
milkings concentrations are decreasing because of dilution effects (Godden 2008) The
small intestine as the site of digestion and absorption of Ig mainly IgG is permeable for
up to 12 to 48 h after birth (Stott et al 1979 Baintner 2007) Feeding the calf leads to
a faster closure of the gut permeability for great Ig independent from the amount fed
(Stott et al 1979) Small intestinal epithelium includes vacuoles that allow intracellular
digestion at birth but soon after colostrum ingestion vacuoles disappear (Blum 2005)
Therefore colostrum influences the gastrointestinal tract as seen among others in
changes in microbial population epithelial cell proliferation protein synthesis and
digestion (Blum 2006) Furthermore colostrum also exerts long-lasting systemic
effects on metabolism and endocrine traits by effecting systemic growth activity and
behavior (Blum 2006)
Endogenous Ig production and thus active immunity in calves is delayed (Chase 2008)
With passive immunity decreasing and active immunity still being insufficient
susceptibility to diseases is highest in the first wk of life (Figure 15) and notable calf
losses occur with pneumonia and diarrhea being the main reasons for it (USDA 2011)
Pneumonia in pre-weaned calves is a multi-factorial disease caused by a number of
viruses and some calf- and environmental related risk factors (Lorenz et al 2011)
Diarrhea is one of the most serious problems in calf rearing worldwide often leading to
other diseases like pneumonia in enfeebled calves Furthermore those calves show
reduced growth So calves suffering from diseases in newborn age may show long-
lasting impaired performance
133 Oxidative stress and antioxidative capacity in neonatal calves
Oxygen is essential for all aerobic living organisms It is part of several chemical
compounds like hydrogen peroxide hypochlorus acid peroxinitrite singlet oxygen and
ozone Importantly oxygen has the potential to destroy cell integrity when building up
reactive oxygen species (ROS) These ROS can be divided in free radicals and non-
LITERATURE OVERVIEW
27
radicals In general a free radical is an atom or molecule with one or more unpaired
electrons (Halliwell 1991) marked by the radical dot (middot) The most reactive ones are
hydroxyl radical superoxide anion nitric oxide and peroxyl radical All these ROS are
naturally produced in the body during energy production and unspecific immune
defense mainly to neutralize bacteria and viruses and thus protecting the body against
pathogens External influences like ionizing radiation toxins drugs and chemicals or
environmental pollutants can considerably increase the generation of ROS (Sies 1991)
resulting in cell toxic conditions
The organism has a pool of reducing systems to neutralize these free radicals called
antioxidants These are substances that when present at low concentrations compared
with those of an oxidizable substrate significantly delay or prevent oxidation of that
substrate (Halliwell 1991) Antioxidants are divided into enzymatic antioxidants like
superoxide-dismutase catalase or glutathion-peroxidase and non-enzymatic
antioxidants including albumin carotenoids bilirubin uric acid glutathion vitamins
A C and E as well as flavonoids Every aerobe living system is aligned to have a
balance between these oxidants and antioxidants but due to inadequate antioxidant
defense or external influences an imbalance between the generation of prooxidants and
the activity of the antioxidant defenses in favor for the prooxidants can occur and is
called oxidative stress (Sies 1985 1991) Oxidative stress is related to numerous
diseases the so called free radical diseases According to Halliwell (1991) for most
human diseases oxidative stress might be secondary to the primary disease process
Next to maturation of the organism (Robles et al 2001 Saugstad 2005 Mutinati et al
2014) nutrient status and nutrition in general plays a major role in the antioxidant
system (Schwerin et al 2002 Sies et al 2005) However neonates have a greater
susceptibility to oxidative stress than adults or juvenile subjects (Saugstad 2005
Mutinati et al 2014) Main reason therefor is the change from the hypoxic intrauterine
environment to extrauterine conditions after birth and the start of regular breathing
(Robles et al 2001 Albera and Kankofer 2011) Especially premature neonates are
prone to oxidative stress (Robles et al 2001)
There are several approaches to measure antioxidative capacity oxidative stress or free
radicals Alam et al (2013) reviewed 29 different in vivo and in vitro methods for
evaluating antioxidant activity and oxidative stress In general common methods range
from quantification of (free) radicals quantification of markers for oxidative stress like
LITERATURE OVERVIEW
28
DNA damage or lipid peroxidation up to the quantification of markers for the
antioxidant system like enzymes Figure 16 gives an overview of the most common
methods for evaluation of oxidative stress and antioxidant capacity In general the
antioxidative status should not only be evaluated by a single test model since there is no
absolute method (Alam et al 2013)
Figure 16 Simplified classification of methods used for determining oxidative stress and
antioxidant capacity
TBARS = thiobarbituric acid reactive substances F2-Iso = F2-isoprostanes TEAC = trolox equivalent
antioxidative capacity FRAP = ferric reducing ability of plasma
Modified from Kohen and Nyska (2002)
There are plenty of studies describing the antioxidative status or oxidative stress in
calves but only a few studies can be compared directly due to different methods of
analyzing and experimental set-up Main studies in calves deal with selected parameters
of oxidative stress or the antioxidant capacity Stohrer et al (2003) investigated the
antioxidant status of cows and calves via trolox equivalent antioxidative capacity
(TEAC) and found impairment during the first wk of life and thus assumed that
ischemiareperfusion injury during birth may affect antioxidative status of neonatal
calves Alexandrovich and Antonovna (2009) confirmed an elevated level of oxidative
stress during the first d of life up to d 45 of age due to an increased level of
LITERATURE OVERVIEW
29
thiobarbituric acid active products and glutathione when calves were less than 15 d old
and reduced values when calves were 50 to 60 d old The authors assume that the
transition period in feeding of calves was the reason for that Also transportation of
calves leads to an increase of markers for oxidative stress Wernicki et al (2006) found
significantly elevated thiobarbituric acid reactive substances (TBARS) plasma
concentration in calves that were transported for 2 h The season did not significantly
change TBARS levels in calves but glutathione peroxidase and superoxide dismutase
were higher in calves born in summer than in calves born in fall (Chigerwe et al 2013)
However in this study no correlation between TBARS and the age of calves was found
but there was an obvious correlation between increased oxidative stress or a reduced
antioxidative capacity and health status of calves These findings confirmed a study by
Ahmed and Hassan (2007) who investigated several parameters of calves infected with
Eimeria species Malondialdehyde and nitric oxide as markers for oxidative stress were
elevated in infected calves Catalase superoxide-dismutase ascorbic acid glutathione
and the total antioxidant capacity were significantly reduced in infected calves
compared to control calves Bronchopneumonia as a major calf disease similarly
showed elevated markers of oxidative stress in calves (Al-Qudah 2009) Also the way
of delivery seems to influence the antioxidative status since higher malondialdehyde
and glutathione concentrations in blood showed an exposure to higher oxidative stress
in calves delivered by caesarian section (Erisir et al 2013) Retskii et al (2010)
lsquocorrectedrsquo the antioxidant status of newborn calves to form higher colostral immunity
due to treatment with glucose ascorbic acid solution and unithiol and thus reduced the
incidence and severity of neonatal diseases
134 Effects of flavonoid administration on development and health status in
neonatal calves
Countless flavonoid-rich feed additives are marketed claiming improvements in animal
health and productivity in cattle nutrition These additives are used in calvesʼ milk
replacer and in feed for heifers lactating cows and fattening cattle
(httpsanogoldeunews2008flavonoidephp httpwwwpultedeAntioxidantien_
Botanische_Wirkstoffeamplang=en httpwwwschaumanndecpsrdeSID-18 120AAB
B3-717B45schaumann-dehsxsl4736html httpwwwprovimicomgrmediagrape_
pp_concentrate_-_engpdf httpwww gainfeedscomruminant goldgrain-calf-nut)
LITERATURE OVERVIEW
30
In general lots of feed additives are supposed to reduce or replace antibiotics thus
terms like phytobiotics phototherapeutic or nutraceutical are commonly used Since
flavonoids are present in all kinds of higher plants young ruminants may have
evolutionary depended on flavonoids (Yaghoubi et al 2008) However results of
studies on feeding flavonoids to young calves are ambiguous As mentioned the
metabolism of calves mainly is influenced by nutrition hence Yaghoubi et al (2008)
postulated an improved growth of calves by feeding flavonoids extracted from propolis
Enhancing growth in ruminants by flavonoid feeding is discussed due to possible effects
on microbial population in the rumen (Aerts et al 1999 Greathead 2003) and
especially in the developing reticulorumen (Yaghoubi et al 2008 Costa Jr et al
2012) According to Aerts et al (1999) the degradation of dietary protein to ammonia
by microorganisms in the rumen of sheep is slowed down by proanthocyanidins which
are polymere forms of catechins and thus increasing the absorption of amino acids in
the small intestine Durmic and Blache (2012) also reviewed beneficial effects of
secondary plant compounds on rumen fermentation focused on the protection of dietary
proteins combined with a reduced microbial proteolysis and release into the duodenum
However mainly tannins are building complexes with proteins (Aerts et al 1999) In
general secondary plant metabolites may exert prebiotic effects due to stimulation of
certain bacteria in the rumen (Greathead 2003) and affect the immune system as
hypothesized by Yaghoubi et al (2008) though the authors found an ambiguous blood
IgG concentrations after feeding flavonoids to calves Metwally et al (2013) reported a
numeric increase in blood IgM concentrations after feeding propolis extract to buffalo
calves considering a non-specific immunostimulating effect Also Oliveira et al (2010)
postulated an improved immune response of calves when feeding a flavonoid-rich
pomegranate extract due to an enhanced total IgG response after ovalbumin vaccination
and increased synthesis of interferon-γ and interleukin-4 On the other hand neutrophil
phagocytic and killing activities of neutrophils against Escherichia coli did not differ
when feeding pomegranate extract to young calves (Oliveira et al 2010) Besides that
some flavonoids have hormone-like structures and activities and therefore are called
phyto-oestrogens (Greathead 2003) probably exerting anabolic effects in calves Such
effects were seen in other species like mice (Sokolova et al 1978) Furthermore it is
noteworthy that quercetin is a major component of several plants used as antidiarrheal
remedies (Middleton et al 2000) Di Carlo et al (1994) showed quercetin feeding
LITERATURE OVERVIEW
31
ameliorating diarrhea in mice by 92 in a dose-related manner as did Gaacutelvez et al
(1995) in quercitrin (3-rhamnosylquercetin)-treated rats and Nielsen (2008) in piglets
Rao et al (1997) pointed out a possible antidiarrheal effect of the flavonoid ternatin
However propolis or pomegranate extract feeding did not ameliorate diarrhea in calves
(Yaghoubi et al 2008 Oliveira et al 2010) but feeding a GTE decreased frequency
and degree of non-pathogenic diarrhea remarkably (Ishihara et al 2001)
14 Conclusive remarks and need for further research
Green feed additives like flavonoids have a considerably role in human and animal
nutrition Numerous feed supplements containing flavonoids are marketed in the dairy
industry to improve health growth and thus productivity
These antioxidative anti-inflammatory and antimicrobial secondary plant metabolites
may especially be used in the neonatal period when calves are just developing their
immune system However little is known about the systemic BV of flavonoids and their
effects in vivo especially in calves Thus the aim of this study is to investigate the BV
of the most abundant flavonoids quercetin and catechin in newborn calves and to
examine their effects on selected aspects of the antioxidative status and metabolism
Therefore dairy calves were fed quercetin as aglycone its glucorhamnoside rutin and
catechins for the first 3 wk of life Parameters of the antioxidative status oxidative
stress and metabolism were determined and studies on BV of quercetin aglycone and
rutin were performed on d 2 and 29 of life representing a different ontogenetic status in
calves
LITERATURE OVERVIEW
32
References
Ader P A Wessmann and S Wolffram 2000 Bioavailability and metabolism of the
flavonol quercetin in the pig Free Radic Biol Med 281056ndash1067
Aerts R J T N Barry and W C McNabb 1999 Polyphenols and agriculture
Beneficial effects of proanthocyanidins in forages Agric Ecosyst Environ 751ndash
12
Aherne S A and N M OrsquoBrien 2002 Dietary flavonols Chemistry food content
and metabolism Nutrition 1875ndash81
Ahmed W M and S E Hassan 2007 Applied studies on coccidiosis in growing
buffalo-calves with special reference to oxidantantioxidant status World J Zool
240ndash48
Alam M N N J Bristi and M Rafiquzzaman 2013 Review on in vivo and in vitro
methods evaluation of antioxidant activity Saudi Pharm J 21143ndash152
Albera E and M Kankofer 2011 The comparison of antioxidativeoxidative profile in
blood colostrum and milk of early post-partum cows and their newborns Reprod
Domest Anim 46763ndash769
Alexandrovich K N and S E Antonovna 2009 Age-dependent level of antioxidant
defence system and lipid metabolism state in calves Int J Appl Res Vet Med
773ndash75
Al-Qudah K M 2009 Oxidative stress in calves with acute or chronic
bronchopneumonia Rev Med Vet 160231ndash236
Arts I C W A L A Sesink M Faassen-Peters and P C H Hollman 2004 The
type of sugar moiety is a major determinant of the small intestinal uptake and
subsequent biliary excretion of dietary quercetin glycosides Br J Nutr 91841ndash
847
Aviram M and B Fuhrman 2003 Effects of flavonoids on the oxidation of low-
density lipoprotein and atherosclerosis Pages 165ndash203 in Flavonoids in Health
and Disease Second Edition C A Rice-Evans and L Packer eds Marcel
Dekker Inc New York USA
LITERATURE OVERVIEW
33
Azuma K K Ippoushi H Ito H Higashio and J Terao 2002 Combination of lipids
and emulsifiers enhances the absorption of orally administered quercetin in rats J
Agr Food Chem 501706ndash1712
Baintner K 2007 Transmission of antibodies from mother to young Evolutionary
strategies in a proteolytic environment Vet Immunol Immunopathol 117153ndash
161
Berger L M S Wein R Blank C C Metges and S Wolffram 2012 Bioavailability
of the flavonol quercetin in cows after intraruminal application of quercetin
aglycone and rutin J Dairy Sci 955047ndash5055
Besle J M D Viala B Martin P Pradel B Meunier J L Berdagueacute D Fraisse J L
Lamaison and J B Coulon 2010 Ultraviolet-absorbing compounds in milk are
related to forage polyphenols J Dairy Sci 932846ndash2856
Bhagwat S D B Haytowitz J M Holden (Ret) 2013 USDA database for the
flavonoid content of selected foods Release 31 US Department of Agriculture
(USDA) Agricultural Research Service
httpwwwarsusdagovSP2UserFilesPlace12354500DataFlavFlav3-1pdf
(Accessed April 2014)
Birt D F S Hendrich and W Wang 2001 Dietary agents in cancer prevention
Flavonoids and isoflavonoids Pharmacol Ther 90157ndash177
Blum J W 2005 Bovine gut development Pages 31ndash52 in Calf and heifer rearing
P C Garnsworthy ed Nottingham University Press Nottingham UK
Blum J W 2006 Nutritional physiology of neonatal calves J Anim Physiol Anim
Nutr 901ndash11
Blum J W and H Hammon 2000 Colostrum effects on the gastrointestinal tract and
on nutritional endocrine and metabolic parameters in neonatal calves Livest
Prod Sci 66151ndash159
Brand W M E Schutte G Williamson J J van Zanden N H P Cnubben J P
Groten P J van Bladeren and I M C M Rietjens 2006 Flavonoid-mediated
inhibition of intestinal ABC transporters may affect the oral bioavailability of
drugs food-borne toxic compounds and bioactive ingredients Biomed
Pharmacother 60508ndash519
LITERATURE OVERVIEW
34
Bose M J D Lambert J Ju K R Reuhl S A Shapses and C S Yang 2008 The
major green tea polyphenol (ndash)-epigallocatechin-3-gallate inhibits obesity
metabolic syndrome and fatty liver disease in high-fat-fed mice J Nutr
138167ndash1683
Boulton D W U K Walle and T Walle 1998 Extensive binding of the bioflavonoid
quercetin to human plasma proteins J Pharm Pharmacol 50243ndash249
Cermak R S Landgraf and S Wolffram 2003 The bioavailability of quercetin in
pigs depends on the glycoside moiety and on dietary factors J Nutr 1332802ndash
2807
Cermak R and S Wolffram 2006 The potential of flavonoids to influence drug
metabolism and pharmacokinetics by local gastrointestinal mechanisms Curr
Drug Metab 7729ndash744
Chase C C L D J Hurley and A J Reber 2008 Neonatal immune development in
the calf and its impact on vaccine response Vet Clin North Am Food Anim
Pract 2487ndash104
Chen C-H H-J Hsu Y-J Huang and C-J Lin 2007 Interaction of flavonoids and
intestinal facilitated glucose transporters Planta Med 73348ndash354
Chen L M-J Lee and C S Yang 1997 Absorption distribution and elimination of
tea polyohenols in rats Drug Metab Dispos 251045ndash1050
Chigerwe M A D Beck S S Kim and D M Coons 2013 Comparison of plasma
oxidative status biomarkers in neonatal dairy calves during summer and fall
seasons J Veterinar Sci Technolo S111ndash4
Chow H-H S I A Hakim D R Vining J A Crowell J Ranger-Moore W M
Chew C A Celaya S R Rodney Y Hara and D S Alberts 2005 Effects of
dosing condition on the oral bioavailability of green tea catechins after single-
dose administration of Polyphenon E in healthy individuals Clin Cancer Res
114627ndash4633
Chung K T C-I Wei and M G Johnson 1998 Are tannins a double-edged sword in
biology and health Trends Food Sci Technol 9168ndash175
LITERATURE OVERVIEW
35
Cos P L Maes A Vlietinck and L Pieters 2008 Plant-derived leading compounds
for chemotherapy of human immunodeficiency virus (HIV) infection - an update
(1998 - 2007) Planta Med 741323ndash1337
Costa Jr J B G L M Zeoula S L Franco L P P de Moura M V Valero F L
Simiono E M da Paula and R B Samensari 2012 Effect of propolis product
on digestibility and ruminal parameters in buffaloes consuming a forage-based
diet Ital J Anim Sci 11e78
Crespy V C Morand C Besson N Cotelle H Veacutezin C Demigneacute and C Reacutemeacutesy
2003 The splanchnic metabolism of flavonoids highly differed according to the
nature of the compound Am J Physiol Gastrointest Liver Physiol 284G980ndash
G988
Crespy V C Morand C Besson C Manach C Demigne and C Remesy 2002
Quercetin but not its glycosides is absorbed from the rat stomach J Agr Food
Chem 50618ndash621
Crespy V C Morand C Manach C Besson C Demigne and C Remesy 1999 Part
of quercetin absorbed in the small intestine is conjugated and further secreted in
the intestinal lumen Part of quercetin absorbed in the small intestine is conjugated
and further secreted in the intestinal lumen Am J Physiol Gastrointest Liver
Physiol 277G120ndashG126
Crozier A M E J Lean M S McDonald and C Black 1997 Quantitative analysis
of the flavonoid content of commercial tomatoes onions lettuce and celery J
Agr Food Chem 45590ndash595
Dangles O and C Dufour 2006 Flavonoid-Protein Interactions Pages 443ndash469 in
Flavonoids Chemistry Biochemistry and Applications O M Andersen and
K R Markham ed Taylor amp Francis Group Boca Raton USA
Das D K 1994 Naturally occurring flavonoids Structure chemistry and high-
performance liquid chromatography methods for separation and characterization
Methods Enzymol 234410ndash420
LITERATURE OVERVIEW
36
Day A J F J Cantildeada J C Diacuteaz P A Kroon R Mclauchlan C B Faulds G W
Plumb M R Morgan and G Williamson 2000 Dietary flavonoid and
isoflavone glycosides are hydrolysed by the lactase site of lactase phlorizin
hydrolase FEBS Lett 468166ndash170
Day A J M S DuPont S Ridley M Rhodes M J Rhodes M R Morgan and G
Williamson 1998 Deglycosylation of flavonoid and isoflavonoid glycosides by
human small intestine and liver beta-glucosidase activity FEBS Lett 43671ndash75
Denny A and J Buttriss 2005 Synthesis Report No 4 Plant Foods and Health Focus
on Plant Bioactives British Nutrition Foundation Norfolk UK
di Carlo G D N Mascolo A A Izzo and F Capasso 1994 Effects of quercetin on
the gastrointestinal tract in rats and mice Phytother Res 842ndash45
di Pietro A G Conseil J M Peacuterez-Victoria G Dayan H Baubichon-Cortay D
Trompier E Steinfels J-M Jault H de Wet M Maitrejean G Comte A
Boumendjel A-M Mariotte C Dumontet D B McIntosh A Goffeau S
Castanys F Gamarro and D Barron 2002 Modulation by flavonoids of cell
multidrug resistance mediated by P-glycoprotein and related ABC transporters
Cell Mol Life Sci 59307ndash322
Donovan J L J R Bell S Kasim-Karakas J B German R L Walzem R J
Hansen and A L Waterhouse 1999 Catechin is present as metabolites in human
plasma after consumption of red wine J Nutr 1291662ndash1668
Dragoni S J Gee R Bennett M Valoti and G Sgaragli 2006 Red wine alcohol
promotes quercetin absorption and directs its metabolism towards isorhamnetin
and tamarixetin in rat intestine in vitro Br J Pharmacol 147765ndash771
Dufour C and O Dangles 2005 Flavonoid-serum albumin complexation
Determination of binding constants and binding sites by fluorescence
spectroscopy Biochim Biophys Acta 1721164ndash173
Durmic Z and D Blache 2012 Bioactive plants and plant products Effects on animal
function health and welfare Anim Feed Sci Technol 176150ndash162
LITERATURE OVERVIEW
37
Egert S J Tereszczuk S Wein M J Muumlller J Frank G Rimbach and S Wolffram
2013 Simultaneous ingestion of dietary proteins reduces the bioavailability of
galloylated catechins from green tea in humans Eur J Nutr 52281ndash288
Egert S S Wolffram A Bosy-Westphal C Boesch-Saadatmandi A E Wagner J
Frank G Rimbach and M J Mueller 2008 Daily quercetin supplementation
dose-dependently increases plasma quercetin concentrations in healthy humans
J Nutr 1381615ndash1621
Erlund I T Kosonen G Alfthan J Maumlenpaumlauml K Perttunen J Kenraali J
Parantainen and A Aro 2000 Pharmacokinetics of quercetin from quercetin
aglycone and rutin in healthy volunteers Eur J Clin Pharmacol 56545ndash553
Erisir M F M Kandemir and M Yuumlksel 2013 The effects of caesarean section on
lipid peroxidation and some antioxidants in the blood of newborn calves Vet
Archiv 83153ndash159
European Agency for the Evaluation of Medicinal Products 2000 Note for guidance on
the investigation of bioavailability and bioequivalence Committee for proprietary
medicinal products London UK
Frey H-H 2007 Allgemeine Pharmakologie Pages 1ndash32 in Lehrbuch der
Pharmakologie und Toxikologie fuumlr die Veterinaumlrmedizin H-H Frey and W
Loumlscher ed Enke Verlag Stuttgart Germany
Fowden A L J Mapstone and A J Forhead 2001 Regulation of glucogenesis by
thyroid hormones in fetal sheep during late gestation J Endocrinol 170461ndash469
Gaacutelvez J F Saacutenchez de Medina J Jimeacutenez M I Torres M I Fernaacutendez M C
Nuacutentildeez A Riacuteos A Gil and A Zarzuelo 1995 Effect of quercitrin on lactose-
induced chronic diarrhoea in rats Planta Med 61302ndash306
Gasparin F R S C L Salgueiro-Pagadigorria L Bracht E L Ishii-Iwamoto A
Bracht and J Constantin 2003a Action of quercetin on glycogen catabolism in
the rat liver Xenobiotica 33587ndash602
Gasparin F R S F L Spitzner E L Ishii-Iwamoto A Bracht and J Constantin
2003b Actions of quercetin on gluconeogenesis and glycolysis in rat liver
Xenobiotica 33903ndash911
LITERATURE OVERVIEW
38
Gee J M M S DuPont M J C Rhodes and I T Johnson 1998 Quercetin
glucosides interact with the intestinal glucose transport pathway Free Radic Biol
Med 2519ndash25
Girard J P Ferreacute J-P Pegorier and P-H Dueacutee 1992 Adaptations of glucose and
fatty acid metabolism during perinatal period and suckling-weaning transition
Physiol Rev 72507ndash562
Gohlke A C J Ingelmann G Nuumlrnberg A Starke S Wolffram and C C Metges
2013 Bioavailability of quercetin from its aglycone and its glucorhamnoside rutin
in lactating dairy cows after intraduodenal administration J Dairy Sci 962303ndash
2313
Goldberg D M J Yan and G J Soleas 2003 Absorption of three wine-related
polyphenols in three different matrices by healthy subjects Clin Biochem 3679ndash
87
Godden S 2008 Colostrum management for dairy calves Vet Clin Food Anim
2419ndash39
Gould K S and C Lister 2006 Flavonoid Functions in Plants Pages 397ndash441 in
Flavonoids Chemistry Biochemistry and Applications O M Andersen and K
R Markham ed Taylor amp Francis Group Boca Raton USA
Greathead H 2003 Plants and plant extracts for improving animal productivity Proc
Nutr Soc 62279ndash290
Gugler R M Leschik and H J Dengler 1975 Disposition of quercetin in man after
single oral and intravenous doses Eur J Clin Pharmacol 9229ndash234
Hackett A M 1986 The metabolism of flavonoid compounds in mammals Pages
177ndash194 in Plant Flavonoids in Biology and Medicine Biochemical
pharmacological and structure-activity relationship V Cody E J Middleton
and J B Harborne ed Alan R Liss Inc New York USA
Hadorn U H Hammon R M Bruckmaier and J W Blum 1997 Delaying colostrum
intake by one day has important effects on metabolic traits and on gastrointestinal
and metabolic hormones in neonatal calves J Nutr 1272011ndash2023
LITERATURE OVERVIEW
39
Halliwell B 1991 Reactive oxygen species in living systems Source biochemistry
and role in human disease Am J Med 91S14ndashS22
Hammon H M and J W Blum 1998 Metabolic and endocrine traits of neonatal
calves are influenced by feeding colostrum for different durations or only milk
replacer J Nutr 128624ndash632
Hammon H M J Steinhoff-Wagner J Flor U Schoumlnhusen and C C Metges 2013
Lactation Biology Symposium Role of colostrum and colostrum components on
glucose metabolism in neonatal calves J Anim Sci 91685ndash695
Hammon H M J Steinhoff-Wagner U Schoumlnhusen C C Metges and J W Blum
2012 Energy metabolism in the newborn farm animal with emphasis on the calf
Endocrine changes and responses to milk-born and systemic hormones Domest
Anim Endocrinol 43171ndash185
Hanhineva K R Toumlrroumlnen I Bondia-Pons J Pekkinen M Kolehmainen H
Mykkaumlnen and K Poutanen 2010 Impact of dietary polyphenols on
carbohydrate metabolism Int J Mol Sci 111365ndash1402
Harborne J B and C A Williams 2000 Advances in flavonoid research since 1992
Phytochemistry 55481ndash504
Heaney R P 2001 Factors influencing the measurement of bioavalability taking
calcium as a model J Nutr 1311344Sndash1348S
Heim K E A R Tagliaferro and D J Bobilya 2002 Flavonoid antioxidants
Chemistry metabolism and structure-activity relationships J Nutr Biochem
13572ndash584
Hertog M G L E J M Feskens P C H Hollman M B Katan and D Kromhout
1993 Dietary antioxidant flavonoids and risk of coronary heart disease The
Zutphen Elderly Study Lancet 3421007ndash1011
Hertog M G L P C H Hollman and M B Katan 1992 Content of potentially
anticarcinogenic flavonoids of 28 vegetables and 9 fruits commonly consumed in
the Netherlands Proc Nutr Soc 402379ndash2383
LITERATURE OVERVIEW
40
Hollman P C H 2001 Determination of flavonols in body fluids Pages 97ndash102 in
Flavonoids and other Polyphenols Methods in Enzymology L Packer ed
Academic Press San Diego USA
Hollman P C H and I C W Arts 2000 Flavonols flavones and flavanols ndash nature
occurrence and dietary burden J Sci Food Agric 801081ndash1093
Hollman P C H M N C P Bijsman Y van Gameren E P J Cnossen J H M de
Vries and M B Katan 1999 The sugar moiety is a major determinant of the
absorption of dietary flavonoid glycosides in man Free Radic Res 31569ndash573
Hollman P C H J H M de Vries S D van Leeuwen M J Mengelers and M B
Katan 1995 Absorption of dietary quercetin glycosides and quercetin in healthy
ileostomy volunteers Am J Clin Nutr 621276ndash1282
Hollman P C H and M B Katan 1997 Absorption metabolism and health effects of
dietary flavonoids in man Biomed Pharmacother 51305ndash310
Hollman P C H L B M Tijburg and C S Yang 1997a Bioavailability of
flavonoids from tea Crit Rev Food Sci Nutr 37719ndash738
Hollman P C H K H van het Hof L B Tijburg and M B Katan 2001 Addition of
milk does not affect the absorption of flavonols from tea in man Free Radic Res
34297ndash300
Hollman P C H J M P van Trijp M N C P Buysman M S vd Gaag M J B
Mengelers J H M de Vries and M B Katan 1997b Relative bioavailability of
the antioxidant flavonoid quercetin from various foods in man FEBS Lett
418152ndash156
Hirvonen T P Pietinen M Virtanen M L Ovaskainen S Haumlkkinen D Albanes
and J Virtamo 2001 Intake of flavonols and flavones and risk of coronary heart
disease in male smokers Epidemiology 1262ndash67
Ishihara N D-C Chu S Akachi and L R Juneja 2001 Improvement of intestinal
microflora balance and prevention of digestive and respiratory organ diseases in
calves by green tea extracts Livest Prod Sci 68217ndash229
LITERATURE OVERVIEW
41
Janisch K M G Williamson P Needs and G W Plumb 2004 Properties of
quercetin conjugates Modulation of LDL oxidation and binding to human serum
albumin Free Radic Res 38877ndash884
Johnston K P Sharp M Clifford and L Morgan 2005 Dietary polyphenols decrease
glucose uptake by human intestinal Caco-2 cells FEBS Lett 5791653ndash1657
Kahle K M Kempf P Schreier W Scheppach D Schrenk T Kautenburger D
Hecker W Huemmer M Ackermann and E Richling 2011 Intestinal transit
and systemic metabolism of apple polyphenols Eur J Nutr 50507ndash22
Kim E-K K-B Kwon M-Y Song M-J Han J-H Lee Y-R Lee D-G Ryu B-
H Park J-W Park 2007 Flavonoids protect against cytokine-induced pancreatic
β-cell damage through suppression of nuclear factor κβ activation Pancreas
35e1ndash9
Knekt P R Jaumlrvinen A Reunanen and J Maatela 1996 Flavonoid intake and
coronary mortality in Finland A cohort study Br Med J 312478ndash482
Knekt P R Jaumlrvinen R Seppaumlnen M Helioumlvaara L Teppo E Pukkala and A
Aromaa 1997 Dietary flavonoids and the risk of lung cancer and other malignant
neoplasms Am J Epidemiol 146223ndash230
Kobayashi Y M Miyazawa A Kamei K Abe and T Kojima 2010 Ameliorative
effects of mulberry (Morus alba L) leaves on hyperlipidemia in rats fed a high-fat
diet Induction of fatty acid oxidation inhibition of lipogenesis and suppression
of oxidative stress Biosci Biotechnol Biochem 742385ndash2395
Kobayashi Y M Suzuki H Satsu S Arai Y Hara K Suzuki Y Miyamoto and M
Shimizu 2000 Green tea polyphenols inhibit the sodium-dependent glucose
transporter of intestinal epithelial cells by a competitive mechanism J Agr Food
Chem 485618ndash5623
Kohen R and A Nyska 2002 Oxidation of biological systems Oxidative stress
phenomena antioxidants redox reactions and methods for their quantification
Toxicol Pathol 30620ndash650
Kootstra A 1994 Protection from UV-B-induced DNA damage by flavonoids Plant
Mol Biol 26771ndash774
LITERATURE OVERVIEW
42
Koster H I Halsema E Scholtens M Knippers and G J Mulder 1981 Dose-
dependent shifts in the sulfation and glucuronidation of phenolic compounds in
the rat in vivo and in isolated hepatocytes Biochem Pharmacol 302569ndash2575
Lamartiniere C A J Moore M Holland and S Barnes 1995 Neonatal genistein
chemoprevents mammary cancer Proc Soc Exp Biol Med 208120ndash123
Lee M-L P Maliakal L Chen X Meng F Y Bondoc S Prabhu G Lambert S
Mohr and C S Yang 2002 Pharmacokinetics of tea catechins after ingestion of
green tea and (ndash)-epigallocatechin-3-gallate by humans Formation of different
metabolites and individual variability Cancer Epidemiol Biomarkers Prev
111025ndash1032
Lesser S R Cermak and S Wolffram 2004 Bioavailability of quercetin in pigs is
influenced by the dietary fat content J Nutr 1431508ndash1511
Liggins G C 1994 The role of cortisol in preparing the fetus for birth Reprod Fertil
Dev 6141ndash50
Loke W M J M Hodgson and K D Croft 2010 The biochemistry behind the
potential cardiovascular protection by dietary flavonoids Pages 91ndash106 in Plant
Phenolics and Human Health Biochemistry Nutrition and Pharmacology C G
Fraga ed J Wiley amp Sons Inc Hoboken USA
Lorenz I B Earley J Gilmore I Hogan E Kennedy and S J More 2011 Calf
health from birth to weaning III Housing and management of calf pneumonia Ir
Vet J 641ndash14
Manach C C Morand C Demigneacute O Texier F Reacutegeacuterat and C Reacutemeacutesy 1997
Bioavailability of rutin and quercetin in rats FEBS Lett 40912ndash16
Manach C C Morand A Gil-Izquierdo C Bouteloup-Demange and C Reacutemeacutesy
2003 Bioavailability in humans of the flavanones hesperidin and narirutin after
the ingestion of two doses of orange juice Eur J Clin Nutr 57235ndash42
Manach C A Scalbert C Morand C Reacutemeacutesy and L Jimeacutenez 2004 Polyphenols
Food sources and bioavailability Am J Clin Nutr 79727ndash747
LITERATURE OVERVIEW
43
Manach C O Texier C Morand V Crespy F Reacutegeacuterat C Demigneacute and C Reacutemeacutesy
1999 Comparison of the bioavailability of quercetin and catechin in rats Free
Radic Biol Med 271259ndash1266
Manach C G Williamson C Morand A Scalbert and C Reacutemeacutesy 2005
Bioavailability and bioefficacy of polyphenols in humans I Review of 97
bioavailability studies Am J Clin Nutr 81230Sndash242S
McMahon L G 1997 Cytosolic pyridoxine-β-D-glucoside hydrolase from porcine
jejunal mucosa Purification properties and comparison with broad specifity β-
glucosidase J Biol Chem 27232025ndash32033
Mennen L I D Sapinho A De Bree N Arnault S Bertrais P Galan and S
Hercberg 2004 Consumption of foods rich in flavonoids is related to a decreased
cardiovascular risk in apparently healthy french women J Nutr 134923ndash926
Metwally M T A A R Khafagy H I Eid and A M Algammal 2013 Studies on
the immunostimulatory effect of propolis in diarrheic buffalo calves J Adv Vet
Res 3114ndash117
Middleton E C Kandaswami and T C Theoharides 2000 The effects of plant
flavonoids on mammalian cells Implications for inflammation heart disease and
cancer Pharmacol Rev 52673ndash751
Miller R L M James-Kracke G Y Sun and A Y Sun 2009 Oxidative and
inflammatory pathways in Parkinsonrsquos disease Neurochem Res 3455ndash65
Morris M E and S Zhang 2006 Flavonoid-drug interactions Effects of flavonoids
on ABC transporters Live Sci 782116ndash2130
Murota K and J Terao 2003 Antioxidative flavonoid quercetin Implication of its
intestinal absorption and metabolism Arch Biochem Biophys 41712ndash17
Mutinati M M Pantaleo M Roncetti M Piccinno A Rizzo and R L Sciorsci
2014 Oxidative stress in neonatology A review Reprod Domest Anim 497ndash
16
LITERATURE OVERVIEW
44
Neacutemeth K G W Plumb J-G Berrin N Juge R Jacob H Y Naim G Williamson
D M Swallow and P A Kroon 2003 Deglycosylation by small intestinal
epithelial cell beta-glucosidases is a critical step in the absorption and metabolism
of dietary flavonoid glycosides in humans Eur J Nutr 4229ndash42
Nielsen B K 2008 Botanicals as feed additives to improve health and production in
pig breeding Res Pig Breed 212ndash18
Nijveldt R J E van Nood D E C van Hoorn P G Boelens K van Norren and P
A M van Leeuwen 2001 Flavonoids A review of probable mechanisms of
action and potential applications Am J Clin Nutr 74418ndash425
Nussbaum A G Schiessler H M Hammon and J W Blum 2002 Growth
performance and metabolic and endocrine traits in calves pair-fed by bucket or by
automate starting in the neonatal period J Anim Sci 801545ndash1555
OrsquoConnell J E and P F Fox 2001 Significance and applications of phenolic
compounds in the production and quality of milk and dairy products A review
Int Dairy J 11103ndash120
Ofer M S Wolffram A Koggel H Spahn-Langguth and P Langguth 2005
Modulation of drug transport by selected flavonoids Involvement of P-gp and
OCT Eur J Pharm Sci 25263ndash271
Oliveira R A C D Narciso R S Bisinotto M C Perdomo M A Ballou M Dreher
and J E P Santos 2010 Effects of feeding polyphenols from pomegranate
extract on health growth nutrient digestion and immunocompetence of calves J
Dairy Sci 934280ndash4291
Olthof M R P C H Hollman T B Vree and M B Katan 2000 Bioavailabilities of
quercetin-3-glucoside and quercetin-4`-glucoside do not differ in humans J Nutr
21200ndash1203
Otake Y F Hsieh and T Walle 2002 Glucuronidation versus oxidation of the
flavonoid galangin by human liver microsomes and hepatocytes Drug Metab
Dispos 30576ndash581
LITERATURE OVERVIEW
45
Passamonti S M Terdoslavich R Franca A Vanzo F Tramer E Braidot E
Petrussa and A Vianello 2009 Bioavailability of flavonoids A review of their
membrane transport and the function of bilitranslocase in animal and plant
organisms Curr Drug Metab 10369ndash394
Petri N C Tannergren B Holst F A Mellon Y Bao G W Plumb J I M Bacon
K A O Leary P A Kroon L Knutson P Forsell T Eriksson H Lennernas
and G Williamson 2003 Absorptionmetabolism of sulforaphane and quercetin
and regulation of phase II enzymes in human jejenum in vivo Drug Metab
Dispos 31805ndash813
Pfeiffer S P Pflegel and H-H Borchert 1995 Grundlagen der Biopharmazie
Pharmakokinetik Bioverfuumlgbarkeit Biotransformation VEB Verlag Volk und
Gesundheit Berlin Germany
Piskula M K 2000 Soy isoflavone conjugation differs in fed and food-deprived rats J
Nutr 1301766ndash1771
Piskula M K and J Terao 1998 Accumulation of (ndash)-epicatechin metabolites in rat
plasma after oral administration and distribution of conjugation enzymes in rat
tissues J Nutr 1281172ndash1178
Piskula M K J Yamakoshi and Y Iwai 1999 Daidzein and genistein but not their
glucosides are absorbed from the rat stomach FEBS Lett 447287ndash291
Rauprich A B E H M Hammon and J W Blum 2000 Effects of feeding colostrum
and a formula with nutrient contents as colostrum on metabolic and endocrine
traits in neonatal calves Biol Neonate 7853ndash64
Rao V S F A Santos T T Sobreira M F Souza C L Melo and E R Silveira
1997 Investigations on the gastroprotective and antidiarrhoeal properties of
ternatin a tetramethoxyflavone from Egletes viscosa Planta Med 63146ndash149
Reddy V C G V Vidya Sagar D Sreeramulu L Venu and M Raghunath 2005
Addition of milk does not alter the antioxidant activity of black tea Ann Nutr
Metab 49189ndash195
LITERATURE OVERVIEW
46
Reinboth M S Wolffram G Abraham F R Ungemach and R Cermak 2010 Oral
bioavailability of quercetin from different quercetin glycosides in dogs Br J
Nutr 104198ndash203
Retskii M I A G Shakhov D V Chusov A I Zolotarev M I Lebedev T G
Ermolova and G N Bliznetsova 2010 Correcting the antioxidant status of
newborn calves for forming higher colostral immunity Russ Agric Sci 36127ndash
Rimm E B M B Katan A Ascherio M J Stampfer and W C Willett 1996
Relation between intake of flavonoids and risk for coronary heart disease in male
health professionals Ann Intern Med 125384ndash389
Robles R N Palomino and A Robles 2001 Oxidative stress in the neonate Early
Hum Dev 65S75ndashS81
Roghani M and T Baluchnejadmojarad 2010 Hypoglycemic and hypolipidemic
effect and antioxidant activity of chronic epigallocatechin-gallate in
streptozotocin-diabetic rats Pathophysiology 1755ndash59
Saugstad O D 2005 Oxidative stress in the newborn A 30-year perspective Biol
Neonate 88228ndash236
Scalbert A and G Williamson 2000 Dietary intake and bioavailability of
polyphenols J Nutr 1302073ndash2085
Schiessler G A Nussbaum H M Hammon and J W Blum 2002 Calves sucking
colostrum and milk from their dams or from an automatic feeding station starting
in the neonatal period metabolic and endocrine traits and growth performance
Anim Sci 74431ndash444
Scholz S and G Williamson 2007 Interactions affecting the bioavailability of dietary
polyphenols in vivo Int J Vitam Nutr Res 77224ndash235
Schwerin M U Dorroch M Beyer H Swalve C C Metges and P Junghans 2002
Dietary protein modifies hepatic gene expression associated with oxidative stress
responsiveness in growing pigs FASEB J 161322ndash1324
LITERATURE OVERVIEW
47
Schroeter H and J P E Spencer 2003 Flavonoids Neurodegenerative agents
Modulation of oxidative stress-induced map kinase signal transduction Pages
233ndash272 in Flavonoids in Health and Disease C A Rice-Evans and L Packer
ed Marcel Dekker Inc New York USA
Seiva F R F L G A Chuffa C P Braga J P A Amorim and A A H Fernandes
2012 Quercetin ameliorates glucose and lipid metabolism and improves
antioxidant status in postnatally monosodium glutamate-induced metabolic
alterations Food Chem Toxicol 503556ndash3561
Serafini M R Bugianesi G Maiani S Valtuena S De Santis and A Crozier 2003
Plasma antioxidants from chocolate Nature 4241013
Sesink A L A I C W Arts V C J de Boer P Breedveld J H M Schellens P C
H Hollman and F G M Russel 2005 Breast cancer resistance protein
(Bcrp1Abcg2) limits net intestinal uptake of quercetin in rats by facilitating
apical efflux of glucuronides Mol Pharmacol 671999ndash2006
Sesink A L A I C W Arts M Faassen-Peters and P C H Hollman 2002
Intestinal uptake of quercetin-3-glucoside in rats involves hydrolysis by lactase
phlorizin hydrolase J Nutr 133773ndash776
Setchell K D R N M Brown P Desai L Zimmer-Nechemias B E Wolfe W T
Brashear A S Kirschner A Cassidy and J E Heubi 2001 Bioavailability of
pure isoflavones in healthy humans and analysis of commercial soy isoflavone
supplements J Nutr 1311362Sndash1375
Shimoi K H Okada M Furugori T Goda S Takase M Suzuki Y Hara H
Yamamoto and N Kinae 1998 Intestinal absorption of luteolin and luteolin 7-O-
β-glucoside in rats and humans FEBS Lett 438220ndash224
Sies H 1985 Oxidative Stress Introductory Remarks Pages 1ndash8 in Oxidative Stress
H Sies ed Academic Press Inc London UK
Sies H 1991 Role of reactive oxygen species in biological processes Klin
Wochenschr 69965ndash968
Sies H W Stahl and A Sevanian 2005 Nutritional dietary and postprandial
oxidative stress J Nutr 135969ndash972
LITERATURE OVERVIEW
48
Sokolova V E E A Vasilrsquochenko and I K Izmaĭlova 1978 Anabolic action of
flavonoids Famakol Toksikol 41323ndash327
Spencer J P G Chowrimootoo R Choudhury E S Debnam S K Srai and C Rice-
Evans 1999 The small intestine can both absorb and glucuronidate luminal
flavonoids FEBS Lett 458224ndash230
Steinhoff-Wagner J S Goumlrs P Junghans R M Bruckmaier E Kanitz C C Metges
and H M Hammon 2011 Maturation of endogenous glucose production in
preterm and term calves J Dairy Sci 945111ndash5123
Steinshamn H S Purup E Thuen and J Hansen-Moslashller 2008 Effects of clover-
grass silages and concentrate supplementation on the content of phytoestrogens in
dairy cow milk J Dairy Sci 912715ndash2725
Stohrer M S Lutz and M Stangassinger 2003 Antioxidant status of calves and foals
declines after birth Acta Vet Scand Suppl 44P38
Stott G H D B Marx B E Menefee and G T Nightengale 1979 Colostral
immunoglobulin transfer in calves I Period of absorption J Dairy Sci 621632ndash
1638
Swezey R R D E Aldridge S E Le Valley J A Crowell Y Hara and C E Green
2003 Absorption tissue distribution and elimination of 4-[3H]-epigallocatechin
gallate in beagle dogs Int J Toxicol 22187ndash193
Tadera K Y Minami K Takamatsu and T Matsuoka 2006 Inhibition of α-
glucosidase and α-amylase by flavonoids J Nutr Sci Vitaminol 52149ndash153
USDA (United States Department of Agriculture) Animal and Plant Health Inspection
Service 2011 Cattle and calves nonpredator death loss in the United States 2010
httpwwwaphisusdagovanimal_healthnahmsgeneraldownloadscattle_calves
_nonpred_2010pdf (Accessed May 2013)
van Het Hof K H G A A Kivits J A Weststrate and L B M Tijburg 1998
Bioavailability of catechins from tea The effect of milk Eur J Clin Nutr
52356ndash359
LITERATURE OVERVIEW
49
Varadarajan S J Kanski M Aksenova C Lauderback and D A Butterfield 2001
Different mechanisms of oxidative stress and neurotoxicity for Alzheimerlsquos
Aβ(1minus42) and Aβ(25minus35) J Am Chem Soc 1235625ndash5631
Walgren R A J Lin R K Kinne and T Walle 2000a Cellular Uptake of dietary
flavonoid quercetin 4`-szlig-glucoside by sodium-dependent glucose transporter
SGLT1 J Pharmacol Exp Ther 294837ndash843
Walgren R A G E Lindenmayer and T Walle 2000b Efflux of dietary flavonoid
quercetin 4`beta-glucoside across human intestinal Caco-2 cell monolayers by
apical multidrug resistance-associated protein-2 J Pharmacol Exp Ther
294830ndash836
Walle T A M Browning L L Steed S G Reed and U K Walle 2005 Human
nutrition and metabolism flavonoid glucosides are hydrolyzed and thus activated
in the oral cavity J Nutr 13548ndash52
Walle U K A Galijatovic and T Walle 1999 Transport of the flavonoid chrysin and
its conjugated metabolites by the human intestinal cell line caco-2 Biochem
Pharmacol 58431ndash438
Wein S and S Wolffram 2013 Oral bioavailability of quercetin in horses J Equine
Vet Sci 33441ndash445
Wernicki A M Kankofer P Mikucki and A Puchalski 2006 Evaluation of plasma
cortisol and TBARS levels in calves after short-term transportation Rev Med
Vet 15730ndash34
Williams C A and J B Harborne 1994 Flavone and flavonol glycosides Pages 337ndash
385 in The Flavonoids Advances in research since 1986 JB Harborne ed
Chapman and Hall London UK
Winkel-Shirley B 2002 Biosynthesis of flavonoids and effects of stress Curr Opin
Plant Biol 5218ndash223
LITERATURE OVERVIEW
50
Wolffram S 2010 Wie viel kommt an Die Bioverfuumlgbarkeit sekundaumlrer
Pflanzenstoffe am Beispiel des Quercetins Pages 10ndash14 in Aktuelle
Ernaumlhrungsmedizin Georg Thieme Verlag KG Stuttgart Germany - New York
USA httpwwwinstitut-danonedeernaehrungsaufklaerungunsere-materialien
(Accessed April 2013)
Wolffram S M Bloeck and P Ader 2002 Quercetin-3-glucoside is transported by
the glucose carrier SGLT1 across the brush border membrane of rat small
intestine J Nutr 132630ndash635
Wolfram S D Raederstorff M Preller Y Wang S R Teixeira C Riegger and P
Weber 2006 Epigallocatechin gallate supplementation alleviates diabetes in
rodents J Nutr 1362512ndash2518
Yaghoubi S M J G R Ghorbani H R Rahmani and A Nikkhah 2008 Growth
weaning performance and blood indicators of humoral immunity in Holstein
calves fed supplemental flavonoids Anim Physiol Anim Nutr 92456ndash462
Yochum L L H Kushi K Meyer and A R Folsom 1999 Dietary flavonoid intake
and risk of cardiovascular disease in postmenopausal women Am J Epidemiol
149943ndash949
Youdim K A and J A Joseph 2003 Phytochemicals and brain aging A multiplicity
of effects Pages 205ndash347 in Flavonoids in Health and Disease C A Rice-Evans
and L Packer ed Marcel Dekker Inc New York USA
Zhu M Y Chen and R C Li 2000 Oral absorption and bioavailability of tea
catechins Planta Med 66444ndash447
Zung A R Reifen Z Keem and Z Zadik 2001 Phytoestrogens The pediatric
perspective J Pediatr Gastroenterol Nutr 33112ndash118
51
Chapter 2
Bioavailability of the flavonol quercetin in neonatal calves
after oral administration of quercetin aglycone or rutin
J Maciej C T Schaumlff E Kanitzdagger A TuchschererDagger R M Bruckmaiersect
S Wolffram and H M Hammon1
Institute of Nutritional Physiology ldquoOskar Kellnerrdquo
daggerInstitute of Behavioural Physiology and
DaggerInstitute of Genetics and Biometry Leibniz Institute for Farm Animal Biology (FBN)
Wilhelm-Stahl-Allee 2 18196 Dummerstorf Germany
sectVeterinary Physiology Vetsuisse Faculty University of Bern 3001 Bern Switzerland
Institute of Animal Nutrition and Physiology Christian Albrechts University Kiel
24118 Kiel Germany
Received January 20 2015
Accepted February 6 2015
1Corresponding author hammonfbn-dummerstorfde
Used by permission of the Journal of Dairy Science
Published in Journal of Dairy Science 2015 983906ndash3917
httpdxdoiorg103168jds2015-9361
CHAPTER 2
52
2 Bioavailability of the flavonol quercetin in neonatal calves
after oral administration of quercetin aglycone or rutin
Abstract
Polyphenols such as flavonoids are secondary plant metabolites with potentially
health-promoting properties In newborn calves flavonoids may improve health status
but little is known about the systemically availability of flavonoids in calves to exert
biological effects The aim of this study was to investigate the oral bioavailability of the
flavonol quercetin applied either as quercetin aglycone (QA) or as its glucorhamnoside
rutin (RU) in newborn dairy calves Twenty-one male newborn German Holstein calves
were fed equal amounts of colostrum and milk replacer according to body weight On d
2 and 29 of life 9 mg of quercetin equivalentskg of body weight either fed as QA or as
RU or no quercetin (control group) were fed together with the morning meal Blood
samples were taken before and 05 1 15 2 25 3 4 5 6 12 24 and 48 h after feed
intake Quercetin and quercetin metabolites with an intact flavonol structure
(isorhamnetin tamarixetin and kaempferol) were analyzed in blood plasma after
treatment with glucuronidasesulfatase by HPLC with fluorescence detection Maximum
individual plasma concentration was depicted from the concentration-time-curve on d 2
and 29 respectively Additional blood samples were taken to measure basal plasma
concentrations of total protein albumin urea and lactate as well as pre- and
postprandial plasma concentrations of glucose non-esterified fatty acids insulin and
cortisol Plasma concentrations of quercetin and its metabolites were significantly
higher on d 2 than on d 29 of life and administration of QA resulted in higher plasma
concentrations of quercetin and its metabolites than RU The relative bioavailability of
total flavonols (sum of quercetin and its metabolites isorhamnetin tamarixetin and
kaempferol) from RU was 725 on d 2 and 496 on d 29 when compared with QA
(100 ) Calves fed QA reached maximum plasma concentrations of total flavonols
much earlier than did RU-fed calves Plasma metabolites and hormones were barely
affected by QA and RU feeding in this experiment Taken together orally administrated
QA resulted in a greater bioavailability of quercetin than RU on d 2 and 29
respectively and differed markedly between calves aged 2 and 29 d
Key Words bioavailability calf flavonoid quercetin rutin
CHAPTER 2
53
21 Introduction
Flavonoids are secondary plant metabolites occurring ubiquitously in all higher plants
(Manach et al 2004 Besle et al 2010) They are known for their health-promoting
properties (eg antioxidative and anti-inflammatory Middleton et al 2000 Nijveldt et
al 2001 Williams et al 2004) Quercetin is one of the most abundant flavonoids and
is present in high concentrations in onions apples and kale (Hertog et al 1992
Nijveldt et al 2001) and in low concentrations also in milk (Besle et al 2010
Bhagwat et al 2013) In addition to their health-promoting properties quercetin and its
metabolites modulate the expression and activity of several metabolic key enzymes and
therefore might be involved in regulation of lipid and carbohydrate metabolism
(Middleton et al 2000 Gasparin et al 2003 Kobayashi et al 2010)
Newborn calves undergo tremendous immunological and metabolic changes after birth
to adapt for extra-uterine life (Blum 2006 Chase et al 2008 Hammon et al 2012)
and colostrum management is one of the most important factors to support neonatal
health and development (Godden 2008 Hammon et al 2012) Nevertheless morbidity
and mortality rates are still high during first weeks of life and calves often suffer from
diarrhea and respiratory disease (McGuirk 2008 Mee 2008 Uetake 2013) as well as
from high levels of oxidative stress (Inanami et al 1999 Gaaacutel et al 2006) Frequent
problems on farms are the lack of high-quality colostrum availability and the
insufficient colostrum supply (Quickley and Drewry 1998 Godden 2008) Colostrum
and mature milk contain antioxidant agents to protect neonatal calves from oxidative
stress (Lindmark-Maringnsson and Aringkesson 2000 Besle et al 2010) Poor quality of
colostrum is reflected by low concentrations of antioxidative substances Thus
supplementing colostrum and milk at beginning of lactation with the natural antioxidant
agent quercetin may improve neonatal oxidative status However there is no
information about the bioavailability (BV) of orally applied quercetin with colostrum
and milk in newborn calves although feeding industry already offers flavonoid-
supplemented feed for dairy calves
Studies on BV of quercetin from quercetin aglycone (QA) or its glucorhamnoside rutin
(RU) in different monogastric species such as rats (Manach et al 1997) pigs (Ader et
al 2000 Cermak et al 2003 Lesser et al 2004) dogs (Reinboth et al 2010) and
humans (Erlund et al 2000 Egert et al 2008) showed marked differences to ruminant
CHAPTER 2
54
species (eg cows with intraruminal QA and RU application Berger et al 2012) These
differences may be due to differnces in gastrointestinal anatomy and physiology (Arts et
al 2004 Berger et al 2012 Gohlke et al 2013) Conversely in newborn calves the
forestomach system is just developing thus newborn calves are functionally
monogastrics (Drackley et al 2008) The aim of the present study was to investigate the
relative BV of quercetin after oral administration of QA or RU in calves during first
month of life We hypothesized that BV in calves depends on the form of application
(QA and RU) and changes with age due to ontogenetic development and maturation of
the gastrointestinal tract during first month of life We further tested the hypothesis that
quercetin application might affect metabolic and endocrine traits especially concerning
glucose metabolism in neonatal calves because findings in literature pointed to impair
carbohydrate digestion and glucose absorption after flavonoid intake (Cermak et al
2004 Tadera et al 2006)
22 Materials and Methods
221 Animals and feeding
The experimental procedures were carried out according to the animal care guidelines
and were approved by the relevant authorities of the State Mecklenburg-West
Pomerania Germany (LVL M-VTSD72213-21-01910) Twenty-one male German
Holstein calves were examined on d 2 and 29 of life All calves were spontaneously
born from multiparous cows on neighboring farms and transported directly after birth to
the experimental barn Calves were kept in single boxes with straw bedding and had
free access to water Calves were fed twice daily (0700 and 1500 h) with a nipple bottle
or nipple bucket On the first 3 d of life calves received pooled colostrum obtained from
milkings 1 3 and 5 (d 1 2 and 3 after parturition respectively Table 21) at amounts
of 8 of BW on d 1 and 10 of BW on d 2 and 3 (Steinhoff-Wagner et al 2011)
From d 4 until d 29 calves received milk replacer (150 gL SalvaLac MiraPro 45
Salvana Tiernahrung GmbH Klein-Offenseth Sparrieshoop Germany) at 12 of
BWd (Table 21) To ensure uptake of equal amounts of feed refused amounts of
colostrum or milk were tube-fed to calves Milk intake was adapted to BW data once a
week
CHAPTER 2
55
Colostrum or milk replacer was supplemented with chicken egg-derived
immunoglobulins (Globigen Life Start 25 EW Nutrition GmbH Visbek Germany)
composed of 75 dextrose and 25 whole egg powder (1075 CP 1050 crude
fat 010 crude fiber and 250 ash) with high antibody titer against Eschericha coli
type K 99 Salmonella Tymphimurium and Salmonella Dublin bovine rotavirus type
G6 and G10 bovine coronavirus Cryptosporidium parvum and Clostridium
perfringens serotype C Immunoglobulins were added from d 2 till d 6 Respective
amounts of immunoglobulins fed twice daily were 40 32 24 16 and 8 gd
From d 4 on calves had free access to pelleted concentrate (Kaumllber Start 183 pell
Vollkraft Mischfutterwerke GmbH Karstaumldt Germany Table 21) and hay
Concentrate intake was measured daily after morning milk feeding To avoid iron
deficiency calves received 600 mg iron dextran subcutaneously (Ursoferran
Serumwerk Bernburg Germany) on their first day of life Navel disinfection was
performed with 10 iodine solution (vet sept Loumlsung Albrecht GmbH Aulendorf
Germany) immediately after birth Health status of calves was determined daily by
measuring rectal temperature heart rate and respiratory rate by evaluation of
behavioral abnormalities nasal discharge respiratory sounds fecal consistence and by
navel inspection
222 Treatment and blood sampling
Calves were randomly assigned to 1 of 3 feeding groups (n = 7 per group) receiving
either no flavonoids (control group CTRL) 9 mg of QAkg of BW (quercetin aglycone
dihydrate Carl Roth GmbH Karlsruhe Germany) or 18 mg of RUkg of BW (rutin
trihydrate Carl Roth GmbH) each resulting in a dose of 9 mg of quercetin equivalents
(QE)kg of BW on d 2 and d 29 of life Calves received the whole dose of QA or RU
during morning feeding applying the QE suspension with a 10-ml syringe directly into
the mouth
CHAPTER 2
56
Ta
ble
21
C
om
po
siti
on
an
d a
mo
un
ts o
f co
lost
rum
m
ilk
rep
lace
r a
nd
co
nce
ntr
ate
fed
to
ca
lves
d
1
d 2
d
3
d 4
to
30
2
Item
co
lost
rum
1
mil
kin
g 1
colo
stru
m1
mil
kin
g 3
colo
stru
m1
mil
kin
g 5
M
ilk
rep
lace
r3
Co
nce
ntr
ate
4
DM
gk
g
20
69
1
54
7
13
93
1
10
0
88
00
CP
gk
g D
M
59
74
3
90
4
33
31
2
01
8
18
00
Cru
de
fat
gk
g D
M
16
92
2
40
5
27
49
1
90
9
43
0
Ash
gk
g D
M
48
3
55
6
56
0
73
6
74
0
Lac
tose
g
kg D
M
13
63
2
60
5
30
87
5
14
6
-
1C
olo
stru
m w
as d
eriv
ed f
rom
mu
ltip
aro
us
cow
s and
sep
arat
ely p
oo
led
fro
m m
ilkin
gs
1
3
and
5 a
fter
par
turi
tio
n
resp
ecti
vel
y
2H
ay w
as o
ffer
ed a
d l
ibit
um
exce
pt
for
days
of
bio
avai
lab
ilit
y s
tud
ies
3M
ilk
rep
lace
r (S
alvaL
ac M
iraP
ro 4
5
Sal
vana
Tie
rnah
run
g G
mb
H
Kle
in-O
ffense
th S
parr
iesh
oo
p
Ger
man
y)
was
com
po
sed
of
45
s
pra
y s
kim
med
mil
k
po
wd
er
35
s
wee
t w
hey p
ow
der
1
8
pla
nt
oil
(p
alm
co
conut
and
so
y o
il)
17
L
ys
08
C
a 0
75
P
an
d a
dd
ed w
ith 5
00
00
IU
of
vit
am
in A
4
000
IU o
f vit
am
in D
3
20
0 m
g o
f vit
am
in E
(α
-to
cop
her
ol
acet
ate)
9
mg C
u (
gly
ceri
ne-
cop
per
chel
ate)
ci
tric
aci
d
sorb
ic a
cid
b
uty
lhyd
rox
yto
luene (
BH
T)
and
12
x 1
09 c
fu E
nte
roco
ccu
s fa
eciu
m E
17
06
4C
once
ntr
ate
(Kaumll
ber
Sta
rt 1
83
V
oll
kra
ft
Mis
ch
futt
erw
erk
e G
mb
H
Kar
staumld
t G
erm
an
y)
was
com
po
sed
of
wh
eat
glu
ten
wh
eat
bra
n
gra
in m
ash
su
gar
bee
t
pulp
ra
pes
eed
mea
l o
at
rye
mo
lass
es
lin
seed
o
at b
ran
soyb
ean m
eal
extr
act
cal
ciu
m c
arb
onat
e s
od
ium
chlo
rid
e 0
6
pho
spho
rous
02
s
od
ium
10
800
IU
of
vit
am
in A
1
21
5 I
U o
f vit
am
in D
3
30
mg o
f vit
am
in E
0
7 m
g o
f I
04
mg o
f C
o
54
mg o
f M
g
81
mg o
f Z
n
and
04
mg o
f S
e p
er k
g o
f D
M
CHAPTER 2
57
The day before the study started a catheter (Certofix Mono 340 Braun Melsungen AG
Melsungen Germany) was inserted into the calvesrsquo right jugular vein and blood
samples were taken before (time point 0) and 05 1 15 2 25 3 4 6 8 12 24 and
48 h after feeding using S-Monovette tubes (Sarstedt AG amp Co Nuumlmbrecht Germany)
containing lithium heparin (16 IUmL blood) for analysis of plasma flavonols
Additional blood samples except on 15 25 and 48 h were taken for measurement of
plasma concentrations of total protein albumin glucose NEFA urea and lactate using
tubes containing sodium fluoride and K3EDTA (10 mgmL fluoride and 12 mgmL
EDTA) Blood sampled into tubes containing dipotassium EDTA (18 mgmL) was used
for determination of insulin and cortisol plasma concentrations Catheters were flushed
with 10 mL sodium chloride solution (09 sodium chloride Braun Melsungen AG)
after each blood sampling Blood was immediately put on ice centrifuged for 20 min at
1500 times g at 4deg C and plasma was stored at -80deg C for flavonol analysis and at -20deg C
for analyses of metabolites and hormones
223 Analytical methods
Flavonols were extracted from plasma as described by Egert et al (2008) and
concentrations of quercetin aglycone and its methylated (isorhamnetin tamarixetin) and
dehydroxylated (kaempferol) derivatives were analyzed by HPLC with fluorescence
detection as previously described (Ader et al 2000 Berger et al 2012 Gohlke et al
2013) Briefly plasma samples were thawed in a 40deg C water bath Then 980 μL of
plasma was acidified with 130 μL of acetic acid (0583 molL) spiked with 20 μL of
methanolic rhamnetin solution (internal standard 1 mg20 mL in methanol Rotichrom
HPLC Carl Roth GmbH) and treated with a mixture of β-glucuronidase and sulfatase
(from Helix pomatia Type H-1 with final activities of 7300 and 130 UmL for
glucuronidase and sulfatase respectively Sigma-Aldrich Chemie GmbH Dreieich
Germany) to cleave the ester bonds of glucuronides and sulfates After incubation at
37deg C for 1 h 3 mL of acetone was added and the samples were centrifuged at 3700 times g
for 45 min at 4deg C) The supernatant was evaporated until dryness Residues were
resolved in 200 μL methanol and after 15 min in an ultrasonic bath 775 μL of
nanopure water and 225 μL of hydrochloric acid (10 molL) were added For flavonol
analyses by HPLC 30 μL of the final solution was injected by a cooled (4deg C)
autosampler (AS-2057 Plus Jasco Deutschland GmbH Groszlig-Umstadt Germany) onto
CHAPTER 2
58
a C-18 Kromasil 100 column (250 times 4 mm particle size = 5 μm Jasco Deutschland
GmbH) guarded by a pre-column (C-18 Inertsil ODS-2 10 times 4 mm particle size = 5
μm Jasco Deutschland GmbH) The eluent (flow rate 1 mLmin) was composed of
0025 molL sodium dihydrogen phosphate (pH 24) acetonitrile and methanol
(68275 volvolvol) In a postcolumn reactor the effluent was mixed with aluminum
nitrate [flow rate = 04 mLmin 1 mmolL in methanol containing 75 [volvol] acetic
acid] for derivatization and fluorescence of the flavonol-aluminum complex was
measured using a fluorescence detector (excitation wavelength = 422 nm emission
wavelength = 485 nm FP920 Jasco Deutschland GmbH) Identification of peaks
obtained was performed using the retention times of the standards which were prepared
with pure flavonols and treated in the same way as samples The detection limit of
flavonols was le10 nmolL and the recovery rate was 92 plusmn 2 (mean plusmn SE) Inter- and
intraassay variances for quercetin were 72 and 05 The sum of plasma
concentrations of quercetin and its metabolites in plasma is referred to as total
flavonols
Plasma metabolites were analyzed spectrophotometrically (ABX Penta 400 Horiba
ABX SAS Montpellier Cedex France) by the Clinic for Cattle (University of
Veterinary Medicine Foundation Hanover Germany) using the respective kits
Albumin (no A11A01664) and lactate (no A11A01721 Horiba Europe GmbH
Hannover Germany) NEFA (no 434-91795 Wako Chemicals GmbH Neuss
Germany) glucose (no 553-230) and total protein (no 553-412 MTI Diagnostics
GmbH Idstein Germany) and urea (no LT-UR 0050 Labor + Technik E Lehmann
GmbH Berlin Germany)
Plasma insulin concentrations were determined using an RIA as previously described
(Vicari et al 2008) Plasma cortisol concentrations were analyzed using a commercial
ELISA kit validated for bovine plasma (EIA-1887 DRG Instruments GmbH Marburg
Germany Weber et al 2013) Cross reactivities of the monoclonal antibody against
corticosteron and progesterone were 45 and 9 respectively and to any further plasma
steroids lower than 2 Test sensitivity was 34 ngmL inter- and intraassay variations
were 53 and 121 respectively
Colostrum was analyzed for DM CP crude fat and ash content (Qualitaumltspruumlfungs- und
Dienstleistungsgesellschaft Mecklenburg-Vorpommern mbH Guumlstrow Germany)
according to the Weender standard procedure (Naumann and Bassler 2004) as shown
CHAPTER 2
59
in Table 21 Chemical composition of milk replacer and concentrates were according to
the manufacturersrsquo declarations (Table 21)
224 Calculations and statistical analyses
Quercetin measurements were corrected by baseline concentration (first blood sample
before QA or RU administration) then area under the curve (AUC) was calculated for
quercetin and its metabolites (isorhamnetin tamarixetin and kaempferol) according to
the trapeziodale rule between 0 and 24 h using GraphPad Prism 3 (GraphPad Software
Inc San Diego CA version 303) For single quercetin metabolites AUC proportion
relative to AUC of total flavonols (sum of quercetin isorhamnetin tamarixetin and
kaempferol) was calculated in addition Maximum plasma flavonol concentrations
(Cmax) and time after intake until Cmax was reached (Tmax) were determined from
individual plasma concentration-time curves Relative BV of quercetin from RU was
calculated as
Relative BV = AUCRUAUCQA times 100
Statistical analyses were performed using SASSTAT software (SAS Institute 2010)
All data are presented as LSM plusmn SE Body weight concentrate intake and
pharmacokinetic parameters (AUC Cmax Tmax) as well as proportions of single
metabolites on d 2 and 29 were analyzed by repeated measurement ANOVA using the
Mixed procedure with group (levels CTRL QA RU for proportional calculations only
QA and RU) repeated variable day (levels d 2 29) and group times day interaction as
fixed effects in the model Repeated measures on each calf were taken into account by
using the repeated statement of the Mixed procedure with an autoregressive residual
covariance structure Plasma concentration of total flavonols as well as metabolite and
hormone data were analyzed by repeated measurement ANOVA using the Mixed
procedure as described previously with group (levels CTRL QA RU) day (levels d
2 29) time changes within d 2 and 29 (several time points before and after feed intake
on d 2 and 29 respectively) and respective interactions as fixed effects Pairwise
differences among treatments and time changes were tested by the Tukey-Kramer-test
Effects were considered significant if P lt 005
CHAPTER 2
60
23 Results
231 Body weight and feed intake
All calves were born spontaneously and healthy Birth weight was 474 plusmn 10 kg Body
weight increased with time in all groups (P lt 001) and was 655 plusmn 13 kg on d 29
without differences between groups Milk intake was 38 plusmn 01 kgd on d 1 (8 of
BW) 48 plusmn 01 kgd on d 2 (10 of BW) and 69 plusmn 01 kg on d 29 Concentrate intake
was 159 plusmn 028 kgcalf and increased equally with time (P lt 001) in all groups
Average daily gain from birth to d 29 was 612 plusmn 28 gd without group differences
232 Bioavailability studies
Plasma concentrations of total flavonols of CTRL were close to or below the detection
limit on d 2 and 29 respectively (Figure 21A B) In QA- and RU-fed calves plasma
concentrations of total flavonols increased (P lt 005) after flavonoid administration on
d 2 and returned to baseline concentrations 48 h after administration (Figure 21A)
Figure 21 Plasma concentration-time-curves of total flavonols after oral administration of 9 mg of
quercetinkg of BW times d as quercetin aglycone () rutin trihydrate () or no flavonoid () on d 2
(A) and 29 (B) of life Values are LSM plusmn SE n = 7
On d 2 plasma concentrations of total flavonols were greater at 8 and 12 h (P lt 001)
but were smaller at 24 h after flavonoid administration (P lt 001) in QA- than in RU-
fed calves On d 29 postprandial plasma concentrations of total flavonols increased far
less distinctly (P lt 001) when compared to d 2 (Figure 21A B) Further plasma
concentrations of total flavonols increased until 8 h after administration (P lt 001) in
A B
Time relative to feeding h
0 2 4 6 8 10 12 24 48
To
tal
fla
vo
no
ls n
mo
lL
0
100
200
300
400
Time relative to feeding h
0 2 4 6 8 10 12 24 48
To
tal
fla
vo
no
ls n
mo
lL
0
100
200
300
400
CHAPTER 2
61
QA- but not in RU-fed calves (Figure 21B) Plasma concentrations of total flavonols
on d 29 tended to be greater (P lt 01) in QA- than in RU-fed calves
Compared with QA- (100 ) RU-fed calves showed a relative BV of quercetin of
725 on d 2 and of 496 on d 29 On d 2 AUC of total flavonols quercetin and
quercetin metabolites in QA- and RU-fed calves differed (P lt 005) from CTRL and
were greater (P lt 0001) on d 2 than on 29 for both treatments (Table 22) On d 2 AUC
of quercetin and isorhamnetin was greater (P lt 005) and tended to be greater for total
flavonols (P lt 01) but was lower for tamarixetin (P lt 005) in QA- than in RU-fed
calves On d 29 AUC of quercetin was greater (P lt 005) in QA-fed calves than in
CTRL
A Day 2
QA RU
Pro
po
rtio
n o
f T
ota
l F
lav
on
ols
AU
C (
)
0
20
40
60
80
100
Quercetin
Isorhamnetin
Tamarixetin
Kaempferol
B Day 29
QA RU
Pro
po
rtio
n o
f T
ota
l F
lav
on
ols
AU
C (
)
0
20
40
60
80
100
Figure 22 Proportion of single flavonols (quercetin isorhamnetin tamarixetin and kaempferol)
in plasma after oral administration of 9 mg of quercetinkg of BW times day as quercetin aglycone
(QA) or rutin trihydrate (RU) on d 2 and 29 of life Values are LSM plusmn SE n = 7
On d 2 Cmax of total flavonols quercetin and quercetin metabolites except kaempferol
of QA- and RU-fed calves differed from CTRL (P lt 005 Table 22) whereas on d 29
only Cmax of total flavonols and quercetin of QA-fed calves differed (P lt 005) from
CTRL Maximal plasma concentrations of total flavonols quercetin and isorhamnetin
decreased (P lt 005) or tended to decrease (kaempferol tamarixetin P lt 01) in QA-
and RU-fed calves from d 2 to 29 respectively On d 2 Cmax was greater (P lt 005) for
quercetin and isorhamnetin but was lower for tamarixetin in QA- than in RU-fed
calves Time to reach Cmax in QA- and RU-fed calves was not affected by day but
indicated treatment effects for total flavonols isorhamnetin and tamarixetin (Table
22) For isorhamnetin Tmax was greater (P lt 005) in RU- than in QA-fed calves on
both days
CHAPTER 2
62
Table 22 Pharmacokinetic parameters after oral administration of quercetin as quercetin
aglycone (QA) or rutin trihydrate (RU) on d 2 and 29 of life calves of the control group (CTRL)
received no flavonoids
Item1 Day
Group2
SE
ANOVA (P-value)
CTRL QA RU Group Day Group
times day
AUC 3 nmolL times h
AUCTotal 2 154c 5947
a 4312
ab 395 0001 0001 0001
29 770 1336 662
AUCQ 2 102c 3413
a 1967
b 228 0001 0001 0001
29 267b 1090
a 535
ab
AUCK 2 319b 152
a 159
a 244 002 0001 005
29 000 111 639
AUCI 2 000c 1390
a 447
b 701 0001 0001 0001
29 000 675 239
AUCT 2 000c 1070
b 1768
a 154 0001 0001 0001
29 000 583 196
Cmax4 nmolL
Cmax Total 2 139b 407
a 330
a 359 0001 0001 0001
29 224b 168
a 747
ab
Cmax Q 2 107c 238
a 129
b 193 0001 0001 003
29 628b 137
a 603
ab
Cmax K 2 196b 124
a 109
ab 207 001 0001 016
29 000 386 212
Cmax I 2 000c 945
a 396
b 585 0001 0001 0001
29 000 155 399
Cmax T 2 000c 771
b 163
a 156 0001 0001 0001
29 000 945 327
Tmax5 h
Tmax Total 2 950 106 164 284 005 012 090
29 649 621 104
Tmax Q 2 665 886 117 277 031 047 076
29 644 593 111
Tmax K 2 100 967 123 401 093 049 076
29 ND6 800 800
Tmax I 2 ND 114b 193
a 256 0001 088 009
29 ND 590b 240
a
Tmax T 2 ND 111 166 357 001 063 018
29 ND 763 240
a-cLSM in a row with different superscripts differ (P lt 005)
1Values are LSM with SE n = 7 per group
2Group QA = 30 micromol(kg BW times d) quercetin aglycone RU = 30 micromol(kg BW times d) rutin trihydrate
CTRL = no flavonol fed 3AUC = area under the plasma concentration-time curve of flavonols from 0 to 24 h calculated by
subtracting baseline values (time point 0) from all other time points according to the trapezoidale rule
AUCTotal AUCQ AUCK AUCI AUCT = AUC of total flavonols (Total) or of the respective quercetin
metabolites quercetin (Q) kaempferol (K) isorhamnetin (I) and tamarixetin (T) respectively 4Cmax = maximum plasma concentration of flavonols subtracted by basal plasma concentration before feed
intake Cmax Total Cmax Q Cmax K Cmax I Cmax T = maximum plasma concentration of total flavonols
(Total) quercetin aglycone (Q) kaempferol (K) isorhamnetin (I) and tamarixetin (T) respectively 5Tmax = time until Cmax was reached Tmax Total Tmax Q Tmax K Tmax I Tmax T = time until Cmax Total Cmax Q
Cmax K Cmax I Cmax T was reached respectively 6ND = Not definable
CHAPTER 2
63
Relative distribution of single flavonols (quercetin isorhamnetin tamarixetin and
kaempferol) proportionately to total flavonols in plasma showed highest values for
quercetin on both days and in both groups (QA and RU) Proportion of single flavonols
changed with time namely increased for quercetin (P lt 005) but decreased for
isorhamnetin and tamarixetin (P lt 005) from d 2 to 29 (Figure 22A B) On d 2
proportion of isorhamnetin was greater (P lt 005) and proportion of tamarixetin was
smaller (P lt 005) in QA- than in RU-fed calves (Figure 22A)
233 Plasma concentrations of metabolites and hormones
Plasma concentrations of total protein decreased (P lt 005) from d 2 to 29 in CTRL and
were greater on d 2 in CTRL than in QA-fed calves (P lt 005 Table 23) Plasma
concentrations of albumin increased (P lt 001) and plasma concentrations of lactate and
urea decreased (P lt 001) from d 2 to 29 without any group effect (Table 23)
Table 23 Blood plasma concentrations of metabolites and hormones of calves after oral
administration of quercetin as quercetin aglycone (QA) rutin trihydrate (RU) or no flavonoid
(CTRL) on d 2 and d 29
Item1 Day
Group2
SE
ANOVA (P-value)
CTRL QA RU Group Day Group
times day
Total
protein gL
2 640a 599
b 617
ab 098 003 0001 007
29 580 565 596
Albumin
gL
2 229 226 225 037 095 0001 042
29 261 265 263
Lactate
mmolL
2 168 237 265 027 031 0001 004
29 063 068 069
Glucose
mmolL
2 737 714 761 028 035 0001 099
29 658 640 679
NEFA
micromolL
2 298 281 298 13 087 0001 065
29 172 177 173
Urea
mmolL
2 380 375 355 026 091 0001 082
29 155 156 155
Insulin
microgL
2 238 179 241 065 012 008 029
29 438 209 277
Cortisol 2 672 629 779 70 043 0001 067
nmolL 29 111 86 130
a-bLSM in a row with different superscripts differ (P lt 005)
1Values are LSM based on plasma concentrations in blood samples taken before and until 24 h after
morning feeding on d 2 and 29 respectively n = 7 per group
2Group QA = 30 micromol(kg BW times d) quercetin aglycone RU = 30 micromol(kg BW times d) rutin trihydrate
CTRL = no flavonol fed
CHAPTER 2
64
A Day 2 B Day 29
Time relative to feeding h
0 2 4 6 8 10 12 24
Glu
cose
m
mo
lL
5
6
7
8
9
10
Time relative to feeding h
0 2 4 6 8 10 12 24
Glu
cose
m
mo
lL
5
6
7
8
9
10
C Day 2 D Day 29
Time relative to feeding h
0 2 4 6 8 10 12 24
NE
FA
m
mo
lL
100
200
300
400
500
Time relative to feeding h
0 2 4 6 8 10 12 24
NE
FA
m
mo
lL
100
200
300
400
500
Figure 23 Plasma concentrations of glucose (A B) and NEFA (C D) after oral administration of 9
mg of quercetinkg BW times d as quercetin aglycone () rutin trihydrate () or no flavonoid () on
d 2 and d 29 of life Values are LSM plusmn SE n = 7
Mean glucose and NEFA plasma concentrations decreased (P lt 005) from d 2 to 29 in
all groups but concentrations did not differ among groups (Table 23) Considering the
day course of the plasma metabolites plasma concentrations of glucose increased (P lt
001) whereas NEFA decreased (P lt 001) after feed intake in all groups on d 2 and 29
respectively (Figure 23A-D)
The increase of plasma insulin concentrations after feed intake was more pronounced (P
lt 005) on d 29 than on d 2 but without group effects (Figure 24A B Table 23)
Plasma concentrations of cortisol decreased (P lt 005) after feed intake on both days
with mean concentrations being greater (P lt 005) on d 2 than on d 29 (Figure 24C D
Table 23)
CHAPTER 2
65
A Day 2 B Day 29
Time relative to feeding h
0 2 4 6 8 10 12 24
Insu
lin
micro
gL
0
2
4
6
8
10
Time relative to feeding h
0 2 4 6 8 10 12 24
Insu
lin
micro
gL
0
2
4
6
8
10
C Day 2 D Day 29
Time relative to feeding h
0 2 4 6 8 10 12 24
Co
rtis
ol
nm
ol
L
0
20
40
60
80
100
Time relative to feeding h
0 2 4 6 8 10 12 24
Co
rtis
ol
nm
ol
L
0
20
40
60
80
100
Figure 24 Plasma concentrations of insulin (A B) and cortisol (C D) after oral administration of 9
mg of quercetinkg of BW times d as quercetin aglycone () rutin trihydrate () or no flavonoid ()
on d 2 and d 29 of life Values are LSM plusmn SE n = 7
24 Discussion
Without dietary supplementation of quercetin (CTRL group) plasma concentrations of
total flavonols were close to or below the detection limit on d 2 and 29 However small
amounts of quercetin and its dehydroxylated metabolite kaempferol were found in blood
plasma on d 2 and 29 in the control group According to Besle et al (2010) flavonoids
are natural components of bovine milk and their concentration is affected by cowrsquos diet
Although colostrum and milk replacer were not analyzed for flavonoid content in the
present study it can be assumed that colostrum is most likely the source for flavonoids
found in CTRL calves at d 2 Apart from colostrum feed components such as
concentrates and hay may also contain flavonoids (Fraisse et al 2007 Reynaud et al
2010) which could explain measurable albeit very low plasma concentrations of
quercetin and its metabolites at least in older calves (d 29)
CHAPTER 2
66
In calves quercetin was systemically available from both supplements QA as well as
RU Interestingly plasma values obtained for quercetin and its metabolites with an
intact flavonol structure were greater on d 2 than on d 29 indicating better absorption or
less excretion in younger animals This may be explained by a different degree of
gastrointestinal maturation and intestinal permeability on d 2 and 29 respectively
(Blum 2006) Thus the epithelium in newborn animals is characterized by vacuolated
epithelial cells which are not present in older animals (Bainter 2002 Blum 2006) This
has possibly contributed to a greater absorption of quercetin from both sources (QA and
RU) on d 2 compared with d 29 in calves Furthermore the reticulorumen and microbial
activities might be already more developed in 29- than in 2-d-old calves resulting in
partial ruminal degradation of the flavonoids applied (Heinrichs and Jones 2003
Guilloteau et al 2009 Berger et al 2012 Li et al 2012) The BV of quercetin from
both QA and RU especially on d 29 could probably be improved when encapsulated
quercetin preparations will be used (Ding et al 2014)
On both days investigated feeding of QA resulted in greater plasma concentrations of
total flavonols quercetin and its metabolites than feeding of RU indicating QA as a
better source of quercetin than RU with respect to the BV of quercetin Markedly lower
plasma concentrations of total flavonols were also seen in monogastric species after
feeding of RU instead of QA at dosages comparable to the current study (Manach et al
1997 Cermak et al 2003 Reinboth et al 2010) Thus the present results obtained in
calves are in principal accordance with studies on the BV of quercetin in monogastric
species such as rats (Manach et al 1997) dogs (Reinboth et al 2010) pigs (Cermak et
al 2003 Lesser et al 2004) and humans (Erlund et al 2000 Egert et al 2008) As
the newborn calf is considered as a functionally monogastric animal (Drackley 2008)
these findings are not surprising
Concerning RU application studies in monogastric species often indicate a delayed
increase of quercetin and its metabolites in blood plasma (Erlund et al 2000 Cermak et
al 2003 Reinboth et al 2010) In the present study maximal plasma concentrations of
quercetin and its metabolites were measured much later after RU than after QA feeding
indicating different intestinal sites for absorption (Erlund et al 2000) In RU-fed
calves quercetin and its metabolites at least on d 2 most likely derive from absorption
in both the small and the large intestine In addition we found the same slow increase of
quercetin and its metabolites in blood plasma after QA and RU feeding but the increase
CHAPTER 2
67
stopped much earlier in RU- than in QA-fed calves In general the sugar moiety in
flavonol molecules determines the absorption of flavonoids in organisms (Day et al
1998 Hollman et al 1999) and QA is supposed to be already absorbed in the small
intestine More complex glycosides such as the glucorhamnoside RU are absorbed in
distal parts of the small intestine or in the colon of monogastric animals where flavonol
molecules are hydrolyzed by microorganisms Thus the lack of rhamnosidase activity
in the small intestine can be considered as one reason for delayed and lower absorption
of RU than of QA (Erlund et al 2000 Cermak et al 2003) Our pattern of relative BV
of total flavonols after RU feeding fits to relative BV of total flavonols in blood plasma
after duodenal but not after ruminal application in dairy cows (Berger et al 2012
Gohlke et al 2013) indicating a low ruminal function in our calves during first month
of life
Interestingly pharmacokinetics of quercetin absorption after QA feeding markedly
differed between calves and adult cattle (Berger et al 2012 Gohlke et al 2013) or
monogastric animals (Erlund et al 2000 Cermak et al 2003 Reinboth et al 2010)
The typical peak of total flavonol plasma concentrations some minutes after QA
administration was not seen in newborn calves As a consequence time for reaching
Cmax was much greater in calves than in adult ruminants and monogastrics Comparable
slow increases of quercetin and its metabolites as in newborn calvesrsquo blood plasma were
only seen in rats (Manach et al 1997) These differences in pharmacokinetics after QA
feeding are difficult to explain but a probable reason is the low release of milk protein
into the duodenum due to abomasal casein clotting (Heinrichs and Jones 2003
Guilloteau et al 2009) and the potential binding of flavonoids to milk proteins (Gugler
et al 1975 Boulton et al 1998 Janisch et al 2004)
All measured metabolites and hormones were in physiological ranges and most of these
findings were in accordance with previous results indicating postnatal growth
especially protein accretion and development in breeding as well as suckling calves
(Egli and Blum 1998 Nussbaum et al 2002 Schiessler et al 2002) Conversely
except for total protein concentrations on d 2 we found no treatment effects by QA or
RU feeding in these calves Plasma protein concentrations were lower in QA-fed than in
CTRL calves a finding that was hard to explain because all calves received the same
pooled colostrum with identical IgG content at first days of life Postprandial changes of
metabolites and hormones have been reported previously (Hadorn et al 1997 Hammon
CHAPTER 2
68
and Blum 1998) but systemic glucose metabolism was not affected by QA or RU
feeding as we have assumed from literature (Cermak et al 2004 Tadera et al 2006)
In conclusion BV of quercetin and its metabolites in newborn calves is more
pronounced when quercetin is fed as QA than as RU These findings go along with data
on BV of quercetin in lactating cows with duodenal application (Gohlke et al 2013)
and in monogastric species like rats dogs and pigs (Manach et al 1997 Cermak et al
2003 Reinboth et al 2010) Greater BV of quercetin on d 2 than on d 29 of life was
probably due to reduced maturation status of the gastrointestinal tract in 2-d old calves
However effects of quercetin feeding on the antioxidative status should be investigated
to validate health-protecting effects of quercetin in neonatal calves
Acknowledgements
We gratefully thank Petra Schulz and Maike Gosse (Christian Albrechts University
Kiel Germany) for excellent laboratory assistance as well as Annette Zeyner Kirsten
Buumlsing (University of Rostock Rostock Germany) and Bernd Stabenow (FBN
Dummerstorf Dummerstorf Germany) for providing experimental facilities Chicken-
egg derived immunoglobulins (Globigen Life Start 25 ) were generously provided by
EW Nutrition GmbH (Visbek Germany) This work is part of the joint research project
Food Chain Plus (FoCus) and was financially supported by the Federal Ministry of
Education and Research Bonn Germany (BMFT grant no 0315538B)
CHAPTER 2
69
References
Ader P A Wessmann and S Wolffram 2000 Bioavailability and metabolism of the
flavonol quercetin in the pig Free Radic Biol Med 281056ndash1067 http
dxdoiorg 101016S0891-5849(00)00195-7
Arts I C W A L A Sesink M Faassen-Peters and P C H Hollman 2004 The
type of sugar moiety is a major determinant of the small intestinal uptake and
subsequent biliary excretion of dietary quercetin glycosides Br J Nutr 91841ndash
847 httpdxdoiorg101079BJN20041123
Bainter K 2002 Vacuolation in the young Pages 55-110 in Biology of the intestine in
Growing Animals R Zabielski P C Gregory and B Westrom ed Elsevier
Amsterdam the Netherlands
Berger L M S Wein R Blank C C Metges and S Wolffram 2012 Bioavailability
of the flavonol quercetin in cows after intraruminal application of quercetin
aglycone and rutin J Dairy Sci 955047ndash5055 httpdxdoiorg103168jds
2012-5439
Besle J M D Viala B Martin P Pradel B Meunier J L Berdagueacute D Fraisse J L
Lamaison and J B Coulon 2010 Ultraviolet-absorbing compounds in milk are
related to forage polyphenols J Dairy Sci 932846ndash2856 httpdxdoiorg
103168jds2009-2939
Bhagwat S D B Haytowitz J M Holden 2013 USDA database for the flavonoid
content of selected foods Release 31 US Department of Agriculture (USDA)
Agricultural Research Service Accessed April 15 2014 httpwwwarsusdagov
SP2UserFilesPlace12354500DataFlavFlav3-1pdf
Blum J W 2006 Nutritional physiology of neonatal calves J Anim Physiol Anim
Nutr (Berl) 901ndash11 httpdxdoiorg101111j1439-0396200500614x
Boulton D W U K Walle and T Walle 1998 Extensive binding of the bioflavonoid
quercetin to human plasma proteins J Pharm Pharmacol 50243ndash249
httpdxdoiorg101111j2042-71581998tb06183x
CHAPTER 2
70
Cermak R S Landgraf and S Wolffram 2003 The bioavailability of quercetin in
pigs depends on the glycoside moiety and on dietary factors J Nutr 1332802ndash
2807
Cermak R S Landgraf and S Wolffram 2004 Quercetin glucosides inhibit glucose
uptake into brush-border-membrane vesicles of porcine jejunum Br J Nutr
91849ndash855 httpdxdoiorg101079BJN20041128
Chase C C D J Hurley and A J Reber 2008 Neonatal immune development in the
calf and its impact on vaccine response Vet Clin North Am Food Anim Pract
2487ndash104
Day A J M S DuPont S Ridley M Rhodes M J Rhodes M R Morgan and G
Williamson 1998 Deglycosylation of flavonoid and isoflavonoid glycosides by
human small intestine and liver beta-glucosidase activity FEBS Lett 43671ndash75
httpdxdoiorg101016S0014-5793(98)01101-6
Ding B P Chen Y Kong Y Zhai X Pang J Dou and G Zhai 2014 Preparation
and evaluation of folate-modified lipid nanocapsules for quercetin delivery J
Drug Target 2267ndash75
Drackley J K 2008 Calf nutrition from birth to breeding Vet Clin North Am Food
Anim Pract 2455ndash86 httpdxdoiorg101016jcvfa200801001
Egert S S Wolffram A Bosy-Westphal C Boesch-Saadatmandi A E Wagner J
Frank G Rimbach and M J Mueller 2008 Daily quercetin supplementation
dose-dependently increases plasma quercetin concentrations in healthy humans J
Nutr 1381615ndash1621
Egli C P and J W Blum 1998 Clinical haematological metabolic and endocrine
traits during the first three months of life of suckling simmentaler calves held in a
cow-calf operation Zentralbl Veterinarmed A 4599ndash118
Erlund I T Kosonen G Alfthan J Maumlenpaumlauml K Perttunen J Kenraali J
Parantainen and A Aro 2000 Pharmacokinetics of quercetin from quercetin
aglycone and rutin in healthy volunteers Eur J Clin Pharmacol 56545ndash553
httpdxdoiorg101007s002280000197
CHAPTER 2
71
Fraisse D A Carnat D Viala P Pradel J-M Besle J-B Coulon C Felgines and
J-L Lamaison 2007 Polyphenolic composition of a permanent pasture
Variations related to the period of harvesting J Sci Food Agric 872427ndash2435
httpdxdoiorg101002jsfa2918
Gaaacutel T R Ribiczeyne-Szabo K Stadler J Jakus J Reiczigel P Kover M Mezes
and L Sumeghy 2006 Free radicals lipid peroxidation and antioxidant system in
the blood of cows and newborn calves around calving Comp Biochem Physiol
B Biochem Mol Biol 143391ndash396
Gasparin F R S C L Salgueiro-Pagadigorria L Bracht E L Ishii-Iwamoto A
Bracht and J Constantin 2003 Action of quercetin on glycogen catabolism in
the rat liver Xenobiotica 33587ndash602 httpdxdoiorg10108000498250310
00089100
Godden S 2008 Colostrum management for dairy calves Vet Clin North Am Food
Anim Pract 2419ndash39
Gohlke A C J Ingelmann G Nuumlrnberg A Starke S Wolffram and C C Metges
2013 Bioavailability of quercetin from its aglycone and its glucorhamnoside rutin
in lactating dairy cows after intraduodenal administration J Dairy Sci 962303ndash
2313 httpdxdoiorg103168jds2012-6234
Gugler R M Leschik and H J Dengler 1975 Disposition of quercetin in man after
single oral and intravenous doses Eur J Clin Pharmacol 9229ndash234
Guilloteau P R Zabielski J W Blum 2009 Gastrointestinal tract and digestion in
the young ruminant Ontogenesis adaptations consequences and manipulations
J Physiol Pharmacol 60(Suppl 3)37ndash46
Hadorn U H Hammon R M Bruckmaier and J W Blum 1997 Delaying colostrum
intake by one day has important effects on metabolic traits and on gastrointestinal
and metabolic hormones in neonatal calves J Nutr 1272011ndash2023
Hammon H M and J W Blum 1998 Metabolic and endocrine traits of neonatal
calves are influenced by feeding colostrum for different durations or only milk
replacer J Nutr 128624ndash632
CHAPTER 2
72
Hammon H M J Steinhoff-Wagner U Schoumlnhusen C C Metges and J W Blum
2012 Energy metabolism in the newborn farm animal with emphasis on the calf
Endocrine changes and responses to milk-born and systemic hormones Domest
Anim Endocrinol 43171ndash185
Heinrichs A J and C M Jones 2003 Feeding the newborn calf College of
Agricultural Sciences Agricultural Research and Cooperative Extension
Pennsylvania State University University Park PA
Hertog M G L P C H Hollman and M B Katan 1992 Content of potentially
anticarcinogenic flavonoids of 28 vegetables and 9 fruits commonly consumed in
the Netherlands Proc Nutr Soc 402379ndash2383 httpdxdoiorg101021
jf00024a011
Hollman P C H M N C P Bijsman Y van Gameren E P J Cnossen J H M de
Vries and M B Katan 1999 The sugar moiety is a major determinant of the
absorption of dietary flavonoid glycosides in man Free Radic Res 31569ndash573
httpdxdoiorg10108010715769900301141
Inanami O A Shiga K J Okada R Sato Y Miyake and M Kuwabara 1999 Lipid
peroxides and antioxidants in serum of neonatal calves Am J Vet Res 60452ndash
457
Janisch K M G Williamson P Needs and G W Plumb 2004 Properties of
quercetin conjugates Modulation of LDL oxidation and binding to human serum
albumin Free Radic Res 38877ndash884 httpdxdoiorg1010801071576041000
1728415
Kobayashi Y M Miyazawa A Kamei K Abe and T Kojima 2010 Ameliorative
effects of mulberry (Morus alba L) leaves on hyperlipidemia in rats fed a high-fat
diet Induction of fatty acid oxidation inhibition of lipogenesis and suppression
of oxidative stress Biosci Biotechnol Biochem 742385ndash2395
Lesser S R Cermak and S Wolffram 2004 Bioavailability of quercetin in pigs is
influenced by the dietary fat content J Nutr 1431508ndash1511
CHAPTER 2
73
Li R W E E Connor C Li R L Baldwin VI and M E Sparks 2012
Characterization of the rumen microbiota of pre-ruminant calves using
metagenomic tools Environ Microbiol 14129ndash139 httpdxdoiorg
101111j1462-2920201102543x
Lindmark-Maringnsson H and B Aringkesson 2000 Antioxidative factors in milk Br J
Nutr 84S103ndashS110
Manach C C Morand C Demigneacute O Texier F Reacutegeacuterat and C Reacutemeacutesy 1997
Bioavailability of rutin and quercetin in rats FEBS Lett 40912ndash16
httpdxdoiorg101016S0014-5793(97)00467-5
Manach C A Scalbert C Morand C Reacutemeacutesy and L Jimeacutenez 2004 Polyphenols
Food sources and bioavailability Am J Clin Nutr 79727ndash747
McGuirk S M 2008 Disease management of dairy calves and heifers Vet Clin North
Am Food Anim Pract 24139ndash153
Mee J F 2008 Newborn dairy calf management Vet Clin North Am Food Anim
Pract 241ndash17
Middleton E C Kandaswami and T C Theoharides 2000 The effects of plant
flavonoids on mammalian cells Implications for inflammation heart disease and
cancer Pharmacol Rev 52673ndash751
Naumann C and R Basler 2004 Die chemische Untersuchung von Futtermitteln
VDLUFA-Verlag Darmstadt Germany
Nijveldt R J E van Nood D E C van Hoorn P G Boelens K van Norren and P
A M van Leeuwen 2001 Flavonoids A review of probable mechanisms of
action and potential applications Am J Clin Nutr 74418ndash425
Nussbaum A G Schiessler H M Hammon and J W Blum 2002 Growth
performance and metabolic and endocrine traits in calves pair-fed by bucket or by
automate starting in the neonatal period J Anim Sci 801545ndash1555
Quigley J D III and J J Drewry 1998 Nutrient and immunity transfer from cow to
calf pre- and postcalving J Dairy Sci 812779ndash2790
CHAPTER 2
74
Reinboth M S Wolffram G Abraham F R Ungemach and R Cermak 2010 Oral
bioavailability of quercetin from different quercetin glycosides in dogs Br J
Nutr 104198ndash203 httpdxdoiorg101017S000711451000053X
Reynaud A D Fraisse A Cornu A Farruggia E Pujos-Guillot J-M Besle B
Martin J-L Lamaison D Paquet M Doreau and B Graulet 2010 Variation in
content and composition of phenolic compounds in permanent pastures according
to botanical variation J Agr Food Chem 585485ndash5494 httpdxdoiorg
101021jf1000293
SAS Institute Inc 2010 SASQC 92 Userrsquos Guide Second Edition Cary NC SAS
Institute Inc
Schiessler G A Nussbaum H M Hammon and J W Blum 2002 Calves sucking
colostrum and milk from their dams or from an automatic feeding station starting
in the neonatal period Metabolic and endocrine traits and growth performance
Anim Sci 74431ndash444
Steinhoff-Wagner J S Goumlrs P Junghans R M Bruckmaier E Kanitz C C Metges
and H M Hammon 2011 Maturation of endogenous glucose production in
preterm and term calves J Dairy Sci 945111ndash5123 httpdxdoiorg
103168jds2011-4355
Tadera K Y Minami K Takamatsu and T Matsuoka 2006 Inhibition of alpha-
glucosidase and alpha-amylase by flavonoids J Nutr Sci Vitaminol (Tokyo)
52149ndash153
Uetake K 2013 Newborn calf welfare A review focusing on mortality rates Anim
Sci J 84101ndash105
Vicari T J J G C van den Borne W J J Gerrits Y Zbinden and J W Blum 2008
Postprandial blood hormone and metabolite concentrations influenced by feeding
frequency and feeding level in veal calves Domest Anim Endocrinol 3474ndash88
httpdxdoiorg101016jdomaniend200611002
CHAPTER 2
75
Weber C C Hametner A Tuchscherer B Losand E Kanitz W Otten S P Singh
R M Bruckmaier F Becker W Kanitz and H M Hammon 2013 Variation in fat
mobilization during early lactation differently affects feed intake body condition
and lipid and glucose metabolism in high-yielding dairy cows J Dairy Sci 96165ndash
180 httpdxdoiorg103168jds2012-5574
Williams R J J P Spencer and C Rice-Evans 2004 Flavonoids Antioxidants or
signalling molecules Free Radic Biol Med 36838ndash849
76
Chapter 3
Effects of oral flavonoid supplementation on metabolic and
antioxidative status in newborn dairy calves
J Maciej C T Schaumlff E Kanitzdagger A TuchschererDagger R M Bruckmaiersect
S Wolffram and H M Hammon1
Institute of Nutritional Physiology ldquoOskar Kellnerrdquo
daggerInstitute of Behavioural Physiology and
DaggerInstitute of Genetics and Biometry Leibniz Institute for Farm Animal Biology (FBN)
Wilhelm-Stahl-Allee 2 18196 Dummerstorf Germany
sectDepartment of Clinical Research and Veterinary Public Health Veterinary Physiology
Vetsuisse Faculty University of Bern 3001 Bern Switzerland
Institute of Animal Nutrition and Physiology Christian Albrechts University Kiel
24118 Kiel Germany
1Corresponding author H M Hammon Leibniz Institute for Farm Animal Biology
(FBN) Institute of Nutritional Physiology ldquoOskar Kellnerrdquo Wilhelm-Stahl-Allee 2
18196 Dummerstorf Germany phone +49-38208-68670 fax +49-38208-68652
e-mail hammonfbn-dummerstorfde
Used by permission of the Journal of Dairy Scince
Manuscript submitted to Journal of Dairy Science
Manuscript ID JDS-15-9906
CHAPTER 3
77
3 Effects of oral flavonoid supplementation on metabolic and
antioxidative status in newborn dairy calves
Abstract
Many studies investigated effects of natural feed additives like flavonoids and verified
their antioxidative or antiinflammatory properties but scientific proof for flavonoids as
health and performance-promoting tool in calf nutrition is weak Thus we investigated
the effects of the most abundant flavonoid quercetin and of a green tea extract (GTE)
containing various catechins on metabolic and antioxidative traits in dairy calves to
further clarify potential health-promoting effects Male newborn German Holstein
calves (n=7 per group) either received no flavonoid (control group) 10 mg of quercetin
equivalents as quercetin aglycone or as rutinkg of body weight (BW) and d or 10
mgkg BW and d of a GTE from d 5 to d 26 of life with morning and evening feeding
All calves were fed equal amounts of colostrum and milk replacer according to BW
Body Weight feed intake and health status were evaluated daily Blood samples were
collected from the jugular vein on d 1 5 12 19 and 26 before morning feeding to
investigate flavonoid metabolic and antioxidative status in calves During the
experiment growth performance data and health status remained unchanged but GTE-
fed calves had less loose feces than controls and calves fed quercetin aglycone required
less medical treatment than other groups Concentrations of quercetin changed over
time and were higher in rutin-fed than control group whereas catechins were below
detection limit Plasma trolox equivalent antioxidative capacity (TEAC) and ferric
reducing ability of plasma (FRAP) were measured as markers for plasma antioxidative
capacity Concentrations of TEAC increased whereas FRAP decreased after the first d
of life in all groups least in controls Oxidative stress markers in plasma were measured
as thiobarbituric acid reactive substances (TBARS) and F2-isoprostances
Concentrations of TBARS were highest during first month of life in the control group
but decreased at the same time in the GTE group F2-isoprostane concentrations
decreased in control group only Plasma concentrations of total protein albumin urea
lactate glucose and non-esterified fatty acids as well as of insulin and cortisol varied in
time but there were no group differences caused by flavavonoid supplementation
Taken together orally administrated quercetin and catechins at dosages used in the
CHAPTER 3
78
present study resulted in no or only weak effects on health metabolic and antioxidative
status in newborn dairy calves
Key Words antioxidative status calf flavonoid quercetin rutin
31 Introduction
After birth calves undergo huge immunological and metabolic changes Though
relatively mature at birth they need to adapt to various morphological and functional
changes after birth (Blum and Hammon 2000) Calf losses mainly occur during first wk
of life mostly because of respiratory and digestive problems (USDA 2011) Good
management like early and sufficient colostrum supply is essential In addition fed
supplements are daily practice in modern dairy Particularly since the ban of antibiotic
growth promoters in the European Union in 2006 the call for ʻnaturalʼ feed additives
gained enormous popularity In this respect flavonoids as secondary plant metabolites
ubiquitous in all higher plants are of interest Their health-promoting properties are
mainly thought to be due to their strong antioxidant activity in vitro associated with
effects on several metabolic key enzymes and inflammatory cells (Middleton et al
2000) glucose and lipid metabolism (Shetty et al 2004 Kobayashi et al 2010) or
incidence of diarrhea (di Carlo et al 1994 Gaacutelvez et al 1995) One of the most
abundant flavonoids is the flavonol quercetin a pentahydroxyflavon mostly bound β-
glycosidic manner to at least one sugar molecule and present in high concentrations in
apples and onions Quercetin bound to rutinose is called rutin and is the major glycoside
of quercetin The predominant flavanol another subgroup of flavonoids is catechin
which is mainly found in high concentrations in green tea
Almost any disease is associated with increased formation of reactive oxygen species
thus causing oxidative stress (Halliwell 1991) In calves enhanced oxidative stress was
seen on the first d of life (Alexandrovich and Antonovna 2009) and especially if sick
(Ahmed and Hassan 2007 Al-Qudah 2009) Because the nutrient status often is
impaired in newborn calves this possibly affects the antioxidant system (Schwerin et
al 2002 Sies et al 2005) Thus improvement of the antioxidant status in newborn
calves may accelerate maturation of the own immune system improve health status and
thus reduce calf losses The bioavailability of quercetin in newborn calves as
prerequisite for biological effects was recently shown (Maciej et al 2015) Based on
these findings we have tested the hypothesis that quercetin and catechin
CHAPTER 3
79
supplementation affect metabolism and the antioxidative and health status during the
first 3 wk of life in dairy calves
32 Materials and Methods
321 Animals and feeding
Procedures performed in this study were in accordance with the German animal
protection law and approved by the relevant authorities (Landesamt fuumlr Landwirtschaft
Lebensmittelsicherheit und Fischerei Mecklenburg-Vorpommern Germany
permission no LVL M-VTSD72213-21-01910) Twenty-eight male German
Holstein calves were examined from d 1 to d 26 of life All calves were spontaneously
born from multiparous cows on neighboring farms and transported directly after birth to
the experimental barn of the University of Rostock where they were kept in single
boxes with straw bedding Calves had free access to water and were fed twice daily by
nipple bottle or nipple bucket On the first 3 d of life calves received pooled colostrum
obtained from milkings 1 3 and 5 (d 1 2 and 3 after parturition respectively) in
amounts of 8 of BW on d 1 and 10 of BW on d 2 and 3 (Table 1) From d 4 until d
26 calves received a commercial milk replacer (150 gL SalvaLac MiraPro 45 Salvana
Tiernahrung GmbH Klein-Offenseth Sparrieshoop Germany) in amounts of 12 of
BWd To ensure equal feed uptake in all groups refused amounts of colostrum or milk
replacer were tub- fed Milk replacer amounts were adapted to BW once a wk
From d 2 to d 6 colostrum or milk replacer was supplemented with chicken-egg derived
immunoglobulins (Globigen Life Start 25 EW Nutrition GmbH Visbek Germany)
fed twice daily in amounts of 40 32 24 16 and 8 gd respectively (Maciej et al
2015)
Calves had free access to pelleted concentrate (Kaumllber Start 183 pell Vollkraft
Mischfutterwerke GmbH Karstaumldt Germany) and hay from d 4 on Concentrate intake
was measured daily after the morning milk feeding (Maciej et al 2015)
CHAPTER 3
80
Ta
ble
31
C
om
po
siti
on
an
d a
mo
un
ts o
f co
lost
rum
m
ilk
rep
lace
r a
nd
co
nce
ntr
ate
fed
to
ca
lves
d
1
d 2
d
3
d 4
to
30
2
Item
co
lost
rum
1
mil
kin
g 1
colo
stru
m1
mil
kin
g 3
colo
stru
m1
mil
kin
g 5
M
ilk
rep
lace
r3
Co
nce
ntr
ate
4
DM
gk
g
20
69
1
54
7
13
93
1
10
0
88
00
CP
gk
g D
M
59
74
3
90
4
33
31
2
01
8
18
00
Cru
de
fat
gk
g D
M
16
92
2
40
5
27
49
1
90
9
43
0
Ash
gk
g D
M
48
3
55
6
56
0
73
6
74
0
Lac
tose
g
kg D
M
13
63
2
60
5
30
87
5
14
6
-
1C
olo
stru
m w
as d
eriv
ed f
rom
mu
ltip
aro
us
cow
s and
sep
arat
ely p
oo
led
fro
m m
ilkin
gs
1
3
and
5 a
fter
par
turi
tio
n
resp
ecti
vel
y
2H
ay w
as o
ffer
ed a
d l
ibit
um
exce
pt
for
days
of
bio
avai
lab
ilit
y s
tud
ies
3M
ilk r
epla
cer
(Sal
vaL
ac M
iraP
ro 4
5
Sal
van
a T
iern
ahru
ng
Gm
bH
K
lein
-Off
ense
th S
parr
iesh
oo
p
Ger
man
y)
was
com
po
sed
of
45
s
pra
y s
kim
med
mil
k
po
wd
er
35
s
wee
t w
hey p
ow
der
1
8
pla
nt
oil
(p
alm
co
conut
and
so
y o
il)
17
L
ys
08
C
a 0
75
P
an
d a
dd
ed w
ith 5
00
00
IU
of
vit
am
in A
4
000
IU o
f vit
am
in D
3
20
0 m
g o
f vit
am
in E
(α
-to
cop
her
ol
acet
ate)
9
mg C
u (
gly
ceri
ne-
cop
per
chel
ate)
ci
tric
aci
d
sorb
ic a
cid
b
uty
lhyd
rox
yto
luene (
BH
T)
and
12
x 1
09 c
fu E
nte
roco
ccu
s fa
eciu
m E
17
06
4C
once
ntr
ate
(Kaumll
ber
Sta
rt 1
83
V
oll
kra
ft
Mis
ch
futt
erw
erk
e G
mb
H
Kar
staumld
t G
erm
an
y)
was
com
po
sed
of
wh
eat
glu
ten
wh
eat
bra
n
gra
in m
ash
su
gar
bee
t
pulp
ra
pes
eed
mea
l o
at
rye
mo
lass
es
lin
seed
o
at b
ran
soyb
ean m
eal
extr
act
cal
ciu
m c
arb
onat
e s
od
ium
chlo
rid
e 0
6
pho
spho
rous
02
s
od
ium
10
800
IU
of
vit
am
in A
1
21
5 I
U o
f vit
am
in D
3
30
mg o
f vit
am
in E
0
7 m
g o
f I
04
mg o
f C
o
54
mg o
f M
g
81
mg o
f Z
n
and
04
mg o
f S
e p
er k
g o
f D
M
CHAPTER 3
81
Health status of calves was determined daily by measuring rectal temperature heart and
respiratory rate by evaluation of behavioral abnormalities nasal discharge respiratory
sounds and by navel inspection Fecal consistence was assessed daily by fecal
consistence score according to Larson et al (1977) normal (1) soft (2) runny (3) or
watery (4) Sick calves were treated by a veterinarian for statistical analysis each calf
was counted as treated for a disease independent from how many times an animal was
treated
322 Treatment and blood sampling
Calves were randomly assigned to one of four feeding groups (n = 7) Control (CTRL)
received no flavonoids QA received 10 mgkg BW times d quercetin aglycone (quercetin
dihydrate Carl Roth GmbH amp Co KG Karlsruhe Germany) RU received 20 mgkg
BW times d quercetin as glucorhamnoside rutin (rutin trihydrate Carl Roth GmbH amp Co
KG) and CA received 10 mgkg BW times d of a green tea extract (GTE) containing
various catechins (Polyphenon 60 Sigma-Aldrich Chemie GmbH Steinheim
Germany) For QA and RU daily dose of quercetin equivalents was 10 mgkg of BW
(30 micromolkg BW) The GTE (703 total catechins) fed in CA was composed of 14
catechin 03 catechin gallate 52 gallocatechin 21 gallocatechin gallate (all as
trans-isomers) and 64 epicatechin 70 epicatechin gallate 190
epigallocatechin 288 epigallocatechin gallate (all as cis-isomers) Amounts of
flavonoid fed to calves in this study were based on previous studies in pigs and dogs
(Lesser et al 2004 Reinboth et al 2010 Luumlhring et al 2011) Due to studies on
bioavailability of flavonoids all calves received their respective daily dose with the
morning feeding on d 2 and no flavonoids were fed on d 3 and 4 From d 5 on the daily
dose was equally split with morning and evening meal since d 26 On d 1 3 and 4 no
flavonoids were fed Flavonoids were suspended in water and administered with a
disposable 10-ml syringe directly into the mouth during milk feeding
Jugular blood samples were taken immediately after birth and on d 5 12 19 and 26
before morning feeding using evacuated tubes (Vacuette Greiner Bio-One GmbH
Frickenhausen Germany) Tubes containing 15 IUmL lithium heparinate were used
for the determination of the plasma concentrations of flavonols catechins and the
markers for antioxidative capacity and oxidative stress tubes containing 25 gL sodium
fluoride and 18 gL potassium EDTA were used for the determination of plasma
CHAPTER 3
82
protein albumin glucose NEFA urea and lactate and tubes containing 18 gL
potassium-EDTA were used for the determination of plasma insulin and cortisol
concentrations The blood samples were immediately put on ice and centrifuged (1500
times g 4degC 20 min) To measure the catechins 1 mL of plasma was mixed with 20 microL of
an ascorbate-EDTA solution (04 molL NaH2PO4 Carl Roth GmbH amp Co KG)
containing 20 ascorbic acid (Merck KGaA Darmstadt Germany) and 01 EDTA
(Carl Roth GmbH amp Co KG) at pH 36 To measure F2-Isoprostanes a 0005
ethanolic butylhydroxytoluene (BHT) solution (0005 BHT in ethanol wv) was
added in one percent proportion for stabilization The plasma samples were stored until
analyzed at -20degC for metabolites and hormones and at -80degC for flavonoid and
(anti)oxidative parameters until analyzed
323 Analytical methods
Plasma concentrations of quercetin aglycone and its methylated (isorhamnetin and
tamarixetin) and dehydroxylated (kaempferol) derivatives were analyzed by HPLC with
fluorescence detection as described previously (Berger et al 2012) The detection limit
of flavonol was le 10 nmolL and the recovery rate of flavonols was 92 plusmn 2 (mean plusmn
SEM) Inter- and intraassay coefficients of variability for quercetin were 72 and 05
respectively The sum of quercetin and its metabolites in plasma is referred to as total
flavonols
Plasma concentrations of individual catechins (gallocatechin epigallocatechin
epigallocatechin gallate epicatechin gallate and epicatechin) were determined by
HPLC (Lee et al 1995) with some modifications (Egert et al 2013) In brief 500 microL
of thawed plasma were mixed with 375 microL of β-glucuronidasesulfatase (final activities
of 7300 and 130 UmL for glucuronidase and sulfatase respectively Sigma Aldrich
Chemie GmbH) and incubated at 37degC for 45 min Hydrolyzation was stopped by
adding 1 mL methylene chloride Samples were mixed for 4 min and centrifuged (3220
times g 4degC 15 min) The supernatant was transferred into another tube mixed with 1 mL
ethyl acetate for 4 min and centrifuged (3220 times g 4degC 20 min) and 800 microL of the
supernatant were transferred into a glass tube with glass pearls and ethyl acetate
extraction was repeated twice Supernatants were combined mixed with 10 microL of 1
aqueous ascorbic acid and dried by vacuum centrifugation (SPD2010 SpeedVac
System Thermo Fischer Scientific GmbH Dreieich Germany) The dried sample was
CHAPTER 3
83
dissolved in 150 microL of the mobile phase A by vortex mixing and ultrasonic bath for 15
min After centrifugation 30 microL of the supernatant were used for HPLC analyses For
catechin analyses by HPLC (Jasco Deutschland GmbH Groszlig-Umstadt Germany pump
model PU-2080 plus) the supernatant was injected into the fully automated autosampler
(AS-2057 Plus Jasco Deutschland GmbH) Separation occurred on a reverse-phase C-
18 Kromasil 100 column (25 times 46 mm 5 microm Jasco Deutschland GmbH) protected by
a pre-column (C-18 Inertsil ODS-2 10 times 4 mm particle size 5 μm Jasco Deutschland
GmbH) at 30degC Mobile phase A and B were composed of water acetonitrile and
trifluoroacetic acid (92801 and 653501 vvv) with a pH of 25 At a flow rate of 09
mLmin the eluent was monitored by electrochemical detection with potential settings
at 0 120 240 and 360 mV in a 4-channel colometric electrochemical detector (Coul
Array 5600A ESA Inc Chelmsford MA) Dominant signals used for quantification of
catechins were 120 mV for epigallocatechin and epicatechin gallate and 240 mV for
catechin gallocatechin epicatechin and epigallocatechin gallate respectively
Quantification of individual plasma catechins were carried out using external standards
which were generated by simultaneously adding catechin gallocatechin
epigallocatechin epigallocatechin gallate epicatechin gallate and epicatechin (Carl
Roth GmbH amp Co KG) to untreated plasma at final concentrations of each catechin of
0125 025 05 1 25 5 75 and 10 micromolL Calibration samples were treated in the
same way as experimental samples The coefficient of determination was r ge 099
detection limit of catechins was le 10 nmolL and the intra-assay coefficient of variation
was 24 plusmn 26 to 65 plusmn 47
Antioxidative capacity and oxidative stress markers were analyzed in repeated
measurements The trolox equivalent antioxidative capacity (TEAC) is defined as
amount of the water-soluble vitamin E derivate trolox (in mmol) needed to show the
same antioxidant capacity at a defined time point as 1 mmol of plasma and is expressed
as trolox equivalents (TE) in mmolL plasma The TEAC was measured according to
the modified protocol of Re et al (1999) by measuring spectrophotometrically the
decolorization of 22-azinobis(3-ethylbenzothiazoline-6-sulphonic acid) radical cation
(ABTS+) caused by binding to antioxidants at a wavelength of 734 nm Ferric reducing
ability of plasma (FRAP) was determined according to Benzie and Strain (1996) and is
given in ascorbic acid equivalents (ASCE) in micromolmL plasma Reduction of Fe3+
-
tripyridyltriazin by antioxidants from plasma results in a color change that is directly
CHAPTER 3
84
proportional to antioxidative capacity Absorbance was measured at a wavelength of
595 nm and compared to the one of ascorbic acid Thiobarbituric acid reactive
substances (TBARS) concentration in plasma was measured according to Yagi (1998)
with modifications and is given as malondialdehyde equivalents (MDAE) in micromolL
plasma Adding thiobarbituric acid to the sample results in formation of a red complex
whose optical density was measured photometrically at a wavelength of 532 nm F2-
isoprostanes especially their main representative 8-iso-prostaglandin F2α are produced
in vivo by peroxidation of the cell membrane lipid component arachidonic acid and is
considered as a reliable marker for lipid peroxidation Detection of 8-iso-prostaglandin
F2α was carried out with an enzymatic immune assay (Direct 8-iso-prostaglandin F2α
Assay Designs MI) and values are expressed in pgmL
Plasma metabolites were analyzed by the Clinic for Cattle (University of Veterinary
Medicine Hannover Foundation Germany) spectrophotometrically on an ABX Pentra
400 (Horiba ABX SAS Montpellier Cedex France) using the respective kits Albumin
(no A11A01664) and lactate (no A11A01721 Horiba Europe GmbH Hannover
Germany) NEFA (no 434-91795 Wako Chemicals GmbH Neuss Germany) glucose
(no 553-230) and total protein (biuret reaction no 553-412 MTI Diagnostics GmbH
Idstein Germany) and urea (no LT-UR 0050 Labor + Technik E Lehmann GmbH
Berlin Germany) Plasma insulin and cortisol concentrations were measured either by
radioimmunoassay or by ELISA respectively as previously described (Maciej et al
2015)
Colostrum was analyzed for DM CP crude fat and ash content (were measured by
MQD Qualitaumltspruumlfungs- und Dienstleistungsgesellschaft Mecklenburg-Vorpommern
Guumlstrow Germany) using standard procedures according to Weende (Naumann and
Bassler 2004) Chemical components and contents of the milk replacer were provided
by the manufacturer according to Weender analysis (Naumann and Bassler 2004 Table
31)
324 Statistical analyses
Statistical analyses were performed using SAS software Version 94 for Windows
Copyright SAS Institute Inc Cary NC USA Data on health performance and from
plasma measurements are presented as least squares means (LSM) plusmn standard error (SE)
and were analyzed by repeated measurement ANOVA using the Mixed procedure of
CHAPTER 3
85
SASSTAT software with a model containing the fixed effects treatment group (levels
CTRL QA RU CA for plasma flavonol concentrations only CTRL QA RU) day
(levels 1 5 12 19 26) and group times day interaction Repeated measures on the same
animal were taken into account by the REPEATED statement of the MIXED procedure
and an autoregressive type for the block diagonal residual covariance matrix Pairwise
differences among treatment groups and days were tested by the Tukey-Kramer-test
Data on fecal score and medical treatment were analyzed with the NPAR1WAY
procedure of SASSTAT software across the one-way classification treatment group
(levels CTRL QA RU CA) using Wilcoxon scores (for each wk seperately) Effects
and differences were considered significant if P lt 005
33 Results
331 Body weight feed intake and health status
All calves were born spontaneously and were evidently healthy Body weight was 473
plusmn 10 kg at birth and did not differ among groups
Average daily gain (616 gd plusmn 25 g n = 28) and final BW (582 kg plusmn 042 kg n = 28)
was not different between groups
Milk intake increased with time (wk 1 = 51 kgd wk 2 = 61 kgd wk 3 = 64 kgd wk
4 = 70 kgd P lt 0001) equally in all groups Concentrate intake also increased with
time (P lt 0001) equally in all groups During the first wk concentrate intake was very
low (4 gd) but increased to 27 gd during the second wk and to 117 gd in wk 4
Average fecal score for all groups was 14 and each calf had on average 2 d of strong
diarrhea indicated by fecal score 4 Severe diarrhea occurred between d 3 and d 20 and
fecal score was highest in wk 2 (fecal score 162) and wk 3 (fecal score 154) During
the first wk of life fecal score differed among groups being lower (P lt 005) in CA
group (fecal score 101) than in CTRL group (fecal score 146) and in group QA (fecal
score 131)
Treatments of diseases showed no significant group differences However group CA
had 3 treated calves (total 7 treatments 2 diarrhea 4 pneumonia 1 other disease) and
other groups 6 treated calves each [CTRL in total 9 treatments (4 diarrhea 2
pneumonia 3 other diseases) RU in total 10 treatments (1 diarrhea 7 pneumonia 2
other diseases) QA in total 10 treatments (1 diarrhea 5 pneumonia 4 other diseases)]
CHAPTER 3
86
Other diseases were omphalitis (n = 2) thromboflibitis (n = 4) polyartritis (n = 1)
obstipation (n = 1) and conjuctivitis (n = 1)
332 Plasma flavonoid concentrations
Plasma concentrations of total flavonols in QA and RU increased (P lt 005) until d 12
but decreased thereafter in QA (Figure 31) Plasma concentrations of total flavonols
(sum of quercetin isorhamnetin and tamarixetin) were higher (P lt 005) in RU than in
CTRL (data for quercetin metabolites not shown)
Plasma concentrations of individual catechins were below detection limit
Time d
5 12 19 26
Tota
l fl
avon
ols
n
mol
L
0
50
100
150
200
Figure 31 Plasma concentrations of total flavonols from d 5 to 26 after feeding of no flavonoid ()
and after oral administration of 9 mg of quercetinkg of BW times day as quercetin aglycone () or as
values are LSM plusmn SE n = 7 per group
333 Markers for antioxidative capacity and oxidative stress
Markers for antioxidative capacity (TEAC FRAP Figure 32A-D) changed with time
with TEAC increasing and FRAP decreasing from d 1 to d 5 and then remaining
relatively stable in all groups Absolute concentrations as well as relative changes did
not differ among groups but FRAP showed a group times time interaction (P lt 0001) for
CHAPTER 3
87
relative changes (in CTRL from d 12 to d 19 P = 003 and in RU from d 5 to d 12 P =
008) but no relative changes in QA and CA
Absolute concentrations of oxidative stress markers (TBARS F2-isoprostanes) revealed
huge individual variations within groups and did not show group or time differences
(Figure 32 E G) However relative changes of both oxidative stress markers showed
overall group effects between CA and CTRL (P lt 005 Figur 32 F H)
A TEAC Absolute plasma values B TEAC Plasma values relative to day 1
Time d
1 5 12 19 26
TE
m
mo
lL
17
18
19
20
21
22
Time d
5 12 19 26
TE
m
mo
lL
00
01
02
03
04
C FRAP Absolute plasma values D FRAP Plasma values relative to day 1
Time d
1 5 12 19 26
AS
CE
micro
mo
lm
L
100
120
140
160
180
200
220
240
Time d
5 12 19 26
AS
CE
micro
mo
lm
L
-140
-120
-100
-80
-60
-40
-20
0
E TBARS Absolute plasma values F TBARS Plasma values relative to day 1
Time d
1 5 12 19 26
MD
AE
micro
mo
lL
03
04
05
06
Time d
5 12 19 26
MD
AE
micro
mo
lL
-02
-01
00
01
02
03
b b
b
b
a a
a
a
a a
a a
a a
a a
a a
a a
a a
a a
a a
a a
a a
a a
a a
a a
b a
b a
b a
a
b
a
b a
b a
b a
b a
a a
a
b
a
a
b
a
a
b
a
a
b
a
a
b
a
a
b
a
a
b
a
CHAPTER 3
88
G F2-isoprostanes Absolute plasma values H F2-isoprostanes Plasma values relative to day 1
Time d
1 5 12 19 260
2000
4000
6000
8000
10000
12000
Time d
5 12 19 26
8-i
so-P
GF2
pg
mL
-8000
-6000
-4000
-2000
0
2000
4000
8-i
so-P
GF2
pg
mL
Figure 32 Time course of different markers for antioxidative capacity (TEAC = trolox equivalent
antioxidative capacity FRAP = ferric reducing ability of plasma) and oxidative stress markers
(TBARS = thiobarbituric acid reactive substances F2-isoprostanes) for each parameters absolute
plasma values are depicted in graphs A C E and G whereas graphs B D F and H show
incremental or decremental values relative to values on d 1 control () rutin () quercetin
aglycone () and green tea extract () a-b
LSM with different superscripts differ values are LSM
plusmn SE n = 7 per group
334 Plasma concentrations of metabolites and hormones
Plasma concentrations of total protein increased (P lt 0001) and plasma concentrations
of albumin decreased (P lt 0001) from d 1 to d 5 in all groups (Table 31) After d 5
there was a slight decrease (P lt 005) for total protein and a slight increase for albumin
(P lt 005) until the end of the study Plasma concentrations of urea decreased (P lt 001)
until d 12 in all groups and then remained relatively low (Table 31) Plasma glucose
concentrations slightly increased (P = 001) in most groups from d 1 to d 5 and then
variably changed up to d 26 (Table 31) Plasma lactate concentrations sharply
decreased after birth up to d 5 but then remained stable up to d 26 (Table 31) Plasma
NEFA concentrations decreased up to d 5 of life and partly increased again until d 12
(Table 31) Plasma insulin and cortisol concentrations decreased after birth in most
groups (P lt 0001) and then remained low (Table 31) All plasma concentrations
measured were comparable among groups except for plasma cortisol where the
decrease after birth differed among groups reflected by group times time interaction (P lt
0001)
CHAPTER 3
89
Ta
ble
32
B
loo
d p
lasm
a c
on
cen
tra
tio
ns
of
met
ab
oli
c tr
ait
s a
nd
ho
rm
on
es
of
calv
es a
fter
no
fla
vo
no
id (
CT
RL
) q
uer
ceti
n a
gly
con
e (Q
A)
ru
tin
(RU
) o
r o
f a
gre
en-t
ea e
xtr
act
fee
din
g c
on
tain
ing
ma
inly
ca
tech
ins
(CA
) fr
om
d 5
to
d 2
6
Sa
mp
les
are
ta
ken
bef
ore
mo
rnin
g m
ilk
fee
din
g
occ
urr
ed
Item
1
Da
y
Gro
up
S
E
AN
OV
A (
P-v
alu
e)
CA
C
TR
L
QA
R
U
Gro
up
D
ay
G
rou
p times
Da
y
To
tal
pro
tein
gL
1
50
6
50
3
50
0
50
3
13
4
03
3
00
0
06
3
5
6
03
6
27
5
88
6
14
12
58
3
60
6
59
4
61
1
19
55
6
58
6
58
0
59
0
26
56
4
58
0
55
7
58
4
Alb
um
in
gL
1
26
1
25
7
24
9
25
2
06
6
02
7
00
0
08
8
5
2
40
2
37
2
34
2
35
12
26
6
24
6
24
4
24
9
19
26
0
25
2
25
6
25
4
26
26
7
25
6
25
7
25
9
Ure
a m
mo
lL
1
3
48
3
61
3
84
3
23
02
6
07
4
00
0
07
8
5
26
1
2
52
2
33
2
31
12
2
02
1
40
1
98
1
72
19
1
58
1
44
1
55
1
72
26
1
43
1
34
1
63
1
52
Glu
cose
m
mo
lL
1
5
46
4
12
4
93
4
98
03
2
05
6
00
0
01
9
5
54
5
5
31
5
84
5
35
12
5
12
4
87
4
94
5
03
19
4
76
5
30
5
50
4
71
26
5
39
5
26
5
38
5
16
CHAPTER 3
90
Ta
ble
32
C
on
tin
ua
tio
n
Item
1
Da
y
Gro
up
S
E
AN
OV
A (
P-v
alu
e)
CA
C
TR
L
QA
R
U
Gro
up
D
ay
G
rou
p times
Da
y
Lac
tate
m
mo
lL
1
55
3
30
2
55
6
41
1
0
77
08
0
00
0
0
50
5
07
6
07
6
18
8
07
6
12
05
9
05
2
05
7
06
2
19
05
5
04
3
06
6
06
1
26
05
6
04
8
04
9
05
6
NE
FA
micro
mo
lL
1
55
2
91
7
67
4
64
8
90
8
05
3
00
0
0
28
5
28
3
22
0
24
8
21
1
12
21
5
46
9
34
4
37
4
19
36
4
30
9
29
5
36
1
26
28
8
28
0
27
6
20
5
Insu
lin
microgL
1
14
9
06
7
06
5
03
5
0
19
02
3
00
0
0
22
5
04
4
04
4
03
7
03
2
12
02
0
02
5
03
5
01
9
19
01
9
01
7
01
7
02
2
26
01
6
02
3
01
5
01
5
Co
rtis
ol
ngm
L
1
9
10
7a
5
50
0b
6
97
7ab
88
60
a
54
2
03
3
00
0
0
00
5
1
90
7
1
90
6
3
20
6
2
34
0
12
81
0
78
7
1
17
3
1
19
6
19
68
4
46
0
83
4
1
03
0
26
46
6
41
7
76
0
64
1
a-bL
SM
in a
ro
w w
ith d
iffe
rent
sup
ersc
rip
ts d
iffe
r (P
lt 0
05
)
1 V
alues
are
LS
M plusmn
SE
n =
7 p
er g
roup
CHAPTER 3
91
34 Discussion
At birth BW was not different among groups as planned and postnatal growth
performance was not affected by treatment The lack of differences in feed intake and
ADG during flavonoid administration is in line with findings of Oliveira et al (2010)
after feeding a flavonoid-rich pomegranate extract to calves for the first 30 d of life
Because concentrate intake did not differ among groups rumen development during
first month of life was unlikely changed by flavonoid administration as supported by
low plasma concentrations of β-hydroxybutyrate that did not increase in flavonoid-
treated calves during the experimental period (Maciej and Hammon unpublished
observations) Nevertheless plant extracts have the potential to affect rumen
development but may be only effective in older calves (Greathead 2003)
The impact of flavonoids on health status is discussed controversially Nielsen (2008)
found fewer diarrhea in weaned piglets after feeding natural feed additives containing a
high amount of flavonoids In contrast Oliveira et al (2010) reported no effects on
health parameters like incidence of diarrhea by feeding a polyphenol-rich feed to
newborn calves Interestingly we found an improved fecal score in CA compared to
CTRL calves In recent studies GTE were shown to inhibit diarrhea in newborn calves
(Ishihara et al 2001) In addition the number of treatments was markedly reduced in
the study of Ishihara et al (2001) confirming our results of numerically less treated
calves because of diarrhea in CA
Plasma antioxidant capacity of calves based on TEAC and FRAP measurements was
not influenced by flavonoid feeding in this study However the sharp changes of both
markers from d 1 to d 5 again highlights the role of colostrum feeding (Blum and
Hammon 2000 Hammon et al 2013) Measurement of TEAC is dependent on the
vitamin E analogue trolox Because vitamin E is provided by colostrum feeding (Blum
et al 1997 Lindmark-Maringnsson and Aringkesson 2000 Zanker et al 2000) and plasma
TEAC also increased rapidly after first colostrum intake in calves Our findings on
FRAP agree with those of Gaaacutel et al (2006) that also showed a decline of this parameter
after first colostrum intake Urea is a major factor influencing FRAP (Benzie and Strain
1996) and albumin and urea are factors influencing TEAC (Miller et al 1993) but
these metabolites only changed in time and were similar among groups Although
plasma metabolites were not affected by treatment decremental changes of FRAP
CHAPTER 3
92
values from d 12 to d 19 in CTRL and from d 5 to d 12 in RU reflect changes of
antioxidative capacity with time
Oxidative stress markers (TBARS and F2-Isoprostanes) did not follow a clear time-
dependent trend as seen for TEAC and FRAP Nevertheless TBARS increased in time
in CTRL and decreased in CA suggesting less oxidative stress in calves fed GTE On
the other hand F2-isoprostane concentrations in plasma decreased only in CTRL
indicating more oxidative stress In previous studies on calves plasma concentrations of
oxidative stress markers distinctly increased when calves were sick or stressed (Erisir et
al 2013 Ahmed and Hassan 2007 Al-Qudah 2009) This suggests that flavonoid
feeding to healthy calves as in the present study may not change oxidative stress
markers A polyphenol-rich diet in humans (Nieman et al 2013) lactating cows
(Gohlke et al 2013) pigs (Luumlhring et al 2011) or rats (Igarashi and Ohmuma 1995)
also led only to slight or no changes of markers of antioxidant activity or oxidative
stress
In general methods for determination of TBARS and F2-isoprostanes were discussed to
be inappropriate because of too low specificity and concomitantly too high inter-assay
variation (Rimbach et al 1999 Halliwell and Whiteman 2004 Celi 2011)
Furthermore antioxidative status tremendously differs between individuals and depends
on medical treatment (Farombi 2001) and season (Bernabucci et al 2002) In addition
plasma flavonol concentrations were relatively low since blood sampling occurred in
the pre-prandial stage and postprandial plasma flavonol concentration in calves
decreased rapidly with age (Maciej et al 2015) Therefore variable results concerning
antioxidative status or oxidative stress markers can be expected Also the amount of
flavonoid used in this study was based on previous studies in pigs and dogs (Lesser et
al 2004 Reinboth et al 2010 Luumlhring et al 2011) which may not be adequate for
colostrum- and milk-fed calves The determination of other parameters such as of
protein damage determination of vitamins E and C or of enzymatic antioxidants might
be more appropriate
We assumed that quercetin feeding may affect metabolic status in calves as some
authors postulate effects of flavonoids on glucose metabolism (Cermak et al 2004
Shetty et al 2004 Gohlke et al 2013) However we found no effects on pre-prandial
plasma glucose concentrations by flavonoid feeding in this study The increase of
plasma glucose concentrations after birth reflects lactose intake by colostrum and milk
CHAPTER 3
93
feeding as well as an increasing endogenous glucose production with age (Hammon et
al 2013) Because plasma glucose is highly regulated with the goal to maintain
euglycemia concentrations were relatively stable throughout the study and
corresponded to earlier presented data measured in young milk-fed calves (Hadorn et
al 1997 Rauprich et al 2000 Nussbaum et al 2002) Plasma concentrations of other
metabolites and insulin were also not affected by flavonoid feeding and simply reflected
physiological changes during first month of life (Nussbaum et al 2002 Schiessler et
al 2002 Hammon et al 2012) Differences in plasma cortisol concentrations among
groups on d 1 were independent of flavonoid administration as blood was sampled
before flavonoid supplementation
In conclusion effects of flavonoid treatment were much less than hoped or expected
However reduced medical treatment fewer incidences of diarrhea and a slight effect
on oxidative stress markers may indicate a potential health-promoting effect of
catechins in this study Nevertheless evidence for biological effects of flavonoid-
containing supplements is not available for young calves Feeding higher doses of
flavonoids than in this study may possibly cause more distinct changes of the metabolic
or antioxidative status in neonatal calves In addition use of more specific markers of
anti-oxidative capacity or stress may be helpful in future studies
Acknowledgements
We gratefully thank Petra Schulz and Maike Gosse (Christian Albrechts University
Kiel) for excellent laboratory assistance as well as Annette Zeyner Kirsten Buumlsing
(University of Rostock) and Bernd Stabenow (Leibniz Institute for Farm Animal
Biology) for providing the experimental facilities Chicken-egg derived
immunoglobulins (Globigen Life Start 25 ) were generously provided by EW
Nutrition GmbH Visbek Germany This work is part of the joint research project Food
Chain Plus (FoCus) and was financially supported by the Federal Ministry of Education
and Research Germany (BMFT grant no 0315538B)
CHAPTER 3
94
References
Ahmed W M and S E Hassan 2007 Applied studies on coccidiosis in growing
Buffalo-calves with special reference to oxidantantioxidant status World J Zool
240ndash48
Alexandrovich K N and S E Antonovna 2009 Age-dependent level of antioxidant
defence system and lipid metabolism state in calves Int J Appl Res Vet Med
773ndash75
Al-Qudah K M 2009 Oxidative stress in calves with acute or chronic
bronchopneumonia Rev Meacuted Veacutet 160231ndash236
Benzie I F and J J Strain 1996 The ferric reducing ability of plasma (FRAP) as a
measure of ldquoantioxidant powerrdquo The FRAP assay Anal Biochem 23970ndash76
Berger L M S Wein R Blank C C Metges and S Wolffram 2012 Bioavailability
of the flavonol quercetin in cows after intraruminal application of quercetin
aglycone and rutin J Dairy Sci 955047ndash5055
Bernabucci U B Ronchi N Lacetera and A Nardone 2002 Markers of oxidative
status in plasma and erythrocytes of transition dairy cows during hot season J
Dairy Sci 852173ndash2179
Blum J W U Hadorn H P Sallmann and W Schuep 1997 Delaying colostrum
intake by one day impairs plasma lipid essential fatty acid carotene retinol and
α-tocopherol status in neonatal calves J Nutr 1272024ndash2029
Blum J and H Hammon 2000 Colostrum effects on the gastrointestinal tract and on
nutritional endocrine and metabolic parameters in neonatal calves Livest Prod
Sci 66151ndash159
Celi P 2011 Biomarkers of oxidative stress in ruminant medicine Immunopharmacol
Immunotoxicol 33233ndash240
Cermak R S Landgraf and S Wolffram 2004 Quercetin glucosides inhibit glucose
uptake into brush-border-membrane vesicles of porcine jejunum Br J Nutr
91849ndash55
di Carlo G D N Mascolo A A Izzo and F Capasso 1994 Effects of quercetin on
the gastrointestinal tract in rats and mice Phytother Res 842ndash45
CHAPTER 3
95
Egert S J Tereszczuk S Wein M J Muumlller J Frank G Rimbach and S Wolffram
2013 Simultaneous ingestion of dietary proteins reduces the bioavailability of
galloylated catechins from green tea in humans Eur J Nutr 52281ndash288
Erisir M F M Kandemir and M Yuumlksel 2013 The effects of Caesarean section on
lipid peroxidation and some antioxidants in the blood of newborn calves Vet
Arch 83153ndash159
Farombi E O 2001 Antioxidant status and hepatic lipid peroxidation in
chloramphenicol-treated rats Tohoku J Exp Med 19491ndash98
Gaaacutel T P Ribiczeyneacute-Szaboacute K Stadler J Jakus J Reiczigel P Koumlveacuter M Meacutezes
and L Suumlmeghy 2006 Free radicals lipid peroxidation and the antioxidant
system in the blood of cows and newborn calves around calving Comp Biochem
Physiol B Biochem Mol Biol 143391ndash396
Gaacutelvez J F Saacutenchez de Medina J Jimeacutenez M I Torres M I Fernaacutendez M C
Nuacutentildeez A Riacuteos A Gil and A Zarzuelo 1995 Effect of quercitrin on lactose-
induced chronic diarrhoea in rats Planta Med 61302ndash306
Gohlke A C J Ingelmann G Nuumlrnberg J M Weitzel H M Hammon S Goumlrs A
Starke S Wolffram and C C Metges 2013 Influence of 4-week intraduodenal
supplementation of quercetin on performance glucose metabolism and mRNA
abundance of genes related to glucose metabolism and antioxidative status in
dairy cows J Dairy Sci 966986-7000
Greathead H 2003 Plants and plant extracts for improving animal productivity Proc
Nutr Soc 62279ndash290
Hadorn U H Hammon R M Bruckmaier and J W Blum 1997 Delaying colostrum
intake by one day has important effects on metabolic traits and on gastrointestinal
and metabolic hormones in neonatal calves J Nutr 1272011ndash2023
Halliwell B 1991 Reactive oxygen species in living systems source biochemistry
and role in human disease Am J Med 9114Sndash22S
Halliwell B and M Whiteman 2004 Measuring reactive species and oxidative
damage in vivo and in cell culture how should you do it and what do the results
mean Br J Pharmacol 142231ndash255
Hammon H M J Steinhoff-Wagner J Flor U Schoumlnhusen and C C Metges 2013
Lactation Biology Symposium role of colostrum and colostrum components on
glucose metabolism in neonatal calves J Anim Sci 91685ndash695
CHAPTER 3
96
Hammon H M J Steinhoff-Wagner U Schoumlnhusen C C Metges and J W Blum
2012 Energy metabolism in the newborn farm animal with emphasis on the calf
endocrine changes and responses to milk-born and systemic hormones Domest
Anim Endocrinol 43171ndash185
Igarashi K and M Ohmuma 1995 Effects of isorhamnetin rhamnetin and quercetin
on the concentrations of cholesterol and lipoperoxide in the serum and liver and
on the blood and liver antioxidative enzyme activities of rats Biosci Biotechnol
Biochem 59595ndash601
Ishihara N D-C Chu S Akachi and L R Juneja 2001 Improvement of intestinal
microflora balance and prevention of digestive and respiratory organ diseases in
calves by green tea extracts Livest Prod Sci 68217ndash229
Kobayashi Y M Miyazawa A Kamei K Abe and T Kojima 2010 Ameliorative
effects of mulberry (Morus alba L) leaves on hyperlipidemia in rats fed a high-fat
diet Induction of fatty acid oxidation inhibition of lipogenesis and suppression
of oxidative stress Biosci Biotechnol Biochem 742385ndash2395
Larson L L F G Owen J L Albright R D Appleman R C Lamb and L D
Muller 1977 Guidelines toward more uniformity in measuring and reporting calf
experimental data J Dairy Sci 60989ndash991
Lee M J Z Y Wang H Li L Chen Y Sun S Gobbo D A Balentine and C S
Yang 1995 Analysis of plasma and urinary tea polyphenols in human subjects
Cancer Epidemiol Biomarkers Prev 4393ndash399
Lesser S R Cermak and S Wolffram 2004 Bioavailability of quercetin in pigs is
influenced by the dietary fat content J Nutr 1431508ndash1511
Lindmark-Maringnsson H and B Aringkesson 2000 Antioxidative factors in milk Br J
Nutr 84103ndash110
Luumlhring M R Blank S Wolffram 2011 Vitamin E-sparing and vitamin E-
independent antioxidative effects of the flavonol quercetin in growing pigs Anim
Feed Sci Technol 169199ndash207
Maciej J C T Schaumlff E Kanitz A Tuchscherer R M Bruckmaier S Wolffram
H M Hammon 2015 Bioavailability of the flavonol quercetin in neonatal calves
after oral administration of quercetin aglycone or rutin J Dairy Sci 98 3906ndash
3917
CHAPTER 3
97
Middleton E C Kandaswami and T C Theoharides 2000 The effects of plant
flavonoids on mammalian cells Implications for inflammation heart disease and
cancer Pharmacol Rev 52673ndash751
Miller J K E Brzezinska-Slebodzinska and F C Madsen 1993 Oxidative stress
antioxidants and animal function J Dairy Sci 762812ndash2823
Naumann C and R Basler 2004 Die chemische Untersuchung von Futtermitteln
VDLUFA-Verlag Darmstadt Germany
Nielsen B K 2008 Botanicals as feed additives to improve health and production in
pig breeding Res Pig Breed 212ndash18
Nieman D C N D Gillitt A M Knab R A Shanely K L Pappan F Jin and M
A Lila 2013 Influence of a polyphenol-enriched protein powder on exercise-
induced inflammation and oxidative stress in athletes a randomized trial using a
metabolomics approach PLoS One 8e72215
Nussbaum A G Schiessler H M Hammon and J W Blum 2002 Growth
performance and metabolic and endocrine traits in calves pair-fed by bucket or by
automate starting in the neonatal period J Anim Sci 801545ndash1555
Oliveira R A C D Narciso R S Bisinotto M C Perdomo M A Ballou M
Dreher and J E P Santos 2010 Effects of feeding polyphenols from
pomegranate extract on health growth nutrient digestion and
immunocompetence of calves J Dairy Sci 934280ndash91
Rauprich A B E H M Hammon and J W Blum 2000 Effects of feeding colostrum
and a formula with nutrient contents as colostrum on metabolic and endocrine
traits in neonatal calves Biol Neonate 7853ndash64
Re R N Pellegrini A Proteggente A Pannala M Yang and C Rice-Evans 1999
Antioxidant activity applying an improved ABTS radical cation decolorization
assay Free Radic Biol Med 261231ndash1237
Reinboth M S Wolffram G Abraham F R Ungemach and R Cermak 2010 Oral
bioavailability of quercetin from different quercetin glycosides in dogs Br J
Nutr 104198ndash203
Rimbach G D Houmlhler A Fischer S Roy F Virgili J Pallauf and L Packer 1999
Methods to assess free radicals and oxidative stress in biological systems Arch
Anim Nutr 52203ndash222
CHAPTER 3
98
Schiessler G A Nussbaum H M Hammon and J W Blum 2002 Calves sucking
colostrum and milk from their dams or from an automatic feeding station starting
in the neonatal period metabolic and endocrine traits and growth performance
Anim Sci 74431ndash444
Schwerin M U Dorroch M Beyer H Swalve C C Metges and P Junghans 2002
Dietary protein modifies hepatic gene expression associated with oxidative stress
responsiveness in growing pigs FASEB J 161322ndash1324
Shetty A K R Rashmi M G R Rajan K Sambaiah and P V Salimath 2004
Antidiabetic influence of quercetin in streptozotocin-induced diabetic rats Nutr
Res 24373ndash381
Sies H W Stahl and A Sevanian 2005 Nutritional dietary and postprandial
oxidative stress J Nutr 135969ndash972
USDA 2011 Cattle and calves nonpredator death loss in the United States 2010
USDAndashAPHISndashVSndashCEAH Fort Collins CO 6311111
Yagi K 1998 Simple assay for the level of total lipid peroxides in serum or plasma
Pages 101ndash106 in Free Radical and Antioxidant Protocols D Armstrong ed
Humana Press New York Buffalo USA
Zanker I A H M Hammon and J W Blum 2000 -Carotene retinol and -
tocopherol status in calves fed colostrum at 0-2 6-7 12-13 or 24-25 hours after
birth Int J Vitam Nutr Res 70305ndash310
99
Chapter 4
General Discussion
CHAPTER 4
100
General Discussion
Rearing neonatal calves healthy and economically is still a major challenge in todayʼs
dairy farming Feed supplements are often claimed to provide an effective and easy way
to improve performance of animals but the actual use of such supplements marketed is
manifold Since flavonoids are ingredients in all higher plants with numerous health-
promoting properties like acting antioxidative antiviral or anti-inflammatory and
beneficial effects on metabolic key enzymes and even antidiarrheal remedies (Chapter
1 Gaacutelvez et al 1995 Rao et al 1997 Middleton et al 2000) their use in dairy
nutrition is comprehensible However biological effects in vivo require systemic BV
Bioavailability in particular means the absorption distribution metabolism and at least
the excretion from the organism For calves systemic BV is widely unknown so far
Therefore this study was performed to examine BV and the biological effects of the
most abundant flavonoids quercetin and catechin in neonatal calves
In the first study of this thesis (Chapter 2) the systemically availability of quercetin
either applied as quercetin aglycone or applied as quercetin glucorhamnoside rutin
linked to the sugar rutinose was evaluated in newborn calves on d 2 and on d 29 of life
to investigate two different ontogenetic states In the second study (Chapter 3) possible
influences of quercetin as aglycone or as rutin and furthermore of catechin on the
metabolic and antioxidative status in calves were examined during a 3-wk feeding from
d 5 to 26 of life
In both studies of this thesis quercetin aglycone and rutin were supplemented at an
amount of 30 micromolkg of BW per d This dosage based results from companion studies
in dairy cows (Berger et al 2012 Gohlke et al 2013) Both quercetin sources were fed
as pure substances suspended in 10 mL of water to enable oral apply of flavonoids
during milk feeding Therefore possible effects can be deduced exclusively from
flavonoid feeding what would not be the case when feeding plant extracts with mixed
compositions or other natural products like propolis as seen in a number of other
studies in calves (Yaghoubi et al 2008 Oliveira et al 2010) In contrast to quercetin
feeding catechin could not be fed as pure substance but was fed by a GTE on a level of
10 mgkg of BW per d of original substance containing 703 catechins Dosage of
catechins was aligned to quercetin dosage and is shown in Table 1 of the appendix of
CHAPTER 4
101
this thesis However plasma catechin concentrations were below the detection limit
(data not shown) thus in further studies higher dosages should be applied
Studies on BV of flavonoids are conducted for a wide variety of species including
humans (Erlund et al 2000 Egert et al 2008) pigs (Ader et al 2000 Lesser et al
2004 Cermak et al 2003) rats (Manach et al 1997 1999) dogs (Reinboth et al
2010) horses (Wein and Wolffram 2013) and cows (Berger et al 2012 Gohlke et al
2013) The enormous differences among the species and ages impeded a transfer of
findings to neonatal calves (Chapter 1 section 225) Hence this thesis shall be a basis
for further more specific investigations on flavonoid feeding in calves Next to
differences among species as mentioned above great inter-individual differences among
calves were found in these experiments confirming previous studies for plasma
flavonol concentrations attributed to individual enzyme expression or differences in
intestinal bacterial colonization (Neacutemeth et al 2003 Manach et al 2005) Calves for
these studies originated from two distinct neighboring farms thus genetic background
feeding of dams and further external influences may partly account for differences
found Such impacts could be avoided by selecting calves from just one dairy operation
with a common pedigree
In the first study of this thesis (Chapter 2) quercetin was systemically available
reflected by increased concentrations of total flavonols quercetin and the quercetin
metabolites tamarixetin isorhamnetin and kaempferol in blood plasma of neonatal
calves both after administration of quercetin as aglycone and as glucorhamnoside rutin
Neonatal calves are regarded as functional monogastrics until development of the
reticulorumen allows rumination (Drackley 2008) Therefore BV in neonatal calves is
more comparable to monogastric but not to ruminant species as quercetin aglycone was
better absorbed than rutin This is in line with a decreasing BV of quercetin with
ontogenesis as on d 29 a higher microbial fermentation thus lower BV due to partial
ruminal degradation of quercetin was expected (Heinrichs and Jones 2003 Guilloteau
et al 2009 Berger et al 2012)
However absorption of quercetin occurred slowly reflected in delayed and lower
maximal reached plasma concentrations than found in monogastrics (Lesser et al 2004
Reinboth et al 2010 Chapter 2) or in adult cattle (Berger et al 2012 Gohlke et al
2013 Chapter 2) although applying comparable amounts of quercetin This once more
underpins that results from studies on BV of other species or adult cattle cannot be
CHAPTER 4
102
deduced to young calves Furthermore a delayed absorption of quercetin as
glucorhamnoside rutin but not as its aglycone was seen as result of different absorption
sites in monogastrics (Hollman et al 1997 Manach et al 1997 Chapter 1) On the
contrary in neonatal calves quercetin aglycone and rutin administration showed the
same slow increase in plasma concentrations indicating similar absorption sites as well
as a special feature in milk-fed calves because of abomasal milk clotting (Chapter 2) To
exclude interactions with milk fed flavonoids may be administered with water only
instead of milk which should result in a faster increase of plasma flavonol
concentrations Anyway to determine the exact place of absorption and metabolism of
flavonoids in calves further studies are required like intraruminal or intraduodenal
application of flavonoids or in vitro absorption tests of flavonoids with different bovine
gastrointestinal tissues
Aside from this the slow absorption of flavonols during BV studies (Chapter 2) seems
to be associated with the accumulation of quercetin in plasma during long-term
administration (Chapter 3) When elimination half-lives of flavonoids are long repeated
absorption of flavonoids can cause accumulation in blood plasma (Aherne and OʼBrien
2002 Chapter 1) Again calves showed differences to other monogastrics like pigs
where long-term quercetin feeding did not lead to an accumulation in plasma mainly
due to much faster absorption of quercetin (Bieger et al 2008) In calves accumulation
of flavonols in plasma during long-term administration was especially seen for rutin
(Chapter 3) what is in line with findings from BV studies of a delayed peak in plasma
flavonol concentrations after rutin feeding especially on d 2 (Chapter 2)
Interestingly even without dietary flavonoid supplementation calves showed
measurable plasma flavonol concentrations during BV studies (Chapter 2) and during
long-term administration (data not shown Chapter 3) This was particularly seen on day
2 when colostrum was fed (Chapter 2) indicating once more the outstanding role of
colostrum for health and welfare of calves (Hammon et al 2013) In addition to further
clarify the source of flavonols analysis of the respective composition of colostrum or
calf feed is required In the superordinate context of these studies bovine milk or
colostrum are probable flavonoid sources in human nutrition as well as veal rich in
flavonoids as so called functional food Precondition for this would be further studies
examining the distribution of flavonoids in calves and distinct tissue analyses after
flavonoid absorption (Chapter 1)
CHAPTER 4
103
However concentrations of metabolites and hormones measured postprandial during
BV studies (Chapter 2) or basal during long-term flavonoid treatment (Chapter 3) were
in line with previous studies on calves without dietary flavonoid supplementation
indicating physiological conditions and an unaffected metabolic status of calves by
flavonoid feeding Results of basal blood samples during long-term flavonoid
administration (Chapter 3) confirmed the findings of unaffected metabolic parameters
found in BV studies (Chapter 2) Flavonoid administration at higher dosage and a more
distinct focus on glucose metabolism during the experimental design putatively may
reveal effects as found in companion studies on calves (Gruse et al 2014) or in
monogastric animals showing an inhibited glucose uptake in intestinal cells after
quercetin feeding (Cermak et al 2004) Nevertheless all data indicated the use of
flavonoids in sensitive neonatal calves is harmless This is noteworthy as secondary
plant metabolites in the past mainly counted as anti-nutritive factors (Durmic and
Blache 2012)
Markers of oxidative stress and of the antioxidative capacity in calves during long-term
administration of quercetin and catechin were barely influenced by feeding regime but
influenced by time reflected by physiological changes during maturation (Chapter 3)
Colostrum as source for antioxidants like vitamins and enzymes (Lindmark-Maringnsson
and Aringkesson 2000) was assumed to induce at least most of the time effects of the
antioxidative status in this study The distinct increase of TE (unit for TEAC) and the
decrease of ASCE (as unit for FRAP) from shortly after birth to d 5 of life demonstrated
the important role of feed intake This was the first study proofing this outstanding
influence of feed intake However similar changes in plasma concentrations were not
seen for TBARS or F2-isoprostanes as oxidative stress markers Therefore relative
changes from d 1 to other d were evaluated which pointed out a possible role of
catechin feeding Taken together reduced medical treatment better fecal scores and a
slight impact on oxidative stress markers possibly indicate health-promoting effects of
catechins in calves This is especially interesting und should be further examined in
regard to the low plasma catechin concentrations found
Nevertheless in this study changes in oxidative stress markers by flavonoid feeding
were weak (Chapter 3) when compared to other studies showing more distinct
differences in oxidative stress markers mainly in obviously impaired calves (Wernicki
et al 2006 Ahmed and Hassan 2007 Al-Qudah 2009) This was not true in the
CHAPTER 4
104
studies of this thesis where all calves were kept under similar conditions Furthermore
in contrast to plasma metabolites like glucose or protein there is a lack of basic
information like data for physiological ranges concerning markers for antioxidative
capacity and oxidative stress Anyway this may be explained by the huge variation
found in the distinct studies and the different methods of analysis (Chapter 1 3) raising
the question whether there are more appropriate markers to determine the antioxidative
status of calves or if additional parameters should be used As presented previously
(Chapter 1 section 233) conceivable suggestions are the determination of vitamins E
and C carotenoids bilirubin or glutathione as well as enzymatic antioxidants like
superoxide-dismutase catalase or glutathione-peroxidase Moreover a more closely
setting of sample collection over longer time periods would allow a deeper insight in
kinetics of flavonoid action Additionally in these studies only 7 calves per group were
investigated Using more animals per group would let findings become more
conclusive
On the other hand dietary flavonoid supplementation namely catechin feeding seemed
to improve health status reflected in fewer sick calves and less diarrhea although
plasma catechin concentrations were below the detection limit (Chapter 3) However
biological effects not only depended on absolute plasma concentrations but also on
concentrations in target tissues which is needed to be examined in further studies A
possible approach is comparing directly the effects of flavonoid supplementation from d
of birth to a control group without flavonoid supplementation or treating sick calves
with flavonoids compared to sick calves without flavonoid treatment with both
approaches using an adequate number of animals Furthermore the chemical form or
the galenical form in general in which the flavonoid is applied greatly influences BV
and thus the biological effects (Chapter 1) as may be seen in studies that compare
quercetin aglycone or rutin administration to natural plant extracts containing quercetin
In previous studies on V urine and feces collection were the appropriate methods used
as due to urine and feces analyses the excretion of the investigated substance can be
verified Since this thesis focused on the more fundamental question if flavonoids were
absorbed at all no excrement was analyzed
In conclusion these studies clearly showed for the first time that quercetin is
systemically available in newborn calves This is a requirement for biological effects in
the organism which already are claimed by feed producers in practical dairy nutrition
CHAPTER 4
105
The great influence of maturation and ontogenetic stage of young calves on BV of
flavonoids was demonstrated just as the influence of the chemical form of the
administered flavonoids It was evaluated to what extend flavonoids affect the
metabolic and antioxidative status in neonatal calves shown in slight changes of the
respective markers This all contributes to a better understanding of the usage the mode
of action and the benefit of flavonoids as ʽnaturalʼ health-promoting feed supplements
CHAPTER 4
106
References
Ader P A Wessmann and S Wolffram 2000 Bioavailability and metabolism of the
flavonol quercetin in the pig Free Radic Biol Med 281056ndash1067
Aherne S A and N M OrsquoBrien 2002 Dietary flavonols Chemistry food content
and metabolism Nutrition 1875ndash81
Ahmed W M and S E Hassan 2007 Applied studies on coccidiosis in growing
Buffalo-calves with special reference to oxidantantioxidant status World J Zool
240ndash48
Al-Qudah K M 2009 Oxidative stress in calves with acute or chronic
bronchopneumonia Rev Meacuted Veacutet 160231ndash236
Berger L M S Wein R Blank C C Metges and S Wolffram 2012 Bioavailability
of the flavonol quercetin in cows after intraruminal application of quercetin
aglycone and rutin J Dairy Sci 955047ndash5055
Bieger J R Cermak R Blank V C J de Boer P C H Hollman J Kamphues and
S Wolffram 2008 Tissue distribution of quercetin in pigs after long-term dietary
supplementation J Nutr 1381417ndash1420
Cermak R S Landgraf and S Wolffram 2003 The bioavailability of quercetin in
pigs depends on the glycoside moiety and on dietary factors J Nutr 1332802ndash
2807
Cermak R S Landgraf and S Wolffram 2004 Quercetin glucosides inhibit glucose
uptake into brush-border-membrane vesicles of porcine jejunum Br J Nutr
91849ndash55
Drackley J K 2008 Calf nutrition from birth to breeding Vet Clin North Am Food
Anim Pract 2455ndash86
Durmic Z and D Blache 2012 Bioactive plants and plant products Effects on animal
function health and welfare Anim Feed Sci Technol 176150ndash162
Egert S S Wolffram A Bosy-Westphal C Boesch-Saadatmandi A E Wagner J
Frank G Rimbach and M J Mueller 2008 Daily quercetin supplementation
dose-dependently increases plasma quercetin concentrations in healthy humans J
Nutr 1381615ndash1621
CHAPTER 4
107
Erlund I T Kosonen G Alfthan J Maumlenpaumlauml K Perttunen J Kenraali J
Parantainen and A Aro 2000 Pharmacokinetics of quercetin from quercetin
aglycone and rutin in healthy volunteers Eur J Clin Pharmacol 56545ndash553
Gaacutelvez J F Saacutenchez de Medina J Jimeacutenez M I Torres M I Fernaacutendez M C
Nuacutentildeez A Riacuteos A Gil and A Zarzuelo 1995 Effect of quercitrin on lactose-
induced chronic diarrhoea in rats Planta Med 61302ndash306
Gohlke A C J Ingelmann G Nuumlrnberg A Starke S Wolffram and C C Metges
2013 Bioavailability of quercetin from its aglycone and its glucorhamnoside rutin
in lactating dairy cows after intraduodenal administration J Dairy Sci 962303ndash
2313
Gruse J S Goumlrs W Otten J Weitzel S Wolffram C C Metges and H M
Hammon 2014 Effects of different milk diets and oral quercetin supplementation
on postprandial glucose metabolism in neonatal calves Proc Soc Nutr Physiol
23114
Guilloteau P R Zabielski J W Blum 2009 Gastrointestinal tract and digestion in
the young ruminant Ontogenesis adaptations consequences and manipulations
J Physiol Pharmacol 60 Suppl 237ndash46
Hammon H M J Steinhoff-Wagner J Flor U Schoumlnhusen and C C Metges 2013
Lactation Biology Symposium Role of colostrum and colostrum components on
glucose metabolism in neonatal calves J Anim Sci 91685ndash695
Hollman P C H J M P van Trijp M N C P Buysman M S vd Gaag M J B
Mengelers J H M de Vries and M B Katan 1997 Relative bioavailability of
the antioxidant flavonoid quercetin from various foods in man FEBS Lett
418152ndash156
Heinrichs A J and C M Jones 2003 Feeding the newborn calf College of
Agricultural Sciences Agricultural Research and Cooperative Extension
Pennsylvania State University University Park PA
Lesser S R Cermak and S Wolffram 2004 Bioavailability of quercetin in pigs is
influenced by the dietary fat content J Nutr 1431508ndash1511
Lindmark-Maringnsson H and B Aringkesson 2000 Antioxidative factors in milk Br J
Nutr 84103ndash110
Manach C C Morand C Demigneacute O Texier F Reacutegeacuterat and C Reacutemeacutesy 1997
Bioavailability of rutin and quercetin in rats FEBS Lett 40912ndash16
CHAPTER 4
108
Manach C O Texier C Morand V Crespy F Reacutegeacuterat C Demigneacute and C Reacutemeacutesy
1999 Comparison of the bioavailability of quercetin and catechin in rats Free
Radic Biol Med 271259ndash1266
Manach C G Williamson C Morand A Scalbert and C Reacutemeacutesy 2005
Bioavailability and bioefficacy of polyphenols in humans I Review of 97
bioavailability studies Am J Clin Nutr 81230Sndash242S
Middleton E C Kandaswami and T C Theoharides 2000 The effects of plant
flavonoids on mammalian cells Implications for inflammation heart disease and
cancer Pharmacol Rev 52673ndash751
Neacutemeth K G W Plumb J-G Berrin N Juge R Jacob H Y Naim G Williamson
D M Swallow and P A Kroon 2003 Deglycosylation by small intestinal
epithelial cell beta-glucosidases is a critical step in the absorption and metabolism
of dietary flavonoid glycosides in humans Eur J Nutr 4229ndash42
Oliveira R A C D Narciso R S Bisinotto M C Perdomo M A Ballou M Dreher
and J E P Santos 2010 Effects of feeding polyphenols from pomegranate
extract on health growth nutrient digestion and immunocompetence of calves J
Dairy Sci 934280ndash4291
Rao V S F A Santos T T Sobreira M F Souza C L Melo and E R Silveira
1997 Investigations on the gastroprotective and antidiarrhoeal properties of
ternatin a tetramethoxyflavone from Egletes viscosa Planta Med 63146ndash149
Reinboth M S Wolffram G Abraham F R Ungemach and R Cermak 2010 Oral
bioavailability of quercetin from different quercetin glycosides in dogs Br J
Nutr 104198ndash203
Wein S and S Wolffram 2013 Oral bioavailability of quercetin in horses J Equine
Vet Sci 33441ndash445
Wernicki A M Kankofer P Mikucki and A Puchalski 2006 Evaluation of plasma
cortisol and TBARS levels in calves after short-term transportation Rev Meacuted
Veacutet 15730ndash34
Yaghoubi S M J G R Ghorbani H R Rahmani and A Nikkhah 2008 Growth
weaning performance and blood indicators of humoral immunity in Holstein
calves fed supplemental flavonoids Anim Physiol Anim Nutr 92456ndash462
109
Summary
SUMMARY
110
Summary
Flavonoids are secondary plant metabolites with numerous health-promoting properties
The feeding industry widely use flavonoids as ʽgreenʼ feed supplements even scientific
evidence of their value are often hypothetical Due to their high susceptibility to
diseases the use of flavonoids in neonatal calves might be especially useful However
to determine biological effects in vivo flavonoids must be systemically available in
calves but this is not known yet Therefore the aim of this study was to determine BV
and their biological effects of the most abundant flavonoids quercetin and catechin in
neonatal calves
In part one of the study calves (n = 7 per group) were fed quercetin as aglycone or as
glucorhamnoside rutin or no flavonoid (control group) on d 2 and 29 of life Blood
samples were taken in defined time intervals before and until 48 h after flavonoid
administration via jugular vein catheters Quercetin and its methylated (isorhamnetin
tamarixetin) and dehydroxylated (kaempferol) metabolites were analyzed in blood
plasma using HPLC with subsequent fluorescence detection It was shown that
quercetin is systemically available both as aglycone and as rutin in neonatal calves but
BV of quercetin aglycone was higher than BV of rutin as previously shown in
monogastric species Furthermore BV of quercetin and its metabolites was greater on d
2 than on d 29 of life and the proportion of quercetin metabolites differed greatly
between the two d which possibly can deduced to maturation of the gastrointestinal
tract
In part two of the study effects of a three-wk administration of quercetin aglycone rutin
or a green tea extract containing mainly catechins on performance health and the
antioxidative capacity and oxidative stress in neonatal calves were evaluated A fourth
group was used as control group (n = 7 calves per group) and did not receive any
flavonoid sopplementation No group differences were found for zootechnical
parameters but a slight benefit in health status when catechins were fed Effects of
flavonoid feeding on metabolic status were not seen in this study but total protein
albumin urea lactate glucose NEFA insulin and cortisol reflected typical time
changes during postnatal calf development Markers of the antioxidative capacity in
blood plasma (TEAC FRAP) showed incisive differences in time seen in a sharp
increase of TEAC and in a decrease of FRAP plasma concentrations postpartum
SUMMARY
111
However oxidative stress markers (TBARS F2-isoprostanes) did not illustrate distinct
group and time effects due to great interindividual variances
Taken together this study clearly demonstrated that the bioavailability of quercetin is
determined by its chemical form and depends to a major extent on physiological
processes of digestion and gastrointestinal maturation in calves In contrast the
influence of flavonoids on the antioxidative status did not show clear results thus an
improvement of the antioxidative status in neonatal calves by flavonoid administration
cannot be confirmed by this study
SUMMARY
112
Zusammenfassung
Flavonoide sind sekundaumlre Pflanzeninhaltsstoffe denen zahlreiche gesundheits-
foumlrdernde Eigenschaften zugesprochen werden In der Futtermittelindustrie haben
Flavonoide deshalb als bdquogruumlneldquo Zusatzstoffe bereits weitreichend Einzug erhalten auch
wenn wissenschaftlich fundierte Nachweise bezuumlglich ihrer Wirkung im Nutztier
oftmals hypothetisch sind Besonders fuumlr neugeborene Kaumllber scheint aufgrund ihrer
erhoumlhten Krankheitsanfaumllligkeit der Einsatz von pflanzlichen Zusatzstoffen sinnvoll
Allerdings muumlssten Flavonoide fuumlr biologische Effekte systemisch im Kalb verfuumlgbar
sein wofuumlr es bis jetzt noch keine Belege gibt Somit war es Ziel dieser Arbeit die
Bioverfuumlgbarkeit und die biologischen Effekte der weit verbreiteten Flavonoide
Quercetin und Catechin beim neugeborenen Kalb zu untersuchen
Dazu erfolgte im ersten Teil dieser Studie die Fuumltterung von Quercetin als reines
Aglykon oder mit entsprechendem Zuckerrest als Glukorhamnosid Rutin am 2 und 29
Lebenstag der Kaumllber (n = 7 pro Gruppe) Vor sowie bis zu 48 Stunden nach der
Flavonoidapplikation wurden in definierten Zeitabstaumlnden Blutproben gewonnen und
der Gehalt an Quercetin sowie der jeweiligen methylierten (Isorhamnetin Tamarixetin)
und dehydroxylierten (Kaempferol) Metaboliten mittels Hochleistungsfluumlssigkeits-
chromatographie mit anschlieszligender Fluoreszenzdetektion analysiert Es konnte gezeigt
werden dass Quercetin sowohl als Aglykon als auch als Rutin systemisch im Kalb
verfuumlgbar war wobei die systemische Verfuumlgbarkeit von Quercetin nach Fuumltterung des
Aglycons houmlher war als nach Fuumltterung von Rutin Weiterhin wurde am 2 Lebenstag
eine deutlich houmlhere Bioverfuumlgbarkeit von Quercetin und seinen Metaboliten festgestellt
als am 29 Lebenstag Auch war der Anteil der einzelnen Quercetinmetabolite an der
Gesamtflavanolkonzentration im Blutplasma stark veraumlndert was moumlglicherweise auf
den unterschiedlichen Grad der Darmentwicklung am 2 und 29 Lebenstag
zuruumlckgefuumlhrt werden kann
Im zweiten Teil der Studie wurde die Leistungsentwicklung der Gesundheitsstatus
sowie die antioxidative Kapazitaumlt und der oxidative Stress bei Kaumllbern untersucht
denen uumlber einen Zeitraum von drei Wochen entweder Quercetin in Form des Aglycons
oder als Rutin oder ein Gruumlnteeextrakt der hauptsaumlchlich Catechine enthielt verabreicht
wurde Eine vierte Kaumllbergruppe bekam keine Flavonoide zugefuumlttert und diente als
Kontrollgruppe (n = 7 pro Gruppe) Hierbei konnten in den erhobenen zootechnischen
SUMMARY
113
Parametern keine Gruppenunterschiede jedoch ein leichter Vorteil durch die Fuumltterung
von Catechin im Gesundheitsstatus festgestellt werden Effekte der Flavonoidfuumltterung
auf den Stoffwechsel der Kaumllber ausgedruumlckt durch Gesamtprotein Albumin
Harnstoff Laktat Glukose nicht-veresterte Fettsaumluren Insulin und Cortisol konnten in
dieser Studie nicht dargelegt werden jedoch wiesen diese Parameter
entwicklungsphysiologische Zeitveraumlnderungen auf Marker der antioxidativen
Kapazitaumlt im Blutplasma (TEAC FRAP) zeigten praumlgnante Zeitunterschiede
ausgedruumlckt durch einen deutlichen Anstieg der TEAC und einen ausgepraumlgten Abfall
der FRAP nach der Geburt Marker fuumlr den oxidativen Stress (TBARS F2-Isoprostane)
hingegen zeigten im Blutplasma aufgrund der starken individuellen Streuung keine
eindeutigen Behandlungs- und Zeiteffekte
Zusammenfassend konnte mit dieser Studie gezeigt werden dass die Bioverfuumlgbarkeit
von Quercetin durch dessen chemische Form determiniert ist und zum groumlszligtenteils von
verdauungsphysiologischen Vorgaumlngen und der Darmreifung des Kalbes abhaumlngig ist
Dagegen zeigten die hier durchgefuumlhrten Untersuchungen zum Einfluss der Flavonoide
auf den antioxidativen Status der Kaumllber keine eindeutigen Ergebnisse so dass eine
Verbesserung des antioxidativen Status nach Flavonoidgabe bei neugeborenen Kaumllbern
mit dieser Studie nicht bestaumltigt werden konnte
APPENDIX
Appendix
APPENDIX
Table 1 Appendix Calculation of flavonoid dosage
Item Formula Molar mass
gmol
Flavonoid dosage
mgkg
BW
micromolkg
BW
Rutintrihydrate (group RU) C27H30O16 3 H2O 6646 20 30
Quercetindihydrate (group QA) C15H10O7 2 H2O 3383 10 30
Water H2O 180
Rutinose C12H22O16 3263
Rutin minus water 6105
Rutin QE1 minus water and
rutinose
2842
30222
9 30
Quercetin QE minus water 3022 9 30
Polyphenon 60 (group CA) 10
Catechin content 703 7
Epigallocatechin C15H14O7 306267 190 620
Epicatechin C15H14O6 290260 064 220
Epigallocatechin gallate C22H18O11 458370 288 628
Epicatechin gallate C22H18O10 442370 070 158
Gallocatechin gallate C22H18O11 458370 021 046
Catechin gallate C22H18O10 442370 003 007
Gallocatechin C15H14O7 306267 052 170
Catechin C15H14O6 290260 014 048
Sum CA 7 19
1 QE = Quercetin equivalents
2 Only theoretically due to binding of 2 H and 1 O from crystalline water
APPENDIX
A Day 2 B Day 29
Time relative to feeding h
0 2 4 6 8 10 12 24 48
Qu
erce
tin
n
mo
lL
0
50
100
150
200
Time relative to feeding h
0 2 4 6 8 10 12 24 48
Qu
erce
tin
n
mo
lL
0
50
100
150
200
C Day 2 D Day 29
Time relative to feeding h
0 2 4 6 8 10 12 24 48
Iso
rha
mn
etin
n
mo
lL
0
20
40
60
80
100
Time relative to feeding h
0 2 4 6 8 10 12 24 48
Iso
rha
mn
etin
n
mo
lL
0
20
40
60
80
100
E Day 2 F Day 29
Time relative to feeding h
0 2 4 6 8 10 12 24 48
Ta
ma
rix
etin
n
mo
lL
0
25
50
75
100
125
150
Time relative to feeding h
0 2 4 6 8 10 12 24 48
Ta
ma
rix
etin
n
mo
lL
0
25
50
75
100
125
150
APPENDIX
G Day 2 H Day 29
Time relative to feeding h
0 2 4 6 8 10 12 24 48
Ka
emp
fero
l n
mo
lL
0
2
4
6
8
10
12
Time relative to feeding h
0 2 4 6 8 10 12 24 48
Ka
emp
fero
l n
mo
lL
0
2
4
6
8
10
12
Figure 1 Appendix Plasma concentration-time curves of quercetin (A B) isorhamnetin (C D)
tamarixetin (E F) and kaempferol (G H) after oral administration of 9 mg of quercetinkg of BW
times d as quercetin aglycone () rutin trihydrate () or no flavonoid () on d 2 and 29 of life Values
are LSM plusmn SE n = 7 per group (Chapter 2)
APPENDIX
A Day 2 B Day 29
Time relative to feeding h
0 2 4 6 8 10 12 24
To
tal
pro
tein
g
L
54
56
58
60
62
64
66
Time relative to feeding h
0 2 4 6 8 10 12 24
To
tal
pro
tein
g
L
54
56
58
60
62
64
66
C Day 2 D Day 29
Time relative to feeding h
0 2 4 6 8 10 12 24
Alb
um
in g
L
21
22
23
24
25
26
27
Time relative to feeding h
0 2 4 6 8 10 12 24
Alb
um
in g
L
21
22
23
24
25
26
27
E Day 2 F Day 29
Time relative to feeding h
0 2 4 6 8 10 12 24
La
cta
te m
mo
lL
0
1
2
3
4
5
Time relative to feeding h
0 2 4 6 8 10 12 24
La
cta
te m
mo
lL
0
1
2
3
4
5
APPENDIX
G Day 2 H Day 29
Time relative to feeding h
0 2 4 6 8 10 12 24
Ure
a m
mo
lL
1
2
3
4
5
Time relative to feeding h
0 2 4 6 8 10 12 24
Ure
a m
mo
lL
1
2
3
4
5
Figure 2 Appendix Plasma concentrations of total protein (A B) albumin (C D) lactate (E F)
and urea (G H) after oral administration of 9 mg of quercetinkg of BW times d as quercetin aglycone
() rutin trihydrate () or no flavonoid () on d 2 and 29 of life Values are LSM plusmn SE n = 7 per
group (Chapter 2)
APPENDIX
A
Time d
1 5 12 19 26
To
tal
pro
tein
g
L
48
52
56
60
64
B
Time d
1 5 12 19 26
Alb
um
in g
L
22
23
24
25
26
27
C
Time d
1 5 12 19 26
La
cta
te m
mo
lL
0
1
2
3
4
5
6
D
Time d
1 5 12 19 26
Glu
cose
m
mo
lL
40
45
50
55
60
E
Time d
1 5 12 19 26
NE
FA
m
mo
lL
200
400
600
800
1000
F
Time d
1 5 12 19 26
Ure
a m
mo
lL
10
15
20
25
30
35
40
APPENDIX
G
Time d
1 5 12 19 26
Insu
lin
micro
gl
00
05
10
15
H
Time d
1 5 12 19 26
Co
rtis
ol
ng
mL
0
20
40
60
80
100
Figure 3 Appendix Plasma concentrations of total protein (A) albumin (B) lactate (C) glucose
(D) NEFA (E) urea (F) insulin (G) and cortisol (H) after oral administration of quercetin
aglycone () rutin trihydrate () a green tea extract () or no flavonoid () Values are LSM plusmn
SE n = 7 per group (Chapter 3)
APPENDIX
Herzlichen Dankhellip
PD Dr Harald M Hammon fuumlr die Uumlberlassung des Themas und die Betreuung dieser
Arbeit sowie fuumlr die Unterstuumltzung bei Fragen und Problemen Prof Dr Siegfried
Wolffram fuumlr die freundliche Uumlbernahme des Zweitgutachtens und fuumlr die konstruktive
Kritik zu den Manuskripten Familie Klodt sowie Ralf Kocher und Ronny Koumllpin
fuumlr die Bereitstellung der Versuchskaumllber Den Mitarbeitern der Tierarztpraxis Dr
Linke fuumlr die medizinische Betreuung der Kaumllber die leider viel zu oft noumltig war Dr
Bernd Linke und Dr Peter Sanftleben da durch ihre exzellente Betreuung waumlhrend
der Masterarbeit erst das Interesse fuumlr das Anfertigen einer Doktorarbeit geweckt
wurde Klaus-Dieter Witt dem Herdenmanager des FBN fuumlr die schnelle
unkomplizierte Hilfe in praktischen und organisatorischen Belangen waumlhrend des
Kaumllberversuches den Handwerkern des FBN fuumlr die tatkraumlftige Unterstuumltzung beim
Kaumllberstall-Bauen bei den Kaumllbertransporten und fuumlr alle weiteren baulich-technischen
Hilfestellungen Petra Schulz und Maike Gosse vom Institut fuumlr Tierernaumlhrung und
Stoffwechselphysiologie der CAU Kiel fuumlr die hervorragenden Laboranalysen und
diesbezuumlglichen Erklaumlrungen Allen Kollegen des Instituts fuumlr Ernaumlhrungsphysiologie
bdquoOskar Kellnerldquo fuumlr die gute Zusammenarbeit Dr Julia Steinhoff-Wagner fuumlr die
dynamische Einfuumlhrung ins FBN und somit fuumlr meine schoumlne Anfangszeit dort sowie
fuumlr die fortwaumlhrende Beratung auch uumlber den groszligen Teich hinweg allen
Doktoranden-Kollegen fuumlr die tolle lehrreiche gemeinsame Zeit am FBN Jeannine
Gruse (vom ersten Tag anhellip ) und Dr Christine Schaumlff fuumlr das Korrekturlesen die
Motivation und sonstige Hilfe vor allem in der Endphase dieser Arbeit Meiner
Mitstreiterin und besten Kollegin der Welt Annika Gohlke fuumlr unzaumlhlige Tierarzt-
Einsaumltze zu jeder Tages- und Nachtzeit fuumlr viele gemeinsame Stunden im Stall und im
Buumlro sowie fuumlr die direkte unkomplizierte Art die Dinge anzupacken
Der groumlszligte Dank allerdings gilt meiner Familie
Meinem Mann meinen Kindern meinen Eltern und Groszligeltern sowie meiner Schwester
danke ich von ganzem Herzen
fuumlr die bedingungslose Unterstuumltzung Liebe Zuversicht
Krasse Herdehellip
APPENDIX
Curriculum Vitae
Josefine Maciej (neacutee Flor) born on October 02 1984 in Kuumlhlungsborn
Nationality German Civil Status Married 2 children
Education
Since 102011 Doctoral student Agricultural Sciences Christian Albrechts
University Kiel Faculty of Agricultural and Nutritional Sciences
102007 ndash 022010 Master of Science Agriculture Ecology University of Rostock
Master program Livestock Sciences Master Thesis The use of
computer tomography for the evaluation of stomach development in
milk-fed calves (Grade 10)
102004 ndash 092007 Bachelor of Science Agriculture Ecology University of Rostock
062004 Abitur Gymnasium Sanitz
WorkProfessional Experience
062010 ndash 062014 Scientific assistantdoctoral student Leibniz Institute for Farm
Animal Biology (FBN) Institute of Nutritional Physiology (ʽOskar-
Kellnerʼ) Dummerstorf
052009 ndash 072009 Student research assistant University of Goumlttingen Research Unit
Agriculture and Environment
092008 ndash 022009 Agricultural journey through the USA Internship at the weekly
dairy farm family magazine ʽFarmshineʼ Brownstown PA
022008 ndash 042008 Internship Landwirtschaftsberatung Mecklenburg-Vorpommern
Schleswig-Holstein (LMS) Bad Doberan
112004 ndash 122005 Student research assistant University of Rostock Faculty of
Agricultural and Environmental Sciences Institute of Animal
Nutrition
082004 ndash 012008 InternshipPractical work Landwirtschaftsgesellschaft Prisannewitz
Personal Engagement
122011 ndash 092012 Representative of public relations for doctoral students Leibniz
Institute for Farm Animal Biology (FBN) Dummerstorf
Since 052010 Member of volunteer fire department Kavelstorf
Kiel May 04 2015

CONTENT
II
Chapter 2
Bioavailability of the flavonol quercetin in neonatal calves after oral
administration of quercetin aglycone or rutin 51
Abstract 52
21 Introduction 53
22 Materials and Methods 54
221 Animals and feeding 54
222 Treatment and blood sampling 55
223 Analytical methods 57
224 Calculations and statistical analyses 59
23 Results 60
231 Body weight and feed intake 60
232 Bioavailability studies 60
233 Plasma concentrations of metabolites and hormones 63
24 Discussion 65
References 69
Chapter 3
Effects of oral flavonoid supplementation on metabolic and antioxidative status
in newborn dairy calves 77
Abstract 77
31 Introduction 78
32 Materials and Methods 80
321 Animals and feeding 79
322 Treatment and blood sampling 81
323 Analytical methods 81
324 Statistical analyses 82
33 Results 84
331 Body weight feed intake and health status 85
332 Plasma flavonoid concentrations 86
CONTENT
III
333 Markers for antioxidative capacity and oxidative stress 86
334 Plasma concentrations of metabolites and hormones 88
34 Discussion 91
References 94
Chapter 4
General Discussion 99
References 106
Summary 109
Zusammenfassung 112
Appendix
ABBREVIATIONS
IV
Abbreviations
ASCE Ascorbic acid equivalent(s)
AUC Area under the curve
BW Body weight
BHT Butylhydroxytoluene
BV Bioavailability
CA Catechins
cfu Colony forming units
Cmax Maximal reached plasma concentration
CP Crude protein
CTRL Control group fed no flavonoid
d Day(s)
DM Dry matter
DNA Deoxyribonucleic acid
EDTA Ethylenediaminetetraacetic acid
8-iso-PGF2α 8-iso-prostaglandin F2α
ELISA Enzyme-linked immunosorbent assay
FRAP Ferric reducing ability of plasma
GH Growth hormone
GLUT Glucose transporter
GTE Green tea extract
h Hour(s)time of day
HPLC High-performance liquid chromatography
Ig Immunoglobulin(s)
IGF Insulin-like growth factor
IU International units
LDL Low-density lipoprotein
LPH Lactase phlorizin hydrolase
MDAE Malondialdehyde equivalent
n Number
NEFA Non-esterified fatty acids
QA Quercetin aglycone
ABBREVIATIONS
V
QE Quercetin equivalents
RIA Radioimmunoassay
ROS Reactive oxygen species
RU Quercetin glucorhamnoside rutin
SE Standard error
SEM Standard error of the mean
SGLT Sodium-dependent glucose co-transporter
TE Trolox equivalents
TEAC Trolox equivalent antioxidative capacity
TBARS Thiobarbituric acid reactive substances
Tmax time until maximal plasma concentration is reached
U Unit(s)
wk week(s)
1
General Introduction
GENERAL INTRODUCTION
2
General Introduction
After birth calves undergo huge immunological and metabolic changes Though
relatively mature when born they must adapt to various morphological and functional
changes after birth (Blum and Hammon 2000 Hammon et al 2012) Because of
impaired neonatal management like colostrum management calf losses are highest in
the first weeks of life mainly due to respiratory and digestive diseases In the United
States 23 million calf losses were counted in 2010 (USDA 2011)
Oxidative stress is assumed to play a key role in numerous diseases as almost any
disease is somehow related to an increased formation of reactive oxygen species
(Halliwell 1991) In calves increased levels of markers for oxidative stress were found
during the first days of life (Stohrer et al 2003 Alexandrovich and Antonovna 2009)
and during sickness (Ahmed and Hassan 2007 Al-Qudah 2009) Furthermore the
nutrient status highly affects the antioxidant system (Schwerin et al 2002 Sies et al
2005) and often is impaired in newborn calves due to the change from intrauterine
continuous energy and nutrient supply via placenta to discontinuous oral supply after
birth Thus improvement of the antioxidant status in newborn calves may contribute to
the development of an own defence against environmental threats which helps to
reduce calf losses and to improve health status during the neonatal development
Because flavonoids as phenolic compounds are claimed to be strong antioxidants and to
have countless other health-promoting effects they are claimed and marketed as health-
promoting substances by the feeding industry Especially since the ban of antibiotic
growth promoters in the European Union in 2006 these ʻgreenrsquo feed additives gained
enormous popularity all over the world However any in vivo biological effect of a
substance requires its bioavailability (BV) In contrast to several monogastric species
where BV of flavonoids is extensively investigated knowledge on BV of flavonoids in
neonatal calves is still lacking Thus the aim of this study was to investigate the oral
BV of the flavonol quercetin one of the most abundant flavonoids in nature fed either
as aglycone or as its glycoside rutin in neonatal calves Studies were carried out on days
2 and 29 of life to show possible differences in absorption distribution and metabolism
of quercetin during ontogenetic development of newborn calves Furthermore oral
supplementation with quercetin and catechins for a three-wk period provides
GENERAL INTRODUCTION
3
information of flavonoid effects on metabolic and antioxidative status in neonatal
calves
This thesis is structured in 4 major chapters At first chapter 1 shows an overview of
flavonoids and their BV and introduces major aspects of the antioxidative system and
metabolic status in neonatal calves Chapter 2 deals with the relative oral bioavailability
of quercetin fed as quercetin aglycone or as its glucorhamnoside rutin in neonatal
calves Chapter 3 focusses on the effects on the metabolic and antioxidative status in
neonatal calves during oral supplementation of quercetin aglycone rutin and catechins
Finally chapter 4 presents a general discussion of the results of chapter 2 and 3 in
consideration of present knowledge in the literature
GENERAL INTRODUCTION
4
References
Ahmed W M and S E Hassan 2007 Applied studies on coccidiosis in growing
buffalo-calves with special reference to oxidantantioxidant status World J Zool
240ndash48
Alexandrovich K N and S E Antonovna 2009 Age-dependent level of antioxidant
defence system and lipid metabolism state in calves Int J Appl Res Vet Med
773ndash75
Al-Qudah K M 2009 Oxidative stress in calves with acute or chronic
bronchopneumonia Rev Med Vet 160231ndash236
Blum J W and H Hammon 2000 Colostrum effects on the gastrointestinal tract and
on nutritional endocrine and metabolic parameters in neonatal calves Livest
Prod Sci 66151ndash159
Halliwell B 1991 Reactive oxygen species in living systems Source biochemistry
and role in human disease Am J Med Suppl 91S14ndashS22
Hammon H M J Steinhoff-Wagner U Schoumlnhusen C C Metges and J W Blum
2012 Energy metabolism in the newborn farm animal with emphasis on the calf
endocrine changes and responses to milk-born and systemic hormones Domest
Anim Endocrinol 43171ndash185
Schwerin M U Dorroch M Beyer H Swalve C C Metges and P Junghans 2002
Dietary protein modifies hepatic gene expression associated with oxidative stress
responsiveness in growing pigs FASEB J 161322ndash1324
Sies H W Stahl and A Sevanian 2005 Nutritional dietary and postprandial
oxidative stress J Nutr 135969ndash972
Stohrer M S Lutz and M Stangassinger 2003 Antioxidant status of calves and foals
declines after birth Acta Vet Scand Suppl 44P38
USDA (US Department of Agriculture) Animal and Plant Health Inspection Service
2011 Cattle and calves nonpredator death loss in the United States 2010
httpwwwaphisusdagovanimal_healthnahmsgeneraldownloadscattle_calves
_nonpred_2010pdf (Accessed May 2013)
5
Chapter 1
Literature Overview
LITERATURE OVERVIEW
6
1 Literature Overview
11 An introduction in flavonoids
111 Chemical structure and natural occurrence
Flavonoids are polyphenols which represent aromatic compounds with one or more
hydroxyl groups directly linked to a benzene ring from the common three-ring nucleus
The chemical backbone is based on a C6ndashC3ndashC6 carbon framework Differences on the
C-ring divide the flavonoids into six main classes Flavanols flavones isoflavones
flavanones flavonols and anthocyanidins (Figure 11 Dangles and Dufour 2006
Manach et al 2004) Differences between flavonoid classes are predicated by the
saturation of the heterocyclic C-ring which means the presence or absence of a double
bond on position 4 the degree of oxidation and the position of the B-ring (flavones and
isoflavones) These variations lead to more than 6000 different forms of flavonoids
known today (Harborne and Williams 2000) Naturally flavonoids mostly occur as
glycoside which means the C-ring is attached to a sugar moiety A flavonoid without a
sugar moiety is called aglycone Glycosides yielding glucose instead of other sugar are
called glucosides Only in flavanols the presence of glycosides is rare (Hollman and
Arts 2000) According to Hollman and Arts (2000) aglycones usually do not appear in
fresh plants but after procession In the class of flavonols there are mainly O-
glycosides The type of sugar bound is predominantly β-glycosidic and the most
prevalent sugars next to glucose are arabinose galactose and rhamnose
The most abundant flavonoid is the flavonol quercetin (Hollman 2001 Nijveldt et al
2001) a pentahydroxyflavon (C15H10O7) Naturally quercetin is always bound to at
least one sugar molecule building quercetin-β-glycoside The type of sugar differs
between plants (Arts et al 2004) Williams and Harborne (1994) describe about 179
different glycosides of quercetin The main ones are isoquercetin rutin and kaempferol
(Figure 12)
LITERATURE OVERVIEW
7
Flavanol
Flavanone
Catechin
Epicatechin
Epigallocatechin gallate
Hesperitin
Naringenin
Eriodictyol
Flavone
Flavonol
Luteolin
Apigenin
Quercetin
Kaempferol
Myricetin
Isorhamnetin
Isoflavone
Anthocyanidin
Genistein
Daidzein
Biochanin A
Pelargonidin
Cyanidin
Delphinidin
Figure 11 Basic structure of the six main flavonoid classes with some representatives for each
group In the flavanol structure the numbers and rings are marked
Modified from Dangles and Dufour (2006) Manach et al (2004)
Quercetin a yellow crystalline powder with a molar mass of 3022 gmol is hardly
water soluble but soluble in ethanol or dimethyl sulfoxide The name quercetin is
derived from the latin name for oak tree Quercus where it was found first Rutin is a
glycoside of quercetin bound to rutinose a disaccharide consisting of rhamnose and
glucose It is also a yellow powder but less hydrophobic than quercetin Rutinʼs molar
mass is 6105 gmol
The most abundant flavonols are catechins which are colorless and slightly water-
soluble compounds They are named after catechu a juice or an extract of Mimosa
catechu Due to its isomer structure catechins occur as trans- (catechins) and cis-
isomers (epicatechins)
In general flavonoids are ubiquitous plant components in all kinds of higher plants
High amounts of flavonoids can be found especially in onions broccoli apples
apricots tomatoes and kale as well as in black currants black and green tea and red
wine (Hertog et al 1992 Crozier et al 1997 Hollman and Arts 2000)
LITERATURE OVERVIEW
8
Quercetin
Kaempferol
Rutin
Isoquercetin
Figure 12 Chemical structure of quercetin kaempferol and the quercetin glycosides rutin and
isoquercetin
Modified from Passamonti et al (2009)
An overview of the quercetin kaempferol catechin and epicatechin content in selected
food is given in Table 11 based on data from the USDA database for the flavonoid
content of selected foods a literature composition based on of 308 different references
(Bhagwat et al 2013) retrieved in December 2013 Further databases on flavonoid
content are available like the Phenol-Explorer (httpphenol-explorereu) or EuroFIR-
BASIS (httpebasiseurofirorg) and countless single references giving the flavonoid
content in plants
For chemical determination of the distinct flavonoids an acceptable separation of the
individual flavonoid molecules must be ensured for example by high-performance-
liquid-chromatography (HPLC) However given values for the flavonoid content in
plants can differ enormously depending on methods of analysis as there is no
standardized method for flavonoid analyses Besides variation of flavonoid content
among plants there are many factors that influence the flavonoid content in plants itself
like seasonal variation light and climatic conditions degree of ripeness as well as food
preparation and processing (Aherne and OrsquoBrien 2002) These natural variations in
plants type of plant and measurement should be kept in mind when comparing
flavonoid content among plants
LITERATURE OVERVIEW
9
Table 11 Flavonoid content in selected food as is in raw material unless indicated otherwise
Source
Flavonoid content mgkg fresh weight or mgL
Flavonol Flavanol
Quercetin Kaempferol Catechin Epicatechin
Alfalfa raw seeds 17 0 - -
Apple 0-115 0-27 0-51 8-192
Apricot 4-29 0-13 3-73 0-83
Buckwheat 51-363 - - -
Blackberry 0-119 0-31 0-3129 0-181
Broccoli 0-137 1-213 0 0
Capers 1493-3234 2150-3083 - -
Celery 0-35 2 0 0
Cherry sweet 1-68 0-7 0-149 4-270
Chives 9-104 55-125 - -
Chocolate dark - - 110-400 520-1250
Cranberry 73-250 0-6 0-11 30-57
Currant black 23-122 0-23 7 47
Dock leaves 862 103 - -
Elderberry 85-600 2-13 - -
Grape black 2-37 0-5 89-108 86-87
Grape seed - - 60-2440 230-2840
Grape whitegreen 1-39 0-3 4-59 1-28
Kale 0-562 5-905 - -
Milk chocolate 1 0 1-2 1-5
Onion red 59-1917 0-45 - -
Soybeans2 0 12 - 374
Spinach 0-272 0-550 - -
Tea black (brewed) 9-48 4-24 4-48 2-87
Tea green (brewed) - - 664-6880 200-216
wine red beverage 0-34 0-13 0-390 0-165
10 = not detectable - = no data available
2Quercetin and kaempferol content from green soybeans epicatechin content from mature soybean seeds
Modified from Bhagwat et al (2013)
Besle et al (2010) analyzed phenolic compositions of forages fed to dairy cows and
found the greatest phenolic content in grassland pastures with 353 gkg DM The
grassland hay however contained 216 gkg DM of phenolic compounds Ryegrass
silage versus ryegrass hay contained 168 and 145 gkg DM of phenolic compounds
The lowest phenolic content was found in corn silage containing 37 gkg DM (Besle et
al 2010) Phenolic compounds are also found in trace amounts in bovine milk wherat
their concentration is influenced by cow feeding (Besle et al 2010 Steinshamn et al
2008 OrsquoConnell and Fox 2001)
LITERATURE OVERVIEW
10
112 Biological effects of flavonoids in plants
Flavonoids have multifarious and important functions in plant biochemistry and
physiology like protecting deoxyribonucleic acid (DNA) from ultraviolet-induced
damage (Kootstra 1994) Flavonoids further affect photosynthesis by catalysing
electron transport processes (Das 1994) In leaves flavonoid pigments protect the
underlying photosynthetic cells by absorbing radiation Most flavonoids accumulate in
the epidermal cell layer of leaves (Winkel-Shirley 2002) and in the skin of fruits
(Manach et al 2004) The diversity of colors in plants is mainly caused by flavonoids
thus flavonoids play a crucial role in attracting pollinators and seed dispersers (Winkel-
Shirley 2002) Furthermore flavonoids protect plants against microbial invasion by
acting as phytoalexins (Harborne and Williams 2000) increasing tolerance against
abiotic stressors or defend other herbivory for example by bitter tasting (Gould and
Lister 2006 Harborne and Williams 2000) The signal transfer between plants and
microorganisms is also triggered by flavonoids as seen in the stimulation of the
Rhizobium bacteria for nitrogen fixation (Gould and Lister 2006) Flavonoids are stored
in plant vacuoles Cell death causes flavonoids to disperse into different fluid
components of the plants like waxes and resins (Das 1994) which are often considered
as enriched with flavonoids
113 Biological effects of flavonoids in humans and animals
The effects of flavonoids in humans and animals are seen ambiguous On the one hand
flavonoids are discussed as anti-nutritive factors whereat on the other hand flavonoids
are claimed health and performance promoting Negative aspects of flavonoids are seen
in tannins where diminishing BV of proteins and minerals or an inhibition of digestive
enzymes can occur (Chung et al 1998) Phytoestrogens are attributed to have adverse
health effects in infant development (Zung et al 2001) However todayʼs research is
mainly focussed on the positive aspects of flavonoids especially their antioxidative
activity and protective capacity against oxidative stress Flavonoids were found to
inhibit oxidation of low-density lipoproteins (LDL) in vitro (Harborne and Williams
2000) Low-density lipoproteins transport lipophilic substances like cholesterol and
plasma cholesterol esters Elevated plasma concentrations of LDL are associated with
vascular diseases like atherosclerosis (Aviram and Fuhrman 2003) and related problems
like coronary heart disease and stroke (Denny and Buttriss 2005) Therefore a large
LITERATURE OVERVIEW
11
body of research deals with the influence of a flavonoid-rich diet on reducing coronary
heart and vascular diseases (Hertog et al 1993 Knekt et al 1996 Rimm et al 1996
Yochum et al 1999 Hirvonen et al 2001 Mennen et al 2004) In spite of all these
investigations Loke et al (2010) postulated the detailed mechanisms of how flavonoids
may protect against cardiovascular diseases as still unknown Besides influencing
cardiovascular diseases flavonoids are involved in cancer control (Lamartiniere et al
1995 Knekt et al 1997 Hirvonen et al 2001) Birt et al (2001) postulated estrogenic
and antiestrogenic activity antiproliferation cell cycle arrest and apoptosis as well as
induction of detoxification enzymes regulation of host immune function and other
mechanisms of flavonoid actions as responsible for tumor growth restriction
Furthermore flavonoids are claimed to be involved in modulation of
neurodegeneration especially age-related cognitive and motoric decline in protection
against cerebral ischemiaperfusion injuries or other brain abnormalities (Youdim and
Joseph 2003) Other neurodegenerative disorders in this context are Alzheimerʼs
disease Parkinsonʼs disease seizures trauma and neuroinflammation (Varadarajan et
al 2001 Schroeter and Spencer 2003 Miller et al 2009) In addition flavonoid
treatment may alleviate infection by human immunodeficiency virus because
flavonoids are capable to inhibit several critical enzymes involved in life cycle of
human immunodeficiency virus (Cos et al 2008)
Effects of flavonoids and their metabolites on the metabolism in organisms are
manifold Especially those on carbohydrate metabolism are well studied and an impact
on glucose homeostasis was found in several studies Hanhineva et al (2010) reviewed
the impact of dietary polyphenols on the carbohydrate metabolism and summarized the
inhibition of carbohydrate digestion and glucose absorption in the intestine the
stimulation of insulin secretion from pancreatic β-cells the modulation of glucose
release from the liver the activation of insulin receptors and glucose uptake in insulin-
sensitive tissues as well as the modulation of intracellular signalling pathways and gene
expression as possible mechanisms of how flavonoids influence carbohydrate
metabolism More in detail flavonoids are capable to inhibit α-amylase and α-
glucosidase activity (Tadera et al 2006) inhibit the sodium-dependent glucose co-
transporter (SGLT) 1 (Kobayashi et al 2000) or glucose transporters itself (Johnston et
al 2005) In rat insulinoma pancreatic cells polyphenols like quercetin apigenin and
luteolin inhibited cytotoxicity and attenuated the decrease of glucose-stimulated insulin
LITERATURE OVERVIEW
12
secretion (Kim et al 2007) However insulin secretion is affected by a wide range of
different plant compounds and extracts Glucose uptake can be stimulated by flavonoids
in both insulin-sensitive and non-insulin sensitive tissue mostly dose-dependent
(Hanhineva et al 2010) Glucose transporter (GLUT) 1 widely distributed in fetal
tissues and GLUT 4 expressed by muscle are supposed to mainly trigger flavonoid
mediated glucose uptake (Hanhineva et al 2010)
However the influence of polyphenols on liver function to maintain glucose
homeostasis may also play a key role in neonates Endogenous glucose production as
important pathway to ensure glucose homeostasis in the neonate (Girard et al 1992)
originates from glycogenolysis and gluconeogenesis both taking place in the liver An
improved hepatic glucose and lipid metabolism was indicated in diabetic rats feeding a
polyphenol-rich diet (Roghani and Baluchnejadmojarad 2010 Bose et al 2008
Wolfram et al 2006) In non-diabetic rats quercetin stimulated glycogenolysis and
inhibited glycolysis and gluconeogenesis (Gasparin et al 2003a b) ex vivo by infusing
the liver with 50 to 300 micromolL quercetin However these concentrations are not
achievable with standard diets for in vivo experiments (Gasparin et al 2003a b)
Furthermore Kobayashi et al (2010) and Seiva et al (2012) showed positive effects of
a flavonoid-rich diet on lipid metabolism in rats fed a high-fat diet as plasma
concentrations of triglycerides non-esterified fatty acids (NEFA) insulin and leptin as
well as lipogenesis were reduced
12 Bioavailability of flavonoids
121 General aspects of bioavailability with focus on ruminants
In general BV can be defined as the rate and extent to which the active ingredient of a
substance is absorbed in the blood compartment or becomes available at the site of
action The European Agency for the Evaluation of Medicinal Products (2000) defines
BV as the extent and rate to which a substance or its active moiety is delivered from a
pharmaceutical form and becomes available in circulation However the effect of a
substance is usually determined by its concentration at the place of action
All postabsorptive biological effects of given substances depend on their BV
Parameters determining BV are liberation absorption distribution metabolism and
excretion abbreviated with their first letters as LADME-system Liberation the first
LITERATURE OVERVIEW
13
step for an effect of a drug or an active compound means drug release or drug delivery
and can be seen as a complex process The drug must disaggregate in smaller particles
dissolve in the present fluid and disperse which is more difficult for water insoluble
substances like flavonoids In the next step the absorption the active compound must
enter the blood or lymph vessels when given orally Absorption of orally given
ingredients is determined by solution rate as well as gut and stomach contentfilling
(Frey 2007) Bioavailability was shown to be influenced by technological (galenical)
factors of the substance the form of application local factors like diarrhea or contact
with other substances and first-pass effects These first-pass effects occur when an
active compound is metabolized very fast and thus inactivated or transformed before
entering the systemic circulation for example in the gut mucosa or liver After
absorption into the bloodstream the active compound is distributed by passive diffusion
or by convective transport from the blood capillaries into neighboring tissues The
metabolism of an active compound means its biotransformation mainly increasing its
hydrophilic properties (Pfeiffer et al 1995) The main organ for biotransformation is
the liver but it also takes place in the mucosa cells of the gastrointestinal tract lung
and kidney Most enzymes involved in this process are located in the endoplasmic
reticulum (Frey 2007) Biotransformation is two-phased Phase-I-reaction is a
transformation where functional groups are built into non-polar molecules mostly by
oxidation reduction or hydrolysis Absorption to water soluble molecules in phase-II-
reaction enables excretion The most important ways of excretion or elimination are
renal biliary and intestinal
To determine BV the concentration of an active ingredient is measured over time in
blood samples collected from the systemic circulation and as plasma concentration-
time curves are specified only by absorption distribution and elimination To calculate
BV area under the curve (AUC) maximal plasma concentration (Cmax) and time until
the maximal plasma concentration is reached (Tmax) are used as pharmacokinetic
parameters (see Figure 13)
Bioavailability is either relative or absolute For determination of the absolute oral BV
of a substance the AUC after oral intake is compared to the AUC after intravenous
injection In contrast to this relative oral BV compares two different drugs containing
the same active principle after oral application As time interval of sampling mainly
determines accuracy sampling frequency should be as high as possible
LITERATURE OVERVIEW
14
Figure 13 Illustration of main pharmacokinetic parameters at 2 different plasma concentration-
time curves after a single oral dose of an active compound to an organism Bold descriptions are for
curve 1
A = absorption D = distribution E = elimination AUC = area under the curve Cmax = maximal plasma
concentration Tmax = time until maximal plasma concentration is reached
Modified from Pfeiffer et al (1995)
122 Absorption and distribution of flavonoids in the organism
Flavonoids can be absorbed in different ways after oral administration from the
gastrointestinal tract Quercetin fed as aglycone without attached sugar can be detected
within 30 minutes after oral administration in plasma of volunteers whereas quercetin
fed as rutinoside with attached sugar (rutin) showed delayed peak levels in plasma
(Hollman et al 1997b Olthof et al 2000 Cermak et al 2003) Thus the main place
of absorption of quercetin monoglycosides is the small intestine More complex
quercetin glycosides like rutin are mainly absorbed in the colon or the distal small
intestine also colonized with microorganisms (Hollman et al 1997b Manach et al
1997) Therefore the sugar moiety and the location of microbial activity in the
gastrointestinal tract account for different absorption sites (Hollman et al 1999 Day et
al 1998) Some flavonoid aglyca can already be absorbed in the stomach but not their
glycosides as shown in studies in rats administered quercetin (Crespy et al 2002) or
daidzein and genistein (Piskula et al 1999) However most flavonoid glycosides resist
acid hydrolysis in the stomach thus reaching the duodenum undegraded
To pass the gastrointestinal epithelium is the first crucial step for systemic availability
in an organism The enterocytes are polarized cells with numerous membrane proteins
LITERATURE OVERVIEW
15
that enable the transport of dietary compounds from the lumen into the blood stream via
channels or active transporters (Figure 14) Lipophilic and small nonpolar substances
can pass the plasma membrane via diffusion following a concentration gradient As
flavonoids are polar and thus hydrophilic substances the passive diffusion of flavonoids
however barely occurs in the gastrointestinal tract (Day et al 2000 Manach et al
2004 Crespy et al 2003) Only for the aglyca a passive absorption is discussed (Day et
al 2000 Cermak et al 2003 Wolffram 2010) Acidic conditions in the stomach
inhibit hydrolysis (Day et al 2000) and pancreatic enzymes are also not able to
hydrolyze β-glycosidic bounds (Arts et al 2004) On the contrary Walle et al (2005)
found hydrolysis of dietary flavonoids already in the oral cavity by both bacteria and
shed epithelial cells but with a large interindividual variability between volunteers
Furthermore Kahle et al (2011) found degradation of polyphenols varying after
incubation with human saliva Different glucosidases like lactase phlorizin hydrolase
(LPH) are known to hydrolyze flavonoids (Day et al 2000 Sesink et al 2002 Neacutemeth
et al 2003) Lactase phlorizin hydrolase is an extracellular enzyme from the brush
border membrane of intestinal mammalian cells and was shown to be important for
intestinal absorption of quercetin glycosides (Figure 14 Sesink et al 2002)
Extracellular glucosidases cleave the sugar from the flavonoid glucosides and the
aglycone can be absorbed Hydrolysis by lactase phlorizin hydrolase might be reduced
in rats and sheep due to their higher microbial population in the stomach than in humans
(Day et al 2000) In human small intestine and liver an intracellular cytosolic β-
glucosidase was described that hydrolyze various flavonoid glycosides (Day et al
1998) Further enzymes hydrolyzing flavonoids in the gut are glucocerebrosidase (Day
et al 1998) and other cytosolic β-glucosidases (McMahon 1997) More complex
glycosides like rhamnosides are hydrolyzed by enzymes of microorganism in the distal
small intestine or in the colon (Crespy et al 1999 Scholz and Williamson 2007)
Besides that active transport systems are prevalently used for flavonoid transport into
the cell (Figure 14) Several studies suggest that quercetin glucosides could be
absorbed in the small intestine via SGLT 1 (Gee et al 1998 Walgren et al 2000a
Wolffram et al 2002) Also GLUT like GLUT 2 (Chen et al 2007) are discussed to
transport quercetin glucosides across the cell membranes Since the membrane transport
of xenobiotics chemical compounds like antibiotics that are neither produced in an
organism nor are part of the regular diet is a key factor in medical treatment and
LITERATURE OVERVIEW
16
flavonoids may interact with the cellular in- and efflux systems like the multidrug-
resistance-associated protein a plethora of studies with the interaction of flavonoids and
the membrane transport of drugs or their interactions exists (Cermak and Wolffram
2006) Among plasma membrane transporters the focus is on adenosine triphosphate-
binding cassette transporters (di Pietro et al 2002 Brand et al 2006 Morris and
Zhang 2006) monocarboxylate transporters and organic anion and bilirubin
transporters (Figure 14 Passamonti et al 2009)
Figure 14 Simplified model of intestinal absorption and metabolism of the flavonol quercetin in
the organism
Solid arrow = enzymatic reactions dotted or dashed arrow = active or passive transport SGLT1 =
sodium-dependent glucose co-transporter 1 LPH = lactase phlorizin hydrolase CBG = cytosolic β-
glucosidase UGT = uridine-5acute-diphospate glucuronosyl-transferase MRP = multidrug resistance-
associated protein SUL = sulfotransferase GLUT = glucose transporter ABC = ATP-binding cassette
transporter MCT = monocarboxylate transporter P-Glyc = P-glycoprotein
Modified from Murota and Terao (2003) Petri et al (2003) Cermak and Wolffram (2006)
However the exact way of action of these membrane proteins on flavonoid transport in
vivo is not given yet Once absorbed into circulation flavonoids are distributed in the
body with more than 98 of quercetin bound to proteins (Gugler et al 1975 Boulton
LITERATURE OVERVIEW
17
et al 1998 Janisch et al 2004) mainly albumin as the most prevalent protein in
plasma Further quercetin is also bound to glycoproteins and LDL (Boulton et al
1998) Depending on their conjugation the affinity of quercetin to bind on serum
albumin differs (Janisch et al 2004) contributing to the huge variation in BV (Dufour
and Dangles 2005) However as it is known that binding of the polyphenol to proteins
alter their biological activity the biological effect of this binding needs still to be
evaluated (Manach et al 2004)
The pattern of metabolites in tissues may be different from the one in the blood stream
due to its cellular uptake or intracellular metabolism (Manach et al 2004)
Furthermore Manach et al (2004) consider that plasma concentrations do not
necessarily correlate with the concentration in tissue Thus plasma concentration of
flavonoids may not be an accurate biomarker of exposure to body tissue
123 Metabolism and excretion of flavonoids
First-pass effect during intestinal absorption is crucial for availability of orally
administered flavonoids as described in chapter 121 Hydrolyzation of some
flavonoids already occurs by passing the enterocytes via the membrane-bound lactase
phlorizin hydrolase Other flavonoids are hydrolyzed in the enterocyte by cytosolic β-
glucosidase before entering the systemic circulation (Day et al 2000 1998 Sesink et
al 2002) and being transported to the liver Flavonoids reaching the colon are
hydrolyzed by microorganisms before absorption In human intestine the presence of
the bacteria species Eubacterium Clostridium and Bacterioides indicated metabolism
of flavonoids Various simple aromatic acids are produced in this process and the
released aglycone is often degraded by colonic microorganisms (Manach et al 2004)
These aglycones are further degraded by splitting the heterocyclic ring thus flavonols
mainly produce hydroxyphenylacetic acids Different flavonoid classes lead to different
acids like flavones and flavanones are mainly metabolized to hydroxyphenylpropionic
acids All breakdown products are further metabolized to derivatives of benzoic acid
microbial metabolites are absorbed in the colon and conjugated with glycine glucuronic
acid or sulfate (Manach et al 2004) Due to the different composition of the colonic
microflora in different species the variations in microbial metabolism of flavonoids are
enormous
LITERATURE OVERVIEW
18
The main site of flavonol metabolism besides the gastrointestinal tract is the liver
(Hollman and Katan 1997 Aherne and OrsquoBrien 2002) Flavonoids are transported to
the liver via the portal vein During absorption in the intestine and later in the liver
flavonoids are conjugated by phase-II-reactions mainly glucuronidation methylation
and sulfation Phase-I-reactions like oxidation by enzymes of the cytochrome P450
system are of minor importance in flavonoid metabolism (Otake et al 2002) The
reactions of phase-II mainly are detoxificating processes in the body like metabolism of
xenobiotics (Manach et al 2004) When methylated a methyl group of quercetin is
transferred catalyzed by the catechol-O-methyl transferase (Manach et al 2004) which
is found in many tissues with highest activity in liver and kidneys (Piskula and Terao
1998) Glucuronidation occurs in the liver but also to a great extent in the intestine
(Spencer et al 1999) This process is catalyzed by the Uridine diphosphate-
glucuronosyltransferase which is located in the endoplasmatic reticulum Here
glucuronic acid from Uridine diphosphate-glucuronic acid is transferred to the
polyphenol Sulfation also mainly occurs in the liver (Piskula and Terao 1998) The
transfer of a sulfate moiety from 3acute-phosphoadenosine-5acute-phosphosulfate to the
hydroxyl group of polyphenols is catalyzed by sulfotransferases According to the kind
of the substance and the ingested dose the importance of glucuronidation methylation
and sulfation varies (Manach et al 2004) A higher ingested dose causes a shift from
sulfation to glucuronidation (Koster et al 1981) However the pattern of conjugation is
further influenced by species sex or food deprivation (Piskula 2000)
Flavonoids formed in the gut mucosa only partially enter circulation and a significant
amount will be secreted back into the gut lumen (Crespy et al 1999) This so called
apical efflux out of the enterocytes is probably triggered by adenosine triphosphate-
binding cassette transporter like the multidrug resistance associated protein 2 (Walle et
al 1999 Walgren et al 2000b) the breast cancer resistance protein 1 (Sesink et al
2005) or the P-glycoprotein (Ofer et al 2005)
However flavonoids often undergo an intensive enterohepatic circulation Due to their
biliary excretion back into the duodenum flavonoids may be further metabolized by
intestinal microorganisms or reabsorbed from the intestine (Hackett 1986) This
recycling may enhance availability of flavonoids in the body (Manach et al 2004) or
cause a second plasma peak (Setchell et al 2001 Manach et al 2003) According to
the site of absorption flavonoids may undergo different metabolic fates thus the liver
LITERATURE OVERVIEW
19
might be more important for flavonoids absorbed in the small intestine than for the ones
absorbed in the colon (Heim et al 2002)
Flavonoids and their metabolites usually are excreted by bile or urine The smaller
conjugates prefer urinary excretion whereas the larger and extensively conjugated
metabolites prefer the biliary one (Manach et al 2004) Flavonoid glucuronides and
sulphates are readily excreted with the urine due to their polarity and water solubility
(Hackett 1986) However though various flavonoids are excreted by urine (Aherne and
OʼBrien 2002 Scalbert and Williamson 2000 Manach et al 2004) this route seems to
be of minor importance (Hollman et al 1995) Due to partially long elimination half-
life flavonoids may be accumulated in blood plasma because of repeated absorption
(Aherne and OrsquoBrien 2002)
124 Factors influencing bioavailability of flavonoids
Bioavailability of flavonoids may be influenced at all states of the described LADME-
system on both pre- as well as post-absorptive by species differences and individual
factors like state of development and nutrition (Heaney 2001) enzyme activities or
secretion other regulatory mechanisms and interindividual differences (Egert et al
2008) Plasma peak concentrations of epigallocatechin gallate increased 35-fold when
catechins were given to fasted compared to non-fasted volunteers (Chow et al 2005)
Further mucosal mass intestinal transit time rate of gastric emptying as well as the up-
and down-regulation of absorption by physiological control because of habituation
influenced flavonoid BV (Heaney 2001) Summarized by Scholz and Williamson
(2007) the most important criterion influencing BV is the attached sugar followed by
the food matrix the added flavonoids the given dose and the adaption to it and the
inhibition of flavonoids by chemical changes after absorption or processing in the
gastrointestinal tract or due to interactions with other feed components
The effects of the food matrix the physical form in which flavonoids are administered
and solubility on BV seem to be more complex Quercetin is slightly soluble in water
but addition of organic solvents such as lipids emulsifiers (Azuma et al 2002) or
propylene glycol (Shimoi et al 1998) may enhance solubility The benefit of alcohol on
BV of flavonoids is discussed ambiguous as some found appreciable improvements
(Azuma et al 2002 Dragoni et al 2006) others not (Donovan et al 1999 Goldberg
et al 2003) However Azuma et al (2002) only enhanced BV of flavonoids using
LITERATURE OVERVIEW
20
alcohol concentrations of more than 30 in the diet Overall composition of the meal
and the source of flavonoids have the main impact on BV Quercetin from onions had a
higher BV than quercetin from apples or pure rutin (Hollman et al 1997b) Food
preparation and processing like cooking also affect BV since it can cause a reduction in
flavonoid content or cause chemical transformation (Manach et al 2004) Furthermore
flavonoid absorption is affected by the fat content in the diet (Lesser et al 2004)
Interestingly interactions of polyphenols with milk proteins partly inhibited positive
aspects of flavonoids or led to differences in absorption or reduced AUC values of
flavonoid plasma concentrations (Serafini et al 2003 Reddy et al 2005 Egert et al
2013) Nevertheless other studies in humans showed no effect of milk on BV of
flavonoids (van Het Hof et al 1998 Hollman et al 2001)
125 Studies on bioavailability of quercetin and catechins
In cattle the companion studies of Berger et al (2012) and Gohlke et al (2013) where
quercetin aglycone and rutin were given intraruminal (10 and 50 mgkg body weight
(BW) Berger et al 2012) and intraduodenal (9 18 or 27 mgkg BW Gohlke et al
2013) to dairy cows showed maximal plasma concentrations of flavonols ranging from
about 20 to 1000 nmolL at 30 min to 2 h after administration Interestingly rutin was
much better available than quercetin aglycone after intraruminal (Berger et al 2012)
than after intraduodenal administration (Gohlke et al 2013) Manach et al (2005)
reported a range from 0 to 4 micromolL plasma concentration of total flavonols after intake
of 50 mg aglycone equivalents in humans whereas an older study of Gugler et al
(1975) found no effect of oral administration on quercetin plasma concentration in
humans and therefore suggested oral administration of quercetin as ineffective
However more recent studies revealed detectable plasma concentrations of quercetin
after oral flavonol administration as shown in Table 12 In this overview only studies
were listed in which pure quercetin substances were administered and plasma
concentrations were measured Though lots of BV studies are conducted with food
containing high contents of flavonoids like apples wine or onions interactions with
other food components or matrix effects cannot be excluded Therefore it is more
reliable using pure substances for comparing BV studies
Studies on the BV of catechins with pure substances are rare as mostly tea extracts
were used According to Manach et al (1999) in rats the catechin metabolites (catechin
LITERATURE OVERVIEW
21
and methylcatechin) reached similar plasma concentrations after oral supplementation
of catechin than the quercetin metabolites quercetin isorhamnetin and tamarixetin after
quercetin administration in comparable doses However metabolites of catechin showed
a faster decline in plasma concentration than those of quercetin possibly due to lesser
binding to plasma albumin or higher urinary excretion (Manach et al 1999) Hollman
et al (1997a) too postulated a good absorption of catechin and its microbial
degradation products after oral administration of radioactively labelled (+)-catechin to
rodents monkeys and humans in different studies Nevertheless BV of catechins
widely depends on species on the administered compound and on the chemically
structure of the distinct catechin isomers such as epicatechin epigallocatechin and
epigallocatechin gallate In rats fed 200 mgkg BW of a green tea extract (GTE) Chen
et al (1997) found a systemic availability of 312 for epicatechin and of 14 for
epigallocatechin but only of 01 for epigallocatechin gallate whereas in dogs after
oral and intravenous administration of 25 mgkg BW of epigallocatechin gallate
absolute BV was about 20 (Swezey et al 2003) However systemic available
epicatechin epigallocatechin and epigallocatechin gallate was very low after oral
administration of 20 mgkg BW of green tea to humans (Lee et al 2002) or after oral
administration of 500 mgkg BW and intravenous administration of 50 mgkg BW
catechin fractions containing 5 epicatechin 13 epicatechin gallate and 50
epigallocatechin gallate to rats (Zhu et al 2000) The consumption of a green tea
beverage by humans resulted in maximal plasma concentrations of total catechins of
4618 plusmn 274 nmolL at 90 min after drinking (Egert et al 2013) Major catechins in this
study detected in plasma samples after consumption of various test drinks were
epigallocatechin gallate (1799 nmolL) epicatechin gallate (1473 nmolL)
epigallocatechin (865 nmolL) epicatechin (482 nmolL) and small amounts of
catechin and gallocatechin (Egert et al 2013)
LITERATURE OVERVIEW
22
Ta
ble
12
O
ver
vie
w o
f th
e b
ioa
va
ila
bil
ity
of
qu
erce
tin
fro
m d
iffe
ren
t n
atu
ral
form
s
Ref
eren
ce
Su
bje
ct
ap
pli
cati
on
Fla
vo
no
id
do
se
Co
nv
erte
d d
ata
AU
C
Tm
ax
Cm
ax
nm
ol
L times
h
min
n
mo
lL
Ber
ger
et
al
(20
12
)
Co
w
intr
aru
min
al
Q
50
mgk
g B
W
18
2
3
0
9
0
Q
1
0 m
gk
g B
W
-
3
0
~
20
R
5
0 m
gk
g B
W
1
39
9
4
2
10
00
R
1
0 m
gk
g B
W
-
3
0
~
80
Go
hlk
e et
al
(2
01
3)
Co
w
intr
aduo
den
al
Q
9 m
gk
g B
W
84
5
10
5
4
07
Q
1
8 m
gk
g B
W
1
33
3
11
0
5
73
Q
2
7 m
gk
g B
W
1
58
7
12
5
6
36
R
9
mgk
g B
W
13
8
-
2
7
R
1
8 m
gk
g B
W
13
2
-
1
8
R
2
7 m
gk
g B
W
10
2
-
1
9
Cer
mak e
t al
(2
00
3)
Pig
o
ral
Q
50
mgk
g B
W
8
67
7
2
0
11
90
R
5
0 m
gk
g B
W
1
99
7
21
0
3
57
Les
ser
et a
l (
20
04)
Pig
o
ral
Q
10
mgk
g B
W
1
95
0
10
2
5
18
Ad
er e
t al
(2
00
0)
Pig
o
ral
Q
50
mgk
g B
W
-
24
0
8
52
Q
50
0 m
gk
g B
W
-
15
0
41
13
Erl
und
et
al
(20
00
) H
um
an
ora
l Q
8
mg
17
44
11
4
1
37
Q
2
0 m
g
2
918
16
2
2
19
Q
5
0 m
g
3
765
29
4
2
85
R
8
mg
6
24
1
41
0
3
8
R
2
0 m
g
1
042
44
4
7
8
R
5
0 m
g
1
666
45
0
1
47
Ho
llm
an e
t al
(1
99
7b
) H
um
an
ora
l R
2
00
mg
16
10
55
8
1
47
LITERATURE OVERVIEW
23
T
ab
le 1
2
Co
nti
nu
ati
on
Ref
eren
ce
Su
bje
ct
ap
pli
cati
on
Fla
vo
no
id
do
se
Co
nv
erte
d d
ata
1
AU
C
Tm
ax
Cm
ax
nm
ol
L times
h
min
n
mo
lL
Ho
llm
an e
t al
(1
99
9)
Hu
man
o
ral
Sp
irae
osi
d
~1
50 m
g
18
800
3
0
3
500
R
uto
sid
um
~
20
0 m
g
3
700
3
60
1
80
Olt
ho
f et
al
(2
00
0)
Hu
man
o
ral
Iso
quer
citr
in
~1
50
mg
19
100
3
7
5
000
S
pir
aeo
sid
~
15
0 m
g
17
500
2
7
4
500
Eger
t et
al
(2
00
8)
Hu
man
o
ral
Q
50
mg
1
268
1
20
1
89
Q
10
0 m
g
3
000
1
80
2
95
Q
15
0 g
5
097
3
60
4
31
Man
ach e
t al
(1
99
7)
R
at
ora
l Q
0
2
of
die
t
-
7
20
550
00
R
04
o
f d
iet
-
14
40
350
00
Man
ach e
t al
(1
99
9)
Rat
o
ral
Q
02
5
of
die
t
-
14
40
520
00
Rei
nb
oth
et
al
(20
10)
Do
g
ora
l Q
1
0 m
gk
g B
W
2
915
1)
72
1)
233
6
2
) 2
34
2)
229
2
R
1
0 m
gk
g B
W
2
667
1)
42
1
) 17
2
) 6
66
2)
113
7
Is
oq
uer
citr
in
10
mg
kg B
W
6
837
1)
48
1)
667
4
2
) 2
46
2)
888
3
Wei
n a
nd
Wo
lffr
am
(2
01
3)
Ho
rse
ora
l Q
2
0 m
gk
g B
W
2
010
6
0
75
0
1A
UC
T
max
and
Cm
ax a
re c
onv
erte
d a
ll i
nto
sam
e un
its
for
com
par
iso
n o
f d
ata
R =
quer
ceti
n a
s glu
corh
am
no
sid
e ru
tin
Q
= q
uer
ceti
n a
s ag
lyco
ne
(wit
ho
ut
atta
ched
sugar)
A
UC
= a
rea
und
er t
he
pla
sma-c
once
ntr
atio
n t
ime
curv
e
Cm
ax =
maxim
al r
each
ed p
lasm
a co
nce
ntr
atio
n o
f to
tal
flav
ono
ls m
easu
red
in e
ach s
tud
y
Tm
ax =
tim
e ti
ll C
max
is
reac
hed
B
W =
bo
dy w
eig
ht
- =
no
val
ues
giv
en
=
dat
a ev
aluate
d f
rom
fig
ure
1
) 2
) =
fir
st a
nd
sec
ond
pea
k
LITERATURE OVERVIEW
24
13 Metabolic and health status in neonatal calves
131 Metabolic status in calves at birth and postnatal changes
Although calves are precocial animals and thus relatively mature when born they still
must adapt to various morphological and functional changes after birth (Blum and
Hammon 2000) During gestation energy supply is continuously via placenta with
glucose as main energy substrate With birth this changes to a discontinuously oral
supply by colostrum and milk intake with lactose and fat as main energy source
(Hammon et al 2013) Prenatal glucocorticoids and catecholamines as well as thyroid
hormones in the fetal blood lead to an increased gluconeogenic activity and hepatic
glycogen storage ensuring coverage of the energy demand of the newborn calf
(Hammon et al 2012) However calves are often hypoglycemic after birth as they
need to adapt to the usage of other fuels than glucose taken up with liquid feeding
Thus endogenous glucose production is an important pathway to ensure glucose
homeostasis in the calf and increases with maturation (Steinhoff-Wagner et al 2011)
Important regulators for endogenous glucose production are hormones like insulin
glucagon catecholamines growth hormone and glucocorticoids The peptide hormone
insulin is built in the pancreatic β-cells Plasma concentrations are reduced at birth and
increase after first feed intake indicating that especially glucose intake stimulates insulin
secretion (Hadorn et al 1997 Hammon and Blum 1998 Rauprich et al 2000) The
peptide hormone glucagon is built in the pancreatic α-cells and acts as antagonist to
insulin Plasma glucagon concentrations also increase after first feed intake in calves
(Hammon et al 2012) Endogenous glucose production is in addition stimulated by
catecholamines glucocorticoids and probably growth hormone (GH) Around birth all
these hormones showed elevated plasma concentrations in calves and catecholamines
and glucocorticoids are known for their promoting effects on metabolic maturation in
the neonate (Hammon et al 2012 2013) Plasma concentrations of cortisol are high at
birth and decrease thereafter (Hadorn et al 1997 Hammon et al 2012 Schiessler et
al 2002) In addition cortisol next to other regulators is a major player for initiating
birth (Liggins 1994) Furthermore thyroid hormones play an important role for
endogenous glucose production during late gestation and after birth (Fowden et al
2001) Plasma concentrations of thyroid hormones are high at birth and decrease
LITERATURE OVERVIEW
25
thereafter in mature calves but not in preterm born calves (Steinhoff-Wagner et al
2011)
In neonatal calves colostrum feeding affects the GH ndash insulin-like growth factor (IGF)
system which most likely is a response to energy supply and improved glucose status in
calves after colostrum feeding (Hammon et al 2012) Amount time point and
frequency of feeding influence plasma IGF-1 concentrations (Hadorn et al 1997
Nussbaum et al 2002) which are lower during the first wk of life in restricted (Hadorn
et al 1997) or formula fed calves (Rauprich et al 2000) indicating the huge
importance of early and sufficient colostrum feeding to newborn calves for their
development and maturation
132 Health status in calves and development of the immune system
Immune defence of newborn calves depends on uptake of immunoglobulins (Ig) with
colostrum as there is no placental transfer of Ig and endogenous production of Ig is
negligible (Chase et al 2008) The ingestion of sufficient colostrum is thus essential for
immunological protection during the first 2 to 4 weeks of life until calves develop an
adequate own active immune system (Chase et al 2008 Figure 15) With colostrum Ig
are transferred from the cow to the newborn calf and activate and regulate the innate
immune response (Chase et al 2008)
Figure 15 Illustration of the development of immunity and immune response of calves
Modified from Chase et al (2008)
Apart from nutrients and Ig colostrum contains minerals vitamins and also non-
nutrient components like growth factors cytokines hormones and further bioactive
LITERATURE OVERVIEW
26
substances (Blum 2006) Most of these non-nutrient factors and bioactive compounds
are derived from blood of dams but some are produced in the mammary gland (Blum
2006) The average Ig concentrations in bovine colostrum varies greatly depending
mainly on breed age of dam nutrition in the preparturient period season or amount of
produced colostrum (Godden 2008) As colostrogenesis ends abruptly at parturition the
greatest concentration of the beneficial compounds is in first colostrum and in further
milkings concentrations are decreasing because of dilution effects (Godden 2008) The
small intestine as the site of digestion and absorption of Ig mainly IgG is permeable for
up to 12 to 48 h after birth (Stott et al 1979 Baintner 2007) Feeding the calf leads to
a faster closure of the gut permeability for great Ig independent from the amount fed
(Stott et al 1979) Small intestinal epithelium includes vacuoles that allow intracellular
digestion at birth but soon after colostrum ingestion vacuoles disappear (Blum 2005)
Therefore colostrum influences the gastrointestinal tract as seen among others in
changes in microbial population epithelial cell proliferation protein synthesis and
digestion (Blum 2006) Furthermore colostrum also exerts long-lasting systemic
effects on metabolism and endocrine traits by effecting systemic growth activity and
behavior (Blum 2006)
Endogenous Ig production and thus active immunity in calves is delayed (Chase 2008)
With passive immunity decreasing and active immunity still being insufficient
susceptibility to diseases is highest in the first wk of life (Figure 15) and notable calf
losses occur with pneumonia and diarrhea being the main reasons for it (USDA 2011)
Pneumonia in pre-weaned calves is a multi-factorial disease caused by a number of
viruses and some calf- and environmental related risk factors (Lorenz et al 2011)
Diarrhea is one of the most serious problems in calf rearing worldwide often leading to
other diseases like pneumonia in enfeebled calves Furthermore those calves show
reduced growth So calves suffering from diseases in newborn age may show long-
lasting impaired performance
133 Oxidative stress and antioxidative capacity in neonatal calves
Oxygen is essential for all aerobic living organisms It is part of several chemical
compounds like hydrogen peroxide hypochlorus acid peroxinitrite singlet oxygen and
ozone Importantly oxygen has the potential to destroy cell integrity when building up
reactive oxygen species (ROS) These ROS can be divided in free radicals and non-
LITERATURE OVERVIEW
27
radicals In general a free radical is an atom or molecule with one or more unpaired
electrons (Halliwell 1991) marked by the radical dot (middot) The most reactive ones are
hydroxyl radical superoxide anion nitric oxide and peroxyl radical All these ROS are
naturally produced in the body during energy production and unspecific immune
defense mainly to neutralize bacteria and viruses and thus protecting the body against
pathogens External influences like ionizing radiation toxins drugs and chemicals or
environmental pollutants can considerably increase the generation of ROS (Sies 1991)
resulting in cell toxic conditions
The organism has a pool of reducing systems to neutralize these free radicals called
antioxidants These are substances that when present at low concentrations compared
with those of an oxidizable substrate significantly delay or prevent oxidation of that
substrate (Halliwell 1991) Antioxidants are divided into enzymatic antioxidants like
superoxide-dismutase catalase or glutathion-peroxidase and non-enzymatic
antioxidants including albumin carotenoids bilirubin uric acid glutathion vitamins
A C and E as well as flavonoids Every aerobe living system is aligned to have a
balance between these oxidants and antioxidants but due to inadequate antioxidant
defense or external influences an imbalance between the generation of prooxidants and
the activity of the antioxidant defenses in favor for the prooxidants can occur and is
called oxidative stress (Sies 1985 1991) Oxidative stress is related to numerous
diseases the so called free radical diseases According to Halliwell (1991) for most
human diseases oxidative stress might be secondary to the primary disease process
Next to maturation of the organism (Robles et al 2001 Saugstad 2005 Mutinati et al
2014) nutrient status and nutrition in general plays a major role in the antioxidant
system (Schwerin et al 2002 Sies et al 2005) However neonates have a greater
susceptibility to oxidative stress than adults or juvenile subjects (Saugstad 2005
Mutinati et al 2014) Main reason therefor is the change from the hypoxic intrauterine
environment to extrauterine conditions after birth and the start of regular breathing
(Robles et al 2001 Albera and Kankofer 2011) Especially premature neonates are
prone to oxidative stress (Robles et al 2001)
There are several approaches to measure antioxidative capacity oxidative stress or free
radicals Alam et al (2013) reviewed 29 different in vivo and in vitro methods for
evaluating antioxidant activity and oxidative stress In general common methods range
from quantification of (free) radicals quantification of markers for oxidative stress like
LITERATURE OVERVIEW
28
DNA damage or lipid peroxidation up to the quantification of markers for the
antioxidant system like enzymes Figure 16 gives an overview of the most common
methods for evaluation of oxidative stress and antioxidant capacity In general the
antioxidative status should not only be evaluated by a single test model since there is no
absolute method (Alam et al 2013)
Figure 16 Simplified classification of methods used for determining oxidative stress and
antioxidant capacity
TBARS = thiobarbituric acid reactive substances F2-Iso = F2-isoprostanes TEAC = trolox equivalent
antioxidative capacity FRAP = ferric reducing ability of plasma
Modified from Kohen and Nyska (2002)
There are plenty of studies describing the antioxidative status or oxidative stress in
calves but only a few studies can be compared directly due to different methods of
analyzing and experimental set-up Main studies in calves deal with selected parameters
of oxidative stress or the antioxidant capacity Stohrer et al (2003) investigated the
antioxidant status of cows and calves via trolox equivalent antioxidative capacity
(TEAC) and found impairment during the first wk of life and thus assumed that
ischemiareperfusion injury during birth may affect antioxidative status of neonatal
calves Alexandrovich and Antonovna (2009) confirmed an elevated level of oxidative
stress during the first d of life up to d 45 of age due to an increased level of
LITERATURE OVERVIEW
29
thiobarbituric acid active products and glutathione when calves were less than 15 d old
and reduced values when calves were 50 to 60 d old The authors assume that the
transition period in feeding of calves was the reason for that Also transportation of
calves leads to an increase of markers for oxidative stress Wernicki et al (2006) found
significantly elevated thiobarbituric acid reactive substances (TBARS) plasma
concentration in calves that were transported for 2 h The season did not significantly
change TBARS levels in calves but glutathione peroxidase and superoxide dismutase
were higher in calves born in summer than in calves born in fall (Chigerwe et al 2013)
However in this study no correlation between TBARS and the age of calves was found
but there was an obvious correlation between increased oxidative stress or a reduced
antioxidative capacity and health status of calves These findings confirmed a study by
Ahmed and Hassan (2007) who investigated several parameters of calves infected with
Eimeria species Malondialdehyde and nitric oxide as markers for oxidative stress were
elevated in infected calves Catalase superoxide-dismutase ascorbic acid glutathione
and the total antioxidant capacity were significantly reduced in infected calves
compared to control calves Bronchopneumonia as a major calf disease similarly
showed elevated markers of oxidative stress in calves (Al-Qudah 2009) Also the way
of delivery seems to influence the antioxidative status since higher malondialdehyde
and glutathione concentrations in blood showed an exposure to higher oxidative stress
in calves delivered by caesarian section (Erisir et al 2013) Retskii et al (2010)
lsquocorrectedrsquo the antioxidant status of newborn calves to form higher colostral immunity
due to treatment with glucose ascorbic acid solution and unithiol and thus reduced the
incidence and severity of neonatal diseases
134 Effects of flavonoid administration on development and health status in
neonatal calves
Countless flavonoid-rich feed additives are marketed claiming improvements in animal
health and productivity in cattle nutrition These additives are used in calvesʼ milk
replacer and in feed for heifers lactating cows and fattening cattle
(httpsanogoldeunews2008flavonoidephp httpwwwpultedeAntioxidantien_
Botanische_Wirkstoffeamplang=en httpwwwschaumanndecpsrdeSID-18 120AAB
B3-717B45schaumann-dehsxsl4736html httpwwwprovimicomgrmediagrape_
pp_concentrate_-_engpdf httpwww gainfeedscomruminant goldgrain-calf-nut)
LITERATURE OVERVIEW
30
In general lots of feed additives are supposed to reduce or replace antibiotics thus
terms like phytobiotics phototherapeutic or nutraceutical are commonly used Since
flavonoids are present in all kinds of higher plants young ruminants may have
evolutionary depended on flavonoids (Yaghoubi et al 2008) However results of
studies on feeding flavonoids to young calves are ambiguous As mentioned the
metabolism of calves mainly is influenced by nutrition hence Yaghoubi et al (2008)
postulated an improved growth of calves by feeding flavonoids extracted from propolis
Enhancing growth in ruminants by flavonoid feeding is discussed due to possible effects
on microbial population in the rumen (Aerts et al 1999 Greathead 2003) and
especially in the developing reticulorumen (Yaghoubi et al 2008 Costa Jr et al
2012) According to Aerts et al (1999) the degradation of dietary protein to ammonia
by microorganisms in the rumen of sheep is slowed down by proanthocyanidins which
are polymere forms of catechins and thus increasing the absorption of amino acids in
the small intestine Durmic and Blache (2012) also reviewed beneficial effects of
secondary plant compounds on rumen fermentation focused on the protection of dietary
proteins combined with a reduced microbial proteolysis and release into the duodenum
However mainly tannins are building complexes with proteins (Aerts et al 1999) In
general secondary plant metabolites may exert prebiotic effects due to stimulation of
certain bacteria in the rumen (Greathead 2003) and affect the immune system as
hypothesized by Yaghoubi et al (2008) though the authors found an ambiguous blood
IgG concentrations after feeding flavonoids to calves Metwally et al (2013) reported a
numeric increase in blood IgM concentrations after feeding propolis extract to buffalo
calves considering a non-specific immunostimulating effect Also Oliveira et al (2010)
postulated an improved immune response of calves when feeding a flavonoid-rich
pomegranate extract due to an enhanced total IgG response after ovalbumin vaccination
and increased synthesis of interferon-γ and interleukin-4 On the other hand neutrophil
phagocytic and killing activities of neutrophils against Escherichia coli did not differ
when feeding pomegranate extract to young calves (Oliveira et al 2010) Besides that
some flavonoids have hormone-like structures and activities and therefore are called
phyto-oestrogens (Greathead 2003) probably exerting anabolic effects in calves Such
effects were seen in other species like mice (Sokolova et al 1978) Furthermore it is
noteworthy that quercetin is a major component of several plants used as antidiarrheal
remedies (Middleton et al 2000) Di Carlo et al (1994) showed quercetin feeding
LITERATURE OVERVIEW
31
ameliorating diarrhea in mice by 92 in a dose-related manner as did Gaacutelvez et al
(1995) in quercitrin (3-rhamnosylquercetin)-treated rats and Nielsen (2008) in piglets
Rao et al (1997) pointed out a possible antidiarrheal effect of the flavonoid ternatin
However propolis or pomegranate extract feeding did not ameliorate diarrhea in calves
(Yaghoubi et al 2008 Oliveira et al 2010) but feeding a GTE decreased frequency
and degree of non-pathogenic diarrhea remarkably (Ishihara et al 2001)
14 Conclusive remarks and need for further research
Green feed additives like flavonoids have a considerably role in human and animal
nutrition Numerous feed supplements containing flavonoids are marketed in the dairy
industry to improve health growth and thus productivity
These antioxidative anti-inflammatory and antimicrobial secondary plant metabolites
may especially be used in the neonatal period when calves are just developing their
immune system However little is known about the systemic BV of flavonoids and their
effects in vivo especially in calves Thus the aim of this study is to investigate the BV
of the most abundant flavonoids quercetin and catechin in newborn calves and to
examine their effects on selected aspects of the antioxidative status and metabolism
Therefore dairy calves were fed quercetin as aglycone its glucorhamnoside rutin and
catechins for the first 3 wk of life Parameters of the antioxidative status oxidative
stress and metabolism were determined and studies on BV of quercetin aglycone and
rutin were performed on d 2 and 29 of life representing a different ontogenetic status in
calves
LITERATURE OVERVIEW
32
References
Ader P A Wessmann and S Wolffram 2000 Bioavailability and metabolism of the
flavonol quercetin in the pig Free Radic Biol Med 281056ndash1067
Aerts R J T N Barry and W C McNabb 1999 Polyphenols and agriculture
Beneficial effects of proanthocyanidins in forages Agric Ecosyst Environ 751ndash
12
Aherne S A and N M OrsquoBrien 2002 Dietary flavonols Chemistry food content
and metabolism Nutrition 1875ndash81
Ahmed W M and S E Hassan 2007 Applied studies on coccidiosis in growing
buffalo-calves with special reference to oxidantantioxidant status World J Zool
240ndash48
Alam M N N J Bristi and M Rafiquzzaman 2013 Review on in vivo and in vitro
methods evaluation of antioxidant activity Saudi Pharm J 21143ndash152
Albera E and M Kankofer 2011 The comparison of antioxidativeoxidative profile in
blood colostrum and milk of early post-partum cows and their newborns Reprod
Domest Anim 46763ndash769
Alexandrovich K N and S E Antonovna 2009 Age-dependent level of antioxidant
defence system and lipid metabolism state in calves Int J Appl Res Vet Med
773ndash75
Al-Qudah K M 2009 Oxidative stress in calves with acute or chronic
bronchopneumonia Rev Med Vet 160231ndash236
Arts I C W A L A Sesink M Faassen-Peters and P C H Hollman 2004 The
type of sugar moiety is a major determinant of the small intestinal uptake and
subsequent biliary excretion of dietary quercetin glycosides Br J Nutr 91841ndash
847
Aviram M and B Fuhrman 2003 Effects of flavonoids on the oxidation of low-
density lipoprotein and atherosclerosis Pages 165ndash203 in Flavonoids in Health
and Disease Second Edition C A Rice-Evans and L Packer eds Marcel
Dekker Inc New York USA
LITERATURE OVERVIEW
33
Azuma K K Ippoushi H Ito H Higashio and J Terao 2002 Combination of lipids
and emulsifiers enhances the absorption of orally administered quercetin in rats J
Agr Food Chem 501706ndash1712
Baintner K 2007 Transmission of antibodies from mother to young Evolutionary
strategies in a proteolytic environment Vet Immunol Immunopathol 117153ndash
161
Berger L M S Wein R Blank C C Metges and S Wolffram 2012 Bioavailability
of the flavonol quercetin in cows after intraruminal application of quercetin
aglycone and rutin J Dairy Sci 955047ndash5055
Besle J M D Viala B Martin P Pradel B Meunier J L Berdagueacute D Fraisse J L
Lamaison and J B Coulon 2010 Ultraviolet-absorbing compounds in milk are
related to forage polyphenols J Dairy Sci 932846ndash2856
Bhagwat S D B Haytowitz J M Holden (Ret) 2013 USDA database for the
flavonoid content of selected foods Release 31 US Department of Agriculture
(USDA) Agricultural Research Service
httpwwwarsusdagovSP2UserFilesPlace12354500DataFlavFlav3-1pdf
(Accessed April 2014)
Birt D F S Hendrich and W Wang 2001 Dietary agents in cancer prevention
Flavonoids and isoflavonoids Pharmacol Ther 90157ndash177
Blum J W 2005 Bovine gut development Pages 31ndash52 in Calf and heifer rearing
P C Garnsworthy ed Nottingham University Press Nottingham UK
Blum J W 2006 Nutritional physiology of neonatal calves J Anim Physiol Anim
Nutr 901ndash11
Blum J W and H Hammon 2000 Colostrum effects on the gastrointestinal tract and
on nutritional endocrine and metabolic parameters in neonatal calves Livest
Prod Sci 66151ndash159
Brand W M E Schutte G Williamson J J van Zanden N H P Cnubben J P
Groten P J van Bladeren and I M C M Rietjens 2006 Flavonoid-mediated
inhibition of intestinal ABC transporters may affect the oral bioavailability of
drugs food-borne toxic compounds and bioactive ingredients Biomed
Pharmacother 60508ndash519
LITERATURE OVERVIEW
34
Bose M J D Lambert J Ju K R Reuhl S A Shapses and C S Yang 2008 The
major green tea polyphenol (ndash)-epigallocatechin-3-gallate inhibits obesity
metabolic syndrome and fatty liver disease in high-fat-fed mice J Nutr
138167ndash1683
Boulton D W U K Walle and T Walle 1998 Extensive binding of the bioflavonoid
quercetin to human plasma proteins J Pharm Pharmacol 50243ndash249
Cermak R S Landgraf and S Wolffram 2003 The bioavailability of quercetin in
pigs depends on the glycoside moiety and on dietary factors J Nutr 1332802ndash
2807
Cermak R and S Wolffram 2006 The potential of flavonoids to influence drug
metabolism and pharmacokinetics by local gastrointestinal mechanisms Curr
Drug Metab 7729ndash744
Chase C C L D J Hurley and A J Reber 2008 Neonatal immune development in
the calf and its impact on vaccine response Vet Clin North Am Food Anim
Pract 2487ndash104
Chen C-H H-J Hsu Y-J Huang and C-J Lin 2007 Interaction of flavonoids and
intestinal facilitated glucose transporters Planta Med 73348ndash354
Chen L M-J Lee and C S Yang 1997 Absorption distribution and elimination of
tea polyohenols in rats Drug Metab Dispos 251045ndash1050
Chigerwe M A D Beck S S Kim and D M Coons 2013 Comparison of plasma
oxidative status biomarkers in neonatal dairy calves during summer and fall
seasons J Veterinar Sci Technolo S111ndash4
Chow H-H S I A Hakim D R Vining J A Crowell J Ranger-Moore W M
Chew C A Celaya S R Rodney Y Hara and D S Alberts 2005 Effects of
dosing condition on the oral bioavailability of green tea catechins after single-
dose administration of Polyphenon E in healthy individuals Clin Cancer Res
114627ndash4633
Chung K T C-I Wei and M G Johnson 1998 Are tannins a double-edged sword in
biology and health Trends Food Sci Technol 9168ndash175
LITERATURE OVERVIEW
35
Cos P L Maes A Vlietinck and L Pieters 2008 Plant-derived leading compounds
for chemotherapy of human immunodeficiency virus (HIV) infection - an update
(1998 - 2007) Planta Med 741323ndash1337
Costa Jr J B G L M Zeoula S L Franco L P P de Moura M V Valero F L
Simiono E M da Paula and R B Samensari 2012 Effect of propolis product
on digestibility and ruminal parameters in buffaloes consuming a forage-based
diet Ital J Anim Sci 11e78
Crespy V C Morand C Besson N Cotelle H Veacutezin C Demigneacute and C Reacutemeacutesy
2003 The splanchnic metabolism of flavonoids highly differed according to the
nature of the compound Am J Physiol Gastrointest Liver Physiol 284G980ndash
G988
Crespy V C Morand C Besson C Manach C Demigne and C Remesy 2002
Quercetin but not its glycosides is absorbed from the rat stomach J Agr Food
Chem 50618ndash621
Crespy V C Morand C Manach C Besson C Demigne and C Remesy 1999 Part
of quercetin absorbed in the small intestine is conjugated and further secreted in
the intestinal lumen Part of quercetin absorbed in the small intestine is conjugated
and further secreted in the intestinal lumen Am J Physiol Gastrointest Liver
Physiol 277G120ndashG126
Crozier A M E J Lean M S McDonald and C Black 1997 Quantitative analysis
of the flavonoid content of commercial tomatoes onions lettuce and celery J
Agr Food Chem 45590ndash595
Dangles O and C Dufour 2006 Flavonoid-Protein Interactions Pages 443ndash469 in
Flavonoids Chemistry Biochemistry and Applications O M Andersen and
K R Markham ed Taylor amp Francis Group Boca Raton USA
Das D K 1994 Naturally occurring flavonoids Structure chemistry and high-
performance liquid chromatography methods for separation and characterization
Methods Enzymol 234410ndash420
LITERATURE OVERVIEW
36
Day A J F J Cantildeada J C Diacuteaz P A Kroon R Mclauchlan C B Faulds G W
Plumb M R Morgan and G Williamson 2000 Dietary flavonoid and
isoflavone glycosides are hydrolysed by the lactase site of lactase phlorizin
hydrolase FEBS Lett 468166ndash170
Day A J M S DuPont S Ridley M Rhodes M J Rhodes M R Morgan and G
Williamson 1998 Deglycosylation of flavonoid and isoflavonoid glycosides by
human small intestine and liver beta-glucosidase activity FEBS Lett 43671ndash75
Denny A and J Buttriss 2005 Synthesis Report No 4 Plant Foods and Health Focus
on Plant Bioactives British Nutrition Foundation Norfolk UK
di Carlo G D N Mascolo A A Izzo and F Capasso 1994 Effects of quercetin on
the gastrointestinal tract in rats and mice Phytother Res 842ndash45
di Pietro A G Conseil J M Peacuterez-Victoria G Dayan H Baubichon-Cortay D
Trompier E Steinfels J-M Jault H de Wet M Maitrejean G Comte A
Boumendjel A-M Mariotte C Dumontet D B McIntosh A Goffeau S
Castanys F Gamarro and D Barron 2002 Modulation by flavonoids of cell
multidrug resistance mediated by P-glycoprotein and related ABC transporters
Cell Mol Life Sci 59307ndash322
Donovan J L J R Bell S Kasim-Karakas J B German R L Walzem R J
Hansen and A L Waterhouse 1999 Catechin is present as metabolites in human
plasma after consumption of red wine J Nutr 1291662ndash1668
Dragoni S J Gee R Bennett M Valoti and G Sgaragli 2006 Red wine alcohol
promotes quercetin absorption and directs its metabolism towards isorhamnetin
and tamarixetin in rat intestine in vitro Br J Pharmacol 147765ndash771
Dufour C and O Dangles 2005 Flavonoid-serum albumin complexation
Determination of binding constants and binding sites by fluorescence
spectroscopy Biochim Biophys Acta 1721164ndash173
Durmic Z and D Blache 2012 Bioactive plants and plant products Effects on animal
function health and welfare Anim Feed Sci Technol 176150ndash162
LITERATURE OVERVIEW
37
Egert S J Tereszczuk S Wein M J Muumlller J Frank G Rimbach and S Wolffram
2013 Simultaneous ingestion of dietary proteins reduces the bioavailability of
galloylated catechins from green tea in humans Eur J Nutr 52281ndash288
Egert S S Wolffram A Bosy-Westphal C Boesch-Saadatmandi A E Wagner J
Frank G Rimbach and M J Mueller 2008 Daily quercetin supplementation
dose-dependently increases plasma quercetin concentrations in healthy humans
J Nutr 1381615ndash1621
Erlund I T Kosonen G Alfthan J Maumlenpaumlauml K Perttunen J Kenraali J
Parantainen and A Aro 2000 Pharmacokinetics of quercetin from quercetin
aglycone and rutin in healthy volunteers Eur J Clin Pharmacol 56545ndash553
Erisir M F M Kandemir and M Yuumlksel 2013 The effects of caesarean section on
lipid peroxidation and some antioxidants in the blood of newborn calves Vet
Archiv 83153ndash159
European Agency for the Evaluation of Medicinal Products 2000 Note for guidance on
the investigation of bioavailability and bioequivalence Committee for proprietary
medicinal products London UK
Frey H-H 2007 Allgemeine Pharmakologie Pages 1ndash32 in Lehrbuch der
Pharmakologie und Toxikologie fuumlr die Veterinaumlrmedizin H-H Frey and W
Loumlscher ed Enke Verlag Stuttgart Germany
Fowden A L J Mapstone and A J Forhead 2001 Regulation of glucogenesis by
thyroid hormones in fetal sheep during late gestation J Endocrinol 170461ndash469
Gaacutelvez J F Saacutenchez de Medina J Jimeacutenez M I Torres M I Fernaacutendez M C
Nuacutentildeez A Riacuteos A Gil and A Zarzuelo 1995 Effect of quercitrin on lactose-
induced chronic diarrhoea in rats Planta Med 61302ndash306
Gasparin F R S C L Salgueiro-Pagadigorria L Bracht E L Ishii-Iwamoto A
Bracht and J Constantin 2003a Action of quercetin on glycogen catabolism in
the rat liver Xenobiotica 33587ndash602
Gasparin F R S F L Spitzner E L Ishii-Iwamoto A Bracht and J Constantin
2003b Actions of quercetin on gluconeogenesis and glycolysis in rat liver
Xenobiotica 33903ndash911
LITERATURE OVERVIEW
38
Gee J M M S DuPont M J C Rhodes and I T Johnson 1998 Quercetin
glucosides interact with the intestinal glucose transport pathway Free Radic Biol
Med 2519ndash25
Girard J P Ferreacute J-P Pegorier and P-H Dueacutee 1992 Adaptations of glucose and
fatty acid metabolism during perinatal period and suckling-weaning transition
Physiol Rev 72507ndash562
Gohlke A C J Ingelmann G Nuumlrnberg A Starke S Wolffram and C C Metges
2013 Bioavailability of quercetin from its aglycone and its glucorhamnoside rutin
in lactating dairy cows after intraduodenal administration J Dairy Sci 962303ndash
2313
Goldberg D M J Yan and G J Soleas 2003 Absorption of three wine-related
polyphenols in three different matrices by healthy subjects Clin Biochem 3679ndash
87
Godden S 2008 Colostrum management for dairy calves Vet Clin Food Anim
2419ndash39
Gould K S and C Lister 2006 Flavonoid Functions in Plants Pages 397ndash441 in
Flavonoids Chemistry Biochemistry and Applications O M Andersen and K
R Markham ed Taylor amp Francis Group Boca Raton USA
Greathead H 2003 Plants and plant extracts for improving animal productivity Proc
Nutr Soc 62279ndash290
Gugler R M Leschik and H J Dengler 1975 Disposition of quercetin in man after
single oral and intravenous doses Eur J Clin Pharmacol 9229ndash234
Hackett A M 1986 The metabolism of flavonoid compounds in mammals Pages
177ndash194 in Plant Flavonoids in Biology and Medicine Biochemical
pharmacological and structure-activity relationship V Cody E J Middleton
and J B Harborne ed Alan R Liss Inc New York USA
Hadorn U H Hammon R M Bruckmaier and J W Blum 1997 Delaying colostrum
intake by one day has important effects on metabolic traits and on gastrointestinal
and metabolic hormones in neonatal calves J Nutr 1272011ndash2023
LITERATURE OVERVIEW
39
Halliwell B 1991 Reactive oxygen species in living systems Source biochemistry
and role in human disease Am J Med 91S14ndashS22
Hammon H M and J W Blum 1998 Metabolic and endocrine traits of neonatal
calves are influenced by feeding colostrum for different durations or only milk
replacer J Nutr 128624ndash632
Hammon H M J Steinhoff-Wagner J Flor U Schoumlnhusen and C C Metges 2013
Lactation Biology Symposium Role of colostrum and colostrum components on
glucose metabolism in neonatal calves J Anim Sci 91685ndash695
Hammon H M J Steinhoff-Wagner U Schoumlnhusen C C Metges and J W Blum
2012 Energy metabolism in the newborn farm animal with emphasis on the calf
Endocrine changes and responses to milk-born and systemic hormones Domest
Anim Endocrinol 43171ndash185
Hanhineva K R Toumlrroumlnen I Bondia-Pons J Pekkinen M Kolehmainen H
Mykkaumlnen and K Poutanen 2010 Impact of dietary polyphenols on
carbohydrate metabolism Int J Mol Sci 111365ndash1402
Harborne J B and C A Williams 2000 Advances in flavonoid research since 1992
Phytochemistry 55481ndash504
Heaney R P 2001 Factors influencing the measurement of bioavalability taking
calcium as a model J Nutr 1311344Sndash1348S
Heim K E A R Tagliaferro and D J Bobilya 2002 Flavonoid antioxidants
Chemistry metabolism and structure-activity relationships J Nutr Biochem
13572ndash584
Hertog M G L E J M Feskens P C H Hollman M B Katan and D Kromhout
1993 Dietary antioxidant flavonoids and risk of coronary heart disease The
Zutphen Elderly Study Lancet 3421007ndash1011
Hertog M G L P C H Hollman and M B Katan 1992 Content of potentially
anticarcinogenic flavonoids of 28 vegetables and 9 fruits commonly consumed in
the Netherlands Proc Nutr Soc 402379ndash2383
LITERATURE OVERVIEW
40
Hollman P C H 2001 Determination of flavonols in body fluids Pages 97ndash102 in
Flavonoids and other Polyphenols Methods in Enzymology L Packer ed
Academic Press San Diego USA
Hollman P C H and I C W Arts 2000 Flavonols flavones and flavanols ndash nature
occurrence and dietary burden J Sci Food Agric 801081ndash1093
Hollman P C H M N C P Bijsman Y van Gameren E P J Cnossen J H M de
Vries and M B Katan 1999 The sugar moiety is a major determinant of the
absorption of dietary flavonoid glycosides in man Free Radic Res 31569ndash573
Hollman P C H J H M de Vries S D van Leeuwen M J Mengelers and M B
Katan 1995 Absorption of dietary quercetin glycosides and quercetin in healthy
ileostomy volunteers Am J Clin Nutr 621276ndash1282
Hollman P C H and M B Katan 1997 Absorption metabolism and health effects of
dietary flavonoids in man Biomed Pharmacother 51305ndash310
Hollman P C H L B M Tijburg and C S Yang 1997a Bioavailability of
flavonoids from tea Crit Rev Food Sci Nutr 37719ndash738
Hollman P C H K H van het Hof L B Tijburg and M B Katan 2001 Addition of
milk does not affect the absorption of flavonols from tea in man Free Radic Res
34297ndash300
Hollman P C H J M P van Trijp M N C P Buysman M S vd Gaag M J B
Mengelers J H M de Vries and M B Katan 1997b Relative bioavailability of
the antioxidant flavonoid quercetin from various foods in man FEBS Lett
418152ndash156
Hirvonen T P Pietinen M Virtanen M L Ovaskainen S Haumlkkinen D Albanes
and J Virtamo 2001 Intake of flavonols and flavones and risk of coronary heart
disease in male smokers Epidemiology 1262ndash67
Ishihara N D-C Chu S Akachi and L R Juneja 2001 Improvement of intestinal
microflora balance and prevention of digestive and respiratory organ diseases in
calves by green tea extracts Livest Prod Sci 68217ndash229
LITERATURE OVERVIEW
41
Janisch K M G Williamson P Needs and G W Plumb 2004 Properties of
quercetin conjugates Modulation of LDL oxidation and binding to human serum
albumin Free Radic Res 38877ndash884
Johnston K P Sharp M Clifford and L Morgan 2005 Dietary polyphenols decrease
glucose uptake by human intestinal Caco-2 cells FEBS Lett 5791653ndash1657
Kahle K M Kempf P Schreier W Scheppach D Schrenk T Kautenburger D
Hecker W Huemmer M Ackermann and E Richling 2011 Intestinal transit
and systemic metabolism of apple polyphenols Eur J Nutr 50507ndash22
Kim E-K K-B Kwon M-Y Song M-J Han J-H Lee Y-R Lee D-G Ryu B-
H Park J-W Park 2007 Flavonoids protect against cytokine-induced pancreatic
β-cell damage through suppression of nuclear factor κβ activation Pancreas
35e1ndash9
Knekt P R Jaumlrvinen A Reunanen and J Maatela 1996 Flavonoid intake and
coronary mortality in Finland A cohort study Br Med J 312478ndash482
Knekt P R Jaumlrvinen R Seppaumlnen M Helioumlvaara L Teppo E Pukkala and A
Aromaa 1997 Dietary flavonoids and the risk of lung cancer and other malignant
neoplasms Am J Epidemiol 146223ndash230
Kobayashi Y M Miyazawa A Kamei K Abe and T Kojima 2010 Ameliorative
effects of mulberry (Morus alba L) leaves on hyperlipidemia in rats fed a high-fat
diet Induction of fatty acid oxidation inhibition of lipogenesis and suppression
of oxidative stress Biosci Biotechnol Biochem 742385ndash2395
Kobayashi Y M Suzuki H Satsu S Arai Y Hara K Suzuki Y Miyamoto and M
Shimizu 2000 Green tea polyphenols inhibit the sodium-dependent glucose
transporter of intestinal epithelial cells by a competitive mechanism J Agr Food
Chem 485618ndash5623
Kohen R and A Nyska 2002 Oxidation of biological systems Oxidative stress
phenomena antioxidants redox reactions and methods for their quantification
Toxicol Pathol 30620ndash650
Kootstra A 1994 Protection from UV-B-induced DNA damage by flavonoids Plant
Mol Biol 26771ndash774
LITERATURE OVERVIEW
42
Koster H I Halsema E Scholtens M Knippers and G J Mulder 1981 Dose-
dependent shifts in the sulfation and glucuronidation of phenolic compounds in
the rat in vivo and in isolated hepatocytes Biochem Pharmacol 302569ndash2575
Lamartiniere C A J Moore M Holland and S Barnes 1995 Neonatal genistein
chemoprevents mammary cancer Proc Soc Exp Biol Med 208120ndash123
Lee M-L P Maliakal L Chen X Meng F Y Bondoc S Prabhu G Lambert S
Mohr and C S Yang 2002 Pharmacokinetics of tea catechins after ingestion of
green tea and (ndash)-epigallocatechin-3-gallate by humans Formation of different
metabolites and individual variability Cancer Epidemiol Biomarkers Prev
111025ndash1032
Lesser S R Cermak and S Wolffram 2004 Bioavailability of quercetin in pigs is
influenced by the dietary fat content J Nutr 1431508ndash1511
Liggins G C 1994 The role of cortisol in preparing the fetus for birth Reprod Fertil
Dev 6141ndash50
Loke W M J M Hodgson and K D Croft 2010 The biochemistry behind the
potential cardiovascular protection by dietary flavonoids Pages 91ndash106 in Plant
Phenolics and Human Health Biochemistry Nutrition and Pharmacology C G
Fraga ed J Wiley amp Sons Inc Hoboken USA
Lorenz I B Earley J Gilmore I Hogan E Kennedy and S J More 2011 Calf
health from birth to weaning III Housing and management of calf pneumonia Ir
Vet J 641ndash14
Manach C C Morand C Demigneacute O Texier F Reacutegeacuterat and C Reacutemeacutesy 1997
Bioavailability of rutin and quercetin in rats FEBS Lett 40912ndash16
Manach C C Morand A Gil-Izquierdo C Bouteloup-Demange and C Reacutemeacutesy
2003 Bioavailability in humans of the flavanones hesperidin and narirutin after
the ingestion of two doses of orange juice Eur J Clin Nutr 57235ndash42
Manach C A Scalbert C Morand C Reacutemeacutesy and L Jimeacutenez 2004 Polyphenols
Food sources and bioavailability Am J Clin Nutr 79727ndash747
LITERATURE OVERVIEW
43
Manach C O Texier C Morand V Crespy F Reacutegeacuterat C Demigneacute and C Reacutemeacutesy
1999 Comparison of the bioavailability of quercetin and catechin in rats Free
Radic Biol Med 271259ndash1266
Manach C G Williamson C Morand A Scalbert and C Reacutemeacutesy 2005
Bioavailability and bioefficacy of polyphenols in humans I Review of 97
bioavailability studies Am J Clin Nutr 81230Sndash242S
McMahon L G 1997 Cytosolic pyridoxine-β-D-glucoside hydrolase from porcine
jejunal mucosa Purification properties and comparison with broad specifity β-
glucosidase J Biol Chem 27232025ndash32033
Mennen L I D Sapinho A De Bree N Arnault S Bertrais P Galan and S
Hercberg 2004 Consumption of foods rich in flavonoids is related to a decreased
cardiovascular risk in apparently healthy french women J Nutr 134923ndash926
Metwally M T A A R Khafagy H I Eid and A M Algammal 2013 Studies on
the immunostimulatory effect of propolis in diarrheic buffalo calves J Adv Vet
Res 3114ndash117
Middleton E C Kandaswami and T C Theoharides 2000 The effects of plant
flavonoids on mammalian cells Implications for inflammation heart disease and
cancer Pharmacol Rev 52673ndash751
Miller R L M James-Kracke G Y Sun and A Y Sun 2009 Oxidative and
inflammatory pathways in Parkinsonrsquos disease Neurochem Res 3455ndash65
Morris M E and S Zhang 2006 Flavonoid-drug interactions Effects of flavonoids
on ABC transporters Live Sci 782116ndash2130
Murota K and J Terao 2003 Antioxidative flavonoid quercetin Implication of its
intestinal absorption and metabolism Arch Biochem Biophys 41712ndash17
Mutinati M M Pantaleo M Roncetti M Piccinno A Rizzo and R L Sciorsci
2014 Oxidative stress in neonatology A review Reprod Domest Anim 497ndash
16
LITERATURE OVERVIEW
44
Neacutemeth K G W Plumb J-G Berrin N Juge R Jacob H Y Naim G Williamson
D M Swallow and P A Kroon 2003 Deglycosylation by small intestinal
epithelial cell beta-glucosidases is a critical step in the absorption and metabolism
of dietary flavonoid glycosides in humans Eur J Nutr 4229ndash42
Nielsen B K 2008 Botanicals as feed additives to improve health and production in
pig breeding Res Pig Breed 212ndash18
Nijveldt R J E van Nood D E C van Hoorn P G Boelens K van Norren and P
A M van Leeuwen 2001 Flavonoids A review of probable mechanisms of
action and potential applications Am J Clin Nutr 74418ndash425
Nussbaum A G Schiessler H M Hammon and J W Blum 2002 Growth
performance and metabolic and endocrine traits in calves pair-fed by bucket or by
automate starting in the neonatal period J Anim Sci 801545ndash1555
OrsquoConnell J E and P F Fox 2001 Significance and applications of phenolic
compounds in the production and quality of milk and dairy products A review
Int Dairy J 11103ndash120
Ofer M S Wolffram A Koggel H Spahn-Langguth and P Langguth 2005
Modulation of drug transport by selected flavonoids Involvement of P-gp and
OCT Eur J Pharm Sci 25263ndash271
Oliveira R A C D Narciso R S Bisinotto M C Perdomo M A Ballou M Dreher
and J E P Santos 2010 Effects of feeding polyphenols from pomegranate
extract on health growth nutrient digestion and immunocompetence of calves J
Dairy Sci 934280ndash4291
Olthof M R P C H Hollman T B Vree and M B Katan 2000 Bioavailabilities of
quercetin-3-glucoside and quercetin-4`-glucoside do not differ in humans J Nutr
21200ndash1203
Otake Y F Hsieh and T Walle 2002 Glucuronidation versus oxidation of the
flavonoid galangin by human liver microsomes and hepatocytes Drug Metab
Dispos 30576ndash581
LITERATURE OVERVIEW
45
Passamonti S M Terdoslavich R Franca A Vanzo F Tramer E Braidot E
Petrussa and A Vianello 2009 Bioavailability of flavonoids A review of their
membrane transport and the function of bilitranslocase in animal and plant
organisms Curr Drug Metab 10369ndash394
Petri N C Tannergren B Holst F A Mellon Y Bao G W Plumb J I M Bacon
K A O Leary P A Kroon L Knutson P Forsell T Eriksson H Lennernas
and G Williamson 2003 Absorptionmetabolism of sulforaphane and quercetin
and regulation of phase II enzymes in human jejenum in vivo Drug Metab
Dispos 31805ndash813
Pfeiffer S P Pflegel and H-H Borchert 1995 Grundlagen der Biopharmazie
Pharmakokinetik Bioverfuumlgbarkeit Biotransformation VEB Verlag Volk und
Gesundheit Berlin Germany
Piskula M K 2000 Soy isoflavone conjugation differs in fed and food-deprived rats J
Nutr 1301766ndash1771
Piskula M K and J Terao 1998 Accumulation of (ndash)-epicatechin metabolites in rat
plasma after oral administration and distribution of conjugation enzymes in rat
tissues J Nutr 1281172ndash1178
Piskula M K J Yamakoshi and Y Iwai 1999 Daidzein and genistein but not their
glucosides are absorbed from the rat stomach FEBS Lett 447287ndash291
Rauprich A B E H M Hammon and J W Blum 2000 Effects of feeding colostrum
and a formula with nutrient contents as colostrum on metabolic and endocrine
traits in neonatal calves Biol Neonate 7853ndash64
Rao V S F A Santos T T Sobreira M F Souza C L Melo and E R Silveira
1997 Investigations on the gastroprotective and antidiarrhoeal properties of
ternatin a tetramethoxyflavone from Egletes viscosa Planta Med 63146ndash149
Reddy V C G V Vidya Sagar D Sreeramulu L Venu and M Raghunath 2005
Addition of milk does not alter the antioxidant activity of black tea Ann Nutr
Metab 49189ndash195
LITERATURE OVERVIEW
46
Reinboth M S Wolffram G Abraham F R Ungemach and R Cermak 2010 Oral
bioavailability of quercetin from different quercetin glycosides in dogs Br J
Nutr 104198ndash203
Retskii M I A G Shakhov D V Chusov A I Zolotarev M I Lebedev T G
Ermolova and G N Bliznetsova 2010 Correcting the antioxidant status of
newborn calves for forming higher colostral immunity Russ Agric Sci 36127ndash
Rimm E B M B Katan A Ascherio M J Stampfer and W C Willett 1996
Relation between intake of flavonoids and risk for coronary heart disease in male
health professionals Ann Intern Med 125384ndash389
Robles R N Palomino and A Robles 2001 Oxidative stress in the neonate Early
Hum Dev 65S75ndashS81
Roghani M and T Baluchnejadmojarad 2010 Hypoglycemic and hypolipidemic
effect and antioxidant activity of chronic epigallocatechin-gallate in
streptozotocin-diabetic rats Pathophysiology 1755ndash59
Saugstad O D 2005 Oxidative stress in the newborn A 30-year perspective Biol
Neonate 88228ndash236
Scalbert A and G Williamson 2000 Dietary intake and bioavailability of
polyphenols J Nutr 1302073ndash2085
Schiessler G A Nussbaum H M Hammon and J W Blum 2002 Calves sucking
colostrum and milk from their dams or from an automatic feeding station starting
in the neonatal period metabolic and endocrine traits and growth performance
Anim Sci 74431ndash444
Scholz S and G Williamson 2007 Interactions affecting the bioavailability of dietary
polyphenols in vivo Int J Vitam Nutr Res 77224ndash235
Schwerin M U Dorroch M Beyer H Swalve C C Metges and P Junghans 2002
Dietary protein modifies hepatic gene expression associated with oxidative stress
responsiveness in growing pigs FASEB J 161322ndash1324
LITERATURE OVERVIEW
47
Schroeter H and J P E Spencer 2003 Flavonoids Neurodegenerative agents
Modulation of oxidative stress-induced map kinase signal transduction Pages
233ndash272 in Flavonoids in Health and Disease C A Rice-Evans and L Packer
ed Marcel Dekker Inc New York USA
Seiva F R F L G A Chuffa C P Braga J P A Amorim and A A H Fernandes
2012 Quercetin ameliorates glucose and lipid metabolism and improves
antioxidant status in postnatally monosodium glutamate-induced metabolic
alterations Food Chem Toxicol 503556ndash3561
Serafini M R Bugianesi G Maiani S Valtuena S De Santis and A Crozier 2003
Plasma antioxidants from chocolate Nature 4241013
Sesink A L A I C W Arts V C J de Boer P Breedveld J H M Schellens P C
H Hollman and F G M Russel 2005 Breast cancer resistance protein
(Bcrp1Abcg2) limits net intestinal uptake of quercetin in rats by facilitating
apical efflux of glucuronides Mol Pharmacol 671999ndash2006
Sesink A L A I C W Arts M Faassen-Peters and P C H Hollman 2002
Intestinal uptake of quercetin-3-glucoside in rats involves hydrolysis by lactase
phlorizin hydrolase J Nutr 133773ndash776
Setchell K D R N M Brown P Desai L Zimmer-Nechemias B E Wolfe W T
Brashear A S Kirschner A Cassidy and J E Heubi 2001 Bioavailability of
pure isoflavones in healthy humans and analysis of commercial soy isoflavone
supplements J Nutr 1311362Sndash1375
Shimoi K H Okada M Furugori T Goda S Takase M Suzuki Y Hara H
Yamamoto and N Kinae 1998 Intestinal absorption of luteolin and luteolin 7-O-
β-glucoside in rats and humans FEBS Lett 438220ndash224
Sies H 1985 Oxidative Stress Introductory Remarks Pages 1ndash8 in Oxidative Stress
H Sies ed Academic Press Inc London UK
Sies H 1991 Role of reactive oxygen species in biological processes Klin
Wochenschr 69965ndash968
Sies H W Stahl and A Sevanian 2005 Nutritional dietary and postprandial
oxidative stress J Nutr 135969ndash972
LITERATURE OVERVIEW
48
Sokolova V E E A Vasilrsquochenko and I K Izmaĭlova 1978 Anabolic action of
flavonoids Famakol Toksikol 41323ndash327
Spencer J P G Chowrimootoo R Choudhury E S Debnam S K Srai and C Rice-
Evans 1999 The small intestine can both absorb and glucuronidate luminal
flavonoids FEBS Lett 458224ndash230
Steinhoff-Wagner J S Goumlrs P Junghans R M Bruckmaier E Kanitz C C Metges
and H M Hammon 2011 Maturation of endogenous glucose production in
preterm and term calves J Dairy Sci 945111ndash5123
Steinshamn H S Purup E Thuen and J Hansen-Moslashller 2008 Effects of clover-
grass silages and concentrate supplementation on the content of phytoestrogens in
dairy cow milk J Dairy Sci 912715ndash2725
Stohrer M S Lutz and M Stangassinger 2003 Antioxidant status of calves and foals
declines after birth Acta Vet Scand Suppl 44P38
Stott G H D B Marx B E Menefee and G T Nightengale 1979 Colostral
immunoglobulin transfer in calves I Period of absorption J Dairy Sci 621632ndash
1638
Swezey R R D E Aldridge S E Le Valley J A Crowell Y Hara and C E Green
2003 Absorption tissue distribution and elimination of 4-[3H]-epigallocatechin
gallate in beagle dogs Int J Toxicol 22187ndash193
Tadera K Y Minami K Takamatsu and T Matsuoka 2006 Inhibition of α-
glucosidase and α-amylase by flavonoids J Nutr Sci Vitaminol 52149ndash153
USDA (United States Department of Agriculture) Animal and Plant Health Inspection
Service 2011 Cattle and calves nonpredator death loss in the United States 2010
httpwwwaphisusdagovanimal_healthnahmsgeneraldownloadscattle_calves
_nonpred_2010pdf (Accessed May 2013)
van Het Hof K H G A A Kivits J A Weststrate and L B M Tijburg 1998
Bioavailability of catechins from tea The effect of milk Eur J Clin Nutr
52356ndash359
LITERATURE OVERVIEW
49
Varadarajan S J Kanski M Aksenova C Lauderback and D A Butterfield 2001
Different mechanisms of oxidative stress and neurotoxicity for Alzheimerlsquos
Aβ(1minus42) and Aβ(25minus35) J Am Chem Soc 1235625ndash5631
Walgren R A J Lin R K Kinne and T Walle 2000a Cellular Uptake of dietary
flavonoid quercetin 4`-szlig-glucoside by sodium-dependent glucose transporter
SGLT1 J Pharmacol Exp Ther 294837ndash843
Walgren R A G E Lindenmayer and T Walle 2000b Efflux of dietary flavonoid
quercetin 4`beta-glucoside across human intestinal Caco-2 cell monolayers by
apical multidrug resistance-associated protein-2 J Pharmacol Exp Ther
294830ndash836
Walle T A M Browning L L Steed S G Reed and U K Walle 2005 Human
nutrition and metabolism flavonoid glucosides are hydrolyzed and thus activated
in the oral cavity J Nutr 13548ndash52
Walle U K A Galijatovic and T Walle 1999 Transport of the flavonoid chrysin and
its conjugated metabolites by the human intestinal cell line caco-2 Biochem
Pharmacol 58431ndash438
Wein S and S Wolffram 2013 Oral bioavailability of quercetin in horses J Equine
Vet Sci 33441ndash445
Wernicki A M Kankofer P Mikucki and A Puchalski 2006 Evaluation of plasma
cortisol and TBARS levels in calves after short-term transportation Rev Med
Vet 15730ndash34
Williams C A and J B Harborne 1994 Flavone and flavonol glycosides Pages 337ndash
385 in The Flavonoids Advances in research since 1986 JB Harborne ed
Chapman and Hall London UK
Winkel-Shirley B 2002 Biosynthesis of flavonoids and effects of stress Curr Opin
Plant Biol 5218ndash223
LITERATURE OVERVIEW
50
Wolffram S 2010 Wie viel kommt an Die Bioverfuumlgbarkeit sekundaumlrer
Pflanzenstoffe am Beispiel des Quercetins Pages 10ndash14 in Aktuelle
Ernaumlhrungsmedizin Georg Thieme Verlag KG Stuttgart Germany - New York
USA httpwwwinstitut-danonedeernaehrungsaufklaerungunsere-materialien
(Accessed April 2013)
Wolffram S M Bloeck and P Ader 2002 Quercetin-3-glucoside is transported by
the glucose carrier SGLT1 across the brush border membrane of rat small
intestine J Nutr 132630ndash635
Wolfram S D Raederstorff M Preller Y Wang S R Teixeira C Riegger and P
Weber 2006 Epigallocatechin gallate supplementation alleviates diabetes in
rodents J Nutr 1362512ndash2518
Yaghoubi S M J G R Ghorbani H R Rahmani and A Nikkhah 2008 Growth
weaning performance and blood indicators of humoral immunity in Holstein
calves fed supplemental flavonoids Anim Physiol Anim Nutr 92456ndash462
Yochum L L H Kushi K Meyer and A R Folsom 1999 Dietary flavonoid intake
and risk of cardiovascular disease in postmenopausal women Am J Epidemiol
149943ndash949
Youdim K A and J A Joseph 2003 Phytochemicals and brain aging A multiplicity
of effects Pages 205ndash347 in Flavonoids in Health and Disease C A Rice-Evans
and L Packer ed Marcel Dekker Inc New York USA
Zhu M Y Chen and R C Li 2000 Oral absorption and bioavailability of tea
catechins Planta Med 66444ndash447
Zung A R Reifen Z Keem and Z Zadik 2001 Phytoestrogens The pediatric
perspective J Pediatr Gastroenterol Nutr 33112ndash118
51
Chapter 2
Bioavailability of the flavonol quercetin in neonatal calves
after oral administration of quercetin aglycone or rutin
J Maciej C T Schaumlff E Kanitzdagger A TuchschererDagger R M Bruckmaiersect
S Wolffram and H M Hammon1
Institute of Nutritional Physiology ldquoOskar Kellnerrdquo
daggerInstitute of Behavioural Physiology and
DaggerInstitute of Genetics and Biometry Leibniz Institute for Farm Animal Biology (FBN)
Wilhelm-Stahl-Allee 2 18196 Dummerstorf Germany
sectVeterinary Physiology Vetsuisse Faculty University of Bern 3001 Bern Switzerland
Institute of Animal Nutrition and Physiology Christian Albrechts University Kiel
24118 Kiel Germany
Received January 20 2015
Accepted February 6 2015
1Corresponding author hammonfbn-dummerstorfde
Used by permission of the Journal of Dairy Science
Published in Journal of Dairy Science 2015 983906ndash3917
httpdxdoiorg103168jds2015-9361
CHAPTER 2
52
2 Bioavailability of the flavonol quercetin in neonatal calves
after oral administration of quercetin aglycone or rutin
Abstract
Polyphenols such as flavonoids are secondary plant metabolites with potentially
health-promoting properties In newborn calves flavonoids may improve health status
but little is known about the systemically availability of flavonoids in calves to exert
biological effects The aim of this study was to investigate the oral bioavailability of the
flavonol quercetin applied either as quercetin aglycone (QA) or as its glucorhamnoside
rutin (RU) in newborn dairy calves Twenty-one male newborn German Holstein calves
were fed equal amounts of colostrum and milk replacer according to body weight On d
2 and 29 of life 9 mg of quercetin equivalentskg of body weight either fed as QA or as
RU or no quercetin (control group) were fed together with the morning meal Blood
samples were taken before and 05 1 15 2 25 3 4 5 6 12 24 and 48 h after feed
intake Quercetin and quercetin metabolites with an intact flavonol structure
(isorhamnetin tamarixetin and kaempferol) were analyzed in blood plasma after
treatment with glucuronidasesulfatase by HPLC with fluorescence detection Maximum
individual plasma concentration was depicted from the concentration-time-curve on d 2
and 29 respectively Additional blood samples were taken to measure basal plasma
concentrations of total protein albumin urea and lactate as well as pre- and
postprandial plasma concentrations of glucose non-esterified fatty acids insulin and
cortisol Plasma concentrations of quercetin and its metabolites were significantly
higher on d 2 than on d 29 of life and administration of QA resulted in higher plasma
concentrations of quercetin and its metabolites than RU The relative bioavailability of
total flavonols (sum of quercetin and its metabolites isorhamnetin tamarixetin and
kaempferol) from RU was 725 on d 2 and 496 on d 29 when compared with QA
(100 ) Calves fed QA reached maximum plasma concentrations of total flavonols
much earlier than did RU-fed calves Plasma metabolites and hormones were barely
affected by QA and RU feeding in this experiment Taken together orally administrated
QA resulted in a greater bioavailability of quercetin than RU on d 2 and 29
respectively and differed markedly between calves aged 2 and 29 d
Key Words bioavailability calf flavonoid quercetin rutin
CHAPTER 2
53
21 Introduction
Flavonoids are secondary plant metabolites occurring ubiquitously in all higher plants
(Manach et al 2004 Besle et al 2010) They are known for their health-promoting
properties (eg antioxidative and anti-inflammatory Middleton et al 2000 Nijveldt et
al 2001 Williams et al 2004) Quercetin is one of the most abundant flavonoids and
is present in high concentrations in onions apples and kale (Hertog et al 1992
Nijveldt et al 2001) and in low concentrations also in milk (Besle et al 2010
Bhagwat et al 2013) In addition to their health-promoting properties quercetin and its
metabolites modulate the expression and activity of several metabolic key enzymes and
therefore might be involved in regulation of lipid and carbohydrate metabolism
(Middleton et al 2000 Gasparin et al 2003 Kobayashi et al 2010)
Newborn calves undergo tremendous immunological and metabolic changes after birth
to adapt for extra-uterine life (Blum 2006 Chase et al 2008 Hammon et al 2012)
and colostrum management is one of the most important factors to support neonatal
health and development (Godden 2008 Hammon et al 2012) Nevertheless morbidity
and mortality rates are still high during first weeks of life and calves often suffer from
diarrhea and respiratory disease (McGuirk 2008 Mee 2008 Uetake 2013) as well as
from high levels of oxidative stress (Inanami et al 1999 Gaaacutel et al 2006) Frequent
problems on farms are the lack of high-quality colostrum availability and the
insufficient colostrum supply (Quickley and Drewry 1998 Godden 2008) Colostrum
and mature milk contain antioxidant agents to protect neonatal calves from oxidative
stress (Lindmark-Maringnsson and Aringkesson 2000 Besle et al 2010) Poor quality of
colostrum is reflected by low concentrations of antioxidative substances Thus
supplementing colostrum and milk at beginning of lactation with the natural antioxidant
agent quercetin may improve neonatal oxidative status However there is no
information about the bioavailability (BV) of orally applied quercetin with colostrum
and milk in newborn calves although feeding industry already offers flavonoid-
supplemented feed for dairy calves
Studies on BV of quercetin from quercetin aglycone (QA) or its glucorhamnoside rutin
(RU) in different monogastric species such as rats (Manach et al 1997) pigs (Ader et
al 2000 Cermak et al 2003 Lesser et al 2004) dogs (Reinboth et al 2010) and
humans (Erlund et al 2000 Egert et al 2008) showed marked differences to ruminant
CHAPTER 2
54
species (eg cows with intraruminal QA and RU application Berger et al 2012) These
differences may be due to differnces in gastrointestinal anatomy and physiology (Arts et
al 2004 Berger et al 2012 Gohlke et al 2013) Conversely in newborn calves the
forestomach system is just developing thus newborn calves are functionally
monogastrics (Drackley et al 2008) The aim of the present study was to investigate the
relative BV of quercetin after oral administration of QA or RU in calves during first
month of life We hypothesized that BV in calves depends on the form of application
(QA and RU) and changes with age due to ontogenetic development and maturation of
the gastrointestinal tract during first month of life We further tested the hypothesis that
quercetin application might affect metabolic and endocrine traits especially concerning
glucose metabolism in neonatal calves because findings in literature pointed to impair
carbohydrate digestion and glucose absorption after flavonoid intake (Cermak et al
2004 Tadera et al 2006)
22 Materials and Methods
221 Animals and feeding
The experimental procedures were carried out according to the animal care guidelines
and were approved by the relevant authorities of the State Mecklenburg-West
Pomerania Germany (LVL M-VTSD72213-21-01910) Twenty-one male German
Holstein calves were examined on d 2 and 29 of life All calves were spontaneously
born from multiparous cows on neighboring farms and transported directly after birth to
the experimental barn Calves were kept in single boxes with straw bedding and had
free access to water Calves were fed twice daily (0700 and 1500 h) with a nipple bottle
or nipple bucket On the first 3 d of life calves received pooled colostrum obtained from
milkings 1 3 and 5 (d 1 2 and 3 after parturition respectively Table 21) at amounts
of 8 of BW on d 1 and 10 of BW on d 2 and 3 (Steinhoff-Wagner et al 2011)
From d 4 until d 29 calves received milk replacer (150 gL SalvaLac MiraPro 45
Salvana Tiernahrung GmbH Klein-Offenseth Sparrieshoop Germany) at 12 of
BWd (Table 21) To ensure uptake of equal amounts of feed refused amounts of
colostrum or milk were tube-fed to calves Milk intake was adapted to BW data once a
week
CHAPTER 2
55
Colostrum or milk replacer was supplemented with chicken egg-derived
immunoglobulins (Globigen Life Start 25 EW Nutrition GmbH Visbek Germany)
composed of 75 dextrose and 25 whole egg powder (1075 CP 1050 crude
fat 010 crude fiber and 250 ash) with high antibody titer against Eschericha coli
type K 99 Salmonella Tymphimurium and Salmonella Dublin bovine rotavirus type
G6 and G10 bovine coronavirus Cryptosporidium parvum and Clostridium
perfringens serotype C Immunoglobulins were added from d 2 till d 6 Respective
amounts of immunoglobulins fed twice daily were 40 32 24 16 and 8 gd
From d 4 on calves had free access to pelleted concentrate (Kaumllber Start 183 pell
Vollkraft Mischfutterwerke GmbH Karstaumldt Germany Table 21) and hay
Concentrate intake was measured daily after morning milk feeding To avoid iron
deficiency calves received 600 mg iron dextran subcutaneously (Ursoferran
Serumwerk Bernburg Germany) on their first day of life Navel disinfection was
performed with 10 iodine solution (vet sept Loumlsung Albrecht GmbH Aulendorf
Germany) immediately after birth Health status of calves was determined daily by
measuring rectal temperature heart rate and respiratory rate by evaluation of
behavioral abnormalities nasal discharge respiratory sounds fecal consistence and by
navel inspection
222 Treatment and blood sampling
Calves were randomly assigned to 1 of 3 feeding groups (n = 7 per group) receiving
either no flavonoids (control group CTRL) 9 mg of QAkg of BW (quercetin aglycone
dihydrate Carl Roth GmbH Karlsruhe Germany) or 18 mg of RUkg of BW (rutin
trihydrate Carl Roth GmbH) each resulting in a dose of 9 mg of quercetin equivalents
(QE)kg of BW on d 2 and d 29 of life Calves received the whole dose of QA or RU
during morning feeding applying the QE suspension with a 10-ml syringe directly into
the mouth
CHAPTER 2
56
Ta
ble
21
C
om
po
siti
on
an
d a
mo
un
ts o
f co
lost
rum
m
ilk
rep
lace
r a
nd
co
nce
ntr
ate
fed
to
ca
lves
d
1
d 2
d
3
d 4
to
30
2
Item
co
lost
rum
1
mil
kin
g 1
colo
stru
m1
mil
kin
g 3
colo
stru
m1
mil
kin
g 5
M
ilk
rep
lace
r3
Co
nce
ntr
ate
4
DM
gk
g
20
69
1
54
7
13
93
1
10
0
88
00
CP
gk
g D
M
59
74
3
90
4
33
31
2
01
8
18
00
Cru
de
fat
gk
g D
M
16
92
2
40
5
27
49
1
90
9
43
0
Ash
gk
g D
M
48
3
55
6
56
0
73
6
74
0
Lac
tose
g
kg D
M
13
63
2
60
5
30
87
5
14
6
-
1C
olo
stru
m w
as d
eriv
ed f
rom
mu
ltip
aro
us
cow
s and
sep
arat
ely p
oo
led
fro
m m
ilkin
gs
1
3
and
5 a
fter
par
turi
tio
n
resp
ecti
vel
y
2H
ay w
as o
ffer
ed a
d l
ibit
um
exce
pt
for
days
of
bio
avai
lab
ilit
y s
tud
ies
3M
ilk
rep
lace
r (S
alvaL
ac M
iraP
ro 4
5
Sal
vana
Tie
rnah
run
g G
mb
H
Kle
in-O
ffense
th S
parr
iesh
oo
p
Ger
man
y)
was
com
po
sed
of
45
s
pra
y s
kim
med
mil
k
po
wd
er
35
s
wee
t w
hey p
ow
der
1
8
pla
nt
oil
(p
alm
co
conut
and
so
y o
il)
17
L
ys
08
C
a 0
75
P
an
d a
dd
ed w
ith 5
00
00
IU
of
vit
am
in A
4
000
IU o
f vit
am
in D
3
20
0 m
g o
f vit
am
in E
(α
-to
cop
her
ol
acet
ate)
9
mg C
u (
gly
ceri
ne-
cop
per
chel
ate)
ci
tric
aci
d
sorb
ic a
cid
b
uty
lhyd
rox
yto
luene (
BH
T)
and
12
x 1
09 c
fu E
nte
roco
ccu
s fa
eciu
m E
17
06
4C
once
ntr
ate
(Kaumll
ber
Sta
rt 1
83
V
oll
kra
ft
Mis
ch
futt
erw
erk
e G
mb
H
Kar
staumld
t G
erm
an
y)
was
com
po
sed
of
wh
eat
glu
ten
wh
eat
bra
n
gra
in m
ash
su
gar
bee
t
pulp
ra
pes
eed
mea
l o
at
rye
mo
lass
es
lin
seed
o
at b
ran
soyb
ean m
eal
extr
act
cal
ciu
m c
arb
onat
e s
od
ium
chlo
rid
e 0
6
pho
spho
rous
02
s
od
ium
10
800
IU
of
vit
am
in A
1
21
5 I
U o
f vit
am
in D
3
30
mg o
f vit
am
in E
0
7 m
g o
f I
04
mg o
f C
o
54
mg o
f M
g
81
mg o
f Z
n
and
04
mg o
f S
e p
er k
g o
f D
M
CHAPTER 2
57
The day before the study started a catheter (Certofix Mono 340 Braun Melsungen AG
Melsungen Germany) was inserted into the calvesrsquo right jugular vein and blood
samples were taken before (time point 0) and 05 1 15 2 25 3 4 6 8 12 24 and
48 h after feeding using S-Monovette tubes (Sarstedt AG amp Co Nuumlmbrecht Germany)
containing lithium heparin (16 IUmL blood) for analysis of plasma flavonols
Additional blood samples except on 15 25 and 48 h were taken for measurement of
plasma concentrations of total protein albumin glucose NEFA urea and lactate using
tubes containing sodium fluoride and K3EDTA (10 mgmL fluoride and 12 mgmL
EDTA) Blood sampled into tubes containing dipotassium EDTA (18 mgmL) was used
for determination of insulin and cortisol plasma concentrations Catheters were flushed
with 10 mL sodium chloride solution (09 sodium chloride Braun Melsungen AG)
after each blood sampling Blood was immediately put on ice centrifuged for 20 min at
1500 times g at 4deg C and plasma was stored at -80deg C for flavonol analysis and at -20deg C
for analyses of metabolites and hormones
223 Analytical methods
Flavonols were extracted from plasma as described by Egert et al (2008) and
concentrations of quercetin aglycone and its methylated (isorhamnetin tamarixetin) and
dehydroxylated (kaempferol) derivatives were analyzed by HPLC with fluorescence
detection as previously described (Ader et al 2000 Berger et al 2012 Gohlke et al
2013) Briefly plasma samples were thawed in a 40deg C water bath Then 980 μL of
plasma was acidified with 130 μL of acetic acid (0583 molL) spiked with 20 μL of
methanolic rhamnetin solution (internal standard 1 mg20 mL in methanol Rotichrom
HPLC Carl Roth GmbH) and treated with a mixture of β-glucuronidase and sulfatase
(from Helix pomatia Type H-1 with final activities of 7300 and 130 UmL for
glucuronidase and sulfatase respectively Sigma-Aldrich Chemie GmbH Dreieich
Germany) to cleave the ester bonds of glucuronides and sulfates After incubation at
37deg C for 1 h 3 mL of acetone was added and the samples were centrifuged at 3700 times g
for 45 min at 4deg C) The supernatant was evaporated until dryness Residues were
resolved in 200 μL methanol and after 15 min in an ultrasonic bath 775 μL of
nanopure water and 225 μL of hydrochloric acid (10 molL) were added For flavonol
analyses by HPLC 30 μL of the final solution was injected by a cooled (4deg C)
autosampler (AS-2057 Plus Jasco Deutschland GmbH Groszlig-Umstadt Germany) onto
CHAPTER 2
58
a C-18 Kromasil 100 column (250 times 4 mm particle size = 5 μm Jasco Deutschland
GmbH) guarded by a pre-column (C-18 Inertsil ODS-2 10 times 4 mm particle size = 5
μm Jasco Deutschland GmbH) The eluent (flow rate 1 mLmin) was composed of
0025 molL sodium dihydrogen phosphate (pH 24) acetonitrile and methanol
(68275 volvolvol) In a postcolumn reactor the effluent was mixed with aluminum
nitrate [flow rate = 04 mLmin 1 mmolL in methanol containing 75 [volvol] acetic
acid] for derivatization and fluorescence of the flavonol-aluminum complex was
measured using a fluorescence detector (excitation wavelength = 422 nm emission
wavelength = 485 nm FP920 Jasco Deutschland GmbH) Identification of peaks
obtained was performed using the retention times of the standards which were prepared
with pure flavonols and treated in the same way as samples The detection limit of
flavonols was le10 nmolL and the recovery rate was 92 plusmn 2 (mean plusmn SE) Inter- and
intraassay variances for quercetin were 72 and 05 The sum of plasma
concentrations of quercetin and its metabolites in plasma is referred to as total
flavonols
Plasma metabolites were analyzed spectrophotometrically (ABX Penta 400 Horiba
ABX SAS Montpellier Cedex France) by the Clinic for Cattle (University of
Veterinary Medicine Foundation Hanover Germany) using the respective kits
Albumin (no A11A01664) and lactate (no A11A01721 Horiba Europe GmbH
Hannover Germany) NEFA (no 434-91795 Wako Chemicals GmbH Neuss
Germany) glucose (no 553-230) and total protein (no 553-412 MTI Diagnostics
GmbH Idstein Germany) and urea (no LT-UR 0050 Labor + Technik E Lehmann
GmbH Berlin Germany)
Plasma insulin concentrations were determined using an RIA as previously described
(Vicari et al 2008) Plasma cortisol concentrations were analyzed using a commercial
ELISA kit validated for bovine plasma (EIA-1887 DRG Instruments GmbH Marburg
Germany Weber et al 2013) Cross reactivities of the monoclonal antibody against
corticosteron and progesterone were 45 and 9 respectively and to any further plasma
steroids lower than 2 Test sensitivity was 34 ngmL inter- and intraassay variations
were 53 and 121 respectively
Colostrum was analyzed for DM CP crude fat and ash content (Qualitaumltspruumlfungs- und
Dienstleistungsgesellschaft Mecklenburg-Vorpommern mbH Guumlstrow Germany)
according to the Weender standard procedure (Naumann and Bassler 2004) as shown
CHAPTER 2
59
in Table 21 Chemical composition of milk replacer and concentrates were according to
the manufacturersrsquo declarations (Table 21)
224 Calculations and statistical analyses
Quercetin measurements were corrected by baseline concentration (first blood sample
before QA or RU administration) then area under the curve (AUC) was calculated for
quercetin and its metabolites (isorhamnetin tamarixetin and kaempferol) according to
the trapeziodale rule between 0 and 24 h using GraphPad Prism 3 (GraphPad Software
Inc San Diego CA version 303) For single quercetin metabolites AUC proportion
relative to AUC of total flavonols (sum of quercetin isorhamnetin tamarixetin and
kaempferol) was calculated in addition Maximum plasma flavonol concentrations
(Cmax) and time after intake until Cmax was reached (Tmax) were determined from
individual plasma concentration-time curves Relative BV of quercetin from RU was
calculated as
Relative BV = AUCRUAUCQA times 100
Statistical analyses were performed using SASSTAT software (SAS Institute 2010)
All data are presented as LSM plusmn SE Body weight concentrate intake and
pharmacokinetic parameters (AUC Cmax Tmax) as well as proportions of single
metabolites on d 2 and 29 were analyzed by repeated measurement ANOVA using the
Mixed procedure with group (levels CTRL QA RU for proportional calculations only
QA and RU) repeated variable day (levels d 2 29) and group times day interaction as
fixed effects in the model Repeated measures on each calf were taken into account by
using the repeated statement of the Mixed procedure with an autoregressive residual
covariance structure Plasma concentration of total flavonols as well as metabolite and
hormone data were analyzed by repeated measurement ANOVA using the Mixed
procedure as described previously with group (levels CTRL QA RU) day (levels d
2 29) time changes within d 2 and 29 (several time points before and after feed intake
on d 2 and 29 respectively) and respective interactions as fixed effects Pairwise
differences among treatments and time changes were tested by the Tukey-Kramer-test
Effects were considered significant if P lt 005
CHAPTER 2
60
23 Results
231 Body weight and feed intake
All calves were born spontaneously and healthy Birth weight was 474 plusmn 10 kg Body
weight increased with time in all groups (P lt 001) and was 655 plusmn 13 kg on d 29
without differences between groups Milk intake was 38 plusmn 01 kgd on d 1 (8 of
BW) 48 plusmn 01 kgd on d 2 (10 of BW) and 69 plusmn 01 kg on d 29 Concentrate intake
was 159 plusmn 028 kgcalf and increased equally with time (P lt 001) in all groups
Average daily gain from birth to d 29 was 612 plusmn 28 gd without group differences
232 Bioavailability studies
Plasma concentrations of total flavonols of CTRL were close to or below the detection
limit on d 2 and 29 respectively (Figure 21A B) In QA- and RU-fed calves plasma
concentrations of total flavonols increased (P lt 005) after flavonoid administration on
d 2 and returned to baseline concentrations 48 h after administration (Figure 21A)
Figure 21 Plasma concentration-time-curves of total flavonols after oral administration of 9 mg of
quercetinkg of BW times d as quercetin aglycone () rutin trihydrate () or no flavonoid () on d 2
(A) and 29 (B) of life Values are LSM plusmn SE n = 7
On d 2 plasma concentrations of total flavonols were greater at 8 and 12 h (P lt 001)
but were smaller at 24 h after flavonoid administration (P lt 001) in QA- than in RU-
fed calves On d 29 postprandial plasma concentrations of total flavonols increased far
less distinctly (P lt 001) when compared to d 2 (Figure 21A B) Further plasma
concentrations of total flavonols increased until 8 h after administration (P lt 001) in
A B
Time relative to feeding h
0 2 4 6 8 10 12 24 48
To
tal
fla
vo
no
ls n
mo
lL
0
100
200
300
400
Time relative to feeding h
0 2 4 6 8 10 12 24 48
To
tal
fla
vo
no
ls n
mo
lL
0
100
200
300
400
CHAPTER 2
61
QA- but not in RU-fed calves (Figure 21B) Plasma concentrations of total flavonols
on d 29 tended to be greater (P lt 01) in QA- than in RU-fed calves
Compared with QA- (100 ) RU-fed calves showed a relative BV of quercetin of
725 on d 2 and of 496 on d 29 On d 2 AUC of total flavonols quercetin and
quercetin metabolites in QA- and RU-fed calves differed (P lt 005) from CTRL and
were greater (P lt 0001) on d 2 than on 29 for both treatments (Table 22) On d 2 AUC
of quercetin and isorhamnetin was greater (P lt 005) and tended to be greater for total
flavonols (P lt 01) but was lower for tamarixetin (P lt 005) in QA- than in RU-fed
calves On d 29 AUC of quercetin was greater (P lt 005) in QA-fed calves than in
CTRL
A Day 2
QA RU
Pro
po
rtio
n o
f T
ota
l F
lav
on
ols
AU
C (
)
0
20
40
60
80
100
Quercetin
Isorhamnetin
Tamarixetin
Kaempferol
B Day 29
QA RU
Pro
po
rtio
n o
f T
ota
l F
lav
on
ols
AU
C (
)
0
20
40
60
80
100
Figure 22 Proportion of single flavonols (quercetin isorhamnetin tamarixetin and kaempferol)
in plasma after oral administration of 9 mg of quercetinkg of BW times day as quercetin aglycone
(QA) or rutin trihydrate (RU) on d 2 and 29 of life Values are LSM plusmn SE n = 7
On d 2 Cmax of total flavonols quercetin and quercetin metabolites except kaempferol
of QA- and RU-fed calves differed from CTRL (P lt 005 Table 22) whereas on d 29
only Cmax of total flavonols and quercetin of QA-fed calves differed (P lt 005) from
CTRL Maximal plasma concentrations of total flavonols quercetin and isorhamnetin
decreased (P lt 005) or tended to decrease (kaempferol tamarixetin P lt 01) in QA-
and RU-fed calves from d 2 to 29 respectively On d 2 Cmax was greater (P lt 005) for
quercetin and isorhamnetin but was lower for tamarixetin in QA- than in RU-fed
calves Time to reach Cmax in QA- and RU-fed calves was not affected by day but
indicated treatment effects for total flavonols isorhamnetin and tamarixetin (Table
22) For isorhamnetin Tmax was greater (P lt 005) in RU- than in QA-fed calves on
both days
CHAPTER 2
62
Table 22 Pharmacokinetic parameters after oral administration of quercetin as quercetin
aglycone (QA) or rutin trihydrate (RU) on d 2 and 29 of life calves of the control group (CTRL)
received no flavonoids
Item1 Day
Group2
SE
ANOVA (P-value)
CTRL QA RU Group Day Group
times day
AUC 3 nmolL times h
AUCTotal 2 154c 5947
a 4312
ab 395 0001 0001 0001
29 770 1336 662
AUCQ 2 102c 3413
a 1967
b 228 0001 0001 0001
29 267b 1090
a 535
ab
AUCK 2 319b 152
a 159
a 244 002 0001 005
29 000 111 639
AUCI 2 000c 1390
a 447
b 701 0001 0001 0001
29 000 675 239
AUCT 2 000c 1070
b 1768
a 154 0001 0001 0001
29 000 583 196
Cmax4 nmolL
Cmax Total 2 139b 407
a 330
a 359 0001 0001 0001
29 224b 168
a 747
ab
Cmax Q 2 107c 238
a 129
b 193 0001 0001 003
29 628b 137
a 603
ab
Cmax K 2 196b 124
a 109
ab 207 001 0001 016
29 000 386 212
Cmax I 2 000c 945
a 396
b 585 0001 0001 0001
29 000 155 399
Cmax T 2 000c 771
b 163
a 156 0001 0001 0001
29 000 945 327
Tmax5 h
Tmax Total 2 950 106 164 284 005 012 090
29 649 621 104
Tmax Q 2 665 886 117 277 031 047 076
29 644 593 111
Tmax K 2 100 967 123 401 093 049 076
29 ND6 800 800
Tmax I 2 ND 114b 193
a 256 0001 088 009
29 ND 590b 240
a
Tmax T 2 ND 111 166 357 001 063 018
29 ND 763 240
a-cLSM in a row with different superscripts differ (P lt 005)
1Values are LSM with SE n = 7 per group
2Group QA = 30 micromol(kg BW times d) quercetin aglycone RU = 30 micromol(kg BW times d) rutin trihydrate
CTRL = no flavonol fed 3AUC = area under the plasma concentration-time curve of flavonols from 0 to 24 h calculated by
subtracting baseline values (time point 0) from all other time points according to the trapezoidale rule
AUCTotal AUCQ AUCK AUCI AUCT = AUC of total flavonols (Total) or of the respective quercetin
metabolites quercetin (Q) kaempferol (K) isorhamnetin (I) and tamarixetin (T) respectively 4Cmax = maximum plasma concentration of flavonols subtracted by basal plasma concentration before feed
intake Cmax Total Cmax Q Cmax K Cmax I Cmax T = maximum plasma concentration of total flavonols
(Total) quercetin aglycone (Q) kaempferol (K) isorhamnetin (I) and tamarixetin (T) respectively 5Tmax = time until Cmax was reached Tmax Total Tmax Q Tmax K Tmax I Tmax T = time until Cmax Total Cmax Q
Cmax K Cmax I Cmax T was reached respectively 6ND = Not definable
CHAPTER 2
63
Relative distribution of single flavonols (quercetin isorhamnetin tamarixetin and
kaempferol) proportionately to total flavonols in plasma showed highest values for
quercetin on both days and in both groups (QA and RU) Proportion of single flavonols
changed with time namely increased for quercetin (P lt 005) but decreased for
isorhamnetin and tamarixetin (P lt 005) from d 2 to 29 (Figure 22A B) On d 2
proportion of isorhamnetin was greater (P lt 005) and proportion of tamarixetin was
smaller (P lt 005) in QA- than in RU-fed calves (Figure 22A)
233 Plasma concentrations of metabolites and hormones
Plasma concentrations of total protein decreased (P lt 005) from d 2 to 29 in CTRL and
were greater on d 2 in CTRL than in QA-fed calves (P lt 005 Table 23) Plasma
concentrations of albumin increased (P lt 001) and plasma concentrations of lactate and
urea decreased (P lt 001) from d 2 to 29 without any group effect (Table 23)
Table 23 Blood plasma concentrations of metabolites and hormones of calves after oral
administration of quercetin as quercetin aglycone (QA) rutin trihydrate (RU) or no flavonoid
(CTRL) on d 2 and d 29
Item1 Day
Group2
SE
ANOVA (P-value)
CTRL QA RU Group Day Group
times day
Total
protein gL
2 640a 599
b 617
ab 098 003 0001 007
29 580 565 596
Albumin
gL
2 229 226 225 037 095 0001 042
29 261 265 263
Lactate
mmolL
2 168 237 265 027 031 0001 004
29 063 068 069
Glucose
mmolL
2 737 714 761 028 035 0001 099
29 658 640 679
NEFA
micromolL
2 298 281 298 13 087 0001 065
29 172 177 173
Urea
mmolL
2 380 375 355 026 091 0001 082
29 155 156 155
Insulin
microgL
2 238 179 241 065 012 008 029
29 438 209 277
Cortisol 2 672 629 779 70 043 0001 067
nmolL 29 111 86 130
a-bLSM in a row with different superscripts differ (P lt 005)
1Values are LSM based on plasma concentrations in blood samples taken before and until 24 h after
morning feeding on d 2 and 29 respectively n = 7 per group
2Group QA = 30 micromol(kg BW times d) quercetin aglycone RU = 30 micromol(kg BW times d) rutin trihydrate
CTRL = no flavonol fed
CHAPTER 2
64
A Day 2 B Day 29
Time relative to feeding h
0 2 4 6 8 10 12 24
Glu
cose
m
mo
lL
5
6
7
8
9
10
Time relative to feeding h
0 2 4 6 8 10 12 24
Glu
cose
m
mo
lL
5
6
7
8
9
10
C Day 2 D Day 29
Time relative to feeding h
0 2 4 6 8 10 12 24
NE
FA
m
mo
lL
100
200
300
400
500
Time relative to feeding h
0 2 4 6 8 10 12 24
NE
FA
m
mo
lL
100
200
300
400
500
Figure 23 Plasma concentrations of glucose (A B) and NEFA (C D) after oral administration of 9
mg of quercetinkg BW times d as quercetin aglycone () rutin trihydrate () or no flavonoid () on
d 2 and d 29 of life Values are LSM plusmn SE n = 7
Mean glucose and NEFA plasma concentrations decreased (P lt 005) from d 2 to 29 in
all groups but concentrations did not differ among groups (Table 23) Considering the
day course of the plasma metabolites plasma concentrations of glucose increased (P lt
001) whereas NEFA decreased (P lt 001) after feed intake in all groups on d 2 and 29
respectively (Figure 23A-D)
The increase of plasma insulin concentrations after feed intake was more pronounced (P
lt 005) on d 29 than on d 2 but without group effects (Figure 24A B Table 23)
Plasma concentrations of cortisol decreased (P lt 005) after feed intake on both days
with mean concentrations being greater (P lt 005) on d 2 than on d 29 (Figure 24C D
Table 23)
CHAPTER 2
65
A Day 2 B Day 29
Time relative to feeding h
0 2 4 6 8 10 12 24
Insu
lin
micro
gL
0
2
4
6
8
10
Time relative to feeding h
0 2 4 6 8 10 12 24
Insu
lin
micro
gL
0
2
4
6
8
10
C Day 2 D Day 29
Time relative to feeding h
0 2 4 6 8 10 12 24
Co
rtis
ol
nm
ol
L
0
20
40
60
80
100
Time relative to feeding h
0 2 4 6 8 10 12 24
Co
rtis
ol
nm
ol
L
0
20
40
60
80
100
Figure 24 Plasma concentrations of insulin (A B) and cortisol (C D) after oral administration of 9
mg of quercetinkg of BW times d as quercetin aglycone () rutin trihydrate () or no flavonoid ()
on d 2 and d 29 of life Values are LSM plusmn SE n = 7
24 Discussion
Without dietary supplementation of quercetin (CTRL group) plasma concentrations of
total flavonols were close to or below the detection limit on d 2 and 29 However small
amounts of quercetin and its dehydroxylated metabolite kaempferol were found in blood
plasma on d 2 and 29 in the control group According to Besle et al (2010) flavonoids
are natural components of bovine milk and their concentration is affected by cowrsquos diet
Although colostrum and milk replacer were not analyzed for flavonoid content in the
present study it can be assumed that colostrum is most likely the source for flavonoids
found in CTRL calves at d 2 Apart from colostrum feed components such as
concentrates and hay may also contain flavonoids (Fraisse et al 2007 Reynaud et al
2010) which could explain measurable albeit very low plasma concentrations of
quercetin and its metabolites at least in older calves (d 29)
CHAPTER 2
66
In calves quercetin was systemically available from both supplements QA as well as
RU Interestingly plasma values obtained for quercetin and its metabolites with an
intact flavonol structure were greater on d 2 than on d 29 indicating better absorption or
less excretion in younger animals This may be explained by a different degree of
gastrointestinal maturation and intestinal permeability on d 2 and 29 respectively
(Blum 2006) Thus the epithelium in newborn animals is characterized by vacuolated
epithelial cells which are not present in older animals (Bainter 2002 Blum 2006) This
has possibly contributed to a greater absorption of quercetin from both sources (QA and
RU) on d 2 compared with d 29 in calves Furthermore the reticulorumen and microbial
activities might be already more developed in 29- than in 2-d-old calves resulting in
partial ruminal degradation of the flavonoids applied (Heinrichs and Jones 2003
Guilloteau et al 2009 Berger et al 2012 Li et al 2012) The BV of quercetin from
both QA and RU especially on d 29 could probably be improved when encapsulated
quercetin preparations will be used (Ding et al 2014)
On both days investigated feeding of QA resulted in greater plasma concentrations of
total flavonols quercetin and its metabolites than feeding of RU indicating QA as a
better source of quercetin than RU with respect to the BV of quercetin Markedly lower
plasma concentrations of total flavonols were also seen in monogastric species after
feeding of RU instead of QA at dosages comparable to the current study (Manach et al
1997 Cermak et al 2003 Reinboth et al 2010) Thus the present results obtained in
calves are in principal accordance with studies on the BV of quercetin in monogastric
species such as rats (Manach et al 1997) dogs (Reinboth et al 2010) pigs (Cermak et
al 2003 Lesser et al 2004) and humans (Erlund et al 2000 Egert et al 2008) As
the newborn calf is considered as a functionally monogastric animal (Drackley 2008)
these findings are not surprising
Concerning RU application studies in monogastric species often indicate a delayed
increase of quercetin and its metabolites in blood plasma (Erlund et al 2000 Cermak et
al 2003 Reinboth et al 2010) In the present study maximal plasma concentrations of
quercetin and its metabolites were measured much later after RU than after QA feeding
indicating different intestinal sites for absorption (Erlund et al 2000) In RU-fed
calves quercetin and its metabolites at least on d 2 most likely derive from absorption
in both the small and the large intestine In addition we found the same slow increase of
quercetin and its metabolites in blood plasma after QA and RU feeding but the increase
CHAPTER 2
67
stopped much earlier in RU- than in QA-fed calves In general the sugar moiety in
flavonol molecules determines the absorption of flavonoids in organisms (Day et al
1998 Hollman et al 1999) and QA is supposed to be already absorbed in the small
intestine More complex glycosides such as the glucorhamnoside RU are absorbed in
distal parts of the small intestine or in the colon of monogastric animals where flavonol
molecules are hydrolyzed by microorganisms Thus the lack of rhamnosidase activity
in the small intestine can be considered as one reason for delayed and lower absorption
of RU than of QA (Erlund et al 2000 Cermak et al 2003) Our pattern of relative BV
of total flavonols after RU feeding fits to relative BV of total flavonols in blood plasma
after duodenal but not after ruminal application in dairy cows (Berger et al 2012
Gohlke et al 2013) indicating a low ruminal function in our calves during first month
of life
Interestingly pharmacokinetics of quercetin absorption after QA feeding markedly
differed between calves and adult cattle (Berger et al 2012 Gohlke et al 2013) or
monogastric animals (Erlund et al 2000 Cermak et al 2003 Reinboth et al 2010)
The typical peak of total flavonol plasma concentrations some minutes after QA
administration was not seen in newborn calves As a consequence time for reaching
Cmax was much greater in calves than in adult ruminants and monogastrics Comparable
slow increases of quercetin and its metabolites as in newborn calvesrsquo blood plasma were
only seen in rats (Manach et al 1997) These differences in pharmacokinetics after QA
feeding are difficult to explain but a probable reason is the low release of milk protein
into the duodenum due to abomasal casein clotting (Heinrichs and Jones 2003
Guilloteau et al 2009) and the potential binding of flavonoids to milk proteins (Gugler
et al 1975 Boulton et al 1998 Janisch et al 2004)
All measured metabolites and hormones were in physiological ranges and most of these
findings were in accordance with previous results indicating postnatal growth
especially protein accretion and development in breeding as well as suckling calves
(Egli and Blum 1998 Nussbaum et al 2002 Schiessler et al 2002) Conversely
except for total protein concentrations on d 2 we found no treatment effects by QA or
RU feeding in these calves Plasma protein concentrations were lower in QA-fed than in
CTRL calves a finding that was hard to explain because all calves received the same
pooled colostrum with identical IgG content at first days of life Postprandial changes of
metabolites and hormones have been reported previously (Hadorn et al 1997 Hammon
CHAPTER 2
68
and Blum 1998) but systemic glucose metabolism was not affected by QA or RU
feeding as we have assumed from literature (Cermak et al 2004 Tadera et al 2006)
In conclusion BV of quercetin and its metabolites in newborn calves is more
pronounced when quercetin is fed as QA than as RU These findings go along with data
on BV of quercetin in lactating cows with duodenal application (Gohlke et al 2013)
and in monogastric species like rats dogs and pigs (Manach et al 1997 Cermak et al
2003 Reinboth et al 2010) Greater BV of quercetin on d 2 than on d 29 of life was
probably due to reduced maturation status of the gastrointestinal tract in 2-d old calves
However effects of quercetin feeding on the antioxidative status should be investigated
to validate health-protecting effects of quercetin in neonatal calves
Acknowledgements
We gratefully thank Petra Schulz and Maike Gosse (Christian Albrechts University
Kiel Germany) for excellent laboratory assistance as well as Annette Zeyner Kirsten
Buumlsing (University of Rostock Rostock Germany) and Bernd Stabenow (FBN
Dummerstorf Dummerstorf Germany) for providing experimental facilities Chicken-
egg derived immunoglobulins (Globigen Life Start 25 ) were generously provided by
EW Nutrition GmbH (Visbek Germany) This work is part of the joint research project
Food Chain Plus (FoCus) and was financially supported by the Federal Ministry of
Education and Research Bonn Germany (BMFT grant no 0315538B)
CHAPTER 2
69
References
Ader P A Wessmann and S Wolffram 2000 Bioavailability and metabolism of the
flavonol quercetin in the pig Free Radic Biol Med 281056ndash1067 http
dxdoiorg 101016S0891-5849(00)00195-7
Arts I C W A L A Sesink M Faassen-Peters and P C H Hollman 2004 The
type of sugar moiety is a major determinant of the small intestinal uptake and
subsequent biliary excretion of dietary quercetin glycosides Br J Nutr 91841ndash
847 httpdxdoiorg101079BJN20041123
Bainter K 2002 Vacuolation in the young Pages 55-110 in Biology of the intestine in
Growing Animals R Zabielski P C Gregory and B Westrom ed Elsevier
Amsterdam the Netherlands
Berger L M S Wein R Blank C C Metges and S Wolffram 2012 Bioavailability
of the flavonol quercetin in cows after intraruminal application of quercetin
aglycone and rutin J Dairy Sci 955047ndash5055 httpdxdoiorg103168jds
2012-5439
Besle J M D Viala B Martin P Pradel B Meunier J L Berdagueacute D Fraisse J L
Lamaison and J B Coulon 2010 Ultraviolet-absorbing compounds in milk are
related to forage polyphenols J Dairy Sci 932846ndash2856 httpdxdoiorg
103168jds2009-2939
Bhagwat S D B Haytowitz J M Holden 2013 USDA database for the flavonoid
content of selected foods Release 31 US Department of Agriculture (USDA)
Agricultural Research Service Accessed April 15 2014 httpwwwarsusdagov
SP2UserFilesPlace12354500DataFlavFlav3-1pdf
Blum J W 2006 Nutritional physiology of neonatal calves J Anim Physiol Anim
Nutr (Berl) 901ndash11 httpdxdoiorg101111j1439-0396200500614x
Boulton D W U K Walle and T Walle 1998 Extensive binding of the bioflavonoid
quercetin to human plasma proteins J Pharm Pharmacol 50243ndash249
httpdxdoiorg101111j2042-71581998tb06183x
CHAPTER 2
70
Cermak R S Landgraf and S Wolffram 2003 The bioavailability of quercetin in
pigs depends on the glycoside moiety and on dietary factors J Nutr 1332802ndash
2807
Cermak R S Landgraf and S Wolffram 2004 Quercetin glucosides inhibit glucose
uptake into brush-border-membrane vesicles of porcine jejunum Br J Nutr
91849ndash855 httpdxdoiorg101079BJN20041128
Chase C C D J Hurley and A J Reber 2008 Neonatal immune development in the
calf and its impact on vaccine response Vet Clin North Am Food Anim Pract
2487ndash104
Day A J M S DuPont S Ridley M Rhodes M J Rhodes M R Morgan and G
Williamson 1998 Deglycosylation of flavonoid and isoflavonoid glycosides by
human small intestine and liver beta-glucosidase activity FEBS Lett 43671ndash75
httpdxdoiorg101016S0014-5793(98)01101-6
Ding B P Chen Y Kong Y Zhai X Pang J Dou and G Zhai 2014 Preparation
and evaluation of folate-modified lipid nanocapsules for quercetin delivery J
Drug Target 2267ndash75
Drackley J K 2008 Calf nutrition from birth to breeding Vet Clin North Am Food
Anim Pract 2455ndash86 httpdxdoiorg101016jcvfa200801001
Egert S S Wolffram A Bosy-Westphal C Boesch-Saadatmandi A E Wagner J
Frank G Rimbach and M J Mueller 2008 Daily quercetin supplementation
dose-dependently increases plasma quercetin concentrations in healthy humans J
Nutr 1381615ndash1621
Egli C P and J W Blum 1998 Clinical haematological metabolic and endocrine
traits during the first three months of life of suckling simmentaler calves held in a
cow-calf operation Zentralbl Veterinarmed A 4599ndash118
Erlund I T Kosonen G Alfthan J Maumlenpaumlauml K Perttunen J Kenraali J
Parantainen and A Aro 2000 Pharmacokinetics of quercetin from quercetin
aglycone and rutin in healthy volunteers Eur J Clin Pharmacol 56545ndash553
httpdxdoiorg101007s002280000197
CHAPTER 2
71
Fraisse D A Carnat D Viala P Pradel J-M Besle J-B Coulon C Felgines and
J-L Lamaison 2007 Polyphenolic composition of a permanent pasture
Variations related to the period of harvesting J Sci Food Agric 872427ndash2435
httpdxdoiorg101002jsfa2918
Gaaacutel T R Ribiczeyne-Szabo K Stadler J Jakus J Reiczigel P Kover M Mezes
and L Sumeghy 2006 Free radicals lipid peroxidation and antioxidant system in
the blood of cows and newborn calves around calving Comp Biochem Physiol
B Biochem Mol Biol 143391ndash396
Gasparin F R S C L Salgueiro-Pagadigorria L Bracht E L Ishii-Iwamoto A
Bracht and J Constantin 2003 Action of quercetin on glycogen catabolism in
the rat liver Xenobiotica 33587ndash602 httpdxdoiorg10108000498250310
00089100
Godden S 2008 Colostrum management for dairy calves Vet Clin North Am Food
Anim Pract 2419ndash39
Gohlke A C J Ingelmann G Nuumlrnberg A Starke S Wolffram and C C Metges
2013 Bioavailability of quercetin from its aglycone and its glucorhamnoside rutin
in lactating dairy cows after intraduodenal administration J Dairy Sci 962303ndash
2313 httpdxdoiorg103168jds2012-6234
Gugler R M Leschik and H J Dengler 1975 Disposition of quercetin in man after
single oral and intravenous doses Eur J Clin Pharmacol 9229ndash234
Guilloteau P R Zabielski J W Blum 2009 Gastrointestinal tract and digestion in
the young ruminant Ontogenesis adaptations consequences and manipulations
J Physiol Pharmacol 60(Suppl 3)37ndash46
Hadorn U H Hammon R M Bruckmaier and J W Blum 1997 Delaying colostrum
intake by one day has important effects on metabolic traits and on gastrointestinal
and metabolic hormones in neonatal calves J Nutr 1272011ndash2023
Hammon H M and J W Blum 1998 Metabolic and endocrine traits of neonatal
calves are influenced by feeding colostrum for different durations or only milk
replacer J Nutr 128624ndash632
CHAPTER 2
72
Hammon H M J Steinhoff-Wagner U Schoumlnhusen C C Metges and J W Blum
2012 Energy metabolism in the newborn farm animal with emphasis on the calf
Endocrine changes and responses to milk-born and systemic hormones Domest
Anim Endocrinol 43171ndash185
Heinrichs A J and C M Jones 2003 Feeding the newborn calf College of
Agricultural Sciences Agricultural Research and Cooperative Extension
Pennsylvania State University University Park PA
Hertog M G L P C H Hollman and M B Katan 1992 Content of potentially
anticarcinogenic flavonoids of 28 vegetables and 9 fruits commonly consumed in
the Netherlands Proc Nutr Soc 402379ndash2383 httpdxdoiorg101021
jf00024a011
Hollman P C H M N C P Bijsman Y van Gameren E P J Cnossen J H M de
Vries and M B Katan 1999 The sugar moiety is a major determinant of the
absorption of dietary flavonoid glycosides in man Free Radic Res 31569ndash573
httpdxdoiorg10108010715769900301141
Inanami O A Shiga K J Okada R Sato Y Miyake and M Kuwabara 1999 Lipid
peroxides and antioxidants in serum of neonatal calves Am J Vet Res 60452ndash
457
Janisch K M G Williamson P Needs and G W Plumb 2004 Properties of
quercetin conjugates Modulation of LDL oxidation and binding to human serum
albumin Free Radic Res 38877ndash884 httpdxdoiorg1010801071576041000
1728415
Kobayashi Y M Miyazawa A Kamei K Abe and T Kojima 2010 Ameliorative
effects of mulberry (Morus alba L) leaves on hyperlipidemia in rats fed a high-fat
diet Induction of fatty acid oxidation inhibition of lipogenesis and suppression
of oxidative stress Biosci Biotechnol Biochem 742385ndash2395
Lesser S R Cermak and S Wolffram 2004 Bioavailability of quercetin in pigs is
influenced by the dietary fat content J Nutr 1431508ndash1511
CHAPTER 2
73
Li R W E E Connor C Li R L Baldwin VI and M E Sparks 2012
Characterization of the rumen microbiota of pre-ruminant calves using
metagenomic tools Environ Microbiol 14129ndash139 httpdxdoiorg
101111j1462-2920201102543x
Lindmark-Maringnsson H and B Aringkesson 2000 Antioxidative factors in milk Br J
Nutr 84S103ndashS110
Manach C C Morand C Demigneacute O Texier F Reacutegeacuterat and C Reacutemeacutesy 1997
Bioavailability of rutin and quercetin in rats FEBS Lett 40912ndash16
httpdxdoiorg101016S0014-5793(97)00467-5
Manach C A Scalbert C Morand C Reacutemeacutesy and L Jimeacutenez 2004 Polyphenols
Food sources and bioavailability Am J Clin Nutr 79727ndash747
McGuirk S M 2008 Disease management of dairy calves and heifers Vet Clin North
Am Food Anim Pract 24139ndash153
Mee J F 2008 Newborn dairy calf management Vet Clin North Am Food Anim
Pract 241ndash17
Middleton E C Kandaswami and T C Theoharides 2000 The effects of plant
flavonoids on mammalian cells Implications for inflammation heart disease and
cancer Pharmacol Rev 52673ndash751
Naumann C and R Basler 2004 Die chemische Untersuchung von Futtermitteln
VDLUFA-Verlag Darmstadt Germany
Nijveldt R J E van Nood D E C van Hoorn P G Boelens K van Norren and P
A M van Leeuwen 2001 Flavonoids A review of probable mechanisms of
action and potential applications Am J Clin Nutr 74418ndash425
Nussbaum A G Schiessler H M Hammon and J W Blum 2002 Growth
performance and metabolic and endocrine traits in calves pair-fed by bucket or by
automate starting in the neonatal period J Anim Sci 801545ndash1555
Quigley J D III and J J Drewry 1998 Nutrient and immunity transfer from cow to
calf pre- and postcalving J Dairy Sci 812779ndash2790
CHAPTER 2
74
Reinboth M S Wolffram G Abraham F R Ungemach and R Cermak 2010 Oral
bioavailability of quercetin from different quercetin glycosides in dogs Br J
Nutr 104198ndash203 httpdxdoiorg101017S000711451000053X
Reynaud A D Fraisse A Cornu A Farruggia E Pujos-Guillot J-M Besle B
Martin J-L Lamaison D Paquet M Doreau and B Graulet 2010 Variation in
content and composition of phenolic compounds in permanent pastures according
to botanical variation J Agr Food Chem 585485ndash5494 httpdxdoiorg
101021jf1000293
SAS Institute Inc 2010 SASQC 92 Userrsquos Guide Second Edition Cary NC SAS
Institute Inc
Schiessler G A Nussbaum H M Hammon and J W Blum 2002 Calves sucking
colostrum and milk from their dams or from an automatic feeding station starting
in the neonatal period Metabolic and endocrine traits and growth performance
Anim Sci 74431ndash444
Steinhoff-Wagner J S Goumlrs P Junghans R M Bruckmaier E Kanitz C C Metges
and H M Hammon 2011 Maturation of endogenous glucose production in
preterm and term calves J Dairy Sci 945111ndash5123 httpdxdoiorg
103168jds2011-4355
Tadera K Y Minami K Takamatsu and T Matsuoka 2006 Inhibition of alpha-
glucosidase and alpha-amylase by flavonoids J Nutr Sci Vitaminol (Tokyo)
52149ndash153
Uetake K 2013 Newborn calf welfare A review focusing on mortality rates Anim
Sci J 84101ndash105
Vicari T J J G C van den Borne W J J Gerrits Y Zbinden and J W Blum 2008
Postprandial blood hormone and metabolite concentrations influenced by feeding
frequency and feeding level in veal calves Domest Anim Endocrinol 3474ndash88
httpdxdoiorg101016jdomaniend200611002
CHAPTER 2
75
Weber C C Hametner A Tuchscherer B Losand E Kanitz W Otten S P Singh
R M Bruckmaier F Becker W Kanitz and H M Hammon 2013 Variation in fat
mobilization during early lactation differently affects feed intake body condition
and lipid and glucose metabolism in high-yielding dairy cows J Dairy Sci 96165ndash
180 httpdxdoiorg103168jds2012-5574
Williams R J J P Spencer and C Rice-Evans 2004 Flavonoids Antioxidants or
signalling molecules Free Radic Biol Med 36838ndash849
76
Chapter 3
Effects of oral flavonoid supplementation on metabolic and
antioxidative status in newborn dairy calves
J Maciej C T Schaumlff E Kanitzdagger A TuchschererDagger R M Bruckmaiersect
S Wolffram and H M Hammon1
Institute of Nutritional Physiology ldquoOskar Kellnerrdquo
daggerInstitute of Behavioural Physiology and
DaggerInstitute of Genetics and Biometry Leibniz Institute for Farm Animal Biology (FBN)
Wilhelm-Stahl-Allee 2 18196 Dummerstorf Germany
sectDepartment of Clinical Research and Veterinary Public Health Veterinary Physiology
Vetsuisse Faculty University of Bern 3001 Bern Switzerland
Institute of Animal Nutrition and Physiology Christian Albrechts University Kiel
24118 Kiel Germany
1Corresponding author H M Hammon Leibniz Institute for Farm Animal Biology
(FBN) Institute of Nutritional Physiology ldquoOskar Kellnerrdquo Wilhelm-Stahl-Allee 2
18196 Dummerstorf Germany phone +49-38208-68670 fax +49-38208-68652
e-mail hammonfbn-dummerstorfde
Used by permission of the Journal of Dairy Scince
Manuscript submitted to Journal of Dairy Science
Manuscript ID JDS-15-9906
CHAPTER 3
77
3 Effects of oral flavonoid supplementation on metabolic and
antioxidative status in newborn dairy calves
Abstract
Many studies investigated effects of natural feed additives like flavonoids and verified
their antioxidative or antiinflammatory properties but scientific proof for flavonoids as
health and performance-promoting tool in calf nutrition is weak Thus we investigated
the effects of the most abundant flavonoid quercetin and of a green tea extract (GTE)
containing various catechins on metabolic and antioxidative traits in dairy calves to
further clarify potential health-promoting effects Male newborn German Holstein
calves (n=7 per group) either received no flavonoid (control group) 10 mg of quercetin
equivalents as quercetin aglycone or as rutinkg of body weight (BW) and d or 10
mgkg BW and d of a GTE from d 5 to d 26 of life with morning and evening feeding
All calves were fed equal amounts of colostrum and milk replacer according to BW
Body Weight feed intake and health status were evaluated daily Blood samples were
collected from the jugular vein on d 1 5 12 19 and 26 before morning feeding to
investigate flavonoid metabolic and antioxidative status in calves During the
experiment growth performance data and health status remained unchanged but GTE-
fed calves had less loose feces than controls and calves fed quercetin aglycone required
less medical treatment than other groups Concentrations of quercetin changed over
time and were higher in rutin-fed than control group whereas catechins were below
detection limit Plasma trolox equivalent antioxidative capacity (TEAC) and ferric
reducing ability of plasma (FRAP) were measured as markers for plasma antioxidative
capacity Concentrations of TEAC increased whereas FRAP decreased after the first d
of life in all groups least in controls Oxidative stress markers in plasma were measured
as thiobarbituric acid reactive substances (TBARS) and F2-isoprostances
Concentrations of TBARS were highest during first month of life in the control group
but decreased at the same time in the GTE group F2-isoprostane concentrations
decreased in control group only Plasma concentrations of total protein albumin urea
lactate glucose and non-esterified fatty acids as well as of insulin and cortisol varied in
time but there were no group differences caused by flavavonoid supplementation
Taken together orally administrated quercetin and catechins at dosages used in the
CHAPTER 3
78
present study resulted in no or only weak effects on health metabolic and antioxidative
status in newborn dairy calves
Key Words antioxidative status calf flavonoid quercetin rutin
31 Introduction
After birth calves undergo huge immunological and metabolic changes Though
relatively mature at birth they need to adapt to various morphological and functional
changes after birth (Blum and Hammon 2000) Calf losses mainly occur during first wk
of life mostly because of respiratory and digestive problems (USDA 2011) Good
management like early and sufficient colostrum supply is essential In addition fed
supplements are daily practice in modern dairy Particularly since the ban of antibiotic
growth promoters in the European Union in 2006 the call for ʻnaturalʼ feed additives
gained enormous popularity In this respect flavonoids as secondary plant metabolites
ubiquitous in all higher plants are of interest Their health-promoting properties are
mainly thought to be due to their strong antioxidant activity in vitro associated with
effects on several metabolic key enzymes and inflammatory cells (Middleton et al
2000) glucose and lipid metabolism (Shetty et al 2004 Kobayashi et al 2010) or
incidence of diarrhea (di Carlo et al 1994 Gaacutelvez et al 1995) One of the most
abundant flavonoids is the flavonol quercetin a pentahydroxyflavon mostly bound β-
glycosidic manner to at least one sugar molecule and present in high concentrations in
apples and onions Quercetin bound to rutinose is called rutin and is the major glycoside
of quercetin The predominant flavanol another subgroup of flavonoids is catechin
which is mainly found in high concentrations in green tea
Almost any disease is associated with increased formation of reactive oxygen species
thus causing oxidative stress (Halliwell 1991) In calves enhanced oxidative stress was
seen on the first d of life (Alexandrovich and Antonovna 2009) and especially if sick
(Ahmed and Hassan 2007 Al-Qudah 2009) Because the nutrient status often is
impaired in newborn calves this possibly affects the antioxidant system (Schwerin et
al 2002 Sies et al 2005) Thus improvement of the antioxidant status in newborn
calves may accelerate maturation of the own immune system improve health status and
thus reduce calf losses The bioavailability of quercetin in newborn calves as
prerequisite for biological effects was recently shown (Maciej et al 2015) Based on
these findings we have tested the hypothesis that quercetin and catechin
CHAPTER 3
79
supplementation affect metabolism and the antioxidative and health status during the
first 3 wk of life in dairy calves
32 Materials and Methods
321 Animals and feeding
Procedures performed in this study were in accordance with the German animal
protection law and approved by the relevant authorities (Landesamt fuumlr Landwirtschaft
Lebensmittelsicherheit und Fischerei Mecklenburg-Vorpommern Germany
permission no LVL M-VTSD72213-21-01910) Twenty-eight male German
Holstein calves were examined from d 1 to d 26 of life All calves were spontaneously
born from multiparous cows on neighboring farms and transported directly after birth to
the experimental barn of the University of Rostock where they were kept in single
boxes with straw bedding Calves had free access to water and were fed twice daily by
nipple bottle or nipple bucket On the first 3 d of life calves received pooled colostrum
obtained from milkings 1 3 and 5 (d 1 2 and 3 after parturition respectively) in
amounts of 8 of BW on d 1 and 10 of BW on d 2 and 3 (Table 1) From d 4 until d
26 calves received a commercial milk replacer (150 gL SalvaLac MiraPro 45 Salvana
Tiernahrung GmbH Klein-Offenseth Sparrieshoop Germany) in amounts of 12 of
BWd To ensure equal feed uptake in all groups refused amounts of colostrum or milk
replacer were tub- fed Milk replacer amounts were adapted to BW once a wk
From d 2 to d 6 colostrum or milk replacer was supplemented with chicken-egg derived
immunoglobulins (Globigen Life Start 25 EW Nutrition GmbH Visbek Germany)
fed twice daily in amounts of 40 32 24 16 and 8 gd respectively (Maciej et al
2015)
Calves had free access to pelleted concentrate (Kaumllber Start 183 pell Vollkraft
Mischfutterwerke GmbH Karstaumldt Germany) and hay from d 4 on Concentrate intake
was measured daily after the morning milk feeding (Maciej et al 2015)
CHAPTER 3
80
Ta
ble
31
C
om
po
siti
on
an
d a
mo
un
ts o
f co
lost
rum
m
ilk
rep
lace
r a
nd
co
nce
ntr
ate
fed
to
ca
lves
d
1
d 2
d
3
d 4
to
30
2
Item
co
lost
rum
1
mil
kin
g 1
colo
stru
m1
mil
kin
g 3
colo
stru
m1
mil
kin
g 5
M
ilk
rep
lace
r3
Co
nce
ntr
ate
4
DM
gk
g
20
69
1
54
7
13
93
1
10
0
88
00
CP
gk
g D
M
59
74
3
90
4
33
31
2
01
8
18
00
Cru
de
fat
gk
g D
M
16
92
2
40
5
27
49
1
90
9
43
0
Ash
gk
g D
M
48
3
55
6
56
0
73
6
74
0
Lac
tose
g
kg D
M
13
63
2
60
5
30
87
5
14
6
-
1C
olo
stru
m w
as d
eriv
ed f
rom
mu
ltip
aro
us
cow
s and
sep
arat
ely p
oo
led
fro
m m
ilkin
gs
1
3
and
5 a
fter
par
turi
tio
n
resp
ecti
vel
y
2H
ay w
as o
ffer
ed a
d l
ibit
um
exce
pt
for
days
of
bio
avai
lab
ilit
y s
tud
ies
3M
ilk r
epla
cer
(Sal
vaL
ac M
iraP
ro 4
5
Sal
van
a T
iern
ahru
ng
Gm
bH
K
lein
-Off
ense
th S
parr
iesh
oo
p
Ger
man
y)
was
com
po
sed
of
45
s
pra
y s
kim
med
mil
k
po
wd
er
35
s
wee
t w
hey p
ow
der
1
8
pla
nt
oil
(p
alm
co
conut
and
so
y o
il)
17
L
ys
08
C
a 0
75
P
an
d a
dd
ed w
ith 5
00
00
IU
of
vit
am
in A
4
000
IU o
f vit
am
in D
3
20
0 m
g o
f vit
am
in E
(α
-to
cop
her
ol
acet
ate)
9
mg C
u (
gly
ceri
ne-
cop
per
chel
ate)
ci
tric
aci
d
sorb
ic a
cid
b
uty
lhyd
rox
yto
luene (
BH
T)
and
12
x 1
09 c
fu E
nte
roco
ccu
s fa
eciu
m E
17
06
4C
once
ntr
ate
(Kaumll
ber
Sta
rt 1
83
V
oll
kra
ft
Mis
ch
futt
erw
erk
e G
mb
H
Kar
staumld
t G
erm
an
y)
was
com
po
sed
of
wh
eat
glu
ten
wh
eat
bra
n
gra
in m
ash
su
gar
bee
t
pulp
ra
pes
eed
mea
l o
at
rye
mo
lass
es
lin
seed
o
at b
ran
soyb
ean m
eal
extr
act
cal
ciu
m c
arb
onat
e s
od
ium
chlo
rid
e 0
6
pho
spho
rous
02
s
od
ium
10
800
IU
of
vit
am
in A
1
21
5 I
U o
f vit
am
in D
3
30
mg o
f vit
am
in E
0
7 m
g o
f I
04
mg o
f C
o
54
mg o
f M
g
81
mg o
f Z
n
and
04
mg o
f S
e p
er k
g o
f D
M
CHAPTER 3
81
Health status of calves was determined daily by measuring rectal temperature heart and
respiratory rate by evaluation of behavioral abnormalities nasal discharge respiratory
sounds and by navel inspection Fecal consistence was assessed daily by fecal
consistence score according to Larson et al (1977) normal (1) soft (2) runny (3) or
watery (4) Sick calves were treated by a veterinarian for statistical analysis each calf
was counted as treated for a disease independent from how many times an animal was
treated
322 Treatment and blood sampling
Calves were randomly assigned to one of four feeding groups (n = 7) Control (CTRL)
received no flavonoids QA received 10 mgkg BW times d quercetin aglycone (quercetin
dihydrate Carl Roth GmbH amp Co KG Karlsruhe Germany) RU received 20 mgkg
BW times d quercetin as glucorhamnoside rutin (rutin trihydrate Carl Roth GmbH amp Co
KG) and CA received 10 mgkg BW times d of a green tea extract (GTE) containing
various catechins (Polyphenon 60 Sigma-Aldrich Chemie GmbH Steinheim
Germany) For QA and RU daily dose of quercetin equivalents was 10 mgkg of BW
(30 micromolkg BW) The GTE (703 total catechins) fed in CA was composed of 14
catechin 03 catechin gallate 52 gallocatechin 21 gallocatechin gallate (all as
trans-isomers) and 64 epicatechin 70 epicatechin gallate 190
epigallocatechin 288 epigallocatechin gallate (all as cis-isomers) Amounts of
flavonoid fed to calves in this study were based on previous studies in pigs and dogs
(Lesser et al 2004 Reinboth et al 2010 Luumlhring et al 2011) Due to studies on
bioavailability of flavonoids all calves received their respective daily dose with the
morning feeding on d 2 and no flavonoids were fed on d 3 and 4 From d 5 on the daily
dose was equally split with morning and evening meal since d 26 On d 1 3 and 4 no
flavonoids were fed Flavonoids were suspended in water and administered with a
disposable 10-ml syringe directly into the mouth during milk feeding
Jugular blood samples were taken immediately after birth and on d 5 12 19 and 26
before morning feeding using evacuated tubes (Vacuette Greiner Bio-One GmbH
Frickenhausen Germany) Tubes containing 15 IUmL lithium heparinate were used
for the determination of the plasma concentrations of flavonols catechins and the
markers for antioxidative capacity and oxidative stress tubes containing 25 gL sodium
fluoride and 18 gL potassium EDTA were used for the determination of plasma
CHAPTER 3
82
protein albumin glucose NEFA urea and lactate and tubes containing 18 gL
potassium-EDTA were used for the determination of plasma insulin and cortisol
concentrations The blood samples were immediately put on ice and centrifuged (1500
times g 4degC 20 min) To measure the catechins 1 mL of plasma was mixed with 20 microL of
an ascorbate-EDTA solution (04 molL NaH2PO4 Carl Roth GmbH amp Co KG)
containing 20 ascorbic acid (Merck KGaA Darmstadt Germany) and 01 EDTA
(Carl Roth GmbH amp Co KG) at pH 36 To measure F2-Isoprostanes a 0005
ethanolic butylhydroxytoluene (BHT) solution (0005 BHT in ethanol wv) was
added in one percent proportion for stabilization The plasma samples were stored until
analyzed at -20degC for metabolites and hormones and at -80degC for flavonoid and
(anti)oxidative parameters until analyzed
323 Analytical methods
Plasma concentrations of quercetin aglycone and its methylated (isorhamnetin and
tamarixetin) and dehydroxylated (kaempferol) derivatives were analyzed by HPLC with
fluorescence detection as described previously (Berger et al 2012) The detection limit
of flavonol was le 10 nmolL and the recovery rate of flavonols was 92 plusmn 2 (mean plusmn
SEM) Inter- and intraassay coefficients of variability for quercetin were 72 and 05
respectively The sum of quercetin and its metabolites in plasma is referred to as total
flavonols
Plasma concentrations of individual catechins (gallocatechin epigallocatechin
epigallocatechin gallate epicatechin gallate and epicatechin) were determined by
HPLC (Lee et al 1995) with some modifications (Egert et al 2013) In brief 500 microL
of thawed plasma were mixed with 375 microL of β-glucuronidasesulfatase (final activities
of 7300 and 130 UmL for glucuronidase and sulfatase respectively Sigma Aldrich
Chemie GmbH) and incubated at 37degC for 45 min Hydrolyzation was stopped by
adding 1 mL methylene chloride Samples were mixed for 4 min and centrifuged (3220
times g 4degC 15 min) The supernatant was transferred into another tube mixed with 1 mL
ethyl acetate for 4 min and centrifuged (3220 times g 4degC 20 min) and 800 microL of the
supernatant were transferred into a glass tube with glass pearls and ethyl acetate
extraction was repeated twice Supernatants were combined mixed with 10 microL of 1
aqueous ascorbic acid and dried by vacuum centrifugation (SPD2010 SpeedVac
System Thermo Fischer Scientific GmbH Dreieich Germany) The dried sample was
CHAPTER 3
83
dissolved in 150 microL of the mobile phase A by vortex mixing and ultrasonic bath for 15
min After centrifugation 30 microL of the supernatant were used for HPLC analyses For
catechin analyses by HPLC (Jasco Deutschland GmbH Groszlig-Umstadt Germany pump
model PU-2080 plus) the supernatant was injected into the fully automated autosampler
(AS-2057 Plus Jasco Deutschland GmbH) Separation occurred on a reverse-phase C-
18 Kromasil 100 column (25 times 46 mm 5 microm Jasco Deutschland GmbH) protected by
a pre-column (C-18 Inertsil ODS-2 10 times 4 mm particle size 5 μm Jasco Deutschland
GmbH) at 30degC Mobile phase A and B were composed of water acetonitrile and
trifluoroacetic acid (92801 and 653501 vvv) with a pH of 25 At a flow rate of 09
mLmin the eluent was monitored by electrochemical detection with potential settings
at 0 120 240 and 360 mV in a 4-channel colometric electrochemical detector (Coul
Array 5600A ESA Inc Chelmsford MA) Dominant signals used for quantification of
catechins were 120 mV for epigallocatechin and epicatechin gallate and 240 mV for
catechin gallocatechin epicatechin and epigallocatechin gallate respectively
Quantification of individual plasma catechins were carried out using external standards
which were generated by simultaneously adding catechin gallocatechin
epigallocatechin epigallocatechin gallate epicatechin gallate and epicatechin (Carl
Roth GmbH amp Co KG) to untreated plasma at final concentrations of each catechin of
0125 025 05 1 25 5 75 and 10 micromolL Calibration samples were treated in the
same way as experimental samples The coefficient of determination was r ge 099
detection limit of catechins was le 10 nmolL and the intra-assay coefficient of variation
was 24 plusmn 26 to 65 plusmn 47
Antioxidative capacity and oxidative stress markers were analyzed in repeated
measurements The trolox equivalent antioxidative capacity (TEAC) is defined as
amount of the water-soluble vitamin E derivate trolox (in mmol) needed to show the
same antioxidant capacity at a defined time point as 1 mmol of plasma and is expressed
as trolox equivalents (TE) in mmolL plasma The TEAC was measured according to
the modified protocol of Re et al (1999) by measuring spectrophotometrically the
decolorization of 22-azinobis(3-ethylbenzothiazoline-6-sulphonic acid) radical cation
(ABTS+) caused by binding to antioxidants at a wavelength of 734 nm Ferric reducing
ability of plasma (FRAP) was determined according to Benzie and Strain (1996) and is
given in ascorbic acid equivalents (ASCE) in micromolmL plasma Reduction of Fe3+
-
tripyridyltriazin by antioxidants from plasma results in a color change that is directly
CHAPTER 3
84
proportional to antioxidative capacity Absorbance was measured at a wavelength of
595 nm and compared to the one of ascorbic acid Thiobarbituric acid reactive
substances (TBARS) concentration in plasma was measured according to Yagi (1998)
with modifications and is given as malondialdehyde equivalents (MDAE) in micromolL
plasma Adding thiobarbituric acid to the sample results in formation of a red complex
whose optical density was measured photometrically at a wavelength of 532 nm F2-
isoprostanes especially their main representative 8-iso-prostaglandin F2α are produced
in vivo by peroxidation of the cell membrane lipid component arachidonic acid and is
considered as a reliable marker for lipid peroxidation Detection of 8-iso-prostaglandin
F2α was carried out with an enzymatic immune assay (Direct 8-iso-prostaglandin F2α
Assay Designs MI) and values are expressed in pgmL
Plasma metabolites were analyzed by the Clinic for Cattle (University of Veterinary
Medicine Hannover Foundation Germany) spectrophotometrically on an ABX Pentra
400 (Horiba ABX SAS Montpellier Cedex France) using the respective kits Albumin
(no A11A01664) and lactate (no A11A01721 Horiba Europe GmbH Hannover
Germany) NEFA (no 434-91795 Wako Chemicals GmbH Neuss Germany) glucose
(no 553-230) and total protein (biuret reaction no 553-412 MTI Diagnostics GmbH
Idstein Germany) and urea (no LT-UR 0050 Labor + Technik E Lehmann GmbH
Berlin Germany) Plasma insulin and cortisol concentrations were measured either by
radioimmunoassay or by ELISA respectively as previously described (Maciej et al
2015)
Colostrum was analyzed for DM CP crude fat and ash content (were measured by
MQD Qualitaumltspruumlfungs- und Dienstleistungsgesellschaft Mecklenburg-Vorpommern
Guumlstrow Germany) using standard procedures according to Weende (Naumann and
Bassler 2004) Chemical components and contents of the milk replacer were provided
by the manufacturer according to Weender analysis (Naumann and Bassler 2004 Table
31)
324 Statistical analyses
Statistical analyses were performed using SAS software Version 94 for Windows
Copyright SAS Institute Inc Cary NC USA Data on health performance and from
plasma measurements are presented as least squares means (LSM) plusmn standard error (SE)
and were analyzed by repeated measurement ANOVA using the Mixed procedure of
CHAPTER 3
85
SASSTAT software with a model containing the fixed effects treatment group (levels
CTRL QA RU CA for plasma flavonol concentrations only CTRL QA RU) day
(levels 1 5 12 19 26) and group times day interaction Repeated measures on the same
animal were taken into account by the REPEATED statement of the MIXED procedure
and an autoregressive type for the block diagonal residual covariance matrix Pairwise
differences among treatment groups and days were tested by the Tukey-Kramer-test
Data on fecal score and medical treatment were analyzed with the NPAR1WAY
procedure of SASSTAT software across the one-way classification treatment group
(levels CTRL QA RU CA) using Wilcoxon scores (for each wk seperately) Effects
and differences were considered significant if P lt 005
33 Results
331 Body weight feed intake and health status
All calves were born spontaneously and were evidently healthy Body weight was 473
plusmn 10 kg at birth and did not differ among groups
Average daily gain (616 gd plusmn 25 g n = 28) and final BW (582 kg plusmn 042 kg n = 28)
was not different between groups
Milk intake increased with time (wk 1 = 51 kgd wk 2 = 61 kgd wk 3 = 64 kgd wk
4 = 70 kgd P lt 0001) equally in all groups Concentrate intake also increased with
time (P lt 0001) equally in all groups During the first wk concentrate intake was very
low (4 gd) but increased to 27 gd during the second wk and to 117 gd in wk 4
Average fecal score for all groups was 14 and each calf had on average 2 d of strong
diarrhea indicated by fecal score 4 Severe diarrhea occurred between d 3 and d 20 and
fecal score was highest in wk 2 (fecal score 162) and wk 3 (fecal score 154) During
the first wk of life fecal score differed among groups being lower (P lt 005) in CA
group (fecal score 101) than in CTRL group (fecal score 146) and in group QA (fecal
score 131)
Treatments of diseases showed no significant group differences However group CA
had 3 treated calves (total 7 treatments 2 diarrhea 4 pneumonia 1 other disease) and
other groups 6 treated calves each [CTRL in total 9 treatments (4 diarrhea 2
pneumonia 3 other diseases) RU in total 10 treatments (1 diarrhea 7 pneumonia 2
other diseases) QA in total 10 treatments (1 diarrhea 5 pneumonia 4 other diseases)]
CHAPTER 3
86
Other diseases were omphalitis (n = 2) thromboflibitis (n = 4) polyartritis (n = 1)
obstipation (n = 1) and conjuctivitis (n = 1)
332 Plasma flavonoid concentrations
Plasma concentrations of total flavonols in QA and RU increased (P lt 005) until d 12
but decreased thereafter in QA (Figure 31) Plasma concentrations of total flavonols
(sum of quercetin isorhamnetin and tamarixetin) were higher (P lt 005) in RU than in
CTRL (data for quercetin metabolites not shown)
Plasma concentrations of individual catechins were below detection limit
Time d
5 12 19 26
Tota
l fl
avon
ols
n
mol
L
0
50
100
150
200
Figure 31 Plasma concentrations of total flavonols from d 5 to 26 after feeding of no flavonoid ()
and after oral administration of 9 mg of quercetinkg of BW times day as quercetin aglycone () or as
values are LSM plusmn SE n = 7 per group
333 Markers for antioxidative capacity and oxidative stress
Markers for antioxidative capacity (TEAC FRAP Figure 32A-D) changed with time
with TEAC increasing and FRAP decreasing from d 1 to d 5 and then remaining
relatively stable in all groups Absolute concentrations as well as relative changes did
not differ among groups but FRAP showed a group times time interaction (P lt 0001) for
CHAPTER 3
87
relative changes (in CTRL from d 12 to d 19 P = 003 and in RU from d 5 to d 12 P =
008) but no relative changes in QA and CA
Absolute concentrations of oxidative stress markers (TBARS F2-isoprostanes) revealed
huge individual variations within groups and did not show group or time differences
(Figure 32 E G) However relative changes of both oxidative stress markers showed
overall group effects between CA and CTRL (P lt 005 Figur 32 F H)
A TEAC Absolute plasma values B TEAC Plasma values relative to day 1
Time d
1 5 12 19 26
TE
m
mo
lL
17
18
19
20
21
22
Time d
5 12 19 26
TE
m
mo
lL
00
01
02
03
04
C FRAP Absolute plasma values D FRAP Plasma values relative to day 1
Time d
1 5 12 19 26
AS
CE
micro
mo
lm
L
100
120
140
160
180
200
220
240
Time d
5 12 19 26
AS
CE
micro
mo
lm
L
-140
-120
-100
-80
-60
-40
-20
0
E TBARS Absolute plasma values F TBARS Plasma values relative to day 1
Time d
1 5 12 19 26
MD
AE
micro
mo
lL
03
04
05
06
Time d
5 12 19 26
MD
AE
micro
mo
lL
-02
-01
00
01
02
03
b b
b
b
a a
a
a
a a
a a
a a
a a
a a
a a
a a
a a
a a
a a
a a
a a
a a
a a
b a
b a
b a
a
b
a
b a
b a
b a
b a
a a
a
b
a
a
b
a
a
b
a
a
b
a
a
b
a
a
b
a
a
b
a
CHAPTER 3
88
G F2-isoprostanes Absolute plasma values H F2-isoprostanes Plasma values relative to day 1
Time d
1 5 12 19 260
2000
4000
6000
8000
10000
12000
Time d
5 12 19 26
8-i
so-P
GF2
pg
mL
-8000
-6000
-4000
-2000
0
2000
4000
8-i
so-P
GF2
pg
mL
Figure 32 Time course of different markers for antioxidative capacity (TEAC = trolox equivalent
antioxidative capacity FRAP = ferric reducing ability of plasma) and oxidative stress markers
(TBARS = thiobarbituric acid reactive substances F2-isoprostanes) for each parameters absolute
plasma values are depicted in graphs A C E and G whereas graphs B D F and H show
incremental or decremental values relative to values on d 1 control () rutin () quercetin
aglycone () and green tea extract () a-b
LSM with different superscripts differ values are LSM
plusmn SE n = 7 per group
334 Plasma concentrations of metabolites and hormones
Plasma concentrations of total protein increased (P lt 0001) and plasma concentrations
of albumin decreased (P lt 0001) from d 1 to d 5 in all groups (Table 31) After d 5
there was a slight decrease (P lt 005) for total protein and a slight increase for albumin
(P lt 005) until the end of the study Plasma concentrations of urea decreased (P lt 001)
until d 12 in all groups and then remained relatively low (Table 31) Plasma glucose
concentrations slightly increased (P = 001) in most groups from d 1 to d 5 and then
variably changed up to d 26 (Table 31) Plasma lactate concentrations sharply
decreased after birth up to d 5 but then remained stable up to d 26 (Table 31) Plasma
NEFA concentrations decreased up to d 5 of life and partly increased again until d 12
(Table 31) Plasma insulin and cortisol concentrations decreased after birth in most
groups (P lt 0001) and then remained low (Table 31) All plasma concentrations
measured were comparable among groups except for plasma cortisol where the
decrease after birth differed among groups reflected by group times time interaction (P lt
0001)
CHAPTER 3
89
Ta
ble
32
B
loo
d p
lasm
a c
on
cen
tra
tio
ns
of
met
ab
oli
c tr
ait
s a
nd
ho
rm
on
es
of
calv
es a
fter
no
fla
vo
no
id (
CT
RL
) q
uer
ceti
n a
gly
con
e (Q
A)
ru
tin
(RU
) o
r o
f a
gre
en-t
ea e
xtr
act
fee
din
g c
on
tain
ing
ma
inly
ca
tech
ins
(CA
) fr
om
d 5
to
d 2
6
Sa
mp
les
are
ta
ken
bef
ore
mo
rnin
g m
ilk
fee
din
g
occ
urr
ed
Item
1
Da
y
Gro
up
S
E
AN
OV
A (
P-v
alu
e)
CA
C
TR
L
QA
R
U
Gro
up
D
ay
G
rou
p times
Da
y
To
tal
pro
tein
gL
1
50
6
50
3
50
0
50
3
13
4
03
3
00
0
06
3
5
6
03
6
27
5
88
6
14
12
58
3
60
6
59
4
61
1
19
55
6
58
6
58
0
59
0
26
56
4
58
0
55
7
58
4
Alb
um
in
gL
1
26
1
25
7
24
9
25
2
06
6
02
7
00
0
08
8
5
2
40
2
37
2
34
2
35
12
26
6
24
6
24
4
24
9
19
26
0
25
2
25
6
25
4
26
26
7
25
6
25
7
25
9
Ure
a m
mo
lL
1
3
48
3
61
3
84
3
23
02
6
07
4
00
0
07
8
5
26
1
2
52
2
33
2
31
12
2
02
1
40
1
98
1
72
19
1
58
1
44
1
55
1
72
26
1
43
1
34
1
63
1
52
Glu
cose
m
mo
lL
1
5
46
4
12
4
93
4
98
03
2
05
6
00
0
01
9
5
54
5
5
31
5
84
5
35
12
5
12
4
87
4
94
5
03
19
4
76
5
30
5
50
4
71
26
5
39
5
26
5
38
5
16
CHAPTER 3
90
Ta
ble
32
C
on
tin
ua
tio
n
Item
1
Da
y
Gro
up
S
E
AN
OV
A (
P-v
alu
e)
CA
C
TR
L
QA
R
U
Gro
up
D
ay
G
rou
p times
Da
y
Lac
tate
m
mo
lL
1
55
3
30
2
55
6
41
1
0
77
08
0
00
0
0
50
5
07
6
07
6
18
8
07
6
12
05
9
05
2
05
7
06
2
19
05
5
04
3
06
6
06
1
26
05
6
04
8
04
9
05
6
NE
FA
micro
mo
lL
1
55
2
91
7
67
4
64
8
90
8
05
3
00
0
0
28
5
28
3
22
0
24
8
21
1
12
21
5
46
9
34
4
37
4
19
36
4
30
9
29
5
36
1
26
28
8
28
0
27
6
20
5
Insu
lin
microgL
1
14
9
06
7
06
5
03
5
0
19
02
3
00
0
0
22
5
04
4
04
4
03
7
03
2
12
02
0
02
5
03
5
01
9
19
01
9
01
7
01
7
02
2
26
01
6
02
3
01
5
01
5
Co
rtis
ol
ngm
L
1
9
10
7a
5
50
0b
6
97
7ab
88
60
a
54
2
03
3
00
0
0
00
5
1
90
7
1
90
6
3
20
6
2
34
0
12
81
0
78
7
1
17
3
1
19
6
19
68
4
46
0
83
4
1
03
0
26
46
6
41
7
76
0
64
1
a-bL
SM
in a
ro
w w
ith d
iffe
rent
sup
ersc
rip
ts d
iffe
r (P
lt 0
05
)
1 V
alues
are
LS
M plusmn
SE
n =
7 p
er g
roup
CHAPTER 3
91
34 Discussion
At birth BW was not different among groups as planned and postnatal growth
performance was not affected by treatment The lack of differences in feed intake and
ADG during flavonoid administration is in line with findings of Oliveira et al (2010)
after feeding a flavonoid-rich pomegranate extract to calves for the first 30 d of life
Because concentrate intake did not differ among groups rumen development during
first month of life was unlikely changed by flavonoid administration as supported by
low plasma concentrations of β-hydroxybutyrate that did not increase in flavonoid-
treated calves during the experimental period (Maciej and Hammon unpublished
observations) Nevertheless plant extracts have the potential to affect rumen
development but may be only effective in older calves (Greathead 2003)
The impact of flavonoids on health status is discussed controversially Nielsen (2008)
found fewer diarrhea in weaned piglets after feeding natural feed additives containing a
high amount of flavonoids In contrast Oliveira et al (2010) reported no effects on
health parameters like incidence of diarrhea by feeding a polyphenol-rich feed to
newborn calves Interestingly we found an improved fecal score in CA compared to
CTRL calves In recent studies GTE were shown to inhibit diarrhea in newborn calves
(Ishihara et al 2001) In addition the number of treatments was markedly reduced in
the study of Ishihara et al (2001) confirming our results of numerically less treated
calves because of diarrhea in CA
Plasma antioxidant capacity of calves based on TEAC and FRAP measurements was
not influenced by flavonoid feeding in this study However the sharp changes of both
markers from d 1 to d 5 again highlights the role of colostrum feeding (Blum and
Hammon 2000 Hammon et al 2013) Measurement of TEAC is dependent on the
vitamin E analogue trolox Because vitamin E is provided by colostrum feeding (Blum
et al 1997 Lindmark-Maringnsson and Aringkesson 2000 Zanker et al 2000) and plasma
TEAC also increased rapidly after first colostrum intake in calves Our findings on
FRAP agree with those of Gaaacutel et al (2006) that also showed a decline of this parameter
after first colostrum intake Urea is a major factor influencing FRAP (Benzie and Strain
1996) and albumin and urea are factors influencing TEAC (Miller et al 1993) but
these metabolites only changed in time and were similar among groups Although
plasma metabolites were not affected by treatment decremental changes of FRAP
CHAPTER 3
92
values from d 12 to d 19 in CTRL and from d 5 to d 12 in RU reflect changes of
antioxidative capacity with time
Oxidative stress markers (TBARS and F2-Isoprostanes) did not follow a clear time-
dependent trend as seen for TEAC and FRAP Nevertheless TBARS increased in time
in CTRL and decreased in CA suggesting less oxidative stress in calves fed GTE On
the other hand F2-isoprostane concentrations in plasma decreased only in CTRL
indicating more oxidative stress In previous studies on calves plasma concentrations of
oxidative stress markers distinctly increased when calves were sick or stressed (Erisir et
al 2013 Ahmed and Hassan 2007 Al-Qudah 2009) This suggests that flavonoid
feeding to healthy calves as in the present study may not change oxidative stress
markers A polyphenol-rich diet in humans (Nieman et al 2013) lactating cows
(Gohlke et al 2013) pigs (Luumlhring et al 2011) or rats (Igarashi and Ohmuma 1995)
also led only to slight or no changes of markers of antioxidant activity or oxidative
stress
In general methods for determination of TBARS and F2-isoprostanes were discussed to
be inappropriate because of too low specificity and concomitantly too high inter-assay
variation (Rimbach et al 1999 Halliwell and Whiteman 2004 Celi 2011)
Furthermore antioxidative status tremendously differs between individuals and depends
on medical treatment (Farombi 2001) and season (Bernabucci et al 2002) In addition
plasma flavonol concentrations were relatively low since blood sampling occurred in
the pre-prandial stage and postprandial plasma flavonol concentration in calves
decreased rapidly with age (Maciej et al 2015) Therefore variable results concerning
antioxidative status or oxidative stress markers can be expected Also the amount of
flavonoid used in this study was based on previous studies in pigs and dogs (Lesser et
al 2004 Reinboth et al 2010 Luumlhring et al 2011) which may not be adequate for
colostrum- and milk-fed calves The determination of other parameters such as of
protein damage determination of vitamins E and C or of enzymatic antioxidants might
be more appropriate
We assumed that quercetin feeding may affect metabolic status in calves as some
authors postulate effects of flavonoids on glucose metabolism (Cermak et al 2004
Shetty et al 2004 Gohlke et al 2013) However we found no effects on pre-prandial
plasma glucose concentrations by flavonoid feeding in this study The increase of
plasma glucose concentrations after birth reflects lactose intake by colostrum and milk
CHAPTER 3
93
feeding as well as an increasing endogenous glucose production with age (Hammon et
al 2013) Because plasma glucose is highly regulated with the goal to maintain
euglycemia concentrations were relatively stable throughout the study and
corresponded to earlier presented data measured in young milk-fed calves (Hadorn et
al 1997 Rauprich et al 2000 Nussbaum et al 2002) Plasma concentrations of other
metabolites and insulin were also not affected by flavonoid feeding and simply reflected
physiological changes during first month of life (Nussbaum et al 2002 Schiessler et
al 2002 Hammon et al 2012) Differences in plasma cortisol concentrations among
groups on d 1 were independent of flavonoid administration as blood was sampled
before flavonoid supplementation
In conclusion effects of flavonoid treatment were much less than hoped or expected
However reduced medical treatment fewer incidences of diarrhea and a slight effect
on oxidative stress markers may indicate a potential health-promoting effect of
catechins in this study Nevertheless evidence for biological effects of flavonoid-
containing supplements is not available for young calves Feeding higher doses of
flavonoids than in this study may possibly cause more distinct changes of the metabolic
or antioxidative status in neonatal calves In addition use of more specific markers of
anti-oxidative capacity or stress may be helpful in future studies
Acknowledgements
We gratefully thank Petra Schulz and Maike Gosse (Christian Albrechts University
Kiel) for excellent laboratory assistance as well as Annette Zeyner Kirsten Buumlsing
(University of Rostock) and Bernd Stabenow (Leibniz Institute for Farm Animal
Biology) for providing the experimental facilities Chicken-egg derived
immunoglobulins (Globigen Life Start 25 ) were generously provided by EW
Nutrition GmbH Visbek Germany This work is part of the joint research project Food
Chain Plus (FoCus) and was financially supported by the Federal Ministry of Education
and Research Germany (BMFT grant no 0315538B)
CHAPTER 3
94
References
Ahmed W M and S E Hassan 2007 Applied studies on coccidiosis in growing
Buffalo-calves with special reference to oxidantantioxidant status World J Zool
240ndash48
Alexandrovich K N and S E Antonovna 2009 Age-dependent level of antioxidant
defence system and lipid metabolism state in calves Int J Appl Res Vet Med
773ndash75
Al-Qudah K M 2009 Oxidative stress in calves with acute or chronic
bronchopneumonia Rev Meacuted Veacutet 160231ndash236
Benzie I F and J J Strain 1996 The ferric reducing ability of plasma (FRAP) as a
measure of ldquoantioxidant powerrdquo The FRAP assay Anal Biochem 23970ndash76
Berger L M S Wein R Blank C C Metges and S Wolffram 2012 Bioavailability
of the flavonol quercetin in cows after intraruminal application of quercetin
aglycone and rutin J Dairy Sci 955047ndash5055
Bernabucci U B Ronchi N Lacetera and A Nardone 2002 Markers of oxidative
status in plasma and erythrocytes of transition dairy cows during hot season J
Dairy Sci 852173ndash2179
Blum J W U Hadorn H P Sallmann and W Schuep 1997 Delaying colostrum
intake by one day impairs plasma lipid essential fatty acid carotene retinol and
α-tocopherol status in neonatal calves J Nutr 1272024ndash2029
Blum J and H Hammon 2000 Colostrum effects on the gastrointestinal tract and on
nutritional endocrine and metabolic parameters in neonatal calves Livest Prod
Sci 66151ndash159
Celi P 2011 Biomarkers of oxidative stress in ruminant medicine Immunopharmacol
Immunotoxicol 33233ndash240
Cermak R S Landgraf and S Wolffram 2004 Quercetin glucosides inhibit glucose
uptake into brush-border-membrane vesicles of porcine jejunum Br J Nutr
91849ndash55
di Carlo G D N Mascolo A A Izzo and F Capasso 1994 Effects of quercetin on
the gastrointestinal tract in rats and mice Phytother Res 842ndash45
CHAPTER 3
95
Egert S J Tereszczuk S Wein M J Muumlller J Frank G Rimbach and S Wolffram
2013 Simultaneous ingestion of dietary proteins reduces the bioavailability of
galloylated catechins from green tea in humans Eur J Nutr 52281ndash288
Erisir M F M Kandemir and M Yuumlksel 2013 The effects of Caesarean section on
lipid peroxidation and some antioxidants in the blood of newborn calves Vet
Arch 83153ndash159
Farombi E O 2001 Antioxidant status and hepatic lipid peroxidation in
chloramphenicol-treated rats Tohoku J Exp Med 19491ndash98
Gaaacutel T P Ribiczeyneacute-Szaboacute K Stadler J Jakus J Reiczigel P Koumlveacuter M Meacutezes
and L Suumlmeghy 2006 Free radicals lipid peroxidation and the antioxidant
system in the blood of cows and newborn calves around calving Comp Biochem
Physiol B Biochem Mol Biol 143391ndash396
Gaacutelvez J F Saacutenchez de Medina J Jimeacutenez M I Torres M I Fernaacutendez M C
Nuacutentildeez A Riacuteos A Gil and A Zarzuelo 1995 Effect of quercitrin on lactose-
induced chronic diarrhoea in rats Planta Med 61302ndash306
Gohlke A C J Ingelmann G Nuumlrnberg J M Weitzel H M Hammon S Goumlrs A
Starke S Wolffram and C C Metges 2013 Influence of 4-week intraduodenal
supplementation of quercetin on performance glucose metabolism and mRNA
abundance of genes related to glucose metabolism and antioxidative status in
dairy cows J Dairy Sci 966986-7000
Greathead H 2003 Plants and plant extracts for improving animal productivity Proc
Nutr Soc 62279ndash290
Hadorn U H Hammon R M Bruckmaier and J W Blum 1997 Delaying colostrum
intake by one day has important effects on metabolic traits and on gastrointestinal
and metabolic hormones in neonatal calves J Nutr 1272011ndash2023
Halliwell B 1991 Reactive oxygen species in living systems source biochemistry
and role in human disease Am J Med 9114Sndash22S
Halliwell B and M Whiteman 2004 Measuring reactive species and oxidative
damage in vivo and in cell culture how should you do it and what do the results
mean Br J Pharmacol 142231ndash255
Hammon H M J Steinhoff-Wagner J Flor U Schoumlnhusen and C C Metges 2013
Lactation Biology Symposium role of colostrum and colostrum components on
glucose metabolism in neonatal calves J Anim Sci 91685ndash695
CHAPTER 3
96
Hammon H M J Steinhoff-Wagner U Schoumlnhusen C C Metges and J W Blum
2012 Energy metabolism in the newborn farm animal with emphasis on the calf
endocrine changes and responses to milk-born and systemic hormones Domest
Anim Endocrinol 43171ndash185
Igarashi K and M Ohmuma 1995 Effects of isorhamnetin rhamnetin and quercetin
on the concentrations of cholesterol and lipoperoxide in the serum and liver and
on the blood and liver antioxidative enzyme activities of rats Biosci Biotechnol
Biochem 59595ndash601
Ishihara N D-C Chu S Akachi and L R Juneja 2001 Improvement of intestinal
microflora balance and prevention of digestive and respiratory organ diseases in
calves by green tea extracts Livest Prod Sci 68217ndash229
Kobayashi Y M Miyazawa A Kamei K Abe and T Kojima 2010 Ameliorative
effects of mulberry (Morus alba L) leaves on hyperlipidemia in rats fed a high-fat
diet Induction of fatty acid oxidation inhibition of lipogenesis and suppression
of oxidative stress Biosci Biotechnol Biochem 742385ndash2395
Larson L L F G Owen J L Albright R D Appleman R C Lamb and L D
Muller 1977 Guidelines toward more uniformity in measuring and reporting calf
experimental data J Dairy Sci 60989ndash991
Lee M J Z Y Wang H Li L Chen Y Sun S Gobbo D A Balentine and C S
Yang 1995 Analysis of plasma and urinary tea polyphenols in human subjects
Cancer Epidemiol Biomarkers Prev 4393ndash399
Lesser S R Cermak and S Wolffram 2004 Bioavailability of quercetin in pigs is
influenced by the dietary fat content J Nutr 1431508ndash1511
Lindmark-Maringnsson H and B Aringkesson 2000 Antioxidative factors in milk Br J
Nutr 84103ndash110
Luumlhring M R Blank S Wolffram 2011 Vitamin E-sparing and vitamin E-
independent antioxidative effects of the flavonol quercetin in growing pigs Anim
Feed Sci Technol 169199ndash207
Maciej J C T Schaumlff E Kanitz A Tuchscherer R M Bruckmaier S Wolffram
H M Hammon 2015 Bioavailability of the flavonol quercetin in neonatal calves
after oral administration of quercetin aglycone or rutin J Dairy Sci 98 3906ndash
3917
CHAPTER 3
97
Middleton E C Kandaswami and T C Theoharides 2000 The effects of plant
flavonoids on mammalian cells Implications for inflammation heart disease and
cancer Pharmacol Rev 52673ndash751
Miller J K E Brzezinska-Slebodzinska and F C Madsen 1993 Oxidative stress
antioxidants and animal function J Dairy Sci 762812ndash2823
Naumann C and R Basler 2004 Die chemische Untersuchung von Futtermitteln
VDLUFA-Verlag Darmstadt Germany
Nielsen B K 2008 Botanicals as feed additives to improve health and production in
pig breeding Res Pig Breed 212ndash18
Nieman D C N D Gillitt A M Knab R A Shanely K L Pappan F Jin and M
A Lila 2013 Influence of a polyphenol-enriched protein powder on exercise-
induced inflammation and oxidative stress in athletes a randomized trial using a
metabolomics approach PLoS One 8e72215
Nussbaum A G Schiessler H M Hammon and J W Blum 2002 Growth
performance and metabolic and endocrine traits in calves pair-fed by bucket or by
automate starting in the neonatal period J Anim Sci 801545ndash1555
Oliveira R A C D Narciso R S Bisinotto M C Perdomo M A Ballou M
Dreher and J E P Santos 2010 Effects of feeding polyphenols from
pomegranate extract on health growth nutrient digestion and
immunocompetence of calves J Dairy Sci 934280ndash91
Rauprich A B E H M Hammon and J W Blum 2000 Effects of feeding colostrum
and a formula with nutrient contents as colostrum on metabolic and endocrine
traits in neonatal calves Biol Neonate 7853ndash64
Re R N Pellegrini A Proteggente A Pannala M Yang and C Rice-Evans 1999
Antioxidant activity applying an improved ABTS radical cation decolorization
assay Free Radic Biol Med 261231ndash1237
Reinboth M S Wolffram G Abraham F R Ungemach and R Cermak 2010 Oral
bioavailability of quercetin from different quercetin glycosides in dogs Br J
Nutr 104198ndash203
Rimbach G D Houmlhler A Fischer S Roy F Virgili J Pallauf and L Packer 1999
Methods to assess free radicals and oxidative stress in biological systems Arch
Anim Nutr 52203ndash222
CHAPTER 3
98
Schiessler G A Nussbaum H M Hammon and J W Blum 2002 Calves sucking
colostrum and milk from their dams or from an automatic feeding station starting
in the neonatal period metabolic and endocrine traits and growth performance
Anim Sci 74431ndash444
Schwerin M U Dorroch M Beyer H Swalve C C Metges and P Junghans 2002
Dietary protein modifies hepatic gene expression associated with oxidative stress
responsiveness in growing pigs FASEB J 161322ndash1324
Shetty A K R Rashmi M G R Rajan K Sambaiah and P V Salimath 2004
Antidiabetic influence of quercetin in streptozotocin-induced diabetic rats Nutr
Res 24373ndash381
Sies H W Stahl and A Sevanian 2005 Nutritional dietary and postprandial
oxidative stress J Nutr 135969ndash972
USDA 2011 Cattle and calves nonpredator death loss in the United States 2010
USDAndashAPHISndashVSndashCEAH Fort Collins CO 6311111
Yagi K 1998 Simple assay for the level of total lipid peroxides in serum or plasma
Pages 101ndash106 in Free Radical and Antioxidant Protocols D Armstrong ed
Humana Press New York Buffalo USA
Zanker I A H M Hammon and J W Blum 2000 -Carotene retinol and -
tocopherol status in calves fed colostrum at 0-2 6-7 12-13 or 24-25 hours after
birth Int J Vitam Nutr Res 70305ndash310
99
Chapter 4
General Discussion
CHAPTER 4
100
General Discussion
Rearing neonatal calves healthy and economically is still a major challenge in todayʼs
dairy farming Feed supplements are often claimed to provide an effective and easy way
to improve performance of animals but the actual use of such supplements marketed is
manifold Since flavonoids are ingredients in all higher plants with numerous health-
promoting properties like acting antioxidative antiviral or anti-inflammatory and
beneficial effects on metabolic key enzymes and even antidiarrheal remedies (Chapter
1 Gaacutelvez et al 1995 Rao et al 1997 Middleton et al 2000) their use in dairy
nutrition is comprehensible However biological effects in vivo require systemic BV
Bioavailability in particular means the absorption distribution metabolism and at least
the excretion from the organism For calves systemic BV is widely unknown so far
Therefore this study was performed to examine BV and the biological effects of the
most abundant flavonoids quercetin and catechin in neonatal calves
In the first study of this thesis (Chapter 2) the systemically availability of quercetin
either applied as quercetin aglycone or applied as quercetin glucorhamnoside rutin
linked to the sugar rutinose was evaluated in newborn calves on d 2 and on d 29 of life
to investigate two different ontogenetic states In the second study (Chapter 3) possible
influences of quercetin as aglycone or as rutin and furthermore of catechin on the
metabolic and antioxidative status in calves were examined during a 3-wk feeding from
d 5 to 26 of life
In both studies of this thesis quercetin aglycone and rutin were supplemented at an
amount of 30 micromolkg of BW per d This dosage based results from companion studies
in dairy cows (Berger et al 2012 Gohlke et al 2013) Both quercetin sources were fed
as pure substances suspended in 10 mL of water to enable oral apply of flavonoids
during milk feeding Therefore possible effects can be deduced exclusively from
flavonoid feeding what would not be the case when feeding plant extracts with mixed
compositions or other natural products like propolis as seen in a number of other
studies in calves (Yaghoubi et al 2008 Oliveira et al 2010) In contrast to quercetin
feeding catechin could not be fed as pure substance but was fed by a GTE on a level of
10 mgkg of BW per d of original substance containing 703 catechins Dosage of
catechins was aligned to quercetin dosage and is shown in Table 1 of the appendix of
CHAPTER 4
101
this thesis However plasma catechin concentrations were below the detection limit
(data not shown) thus in further studies higher dosages should be applied
Studies on BV of flavonoids are conducted for a wide variety of species including
humans (Erlund et al 2000 Egert et al 2008) pigs (Ader et al 2000 Lesser et al
2004 Cermak et al 2003) rats (Manach et al 1997 1999) dogs (Reinboth et al
2010) horses (Wein and Wolffram 2013) and cows (Berger et al 2012 Gohlke et al
2013) The enormous differences among the species and ages impeded a transfer of
findings to neonatal calves (Chapter 1 section 225) Hence this thesis shall be a basis
for further more specific investigations on flavonoid feeding in calves Next to
differences among species as mentioned above great inter-individual differences among
calves were found in these experiments confirming previous studies for plasma
flavonol concentrations attributed to individual enzyme expression or differences in
intestinal bacterial colonization (Neacutemeth et al 2003 Manach et al 2005) Calves for
these studies originated from two distinct neighboring farms thus genetic background
feeding of dams and further external influences may partly account for differences
found Such impacts could be avoided by selecting calves from just one dairy operation
with a common pedigree
In the first study of this thesis (Chapter 2) quercetin was systemically available
reflected by increased concentrations of total flavonols quercetin and the quercetin
metabolites tamarixetin isorhamnetin and kaempferol in blood plasma of neonatal
calves both after administration of quercetin as aglycone and as glucorhamnoside rutin
Neonatal calves are regarded as functional monogastrics until development of the
reticulorumen allows rumination (Drackley 2008) Therefore BV in neonatal calves is
more comparable to monogastric but not to ruminant species as quercetin aglycone was
better absorbed than rutin This is in line with a decreasing BV of quercetin with
ontogenesis as on d 29 a higher microbial fermentation thus lower BV due to partial
ruminal degradation of quercetin was expected (Heinrichs and Jones 2003 Guilloteau
et al 2009 Berger et al 2012)
However absorption of quercetin occurred slowly reflected in delayed and lower
maximal reached plasma concentrations than found in monogastrics (Lesser et al 2004
Reinboth et al 2010 Chapter 2) or in adult cattle (Berger et al 2012 Gohlke et al
2013 Chapter 2) although applying comparable amounts of quercetin This once more
underpins that results from studies on BV of other species or adult cattle cannot be
CHAPTER 4
102
deduced to young calves Furthermore a delayed absorption of quercetin as
glucorhamnoside rutin but not as its aglycone was seen as result of different absorption
sites in monogastrics (Hollman et al 1997 Manach et al 1997 Chapter 1) On the
contrary in neonatal calves quercetin aglycone and rutin administration showed the
same slow increase in plasma concentrations indicating similar absorption sites as well
as a special feature in milk-fed calves because of abomasal milk clotting (Chapter 2) To
exclude interactions with milk fed flavonoids may be administered with water only
instead of milk which should result in a faster increase of plasma flavonol
concentrations Anyway to determine the exact place of absorption and metabolism of
flavonoids in calves further studies are required like intraruminal or intraduodenal
application of flavonoids or in vitro absorption tests of flavonoids with different bovine
gastrointestinal tissues
Aside from this the slow absorption of flavonols during BV studies (Chapter 2) seems
to be associated with the accumulation of quercetin in plasma during long-term
administration (Chapter 3) When elimination half-lives of flavonoids are long repeated
absorption of flavonoids can cause accumulation in blood plasma (Aherne and OʼBrien
2002 Chapter 1) Again calves showed differences to other monogastrics like pigs
where long-term quercetin feeding did not lead to an accumulation in plasma mainly
due to much faster absorption of quercetin (Bieger et al 2008) In calves accumulation
of flavonols in plasma during long-term administration was especially seen for rutin
(Chapter 3) what is in line with findings from BV studies of a delayed peak in plasma
flavonol concentrations after rutin feeding especially on d 2 (Chapter 2)
Interestingly even without dietary flavonoid supplementation calves showed
measurable plasma flavonol concentrations during BV studies (Chapter 2) and during
long-term administration (data not shown Chapter 3) This was particularly seen on day
2 when colostrum was fed (Chapter 2) indicating once more the outstanding role of
colostrum for health and welfare of calves (Hammon et al 2013) In addition to further
clarify the source of flavonols analysis of the respective composition of colostrum or
calf feed is required In the superordinate context of these studies bovine milk or
colostrum are probable flavonoid sources in human nutrition as well as veal rich in
flavonoids as so called functional food Precondition for this would be further studies
examining the distribution of flavonoids in calves and distinct tissue analyses after
flavonoid absorption (Chapter 1)
CHAPTER 4
103
However concentrations of metabolites and hormones measured postprandial during
BV studies (Chapter 2) or basal during long-term flavonoid treatment (Chapter 3) were
in line with previous studies on calves without dietary flavonoid supplementation
indicating physiological conditions and an unaffected metabolic status of calves by
flavonoid feeding Results of basal blood samples during long-term flavonoid
administration (Chapter 3) confirmed the findings of unaffected metabolic parameters
found in BV studies (Chapter 2) Flavonoid administration at higher dosage and a more
distinct focus on glucose metabolism during the experimental design putatively may
reveal effects as found in companion studies on calves (Gruse et al 2014) or in
monogastric animals showing an inhibited glucose uptake in intestinal cells after
quercetin feeding (Cermak et al 2004) Nevertheless all data indicated the use of
flavonoids in sensitive neonatal calves is harmless This is noteworthy as secondary
plant metabolites in the past mainly counted as anti-nutritive factors (Durmic and
Blache 2012)
Markers of oxidative stress and of the antioxidative capacity in calves during long-term
administration of quercetin and catechin were barely influenced by feeding regime but
influenced by time reflected by physiological changes during maturation (Chapter 3)
Colostrum as source for antioxidants like vitamins and enzymes (Lindmark-Maringnsson
and Aringkesson 2000) was assumed to induce at least most of the time effects of the
antioxidative status in this study The distinct increase of TE (unit for TEAC) and the
decrease of ASCE (as unit for FRAP) from shortly after birth to d 5 of life demonstrated
the important role of feed intake This was the first study proofing this outstanding
influence of feed intake However similar changes in plasma concentrations were not
seen for TBARS or F2-isoprostanes as oxidative stress markers Therefore relative
changes from d 1 to other d were evaluated which pointed out a possible role of
catechin feeding Taken together reduced medical treatment better fecal scores and a
slight impact on oxidative stress markers possibly indicate health-promoting effects of
catechins in calves This is especially interesting und should be further examined in
regard to the low plasma catechin concentrations found
Nevertheless in this study changes in oxidative stress markers by flavonoid feeding
were weak (Chapter 3) when compared to other studies showing more distinct
differences in oxidative stress markers mainly in obviously impaired calves (Wernicki
et al 2006 Ahmed and Hassan 2007 Al-Qudah 2009) This was not true in the
CHAPTER 4
104
studies of this thesis where all calves were kept under similar conditions Furthermore
in contrast to plasma metabolites like glucose or protein there is a lack of basic
information like data for physiological ranges concerning markers for antioxidative
capacity and oxidative stress Anyway this may be explained by the huge variation
found in the distinct studies and the different methods of analysis (Chapter 1 3) raising
the question whether there are more appropriate markers to determine the antioxidative
status of calves or if additional parameters should be used As presented previously
(Chapter 1 section 233) conceivable suggestions are the determination of vitamins E
and C carotenoids bilirubin or glutathione as well as enzymatic antioxidants like
superoxide-dismutase catalase or glutathione-peroxidase Moreover a more closely
setting of sample collection over longer time periods would allow a deeper insight in
kinetics of flavonoid action Additionally in these studies only 7 calves per group were
investigated Using more animals per group would let findings become more
conclusive
On the other hand dietary flavonoid supplementation namely catechin feeding seemed
to improve health status reflected in fewer sick calves and less diarrhea although
plasma catechin concentrations were below the detection limit (Chapter 3) However
biological effects not only depended on absolute plasma concentrations but also on
concentrations in target tissues which is needed to be examined in further studies A
possible approach is comparing directly the effects of flavonoid supplementation from d
of birth to a control group without flavonoid supplementation or treating sick calves
with flavonoids compared to sick calves without flavonoid treatment with both
approaches using an adequate number of animals Furthermore the chemical form or
the galenical form in general in which the flavonoid is applied greatly influences BV
and thus the biological effects (Chapter 1) as may be seen in studies that compare
quercetin aglycone or rutin administration to natural plant extracts containing quercetin
In previous studies on V urine and feces collection were the appropriate methods used
as due to urine and feces analyses the excretion of the investigated substance can be
verified Since this thesis focused on the more fundamental question if flavonoids were
absorbed at all no excrement was analyzed
In conclusion these studies clearly showed for the first time that quercetin is
systemically available in newborn calves This is a requirement for biological effects in
the organism which already are claimed by feed producers in practical dairy nutrition
CHAPTER 4
105
The great influence of maturation and ontogenetic stage of young calves on BV of
flavonoids was demonstrated just as the influence of the chemical form of the
administered flavonoids It was evaluated to what extend flavonoids affect the
metabolic and antioxidative status in neonatal calves shown in slight changes of the
respective markers This all contributes to a better understanding of the usage the mode
of action and the benefit of flavonoids as ʽnaturalʼ health-promoting feed supplements
CHAPTER 4
106
References
Ader P A Wessmann and S Wolffram 2000 Bioavailability and metabolism of the
flavonol quercetin in the pig Free Radic Biol Med 281056ndash1067
Aherne S A and N M OrsquoBrien 2002 Dietary flavonols Chemistry food content
and metabolism Nutrition 1875ndash81
Ahmed W M and S E Hassan 2007 Applied studies on coccidiosis in growing
Buffalo-calves with special reference to oxidantantioxidant status World J Zool
240ndash48
Al-Qudah K M 2009 Oxidative stress in calves with acute or chronic
bronchopneumonia Rev Meacuted Veacutet 160231ndash236
Berger L M S Wein R Blank C C Metges and S Wolffram 2012 Bioavailability
of the flavonol quercetin in cows after intraruminal application of quercetin
aglycone and rutin J Dairy Sci 955047ndash5055
Bieger J R Cermak R Blank V C J de Boer P C H Hollman J Kamphues and
S Wolffram 2008 Tissue distribution of quercetin in pigs after long-term dietary
supplementation J Nutr 1381417ndash1420
Cermak R S Landgraf and S Wolffram 2003 The bioavailability of quercetin in
pigs depends on the glycoside moiety and on dietary factors J Nutr 1332802ndash
2807
Cermak R S Landgraf and S Wolffram 2004 Quercetin glucosides inhibit glucose
uptake into brush-border-membrane vesicles of porcine jejunum Br J Nutr
91849ndash55
Drackley J K 2008 Calf nutrition from birth to breeding Vet Clin North Am Food
Anim Pract 2455ndash86
Durmic Z and D Blache 2012 Bioactive plants and plant products Effects on animal
function health and welfare Anim Feed Sci Technol 176150ndash162
Egert S S Wolffram A Bosy-Westphal C Boesch-Saadatmandi A E Wagner J
Frank G Rimbach and M J Mueller 2008 Daily quercetin supplementation
dose-dependently increases plasma quercetin concentrations in healthy humans J
Nutr 1381615ndash1621
CHAPTER 4
107
Erlund I T Kosonen G Alfthan J Maumlenpaumlauml K Perttunen J Kenraali J
Parantainen and A Aro 2000 Pharmacokinetics of quercetin from quercetin
aglycone and rutin in healthy volunteers Eur J Clin Pharmacol 56545ndash553
Gaacutelvez J F Saacutenchez de Medina J Jimeacutenez M I Torres M I Fernaacutendez M C
Nuacutentildeez A Riacuteos A Gil and A Zarzuelo 1995 Effect of quercitrin on lactose-
induced chronic diarrhoea in rats Planta Med 61302ndash306
Gohlke A C J Ingelmann G Nuumlrnberg A Starke S Wolffram and C C Metges
2013 Bioavailability of quercetin from its aglycone and its glucorhamnoside rutin
in lactating dairy cows after intraduodenal administration J Dairy Sci 962303ndash
2313
Gruse J S Goumlrs W Otten J Weitzel S Wolffram C C Metges and H M
Hammon 2014 Effects of different milk diets and oral quercetin supplementation
on postprandial glucose metabolism in neonatal calves Proc Soc Nutr Physiol
23114
Guilloteau P R Zabielski J W Blum 2009 Gastrointestinal tract and digestion in
the young ruminant Ontogenesis adaptations consequences and manipulations
J Physiol Pharmacol 60 Suppl 237ndash46
Hammon H M J Steinhoff-Wagner J Flor U Schoumlnhusen and C C Metges 2013
Lactation Biology Symposium Role of colostrum and colostrum components on
glucose metabolism in neonatal calves J Anim Sci 91685ndash695
Hollman P C H J M P van Trijp M N C P Buysman M S vd Gaag M J B
Mengelers J H M de Vries and M B Katan 1997 Relative bioavailability of
the antioxidant flavonoid quercetin from various foods in man FEBS Lett
418152ndash156
Heinrichs A J and C M Jones 2003 Feeding the newborn calf College of
Agricultural Sciences Agricultural Research and Cooperative Extension
Pennsylvania State University University Park PA
Lesser S R Cermak and S Wolffram 2004 Bioavailability of quercetin in pigs is
influenced by the dietary fat content J Nutr 1431508ndash1511
Lindmark-Maringnsson H and B Aringkesson 2000 Antioxidative factors in milk Br J
Nutr 84103ndash110
Manach C C Morand C Demigneacute O Texier F Reacutegeacuterat and C Reacutemeacutesy 1997
Bioavailability of rutin and quercetin in rats FEBS Lett 40912ndash16
CHAPTER 4
108
Manach C O Texier C Morand V Crespy F Reacutegeacuterat C Demigneacute and C Reacutemeacutesy
1999 Comparison of the bioavailability of quercetin and catechin in rats Free
Radic Biol Med 271259ndash1266
Manach C G Williamson C Morand A Scalbert and C Reacutemeacutesy 2005
Bioavailability and bioefficacy of polyphenols in humans I Review of 97
bioavailability studies Am J Clin Nutr 81230Sndash242S
Middleton E C Kandaswami and T C Theoharides 2000 The effects of plant
flavonoids on mammalian cells Implications for inflammation heart disease and
cancer Pharmacol Rev 52673ndash751
Neacutemeth K G W Plumb J-G Berrin N Juge R Jacob H Y Naim G Williamson
D M Swallow and P A Kroon 2003 Deglycosylation by small intestinal
epithelial cell beta-glucosidases is a critical step in the absorption and metabolism
of dietary flavonoid glycosides in humans Eur J Nutr 4229ndash42
Oliveira R A C D Narciso R S Bisinotto M C Perdomo M A Ballou M Dreher
and J E P Santos 2010 Effects of feeding polyphenols from pomegranate
extract on health growth nutrient digestion and immunocompetence of calves J
Dairy Sci 934280ndash4291
Rao V S F A Santos T T Sobreira M F Souza C L Melo and E R Silveira
1997 Investigations on the gastroprotective and antidiarrhoeal properties of
ternatin a tetramethoxyflavone from Egletes viscosa Planta Med 63146ndash149
Reinboth M S Wolffram G Abraham F R Ungemach and R Cermak 2010 Oral
bioavailability of quercetin from different quercetin glycosides in dogs Br J
Nutr 104198ndash203
Wein S and S Wolffram 2013 Oral bioavailability of quercetin in horses J Equine
Vet Sci 33441ndash445
Wernicki A M Kankofer P Mikucki and A Puchalski 2006 Evaluation of plasma
cortisol and TBARS levels in calves after short-term transportation Rev Meacuted
Veacutet 15730ndash34
Yaghoubi S M J G R Ghorbani H R Rahmani and A Nikkhah 2008 Growth
weaning performance and blood indicators of humoral immunity in Holstein
calves fed supplemental flavonoids Anim Physiol Anim Nutr 92456ndash462
109
Summary
SUMMARY
110
Summary
Flavonoids are secondary plant metabolites with numerous health-promoting properties
The feeding industry widely use flavonoids as ʽgreenʼ feed supplements even scientific
evidence of their value are often hypothetical Due to their high susceptibility to
diseases the use of flavonoids in neonatal calves might be especially useful However
to determine biological effects in vivo flavonoids must be systemically available in
calves but this is not known yet Therefore the aim of this study was to determine BV
and their biological effects of the most abundant flavonoids quercetin and catechin in
neonatal calves
In part one of the study calves (n = 7 per group) were fed quercetin as aglycone or as
glucorhamnoside rutin or no flavonoid (control group) on d 2 and 29 of life Blood
samples were taken in defined time intervals before and until 48 h after flavonoid
administration via jugular vein catheters Quercetin and its methylated (isorhamnetin
tamarixetin) and dehydroxylated (kaempferol) metabolites were analyzed in blood
plasma using HPLC with subsequent fluorescence detection It was shown that
quercetin is systemically available both as aglycone and as rutin in neonatal calves but
BV of quercetin aglycone was higher than BV of rutin as previously shown in
monogastric species Furthermore BV of quercetin and its metabolites was greater on d
2 than on d 29 of life and the proportion of quercetin metabolites differed greatly
between the two d which possibly can deduced to maturation of the gastrointestinal
tract
In part two of the study effects of a three-wk administration of quercetin aglycone rutin
or a green tea extract containing mainly catechins on performance health and the
antioxidative capacity and oxidative stress in neonatal calves were evaluated A fourth
group was used as control group (n = 7 calves per group) and did not receive any
flavonoid sopplementation No group differences were found for zootechnical
parameters but a slight benefit in health status when catechins were fed Effects of
flavonoid feeding on metabolic status were not seen in this study but total protein
albumin urea lactate glucose NEFA insulin and cortisol reflected typical time
changes during postnatal calf development Markers of the antioxidative capacity in
blood plasma (TEAC FRAP) showed incisive differences in time seen in a sharp
increase of TEAC and in a decrease of FRAP plasma concentrations postpartum
SUMMARY
111
However oxidative stress markers (TBARS F2-isoprostanes) did not illustrate distinct
group and time effects due to great interindividual variances
Taken together this study clearly demonstrated that the bioavailability of quercetin is
determined by its chemical form and depends to a major extent on physiological
processes of digestion and gastrointestinal maturation in calves In contrast the
influence of flavonoids on the antioxidative status did not show clear results thus an
improvement of the antioxidative status in neonatal calves by flavonoid administration
cannot be confirmed by this study
SUMMARY
112
Zusammenfassung
Flavonoide sind sekundaumlre Pflanzeninhaltsstoffe denen zahlreiche gesundheits-
foumlrdernde Eigenschaften zugesprochen werden In der Futtermittelindustrie haben
Flavonoide deshalb als bdquogruumlneldquo Zusatzstoffe bereits weitreichend Einzug erhalten auch
wenn wissenschaftlich fundierte Nachweise bezuumlglich ihrer Wirkung im Nutztier
oftmals hypothetisch sind Besonders fuumlr neugeborene Kaumllber scheint aufgrund ihrer
erhoumlhten Krankheitsanfaumllligkeit der Einsatz von pflanzlichen Zusatzstoffen sinnvoll
Allerdings muumlssten Flavonoide fuumlr biologische Effekte systemisch im Kalb verfuumlgbar
sein wofuumlr es bis jetzt noch keine Belege gibt Somit war es Ziel dieser Arbeit die
Bioverfuumlgbarkeit und die biologischen Effekte der weit verbreiteten Flavonoide
Quercetin und Catechin beim neugeborenen Kalb zu untersuchen
Dazu erfolgte im ersten Teil dieser Studie die Fuumltterung von Quercetin als reines
Aglykon oder mit entsprechendem Zuckerrest als Glukorhamnosid Rutin am 2 und 29
Lebenstag der Kaumllber (n = 7 pro Gruppe) Vor sowie bis zu 48 Stunden nach der
Flavonoidapplikation wurden in definierten Zeitabstaumlnden Blutproben gewonnen und
der Gehalt an Quercetin sowie der jeweiligen methylierten (Isorhamnetin Tamarixetin)
und dehydroxylierten (Kaempferol) Metaboliten mittels Hochleistungsfluumlssigkeits-
chromatographie mit anschlieszligender Fluoreszenzdetektion analysiert Es konnte gezeigt
werden dass Quercetin sowohl als Aglykon als auch als Rutin systemisch im Kalb
verfuumlgbar war wobei die systemische Verfuumlgbarkeit von Quercetin nach Fuumltterung des
Aglycons houmlher war als nach Fuumltterung von Rutin Weiterhin wurde am 2 Lebenstag
eine deutlich houmlhere Bioverfuumlgbarkeit von Quercetin und seinen Metaboliten festgestellt
als am 29 Lebenstag Auch war der Anteil der einzelnen Quercetinmetabolite an der
Gesamtflavanolkonzentration im Blutplasma stark veraumlndert was moumlglicherweise auf
den unterschiedlichen Grad der Darmentwicklung am 2 und 29 Lebenstag
zuruumlckgefuumlhrt werden kann
Im zweiten Teil der Studie wurde die Leistungsentwicklung der Gesundheitsstatus
sowie die antioxidative Kapazitaumlt und der oxidative Stress bei Kaumllbern untersucht
denen uumlber einen Zeitraum von drei Wochen entweder Quercetin in Form des Aglycons
oder als Rutin oder ein Gruumlnteeextrakt der hauptsaumlchlich Catechine enthielt verabreicht
wurde Eine vierte Kaumllbergruppe bekam keine Flavonoide zugefuumlttert und diente als
Kontrollgruppe (n = 7 pro Gruppe) Hierbei konnten in den erhobenen zootechnischen
SUMMARY
113
Parametern keine Gruppenunterschiede jedoch ein leichter Vorteil durch die Fuumltterung
von Catechin im Gesundheitsstatus festgestellt werden Effekte der Flavonoidfuumltterung
auf den Stoffwechsel der Kaumllber ausgedruumlckt durch Gesamtprotein Albumin
Harnstoff Laktat Glukose nicht-veresterte Fettsaumluren Insulin und Cortisol konnten in
dieser Studie nicht dargelegt werden jedoch wiesen diese Parameter
entwicklungsphysiologische Zeitveraumlnderungen auf Marker der antioxidativen
Kapazitaumlt im Blutplasma (TEAC FRAP) zeigten praumlgnante Zeitunterschiede
ausgedruumlckt durch einen deutlichen Anstieg der TEAC und einen ausgepraumlgten Abfall
der FRAP nach der Geburt Marker fuumlr den oxidativen Stress (TBARS F2-Isoprostane)
hingegen zeigten im Blutplasma aufgrund der starken individuellen Streuung keine
eindeutigen Behandlungs- und Zeiteffekte
Zusammenfassend konnte mit dieser Studie gezeigt werden dass die Bioverfuumlgbarkeit
von Quercetin durch dessen chemische Form determiniert ist und zum groumlszligtenteils von
verdauungsphysiologischen Vorgaumlngen und der Darmreifung des Kalbes abhaumlngig ist
Dagegen zeigten die hier durchgefuumlhrten Untersuchungen zum Einfluss der Flavonoide
auf den antioxidativen Status der Kaumllber keine eindeutigen Ergebnisse so dass eine
Verbesserung des antioxidativen Status nach Flavonoidgabe bei neugeborenen Kaumllbern
mit dieser Studie nicht bestaumltigt werden konnte
APPENDIX
Appendix
APPENDIX
Table 1 Appendix Calculation of flavonoid dosage
Item Formula Molar mass
gmol
Flavonoid dosage
mgkg
BW
micromolkg
BW
Rutintrihydrate (group RU) C27H30O16 3 H2O 6646 20 30
Quercetindihydrate (group QA) C15H10O7 2 H2O 3383 10 30
Water H2O 180
Rutinose C12H22O16 3263
Rutin minus water 6105
Rutin QE1 minus water and
rutinose
2842
30222
9 30
Quercetin QE minus water 3022 9 30
Polyphenon 60 (group CA) 10
Catechin content 703 7
Epigallocatechin C15H14O7 306267 190 620
Epicatechin C15H14O6 290260 064 220
Epigallocatechin gallate C22H18O11 458370 288 628
Epicatechin gallate C22H18O10 442370 070 158
Gallocatechin gallate C22H18O11 458370 021 046
Catechin gallate C22H18O10 442370 003 007
Gallocatechin C15H14O7 306267 052 170
Catechin C15H14O6 290260 014 048
Sum CA 7 19
1 QE = Quercetin equivalents
2 Only theoretically due to binding of 2 H and 1 O from crystalline water
APPENDIX
A Day 2 B Day 29
Time relative to feeding h
0 2 4 6 8 10 12 24 48
Qu
erce
tin
n
mo
lL
0
50
100
150
200
Time relative to feeding h
0 2 4 6 8 10 12 24 48
Qu
erce
tin
n
mo
lL
0
50
100
150
200
C Day 2 D Day 29
Time relative to feeding h
0 2 4 6 8 10 12 24 48
Iso
rha
mn
etin
n
mo
lL
0
20
40
60
80
100
Time relative to feeding h
0 2 4 6 8 10 12 24 48
Iso
rha
mn
etin
n
mo
lL
0
20
40
60
80
100
E Day 2 F Day 29
Time relative to feeding h
0 2 4 6 8 10 12 24 48
Ta
ma
rix
etin
n
mo
lL
0
25
50
75
100
125
150
Time relative to feeding h
0 2 4 6 8 10 12 24 48
Ta
ma
rix
etin
n
mo
lL
0
25
50
75
100
125
150
APPENDIX
G Day 2 H Day 29
Time relative to feeding h
0 2 4 6 8 10 12 24 48
Ka
emp
fero
l n
mo
lL
0
2
4
6
8
10
12
Time relative to feeding h
0 2 4 6 8 10 12 24 48
Ka
emp
fero
l n
mo
lL
0
2
4
6
8
10
12
Figure 1 Appendix Plasma concentration-time curves of quercetin (A B) isorhamnetin (C D)
tamarixetin (E F) and kaempferol (G H) after oral administration of 9 mg of quercetinkg of BW
times d as quercetin aglycone () rutin trihydrate () or no flavonoid () on d 2 and 29 of life Values
are LSM plusmn SE n = 7 per group (Chapter 2)
APPENDIX
A Day 2 B Day 29
Time relative to feeding h
0 2 4 6 8 10 12 24
To
tal
pro
tein
g
L
54
56
58
60
62
64
66
Time relative to feeding h
0 2 4 6 8 10 12 24
To
tal
pro
tein
g
L
54
56
58
60
62
64
66
C Day 2 D Day 29
Time relative to feeding h
0 2 4 6 8 10 12 24
Alb
um
in g
L
21
22
23
24
25
26
27
Time relative to feeding h
0 2 4 6 8 10 12 24
Alb
um
in g
L
21
22
23
24
25
26
27
E Day 2 F Day 29
Time relative to feeding h
0 2 4 6 8 10 12 24
La
cta
te m
mo
lL
0
1
2
3
4
5
Time relative to feeding h
0 2 4 6 8 10 12 24
La
cta
te m
mo
lL
0
1
2
3
4
5
APPENDIX
G Day 2 H Day 29
Time relative to feeding h
0 2 4 6 8 10 12 24
Ure
a m
mo
lL
1
2
3
4
5
Time relative to feeding h
0 2 4 6 8 10 12 24
Ure
a m
mo
lL
1
2
3
4
5
Figure 2 Appendix Plasma concentrations of total protein (A B) albumin (C D) lactate (E F)
and urea (G H) after oral administration of 9 mg of quercetinkg of BW times d as quercetin aglycone
() rutin trihydrate () or no flavonoid () on d 2 and 29 of life Values are LSM plusmn SE n = 7 per
group (Chapter 2)
APPENDIX
A
Time d
1 5 12 19 26
To
tal
pro
tein
g
L
48
52
56
60
64
B
Time d
1 5 12 19 26
Alb
um
in g
L
22
23
24
25
26
27
C
Time d
1 5 12 19 26
La
cta
te m
mo
lL
0
1
2
3
4
5
6
D
Time d
1 5 12 19 26
Glu
cose
m
mo
lL
40
45
50
55
60
E
Time d
1 5 12 19 26
NE
FA
m
mo
lL
200
400
600
800
1000
F
Time d
1 5 12 19 26
Ure
a m
mo
lL
10
15
20
25
30
35
40
APPENDIX
G
Time d
1 5 12 19 26
Insu
lin
micro
gl
00
05
10
15
H
Time d
1 5 12 19 26
Co
rtis
ol
ng
mL
0
20
40
60
80
100
Figure 3 Appendix Plasma concentrations of total protein (A) albumin (B) lactate (C) glucose
(D) NEFA (E) urea (F) insulin (G) and cortisol (H) after oral administration of quercetin
aglycone () rutin trihydrate () a green tea extract () or no flavonoid () Values are LSM plusmn
SE n = 7 per group (Chapter 3)
APPENDIX
Herzlichen Dankhellip
PD Dr Harald M Hammon fuumlr die Uumlberlassung des Themas und die Betreuung dieser
Arbeit sowie fuumlr die Unterstuumltzung bei Fragen und Problemen Prof Dr Siegfried
Wolffram fuumlr die freundliche Uumlbernahme des Zweitgutachtens und fuumlr die konstruktive
Kritik zu den Manuskripten Familie Klodt sowie Ralf Kocher und Ronny Koumllpin
fuumlr die Bereitstellung der Versuchskaumllber Den Mitarbeitern der Tierarztpraxis Dr
Linke fuumlr die medizinische Betreuung der Kaumllber die leider viel zu oft noumltig war Dr
Bernd Linke und Dr Peter Sanftleben da durch ihre exzellente Betreuung waumlhrend
der Masterarbeit erst das Interesse fuumlr das Anfertigen einer Doktorarbeit geweckt
wurde Klaus-Dieter Witt dem Herdenmanager des FBN fuumlr die schnelle
unkomplizierte Hilfe in praktischen und organisatorischen Belangen waumlhrend des
Kaumllberversuches den Handwerkern des FBN fuumlr die tatkraumlftige Unterstuumltzung beim
Kaumllberstall-Bauen bei den Kaumllbertransporten und fuumlr alle weiteren baulich-technischen
Hilfestellungen Petra Schulz und Maike Gosse vom Institut fuumlr Tierernaumlhrung und
Stoffwechselphysiologie der CAU Kiel fuumlr die hervorragenden Laboranalysen und
diesbezuumlglichen Erklaumlrungen Allen Kollegen des Instituts fuumlr Ernaumlhrungsphysiologie
bdquoOskar Kellnerldquo fuumlr die gute Zusammenarbeit Dr Julia Steinhoff-Wagner fuumlr die
dynamische Einfuumlhrung ins FBN und somit fuumlr meine schoumlne Anfangszeit dort sowie
fuumlr die fortwaumlhrende Beratung auch uumlber den groszligen Teich hinweg allen
Doktoranden-Kollegen fuumlr die tolle lehrreiche gemeinsame Zeit am FBN Jeannine
Gruse (vom ersten Tag anhellip ) und Dr Christine Schaumlff fuumlr das Korrekturlesen die
Motivation und sonstige Hilfe vor allem in der Endphase dieser Arbeit Meiner
Mitstreiterin und besten Kollegin der Welt Annika Gohlke fuumlr unzaumlhlige Tierarzt-
Einsaumltze zu jeder Tages- und Nachtzeit fuumlr viele gemeinsame Stunden im Stall und im
Buumlro sowie fuumlr die direkte unkomplizierte Art die Dinge anzupacken
Der groumlszligte Dank allerdings gilt meiner Familie
Meinem Mann meinen Kindern meinen Eltern und Groszligeltern sowie meiner Schwester
danke ich von ganzem Herzen
fuumlr die bedingungslose Unterstuumltzung Liebe Zuversicht
Krasse Herdehellip
APPENDIX
Curriculum Vitae
Josefine Maciej (neacutee Flor) born on October 02 1984 in Kuumlhlungsborn
Nationality German Civil Status Married 2 children
Education
Since 102011 Doctoral student Agricultural Sciences Christian Albrechts
University Kiel Faculty of Agricultural and Nutritional Sciences
102007 ndash 022010 Master of Science Agriculture Ecology University of Rostock
Master program Livestock Sciences Master Thesis The use of
computer tomography for the evaluation of stomach development in
milk-fed calves (Grade 10)
102004 ndash 092007 Bachelor of Science Agriculture Ecology University of Rostock
062004 Abitur Gymnasium Sanitz
WorkProfessional Experience
062010 ndash 062014 Scientific assistantdoctoral student Leibniz Institute for Farm
Animal Biology (FBN) Institute of Nutritional Physiology (ʽOskar-
Kellnerʼ) Dummerstorf
052009 ndash 072009 Student research assistant University of Goumlttingen Research Unit
Agriculture and Environment
092008 ndash 022009 Agricultural journey through the USA Internship at the weekly
dairy farm family magazine ʽFarmshineʼ Brownstown PA
022008 ndash 042008 Internship Landwirtschaftsberatung Mecklenburg-Vorpommern
Schleswig-Holstein (LMS) Bad Doberan
112004 ndash 122005 Student research assistant University of Rostock Faculty of
Agricultural and Environmental Sciences Institute of Animal
Nutrition
082004 ndash 012008 InternshipPractical work Landwirtschaftsgesellschaft Prisannewitz
Personal Engagement
122011 ndash 092012 Representative of public relations for doctoral students Leibniz
Institute for Farm Animal Biology (FBN) Dummerstorf
Since 052010 Member of volunteer fire department Kavelstorf
Kiel May 04 2015
ABBREVIATIONS
IV
Abbreviations
ASCE Ascorbic acid equivalent(s)
AUC Area under the curve
BW Body weight
BHT Butylhydroxytoluene
BV Bioavailability
CA Catechins
cfu Colony forming units
Cmax Maximal reached plasma concentration
CP Crude protein
CTRL Control group fed no flavonoid
d Day(s)
DM Dry matter
DNA Deoxyribonucleic acid
EDTA Ethylenediaminetetraacetic acid
8-iso-PGF2α 8-iso-prostaglandin F2α
ELISA Enzyme-linked immunosorbent assay
FRAP Ferric reducing ability of plasma
GH Growth hormone
GLUT Glucose transporter
GTE Green tea extract
h Hour(s)time of day
HPLC High-performance liquid chromatography
Ig Immunoglobulin(s)
IGF Insulin-like growth factor
IU International units
LDL Low-density lipoprotein
LPH Lactase phlorizin hydrolase
MDAE Malondialdehyde equivalent
n Number
NEFA Non-esterified fatty acids
QA Quercetin aglycone
ABBREVIATIONS
V
QE Quercetin equivalents
RIA Radioimmunoassay
ROS Reactive oxygen species
RU Quercetin glucorhamnoside rutin
SE Standard error
SEM Standard error of the mean
SGLT Sodium-dependent glucose co-transporter
TE Trolox equivalents
TEAC Trolox equivalent antioxidative capacity
TBARS Thiobarbituric acid reactive substances
Tmax time until maximal plasma concentration is reached
U Unit(s)
wk week(s)
1
General Introduction
GENERAL INTRODUCTION
2
General Introduction
After birth calves undergo huge immunological and metabolic changes Though
relatively mature when born they must adapt to various morphological and functional
changes after birth (Blum and Hammon 2000 Hammon et al 2012) Because of
impaired neonatal management like colostrum management calf losses are highest in
the first weeks of life mainly due to respiratory and digestive diseases In the United
States 23 million calf losses were counted in 2010 (USDA 2011)
Oxidative stress is assumed to play a key role in numerous diseases as almost any
disease is somehow related to an increased formation of reactive oxygen species
(Halliwell 1991) In calves increased levels of markers for oxidative stress were found
during the first days of life (Stohrer et al 2003 Alexandrovich and Antonovna 2009)
and during sickness (Ahmed and Hassan 2007 Al-Qudah 2009) Furthermore the
nutrient status highly affects the antioxidant system (Schwerin et al 2002 Sies et al
2005) and often is impaired in newborn calves due to the change from intrauterine
continuous energy and nutrient supply via placenta to discontinuous oral supply after
birth Thus improvement of the antioxidant status in newborn calves may contribute to
the development of an own defence against environmental threats which helps to
reduce calf losses and to improve health status during the neonatal development
Because flavonoids as phenolic compounds are claimed to be strong antioxidants and to
have countless other health-promoting effects they are claimed and marketed as health-
promoting substances by the feeding industry Especially since the ban of antibiotic
growth promoters in the European Union in 2006 these ʻgreenrsquo feed additives gained
enormous popularity all over the world However any in vivo biological effect of a
substance requires its bioavailability (BV) In contrast to several monogastric species
where BV of flavonoids is extensively investigated knowledge on BV of flavonoids in
neonatal calves is still lacking Thus the aim of this study was to investigate the oral
BV of the flavonol quercetin one of the most abundant flavonoids in nature fed either
as aglycone or as its glycoside rutin in neonatal calves Studies were carried out on days
2 and 29 of life to show possible differences in absorption distribution and metabolism
of quercetin during ontogenetic development of newborn calves Furthermore oral
supplementation with quercetin and catechins for a three-wk period provides
GENERAL INTRODUCTION
3
information of flavonoid effects on metabolic and antioxidative status in neonatal
calves
This thesis is structured in 4 major chapters At first chapter 1 shows an overview of
flavonoids and their BV and introduces major aspects of the antioxidative system and
metabolic status in neonatal calves Chapter 2 deals with the relative oral bioavailability
of quercetin fed as quercetin aglycone or as its glucorhamnoside rutin in neonatal
calves Chapter 3 focusses on the effects on the metabolic and antioxidative status in
neonatal calves during oral supplementation of quercetin aglycone rutin and catechins
Finally chapter 4 presents a general discussion of the results of chapter 2 and 3 in
consideration of present knowledge in the literature
GENERAL INTRODUCTION
4
References
Ahmed W M and S E Hassan 2007 Applied studies on coccidiosis in growing
buffalo-calves with special reference to oxidantantioxidant status World J Zool
240ndash48
Alexandrovich K N and S E Antonovna 2009 Age-dependent level of antioxidant
defence system and lipid metabolism state in calves Int J Appl Res Vet Med
773ndash75
Al-Qudah K M 2009 Oxidative stress in calves with acute or chronic
bronchopneumonia Rev Med Vet 160231ndash236
Blum J W and H Hammon 2000 Colostrum effects on the gastrointestinal tract and
on nutritional endocrine and metabolic parameters in neonatal calves Livest
Prod Sci 66151ndash159
Halliwell B 1991 Reactive oxygen species in living systems Source biochemistry
and role in human disease Am J Med Suppl 91S14ndashS22
Hammon H M J Steinhoff-Wagner U Schoumlnhusen C C Metges and J W Blum
2012 Energy metabolism in the newborn farm animal with emphasis on the calf
endocrine changes and responses to milk-born and systemic hormones Domest
Anim Endocrinol 43171ndash185
Schwerin M U Dorroch M Beyer H Swalve C C Metges and P Junghans 2002
Dietary protein modifies hepatic gene expression associated with oxidative stress
responsiveness in growing pigs FASEB J 161322ndash1324
Sies H W Stahl and A Sevanian 2005 Nutritional dietary and postprandial
oxidative stress J Nutr 135969ndash972
Stohrer M S Lutz and M Stangassinger 2003 Antioxidant status of calves and foals
declines after birth Acta Vet Scand Suppl 44P38
USDA (US Department of Agriculture) Animal and Plant Health Inspection Service
2011 Cattle and calves nonpredator death loss in the United States 2010
httpwwwaphisusdagovanimal_healthnahmsgeneraldownloadscattle_calves
_nonpred_2010pdf (Accessed May 2013)
5
Chapter 1
Literature Overview
LITERATURE OVERVIEW
6
1 Literature Overview
11 An introduction in flavonoids
111 Chemical structure and natural occurrence
Flavonoids are polyphenols which represent aromatic compounds with one or more
hydroxyl groups directly linked to a benzene ring from the common three-ring nucleus
The chemical backbone is based on a C6ndashC3ndashC6 carbon framework Differences on the
C-ring divide the flavonoids into six main classes Flavanols flavones isoflavones
flavanones flavonols and anthocyanidins (Figure 11 Dangles and Dufour 2006
Manach et al 2004) Differences between flavonoid classes are predicated by the
saturation of the heterocyclic C-ring which means the presence or absence of a double
bond on position 4 the degree of oxidation and the position of the B-ring (flavones and
isoflavones) These variations lead to more than 6000 different forms of flavonoids
known today (Harborne and Williams 2000) Naturally flavonoids mostly occur as
glycoside which means the C-ring is attached to a sugar moiety A flavonoid without a
sugar moiety is called aglycone Glycosides yielding glucose instead of other sugar are
called glucosides Only in flavanols the presence of glycosides is rare (Hollman and
Arts 2000) According to Hollman and Arts (2000) aglycones usually do not appear in
fresh plants but after procession In the class of flavonols there are mainly O-
glycosides The type of sugar bound is predominantly β-glycosidic and the most
prevalent sugars next to glucose are arabinose galactose and rhamnose
The most abundant flavonoid is the flavonol quercetin (Hollman 2001 Nijveldt et al
2001) a pentahydroxyflavon (C15H10O7) Naturally quercetin is always bound to at
least one sugar molecule building quercetin-β-glycoside The type of sugar differs
between plants (Arts et al 2004) Williams and Harborne (1994) describe about 179
different glycosides of quercetin The main ones are isoquercetin rutin and kaempferol
(Figure 12)
LITERATURE OVERVIEW
7
Flavanol
Flavanone
Catechin
Epicatechin
Epigallocatechin gallate
Hesperitin
Naringenin
Eriodictyol
Flavone
Flavonol
Luteolin
Apigenin
Quercetin
Kaempferol
Myricetin
Isorhamnetin
Isoflavone
Anthocyanidin
Genistein
Daidzein
Biochanin A
Pelargonidin
Cyanidin
Delphinidin
Figure 11 Basic structure of the six main flavonoid classes with some representatives for each
group In the flavanol structure the numbers and rings are marked
Modified from Dangles and Dufour (2006) Manach et al (2004)
Quercetin a yellow crystalline powder with a molar mass of 3022 gmol is hardly
water soluble but soluble in ethanol or dimethyl sulfoxide The name quercetin is
derived from the latin name for oak tree Quercus where it was found first Rutin is a
glycoside of quercetin bound to rutinose a disaccharide consisting of rhamnose and
glucose It is also a yellow powder but less hydrophobic than quercetin Rutinʼs molar
mass is 6105 gmol
The most abundant flavonols are catechins which are colorless and slightly water-
soluble compounds They are named after catechu a juice or an extract of Mimosa
catechu Due to its isomer structure catechins occur as trans- (catechins) and cis-
isomers (epicatechins)
In general flavonoids are ubiquitous plant components in all kinds of higher plants
High amounts of flavonoids can be found especially in onions broccoli apples
apricots tomatoes and kale as well as in black currants black and green tea and red
wine (Hertog et al 1992 Crozier et al 1997 Hollman and Arts 2000)
LITERATURE OVERVIEW
8
Quercetin
Kaempferol
Rutin
Isoquercetin
Figure 12 Chemical structure of quercetin kaempferol and the quercetin glycosides rutin and
isoquercetin
Modified from Passamonti et al (2009)
An overview of the quercetin kaempferol catechin and epicatechin content in selected
food is given in Table 11 based on data from the USDA database for the flavonoid
content of selected foods a literature composition based on of 308 different references
(Bhagwat et al 2013) retrieved in December 2013 Further databases on flavonoid
content are available like the Phenol-Explorer (httpphenol-explorereu) or EuroFIR-
BASIS (httpebasiseurofirorg) and countless single references giving the flavonoid
content in plants
For chemical determination of the distinct flavonoids an acceptable separation of the
individual flavonoid molecules must be ensured for example by high-performance-
liquid-chromatography (HPLC) However given values for the flavonoid content in
plants can differ enormously depending on methods of analysis as there is no
standardized method for flavonoid analyses Besides variation of flavonoid content
among plants there are many factors that influence the flavonoid content in plants itself
like seasonal variation light and climatic conditions degree of ripeness as well as food
preparation and processing (Aherne and OrsquoBrien 2002) These natural variations in
plants type of plant and measurement should be kept in mind when comparing
flavonoid content among plants
LITERATURE OVERVIEW
9
Table 11 Flavonoid content in selected food as is in raw material unless indicated otherwise
Source
Flavonoid content mgkg fresh weight or mgL
Flavonol Flavanol
Quercetin Kaempferol Catechin Epicatechin
Alfalfa raw seeds 17 0 - -
Apple 0-115 0-27 0-51 8-192
Apricot 4-29 0-13 3-73 0-83
Buckwheat 51-363 - - -
Blackberry 0-119 0-31 0-3129 0-181
Broccoli 0-137 1-213 0 0
Capers 1493-3234 2150-3083 - -
Celery 0-35 2 0 0
Cherry sweet 1-68 0-7 0-149 4-270
Chives 9-104 55-125 - -
Chocolate dark - - 110-400 520-1250
Cranberry 73-250 0-6 0-11 30-57
Currant black 23-122 0-23 7 47
Dock leaves 862 103 - -
Elderberry 85-600 2-13 - -
Grape black 2-37 0-5 89-108 86-87
Grape seed - - 60-2440 230-2840
Grape whitegreen 1-39 0-3 4-59 1-28
Kale 0-562 5-905 - -
Milk chocolate 1 0 1-2 1-5
Onion red 59-1917 0-45 - -
Soybeans2 0 12 - 374
Spinach 0-272 0-550 - -
Tea black (brewed) 9-48 4-24 4-48 2-87
Tea green (brewed) - - 664-6880 200-216
wine red beverage 0-34 0-13 0-390 0-165
10 = not detectable - = no data available
2Quercetin and kaempferol content from green soybeans epicatechin content from mature soybean seeds
Modified from Bhagwat et al (2013)
Besle et al (2010) analyzed phenolic compositions of forages fed to dairy cows and
found the greatest phenolic content in grassland pastures with 353 gkg DM The
grassland hay however contained 216 gkg DM of phenolic compounds Ryegrass
silage versus ryegrass hay contained 168 and 145 gkg DM of phenolic compounds
The lowest phenolic content was found in corn silage containing 37 gkg DM (Besle et
al 2010) Phenolic compounds are also found in trace amounts in bovine milk wherat
their concentration is influenced by cow feeding (Besle et al 2010 Steinshamn et al
2008 OrsquoConnell and Fox 2001)
LITERATURE OVERVIEW
10
112 Biological effects of flavonoids in plants
Flavonoids have multifarious and important functions in plant biochemistry and
physiology like protecting deoxyribonucleic acid (DNA) from ultraviolet-induced
damage (Kootstra 1994) Flavonoids further affect photosynthesis by catalysing
electron transport processes (Das 1994) In leaves flavonoid pigments protect the
underlying photosynthetic cells by absorbing radiation Most flavonoids accumulate in
the epidermal cell layer of leaves (Winkel-Shirley 2002) and in the skin of fruits
(Manach et al 2004) The diversity of colors in plants is mainly caused by flavonoids
thus flavonoids play a crucial role in attracting pollinators and seed dispersers (Winkel-
Shirley 2002) Furthermore flavonoids protect plants against microbial invasion by
acting as phytoalexins (Harborne and Williams 2000) increasing tolerance against
abiotic stressors or defend other herbivory for example by bitter tasting (Gould and
Lister 2006 Harborne and Williams 2000) The signal transfer between plants and
microorganisms is also triggered by flavonoids as seen in the stimulation of the
Rhizobium bacteria for nitrogen fixation (Gould and Lister 2006) Flavonoids are stored
in plant vacuoles Cell death causes flavonoids to disperse into different fluid
components of the plants like waxes and resins (Das 1994) which are often considered
as enriched with flavonoids
113 Biological effects of flavonoids in humans and animals
The effects of flavonoids in humans and animals are seen ambiguous On the one hand
flavonoids are discussed as anti-nutritive factors whereat on the other hand flavonoids
are claimed health and performance promoting Negative aspects of flavonoids are seen
in tannins where diminishing BV of proteins and minerals or an inhibition of digestive
enzymes can occur (Chung et al 1998) Phytoestrogens are attributed to have adverse
health effects in infant development (Zung et al 2001) However todayʼs research is
mainly focussed on the positive aspects of flavonoids especially their antioxidative
activity and protective capacity against oxidative stress Flavonoids were found to
inhibit oxidation of low-density lipoproteins (LDL) in vitro (Harborne and Williams
2000) Low-density lipoproteins transport lipophilic substances like cholesterol and
plasma cholesterol esters Elevated plasma concentrations of LDL are associated with
vascular diseases like atherosclerosis (Aviram and Fuhrman 2003) and related problems
like coronary heart disease and stroke (Denny and Buttriss 2005) Therefore a large
LITERATURE OVERVIEW
11
body of research deals with the influence of a flavonoid-rich diet on reducing coronary
heart and vascular diseases (Hertog et al 1993 Knekt et al 1996 Rimm et al 1996
Yochum et al 1999 Hirvonen et al 2001 Mennen et al 2004) In spite of all these
investigations Loke et al (2010) postulated the detailed mechanisms of how flavonoids
may protect against cardiovascular diseases as still unknown Besides influencing
cardiovascular diseases flavonoids are involved in cancer control (Lamartiniere et al
1995 Knekt et al 1997 Hirvonen et al 2001) Birt et al (2001) postulated estrogenic
and antiestrogenic activity antiproliferation cell cycle arrest and apoptosis as well as
induction of detoxification enzymes regulation of host immune function and other
mechanisms of flavonoid actions as responsible for tumor growth restriction
Furthermore flavonoids are claimed to be involved in modulation of
neurodegeneration especially age-related cognitive and motoric decline in protection
against cerebral ischemiaperfusion injuries or other brain abnormalities (Youdim and
Joseph 2003) Other neurodegenerative disorders in this context are Alzheimerʼs
disease Parkinsonʼs disease seizures trauma and neuroinflammation (Varadarajan et
al 2001 Schroeter and Spencer 2003 Miller et al 2009) In addition flavonoid
treatment may alleviate infection by human immunodeficiency virus because
flavonoids are capable to inhibit several critical enzymes involved in life cycle of
human immunodeficiency virus (Cos et al 2008)
Effects of flavonoids and their metabolites on the metabolism in organisms are
manifold Especially those on carbohydrate metabolism are well studied and an impact
on glucose homeostasis was found in several studies Hanhineva et al (2010) reviewed
the impact of dietary polyphenols on the carbohydrate metabolism and summarized the
inhibition of carbohydrate digestion and glucose absorption in the intestine the
stimulation of insulin secretion from pancreatic β-cells the modulation of glucose
release from the liver the activation of insulin receptors and glucose uptake in insulin-
sensitive tissues as well as the modulation of intracellular signalling pathways and gene
expression as possible mechanisms of how flavonoids influence carbohydrate
metabolism More in detail flavonoids are capable to inhibit α-amylase and α-
glucosidase activity (Tadera et al 2006) inhibit the sodium-dependent glucose co-
transporter (SGLT) 1 (Kobayashi et al 2000) or glucose transporters itself (Johnston et
al 2005) In rat insulinoma pancreatic cells polyphenols like quercetin apigenin and
luteolin inhibited cytotoxicity and attenuated the decrease of glucose-stimulated insulin
LITERATURE OVERVIEW
12
secretion (Kim et al 2007) However insulin secretion is affected by a wide range of
different plant compounds and extracts Glucose uptake can be stimulated by flavonoids
in both insulin-sensitive and non-insulin sensitive tissue mostly dose-dependent
(Hanhineva et al 2010) Glucose transporter (GLUT) 1 widely distributed in fetal
tissues and GLUT 4 expressed by muscle are supposed to mainly trigger flavonoid
mediated glucose uptake (Hanhineva et al 2010)
However the influence of polyphenols on liver function to maintain glucose
homeostasis may also play a key role in neonates Endogenous glucose production as
important pathway to ensure glucose homeostasis in the neonate (Girard et al 1992)
originates from glycogenolysis and gluconeogenesis both taking place in the liver An
improved hepatic glucose and lipid metabolism was indicated in diabetic rats feeding a
polyphenol-rich diet (Roghani and Baluchnejadmojarad 2010 Bose et al 2008
Wolfram et al 2006) In non-diabetic rats quercetin stimulated glycogenolysis and
inhibited glycolysis and gluconeogenesis (Gasparin et al 2003a b) ex vivo by infusing
the liver with 50 to 300 micromolL quercetin However these concentrations are not
achievable with standard diets for in vivo experiments (Gasparin et al 2003a b)
Furthermore Kobayashi et al (2010) and Seiva et al (2012) showed positive effects of
a flavonoid-rich diet on lipid metabolism in rats fed a high-fat diet as plasma
concentrations of triglycerides non-esterified fatty acids (NEFA) insulin and leptin as
well as lipogenesis were reduced
12 Bioavailability of flavonoids
121 General aspects of bioavailability with focus on ruminants
In general BV can be defined as the rate and extent to which the active ingredient of a
substance is absorbed in the blood compartment or becomes available at the site of
action The European Agency for the Evaluation of Medicinal Products (2000) defines
BV as the extent and rate to which a substance or its active moiety is delivered from a
pharmaceutical form and becomes available in circulation However the effect of a
substance is usually determined by its concentration at the place of action
All postabsorptive biological effects of given substances depend on their BV
Parameters determining BV are liberation absorption distribution metabolism and
excretion abbreviated with their first letters as LADME-system Liberation the first
LITERATURE OVERVIEW
13
step for an effect of a drug or an active compound means drug release or drug delivery
and can be seen as a complex process The drug must disaggregate in smaller particles
dissolve in the present fluid and disperse which is more difficult for water insoluble
substances like flavonoids In the next step the absorption the active compound must
enter the blood or lymph vessels when given orally Absorption of orally given
ingredients is determined by solution rate as well as gut and stomach contentfilling
(Frey 2007) Bioavailability was shown to be influenced by technological (galenical)
factors of the substance the form of application local factors like diarrhea or contact
with other substances and first-pass effects These first-pass effects occur when an
active compound is metabolized very fast and thus inactivated or transformed before
entering the systemic circulation for example in the gut mucosa or liver After
absorption into the bloodstream the active compound is distributed by passive diffusion
or by convective transport from the blood capillaries into neighboring tissues The
metabolism of an active compound means its biotransformation mainly increasing its
hydrophilic properties (Pfeiffer et al 1995) The main organ for biotransformation is
the liver but it also takes place in the mucosa cells of the gastrointestinal tract lung
and kidney Most enzymes involved in this process are located in the endoplasmic
reticulum (Frey 2007) Biotransformation is two-phased Phase-I-reaction is a
transformation where functional groups are built into non-polar molecules mostly by
oxidation reduction or hydrolysis Absorption to water soluble molecules in phase-II-
reaction enables excretion The most important ways of excretion or elimination are
renal biliary and intestinal
To determine BV the concentration of an active ingredient is measured over time in
blood samples collected from the systemic circulation and as plasma concentration-
time curves are specified only by absorption distribution and elimination To calculate
BV area under the curve (AUC) maximal plasma concentration (Cmax) and time until
the maximal plasma concentration is reached (Tmax) are used as pharmacokinetic
parameters (see Figure 13)
Bioavailability is either relative or absolute For determination of the absolute oral BV
of a substance the AUC after oral intake is compared to the AUC after intravenous
injection In contrast to this relative oral BV compares two different drugs containing
the same active principle after oral application As time interval of sampling mainly
determines accuracy sampling frequency should be as high as possible
LITERATURE OVERVIEW
14
Figure 13 Illustration of main pharmacokinetic parameters at 2 different plasma concentration-
time curves after a single oral dose of an active compound to an organism Bold descriptions are for
curve 1
A = absorption D = distribution E = elimination AUC = area under the curve Cmax = maximal plasma
concentration Tmax = time until maximal plasma concentration is reached
Modified from Pfeiffer et al (1995)
122 Absorption and distribution of flavonoids in the organism
Flavonoids can be absorbed in different ways after oral administration from the
gastrointestinal tract Quercetin fed as aglycone without attached sugar can be detected
within 30 minutes after oral administration in plasma of volunteers whereas quercetin
fed as rutinoside with attached sugar (rutin) showed delayed peak levels in plasma
(Hollman et al 1997b Olthof et al 2000 Cermak et al 2003) Thus the main place
of absorption of quercetin monoglycosides is the small intestine More complex
quercetin glycosides like rutin are mainly absorbed in the colon or the distal small
intestine also colonized with microorganisms (Hollman et al 1997b Manach et al
1997) Therefore the sugar moiety and the location of microbial activity in the
gastrointestinal tract account for different absorption sites (Hollman et al 1999 Day et
al 1998) Some flavonoid aglyca can already be absorbed in the stomach but not their
glycosides as shown in studies in rats administered quercetin (Crespy et al 2002) or
daidzein and genistein (Piskula et al 1999) However most flavonoid glycosides resist
acid hydrolysis in the stomach thus reaching the duodenum undegraded
To pass the gastrointestinal epithelium is the first crucial step for systemic availability
in an organism The enterocytes are polarized cells with numerous membrane proteins
LITERATURE OVERVIEW
15
that enable the transport of dietary compounds from the lumen into the blood stream via
channels or active transporters (Figure 14) Lipophilic and small nonpolar substances
can pass the plasma membrane via diffusion following a concentration gradient As
flavonoids are polar and thus hydrophilic substances the passive diffusion of flavonoids
however barely occurs in the gastrointestinal tract (Day et al 2000 Manach et al
2004 Crespy et al 2003) Only for the aglyca a passive absorption is discussed (Day et
al 2000 Cermak et al 2003 Wolffram 2010) Acidic conditions in the stomach
inhibit hydrolysis (Day et al 2000) and pancreatic enzymes are also not able to
hydrolyze β-glycosidic bounds (Arts et al 2004) On the contrary Walle et al (2005)
found hydrolysis of dietary flavonoids already in the oral cavity by both bacteria and
shed epithelial cells but with a large interindividual variability between volunteers
Furthermore Kahle et al (2011) found degradation of polyphenols varying after
incubation with human saliva Different glucosidases like lactase phlorizin hydrolase
(LPH) are known to hydrolyze flavonoids (Day et al 2000 Sesink et al 2002 Neacutemeth
et al 2003) Lactase phlorizin hydrolase is an extracellular enzyme from the brush
border membrane of intestinal mammalian cells and was shown to be important for
intestinal absorption of quercetin glycosides (Figure 14 Sesink et al 2002)
Extracellular glucosidases cleave the sugar from the flavonoid glucosides and the
aglycone can be absorbed Hydrolysis by lactase phlorizin hydrolase might be reduced
in rats and sheep due to their higher microbial population in the stomach than in humans
(Day et al 2000) In human small intestine and liver an intracellular cytosolic β-
glucosidase was described that hydrolyze various flavonoid glycosides (Day et al
1998) Further enzymes hydrolyzing flavonoids in the gut are glucocerebrosidase (Day
et al 1998) and other cytosolic β-glucosidases (McMahon 1997) More complex
glycosides like rhamnosides are hydrolyzed by enzymes of microorganism in the distal
small intestine or in the colon (Crespy et al 1999 Scholz and Williamson 2007)
Besides that active transport systems are prevalently used for flavonoid transport into
the cell (Figure 14) Several studies suggest that quercetin glucosides could be
absorbed in the small intestine via SGLT 1 (Gee et al 1998 Walgren et al 2000a
Wolffram et al 2002) Also GLUT like GLUT 2 (Chen et al 2007) are discussed to
transport quercetin glucosides across the cell membranes Since the membrane transport
of xenobiotics chemical compounds like antibiotics that are neither produced in an
organism nor are part of the regular diet is a key factor in medical treatment and
LITERATURE OVERVIEW
16
flavonoids may interact with the cellular in- and efflux systems like the multidrug-
resistance-associated protein a plethora of studies with the interaction of flavonoids and
the membrane transport of drugs or their interactions exists (Cermak and Wolffram
2006) Among plasma membrane transporters the focus is on adenosine triphosphate-
binding cassette transporters (di Pietro et al 2002 Brand et al 2006 Morris and
Zhang 2006) monocarboxylate transporters and organic anion and bilirubin
transporters (Figure 14 Passamonti et al 2009)
Figure 14 Simplified model of intestinal absorption and metabolism of the flavonol quercetin in
the organism
Solid arrow = enzymatic reactions dotted or dashed arrow = active or passive transport SGLT1 =
sodium-dependent glucose co-transporter 1 LPH = lactase phlorizin hydrolase CBG = cytosolic β-
glucosidase UGT = uridine-5acute-diphospate glucuronosyl-transferase MRP = multidrug resistance-
associated protein SUL = sulfotransferase GLUT = glucose transporter ABC = ATP-binding cassette
transporter MCT = monocarboxylate transporter P-Glyc = P-glycoprotein
Modified from Murota and Terao (2003) Petri et al (2003) Cermak and Wolffram (2006)
However the exact way of action of these membrane proteins on flavonoid transport in
vivo is not given yet Once absorbed into circulation flavonoids are distributed in the
body with more than 98 of quercetin bound to proteins (Gugler et al 1975 Boulton
LITERATURE OVERVIEW
17
et al 1998 Janisch et al 2004) mainly albumin as the most prevalent protein in
plasma Further quercetin is also bound to glycoproteins and LDL (Boulton et al
1998) Depending on their conjugation the affinity of quercetin to bind on serum
albumin differs (Janisch et al 2004) contributing to the huge variation in BV (Dufour
and Dangles 2005) However as it is known that binding of the polyphenol to proteins
alter their biological activity the biological effect of this binding needs still to be
evaluated (Manach et al 2004)
The pattern of metabolites in tissues may be different from the one in the blood stream
due to its cellular uptake or intracellular metabolism (Manach et al 2004)
Furthermore Manach et al (2004) consider that plasma concentrations do not
necessarily correlate with the concentration in tissue Thus plasma concentration of
flavonoids may not be an accurate biomarker of exposure to body tissue
123 Metabolism and excretion of flavonoids
First-pass effect during intestinal absorption is crucial for availability of orally
administered flavonoids as described in chapter 121 Hydrolyzation of some
flavonoids already occurs by passing the enterocytes via the membrane-bound lactase
phlorizin hydrolase Other flavonoids are hydrolyzed in the enterocyte by cytosolic β-
glucosidase before entering the systemic circulation (Day et al 2000 1998 Sesink et
al 2002) and being transported to the liver Flavonoids reaching the colon are
hydrolyzed by microorganisms before absorption In human intestine the presence of
the bacteria species Eubacterium Clostridium and Bacterioides indicated metabolism
of flavonoids Various simple aromatic acids are produced in this process and the
released aglycone is often degraded by colonic microorganisms (Manach et al 2004)
These aglycones are further degraded by splitting the heterocyclic ring thus flavonols
mainly produce hydroxyphenylacetic acids Different flavonoid classes lead to different
acids like flavones and flavanones are mainly metabolized to hydroxyphenylpropionic
acids All breakdown products are further metabolized to derivatives of benzoic acid
microbial metabolites are absorbed in the colon and conjugated with glycine glucuronic
acid or sulfate (Manach et al 2004) Due to the different composition of the colonic
microflora in different species the variations in microbial metabolism of flavonoids are
enormous
LITERATURE OVERVIEW
18
The main site of flavonol metabolism besides the gastrointestinal tract is the liver
(Hollman and Katan 1997 Aherne and OrsquoBrien 2002) Flavonoids are transported to
the liver via the portal vein During absorption in the intestine and later in the liver
flavonoids are conjugated by phase-II-reactions mainly glucuronidation methylation
and sulfation Phase-I-reactions like oxidation by enzymes of the cytochrome P450
system are of minor importance in flavonoid metabolism (Otake et al 2002) The
reactions of phase-II mainly are detoxificating processes in the body like metabolism of
xenobiotics (Manach et al 2004) When methylated a methyl group of quercetin is
transferred catalyzed by the catechol-O-methyl transferase (Manach et al 2004) which
is found in many tissues with highest activity in liver and kidneys (Piskula and Terao
1998) Glucuronidation occurs in the liver but also to a great extent in the intestine
(Spencer et al 1999) This process is catalyzed by the Uridine diphosphate-
glucuronosyltransferase which is located in the endoplasmatic reticulum Here
glucuronic acid from Uridine diphosphate-glucuronic acid is transferred to the
polyphenol Sulfation also mainly occurs in the liver (Piskula and Terao 1998) The
transfer of a sulfate moiety from 3acute-phosphoadenosine-5acute-phosphosulfate to the
hydroxyl group of polyphenols is catalyzed by sulfotransferases According to the kind
of the substance and the ingested dose the importance of glucuronidation methylation
and sulfation varies (Manach et al 2004) A higher ingested dose causes a shift from
sulfation to glucuronidation (Koster et al 1981) However the pattern of conjugation is
further influenced by species sex or food deprivation (Piskula 2000)
Flavonoids formed in the gut mucosa only partially enter circulation and a significant
amount will be secreted back into the gut lumen (Crespy et al 1999) This so called
apical efflux out of the enterocytes is probably triggered by adenosine triphosphate-
binding cassette transporter like the multidrug resistance associated protein 2 (Walle et
al 1999 Walgren et al 2000b) the breast cancer resistance protein 1 (Sesink et al
2005) or the P-glycoprotein (Ofer et al 2005)
However flavonoids often undergo an intensive enterohepatic circulation Due to their
biliary excretion back into the duodenum flavonoids may be further metabolized by
intestinal microorganisms or reabsorbed from the intestine (Hackett 1986) This
recycling may enhance availability of flavonoids in the body (Manach et al 2004) or
cause a second plasma peak (Setchell et al 2001 Manach et al 2003) According to
the site of absorption flavonoids may undergo different metabolic fates thus the liver
LITERATURE OVERVIEW
19
might be more important for flavonoids absorbed in the small intestine than for the ones
absorbed in the colon (Heim et al 2002)
Flavonoids and their metabolites usually are excreted by bile or urine The smaller
conjugates prefer urinary excretion whereas the larger and extensively conjugated
metabolites prefer the biliary one (Manach et al 2004) Flavonoid glucuronides and
sulphates are readily excreted with the urine due to their polarity and water solubility
(Hackett 1986) However though various flavonoids are excreted by urine (Aherne and
OʼBrien 2002 Scalbert and Williamson 2000 Manach et al 2004) this route seems to
be of minor importance (Hollman et al 1995) Due to partially long elimination half-
life flavonoids may be accumulated in blood plasma because of repeated absorption
(Aherne and OrsquoBrien 2002)
124 Factors influencing bioavailability of flavonoids
Bioavailability of flavonoids may be influenced at all states of the described LADME-
system on both pre- as well as post-absorptive by species differences and individual
factors like state of development and nutrition (Heaney 2001) enzyme activities or
secretion other regulatory mechanisms and interindividual differences (Egert et al
2008) Plasma peak concentrations of epigallocatechin gallate increased 35-fold when
catechins were given to fasted compared to non-fasted volunteers (Chow et al 2005)
Further mucosal mass intestinal transit time rate of gastric emptying as well as the up-
and down-regulation of absorption by physiological control because of habituation
influenced flavonoid BV (Heaney 2001) Summarized by Scholz and Williamson
(2007) the most important criterion influencing BV is the attached sugar followed by
the food matrix the added flavonoids the given dose and the adaption to it and the
inhibition of flavonoids by chemical changes after absorption or processing in the
gastrointestinal tract or due to interactions with other feed components
The effects of the food matrix the physical form in which flavonoids are administered
and solubility on BV seem to be more complex Quercetin is slightly soluble in water
but addition of organic solvents such as lipids emulsifiers (Azuma et al 2002) or
propylene glycol (Shimoi et al 1998) may enhance solubility The benefit of alcohol on
BV of flavonoids is discussed ambiguous as some found appreciable improvements
(Azuma et al 2002 Dragoni et al 2006) others not (Donovan et al 1999 Goldberg
et al 2003) However Azuma et al (2002) only enhanced BV of flavonoids using
LITERATURE OVERVIEW
20
alcohol concentrations of more than 30 in the diet Overall composition of the meal
and the source of flavonoids have the main impact on BV Quercetin from onions had a
higher BV than quercetin from apples or pure rutin (Hollman et al 1997b) Food
preparation and processing like cooking also affect BV since it can cause a reduction in
flavonoid content or cause chemical transformation (Manach et al 2004) Furthermore
flavonoid absorption is affected by the fat content in the diet (Lesser et al 2004)
Interestingly interactions of polyphenols with milk proteins partly inhibited positive
aspects of flavonoids or led to differences in absorption or reduced AUC values of
flavonoid plasma concentrations (Serafini et al 2003 Reddy et al 2005 Egert et al
2013) Nevertheless other studies in humans showed no effect of milk on BV of
flavonoids (van Het Hof et al 1998 Hollman et al 2001)
125 Studies on bioavailability of quercetin and catechins
In cattle the companion studies of Berger et al (2012) and Gohlke et al (2013) where
quercetin aglycone and rutin were given intraruminal (10 and 50 mgkg body weight
(BW) Berger et al 2012) and intraduodenal (9 18 or 27 mgkg BW Gohlke et al
2013) to dairy cows showed maximal plasma concentrations of flavonols ranging from
about 20 to 1000 nmolL at 30 min to 2 h after administration Interestingly rutin was
much better available than quercetin aglycone after intraruminal (Berger et al 2012)
than after intraduodenal administration (Gohlke et al 2013) Manach et al (2005)
reported a range from 0 to 4 micromolL plasma concentration of total flavonols after intake
of 50 mg aglycone equivalents in humans whereas an older study of Gugler et al
(1975) found no effect of oral administration on quercetin plasma concentration in
humans and therefore suggested oral administration of quercetin as ineffective
However more recent studies revealed detectable plasma concentrations of quercetin
after oral flavonol administration as shown in Table 12 In this overview only studies
were listed in which pure quercetin substances were administered and plasma
concentrations were measured Though lots of BV studies are conducted with food
containing high contents of flavonoids like apples wine or onions interactions with
other food components or matrix effects cannot be excluded Therefore it is more
reliable using pure substances for comparing BV studies
Studies on the BV of catechins with pure substances are rare as mostly tea extracts
were used According to Manach et al (1999) in rats the catechin metabolites (catechin
LITERATURE OVERVIEW
21
and methylcatechin) reached similar plasma concentrations after oral supplementation
of catechin than the quercetin metabolites quercetin isorhamnetin and tamarixetin after
quercetin administration in comparable doses However metabolites of catechin showed
a faster decline in plasma concentration than those of quercetin possibly due to lesser
binding to plasma albumin or higher urinary excretion (Manach et al 1999) Hollman
et al (1997a) too postulated a good absorption of catechin and its microbial
degradation products after oral administration of radioactively labelled (+)-catechin to
rodents monkeys and humans in different studies Nevertheless BV of catechins
widely depends on species on the administered compound and on the chemically
structure of the distinct catechin isomers such as epicatechin epigallocatechin and
epigallocatechin gallate In rats fed 200 mgkg BW of a green tea extract (GTE) Chen
et al (1997) found a systemic availability of 312 for epicatechin and of 14 for
epigallocatechin but only of 01 for epigallocatechin gallate whereas in dogs after
oral and intravenous administration of 25 mgkg BW of epigallocatechin gallate
absolute BV was about 20 (Swezey et al 2003) However systemic available
epicatechin epigallocatechin and epigallocatechin gallate was very low after oral
administration of 20 mgkg BW of green tea to humans (Lee et al 2002) or after oral
administration of 500 mgkg BW and intravenous administration of 50 mgkg BW
catechin fractions containing 5 epicatechin 13 epicatechin gallate and 50
epigallocatechin gallate to rats (Zhu et al 2000) The consumption of a green tea
beverage by humans resulted in maximal plasma concentrations of total catechins of
4618 plusmn 274 nmolL at 90 min after drinking (Egert et al 2013) Major catechins in this
study detected in plasma samples after consumption of various test drinks were
epigallocatechin gallate (1799 nmolL) epicatechin gallate (1473 nmolL)
epigallocatechin (865 nmolL) epicatechin (482 nmolL) and small amounts of
catechin and gallocatechin (Egert et al 2013)
LITERATURE OVERVIEW
22
Ta
ble
12
O
ver
vie
w o
f th
e b
ioa
va
ila
bil
ity
of
qu
erce
tin
fro
m d
iffe
ren
t n
atu
ral
form
s
Ref
eren
ce
Su
bje
ct
ap
pli
cati
on
Fla
vo
no
id
do
se
Co
nv
erte
d d
ata
AU
C
Tm
ax
Cm
ax
nm
ol
L times
h
min
n
mo
lL
Ber
ger
et
al
(20
12
)
Co
w
intr
aru
min
al
Q
50
mgk
g B
W
18
2
3
0
9
0
Q
1
0 m
gk
g B
W
-
3
0
~
20
R
5
0 m
gk
g B
W
1
39
9
4
2
10
00
R
1
0 m
gk
g B
W
-
3
0
~
80
Go
hlk
e et
al
(2
01
3)
Co
w
intr
aduo
den
al
Q
9 m
gk
g B
W
84
5
10
5
4
07
Q
1
8 m
gk
g B
W
1
33
3
11
0
5
73
Q
2
7 m
gk
g B
W
1
58
7
12
5
6
36
R
9
mgk
g B
W
13
8
-
2
7
R
1
8 m
gk
g B
W
13
2
-
1
8
R
2
7 m
gk
g B
W
10
2
-
1
9
Cer
mak e
t al
(2
00
3)
Pig
o
ral
Q
50
mgk
g B
W
8
67
7
2
0
11
90
R
5
0 m
gk
g B
W
1
99
7
21
0
3
57
Les
ser
et a
l (
20
04)
Pig
o
ral
Q
10
mgk
g B
W
1
95
0
10
2
5
18
Ad
er e
t al
(2
00
0)
Pig
o
ral
Q
50
mgk
g B
W
-
24
0
8
52
Q
50
0 m
gk
g B
W
-
15
0
41
13
Erl
und
et
al
(20
00
) H
um
an
ora
l Q
8
mg
17
44
11
4
1
37
Q
2
0 m
g
2
918
16
2
2
19
Q
5
0 m
g
3
765
29
4
2
85
R
8
mg
6
24
1
41
0
3
8
R
2
0 m
g
1
042
44
4
7
8
R
5
0 m
g
1
666
45
0
1
47
Ho
llm
an e
t al
(1
99
7b
) H
um
an
ora
l R
2
00
mg
16
10
55
8
1
47
LITERATURE OVERVIEW
23
T
ab
le 1
2
Co
nti
nu
ati
on
Ref
eren
ce
Su
bje
ct
ap
pli
cati
on
Fla
vo
no
id
do
se
Co
nv
erte
d d
ata
1
AU
C
Tm
ax
Cm
ax
nm
ol
L times
h
min
n
mo
lL
Ho
llm
an e
t al
(1
99
9)
Hu
man
o
ral
Sp
irae
osi
d
~1
50 m
g
18
800
3
0
3
500
R
uto
sid
um
~
20
0 m
g
3
700
3
60
1
80
Olt
ho
f et
al
(2
00
0)
Hu
man
o
ral
Iso
quer
citr
in
~1
50
mg
19
100
3
7
5
000
S
pir
aeo
sid
~
15
0 m
g
17
500
2
7
4
500
Eger
t et
al
(2
00
8)
Hu
man
o
ral
Q
50
mg
1
268
1
20
1
89
Q
10
0 m
g
3
000
1
80
2
95
Q
15
0 g
5
097
3
60
4
31
Man
ach e
t al
(1
99
7)
R
at
ora
l Q
0
2
of
die
t
-
7
20
550
00
R
04
o
f d
iet
-
14
40
350
00
Man
ach e
t al
(1
99
9)
Rat
o
ral
Q
02
5
of
die
t
-
14
40
520
00
Rei
nb
oth
et
al
(20
10)
Do
g
ora
l Q
1
0 m
gk
g B
W
2
915
1)
72
1)
233
6
2
) 2
34
2)
229
2
R
1
0 m
gk
g B
W
2
667
1)
42
1
) 17
2
) 6
66
2)
113
7
Is
oq
uer
citr
in
10
mg
kg B
W
6
837
1)
48
1)
667
4
2
) 2
46
2)
888
3
Wei
n a
nd
Wo
lffr
am
(2
01
3)
Ho
rse
ora
l Q
2
0 m
gk
g B
W
2
010
6
0
75
0
1A
UC
T
max
and
Cm
ax a
re c
onv
erte
d a
ll i
nto
sam
e un
its
for
com
par
iso
n o
f d
ata
R =
quer
ceti
n a
s glu
corh
am
no
sid
e ru
tin
Q
= q
uer
ceti
n a
s ag
lyco
ne
(wit
ho
ut
atta
ched
sugar)
A
UC
= a
rea
und
er t
he
pla
sma-c
once
ntr
atio
n t
ime
curv
e
Cm
ax =
maxim
al r
each
ed p
lasm
a co
nce
ntr
atio
n o
f to
tal
flav
ono
ls m
easu
red
in e
ach s
tud
y
Tm
ax =
tim
e ti
ll C
max
is
reac
hed
B
W =
bo
dy w
eig
ht
- =
no
val
ues
giv
en
=
dat
a ev
aluate
d f
rom
fig
ure
1
) 2
) =
fir
st a
nd
sec
ond
pea
k
LITERATURE OVERVIEW
24
13 Metabolic and health status in neonatal calves
131 Metabolic status in calves at birth and postnatal changes
Although calves are precocial animals and thus relatively mature when born they still
must adapt to various morphological and functional changes after birth (Blum and
Hammon 2000) During gestation energy supply is continuously via placenta with
glucose as main energy substrate With birth this changes to a discontinuously oral
supply by colostrum and milk intake with lactose and fat as main energy source
(Hammon et al 2013) Prenatal glucocorticoids and catecholamines as well as thyroid
hormones in the fetal blood lead to an increased gluconeogenic activity and hepatic
glycogen storage ensuring coverage of the energy demand of the newborn calf
(Hammon et al 2012) However calves are often hypoglycemic after birth as they
need to adapt to the usage of other fuels than glucose taken up with liquid feeding
Thus endogenous glucose production is an important pathway to ensure glucose
homeostasis in the calf and increases with maturation (Steinhoff-Wagner et al 2011)
Important regulators for endogenous glucose production are hormones like insulin
glucagon catecholamines growth hormone and glucocorticoids The peptide hormone
insulin is built in the pancreatic β-cells Plasma concentrations are reduced at birth and
increase after first feed intake indicating that especially glucose intake stimulates insulin
secretion (Hadorn et al 1997 Hammon and Blum 1998 Rauprich et al 2000) The
peptide hormone glucagon is built in the pancreatic α-cells and acts as antagonist to
insulin Plasma glucagon concentrations also increase after first feed intake in calves
(Hammon et al 2012) Endogenous glucose production is in addition stimulated by
catecholamines glucocorticoids and probably growth hormone (GH) Around birth all
these hormones showed elevated plasma concentrations in calves and catecholamines
and glucocorticoids are known for their promoting effects on metabolic maturation in
the neonate (Hammon et al 2012 2013) Plasma concentrations of cortisol are high at
birth and decrease thereafter (Hadorn et al 1997 Hammon et al 2012 Schiessler et
al 2002) In addition cortisol next to other regulators is a major player for initiating
birth (Liggins 1994) Furthermore thyroid hormones play an important role for
endogenous glucose production during late gestation and after birth (Fowden et al
2001) Plasma concentrations of thyroid hormones are high at birth and decrease
LITERATURE OVERVIEW
25
thereafter in mature calves but not in preterm born calves (Steinhoff-Wagner et al
2011)
In neonatal calves colostrum feeding affects the GH ndash insulin-like growth factor (IGF)
system which most likely is a response to energy supply and improved glucose status in
calves after colostrum feeding (Hammon et al 2012) Amount time point and
frequency of feeding influence plasma IGF-1 concentrations (Hadorn et al 1997
Nussbaum et al 2002) which are lower during the first wk of life in restricted (Hadorn
et al 1997) or formula fed calves (Rauprich et al 2000) indicating the huge
importance of early and sufficient colostrum feeding to newborn calves for their
development and maturation
132 Health status in calves and development of the immune system
Immune defence of newborn calves depends on uptake of immunoglobulins (Ig) with
colostrum as there is no placental transfer of Ig and endogenous production of Ig is
negligible (Chase et al 2008) The ingestion of sufficient colostrum is thus essential for
immunological protection during the first 2 to 4 weeks of life until calves develop an
adequate own active immune system (Chase et al 2008 Figure 15) With colostrum Ig
are transferred from the cow to the newborn calf and activate and regulate the innate
immune response (Chase et al 2008)
Figure 15 Illustration of the development of immunity and immune response of calves
Modified from Chase et al (2008)
Apart from nutrients and Ig colostrum contains minerals vitamins and also non-
nutrient components like growth factors cytokines hormones and further bioactive
LITERATURE OVERVIEW
26
substances (Blum 2006) Most of these non-nutrient factors and bioactive compounds
are derived from blood of dams but some are produced in the mammary gland (Blum
2006) The average Ig concentrations in bovine colostrum varies greatly depending
mainly on breed age of dam nutrition in the preparturient period season or amount of
produced colostrum (Godden 2008) As colostrogenesis ends abruptly at parturition the
greatest concentration of the beneficial compounds is in first colostrum and in further
milkings concentrations are decreasing because of dilution effects (Godden 2008) The
small intestine as the site of digestion and absorption of Ig mainly IgG is permeable for
up to 12 to 48 h after birth (Stott et al 1979 Baintner 2007) Feeding the calf leads to
a faster closure of the gut permeability for great Ig independent from the amount fed
(Stott et al 1979) Small intestinal epithelium includes vacuoles that allow intracellular
digestion at birth but soon after colostrum ingestion vacuoles disappear (Blum 2005)
Therefore colostrum influences the gastrointestinal tract as seen among others in
changes in microbial population epithelial cell proliferation protein synthesis and
digestion (Blum 2006) Furthermore colostrum also exerts long-lasting systemic
effects on metabolism and endocrine traits by effecting systemic growth activity and
behavior (Blum 2006)
Endogenous Ig production and thus active immunity in calves is delayed (Chase 2008)
With passive immunity decreasing and active immunity still being insufficient
susceptibility to diseases is highest in the first wk of life (Figure 15) and notable calf
losses occur with pneumonia and diarrhea being the main reasons for it (USDA 2011)
Pneumonia in pre-weaned calves is a multi-factorial disease caused by a number of
viruses and some calf- and environmental related risk factors (Lorenz et al 2011)
Diarrhea is one of the most serious problems in calf rearing worldwide often leading to
other diseases like pneumonia in enfeebled calves Furthermore those calves show
reduced growth So calves suffering from diseases in newborn age may show long-
lasting impaired performance
133 Oxidative stress and antioxidative capacity in neonatal calves
Oxygen is essential for all aerobic living organisms It is part of several chemical
compounds like hydrogen peroxide hypochlorus acid peroxinitrite singlet oxygen and
ozone Importantly oxygen has the potential to destroy cell integrity when building up
reactive oxygen species (ROS) These ROS can be divided in free radicals and non-
LITERATURE OVERVIEW
27
radicals In general a free radical is an atom or molecule with one or more unpaired
electrons (Halliwell 1991) marked by the radical dot (middot) The most reactive ones are
hydroxyl radical superoxide anion nitric oxide and peroxyl radical All these ROS are
naturally produced in the body during energy production and unspecific immune
defense mainly to neutralize bacteria and viruses and thus protecting the body against
pathogens External influences like ionizing radiation toxins drugs and chemicals or
environmental pollutants can considerably increase the generation of ROS (Sies 1991)
resulting in cell toxic conditions
The organism has a pool of reducing systems to neutralize these free radicals called
antioxidants These are substances that when present at low concentrations compared
with those of an oxidizable substrate significantly delay or prevent oxidation of that
substrate (Halliwell 1991) Antioxidants are divided into enzymatic antioxidants like
superoxide-dismutase catalase or glutathion-peroxidase and non-enzymatic
antioxidants including albumin carotenoids bilirubin uric acid glutathion vitamins
A C and E as well as flavonoids Every aerobe living system is aligned to have a
balance between these oxidants and antioxidants but due to inadequate antioxidant
defense or external influences an imbalance between the generation of prooxidants and
the activity of the antioxidant defenses in favor for the prooxidants can occur and is
called oxidative stress (Sies 1985 1991) Oxidative stress is related to numerous
diseases the so called free radical diseases According to Halliwell (1991) for most
human diseases oxidative stress might be secondary to the primary disease process
Next to maturation of the organism (Robles et al 2001 Saugstad 2005 Mutinati et al
2014) nutrient status and nutrition in general plays a major role in the antioxidant
system (Schwerin et al 2002 Sies et al 2005) However neonates have a greater
susceptibility to oxidative stress than adults or juvenile subjects (Saugstad 2005
Mutinati et al 2014) Main reason therefor is the change from the hypoxic intrauterine
environment to extrauterine conditions after birth and the start of regular breathing
(Robles et al 2001 Albera and Kankofer 2011) Especially premature neonates are
prone to oxidative stress (Robles et al 2001)
There are several approaches to measure antioxidative capacity oxidative stress or free
radicals Alam et al (2013) reviewed 29 different in vivo and in vitro methods for
evaluating antioxidant activity and oxidative stress In general common methods range
from quantification of (free) radicals quantification of markers for oxidative stress like
LITERATURE OVERVIEW
28
DNA damage or lipid peroxidation up to the quantification of markers for the
antioxidant system like enzymes Figure 16 gives an overview of the most common
methods for evaluation of oxidative stress and antioxidant capacity In general the
antioxidative status should not only be evaluated by a single test model since there is no
absolute method (Alam et al 2013)
Figure 16 Simplified classification of methods used for determining oxidative stress and
antioxidant capacity
TBARS = thiobarbituric acid reactive substances F2-Iso = F2-isoprostanes TEAC = trolox equivalent
antioxidative capacity FRAP = ferric reducing ability of plasma
Modified from Kohen and Nyska (2002)
There are plenty of studies describing the antioxidative status or oxidative stress in
calves but only a few studies can be compared directly due to different methods of
analyzing and experimental set-up Main studies in calves deal with selected parameters
of oxidative stress or the antioxidant capacity Stohrer et al (2003) investigated the
antioxidant status of cows and calves via trolox equivalent antioxidative capacity
(TEAC) and found impairment during the first wk of life and thus assumed that
ischemiareperfusion injury during birth may affect antioxidative status of neonatal
calves Alexandrovich and Antonovna (2009) confirmed an elevated level of oxidative
stress during the first d of life up to d 45 of age due to an increased level of
LITERATURE OVERVIEW
29
thiobarbituric acid active products and glutathione when calves were less than 15 d old
and reduced values when calves were 50 to 60 d old The authors assume that the
transition period in feeding of calves was the reason for that Also transportation of
calves leads to an increase of markers for oxidative stress Wernicki et al (2006) found
significantly elevated thiobarbituric acid reactive substances (TBARS) plasma
concentration in calves that were transported for 2 h The season did not significantly
change TBARS levels in calves but glutathione peroxidase and superoxide dismutase
were higher in calves born in summer than in calves born in fall (Chigerwe et al 2013)
However in this study no correlation between TBARS and the age of calves was found
but there was an obvious correlation between increased oxidative stress or a reduced
antioxidative capacity and health status of calves These findings confirmed a study by
Ahmed and Hassan (2007) who investigated several parameters of calves infected with
Eimeria species Malondialdehyde and nitric oxide as markers for oxidative stress were
elevated in infected calves Catalase superoxide-dismutase ascorbic acid glutathione
and the total antioxidant capacity were significantly reduced in infected calves
compared to control calves Bronchopneumonia as a major calf disease similarly
showed elevated markers of oxidative stress in calves (Al-Qudah 2009) Also the way
of delivery seems to influence the antioxidative status since higher malondialdehyde
and glutathione concentrations in blood showed an exposure to higher oxidative stress
in calves delivered by caesarian section (Erisir et al 2013) Retskii et al (2010)
lsquocorrectedrsquo the antioxidant status of newborn calves to form higher colostral immunity
due to treatment with glucose ascorbic acid solution and unithiol and thus reduced the
incidence and severity of neonatal diseases
134 Effects of flavonoid administration on development and health status in
neonatal calves
Countless flavonoid-rich feed additives are marketed claiming improvements in animal
health and productivity in cattle nutrition These additives are used in calvesʼ milk
replacer and in feed for heifers lactating cows and fattening cattle
(httpsanogoldeunews2008flavonoidephp httpwwwpultedeAntioxidantien_
Botanische_Wirkstoffeamplang=en httpwwwschaumanndecpsrdeSID-18 120AAB
B3-717B45schaumann-dehsxsl4736html httpwwwprovimicomgrmediagrape_
pp_concentrate_-_engpdf httpwww gainfeedscomruminant goldgrain-calf-nut)
LITERATURE OVERVIEW
30
In general lots of feed additives are supposed to reduce or replace antibiotics thus
terms like phytobiotics phototherapeutic or nutraceutical are commonly used Since
flavonoids are present in all kinds of higher plants young ruminants may have
evolutionary depended on flavonoids (Yaghoubi et al 2008) However results of
studies on feeding flavonoids to young calves are ambiguous As mentioned the
metabolism of calves mainly is influenced by nutrition hence Yaghoubi et al (2008)
postulated an improved growth of calves by feeding flavonoids extracted from propolis
Enhancing growth in ruminants by flavonoid feeding is discussed due to possible effects
on microbial population in the rumen (Aerts et al 1999 Greathead 2003) and
especially in the developing reticulorumen (Yaghoubi et al 2008 Costa Jr et al
2012) According to Aerts et al (1999) the degradation of dietary protein to ammonia
by microorganisms in the rumen of sheep is slowed down by proanthocyanidins which
are polymere forms of catechins and thus increasing the absorption of amino acids in
the small intestine Durmic and Blache (2012) also reviewed beneficial effects of
secondary plant compounds on rumen fermentation focused on the protection of dietary
proteins combined with a reduced microbial proteolysis and release into the duodenum
However mainly tannins are building complexes with proteins (Aerts et al 1999) In
general secondary plant metabolites may exert prebiotic effects due to stimulation of
certain bacteria in the rumen (Greathead 2003) and affect the immune system as
hypothesized by Yaghoubi et al (2008) though the authors found an ambiguous blood
IgG concentrations after feeding flavonoids to calves Metwally et al (2013) reported a
numeric increase in blood IgM concentrations after feeding propolis extract to buffalo
calves considering a non-specific immunostimulating effect Also Oliveira et al (2010)
postulated an improved immune response of calves when feeding a flavonoid-rich
pomegranate extract due to an enhanced total IgG response after ovalbumin vaccination
and increased synthesis of interferon-γ and interleukin-4 On the other hand neutrophil
phagocytic and killing activities of neutrophils against Escherichia coli did not differ
when feeding pomegranate extract to young calves (Oliveira et al 2010) Besides that
some flavonoids have hormone-like structures and activities and therefore are called
phyto-oestrogens (Greathead 2003) probably exerting anabolic effects in calves Such
effects were seen in other species like mice (Sokolova et al 1978) Furthermore it is
noteworthy that quercetin is a major component of several plants used as antidiarrheal
remedies (Middleton et al 2000) Di Carlo et al (1994) showed quercetin feeding
LITERATURE OVERVIEW
31
ameliorating diarrhea in mice by 92 in a dose-related manner as did Gaacutelvez et al
(1995) in quercitrin (3-rhamnosylquercetin)-treated rats and Nielsen (2008) in piglets
Rao et al (1997) pointed out a possible antidiarrheal effect of the flavonoid ternatin
However propolis or pomegranate extract feeding did not ameliorate diarrhea in calves
(Yaghoubi et al 2008 Oliveira et al 2010) but feeding a GTE decreased frequency
and degree of non-pathogenic diarrhea remarkably (Ishihara et al 2001)
14 Conclusive remarks and need for further research
Green feed additives like flavonoids have a considerably role in human and animal
nutrition Numerous feed supplements containing flavonoids are marketed in the dairy
industry to improve health growth and thus productivity
These antioxidative anti-inflammatory and antimicrobial secondary plant metabolites
may especially be used in the neonatal period when calves are just developing their
immune system However little is known about the systemic BV of flavonoids and their
effects in vivo especially in calves Thus the aim of this study is to investigate the BV
of the most abundant flavonoids quercetin and catechin in newborn calves and to
examine their effects on selected aspects of the antioxidative status and metabolism
Therefore dairy calves were fed quercetin as aglycone its glucorhamnoside rutin and
catechins for the first 3 wk of life Parameters of the antioxidative status oxidative
stress and metabolism were determined and studies on BV of quercetin aglycone and
rutin were performed on d 2 and 29 of life representing a different ontogenetic status in
calves
LITERATURE OVERVIEW
32
References
Ader P A Wessmann and S Wolffram 2000 Bioavailability and metabolism of the
flavonol quercetin in the pig Free Radic Biol Med 281056ndash1067
Aerts R J T N Barry and W C McNabb 1999 Polyphenols and agriculture
Beneficial effects of proanthocyanidins in forages Agric Ecosyst Environ 751ndash
12
Aherne S A and N M OrsquoBrien 2002 Dietary flavonols Chemistry food content
and metabolism Nutrition 1875ndash81
Ahmed W M and S E Hassan 2007 Applied studies on coccidiosis in growing
buffalo-calves with special reference to oxidantantioxidant status World J Zool
240ndash48
Alam M N N J Bristi and M Rafiquzzaman 2013 Review on in vivo and in vitro
methods evaluation of antioxidant activity Saudi Pharm J 21143ndash152
Albera E and M Kankofer 2011 The comparison of antioxidativeoxidative profile in
blood colostrum and milk of early post-partum cows and their newborns Reprod
Domest Anim 46763ndash769
Alexandrovich K N and S E Antonovna 2009 Age-dependent level of antioxidant
defence system and lipid metabolism state in calves Int J Appl Res Vet Med
773ndash75
Al-Qudah K M 2009 Oxidative stress in calves with acute or chronic
bronchopneumonia Rev Med Vet 160231ndash236
Arts I C W A L A Sesink M Faassen-Peters and P C H Hollman 2004 The
type of sugar moiety is a major determinant of the small intestinal uptake and
subsequent biliary excretion of dietary quercetin glycosides Br J Nutr 91841ndash
847
Aviram M and B Fuhrman 2003 Effects of flavonoids on the oxidation of low-
density lipoprotein and atherosclerosis Pages 165ndash203 in Flavonoids in Health
and Disease Second Edition C A Rice-Evans and L Packer eds Marcel
Dekker Inc New York USA
LITERATURE OVERVIEW
33
Azuma K K Ippoushi H Ito H Higashio and J Terao 2002 Combination of lipids
and emulsifiers enhances the absorption of orally administered quercetin in rats J
Agr Food Chem 501706ndash1712
Baintner K 2007 Transmission of antibodies from mother to young Evolutionary
strategies in a proteolytic environment Vet Immunol Immunopathol 117153ndash
161
Berger L M S Wein R Blank C C Metges and S Wolffram 2012 Bioavailability
of the flavonol quercetin in cows after intraruminal application of quercetin
aglycone and rutin J Dairy Sci 955047ndash5055
Besle J M D Viala B Martin P Pradel B Meunier J L Berdagueacute D Fraisse J L
Lamaison and J B Coulon 2010 Ultraviolet-absorbing compounds in milk are
related to forage polyphenols J Dairy Sci 932846ndash2856
Bhagwat S D B Haytowitz J M Holden (Ret) 2013 USDA database for the
flavonoid content of selected foods Release 31 US Department of Agriculture
(USDA) Agricultural Research Service
httpwwwarsusdagovSP2UserFilesPlace12354500DataFlavFlav3-1pdf
(Accessed April 2014)
Birt D F S Hendrich and W Wang 2001 Dietary agents in cancer prevention
Flavonoids and isoflavonoids Pharmacol Ther 90157ndash177
Blum J W 2005 Bovine gut development Pages 31ndash52 in Calf and heifer rearing
P C Garnsworthy ed Nottingham University Press Nottingham UK
Blum J W 2006 Nutritional physiology of neonatal calves J Anim Physiol Anim
Nutr 901ndash11
Blum J W and H Hammon 2000 Colostrum effects on the gastrointestinal tract and
on nutritional endocrine and metabolic parameters in neonatal calves Livest
Prod Sci 66151ndash159
Brand W M E Schutte G Williamson J J van Zanden N H P Cnubben J P
Groten P J van Bladeren and I M C M Rietjens 2006 Flavonoid-mediated
inhibition of intestinal ABC transporters may affect the oral bioavailability of
drugs food-borne toxic compounds and bioactive ingredients Biomed
Pharmacother 60508ndash519
LITERATURE OVERVIEW
34
Bose M J D Lambert J Ju K R Reuhl S A Shapses and C S Yang 2008 The
major green tea polyphenol (ndash)-epigallocatechin-3-gallate inhibits obesity
metabolic syndrome and fatty liver disease in high-fat-fed mice J Nutr
138167ndash1683
Boulton D W U K Walle and T Walle 1998 Extensive binding of the bioflavonoid
quercetin to human plasma proteins J Pharm Pharmacol 50243ndash249
Cermak R S Landgraf and S Wolffram 2003 The bioavailability of quercetin in
pigs depends on the glycoside moiety and on dietary factors J Nutr 1332802ndash
2807
Cermak R and S Wolffram 2006 The potential of flavonoids to influence drug
metabolism and pharmacokinetics by local gastrointestinal mechanisms Curr
Drug Metab 7729ndash744
Chase C C L D J Hurley and A J Reber 2008 Neonatal immune development in
the calf and its impact on vaccine response Vet Clin North Am Food Anim
Pract 2487ndash104
Chen C-H H-J Hsu Y-J Huang and C-J Lin 2007 Interaction of flavonoids and
intestinal facilitated glucose transporters Planta Med 73348ndash354
Chen L M-J Lee and C S Yang 1997 Absorption distribution and elimination of
tea polyohenols in rats Drug Metab Dispos 251045ndash1050
Chigerwe M A D Beck S S Kim and D M Coons 2013 Comparison of plasma
oxidative status biomarkers in neonatal dairy calves during summer and fall
seasons J Veterinar Sci Technolo S111ndash4
Chow H-H S I A Hakim D R Vining J A Crowell J Ranger-Moore W M
Chew C A Celaya S R Rodney Y Hara and D S Alberts 2005 Effects of
dosing condition on the oral bioavailability of green tea catechins after single-
dose administration of Polyphenon E in healthy individuals Clin Cancer Res
114627ndash4633
Chung K T C-I Wei and M G Johnson 1998 Are tannins a double-edged sword in
biology and health Trends Food Sci Technol 9168ndash175
LITERATURE OVERVIEW
35
Cos P L Maes A Vlietinck and L Pieters 2008 Plant-derived leading compounds
for chemotherapy of human immunodeficiency virus (HIV) infection - an update
(1998 - 2007) Planta Med 741323ndash1337
Costa Jr J B G L M Zeoula S L Franco L P P de Moura M V Valero F L
Simiono E M da Paula and R B Samensari 2012 Effect of propolis product
on digestibility and ruminal parameters in buffaloes consuming a forage-based
diet Ital J Anim Sci 11e78
Crespy V C Morand C Besson N Cotelle H Veacutezin C Demigneacute and C Reacutemeacutesy
2003 The splanchnic metabolism of flavonoids highly differed according to the
nature of the compound Am J Physiol Gastrointest Liver Physiol 284G980ndash
G988
Crespy V C Morand C Besson C Manach C Demigne and C Remesy 2002
Quercetin but not its glycosides is absorbed from the rat stomach J Agr Food
Chem 50618ndash621
Crespy V C Morand C Manach C Besson C Demigne and C Remesy 1999 Part
of quercetin absorbed in the small intestine is conjugated and further secreted in
the intestinal lumen Part of quercetin absorbed in the small intestine is conjugated
and further secreted in the intestinal lumen Am J Physiol Gastrointest Liver
Physiol 277G120ndashG126
Crozier A M E J Lean M S McDonald and C Black 1997 Quantitative analysis
of the flavonoid content of commercial tomatoes onions lettuce and celery J
Agr Food Chem 45590ndash595
Dangles O and C Dufour 2006 Flavonoid-Protein Interactions Pages 443ndash469 in
Flavonoids Chemistry Biochemistry and Applications O M Andersen and
K R Markham ed Taylor amp Francis Group Boca Raton USA
Das D K 1994 Naturally occurring flavonoids Structure chemistry and high-
performance liquid chromatography methods for separation and characterization
Methods Enzymol 234410ndash420
LITERATURE OVERVIEW
36
Day A J F J Cantildeada J C Diacuteaz P A Kroon R Mclauchlan C B Faulds G W
Plumb M R Morgan and G Williamson 2000 Dietary flavonoid and
isoflavone glycosides are hydrolysed by the lactase site of lactase phlorizin
hydrolase FEBS Lett 468166ndash170
Day A J M S DuPont S Ridley M Rhodes M J Rhodes M R Morgan and G
Williamson 1998 Deglycosylation of flavonoid and isoflavonoid glycosides by
human small intestine and liver beta-glucosidase activity FEBS Lett 43671ndash75
Denny A and J Buttriss 2005 Synthesis Report No 4 Plant Foods and Health Focus
on Plant Bioactives British Nutrition Foundation Norfolk UK
di Carlo G D N Mascolo A A Izzo and F Capasso 1994 Effects of quercetin on
the gastrointestinal tract in rats and mice Phytother Res 842ndash45
di Pietro A G Conseil J M Peacuterez-Victoria G Dayan H Baubichon-Cortay D
Trompier E Steinfels J-M Jault H de Wet M Maitrejean G Comte A
Boumendjel A-M Mariotte C Dumontet D B McIntosh A Goffeau S
Castanys F Gamarro and D Barron 2002 Modulation by flavonoids of cell
multidrug resistance mediated by P-glycoprotein and related ABC transporters
Cell Mol Life Sci 59307ndash322
Donovan J L J R Bell S Kasim-Karakas J B German R L Walzem R J
Hansen and A L Waterhouse 1999 Catechin is present as metabolites in human
plasma after consumption of red wine J Nutr 1291662ndash1668
Dragoni S J Gee R Bennett M Valoti and G Sgaragli 2006 Red wine alcohol
promotes quercetin absorption and directs its metabolism towards isorhamnetin
and tamarixetin in rat intestine in vitro Br J Pharmacol 147765ndash771
Dufour C and O Dangles 2005 Flavonoid-serum albumin complexation
Determination of binding constants and binding sites by fluorescence
spectroscopy Biochim Biophys Acta 1721164ndash173
Durmic Z and D Blache 2012 Bioactive plants and plant products Effects on animal
function health and welfare Anim Feed Sci Technol 176150ndash162
LITERATURE OVERVIEW
37
Egert S J Tereszczuk S Wein M J Muumlller J Frank G Rimbach and S Wolffram
2013 Simultaneous ingestion of dietary proteins reduces the bioavailability of
galloylated catechins from green tea in humans Eur J Nutr 52281ndash288
Egert S S Wolffram A Bosy-Westphal C Boesch-Saadatmandi A E Wagner J
Frank G Rimbach and M J Mueller 2008 Daily quercetin supplementation
dose-dependently increases plasma quercetin concentrations in healthy humans
J Nutr 1381615ndash1621
Erlund I T Kosonen G Alfthan J Maumlenpaumlauml K Perttunen J Kenraali J
Parantainen and A Aro 2000 Pharmacokinetics of quercetin from quercetin
aglycone and rutin in healthy volunteers Eur J Clin Pharmacol 56545ndash553
Erisir M F M Kandemir and M Yuumlksel 2013 The effects of caesarean section on
lipid peroxidation and some antioxidants in the blood of newborn calves Vet
Archiv 83153ndash159
European Agency for the Evaluation of Medicinal Products 2000 Note for guidance on
the investigation of bioavailability and bioequivalence Committee for proprietary
medicinal products London UK
Frey H-H 2007 Allgemeine Pharmakologie Pages 1ndash32 in Lehrbuch der
Pharmakologie und Toxikologie fuumlr die Veterinaumlrmedizin H-H Frey and W
Loumlscher ed Enke Verlag Stuttgart Germany
Fowden A L J Mapstone and A J Forhead 2001 Regulation of glucogenesis by
thyroid hormones in fetal sheep during late gestation J Endocrinol 170461ndash469
Gaacutelvez J F Saacutenchez de Medina J Jimeacutenez M I Torres M I Fernaacutendez M C
Nuacutentildeez A Riacuteos A Gil and A Zarzuelo 1995 Effect of quercitrin on lactose-
induced chronic diarrhoea in rats Planta Med 61302ndash306
Gasparin F R S C L Salgueiro-Pagadigorria L Bracht E L Ishii-Iwamoto A
Bracht and J Constantin 2003a Action of quercetin on glycogen catabolism in
the rat liver Xenobiotica 33587ndash602
Gasparin F R S F L Spitzner E L Ishii-Iwamoto A Bracht and J Constantin
2003b Actions of quercetin on gluconeogenesis and glycolysis in rat liver
Xenobiotica 33903ndash911
LITERATURE OVERVIEW
38
Gee J M M S DuPont M J C Rhodes and I T Johnson 1998 Quercetin
glucosides interact with the intestinal glucose transport pathway Free Radic Biol
Med 2519ndash25
Girard J P Ferreacute J-P Pegorier and P-H Dueacutee 1992 Adaptations of glucose and
fatty acid metabolism during perinatal period and suckling-weaning transition
Physiol Rev 72507ndash562
Gohlke A C J Ingelmann G Nuumlrnberg A Starke S Wolffram and C C Metges
2013 Bioavailability of quercetin from its aglycone and its glucorhamnoside rutin
in lactating dairy cows after intraduodenal administration J Dairy Sci 962303ndash
2313
Goldberg D M J Yan and G J Soleas 2003 Absorption of three wine-related
polyphenols in three different matrices by healthy subjects Clin Biochem 3679ndash
87
Godden S 2008 Colostrum management for dairy calves Vet Clin Food Anim
2419ndash39
Gould K S and C Lister 2006 Flavonoid Functions in Plants Pages 397ndash441 in
Flavonoids Chemistry Biochemistry and Applications O M Andersen and K
R Markham ed Taylor amp Francis Group Boca Raton USA
Greathead H 2003 Plants and plant extracts for improving animal productivity Proc
Nutr Soc 62279ndash290
Gugler R M Leschik and H J Dengler 1975 Disposition of quercetin in man after
single oral and intravenous doses Eur J Clin Pharmacol 9229ndash234
Hackett A M 1986 The metabolism of flavonoid compounds in mammals Pages
177ndash194 in Plant Flavonoids in Biology and Medicine Biochemical
pharmacological and structure-activity relationship V Cody E J Middleton
and J B Harborne ed Alan R Liss Inc New York USA
Hadorn U H Hammon R M Bruckmaier and J W Blum 1997 Delaying colostrum
intake by one day has important effects on metabolic traits and on gastrointestinal
and metabolic hormones in neonatal calves J Nutr 1272011ndash2023
LITERATURE OVERVIEW
39
Halliwell B 1991 Reactive oxygen species in living systems Source biochemistry
and role in human disease Am J Med 91S14ndashS22
Hammon H M and J W Blum 1998 Metabolic and endocrine traits of neonatal
calves are influenced by feeding colostrum for different durations or only milk
replacer J Nutr 128624ndash632
Hammon H M J Steinhoff-Wagner J Flor U Schoumlnhusen and C C Metges 2013
Lactation Biology Symposium Role of colostrum and colostrum components on
glucose metabolism in neonatal calves J Anim Sci 91685ndash695
Hammon H M J Steinhoff-Wagner U Schoumlnhusen C C Metges and J W Blum
2012 Energy metabolism in the newborn farm animal with emphasis on the calf
Endocrine changes and responses to milk-born and systemic hormones Domest
Anim Endocrinol 43171ndash185
Hanhineva K R Toumlrroumlnen I Bondia-Pons J Pekkinen M Kolehmainen H
Mykkaumlnen and K Poutanen 2010 Impact of dietary polyphenols on
carbohydrate metabolism Int J Mol Sci 111365ndash1402
Harborne J B and C A Williams 2000 Advances in flavonoid research since 1992
Phytochemistry 55481ndash504
Heaney R P 2001 Factors influencing the measurement of bioavalability taking
calcium as a model J Nutr 1311344Sndash1348S
Heim K E A R Tagliaferro and D J Bobilya 2002 Flavonoid antioxidants
Chemistry metabolism and structure-activity relationships J Nutr Biochem
13572ndash584
Hertog M G L E J M Feskens P C H Hollman M B Katan and D Kromhout
1993 Dietary antioxidant flavonoids and risk of coronary heart disease The
Zutphen Elderly Study Lancet 3421007ndash1011
Hertog M G L P C H Hollman and M B Katan 1992 Content of potentially
anticarcinogenic flavonoids of 28 vegetables and 9 fruits commonly consumed in
the Netherlands Proc Nutr Soc 402379ndash2383
LITERATURE OVERVIEW
40
Hollman P C H 2001 Determination of flavonols in body fluids Pages 97ndash102 in
Flavonoids and other Polyphenols Methods in Enzymology L Packer ed
Academic Press San Diego USA
Hollman P C H and I C W Arts 2000 Flavonols flavones and flavanols ndash nature
occurrence and dietary burden J Sci Food Agric 801081ndash1093
Hollman P C H M N C P Bijsman Y van Gameren E P J Cnossen J H M de
Vries and M B Katan 1999 The sugar moiety is a major determinant of the
absorption of dietary flavonoid glycosides in man Free Radic Res 31569ndash573
Hollman P C H J H M de Vries S D van Leeuwen M J Mengelers and M B
Katan 1995 Absorption of dietary quercetin glycosides and quercetin in healthy
ileostomy volunteers Am J Clin Nutr 621276ndash1282
Hollman P C H and M B Katan 1997 Absorption metabolism and health effects of
dietary flavonoids in man Biomed Pharmacother 51305ndash310
Hollman P C H L B M Tijburg and C S Yang 1997a Bioavailability of
flavonoids from tea Crit Rev Food Sci Nutr 37719ndash738
Hollman P C H K H van het Hof L B Tijburg and M B Katan 2001 Addition of
milk does not affect the absorption of flavonols from tea in man Free Radic Res
34297ndash300
Hollman P C H J M P van Trijp M N C P Buysman M S vd Gaag M J B
Mengelers J H M de Vries and M B Katan 1997b Relative bioavailability of
the antioxidant flavonoid quercetin from various foods in man FEBS Lett
418152ndash156
Hirvonen T P Pietinen M Virtanen M L Ovaskainen S Haumlkkinen D Albanes
and J Virtamo 2001 Intake of flavonols and flavones and risk of coronary heart
disease in male smokers Epidemiology 1262ndash67
Ishihara N D-C Chu S Akachi and L R Juneja 2001 Improvement of intestinal
microflora balance and prevention of digestive and respiratory organ diseases in
calves by green tea extracts Livest Prod Sci 68217ndash229
LITERATURE OVERVIEW
41
Janisch K M G Williamson P Needs and G W Plumb 2004 Properties of
quercetin conjugates Modulation of LDL oxidation and binding to human serum
albumin Free Radic Res 38877ndash884
Johnston K P Sharp M Clifford and L Morgan 2005 Dietary polyphenols decrease
glucose uptake by human intestinal Caco-2 cells FEBS Lett 5791653ndash1657
Kahle K M Kempf P Schreier W Scheppach D Schrenk T Kautenburger D
Hecker W Huemmer M Ackermann and E Richling 2011 Intestinal transit
and systemic metabolism of apple polyphenols Eur J Nutr 50507ndash22
Kim E-K K-B Kwon M-Y Song M-J Han J-H Lee Y-R Lee D-G Ryu B-
H Park J-W Park 2007 Flavonoids protect against cytokine-induced pancreatic
β-cell damage through suppression of nuclear factor κβ activation Pancreas
35e1ndash9
Knekt P R Jaumlrvinen A Reunanen and J Maatela 1996 Flavonoid intake and
coronary mortality in Finland A cohort study Br Med J 312478ndash482
Knekt P R Jaumlrvinen R Seppaumlnen M Helioumlvaara L Teppo E Pukkala and A
Aromaa 1997 Dietary flavonoids and the risk of lung cancer and other malignant
neoplasms Am J Epidemiol 146223ndash230
Kobayashi Y M Miyazawa A Kamei K Abe and T Kojima 2010 Ameliorative
effects of mulberry (Morus alba L) leaves on hyperlipidemia in rats fed a high-fat
diet Induction of fatty acid oxidation inhibition of lipogenesis and suppression
of oxidative stress Biosci Biotechnol Biochem 742385ndash2395
Kobayashi Y M Suzuki H Satsu S Arai Y Hara K Suzuki Y Miyamoto and M
Shimizu 2000 Green tea polyphenols inhibit the sodium-dependent glucose
transporter of intestinal epithelial cells by a competitive mechanism J Agr Food
Chem 485618ndash5623
Kohen R and A Nyska 2002 Oxidation of biological systems Oxidative stress
phenomena antioxidants redox reactions and methods for their quantification
Toxicol Pathol 30620ndash650
Kootstra A 1994 Protection from UV-B-induced DNA damage by flavonoids Plant
Mol Biol 26771ndash774
LITERATURE OVERVIEW
42
Koster H I Halsema E Scholtens M Knippers and G J Mulder 1981 Dose-
dependent shifts in the sulfation and glucuronidation of phenolic compounds in
the rat in vivo and in isolated hepatocytes Biochem Pharmacol 302569ndash2575
Lamartiniere C A J Moore M Holland and S Barnes 1995 Neonatal genistein
chemoprevents mammary cancer Proc Soc Exp Biol Med 208120ndash123
Lee M-L P Maliakal L Chen X Meng F Y Bondoc S Prabhu G Lambert S
Mohr and C S Yang 2002 Pharmacokinetics of tea catechins after ingestion of
green tea and (ndash)-epigallocatechin-3-gallate by humans Formation of different
metabolites and individual variability Cancer Epidemiol Biomarkers Prev
111025ndash1032
Lesser S R Cermak and S Wolffram 2004 Bioavailability of quercetin in pigs is
influenced by the dietary fat content J Nutr 1431508ndash1511
Liggins G C 1994 The role of cortisol in preparing the fetus for birth Reprod Fertil
Dev 6141ndash50
Loke W M J M Hodgson and K D Croft 2010 The biochemistry behind the
potential cardiovascular protection by dietary flavonoids Pages 91ndash106 in Plant
Phenolics and Human Health Biochemistry Nutrition and Pharmacology C G
Fraga ed J Wiley amp Sons Inc Hoboken USA
Lorenz I B Earley J Gilmore I Hogan E Kennedy and S J More 2011 Calf
health from birth to weaning III Housing and management of calf pneumonia Ir
Vet J 641ndash14
Manach C C Morand C Demigneacute O Texier F Reacutegeacuterat and C Reacutemeacutesy 1997
Bioavailability of rutin and quercetin in rats FEBS Lett 40912ndash16
Manach C C Morand A Gil-Izquierdo C Bouteloup-Demange and C Reacutemeacutesy
2003 Bioavailability in humans of the flavanones hesperidin and narirutin after
the ingestion of two doses of orange juice Eur J Clin Nutr 57235ndash42
Manach C A Scalbert C Morand C Reacutemeacutesy and L Jimeacutenez 2004 Polyphenols
Food sources and bioavailability Am J Clin Nutr 79727ndash747
LITERATURE OVERVIEW
43
Manach C O Texier C Morand V Crespy F Reacutegeacuterat C Demigneacute and C Reacutemeacutesy
1999 Comparison of the bioavailability of quercetin and catechin in rats Free
Radic Biol Med 271259ndash1266
Manach C G Williamson C Morand A Scalbert and C Reacutemeacutesy 2005
Bioavailability and bioefficacy of polyphenols in humans I Review of 97
bioavailability studies Am J Clin Nutr 81230Sndash242S
McMahon L G 1997 Cytosolic pyridoxine-β-D-glucoside hydrolase from porcine
jejunal mucosa Purification properties and comparison with broad specifity β-
glucosidase J Biol Chem 27232025ndash32033
Mennen L I D Sapinho A De Bree N Arnault S Bertrais P Galan and S
Hercberg 2004 Consumption of foods rich in flavonoids is related to a decreased
cardiovascular risk in apparently healthy french women J Nutr 134923ndash926
Metwally M T A A R Khafagy H I Eid and A M Algammal 2013 Studies on
the immunostimulatory effect of propolis in diarrheic buffalo calves J Adv Vet
Res 3114ndash117
Middleton E C Kandaswami and T C Theoharides 2000 The effects of plant
flavonoids on mammalian cells Implications for inflammation heart disease and
cancer Pharmacol Rev 52673ndash751
Miller R L M James-Kracke G Y Sun and A Y Sun 2009 Oxidative and
inflammatory pathways in Parkinsonrsquos disease Neurochem Res 3455ndash65
Morris M E and S Zhang 2006 Flavonoid-drug interactions Effects of flavonoids
on ABC transporters Live Sci 782116ndash2130
Murota K and J Terao 2003 Antioxidative flavonoid quercetin Implication of its
intestinal absorption and metabolism Arch Biochem Biophys 41712ndash17
Mutinati M M Pantaleo M Roncetti M Piccinno A Rizzo and R L Sciorsci
2014 Oxidative stress in neonatology A review Reprod Domest Anim 497ndash
16
LITERATURE OVERVIEW
44
Neacutemeth K G W Plumb J-G Berrin N Juge R Jacob H Y Naim G Williamson
D M Swallow and P A Kroon 2003 Deglycosylation by small intestinal
epithelial cell beta-glucosidases is a critical step in the absorption and metabolism
of dietary flavonoid glycosides in humans Eur J Nutr 4229ndash42
Nielsen B K 2008 Botanicals as feed additives to improve health and production in
pig breeding Res Pig Breed 212ndash18
Nijveldt R J E van Nood D E C van Hoorn P G Boelens K van Norren and P
A M van Leeuwen 2001 Flavonoids A review of probable mechanisms of
action and potential applications Am J Clin Nutr 74418ndash425
Nussbaum A G Schiessler H M Hammon and J W Blum 2002 Growth
performance and metabolic and endocrine traits in calves pair-fed by bucket or by
automate starting in the neonatal period J Anim Sci 801545ndash1555
OrsquoConnell J E and P F Fox 2001 Significance and applications of phenolic
compounds in the production and quality of milk and dairy products A review
Int Dairy J 11103ndash120
Ofer M S Wolffram A Koggel H Spahn-Langguth and P Langguth 2005
Modulation of drug transport by selected flavonoids Involvement of P-gp and
OCT Eur J Pharm Sci 25263ndash271
Oliveira R A C D Narciso R S Bisinotto M C Perdomo M A Ballou M Dreher
and J E P Santos 2010 Effects of feeding polyphenols from pomegranate
extract on health growth nutrient digestion and immunocompetence of calves J
Dairy Sci 934280ndash4291
Olthof M R P C H Hollman T B Vree and M B Katan 2000 Bioavailabilities of
quercetin-3-glucoside and quercetin-4`-glucoside do not differ in humans J Nutr
21200ndash1203
Otake Y F Hsieh and T Walle 2002 Glucuronidation versus oxidation of the
flavonoid galangin by human liver microsomes and hepatocytes Drug Metab
Dispos 30576ndash581
LITERATURE OVERVIEW
45
Passamonti S M Terdoslavich R Franca A Vanzo F Tramer E Braidot E
Petrussa and A Vianello 2009 Bioavailability of flavonoids A review of their
membrane transport and the function of bilitranslocase in animal and plant
organisms Curr Drug Metab 10369ndash394
Petri N C Tannergren B Holst F A Mellon Y Bao G W Plumb J I M Bacon
K A O Leary P A Kroon L Knutson P Forsell T Eriksson H Lennernas
and G Williamson 2003 Absorptionmetabolism of sulforaphane and quercetin
and regulation of phase II enzymes in human jejenum in vivo Drug Metab
Dispos 31805ndash813
Pfeiffer S P Pflegel and H-H Borchert 1995 Grundlagen der Biopharmazie
Pharmakokinetik Bioverfuumlgbarkeit Biotransformation VEB Verlag Volk und
Gesundheit Berlin Germany
Piskula M K 2000 Soy isoflavone conjugation differs in fed and food-deprived rats J
Nutr 1301766ndash1771
Piskula M K and J Terao 1998 Accumulation of (ndash)-epicatechin metabolites in rat
plasma after oral administration and distribution of conjugation enzymes in rat
tissues J Nutr 1281172ndash1178
Piskula M K J Yamakoshi and Y Iwai 1999 Daidzein and genistein but not their
glucosides are absorbed from the rat stomach FEBS Lett 447287ndash291
Rauprich A B E H M Hammon and J W Blum 2000 Effects of feeding colostrum
and a formula with nutrient contents as colostrum on metabolic and endocrine
traits in neonatal calves Biol Neonate 7853ndash64
Rao V S F A Santos T T Sobreira M F Souza C L Melo and E R Silveira
1997 Investigations on the gastroprotective and antidiarrhoeal properties of
ternatin a tetramethoxyflavone from Egletes viscosa Planta Med 63146ndash149
Reddy V C G V Vidya Sagar D Sreeramulu L Venu and M Raghunath 2005
Addition of milk does not alter the antioxidant activity of black tea Ann Nutr
Metab 49189ndash195
LITERATURE OVERVIEW
46
Reinboth M S Wolffram G Abraham F R Ungemach and R Cermak 2010 Oral
bioavailability of quercetin from different quercetin glycosides in dogs Br J
Nutr 104198ndash203
Retskii M I A G Shakhov D V Chusov A I Zolotarev M I Lebedev T G
Ermolova and G N Bliznetsova 2010 Correcting the antioxidant status of
newborn calves for forming higher colostral immunity Russ Agric Sci 36127ndash
Rimm E B M B Katan A Ascherio M J Stampfer and W C Willett 1996
Relation between intake of flavonoids and risk for coronary heart disease in male
health professionals Ann Intern Med 125384ndash389
Robles R N Palomino and A Robles 2001 Oxidative stress in the neonate Early
Hum Dev 65S75ndashS81
Roghani M and T Baluchnejadmojarad 2010 Hypoglycemic and hypolipidemic
effect and antioxidant activity of chronic epigallocatechin-gallate in
streptozotocin-diabetic rats Pathophysiology 1755ndash59
Saugstad O D 2005 Oxidative stress in the newborn A 30-year perspective Biol
Neonate 88228ndash236
Scalbert A and G Williamson 2000 Dietary intake and bioavailability of
polyphenols J Nutr 1302073ndash2085
Schiessler G A Nussbaum H M Hammon and J W Blum 2002 Calves sucking
colostrum and milk from their dams or from an automatic feeding station starting
in the neonatal period metabolic and endocrine traits and growth performance
Anim Sci 74431ndash444
Scholz S and G Williamson 2007 Interactions affecting the bioavailability of dietary
polyphenols in vivo Int J Vitam Nutr Res 77224ndash235
Schwerin M U Dorroch M Beyer H Swalve C C Metges and P Junghans 2002
Dietary protein modifies hepatic gene expression associated with oxidative stress
responsiveness in growing pigs FASEB J 161322ndash1324
LITERATURE OVERVIEW
47
Schroeter H and J P E Spencer 2003 Flavonoids Neurodegenerative agents
Modulation of oxidative stress-induced map kinase signal transduction Pages
233ndash272 in Flavonoids in Health and Disease C A Rice-Evans and L Packer
ed Marcel Dekker Inc New York USA
Seiva F R F L G A Chuffa C P Braga J P A Amorim and A A H Fernandes
2012 Quercetin ameliorates glucose and lipid metabolism and improves
antioxidant status in postnatally monosodium glutamate-induced metabolic
alterations Food Chem Toxicol 503556ndash3561
Serafini M R Bugianesi G Maiani S Valtuena S De Santis and A Crozier 2003
Plasma antioxidants from chocolate Nature 4241013
Sesink A L A I C W Arts V C J de Boer P Breedveld J H M Schellens P C
H Hollman and F G M Russel 2005 Breast cancer resistance protein
(Bcrp1Abcg2) limits net intestinal uptake of quercetin in rats by facilitating
apical efflux of glucuronides Mol Pharmacol 671999ndash2006
Sesink A L A I C W Arts M Faassen-Peters and P C H Hollman 2002
Intestinal uptake of quercetin-3-glucoside in rats involves hydrolysis by lactase
phlorizin hydrolase J Nutr 133773ndash776
Setchell K D R N M Brown P Desai L Zimmer-Nechemias B E Wolfe W T
Brashear A S Kirschner A Cassidy and J E Heubi 2001 Bioavailability of
pure isoflavones in healthy humans and analysis of commercial soy isoflavone
supplements J Nutr 1311362Sndash1375
Shimoi K H Okada M Furugori T Goda S Takase M Suzuki Y Hara H
Yamamoto and N Kinae 1998 Intestinal absorption of luteolin and luteolin 7-O-
β-glucoside in rats and humans FEBS Lett 438220ndash224
Sies H 1985 Oxidative Stress Introductory Remarks Pages 1ndash8 in Oxidative Stress
H Sies ed Academic Press Inc London UK
Sies H 1991 Role of reactive oxygen species in biological processes Klin
Wochenschr 69965ndash968
Sies H W Stahl and A Sevanian 2005 Nutritional dietary and postprandial
oxidative stress J Nutr 135969ndash972
LITERATURE OVERVIEW
48
Sokolova V E E A Vasilrsquochenko and I K Izmaĭlova 1978 Anabolic action of
flavonoids Famakol Toksikol 41323ndash327
Spencer J P G Chowrimootoo R Choudhury E S Debnam S K Srai and C Rice-
Evans 1999 The small intestine can both absorb and glucuronidate luminal
flavonoids FEBS Lett 458224ndash230
Steinhoff-Wagner J S Goumlrs P Junghans R M Bruckmaier E Kanitz C C Metges
and H M Hammon 2011 Maturation of endogenous glucose production in
preterm and term calves J Dairy Sci 945111ndash5123
Steinshamn H S Purup E Thuen and J Hansen-Moslashller 2008 Effects of clover-
grass silages and concentrate supplementation on the content of phytoestrogens in
dairy cow milk J Dairy Sci 912715ndash2725
Stohrer M S Lutz and M Stangassinger 2003 Antioxidant status of calves and foals
declines after birth Acta Vet Scand Suppl 44P38
Stott G H D B Marx B E Menefee and G T Nightengale 1979 Colostral
immunoglobulin transfer in calves I Period of absorption J Dairy Sci 621632ndash
1638
Swezey R R D E Aldridge S E Le Valley J A Crowell Y Hara and C E Green
2003 Absorption tissue distribution and elimination of 4-[3H]-epigallocatechin
gallate in beagle dogs Int J Toxicol 22187ndash193
Tadera K Y Minami K Takamatsu and T Matsuoka 2006 Inhibition of α-
glucosidase and α-amylase by flavonoids J Nutr Sci Vitaminol 52149ndash153
USDA (United States Department of Agriculture) Animal and Plant Health Inspection
Service 2011 Cattle and calves nonpredator death loss in the United States 2010
httpwwwaphisusdagovanimal_healthnahmsgeneraldownloadscattle_calves
_nonpred_2010pdf (Accessed May 2013)
van Het Hof K H G A A Kivits J A Weststrate and L B M Tijburg 1998
Bioavailability of catechins from tea The effect of milk Eur J Clin Nutr
52356ndash359
LITERATURE OVERVIEW
49
Varadarajan S J Kanski M Aksenova C Lauderback and D A Butterfield 2001
Different mechanisms of oxidative stress and neurotoxicity for Alzheimerlsquos
Aβ(1minus42) and Aβ(25minus35) J Am Chem Soc 1235625ndash5631
Walgren R A J Lin R K Kinne and T Walle 2000a Cellular Uptake of dietary
flavonoid quercetin 4`-szlig-glucoside by sodium-dependent glucose transporter
SGLT1 J Pharmacol Exp Ther 294837ndash843
Walgren R A G E Lindenmayer and T Walle 2000b Efflux of dietary flavonoid
quercetin 4`beta-glucoside across human intestinal Caco-2 cell monolayers by
apical multidrug resistance-associated protein-2 J Pharmacol Exp Ther
294830ndash836
Walle T A M Browning L L Steed S G Reed and U K Walle 2005 Human
nutrition and metabolism flavonoid glucosides are hydrolyzed and thus activated
in the oral cavity J Nutr 13548ndash52
Walle U K A Galijatovic and T Walle 1999 Transport of the flavonoid chrysin and
its conjugated metabolites by the human intestinal cell line caco-2 Biochem
Pharmacol 58431ndash438
Wein S and S Wolffram 2013 Oral bioavailability of quercetin in horses J Equine
Vet Sci 33441ndash445
Wernicki A M Kankofer P Mikucki and A Puchalski 2006 Evaluation of plasma
cortisol and TBARS levels in calves after short-term transportation Rev Med
Vet 15730ndash34
Williams C A and J B Harborne 1994 Flavone and flavonol glycosides Pages 337ndash
385 in The Flavonoids Advances in research since 1986 JB Harborne ed
Chapman and Hall London UK
Winkel-Shirley B 2002 Biosynthesis of flavonoids and effects of stress Curr Opin
Plant Biol 5218ndash223
LITERATURE OVERVIEW
50
Wolffram S 2010 Wie viel kommt an Die Bioverfuumlgbarkeit sekundaumlrer
Pflanzenstoffe am Beispiel des Quercetins Pages 10ndash14 in Aktuelle
Ernaumlhrungsmedizin Georg Thieme Verlag KG Stuttgart Germany - New York
USA httpwwwinstitut-danonedeernaehrungsaufklaerungunsere-materialien
(Accessed April 2013)
Wolffram S M Bloeck and P Ader 2002 Quercetin-3-glucoside is transported by
the glucose carrier SGLT1 across the brush border membrane of rat small
intestine J Nutr 132630ndash635
Wolfram S D Raederstorff M Preller Y Wang S R Teixeira C Riegger and P
Weber 2006 Epigallocatechin gallate supplementation alleviates diabetes in
rodents J Nutr 1362512ndash2518
Yaghoubi S M J G R Ghorbani H R Rahmani and A Nikkhah 2008 Growth
weaning performance and blood indicators of humoral immunity in Holstein
calves fed supplemental flavonoids Anim Physiol Anim Nutr 92456ndash462
Yochum L L H Kushi K Meyer and A R Folsom 1999 Dietary flavonoid intake
and risk of cardiovascular disease in postmenopausal women Am J Epidemiol
149943ndash949
Youdim K A and J A Joseph 2003 Phytochemicals and brain aging A multiplicity
of effects Pages 205ndash347 in Flavonoids in Health and Disease C A Rice-Evans
and L Packer ed Marcel Dekker Inc New York USA
Zhu M Y Chen and R C Li 2000 Oral absorption and bioavailability of tea
catechins Planta Med 66444ndash447
Zung A R Reifen Z Keem and Z Zadik 2001 Phytoestrogens The pediatric
perspective J Pediatr Gastroenterol Nutr 33112ndash118
51
Chapter 2
Bioavailability of the flavonol quercetin in neonatal calves
after oral administration of quercetin aglycone or rutin
J Maciej C T Schaumlff E Kanitzdagger A TuchschererDagger R M Bruckmaiersect
S Wolffram and H M Hammon1
Institute of Nutritional Physiology ldquoOskar Kellnerrdquo
daggerInstitute of Behavioural Physiology and
DaggerInstitute of Genetics and Biometry Leibniz Institute for Farm Animal Biology (FBN)
Wilhelm-Stahl-Allee 2 18196 Dummerstorf Germany
sectVeterinary Physiology Vetsuisse Faculty University of Bern 3001 Bern Switzerland
Institute of Animal Nutrition and Physiology Christian Albrechts University Kiel
24118 Kiel Germany
Received January 20 2015
Accepted February 6 2015
1Corresponding author hammonfbn-dummerstorfde
Used by permission of the Journal of Dairy Science
Published in Journal of Dairy Science 2015 983906ndash3917
httpdxdoiorg103168jds2015-9361
CHAPTER 2
52
2 Bioavailability of the flavonol quercetin in neonatal calves
after oral administration of quercetin aglycone or rutin
Abstract
Polyphenols such as flavonoids are secondary plant metabolites with potentially
health-promoting properties In newborn calves flavonoids may improve health status
but little is known about the systemically availability of flavonoids in calves to exert
biological effects The aim of this study was to investigate the oral bioavailability of the
flavonol quercetin applied either as quercetin aglycone (QA) or as its glucorhamnoside
rutin (RU) in newborn dairy calves Twenty-one male newborn German Holstein calves
were fed equal amounts of colostrum and milk replacer according to body weight On d
2 and 29 of life 9 mg of quercetin equivalentskg of body weight either fed as QA or as
RU or no quercetin (control group) were fed together with the morning meal Blood
samples were taken before and 05 1 15 2 25 3 4 5 6 12 24 and 48 h after feed
intake Quercetin and quercetin metabolites with an intact flavonol structure
(isorhamnetin tamarixetin and kaempferol) were analyzed in blood plasma after
treatment with glucuronidasesulfatase by HPLC with fluorescence detection Maximum
individual plasma concentration was depicted from the concentration-time-curve on d 2
and 29 respectively Additional blood samples were taken to measure basal plasma
concentrations of total protein albumin urea and lactate as well as pre- and
postprandial plasma concentrations of glucose non-esterified fatty acids insulin and
cortisol Plasma concentrations of quercetin and its metabolites were significantly
higher on d 2 than on d 29 of life and administration of QA resulted in higher plasma
concentrations of quercetin and its metabolites than RU The relative bioavailability of
total flavonols (sum of quercetin and its metabolites isorhamnetin tamarixetin and
kaempferol) from RU was 725 on d 2 and 496 on d 29 when compared with QA
(100 ) Calves fed QA reached maximum plasma concentrations of total flavonols
much earlier than did RU-fed calves Plasma metabolites and hormones were barely
affected by QA and RU feeding in this experiment Taken together orally administrated
QA resulted in a greater bioavailability of quercetin than RU on d 2 and 29
respectively and differed markedly between calves aged 2 and 29 d
Key Words bioavailability calf flavonoid quercetin rutin
CHAPTER 2
53
21 Introduction
Flavonoids are secondary plant metabolites occurring ubiquitously in all higher plants
(Manach et al 2004 Besle et al 2010) They are known for their health-promoting
properties (eg antioxidative and anti-inflammatory Middleton et al 2000 Nijveldt et
al 2001 Williams et al 2004) Quercetin is one of the most abundant flavonoids and
is present in high concentrations in onions apples and kale (Hertog et al 1992
Nijveldt et al 2001) and in low concentrations also in milk (Besle et al 2010
Bhagwat et al 2013) In addition to their health-promoting properties quercetin and its
metabolites modulate the expression and activity of several metabolic key enzymes and
therefore might be involved in regulation of lipid and carbohydrate metabolism
(Middleton et al 2000 Gasparin et al 2003 Kobayashi et al 2010)
Newborn calves undergo tremendous immunological and metabolic changes after birth
to adapt for extra-uterine life (Blum 2006 Chase et al 2008 Hammon et al 2012)
and colostrum management is one of the most important factors to support neonatal
health and development (Godden 2008 Hammon et al 2012) Nevertheless morbidity
and mortality rates are still high during first weeks of life and calves often suffer from
diarrhea and respiratory disease (McGuirk 2008 Mee 2008 Uetake 2013) as well as
from high levels of oxidative stress (Inanami et al 1999 Gaaacutel et al 2006) Frequent
problems on farms are the lack of high-quality colostrum availability and the
insufficient colostrum supply (Quickley and Drewry 1998 Godden 2008) Colostrum
and mature milk contain antioxidant agents to protect neonatal calves from oxidative
stress (Lindmark-Maringnsson and Aringkesson 2000 Besle et al 2010) Poor quality of
colostrum is reflected by low concentrations of antioxidative substances Thus
supplementing colostrum and milk at beginning of lactation with the natural antioxidant
agent quercetin may improve neonatal oxidative status However there is no
information about the bioavailability (BV) of orally applied quercetin with colostrum
and milk in newborn calves although feeding industry already offers flavonoid-
supplemented feed for dairy calves
Studies on BV of quercetin from quercetin aglycone (QA) or its glucorhamnoside rutin
(RU) in different monogastric species such as rats (Manach et al 1997) pigs (Ader et
al 2000 Cermak et al 2003 Lesser et al 2004) dogs (Reinboth et al 2010) and
humans (Erlund et al 2000 Egert et al 2008) showed marked differences to ruminant
CHAPTER 2
54
species (eg cows with intraruminal QA and RU application Berger et al 2012) These
differences may be due to differnces in gastrointestinal anatomy and physiology (Arts et
al 2004 Berger et al 2012 Gohlke et al 2013) Conversely in newborn calves the
forestomach system is just developing thus newborn calves are functionally
monogastrics (Drackley et al 2008) The aim of the present study was to investigate the
relative BV of quercetin after oral administration of QA or RU in calves during first
month of life We hypothesized that BV in calves depends on the form of application
(QA and RU) and changes with age due to ontogenetic development and maturation of
the gastrointestinal tract during first month of life We further tested the hypothesis that
quercetin application might affect metabolic and endocrine traits especially concerning
glucose metabolism in neonatal calves because findings in literature pointed to impair
carbohydrate digestion and glucose absorption after flavonoid intake (Cermak et al
2004 Tadera et al 2006)
22 Materials and Methods
221 Animals and feeding
The experimental procedures were carried out according to the animal care guidelines
and were approved by the relevant authorities of the State Mecklenburg-West
Pomerania Germany (LVL M-VTSD72213-21-01910) Twenty-one male German
Holstein calves were examined on d 2 and 29 of life All calves were spontaneously
born from multiparous cows on neighboring farms and transported directly after birth to
the experimental barn Calves were kept in single boxes with straw bedding and had
free access to water Calves were fed twice daily (0700 and 1500 h) with a nipple bottle
or nipple bucket On the first 3 d of life calves received pooled colostrum obtained from
milkings 1 3 and 5 (d 1 2 and 3 after parturition respectively Table 21) at amounts
of 8 of BW on d 1 and 10 of BW on d 2 and 3 (Steinhoff-Wagner et al 2011)
From d 4 until d 29 calves received milk replacer (150 gL SalvaLac MiraPro 45
Salvana Tiernahrung GmbH Klein-Offenseth Sparrieshoop Germany) at 12 of
BWd (Table 21) To ensure uptake of equal amounts of feed refused amounts of
colostrum or milk were tube-fed to calves Milk intake was adapted to BW data once a
week
CHAPTER 2
55
Colostrum or milk replacer was supplemented with chicken egg-derived
immunoglobulins (Globigen Life Start 25 EW Nutrition GmbH Visbek Germany)
composed of 75 dextrose and 25 whole egg powder (1075 CP 1050 crude
fat 010 crude fiber and 250 ash) with high antibody titer against Eschericha coli
type K 99 Salmonella Tymphimurium and Salmonella Dublin bovine rotavirus type
G6 and G10 bovine coronavirus Cryptosporidium parvum and Clostridium
perfringens serotype C Immunoglobulins were added from d 2 till d 6 Respective
amounts of immunoglobulins fed twice daily were 40 32 24 16 and 8 gd
From d 4 on calves had free access to pelleted concentrate (Kaumllber Start 183 pell
Vollkraft Mischfutterwerke GmbH Karstaumldt Germany Table 21) and hay
Concentrate intake was measured daily after morning milk feeding To avoid iron
deficiency calves received 600 mg iron dextran subcutaneously (Ursoferran
Serumwerk Bernburg Germany) on their first day of life Navel disinfection was
performed with 10 iodine solution (vet sept Loumlsung Albrecht GmbH Aulendorf
Germany) immediately after birth Health status of calves was determined daily by
measuring rectal temperature heart rate and respiratory rate by evaluation of
behavioral abnormalities nasal discharge respiratory sounds fecal consistence and by
navel inspection
222 Treatment and blood sampling
Calves were randomly assigned to 1 of 3 feeding groups (n = 7 per group) receiving
either no flavonoids (control group CTRL) 9 mg of QAkg of BW (quercetin aglycone
dihydrate Carl Roth GmbH Karlsruhe Germany) or 18 mg of RUkg of BW (rutin
trihydrate Carl Roth GmbH) each resulting in a dose of 9 mg of quercetin equivalents
(QE)kg of BW on d 2 and d 29 of life Calves received the whole dose of QA or RU
during morning feeding applying the QE suspension with a 10-ml syringe directly into
the mouth
CHAPTER 2
56
Ta
ble
21
C
om
po
siti
on
an
d a
mo
un
ts o
f co
lost
rum
m
ilk
rep
lace
r a
nd
co
nce
ntr
ate
fed
to
ca
lves
d
1
d 2
d
3
d 4
to
30
2
Item
co
lost
rum
1
mil
kin
g 1
colo
stru
m1
mil
kin
g 3
colo
stru
m1
mil
kin
g 5
M
ilk
rep
lace
r3
Co
nce
ntr
ate
4
DM
gk
g
20
69
1
54
7
13
93
1
10
0
88
00
CP
gk
g D
M
59
74
3
90
4
33
31
2
01
8
18
00
Cru
de
fat
gk
g D
M
16
92
2
40
5
27
49
1
90
9
43
0
Ash
gk
g D
M
48
3
55
6
56
0
73
6
74
0
Lac
tose
g
kg D
M
13
63
2
60
5
30
87
5
14
6
-
1C
olo
stru
m w
as d
eriv
ed f
rom
mu
ltip
aro
us
cow
s and
sep
arat
ely p
oo
led
fro
m m
ilkin
gs
1
3
and
5 a
fter
par
turi
tio
n
resp
ecti
vel
y
2H
ay w
as o
ffer
ed a
d l
ibit
um
exce
pt
for
days
of
bio
avai
lab
ilit
y s
tud
ies
3M
ilk
rep
lace
r (S
alvaL
ac M
iraP
ro 4
5
Sal
vana
Tie
rnah
run
g G
mb
H
Kle
in-O
ffense
th S
parr
iesh
oo
p
Ger
man
y)
was
com
po
sed
of
45
s
pra
y s
kim
med
mil
k
po
wd
er
35
s
wee
t w
hey p
ow
der
1
8
pla
nt
oil
(p
alm
co
conut
and
so
y o
il)
17
L
ys
08
C
a 0
75
P
an
d a
dd
ed w
ith 5
00
00
IU
of
vit
am
in A
4
000
IU o
f vit
am
in D
3
20
0 m
g o
f vit
am
in E
(α
-to
cop
her
ol
acet
ate)
9
mg C
u (
gly
ceri
ne-
cop
per
chel
ate)
ci
tric
aci
d
sorb
ic a
cid
b
uty
lhyd
rox
yto
luene (
BH
T)
and
12
x 1
09 c
fu E
nte
roco
ccu
s fa
eciu
m E
17
06
4C
once
ntr
ate
(Kaumll
ber
Sta
rt 1
83
V
oll
kra
ft
Mis
ch
futt
erw
erk
e G
mb
H
Kar
staumld
t G
erm
an
y)
was
com
po
sed
of
wh
eat
glu
ten
wh
eat
bra
n
gra
in m
ash
su
gar
bee
t
pulp
ra
pes
eed
mea
l o
at
rye
mo
lass
es
lin
seed
o
at b
ran
soyb
ean m
eal
extr
act
cal
ciu
m c
arb
onat
e s
od
ium
chlo
rid
e 0
6
pho
spho
rous
02
s
od
ium
10
800
IU
of
vit
am
in A
1
21
5 I
U o
f vit
am
in D
3
30
mg o
f vit
am
in E
0
7 m
g o
f I
04
mg o
f C
o
54
mg o
f M
g
81
mg o
f Z
n
and
04
mg o
f S
e p
er k
g o
f D
M
CHAPTER 2
57
The day before the study started a catheter (Certofix Mono 340 Braun Melsungen AG
Melsungen Germany) was inserted into the calvesrsquo right jugular vein and blood
samples were taken before (time point 0) and 05 1 15 2 25 3 4 6 8 12 24 and
48 h after feeding using S-Monovette tubes (Sarstedt AG amp Co Nuumlmbrecht Germany)
containing lithium heparin (16 IUmL blood) for analysis of plasma flavonols
Additional blood samples except on 15 25 and 48 h were taken for measurement of
plasma concentrations of total protein albumin glucose NEFA urea and lactate using
tubes containing sodium fluoride and K3EDTA (10 mgmL fluoride and 12 mgmL
EDTA) Blood sampled into tubes containing dipotassium EDTA (18 mgmL) was used
for determination of insulin and cortisol plasma concentrations Catheters were flushed
with 10 mL sodium chloride solution (09 sodium chloride Braun Melsungen AG)
after each blood sampling Blood was immediately put on ice centrifuged for 20 min at
1500 times g at 4deg C and plasma was stored at -80deg C for flavonol analysis and at -20deg C
for analyses of metabolites and hormones
223 Analytical methods
Flavonols were extracted from plasma as described by Egert et al (2008) and
concentrations of quercetin aglycone and its methylated (isorhamnetin tamarixetin) and
dehydroxylated (kaempferol) derivatives were analyzed by HPLC with fluorescence
detection as previously described (Ader et al 2000 Berger et al 2012 Gohlke et al
2013) Briefly plasma samples were thawed in a 40deg C water bath Then 980 μL of
plasma was acidified with 130 μL of acetic acid (0583 molL) spiked with 20 μL of
methanolic rhamnetin solution (internal standard 1 mg20 mL in methanol Rotichrom
HPLC Carl Roth GmbH) and treated with a mixture of β-glucuronidase and sulfatase
(from Helix pomatia Type H-1 with final activities of 7300 and 130 UmL for
glucuronidase and sulfatase respectively Sigma-Aldrich Chemie GmbH Dreieich
Germany) to cleave the ester bonds of glucuronides and sulfates After incubation at
37deg C for 1 h 3 mL of acetone was added and the samples were centrifuged at 3700 times g
for 45 min at 4deg C) The supernatant was evaporated until dryness Residues were
resolved in 200 μL methanol and after 15 min in an ultrasonic bath 775 μL of
nanopure water and 225 μL of hydrochloric acid (10 molL) were added For flavonol
analyses by HPLC 30 μL of the final solution was injected by a cooled (4deg C)
autosampler (AS-2057 Plus Jasco Deutschland GmbH Groszlig-Umstadt Germany) onto
CHAPTER 2
58
a C-18 Kromasil 100 column (250 times 4 mm particle size = 5 μm Jasco Deutschland
GmbH) guarded by a pre-column (C-18 Inertsil ODS-2 10 times 4 mm particle size = 5
μm Jasco Deutschland GmbH) The eluent (flow rate 1 mLmin) was composed of
0025 molL sodium dihydrogen phosphate (pH 24) acetonitrile and methanol
(68275 volvolvol) In a postcolumn reactor the effluent was mixed with aluminum
nitrate [flow rate = 04 mLmin 1 mmolL in methanol containing 75 [volvol] acetic
acid] for derivatization and fluorescence of the flavonol-aluminum complex was
measured using a fluorescence detector (excitation wavelength = 422 nm emission
wavelength = 485 nm FP920 Jasco Deutschland GmbH) Identification of peaks
obtained was performed using the retention times of the standards which were prepared
with pure flavonols and treated in the same way as samples The detection limit of
flavonols was le10 nmolL and the recovery rate was 92 plusmn 2 (mean plusmn SE) Inter- and
intraassay variances for quercetin were 72 and 05 The sum of plasma
concentrations of quercetin and its metabolites in plasma is referred to as total
flavonols
Plasma metabolites were analyzed spectrophotometrically (ABX Penta 400 Horiba
ABX SAS Montpellier Cedex France) by the Clinic for Cattle (University of
Veterinary Medicine Foundation Hanover Germany) using the respective kits
Albumin (no A11A01664) and lactate (no A11A01721 Horiba Europe GmbH
Hannover Germany) NEFA (no 434-91795 Wako Chemicals GmbH Neuss
Germany) glucose (no 553-230) and total protein (no 553-412 MTI Diagnostics
GmbH Idstein Germany) and urea (no LT-UR 0050 Labor + Technik E Lehmann
GmbH Berlin Germany)
Plasma insulin concentrations were determined using an RIA as previously described
(Vicari et al 2008) Plasma cortisol concentrations were analyzed using a commercial
ELISA kit validated for bovine plasma (EIA-1887 DRG Instruments GmbH Marburg
Germany Weber et al 2013) Cross reactivities of the monoclonal antibody against
corticosteron and progesterone were 45 and 9 respectively and to any further plasma
steroids lower than 2 Test sensitivity was 34 ngmL inter- and intraassay variations
were 53 and 121 respectively
Colostrum was analyzed for DM CP crude fat and ash content (Qualitaumltspruumlfungs- und
Dienstleistungsgesellschaft Mecklenburg-Vorpommern mbH Guumlstrow Germany)
according to the Weender standard procedure (Naumann and Bassler 2004) as shown
CHAPTER 2
59
in Table 21 Chemical composition of milk replacer and concentrates were according to
the manufacturersrsquo declarations (Table 21)
224 Calculations and statistical analyses
Quercetin measurements were corrected by baseline concentration (first blood sample
before QA or RU administration) then area under the curve (AUC) was calculated for
quercetin and its metabolites (isorhamnetin tamarixetin and kaempferol) according to
the trapeziodale rule between 0 and 24 h using GraphPad Prism 3 (GraphPad Software
Inc San Diego CA version 303) For single quercetin metabolites AUC proportion
relative to AUC of total flavonols (sum of quercetin isorhamnetin tamarixetin and
kaempferol) was calculated in addition Maximum plasma flavonol concentrations
(Cmax) and time after intake until Cmax was reached (Tmax) were determined from
individual plasma concentration-time curves Relative BV of quercetin from RU was
calculated as
Relative BV = AUCRUAUCQA times 100
Statistical analyses were performed using SASSTAT software (SAS Institute 2010)
All data are presented as LSM plusmn SE Body weight concentrate intake and
pharmacokinetic parameters (AUC Cmax Tmax) as well as proportions of single
metabolites on d 2 and 29 were analyzed by repeated measurement ANOVA using the
Mixed procedure with group (levels CTRL QA RU for proportional calculations only
QA and RU) repeated variable day (levels d 2 29) and group times day interaction as
fixed effects in the model Repeated measures on each calf were taken into account by
using the repeated statement of the Mixed procedure with an autoregressive residual
covariance structure Plasma concentration of total flavonols as well as metabolite and
hormone data were analyzed by repeated measurement ANOVA using the Mixed
procedure as described previously with group (levels CTRL QA RU) day (levels d
2 29) time changes within d 2 and 29 (several time points before and after feed intake
on d 2 and 29 respectively) and respective interactions as fixed effects Pairwise
differences among treatments and time changes were tested by the Tukey-Kramer-test
Effects were considered significant if P lt 005
CHAPTER 2
60
23 Results
231 Body weight and feed intake
All calves were born spontaneously and healthy Birth weight was 474 plusmn 10 kg Body
weight increased with time in all groups (P lt 001) and was 655 plusmn 13 kg on d 29
without differences between groups Milk intake was 38 plusmn 01 kgd on d 1 (8 of
BW) 48 plusmn 01 kgd on d 2 (10 of BW) and 69 plusmn 01 kg on d 29 Concentrate intake
was 159 plusmn 028 kgcalf and increased equally with time (P lt 001) in all groups
Average daily gain from birth to d 29 was 612 plusmn 28 gd without group differences
232 Bioavailability studies
Plasma concentrations of total flavonols of CTRL were close to or below the detection
limit on d 2 and 29 respectively (Figure 21A B) In QA- and RU-fed calves plasma
concentrations of total flavonols increased (P lt 005) after flavonoid administration on
d 2 and returned to baseline concentrations 48 h after administration (Figure 21A)
Figure 21 Plasma concentration-time-curves of total flavonols after oral administration of 9 mg of
quercetinkg of BW times d as quercetin aglycone () rutin trihydrate () or no flavonoid () on d 2
(A) and 29 (B) of life Values are LSM plusmn SE n = 7
On d 2 plasma concentrations of total flavonols were greater at 8 and 12 h (P lt 001)
but were smaller at 24 h after flavonoid administration (P lt 001) in QA- than in RU-
fed calves On d 29 postprandial plasma concentrations of total flavonols increased far
less distinctly (P lt 001) when compared to d 2 (Figure 21A B) Further plasma
concentrations of total flavonols increased until 8 h after administration (P lt 001) in
A B
Time relative to feeding h
0 2 4 6 8 10 12 24 48
To
tal
fla
vo
no
ls n
mo
lL
0
100
200
300
400
Time relative to feeding h
0 2 4 6 8 10 12 24 48
To
tal
fla
vo
no
ls n
mo
lL
0
100
200
300
400
CHAPTER 2
61
QA- but not in RU-fed calves (Figure 21B) Plasma concentrations of total flavonols
on d 29 tended to be greater (P lt 01) in QA- than in RU-fed calves
Compared with QA- (100 ) RU-fed calves showed a relative BV of quercetin of
725 on d 2 and of 496 on d 29 On d 2 AUC of total flavonols quercetin and
quercetin metabolites in QA- and RU-fed calves differed (P lt 005) from CTRL and
were greater (P lt 0001) on d 2 than on 29 for both treatments (Table 22) On d 2 AUC
of quercetin and isorhamnetin was greater (P lt 005) and tended to be greater for total
flavonols (P lt 01) but was lower for tamarixetin (P lt 005) in QA- than in RU-fed
calves On d 29 AUC of quercetin was greater (P lt 005) in QA-fed calves than in
CTRL
A Day 2
QA RU
Pro
po
rtio
n o
f T
ota
l F
lav
on
ols
AU
C (
)
0
20
40
60
80
100
Quercetin
Isorhamnetin
Tamarixetin
Kaempferol
B Day 29
QA RU
Pro
po
rtio
n o
f T
ota
l F
lav
on
ols
AU
C (
)
0
20
40
60
80
100
Figure 22 Proportion of single flavonols (quercetin isorhamnetin tamarixetin and kaempferol)
in plasma after oral administration of 9 mg of quercetinkg of BW times day as quercetin aglycone
(QA) or rutin trihydrate (RU) on d 2 and 29 of life Values are LSM plusmn SE n = 7
On d 2 Cmax of total flavonols quercetin and quercetin metabolites except kaempferol
of QA- and RU-fed calves differed from CTRL (P lt 005 Table 22) whereas on d 29
only Cmax of total flavonols and quercetin of QA-fed calves differed (P lt 005) from
CTRL Maximal plasma concentrations of total flavonols quercetin and isorhamnetin
decreased (P lt 005) or tended to decrease (kaempferol tamarixetin P lt 01) in QA-
and RU-fed calves from d 2 to 29 respectively On d 2 Cmax was greater (P lt 005) for
quercetin and isorhamnetin but was lower for tamarixetin in QA- than in RU-fed
calves Time to reach Cmax in QA- and RU-fed calves was not affected by day but
indicated treatment effects for total flavonols isorhamnetin and tamarixetin (Table
22) For isorhamnetin Tmax was greater (P lt 005) in RU- than in QA-fed calves on
both days
CHAPTER 2
62
Table 22 Pharmacokinetic parameters after oral administration of quercetin as quercetin
aglycone (QA) or rutin trihydrate (RU) on d 2 and 29 of life calves of the control group (CTRL)
received no flavonoids
Item1 Day
Group2
SE
ANOVA (P-value)
CTRL QA RU Group Day Group
times day
AUC 3 nmolL times h
AUCTotal 2 154c 5947
a 4312
ab 395 0001 0001 0001
29 770 1336 662
AUCQ 2 102c 3413
a 1967
b 228 0001 0001 0001
29 267b 1090
a 535
ab
AUCK 2 319b 152
a 159
a 244 002 0001 005
29 000 111 639
AUCI 2 000c 1390
a 447
b 701 0001 0001 0001
29 000 675 239
AUCT 2 000c 1070
b 1768
a 154 0001 0001 0001
29 000 583 196
Cmax4 nmolL
Cmax Total 2 139b 407
a 330
a 359 0001 0001 0001
29 224b 168
a 747
ab
Cmax Q 2 107c 238
a 129
b 193 0001 0001 003
29 628b 137
a 603
ab
Cmax K 2 196b 124
a 109
ab 207 001 0001 016
29 000 386 212
Cmax I 2 000c 945
a 396
b 585 0001 0001 0001
29 000 155 399
Cmax T 2 000c 771
b 163
a 156 0001 0001 0001
29 000 945 327
Tmax5 h
Tmax Total 2 950 106 164 284 005 012 090
29 649 621 104
Tmax Q 2 665 886 117 277 031 047 076
29 644 593 111
Tmax K 2 100 967 123 401 093 049 076
29 ND6 800 800
Tmax I 2 ND 114b 193
a 256 0001 088 009
29 ND 590b 240
a
Tmax T 2 ND 111 166 357 001 063 018
29 ND 763 240
a-cLSM in a row with different superscripts differ (P lt 005)
1Values are LSM with SE n = 7 per group
2Group QA = 30 micromol(kg BW times d) quercetin aglycone RU = 30 micromol(kg BW times d) rutin trihydrate
CTRL = no flavonol fed 3AUC = area under the plasma concentration-time curve of flavonols from 0 to 24 h calculated by
subtracting baseline values (time point 0) from all other time points according to the trapezoidale rule
AUCTotal AUCQ AUCK AUCI AUCT = AUC of total flavonols (Total) or of the respective quercetin
metabolites quercetin (Q) kaempferol (K) isorhamnetin (I) and tamarixetin (T) respectively 4Cmax = maximum plasma concentration of flavonols subtracted by basal plasma concentration before feed
intake Cmax Total Cmax Q Cmax K Cmax I Cmax T = maximum plasma concentration of total flavonols
(Total) quercetin aglycone (Q) kaempferol (K) isorhamnetin (I) and tamarixetin (T) respectively 5Tmax = time until Cmax was reached Tmax Total Tmax Q Tmax K Tmax I Tmax T = time until Cmax Total Cmax Q
Cmax K Cmax I Cmax T was reached respectively 6ND = Not definable
CHAPTER 2
63
Relative distribution of single flavonols (quercetin isorhamnetin tamarixetin and
kaempferol) proportionately to total flavonols in plasma showed highest values for
quercetin on both days and in both groups (QA and RU) Proportion of single flavonols
changed with time namely increased for quercetin (P lt 005) but decreased for
isorhamnetin and tamarixetin (P lt 005) from d 2 to 29 (Figure 22A B) On d 2
proportion of isorhamnetin was greater (P lt 005) and proportion of tamarixetin was
smaller (P lt 005) in QA- than in RU-fed calves (Figure 22A)
233 Plasma concentrations of metabolites and hormones
Plasma concentrations of total protein decreased (P lt 005) from d 2 to 29 in CTRL and
were greater on d 2 in CTRL than in QA-fed calves (P lt 005 Table 23) Plasma
concentrations of albumin increased (P lt 001) and plasma concentrations of lactate and
urea decreased (P lt 001) from d 2 to 29 without any group effect (Table 23)
Table 23 Blood plasma concentrations of metabolites and hormones of calves after oral
administration of quercetin as quercetin aglycone (QA) rutin trihydrate (RU) or no flavonoid
(CTRL) on d 2 and d 29
Item1 Day
Group2
SE
ANOVA (P-value)
CTRL QA RU Group Day Group
times day
Total
protein gL
2 640a 599
b 617
ab 098 003 0001 007
29 580 565 596
Albumin
gL
2 229 226 225 037 095 0001 042
29 261 265 263
Lactate
mmolL
2 168 237 265 027 031 0001 004
29 063 068 069
Glucose
mmolL
2 737 714 761 028 035 0001 099
29 658 640 679
NEFA
micromolL
2 298 281 298 13 087 0001 065
29 172 177 173
Urea
mmolL
2 380 375 355 026 091 0001 082
29 155 156 155
Insulin
microgL
2 238 179 241 065 012 008 029
29 438 209 277
Cortisol 2 672 629 779 70 043 0001 067
nmolL 29 111 86 130
a-bLSM in a row with different superscripts differ (P lt 005)
1Values are LSM based on plasma concentrations in blood samples taken before and until 24 h after
morning feeding on d 2 and 29 respectively n = 7 per group
2Group QA = 30 micromol(kg BW times d) quercetin aglycone RU = 30 micromol(kg BW times d) rutin trihydrate
CTRL = no flavonol fed
CHAPTER 2
64
A Day 2 B Day 29
Time relative to feeding h
0 2 4 6 8 10 12 24
Glu
cose
m
mo
lL
5
6
7
8
9
10
Time relative to feeding h
0 2 4 6 8 10 12 24
Glu
cose
m
mo
lL
5
6
7
8
9
10
C Day 2 D Day 29
Time relative to feeding h
0 2 4 6 8 10 12 24
NE
FA
m
mo
lL
100
200
300
400
500
Time relative to feeding h
0 2 4 6 8 10 12 24
NE
FA
m
mo
lL
100
200
300
400
500
Figure 23 Plasma concentrations of glucose (A B) and NEFA (C D) after oral administration of 9
mg of quercetinkg BW times d as quercetin aglycone () rutin trihydrate () or no flavonoid () on
d 2 and d 29 of life Values are LSM plusmn SE n = 7
Mean glucose and NEFA plasma concentrations decreased (P lt 005) from d 2 to 29 in
all groups but concentrations did not differ among groups (Table 23) Considering the
day course of the plasma metabolites plasma concentrations of glucose increased (P lt
001) whereas NEFA decreased (P lt 001) after feed intake in all groups on d 2 and 29
respectively (Figure 23A-D)
The increase of plasma insulin concentrations after feed intake was more pronounced (P
lt 005) on d 29 than on d 2 but without group effects (Figure 24A B Table 23)
Plasma concentrations of cortisol decreased (P lt 005) after feed intake on both days
with mean concentrations being greater (P lt 005) on d 2 than on d 29 (Figure 24C D
Table 23)
CHAPTER 2
65
A Day 2 B Day 29
Time relative to feeding h
0 2 4 6 8 10 12 24
Insu
lin
micro
gL
0
2
4
6
8
10
Time relative to feeding h
0 2 4 6 8 10 12 24
Insu
lin
micro
gL
0
2
4
6
8
10
C Day 2 D Day 29
Time relative to feeding h
0 2 4 6 8 10 12 24
Co
rtis
ol
nm
ol
L
0
20
40
60
80
100
Time relative to feeding h
0 2 4 6 8 10 12 24
Co
rtis
ol
nm
ol
L
0
20
40
60
80
100
Figure 24 Plasma concentrations of insulin (A B) and cortisol (C D) after oral administration of 9
mg of quercetinkg of BW times d as quercetin aglycone () rutin trihydrate () or no flavonoid ()
on d 2 and d 29 of life Values are LSM plusmn SE n = 7
24 Discussion
Without dietary supplementation of quercetin (CTRL group) plasma concentrations of
total flavonols were close to or below the detection limit on d 2 and 29 However small
amounts of quercetin and its dehydroxylated metabolite kaempferol were found in blood
plasma on d 2 and 29 in the control group According to Besle et al (2010) flavonoids
are natural components of bovine milk and their concentration is affected by cowrsquos diet
Although colostrum and milk replacer were not analyzed for flavonoid content in the
present study it can be assumed that colostrum is most likely the source for flavonoids
found in CTRL calves at d 2 Apart from colostrum feed components such as
concentrates and hay may also contain flavonoids (Fraisse et al 2007 Reynaud et al
2010) which could explain measurable albeit very low plasma concentrations of
quercetin and its metabolites at least in older calves (d 29)
CHAPTER 2
66
In calves quercetin was systemically available from both supplements QA as well as
RU Interestingly plasma values obtained for quercetin and its metabolites with an
intact flavonol structure were greater on d 2 than on d 29 indicating better absorption or
less excretion in younger animals This may be explained by a different degree of
gastrointestinal maturation and intestinal permeability on d 2 and 29 respectively
(Blum 2006) Thus the epithelium in newborn animals is characterized by vacuolated
epithelial cells which are not present in older animals (Bainter 2002 Blum 2006) This
has possibly contributed to a greater absorption of quercetin from both sources (QA and
RU) on d 2 compared with d 29 in calves Furthermore the reticulorumen and microbial
activities might be already more developed in 29- than in 2-d-old calves resulting in
partial ruminal degradation of the flavonoids applied (Heinrichs and Jones 2003
Guilloteau et al 2009 Berger et al 2012 Li et al 2012) The BV of quercetin from
both QA and RU especially on d 29 could probably be improved when encapsulated
quercetin preparations will be used (Ding et al 2014)
On both days investigated feeding of QA resulted in greater plasma concentrations of
total flavonols quercetin and its metabolites than feeding of RU indicating QA as a
better source of quercetin than RU with respect to the BV of quercetin Markedly lower
plasma concentrations of total flavonols were also seen in monogastric species after
feeding of RU instead of QA at dosages comparable to the current study (Manach et al
1997 Cermak et al 2003 Reinboth et al 2010) Thus the present results obtained in
calves are in principal accordance with studies on the BV of quercetin in monogastric
species such as rats (Manach et al 1997) dogs (Reinboth et al 2010) pigs (Cermak et
al 2003 Lesser et al 2004) and humans (Erlund et al 2000 Egert et al 2008) As
the newborn calf is considered as a functionally monogastric animal (Drackley 2008)
these findings are not surprising
Concerning RU application studies in monogastric species often indicate a delayed
increase of quercetin and its metabolites in blood plasma (Erlund et al 2000 Cermak et
al 2003 Reinboth et al 2010) In the present study maximal plasma concentrations of
quercetin and its metabolites were measured much later after RU than after QA feeding
indicating different intestinal sites for absorption (Erlund et al 2000) In RU-fed
calves quercetin and its metabolites at least on d 2 most likely derive from absorption
in both the small and the large intestine In addition we found the same slow increase of
quercetin and its metabolites in blood plasma after QA and RU feeding but the increase
CHAPTER 2
67
stopped much earlier in RU- than in QA-fed calves In general the sugar moiety in
flavonol molecules determines the absorption of flavonoids in organisms (Day et al
1998 Hollman et al 1999) and QA is supposed to be already absorbed in the small
intestine More complex glycosides such as the glucorhamnoside RU are absorbed in
distal parts of the small intestine or in the colon of monogastric animals where flavonol
molecules are hydrolyzed by microorganisms Thus the lack of rhamnosidase activity
in the small intestine can be considered as one reason for delayed and lower absorption
of RU than of QA (Erlund et al 2000 Cermak et al 2003) Our pattern of relative BV
of total flavonols after RU feeding fits to relative BV of total flavonols in blood plasma
after duodenal but not after ruminal application in dairy cows (Berger et al 2012
Gohlke et al 2013) indicating a low ruminal function in our calves during first month
of life
Interestingly pharmacokinetics of quercetin absorption after QA feeding markedly
differed between calves and adult cattle (Berger et al 2012 Gohlke et al 2013) or
monogastric animals (Erlund et al 2000 Cermak et al 2003 Reinboth et al 2010)
The typical peak of total flavonol plasma concentrations some minutes after QA
administration was not seen in newborn calves As a consequence time for reaching
Cmax was much greater in calves than in adult ruminants and monogastrics Comparable
slow increases of quercetin and its metabolites as in newborn calvesrsquo blood plasma were
only seen in rats (Manach et al 1997) These differences in pharmacokinetics after QA
feeding are difficult to explain but a probable reason is the low release of milk protein
into the duodenum due to abomasal casein clotting (Heinrichs and Jones 2003
Guilloteau et al 2009) and the potential binding of flavonoids to milk proteins (Gugler
et al 1975 Boulton et al 1998 Janisch et al 2004)
All measured metabolites and hormones were in physiological ranges and most of these
findings were in accordance with previous results indicating postnatal growth
especially protein accretion and development in breeding as well as suckling calves
(Egli and Blum 1998 Nussbaum et al 2002 Schiessler et al 2002) Conversely
except for total protein concentrations on d 2 we found no treatment effects by QA or
RU feeding in these calves Plasma protein concentrations were lower in QA-fed than in
CTRL calves a finding that was hard to explain because all calves received the same
pooled colostrum with identical IgG content at first days of life Postprandial changes of
metabolites and hormones have been reported previously (Hadorn et al 1997 Hammon
CHAPTER 2
68
and Blum 1998) but systemic glucose metabolism was not affected by QA or RU
feeding as we have assumed from literature (Cermak et al 2004 Tadera et al 2006)
In conclusion BV of quercetin and its metabolites in newborn calves is more
pronounced when quercetin is fed as QA than as RU These findings go along with data
on BV of quercetin in lactating cows with duodenal application (Gohlke et al 2013)
and in monogastric species like rats dogs and pigs (Manach et al 1997 Cermak et al
2003 Reinboth et al 2010) Greater BV of quercetin on d 2 than on d 29 of life was
probably due to reduced maturation status of the gastrointestinal tract in 2-d old calves
However effects of quercetin feeding on the antioxidative status should be investigated
to validate health-protecting effects of quercetin in neonatal calves
Acknowledgements
We gratefully thank Petra Schulz and Maike Gosse (Christian Albrechts University
Kiel Germany) for excellent laboratory assistance as well as Annette Zeyner Kirsten
Buumlsing (University of Rostock Rostock Germany) and Bernd Stabenow (FBN
Dummerstorf Dummerstorf Germany) for providing experimental facilities Chicken-
egg derived immunoglobulins (Globigen Life Start 25 ) were generously provided by
EW Nutrition GmbH (Visbek Germany) This work is part of the joint research project
Food Chain Plus (FoCus) and was financially supported by the Federal Ministry of
Education and Research Bonn Germany (BMFT grant no 0315538B)
CHAPTER 2
69
References
Ader P A Wessmann and S Wolffram 2000 Bioavailability and metabolism of the
flavonol quercetin in the pig Free Radic Biol Med 281056ndash1067 http
dxdoiorg 101016S0891-5849(00)00195-7
Arts I C W A L A Sesink M Faassen-Peters and P C H Hollman 2004 The
type of sugar moiety is a major determinant of the small intestinal uptake and
subsequent biliary excretion of dietary quercetin glycosides Br J Nutr 91841ndash
847 httpdxdoiorg101079BJN20041123
Bainter K 2002 Vacuolation in the young Pages 55-110 in Biology of the intestine in
Growing Animals R Zabielski P C Gregory and B Westrom ed Elsevier
Amsterdam the Netherlands
Berger L M S Wein R Blank C C Metges and S Wolffram 2012 Bioavailability
of the flavonol quercetin in cows after intraruminal application of quercetin
aglycone and rutin J Dairy Sci 955047ndash5055 httpdxdoiorg103168jds
2012-5439
Besle J M D Viala B Martin P Pradel B Meunier J L Berdagueacute D Fraisse J L
Lamaison and J B Coulon 2010 Ultraviolet-absorbing compounds in milk are
related to forage polyphenols J Dairy Sci 932846ndash2856 httpdxdoiorg
103168jds2009-2939
Bhagwat S D B Haytowitz J M Holden 2013 USDA database for the flavonoid
content of selected foods Release 31 US Department of Agriculture (USDA)
Agricultural Research Service Accessed April 15 2014 httpwwwarsusdagov
SP2UserFilesPlace12354500DataFlavFlav3-1pdf
Blum J W 2006 Nutritional physiology of neonatal calves J Anim Physiol Anim
Nutr (Berl) 901ndash11 httpdxdoiorg101111j1439-0396200500614x
Boulton D W U K Walle and T Walle 1998 Extensive binding of the bioflavonoid
quercetin to human plasma proteins J Pharm Pharmacol 50243ndash249
httpdxdoiorg101111j2042-71581998tb06183x
CHAPTER 2
70
Cermak R S Landgraf and S Wolffram 2003 The bioavailability of quercetin in
pigs depends on the glycoside moiety and on dietary factors J Nutr 1332802ndash
2807
Cermak R S Landgraf and S Wolffram 2004 Quercetin glucosides inhibit glucose
uptake into brush-border-membrane vesicles of porcine jejunum Br J Nutr
91849ndash855 httpdxdoiorg101079BJN20041128
Chase C C D J Hurley and A J Reber 2008 Neonatal immune development in the
calf and its impact on vaccine response Vet Clin North Am Food Anim Pract
2487ndash104
Day A J M S DuPont S Ridley M Rhodes M J Rhodes M R Morgan and G
Williamson 1998 Deglycosylation of flavonoid and isoflavonoid glycosides by
human small intestine and liver beta-glucosidase activity FEBS Lett 43671ndash75
httpdxdoiorg101016S0014-5793(98)01101-6
Ding B P Chen Y Kong Y Zhai X Pang J Dou and G Zhai 2014 Preparation
and evaluation of folate-modified lipid nanocapsules for quercetin delivery J
Drug Target 2267ndash75
Drackley J K 2008 Calf nutrition from birth to breeding Vet Clin North Am Food
Anim Pract 2455ndash86 httpdxdoiorg101016jcvfa200801001
Egert S S Wolffram A Bosy-Westphal C Boesch-Saadatmandi A E Wagner J
Frank G Rimbach and M J Mueller 2008 Daily quercetin supplementation
dose-dependently increases plasma quercetin concentrations in healthy humans J
Nutr 1381615ndash1621
Egli C P and J W Blum 1998 Clinical haematological metabolic and endocrine
traits during the first three months of life of suckling simmentaler calves held in a
cow-calf operation Zentralbl Veterinarmed A 4599ndash118
Erlund I T Kosonen G Alfthan J Maumlenpaumlauml K Perttunen J Kenraali J
Parantainen and A Aro 2000 Pharmacokinetics of quercetin from quercetin
aglycone and rutin in healthy volunteers Eur J Clin Pharmacol 56545ndash553
httpdxdoiorg101007s002280000197
CHAPTER 2
71
Fraisse D A Carnat D Viala P Pradel J-M Besle J-B Coulon C Felgines and
J-L Lamaison 2007 Polyphenolic composition of a permanent pasture
Variations related to the period of harvesting J Sci Food Agric 872427ndash2435
httpdxdoiorg101002jsfa2918
Gaaacutel T R Ribiczeyne-Szabo K Stadler J Jakus J Reiczigel P Kover M Mezes
and L Sumeghy 2006 Free radicals lipid peroxidation and antioxidant system in
the blood of cows and newborn calves around calving Comp Biochem Physiol
B Biochem Mol Biol 143391ndash396
Gasparin F R S C L Salgueiro-Pagadigorria L Bracht E L Ishii-Iwamoto A
Bracht and J Constantin 2003 Action of quercetin on glycogen catabolism in
the rat liver Xenobiotica 33587ndash602 httpdxdoiorg10108000498250310
00089100
Godden S 2008 Colostrum management for dairy calves Vet Clin North Am Food
Anim Pract 2419ndash39
Gohlke A C J Ingelmann G Nuumlrnberg A Starke S Wolffram and C C Metges
2013 Bioavailability of quercetin from its aglycone and its glucorhamnoside rutin
in lactating dairy cows after intraduodenal administration J Dairy Sci 962303ndash
2313 httpdxdoiorg103168jds2012-6234
Gugler R M Leschik and H J Dengler 1975 Disposition of quercetin in man after
single oral and intravenous doses Eur J Clin Pharmacol 9229ndash234
Guilloteau P R Zabielski J W Blum 2009 Gastrointestinal tract and digestion in
the young ruminant Ontogenesis adaptations consequences and manipulations
J Physiol Pharmacol 60(Suppl 3)37ndash46
Hadorn U H Hammon R M Bruckmaier and J W Blum 1997 Delaying colostrum
intake by one day has important effects on metabolic traits and on gastrointestinal
and metabolic hormones in neonatal calves J Nutr 1272011ndash2023
Hammon H M and J W Blum 1998 Metabolic and endocrine traits of neonatal
calves are influenced by feeding colostrum for different durations or only milk
replacer J Nutr 128624ndash632
CHAPTER 2
72
Hammon H M J Steinhoff-Wagner U Schoumlnhusen C C Metges and J W Blum
2012 Energy metabolism in the newborn farm animal with emphasis on the calf
Endocrine changes and responses to milk-born and systemic hormones Domest
Anim Endocrinol 43171ndash185
Heinrichs A J and C M Jones 2003 Feeding the newborn calf College of
Agricultural Sciences Agricultural Research and Cooperative Extension
Pennsylvania State University University Park PA
Hertog M G L P C H Hollman and M B Katan 1992 Content of potentially
anticarcinogenic flavonoids of 28 vegetables and 9 fruits commonly consumed in
the Netherlands Proc Nutr Soc 402379ndash2383 httpdxdoiorg101021
jf00024a011
Hollman P C H M N C P Bijsman Y van Gameren E P J Cnossen J H M de
Vries and M B Katan 1999 The sugar moiety is a major determinant of the
absorption of dietary flavonoid glycosides in man Free Radic Res 31569ndash573
httpdxdoiorg10108010715769900301141
Inanami O A Shiga K J Okada R Sato Y Miyake and M Kuwabara 1999 Lipid
peroxides and antioxidants in serum of neonatal calves Am J Vet Res 60452ndash
457
Janisch K M G Williamson P Needs and G W Plumb 2004 Properties of
quercetin conjugates Modulation of LDL oxidation and binding to human serum
albumin Free Radic Res 38877ndash884 httpdxdoiorg1010801071576041000
1728415
Kobayashi Y M Miyazawa A Kamei K Abe and T Kojima 2010 Ameliorative
effects of mulberry (Morus alba L) leaves on hyperlipidemia in rats fed a high-fat
diet Induction of fatty acid oxidation inhibition of lipogenesis and suppression
of oxidative stress Biosci Biotechnol Biochem 742385ndash2395
Lesser S R Cermak and S Wolffram 2004 Bioavailability of quercetin in pigs is
influenced by the dietary fat content J Nutr 1431508ndash1511
CHAPTER 2
73
Li R W E E Connor C Li R L Baldwin VI and M E Sparks 2012
Characterization of the rumen microbiota of pre-ruminant calves using
metagenomic tools Environ Microbiol 14129ndash139 httpdxdoiorg
101111j1462-2920201102543x
Lindmark-Maringnsson H and B Aringkesson 2000 Antioxidative factors in milk Br J
Nutr 84S103ndashS110
Manach C C Morand C Demigneacute O Texier F Reacutegeacuterat and C Reacutemeacutesy 1997
Bioavailability of rutin and quercetin in rats FEBS Lett 40912ndash16
httpdxdoiorg101016S0014-5793(97)00467-5
Manach C A Scalbert C Morand C Reacutemeacutesy and L Jimeacutenez 2004 Polyphenols
Food sources and bioavailability Am J Clin Nutr 79727ndash747
McGuirk S M 2008 Disease management of dairy calves and heifers Vet Clin North
Am Food Anim Pract 24139ndash153
Mee J F 2008 Newborn dairy calf management Vet Clin North Am Food Anim
Pract 241ndash17
Middleton E C Kandaswami and T C Theoharides 2000 The effects of plant
flavonoids on mammalian cells Implications for inflammation heart disease and
cancer Pharmacol Rev 52673ndash751
Naumann C and R Basler 2004 Die chemische Untersuchung von Futtermitteln
VDLUFA-Verlag Darmstadt Germany
Nijveldt R J E van Nood D E C van Hoorn P G Boelens K van Norren and P
A M van Leeuwen 2001 Flavonoids A review of probable mechanisms of
action and potential applications Am J Clin Nutr 74418ndash425
Nussbaum A G Schiessler H M Hammon and J W Blum 2002 Growth
performance and metabolic and endocrine traits in calves pair-fed by bucket or by
automate starting in the neonatal period J Anim Sci 801545ndash1555
Quigley J D III and J J Drewry 1998 Nutrient and immunity transfer from cow to
calf pre- and postcalving J Dairy Sci 812779ndash2790
CHAPTER 2
74
Reinboth M S Wolffram G Abraham F R Ungemach and R Cermak 2010 Oral
bioavailability of quercetin from different quercetin glycosides in dogs Br J
Nutr 104198ndash203 httpdxdoiorg101017S000711451000053X
Reynaud A D Fraisse A Cornu A Farruggia E Pujos-Guillot J-M Besle B
Martin J-L Lamaison D Paquet M Doreau and B Graulet 2010 Variation in
content and composition of phenolic compounds in permanent pastures according
to botanical variation J Agr Food Chem 585485ndash5494 httpdxdoiorg
101021jf1000293
SAS Institute Inc 2010 SASQC 92 Userrsquos Guide Second Edition Cary NC SAS
Institute Inc
Schiessler G A Nussbaum H M Hammon and J W Blum 2002 Calves sucking
colostrum and milk from their dams or from an automatic feeding station starting
in the neonatal period Metabolic and endocrine traits and growth performance
Anim Sci 74431ndash444
Steinhoff-Wagner J S Goumlrs P Junghans R M Bruckmaier E Kanitz C C Metges
and H M Hammon 2011 Maturation of endogenous glucose production in
preterm and term calves J Dairy Sci 945111ndash5123 httpdxdoiorg
103168jds2011-4355
Tadera K Y Minami K Takamatsu and T Matsuoka 2006 Inhibition of alpha-
glucosidase and alpha-amylase by flavonoids J Nutr Sci Vitaminol (Tokyo)
52149ndash153
Uetake K 2013 Newborn calf welfare A review focusing on mortality rates Anim
Sci J 84101ndash105
Vicari T J J G C van den Borne W J J Gerrits Y Zbinden and J W Blum 2008
Postprandial blood hormone and metabolite concentrations influenced by feeding
frequency and feeding level in veal calves Domest Anim Endocrinol 3474ndash88
httpdxdoiorg101016jdomaniend200611002
CHAPTER 2
75
Weber C C Hametner A Tuchscherer B Losand E Kanitz W Otten S P Singh
R M Bruckmaier F Becker W Kanitz and H M Hammon 2013 Variation in fat
mobilization during early lactation differently affects feed intake body condition
and lipid and glucose metabolism in high-yielding dairy cows J Dairy Sci 96165ndash
180 httpdxdoiorg103168jds2012-5574
Williams R J J P Spencer and C Rice-Evans 2004 Flavonoids Antioxidants or
signalling molecules Free Radic Biol Med 36838ndash849
76
Chapter 3
Effects of oral flavonoid supplementation on metabolic and
antioxidative status in newborn dairy calves
J Maciej C T Schaumlff E Kanitzdagger A TuchschererDagger R M Bruckmaiersect
S Wolffram and H M Hammon1
Institute of Nutritional Physiology ldquoOskar Kellnerrdquo
daggerInstitute of Behavioural Physiology and
DaggerInstitute of Genetics and Biometry Leibniz Institute for Farm Animal Biology (FBN)
Wilhelm-Stahl-Allee 2 18196 Dummerstorf Germany
sectDepartment of Clinical Research and Veterinary Public Health Veterinary Physiology
Vetsuisse Faculty University of Bern 3001 Bern Switzerland
Institute of Animal Nutrition and Physiology Christian Albrechts University Kiel
24118 Kiel Germany
1Corresponding author H M Hammon Leibniz Institute for Farm Animal Biology
(FBN) Institute of Nutritional Physiology ldquoOskar Kellnerrdquo Wilhelm-Stahl-Allee 2
18196 Dummerstorf Germany phone +49-38208-68670 fax +49-38208-68652
e-mail hammonfbn-dummerstorfde
Used by permission of the Journal of Dairy Scince
Manuscript submitted to Journal of Dairy Science
Manuscript ID JDS-15-9906
CHAPTER 3
77
3 Effects of oral flavonoid supplementation on metabolic and
antioxidative status in newborn dairy calves
Abstract
Many studies investigated effects of natural feed additives like flavonoids and verified
their antioxidative or antiinflammatory properties but scientific proof for flavonoids as
health and performance-promoting tool in calf nutrition is weak Thus we investigated
the effects of the most abundant flavonoid quercetin and of a green tea extract (GTE)
containing various catechins on metabolic and antioxidative traits in dairy calves to
further clarify potential health-promoting effects Male newborn German Holstein
calves (n=7 per group) either received no flavonoid (control group) 10 mg of quercetin
equivalents as quercetin aglycone or as rutinkg of body weight (BW) and d or 10
mgkg BW and d of a GTE from d 5 to d 26 of life with morning and evening feeding
All calves were fed equal amounts of colostrum and milk replacer according to BW
Body Weight feed intake and health status were evaluated daily Blood samples were
collected from the jugular vein on d 1 5 12 19 and 26 before morning feeding to
investigate flavonoid metabolic and antioxidative status in calves During the
experiment growth performance data and health status remained unchanged but GTE-
fed calves had less loose feces than controls and calves fed quercetin aglycone required
less medical treatment than other groups Concentrations of quercetin changed over
time and were higher in rutin-fed than control group whereas catechins were below
detection limit Plasma trolox equivalent antioxidative capacity (TEAC) and ferric
reducing ability of plasma (FRAP) were measured as markers for plasma antioxidative
capacity Concentrations of TEAC increased whereas FRAP decreased after the first d
of life in all groups least in controls Oxidative stress markers in plasma were measured
as thiobarbituric acid reactive substances (TBARS) and F2-isoprostances
Concentrations of TBARS were highest during first month of life in the control group
but decreased at the same time in the GTE group F2-isoprostane concentrations
decreased in control group only Plasma concentrations of total protein albumin urea
lactate glucose and non-esterified fatty acids as well as of insulin and cortisol varied in
time but there were no group differences caused by flavavonoid supplementation
Taken together orally administrated quercetin and catechins at dosages used in the
CHAPTER 3
78
present study resulted in no or only weak effects on health metabolic and antioxidative
status in newborn dairy calves
Key Words antioxidative status calf flavonoid quercetin rutin
31 Introduction
After birth calves undergo huge immunological and metabolic changes Though
relatively mature at birth they need to adapt to various morphological and functional
changes after birth (Blum and Hammon 2000) Calf losses mainly occur during first wk
of life mostly because of respiratory and digestive problems (USDA 2011) Good
management like early and sufficient colostrum supply is essential In addition fed
supplements are daily practice in modern dairy Particularly since the ban of antibiotic
growth promoters in the European Union in 2006 the call for ʻnaturalʼ feed additives
gained enormous popularity In this respect flavonoids as secondary plant metabolites
ubiquitous in all higher plants are of interest Their health-promoting properties are
mainly thought to be due to their strong antioxidant activity in vitro associated with
effects on several metabolic key enzymes and inflammatory cells (Middleton et al
2000) glucose and lipid metabolism (Shetty et al 2004 Kobayashi et al 2010) or
incidence of diarrhea (di Carlo et al 1994 Gaacutelvez et al 1995) One of the most
abundant flavonoids is the flavonol quercetin a pentahydroxyflavon mostly bound β-
glycosidic manner to at least one sugar molecule and present in high concentrations in
apples and onions Quercetin bound to rutinose is called rutin and is the major glycoside
of quercetin The predominant flavanol another subgroup of flavonoids is catechin
which is mainly found in high concentrations in green tea
Almost any disease is associated with increased formation of reactive oxygen species
thus causing oxidative stress (Halliwell 1991) In calves enhanced oxidative stress was
seen on the first d of life (Alexandrovich and Antonovna 2009) and especially if sick
(Ahmed and Hassan 2007 Al-Qudah 2009) Because the nutrient status often is
impaired in newborn calves this possibly affects the antioxidant system (Schwerin et
al 2002 Sies et al 2005) Thus improvement of the antioxidant status in newborn
calves may accelerate maturation of the own immune system improve health status and
thus reduce calf losses The bioavailability of quercetin in newborn calves as
prerequisite for biological effects was recently shown (Maciej et al 2015) Based on
these findings we have tested the hypothesis that quercetin and catechin
CHAPTER 3
79
supplementation affect metabolism and the antioxidative and health status during the
first 3 wk of life in dairy calves
32 Materials and Methods
321 Animals and feeding
Procedures performed in this study were in accordance with the German animal
protection law and approved by the relevant authorities (Landesamt fuumlr Landwirtschaft
Lebensmittelsicherheit und Fischerei Mecklenburg-Vorpommern Germany
permission no LVL M-VTSD72213-21-01910) Twenty-eight male German
Holstein calves were examined from d 1 to d 26 of life All calves were spontaneously
born from multiparous cows on neighboring farms and transported directly after birth to
the experimental barn of the University of Rostock where they were kept in single
boxes with straw bedding Calves had free access to water and were fed twice daily by
nipple bottle or nipple bucket On the first 3 d of life calves received pooled colostrum
obtained from milkings 1 3 and 5 (d 1 2 and 3 after parturition respectively) in
amounts of 8 of BW on d 1 and 10 of BW on d 2 and 3 (Table 1) From d 4 until d
26 calves received a commercial milk replacer (150 gL SalvaLac MiraPro 45 Salvana
Tiernahrung GmbH Klein-Offenseth Sparrieshoop Germany) in amounts of 12 of
BWd To ensure equal feed uptake in all groups refused amounts of colostrum or milk
replacer were tub- fed Milk replacer amounts were adapted to BW once a wk
From d 2 to d 6 colostrum or milk replacer was supplemented with chicken-egg derived
immunoglobulins (Globigen Life Start 25 EW Nutrition GmbH Visbek Germany)
fed twice daily in amounts of 40 32 24 16 and 8 gd respectively (Maciej et al
2015)
Calves had free access to pelleted concentrate (Kaumllber Start 183 pell Vollkraft
Mischfutterwerke GmbH Karstaumldt Germany) and hay from d 4 on Concentrate intake
was measured daily after the morning milk feeding (Maciej et al 2015)
CHAPTER 3
80
Ta
ble
31
C
om
po
siti
on
an
d a
mo
un
ts o
f co
lost
rum
m
ilk
rep
lace
r a
nd
co
nce
ntr
ate
fed
to
ca
lves
d
1
d 2
d
3
d 4
to
30
2
Item
co
lost
rum
1
mil
kin
g 1
colo
stru
m1
mil
kin
g 3
colo
stru
m1
mil
kin
g 5
M
ilk
rep
lace
r3
Co
nce
ntr
ate
4
DM
gk
g
20
69
1
54
7
13
93
1
10
0
88
00
CP
gk
g D
M
59
74
3
90
4
33
31
2
01
8
18
00
Cru
de
fat
gk
g D
M
16
92
2
40
5
27
49
1
90
9
43
0
Ash
gk
g D
M
48
3
55
6
56
0
73
6
74
0
Lac
tose
g
kg D
M
13
63
2
60
5
30
87
5
14
6
-
1C
olo
stru
m w
as d
eriv
ed f
rom
mu
ltip
aro
us
cow
s and
sep
arat
ely p
oo
led
fro
m m
ilkin
gs
1
3
and
5 a
fter
par
turi
tio
n
resp
ecti
vel
y
2H
ay w
as o
ffer
ed a
d l
ibit
um
exce
pt
for
days
of
bio
avai
lab
ilit
y s
tud
ies
3M
ilk r
epla
cer
(Sal
vaL
ac M
iraP
ro 4
5
Sal
van
a T
iern
ahru
ng
Gm
bH
K
lein
-Off
ense
th S
parr
iesh
oo
p
Ger
man
y)
was
com
po
sed
of
45
s
pra
y s
kim
med
mil
k
po
wd
er
35
s
wee
t w
hey p
ow
der
1
8
pla
nt
oil
(p
alm
co
conut
and
so
y o
il)
17
L
ys
08
C
a 0
75
P
an
d a
dd
ed w
ith 5
00
00
IU
of
vit
am
in A
4
000
IU o
f vit
am
in D
3
20
0 m
g o
f vit
am
in E
(α
-to
cop
her
ol
acet
ate)
9
mg C
u (
gly
ceri
ne-
cop
per
chel
ate)
ci
tric
aci
d
sorb
ic a
cid
b
uty
lhyd
rox
yto
luene (
BH
T)
and
12
x 1
09 c
fu E
nte
roco
ccu
s fa
eciu
m E
17
06
4C
once
ntr
ate
(Kaumll
ber
Sta
rt 1
83
V
oll
kra
ft
Mis
ch
futt
erw
erk
e G
mb
H
Kar
staumld
t G
erm
an
y)
was
com
po
sed
of
wh
eat
glu
ten
wh
eat
bra
n
gra
in m
ash
su
gar
bee
t
pulp
ra
pes
eed
mea
l o
at
rye
mo
lass
es
lin
seed
o
at b
ran
soyb
ean m
eal
extr
act
cal
ciu
m c
arb
onat
e s
od
ium
chlo
rid
e 0
6
pho
spho
rous
02
s
od
ium
10
800
IU
of
vit
am
in A
1
21
5 I
U o
f vit
am
in D
3
30
mg o
f vit
am
in E
0
7 m
g o
f I
04
mg o
f C
o
54
mg o
f M
g
81
mg o
f Z
n
and
04
mg o
f S
e p
er k
g o
f D
M
CHAPTER 3
81
Health status of calves was determined daily by measuring rectal temperature heart and
respiratory rate by evaluation of behavioral abnormalities nasal discharge respiratory
sounds and by navel inspection Fecal consistence was assessed daily by fecal
consistence score according to Larson et al (1977) normal (1) soft (2) runny (3) or
watery (4) Sick calves were treated by a veterinarian for statistical analysis each calf
was counted as treated for a disease independent from how many times an animal was
treated
322 Treatment and blood sampling
Calves were randomly assigned to one of four feeding groups (n = 7) Control (CTRL)
received no flavonoids QA received 10 mgkg BW times d quercetin aglycone (quercetin
dihydrate Carl Roth GmbH amp Co KG Karlsruhe Germany) RU received 20 mgkg
BW times d quercetin as glucorhamnoside rutin (rutin trihydrate Carl Roth GmbH amp Co
KG) and CA received 10 mgkg BW times d of a green tea extract (GTE) containing
various catechins (Polyphenon 60 Sigma-Aldrich Chemie GmbH Steinheim
Germany) For QA and RU daily dose of quercetin equivalents was 10 mgkg of BW
(30 micromolkg BW) The GTE (703 total catechins) fed in CA was composed of 14
catechin 03 catechin gallate 52 gallocatechin 21 gallocatechin gallate (all as
trans-isomers) and 64 epicatechin 70 epicatechin gallate 190
epigallocatechin 288 epigallocatechin gallate (all as cis-isomers) Amounts of
flavonoid fed to calves in this study were based on previous studies in pigs and dogs
(Lesser et al 2004 Reinboth et al 2010 Luumlhring et al 2011) Due to studies on
bioavailability of flavonoids all calves received their respective daily dose with the
morning feeding on d 2 and no flavonoids were fed on d 3 and 4 From d 5 on the daily
dose was equally split with morning and evening meal since d 26 On d 1 3 and 4 no
flavonoids were fed Flavonoids were suspended in water and administered with a
disposable 10-ml syringe directly into the mouth during milk feeding
Jugular blood samples were taken immediately after birth and on d 5 12 19 and 26
before morning feeding using evacuated tubes (Vacuette Greiner Bio-One GmbH
Frickenhausen Germany) Tubes containing 15 IUmL lithium heparinate were used
for the determination of the plasma concentrations of flavonols catechins and the
markers for antioxidative capacity and oxidative stress tubes containing 25 gL sodium
fluoride and 18 gL potassium EDTA were used for the determination of plasma
CHAPTER 3
82
protein albumin glucose NEFA urea and lactate and tubes containing 18 gL
potassium-EDTA were used for the determination of plasma insulin and cortisol
concentrations The blood samples were immediately put on ice and centrifuged (1500
times g 4degC 20 min) To measure the catechins 1 mL of plasma was mixed with 20 microL of
an ascorbate-EDTA solution (04 molL NaH2PO4 Carl Roth GmbH amp Co KG)
containing 20 ascorbic acid (Merck KGaA Darmstadt Germany) and 01 EDTA
(Carl Roth GmbH amp Co KG) at pH 36 To measure F2-Isoprostanes a 0005
ethanolic butylhydroxytoluene (BHT) solution (0005 BHT in ethanol wv) was
added in one percent proportion for stabilization The plasma samples were stored until
analyzed at -20degC for metabolites and hormones and at -80degC for flavonoid and
(anti)oxidative parameters until analyzed
323 Analytical methods
Plasma concentrations of quercetin aglycone and its methylated (isorhamnetin and
tamarixetin) and dehydroxylated (kaempferol) derivatives were analyzed by HPLC with
fluorescence detection as described previously (Berger et al 2012) The detection limit
of flavonol was le 10 nmolL and the recovery rate of flavonols was 92 plusmn 2 (mean plusmn
SEM) Inter- and intraassay coefficients of variability for quercetin were 72 and 05
respectively The sum of quercetin and its metabolites in plasma is referred to as total
flavonols
Plasma concentrations of individual catechins (gallocatechin epigallocatechin
epigallocatechin gallate epicatechin gallate and epicatechin) were determined by
HPLC (Lee et al 1995) with some modifications (Egert et al 2013) In brief 500 microL
of thawed plasma were mixed with 375 microL of β-glucuronidasesulfatase (final activities
of 7300 and 130 UmL for glucuronidase and sulfatase respectively Sigma Aldrich
Chemie GmbH) and incubated at 37degC for 45 min Hydrolyzation was stopped by
adding 1 mL methylene chloride Samples were mixed for 4 min and centrifuged (3220
times g 4degC 15 min) The supernatant was transferred into another tube mixed with 1 mL
ethyl acetate for 4 min and centrifuged (3220 times g 4degC 20 min) and 800 microL of the
supernatant were transferred into a glass tube with glass pearls and ethyl acetate
extraction was repeated twice Supernatants were combined mixed with 10 microL of 1
aqueous ascorbic acid and dried by vacuum centrifugation (SPD2010 SpeedVac
System Thermo Fischer Scientific GmbH Dreieich Germany) The dried sample was
CHAPTER 3
83
dissolved in 150 microL of the mobile phase A by vortex mixing and ultrasonic bath for 15
min After centrifugation 30 microL of the supernatant were used for HPLC analyses For
catechin analyses by HPLC (Jasco Deutschland GmbH Groszlig-Umstadt Germany pump
model PU-2080 plus) the supernatant was injected into the fully automated autosampler
(AS-2057 Plus Jasco Deutschland GmbH) Separation occurred on a reverse-phase C-
18 Kromasil 100 column (25 times 46 mm 5 microm Jasco Deutschland GmbH) protected by
a pre-column (C-18 Inertsil ODS-2 10 times 4 mm particle size 5 μm Jasco Deutschland
GmbH) at 30degC Mobile phase A and B were composed of water acetonitrile and
trifluoroacetic acid (92801 and 653501 vvv) with a pH of 25 At a flow rate of 09
mLmin the eluent was monitored by electrochemical detection with potential settings
at 0 120 240 and 360 mV in a 4-channel colometric electrochemical detector (Coul
Array 5600A ESA Inc Chelmsford MA) Dominant signals used for quantification of
catechins were 120 mV for epigallocatechin and epicatechin gallate and 240 mV for
catechin gallocatechin epicatechin and epigallocatechin gallate respectively
Quantification of individual plasma catechins were carried out using external standards
which were generated by simultaneously adding catechin gallocatechin
epigallocatechin epigallocatechin gallate epicatechin gallate and epicatechin (Carl
Roth GmbH amp Co KG) to untreated plasma at final concentrations of each catechin of
0125 025 05 1 25 5 75 and 10 micromolL Calibration samples were treated in the
same way as experimental samples The coefficient of determination was r ge 099
detection limit of catechins was le 10 nmolL and the intra-assay coefficient of variation
was 24 plusmn 26 to 65 plusmn 47
Antioxidative capacity and oxidative stress markers were analyzed in repeated
measurements The trolox equivalent antioxidative capacity (TEAC) is defined as
amount of the water-soluble vitamin E derivate trolox (in mmol) needed to show the
same antioxidant capacity at a defined time point as 1 mmol of plasma and is expressed
as trolox equivalents (TE) in mmolL plasma The TEAC was measured according to
the modified protocol of Re et al (1999) by measuring spectrophotometrically the
decolorization of 22-azinobis(3-ethylbenzothiazoline-6-sulphonic acid) radical cation
(ABTS+) caused by binding to antioxidants at a wavelength of 734 nm Ferric reducing
ability of plasma (FRAP) was determined according to Benzie and Strain (1996) and is
given in ascorbic acid equivalents (ASCE) in micromolmL plasma Reduction of Fe3+
-
tripyridyltriazin by antioxidants from plasma results in a color change that is directly
CHAPTER 3
84
proportional to antioxidative capacity Absorbance was measured at a wavelength of
595 nm and compared to the one of ascorbic acid Thiobarbituric acid reactive
substances (TBARS) concentration in plasma was measured according to Yagi (1998)
with modifications and is given as malondialdehyde equivalents (MDAE) in micromolL
plasma Adding thiobarbituric acid to the sample results in formation of a red complex
whose optical density was measured photometrically at a wavelength of 532 nm F2-
isoprostanes especially their main representative 8-iso-prostaglandin F2α are produced
in vivo by peroxidation of the cell membrane lipid component arachidonic acid and is
considered as a reliable marker for lipid peroxidation Detection of 8-iso-prostaglandin
F2α was carried out with an enzymatic immune assay (Direct 8-iso-prostaglandin F2α
Assay Designs MI) and values are expressed in pgmL
Plasma metabolites were analyzed by the Clinic for Cattle (University of Veterinary
Medicine Hannover Foundation Germany) spectrophotometrically on an ABX Pentra
400 (Horiba ABX SAS Montpellier Cedex France) using the respective kits Albumin
(no A11A01664) and lactate (no A11A01721 Horiba Europe GmbH Hannover
Germany) NEFA (no 434-91795 Wako Chemicals GmbH Neuss Germany) glucose
(no 553-230) and total protein (biuret reaction no 553-412 MTI Diagnostics GmbH
Idstein Germany) and urea (no LT-UR 0050 Labor + Technik E Lehmann GmbH
Berlin Germany) Plasma insulin and cortisol concentrations were measured either by
radioimmunoassay or by ELISA respectively as previously described (Maciej et al
2015)
Colostrum was analyzed for DM CP crude fat and ash content (were measured by
MQD Qualitaumltspruumlfungs- und Dienstleistungsgesellschaft Mecklenburg-Vorpommern
Guumlstrow Germany) using standard procedures according to Weende (Naumann and
Bassler 2004) Chemical components and contents of the milk replacer were provided
by the manufacturer according to Weender analysis (Naumann and Bassler 2004 Table
31)
324 Statistical analyses
Statistical analyses were performed using SAS software Version 94 for Windows
Copyright SAS Institute Inc Cary NC USA Data on health performance and from
plasma measurements are presented as least squares means (LSM) plusmn standard error (SE)
and were analyzed by repeated measurement ANOVA using the Mixed procedure of
CHAPTER 3
85
SASSTAT software with a model containing the fixed effects treatment group (levels
CTRL QA RU CA for plasma flavonol concentrations only CTRL QA RU) day
(levels 1 5 12 19 26) and group times day interaction Repeated measures on the same
animal were taken into account by the REPEATED statement of the MIXED procedure
and an autoregressive type for the block diagonal residual covariance matrix Pairwise
differences among treatment groups and days were tested by the Tukey-Kramer-test
Data on fecal score and medical treatment were analyzed with the NPAR1WAY
procedure of SASSTAT software across the one-way classification treatment group
(levels CTRL QA RU CA) using Wilcoxon scores (for each wk seperately) Effects
and differences were considered significant if P lt 005
33 Results
331 Body weight feed intake and health status
All calves were born spontaneously and were evidently healthy Body weight was 473
plusmn 10 kg at birth and did not differ among groups
Average daily gain (616 gd plusmn 25 g n = 28) and final BW (582 kg plusmn 042 kg n = 28)
was not different between groups
Milk intake increased with time (wk 1 = 51 kgd wk 2 = 61 kgd wk 3 = 64 kgd wk
4 = 70 kgd P lt 0001) equally in all groups Concentrate intake also increased with
time (P lt 0001) equally in all groups During the first wk concentrate intake was very
low (4 gd) but increased to 27 gd during the second wk and to 117 gd in wk 4
Average fecal score for all groups was 14 and each calf had on average 2 d of strong
diarrhea indicated by fecal score 4 Severe diarrhea occurred between d 3 and d 20 and
fecal score was highest in wk 2 (fecal score 162) and wk 3 (fecal score 154) During
the first wk of life fecal score differed among groups being lower (P lt 005) in CA
group (fecal score 101) than in CTRL group (fecal score 146) and in group QA (fecal
score 131)
Treatments of diseases showed no significant group differences However group CA
had 3 treated calves (total 7 treatments 2 diarrhea 4 pneumonia 1 other disease) and
other groups 6 treated calves each [CTRL in total 9 treatments (4 diarrhea 2
pneumonia 3 other diseases) RU in total 10 treatments (1 diarrhea 7 pneumonia 2
other diseases) QA in total 10 treatments (1 diarrhea 5 pneumonia 4 other diseases)]
CHAPTER 3
86
Other diseases were omphalitis (n = 2) thromboflibitis (n = 4) polyartritis (n = 1)
obstipation (n = 1) and conjuctivitis (n = 1)
332 Plasma flavonoid concentrations
Plasma concentrations of total flavonols in QA and RU increased (P lt 005) until d 12
but decreased thereafter in QA (Figure 31) Plasma concentrations of total flavonols
(sum of quercetin isorhamnetin and tamarixetin) were higher (P lt 005) in RU than in
CTRL (data for quercetin metabolites not shown)
Plasma concentrations of individual catechins were below detection limit
Time d
5 12 19 26
Tota
l fl
avon
ols
n
mol
L
0
50
100
150
200
Figure 31 Plasma concentrations of total flavonols from d 5 to 26 after feeding of no flavonoid ()
and after oral administration of 9 mg of quercetinkg of BW times day as quercetin aglycone () or as
values are LSM plusmn SE n = 7 per group
333 Markers for antioxidative capacity and oxidative stress
Markers for antioxidative capacity (TEAC FRAP Figure 32A-D) changed with time
with TEAC increasing and FRAP decreasing from d 1 to d 5 and then remaining
relatively stable in all groups Absolute concentrations as well as relative changes did
not differ among groups but FRAP showed a group times time interaction (P lt 0001) for
CHAPTER 3
87
relative changes (in CTRL from d 12 to d 19 P = 003 and in RU from d 5 to d 12 P =
008) but no relative changes in QA and CA
Absolute concentrations of oxidative stress markers (TBARS F2-isoprostanes) revealed
huge individual variations within groups and did not show group or time differences
(Figure 32 E G) However relative changes of both oxidative stress markers showed
overall group effects between CA and CTRL (P lt 005 Figur 32 F H)
A TEAC Absolute plasma values B TEAC Plasma values relative to day 1
Time d
1 5 12 19 26
TE
m
mo
lL
17
18
19
20
21
22
Time d
5 12 19 26
TE
m
mo
lL
00
01
02
03
04
C FRAP Absolute plasma values D FRAP Plasma values relative to day 1
Time d
1 5 12 19 26
AS
CE
micro
mo
lm
L
100
120
140
160
180
200
220
240
Time d
5 12 19 26
AS
CE
micro
mo
lm
L
-140
-120
-100
-80
-60
-40
-20
0
E TBARS Absolute plasma values F TBARS Plasma values relative to day 1
Time d
1 5 12 19 26
MD
AE
micro
mo
lL
03
04
05
06
Time d
5 12 19 26
MD
AE
micro
mo
lL
-02
-01
00
01
02
03
b b
b
b
a a
a
a
a a
a a
a a
a a
a a
a a
a a
a a
a a
a a
a a
a a
a a
a a
b a
b a
b a
a
b
a
b a
b a
b a
b a
a a
a
b
a
a
b
a
a
b
a
a
b
a
a
b
a
a
b
a
a
b
a
CHAPTER 3
88
G F2-isoprostanes Absolute plasma values H F2-isoprostanes Plasma values relative to day 1
Time d
1 5 12 19 260
2000
4000
6000
8000
10000
12000
Time d
5 12 19 26
8-i
so-P
GF2
pg
mL
-8000
-6000
-4000
-2000
0
2000
4000
8-i
so-P
GF2
pg
mL
Figure 32 Time course of different markers for antioxidative capacity (TEAC = trolox equivalent
antioxidative capacity FRAP = ferric reducing ability of plasma) and oxidative stress markers
(TBARS = thiobarbituric acid reactive substances F2-isoprostanes) for each parameters absolute
plasma values are depicted in graphs A C E and G whereas graphs B D F and H show
incremental or decremental values relative to values on d 1 control () rutin () quercetin
aglycone () and green tea extract () a-b
LSM with different superscripts differ values are LSM
plusmn SE n = 7 per group
334 Plasma concentrations of metabolites and hormones
Plasma concentrations of total protein increased (P lt 0001) and plasma concentrations
of albumin decreased (P lt 0001) from d 1 to d 5 in all groups (Table 31) After d 5
there was a slight decrease (P lt 005) for total protein and a slight increase for albumin
(P lt 005) until the end of the study Plasma concentrations of urea decreased (P lt 001)
until d 12 in all groups and then remained relatively low (Table 31) Plasma glucose
concentrations slightly increased (P = 001) in most groups from d 1 to d 5 and then
variably changed up to d 26 (Table 31) Plasma lactate concentrations sharply
decreased after birth up to d 5 but then remained stable up to d 26 (Table 31) Plasma
NEFA concentrations decreased up to d 5 of life and partly increased again until d 12
(Table 31) Plasma insulin and cortisol concentrations decreased after birth in most
groups (P lt 0001) and then remained low (Table 31) All plasma concentrations
measured were comparable among groups except for plasma cortisol where the
decrease after birth differed among groups reflected by group times time interaction (P lt
0001)
CHAPTER 3
89
Ta
ble
32
B
loo
d p
lasm
a c
on
cen
tra
tio
ns
of
met
ab
oli
c tr
ait
s a
nd
ho
rm
on
es
of
calv
es a
fter
no
fla
vo
no
id (
CT
RL
) q
uer
ceti
n a
gly
con
e (Q
A)
ru
tin
(RU
) o
r o
f a
gre
en-t
ea e
xtr
act
fee
din
g c
on
tain
ing
ma
inly
ca
tech
ins
(CA
) fr
om
d 5
to
d 2
6
Sa
mp
les
are
ta
ken
bef
ore
mo
rnin
g m
ilk
fee
din
g
occ
urr
ed
Item
1
Da
y
Gro
up
S
E
AN
OV
A (
P-v
alu
e)
CA
C
TR
L
QA
R
U
Gro
up
D
ay
G
rou
p times
Da
y
To
tal
pro
tein
gL
1
50
6
50
3
50
0
50
3
13
4
03
3
00
0
06
3
5
6
03
6
27
5
88
6
14
12
58
3
60
6
59
4
61
1
19
55
6
58
6
58
0
59
0
26
56
4
58
0
55
7
58
4
Alb
um
in
gL
1
26
1
25
7
24
9
25
2
06
6
02
7
00
0
08
8
5
2
40
2
37
2
34
2
35
12
26
6
24
6
24
4
24
9
19
26
0
25
2
25
6
25
4
26
26
7
25
6
25
7
25
9
Ure
a m
mo
lL
1
3
48
3
61
3
84
3
23
02
6
07
4
00
0
07
8
5
26
1
2
52
2
33
2
31
12
2
02
1
40
1
98
1
72
19
1
58
1
44
1
55
1
72
26
1
43
1
34
1
63
1
52
Glu
cose
m
mo
lL
1
5
46
4
12
4
93
4
98
03
2
05
6
00
0
01
9
5
54
5
5
31
5
84
5
35
12
5
12
4
87
4
94
5
03
19
4
76
5
30
5
50
4
71
26
5
39
5
26
5
38
5
16
CHAPTER 3
90
Ta
ble
32
C
on
tin
ua
tio
n
Item
1
Da
y
Gro
up
S
E
AN
OV
A (
P-v
alu
e)
CA
C
TR
L
QA
R
U
Gro
up
D
ay
G
rou
p times
Da
y
Lac
tate
m
mo
lL
1
55
3
30
2
55
6
41
1
0
77
08
0
00
0
0
50
5
07
6
07
6
18
8
07
6
12
05
9
05
2
05
7
06
2
19
05
5
04
3
06
6
06
1
26
05
6
04
8
04
9
05
6
NE
FA
micro
mo
lL
1
55
2
91
7
67
4
64
8
90
8
05
3
00
0
0
28
5
28
3
22
0
24
8
21
1
12
21
5
46
9
34
4
37
4
19
36
4
30
9
29
5
36
1
26
28
8
28
0
27
6
20
5
Insu
lin
microgL
1
14
9
06
7
06
5
03
5
0
19
02
3
00
0
0
22
5
04
4
04
4
03
7
03
2
12
02
0
02
5
03
5
01
9
19
01
9
01
7
01
7
02
2
26
01
6
02
3
01
5
01
5
Co
rtis
ol
ngm
L
1
9
10
7a
5
50
0b
6
97
7ab
88
60
a
54
2
03
3
00
0
0
00
5
1
90
7
1
90
6
3
20
6
2
34
0
12
81
0
78
7
1
17
3
1
19
6
19
68
4
46
0
83
4
1
03
0
26
46
6
41
7
76
0
64
1
a-bL
SM
in a
ro
w w
ith d
iffe
rent
sup
ersc
rip
ts d
iffe
r (P
lt 0
05
)
1 V
alues
are
LS
M plusmn
SE
n =
7 p
er g
roup
CHAPTER 3
91
34 Discussion
At birth BW was not different among groups as planned and postnatal growth
performance was not affected by treatment The lack of differences in feed intake and
ADG during flavonoid administration is in line with findings of Oliveira et al (2010)
after feeding a flavonoid-rich pomegranate extract to calves for the first 30 d of life
Because concentrate intake did not differ among groups rumen development during
first month of life was unlikely changed by flavonoid administration as supported by
low plasma concentrations of β-hydroxybutyrate that did not increase in flavonoid-
treated calves during the experimental period (Maciej and Hammon unpublished
observations) Nevertheless plant extracts have the potential to affect rumen
development but may be only effective in older calves (Greathead 2003)
The impact of flavonoids on health status is discussed controversially Nielsen (2008)
found fewer diarrhea in weaned piglets after feeding natural feed additives containing a
high amount of flavonoids In contrast Oliveira et al (2010) reported no effects on
health parameters like incidence of diarrhea by feeding a polyphenol-rich feed to
newborn calves Interestingly we found an improved fecal score in CA compared to
CTRL calves In recent studies GTE were shown to inhibit diarrhea in newborn calves
(Ishihara et al 2001) In addition the number of treatments was markedly reduced in
the study of Ishihara et al (2001) confirming our results of numerically less treated
calves because of diarrhea in CA
Plasma antioxidant capacity of calves based on TEAC and FRAP measurements was
not influenced by flavonoid feeding in this study However the sharp changes of both
markers from d 1 to d 5 again highlights the role of colostrum feeding (Blum and
Hammon 2000 Hammon et al 2013) Measurement of TEAC is dependent on the
vitamin E analogue trolox Because vitamin E is provided by colostrum feeding (Blum
et al 1997 Lindmark-Maringnsson and Aringkesson 2000 Zanker et al 2000) and plasma
TEAC also increased rapidly after first colostrum intake in calves Our findings on
FRAP agree with those of Gaaacutel et al (2006) that also showed a decline of this parameter
after first colostrum intake Urea is a major factor influencing FRAP (Benzie and Strain
1996) and albumin and urea are factors influencing TEAC (Miller et al 1993) but
these metabolites only changed in time and were similar among groups Although
plasma metabolites were not affected by treatment decremental changes of FRAP
CHAPTER 3
92
values from d 12 to d 19 in CTRL and from d 5 to d 12 in RU reflect changes of
antioxidative capacity with time
Oxidative stress markers (TBARS and F2-Isoprostanes) did not follow a clear time-
dependent trend as seen for TEAC and FRAP Nevertheless TBARS increased in time
in CTRL and decreased in CA suggesting less oxidative stress in calves fed GTE On
the other hand F2-isoprostane concentrations in plasma decreased only in CTRL
indicating more oxidative stress In previous studies on calves plasma concentrations of
oxidative stress markers distinctly increased when calves were sick or stressed (Erisir et
al 2013 Ahmed and Hassan 2007 Al-Qudah 2009) This suggests that flavonoid
feeding to healthy calves as in the present study may not change oxidative stress
markers A polyphenol-rich diet in humans (Nieman et al 2013) lactating cows
(Gohlke et al 2013) pigs (Luumlhring et al 2011) or rats (Igarashi and Ohmuma 1995)
also led only to slight or no changes of markers of antioxidant activity or oxidative
stress
In general methods for determination of TBARS and F2-isoprostanes were discussed to
be inappropriate because of too low specificity and concomitantly too high inter-assay
variation (Rimbach et al 1999 Halliwell and Whiteman 2004 Celi 2011)
Furthermore antioxidative status tremendously differs between individuals and depends
on medical treatment (Farombi 2001) and season (Bernabucci et al 2002) In addition
plasma flavonol concentrations were relatively low since blood sampling occurred in
the pre-prandial stage and postprandial plasma flavonol concentration in calves
decreased rapidly with age (Maciej et al 2015) Therefore variable results concerning
antioxidative status or oxidative stress markers can be expected Also the amount of
flavonoid used in this study was based on previous studies in pigs and dogs (Lesser et
al 2004 Reinboth et al 2010 Luumlhring et al 2011) which may not be adequate for
colostrum- and milk-fed calves The determination of other parameters such as of
protein damage determination of vitamins E and C or of enzymatic antioxidants might
be more appropriate
We assumed that quercetin feeding may affect metabolic status in calves as some
authors postulate effects of flavonoids on glucose metabolism (Cermak et al 2004
Shetty et al 2004 Gohlke et al 2013) However we found no effects on pre-prandial
plasma glucose concentrations by flavonoid feeding in this study The increase of
plasma glucose concentrations after birth reflects lactose intake by colostrum and milk
CHAPTER 3
93
feeding as well as an increasing endogenous glucose production with age (Hammon et
al 2013) Because plasma glucose is highly regulated with the goal to maintain
euglycemia concentrations were relatively stable throughout the study and
corresponded to earlier presented data measured in young milk-fed calves (Hadorn et
al 1997 Rauprich et al 2000 Nussbaum et al 2002) Plasma concentrations of other
metabolites and insulin were also not affected by flavonoid feeding and simply reflected
physiological changes during first month of life (Nussbaum et al 2002 Schiessler et
al 2002 Hammon et al 2012) Differences in plasma cortisol concentrations among
groups on d 1 were independent of flavonoid administration as blood was sampled
before flavonoid supplementation
In conclusion effects of flavonoid treatment were much less than hoped or expected
However reduced medical treatment fewer incidences of diarrhea and a slight effect
on oxidative stress markers may indicate a potential health-promoting effect of
catechins in this study Nevertheless evidence for biological effects of flavonoid-
containing supplements is not available for young calves Feeding higher doses of
flavonoids than in this study may possibly cause more distinct changes of the metabolic
or antioxidative status in neonatal calves In addition use of more specific markers of
anti-oxidative capacity or stress may be helpful in future studies
Acknowledgements
We gratefully thank Petra Schulz and Maike Gosse (Christian Albrechts University
Kiel) for excellent laboratory assistance as well as Annette Zeyner Kirsten Buumlsing
(University of Rostock) and Bernd Stabenow (Leibniz Institute for Farm Animal
Biology) for providing the experimental facilities Chicken-egg derived
immunoglobulins (Globigen Life Start 25 ) were generously provided by EW
Nutrition GmbH Visbek Germany This work is part of the joint research project Food
Chain Plus (FoCus) and was financially supported by the Federal Ministry of Education
and Research Germany (BMFT grant no 0315538B)
CHAPTER 3
94
References
Ahmed W M and S E Hassan 2007 Applied studies on coccidiosis in growing
Buffalo-calves with special reference to oxidantantioxidant status World J Zool
240ndash48
Alexandrovich K N and S E Antonovna 2009 Age-dependent level of antioxidant
defence system and lipid metabolism state in calves Int J Appl Res Vet Med
773ndash75
Al-Qudah K M 2009 Oxidative stress in calves with acute or chronic
bronchopneumonia Rev Meacuted Veacutet 160231ndash236
Benzie I F and J J Strain 1996 The ferric reducing ability of plasma (FRAP) as a
measure of ldquoantioxidant powerrdquo The FRAP assay Anal Biochem 23970ndash76
Berger L M S Wein R Blank C C Metges and S Wolffram 2012 Bioavailability
of the flavonol quercetin in cows after intraruminal application of quercetin
aglycone and rutin J Dairy Sci 955047ndash5055
Bernabucci U B Ronchi N Lacetera and A Nardone 2002 Markers of oxidative
status in plasma and erythrocytes of transition dairy cows during hot season J
Dairy Sci 852173ndash2179
Blum J W U Hadorn H P Sallmann and W Schuep 1997 Delaying colostrum
intake by one day impairs plasma lipid essential fatty acid carotene retinol and
α-tocopherol status in neonatal calves J Nutr 1272024ndash2029
Blum J and H Hammon 2000 Colostrum effects on the gastrointestinal tract and on
nutritional endocrine and metabolic parameters in neonatal calves Livest Prod
Sci 66151ndash159
Celi P 2011 Biomarkers of oxidative stress in ruminant medicine Immunopharmacol
Immunotoxicol 33233ndash240
Cermak R S Landgraf and S Wolffram 2004 Quercetin glucosides inhibit glucose
uptake into brush-border-membrane vesicles of porcine jejunum Br J Nutr
91849ndash55
di Carlo G D N Mascolo A A Izzo and F Capasso 1994 Effects of quercetin on
the gastrointestinal tract in rats and mice Phytother Res 842ndash45
CHAPTER 3
95
Egert S J Tereszczuk S Wein M J Muumlller J Frank G Rimbach and S Wolffram
2013 Simultaneous ingestion of dietary proteins reduces the bioavailability of
galloylated catechins from green tea in humans Eur J Nutr 52281ndash288
Erisir M F M Kandemir and M Yuumlksel 2013 The effects of Caesarean section on
lipid peroxidation and some antioxidants in the blood of newborn calves Vet
Arch 83153ndash159
Farombi E O 2001 Antioxidant status and hepatic lipid peroxidation in
chloramphenicol-treated rats Tohoku J Exp Med 19491ndash98
Gaaacutel T P Ribiczeyneacute-Szaboacute K Stadler J Jakus J Reiczigel P Koumlveacuter M Meacutezes
and L Suumlmeghy 2006 Free radicals lipid peroxidation and the antioxidant
system in the blood of cows and newborn calves around calving Comp Biochem
Physiol B Biochem Mol Biol 143391ndash396
Gaacutelvez J F Saacutenchez de Medina J Jimeacutenez M I Torres M I Fernaacutendez M C
Nuacutentildeez A Riacuteos A Gil and A Zarzuelo 1995 Effect of quercitrin on lactose-
induced chronic diarrhoea in rats Planta Med 61302ndash306
Gohlke A C J Ingelmann G Nuumlrnberg J M Weitzel H M Hammon S Goumlrs A
Starke S Wolffram and C C Metges 2013 Influence of 4-week intraduodenal
supplementation of quercetin on performance glucose metabolism and mRNA
abundance of genes related to glucose metabolism and antioxidative status in
dairy cows J Dairy Sci 966986-7000
Greathead H 2003 Plants and plant extracts for improving animal productivity Proc
Nutr Soc 62279ndash290
Hadorn U H Hammon R M Bruckmaier and J W Blum 1997 Delaying colostrum
intake by one day has important effects on metabolic traits and on gastrointestinal
and metabolic hormones in neonatal calves J Nutr 1272011ndash2023
Halliwell B 1991 Reactive oxygen species in living systems source biochemistry
and role in human disease Am J Med 9114Sndash22S
Halliwell B and M Whiteman 2004 Measuring reactive species and oxidative
damage in vivo and in cell culture how should you do it and what do the results
mean Br J Pharmacol 142231ndash255
Hammon H M J Steinhoff-Wagner J Flor U Schoumlnhusen and C C Metges 2013
Lactation Biology Symposium role of colostrum and colostrum components on
glucose metabolism in neonatal calves J Anim Sci 91685ndash695
CHAPTER 3
96
Hammon H M J Steinhoff-Wagner U Schoumlnhusen C C Metges and J W Blum
2012 Energy metabolism in the newborn farm animal with emphasis on the calf
endocrine changes and responses to milk-born and systemic hormones Domest
Anim Endocrinol 43171ndash185
Igarashi K and M Ohmuma 1995 Effects of isorhamnetin rhamnetin and quercetin
on the concentrations of cholesterol and lipoperoxide in the serum and liver and
on the blood and liver antioxidative enzyme activities of rats Biosci Biotechnol
Biochem 59595ndash601
Ishihara N D-C Chu S Akachi and L R Juneja 2001 Improvement of intestinal
microflora balance and prevention of digestive and respiratory organ diseases in
calves by green tea extracts Livest Prod Sci 68217ndash229
Kobayashi Y M Miyazawa A Kamei K Abe and T Kojima 2010 Ameliorative
effects of mulberry (Morus alba L) leaves on hyperlipidemia in rats fed a high-fat
diet Induction of fatty acid oxidation inhibition of lipogenesis and suppression
of oxidative stress Biosci Biotechnol Biochem 742385ndash2395
Larson L L F G Owen J L Albright R D Appleman R C Lamb and L D
Muller 1977 Guidelines toward more uniformity in measuring and reporting calf
experimental data J Dairy Sci 60989ndash991
Lee M J Z Y Wang H Li L Chen Y Sun S Gobbo D A Balentine and C S
Yang 1995 Analysis of plasma and urinary tea polyphenols in human subjects
Cancer Epidemiol Biomarkers Prev 4393ndash399
Lesser S R Cermak and S Wolffram 2004 Bioavailability of quercetin in pigs is
influenced by the dietary fat content J Nutr 1431508ndash1511
Lindmark-Maringnsson H and B Aringkesson 2000 Antioxidative factors in milk Br J
Nutr 84103ndash110
Luumlhring M R Blank S Wolffram 2011 Vitamin E-sparing and vitamin E-
independent antioxidative effects of the flavonol quercetin in growing pigs Anim
Feed Sci Technol 169199ndash207
Maciej J C T Schaumlff E Kanitz A Tuchscherer R M Bruckmaier S Wolffram
H M Hammon 2015 Bioavailability of the flavonol quercetin in neonatal calves
after oral administration of quercetin aglycone or rutin J Dairy Sci 98 3906ndash
3917
CHAPTER 3
97
Middleton E C Kandaswami and T C Theoharides 2000 The effects of plant
flavonoids on mammalian cells Implications for inflammation heart disease and
cancer Pharmacol Rev 52673ndash751
Miller J K E Brzezinska-Slebodzinska and F C Madsen 1993 Oxidative stress
antioxidants and animal function J Dairy Sci 762812ndash2823
Naumann C and R Basler 2004 Die chemische Untersuchung von Futtermitteln
VDLUFA-Verlag Darmstadt Germany
Nielsen B K 2008 Botanicals as feed additives to improve health and production in
pig breeding Res Pig Breed 212ndash18
Nieman D C N D Gillitt A M Knab R A Shanely K L Pappan F Jin and M
A Lila 2013 Influence of a polyphenol-enriched protein powder on exercise-
induced inflammation and oxidative stress in athletes a randomized trial using a
metabolomics approach PLoS One 8e72215
Nussbaum A G Schiessler H M Hammon and J W Blum 2002 Growth
performance and metabolic and endocrine traits in calves pair-fed by bucket or by
automate starting in the neonatal period J Anim Sci 801545ndash1555
Oliveira R A C D Narciso R S Bisinotto M C Perdomo M A Ballou M
Dreher and J E P Santos 2010 Effects of feeding polyphenols from
pomegranate extract on health growth nutrient digestion and
immunocompetence of calves J Dairy Sci 934280ndash91
Rauprich A B E H M Hammon and J W Blum 2000 Effects of feeding colostrum
and a formula with nutrient contents as colostrum on metabolic and endocrine
traits in neonatal calves Biol Neonate 7853ndash64
Re R N Pellegrini A Proteggente A Pannala M Yang and C Rice-Evans 1999
Antioxidant activity applying an improved ABTS radical cation decolorization
assay Free Radic Biol Med 261231ndash1237
Reinboth M S Wolffram G Abraham F R Ungemach and R Cermak 2010 Oral
bioavailability of quercetin from different quercetin glycosides in dogs Br J
Nutr 104198ndash203
Rimbach G D Houmlhler A Fischer S Roy F Virgili J Pallauf and L Packer 1999
Methods to assess free radicals and oxidative stress in biological systems Arch
Anim Nutr 52203ndash222
CHAPTER 3
98
Schiessler G A Nussbaum H M Hammon and J W Blum 2002 Calves sucking
colostrum and milk from their dams or from an automatic feeding station starting
in the neonatal period metabolic and endocrine traits and growth performance
Anim Sci 74431ndash444
Schwerin M U Dorroch M Beyer H Swalve C C Metges and P Junghans 2002
Dietary protein modifies hepatic gene expression associated with oxidative stress
responsiveness in growing pigs FASEB J 161322ndash1324
Shetty A K R Rashmi M G R Rajan K Sambaiah and P V Salimath 2004
Antidiabetic influence of quercetin in streptozotocin-induced diabetic rats Nutr
Res 24373ndash381
Sies H W Stahl and A Sevanian 2005 Nutritional dietary and postprandial
oxidative stress J Nutr 135969ndash972
USDA 2011 Cattle and calves nonpredator death loss in the United States 2010
USDAndashAPHISndashVSndashCEAH Fort Collins CO 6311111
Yagi K 1998 Simple assay for the level of total lipid peroxides in serum or plasma
Pages 101ndash106 in Free Radical and Antioxidant Protocols D Armstrong ed
Humana Press New York Buffalo USA
Zanker I A H M Hammon and J W Blum 2000 -Carotene retinol and -
tocopherol status in calves fed colostrum at 0-2 6-7 12-13 or 24-25 hours after
birth Int J Vitam Nutr Res 70305ndash310
99
Chapter 4
General Discussion
CHAPTER 4
100
General Discussion
Rearing neonatal calves healthy and economically is still a major challenge in todayʼs
dairy farming Feed supplements are often claimed to provide an effective and easy way
to improve performance of animals but the actual use of such supplements marketed is
manifold Since flavonoids are ingredients in all higher plants with numerous health-
promoting properties like acting antioxidative antiviral or anti-inflammatory and
beneficial effects on metabolic key enzymes and even antidiarrheal remedies (Chapter
1 Gaacutelvez et al 1995 Rao et al 1997 Middleton et al 2000) their use in dairy
nutrition is comprehensible However biological effects in vivo require systemic BV
Bioavailability in particular means the absorption distribution metabolism and at least
the excretion from the organism For calves systemic BV is widely unknown so far
Therefore this study was performed to examine BV and the biological effects of the
most abundant flavonoids quercetin and catechin in neonatal calves
In the first study of this thesis (Chapter 2) the systemically availability of quercetin
either applied as quercetin aglycone or applied as quercetin glucorhamnoside rutin
linked to the sugar rutinose was evaluated in newborn calves on d 2 and on d 29 of life
to investigate two different ontogenetic states In the second study (Chapter 3) possible
influences of quercetin as aglycone or as rutin and furthermore of catechin on the
metabolic and antioxidative status in calves were examined during a 3-wk feeding from
d 5 to 26 of life
In both studies of this thesis quercetin aglycone and rutin were supplemented at an
amount of 30 micromolkg of BW per d This dosage based results from companion studies
in dairy cows (Berger et al 2012 Gohlke et al 2013) Both quercetin sources were fed
as pure substances suspended in 10 mL of water to enable oral apply of flavonoids
during milk feeding Therefore possible effects can be deduced exclusively from
flavonoid feeding what would not be the case when feeding plant extracts with mixed
compositions or other natural products like propolis as seen in a number of other
studies in calves (Yaghoubi et al 2008 Oliveira et al 2010) In contrast to quercetin
feeding catechin could not be fed as pure substance but was fed by a GTE on a level of
10 mgkg of BW per d of original substance containing 703 catechins Dosage of
catechins was aligned to quercetin dosage and is shown in Table 1 of the appendix of
CHAPTER 4
101
this thesis However plasma catechin concentrations were below the detection limit
(data not shown) thus in further studies higher dosages should be applied
Studies on BV of flavonoids are conducted for a wide variety of species including
humans (Erlund et al 2000 Egert et al 2008) pigs (Ader et al 2000 Lesser et al
2004 Cermak et al 2003) rats (Manach et al 1997 1999) dogs (Reinboth et al
2010) horses (Wein and Wolffram 2013) and cows (Berger et al 2012 Gohlke et al
2013) The enormous differences among the species and ages impeded a transfer of
findings to neonatal calves (Chapter 1 section 225) Hence this thesis shall be a basis
for further more specific investigations on flavonoid feeding in calves Next to
differences among species as mentioned above great inter-individual differences among
calves were found in these experiments confirming previous studies for plasma
flavonol concentrations attributed to individual enzyme expression or differences in
intestinal bacterial colonization (Neacutemeth et al 2003 Manach et al 2005) Calves for
these studies originated from two distinct neighboring farms thus genetic background
feeding of dams and further external influences may partly account for differences
found Such impacts could be avoided by selecting calves from just one dairy operation
with a common pedigree
In the first study of this thesis (Chapter 2) quercetin was systemically available
reflected by increased concentrations of total flavonols quercetin and the quercetin
metabolites tamarixetin isorhamnetin and kaempferol in blood plasma of neonatal
calves both after administration of quercetin as aglycone and as glucorhamnoside rutin
Neonatal calves are regarded as functional monogastrics until development of the
reticulorumen allows rumination (Drackley 2008) Therefore BV in neonatal calves is
more comparable to monogastric but not to ruminant species as quercetin aglycone was
better absorbed than rutin This is in line with a decreasing BV of quercetin with
ontogenesis as on d 29 a higher microbial fermentation thus lower BV due to partial
ruminal degradation of quercetin was expected (Heinrichs and Jones 2003 Guilloteau
et al 2009 Berger et al 2012)
However absorption of quercetin occurred slowly reflected in delayed and lower
maximal reached plasma concentrations than found in monogastrics (Lesser et al 2004
Reinboth et al 2010 Chapter 2) or in adult cattle (Berger et al 2012 Gohlke et al
2013 Chapter 2) although applying comparable amounts of quercetin This once more
underpins that results from studies on BV of other species or adult cattle cannot be
CHAPTER 4
102
deduced to young calves Furthermore a delayed absorption of quercetin as
glucorhamnoside rutin but not as its aglycone was seen as result of different absorption
sites in monogastrics (Hollman et al 1997 Manach et al 1997 Chapter 1) On the
contrary in neonatal calves quercetin aglycone and rutin administration showed the
same slow increase in plasma concentrations indicating similar absorption sites as well
as a special feature in milk-fed calves because of abomasal milk clotting (Chapter 2) To
exclude interactions with milk fed flavonoids may be administered with water only
instead of milk which should result in a faster increase of plasma flavonol
concentrations Anyway to determine the exact place of absorption and metabolism of
flavonoids in calves further studies are required like intraruminal or intraduodenal
application of flavonoids or in vitro absorption tests of flavonoids with different bovine
gastrointestinal tissues
Aside from this the slow absorption of flavonols during BV studies (Chapter 2) seems
to be associated with the accumulation of quercetin in plasma during long-term
administration (Chapter 3) When elimination half-lives of flavonoids are long repeated
absorption of flavonoids can cause accumulation in blood plasma (Aherne and OʼBrien
2002 Chapter 1) Again calves showed differences to other monogastrics like pigs
where long-term quercetin feeding did not lead to an accumulation in plasma mainly
due to much faster absorption of quercetin (Bieger et al 2008) In calves accumulation
of flavonols in plasma during long-term administration was especially seen for rutin
(Chapter 3) what is in line with findings from BV studies of a delayed peak in plasma
flavonol concentrations after rutin feeding especially on d 2 (Chapter 2)
Interestingly even without dietary flavonoid supplementation calves showed
measurable plasma flavonol concentrations during BV studies (Chapter 2) and during
long-term administration (data not shown Chapter 3) This was particularly seen on day
2 when colostrum was fed (Chapter 2) indicating once more the outstanding role of
colostrum for health and welfare of calves (Hammon et al 2013) In addition to further
clarify the source of flavonols analysis of the respective composition of colostrum or
calf feed is required In the superordinate context of these studies bovine milk or
colostrum are probable flavonoid sources in human nutrition as well as veal rich in
flavonoids as so called functional food Precondition for this would be further studies
examining the distribution of flavonoids in calves and distinct tissue analyses after
flavonoid absorption (Chapter 1)
CHAPTER 4
103
However concentrations of metabolites and hormones measured postprandial during
BV studies (Chapter 2) or basal during long-term flavonoid treatment (Chapter 3) were
in line with previous studies on calves without dietary flavonoid supplementation
indicating physiological conditions and an unaffected metabolic status of calves by
flavonoid feeding Results of basal blood samples during long-term flavonoid
administration (Chapter 3) confirmed the findings of unaffected metabolic parameters
found in BV studies (Chapter 2) Flavonoid administration at higher dosage and a more
distinct focus on glucose metabolism during the experimental design putatively may
reveal effects as found in companion studies on calves (Gruse et al 2014) or in
monogastric animals showing an inhibited glucose uptake in intestinal cells after
quercetin feeding (Cermak et al 2004) Nevertheless all data indicated the use of
flavonoids in sensitive neonatal calves is harmless This is noteworthy as secondary
plant metabolites in the past mainly counted as anti-nutritive factors (Durmic and
Blache 2012)
Markers of oxidative stress and of the antioxidative capacity in calves during long-term
administration of quercetin and catechin were barely influenced by feeding regime but
influenced by time reflected by physiological changes during maturation (Chapter 3)
Colostrum as source for antioxidants like vitamins and enzymes (Lindmark-Maringnsson
and Aringkesson 2000) was assumed to induce at least most of the time effects of the
antioxidative status in this study The distinct increase of TE (unit for TEAC) and the
decrease of ASCE (as unit for FRAP) from shortly after birth to d 5 of life demonstrated
the important role of feed intake This was the first study proofing this outstanding
influence of feed intake However similar changes in plasma concentrations were not
seen for TBARS or F2-isoprostanes as oxidative stress markers Therefore relative
changes from d 1 to other d were evaluated which pointed out a possible role of
catechin feeding Taken together reduced medical treatment better fecal scores and a
slight impact on oxidative stress markers possibly indicate health-promoting effects of
catechins in calves This is especially interesting und should be further examined in
regard to the low plasma catechin concentrations found
Nevertheless in this study changes in oxidative stress markers by flavonoid feeding
were weak (Chapter 3) when compared to other studies showing more distinct
differences in oxidative stress markers mainly in obviously impaired calves (Wernicki
et al 2006 Ahmed and Hassan 2007 Al-Qudah 2009) This was not true in the
CHAPTER 4
104
studies of this thesis where all calves were kept under similar conditions Furthermore
in contrast to plasma metabolites like glucose or protein there is a lack of basic
information like data for physiological ranges concerning markers for antioxidative
capacity and oxidative stress Anyway this may be explained by the huge variation
found in the distinct studies and the different methods of analysis (Chapter 1 3) raising
the question whether there are more appropriate markers to determine the antioxidative
status of calves or if additional parameters should be used As presented previously
(Chapter 1 section 233) conceivable suggestions are the determination of vitamins E
and C carotenoids bilirubin or glutathione as well as enzymatic antioxidants like
superoxide-dismutase catalase or glutathione-peroxidase Moreover a more closely
setting of sample collection over longer time periods would allow a deeper insight in
kinetics of flavonoid action Additionally in these studies only 7 calves per group were
investigated Using more animals per group would let findings become more
conclusive
On the other hand dietary flavonoid supplementation namely catechin feeding seemed
to improve health status reflected in fewer sick calves and less diarrhea although
plasma catechin concentrations were below the detection limit (Chapter 3) However
biological effects not only depended on absolute plasma concentrations but also on
concentrations in target tissues which is needed to be examined in further studies A
possible approach is comparing directly the effects of flavonoid supplementation from d
of birth to a control group without flavonoid supplementation or treating sick calves
with flavonoids compared to sick calves without flavonoid treatment with both
approaches using an adequate number of animals Furthermore the chemical form or
the galenical form in general in which the flavonoid is applied greatly influences BV
and thus the biological effects (Chapter 1) as may be seen in studies that compare
quercetin aglycone or rutin administration to natural plant extracts containing quercetin
In previous studies on V urine and feces collection were the appropriate methods used
as due to urine and feces analyses the excretion of the investigated substance can be
verified Since this thesis focused on the more fundamental question if flavonoids were
absorbed at all no excrement was analyzed
In conclusion these studies clearly showed for the first time that quercetin is
systemically available in newborn calves This is a requirement for biological effects in
the organism which already are claimed by feed producers in practical dairy nutrition
CHAPTER 4
105
The great influence of maturation and ontogenetic stage of young calves on BV of
flavonoids was demonstrated just as the influence of the chemical form of the
administered flavonoids It was evaluated to what extend flavonoids affect the
metabolic and antioxidative status in neonatal calves shown in slight changes of the
respective markers This all contributes to a better understanding of the usage the mode
of action and the benefit of flavonoids as ʽnaturalʼ health-promoting feed supplements
CHAPTER 4
106
References
Ader P A Wessmann and S Wolffram 2000 Bioavailability and metabolism of the
flavonol quercetin in the pig Free Radic Biol Med 281056ndash1067
Aherne S A and N M OrsquoBrien 2002 Dietary flavonols Chemistry food content
and metabolism Nutrition 1875ndash81
Ahmed W M and S E Hassan 2007 Applied studies on coccidiosis in growing
Buffalo-calves with special reference to oxidantantioxidant status World J Zool
240ndash48
Al-Qudah K M 2009 Oxidative stress in calves with acute or chronic
bronchopneumonia Rev Meacuted Veacutet 160231ndash236
Berger L M S Wein R Blank C C Metges and S Wolffram 2012 Bioavailability
of the flavonol quercetin in cows after intraruminal application of quercetin
aglycone and rutin J Dairy Sci 955047ndash5055
Bieger J R Cermak R Blank V C J de Boer P C H Hollman J Kamphues and
S Wolffram 2008 Tissue distribution of quercetin in pigs after long-term dietary
supplementation J Nutr 1381417ndash1420
Cermak R S Landgraf and S Wolffram 2003 The bioavailability of quercetin in
pigs depends on the glycoside moiety and on dietary factors J Nutr 1332802ndash
2807
Cermak R S Landgraf and S Wolffram 2004 Quercetin glucosides inhibit glucose
uptake into brush-border-membrane vesicles of porcine jejunum Br J Nutr
91849ndash55
Drackley J K 2008 Calf nutrition from birth to breeding Vet Clin North Am Food
Anim Pract 2455ndash86
Durmic Z and D Blache 2012 Bioactive plants and plant products Effects on animal
function health and welfare Anim Feed Sci Technol 176150ndash162
Egert S S Wolffram A Bosy-Westphal C Boesch-Saadatmandi A E Wagner J
Frank G Rimbach and M J Mueller 2008 Daily quercetin supplementation
dose-dependently increases plasma quercetin concentrations in healthy humans J
Nutr 1381615ndash1621
CHAPTER 4
107
Erlund I T Kosonen G Alfthan J Maumlenpaumlauml K Perttunen J Kenraali J
Parantainen and A Aro 2000 Pharmacokinetics of quercetin from quercetin
aglycone and rutin in healthy volunteers Eur J Clin Pharmacol 56545ndash553
Gaacutelvez J F Saacutenchez de Medina J Jimeacutenez M I Torres M I Fernaacutendez M C
Nuacutentildeez A Riacuteos A Gil and A Zarzuelo 1995 Effect of quercitrin on lactose-
induced chronic diarrhoea in rats Planta Med 61302ndash306
Gohlke A C J Ingelmann G Nuumlrnberg A Starke S Wolffram and C C Metges
2013 Bioavailability of quercetin from its aglycone and its glucorhamnoside rutin
in lactating dairy cows after intraduodenal administration J Dairy Sci 962303ndash
2313
Gruse J S Goumlrs W Otten J Weitzel S Wolffram C C Metges and H M
Hammon 2014 Effects of different milk diets and oral quercetin supplementation
on postprandial glucose metabolism in neonatal calves Proc Soc Nutr Physiol
23114
Guilloteau P R Zabielski J W Blum 2009 Gastrointestinal tract and digestion in
the young ruminant Ontogenesis adaptations consequences and manipulations
J Physiol Pharmacol 60 Suppl 237ndash46
Hammon H M J Steinhoff-Wagner J Flor U Schoumlnhusen and C C Metges 2013
Lactation Biology Symposium Role of colostrum and colostrum components on
glucose metabolism in neonatal calves J Anim Sci 91685ndash695
Hollman P C H J M P van Trijp M N C P Buysman M S vd Gaag M J B
Mengelers J H M de Vries and M B Katan 1997 Relative bioavailability of
the antioxidant flavonoid quercetin from various foods in man FEBS Lett
418152ndash156
Heinrichs A J and C M Jones 2003 Feeding the newborn calf College of
Agricultural Sciences Agricultural Research and Cooperative Extension
Pennsylvania State University University Park PA
Lesser S R Cermak and S Wolffram 2004 Bioavailability of quercetin in pigs is
influenced by the dietary fat content J Nutr 1431508ndash1511
Lindmark-Maringnsson H and B Aringkesson 2000 Antioxidative factors in milk Br J
Nutr 84103ndash110
Manach C C Morand C Demigneacute O Texier F Reacutegeacuterat and C Reacutemeacutesy 1997
Bioavailability of rutin and quercetin in rats FEBS Lett 40912ndash16
CHAPTER 4
108
Manach C O Texier C Morand V Crespy F Reacutegeacuterat C Demigneacute and C Reacutemeacutesy
1999 Comparison of the bioavailability of quercetin and catechin in rats Free
Radic Biol Med 271259ndash1266
Manach C G Williamson C Morand A Scalbert and C Reacutemeacutesy 2005
Bioavailability and bioefficacy of polyphenols in humans I Review of 97
bioavailability studies Am J Clin Nutr 81230Sndash242S
Middleton E C Kandaswami and T C Theoharides 2000 The effects of plant
flavonoids on mammalian cells Implications for inflammation heart disease and
cancer Pharmacol Rev 52673ndash751
Neacutemeth K G W Plumb J-G Berrin N Juge R Jacob H Y Naim G Williamson
D M Swallow and P A Kroon 2003 Deglycosylation by small intestinal
epithelial cell beta-glucosidases is a critical step in the absorption and metabolism
of dietary flavonoid glycosides in humans Eur J Nutr 4229ndash42
Oliveira R A C D Narciso R S Bisinotto M C Perdomo M A Ballou M Dreher
and J E P Santos 2010 Effects of feeding polyphenols from pomegranate
extract on health growth nutrient digestion and immunocompetence of calves J
Dairy Sci 934280ndash4291
Rao V S F A Santos T T Sobreira M F Souza C L Melo and E R Silveira
1997 Investigations on the gastroprotective and antidiarrhoeal properties of
ternatin a tetramethoxyflavone from Egletes viscosa Planta Med 63146ndash149
Reinboth M S Wolffram G Abraham F R Ungemach and R Cermak 2010 Oral
bioavailability of quercetin from different quercetin glycosides in dogs Br J
Nutr 104198ndash203
Wein S and S Wolffram 2013 Oral bioavailability of quercetin in horses J Equine
Vet Sci 33441ndash445
Wernicki A M Kankofer P Mikucki and A Puchalski 2006 Evaluation of plasma
cortisol and TBARS levels in calves after short-term transportation Rev Meacuted
Veacutet 15730ndash34
Yaghoubi S M J G R Ghorbani H R Rahmani and A Nikkhah 2008 Growth
weaning performance and blood indicators of humoral immunity in Holstein
calves fed supplemental flavonoids Anim Physiol Anim Nutr 92456ndash462
109
Summary
SUMMARY
110
Summary
Flavonoids are secondary plant metabolites with numerous health-promoting properties
The feeding industry widely use flavonoids as ʽgreenʼ feed supplements even scientific
evidence of their value are often hypothetical Due to their high susceptibility to
diseases the use of flavonoids in neonatal calves might be especially useful However
to determine biological effects in vivo flavonoids must be systemically available in
calves but this is not known yet Therefore the aim of this study was to determine BV
and their biological effects of the most abundant flavonoids quercetin and catechin in
neonatal calves
In part one of the study calves (n = 7 per group) were fed quercetin as aglycone or as
glucorhamnoside rutin or no flavonoid (control group) on d 2 and 29 of life Blood
samples were taken in defined time intervals before and until 48 h after flavonoid
administration via jugular vein catheters Quercetin and its methylated (isorhamnetin
tamarixetin) and dehydroxylated (kaempferol) metabolites were analyzed in blood
plasma using HPLC with subsequent fluorescence detection It was shown that
quercetin is systemically available both as aglycone and as rutin in neonatal calves but
BV of quercetin aglycone was higher than BV of rutin as previously shown in
monogastric species Furthermore BV of quercetin and its metabolites was greater on d
2 than on d 29 of life and the proportion of quercetin metabolites differed greatly
between the two d which possibly can deduced to maturation of the gastrointestinal
tract
In part two of the study effects of a three-wk administration of quercetin aglycone rutin
or a green tea extract containing mainly catechins on performance health and the
antioxidative capacity and oxidative stress in neonatal calves were evaluated A fourth
group was used as control group (n = 7 calves per group) and did not receive any
flavonoid sopplementation No group differences were found for zootechnical
parameters but a slight benefit in health status when catechins were fed Effects of
flavonoid feeding on metabolic status were not seen in this study but total protein
albumin urea lactate glucose NEFA insulin and cortisol reflected typical time
changes during postnatal calf development Markers of the antioxidative capacity in
blood plasma (TEAC FRAP) showed incisive differences in time seen in a sharp
increase of TEAC and in a decrease of FRAP plasma concentrations postpartum
SUMMARY
111
However oxidative stress markers (TBARS F2-isoprostanes) did not illustrate distinct
group and time effects due to great interindividual variances
Taken together this study clearly demonstrated that the bioavailability of quercetin is
determined by its chemical form and depends to a major extent on physiological
processes of digestion and gastrointestinal maturation in calves In contrast the
influence of flavonoids on the antioxidative status did not show clear results thus an
improvement of the antioxidative status in neonatal calves by flavonoid administration
cannot be confirmed by this study
SUMMARY
112
Zusammenfassung
Flavonoide sind sekundaumlre Pflanzeninhaltsstoffe denen zahlreiche gesundheits-
foumlrdernde Eigenschaften zugesprochen werden In der Futtermittelindustrie haben
Flavonoide deshalb als bdquogruumlneldquo Zusatzstoffe bereits weitreichend Einzug erhalten auch
wenn wissenschaftlich fundierte Nachweise bezuumlglich ihrer Wirkung im Nutztier
oftmals hypothetisch sind Besonders fuumlr neugeborene Kaumllber scheint aufgrund ihrer
erhoumlhten Krankheitsanfaumllligkeit der Einsatz von pflanzlichen Zusatzstoffen sinnvoll
Allerdings muumlssten Flavonoide fuumlr biologische Effekte systemisch im Kalb verfuumlgbar
sein wofuumlr es bis jetzt noch keine Belege gibt Somit war es Ziel dieser Arbeit die
Bioverfuumlgbarkeit und die biologischen Effekte der weit verbreiteten Flavonoide
Quercetin und Catechin beim neugeborenen Kalb zu untersuchen
Dazu erfolgte im ersten Teil dieser Studie die Fuumltterung von Quercetin als reines
Aglykon oder mit entsprechendem Zuckerrest als Glukorhamnosid Rutin am 2 und 29
Lebenstag der Kaumllber (n = 7 pro Gruppe) Vor sowie bis zu 48 Stunden nach der
Flavonoidapplikation wurden in definierten Zeitabstaumlnden Blutproben gewonnen und
der Gehalt an Quercetin sowie der jeweiligen methylierten (Isorhamnetin Tamarixetin)
und dehydroxylierten (Kaempferol) Metaboliten mittels Hochleistungsfluumlssigkeits-
chromatographie mit anschlieszligender Fluoreszenzdetektion analysiert Es konnte gezeigt
werden dass Quercetin sowohl als Aglykon als auch als Rutin systemisch im Kalb
verfuumlgbar war wobei die systemische Verfuumlgbarkeit von Quercetin nach Fuumltterung des
Aglycons houmlher war als nach Fuumltterung von Rutin Weiterhin wurde am 2 Lebenstag
eine deutlich houmlhere Bioverfuumlgbarkeit von Quercetin und seinen Metaboliten festgestellt
als am 29 Lebenstag Auch war der Anteil der einzelnen Quercetinmetabolite an der
Gesamtflavanolkonzentration im Blutplasma stark veraumlndert was moumlglicherweise auf
den unterschiedlichen Grad der Darmentwicklung am 2 und 29 Lebenstag
zuruumlckgefuumlhrt werden kann
Im zweiten Teil der Studie wurde die Leistungsentwicklung der Gesundheitsstatus
sowie die antioxidative Kapazitaumlt und der oxidative Stress bei Kaumllbern untersucht
denen uumlber einen Zeitraum von drei Wochen entweder Quercetin in Form des Aglycons
oder als Rutin oder ein Gruumlnteeextrakt der hauptsaumlchlich Catechine enthielt verabreicht
wurde Eine vierte Kaumllbergruppe bekam keine Flavonoide zugefuumlttert und diente als
Kontrollgruppe (n = 7 pro Gruppe) Hierbei konnten in den erhobenen zootechnischen
SUMMARY
113
Parametern keine Gruppenunterschiede jedoch ein leichter Vorteil durch die Fuumltterung
von Catechin im Gesundheitsstatus festgestellt werden Effekte der Flavonoidfuumltterung
auf den Stoffwechsel der Kaumllber ausgedruumlckt durch Gesamtprotein Albumin
Harnstoff Laktat Glukose nicht-veresterte Fettsaumluren Insulin und Cortisol konnten in
dieser Studie nicht dargelegt werden jedoch wiesen diese Parameter
entwicklungsphysiologische Zeitveraumlnderungen auf Marker der antioxidativen
Kapazitaumlt im Blutplasma (TEAC FRAP) zeigten praumlgnante Zeitunterschiede
ausgedruumlckt durch einen deutlichen Anstieg der TEAC und einen ausgepraumlgten Abfall
der FRAP nach der Geburt Marker fuumlr den oxidativen Stress (TBARS F2-Isoprostane)
hingegen zeigten im Blutplasma aufgrund der starken individuellen Streuung keine
eindeutigen Behandlungs- und Zeiteffekte
Zusammenfassend konnte mit dieser Studie gezeigt werden dass die Bioverfuumlgbarkeit
von Quercetin durch dessen chemische Form determiniert ist und zum groumlszligtenteils von
verdauungsphysiologischen Vorgaumlngen und der Darmreifung des Kalbes abhaumlngig ist
Dagegen zeigten die hier durchgefuumlhrten Untersuchungen zum Einfluss der Flavonoide
auf den antioxidativen Status der Kaumllber keine eindeutigen Ergebnisse so dass eine
Verbesserung des antioxidativen Status nach Flavonoidgabe bei neugeborenen Kaumllbern
mit dieser Studie nicht bestaumltigt werden konnte
APPENDIX
Appendix
APPENDIX
Table 1 Appendix Calculation of flavonoid dosage
Item Formula Molar mass
gmol
Flavonoid dosage
mgkg
BW
micromolkg
BW
Rutintrihydrate (group RU) C27H30O16 3 H2O 6646 20 30
Quercetindihydrate (group QA) C15H10O7 2 H2O 3383 10 30
Water H2O 180
Rutinose C12H22O16 3263
Rutin minus water 6105
Rutin QE1 minus water and
rutinose
2842
30222
9 30
Quercetin QE minus water 3022 9 30
Polyphenon 60 (group CA) 10
Catechin content 703 7
Epigallocatechin C15H14O7 306267 190 620
Epicatechin C15H14O6 290260 064 220
Epigallocatechin gallate C22H18O11 458370 288 628
Epicatechin gallate C22H18O10 442370 070 158
Gallocatechin gallate C22H18O11 458370 021 046
Catechin gallate C22H18O10 442370 003 007
Gallocatechin C15H14O7 306267 052 170
Catechin C15H14O6 290260 014 048
Sum CA 7 19
1 QE = Quercetin equivalents
2 Only theoretically due to binding of 2 H and 1 O from crystalline water
APPENDIX
A Day 2 B Day 29
Time relative to feeding h
0 2 4 6 8 10 12 24 48
Qu
erce
tin
n
mo
lL
0
50
100
150
200
Time relative to feeding h
0 2 4 6 8 10 12 24 48
Qu
erce
tin
n
mo
lL
0
50
100
150
200
C Day 2 D Day 29
Time relative to feeding h
0 2 4 6 8 10 12 24 48
Iso
rha
mn
etin
n
mo
lL
0
20
40
60
80
100
Time relative to feeding h
0 2 4 6 8 10 12 24 48
Iso
rha
mn
etin
n
mo
lL
0
20
40
60
80
100
E Day 2 F Day 29
Time relative to feeding h
0 2 4 6 8 10 12 24 48
Ta
ma
rix
etin
n
mo
lL
0
25
50
75
100
125
150
Time relative to feeding h
0 2 4 6 8 10 12 24 48
Ta
ma
rix
etin
n
mo
lL
0
25
50
75
100
125
150
APPENDIX
G Day 2 H Day 29
Time relative to feeding h
0 2 4 6 8 10 12 24 48
Ka
emp
fero
l n
mo
lL
0
2
4
6
8
10
12
Time relative to feeding h
0 2 4 6 8 10 12 24 48
Ka
emp
fero
l n
mo
lL
0
2
4
6
8
10
12
Figure 1 Appendix Plasma concentration-time curves of quercetin (A B) isorhamnetin (C D)
tamarixetin (E F) and kaempferol (G H) after oral administration of 9 mg of quercetinkg of BW
times d as quercetin aglycone () rutin trihydrate () or no flavonoid () on d 2 and 29 of life Values
are LSM plusmn SE n = 7 per group (Chapter 2)
APPENDIX
A Day 2 B Day 29
Time relative to feeding h
0 2 4 6 8 10 12 24
To
tal
pro
tein
g
L
54
56
58
60
62
64
66
Time relative to feeding h
0 2 4 6 8 10 12 24
To
tal
pro
tein
g
L
54
56
58
60
62
64
66
C Day 2 D Day 29
Time relative to feeding h
0 2 4 6 8 10 12 24
Alb
um
in g
L
21
22
23
24
25
26
27
Time relative to feeding h
0 2 4 6 8 10 12 24
Alb
um
in g
L
21
22
23
24
25
26
27
E Day 2 F Day 29
Time relative to feeding h
0 2 4 6 8 10 12 24
La
cta
te m
mo
lL
0
1
2
3
4
5
Time relative to feeding h
0 2 4 6 8 10 12 24
La
cta
te m
mo
lL
0
1
2
3
4
5
APPENDIX
G Day 2 H Day 29
Time relative to feeding h
0 2 4 6 8 10 12 24
Ure
a m
mo
lL
1
2
3
4
5
Time relative to feeding h
0 2 4 6 8 10 12 24
Ure
a m
mo
lL
1
2
3
4
5
Figure 2 Appendix Plasma concentrations of total protein (A B) albumin (C D) lactate (E F)
and urea (G H) after oral administration of 9 mg of quercetinkg of BW times d as quercetin aglycone
() rutin trihydrate () or no flavonoid () on d 2 and 29 of life Values are LSM plusmn SE n = 7 per
group (Chapter 2)
APPENDIX
A
Time d
1 5 12 19 26
To
tal
pro
tein
g
L
48
52
56
60
64
B
Time d
1 5 12 19 26
Alb
um
in g
L
22
23
24
25
26
27
C
Time d
1 5 12 19 26
La
cta
te m
mo
lL
0
1
2
3
4
5
6
D
Time d
1 5 12 19 26
Glu
cose
m
mo
lL
40
45
50
55
60
E
Time d
1 5 12 19 26
NE
FA
m
mo
lL
200
400
600
800
1000
F
Time d
1 5 12 19 26
Ure
a m
mo
lL
10
15
20
25
30
35
40
APPENDIX
G
Time d
1 5 12 19 26
Insu
lin
micro
gl
00
05
10
15
H
Time d
1 5 12 19 26
Co
rtis
ol
ng
mL
0
20
40
60
80
100
Figure 3 Appendix Plasma concentrations of total protein (A) albumin (B) lactate (C) glucose
(D) NEFA (E) urea (F) insulin (G) and cortisol (H) after oral administration of quercetin
aglycone () rutin trihydrate () a green tea extract () or no flavonoid () Values are LSM plusmn
SE n = 7 per group (Chapter 3)
APPENDIX
Herzlichen Dankhellip
PD Dr Harald M Hammon fuumlr die Uumlberlassung des Themas und die Betreuung dieser
Arbeit sowie fuumlr die Unterstuumltzung bei Fragen und Problemen Prof Dr Siegfried
Wolffram fuumlr die freundliche Uumlbernahme des Zweitgutachtens und fuumlr die konstruktive
Kritik zu den Manuskripten Familie Klodt sowie Ralf Kocher und Ronny Koumllpin
fuumlr die Bereitstellung der Versuchskaumllber Den Mitarbeitern der Tierarztpraxis Dr
Linke fuumlr die medizinische Betreuung der Kaumllber die leider viel zu oft noumltig war Dr
Bernd Linke und Dr Peter Sanftleben da durch ihre exzellente Betreuung waumlhrend
der Masterarbeit erst das Interesse fuumlr das Anfertigen einer Doktorarbeit geweckt
wurde Klaus-Dieter Witt dem Herdenmanager des FBN fuumlr die schnelle
unkomplizierte Hilfe in praktischen und organisatorischen Belangen waumlhrend des
Kaumllberversuches den Handwerkern des FBN fuumlr die tatkraumlftige Unterstuumltzung beim
Kaumllberstall-Bauen bei den Kaumllbertransporten und fuumlr alle weiteren baulich-technischen
Hilfestellungen Petra Schulz und Maike Gosse vom Institut fuumlr Tierernaumlhrung und
Stoffwechselphysiologie der CAU Kiel fuumlr die hervorragenden Laboranalysen und
diesbezuumlglichen Erklaumlrungen Allen Kollegen des Instituts fuumlr Ernaumlhrungsphysiologie
bdquoOskar Kellnerldquo fuumlr die gute Zusammenarbeit Dr Julia Steinhoff-Wagner fuumlr die
dynamische Einfuumlhrung ins FBN und somit fuumlr meine schoumlne Anfangszeit dort sowie
fuumlr die fortwaumlhrende Beratung auch uumlber den groszligen Teich hinweg allen
Doktoranden-Kollegen fuumlr die tolle lehrreiche gemeinsame Zeit am FBN Jeannine
Gruse (vom ersten Tag anhellip ) und Dr Christine Schaumlff fuumlr das Korrekturlesen die
Motivation und sonstige Hilfe vor allem in der Endphase dieser Arbeit Meiner
Mitstreiterin und besten Kollegin der Welt Annika Gohlke fuumlr unzaumlhlige Tierarzt-
Einsaumltze zu jeder Tages- und Nachtzeit fuumlr viele gemeinsame Stunden im Stall und im
Buumlro sowie fuumlr die direkte unkomplizierte Art die Dinge anzupacken
Der groumlszligte Dank allerdings gilt meiner Familie
Meinem Mann meinen Kindern meinen Eltern und Groszligeltern sowie meiner Schwester
danke ich von ganzem Herzen
fuumlr die bedingungslose Unterstuumltzung Liebe Zuversicht
Krasse Herdehellip
APPENDIX
Curriculum Vitae
Josefine Maciej (neacutee Flor) born on October 02 1984 in Kuumlhlungsborn
Nationality German Civil Status Married 2 children
Education
Since 102011 Doctoral student Agricultural Sciences Christian Albrechts
University Kiel Faculty of Agricultural and Nutritional Sciences
102007 ndash 022010 Master of Science Agriculture Ecology University of Rostock
Master program Livestock Sciences Master Thesis The use of
computer tomography for the evaluation of stomach development in
milk-fed calves (Grade 10)
102004 ndash 092007 Bachelor of Science Agriculture Ecology University of Rostock
062004 Abitur Gymnasium Sanitz
WorkProfessional Experience
062010 ndash 062014 Scientific assistantdoctoral student Leibniz Institute for Farm
Animal Biology (FBN) Institute of Nutritional Physiology (ʽOskar-
Kellnerʼ) Dummerstorf
052009 ndash 072009 Student research assistant University of Goumlttingen Research Unit
Agriculture and Environment
092008 ndash 022009 Agricultural journey through the USA Internship at the weekly
dairy farm family magazine ʽFarmshineʼ Brownstown PA
022008 ndash 042008 Internship Landwirtschaftsberatung Mecklenburg-Vorpommern
Schleswig-Holstein (LMS) Bad Doberan
112004 ndash 122005 Student research assistant University of Rostock Faculty of
Agricultural and Environmental Sciences Institute of Animal
Nutrition
082004 ndash 012008 InternshipPractical work Landwirtschaftsgesellschaft Prisannewitz
Personal Engagement
122011 ndash 092012 Representative of public relations for doctoral students Leibniz
Institute for Farm Animal Biology (FBN) Dummerstorf
Since 052010 Member of volunteer fire department Kavelstorf
Kiel May 04 2015