Embed Size (px)
Citation preview
Plankton in an acidifying ocean: from individual responses
to community changes and the potential of adaptation
DISSERTATION
Zur Erlangung des Grades
Doktorin der Naturwissenschaften
– Dr. rer. nat. –
Dem Fachbereich Biologie / Chemie der
Universität Bremen
vorgelegt
von
JULIA A. F. LANGER
Bremen, 19.04.2018
Die vorliegende Arbeit wurde in der Zeit von September 2013 bis April 2018 an der
Biologischen Anstalt Helgoland, Alfred-Wegener-Institut Helmholtz Zentrum für
Polar- und Meeresforschung sowie an der Universität Koblenz-Landau angefertigt.
1. Gutachter: Prof. Dr. Maarten Boersma
Alfred-Wegener-Institut Helmholtz Zentrum für Polar- und Meeresforschung,
Biologische Anstalt Helgoland; FB2 Universität Bremen
2. Gutachter: Prof. Dr. Klaus Schwenk
Universität Koblenz-Landau, Institut für Umweltwissenschaften, Landau in
der Pfalz

„In der lebendigen Natur geschieht nichts, was nicht in der
Verbindung mit dem Ganzen steht.“
- Johann Wolfgang von Goethe -
TABLE OF CONTENTS
Table of contents
Summary ________________________________________________________ i
Zusammenfassung _________________________________________________ v
Abbreviations ___________________________________________________ ix
Introduction ______________________________________________________ 1
Ocean acidification _________________________________________________ 1 Marine pelagic food webs ____________________________________________ 2 Direct and indirect effects of OA on marine biota _________________________ 4 Physiological acclimatisation and genetic adaptation _______________________ 6 Investigating the effects of OA on marine plankton communities _____________ 8 Experimental approaches __________________________________________________ 8 Community barcoding ____________________________________________________ 9
Research aims & chapter outline ____________________________________ 11
CHAPTER I ______________________________________________________ 19
Marine oomycetes: community barcoding results from an early winter plankton bloom (2012) in the Brudenell River (Prince Edward Island)
CHAPTER II ______________________________________________________ 31
Community barcoding reveals little effect of ocean acidification on the composition of coastal plankton communities: evidence from a long-term mesocosm study in the Gullmar Fjord, Skagerrak
CHAPTER III _____________________________________________________ 57
Direct and indirect effects of near-future pCO2 levels on zooplankton dynamics
CHAPTER IV _____________________________________________________ 75
On the evolutionary potential of the calanoid copepod Acartia tonsa towards ocean acidification: insights from a long-term laboratory selection study
General discussion _______________________________________________ 109
Effects of OA on copepods _________________________________________ 109 Effects of OA on plankton communities _______________________________ 112 Acclimatisation and adaptation ______________________________________ 115 Metagenomics ___________________________________________________ 119
Conclusion and future perspectives _________________________________ 122
References _____________________________________________________ 126
Curriculum vitae ________________________________________________ 152
Acknowledgments _______________________________________________ 156
Eidesstattliche Erklärung _________________________________________ 157
SUMMARY
i
Summary Ocean acidification has strong direct (decreased seawater pH) and indirect (altered
food regimes) effects on the performance of marine organisms, their trophic
interactions and, consequently, whole ecosystems. Therefore, the aim of this thesis
was to investigate potential direct and indirect effects of elevated pCO2 on marine
planktonic organisms and their community composition, with a main emphasise on
copepods and their adaptational potential.
The development of high throughput sequencing technologies has provided scientists
with an efficient tool to assess the biodiversity of marine communities, particularly
with the recent advances in community barcoding technologies using universal
primers. Another aim of this thesis was therefore, to test whether community
barcoding is suitable for the assessment of marine planktonic communities, and
allows the detection of compositional changes, which would probably remain
unnoticed using classical morphological approaches. Research results are presented
in four chapters (CHAPTER I to IV), each of which is representing a manuscript for
scientific publication.
Additional stressors such as ocean warming, eutrophication, the threat of invasive
species and parasite infections might accelerate or dampen the effects of ocean
acidification on marine taxa, emphasizing the importance of community level,
multi-stressor experiments. The traceability and taxonomic classification of parasitic
species based on morphological characteristics is particularly difficult and often
insufficient. Thus, little is known about their impacts on food web interactions and
ecosystem functions. This applies especially to marine oomycetes, which are
predominantly parasites of marine diatoms, crustaceans and nematodes. In this study,
(CHAPTER I) a primer pair (gene region cytochrome-c-oxidase subunit II) already
successfully used for phylogenetic investigations of marine and terrestrial oomycetes,
was tested to be suitable for community barcoding on a high throughput sequencing
platform. The Illumina sequencing of a plankton sample, taken in the Brudenell
River (Canada), revealed six distinct phylotypes, reflecting the results of a
comparable community barcoding study based on the 16S gene region. However, not
all operational taxonomical units could be assigned to corresponding reference
SUMMARY
ii
sequences, indicating the incompleteness of present genetic databases and the lack of
knowledge about marine oomycete biodiversity.
In the KOSMOS (Kiel Off-Shore Mesocosms for Future Ocean Simulations) 2013
experiment, carried out in the Gullmar Fjord, Skagerrak (58° 15’ 9 N, 11° 28’ 7 E),
the response of different trophic levels to elevated pCO2 concentrations during a
winter-to-summer plankton succession was investigated over 113 days. Using
community barcoding, the diversity of a broad spectrum of the biocoenosis including
all trophic levels (producers, consumers, decomposers) was assessed and the effects
of ocean acidification on the coastal plankton community composition investigated
(CHAPTER II). Based on the community barcoding data we found no significant effect
of elevated CO2 on the relative abundance or compilation of the coastal planktonic
taxa. Observed shifts in the planktonic community composition were predominantly
caused by seasonal changes in temperature and availability of nutrients.
As the large-scale community experiment did not allow to discriminate between
direct (decreased seawater pH) and indirect (altered food regimes) pCO2 effects on
zooplankton, an additional short-term laboratory experiment was conducted. Therein,
a heterotrophic dinoflagellate and a calanoid copepod were cultured at low and high
pCO2 concentrations and fed with phytoplankton grown at the same pCO2 levels
(CHAPTER III). While direct effects of high pCO2 exposure were negligible, the
ingestion of algae cultured under high pCO2 conditions, significantly decreased the
growth and developmental rate of both grazers. Furthermore, copepods fed algae,
cultured under high pCO2, showed an increased respiration rate, probably a reaction
to excrete excess carbon ingested with food.
To investigate the combined, direct and indirect, effects of elevated pCO2 on a
calanoid copepod and its adaptability, a 3 ½ years long selection line study was
designed (CHAPTER IV). In reciprocal transplant experiments the performance of the
low and high CO2 selection line copepods were compared analysing their body
stoichiometry and different fitness parameter. The reduced algae food quality (higher
carbon to nutrient ratio) in combination with the high seawater pCO2 significantly
altered copepods’ stoichiometry and consequently their developmental rates
independent from the prior CO2 treatment in the selection lines. However, copepods
SUMMARY
iii
from both selection lines showed a high plasticity in the regulation of their elemental
body composition and became more homeostatic after one year. Most likely due to
the lack of a strong selective pressure, no beneficial acclimatization or adaption of
the high CO2 selection line copepods (e.g. an increased developmental rate or egg
production under high CO2 conditions compared to the controls) was observed. After
3 years, despite their increased homeostasis, high CO2 selection line copepods had a,
in relation to their body length, higher carbon and nitrogen body content, indicating
that under nutrient repletion copepods’ body mass might increase in high pCO2
environments. The results suggest that ocean acidification might have fundamental
long-term effects on marine copepods and consequently for ecosystem structures and
functions.
Overall, the results showed that mesozooplankton communities are hardly directly
affected by ocean acidification, but the laboratory studies indicated that indirect
ocean acidification effects due to a changed nutritional status of the primary producer
can significantly impact mesozooplankton development and, in the long-term, their
physiology. However, results from laboratory studies with single species and / or
artificial predator-prey combinations cannot simply be translated to the community
level, where e.g. complex food web interactions might accelerate or mitigate the
effects of ocean acidification. Generally, the sensitivity of marine organisms to
elevated pCO2 conditions very much depends on their environmental prehistory.
Since coastal plankton communities already experience pronounced fluctuations in
seawater pH, caused by e.g. upwelling events of CO2-rich deep-water masses, they
are probably acclimatised or adapted to higher pCO2 conditions, reducing their
sensitivity to future ocean acidification conditions.
The results of the thesis highlight two main objectives for future ocean acidification
and climate change research. First, the importance to perform, long-term, near
natural, multi-stressor, mesocosm community experiments during different seasons
(nutritional situations), to get a possibly comprehensive picture of the effects of
climate and environmental changes on marine communities and ecosystems. Second,
as the response of marine communities is shaped by their taxa compilation and
environmental prehistory, future climate change research should intensify the
monitoring of relevant seawater parameters (e.g. temperature, pCO2, nutrients and
light penetration) and biodiversity assessments, to substantially improve the

SUMMARY
iv
predictability of how future oceans might look like. Thereby, with little restrictions,
community barcoding offers a promising tool for the assessment of the marine
biodiversity and thereby for the detection of e.g. pCO2 induced changes in
community compositions, during short-term observations and large-scale monitoring
project.
ZUSAMMENFASSUNG
v
Zusammenfassung Die Versauerung der Ozeane hat starke direkte (erniedrigter pH-Wert) und indirekte
(geänderte Nahrungsqualität) Auswirkungen auf marine Organismen, ihre
trophischen Interaktionen und schlussendlich auf gesamte Ökosysteme. Ziel dieser
Arbeit war es daher, potentielle direkte und indirekte Auswirkungen von erhöhtem
pCO2 auf marine Planktonorganismen und die Zusammensetzung ihrer
Lebensgemeinschaften zu untersuchen sowie das Anpassungspotenzial von
Copepoden zu ermitteln. Die Entwicklung von Hochdurchsatz-
Sequenzierungstechnologien insbesondere „community barcoding“ bieten
Wissenschaftlern eine effiziente Methode zur Erfassung mariner
Lebensgemeinschaften. Es war daher auch Aufgabe dieser Arbeit zu testen, ob
„community barcoding“ für die Erfassung mariner Planktongemeinschaften geeignet
ist und dazu genutzt werden kann Veränderungen in der Artenzusammensetzung
aufzudecken, welche mit klassischen morphologischen Methoden wahrscheinlich
unbemerkt bleiben würden. Die Forschungsergebnisse sind in vier Kapitel
(KAPITEL I bis IV) gegliedert, wobei jedes ein Manuskript für eine
wissenschaftliche Publikation repräsentiert.
Zusätzliche Stressfaktoren wie die Ozeanerwärmung, Eutrophierung und die
Bedrohung durch invasive Arten sowie Parasiteninfektionen könnten die
Auswirkungen der Ozeanversauerung auf marine Organismen beschleunigen oder
abmildern. Daher sind besonders solche Experimente wichtig, die mehrere
Umweltstressoren kombinieren und auf der Ebene von Lebensgemeinschaften
durchgeführt werden. Die Erfassung und taxonomische Einordnung parasitärer Arten
anhand morphologischer Merkmale ist sehr zeitintensiv und liefert oft nur eine
unzureichende taxonomische Auflösung. Daher ist nur wenig über ihre Rolle in
Nahrungsnetzen und über ihre Einflüsse auf Ökosystemfunktionen bekannt. Dies gilt
insbesondere für marine oomyceten, welche vorwiegend als Parasiten von marinen
Kieselalgen, Krebsen und Nematoden leben. In dieser Arbeit (KAPITEL I) wurde
getestet, ob ein Primerpaar (für die Genregion der Cytochrome-c-Oxidase
Untereinheit II), das bereits erfolgreich für phylogenetische Untersuchungen mariner
und terrestrischer oomyceten verwendet wurde, auch für „community barcoding“ auf
einer Hochdurchsatz-Sequenzierungsplattform genutzt werden kann. Die Illumina-
ZUSAMMENFASSUNG
vi
Sequenzierung einer Planktonprobe aus dem Brudenell River (Kanada) ergab sechs
verschiedene Phylotypen und reflektiert damit die Ergebnisse einer vergleichbaren,
auf der 16S Genregion basierenden, „community barcoding“ Studie. Die Tatsache,
dass nicht alle operativen taxonomischen Einheiten entsprechenden
Referenzsequenzen zugeordnet werden konnten, zeigt die Unvollständigkeit
vorhandener genetischer Datenbanken und das noch lückenhafte Wissen über die
Diversität mariner oomyceten.
In dem im Jahr 2013 im Gullmarsfjord, Skagerrak (58° 15’ 9 N, 11° 28’ 7 E)
durchgeführten KOSMOS (Kiel Off-Shore Mesocosms for Future Ocean
Simulations) Experiment wurden die Reaktionen verschiedener trophischer Ebenen
marinen Planktons auf erhöhtes pCO2 während einer Winter-Sommer-Sukzession
über einen Zeitraum von 113 Tagen untersucht. Unter Verwendung von „community
barcoding“ wurde die Diversität eines breiten Spektrums der Biozönose
einschließlich aller trophischer Ebenen (Produzenten, Konsumenten, Zersetzter) und
die Auswirkungen der simulierten Ozeanversauerung auf die Zusammensetzung der
Küstenplanktongemeinschaft untersucht (KAPITEL II). Basierend auf den
„community barcoding“ Daten fanden wir keinen signifikanten CO2 Effekt bezüglich
der relativen Häufigkeiten einzelner Arten oder der Zusammensetzung der
Planktongemeinschaft. Die Artenzusammensetzung wurde hauptsächlich durch
saisonale Temperaturveränderungen und wechselnde Nährstoffverfügbarkeiten
bestimmt.
Da während des Mesokosmen-Experimentes keine Unterscheidung zwischen
direkten (erniedrigter pH-Wert) und indirekten (geänderte Nahrungsqualität) pCO2
Auswirkungen auf Zooplankton möglich war, wurde ein zusätzliches
Laborexperiment durchgeführt. Dabei wurde ein heterotropher Dinoflagellat und ein
Copepod jeweils unter niedrig und hoch pCO2 Bedingungen gehältert und mit
Phytoplankton gefüttert, welches bei den entsprechend gleichen pCO2
Konzentrationen kultiviert wurde (KAPITEL III). Während die direkten pCO2
Effekte vernachlässigbar waren, verringerte die Aufnahme von Algen, die unter
hohen pCO2 Bedingungen kultiviert wurden, das Wachstum und die
Entwicklungsrate beider Konsumenten signifikant. Darüber hinaus war die Atmung
von Copepoden, die Algen gefressen hatten, welche unter hohem pCO2 kultiviert
ZUSAMMENFASSUNG
vii
wurden, erhöht. Wahrscheinlich diente diese Reaktion dazu, überschüssigen
Kohlenstoff, der mit der Nahrung aufgenommen wurde, auszuscheiden.
Um die direkten und indirekten Auswirkungen einer erhöhten pCO2 Konzentration
auf einen calanoiden Copepoden und seine Anpassungsfähigkeit zu untersuchen,
wurde über einen Zeitraum von 3 ½ Jahren eine Selektionsstudie durchgeführt
(KAPITEL IV). In reziproken Transplantationsexperimenten wurde durch die
Analyse der Körperstöchiometrie sowie verschiedener Fitnessparameter die
Leistungsfähigkeit der Copepoden aus den Niedrig- und Hoch-CO2-Selektionslinien
miteinander verglichen. Die Hälterung unter erhöhten pCO2 Bedingungen und die
damit verbundene schlechtere Futterqualität der Algen (erhöhtes
Kohlenstoff : Nährstoff-Verhältnis) veränderte die Stöchiometrie der Copepoden und
verlangsamte ihre Entwicklung unabhängig von den vorherigen CO2 Bedingungen in
den Selektionslinien. Copepoden aus beiden Selektionslinien zeigten eine hohe
Plastizität in der Regulierung ihrer Körperstöchiometrie, was sich nach einem Jahr in
einer erhöhten Homöostase zeigte. Während der Selektionsstudie wurde keine
vorteilhafte Akklimatisierung oder Anpassung der Copepoden aus den Hoch-CO2-
Selektionslinien an die erhöhten CO2 Bedingungen (z.B. eine im Vergleich zu den
Niedrig-CO2-Selektionslinien schnellere Entwicklung oder höhere Eiproduktion
unter Hoch-CO2-Bedingungen) beobachtet, was wahrscheinlich an einem zu
geringen Selektionsdruck lag. Trotz der gesteigerten Homöostase wiesen die
Copepoden der Hoch-CO2-Selektionslinien nach 3 Jahren einen im Verhältnis zu
ihrer Körperlänge erhöhten Kohlenstoff- und Stickstoffgehalt auf. Dies deutet an,
dass in Habitaten mit einer erhöhten pCO2 Konzentration die Körpermasse von
Copepoden zunehmen könnte. Die Ergebnisse des Selektionsexperimentes zeigen,
dass die Versauerung der Ozeane langfristige Auswirkungen auf marine Copepoden
und damit auf Ökosystemstrukturen und -funktionen haben könnte.
Insgesamt lässt sich sagen, dass die direkten Auswirkungen der Ozeanversauerung
auf marines Mesozooplankton gering sind. Die Laborstudien haben allerdings
gezeigt, dass eine erhöhte pCO2 Konzentration indirekt durch eine veränderte
Stöchiometrie der Primärproduzenten die Entwicklungsgeschwindigkeit von
Copepoden verlangsamen und über einen längeren Zeitraum ihre Physiologie
beeinflussen kann. Allerdings können Ergebnisse aus Laborexperimenten mit
ZUSAMMENFASSUNG
viii
einzelnen Arten und künstlichen Räuber-Beutetier-Kombinationen nicht einfach auf
die Gemeinschaftsebene übertragen werden, wo z.B. komplexe Interaktionen im
Nahrungsnetz die Auswirkungen der Ozeanversauerung beschleunigen oder
abmildern könnten. Im Allgemeinen hängt die pCO2 Empfindlichkeit von marinen
Organismen sehr stark von ihrer Umweltgeschichte und den erlebten pCO2
Bedingungen ab. Planktongemeinschaften in Küstennähe, welche starken pH-Wert
Schwankungen durch z.B., den Aufstieg von CO2-reichem Tiefenwasser ausgesetzt
sind, haben sich wahrscheinlich bereits akklimatisiert oder an höhere pCO2
Bedingungen angepasst, wodurch sie gegenüber zukünftigen
Ozeanversauerungszuständen weniger empfindlich sind.
Basierend auf den Ergebnissen dieser Arbeit ergeben sich zwei Hauptziele für
künftige Forschungsprojekte im Bereich Ozeanversauerung und Klimawandel. Um
ein besseres Bild von den Auswirkungen der Klima- und Umweltveränderungen auf
marine Lebensgemeinschaften und Ökosysteme zu erhalten, sollte ein Fokus auf
Mesokosmos-Experimenten liegen, welche mehrere Umweltstressoren kombinieren
und möglichst lange Zeiträume umfassen. Diese sollten weiterhin zu verschiedenen
Jahreszeiten (Ernährungssituationen) und in möglichst vielen verschieden Habitaten
durchgeführt werden. Da die Reaktion von marinen Lebensgemeinschaften auf
Umweltveränderungen substantiell durch ihre Artenzusammensetzung und
Umweltvorgeschichte geprägt ist, sollten des Weiteren die Überwachung relevanter
Meerwasserparameter (z.B. Temperatur, pCO2, Nährstoffgehalt und
Lichtdurchflutung) und die Erfassung der marinen Biodiversität intensiviert werden,
um bessere Vorhersagen treffen zu können wie die Weltmeere in Zukunft aussehen
könnten. „community barcoding“ bietet mit wenigen Einschränkungen eine schnelle
und effiziente Methode zur Erfassung mariner Lebensgemeinschaften und kann
sowohl in Kurzzeitexperimenten als auch in großangelegten Monitoringprojekten für
die Untersuchung von z.B., durch pCO2 ausgelöste Veränderungen in der
Artenzusammensetzung von Lebensgemeinschaften, genutzt werden.
ABBREVIATIONS
ix
Abbreviations % ............................................................................................................................................. Percent ~ .................................................................................................................................. Approximately °C ................................................................................................................................ Degree Celsius µatm ........................................................................................................................ Microatmosphere µg ...................................................................................................................................... Microgram µL ........................................................................................................................................ Microliter µmol .................................................................................................................................. Micromole ANOVA ............................................................................................................. Analysis of variance ASW ....................................................................................................................... Artificial seawater BIOACID ....................................................................... Biological Impacts of Ocean ACIDification BLAST ....................................................................................... Basic Local Alignment Search Tool BMBF ...................................................................... Bundesministerium für Bildung und Forschung bp .......................................................................................................................................... Base pair BSA ................................................................................................................. Bovine serum albumin C .............................................................................................................................................. Carbon CaCO3 ................................................................................................................... Calcium carbonate CASY ........................................................................................... Cell Counter and Analyzer System CCA .................................................................................................... Canonical correlation analysis chl a ............................................................................................................................... Chlorophyll a CO2 ............................................................................................................................. Carbon dioxide CO3
2- ............................................................................................................................ Carbonate ions COI ................................................................................................... Cytochrome-c-oxidase subunit I cox1 .................................................................................................. Cytochrome-c-oxidase subunit I cox2 ................................................................................................. Cytochrome-c-oxidase subunit II CTD ................................................................................................ Conductivity-Temperature-Depth d.................................................................................................................................................... Day DIN ...................................................................................................... Dissolved inorganic nutrients DNA ................................................................................................................ Deoxyribonucleic acid dNTP ................................................................................... 2´-Desoxyribonucleosid-5´-triphosphate DOM ........................................................................................................... Dissolved organic matter e.g. ................................................................................................................................... For example EDTA ............................................................................................... Ethylenediaminetetraacetic acid EPSAG .... Experimental Phycology and Culture Collection of Algae at the University of Göttingen Fig ............................................................................................................................................. Figure g.................................................................................................................................................. Gram h................................................................................................................................................... Hour H+ .................................................................................................................................Hydrogen ions H2CO3 ............................................................................................................................ Carbonic acid H2SO4 .............................................................................................................................. Sulfuric acid HCO3
- ............................................................................................................................... Bicarbonate Het ................................................................................................................................. Heterotrophic HPLC ............................................................................... High-performance liquid chromatography HTS ....................................................................................................... High-throughput sequencing i.a. .......................................................................................................................................... Inter alia i.e. ............................................................................................................. Id est (Latin), that is to say ID ............................................................................................................................................ Identity ind ....................................................................................................................................... Individual IPCC ............................................................................. Intergovernmental Panel on Climate Change IWS ........................................................................................................... Integrating Water Sampler kg ..................................................................................................................................... Kilogramme KOSMOS ................................................ Kiel Off-Shore Mesocosms for Future Ocean Simulations L .................................................................................................................................................. Litre m ................................................................................................................................................Meter M ............................................................................................................................................... Molar m2 ................................................................................................................................... Square meter MEGAN ....................................................................................................... MEtaGenome ANalyzer MgCl2 ................................................................................................................. Magnesium chloride min ...........................................................................................................................................Minute
ABBREVIATIONS
x
mL ......................................................................................................................................... Millilitre mM ..................................................................................................................................... Millimolar n................................................................................................. Number of measurements, replicates N ............................................................................................................................................ Nitrogen NaCl .......................................................................................................................... Sodium chloride NaH2PO4 ............................................................................................ Sodium dihydrogen phosphate NaNO3 ..........................................................................................................................Sodium nitrate NCBI ........................................................................ National Center for Biotechnology Information ng ........................................................................................................................................ Nanogram NGS ......................................................................................................... Next generation sequencing NH4
+ ................................................................................................................................. Ammonium nMDS ........................................................................................ Nonmetric multidimensional scaling NO2
- ........................................................................................................................................... Nitrite NO3
- .......................................................................................................................................... Nitrate nt ........................................................................................................................................ Nucleotide OA ........................................................................................................................ Ocean acidification OTU ..................................................................................................... Operational taxonomical unit p.......................................................................................................... P-value, statistical significance P ....................................................................................................................................... Phosphorus PCA ...................................................................................................... Principal component analysis pCO2 .............................................................................................. Partial pressure of carbon dioxide PCR ........................................................................................................... Polymerase chain reaction pH ......................................................................................................................... Potentia hydrogenii PO4
3- .................................................................................................................................... Phosphate POM ........................................................................................................... Particulate organic matter psu .................................................................................................................. Practical Salinity Units RDA .................................................................................................................. Redundancy analyses rDNA ........................................................................................................................ Ribosomal DNA RNase ............................................................................................................................. Ribonuclease SD ......................................................................................................................... Standard deviation SDS ................................................................................................................Sodium dodecyl sulfate SiO4
3- ....................................................................................................................... Dissolved silicate SL .................................................................................................................................. Selection line sp. ........................................................................................................................... Species (singular) spp. ............................................................................................................................. Species (plural) t ......................................................................................................................................... Time point T .......................................................................................................................................... Treatment TA ............................................................................................................................... Total alkalinity TAQ ...................................................................................................................... Thermus aquaticus temp ................................................................................................................................. Temperature Tris ................................................................................................ Trishydroxymethylaminomethane Tris-HCl ................................................................................................................ Tris hydrochloride
INTRODUCTION
1
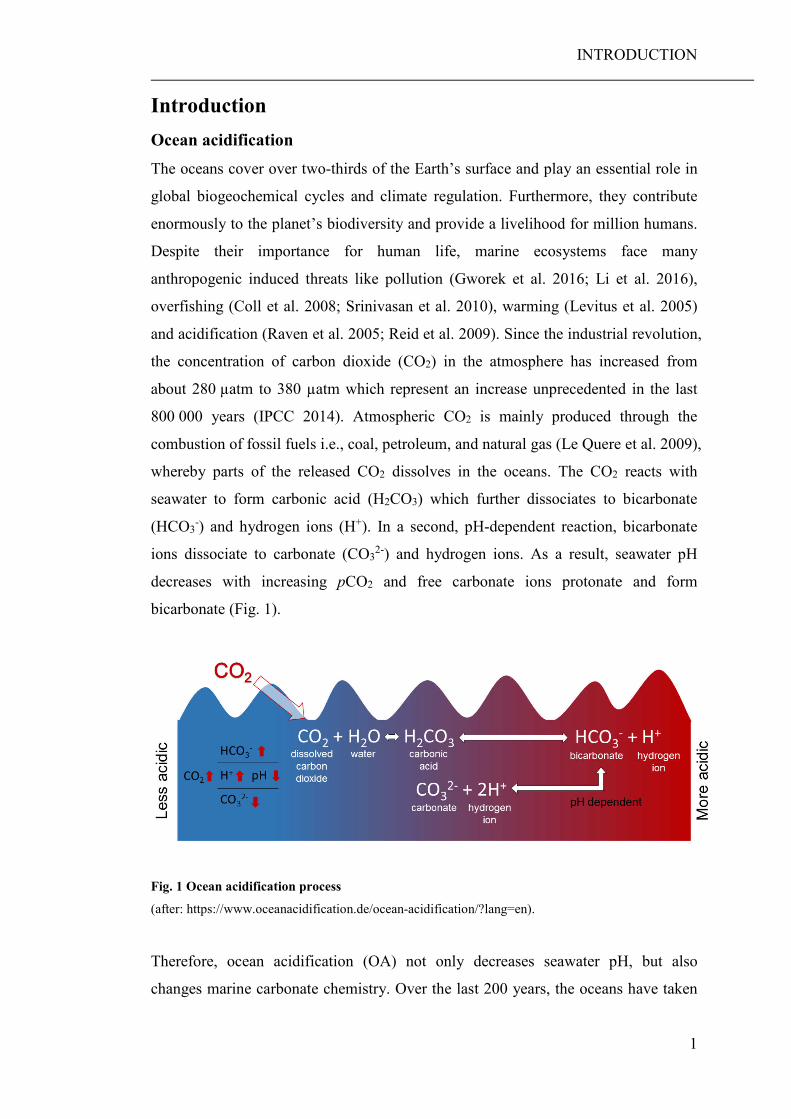
Introduction Ocean acidification The oceans cover over two-thirds of the Earth’s surface and play an essential role in
global biogeochemical cycles and climate regulation. Furthermore, they contribute
enormously to the planet’s biodiversity and provide a livelihood for million humans.
Despite their importance for human life, marine ecosystems face many
anthropogenic induced threats like pollution (Gworek et al. 2016; Li et al. 2016),
overfishing (Coll et al. 2008; Srinivasan et al. 2010), warming (Levitus et al. 2005)
and acidification (Raven et al. 2005; Reid et al. 2009). Since the industrial revolution,
the concentration of carbon dioxide (CO2) in the atmosphere has increased from
about 280 µatm to 380 µatm which represent an increase unprecedented in the last
800 000 years (IPCC 2014). Atmospheric CO2 is mainly produced through the
combustion of fossil fuels i.e., coal, petroleum, and natural gas (Le Quere et al. 2009),
whereby parts of the released CO2 dissolves in the oceans. The CO2 reacts with
seawater to form carbonic acid (H2CO3) which further dissociates to bicarbonate
(HCO3-) and hydrogen ions (H+). In a second, pH-dependent reaction, bicarbonate
ions dissociate to carbonate (CO32-) and hydrogen ions. As a result, seawater pH
decreases with increasing pCO2 and free carbonate ions protonate and form
bicarbonate (Fig. 1).
Fig. 1 Ocean acidification process
(after: https://www.oceanacidification.de/ocean-acidification/?lang=en).
Therefore, ocean acidification (OA) not only decreases seawater pH, but also
changes marine carbonate chemistry. Over the last 200 years, the oceans have taken
INTRODUCTION
2
up around 25 - 50% of anthropogenic CO2 emissions (Sabine et al. 2004; Feely et al.
2009), resulting in a pH decrease in surface waters of ~ 0.1 units since pre-industrial
times. Based on the IPCC worst case scenario, atmospheric CO2 concentrations are
predicted to reach levels exceeding 1000 µatm by the end of this century, which
could lead to a further decrease in seawater pH by up to 0.3 - 0.5 units (Caldeira and
Wickett 2003). Since the CO2 solubility is higher in cold compared to warm waters,
most rapid changes in ocean chemistry will occur in high latitude areas (Orr et al.
2005; Fabry et al. 2009).
Marine pelagic food webs The foundation of the sea's food chain is largely invisible. Masses of phytoplankton
organisms populate the sunlit upper ocean layer. Those photosynthetic organisms
play a major ecological role, as they provide more than 99% of the organic matter
used by marine food webs (Field et al. 1998). Converting dissolved CO2 to organic
carbon, they account for around 40% of the total global primary productivity
(Falkowski 1994). Furthermore, it is considered that at least half of the oxygen in the
atmosphere is produced by phytoplanktonic primary produces (Suthers and Rissik
2009). For phytoplankton growth nitrate (NO3-), phosphate (PO4
3-) and, for diatoms,
silicate (SiO43-) are the most important macronutrients. If nutrients are not limited,
phytoplankton cells take up dissolved forms of carbon (C), nitrogen (N) and
phosphorus (P) in an atomic ratio of 106C:16N:1P (Redfield ratio; (Redfield 1934)).
In areas of low phytoplankton productivity, most of phytoplankton growth is
sustained through recycled nutrients. The primary organisms involved in the
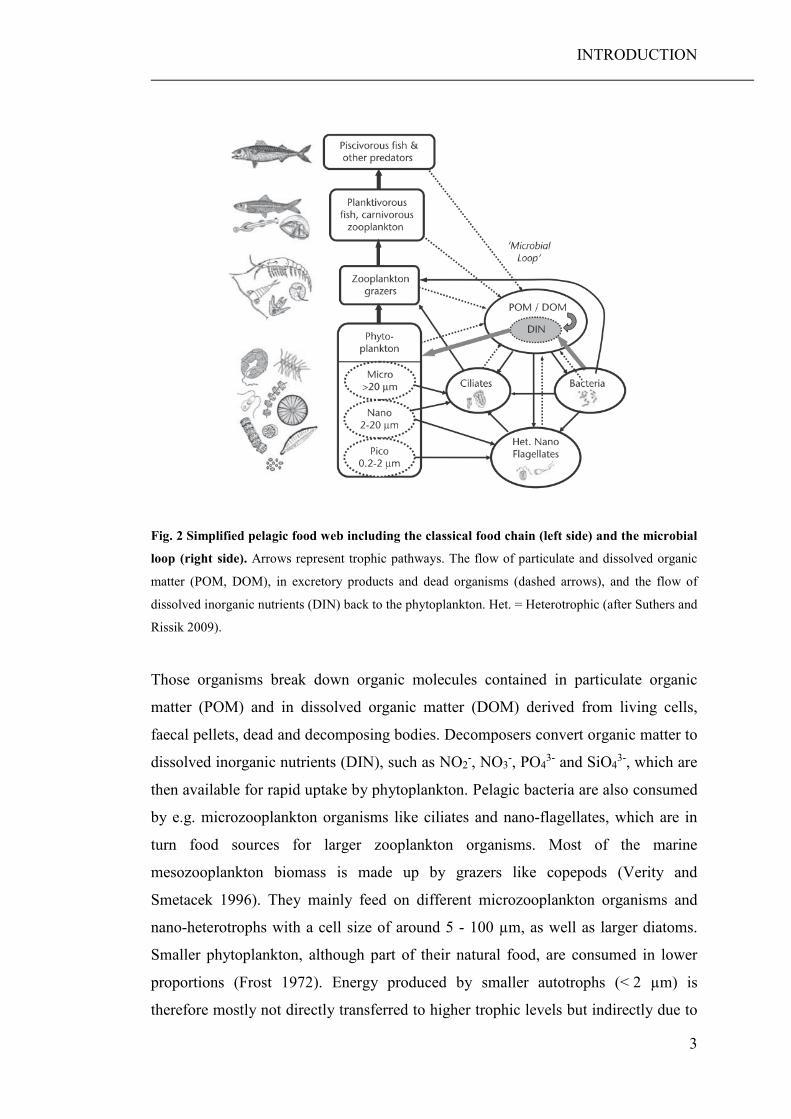
recycling activities of the microbial loop (Fig.2; (Azam et al. 1983)) are
water-column bacteria, heterotrophic flagellates and ciliates.
INTRODUCTION
3
Fig. 2 Simplified pelagic food web including the classical food chain (left side) and the microbial
loop (right side). Arrows represent trophic pathways. The flow of particulate and dissolved organic
matter (POM, DOM), in excretory products and dead organisms (dashed arrows), and the flow of
dissolved inorganic nutrients (DIN) back to the phytoplankton. Het. = Heterotrophic (after Suthers and
Rissik 2009).
Those organisms break down organic molecules contained in particulate organic
matter (POM) and in dissolved organic matter (DOM) derived from living cells,
faecal pellets, dead and decomposing bodies. Decomposers convert organic matter to
dissolved inorganic nutrients (DIN), such as NO2-, NO3
-, PO43- and SiO4
3-, which are
then available for rapid uptake by phytoplankton. Pelagic bacteria are also consumed
by e.g. microzooplankton organisms like ciliates and nano-flagellates, which are in
turn food sources for larger zooplankton organisms. Most of the marine
mesozooplankton biomass is made up by grazers like copepods (Verity and
Smetacek 1996). They mainly feed on different microzooplankton organisms and
nano-heterotrophs with a cell size of around 5 - 100 µm, as well as larger diatoms.
Smaller phytoplankton, although part of their natural food, are consumed in lower
proportions (Frost 1972). Energy produced by smaller autotrophs (< 2 µm) is
therefore mostly not directly transferred to higher trophic levels but indirectly due to
INTRODUCTION
4
the grazing of mesozooplankton on intermediate consumers like ciliates and
heterotrophic flagellates (Calbet and Landry 1999). Fish, large invertebrate
zooplankton and mammals represent the top predators in marine food webs.
Direct and indirect effects of OA on marine biota OA is expected to impact marine environments in various ways (Riebesell et al.
2009; Kroeker et al. 2010; Mostofa et al. 2016), whereby most of all the rapid
changes in ocean chemistry are likely to have substantial direct and indirect effects
on marine organisms and their habitats (Fabry et al. 2008). In contrast to direct
effects which are caused by an increased CO2 concentration and acidity, indirect
effects are driven by changes in the availability or composition of nutrients. The
decrease in both pH and availability of free carbonate ions affects above all
calcifying organisms including i.a. various algae, crustaceans, echinoderms and
molluscs (Feely et al. 2004; Fabry et al. 2008). Their ability to build up calcium
shells and skeleton structures is directly affected by seawater CO2 chemistry
(Riebesell et al. 2000; Orr et al. 2005; Enochs et al. 2016; Kwiatkowski et al. 2016),
whereby the sensitivity of organisms is depending on the mineral forms (e.g.
aragonite, calcite) of calcium carbonate (CaCO3) they use to build up their shells or
skeletons (Kroeker et al. 2010). Furthermore, plankton organisms might be directly
impacted by hypercapnia, the acidification of body fluids. As the CO2 concentration
in seawater increases, dissolved CO2 diffuses more easily across body surfaces and
equilibrates in both intra- and extracellular spaces. In the body, the CO2 reacts, as in
seawater, with internal body fluids, causing H+ ions to increase and the pH to
decrease. Hypercapnia can suppress metabolic processes (Michaelidis et al. 2005;
Pörtner 2008) and interfere with acid-base homeostasis (Miles et al. 2007), resulting
in decreased growth rates and reproductive success and increased mortality (Yamada
and Ikeda 1999). Thereby, due to their smaller volume to surface ratios,
microzooplankton are likely to be more affected by hypercapnia than larger
mesozooplankton (Hinga 2002). In contrast, elevated CO2 levels can also have
positive effects on marine organisms. Various studies dealing with eukaryotic
phytoplankton suggested that increased carbon availability due to OA could also
have fertilizing effects on primary production (Riebesell et al. 2007; Low-Décarie et
al. 2014; Liu et al. 2017). As described before, mesozooplankton organisms play a
key role in marine food webs, as they transfer energy captured by primary producers
INTRODUCTION
5
to higher trophic levels. Since copepods (Fig. 3) typically form a significant
proportion of the marine mesozooplankton (Verity and Smetacek 1996), any impact
of OA on their growth, development or overall survival, could have far reaching
consequences for marine food webs and trophic interactions. Although adult
copepods are hardly directly affected by lower pH, there is evidence that early life
stages are much more sensitive to decreased pH or changes in seawater carbonate
chemistry (Ross et al. 2011; Cripps et al. 2014b). Elevated pCO2 concentrations also
influence the stoichiometry (higher C to nutrient ratios) of autotrophs, which is more
pronounced in areas of low nutrient supply (Urabe et al. 2003; Verschoor et al. 2013;
Meunier et al. 2016). As heterotrophs are more restricted in their elemental
composition compared to autotrophs, stoichiometric discrepancies between predator
and prey can diminish consumer growth, fecundity and survival (Sterner and Elser
2002; Bukovinszky et al. 2012). Therefore, copepods can be indirectly effected by
OA due to changes in the elemental composition of their food sources (Cripps et al.
2016). Correlations between the decreases in the developmental rate and
reproduction of copepods and the intake of CO2 manipulated algae were
demonstrated in various laboratory experiments (Rossoll et al. 2012; Schoo et al.
2013; Meunier et al. 2016).
In general organisms at higher latitudes are likely to be more impacted due to the
higher solubility of CO2 in cold waters (Andersson et al. 2008; Cummings et al.
2011). At small regional and temporal scales seawater pH and carbonate chemistry
can strongly fluctuate due to an increased uptake of C during bloom events
(Riebesell et al. 2007), stratification and / or upwelling events of CO2 - rich
deep-water (Feely et al. 2008; Hofmann et al. 2011). Especially, in coastal
environments the pH can fluctuate seasonally and even daily by up to one or more
pH units. Therefore, open ocean plankton communities are considered more
vulnerable to OA, as species living in coastal waters that need to be pH-tolerant to
cope with the relatively large natural pH fluctuations (Nielsen et al. 2010; Nielsen et
al. 2012; Baumann et al. 2015; Wahl et al. 2015)
INTRODUCTION
6
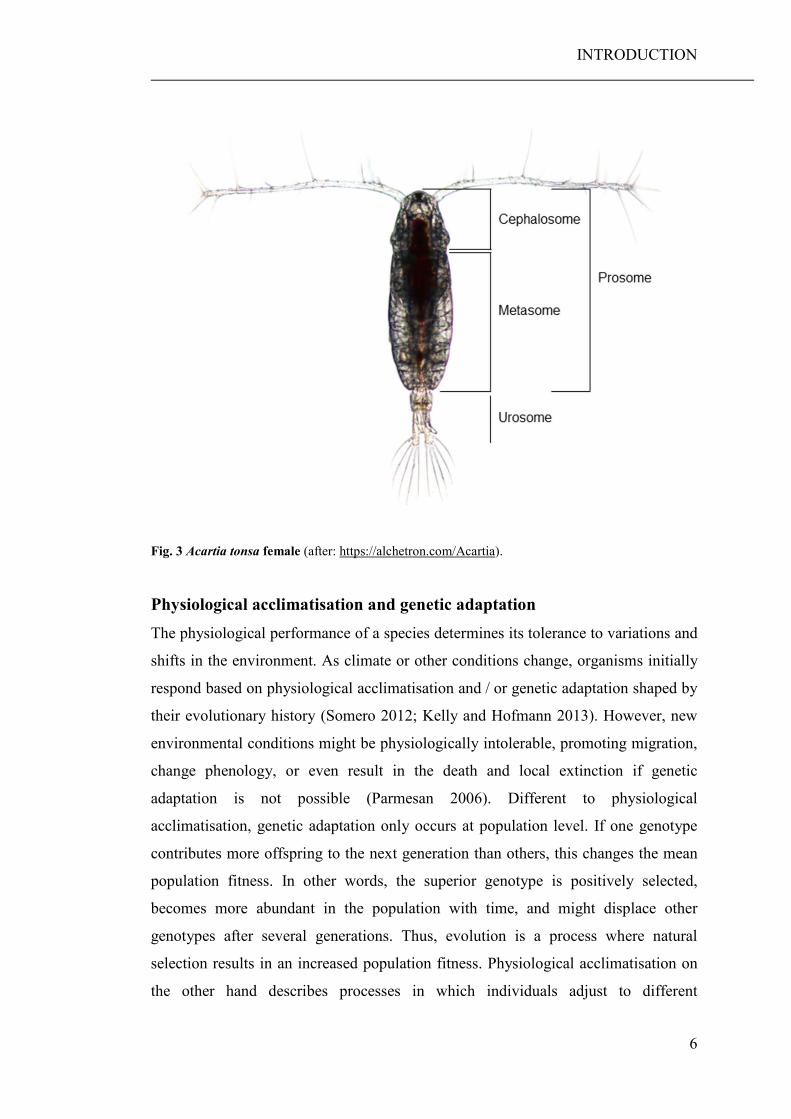
Fig. 3 Acartia tonsa female (after: https://alchetron.com/Acartia).
Physiological acclimatisation and genetic adaptation The physiological performance of a species determines its tolerance to variations and
shifts in the environment. As climate or other conditions change, organisms initially
respond based on physiological acclimatisation and / or genetic adaptation shaped by
their evolutionary history (Somero 2012; Kelly and Hofmann 2013). However, new
environmental conditions might be physiologically intolerable, promoting migration,
change phenology, or even result in the death and local extinction if genetic
adaptation is not possible (Parmesan 2006). Different to physiological
acclimatisation, genetic adaptation only occurs at population level. If one genotype
contributes more offspring to the next generation than others, this changes the mean
population fitness. In other words, the superior genotype is positively selected,
becomes more abundant in the population with time, and might displace other
genotypes after several generations. Thus, evolution is a process where natural
selection results in an increased population fitness. Physiological acclimatisation on
the other hand describes processes in which individuals adjust to different
INTRODUCTION
7
environmental conditions (Garland and Kelly 2006). Such phenotypic plasticity is
usually defined as the ability of one genotype to produce different phenotypes when
exposed to various environments (Scheiner 1993) Thereby, the range of phenotypes
that a given genotype can produce represent its reaction norm (Garland and Kelly
2006). Different to phenotypic plasticity (the extent to which the phenotype is
changed in dependency of the environment), phenotypic buffering describes how
broad the spectrum of environmental conditions is under which a genotype can
maintain its fitness (Reusch 2014). Both, phenotypic plasticity and buffering can
alleviate the impacts of environmental changes and help populations to persist in the
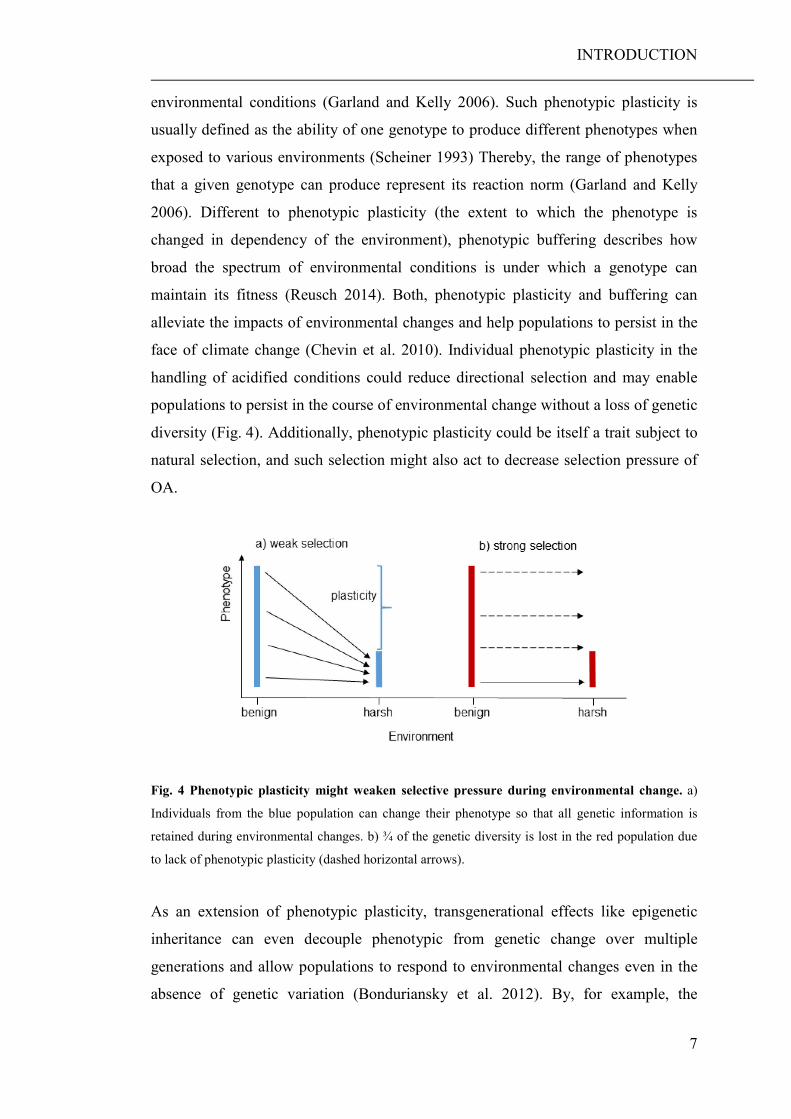
face of climate change (Chevin et al. 2010). Individual phenotypic plasticity in the
handling of acidified conditions could reduce directional selection and may enable
populations to persist in the course of environmental change without a loss of genetic
diversity (Fig. 4). Additionally, phenotypic plasticity could be itself a trait subject to
natural selection, and such selection might also act to decrease selection pressure of
OA.
Fig. 4 Phenotypic plasticity might weaken selective pressure during environmental change. a)
Individuals from the blue population can change their phenotype so that all genetic information is
retained during environmental changes. b) ¾ of the genetic diversity is lost in the red population due
to lack of phenotypic plasticity (dashed horizontal arrows).
As an extension of phenotypic plasticity, transgenerational effects like epigenetic
inheritance can even decouple phenotypic from genetic change over multiple
generations and allow populations to respond to environmental changes even in the
absence of genetic variation (Bonduriansky et al. 2012). By, for example, the
INTRODUCTION
8
transmission of nutritional, somatic, cytoplasmatic or epigenetic material, parents can
significantly affect the performance (survival and fitness) of their offspring
(Bonduriansky and Day 2009, Marshall and Morgan 2011, Klironomos, Berg et al.
2013).
Even the smallest change of a single species will influence species’ interactions
within the food web regarding e.g. competition, grazing, predation and disease
dynamics. In combination with invasion and extinction of species, these processes
can alter whole community structures or even result in the development of novel
ecosystems (Matthews et al. 2011; Doney et al. 2012). Therefore, it is tremendously
important to consider the adaptation potential, including physiological
acclimatisation and genetic adaptation, of species when investigating the effects of
OA.
Investigating the effects of OA on marine plankton communities
Experimental approaches
Laboratory experiments with single species as well as bi- or tri-trophic approaches
are well suited to investigate physiological thresholds and biological mechanisms.
However, those experiments cannot answer the question how planktonic organisms
respond in their natural environments. Under natural conditions, effects of OA,
detected in laboratory studies, might be dampened or accelerated by the presence of
competitive and synergistic trophic interactions, may causing extreme changes in the
community structure and functioning of marine ecosystems (Rossoll et al. 2013). To
predict how OA might impact and change future marine ecosystems, investigations
on a community level including multiple species are needed (Riebesell and Gattuso
2014). Additionally, long exposure to high pCO2 conditions (over several weeks) can
either trigger negative effects on the survival of marine invertebrates (Langenbuch
and Portner 2004; Shirayama and Thornton 2005; Kurihara and Ishimatsu 2008) or
allow species to acclimatise or even adapt to the new environmental conditions
(Munday et al. 2013; Sunday et al. 2014; Thor and Dupont 2015). Besides laboratory
set-ups, where the effects of OA can be investigated under controlled conditions,
long-term studies including various species over several generations should be
performed, to get a profound knowledge of the effects of OA on marine ecosystems.
Besides laboratory studies, mesocosm experiments are a suitable tool to study the
INTRODUCTION
9
impacts of OA on marine ecosystems including natural marine communities at their
usual habitats (Riebesell et al. 2008).
Community barcoding
Up to now detections of possible changes in the community composition of
planktonic organisms were mainly based on optical (microscopic and flow
cytometry) investigations, whereby the actual diversity of species might be
underestimated, especially in organism groups with little morphological differences.
Marine planktonic taxa (phyto-, bacterio- and zooplankton) are highly diverse and
discrimination by eye at genus and species level is time consuming and requires high
specialized taxonomic expertise. Additionally, there is a potentially high diversity of
cryptic species as well as larval stages, which are not captured by morphological
investigations.
The dramatic progress in molecular biological methods over the last ~ 60 years
represent one of the most exciting stories of scientific development (Moss 2010). The
drastic development started with the description of the DNA double helix (Franklin
and Gosling 1953; Watson and Crick 1953) and was followed by the development of
the polymerase chain reaction (Mullis et al. 1994) and DNA sequencing (Sanger et al.
1977) up until the modern high-throughput sequencing (HTS) technologies, that are
available today. In recent years, 454 pyrosequencing and Illumina sequencing were
the most frequently used next generation sequencing (NGS) techniques. Platforms
like Illumina MiSeq enable the processing of a large number of samples in parallel.
Around five million paired end sequence reads with a length of 300 base pairs (bp)
can be obtained during a single run. Molecular biological techniques like community
barcoding, which combines DNA barcoding and HTS, can provide accurate and
high-resolution taxonomic data for species identification and provides unprecedented
insights into the composition of communities (Pochon et al. 2013; Wood et al. 2013;
Lejzerowicz et al. 2015; Zaiko et al. 2015).
However, there are general challenges associated with the use of community
barcoding for ecosystem assessments. The success of those studies mainly depends
on the quality and availability of reference sequences in molecular data bases, which
are still incomplete. For a steady improvement of those databases good cooperation
between taxonomists and molecular biologists is therefore crucial. Furthermore,
sampled organisms have vastly different biomasses and occur in different amounts
INTRODUCTION
10
within a sample, thus small or very scarce species might be overlooked due to a low
number of resulting sequence reads (Carew et al. 2013). Another technical challenge
is preferential annealing of universal primers in some species over others which
might severely bias results (Elbrecht and Leese 2015). Furthermore, data processing
in bioinformatic pipelines can be challenging, requiring specialized bioinformatic
expertise at different stages during data processing, such as the assembly of paired-
end reads, chimera removal, correction of sequencing errors, and the clustering of
obtained sequences into operational taxonomic units (OTUs), which can
subsequently be used for estimations of species diversity and composition.
Furthermore, pipeline specifications depend on peculiarities of taxonomic markers,
sequencing platform (e.g. Illumina) and chemistry, as well as experimental needs,
such as requirements for sample multiplexing (sample identification based on unique
sequence tags). Therefore, even existing pipelines must be adjusted to the applied
experimental design and research question. Nevertheless, community barcoding
rapidly gains importance in ecology including marine community assessments (Porco
et al. 2013; Hirai et al. 2015; Lejzerowicz et al. 2015; Zaiko et al. 2015; Endo et al.
2016).
Estimations of the global biodiversity suggest that there are 0.7 - 1 million marine
species, and that most undescribed taxa are small or very small, meio- and
microbiota (Appeltans et al. 2012). During the two and a half year TARA expedition,
high quality and standardised genetic (total DNA / RNA), morphological, and
physico-chemical samples from 210 stations across the world oceans were collected.
The molecular biological analysis of 334 plankton samples collected during the
TARA expedition revealed that most of the eukaryotic plankton biodiversity is made
up by heterotrophic protists, especially those known to be parasites or symbiotic
hosts (de Vargas et al. 2015). Based on the genetic data it was even possible to
identify interactions between grazers, primary producers, viruses, and (mainly
parasitic) symbionts (Lima-Mendez et al. 2015). As parasites and mutualistic
symbionts increase the connectivity and complexity of pelagic food webs they
significantly contribute to its stability (Lafferty et al. 2006). Therefore, to allow a
comprehensive understanding of the impacts of e.g. OA on marine biocoenoses,
heterotrophic protists, like parasites should more intensively be considered in
ecosystem analyses.
RESEARCH AIMS & CHAPTER OUTLINE
11
Research aims & chapter outline The ongoing acidification process of the oceans is predicted to have consequences
for many marine biota and could potentially alter marine plankton communities and
thereby ecosystem functions. As an additional environmental stressor, like ocean
warming and eutrophication, parasitism may enhance or mitigate the effects of OA
on marine planktonic organisms and should be particularly considered in ecosystem
analyses. To be able to detect already little, pCO2 induced, changes in the
composition of species, plankton communities need to be recorded as accurately as
possible. Morphological assessments of marine communities are very
labour-intensive and require high taxonomic expertise. Especially, the identification
of marine parasites based on morphological characteristics is difficult, as some
species are even only visible after dissecting their host. Furthermore, small pico-,
nano- and microplankton organisms can easily be overlooked and a clear taxonomic
determination of larval stages and cryptic species is not possible. Prior studies
(Pochon et al. 2013; Wood et al. 2013; Lejzerowicz et al. 2015; Zaiko et al. 2015)
have shown that, the combination of DNA barcoding and next generation sequencing
(community barcoding) can provide accurate and high-resolution taxonomic data.
The main objectives of this thesis were:
• to advance the molecular biological detection of marine oomycetes,
• to investigate the effects of simulated OA on the composition of a coastal
plankton community during a near natural mesocosm experiment using
community barcoding,
• to determine potential direct and indirect effects of elevated pCO2 on two
zooplankton species: Oxyrrhis marina and Acartia tonsa,
• to examine the ability of the calanoid copepod A. tonsa to acclimatise and adapt
to the combined effects of elevated pCO2 and an entailed food quality reduction.
RESEARCH AIMS & CHAPTER OUTLINE
12
CHAPTER I
Assessment of marine oomycetes using community barcoding Saprophytic living oomycetes play an important role in the decomposition and
recycling of decaying matter. As oomycetes zoospores significantly contribute to the
pool of heterotrophic flagellates in the plankton of streams, estuaries and marine
habitats (Sime-Ngando et al. 2011) they serve as an important food source for
zooplankton organisms (Buck et al. 2011). Parasitic living oomycetes are common in
marine environments and well known to infect several planktonic (Drebes 1966;
Sparrow 1969; Gotelli 1971) and benthic diatoms (Scholz et al. 2014; Scholz et al.
2016b) as well as macroalgal, seagrass species (Sekimoto et al. 2008a; Sekimoto et al.
2008b; Govers et al. 2016) and nematodes (Beakes et al. 2012). Diatom pathogens
are potentially of great ecological importance as they might play a role in the
breakdown of plankton blooms (Thines et al. 2015). As marine oomycetes are highly
diverse and with morphological methods hard to classify they are, however, little
studied so far. In CHAPTER I we used community barcoding, to identify marine
oomycetes directly from a mixed plankton water sample. This preliminary study was
carried out to verify, if the cytochrome-c-oxidase subunit II (cox2) barcode primers,
introduced by Choi et al. (2015) as to be well suited for phylogenetic studies of
oomycetes, can also be used on HTS platforms. In the subsequent mesocosm
experiment, the tested cox2 primers should than be used in a community barcoding
approach to investigate the potential effects of OA on the diversity of marine
oomycetes.
Publication
Langer JAF, Sharma R, Nam B, Beorsma M, Schwenk K, Thines M Marine
oomycetes: community barcoding results from an early winter plankton bloom
(2012) in the Brudenell River (Prince Edward Island). Mycological progress
DOI: in review
The sample was taken by participants of the Prince Edward Island Mussel
Monitoring Program (Smith and Ramsay 2012) and send to the Biodiversity and
Climate Research Centre, Germany. Bora Nam did the laboratory work and the
Illumina MiSeq sequencing was carried out at Eurofins Genomics (Ebersberg,
Germany). The bioinformatic data processing was performed by Rahul Sharma.
RESEARCH AIMS & CHAPTER OUTLINE
13
Further data processing, calculation of phytogenic trees, and writing were done by
Julia Langer under the guidance of Marco Thines. All authors contributed to the final
manuscript.
The Illumina sequencing of the investigated plankton sample, revealed six distinct
phylotypes, reflecting mean oomycete diversity in a marine plankton sample. The
implemented community barcoding pipeline provides a reliable application for the
identification of marine oomycetes and would also be suitable for future barcoding
programs.
RESEARCH AIMS & CHAPTER OUTLINE
14
CHAPTER II
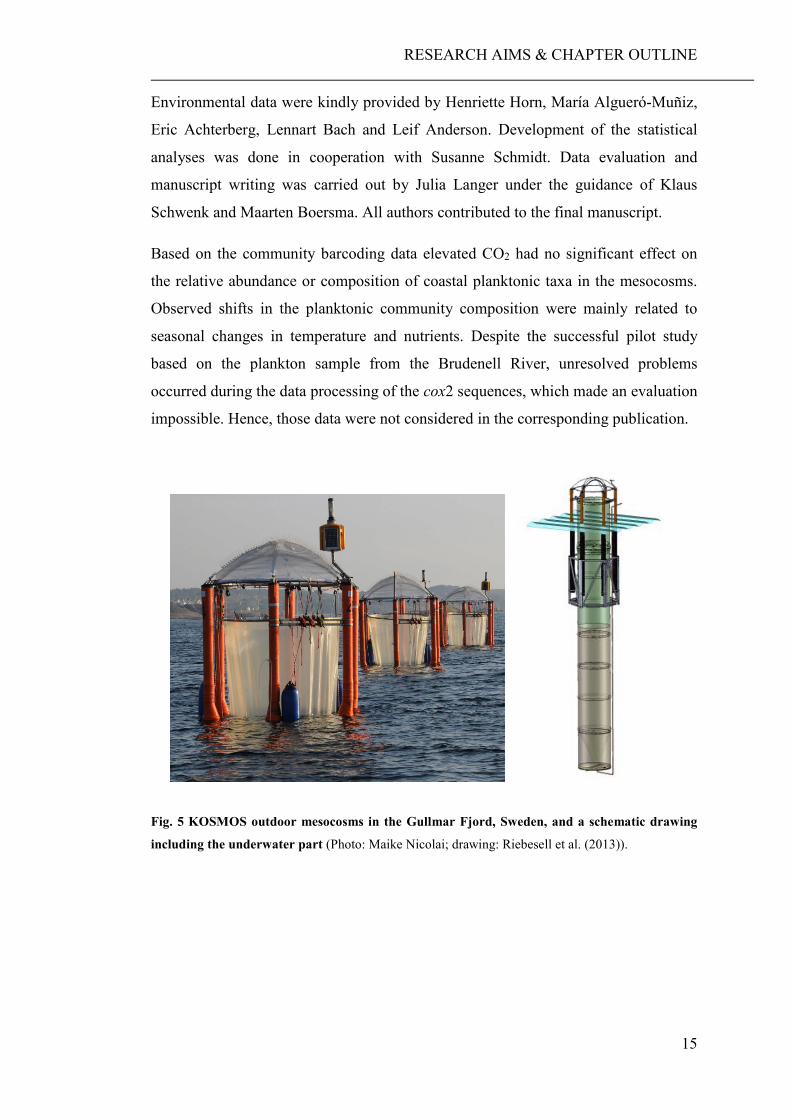
Coastal plankton communities under elevated CO2 In CHAPTER II, the results from the KOSMOS (Kiel Off-Shore Mesocosms for
Future Ocean Simulations; Fig. 5) 2013 large-scale mesocosm study in the Gullmar
Fjord, Skagerrak (58° 15’ 9 N, 11° 28’ 7 E), are presented. In the long-term
mesocosm experiment, the response of different trophic levels to elevated pCO2
concentrations during a winter-to-summer plankton succession was investigated over
113 days. Thereby, we focused on the assessment of the diversity of a broad
spectrum of the biocoenosis including all trophic levels (producers, consumers,
decomposers). In prior experiments the assessment of possible changes in the
community composition of planktonic organisms, due to the elevated pCO2
conditions, were mainly based on optical (microscopic and flow cytometry)
investigations. Thereby, the actual diversity of species may be underestimated,
especially in organism groups with small morphological differences. In CHAPTER II
we used community barcoding to investigate potential pCO2 induced shifts in the
plankton community compositions. We choose a molecular genetic approach as we
aimed for a possibly high resolution of the present plankton community, even
including genetic changes within species.
Publication
Langer JAF, Sharma R, Schmidt SI, Bahrdt S, Horn HG, Algueró-Muñiz M, Nam B,
Achterberg EP., Riebesell U, Boersma M, Thines M, Schwenk K (2017)
Community barcoding reveals little effect of ocean acidification on the
composition of coastal plankton communities: evidence from a long-term
mesocosm study in the Gullmar Fjord, Skagerrak. PloS one DOI:
10.1371/journal.pone.0175808
This study was performed in the framework of a mesocosm experiment carried out
under the project administration of Ulf Riebesell. Sampling on side was
accomplished by Julia Langer, Henriette Horn and María Algueró-Muñiz. DNA
isolations and PCRs were carried out by Julia Langer and supported by Sebastian
Bahrdt. Barcode PCRs were done by Bora Nam. The Illumina MiSeq sequencing
was performed at Eurofins Genomics (Ebersberg, Germany) and the bioinformatic
data processing was done by Rahul Sharma under the guidance of Marco Thines.
RESEARCH AIMS & CHAPTER OUTLINE
15
Environmental data were kindly provided by Henriette Horn, María Algueró-Muñiz,
Eric Achterberg, Lennart Bach and Leif Anderson. Development of the statistical
analyses was done in cooperation with Susanne Schmidt. Data evaluation and
manuscript writing was carried out by Julia Langer under the guidance of Klaus
Schwenk and Maarten Boersma. All authors contributed to the final manuscript.
Based on the community barcoding data elevated CO2 had no significant effect on
the relative abundance or composition of coastal planktonic taxa in the mesocosms.
Observed shifts in the planktonic community composition were mainly related to
seasonal changes in temperature and nutrients. Despite the successful pilot study
based on the plankton sample from the Brudenell River, unresolved problems
occurred during the data processing of the cox2 sequences, which made an evaluation
impossible. Hence, those data were not considered in the corresponding publication.
Fig. 5 KOSMOS outdoor mesocosms in the Gullmar Fjord, Sweden, and a schematic drawing
including the underwater part (Photo: Maike Nicolai; drawing: Riebesell et al. (2013)).
RESEARCH AIMS & CHAPTER OUTLINE
16
CHAPTER III
Direct and indirect effects of pCO2 on zooplankton OA may affect marine organisms either directly due to changes in seawater pH or
indirectly via trophic pathways. In CHAPTER III, the effects of elevated pCO2 on
zooplankton (micro- and mesozooplankton) were investigated in more detail using a
laboratory set-up with two model organisms. Thereby, the laboratory experiment was
especially designed to discriminate between direct OA effects due to an increased
water pH and indirect effects caused by food quality changes. During the experiment
the individual effects of short-term exposure to high and low seawater pCO2, and
different qualities of the alga Rhodomonas salina on the growth and development of
two zooplankton species: O. marina and A. tonsa, were investigated. Although
microzooplankton are an essential component in planktonic ecosystems, this is the
first study directly investigating the sensitivity of a microzooplankton species to
hypercapnia.
Publication
Meunier CL, Algueró-Muñiz M, Horn HG, Lange JAF, Boersma M (2016) Direct
and indirect effects of near-future pCO2 levels on zooplankton dynamics. Marine
& Freshwater Research DOI: 10.1071/MF15296
The experiment was setup and carried out by Julia Langer, Henriette Horn, Maria
Algueró-Muñiz and Cedric Meunier. The determination of the developmental rate of
A. tonsa was done by Julia Langer. All other laboratory analyses were carried out in
equal parts by the authors. Final data evaluation and preparation of the first draft was
done by Cedric Meunier. Julia Langer, Henriette Horn and Maria Algueró-Muñiz
equally contributed to the final manuscript.
Results show that consumers are hardly directly affected by a lowered seawater pH.
However, stoichiometric discrepancies between the primary producers, cultured
under high pCO2 conditions, and the needs of the consumers, resulted in a significant
reduced growth and developmental rate of the micro- and mesozooplankton species,
respectively. Lower growth rates of zooplankton can lead to lack of food at the next
trophic level, which in turn may reduce the fitness of these consumers. Furthermore,
stoichiometric discrepancies can travel up the food chain and affect higher trophic
levels.
RESEARCH AIMS & CHAPTER OUTLINE
17
CHAPTER IV
Long-term selection experiment Although evolutionary responses are expected during persisting environmental
change, most studies only investigated the effects on one generation. Little is known
about the evolutionary potential of populations to counter direct or indirect effects of
elevated pCO2. In CHAPTER IV, this study aimed to investigate the impacts of
elevated pCO2 on the fitness of the cosmopolitan calanoid copepod A. tonsa and its
adaptability to the combined effects of elevated seawater pCO2 and an associated
food quality reduction.
Publication
Langer JAF, Meunier CL, Ecker U, Horn HG, Schwenk K and Boersma M (2018)
On the evolutionary potential of the calanoid copepod Acartia tonsa towards
ocean acidification: insights from a long-term laboratory selection study. Marine
Ecology Progress Series DOI: in review
The long-term selection experiment was setup by Julia Langer. Further maintenance
was performed by Julia Langer, Toshia Schmithüsen, Saskia Ohse, Ursula Ecker,
Maria Algueró-Muñiz, Rebekka Schüller, Joon Sudhir Kumar, Julia Haafke, Thomas
Lesniowski and the students Anna Sophie Brandes, Gerald Leichtweiß and Svenja
Schliefke (volunteers doing an ecological year). The Transplant experiments in 2014
and 2015 were carried out by Julia Langer. In 2016 the transplant experiment was
performed by Cedric Meunier and in 2017 by Julia Haafke. Laboratory work and
analyses of sequencing data were done by Julia Langer. Statistical analyses,
evaluation and writing was performed by Julia Langer under the guidance of Maarten
Boersma and Klaus Schwenk. All authors contributed to the final manuscript.
The elevated seawater pCO2 concentration in combination with the dietary
conditions in the high CO2 treatment significantly altered the stoichiometry of the
copepods and reduced their developmental rates. Although A. tonsa showed a high
plasticity level in the regulation of its body stoichiometry, we found evidence that the
cultivation under elevated pCO2 and the ingestion of high CO2 algae, with a high
energy content (high C : nutrient ratio), for several years, might lead to an increased
lipid storage and reduced body length.
RESEARCH AIMS & CHAPTER OUTLINE
18
Contribution of the PhD candidate in percentage of the total work load
(up to 100% for each of the following categories):
Manuscript I
Experimental concept and design: 5%
Experimental work and/or acquisition of (experimental) data: 0%
Data analysis and interpretation: 70%
Preparation of Figures and Tables: 100%
Drafting of the manuscript: 95%
Manuscript II
Experimental concept and design: 70%
Experimental work and/or acquisition of (experimental) data: 80%
Data analysis and interpretation: 80%
Preparation of Figures and Tables: 100%
Drafting of the manuscript: 90%
Manuscript III
Experimental concept and design: 10%
Experimental work and/or acquisition of (experimental) data: 35%
Data analysis and interpretation: 25%
Preparation of Figures and Tables: 0%
Drafting of the manuscript: 3%
Manuscript IV
Experimental concept and design: 90%
Experimental work and/or acquisition of (experimental) data: 50%
Data analysis and interpretation: 95%
Preparation of Figures and Tables: 100%
Drafting of the manuscript: 90%
CHAPTER I
19
CHAPTER I
Marine oomycetes: community barcoding results from an early
winter plankton bloom (2012) in the Brudenell River (Prince
Edward Island)
Julia A. F. Langer1, Rahul Sharma2,3, Bora Nam2,3, Lisa Nigrelli2,3, Louis Hanic4,
Maarten Boersma1,5, Klaus Schwenk6, Marco Thines2,3
1 Alfred-Wegener-Institut Helmholtz-Zentrum für Polar- und Meeresforschung, Biologische Anstalt
Helgoland, Helgoland, Germany 2 Biodiversity and Climate Research Centre (BiK-F), Senckenberg Gesellschaft für Naturkunde,
Frankfurt am Main, Germany 3 Institute of Ecology, Evolution and Diversity, Faculty of Biological Sciences, Frankfurt am Main,
Germany 4 University of Prince Edward Island, Department of Biology, Charlottetown, Canada 5 University of Bremen, Bremen, Germany 6 University Koblenz-Landau, Institute of Environmental Science, Landau in der Pfalz, Germany
Submitted to:
Mycological Progress
CHAPTER I
20
Abstract Marine oomycetes are highly diverse, globally distributed and play key roles in
marine food webs as decomposers, food source, and parasites. As species
identification based on morphological characteristics and molecular genetic analyses
of specimens is labour-intensive, knowledge about oomycetes remains limited and is
mostly restricted to pathogenic species of economically important crops. As a result,
despite their potential importance in the world’s ocean ecosystems, marine
oomycetes are comparatively little studied. Here, we tested if the primer pair
cox2F_Hud and cox2-RC4, which is already well established for phylogenetic
investigations of oomycetes, can also be used on a high throughput sequencing
platform in a community barcoding approach. The Illumina sequencing of the
investigated plankton sample, taken in the Brudenell River, revealed six distinct
oomycete phylotypes. The fact that the identified phylotypes could not
unambiguously be assigned to available reference sequences from online databases
reflects that marine oomycetes are still understudied. The community barcoding
pipeline implemented here provides a fast and accurate tool for the identification of
marine oomycetes and might also be suitable for future barcoding studies.
CHAPTER I
21
Introduction Oomycetes are a diverse group of fungus-like eukaryotic microorganisms occurring
in terrestrial, limnic and marine habitats worldwide. They are classified within the
kingdom Straminipila together with diatoms, golden-brown and brown algae
(Baldauf 2003). Oomycetes species are none-photosynthetic, and exhibit either a
saprophytic or pathogenic lifestyle (Grenville-Briggs and van West 2005; Thines
2014). Saprotrophic oomycetes absorb their food from the dead organic substrates
they colonise, thereby playing an important role in the decomposition and recycling
of decaying matter. By the colonization of plant debris, they change the nutritional
content of the substrate. Furthermore, host penetration and germination of the
oomycetes increase the palatability of the organic material for detritivores (Marano et
al. 2016). Besides, oomycete zoospores substantially contribute to the pool of
heterotrophic flagellates in the plankton of marine habitats (Sime-Ngando et al.
2011). Thereby, zoospores serve as an additional source of essential compounds,
such as polyunsaturated fatty acids (PUFAs) and sterols for zooplankton organisms
(Marano et al. 2016).
As pathogens, oomycetes can invade living plants, insects, crustaceans, fish, other
vertebrate animals, and various microorganisms. As such, they cause diseases in
various plants and algae (Tyler 2009; Grenville-Briggs et al. 2011) or severe losses
in aquaculture and fisheries. Representatives of the oomycetes are common in marine
environments and well known to infect several planktonic (Drebes 1966; Sparrow
1969; Gotelli 1971; Hanic et al. 2009) and benthic diatoms (Scholz et al. 2014;
Scholz et al. 2016b) as well as macroalgal, seagrass species (Sekimoto et al. 2008a;
Sekimoto et al. 2008b; Govers et al. 2016), and nematodes (Beakes et al. 2012).
Diatom pathogens are potentially of great ecological importance as they might play a
role in the breakdown of plankton blooms (Thines et al. 2015). Although parasitism
is a frequent strategy in most natural habitats, infectious disease agents were only
recently considered in food web analyses (Lafferty et al. 2008). Thompson et al.
(2005) showed that parasites have the potential to uniquely alter marine food web
topology, especially in terms of chain length and the proportions of top, intermediate
and basal species. Furthermore, parasites and pathogens might also influence food-
web stability and energy flow and should therefore receive more attention in future
investigations of marine food webs.
CHAPTER I
22
As the most basal lineages of the oomycota are predominantly marine parasites
(Beakes et al. 2012), oomycetes have most likely evolved in marine environments
(Thines 2014). However, of the roughly 2000 reported oomycetes species so far, only
about 60 have been described from marine environments (Nigrelli and Thines 2013).
The identification of marine oomycetes using morphological methods, is labour-
intensive and time-consuming. Furthermore, species determination by eye is
challenging due a limited amount of available morphological characters (Bennett et
al. 2017). Several studies using molecular biological methods, have already revealed
that morphological investigations have largely underestimated the diversity of
terrestrial, limnic and marine oomycetes (Bala et al. 2010; Hulvey et al. 2010; Man
in 't Veld et al. 2011; Singer et al. 2016; Thines and Choi 2016). Furthermore, their
impact on marine ecosystems and / or prevalence on marine biotas remain virtually
unknown.
Community barcoding (DNA barcoding in combination with high throughput
sequencing (HTS)) could provide a fast and accurate method to identify marine
oomycete species with high taxonomic resolution directly from a mixed plankton
water sample. In the TARA project, this technique was already successfully used to
explore patterns of the global photic-zone eukaryotic plankton biodiversity, including
oomycota (de Vargas et al. 2015). Also utilizing community barcoding Singer et al.
(2016) detected highly diverse oomycete communities in peat bog micro-habitats.
However, both studies were based on the analysis of the V9 region of the nuclear
gene that encodes 18S rRNA, which on the one hand allows the detection of a broad
range of eukaryotic taxa but on the other hand shows a poor resolution on the species
level. The most common gene region currently used for the identification of
oomycetes to the genus or species level is the internal transcribed spacer (ITS) region
of rDNA (Robideau et al. 2011). However, due to the lack of functional constrains on
this untranslated gene region, alignments of ITS sequences can be hampered by large
amounts of insertions and deletions, which complicate species classification.
Additionally, differences in alleles or among the multiple copies of the ITS, can even
lead to the appearance of indels within a single oomycete strain, as observed by
Kageyama et al. (2007). Furthermore, the resolution of ITS is insufficient to
discriminate between species in some groups (Choi et al. 2015b).
Based on the study of Choi et al. (2015) the cox2 locus otherwise seems to be an
appropriate gene region to serve as a universal barcode for the investigation of
CHAPTER I
23
oomycetes, according to the PCR efficiency and in terms of the intra- and
interspecific divergence. Furthermore, the cox2 locus was already widely used in
phylogenetic studies of various oomycete species, wherefore the amount of available
reference sequences, especially for terrestrial species, is accordingly high (Choi et al.
(2015) and references therein). The aim of this study was to test if the cox2 barcode
primers which were applied in the study of Choi et al. (2015) are also suitable for
HTS platforms and therefore for community barcoding of oomycetes.
Methods The sample analysed in this study was taken in November 2012 in the Brudenell
River, Prince Edward Island (PEI). Sampling took place within the framework of the
PEI Mussel Monitoring Program (Smith and Ramsay 2012) which was carried out
from September 4th to December 13th. For the sampling, an Apstein net (20 µm mesh
size, 1 m long, Hydro-Bios) was drawn through the water for 100 m. The
concentrated plankton sample was rinsed into a 100 mL bottle and filled up with
90% pure ethanol.
DNA isolation and PCR DNA isolation was performed using the innuPREP Plant DNA Kit from Analytic
Jena AG (Jena, Germany), following the instructions of the manual for gDNA
isolation from plant material with Lysis Solution SLS. From the 100 mL bottle ~ 150
mg sample material were transferred in a 2 mL tube and homogenized for 5 min at
25 Hz with the Mixer Mill MM 200 from Retsch (Germany). Deferred to the Kit
manual, lysis was carried out for 60 min and for the final DNA elution we used 50 µl
elution buffer. Until further use, the isolated DNA and the remaining part of the
plankton sample were stored at -20 °C and -80°C, respectively.
For the community barcoding the gene region cox2 was amplified using the primer
pair cox2F_Hud (5`- GGCAAATGGGTTTTCAAGATCC - 3`) / cox2-RC4 (5`-
ATTWAYNCCACAAATTTCRCTACATTG - 3`) (Hudspeth et al. 2003; Choi et al.
2015). Amplification was carried out in a total volume of 25 µL using ~ 10 ng DNA.
The reaction mix contained 1 x Phusion HF buffer, 0.2 mM dNTPs, 0.5 µM each
primer and 0.02 units Phusion polymerase. PCR conditions were 2 min at 95 °C,
followed by 35 cycles of 20 s at 95 °C, 30 s at 50 °C, and 1 min at 72 °C, and a final
CHAPTER I
24
elongation for 6 min at 72 °C. 228 ng µl-1 PCR product was send to Eurofins
Genomics (Ebersberg, Germany) for HTS on an Illumina MiSeq platform using the
paired end (2 x 300 bp) option. Sequence reads are deposited in the European
Nucleotide Archive (PRJEB25385).
Illumina data processing The Illumina adapter and primer sequences of the raw sequence pairs were trimmed
using the Trimmomatic (Bolger et al. 2014) software. Quality filtration was
performed using a window size of 5 bp with an average phred quality score of 25 and
a read length cutoff of 220 bp. Furthermore, sequences including ambiguous bases
(Ns) were deleted and sequences were again filtered by keeping a minimum quality
phred score of 3 per base using the FastQFS tool (Sharma and Thines 2015).
Afterwards, related forward and reverse reads were concatenated. Then the primer
sequences were trimmed and all reads were oriented in 5` - 3` direction. The
prediction of operational taxonomical units (OTUs) was carried out with the
USEARCH v7 software (Edgar 2010). For this, both a de-novo and a reference-based
chimera filters were applied. The minimum cluster size was three reads using an
identity cutoff of 99%.
Phylogenetic analyses To separate the oomycetes OTUs from other eukaryotic OTUs we firstly aligned the
representative OTU sequences with the NCBI nucleotide database (nt) using the
BLASTn (Altschul et al. 1990) algorithm and further analysed the result with
MEGAN (Huson et al. 2007). All OTU sequences which were assigned to oomycetes
were extracted and used for the subsequent phylogenetic analyses. For this, we
generated a MUSCEL alignment with default settings (Edgar 2004) using MEGA
7.0.26 (Tamura et al. 2011), including the obtained oomycete OTUs and reference
sequences from the NCBI database, focussing on marine samples. Sequences related
to amplification artefacts (non-homologous amplification) were manually detected
based on their lack of homology to the target regions and deleted from the set.
Afterwards sequences were trimmed to the same length. The subsequent calculation
and evaluation of the phylogenetic trees were also performed in MEGA 7.0.26.
Minimum evolution (ME) inference was calculated with 1000 bootstrap replicates
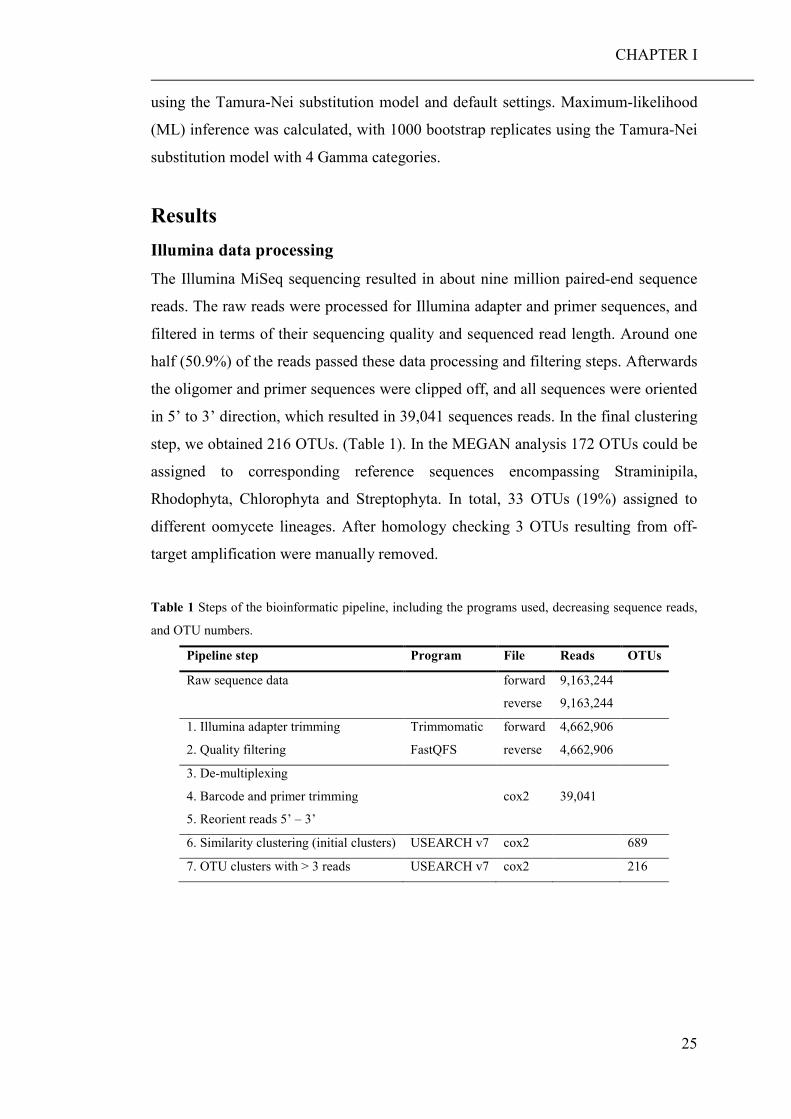
CHAPTER I
25
using the Tamura-Nei substitution model and default settings. Maximum-likelihood
(ML) inference was calculated, with 1000 bootstrap replicates using the Tamura-Nei
substitution model with 4 Gamma categories.
Results Illumina data processing The Illumina MiSeq sequencing resulted in about nine million paired-end sequence
reads. The raw reads were processed for Illumina adapter and primer sequences, and
filtered in terms of their sequencing quality and sequenced read length. Around one
half (50.9%) of the reads passed these data processing and filtering steps. Afterwards
the oligomer and primer sequences were clipped off, and all sequences were oriented
in 5’ to 3’ direction, which resulted in 39,041 sequences reads. In the final clustering
step, we obtained 216 OTUs. (Table 1). In the MEGAN analysis 172 OTUs could be
assigned to corresponding reference sequences encompassing Straminipila,
Rhodophyta, Chlorophyta and Streptophyta. In total, 33 OTUs (19%) assigned to
different oomycete lineages. After homology checking 3 OTUs resulting from off-
target amplification were manually removed.
Table 1 Steps of the bioinformatic pipeline, including the programs used, decreasing sequence reads,
and OTU numbers.
Pipeline step Program File Reads OTUs
Raw sequence data forward 9,163,244
reverse 9,163,244
1. Illumina adapter trimming
2. Quality filtering
Trimmomatic
FastQFS
forward
reverse
4,662,906
4,662,906
3. De-multiplexing
4. Barcode and primer trimming cox2 39,041
5. Reorient reads 5’ – 3’
6. Similarity clustering (initial clusters) USEARCH v7 cox2 689
7. OTU clusters with > 3 reads USEARCH v7 cox2 216
CHAPTER I
26
Phylogenetic analyses The final sequence alignment included 30 oomycete OTUs and 37 reference
sequences of ~ 240 bp length. Both phylogenetic analyses, ME and ML, yielded
highly similar topologies and we did not observe strongly supported inconsistencies.
Hence, the bootstrap values from the ML inference were included in the Figure of the
ME tree (Fig 1). In the phylogenetic analyses, the 30 oomycete OTUs clustered
together in four distinct groups and two single OTUs, representing six different
oomycete phylotypes. Two groups, comprising three and four OTUs each, were
assigned to the basal oomycete orders Haliphthorales and Olpidiopsidales. The
groups with 12 and nine OTUs were allocated in the Pythiaceae s.lat. and
Peronosporaceae s.lat. family, respectively. The two single OTUs were assigned
within the Saprolegniomycetes, next to the genera Pythiopsis and Saprolegnia.
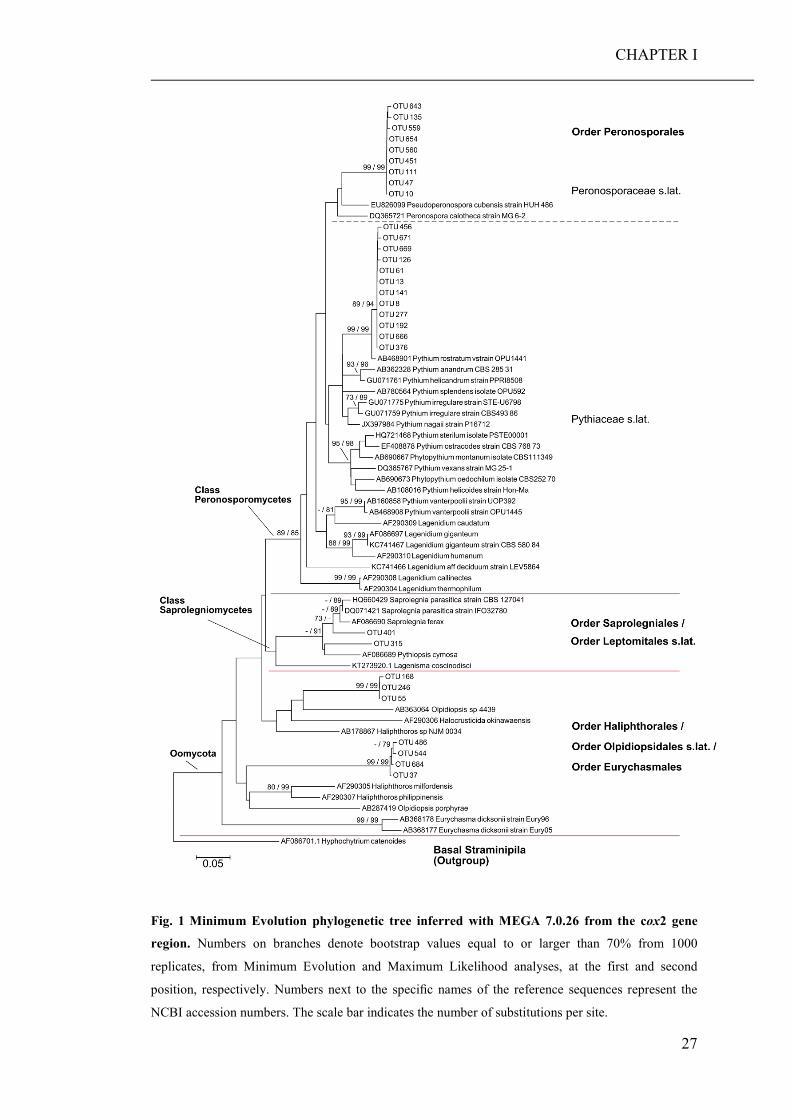
CHAPTER I
27
Fig. 1 Minimum Evolution phylogenetic tree inferred with MEGA 7.0.26 from the cox2 gene
region. Numbers on branches denote bootstrap values equal to or larger than 70% from 1000
replicates, from Minimum Evolution and Maximum Likelihood analyses, at the first and second
position, respectively. Numbers next to the specific names of the reference sequences represent the
NCBI accession numbers. The scale bar indicates the number of substitutions per site.
CHAPTER I
28
Discussion Method The analyses of the community barcoding data resulted in a total number of 216
OTUs. The filtering steps applied in the bioinformatic pipeline resulted in a high
confident set of OTUs. During the MEGAN analyses 81% of the OTUs (172) could
be assigned to reference sequences on the class level. The remaining OTUs could not
be assigned, likely because corresponding cox2 reference sequences are still missing
in the reference database.
At first glance, community barcoding seems to have revealed a rather low oomycete
diversity (6 phylotypes) in the investigated plankton community of the Brudenell
River. However, compared to the globally observed diversity of marine oomycetes in
the TARA project, which encompasses 69 phylotypes from 334 size fractionated
plankton samples (de Vargas et al. 2015), the magnitude of around six highly distinct
phylotypes appears to represent a normal oomycetes diversity in a marine plankton
sample. In conclusion, community barcoding using the cox2 gene region with the
primer pair cox2F_Hud and cox2-RC4 seems to reliably reflect the oomycete
diversity present at the sampling site.
Phylogenetic assignment The phylum oomycota represents the largest group within the Straminipila, including
marine, freshwater, and terrestrial species (Dick 2001b; Dick 2001a). The base of the
oomycota is formed by four early-diverging orders: Eurychasmales, Haptoglossales,
Olpidiopsidales s.lat., and Haliphthorales. Most of the early-diverging genera, are
marine organisms that are mainly parasites of seaweeds, diatoms, nematodes and
crustaceans (Thines and Kamoun 2010). Members of the later-diverging
monophyletic classes Saprolegniomycetes and Peronosporomycetes mainly occur in
freshwater and terrestrial ecosystems. The class Saprolegniomycetes is split into the
orders Atkinsiellales, Leptomitales s. lat. and Saprolegniales. The
Peronosporomycetes comprises the orders Rhipidiales, Albuginales, and
Peronosporales s. lat. (Beakes et al. 2014).
In our phylogenetic analyses, the two largest OTU groups assigned to the order
Peronosporales. Although the cox2 locus resolved the terminal nodes of the
phylogenetic trees for the most parts, deeper nodes towards the backbone did not
CHAPTER I
29
show a high resolution. Therefore, the assignment of the two OTU groups to a
specific genus could not be exactly determined in case of one OTU affiliated with the
highly diverse downy mildews, while the other was a member of the genus Pythium,
closely related to P. rostratum. The OTUs of the phylotype clustering with the
downy mildews probably represent a terrestrial species, with conidia having been
blown into the water by wind. One known and abundant terrestrial oomycete on the
PEI is Peronospora cakiles (Savile 1957) a parasites of the plant Cakile endentula
(Bigelow) Hook. (Maun et al. 1990) growing in salty places like coasts, dunes and
salt pans. Unfortunately, there is no cox2 reference sequence available for P. cakiles,
yet. Two of the six phylotypes (represented by one OTU, each) were located within
the Saprolegniaceae, with unclear genus affinity. The two remaining phylotypes were
assigned to the basal oomycetes, one to the order Olpidiopsidales s.lat. and the other
showing some affinity to the Haliphthorales. Those early diverging orders are both
marine and, without exception, parasites (Beakes et al. 2012). During the PEI Mussel
Monitoring Program a dramatic decline in the population of the marine diatom
Pseudo-nitzschia was observed. Hanic et al. (2009) identified one oomycete parasite
infecting the diatom on-site, which was recently described as a new genus and
species, Miracula helgolandica (Buaya et al. 2017). It seems possible that the
phylotype with the long branch and affinities to Haliphthoros represents this species,
but unfortunately, no cox2 sequence is available for this enigmatic species. The other
early-diverging phylotype is affiliated with Olpidiopsis s.lat., a genus that also
includes diatom parasites (Sparrow 1960). Recently, Buaya et al. (2017) have
described O. drebesii from a marine diatom. However, also for this species, no cox2
sequence is available, yet, so that it remains unclear, if the OTUs associated with
Olpidiopsis can be assigned to that species. However, with the steady growth of
available sequences for the cox2 barcoding locus (Choi et al. 2015), and the fast pace
at which new oomycetes from the marine environment are being described (Hulvey
et al. 2010; Bennett et al. 2017; Bennett and Thines 2017) it seems likely that in the
near future, a species-level assignment will be possible using cox2-based community
sequencing.
Although marine oomycetes have attracted renewed interest during the last decade
little is known about their significance in ecosystem functioning (Strittmatter et al.
2008). There are reports of oomycete infections in marine primary producers
(Grahame 1976; Wetsteyn and Peperzak 1991; Hanic et al. 2009; Scholz et al. 2014)
CHAPTER I
30
however, it is unclear whether these play a role in the breakdown of phytoplankton
blooms. Saprophytic and pathogenic oomycetes might have important impacts on
marine ecosystem functioning including energy fluxes and overall stability (Lafferty
et al. 2006; Wood et al. 2007). Besides, there is evidence that oomycetes are likely to
play a significant and similarly nuanced role in the biology and abundance of their
hosts (Strittmatter et al. 2008). Wilce et al. (1982) suggested that an Eurychasma
dicksonii infection of the sessile filamentous brown alga Pylaiella littoralis might
have a positive influence on its distribution range, as during the release of zoospores
from the sporangia algal filaments are fragmented and further distributed. Recent
investigations place the origin of oomycete-plant associations in the Devonian, or
earlier (Taylor et al. 2006), when lycophytes, ferns, seed ferns and gymnosperms
were hosts of early oomycete species (Selosse et al. 2015). Since then, oomycetes
have shaped our biosphere and probably will also take on a major role in the future
times of climate change. The technique presented here seems to be well suited for the
detection of marine oomycetes in a mixed plankton sample. As a fast and reliable
method for species identification it can lay the foundation for future studies,
enhancing and enlarging our view of marine oomycetes and their influence on
marine ecosystems.
Acknowledgements We thank the scientists from the PEI Mussel Monitoring Program for taking and providing the
plankton sample. This study was part of the BMBF financed BIOACID II project, consortium 1, work
package 1.14 (FKZ 03F0655B).
CHAPTER II
31
CHAPTER II
Community barcoding reveals little effect of ocean acidification on
the composition of coastal plankton communities: evidence from a
long-term mesocosm study in the Gullmar Fjord, Skagerrak
Julia A. F. Lange1, Rahul Sharma2,3, Susanne I. Schmidt4, Sebastian Bahrdt4,
Henriette G. Horn1, María Algueró-Muñiz1, Bora Nam2,3
, Eric P. Achterberg5,
Maarten Boersma1,6, Marco Thines2,3, Klaus Schwenk4
1 Alfred-Wegener-Institut Helmholtz-Zentrum für Polar- und Meeresforschung, Biologische Anstalt
Helgoland, Germany 2 Biodiversity and Climate Research Centre (BiK-F), Senckenberg Gesellschaft für Naturkunde,
Frankfurt am Main, Germany 3 Institute of Ecology, Evolution and Diversity, Faculty of Biological Sciences, Frankfurt am Main,
Germany 4 University Koblenz-Landau, Institute of Environmental Science, Landau in der Pfalz, Germany 5 GEOMAR Helmholtz Centre for Ocean Research Kiel, Kiel, Germany 6 University of Bremen, Bremen, Germany
Published in:
PloS one (2017); DOI: 10.1371/journal.pone.0175808
CHAPTER II
32
Abstract The acidification of the oceans could potentially alter marine plankton communities
with consequences for ecosystem functioning. While several studies have
investigated effects of ocean acidifications on communities using traditional methods,
few have used genetic analyses. Here, we use community barcoding to assess the
impact of ocean acidification on the composition of a coastal plankton community in
a large scale, in situ, long-term mesocosm experiment. High-throughput sequencing
resulted in the identification of a wide range of planktonic taxa (Alveolata,
Cryptophyta, Haptophyceae, Fungi, Metazoa, Hydrozoa, Rhizaria, Straminipila,
Chlorophyta). Analyses based on predicted operational taxonomical units as well as
taxonomical compositions revealed no differences between communities in high CO2
mesocosms (~ 760 µatm) and those exposed to present-day CO2 conditions.
Observed shifts in the planktonic community composition were mainly related to
seasonal changes in temperature and nutrients. Furthermore, based on our
investigations, the elevated CO2 did not affect the intraspecific diversity of the
calanoid copepod Pseudocalanus acuspes. However, accompanying studies found
temporary effects of raised CO2 on single taxa. Picoeukaryotic phytoplankton
profited from high CO2 during times of nutrient limitation, leading to higher
abundances. Furthermore, towards the end of the experiment dinoflagellate
abundance was significantly higher under elevated CO2 conditions. However, those
differences in taxa compilations between the CO2 treatments could only be observed
in a specific period of the experiment. Based on our genetic investigations, no
compositional long-term shifts of the plankton communities exposed to elevated CO2
conditions were observed. Thus, we conclude that the composition of planktonic
communities, especially those in coastal areas, remain rather unaffected by increased
CO2.
CHAPTER II
33
Introduction Enhanced atmospheric CO2 concentrations result in an increase in surface ocean
pCO2 with a subsequent decrease in pH. Several studies have investigated the effects
of ocean acidification (OA) on marine biota under laboratory and field conditions.
Generally, OA has been shown to negatively affect survival, calcification, growth
and reproduction of a range of organisms (Kroeker et al. 2010). However, there is
significant variation among marine species in their sensitivity to elevated CO2. Direct
and indirect effects of OA on single species, which retard development (Schoo et al.
2013), reduce reproduction (Kurihara et al. 2004; Rossoll et al. 2012) and survival
(Cripps et al. 2014b), may also alter community structures (Doney et al. 2012) and
thereby impact the food web (Fabry et al. 2008; Peck et al. 2015). Investigations
during large-scale mesocosm field studies in Espegrend (Bergen, Norway) and
Kongsfjorden (Ny-Ålesund, Svalbard) showed an overall resilience of plankton
communities (bacteria, phytoplankton, micro- and mesozooplankton) towards
enhanced CO2 concentrations, whereby observed biological responses were largely
depending on temperature and nutrient availability (Riebesell et al. 2008; Aberle et al.
2013; Niehoff et al. 2013; Silyakova et al. 2013; Sperling et al. 2013).
Up to now possible changes in the community composition of planktonic organisms
were mainly based on optical (microscopic and flow cytometry) investigations,
where the actual diversity of species may be underestimated, especially in organism
groups with little morphological differences. Marine planktonic taxa (phyto-,
bacterio- and zooplankton) are highly diverse and the differentiation at genus and
species level is time consuming and requires highly specialized taxonomic expertise.
Additionally, there is a potentially high diversity of cryptic species as well as larval
stages, which are not captured by morphological investigations. New molecular
techniques show rapid advancements, with promising tools for species identification.
Especially the combination of DNA barcoding and next generation sequencing
(community barcoding) can provide accurate and high-resolution taxonomic data
(Pochon et al. 2013; Wood et al. 2013; Lejzerowicz et al. 2015; Zaiko et al. 2015).
In the long-term mesocosm experiment in Kristineberg (west coast of Sweden),
which was part of the BIOACID II project, the response of different trophic levels to
elevated CO2 concentrations during a winter-to-summer plankton succession over
113 days was investigated (also see other publications within this collection). Within
CHAPTER II
34
that framework our present study focused on the assessment of the diversity of a
broad spectrum of the biocoenosis including all trophic levels (producers, consumers,
decomposers).
DNA barcoding in combination with high-throughput sequencing (HTS) was utilized
to investigate potential CO2 induced shifts in the plankton community compositions.
We hypothesized that OA may induce taxonomic shifts in the planktonic community
composition, although undetectable using morphological techniques, they might be
revealed using genetic methods.
Methods Experimental design In Gullmar Fjord, Sweden (58° 15’ 9 N, 11° 28’ 7 E) ten pelagic mesocosms
reaching to 19 m water depth were deployed. All of them enclosed roughly 50 m3 of
seawater and contained all organisms present in the fjord which were < 1 mm at the
time the mesocosms were closed (note, however, that larger species were included in
the study later on). Organisms grew under in situ temperature and close to in situ
light levels. Five of the mesocosms were manipulated with CO2 enriched water
(~ 760 µatm), the others remained unchanged to serve as controls (~ 380 µatm). Due
to net outgassing, the CO2 concentration decreased in the high CO2 mesocosms and
needed to be re-adjusted repeatedly. However, the ambient and high CO2 treatment
remained different throughout the experiment (Fig 1). As some taxa appearing later
in the seasonal succession might not have been present in the water column when the
mesocosms were closed, we added 22 L of water from the fjord every fourth day to
each mesocosm. Additional to smaller plankton, we also added herring eggs (Clupea
harengus) and green sea-urchin gastrula stages (Strongylocentrotus droebrachiensis)
to the mesocosms. Adult herring, caught in the Oslo fjord were taken over from a
local fisherman. In the laboratory eggs from the dead herrings were stripped off and
fertilized. Afterwards, eggs were stuck on plastic plates and placed in the middle of
each mesocosm at 3 m depth from day 48 until peak hatching on day 63. Around day
71 after they reached the yolk-sac stage herring larvae presumably fed on copepod
nauplii and ciliates. With growing size, they switched to lager prey. The species used
in this study is not endangered and animal welfare was assured according to the
ethical permission (number 332-2012). Sacrificed specimens were anaesthetized in
CHAPTER II
35
advance with MS-222, to reduce stress to a minimum (for further details see Sswat et
al. (2018)). Green sea-urchin larvae were cultured in the laboratory following Dorey
et al. (Dorey et al. 2013). When they reached the swimming gastrula stage they were
gently added to each mesocosm on day 56 (for further details see Dupont et al., PloS
collection). CTD (Conductivity-Temperature-Depth) casts were taken every second
day between 11 am and 3 pm to monitor inter alia the development of salinity,
temperature and pH in the mesocosms and fjord. Depth-integrated water samples
were taken every second day using an Integrating Water Sampler (IWS, Hydro-Bios,
Kiel, Germany) which sampled a total volume of 5 L evenly distributed over the
depth range from 0 - 18 m. From this water among other properties, concentrations
of nitrate (NO3-), nitrite (NO2
-), dissolved silicate (SiO43-), ammonium (NH4
+), and
phosphate (PO43-) were measured using standard auto-analyser (Seal Analytical
QuAAtro) techniques according to Murphy and Riley (1962) (Murphy and Riley
1962), Hansen and Grasshoff (1983) (Hansen 2007) and Holmes et al. (1999)
(Holmes et al. 1999), in addition to nanomolar nutrient techniques (Patey et al. 2008)
for periods with depleted nutrient levels. In addition, pigment analyses (Bach et al.
2016) and microzooplankton microscopy (Horn et al. 2016) were performed.
Mesozooplankton samples were taken with an Apstein net (55 µm mesh size, 1 m
long, Hydro-Bios) from 17 m depth to the top of each mesocosm (Algueró-Muñiz et
al. 2017a). The chlorophyll a concentrations measured via pigment analysis indicated
two bloom events which occurred simultaneously in the ten mesocosms (Fig 1).
Further details on mesocosm setup and performance as well as CO2 manipulation can
be found in the overview paper of the PloS collection (Bach et al. 2016).
CHAPTER II
36
Fig. 1 pCO2 and chlorophyll a concentration in mesocosms over the experimental period. High
CO2 mesocosms (red lines); ambient CO2 (blue lines); fjord (black dashed line); mean chlorophyll a
concentration in the selected ambient CO2 mesocosms (light green line); mean chlorophyll a
concentration in the selected high CO2 mesocosms (dark green line); x axis: experimental days; left
y axis: pCO2 concentrations; right y axis: mean chlorophyll a concentrations. Data pooled from three
ambient and three high CO2 mesocosms, error bars = SD.
Plankton samples were taken every 8th day from each mesocosm plus the
surrounding fjord. For the mesoplankton (> 200 µm) samples the content of the
mesozooplankton net hauls was prescreened with a 200 µm sieve and fixed with 90%
pure ethanol in 100 mL bottles. To sample small-sized plankton including pico-,
nano- and microplankton (> 0.45 µm and < 200 µm), 500 mL of water sampled with
the IWS was sieved with a 200 µm mesh to remove large phyto- and zooplankton.
The sieved water was subsequently filtered onto a nylon filter (0.45 µm pore size,
25 mm diameter, Whatman®) and fixed with 99.9% pure ethanol in 2 mL tubes.
For the community barcoding, filter and net samples from three randomly selected
ambient (M1, M5, M9) and high (M2, M4, M6) CO2 mesocosms, and the fjord, from
four time points (t17, t41, t65, t97), were used (in total 28 samples). In this study we
focused on long-term effects of OA on the composition of plankton communities, as
sample size for the HTS was financially limited. Therefore, we selected the time
points to be equally distributed over the experimental period, before and after the
bloom events.
CHAPTER II
37
DNA isolation For DNA isolation we used a modified version of a phenol/chloroform method
(McKinney et al. 1995). To extract the DNA of the mesoplankton the sample bottles
were gently homogenized, 2 mL sample were transferred into a 2 mL tube and
ethanol was removed with a pipette. This procedure was repeated until 0.25 µL
(maximum number of organisms per isolation tube) of the tube was filled with
organisms. In total, 10% (10 mL) of each mesoplankton net sample was used for
DNA isolation. Samples were dried at 40°C to completely remove the ethanol. Nylon
filter carrying pico-, nano- and microplankton were placed in a petri dish, cut in
small pieces and dried at 40°C. The filter pieces were put in 2 mL tubes with three
metal beads (3 mm) and frozen overnight at -80°C. The frozen filter pieces were
tissue-lysed once for 50 s at a frequency of 20 Hz (TissueLyser II, Qiagen) to crush
phytoplankton cells. For cell lysis 800 µL lyse buffer (50 mM Tris-HCl pH 8,
200 mM NaCl, 0.2 mM EDTA, 0.5% SDS, 0.1 mg mL-1 proteinase K, 0.25 mg mL-1
glycogen) was added. Subsequently samples were vortexed, centrifuged and
incubated at 37°C overnight with gentle mixing. Then 4 µL RNase (100 mg mL-1)
was added followed by another incubation at 37°C for 15 min. The buffer and RNase
volume was doubled for the mesoplankton samples. Afterwards the lysate was
transferred into new 2 mL tubes whereby the mesoplankton solution was divided into
two tubes. Filter and organism leftovers were not transferred. Then 804 µL
phenol/chloroform/isoamyl alcohol (25:24:1) were added. These samples were
vortexed and centrifuged at 13000 g for two min. Subsequently the liquid supernatant
was pipetted into a new 2 mL tube followed by another addition of 4 µL RNase and
an incubation at 37 °C for 15 min with gentle mixing. Then the phenol/chloroform
addition was repeated and the liquid supernatant was again transferred into new 2 mL
tubes (maximum 400 µL). Afterwards, 36 µL sodium acetate solution (3 M) and
900 µL pure ethanol (98%) were added, the samples were vortexed and centrifuged
at 8000 g for 10 min. The liquid above the DNA pellets was removed and pellets
from the same sample were pooled and washed twice with 500 µL pure ethanol
(70%). Then the pellets were dried at 40 °C and resuspended in 100 µL 1x TE buffer
(10 mM Tris, 1 mM EDTA). Until further use the isolated DNA was stored at -20 °C.
CHAPTER II
38
Polymerase chain reaction (PCR) We analysed a part (V4 and V5) of the small subunit rDNA (18S) to cover a
potentially wide range of marine planktonic taxa in the community barcoding
(Hadziavdic et al. 2014). Furthermore, we sequenced the more variable gene region
cytochrome-c-oxidase subunit I (cox1) to achieve a sufficient resolution for species
identification. The gene regions 18S and cox1 were amplified using the primer pairs
554f (5`-AAGTCTGGTGCCAGCAGCCGC-3`) / 1282r (5`-
TCACTCCACCAACTAAGAAGGGC-3`) and LCO1490_t1 (5`-
TGTAAAACGACGGCCAGTGGTCAACAAATCATAAAGA-3`) / HCO2198_t1
(5`- CAGGAAACAGCTATGACTAAACTTCAGGGTGACCAAA-3`), respectively
(Messing 1983; Folmer et al. 1994; Huys et al. 2006). Amplification was carried out
in a total volume of 20 µL (cox1) and 25 µL (18S) using ~ 10 ng DNA. The reaction
mix contained 2.5 (cox1), 1.25 (18S), mM MgCl2, 1 x PCR-buffer, 0.2 (cox1), 0.25
(18S) mM dNTPs, 0.2 (cox1), 0.3 (18S), 0.4 µM each primer and 0.5 (cox1), 0.1
(18S) units TAQ polymerase. Additionally, 0.1 µg µL-1 BSA were added for the 18S
PCRs. PCR conditions for cox1 were 2 min at 95 °C, followed by 35 cycles of 1 min
at 95 °C, 1 min at 45 °C, and 1 min 30 s at 72 °C, and a final elongation for 7 min at
72 °C. For 18S, the PCR conditions were 2 min at 95 °C, followed by 34 cycles of 30
s at 95 °C, 1 min at 56 ° C, and 1 min 30 s at 72 °C, and a final elongation for 10 min
at 72 °C. PCR-products were purified using the ISOLATEII PCR and Gel Kit from
Bioline. Clean PCR-products were used as templates for a barcode PCR in which the
DNA fragments of each sample were tagged with a specific barcode to enable the
identification after the multiplexed sequencing. Therefore, primers were labeled with
tags of 6-7 bps. Amplifications were carried out in a total volume of 25 µL using ca.
10 ng PCR product as template. The reaction mix contained 1 x Phusion® High
Fidelity buffer, 0.2 mM dNTP’s, 1 µM each primer, and 0.02 units Phusion® High
Fidelity polymerase. PCR conditions for cox1 were 2 min at 98 °C, followed by 27
cycles of 20 s at 98 °C, 30 s at 45 °C, and 1 min at 72 °C, and a final elongation for 6
min at 72 °C. For 18S the PCR conditions did not change - only the number of cycles
was reduced to 27. Amplification success was 99% and was controlled with gel
electrophoresis. PCR of the isolated DNA from the net sample of mesocosm six (t97)
yielded no amplicon for the cox1 gene region.
After purification, 68.57 and 76.80 ng DNA sample-1 from the 18S and cox1 PCR
products were pooled, respectively. The amplicon pool was sequenced on an
CHAPTER II
39
Illumina MiSeq platform using the paired end (2 x 300 bp) option at Eurofins
Genomics (Ebersberg, Germany). Sequence reads are deposited in the European
Nucleotide Archive (PRJEB15126).
Prior to the preparations for the community barcoding we set up a reference database,
containing 18S and cox1 sequences, obtained by standard Sanger sequencing, of
single individuals of the most abundant taxa from the mesocosms. PCR conditions
and primer were equal to those described above.
Illumina data processing The Illumina adapter and primer sequences of the raw sequence pairs were trimmed
by using the Trimmomatic (Bolger et al. 2014) software. Quality filtration was
performed using a window size of 5 bp with an average phred quality score of 25 and
a read length cutoff of 220 bp. Furthermore, sequences including ambiguous bases
(Ns) were deleted and sequences were again filtered by keeping a minimum quality
phred score of 3 per base using the FastQFS tool (Sharma and Thines 2015).
Afterwards, based on the barcode sequence, each read was renamed after the
corresponding sample ID and related forward and reverse reads were concatenated.
Then the barcode and primer sequences were trimmed and all reads were oriented in
5` - 3` direction. The prediction of operational taxonomical units (OTUs) was carried
out with the USEARCH v7 software (Edgar 2010). Thereby both a de-novo and a
reference-based (reference sequences for each primer i.e., 18S and cox1 were
downloaded from the NCBI database) chimera filters were applied. The minimum
cluster size was three reads with an identity cutoff of 99%. To further de-multiplex
sequence data, the 18S and cox1 reads were re-assembled with a minimum identity
of 99% using the program Geneious® version 7.0.4 (Kearse et al. 2012). Consensus
sequences of clustered OTU sequences were generated on the strength of base
majority. Afterwards, sequences of new and not further assembled OTUs were
aligned and trimmed to the same length. Sequences related to amplification artifacts
were manually detected based on their lack of homology to the target regions and
deleted from the set. The resulting set of high-confidence OTUs were mapped by the
processed reads, only those OTUs were kept which had a mapping support of at least
three reads. This filtered set of OTUs was then used for the community analysis and
abundance tables were generated keeping only those OTUs which occurred in a
minimum of 2 samples (S1 (18S), S2 (cox1)). OTU distribution among net and filter
CHAPTER II
40
samples were calculated in Microsoft Excel 2016. For species identification OTU
representative sequences were aligned with the NCBI nucleotide database (nt) using
the BLASTn (Altschul et al. 1990) algorithm. For this, OTUs were separated
according to their sample ID. Those from the same time point and CO2 treatment
were processed together. Further taxonomical classification of the OTUs was carried
out by using the MEGAN program (Huson et al. 2007). Thereby, we kept only those
taxa for which the pairwise identity between the forward and/or reverse part of the
assigned OTU sequences and the NCBI reference sequence was 100%. If an OTU
assigned to different taxa with equal pairwise identities, we used the next higher
taxonomical level. Resulting taxa and their number of assigned OTUs were put
together in a table for further community composition analyses.
Statistics Data analyses were performed using the vegan package in R software (Oksanen et al.
2016). For the statistical analyses we used two Hellinger transformed (Rao 1995)
OTU datasets of the 18S gene region. The first data set consisted of the raw OTU
abundance data, i.e. the number of sequence reads from the HTS. The second data set
were the presence-absence-transformed OTU abundance data (as suggested by
Borcard, Gillet (Borcard et al. 2011)). In contrast to the presence-absence-
transformed data which only reflects the OTU composition, the number of HTS reads
per OTU provide additional information on the relative abundance of species, since
the amount of sequence reads is positively correlated with the available amount of
genetic material. Although the amount of sequence reads per OTU does not reflect
real biomasses or abundances of the planktonic taxa on-site, these values can serve as
a proxy for relative abundances or biomasses of taxa and can be compared between
mesocosms and/or time points. The data set consisting of raw sequence reads per
OTU is referred to as “sequence read” data subsequently. Statistical analyses were
performed with environmental data which were 𝑙𝑙𝑙𝑙𝑙𝑙10(𝑥𝑥 + 1) transformed, to
approximate normality, and standardized to bring all of the variables into proportion
with one another (decostand with the option “standardize”). For all statistical
analyses, a probability value of p < 0.05 was considered significant. To test for
significant differences in the OTU composition and/or in the amount of assigned
HTS reads per OTU between the size fractions (filter and net samples), permutational
multivariate analyses of variance (adonis) were performed, based on the Bray-Curtis
CHAPTER II
41
distance matrix of the 18S presence-absence-transformed and sequence read data. To
investigate whether there were significant differences in the OTU composition of the
plankton samples between the ambient and high CO2 treatment over the experimental
period we performed an adonis, based on Bray-Curtis dissimilarity matrices of the
18S presence-absence-transformed and sequence read data. OTU composition
changes within and between mesocosms and fjord system, were visualized in
nonmetric multidimensional scaling (nMDS) ordinations.
The development of the environmental conditions over the experimental period was
investigated with a principal component analysis (PCA). For the PCA we considered
temperature, salinity and chlorophyll a as measured via pigment analysis using
HPLC, as well as the concentrations of different nutrients (NO3- / NO2
-, PO43-, SiO4
3-,
NH4+) and the abundances of micro- and mesozooplankton. Here, these data were
only included as covariates, detailed interpretations and discussions are presented
elsewhere (Bach et al. 2016). In this study, counts of the most abundant
microzooplankton group (ciliates) and the most abundant mesozooplankton species
(all stages of Pseudocalanus acuspes) were considered in the corresponding taxa
abundance variables. Chlorophyll a measurement in the fjord for day 41 was missing,
therefore this data point was extrapolated by averaging the measurements from days
33, 35, 37, 39, 43, and 45. Due to a deviating sampling schedule, ciliate counts from
day 103 instead of day 97 were used. Furthermore, biomass calculations of the
microzooplankton, which included also different dinoflagellate species, were
included in the PCA analysis.
Since absence represents a statistical information in presence-absence-transformed
data sets, redundancy analyses (RDA) is preferred over canonical correspondence
analysis (Dray et al. 2003). Additionally, for short gradients as found in the present
study, where species abundance or frequency is a linear function, canonical
correlation analysis (CCA) is an inappropriate model (Palmer 1993). Therefore, OTU
compositions of the plankton (pico-, nano-, micro- and mesoplankton) in the
mesocosms in dependence of environmental variables were investigated via RDA
(Legendre and Legendre 2012) on the Hellinger-transformed sequence read and
presence-absence-transformed data. The stepwise model builder based on
permutation tests (ordistep) was used to determine the set of significant explanatory
environmental variables for the final RDA.
CHAPTER II
42
As already mentioned for the sequence read data, the number of assigned OTUs to
certain taxa, identified by the BLAST searches and MEGAN analyses, do also not
necessarily reflect species abundances and/or biomasses on-site. However, they can
be used to test whether the composition of the planktonic taxa was different between
the CO2 treatments and/or over the time. Therefore, we performed an adonis based
on the number of assigned OTUs to certain taxa. To investigate potential differences
in the diversity of the detected taxa between the high and ambient CO2 treatment
and/or over the experimental period, we calculated taxa diversity indices (𝐻𝐻´ =
−∑ (𝑝𝑝𝑖𝑖ln𝑝𝑝𝑖𝑖) ∗ (−1))𝑅𝑅𝑖𝑖=𝑙𝑙 (Shannon 1948), where pi is the proportion of OTUs
belonging to the ith taxa in the subset. Furthermore, OTU evenness ( 𝐽𝐽` = 𝐻𝐻´ln(𝑆𝑆))
(Pielou 1966) (S = total number of detected taxa in the dataset), was calculated to
detect imbalances in the number of assigned OTUs among taxa.
We additionally investigated whether elevated CO2 affected the intraspecific genetic
diversity of Pseudocalanus spp. (later identified as P. acuspes), which was the most
abundant copepod throughout the experiment. Therefore, we performed an adonis
based on presence-absence-transformed and sequence read data, which exclusively
included OTUs from this species.
Results Illumina data processing The Illumina MiSeq sequencing resulted in about five million paired-end sequence
reads. The raw reads were processed for Illumina adapter and primer sequences, and
filtered in terms of their sequencing quality and sequenced read length. In total,
32.6% of the reads passed the data processing and filtering steps. This filtered set of
reads was then further processed to assign sample information (18S and cox1) on the
basis of their unique oligomer and primer sequence combinations. After categorizing
the filtered reads into samples, the oligomer and primer sequences were clipped off,
and all sequences were oriented in 5’ to 3’ direction. Using this sample assignment
step 653,789 and 3,417 sequences were assigned as 18S and cox1 sequences,
respectively. Assigned sequences were then clustered into OTUs, which resulted in
7,734 and 96 OTUs for 18S and cox1 samples, respectively. After the re-assembly,
alignment clean up and mapping, the final 18S and cox1 abundance tables contained
a high confident set of 740 (Table S1) and 31 (Table S2) OTUs, respectively. Steps
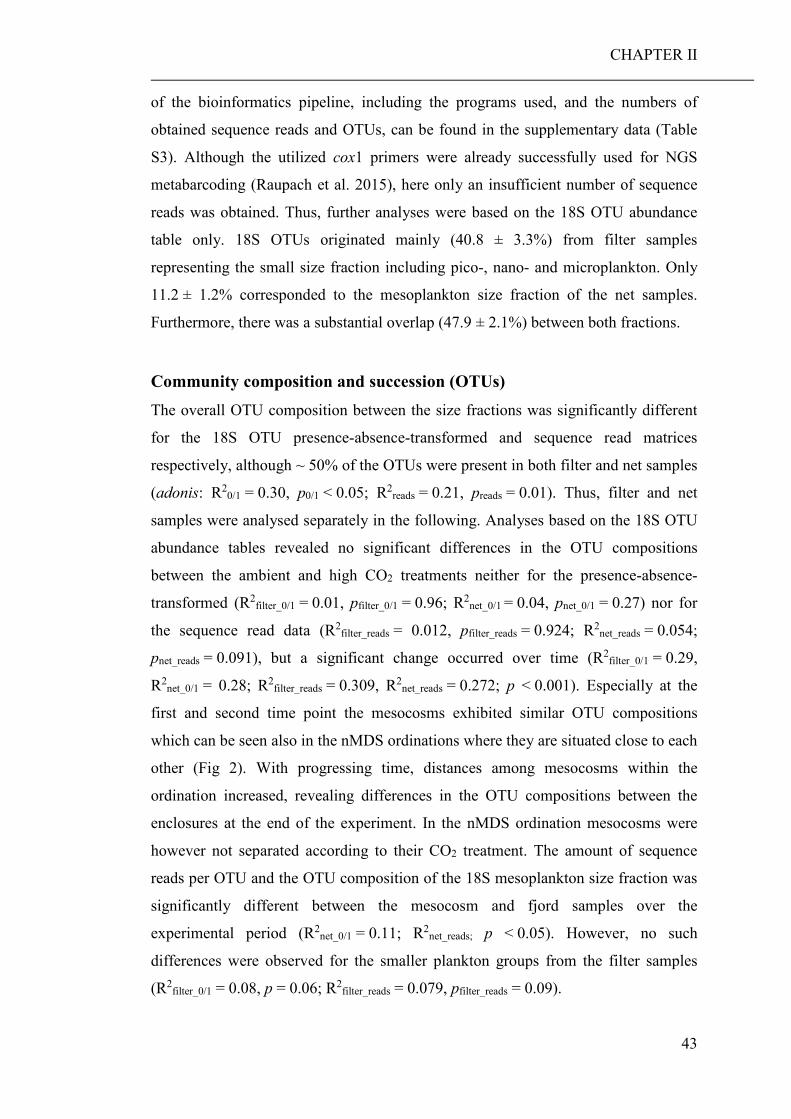
CHAPTER II
43
of the bioinformatics pipeline, including the programs used, and the numbers of
obtained sequence reads and OTUs, can be found in the supplementary data (Table
S3). Although the utilized cox1 primers were already successfully used for NGS
metabarcoding (Raupach et al. 2015), here only an insufficient number of sequence
reads was obtained. Thus, further analyses were based on the 18S OTU abundance
table only. 18S OTUs originated mainly (40.8 ± 3.3%) from filter samples
representing the small size fraction including pico-, nano- and microplankton. Only
11.2 ± 1.2% corresponded to the mesoplankton size fraction of the net samples.
Furthermore, there was a substantial overlap (47.9 ± 2.1%) between both fractions.
Community composition and succession (OTUs) The overall OTU composition between the size fractions was significantly different
for the 18S OTU presence-absence-transformed and sequence read matrices
respectively, although ~ 50% of the OTUs were present in both filter and net samples
(adonis: R20/1 = 0.30, p0/1 < 0.05; R2
reads = 0.21, preads = 0.01). Thus, filter and net
samples were analysed separately in the following. Analyses based on the 18S OTU
abundance tables revealed no significant differences in the OTU compositions
between the ambient and high CO2 treatments neither for the presence-absence-
transformed (R2filter_0/1 = 0.01, pfilter_0/1 = 0.96; R2
net_0/1 = 0.04, pnet_0/1 = 0.27) nor for
the sequence read data (R2filter_reads = 0.012, pfilter_reads = 0.924; R2
net_reads = 0.054;
pnet_reads = 0.091), but a significant change occurred over time (R2filter_0/1 = 0.29,
R2net_0/1 = 0.28; R2
filter_reads = 0.309, R2net_reads = 0.272; p < 0.001). Especially at the
first and second time point the mesocosms exhibited similar OTU compositions
which can be seen also in the nMDS ordinations where they are situated close to each
other (Fig 2). With progressing time, distances among mesocosms within the
ordination increased, revealing differences in the OTU compositions between the
enclosures at the end of the experiment. In the nMDS ordination mesocosms were
however not separated according to their CO2 treatment. The amount of sequence
reads per OTU and the OTU composition of the 18S mesoplankton size fraction was
significantly different between the mesocosm and fjord samples over the
experimental period (R2net_0/1 = 0.11; R2
net_reads; p < 0.05). However, no such
differences were observed for the smaller plankton groups from the filter samples
(R2filter_0/1 = 0.08, p = 0.06; R2
filter_reads = 0.079, pfilter_reads = 0.09).
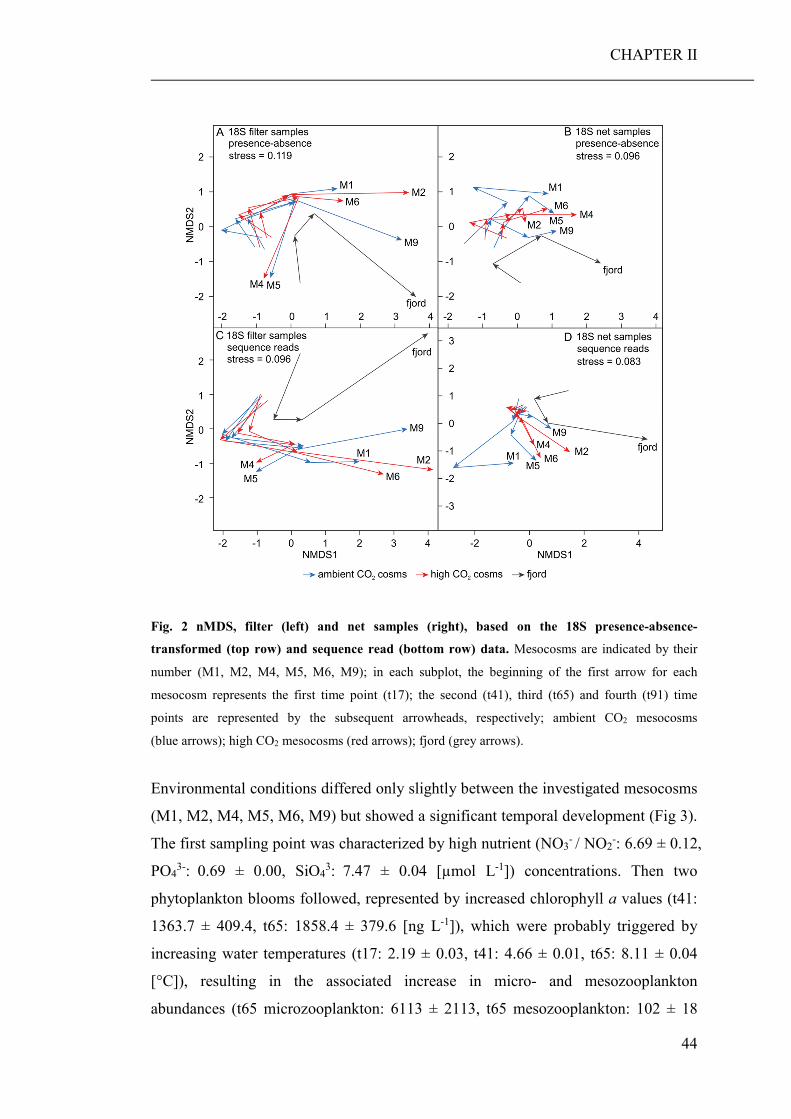
CHAPTER II
44
Fig. 2 nMDS, filter (left) and net samples (right), based on the 18S presence-absence-
transformed (top row) and sequence read (bottom row) data. Mesocosms are indicated by their
number (M1, M2, M4, M5, M6, M9); in each subplot, the beginning of the first arrow for each
mesocosm represents the first time point (t17); the second (t41), third (t65) and fourth (t91) time
points are represented by the subsequent arrowheads, respectively; ambient CO2 mesocosms
(blue arrows); high CO2 mesocosms (red arrows); fjord (grey arrows).
Environmental conditions differed only slightly between the investigated mesocosms
(M1, M2, M4, M5, M6, M9) but showed a significant temporal development (Fig 3).
The first sampling point was characterized by high nutrient (NO3- / NO2
-: 6.69 ± 0.12,
PO43-: 0.69 ± 0.00, SiO4
3: 7.47 ± 0.04 [µmol L-1]) concentrations. Then two
phytoplankton blooms followed, represented by increased chlorophyll a values (t41:
1363.7 ± 409.4, t65: 1858.4 ± 379.6 [ng L-1]), which were probably triggered by
increasing water temperatures (t17: 2.19 ± 0.03, t41: 4.66 ± 0.01, t65: 8.11 ± 0.04
[°C]), resulting in the associated increase in micro- and mesozooplankton
abundances (t65 microzooplankton: 6113 ± 2113, t65 mesozooplankton: 102 ± 18
CHAPTER II
45
[ind L-1]) and a simultaneous decrease in nutrients. The end of the experiment was
characterized by nutrient depletion (NO3- / NO2
- and PO43- concentrations were
below the detection limit; SiO43: 0.03 ± 0.05 [µmol L-1]), maximum water
temperature (t97: 14.28 ± 0.03 [°C]), decreased mesozooplankton abundance (t97: 11
± 2 [ind L-1]) and slightly increased microzooplankton biomass (t65: 33.9 ± 14.3 [µg
C-1]). Ammonium concentration in the mesocosms stayed rather low during the
experiment (t17 to t97: 0.08 ± 0.07 [µmol L-1]) and salinity increased slightly (t17:
29.22 ± 0.13, t97: 29.35 ± 0.11 [psu]). Values for all sampling days and mesocosms
can be found in the overview paper (Bach et al. 2016).
Fig. 3 PCA of measured environmental variables and CO2 concentrations in the mesocosms.
Mesocosms are indicated by their number; high CO2 (2, 4, 6); ambient CO2 (1, 5, 9); the time points
are indicated by color: t17 = red, t41 = purple, t65 = green and t97 = blue; environmental variables are
represented by circles, with NO3- / NO2
- = nitrate and nitrite [µmol L-1]; NH4
+ = ammonium [µmol L-
1]; PO43-
= phosphate [µmol L-1]; SiO43-
= silicate [µmol L-1]; sal. = salinity [psu]; temp. = temperature
[°C]; chl a = chlorophyll a [ng L-1]; mesozoopl. = mesozooplankton [ind L-1]; microzoopl. =
microzooplankton [ind L-1]; biomass microzoopl. = biomass microzooplankton [µg C L-1].
Shifts in the OTU compositions of the 18S plankton matched the changes of
environmental conditions over time as we determined based on the presence-
absence-transformed and sequence read datasets (Fig 4). The OTU composition of
the plankton was mainly shaped by nutrient and temperature development. After the
first bloom (t41), the OTU composition (presence-absence-transformed data) of the
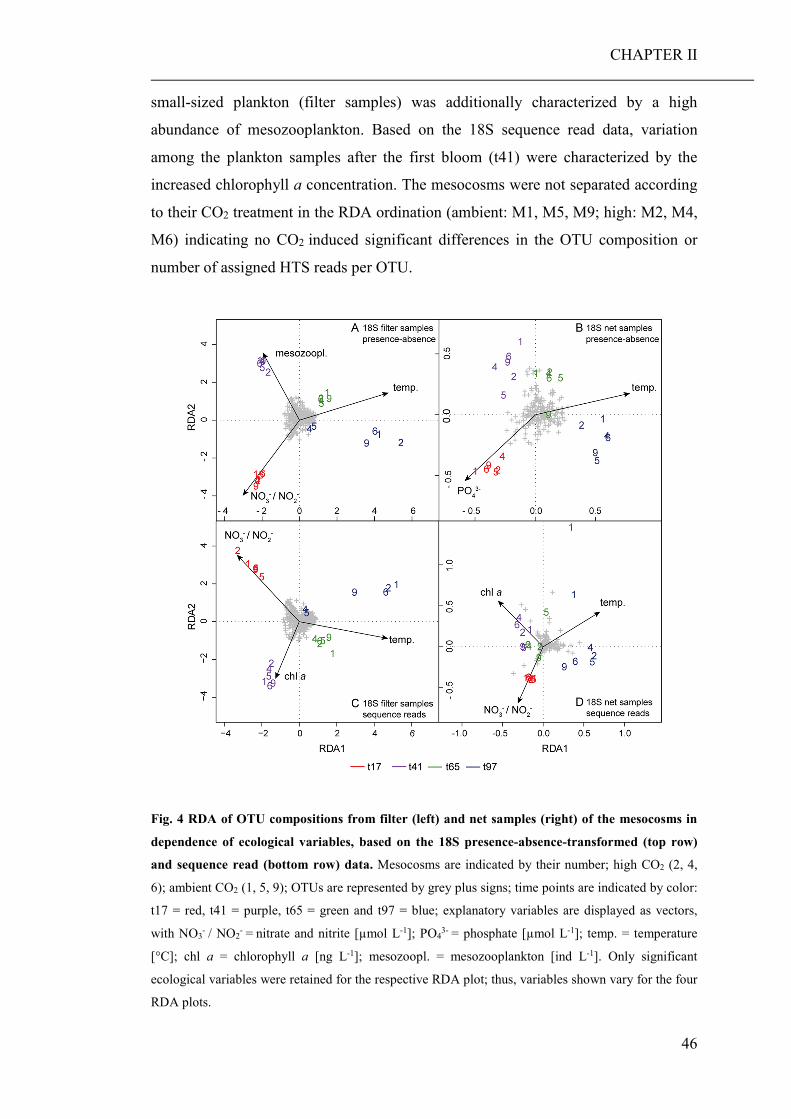
CHAPTER II
46
small-sized plankton (filter samples) was additionally characterized by a high
abundance of mesozooplankton. Based on the 18S sequence read data, variation
among the plankton samples after the first bloom (t41) were characterized by the
increased chlorophyll a concentration. The mesocosms were not separated according
to their CO2 treatment in the RDA ordination (ambient: M1, M5, M9; high: M2, M4,
M6) indicating no CO2 induced significant differences in the OTU composition or
number of assigned HTS reads per OTU.
Fig. 4 RDA of OTU compositions from filter (left) and net samples (right) of the mesocosms in
dependence of ecological variables, based on the 18S presence-absence-transformed (top row)
and sequence read (bottom row) data. Mesocosms are indicated by their number; high CO2 (2, 4,
6); ambient CO2 (1, 5, 9); OTUs are represented by grey plus signs; time points are indicated by color:
t17 = red, t41 = purple, t65 = green and t97 = blue; explanatory variables are displayed as vectors,
with NO3- / NO2
- = nitrate and nitrite [µmol L-1]; PO4
3- = phosphate [µmol L-1]; temp. = temperature
[°C]; chl a = chlorophyll a [ng L-1]; mesozoopl. = mesozooplankton [ind L-1]. Only significant
ecological variables were retained for the respective RDA plot; thus, variables shown vary for the four
RDA plots.
CHAPTER II
47
Plankton community composition and succession (Taxa) Comparing the taxonomic composition recorded with the 18S marker, in the high
(M2, M4, M6) and ambient (M1, M5, M9) CO2 mesocosms, there were no
significant differences (R2 = 0.02; adonis; p > 0.05). However, the plankton
community composition was significantly changing over time (R2 = 0.61; adonis; p
< 0.01). The BLAST searches and MEGAN analyses of the 18S and cox1 OTUs
resulted in the identification of 30 (± 5) and 10 (± 3) taxa per treatment and time
point from different hierarchal levels, respectively. 18S OTUs assigned to various
planktonic taxa within the groups Ciliophora, Dinophyceae, Amoebozoa, Fungi,
Haptophyceae, Cryptophyta, Deuterostomia, Copepoda, Hydrozoa, Rhizaria,
Straminipila and Chlorophyta covering all trophic levels (Fig 5). OTU evenness for
the investigated 18S community was 0.57 (± 0.04), indicating the presence of
dominating species in terms of biomass. From the 18S OTUs nearly half (45.1% ±
3.1) assigned to Pseudocalanus spp. (later identified as P. acuspes) which was also
the most abundant copepod throughout the experiment - with a decrease towards the
end of the experiment (based on mesozooplankton counts, Algueró-Muñiz et al.
(2017a)). With the exception of copepods (54.9% ± 2.2), OTUs assigned mainly to
green algae (9.3% ± 1.6), diatoms (9.2% ± 1.2) and other Straminipila (12.2% ± 3.3)
at day 17 and 41. With time ciliate (t97: 13.0% ± 0.1) and dinoflagellate (t97: 6.0% ±
0.4) diversity increased. During most of the experimental period (t17, t41, t65) the
recorded taxa diversity based on the 18S marker was quite similar among the
mesocosms (Taxa diversity index: 2.2 ± 0.07). At the last time point (t97) taxa
diversity increased (Taxa diversity index: 2.5 ± 0.03) and we detected two additional
copepod species (Calanus helgolandicus, Temora longicornis), two Ciliophora
(Askenasia sp., Acineta flava) and four Dinophyceae (Scippsiella sp.,
Protoperidinum bipes, Protoperidinium pellucidum, Lophodiniales) taxa as well as
three other taxa (Oikopleura dioica, Gnathostomata, Amoebozoa) belonging to
various groups.
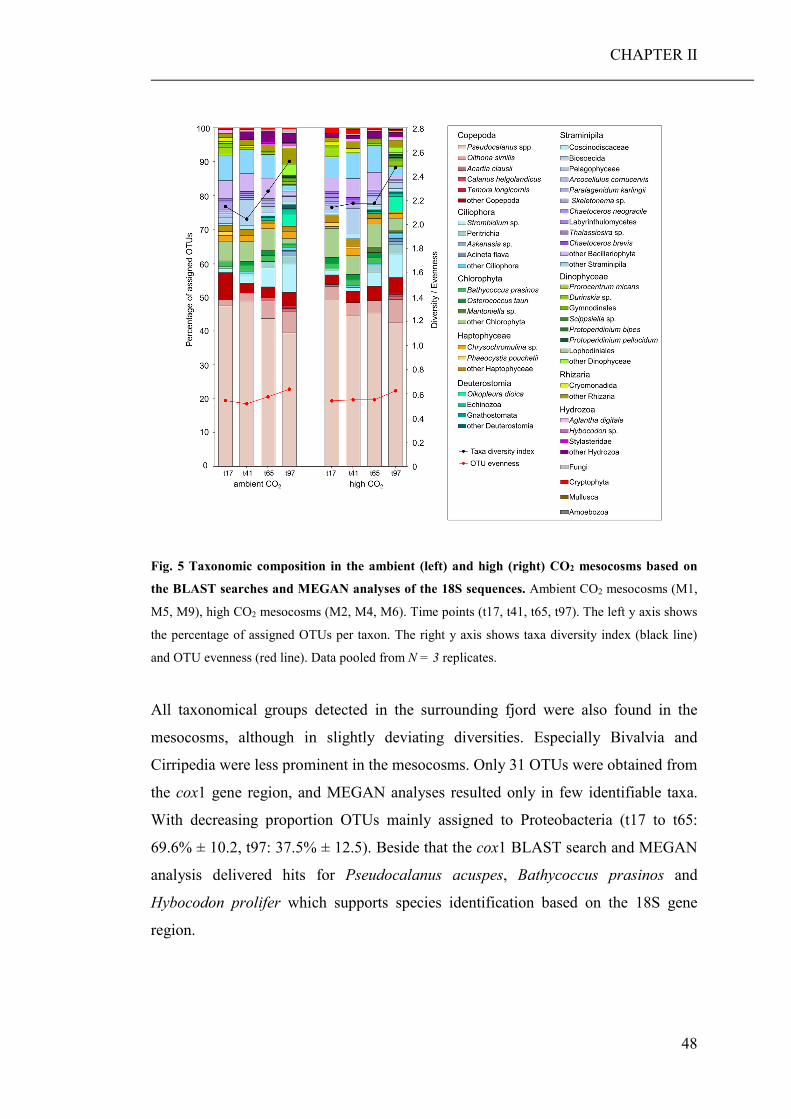
CHAPTER II
48
Fig. 5 Taxonomic composition in the ambient (left) and high (right) CO2 mesocosms based on
the BLAST searches and MEGAN analyses of the 18S sequences. Ambient CO2 mesocosms (M1,
M5, M9), high CO2 mesocosms (M2, M4, M6). Time points (t17, t41, t65, t97). The left y axis shows
the percentage of assigned OTUs per taxon. The right y axis shows taxa diversity index (black line)
and OTU evenness (red line). Data pooled from N = 3 replicates.
All taxonomical groups detected in the surrounding fjord were also found in the
mesocosms, although in slightly deviating diversities. Especially Bivalvia and
Cirripedia were less prominent in the mesocosms. Only 31 OTUs were obtained from
the cox1 gene region, and MEGAN analyses resulted only in few identifiable taxa.
With decreasing proportion OTUs mainly assigned to Proteobacteria (t17 to t65:
69.6% ± 10.2, t97: 37.5% ± 12.5). Beside that the cox1 BLAST search and MEGAN
analysis delivered hits for Pseudocalanus acuspes, Bathycoccus prasinos and
Hybocodon prolifer which supports species identification based on the 18S gene
region.
CHAPTER II
49
Pseudocalanus acuspes – species identification & intraspecific diversity BLAST searches of the 18S sequences from the community barcoding and our
reference database, delivered P. elongates as the best hit (100% pairwise identity
over 187 bp and 685 bp, respectively). In contrast to that, BLAST searches of cox1
sequences (141 individuals) from our reference database exclusively revealed hits for
P. acuspes. Therefore, we aligned (Geneious® version 7.0.4) the NCBI 18S
reference sequence of P. acuspes (GenBank: KF991205.1, 419 bp) with our own 18S
reference sequences (~ 675 bp), which were proven to belong to P. acuspes by
Sanger sequencing of the cox1 gene region of the same individuals. The alignment
(89% pairwise identity over 214 bp) suggested that the sequence fragments represent
different parts of the 18S gene region, what prevented an appropriate species
identification using BLAST. Another investigation in the Gullmar Fjord based on
species-specific PCR of 100 individuals, also resulted in the identification of
P. acuspes exclusively (Thor and Oliva 2015). Thus, based on these findings, we
consider P. acuspes as the only present Pseudocalanus species throughout the
experiment.
Investigations of the intraspecific genetic diversity revealed no differences between
the CO2 treatments or sampling days, except for mesocosm two (M2). There were no
CO2 induced differences in the OTU composition (presence-absence-transformed
data, adonis: R2 = 0.008, p = 0.924) nor in the OTU frequencies (sequence read data,
adonis: R2 = 0.010, p = 0.991) of the investigated P. acuspes populations. However,
in M2 the OTU frequency and composition and therefore the haplotype compilation
changed significantly in the course of the experimental period (presence-absence-
transformed, adonis: R2 = 0.297, p < 0.05; sequence read data, R2 = 0.308, p < 0.05).
Discussion The combination of DNA barcoding and high throughput sequencing (HTS) applied
here revealed no CO2 induced compositional shifts in the investigated coastal
plankton communities. Changes in relative taxa abundances and taxa compilations
were mainly observed along the seasonal succession, which was driven by
temperature and nutrient availability.
CHAPTER II
50
Experimental setup Ambient and high CO2 treatments remained different with respect to pCO2
throughout the whole experiment, although CO2 concentrations were fluctuating in
the mesocosms, due to outgassing and CO2 uptake by algae followed by additions of
CO2 enriched water to compensate for CO2 losses. Starting with similar
biogeochemical variables and plankton communities, variation among mesocosm
replicates increased over time (Fig 2). Initial subtle differences between the
enclosures intensified over the succession. Therefore, the detection of possible CO2
effects became more difficult with time, because they potentially occurred at
different days in the replicates. Although increasing variation among replicates is a
common complication of long-term studies in natural systems, it will be a major task
to resolve this problem for future studies to avoid an underestimation of the
implications of increasing CO2.
The mesocosms included the majority of the natural plankton community, all taxa
found in the surrounding fjord were also detected in the enclosures. However, the
OTU composition of the mesoplankton was significantly different between the
mesocosms and the fjord at the investigated time points (Fig 2). This indicates either
a displacement in species succession or differences in species abundances. Some
species were underrepresented in the mesocosms compared to the fjord e.g. Bivalvia
and Cirripedia. As mesocosm walls were regularly cleaned, substrate-bound or
sessile taxa probably did not find an appropriate environment. Although blooms in
the fjord and the mesocosms developed in parallel, they were more intense in the
enclosures (Bach et al. 2016). This suggests a similar succession, but differences in
species composition and abundance among the mesocosms and the fjord.
Community barcoding The analyses of the community barcoding data resulted in a total number of 771
OTUs. This indicated a high sequencing depth and thereby a high coverage of the
species (and intraspecific genetic variation) diversity present in the mesocosms and
in the surrounding fjord. The plankton communities in the three ambient (M1, M5,
M9) and high CO2 (M2, M4, M6) mesocosms were represented by 375 ± 66 OTUs
per time point. During the MEGAN analyses around one half of the OTUs (198 ± 33)
could be assigned to reference sequences. The other half could not be assigned,
CHAPTER II
51
probably because corresponding 18S reference sequences are missing in the database
yet. Furthermore, multiple OTUs were assigned to the same taxa, since some OTUs
represent haplotypes of the same species. Overall, based on the 18S and cox1
sequences we could identify 19 species, 9 genera, 16 higher taxonomical groups i.e.
44 different taxa. The success of studies such as the present depends very much on
the quality of the available molecular data bases. For a steady improvement of those
databases good cooperation between taxonomists and molecular biologists is
therefore crucial.
Despite the high taxonomic resolution based on OTUs, metabarcoding data cannot be
used to make predictions about species abundances and / or biomasses on-site, due to
preferential annealing of universal primers in some species over others during PCRs
and HTS (Elbrecht and Leese 2015). Therefore, relative abundances and diversity
indices, based on HTS reads and the number of OTUs assigned to certain taxa,
respectively, are not directly comparable to those determined using count abundance
data. However, comparisons among the enclosures and time points are feasible
because amplification and sequence success between taxa remains constant.
Based on the number of assigned OTUs to a certain taxon, predictions about the
intraspecific diversity is only possible to a limited extent. For investigations of the
intraspecific diversity a sufficient sample size is crucial, because up to a certain point
the observed intraspecific variation is positively correlated with the number of
investigated individuals. Therefore, the percentages of assigned OTUs shown in Fig
5 do not reflect the actual level of intraspecific variation, since it is unlikely that a
representative sample size could be reached for all taxa detected with the community
barcoding. P. acuspes, however, was the most abundant copepod (based on
mesozooplankton counts, Algueró-Muñiz et al. (2017a)) throughout the experiment
and with 1,351 (± 561) assigned sequence reads per sample also the best covered
taxa in the HTS of the 18S gene region. We observed no effect of elevated CO2 on
the genetic intraspecific diversity of the investigated P. acuspes populations.
Furthermore, in all investigated mesocosms (M1, M4, M5, M6, M9) except M2 the
OTU, and thus the haplotype compilations of the P. acuspes populations, were
similar at the sampling days 17, 41, 65, and 97. The temporal change in the OTU
composition of the P. acuspes population of M2 was probably due to a decline in the
number of detected OTUs (~ 40 less) on the filter sample on day 97. Since the
intraspecific diversity decrease was only detected in one of the three replicates and
CHAPTER II
52
we further cannot exclude a potential methodological flaw this finding should not be
overinterpreted.
The relatively high number of 18S OTUs (174) assigned to P. acuspes, might
indicate that several cryptic lineages co-occur in a species complex. Although such a
high intraspecific variation was not observed with our cox1 reference sequences (141
individuals), the actual genetic variation could have been underestimated due to the
relatively low number of investigated individuals. The community barcoding of the
cox1 gene region delivered only one OTU assigned to P. acuspes (containing 14
sequences), i.e. not a representative sample of the population. Thus, to resolve the
Pseudocalanus species complex, further investigations will be necessary.
The OTU distribution among the filter and net samples was quite different. A higher
proportion of the OTUs originated from filter samples. However, this is not
surprising since species diversity is in general higher in small organisms (here
microplankton) compared to large ones (here mesoplankton) and taxa larger than
1 mm were excluded. Around 50% of the OTUs corresponded to both size fractions
(filter and net samples), because eggs, larvae and nauplii of mesozooplankton as well
as smaller cells of large diatoms (e.g. Coscinodiscaceae) are also captured on the
filter samples. Furthermore, pico-, nano- and microplankton were ingested by larger
planktonic taxa or just attached to them and will be detected along with the
grazer/predator.
CO2 effects on the plankton community composition and food web
interactions The composition of plankton communities investigated in this mesocosm study was
not affected by increased CO2 levels. At the analysed time points (t17, t41, t65, t97)
no significant differences between the CO2 treatments could be observed. Yet, there
were significant compositional changes over time (Fig 2), which were primarily
induced by changing temperature and decreasing nutrient availability over the course
of the succession (Fig 4). Additionally, at day 41, the 18S OTU composition
(presence-absence-transformed data) of the small-sized plankton communities (pico-,
nano- and microplankton) also seemed to be driven by mesozooplankton abundances,
i.e. rather by top-down effects from predators than by bottom-up effects from food
sources (Fig 4, top row). Löder et al. (2011) found copepods to be less important
CHAPTER II
53
phytoplankton grazers, but important top-down regulators of microzooplankton,
especially with decreasing quality of phytoplankton food due to nutrient limitation
during blooms (Löder et al. 2011). Furthermore, many copepods are known to be
size-selective feeders, preferring a size class between 11 and 87 µm (Frost 1972).
During the bloom events the phytoplankton community was mainly made up by
picoeukaryotes (< 2 µm) and Coscinodiscus sp. (> 200 µm), a giant diatom.
Therefore, the vast majority of the phytoplankton present did not represent a suitable
food source for copepods, due to the unfavorable cell size. Thus, copepods probably
intensively grazed on microzooplankton organisms (Horn et al. 2016), most likely
ciliates and dinoflagellates. This is corroborated by the 18S mesoplankton OTU
composition (presence-absence-transformed data) obviously not being related to
phytoplankton densities (chlorophyll a) in the RDA analysis (Fig 4, top row). On day
97 towards the end of the experiment more OTUs assigned to ciliate and
dinoflagellate species (Fig 5), after the top-down control by mesoplankton subsided
due to decreasing copepod abundances. Considering the amount of assigned HTS
reads per OTU in the RDA the predator-prey food web interaction was probably
masked, because the high numbers of sequence reads, which correspond to OTUs
representing the main contributing taxa of the blooms, (Chlorophyta, Rhizaria and
Stramenopila) carried more weight in the analysis then the actual composition of the
OTUs. Therefore, in the RDA, variation between plankton samples at day 41 were
rather explained by the chlorophyll a concentration than by the abundance of
mesozooplankton. The introduced herring larvae potentially controlled both micro-
and mesozooplankton abundances. In their early life stages from day ~ 64 to 74 they
were probably feeding first on small-sized microzooplankton e.g. ciliates and
subsequently on larger microzooplankton organisms and nauplii stages of
mesozooplankton taxa. Towards the end of the experiment they most likely started to
feed on adult mesozooplankton organisms. As P. acuspes was the dominant copepod
species it was probably mostly consumed by the herring larvae. Decreasing densities
of P. acuspes towards the end of the experiment, thereby also facilitated the
development of other copepod species (Fig 5) due to reduced competition.
As part of this mesocosm experiment other studies found temporal effects of high
CO2 on planktonic taxa. Dinoflagellates were more abundant in the high CO2
mesocosms towards the end of the experimental period (Horn et al. 2016), and the
phytoplankton community structure was significantly different between the CO2
CHAPTER II
54
treatments during the second bloom period, with a higher abundance of
picophytoplankton (Bach et al. 2016). Lischka et al. (2015) also observed temporal
effects of elevated CO2 on a microzooplankton community whereby inter alia a shift
towards smaller taxa with increasing CO2 was detected (Lischka et al. 2015). The
second bloom was fueled by recycled nutrients, thus resources for plankton growth
needed to by delivered by the food web, thereby the limitation of inorganic nutrients
seemed to indirectly enhance CO2 effects on planktonic organisms. The food web
becoming rather bottom-up driven is supported by a higher Proteobacteria diversity
(number of assigned OTUs based on the cox1 gene region) in the period after the
blooms (t41, t65). After decomposition and remineralization of the particulate
organic matter, Proteobacteria diversity decreased towards day 97. Dependencies
between nutrient availability and impacts of elevated CO2 on marine organisms were
also demonstrated in previous studies (Li et al. 2012; Rouco et al. 2013; Hofmann et
al. 2015a; Sala et al. 2015). Therefore, future studies investigating the impacts of OA
on marine biota should focus on nutrient limited systems.
Study hypothesis Based on the results of this study our hypothesis that DNA barcoding in combination
with HTS can unravel previously hidden (based on morphological analyses) CO2
sensitivities of plankton communities cannot be confirmed. We focused on the
investigation of potential long-term effects of CO2 on planktonic taxa compilations,
because the number of samples for the HTS was limited (financial constrains).
Thereby, samples from the distinct bloom events were not considered for the
community barcoding. Thus, we cannot assess whether the CO2 induced increase in
the abundance of picoeukaryotic phytoplankton (Bach et al. 2016), which was
observed during the second bloom, could have been detected with community
barcoding. Although our genetic approach allowed a detailed investigation of the
majority of the planktonic communities (down to haplotype level), the technique is
not appropriate to detect slight changes in species abundances and stage specific
effects, as it has been observed for some dinoflagellate (Horn et al. 2016) and
copepod species (Algueró-Muñiz et al. 2017a), respectively. However, community
barcoding data delivers additional information about the genetic diversity of a
community and the presence of potentially cryptic or even unknown species. Thus,
for future studies we suggest to use community barcoding as applied here, not as a
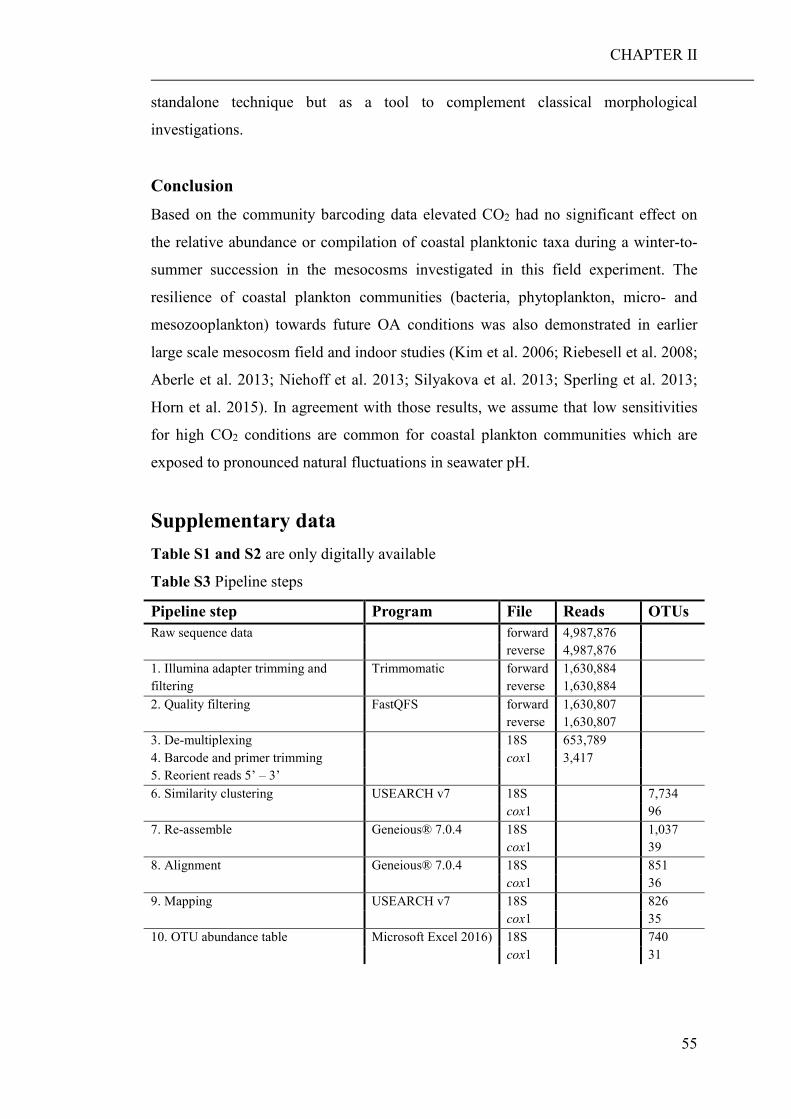
CHAPTER II
55
standalone technique but as a tool to complement classical morphological
investigations.
Conclusion Based on the community barcoding data elevated CO2 had no significant effect on
the relative abundance or compilation of coastal planktonic taxa during a winter-to-
summer succession in the mesocosms investigated in this field experiment. The
resilience of coastal plankton communities (bacteria, phytoplankton, micro- and
mesozooplankton) towards future OA conditions was also demonstrated in earlier
large scale mesocosm field and indoor studies (Kim et al. 2006; Riebesell et al. 2008;
Aberle et al. 2013; Niehoff et al. 2013; Silyakova et al. 2013; Sperling et al. 2013;
Horn et al. 2015). In agreement with those results, we assume that low sensitivities
for high CO2 conditions are common for coastal plankton communities which are
exposed to pronounced natural fluctuations in seawater pH.
Supplementary data Table S1 and S2 are only digitally available
Table S3 Pipeline steps
Pipeline step Program File Reads OTUs Raw sequence data forward 4,987,876 reverse 4,987,876 1. Illumina adapter trimming and filtering
Trimmomatic forward reverse
1,630,884 1,630,884
2. Quality filtering FastQFS forward 1,630,807 reverse 1,630,807 3. De-multiplexing 18S 653,789 4. Barcode and primer trimming cox1 3,417 5. Reorient reads 5’ – 3’ 6. Similarity clustering USEARCH v7 18S 7,734 cox1 96 7. Re-assemble Geneious® 7.0.4 18S 1,037 cox1 39 8. Alignment Geneious® 7.0.4 18S 851 cox1 36 9. Mapping USEARCH v7 18S 826 cox1 35 10. OTU abundance table Microsoft Excel 2016) 18S 740 cox1 31
CHAPTER II
56
Acknowledgements We thank the Sven Lovén Centre for Marine Sciences (University of Gothenburg) for providing
research facilities and accommodation. Furthermore, we acknowledge the whole team of the R/V
Alkor for their work with the transport and setup of the mesocosms during their cruses AL406 and
AL420. We also gratefully thank the KOSMOS 2013 team for their extensive maintenance work
throughout the experiment. Furthermore, we acknowledge Prof. Ulf Riebesell (GEOMAR, Kiel) as
the initiator and coordinator of the mesocosm study and Andrea Ludwig (GEOMAR, Kiel) for her
outstanding organization and coordination performance before and during the experiment. We thank
Dr. Lennart Bach (GEOMAR, Kiel) for providing his chlorophyll data and for his comments on an
earlier version of this manuscript. For their laboratory assistance, we would like to thank the technical
assistants M. Sinn and B. Lösch (University Koblenz-Landau). Additionally, we thank Dr. Sven
Neulinger (omics2view, Kiel) and Prof. Stephan Frickenhaus (Alfred-Wegener-Institute,
Bremerhaven) for providing their expertise in statistical analyses of NGS data.
CHAPTER III
57
CHAPTER III
Direct and indirect effects of near-future pCO2 levels on zooplankton
dynamics
Cédric L. Meunier1, María Algueró-Muñiz1, Henriette G. Horn1, Julia A. F. Langer1,
Maarten Boersma1,2
1 Alfred-Wegener-Institut Helmholtz-Zentrum für Polar- und Meeresforschung, Biologische Anstalt
Helgoland, Helgoland, 27498, Germany 2 University of Bremen, Bremen, 28359, Germany
Published in:
Marine & Freshwater Research (2016); DOI: 10.1071/MF15296
CHAPTER III
58
Abstract Ocean acidification has direct physiological effects on organisms by, for example,
dissolving the calcium carbonate structures of calcifying species. However, non-
calcifiers may also be affected by changes in seawater chemistry. To disentangle the
direct and indirect effects of ocean acidification on zooplankton growth, we carried
out a study with two model organisms. We investigated the individual effect of short
term exposure to (1) high and low seawater pCO2 and (2) different phytoplankton
qualities as a result of different CO2 incubations on the growth of a heterotrophic
dinoflagellate and a copepod species. It has been previously observed that higher
CO2 concentrations can decrease phytoplankton food quality in terms of
carbon : nutrient ratios. We therefore expected both seawater pCO2 (pH) and
phytoplankton quality to result in a decrease of zooplankton growth. Although we
expected lowest growth rates for all zooplankters under high seawater pCO2 and low
algal quality, we found that direct pH effects on consumers seem to be of lesser
importance than the associated decrease in algal quality. The decrease of primary
producers’ quality under high pCO2 conditions negatively affected zooplankton
growth, which may lead to lower availability of food for the next trophic level and
thus potentially affect the recruitment of higher trophic levels.
CHAPTER III
59
Introduction Human industrial activities have increased atmospheric carbon dioxide (CO2)
concentrations which have now reached values of over 400 ppm on average (Tans
and Keeling 2013), the highest level for millions of years (Royer 2006; Pagani et al.
2011). About 25% of the CO2 enters the oceans which can act as carbon (C) sinks
(Canadell et al. 2007). As a result, the carbonate chemistry of oceans has changed,
especially in the upper 100 meters where ocean acidification has a major influence
(Doney et al. 2009).
Ocean acidification negatively affects a number of organisms directly by, for
example, dissolving the calcium carbonate structures of calcifying species (Orr et al.
2005). However, marine organisms, such as micro- and mesozooplankton, may be
subjected to other adverse effects. Lower seawater pH resulting from increasing
pCO2 could directly affect the physiology of both phyto- and zooplankton by
changing intracellular pH, membrane potentials, and enzyme activities (Nielsen et al.
2010). This acidification of body fluids is known as hypercapnia (Fabry et al. 2008).
When CO2 levels increase in seawater, dissolved CO2 more readily diffuses across
body surfaces and equilibrates in both intra- and extracellular spaces. As in seawater,
CO2 reacts with internal body fluids causing H+ ions to increase and pH to decrease.
Hypercapnia can cause the suppression of metabolic processes (Michaelidis et al.
2005; Pörtner 2008) and disrupt acid-base homeostasis (Miles et al. 2007), thus
decreasing growth rate and reproductive success and increasing mortality of marine
organisms (Yamada and Ikeda 1999). Smaller organisms are likely to be more
affected by changes in seawater chemistry than larger ones as a result of the
differences in volume to surface ratios and future conditions will increase variations
in pH at the cell surface (Flynn et al. 2012). However, despite their ecological
importance, only few studies have focused on the impact of ocean acidification on
microzooplankton so far, and, to our knowledge, their sensitivity to hypercapnia has
never been investigated. Microzooplankton are an essential component in planktonic
ecosystems. Indeed, they often comprise the major predatory group in microbial food
webs (Sherr and Sherr 2002), and microzooplankters form a trophic link between
pico-, nano- and microplankton on the one hand and higher trophic levels, such as
copepods, on the other hand (Sommer et al. 2005). Although there is indication that
microzooplankton are sensitive to elevated pH (Hinga 2002; Pedersen and Hansen
CHAPTER III
60
2003), to our knowledge no studies have directly tested the effects of CO2-induced
lowering of the pH on marine microzooplankton. The few existing experimental
studies were carried out using natural plankton communities and observed no effects
of a high pCO2 / low pH on microzooplankton, independent on whether the systems
were fixed pH, or whether pH was allowed to drift as it would in reality (Suffrian et
al. 2008; Rose et al. 2009; Aberle et al. 2013). Ocean acidification does not only
reduce the global base pH but also influences smaller-scale fluctuations. For example,
ocean acidification may influence spatial and seasonal variations by modulating
seawater alkalinisation during intense C-fixation associated with phytoplankton
blooms (Flynn et al. 2012). Having said this, as the knowledge on effects of ocean
acidification on microzooplankton is so limited we decided to focus on effects of
fixed changes in pCO2 only. However, it is generally difficult to observe
physiological effects in natural community experiments whereas smaller and more
controlled microcosm studies are more helpful to understand physiological responses
such as microzooplankton sensitivity to hypercapnia. Further, most studies
measuring copepod physiological performance at lower seawater pH observed that
copepods are relatively tolerant to hypercapnia (Mayor et al. 2012; McConville et al.
2013). Yet, recent studies observed strong negative effects of near-future ocean
acidification levels on copepods (Lewis et al. 2013; Thor and Dupont 2015), and
others suggest that inappropriate experimental designs might have underestimated
the actual direct effect of ocean acidification on copepods, and potentially
microzooplankton (Cripps et al. 2014a; Cripps et al. 2014b) Since micro- and
mesozooplankton play different roles in the pelagic ecosystem, it is important to
determine whether those two groups are differently affected by high pCO2.
Apart from direct acidification effects, the increasing C availability in the marine
environment will likely change primary productivity and the quality of
phytoplankton as food for higher trophic levels (Low-Décarie et al. 2014). As
primary producers reflect the nutrient composition of their surrounding medium, they
are expected to show higher C : nutrient ratios as CO2 availability increases
(Burkhardt et al. 1999; Urabe et al. 2003; van de Waal et al. 2010). Further, algae
with high C : nutrient ratios are known to often be food of inferior quality for
herbivorous consumers since there is a larger difference between resource chemical
composition and consumer metabolic requirements (Sterner and Elser 2002). Recent
results indicate negative indirect effects of ocean acidification on copepods caused
CHAPTER III
61
by a decline in prey quality when grown under high pCO2 (Rossoll et al. 2012; Schoo
et al. 2013). In the light of the predicted increase of pCO2 and the observed trend of
decreasing nitrogen (N) and phosphorus (P) inputs to coastal areas (Grizzetti et al.
2012), the potential for an excess of C and a concurrent nutrient limitation at the base
of the food web is considerably heightened. Although evidence is increasing that the
growth rate of zooplankters decreases with increasing CO2 availability to the algae
(Olson and Kawaguchi 2011; Rossoll et al. 2012; Schoo et al. 2013), it remains
unclear whether direct or indirect effects on consumer fitness play the more
prominent role. Indeed, only one study investigated the direct and indirect effects of
acidification on zooplankton growth and reproduction (Rossoll et al. 2012). This
study concluded that high CO2 availability decreases copepods fitness mostly
indirectly. Further, Melzner et al. (2011) showed that the effects of high CO2 may be
less pronounced when there is enough food available, as the energy needed to deal
with the unhealthy environment is available. If energy is the limiting compound in
the study of Melzner et al. (2011), at low food concentrations higher algal
carbon : nutrient ratios might benefit herbivores since algae grown under high CO2
conditions are more energy rich as they often contain more lipids (Rossoll et al.
2012). The generality of this result remains unclear, as trophic upgrading and
differential algae sensitivity in terms of growth rate and stoichiometry to pCO2 may
compensate for low food quality. For instance, Isari et al. (2015) recently observed
that increased pCO2 does not affect the stoichiometric quality of the phytoplankton
species Heterocapsa sp. and, logically, did not alter performances of copepods
feeding on that prey. Further, Klein Breteler et al. (1999) showed that inadequate
algal food could be biochemically upgraded by protozoans to high quality food for
copepods. Hence, protozoan herbivores might dampen the negative effect of
acidification on algal food quality through trophic upgrading. In fact, Caron &
Hutchins (Caron and Hutchins 2013) identified lack of data on the effects of ocean
acidification on microzooplankton as one of the major knowledge gaps.
To disentangle the direct and indirect effects of ocean acidification on both
microzooplankton and mesozooplankton, we carried out a study with model
organisms. We investigated the individual effect of short term exposure to (1) high
and low seawater pCO2 and (2) different qualities of the alga Rhodomonas salina on
the growth and development of two model zooplankton species Oxyrrhis marina
(Montagnes et al. 2011) and Acartia tonsa (Mauchline 1998). The different algal
CHAPTER III
62
qualities were obtained by growing R. salina in high and low seawater pCO2 relative
to current scenarios. We hypothesize that a significant interaction of seawater pCO2
and phytoplankton quality should affect zooplankton growth and that lowest growth
rates for both micro- and mesozooplankters should be observed under high pCO2
seawater and low algal quality.
Material and methods To test whether planktonic herbivores growth is affected by seawater pCO2 or by
algal quality differences caused by seawater pCO2 (direct versus indirect effect), we
conducted a laboratory experiment with nauplius and copepodite stages of the
copepod A. tonsa as well as with the heterotrophic dinoflagellate O. marina. The
zooplankton species were cultured under high and low pCO2 and were fed with two
algal qualities in full factorial design, i.e. four treatments. The different algal
qualities were obtained by growing the model organism R. salina in high and low
seawater pCO2 relative to current scenarios. Using model organisms such as O.
marina and R. salina entails limitations regarding the extent to which experimental
results can be interpreted. Nevertheless, due to its high growth rate and to the
reproducibility of nutrient treatments, R. salina is a useful model organism when
studying the importance of phytoplankton food quality for zooplankton. Further,
Davidson et al. (2011) made a critical assessment of the advantages and
disadvantages of using O. marina as a model organism. Their study supports the use
of this dinoflagellate in experimental studies since its feeding mode and
predator:prey size ratio are comparable to most protozoa. Both O. marina and
R. salina are planktonic, not benthic, and in this sense, they are appropriate model
organisms for planktonic processes.
Phytoplankton R. salina (Wislouch) Hill et Wetherbee was kept in f/2 medium prepared with 0.2µm
filtered seawater (Guillard and Ryther 1962). R. salina was grown in continuous
chemostat cultures maintained at steady state. The phytoplankton cultures were
constantly aerated with a mixture of air stripped of CO2 by soda lime and pure CO2
adjusted to 200 and 800 μatm (Rho 200 and Rho 800) to represent pre-industrial and
predicted future scenarios. The pre-defined pCO2 level was achieved following
CHAPTER III
63
Schoo et al. (2013). A sensor (HTK Hamburg) continuously monitored the pCO2 of
the gas mixture distributed to the algal cultures and automatically adjusted the CO2
content and flow rate. Preliminary experiments showed that the pCO2 of the growth
medium was in equilibrium with the target level of the gas pCO2 within 1h of
aeration. The algal chemostat cultures (5 L) were stirred continuously and kept at
18°C under a 16h:8h light:dark regime (185 µmol m-2 s-1). Subsamples from the
surplus culture collected in an overflow container were taken daily to measure the
cell density of the cultures with a CASY cell counter (SCHÄRFE SYSTEMS,
Reutlingen, Germany) as well as the algal stoichiometry (see procedure below).
To feed the zooplankton populations, two new R. salina batch cultures were created
daily at concentrations of 0.5 * 10-6 cells L-1 to ensure that, within each treatment,
zooplankters were feeding on the same algal quality for the duration of the
experiment. We needed to prepare batch cultures since the volume of algae needed to
feed the zooplankton populations was too important to be taken from the chemostats.
The phytoplankton cultures were constantly aerated with air at pCO2 of 200 and 800
μatm (Rho 200 and Rho 800). It is important to note that this study was conducted
using a controlled system with fixed pH which might induce different responses than
in the field where pH drifts with phytoplankton growth (Flynn et al. 2015). The algae
were cultivated in 1 L batch cultures in f/2 medium at 18ºC under a 16h:8h light:dark
regime (185µmol m-2 s-1). After three days of growth, an aliquot of each R. salina
culture was filtered onto pre-combusted Whatman GF/F filters. The particulate C and
N content of R. salina was measured with a Vario Micro Cube/CN-analyser
(Elementar). Particulate P was analysed as orthophosphate after acidic oxidative
hydrolysis with 5% H2SO4 (Grasshoff et al. 1999).
Microzooplankton O. marina Dujardin was obtained from the Göttingen culture collection (Strain
B21.89) and fed R. salina at 18ºC under a dim continuous light regime (50 µmol m-2
s-1). Prior to the experiment, the O. marina culture was starved for 1 week in order to
eradicate any effects of preculture conditions. This culture was then split into 28
separate cultures (four treatments, seven replicates) which were all diluted to a start
concentration of 20,000 cells mL-1 with CO2 preconditioned artificial, sterile and
nutrient-free seawater (Aqua Marin) at a salinity of 32. Cell concentrations of the
cultures were determined using a CASY particle counter (SCHÄRFE SYSTEMS,
CHAPTER III
64
Reutlingen, Germany). The O. marina cultures were gently aerated with a mixture of
air and pure CO2 adjusted to 200 (Water 200) and 800 μatm (Water 800). As for
phytoplankton cultures, a sensor continuously monitored the pCO2 of the gas mixture
distributed to the algal cultures and automatically adjusted the CO2 content and flow
rate. Pre-experiments indicated that gentle bubbling does not affect O. marina
growth rate. The cultures had pH of 8.3 (±0.06) and 7.8 (±0.05) when aerated with
200 and 800 pCO2, respectively. The total alkalinity of the CO2 preconditioned
artificial seawater was 3300 µmol L-1 for the 200 µatm and 3197 µmol L-1 for the 800
µatm pCO2 treatment. The pH was measured with a ProLab 3000 pH meter with an
IoLine pH combination electrode with temperature sensor (type IL-pHT-
A170MFDIN-N). TA was estimated from open-cell duplicate potentiometric titration
and calculation with modified Gran plots (Bradshaw et al. 1981), using a TitroLine
alpha plus titrator with an IoLine pH combination electrode with temperature sensor
(type IL-pHT-A120MF-DIN-N). The carbonate system was calculated from TA, pH,
temperature and salinity using CO2SYS (Lewis and Wallace 1998), the pCO2 values
obtained were 292 and 911 ppm for the 200 and 800 treatments, respectively. To
calculate the carbonate system, we used the equilibrium constants of Mehrbach et al.
(1973) refitted by Dickson and Millero (1987). Each of the two pCO2 culture sets
(Water 200 and Water 800) was fed ad libitum with 35 algal cells per O. marina
daily during four days with either Rho 200 or Rho 800 (Rho 200-Water 200,
Rho 200-Water 800, Rho 800-Water 200, Rho 800-Water 800). The quantity of food
given daily was sufficient to prevent food quantity limitation and was adjusted at the
last feeding day to minimize the amount of remaining algal cells after 24h. After four
days of growth, the cell concentration of each O. marina culture was determined by
CASY counting and the relative growth rate of each culture was calculated.
Mesozooplankton Eggs of the calanoid copepod A. tonsa were produced in 200-litre cylindrical tanks,
where the animals were cultivated at 18ºC at a 16:8 light:dark cycle. Copepods were
fed with R. salina. Eggs were siphoned from the bottom of the tanks daily and stored
in seawater at 4ºC for later use. The stored eggs were incubated in fresh seawater at
18ºC for hatching. Since hatching peaks between 24h and 36h of incubation, we
collected the nauplii hatched during this period to minimize age differences between
individuals. Nauplii were placed at 18ºC under a dim 16:8 light:dark regime in the
CHAPTER III
65
same four treatments above-described for microzooplankton and fed daily for 12
days. The cultures were put in 1 L glass containers at densities of 1,000 individuals
L-1 in seven replicates per treatment. Copepods were fed ad libitum with 20,000 algal
cells per copepod and all experimental animals were washed daily over a sieve
(75 µm mesh size) to separate them from any algae before being introduced to fresh
CO2 preconditioned artificial seawater prior to feeding in order to minimise changes
in the nutrient composition of the algae by waste products of the animals. The
developmental rate of the juvenile copepods was determined after 12 days. The
developmental stages of the copepods were determined for at least 100 individual
animals from subsamples at the end of the experiment. For the calculation of the
developmental rates, all naupliar larvae were assigned to stage 6, the last naupliar
stage before transition to the copepodite stages. The number of individuals per stage
was divided by the number of days of growth, and the developmental rate per
treatment was then calculated by dividing this sum by the number of individuals
counted. We also tested the copepods reaction to the treatments by measuring the
respiration rates of stage 4 nauplii and stage 3 copepodites. Copepods respiration
rates were measured following the procedure described by Schoo et al. (2013).
Respiration rates were determined with a microsensor oxygen metre (PreSens
Precision Sensing, Germany) equipped with oxygen microoptodes. Approximately
100 nauplii and 75 copepodites were sampled from the incubation containers at day 5
and 10 and were washed over a sieve (75 µm mesh size) to separate them from any
algae before being introduced into the 5 mL incubation vessel. Oxygen air saturation
values were below 80% at the end of the 1h measurements. Bacterial respiration rates
were measured as a control treatment at the same time and the measured bacterial
respiration rates were deduced from the total respiration rates of the copepod
measurements. The animals were collected and counted after the incubation to
determine the precise number of animals in each vessel, permitting an accurate
calculation of respiration rates per individual animal. Respiration rates were
calculated by linear regression of oxygen concentration over time. Technical issues
unfortunately prevented us from measuring the respiration for O. marina. It is not
possible to separate O. marina from R. salina due to small size differences between
the two species and pre-experiments showed that using a control with algae only
generates too large standard deviations.
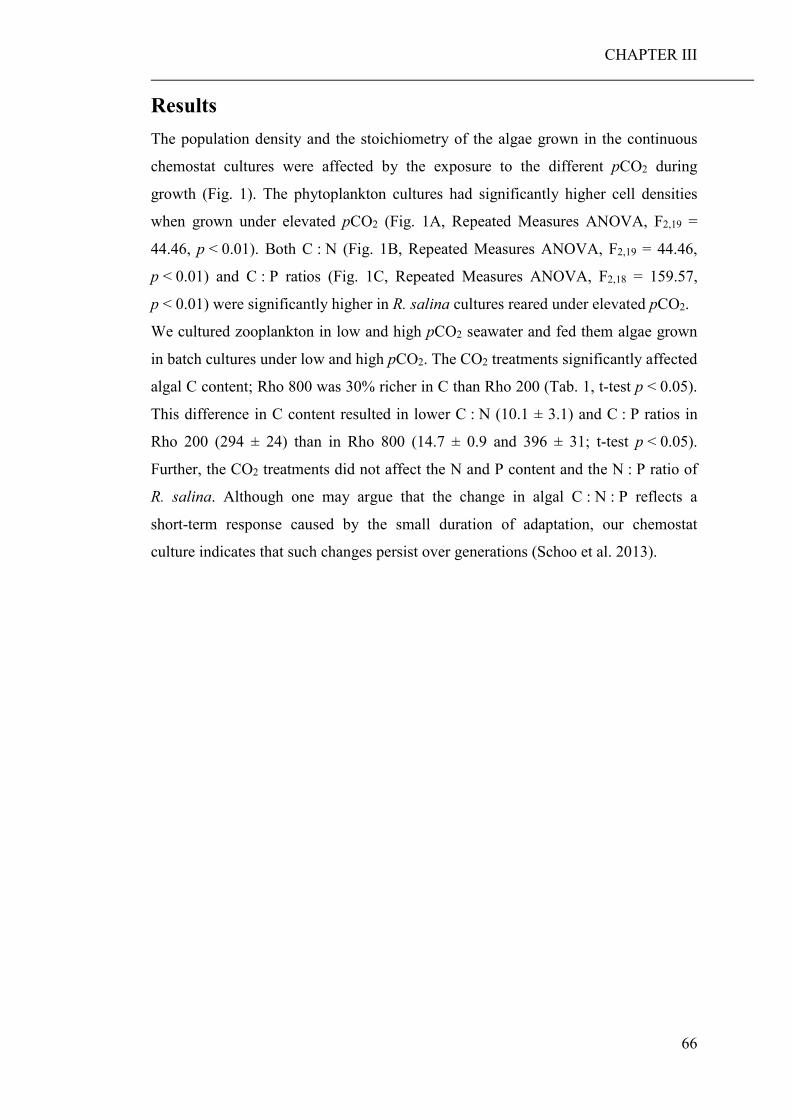
CHAPTER III
66
Results The population density and the stoichiometry of the algae grown in the continuous
chemostat cultures were affected by the exposure to the different pCO2 during
growth (Fig. 1). The phytoplankton cultures had significantly higher cell densities
when grown under elevated pCO2 (Fig. 1A, Repeated Measures ANOVA, F2,19 =
44.46, p < 0.01). Both C : N (Fig. 1B, Repeated Measures ANOVA, F2,19 = 44.46,
p < 0.01) and C : P ratios (Fig. 1C, Repeated Measures ANOVA, F2,18 = 159.57,
p < 0.01) were significantly higher in R. salina cultures reared under elevated pCO2.
We cultured zooplankton in low and high pCO2 seawater and fed them algae grown
in batch cultures under low and high pCO2. The CO2 treatments significantly affected
algal C content; Rho 800 was 30% richer in C than Rho 200 (Tab. 1, t-test p < 0.05).
This difference in C content resulted in lower C : N (10.1 ± 3.1) and C : P ratios in
Rho 200 (294 ± 24) than in Rho 800 (14.7 ± 0.9 and 396 ± 31; t-test p < 0.05).
Further, the CO2 treatments did not affect the N and P content and the N : P ratio of
R. salina. Although one may argue that the change in algal C : N : P reflects a
short-term response caused by the small duration of adaptation, our chemostat
culture indicates that such changes persist over generations (Schoo et al. 2013).
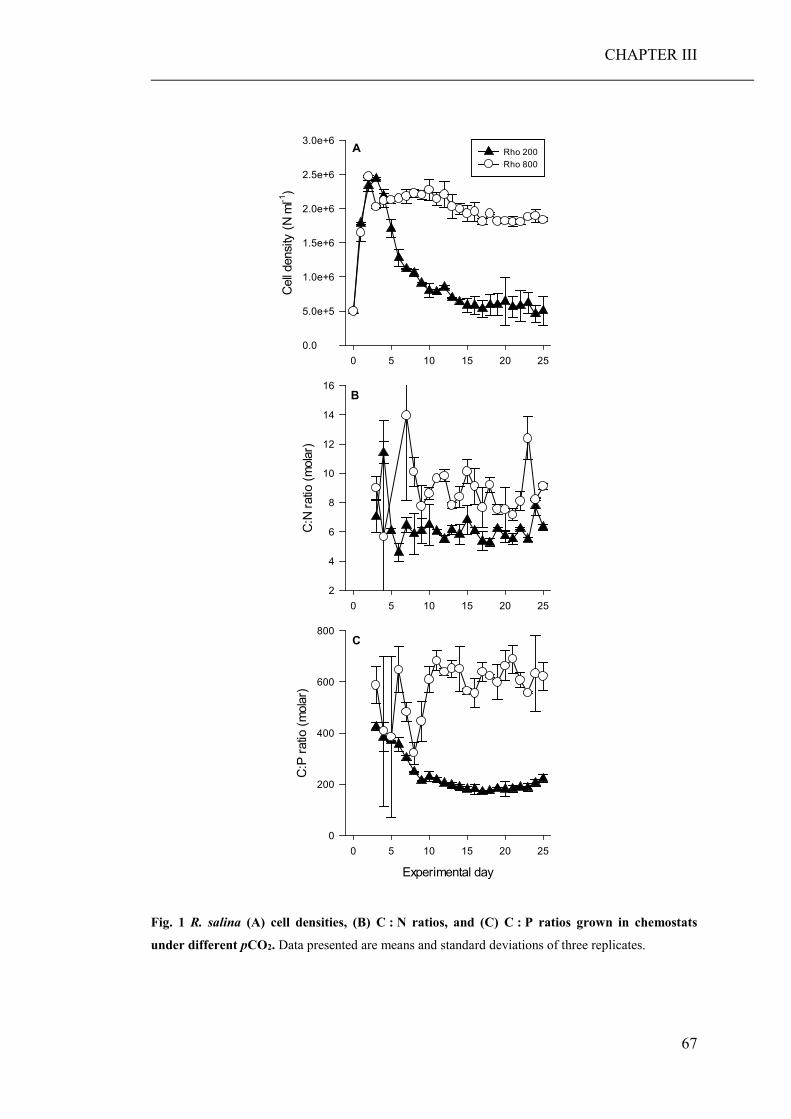
CHAPTER III
67
0 5 10 15 20 25
Cel
l den
sity
(N m
l-1)
0.0
5.0e+5
1.0e+6
1.5e+6
2.0e+6
2.5e+6
3.0e+6Rho 200Rho 800
A
0 5 10 15 20 25
C:N
ratio
(mol
ar)
2
4
6
8
10
12
14
16B
Experimental day
0 5 10 15 20 25
C:P
ratio
(mol
ar)
0
200
400
600
800C
Fig. 1 R. salina (A) cell densities, (B) C : N ratios, and (C) C : P ratios grown in chemostats
under different pCO2. Data presented are means and standard deviations of three replicates.
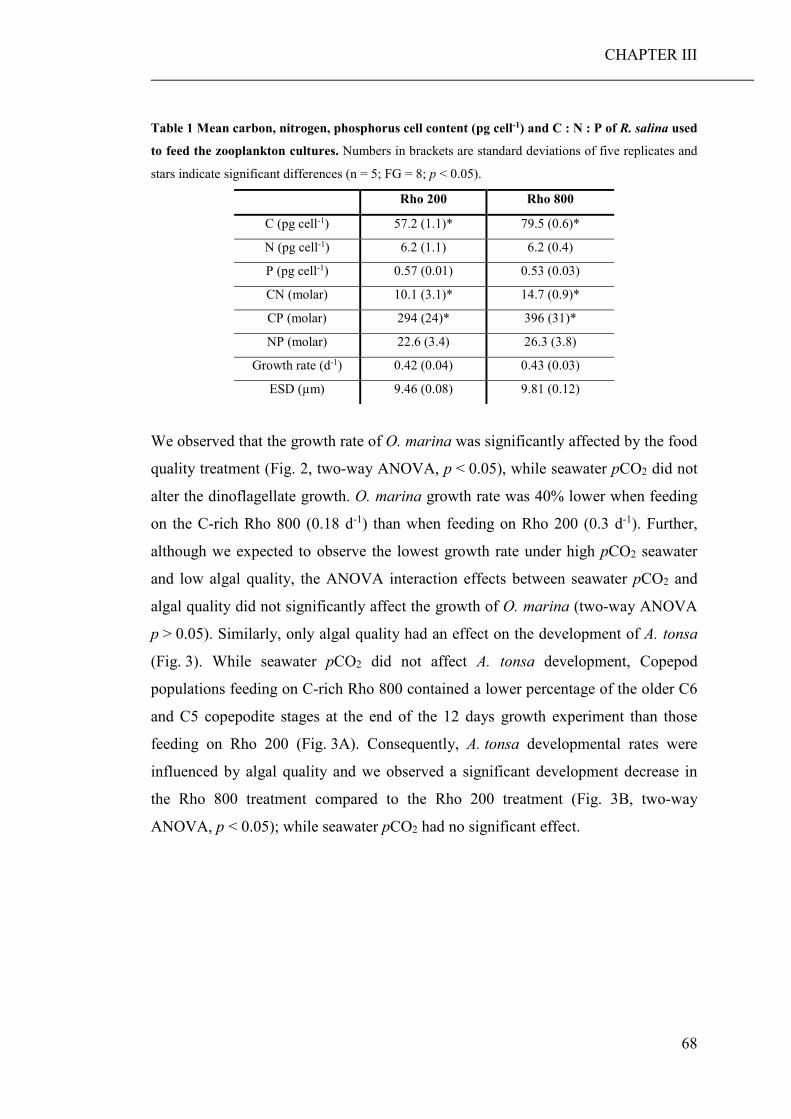
CHAPTER III
68
Table 1 Mean carbon, nitrogen, phosphorus cell content (pg cell-1) and C : N : P of R. salina used
to feed the zooplankton cultures. Numbers in brackets are standard deviations of five replicates and
stars indicate significant differences (n = 5; FG = 8; p < 0.05).
Rho 200 Rho 800
C (pg cell-1) 57.2 (1.1)* 79.5 (0.6)*
N (pg cell-1) 6.2 (1.1) 6.2 (0.4)
P (pg cell-1) 0.57 (0.01) 0.53 (0.03)
CN (molar) 10.1 (3.1)* 14.7 (0.9)*
CP (molar) 294 (24)* 396 (31)*
NP (molar) 22.6 (3.4) 26.3 (3.8)
Growth rate (d-1) 0.42 (0.04) 0.43 (0.03)
ESD (µm) 9.46 (0.08) 9.81 (0.12)
We observed that the growth rate of O. marina was significantly affected by the food
quality treatment (Fig. 2, two-way ANOVA, p < 0.05), while seawater pCO2 did not
alter the dinoflagellate growth. O. marina growth rate was 40% lower when feeding
on the C-rich Rho 800 (0.18 d-1) than when feeding on Rho 200 (0.3 d-1). Further,
although we expected to observe the lowest growth rate under high pCO2 seawater
and low algal quality, the ANOVA interaction effects between seawater pCO2 and
algal quality did not significantly affect the growth of O. marina (two-way ANOVA
p > 0.05). Similarly, only algal quality had an effect on the development of A. tonsa
(Fig. 3). While seawater pCO2 did not affect A. tonsa development, Copepod
populations feeding on C-rich Rho 800 contained a lower percentage of the older C6
and C5 copepodite stages at the end of the 12 days growth experiment than those
feeding on Rho 200 (Fig. 3A). Consequently, A. tonsa developmental rates were
influenced by algal quality and we observed a significant development decrease in
the Rho 800 treatment compared to the Rho 200 treatment (Fig. 3B, two-way
ANOVA, p < 0.05); while seawater pCO2 had no significant effect.
CHAPTER III
69
Treatment
Rho 200-Water 200
Rho 200-Water 800
Rho 800-Water 200
Rho 800-Water 800
O. m
arin
a re
lativ
e gr
owth
rate
(d-1
)
0.0
0.1
0.2
0.3
0.4
a a
b b
Fig. 2 Growth rates of O. marina reared under different pCO2 and fed with different pCO2 R.
salina. Data presented are means and standard deviations of seven replicates. Statistically significant
differences (p<0.05) are indicated by letters.
The different food qualities also led to differences in copepod respiration rates.
Copepods feeding on C-rich Rho 800 had significantly higher respiration rates than
those feeding on Rho 200 (Fig. 4, two-way ANOVA, Tukey’s honest significant
difference posthoc test, p < 0.01); while no effect of seawater pCO2 could be
identified. Further, although we expected the combination of high pCO2 seawater and
low algal quality to have a strong effect, the ANOVA interaction effects between
seawater pCO2 and algal quality did not significantly affect the development and
respiration of A. tonsa (two-way ANOVA p > 0.05).
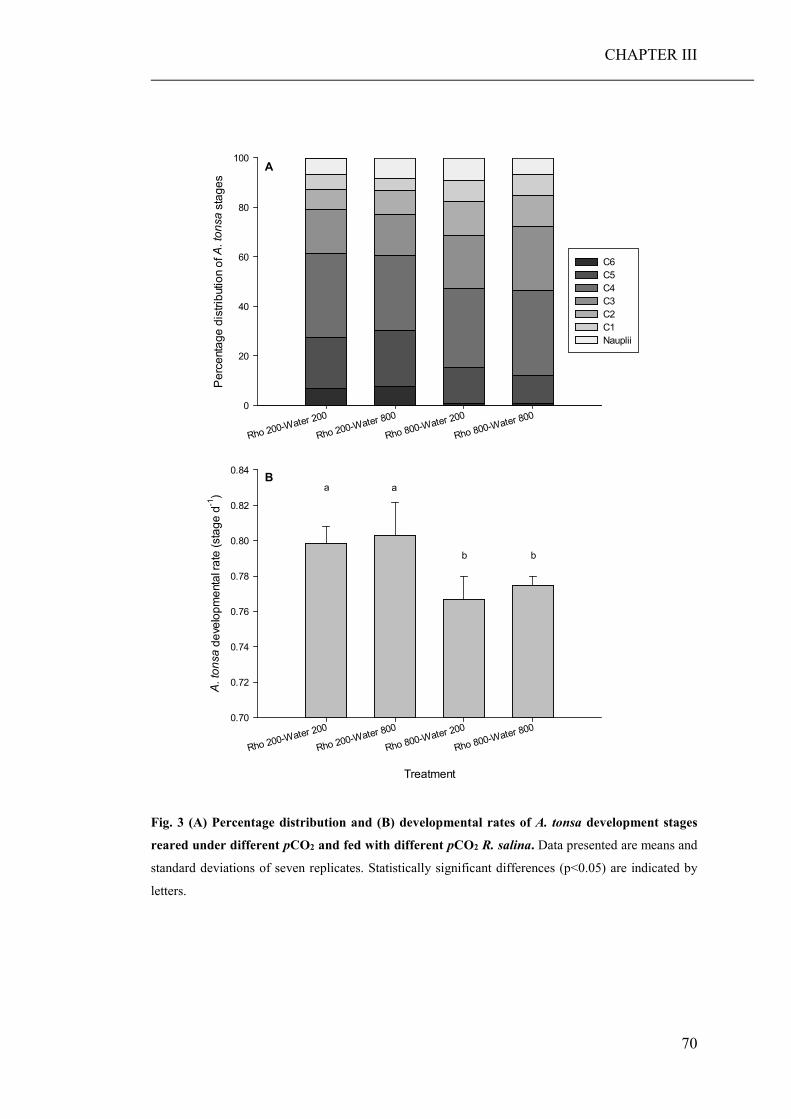
CHAPTER III
70
Rho 200-Water 200
Rho 200-Water 800
Rho 800-Water 200
Rho 800-Water 800
Per
cent
age
dist
ribut
ion
of A
. ton
sa s
tage
s
0
20
40
60
80
100
C6C5C4C3C2C1Nauplii
Treatment
Rho 200-Water 200
Rho 200-Water 800
Rho 800-Water 200
Rho 800-Water 800
A. t
onsa
dev
elop
men
tal r
ate
(sta
ge d
-1)
0.70
0.72
0.74
0.76
0.78
0.80
0.82
0.84
a a
b b
A
B
Fig. 3 (A) Percentage distribution and (B) developmental rates of A. tonsa development stages
reared under different pCO2 and fed with different pCO2 R. salina. Data presented are means and
standard deviations of seven replicates. Statistically significant differences (p<0.05) are indicated by
letters.
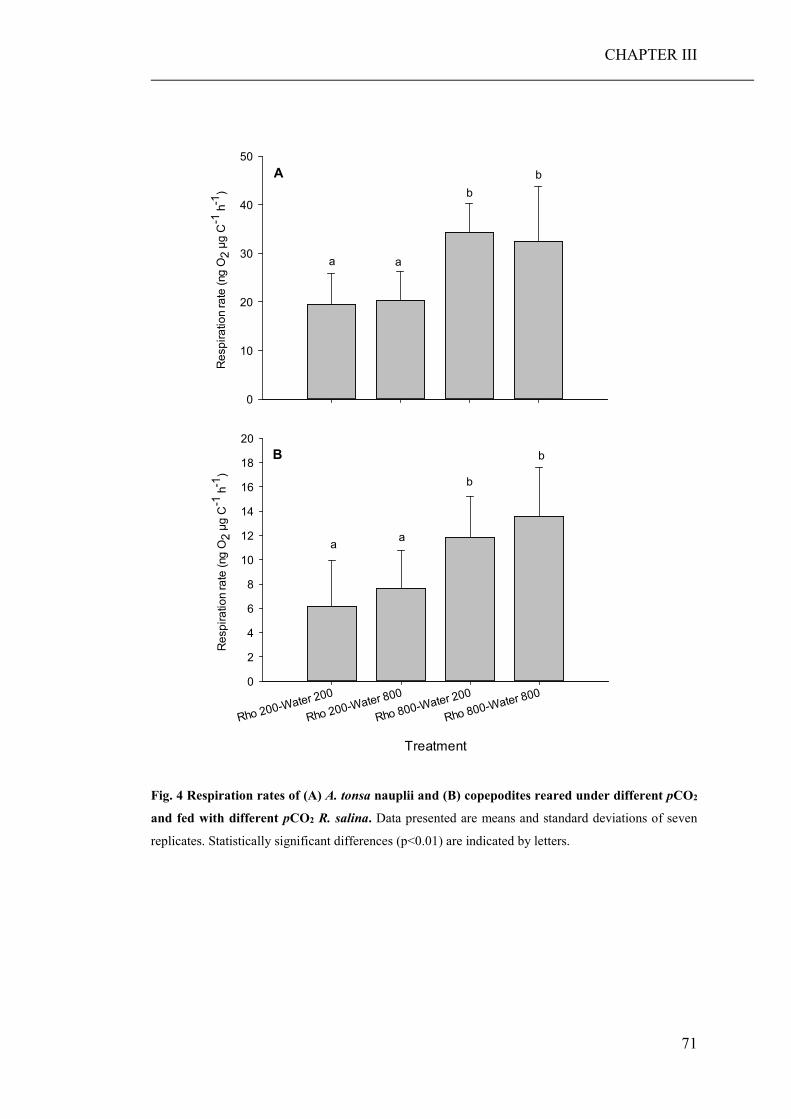
CHAPTER III
71
Res
pira
tion
rate
(ng
O2
µg C
-1 h
-1)
0
10
20
30
40
50
Treatment
Rho 200-Water 200
Rho 200-Water 800
Rho 800-Water 200
Rho 800-Water 800
Res
pira
tion
rate
(ng
O2
µg C
-1 h
-1)
0
2
4
6
8
10
12
14
16
18
20
A
B
a a
bb
a a
b
b
Fig. 4 Respiration rates of (A) A. tonsa nauplii and (B) copepodites reared under different pCO2
and fed with different pCO2 R. salina. Data presented are means and standard deviations of seven
replicates. Statistically significant differences (p<0.01) are indicated by letters.
CHAPTER III
72
Discussion Although it has previously been suggested that smaller organisms should be more
affected by ocean acidification (Flynn et al. 2012), we found no direct effect of
seawater pCO2 on the dinoflagellate and copepod species we studied. This indicates
that zooplankton might already be resistant to hypercapnia. Due to environmental
variability (e.g., upwelling, rock pools), diapause at depth, many zooplankton
(including larval stages) already face pH levels much lower than those predicted for
surface waters in the coming century (Olson and Kawaguchi 2011). Thus, predicted
changes in surface seawater pH may be small relative to the range of pH zooplankton
experience during their lifespan. These organisms could already be well adapted to
seawater pH variations and potential effects of hypercapnia.
Our study, however, shows that the primary producer used in this study increased its
cellular carbon content when cultured under elevated pCO2. Both higher C fixation
and increased growth rate under high pCO2 could result in increased C : nutrient
ratios. Culturing R. salina under different pCO2 at identical dilution rates (i.e. growth
rates) in chemostats yielded different C : nutrient ratios (Fig.1, see also Schoo et al.
2013). This indicates that elemental stoichiometric differences are caused by higher
C fixation rather than by higher growth rates under high pCO2. This change in algal
biochemical composition, and therefore quality, decreased the growth of the
dinoflagellate O. marina as well as the development of the copepod A. tonsa. Thus,
not only copepodites (as shown by Schoo et al. 2013) but also nauplii and
microzooplankton react with decreasing growth with increasing CO2 availability to
the algae. Altogether, the growth rate and development of microzooplankton and
mesozooplankton decrease at higher pCO2, coupled with the suppression of
reproductive scope identified by other studies (Cripps et al. 2014a) have clear
potential to damage population growth dynamics.
To our knowledge, none of the previous studies investigated the direct and indirect
effects of near-future pCO2 levels on zooplankton. Only Rossoll et al. (2012)
conducted a full factorial experiment testing direct and indirect high pCO2 effects on
copepods. However, their work suffers from the fact that copepods did not contain
any long chain fatty acids in acid treatments although they were provided by the
algae (at decreased amounts). This points to an unexplained lack of feeding rather
than an effect of food quality. Our results therefore bring important new knowledge
CHAPTER III
73
on the impact of ocean acidification on copepods. Further, our study contradicts the
conclusions of the few existing experimental studies on microzooplankton which
found no effects of increased pCO2 (Suffrian et al. 2008; Rose et al. 2009; Aberle et
al. 2013). However, the major focus of those studies was on the direct effects of
increased pCO2, which, as we identified here, does not impact microzooplankton.
Although we expected that the direct effect of high CO2 would be most pronounced
when the grazers were feeding on low algal quality, the interaction between these
two treatments did not alter zooplankton performances. This could be the result of an
elevated energy expenditure enabled by higher algal energy content and should result
in higher grazers’ respiration rates. However, nauplii and copepodites respiration was
only increased by low algal quality. As previously described by Schoo et al. (2013),
we suggest that increased respiration rates represented a physiological response to
excrete the excess C obtained from prey grown in high pCO2 conditions, rather than
a stress response to deal with low pH.
In this study, we found that direct pCO2 effects on consumers seem to be of lesser
importance than the associated decrease in algal quality. Several studies have
investigated the direct effects of ocean acidification on zooplankton. While elevated
pCO2 does not seem to affect adult copepods, hatching rates are negatively affected
by very high pCO2 (Kurihara et al. 2004; Mayor et al. 2007; Cripps et al. 2014b).
Further, the decrease of primary producers’ quality under high pCO2 conditions
negatively affects zooplankton production and growth. However, the generality of
this result remains uncertain, as community level dampening, such as species
richness and complex trophic interactions, may compensate for low food quality
(Rossoll et al. 2013). Indeed, the CO2 effect in the one alga – one copepod species
food chain in the study by Rossoll et al. (2012) vanished when the same zooplankton
species fed on a semi-natural food mixture in mesocosms (Rossoll et al. 2013).
Nevertheless, lower growth rates of zooplankton, as shown in this study, may lead to
lower availability of food for the next trophic level and thus potentially affect the
recruitment of higher trophic levels. Furthermore, quality effects have also been
shown to travel up the food chains (Malzahn et al. 2007), and decreased algal quality
may affect higher trophic levels as well.
CHAPTER III
74
Acknowledgments This study is a part of the PhD study conducted by M.A.M., H.G.H., J.A.F.L., in the Helgoland
Foodweb Project at the Biologische Anstalt Helgoland, funded within the framework of BIOACID,
the German national project on ocean acidification (03F0655A). This work was carried out within the
framework of the PACES II Programme of the Helmholtz Society. We thank Arne Malzahn and
Nicole Aberle-Malzahn for continuing fruitful discussions and for their comments on earlier version
of the manuscript. We also thank Saskia Ohse and Silvia Peters for their help in the laboratory. This
study completely complies with current German legislation on animal studies.
CHAPTER IV
75
CHAPTER IV
On the evolutionary potential of the calanoid copepod Acartia tonsa
towards ocean acidification: insights from a long-term laboratory
selection study
Julia A. F. Langer1, Cédric L. Meunier1, Ursula Ecker1, Henriette G. Horn1,2, Klaus
Schwenk3, Maarten Boersma1,4
1 Alfred-Wegener-Institut Helmholtz-Zentrum für Polar- und Meeresforschung, Biologische Anstalt
Helgoland, Helgoland, 27498, Germany 2 Present address: Royal Netherlands Institute for Sea Research and Utrecht University, Yerseke, 4400
AC, The Netherlands 3 University Koblenz-Landau, Institute of Environmental Science, Landau in der Pfalz, 76829,
Germany 4 University of Bremen, Bremen, 28359, Germany
Submitted to:
Marine Ecology Progress Series
CHAPTER IV
76
Abstract The ongoing acidification process of the oceans is likely to have consequences for
many marine biota. Although evolutionary responses are expected during persisting
environmental change, little is known about the adaptability of copepods. Therefore,
we set up a 3 ½ years long selection study, culturing Acartia tonsa populations in
water treated with 200 and 800 µatm pCO2, feeding them with algae grown in f/2
medium under 200 µatm pCO2 and in f/2 -N-P medium under 800 µatm pCO2. After
three reciprocal transplant experiments we measured copepods’ developmental rates,
carbon to nutrient ratios, egg production and resulting hatching rates. Under high
CO2 conditions, stoichiometric discrepancies between the requirements of A. tonsa
and its food resulted in a significantly decreased developmental rate independent
from the selective history. After one year, these discrepancies appeared alleviated by
an increased homeostasis of the copepods, indicating a high body stoichiometry
regulation plasticity. Egg production and the overall hatching success was unaffected
by the experimental conditions, however, results indicated a premature hatching of
eggs from females with a high CO2 selective history. Potentially due to the lack of a
strong selective pressure, we did not detect any beneficial evolutionary adaptations
of the copepods cultured under high CO2 conditions. Towards the end of the
experiment, copepods cultured under elevated pCO2 and fed with high CO2 algae
(high energy, low nutrients), showed an increased body mass and decreased prosoma
length. Such physiological changes could have profound long-term consequences for
marine copepods, food web interactions, and ultimately ecosystem structures and
functions.
CHAPTER IV
77
Introduction Since the industrial revolution, oceanic uptake of CO2 from the atmosphere has
resulted in a decrease of the ocean surface water pH by more than 0.1 units,
representing the most rapid change in carbonate chemistry experienced in the past 20
million years (Caldeira and Wickett 2003; Pörtner et al. 2014). This decrease in both
pH and the availability of free carbonate ions (CO32-) affects above all calcifying
organisms such as coccolithophores, foraminifera, echinoderms, molluscs and corals,
as their ability to build up calcium shells and skeleton structures is directly affected
by seawater carbonate chemistry (Riebesell et al. 2000; Langdon et al. 2003; Feely et
al. 2004; Orr et al. 2005; Raven et al. 2005; Kleypas et al. 2006; Fabry et al. 2008).
Direct effects on non-calcifying zooplankton taxa such as cnidaria (Attrill et al. 2007;
Lesniowski et al. 2015) and crustaceans (Wittmann and Pörtner 2013) are rarer. Most
experiments on adult copepods, for example, indicated low sensitivities to increased
pCO2 (decreased seawater pH) conditions (Kurihara and Ishimatsu 2008; Mayor et al.
2012; McConville et al. 2013). Only under pCO2 pressures above 5000 µatm (which
are unlikely to be reached in most parts of the oceans by the end of the century
(Caldeira and Wickett 2003)), developmental rates, egg production, hatching rates
and survival of copepods were negatively affected (Kurihara et al. 2004; Mayor et al.
2007; Niehoff et al. 2013; Hildebrandt et al. 2014; Pedersen et al. 2014). However,
younger developmental stages seem to be more vulnerable to direct effects of
increased seawater pCO2 than older ones. Fitzer et al. (2012) observed a negative
effect of increased pCO2 (~ 600 µatm) on the nauplii production in Tispe battagliai.
Furthermore, Cripps et al. (2014b) detected lethal effects on Acartia tonsa nauplii
already under 1000 µatm pCO2 concentrations. Contrary, in another experiment the
developmental rate and egg production of A. tonsa was not affected by increased
pCO2 (~ 800 µatm) (Meunier et al. 2016). Conducted studies indicate that copepods’
responses to ocean acidification (OA) are very much species- and stage-specific,
with adult stages to be less sensitive.
Besides direct effects due to a lower seawater pH, increased CO2 levels can also have
indirect effects on herbivores through changes in stoichiometry (higher carbon (C) to
nutrient ratios) and fatty acid composition of primary producers (Urabe et al. 2003;
Rossoll et al. 2012; Verschoor et al. 2013; Meunier et al. 2016), which may be
especially pronounced under nutrient limitation during e.g. phytoplankton bloom
CHAPTER IV
78
periods (Bach et al. 2016). Since heterotrophs are more restricted in their elemental
composition than autotrophs, stoichiometric discrepancies between predator and prey
can diminish consumer growth, fecundity and survival (Sterner and Elser 2002;
Bukovinszky et al. 2012). Indeed in previous studies, the copepod Acartia tonsa
showed a decreased developmental rate (by nearly 50%) and reproduction (from 34
to 5 eggs female-1 day-1) when fed algae cultured under high pCO2 (~ 800 µatm)
conditions (Rossoll et al. 2012; Schoo et al. 2013; Meunier et al. 2016).
Confronted with a changing environment, organisms can inter alia react with
geographic range shifts, physiological acclimatisation and / or genetic adaptations
(Kelly and Hofmann 2013). Studies on species with short generation times, for
example on the coccolithophore Emiliania huxleyi (Lohbeck et al. 2012) and the
microalgae Chlamydomonas (Collins and Bell 2004), revealed evolutionary
adaptations to OA after 500 and 1000 generations, respectively. However, as most
temperate copepod species have generation times of approximately 15 to 30 days
(Peterson 2001) and are elaborate to culture, real-time investigations on
acclimatisation and / or adaptation to environmental change are scarce. In a
laboratory experiment Colin and Dam (2004) exposed the copepod Acartia
hudsonica to a diet containing the toxic dinoflagellate Alexandrium fundyense. After
three generations, copepods acclimatised or adapted to the food conditions, reflected
by an improved ingestion and egg production of the adult females. Thus, although
there is evidence that some species can adapt to altered environmental conditions
within a short time scale, organisms with longer generation periods such as copepods
often show phenotypic plasticity to compensate unfavourable changes in their
environment (Dam 2013; Thor and Dupont 2015). This kind of flexibility allows
species to persist in the face of climate change and gives populations time to adapt to
new environmental settings (Chevin et al. 2010). Additional, as an extension of
phenotypic plasticity, transgenerational effects such as epigenetic inheritance are
observed among organisms. By, for example, the transmission of nutritional, somatic,
cytoplasmatic or epigenetic material, parents can significantly affect the performance
(survival and fitness) of the following generation (Bonduriansky and Day 2009).
Transgenerational carry-over effects of marine organisms exposed to OA were for
example found in fishes (Munday 2014), oysters (Parker et al. 2012), sea urchins
(Dupont et al. 2013) and copepods (Vehmaa et al. 2012; Cripps et al. 2014a; Thor
and Dupont 2015). In the study of Thor and Dupont (2015), populations of the
CHAPTER IV
79
copepod Pseudocalanus acuspes were cultured for two generations under 400, 900
and 1550 µatm pCO2. Reciprocal transplant experiments showed that the
investigated fecundity decrease under higher pCO2 conditions was reversible and
thus an expression of phenotypic plasticity. Furthermore, due to transgenerational
effects the reduction in fecundity of the offspring was lower if the parents were
cultured in a high pCO2 environment. Further, based on their investigations of the
effects of simulated OA on Acartia sp. during a mesocosm experiment in the Baltic,
Vehmaa et al. (2016) suggested maternal effects as important components defining
phenotypic buffering of copepods against OA. However, as the mesocosm
experiment only lasted 45 days, potential long-term effects remained unknown.
Although adaptive responses of various marine taxa to OA have been observed in
several studies, long-term studies covering several generations are still lacking.
Evolutionary processes can affect inter- and intraspecific interactions within the food
web and, at a larger scale, alter the marine ecosystem (Thompson 1998; Matthews et
al. 2011). In the context of stoichiometry, rapid evolution can affect the elemental
balances (C, N, P) of organisms, thereby not only influencing population and
community dynamics but also ecosystem functions such as nutrient cycling
(Declerck et al. 2015; Yamamichi et al. 2015). As copepods (zooplankton) are
indispensable to the functioning of pelagic food webs and contribute to many
ecosystem services (Bron et al. 2011), their reaction to stressors is particularly
relevant. As a cosmopolitan primary consumer A. tonsa plays a key role in marine
communities, transferring energy captured by phytoplankton to higher trophic levels.
Changes in the performance (e.g. reproduction, development) or physiology (e.g.
body stoichiometry) of such a primary consumer could have far reaching
consequences for ecosystem structures and functions.
In our long-term selection study, we investigated the combined direct (lower water
pH) and indirect (changed food quality) effects of elevated pCO2 on laboratory
populations of the calanoid copepod A. tonsa and its potential to acclimatise and / or
adapt to increased pCO2 conditions accompanied with a reduced food quality. We set
up a 3 ½ years long selection study, culturing A. tonsa populations in water aerated
with 200 and 800 µatm pCO2 concentration, feeding them with algae, grown in f/2
medium under 200 µatm pCO2 and in f/2 -N-P medium under 800 µatm pCO2. We
hypothesised that the high CO2 selection line (SL) populations should adapt to the
high CO2 conditions of increased seawater pCO2 and associated food quality
CHAPTER IV
80
reduction, leading to an increased fitness under high CO2 conditions compared to the
low CO2 SL copepods. To detect possible adaptations of the high CO2 SL
populations, we carried out two different reciprocal transplant experiments, which
were repeated at an interval of around one year. In those transplant experiments, we
investigated the performance of the high and low CO2 SLs in their original and
experimental CO2 treatment, comparing several fitness parameters (developmental
rate, egg production and hatching rate) and their elemental body stoichiometry.
Furthermore, we investigated possible changes in the body size of A. tonsa by
measuring the prosoma length of adult females throughout the long-term experiment.
To exclude effects of genetic drift (e.g. bottleneck effects) that could reduce the
genetic diversity and thus the physiological and genetic adaptability of our
experimental populations, we regularly reviewed the genetic diversity of the
selection lines by analysing the neutral gene region cytochrome-c-oxidase I (COI).
Methods Long-term CO2 selection experiment In September 2013, the long-term CO2 SLs of A. tonsa were started using a random
selection of eggs from our copepod cultures already present in the laboratory to avoid
running the risk of different initial conditions between the selection lines and
replicates. The CO2 SLs ran 41 months, which represents around 80 generations
based on the investigations of Peterson (2001). Figure 1 shows a schematic
illustration of the experimental setup and time line.
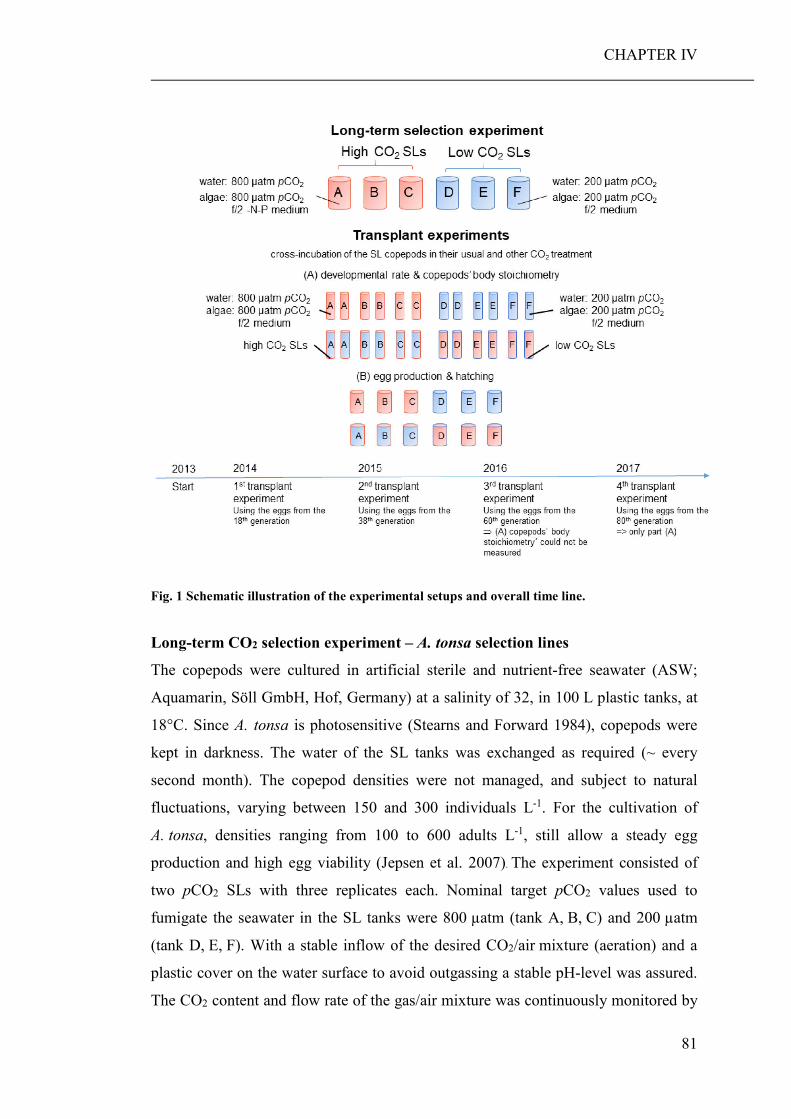
CHAPTER IV
81
Fig. 1 Schematic illustration of the experimental setups and overall time line.
Long-term CO2 selection experiment – A. tonsa selection lines
The copepods were cultured in artificial sterile and nutrient-free seawater (ASW;
Aquamarin, Söll GmbH, Hof, Germany) at a salinity of 32, in 100 L plastic tanks, at
18°C. Since A. tonsa is photosensitive (Stearns and Forward 1984), copepods were
kept in darkness. The water of the SL tanks was exchanged as required (~ every
second month). The copepod densities were not managed, and subject to natural
fluctuations, varying between 150 and 300 individuals L-1. For the cultivation of
A. tonsa, densities ranging from 100 to 600 adults L-1, still allow a steady egg
production and high egg viability (Jepsen et al. 2007). The experiment consisted of
two pCO2 SLs with three replicates each. Nominal target pCO2 values used to
fumigate the seawater in the SL tanks were 800 µatm (tank A, B, C) and 200 µatm
(tank D, E, F). With a stable inflow of the desired CO2/air mixture (aeration) and a
plastic cover on the water surface to avoid outgassing a stable pH-level was assured.
The CO2 content and flow rate of the gas/air mixture was continuously monitored by
CHAPTER IV
82
a sensor (HTK Hamburg) and automatically adjusted. The water pH of the SL tanks
was controlled after cleaning activities or maintenance work on the gas mixing
system using a ProLab 3000 pH meter with an IoLine pH combination electrode with
temperature sensor (type IL-pHT-A170MFDIN-N). From 2015 on, we additionally
started a weekly documented pH measurement of the SL tanks (Fig. 2).
Fig. 2 Mean pH of the water in the selection line (SL) tanks. x axis: time points, numbers represent
the month; y axis: mean pH; legend: CO2 treatments of the SLs, (high CO2) food and water
manipulated with 800 µatm CO2, (low CO2) food and water manipulated with 200 µatm. Error
bar = SD, data pooled from the three SL replicates (n = 3).
We aimed to lower our control treatment from today’s pCO2 level (400 µatm) to
preindustrial conditions (200 µatm), to possibly maximise the difference between the
experimental CO2 treatments without exceeding the pCO2 concentrations predicted
for the end of the century (Intergovernmental Panel on Climate 2014). However,
subsequent total alkalinity measurements illustrated, that the intended pCO2 of
200 µatm could not be reached and instead slightly varied around 400 µatm pCO2.
To control the target pCO2 values at the start of the long-term selection experiment
we also measured the total alkalinity (TA) of the water from each SL tank. The SL
tanks D, E and F aerated with 200 µatm pCO2 had a TA (and pH) of 3102 µmol kg-1
ASW-1 (8.09), 2962 µmol kg-1 ASW-1 (8.06) and 3060 µmol kg-1 ASW-1 (8.12),
respectively. For the SL tanks A, B and C aerated with 800 µatm pCO2 a TA (and
pH) of 3041 µmol kg-1 ASW-1 (7.87), 3106 µmol kg-1 ASW-1 (7.86) and 3082 µmol
kg-1 ASW-1 (7.49) was measured, respectively. TA was determined by open-cell
duplicate potentiometric titration and calculation with modified Gran plots
(Bradshaw et al. 1981), using a TitroLine alpha plus titrator with an IoLine pH
CHAPTER IV
83
combination electrode with temperature sensor (type IL-pHT-A120MF-DIN-N).
Measured values were corrected using certified reference material (CRM, Batch No.
104, Scripps Institution of Oceanography, USA). For the calculation of the final
pCO2 the online program CO2calc version 1.3.0 (Robbins et al. 2010) was used,
utilizing the dissociation constants of carbonic acid of Mehrbach et al. (1973) and
Hansson (1973), refitted by Dickson and Millero (1987), and the dissociation
constants for H2SO4 from Dickson (1990). The back calculated pCO2 concentrations
of the low CO2 SL tanks (D, E, F) were 495, 512 and 450 µatm pCO2 and of the
high CO2 SL tanks (A, B, C) 871, 913 and 838 µatm pCO2, respectively. Additional
alkalinity and pH control measurements of the water from one low CO2 SL tank (D)
and one high CO2 SL tank (A) in 2016 resulted in a TA (and pH) of 2826 µmol kg-1
water-1 (8.13) and 3093 µmol kg-1 water-1 (7.86), respectively. The back calculated
pCO2 concentrations were 403 µatm for the low and 909 µatm for the high pCO2
treatment. As the CO2 content and flow rate of the gas/air mixture introduced in the
SL tanks was continuously monitored by a sensor and automatically adjusted, there
was no reason for additional TA measurements. Additionally, a change in the pCO2
inflow would have led to a change in the water pH, which was measured regularly.
To measure copepods’ prosoma length and to investigate possible genetic changes,
we took two samples from each tank every second week, by pulling a small sieve
through the water column (collecting ~ 50 individuals). For the genetic analyses and
prosoma length measurements individuals were preserved in 96% ethanol and
sodium tetraborate buffered formaldehyde (4%), respectively. For the determination
of possible prosoma length differences due to the CO2 treatments ~ 20 adult females
were taken from formaldehyde samples, rinsed with tap water (2–3 min) and
measured under a stereo microscope (SZX16) using the CellSens Dimension
software version 1.6 (Olympus). Prosoma lengths were measured from 19 time
points.
To analyse the genetic variability of the A. tonsa start population and to observe
possible changes in the haplotype frequencies over the experimental period, the
marker region COI was analysed. The DNA of five individuals per SL tank (A-F)
from five time points (t1: 11.10.2013 A-F; t2: 06.12.2013 D-F, 08.01.2014 A-C; t3:
17.03.2014 A-F, t4: 15.04.2015 A-F, t5: 01.06.16 A-F) were isolated (ISOLATE II
Genomic DNA Kit, Bioline) and amplified. The master mix consisted of 2.5 mM
MgCl2, 1 mM 10x PCR buffer, 0.2 mM dNTPs, 0.2 mM each primer (HCO2198_t1
CHAPTER IV
84
(5`-CAGGAAACAGCTATGACTAAACTTCAGGGTGACCAAA-3`), LCO1490_t1 (5`-
TGTAAAACGACGGCCAGTGGTCAACAAATCATAAAGA-3`) (Messing 1983;
Folmer et al. 1994)) and 0.5 mM taq polymerase in a total volume of 20 µL with
1 µL template DNA. The amplification conditions for the PCR reaction were 2 min
at 95 °C followed by 35 cycles of 1 min at 95 °C, 1 min at 45 °C and 1 min 30 s at
72 °C and a final elongation for 7 min at 72 °C. The amplification success was
controlled via agarose gel electrophoresis. Positive PCR products of the predicted
length and purity were sequenced. Single sequences were edited and aligned in
Geneious 7.0.4 and used to calculate a haplotype network (median joining) in
PopART 1.7. Statistics of DNA polymorphism were done in DnaSP version 5.10.01.
Additionally, we calculated the frequency of each haplotype for the ambient and high
CO2 treatment at the different time points throughout the experimental period.
To ensure the persistence of the long-term experiment, eggs were collected every
month and stored at 4°C. In case of the death of a SL population, those eggs were
used to restart the specific replicate. Over the whole experiment, we only needed to
restart the 200 µatm pCO2 SL tanks from the collected eggs once, after one year.
Long-term CO2 selection experiment - food cultures
Two 5 L chemostat cultures of the algae Pyrenomonas salina (EPSAG: Experimental
Phycology and Culture Collection of Algae at the University of Göttingen, Germany)
were grown under a 16h:8h light:dark regime (185 µmol m-2 s-1) and stirred
continuously. Chemostat cultures were continuously supplied with f/2 medium
(Guillard and Ryther 1962), at a rate of 500 mL per day, resulting in a dilatation rate
of 10% d-1. Once per month we cleaned the chemostats and setup new algae cultures.
For the preparation of the f/2 medium we used sterile filtered sea water (CA, pore
size 0.2 µm, Sartorius) as it would have been an excessively effort to always keep a
sufficient amount of ASW in stock. The chemostat cultures were aerated with the
same 800 µatm or 200 µatm pCO2 air as the copepod tanks. To prepare the food for
the low CO2 SL copepods, 500 mL of the 200 µatm pCO2 chemostat culture were
mixed with 2.5 L f/2 medium. For the high CO2 SL copepods, 500 mL of the
800 µatm pCO2 algae culture were mixed with 2.5 L f/2 -N-P medium (f/2 recipe
without NaH2PO4 and 80% less NaNO3). All algae mixtures were aerated with
800 µatm or 200 µatm pCO2 and were grown for three days. After this time, algae
entered the stationary phase (indicated by a yellowish colour) and were used as food.
CHAPTER IV
85
SL copepods were fed ad libitum with 1 L of the corresponding algae culture, every
day. Based on a mean density of the algae food culture of 14 x 105 cell mL-1
(calculated based on the density measurements of the algae food cultures during the
transplant experiments) and a mean copepod density of 25,000 individuals per tank,
~ 350 mL algae culture would have been sufficient to reach a food supply of 20,000
cells ind-1, which is recommended for A. tonsa in the literature (Marcus and Wilcox
2007).
We specifically chose to manipulate the medium of the high CO2 SL food algae and
thereby accelerating their stoichiometric change for several reasons. As algae take up
nutrients from the surrounding water, a less intense stoichiometric change would
have made it necessary to clean the tanks daily to assure constant food qualities
(algae stoichiometry). Obviously, this would not have been possible during the entire
long-term experiment. Therefore, it was necessary to exacerbate the nutrient
stoichiometry of the high CO2 food algae to ensure that the differences in food
qualities between the CO2 SL tanks persisted. Furthermore, as many studies on
copepods have suggested that the indirect effects of OA are more important than the
direct ones (Rossoll et al. 2012; Schoo et al. 2013; Verschoor et al. 2013; Meunier et
al. 2016), especially under realistic scenarios, it was essential to make sure that food
quality changes were included in the selection experiment. We specifically chose this
approach, as we were not interested in a distinction between direct and indirect
effects of increased pCO2 on copepods, but rather in the combined effect.
Transplant experiments Based on the long-term selection experiment we carried out two different short-term
reciprocal transplant experiments (A, B) which were repeated three to four times at
an interval of at least one year to investigate possible adaptations of the SLs to the
CO2 treatments. For reasons of time, a denser implementation of transplant
experiments was not possible. With transplant experiment (A) we investigated the
developmental rate and the elemental body composition of the copepods (C : N;
C : P). The egg production and hatching rate, as further fitness parameters were
measured in transplant experiment (B). The transplant experiments were carried out
using the eggs produced by the copepods of the long-term selection experiment of
roughly the 18th generation in May 2014, the 38th generation in April 2015 and the
60th generation in April 2016. Due to a high nauplii mortality during the transplant
CHAPTER IV
86
experiments in 2016, we repeated transplant experiment (A) in January 2017 using
the eggs of the 80th copepod generation. All transplant experiments consisted of
4 treatments with 3 replicates and two additional replicates within the SLs. Thereby
the two CO2 SLs (high CO2 A, B, C; low CO2 D, E, F) were cross incubated under
their usual and other CO2 condition and fed with the corresponding CO2 manipulated
algae (Fig. 1).
Transplant experiments - food cultures
For the transplant experiments, we set up P. salina stock cultures grown in f/2
medium under ambient aeration. To ensure that the copepods were fed with equal
algal stoichiometric qualities every day, precultures were prepared daily from the
stock culture at a start concentration of 10 x 105 cells mL-1. After one day, the
precultures were used to prepare the food cultures started at concentrations of 7.5
x 105 cell mL-1 and aerated with either 200 µatm or 800 µatm pCO2. After
approximately five days, algae entered the stationary phase (indicated by a yellowish
colour) and were used as food. During the transplant experiments we took filter
samples of the food algae (at least every 2nd day), which were analysed after the
experiment to investigate the C : N and C : P ratios. For the C and N measurements,
4 x 10⁶ cells P. salina were filtered onto precombusted GF/F filters (Whatman) and
analysed using a vario MICRO cube CHN analyzer (Elementar). The P content of the
algae was measured photometrically (Hansen and Koroleff 2007). The cell
concentrations were determined with a CASY cell counter (Schärfe System CASY
Cell Counter and Analyzer System).
Transplant experiment (A) – A. tonsa cultures
In transplant experiment (A), the developmental rate of the nauplii was investigated.
Eggs of the long-term SLs were collected at one day and incubated for two days in
ASW at 18°C for hatching. Afterwards, 1500 nauplii were transferred into 1 L Schott
incubation bottles, filled with ASW and connected to the CO2 aeration system. One
half of each SL was gently aerated with 200 µatm and the other half with 800 µatm
pCO2 (24 bottles in total). In correspondence with recommendations from literature
(Marcus and Wilcox 2007), copepods were fed with 20,000 cells ind-1 day-1, ensuring
a sufficient food supply. For space reasons incubation bottles and food cultures
needed to be placed in the same room. Therefore, we covered the incubation bottles
CHAPTER IV
87
with a light-diminishing foil, to avoid further algae growth and to reduce the stress
for the light sensitive copepods. To minimise changes in the nutrient composition of
the algae by animal waste products, the water was exchanged with CO2
preconditioned (overnight) ASW every day before feeding. For the transplant
experiment in 2017 we used 3000 nauplii and 2 L incubation beakers. Furthermore,
the incubation beakers were not directly aerated with CO2. Instead, to further
minimize the disturbance and mortality of the copepods, we aerated the headspace of
the incubation beakers with the appropriate CO2 concentrations.
To control the target pCO2 of the preconditioned ASW, total alkalinity (TA) and pH
were measured during the first transplant experiment in 2014. The ASW aerated with
200 µatm pCO2 had a TA (and pH) of 2958 µmol kg-1 ASW-1 (8.43), for the water
preconditioned with 800 µatm pCO2 a TA (and pH) of 2951 µmol kg-1 ASW-1 (8.00)
was measured. The back calculated pCO2 concentration of the 200 µatm and
800 µatm pCO2 treatments of the ASW were 180.98 and 615.23 µatm pCO2,
respectively. The mean pH of the ASW within the incubation bottles during the
transplant experiments in 2015, 2016 and 2017 did not differ from the ones in 2014
and were 8.59 (±0.16) for the 200 µatm and 8.17 (±0.14) for the 800 µatm pCO2
treatment (data pooled from n = 18 measurements; 4 per CO2 treatment and year).
Further TA measurements in 2015, 2016 or 2017 were not done because there was no
reason to assume that the pCO2 pressure in the incubation bottles of the both CO2
treatments could have been significantly different from 2014, as copepods were
incubated in ASW and pH values did not differ.
After ten days of incubation the stage distribution of the copepods was investigated.
The individuals from the incubation bottles were fixed in acidic Lugol's solution and
the developmental stage of at least 60 individuals per incubation bottle was
determined. The arithmetic mean of the counted stages of each incubation bottle was
calculated, averaged over the replicates, and divided by the number of incubation
days to obtain the developmental rate. Furthermore, in 2014, 2015 and 2017, the C,
N, P content of the copepods from each incubation bottle was measured and the C to
nutrient ratios were calculated. Measurements were done with the same device as
used for the algae samples. The exact number of analysed individuals can be found in
the raw data, which is available in the PANGAEA repository. In 2016 a
measurement of the copepods’ body stoichiometry was not possible due to too low
individual numbers after the transplant experiment.
CHAPTER IV
88
Transplant experiment (B) – A. tonsa cultures
To investigate possible adaptations of the SL individuals to the CO2 treatments in
terms of egg production and hatching success, another transplant experiment (B) was
carried out in 2014, 2015 and 2016. Eggs from the different CO2 SLs, taken at the
same day as for transplant experiment (A), were separately placed in 5 L beakers,
filled with ASW, for hatching and development (6 beakers). To prevent shock
reactions, copepods were kept in those beakers for 14 days, at 18°C, without light
and gentle aeration until they reached adulthood. During this time, copepods were
fed ad libitum with P. salina, cultured in f/2 medium. Afterwards the transplant
experiment was carried out for four days. Each culture was split and each half was
poured into a 5 L beaker with ASW and covered with a light-diminishing foil
(12 beakers in total). The subsequent CO2 treatment, water exchange and feeding
procedures were equivalent to transplant experiment (A). After the incubation
18 females from each beaker were picked and separately placed into 6-well-plates
containing ASW and ~ 20,000 cells P. salina. After 24 h we counted the number of
produced eggs and removed the females from the wells to avoid cannibalism
(Boersma et al. 2014). The number of hatched nauplii was counted after 24 h and
48 h.
Statistical analyses All statistical analyses were carried out using the program STATISTICA version 9.1
(© StatSoft, Inc). In the analyses each high (A, B, C) and each low CO2 (D, E, F) SL
replicate as well as additional replicates within SLs were pooled. For the evaluation
of the C, N, P and prosoma length measurements, we calculated whisker plots to
identify outliers and extreme values. Values outside the 1.5 upper and lower
interquartile range, the calibration range or negative values were not considered.
Results Long-term CO2 selection experiment – A. tonsa selection lines Over the experimental period the mean pH in the low CO2 SLs was 8.14 ±0.11 and in
the high CO2 SLs 7.91 ±0.09 (Fig. 2).
The prosoma length of the CO2 SL copepods changed significantly over the
experimental period (Repeated Measurement ANOVA using prosoma length as
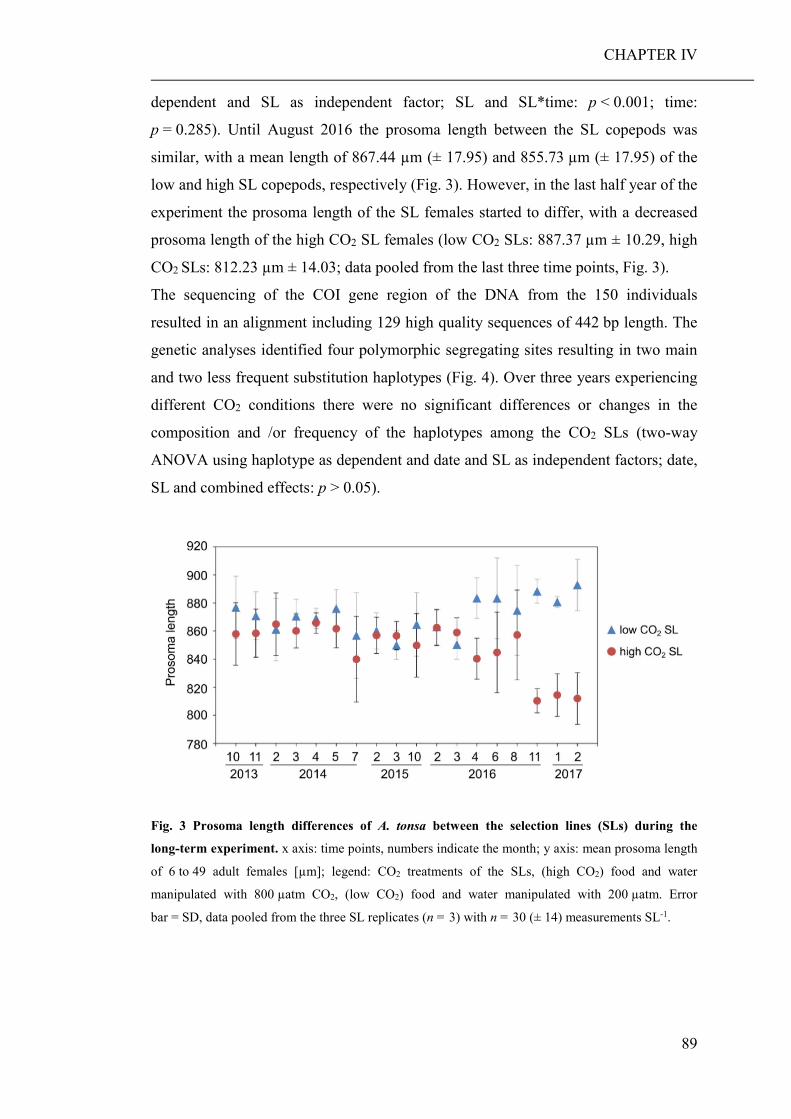
CHAPTER IV
89
dependent and SL as independent factor; SL and SL*time: p < 0.001; time:
p = 0.285). Until August 2016 the prosoma length between the SL copepods was
similar, with a mean length of 867.44 µm (± 17.95) and 855.73 µm (± 17.95) of the
low and high SL copepods, respectively (Fig. 3). However, in the last half year of the
experiment the prosoma length of the SL females started to differ, with a decreased
prosoma length of the high CO2 SL females (low CO2 SLs: 887.37 µm ± 10.29, high
CO2 SLs: 812.23 µm ± 14.03; data pooled from the last three time points, Fig. 3).
The sequencing of the COI gene region of the DNA from the 150 individuals
resulted in an alignment including 129 high quality sequences of 442 bp length. The
genetic analyses identified four polymorphic segregating sites resulting in two main
and two less frequent substitution haplotypes (Fig. 4). Over three years experiencing
different CO2 conditions there were no significant differences or changes in the
composition and /or frequency of the haplotypes among the CO2 SLs (two-way
ANOVA using haplotype as dependent and date and SL as independent factors; date,
SL and combined effects: p > 0.05).
Fig. 3 Prosoma length differences of A. tonsa between the selection lines (SLs) during the
long-term experiment. x axis: time points, numbers indicate the month; y axis: mean prosoma length
of 6 to 49 adult females [µm]; legend: CO2 treatments of the SLs, (high CO2) food and water
manipulated with 800 µatm CO2, (low CO2) food and water manipulated with 200 µatm. Error
bar = SD, data pooled from the three SL replicates (n = 3) with n = 30 (± 14) measurements SL-1.
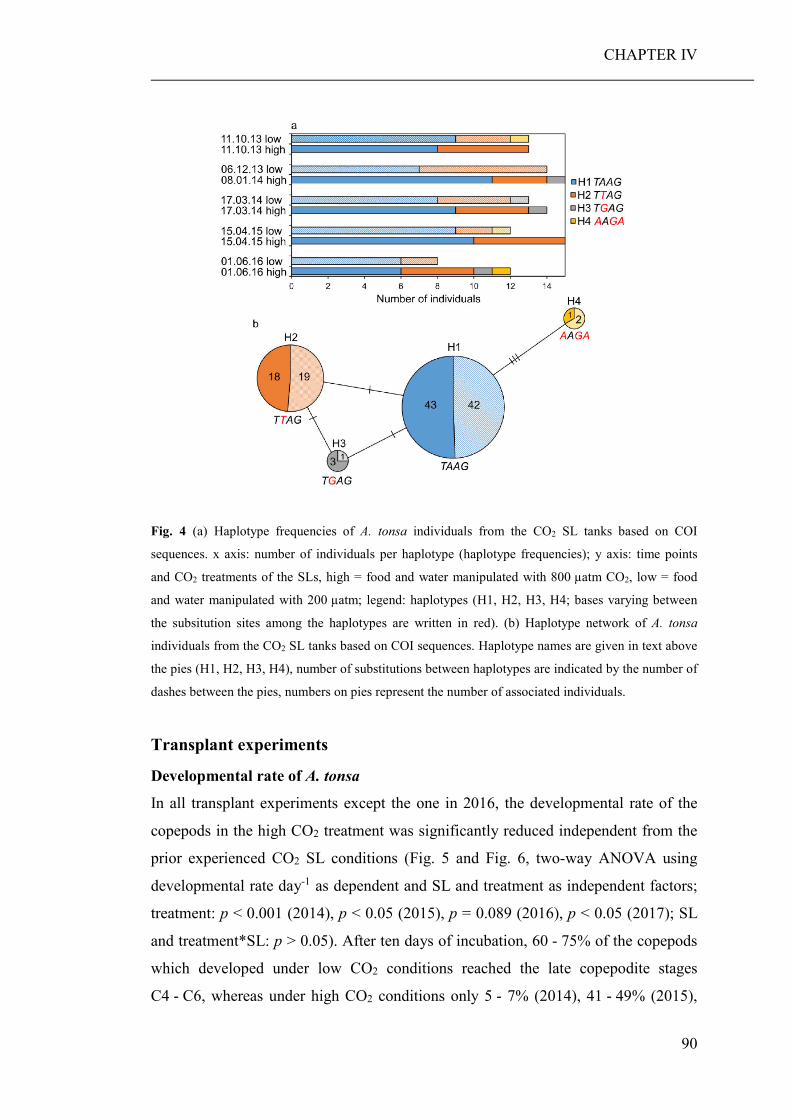
CHAPTER IV
90
Fig. 4 (a) Haplotype frequencies of A. tonsa individuals from the CO2 SL tanks based on COI
sequences. x axis: number of individuals per haplotype (haplotype frequencies); y axis: time points
and CO2 treatments of the SLs, high = food and water manipulated with 800 µatm CO2, low = food
and water manipulated with 200 µatm; legend: haplotypes (H1, H2, H3, H4; bases varying between
the subsitution sites among the haplotypes are written in red). (b) Haplotype network of A. tonsa
individuals from the CO2 SL tanks based on COI sequences. Haplotype names are given in text above
the pies (H1, H2, H3, H4), number of substitutions between haplotypes are indicated by the number of
dashes between the pies, numbers on pies represent the number of associated individuals.
Transplant experiments
Developmental rate of A. tonsa
In all transplant experiments except the one in 2016, the developmental rate of the
copepods in the high CO2 treatment was significantly reduced independent from the
prior experienced CO2 SL conditions (Fig. 5 and Fig. 6, two-way ANOVA using
developmental rate day-1 as dependent and SL and treatment as independent factors;
treatment: p < 0.001 (2014), p < 0.05 (2015), p = 0.089 (2016), p < 0.05 (2017); SL
and treatment*SL: p > 0.05). After ten days of incubation, 60 - 75% of the copepods
which developed under low CO2 conditions reached the late copepodite stages
C4 - C6, whereas under high CO2 conditions only 5 - 7% (2014), 41 - 49% (2015),
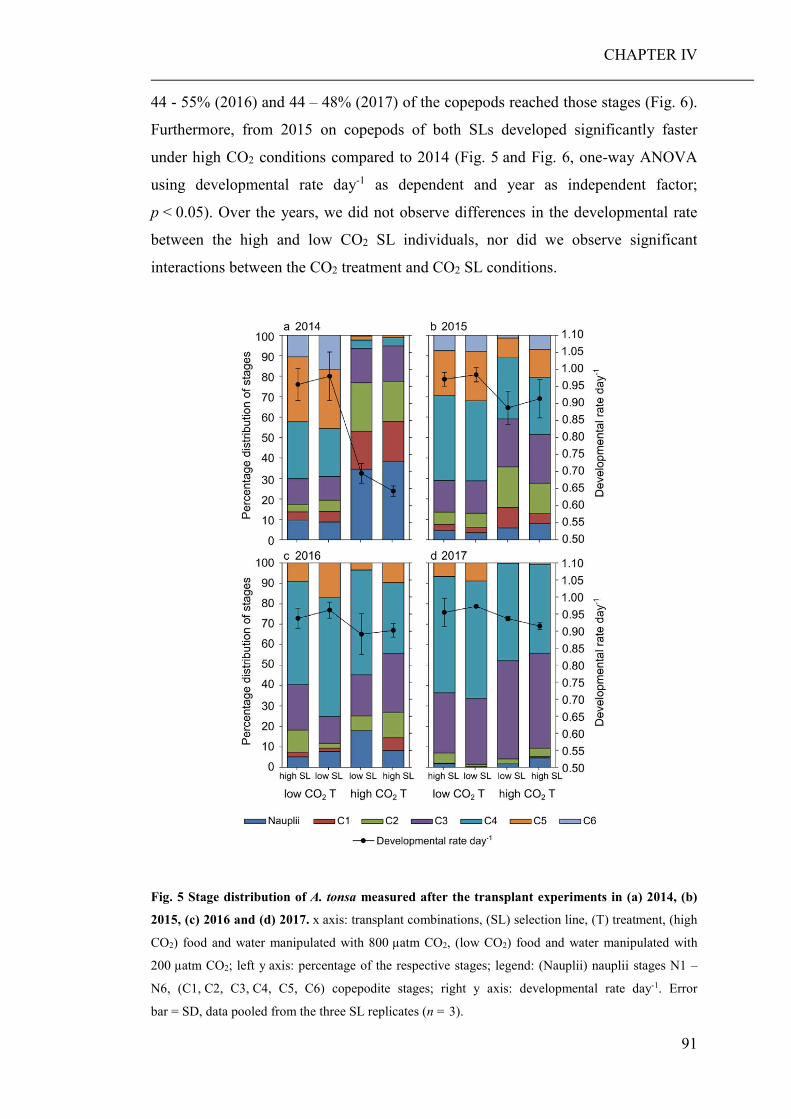
CHAPTER IV
91
44 - 55% (2016) and 44 – 48% (2017) of the copepods reached those stages (Fig. 6).
Furthermore, from 2015 on copepods of both SLs developed significantly faster
under high CO2 conditions compared to 2014 (Fig. 5 and Fig. 6, one-way ANOVA
using developmental rate day-1 as dependent and year as independent factor;
p < 0.05). Over the years, we did not observe differences in the developmental rate
between the high and low CO2 SL individuals, nor did we observe significant
interactions between the CO2 treatment and CO2 SL conditions.
Fig. 5 Stage distribution of A. tonsa measured after the transplant experiments in (a) 2014, (b)
2015, (c) 2016 and (d) 2017. x axis: transplant combinations, (SL) selection line, (T) treatment, (high
CO2) food and water manipulated with 800 µatm CO2, (low CO2) food and water manipulated with
200 µatm CO2; left y axis: percentage of the respective stages; legend: (Nauplii) nauplii stages N1 –
N6, (C1, C2, C3, C4, C5, C6) copepodite stages; right y axis: developmental rate day-1. Error
bar = SD, data pooled from the three SL replicates (n = 3).
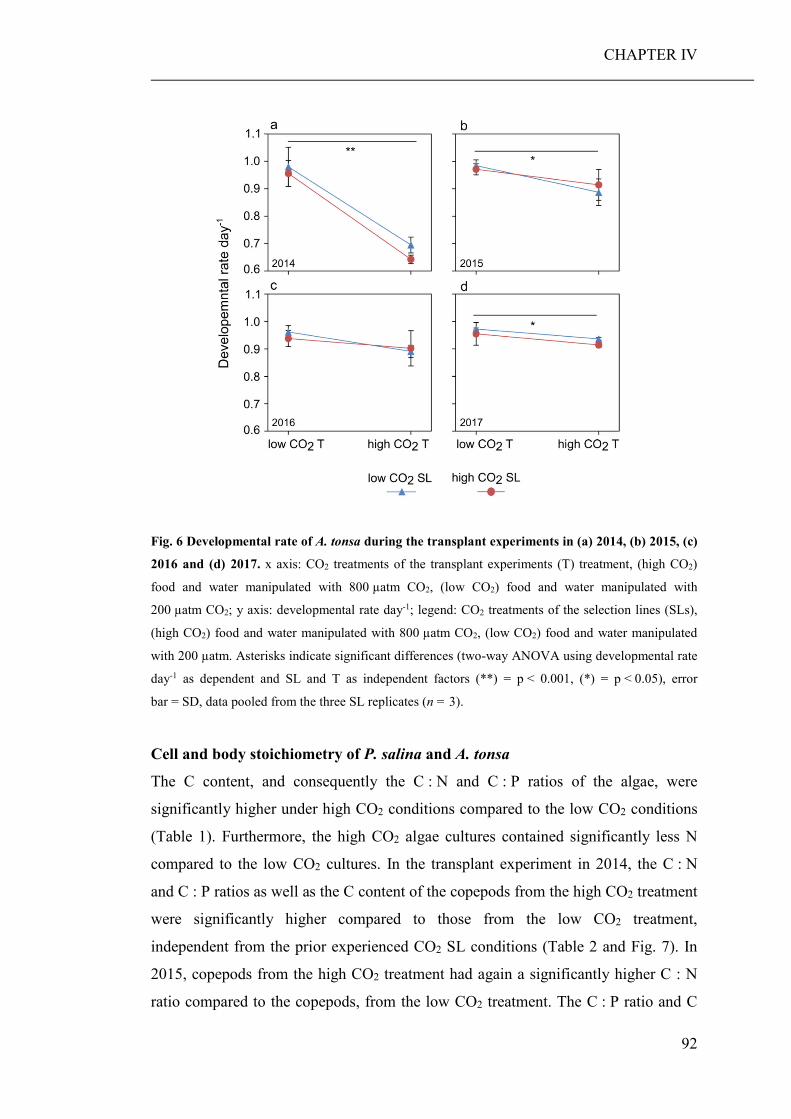
CHAPTER IV
92
Fig. 6 Developmental rate of A. tonsa during the transplant experiments in (a) 2014, (b) 2015, (c)
2016 and (d) 2017. x axis: CO2 treatments of the transplant experiments (T) treatment, (high CO2)
food and water manipulated with 800 µatm CO2, (low CO2) food and water manipulated with
200 µatm CO2; y axis: developmental rate day-1; legend: CO2 treatments of the selection lines (SLs),
(high CO2) food and water manipulated with 800 µatm CO2, (low CO2) food and water manipulated
with 200 µatm. Asterisks indicate significant differences (two-way ANOVA using developmental rate
day-1 as dependent and SL and T as independent factors (**) = p < 0.001, (*) = p < 0.05), error
bar = SD, data pooled from the three SL replicates (n = 3).
Cell and body stoichiometry of P. salina and A. tonsa
The C content, and consequently the C : N and C : P ratios of the algae, were
significantly higher under high CO2 conditions compared to the low CO2 conditions
(Table 1). Furthermore, the high CO2 algae cultures contained significantly less N
compared to the low CO2 cultures. In the transplant experiment in 2014, the C : N
and C : P ratios as well as the C content of the copepods from the high CO2 treatment
were significantly higher compared to those from the low CO2 treatment,
independent from the prior experienced CO2 SL conditions (Table 2 and Fig. 7). In
2015, copepods from the high CO2 treatment had again a significantly higher C : N
ratio compared to the copepods, from the low CO2 treatment. The C : P ratio and C
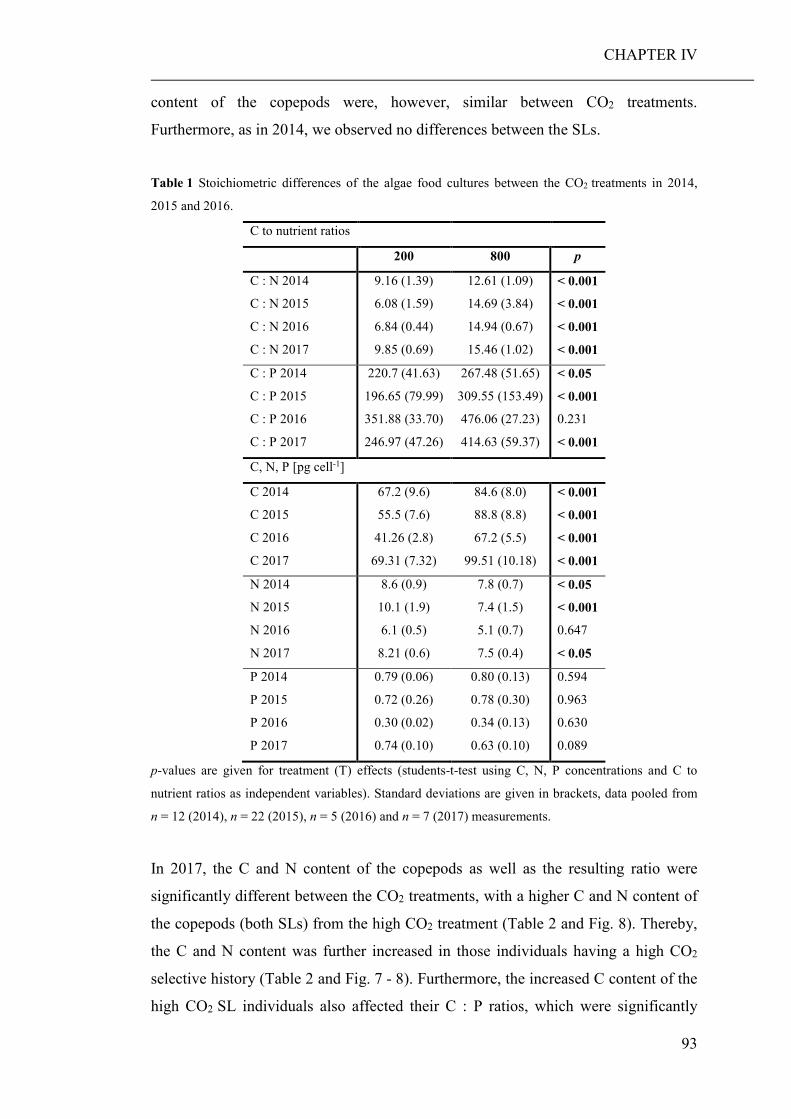
CHAPTER IV
93
content of the copepods were, however, similar between CO2 treatments.
Furthermore, as in 2014, we observed no differences between the SLs.
Table 1 Stoichiometric differences of the algae food cultures between the CO2 treatments in 2014,
2015 and 2016.
C to nutrient ratios
200 800 p
C : N 2014
C : N 2015
C : N 2016
C : N 2017
9.16 (1.39)
6.08 (1.59)
6.84 (0.44)
9.85 (0.69)
12.61 (1.09)
14.69 (3.84)
14.94 (0.67)
15.46 (1.02)
< 0.001
< 0.001
< 0.001
< 0.001
C : P 2014
C : P 2015
C : P 2016
C : P 2017
220.7 (41.63)
196.65 (79.99)
351.88 (33.70)
246.97 (47.26)
267.48 (51.65)
309.55 (153.49)
476.06 (27.23)
414.63 (59.37)
< 0.05
< 0.001
0.231
< 0.001
C, N, P [pg cell-1]
C 2014
C 2015
C 2016
C 2017
67.2 (9.6)
55.5 (7.6)
41.26 (2.8)
69.31 (7.32)
84.6 (8.0)
88.8 (8.8)
67.2 (5.5)
99.51 (10.18)
< 0.001
< 0.001
< 0.001
< 0.001
N 2014
N 2015
N 2016
N 2017
8.6 (0.9)
10.1 (1.9)
6.1 (0.5)
8.21 (0.6)
7.8 (0.7)
7.4 (1.5)
5.1 (0.7)
7.5 (0.4)
< 0.05
< 0.001
0.647
< 0.05
P 2014
P 2015
P 2016
P 2017
0.79 (0.06)
0.72 (0.26)
0.30 (0.02)
0.74 (0.10)
0.80 (0.13)
0.78 (0.30)
0.34 (0.13)
0.63 (0.10)
0.594
0.963
0.630
0.089
p-values are given for treatment (T) effects (students-t-test using C, N, P concentrations and C to
nutrient ratios as independent variables). Standard deviations are given in brackets, data pooled from
n = 12 (2014), n = 22 (2015), n = 5 (2016) and n = 7 (2017) measurements.
In 2017, the C and N content of the copepods as well as the resulting ratio were
significantly different between the CO2 treatments, with a higher C and N content of
the copepods (both SLs) from the high CO2 treatment (Table 2 and Fig. 8). Thereby,
the C and N content was further increased in those individuals having a high CO2
selective history (Table 2 and Fig. 7 - 8). Furthermore, the increased C content of the
high CO2 SL individuals also affected their C : P ratios, which were significantly
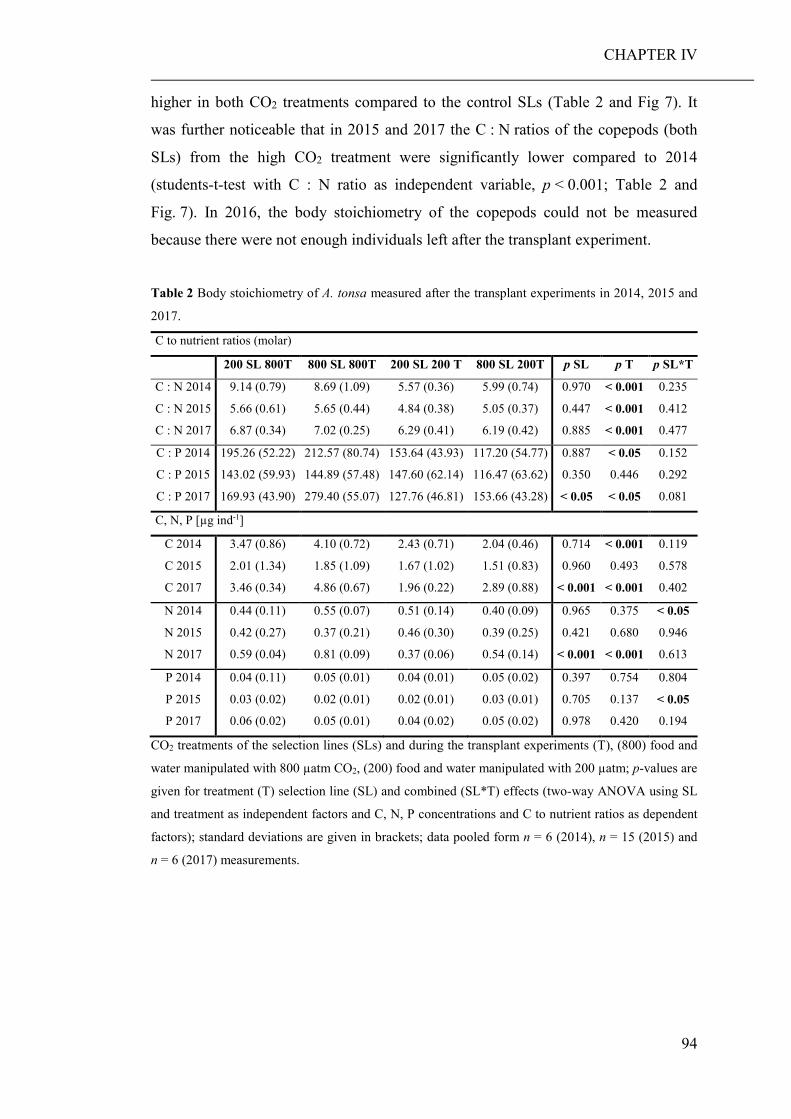
CHAPTER IV
94
higher in both CO2 treatments compared to the control SLs (Table 2 and Fig 7). It
was further noticeable that in 2015 and 2017 the C : N ratios of the copepods (both
SLs) from the high CO2 treatment were significantly lower compared to 2014
(students-t-test with C : N ratio as independent variable, p < 0.001; Table 2 and
Fig. 7). In 2016, the body stoichiometry of the copepods could not be measured
because there were not enough individuals left after the transplant experiment.
Table 2 Body stoichiometry of A. tonsa measured after the transplant experiments in 2014, 2015 and
2017.
C to nutrient ratios (molar)
200 SL 800T 800 SL 800T 200 SL 200 T 800 SL 200T p SL p T p SL*T
C : N 2014
C : N 2015
C : N 2017
9.14 (0.79)
5.66 (0.61)
6.87 (0.34)
8.69 (1.09)
5.65 (0.44)
7.02 (0.25)
5.57 (0.36)
4.84 (0.38)
6.29 (0.41)
5.99 (0.74)
5.05 (0.37)
6.19 (0.42)
0.970
0.447
0.885
< 0.001
< 0.001
< 0.001
0.235
0.412
0.477
C : P 2014
C : P 2015
C : P 2017
195.26 (52.22)
143.02 (59.93)
169.93 (43.90)
212.57 (80.74)
144.89 (57.48)
279.40 (55.07)
153.64 (43.93)
147.60 (62.14)
127.76 (46.81)
117.20 (54.77)
116.47 (63.62)
153.66 (43.28)
0.887
0.350
< 0.05
< 0.05
0.446
< 0.05
0.152
0.292
0.081
C, N, P [µg ind-1]
C 2014
C 2015
C 2017
3.47 (0.86)
2.01 (1.34)
3.46 (0.34)
4.10 (0.72)
1.85 (1.09)
4.86 (0.67)
2.43 (0.71)
1.67 (1.02)
1.96 (0.22)
2.04 (0.46)
1.51 (0.83)
2.89 (0.88)
0.714
0.960
< 0.001
< 0.001
0.493
< 0.001
0.119
0.578
0.402
N 2014
N 2015
N 2017
0.44 (0.11)
0.42 (0.27)
0.59 (0.04)
0.55 (0.07)
0.37 (0.21)
0.81 (0.09)
0.51 (0.14)
0.46 (0.30)
0.37 (0.06)
0.40 (0.09)
0.39 (0.25)
0.54 (0.14)
0.965
0.421
< 0.001
0.375
0.680
< 0.001
< 0.05
0.946
0.613
P 2014
P 2015
P 2017
0.04 (0.11)
0.03 (0.02)
0.06 (0.02)
0.05 (0.01)
0.02 (0.01)
0.05 (0.01)
0.04 (0.01)
0.02 (0.01)
0.04 (0.02)
0.05 (0.02)
0.03 (0.01)
0.05 (0.02)
0.397
0.705
0.978
0.754
0.137
0.420
0.804
< 0.05
0.194
CO2 treatments of the selection lines (SLs) and during the transplant experiments (T), (800) food and
water manipulated with 800 µatm CO2, (200) food and water manipulated with 200 µatm; p-values are
given for treatment (T) selection line (SL) and combined (SL*T) effects (two-way ANOVA using SL
and treatment as independent factors and C, N, P concentrations and C to nutrient ratios as dependent
factors); standard deviations are given in brackets; data pooled form n = 6 (2014), n = 15 (2015) and
n = 6 (2017) measurements.
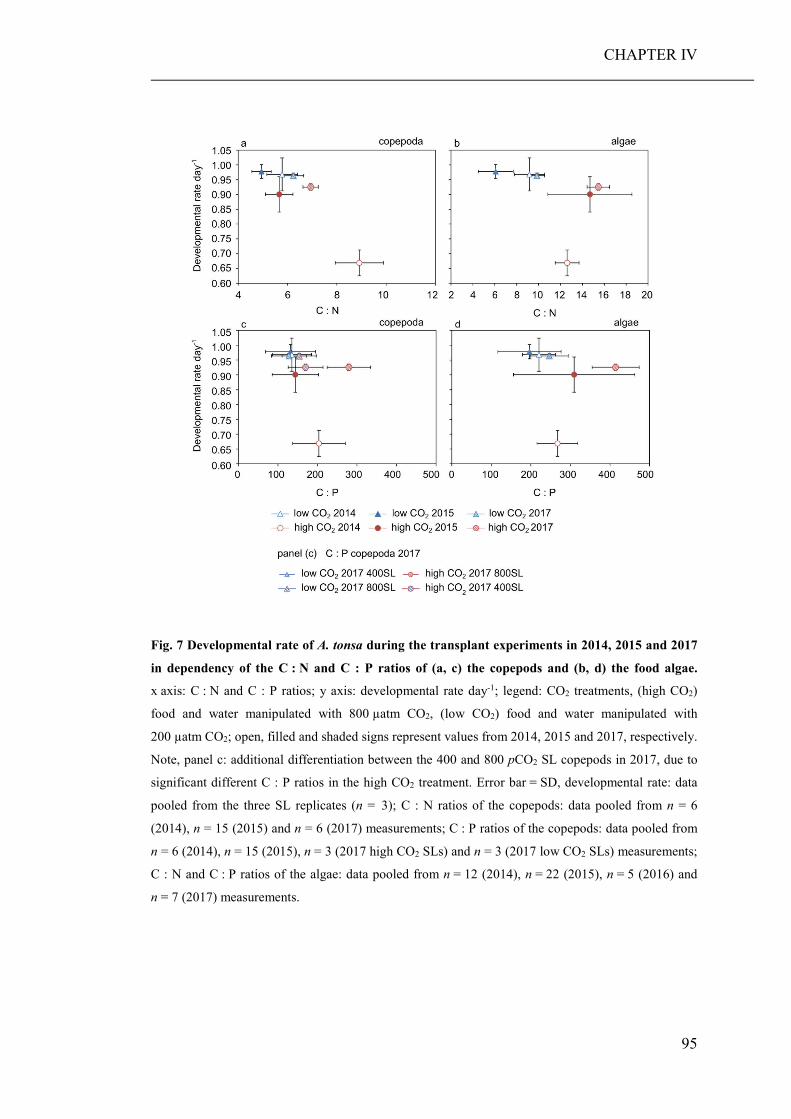
CHAPTER IV
95
Fig. 7 Developmental rate of A. tonsa during the transplant experiments in 2014, 2015 and 2017
in dependency of the C : N and C : P ratios of (a, c) the copepods and (b, d) the food algae.
x axis: C : N and C : P ratios; y axis: developmental rate day-1; legend: CO2 treatments, (high CO2)
food and water manipulated with 800 µatm CO2, (low CO2) food and water manipulated with
200 µatm CO2; open, filled and shaded signs represent values from 2014, 2015 and 2017, respectively.
Note, panel c: additional differentiation between the 400 and 800 pCO2 SL copepods in 2017, due to
significant different C : P ratios in the high CO2 treatment. Error bar = SD, developmental rate: data
pooled from the three SL replicates (n = 3); C : N ratios of the copepods: data pooled from n = 6
(2014), n = 15 (2015) and n = 6 (2017) measurements; C : P ratios of the copepods: data pooled from
n = 6 (2014), n = 15 (2015), n = 3 (2017 high CO2 SLs) and n = 3 (2017 low CO2 SLs) measurements;
C : N and C : P ratios of the algae: data pooled from n = 12 (2014), n = 22 (2015), n = 5 (2016) and
n = 7 (2017) measurements.
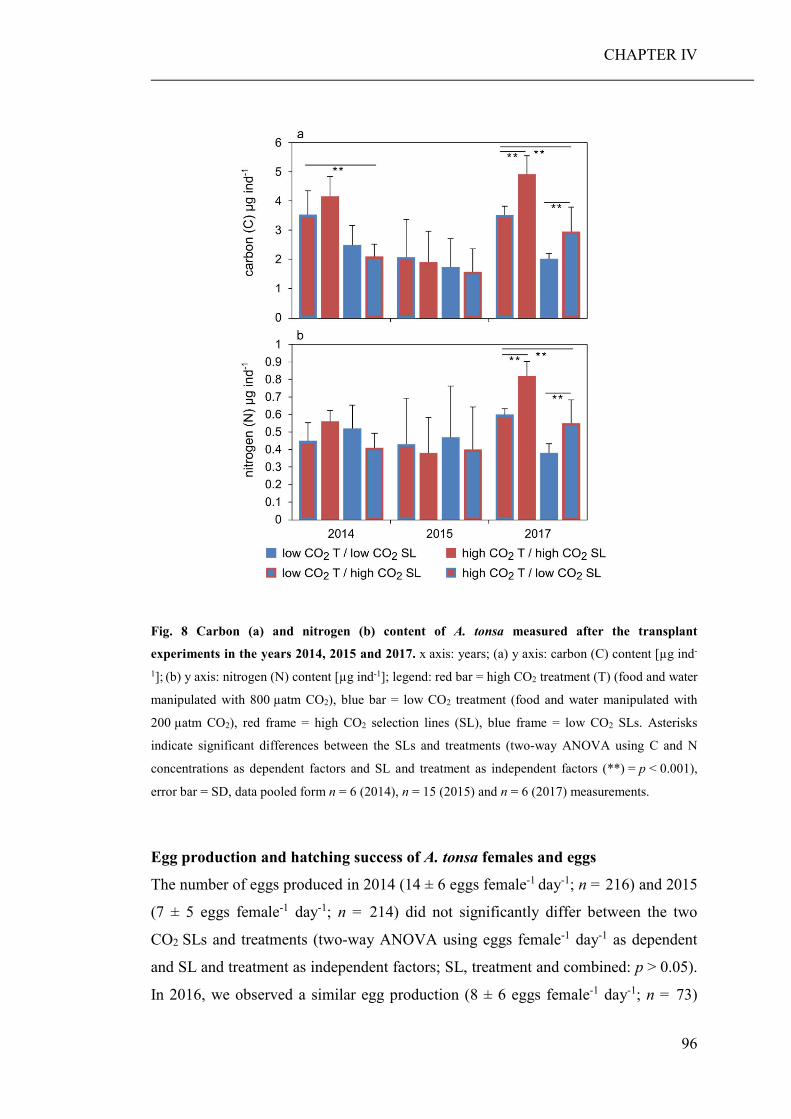
CHAPTER IV
96
Fig. 8 Carbon (a) and nitrogen (b) content of A. tonsa measured after the transplant
experiments in the years 2014, 2015 and 2017. x axis: years; (a) y axis: carbon (C) content [µg ind-
1]; (b) y axis: nitrogen (N) content [µg ind-1]; legend: red bar = high CO2 treatment (T) (food and water
manipulated with 800 µatm CO2), blue bar = low CO2 treatment (food and water manipulated with
200 µatm CO2), red frame = high CO2 selection lines (SL), blue frame = low CO2 SLs. Asterisks
indicate significant differences between the SLs and treatments (two-way ANOVA using C and N
concentrations as dependent factors and SL and treatment as independent factors (**) = p < 0.001),
error bar = SD, data pooled form n = 6 (2014), n = 15 (2015) and n = 6 (2017) measurements.
Egg production and hatching success of A. tonsa females and eggs
The number of eggs produced in 2014 (14 ± 6 eggs female-1 day-1; n = 216) and 2015
(7 ± 5 eggs female-1 day-1; n = 214) did not significantly differ between the two
CO2 SLs and treatments (two-way ANOVA using eggs female-1 day-1 as dependent
and SL and treatment as independent factors; SL, treatment and combined: p > 0.05).
In 2016, we observed a similar egg production (8 ± 6 eggs female-1 day-1; n = 73)
CHAPTER IV
97
between the SL tanks B, C, D, E and F (n = 17, 12, 18, 12 and 14, respectively)
under high CO2 conditions (students-t-test with egg production as independent
variable, p > 0.05). As the egg production of females from SL tank A (zero eggs,
n = 18) was significantly different to the other high CO2 SL replicates B (n = 17)
and C (n = 12) (students-t-test with eggs female-1 day-1 as independent variable,
p < 0.001), it was not considered for the calculation of the egg production in the high
CO2 treatment. In the low CO2 treatment egg production was very low in all SL tanks
(1 ± 1 eggs female-1 day-1; n = 80). In 2014 and 2015 the percentage of hatched
nauplii in the first 24 h was significantly different between the CO2 SLs independent
from the CO2 treatment (Fig. 9, two-way ANOVA using the number of hatched
nauplii after 24 h as dependent and SL and treatment as independent
factors; SL: p < 0.001, treatment and combined: p > 0.05), with a higher hatching
rate of the eggs from females with a high CO2 selective history. In 2014, 76% (±27)
of the eggs from females with a high CO2 selective history and 55% (± 25) of the
eggs from low CO2 SL females hatched during the first 24 h. After 48 h, 90% (± 1)
of the eggs from both SLs were hatched. In 2015, the percentage of hatched nauplii
after the first 24 h differed only by 8% between the eggs from high and low CO2 SL
females. In 2016, we observed no significant differences between the SLs and CO2
treatments (Fig. 9, two-way ANOVA; SL, treatment and combined: p > 0.05).
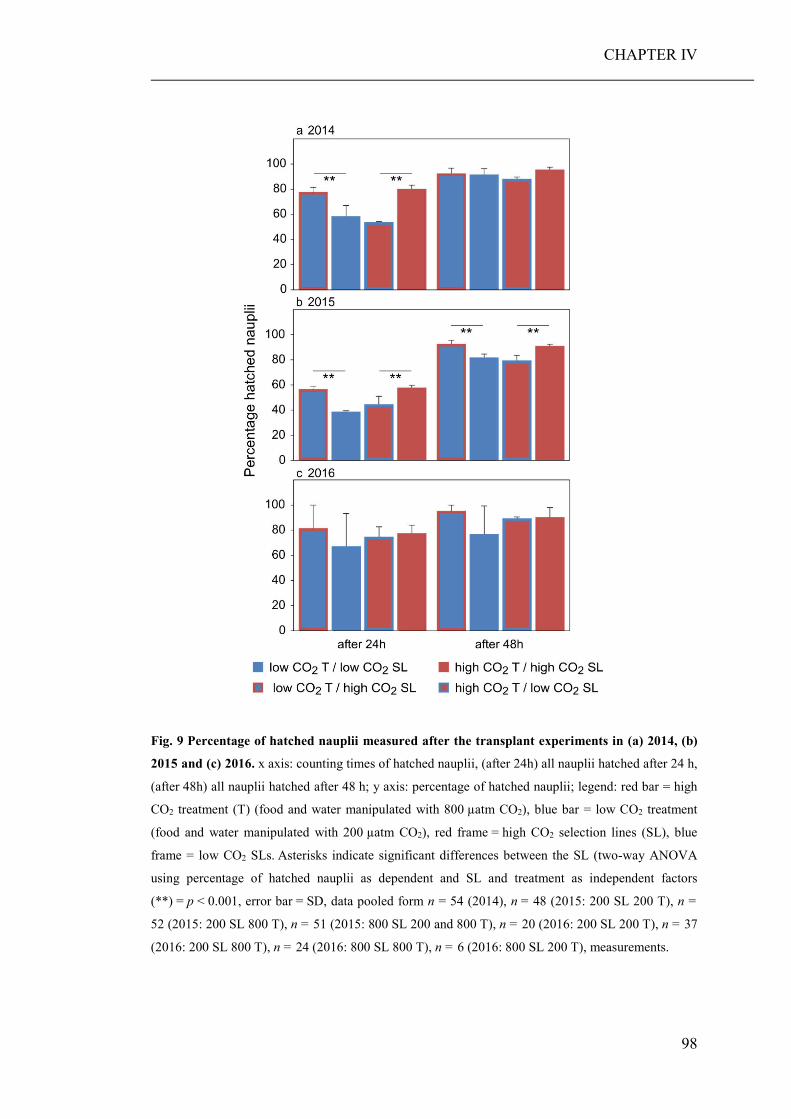
CHAPTER IV
98
Fig. 9 Percentage of hatched nauplii measured after the transplant experiments in (a) 2014, (b)
2015 and (c) 2016. x axis: counting times of hatched nauplii, (after 24h) all nauplii hatched after 24 h,
(after 48h) all nauplii hatched after 48 h; y axis: percentage of hatched nauplii; legend: red bar = high
CO2 treatment (T) (food and water manipulated with 800 µatm CO2), blue bar = low CO2 treatment
(food and water manipulated with 200 µatm CO2), red frame = high CO2 selection lines (SL), blue
frame = low CO2 SLs. Asterisks indicate significant differences between the SL (two-way ANOVA
using percentage of hatched nauplii as dependent and SL and treatment as independent factors
(**) = p < 0.001, error bar = SD, data pooled form n = 54 (2014), n = 48 (2015: 200 SL 200 T), n =
52 (2015: 200 SL 800 T), n = 51 (2015: 800 SL 200 and 800 T), n = 20 (2016: 200 SL 200 T), n = 37
(2016: 200 SL 800 T), n = 24 (2016: 800 SL 800 T), n = 6 (2016: 800 SL 200 T), measurements.
CHAPTER IV
99
Data availability The datasets generated and analysed during the current study are available in the
PANGAEA data repository (https://doi.org/10.1594/PANGAEA.879370).
Discussion Within the 3 ½ years of the long-term selection experiment, we did not observe any
clear adaptive advantages of the high CO2 SL copepods under high CO2 conditions
(e.g. an increased developmental rate or egg production under high CO2 conditions
compared to the control SLs). The elevated seawater pCO2 and changed food
conditions in combination with the otherwise favourable and constant laboratory
conditions were probably not harsh enough to trigger evolutionary adaptations in the
high CO2 SLs. As will be discussed below, phenotypic buffering and
transgenerational effects probably further reduced the selective pressure on the high
CO2 SL populations. Nevertheless, our results demonstrated that an increased
seawater pCO2 and entailed food quality reduction can significantly alter copepods’
stoichiometry, and over a long-term also effects physical characteristics such as body
length and mass (indicated by a higher C and N content of the copepods in relation to
body length), which probably could have consequences for the copepod itself and
ecosystem functions. However, to clarify the extent to which changes in the physique
(ratio between body length and mass) of A. tonsa will affect the copepod and
consequently ecosystem functions (positively or negatively), further studies will be
necessary.
Experimental setup To possibly maximise the difference between the experimental CO2 treatments
without exceeding realistic end-of-the century pCO2 concentrations, we aimed to
lower our control treatment from today’s pCO2 level (400 µatm) to preindustrial
conditions (200 µatm). TA measurements, performed at the beginning of the
experiment and in 2016, however, illustrated that a pCO2 concentration of 200 µatm
was not reached in the low CO2 SL tanks (D, E, F). The amount of the introduced
gas/air mixture was probably not high enough to compensate for the respiratory
activities in the tank. However, an increase in the flowrate was not possible as the
resulting water turbulences would have injured the copepods. The target pCO2
CHAPTER IV
100
concentration of 200 µatm could only be reached during the transplant experiments,
as the incubation bottles were 100 fold smaller compared to the SL tanks and
included fewer copepods L-1.
Although modest fluctuations in the experimental parameters are almost inevitable
when carrying out an extensive life history experiment over several years, the pCO2
treatments (represented by the water pH) of the high and low CO2 SLs remained
different over the whole experimental period. However, as it was the aim of the study
to investigate possible long-term effects of simulated OA (combining direct and
indirect effects) on A. tonsa, an exclusion of short-term fluctuations in the
experimental parameters was not crucial for the experimental success.
Reducing the nutrient amount in the growth medium of the food algae supplied to the
high CO2 SL tanks was necessary to accelerate the stoichiometry change of the food
algae and thereby ascertain a stable food quality in the high CO2 SL tanks. However,
since the differences in algae stoichiometry between the SL treatments cannot solely
be attributed to differences in the pCO2 concentrations we cannot state to have only
studied the effects of increased pCO2 on A. tonsa. However, manipulating only the
pCO2 concentrations in the SL tanks would have yielded less significant results, but
most importantly, would have potentially underestimated the response of A. tonsa to
future OA conditions. As it was the purpose of our experiment to investigate if
A. tonsa may acclimatise and / or adapt to increased seawater pCO2 and the
associated food quality reduction, it was substantial to ascertain stable and
pronounced differences in the food algae supplied to the SL copepods.
Genetic diversity of the A. tonsa SL populations Based on the COI gene region, the genetic diversity of our laboratory population was
comparable to natural A. tonsa populations investigated in other studies which
observed less than 2% variation among haplotypes of one lineage and an average of
four substitution haplotypes per lineage (Caudill and Bucklin 2004; Costa et al.
2014). Although haplotype frequencies were fluctuating over the experimental time
there was no indication for genetic drift (e.g. bottleneck effects), proving stable and
disturbance free maintenance conditions. However, as more sensitive analytical
methods like microsatellite analyses might have revealed changes in the genetic
diversity, which were not detected based on the analyses of the COI gene region, we
cannot completely rule out changes in the genetic diversity within the selection lines.
CHAPTER IV
101
Additionally, it is possible that the initial genetic variation at the COI locus was
already too low to detect potential changes in haplotype compositions or frequencies.
Effects of elevated CO2 on the stoichiometry and development of A. tonsa Supporting the results of preceding studies (Riebesell et al. 2007; Schoo et al. 2013;
Verschoor et al. 2013), we observed an increased cellular C content of the primary
producer (here: P. salina) when cultured under elevated CO2 conditions. As a
consequence the C : N and C : P ratio of the high CO2 algae increased. Differences in
the nutrient content of the algae between the four years were probably due to
differences in the nutrient uptake of the algae, potentially caused by slightly different
growth rates and light conditions. As grazers have rather defined metabolic
requirements, stoichiometric discrepancies between the prey and needs of the
consumer can considerably impact its fitness (Sterner and Elser 2002; Bukovinszky
et al. 2012; Schoo et al. 2013; Meunier et al. 2016). Many grazers, including
copepods, can adjust their elemental body composition to a certain extent by, for
example, the selective retention of scarce nutrients and / or the excretion of excess
elements (Hall 2009). In our study, however, the C : N ratio and the C : P ratio as
well as the C content (except in 2015) of the analysed A. tonsa individuals reared
under high seawater pCO2 conditions and fed with high CO2 algae were significantly
increased, and we did not detect any difference between the SLs until 2017. In 2014
and 2017, the significant difference in the C : N and C : P ratios between the CO2
treatments were due to a significantly higher C content of the copepods (both SLs).
As in 2015 the C contents of both SLs were not different between the CO2 treatments,
the significantly different C : N ratio was merely a joint effect of a slightly lower N
and a slightly higher C content of the copepods under high CO2 conditions. Under
conditions in which C is present in excess, other essential nutrients (N and P) might
be limited, with probably far-reaching physiological consequences for the consumer.
In fact, in each of our transplant experiments, we observed a substantially reduced
developmental rate of the nauplii reared under high seawater pCO2 conditions getting
high CO2 algae. Beyond that, developmental rates of the nauplii were always similar
between the SLs and thus independent from the preceding CO2 experiences of the
copepods.
Unexpectedly, we observed an enhanced regulation of the elemental body
composition of both SL populations from 2015 on - they became both more
CHAPTER IV
102
homeostatic throughout the long-term experiment. In 2015 after 38 generations, the
C : N ratio of the copepods (both SLs) increased by just 15% and after 82
generations in 2017 by just 11% when reared under high seawater pCO2 conditions
and fed with high CO2 algae. Simultaneously to the elevated homeostasis we
observed a significantly improved juvenile development under high CO2 conditions
(Fig. 7), suggesting a correlation between the elemental body composition of
A. tonsa and its developmental rate. During the transplant experiments in 2015, 2016
and 2017, the high and low CO2 SL individuals developed significantly faster in the
high CO2 treatment compared to 2014 (one-way ANOVA using developmental rate
day-1 as dependent and year as independent factor; p < 0.05). In a previous
experiment, carried out with eggs from the same laboratory cultures, which were
used to start the long-term experiment, and an equal algal food quality, Meunier et al.
(2016) observed similar developmental rates as in our study in 2014. Therefore, it is
highly unlikely that the observed developmental rates in the high CO2 treatment in
2014 were just artefacts. Nevertheless, we do not have a concrete explanation for the
elevated homeostasis of both SL populations, although it is conceivable that the very
constant experimental conditions played a relevant role. However, we can say that
the regulation of the elemental body composition of A. tonsa seemed to be rather
flexible and independent from the formerly experienced CO2 concentration.
Although low CO2 SL individuals were not exposed to high CO2 conditions before
the transplant experiments, low CO2 SL copepods could reach a similar level of
homeostasis as copepods with a high CO2 selective history, which suggest a high
plasticity level of A. tonsa in the regulation of its elemental body composition.
Long-term effects of elevated CO2 on the phenotype of A. tonsa There are three potential physiological solutions for herbivores to deal with excess C.
(1) A reduced assimilation across gut walls. (2) Assimilated excess C can be stored
as C-rich compounds like lipids and (3), assimilated C can be disposed by respiration
or extracellular release of organic substances (Sterner and Hessen 1994). Our results
indicate that A. tonsa can use different strategies to deal with excess C. In 2015, the
C content of the copepods (both SLs), measured after the transplant experiment, was
not increased when reared under high seawater pCO2 conditions and fed high CO2
algae, suggesting an elevated excretion of C. In a previous study, Schoo et al. (2013)
also showed that A. tonsa released surplus C through excretion products (mainly
CHAPTER IV
103
observed in adults) and a higher respiration rate (mainly observed in nauplii), when
fed high CO2 algae. As observed after the first transplant experiment in 2014, in
2017, the C content of both SLs was significantly higher under high CO2 conditions
compared to the low CO2 treatment (Table 2 and Fig. 8). However, different from
2014, the N content of the copepods also significantly increased in the high CO2
treatment (Table 2 and Fig. 8). Therefore, we assume that A. tonsa individuals
retained more N to compensate for their elevated C content, which is also no atypical
reaction. Likewise, investigations of Miller and Glibert (1998) of the N excretion of
A. tonsa during a mesocosm study showed a high plasticity level of the copepod to
regulate the amount of retained and released N, depending on its physiological and
nutritional status.
Although in our study A. tonsa seemed to have a high phenotypic buffering capacity
to deal with the impaired food quality under high CO2 conditions, the detrimental
elemental composition of their food probably had extensive physical long-term
consequences for the copepod. Over the period of the long-term experiment, the
mean female prosoma lengths slightly fluctuated, however not exceeding the range
observed in other studies at 18°C (Holste et al. 2004; Holste and Peck 2005).
Approximately three years after the start of the experiment we observed that A. tonsa
individuals which were cultured under high CO2 conditions became significantly
smaller compared to the ones from the low CO2 SL tanks (Repeated Measurement
ANOVA using prosoma length as dependent and SL as independent factor; SL and
SL*time: p < 0.001; time: p = 0.285; Fig. 3). Furthermore, measurements performed
after the transplant experiment in 2017, showed a significantly increased C and N
content of the high CO2 SL individuals compared to the low CO2 SL copepods
independently from the CO2 treatment (Table 2 and Fig. 8). This suggests that the
body mass of the high CO2 SL individuals that grazed on high C (energy) algae
increased, even though they became smaller. Although there is usually a positive
correlation between body length and body mass (C and N ind-1) especially in the
growth phase of copepods, this relationship is weak among adults (Kankaala and
Johansson 1986; Durbin et al. 1992). Therefore, it is likely that adult copepods gain
body mass although they became smaller at the same time. In our study, A. tonsa
individuals probably stored excess C partly in the form of lipids as adipose tissue,
resulting in the increased body mass. Generally, when food is sufficiently available
herbivores store lipids as an energy reserve for times of low food supply and for
CHAPTER IV
104
reproduction (Richard et al. 2006). However, a large lipid load can also result from
an unbalanced diet (Sterner and Hessen 1994), as it was the case for the high CO2
SLs (excess C and N, P in deficiency). During a mesocosm experiment (lasting 45
days) conducted at the south-western-coast of Finland (Baltic), Vehmaa et al. (2016)
also found negative effects of elevated CO2 on the prosoma length of Acartia sp. that
were strongest in the highest CO2 treatment at 1650 µatm pCO2. Besides the pCO2
concentration, the amount of total particulate carbon (reflecting food supply)
significantly affected the prosoma length of the copepods. Differently to the
mesocosm experiment, food was not limiting during our long-term selection
experiment, therefore the observed effects on the prosoma length should have
primarily been caused by the elevated pCO2 conditions and associated algae food
quality, not quantity.
Effects of elevated CO2 on the reproduction of A. tonsa Although extensive research has been conducted on the effects of food concentration
on the egg production of A. tonsa (Roman 1991; Kleppel et al. 1998b; Teixeira et al.
2010; Zhang et al. 2015), surprisingly little is known about the effects of food quality
(other than using different food species) on egg production. The few experimental
studies dealing with the indirect effects of OA (changed nutritional quality of the
food) on the reproduction of A. tonsa indicate a connection between the fatty acid
composition of the prey and the egg production of the copepod, with a lower
production rate under a high CO2 nutrition (Kleppel et al. 1998a; Hazzard and
Kleppel 2003; Rossoll et al. 2012). Since those studies comprised only one copepod
generation, so far nothing is known about long-term dietary effects on the
reproductive output of A. tonsa. During our experiment, copepod egg production
(number of eggs female-1) was not impacted by the combination of increased
seawater pCO2 and changed algal food quality. Measurements performed after the
transplant experiments in 2014 and 2015, showed no substantial differences between
the CO2 SLs and treatments according to the number of eggs female-1. However, our
results indicated that the nutrition of the high CO2 SLs affected females’ egg
production in terms of egg size and / or nutrient content. In 2014 and 2015 we
observed that eggs from high CO2 SL females hatched significantly earlier compared
to the eggs from low CO2 SL females. Guisande and Harris (1995) found a positive
correlation between the size, protein, carbohydrate and lipid content of eggs from
CHAPTER IV
105
Calanus helgolandicus females and the amount of available food. Thus, the
nutritional status of a female can directly affect egg size. Especially the availability
of N (protein) is known to effect egg production in copepods (Checkley 1980;
Kiørboe 1989). Therefore, it is very likely that due to the detrimental elemental body
composition, the high CO2 SL females had fewer nutrients available for
physiological processes like development and egg production, wherefore the
production of smaller or nutrient-poor eggs would be beneficial to save resources and
to avoid a decrease of reproductive power by lower egg numbers female-1
(no differences between the SLs). The reproductive output (number of eggs female-1)
of a population is important as there is a positive correlation between the number of
offspring and the genetic diversity and thus the fitness of a population (Reed and
Frankham 2003). Steele and Steele (1975) already showed that the time for the
embryonic development is positively correlated with the egg size. Therefore, a
reduced egg size or nutrient amount within the eggs could have shortened the time
for embryonic development, which could have resulted in the earlier hatching we
observed. The earlier hatching of eggs from high CO2 SL females occurred
independently of the CO2 treatment experienced during the transplant experiment. So
even under optimal environmental conditions females with a high CO2 selective
history seemed to invest less in the production of eggs. This pattern suggests
epigenetic inheritance, whereby the quality of produced eggs was determined by the
environmental conditions of the previous generations. It is known that
transgenerational effects can even decouple phenotypic from genetic change over
multiple generations and allow populations to respond to environmental changes
even in the absence of genetic variation (Bonduriansky et al. 2012). If the expression
of the here observed phenotype is solely due to transgenerational effects or has
already been genetically assimilated remains, however, unclear. In 2016, we did not
detect differences in the hatching between the eggs from the high and low CO2 SLs
neither under low nor under high CO2 conditions. The normalization of the hatching
pattern was probably a result of the improvements in the regulation of the elemental
body composition. However, we cannot exclude that significant differences between
the CO2 SLs or treatments might have been obscured by the increased variation
among replicates.
CHAPTER IV
106
Effects of stoichiometric phenotypic plasticity on ecosystem functions Eco-evolutionary dynamics posits that both directions of effects, from ecology to
evolution and vice versa, are substantial in their influence (Schoener 2011), and, in
some cases, may result in eco-evolutionary feedback loops (Post and Palkovacs
2009). It is well established that the product of evolution by natural selection (e.g.
species richness and trait variability) can alter ecosystem functions (Matthews et al.
2011), but little is known whether phenotypic plasticity has the strength to influence
ecosystem services (Fischer et al. 2014). Within one year after the start of the long-
term experiment, we observed an increased regulation of the elemental body
composition of the A. tonsa SLs. Since grazers like copepods preferentially retain
nutrients limiting their growth (N and P) and release those supplied in excess (C),
they can impact the amounts and ratio at which nutrients are recycled (Hall 2009).
Additionally, copepods must get rid of surplus C when nutrients are limited. Excess
C released by excretion of dissolved organic carbon, defecation and respiration can
then intensify microbial growth. Thereby, low nutrient content of detritus typically
means lower and slower decomposition and hence sequestration of C (Hessen et al.
2004). However, experimental studies (Olsen et al. 1986; Goldman et al. 1987)
showed that simultaneously nutrient regeneration rates are constrained when nutrient
elements are decreased relative to C in food substrates, which then again accelerate
nutrient limitation in autotrophs. Therefore, the regulation of the elemental body
composition of consumer species and the associated release of e.g. excess C or an
increased retention of nutrients (here: N) under elevated CO2 conditions, especially
in nutrient depleted water, could negatively feedback on consumers’ food sources
and a priori the consumer itself. Consequently, stoichiometric changes in the range of
phenotypic plasticity can substantially affect C and nutrient fluxes within the food
web and alter ecosystem functions.
Conclusion Our results showed that A. tonsa can be substantially affected by simulated OA, both
immediately and in the long-term. In the first place, most likely due to the dietary
conditions in the high CO2 treatment, copepods’ elemental body composition
changed, and their developmental rate decreased. Although A. tonsa showed a high
plasticity level in the regulation of its body stoichiometry, we found evidence that the
CHAPTER IV
107
ingestion of high CO2 algae with a high energy content (high C : nutrient ratio) for
several years can result in a reduced body length accompanied by an increased lipid
storage, as indicated by the increased C and N content of the high CO2 SL copepods
in both CO2 treatments in 2017. However, we do not know whether these were
phenotypic or genotypic changes, as we did not test the reversibility of these
processes. Besides possible corresponding implications for the copepod itself, such
changes in the phenotype and nutritional composition can have substantial
consequences for trophic interactions in the food web.
Several studies on various species (oysters, sea urchins, mussels, and phytoplankton)
predict that complex adaptations to OA are likely over longer time scales (Sunday et
al. 2011; Parker et al. 2012; Reusch and Boyd 2013). Probably due to an insufficient
selection pressure, we did not detect any SL specific adaptations to the CO2
conditions in the observed traits (body stoichiometry, developmental rate, egg
production and hatching rate) during our long-term CO2 selection study. Additional,
phenotypic buffering and transgenerational effects, as observed in A. tonsa in the
regulation of its elemental body composition and egg production, probably further
reduced the selective pressure on the high CO2 SL populations. It cannot be ruled out
that the effects on the prosoma length and body mass of the high CO2 SL copepods,
observed towards the end of this study, elevated the selective pressure, which would
have possibly lead to specific acclimatisation and / or genetic adaptation in the future.
Under naturally fluctuating conditions with changing food availability and
differences in nutrient supply, indirect effects of elevated CO2 on A. tonsa
populations might be even worse and adaptions even more challenging. Especially,
stoichiometric regulations may not occur because metabolic costs of the regulation
processes would probably outweigh the advantages (Meunier et al. 2014).
Furthermore, in natural field populations, many traits are under selection and an
effective response to one stressor may limit the response to another, which hampers
adaptations when multiple environmental changes occur (Hofmann and Todgham
2010; Collins et al. 2014). Thus, laboratory experiments possibly underestimate the
intensity of constraints on acclimatisation and evolutionary responses to
environmental changes (Collins et al. 2014). To be able to make fundamental
predictions on how OA and potentially associated stoichiometry changes of primary
producers will influence food web interactions, further investigations under natural
CHAPTER IV
108
field conditions are needed, including multiple producer and consumer species as
well as fluctuations in abiotic and biotic factors.
Acknowledgments We are grateful for the support of our colleagues S. Ohse, T. Schmithüsen, J. Haafke, R. Schüller, J.
Sudhir Kumar, M. Algueró-Muñiz, T. Lesniowski, and the students A. Brandes, G. Leichtweiß and S.
Schliefke (performing a voluntary ecological year) involved in maintaining the long-term CO2
selection lines and for their assistance during the transplant experiments. Additionally, we thank S.
Ohse and J. Haafke for technical assistance during the C, N, P measurements. This study was part of
the BMBF financed BIOACID II project, consortium 1, work package 1.14 (FKZ 03F0655B). CL.M
was supported by the Bundesministerium für Bildung und Forschung (BMBF grant no. 01LN1702A
GENERAL DISCUSSION
109
General discussion The uptake of anthropogenic CO2 by the world’s oceans induces fundamental
changes in seawater chemistry, with far reaching consequences for marine
ecosystems. Investigations presented in this thesis showed that copepods are hardly
directly affected by lowered seawater pH (CHAPTER III) and revealed low
sensitivities of coastal plankton communities to the combined direct and indirect
effects of OA (CHAPTER II). In addition, observations made during the long-term
selection experiment suggest that there is a high potential for acclimatisation and
adaptation of copepods to increased pCO2 conditions, but also, that a long-term
exposure to future acidification states may alter copepods’ physical characteristics
(CHAPTER IV). Furthermore, this study demonstrated the applicability of the HTS
technique community barcoding for the assessment of marine plankton communities,
including oomycetes, and illustrated remaining methodological weaknesses
(CHAPTER I and II).
In the following, findings of this study will be discussed in a broader context,
including recent literature on the effects of OA on plankton communities and their
acclimatisation and adaptation responses. Additionally, possibilities offered by new
molecular biological techniques for investigation of the effects of OA on marine
communities, like community barcoding, will be presented. Finally, an outlook on
areas where future research efforts should be made will be given.
Effects of OA on copepods Calanoid copepods account for up to 80% of the zooplankton biomass (Longhurst
1985) and play a key role in marine pelagic ecosystems, transferring energy captured
by primary producers to higher trophic levels (Runge 1988; Calbet and Saiz 2005).
Copepods are indispensable to the functioning of the entire pelagic ecosystem and
contribute to many ecosystem services (Bron et al. 2011) e.g. the carbon transport
from the surface to the deep sea (e.g. Schnack-Schiel and Isla 2005). Generally,
crustaceans have been considered as less sensitive to end of the century pCO2
scenarios (Wittmann and Pörtner 2013), however, copepods’ responses to OA seem
to be complex. Reactions differ among (Zhang et al. 2011) and within species
(Drillet et al. 2008), i.a. depending on their ecological history (Vargas et al. 2017), as
GENERAL DISCUSSION
110
well as between developmental stages, with early life stages being more vulnerable
(Cripps et al. 2014b; Pedersen et al. 2014; Wang et al. 2018). In accordance with
earlier studies (Mayor et al. 2012; McConville et al. 2013), results from the
short-term laboratory experiment (CHAPTER III) support the observation that
copepods (here A. tonsa) are hardly directly affected by increased pCO2
concentrations (e.g. hypercapnia). As many zooplankton (including larval stages)
already face pH levels much lower than those predicted for surface waters in the
coming century (Meunier et al. 2016), copepods are potentially already adapted to
variations in seawater pH and the effects of hypercapnia.
However, indirect effects of OA via altered food regimes might be a more serious
threat to copepod species. Rising pCO2, for instance, was shown to rise elemental
C : N and C : P ratios (Tortell 2000; Urabe et al. 2003; Riebesell et al. 2007; van de
Waal et al. 2010; Schoo et al. 2013; Verschoor et al. 2013; Eggers et al. 2014) in
experimental studies using single species and phytoplankton communities.
Furthermore, Rossoll et al. (2012) demonstrated that elevated pCO2 (~ 750 µatm)
significantly changes the fatty acid composition of the diatom Thalassiosira
pseudonana, with a decline in both, total fatty acids and the ratio between long-chain
polyunsaturated to saturated fatty acids. In contrast to that, Isari et al. (2015) found
no effect of elevated pCO2 on the dinoflagellate Heterocapsa sp., neither on the
elemental ratio nor on the fatty acid composition. The fact that different studies
yielded different results supports the assumption that organisms’ responses to
increased pCO2 are highly species specific. In the short- and long-term laboratory
experiments in this study (CHAPTER III and IV), culturing of the algae R. salina and
P. salina under elevated pCO2 (800 µatm) concentrations significantly increased the
C content and thus the C : N and C : P elemental ratios. Besides fatty acids
(Glencross 2009), N and P, as essential building blocks for proteins and RNA, play
important roles in the construction of organisms. Thus, these elements mutually
regulate the pace of protein synthesis and the associated growth rate (Elser et al.
2003; Hessen and Anderson 2008). Since heterotrophs are more restricted in their
elemental composition compared to autotrophs, stoichiometric discrepancies between
predator and prey can have far reaching consequences for the fitness of the consumer,
diminishing its growth, fecundity and survival (Sterner and Elser 2002; Bukovinszky
et al. 2012). Generally, many grazers including copepods can adjust their elemental
body composition to a certain extent by e.g. selective retention of scarce nutrients or
GENERAL DISCUSSION
111
the excretion of excess elements (Hall 2009). In this study (CHAPTER III and IV)
however, the ingestion of algae, reared under elevated pCO2, significantly reduced
the developmental rate of the copepods. Additionally, measurements of copepods’
elemental body composition (CHAPTER IV), revealed a significantly increased C
content of copepods cultured under elevated pCO2 conditions, grazing on high CO2
algae. Hence, copepods could most likely not compensate the stoichiometric
discrepancy between their food and their somatic needs for a balanced growth.
Contradictory to a study of Rossoll et al. (2012), in which the egg production of
A. tonsa females, fed algae reared under high CO2 concentrations, significantly
decreased from 34 to 5 eggs female-1 day-1, no detrimental effects on the egg
production of A tonsa were observed during the long-term selection experiment in
this study (CHAPTER IV). However, since egg production was only measured after
several months, copepods were probably already acclimatised to the elevated pCO2
concentration and associated food condition, which will be discussed in more detail
later.
As many studies investigating the effects of OA on marine organisms were
performed with single species and / or artificial predator-prey combinations, obtained
results cannot simply be extrapolated to the community or ecosystem level. For
instance, it was shown that food quality effects can travel up the food web (Malzahn
et al. 2007) and might affect higher trophic levels (e.g. fish) as well. However, under
natural conditions, copepods probably compensate the deficiencies in the food
quality by selective feeding, choosing those prey organisms most closely matching
their metabolic needs. Indeed, copepod species actively choose specific food based
on taxonomic differences of the prey (Gentsch et al. 2009; Saage et al. 2009)
Gentsch et al. 2009), prey size (Paffenhöfer 1988), prey nutrient composition
(Cowles et al. 1988) and in relation to their own developmental stages (Berggreen et
al. 1988; Mauchline 1998). Besides, in nature, copepods’ responses to OA are
additionally significantly influenced by abiotic factors like temperature and light, by
the diversity and abundance of potential prey organisms and their quality (nutrient
composition) (Cripps et al. 2016; Algueró-Muñiz et al. 2017a; Lischka et al. 2017),
as well as by the presence of predators and / or other harmful organisms e.g. parasites
(Lafferty et al. 2006; Scholz et al. 2016a).
GENERAL DISCUSSION
112
Effects of OA on plankton communities Considering the constrains of laboratory experiments, large-scale in situ mesocosm
experiments were carried out in recent years, as they provide a powerful tool to
investigate the impact of elevated pCO2 concentrations on marine communities under
near-natural conditions (Riebesell et al. 2010).
Since organisms living at higher latitudes are expected to be more impacted by OA,
due to the higher solubility of CO2 in cold waters, mesocosm experiments were until
recently preferably performed in northern areas. Mesocosm field studies conducted
in Espegrend (Bergen, Norway) and Kongsfjorden (Ny-Ålesund, Svalbard, Norway)
revealed an overall resilience of the present plankton communities (bacteria,
phytoplankton, micro- and mesozooplankton) towards elevated pCO2 conditions,
whereby observed biological responses were mainly depending on temperature and
nutrient availability (Riebesell et al. 2008; Aberle et al. 2013; Niehoff et al. 2013;
Schulz et al. 2013; Silyakova et al. 2013; Sperling et al. 2013). Since both mesocosm
experiments lasted only for around 30 days, the time span was probably not
sufficient to detect changes in slowly developing artic communities, raising not only
the need for longer lasting mesocosm studies but also the need of experiments at
lower latitudes, where most taxa have shorter generation times (Niehoff et al. 2013).
The Gullmar Fjord KOSMOS 2013 study was the first study to last 113 days,
encompassing a whole winter-to-summer plankton succession with two
phytoplankton bloom phases. Overall, the results presented in CHAPTER II and from
other accompanied studies revealed no persistent pCO2 induced compositional shifts
in the investigated coastal plankton communities. As observed during the prior
mesocosm studies in Espegrend and Kongsfjorden, changes in relative taxa
abundances and taxa compilations were mainly driven by temperature and nutrient
availability (CHAPTER II). However, during the second bloom phase, some studies
observed pCO2 induced fertilizing effects on photosynthetic organisms, leading to an
increased biomass of autotrophic phytoplankton (Bach et al. 2016) and associated
micro- and mesozooplankton grazers (Horn et al. 2016; Algueró-Muñiz et al. 2017a;
Taucher et al. 2017), which probably benefited from the increased food availability. In contrast to the first bloom, which was fuelled by inorganic nutrients that were
initially available from the winter upwelling, the second bloom was mainly driven by
remineralized nutrients in lower concentration. Resources for plankton growth
needed to be delivered by the food web, whereby the limitation of inorganic nutrients
GENERAL DISCUSSION
113
seemed to indirectly enhance pCO2 effects on planktonic organisms. Theoretically,
one would expect that larger phytoplankton species benefit more from increased
pCO2, because they are more diffusion-limited due to their lower surface to volume
ratio (Flynn et al. 2012). Contradictory, during the Gullmar Fjord mesocosm
experiment especially very small picophytoplankton species (0.2 - 2 µm) showed a
pronounced positive response to the increased pCO2 conditions during several
succession stages (Bach et al. 2017). In the study of Bach et al. (2017) different
mechanisms are presented to explain the advantages of small-sized phytoplankton
under OA when inorganic nutrients are limiting. Firstly, they are more efficient in the
acquisition of nutrients than larger species, due to their higher surface to volume
ratio (Pasciak and Gavis 1974). Secondly, they possibly benefit from an increase of
extracellular enzymes involved in organic matter remineralization under low pH.
However, this phenomenon was so far only reported from auto- and heterotrophic
bacteria (Grossart et al. 2006; Maas et al. 2013; Piontek et al. 2013; Endres et al.
2014). In a third mechanism, mixotrophic picoeukaryotes graze on bacteria as an
alternative nutrient source, thereby additionally weakening them as nutrient
competitors (Thingstad et al. 1996). Results from the community barcoding
performed in this study are in line with this theory as they indicated decreasing
Proteobacteria abundances over the experimental period (CHAPTER II). Furthermore,
an under high pCO2 conditions significantly increased abundance ratio of
picophytoplankton to heterotrophic bacteria during the second bloom phase observed
by (Bach et al. 2017), support this hypothesis.
Other mesocosm studies further revealed that nutrient conditions play an important
role in the response of plankton communities to OA (Alvarez-Fernandez et al. 2018),
with more intense pCO2 effects under limiting inorganic nutrient concentrations
(Paul et al. 2015; Sala et al. 2015; Spilling et al. 2016b). As mentioned before,
investigations accompanied with the Gullmar Fjord KOSMOS 2013 experiment
showed, that a CO2-enhanced increase in autotrophs abundances can travel up the
food chain, whereby heterotrophic consumers (Horn et al. 2016; Algueró-Muñiz et al.
2017a; Taucher et al. 2017) and higher trophic levels (Sswat et al. 2018) benefit from
an increased availability of prey. A positive indirect pCO2 effect on the food supply
of zooplankton was also observed during a 45-days-long mesocosm experiment
conducted in the Baltic, Storfjärden (southwest coast of Finland) in 2012. An
interesting aspect of this experiment was the pronounced role of the microbial loop in
GENERAL DISCUSSION
114
the study area (Uitto et al. 1997; Koski et al. 1999), which substantially shaped
biological processes in the post bloom phase of the mesocosm experiment. Here,
most of the secondary production was fuelled by carbon channelled from the
microbial loop to higher trophic levels (Paul et al. 2015). After an initial
phytoplankton bloom, which was of similar strength among CO2 treatments, carbon
was mainly channelled into sinking material flux and higher trophic levels, instead of
being accumulated in the DOC pool, which was probably mediated by increased
zooplankton grazing. In the further course of the post bloom phase, the zooplankton
community in the high CO2 mesocosms was dominated by the cladoceran Bosmina
sp. and the mixtrophic ciliate Myrionecta rubra. These species seemed to benefit
twice from increased pCO2 concentrations, directly through their autotrophy and
indirectly by an increased occurrence of potential prey organisms
(i.e. picoeukaryotes). Bosmina species are filter feeders consuming algae and
protozoans, therefore their reproduction was probably further stimulated by an
increased food availability in the form of bacteria (Lischka et al. 2017). Thereby, the
direct feeding of cladocerans on bacteria, which was evident in a reduced bacterial
production (Crawfurd et al. 2017), enhanced the microbial loop and stimulated
carbon transfer to higher trophic levels. As observed in earlier mesocosm
experiments (Bach et al. 2017), elevated pCO2 concentrations increased
phytoplankton productivity, positively effecting higher trophic levels e.g. the
calanoid copepod Eurytemora affinis (Almén et al. 2016). Under the nutrient
depleted conditions, the picophytoplankton benefited most from the increased pCO2
conditions (Hornick et al. 2017). As size is a key parameter for sinking speed,
picoplankton organisms are very inefficient in transporting carbon out of the
euphotic layer (Michaels and Silver 1988). Thus, a shift towards smaller size classes
might result in a reduced carbon export and sequestration (Spilling et al. 2016a).
Additionally, a persistent shift to smaller phytoplankton size classes might create a
gap between prey size and primary consumer’s needs, with negative impacts on
population size and subsequently on the recruitment of secondary consumers and
higher trophic levels. In line with the Gullmar Fjord results (CHAPTER II), the
investigated plankton community in the Baltic appeared to be quite resistant towards
future OA conditions as well. Again, this response was probably a result of the
ecological prehistory of the present biocenosis. The northern Baltic Sea is
characterised by a low salinity (∼ 5.7 ‰) and, as many other coastal areas, by large
GENERAL DISCUSSION
115
inter- and intra-seasonal pH variations, sometimes reaching extreme values of 9.2
and 7.4 (Brutemark et al. 2011). Thus, the on-site plankton community is probably
composed by species and genotypes that are less sensitive to increased pCO2
(reduced pH) (Nielsen et al. 2010; Lohbeck et al. 2012; Rossoll et al. 2013; Almén et
al. 2014).
Observations of the zooplankton succession made during another mesocosm study
conducted in 2014, in Gando Bay, on the west coast of Gran Canaria (oligotrophic
conditions), showed, as observed during the Gullmar Fjord mesocosm study, a
positive, however delayed response of the zooplankton community to the
phytoplankton bloom under high pCO2 conditions (Algueró-Muñiz et al. 2017b).
Those changes in the phenology of species could cause mismatches between trophic
levels and functional groups, with consequences for the entire ecosystem (Edwards
and Richardson 2004).
All in all, past mesocosm experiments revealed that responses of marine plankton
communities to OA (increase pCO2) are highly complex, depending on various
factors. While this is certainly only the tip of the iceberg, some factors shaping the
effects of increased pCO2 concentrations on marine plankton communities were
revealed during the past years. Besides nutrient conditions, temperature and season,
the taxa composition of the plankton community as well as their adaptive history
seem to be essential factors. This raises the questions if observed responses of marine
taxa to increased pCO2 concentrations will either persist for longer periods covering
multiple generations and growth cycles, or if organisms acclimatise and adapt to the
changed environmental condition. However, prolonging mesocosm experiments is
not trivial, due to e.g. wall effects and artificial water mixing conditions, as there is
an inherent danger of driving the community away from the natural world over time.
Acclimatisation and adaptation The main determinant of species’ tolerance to environmental changes is their
physiological performance. If conditions change, organisms initially respond based
on physiological and behavioural adjustments that have been shaped by their
ecological prehistory (Doney et al. 2012). New environmental conditions may be
physiologically tolerable, allowing acclimatisation and adaptation, or may be
intolerable, causing migration, change in phenology or death and local extinction
(Parmesan 2006). Each of these responses of single species affect overall food web
GENERAL DISCUSSION
116
interactions in a variety of ways, with potentially dramatic implications for
ecosystem structure (e.g. community composition) and function. Mesocosm
experiments revealed that zooplankton living in costal upwelling regions are
potentially acclimatised or adapted to extremes in seawater chemistry, and therefore
rather resistant against the effects of future OA conditions (Pansch et al. 2014).
However, local adaptation to future OA conditions may not be a ubiquitous process
in marine environments. Instead, there might be large variations among species in
their evolutionary responses. For example, Lucey et al. (2016) showed that for the
calcifying polychaete Simplaria sp., inhabiting naturally elevated pCO2 volcanic vent
areas, neither local adaptation nor phenotypic plasticity are likely to be sufficient to
buffer the negative impacts of future OA. Among copepods, local adaptation to the
environmental parameters temperature, oxygen concentration and salinity was
described for Tigriopus californicus (Kelly et al. 2012), A. tonsa (Decker et al. 2003)
and Eurytemora affinis (Lee et al. 2007), respectively. It was further suggested that
the evolutionary history of marine populations greatly influences the adaptability of
organisms to future OA conditions (Hofmann et al. 2011). Accordingly, organisms
living in coastal areas characterised by strong variations in e.g. pH, oxygen content
and temperature (Feely et al. 2008; Melzner et al. 2013), do not necessarily have a
higher potential for acclimatisation or adaptation compared to organisms form
temperate zones. Strong directional selection for resistance to e.g. low pH might
reduce the total genetic variation of a population and thus the potential to acclimatise
or adapt to alterations in other environmental parameters associated with climate
change as ocean warming (Gaitan-Espitia et al. 2017). Likewise, phenotypic
plasticity followed by genetic assimilation (selective pressure on a specific
phenotype) could reduce a populations’ genetic diversity. However, seasonal
fluctuations in environmental parameters might result in the maintenance of
alternatively adaptive phenotypes (higher genetic diversity) (Pespeni et al. 2013) or
favour plastic phenotypes with large tolerance to pH variations (Futuyma and
Moreno 1988). All in all, evolutionary responses of marine populations to future OA
are likely to be very specific and shaped by the experienced environmental history.
To study the adaptive potential of organisms, one can measure the standing genetic
variation in climate-sensitive traits, infer past adaptation from comparisons across
time and space, as it was done in the studies describe above, or conduct real time
evolution experiments (Sunday et al. 2014). Only the latter approach is a direct test
GENERAL DISCUSSION
117
of adaptive evolution. Investigation of the adaptability of key species in marine food
webs may enable the identification of the thresholds (rate and magnitude) of
environmental change, beyond which evolution might not be effective to save marine
organisms from extinction. Due to their rather long generation times of 15 - 30 days
(Peterson 2001), investigations of real-time evolution in copepods experiencing
future OA conditions are scarce. The long-term selection experiment presented in
CHAPTER IV was the first one investigating the effects of simulated OA on the
calanoid copepod A. tonsa over a period of 3 ½ years. At the first instance, the
elevated seawater pCO2 and impaired quality of the food algae (increased carbon to
nutrient ratio), cultured under high pCO2 concentrations, increased the C to nutrient
(N, P) elemental body ratio and decreased the developmental rate of the copepod.
However, under constant laboratory conditions, A. tonsa showed a high plasticity in
the regulation of its body stoichiometry, indicated by an increased homeostasis and
associated increased developmental rate of the copepods from both SLs under high
CO2 conditions, within one year. Organisms with longer generation periods often
show phenotypic plasticity and buffering to compensate unfavourable changes in
their environment (Dam 2013; Thor and Dupont 2015). If environmental change
persists over the life time of organisms, transgenerational acclimation comes to effect.
By, for example, nutritional, somatic, cytoplasmic or epigenetic transfer, parents can
significantly affect the performance (survival and fitness) of their offspring
(Bonduriansky and Day 2009; Marshall and Morgan 2011; Klironomos et al. 2013).
Maternal effects on offspring can be a significant factor influencing population
dynamics of copepods (Kahan et al. 1988) and other marine taxa (Fowler 2005;
Räsänen and Kruuk 2007; Munday 2014). During the long-term experiment
(CHAPTER IV) copepods’ development was significantly reduced under simulated
OA conditions, however, the number of produced eggs per female was not affected
by the increased water pCO2 combined with the poor food quality of the algae
cultured under elevated pCO2 concentrations. Under nutrient depleted conditions due
to the changed stoichiometry of the food algae (high C, less nutrients), high CO2 SL
females optioned for quantity rather than quality, according reproduction, and
invested less resources in the production of each egg. Consequently, those eggs were
probably smaller or contained less yolk. Thus, eggs from females with a high CO2
selective history hatched earlier compared to those from control SL females,
independent from the experienced CO2 treatment during the transplant experiments.
GENERAL DISCUSSION
118
Hence, there was a potential trade-off between copepods’ developmental rate and its
reproductive output as well as between the number of produced eggs and their
quality. Already Darwin (1859) referred to trade-offs as compensation and stated that
“in order to spend on one side, nature is forced to economise on the other side.” The
results of the conducted laboratory experiments (CHAPTER III and IV) with A. tonsa
in this study are in accordance with Fitzer et al. (2012), who observed similar
responses of Tispe battagliai when exposed to OA-induced stress. They suggested
that copepods preferentially reallocate resources to maintain their reproductive
output at the expense of somatic growth and cuticle composition.
Although many laboratory experiments revealed a high potential of organisms to
acclimatise and adapt to OA associated environmental changes e.g. lowered pH and
altered food regimes, it is still unclear how organisms will respond under natural
conditions. Physiological acclimatisation (in the form of phenotypic plasticity) and
evolutionary adaptation processes, affect inter- and intraspecific interactions within
the food web and, at a larger scale, alter the marine ecosystem (Thompson 1998;
Matthews et al. 2011). Changes in the way organisms regulate their elemental ratios
or changes in their stoichiometry, as observed during the long-term selection
experiment (CHAPTER IV), could significantly influence population and community
dynamics as well as ecosystem functions such as nutrient cycling (Yamamichi et al.
2015). A higher relative assimilation or retention of limiting elements might further
distort the elemental ratios of primary producers (Hall 2009) and potentially
reinforce existing stoichiometric selection pressures on herbivores (eco-evolutionary
feedback) (Pelletier et al. 2009). In this study, A. tonsa exhibited a high plasticity in
the regulation of its body stoichiometry, however, the one-sided ingestion of algae,
cultured under high pCO2 conditions, with a high energy content (high C : nutrient
ratio), resulted in an increased body mass and reduced body length of the copepods
(CHAPTER IV). In nature, besides potential food web implications, such physiological
alterations could directly affect copepods’ survivability by a reduced swimming
speed and consequently lowered ability for predator avoidance (Strickler 1975;
Sullivan et al. 1983; Burdick et al. 2007).
Whatever the case, observed impacts of OA on single species cannot simply be
transferred to the community level as effects might be accelerated or compensated at
the ecosystem level by additional environmental stressors, species richness, and
trophic interactions. Indeed, experimental evidence suggests that adaptation to
GENERAL DISCUSSION
119
environmental stress of phytoplankton (Collins et al. 2014; Eggers et al. 2014),
bacteria (Lawrence et al. 2012) and zooplankton (Declerck et al. 2015; Spilling et al.
2016a) might follow different evolutionary paths in monocultures than in the
presence of competitors. Therefore, to investigate the adaptive potential of species to
environmental changes, selection studies should be performed in an environment as
close as possible to natural conditions (Bach et al. 2018). Although mesocosm
studies enable the investigation of the effects of future OA conditions on a
community level under near natural conditions, these studies are limited technically
by their massive maintenance effort and systematically by the inevitable progressive
deviation of the enclosed biomes from natural patterns. However, to detect signals of
climate change associated processes like OA from substantial natural variability,
observation over multidecadal time spans are needed (Doney et al. 2012). Since
marine communities at naturally-acidified sites are already adapted to the specific
habitat conditions, those places are often used as OA analogues to investigate the
effects of acidification on the present biocoenosis, either along pCO2 gradients
(Raulf et al. 2015) or between acidified and control sites (Hassenrück et al. 2015;
Hofmann et al. 2015b). Furthermore, those sites can be used to investigate
acclimatisation and adaptation patterns, e.g. by reciprocally transplanting species
from ambient (i.e. high pCO2) to low pCO2 habitats (Lucey et al. 2016). A vulnerable
point of such studies is the characterization of the naturally-acidified sites, which is
often limited to OA-related variables, omitting other environmental variables that
might interact with the effects of OA (Hassenruck et al. 2016).
Metagenomics Marine environments are experiencing rapid changes in important processes and
parameters like temperature, light penetration, nutrient availability, and OA.
Resulting changes in the physiological condition of species, their ecological
functioning and biogeographical distribution as well as their abundance will
inevitable alter marine ecosystems. How species acclimatise and / or adapt to
environmental changes, and how physiological or genetic adaptations of species
might change food web interactions and ecosystem structures and functions, can be
examined by various ways, whereby community barcoding seems to be a convenient
and powerful tool. As presented in CHAPTER I and II, community barcoding
approaches analyse DNA obtained from environmental samples and reflect the
GENERAL DISCUSSION
120
biodiversity of entire plankton communities (de Vargas et al. 2015), with the
advantage of detecting also the “hidden species diversity” (Lindeque et al. 2013). In
this study, community barcoding was used, in a mesocosm experiment, to asses OA
induced changes in the composition of a coastal plankton community (CHAPTER II).
With the analysis of the 18S gene region, a broad range of the present biodiversity
was captured, including phyto- and zooplankton of different size classes as well as
fungi and prokaryotes. The results demonstrated that the composition of the
investigated coastal plankton community is rather resistant to future OA condition.
Over the experimental period, plankton community compositions were rather shaped
by changes in light, temperature and nutrient availability, following the natural
winter-to-summer succession. Despite the high taxonomic resolution, community
barcoding data cannot be used to make predictions about species abundances and / or
biomasses on-site. Preferential annealing of universal primers in some species over
others hinder species abundance assessments of this PCR-based approach (Elbrecht
and Leese 2015). For reliable biomass estimates, or even rough estimates, a PCR-free
approach would be needed. However, to date no such approach is available (Zhou et
al. 2013).
Recent research revealed that the ecological prehistory and taxonomical composition
of marine plankton communities greatly influence their ability to acclimatise or adapt
to future OA conditions. The lack of environmental data regarding seawater
chemistry (e.g. pH / pCO2 variability) and geographic distribution of species are
critical research gaps for studies dealing with the projection of organismal responses
to OA (Ducklow et al. 2009). Several studies and this thesis (CHAPTER I and II)
demonstrated the suitability of community barcoding for biodiversity assessments of
marine zooplankton (Lindeque et al. 2013; Pearman and Irigoien 2015), bacteria
(Herlemann et al. 2011; Gilbert et al. 2012) and protozoa (Massana et al. 2015)
communities as well as for long-term plankton monitoring projects (Abad et al.
2016) including e.g. microalgae (Visco et al. 2015). Additionally, community
barcoding was successfully used for global ocean biodiversity analyses (Bik et al.
2012; de Vargas et al. 2015). Compared to classical microscopic examinations, a
genetic approach like community barcoding allows for an accurate and fast
assessment of extreme small (pico-, nano- and microplankton), rare and cryptic
species. The approach is especially advantageous for the detection and investigation
of marine parasites (CHAPTER I), which are virtually impossible to detect by eye as
GENERAL DISCUSSION
121
they often inhabit their hosts. Community barcoding is a powerful technique with
excellent possibilities for use in plankton assessment and monitoring as well as for an
early detection of e.g. OA induced plankton diversity shifts including the
immigration of new non-indigenous species (Abad et al. 2016). However, study
success highly depends on the quality of public databases. Still, some organism
groups, e.g. marine oomycetes, have none or only very few publicly available
reference sequences. Thus, the current incompleteness of databases is one of the
main drawbacks for community barcoding studies. For an improvement of those
databases, fruitful cooperation between taxonomists and molecular biologists is
needed.
Nonetheless, new population genomic approaches offer various research possibilities
including i.a. the detection of impacts of selection and local adaptation (Stapley et al.
2010). Thereby, non-neutral markers which are targeted by selection can be used to
reveal adaptation of populations to local environmental conditions across the
distribution range of a species (Whitehead 2012). Furthermore, evolutionary drivers,
like introgressive hybridization and hitch-hiking (Smith and Haigh 1974), which lead
genomic traits away from neutrality (Bucklin et al. 2018), can indicate ongoing
adaptation processes. The continuing development of sequencing technologies and
decreasing costs might soon allow the frequent sequencing of whole genomes. The
so obtained data would be a valuable resource for various population genetic
approaches, including the detection of loci under selection and the investigation of
genomic bases of adaptations of marine plankton (Bucklin et al. 2018).
CONCLUSION AND FUTURE PERSPECTIVES
122
Conclusion and future perspectives Aims of this thesis were the investigation of the potential direct (lowered water pH)
and indirect (changed food regime) effects of elevated seawater pCO2 on A. tonsa
(CHAPTER III) and the investigation of its adaptability to future OA conditions
(CHAPTER IV). Furthermore, as a technique providing high resolution taxonomic data,
community barcoding was used to detect changes in the composition of a coastal
plankton community exposed to future OA conditions (CHAPTER II). Due to their
cumbersome detection and taxonomical classification, marine parasites, although
playing an important role in marine food webs, are often not considered in marine
ecosystem analyses. Therefore, it was another goal of this study to advance the
molecular biological detection of marine oomycetes, which are predominantly
parasites of various marine taxa (CHAPTER I).
In conclusion, the effects of OA on marine biota were very species and
developmental stage specific. Adult stages of the calanoid copepod A. tonsa seemed
to be rather resistant towards direct effects of elevated pCO2, while naupliar stages
were more sensitive. Contrary to that, A. tonsa is indirectly impacted by OA, due to
changes in the elemental composition of their prey. Stoichiometric discrepancies
between predator and prey significantly diminished consumer growth. The ingestions
of low quality food (unfavourable ratio between energy (C) and nutrients (N, P))
potentially resulted in a trade-off between copepods’ developmental rate and
reproductive output, which was in favour of the latter. However, during the
long-term selection experiment, A. tonsa showed, independent from its selective
history, a high plasticity in the regulation of its body stoichiometry and became more
homeostatic, suggesting a high physiological adaptability to OA associated
environmental changes.
Results from laboratory experiments on single species and / or artificial predator-
prey combinations cannot simply be translated to the community level, because
species richness and complex trophic interactions might mitigate or accelerate the
potential direct and indirect effects of OA. Mesocosm experiments, which enable the
investigation of the effects of OA on plankton communities under near natural
conditions (Riebesell et al. 2013), revealed that coastal plankton communities were
rather resistant towards future acidification states (Nielsen et al. 2010; Lohbeck et al.
CONCLUSION AND FUTURE PERSPECTIVES
123
2012; Nielsen et al. 2012; Rossoll et al. 2013; Almén et al. 2014; Baumann et al.
2015). Furthermore, a pCO2 induced fertilisation effect on photosynthetic organisms
was observed, whereby small picophytoplankton seemed to benefit most, especially
under nutrient depletion (Bach et al. 2017). An increased food supply can in turn
have advantageous effects on the recruitment of micro- and mesozooplankton grazers
as well as higher trophic levels (Horn et al. 2016; Algueró-Muñiz et al. 2017a;
Taucher et al. 2017; Sswat et al. 2018). Possible disadvantages for secondary
consumers, due to a poor food quality of primary producers, might be alleviated in
complex food webs by compensatory feeding (e.g. Cowles et al. (1988)). Summing
up, the research of the past years revealed potential winners and losers of the ongoing
OA process. A majority of marine organisms including several phyto- and
zooplankton species tolerate an increase in pCO2 and even benefit from it, while
others, especially calcifying taxa like mussels and corals, are more vulnerable.
Although it seems that OA is not the greatest threat for marine organisms, in
combination with other environmental stressors, it will likely cause significant shifts
in the community composition of marine species, and the resulting ecosystem might
not be what people want.
The complexity of entire ecosystems cannot be incorporated into any feasible
experimental set-up. Even in large-scale mesocosm experiments it is not possible to
include all regional occurring species. For instance, big predators (exceeding a length
of ~ 1 mm) need to be excluded, as they would otherwise eat up most of the enclosed
zooplankton community in a short time. Furthermore, the running time of mesocosm
experiments is limited, due to a progressing deviation of the enclosed system from
real nature. This is especially problematic, as, although possible to take place over
short timescales, physical acclimatisation and adaptation processes of e.g. marine
copepods to OA, are often superimposed by responses to other varying
environmental factors. Sometimes even multidecadal time spans are needed to
separate climate change signals from substantial natural variability (Doney et al.
2012). Besides, the environmental prehistory and species composition of marine
plankton communities significantly determine their sensitivity or resilience towards
OA and associated environmental changes. Therefore, future research efforts should
include intensive long-term observations (monitoring projects) at different sites,
regularly assessing the present biodiversity and relevant seawater parameters, e.g.
temperature, pH, pCO2, light penetration and inorganic nutrient concentrations. If
CONCLUSION AND FUTURE PERSPECTIVES
124
time series data contain information on a sufficient number of generations across
different environmental conditions, they would be extreme valuable in predicting
how future oceans might look like (Attrill et al. 2007; Wiltshire et al. 2010).
Furthermore, OA does not occur in isolation but in combination with other
environmental stressors like ocean warming, eutrophication, invasive species,
parasitism and pollution. Again, positive or negative correlations between the effects
of OA and further environmental stressors could influence the magnitude at which
marine biota and consequently ecosystems might be impacted (Breitburg et al. 2015).
In conclusion, objectives for future research will be to continue assessing numerous
reactions of marine communities and ecosystems to a multitude of stressors.
Therefore, besides implementation of additional monitoring projects, the
performance of long-term, near natural, multi-stressor, mesocosm community
experiments during different seasons (nutritional situations) and at different
geographical sites is recommended, to get a comprehensive picture of how marine
communities respond to future acidification states and to uncover respond patterns
that can be generalized. Furthermore, investigations at naturally-acidified sites are
endorsed to improve understanding about acclimatisation and adaptation processes in
marine communities.
The development of HTS techniques offered a fast and logistically convenient way to
assess marine communities in environmental samples. However, sequencing
techniques like community barcoding only provide relative but not absolute species
abundance data. Although usually more time-consuming compared to sequencing,
quantitative methods, such as classical microscopy-based techniques, should be used
to confirm patterns in relative sequence abundance. To elucidate OA induced
changes in marine communities, especially short time alterations in the abundance of
a few species, a combined approach of screening and targeted techniques for future
research studies is suggested until molecular techniques have been further improved.
However, for long-term observations of marine biocoenoses, which imply enormous
sample numbers and potentially cover wide areas, community barcoding can provide
a fast, accurate and reliable tool.
The German philosopher Johann Wolfgang von Goethe said “In living nature nothing
happens which is unconnected to the whole”. The consequences, of the ongoing OA
and other climate change-related threats as well as anthropogenic influences for
CONCLUSION AND FUTURE PERSPECTIVES
125
marine ecosystems are to date impossible to forecast and, at best, quasi-predictable.
Nevertheless, the effects of the ongoing environmental changes will not be restricted
to specific areas but will affect the whole biosphere. No matter how many
experiments will be performed and how much data will be collected, all that will not
save our environment. We know what is needed in the first place – the global CO2
emissions must be substantially reduced.
REFERENCES
126
References Abad D, Albaina A, Aguirre M, Laza-Martínez A, Uriarte I, Iriarte A, Villate F,
Estonba A (2016) Is metabarcoding suitable for estuarine plankton monitoring? A comparative study with microscopy. Mar Biol 163: 149 doi 10.1007/s00227-016-2920-0
Aberle N, Schulz KG, Stuhr A, Malzahn AM, Ludwig A, Riebesell U (2013) High tolerance of microzooplankton to ocean acidification in an Arctic coastal plankton community. Biogeosciences 10: 1471-1481 doi 10.5194/bg-10-1471-2013
Algueró-Muñiz M, Alvarez-Fernandez S, Thor P, Bach LT, Esposito M, Horn HG, Ecker U, Langer JAF, Taucher J, Malzahn AM, Riebesell U, Boersma M (2017a) Ocean acidification effects on mesozooplankton community development: Results from a long-term mesocosm experiment. PloS one 12: e0175851 doi 10.1371/journal.pone.0175851
Algueró-Muñiz M, Horn H, Alvarez-Fernandez S, Spisla C, Aberle N, Bach L, Guan W, EP A, Riebesell U, Boersma M (2017b) Impacts of ocean acidification on the development of a subtropical zooplankton community during oligotrophic and simulated bloom conditions (Doctoral dissertation). Retrieved from the Staats- und Universitätsbibliothek Bremen
Almén A-K, Vehmaa A, Brutemark A, Bach L, Lischka S, Stuhr A, Furuhagen S, Paul A, Bermúdez JR, Riebesell U, Engström-Öst J (2016) Negligible effects of ocean acidification on Eurytemora affinis (Copepoda) offspring production. Biogeosciences 13: 1726-4189 doi 10.5194/bg-13-1037-2016
Almén A-K, Vehmaa A, Brutemark A, Engström-Öst J (2014) Coping with climate change? Copepods experience drastic variations in their physicochemical environment on a diurnal basis. J Exp Mar Bio Ecol 460: 120-128 doi 10.1016/j.jembe.2014.07.001
Altschul SF, Gish W, Miller W, Myers EW, Lipman DJ (1990) Basic local alignment search tool. Journal of molecular biology 215: 403-410 doi 10.1016/s0022-2836(05)80360-2
Alvarez-Fernandez S, Bach LT, Taucher J, Riebesell U, Sommer U, Aberle N, Brussaard CPD, Boersma M (2018) Plankton responses to ocean acidification: The role of nutrient limitation. Prog Oceanogr doi 10.1016/j.pocean.2018.04.006
Andersson AJ, Mackenzie FT, Bates NR (2008) Life on the margin: implications of ocean acidification on Mg-calcite, high latitude and cold-water marine calcifiers. Mar Ecol Prog Ser 373: 265-273
Appeltans W, Ahyong ST, Anderson G, Angel MV, Artois T, Bailly N, Bamber R, Barber A, Bartsch I, Berta A, Blazewicz-Paszkowycz M, Bock P, Boxshall G, Boyko CB, Brandao SN, Bray RA, Bruce NL, Cairns SD, Chan TY, Cheng L, Collins AG, Cribb T, Curini-Galletti M, Dahdouh-Guebas F, Davie PJ, Dawson MN, De Clerck O, Decock W, De Grave S, de Voogd NJ, Domning DP, Emig CC, Erseus C, Eschmeyer W, Fauchald K, Fautin DG, Feist SW, Fransen CH, Furuya H, Garcia-Alvarez O, Gerken S, Gibson D, Gittenberger A, Gofas S, Gomez-Daglio L, Gordon DP, Guiry MD, Hernandez F, Hoeksema BW, Hopcroft RR, Jaume D, Kirk P, Koedam N, Koenemann S, Kolb JB, Kristensen RM, Kroh A, Lambert G, Lazarus DB, Lemaitre R, Longshaw M, Lowry J, Macpherson E, Madin LP, Mah C, Mapstone G, McLaughlin PA, Mees J, Meland K, Messing CG, Mills CE, Molodtsova TN,
REFERENCES
127
Mooi R, Neuhaus B, Ng PK, Nielsen C, Norenburg J, Opresko DM, Osawa M, Paulay G, Perrin W, Pilger JF, Poore GC, Pugh P, Read GB, Reimer JD, Rius M, Rocha RM, Saiz-Salinas JI, Scarabino V, Schierwater B, Schmidt-Rhaesa A, Schnabel KE, Schotte M, Schuchert P, Schwabe E, Segers H, Self-Sullivan C, Shenkar N, Siegel V, Sterrer W, Stohr S, Swalla B, Tasker ML, Thuesen EV, Timm T, Todaro MA, Turon X, Tyler S, Uetz P, van der Land J, Vanhoorne B, van Ofwegen LP, van Soest RW, Vanaverbeke J, Walker-Smith G, Walter TC, Warren A, Williams GC, Wilson SP, Costello MJ (2012) The magnitude of global marine species diversity. Curr Biol 22: 2189-2202 doi 10.1016/j.cub.2012.09.036
Attrill MJ, Wright J, Edwards M (2007) Climate-related increases in jellyfish frequency suggest a more gelatinous future for the North Sea. Limnol Oceanogr 52: 480-485 doi 10.4319/lo.2007.52.1.0480
Azam F, Fenchel T, Field JG, Gray JS, Meyer-Reil LA, Thingstad F (1983) The Ecological Role of Water-Column Microbes in the Sea. Mar Ecol Prog Ser 10: 257-263
Bach LT, Alvarez-Fernandez S, Hornick T, Stuhr A, Riebesell U (2017) Simulated ocean acidification reveals winners and losers in coastal phytoplankton. PloS one 12: e0188198 doi 10.1371/journal.pone.0188198
Bach LT, Lohbeck KT, Reusch TBH, Riebesell U (2018) Rapid evolution of highly variable competitive abilities in a key phytoplankton species. Nature ecology & evolution doi 10.1038/s41559-018-0474-x
Bach LT, Taucher J, Boxhammer T, Ludwig A, Achterberg EP, Alguero-Muniz M, Anderson LG, Bellworthy J, Budenbender J, Czerny J, Ericson Y, Esposito M, Fischer M, Haunost M, Hellemann D, Horn HG, Hornick T, Meyer J, Sswat M, Zark M, Riebesell U (2016) Influence of Ocean Acidification on a Natural Winter-to-Summer Plankton Succession: First Insights from a Long-Term Mesocosm Study Draw Attention to Periods of Low Nutrient Concentrations. PloS one 11: e0159068 doi 10.1371/journal.pone.0159068
Bala K, Robideau GP, Désaulniers N, de Cock A, Lévesque CA (2010) Taxonomy, DNA barcoding and phylogeny of three new species of Pythium from Canada. Persoonia 25: 22-31 doi 10.3767/003158510X524754
Baldauf SL (2003) The deep roots of eukaryotes. Science 300: 1703-1706 doi 10.1126/science.1085544
Baumann H, Wallace RB, Tagliaferri T, Gobler CJ (2015) Large Natural pH, CO2 and O2 Fluctuations in a Temperate Tidal Salt Marsh on Diel, Seasonal, and Interannual Time Scales. Estuaries and Coasts 38: 220-231 doi 10.1007/s12237-014-9800-y
Beakes GW, Glockling SL, Sekimoto S (2012) The evolutionary phylogeny of the oomycete "fungi". Protoplasma 249: 3-19 doi 10.1007/s00709-011-0269-2
Beakes GW, Honda D, Thines M (2014) 3 Systematics of the Straminipila: Labyrinthulomycota, Hyphochytriomycota, and Oomycota. In: McLaughlin DJ, Spatafora JW (eds) Systematics and Evolution: Part A. Springer Berlin Heidelberg, Berlin, Heidelberg, pp 39-97
Bennett RM, de Cock AWAM, Lévesque CA, Thines M (2017) Calycofera gen. nov., an estuarine sister taxon to Phytopythium, Peronosporaceae. Mycol Prog 16: 947-954 doi 10.1007/s11557-017-1326-9
Bennett RM, Thines M (2017) Confirmation that Phytophthora insolita (Peronosporaceae) is present as a marine saprotroph on mangrove leaves and
REFERENCES
128
first report of the species for the Philippines. Nova Hedwigia 105: 185-196 doi 10.1127/nova_hedwigia/2017/0404
Berggreen U, Hansen B, Kiørboe T (1988) Food size spectra, ingestion and growth of the copepod Acartia tonsa during development: Implications for determination of copepod production. Mar Biol 99: 341-352 doi 10.1007/BF02112126
Bik HM, Porazinska DL, Creer S, Caporaso JG, Knight R, Thomas WK (2012) Sequencing our way towards understanding global eukaryotic biodiversity. Trends Ecol Evol 27: 233-243 doi 10.1016/j.tree.2011.11.010
Boersma M, Wesche A, Hirche H-J (2014) Predation of calanoid copepods on their own and other copepods’ offspring. Mar Biol 161: 733-743 doi 10.1007/s00227-013-2373-7
Bolger AM, Lohse M, Usadel B (2014) Trimmomatic: a flexible trimmer for Illumina sequence data. Bioinformatics 30: 2114-2120 doi 10.1093/bioinformatics/btu170
Bonduriansky R, Crean AJ, Day T (2012) The implications of nongenetic inheritance for evolution in changing environments. Evol Appl 5: 192-201 doi 10.1111/j.1752-4571.2011.00213.x
Bonduriansky R, Day T (2009) Nongenetic Inheritance and Its Evolutionary Implications. Annu Rev Ecol Evol Syst 40: 103-125 doi 10.1146/annurev.ecolsys.39.110707.173441
Borcard D, Gillet F, Legendre P (2011) Introduction Numerical Ecology with R. Springer, New York, pp 1-7
Bradshaw AL, Brewer PG, Shafer DK, Williams RT (1981) Measurements of total carbon dioxide and alkalinity by potentiometric titration in the GEOSECS program. EPSL 55: 99-115 doi 10.1016/0012-821X(81)90090-X
Breitburg DL, Salisbury J, Bernhard JM, Cai W-J, Dupont S, Doney SC, Kroeker KJ, Levin LA, Long WC, Milke LM, Miller SH, Phelan B, Passow U, Seibel BA, Todgham AE, Tarrant AM (2015) And on Top of All That... Coping with Ocean Acidification in the Midst of Many Stressors. Oceanography 28: 48-61 doi 10.5670/oceanog.2015.31
Bron JE, Frisch D, Goetze E, Johnson SC, Lee CE, Wyngaard GA (2011) Observing copepods through a genomic lens. Frontiers in zoology 8: 22 doi 10.1186/1742-9994-8-22
Brutemark A, Engström-Öst J, Vehmaa A (2011) Long-term monitoring data reveal pH dynamics, trends and variability in the western Gulf of Finland. Oceanol Hydrobiol Stud 40: 91-94 doi 10.2478/s13545-011-0034-3
Buaya AT, Ploch S, Hanic L, Nam B, Nigrelli L, Kraberg AC, Thines M (2017) Phylogeny of Miracula helgolandica gen. et sp. nov. and Olpidiopsis drebesii sp. nov., two basal oomycete parasitoids of marine diatoms, with notes on the taxonomy of Ectrogella-like species. Mycol Prog 16: 1041-1050 doi 10.1007/s11557-017-1345-6
Buck JC, Truong L, Blaustein AR (2011) Predation by zooplankton on Batrachochytrium dendrobatidis: biological control of the deadly amphibian chytrid fungus? Biodiversity Conserv 20: 3549-3553 doi 10.1007/s10531-011-0147-4
Bucklin A, DiVito KR, Smolina I, Choquet M, Questel JM, Hoarau G, O’Neill RJ (2018) Population Genomics of Marine Zooplankton. Springer International Publishing, Cham, pp 1-42
REFERENCES
129
Bukovinszky T, Verschoor AM, Helmsing NR, Bezemer TM, Bakker ES, Vos M, de Senerpont Domis LN (2012) The good, the bad and the plenty: interactive effects of food quality and quantity on the growth of different Daphnia species. PloS one 7: e42966 doi 10.1371/journal.pone.0042966
Burdick DS, Hartline DK, Lenz PH (2007) Escape strategies in co‐occurring calanoid copepods. Limnol Oceanogr 52: 2373-2385 doi 10.4319/lo.2007.52.6.2373
Burkhardt S, Zondervan I, Riebesell U (1999) Effect of CO2 concentration on C : N : P ratio in marine phytoplankton: A species comparison. Limnol Oceanogr 44: 683-690
Calbet A, Landry MR (1999) Mesozooplankton influences on the microbial food web: Direct and indirect trophic interactions in the oligotrophic open ocean. Limnol Oceanogr 44: 1370-1380 doi 10.4319/lo.1999.44.6.1370
Calbet A, Saiz E (2005) The ciliate-copepod link in marine ecosystems. Aquatic Microbial Ecology 38: 157-167 doi 10.3354/ame038157
Caldeira K, Wickett ME (2003) Oceanography: anthropogenic carbon and ocean pH. Nature 425: 365 doi 10.1038/425365a
Canadell JG, Le Quere C, Raupach MR, Field CB, Buitenhuis ET, Ciais P, Conway TJ, Gillett NP, Houghton RA, Marland G (2007) Contributions to accelerating atmospheric CO2 growth from economic activity, carbon intensity, and efficiency of natural sinks. Proc Natl Acad Sci USA 104: 18866-18870 doi 10.1073/pnas.0702737104
Carew ME, Pettigrove VJ, Metzeling L, Hoffmann AA (2013) Environmental monitoring using next generation sequencing: rapid identification of macroinvertebrate bioindicator species. Frontiers in zoology 10: 45 doi 10.1186/1742-9994-10-45
Caron DA, Hutchins DA (2013) The effects of changing climate on microzooplankton grazing and community structure: drivers, predictions and knowledge gaps. J Plankton Res 35: 235-252 doi 10.1093/plankt/fbs091
Caudill C, Bucklin A (2004) Molecular phylogeography and evolutionary history of the estuarine copepod, Acartia tonsa, on the Northwest Atlantic coast. Hydrobiologia 511: 91-102 doi 10.1023/B:HYDR.0000014032.05680.9d
Checkley DM (1980) The egg production of a marine planktonic copepod in relation to its food supply: Laboratory studies1. Limnol Oceanogr 25: 430-446 doi 10.4319/lo.1980.25.3.0430
Chevin LM, Lande R, Mace GM (2010) Adaptation, plasticity, and extinction in a changing environment: towards a predictive theory. PLoS Biol 8: e1000357 doi 10.1371/journal.pbio.1000357
Choi YJ, Beakes G, Glockling S, Kruse J, Nam B, Nigrelli L, Ploch S, Shin HD, Shivas RG, Telle S, Voglmayr H, Thines M (2015) Towards a universal barcode of oomycetes--a comparison of the cox1 and cox2 loci. Molecular ecology resources 15: 1275-1288 doi 10.1111/1755-0998.12398
Colin SP, Dam HG (2004) Testing for resistance of pelagic marine copepods to a toxic dinoflagellate. Evolutionary Ecology 18: 355-377 doi 10.1007/s10682-004-2369-3
Coll M, Libralato S, Tudela S, Palomera I, Pranovi F (2008) Ecosystem Overfishing in the Ocean. PloS one 3: e3881 doi 10.1371/journal.pone.0003881
Collins S, Bell G (2004) Phenotypic consequences of 1,000 generations of selection at elevated CO2 in a green alga. Nature 431: 566-569 doi 10.1038/nature02945
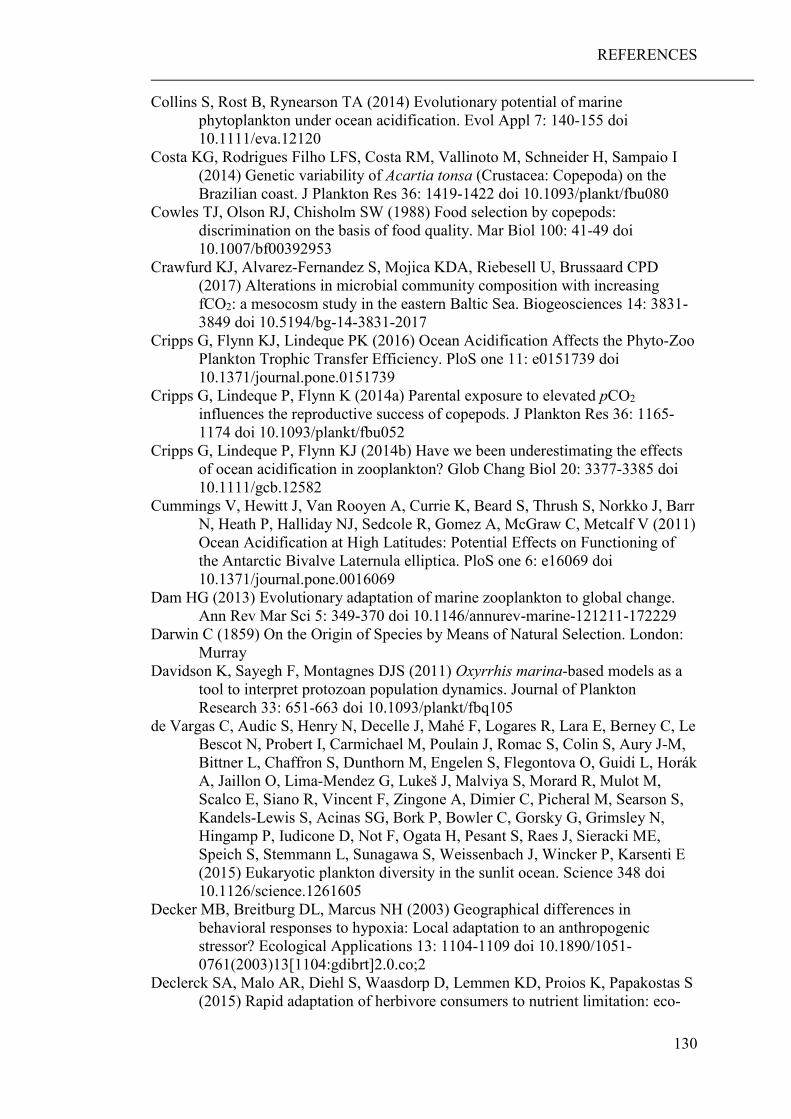
REFERENCES
130
Collins S, Rost B, Rynearson TA (2014) Evolutionary potential of marine phytoplankton under ocean acidification. Evol Appl 7: 140-155 doi 10.1111/eva.12120
Costa KG, Rodrigues Filho LFS, Costa RM, Vallinoto M, Schneider H, Sampaio I (2014) Genetic variability of Acartia tonsa (Crustacea: Copepoda) on the Brazilian coast. J Plankton Res 36: 1419-1422 doi 10.1093/plankt/fbu080
Cowles TJ, Olson RJ, Chisholm SW (1988) Food selection by copepods: discrimination on the basis of food quality. Mar Biol 100: 41-49 doi 10.1007/bf00392953
Crawfurd KJ, Alvarez-Fernandez S, Mojica KDA, Riebesell U, Brussaard CPD (2017) Alterations in microbial community composition with increasing fCO2: a mesocosm study in the eastern Baltic Sea. Biogeosciences 14: 3831-3849 doi 10.5194/bg-14-3831-2017
Cripps G, Flynn KJ, Lindeque PK (2016) Ocean Acidification Affects the Phyto-Zoo Plankton Trophic Transfer Efficiency. PloS one 11: e0151739 doi 10.1371/journal.pone.0151739
Cripps G, Lindeque P, Flynn K (2014a) Parental exposure to elevated pCO2 influences the reproductive success of copepods. J Plankton Res 36: 1165-1174 doi 10.1093/plankt/fbu052
Cripps G, Lindeque P, Flynn KJ (2014b) Have we been underestimating the effects of ocean acidification in zooplankton? Glob Chang Biol 20: 3377-3385 doi 10.1111/gcb.12582
Cummings V, Hewitt J, Van Rooyen A, Currie K, Beard S, Thrush S, Norkko J, Barr N, Heath P, Halliday NJ, Sedcole R, Gomez A, McGraw C, Metcalf V (2011) Ocean Acidification at High Latitudes: Potential Effects on Functioning of the Antarctic Bivalve Laternula elliptica. PloS one 6: e16069 doi 10.1371/journal.pone.0016069
Dam HG (2013) Evolutionary adaptation of marine zooplankton to global change. Ann Rev Mar Sci 5: 349-370 doi 10.1146/annurev-marine-121211-172229
Darwin C (1859) On the Origin of Species by Means of Natural Selection. London: Murray
Davidson K, Sayegh F, Montagnes DJS (2011) Oxyrrhis marina-based models as a tool to interpret protozoan population dynamics. Journal of Plankton Research 33: 651-663 doi 10.1093/plankt/fbq105
de Vargas C, Audic S, Henry N, Decelle J, Mahé F, Logares R, Lara E, Berney C, Le Bescot N, Probert I, Carmichael M, Poulain J, Romac S, Colin S, Aury J-M, Bittner L, Chaffron S, Dunthorn M, Engelen S, Flegontova O, Guidi L, Horák A, Jaillon O, Lima-Mendez G, Lukeš J, Malviya S, Morard R, Mulot M, Scalco E, Siano R, Vincent F, Zingone A, Dimier C, Picheral M, Searson S, Kandels-Lewis S, Acinas SG, Bork P, Bowler C, Gorsky G, Grimsley N, Hingamp P, Iudicone D, Not F, Ogata H, Pesant S, Raes J, Sieracki ME, Speich S, Stemmann L, Sunagawa S, Weissenbach J, Wincker P, Karsenti E (2015) Eukaryotic plankton diversity in the sunlit ocean. Science 348 doi 10.1126/science.1261605
Decker MB, Breitburg DL, Marcus NH (2003) Geographical differences in behavioral responses to hypoxia: Local adaptation to an anthropogenic stressor? Ecological Applications 13: 1104-1109 doi 10.1890/1051-0761(2003)13[1104:gdibrt]2.0.co;2
Declerck SA, Malo AR, Diehl S, Waasdorp D, Lemmen KD, Proios K, Papakostas S (2015) Rapid adaptation of herbivore consumers to nutrient limitation: eco-
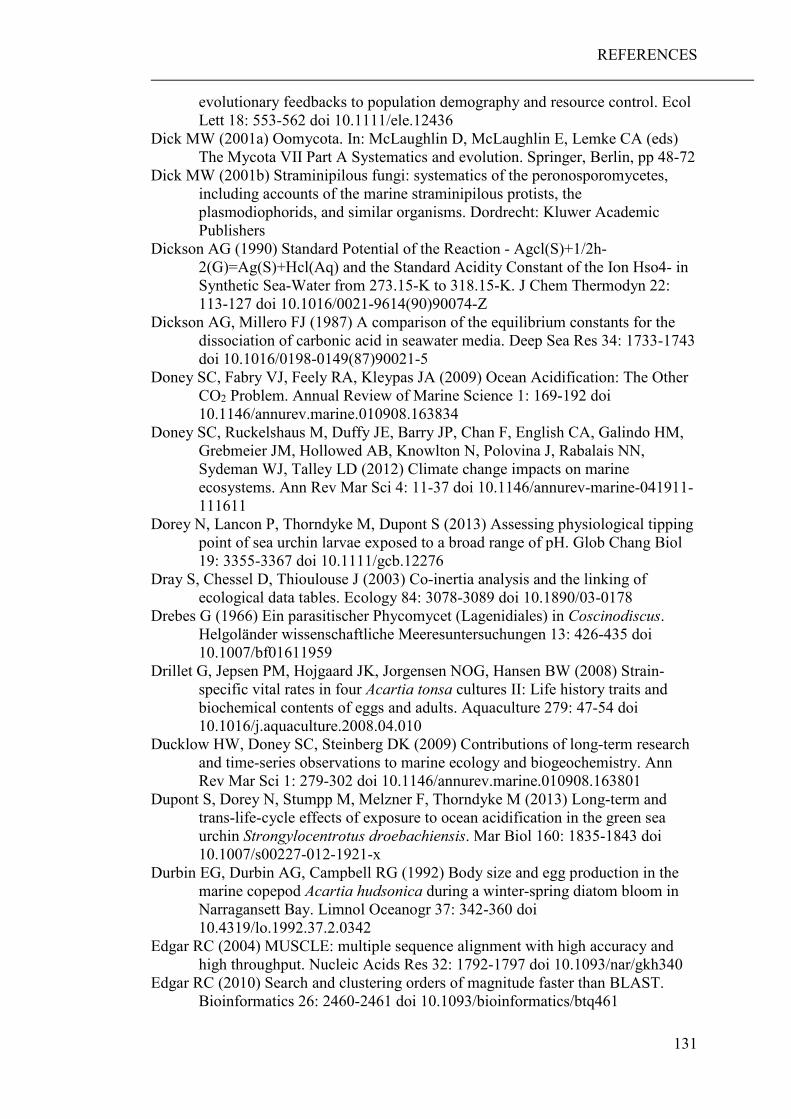
REFERENCES
131
evolutionary feedbacks to population demography and resource control. Ecol Lett 18: 553-562 doi 10.1111/ele.12436
Dick MW (2001a) Oomycota. In: McLaughlin D, McLaughlin E, Lemke CA (eds) The Mycota VII Part A Systematics and evolution. Springer, Berlin, pp 48-72
Dick MW (2001b) Straminipilous fungi: systematics of the peronosporomycetes, including accounts of the marine straminipilous protists, the plasmodiophorids, and similar organisms. Dordrecht: Kluwer Academic Publishers
Dickson AG (1990) Standard Potential of the Reaction - Agcl(S)+1/2h-2(G)=Ag(S)+Hcl(Aq) and the Standard Acidity Constant of the Ion Hso4- in Synthetic Sea-Water from 273.15-K to 318.15-K. J Chem Thermodyn 22: 113-127 doi 10.1016/0021-9614(90)90074-Z
Dickson AG, Millero FJ (1987) A comparison of the equilibrium constants for the dissociation of carbonic acid in seawater media. Deep Sea Res 34: 1733-1743 doi 10.1016/0198-0149(87)90021-5
Doney SC, Fabry VJ, Feely RA, Kleypas JA (2009) Ocean Acidification: The Other CO2 Problem. Annual Review of Marine Science 1: 169-192 doi 10.1146/annurev.marine.010908.163834
Doney SC, Ruckelshaus M, Duffy JE, Barry JP, Chan F, English CA, Galindo HM, Grebmeier JM, Hollowed AB, Knowlton N, Polovina J, Rabalais NN, Sydeman WJ, Talley LD (2012) Climate change impacts on marine ecosystems. Ann Rev Mar Sci 4: 11-37 doi 10.1146/annurev-marine-041911-111611
Dorey N, Lancon P, Thorndyke M, Dupont S (2013) Assessing physiological tipping point of sea urchin larvae exposed to a broad range of pH. Glob Chang Biol 19: 3355-3367 doi 10.1111/gcb.12276
Dray S, Chessel D, Thioulouse J (2003) Co-inertia analysis and the linking of ecological data tables. Ecology 84: 3078-3089 doi 10.1890/03-0178
Drebes G (1966) Ein parasitischer Phycomycet (Lagenidiales) in Coscinodiscus. Helgoländer wissenschaftliche Meeresuntersuchungen 13: 426-435 doi 10.1007/bf01611959
Drillet G, Jepsen PM, Hojgaard JK, Jorgensen NOG, Hansen BW (2008) Strain-specific vital rates in four Acartia tonsa cultures II: Life history traits and biochemical contents of eggs and adults. Aquaculture 279: 47-54 doi 10.1016/j.aquaculture.2008.04.010
Ducklow HW, Doney SC, Steinberg DK (2009) Contributions of long-term research and time-series observations to marine ecology and biogeochemistry. Ann Rev Mar Sci 1: 279-302 doi 10.1146/annurev.marine.010908.163801
Dupont S, Dorey N, Stumpp M, Melzner F, Thorndyke M (2013) Long-term and trans-life-cycle effects of exposure to ocean acidification in the green sea urchin Strongylocentrotus droebachiensis. Mar Biol 160: 1835-1843 doi 10.1007/s00227-012-1921-x
Durbin EG, Durbin AG, Campbell RG (1992) Body size and egg production in the marine copepod Acartia hudsonica during a winter-spring diatom bloom in Narragansett Bay. Limnol Oceanogr 37: 342-360 doi 10.4319/lo.1992.37.2.0342
Edgar RC (2004) MUSCLE: multiple sequence alignment with high accuracy and high throughput. Nucleic Acids Res 32: 1792-1797 doi 10.1093/nar/gkh340
Edgar RC (2010) Search and clustering orders of magnitude faster than BLAST. Bioinformatics 26: 2460-2461 doi 10.1093/bioinformatics/btq461
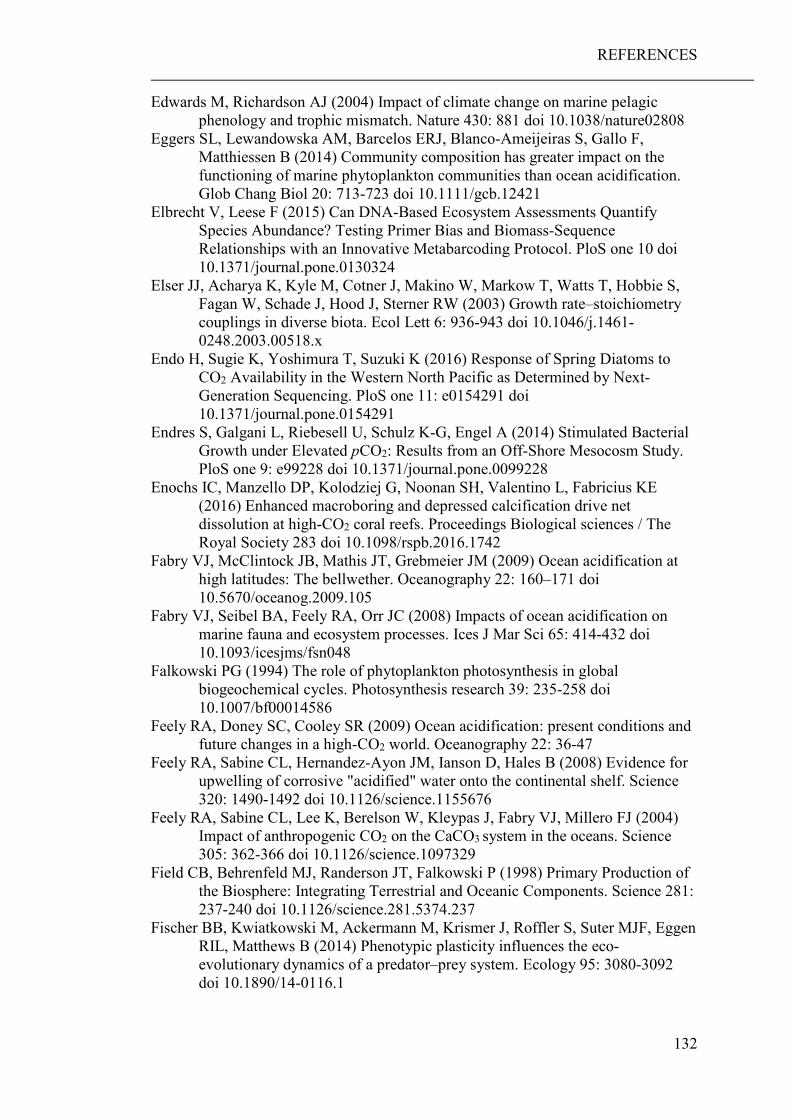
REFERENCES
132
Edwards M, Richardson AJ (2004) Impact of climate change on marine pelagic phenology and trophic mismatch. Nature 430: 881 doi 10.1038/nature02808
Eggers SL, Lewandowska AM, Barcelos ERJ, Blanco-Ameijeiras S, Gallo F, Matthiessen B (2014) Community composition has greater impact on the functioning of marine phytoplankton communities than ocean acidification. Glob Chang Biol 20: 713-723 doi 10.1111/gcb.12421
Elbrecht V, Leese F (2015) Can DNA-Based Ecosystem Assessments Quantify Species Abundance? Testing Primer Bias and Biomass-Sequence Relationships with an Innovative Metabarcoding Protocol. PloS one 10 doi 10.1371/journal.pone.0130324
Elser JJ, Acharya K, Kyle M, Cotner J, Makino W, Markow T, Watts T, Hobbie S, Fagan W, Schade J, Hood J, Sterner RW (2003) Growth rate–stoichiometry couplings in diverse biota. Ecol Lett 6: 936-943 doi 10.1046/j.1461-0248.2003.00518.x
Endo H, Sugie K, Yoshimura T, Suzuki K (2016) Response of Spring Diatoms to CO2 Availability in the Western North Pacific as Determined by Next-Generation Sequencing. PloS one 11: e0154291 doi 10.1371/journal.pone.0154291
Endres S, Galgani L, Riebesell U, Schulz K-G, Engel A (2014) Stimulated Bacterial Growth under Elevated pCO2: Results from an Off-Shore Mesocosm Study. PloS one 9: e99228 doi 10.1371/journal.pone.0099228
Enochs IC, Manzello DP, Kolodziej G, Noonan SH, Valentino L, Fabricius KE (2016) Enhanced macroboring and depressed calcification drive net dissolution at high-CO2 coral reefs. Proceedings Biological sciences / The Royal Society 283 doi 10.1098/rspb.2016.1742
Fabry VJ, McClintock JB, Mathis JT, Grebmeier JM (2009) Ocean acidification at high latitudes: The bellwether. Oceanography 22: 160–171 doi 10.5670/oceanog.2009.105
Fabry VJ, Seibel BA, Feely RA, Orr JC (2008) Impacts of ocean acidification on marine fauna and ecosystem processes. Ices J Mar Sci 65: 414-432 doi 10.1093/icesjms/fsn048
Falkowski PG (1994) The role of phytoplankton photosynthesis in global biogeochemical cycles. Photosynthesis research 39: 235-258 doi 10.1007/bf00014586
Feely RA, Doney SC, Cooley SR (2009) Ocean acidification: present conditions and future changes in a high-CO2 world. Oceanography 22: 36-47
Feely RA, Sabine CL, Hernandez-Ayon JM, Ianson D, Hales B (2008) Evidence for upwelling of corrosive "acidified" water onto the continental shelf. Science 320: 1490-1492 doi 10.1126/science.1155676
Feely RA, Sabine CL, Lee K, Berelson W, Kleypas J, Fabry VJ, Millero FJ (2004) Impact of anthropogenic CO2 on the CaCO3 system in the oceans. Science 305: 362-366 doi 10.1126/science.1097329
Field CB, Behrenfeld MJ, Randerson JT, Falkowski P (1998) Primary Production of the Biosphere: Integrating Terrestrial and Oceanic Components. Science 281: 237-240 doi 10.1126/science.281.5374.237
Fischer BB, Kwiatkowski M, Ackermann M, Krismer J, Roffler S, Suter MJF, Eggen RIL, Matthews B (2014) Phenotypic plasticity influences the eco-evolutionary dynamics of a predator–prey system. Ecology 95: 3080-3092 doi 10.1890/14-0116.1
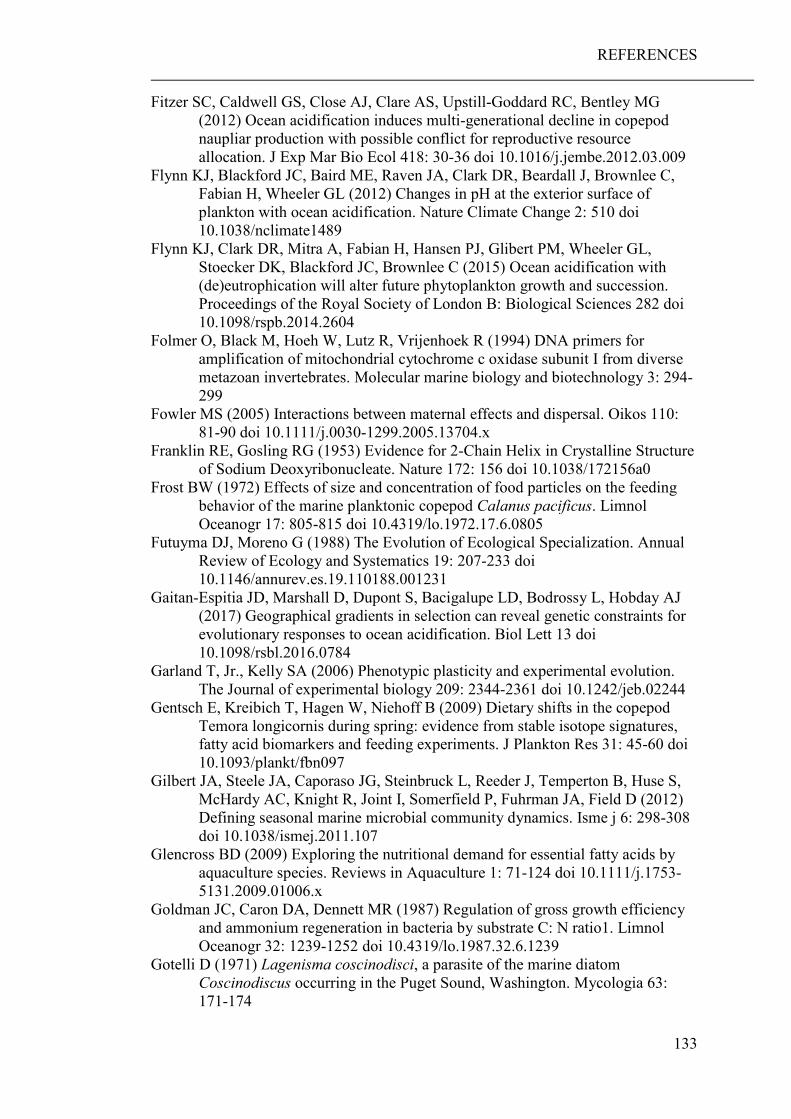
REFERENCES
133
Fitzer SC, Caldwell GS, Close AJ, Clare AS, Upstill-Goddard RC, Bentley MG (2012) Ocean acidification induces multi-generational decline in copepod naupliar production with possible conflict for reproductive resource allocation. J Exp Mar Bio Ecol 418: 30-36 doi 10.1016/j.jembe.2012.03.009
Flynn KJ, Blackford JC, Baird ME, Raven JA, Clark DR, Beardall J, Brownlee C, Fabian H, Wheeler GL (2012) Changes in pH at the exterior surface of plankton with ocean acidification. Nature Climate Change 2: 510 doi 10.1038/nclimate1489
Flynn KJ, Clark DR, Mitra A, Fabian H, Hansen PJ, Glibert PM, Wheeler GL, Stoecker DK, Blackford JC, Brownlee C (2015) Ocean acidification with (de)eutrophication will alter future phytoplankton growth and succession. Proceedings of the Royal Society of London B: Biological Sciences 282 doi 10.1098/rspb.2014.2604
Folmer O, Black M, Hoeh W, Lutz R, Vrijenhoek R (1994) DNA primers for amplification of mitochondrial cytochrome c oxidase subunit I from diverse metazoan invertebrates. Molecular marine biology and biotechnology 3: 294-299
Fowler MS (2005) Interactions between maternal effects and dispersal. Oikos 110: 81-90 doi 10.1111/j.0030-1299.2005.13704.x
Franklin RE, Gosling RG (1953) Evidence for 2-Chain Helix in Crystalline Structure of Sodium Deoxyribonucleate. Nature 172: 156 doi 10.1038/172156a0
Frost BW (1972) Effects of size and concentration of food particles on the feeding behavior of the marine planktonic copepod Calanus pacificus. Limnol Oceanogr 17: 805-815 doi 10.4319/lo.1972.17.6.0805
Futuyma DJ, Moreno G (1988) The Evolution of Ecological Specialization. Annual Review of Ecology and Systematics 19: 207-233 doi 10.1146/annurev.es.19.110188.001231
Gaitan-Espitia JD, Marshall D, Dupont S, Bacigalupe LD, Bodrossy L, Hobday AJ (2017) Geographical gradients in selection can reveal genetic constraints for evolutionary responses to ocean acidification. Biol Lett 13 doi 10.1098/rsbl.2016.0784
Garland T, Jr., Kelly SA (2006) Phenotypic plasticity and experimental evolution. The Journal of experimental biology 209: 2344-2361 doi 10.1242/jeb.02244
Gentsch E, Kreibich T, Hagen W, Niehoff B (2009) Dietary shifts in the copepod Temora longicornis during spring: evidence from stable isotope signatures, fatty acid biomarkers and feeding experiments. J Plankton Res 31: 45-60 doi 10.1093/plankt/fbn097
Gilbert JA, Steele JA, Caporaso JG, Steinbruck L, Reeder J, Temperton B, Huse S, McHardy AC, Knight R, Joint I, Somerfield P, Fuhrman JA, Field D (2012) Defining seasonal marine microbial community dynamics. Isme j 6: 298-308 doi 10.1038/ismej.2011.107
Glencross BD (2009) Exploring the nutritional demand for essential fatty acids by aquaculture species. Reviews in Aquaculture 1: 71-124 doi 10.1111/j.1753-5131.2009.01006.x
Goldman JC, Caron DA, Dennett MR (1987) Regulation of gross growth efficiency and ammonium regeneration in bacteria by substrate C: N ratio1. Limnol Oceanogr 32: 1239-1252 doi 10.4319/lo.1987.32.6.1239
Gotelli D (1971) Lagenisma coscinodisci, a parasite of the marine diatom Coscinodiscus occurring in the Puget Sound, Washington. Mycologia 63: 171-174
REFERENCES
134
Govers LL, Man In 't Veld WA, Meffert JP, Bouma TJ, van Rijswick PC, Heusinkveld JH, Orth RJ, van Katwijk MM, van der Heide T (2016) Marine Phytophthora species can hamper conservation and restoration of vegetated coastal ecosystems. Proceedings Biological sciences / The Royal Society 283 doi 10.1098/rspb.2016.0812
Grahame ES (1976) The occurrence of Lagenisma coscinodisci in Palmeria hardmaniana from Kingston harbor. Jamaica Br Phycol 11: 57-61
Grasshoff K, Ehrhardt M, Kremling K (1999) Methods of Seawater Analysis. Wileyh-VCH
Grenville-Briggs L, Gachon CM, Strittmatter M, Sterck L, Kupper FC, van West P (2011) A molecular insight into algal-oomycete warfare: cDNA analysis of Ectocarpus siliculosus infected with the basal oomycete Eurychasma dicksonii. PloS one 6: e24500 doi 10.1371/journal.pone.0024500
Grenville-Briggs LJ, van West P (2005) The biotrophic stages of oomycete-plant interactions. Advances in applied microbiology 57: 217-243 doi 10.1016/s0065-2164(05)57007-2
Grizzetti B, Bouraoui F, Aloe A (2012) Changes of nitrogen and phosphorus loads to European seas. Global Change Biol 18: 769-782
Grossart H-P, Allgaier M, Passow U, Riebesell U (2006) Testing the effect of CO2 concentration on the dynamics of marine heterotrophic bacterioplankton. Limnol Oceanogr 51: 1-11 doi 10.4319/lo.2006.51.1.0001
Guillard RRL, Ryther JH (1962) Studies of marine planktonic diatoms: I. Cyclotella nana Hustedt, and Detonula confervacea (Cleve) gran. Can J Microbiol 8: 229-239 doi 10.1139/m62-029
Guisande C, Harris R (1995) Effect of total organic content of eggs on hatching success and naupliar survival in the copepod Calanus helgolandicus. Limnol Oceanogr 40: 476-482 doi 10.4319/lo.1995.40.3.0476
Gworek B, Bemowska-Kalabun O, Kijenska M, Wrzosek-Jakubowska J (2016) Mercury in Marine and Oceanic Waters-a Review. Water Air Soil Pollut 227: 371 doi 10.1007/s11270-016-3060-3
Hadziavdic K, Lekang K, Lanzen A, Jonassen I, Thompson EM, Troedsson C (2014) Characterization of the 18S rRNA Gene for Designing Universal Eukaryote Specific Primers. PloS one 9: e87624 doi 10.1371/journal.pone.0087624
Hall SR (2009) Stoichiometrically Explicit Food Webs: Feedbacks between Resource Supply, Elemental Constraints, and Species Diversity. Annu Rev Ecol Evol Syst 40: 503-528 doi 10.1146/annurev.ecolsys.39.110707.173518
Hanic LA, Sekimoto S, Bates S (2009) Oomycete and chytrid infections of the marine diatom Pseudo-nitzschia pungens (Bacillariophyceae) from Prince Edward Island, Canada87: 1096-1105 doi 10.1139/B09-070
Hansen HP (2007) In situ determination of pH and oxygen Methods of Seawater Analysis. Wiley-VCH Verlag GmbH, pp 399-405
Hansen HP, Koroleff F (2007) Determination of nutrients Methods of Seawater Analysis. Wiley-VCH Verlag GmbH, pp 159-228
Hansson I (1973) A new set of acidity constants for carbonic acid and boric acid in sea water. Deep-Sea Res Oceanogr Abstr 20: 461-478 doi 10.1016/0011-7471(73)90100-9
Hassenruck C, Fink A, Lichtschlag A, Tegetmeyer HE, de Beer D, Ramette A (2016) Quantification of the effects of ocean acidification on sediment microbial communities in the environment: the importance of ecosystem approaches. FEMS Microbiol Ecol 92 doi 10.1093/femsec/fiw027
REFERENCES
135
Hassenrück C, Hofmann LC, Bischof K, Ramette A (2015) Seagrass biofilm communities at a naturally CO2-rich vent. Environmental Microbiology Reports 7: 516-525 doi 10.1111/1758-2229.12282
Hazzard SE, Kleppel GS (2003) Egg production of the copepod Acartia tonsa in Florida Bay: role of fatty acids in the nutritional composition of the food environment. Mar Ecol Prog Ser 252: 199-206 doi 10.3354/meps252199
Herlemann DP, Labrenz M, Jurgens K, Bertilsson S, Waniek JJ, Andersson AF (2011) Transitions in bacterial communities along the 2000 km salinity gradient of the Baltic Sea. Isme j 5: 1571-1579 doi 10.1038/ismej.2011.41
Hessen DO, Ågren GI, Anderson TR, Elser JJ, de Ruiter PC (2004) Carbon sequestration in ecosystems: The role of stoichiometry. Ecology 85: 1179-1192 doi 10.1890/02-0251
Hessen DO, Anderson TR (2008) Excess carbon in aquatic organisms and ecosystems: Physiological, ecological, and evolutionary implications. Limnol Oceanogr 53: 1685-1696 doi 10.4319/lo.2008.53.4.1685
Hildebrandt N, Niehoff B, Sartoris FJ (2014) Long-term effects of elevated CO2 and temperature on the Arctic calanoid copepods Calanus glacialis and C. hyperboreus. Marine Poll Bull 80: 59-70 doi 10.1016/j.marpolbul.2014.01.050
Hinga KR (2002) Effects of pH on coastal marine phytoplankton. Mar Ecol Prog Ser 238: 281-300 doi 10.3354/meps238281
Hirai J, Kuriyama M, Ichikawa T, Hidaka K, Tsuda A (2015) A metagenetic approach for revealing community structure of marine planktonic copepods. Molecular ecology resources 15: 68-80 doi 10.1111/1755-0998.12294
Hofmann GE, Smith JE, Johnson KS, Send U, Levin LA, Micheli F, Paytan A, Price NN, Peterson B, Takeshita Y, Matson PG, Crook ED, Kroeker KJ, Gambi MC, Rivest EB, Frieder CA, Yu PC, Martz TR (2011) High-Frequency Dynamics of Ocean pH: A Multi-Ecosystem Comparison. PloS one 6: e28983 doi 10.1371/journal.pone.0028983
Hofmann GE, Todgham AE (2010) Living in the now: physiological mechanisms to tolerate a rapidly changing environment. Annu Rev Physiol 72: 127-145 doi 10.1146/annurev-physiol-021909-135900
Hofmann LC, Bischof K, Baggini C, Johnson A, Koop-Jakobsen K, Teichberg M (2015a) CO2 and inorganic nutrient enrichment affect the performance of a calcifying green alga and its noncalcifying epiphyte. Oecologia 177: 1157-1169 doi 10.1007/s00442-015-3242-5
Hofmann LC, Fink A, Bischof K, de Beer D (2015b) Microsensor studies on Padina from a natural CO2 seep: implications of morphology on acclimation to low pH. J Phycol 51: 1106-1115 doi 10.1111/jpy.12347
Holmes RM, Aminot A, Kérouel R, Hooker BA, Peterson BJ (1999) A simple and precise method for measuring ammonium in marine and freshwater ecosystems. Can J Fish Aquat Sci 56: 1801-1808 doi 10.1139/f99-128
Holste L, Peck MA (2005) The effects of temperature and salinity on egg production and hatching success of Baltic Acartia tonsa (Copepoda: Calanoida): a laboratory investigation. Mar Biol 148: 1061-1070 doi 10.1007/s00227-005-0132-0
Holste L, Peck MA, St. John, Michael A. (2004) The influence of temperature, salinity and feeding history on population characteristics of Baltic Acartia tonsa: Egg production, hatching success and cohort development. Institute for Hydrobiology and Fisheries Research
REFERENCES
136
Horn HG, Boersma M, Garzke J, Löder MGJ, Sommer U, Aberle N (2015) Effects of high CO2 and warming on a Baltic Sea microzooplankton community. Ices J Mar Sci doi 10.1093/icesjms/fsv198
Horn HG, Sander N, Stuhr A, Algueró-Muñiz M, Bach LT, Löder MGJ, Boersma M, Riebesell U, Aberle N (2016) Low CO2 Sensitivity of Microzooplankton Communities in the Gullmar Fjord, Skagerrak: Evidence from a Long-Term Mesocosm Study PloS one 11: e0165800 doi 10.1371/journal.pone.0165800
Hornick T, Bach LT, Crawfurd KJ, Spilling K, Achterberg EP, Woodhouse JN, Schulz KG, Brussaard CPD, Riebesell U, Grossart HP (2017) Ocean acidification impacts bacteria–phytoplankton coupling at low-nutrient conditions. Biogeosciences 14: 1-15 doi 10.5194/bg-14-1-2017
Hudspeth DS, Stenger DC, Hudspeth ME (2003) A cox2 phylogenetic hypothesis for the downy mildews and white rusts. Fungal Diversity: 47-57
Hulvey J, Telle S, Nigrelli L, Lamour K, Thines M (2010) Salisapiliaceae - a new family of oomycetes from marsh grass litter of southeastern North America. Persoonia 25: 109-116 doi 10.3767/003158510X551763
Huson DH, Auch AF, Qi J, Schuster SC (2007) MEGAN analysis of metagenomic data. Genome Res 17: 377-386 doi 10.1101/gr.5969107
Huys R, Llewellyn-Hughes J, Olson PD, Nagasawa K (2006) Small subunit rDNA and Bayesian inference reveal Pectenophilus ornatus (Copepoda incertae sedis) as highly transformed Mytilicolidae, and support assignment of Chondracanthidae and Xarifiidae to Lichomolgoidea (Cyclopoida). Biol J Linn Soc 87: 403-425 doi 10.1111/j.1095-8312.2005.00579.x
Intergovernmental Panel on Climate C (2014) Climate Change 2013 – The Physical Science Basis: Working Group I Contribution to the Fifth Assessment Report of the Intergovernmental Panel on Climate Change. Cambridge University Press, Cambridge
IPCC (2014) Long-term Climate Change: Projections, Commitments and Irreversibility Pages 1029 to 1076 Climate Change 2013 – The Physical Science Basis: Working Group I Contribution to the Fifth Assessment Report of the Intergovernmental Panel on Climate Change. Cambridge University Press, Cambridge, pp 1029-1136
Isari S, Zervoudaki S, Peters J, Papantoniou G, Pelejero C, Saiz E (2015) Lack of evidence for elevated CO2-induced bottom-up effects on marine copepods: a dinoflagellate–calanoid prey–predator pair. Ices J Mar Sci 73: 650-658 doi 10.1093/icesjms/fsv078
Jepsen PM, Andersen N, Holm T, Jørgensen AT, Højgaard JK, Hansen BW (2007) Effects of adult stocking density on egg production and viability in cultures of the calanoid copepod Acartia tonsa (Dana). Aquacult Res 38: 764-772 doi 10.1111/j.1365-2109.2007.01730.x
Kageyama K, Senda M, Asano T, Suga H, Ishiguro K (2007) Intra-isolate heterogeneity of the ITS region of rDNA in Pythium helicoides. Mycol Res 111: 416-423 doi 10.1016/j.mycres.2007.01.019
Kahan D, Berman Y, Barel T (1988) Maternal inhibition of hatching at high population densities in Tigriopus japonicus (Copepoda, Crustacea). Biol Bull 174: 139-144
Kankaala P, Johansson S (1986) The influence of individual variation on length-biomass regressions in three crustacean zooplankton species. J Plankton Res 8: 1027-1038 doi 10.1093/plankt/8.6.1027
REFERENCES
137
Kearse M, Moir R, Wilson A, Stones-Havas S, Cheung M, Sturrock S, Buxton S, Cooper A, Markowitz S, Duran C, Thierer T, Ashton B, Meintjes P, Drummond A (2012) Geneious Basic: an integrated and extendable desktop software platform for the organization and analysis of sequence data. Bioinformatics 28: 1647-1649 doi 10.1093/bioinformatics/bts199
Kelly MW, Hofmann GE (2013) Adaptation and the physiology of ocean acidification. Funct Ecol 27: 980-990 doi 10.1111/j.1365-2435.2012.02061.x
Kelly MW, Sanford E, Grosberg RK (2012) Limited potential for adaptation to climate change in a broadly distributed marine crustacean. Proceedings Biological sciences / The Royal Society 279: 349-356 doi 10.1098/rspb.2011.0542
Kim J-M, Lee K, Shin K, Kang J-H, Lee H-W, Kim M, Jang P-G, Jang M-C (2006) The effect of seawater CO2 concentration on growth of a natural phytoplankton assemblage in a controlled mesocosm experiment. Limnol Oceanogr 51: 1629-1636 doi 10.4319/lo.2006.51.4.1629
Kiørboe T (1989) Phytoplankton growth rate and nitrogen content: implications for feeding and fecundity in a herbivorous copepod. Mar Ecol Prog Ser 55: 229-234
Klein Breteler WCM, Schogt N, Baas M, Schouten S, Kraay GW (1999) Trophic upgrading of food quality by protozoans enhancing copepod growth: role of essential lipids. Marine Biology 135: 191-198 doi 10.1007/s002270050616
Kleppel GS, Burkart CA, Houchin L (1998a) Nutrition and the regulation of egg production in the calanoid copepod Acartia tonsa. Limnol Oceanogr 43: 1000-1007 doi 10.4319/lo.1998.43.5.1000
Kleppel GS, Burkart CA, Houchin L, Tomas C (1998b) Egg production of the copepod Acartia tonsa in Florida Bay during summer. 1. The roles of food environment and diet. Estuaries 21: 328-339 doi 10.2307/1352479
Kleypas JA, Feely RA, Fabry VJ, Langdon C, Sabine CL, Robbins LL (2006) Impacts of ocean acidification on coral reefs and other marine calcifiers: a guide for future research. Report of a workshop held 18-20 April 2005, St Petersburg, FL, sponsored by NSF, NOAA, and the US Geological Survey. 88 pp.
Klironomos FD, Berg J, Collins S (2013) How epigenetic mutations can affect genetic evolution: Model and mechanism. Bioessays 35: 571-578 doi 10.1002/bies.201200169
Koski M, Viitasalo M, Kuosa H (1999) Seasonal development of meso-zooplankton biomass and production on the sw coast of Finland. Ophelia 50: 69-91 doi 10.1080/00785326.1999.10409390
Kroeker KJ, Kordas RL, Crim RN, Singh GG (2010) Meta-analysis reveals negative yet variable effects of ocean acidification on marine organisms. Ecol Lett 13: 1419-1434 doi 10.1111/j.1461-0248.2010.01518.x
Kurihara H, Ishimatsu A (2008) Effects of high CO2 seawater on the copepod (Acartia tsuensis) through all life stages and subsequent generations. Marine Poll Bull 56: 1086-1090 doi 10.1016/j.marpolbul.2008.03.023
Kurihara H, Shimode S, Shirayama Y (2004) Effects of raised CO2 concentration on the egg production rate and early development of two marine copepods (Acartia steueri and Acartia erythraea). Marine Poll Bull 49: 721-727 doi 10.1016/j.marpolbul.2004.05.005
Kwiatkowski L, Gaylord B, Hill T, Hosfelt J, Kroeker KJ, Nebuchina Y, Ninokawa A, Russell AD, Rivest EB, Sesboue M, Caldeira K (2016) Nighttime
REFERENCES
138
dissolution in a temperate coastal ocean ecosystem increases under acidification. Sci Rep 6: 22984 doi 10.1038/srep22984
Lafferty KD, Allesina S, Arim M, Briggs CJ, De Leo G, Dobson AP, Dunne JA, Johnson PTJ, Kuris AM, Marcogliese DJ, Martinez ND, Memmott J, Marquet PA, McLaughlin JP, Mordecai EA, Pascual M, Poulin R, Thieltges DW (2008) Parasites in food webs: the ultimate missing links. Ecol Lett 11: 533-546 doi 10.1111/j.1461-0248.2008.01174.x
Lafferty KD, Dobson AP, Kuris AM (2006) Parasites dominate food web links. Proc Natl Acad Sci USA 103: 11211-11216 doi 10.1073/pnas.0604755103
Langdon C, Broecker WS, Hammond DE, Glenn E, Fitzsimmons K, Nelson SG, Peng T-H, Hajdas I, Bonani G (2003) Effect of elevated CO2 on the community metabolism of an experimental coral reef. Global Biogeochemical Cycles 17: n/a-n/a doi 10.1029/2002GB001941
Langenbuch M, Portner HO (2004) High sensitivity to chronically elevated CO2 levels in a eurybathic marine sipunculid. Aquatic toxicology (Amsterdam, Netherlands) 70: 55-61 doi 10.1016/j.aquatox.2004.07.006
Lawrence D, Fiegna F, Behrends V, Bundy JG, Phillimore AB, Bell T, Barraclough TG (2012) Species Interactions Alter Evolutionary Responses to a Novel Environment. PLoS Biol 10: e1001330 doi 10.1371/journal.pbio.1001330
Le Quere C, Raupach MR, Canadell JG, Marland G, et al. (2009) Trends in the sources and sinks of carbon dioxide. Nature Geosci 2: 831-836 doi 10.1038/NGEO689
Lee CE, Remfert JL, Chang YM (2007) Response to selection and evolvability of invasive populations. Genetica 129: 179-192 doi 10.1007/s10709-006-9013-9
Legendre P, Legendre LF (2012) Numerical ecology. Elsevier Lejzerowicz F, Esling P, Pillet L, Wilding TA, Black KD, Pawlowski J (2015) High-
throughput sequencing and morphology perform equally well for benthic monitoring of marine ecosystems. Sci Rep-Uk 5 doi 10.1038/srep13932
Lesniowski T, Gambill M, Holst S, Peck M, Algueró-Muñiz M, Haunost M, Malzahn A, Boersma M (2015) Effects of food and CO2 on growth dynamics of polyps of two scyphozoan species (Cyanea capillata and Chrysaora hysoscella). Mar Biol 162: 1371-1382 doi 10.1007/s00227-015-2660-6
Levitus S, Antonov J, Boyer T (2005) Warming of the world ocean, 1955–2003. Geophysical Research Letters 32: n/a-n/a doi 10.1029/2004GL021592
Lewis CN, Brown KA, Edwards LA, Cooper G, Findlay HS (2013) Sensitivity to ocean acidification parallels natural pCO2 gradients experienced by Arctic copepods under winter sea ice. Proc Natl Acad Sci USA 110: E4960-E4967 doi 10.1073/pnas.1315162110
Lewis E, Wallace D (1998) Program Developed for CO2 System Calculations. Carbon Dioxide Information Analysis Center, Oak Ridge National Laboratory, US Department of Energy, Oak Ridge, TN
Li W, Gao K, Beardall J (2012) Interactive effects of ocean acidification and nitrogen-limitation on the diatom Phaeodactylum tricornutum. PloS one 7: e51590 doi 10.1371/journal.pone.0051590
Li WC, Tse HF, Fok L (2016) Plastic waste in the marine environment: A review of sources, occurrence and effects. Sci Total Environ 566-567: 333-349 doi 10.1016/j.scitotenv.2016.05.084
Lima-Mendez G, Faust K, Henry N, Decelle J, Colin S, Carcillo F, Chaffron S, Ignacio-Espinosa JC, Roux S, Vincent F, Bittner L, Darzi Y, Wang J, Audic S, Berline L, Bontempi G, Cabello AM, Coppola L, Cornejo-Castillo FM,
REFERENCES
139
d'Ovidio F, De Meester L, Ferrera I, Garet-Delmas MJ, Guidi L, Lara E, Pesant S, Royo-Llonch M, Salazar G, Sanchez P, Sebastian M, Souffreau C, Dimier C, Picheral M, Searson S, Kandels-Lewis S, Tara Oceans c, Gorsky G, Not F, Ogata H, Speich S, Stemmann L, Weissenbach J, Wincker P, Acinas SG, Sunagawa S, Bork P, Sullivan MB, Karsenti E, Bowler C, de Vargas C, Raes J (2015) Ocean plankton. Determinants of community structure in the global plankton interactome. Science 348: 1262073 doi 10.1126/science.1262073
Lindeque PK, Parry HE, Harmer RA, Somerfield PJ, Atkinson A (2013) Next Generation Sequencing Reveals the Hidden Diversity of Zooplankton Assemblages. PloS one 8: e81327 doi 10.1371/journal.pone.0081327
Lischka S, Bach LT, Schulz KG, Riebesell U (2015) Micro- and mesozooplankton community response to increasing CO2 levels in the Baltic Sea: insights from a large-scale mesocosm experiment. Biogeosciences Discuss 2015: 20025-20070 doi 10.5194/bgd-12-20025-2015
Lischka S, Bach LT, Schulz KG, Riebesell U (2017) Ciliate and mesozooplankton community response to increasing CO2 levels in the Baltic Sea: insights from a large-scale mesocosm experiment. Biogeosciences 14: 447-466 doi 10.5194/bg-14-447-2017
Liu X, Li Y, Wu Y, Huang B, Dai M, Fu F, Hutchins DA, Gao K (2017) Effects of elevated CO2 on phytoplankton during a mesocosm experiment in the southern eutrophicated coastal water of China. Sci Rep-Uk 7: 6868 doi 10.1038/s41598-017-07195-8
Löder MGJ, Meunier C, Wiltshire KH, Boersma M, Aberle N (2011) The role of ciliates, heterotrophic dinoflagellates and copepods in structuring spring plankton communities at Helgoland Roads, North Sea. Mar Biol 158: 1551-1580 doi 10.1007/s00227-011-1670-2
Lohbeck KT, Riebesell U, Reusch TBH (2012) Adaptive evolution of a key phytoplankton species to ocean acidification. Nature Geosci 5: 346 doi 10.1038/ngeo1441
Longhurst AR (1985) The structure and evolution of plankton communities. Progress in Oceanography 15: 1-35 doi 10.1016/0079-6611(85)90036-9
Low-Décarie E, Fussmann GF, Bell G (2014) Aquatic primary production in a high-CO2 world. Trends Ecol Evol 29: 223-232 doi 10.1016/j.tree.2014.02.006
Lucey NM, Lombardi C, Florio M, DeMarchi L, Nannini M, Rundle S, Gambi MC, Calosi P (2016) An in situ assessment of local adaptation in a calcifying polychaete from a shallow CO2 vent system. Evol Appl 9: 1054-1071 doi 10.1111/eva.12400
Maas EW, Law CS, Hall JA, Pickmere S, Currie KI, Chang FH, Voyles KM, Caird D (2013) Effect of ocean acidification on bacterial abundance, activity and diversity in the Ross Sea, Antarctica. Aquatic Microbial Ecology 70: 1-15 doi 10.3354/ame01633
Malzahn AM, Aberle N, Clemmesen C, Boersma M (2007) Nutrient limitation of primary producers affects planktivorous fish condition. Limnol Oceanogr 52: 2062-2071 doi 10.4319/lo.2007.52.5.2062
Man in 't Veld WA, Rosendahl KC, Brouwer H, de Cock AW (2011) Phytophthora gemini sp. nov., a new species isolated from the halophilic plant Zostera marina in the Netherlands. Fungal biology 115: 724-732 doi 10.1016/j.funbio.2011.05.006
REFERENCES
140
Marano AV, Jesus AL, de Souza JI, Jerônimo GH, Gonçalves DR, Boro MC, Rocha SCO, Pires-Zottarelli CLA (2016) Ecological roles of saprotrophic Peronosporales (Oomycetes, Straminipila) in natural environments. Fungal Ecology 19: 77-88 doi 10.1016/j.funeco.2015.06.003
Marcus NH, Wilcox JA (2007) A guide to the meso-scale production of the copepod Acartia tonsa. . Fla Sea Grant
Marshall DJ, Morgan SG (2011) Ecological and Evolutionary Consequences of Linked Life-History Stages in the Sea. Curr Biol 21: R718-R725 doi 10.1016/j.cub.2011.08.022
Massana R, Gobet A, Audic S, Bass D, Bittner L, Boutte C, Chambouvet A, Christen R, Claverie JM, Decelle J, Dolan JR, Dunthorn M, Edvardsen B, Forn I, Forster D, Guillou L, Jaillon O, Kooistra WH, Logares R, Mahe F, Not F, Ogata H, Pawlowski J, Pernice MC, Probert I, Romac S, Richards T, Santini S, Shalchian-Tabrizi K, Siano R, Simon N, Stoeck T, Vaulot D, Zingone A, de Vargas C (2015) Marine protist diversity in European coastal waters and sediments as revealed by high-throughput sequencing. Environ Microbiol 17: 4035-4049 doi 10.1111/1462-2920.12955
Matthews B, Narwani A, Hausch S, Nonaka E, Peter H, Yamamichi M, Sullam KE, Bird KC, Thomas MK, Hanley TC, Turner CB (2011) Toward an integration of evolutionary biology and ecosystem science. Ecol Lett 14: 690-701 doi 10.1111/j.1461-0248.2011.01627.x
Mauchline J (1998) The biology of calanoid copepods. In ‘Advances in Marine Biology’. (Academic Press: New York) 33: 1-143
Maun MA, Boyd RS, Lynda O (1990) The Biological Flora of Coastal Dunes and Wetlands. 1. "Cakile Edentula" (Bigel.) Hook. J Coast Res 6: 137-156
Mayor DJ, Everett NR, Cook KB (2012) End of century ocean warming and acidification effects on reproductive success in a temperate marine copepod. J Plankton Res 34: 258-262 doi 10.1093/plankt/fbr107
Mayor DJ, Matthews C, Cook K, Zuur AF, Hay S (2007) CO2-induced acidification affects hatching success in Calanus finmarchicus. Mar Ecol Prog Ser 350: 91-97 doi 10.3354/meps07142
McConville K, Halsband C, Fileman ES, Somerfield PJ, Findlay HS, Spicer JI (2013) Effects of elevated CO2 on the reproduction of two calanoid copepods. Marine Poll Bull 73: 428-434 doi 10.1016/j.marpolbul.2013.02.010
McKinney EC, Ali N, Traut A, Feldmann KA, Belostotsky DA, McDowell JM, Meagher RB (1995) Sequence-based identification of T-DNA insertion mutations in Arabidopsis: actin mutants act2-1 and act4-1. Plant J 8: 613-622 doi 10.1046/j.1365-313X.1995.8040613.x
Mehrbach C, Culberson CH, Hawley JE, Pytkowicx RM (1973) Measurement of the apparent dissociation constants of carbonic acid in seawater at atmospheric pressure. Limnol Oceanogr 18: 897-907 doi 10.4319/lo.1973.18.6.0897
Melzner F, Stange P, Trübenbach K, Thomsen J, Casties I, Panknin U, Gorb SN, Gutowska MA (2011) Food Supply and Seawater pCO2 Impact Calcification and Internal Shell Dissolution in the Blue Mussel Mytilus edulis. PloS one 6: e24223 doi 10.1371/journal.pone.0024223
Melzner F, Thomsen J, Koeve W, Oschlies A, Gutowska MA, Bange HW, Hansen HP, Körtzinger A (2013) Future ocean acidification will be amplified by hypoxia in coastal habitats. Marine Biology 160: 1875-1888 doi 10.1007/s00227-012-1954-1
Messing J (1983) New M13 vectors for cloning. Methods Enzymol 101: 20-78
REFERENCES
141
Meunier CL, Algueró-Muñiz M, Horn HG, Lange JAF, Boersma M (2016) Direct and indirect effects of near-future pCO2 levels on zooplankton dynamics. Mar Freshwater Res 68: 373-380 doi 10.1071/MF15296
Meunier CL, Malzahn AM, Boersma M (2014) A new approach to homeostatic regulation: towards a unified view of physiological and ecological concepts. PloS one 9: e107737 doi 10.1371/journal.pone.0107737
Michaelidis B, Ouzounis C, Paleras A, Pörtner HO (2005) Effects of long-term moderate hypercapnia on acid-base balance and growth rate in marine mussels Mytilus galloprovincialis. Mar Ecol Prog Ser 293: 109-118 doi 10.3354/meps293109
Michaels AF, Silver MW (1988) Primary production, sinking fluxes and the microbial food web. Deep Sea Research Part A Oceanographic Research Papers 35: 473-490 doi 10.1016/0198-0149(88)90126-4
Miles H, Widdicombe S, Spicer JI, Hall-Spencer J (2007) Effects of anthropogenic seawater acidification on acid-base balance in the sea urchin Psammechinus miliaris. Marine pollution bulletin 54: 89-96 doi 10.1016/j.marpolbul.2006.09.021
Miller CA, Glibert PM (1998) Nitrogen excretion by the calanoid copepod Acartia tonsa: results of mesocosm experiments. J Plankton Res 20: 1767-1780 doi 10.1093/plankt/20.9.1767
Montagnes DJS, Lowe CD, Roberts EC, Breckels MN, Boakes DE, Davidson K, Keeling PJ, Slamovits CH, Steinke M, Yang Z, Watts PC (2011) An introduction to the special issue: Oxyrrhis marina, a model organism? J Plankton Res 33: 549-554 doi 10.1093/plankt/fbq121
Moss P (2010) History and Development of Molecular Biology Molecular Hematology. Wiley-Blackwell, pp 360-369
Mostofa KMG, Liu CQ, Zhai W, Minella M, Vione D, Gao K, Minakata D, Arakaki T, Yoshioka T, Hayakawa K, Konohira E, Tanoue E, Akhand A, Chanda A, Wang B, Sakugawa H (2016) Reviews and Syntheses: Ocean acidification and its potential impacts on marine ecosystems. Biogeosciences 13: 1767-1786 doi 10.5194/bg-13-1767-2016
Mullis KB, Ferré F, Gibbs RA (1994) The polymerase chain reaction. Boston, MA Munday PL (2014) Transgenerational acclimation of fishes to climate change and
ocean acidification. F1000prime reports 6: 99 doi 10.12703/P6-99 Munday PL, Warner RR, Monro K, Pandolfi JM, Marshall DJ (2013) Predicting
evolutionary responses to climate change in the sea. Ecol Lett 16: 1488-1500 doi 10.1111/ele.12185
Murphy J, Riley JP (1962) A modified single solution method for the determination of phosphate in natural waters. Analytica Chimica Acta 27: 31-36 doi 10.1016/S0003-2670(00)88444-5
Niehoff B, Schmithusen T, Knuppel N, Daase M, Czerny J, Boxhammer T (2013) Mesozooplankton community development at elevated CO2 concentrations: results from a mesocosm experiment in an Arctic fjord. Biogeosciences 10: 1391-1406 doi 10.5194/bg-10-1391-2013
Nielsen LT, Hallegraeff GM, Wright SW, Hansen PJ (2012) Effects of experimental seawater acidification on an estuarine plankton community. Aquatic Microbial Ecology 65: 271-285
Nielsen LT, Jakobsen HH, Hansen PJ (2010) High resilience of two coastal plankton communities to twenty-first century seawater acidification: Evidence from
REFERENCES
142
microcosm studies. Marine Biology Research 6: 542-555 doi 10.1080/17451000903476941
Nigrelli L, Thines M (2013) Tropical oomycetes in the German Bight – Climate warming or overlooked diversity? Fungal Ecology 6: 152-160 doi 10.1016/j.funeco.2012.11.003
Oksanen J, Blanchet FG, Kindt R, Legendre P, Minchin PR, O'Hara RB, Simpson GL, Solymos P, Henry M, Stevens H, Wagner H (2016) vegan: Community Ecology Package. R package version 2.3-4. https://CRANR-projectorg/package=vegan
Olsen Y, Jensen A, Reinertsen H, BØrsheim KY, Heldal M, Langeland A (1986) Dependence of the rate of release of phosphorus by zooplankton on the P: C ratio in the food supply, as calculated by a recycling model1. Limnol Oceanogr 31: 34-44 doi 10.4319/lo.1986.31.1.0034
Olson MB, Kawaguchi S (2011) Workshop on “Impacts of Ocean Acidification on Zooplankton”. PICES Press 19: 28-29
Orr JC, Fabry VJ, Aumont O, Bopp L, Doney SC, Feely RA, Gnanadesikan A, Gruber N, Ishida A, Joos F, Key RM, Lindsay K, Maier-Reimer E, Matear R, Monfray P, Mouchet A, Najjar RG, Plattner GK, Rodgers KB, Sabine CL, Sarmiento JL, Schlitzer R, Slater RD, Totterdell IJ, Weirig MF, Yamanaka Y, Yool A (2005) Anthropogenic ocean acidification over the twenty-first century and its impact on calcifying organisms. Nature 437: 681-686 doi 10.1038/nature04095
Paffenhöfer GA (1988) Feeding Rates and Behavior of Zooplankton. Bulletin of Marine Science 43: 430-445
Pagani M, Huber M, Liu Z, Bohaty SM, Henderiks J, Sijp W, Krishnan S, DeConto RM (2011) The Role of Carbon Dioxide During the Onset of Antarctic Glaciation. Science 334: 1261-1264 doi 10.1126/science.1203909
Palmer MW (1993) Putting Things in Even Better Order: The Advantages of Canonical Correspondence Analysis. Ecology 74: 2215-2230 doi 10.2307/1939575
Pansch C, Schaub I, Havenhand J, Wahl M (2014) Habitat traits and food availability determine the response of marine invertebrates to ocean acidification. Glob Chang Biol 20: 765-777 doi 10.1111/gcb.12478
Parker LM, Ross PM, O'Connor WA, Borysko L, Raftos DA, Pörtner H-O (2012) Adult exposure influences offspring response to ocean acidification in oysters. Glob Chang Biol 18: 82-92 doi 10.1111/j.1365-2486.2011.02520.x
Parmesan C (2006) Ecological and Evolutionary Responses to Recent Climate Change. Annual Review of Ecology, Evolution, and Systematics 37: 637-669
Pasciak WJ, Gavis J (1974) Transport limitation of nutrient uptake in phytoplankton1. Limnol Oceanogr 19: 881-888 doi 10.4319/lo.1974.19.6.0881
Patey MD, Rijkenberg MJA, Statham PJ, Stinchcombe MC, Achterberg EP, Mowlem M (2008) Determination of nitrate and phosphate in seawater at nanomolar concentrations. TrAC 27: 169-182 doi 10.1016/j.trac.2007.12.006
Paul AJ, Bach LT, Schulz KG, Boxhammer T, Czerny J, Achterberg EP, Hellemann D, Trense Y, Nausch M, Sswat M, Riebesell U (2015) Effect of elevated CO2 on organic matter pools and fluxes in a summer Baltic Sea plankton community. Biogeosciences 12: 6181-6203 doi 10.5194/bg-12-6181-2015
Pearman JK, Irigoien X (2015) Assessment of Zooplankton Community Composition along a Depth Profile in the Central Red Sea. PloS one 10: e0133487 doi 10.1371/journal.pone.0133487
REFERENCES
143
Peck LS, Clark MS, Power D, Reis J, Batista FM, Harper EM (2015) Acidification effects on biofouling communities: winners and losers. Glob Chang Biol 21: 1907-1913 doi 10.1111/gcb.12841
Pedersen MF, Hansen PJ (2003) Effects of high pH on the growth and survival of six marine heterotrophic protists. Mar Ecol Prog Ser 260: 33-41 doi 10.3354/meps260033
Pedersen SA, Våge VT, Olsen AJ, Hammer KM, Altin D (2014) Effects of Elevated Carbon Dioxide (CO2) Concentrations on Early Developmental Stages of the Marine Copepod Calanus finmarchicus Gunnerus (Copepoda: Calanoidae). J Toxicol Environ Health, Part A 77: 535-549 doi 10.1080/15287394.2014.887421
Pelletier F, Garant D, Hendry AP (2009) Eco-evolutionary dynamics. Philos Trans R Soc Lond B Biol Sci 364: 1483-1489 doi 10.1098/rstb.2009.0027
Pespeni MH, Sanford E, Gaylord B, Hill TM, Hosfelt JD, Jaris HK, LaVigne M, Lenz EA, Russell AD, Young MK, Palumbi SR (2013) Evolutionary change during experimental ocean acidification. Proc Natl Acad Sci USA 110: 6937-6942 doi 10.1073/pnas.1220673110
Peterson WT (2001) Patterns in stage duration and development among marine and freshwater calanoid and cyclopoid copepods: a review of rules, physiological constraints, and evolutionary significance. Hydrobiologia 453: 91-105 doi 10.1023/A:1013111832700
Pielou EC (1966) The measurement of diversity in different types of biological collections. Journal of Theoretical Biology 13: 131-144 doi 10.1016/0022-5193(66)90013-0
Piontek J, Borchard C, Sperling M, Schulz KG, Riebesell U, Engel A (2013) Response of bacterioplankton activity in an Arctic fjord system to elevated pCO2: results from a mesocosm perturbation study. Biogeosciences 10: 297-314 doi 10.5194/bg-10-297-2013
Pochon X, Bott NJ, Smith KF, Wood SA (2013) Evaluating detection limits of next-generation sequencing for the surveillance and monitoring of international marine pests. PloS one 8: e73935 doi 10.1371/journal.pone.0073935
Porco D, Decaëns T, Deharveng L, James SW, Skarżyński D, Erséus C, Butt KR, Richard B, Hebert PDN (2013) Biological invasions in soil: DNA barcoding as a monitoring tool in a multiple taxa survey targeting European earthworms and springtails in North America. Biological Invasions 15: 899-910 doi 10.1007/s10530-012-0338-2
Pörtner H (2008) Ecosystem effects of ocean acidification in times of ocean warming: a physiologist’s view. Mar Ecol Prog Ser 373: 203-217 doi 10.3354/meps07768
Pörtner HO, Karl D, Boyd PW, Cheung W, Lluch-Cota SE, Nojiri Y, Schmidt DN, Zavialov P (2014) Ocean systems. In: Field CB, Barros VR, Dokken DJ, Mach KJ, Mastrandrea MD, Bilir TE, Chatterjee M, Ebi KL, Estrada YO, Genova RC, Girma B, Kissel ES, Levy AN, MacCracken S, Mastrandrea PR, White LL (eds) Climate Change 2014: Impacts, Adaptation, and Vulnerability Part A: Global and Sectoral Aspects Contribution of Working Group II to the Fifth Assessment Report of the Intergovernmental Panel of Climate Change. Cambridge University Press, Cambridge, United Kingdom and New York, NY, USA, pp 411-484
Post DM, Palkovacs EP (2009) Eco-evolutionary feedbacks in community and ecosystem ecology: interactions between the ecological theatre and the
REFERENCES
144
evolutionary play. Philos Trans R Soc Lond B Biol Sci 364: 1629-1640 doi 10.1098/rstb.2009.0012
Rao CR (1995) A review of canonical coordinates and an alternative to correspondence analysis using Hellinger distance. Qüestiió 19: 23-63
Räsänen K, Kruuk LEB (2007) Maternal effects and evolution at ecological time-scales. Funct Ecol 21: 408-421 doi 10.1111/j.1365-2435.2007.01246.x
Raulf FF, Fabricius K, Uthicke S, de Beer D, Abed RM, Ramette A (2015) Changes in microbial communities in coastal sediments along natural CO2 gradients at a volcanic vent in Papua New Guinea. Environ Microbiol 17: 3678-3691 doi 10.1111/1462-2920.12729
Raupach MJ, Barco A, Steinke D, Beermann J, Laakmann S, Mohrbeck I, Neumann H, Kihara TC, Pointner K, Radulovici A, Segelken-Voigt A, Wesse C, Knebelsberger T (2015) The Application of DNA Barcodes for the Identification of Marine Crustaceans from the North Sea and Adjacent Regions. PloS one 10: e0139421 doi 10.1371/journal.pone.0139421
Raven J, Caldeira K, Elderfield H, Hoegh-Guldberg O, Liss P, Riebesell U, Shepherd J, Turley C, Watson A (2005) Ocean acidification due to increasing atmospheric carbon dioxide. The Royal Society
Redfield AC (1934) On the Proportions of Organic Derivatives in Sea Water and Their Relation to the Composition of Plankton. University Press of Liverpool: 176-192
Reed DH, Frankham R (2003) Correlation between Fitness and Genetic Diversity. Conserv Biol 17: 230-237 doi 10.1046/j.1523-1739.2003.01236.x
Reid PC, Fischer AC, Lewis-Brown E, Meredith MP, Sparrow M, Andersson AJ, Antia A, Bates NR, Bathmann U, Beaugrand G, Brix H, Dye S, Edwards M, Furevik T, Gangsto R, Hatun H, Hopcroft RR, Kendall M, Kasten S, Keeling R, Le Quere C, Mackenzie FT, Malin G, Mauritzen C, Olafsson J, Paull C, Rignot E, Shimada K, Vogt M, Wallace C, Wang Z, Washington R (2009) Chapter 1. Impacts of the oceans on climate change. Adv Mar Biol 56: 1-150 doi 10.1016/S0065-2881(09)56001-4
Reusch TB, Boyd PW (2013) Experimental evolution meets marine phytoplankton. Evolution 67: 1849-1859 doi 10.1111/evo.12035
Reusch TBH (2014) Climate change in the oceans: evolutionary versus phenotypically plastic responses of marine animals and plants. Evolutionary Applications 7: 104-122 doi 10.1111/eva.12109
Richard FL, Wilhelm H, Gerhard K (2006) Lipid storage in marine zooplankton. Mar Ecol Prog Ser 307: 273-306
Riebesell U, Bellerby RGJ, Grossart HP, Thingstad F (2008) Mesocosm CO2 perturbation studies: from organism to community level. Biogeosciences 5: 1157-1164 doi 10.5194/bg-5-1157-2008
Riebesell U, Czerny J, von Brockel K, Boxhammer T, Budenbender J, Deckelnick M, Fischer M, Hoffmann D, Krug SA, Lentz U, Ludwig A, Muche R, Schulz KG (2013) Technical Note: A mobile sea-going mesocosm system - new opportunities for ocean change research. Biogeosciences 10: 1835-1847 doi DOI 10.5194/bg-10-1835-2013
Riebesell U, Gattuso J-P (2014) Lessons learned from ocean acidification research. Nature Climate Change 5: 12 doi 10.1038/nclimate2456
Riebesell U, Kortzinger A, Oschlies A (2009) Sensitivities of marine carbon fluxes to ocean change. Proc Natl Acad Sci USA 106: 20602-20609 doi 10.1073/pnas.0813291106
REFERENCES
145
Riebesell U, Lee K, Neijstgaard J (2010) Pelagic mesocosms. In: Riebesell, U., Fabry, V. J., Hansson, L. and Gattuso, J.-P. (eds.). Guide to best practices for ocean acidification research and data reporting Publications Office of the European Union, Luxembourg: 95-112
Riebesell U, Schulz KG, Bellerby RGJ, Botros M, Fritsche P, Meyerhofer M, Neill C, Nondal G, Oschlies A, Wohlers J, Zollner E (2007) Enhanced biological carbon consumption in a high CO2 ocean. Nature 450: 545-U510 doi Doi 10.1038/Nature06267
Riebesell U, Zondervan I, Rost B, Tortell PD, Zeebe RE, Morel FMM (2000) Reduced calcification of marine plankton in response to increased atmospheric CO2. Nature 407: 346-367
Robideau GP, De Cock AWAM, Coffey MD, Voglmayr H, Brouwer H, Bala K, Chitty DW, DÉSaulniers N, Eggertson QA, Gachon CMM, Hu C-H, KÜPper FC, Rintoul TL, Sarhan E, Verstappen ECP, Zhang Y, Bonants PJM, Ristaino JB, AndrÉ LÉVesque C (2011) DNA barcoding of oomycetes with cytochrome c oxidase subunit I and internal transcribed spacer. Molecular ecology resources 11: 1002-1011 doi 10.1111/j.1755-0998.2011.03041.x
Roman MR (1991) Pathways of carbon incorporation in marine copepods: Effects of developmental stage and food quantity. Limnol Oceanogr 36: 796-807 doi 10.4319/lo.1991.36.4.0796
Rose JM, Feng Y, Gobler CJ, Gutierrez R, Hare CE, Leblanc K, Hutchins DA (2009) Effects of increased pCO2 and temperature on the North Atlantic spring bloom. II. Microzooplankton abundance and grazing. Marine Ecology Progress Series 388: 27-40 doi 10.3354/meps08134
Ross PM, Parker L, O'Connor WA, Bailey EA (2011) The Impact of Ocean Acidification on Reproduction, Early Development and Settlement of Marine Organisms. Water-Sui 3: 1005-1030 doi DOI 10.3390/w3041005
Rossoll D, Bermudez R, Hauss H, Schulz KG, Riebesell U, Sommer U, Winder M (2012) Ocean acidification-induced food quality deterioration constrains trophic transfer. PloS one 7: e34737 doi 10.1371/journal.pone.0034737
Rossoll D, Sommer U, Winder M (2013) Community interactions dampen acidification effects in a coastal plankton system. Mar Ecol Prog Ser 486: 37-46 doi 10.3354/meps10352
Rouco M, Branson O, Lebrato M, Iglesias-Rodriguez MD (2013) The effect of nitrate and phosphate availability on Emiliania huxleyi (NZEH) physiology under different CO2 scenarios. Front Microbiol 4: 155 doi 10.3389/fmicb.2013.00155
Royer DL (2006) CO2-forced climate thresholds during the Phanerozoic. Geochimica et Cosmochimica Acta 70: 5665-5675 doi 10.1016/j.gca.2005.11.031
Runge JA (1988) Should we expect a relationship between primary production and fisheries? The role of copepod dynamics as a filter of trophic variability. Hydrobiologia 167: 61-71 doi 10.1007/bf00026294
Saage A, Vadstein O, Sommer U (2009) Feeding behaviour of adult Centropages hamatus (Copepoda, Calanoida): Functional response and selective feeding experiments. J Sea Res 62: 16-21 doi 10.1016/j.seares.2009.01.002
Sabine CL, Feely RA, Gruber N, Key RM, Lee K, Bullister JL, Wanninkhof R, Wong CS, Wallace DWR, Tilbrook B, Millero FJ, Peng T-H, Kozyr A, Ono T, Rios AF (2004) The Oceanic Sink for Anthropogenic CO2. Science 305: 367-371 doi 10.1126/science.1097403
REFERENCES
146
Sala MM, Aparicio FL, Balagué V, Boras JA, Borrull E, Cardelús C, Cros L, Gomes A, López-Sanz A, Malits A, Martínez RA, Mestre M, Movilla J, Sarmento H, Vázquez-Domínguez E, Vaqué D, Pinhassi J, Calbet A, Calvo E, Gasol JM, Pelejero C, Marrasé C (2015) Contrasting effects of ocean acidification on the microbial food web under different trophic conditions. Ices J Mar Sci doi 10.1093/icesjms/fsv130
Sanger F, Nicklen S, Coulson AR (1977) DNA sequencing with chain-terminating inhibitors. Proc Natl Acad Sci USA 74: 5463-5467
Savile DBO (1957) ADDITIONS TO THE PARASITIC FUNGI OF NOVA SCOTIA. Can J Bot 35: 197-206 doi 10.1139/b57-019
Scheiner SM (1993) Genetics and Evolution of Phenotypic Plasticity. Annual Review of Ecology and Systematics 24: 35-68 doi 10.1146/annurev.es.24.110193.000343
Schnack-Schiel SB, Isla E (2005) The role of zooplankton in the pelagic-benthic coupling of the Southern Ocean. Sci Mar 69: 39-55
Schoener TW (2011) The newest synthesis: understanding the interplay of evolutionary and ecological dynamics. Science 331: 426-429 doi 10.1126/science.1193954
Scholz B, Guillou L, Marano AV, Neuhauser S, Sullivan BK, Karsten U, Kupper FC, Gleason FH (2016a) Zoosporic parasites infecting marine diatoms - A black box that needs to be opened. Fungal Ecol 19: 59-76 doi 10.1016/j.funeco.2015.09.002
Scholz B, Kupper FC, Vyverman W, Karsten U (2014) Eukaryotic pathogens (Chytridiomycota and Oomycota) infecting marine microphytobenthic diatoms - a methodological comparison. J Phycol 50: 1009-1019 doi 10.1111/jpy.12230
Scholz B, Küpper FC, Vyverman W, Karsten U (2016b) Effects of eukaryotic pathogens (Chytridiomycota and Oomycota) on marine benthic diatom communities in the Solthörn tidal flat (southern North Sea, Germany). Eur J Phycol 51: 253-269 doi 10.1080/09670262.2015.1134814
Schoo KL, Malzahn AM, Krause E, Boersma M (2013) Increased carbon dioxide availability alters phytoplankton stoichiometry and affects carbon cycling and growth of a marine planktonic herbivore. Mar Biol 160: 2145-2155 doi 10.1007/s00227-012-2121-4
Schulz KG, Bellerby RGJ, Brussaard CPD, Büdenbender J, Czerny J, Engel A, Fischer M, Koch-Klavsen S, Krug SA, Lischka S, Ludwig A, Meyerhöfer M, Nondal G, Silyakova A, Stuhr A, Riebesell U (2013) Temporal biomass dynamics of an Arctic plankton bloom in response to increasing levels of atmospheric carbon dioxide. Biogeosciences 10: 161-180 doi 10.5194/bg-10-161-2013
Sekimoto S, Beakes GW, Gachon CM, Muller DG, Kupper FC, Honda D (2008a) The development, ultrastructural cytology, and molecular phylogeny of the basal oomycete Eurychasma dicksonii, infecting the filamentous phaeophyte algae Ectocarpus siliculosus and Pylaiella littoralis. Protist 159: 299-318 doi 10.1016/j.protis.2007.11.004
Sekimoto S, Yokoo K, Kawamura Y, Honda D (2008b) Taxonomy, molecular phylogeny, and ultrastructural morphology of Olpidiopsis porphyrae sp. nov. (Oomycetes, straminipiles), a unicellular obligate endoparasite of Bangia and Porphyra spp. (Bangiales, Rhodophyta). Mycol Res 112: 361-374 doi 10.1016/j.mycres.2007.11.002
REFERENCES
147
Selosse M-A, Strullu-Derrien C, Martin FM, Kamoun S, Kenrick P (2015) Plants, fungi and oomycetes: a 400-million year affair that shapes the biosphere. New Phytologist 206: 501-506 doi 10.1111/nph.13371
Shannon CE (1948) A Mathematical Theory of Communication. Bell System Technical Journal 27: 379-423 doi 10.1002/j.1538-7305.1948.tb01338.x
Sharma R, Thines M (2015) FastQFS – A tool for evaluating and filtering paired-end sequencing data generated from high throughput sequencing. Mycol Prog 14: 1-7 doi 10.1007/s11557-015-1077-4
Sherr EB, Sherr BF (2002) Significance of predation by protists in aquatic microbial food webs. Antonie Van Leeuwenhoek 81: 293-308
Shirayama Y, Thornton H (2005) Effect of increased atmospheric CO2 on shallow water marine benthos. J Geophys Res: Oceans 110: n/a-n/a doi 10.1029/2004JC002618
Silyakova A, Bellerby RGJ, Schulz KG, Czerny J, Tanaka T, Nondal G, Riebesell U, Engel A, De Lange T, Ludvig A (2013) Pelagic community production and carbon-nutrient stoichiometry under variable ocean acidification in an Arctic fjord. Biogeosciences 10: 4847-4859 doi 10.5194/bg-10-4847-2013
Sime-Ngando T, Lefèvre E, Gleason FH (2011) Hidden diversity among aquatic heterotrophic flagellates: ecological potentials of zoosporic fungi. Hydrobiologia 659: 5-22 doi 10.1007/s10750-010-0230-y
Singer D, Lara E, Steciow MM, Seppey CVW, Paredes N, Pillonel A, Oszako T, Belbahri L (2016) High-throughput sequencing reveals diverse oomycete communities in oligotrophic peat bog micro-habitat. Fungal Ecology 23: 42-47 doi 10.1016/j.funeco.2016.05.009
Smith G, Ramsay A (2012) PEI Mussel Monitoring Program. (Technical Report # 250) Retrieved from http://wwwgovpeca/photos/original/FARD_Tech250pdf
Smith JM, Haigh J (1974) The hitch-hiking effect of a favourable gene. Genetical research 23: 23-35 doi 10.1017/S0016672300014634
Somero GN (2012) The physiology of global change: linking patterns to mechanisms. Ann Rev Mar Sci 4: 39-61 doi 10.1146/annurev-marine-120710-100935
Sommer U, Hansen T, Blum O, Holzner N, Vadstein O, Stibor H (2005) Copepod and microzooplankton grazing in mesocosms fertilised with different Si:N ratios: no overlap between food spectra and Si:N influence on zooplankton trophic level. Oecologia 142: 274-283
Sparrow FK (1960) Aquatic phycomycetes, 2nd edn. University of Michigan Press, Ann Arbor
Sparrow FK (1969) Zoosporic marine fungi from the Pacific Northwest (U.S.A.). Archiv für Mikrobiologie 66: 129-146 doi 10.1007/bf00410220
Sperling M, Piontek J, Gerdts G, Wichels A, Schunck H, Roy AS, La Roche J, Gilbert J, Nissimov JI, Bittner L, Romac S, Riebesell U, Engel A (2013) Effect of elevated CO2 on the dynamics of particle-attached and free-living bacterioplankton communities in an Arctic fjord. Biogeosciences 10: 181-191 doi 10.5194/bg-10-181-2013
Spilling K, Paul AJ, Virkkala N, Hastings T, Lischka S, Stuhr A, Bermúdez R, Czerny J, Boxhammer T, Schulz KG, Ludwig A, Riebesell U (2016a) Ocean acidification decreases plankton respiration: evidence from a mesocosm experiment. Biogeosciences 13: 4707-4719 doi 10.5194/bg-13-4707-2016
Spilling K, Schulz KG, Paul AJ, Boxhammer T, Achterberg EP, Hornick T, Lischka S, Stuhr A, Bermúdez R, Czerny J, Crawfurd K, Brussaard CPD, Grossart HP, Riebesell U (2016b) Effects of ocean acidification on pelagic carbon fluxes in
REFERENCES
148
a mesocosm experiment. Biogeosciences 13: 6081-6093 doi 10.5194/bg-13-6081-2016
Srinivasan UT, Cheung WWL, Watson R, Sumaila UR (2010) Food security implications of global marine catch losses due to overfishing. Journal of Bioeconomics 12: 183-200 doi 10.1007/s10818-010-9090-9
Sswat M, Stiasny MH, Taucher J, Algueró-Muñiz M, Bach LT, Jutfelt F, Riebesell U, Clemmesen C (2018) Food web changes under ocean acidification promote herring larvae survival. Nature ecology & evolution doi 10.1038/s41559-018-0514-6
Stapley J, Reger J, Feulner PG, Smadja C, Galindo J, Ekblom R, Bennison C, Ball AD, Beckerman AP, Slate J (2010) Adaptation genomics: the next generation. Trends Ecol Evol 25: 705-712 doi 10.1016/j.tree.2010.09.002
Stearns DE, Forward RB (1984) Photosensitivity of the calanoid copepod Acartia tonsa. Mar Biol 82: 85-89 doi 10.1007/bf00392766
Steele DH, Steele VJ (1975) Egg size and duration of embryonic development in Crustacea. Int Rev Gesamten Hydrobiol 60: 711-715 doi 10.1002/iroh.19750600609
Sterner RW, Elser JJ (2002) Ecological stoichiometry: the biology of elements from molecules to the biosphere. Princeton University Press
Sterner RW, Hessen DO (1994) Algal Nutrient Limitation and the Nutrition of Aquatic Herbivores. Annu Rev Ecol Evol Syst 25: 1-29
Strickler JR (1975) Swimming of Planktonic Cyclops Species (Copepoda, Crustacea): Pattern, Movements and Their Control. In: Wu TYT, Brokaw CJ, Brennen C (eds) Swimming and Flying in Nature: Volume 2. Springer US, Boston, MA, pp 599-613
Strittmatter M, Gachon CMM, Küpper FC (2008) Ecology of Lower Oomycetes Oomycete Genetics and Genomics. John Wiley & Sons, Inc., pp 25-46
Suffrian K, Simonelli P, Nejstgaard JC, Putzeys S, Carotenuto Y, Antia AN (2008) Microzooplankton grazing and phytoplankton growth in marine mesocosms with increased CO2 levels. Biogeosciences 5: 1145-1156 doi 10.5194/bg-5-1145-2008
Sullivan BK, Buskey E, Miller DC, Ritacco PJ (1983) Effects of copper and cadmium on growth, swimming and predator avoidance in Eurytemora affinis (Copepoda). Mar Biol 77: 299-306 doi 10.1007/bf00395819
Sunday JM, Calosi P, Dupont S, Munday PL, Stillman JH, Reusch TB (2014) Evolution in an acidifying ocean. Trends Ecol Evol 29: 117-125 doi 10.1016/j.tree.2013.11.001
Sunday JM, Crim RN, Harley CD, Hart MW (2011) Quantifying rates of evolutionary adaptation in response to ocean acidification. PloS one 6: e22881 doi 10.1371/journal.pone.0022881
Suthers IM, Rissik D (2009) Plankton: a guide to their ecology and monitoring for water quality CSIRO Publishing (Australia)
Tamura K, Peterson D, Peterson N, Stecher G, Nei M, Kumar S (2011) MEGA5: molecular evolutionary genetics analysis using maximum likelihood, evolutionary distance, and maximum parsimony methods. Mol Biol Evol 28: 2731-2739 doi 10.1093/molbev/msr121
Tans P, Keeling R (2013) Trends in Atmospheric Carbon Dioxide, Global Greenhouse Gas Reference Network
Taucher J, Haunost M, Boxhammer T, Bach LT, Algueró-Muñiz M, Riebesell U (2017) Influence of ocean acidification on plankton community structure
REFERENCES
149
during a winter-to-summer succession: An imaging approach indicates that copepods can benefit from elevated CO2 via indirect food web effects. PloS one 12: e0169737 doi 10.1371/journal.pone.0169737
Taylor TN, Krings M, Kerp H (2006) Hassiella monospora gen. et sp. nov., a microfungus from the 400 million year old Rhynie chert. Mycol Res 110: 628-632 doi 10.1016/j.mycres.2006.02.009
Teixeira PF, Kaminski SM, Avila TR, Cardozo AP, Bersano JGF, Bianchini A (2010) Diet influence on egg production of the copepod Acartia tonsa (Dana, 1896). Anais da Academia Brasileira de Ciências 82: 333-339 doi 10.1590/S0001-37652010000200009
Thines M (2014) Phylogeny and evolution of plant pathogenic oomycetes—a global overview. Eur J Plant Pathol 138: 431-447 doi 10.1007/s10658-013-0366-5
Thines M, Choi YJ (2016) Evolution, Diversity, and Taxonomy of the Peronosporaceae, with Focus on the Genus Peronospora. Phytopathology 106: 6-18 doi 10.1094/PHYTO-05-15-0127-RVW
Thines M, Kamoun S (2010) Oomycete–plant coevolution: recent advances and future prospects. Current Opinion in Plant Biology 13: 427-433 doi 10.1016/j.pbi.2010.04.001
Thines M, Nam B, Nigrelli L, Beakes G, Kraberg A (2015) The diatom parasite Lagenisma coscinodisci (Lagenismatales, Oomycota) is an early diverging lineage of the Saprolegniomycetes. Mycol Prog 14: 75 doi 10.1007/s11557-015-1099-y
Thingstad TF, Havskum H, Garde K, Riemann B (1996) On the Strategy of "Eating Your Competitor": A Mathematical Analysis of Algal Mixotrophy. Ecology 77: 2108-2118 doi 10.2307/2265705
Thompson JN (1998) Rapid evolution as an ecological process. Trends Ecol Evol 13: 329-332 doi 10.1016/S0169-5347(98)01378-0
Thompson RM, Mouritsen KN, Poulin R (2005) Importance of parasites and their life cycle characteristics in determining the structure of a large marine food web. J Anim Ecol 74: 77-85 doi 10.1111/j.1365-2656.2004.00899.x
Thor P, Dupont S (2015) Transgenerational effects alleviate severe fecundity loss during ocean acidification in a ubiquitous planktonic copepod. Glob Chang Biol 21: 2261-2271 doi 10.1111/gcb.12815
Thor P, Oliva EO (2015) Ocean acidification elicits different energetic responses in an Arctic and a boreal population of the copepod Pseudocalanus acuspes. Mar Biol 162: 799-807 doi DOI 10.1007/s00227-015-2625-9
Tortell PD (2000) Evolutionary and ecological perspectives on carbon acquisition in phytoplankton. Limnol Oceanogr 45: 744-750 doi 10.4319/lo.2000.45.3.0744
Tyler BM (2009) Entering and breaking: virulence effector proteins of oomycete plant pathogens. Cell Microbiol 11: 13-20 doi 10.1111/j.1462-5822.2008.01240.x
Uitto A, Heiskanen AS, Lignell R, Autio R, Pajuniemi R (1997) Summer dynamics of the coastal planktonic food web in the northern Baltic Sea. Mar Ecol Prog Ser 151: 27-41 doi doi:10.3354/meps151027
Urabe J, Togari J, Elser JJ (2003) Stoichiometric impacts of increased carbon dioxide on a planktonic herbivore. Glob Chang Biol 9: 818-825 doi 10.1046/j.1365-2486.2003.00634.x
van de Waal DB, Verschoor AM, Verspagen JMH, van Donk E, Huisman J (2010) Climate-driven changes in the ecological stoichiometry of aquatic ecosystems. Front Ecol Environ 8: 145-152 doi 10.1890/080178
REFERENCES
150
Vargas CA, Lagos NA, Lardies MA, Duarte C, Manriquez PH, Aguilera VM, Broitman B, Widdicombe S, Dupont S (2017) Species-specific responses to ocean acidification should account for local adaptation and adaptive plasticity. Nature ecology & evolution 1: 84 doi 10.1038/s41559-017-0084
Vehmaa A, Almén AK, Brutemark A, Paul A, Riebesell U, Furuhagen S, Engström-Öst J (2016) Ocean acidification challenges copepod phenotypic plasticity. Biogeosciences 13: 6171-6182 doi 10.5194/bg-13-6171-2016
Vehmaa A, Brutemark A, Engström-Öst J (2012) Maternal Effects May Act as an Adaptation Mechanism for Copepods Facing pH and Temperature Changes. PloS one 7: e48538 doi 10.1371/journal.pone.0048538
Verity PG, Smetacek V (1996) Organism life cycles, predation, and the structure of marine pelagic ecosystems. Mar Ecol Prog Ser 130: 277-293
Verschoor AM, Van Dijk MA, Huisman J, Van Donk E (2013) Elevated CO2 concentrations affect the elemental stoichiometry and species composition of an experimental phytoplankton community. Freshwater Biol 58: 597-611 doi 10.1111/j.1365-2427.2012.02833.x
Visco JA, Apotheloz-Perret-Gentil L, Cordonier A, Esling P, Pillet L, Pawlowski J (2015) Environmental Monitoring: Inferring the Diatom Index from Next-Generation Sequencing Data. Environmental science & technology 49: 7597-7605 doi 10.1021/es506158m
Wahl M, Saderne V, Sawall Y (2015) How good are we at assessing the impact of ocean acidification in coastal systems? Limitations, omissions and strengths of commonly used experimental approaches with special emphasis on the neglected role of fluctuations. Mar Freshw Res 67: 25-36 doi 10.1071/MF14154
Wang M, Jeong CB, Lee YH, Lee JS (2018) Effects of ocean acidification on copepods. Aquatic toxicology (Amsterdam, Netherlands) 196: 17-24 doi 10.1016/j.aquatox.2018.01.004
Watson JD, Crick FH (1953) Molecular structure of nucleic acids. Nature 171: 737-738
Wetsteyn LPMJ, Peperzak L (1991) Field observations in the Oosterschelde (The Netherlands) on Coscinodiscus concinnus and Coscinodiscus granii (Bacillariophyceae) infected by the marine fungus Lagenisma coscinodisci (Oomycetes). Hydrobiol Bull 25: 15-21 doi 10.1007/bf02259584
Whitehead A (2012) Comparative genomics in ecological physiology: toward a more nuanced understanding of acclimation and adaptation. The Journal of experimental biology 215: 884-891 doi 10.1242/jeb.058735
Wilce RT, Schneider CW, Quinlan AV, Bosch Kv (1982) The life history and morphology of free-living Pilayella littoralis (L.) Kjellm. (Ectocarpaceae, Ectocarpales) in Nahant Bay, Massachusetts. Phycologia 21: 336-354 doi 10.2216/i0031-8884-21-3-336.1
Wiltshire KH, Kraberg A, Bartsch I, Boersma M, Franke H-D, Freund J, Gebühr C, Gerdts G, Stockmann K, Wichels A (2010) Helgoland Roads, North Sea: 45 Years of Change. Estuaries and Coasts 33: 295-310 doi 10.1007/s12237-009-9228-y
Wittmann AC, Pörtner H-O (2013) Sensitivities of extant animal taxa to ocean acidification. Nature Climate Change 3: 995 doi 10.1038/nclimate1982
Wood CL, Byers JE, Cottingham KL, Altman I, Donahue MJ, Blakeslee AMH (2007) Parasites alter community structure. Proc Natl Acad Sci USA 104: 9335-9339 doi 10.1073/pnas.0700062104
REFERENCES
151
Wood SA, Smith KF, Banks JC, Tremblay LA, Rhodes L, Mountfort D, Cary SC, Pochon X (2013) Molecular genetic tools for environmental monitoring of New Zealand's aquatic habitats, past, present and the future. New Zeal J Mar Fresh 47: 90-119 doi 10.1080/00288330.2012.745885
Yamada Y, Ikeda T (1999) Acute toxicity of lowered pH to some oceanic zooplankton. Plankton Biol Ecol 46: 62-67
Yamamichi M, Meunier CL, Peace A, Prater C, Rua MA (2015) Rapid evolution of a consumer stoichiometric trait destabilizes consumer-producer dynamics. Oikos 124: 960-969 doi 10.1111/oik.02388
Zaiko A, Samuiloviene A, Ardura A, Garcia-Vazquez E (2015) Metabarcoding approach for nonindigenous species surveillance in marine coastal waters. Marine Poll Bull 100: 53-59 doi 10.1016/j.marpolbul.2015.09.030
Zhang D, Li S, Wang G, Guo D (2011) Impacts of CO2-driven seawater acidification on survival, egg production rate and hatching success of four marine copepods. Acta Oceanol Sin 30: 86-94 doi 10.1007/s13131-011-0165-9
Zhang J, Ianora A, Wu C, Pellegrini D, Esposito F, Buttino I (2015) How to increase productivity of the copepod Acartia tonsa (Dana): effects of population density and food concentration. Aquaculture Research 46: 2982-2990 doi 10.1111/are.12456
Zhou X, Li Y, Liu S, Yang Q, Su X, Zhou L, Tang M, Fu R, Li J, Huang Q (2013) Ultra-deep sequencing enables high-fidelity recovery of biodiversity for bulk arthropod samples without PCR amplification. GigaScience 2: 1-12 doi 10.1186/2047-217X-2-4
CURRICULUM VITAE
152
Curriculum vitae Name: Julia Anna Franziska Langer
Date of birth: 30.06.1987
Nationality: German
Work Experience PhD in Marine Biology, University of Bremen 2012 – June
2018
(expected)
Alfred-Wegener-Institute Helmholtz-Zentrum für Polar- und
Meeresforschung, Biologische Anstalt Helgoland (BAH) and University
Koblenz Landau, Institute for Environmental Science, Molecular Ecology
Dissertation: Plankton in an acidifying ocean: from individual responses to
community changes and the potential of adaptation
Publications
2017 Algueró-Muñiz M, Alvarez-Fernandes S, Thor P, Bach LT, Esposito M,
Horn HG, Ecker U, Langer JAF, Taucher J, Malzahn AM,
Riebesell U, Boersma M (2017) Ocean acidification effects on
mesozooplankton community development: results from a
long-term mesocosm experiment. PloS one
DOI: 0.1371/journal.pone.0175851
2016 Lange JAF, Sharma R, Schmidt SI, Bahrdt S, Horn HG, Algueró-Muñiz
M, Nam B, Achterberg EP, Boersma M, Thines M, Schwenk K
(2016). Community barcoding reveals little effect of ocean
acidification on the composition of coastal plankton communities:
evidence from a long-term mesocosm study in the Gullmar Fjord,
Skagerrak. PloS one DOI: 10.1371/journal.pone.0175808
2016 Meunier CL, Algueró-Muñiz M, Horn HG, Lange JAF, Boersma M
(2016). Direct and indirect effects of near-future pCO2 levels on
zooplankton dynamics. Marine and Freshwater Research:
DOI: 10.1071/MF15296
CURRICULUM VITAE
153
in review or preparation
Langer JAF, Meunier CL, Ecker U, Horn HG, Schwenk K and Boersma M
(2018) On the evolutionary potential of the calanoid copepod
Acartia tonsa towards ocean acidification: insights from a
long-term laboratory selection study. Submitted.
Langer JAF, Sharma R, Nam B, Beorsma M, Schwenk K, Thines M.
Marine oomycetes: community barcoding results from an early
winter plankton bloom (2012) in the Brudenell River
(Prince Edward Island). Submitted.
Conference presentations
2015
Langer JAF, Sharma R, Schmidt S, Nam B, Thines M, Schwenk K,
Boersma M.: Effects of ocean acidification on zooplankton:
Metabarcoding results from a mesocosm experiment. 50th European
Marine Biology Symposium, Germany
2015 Langer JAF, Sharma R, Schmidt S, Nam B, Thines M, Schwenk K,
Boersma M.: Effects of ocean acidification on zooplankton:
Metabarcoding results from a long-term mesocosm experiment in the
North Sea. KOSMOS 2013 Data Workshop, Kiel, Germany
2015 Langer JAF, Sharma R, Schmidt S, Nam B, Thines M, Schwenk K,
Boersma M.: Effects of ocean acidification on zooplankton:
Metabarcoding results from a long-term mesocosm experiment in the
North Sea. ASLO Aquatic Science Meeting, Spain
2014 Langer JAF, Röder N, Boersma M, Schwenk K.: Mesozooplankton’s
adaptations to ocean acidification: an overview. AWI PhD Days,
Helgoland, Germany
2013 Langer JAF, Schwenk K, Boersma M.: Presentation about the plans for the
genetic analyses of the taken meso- and microzooplankton samples
during the KOSMOS experiment in Kristineberg. KOSMOS 2013
Data Workshop, Kiel, Germany
CURRICULUM VITAE
154
Poster
2015 Langer JAF, Sharma R, Schmidt S, Nam B, Thines M, Schwenk K,
Boersma M.: Metabarcoding results from a long-term mesocosm
experiment in the North Sea. BIOACID Phase II Final Meeting, Kiel,
Germany
2014 Langer JAF, Boersma M, Schwenk K.: Evolutionary response to ocean
acidification. BIOACID Phase II Meeting, Kiel, Germany
2013 Langer JAF, Boersma M, Schwenk K.: Can mesozooplankton organisms
adapt to the changing chemical composition and degradation in food
quality caused by ocean acidification? BIOACID Phase II Meeting,
Warnemünde, Germany
2012 Langer JAF, Boersma M, Schwenk K.: Mesozooplankton’s adaptations to
ocean acidification: genetic responses. BIOACID Phase II Kick-off
Meeting, Kiel, Germany
Research stays
2013 Sven Lovén Centre for Marine Science, Sweden (4 months)
2014 Plataforma Oceánica de Canarias (PLOCAN), Spain (2 weeks)
Education Studies
2006 - 2012 Biology of Organisms at the University of Osnabrück
2012 Master of Science Master Thesis: “Determination of microsatellite-markers for first phylogeography and
population genetic studies of selected East-Atlantic populations of Stygocapitella
subterranea (Parergodrilidae, Annelida)”
CURRICULUM VITAE
155
2009 Bachelor of Science Bachelor Thesis: “Faunistic investigation and distribution ranges of selected taxa of marine
meiofauna in the area of the “Königshafen” on the North Sea island of Sylt and the adjacent
areas”
Student activities
2010 Student assistant with teaching responsibilities Practical guidance of 10-20 students in a variety of basic courses dealing with the
identification of plants and the anatomy and physiology of different animal groups.
ACKNOWLEDGMENTS
156
Acknowledgments
First, I would like to thank Maarten Boersma for being a trustful and patient
supervisor and for giving me the opportunity to be part of the BIOACID II project as
well as for his support and encouragement during my PhD time.
Special thanks to Klaus Schwenk for his supervision, the fruitful discussions and
helpful feedback to questions regarding experiments, manuscripts and analyses.
Many thanks also to his entire working group for the warm welcome and the
fantastic time during my stays in Landau.
I also would like to thank Kai Bischoff and Barbara Niehoff, for agreeing to be part
of my thesis committee.
Many thanks go to all members of the KOSMOS Team in Kristineberg for making
this experiment happen. It was a great experience and well worth it.
Many thanks to my colleagues at the BAH; Saskia Ohse, Henriette Horn, Ursula
Ecker, María Algueró-Muñiz, Cédric Meunier, Thomas Lesniowski and many more,
for their support and friendship. With particular consideration I would like to thank
the whole barbeque community for the unique and unforgettable time on the island.
Special thanks also to my colleagues and friends from the University of Landau;
Anne Thielsch, Lena & Sebastian Bauer-Bahrdt, Susanne Schmidt and Melanie Sinn
for their help with laboratory work and data analyses as well as for giving me a home
whenever I was there.
Finally, I would like to thank my family and my husband for their patient,
encouragement, support and understanding during all these years.
– THANK YOU SO MUCH–
EIDESSTATTLICHE ERKLÄHRUNG
157
Eidesstattliche Erklärung
Hiermit erkläre ich, dass ich die Doktorarbeit mit dem Titel:
“Plankton in an acidifying ocean: from individual responses to community changes
and the potential of adaptation”
selbstständig verfasst und geschrieben habe und außer den angegebenen Quellen keine
weiteren Hilfsmittel verwendet habe.
Ebenfalls erkläre ich hiermit, dass es sich bei den von mir abgegebenen Arbeiten um drei
identische Exemplare handelt.
Ort, Datum Julia Anna Franziska Langer