Embed Size (px)
Citation preview
Forschungszentrum Karlsruhein der Helmholtz-Gemeinschaft
J. Stuckert, FZK/IMF-III 12 th QUENCH Workshop. October 24-26. 2006 1
QUENCH-12 testFirst results
J. Stuckert, J. Moch, L. Sepold, U. Stegmaier, L. Steinbock, M. Steinbrück
Institute for Materials Research IIIInstitute for Materials Research I
Forschungszentrum KarlsruhePostfach 3640. 76021 Karlsruhe. Germany
Forschungszentrum Karlsruhein der Helmholtz-Gemeinschaft
J. Stuckert, FZK/IMF-III 12 th QUENCH Workshop. October 24-26. 2006 2
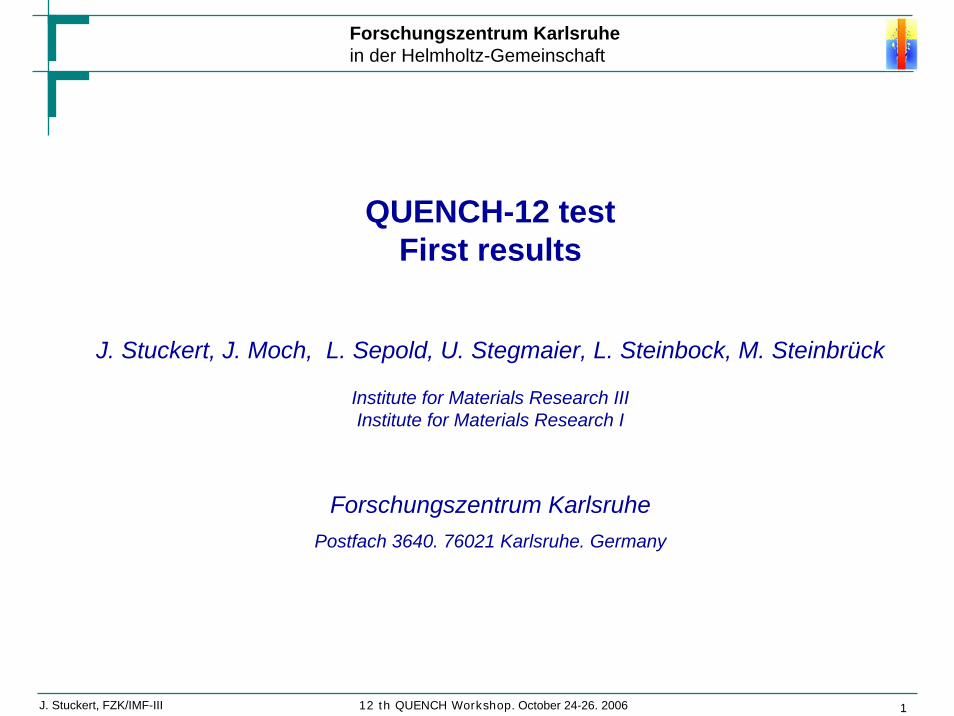
Objectives of the QUENCH-12 test
• investigation of the effects of VVER materials and bundle geometry on core reflood
• comparison with the PWR bundle on the base of repeat of the test QUENCH-06 (ISP-45) scenario
Forschungszentrum Karlsruhein der Helmholtz-Gemeinschaft
J. Stuckert, FZK/IMF-III 12 th QUENCH Workshop. October 24-26. 2006 3
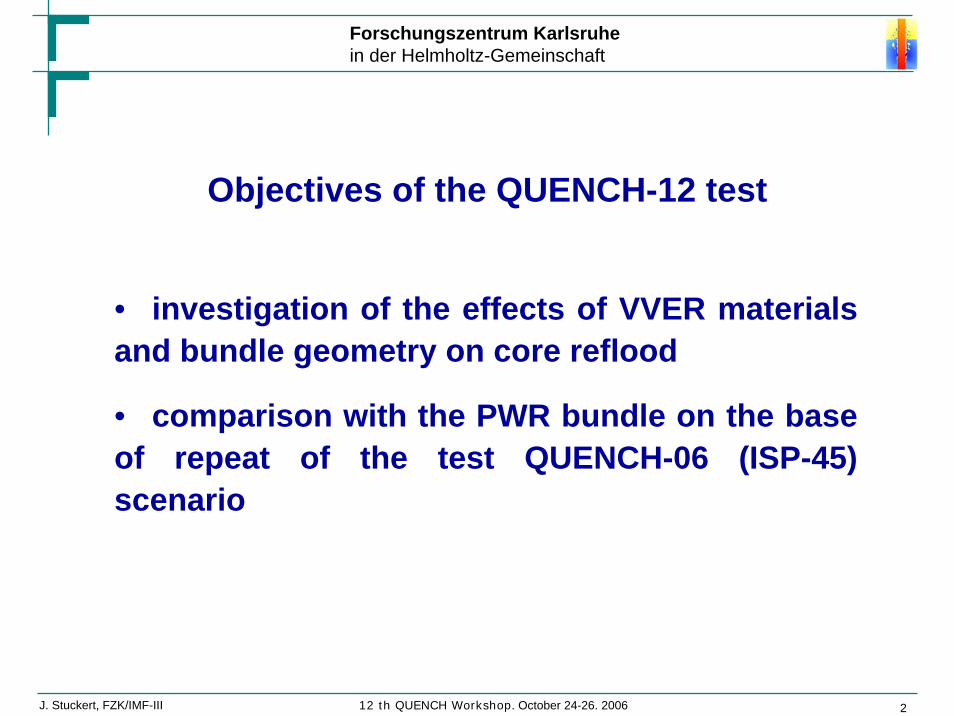
Removable corner rod. Zr1%Nb. ø6 mm
Heated fuel rod simulator (18 rods)cladding Zr1%Nb. ø9.15/7.73 mm;W-heater. ø4mm;pellet ZrO2. ø7.57/4.15mm.
Instrumented tube.Zr1%Nb. ø5.75 mm
Unheated fuel rod simulator (13 rods)cladding Zr1%Nb. ø9.13/7.73mm;central thermocouple;ZrO2 pellet. ø7.57/2.5 mm.
Shroud tube Zr2.5%Nb ø 88.0/83.5mm
Thermal insulation: ZrO2 fibre;thickness 37 mm
QUENCH-12: Cross section of the VVER-column.
pitch 12.75
Forschungszentrum Karlsruhein der Helmholtz-Gemeinschaft
J. Stuckert, FZK/IMF-III 12 th QUENCH Workshop. October 24-26. 2006 4
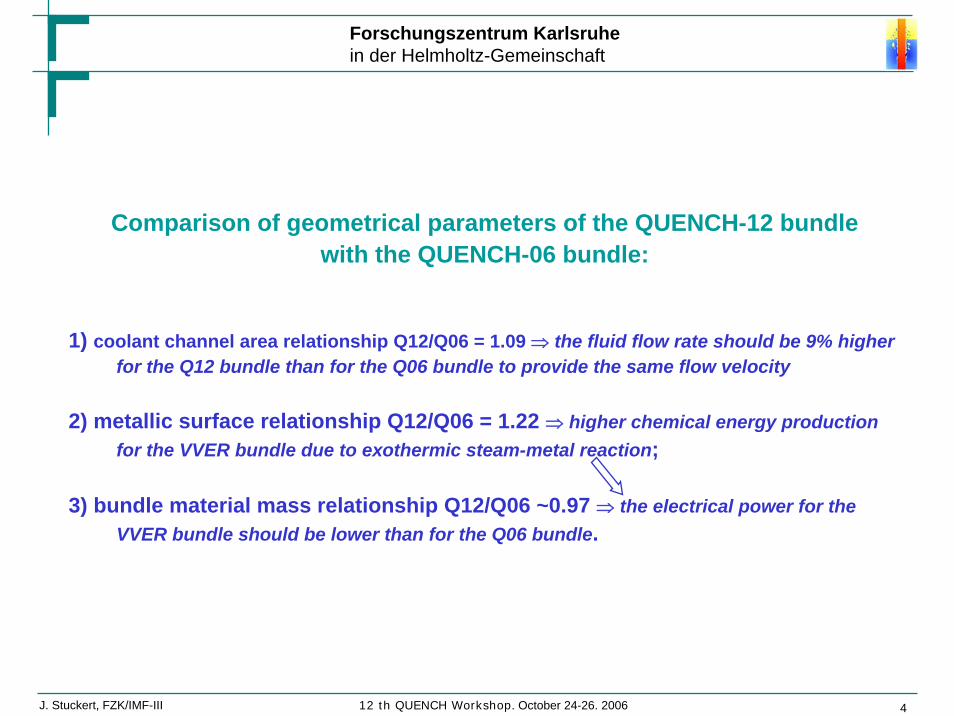
Comparison of geometrical parameters of the QUENCH-12 bundlewith the QUENCH-06 bundle:
1) coolant channel area relationship Q12/Q06 = 1.09 ⇒ the fluid flow rate should be 9% higher for the Q12 bundle than for the Q06 bundle to provide the same flow velocity
2) metallic surface relationship Q12/Q06 = 1.22 ⇒ higher chemical energy production for the VVER bundle due to exothermic steam-metal reaction;
3) bundle material mass relationship Q12/Q06 ~0.97 ⇒ the electrical power for the VVER bundle should be lower than for the Q06 bundle.
Forschungszentrum Karlsruhein der Helmholtz-Gemeinschaft
J. Stuckert, FZK/IMF-III 12 th QUENCH Workshop. October 24-26. 2006 5
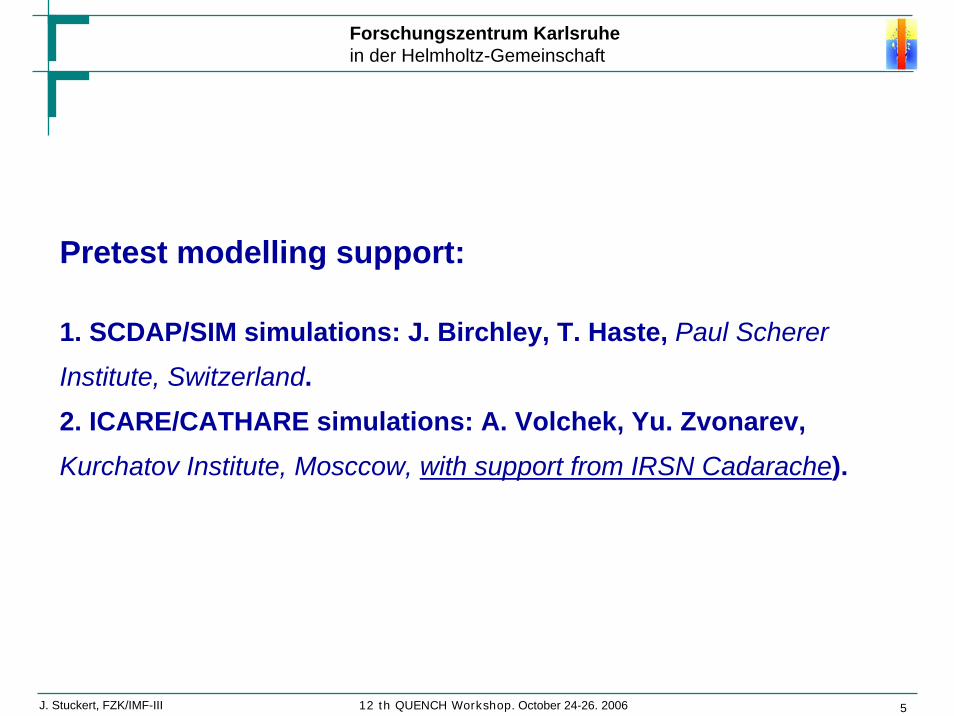
Pretest modelling support:
1. SCDAP/SIM simulations: J. Birchley, T. Haste, Paul Scherer
Institute, Switzerland.2. ICARE/CATHARE simulations: A. Volchek, Yu. Zvonarev, Kurchatov Institute, Mosccow, with support from IRSN Cadarache).
Forschungszentrum Karlsruhein der Helmholtz-Gemeinschaft
J. Stuckert, FZK/IMF-III 12 th QUENCH Workshop. October 24-26. 2006 6
350
400
450
500
550
600
650
700
750
800
-1000 -500 0 500 1000 1500 2000 2500 3000 3500 4000Time, s
Tem
pera
ture
, °C
0
1
2
3
4
5
6
Pow
er, k
W
TFC 1/13 TFC 14/4/13 TFSH 2/2/13 TFSU 17/3/13 TSH 13/90 TIT A/13 TFC 1/12 TIT C/12 T 511 inlet P_el.
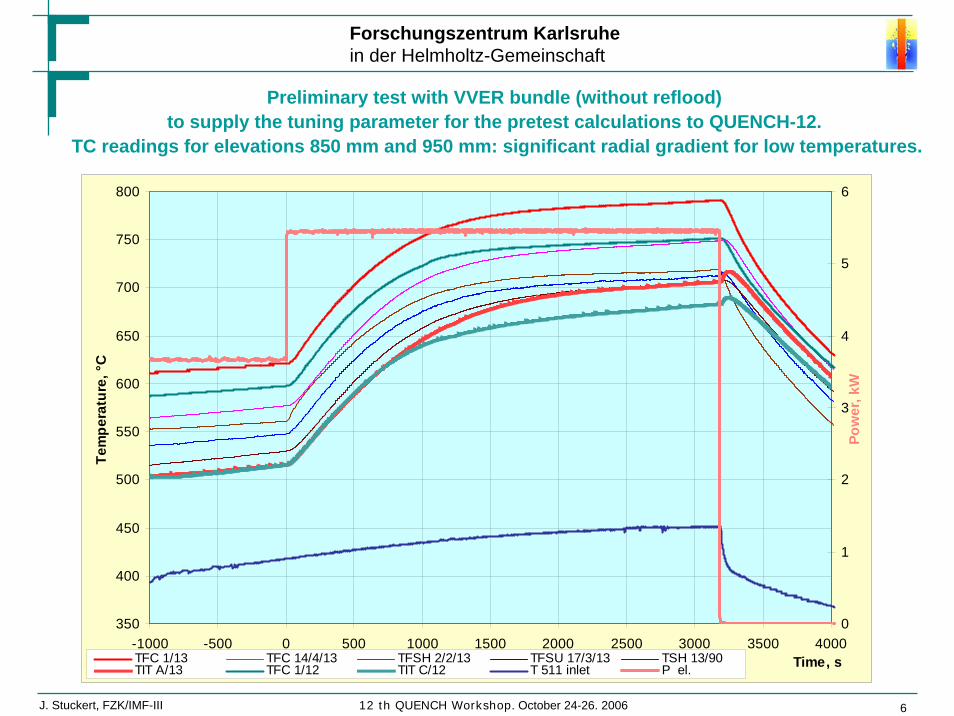
Preliminary test with VVER bundle (without reflood)to supply the tuning parameter for the pretest calculations to QUENCH-12.
TC readings for elevations 850 mm and 950 mm: significant radial gradient for low temperatures.
Forschungszentrum Karlsruhein der Helmholtz-Gemeinschaft
J. Stuckert, FZK/IMF-III 12 th QUENCH Workshop. October 24-26. 2006 7
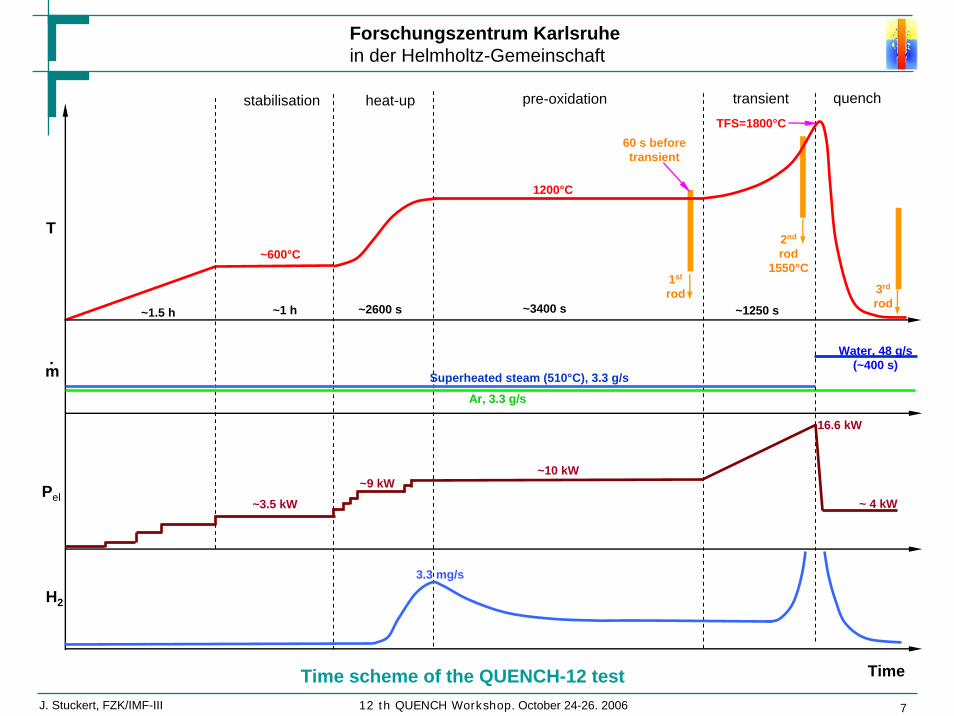
1st
rod~1.5 h ~1 h
~600°C
~3400 s ~2600 s
Ar, 3.3 g/s
Superheated steam (510°C), 3.3 g/s
TFS=1800°C
Water, 48 g/s(~400 s)
2nd
rod1550°C
~3.5 kW
~10 kW
~ 4 kW
3.3 mg/s
m
Pel
H2
.
~9 kW
1200°C
16.6 kW
T
60 s beforetransient
~1250 s
Time
stabilisation heat-up pre-oxidation quenchtransient
Time scheme of the QUENCH-12 test
3rd
rod
Forschungszentrum Karlsruhein der Helmholtz-Gemeinschaft
J. Stuckert, FZK/IMF-III 12 th QUENCH Workshop. October 24-26. 2006 8
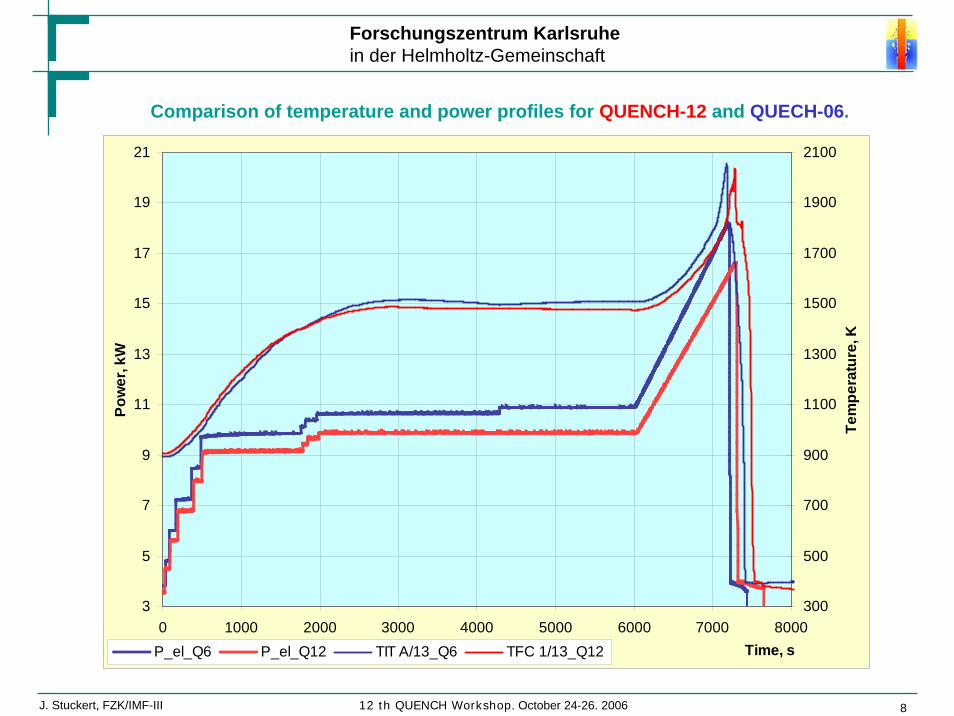
3
5
7
9
11
13
15
17
19
21
0 1000 2000 3000 4000 5000 6000 7000 8000Time, s
Pow
er, k
W
300
500
700
900
1100
1300
1500
1700
1900
2100
Tem
pera
ture
, K
P_el_Q6 P_el_Q12 TIT A/13_Q6 TFC 1/13_Q12
Comparison of temperature and power profiles for QUENCH-12 and QUECH-06.
Forschungszentrum Karlsruhein der Helmholtz-Gemeinschaft
J. Stuckert, FZK/IMF-III 12 th QUENCH Workshop. October 24-26. 2006 9
300
500
700
900
1100
1300
1500
1700
1900
2100
0 1000 2000 3000 4000 5000 6000 7000 8000
Time, s
Tem
pera
ture
, K
TFSU 31/5/17 TFC 13/3/16 TFSH 5/2/15 TFC 9/3/14 TFC 1/13 TFSH 3/2/12 TFSH 23/5/11 TFSU 1/9 TFSH 5/2/7 TFSH 24/5/4 TFSH 4/2/1
950 mm1050 mm
850 mm1150 mm
750 mm1250 mm
550 mm 350 mm
1350 mm
50 mm
-250 mm
QUENCH-12: selected reading of the bundle thermocouples.
Forschungszentrum Karlsruhein der Helmholtz-Gemeinschaft
J. Stuckert, FZK/IMF-III 12 th QUENCH Workshop. October 24-26. 2006 10
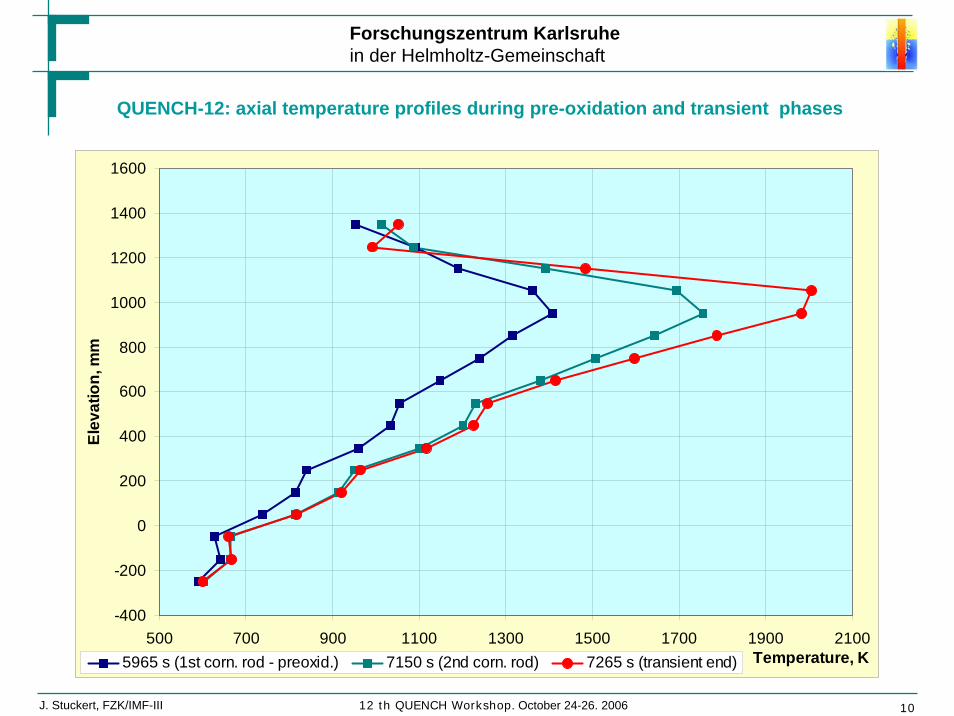
-400
-200
0
200
400
600
800
1000
1200
1400
1600
500 700 900 1100 1300 1500 1700 1900 2100Temperature, K
Elev
atio
n, m
m
5965 s (1st corn. rod - preoxid.) 7150 s (2nd corn. rod) 7265 s (transient end)
QUENCH-12: axial temperature profiles during pre-oxidation and transient phases
Forschungszentrum Karlsruhein der Helmholtz-Gemeinschaft
J. Stuckert, FZK/IMF-III 12 th QUENCH Workshop. October 24-26. 2006 11
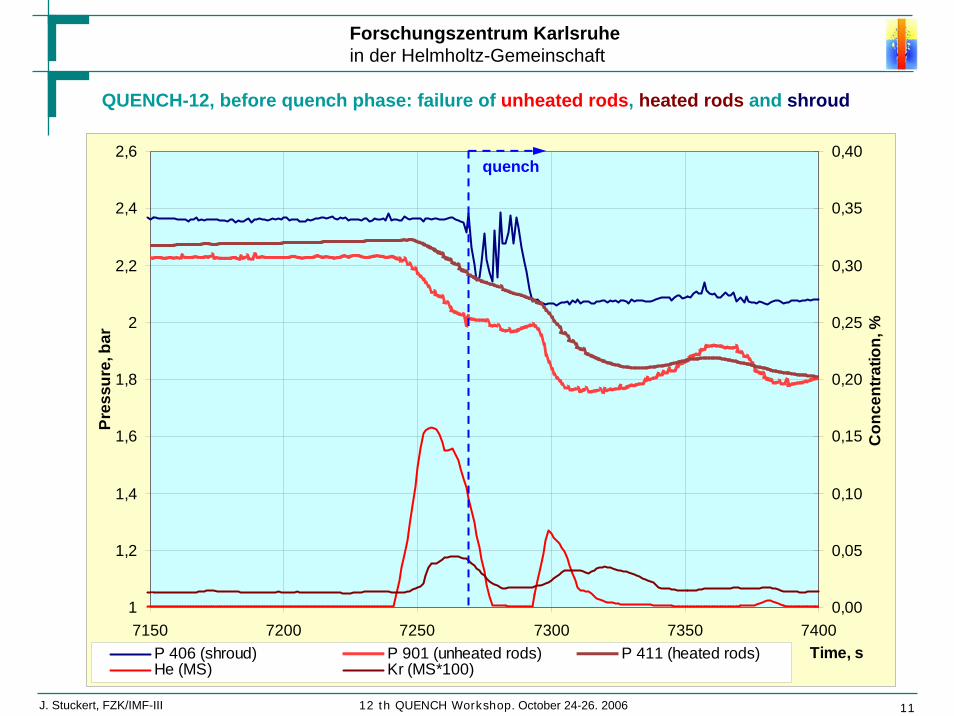
QUENCH-12, before quench phase: failure of unheated rods, heated rods and shroud
1
1,2
1,4
1,6
1,8
2
2,2
2,4
2,6
7150 7200 7250 7300 7350 7400Time, s
Pres
sure
, bar
0,00
0,05
0,10
0,15
0,20
0,25
0,30
0,35
0,40
Con
cent
ratio
n, %
P 406 (shroud) P 901 (unheated rods) P 411 (heated rods)He (MS) Kr (MS*100)
quench
Forschungszentrum Karlsruhein der Helmholtz-Gemeinschaft
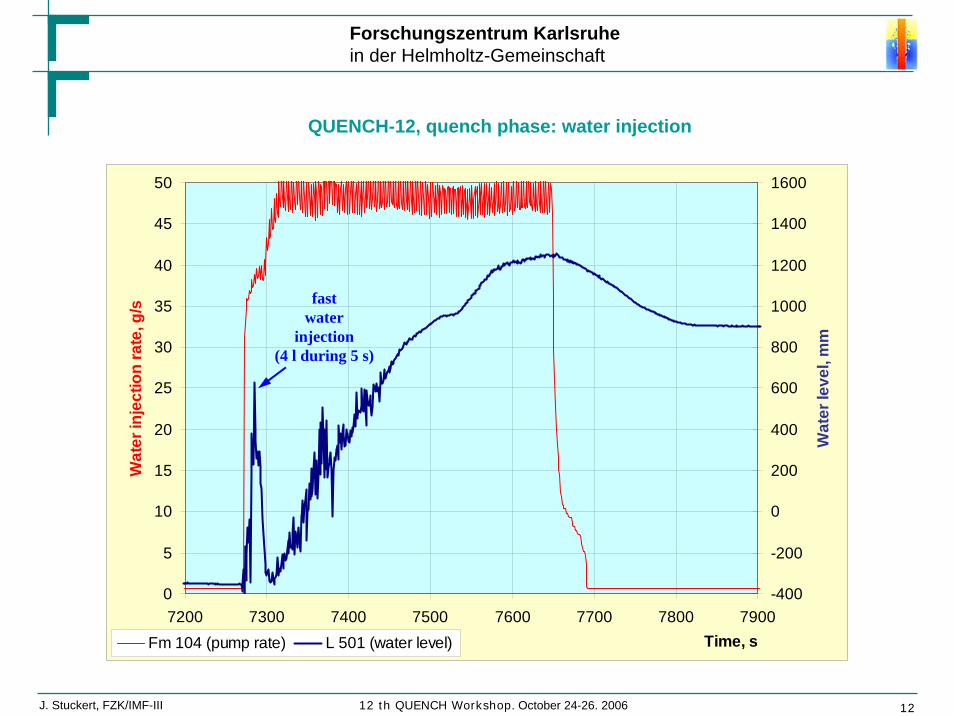
J. Stuckert, FZK/IMF-III 12 th QUENCH Workshop. October 24-26. 2006 12
0
5
10
15
20
25
30
35
40
45
50
7200 7300 7400 7500 7600 7700 7800 7900Time, s
Wat
er in
ject
ion
rate
, g/s
-400
-200
0
200
400
600
800
1000
1200
1400
1600
Wat
er le
vel,
mm
Fm 104 (pump rate) L 501 (water level)
QUENCH-12, quench phase: water injection
fastwater
injection(4 l during 5 s)
Forschungszentrum Karlsruhein der Helmholtz-Gemeinschaft
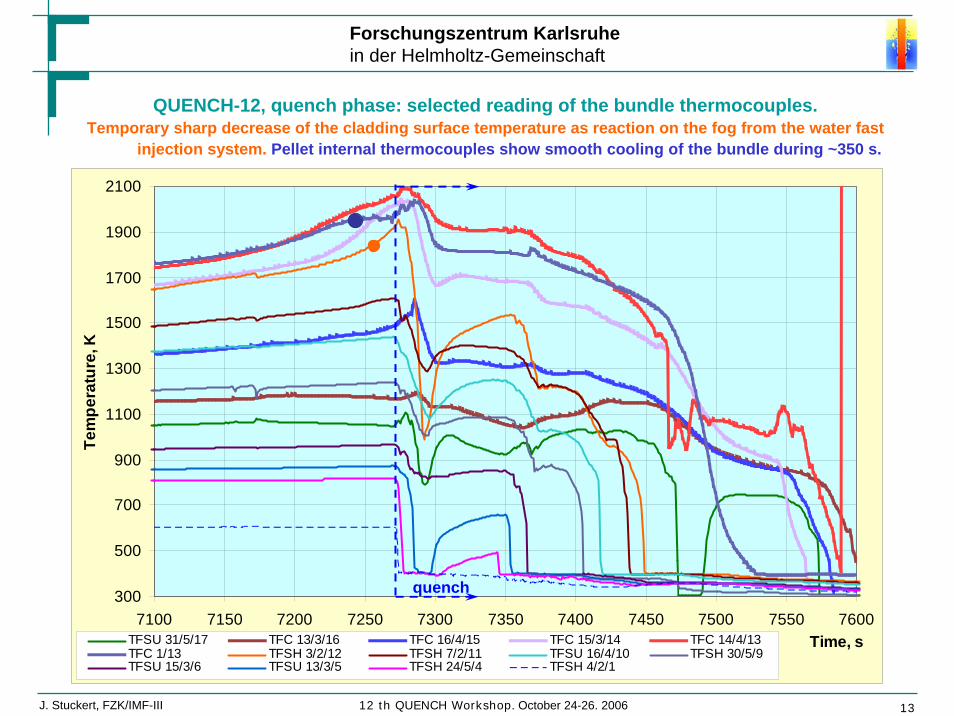
J. Stuckert, FZK/IMF-III 12 th QUENCH Workshop. October 24-26. 2006 13
300
500
700
900
1100
1300
1500
1700
1900
2100
7100 7150 7200 7250 7300 7350 7400 7450 7500 7550 7600Time, s
Tem
pera
ture
, K
TFSU 31/5/17 TFC 13/3/16 TFC 16/4/15 TFC 15/3/14 TFC 14/4/13 TFC 1/13 TFSH 3/2/12 TFSH 7/2/11 TFSU 16/4/10 TFSH 30/5/9 TFSU 15/3/6 TFSU 13/3/5 TFSH 24/5/4 TFSH 4/2/1
QUENCH-12, quench phase: selected reading of the bundle thermocouples.Temporary sharp decrease of the cladding surface temperature as reaction on the fog from the water fast
injection system. Pellet internal thermocouples show smooth cooling of the bundle during ~350 s.
quench
Forschungszentrum Karlsruhein der Helmholtz-Gemeinschaft
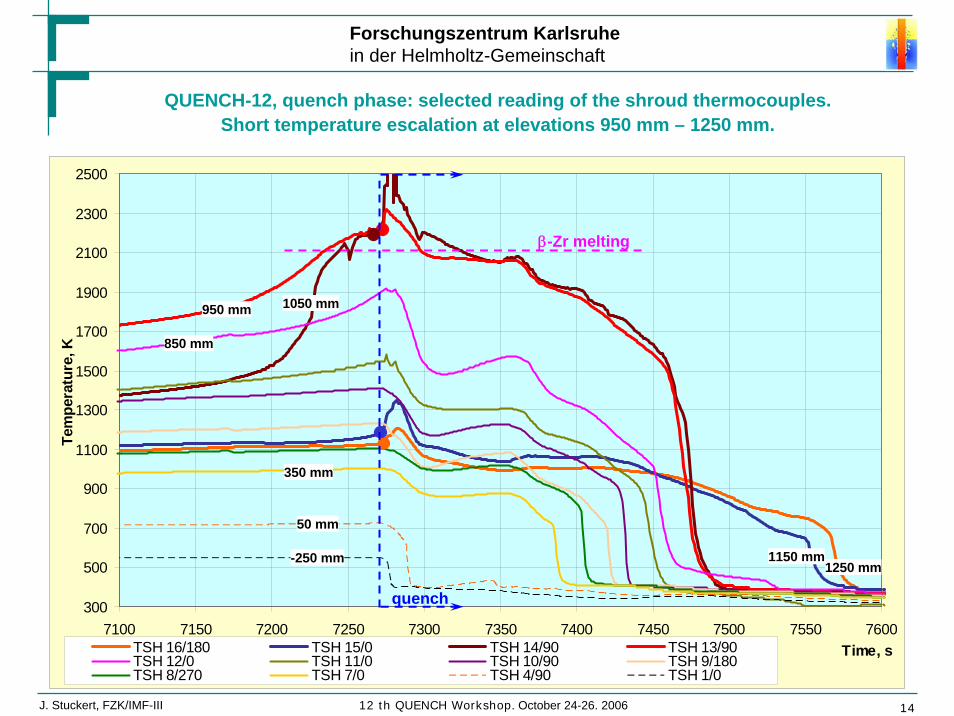
J. Stuckert, FZK/IMF-III 12 th QUENCH Workshop. October 24-26. 2006 14
300
500
700
900
1100
1300
1500
1700
1900
2100
2300
2500
7100 7150 7200 7250 7300 7350 7400 7450 7500 7550 7600Time, s
Tem
pera
ture
, K
TSH 16/180 TSH 15/0 TSH 14/90 TSH 13/90 TSH 12/0 TSH 11/0 TSH 10/90 TSH 9/180 TSH 8/270 TSH 7/0 TSH 4/90 TSH 1/0
QUENCH-12, quench phase: selected reading of the shroud thermocouples.Short temperature escalation at elevations 950 mm – 1250 mm.
50 mm
-250 mm
350 mm
850 mm
950 mm 1050 mm
1150 mm1250 mm
quench
β-Zr melting
Forschungszentrum Karlsruhein der Helmholtz-Gemeinschaft
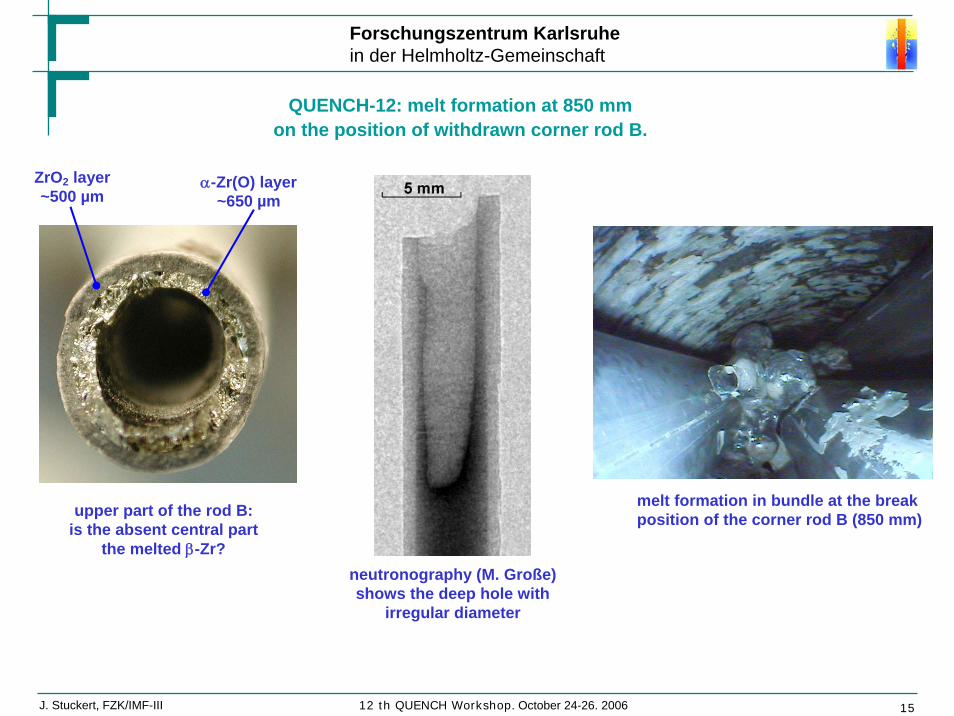
J. Stuckert, FZK/IMF-III 12 th QUENCH Workshop. October 24-26. 2006 15
neutronography (M. Große)shows the deep hole with
irregular diameter
melt formation in bundle at the breakposition of the corner rod B (850 mm)upper part of the rod B:
is the absent central partthe melted β-Zr?
QUENCH-12: melt formation at 850 mmon the position of withdrawn corner rod B.
ZrO2 layer~500 µm
α-Zr(O) layer~650 µm
Forschungszentrum Karlsruhein der Helmholtz-Gemeinschaft
J. Stuckert, FZK/IMF-III 12 th QUENCH Workshop. October 24-26. 2006 16
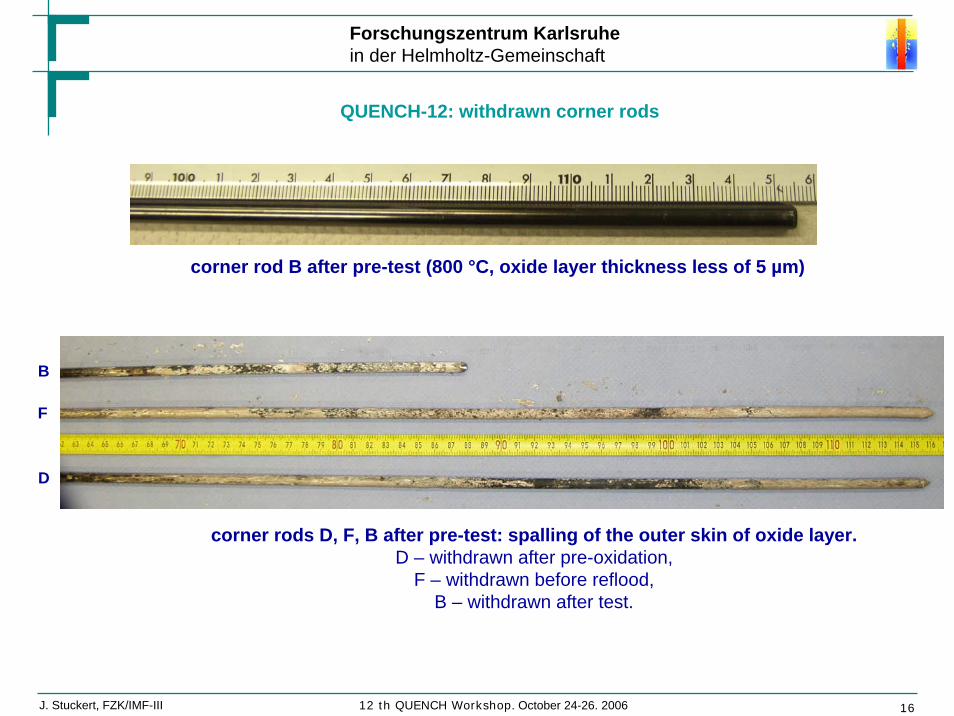
corner rod B after pre-test (800 °C, oxide layer thickness less of 5 µm)
corner rods D, F, B after pre-test: spalling of the outer skin of oxide layer.D – withdrawn after pre-oxidation,
F – withdrawn before reflood,B – withdrawn after test.
D
F
B
QUENCH-12: withdrawn corner rods
Forschungszentrum Karlsruhein der Helmholtz-Gemeinschaft
J. Stuckert, FZK/IMF-III 12 th QUENCH Workshop. October 24-26. 2006 17
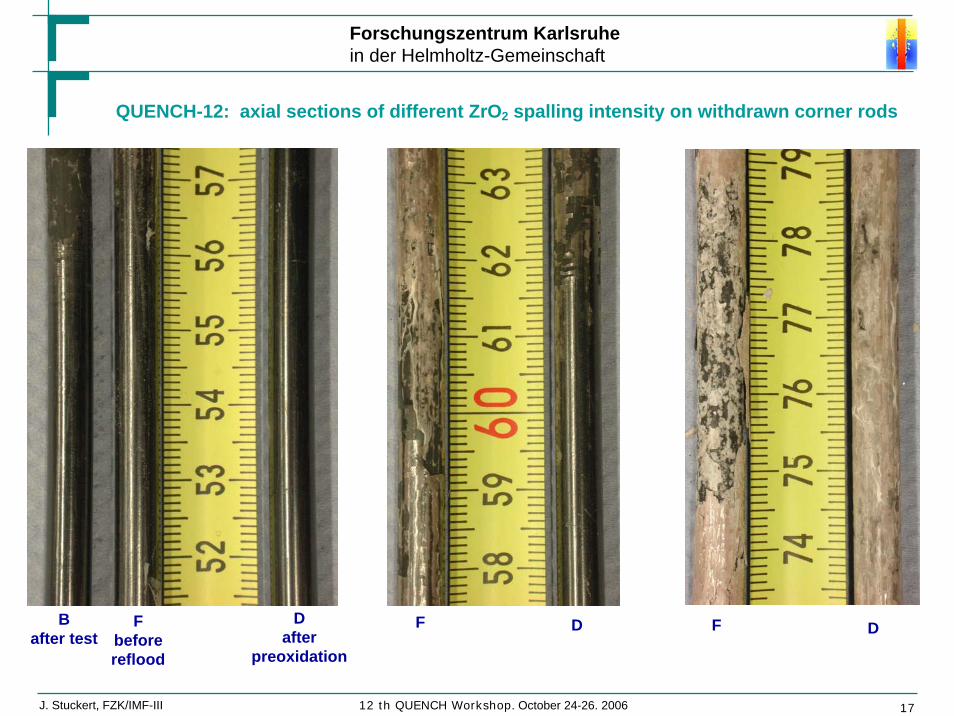
QUENCH-12: axial sections of different ZrO2 spalling intensity on withdrawn corner rods
Bafter test
Fbeforereflood
Dafter
preoxidation
F D F D
Forschungszentrum Karlsruhein der Helmholtz-Gemeinschaft
J. Stuckert, FZK/IMF-III 12 th QUENCH Workshop. October 24-26. 2006 18
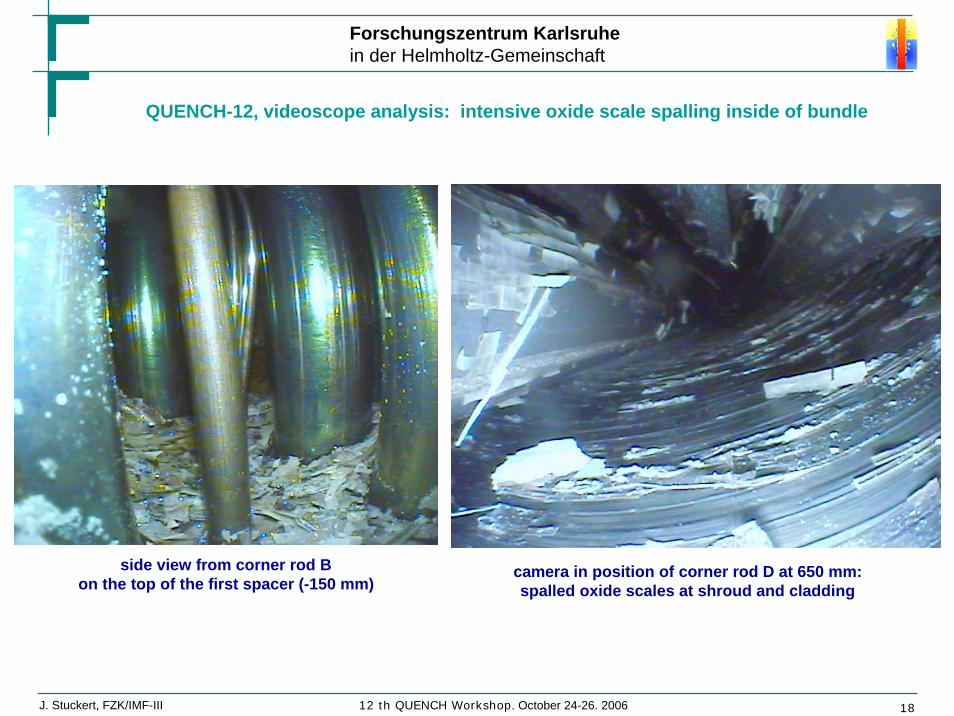
side view from corner rod Bon the top of the first spacer (-150 mm)
camera in position of corner rod D at 650 mm:spalled oxide scales at shroud and cladding
QUENCH-12, videoscope analysis: intensive oxide scale spalling inside of bundle
Forschungszentrum Karlsruhein der Helmholtz-Gemeinschaft
J. Stuckert, FZK/IMF-III 12 th QUENCH Workshop. October 24-26. 2006 19
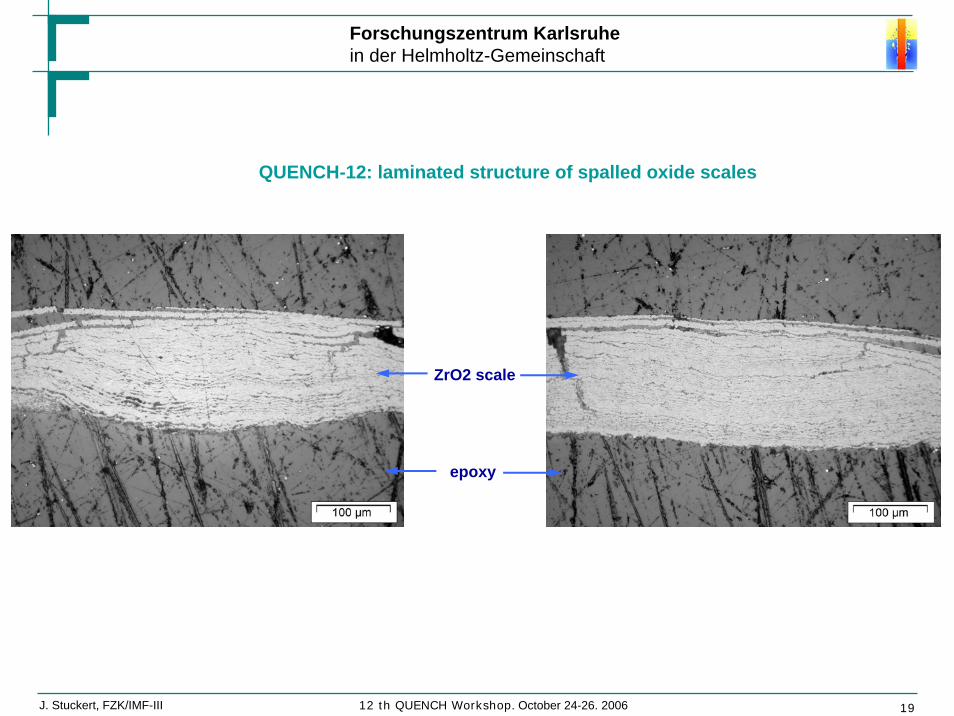
epoxy
ZrO2 scale
QUENCH-12: laminated structure of spalled oxide scales
Forschungszentrum Karlsruhein der Helmholtz-Gemeinschaft
J. Stuckert, FZK/IMF-III 12 th QUENCH Workshop. October 24-26. 2006 20
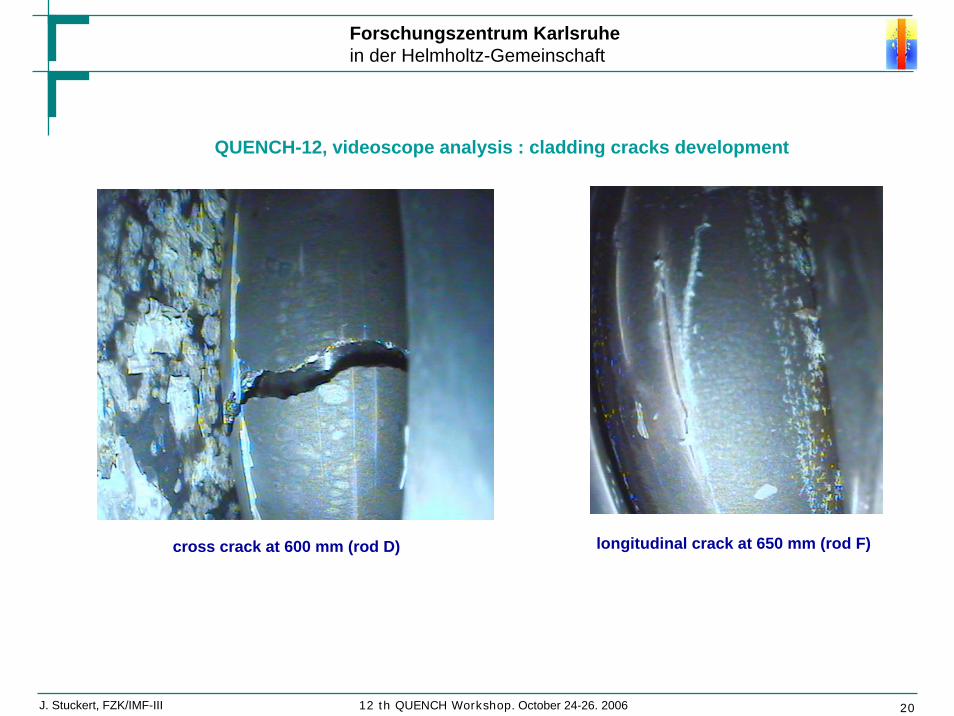
QUENCH-12, videoscope analysis : cladding cracks development
cross crack at 600 mm (rod D) longitudinal crack at 650 mm (rod F)
Forschungszentrum Karlsruhein der Helmholtz-Gemeinschaft
J. Stuckert, FZK/IMF-III 12 th QUENCH Workshop. October 24-26. 2006 21
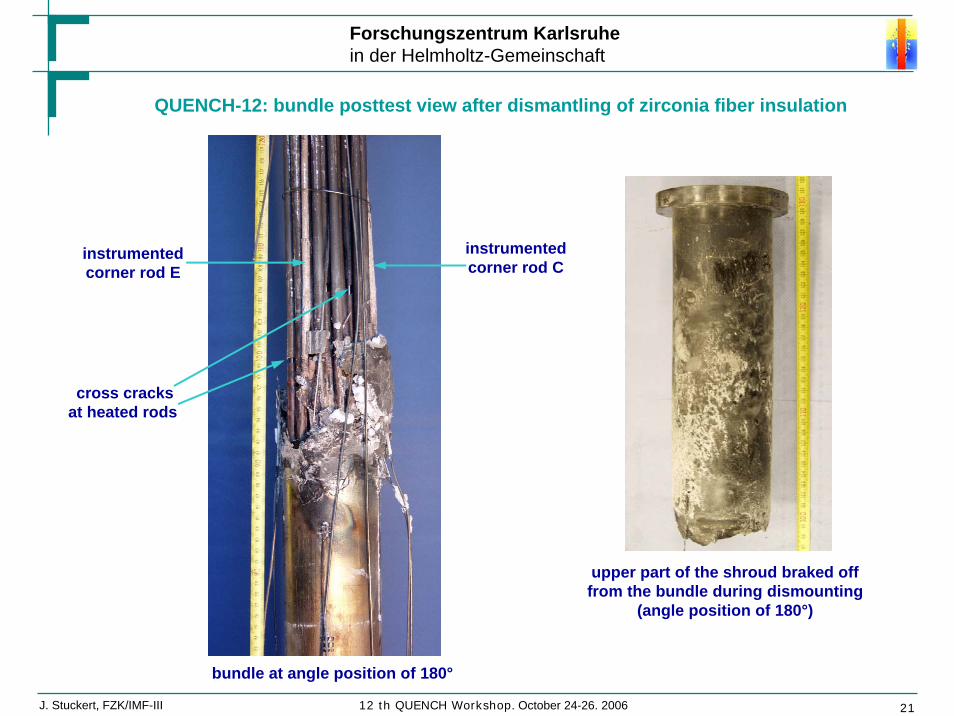
bundle at angle position of 180°
upper part of the shroud braked offfrom the bundle during dismounting
(angle position of 180°)
instrumentedcorner rod E
instrumentedcorner rod C
cross cracksat heated rods
QUENCH-12: bundle posttest view after dismantling of zirconia fiber insulation
Forschungszentrum Karlsruhein der Helmholtz-Gemeinschaft
J. Stuckert, FZK/IMF-III 12 th QUENCH Workshop. October 24-26. 2006 22
0
5
10
15
20
25
30
35
40
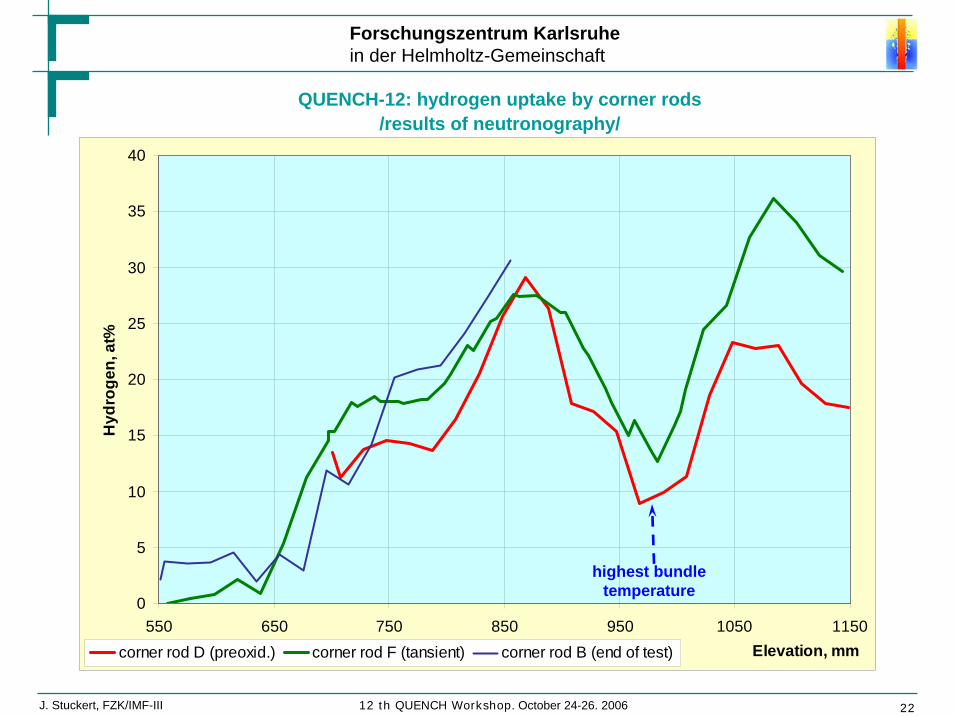
550 650 750 850 950 1050 1150Elevation, mm
Hyd
roge
n, a
t%
corner rod D (preoxid.) corner rod F (tansient) corner rod B (end of test)
QUENCH-12: hydrogen uptake by corner rods/results of neutronography/
highest bundletemperature
Forschungszentrum Karlsruhein der Helmholtz-Gemeinschaft
J. Stuckert, FZK/IMF-III 12 th QUENCH Workshop. October 24-26. 2006 23
0,0
0,5
1,0
1,5
2,0
2,5
3,0
7000 7050 7100 7150 7200 7250 7300 7350 7400 7450 7500Time, s
Rat
e, m
g/s
0
10
20
30
40
50
60
Inte
gral
, g
rate_H2_Q12 rate_H2_Q6 intl_H2_Q12 intl_H2_Q6
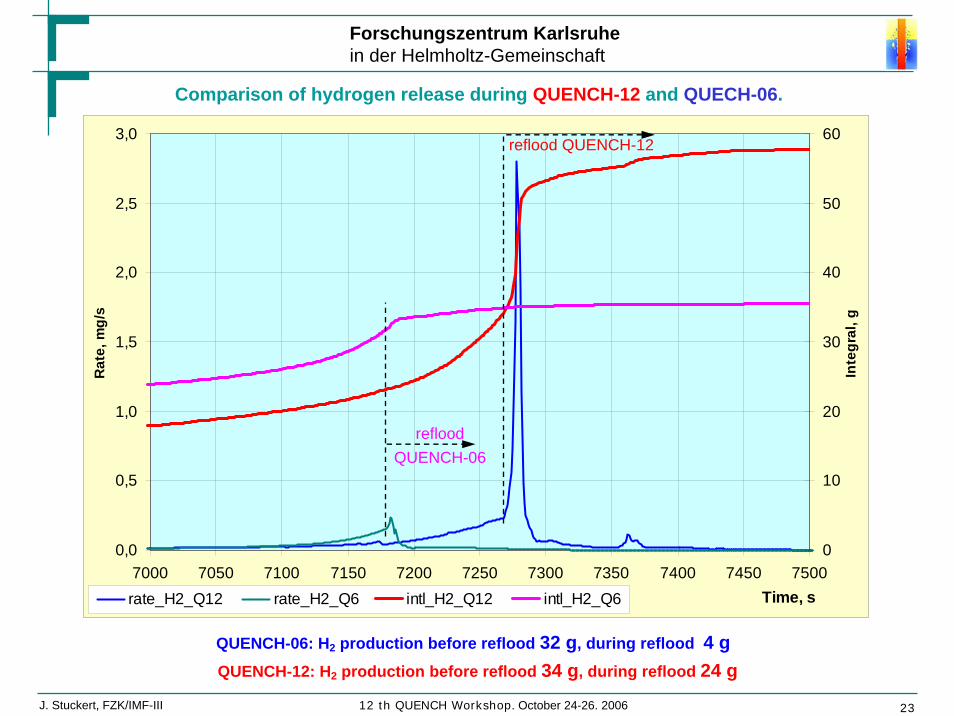
Comparison of hydrogen release during QUENCH-12 and QUECH-06.
QUENCH-12: H2 production before reflood 34 g, during reflood 24 gQUENCH-06: H2 production before reflood 32 g, during reflood 4 g
refloodQUENCH-06
reflood QUENCH-12
Forschungszentrum Karlsruhein der Helmholtz-Gemeinschaft
J. Stuckert, FZK/IMF-III 12 th QUENCH Workshop. October 24-26. 2006 24
SUMMARY
• The QUENCH-12 experiment investigated the effects of VVER materials and bundle geometry on core reflood, in comparison with test QUENCH-06 (ISP-45) with Western PWR geometry.
• The preliminary test at the maximum temperature 800°C was performed. The corresponding oxidation was negligible: less of 5 µm. The results of this test were used to fine attenuation of the pretest modelling.
• The electrical power changing during the test corresponds completely to calculated values up to reflood phase. The temperature history during preoxidation is very similar to the QUENCH-06 temperature history.
• Two corner rods were withdrawn at the end of preoxidation and transient phases correspondingly. The surface of the rods shows intensive traces of the break-away effect influence. Many oxide scales with thickness about 100 µm were spalled during withdrawn.
• Following reflood initiation, a moderate temperature excursion of ca. 50 K was observed, over a longer period than in QUENCH-06. The temperatures at elevations between 850 mm and 1050 mm exceeded the melting temperature of β-Zr.
• The total hydrogen production was 58 g (for QUENCH-06: 36 g), during the reflood was released 24 g hydrogen (for QUENCH-06: 4 g).


![Transcatheter Closure of VSDs : the first results at Hue ...hntmmttn.vn/Upload/File/DVC 13PM/[CD7.58] ThongLienThat2015.pdf · Predescu 2008 20 0.5-16 100 0 0 23.1 22 . Conclusions](https://img.pdfslide.org/doc/110x75/5ec32dddc81c2a386c24cb78/transcatheter-closure-of-vsds-the-first-results-at-hue-13pmcd758-thonglienthat2015pdf.jpg)