Embed Size (px)
Citation preview
Dominik Strohmeier n Satu Jumisko-Pyykkö n Kristina Kunze n Gerhard Tech
Döne Buğdaycı n Mehmet OguzBici
Results of quality attributes of coding, transmission, and their combinations
MOBILE3DTV
Project No. 216503
Results of quality attributes of coding, transmission, and their combinations
Dominik Strohmeier, Satu Jumisko-Pyykkö, Kristina Kunze, Gerhard Tech, Döne Buğdaycı,
Mehmet Oguz Bici
Abstract: The report presents the results of two large-scale user studies in which we evaluated the perceived quality of mobile 3D television and video along its production chain. Open Profiling of Quality (OPQ) was applied as research method. OPQ is a combined research method of psychoperceptual evaluation and sensory profiling. It allows connecting user preferences to experienced quality factors. In our studies, we evaluated different coding approaches and transmission parameters in two large-scale studies. The results showed that mobile3DTV can reach acceptable quality when parameters are chosen correctly. Multiview Coding and the Video+Depth approach are the preferred coding methods. Transmission parameters strongly depend on the channel characteristics. The critical quality factor in the perception of mobile3DTV is the level of perceivable artifacts. The application of OPQ showed that added value by depth perception is only given if artifact-free content is perceived. The results of these studies give recommendations for the development of the critical system components.
Keywords: 3DTV, mobile video, Open Profiling of Quality, subjective quality, experienced quality
MOBILE3DTV D4.3 Results of quality attributes of coding, transmission, and their combinations
2
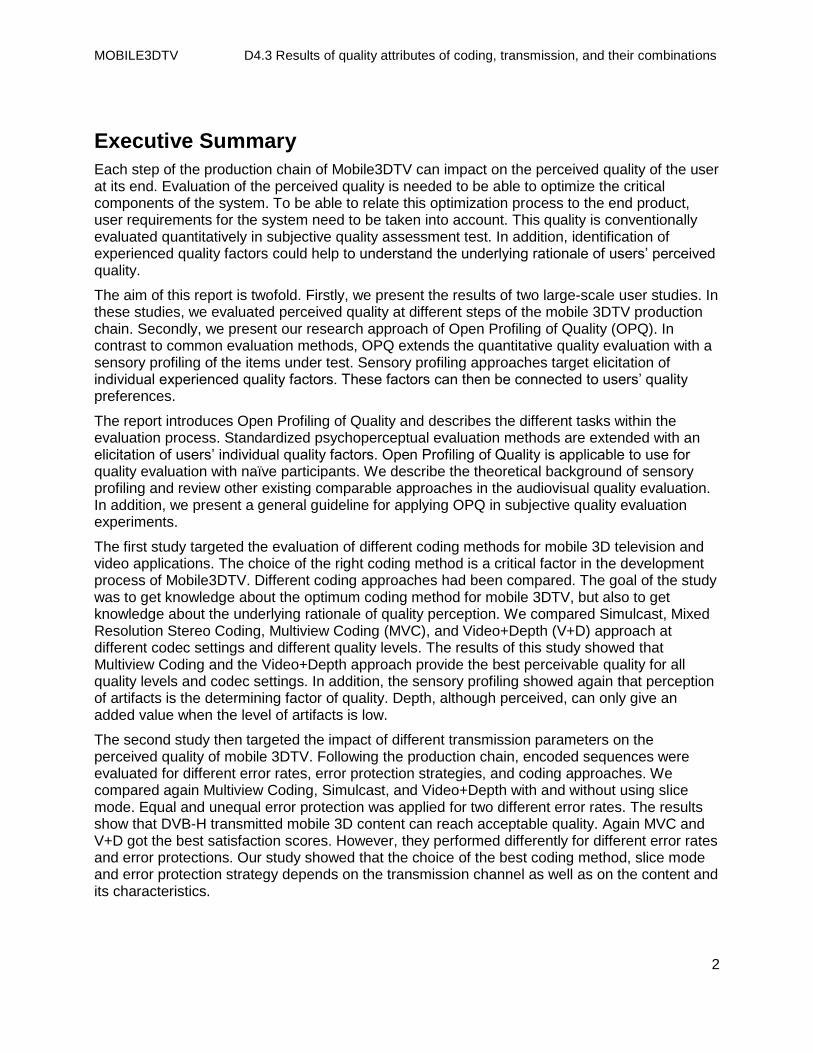
Executive Summary
Each step of the production chain of Mobile3DTV can impact on the perceived quality of the user at its end. Evaluation of the perceived quality is needed to be able to optimize the critical components of the system. To be able to relate this optimization process to the end product, user requirements for the system need to be taken into account. This quality is conventionally evaluated quantitatively in subjective quality assessment test. In addition, identification of experienced quality factors could help to understand the underlying rationale of users‟ perceived quality.
The aim of this report is twofold. Firstly, we present the results of two large-scale user studies. In these studies, we evaluated perceived quality at different steps of the mobile 3DTV production chain. Secondly, we present our research approach of Open Profiling of Quality (OPQ). In contrast to common evaluation methods, OPQ extends the quantitative quality evaluation with a sensory profiling of the items under test. Sensory profiling approaches target elicitation of individual experienced quality factors. These factors can then be connected to users‟ quality preferences.
The report introduces Open Profiling of Quality and describes the different tasks within the evaluation process. Standardized psychoperceptual evaluation methods are extended with an elicitation of users‟ individual quality factors. Open Profiling of Quality is applicable to use for quality evaluation with naïve participants. We describe the theoretical background of sensory profiling and review other existing comparable approaches in the audiovisual quality evaluation. In addition, we present a general guideline for applying OPQ in subjective quality evaluation experiments.
The first study targeted the evaluation of different coding methods for mobile 3D television and video applications. The choice of the right coding method is a critical factor in the development process of Mobile3DTV. Different coding approaches had been compared. The goal of the study was to get knowledge about the optimum coding method for mobile 3DTV, but also to get knowledge about the underlying rationale of quality perception. We compared Simulcast, Mixed Resolution Stereo Coding, Multiview Coding (MVC), and Video+Depth (V+D) approach at different codec settings and different quality levels. The results of this study showed that Multiview Coding and the Video+Depth approach provide the best perceivable quality for all quality levels and codec settings. In addition, the sensory profiling showed again that perception of artifacts is the determining factor of quality. Depth, although perceived, can only give an added value when the level of artifacts is low.
The second study then targeted the impact of different transmission parameters on the perceived quality of mobile 3DTV. Following the production chain, encoded sequences were evaluated for different error rates, error protection strategies, and coding approaches. We compared again Multiview Coding, Simulcast, and Video+Depth with and without using slice mode. Equal and unequal error protection was applied for two different error rates. The results show that DVB-H transmitted mobile 3D content can reach acceptable quality. Again MVC and V+D got the best satisfaction scores. However, they performed differently for different error rates and error protections. Our study showed that the choice of the best coding method, slice mode and error protection strategy depends on the transmission channel as well as on the content and its characteristics.
MOBILE3DTV D4.3 Results of quality attributes of coding, transmission, and their combinations
3
Table of Contents
1 Introduction .......................................................................................................................... 6
2 Open Profiling of Quality – a new research method .............................................................. 8
2.1 Mixed method research in audio, visual and audiovisual quality evaluation .................. 8
2.2 Open Profiling of Quality – a mixed method approach in the evaluation of mobile 3D television and video ............................................................................................................... 10
2.2.1 Assessors .............................................................................................................. 10
2.2.2 Test method ........................................................................................................... 11
2.2.3 Method of Analysis ................................................................................................. 14
3 Study 1: Influence of coding methods on experienced quality of mobile 3D television and video ......................................................................................................................................... 15
3.1 Introduction and research problem ............................................................................. 15
3.2 Research Method ....................................................................................................... 15
3.2.1 Participants ............................................................................................................ 15
3.2.2 Test design ............................................................................................................ 15
3.2.3 Test procedure ....................................................................................................... 15
3.2.4 Test Material and Apparatus .................................................................................. 17
3.2.5 Preparation of test sequences ................................................................................ 20
3.2.6 Method of Analysis ................................................................................................. 22
3.3 Results ....................................................................................................................... 23
3.3.1 Simulator Sickness Questionnaire .......................................................................... 23
3.3.2 Acceptance of quality ............................................................................................. 23
3.3.3 Quantitative results of IPPP sequences ................................................................. 25
3.3.4 Quantitative results of Hierarchical-B sequences ................................................... 26
3.3.5 Comparison of IPPP and Hierarchical-B results ..................................................... 28
3.3.6 Sensory Profiling of IPPP sequences ..................................................................... 30
3.4 Discussion and Conclusion ........................................................................................ 33
4 Study 2: Impact of transmission parameters on the perceived quality of encoded mobile 3D television and video sequences ................................................................................................. 34
4.1 Research Method ....................................................................................................... 34
4.1.1 Participants ............................................................................................................ 34
4.1.2 Test procedure ....................................................................................................... 34
4.1.3 Test Material and Apparatus .................................................................................. 34
4.1.4 Selection of test sequences ................................................................................... 34
MOBILE3DTV D4.3 Results of quality attributes of coding, transmission, and their combinations
4
4.1.5 Preparation of test sequences ................................................................................ 35
4.1.6 Method of Analysis ................................................................................................. 42
4.2 Results ....................................................................................................................... 42
4.2.1 Acceptance of overall quality .................................................................................. 42
4.2.2 Satisfaction with overall quality ............................................................................... 45
4.3 Discussion and Conclusion ........................................................................................ 46
5 Conclusions ........................................................................................................................ 48
6 Acknowledgements ............................................................................................................ 49
References ................................................................................................................................ 50
A Loss Analysis Tables per Content ...................................................................................... 53
B Screenshots of the test items with typical transmission errors ............................................ 58

MOBILE3DTV D4.3 Results of quality attributes of coding, transmission, and their combinations
5
MOBILE3DTV D4.3 Results of quality attributes of coding, transmission, and their combinations
6
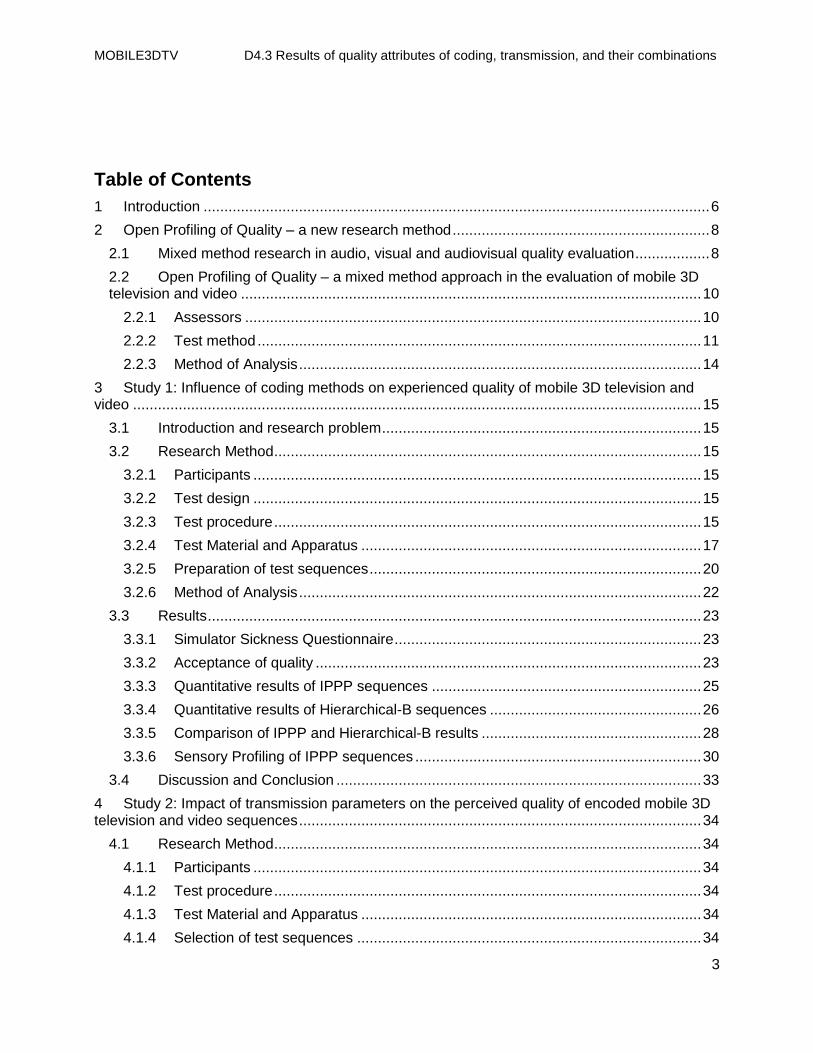
1 Introduction The technical approach of the Mobile3DTV development covers the channel as a whole. The development of the optimized delivery system and its core technologies follows the production chain from capture over coding and transmission to display. Figure 1 illustrates the different stages of the production chain for mobile 3D television and video over DVB-H. Given for each stage are some parameters that impact on the quality of the final mobile 3D video.
Figure 1 The production chain and possible quality factors that are added to the content during the content
production.
From the viewpoint of quality, each processing step within the production chain equals a new quality factor. Each quality factor can impact on the final quality that the user will perceive when watching content on his Mobile3DTV device. Each error introduced at a certain step of the production process will propagate through the chain. For example, errors introduced through compression in the coding step will propagate and impact on the transmission quality. So the overall quality that the system will provide to the user is a combination and an interaction of different kind of errors [6]. However, produced quality, i.e. the overall quality provided by the system, is not perceived quality, i.e. the quality that the users perceive [19].
Quality perception is an active process that combines low-level and high-level processes of human‟s perception. Low-level or sensorial processes cover the perception of the stimulus with our different modalities. This processed information is further interpreted in the high-level processes. These processes are influenced by users‟ knowledge, expectations, or the current purpose of use [8]. With our research approach [16] that has been applied in the studies presented in this report, we try to elicit experienced quality factors in addition to standardized quantitative quality evaluation.
The goal of the user-centered quality optimization within the development process of Mobile3DTV is to study the critical components and to optimize them in accordance to potential use. Especially the inclusion of potential users and their requirements is an important aspect within the studies. In contrast to former quality evaluations in which critical components of a system under development were studied independently from the end-product, our approach optimizes the Mobile3DTV system in relation to prospective users, systems, and services.
The purpose of this report is twofold. Firstly, we will introduce a new research method called Open Profiling of Quality. Open Profiling of Quality was developed within the project to have a tool that allows studying the underlying rationale of quality perception in addition to existing, standardized evaluation methods. Secondly, we present the results of the two major studies on coding and transmission of mobile3DTV content that were conducted within the project. These
MOBILE3DTV D4.3 Results of quality attributes of coding, transmission, and their combinations
7
two studies follow the quality aspects of the production chain for mobile devices. The results give recommendations for the selection of coding method and transmission settings within an optimized system for mobile 3DTV content delivery over DVB-H.
The report is organized as follows. In section 2 we present an overview of related work in the field of 3DTV quality evaluations. Additionally, we will introduce our research method of Open Profiling of Quality (OPQ). We describe the method and present the results of a benchmarking study in which compared OPQ to other existing sensory profiling approaches. In section 3 we present the results of our study on the selection of an optimum coding method for mobile 3D television and video. The results of this study were used as an input for the second main study on optimizing the transmission settings of the Mobile3DTV system. The results of the second study are reported in section 4. Section 5 finally summarizes and discusses the results of the studies and concludes the report.
MOBILE3DTV D4.3 Results of quality attributes of coding, transmission, and their combinations
8
2 Open Profiling of Quality – a new research method Until now, quantitative methods have mainly been used to measure subjective quality of these systems. Different standardization bodies provide their guidelines how to measure audiovisual quality subjectively. All the methods have in common that test participants grade the overall quality different stimuli under test. These stimuli differ in one or more parameters and comparison of the test participants‟ ratings leads to a preference ranking of the stimuli.
Nevertheless, the researcher doesn't get any knowledge about the test participants' concepts of rating or comparing quality. In this section, we want to present currently existing research methods. The review includes standardized methods of the psychoperceptual approach as well as new approaches coming from a new user-centered quality of experience evaluation. In the second part of this chapter, we introduce our new research method of Open Profiling of Quality. We present the theoretical background and the general methodology. Open Profiling was applied in the two main quality evaluations into quality aspects of coding and transmission in the Mobile3DTV system.
Quantitative quality evaluation has been applied for long time in the history of audiovisual quality evaluation. A review of existing psychoperceptual research methods and their application in fields related to mobile 3D television and video is included in [16].
However, current audiovisual quality research extends the existing approaches towards new methodologies targeting a user-centered Quality of Experience evaluation. These new approaches adapt or extend existing psychoperceptual evaluation. Important methodologies include evaluation of the Acceptance Threshold to measure users‟ acceptance as one important factor for the prospective success of the end-product. Other approaches leave the controlled lab environment and extend their studies to the real context of use [15] overcoming the shortcomings of an unknown level of realism in the artificial lab environment [48]. In the Mobile3DTV project a large study was conducted comparing quality evaluation in the lab and different contexts of use. The results of this study are reported [20] and [21].
Another focus in the development of our methodological research framework [16] targets the combination of quantitative preference rankings and experienced quality factors. Combining quantitative data with quality attributes allows getting a preference order of the items under test and additional information about the underlying rationale of quality perception. Mixed method research, i.e. the combination of quantitative and qualitative data, has been applied in different studies in audiovisual quality research. The following chapter reviews the existing methodologies before we present our approach of Open Profiling of Quality.
2.1 Mixed method research in audio, visual and audiovisual quality evaluation
This section reviews existing approaches of mixed method research in the field of audiovisual quality evaluation and the application of these methods in different studies. An overview can be found in Table 1.
.
MOBILE3DTV D4.3 Results of quality attributes of coding, transmission, and their combinations
9
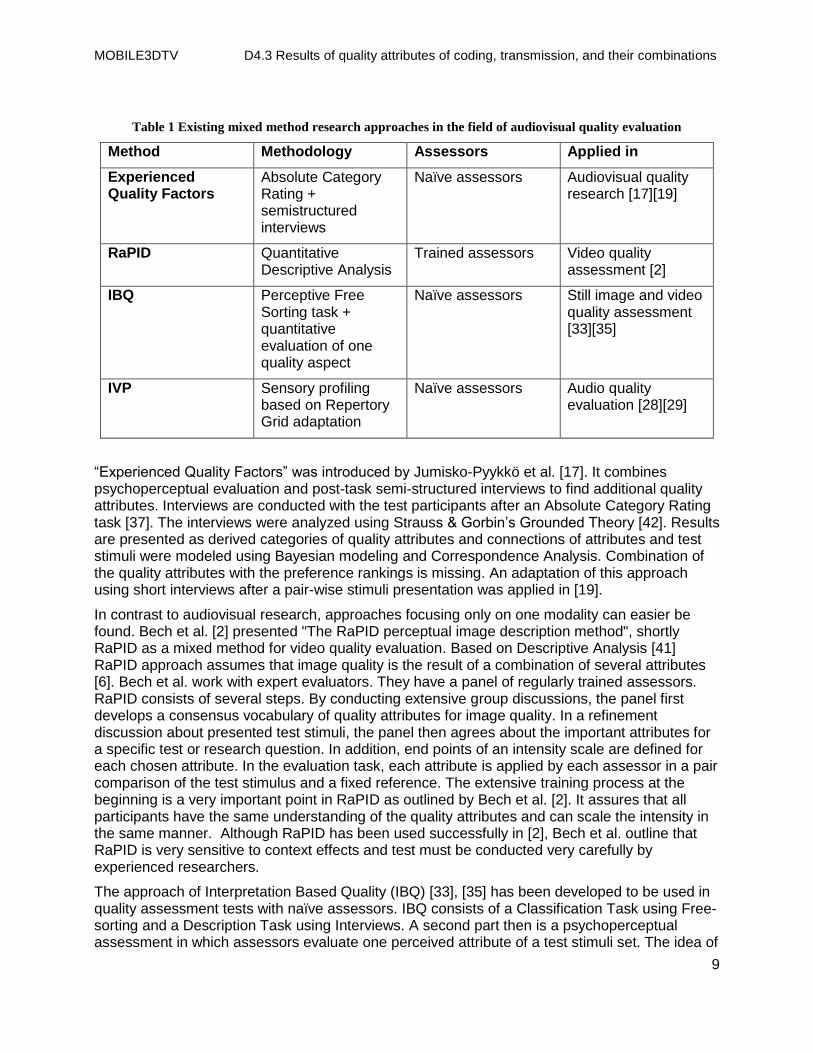
Table 1 Existing mixed method research approaches in the field of audiovisual quality evaluation
Method Methodology Assessors Applied in
Experienced Quality Factors
Absolute Category Rating + semistructured interviews
Naïve assessors Audiovisual quality research [17][19]
RaPID Quantitative Descriptive Analysis
Trained assessors Video quality assessment [2]
IBQ Perceptive Free Sorting task + quantitative evaluation of one quality aspect
Naïve assessors Still image and video quality assessment [33][35]
IVP Sensory profiling based on Repertory Grid adaptation
Naïve assessors Audio quality evaluation [28][29]
“Experienced Quality Factors” was introduced by Jumisko-Pyykkö et al. [17]. It combines psychoperceptual evaluation and post-task semi-structured interviews to find additional quality attributes. Interviews are conducted with the test participants after an Absolute Category Rating task [37]. The interviews were analyzed using Strauss & Gorbin‟s Grounded Theory [42]. Results are presented as derived categories of quality attributes and connections of attributes and test stimuli were modeled using Bayesian modeling and Correspondence Analysis. Combination of the quality attributes with the preference rankings is missing. An adaptation of this approach using short interviews after a pair-wise stimuli presentation was applied in [19].
In contrast to audiovisual research, approaches focusing only on one modality can easier be found. Bech et al. [2] presented "The RaPID perceptual image description method", shortly RaPID as a mixed method for video quality evaluation. Based on Descriptive Analysis [41] RaPID approach assumes that image quality is the result of a combination of several attributes [6]. Bech et al. work with expert evaluators. They have a panel of regularly trained assessors. RaPID consists of several steps. By conducting extensive group discussions, the panel first develops a consensus vocabulary of quality attributes for image quality. In a refinement discussion about presented test stimuli, the panel then agrees about the important attributes for a specific test or research question. In addition, end points of an intensity scale are defined for each chosen attribute. In the evaluation task, each attribute is applied by each assessor in a pair comparison of the test stimulus and a fixed reference. The extensive training process at the beginning is a very important point in RaPID as outlined by Bech et al. [2]. It assures that all participants have the same understanding of the quality attributes and can scale the intensity in the same manner. Although RaPID has been used successfully in [2], Bech et al. outline that RaPID is very sensitive to context effects and test must be conducted very carefully by experienced researchers.
The approach of Interpretation Based Quality (IBQ) [33], [35] has been developed to be used in quality assessment tests with naïve assessors. IBQ consists of a Classification Task using Free-sorting and a Description Task using Interviews. A second part then is a psychoperceptual assessment in which assessors evaluate one perceived attribute of a test stimuli set. The idea of
MOBILE3DTV D4.3 Results of quality attributes of coding, transmission, and their combinations
10
using Free-sorting tasks as an alternative to descriptive analysis was already used by Picard et al. [34] and Faye et al. [7]. Comparing these results of free-sorting task to those obtained in a descriptive mapping with expert listeners Faye et al. [7] showed that both results are comparable in terms of describing the same sensations and the related wording of the attributes at lower costs due to naïve assessors, missing training, and fast assessment of a large test set. However, Faye et al. underline that detailed knowledge about the used stimuli and their perceptual differences was helpful to interpret the results. Extending the idea of free-sorting tasks, IBQ allows combining preference data and descriptive data in a mixed analysis to better understand preference and underlying quality factors [35]. However, analysis of the interview data is a time consuming work and needs to be done very carefully as the researcher doing the analysis may not introduce to much interpretation. Cross-checking of the coded interviews using e.g. intercoder reliability is needed as verification.
While the methods of Jumisko-Pyykkö et al. and Radun et al. [35] are based on interviews to generate quality factors, Lorho [28], [29] was the first to adapt methods from Sensory Profiling to study quality factors in audio perception. While in Quantitative Descriptive Analysis (QDA) [41] (or RaPID as an adaptation) quality attributes are developed in group discussions as a group consensus, methods of individual vocabulary profiling like Free Choice Profiling [14] allow the test participants to develop their own, individual quality attributes. An overview about application of descriptive methods in audio quality research is included in [3]. Lorho's individual profiling methods also targets naïve, inexperienced participants as evaluators [29]. It can be described in four steps. After familiarizing with the stimuli in step 1, participants develop their individual vocabulary in two consecutive tasks. Using Repertory Grid Technique as elicitation method in step 2, an attribute list is generated in a triad stimulus comparison. In a third step, the developed attributes are used to generate scales for the evaluation. Each scale consists of an attribute and its minimal and maximal quantity. Following, test participants can practice the rating task on these scales before the evaluation of quality takes place in fourth step. The data is analyzed through hierarchical clustering to identify underlying groups among all attributes and Generalized Procrustes Analysis [9] to develop perceptual spaces of quality.
2.2 Open Profiling of Quality – a mixed method approach in the evaluation of mobile 3D television and video
This section describes the methodology of the Open Profiling of Quality (OPQ) approach. It is „open‟ in a sense that we don‟t limit the test participants in their description of the quality. We target a holistic description of individual quality attributes with which we model the underlying quality rationale. OPQ targets understanding of overall quality. Four goals describe the development of the new research method:
a) … To get a preference order related to perceived overall quality of the test items by applying standardized evaluation methods
b) … To understand the rationale of audiovisual quality perception by collecting individual quality attributes applying sensory profiling
c) … To combine quantitative and sensory data to link preferences with quality attributes
d) … To provide a test methodology that is applicable to use with naïve assessors
2.2.1 Assessors
As part of our user-centered research methodology [16], OPQ aims on using naïve test participants. Naïve participants relates to two facts. First, test participants should not work professionally in the field of research. Second, naïve participants are not experienced in the
MOBILE3DTV D4.3 Results of quality attributes of coding, transmission, and their combinations
11
quality evaluation task. All participants should be screened for myopia, hyperopia, color vision according to Ishihara, 3D vision using Randot Stereo Test. In addition, hearing threshold should be tested for audiovisual quality assessment. In the study presented in section 3, we selected a large number of test participants for the psychoperceptual evaluation. A subgroup of these assessors was invited for a second session to conduct sensory profiling with them. During the study, Simulator Sickness Questionnaire [23] or similar methods targeting visual fatigue and discomfort should be applied. Visual discomfort has been reported as impacting quality factors of stereoscopic displays [26][25].
2.2.2 Test method
Open Profiling of Quality (OPQ) combines existing psychoperceptual evaluation methods [36][37] with an adaption of Free Choice Profiling [14][47]. As already mentioned above, OPQ targets to evaluate users‟ quality preferences in connection with an evaluation of underlying experienced quality factors. The quality factors will be used to model the quality rationale that led to a certain preference order of the test items.
2.2.2.1 Psychoperceptual Evaluation
Psychoperceptual evaluation is the classical approach to study multimodal quality perception. Evaluation methods are provided by several standardization bodies and an overview of existing methods is included in [16]. The existing methods can be used to study perceptual quality quantitatively. They create a preference order of the test items.
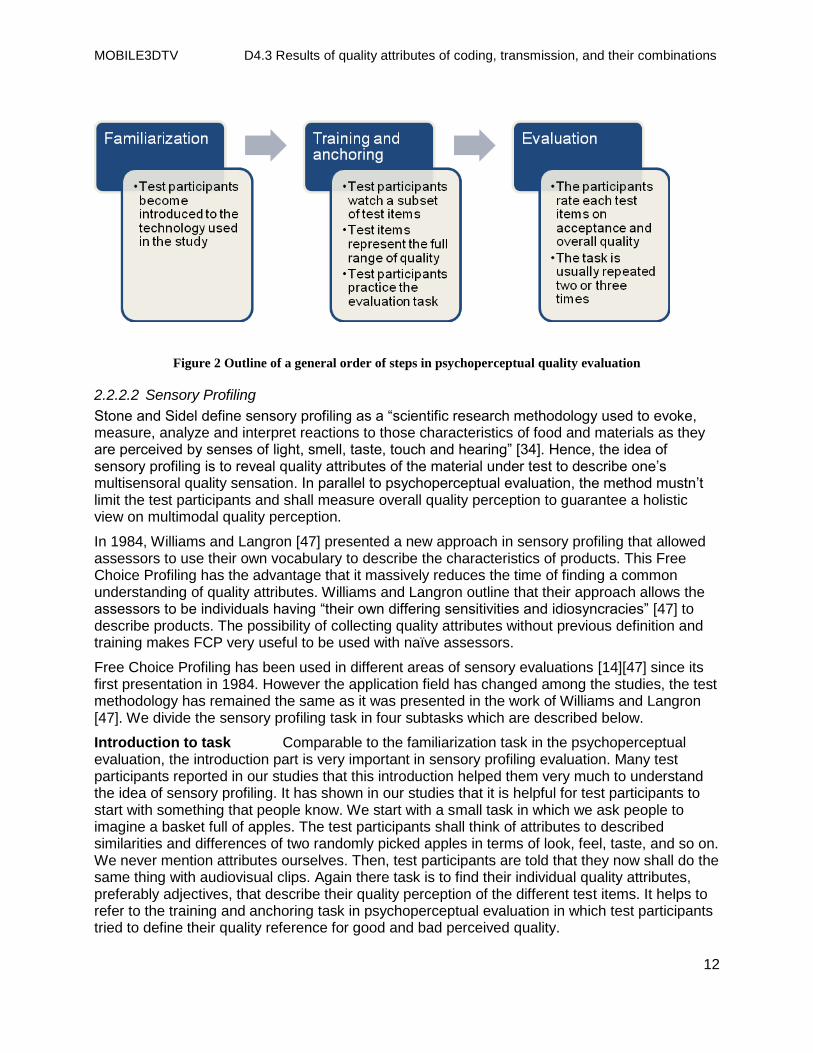
Our psychoperceptual evaluation task commonly consists of three steps. In the first step, familiarization, the naïve test participants get in touch with the technology for the first time. Especially in 3D research, this part is very important as the test participants usually haven‟t seen 3D video before. In this task, we present a small subset of the test items. We don‟t mention anything about the task that the people are expected to do nor do we mention the word „quality‟. After familiarization, test participants pass the training and anchoring. This task has two goals. Test participants watch again a subset of test items that represent the full range of quality under test. Participants are introduced that they should rate the overall quality of the items under test. We don‟t make any limitations nor give hints about critical items. In training and anchoring, the test participants then evaluate each item of the subset on the scale and try to match perceived quality to the scale. The third part is the evaluation task. In evaluation, test participants rate each test item on acceptance and overall quality. Usually, this task is repeated two or three times. The order of the test items is randomized hereby to avoid bias effects.
MOBILE3DTV D4.3 Results of quality attributes of coding, transmission, and their combinations
12
Figure 2 Outline of a general order of steps in psychoperceptual quality evaluation
2.2.2.2 Sensory Profiling
Stone and Sidel define sensory profiling as a “scientific research methodology used to evoke, measure, analyze and interpret reactions to those characteristics of food and materials as they are perceived by senses of light, smell, taste, touch and hearing” [34]. Hence, the idea of sensory profiling is to reveal quality attributes of the material under test to describe one‟s multisensoral quality sensation. In parallel to psychoperceptual evaluation, the method mustn‟t limit the test participants and shall measure overall quality perception to guarantee a holistic view on multimodal quality perception.
In 1984, Williams and Langron [47] presented a new approach in sensory profiling that allowed assessors to use their own vocabulary to describe the characteristics of products. This Free Choice Profiling has the advantage that it massively reduces the time of finding a common understanding of quality attributes. Williams and Langron outline that their approach allows the assessors to be individuals having “their own differing sensitivities and idiosyncracies” [47] to describe products. The possibility of collecting quality attributes without previous definition and training makes FCP very useful to be used with naïve assessors.
Free Choice Profiling has been used in different areas of sensory evaluations [14][47] since its first presentation in 1984. However the application field has changed among the studies, the test methodology has remained the same as it was presented in the work of Williams and Langron [47]. We divide the sensory profiling task in four subtasks which are described below.
Introduction to task Comparable to the familiarization task in the psychoperceptual evaluation, the introduction part is very important in sensory profiling evaluation. Many test participants reported in our studies that this introduction helped them very much to understand the idea of sensory profiling. It has shown in our studies that it is helpful for test participants to start with something that people know. We start with a small task in which we ask people to imagine a basket full of apples. The test participants shall think of attributes to described similarities and differences of two randomly picked apples in terms of look, feel, taste, and so on. We never mention attributes ourselves. Then, test participants are told that they now shall do the same thing with audiovisual clips. Again there task is to find their individual quality attributes, preferably adjectives, that describe their quality perception of the different test items. It helps to refer to the training and anchoring task in psychoperceptual evaluation in which test participants tried to define their quality reference for good and bad perceived quality.
MOBILE3DTV D4.3 Results of quality attributes of coding, transmission, and their combinations
13
Attribute elicitation Following this introduction, test participants now need to find their individual attributes. There are different methods available. While in original Free Choice Profiling assessors write down their attributes without limitations, other researcher propose using Repertory Grid Technique or Natural Grouping as a supporting technique for this task. However, the attribute finding is a very important step for successful sensory profiling. Only attributes that will be found in this part will be taken into account in the later evaluation. Our experience shows that people need enough time to watch the test items, to write down attributes, or to rethink what they have already written.
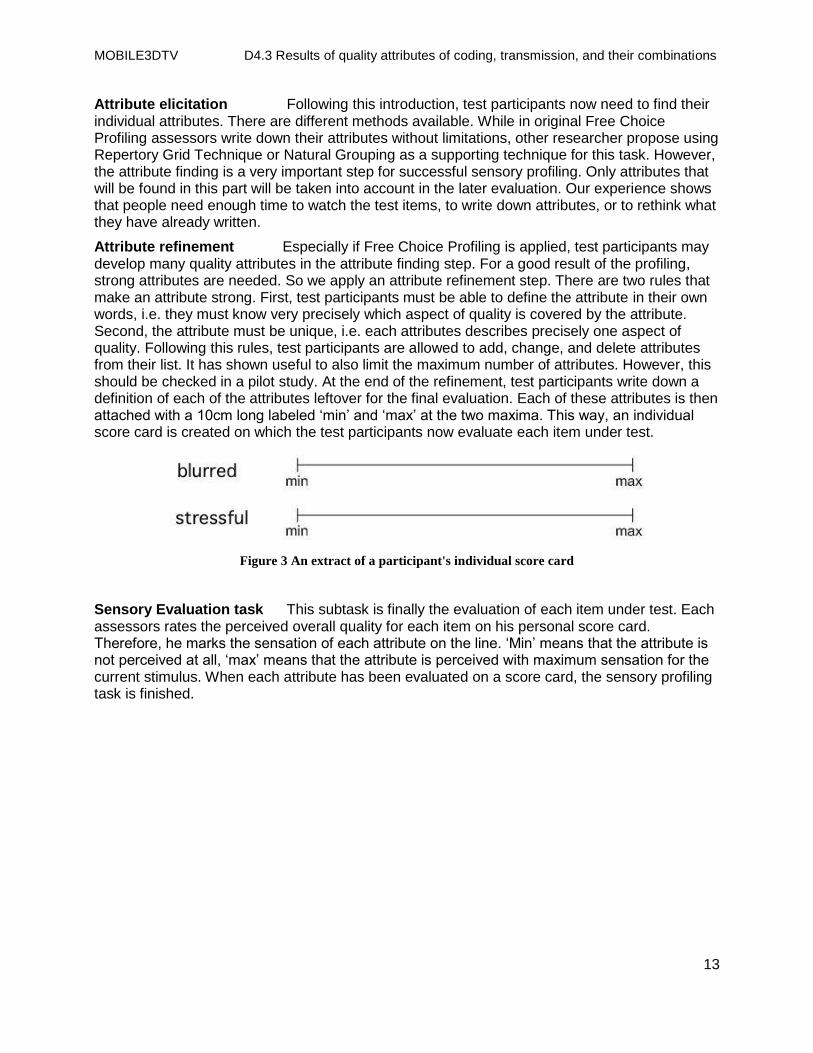
Attribute refinement Especially if Free Choice Profiling is applied, test participants may develop many quality attributes in the attribute finding step. For a good result of the profiling, strong attributes are needed. So we apply an attribute refinement step. There are two rules that make an attribute strong. First, test participants must be able to define the attribute in their own words, i.e. they must know very precisely which aspect of quality is covered by the attribute. Second, the attribute must be unique, i.e. each attributes describes precisely one aspect of quality. Following this rules, test participants are allowed to add, change, and delete attributes from their list. It has shown useful to also limit the maximum number of attributes. However, this should be checked in a pilot study. At the end of the refinement, test participants write down a definition of each of the attributes leftover for the final evaluation. Each of these attributes is then attached with a 10cm long labeled „min‟ and „max‟ at the two maxima. This way, an individual score card is created on which the test participants now evaluate each item under test.
Figure 3 An extract of a participant's individual score card
Sensory Evaluation task This subtask is finally the evaluation of each item under test. Each assessors rates the perceived overall quality for each item on his personal score card. Therefore, he marks the sensation of each attribute on the line. „Min‟ means that the attribute is not perceived at all, „max‟ means that the attribute is perceived with maximum sensation for the current stimulus. When each attribute has been evaluated on a score card, the sensory profiling task is finished.
MOBILE3DTV D4.3 Results of quality attributes of coding, transmission, and their combinations
14
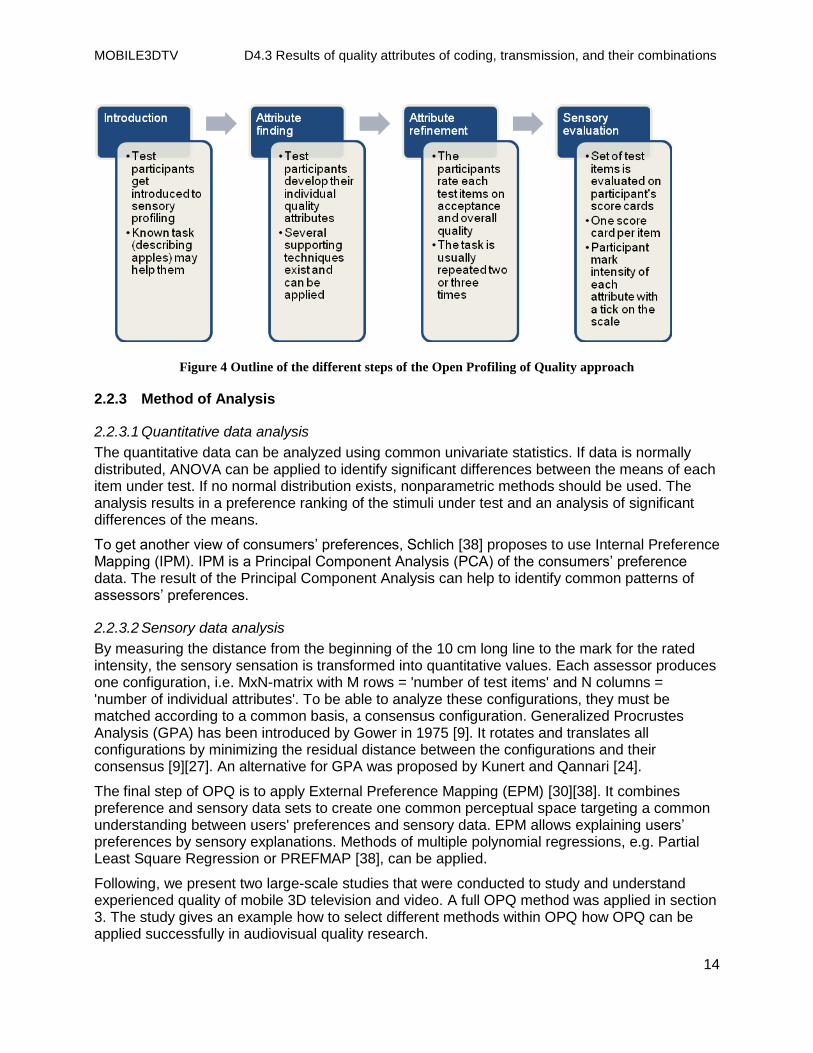
Figure 4 Outline of the different steps of the Open Profiling of Quality approach
2.2.3 Method of Analysis
2.2.3.1 Quantitative data analysis
The quantitative data can be analyzed using common univariate statistics. If data is normally distributed, ANOVA can be applied to identify significant differences between the means of each item under test. If no normal distribution exists, nonparametric methods should be used. The analysis results in a preference ranking of the stimuli under test and an analysis of significant differences of the means.
To get another view of consumers‟ preferences, Schlich [38] proposes to use Internal Preference Mapping (IPM). IPM is a Principal Component Analysis (PCA) of the consumers‟ preference data. The result of the Principal Component Analysis can help to identify common patterns of assessors‟ preferences.
2.2.3.2 Sensory data analysis
By measuring the distance from the beginning of the 10 cm long line to the mark for the rated intensity, the sensory sensation is transformed into quantitative values. Each assessor produces one configuration, i.e. MxN-matrix with M rows = 'number of test items' and N columns = 'number of individual attributes'. To be able to analyze these configurations, they must be matched according to a common basis, a consensus configuration. Generalized Procrustes Analysis (GPA) has been introduced by Gower in 1975 [9]. It rotates and translates all configurations by minimizing the residual distance between the configurations and their consensus [9][27]. An alternative for GPA was proposed by Kunert and Qannari [24].
The final step of OPQ is to apply External Preference Mapping (EPM) [30][38]. It combines preference and sensory data sets to create one common perceptual space targeting a common understanding between users' preferences and sensory data. EPM allows explaining users‟ preferences by sensory explanations. Methods of multiple polynomial regressions, e.g. Partial Least Square Regression or PREFMAP [38], can be applied.
Following, we present two large-scale studies that were conducted to study and understand experienced quality of mobile 3D television and video. A full OPQ method was applied in section 3. The study gives an example how to select different methods within OPQ how OPQ can be applied successfully in audiovisual quality research.
MOBILE3DTV D4.3 Results of quality attributes of coding, transmission, and their combinations
15
3 Study 1: Influence of coding methods on experienced quality of mobile 3D television and video
3.1 Introduction and research problem Within the core technology development process of Mobile3DTV, different coding methods have been developed adapted for mobile 3D content to efficiently compress content for transmission over DVB-H. This process needs to consider limited bandwidth of the channel and calculation power of the mobile receiver device. According to user requirements for mobile 3D stereo and video [22], mobile3DTV is expected to be mainly private viewing. So, only two encoded views are taken into account. From the users' point of view the developed coding methods need to provide good enough overall quality to satisfy users‟ needs and expectations. Only end users' quality acceptance will guarantee success of the system under development.
Different coding methods also target different technologies and coding approaches. Two main approaches exist. Stereoscopic video can either be transmitted as left and right video or as a combination of video and its depth map. Both approaches will be considered in the presented study. Also the problem of limited calculation power of current mobile devices and bit rate savings of more advanced coding methods is targeted.
By applying Open Profiling of Quality, we were able to identify an optimum coding method for mobile 3D television and video. Additionally, we got a experienced quality model to deeper understand the perception of encoded stereoscopic videos on mobile devices.
3.2 Research Method
3.2.1 Participants
87 participants (age: 16-37, mean: 24) equally stratified in gender took part in this study. A parents' consent was collected for all underage participants before the study. All participants were recruited according to the user requirements for mobile 3D television and system. All participants were screened for normal or corrected to normal visual acuity (myopia and hyperopia, Snellen index: 20/30), color vision using Ishihara test, and stereo vision using Randot Stereo Test (≤ 60 arcsec). The sample consisted of naive participants who didn't have any previous experience in quality assessments. They were no professionals in the field of multimedia technology. 15 test participants were chosen randomly to take part in the additional sensory profiling part of the study.
3.2.2 Test design
A factorial, mixed design [5] was used in this experiment. Within subject variables were content, coding method, and quality level. Coding profiles were used as the between subject variable.
3.2.3 Test procedure
Open Profiling of Quality (OPQ) approach was chosen for the quality evaluation (c.f. section 2). OPQ combines standardized quantitative evaluation methods and sensory quality profiling method. The method and its different parts are presented in section 2. The psychoperceptual quality evaluation consisted of pre-test, evaluation, and a post-test task. Pre- and post-task tests included demographic data collection, screening and Simulator Sickness Questionnaire measurement.
MOBILE3DTV D4.3 Results of quality attributes of coding, transmission, and their combinations
16
3.2.3.1 Psychoperceptual evaluation
Pretest
Before the test participants were introduced to the test, they signed a data protection policy. After that we collected demographic data followed by a screening of vision. This screening included measures of hyperopia, myopia, color vision, and stereo vision. Studies have shown that the use of mobile stereoscopic devices can lead to visual fatigue and discomfort. To be able to assess impact of the study on participants‟ feelings participants were introduced to the use of the Simulator Sickness Questionnaire [23] and filled it initially.
Accomodation and training
As the test participants had never used mobile 3DTV display before, we conducted an accommodation task. In this accommodation, test participants watched a selection of the high quality level test items. They were asked to practice to hold the mobile 3DTV in the correct viewing distance. Additionally, they got used to perceive the three-dimensional impression quickly. This assured that test participants were able to evaluate the short test stimuli sufficiently.
Following the accommodation task training and anchoring were conducted in which test participants watched a subset of test items. The subset was selected that it presents the extreme values and all contents of the study. In the training, test participants familiarized with the evaluation task and the usage of quality evaluation scales. We don‟t tell about quality factors so that test participants are free to choose their own quality reference. Participants are introduced to evaluate the overall quality of the test items.
Evaluation
For the evaluation task, Absolute Category Rating (ACR) according to ITU-R P.910 was chosen. In ACR, stimuli are presented consecutively and rated independently after each test item. In addition, Acceptance Threshold by Jumisko-Pyykkö et al. [18] was applied for measuring general quality acceptance to watch the presented video on a mobile device. Test participants rated general overall quality acceptance on a binary yes-no scale. The overall quality satisfaction was evaluated on an 11-point unlabeled scale. The ratings were given on paper. Each test item was evaluated twice. The order of the stimuli was randomized. The quantitative session took 90 minutes in total.
3.2.3.2 Sensory evaluation
The sensory profiling part of OPQ adapts Free Choice Profiling in which test participants develop their individual quality attributes. In the attribute elicitation task, test participants were asked to use their own words to evaluate perceived quality. While watching a subset of 24 randomly chosen test items, test participants wrote down their quality attributes (preferably adjectives) that described their individual quality sensation. In the following attribute refinement task, test participants selected a maximum of 15 attributes. These attributes must be unique, i.e. describe one specific quality aspect. Additionally, test participants must be able to define the attributes precisely. The selected attributes were transferred to a score card on which each attribute is attached to a 10cm long line. This line is labeled from 'min' to 'max' at the ends. In the evaluation task, the participants then rated overall quality on these attributes for each test item independently one after another. Therefore they marked the sensation intensity of each attribute on the 10cm long line, 'min' refers to no sensation of the attribute, 'max' to maximal sensation of the attribute for the respective item under assessment. The sensory profiling session took 75 minutes in total.
MOBILE3DTV D4.3 Results of quality attributes of coding, transmission, and their combinations
17
3.2.4 Test Material and Apparatus
3.2.4.1 Selection of test sequences
Six different contents were chosen for the study. They all were chosen according to the user requirements of mobile 3D television and video [22][43][44]. However, the variety of available test stimuli for stereo mobile content is still limited. So the selection of the test stimuli was a compromise between the requirements and available test content. Each video has an approximate length of 10 seconds.
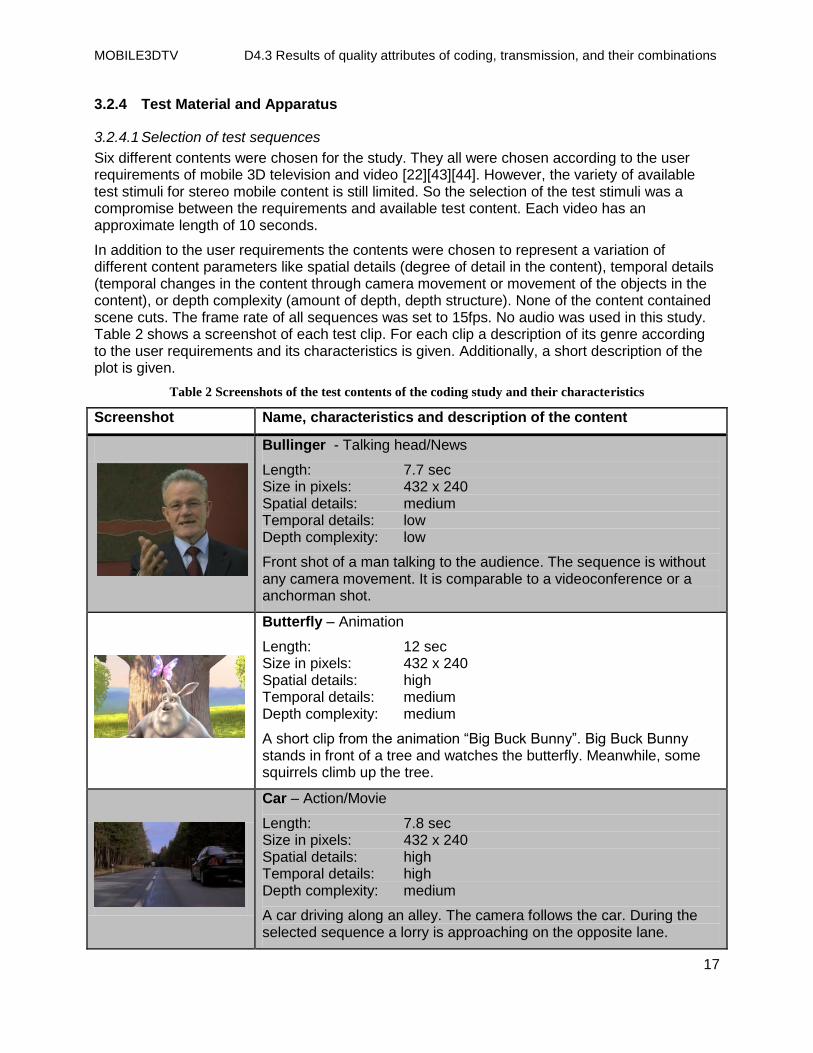
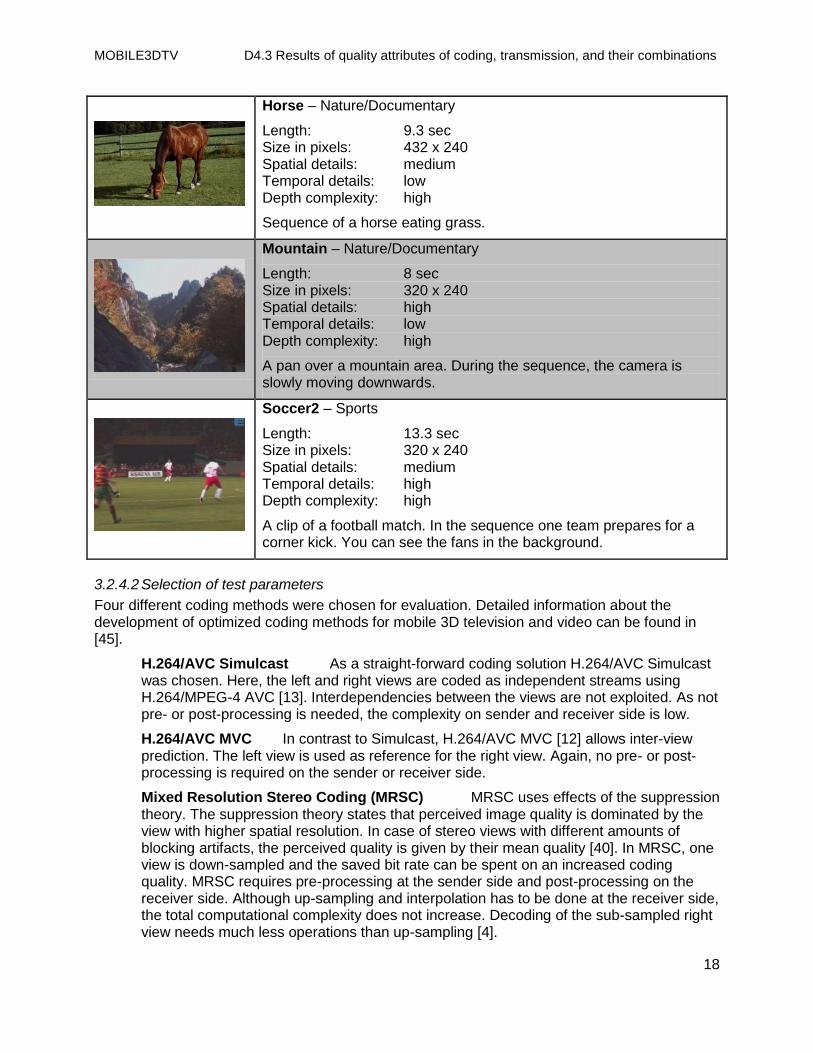
In addition to the user requirements the contents were chosen to represent a variation of different content parameters like spatial details (degree of detail in the content), temporal details (temporal changes in the content through camera movement or movement of the objects in the content), or depth complexity (amount of depth, depth structure). None of the content contained scene cuts. The frame rate of all sequences was set to 15fps. No audio was used in this study. Table 2 shows a screenshot of each test clip. For each clip a description of its genre according to the user requirements and its characteristics is given. Additionally, a short description of the plot is given.
Table 2 Screenshots of the test contents of the coding study and their characteristics
Screenshot Name, characteristics and description of the content
Bullinger - Talking head/News
Length: 7.7 sec Size in pixels: 432 x 240 Spatial details: medium Temporal details: low Depth complexity: low
Front shot of a man talking to the audience. The sequence is without any camera movement. It is comparable to a videoconference or a anchorman shot.
Butterfly – Animation
Length: 12 sec Size in pixels: 432 x 240 Spatial details: high Temporal details: medium Depth complexity: medium
A short clip from the animation “Big Buck Bunny”. Big Buck Bunny stands in front of a tree and watches the butterfly. Meanwhile, some squirrels climb up the tree.
Car – Action/Movie
Length: 7.8 sec Size in pixels: 432 x 240 Spatial details: high Temporal details: high Depth complexity: medium
A car driving along an alley. The camera follows the car. During the selected sequence a lorry is approaching on the opposite lane.
MOBILE3DTV D4.3 Results of quality attributes of coding, transmission, and their combinations
18
Horse – Nature/Documentary
Length: 9.3 sec Size in pixels: 432 x 240 Spatial details: medium Temporal details: low Depth complexity: high
Sequence of a horse eating grass.
Mountain – Nature/Documentary
Length: 8 sec Size in pixels: 320 x 240 Spatial details: high Temporal details: low Depth complexity: high
A pan over a mountain area. During the sequence, the camera is slowly moving downwards.
Soccer2 – Sports
Length: 13.3 sec Size in pixels: 320 x 240 Spatial details: medium Temporal details: high Depth complexity: high
A clip of a football match. In the sequence one team prepares for a corner kick. You can see the fans in the background.
3.2.4.2 Selection of test parameters
Four different coding methods were chosen for evaluation. Detailed information about the development of optimized coding methods for mobile 3D television and video can be found in [45].
H.264/AVC Simulcast As a straight-forward coding solution H.264/AVC Simulcast was chosen. Here, the left and right views are coded as independent streams using H.264/MPEG-4 AVC [13]. Interdependencies between the views are not exploited. As not pre- or post-processing is needed, the complexity on sender and receiver side is low.
H.264/AVC MVC In contrast to Simulcast, H.264/AVC MVC [12] allows inter-view prediction. The left view is used as reference for the right view. Again, no pre- or post-processing is required on the sender or receiver side.
Mixed Resolution Stereo Coding (MRSC) MRSC uses effects of the suppression theory. The suppression theory states that perceived image quality is dominated by the view with higher spatial resolution. In case of stereo views with different amounts of blocking artifacts, the perceived quality is given by their mean quality [40]. In MRSC, one view is down-sampled and the saved bit rate can be spent on an increased coding quality. MRSC requires pre-processing at the sender side and post-processing on the receiver side. Although up-sampling and interpolation has to be done at the receiver side, the total computational complexity does not increase. Decoding of the sub-sampled right view needs much less operations than up-sampling [4].
MOBILE3DTV D4.3 Results of quality attributes of coding, transmission, and their combinations
19
Video plus Depth (V+D) While Simulcast, MVC, and MRSC are Video plus Video solutions, i.e. left and right view of the scene are recorded, Video plus Depth follows another approach. If from a video one view and its depth are given, a second virtual view can be synthesized by shifting the samples of the view by the disparity derived from its depth. Therefore a stereo sequence can be converted to the V+D format. Video plus Depth data transmission is based on ISO/IEC 23002-3 (\MPEG-C Part 3") [11] standard. The V+D approach requires the highest amount of pre- and post-processing. At the sender side, depth has to be estimated from a given left and right view. This estimation can be done offline. At the receiver side, rendering of the virtual view has to be performed.
To be able to evaluate the perceived quality provided by each of the contents, the parameters were chosen in accordance with the settings of the prospective Mobile3DTV system.
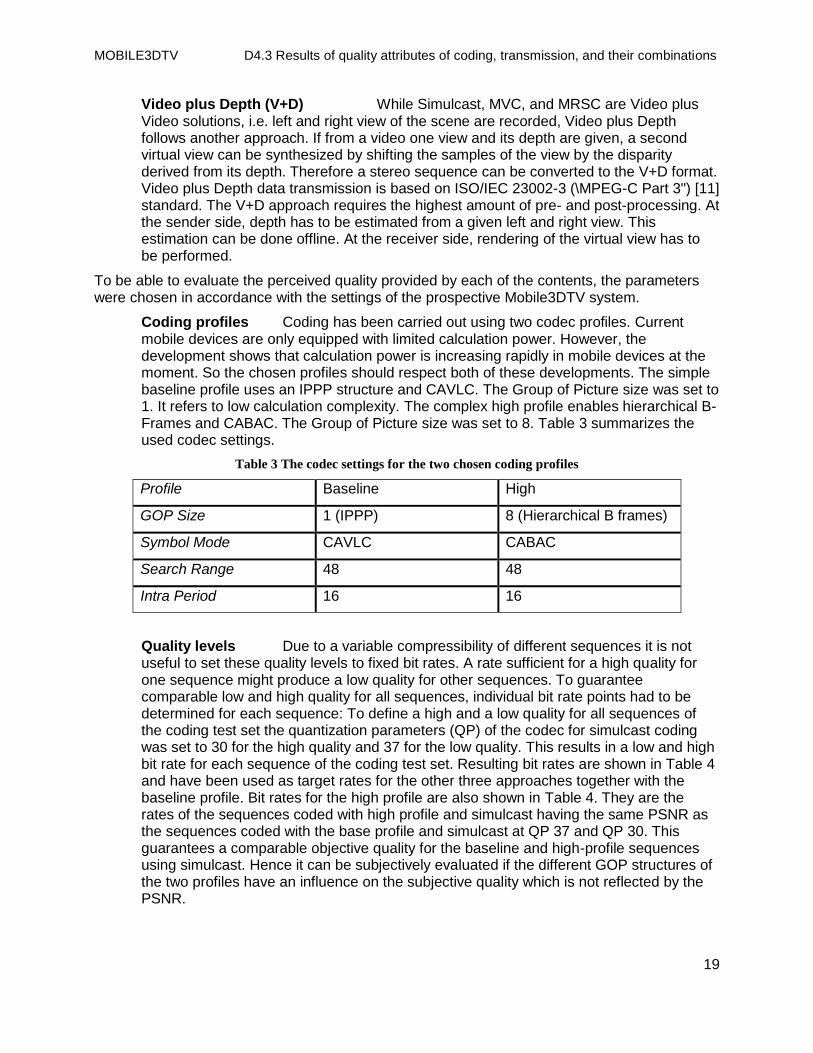
Coding profiles Coding has been carried out using two codec profiles. Current mobile devices are only equipped with limited calculation power. However, the development shows that calculation power is increasing rapidly in mobile devices at the moment. So the chosen profiles should respect both of these developments. The simple baseline profile uses an IPPP structure and CAVLC. The Group of Picture size was set to 1. It refers to low calculation complexity. The complex high profile enables hierarchical B-Frames and CABAC. The Group of Picture size was set to 8. Table 3 summarizes the used codec settings.
Table 3 The codec settings for the two chosen coding profiles
Profile Baseline High
GOP Size 1 (IPPP) 8 (Hierarchical B frames)
Symbol Mode CAVLC CABAC
Search Range 48 48
Intra Period 16 16
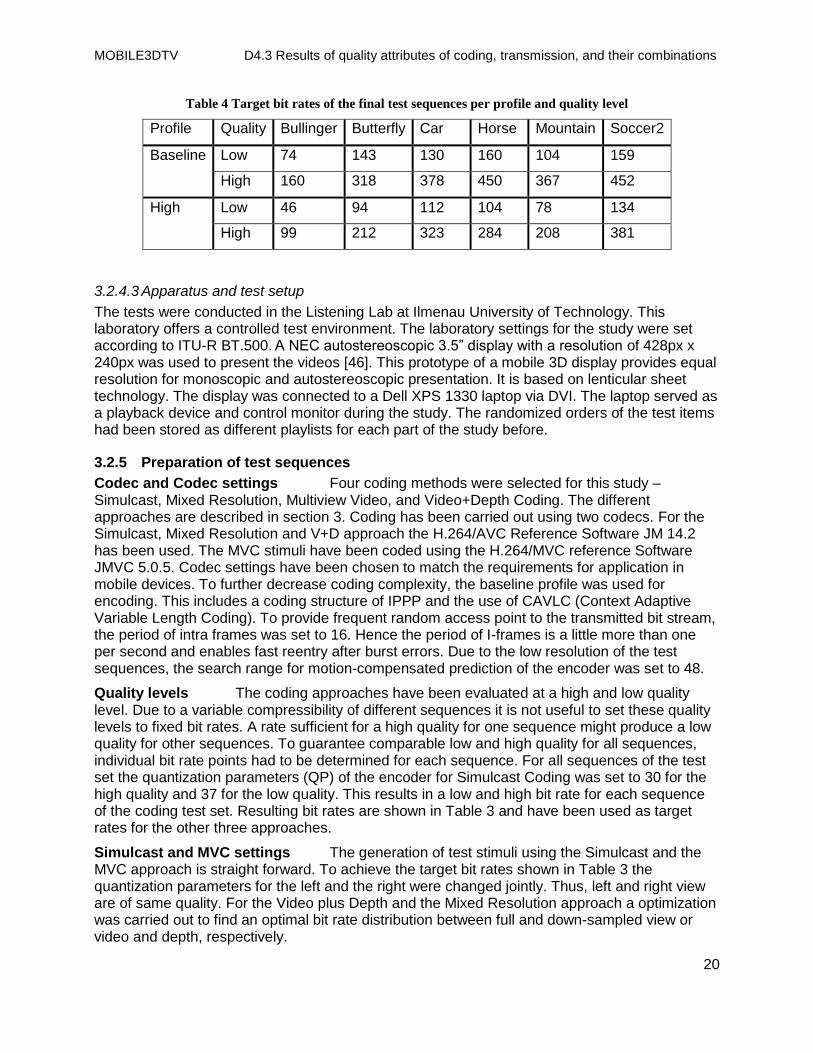
Quality levels Due to a variable compressibility of different sequences it is not useful to set these quality levels to fixed bit rates. A rate sufficient for a high quality for one sequence might produce a low quality for other sequences. To guarantee comparable low and high quality for all sequences, individual bit rate points had to be determined for each sequence: To define a high and a low quality for all sequences of the coding test set the quantization parameters (QP) of the codec for simulcast coding was set to 30 for the high quality and 37 for the low quality. This results in a low and high bit rate for each sequence of the coding test set. Resulting bit rates are shown in Table 4 and have been used as target rates for the other three approaches together with the baseline profile. Bit rates for the high profile are also shown in Table 4. They are the rates of the sequences coded with high profile and simulcast having the same PSNR as the sequences coded with the base profile and simulcast at QP 37 and QP 30. This guarantees a comparable objective quality for the baseline and high-profile sequences using simulcast. Hence it can be subjectively evaluated if the different GOP structures of the two profiles have an influence on the subjective quality which is not reflected by the PSNR.
MOBILE3DTV D4.3 Results of quality attributes of coding, transmission, and their combinations
20
Table 4 Target bit rates of the final test sequences per profile and quality level
Profile Quality Bullinger Butterfly Car Horse Mountain Soccer2
Baseline Low 74 143 130 160 104 159
High 160 318 378 450 367 452
High Low 46 94 112 104 78 134
High 99 212 323 284 208 381
3.2.4.3 Apparatus and test setup
The tests were conducted in the Listening Lab at Ilmenau University of Technology. This laboratory offers a controlled test environment. The laboratory settings for the study were set according to ITU-R BT.500. A NEC autostereoscopic 3.5” display with a resolution of 428px x 240px was used to present the videos [46]. This prototype of a mobile 3D display provides equal resolution for monoscopic and autostereoscopic presentation. It is based on lenticular sheet technology. The display was connected to a Dell XPS 1330 laptop via DVI. The laptop served as a playback device and control monitor during the study. The randomized orders of the test items had been stored as different playlists for each part of the study before.
3.2.5 Preparation of test sequences
Codec and Codec settings Four coding methods were selected for this study – Simulcast, Mixed Resolution, Multiview Video, and Video+Depth Coding. The different approaches are described in section 3. Coding has been carried out using two codecs. For the Simulcast, Mixed Resolution and V+D approach the H.264/AVC Reference Software JM 14.2 has been used. The MVC stimuli have been coded using the H.264/MVC reference Software JMVC 5.0.5. Codec settings have been chosen to match the requirements for application in mobile devices. To further decrease coding complexity, the baseline profile was used for encoding. This includes a coding structure of IPPP and the use of CAVLC (Context Adaptive Variable Length Coding). To provide frequent random access point to the transmitted bit stream, the period of intra frames was set to 16. Hence the period of I-frames is a little more than one per second and enables fast reentry after burst errors. Due to the low resolution of the test sequences, the search range for motion-compensated prediction of the encoder was set to 48.
Quality levels The coding approaches have been evaluated at a high and low quality level. Due to a variable compressibility of different sequences it is not useful to set these quality levels to fixed bit rates. A rate sufficient for a high quality for one sequence might produce a low quality for other sequences. To guarantee comparable low and high quality for all sequences, individual bit rate points had to be determined for each sequence. For all sequences of the test set the quantization parameters (QP) of the encoder for Simulcast Coding was set to 30 for the high quality and 37 for the low quality. This results in a low and high bit rate for each sequence of the coding test set. Resulting bit rates are shown in Table 3 and have been used as target rates for the other three approaches.
Simulcast and MVC settings The generation of test stimuli using the Simulcast and the MVC approach is straight forward. To achieve the target bit rates shown in Table 3 the quantization parameters for the left and the right were changed jointly. Thus, left and right view are of same quality. For the Video plus Depth and the Mixed Resolution approach a optimization was carried out to find an optimal bit rate distribution between full and down-sampled view or video and depth, respectively.
MOBILE3DTV D4.3 Results of quality attributes of coding, transmission, and their combinations
21
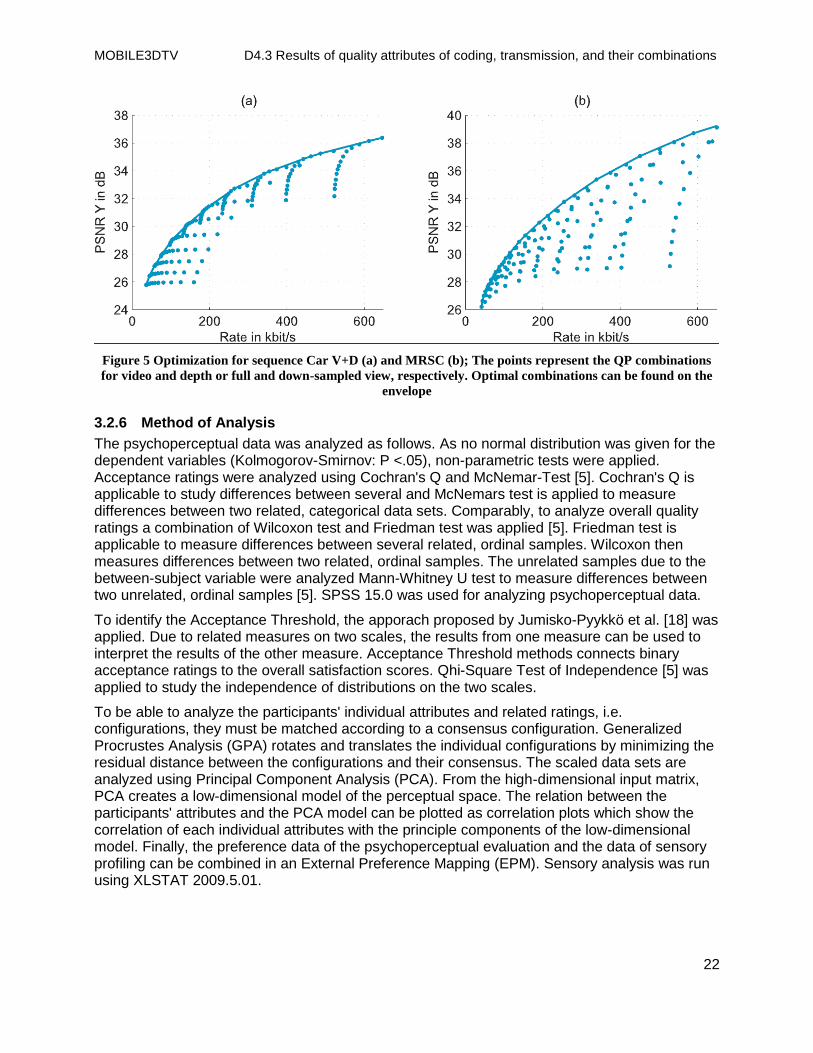
Video + Depth settings For the V+D approach depth has been estimated using a Hybrid Recursive Matching algorithm. For view synthesis the simple algorithm presented by Yongzhe et al. [32] was used. Figure 1 gives an example for the optimization of V+D approach. The PSNR was calculated based on the average MSE of the left and the rendered right view. The rendered right view from uncoded data has been taken as reference for the rendered right view from coded data. Rendering artifacts already existing in the uncoded data are neglected with this approach. Hence the PSNR calculated this way only evaluates the coding quality and not the overall quality. The optimization has been carried out using QPs from 18 to 44 and a step size of two for the left view. For depth QPs from 8 to 44 or 18 to 44 depending on the sequence have been used. The step size has been two. Each point in Figure 5 (a) represents a combination of QPs for video and depth. The envelope of these points gives the optimal QP-combinations. Sequences coded with optimal QP combinations and matching the bit rates defined in Table 4 have been taken as test stimuli. If necessary, coding with intermediate QP-combinations has been done to match the target bit rates more precisely. The optimization results in a bit rate for depth of approximately 10% to 30% of the total rate depending on the complexity of depth.
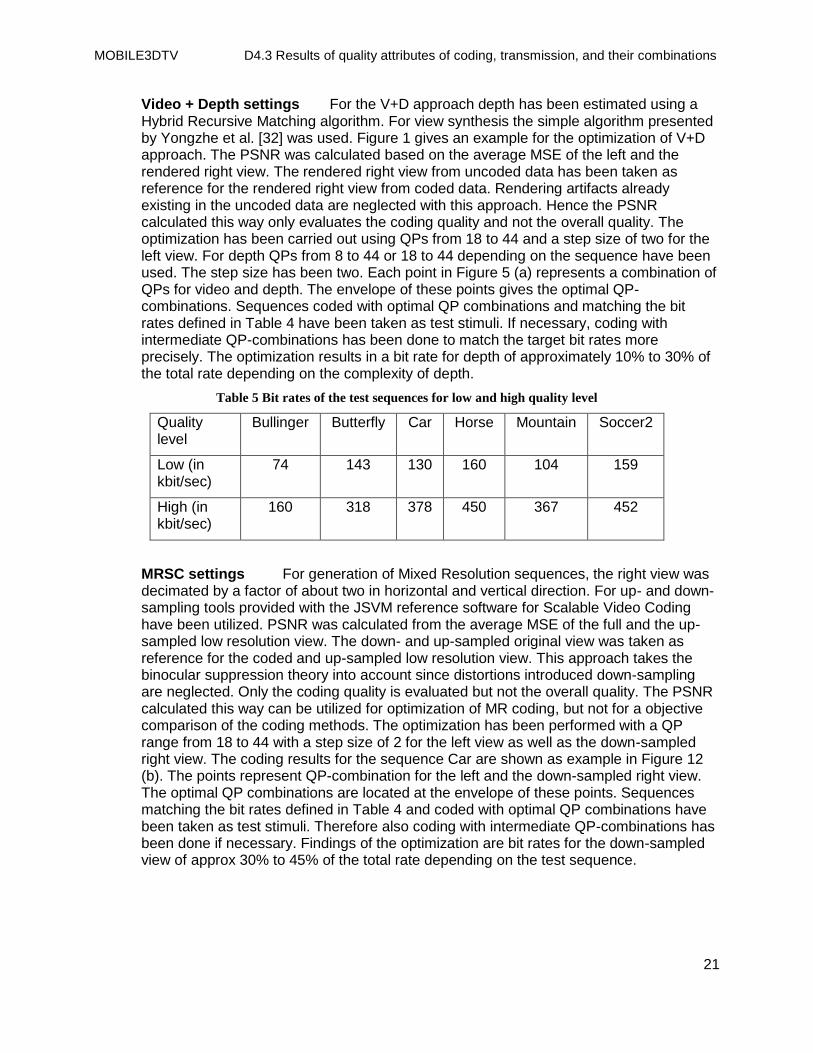
Table 5 Bit rates of the test sequences for low and high quality level
Quality level
Bullinger Butterfly Car Horse Mountain Soccer2
Low (in kbit/sec)
74 143 130 160 104 159
High (in kbit/sec)
160 318 378 450 367 452
MRSC settings For generation of Mixed Resolution sequences, the right view was decimated by a factor of about two in horizontal and vertical direction. For up- and down-sampling tools provided with the JSVM reference software for Scalable Video Coding have been utilized. PSNR was calculated from the average MSE of the full and the up-sampled low resolution view. The down- and up-sampled original view was taken as reference for the coded and up-sampled low resolution view. This approach takes the binocular suppression theory into account since distortions introduced down-sampling are neglected. Only the coding quality is evaluated but not the overall quality. The PSNR calculated this way can be utilized for optimization of MR coding, but not for a objective comparison of the coding methods. The optimization has been performed with a QP range from 18 to 44 with a step size of 2 for the left view as well as the down-sampled right view. The coding results for the sequence Car are shown as example in Figure 12 (b). The points represent QP-combination for the left and the down-sampled right view. The optimal QP combinations are located at the envelope of these points. Sequences matching the bit rates defined in Table 4 and coded with optimal QP combinations have been taken as test stimuli. Therefore also coding with intermediate QP-combinations has been done if necessary. Findings of the optimization are bit rates for the down-sampled view of approx 30% to 45% of the total rate depending on the test sequence.
MOBILE3DTV D4.3 Results of quality attributes of coding, transmission, and their combinations
22
Figure 5 Optimization for sequence Car V+D (a) and MRSC (b); The points represent the QP combinations
for video and depth or full and down-sampled view, respectively. Optimal combinations can be found on the
envelope
3.2.6 Method of Analysis
The psychoperceptual data was analyzed as follows. As no normal distribution was given for the dependent variables (Kolmogorov-Smirnov: P <.05), non-parametric tests were applied. Acceptance ratings were analyzed using Cochran's Q and McNemar-Test [5]. Cochran's Q is applicable to study differences between several and McNemars test is applied to measure differences between two related, categorical data sets. Comparably, to analyze overall quality ratings a combination of Wilcoxon test and Friedman test was applied [5]. Friedman test is applicable to measure differences between several related, ordinal samples. Wilcoxon then measures differences between two related, ordinal samples. The unrelated samples due to the between-subject variable were analyzed Mann-Whitney U test to measure differences between two unrelated, ordinal samples [5]. SPSS 15.0 was used for analyzing psychoperceptual data.
To identify the Acceptance Threshold, the apporach proposed by Jumisko-Pyykkö et al. [18] was applied. Due to related measures on two scales, the results from one measure can be used to interpret the results of the other measure. Acceptance Threshold methods connects binary acceptance ratings to the overall satisfaction scores. Qhi-Square Test of Independence [5] was applied to study the independence of distributions on the two scales.
To be able to analyze the participants' individual attributes and related ratings, i.e. configurations, they must be matched according to a consensus configuration. Generalized Procrustes Analysis (GPA) rotates and translates the individual configurations by minimizing the residual distance between the configurations and their consensus. The scaled data sets are analyzed using Principal Component Analysis (PCA). From the high-dimensional input matrix, PCA creates a low-dimensional model of the perceptual space. The relation between the participants' attributes and the PCA model can be plotted as correlation plots which show the correlation of each individual attributes with the principle components of the low-dimensional model. Finally, the preference data of the psychoperceptual evaluation and the data of sensory profiling can be combined in an External Preference Mapping (EPM). Sensory analysis was run using XLSTAT 2009.5.01.
MOBILE3DTV D4.3 Results of quality attributes of coding, transmission, and their combinations
23
3.3 Results
3.3.1 Simulator Sickness Questionnaire
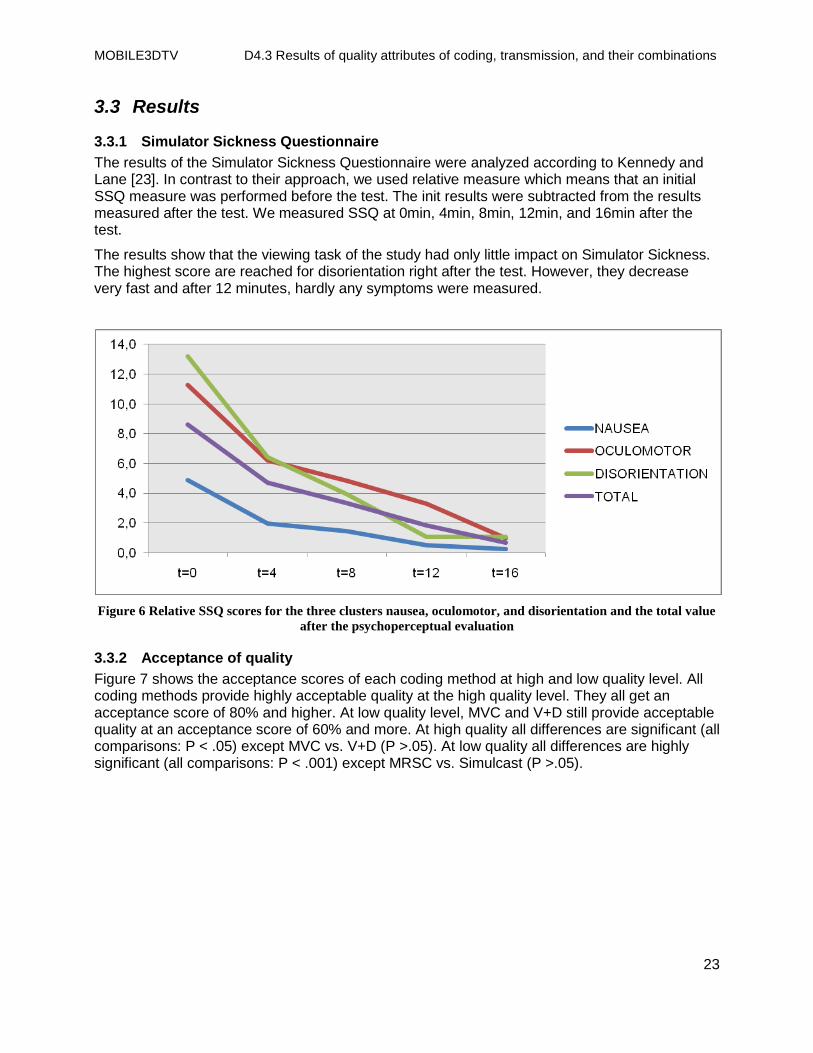
The results of the Simulator Sickness Questionnaire were analyzed according to Kennedy and Lane [23]. In contrast to their approach, we used relative measure which means that an initial SSQ measure was performed before the test. The init results were subtracted from the results measured after the test. We measured SSQ at 0min, 4min, 8min, 12min, and 16min after the test.
The results show that the viewing task of the study had only little impact on Simulator Sickness. The highest score are reached for disorientation right after the test. However, they decrease very fast and after 12 minutes, hardly any symptoms were measured.
Figure 6 Relative SSQ scores for the three clusters nausea, oculomotor, and disorientation and the total value
after the psychoperceptual evaluation
3.3.2 Acceptance of quality
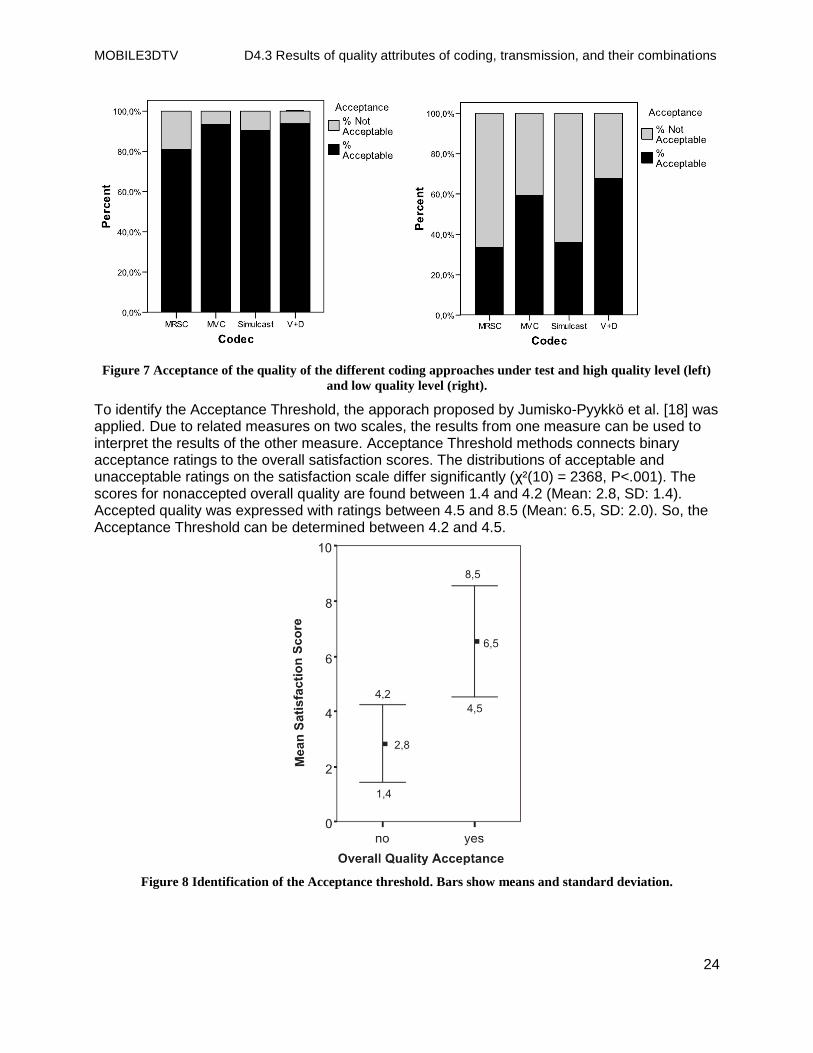
Figure 7 shows the acceptance scores of each coding method at high and low quality level. All coding methods provide highly acceptable quality at the high quality level. They all get an acceptance score of 80% and higher. At low quality level, MVC and V+D still provide acceptable quality at an acceptance score of 60% and more. At high quality all differences are significant (all comparisons: P < .05) except MVC vs. V+D (P >.05). At low quality all differences are highly significant (all comparisons: P < .001) except MRSC vs. Simulcast (P >.05).
MOBILE3DTV D4.3 Results of quality attributes of coding, transmission, and their combinations
24
Figure 7 Acceptance of the quality of the different coding approaches under test and high quality level (left)
and low quality level (right).
To identify the Acceptance Threshold, the apporach proposed by Jumisko-Pyykkö et al. [18] was applied. Due to related measures on two scales, the results from one measure can be used to interpret the results of the other measure. Acceptance Threshold methods connects binary acceptance ratings to the overall satisfaction scores. The distributions of acceptable and unacceptable ratings on the satisfaction scale differ significantly (χ²(10) = 2368, P<.001). The scores for nonaccepted overall quality are found between 1.4 and 4.2 (Mean: 2.8, SD: 1.4). Accepted quality was expressed with ratings between 4.5 and 8.5 (Mean: 6.5, SD: 2.0). So, the Acceptance Threshold can be determined between 4.2 and 4.5.
Figure 8 Identification of the Acceptance threshold. Bars show means and standard deviation.
MOBILE3DTV D4.3 Results of quality attributes of coding, transmission, and their combinations
25
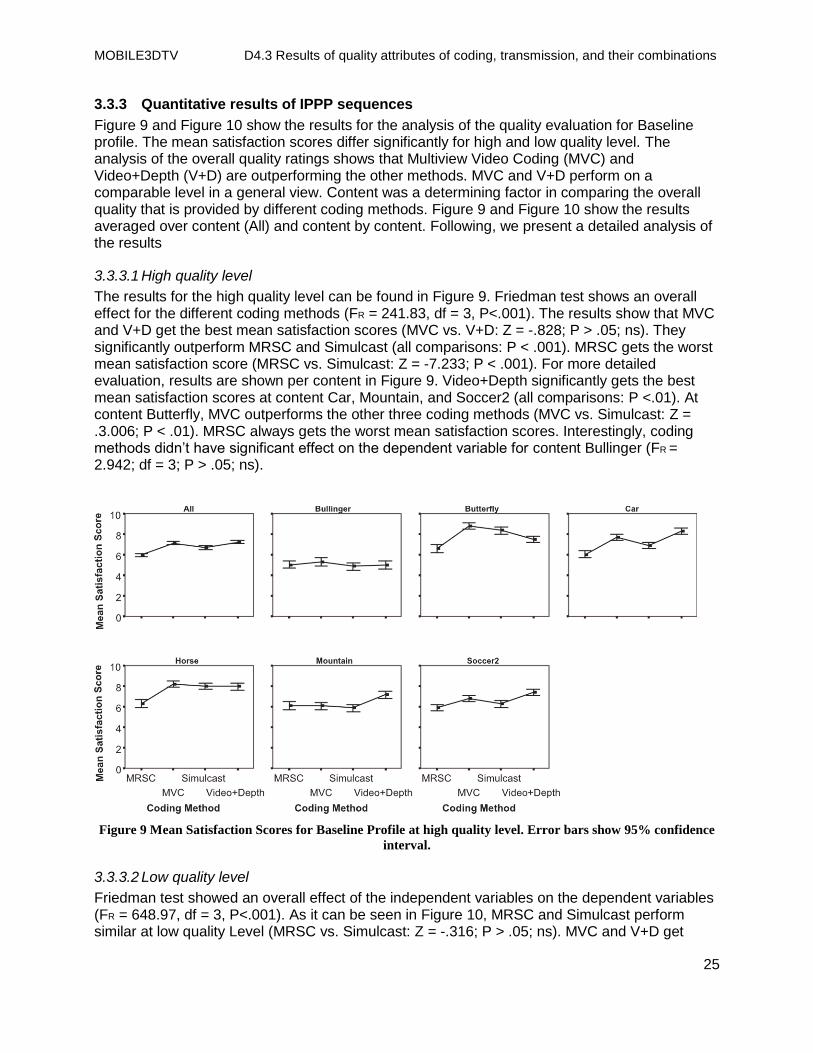
3.3.3 Quantitative results of IPPP sequences
Figure 9 and Figure 10 show the results for the analysis of the quality evaluation for Baseline profile. The mean satisfaction scores differ significantly for high and low quality level. The analysis of the overall quality ratings shows that Multiview Video Coding (MVC) and Video+Depth (V+D) are outperforming the other methods. MVC and V+D perform on a comparable level in a general view. Content was a determining factor in comparing the overall quality that is provided by different coding methods. Figure 9 and Figure 10 show the results averaged over content (All) and content by content. Following, we present a detailed analysis of the results
3.3.3.1 High quality level
The results for the high quality level can be found in Figure 9. Friedman test shows an overall effect for the different coding methods (FR = 241.83, df = 3, P<.001). The results show that MVC and V+D get the best mean satisfaction scores (MVC vs. V+D: Z = -.828; P > .05; ns). They significantly outperform MRSC and Simulcast (all comparisons: P < .001). MRSC gets the worst mean satisfaction score (MRSC vs. Simulcast: Z = -7.233; P < .001). For more detailed evaluation, results are shown per content in Figure 9. Video+Depth significantly gets the best mean satisfaction scores at content Car, Mountain, and Soccer2 (all comparisons: P <.01). At content Butterfly, MVC outperforms the other three coding methods (MVC vs. Simulcast: Z = .3.006; P < .01). MRSC always gets the worst mean satisfaction scores. Interestingly, coding methods didn‟t have significant effect on the dependent variable for content Bullinger (FR = 2.942; df = 3; P > .05; ns).
Figure 9 Mean Satisfaction Scores for Baseline Profile at high quality level. Error bars show 95% confidence
interval.
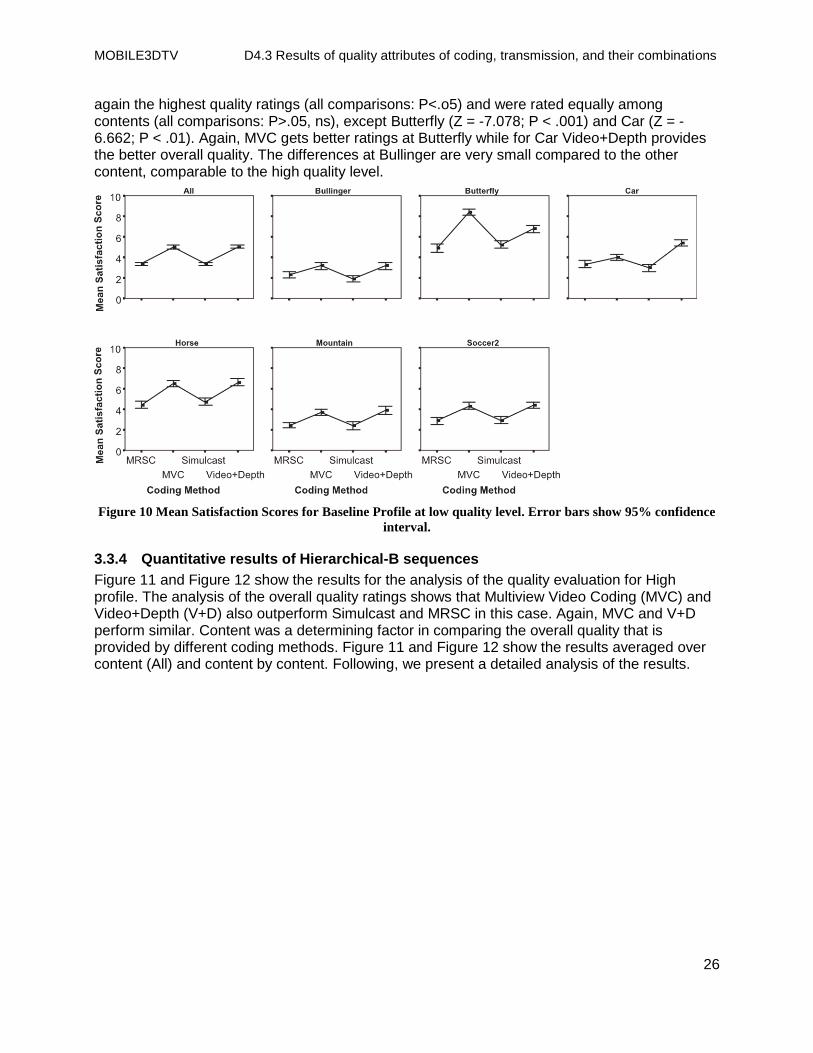
3.3.3.2 Low quality level
Friedman test showed an overall effect of the independent variables on the dependent variables (FR = 648.97, df = 3, P<.001). As it can be seen in Figure 10, MRSC and Simulcast perform similar at low quality Level (MRSC vs. Simulcast: Z = -.316; P > .05; ns). MVC and V+D get
MOBILE3DTV D4.3 Results of quality attributes of coding, transmission, and their combinations
26
again the highest quality ratings (all comparisons: P<.o5) and were rated equally among contents (all comparisons: P>.05, ns), except Butterfly (Z = -7.078; P < .001) and Car (Z = -6.662; P < .01). Again, MVC gets better ratings at Butterfly while for Car Video+Depth provides the better overall quality. The differences at Bullinger are very small compared to the other content, comparable to the high quality level.
Figure 10 Mean Satisfaction Scores for Baseline Profile at low quality level. Error bars show 95% confidence
interval.
3.3.4 Quantitative results of Hierarchical-B sequences
Figure 11 and Figure 12 show the results for the analysis of the quality evaluation for High profile. The analysis of the overall quality ratings shows that Multiview Video Coding (MVC) and Video+Depth (V+D) also outperform Simulcast and MRSC in this case. Again, MVC and V+D perform similar. Content was a determining factor in comparing the overall quality that is provided by different coding methods. Figure 11 and Figure 12 show the results averaged over content (All) and content by content. Following, we present a detailed analysis of the results.
MOBILE3DTV D4.3 Results of quality attributes of coding, transmission, and their combinations
27
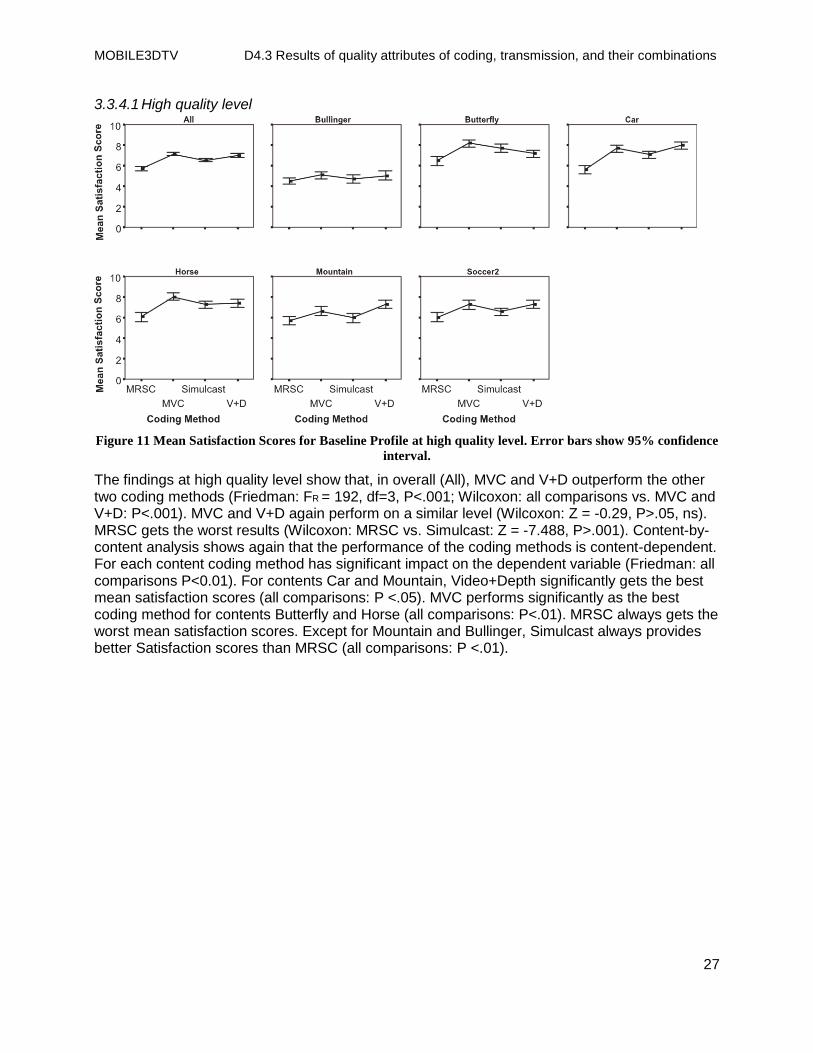
3.3.4.1 High quality level
Figure 11 Mean Satisfaction Scores for Baseline Profile at high quality level. Error bars show 95% confidence
interval.
The findings at high quality level show that, in overall (All), MVC and V+D outperform the other two coding methods (Friedman: FR = 192, df=3, P<.001; Wilcoxon: all comparisons vs. MVC and V+D: P<.001). MVC and V+D again perform on a similar level (Wilcoxon: Z = -0.29, P>.05, ns). MRSC gets the worst results (Wilcoxon: MRSC vs. Simulcast: Z = -7.488, P>.001). Content-by-content analysis shows again that the performance of the coding methods is content-dependent. For each content coding method has significant impact on the dependent variable (Friedman: all comparisons P<0.01). For contents Car and Mountain, Video+Depth significantly gets the best mean satisfaction scores (all comparisons: P <.05). MVC performs significantly as the best coding method for contents Butterfly and Horse (all comparisons: P<.01). MRSC always gets the worst mean satisfaction scores. Except for Mountain and Bullinger, Simulcast always provides better Satisfaction scores than MRSC (all comparisons: P <.01).
MOBILE3DTV D4.3 Results of quality attributes of coding, transmission, and their combinations
28
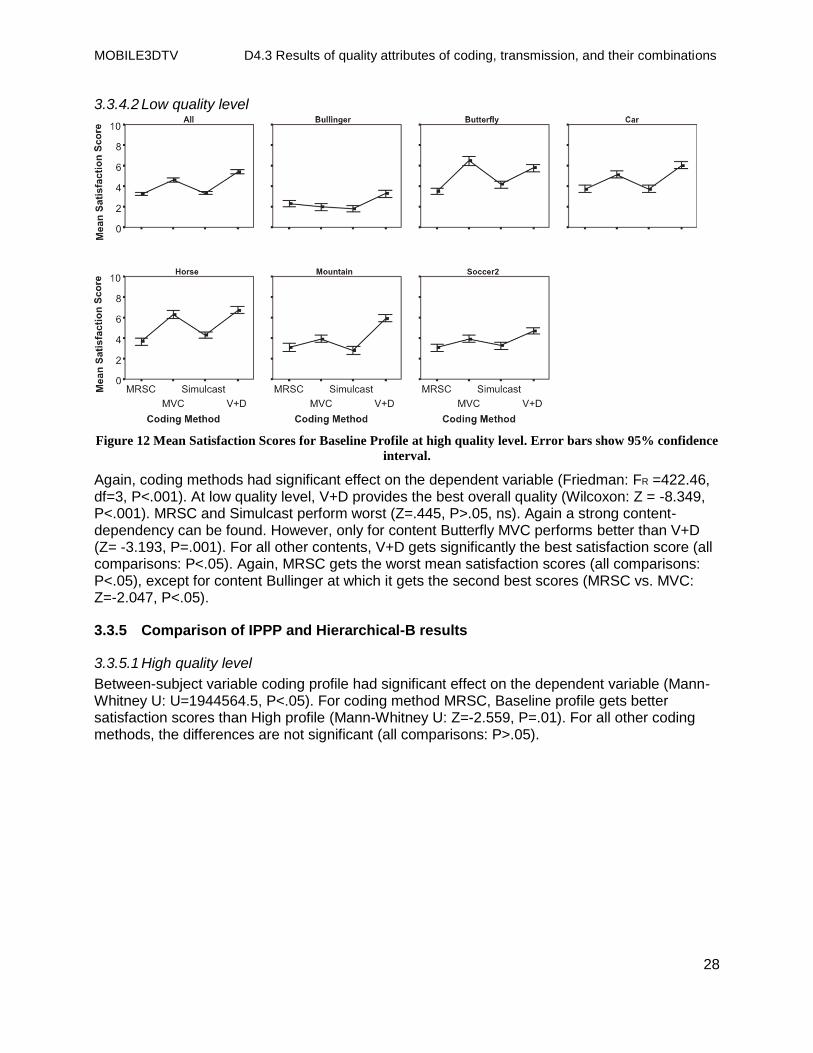
3.3.4.2 Low quality level
Figure 12 Mean Satisfaction Scores for Baseline Profile at high quality level. Error bars show 95% confidence
interval.
Again, coding methods had significant effect on the dependent variable (Friedman: FR =422.46, df=3, P<.001). At low quality level, V+D provides the best overall quality (Wilcoxon: Z = -8.349, P<.001). MRSC and Simulcast perform worst (Z=.445, P>.05, ns). Again a strong content-dependency can be found. However, only for content Butterfly MVC performs better than V+D (Z= -3.193, P=.001). For all other contents, V+D gets significantly the best satisfaction score (all comparisons: P<.05). Again, MRSC gets the worst mean satisfaction scores (all comparisons: P<.05), except for content Bullinger at which it gets the second best scores (MRSC vs. MVC: Z=-2.047, P<.05).
3.3.5 Comparison of IPPP and Hierarchical-B results
3.3.5.1 High quality level
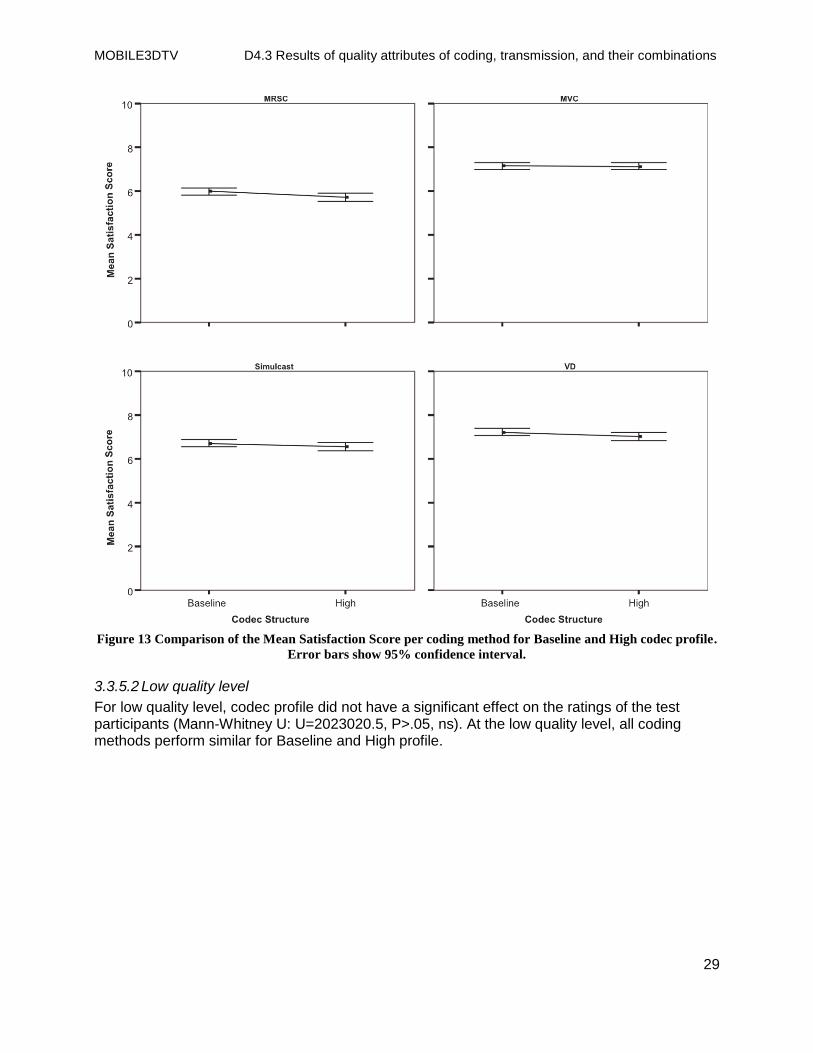
Between-subject variable coding profile had significant effect on the dependent variable (Mann-Whitney U: U=1944564.5, P<.05). For coding method MRSC, Baseline profile gets better satisfaction scores than High profile (Mann-Whitney U: Z=-2.559, P=.01). For all other coding methods, the differences are not significant (all comparisons: P>.05).
MOBILE3DTV D4.3 Results of quality attributes of coding, transmission, and their combinations
29
Figure 13 Comparison of the Mean Satisfaction Score per coding method for Baseline and High codec profile.
Error bars show 95% confidence interval.
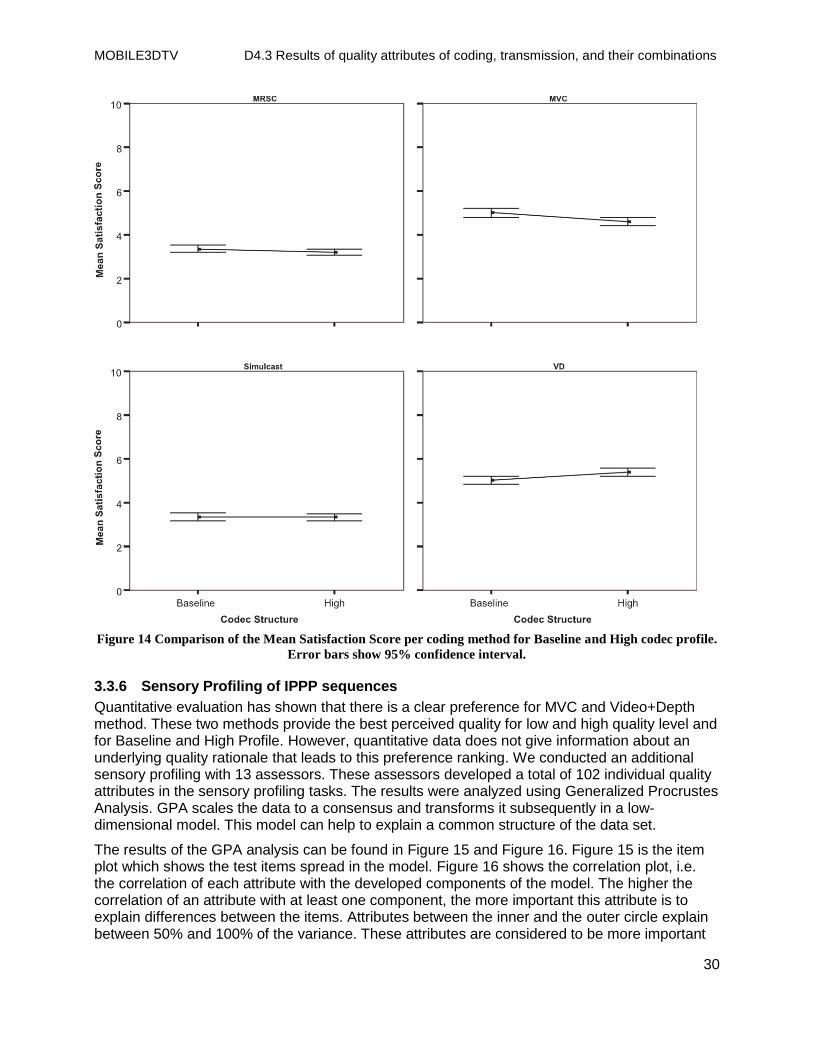
3.3.5.2 Low quality level
For low quality level, codec profile did not have a significant effect on the ratings of the test participants (Mann-Whitney U: U=2023020.5, P>.05, ns). At the low quality level, all coding methods perform similar for Baseline and High profile.
MOBILE3DTV D4.3 Results of quality attributes of coding, transmission, and their combinations
30
Figure 14 Comparison of the Mean Satisfaction Score per coding method for Baseline and High codec profile.
Error bars show 95% confidence interval.
3.3.6 Sensory Profiling of IPPP sequences
Quantitative evaluation has shown that there is a clear preference for MVC and Video+Depth method. These two methods provide the best perceived quality for low and high quality level and for Baseline and High Profile. However, quantitative data does not give information about an underlying quality rationale that leads to this preference ranking. We conducted an additional sensory profiling with 13 assessors. These assessors developed a total of 102 individual quality attributes in the sensory profiling tasks. The results were analyzed using Generalized Procrustes Analysis. GPA scales the data to a consensus and transforms it subsequently in a low-dimensional model. This model can help to explain a common structure of the data set.
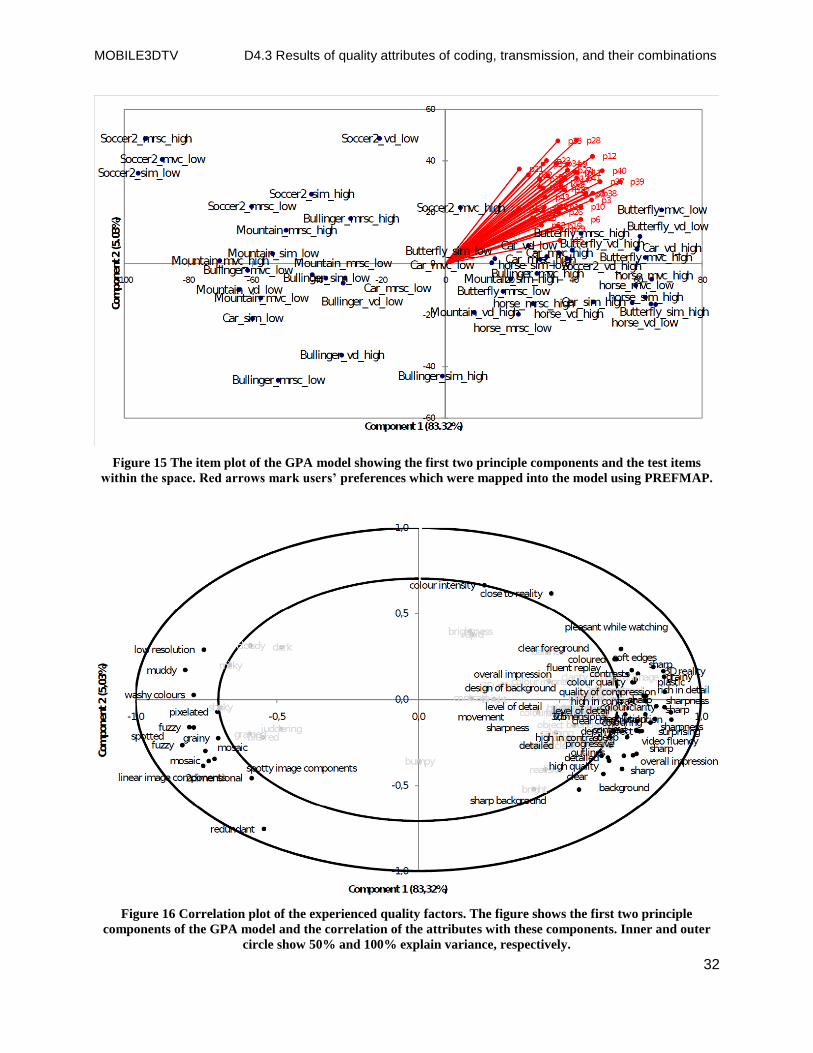
The results of the GPA analysis can be found in Figure 15 and Figure 16. Figure 15 is the item plot which shows the test items spread in the model. Figure 16 shows the correlation plot, i.e. the correlation of each attribute with the developed components of the model. The higher the correlation of an attribute with at least one component, the more important this attribute is to explain differences between the items. Attributes between the inner and the outer circle explain between 50% and 100% of the variance. These attributes are considered to be more important
MOBILE3DTV D4.3 Results of quality attributes of coding, transmission, and their combinations
31
and so are more emphasized in the following interpretation. The first two components of the GPA model have 88.36% explained variance. To understand the meaning of the model, the first goal is to identify the resulting components. Having a look at the correlation plot it can be seen that component 1 correlates on negative polarity with attributes like ‟blurry‟, ‟blocky‟, or ‟grainy‟. In contrast, its positive polarity shows high correlation with attributes like ‟sharp‟, ‟detailed‟, and ‟resolution‟. By interpreting the attributes this component seems to describe bad and good video quality. In addition, it contains descriptions of the kind of artifacts that people perceive. The second dimension can be identified from the item distribution in Figure 15. While static test content (Bullinger, Mountain, Horse) is located on the negative polarity, content with high motion can be found on the opposite side.
Interestingly, there is no model component that describes depth and its perception. The correlation plot shows that 3D-related attributes like ‟spacious‟, ‟3D reality‟, or ‟background depth‟ correlate with the positive polarity of component 1. No depth-related attributes can be found on its negative polarity. Depth impression only seems to contribute to quality perception if the perceivable level of artifacts is low. If the video quality is low due to coding artifacts, then this quality degradation will exceed the additional value provided by the stereoscopic video presentation. Finally, we can see from the profile that there participants cannot differentiate different coding structures. The model shows that perceived quality is depending on a combination of content, its characteristics (especially motion), existing artifacts, and, in case of high video quality, depth perception.
The final step of analysis lets us combine users‟ quality preference and the sensory profile using EPM. The arrows in Figure 4 mark the assessors‟ preferences. Expectedly, it shows a clear preference structure for artifact-free content. The best-rated sequences (c.f. Figure 2 and Figure 3) highly correlate with component 1. Least preferred items are all Bullinger clips at the opposite side of the arrows. It can also be seen that the Bullinger clips correlate with an attribute called „redundant‟. Although this attribute was only mentioned once it might give us some hints. Quantitative analysis has shown that differences between coding methods are rather small for content Bullinger. The „redundancy‟ of the Bullinger items may show that participants evaluated the content on a more affective level, not on its provided quality.
MOBILE3DTV D4.3 Results of quality attributes of coding, transmission, and their combinations
32
Figure 15 The item plot of the GPA model showing the first two principle components and the test items
within the space. Red arrows mark users’ preferences which were mapped into the model using PREFMAP.
Figure 16 Correlation plot of the experienced quality factors. The figure shows the first two principle
components of the GPA model and the correlation of the attributes with these components. Inner and outer
circle show 50% and 100% explain variance, respectively.
MOBILE3DTV D4.3 Results of quality attributes of coding, transmission, and their combinations
33
3.4 Discussion and Conclusion The goal of this study was to find an optimum coding method for mobile 3D television and video systems. We compared current coding approach taking into account Video+Video as well as Video+Depth approaches. Two different coding profiles were selected to get results for currently limited calculation power of mobile devices (Baseline profile) as well as for prospective mobile devices with increased calculation power. These devices are supposed to be able to handle more complex coding structures (High profile). Related to the DVB-H channel the coding approaches were evaluated at two different quality levels which were related with a high and a low bit rate (c.f. Table 5).
Evaluation of general quality acceptance for watching the content of mobile devices was at least 60% for all cases. This showed a relatively high general quality level compared to other studies [21]. The satisfaction results showed that Multiview Coding and Video+Depth provide the best overall quality. The two methods represent contrary methods in the coding of 3D video. While MVC uses inter- and intraview dependences of the two video streams (left and right eye), the Video+Depth approach renders virtual videos from a given view and its depth map. Our results show that the performance of the coding methods strongly depends on the content and its characteristics. The results showed also that the baseline and high profiles were equally evaluated. However, using High profile, i.e hierarchical-B pictures and CABAC, uses less bit rate to provide comparable quality. These findings are promising for the future when mobile devices‟ calculation power will increase.
A second goal of the study was the application of sensory profiling. The use of OPQ method allowed us to collect individual quality factors. With the help of the profiles we were able to understand rationale used to evaluate experienced quality. The results showed that for 3D video artifacts are still the determining quality factor. Expected added value through depth perception was rarely mentioned by the test participants. When added value of 3D was mentioned it was connected to the artifact-free video. These results are in line with previous studies [40]. Depth perception and artifacts are both determining 3D quality perception. In contrast to Seuntïens‟ model [39], our profiles showed a hierarchical dependency between depth perception and artifacts. When the visibility of artifacts is low, depth perception seems to contribute to the added value of 3D.
The results show that 3D quality and its perception depends on several factors that interact with each other. Importance of these factors (video quality, depth) seems to change depending on the provided video quality. The expected added value provided by the depth impression only enhances users‟ quality perception when artifacts are low in the presented material. Sensory Profiling techniques such as the presented Open Profiling of Quality approach are a promising way to be able to detect these quality models holistically by giving the test participants full freedom in describing their quality sensation.
To conclude, for the further development of 3D television, Multiview Coding and Video+Depth are the preferred coding methods. Although current devices still don‟t have the calculation power to handle complex coding structures, the application of hierarchical-B pictures is a promising approach for future applications. The development of optimized coding methods for mobile 3D television and video must target artifact-free videos so that the depth perception can result in an added value.
MOBILE3DTV D4.3 Results of quality attributes of coding, transmission, and their combinations
34
4 Study 2: Impact of transmission parameters on the perceived quality of encoded mobile 3D television and video sequences
4.1 Research Method
4.1.1 Participants
77 participants (age: 16-56, mean: 24) took part in this study. All participants were recruited following the same procedure presented in section 3.2.1. The sample consisted of almost only naive participants who didn't have any previous experience in quality assessments. 3 participants took part in a quality evaluation before, one of them even regularly. All participants were no professionals in the field of multimedia technology. No participant reported Simulator Sickness symptoms in the test. Simulator Sickness was again measured using Simulator Sickness Questionnaire.
4.1.2 Test procedure
Absolute Category Rating (ACR) was chosen as test method for this study according to [12]. Two parameters, acceptance of overall quality and overall quality were rated for every item retrospectively and independent. Acceptance was rated on a binary yes-no-scale and overall quality was rated on a 11-point unlabeled scale. The test started with a familiarization phase, in which participant were shown 4 videos (one of each content) to familiarize the participants with the technology and the display. Afterwards, 10 items were presented and rated in a training phase. In the actual evaluation phase 32 items were rated twice. Item presentation order was randomized to avoid bias effects. The whole test (including pre-tests, demographic survey and ssq) took 120 minutes.
4.1.3 Test Material and Apparatus
The same test environment (the Listening lab at TUI) as for the coding study (c.f. section 3) was chosen for the test. Additionally, AKG K 450 headphones were connected to the laptop for sound reproduction.
4.1.4 Selection of test sequences
Four different contents were chosen for the study to the user requirements of mobile 3D television and video [22][43][44]. Due to the limited variety of available test stimuli for stereo mobile the selection of the test stimuli was a compromise between the requirements and available test content. Each video has a length of 60 seconds.
In addition to the user requirements the contents were chosen to represent a variation of different content parameters like spatial details (degree of detail in the content), temporal details (temporal changes in the content through camera movement or movement of the objects in the content), or depth complexity (amount of depth, depth structure. Table 6 shows the screenshots and descriptions of the four contents under assessment.
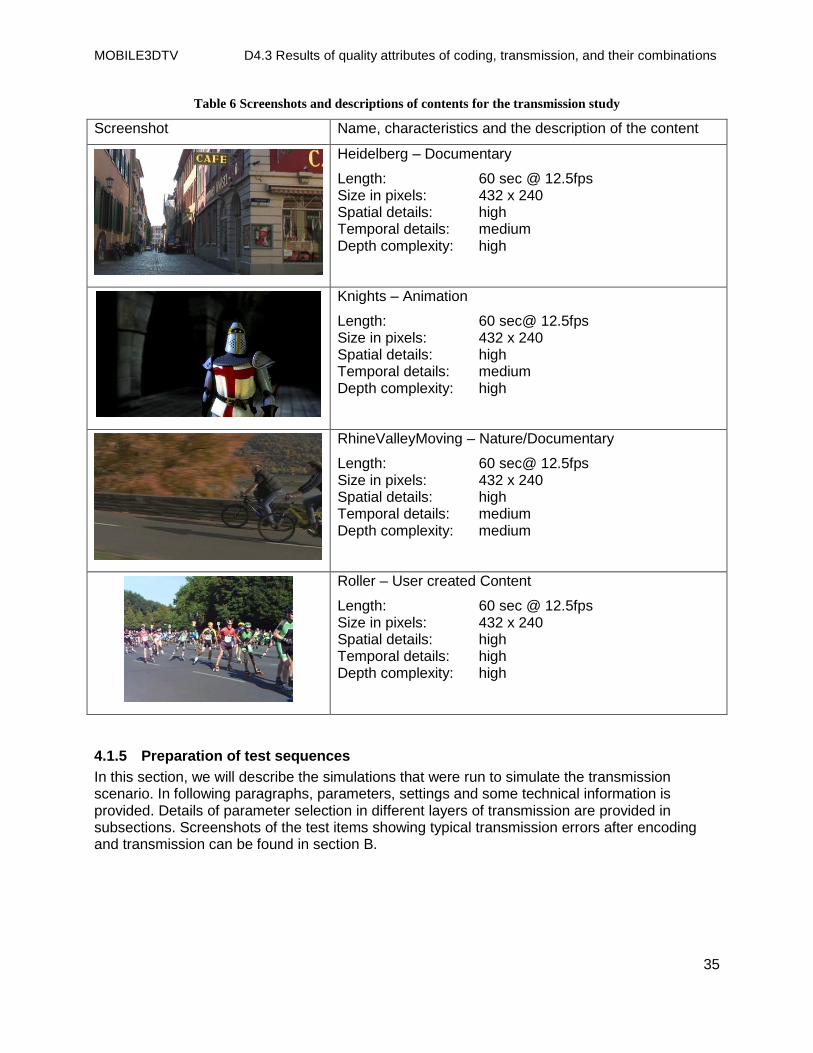
MOBILE3DTV D4.3 Results of quality attributes of coding, transmission, and their combinations
35
Table 6 Screenshots and descriptions of contents for the transmission study
Screenshot Name, characteristics and the description of the content
Heidelberg – Documentary
Length: 60 sec @ 12.5fps Size in pixels: 432 x 240 Spatial details: high Temporal details: medium Depth complexity: high
Knights – Animation
Length: 60 sec@ 12.5fps Size in pixels: 432 x 240 Spatial details: high Temporal details: medium Depth complexity: high
RhineValleyMoving – Nature/Documentary
Length: 60 sec@ 12.5fps Size in pixels: 432 x 240 Spatial details: high Temporal details: medium Depth complexity: medium
Roller – User created Content
Length: 60 sec @ 12.5fps Size in pixels: 432 x 240 Spatial details: high Temporal details: high Depth complexity: high
4.1.5 Preparation of test sequences
In this section, we will describe the simulations that were run to simulate the transmission scenario. In following paragraphs, parameters, settings and some technical information is provided. Details of parameter selection in different layers of transmission are provided in subsections. Screenshots of the test items showing typical transmission errors after encoding and transmission can be found in section B.
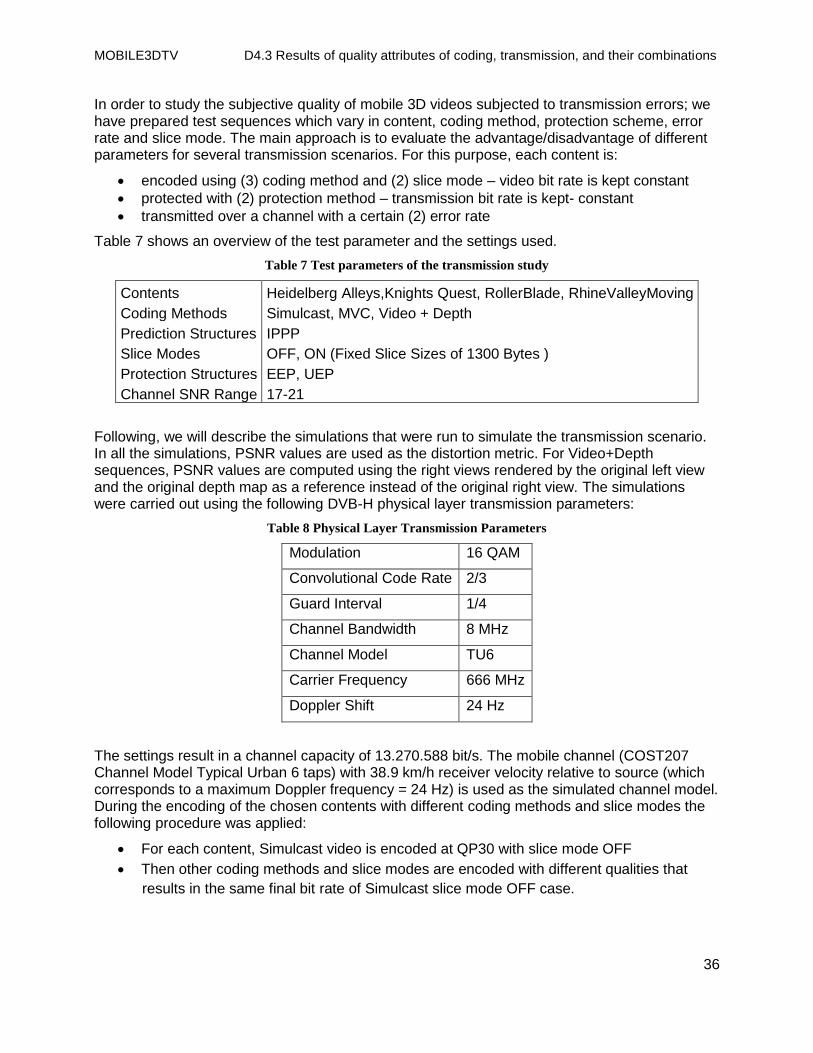
MOBILE3DTV D4.3 Results of quality attributes of coding, transmission, and their combinations
36
In order to study the subjective quality of mobile 3D videos subjected to transmission errors; we have prepared test sequences which vary in content, coding method, protection scheme, error rate and slice mode. The main approach is to evaluate the advantage/disadvantage of different parameters for several transmission scenarios. For this purpose, each content is:
encoded using (3) coding method and (2) slice mode – video bit rate is kept constant
protected with (2) protection method – transmission bit rate is kept- constant
transmitted over a channel with a certain (2) error rate
Table 7 shows an overview of the test parameter and the settings used.
Table 7 Test parameters of the transmission study
Contents Heidelberg Alleys,Knights Quest, RollerBlade, RhineValleyMoving
Coding Methods Simulcast, MVC, Video + Depth
Prediction Structures IPPP
Slice Modes OFF, ON (Fixed Slice Sizes of 1300 Bytes )
Protection Structures EEP, UEP
Channel SNR Range 17-21
Following, we will describe the simulations that were run to simulate the transmission scenario. In all the simulations, PSNR values are used as the distortion metric. For Video+Depth sequences, PSNR values are computed using the right views rendered by the original left view and the original depth map as a reference instead of the original right view. The simulations were carried out using the following DVB-H physical layer transmission parameters:
Table 8 Physical Layer Transmission Parameters
Modulation 16 QAM
Convolutional Code Rate 2/3
Guard Interval 1/4
Channel Bandwidth 8 MHz
Channel Model TU6
Carrier Frequency 666 MHz
Doppler Shift 24 Hz
The settings result in a channel capacity of 13.270.588 bit/s. The mobile channel (COST207 Channel Model Typical Urban 6 taps) with 38.9 km/h receiver velocity relative to source (which corresponds to a maximum Doppler frequency = 24 Hz) is used as the simulated channel model. During the encoding of the chosen contents with different coding methods and slice modes the following procedure was applied:
For each content, Simulcast video is encoded at QP30 with slice mode OFF
Then other coding methods and slice modes are encoded with different qualities that
results in the same final bit rate of Simulcast slice mode OFF case.
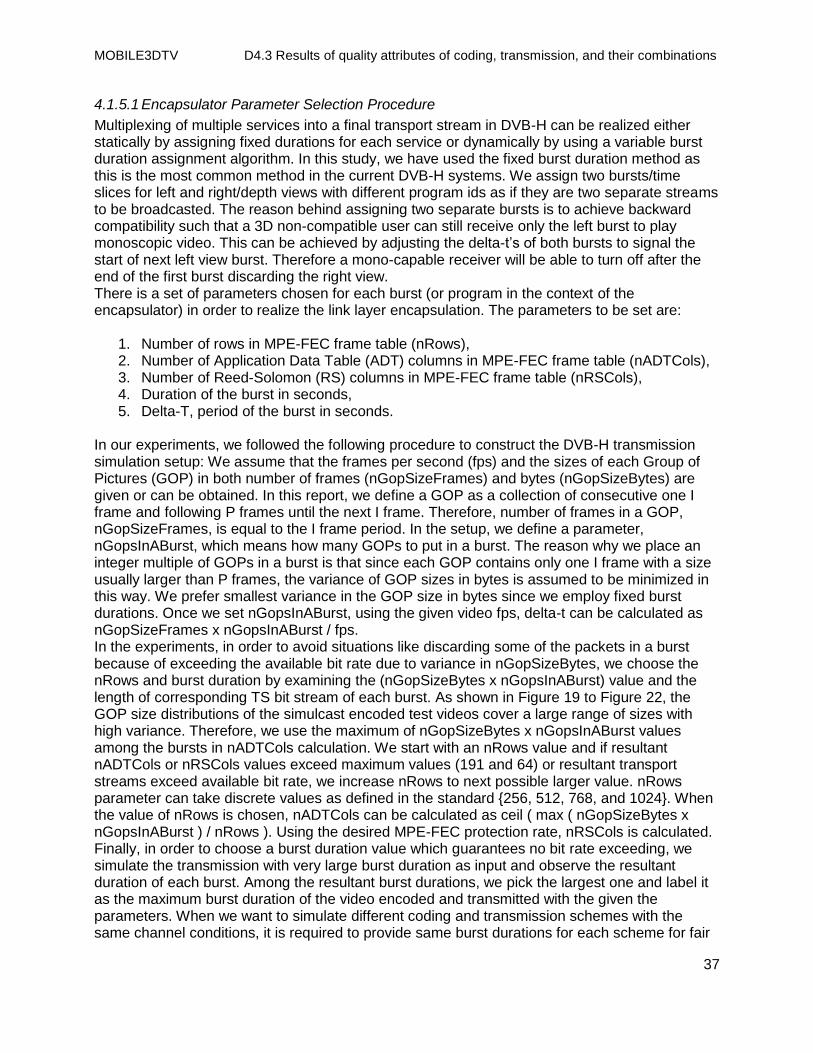
MOBILE3DTV D4.3 Results of quality attributes of coding, transmission, and their combinations
37
4.1.5.1 Encapsulator Parameter Selection Procedure
Multiplexing of multiple services into a final transport stream in DVB-H can be realized either statically by assigning fixed durations for each service or dynamically by using a variable burst duration assignment algorithm. In this study, we have used the fixed burst duration method as this is the most common method in the current DVB-H systems. We assign two bursts/time slices for left and right/depth views with different program ids as if they are two separate streams to be broadcasted. The reason behind assigning two separate bursts is to achieve backward compatibility such that a 3D non-compatible user can still receive only the left burst to play monoscopic video. This can be achieved by adjusting the delta-t‟s of both bursts to signal the start of next left view burst. Therefore a mono-capable receiver will be able to turn off after the end of the first burst discarding the right view. There is a set of parameters chosen for each burst (or program in the context of the encapsulator) in order to realize the link layer encapsulation. The parameters to be set are:
1. Number of rows in MPE-FEC frame table (nRows), 2. Number of Application Data Table (ADT) columns in MPE-FEC frame table (nADTCols), 3. Number of Reed-Solomon (RS) columns in MPE-FEC frame table (nRSCols), 4. Duration of the burst in seconds, 5. Delta-T, period of the burst in seconds.
In our experiments, we followed the following procedure to construct the DVB-H transmission simulation setup: We assume that the frames per second (fps) and the sizes of each Group of Pictures (GOP) in both number of frames (nGopSizeFrames) and bytes (nGopSizeBytes) are given or can be obtained. In this report, we define a GOP as a collection of consecutive one I frame and following P frames until the next I frame. Therefore, number of frames in a GOP, nGopSizeFrames, is equal to the I frame period. In the setup, we define a parameter, nGopsInABurst, which means how many GOPs to put in a burst. The reason why we place an integer multiple of GOPs in a burst is that since each GOP contains only one I frame with a size usually larger than P frames, the variance of GOP sizes in bytes is assumed to be minimized in this way. We prefer smallest variance in the GOP size in bytes since we employ fixed burst durations. Once we set nGopsInABurst, using the given video fps, delta-t can be calculated as nGopSizeFrames x nGopsInABurst / fps. In the experiments, in order to avoid situations like discarding some of the packets in a burst because of exceeding the available bit rate due to variance in nGopSizeBytes, we choose the nRows and burst duration by examining the (nGopSizeBytes x nGopsInABurst) value and the length of corresponding TS bit stream of each burst. As shown in Figure 19 to Figure 22, the GOP size distributions of the simulcast encoded test videos cover a large range of sizes with high variance. Therefore, we use the maximum of nGopSizeBytes x nGopsInABurst values among the bursts in nADTCols calculation. We start with an nRows value and if resultant nADTCols or nRSCols values exceed maximum values (191 and 64) or resultant transport streams exceed available bit rate, we increase nRows to next possible larger value. nRows parameter can take discrete values as defined in the standard {256, 512, 768, and 1024}. When the value of nRows is chosen, nADTCols can be calculated as ceil ( max ( nGopSizeBytes x nGopsInABurst ) / nRows ). Using the desired MPE-FEC protection rate, nRSCols is calculated. Finally, in order to choose a burst duration value which guarantees no bit rate exceeding, we simulate the transmission with very large burst duration as input and observe the resultant duration of each burst. Among the resultant burst durations, we pick the largest one and label it as the maximum burst duration of the video encoded and transmitted with the given the parameters. When we want to simulate different coding and transmission schemes with the same channel conditions, it is required to provide same burst durations for each scheme for fair
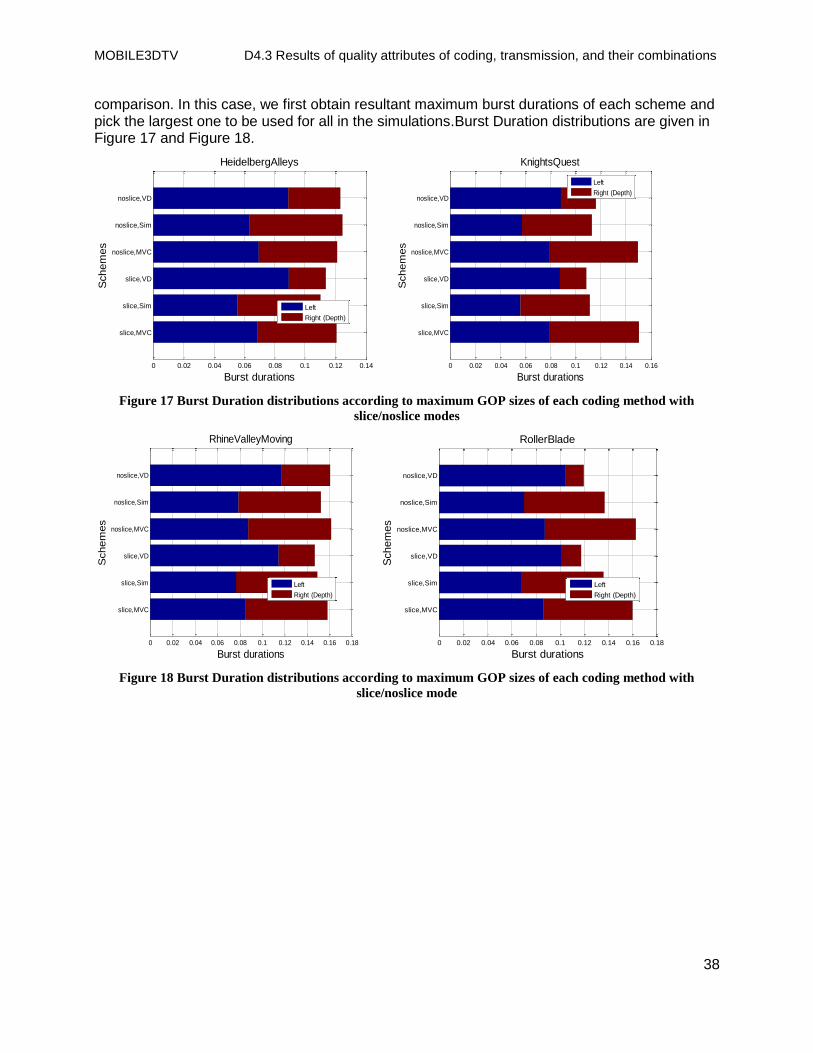
MOBILE3DTV D4.3 Results of quality attributes of coding, transmission, and their combinations
38
comparison. In this case, we first obtain resultant maximum burst durations of each scheme and pick the largest one to be used for all in the simulations.Burst Duration distributions are given in Figure 17 and Figure 18.
0 0.02 0.04 0.06 0.08 0.1 0.12 0.14
slice,MVC
slice,Sim
slice,VD
noslice,MVC
noslice,Sim
noslice,VD
Burst durations
Schem
es
HeidelbergAlleys
Left
Right (Depth)
0 0.02 0.04 0.06 0.08 0.1 0.12 0.14 0.16
slice,MVC
slice,Sim
slice,VD
noslice,MVC
noslice,Sim
noslice,VD
Burst durations
Schem
es
KnightsQuest
Left
Right (Depth)
Figure 17 Burst Duration distributions according to maximum GOP sizes of each coding method with
slice/noslice modes
0 0.02 0.04 0.06 0.08 0.1 0.12 0.14 0.16 0.18
slice,MVC
slice,Sim
slice,VD
noslice,MVC
noslice,Sim
noslice,VD
Burst durations
Schem
es
RhineValleyMoving
Left
Right (Depth)
0 0.02 0.04 0.06 0.08 0.1 0.12 0.14 0.16 0.18
slice,MVC
slice,Sim
slice,VD
noslice,MVC
noslice,Sim
noslice,VD
Burst durations
Schem
es
RollerBlade
Left
Right (Depth)
Figure 18 Burst Duration distributions according to maximum GOP sizes of each coding method with
slice/noslice mode
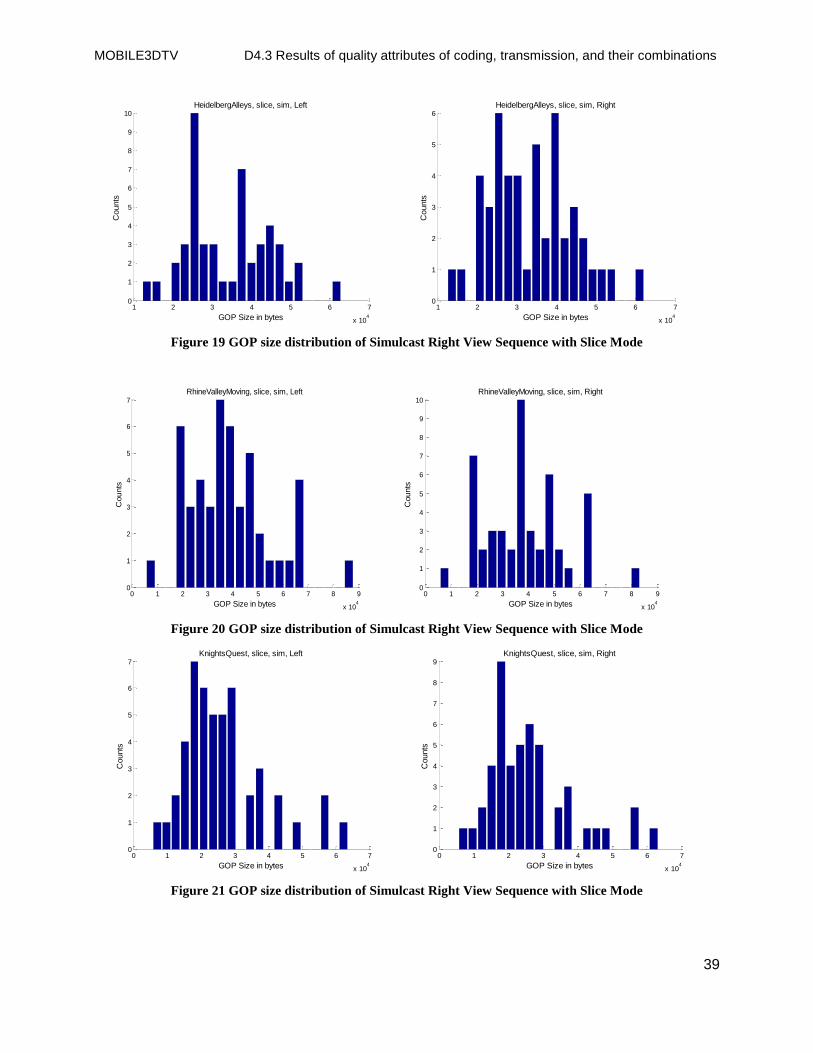
MOBILE3DTV D4.3 Results of quality attributes of coding, transmission, and their combinations
39
1 2 3 4 5 6 7
x 104
0
1
2
3
4
5
6
7
8
9
10HeidelbergAlleys, slice, sim, Left
GOP Size in bytes
Counts
1 2 3 4 5 6 7
x 104
0
1
2
3
4
5
6HeidelbergAlleys, slice, sim, Right
GOP Size in bytes
Counts
Figure 19 GOP size distribution of Simulcast Right View Sequence with Slice Mode
0 1 2 3 4 5 6 7 8 9
x 104
0
1
2
3
4
5
6
7RhineValleyMoving, slice, sim, Left
GOP Size in bytes
Counts
0 1 2 3 4 5 6 7 8 9
x 104
0
1
2
3
4
5
6
7
8
9
10RhineValleyMoving, slice, sim, Right
GOP Size in bytes
Counts
Figure 20 GOP size distribution of Simulcast Right View Sequence with Slice Mode
0 1 2 3 4 5 6 7
x 104
0
1
2
3
4
5
6
7KnightsQuest, slice, sim, Left
GOP Size in bytes
Counts
0 1 2 3 4 5 6 7
x 104
0
1
2
3
4
5
6
7
8
9KnightsQuest, slice, sim, Right
GOP Size in bytes
Counts
Figure 21 GOP size distribution of Simulcast Right View Sequence with Slice Mode
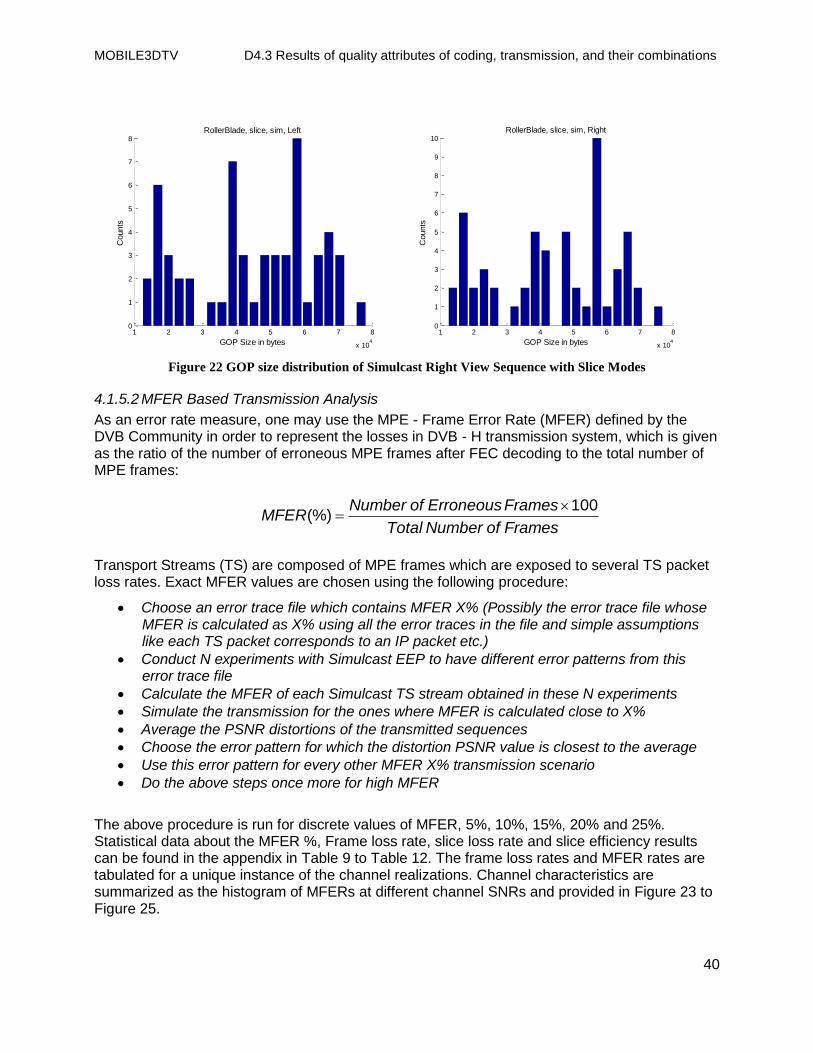
MOBILE3DTV D4.3 Results of quality attributes of coding, transmission, and their combinations
40
1 2 3 4 5 6 7 8
x 104
0
1
2
3
4
5
6
7
8RollerBlade, slice, sim, Left
GOP Size in bytes
Counts
1 2 3 4 5 6 7 8
x 104
0
1
2
3
4
5
6
7
8
9
10RollerBlade, slice, sim, Right
GOP Size in bytes
Counts
Figure 22 GOP size distribution of Simulcast Right View Sequence with Slice Modes
4.1.5.2 MFER Based Transmission Analysis
As an error rate measure, one may use the MPE - Frame Error Rate (MFER) defined by the DVB Community in order to represent the losses in DVB - H transmission system, which is given as the ratio of the number of erroneous MPE frames after FEC decoding to the total number of MPE frames:
100(%)
Number of ErroneousFramesMFER
Total Number of Frames
Transport Streams (TS) are composed of MPE frames which are exposed to several TS packet loss rates. Exact MFER values are chosen using the following procedure:
Choose an error trace file which contains MFER X% (Possibly the error trace file whose MFER is calculated as X% using all the error traces in the file and simple assumptions like each TS packet corresponds to an IP packet etc.)
Conduct N experiments with Simulcast EEP to have different error patterns from this error trace file
Calculate the MFER of each Simulcast TS stream obtained in these N experiments
Simulate the transmission for the ones where MFER is calculated close to X%
Average the PSNR distortions of the transmitted sequences
Choose the error pattern for which the distortion PSNR value is closest to the average
Use this error pattern for every other MFER X% transmission scenario
Do the above steps once more for high MFER
The above procedure is run for discrete values of MFER, 5%, 10%, 15%, 20% and 25%. Statistical data about the MFER %, Frame loss rate, slice loss rate and slice efficiency results can be found in the appendix in Table 9 to Table 12. The frame loss rates and MFER rates are tabulated for a unique instance of the channel realizations. Channel characteristics are summarized as the histogram of MFERs at different channel SNRs and provided in Figure 23 to Figure 25.
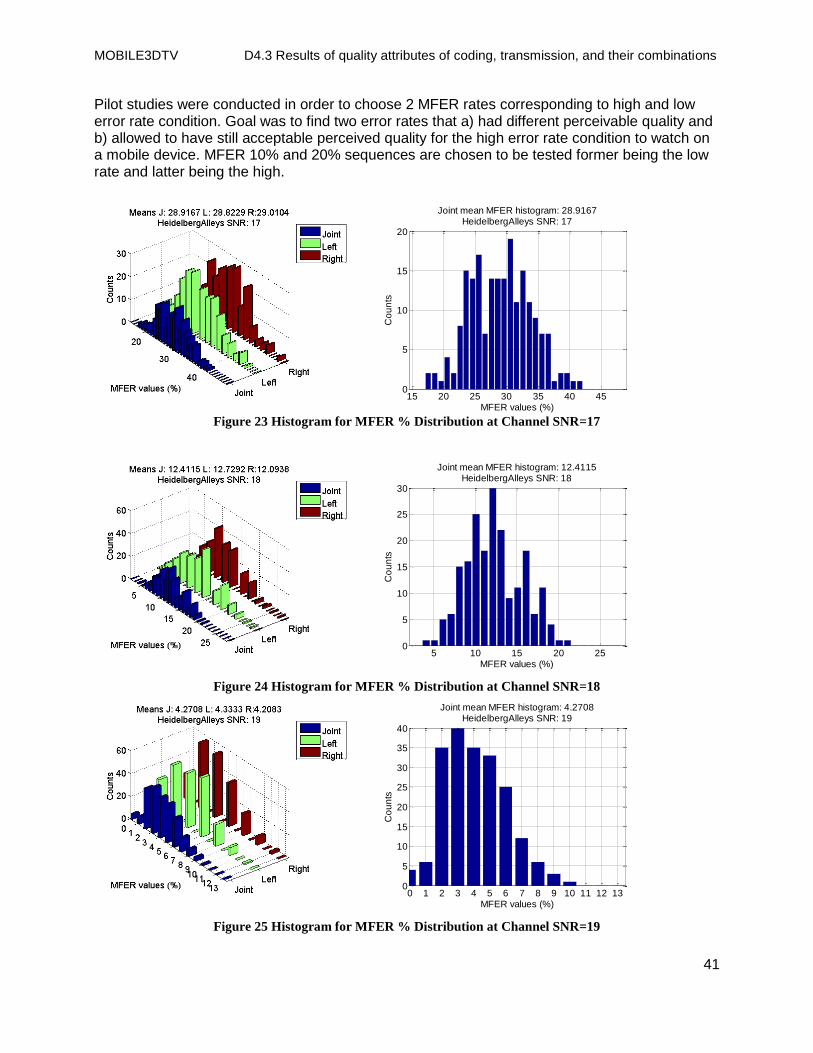
MOBILE3DTV D4.3 Results of quality attributes of coding, transmission, and their combinations
41
Pilot studies were conducted in order to choose 2 MFER rates corresponding to high and low error rate condition. Goal was to find two error rates that a) had different perceivable quality and b) allowed to have still acceptable perceived quality for the high error rate condition to watch on a mobile device. MFER 10% and 20% sequences are chosen to be tested former being the low rate and latter being the high.
15 20 25 30 35 40 450
5
10
15
20
Joint mean MFER histogram: 28.9167HeidelbergAlleys SNR: 17
MFER values (%)
Co
un
ts
Figure 23 Histogram for MFER % Distribution at Channel SNR=17
5 10 15 20 250
5
10
15
20
25
30
Joint mean MFER histogram: 12.4115HeidelbergAlleys SNR: 18
MFER values (%)
Co
un
ts
Figure 24 Histogram for MFER % Distribution at Channel SNR=18
0 1 2 3 4 5 6 7 8 9 10 11 12 130
5
10
15
20
25
30
35
40
Joint mean MFER histogram: 4.2708HeidelbergAlleys SNR: 19
MFER values (%)
Co
un
ts
Figure 25 Histogram for MFER % Distribution at Channel SNR=19
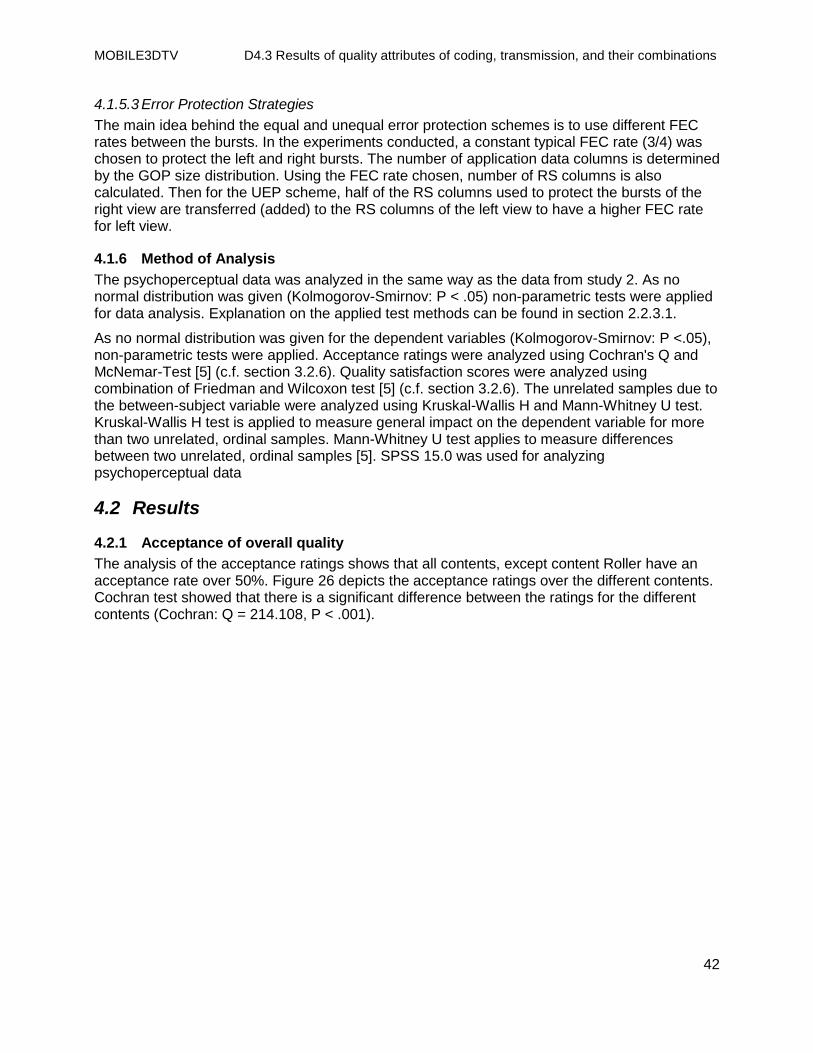
MOBILE3DTV D4.3 Results of quality attributes of coding, transmission, and their combinations
42
4.1.5.3 Error Protection Strategies
The main idea behind the equal and unequal error protection schemes is to use different FEC rates between the bursts. In the experiments conducted, a constant typical FEC rate (3/4) was chosen to protect the left and right bursts. The number of application data columns is determined by the GOP size distribution. Using the FEC rate chosen, number of RS columns is also calculated. Then for the UEP scheme, half of the RS columns used to protect the bursts of the right view are transferred (added) to the RS columns of the left view to have a higher FEC rate for left view.
4.1.6 Method of Analysis
The psychoperceptual data was analyzed in the same way as the data from study 2. As no normal distribution was given (Kolmogorov-Smirnov: P < .05) non-parametric tests were applied for data analysis. Explanation on the applied test methods can be found in section 2.2.3.1.
As no normal distribution was given for the dependent variables (Kolmogorov-Smirnov: P <.05), non-parametric tests were applied. Acceptance ratings were analyzed using Cochran's Q and McNemar-Test [5] (c.f. section 3.2.6). Quality satisfaction scores were analyzed using combination of Friedman and Wilcoxon test [5] (c.f. section 3.2.6). The unrelated samples due to the between-subject variable were analyzed using Kruskal-Wallis H and Mann-Whitney U test. Kruskal-Wallis H test is applied to measure general impact on the dependent variable for more than two unrelated, ordinal samples. Mann-Whitney U test applies to measure differences between two unrelated, ordinal samples [5]. SPSS 15.0 was used for analyzing psychoperceptual data
4.2 Results
4.2.1 Acceptance of overall quality
The analysis of the acceptance ratings shows that all contents, except content Roller have an acceptance rate over 50%. Figure 26 depicts the acceptance ratings over the different contents. Cochran test showed that there is a significant difference between the ratings for the different contents (Cochran: Q = 214.108, P < .001).
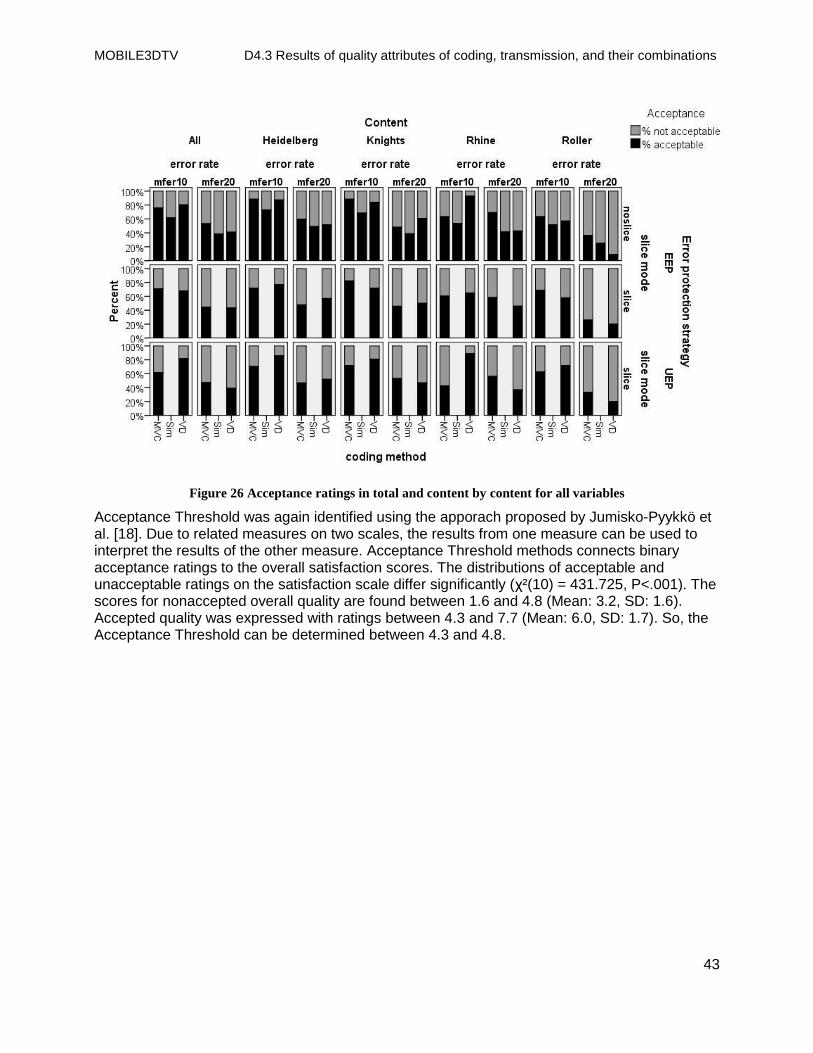
MOBILE3DTV D4.3 Results of quality attributes of coding, transmission, and their combinations
43
Figure 26 Acceptance ratings in total and content by content for all variables
Acceptance Threshold was again identified using the apporach proposed by Jumisko-Pyykkö et al. [18]. Due to related measures on two scales, the results from one measure can be used to interpret the results of the other measure. Acceptance Threshold methods connects binary acceptance ratings to the overall satisfaction scores. The distributions of acceptable and unacceptable ratings on the satisfaction scale differ significantly (χ²(10) = 431.725, P<.001). The scores for nonaccepted overall quality are found between 1.6 and 4.8 (Mean: 3.2, SD: 1.6). Accepted quality was expressed with ratings between 4.3 and 7.7 (Mean: 6.0, SD: 1.7). So, the Acceptance Threshold can be determined between 4.3 and 4.8.
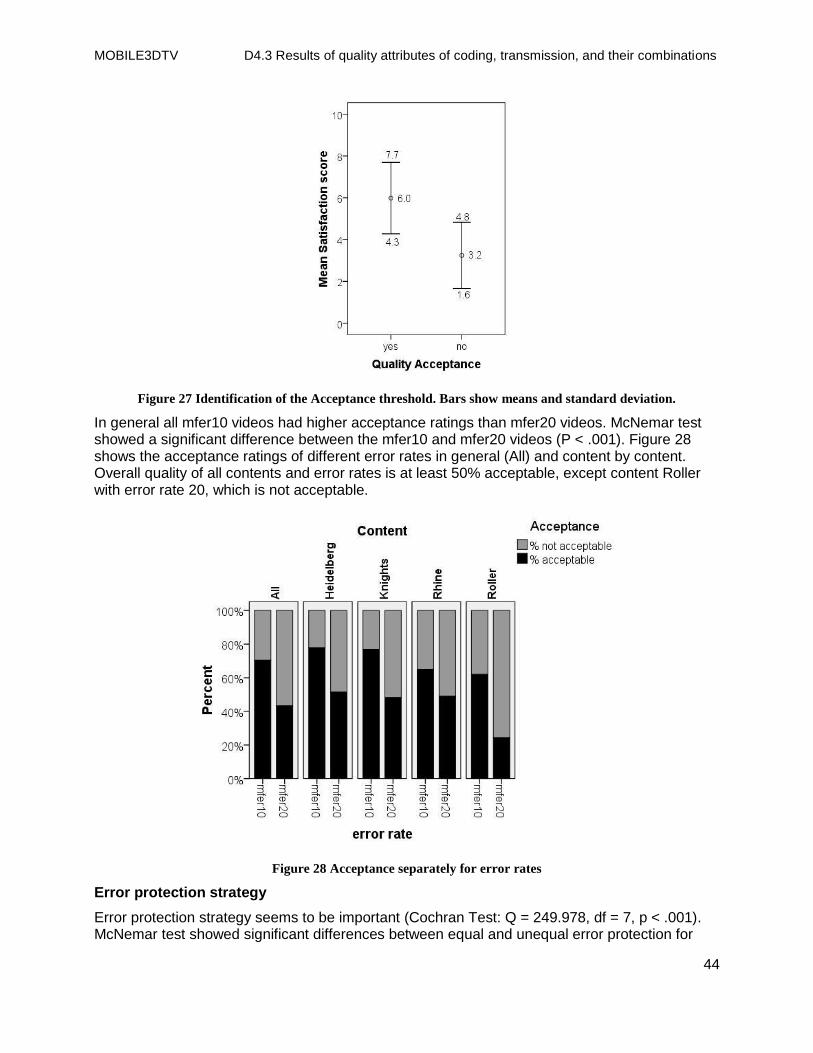
MOBILE3DTV D4.3 Results of quality attributes of coding, transmission, and their combinations
44
Figure 27 Identification of the Acceptance threshold. Bars show means and standard deviation.
In general all mfer10 videos had higher acceptance ratings than mfer20 videos. McNemar test showed a significant difference between the mfer10 and mfer20 videos (P < .001). Figure 28 shows the acceptance ratings of different error rates in general (All) and content by content. Overall quality of all contents and error rates is at least 50% acceptable, except content Roller with error rate 20, which is not acceptable.
Figure 28 Acceptance separately for error rates
Error protection strategy
Error protection strategy seems to be important (Cochran Test: Q = 249.978, df = 7, p < .001). McNemar test showed significant differences between equal and unequal error protection for
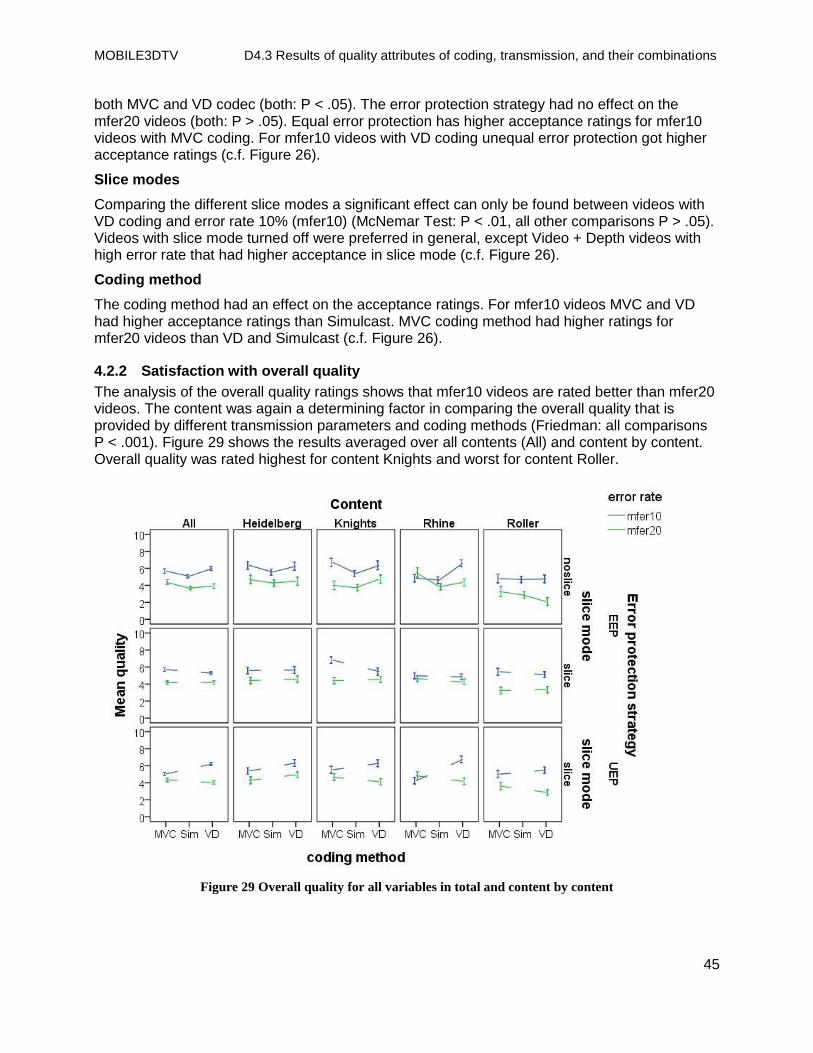
MOBILE3DTV D4.3 Results of quality attributes of coding, transmission, and their combinations
45
both MVC and VD codec (both: P < .05). The error protection strategy had no effect on the mfer20 videos (both: P > .05). Equal error protection has higher acceptance ratings for mfer10 videos with MVC coding. For mfer10 videos with VD coding unequal error protection got higher acceptance ratings (c.f. Figure 26).
Slice modes
Comparing the different slice modes a significant effect can only be found between videos with VD coding and error rate 10% (mfer10) (McNemar Test: P < .01, all other comparisons P > .05). Videos with slice mode turned off were preferred in general, except Video + Depth videos with high error rate that had higher acceptance in slice mode (c.f. Figure 26).
Coding method
The coding method had an effect on the acceptance ratings. For mfer10 videos MVC and VD had higher acceptance ratings than Simulcast. MVC coding method had higher ratings for mfer20 videos than VD and Simulcast (c.f. Figure 26).
4.2.2 Satisfaction with overall quality
The analysis of the overall quality ratings shows that mfer10 videos are rated better than mfer20 videos. The content was again a determining factor in comparing the overall quality that is provided by different transmission parameters and coding methods (Friedman: all comparisons P < .001). Figure 29 shows the results averaged over all contents (All) and content by content. Overall quality was rated highest for content Knights and worst for content Roller.
Figure 29 Overall quality for all variables in total and content by content
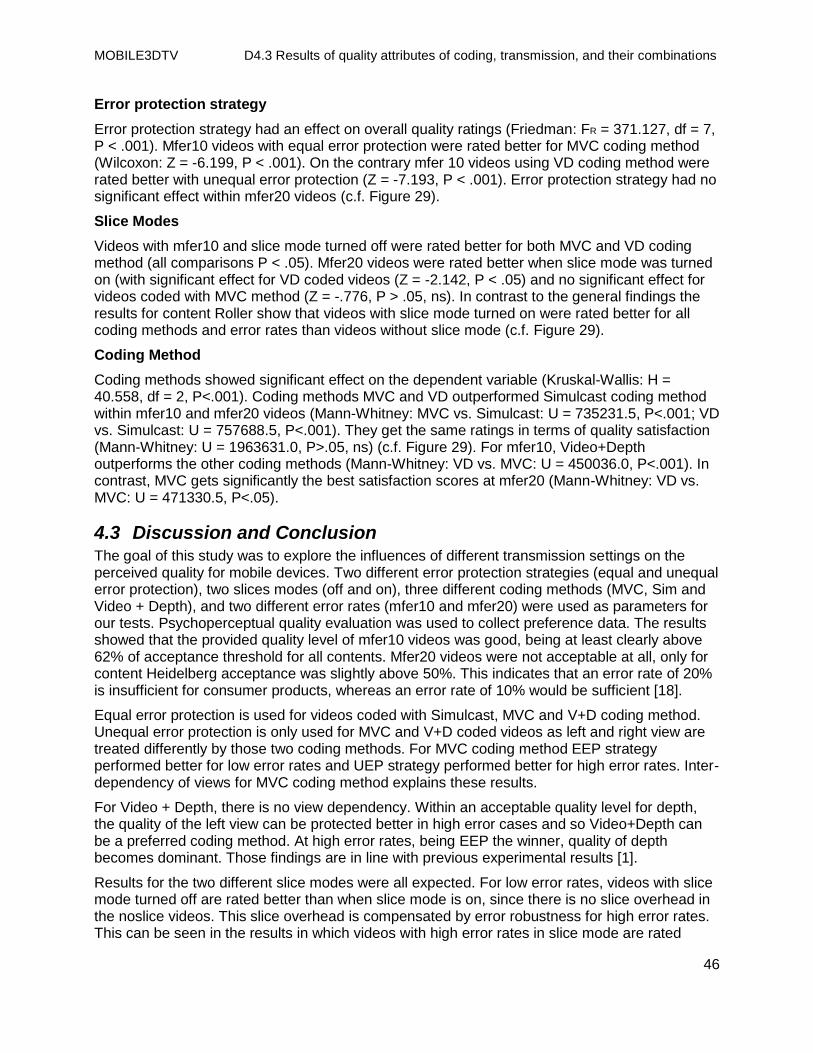
MOBILE3DTV D4.3 Results of quality attributes of coding, transmission, and their combinations
46
Error protection strategy
Error protection strategy had an effect on overall quality ratings (Friedman: FR = 371.127, df = 7, P < .001). Mfer10 videos with equal error protection were rated better for MVC coding method (Wilcoxon: Z = -6.199, P < .001). On the contrary mfer 10 videos using VD coding method were rated better with unequal error protection (Z = -7.193, P < .001). Error protection strategy had no significant effect within mfer20 videos (c.f. Figure 29).
Slice Modes
Videos with mfer10 and slice mode turned off were rated better for both MVC and VD coding method (all comparisons P < .05). Mfer20 videos were rated better when slice mode was turned on (with significant effect for VD coded videos (Z = -2.142, P < .05) and no significant effect for videos coded with MVC method (Z = -.776, P > .05, ns). In contrast to the general findings the results for content Roller show that videos with slice mode turned on were rated better for all coding methods and error rates than videos without slice mode (c.f. Figure 29).
Coding Method
Coding methods showed significant effect on the dependent variable (Kruskal-Wallis: H = 40.558, df = 2, P<.001). Coding methods MVC and VD outperformed Simulcast coding method within mfer10 and mfer20 videos (Mann-Whitney: MVC vs. Simulcast: U = 735231.5, P<.001; VD vs. Simulcast: U = 757688.5, P<.001). They get the same ratings in terms of quality satisfaction (Mann-Whitney: U = 1963631.0, P>.05, ns) (c.f. Figure 29). For mfer10, Video+Depth outperforms the other coding methods (Mann-Whitney: VD vs. MVC: U = 450036.0, P<.001). In contrast, MVC gets significantly the best satisfaction scores at mfer20 (Mann-Whitney: VD vs. MVC: U = 471330.5, P<.05).
4.3 Discussion and Conclusion The goal of this study was to explore the influences of different transmission settings on the perceived quality for mobile devices. Two different error protection strategies (equal and unequal error protection), two slices modes (off and on), three different coding methods (MVC, Sim and Video + Depth), and two different error rates (mfer10 and mfer20) were used as parameters for our tests. Psychoperceptual quality evaluation was used to collect preference data. The results showed that the provided quality level of mfer10 videos was good, being at least clearly above 62% of acceptance threshold for all contents. Mfer20 videos were not acceptable at all, only for content Heidelberg acceptance was slightly above 50%. This indicates that an error rate of 20% is insufficient for consumer products, whereas an error rate of 10% would be sufficient [18].
Equal error protection is used for videos coded with Simulcast, MVC and V+D coding method. Unequal error protection is only used for MVC and V+D coded videos as left and right view are treated differently by those two coding methods. For MVC coding method EEP strategy performed better for low error rates and UEP strategy performed better for high error rates. Inter-dependency of views for MVC coding method explains these results.
For Video + Depth, there is no view dependency. Within an acceptable quality level for depth, the quality of the left view can be protected better in high error cases and so Video+Depth can be a preferred coding method. At high error rates, being EEP the winner, quality of depth becomes dominant. Those findings are in line with previous experimental results [1].
Results for the two different slice modes were all expected. For low error rates, videos with slice mode turned off are rated better than when slice mode is on, since there is no slice overhead in the noslice videos. This slice overhead is compensated by error robustness for high error rates. This can be seen in the results in which videos with high error rates in slice mode are rated
MOBILE3DTV D4.3 Results of quality attributes of coding, transmission, and their combinations
47
better than noslice videos. Furthermore, the effect of the slice mode depends on the frame rate of the video. As video Roller has a slightly higher bit rate, effects of the slice mode can be observed. The results show that for this content, videos in slice mode are rated better at low, as well as at high error rates.
At low error rates MVC and Video + Depth get comparable overall acceptance as well as comparable satisfaction score. However, the findings are different for high error rates. In this case MVC is rated better than V+D in terms of overall acceptance and satisfaction. Simulcast coding method as always rated inferior to both joint coding methods. From these results one may conclude that MVC is more robust to channel errors as error rate increases. Therefore, it is reasonable to choose MVC for a time varying channel in which high error rates are also observed. Furthermore, artifacts introduced by MVC and V+D coding methods have different characteristics and are accepted differently. In MVC blocking effect occurs when error propagation is observed, especially in scenes with high motion. However, at high error rates the quality of depth is probably out of acceptable range so that MVC is preferred over V+D.
In summary, our study showed that videos at low error rates of 10% have an acceptable quality for consumers. At high error rates, acceptance of overall quality strongly depends on the settings of the parameters like coding method or error protection. However, also videos at high error rates reach acceptance of nearly 60%. Choosing the best coding method, slice mode and error protection strategy depends on the transmission channel as well as on the content and its characteristics. The results confirm the findings of the coding study (c.f. section 3.3). Again, MVC and Video+Depth outperform Simulcast as coding method for mobile3DTV. In addition to the coding results, transmission results showed that MVC is the preferable coding method due to its higher error robustness in time varying channels like DVB-H.
MOBILE3DTV D4.3 Results of quality attributes of coding, transmission, and their combinations
48
5 Conclusions The work reported in this deliverable presents the results of two large-scale studies to evaluate the impact of coding, transmission, and their combination on the perceived quality of Mobile3DTV. Both studies were planned and conducted according to the user requirements of mobile 3D television and video. The results provide a valid and reliable basis for technological decisions that need to be made. Critical components of the system have been studied and can now be optimized according to the potential end user of the Mobile3DTV system.
Summarizing the results of our studies show that MVC and V+D are the two best approaches to efficiently encode mobile 3D video. They provide the best quality for the evaluation of coding as well as later transmission of content over DVB-H channel. It is arguable if the simple Baseline profile or the more complex High profile will be used in the future. Both offer comparable results. However, High profile works at lower bit rates. The results of the transmission study show that error protection strategies, and so high demand for bit rate, are very important to transmit content at acceptable quality. As computational power of prospective mobile devices will increase in the near future, more complex coding methods might provide possibilities for resistant error protection methods.
We argued at the beginning that the end user has been forgotten in technological development of multimedia applications. Critical components have been studies without a relation to the targeted end product and its requirements. In our studies, we conduct our tests with naïve participants in a user-centered quality evaluation approach. The Open Profiling of Quality research method that has been developed within the project and which is presented in this report closes the gap of a connection between users‟ quality preference and the underlying quality rationale. Reviewing requirements and quality evaluations for three-dimensional television Meesters et al. [31] outline the need for new research methods “to arrive at a better understanding of the attributes underlying a multidimensional concept like image quality” [31]. OPQ successfully extends existing standardized quantitative evaluation methods with the methods of sensory profiling. The adaption of Free-Choice Profiling makes applicable to use with naïve participants. The sensory profile elicited in the presented study showed that video quality is still the challenging task in the development of mobile 3D television and video. Added value through additional depth perception is only valid if the perceivable level of artifacts is low.

MOBILE3DTV D4.3 Results of quality attributes of coding, transmission, and their combinations
49
6 Acknowledgements The authors like to thank Katja Eulenberg, Klemens Göbel, Sebastian Kull, Sören Nagel, and Elisabeth Weber for their support in conducting the tests. The authors would like to thank KUK Filmproduktion (Horse, Car: http://www.kuk-film.de), Electronics and Telecommunications Research Institute (ETRI) (Mountain, Soccer2: http://www.etri.re.kr), Meinolf Amekudzi (Mouldpenny, HeidelbergAlleys: www.dongleware.de), Detlef Krause (RhineValleyMoving: www.cinovent.de), and Benjamin Smith (Knight‟s Quest: http://www.redstarstudio.co.uk) for providing stereoscopic content. Without their support of our work, studies would not be possible. The Butterfly sequence was rendered from 3D models provided on www.bigbuckbunny.org (copyright by Blender Foundation).
MOBILE3DTV D4.3 Results of quality attributes of coding, transmission, and their combinations
50
References
[1] A. Aksay, M. O. Bici, D. Bugdayci, A. Tikanmaki, A. Gotchev, G. B. Akar, "A Study on the Effect of MPE-FEC for 3D Video Broadcasting over DVB-H," Mobimedia 2009, London, UK, Sept'09
[2] Bech, S., Hamberg, R., Nijenhuis, M., Teunissen, C., de Jong, H., Houben, P., and Pramanik, S. 1996. The RaPID perceptual image description method (RaPID). In Proc. SPIE. Vol. 2657. 317fi328.
[3] Bech, S., Zacharov, N. “Perceptual Audio Evaluation”, John Wiley and Sons Ltd., 2006 [4] Brust, H., Smolic, A., M•uller, K., Tech, G., and Wiegand, T., \Mixed resolution coding of
stereoscopic video for mobile devices," 3DTV Conference (2009). [5] Coolican, H. “Research methods and statistics in psychology”, 4th ed, London: J. W.
Arrowsmith Ltd, 2004. [6] Engeldrum, P. 2000. Psychometric scaling: a toolkit for imaging systems development.
Imcotek Press, Winchester, Mass. [7] Faye, P., Brémaud, D., Daubin, M. D., Courcoux, P., Giboreau, A., and Nicod, H. 2004.
Perceptive free sorting and verbalization tasks with naive subjects: an alternative to descriptive mappings. Food Quality and Preference 15, 7-8, 781 fi 791. Fifth Rose Marie Pangborn Sensory Science Symposium.
[8] Goldstein, E. B., Sensation and Perception,Wadsworth, Pacific Grove, USA, 2002. p. 684.
[9] Gower, J. 1975. Generalized procrustes analysis. Psychometrika 40, 1, 33-51. [10] Häkkinen, J., Pölönen, M., Takatalo, J., Nyman, G. “Simulator sickness in virtual display
gaming: a comparison of stereoscopic and non-stereoscopic situations”, In: Proceedings of the 8th Conference on Human-Computer interaction with Mobile Devices and Services, MobileHCI, Vol. 159, ACM, NY, pp. 227-230, 2006
[11] ISO/IEC JTC1/SC29/WG11, ISO/IEC CD 23002-3: Representation of auxiliary video and supplemental information. Doc. N8259, Klagenfurt, Austria (July 2007).
[12] ISO/IEC JTC1/SC29/WG11, Text of ISO/IEC 14496-10:200X/FDAM 1 Multiview Video Coding. Doc. N9978, Hannover, Germany (July 2008).
[13] ITU-T Rec. H.264 and ISO/IEC 14496-10 (MPEG-4 AVC), ITU-T and ISO/IEC JTC 1, Advanced Video Coding for Generic Audiovisual Services (November 2007).
[14] Jack, F. and Piggott, J. 1991. Free choice profiling in consumer research. Food quality and preference 3, 3, 129-134.
[15] Jumisko-Pyykkö, S. & Vainio, T. “Framing the Context of Use for Mobile HCI”, review paper about mobile contexts of use between 2000-2007, International Journal of Mobile-Human-Computer-Interaction (IJMHCI), in press
[16] Jumisko-Pyykkö, S. Strohmeier, D. “Report on research methodologies for the experiments”, Technical report Project Mobile3DTV, November 2008
[17] Jumisko-Pyykkö, S., Häkkinen, J., and Nyman, G. 2007. Experienced quality factors qualitative evaluation approach to audiovisual quality. Proceedings of the IS&T/SPIE 19th Annual Symposium of Electronic Imaging , Convention Paper 6507-21.
[18] Jumisko-Pyykkö, S., Kumar Malamal Vadakital, V., Hannuksela, M.M. “Acceptance Threshold: Bidimensional Research Method for User-Oriented Quality Evaluation Studies”, International Journal of Digital Multimedia Broadcasting, 2008
[19] Jumisko-Pyykkö, S., Reiter, U., and Weigel, C. 2007. Produced quality is not perceived quality - a qualitative approach to overall audiovisual quality. In Proceedings of the 3DTV Conference.
[20] Jumisko-Pyykkö, S., Utriainen, T. “User.centered Quality of Experience: Is mobile 3D video good enough in the actual context of use?”, Proceedings of VPQM 2010, Scottsdale, AZ, USA, 2010
MOBILE3DTV D4.3 Results of quality attributes of coding, transmission, and their combinations
51
[21] Jumisko-Pyykkö, S., Utriainen, T. “User-centered Quality of Experience of mobile 3DTV: How to evaluate quality in the context of use?”, Proceedings of 'Multimedia on Mobile Devices', a part of the Electronic Imaging Symposium 2010, San Jose, California, USA, January 2010.
[22] Jumisko-Pyykkö, S., Weitzel, M., Strohmeier, D. "Designing for User Experience: What to Expect from Mobile 3D TV and Video?". First International Conference on Designing Interactive User Experiences for TV and Video. October 22 - 24, 2008, Silicon Valley, California, USA.
[23] Kennedy, R.S., Lane, N.E. “Simulator Sickness Questionnaire: An Enhanced Method for Quantifying Simulator Sickness.”, The International Journal of Aviation Psychology 3, pp. 203-220, 1993
[24] Kunert, J. and Qannari, E. 1999. A simple alternative to generalized procrustes analysis: application to sensory profiling data. Journal of sensory studies 14, 2, 197-208.
[25] Lambooij, M., Fortuin, M., IJsselsteijn, W.A., Heynderickx, I. “Measuring Visual Discomfort associated with 3D Displays”, Proc. SPIE 7237, San Jose, CA, USA, 72370K (2009), DOI: 10.1117/12.805977
[26] Lambooij, M., IJsselsteijn, W.A., Fortuin, M, Heyndrickx, I, “Visual discomfort in stereoscopic displays: a review”, Journal of Imaging Science and Technology, Vol. 53 (3), pp. 1-14, 2009
[27] Lawless, H. T., Heymann, H. “Sensory evaluation of food: principles and practices.” Chapman & Hall, New York. 1999
[28] Lorho, G. 2005. Individual Vocabulary Profiling of Spatial Enhancement Systems for Stereo Headphone Reproduction. Proceedings of Audio Engineering Society 119th Convention, New York (NY), USA, Convention Paper 6629.
[29] Lorho, G. 2007. Perceptual evaluation of mobile multimedia loudspeakers. Proceedings of Audio Engineering Society 122th Convention, Vienna, Austria .
[30] McEwan, J.A. “Preference Mapping for Product Optimization. In: Naes, T., Risvik, E. “Multivariate Analysis of Data in Sensory Science”, Elsevier Science, 1996, pp. 71-102
[31] Meesters, L., IJsselsteijn, W., and Seuntiens, P., “A survey of perceptual evaluations and requirements of three-dimensional tv," Circuits and Systems for Video Technology, IEEE Transactions on 14, 381-391, March 2004.
[32] Merkle, P., Wang, Y., Müller, K., Smolic, A., and Wiegand, T., “Video plus depth compression for mobile 3D services," 3DTV Conference, Potsdam, Germany, 2009.
[33] Nyman, G., Radun, J., Leisti, T., Oja, J., Ojanen, H., Olives, J., Vuori, T., and Häkkinen, J. 2006. What do users really perceive: probing the subjective image quality. Proceedings of SPIE 6059, 605902.
[34] Picard, D., Dacremont, C., Valentin, D., and Giboreau, A. 2003. Perceptual dimensions of tactile textures. Acta Psychologica 114, 2, 165 fi 184.
[35] Radun, J., Leisti, T., Häkkinen, J., Ojanen, H., Olives, J.-L., Vuori, T., and Nyman, G. 2008. Content and quality: Interpretation-based estimation of image quality. ACM Trans. Appl. Percept. 4, 4, 1-15.
[36] Recommendation ITU-R BT.500-11. 2002. Methodology for the Subjective Assessment of the Quality of Television Pictures, Recommendation ITU-R BT.500-11. ITU Telecom. Standardization Sector of ITU.
[37] Recommendation ITU-T P.910. 1999. Subjective video quality assessment methods for multimedia applications, Recommendation ITU-T P.910. ITU Telecom. Standardization Sector of ITU.
[38] Schlich, P. “Preference Mapping: Relating Consumer Preferences to Sensory or Instrumental Measurements. In: Bioflavour 95. Analysis – Precursor studies – Biotechnology, 1995
MOBILE3DTV D4.3 Results of quality attributes of coding, transmission, and their combinations
52
[39] Seuntïens, P.J.H. “Visual Experience of 3D TV”, PhD thesis, Eindhoven: Technische Universiteit Eindhoven, 2006
[40] Stelmach, L., Tam, W. J., Meegan, D., and Vincent, A., “Stereo image quality: Effects of mixed spatiotemporal resolution," IEEE Transactions on Circuits and Systems for Video Technology 10, 188{193 (2000).
[41] Stone, H. and Sidel, J. L. 2004. Sensory evaluation practices , 3rd ed. ed. Academic Press, San Diego:.
[42] Strauss, A., and Corbin, J., Basics of qualitative research: Techniques and procedures for developing grounded theory (2nd ed.),Thousand Oaks, CA: Sage, 1998
[43] Strohmeier, D., Jumisko-Pyykkö, S., Weitzel, M., Schneider, S. “Report on User Needs and Expectations for Mobile Stereo-video”. Tampere University of Technology, 2008.
[44] Strohmeier, D., Weitzel, M., Jumisko-Pyykkö, S. "Use scenarios - mobile 3D television and video", special session 'Delivery of 3D Video to Mobile Devices' at the conference 'Multimedia on Mobile Devices', a part of the Electronic Imaging Symposium 2009 in San Jose, California, USA, January 2009.
[45] Tech, G., Brust, H., Müller, K., Aksay, A., Bugdayci, D. “Development and optimization of coding algorithms for mobile 3DTV”, Technical Report Mobile3DTV, 2009
[46] Uehara, S., Hiroya, T., Kusanagi, H., Shigemura, K., Asada, H. “1-inch diagonal transflective 2D and 3D LCD with HDDP arrangement”, In: Proc. SPIE-IS&T Electronic Imaging 2008, Stereoscopic Displays and Applications XIX, Vol. 6803, San Jose, USA, January 2008
[47] Williams, A. A., Langron, S. P “Use of free-choice profiling for the evaluation of commercial ports.” Journal of the Science of Food and Agriculture. Vol. 35, pp. 558-68. May 1984
[48] Wynekoop, J.L. & Russo, N.L. “Studying system development methodologies: an examination of research methods”, Information Systems Journal (7) 1997, pp. 47-65

MOBILE3DTV D4.3 Results of quality attributes of coding, transmission, and their combinations
53
A Loss Analysis Tables per Content
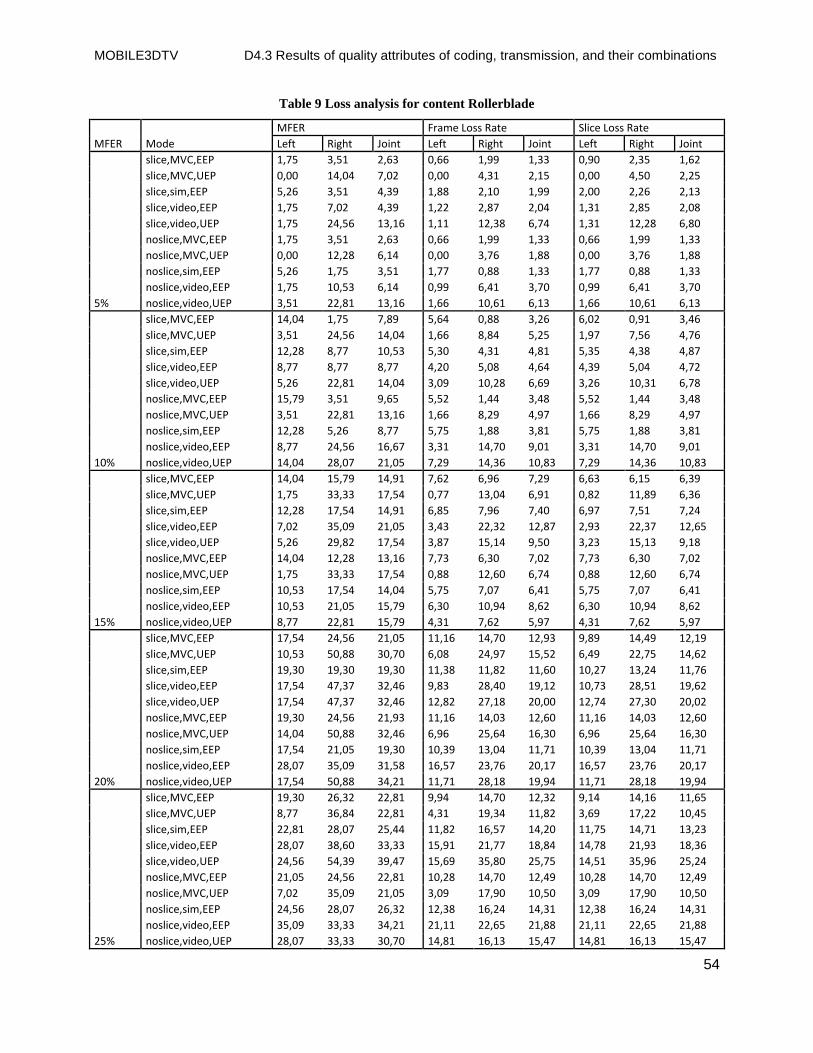
MOBILE3DTV D4.3 Results of quality attributes of coding, transmission, and their combinations
54
Table 9 Loss analysis for content Rollerblade
MFER Mode
MFER Frame Loss Rate Slice Loss Rate
Left Right Joint Left Right Joint Left Right Joint
5%
slice,MVC,EEP 1,75 3,51 2,63 0,66 1,99 1,33 0,90 2,35 1,62
slice,MVC,UEP 0,00 14,04 7,02 0,00 4,31 2,15 0,00 4,50 2,25
slice,sim,EEP 5,26 3,51 4,39 1,88 2,10 1,99 2,00 2,26 2,13
slice,video,EEP 1,75 7,02 4,39 1,22 2,87 2,04 1,31 2,85 2,08
slice,video,UEP 1,75 24,56 13,16 1,11 12,38 6,74 1,31 12,28 6,80
noslice,MVC,EEP 1,75 3,51 2,63 0,66 1,99 1,33 0,66 1,99 1,33
noslice,MVC,UEP 0,00 12,28 6,14 0,00 3,76 1,88 0,00 3,76 1,88
noslice,sim,EEP 5,26 1,75 3,51 1,77 0,88 1,33 1,77 0,88 1,33
noslice,video,EEP 1,75 10,53 6,14 0,99 6,41 3,70 0,99 6,41 3,70
noslice,video,UEP 3,51 22,81 13,16 1,66 10,61 6,13 1,66 10,61 6,13
10%
slice,MVC,EEP 14,04 1,75 7,89 5,64 0,88 3,26 6,02 0,91 3,46
slice,MVC,UEP 3,51 24,56 14,04 1,66 8,84 5,25 1,97 7,56 4,76
slice,sim,EEP 12,28 8,77 10,53 5,30 4,31 4,81 5,35 4,38 4,87
slice,video,EEP 8,77 8,77 8,77 4,20 5,08 4,64 4,39 5,04 4,72
slice,video,UEP 5,26 22,81 14,04 3,09 10,28 6,69 3,26 10,31 6,78
noslice,MVC,EEP 15,79 3,51 9,65 5,52 1,44 3,48 5,52 1,44 3,48
noslice,MVC,UEP 3,51 22,81 13,16 1,66 8,29 4,97 1,66 8,29 4,97
noslice,sim,EEP 12,28 5,26 8,77 5,75 1,88 3,81 5,75 1,88 3,81
noslice,video,EEP 8,77 24,56 16,67 3,31 14,70 9,01 3,31 14,70 9,01
noslice,video,UEP 14,04 28,07 21,05 7,29 14,36 10,83 7,29 14,36 10,83
15%
slice,MVC,EEP 14,04 15,79 14,91 7,62 6,96 7,29 6,63 6,15 6,39
slice,MVC,UEP 1,75 33,33 17,54 0,77 13,04 6,91 0,82 11,89 6,36
slice,sim,EEP 12,28 17,54 14,91 6,85 7,96 7,40 6,97 7,51 7,24
slice,video,EEP 7,02 35,09 21,05 3,43 22,32 12,87 2,93 22,37 12,65
slice,video,UEP 5,26 29,82 17,54 3,87 15,14 9,50 3,23 15,13 9,18
noslice,MVC,EEP 14,04 12,28 13,16 7,73 6,30 7,02 7,73 6,30 7,02
noslice,MVC,UEP 1,75 33,33 17,54 0,88 12,60 6,74 0,88 12,60 6,74
noslice,sim,EEP 10,53 17,54 14,04 5,75 7,07 6,41 5,75 7,07 6,41
noslice,video,EEP 10,53 21,05 15,79 6,30 10,94 8,62 6,30 10,94 8,62
noslice,video,UEP 8,77 22,81 15,79 4,31 7,62 5,97 4,31 7,62 5,97
20%
slice,MVC,EEP 17,54 24,56 21,05 11,16 14,70 12,93 9,89 14,49 12,19
slice,MVC,UEP 10,53 50,88 30,70 6,08 24,97 15,52 6,49 22,75 14,62
slice,sim,EEP 19,30 19,30 19,30 11,38 11,82 11,60 10,27 13,24 11,76
slice,video,EEP 17,54 47,37 32,46 9,83 28,40 19,12 10,73 28,51 19,62
slice,video,UEP 17,54 47,37 32,46 12,82 27,18 20,00 12,74 27,30 20,02
noslice,MVC,EEP 19,30 24,56 21,93 11,16 14,03 12,60 11,16 14,03 12,60
noslice,MVC,UEP 14,04 50,88 32,46 6,96 25,64 16,30 6,96 25,64 16,30
noslice,sim,EEP 17,54 21,05 19,30 10,39 13,04 11,71 10,39 13,04 11,71
noslice,video,EEP 28,07 35,09 31,58 16,57 23,76 20,17 16,57 23,76 20,17
noslice,video,UEP 17,54 50,88 34,21 11,71 28,18 19,94 11,71 28,18 19,94
25%
slice,MVC,EEP 19,30 26,32 22,81 9,94 14,70 12,32 9,14 14,16 11,65
slice,MVC,UEP 8,77 36,84 22,81 4,31 19,34 11,82 3,69 17,22 10,45
slice,sim,EEP 22,81 28,07 25,44 11,82 16,57 14,20 11,75 14,71 13,23
slice,video,EEP 28,07 38,60 33,33 15,91 21,77 18,84 14,78 21,93 18,36
slice,video,UEP 24,56 54,39 39,47 15,69 35,80 25,75 14,51 35,96 25,24
noslice,MVC,EEP 21,05 24,56 22,81 10,28 14,70 12,49 10,28 14,70 12,49
noslice,MVC,UEP 7,02 35,09 21,05 3,09 17,90 10,50 3,09 17,90 10,50
noslice,sim,EEP 24,56 28,07 26,32 12,38 16,24 14,31 12,38 16,24 14,31
noslice,video,EEP 35,09 33,33 34,21 21,11 22,65 21,88 21,11 22,65 21,88
noslice,video,UEP 28,07 33,33 30,70 14,81 16,13 15,47 14,81 16,13 15,47
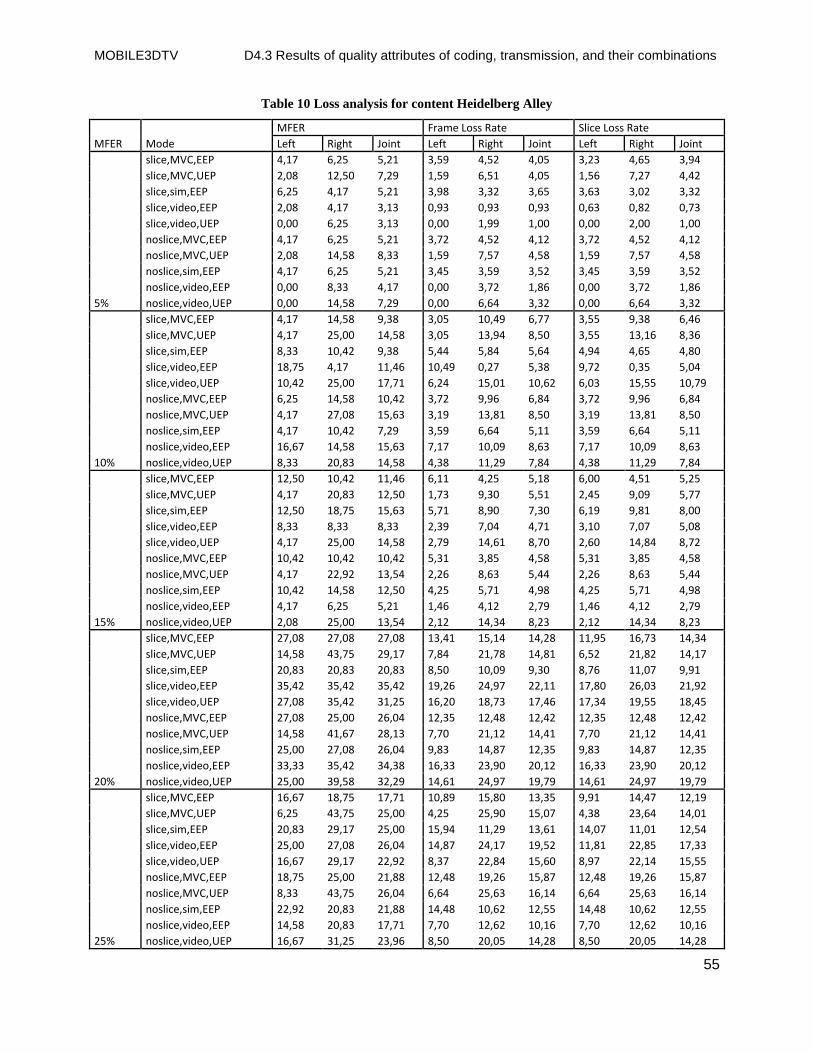
MOBILE3DTV D4.3 Results of quality attributes of coding, transmission, and their combinations
55
Table 10 Loss analysis for content Heidelberg Alley
MFER Mode
MFER Frame Loss Rate Slice Loss Rate
Left Right Joint Left Right Joint Left Right Joint
5%
slice,MVC,EEP 4,17 6,25 5,21 3,59 4,52 4,05 3,23 4,65 3,94
slice,MVC,UEP 2,08 12,50 7,29 1,59 6,51 4,05 1,56 7,27 4,42
slice,sim,EEP 6,25 4,17 5,21 3,98 3,32 3,65 3,63 3,02 3,32
slice,video,EEP 2,08 4,17 3,13 0,93 0,93 0,93 0,63 0,82 0,73
slice,video,UEP 0,00 6,25 3,13 0,00 1,99 1,00 0,00 2,00 1,00
noslice,MVC,EEP 4,17 6,25 5,21 3,72 4,52 4,12 3,72 4,52 4,12
noslice,MVC,UEP 2,08 14,58 8,33 1,59 7,57 4,58 1,59 7,57 4,58
noslice,sim,EEP 4,17 6,25 5,21 3,45 3,59 3,52 3,45 3,59 3,52
noslice,video,EEP 0,00 8,33 4,17 0,00 3,72 1,86 0,00 3,72 1,86
noslice,video,UEP 0,00 14,58 7,29 0,00 6,64 3,32 0,00 6,64 3,32
10%
slice,MVC,EEP 4,17 14,58 9,38 3,05 10,49 6,77 3,55 9,38 6,46
slice,MVC,UEP 4,17 25,00 14,58 3,05 13,94 8,50 3,55 13,16 8,36
slice,sim,EEP 8,33 10,42 9,38 5,44 5,84 5,64 4,94 4,65 4,80
slice,video,EEP 18,75 4,17 11,46 10,49 0,27 5,38 9,72 0,35 5,04
slice,video,UEP 10,42 25,00 17,71 6,24 15,01 10,62 6,03 15,55 10,79
noslice,MVC,EEP 6,25 14,58 10,42 3,72 9,96 6,84 3,72 9,96 6,84
noslice,MVC,UEP 4,17 27,08 15,63 3,19 13,81 8,50 3,19 13,81 8,50
noslice,sim,EEP 4,17 10,42 7,29 3,59 6,64 5,11 3,59 6,64 5,11
noslice,video,EEP 16,67 14,58 15,63 7,17 10,09 8,63 7,17 10,09 8,63
noslice,video,UEP 8,33 20,83 14,58 4,38 11,29 7,84 4,38 11,29 7,84
15%
slice,MVC,EEP 12,50 10,42 11,46 6,11 4,25 5,18 6,00 4,51 5,25
slice,MVC,UEP 4,17 20,83 12,50 1,73 9,30 5,51 2,45 9,09 5,77
slice,sim,EEP 12,50 18,75 15,63 5,71 8,90 7,30 6,19 9,81 8,00
slice,video,EEP 8,33 8,33 8,33 2,39 7,04 4,71 3,10 7,07 5,08
slice,video,UEP 4,17 25,00 14,58 2,79 14,61 8,70 2,60 14,84 8,72
noslice,MVC,EEP 10,42 10,42 10,42 5,31 3,85 4,58 5,31 3,85 4,58
noslice,MVC,UEP 4,17 22,92 13,54 2,26 8,63 5,44 2,26 8,63 5,44
noslice,sim,EEP 10,42 14,58 12,50 4,25 5,71 4,98 4,25 5,71 4,98
noslice,video,EEP 4,17 6,25 5,21 1,46 4,12 2,79 1,46 4,12 2,79
noslice,video,UEP 2,08 25,00 13,54 2,12 14,34 8,23 2,12 14,34 8,23
20%
slice,MVC,EEP 27,08 27,08 27,08 13,41 15,14 14,28 11,95 16,73 14,34
slice,MVC,UEP 14,58 43,75 29,17 7,84 21,78 14,81 6,52 21,82 14,17
slice,sim,EEP 20,83 20,83 20,83 8,50 10,09 9,30 8,76 11,07 9,91
slice,video,EEP 35,42 35,42 35,42 19,26 24,97 22,11 17,80 26,03 21,92
slice,video,UEP 27,08 35,42 31,25 16,20 18,73 17,46 17,34 19,55 18,45
noslice,MVC,EEP 27,08 25,00 26,04 12,35 12,48 12,42 12,35 12,48 12,42
noslice,MVC,UEP 14,58 41,67 28,13 7,70 21,12 14,41 7,70 21,12 14,41
noslice,sim,EEP 25,00 27,08 26,04 9,83 14,87 12,35 9,83 14,87 12,35
noslice,video,EEP 33,33 35,42 34,38 16,33 23,90 20,12 16,33 23,90 20,12
noslice,video,UEP 25,00 39,58 32,29 14,61 24,97 19,79 14,61 24,97 19,79
25%
slice,MVC,EEP 16,67 18,75 17,71 10,89 15,80 13,35 9,91 14,47 12,19
slice,MVC,UEP 6,25 43,75 25,00 4,25 25,90 15,07 4,38 23,64 14,01
slice,sim,EEP 20,83 29,17 25,00 15,94 11,29 13,61 14,07 11,01 12,54
slice,video,EEP 25,00 27,08 26,04 14,87 24,17 19,52 11,81 22,85 17,33
slice,video,UEP 16,67 29,17 22,92 8,37 22,84 15,60 8,97 22,14 15,55
noslice,MVC,EEP 18,75 25,00 21,88 12,48 19,26 15,87 12,48 19,26 15,87
noslice,MVC,UEP 8,33 43,75 26,04 6,64 25,63 16,14 6,64 25,63 16,14
noslice,sim,EEP 22,92 20,83 21,88 14,48 10,62 12,55 14,48 10,62 12,55
noslice,video,EEP 14,58 20,83 17,71 7,70 12,62 10,16 7,70 12,62 10,16
noslice,video,UEP 16,67 31,25 23,96 8,50 20,05 14,28 8,50 20,05 14,28
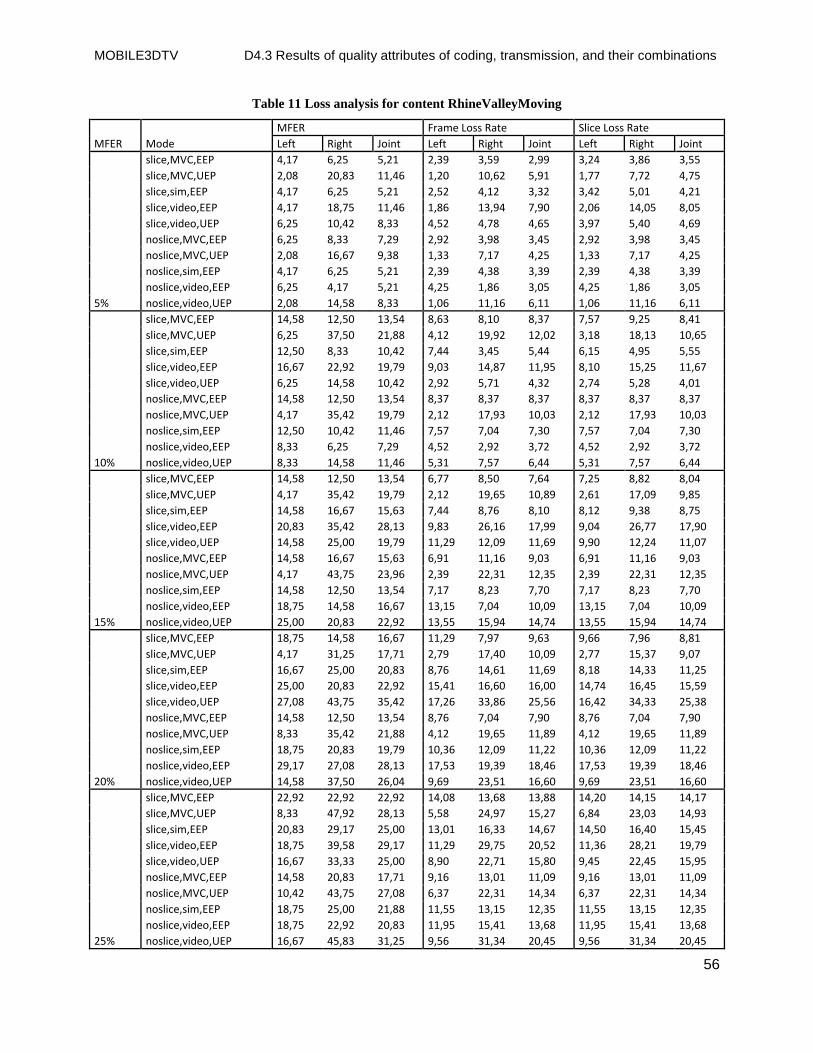
MOBILE3DTV D4.3 Results of quality attributes of coding, transmission, and their combinations
56
Table 11 Loss analysis for content RhineValleyMoving
MFER Mode
MFER Frame Loss Rate Slice Loss Rate
Left Right Joint Left Right Joint Left Right Joint
5%
slice,MVC,EEP 4,17 6,25 5,21 2,39 3,59 2,99 3,24 3,86 3,55
slice,MVC,UEP 2,08 20,83 11,46 1,20 10,62 5,91 1,77 7,72 4,75
slice,sim,EEP 4,17 6,25 5,21 2,52 4,12 3,32 3,42 5,01 4,21
slice,video,EEP 4,17 18,75 11,46 1,86 13,94 7,90 2,06 14,05 8,05
slice,video,UEP 6,25 10,42 8,33 4,52 4,78 4,65 3,97 5,40 4,69
noslice,MVC,EEP 6,25 8,33 7,29 2,92 3,98 3,45 2,92 3,98 3,45
noslice,MVC,UEP 2,08 16,67 9,38 1,33 7,17 4,25 1,33 7,17 4,25
noslice,sim,EEP 4,17 6,25 5,21 2,39 4,38 3,39 2,39 4,38 3,39
noslice,video,EEP 6,25 4,17 5,21 4,25 1,86 3,05 4,25 1,86 3,05
noslice,video,UEP 2,08 14,58 8,33 1,06 11,16 6,11 1,06 11,16 6,11
10%
slice,MVC,EEP 14,58 12,50 13,54 8,63 8,10 8,37 7,57 9,25 8,41
slice,MVC,UEP 6,25 37,50 21,88 4,12 19,92 12,02 3,18 18,13 10,65
slice,sim,EEP 12,50 8,33 10,42 7,44 3,45 5,44 6,15 4,95 5,55
slice,video,EEP 16,67 22,92 19,79 9,03 14,87 11,95 8,10 15,25 11,67
slice,video,UEP 6,25 14,58 10,42 2,92 5,71 4,32 2,74 5,28 4,01
noslice,MVC,EEP 14,58 12,50 13,54 8,37 8,37 8,37 8,37 8,37 8,37
noslice,MVC,UEP 4,17 35,42 19,79 2,12 17,93 10,03 2,12 17,93 10,03
noslice,sim,EEP 12,50 10,42 11,46 7,57 7,04 7,30 7,57 7,04 7,30
noslice,video,EEP 8,33 6,25 7,29 4,52 2,92 3,72 4,52 2,92 3,72
noslice,video,UEP 8,33 14,58 11,46 5,31 7,57 6,44 5,31 7,57 6,44
15%
slice,MVC,EEP 14,58 12,50 13,54 6,77 8,50 7,64 7,25 8,82 8,04
slice,MVC,UEP 4,17 35,42 19,79 2,12 19,65 10,89 2,61 17,09 9,85
slice,sim,EEP 14,58 16,67 15,63 7,44 8,76 8,10 8,12 9,38 8,75
slice,video,EEP 20,83 35,42 28,13 9,83 26,16 17,99 9,04 26,77 17,90
slice,video,UEP 14,58 25,00 19,79 11,29 12,09 11,69 9,90 12,24 11,07
noslice,MVC,EEP 14,58 16,67 15,63 6,91 11,16 9,03 6,91 11,16 9,03
noslice,MVC,UEP 4,17 43,75 23,96 2,39 22,31 12,35 2,39 22,31 12,35
noslice,sim,EEP 14,58 12,50 13,54 7,17 8,23 7,70 7,17 8,23 7,70
noslice,video,EEP 18,75 14,58 16,67 13,15 7,04 10,09 13,15 7,04 10,09
noslice,video,UEP 25,00 20,83 22,92 13,55 15,94 14,74 13,55 15,94 14,74
20%
slice,MVC,EEP 18,75 14,58 16,67 11,29 7,97 9,63 9,66 7,96 8,81
slice,MVC,UEP 4,17 31,25 17,71 2,79 17,40 10,09 2,77 15,37 9,07
slice,sim,EEP 16,67 25,00 20,83 8,76 14,61 11,69 8,18 14,33 11,25
slice,video,EEP 25,00 20,83 22,92 15,41 16,60 16,00 14,74 16,45 15,59
slice,video,UEP 27,08 43,75 35,42 17,26 33,86 25,56 16,42 34,33 25,38
noslice,MVC,EEP 14,58 12,50 13,54 8,76 7,04 7,90 8,76 7,04 7,90
noslice,MVC,UEP 8,33 35,42 21,88 4,12 19,65 11,89 4,12 19,65 11,89
noslice,sim,EEP 18,75 20,83 19,79 10,36 12,09 11,22 10,36 12,09 11,22
noslice,video,EEP 29,17 27,08 28,13 17,53 19,39 18,46 17,53 19,39 18,46
noslice,video,UEP 14,58 37,50 26,04 9,69 23,51 16,60 9,69 23,51 16,60
25%
slice,MVC,EEP 22,92 22,92 22,92 14,08 13,68 13,88 14,20 14,15 14,17
slice,MVC,UEP 8,33 47,92 28,13 5,58 24,97 15,27 6,84 23,03 14,93
slice,sim,EEP 20,83 29,17 25,00 13,01 16,33 14,67 14,50 16,40 15,45
slice,video,EEP 18,75 39,58 29,17 11,29 29,75 20,52 11,36 28,21 19,79
slice,video,UEP 16,67 33,33 25,00 8,90 22,71 15,80 9,45 22,45 15,95
noslice,MVC,EEP 14,58 20,83 17,71 9,16 13,01 11,09 9,16 13,01 11,09
noslice,MVC,UEP 10,42 43,75 27,08 6,37 22,31 14,34 6,37 22,31 14,34
noslice,sim,EEP 18,75 25,00 21,88 11,55 13,15 12,35 11,55 13,15 12,35
noslice,video,EEP 18,75 22,92 20,83 11,95 15,41 13,68 11,95 15,41 13,68
noslice,video,UEP 16,67 45,83 31,25 9,56 31,34 20,45 9,56 31,34 20,45
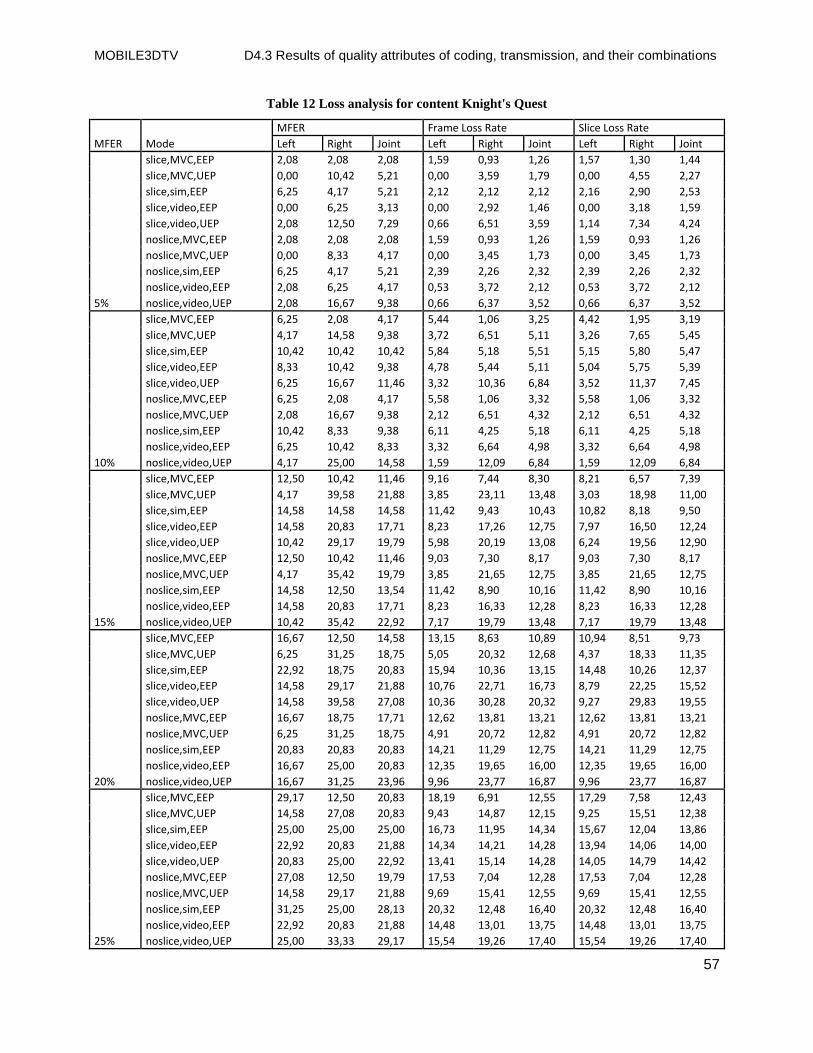
MOBILE3DTV D4.3 Results of quality attributes of coding, transmission, and their combinations
57
Table 12 Loss analysis for content Knight's Quest
MFER Mode
MFER Frame Loss Rate Slice Loss Rate
Left Right Joint Left Right Joint Left Right Joint
5%
slice,MVC,EEP 2,08 2,08 2,08 1,59 0,93 1,26 1,57 1,30 1,44
slice,MVC,UEP 0,00 10,42 5,21 0,00 3,59 1,79 0,00 4,55 2,27
slice,sim,EEP 6,25 4,17 5,21 2,12 2,12 2,12 2,16 2,90 2,53
slice,video,EEP 0,00 6,25 3,13 0,00 2,92 1,46 0,00 3,18 1,59
slice,video,UEP 2,08 12,50 7,29 0,66 6,51 3,59 1,14 7,34 4,24
noslice,MVC,EEP 2,08 2,08 2,08 1,59 0,93 1,26 1,59 0,93 1,26
noslice,MVC,UEP 0,00 8,33 4,17 0,00 3,45 1,73 0,00 3,45 1,73
noslice,sim,EEP 6,25 4,17 5,21 2,39 2,26 2,32 2,39 2,26 2,32
noslice,video,EEP 2,08 6,25 4,17 0,53 3,72 2,12 0,53 3,72 2,12
noslice,video,UEP 2,08 16,67 9,38 0,66 6,37 3,52 0,66 6,37 3,52
10%
slice,MVC,EEP 6,25 2,08 4,17 5,44 1,06 3,25 4,42 1,95 3,19
slice,MVC,UEP 4,17 14,58 9,38 3,72 6,51 5,11 3,26 7,65 5,45
slice,sim,EEP 10,42 10,42 10,42 5,84 5,18 5,51 5,15 5,80 5,47
slice,video,EEP 8,33 10,42 9,38 4,78 5,44 5,11 5,04 5,75 5,39
slice,video,UEP 6,25 16,67 11,46 3,32 10,36 6,84 3,52 11,37 7,45
noslice,MVC,EEP 6,25 2,08 4,17 5,58 1,06 3,32 5,58 1,06 3,32
noslice,MVC,UEP 2,08 16,67 9,38 2,12 6,51 4,32 2,12 6,51 4,32
noslice,sim,EEP 10,42 8,33 9,38 6,11 4,25 5,18 6,11 4,25 5,18
noslice,video,EEP 6,25 10,42 8,33 3,32 6,64 4,98 3,32 6,64 4,98
noslice,video,UEP 4,17 25,00 14,58 1,59 12,09 6,84 1,59 12,09 6,84
15%
slice,MVC,EEP 12,50 10,42 11,46 9,16 7,44 8,30 8,21 6,57 7,39
slice,MVC,UEP 4,17 39,58 21,88 3,85 23,11 13,48 3,03 18,98 11,00
slice,sim,EEP 14,58 14,58 14,58 11,42 9,43 10,43 10,82 8,18 9,50
slice,video,EEP 14,58 20,83 17,71 8,23 17,26 12,75 7,97 16,50 12,24
slice,video,UEP 10,42 29,17 19,79 5,98 20,19 13,08 6,24 19,56 12,90
noslice,MVC,EEP 12,50 10,42 11,46 9,03 7,30 8,17 9,03 7,30 8,17
noslice,MVC,UEP 4,17 35,42 19,79 3,85 21,65 12,75 3,85 21,65 12,75
noslice,sim,EEP 14,58 12,50 13,54 11,42 8,90 10,16 11,42 8,90 10,16
noslice,video,EEP 14,58 20,83 17,71 8,23 16,33 12,28 8,23 16,33 12,28
noslice,video,UEP 10,42 35,42 22,92 7,17 19,79 13,48 7,17 19,79 13,48
20%
slice,MVC,EEP 16,67 12,50 14,58 13,15 8,63 10,89 10,94 8,51 9,73
slice,MVC,UEP 6,25 31,25 18,75 5,05 20,32 12,68 4,37 18,33 11,35
slice,sim,EEP 22,92 18,75 20,83 15,94 10,36 13,15 14,48 10,26 12,37
slice,video,EEP 14,58 29,17 21,88 10,76 22,71 16,73 8,79 22,25 15,52
slice,video,UEP 14,58 39,58 27,08 10,36 30,28 20,32 9,27 29,83 19,55
noslice,MVC,EEP 16,67 18,75 17,71 12,62 13,81 13,21 12,62 13,81 13,21
noslice,MVC,UEP 6,25 31,25 18,75 4,91 20,72 12,82 4,91 20,72 12,82
noslice,sim,EEP 20,83 20,83 20,83 14,21 11,29 12,75 14,21 11,29 12,75
noslice,video,EEP 16,67 25,00 20,83 12,35 19,65 16,00 12,35 19,65 16,00
noslice,video,UEP 16,67 31,25 23,96 9,96 23,77 16,87 9,96 23,77 16,87
25%
slice,MVC,EEP 29,17 12,50 20,83 18,19 6,91 12,55 17,29 7,58 12,43
slice,MVC,UEP 14,58 27,08 20,83 9,43 14,87 12,15 9,25 15,51 12,38
slice,sim,EEP 25,00 25,00 25,00 16,73 11,95 14,34 15,67 12,04 13,86
slice,video,EEP 22,92 20,83 21,88 14,34 14,21 14,28 13,94 14,06 14,00
slice,video,UEP 20,83 25,00 22,92 13,41 15,14 14,28 14,05 14,79 14,42
noslice,MVC,EEP 27,08 12,50 19,79 17,53 7,04 12,28 17,53 7,04 12,28
noslice,MVC,UEP 14,58 29,17 21,88 9,69 15,41 12,55 9,69 15,41 12,55
noslice,sim,EEP 31,25 25,00 28,13 20,32 12,48 16,40 20,32 12,48 16,40
noslice,video,EEP 22,92 20,83 21,88 14,48 13,01 13,75 14,48 13,01 13,75
noslice,video,UEP 25,00 33,33 29,17 15,54 19,26 17,40 15,54 19,26 17,40
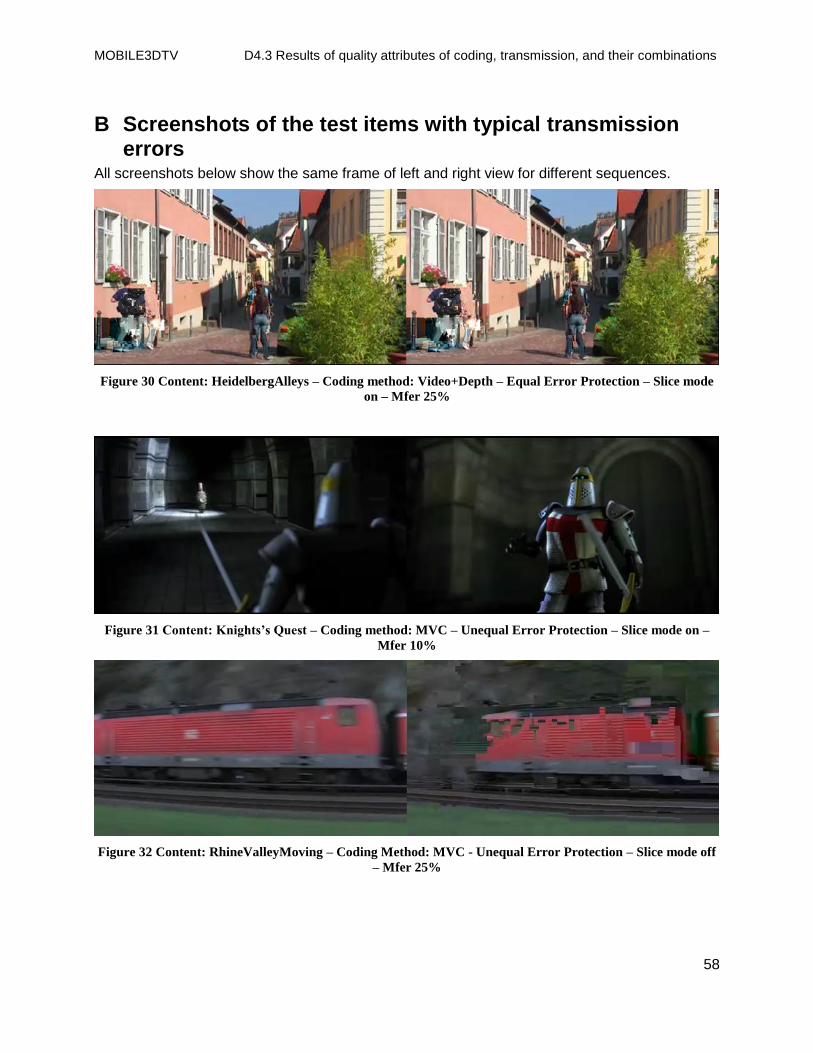
MOBILE3DTV D4.3 Results of quality attributes of coding, transmission, and their combinations
58
B Screenshots of the test items with typical transmission errors
All screenshots below show the same frame of left and right view for different sequences.
Figure 30 Content: HeidelbergAlleys – Coding method: Video+Depth – Equal Error Protection – Slice mode
on – Mfer 25%
Figure 31 Content: Knights’s Quest – Coding method: MVC – Unequal Error Protection – Slice mode on –
Mfer 10%
Figure 32 Content: RhineValleyMoving – Coding Method: MVC - Unequal Error Protection – Slice mode off
– Mfer 25%
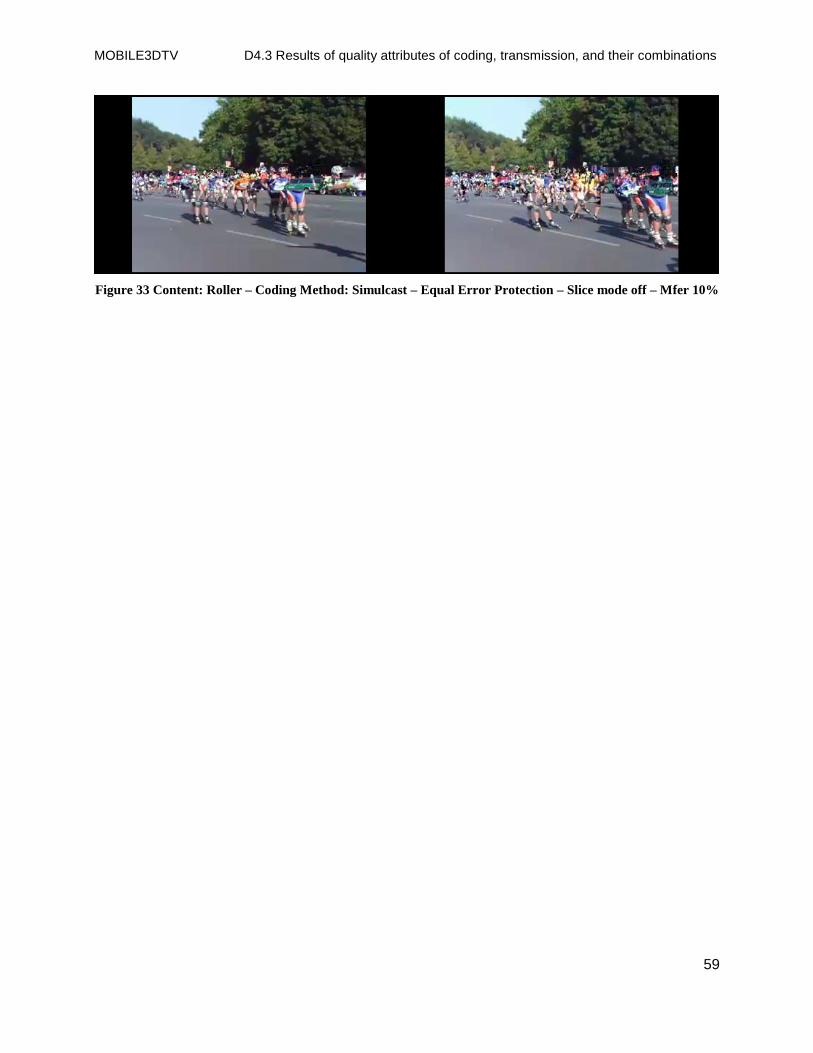
MOBILE3DTV D4.3 Results of quality attributes of coding, transmission, and their combinations
59
Figure 33 Content: Roller – Coding Method: Simulcast – Equal Error Protection – Slice mode off – Mfer 10%
Mobile 3DTV Content Delivery Optimization over DVB-H System
MOBILE3DTV - Mobile 3DTV Content Delivery Optimization over DVB-H System - is a three-yearproject which started in January 2008. The project is partly funded by the European Union 7th
RTD Framework Programme in the context of the Information & Communication Technology (ICT)Cooperation Theme.
The main objective of MOBILE3DTV is to demonstrate the viability of the new technology ofmobile 3DTV. The project develops a technology demonstration system for the creation andcoding of 3D video content, its delivery over DVB-H and display on a mobile device, equippedwith an auto-stereoscopic display.
The MOBILE3DTV consortium is formed by three universities, a public research institute and twoSMEs from Finland, Germany, Turkey, and Bulgaria. Partners span diverse yet complementaryexpertise in the areas of 3D content creation and coding, error resilient transmission, userstudies, visual quality enhancement and project management.
For further information about the project, please visit www.mobile3dtv.eu.
Tuotekehitys Oy TamlinkProject coordinator
FINLAND
Tampereen Teknillinen Yliopisto
Visual quality enhancement,
Scientific coordinator
FINLAND
Fraunhofer Gesellschaft zur Förderung der angewandten Forschung e.V
Middle East Technical UniversityError resilient transmission
TURKEY
Stereo video content creation and coding
GERMANY
Technische Universität IlmenauDesign and execution of subjective tests
GERMANY
MM Solutions Ltd. Design of prototype terminal device
BULGARIA
MOBILE3DTV project has received funding from the European Community’s ICT programme in the context of theSeventh Framework Programme (FP7/2007-2011) under grant agreement n° 216503. This document reflects onlythe authors’ views and the Community or other project partners are not liable for any use that may be made of theinformation contained therein.