Embed Size (px)
Citation preview
SScciieennttiisstt EEnnttrreepprreenneeuurrss aanndd UUnniivveerrssiittyy CCoommmmeerrcciiaalliizzaattiioonn
Dissertation zur Erlangung eines Doktor rerum politicarum (Dr. rer. pol.)
an der Wirtschaftswissenschaftlichen Fakultät der Universität Augsburg
Vorgelegt von Master of Public Affairs Thomas Taylor Aldridge September 15th, 2008
2
Gutachter
(1) Erstgutachter: Prof. Dr. Erik Lehmann
(2) Zweitgutachter: Prof. Dr. David Audretsch
(3) Vorsitzender der mündlichen Prüfung: Prof. Dr. Welzel
Datum der mündlichen Prüfung: 27. Januar 2009
3
Outline Chapter 1: Acknowledgements and Publications ............................................................... 5
1.1 Acknowledgements................................................................................................... 5 1.2 Publications............................................................................................................... 6
Chapter 2: Introduction and Overview ............................................................................... 7 2.1 Introduction............................................................................................................... 7 2.2 Contribution to the Literature ................................................................................... 8 2.3 Overview................................................................................................................... 9
Chapter 3: The Knowledge Filter and Routes of Scientist Commercialization................ 11 Figure 3.1.1: University Patents as a Share of All Patents with Domestic Assignees................................................................................................................................... 14
3.2 Scientist Commercialization of University Research ............................................. 18 3.3 Measurement Issues ................................................................................................ 20
Figure 3.2: Patents by Institution and Gender .......................................................... 25 Figure 3.3: NCI Grant Award by Gender for Patenting Scientists ........................... 26
3.4 Determinants of Scientist Commercialization ........................................................ 30 3.4.4 Technology Transfer Office............................................................................. 32
3.5 Estimation of a Probit Model.................................................................................. 38 Table 3.1: Variable Description of The Modes of Commercialization .................... 38 Table 3.2: Description of Independent Variables ..................................................... 46 Table 3.3: Means and Standard Deviations of All Variables.................................... 47 Table 3.4: Simple Correlation Matrix....................................................................... 48 Figure 3.5: TTO Helpfulness to Scientist by Commercialization Mode .................. 49 Figure 3.6: Scientist Commercialization Route by Commercialization Mode ......... 50 Figure 3.7: Social Capital by Commercialization Mode .......................................... 51
3.6 Empirical Results .................................................................................................... 51 Table 3.8: Probit Regression Results Estimating Scientist Commercialization - Startups ..................................................................................................................... 53 Table 3.9: Probit Regression Results Estimating Scientist Commercialization - License ...................................................................................................................... 57 Table 3.10: Probit Regression Results Estimating Scientist Commercialization - Commercialize .......................................................................................................... 62 Table 3.11: Probit Regression Results Estimating Scientist Commercialization - Patents ....................................................................................................................... 64 Table 3.12: Probit Regression Results Estimating Scientist Licensing by Helpfulness of TTO ...................................................................................................................... 66
3.7 Conclusions............................................................................................................. 67 3.8 Appendix A: Breakdown of Patents by U. S. Patent and Trademark Office Classification............................................................................................................. 71
Chapter 4: Academic Entrepreneurship: The Role of Novel and General Heterogonous Innovation ......................................................................................................................... 72
4.1 Introduction............................................................................................................. 72 4.2 Scientist Entrepreneurship ...................................................................................... 74
4
4.3 Novelty and Generality ........................................................................................... 81 4.4 Measurement Issues ................................................................................................ 82
Table 4.1: Description of Variables .......................................................................... 86 Table 4.2: Means and Deviations of Variables......................................................... 87 Table 4.3: Correlation Table of Variables ................................................................ 89
4.6 Empirical Results .................................................................................................... 90 Table 4.4: Clustered Probit Estimate of Scientist Entrepreneurship......................... 91 Table 4.5: Marginal Affects Table of Scientist......................................................... 93
4.7 Conclusion .............................................................................................................. 94 Chapter 5: Scientist Commercialization as a Conduit of Knowledge Spillovers ............. 97
5.1 Introduction............................................................................................................. 97 5.2 How and Where are Scientists Creative?................................................................ 98 5.3 Measurement Issues .............................................................................................. 101
Figure 1: Patents by Region and Gender ................................................................ 103 Figure 2: NCI Grant Award by Gender for Patenting Scientists ............................ 104
5.4 Conclusions........................................................................................................... 110 Chapter 6: Radical Innovation: Literature Review and Development of an Indicator ... 111
6.1 Introduction........................................................................................................... 111 6.2 Origins of Radical Innovation............................................................................... 112
Table 1: Radical Innovations from Small Firm Entrepreneurs............................... 115 Table 2 Radical Innovations from Large Firms...................................................... 116
6.3 Characteristics of Radical Innovation vis-à-vis Incremental Innovation.............. 116 Table 3 Distinguishing between Incremental and Radical Innovations.................. 119
6.4 Entrepreneurship, Radical Innovation and the Knowledge Filter......................... 120 6.5 Measuring and Defining Radical Innovation........................................................ 128
Table 4 Distribution of Innovations of Large and Small Firms According to their Level of Significance (percentages in parentheses)................................................ 130 Figure 1: Share of Radical Innovations by Firm Size and Country for Consumer Durables and Office Products ................................................................................. 132 Figure 2: S-Curve of Radical Innovation................................................................ 134 Table 5: Literature Summary of Radical Innovations............................................. 139 Table 6: Characterizing Each Definitional Form of Radical Innovation................ 143
6.5. Conclusions.......................................................................................................... 144 Chapter 7: Summary and Conclusions............................................................................ 145
7.1 Summary ............................................................................................................... 145 7.2 Future research...................................................................................................... 146
7. References................................................................................................................... 149
Chapter 1: Acknowledgements and Publications 1.1 Acknowledgements A scholar is only as good as the giants on which she stands. Many scholars have helped
with broad shoulders and robust input for this book. I am forever indebted to Dr. David
Audretsch, mentor, friend, and partner at the Max Planck Institute of Economics, for his six
years of guidance dating back to the olden days during my Master’s of Public Affairs at Indiana
University. His profound insights in the field of entrepreneurship helped catapult a student, at
that time, attending Indiana University interested in nonprofit management into a Ph.D.
candidate with a passion for academic entrepreneurship. His generosity and reward for hard work
and getting the job done all substantially improved this book. Alexander Oettl, friend, mentor
and, at times, guide to the wacky world of business management literature, offered daily support
at the University of Toronto. Alex, partially because of time zone differences was always there
for me late at night. I still owe him several beers for his patience and dedication to substantially
improving this book.
Lesa Mitchell at the Marion Ewing Kauffman foundation, who is also a guiding light in
the field of academic entrepreneurship, provided kind and generous help. I doubt very much that
my work would be nearly as rich without her contributions. Dr. Anders Hoffman at FORA, in
Copenhagen, deserves significant credit for his continued support in connecting radical
innovation to entrepreneurship. The Entrepreneurship, Growth and Public Policy division at the
Max Planck Institute of Economics must be generously cited for their daily support and
contributions to all my work. Another important scholar, while not contributing directly to this
book is Dr. Rajaram Krishnan. Without his inspirational teaching at Earlham College I would

6
have never studied Economics as an undergraduate. He is a friend and mentor who showed me
that most questions in life could be answered in economic terms; if one was brave enough to ask
honest questions and, more importantly, to accept honest answers.
Other notable contributors through scholarship or research support are: Dr. Chad Jackson
at Emory University, Dr. Till Heine at the Free University of Berlin, Dr. Tamer Mahmoud at
American University/White & Case LLP, Sandy Miller at Stanford University, Dr. Farid
Moustafi at the Medical School of Toledo, and Betty Fiscus, my North Star, at Indiana
University for always making sure I dotted my “i”s and crossed my “t”s.
I would also like to humbly thank my Ph.D. committee for their time and help with my
book, notably, Dr. Erik Lehman, at the University of Augsburg.
Finally, I would like to thank my family: Melanie Fabich, beautiful Lilly Aldridge and
Athena Aldridge, my mother Susan Aldridge, step father Dr. Erhard Schellman, and my
Grandmother Millicent Taylor.
1.2 Publications This book draws heavily from papers that have been published or which are forthcoming.
Chapter three draws heavily from a paper published in an edited book volume with Cambridge
Press, an accepted forthcoming paper to be published in Research Policy, and a paper to be
submitted to Nature. Chapter four is currently in the process of improvement with the ambition
of being submitted to Management Science by the end of 2009. Chapter five, draws on an
accepted forthcoming publication in Annals of Regional Science. Chapter six draws on an
accepted forthcoming publication in International Small Business Journal.
7
The content of these chapters has also been featured, among others, in Nature “U.S.
Cancer Funding Creates Business as Well as Science”, New York Times “U.S. Research Funds
Often Lead to Startups”, and Max Planck Forschung “Geschäftsideen aus dem Labor”
Chapter 2: Introduction and Overview
2.1 Introduction
It is often said that Silicon Valley is the cradle of Biotechnology. If however, the Bay
Area is the cradle, then the parents of such high growth and innovation can only be academic
scientists. Indeed, academic entrepreneurship in the United States has provided incredible
amounts of highly innovative and successful enterprises. While Silicon Valley may be the most
dazzling example of successful scientist entrepreneurship, many other regions and universities
have also had highly academic entrepreneurship. Some of these examples are: Genentech,
Google, Gatorade, Digital, Medtronic, Amgen, Biogen and Cellomics. In fact, over 50 scientist
founded companies have graced the Fortune 500 club. Yet, as regions and policy makers turn to
find new ways of growth and innovation, the notion of individual scientist entrepreneurs as
pistons of economic growth, have never truly been entered into either the policy discussions or
into economic literature.
These discussions have remained relatively obscure and enigmatic for several reasons.
First, there is a clear lack of systematic data. Following scientist startups are incredibly costly for
third parties. Part of the problem why there is little understanding of scientist startups is largely
associated on a reliance on Technology Transfer Offices (TTOs). While the TTOs serve as the
commercial mechanism for university knowledge to transform into commercial success, there is
an underlying problem in their mission. These TTOs serves as financial arms for the university to
8
maximize licensing income, while substituting optimal commercialization whether through
scientist entrepreneurship or other means.
The second problem is the TTOs are viewed as the primary meausre of university
commercialization. Currently, the United States issues 40 billion dollars a year in federal grants,
roughly 30 percent of total research and development (R&D) dollars spent in the United States
per year. This public investment has left scholars and policy makers asking the question of what
the rate of return is on this investment. Indeed, the rate is somewhere around 2.5% per year on
public R&D. Yet, given this incredible investment, how can one justify such a low rate of return?
The devil is in the details. By using almost exclusively TTO data, scientist startups, if indeed
occurring, go unreported and therefore not included in the rate of return.
The third important problem relates to how academic knowledge spillovers into a
mechanism for commercialization. Economic literature has relied heavily on the Solow and
Romer growth models. These models have suggested that where there are high investments in
knowledge, there will be higher rates of growth. But understanding exactly how these knowledge
investments manifests themselves into growth have remained largely unclear for policy makers.
Specifically, while knowledge generation is incredibly important, the path from knowledge
creation to economic growth is not entirely clear. Many countries for example, have turned to
high investments in knowledge but have had little success actually transforming knowledge into
economic growth. This book will help to demonstrate that one path for knowledge to directly
transform itself into growth are academic scientist startups. These startups inject high quality
knowledge into the market and led to high economic growth.
2.2 Contribution to the Literature
9
There are three key areas of contribution. The first subject is quantifying and following
scientist startup activity. As mentioned above, traditional mechanisms of measurement have
relied on TTO data. This book offers an insight into scientist startup data using a unique dataset
of scientist startups from 1998 to 2004. The contribution helps explain that there is indeed, much
more commercialization occurring than previously thought. Secondly, it explains the route of
commercialization. These routes are defined by whether a scientist startups up a company with
TTO permission, whether the scientist startups a company that is not registered with the TTO
and finally, licensing the technology through to TTO.
The second contribution is demonstrating that the only significant variables for scientists
starting up are how heterogeneous her knowledge stock may be. Classifying the scientists
registered patents using their forward and backward patent citations, the book offers a first look
into how scientist startups actually occur. The book offers a clear suggestion that startups occur
when a scientist has either a patent which has either a broad set of patent citations or a very
narrow set of patent citations. The degree to which these patent citations are measured is used by
applying Generality and Originality Herfindahl index.
The third contribution to the literature is demonstrating that there is indeed a substitution
affect between starting up and licensing a patent. There is an open question as to what sort of
commercialization occurs when scientist have a knowledge stock. The book will show that
substation affects between starting up a company and licensing. This finding may have important
affects for optimizing growth for the university, region and country.
2.3 Overview
The book will offer four scholarly chapters. Chapter three will offer several contributions.
The chapter will first review the Romer and Solow model of economic growth and then offer the
10
Audretsch’s “Knowledge Spillover of Economic Growth.” The chapter will then proceed to offer
a dataset which can qualitatively address the knowledge spillover of growth by using scientist
data. The chapter then explains why academic commercialization may not be fully reported as
previously thought. The chapter has offers three important conclusions. First the chapter finds
that over 25 percent of scientists startup, second that there is a substitution affect between
starting up and licensing, third that scientist have started up off of patents which are not
registered with the TTO.
Chapter four offers a theoretical and empirical model as to why scientists startup firms.
Controlling for a broad lists of usual suspects variables, the chapter attempts to categorize the
scientist’s knowledge stock. The chapter applies the Henderson et al (1998) model of patent
classification. The model categorizes the knowledge stock of a patent in two ways. First it uses
the patent’s backward citation. These citations are where the patent cites its previous knowledge
stock of off which it is built. This measure is defined by how Original the patent may be. For
example, the patent may have very few backward citations drawing from different patent
classification fields. The patent would therefore have a high originality score. The second
measure is how often a patent is cited from future patents. If, for example, a patent is heavily
cited from future issued patents, it would have a high Generality score. The paper then applies
this metric to show that the only significant variables for starting a company are how
heterogeneous her knowledge stock may be.
Chapter five explains geographic knowledge generation in scientists. Using the theory of
knowledge spillover, the chapter explains how and where scientists generate their knowledge
stock. The paper categorizes knowledge creation through where the scientist generates patents
and what variables are important for a region to generate knowledge. The chapter finds that
11
several key variables are important for generating a high quality knowledge stock in a region.
This knowledge stock for regions therefore becomes quite important to manifest itself into
economic growth.
Chapter six taxonomizes the radical and incremental innovation literature. This paper
offers a broad lens of understanding where the literature is with radical and incremental
innovation. There is a broad understanding how radical and incremental literature has developed
in scholarship. The chapter then attempts of find an ex ante approach to identifying radical
innovation in patents. The conclusion finds the Dahlin Behrens method of identifying radical
innovative patents may be the best method for scholars trying to identify radical innovations ex
ante.
Chapter 3: The Knowledge Filter and Routes of Scientist Commercialization
3.1 Introduction
The enormous investment in physical plant and equipment propelled the United
States to unprecedented post World War II prosperity. In the new era of globalization, both
scholars and policy makers have been looking towards the country’s unrivaled investment
in research and knowledge to generate economic growth, employment and competitiveness
in internationally linked markets for continued prosperity. However, it has been long
recognized that investment in scientific knowledge and research alone will not
automatically generate growth and prosperity. Rather, these new knowledge investments
must penete what Audretsch et al. (2006) Acs and Armington (2006) and Acs et al. (2004)
term “the knowledge filter” in order to contribute to innovation, competitiveness and
ultimately economic growth. In fact, the knowledge filter impeding the commercialization
12
of investments in research and knowledge can be formidable. As Senator Birch Bayh
warned, “A wealth of scientific talent at American colleges and universities — talent
responsible for the development of numerous innovative scientific breakthroughs each year
— is going to waste as a result of bureaucratic red tape and illogical government
regulations…”1 It is the knowledge filter that stands between investment in research on the
one hand, and its commercialization through innovation, leading ultimately to economic
growth, on the other.
Seen through the eyes of Senator Bayh, the magnitude of the knowledge filter is
daunting, “What sense does it make to spend billions of dollars each year on government-
supported research and then prevent new developments from benefiting the American
people because of dumb bureaucratic red tape?”2
In an effort to penetrate such a formidable knowledge filter, the Congress enacted
the Bayh-Dole Act in 1980 to spur the transfer of technology from university research to
commercialization.3 The goal of the Bayh-Dole Act was to facilitate the commercialization
of university science. Assessments about the impact of the Bayh-Dole Act on penetrating
the knowledge filter and facilitating the commercialization of university research have
bordered on the euphoric:4
1 Introductory statement of Birch Bayh, September 13, 1978, cited from the Association of University Technology Managers Report (AUTM ) (2004, p. 5). 2 Statement by Birch Bayh, April 13, 1980, on the approval of S. 414 (Bayh-Dole) by the U.S. Senate on a 91-4 vote, cited from (AUTM) (2004, p. 16). 3 Public Law 98-620 4 Mowery (2005, p. 40-41) argues that such a positive assessment of the impact on Bayh-Dole is exaggerated, “Although it seems clear that the criticism of high-technology startups that was widespread during the period of pessimism over U.S. competitiveness was overstated, the recent focus on patenting and licensing as the essential ingredient in university-industry collaboration and knowledge transfer may be no less exaggerated. The emphasis on the Bayh-Dole Act as a catalyst to these interactions also seems somewhat misplaced.”
13
Possibly the most inspired piece of legislation to be enacted in America over the past half-century was the Bayh-Dole Act of 1980. Together with amendments in 1984 and augmentation in 1986, this unlocked all the inventions and discoveries that had been made in laboratories through the United States with the help of taxpayers’ money. More than anything, this single policy measure helped to reverse America’s precipitous slide into industrial irrelevance. Before Bayh-Dole, the fruits of research supported by government agencies had gone strictly to the federal government. Nobody could exploit such research without tedious negotiations with a federal agency concerned. Worse, companies found it nearly impossible to acquire exclusive rights to a government owned patent. And without that, few firms were willing to invest millions more of their own money to turn a basic research idea into a marketable product.5
An even more enthusiastic assessment suggested that:
The Bayh-Dole Act turned out to be the Viagra for campus innovation. Universities that would previously have let their intellectual property lie fallow began filing for – and getting patents at unprecedented rates. Coupled with other legal, economic and political developments that also spurred patenting and licensing, the results seems nothing less than a major boom to national economic growth.6
The mechanism or instrument attributed to facilitating the commercialization of
university scientist research has been the university Technology Transfer Office (TTO).
While the TTO was not an invention of the Bayh-Dole Act, its prevalence exploded
following passage of the Act in 1980. Not only does the TTO typically engage in
painstaking collection of the intellectual property disclosed by scientists to the university
but also the extent of commercialization emanating from the TTO. The Association of
University Technology Managers (AUTM) collects and reports a number of measures
reflecting the intellectual property and commercialization of its member universities. A
voluminous and growing body of research has emerged documenting the impact of TTOs
on the commercialization of university research. Most of these studies focus on various
measures of output associated with university TTOs (Shane, 2004, Siegel and Phan, 2005;
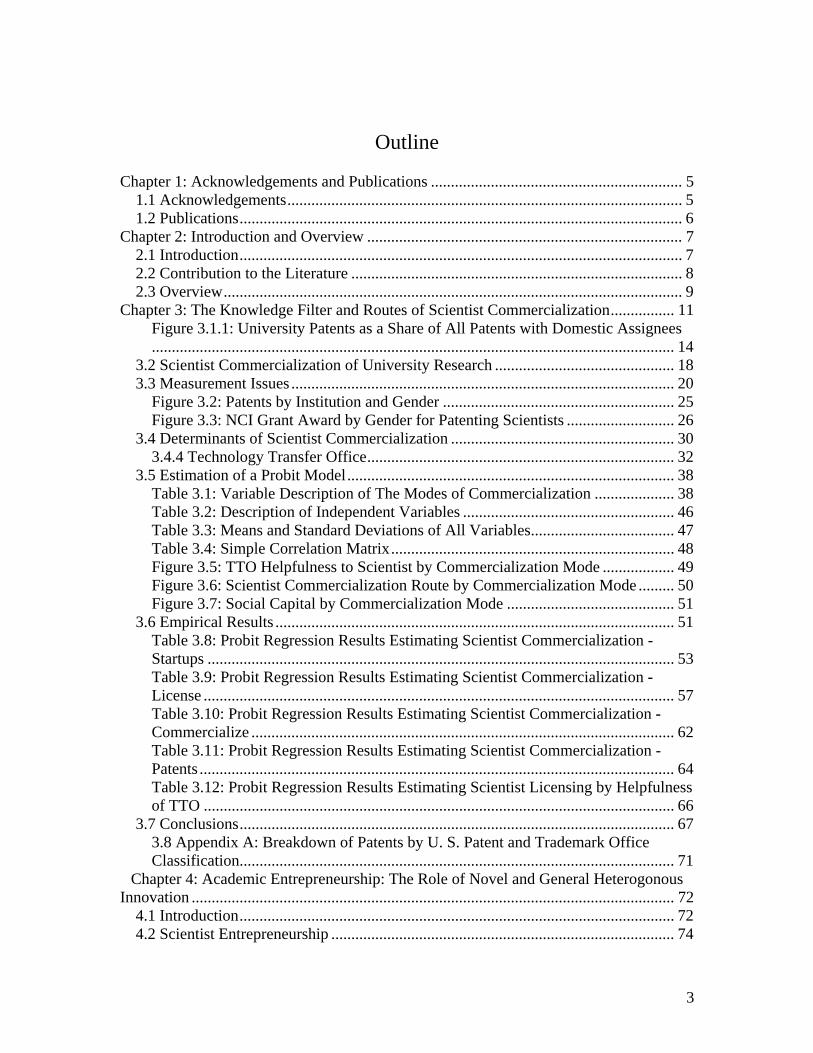
Mowery, 2005.) By most accounts, the impact on facilitating the commercialization of
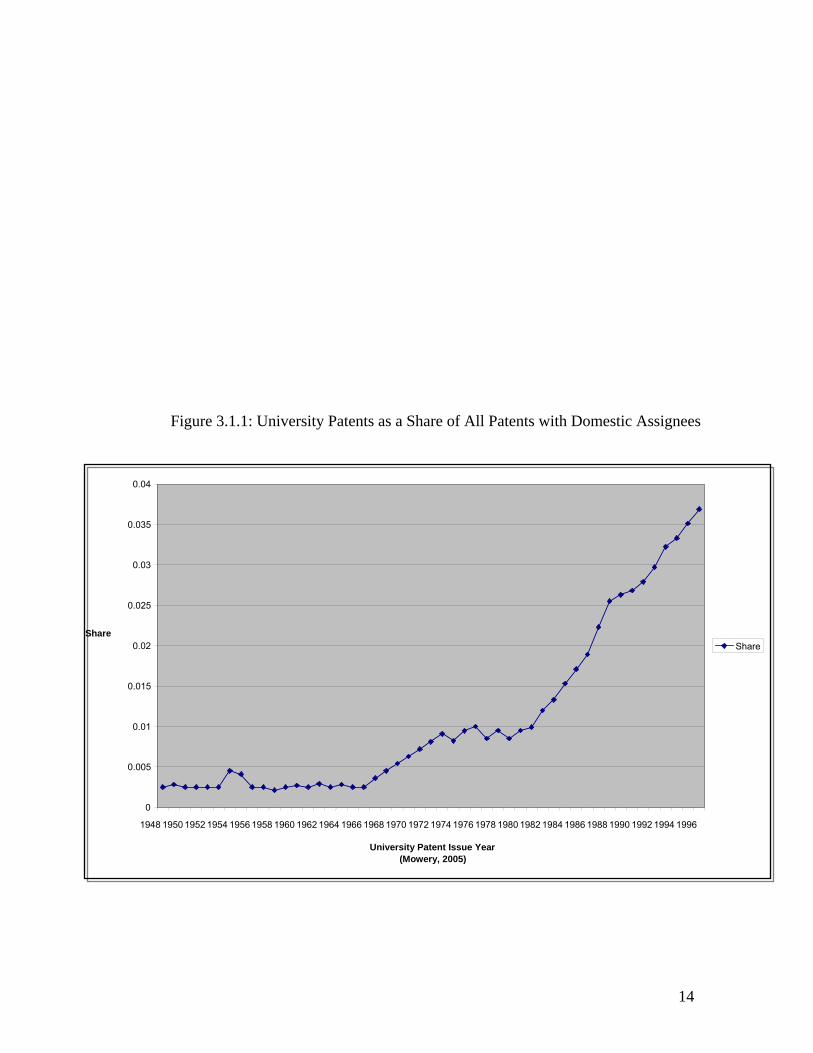
university science research has been impressive. For example, as Figure 1 shows, the
number of patents registered by universities exploded subsequent to passage of Bayh-Dole.
5 “Innovation’s Golden Goose,” The Economist, 12 December, 2002. 6 Cited in Mowery (2005, p. 64)
14
Figure 3.1.1: University Patents as a Share of All Patents with Domestic Assignees
0
0.005
0.01
0.015
0.02
0.025
0.03
0.035
0.04
1948 1950 1952 1954 1956 1958 1960 1962 1964 1966 1968 1970 1972 1974 1976 1978 1980 1982 1984 1986 1988 1990 1992 1994 1996
University Patent Issue Year (Mowery, 2005)
ShareShare
15
However, there are compelling reasons to suspect that measuring and analyzing the
commercialization of university research by relying solely upon the intellectual property
disclosed to and registered by the TTOs may lead to a systematic underestimation of
commercialization and innovation emanating from university research. The mandate of the
TTO is not to measure and document all of the intellectual property created by university
research along with the subsequent commercialization. Rather, what is measured and
documented is the intellectual property and commercialization activities with which the
TTO is involved. This involvement is typically a subset of the broader and more pervasive
intellectual property being generated by university research and its commercialization
which may or may not involve the TTO office (Thursby and Thursby, 2005). For example,
in his exhaustive study on academic spinoffs, Scott Shane (2004, p. 4) warns:
Sometimes patents, copyrights and other legal mechanisms are used to protect the intellectual property that leads to spinoffs, while at other times the intellectual property that leads to a spinoff company formation takes the form of know how or trade secrets. Moreover, sometimes entrepreneurs create university spinoffs by licensing university inventions, while at other times the spinoffs are created without the intellectual property being formally licensed from the institution in which it was created. These distinctions are important for two reasons. First it is harder for researchers to measure the formation of spinoff companies created to exploit intellectual property that is not protected by legal mechanisms or that has not been disclosed by inventors to university administrators. As a result, this book likely underestimates the spin-off activity that occurs to exploit inventions that are neither patented nor protected by copyrights. This book also underestimates the spin-off activity that occurs “through the back door”, that is companies founded to exploit technologies that investors fail to disclose to university administrators.
There is little empirical evidence supporting Shane’s admonition that relying solely
upon the data registered with and collected by the TTO will result in a systematic
underestimation of commercialization of university research. Such an underestimation of
commercialization of university research may lead to an underestimation of the impact that
spillovers of investment in university research have on innovation and ultimately economic
growth.
16
If the spillover of knowledge generated by university research is viewed as
essential for economic growth, employment creation, and international competitiveness in
global markets, the systematic underreporting of university spillovers resulting from the
commercialization of scientist research concomitantly may lead to severe policy
distortions. Thus, rather than relying on commercialization reported by the TTO to
measure and analyze the commercialization of university research, this chapter instead
develops alternative measures based on the commercialization activities reported by
scientists. In particular, the purpose of this chapter is to provide a measure of scientist
commercialization of university research and identify which factors are conducive to
scientist commercialization and which factors inhibit scientist commercialization. We do
this by developing a new database measuring the propensity of scientists funded by grants
from the National Cancer Institute (NCI) to commercialize their research as well as the
mode of commercialization. We then subject this new university scientist-based data set to
empirical scrutiny to ascertain which factors influence both the propensity and mode of
scientist commercialization of university research.
As the second section of this chapter makes clear, there is no singular mode for
scientist commercialization of research. Thus, in the third section, four distinct measures of
scientist commercialization of research are introduced and explained: patents, SBIR
awards, new firm startups and licenses. The main factors influencing the decision scientists
make in choosing to commercialize their research are introduced in the fourth section. The
four modes of commercialization are used to empirically identify the main determinants of
scientist commercialization of research in the fifth section. Finally, in the last section, a
summary and conclusion are provided. In particular, the results of this chapter suggest that
17
exclusive reliance upon measures of commercialization of university research published by
the TTOs may systematically underestimate the contribution university research makes to
commercialization, innovation and ultimately economic growth. University scientists
appear to be more vigorously involved in entrepreneurial activity, in the form of starting
new science-based firms, than had been perceived by relying solely upon the more easily
accessible databases offered by the TTOs. In particular, over one-quarter of the scientists
who were awarded a patent report that they have also started their own business, which is
an astonishingly high rate of entrepreneurship based on comparable measures for other
sub-groups of the population. Scientist entrepreneurship appears to be the sleeping giant of
the commercialization of university research.
The modes of research commercialization used by NCI funded scientists are quite
heterogeneous with respect to both prevalence and determinants. Reliance on publicly
accessible databases, such as patents and SBIR, represent, at best, the tip of the iceberg of
commercialization activities by NCI scientists. Other important commercialization modes,
such as new-firm startups, can only be measured and analyzed by creating new systematic
and comprehensive sources of data. In addition, both the prevalence and mode of
commercialization vary considerably across scientists. Not all scientists are equally helped
by the TTOs. Those that do report being helped by the TTO have a higher propensity to
license their intellectual property to an existing firm but a lower propensity to start a new
firm. By contrast, scientists reporting not being helped by the TTO have a lower propensity
to license their intellectual property to existing firms but a higher propensity to start their
own firm.
18
Scientists assigning their patents to the TTO, or those commercializing through the
TTO route, exhibit a higher propensity to commercialize their research by licensing but not
by starting a new firm. By contrast, those scientists choosing what we term as the
entrepreneurial route to commercialize their research, in that they do not assign all of their
patents to the TTO, exhibit a higher propensity to start a new firm but a lower likelihood of
licensing their intellectual property.
Social capital and networks, as measured by the extent to which a scientist engages
in industry co-publication, co-patenting with other NCI scientists, and serving on a
company board of directors or scientific advisory board (SAB) clearly promote the
likelihood of commercialization, particularly for the mode of entrepreneurship. The impact
of social capital on entrepreneurial activity is more pronounced for scientists not helped by
the TTO, suggesting that social networks may be an additional mechanism to the TTO in
facilitating the commercialization of university research.
3.2 Scientist Commercialization of University Research
Why and how will scientists decide to commercialize their scientific research? One
answer to the question of why was provided by Stephan and Levin (1992), who suggest
that a scientist will choose to commercialize research if this furthers her life goals. But how
should a scientist best appropriate the value of her human capital? That is, what mode of
commercialization is most appropriate for a given scientist with a stock of knowledge and
scientific human capital? Alternatives abound, such as working full time or part time with
an incumbent firm, licensing the knowledge to an incumbent firm, starting a new firm, or
joining an existing firm.
19
Previous studies have identified several major modes of scientist
commercialization. Ownership of intellectual property, in the form of patented inventions,
is an important step in the commercialization process. Jaffe and Lerner (2001), Henderson,
Jaffe and Trajtenberg (1998) and Jaffe, Trajtenberg and Henderson (1993) all identify
patents as an important mode by which scientists commercialize their research.
Thursby and Jensen (2005), Thursby, Jensen and Thursby (2001) and Jensen and
Thursby (2001) identify both patents and the licensing of patents as important modes of
scientist commercialization. In particular, Thursby and Jensen (2004, p. 4) employ a
principal-agent framework in which the university administration is the principal and the
faculty scientist is the agent, and identify that the “whether or not the researcher remains in
the university, and if so her choice of the amount of time to spend on basic and applied
research, is complicated by the fact that she earns license income and prestige both inside
and outside the university.”
Several studies have identified the important role that the Small Business
Innovation Research (SBIR) program can play as a mode of scientist commercialization
(Lerner, 1999; Audretsch, Link and Scott, 2002). Toole and Czarnitzki (2005) find that
only eight percent of the unique Principle Investigators (PIs) were awarded an SBIR grant
from the U.S. Department of Health and Human Services between 1983 and 1996, which
suggests that the SBIR may perhaps be an important instrument of public policy, but not a
prevalent mechanism for commercializing university scientist research.
A different mode of commercialization involves academic entrepreneurship, where
the scientist starts a new firm to bring her research to the market. Louis, Blumenthal,
20
Gluck and Sioto (1989) identify the role of individual characteristics and attitudes, along
with the norms of scientific peer groups as important factors in influencing the scientists’
decision to commercialize their research in the form of a new-firm startup. Similarly,
Shane (2004), Lockett, Siegel, Wright and Ensley (2005), Zucker, Darby and Brewer
(1997), O’Shea, Allen, Chevalier and Roche (2005) and Audretsch and Stephan (1996 and
1999) focus on the role that new-firm startups play as a conduit for commercializing
scientific research. Thus, research has pointed to four principle modes of scientist
commercialization: patents, SBIR, licenses, and new-firm startups.
3.3 Measurement Issues
The commercialization activity of university scientists was measured by starting
with those scientists awarded a research grant by the National Cancer Institute between
1998 and 2002. Of those research grant awards, the largest twenty percent, which
corresponded to 1,693 scientist awardees, were taken to form the database used in this
chapter. The National Cancer Institute (NCI) awarded a total of $5,350,977,742 to the
1,693 highest funded quintile of United States-based scientists from 1998 to 2002.
Since the focus of this chapter is on the propensity for scientists to commercialize
their research, commercialization must be operationalized and measured. Based on the
literature identified in the previous section, five main measures of scientist
commercialization are used, which reflect five different modes by which scientists can and
do commercialize their research. These are (1) patenting inventions, (2) issuing licenses,
(3) receiving an SBIR grant to obtain funding for an innovative small business, (4) starting
a new firm, and (5) selling a patent. In fact, there certainly are additional modes of
commercialization remaining unexplored by this chapter. Examples include non-patenting
21
scientists who start a new firm, the mobility of students or faculty from the university to
the private sector, consulting contracts, and informal interactions. The absence of these
types of modes of commercialization of university research by scientists from this chapter
does not suggest that they are unimportant, but rather that they are difficult to measure.
Based on these five different measures reflecting distinct modes of scientist
commercialization of research, an NCI awardee database was created to answer the
question, “Why do some scientists commercialize while others do not?”
3.3.1 Patents
The first measure of commercialization of research by an NCI award scientist is
inventions which are patented. The propensity for NCI award scientists to patent was
analyzed by obtaining patent data from the United States Patent and Trademark Office
(USPTO).7 The patent database spans 1975 to 2004 and contains over three million
patents.
To match the patent records with the 1,692 NCI recipient scientists, Structured
Query Language (SQL) and Python programming languages were written to extract and
manipulate data. A match between the patentee and NCI awardee databases was
considered to be positive if all four of the following necessary conditions were met:
(1) A positive match was made with the first, middle, and last name. If, for
example, the scientist did not have a middle name listed on either the NCI award database
7 On July 25th, 2005, Jim Hirabashi of the Office of Electronic Information Products at the patent Technology Monitoring Division was sent a request order for the “U.S. Patent CDs” from 1975 to 2004.
22
or the patent database, but did have a positive first and last name, this first condition was
considered to be fulfilled.
(2) The second criterion involved matching the relevant time periods between the
two databases. Observations from both databases were matched over the time period 1998-
2004, which corresponds to the initial year in which observations were available from the
NCI database (1998-2002) and the final year in which patents were recorded in the patent
database (1975-2004). Because applications of patents may take anywhere from three
months to two years to be issued, the 2003 and 2004 USPTO patent records were included
in our query. Issued patents from 1998 to 2004 by NCI scientists fulfilled the second
criterion.
(3) The third criterion was based on location. If the patentee resided within an
approximate radius of 60 miles from the geographic location of the university, the third
condition was fulfilled.
(4) The fourth criterion was based on USPTO patent classification. Using the
USPTO patent classification code, all patents were separated into respective coding
groups. Patents which did not fall under the traditional categories of biotechnology were
identified. All non biotech patents were evaluated and patents such as “Bread Alfalfa
Enhancer” were rejected as an NCI scientist patent (see Appendix A for a distribution of
patent categories).
Based on these four match criteria, a subset of 398 distinctly issued patentees were
identified between 1998 and 2004 with a total of 1,204 patents.
23
3.3.2 Survey Implementation
After identifying the full set of NCI patentees, a survey instrument was designed
with two main criteria:
(1) To maximize information without overly burdening the nation’s top
medical scientists. Reducing the time and input burden imposed on the
scientist was considered to have a favorable impact on the response
rate; and
(2) To maximize information revealing the creation of intellectual property
and its subsequent commercialization through licensing and
entrepreneurial activity, while at the same time respecting the need for
scientist confidentiality and not confronting the scientist with
information requests that might compromise such confidentiality.
Based on these two criteria, an interview instrument was designed probing four
subgroups of issues: licensing, entrepreneurship, social capital and the role of the TTO.
The question in the licensing section asked if the scientist has licensed. The
question contained in the entrepreneurship section identified whether the scientist started a
new firm. The questions concerning social capital asked the scientist if she sat on any
industry science advisory boards (SAB) or board of directors, the extent to which the NCI
grant award facilitated commercialization, along with other sources of major funding
received from a governmental agency. The questions concerning the influence of the TTO
asked whether the university’s TTO “directly helped you to commercialize your research
between 1998 to 2004”.
24
The 398 patenting scientists were “Googled” to obtain their e-mail and telephone
information. The records could, generally, be found by typing their full name, university
and the word “oncology”. The ensuing patentee e-mail accounts and telephone numbers
were then collected and registered in the scientist database. Of those 398 scientists
identified in the database, 146 responded. Six respondents indicated that they had not
patented the ascribed patents, therefore reducing the number of patentees to 392. The
number of respondent, therefore, reflects a response rate of 36 percent. NCI awarded
scientists commercializing through patents varied from those not commercializing in
several important ways.
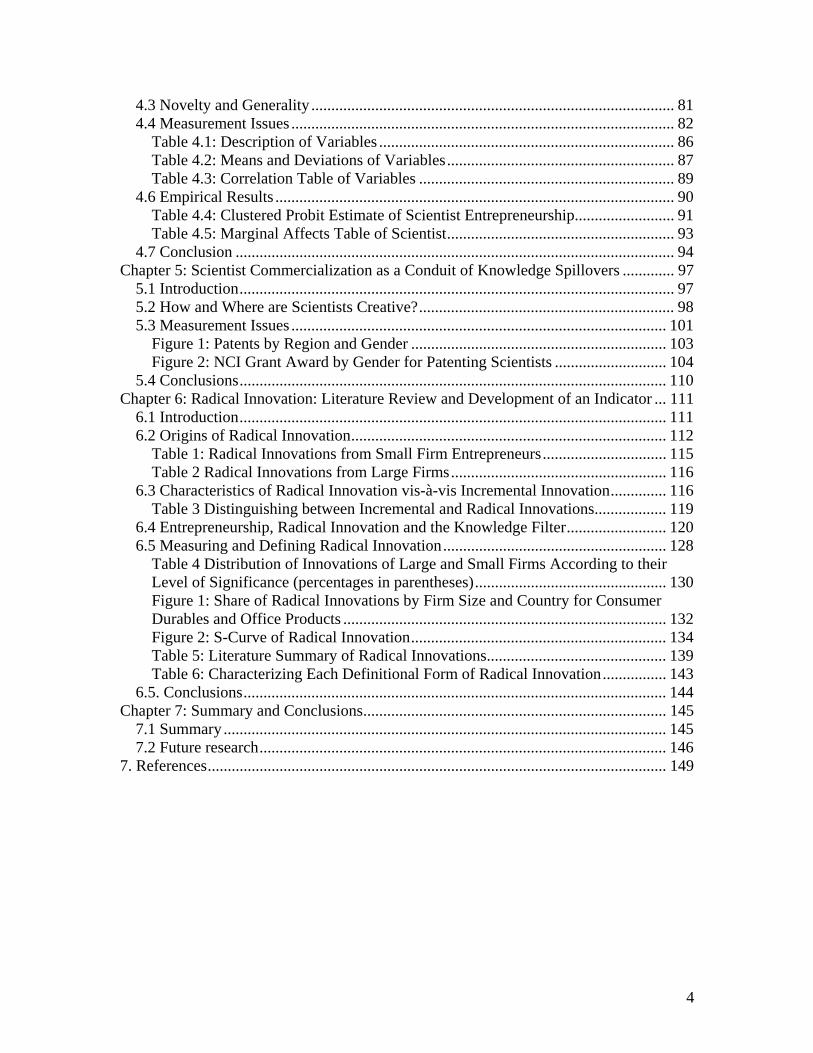
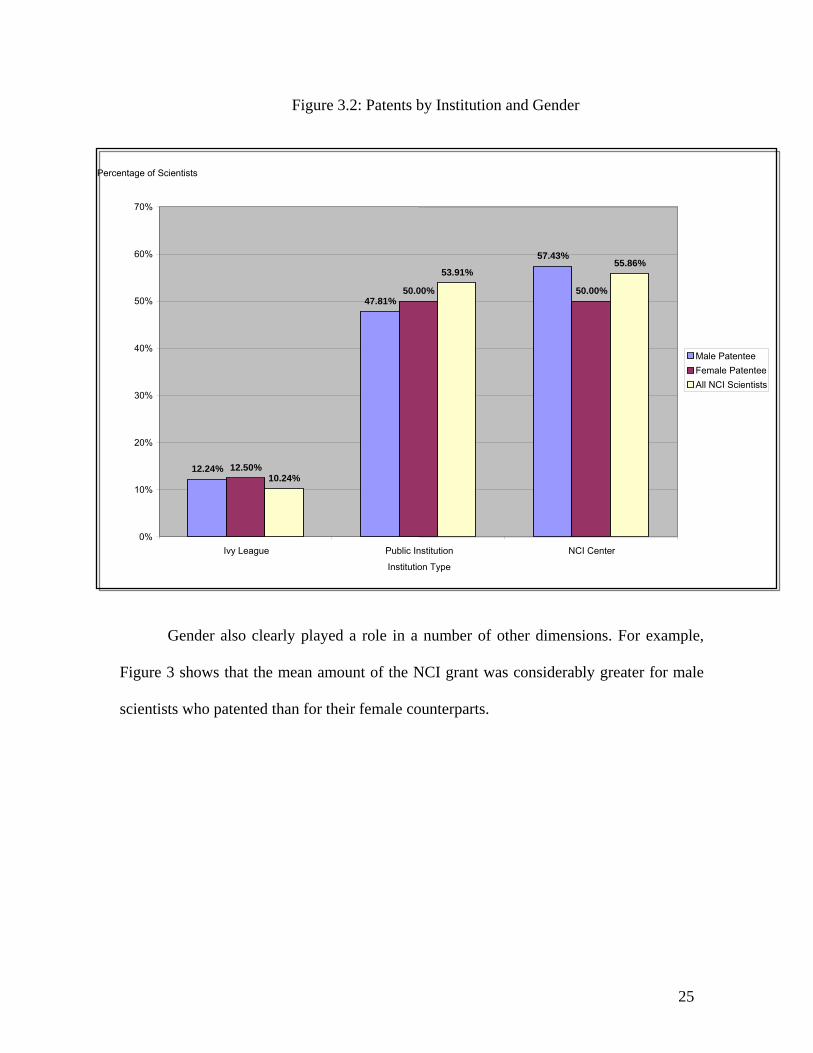
Figure 2 shows that the distribution of patentees varied both across institutions as
well as by gender. In Ivy League and public institutions, the propensity for females to
patent exceeded that of their male colleagues. Male scientists at universities with an NCI
Center, however, had a greater propensity to patent.
25
Figure 3.2: Patents by Institution and Gender
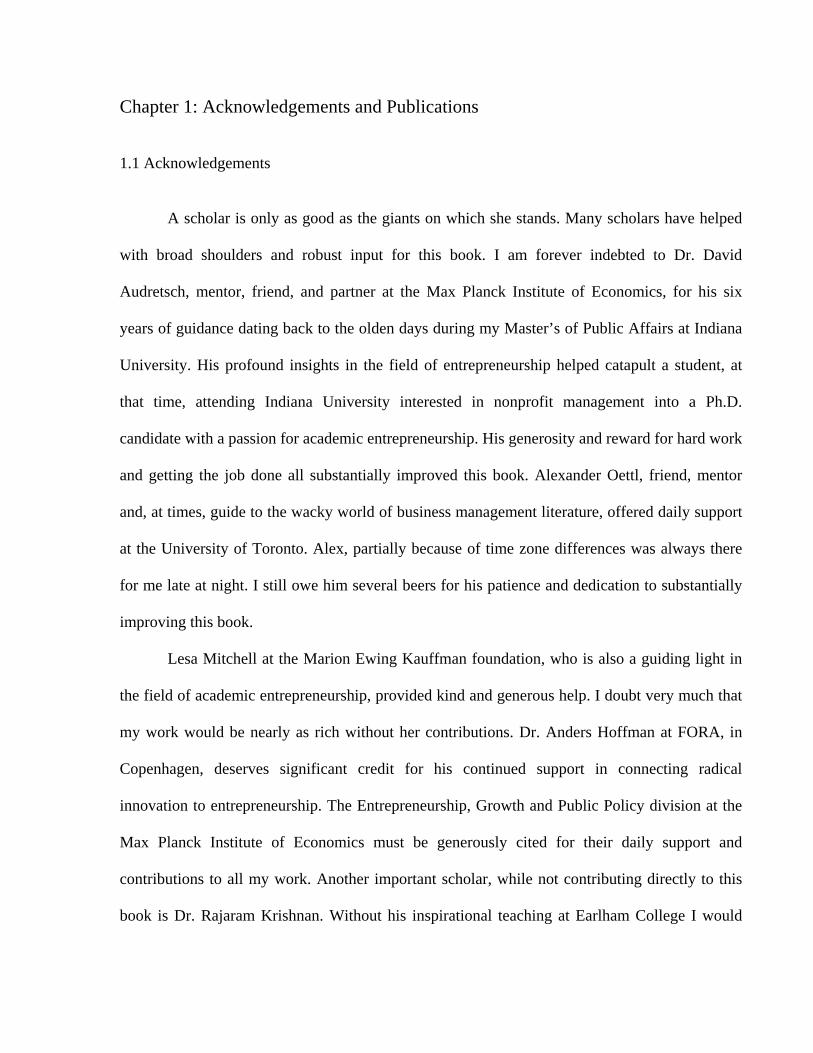
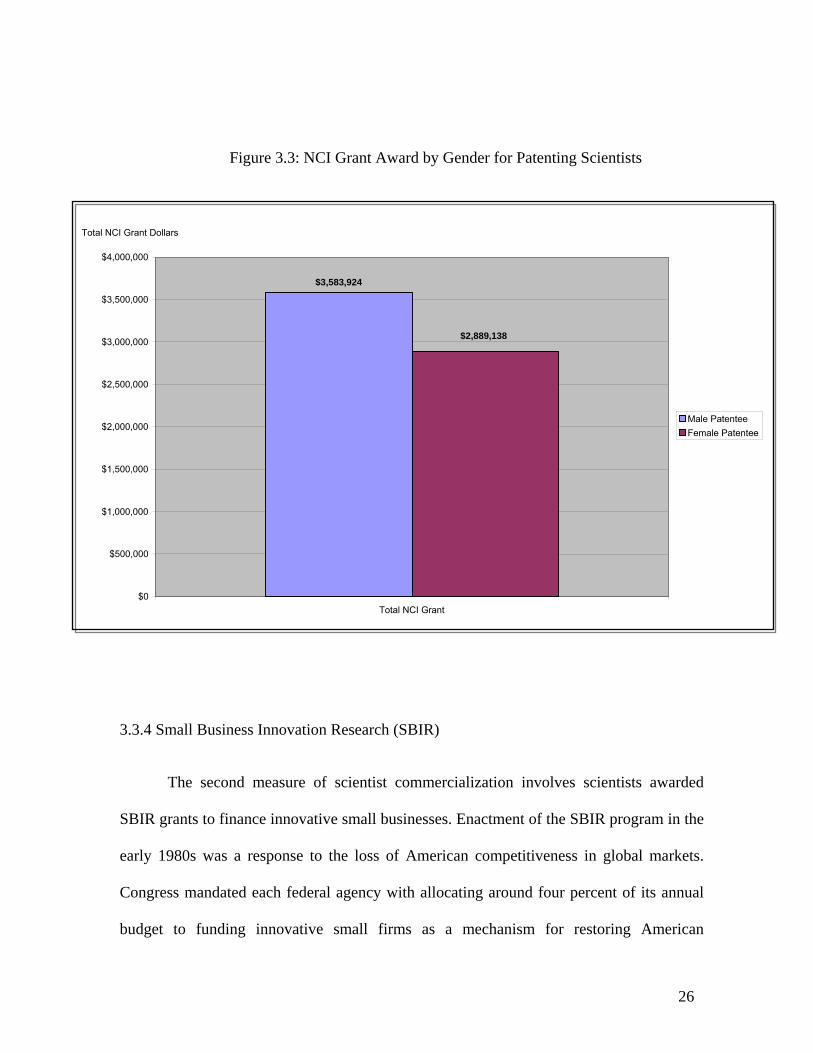
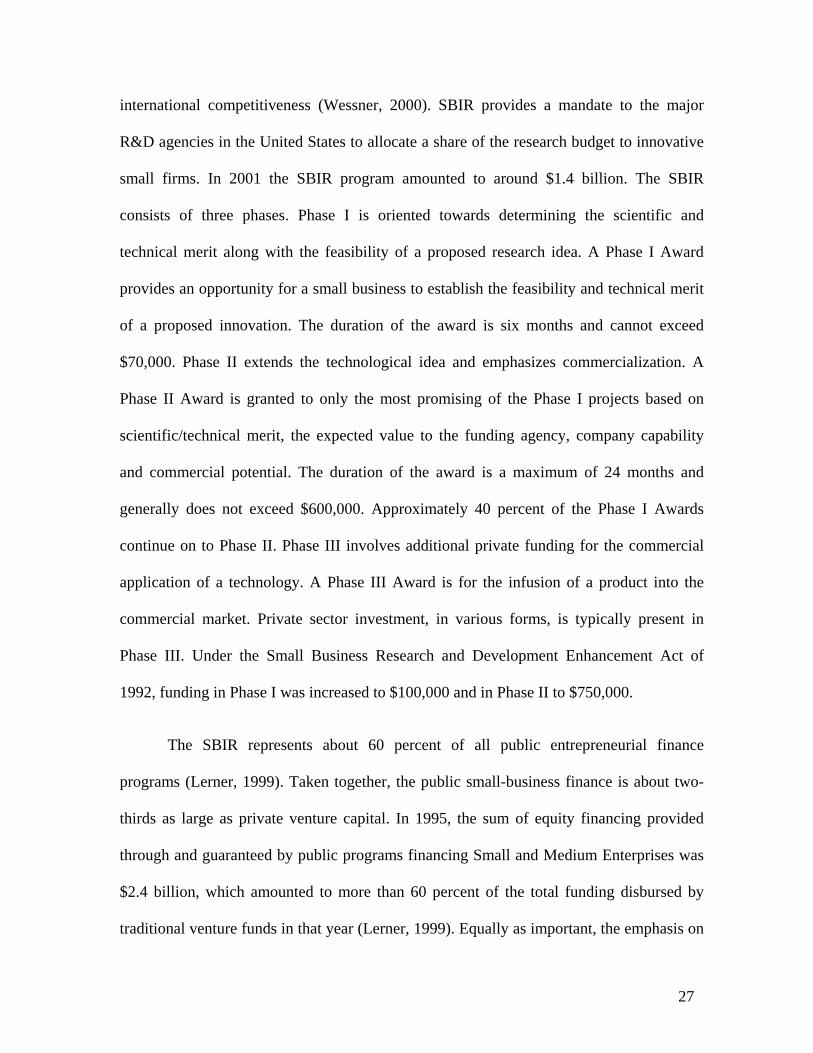
Gender also clearly played a role in a number of other dimensions. For example,
Figure 3 shows that the mean amount of the NCI grant was considerably greater for male
scientists who patented than for their female counterparts.
12.24%
47.81%
57.43%
12.50%
50.00% 50.00%
10.24%
53.91%55.86%
0%
10%
20%
30%
40%
50%
60%
70%
Ivy League Public Institution NCI Center Institution Type
Percentage of Scientists
Male PatenteeFemale PatenteeAll NCI Scientists
26
Figure 3.3: NCI Grant Award by Gender for Patenting Scientists
3.3.4 Small Business Innovation Research (SBIR)
The second measure of scientist commercialization involves scientists awarded
SBIR grants to finance innovative small businesses. Enactment of the SBIR program in the
early 1980s was a response to the loss of American competitiveness in global markets.
Congress mandated each federal agency with allocating around four percent of its annual
budget to funding innovative small firms as a mechanism for restoring American
$3,583,924
$2,889,138
$0
$500,000
$1,000,000
$1,500,000
$2,000,000
$2,500,000
$3,000,000
$3,500,000
$4,000,000
Total NCI Grant
Total NCI Grant Dollars
Male PatenteeFemale Patentee
27
international competitiveness (Wessner, 2000). SBIR provides a mandate to the major
R&D agencies in the United States to allocate a share of the research budget to innovative
small firms. In 2001 the SBIR program amounted to around $1.4 billion. The SBIR
consists of three phases. Phase I is oriented towards determining the scientific and
technical merit along with the feasibility of a proposed research idea. A Phase I Award
provides an opportunity for a small business to establish the feasibility and technical merit
of a proposed innovation. The duration of the award is six months and cannot exceed
$70,000. Phase II extends the technological idea and emphasizes commercialization. A
Phase II Award is granted to only the most promising of the Phase I projects based on
scientific/technical merit, the expected value to the funding agency, company capability
and commercial potential. The duration of the award is a maximum of 24 months and
generally does not exceed $600,000. Approximately 40 percent of the Phase I Awards
continue on to Phase II. Phase III involves additional private funding for the commercial
application of a technology. A Phase III Award is for the infusion of a product into the
commercial market. Private sector investment, in various forms, is typically present in
Phase III. Under the Small Business Research and Development Enhancement Act of
1992, funding in Phase I was increased to $100,000 and in Phase II to $750,000.
The SBIR represents about 60 percent of all public entrepreneurial finance
programs (Lerner, 1999). Taken together, the public small-business finance is about two-
thirds as large as private venture capital. In 1995, the sum of equity financing provided
through and guaranteed by public programs financing Small and Medium Enterprises was
$2.4 billion, which amounted to more than 60 percent of the total funding disbursed by
traditional venture funds in that year (Lerner, 1999). Equally as important, the emphasis on
28
SBIR and most public funds is on early stage finance, which is generally ignored by
private venture capital. Some of the most innovative American companies received early
stage finance from SBIR, including Apple Computer, Chiron, Compaq and Intel.
There is compelling evidence that the SBIR program has had a positive impact on
economic performance in the U.S. (Wessner, 2000; Audretsch, 2003; Audretsch, Weigand
and Weigand, 2002; and Lerner, 1999). The relevant agency awarding SBIR grants to
scientists for commercialization of science involving cancer research is the National
Institutes of Health. This does not preclude the possibility that SBIR awards could be made
to scientists engaged in cancer research from other agencies. The SBIR award data from
the NIH between 1998 and 2002 is listed on the NIH home webpage at
http://grants.nih.gov/grants/funding/award_data.htm.8 The information provided in each
SBIR record in the NIH database includes the phase type of the award, fiscal year, state,
formal organizational name, award, application type, grant number, principle investigator
(PI), project title, contact name, contact e-mail, organization line, address, research partner,
and whether the SBIR award was a new grant.
Between 1998 and 2002, 6,461 SBIR awards were granted to 3,230 distinct
scientists from the NIH. The Principle Investigator (PI) of each SBIR award was then
matched to the 1,693 NCI scientists using an SQL program. Those scientists included in
both the SBIR database as a PI and an NCI award recipient, and that were matched by last
and first names, were considered for this chapter. The resulting 34 matches were then
subjected to a location criterion: the address of the PI listed in the SBIR grant was matched
8 The acting director of the Office of Extramural Research at NIH, Joanne Goodnight, and the “general help e-mail address” were twice e-mailed and called to confirm the veracity of the website’s content. Neither the director nor any staff responded to confirmation requests.
29
to the NCI scientists using a 75 mile radius to the respective university. If the location was
outside of a 75 mile radius, the match was not considered to be valid. For example, there
are four PI scientists with the name David Johnson listed in the NIH SBIR database. Their
addresses are given as Hamilton, Montana; Lawrence, Kansas; San Diego, California and
Seattle, Washington. None of these addresses matched the two NCI recipients named
David Johnson from Houston, Texas and Nashville, Tennessee. The geography criterion
reduced the number of confirmed SBIR-NCI recipients to eight. Thus, one of the most
striking insights to emerge in this chapter is that use of the SBIR is not a prevalent or even
common mode of commercialization by scientists receiving NCI awards.
The most striking feature of the (small) group of SBIR scientists is that they tend to
be highly accomplished in terms of research output and reputation. As Table 3 shows, their
citations were about three times as great as the overall group of NCI scientists. Most of the
SBIR scientists are employed at NCI Centers.
Interestingly, the mean value of their NCI award was relatively low. Thus, there
are considerable reasons to view those scientists funded by the NCI who also obtain an
SBIR grant as being outliers.
30
3.4 Determinants of Scientist Commercialization
3.4.1 Main Factors
A number of theories and hypotheses have posited why some scientists choose to
commercialize research while others do not, and some compelling insights have been
garnered through previous empirical studies. These include the gender, age, experience and
also reputation of the scientist, as well the role of scientific human capital and resources,
and the regional and university contexts, which highlight the role of geographically
bounded spillovers and institutional incentives.
In addition to these control variables, which have already been probed in a number
of studies examining factors that influence the propensity for a scientist to engage in
commercialization activities, we also include a number of factors that can only be
measured with the type of scientist-based data set constructed and described in the
previous section. These additional factors include not just scientific human capital, but
social capital as well, along with the role of the TTO, and the commercialization route
selected by the scientist.
3.4.2 Social Capital
Social capital refers to meaningful interactions and linkages the scientist has with
others. While physical capital refers to the importance of machines and tools as a factor of
production (Solow, 1956), the endogenous growth theory (Romer 1986, 1990; Lucas 1988)
puts the emphasis on the process of knowledge accumulation, and hence the creation of
knowledge capital. The concept of social capital (Putnam, 1993 and Coleman, 1988) can
31
be considered a further extension because it adds a social component to those factors
shaping economic growth and prosperity. According to Putnam (2000, p.19):
Whereas physical capital refers to physical objects and human capital refers to the properties of individuals, social capital refers to connections among individuals – social networks. By analogy with notions of physical capital and human capital – tools and training that enhance individual productivity – social capital refers to features of social organization, such as networks that facilitate coordination and cooperation for mutual benefits.
A large and robust literature has emerged attempting to link social capital to
entrepreneurship (Aldrich and Martinez, 2003; Aldrich, 2005; and Thorton and Flynn,
2003). According to this literature, entrepreneurial activity should be enhanced where
investments in social capital are greater. Interactions and linkages, such as working
together with industry, are posited as conduits not just of knowledge spillovers but also for
the demonstration effect providing a flow of information across scientists about how
scientific research can be commercialized (Thursby and Thursby, 2004). Thus, the social
capital of a scientist is posited to be conducive to the commercialization of research.
3.4.3 Scientist Commercialization Route
Scientists choose to commercialize their research through two different routes.
They can assign their patents to the university’s TTO, which we refer to as the TTO route.
Alternatively, they can choose what we term the entrepreneurial route of
commercialization. The entrepreneurial route to scientist commercialization refers to those
scientists who do not assign all of their patents to the university’s TTO. Of the NCI
patenting scientists, 70 percent assigned all of their patents to their university TTO and 30
percent chose the entrepreneurial route to commercialize their research.
32
Whether or not the particular commercialization route influences the
commercialization mode is an empirical question best left for the data analysis to answer.
3.4.4 Technology Transfer Office
The TTO has a mandate to facilitate and promote the commercialization of
university science. As the President of the Association of American Universities observed:
Before Bayh-Dole, the federal government had accumulated 30,000 patents, of which only 5% had been licensed and even fewer had found their way into commercial products. Today under Bayh-Dole more than 200 universities are engaged in technology transfer, adding more than $21 billion each year to the economy9
The Commission of the U.S. Patent and Trademark Office claimed:
In the 1970s, the government discovered that inventions that resulted from public funding were not reaching the marketplace because no one could make the additional investment to turn basic research into marketable products. That finding resulted in the Bayh-Dole Act, passed in 1980. It enabled universities, small companies, and nonprofit organizations to commercialize the results of federally funded research. The results of Bayh-Dole have been significant. Before 1981, fewer than 250 patents were issued to universities each year. A decade later universities were averaging approximately 1,000 patents a year.10
This, presumably, would suggest that the TTO is expected to have a positive impact on
scientist commercialization of university research.
On the other hand, there are reasons to suspect that involvement of the TTO might
not have the same impact across all modes of commercialization. For example, one
response from the in-depth scientist interviews conducted in this chapter revealed:
9 Cited in Mowery (2005, p. 65) 10 Cited in Mowery (2005, p. 65)
33
I refuse to work with the TTO. They have destroyed any of my commercial work. I have given up on any sort of commercial enterprises with my TTO. I don’t think any of my colleagues have attempted to commercialize anything here for the past six years.11
Similarly, a different scientist shared that “My commercial spirit stops at the TTO door.”12
However, it is important to emphasize that such views are not reflective of all
scientists. For example, a different scientist responded that “Our university technology
transfer office does ok. They occasionally have some problems with some technical issues,
but over all, they have served me for the better.”13
Thus, the actual impact of the TTO on scientist commercialization in general and
on the specific commercialization modes of entrepreneurship and licensing is a question
best left to empirical scrutiny.
3.4.5 Scientific Human Capital
An implication of the knowledge production function is that those scientists with
greater research and scientific prowess have the capacity for generating greater scientific
output. But how does scientific capability translate into observable characteristics that can
promote or impede commercialization efforts? Because the commercialization of scientific
research is particularly risky and uncertain (Audretsch and Stephan, 2000), a strong
scientific reputation, as evidenced through citations, provides a greatly valued signal of
scientific credibility and capability to any anticipated commercialized venture or project.
This suggests a hypothesis linking measures of the quality of the scientist, or her scientific
reputation as measured by citations, to commercialization. 11 NCI scientist quote taken on January 25th, 2005 12 NCI scientist quote taken January 15th, 2005 13 NCI scientist quote taken on October 12th, 2005
34
3.4.6 Scientific Resources
The question of why some contexts generate more innovative activity than others
has been the subject of considerable research in economics. While the conventional
approach to analyzing innovative output at the microeconomic level has been at the level
of the firm, it conceivably can apply to the unit of analysis of the individual knowledge
worker, such as a scientist. The fundamental questions addressed in this literature are:
“What do firms do to generate innovative output?” and “Why are some firms more
innovative than others?” For the unit of observation of the individual scientist, this
question translates into: “What do scientists do to generate innovative output?” and “Why
are some scientists more engaged in commercialization of scientific activity than others?”
In what Zvi Griliches (1979) formalized as the model of the knowledge production
function, knowledge generating inputs are linked to innovative outputs. Griliches, in fact,
suggested that it was investments in knowledge inputs that would generate the greatest
yield in terms of innovative output.
This might suggest a hypothesis that the propensity for a scientist to engage in
commercialization activity is positively related to the amount of the award, on the grounds
that a greater award amount, ceteris paribus, represents a greater investment in new
knowledge.
3.4.7 Scientist Life-Cycle
A large literature has emerged focusing on what has become known as the
appropriability problem. The underlying issue revolves around how firms which invest in
35
the creation of new knowledge can best appropriate the economic returns from that
knowledge (Arrow, 1962). Audretsch (1995) proposed shifting the unit of observation
away from exogenously assumed firms to individuals — agents with endowments of new
economic knowledge. When the lens is shifted away from the firm to the individual as the
relevant unit of analysis, the appropriability issue remains, but the question becomes;
"How can scientists with a given endowment of new knowledge best appropriate the
returns from that knowledge?" Levin and Stephan (1991) suggest that the answer is, It
depends – it depends on both the career trajectory as well as the stage of the life-cycle of
the scientist.
The university or academic career trajectory encourages and rewards the production
of new scientific knowledge. Thus, the goal of the scientist in the university context is to
establish priority. This is done most efficiently through publication in scientific journals
(Audretsch and Stephan, 2000). By contrast, with a career trajectory in the private sector,
scientists are rewarded for the production of new economic knowledge, or knowledge
which has been commercialized in the market, but not necessarily new scientific
knowledge per se. In fact, scientists working in industry are often discouraged from
sharing knowledge externally with the scientific community through publication. As a
result of these differential incentive structures, industrial and academic scientists develop
distinct career trajectories.
The appropriability question confronting academic scientists can be considered in
the context of the model of scientist human capital over the life-cycle. Scientist life-cycle
models suggest that early in their careers scientists invest heavily in human capital in order
to build a scientific reputation (Levin and Stephan, 1991). In the later stages of their career,
36
the scientist trades or cashes in this reputation for economic return. Thus, early in her
career, the scientist invests in the creation of scientific knowledge in order to establish a
reputation that signals the value of that knowledge to the scientific community.
With maturity, scientists seek ways to appropriate the economic value of the new
knowledge. Thus, academic scientists may seek to commercialize their scientific research
within a life-cycle context. The life-cycle model of the scientist implies that, ceteris
paribus, scientist age should play a role in the decision to commercialize. In the early
stages of her career, a scientist will tend to invest in her scientific reputation. As she
evolves towards maturity and the marginal productivity of her scientific research starts to
hit diminishing returns, the incentive for cashing in through commercialization becomes
greater.
Scientists working in the private sector are arguably more fully compensated for
the economic value of their knowledge. This will not be the case for academic scientists,
unless they cash out, in terms of Dasgupta and David (1994), by commercializing their
scientific knowledge. This suggests that academic scientists seek commercialization within
a life-cycle context. This life-cycle context presents two distinct hypotheses: both age and
scientific reputation should influence the decision of a university scientist to engage in
commercialization activities.
3.4.8 Locational and Institutional Contexts
Scientist location can influence the decision to commercialize for two reasons.
First, as Jaffe (1989), Audretsch and Feldman (1996), Jaffe, Trajtenberg and Henderson
(1993), and Glaeser, Kallal, Sheinkman and Shleifer (2002) show, knowledge tends to spill
37
over within geographically bounded regions. This implies that scientists working in
regions with a high level of investments in new knowledge can more easily access and
generate new scientific ideas. This suggests that scientists working in knowledge clusters
should tend to be more productive than their counterparts who are geographically isolated.
As Glaeser, Kallal, Scheinkman and Shleifer (1992, p. 1,126) have observed, “Intellectual
breakthroughs must cross hallways and streets more easily than oceans and continents.”
A second component of externalities involves not the technological knowledge, but
rather behavioral knowledge. As Bercoviz and Feldman (2004) show for a study based on
the commercialization activities of scientists at Johns Hopkins University and Duke
University, the likelihood of a scientist engaging in commercialization activity, which is
measured as disclosing an invention, is shaped by the commercialization behaviour of the
doctoral supervisor in the institution where the scientist was trained, as well as the
commercialization behaviour and attitudes exhibited by the chair and peers in the relevant
department. Similarly, based on a study of 778 faculty members from 40 universities,
Louis et al. (1998) find that it is the local norms of behaviour and attitudes towards
commercialization that shape the likelihood of an individual university scientist to engage
in commercialization activity, in their case by starting a new firm.
Thus, the location and institutional contexts can influence the propensity for
scientists to engage in commercialization activities by providing access to spatially
bounded knowledge spillovers and by shaping the institutional setting and behavioural
norms and attitudes towards commercialization.
38
3.5 Estimation of a Probit Model
To shed light on the question; “Why do some scientists commercialize their scientific
research while others do not?” a probit model was estimated for the unit of observation of the
scientist identified in the NCI database where the dependent variable takes on the value of one
if she has commercialized over the time period 1998-2004 and zero if she has not. As the
previous section emphasized, there is no singular mode for scientist commercialization. Rather,
scientists select across multiple modes of possible commercialization. Thus, the probit model
was estimated for each of the main modes of commercialization – patents, licenses, new-firm
startups, patent selling and SBIR discussed in the previous section. Each of these measures of
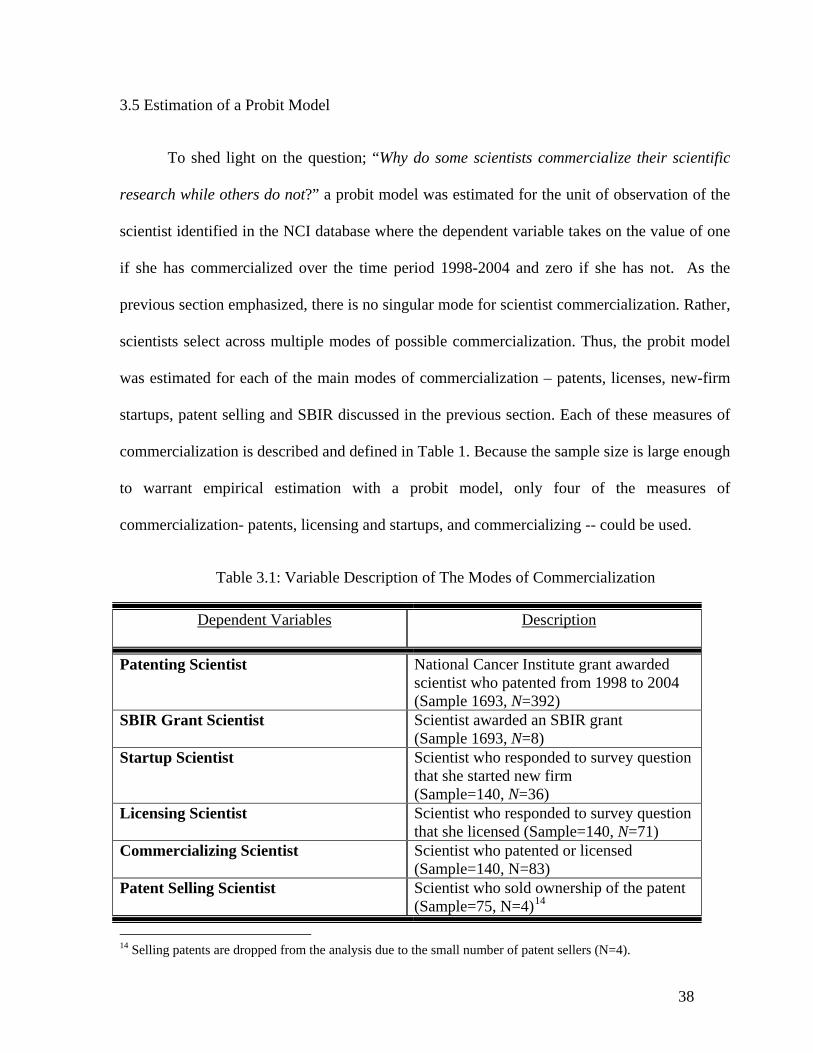
commercialization is described and defined in Table 1. Because the sample size is large enough
to warrant empirical estimation with a probit model, only four of the measures of
commercialization- patents, licensing and startups, and commercializing -- could be used.
Table 3.1: Variable Description of The Modes of Commercialization
Dependent Variables Description
Patenting Scientist National Cancer Institute grant awarded scientist who patented from 1998 to 2004 (Sample 1693, N=392)
SBIR Grant Scientist Scientist awarded an SBIR grant (Sample 1693, N=8)
Startup Scientist Scientist who responded to survey question that she started new firm (Sample=140, N=36)
Licensing Scientist Scientist who responded to survey question that she licensed (Sample=140, N=71)
Commercializing Scientist Scientist who patented or licensed (Sample=140, N=83)
Patent Selling Scientist Scientist who sold ownership of the patent (Sample=75, N=4)14
14 Selling patents are dropped from the analysis due to the small number of patent sellers (N=4).
39
The previous section suggests five different types of factors shaping the decision by
a scientist to commercialize her research: social capital, the TTO, resources, age, scientific
human capital (quality), nature of the university, and location. These factors are
empirically operationalized through the following measures:
Social Capital
Co-patents – This variable reflects the extent of social capital and linkages between
scientists by measuring the number of patents where two NCI scientists shared a patent. It
is expected to have a positive coefficient, reflecting the propensity for social capital to be
positively related to scientist commercialization of research.
Board – This is a binary variable taking on the value of one if the scientist has sat on a
scientific advisory board or the board of directors of a firm. A positive coefficient would
indicate that social capital, as reflected by board membership, is conducive to the
commercialization of university research.
Industry Co-publications – This variable reflects social capital and linkages between
university scientists and their counterparts in industry and is measured as co-authorship
between a university scientist and an industry scientist in the Science Citation Index using
the Institute for Scientist Information (ISI) Web of Science citation database. The total
count of papers coauthored with an industry scientist between the years of 1998 and 2004
was estimated using several search queries on the ISI database. Using the address fields
within each publication value in the ISI database, Co-publications were identified as a
private sector address if the terms Co, Co Ltd, Inc, or LLC, were found. Also, in order to
not misidentify the University of Colorado as a company, for example, the query forced
40
the previously mentioned search terms to be standalone words, and not part of larger
words. The coefficient is expected to be positive, which would reflect that university-
industry scientist interactions are conducive to commercialization.
Industry Co-publication Asia -- This variable reflects social capital and linkages between
university scientists and their counterparts located in Asia. Scientist linkages are measured
as co-authorship between a university and an Asian scientist in the Science Citation Index
using the ISI Web of Science citation database. Using the address fields within each
publication value of the ISI Web of Science citation index Industry Co-publication Asia
was identified if any of the terms of China, Japan, South Korea and Taiwan were found in
the ISI Web of Science address field. A binary variable was then created, taking on the
value of one for all scientists with linkages in Asia and zero otherwise. The coefficient is
expected to be positive which would reflect that interactions involving scientists located in
Asia are conducive to commercialization.
Scientist Commercialization Route
Non TTO Assignee – This is a binary variable taking on the value of one for scientists who
had at least one patent which was not assigned to their universities’ TTO office, reflecting
the TTO route to commercialization. According to the U.S. Patent Trademark Office a
patent assignee may be defined as “The assignee, when the patent is assigned to him or her,
becomes the owner of the patent and has the same rights that the original patentee had. The
statute [of law] also provides for the assignment of a part interest, that is, a half interest, a
fourth interest etc., in a patent.”15 Scientists not assigning a patent to their TTO are
15 http://www.uspto.gov/web/offices/pac/doc/general
41
considered to choose the entrepreneurial route to commercialize their research. A positive
coefficient would indicate that those scientists who have at least one non TTO assignee
patent have a higher propensity to commercialize their research. A negative coefficient
would suggest that those scientists choosing the TTO route are more likely to engage in
commercializing their research.
Of the 392 patentees, 29.80 percent were determined to choose the entrepreneurial
route to commercialization, in that they assigned at least one patent not to their university.
For example, seven out of eight of Dr. Jon Doe’s patent assignees belonged to the Curators
of the University of Missouri. The eighth patent was assigned ownership to Pfizer, Inc. and
not to the Curators of the University of Missouri. This example is typical of the
entrepreneurial route to commercialization and was therefore categorized as a Non TTO
Patent Assignee. In comparison, 70.20 percent of the 392 patenting scientist selected the
TTO route to commercialization, in that they assigned all of their patents to the TTO.
Technology Transfer Office TTO Helpful – This is a binary variable taking on the value of one for scientists who
responded to the survey that their TTO directly helped them commercialize their research
and zero otherwise. A positive coefficient would indicate that those scientists reporting that
their TTO was helpful in commercializing their research have a higher propensity to
commercialize their research.
TTO Age – This variable reflects the TTO age and is measured as the year in which the
TTO was founded at the particular university. The measure is taken from the AUTM
42
database. Because more recent years indicate a younger TTO, a positive coefficient would
reflect a negative relationship between TTO age and the propensity for scientists to
commercialize.
TTO Employees – This variable measures the mean number of employees per year
responsible for license and patent acquisitions. The measure is taken from the AUTM
database. A positive relationship would suggest that a greater commitment of TTO
employee resources yields a higher propensity for scientists to commercialize their
research.
TTO Licensing Commitment – Dividing the number of employees dedicated to licensing
technology by the number of administrative employees reflects the commitment of the
TTO to licensing relative to other TTO functions. This measure is derived from the AUTM
database. A positive relationship would suggest that allocating a greater share of TTO
employees to licensing would increase scientist commercialization.
TTO Efficiency – The mean number of patents applied for is divided by the number of
issued patents, which reflects the efficiency of the TTO. This measure is derived from the
AUTM database. A positive coefficient would reflect that a higher yield of patent
applications resulting in patents granted lead to greater scientist commercialization.
Scientific Human Capital
Scientist Citations – A specific computer program was designed to measure the citations of
NCI scientists between 1998 and 2004 through the “Expanded Science Citation Index.” A
higher number of citations reflects a higher level of human capital and scientific reputation
43
(Audretsch and Stephan, 2000). A positive coefficient would reflect that the likelihood of
commercialization is greater for more productive scientists.
Prior Patents – This variable is measured as the number of patents issued to a scientist
prior to 1998. The variable is included to control for previous experience with
commercialization activities. A positive coefficient would suggest that, even after
controlling for the influences of social capital, the TTO, scientific human capital,
resources, age, and locational and institutional contexts, previous commercialization
experiences elevates the propensity of a scientist to engage in commercialization activity.
Resources
NCI Grant – This variable is the mean total NCI grant awarded to a scientist between 1998
and 2002. If external funding of scientific research is conducive to commercialization, a
positive coefficient of the NCI Grant would be expected.16
Government Funding – This binary variable takes on the value of one for scientists
responding to the scientist survey that they received additional funding in excess of
$750,000 from government sources and zero otherwise. A positive coefficient would
indicate that an increase in funding from the government facilitates scientist
commercialization.
16 The NCI grant coefficient was multiplied by 1,000 for presentation purposes
44
Scientist Life-Cycle
Scientist Age -- The age of the scientist, measured in terms of years, was obtained from the
scientist survey. The Life-Cycle hypothesis of Stephan and Levin (1990) suggests a
positive coefficient, which would reflect a higher propensity for more mature scientists to
engage in commercialization activities.
Gender – This is a dummy variable assigned the value of one for males (1,310) of the
overall 1,693 included in the NCI database. The gender of each scientist was obtained by
“Googling” their names and finding their picture profile online. The estimated coefficient
will reflect whether the gender of the scientist influences the propensity to commercialize
research.
Locational and Institutional Contexts
Three different locational binary variables taking on the value of one for the North
East, which includes all states on the Eastern Seaboard between Washington, D.C. and
Maine (Washington, D.C., Connecticut, Rhode Island, New Hampshire, New Jersey, New
York, Pennsylvania, Massachusetts, Maryland and Vermont), California and the Great
Lakes (Ohio, Indiana, Illinois, Michigan and Wisconsin). Those regions which tend to have
greater investments in research and science, and also have developed a culture more
encouraging of university and scientist commercialization, such as California and the
North East, might be expected to have a positive coefficient.
NCI Center – This is a binary variable taking on the value of one if the scientist is
employed at one of the 39 nationally-recognized cancer centers, and zero otherwise. A
45
comprehensive cancer center integrates research activities across the three major areas of
laboratory, clinical and population-based research. The comprehensive cancer centers
generally have the mission to support research infrastructure, but some centers also provide
clinical care and service, reflecting the priority that community outreach and information
dissemination play at the centers.17 A positive coefficient would reflect that being located
at a comprehensive center facilitates commercialization.
Ivy League – A binary variable taking on the value of one for all scientists employed at
Brown University, Cornell University, Columbia University, Dartmouth College, Harvard
University, Princeton University, the University of Pennsylvania and Yale University, and
zero otherwise.
Public Institution – A binary variable taking on the value of one for scientists employed at
public universities and zero otherwise. Because they are at least partially financed by the
public, state universities tend to have a stronger mandate for outreach and
commercialization of research. This may suggest a positive coefficient.
The definitions of the independent variables are summarized in Table 2. The means
and standard deviations of all variables are provided in Table 3. Table 4 provides a
correlation matrix between all variables.
17 http://www3.cancer.gov/cancercenters/description.html
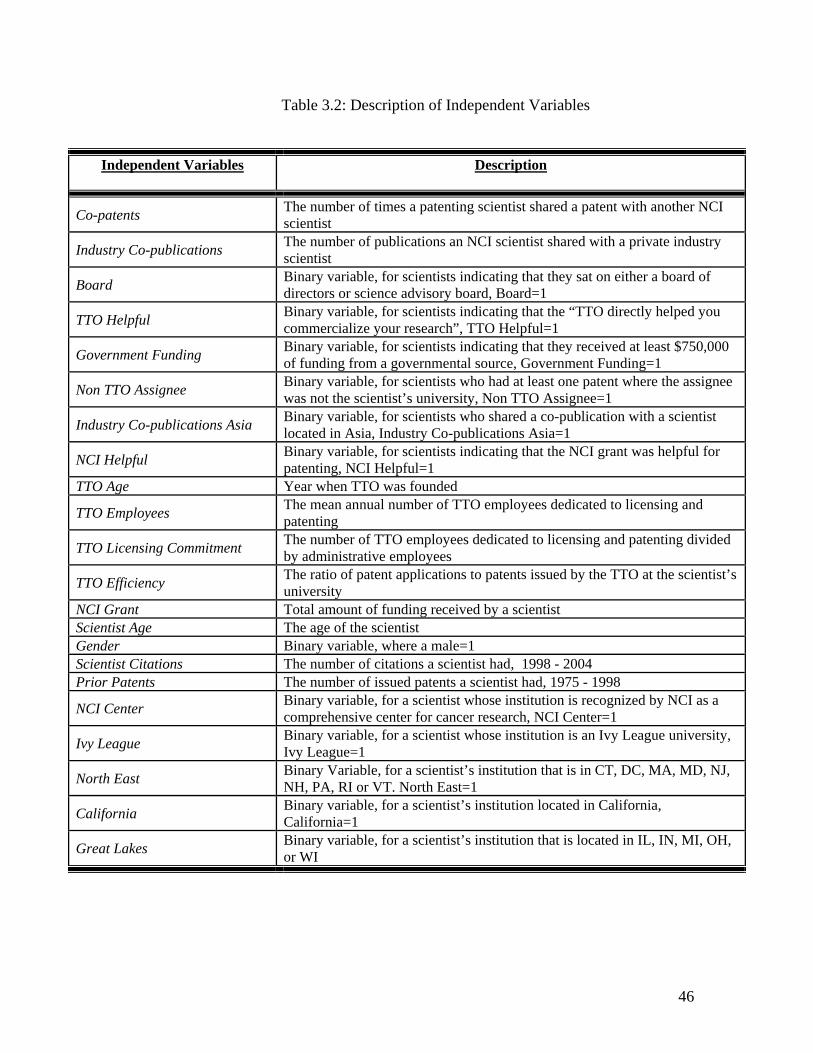
46
Table 3.2: Description of Independent Variables
Independent Variables
Description
Co-patents The number of times a patenting scientist shared a patent with another NCI scientist
Industry Co-publications The number of publications an NCI scientist shared with a private industry scientist
Board Binary variable, for scientists indicating that they sat on either a board of directors or science advisory board, Board=1
TTO Helpful Binary variable, for scientists indicating that the “TTO directly helped you commercialize your research”, TTO Helpful=1
Government Funding Binary variable, for scientists indicating that they received at least $750,000 of funding from a governmental source, Government Funding=1
Non TTO Assignee Binary variable, for scientists who had at least one patent where the assignee was not the scientist’s university, Non TTO Assignee=1
Industry Co-publications Asia Binary variable, for scientists who shared a co-publication with a scientist located in Asia, Industry Co-publications Asia=1
NCI Helpful Binary variable, for scientists indicating that the NCI grant was helpful for patenting, NCI Helpful=1
TTO Age Year when TTO was founded
TTO Employees The mean annual number of TTO employees dedicated to licensing and patenting
TTO Licensing Commitment The number of TTO employees dedicated to licensing and patenting divided by administrative employees
TTO Efficiency The ratio of patent applications to patents issued by the TTO at the scientist’s university
NCI Grant Total amount of funding received by a scientist Scientist Age The age of the scientist Gender Binary variable, where a male=1 Scientist Citations The number of citations a scientist had, 1998 - 2004 Prior Patents The number of issued patents a scientist had, 1975 - 1998
NCI Center Binary variable, for a scientist whose institution is recognized by NCI as a comprehensive center for cancer research, NCI Center=1
Ivy League Binary variable, for a scientist whose institution is an Ivy League university, Ivy League=1
North East Binary Variable, for a scientist’s institution that is in CT, DC, MA, MD, NJ, NH, PA, RI or VT. North East=1
California Binary variable, for a scientist’s institution located in California, California=1
Great Lakes Binary variable, for a scientist’s institution that is located in IL, IN, MI, OH, or WI
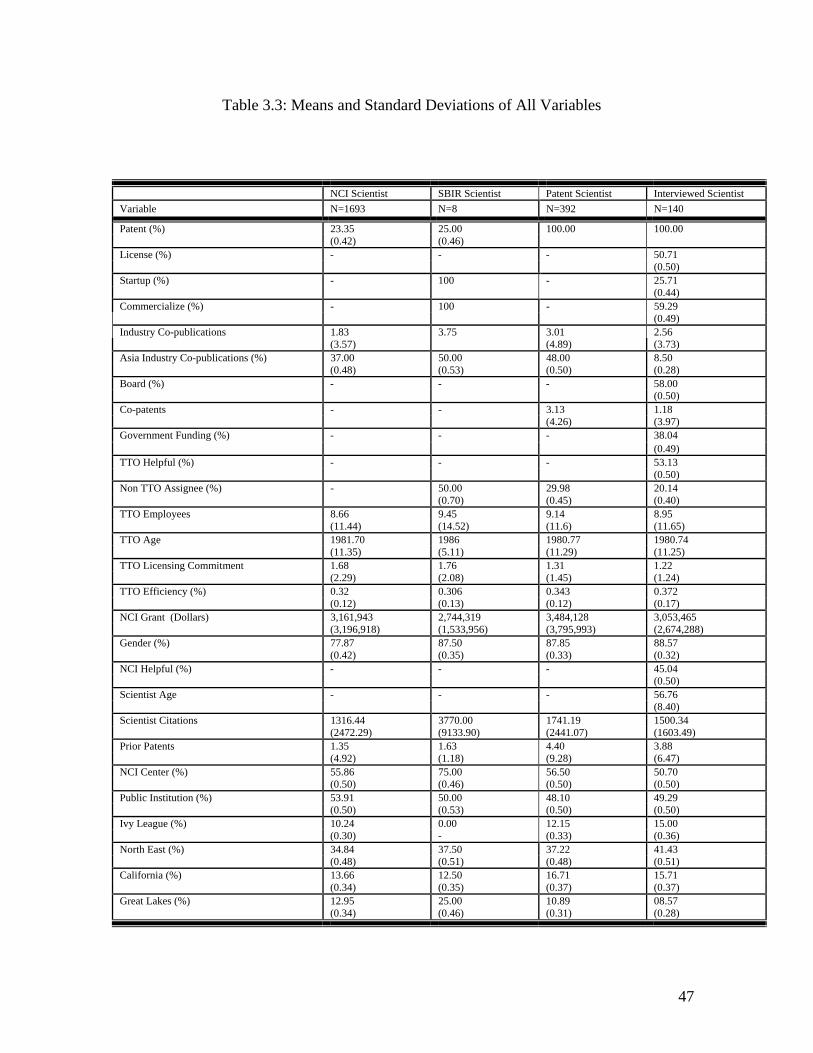
47
Table 3.3: Means and Standard Deviations of All Variables
NCI Scientist SBIR Scientist Patent Scientist Interviewed Scientist Variable N=1693 N=8 N=392 N=140
Patent (%) 23.35 25.00 100.00 100.00 (0.42) (0.46) License (%) - - - 50.71 (0.50) Startup (%) - 100 - 25.71 (0.44) Commercialize (%) - 100 - 59.29 (0.49) Industry Co-publications 1.83 3.75 3.01 2.56 (3.57) (4.89) (3.73) Asia Industry Co-publications (%) 37.00 50.00 48.00 8.50 (0.48) (0.53) (0.50) (0.28) Board (%) - - - 58.00 (0.50) Co-patents - - 3.13 1.18 (4.26) (3.97)
- - - 38.04 Government Funding (%) (0.49) TTO Helpful (%) - - - 53.13 (0.50) Non TTO Assignee (%) - 50.00 29.98 20.14 (0.70) (0.45) (0.40) TTO Employees 8.66 9.45 9.14 8.95 (11.44) (14.52) (11.6) (11.65) TTO Age 1981.70 1986 1980.77 1980.74 (11.35) (5.11) (11.29) (11.25)
1.68 1.76 1.31 1.22 TTO Licensing Commitment (2.29) (2.08) (1.45) (1.24) TTO Efficiency (%) 0.32 0.306 0.343 0.372 (0.12) (0.13) (0.12) (0.17) NCI Grant (Dollars) 3,161,943 2,744,319 3,484,128 3,053,465 (3,196,918) (1,533,956) (3,795,993) (2,674,288) Gender (%) 77.87 87.50 87.85 88.57 (0.42) (0.35) (0.33) (0.32) NCI Helpful (%) - - - 45.04 (0.50) Scientist Age - - - 56.76 (8.40) Scientist Citations 1316.44 3770.00 1741.19 1500.34 (2472.29) (9133.90) (2441.07) (1603.49) Prior Patents 1.35 1.63 4.40 3.88 (4.92) (1.18) (9.28) (6.47) NCI Center (%) 55.86 75.00 56.50 50.70 (0.50) (0.46) (0.50) (0.50) Public Institution (%) 53.91 50.00 48.10 49.29 (0.50) (0.53) (0.50) (0.50) Ivy League (%) 10.24 0.00 12.15 15.00 (0.30) - (0.33) (0.36) North East (%) 34.84 37.50 37.22 41.43 (0.48) (0.51) (0.48) (0.51) California (%) 13.66 12.50 16.71 15.71 (0.34) (0.35) (0.37) (0.37) Great Lakes (%) 12.95 25.00 10.89 08.57 (0.34) (0.46) (0.31) (0.28)
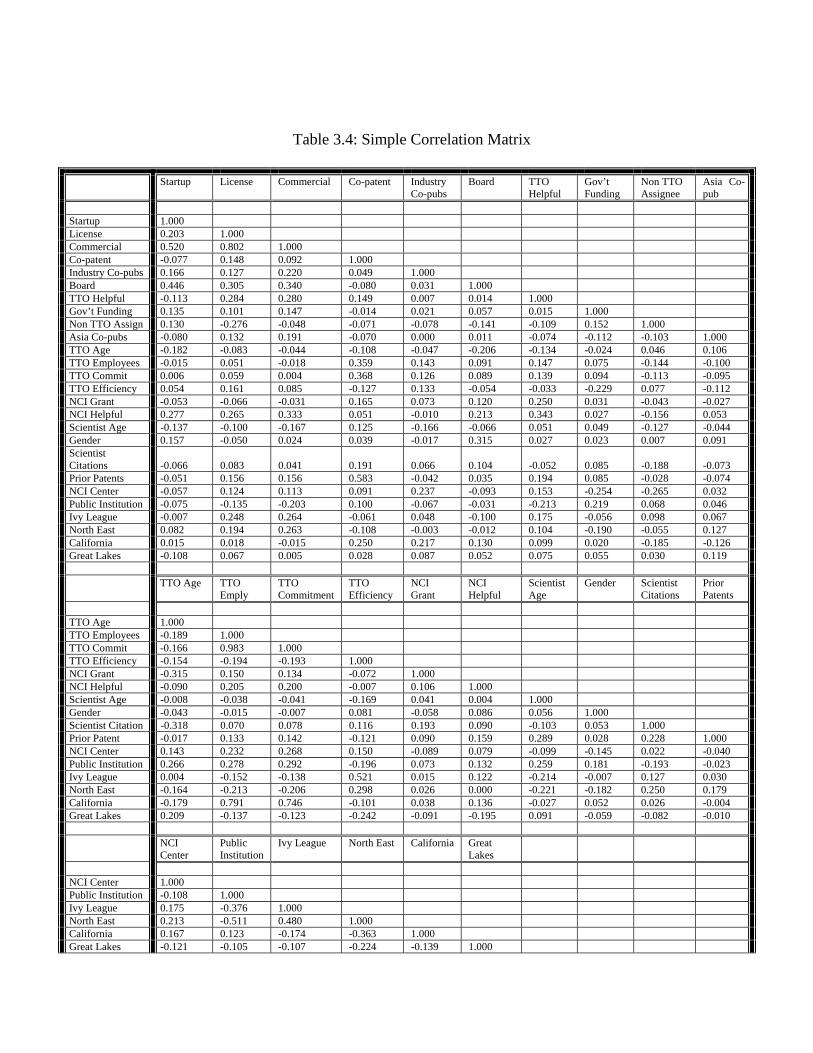
Table 3.4: Simple Correlation Matrix
Startup
License
Commercial
Co-patent
Industry Co-pubs
Board
TTO Helpful
Gov’t Funding
Non TTO Assignee
Asia Co-pub
Startup 1.000 License 0.203 1.000 Commercial 0.520 0.802 1.000 Co-patent -0.077 0.148 0.092 1.000 Industry Co-pubs 0.166 0.127 0.220 0.049 1.000 Board 0.446 0.305 0.340 -0.080 0.031 1.000 TTO Helpful -0.113 0.284 0.280 0.149 0.007 0.014 1.000 Gov’t Funding 0.135 0.101 0.147 -0.014 0.021 0.057 0.015 1.000 Non TTO Assign 0.130 -0.276 -0.048 -0.071 -0.078 -0.141 -0.109 0.152 1.000 Asia Co-pubs -0.080 0.132 0.191 -0.070 0.000 0.011 -0.074 -0.112 -0.103 1.000 TTO Age -0.182 -0.083 -0.044 -0.108 -0.047 -0.206 -0.134 -0.024 0.046 0.106 TTO Employees -0.015 0.051 -0.018 0.359 0.143 0.091 0.147 0.075 -0.144 -0.100 TTO Commit 0.006 0.059 0.004 0.368 0.126 0.089 0.139 0.094 -0.113 -0.095 TTO Efficiency 0.054 0.161 0.085 -0.127 0.133 -0.054 -0.033 -0.229 0.077 -0.112 NCI Grant -0.053 -0.066 -0.031 0.165 0.073 0.120 0.250 0.031 -0.043 -0.027 NCI Helpful 0.277 0.265 0.333 0.051 -0.010 0.213 0.343 0.027 -0.156 0.053 Scientist Age -0.137 -0.100 -0.167 0.125 -0.166 -0.066 0.051 0.049 -0.127 -0.044 Gender 0.157 -0.050 0.024 0.039 -0.017 0.315 0.027 0.023 0.007 0.091 Scientist Citations -0.066 0.083 0.041 0.191 0.066 0.104 -0.052 0.085 -0.188 -0.073 Prior Patents -0.051 0.156 0.156 0.583 -0.042 0.035 0.194 0.085 -0.028 -0.074 NCI Center -0.057 0.124 0.113 0.091 0.237 -0.093 0.153 -0.254 -0.265 0.032 Public Institution -0.075 -0.135 -0.203 0.100 -0.067 -0.031 -0.213 0.219 0.068 0.046 Ivy League -0.007 0.248 0.264 -0.061 0.048 -0.100 0.175 -0.056 0.098 0.067 North East 0.082 0.194 0.263 -0.108 -0.003 -0.012 0.104 -0.190 -0.055 0.127 California 0.015 0.018 -0.015 0.250 0.217 0.130 0.099 0.020 -0.185 -0.126 Great Lakes -0.108 0.067 0.005 0.028 0.087 0.052 0.075 0.055 0.030 0.119
TTO Age
TTO Emply
TTO Commitment
TTO Efficiency
NCI Grant
NCI Helpful
Scientist Age
Gender
Scientist Citations
Prior Patents
TTO Age 1.000 TTO Employees -0.189 1.000 TTO Commit -0.166 0.983 1.000 TTO Efficiency -0.154 -0.194 -0.193 1.000 NCI Grant -0.315 0.150 0.134 -0.072 1.000 NCI Helpful -0.090 0.205 0.200 -0.007 0.106 1.000 Scientist Age -0.008 -0.038 -0.041 -0.169 0.041 0.004 1.000 Gender -0.043 -0.015 -0.007 0.081 -0.058 0.086 0.056 1.000 Scientist Citation -0.318 0.070 0.078 0.116 0.193 0.090 -0.103 0.053 1.000 Prior Patent -0.017 0.133 0.142 -0.121 0.090 0.159 0.289 0.028 0.228 1.000 NCI Center 0.143 0.232 0.268 0.150 -0.089 0.079 -0.099 -0.145 0.022 -0.040 Public Institution 0.266 0.278 0.292 -0.196 0.073 0.132 0.259 0.181 -0.193 -0.023 Ivy League 0.004 -0.152 -0.138 0.521 0.015 0.122 -0.214 -0.007 0.127 0.030 North East -0.164 -0.213 -0.206 0.298 0.026 0.000 -0.221 -0.182 0.250 0.179 California -0.179 0.791 0.746 -0.101 0.038 0.136 -0.027 0.052 0.026 -0.004 Great Lakes 0.209 -0.137 -0.123 -0.242 -0.091 -0.195 0.091 -0.059 -0.082 -0.010
NCI Center
Public Institution
Ivy League
North East
California
Great Lakes
NCI Center 1.000 Public Institution -0.108 1.000 Ivy League 0.175 -0.376 1.000 North East 0.213 -0.511 0.480 1.000 California 0.167 0.123 -0.174 -0.363 1.000 Great Lakes -0.121 -0.105 -0.107 -0.224 -0.139 1.000
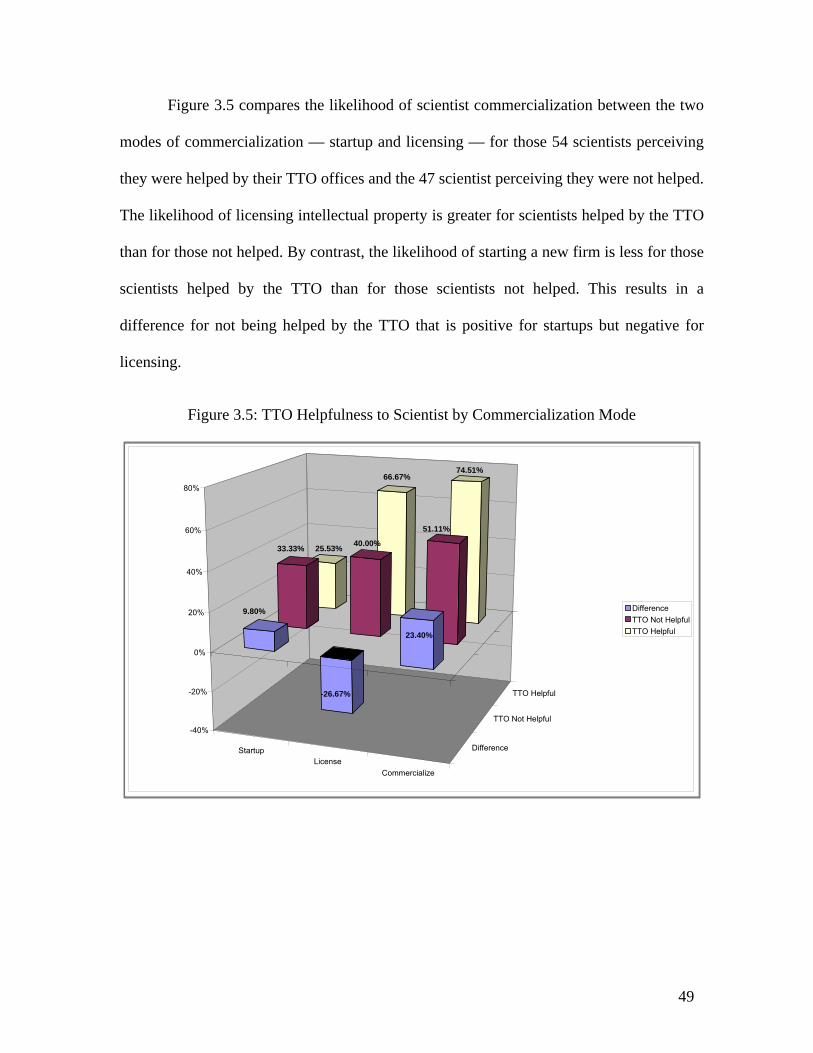
49
Figure 3.5 compares the likelihood of scientist commercialization between the two
modes of commercialization — startup and licensing — for those 54 scientists perceiving
they were helped by their TTO offices and the 47 scientist perceiving they were not helped.
The likelihood of licensing intellectual property is greater for scientists helped by the TTO
than for those not helped. By contrast, the likelihood of starting a new firm is less for those
scientists helped by the TTO than for those scientists not helped. This results in a
difference for not being helped by the TTO that is positive for startups but negative for
licensing.
Figure 3.5: TTO Helpfulness to Scientist by Commercialization Mode
StartupLicense
Commercialize
Difference
TTO Not Helpful
TTO Helpful
25.53%
66.67%74.51%
33.33% 40.00%
51.11%
9.80%
-26.67%
23.40%
-40%
-20%
0%
20%
40%
60%
80%
DifferenceTTO Not HelpfulTTO Helpful
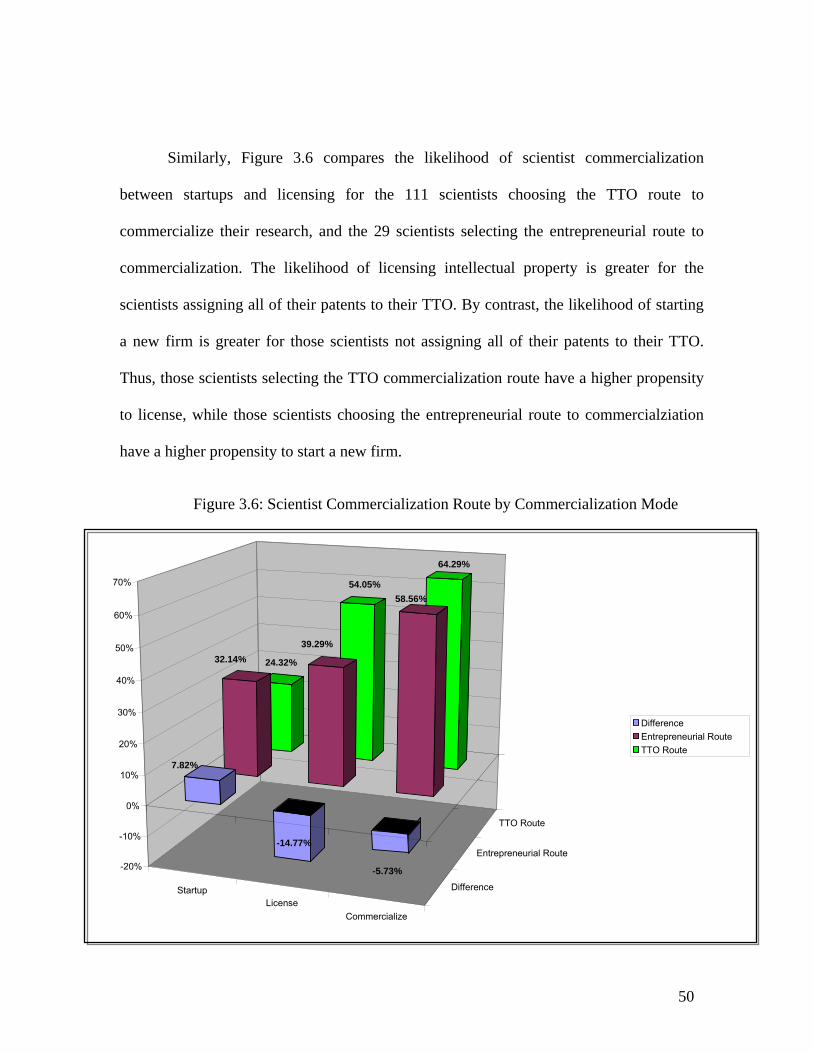
50
Similarly, Figure 3.6 compares the likelihood of scientist commercialization
between startups and licensing for the 111 scientists choosing the TTO route to
commercialize their research, and the 29 scientists selecting the entrepreneurial route to
commercialization. The likelihood of licensing intellectual property is greater for the
scientists assigning all of their patents to their TTO. By contrast, the likelihood of starting
a new firm is greater for those scientists not assigning all of their patents to their TTO.
Thus, those scientists selecting the TTO commercialization route have a higher propensity
to license, while those scientists choosing the entrepreneurial route to commercialziation
have a higher propensity to start a new firm.
Figure 3.6: Scientist Commercialization Route by Commercialization Mode
StartupLicense
Commercialize
Difference
Entrepreneurial Route
TTO Route
24.32%
54.05%
64.29%
32.14% 39.29%
58.56%
7.82%
-14.77%
-5.73%-20%
-10%
0%
10%
20%
30%
40%
50%
60%
70%
DifferenceEntrepreneurial RouteTTO Route
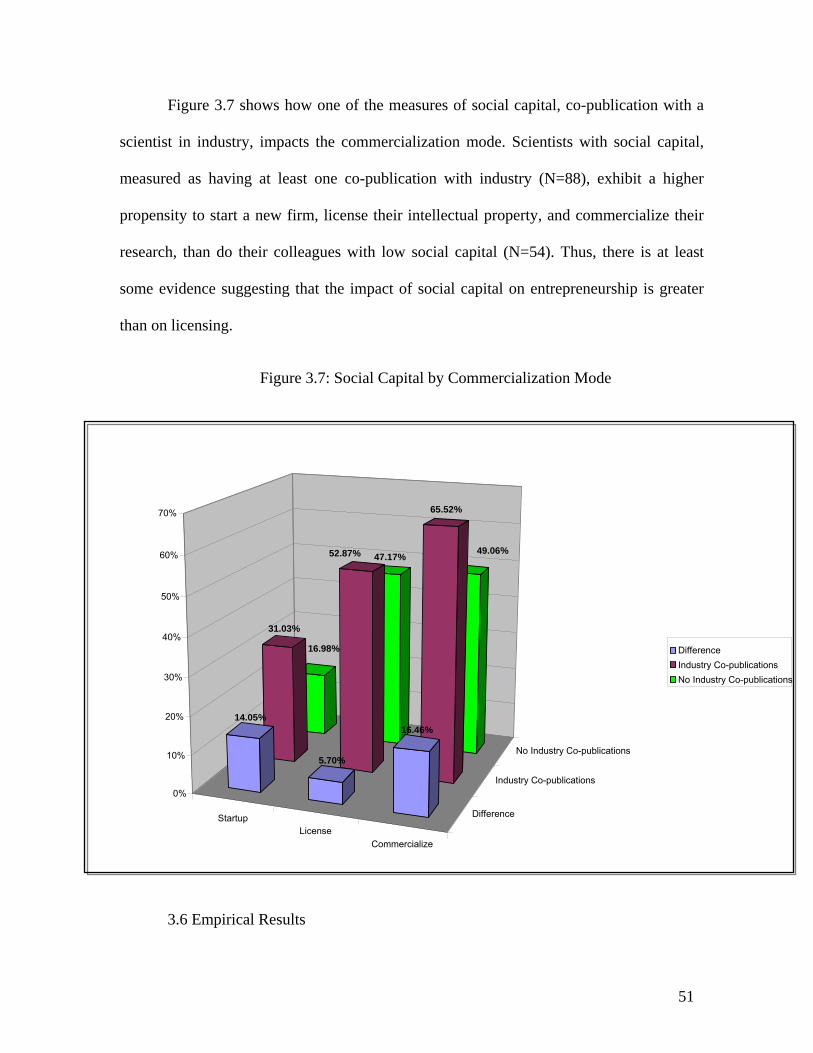
51
Figure 3.7 shows how one of the measures of social capital, co-publication with a
scientist in industry, impacts the commercialization mode. Scientists with social capital,
measured as having at least one co-publication with industry (N=88), exhibit a higher
propensity to start a new firm, license their intellectual property, and commercialize their
research, than do their colleagues with low social capital (N=54). Thus, there is at least
some evidence suggesting that the impact of social capital on entrepreneurship is greater
than on licensing.
Figure 3.7: Social Capital by Commercialization Mode
3.6 Empirical Results
StartupLicense
Commercialize
Difference
Industry Co-publications
No Industry Co-publications
16.98%
47.17%
49.06%
31.03%
52.87%
65.52%
14.05%
5.70%
16.46%
0%
10%
20%
30%
40%
50%
60%
70%
DifferenceIndustry Co-publicationsNo Industry Co-publications

52
The results from estimating the probit model using the mode of scientist
commercialization as starting a new firm are provided in Table 5. Because of
multicollinearity, not all of the control variables could be included in the same estimation
model.
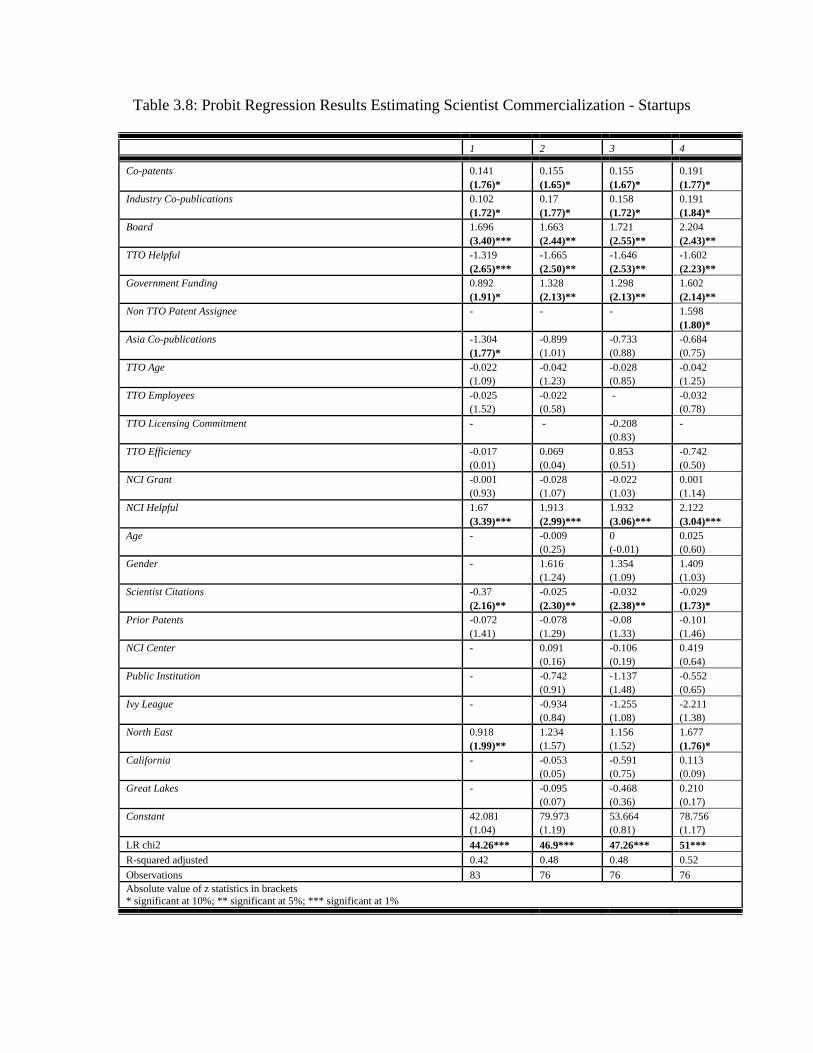
Table 3.8: Probit Regression Results Estimating Scientist Commercialization - Startups
1 2 3 4
Co-patents 0.141 0.155 0.155 0.191 (1.76)* (1.65)* (1.67)* (1.77)* Industry Co-publications 0.102 0.17 0.158 0.191 (1.72)* (1.77)* (1.72)* (1.84)* Board 1.696 1.663 1.721 2.204 (3.40)*** (2.44)** (2.55)** (2.43)** TTO Helpful -1.319 -1.665 -1.646 -1.602 (2.65)*** (2.50)** (2.53)** (2.23)** Government Funding 0.892 1.328 1.298 1.602 (1.91)* (2.13)** (2.13)** (2.14)** Non TTO Patent Assignee - - - 1.598 (1.80)* Asia Co-publications -1.304 -0.899 -0.733 -0.684 (1.77)* (1.01) (0.88) (0.75) TTO Age -0.022 -0.042 -0.028 -0.042 (1.09) (1.23) (0.85) (1.25) TTO Employees -0.025 -0.022 - -0.032 (1.52) (0.58) (0.78) TTO Licensing Commitment - - -0.208 - (0.83) TTO Efficiency -0.017 0.069 0.853 -0.742 (0.01) (0.04) (0.51) (0.50) NCI Grant -0.001 -0.028 -0.022 0.001 (0.93) (1.07) (1.03) (1.14) NCI Helpful 1.67 1.913 1.932 2.122 (3.39)*** (2.99)*** (3.06)*** (3.04)*** Age - -0.009 0 0.025 (0.25) (-0.01) (0.60) Gender - 1.616 1.354 1.409 (1.24) (1.09) (1.03) Scientist Citations -0.37 -0.025 -0.032 -0.029 (2.16)** (2.30)** (2.38)** (1.73)* Prior Patents -0.072 -0.078 -0.08 -0.101 (1.41) (1.29) (1.33) (1.46) NCI Center - 0.091 -0.106 0.419 (0.16) (0.19) (0.64) Public Institution - -0.742 -1.137 -0.552 (0.91) (1.48) (0.65) Ivy League - -0.934 -1.255 -2.211 (0.84) (1.08) (1.38) North East 0.918 1.234 1.156 1.677 (1.99)** (1.57) (1.52) (1.76)* California - -0.053 -0.591 0.113 (0.05) (0.75) (0.09) Great Lakes - -0.095 -0.468 0.210 (0.07) (0.36) (0.17) Constant 42.081 79.973 53.664 78.756 (1.04) (1.19) (0.81) (1.17) LR chi2 44.26*** 46.9*** 47.26*** 51*** R-squared adjusted 0.42 0.48 0.48 0.52 Observations 83 76 76 76 Absolute value of z statistics in brackets * significant at 10%; ** significant at 5%; *** significant at 1%
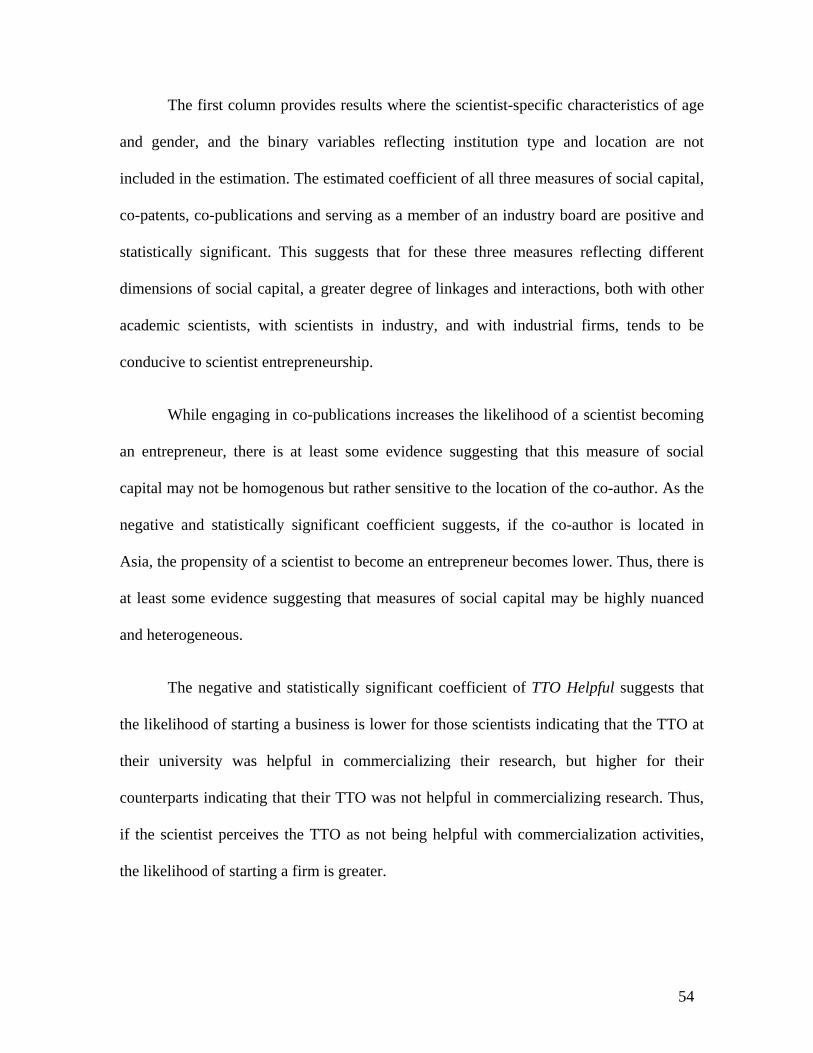
54
The first column provides results where the scientist-specific characteristics of age
and gender, and the binary variables reflecting institution type and location are not
included in the estimation. The estimated coefficient of all three measures of social capital,
co-patents, co-publications and serving as a member of an industry board are positive and
statistically significant. This suggests that for these three measures reflecting different
dimensions of social capital, a greater degree of linkages and interactions, both with other
academic scientists, with scientists in industry, and with industrial firms, tends to be
conducive to scientist entrepreneurship.
While engaging in co-publications increases the likelihood of a scientist becoming
an entrepreneur, there is at least some evidence suggesting that this measure of social
capital may not be homogenous but rather sensitive to the location of the co-author. As the
negative and statistically significant coefficient suggests, if the co-author is located in
Asia, the propensity of a scientist to become an entrepreneur becomes lower. Thus, there is
at least some evidence suggesting that measures of social capital may be highly nuanced
and heterogeneous.
The negative and statistically significant coefficient of TTO Helpful suggests that
the likelihood of starting a business is lower for those scientists indicating that the TTO at
their university was helpful in commercializing their research, but higher for their
counterparts indicating that their TTO was not helpful in commercializing research. Thus,
if the scientist perceives the TTO as not being helpful with commercialization activities,
the likelihood of starting a firm is greater.
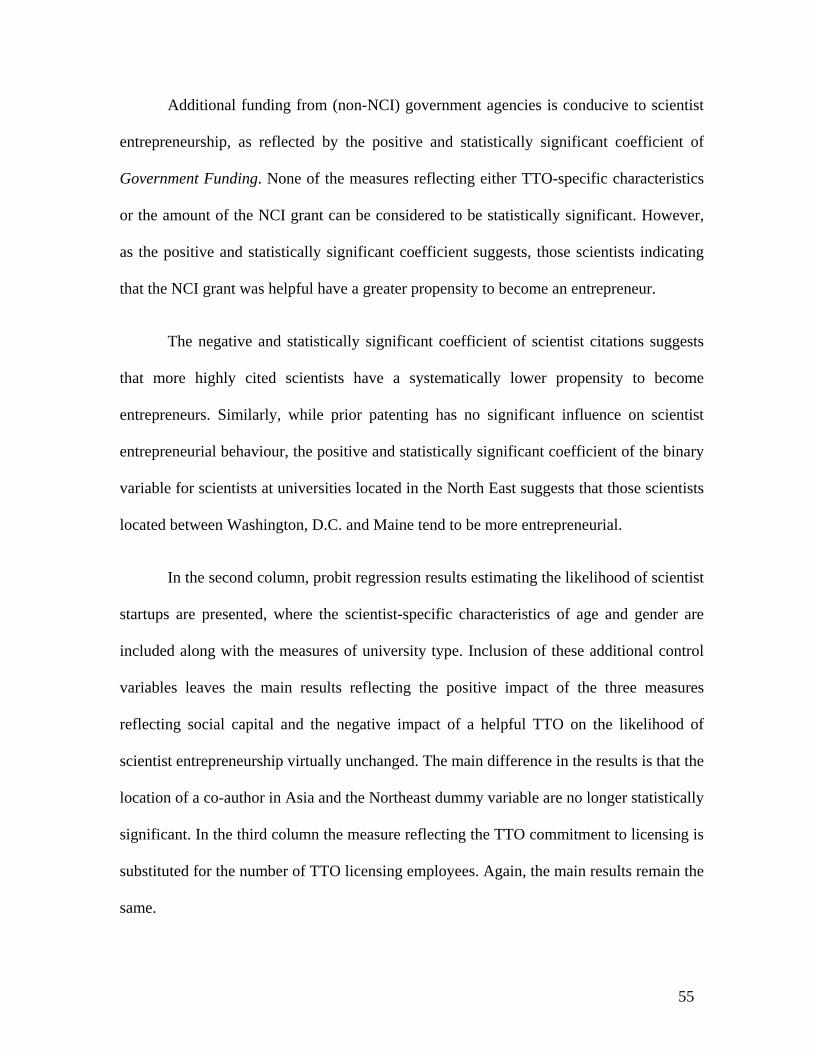
55
Additional funding from (non-NCI) government agencies is conducive to scientist
entrepreneurship, as reflected by the positive and statistically significant coefficient of
Government Funding. None of the measures reflecting either TTO-specific characteristics
or the amount of the NCI grant can be considered to be statistically significant. However,
as the positive and statistically significant coefficient suggests, those scientists indicating
that the NCI grant was helpful have a greater propensity to become an entrepreneur.
The negative and statistically significant coefficient of scientist citations suggests
that more highly cited scientists have a systematically lower propensity to become
entrepreneurs. Similarly, while prior patenting has no significant influence on scientist
entrepreneurial behaviour, the positive and statistically significant coefficient of the binary
variable for scientists at universities located in the North East suggests that those scientists
located between Washington, D.C. and Maine tend to be more entrepreneurial.
In the second column, probit regression results estimating the likelihood of scientist
startups are presented, where the scientist-specific characteristics of age and gender are
included along with the measures of university type. Inclusion of these additional control
variables leaves the main results reflecting the positive impact of the three measures
reflecting social capital and the negative impact of a helpful TTO on the likelihood of
scientist entrepreneurship virtually unchanged. The main difference in the results is that the
location of a co-author in Asia and the Northeast dummy variable are no longer statistically
significant. In the third column the measure reflecting the TTO commitment to licensing is
substituted for the number of TTO licensing employees. Again, the main results remain the
same.
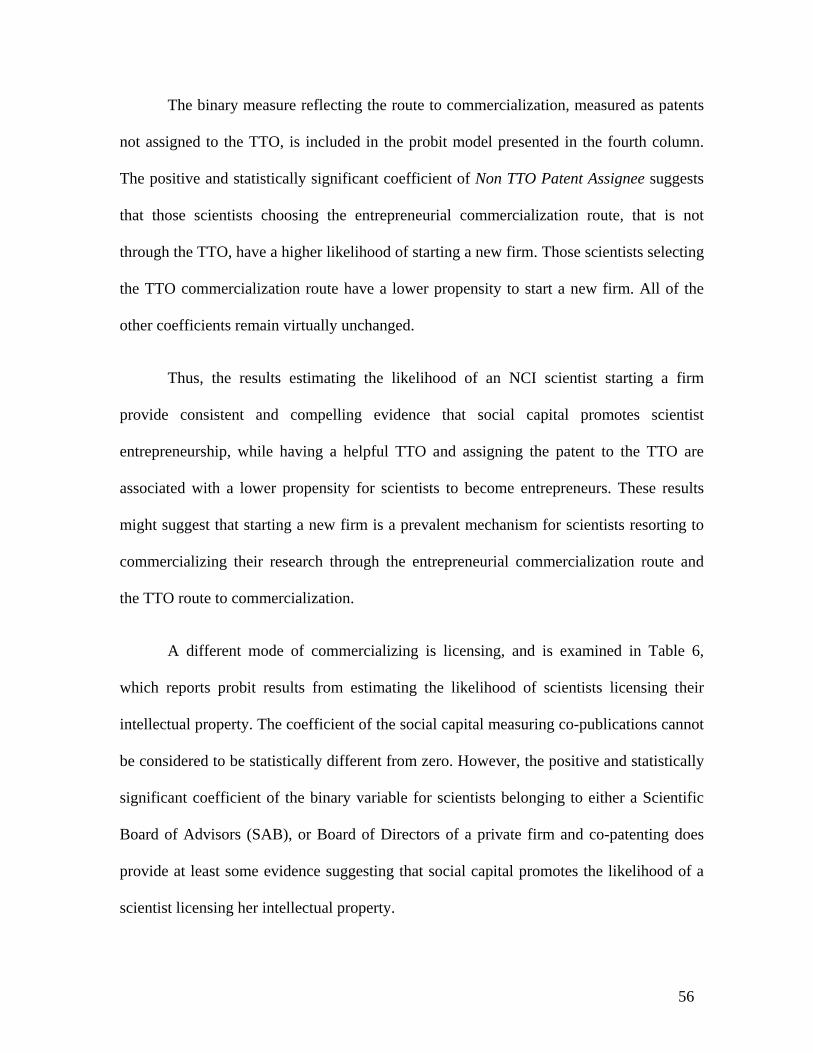
56
The binary measure reflecting the route to commercialization, measured as patents
not assigned to the TTO, is included in the probit model presented in the fourth column.
The positive and statistically significant coefficient of Non TTO Patent Assignee suggests
that those scientists choosing the entrepreneurial commercialization route, that is not
through the TTO, have a higher likelihood of starting a new firm. Those scientists selecting
the TTO commercialization route have a lower propensity to start a new firm. All of the
other coefficients remain virtually unchanged.
Thus, the results estimating the likelihood of an NCI scientist starting a firm
provide consistent and compelling evidence that social capital promotes scientist
entrepreneurship, while having a helpful TTO and assigning the patent to the TTO are
associated with a lower propensity for scientists to become entrepreneurs. These results
might suggest that starting a new firm is a prevalent mechanism for scientists resorting to
commercializing their research through the entrepreneurial commercialization route and
the TTO route to commercialization.
A different mode of commercializing is licensing, and is examined in Table 6,
which reports probit results from estimating the likelihood of scientists licensing their
intellectual property. The coefficient of the social capital measuring co-publications cannot
be considered to be statistically different from zero. However, the positive and statistically
significant coefficient of the binary variable for scientists belonging to either a Scientific
Board of Advisors (SAB), or Board of Directors of a private firm and co-patenting does
provide at least some evidence suggesting that social capital promotes the likelihood of a
scientist licensing her intellectual property.
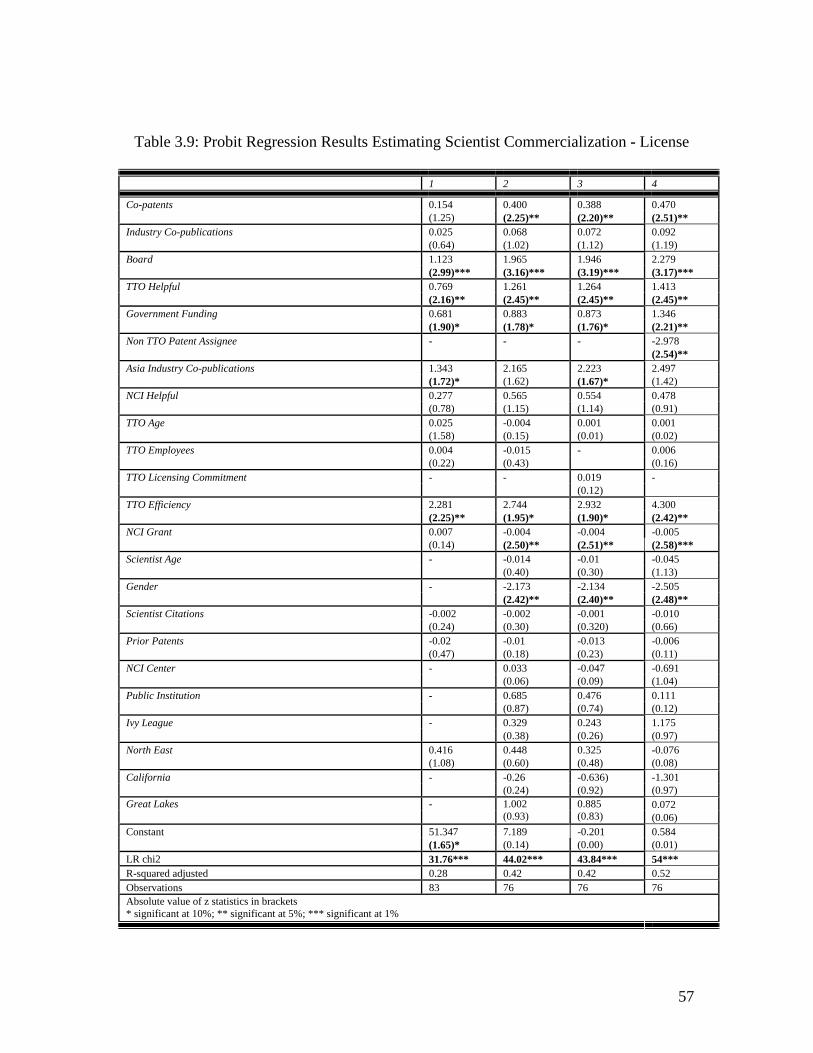
57
Table 3.9: Probit Regression Results Estimating Scientist Commercialization - License
1 2 3 4
Co-patents 0.154 0.400 0.388 0.470 (1.25) (2.25)** (2.20)** (2.51)** Industry Co-publications 0.025 0.068 0.072 0.092 (0.64) (1.02) (1.12) (1.19) Board 1.123 1.965 1.946 2.279 (2.99)*** (3.16)*** (3.19)*** (3.17)*** TTO Helpful 0.769 1.261 1.264 1.413 (2.16)** (2.45)** (2.45)** (2.45)** Government Funding 0.681 0.883 0.873 1.346 (1.90)* (1.78)* (1.76)* (2.21)** Non TTO Patent Assignee - - - -2.978 (2.54)** Asia Industry Co-publications 1.343 2.165 2.223 2.497 (1.72)* (1.62) (1.67)* (1.42) NCI Helpful 0.277 0.565 0.554 0.478 (0.78) (1.15) (1.14) (0.91) TTO Age 0.025 -0.004 0.001 0.001 (1.58) (0.15) (0.01) (0.02) TTO Employees 0.004 -0.015 - 0.006 (0.22) (0.43) (0.16) TTO Licensing Commitment - - 0.019 - (0.12) TTO Efficiency 2.281 2.744 2.932 4.300 (2.25)** (1.95)* (1.90)* (2.42)** NCI Grant 0.007 -0.004 -0.004 -0.005 (0.14) (2.50)** (2.51)** (2.58)*** Scientist Age - -0.014 -0.01 -0.045 (0.40) (0.30) (1.13) Gender - -2.173 -2.134 -2.505 (2.42)** (2.40)** (2.48)** Scientist Citations -0.002 -0.002 -0.001 -0.010 (0.24) (0.30) (0.320) (0.66) Prior Patents -0.02 -0.01 -0.013 -0.006 (0.47) (0.18) (0.23) (0.11) NCI Center - 0.033 -0.047 -0.691 (0.06) (0.09) (1.04) Public Institution - 0.685 0.476 0.111 (0.87) (0.74) (0.12) Ivy League - 0.329 0.243 1.175 (0.38) (0.26) (0.97) North East 0.416 0.448 0.325 -0.076 (1.08) (0.60) (0.48) (0.08) California - -0.26 -0.636) -1.301 (0.24) (0.92) (0.97)
0.072 Great Lakes
-
1.002 (0.93)
0.885 (0.83) (0.06)
Constant 51.347 7.189 -0.201 0.584 (1.65)* (0.14) (0.00) (0.01) LR chi2 31.76*** 44.02*** 43.84*** 54*** R-squared adjusted 0.28 0.42 0.42 0.52 Observations 83 76 76 76
Absolute value of z statistics in brackets * significant at 10%; ** significant at 5%; *** significant at 1%
58
As for the commercialization mode of startups, the coefficient of the TTO being
helpful with scientist commercialization is statistically significant. However, the sign of
the coefficient is actually the opposite, i.e. positive, suggesting that those scientists who
indicate that they are helped by the TTO have a higher propensity to license their
intellectual property, which is in stark contrast to the findings in Table 6 indicating a lower
propensity to become an entrepreneur. This might suggest an asymmetric effect of TTOs
on scientist entrepreneurship versus scientist licensing. The TTOs appear to be more
helpful to a scientist in licensing their intellectual property than for starting a new firm.
While the positive and statistically significant coefficient of Government Funding
is similar to that found for the mode of startups, the positive and statistically significant
coefficient of the variable measuring co-publications with an industry co-author located in
Asia is the opposite. This might indicate that while having a co-author located in Asia
reduces the likelihood of starting a firm it actually increases the propensity for U.S. based
scientists to license their intellectual property.
The coefficients of the variables measuring the helpfulness of the NCI Grant
towards commercialization, TTO Age, and number of TTO employees are not statistically
significant. However, the positive and statistically significant coefficient of TTO Efficiency
indicates that those scientists located at a university where the TTO is more efficient
exhibit a higher likelihood of licensing their intellectual property. None of the remaining
variables, Scientist Citations, Prior Patents, or Northeast, are found to have statistically
significant impact on the likelihood of scientist licensing.
59
The second column reports regression results where measures reflecting scientist
age, gender, and university type and location are included in the estimation model. There
are three main differences. First, the coefficient of Co-patents becomes statistically
significant and positive, indicating that, for the entrepreneurship mode of
commercialization, this dimension of social capital is positively related to the likelihood of
licensing intellectual property.
Second, the coefficient of NCI Grant becomes negative and statistically significant,
suggesting that the higher the NCI grant award, the lower is the likelihood of a scientist
licensing their intellectual property. Finally, the coefficient of Gender is negative and
statistically significant. The negative coefficient of this binary variable may seem
surprising, given that a slightly higher share of male scientists license their intellectual
property than do their female colleagues.18 However, one interpretation of the negative
coefficient is that if female scientists had the same degree of co-patenting with other
scientists, participation on boards, help from the TTO, additional funding from non-NCI
government agencies, and level of efficiency at their universities’ TTO, they would
actually exhibit a higher propensity to license than do their male colleagues. According to
this interpretation, what explains the gender gap, in terms of licensing behaviour, is not
gender per se, but rather access to and participation in social capital, such as sitting on
scientific advisory boards and boards of directors, as well as co-patenting with other
academic scientists. The measure of TTO Licensing Commitment is substituted for TTO
Employees in the regression results presented in the third column. The results remain
virtually identical to those reported in column two. 18 51 percent of the patenting male scientists licensed their intellectual property and 49 percent of the patenting female scientists licensed their intellectual property.
60
The measure reflecting the scientist commercialization route is included in the
fourth column. As the negative and statistically significant coefficient of Non TTO Patent
Assignee suggests, those scientists choosing the entrepreneurial route to commercialize
their research exhibit a lower likelihood of licensing their intellectual property. In
comparison, those scientists selecting the TTO commercialization route have a higher
propensity to license.
Overall, the results reported from estimating scientist licensing reveal several
striking similarities but also differences from those estimating scientist entrepreneurship.
First, the impact of social capital is positive for both entrepreneurship and licensing. Co-
patenting with other academic scientists as well as sitting on a scientific advisory board or
board of directors of a private company increases the likelihood of a scientist both starting
a business and licensing her intellectual property. However, co-publishing with scientists
in industry spurs scientist entrepreneurship, while it has no impact on licensing behaviour.
Second, scientist perception that the TTO is helpful in commercializing research
leads to disparate results between the two modes of commercialization. While those
scientists indicating that the TTO was helpful exhibited a higher propensity to license their
intellectual property, they also were less entrepreneurial in that they have a lower
likelihood to start a new firm. However, those scientists indicating that the TTO was not
helpful were less likely to license their intellectual property, but had a higher propensity to
start a new business. This is also consistent with the finding that TTO efficiency promotes
scientist licensing but not entrepreneurship. These disparate findings may suggest that the
impact of the TTOs is not symmetric across difference modes of commercialization.
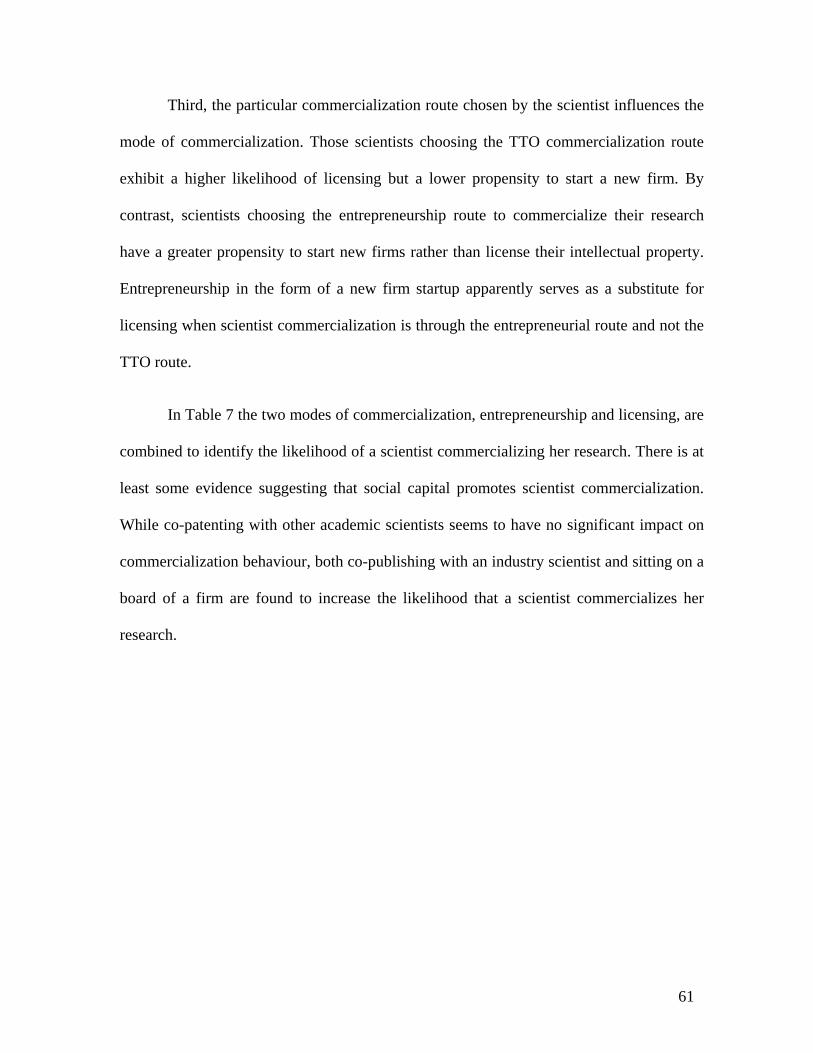
61
Third, the particular commercialization route chosen by the scientist influences the
mode of commercialization. Those scientists choosing the TTO commercialization route
exhibit a higher likelihood of licensing but a lower propensity to start a new firm. By
contrast, scientists choosing the entrepreneurship route to commercialize their research
have a greater propensity to start new firms rather than license their intellectual property.
Entrepreneurship in the form of a new firm startup apparently serves as a substitute for
licensing when scientist commercialization is through the entrepreneurial route and not the
TTO route.
In Table 7 the two modes of commercialization, entrepreneurship and licensing, are
combined to identify the likelihood of a scientist commercializing her research. There is at
least some evidence suggesting that social capital promotes scientist commercialization.
While co-patenting with other academic scientists seems to have no significant impact on
commercialization behaviour, both co-publishing with an industry scientist and sitting on a
board of a firm are found to increase the likelihood that a scientist commercializes her
research.
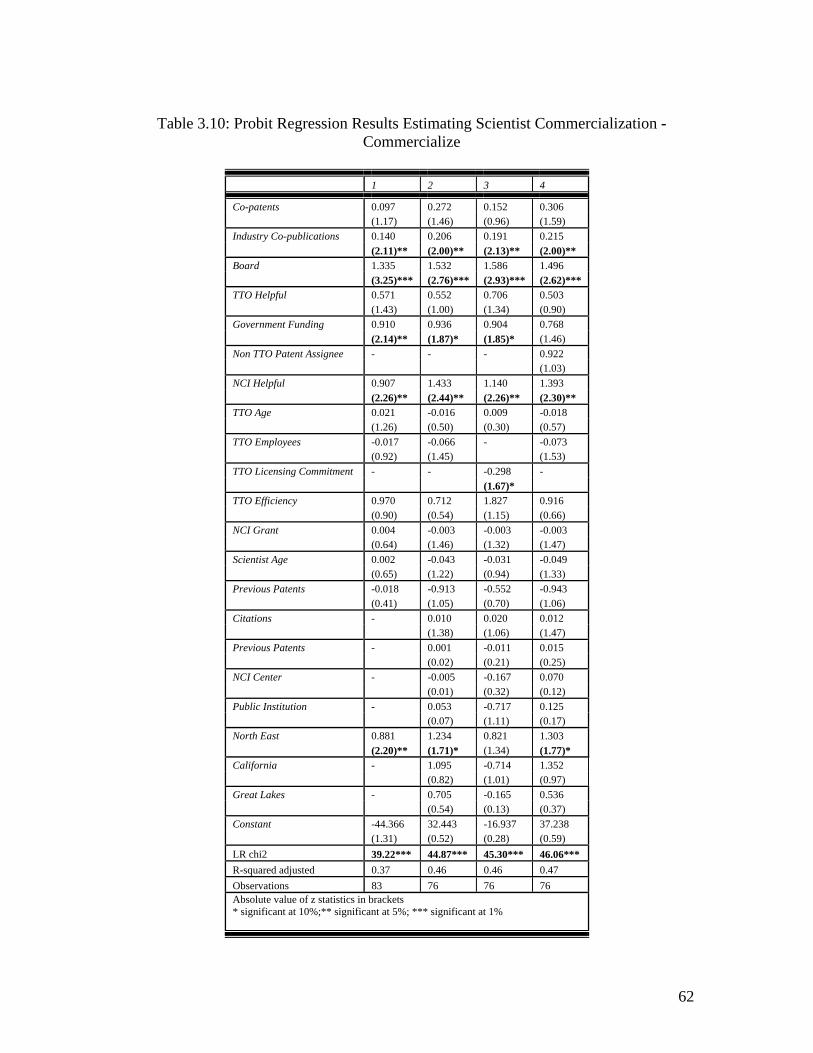
62
Table 3.10: Probit Regression Results Estimating Scientist Commercialization -
Commercialize
1 2 3 4
Co-patents 0.097 0.272 0.152 0.306 (1.17) (1.46) (0.96) (1.59) Industry Co-publications 0.140 0.206 0.191 0.215 (2.11)** (2.00)** (2.13)** (2.00)** Board 1.335 1.532 1.586 1.496 (3.25)*** (2.76)*** (2.93)*** (2.62)*** TTO Helpful 0.571 0.552 0.706 0.503 (1.43) (1.00) (1.34) (0.90) Government Funding 0.910 0.936 0.904 0.768 (2.14)** (1.87)* (1.85)* (1.46) Non TTO Patent Assignee - - - 0.922 (1.03) NCI Helpful 0.907 1.433 1.140 1.393 (2.26)** (2.44)** (2.26)** (2.30)** TTO Age 0.021 -0.016 0.009 -0.018 (1.26) (0.50) (0.30) (0.57) TTO Employees -0.017 -0.066 - -0.073 (0.92) (1.45) (1.53) TTO Licensing Commitment - - -0.298 - (1.67)* TTO Efficiency 0.970 0.712 1.827 0.916 (0.90) (0.54) (1.15) (0.66) NCI Grant 0.004 -0.003 -0.003 -0.003 (0.64) (1.46) (1.32) (1.47) Scientist Age 0.002 -0.043 -0.031 -0.049 (0.65) (1.22) (0.94) (1.33) Previous Patents -0.018 -0.913 -0.552 -0.943 (0.41) (1.05) (0.70) (1.06) Citations - 0.010 0.020 0.012 (1.38) (1.06) (1.47) Previous Patents - 0.001 -0.011 0.015 (0.02) (0.21) (0.25) NCI Center - -0.005 -0.167 0.070 (0.01) (0.32) (0.12) Public Institution - 0.053 -0.717 0.125 (0.07) (1.11) (0.17) North East 0.881 1.234 0.821 1.303 (2.20)** (1.71)* (1.34) (1.77)* California - 1.095 -0.714 1.352 (0.82) (1.01) (0.97) Great Lakes - 0.705 -0.165 0.536 (0.54) (0.13) (0.37) Constant -44.366 32.443 -16.937 37.238 (1.31) (0.52) (0.28) (0.59) LR chi2 39.22*** 44.87*** 45.30*** 46.06*** R-squared adjusted 0.37 0.46 0.46 0.47 Observations 83 76 76 76 Absolute value of z statistics in brackets * significant at 10%;** significant at 5%; *** significant at 1%
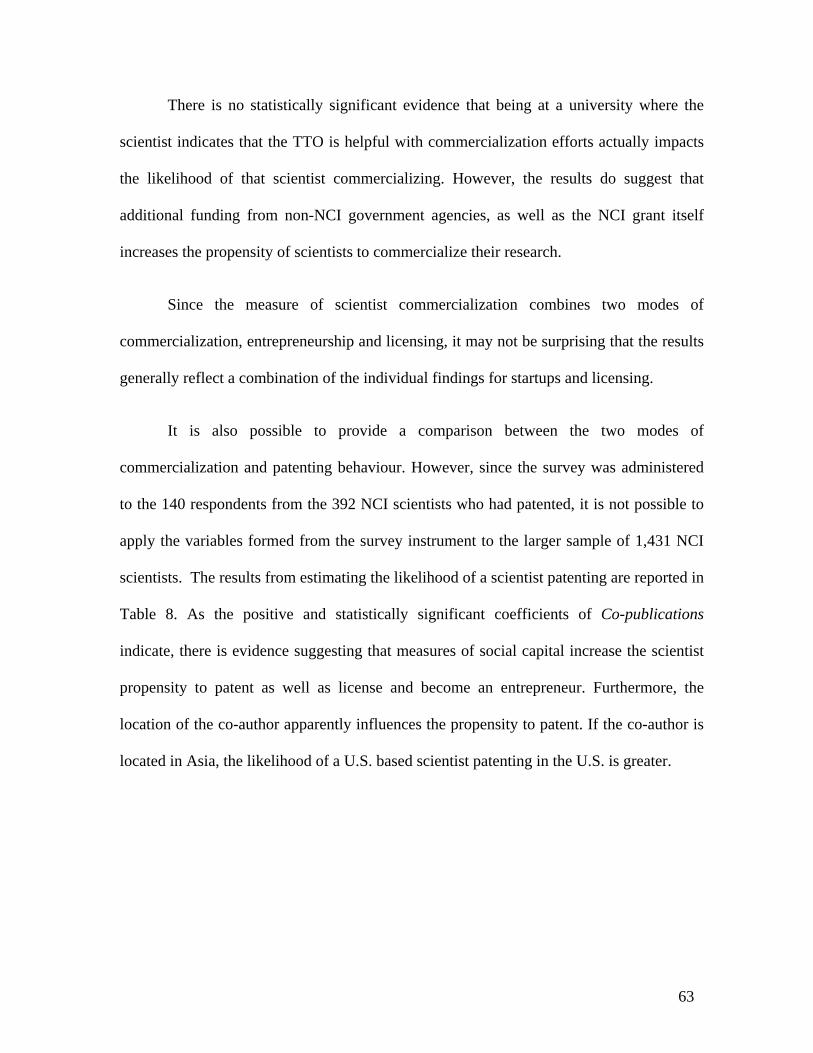
63
There is no statistically significant evidence that being at a university where the
scientist indicates that the TTO is helpful with commercialization efforts actually impacts
the likelihood of that scientist commercializing. However, the results do suggest that
additional funding from non-NCI government agencies, as well as the NCI grant itself
increases the propensity of scientists to commercialize their research.
Since the measure of scientist commercialization combines two modes of
commercialization, entrepreneurship and licensing, it may not be surprising that the results
generally reflect a combination of the individual findings for startups and licensing.
It is also possible to provide a comparison between the two modes of
commercialization and patenting behaviour. However, since the survey was administered
to the 140 respondents from the 392 NCI scientists who had patented, it is not possible to
apply the variables formed from the survey instrument to the larger sample of 1,431 NCI
scientists. The results from estimating the likelihood of a scientist patenting are reported in
Table 8. As the positive and statistically significant coefficients of Co-publications
indicate, there is evidence suggesting that measures of social capital increase the scientist
propensity to patent as well as license and become an entrepreneur. Furthermore, the
location of the co-author apparently influences the propensity to patent. If the co-author is
located in Asia, the likelihood of a U.S. based scientist patenting in the U.S. is greater.
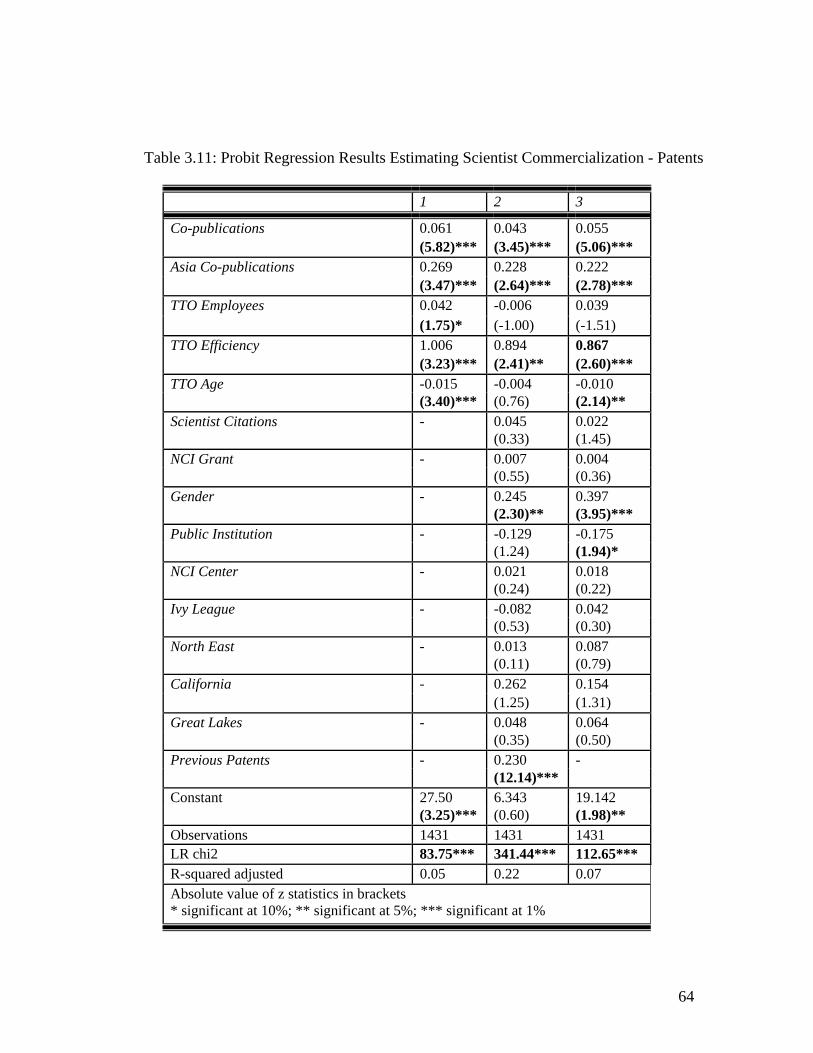
64
Table 3.11: Probit Regression Results Estimating Scientist Commercialization - Patents
1 2 3
Co-publications 0.061 0.043 0.055 (5.82)*** (3.45)*** (5.06)*** Asia Co-publications 0.269 0.228 0.222 (3.47)*** (2.64)*** (2.78)***
0.042 -0.006 0.039 TTO Employees (1.75)* (-1.00) (-1.51) TTO Efficiency 1.006 0.894 0.867 (3.23)*** (2.41)** (2.60)*** TTO Age -0.015 -0.004 -0.010 (3.40)*** (0.76) (2.14)** Scientist Citations - 0.045 0.022 (0.33) (1.45) NCI Grant - 0.007 0.004 (0.55) (0.36) Gender - 0.245 0.397 (2.30)** (3.95)*** Public Institution - -0.129 -0.175 (1.24) (1.94)* NCI Center - 0.021 0.018 (0.24) (0.22) Ivy League - -0.082 0.042 (0.53) (0.30) North East - 0.013 0.087 (0.11) (0.79) California - 0.262 0.154 (1.25) (1.31) Great Lakes - 0.048 0.064 (0.35) (0.50) Previous Patents - 0.230 - (12.14)*** Constant 27.50 6.343 19.142 (3.25)*** (0.60) (1.98)** Observations 1431 1431 1431 LR chi2 83.75*** 341.44*** 112.65*** R-squared adjusted 0.05 0.22 0.07 Absolute value of z statistics in brackets * significant at 10%; ** significant at 5%; *** significant at 1%
65
The other consistent result involves TTO Efficiency. Those scientists working at
universities with a more efficient TTO exhibit a higher propensity to patent. There is also
at least some evidence suggesting that older and more established TTOs and larger TTOs,
as measured by employment, tend to be associated with a higher scientist propensity to
patent.
Because the samples of scientists are not the same, comparisons across these
different commercialization modes must be qualified and considered to be provisional at
best. Still, there are at least some indications suggesting that social capital promotes all
modes of commercialization, but perhaps entrepreneurship the strongest. By contrast, the
TTO seems to be most effective in promoting first and foremost patents and then licensing,
but much less startups.
To further probe the impact that the TTO plays in facilitating different
commercialization modes, the sample of survey respondents is decomposed into those
scientists indicating that they were helped with their commercialization efforts by the TTO
and those that were not. Based on these two sub-samples, regression results estimating the
likelihood of a scientist licensing are reported in Table 9. Results for the sub-sample of
scientists indicating that they were helped by the TTO are reported in the first two
columns, while those not helped are reported in the last two columns.
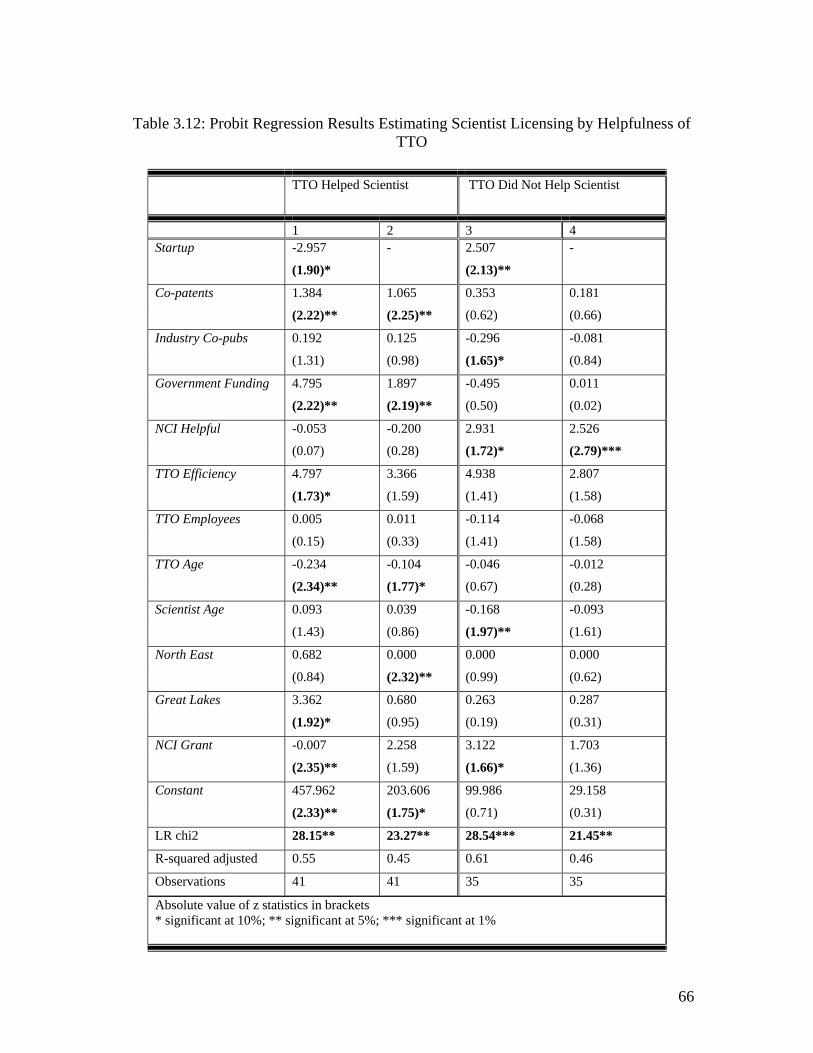
66
Table 3.12: Probit Regression Results Estimating Scientist Licensing by Helpfulness of
TTO
TTO Helped Scientist
TTO Did Not Help Scientist
1 2 3 4 Startup -2.957 - 2.507 -
(1.90)* (2.13)**
Co-patents 1.384 1.065 0.353 0.181
(2.22)** (2.25)** (0.62) (0.66)
Industry Co-pubs 0.192 0.125 -0.296 -0.081
(1.31) (0.98) (1.65)* (0.84)
Government Funding 4.795 1.897 -0.495 0.011
(2.22)** (2.19)** (0.50) (0.02)
NCI Helpful -0.053 -0.200 2.931 2.526
(0.07) (0.28) (1.72)* (2.79)***
TTO Efficiency 4.797 3.366 4.938 2.807
(1.73)* (1.59) (1.41) (1.58)
TTO Employees 0.005 0.011 -0.114 -0.068
(0.15) (0.33) (1.41) (1.58)
TTO Age -0.234 -0.104 -0.046 -0.012
(2.34)** (1.77)* (0.67) (0.28)
Scientist Age 0.093 0.039 -0.168 -0.093
(1.43) (0.86) (1.97)** (1.61)
North East 0.682 0.000 0.000 0.000
(0.84) (2.32)** (0.99) (0.62)
Great Lakes 3.362 0.680 0.263 0.287
(1.92)* (0.95) (0.19) (0.31)
NCI Grant -0.007 2.258 3.122 1.703
(2.35)** (1.59) (1.66)* (1.36)
Constant 457.962 203.606 99.986 29.158
(2.33)** (1.75)* (0.71) (0.31)
LR chi2 28.15** 23.27** 28.54*** 21.45**
R-squared adjusted 0.55 0.45 0.61 0.46
Observations 41 41 35 35
Absolute value of z statistics in brackets * significant at 10%; ** significant at 5%; *** significant at 1%
67
The first column also includes a binary variable taking on the value of one if the
scientist started a new firm. As the negative and statistically significant coefficient of this
variable suggests, those scientists indicating they were helped by TTO and started a new
firm exhibited a lower likelihood of licensing their intellectual property. The positive and
statistically significant coefficient of this binary variable in the third column suggests that
of those scientists not helped by the TTO, starting a firm increases the likelihood of
licensing. Taken together, these results might suggest that for those scientists helped by the
TTO, entrepreneurship and licensing tend to be substitutes. Scientists tend to do one or the
other, but not both. By contrast, for those scientists not helped by the TTO,
entrepreneurship and licensing tend to be complements. Those scientists who start a new
business also tend to license their intellectual property.
3.7 Conclusions
A consequence of globalization in the most developed countries, such as the United
States, has been to shift the comparative advantage away from traditional manufacturing
industries and towards new knowledge-based economic activity. But where is this
knowledge to come from? At this point, the answer is uncertain, but along with education
and human capital, as well as critical research and development (R&D) by private industry
and government agencies, research undertaken by universities is sure to play a prominent
role. As research and knowledge become perhaps the most crucial component to
generating economic growth and competitive jobs in globally-linked markets, universities
emerge as a key factor in determining the future well-being of the country. After all, it
ranks among the most important tasks of universities to create new scientific knowledge.
68
In addition, the magnitude of resources being invested in university research, including
some of the most capable and creative scientists in the country, is the envy of the world.
The massive investment in university research can impact economic growth only if
knowledge can be transformed into actual innovations and new and better products through
the commercialization process. That is, the extent to which university research becomes
commercialized. It matters for economic growth, for jobs and for global competitiveness.
Thus, a large literature has emerged trying to gauge and analyze the extent to which
university research spills over into commercial activity. Much, if not most, of this previous
research has been restricted to focusing on the activities emanating from Technology
Transfer Offices, which have provided systematic and consistent documentation of their
efforts over a fairly long period of time. Analyses of these data have typically led to
conclusions suggesting that while patents and licenses from university research have
increased over time, the typical TTO does not generate significant commercialization of
university research. However, an important qualification is that, by restricting themselves
to TTO generated data, such studies are not able to consider any commercialization
activities not emanating from the TTOs.
This chapter has taken a different approach. Rather than focus on what the TTOs
do, it instead focuses on what university scientists do. Thus, the findings about the
commercialization of university research are based on actual university scientists and not
the TTOs. The results are revealing. In particular, while all modes of commercialization
are important, scientist entrepreneurship emerges as an important and prevalent mode of
commercialization of university research. More than one in four patenting NCI scientists
69
has started a new firm. This is a remarkably high rate of entrepreneurship for any group of
people, let alone university scientists. Thus, the extent to which university research is
being commercialized and entering the market may be significantly greater than might
have been inferred from studies restricted only to the commercialization activities of the
TTO. Scientist entrepreneurship may prove to be the sleeping giant of university
commercialization.
Second, the mode of commercialization is apparently not independent of the
commercialization route. Nearly one-third of patenting NCI scientists rely on the
entrepreneurial commercialization route, in that they do not assign all of their patents to the
university. These scientists exhibit a higher likelihood of starting a new firm but a lower
propensity to license. By contrast, scientists choosing the TTO commercialization route
exhibit a higher propensity to license but a lower likelihood to start a new firm.
Third, we find that the determinants of scientist commercialization vary
considerably according to the specific mode of commercialization. Social capital,
measured in terms of co-patenting with other NCI scientists, co-publishing with industry
scientists, and sitting on a scientific advisory board (SAB) or board of directors, generally
promotes all modes of commercialization, although the impact seems to be the strongest
for scientist entrepreneurship. However, the role of the TTO is sharply divided depending
upon the commercialization mode. Having a TTO that is perceived to be helpful for
commercialization seems to increase the likelihood of a scientist licensing but decrease the
propensity of the scientist to start a new firm. By contrast, having a TTO that is perceived
not to be helpful reduces the licensing activity of scientists but increases their likelihood of
70
becoming entrepreneurs. Thus, licensing and entrepreneurship appear to be substitutes
when the TTO is helpful to the scientists and complements when not.
How are scientists able to start a business without TTO support? There is at least
some evidence indicating that social capital can serve as a mechanism to compensate for
lack of TTO help when starting a new firm. This would suggest that university governance
and public policy facilitating participation in scientific networks may be a valuable
investment accruing positive returns in terms of knowledge spillovers and technology
transfer, ultimately leading to commercialization, innovation and economic growth.
Future research needs to further probe why and how scientists choose to
commercialize their research, what commercialization route they select, what mode of
commercialization is most effective, and how university governance and public policy can
best promote such commercialization efforts. A host of pressing questions remain. For
example, are all social networks equivalent, that is are they homogeneous, or do some
facilitate scientist commercialization more than others? Similarly, do non-patenting
scientists engage in commercialization activities, particularly entrepreneurship, or does
their lack of patented intellectual propensity preclude commercialization of their research?
Whatever answers to these and other crucial questions future research can uncover, the
sleeping giant of scientist entrepreneurship may prove to be one giant that is worth waking
up.
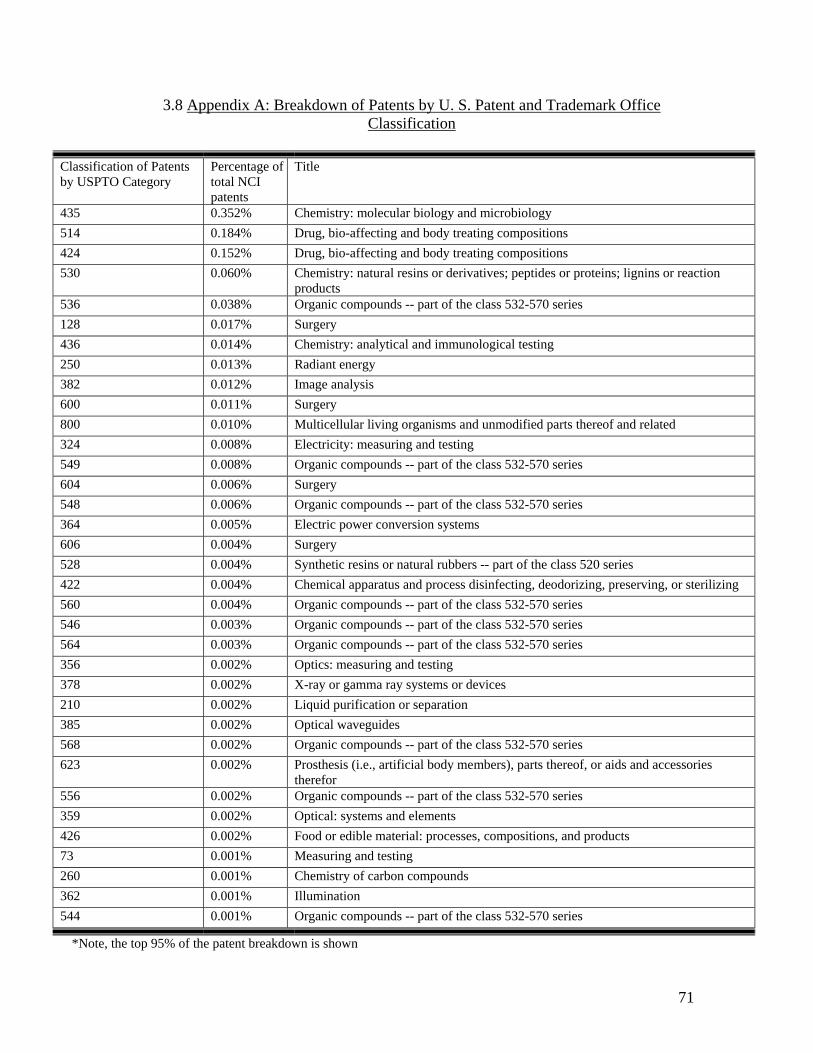
71
3.8 Appendix A: Breakdown of Patents by U. S. Patent and Trademark Office Classification
Classification of Patents by USPTO Category
Percentage of total NCI patents
Title
435 0.352% Chemistry: molecular biology and microbiology 514 0.184% Drug, bio-affecting and body treating compositions 424 0.152% Drug, bio-affecting and body treating compositions 530 0.060% Chemistry: natural resins or derivatives; peptides or proteins; lignins or reaction
products 536 0.038% Organic compounds -- part of the class 532-570 series 128 0.017% Surgery 436 0.014% Chemistry: analytical and immunological testing 250 0.013% Radiant energy 382 0.012% Image analysis 600 0.011% Surgery 800 0.010% Multicellular living organisms and unmodified parts thereof and related 324 0.008% Electricity: measuring and testing 549 0.008% Organic compounds -- part of the class 532-570 series 604 0.006% Surgery 548 0.006% Organic compounds -- part of the class 532-570 series 364 0.005% Electric power conversion systems 606 0.004% Surgery 528 0.004% Synthetic resins or natural rubbers -- part of the class 520 series 422 0.004% Chemical apparatus and process disinfecting, deodorizing, preserving, or sterilizing 560 0.004% Organic compounds -- part of the class 532-570 series 546 0.003% Organic compounds -- part of the class 532-570 series 564 0.003% Organic compounds -- part of the class 532-570 series 356 0.002% Optics: measuring and testing 378 0.002% X-ray or gamma ray systems or devices 210 0.002% Liquid purification or separation 385 0.002% Optical waveguides 568 0.002% Organic compounds -- part of the class 532-570 series 623 0.002% Prosthesis (i.e., artificial body members), parts thereof, or aids and accessories
therefor 556 0.002% Organic compounds -- part of the class 532-570 series 359 0.002% Optical: systems and elements 426 0.002% Food or edible material: processes, compositions, and products 73 0.001% Measuring and testing 260 0.001% Chemistry of carbon compounds 362 0.001% Illumination 544 0.001% Organic compounds -- part of the class 532-570 series
*Note, the top 95% of the patent breakdown is shown
72
Chapter 4: Academic Entrepreneurship: The Role of Novel and General Heterogonous Innovation
4.1 Introduction
Perhaps triggered by passage of the Bayh-Dole Act, and the subsequent
proliferation of technology transfer offices at universities around the world, a recent
literature has exploded focusing on the transfer and spill over of university research
(Shane, 2002 and Shane and Stuart, 2002). This research has typically examined what
universities do, particularly in terms of patented inventions (Herderson, Jaffe and
Trajtenberg, 1998; Colyvas et al., 2002; and Thursby and Thursby, 2002).
However, much less attention has been given to what the scientists themselves do
themselves, in terms of commercialization, either with or without the assistance of the
technology transfer office (TTO). As Shane (2004, p.4) points out, “Sometimes patents,
copyrights and other legal mechanisms are used to protect the intellectual property that
leads to spinoffs, while at other times the intellectual property that leads to a spinoff
company formation takes the form of know how or trade secrets. Moreover, sometimes
entrepreneurs create university spinoffs by licensing university inventions, while at other
times the spinoffs are created without the intellectual property being formally licensed
from the institution in which it was created. These distinctions are important for two
reasons. First it is harder for researchers to measure the formation of spinoff companies
created to exploit intellectual property that is not protected by legal mechanisms or that
has not been disclosed by inventors to university administrators.”
73
The few studies that have analyzed the commercialization activities of scientists
have focused on characteristics specific to the scientists, such as age and gender (Stephan
and Levin 1991 and Audretsch and Stephan, 1996), as well as the scientist’s human
capital (measured in terms of publications and citations) (Zucker, Darby and Brewer,
1998; Audretsch and Stephan, 1996) and social capital. In addition, several studies have
considered the impact of the technology transfer office on the propensity for scientists to
become an entrepreneur ( Feldman et al. 2002, Zucker et al. 2002 ). These studies
generally find that a higher degree of human capital, or scientist knowledge, as measured
in terms of publications and citations, leads to a higher propensity to commercialize that
knowledge in the form of a patented invention of becoming an entrepreneur.
However, a very different literature suggests that the knowledge underlying a
patented invention may not be homogenous in nature. Rather, Trajtenberg, Jaffe and
Henderson (1997) and Agarwal and Henderson (2002) suggest that knowledge is
remarkably heterogeneous. They introduce a method for distinguishing between and
measuring the extent to which knowledge reflects originality or novelty, rather than being
incremental in nature. Similarly, they are able to distinguish between knowledge that is
general versus specific knowledge.
The purpose of this chapter is to examine whether the type of knowledge
underling a scientist’s patent, rather than the more traditional measures reflecting
characteristics specific to the scientist, influences the likelihood that she will become an
entrepreneur. In particular, this chapter links to characteristics of a scientist’s patents,
novelty and generality, to the propensity that scientist will become an entrepreneur.
Based on a large data set of scientists awarded a research grant from the National Cancer
74
Institute (NCI) and holding patents, this chapter finds that scientist holding a patent that
is more original and general have a higher likelihood of becoming an entrepreneur that
those with a patent that reflects incremental knowledge and specific knowledge. Thus, the
empirical evidence suggests that the type of knowledge underlying a patent may
influence the decision for a scientist to become an entrepreneur, rather than
characteristics specific to the entrepreneur found in previous literature.
4.2 Scientist Entrepreneurship
The focus of the growing literature on scientist entrepreneurship has been to
address the question of why some scientists choose to become entrepreneurs while others
do not. In seeking an answer, studies have generally focused on five factors. The first
factor is the amount of knowledge or human capital associated with the scientist. If new
knowledge drives new commercial opportunities, then scientists with more knowledge
should have a greater propensity to become an entrepreneur. In an important study,
Zucker et al. (2002) find that startup activity tends to be greater where star scientists,
measured in terms of scientific output, is greater.
The second factor influencing the decision by scientists to become an entrepreneur
involves the social capital accessed by the capital or linkages to important networks. Social capital
refers to meaningful interactions and linkages the scientist has with others. While physical capital
refers to the importance of machines and tools as a factor of production (Solow, 1956), the
endogenous growth theory (Romer 1986, 1990; Lucas 1988) puts the emphasis on the process of
knowledge accumulation, and hence the creation of knowledge capital. The concept of social
capital (Putnam, 1993 and Coleman, 1988) can be considered a further extension because it adds a
social component to those factors shaping economic growth and prosperity. According to Putnam
75
(2000, p.19), “Whereas physical capital refers to physical objects and human capital refers to the
properties of individuals, social capital refers to connections among individuals – social networks.
By analogy with notions of physical capital and human capital – tools and training that enhance
individual productivity – social capital refers to features of social organization, such as networks
that facilitate coordination and cooperation for mutual benefits.”
A large and robust literature has emerged attempting to link social capital to
entrepreneurship (Aldrich and Martinez, 2003; Aldrich, 2005; and Thorton and Flynn,
2003). According to this literature, entrepreneurial activity should be enhanced where
investments in social capital are greater. Interactions and linkages, such as working
together with industry, are posited as conduits not just of knowledge spillovers but also for
the demonstration effect providing a flow of information across scientists about how
scientific research can be commercialized (Thursby and Thursby, 2004).
Nicolaou and Birley (2003) examine the influences of social networks on university
spin-outs. Their data base consists of 45 spin- outs comprising 111 inventors originating
from Imperial College London. They find that a high level of non redundancy in the
academic’s institutional business discussion networks, coupled with a high strength of ties,
increases the propensity for a scientist to become an entrepreneur.
Rappert et al. (1999) find empirical evidence supporting the importance of
linkages with industry for academic entrepreneurs. Based on detailed interviews with 94
individuals from 59 university spin-offs in the United Kingdom, they find that linkages
play a crucial role. Similarly, Murray (2004), using data from 23 U.S. biotechnology
firms, finds that the academic inventors’ social capital contributes to entrepreneurial
capabilities. In analyzing the impact of star scientists on the success of biotechnology in
76
Japan, Zucker and Darby (2001) identify collaboration between the scientists and
industry plays an important role. Based on a survey of 291 university scientists involved
in biotechnology in Isreal, Oliver (2004) finds that scientists with significantly more
industrial collaborations were more likely to submit patent applications. Thus, there are
both compelling theoretical reasons as well as supporting empirical evidence linking
social capital to scientist entrepreneurship.
The third factor influencing the decision to become an entrepreneur by a scientist
is the institutional context in which she works. One of the important mechanisms
facilitating the entrepreneurial activities of universities is the technology office of the
university (TTO), which has a mandate to facilitate and promote the commercialization
of university science. As the President of the Association of American Universities
observed, “Before Bayh-Dole, the federal government had accumulated 30,000 patents,
of which only 5% had been licensed and even fewer had found their way into commercial
products. Today under Bayh-Dole more than 200 universities are engaged in technology
transfer, adding more than $21 billion each year to the economy,”19 and the Commission
of the U.S. Patent and Trademark Office claimed, “In the 1970s, the government
discovered that inventions that resulted from public funding were not reaching the
marketplace because no one could make the additional investment to turn basic research
into marketable products. That finding resulted in the Bayh-Dole Act, passed in 1980. It
enabled universities, small companies, and nonprofit organizations to commercialize the
results of federally funded research. The results of Bayh-Dole have been significant.
19 cited in Mowery (2005, p. 2).
77
Before 1981, fewer than 250 patents were issued to universities each year. A decade later
universities were averaging approximately 1,000 patents a year.”20
Research has found that the TTO influences entrepreneurial activities emanating
from university scientists. For example, Leitch and Harrrison (2005) undertook a series of
interviews with the directors of TTOs and found that the TTO can influence start-up
ventures. Link and Scott (2005) found that the proximity of the university to a research
park facilitates the ability of a TTO to generate spinoffs. Jensen and Thursby (2001)
examined 62 TTOs at U.S. universities and concluded that the ability of the TTO to
license inventions increases the speed to which intellectual property becomes
commercialized. Markman et al. (2004) interviewed 128 TTO directors and found a link
between the compensation of TTO personnel and entrepreneurial activity generated by
the TTO.
The fourth factor influencing scientist entrepreneurship involves characteristics
specific to the particular scientist, in particular age. The university or academic career
trajectory encourages and rewards the production of new scientific knowledge. Thus, the
goal of the scientist in the university context is to establish priority. This is done most
efficiently through publication in scientific journals (Audretsch and Stephan, 2000). By
contrast, with a career trajectory in the private sector, scientists are rewarded for the
production of new economic knowledge, or knowledge which has been commercialized
in the market, but not necessarily new scientific knowledge per se. In fact, scientists
working in industry are often discouraged from sharing knowledge externally with the
20 cited in Mowery (2005, p. 2)
78
scientific community through publication. As a result of these differential incentive
structures, industrial and academic scientists develop distinct career trajectories.
The appropriability question confronting academic scientists can be considered in
the context of the model of scientist human capital over the life-cycle. Scientist life-cycle
models suggest that early in their careers scientists invest heavily in human capital in
order to build a scientific reputation (Levin and Stephan, 1991). In the later stages of their
career, the scientist trades or cashes in this reputation for economic return. Thus, early in
her career, the scientist invests in the creation of scientific knowledge in order to
establish a reputation that signals the value of that knowledge to the scientific
community.
With maturity, scientists seek ways to appropriate the economic value of the new
knowledge. Thus, academic scientists may seek to commercialize their scientific research
within a life-cycle context. The life-cycle model of the scientist implies that, ceteris
paribus, scientist age should play a role in the decision to commercialize. In the early
stages of her career, a scientist will tend to invest in her scientific reputation. As she
evolves towards maturity and the marginal productivity of her scientific research starts to
hit diminishing returns, the incentive for cashing in through commercialization becomes
greater.
Scientists working in the private sector are arguably more fully compensated for
the economic value of their knowledge. This will not be the case for academic scientists,
unless they cash out, in terms of Dasgupta and David (1994), by commercializing their
scientific knowledge. This suggests that academic scientists seek commercialization
79
within a life-cycle context, where they are more likely to enter into entrepreneurship as
they mature.
The fifth factor influencing scientist entrepreneurship is geography. Scientist
location can influence the decision to commercialize for two reasons. First, as Jaffe
(1989), Audretsch and Feldman (1996), Jaffe, Trajtenberg and Henderson (1993), and
Glaeser, Kallal, Sheinkman and Shleifer (2002) show, knowledge tends to spill over
within geographically bounded regions. This implies that scientists working in regions
with a high level of investments in new knowledge can more easily access and generate
new scientific ideas. This suggests that scientists working in knowledge clusters should
tend to be more productive than their counterparts who are geographically isolated. As
Glaeser, Kallal, Scheinkman and Shleifer (1992, p. 1126) have observed, “Intellectual
breakthroughs must cross hallways and streets more easily than oceans and continents.”
A second component of externalities involves not the technological knowledge,
but rather behavioural knowledge. As Bercoviz and Feldman (2004) show for a study
based on the commercialization activities of scientists at Johns Hopkins and Duke
University, the likelihood of a scientist engaging in commercialization activity, which is
measured as disclosing an invention, is shaped based on the commercialization behaviour
of the doctoral supervisor in the institution where the scientist was trained, as well as the
commercialization behaviour and attitudes exhibited by the chair and peers at the relevant
department. Similarly, based on a study of 778 faculty members from 40 universities,
Louis et al. (1989) find that it is the local norms of behaviour and attitudes towards
commercialization that shape the likelihood of an individual university scientist to engage
in commercialization activity, in their case by starting a new firm.
80
Audretsch and Stephan (1996) find that geography matters more in certain
economic relationships than in others. In particular, from a data set of 54 beiotechnology
firms affiliated with 445 university scientists, they find that the probability of a scientist-
firm contact being local is shaped by the role played by the scientists: (i) Proximity
matters more in the case of founders and chairs of scientific advisory board (SABs); (ii)
Proximity does not matter as much in the case of members of SABs; (iii) When
knowledge is transmitted through formal ties, geographic proximity is not necessary.
Zucker et al. (1998) examine 327 star sciences in the life sciences and 751 U.S. firms and
find that the location of new dedicated biotechnology firms and new biotech subunits of
existing firms are primarily explained by the presence of academic star scientists. Thus,
the locational context can influence the propensity for scientists to engage in
commercialization activities by providing access to spatially bounded knowledge
spillovers and by shaping the behavioural norms and attitudes towards entrepreneurship.
While extant research has identified these five factors – human capital, social
capital, institutional context, age and geography – the impact of the type of knowledge
associated with the scientist on entrepreneurship has largely been neglected. Even though
the first factor considers the amount of knowledge, it typically is measured in terms of the
quantity of publications and citations and is therefore considered to be homogeneous. In
the next section we will suggest that, in fact, knowledge emerging from scientific
research is remarkably heterogeneous in such a manner as to influence the decision of
scientists to become an entrepreneur.
81
4.3 Novelty and Generality
The previous section identified a growing literature suggesting that the knowledge
embodied in a scientist is an in important factor influencing the likelihood of her
becoming an entrepreneur. In particular, the degree to which the knowledge is novel
versus incremental should influence the decision to become an entrepreneur in order to
commercialize that knowledge. Knowledge that is more incremental in nature can be
characterized more by risk, where the outcomes are known along with their associated
probability distributions. By contrast, knowledge that is novel is characterized more by
uncertainty where not only are the outcomes not known but no associated probability
distributions can be assigned (Alvarez, 2003, Barney, 1986 and Alvarez and Barney,
2005 and 2006).
The cost of the scientist transferring incremental knowledge through a license or
consulting contract is relatively low because the associated risk can be calculated and
incorporated into the contract. By contrast, it is very difficult for a scientist to transfer
novel knowledge through the standard instruments of licensing or consulting because of
the inherent uncertainty which cannot be written into a contract. Thus, as Alvarez (2003),
Barney (1986) and Alvarez and Barney (2005 and 2006) point out, entrepreneurial
opportunities tend to be more highly associated with knowledge characterized by
uncertainty rather than risk, or in this case novel knowledge rather than incremental
knowledge.
Arrow (1962) and Williamson (1975) argued that when knowledge created
outside of incumbent firms cannot be easily transferred to those incumbent firms, as a
result of agency and bureaucracy problems, the holder of such knowledge is not able to
82
transfer that knowledge via a licensing or consulting contract but must rather start her
own firm in order to appropriate the expected returns on that knowledge. This reflects
what Winter (1984, p. 297) termed as an entrepreneurial technological regime where,
“An entrepreneurial regime is one that is favorable to innovative entry and unfavorable to
innovative activity by established firms.”
Winter’s (1982) entrepreneurial regime corresponds to Alvarez and Barney’s
(2007) high uncertainty context associated with novel knowledge. This would suggest
that scientists with knowledge that can be characterized as being relatively novel rather
than incremental would more likely choose to become entrepreneurs.
Similarly, knowledge that is more general in nature and less specific to a
particular application is also characterized by a greater degree of uncertainty. It is very
difficult for a scientist to know all of the ways in which general knowledge can be
applied and commercialized. Thus, general knowledge would also be expected to be more
conducive to entrepreneurship than would very specific knowledge. This leads to the
hypotheses that the likelihood of a scientist becoming an entrepreneur should be higher if
she holds patents reflecting more novel knowledge as well as more general knowledge.
4.4 Measurement Issues
In order to link the propensity for a scientist to become an entrepreneur to the
nature of her underlying intellectual property, a new data base was created based on
scientists awarded a research grant by the National Cancer Institute between 1998 and
2002. Of those research grant awards, the largest twenty percent, which included 1,693
scientist awardees, were taken to form the database used in this chapter. The National
83
Cancer Institute (NCI) awarded a total of $5,350,977,742 to the top 1,693 scientists in the
United States from 1998 to 2002.
To match the patent records with the 1,692 NCI recipient scientists, Structured
Query Language (SQL) and Python programming languages were written to extract and
manipulate data. A match between the patentee and NCI awardee databases was
considered to be positive if all four of the following necessary conditions were met:
(1) A positive match was made with the first, middle, and last name. If, for
example, the scientist did not have a middle name listed on either the NCI award database
or the patent database, but did have a positive first and last name, this first condition was
considered to be fulfilled.
(2) The second criterion involved matching the relevant time periods between the
two databases. Observations from both databases were matched over the time period 1998-
2004, which corresponds to the initial year in which observations were available from the
NCI database (1998-2002) and the final year in which patents were recorded in the patent
database (1975-2004). Because applications of patents may take anywhere from three
months to two years to be issued, the 2003 and 2004 USPTO patent records were included
in our query. Issued patents from 1998 to 2004 by NCI scientists fulfilled the second
criterion.
(3) The third criterion was based on location. If the patentee resided within an
approximate radius of 60 miles from the geographic location of the university, the third
condition was fulfilled.
84
(4) The fourth criterion was based on USPTO patent classification. Using the
USPTO patent classification code, all patents were separated into respective coding
groups. Patents which did not fall under the traditional categories of biotechnology were
identified. All non biotech patents were evaluated and patents such as “Bread Alfalfa
Enhancer” were rejected as an NCI scientist patent (see Appendix A for a distribution of
patent categories). Based on these four match criteria, a subset of 398 distinctly issued
patentees were identified between 1998 and 2004 with a total of 1,204 patents.
Since the focus of this chapter is to link the propensity of scientists to become
entrepreneurs to the type of knowledge involved in their patented inventions, patent data
for each scientist was obtained from the United States Patent and Trade Office (USPTO).
The patent records span 1975 to 2004. The inventor patent data included identification of
the patent number of the invention, the name and address of the inventor, and the
inventor sequence number.
However, the USPTO records do not identify whether the scientist holding the
patent has become an entrepreneur in the form of founding a new business. To identify
whether the scientist had become an entrepreneur, a series of interviews with each
scientist were undertaken, where the scientists was asked whether she had founded a
company between 1998 and 2004. The dependent variable in the estimated probit
regressions takes on the value of one if the scientist also started a new firm or zero
otherwise.
85
4.4.1 Measuring Generality and Originality
We follow Trajtenberg, Jaffe and Henderson (1997) to measure the extent to
which a patent reflects novelty and the extent to which it reflects generality. This second
concept, generality, refers to the extent to which the forward patents citations are spread
across different technological fields, rather than being concentrated in just a few
technological fields. We compute a measure of generality of technology on the basis of a
herfindahl index of concentration, where the number of citations in each 3 digit patent
classification plays the same role as the sales of each firm in the traditional industrial
organization measure.
Two measures reflecting, “Generality” and “Originality,” as suggested by
Trajtenberg, Jaffe and Henderson (1997) were created, where nii j ij Generality 1 s2
,where sij denotes the percentage of citations received by patent i that belong to
patentclass j, out of ni patent classes (note that the sum is the Herfindahl concentration
index). Thus as written in Trajtenberg, Jaffe and Henderson:
“if a patent is cited by subsequent patents that belong to a wide range of fields the measure will be high, whereas if most citations are concentrated in a few fields it will below (close to zero). Thinking of forward citations as indicative of the impact of a patent, a high generality score suggests that the patent presumably had a widespread impact, in that it influenced subsequent innovations in a variety of fields (hence the “generality” label). “Originality” is defined the same way, except that it refers to the backward citations issued. Thus, if a patent cites previous patents that belong to a narrow set of technologies the originality score will be low, whereas citing patents in a wide range of fields would render a high score. Note that these measures depend of course upon the patent classification system: a finer classification system would render higher measures, and conversely for a coarser system.” P.2 (2001)
Several other variables were included in estimating the probit model to control for
influences on the propensity for a scientist to become an entrepreneur already identified
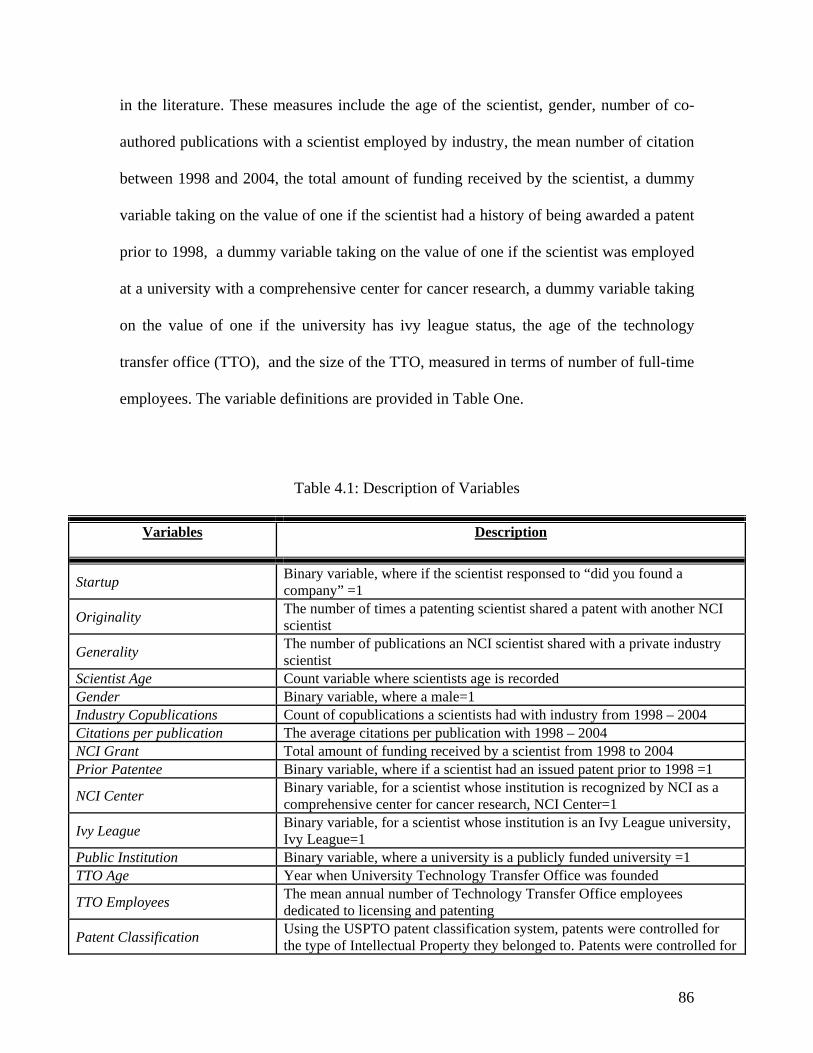
86
in the literature. These measures include the age of the scientist, gender, number of co-
authored publications with a scientist employed by industry, the mean number of citation
between 1998 and 2004, the total amount of funding received by the scientist, a dummy
variable taking on the value of one if the scientist had a history of being awarded a patent
prior to 1998, a dummy variable taking on the value of one if the scientist was employed
at a university with a comprehensive center for cancer research, a dummy variable taking
on the value of one if the university has ivy league status, the age of the technology
transfer office (TTO), and the size of the TTO, measured in terms of number of full-time
employees. The variable definitions are provided in Table One.
Table 4.1: Description of Variables
Variables
Description
Startup Binary variable, where if the scientist responsed to “did you found a company” =1
Originality The number of times a patenting scientist shared a patent with another NCI scientist
Generality The number of publications an NCI scientist shared with a private industry scientist
Scientist Age Count variable where scientists age is recorded Gender Binary variable, where a male=1 Industry Copublications Count of copublications a scientists had with industry from 1998 – 2004 Citations per publication The average citations per publication with 1998 – 2004 NCI Grant Total amount of funding received by a scientist from 1998 to 2004 Prior Patentee Binary variable, where if a scientist had an issued patent prior to 1998 =1
NCI Center Binary variable, for a scientist whose institution is recognized by NCI as a comprehensive center for cancer research, NCI Center=1
Ivy League Binary variable, for a scientist whose institution is an Ivy League university, Ivy League=1
Public Institution Binary variable, where a university is a publicly funded university =1 TTO Age Year when University Technology Transfer Office was founded
TTO Employees The mean annual number of Technology Transfer Office employees dedicated to licensing and patenting
Patent Classification Using the USPTO patent classification system, patents were controlled for the type of Intellectual Property they belonged to. Patents were controlled for
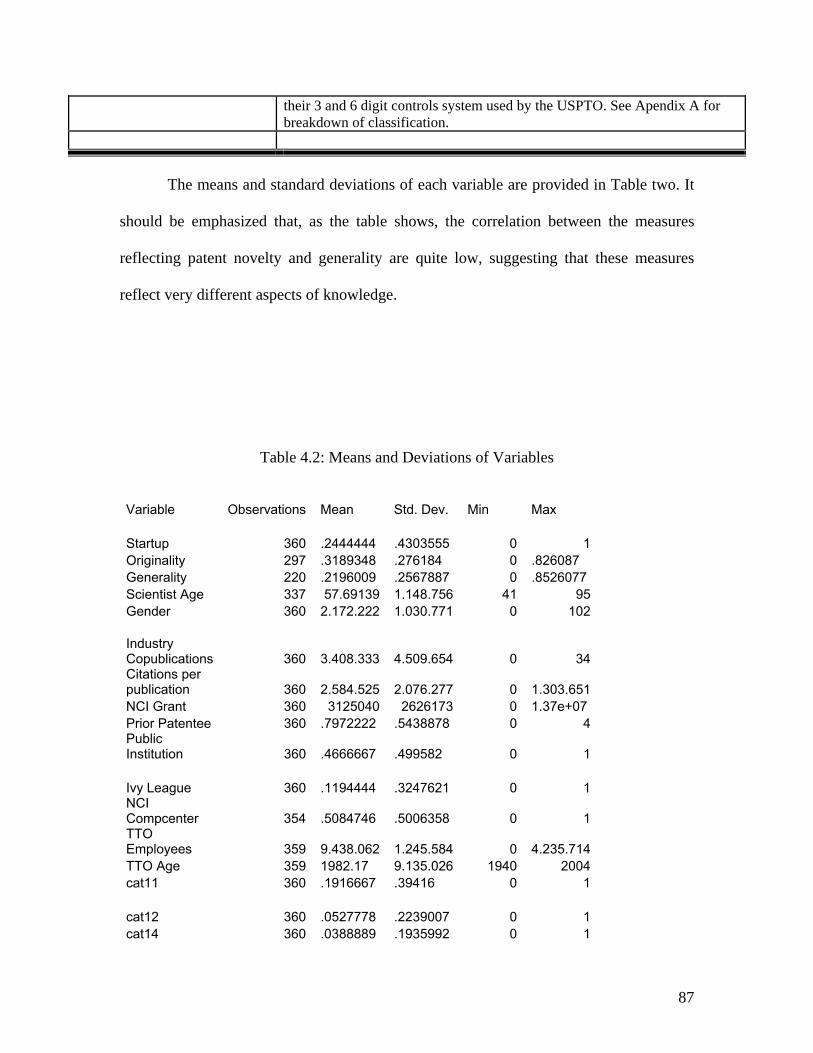
87
their 3 and 6 digit controls system used by the USPTO. See Apendix A for breakdown of classification.
The means and standard deviations of each variable are provided in Table two. It
should be emphasized that, as the table shows, the correlation between the measures
reflecting patent novelty and generality are quite low, suggesting that these measures
reflect very different aspects of knowledge.
Table 4.2: Means and Deviations of Variables Variable Observations Mean Std. Dev. Min Max Startup 360 .2444444 .4303555 0 1 Originality 297 .3189348 .276184 0 .826087 Generality 220 .2196009 .2567887 0 .8526077 Scientist Age 337 57.69139 1.148.756 41 95 Gender 360 2.172.222 1.030.771 0 102 Industry Copublications 360 3.408.333 4.509.654 0 34 Citations per publication 360 2.584.525 2.076.277 0 1.303.651 NCI Grant 360 3125040 2626173 0 1.37e+07 Prior Patentee 360 .7972222 .5438878 0 4 Public Institution 360 .4666667 .499582 0 1 Ivy League 360 .1194444 .3247621 0 1 NCI Compcenter 354 .5084746 .5006358 0 1 TTO Employees 359 9.438.062 1.245.584 0 4.235.714 TTO Age 359 1982.17 9.135.026 1940 2004 cat11 360 .1916667 .39416 0 1 cat12 360 .0527778 .2239007 0 1 cat14 360 .0388889 .1935992 0 1

88
cat21 359 .0557103 .2296815 0 1 cat22 359 .0724234 .2595494 0 1 cat25 359 .2785515 .4489119 0 1 cat26 359 .0362117 .1870773 0 1 cat27 359 .4011142 .4908081 0 1
The correlation coefficient for each variable pair is shown in Table three.
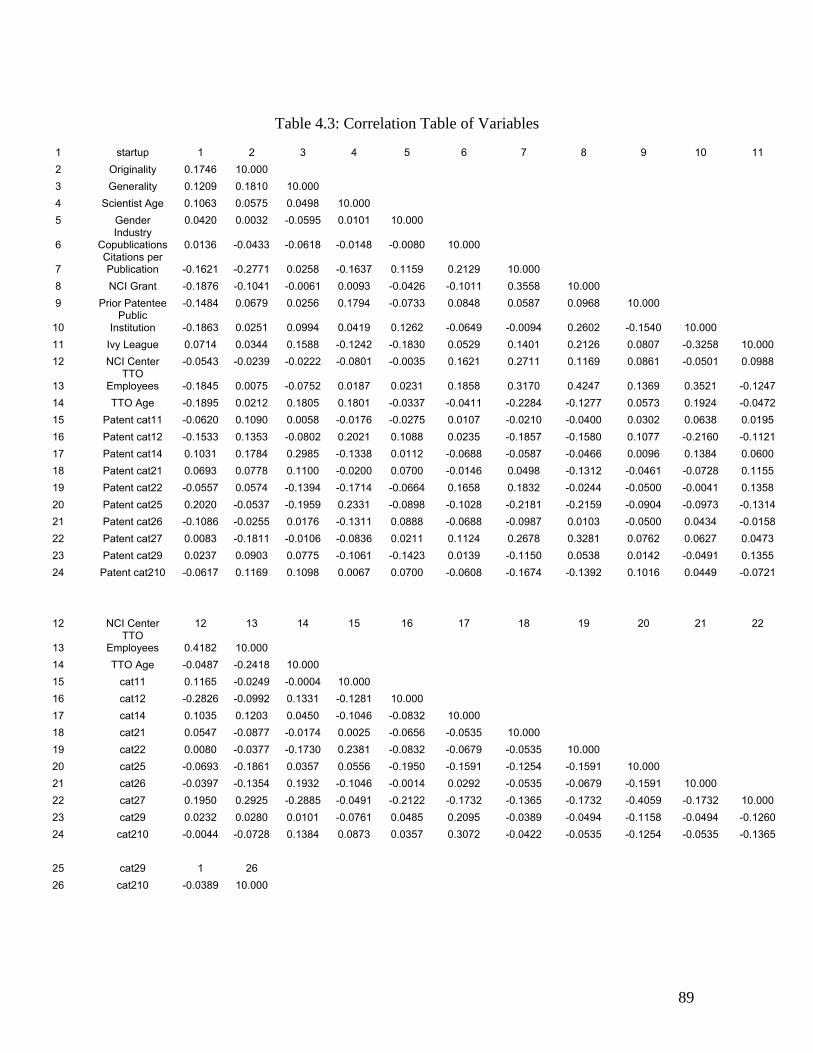
89
Table 4.3: Correlation Table of Variables
1 startup 1 2 3 4 5 6 7 8 9 10 11 2 Originality 0.1746 10.000 3 Generality 0.1209 0.1810 10.000 4 Scientist Age 0.1063 0.0575 0.0498 10.000 5 Gender 0.0420 0.0032 -0.0595 0.0101 10.000
6 Industry
Copublications 0.0136 -0.0433 -0.0618 -0.0148 -0.0080 10.000
7 Citations per Publication -0.1621 -0.2771 0.0258 -0.1637 0.1159 0.2129 10.000
8 NCI Grant -0.1876 -0.1041 -0.0061 0.0093 -0.0426 -0.1011 0.3558 10.000 9 Prior Patentee -0.1484 0.0679 0.0256 0.1794 -0.0733 0.0848 0.0587 0.0968 10.000
10 Public
Institution -0.1863 0.0251 0.0994 0.0419 0.1262 -0.0649 -0.0094 0.2602 -0.1540 10.000 11 Ivy League 0.0714 0.0344 0.1588 -0.1242 -0.1830 0.0529 0.1401 0.2126 0.0807 -0.3258 10.000 12 NCI Center -0.0543 -0.0239 -0.0222 -0.0801 -0.0035 0.1621 0.2711 0.1169 0.0861 -0.0501 0.0988
13 TTO
Employees -0.1845 0.0075 -0.0752 0.0187 0.0231 0.1858 0.3170 0.4247 0.1369 0.3521 -0.1247 14 TTO Age -0.1895 0.0212 0.1805 0.1801 -0.0337 -0.0411 -0.2284 -0.1277 0.0573 0.1924 -0.0472 15 Patent cat11 -0.0620 0.1090 0.0058 -0.0176 -0.0275 0.0107 -0.0210 -0.0400 0.0302 0.0638 0.0195 16 Patent cat12 -0.1533 0.1353 -0.0802 0.2021 0.1088 0.0235 -0.1857 -0.1580 0.1077 -0.2160 -0.1121 17 Patent cat14 0.1031 0.1784 0.2985 -0.1338 0.0112 -0.0688 -0.0587 -0.0466 0.0096 0.1384 0.0600 18 Patent cat21 0.0693 0.0778 0.1100 -0.0200 0.0700 -0.0146 0.0498 -0.1312 -0.0461 -0.0728 0.1155 19 Patent cat22 -0.0557 0.0574 -0.1394 -0.1714 -0.0664 0.1658 0.1832 -0.0244 -0.0500 -0.0041 0.1358 20 Patent cat25 0.2020 -0.0537 -0.1959 0.2331 -0.0898 -0.1028 -0.2181 -0.2159 -0.0904 -0.0973 -0.1314 21 Patent cat26 -0.1086 -0.0255 0.0176 -0.1311 0.0888 -0.0688 -0.0987 0.0103 -0.0500 0.0434 -0.0158 22 Patent cat27 0.0083 -0.1811 -0.0106 -0.0836 0.0211 0.1124 0.2678 0.3281 0.0762 0.0627 0.0473 23 Patent cat29 0.0237 0.0903 0.0775 -0.1061 -0.1423 0.0139 -0.1150 0.0538 0.0142 -0.0491 0.1355 24 Patent cat210 -0.0617 0.1169 0.1098 0.0067 0.0700 -0.0608 -0.1674 -0.1392 0.1016 0.0449 -0.0721
12 NCI Center 12 13 14 15 16 17 18 19 20 21 22
13 TTO
Employees 0.4182 10.000 14 TTO Age -0.0487 -0.2418 10.000 15 cat11 0.1165 -0.0249 -0.0004 10.000 16 cat12 -0.2826 -0.0992 0.1331 -0.1281 10.000 17 cat14 0.1035 0.1203 0.0450 -0.1046 -0.0832 10.000 18 cat21 0.0547 -0.0877 -0.0174 0.0025 -0.0656 -0.0535 10.000 19 cat22 0.0080 -0.0377 -0.1730 0.2381 -0.0832 -0.0679 -0.0535 10.000 20 cat25 -0.0693 -0.1861 0.0357 0.0556 -0.1950 -0.1591 -0.1254 -0.1591 10.000 21 cat26 -0.0397 -0.1354 0.1932 -0.1046 -0.0014 0.0292 -0.0535 -0.0679 -0.1591 10.000 22 cat27 0.1950 0.2925 -0.2885 -0.0491 -0.2122 -0.1732 -0.1365 -0.1732 -0.4059 -0.1732 10.000 23 cat29 0.0232 0.0280 0.0101 -0.0761 0.0485 0.2095 -0.0389 -0.0494 -0.1158 -0.0494 -0.1260 24 cat210 -0.0044 -0.0728 0.1384 0.0873 0.0357 0.3072 -0.0422 -0.0535 -0.1254 -0.0535 -0.1365
25 cat29 1 26 26 cat210 -0.0389 10.000
90
4.6 Empirical Results
To test the hypothesis that the propensity for a scientist to become an entrepreneur
is influenced by the extent to which her intellectual property can be characterized as
being novel and by being general, a probit model was estimated where the dependent
variable takes on the value of one if the scientist started a new firm and zero if she did not
(table three) and a marginal affects table is provided (table four).
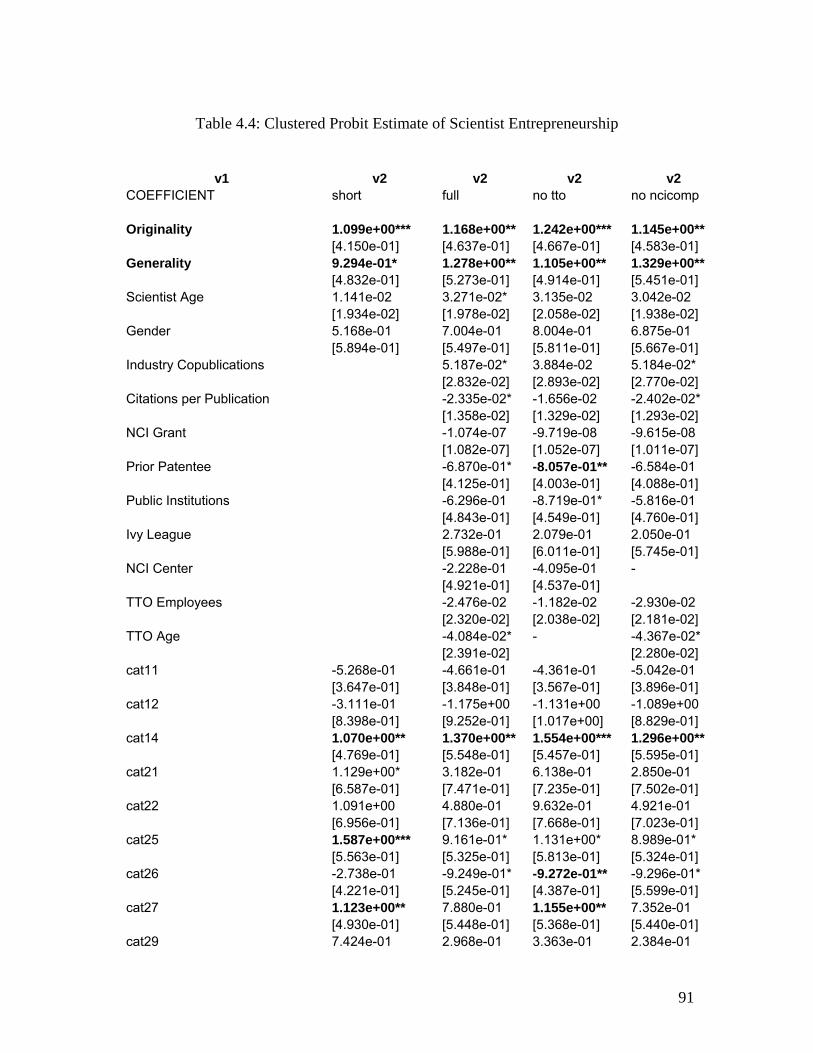
91
Table 4.4: Clustered Probit Estimate of Scientist Entrepreneurship
v1 v2 v2 v2 v2 COEFFICIENT short full no tto no ncicomp Originality 1.099e+00*** 1.168e+00** 1.242e+00*** 1.145e+00** [4.150e-01] [4.637e-01] [4.667e-01] [4.583e-01] Generality 9.294e-01* 1.278e+00** 1.105e+00** 1.329e+00** [4.832e-01] [5.273e-01] [4.914e-01] [5.451e-01] Scientist Age 1.141e-02 3.271e-02* 3.135e-02 3.042e-02 [1.934e-02] [1.978e-02] [2.058e-02] [1.938e-02] Gender 5.168e-01 7.004e-01 8.004e-01 6.875e-01 [5.894e-01] [5.497e-01] [5.811e-01] [5.667e-01] Industry Copublications 5.187e-02* 3.884e-02 5.184e-02* [2.832e-02] [2.893e-02] [2.770e-02] Citations per Publication -2.335e-02* -1.656e-02 -2.402e-02* [1.358e-02] [1.329e-02] [1.293e-02] NCI Grant -1.074e-07 -9.719e-08 -9.615e-08 [1.082e-07] [1.052e-07] [1.011e-07] Prior Patentee -6.870e-01* -8.057e-01** -6.584e-01 [4.125e-01] [4.003e-01] [4.088e-01] Public Institutions -6.296e-01 -8.719e-01* -5.816e-01 [4.843e-01] [4.549e-01] [4.760e-01] Ivy League 2.732e-01 2.079e-01 2.050e-01 [5.988e-01] [6.011e-01] [5.745e-01] NCI Center -2.228e-01 -4.095e-01 - [4.921e-01] [4.537e-01] TTO Employees -2.476e-02 -1.182e-02 -2.930e-02 [2.320e-02] [2.038e-02] [2.181e-02] TTO Age -4.084e-02* - -4.367e-02* [2.391e-02] [2.280e-02] cat11 -5.268e-01 -4.661e-01 -4.361e-01 -5.042e-01 [3.647e-01] [3.848e-01] [3.567e-01] [3.896e-01] cat12 -3.111e-01 -1.175e+00 -1.131e+00 -1.089e+00 [8.398e-01] [9.252e-01] [1.017e+00] [8.829e-01] cat14 1.070e+00** 1.370e+00** 1.554e+00*** 1.296e+00** [4.769e-01] [5.548e-01] [5.457e-01] [5.595e-01] cat21 1.129e+00* 3.182e-01 6.138e-01 2.850e-01 [6.587e-01] [7.471e-01] [7.235e-01] [7.502e-01] cat22 1.091e+00 4.880e-01 9.632e-01 4.921e-01 [6.956e-01] [7.136e-01] [7.668e-01] [7.023e-01] cat25 1.587e+00*** 9.161e-01* 1.131e+00* 8.989e-01* [5.563e-01] [5.325e-01] [5.813e-01] [5.324e-01] cat26 -2.738e-01 -9.249e-01* -9.272e-01** -9.296e-01* [4.221e-01] [5.245e-01] [4.387e-01] [5.599e-01] cat27 1.123e+00** 7.880e-01 1.155e+00** 7.352e-01 [4.930e-01] [5.448e-01] [5.368e-01] [5.440e-01] cat29 7.424e-01 2.968e-01 3.363e-01 2.384e-01
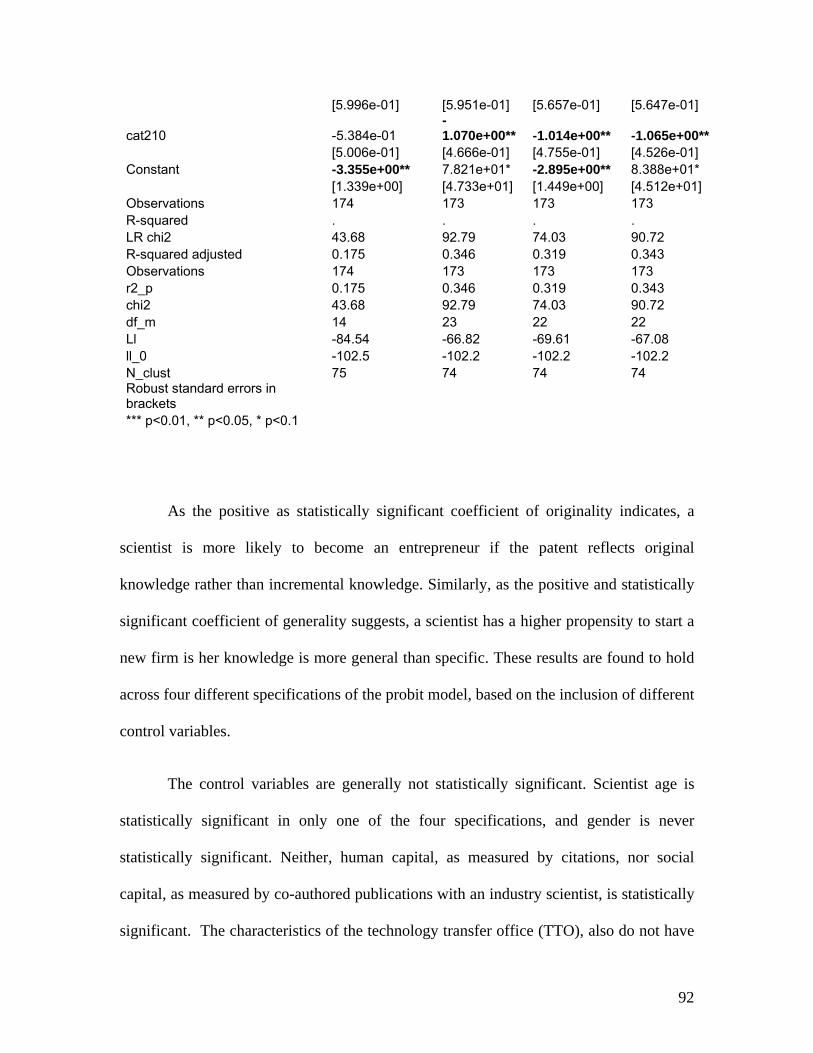
92
[5.996e-01] [5.951e-01] [5.657e-01] [5.647e-01]
cat210 -5.384e-01 -1.070e+00** -1.014e+00** -1.065e+00**
[5.006e-01] [4.666e-01] [4.755e-01] [4.526e-01] Constant -3.355e+00** 7.821e+01* -2.895e+00** 8.388e+01* [1.339e+00] [4.733e+01] [1.449e+00] [4.512e+01] Observations 174 173 173 173 R-squared . . . . LR chi2 43.68 92.79 74.03 90.72 R-squared adjusted 0.175 0.346 0.319 0.343 Observations 174 173 173 173 r2_p 0.175 0.346 0.319 0.343 chi2 43.68 92.79 74.03 90.72 df_m 14 23 22 22 Ll -84.54 -66.82 -69.61 -67.08 ll_0 -102.5 -102.2 -102.2 -102.2 N_clust 75 74 74 74 Robust standard errors in brackets *** p<0.01, ** p<0.05, * p<0.1
As the positive as statistically significant coefficient of originality indicates, a
scientist is more likely to become an entrepreneur if the patent reflects original
knowledge rather than incremental knowledge. Similarly, as the positive and statistically
significant coefficient of generality suggests, a scientist has a higher propensity to start a
new firm is her knowledge is more general than specific. These results are found to hold
across four different specifications of the probit model, based on the inclusion of different
control variables.
The control variables are generally not statistically significant. Scientist age is
statistically significant in only one of the four specifications, and gender is never
statistically significant. Neither, human capital, as measured by citations, nor social
capital, as measured by co-authored publications with an industry scientist, is statistically
significant. The characteristics of the technology transfer office (TTO), also do not have
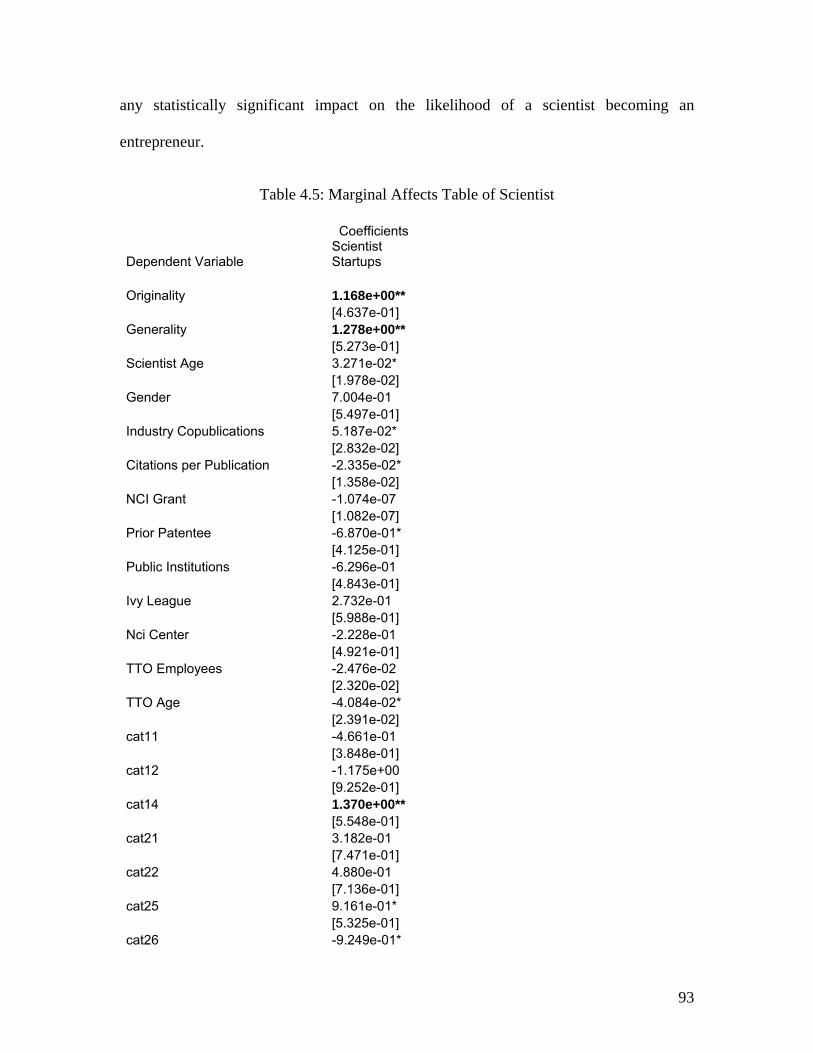
93
any statistically significant impact on the likelihood of a scientist becoming an
entrepreneur.
Table 4.5: Marginal Affects Table of Scientist
Coefficients
Dependent Variable Scientist Startups
Originality 1.168e+00** [4.637e-01] Generality 1.278e+00** [5.273e-01] Scientist Age 3.271e-02* [1.978e-02] Gender 7.004e-01 [5.497e-01] Industry Copublications 5.187e-02* [2.832e-02] Citations per Publication -2.335e-02* [1.358e-02] NCI Grant -1.074e-07 [1.082e-07] Prior Patentee -6.870e-01* [4.125e-01] Public Institutions -6.296e-01 [4.843e-01] Ivy League 2.732e-01 [5.988e-01] Nci Center -2.228e-01 [4.921e-01] TTO Employees -2.476e-02 [2.320e-02] TTO Age -4.084e-02* [2.391e-02] cat11 -4.661e-01 [3.848e-01] cat12 -1.175e+00 [9.252e-01] cat14 1.370e+00** [5.548e-01] cat21 3.182e-01 [7.471e-01] cat22 4.880e-01 [7.136e-01] cat25 9.161e-01* [5.325e-01] cat26 -9.249e-01*

94
[5.245e-01] cat27 7.880e-01 [5.448e-01] cat29 2.968e-01 [5.951e-01] cat210 -1.070e+00** [4.666e-01] Constant 7.821e+01* [4.733e+01] Observations 173 R-squared . LR chi2 92.79 R-squared adjusted 0.346 Observations 173 Xmfx_y 0.167 N_clust 74 ll_0 -102.2 Ll -66.82 df_m 23 chi2 92.79 r2_p 0.346 Robust standard errors in brackets *** p<0.01, ** p<0.05, * p<0.1
As shown in Table four, the marginal affects are only significant for originality
and generality. Indicating that with one lest patent citation for originality, there is a 116%
change of a scientist starting a company while with one more forward patent citation in
generality equaling a 127% likelihood of a scientist starting a firm.
4.7 Conclusion
The empirical results provide a striking contrast to previous studies. Rather than
pointing to characteristics specific to the scientist, such as age and gender, or
characteristics specific to her human capital and social capital, such as citations and co-
publications with industry scientists, or even characteristics specific to the TTO, this
95
chapter has found that it is the nature of the knowledge and technology inherent in the
patent that influences whether or not a scientist becomes an entrepreneur.
In particular, this chapter has found two characteristics reflecting the knowledge
underlying a patented invention influence scientist entrepreneurship. The first is the
degree of originality or novelty of the patent. The empirical results of this chapter suggest
that the more original or novel the patent, the more likely a scientist is to become an
entrepreneur. This empirical finding is consistent with the view that knowledge which is
highly novel or original is characterized by a greater extent of uncertainty, making it
more difficult for the holder of that knowledge, i.e. the scientist, to appropriate the value
of her ideas using some alternative mode of commercialization. Similarly, the degree of
generality also increases the likelihood of a scientist becoming an entrepreneur. Again,
more general knowledge is associated with a greater degree of uncertainty, making it
more difficult for the holder of that knowledge to appropriate its value through traditional
modes of technology transfer.
Thus, the results of this chapter suggest that while the amount of human capital
and social capital may be important in generating entrepreneurship from universities, it is
the type of knowledge underling inventive activity that may also be important in
understanding why some scientists choose to become entrepreneurs while others do not.
Knowledge that is highly uncertain, in that it reflects originality and generality, increases
the likelihood of a scientist becoming an entrepreneur. There may, in fact, be other
characteristics of knowledge that do not have a neutural effect on scientist
entrepreneurship. Subsequent research might prove fruitful in considering not just the

96
amount of knowledge generated by scientific work, but also other dimensions shaping the
type of knowledge generated, and how it is linked to scientist entrepreneurship.
97
Chapter 5: Scientist Commercialization as a Conduit of Knowledge Spillovers
5.1 Introduction
Why and how will scientists decide to combine to commercialize their academic
research? The answers to this question are not only important to institutions and scientists
engaged in research. The New Endogenous Growth models and theories highlight the
central role that investments in science and research play in generating economic growth
(Romer, 1985; and Lucas, 1993). But more recently, public policy makers, ranging from
local communities, to states and even entire countries have pointed out that such
investments in knowledge and research do not automatically spill over into
commercialized new products and innovations. Rather, what Acs et al. (2004) and
Audretsch et al. (2005) term as the knowledge filter effectively impedes the spillover and
commercialization of investments in knowledge, thereby limiting the rate of return in
terms of employment creation and economic growth accruing from public and private
investments in science and research. In the presence of a high knowledge filter,
investments in science and research do not automatically spill over and become
commercialized, resulting in vigorous rates of economic growth and employment
generation, as assumed in models of endogenous growth. The combination of high
investments in science and research but low rates of economic growth and employment
generation led first to what was termed as the Swedish Paradox and somewhat later
adapted by European Commission as The European Paradox. Audretsch et al. (2005) and
Acs et. al (2004) identify activities that involve the commercialization of science and
98
research as the Missing Link in the process of economic growth. In the absence of
scientist commercialization of research, investments in science and research will not
generate an adequate rate of return, in terms of economic growth and job creation.
5.2 How and Where are Scientists Creative?
Why will a scientist choose to combine her scientific creativity with
entrepreneurial creativity? A number of theories and hypotheses have posited why some
scientists choose to commercialize research while others do not, and some compelling
insights have been garnered through previous empirical studies. These include the
scientist life-cycle, which highlights the role of reputation, the knowledge production
function, which highlights the role of scientific human capital and resources, and the
regional and university contexts, which highlight the role of geographically bounded
spillovers and institutional incentives.
A large literature has emerged focusing on what has become known as the
appropriability problem. The underlying issue revolves around how firms which invest in
the creation of new knowledge can best appropriate the economic returns from that
knowledge (Arrow, 1962). Audretsch (1995) proposed shifting the unit of observation
away from exogenously assumed firms to individuals – agents with endowments of new
economic knowledge. When the lens is shifted away from the firm to the individual as the
relevant unit of analysis, the appropriability issue remains, but the question becomes;
"How can scientists with a given endowment of new knowledge best appropriate the
returns from that knowledge?" Levin and Stephan (1991) suggest that the answer is, It
99
depends – it depends on both the career trajectory as well as the stage of the life-cycle of
the scientist.
The university or academic career trajectory encourages and rewards the
production of new scientific knowledge. Thus, the goal of the scientist in the university
context is to establish priority. This is done most efficiently through publication in
scientific journals (Audretsch and Stephan, 2000). By contrast, with a career trajectory in
the private sector, scientists are rewarded for the production of new economic knowledge,
or knowledge which has been commercialized in the market, but not necessarily new
scientific knowledge per se. In fact, scientists working in industry are often discouraged
from sharing knowledge externally with the scientific community through publication. As
a result of these differential incentive structures, industrial and academic scientists
develop distinct career trajectories.
The appropriability question confronting academic scientists can be considered in
the context of the model of scientist human capital over the life-cycle. Scientist life-cycle
models suggest that early in their careers scientists invest heavily in human capital in
order to build a scientific reputation (Levin and Stephan, 1991). In the later stages of their
career, the scientist trades or cashes in this reputation for economic return. Thus, early in
her career, the scientist invests in the creation of scientific knowledge in order to
establish a reputation that signals the value of that knowledge to the scientific
community.
With maturity, scientists seek ways to appropriate the economic value of the new
knowledge. Thus, academic scientists may seek to commercialize their scientific research
100
within a life-cycle context. The life-cycle model of the scientist implies that, ceteris
paribus, scientist reputation should play a role in the decision to commercialize
An implication of the knowledge production function formalized by Zvi Griliches
(1978) is that those scientists with a greater research and scientific prowess have the
capacity for generating a greater scientific output. But how does scientific capability
translate into observable characteristics that can promote or impede commercialization
efforts? Because the commercialization of scientific research is particularly risky and
uncertain (Audretsch and Stephan, 2000), a strong scientific reputation, as evidenced
through vigorous publication and formidable citations, provides a greatly valued signal of
scientific credibility and capability to any anticipated commercialized venture or project.
This suggests a hypothesis linking measures of the quality of the scientist, or her
scientific reputation as measured by citations and publications, to commercialization.
Scientist location can influence the decision to commercialize for two reasons.
First, as Jaffe (1989), Audretsch and Feldman (1996), Jaffe, Trajtenberg and Henderson
(1993), and Glaeser, Kallal, Sheinkman and Shleifer (2002) show, knowledge tends to
spill over within geographically bounded regions. This implies that scientists working in
regions with a high level of investments in new knowledge can more easily access and
generate new scientific ideas. This suggests that scientists working in knowledge clusters
should tend to be more productive than their counterparts who are geographically
isolated. As Glaeser, Kallal, Scheinkman and Shleifer (1992, p. 1126) have observed,
“Intellectual breakthroughs must cross hallways and streets more easily than oceans and
continents.”
101
A second component of externalities involves not the technological knowledge,
but rather behavioural knowledge. As Bercoviz and Feldman (2004) show for a study
based on the commercialization activities of scientists at Johns Hopkins and Duke
University, the likelihood of a scientist engaging in commercialization activity, which is
measured as disclosing an invention, is shaped based on the commercialization behaviour
of the doctoral supervisor in the institution where the scientist was trained, as well as the
commercialization behaviour and attitudes exhibited by the chair and peers at the relevant
department.
Thus, the locational and institutional contexts can influence the propensity for
scientists to engage in commercialization activities by providing access to spatially
bounded knowledge spillovers and by shaping the institutional setting and behavioural
norms and attitudes towards commercialization.
5.3 Measurement Issues
The commercialization activity of university scientists was measured by starting
with those scientists awarded a research grant by the National Cancer Institute between
1998 and 2002. Of those research grant awards, the largest twenty percent, which
included 1,693 scientist awardees, were taken to form the database used in this chapter.
The National Cancer Institute (NCI) awarded a total of $5,350,977,742 to the top 1,693
scientists in the United States from 1998 to 2002.
Since the focus of this chapter is on the propensity for scientists to commercialize
their research, commercialization must be operationalized and measured. The most
common measure of commercialization of research is patents. Thus, the propensity for
102
NCI recipient scientists to patent was analyzed by obtaining patent data from the United
States Patent and Trade Office (USPTO). The patent database spans 1975 to 2004. The
inventor patent data included identification of the patent number of the invention, the
name and address of the inventor, and the inventor sequence number.
Figure 1 shows that the geographic distribution of patentees varied both across
regions as well as by gender. In some regions, such as New York, Mid-Atlantic, the
North West and Texas, the propensity for females to patent exceeded that of their male
colleagues. By contrast, in other regions, such as California, New England and the Great
Lakes, male scientists exceeded a greater propensity to patent.
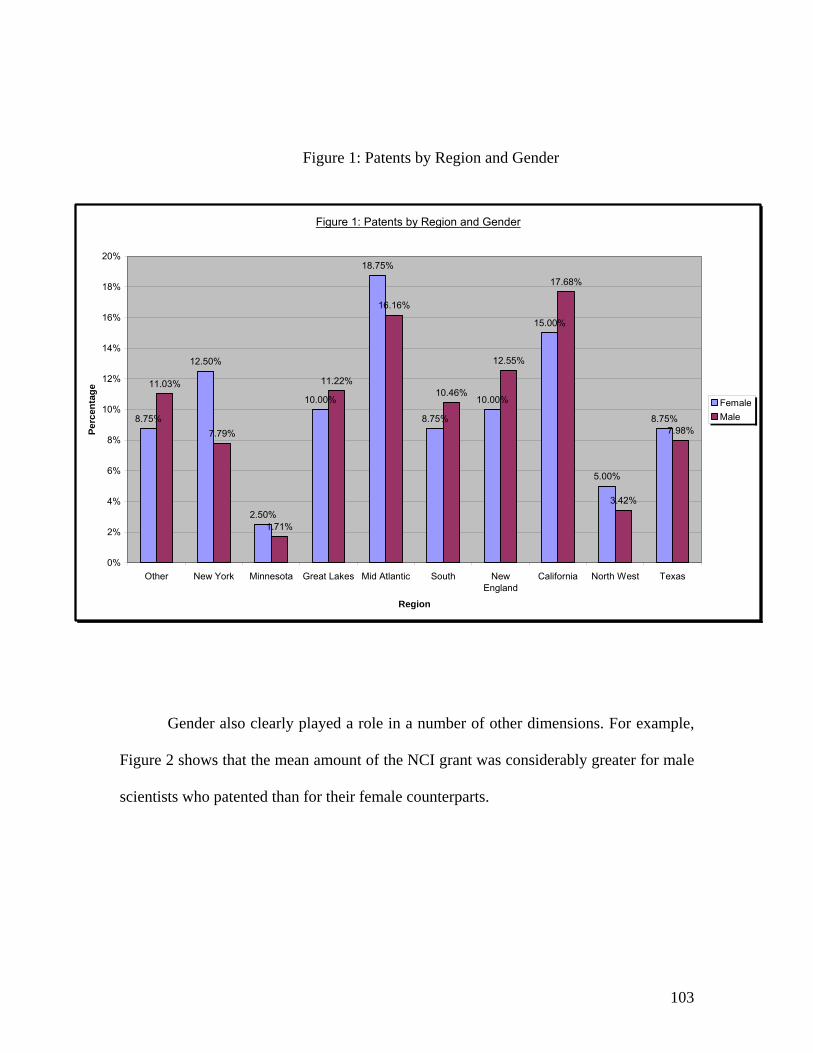
103
Figure 1: Patents by Region and Gender
Figure 1: Patents by Region and Gender
8.75%
12.50%
2.50%
10.00%
18.75%
8.75%
10.00%
15.00%
5.00%
8.75%
11.03%
7.79%
1.71%
11.22%
16.16%
10.46%
12.55%
17.68%
3.42%
7.98%
0%
2%
4%
6%
8%
10%
12%
14%
16%
18%
20%
Other New York Minnesota Great Lakes Mid Atlantic South NewEngland
California North West Texas
Region
Perc
enta
ge
FemaleMale
Gender also clearly played a role in a number of other dimensions. For example,
Figure 2 shows that the mean amount of the NCI grant was considerably greater for male
scientists who patented than for their female counterparts.
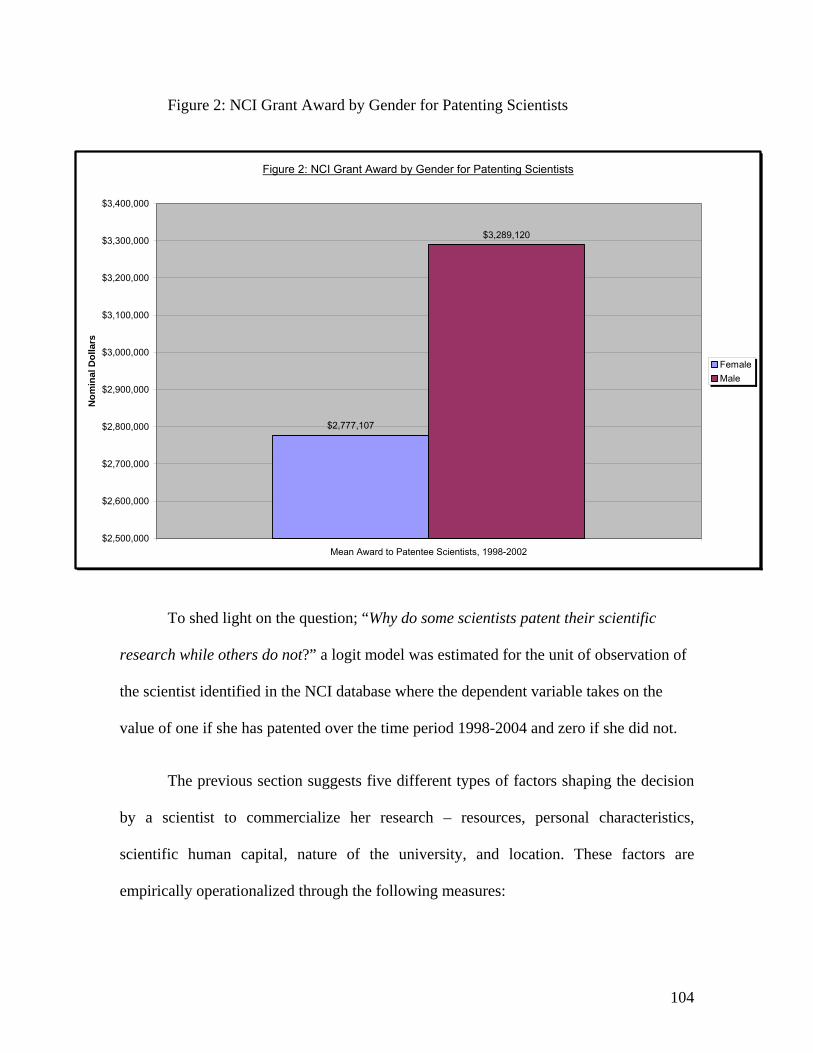
104
Figure 2: NCI Grant Award by Gender for Patenting Scientists
Figure 2: NCI Grant Award by Gender for Patenting Scientists
$2,777,107
$3,289,120
$2,500,000
$2,600,000
$2,700,000
$2,800,000
$2,900,000
$3,000,000
$3,100,000
$3,200,000
$3,300,000
$3,400,000
Mean Award to Patentee Scientists, 1998-2002
Nom
inal
Dol
lars
FemaleMale
To shed light on the question; “Why do some scientists patent their scientific
research while others do not?” a logit model was estimated for the unit of observation of
the scientist identified in the NCI database where the dependent variable takes on the
value of one if she has patented over the time period 1998-2004 and zero if she did not.
The previous section suggests five different types of factors shaping the decision
by a scientist to commercialize her research – resources, personal characteristics,
scientific human capital, nature of the university, and location. These factors are
empirically operationalized through the following measures:
105
Award Amount – This variable is the mean total NCI awarded to the scientist between
1998 and 2002. The award amount was obtained from the original NCI award excel
sheet. If external funding of scientific research is conducive to commercialization, a
positive coefficient of the Award Amount would be expected.
Male –This is a dummy variable assigned the value of one for males (1,310) of the
overall 1,693 included in the NCI database. The gender of each scientist was obtained by
“Googling” their names. The estimated coefficient will reflect whether the gender of the
scientist influences the propensity to commercialize research.
Location --Ten different locational dummy variables were created taking on the value of
one for Texas, California, New York, Minnesota, Great Lakes (Ohio, Indiana, Illinois,
Michigan and Wisconsin), North West (Oregon and Washington), New England (Maine,
Vermont, New Hampshire, Connecticut, Rhode Island and Massachusetts), South Atlantic
(Virginia, North Carolina, South Carolina, Georgia and Florida), Mid Atlantic
(Washington DC, Maryland, Pennsylvania), and Other (Arizona, Alabama, New Mexico,
Colorado, Nebraska, Hawaii and Iowa.) Those regions which tend to have greater
investments in research and science, and also have developed a culture more encouraging
university and scientist commercialization, such as California and New England, might
be expected to have a positive coefficient.
University Type
Ivy League – A dummy variable was created taking on the value of one for all scientists
employed at Brown University, Cornell University, Columbia University, Dartmouth
106
College, Harvard University, Princeton University, the University of Pennsylvania and
Yale University.
Public Universities – A dummy variable was created taking on the value of one for
scientists employed at public universities and zero otherwise. Because they are at least
partially financed by the public, state universities tend to have a stronger mandate for
outreach and commercialization of research. This may suggest a positive coefficient.
Carnegie Classifications – The Carnegie Classification of Universities (2000 edition)
provides a comprehensive study classifying universities by types of degree offered. Each
type of institution is defined according to the types and numbers of degrees offered in
different fields. The categories are:
1. Special Medical Institution (graduate only that specializes in medical degrees (i.e.
doctors and nurses)
2. Research Intensive University (grants doctoral degrees in three fields and fewer
than 50 annually)
3. Research Extensive University (grants doctoral degrees in more than three fields
and more degrees than 50 annually)
4. Bachelors and Masters College (grants only BA/BS and masters degrees but no
Ph.D.s)
5. Associate’s College (two year institution)
107
Scientist Human Capital
Citations – A specific computer program was designed to measure the citations of the
1,693 scientists through the “Expanded Science Citation Index.” A higher number of
citations reflex a higher level of human capital and scientific reputation (Audretsch and
Stephan, 2000). A positive coefficient would reflect that the likelihood of
commercialization is greater for more productive scientists.
Publications – A specific computer program was designed to measure the publications of
the scientist, which should also reflect the level of human capital and scientific reputation
(Audretsch and Stephan, 2000).
Star Scientist – A scientist is classified as being a star if she is in the top ten percent of
publications. A dummy variable was created taking on the value of one for those
scientists with a star classification and zero otherwise. Star scientists may be able to
attract resources for commercialization, suggesting a positive coefficient (Audretsch and
Stephan, 1996).
The results from estimating the logit model using the patent measure for scientist
commercialization are provided in Table 1.
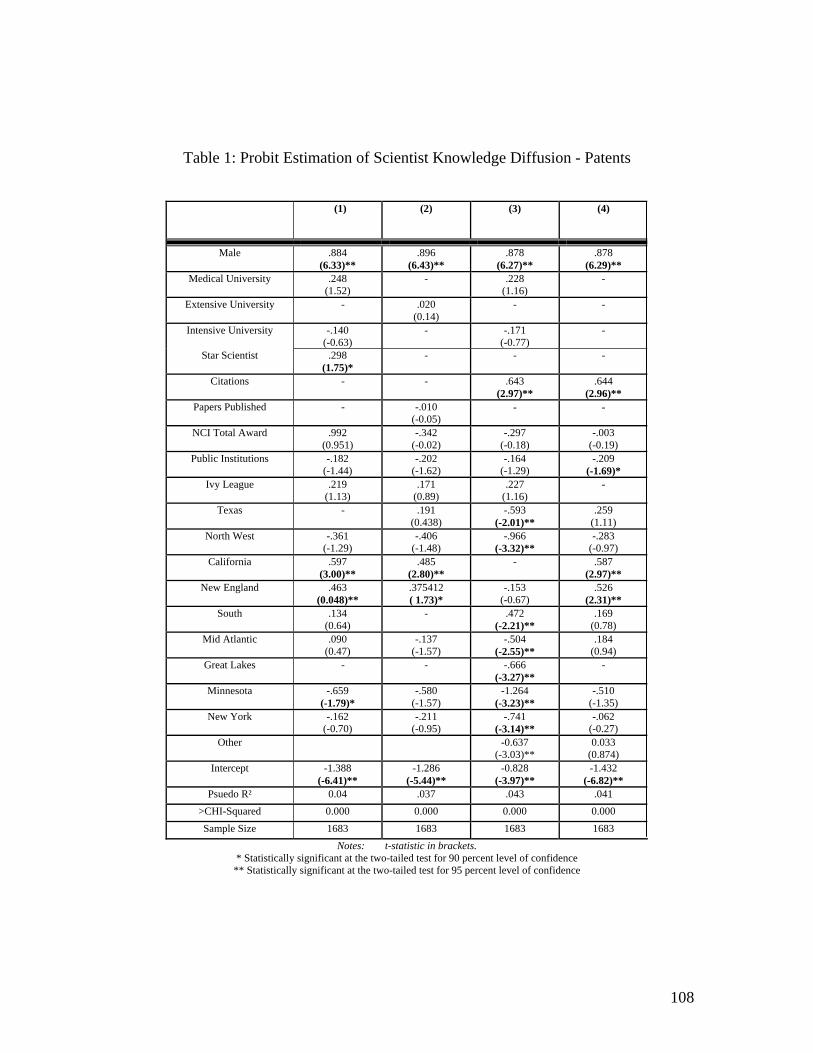
108
Table 1: Probit Estimation of Scientist Knowledge Diffusion - Patents
(1) (2) (3) (4)
Male .884 (6.33)**
.896 (6.43)**
.878 (6.27)**
.878 (6.29)**
Medical University .248 (1.52)
- .228 (1.16)
-
Extensive University - .020 (0.14)
- -
Intensive University -.140 (-0.63)
- -.171 (-0.77)
-
Star Scientist .298 (1.75)*
- - -
Citations - - .643 (2.97)**
.644 (2.96)**
Papers Published - -.010 (-0.05)
- -
NCI Total Award .992 (0.951)
-.342 (-0.02)
-.297 (-0.18)
-.003 (-0.19)
Public Institutions -.182 (-1.44)
-.202 (-1.62)
-.164 (-1.29)
-.209 (-1.69)*
Ivy League .219 (1.13)
.171 (0.89)
.227 (1.16)
-
Texas - .191 (0.438)
-.593 (-2.01)**
.259 (1.11)
North West -.361 (-1.29)
-.406 (-1.48)
-.966 (-3.32)**
-.283 (-0.97)
California .597 (3.00)**
.485 (2.80)**
- .587 (2.97)**
New England .463 (0.048)**
.375412 ( 1.73)*
-.153 (-0.67)
.526 (2.31)**
South .134 (0.64)
- .472 (-2.21)**
.169 (0.78)
Mid Atlantic .090 (0.47)
-.137 (-1.57)
-.504 (-2.55)**
.184 (0.94)
Great Lakes - - -.666 (-3.27)**
-
Minnesota -.659 (-1.79)*
-.580 (-1.57)
-1.264 (-3.23)**
-.510 (-1.35)
New York -.162 (-0.70)
-.211 (-0.95)
-.741 (-3.14)**
-.062 (-0.27)
Other -0.637 (-3.03)**
0.033 (0.874)
Intercept -1.388 (-6.41)**
-1.286 (-5.44)**
-0.828 (-3.97)**
-1.432 (-6.82)**
Psuedo R² 0.04 .037 .043 .041 >CHI-Squared 0.000 0.000 0.000 0.000 Sample Size 1683 1683 1683 1683
Notes: t-statistic in brackets. * Statistically significant at the two-tailed test for 90 percent level of confidence
** Statistically significant at the two-tailed test for 95 percent level of confidence
109
The various measures of scientist human capital, or scientist quality, are highly
correlated and therefore including them in the same estimated model may result in
multicollinearity. Thus, the first column presents results when the measure of star
scientist is used, while the second column includes the measure of publications, and the
third and fourth column citations. As the positive and statistically significant coefficient
of start scientist suggests, those scientists with a prolific publication record tend to have a
higher propensity to commercialize research through patents. Similarly, those scientists
with greater citations also have a greater likelihood of filing for a patent.
There is also considerable statistical evidence suggesting that the gender of a
scientist influences the likelihood of commercialization in the form of patents. In
particular, being a male will elevate the propensity for a scientist to patent. The evidence
concerning the impact on university type on the patenting activities of scientists is weaker
and more ambiguous. There is at least some evidence suggesting that being employed in
a public university may actually reduce the likelihood of a scientist patenting. Finally, the
region in which the scientist is located apparently influences her propensity to patent. In
particular, those scientists located in California and New England exhibit a greater
likelihood of patenting, even after controlling for the other main factors, such as scientist
quality and gender.
5.4 Conclusions
Globalization has triggered a shift in the comparative advantage of leading
developed countries away from the factor of capital and towards knowledge. For the
factor of knowledge to be effective in generating employment, economic growth
and international competitiveness, it must spill over to become commercialized. As
Acs et al. (2003) and Audretsch et al. (2006) emphasize, such knowledge spillovers
are not automatic and cannot be assumed to exist. Thus, in terms of Richard
Florida’s insights about creativity, investments in scientific creativity need to be
combined with commercial creativity to facilitate the spillover of such knowledge
that can ultimately contribute to economic growth. Such scientific creativity can be
combined with commercial creativity by scientists who choose to commercialize
their research.
This chapter has identified why some scientists choose to combine scientific
and commercial creativity while others do not. In particular, the human capital and
reputation of the scientist play an important, as does the context, in terms of
location and particular type of institution where the scientist is employed. The
evidence suggests that it is those scientists with the greatest amount of knowledge
who have a higher propensity to commercialize their research. However, such
scientist commercialization is conditioned by both the type of university as well as
the region
111
Chapter 6: Radical Innovation: Literature Review and Development of
an Indicator
6.1 Introduction
Since the early days of Joseph Schumpeter in the 1920s, the concept of
radical innovation in economic theory has been a driving force for economic
growth. Yet the term offers an abundance of concepts and definitions that can be
difficult for policy-makers and scholars hoping to identify ex ante radical
innovations to expedite and facilitate growth. Building a universal and compelling
concept and methodology to identify radical innovation remains elusive and
problematic for scholars for several reasons. First, terminology of the definition has
varied from really new to breakthrough, discontinuous, generational and, finally,
radical innovation. The differing etymology is, in part, due to the differing fields of
research involved in the study of radical innovation. The differing terms each carry
the spirit of what radical innovation creates, yet they are unable to provide a
unifying foundation for distinguishing radical innovation.
The second problem relates to the difficulty associated with quantifying or
recognizing what actually constitutes a radical innovation ex ante, (the famous “I
know it when I see it issue.”) Traditionally, policy-makers and scholars have been
unable to identify nascent radical innovations ex ante. Given the difficulty of
identifying innovations ex ante, how can one aggregate radical innovations’
contribution to economic growth for a region or country? For this reason, most
112
scholars have left the definition abstract and instead have focused their research on
the concept and the ex post impact of singular fields of radical innovative activity.
This chapter will define innovation and provide a brief description of and
distinction between radical innovation and incremental innovative activity. It then
applies the Dahlin and Behrens (2005) heterogeneous classifications of radical
innovations found in the literature. The classifications identify the different forms
of radical innovation that are found in the literature. Finally, the chapter offers
conclusions and suggestions to identify radical innovations ex ante in a uniform
manner.
6.2 Origins of Radical Innovation
The concept of innovation, at least implicitly, dates back at least to Joseph
Schumpeter’s seminal 1934 treatise, The Theory of Economic Development; and
Inquiry into Profits, Capital, Credit, Interest and the Business Cycle. His term, the
“process of creative destruction,” conceptually and literally began a radical
revolution in economic theory and commercial orientation. The process, as
Schumpeter argued, was one where large firms were destroyed by the entrepreneur
who seizes commercial opportunities from inventors. Entrepreneurs enter the
market with such commercial competitive advantages, due to their potential
innovations, that they not only compete but “destroy” incumbent firms and their
respective economies of scale due to the entrepreneur’s superior innovation.
Schumpeter’s work on creative destruction created the foundation for innovation.
113
As McCraw (2007) points out, at the centre of Schumpeter’s intellectual
contribution was a focus on innovation. Schumpeter, more than any of the great
economists before him, viewed innovation as the driving force of progress and
development. But Schumpeter also emphasized that innovation, and therefore
economic progress, comes at a price ― creative destruction. Just as the factory
wiped out the blacksmith shop and the car superseded the horse and buggy,
incumbents will be displaced by innovating entrepreneurs. As McCraw (2007, p. 6)
concludes about Schumpeter, “He knew that creative destruction fosters economic
growth but also that it undercuts cherished human values. He saw that poverty
brings misery but also that prosperity cannot assure peace of mind.”
Schumpeter did not distinguish explicitly between radical innovation and
other types of innovative activity, however. While one may infer that Schumpeter’s
creative destruction replaces old technologies and expands new commercial
opportunities, the concept of radical innovation must refer to a much more specific
type of innovation that is traditionally identified in ex post analysis.
Along with Schumpeter, many other scholars applied ex post identification
of radical innovations for their empirical investigation. This method, however,
creates several problems for both scholars as well as policy-makers. As will be
discussed below, ex post identification causes two problems. Firstly, in a practical
sense, one would ideally wish to identify an emerging radical innovation at an early
stage in order to expedite commercial entry into the market. Secondly, and more
importantly, studies based on ex post analysis have inherent methodological
problems. According to Dahlin and Behrens (2005, p. 718), “basing identification
114
of radical inventions on market success by only including innovations in a study,
for instance, ignoring inventions that never reach the market, creates a selection
bias; indeed, technologies might be radical in a technological sense without having
significant market impact, since the market impact of a technology is affected by
many non-technological conditions.”
6.2.1 Firm Size and Radical Innovations
In order to understand where radical innovations originate, we will first
offer a brief summary of radical innovations to better understand how
heterogeneous the sources of radical innovations are.
Small Firm Entrepreneurship
As illustrated in Table 1, radical innovations delivered by small firm
entrepreneurs up until 1995 are substantial. Since 1995, many new drivers of
economic growth have emerged; for example, information technology (e.g.
Microsoft, Dell, Skype and eBay) and renewable resource technology (hybrid
motor, wind technology) have been placed on the impressive list. While there is no
empirical investigation of how the radical technologies were developed, one can ex
post immediately appreciate their value-added to economies.
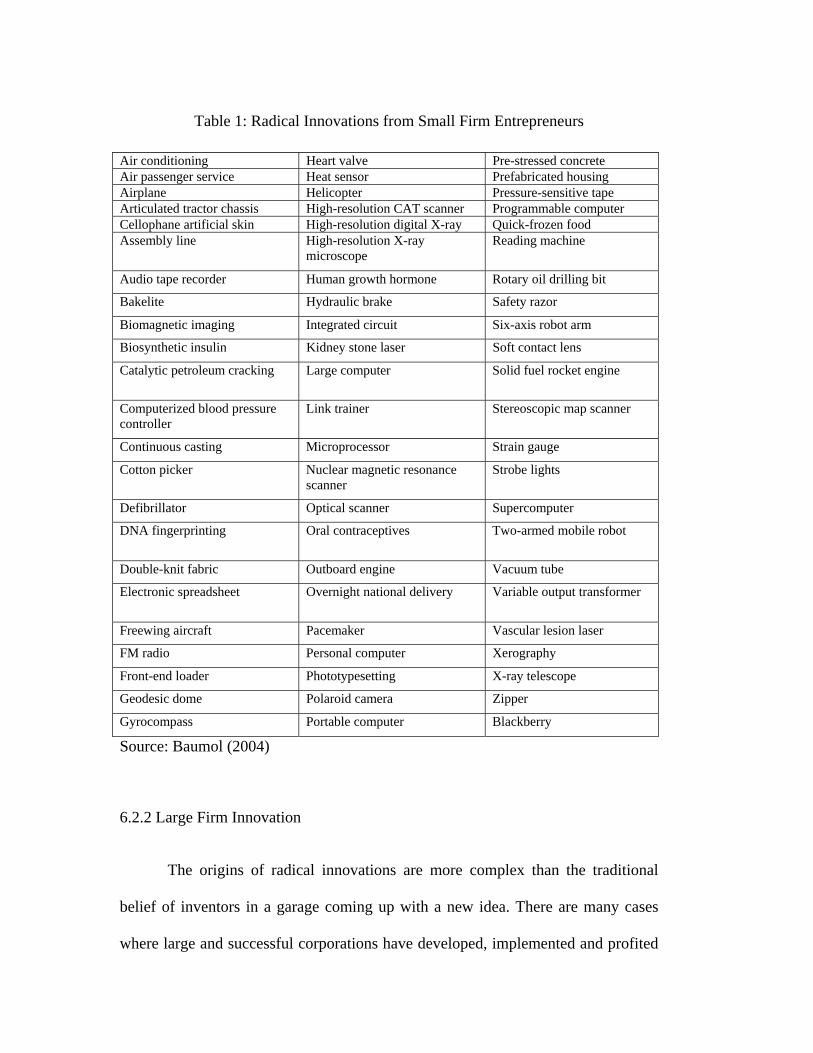
Table 1: Radical Innovations from Small Firm Entrepreneurs
Air conditioning Heart valve Pre-stressed concrete Air passenger service Heat sensor Prefabricated housing Airplane Helicopter Pressure-sensitive tape Articulated tractor chassis High-resolution CAT scanner Programmable computer Cellophane artificial skin High-resolution digital X-ray Quick-frozen food Assembly line High-resolution X-ray
microscope Reading machine
Audio tape recorder Human growth hormone Rotary oil drilling bit
Bakelite Hydraulic brake Safety razor
Biomagnetic imaging Integrated circuit Six-axis robot arm
Biosynthetic insulin Kidney stone laser Soft contact lens
Catalytic petroleum cracking Large computer Solid fuel rocket engine
Computerized blood pressure controller
Link trainer Stereoscopic map scanner
Continuous casting Microprocessor Strain gauge
Cotton picker Nuclear magnetic resonance scanner
Strobe lights
Defibrillator Optical scanner Supercomputer
DNA fingerprinting Oral contraceptives Two-armed mobile robot
Double-knit fabric Outboard engine Vacuum tube
Electronic spreadsheet Overnight national delivery Variable output transformer
Freewing aircraft Pacemaker Vascular lesion laser
FM radio Personal computer Xerography
Front-end loader Phototypesetting X-ray telescope
Geodesic dome Polaroid camera Zipper
Gyrocompass Portable computer Blackberry
Source: Baumol (2004)
6.2.2 Large Firm Innovation
The origins of radical innovations are more complex than the traditional
belief of inventors in a garage coming up with a new idea. There are many cases
where large and successful corporations have developed, implemented and profited
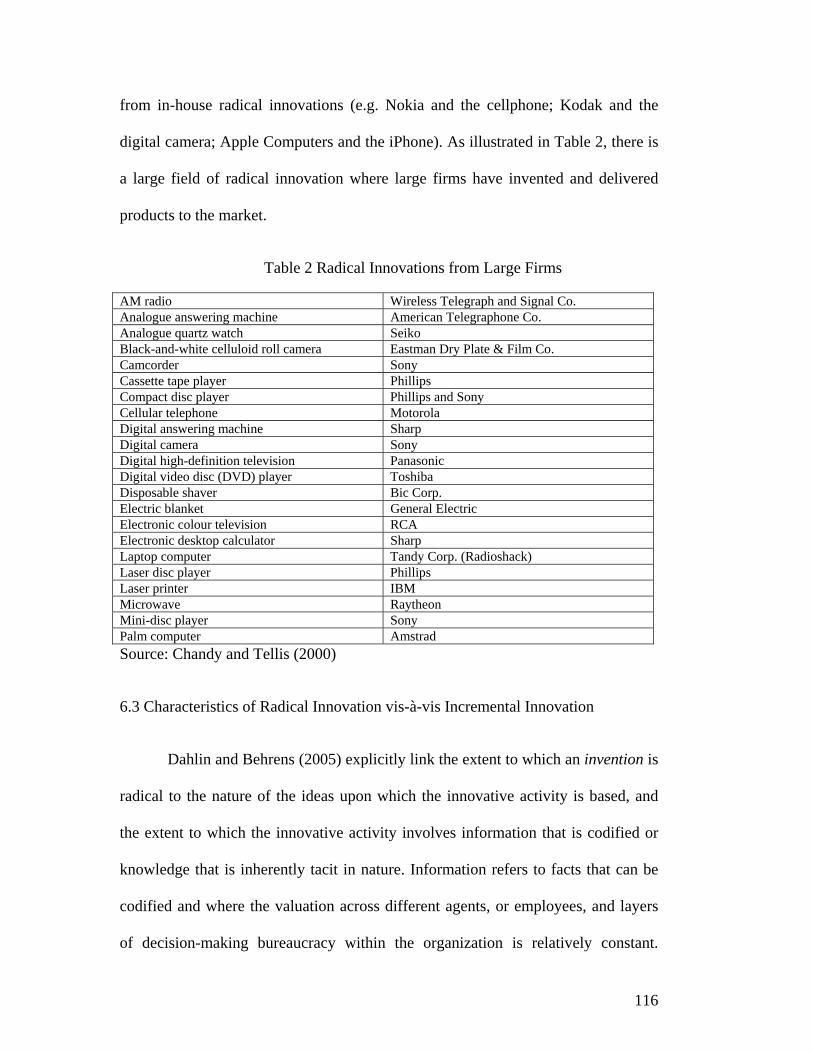
116
from in-house radical innovations (e.g. Nokia and the cellphone; Kodak and the
digital camera; Apple Computers and the iPhone). As illustrated in Table 2, there is
a large field of radical innovation where large firms have invented and delivered
products to the market.
Table 2 Radical Innovations from Large Firms
AM radio Wireless Telegraph and Signal Co. Analogue answering machine American Telegraphone Co. Analogue quartz watch Seiko Black-and-white celluloid roll camera Eastman Dry Plate & Film Co. Camcorder Sony Cassette tape player Phillips Compact disc player Phillips and Sony Cellular telephone Motorola Digital answering machine Sharp Digital camera Sony Digital high-definition television Panasonic Digital video disc (DVD) player Toshiba Disposable shaver Bic Corp. Electric blanket General Electric Electronic colour television RCA Electronic desktop calculator Sharp Laptop computer Tandy Corp. (Radioshack) Laser disc player Phillips Laser printer IBM Microwave Raytheon Mini-disc player Sony Palm computer Amstrad Source: Chandy and Tellis (2000)
6.3 Characteristics of Radical Innovation vis-à-vis Incremental Innovation
Dahlin and Behrens (2005) explicitly link the extent to which an invention is
radical to the nature of the ideas upon which the innovative activity is based, and
the extent to which the innovative activity involves information that is codified or
knowledge that is inherently tacit in nature. Information refers to facts that can be
codified and where the valuation across different agents, or employees, and layers
of decision-making bureaucracy within the organization is relatively constant.
117
Innovative activity based on economic information tends to be incremental in nature
in that it generally involves an organizational consensus about the potential value
and impact of the innovation. Thus, incremental innovation tends to support and
enhance the status quo organization.
By contrast, radical innovation is based on knowledge involving tacit ideas
that not only defy codification, but also whose economic value remains highly
uncertain and asymmetric and tends to generate radical innovations. The expected
value of any new idea is highly uncertain, and has a much greater variance than
would be associated with innovative activity based on information. When it comes
to radical innovation, there is uncertainty about whether the new producer service
can be produced, how it can be produced, and whether sufficient demand for that
visualized new product or service might actually materialize (Arrow, 1962).
In addition, new ideas constituting tacit knowledge are typically associated
with considerable asymmetries. For example, in order to evaluate a proposed new
idea concerning a new biotechnology product, the decision maker might not only
need to have a PhD in biotechnology, but also a specialization in the exact scientific
area. Differences in education, background and experience can result in divergence
in the expected value of a new project or variance in the outcomes anticipated from
pursuing that new idea, both of which can lead to divergence in recognition and
evaluation of opportunities between economic agents and decision-making
hierarchies. Such divergence in the valuation of new ideas will become even greater
if the new idea is not consistent with the core competence and technological
118
direction of the incumbent firm. Thus, radical innovation tends to be disruptive to
the status quo organization and strategy of the firm.
In fact, what actually constitutes a radical innovation and distinguishes it
from an incremental innovation may depend upon the question being asked and the
perspective in which innovative activity is being considered. Table 3 presents a
broad spectrum of perspectives on what distinguishes a radical innovation from an
incremental innovation. For example, in terms of the time frame, the impacts of
incremental innovations tend to be realized over a shorter time period than those of
radical innovations. Similarly, the source and process of idea generation and
opportunity recognition varies between incremental and radical innovations.
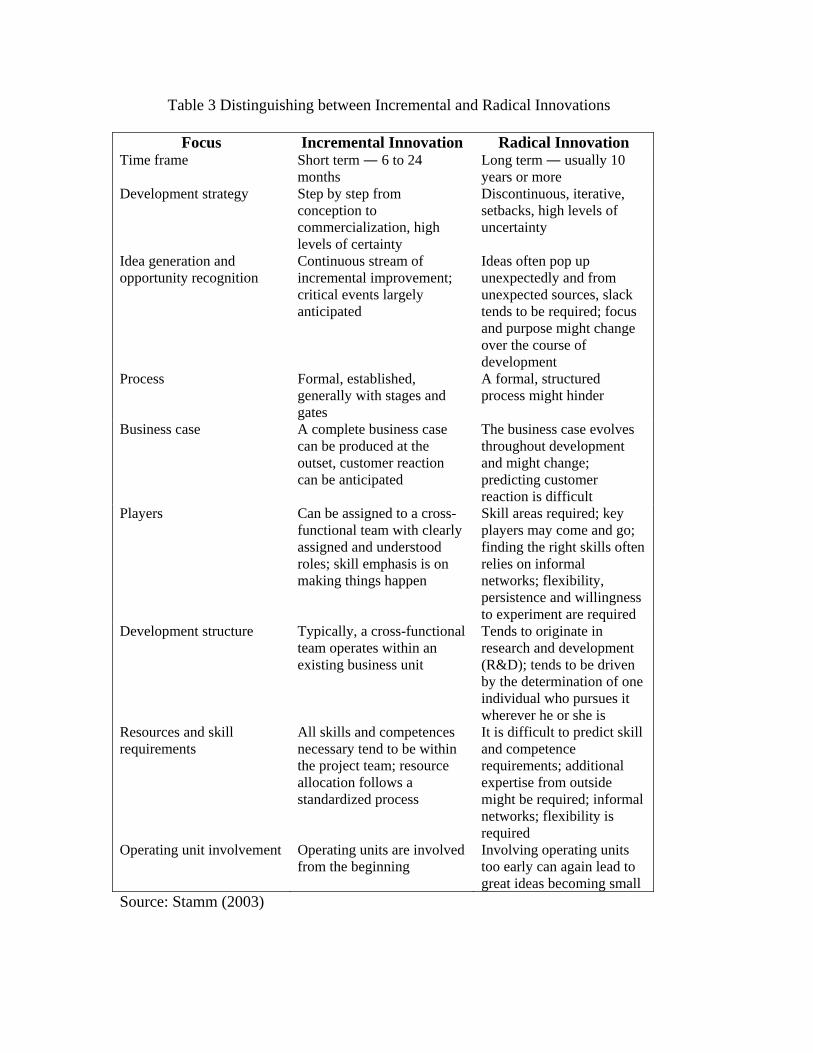
Table 3 Distinguishing between Incremental and Radical Innovations
Focus Incremental Innovation Radical Innovation Time frame Short term ― 6 to 24
months Long term ― usually 10 years or more
Development strategy Step by step from conception to commercialization, high levels of certainty
Discontinuous, iterative, setbacks, high levels of uncertainty
Idea generation and opportunity recognition
Continuous stream of incremental improvement; critical events largely anticipated
Ideas often pop up unexpectedly and from unexpected sources, slack tends to be required; focus and purpose might change over the course of development
Process Formal, established, generally with stages and gates
A formal, structured process might hinder
Business case A complete business case can be produced at the outset, customer reaction can be anticipated
The business case evolves throughout development and might change; predicting customer reaction is difficult
Players Can be assigned to a cross-functional team with clearly assigned and understood roles; skill emphasis is on making things happen
Skill areas required; key players may come and go; finding the right skills often relies on informal networks; flexibility, persistence and willingness to experiment are required
Development structure Typically, a cross-functional team operates within an existing business unit
Tends to originate in research and development (R&D); tends to be driven by the determination of one individual who pursues it wherever he or she is
Resources and skill requirements
All skills and competences necessary tend to be within the project team; resource allocation follows a standardized process
It is difficult to predict skill and competence requirements; additional expertise from outside might be required; informal networks; flexibility is required
Operating unit involvement Operating units are involved from the beginning
Involving operating units too early can again lead to great ideas becoming small
Source: Stamm (2003)
120
6.4 Entrepreneurship, Radical Innovation and the Knowledge Filter
An important and broadly accepted strand of literature suggests that small
and new firms will be at a competitive disadvantage with respect to generating
innovative activity in general and radical innovations in particular. According to
Griliches’ (1979) model of the knowledge production function, innovative activity
is the direct result of investments made by a firm in knowledge inputs, such as
R&D and human capital. Since larger firms generally invest significantly more in
R&D than small and new firms, they would be expected to generate more
innovative activity.
Since radical innovation generates more value than incremental innovation,
some scholars have assumed, and even developed elaborate theoretical models to
explain why, large firms, which have large R&D departments, will generate more
radical innovations than small and new firms, which are constrained by size in their
ability to invest in R&D (Cohen and Klepper, 1992a, b).
Five factors favouring the innovative advantage of large enterprises have
been identified in the literature. First is the argument that innovative activity
requires a high fixed cost. As Comanor (1967) observes, R&D typically involves a
“lumpy” process that yields scale economies. Similarly, Galbraith (1956, p. 87)
argues, “Because development is costly, it follows that it can be carried on only by
a firm that has the resources which are associated with considerable size.”
121
Second, only firms that are large enough to attain at least temporary market
power will choose innovation as a means for maximization (Kamien and Schwartz,
1975). This is because the ability of firms to appropriate the economic returns
accruing from R&D and other knowledge-generating investments is directly related
to the extent of that enterprise’s market power (Levin et al., 1985, 1987; Cohen et
al., 1987; Cohen and Klepper, 1991).
Third, R&D is a risky investment; small firms engaging in R&D make
themselves vulnerable by investing a large proportion of their resources in a single
project. However, their larger counterparts can reduce the risk accompanying
innovation through diversification into simultaneous research projects. The larger
firm is also more likely to find an economic application for the uncertain outcomes
resulting from innovative activity (Nelson, 1959).
Fourth, scale economies in production may also provide scope economies
for R&D. Scherer (1991) notes that economies of scale in promotion and
distribution facilitate penetration of new products, enabling larger firms to enjoy
greater profit potential from innovation. Finally, an innovation yielding cost
reductions of a given percentage results in higher profit margins for larger firms
than for smaller firms.
There is also substantial evidence that technological change, or rather one
aspect of technological change, R&D, is, in fact, positively related to firm size. The
abundance of empirical studies relating R&D to firm size is thoroughly reviewed in
122
Acs and Audretsch (2003). The empirical evidence is generally consistent with the
hypothesis that large firms invest in proportionately more R&D.
Using a direct measure of innovative output from the U.S. Small Business
Administration’s innovation data base, Acs and Audretsch (1990) and Pavitt et al.
(1987), in a similar study for the U.K., show that the most innovative U.S. firms are
large corporations. Furthermore, the most innovative American corporations also
tend to have large R&D laboratories and be R&D intensive. At first glance, these
findings, based on direct measures of innovative activity, seem to confirm the
conventional wisdom. However, in the most innovative four-digit standard
industrial classification (SIC) industries, large firms, defined as enterprises with at
least 500 employees, contributed more innovations in some instances, while in other
industries small firms produced more innovations. For example, in the area of
computers and process control instruments, small firms contributed the bulk of
innovations. By contrast, in the area of pharmaceutical preparation and aircraft
industries, large firms were much more innovative.
Probably the best measure of innovative activity is the total innovation rate,
which is defined as the total number of innovations per thousand employees in each
industry. The innovation rate for large firms is defined as the number of innovations
made by firms with at least 500 employees divided by the number of employees
(thousands) in large firms. Similarly, the innovation rate for small firms is defined
as the number of innovations made by firms with fewer than 500 employees divided
by the number of employees (thousands) in small firms.
123
Innovation rates, or the number of innovations per thousand employees,
have the advantage that they measure innovative activity in large and small firms
relative to the presence of large and small firms in any given industry. Thus, for
example, while large firms in manufacturing introduced 2445 innovations and small
firms contributed slightly fewer (1954), employment in small firms was only half
that in large firms, yielding an average innovation rate in manufacturing of 0.309
for small firms compared with an average innovation rate of 0.202 for large firms
(Acs and Audretsch, 1988, 1990).
What explains this innovation paradox, where small and new firms are
empirically found to generate more innovative activity than would be expected
given their meagre R&D resources? Resolution of this paradox lies again in
considering both the nature of knowledge within the context of the organizations
creating that knowledge and the role of entrepreneurship, or what Audretsch et al.
(2006) term the knowledge spillover theory of entrepreneurship.
Because of the conditions inherent in radical innovation based on knowledge
― high uncertainty, asymmetries and transactions cost ― decision-making
hierarchies can reach the decision not to commercialize new ideas that individual
economic agents, or groups of economic agents, think are potentially valuable and
should be pursued. The characteristics of knowledge that distinguish it from
information ― a high degree of uncertainty combined with non-trivial asymmetries,
combined with a broad spectrum of institutions, rules and regulations ― distinguish
radical innovation from incremental innovation.
124
Thus, not all potential innovative activity, especially radical innovations
created through scientific discoveries and inventions, is fully appropriated within
the firm making investments to create that knowledge in the first place. Various
constraints on the ability of a large firm to determine the value of knowledge
prevent it from fully exploiting the inherent value of its knowledge assets (Moran
and Ghoshal, 1999). In fact, evidence suggests that many large, established
companies find it difficult to take advantage of all the opportunities emanating from
their investment in scientific knowledge (Christensen and Overdorf, 2000). For
example, Xerox’s Palo Alto research centre succeeded in generating a large number
of scientific breakthroughs (a superior personal computer, the facsimile machine,
the Ethernet and the laser printer, among others), yet failed to commercialize many
of them and develop them into innovations (Smith and Alexander, 1988;
Chesbrough and Rosenbloom, 2002).
The knowledge conditions inherent in radical innovation impose what
Audretsch et al. (2006) and Acs et al. (2004) term the knowledge filter. The
knowledge filter is the gap between knowledge that has potential commercial value
and knowledge that is actually commercialized in the form of innovative activity.
The greater the knowledge filter, the more pronounced the gap between new
knowledge and commercialized knowledge in the form of innovative activity.
An example of the knowledge filter confronting a large firm is provided by
the response of IBM to Bill Gates, who approached IBM to see if it was interested
in purchasing the then struggling Microsoft. They weren’t interested. IBM turned
down, “the chance to buy ten percent of Microsoft for a song in 1986, a missed
125
opportunity that would cost $3 billion today.”21 IBM reached its decision on the
grounds that “neither Gates nor any of his band of thirty some employees had
anything approaching the credentials or personal characteristics required to work at
IBM.”22
Thus, the knowledge filter serves as a barrier impeding investments in new
knowledge from being pursued and developed to generate innovative activity. In
some cases, a firm will decide against developing and commercializing new ideas
emanating from its knowledge investments even if an employee, or group of
employees, think they have a positive expected value. As explained above, this
divergence arises because of the inherent conditions of uncertainty, asymmetries
and high transactions costs which create the knowledge filter.
While Griliches’ model of the knowledge production function focuses on the
decision-making context of the firm concerning investments in new knowledge,
Audretsch (1995) proposed shifting the unit of analysis from the firm to the
individual knowledge worker (or group of knowledge workers). This shifted the
fundamental decision-making unit of observation in the model of the knowledge
production function away from exogenously assumed firms to individuals, such as
scientists, engineers or other knowledge workers ― agents with endowments of
new economic knowledge. Shifting the focus away from the firm to the individual
as the relevant unit of observation also shifts the appropriation problem to the
individual, so that the relevant question becomes how economic agents with a given
21 “System Error,” The Economist, September 18, 1993, p. 99. 22 Paul Carrol, “Die Offene Schlacht,” Die Zeit, No. 39, September 1993, p.18.
126
endowment of new knowledge can best appropriate the returns from that
knowledge. If an employee can pursue a new idea within the context of the
organizational structure of the incumbent firm, there is no reason to leave the firm.
If, on the other hand, employees place greater value on their ideas than the decision-
making hierarchy of the incumbent firm, they may face forgoing what has been
determined to be a good idea. Such divergences in the valuation of new ideas force
workers to choose between forgoing ideas or starting a new firm to appropriate the
value of their knowledge.
By focusing on the decision-making context confronting the individual, the
knowledge production function is actually reversed. Knowledge becomes
exogenous and embodied in a worker. The firm is created endogenously in the
workers’ efforts to appropriate the value of their knowledge through innovative
activity. Typically, an employee in an incumbent large corporation, often a scientist
or engineer working in a research laboratory, will have an idea for an invention and
ultimately for an innovation. Accompanying this potential innovation is an expected
net return from the new product. The inventor would expect compensation for the
potential innovation accordingly. If the company has a different, presumably lower,
valuation of the potential innovation, it may decide either not to pursue its
development or that it merits a lower level of compensation than that expected by
the employee.
In either case, employees will weigh the alternative of starting their own
firm. If the gap in the expected return accruing from the potential innovation
between the inventor and the corporate decision maker is sufficiently large, and if
127
the cost of starting a new firm is sufficiently low, the employee may decide to leave
the large corporation and establish a new enterprise. Since the knowledge was
generated in the established corporation, the new start-up is considered to be a
spinoff from the existing firm. Such start-ups typically do not have direct access to
a large R&D laboratory. Rather, the entrepreneurial opportunity emanates from the
knowledge and experience accrued from the R&D laboratories of the previous
employer. Thus, entrepreneurship is an endogenous response to opportunities
created by investments in new knowledge that are not commercialized because of
the knowledge filter. By resorting to starting up a new firm to actualize the
commercialization of ideas that otherwise might remain dormant in the incumbent
firm, entrepreneurship serves as a conduit for knowledge spillovers.
Knowledge created in one organizational context that remains
uncommercialized due to the knowledge filter provides an important source of new
entrepreneurial opportunities. It is new knowledge and ideas created in one context
but left uncommercialized or not vigorously pursued by the organization actually
creating those ideas, such as a research laboratory in a large corporation or research
undertaken by a university, that serves as the source of knowledge generating
entrepreneurial opportunities. Thus, entrepreneurship can serve as an important
mechanism facilitating the spillover of knowledge. The incumbent organization
creating the knowledge and opportunities is not the same firm that actually exploits
the opportunities. If the exploitation of those opportunities by the entrepreneur does
not involve full payment to the firm for producing those opportunities, such as a
128
licence or royalty, then the entrepreneurial act of starting a new firm serves as a
mechanism for knowledge spillovers.
Thus, new knowledge generating opportunities for entrepreneurship is the
duality of the knowledge filter. The higher the knowledge filter, the greater the
divergence in the valuation of new ideas between economic agents and the
decision-making hierarchies of incumbent firms. Entrepreneurial opportunities are
generated not just by investments in new knowledge and ideas, but by the
propensity for only a distinct subset of those knowledge opportunities to be fully
pursued and commercialized by incumbent firms. Thus, entrepreneurship is
important in generating innovative activity in general and radical innovations in
particular by serving as an important conduit of knowledge spillovers.
6.5 Measuring and Defining Radical Innovation
6.4.1 Expert Panels
There is a long tradition of relying on industry experts to identify innovative
activity. The first serious attempt to directly measure innovative output was made
by a panel of industry experts assembled by the Gellman Research Associates
(1976) for the National Science Foundation. The Gellman panel identified 500
major innovations that were introduced into the market between 1953 and 1973 in
the United States, the United Kingdom, Japan, West Germany, France and Canada.
The database was compiled by an international panel of experts who identified
those innovations representing the “most significant new industrial products and
129
processes, in terms of their technological importance and economic and social
impact” (National Science Board, 1975, p. 100).
A second and comparable database once again involved an expert panel
assembled by the Gellman Research Associates (1982), this time for the U.S. Small
Business Administration. In their second study, the Gellman panel identified 635
U.S. innovations, including 45 from the earlier study for the National Science
Foundation. The remaining 590 innovations were selected from 14 industry trade
journals for the period 1970–1979. About 43 percent of the sample was selected
from award-winning innovations described in Industrial Research and Development
magazine.
A third data source to directly measure innovation activity was compiled at
the Science Policy Research Unit (SPRU) of the University of Sussex in the United
Kingdom.23 The SPRU data consist of a survey of 4378 innovations that were
identified over a period of 15 years. The survey was compiled by writing to experts
in each industry and requesting them to identify “significant technical innovations
that had been successfully commercialized in the United Kingdom since 1945, and
to name the firm responsible” (Pavitt et al., 1987, p. 299).
Another study conducted by Acs and Audretsch (1990) looked at 4938
innovations and their levels of significance (Table 4): (1) the innovation established
an entirely new category of product, (2) the innovation is the first of its type on the
market in a product category already in existence, (3) the innovation represents a 5 The SPRU innovation data are explained in detail in Pavitt et al. (1987), Townsend et al. (1981), Robson and Townsend (1984) and Rothwell (1989).
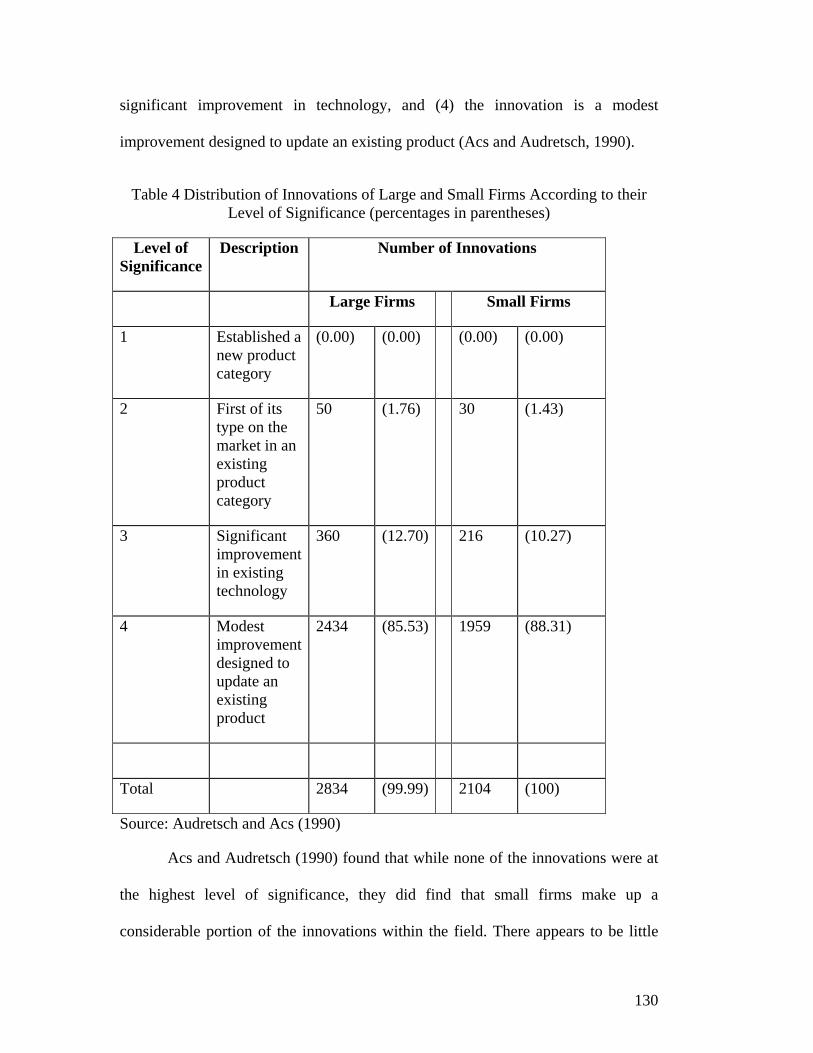
130
significant improvement in technology, and (4) the innovation is a modest
improvement designed to update an existing product (Acs and Audretsch, 1990).
Table 4 Distribution of Innovations of Large and Small Firms According to their Level of Significance (percentages in parentheses)
Level of Significance
Description Number of Innovations
Large Firms Small Firms
1 Established a new product category
(0.00) (0.00) (0.00) (0.00)
2 First of its type on the market in an existing product category
50 (1.76) 30 (1.43)
3 Significant improvement in existing technology
360 (12.70) 216 (10.27)
4 Modest improvement designed to update an existing product
2434 (85.53) 1959 (88.31)
Total 2834 (99.99) 2104 (100)
Source: Audretsch and Acs (1990)
Acs and Audretsch (1990) found that while none of the innovations were at
the highest level of significance, they did find that small firms make up a
considerable portion of the innovations within the field. There appears to be little
131
difference in the “quality” and significance of innovations between large and small
firms.
The most recent and ambitious major database providing a direct measure of
innovative activity is the U.S. Small Business Administration’s Innovation Data
Base (SBIDB). The database consists of 8074 innovations commercially introduced
in the U.S. in 1982. A private firm, The Futures Group, compiled the data and
performed quality-control analyses for the U.S. Small Business Administration by
examining more than 100 technology, engineering and trade journals spanning
every industry in manufacturing. Industry experts were relied upon to identify
innovations as well as their significance. From the sections in each trade journal
listing innovations and new products, a database consisting of innovations by four-
digit standard industrial classification (SIC) industries was established. Many of the
innovations were classified according to four distinct levels of significance, ranging
from incremental, which referred to quality improvement, to most significant,
which presumably referred to a radical innovation.24
Dewar and Dutton similarly relied upon an ex post study of experts to
identify specific radical innovations and suggest that, “the major difference
captured by the labels radical and incremental is the degree of novel technical
process content embodied in the innovation and hence, the degree of new
knowledge embedded in the innovation” (Dewar and Dutton, 1986, p. 1429). This
distinction is consistent with those researchers who define technology in terms of its
6 A detailed description of the U.S. Small Business Administration’s Innovation Data Base can be found in Chapter 2 of Acs and Audretsch (1990).
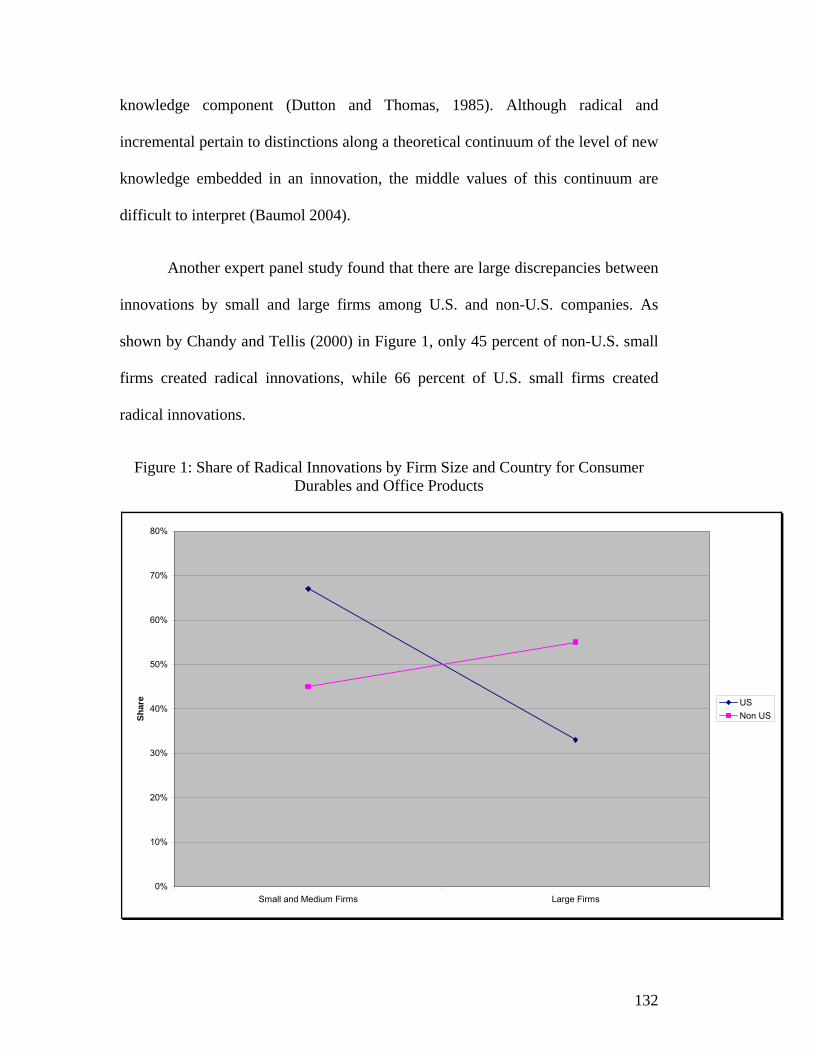
132
knowledge component (Dutton and Thomas, 1985). Although radical and
incremental pertain to distinctions along a theoretical continuum of the level of new
knowledge embedded in an innovation, the middle values of this continuum are
difficult to interpret (Baumol 2004).
Another expert panel study found that there are large discrepancies between
innovations by small and large firms among U.S. and non-U.S. companies. As
shown by Chandy and Tellis (2000) in Figure 1, only 45 percent of non-U.S. small
firms created radical innovations, while 66 percent of U.S. small firms created
radical innovations.
Figure 1: Share of Radical Innovations by Firm Size and Country for Consumer Durables and Office Products
0%
10%
20%
30%
40%
50%
60%
70%
80%
Small and Medium Firms Large Firms
Shar
e USNon US
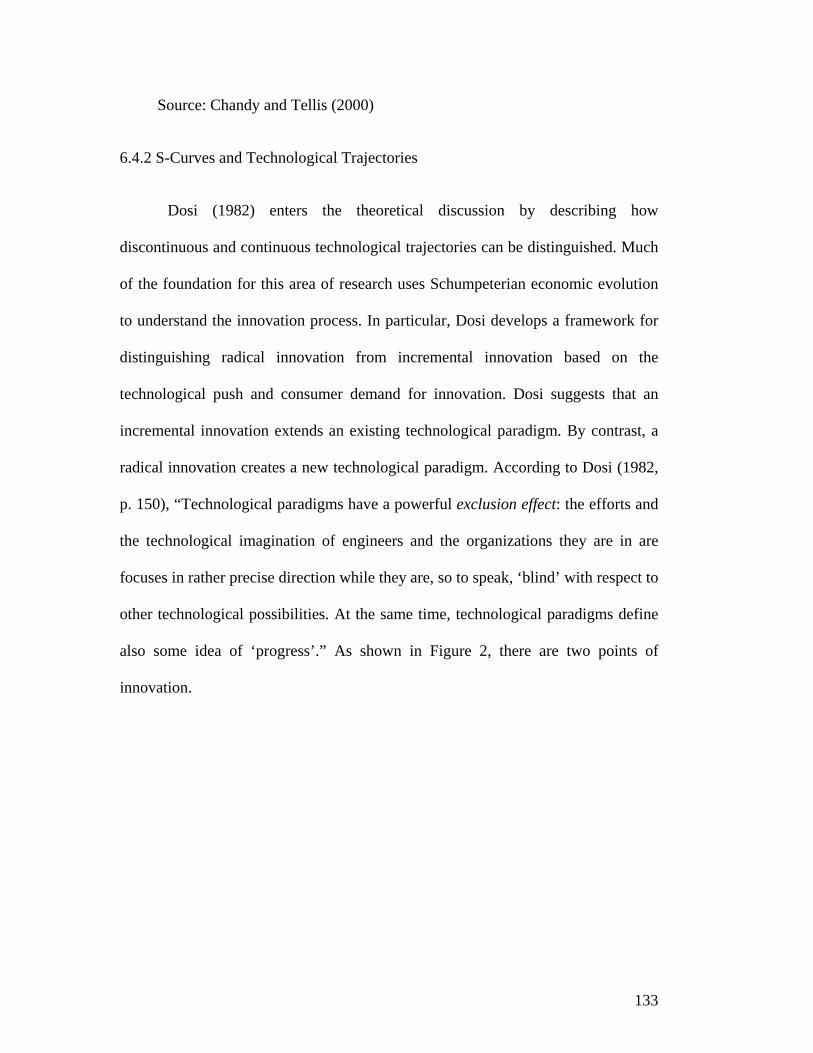
133
Source: Chandy and Tellis (2000)
6.4.2 S-Curves and Technological Trajectories
Dosi (1982) enters the theoretical discussion by describing how
discontinuous and continuous technological trajectories can be distinguished. Much
of the foundation for this area of research uses Schumpeterian economic evolution
to understand the innovation process. In particular, Dosi develops a framework for
distinguishing radical innovation from incremental innovation based on the
technological push and consumer demand for innovation. Dosi suggests that an
incremental innovation extends an existing technological paradigm. By contrast, a
radical innovation creates a new technological paradigm. According to Dosi (1982,
p. 150), “Technological paradigms have a powerful exclusion effect: the efforts and
the technological imagination of engineers and the organizations they are in are
focuses in rather precise direction while they are, so to speak, ‘blind’ with respect to
other technological possibilities. At the same time, technological paradigms define
also some idea of ‘progress’.” As shown in Figure 2, there are two points of
innovation.
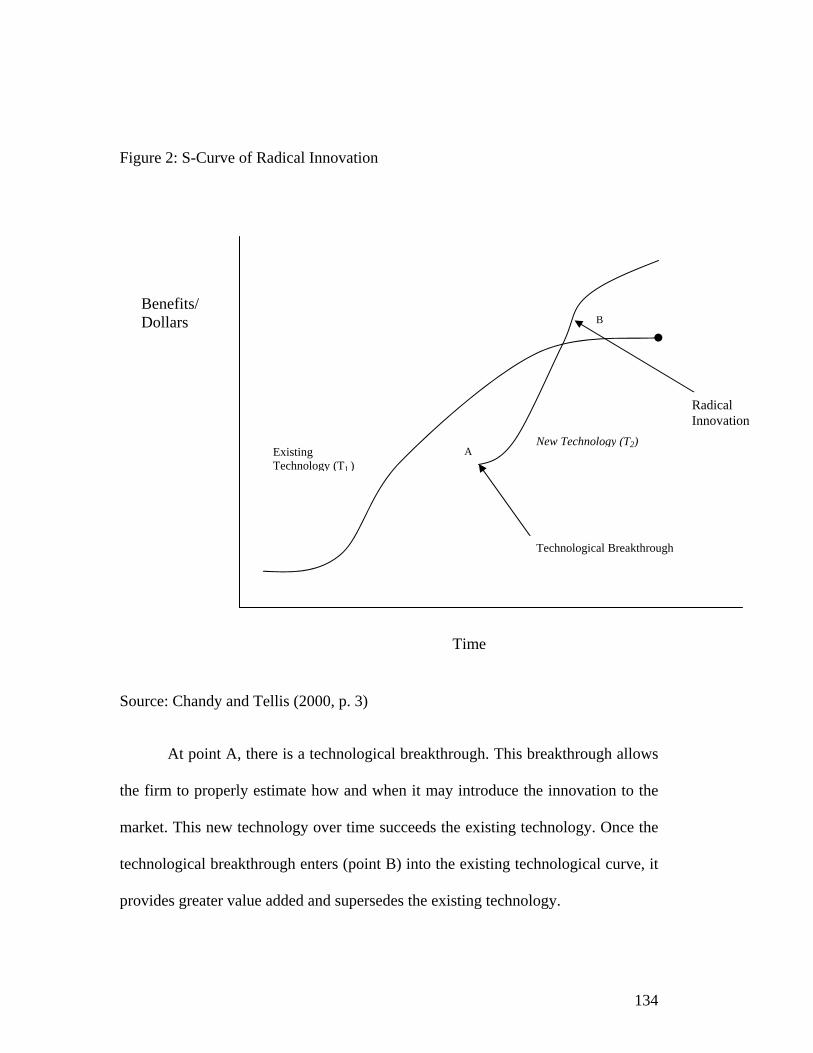
134
Figure 2: S-Curve of Radical Innovation
Source: Chandy and Tellis (2000, p. 3)
At point A, there is a technological breakthrough. This breakthrough allows
the firm to properly estimate how and when it may introduce the innovation to the
market. This new technology over time succeeds the existing technology. Once the
technological breakthrough enters (point B) into the existing technological curve, it
provides greater value added and supersedes the existing technology.
Existing Technology (T1 )
New Technology (T2) A
Technological Breakthrough
B
Radical Innovation
Benefits/ Dollars
Time
135
As Dahlin and Bohrens (2004) rightly point out: “A related approach
suggests that the development of technologies subsequent to the introduction of a
radical innovation will follow the path of an S-curve. However, as is the case for
technological trajectories, S-curves do not offer a precise manner for mapping
technologies. Neither do they help us identify, or define, the radical invention that
will start a new S-curve. In effect, whereas one needs to have good ideas about what
the important performance criteria are a priori, such ideas appear to us only a
fortiori in Dosi and Foster’s framework analyzing radical innovations.”
6.4.3 Hedonic Price Models
This strand of literature stems from Henderson and Clark (1990) and
Henderson (1993), where price is the empirical measure used to determine radical
innovation. Henderson studies the lithographic industry. While hedonic pricing
traditionally limits itself to technological fields, it provides a quantifiable means to
understand the impact of variables on price. For example, instead of just comparing
the price of a black-box camera with a digital camera, the model would adjust for
incremental improvements in the process, such as a flash or quicker shutter speed.
Therefore, it provides a simple way to understand how supplementary additions in
the quality of a product affect price. Henderson (1993, p. 258) finds that “prior
experience is significantly and negatively correlated with realized market share for
radical innovation, providing strong support for the hypothesis that incumbents
attempting to introduce products that require quite different organizational
capabilities were severely handicapped.”
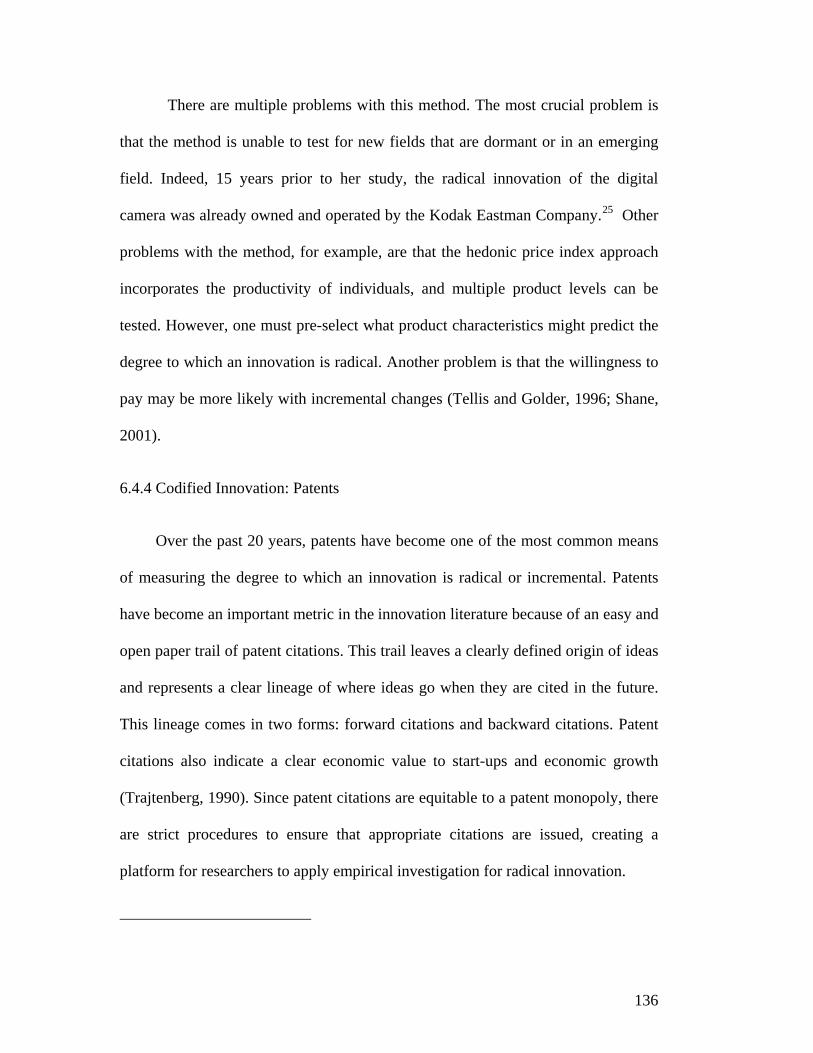
136
There are multiple problems with this method. The most crucial problem is
that the method is unable to test for new fields that are dormant or in an emerging
field. Indeed, 15 years prior to her study, the radical innovation of the digital
camera was already owned and operated by the Kodak Eastman Company.25 Other
problems with the method, for example, are that the hedonic price index approach
incorporates the productivity of individuals, and multiple product levels can be
tested. However, one must pre-select what product characteristics might predict the
degree to which an innovation is radical. Another problem is that the willingness to
pay may be more likely with incremental changes (Tellis and Golder, 1996; Shane,
2001).
6.4.4 Codified Innovation: Patents
Over the past 20 years, patents have become one of the most common means
of measuring the degree to which an innovation is radical or incremental. Patents
have become an important metric in the innovation literature because of an easy and
open paper trail of patent citations. This trail leaves a clearly defined origin of ideas
and represents a clear lineage of where ideas go when they are cited in the future.
This lineage comes in two forms: forward citations and backward citations. Patent
citations also indicate a clear economic value to start-ups and economic growth
(Trajtenberg, 1990). Since patent citations are equitable to a patent monopoly, there
are strict procedures to ensure that appropriate citations are issued, creating a
platform for researchers to apply empirical investigation for radical innovation.
137
6.4.5 Forward Patent Citation Radicalness
Forward patent citation involves future citations of a patent. These citations
come from United States patent examiners. These professionals cite the previous
patent only when there is a legitimate reason to cite the previous patent’s
intellectual property. These future citations are called forward patent citations.
Rosenkopf and Nerkar (2001) measure the degree of radicalness by examining the
computer disk industry to investigate the impact patents have on future citations in
domains of patent classification. Patent domains are maintained and categorized by
the United States Patent and Trademark Office (USPTO). The authors’ show how
incremental patents are often more narrowly cited within a certain domain of
patents and radical patents are often cited by multiple domains of patents.
The forward patent count that Rosenkopf and Nerkar (2001) use is, in many
ways, comparable to forward citations in scholarly journals. There are, however,
two detrimental differences when using citations. First, there is a motivation from
the patent inventor to cite as little as possible from previous work. The less work
that is cited in the grant application, the more intellectual property (IP) monopoly is
granted to the inventor. Second, a patent examiner is required to assign relevant
patent citations to the patent application. For a greater understanding of deficiencies
in the U.S. patent-examining process, see Graham and Harhoff (2006) and Harhoff
et al. (2002). Drawing on patent citations creates other problems as well. As
Rosenberg and Nekar (2001, p. 290) define radical innovation: “‘radical’
138
exploration builds upon distant technology that resides outside of the firm. The
technological subunit utilizes knowledge from a different technological domain and
does not obtain that knowledge from other subunits with the firm.”
The definition of radicalness holds innovation exogenous to the human capital
and tacit knowledge of the firm. As Klepper and Graddy (1990) suggest, new and
radical innovations can come from subunits within the firm. The distant technology
can often be found within the incumbent firm. However, the firm is unwilling to
either operationalize the potential radical innovation due to managerial
disagreements or commit resources to a new and uncertain venture.
6.4.6 Backward Patent Classification and Citations
Backward patent citations are citations given to prior work. These citations are
issued by patent examiners where examiners cite previous patents, thereby giving
the citations a clear line of intellectual property rights. Shane (2001) shows, through
a unique data set from Massachusetts Institute of Technology (MIT) inventors
involving 1397 licensed MIT patents, that the more radical the invention, the more
likely it was made by a small firm. As Shane (2001, p. 208) explains, radical
innovations will tend to originate from small firms and large firms: “First, radical
technologies destroy the capabilities of existing firms because they draw on new
technical skills. Since organizational capabilities are difficult and costly to create
(Nelson and Winter, 1982; Hannan and Feeman, 1984), established firms are
organized to exploit established technologies. Firms find it difficult to change their
activities to exploit technologies based on different technical skills.” Shane (2001)
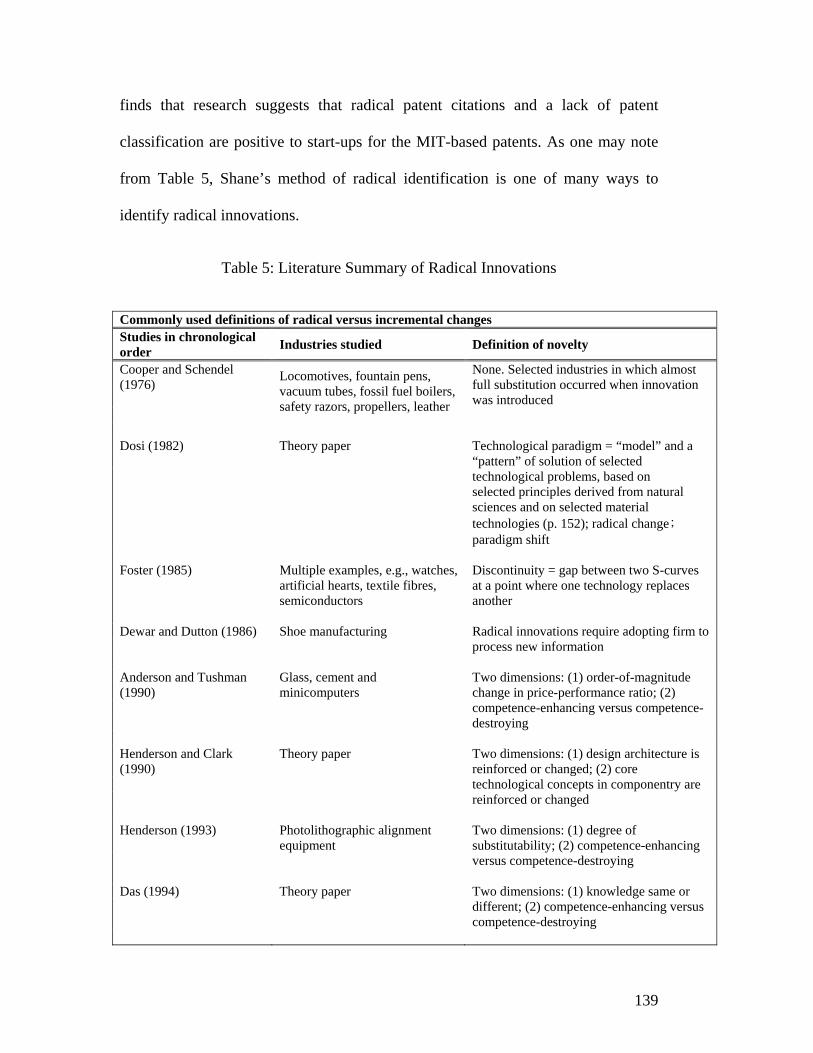
139
finds that research suggests that radical patent citations and a lack of patent
classification are positive to start-ups for the MIT-based patents. As one may note
from Table 5, Shane’s method of radical identification is one of many ways to
identify radical innovations.
Table 5: Literature Summary of Radical Innovations
Commonly used definitions of radical versus incremental changes Studies in chronological order Industries studied Definition of novelty
Cooper and Schendel (1976)
None. Selected industries in which almost full substitution occurred when innovation was introduced
Locomotives, fountain pens, vacuum tubes, fossil fuel boilers, safety razors, propellers, leather
Dosi (1982) Theory paper
Technological paradigm = “model” and a “pattern” of solution of selected technological problems, based on selected principles derived from natural sciences and on selected material technologies (p. 152); radical change; paradigm shift
Foster (1985) Multiple examples, e.g., watches,
artificial hearts, textile fibres, semiconductors
Discontinuity = gap between two S-curves at a point where one technology replaces another
Dewar and Dutton (1986) Shoe manufacturing
Radical innovations require adopting firm to process new information
Anderson and Tushman (1990)
Glass, cement and minicomputers
Two dimensions: (1) order-of-magnitude change in price-performance ratio; (2) competence-enhancing versus competence-destroying
Henderson and Clark (1990)
Theory paper
Two dimensions: (1) design architecture is reinforced or changed; (2) core technological concepts in componentry are reinforced or changed
Henderson (1993) Photolithographic alignment
equipment
Two dimensions: (1) degree of substitutability; (2) competence-enhancing versus competence-destroying
Das (1994) Theory paper
Two dimensions: (1) knowledge same or different; (2) competence-enhancing versus competence-destroying
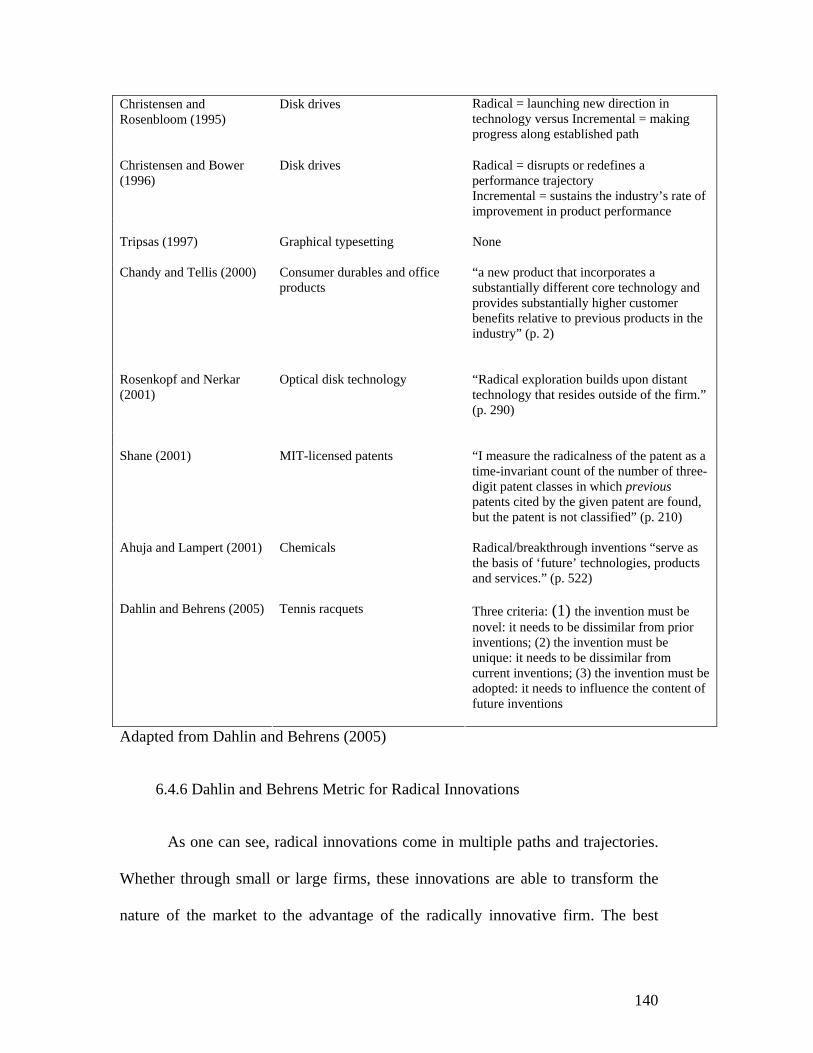
140
Christensen and Rosenbloom (1995)
Disk drives
Radical = launching new direction in technology versus Incremental = making progress along established path
Christensen and Bower (1996)
Disk drives
Radical = disrupts or redefines a performance trajectory Incremental = sustains the industry’s rate of improvement in product performance
Tripsas (1997) Graphical typesetting None Chandy and Tellis (2000) Consumer durables and office
products “a new product that incorporates a substantially different core technology and provides substantially higher customer benefits relative to previous products in the industry” (p. 2)
Rosenkopf and Nerkar (2001)
Optical disk technology “Radical exploration builds upon distant technology that resides outside of the firm.” (p. 290)
Shane (2001) MIT-licensed patents “I measure the radicalness of the patent as a
time-invariant count of the number of three-digit patent classes in which previous patents cited by the given patent are found, but the patent is not classified” (p. 210)
Ahuja and Lampert (2001) Chemicals
Radical/breakthrough inventions “serve as the basis of ‘future’ technologies, products and services.” (p. 522)
Dahlin and Behrens (2005) Tennis racquets
Three criteria: (1) the invention must be novel: it needs to be dissimilar from prior inventions; (2) the invention must be unique: it needs to be dissimilar from current inventions; (3) the invention must be adopted: it needs to influence the content of future inventions
Adapted from Dahlin and Behrens (2005)
6.4.6 Dahlin and Behrens Metric for Radical Innovations
As one can see, radical innovations come in multiple paths and trajectories.
Whether through small or large firms, these innovations are able to transform the
nature of the market to the advantage of the radically innovative firm. The best
141
method to identify an ex ante radical innovation, therefore, is through the only
available paper trail of patents. As mentioned earlier, analysis has used either
forward patent or backward patent citations, but has never used both to dynamically
analyze the data. Dahlin and Behrens (2005) use patents from the tennis racquet
industry to show that there is not only a way to ex ante identify whether an
invention is radical, but also a way to systematically analyze a product market to
determine whether the innovation is radical.
Dahlin and Behrens offer an attractive means to identify incipient radical
innovations a priori, or before they are actually fully developed and introduced.
They create a three-stage metric process that distinguishes between radical
invention and radical innovation. This is an important process. As mentioned in
previous sections, other methods were unable to identify radical inventions and
therefore the potential radical innovation in the pipeline. As mentioned above, for
example, innovations from large firms, such as the Kodak digital camera, were not
recognized as radical inventions due to a lack of proper identification metrics. This
method offers a needed predictive power of identifying patents that have the
potential to be radical innovations. The model offers three criteria and is based on
the structure of patent citations and replication of new patent citations.
The Dahlin and Behrens model identifies radical inventions as inventions
that heavily influence and affect the future content of patent families. Therefore, the
patent must be unique to other patents in terms of its patent structure and future
citations. This uniqueness is identified by the criteria presented in Table 5.
142
Dahlin and Behrens’ model places emphasis on how dissimilar the patent is
to past and current inventions. Therefore, when new patents are filed, the new
patents’ citations are compared with the identified radical invention. If the new
patents replicate a similar patent structure to the identified radical patent, the radical
patent is then classified as a radical innovation. In Table 6, the advantages of using
the Dahlin-Behrens model are examined.
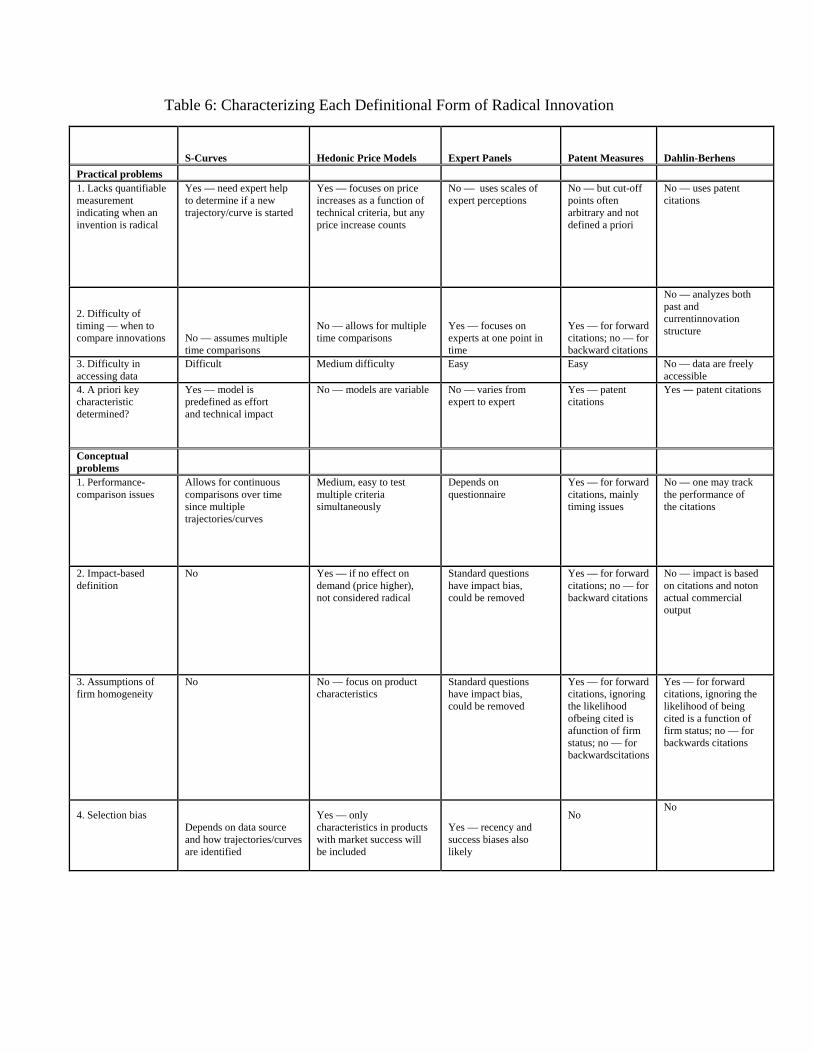
Table 6: Characterizing Each Definitional Form of Radical Innovation
S-Curves Hedonic Price Models Expert Panels Patent Measures
Dahlin-Berhens
Practical problems 1. Lacks quantifiable measurement indicating when an invention is radical
Yes — need expert help to determine if a new trajectory/curve is started
Yes — focuses on price increases as a function of technical criteria, but any price increase counts
No — uses scales of expert perceptions
No — but cut-off points often arbitrary and not defined a priori
No — uses patent citations
2. Difficulty of timing — when to compare innovations
No — assumes multiple time comparisons
No — allows for multiple time comparisons
Yes — focuses on experts at one point in time
Yes — for forward citations; no — for backward citations
No — analyzes both past and currentinnovation structure
3. Difficulty in accessing data
Difficult Medium difficulty Easy Easy No — data are freely accessible
4. A priori key characteristic determined?
Yes — model is predefined as effort and technical impact
No — models are variable
No — varies from expert to expert
Yes — patent citations
Yes ― patent citations
Conceptual problems
1. Performance-comparison issues
Allows for continuous comparisons over time since multiple trajectories/curves
Medium, easy to test multiple criteria simultaneously
Depends on questionnaire
Yes — for forward citations, mainly timing issues
No — one may track the performance of the citations
2. Impact-based definition
No Yes — if no effect on demand (price higher), not considered radical
Standard questions have impact bias, could be removed
Yes — for forward citations; no — for backward citations
No — impact is based on citations and noton actual commercial output
3. Assumptions of firm homogeneity
No No — focus on product characteristics
Standard questions have impact bias, could be removed
Yes — for forward citations, ignoring the likelihood ofbeing cited is afunction of firm status; no — for backwardscitations
Yes — for forward citations, ignoring the likelihood of being cited is a function of firm status; no — for backwards citations
4. Selection bias
Depends on data source and how trajectories/curves are identified
Yes — only characteristics in products with market success will be included
Yes — recency and success biases also likely
No
No
144
6.5. Conclusions In this chapter, we offer a literature review of how radical innovation is
quantified and the metrics applied for identifying radical innovation. As suggested
in the literature, there are conflicting empirical metrics identifying radical
innovation. Consequently, there is conflicting empirical evidence on the propensity
for small and large firms to engage in radical innovation. After all, according to the
literature, it surely cannot be that both large firms are “incompetent” and small
firms are “inferior” with respect to radical innovations. These empirical
inconsistencies lie, to some degree, in how one identifies a radical invention.
While not perfect, the Dahlin-Behrens model provides policy-makers with
an easily accessible and identifiable means to properly identify radical innovations
ex ante. This identification requires that the radical innovation 1) be dissimilar to
previous patent citations, 2) differ from existing patent citations, and 3) affect future
patent citation structures. The three-stage definition offers explicit advantages over
previous identification regimes. Specifically, technical content is identified and
tracked over time. The definition also eliminates many of the problems found in
other identification metrics, such as 1) definition and measurement, 2) ability to
identify an invention that is still in the development phase, and 3) identification is
not measured by ex post analysis.
While it will continue to be unclear what share of radical innovation
originates from small and large firms, the ability to identify the invention will be the
critical aspect for policy-makers and then to identify whether the invention is from a
large or small firm. Therefore, the authors believe that radical innovation should not
145
necessarily be analyzed under the large or small firm unit of analysis, but rather
radical innovations should be identified and tracked within and coming out of the
pipeline.
Chapter 7: Summary and Conclusions 7.1 Summary
A result of globalization and investment in knowledge has led countries to
shift their comparative advantage away from traditional industries such as
manufacturing and large scale firm production towards new territories of
knowledge-based economic activity. But how and where will policy makers turn for
new forms of knowledge-based activity? While the overall answers remains
clouded, one area where policy makers will be turning their heads is toward
university knowledge and scientist entrepreneurship.
As research and knowledge become perhaps the most crucial component to
generating economic growth and competitive jobs in globally-linked markets,
universities emerge as a key factor in determining the future well-being of the
country. After all, it ranks among the most important tasks of universities to create
new scientific knowledge. In addition, the magnitude of resources being invested in
university research, including some of the most capable and creative scientists in the
country, is the envy of the world.
The massive investment in university research can impact economic growth
only if knowledge can be transformed into actual innovations and new and better
146
products through the commercialization process. That is, the extent to which
university research becomes commercialized. It matters for economic growth, for
jobs and for global competitiveness.
This book has taken a different approach towards addressing where
knowledge-based entrepreneurship may manifest itself. Rather than focus on what
the TTOs do, it instead focuses on what university scientists do. Thus, the findings
about the commercialization of university research are based on actual university
scientists and not the TTOs. The results are revealing. In particular, while all modes
of commercialization are important, scientist entrepreneurship emerges as an
important and prevalent mode of commercialization of university research. More than
one in four patenting NCI scientists has started a new firm. This is a remarkably high
rate of entrepreneurship for any group of people, let alone university scientists. Thus,
the extent to which university research is being commercialized and entering the
market may be significantly greater than might have been inferred from studies
restricted only to the commercialization activities of the TTO. Scientist
entrepreneurship may prove to be the sleeping giant of university commercialization.
7.2 Future research
There are three primary areas of future research. The first area needs to
further probe why and how scientists choose to commercialize their research, what
commercialization route they select, what mode of commercialization is most
effective, and how university governance and public policy can best promote such
commercialization efforts. A host of pressing questions remains. For example, are all
147
social networks equivalent, that is are they homogeneous, or do some facilitate
scientist commercialization more than others? Similarly, do non-patenting scientists
engage in commercialization activities, particularly entrepreneurship, or does their
lack of patented intellectual propensity preclude commercialization of their research?
Whatever answers to these and other crucial questions future research can uncover
will be highly important.
Another stream of research will require similar studies in other fields of
technology. While Oncology research is a critical area for commercialization, it
remains to be seen whether other fields of knowledge share similar variables for
entrepreneurship and economic growth. Indeed, given that Oncology has a relatively
development field, other fields such as Green Technology may have a very different
fate for commercialization.
The third area of future research is to fully understand how managing
intellectual property (IP) at universities may be optimized. As noted in chapter three,
there are several routes to commercialize knowledge, but most IP is, at least in the
initial stage, channeled through the TTO. Given that the TTOs primary objective is to
maximize revenue through licensing, there could very well be some form of loss to
growth by not allowing scientists to startup on their own invented patent technology.
This loss may also ferment what is called the backdoor approach to patenting where
scientists do not register their IP with the TTO, furthering the problem of accurately
estimating to true rate of return on public R&D. The questions will further help
policy makers understand how important knowledge-based scientist entrepreneurship
are to regions and economic growth. Whatever the answers may be, it is well worth

148
noting that scientist entrepreneurship will continue to be an increasingly important
field of research for economics and public policy.
149
7. References
Acs, Z. and Audretsch, D. (1988). “Innovation in Large and Small Firms: An Empirical Analysis.” American Economic Review, 78, 678–690.
Acs, Z. and Audretsch, D. (1990). Innovation and Small Firms. Cambridge: MIT Press.
Acs, Z. and Audretsch, D. (2003). Handbook of Entrepreneurship Research. Dordrecht: Kluwer Academic Publishers.
Acs, Z., Audretsch, D., Braunerhjelm, P. and Carlsson, B. “The Missing Link: The Knowledge Filter and Entrepreneurship in Endogenous Growth”, Centre for Economic Policy Research (CEPR) Discussion Paper, (2004)
Acs, Zolton J. and Armington, K. (2006). Entrepreneurship Regional Agglomeration and U.S. Growth. Cambridge: Cambridge University Press. 2006.
Aestebro, T. and Dahlin, K. (2005). “Opportunity Knocks.” Research Policy, 34(5), 1404–1418.
Agrawal, A. and Henderson, R. (2002). ‘Putting Patents in Context: Exploring Knowledge Transfer from MIT,’ Management Science, 48(1), 44–60.
Ahuja, G. and Lampert, C. (2001). “Entrepreneurship in the Large Corporation: A Longitudinal Study of How Established Firms Create Breakthrough Inventions.” Strategic Management Journal, 22(3), 521–543.
Albert, M., Avery, D., McAllister, P. and Narin, F. (1991). “Direct Validation of Citation Counts as Indicators of Industrially Important Patents.” Research Policy, 20(3), 251–259.
Aldrich, H., and Martinez, M. (2003). Entrepreneurship as Social Construction. En Acs, Z.J. y Audretsch, A.B. eds., The International Handbook of Entrepreneurship. Dordrecht: Kluwer Academic Publishers.
Alvarez, S. and Barney, J. (2005). “How do Entrepreneurs Organize Firms Under Conditions of Uncertainty?” Journal of Management, 31(3), 776–93.
Anderson, P. and Tushman, M. (1990). “Technological Discontinuities and Dominant Designs: A Cyclical Model of Technological Change.” Administrative Science Quarterly, 35(3), 604–633.
Arrow, K. (1962). “Economic Welfare and the Allocation of Resources for Invention.” In Nelson, R.R., ed., The Rate and Direction of Inventive Activity. Princeton: Princeton University Press, pp. 609–626.
Association of University Technology Managers. Recollections: celebrating the History of AUTUM and the Legacy of Bayh-Dole. AUTUM, 2004
Audretsch, D. and Stephan, P. (1996), “Company-scientist Locational Links: the Case of Biotechnology.” The American Economic Review, 86(4), 641–652.
Audretsch, D., Keilbach, M. and Lehmann, E. (2006). Entrepreneurship and Economic Growth. Oxford: Oxford University Press.
150
Audretsch, D. (1995). Innovation and Industry Evolution. Cambridge: MIT Press.
Audretsch, D. and Feldman, M. “R&D Spillovers and the Geography of Innovation and Production.” American Economic Review, 1996, 86(3), 630-640.
Audretsch, D. and Stephan, P. (2000), The Economics of Science and Innovation, Volumes I and II, London: Edward Elgar.
Audretsch, D., Link, A. and Scott, J. (2002). “Public/private Technology Partnerships: Evaluating SBIR-Supported Research”. Research Policy, 31(1), 145-158.
Bania, N., Eberts, R. and Fogarty, M. (1993), “Universities and the startup of newcompanies: can we generalize from route 128 and Silicon valley?” The Review of Economics and Statistics, 75(4), 761–766.
Barney, J. (1986). “Strategic Factor Markets: Expectations, Luck, and Business Strategy”. Management Science, 32(4), 1231–41.
Baumol, W. (2004). “Education for Innovation: Entrepreneurial Breakthrough vs. Corporate Incremental Improvements.” NBER Working Paper, No. 10578.
Carrol, P. (1993). “Die Offene Schlacht.” Die Zeit, No. 39, September, p. 18.
Christensen, C. and Bower, J. (1996). “Customer Power, Strategic Investment, and the Failure of Leading Firms.” Strategic Management Journal, 17(3), 197–218.
Christensen, C. and Rosenbloom, R. (1995). “Explaining the Attacker’s Advantage: Technological Paradigms, Organizational Dynamics, and the Value Network.” Research Policy, 24(2), 233–257.
Cohen, W. and Klepper, S. (1990). A Reprise of Size and R&D, Market Structure and Technological Change. Chur: Harwood Academic Publishers, Carnegie Mellon University.
Cohen, W. and Klepper, S. (1992a). “The Tradeoff between Firm Size and Diversity in the Pursuit of Technological Progress.” Small Business Economics, 4(1), 1–14.
Cohen, W. and Klepper, S. (1992b). “The Anatomy of Industry R&D Intensity Distributions.” American Economic Review, 82(4), 773–799.
Colyvas, J., Crow, M., Gelijns, A., Mazzoleni R., Nelson, R., Rosenberg N. (2002), “How do University inventions get into practice?” Management Science, 48(1), 61–72.
Comanor, W. (1967). “Market Structure, Product Differentiation and Industrial Research.” Quarterly Journal of Economics, 81(4), 639–657.
Coombs, R., Narandren, P. and Richards, A. (1996). “A Literature-Based Innovation Output Indicator.” Research Policy, 25(3), 403–413.
Cooper, A. and Schendel, D. (1976). “Strategic Responses to Technological Threats.” Business Horizons, 19(1), 61–69.
Dahlin, K. and Behrens, D. (2005). “When is an Invention Really Radical? Defining and Measuring Technological Radicalness.” Research Policy, 34(5), 717–737.
151
Das, S. (1994). “A Question of Wines and Bottles? Examining New Technology and Competitiveness Between New Technologies.” Best Paper Proceedings, 54th Academy of Management Meeting, 335–339.
Dasgupta, P. and David, P. (1994). “Toward a New Economics of Science”, Research Policy, 23(5). 487-521.
Dewar, R. and Dutton, J. (1986). “The Adoption of Radical and Incremental Innovations: An Empirical Analysis.” Management Science, 32(11), 1422–1433.
Dosi, G. (1982). “Technological Paradigms and Technological Trajectories: A Suggested Interpretation of the Determinants and Directions of Technical Change.” Research Policy, 11(2), 147–162.
Feldman, M., I. Feller, J. Bercovitz and R. Burton (2002). “Equity and the technology transfer strategies of American Research Universities.” Management Science, 48(1), 105-121.
Feldman, M. and Desrochers, P. (2004)."Truth for Its Own Sake: Academic Culture and Technology Transfer at the Johns Hopkins University." Minerva, 42(2), 105-126
Florida, Richard, (2002). The Rise of the Creative Class and How Transforming Works, Leisure and Everyday Life. New York, New York. Basic Books
Foster, R. (1985). “Timing Technological Transitions.” Technology in Society, 7(1), 127–141.
Freeman, C. and Soete, L. (1997). The Economics of Industrial Innovation. 3rd ed. Cambridge: MIT Press.
Galbraith, J. (1956). American Capitalism. Boston: Houghton Mifflin.
Gellman Research Associates. (1976). Indicators of International Trends in Technological Innovation. Prepared for the National Science Foundation.
Gellman Research Associates. (1982). The Relationship between Industrial Concentration, Firm Size, and Technological Innovation. Prepared for the Office of Advocacy, U.S. Small Business Administration, under award no. SBA-2633-OA-79.
Gersick, C. (1991). “Revolutionary Change Theories: A Multilevel Exploration of the Punctuated Equilibrium Paradigm.” Academy of Management Review, 16 (1), 10–36.
Glaeser, E., Kallal, H., Scheinkman, J. and Shleifer, A. (1992) “Growth of Cities.” Journal of Political Economy, 100(6). 1126-1152.
Graham, S. and Harhoff, D. (2006). “Can Post-Grant Reviews Improve Patent System Design? A Twin Study of U.S. and European Patents.” CEPR Discussion Papers, 5680.
Graham, S. and Mowery, D. (2004). “Submarines in Software? Continuations in U.S. Software Patenting in the 1980s and 1990s.” Economics of Innovation and New Technology, 13 (4), 443–456.
Griliches, Zvi. (1979). “Issues in Assessing the Contribution of R&D to Productivity Growth”, Bell Journal of Economics, 10, 92-116.
152
Graham, S. and Harhoff, D. (2005). “Can Post-Grant Reviews Improve Patent System Design? A Twin Study of US and European Patents.” CEPR Discussion Paper No. 5680, Centre for Economic Policy Research, London.
Hargadon, A. and Sutton, R. (1997). “Technology Brokering and Innovation in a Product Development Firm.” Administrative Science Quarterly, 42(4), 716–749.
Henderson, R. (1993). “Underinvestment and Incompetence as Responses to Radical Innovation: Evidence from the Photolithographic Alignment Equipment Industry.” RAND Journal of Economics, 24(2), 248–270.
Henderson, R. and Clark, K. (1990). “Architectural Innovation: The Reconfiguration of Existing Product Technologies and the Failure of Established Firms.” Administrative Science Quarterly, 35(1), 9–30.
Henderson, R., A. B. Jaffe and M. Trajtenberg (1998). “Universities as a source of commercial technology: a detailed analysis of university patenting, 1965–1988.” Review of Economics and Statistics, 80(1), 119–127.
Jaffe, A. (1986). “Technological Opportunity and Spillover of R&D: Evidence from Firms’ Patents, Profits and Market Value.” American Economic Review, 76(5), 984–1001.
Jaffe, A., Trajtenberg, M. and Henderson, R. (1993). “Geographic Localization of Knowledge Spillovers as Evidenced by Patent Citations.” Quarterly Journal of Economics, 108(3), 577-598.
Jaffe, A. (1989). “Real Effects of Academic Research.” American Economic Review, 79(5), 957-970.
Jaffe, A. and Lerner, J. (2001). “Reinventing Public R&D: Patent Policy and the Commercialization of National Laboratory Technologies”. Rand Journal of Economics, 32(1), pp. 167-198.
Jensen, R. and Thursby, M. (2001), ‘Proofs and Prototypes for Sale: the Licensing of University Inventions,’ American Economic Review, 91(1), 240–259.
Klepper, S. and Graddy, K. (1990). “The Evolution of New Industries and the Determinants of Market Structure.” RAND Journal of Economics, 21 (1), 27–44.
Leitch, C. and Harrison R. (2005). “Maximising the Potential of University Spin Outs: the Development of Second-order Commercialization Activities.” R & D Management, 35(3), 257–272.
Lerner, J. (1999). “The Government as Venture Capitalist: The Long-run Impact of the SBIR program.” Journal of Business, 1999, 72(3), pp. 285-318.
Levin, R., Cohen, W. and Mowery, D. (1985). “R&D Appropriability, Opportunity, and Market Structure: New Evidence on Some Schumpeterian Hypotheses.” American Economic Review, 75(2), 20–24.
Levin, R., Klevorick, A., Nelson, R. and Winter, S. (1987). “Appropriating the Returns from Industrial Research and Development.” Brookings Papers on Economic Activity, 3, 783–832.
153
Levin, S. and Stephan, P. (1991). “Research Productivity over the Life Cycle: Evidence for Academic Scientists.” American Economic Review, 81(4). 114-132.
Link, A. and Scott J. (2003). “The Growth of Research Triangle Park.” Small Business Economics, 20(2), 167–175.
Lockett, A., Siegel, D., Wright, M. and Ensley, D. (2005). “The Creation of Spin-off Firms at Public Research Institutions: Managerial and Policy Implications.” Research Policy, 34(7), 981-993.
Louis, K., Blumenthal, D., Gluck M. and Stoto, M. (1989). “Entrepreneurs in Academe: an Exploration of Behaviors among Life Scientists.” Administrative Science Quarterly, 34(1), 110–131.
Lucas, R. (1993). “Making a Miracle”, Econometrica, 61, 251-272.
Markman, G., Gianiodis, P., Phan, P. and Balkin, D. (2004), “Entrepreneurship from the Ivory Tower: do Incentive Systems Matter?” Journal of Technology Transfer, 29(3–4), 353–364.
McCraw, K. (2007). Prophet of Innovation: Joseph Schumpeter and Creative Destruction. Cambridge: Beleknap Press.
Moran, P. and Goshal, S. (1999). “Markets, Firms, and the Processes of Economic Development.” Academy of Management Review, 24(3), 390–412.
Mowery, D. “The Bayh-Dole Act and High-Technology Entrepreneurship in U.S. Universities: Chicken, Egg, Or something Else?” In Gary Liebcap ed., University Entrepreneurship and Technology Transfers. Amsterdam: Elsevier, 2005, pp. 38-68.
Mowery, D., Nelson, R., Sampat, B. and Ziedonis, A. Ivory Tower and Industrial Innovation: University-Industry Technology Transfer before and after the Bayh-Dole Act. Stanford, CA: Stanford University Press, 2004.
Murray, F. (2004), “The Role of Academic Inventors in Entrepreneurial Firms: Sharing the Laboratory Life” Research Policy, 33(4), 643–659.
Nicolaou, N. and Birley S. (2003a), “Academic Networks in a Trichotomous Categorisation of University Spinouts.” Journal of Business Venturing, 18(3), 333–359.
Nicolaou, N. and Birley, S. (2003b), “Social Networks in Organizational Emergence: the University Spinout Phenomenon.” Management Science, 49(12), 1702–1725.
Oliver, L. (2004), “Biotechnology Entrepreneurial Scientists and their Collaborations.” Research Policy, 33(4), 583.
Pavitt, K., Robson, M. and Townsend, J. (1987). “The Size Distribution of Innovating Firms in the U.K.: 1945–1983.” The Journal of Industrial Economics, 35 (3), 297–316.
Podolny, J. and Stuart, T. (1995). “A Role-Based Ecology of Technical Change.” American Journal of Sociology, 100, 1224–1260.
Rao, B., Angelov, B. and Nov, O. (2006). “Fusion of Disruptive Technologies: Lessons from the Skype Case.” European Management Journal, 24, 174–188.
154
Rappert, B., Webster, A. and Charles, D. (1999). “Making Sense of Diversity and Reluctance: Academic-industrial Relations and Intellectual Property.” Research Policy, 28(8), 873.
Reitzig, M. (2003). “What Determines Patent Value? Insights from the Semiconductor Industry.” Research Policy, 32, 13–26.
Robson, M. and Townsend, J. (1984). “Users Manual for ESRC Archive File on Innovations in Britain Since 1945: 1984 Update.” Science Policy Research Unit, University of Sussex.
Romer, P. (1990). “Endogenous Technological Change.” Journal of Political Economy, 98(5), 71–102.
Romer, P. (1986). “Increasing Returns and Long-Run Growth”, Journal of Political Economy, 94(5). 1002–1037.
Rosenkopf, L. and Nerkar, A. (2001). “Beyond Local Search: Boundary Spanning, Exploration, and Impact in the Optical Disk Industry.” Strategic Management Journal, 22, 287–306.
Rothwell, R. (1989). “Small Firms, Innovation and Industrial Change.” Small Business Economics, 1, 51–64.
Scherer, F. (1991). “Changing Perspectives on the Firm Size Problem.” In Acs, Z.J. and Audretsch, D.B., eds., Innovation and Technological Change: An International Comparison. New York: Harvester Wheatsheaf.
Schumpeter, J. (1934). The Theory of Economic Development; and Inquiry into Profits, Capital, Credit, Interest and the Business Cycle. Cambridge: Harvard University Press.
Shane, S. (2001). “Technological Opportunities and New Firm Creation.” Management Science, 47 (2), 205–220.
Shane, S. (2002). “Selling University Technology: Patterns from MIT.” Management Science, 48(1), 122–137.
Shane, S. and T. Stuart (2002), “Organizational Endowments and the Performance of University Start-ups,” Management Science, 48(1), 154–170.
Shane, Scott. Academic Entrepreneurship. Cheltenham, United Kingdom: Edward Elgar Publishing, 2004.
Stamm, B. von. (2003). “Managing Innovation, Design & Creativity.” Wiley, London Business School.
Stephan, P. and Levin, S. (1992). Striking the Mother Lode in Science, New York: Oxford University Press
Stuart, T. (1998). “Network Positions and Propensities to Collaborate: An Investigation of Strategic Alliance Formation in a High-Technology Industry.” Administrative Science Quarterly, 43, 668–698.
Tellis, G. and Golder, P. (1996). “First to Market, First to Fail? Real Causes of Enduring Market Leadership!” Sloan Management Review, 37(2), 65–75.
155
The Economist. “System Error.” September 18, 1993, p. 99.
Thorton, P. and Flynn, K. (2003). Entrepreneurship, Networks and Geographies. En Acs, Z. Audretsch, D. (eds.), Handbook of Entrepreneurship Research. Dordrecht: Kluwer Academic Publishers.
Thursby, J. and Thursby, M. (2002). “Who is Selling the Ivory Tower? Sources of Growth in University Licensing.” Management Science, 48(1), 90–104.
Thursby, J., Jensen, R. and Thursby, M. (2001). “Objectives, Characteristics and Outcomes of University Licensing: A Survey of Major U.S. Universities.” Journal of Technology Transfer, 26, 59-72.
Thursby, Marie, Jensen, Richard. (2005). “Patent Licensing and the Research University” NBER Working Paper No. W10758.
Tirole, J. (1988). The Theory of Industrial Organization. Cambridge: MIT Press.
Toole, A. and Czarnitzki, D. (2005). “Biomedical Academic Entrepreneurship through the SBIR Program”. NBER Working Paper No. 11450 ,
Trajtenberg, M. (1990). “A Penny for Your Quotes: Patent Citations and the Value of Innovations.” RAND Journal of Economics, 21(1), 172–187.
Tushman, M. and Anderson, P. (1986). “Technological Discontinuities and Organizational Environments.” Administrative Science Quarterly, 31, 439–465.
Urabe, K. (1988). “Innovation and the Japanese Management System.” In Urabe, K., Child, J. and Kagono, T., eds., Innovation and Management: International Comparisons. Berlin: Walter de Gruyter.
Utterback, J. and Abernathy, W. (1975). “A Dynamic Model of Process and Product Innovation.” Omega, 3(6), 639–656.
Wessner, Charles. (2000). The Small Business Innovation Research Program (SBIR). Washington D.C.: National Academy Press,
Williamson, O. (1975). Markets and Hierarchies New York: The Free Press .
Winter, S., (1984). “Schumpeterian competition in alternative technological regimes," Journal of Economic Behavior & Organization, 5(34), 287-320
Zucker, L., Darby, M. and Armstrong, J. (2002). “Commercializing knowledge: university science, knowledge capture, and firm performance in biotechnology.” Management Science, 48(1), 138–153.
Zucker, L., Darby, M. and Brewer, Ma. (1997). “Intellectual Human Capital and the Birth of U.S. Biotechnology Enterprises”, American Economic Review (87). 290-306.