Embed Size (px)
Citation preview
Secondary Metabolites of Marine-Derived Fungi: Natural Product Chemistry and Biological Activity
D i s s e r t a t i on zur
Erlangung des Doktorgrades (Dr. rer. nat.) der
Mathematisch-Naturwissenschaftlichen Fakultät der
Rheinischen Friedrich-Wilhelms-Universität Bonn
vorgelegt von Ahmed Abdel-Azim Mahdy Abdel-Lateff
aus Ägypten
Bonn 2004
Angefertig mit Genehmigung der Mathematisch-Naturwissenschaftlichen Fakultät der Rheinischen Friedrich-Wilhelms-Universität Bonn
1. Referentin: Prof. Dr. G. M. König 2. Referent: PD. Dr. W. Knöss
Vorveröffentlichungen der Dissertation /In Advance Publications of the
Dissertation
Teilergebnisse aus dieser Arbeit wurden mit Genehmigung der Mathematisch-Naturwissenschaftlichen Fakultät, vertreten durch die Mentorin/Betreuerin der Arbeit, in folgenden Beiträgen vorab veröffentlicht: Parts of the results of this study have been published in advance by permission of the Mathematisch-Naturwissenschaftlichen Fakultät, represented by the supervisor of this study: Publikationen /Research Papers Ahmed Abdel-Lateff, Gabriele M. König, Katja M. Fisch, Ulrich Höller, Peter G. Jones, and Anthony D. Wright; New Antioxidant Hydroquinone Derivatives from the Algicolous Marine Fungus Acremonium sp. J. Nat. Prod. 2002, 65, 1605-1611.
Ahmed Abdel-Lateff, Christine Klemke, Gabriele M. König, and Anthony D. Wright; Two New Xanthone Derivatives from the Algicolous Marine Fungus Wardomyces anomalus J. Nat. Prod. 2003, 66, 706-708.
Ahmed Abdel-Lateff, Katja M. Fisch, Gabriele M. König, and A. D. Wright; A New Antioxidant Isobenzofuranone Derivative from the Algicolous Marine Fungus Epicoccum sp. Planta Med. 2003, 69, 831-834. Ahmed Abdel-Lateff, Stefan Kehraus, Anja Krick, Anthony D. Wright, and Gabriele M. König, Novel Sorbicillinoid Derivatives from the Marine Fungus Trichoderma viride Associated with the Caribbean Sponge Agelas dispar, in preparation. Tagungsbeiträge/Research Presentations A. Abdel-Lateff, G. M. König, K. M. Fisch, U. Höller, P. G. Jones, A. D. Wright; New Antioxidant Hydroquinone Derivatives from the Algicolous Marine Fungus Acremonium sp. Poster presented at 50th G A Annual Congress, Barcelona, Spain, 8-12 September 2002.
A. Abdel-Lateff, G. M. König, A. D. Wright; A New Isobenzofuranone derivative from Epicoccum sp., a fungus associated with Fucus vesiculosus Poster presented at the third Euroconference on Marine Natural Products, Elmau Castle, Bavaria, 15-20 September 2002.

A. Abdel-Lateff, G. M. König, A. D. Wright; Three New Xanthone Derivatives from the Algicolous Marine Fungus Wardomyces anomalus. Poster presented at the third Euroconference on Marine Natural Products, Elmau Castle, Bavaria, 15-20 September 2002.
Acknowledgements I wish to express my sincere gratitude to Prof. Dr. G. M. König for supervising this study, suggesting the research project, guiding, and sponsoring this work, and also for providing excellent both scientific and working facilities. She always had time for questions and discussions. I am very lucky being one of her students.
I would like to express my sincere gratitude to Prof. Dr. Mohamed M. Kalifa (Dean of faculty of Pharmacy, El-Menia University, Egypt) and Prof. Dr. Mohamed A. A. R. ElShanawany (Dean of faculty of Pharmacy, Assuit University, Egypt) for their help to gain my scholarship.
I would like to express my thanks to PD. Dr. W. Knöss for accepting the co-examination. I would like to thank Dr. A. D. Wright for introducing me to the world of chemical structures, his scientific instructions in the spectral interpretation and sponsoring part of my work. I would like to express my deep thanks to Dr. Ulrich Höller for guiding me in the first step of the spectral interpretation, helping in structural elucidation of Acremonium hydroquinones, fruitful and also effective cooperation. I would like to express my deep gratitude to Dr. Stefan Kehraus for showing me NMR measurements, helping in structural elucidation of Trichoderma polyketides and solving most of the technical problems which occurred during this thesis. This study is dealing with marine fungi which, were isolated by Dr. Ulrich Höller and Dr. Claudia Osterhage during their Ph.D. study. I am grateful for being allowed to work with this resource. I would like to extend my thanks to Prof. Dr. P. G. Jones (Institut for Inorganic and Analytical Chemistry, TU Braunschweig) for performing the single crystal X-ray analysis of 2-(1-methylethylidene)-pentanedioic acid (5) and epicoccone (17). Thanks also go to Prof. Dr. Heinz-Herbert Fiebig and his group (Institute for Experimental Onkology in Freiburg) for performing the antitumor activity of Trichoderma metabolites. I would like to thank Dr. Anja Krick for measuring LC-ESIMS spectra of some Trichoderma polyketides, helping me in the ESIMS spectral interpretation, and for introducing me to HPLC-DAD.
Dr. G. Eckhardt, Ms. C. Sondag and Ms. K. Peters (Department of Chemistry, University Bonn) are grateful thanked for EI, FAB and ESI-MS measurements. Part of this study was an excursion to Egypt financially supported from the Egyptian government. The aim was the collection of some algal samples useful for the isolation of fungi. Important arrangements were done by Prof. Ahmed Abdella (Department of Chemistry, Faculty of Science, El-Menia University, Egypt), Dr. Kamel Shaker (Department of Pharmaceutical Science, National Resaerch Centre, Egypt), and Dr. Mary Hana (National Resaerch Centre, Egypt). Finally, the algal samples were collected and identified by Dr. Mohamed Hegazi (Marine Science Department, Faculty of Science, Suiz Canal University). I am profoundly grateful to these scientists. I would like to extend my thanks to Mr. Harald Gross for his assisting me in solving technical problems concerning computational ware. Thanks go to Mr. C. Dreikorn ELISAs and agar diffusion assays; to Ms Edit Neu for performing a part of agar diffusion assays; to Ms. Katja M. Fisch for performing antioxidative activity assays, to Mr. Markus Nett for testing the Trichoderma metabolites for estrogenic activities. Finally, thanks go to Ms. Christine Klemke, Doris Akkermann, and Daniela Müller for performing ELISAs assays. I would like express my deep thanks Ms. E. Gassen, and Ms. J. Dornbusch for their indispensable help concerning against administrative issues. I would like express my deep thanks to Ms. Amal Abdoun, and Ms. Kamilia Sheha (Egyptian Culture Office, Berlin, Germany) for their valuable help regarding administrative issues of the scholarship. Special thanks also go to all members of the Institut für Pharmazeutische Biologie, Universität Bonn, for their hospitality and friendliness. I would like to express my sincere thanks to the Egyptian government for a PhD scholarship, and also for the financial support of the collection trip to Egypt in 2002. Financial support from the Bundesministerium für Bildung und Forschung (BMBF) is also gratefully acknowledged.
Abbreviations
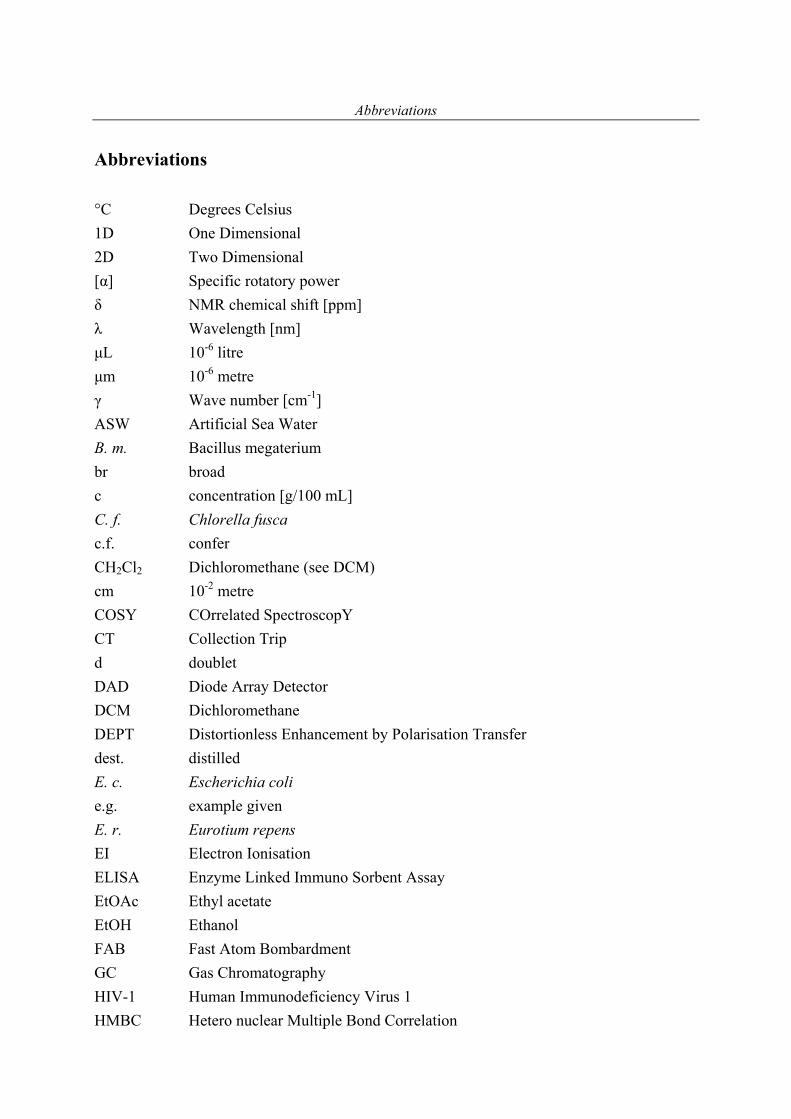
Abbreviations °C Degrees Celsius 1D One Dimensional 2D Two Dimensional [α] Specific rotatory power δ NMR chemical shift [ppm] λ Wavelength [nm] µL 10-6 litre µm 10-6 metre γ Wave number [cm-1] ASW Artificial Sea Water B. m. Bacillus megaterium br broad c concentration [g/100 mL] C. f. Chlorella fusca c.f. confer CH2Cl2 Dichloromethane (see DCM) cm 10-2 metre COSY COrrelated SpectroscopY CT Collection Trip d doublet DAD Diode Array Detector DCM Dichloromethane DEPT Distortionless Enhancement by Polarisation Transfer dest. distilled E. c. Escherichia coli e.g. example given E. r. Eurotium repens EI Electron Ionisation ELISA Enzyme Linked Immuno Sorbent Assay EtOAc Ethyl acetate EtOH Ethanol FAB Fast Atom Bombardment GC Gas Chromatography HIV-1 Human Immunodeficiency Virus 1 HMBC Hetero nuclear Multiple Bond Correlation
Abbreviations
HMQC Hetero nuclear Multiple Quantum Coherence HPLC High Performance Liquid Chromatography HR High Resolution Hz Hertz IC Inhibition Concentration IR Infrared J Spin-spin coupling constant [Hz] m multiplet (in connection with NMR data) M. m. Mycotypha microspora M. v. Microbotryum violaceum MeOH Methanol MHz Megahertz min minute mL 10-3 litre mM 10-3 Mol m. p. melting point MS Mass Spectrometry nm 10-9 metre NMR Nuclear Magnetic Resonance NOE Nuclear Overhauser Effect ppm parts per million q quartet RI Refractive Index RP Reversed Phase RT Room Temperature RT Reverse Transcriptase (in connection with HIV-1) s singlet sp. species t triplet TK Tyrosine Kinase TLC Thin Layer Chromatography UV Ultra Violet VLC Vacuum-Liquid Chromatography
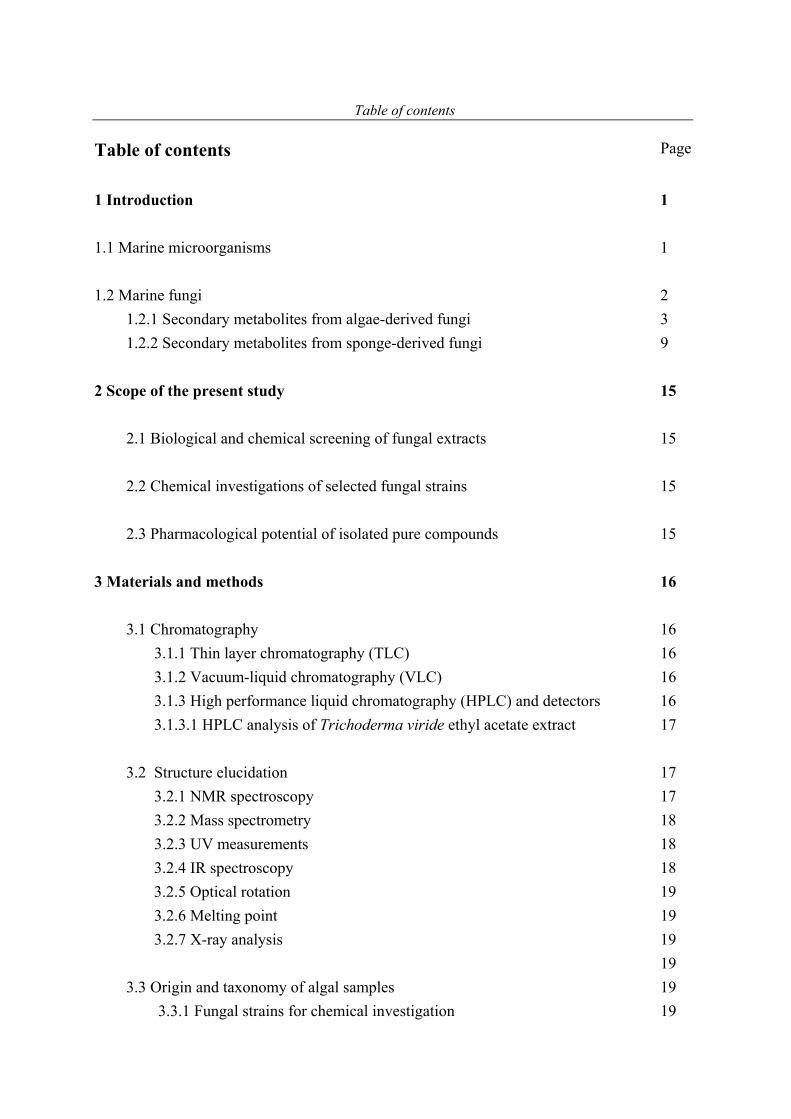
Table of contents
Table of contents Page
1 Introduction 1 1.1 Marine microorganisms 1 1.2 Marine fungi 2 1.2.1 Secondary metabolites from algae-derived fungi 3 1.2.2 Secondary metabolites from sponge-derived fungi 9 2 Scope of the present study 15 2.1 Biological and chemical screening of fungal extracts 15 2.2 Chemical investigations of selected fungal strains 15 2.3 Pharmacological potential of isolated pure compounds 15 3 Materials and methods 16 3.1 Chromatography 16 3.1.1 Thin layer chromatography (TLC) 16 3.1.2 Vacuum-liquid chromatography (VLC) 16 3.1.3 High performance liquid chromatography (HPLC) and detectors 16 3.1.3.1 HPLC analysis of Trichoderma viride ethyl acetate extract 17 3.2 Structure elucidation 17 3.2.1 NMR spectroscopy 17 3.2.2 Mass spectrometry 18 3.2.3 UV measurements 18 3.2.4 IR spectroscopy 18 3.2.5 Optical rotation 19 3.2.6 Melting point 19 3.2.7 X-ray analysis 19 19 3.3 Origin and taxonomy of algal samples 19 3.3.1 Fungal strains for chemical investigation 19
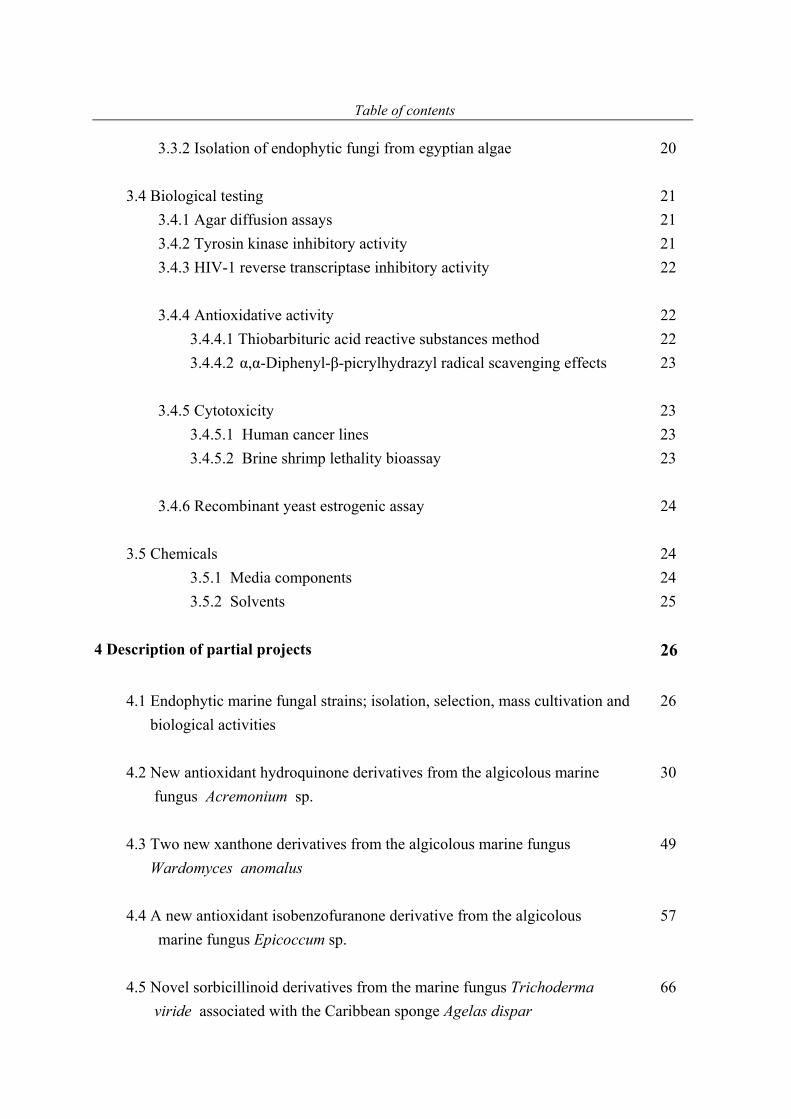
Table of contents
3.3.2 Isolation of endophytic fungi from egyptian algae 20 3.4 Biological testing 21 3.4.1 Agar diffusion assays 21 3.4.2 Tyrosin kinase inhibitory activity 21 3.4.3 HIV-1 reverse transcriptase inhibitory activity 22 3.4.4 Antioxidative activity 22
3.4.4.1 Thiobarbituric acid reactive substances method 22 3.4.4.2 α,α-Diphenyl-β-picrylhydrazyl radical scavenging effects 23
3.4.5 Cytotoxicity 23 3.4.5.1 Human cancer lines 23 3.4.5.2 Brine shrimp lethality bioassay 23 3.4.6 Recombinant yeast estrogenic assay 24 3.5 Chemicals 24 3.5.1 Media components 24 3.5.2 Solvents 25 4 Description of partial projects 26
4.1 Endophytic marine fungal strains; isolation, selection, mass cultivation and biological activities
26
4.2 New antioxidant hydroquinone derivatives from the algicolous marine
fungus Acremonium sp. 30
4.3 Two new xanthone derivatives from the algicolous marine fungus Wardomyces anomalus
49
4.4 A new antioxidant isobenzofuranone derivative from the algicolous
marine fungus Epicoccum sp. 57
4.5 Novel sorbicillinoid derivatives from the marine fungus Trichoderma
viride associated with the Caribbean sponge Agelas dispar 66
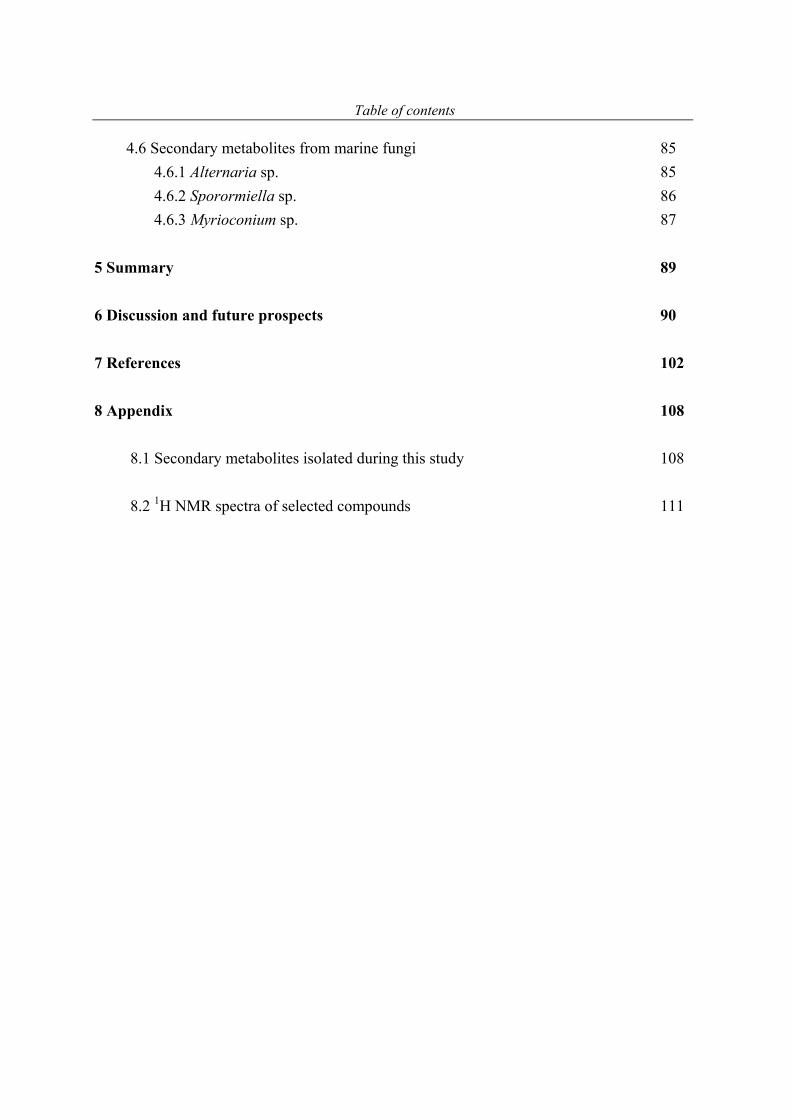
Table of contents
4.6 Secondary metabolites from marine fungi 85 4.6.1 Alternaria sp. 85 4.6.2 Sporormiella sp. 86 4.6.3 Myrioconium sp. 87 5 Summary 89 6 Discussion and future prospects 90 7 References 102 8 Appendix 108 8.1 Secondary metabolites isolated during this study 108 8.2 1H NMR spectra of selected compounds 111

Introduction
1
1 Introduction 1.1 Marine microorganisms Marine microorganisms, particularly fungi and bacteria, have provided new incentives for marine natural products research over the past 15 years, and also continue to be the subject of vigorous chemical investigation (Liberra & Lindequist, 1995; Faulkner, 2001; Blunt et al., 2003). The diversity of secondary metabolites reported during the recent decade is fascinating. This highlights the importance of marine microorganisms as a source of natural products (König & Wright, 1996; Pietra, 1997; Faulkner, 2000 a and b). The marine environment comprises nearly three quarters of the earth’s surface, and can be considered a soup of essentially all imaginable types of microbes (König & Wright, 1999). They may occur suspended, on living or inanimate surfaces as epibionts, or as symbionts. Microorganisms play important roles in all the major elemental cycles in the oceans (Hawksworth, 1991), and are intimately involved in ecological phenomena, e.g. biofouling, settlement, and metamorphosis. The marine environment is unique in terms of its specific composition in both organic and inorganic substances, as well as temperature ranges, and pressure conditions. Ecological niches e.g. deep-sea hydrothermal vents, mangrove forests, algae, sponge, and fish provide habitats for the evaluation of specific microorganisms (Kohlmeyer, 1979). The difficulties associated with the collection of marine macroorganisms as well as the inadequate amount of the bioactive substance isolated (Proksch et al., 2002), motivated many research groups to investigate the microbes associated with them, or those found directly in the water column and/or marine sediments (König & Wright, 1996). There are some advantages obvious when investigating microbes as compared to macroorganisms. These include; e.g. biotechnological fermentations with different parameters are possible without ecological exploitation, reisolation of the compounds is possible after large scale cultivation of the microorganism, and microorganisms are easier manipulated genetically. On this basis, marine microbes become a central topic for many groups investigating natural products with the aim of finding pharmaceutical drugs or compounds useful for agriculture (Osterhage, 2001). An endophyte (Tan and Zou, 2001) is a bacterium (including actinomycetes) or fungal micro-organism, which spends the whole or part of its life cycle colonizing inter- and/or intra-cellular space inside the healthy tissues of the host plants, typically causing no apparent symptoms of disease. Often endophytes remain asymptomatic for many years and only
Introduction
2
become parasitic when their hosts are stressed. For the isolation of endophytes it is important that collected algal material looks healthy, it must not have any visual symptoms of disease (Osterhage Dissertation, 2001). 1.2 Marine fungi Marine microbes, particularly fungi, have recently been utilized as a new source of novel bioactive secondary metabolites (Biabani & Laatsch, 1998; König & Wright, 1999). This study is thus devoted to the investigation of some marine fungal strains, derived from algae or sponges, and aims at finding new natural products with biological activity and/or novel chemical structures. The kingdom of fungi is the second largest group after insects, and widely distributed in nature. Fungi occur in Antarctic ice, tropical, and temperate regions. They inhabit soils, the surface of mountain rocks, and seawater (Feofilova, 2001). Fungi parasitize plants, protozoa, fishes, insects, and mammals. The generally accepted estimate of the number of the fungal species on Earth is a conservative 1.5 million (Hawksworth & Rossman, 1997). Although it is uncertain exactly how many fungal species are already known, one can be reasonably sure that it is in the range of 72,000 to 100,000. This implies that the fungi known today do not exceed 5% of all existing species. Evidently, the majority of fungi inhabiting the world have not yet been described. This implies that fungi represent an enormous source for natural products with diverse chemical structures and activities (Hawksworth, 1991, 1997). Fungi from marine habitats are separated into obligate and facultative marine species, the former being restricted to the marine environment and the latter occurring also in freshwater or terrestrial localities, or both (Kohlmeyer, 1974). In 1991 Kohlmeyer & Volkmann-Kohlmeyer listed 321 filamentous higher marine fungi. Their key included 255 Ascomycetes, 60 mitosporic fungi, and only six Basidiomycetes. The isolation of a fungal strain from a marine sample does not prove that this fungus is actively living in the marine environment. It is always possible to isolate a terrestrial fungus being a contaminant in the marine habitat. Possibly such a fungal isolate was dormant in the form of spores or hyphen fragments until the surrounding conditions in the laboratory became favorable for germination and growth. Most fungi isolated from marine samples are not proven to be obligate or facultative marine. Thus, the more general expression marine-derived fungi is used (Kohlmeyer & Kohlmeyer, 1979).
Introduction
3
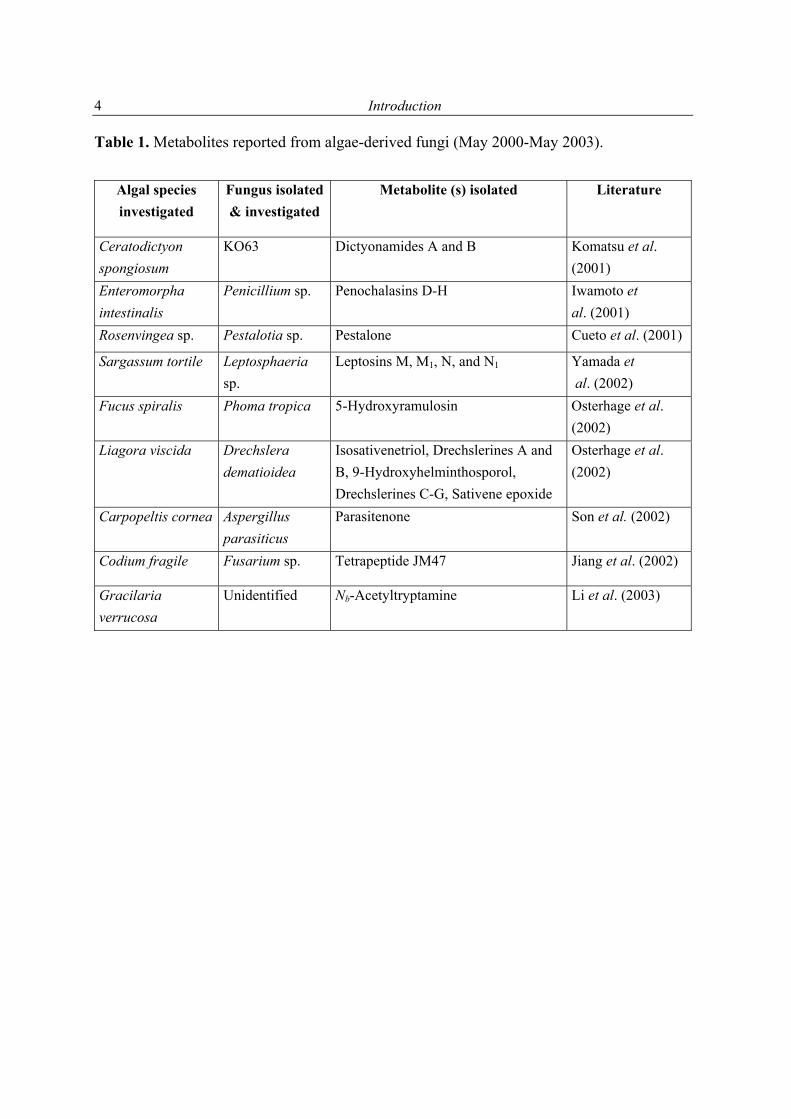
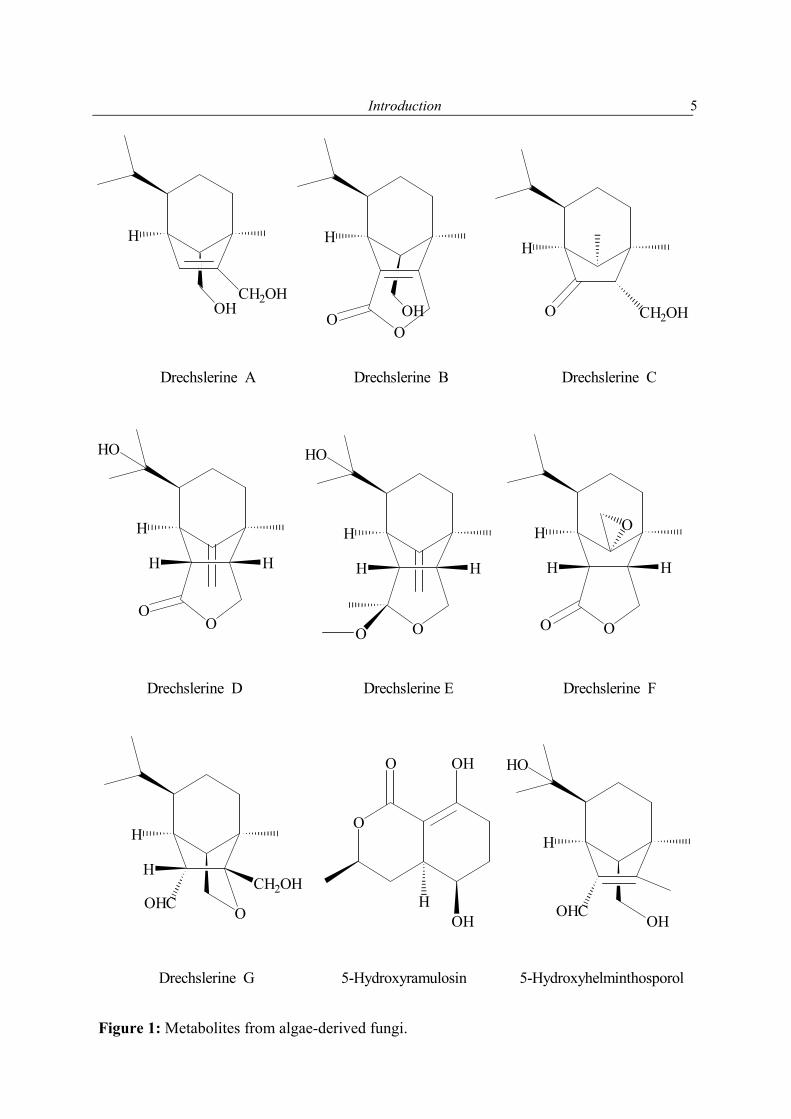
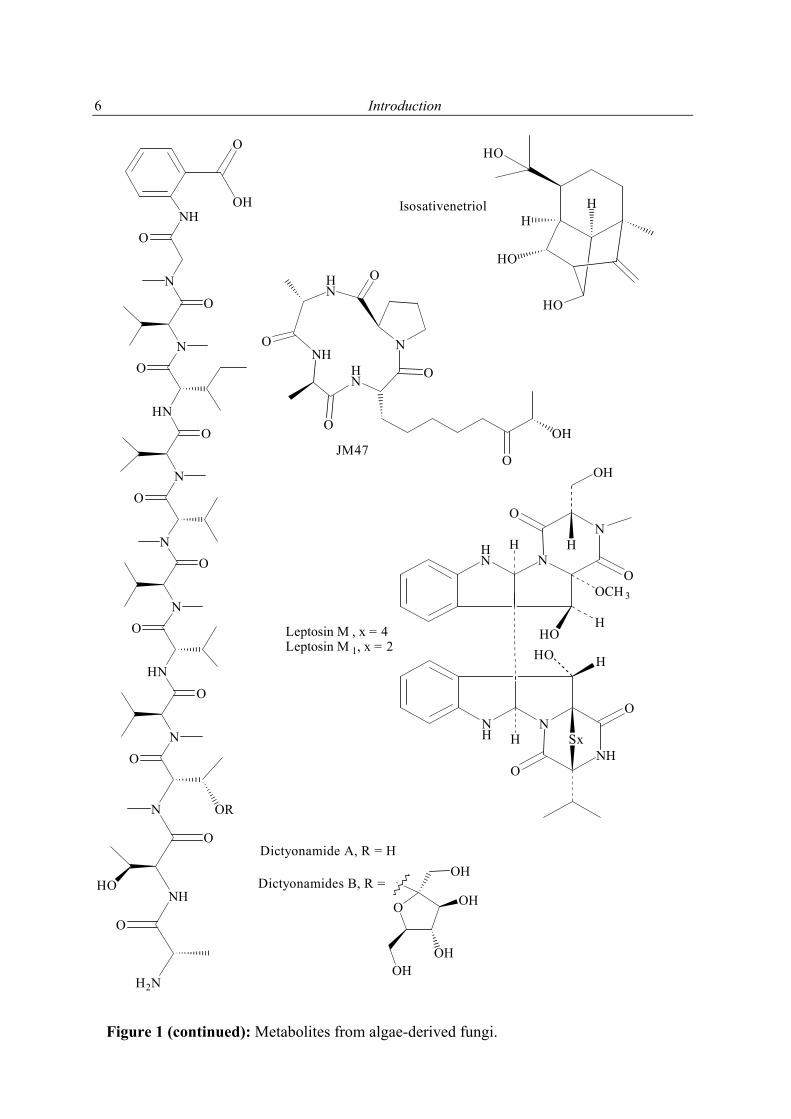
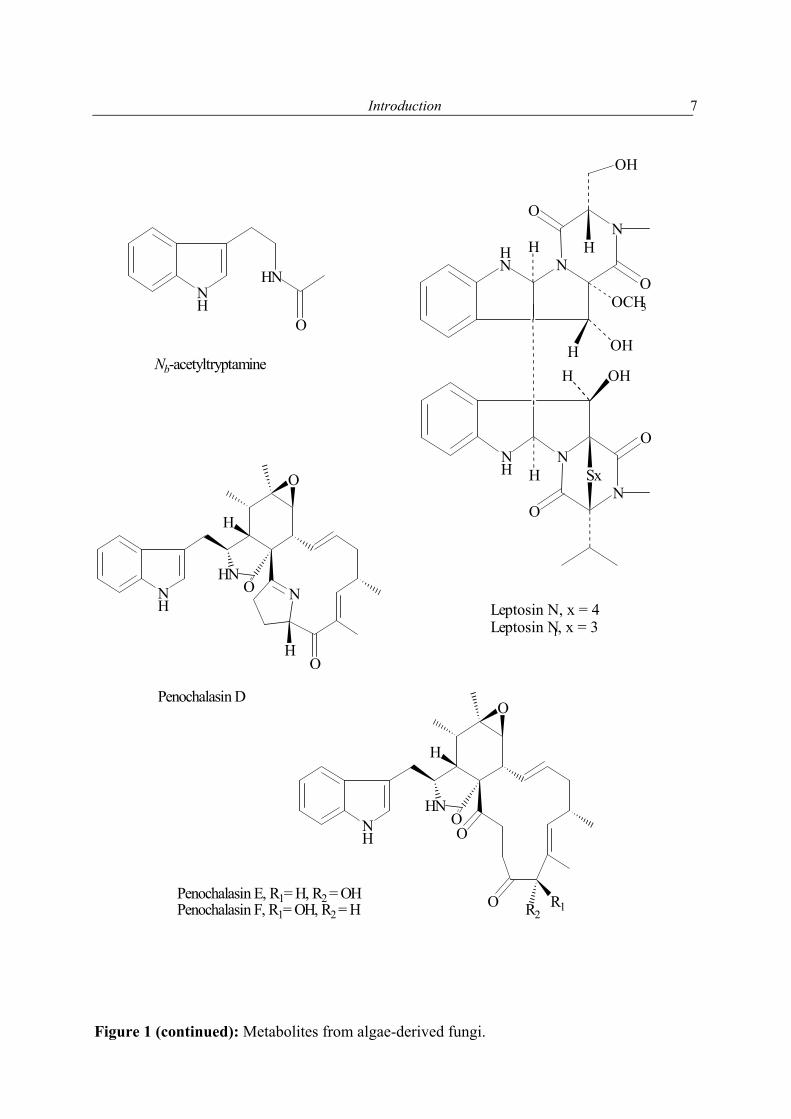
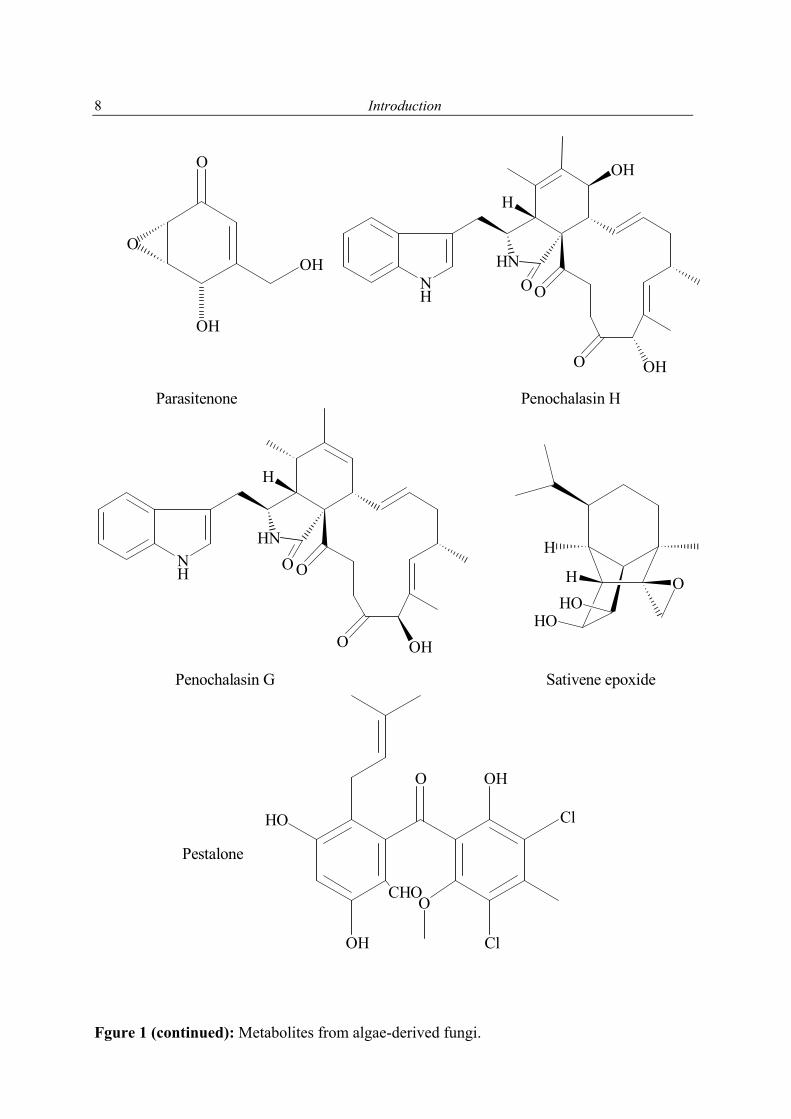
1.2.1 Secondary metabolites of algae-derived fungi Special ecological niches in the marine environment have been observed as interesting for many natural products chemists. Such niches are marine microorganisms associated with macroorganisms e.g. algae, sponges. Most kinds of macroorganisms e.g. algae, sponges, corals, tunicates, and fish have extensively been investigated for their natural products content (Faulkner, 2001). These macroorganisms also serve as hosts for microorganisms and were recently considered as an important source of natural products. The current project focused on fungi associated with marine algae and sponges. Natural products in these association may have an ecological purpose. In many cases the natural function of secondary metabolites is, however unknown (König & Wright, 1996). There are several reviews dealing with marine fungal metabolites (Faulkner, 2001; Pietra, 1997). They covered the isolated metabolites till 2000. In addition to this reviews, Dr. Claudia Osterhage, a prior Ph. D. student in our group, listed the metabolites isolated from algicolous fungi for the period from 1993 till May 2000. For these reasons only the metabolites isolated from algicolous fungi after May 2000 up to May 2003 are listed in Table 1. In Figure 1 the chemical structures of the compounds are shown (drawn in an alphabetical order).
Introduction
4
Table 1. Metabolites reported from algae-derived fungi (May 2000-May 2003).
Algal species investigated
Fungus isolated & investigated
Metabolite (s) isolated Literature
Ceratodictyon spongiosum
KO63 Dictyonamides A and B Komatsu et al. (2001)
Enteromorpha intestinalis
Penicillium sp.
Penochalasins D-H
Iwamoto et al. (2001)
Rosenvingea sp. Pestalotia sp. Pestalone Cueto et al. (2001)
Sargassum tortile Leptosphaeria sp.
Leptosins M, M1, N, and N1 Yamada et al. (2002)
Fucus spiralis Phoma tropica 5-Hydroxyramulosin Osterhage et al. (2002)
Liagora viscida Drechslera dematioidea
Isosativenetriol, Drechslerines A and B, 9-Hydroxyhelminthosporol, Drechslerines C-G, Sativene epoxide
Osterhage et al. (2002)
Carpopeltis cornea Aspergillus parasiticus
Parasitenone Son et al. (2002)
Codium fragile Fusarium sp. Tetrapeptide JM47 Jiang et al. (2002)
Gracilaria verrucosa
Unidentified Nb-Acetyltryptamine Li et al. (2003)
Introduction
5
OOH
H
OOH
H
CH2OH
Drechslerine A Drechslerine B Drechslerine C
H
CH2OH
O
H
O
Drechslerine D Drechslerine E Drechslerine F
O
HH
HO
O
H
HH
HO
O O
H
HH
O
O
O
O OH
OHH
Drechslerine G 5-Hydroxyramulosin 5-Hydroxyhelminthosporol
H
CH2OHH
OHCO
H
OHCOH
HO
Figure 1: Metabolites from algae-derived fungi.
Introduction
6
NH
N
N
HN
N
N
N
HN
N
O
O
O
O
O
O
O
O
O
N
NH
H2N
O
HO
O
O
OH
OR
Dictyonamide A, R = H
Dictyonamides B, R =
O
OH
OH
OHOH
O
OH
HN
N
O
ONH
O
HN
O
JM47
HO
HO
H
HO
HIsosativenetriol
HN N
NH
N
N
NH
O
OOCH 3
HHO
HHO
O
O
H
OH
H
Sx
H
Leptosin M , x = 4 Leptosin M 1, x = 2
Figure 1 (continued): Metabolites from algae-derived fungi.
Introduction
7
NH
O
NHN
O
H
O
H
Penochalasin D
HN N
NH
N
N
N
O
OOCH3
OHHOHH
O
O
H
OH
H
Sx
H
Leptosin N, x = 4 Leptosin N1, x = 3
NH
Nb-acetyltryptamine
HN
O
NH O
HNO
O
H
O R1R2
Penochalasin E, R1= H, R2 = OHPenochalasin F, R1= OH, R2 = H
Figure 1 (continued): Metabolites from algae-derived fungi.
Introduction
8
H
OHHO
HO
O OH
HO
OH
CHOO
Cl
Cl
Pestalone
NH O
HNO
H
O OH
OHO
OH
OH
O
Parasitenone Penochalasin H
NH O
HNO
H
O OH
Penochalasin G Sativene epoxide
Fgure 1 (continued): Metabolites from algae-derived fungi.
Introduction
9
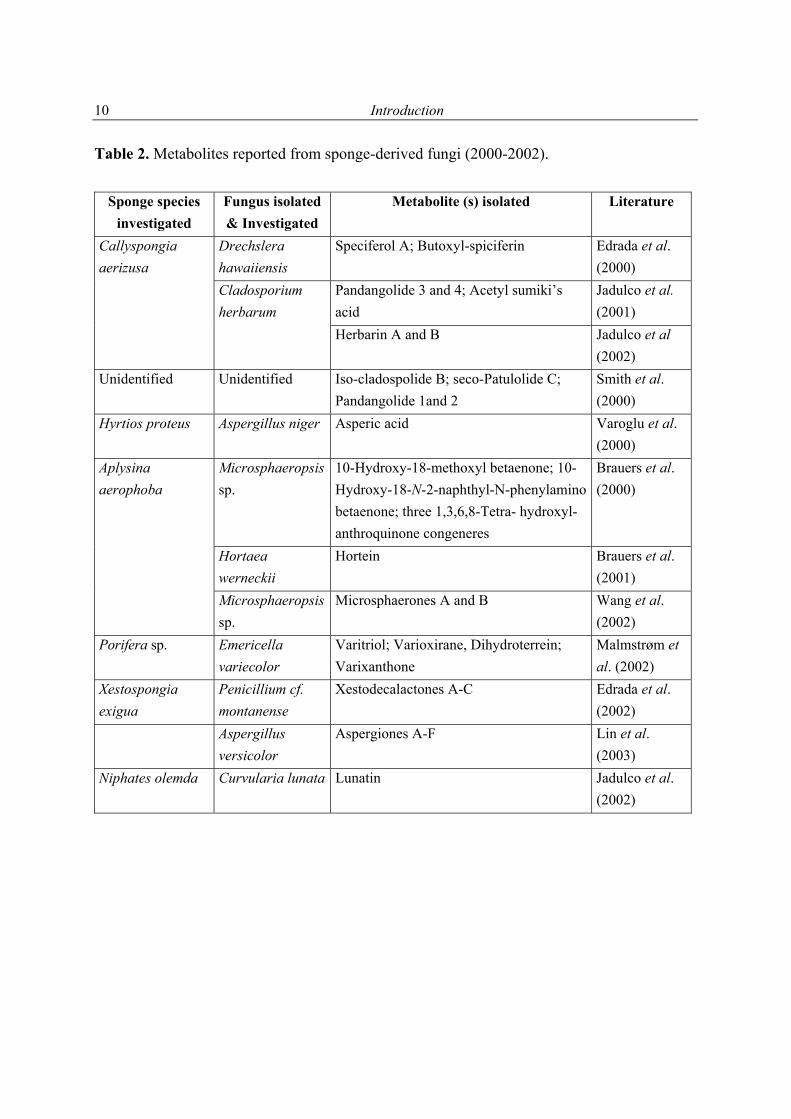
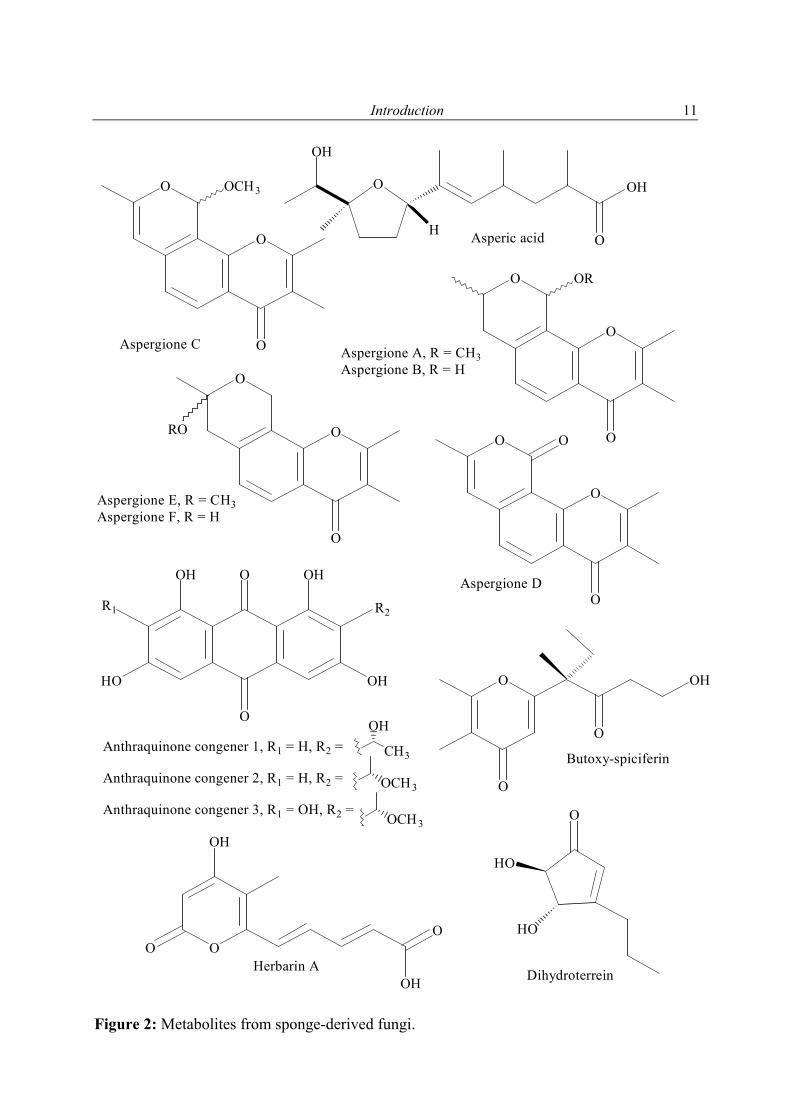
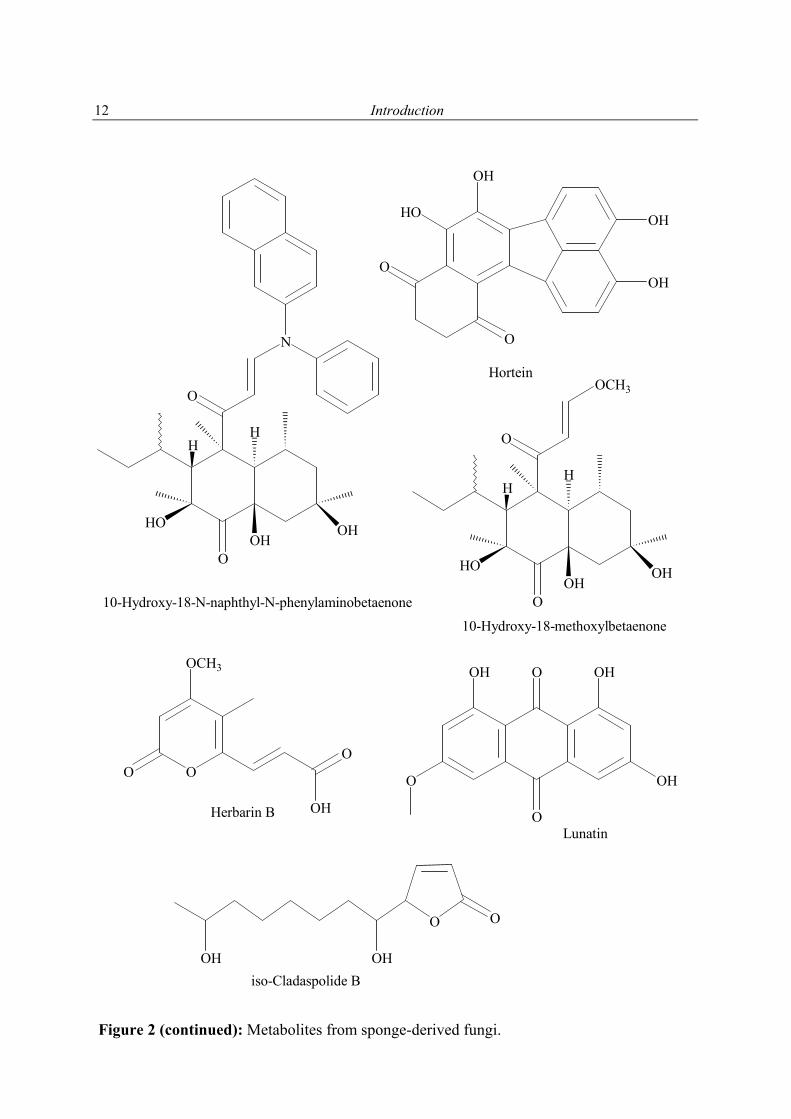
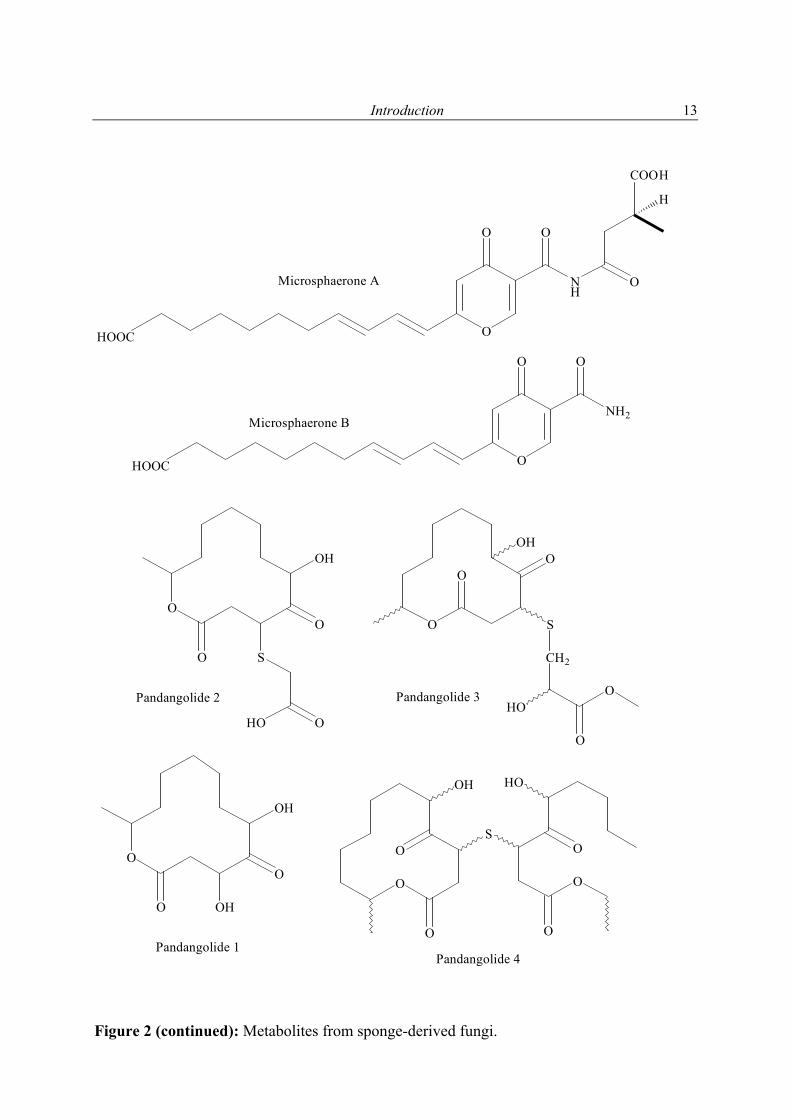
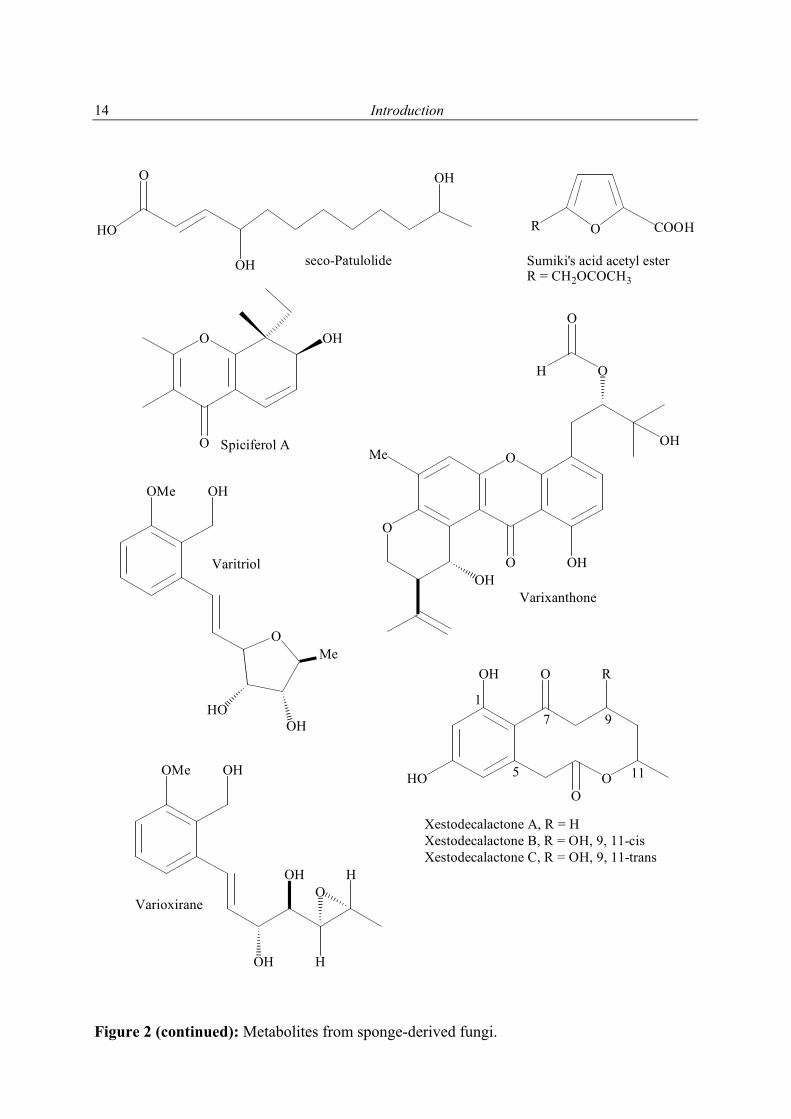
1.2.2 Secondary metabolites from sponge-derived fungi As some marine microorganisms survive under extreme environmental conditions, it can be expected that they may have evolved to biosynthesize biologically active chemical compounds (Brauers et al., 2000). They often live in symbiosis with soft bodied filter feeding invertebrates such as sponges, and their bioactive metabolites may be interpreted as chemical mediated defense mechanisms for protecting their host organism from environmental dangers such as predation (Proksch et al., 2002). The association between sponge and microorganisms probably dates back to 500 million years ago (Friedrich et al., 1999). The relationship between marine invertebrate (sponge) and marine microorganisms (fungi or bacteria) may be manifold, it can serve as food or just live inside it. Thus, this relation is complex and far from being understood (Proksch et al., 2002, Steinert et al., 2000). The relationship between host sponges and fungi is still unknown; only marine Ascomycetes of the genus Koralionastes have been reported to be in some way associated with crustaceous sponges (Kohlmeyer & Volkmann-Kohlmeyer, 1991). As sponges are filter-feeding organisms, which take up the spores and mycelium fragments from seawater, the development of these fungi under laboratory conditions does not mean that they are active inside the sponge (Höller et al., 2000; Biabani et al., 1998). The isolation of a fungus from a marine organism also does not indicate whether the fungus is obligate or facultative marine (Proksch et al., 2002). As mentioned before, there are valuable reviews dealing with marine fungi (Liberra & Lindequist, 1995; Pietra, 1997; Faulkner, 2001; Blunt et al., 2003). In addition to these reviews, Dr. Ulrich Höller, a former Ph. D. student in our group, listed the metabolites isolated from sponges-derived fungi in the time between 1993 and 1998. For these reasones only the metabolites which were isolated after this date are listed in Table 2 (1998-May 2003). In Figure 2 the chemical structures of the compounds are shown (drawn in an alphabetical order).
Introduction
10
Table 2. Metabolites reported from sponge-derived fungi (2000-2002).
Sponge species investigated
Fungus isolated & Investigated
Metabolite (s) isolated Literature
Drechslera hawaiiensis
Speciferol A; Butoxyl-spiciferin Edrada et al. (2000)
Pandangolide 3 and 4; Acetyl sumiki’s acid
Jadulco et al. (2001)
Callyspongia aerizusa
Cladosporium herbarum
Herbarin A and B Jadulco et al (2002)
Unidentified
Unidentified Iso-cladospolide B; seco-Patulolide C; Pandangolide 1and 2
Smith et al. (2000)
Hyrtios proteus Aspergillus niger Asperic acid Varoglu et al. (2000)
Microsphaeropsis sp.
10-Hydroxy-18-methoxyl betaenone; 10-Hydroxy-18-N-2-naphthyl-N-phenylamino betaenone; three 1,3,6,8-Tetra- hydroxyl- anthroquinone congeneres
Brauers et al. (2000)
Hortaea werneckii
Hortein Brauers et al. (2001)
Aplysina aerophoba
Microsphaeropsis sp.
Microsphaerones A and B Wang et al. (2002)
Porifera sp. Emericella variecolor
Varitriol; Varioxirane, Dihydroterrein; Varixanthone
Malmstrøm et al. (2002)
Xestospongia exigua
Penicillium cf. montanense
Xestodecalactones A-C Edrada et al. (2002)
Aspergillus versicolor
Aspergiones A-F Lin et al. (2003)
Niphates olemda Curvularia lunata Lunatin Jadulco et al. (2002)
Introduction
11
O
O
O
O
O
O
O
O
O
O
O
O
OR
OCH3
ORO
Aspergione A, R = CH3Aspergione B, R = H
Aspergione C
Aspergione D
Aspergione E, R = CH3Aspergione F, R = H
O
O OHOH
HO OH
R1 R2
Anthraquinone congener 1, R1 = H, R2 = Anthraquinone congener 2, R1 = H, R2 =
Anthraquinone congener 3, R1 = OH, R2 =
CH3
OCH3
OCH3
OH
O
OH
O
OH
H Asperic acid
O
HO
HO
Dihydroterrein
O
O
OH
Butoxy-spiciferin
O
OO
O
OH
OHHerbarin A
Figure 2: Metabolites from sponge-derived fungi.
Introduction
12
HO
OCH3
O
OOH
OH
HH
10-Hydroxy-18-methoxylbetaenone
OO
O
OCH3
OHHerbarin B
HO
N
O
OOH
OH
HH
10-Hydroxy-18-N-naphthyl-N-phenylaminobetaenone
O
OOH
OH
OH
HO
Hortein
O
O OHOH
O OH
Lunatin
O O
OHOHiso-Cladaspolide B
Figure 2 (continued): Metabolites from sponge-derived fungi.
Introduction
13
O
OH
Pandangolide 3
Pandangolide 1
O
OHO
O
O
HOOC
O
NH2Microsphaerone B
O
O
HOOC
O
NH
O
H
COOH
Microsphaerone A
Pandangolide 2
O
OH
S
HO O
O
O
O
O S
OOH
CH2
HO
O
O
O O
O O
OH HO
S
OO
Pandangolide 4 Figure 2 (continued): Metabolites from sponge-derived fungi.
Introduction
14
OMe OH
OHO
H
H
OH
Varioxirane
OMe OH
O
OHHO
Me
Varitriol
OR COOH
O
O
OH
Spiciferol A
OH
OH
O
HO
seco-Patulolide
OO
O
HO
OH R
Xestodecalactone A, R = HXestodecalactone B, R = OH, 9, 11-cisXestodecalactone C, R = OH, 9, 11-trans
Sumiki's acid acetyl esterR = CH2OCOCH3
O
O
O
OHOH
OH
O
O
H
Me
Varixanthone
5
9
11
17
Figure 2 (continued): Metabolites from sponge-derived fungi.
Scope of the present study
15
2 Scope of the present study The main objective of the present study was the isolation of new and preferably biologically active secondary metabolites from marine microorganisms, especially marine-derived fungi. Marine fungi were obtained from macroalgae and to a lesser extent from sponges. 2.1 Biological and chemical screening of fungal extracts After taxonomical identification of fungal strains, isolates belonging to typical marine genera were selected for further investigation. Small scale cultivation and extraction enabled biological activity testing. These tests mainly consisted of agar diffusion assays for antibacterial, antifungal and antialgal activity. An additional investigation by 1H NMR was used for chemical characterisation of the fungal extract. The results obtained with these methods were used for the selection of strains for detailed chemical investigation. 2.2 Chemical investigation of fungal strains Large-scale cultivation, extraction and separation using diverse chromatographic methods, mainly HPLC, was to be employed, in order to isolate pure compounds. Structure elucidation was performed using mainly 1D NMR and 2D NMR techniques, and by physical characterisation of the isolated metabolites. 2.3 Pharmacological potential of isolated pure compounds Each pure compound obtained during this study was to be tested in as many different bioassays as possible. Especially antimicrobial, antioxidant and enzyme inhibitory activities were to be evaluated with the help of collaborating scientists.
Materials and methods
16
3 Materials and methods The special materials and methods used during this study are described in detail in the "Description of partial projects" chapter as they are of specific interest for the respective study. This chapter describes the general materials and methods, which were used in many or all partial projects in order to avoid repetitions. 3.1 Chromatography 3.1.1 Thin layer chromatography (TLC) TLC was carried out using either TLC aluminium sheets silica gel 60 F254 (Merck 5554) or pre-coated TLC plates SIL RP-18W / UV 254 (Macherey-Nagel). Standard chromatograms of fungal extracts were prepared by applying 20 µL solution (5 mg/mL) to a silica gel TLC plate and developing it with DCM/MeOH (95/5 v/v) under saturated conditions. Chromatograms were detected under UV light (254 and 366 nm), and with vanillin-H2SO4 reagent (1g vanillin dissolved in 100 ml H2SO4, heated at 100 °C after spraying). 3.1.2 Vacuum-liquid chromatography (VLC) Sorbents for VLC were either silica gel 60 (0.063-0.200 mm, Merck 7734; Merck 7739; normal-phase) or Polyprep 60-50 C18 (Machery-Nagel 71150; reversed-phase). Columns were filled with the appropriate sorbent soaked with petroleum ether or MeOH. Before applying the sample, the column was equilibrated with the first designated eluent. 3.1.3 High performance liquid chromatography (HPLC) and detectors HPLC was carried out either using a Merck-Hitachi system equipped with an L-6200A Intelligent Pump, a L-4500A diode array detector, a D-6000A interface with D-7000 HSM software, a Rheodyne 7725i injection system, or a system equipped with a Waters associates chromatography pump, a Knauer Differential refractometer, a Rheodyne 7725i injection system and a Linseis L 200 E recorder. If not stated otherwise, the system with differential refractometer as detector was used. Columns used were either a Knauer Spherisorb S ODS 2 (5 µm, 250 x 8 mm), a Merck LiChrospher Si 60 (5 µm, 250 x 7 mm), or similar columns. Typical flow rates were 2.0 - 3.0 mL/min, or 1.0 mL/min in special cases (see partial project chapter). All solvents were distilled prior to use. The eluents were degassed under reduced pressure. If not stated otherwise, samples were diluted in the eluent to yield solutions of 20-40
Materials and methods
17
mg/mL. Injected amounts usually equalled 5-10 mg of extract/run. 3.1.3.1 HPLC analysis of Trichoderma viride ethyl acetate extract The HPLC analysis was performed on a Waters apparatus (four solvent delivery systems model 600 controller pump, automatic sample injector model 717, and photodiode array detector model 996, using RP-HPLC column (XTerra RP-18, 5 µm, 250 x 4.6 mm, Waters). Data acquisition and quantification were performed with Millennium 32 version 3.1 software (Waters). The mobile phase was gradient elution from 70:30 H2O:MeOH to 30:70 H2O:MeOH, for 60 min; then to MeOH, for 40 min; followed by 10 min MeOH, finally, return back to 70:30 H2O:MeOH in 5 min. The injecting volume of the ethyl acetate extract was 25 µl of 2 mg/mL (methanol). All the compounds were detected at λmax 360 nm and 300 nm. Before each elution the column calibrated for 20 minuts. 3.2 Structure elucidation Structures were elucidated mainly using 1D and 2D NMR techniques and various MS methods. If necessary, additional parameters such as optical rotation, UV and IR properties were determined. Identity of isolated compounds with compounds reported in literature was judged, if not stated otherwise, based on 1H and 13C NMR spectroscopic data, and specific optical rotation. Literature searches were done using Chapman & Hall Natural Products on CD-ROM (Buckingham, 2001), and Beilstein on-line databases. Structures were designated as new, if they could not be found in Beilstein database and Chemical Abstracts. 3.2.1 NMR spectroscopy
1H NMR spectra of extracts and pure compounds as a purity check were recorded at the Pharmaceutical Biology Institute, Bonn, on Bruker Avance 300 DPX spectrometer operating at 300 MHz or a Bruker Avance 500 DRX spectrometer operating at 500 MHz (with (CD3)2CO, or MeOH-d4, or C6D6, or CDCl3 as solvent). 1H NMR spectra of pure compounds and all other NMR measurements were performed at Pharmaceutical Biology Institute on Bruker DPX-300, or at Pharmaceutical Chemistry Institute on Bruker DRX-500 NMR spectrometer operating at 300, or 500 MHz (1H), and 75.5, or 125 MHz (13C), respectively. Spectra of pure compounds were processed using Bruker 1D WIN-NMR or 2D WIN-NMR software. They were calibrated using solvent signals (13C: CDCl3 77.0 ppm, CD3OD 49.0 ppm, C6D6 128.0 ppm, (CD3)2CO 29.8 ppm) or a signal of the portion of the partly or not deuterated solvent (1H: CHCl3 in CDCl3: 7.26 ppm, CH3OH in CD3OD: 3.35 ppm, C6H6 in C6D6: 7.20, (CH3)2CO in (CD3)2CO: 2.04 ppm). Multiplicity for 13C was deduced from DEPT
Materials and methods
18
experiments; s = C, d = CH, t = CH2, q = CH3. Structural assignments were based on spectra resulting from one or more of the following NMR experiments: 1H, 13C, DEPT, 1H-1H COSY, 1H-13C direct correlation (HMQC), 1H-13C long-range correlation (HMBC), 2D NOESY and 1H difference NOE. 3.2.2 Mass spectrometry Mass spectral measurements were performed by Dr. G. Eckardt, Ms. C. Sondag and Ms. K. Peters (All Department of Chemistry, University of Bonn) using a Kratos MS 50 (EI), Kratos Concept 1H (FAB) and a Finnigan MAT 95 (EI, ESI) spectrometer. The GC-MS analysis was carried out on a Perkin-Elmer (Auto system XL) gas chromatograph equipped and coupled to a Perkin-Elmer Turbomass spectrometer with a 30 m x 0.32 mm N931-6023 Pe-1 (film thickness of 0.25 µm) capillary column. The instrument was set to an initial temperature of 50 °C, and maintained at this temperature for 10 min. At the end of this period the oven was heated at 10°/min up to 250°C, and kept there for 10 min. Injection port temperature was 220°C, He flow rate was 2 mL/min, and samples were injected in splitless mode. Mass spectral scan range was 35-650 Da. LC-ESIMS experiments were carried out on API 2000, Triple Quadrupole LC-MS/MS, Applied Biosystems/MDS Sciex equipped with Agilent 1100 Serie incl. DAD. The column was Macherey-Nagel Nucleodure 100-5 C18 HPLC column, 2mm x 125 mm. The solvents were (A) 2 mmol aqueous NH4Ac and (B) 2 mmol NH4Ac of MeOH, employing gradient elution from 9:1 H2O:MeOH to MeOH in 20 min, followed by 10 min MeOH, 0.25 mL/min, 10 µL injecting volume of 1mg/mL of the total extract. Following are the MS parameters: ionization mode, positive and negative mode; scan range, 100-700 amu; scan rate, 0.5 scan/sec; and cone voltage, 20 eV. 3.2.3 UV measurements UV spectra were recorded a Perkin-Elmer Lambda 40 with a UV WinLab software, using 1.000 cm quartz cells (Institute for Pharmaceutical Biology, University Bonn). 3.2.4 IR spectroscopy IR spectra were recorded a Perkin-Elmer spectrometer, Spectrum BX Instruments with FT-IR Paragon 1000 PC software, at the Institute for Pharmaceutical Biology, University of Bonn.
Materials and methods
19
3.2.5 Optical rotation Optical rotations were measured by using a Jasco DIP 140 Polarimeter (Institute for Pharmaceutical Biology, University of Bonn). The tested samples were dissolved in the proper solvent (e.g. MeOH or CHCl3). Then transferred into specific cell (10.0 cm) and using a Monochromatic Sodium D-line light by 589 nm at room temperature (22-23°C). 3.2.6 Melting point Melting points were measured by Leitz 350 Microscope Heating Stage and are not corrected. 3.2.7 X-ray analysis The single crystal X-ray analysis of 2-(1-methylethylidene) pentanedioic acid (5) was performed by Prof. Dr. P. G. Jones, Institute for Inorganic and Analytical Chemistry, TU Braunschweig. Crystals were grown from MeOH. 3.3 Origin and taxonomy of fungal samples 3.3.1 Fungal strains for chemical investigation All chemically investigated fungi, in this study, were obtained from fungal culture collection of Professor G. M. König (Pharmaceutical Biology Institute, University Bonn), and were isolated by former Ph. D. student Dr. Ulrich Höller and Claudia Osterhage. Acremonium sp., closely related to A. roseogriseum (S. B. Saksena) W. (Hypocreace, Ascomycota, M 1-11-1, 506) was isolated from the brown alga Cladostephus spongius (Hudson) C. Agardh, collected at the Spanish coast (Moraira, Mediterranean Sea). Alternaria sp. (Pleosporaceae, Ascomycota, M7-19, 539), isolated from red alga, Jania rubens L. (Corallinaceae), collect from water around Island of Morira, Mediterranean sea. Epicoccum sp. (Tuberculaiaceae, Hyphomycetes, N1-12, 353), was isolated from the brown alga Fucus vesiculosus L., collected at the German coast (Tönning, North Sea). Myrioconium sp. (Coelomycetes Ascomycota, Cux 3-10, 547), isolated from Fucus vesiculosus. L CUX-3 (Fucaceae), was collected from water around the Cuxhaven, North Sea.
Materials and methods
20
Sporormiella sp. (Anamorph, Ascomycota, G 2-1, 493), isolated from brown alga Stypopodium sp. (Stypocaulaceae). Trichoderma viride Persoon in Römer (Hypocreaceae, Ascomycota, 193E61, 54), was isolated from the sponge Agelas dispar J (Family Agelasidae, order Agelasida, CT193 E), collected by divers from the waters around the Caribbean Island of Dominica. Wardomyces anomalus Brooks & Hansford (Microascaceae, Ascomycota, OS4T3-2-1, 406), was isolated from the green alga Enteromorpha sp. (Ulvaceae) collected around Fehmarn island in the Baltic Sea. 3.3.2 Isolation of endophytic fungi from egyptian algae All algal samples were stored in sterile ASW supplied with 250 mg/L benzylpenicillin and 250 mg/L streptomycin sulphate at 4 °C for a week until examination. Algal samples were sliced aseptically into small pieces and placed in EtOH (70 %) or sodium hypochlorite solution (3.5 %), rinsed three times with sterile DW to remove the EtOH, and placed on isolation media. Surface sterilization time was optimised for each alga before placing cubes onto isolation medium. For the inoculation of algal samples medium I was used containing antibiotics (250 mg/L benzylpenicillin and 250 mg/L streptomycin sulphate). Samples were incubated at RT (Approx. 20 °C). Fungal colonies were transferred to one or more of the media for identification. These included media II, III. The preservation and maintenance of stock cultures were carried out in test tubes using medium 1V, then kept at 4 °C. Medium 1: Standard nutrient agar (SNA): KH2PO4 1 g/L, KNO3 1 g/L, MgSO4 × 7 H2O
0.5 g/L, KCl 0.5 g/L, glucose × H2O 0.2 g/L, sucrose 0.2 g/L, agar 20 g/L.
Medium II: Glucose peptone yeast extract agar (GPY): glucose × H2O 1 g/L, peptone from soymeal 0.5 g/L, yeast extract 0.1 g/L, agar 15 g/L, ASW IL.
Medium III: Biomalt 20 g/L, agar 20 g/L and ASW 1 L.
Medium 1V: Biomalt 50 g/L, agar 20 g/L and ASW 1 L.
Materials and methods
21
3.4 Biological testing 3.4.1 Agar diffusion assays Agar diffusion assays were carried out in principle according to Schulz et al. (1995). Test organisms were the bacteria Bacillus megaterium de Bary (gram positive) and Escherichia coli (Migula) Castellani & Chambers (gram negative), the fungi Microbotryum violaceum (Pers.) Roussel (Ustomycetes), Mycotypha microspora Fenner (Zygomycetes), and Eurotium repens Corda (Ascomycetes), and the alga Chlorella fusca Shih Krauss (Chlorophyceae). Sample solutions contained 5 mg/mL extract or 1 mg/mL pure compound. Samples were prepared by taking 50 µL of each solution and pipetting it onto a sterile antibiotic filter disk (Schleicher & Schuell 2668), which was then placed onto the appropriate agar medium and sprayed with a suspension of the test organism. Growth media, preparation of spraying suspensions, and conditions of incubation were as employed by Schulz et al. (1995). The radii of the resultant zones of inhibition were measured from the edge of the filter disks. For extracts, a growth inhibition zone or complete inhibition zone ≥3 mm and /or a complete inhibition ≥1 mm were regarded as a positive result; growth inhibition: growth of the appropriate test organism was significantly inhibited compared to a negative control; complete inhibition: no growth at all in the appropriate zone. 3.4.2 Tyrosine kinase inhibitory activity The DMSO sample solution of the appropriate extract/pure compound was diluted with H2O (1:1 v/v) to yield corresponding sample solutions (1 mg/mL). TK inhibitory activity was determined using a commercial test kit (Tyrosine Kinase Assay Kit, non-radioactively, Boehringer Mannheim, Cat. No. 1 534 513), modified by Dr. G. F. Matthée (Dissertation, 1999). Assays were carried out by Christine Klemke using T cell tyrosine kinase p56lck
(Upstate Biotechnology). Sample solutions were incubated with 1 µM TK substrate II, biotin-labelled (Boehringer Mannheim), 1 mM ATP, 10 mM MgCl2, 1 U TK p56lck, 20 µL dilution buffer, and 20 µL assay buffer for 1 h at 30 °C. The resultant concentration of the extract/compound in the test mixture was 200 µg/mL. Dilution buffer (pH 7.0) contained 25 mM 4-(2-hydroxyethyl)-1-piperazineethanesulphonic acid (HEPES), 10 % glycerol, and 0.1 % ethylphenolpoly(ethylene-glycolether)n (NP-40). Assay buffer (pH 7.5) contained 250 mM Tris, 25 mM NaF, 2.5 mM EDTA-Na2, 4.0 mM [ethylenebis (oxyethylene-nitrilo)] tetraacetic acid (EGTA), 5 mM DTT, and 150 µM Na3VO4. The enzyme activity was determined as described in the TK Assay Kit, except the measuring wavelength was 415 nm instead of 405
Materials and methods
22
nm. In each test series 3 mM piceatannol (Boehringer Mannheim) was included as a positive control. Samples which reduced the enzyme activity to 60 % or less relative to a negative control were regarded as active. 3.4.3 HIV-1 reverse transcriptase inhibitory activity The assay was performed by Mr. C. Dreikorn according to a protocol established by Dr. G. F. Kirsch (2000). DMSO standard solutions of the appropriate extracts/compounds were diluted with lysis buffer (1:10 v/v) to yield corresponding sample solutions. HIV-1 RT inhibitory activity was measured using 20 µL of the sample solution, 20 µL lysis buffer, and 20 µL reaction mixture which were then incubated for 1 h at 37 °C. The resultant concentration of the extract in the test mixture was 66 µg/mL. Lysis buffer (pH 7.8) contained 1 ng recombinant HIV-1 RT (Boehringer Mannheim), 50 mM Tris, 80 mM KCl, 2.5 mM dithiothreitol (DTT), 0.75 mM ethylenediamintetraacetic acid (EDTA), and 0.5 % Triton-X100. The reaction mixture contained template/primer hybrid poly(A)*oligo(dT)15 (600A260 nm/mL), 8 µM thymidine-5'- triphosphate (dTTP), 8 µ M digoxigenin- and biotin-labeled-2'-deoxy-(uridine-5'- triphosphate) (dUTP), 40 µ M TrisHCl, 230 mM KCl, 24 mM MgCl2, and 8 mM DTT (all Boehringer Mannheim). Enzyme activity was measured following the ELISA protocol described by Eberle & Seibl (1992) at λ = 415 nm versus λ = 490 nm using an ELISA reader (Rainbow, SLT Labinstruments Deutschland GmbH). As a positive control, 10 µ M of phosphonoformic acid (Sigma) was included in each test series. Extracts which reduced the enzyme activity to 80 % or less relative to a negative control were regarded as active. 3.4.4 Antioxidative activity 3.4.4.1 Thiobarbituric acid reactive substances method (TBARS assay) The method used was adapted from Wallin et al. (1993) and modified by K. M. Fisch as follows: Assays were performed in flat bottom polystyrene 96 well microtiter plates. The final volume of the reaction mixture in the oxidation step of linolenic acid methyl ester was 70 µL/well. The solution was made of 40 µL of 50 mM phosphate buffer (pH = 7.2), 10 µL of 10 % (w/v) sodium dodecyl sulphate, 5 µL of sample in ethanol (1 mg/mL and 0.2 mg/mL), 5 µL linolenic acid methyl ester 70 mM in ethanol, and finally 10 µL of 0.08 % (w/v) FeSO4.7H2O in 0.025 M HCl. Plates were placed in a thermomixer and incubated at 50 °C and 500 rpm for 30 min. At the end of this period 5 µL butylated hydroxytoluene (BHT) 15 mM in ethanol was added immediately so as to prevent further oxidation. To each well 20 µL of 50 % (w/v)
Materials and methods
23
trichloroacetic acid and 40 µL of 0.88 % (w/v) thiobarbituric acid, dissolved in 0.3 % (w/v) NaOH, were added. The plate was then covered with a micromat and incubated at 60 °C and 500 rpm for a further 30 min. At the end of this period the plate was maintained at room temperature for 4 min and the absorbances then determined at 532 nm, less the background absorbance at 600 nm, using a SLT Spectral Rainbow microtiter plate reader. 3.4.4.2 α,α-Diphenyl-ß-picrylhydrazyl (DPPH) radical scavenging effects Assays were performed in flat bottom polystyrene 96 well microtiter plates. The DPPH radical scavenging effects of the total extract and compounds were performed by using a modified previously established methodology (Blois et al., 1958 and Amarowicz et al., 2000). To 100 µL of each sample (1 mg/mL) in EtOH 25 µL DPPH (1 mM) in EtOH was added. The resultant mixture was briefly shaken and maintained at room temperature, in the dark for 30 min. At the end of this period the absorbance of the mixture was measured at 517 nm, using a SLT Spectral Rainbow microtiter plate reader. 3.4.5 Cytotoxicity 3.4.5.1 Human cancer cell lines The cytotoxicity was carried out at the Institute for Experimental Onkology in Freiburg, through the cooperation with Prof. Dr. Heinz-Herbert Fiebig. Ten human cancer lines were tested i.e. three lung carcinoma (LCL H460, LXFL 529L, and LXFA 629L), two breast cancer (MACL MCF7, and MAXF 401NL) two melanoma (MEXF 462NL and MEXF 486L), two kidney cancer (RXF 944L and RXF 486L) and a uterine cancer (UXF 1138L). The assays were performed as previously published (Grever et al., 992). 3.4.5.2 Brine shrimp lethality bioassay Brine shrimps (Artemia salina) is a simple convenient general bioassay and also indicative for cytotoxicity (Meyer et al., 1982; Solis et al., 1993). The brine shrimp eggs were hatched in artificial seawater (ASW). 40 mg/L of the eggs supplemented with 6 mg/L dried yeast and oxygenated with aquarium pump for 48 hours in room temperature (22-25°C). 100 µL of the sample solution (1 mg/mL) transferred into sterile microtiter plate. The plate left till evaporated over night. Then 150 µL of the A. salina culture medium together with a few A. salina larvae was added, followed by 150 µL water. For each sample four replicate were performed. After 24 and 48 hours the plates were examined under a binocular microscope and
Materials and methods
24
the numbers of dead (non-motile) nauplii in each well were counted aginst the negative control. Culture medium for A. salina: 2.4 g Tris, 25.7 g NaCl, 4.7 MgCl2 (presolved), 0.7 g KCl, 0.2 g Na2CO3 (presolved), 6.4 g MgSO4 (presolved), 1.1 g CaCl2 (presolved), 1000 mL aqua bidest, adjusted to pH 7.1, stored at 4 °C or 10.0 g spezial artemia salt (Dohse aquaristik Bonn), 1000 mL aqua bidest. Culture: 0.3 g Artemia cysts/400mL culture medium (RT) in a 1 L beaker covered with gas was ventilated under oxygen for 48 h. Collecting: The adult were collected by using a brine-shrimp sieve (Dohse aquaristik Bonn). 3.4.6 Recombinant yeast estrogenic assay The assay was performed by Mr. M. Nett (Pharmaceutical Biology Institute, University of Bonn). Details procedure and medium components of this assay have been previously described (Routledge and Sumpter, 1996). In brief, yeast cells transfected with the human estrogen recptor (ERα) gene, together with expression plasmids, were incubated in medium containing the extract or pure compounds, in addition to the chromogenic substrate, chlorophenol red-β-D-galactopyranoside (CPRG). Upon binding the active ligand, the estrogen-occupied receptor intertacts with transcription factors and other transcriptional componenta to modulate gene transcription. This causes expression of the reporter gen Lac-Z and the enzyme produced (galactosidase) is secreted into the medium, which causes the CPRG to change into red product that can be measured by absorbance at λmax 540 nm. 3.5 Chemicals 3.5.1 Media components: Agar (Fluka 05040) Biomalt (Villa Natura, Kirn) Malt extract (Merck 5391) Peptone from casein, tryptic digest (Fluka 70172) Peptone from meat, enzymatic digest (Fluka 70175) Peptone from Soya meal, papain-digested (Merck 7212) Yeast extract (Fluka 70161)
Materials and methods
25
Benzylpenicillin (Fluka 13750) Streptomycin sulphate (Fluka 85880) Water used was de-ionised using a Millipore (milli-Q®) system. All other chemicals/components were research grade, and if not stated otherwise in the text, supplied by Merck. 3.5.2 Solvents: EtOH for UV-measurements was from Merck (Uvasol®980). All other solvents were research grade and supplied by Merck, except n-BuOH (Roth). Water used was deionised using a Millipore (milli-Q®) system. Acetone, CHCl3, DCM, EtOAc, hexane, cyclohexane, MeOH and petroleum ether were distilled prior to use. Acetone-d6 (Chemotrade 97509, 99.8 % D). Methanol-d4 (ICB 0844-25, 99.8 % D). Benzene-d6 Chemotrade, 99.87 % D).
Endophytic fungi
26
4 Description of partial projects
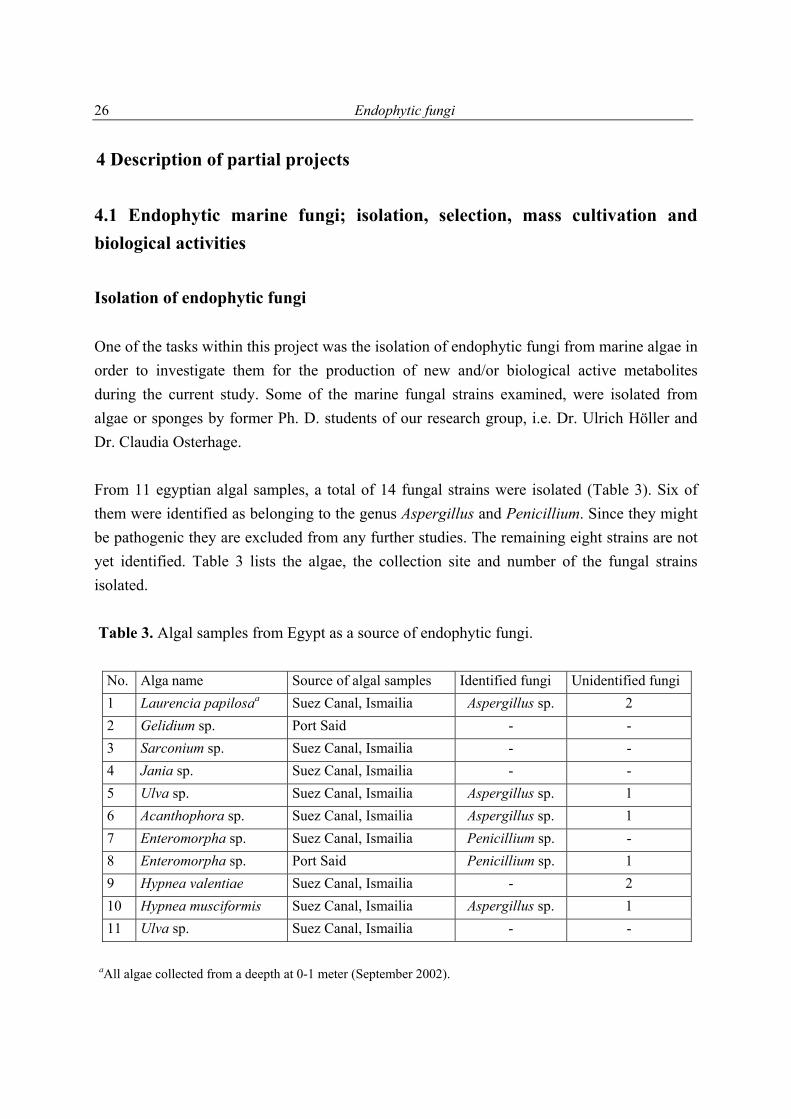
4.1 Endophytic marine fungi; isolation, selection, mass cultivation and biological activities Isolation of endophytic fungi One of the tasks within this project was the isolation of endophytic fungi from marine algae in order to investigate them for the production of new and/or biological active metabolites during the current study. Some of the marine fungal strains examined, were isolated from algae or sponges by former Ph. D. students of our research group, i.e. Dr. Ulrich Höller and Dr. Claudia Osterhage. From 11 egyptian algal samples, a total of 14 fungal strains were isolated (Table 3). Six of them were identified as belonging to the genus Aspergillus and Penicillium. Since they might be pathogenic they are excluded from any further studies. The remaining eight strains are not yet identified. Table 3 lists the algae, the collection site and number of the fungal strains isolated. Table 3. Algal samples from Egypt as a source of endophytic fungi.
No. Alga name Source of algal samples Identified fungi Unidentified fungi 1 Laurencia papilosaa Suez Canal, Ismailia Aspergillus sp. 2 2 Gelidium sp. Port Said - - 3 Sarconium sp. Suez Canal, Ismailia - - 4 Jania sp. Suez Canal, Ismailia - - 5 Ulva sp. Suez Canal, Ismailia Aspergillus sp. 1 6 Acanthophora sp. Suez Canal, Ismailia Aspergillus sp. 1 7 Enteromorpha sp. Suez Canal, Ismailia Penicillium sp. - 8 Enteromorpha sp. Port Said Penicillium sp. 1 9 Hypnea valentiae Suez Canal, Ismailia - 2 10 Hypnea musciformis Suez Canal, Ismailia Aspergillus sp. 1 11 Ulva sp. Suez Canal, Ismailia - -
aAll algae collected from a deepth at 0-1 meter (September 2002).
Endophytic fungi
27
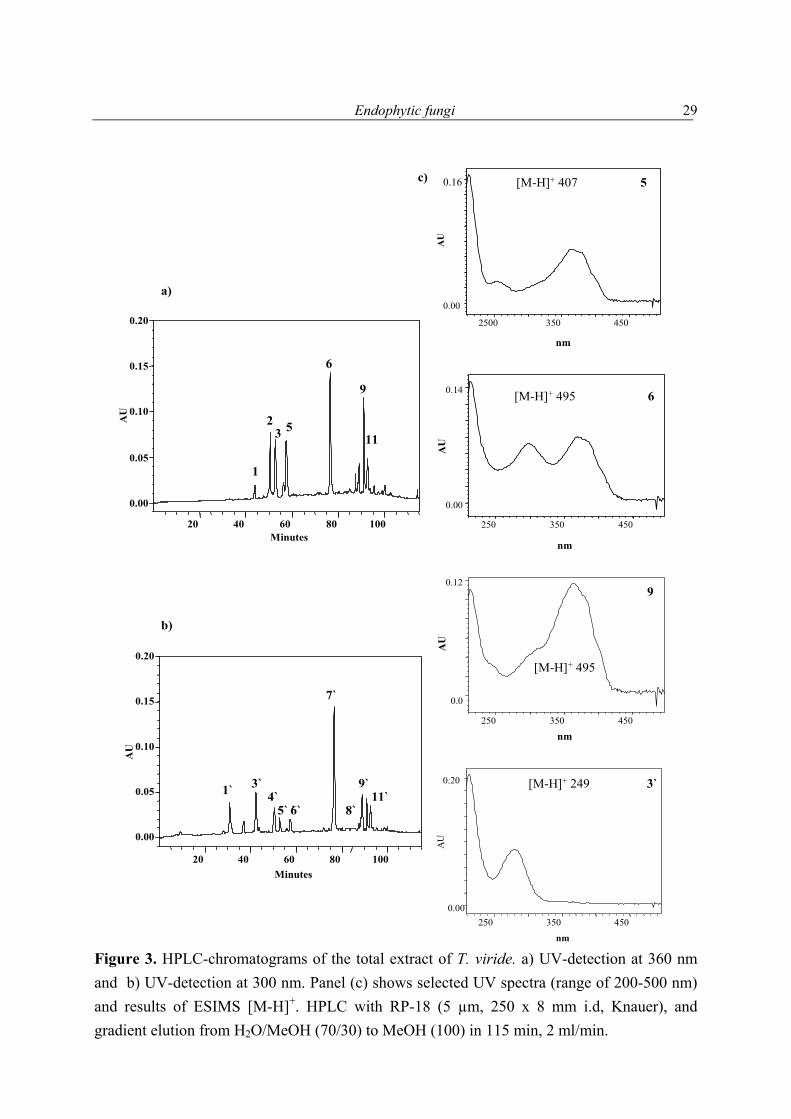
Selection of strains for further investigations of their secondary metabolites, example Trichoderma viride The selection of strains for mass cultivation was based on the biological activity of the extract, and/or secondary metabolites detected in 1H NMR spectra, especially from signals present in the δ 5-9 region. In some cases, the total extract was subjected to further analysis employing HPLC-DAD and/or LC-ESIMS with the aim to confirm the 1H NMR data. As an example the HPLC-DAD and LC-ESIMS investigation of the ethylacetate extract of the fungus Trichoderma viride shall be discussed in this chapter. In all cases, a literature survey was performed to obtain information on published compounds from relevant genera, which revealed the ability of the selected strain might be producing variable structures. The ethylacetate extract of T. viride was analysed on reversed phase HPLC-DAD. A H2O/MeOH gradient from 70/30 to 0/100 H2O/MeOH on RP-18 used for this purpose. Thus, eleven peaks in the total extract of T. viride were detected at 360 nm (Fig. 3a), and also at 300 nm. The latter had partially different retention times (Fig. 3b) and thus, are different substances. Studying the UV spectra indicated that peaks 5, 6 and 9 possess a similar chromophore and comparable molecular weights as detected by LC-ESIMS. UV maxima and Rt (min) of Trichoderma extract: 213/280 at 42.5, 212/264/366 at 43.8, 212/363 at 50.5, 212/363 at 52.9, 212/366 at 56.3, 212/255/363 at 57.5, 213/298/369 at 76.7, 213/366 at 87.3, 212/297/374 at 88.9, 212/362 at 91.2, 213/272/306/406 at 92.7. T. viride extract was also analysed by LC-ESIMS (positive and negative mode), and eleven peaks were detected. LC-MS spectra allowed to deduce the molecular weight of the metabolites produced by T. viride. The positive mode ESIMS analysis led to detection of seven peaks [m/z/ Rt (min)] 265/8.6, 251/9.1, 225/15.0, 497/16.5, 499/19.1, 497/21.1, and 497/21.5. The negative mode ESIMS analysis led to the detection of ten peaks [m/z/ Rt (min)]: 263/8.6, 249/9.1, 359/13.5, 393/16.7, 495/16.5, 407/16.9, 407/18.1, 497/19.1, 495/ 21.1, and 495/21.5. Subtraction of the peaks detected by the two modes from each other showed that eleven individual peaks were detected. The results obtained from HPLC-DAD analysis were in a good agreement with those obtained from the LC-ESIMS analysis. A similar number of peaks was detected. UV maxima of some detected peaks indicated that those compounds had a similar chromophore, where others differed, selected spectra are shown in Figure 3C.
Endophytic fungi
28
Biological activity of the fungal strains All extracts were subjected to brine shrimp lethality and antibacterial, antifungal and antialgal assays. Few of them were tested for their antioxidant properties. The bioactivities will be disscussed in the individual partial projects. The combination of HPLC-DAD/MS results with those obtained from the 1H NMR spectrum and the biological assays, facilitated the selection of the seven fungal strains for chemical investigation. These fungi represented different genera. Six of them are mitosporic fungi i.e. Acremonium sp., Wardomyces anomalus,, Epicoccum sp., Trichoderma viride, Alternaria sp. and Myrioconium sp., and one is a fungus belonging to the Ascomycetes i.e. Sporormiella sp. (Table 4). Table 4. Selected fungi for chemical investigation. C. Noa Code Name
54 193E61 Trichoderma viride
353 N1-12 Epicoccum sp.
406 OS4T3-2-1 Wardomyces anomalus
493 G 2-1 Sporormiella sp.
506 M 1-11-1 Acremonium sp.
539 M7-19 Alternaria sp.
547 Cux 3-10 Myrioconium sp.
aThis number refers to the fungal collection (Pharmaceutical Biology Institute, Bonn).
Endophytic fungi
29
A
U
0.00
0.05
0.10
0.15
0.20
Minutes20 40 60 80 100
1
32 5
6
9
11A
U
0.00
0.16
nm
2500 350 450
[M-H]+ 407 5
AU
0.00
0.14
nm
250 350 450
[M-H]+ 495 6
AU
0.12
nm250 350 450
9
AU
0.00
0.05
0.10
0.15
0.20
Minutes20 40 60 80 100
1` 3`
7`
9`
8`11`4`
5` 6̀`
AU
0.00
0.20
nm
250 350 450
[M-H]+ 249 3`
[M-H]+ 495
a)
b)
c)
0.0
Figure 3. HPLC-chromatograms of the total extract of T. viride. a) UV-detection at 360 nm and b) UV-detection at 300 nm. Panel (c) shows selected UV spectra (range of 200-500 nm) and results of ESIMS [M-H]+. HPLC with RP-18 (5 µm, 250 x 8 mm i.d, Knauer), and gradient elution from H2O/MeOH (70/30) to MeOH (100) in 115 min, 2 ml/min.
Acremonium sp.
30
4.2 New antioxidant hydroquinone derivatives from the algicolous marine fungus Acremonium sp. Abstract A marine fungal isolate, identified as Acremonium sp., was mass cultivated and found to produce two novel hydroquinone derivatives, 7-isopropenylbicyclo[4.2.0]octa-1,3,5-triene-2,5-diol (1) and 7-isopropenylbicyclo-[4.2.0]octa-1,3,5-triene-2,5-diol-5-β-D-gluopyranoside (2). Compound 1 and its glucoside 2 possess a most unusual ring system. The new natural products (3R*,4S*)-3,4-dihydroxy-7-methyl-3,4-dihydro-1(2H)-naphthalenone (3) and (3S*, 4S*)-3,4-dihydroxy-7-methyl-3,4-dihydro-1(2H)-naphthalenone (4) were obtained as a 1:0.84 mixture. 2-(1-Methylethylidene) pentanedioic acid (5) was isolated for the first time as a natural product and its structure proven by X-ray analysis. In addition to these compounds an inseparable mixture of three new isomeric compounds, pentanedioic acid 2-(1-methyl-ethylidene)-5-methyl ester (6), pentanedioic acid 2-(1-methylethylidene)-1-methyl ester (7), and pentanedioic acid 2-(1-methylethenyl)-5-methyl ester (8), was also obtained. Isolated together with the new compounds were three known hydroquinone derivatives, 9-11. The structures of all compounds were determined by interpretation of their spectroscopic data (1D and 2D NMR, MS, UV, and IR). Each isolate was tested for its antioxidant properties, and compounds 1 and 9-11 were found to have significant activity.
Acremonium sp.
31
Introduction Marine microorganisms, particularly marine fungi, have recently gained prominence as an important source of biologically active secondary metabolites (König & Wright, 1996). Among marine fungi, those living in association with marine algae are a particularly promising source of novel natural products due to the special ecological niche in which they exist. The association between algae and fungi appears to be highly developed since nearly one third of all higher marine fungi described are so-called algicolous or algae- associated organisms (Kohlmyeyer & Kohlmeyer, 1979). Recently, marine derived fungi have yielded some unique biologically active metabolites, such as ascosalipyrrolidinone and ascosalipyrone (Osterhage et al., 2000), microsphaeropsisin (Höller et al., 1999), and mactanamide (Lorenz et al.,1998), further supporting the idea that these organisms are truly valuable producers of potential therapeutic agents. Natural antioxidants (Yen et al., 1996) are known to be produced by Penicillium roquefortii (Hayashi et al., 1995), Aspergillus candidus (Yen et al., 1999, 2001), Mortierella sp. (Hirota et al., 1997), and Emericella falconensis (Takahashi et al., 2000) and by fungi of the genus Acremonium (Teshima et al., 1991). Acremonium sp. (Hypocreace, Ascomycetes), are noted for their secondary metabolite content, with around 132 compounds having been reported from fungi of this genus, including the halymecins (Chen et al., 1996), oxepinamides A-C (Belofsky et al., 2000), acremolactone (Sassa et al., 1998), and orbuticin (Roy et al., 1996). Materials and methods Isolation and taxonomy of the fungal strain Algal material (Cladostephus spongius, Cladostephaceae, M 1) was collected by divers from waters around Spain (Moraira, Mediterranean Sea). After sterilization with 70 % ethanol, algal samples were rinsed with sterile water and pressed onto agar plates to detect any residual fungal spores on the surface. Sterilized algae were then cut into pieces and placed on agar plates containing isolation medium: 15 g/L agar, 1 L seawater from the sample-collecting site, benzyl penicillin and streptomycin sulphate (250 mg/L). Fungal colonies growing out of the algal tissue were transferred onto medium for sporulation: 1.0 g/L glucose, 0.1 g/L yeast extract, 0.5 g/L peptone from meat, enzymatic digest, 15 g/L agar, 1 L artificial seawater, the pH was adjusted at 8, in order to enable taxonomy of the isolates.
Acremonium sp.
32
Cultivation The fungus Acremonium sp. (Hypocreace, Ascomycetes, M 1-11-1, 506) was cultivated at room temperature for two months in 7 L (14 Fernbach flasks) of solid biomalt agar containing 50 g biomalt, 15 g agar, and 1 L ASW. Each Fernbach flask was inoculated with 10 ml of 10-day-old cultures (room temperature) grown in biomalt media without agar. Biological activity, see chapter 3.4. Extraction and isolation The mass cultivated fungus, mycelia and medium, was diluted with water (100 mL/L) and homogenized using an Ultra-turrax model T25 at 8000 min-1, the resulting mixture was exhaustively extracted with EtOAc (3 x 10 L) to yield 4.5 g of a highly viscous brownish black gum. The extract (4.3 g) was fractionated by VLC (Si gel 60, 0.063-0.200 mm, Merck) employing gradient elution from petroleum ether to EtOAc to MeOH, to yield 8 fractions (Pet.ether:EtOAc:MeOH, 1:0:0; 5:5:0; 2.5:7.5:0; 0:1:0; 0:7.5:2.5; 0:5:5; 0:2.5:7.5; 0:0:1, each 200 mL) (47.6, 433, 1050, 1114, 99, 600, 385 and 41 mg, respectively). VLC fraction 3 (1.05 g) was further fractionated by VLC using RP-18 material (Polyprep 60-50 C18, Machery-Nagel 71150), and gradient elution from H2O to MeOH, to yield 15 fractions (H2O: MeOH, 1:0; 1:0; 9:1; 8:2; 7:3; 6:4; 5:5; 4:6; 3:7; 2:8; 1:9; 0:1; 0:1; 0:1; 0:1, each in 50 mL), which were combined, based on 1H NMR spectral similarities, to give nine fractions (20, 42.8, 236, 60, 10, 48, 8, 10, 2 mg, respectively). Fraction 3 appeared most promising based on several 1H NMR resonances in the δ 6-9 region, and was further fractionated by normal phase HPLC (Eurospher Si, 5 µm, 250 x 8 i.d., Knauer) with cyclohexane:acetone, 8:2, in 30 min, 3 mL/min, as eluent to yield six compounds; 1 (tR = 10 min, 14 mg or 2 mg/L), 6-8 (tR = 8 min, 14 mg or 2 mg/L), 9 (tR = 13 min, 8 mg or 1.1 mg/L), and 10 (tR =13 min, 10 mg or 1.4 mg/L). VLC Fraction 4 (1.1 g) was also further fractionated by VLC using normal phase silica and gradient elution from n-hexane to EtOAc to MeOH, to yield 15 fractions (n-hexane:EtOAc:MeOH, 1:0:0; 1:0:0; 9:1:0; 8:2:0; 7:3:0; 6.4:0; 5:5:0; 4:6:0; 3:7:0; 2:8:0; 1:9:0; 0:1:0; 0:5:5; 0:0:1; 0:0:1, 50 mL each), which were combined, again based on their 1H NMR spectral data, into 6 fractions (5.0, 85.5, 116.4, 5.1, 195.6, 3.2 mg, respectively). Of these, fraction 5 was purified using HPLC with RP-18 (Eurospher-100, 5 µm, 250 x 8 mm i.d., Knauer), and gradient elution from H2O:MeOH, 3:1 to MeOH in 25 min, 2 mL/min, to yield 11 (tR = 11 min, 25 mg or 3.5 mg/L). From fraction 4 crystals of 5 (6 mg or 0.85 mg/L) were obtained by recrystallisation from CH2Cl2:(CH3) 2CO (3:7); the mother liquor was purified by
Acremonium sp.
33
RP-18 HPLC employing gradient elution from H2O:MeCN, 4:1 to MeCN in 40 min, 2 mL/min, to yield 3 and 4 (tR =15 min, 2 mg or 0.28 mg/L) and 10 (tR = 17 min, 3 mg, 0.42 mg/mL). VLC fraction 6 (0.6 g) was further fractionated by VLC over normal phase (230-400 mesh ASTM, Merck), 15 fractions were collected as mentioned above (50 mL each), and combined into 7 pools (15, 185, 100, 35, 117, 66, 10 mg, respectively), according to 1H NMR spectral data. Pool 3 (0.1 g) was the most promising one and fractionated over normal phase HPLC (Eurospher Si, 5µ, 250 x 8 i.d., Knauer) using a gradient from CH2Cl2 to MeOH, in 25 min, 2 mL/min, to afford 2 (tR = 17 , 20 mg, 2.8 mg/L). Acid hydrolysis of 2 A solution of 2 (5 mg in 1 mL EtOH) and 10 mL of 7 % HCl:EtOH (3:7) was refluxed for 4 hours. At the end of this period the mixture was extracted with EtOAc, and the aqueous layer neutralised with 7 % KOH. After evaporation of the solvent, the residue was extracted with C5H5N. HPLC purification of the C5H5N extract (Lichrosorb-100 NH2, 5 µ, 250 x 8 i.d., Knauer), using MeCN:H2O 8:2 as eluent yielded glucose (1 mg), [α]23
D = +20.7° (c 0.08, H2O), lit. (Merck index online) [α]23
D = +18.7° - +52.7° (c 10.0, H2O). GC-MS analysis of 3 and 4 This analysis was carried out on a Perkin-Elmer (Auto system XL) gas chromatograph coupled with a Perkin-Elmer Turbomass spectrometer using a 30 m x 0.32 mm N931-6023 Pe-1 (film thickness of 0.25 µm) capillary column. The instrument was set to an initial temperature of 50 °C and maintained at this temperature for 10 min. At the end of this period the oven was heated at 10°/min up to 250°C, and kept there for 10 min. Injection port temperature was 220°C, He flow rate was 2 mL/min, and samples were injected in the splitless mode. Mass spectral scan range was 35-650 DA. The GC of 3 and 4 showed two peaks. Retention times, relative intensities (%) and EIMS of the relevant peaks were as follows: Peak A, 21.4 min, 100, EIMS m/z (% rel int), 192 [M+] (<1), 174 (77), 159 (5), 145 (11), 119 (32), 90 (18); Peak B, 24.2 min, 84, EIMS m/z (% rel int), 192 [M+] (<1), 174 (77), 159 (5), 148 (46), 145 (13), 119 (100), 90 (20). GC-MS analysis of 6-8 The mixture of compounds 6-8 was analysed by GC-MS in an identical manner to the analysis performed with 3 and 4. Retention times, relative intensities and EIMS of the relevant peaks were: Peak A (19.4 min, 92), EIMS m/z (% rel int), 186 (1), 168 (50), 140 (100
Acremonium sp.
34
), 81 (90), 67 (100); Peak B (19.8 min, 72); EIMS m/z [M]+ (% rel int), 186 [M+] (3), 168 (10), 140 (33), 81 (40), 67 (100) Peak C (20.2 min, 100) EIMS m/z (% rel int), 186 [M+] (2), 168 (77), 140 (100), 81 (60), 67 (100). X-ray structure analysis of compound 5 2-(1-Methylethylidene)-pentanedioic acid (5) was recrystallised from MeOH to yield transparent prismatic crystals. A crystal 0.34 x 0.15 x 0.11 mm3 was selected for crystallographic measurement. It has, molecular formaula = C9H12O4, molecular mass = 172.18 amu, crystal system = triclinic, space group P(11-1), unit cell dimensions a = 5.0439 Å, b = 7.2708 Å, c = 12.3363(16), α = 89.527(3)°, β = 84.456(3)°, γ = 74.754(3)°, volume = 434.37(10) Å3, Z = 2, density = 1.316 mg/m3, F(000) = 184, absorption = 0.106 µ, λ (Mo K α) = 0.71073 Å. The intensity data were collected at 133 K to q(max) 30° on a Bruker SMART 1000 CCD diffractometer. A total of 5047 reflections were recorded, of which 2495 [R(int) = 0.0282] were unique. The structure was solved by direct methods and refined by full matrix least-squares methods on F2 using the SHELXL97 program (Sheldrick`s program). Acidic hydrogens were refined freely, methyls as rigid groups, methylene hydrogens with a riding model. Final R indices: R1 [I > 2σ(I)] = 0.042, wR2 (all reflections) = 0.124; goodness of fit 1.047 (these data have been deposited at the Cambridge crystallographic data center).The molecule is shown in Fig. 5. Its dimensions may be regarded as normal. The molecular conformation is illustrated by the torsion angles C2-C3-C4-C5 177.3(1), C3-C4-C5-O3 177.6(1)° (antiperiplanar) and C1-C2-C3-C4 85.0(1), C6-C2-C3-C4 93.2(1)° (orthogonal). The molecules are connected by hydrogen bonds of the "carboxylic acid dimer" type [O3-H03….O4' and O1-H01...O2'] across inversion centres to form chains of molecules parallel to [11-1] (Fig. 6). Results and discussion The fungus Acremonium sp. closely related to A. roseogriseum (S. B. Saksena) W. Gams based on morphological characteristics was isolated from tissues of the brown alga Cladostephus spongius (Hudson) C. Agardh. The fungus was cultivated on a solid biomalt medium with added artificial sea salt. Successive fractionation of the EtOAc extract by vacuum liquid chromatography (VLC) over silica followed by normal (NP), and reversed phase (RP-18) HPLC yielded compounds 1-11. In the current partial project, the isolation and structure elucidation of two novel hydroquinone derivatives (1 and 2), two new dihydronaphthalenones (3 and 4), four new acyclic carboxylic acid derivatives (5-8), and three known fungal metabolites (9-11) are reported (Tanaka et al., 1999).
Acremonium sp.
35
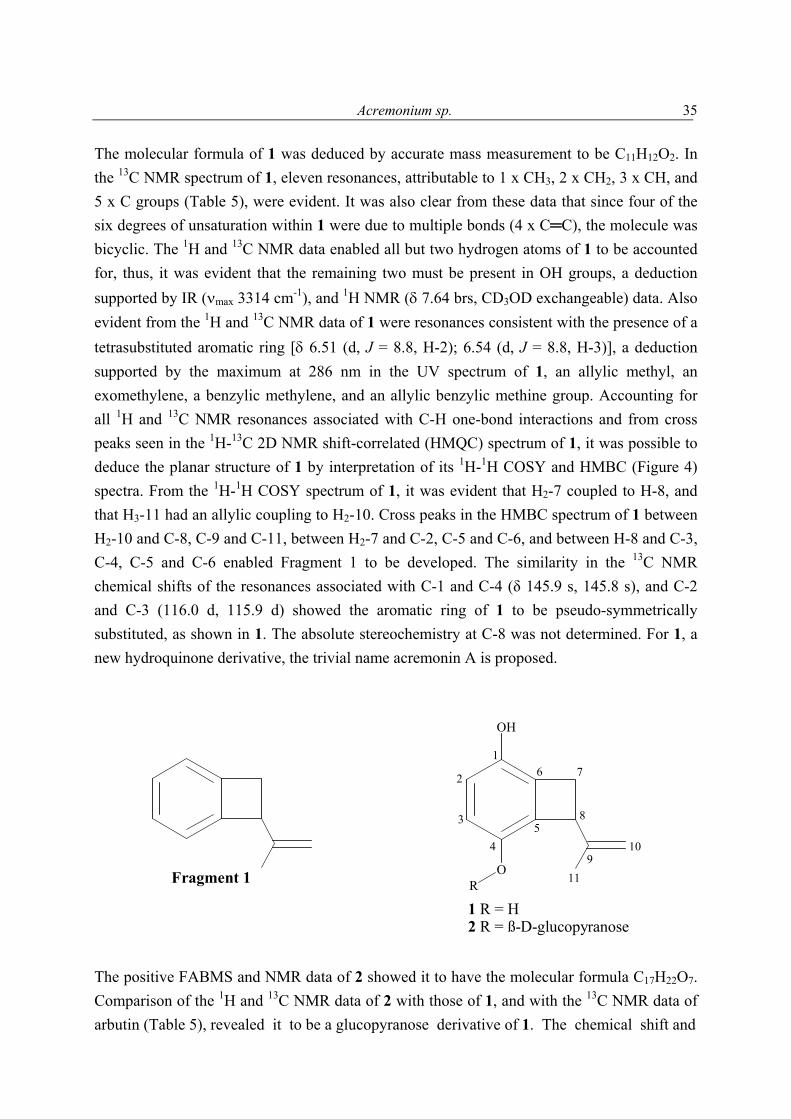
The molecular formula of 1 was deduced by accurate mass measurement to be C11H12O2. In the 13C NMR spectrum of 1, eleven resonances, attributable to 1 x CH3, 2 x CH2, 3 x CH, and 5 x C groups (Table 5), were evident. It was also clear from these data that since four of the six degrees of unsaturation within 1 were due to multiple bonds (4 x C═C), the molecule was bicyclic. The 1H and 13C NMR data enabled all but two hydrogen atoms of 1 to be accounted for, thus, it was evident that the remaining two must be present in OH groups, a deduction supported by IR (νmax 3314 cm-1), and 1H NMR (δ 7.64 brs, CD3OD exchangeable) data. Also evident from the 1H and 13C NMR data of 1 were resonances consistent with the presence of a tetrasubstituted aromatic ring [δ 6.51 (d, J = 8.8, H-2); 6.54 (d, J = 8.8, H-3)], a deduction supported by the maximum at 286 nm in the UV spectrum of 1, an allylic methyl, an exomethylene, a benzylic methylene, and an allylic benzylic methine group. Accounting for all 1H and 13C NMR resonances associated with C-H one-bond interactions and from cross peaks seen in the 1H-13C 2D NMR shift-correlated (HMQC) spectrum of 1, it was possible to deduce the planar structure of 1 by interpretation of its 1H-1H COSY and HMBC (Figure 4) spectra. From the 1H-1H COSY spectrum of 1, it was evident that H2-7 coupled to H-8, and that H3-11 had an allylic coupling to H2-10. Cross peaks in the HMBC spectrum of 1 between H2-10 and C-8, C-9 and C-11, between H2-7 and C-2, C-5 and C-6, and between H-8 and C-3, C-4, C-5 and C-6 enabled Fragment 1 to be developed. The similarity in the 13C NMR chemical shifts of the resonances associated with C-1 and C-4 (δ 145.9 s, 145.8 s), and C-2 and C-3 (116.0 d, 115.9 d) showed the aromatic ring of 1 to be pseudo-symmetrically substituted, as shown in 1. The absolute stereochemistry at C-8 was not determined. For 1, a new hydroquinone derivative, the trivial name acremonin A is proposed.
1 R = H2 R = ß-D-glucopyranose
1
2
45
7
910
11
3 8
OH
OR
6
Fragment 1
The positive FABMS and NMR data of 2 showed it to have the molecular formula C17H22O7. Comparison of the 1H and 13C NMR data of 2 with those of 1, and with the 13C NMR data of arbutin (Table 5), revealed it to be a glucopyranose derivative of 1. The chemical shift and
Acremonium sp.
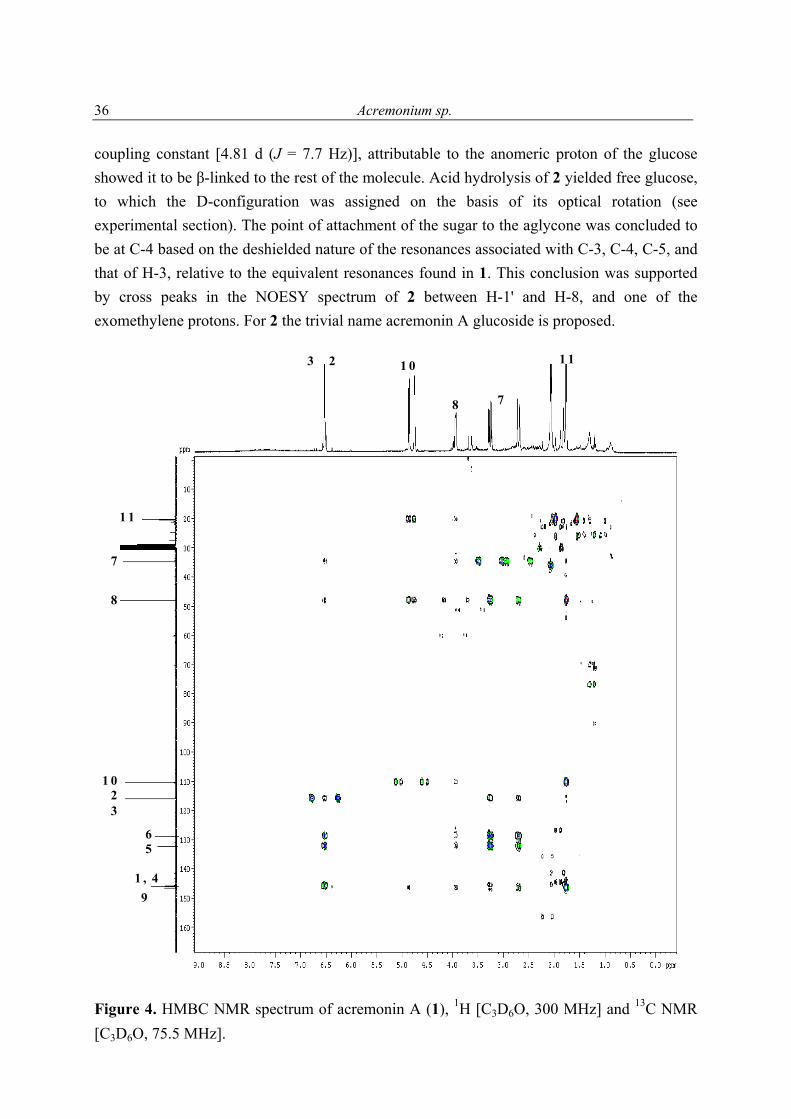
36
coupling constant [4.81 d (J = 7.7 Hz)], attributable to the anomeric proton of the glucose showed it to be β-linked to the rest of the molecule. Acid hydrolysis of 2 yielded free glucose, to which the D-configuration was assigned on the basis of its optical rotation (see experimental section). The point of attachment of the sugar to the aglycone was concluded to be at C-4 based on the deshielded nature of the resonances associated with C-3, C-4, C-5, and that of H-3, relative to the equivalent resonances found in 1. This conclusion was supported by cross peaks in the NOESY spectrum of 2 between H-1' and H-8, and one of the exomethylene protons. For 2 the trivial name acremonin A glucoside is proposed.
1 1
78
1 023
6
1 1
7
8
1 023
5
1 , 49
Figure 4. HMBC NMR spectrum of acremonin A (1), 1H [C3D6O, 300 MHz] and 13C NMR [C3D6O, 75.5 MHz].
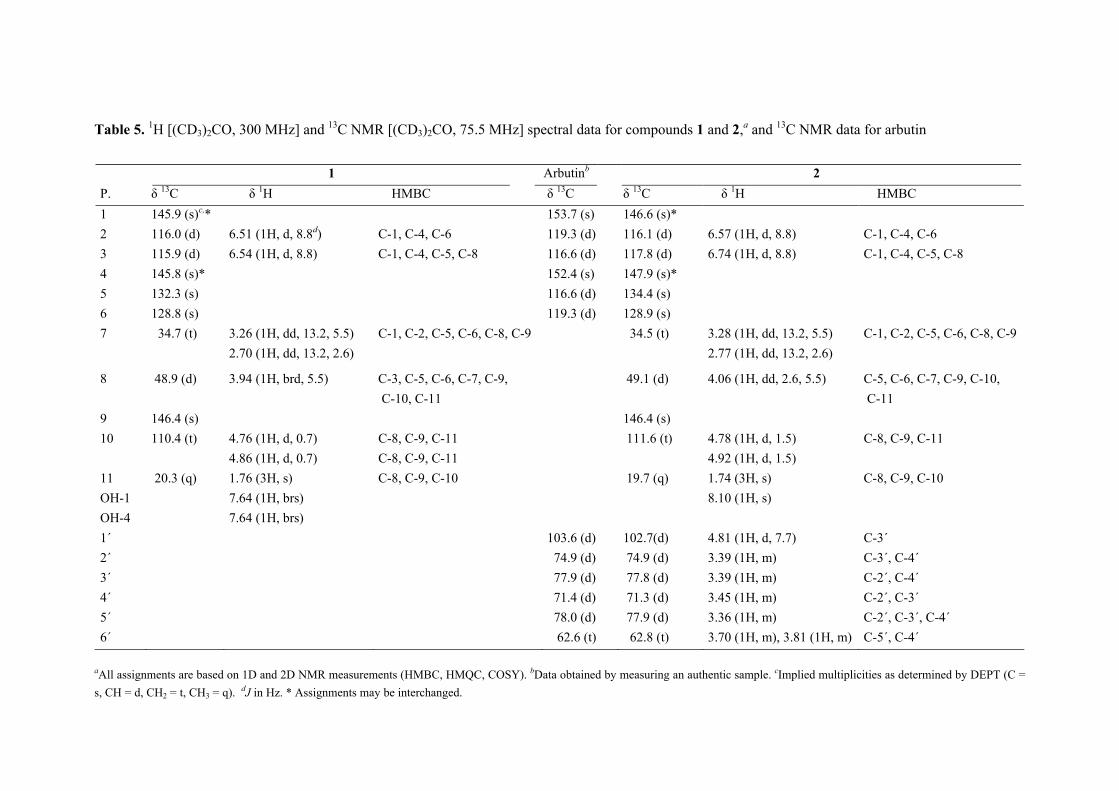
Table 5. 1H [(CD3)2CO, 300 MHz] and 13C NMR [(CD3)2CO, 75.5 MHz] spectral data for compounds 1 and 2,a and 13C NMR data for arbutin 1 Arbutinb 2 P. δ 13C δ 1H HMBC δ 13C δ 13C δ 1H HMBC 1 145.9 (s)c,* 153.7 (s) 146.6 (s)* 2 116.0 (d) 6.51 (1H, d, 8.8d) C-1, C-4, C-6 119.3 (d) 116.1 (d) 6.57 (1H, d, 8.8) C-1, C-4, C-6 3 115.9 (d) 6.54 (1H, d, 8.8) C-1, C-4, C-5, C-8 116.6 (d) 117.8 (d) 6.74 (1H, d, 8.8) C-1, C-4, C-5, C-8 4 145.8 (s)* 152.4 (s) 147.9 (s)* 5 132.3 (s) 116.6 (d) 134.4 (s) 6 128.8 (s) 119.3 (d) 128.9 (s) 7 34.7 (t) 3.26 (1H, dd, 13.2, 5.5)
2.70 (1H, dd, 13.2, 2.6) C-1, C-2, C-5, C-6, C-8, C-9 34.5 (t) 3.28 (1H, dd, 13.2, 5.5)
2.77 (1H, dd, 13.2, 2.6) C-1, C-2, C-5, C-6, C-8, C-9
8 48.9 (d) 3.94 (1H, brd, 5.5) C-3, C-5, C-6, C-7, C-9, C-10, C-11
49.1 (d) 4.06 (1H, dd, 2.6, 5.5) C-5, C-6, C-7, C-9, C-10, C-11
9 146.4 (s) 146.4 (s) 10 110.4 (t) 4.76 (1H, d, 0.7)
4.86 (1H, d, 0.7) C-8, C-9, C-11 C-8, C-9, C-11
111.6 (t) 4.78 (1H, d, 1.5) 4.92 (1H, d, 1.5)
C-8, C-9, C-11
11 20.3 (q) 1.76 (3H, s) C-8, C-9, C-10 19.7 (q) 1.74 (3H, s) C-8, C-9, C-10 OH-1 7.64 (1H, brs) 8.10 (1H, s) OH-4 7.64 (1H, brs) 1´ 103.6 (d) 102.7(d) 4.81 (1H, d, 7.7) C-3´ 2´ 74.9 (d) 74.9 (d) 3.39 (1H, m) C-3´, C-4´ 3´ 77.9 (d) 77.8 (d) 3.39 (1H, m) C-2´, C-4´ 4´ 71.4 (d) 71.3 (d) 3.45 (1H, m) C-2´, C-3´ 5´ 78.0 (d) 77.9 (d) 3.36 (1H, m) C-2´, C-3´, C-4´ 6´ 62.6 (t) 62.8 (t) 3.70 (1H, m), 3.81 (1H, m) C-5´, C-4´
aAll assignments are based on 1D and 2D NMR measurements (HMBC, HMQC, COSY). bData obtained by measuring an authentic sample. cImplied multiplicities as determined by DEPT (C = s, CH = d, CH2 = t, CH3 = q). dJ in Hz. * Assignments may be interchanged.
Acremonium sp.
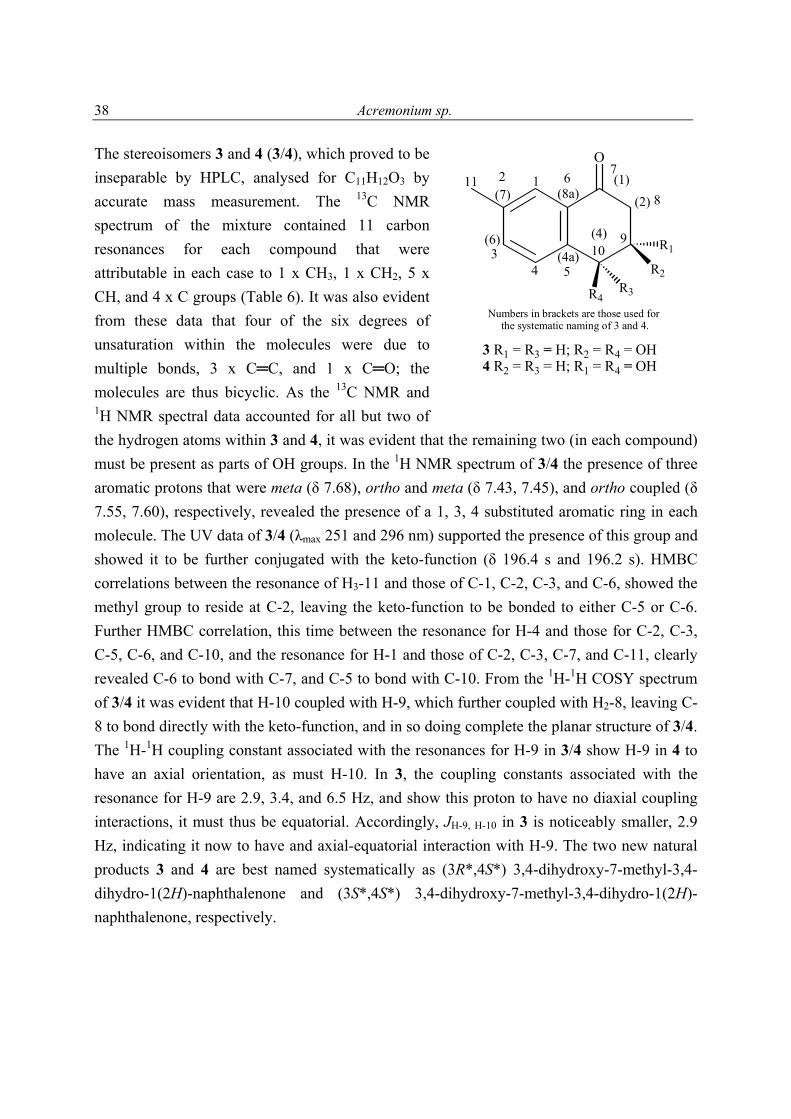
38
The stereoisomers 3 and 4 (3/4), which proved to be inseparable by HPLC, analysed for C11H12O3 by accurate mass measurement. The 13C NMR spectrum of the mixture contained 11 carbon resonances for each compound that were attributable in each case to 1 x CH3, 1 x CH2, 5 x CH, and 4 x C groups (Table 6). It was also evident from these data that four of the six degrees of unsaturation within the molecules were due to multiple bonds, 3 x C═C, and 1 x C═O; the molecules are thus bicyclic. As the 13C NMR and 1H NMR spectral data accounted for all but two of the hydrogen atoms within 3 and 4, it was evident that the remaining two (in each compound) must be present as parts of OH groups. In the 1H NMR spectrum of 3/4 the presence of three aromatic protons that were meta (δ 7.68), ortho and meta (δ 7.43, 7.45), and ortho coupled (δ 7.55, 7.60), respectively, revealed the presence of a 1, 3, 4 substituted aromatic ring in each molecule. The UV data of 3/4 (λmax 251 and 296 nm) supported the presence of this group and showed it to be further conjugated with the keto-function (δ 196.4 s and 196.2 s). HMBC correlations between the resonance of H3-11 and those of C-1, C-2, C-3, and C-6, showed the methyl group to reside at C-2, leaving the keto-function to be bonded to either C-5 or C-6. Further HMBC correlation, this time between the resonance for H-4 and those for C-2, C-3, C-5, C-6, and C-10, and the resonance for H-1 and those of C-2, C-3, C-7, and C-11, clearly revealed C-6 to bond with C-7, and C-5 to bond with C-10. From the 1H-1H COSY spectrum of 3/4 it was evident that H-10 coupled with H-9, which further coupled with H2-8, leaving C-8 to bond directly with the keto-function, and in so doing complete the planar structure of 3/4. The 1H-1H coupling constant associated with the resonances for H-9 in 3/4 show H-9 in 4 to have an axial orientation, as must H-10. In 3, the coupling constants associated with the resonance for H-9 are 2.9, 3.4, and 6.5 Hz, and show this proton to have no diaxial coupling interactions, it must thus be equatorial. Accordingly, JH-9, H-10 in 3 is noticeably smaller, 2.9 Hz, indicating it now to have and axial-equatorial interaction with H-9. The two new natural products 3 and 4 are best named systematically as (3R*,4S*) 3,4-dihydroxy-7-methyl-3,4-dihydro-1(2H)-naphthalenone and (3S*,4S*) 3,4-dihydroxy-7-methyl-3,4-dihydro-1(2H)-naphthalenone, respectively.
O
R4
R2R3
R1
Numbers in brackets are those used for the systematic naming of 3 and 4.
(8a)(7)
(6)(4a)
(2)(1)1
3
2
5
67
8
910
4
11
(4)
3 R1 = R3 = H; R2 = R4 = OH4 R2 = R3 = H; R1 = R4 = OH
Acremonium sp.
39
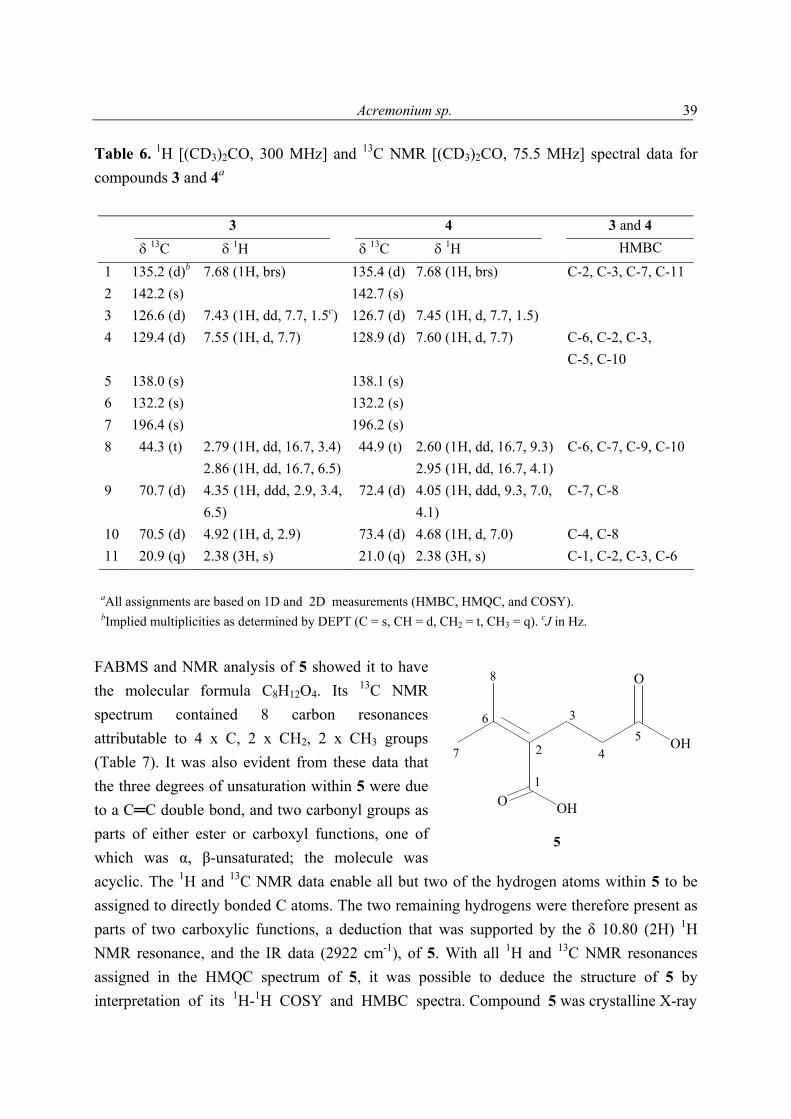
Table 6. 1H [(CD3)2CO, 300 MHz] and 13C NMR [(CD3)2CO, 75.5 MHz] spectral data for compounds 3 and 4a
3 4 3 and 4 δ 13C δ 1H δ 13C δ 1H HMBC 1 135.2 (d)b 7.68 (1H, brs) 135.4 (d) 7.68 (1H, brs) C-2, C-3, C-7, C-11 2 142.2 (s) 142.7 (s) 3 126.6 (d) 7.43 (1H, dd, 7.7, 1.5c) 126.7 (d) 7.45 (1H, d, 7.7, 1.5) 4 129.4 (d) 7.55 (1H, d, 7.7) 128.9 (d) 7.60 (1H, d, 7.7) C-6, C-2, C-3,
C-5, C-10 5 138.0 (s) 138.1 (s) 6 132.2 (s) 132.2 (s) 7 196.4 (s) 196.2 (s) 8 44.3 (t) 2.79 (1H, dd, 16.7, 3.4)
2.86 (1H, dd, 16.7, 6.5) 44.9 (t) 2.60 (1H, dd, 16.7, 9.3)
2.95 (1H, dd, 16.7, 4.1) C-6, C-7, C-9, C-10
9 70.7 (d) 4.35 (1H, ddd, 2.9, 3.4, 6.5)
72.4 (d) 4.05 (1H, ddd, 9.3, 7.0, 4.1)
C-7, C-8
10 70.5 (d) 4.92 (1H, d, 2.9) 73.4 (d) 4.68 (1H, d, 7.0) C-4, C-8 11 20.9 (q) 2.38 (3H, s) 21.0 (q) 2.38 (3H, s) C-1, C-2, C-3, C-6
aAll assignments are based on 1D and 2D measurements (HMBC, HMQC, and COSY). bImplied multiplicities as determined by DEPT (C = s, CH = d, CH2 = t, CH3 = q). cJ in Hz.
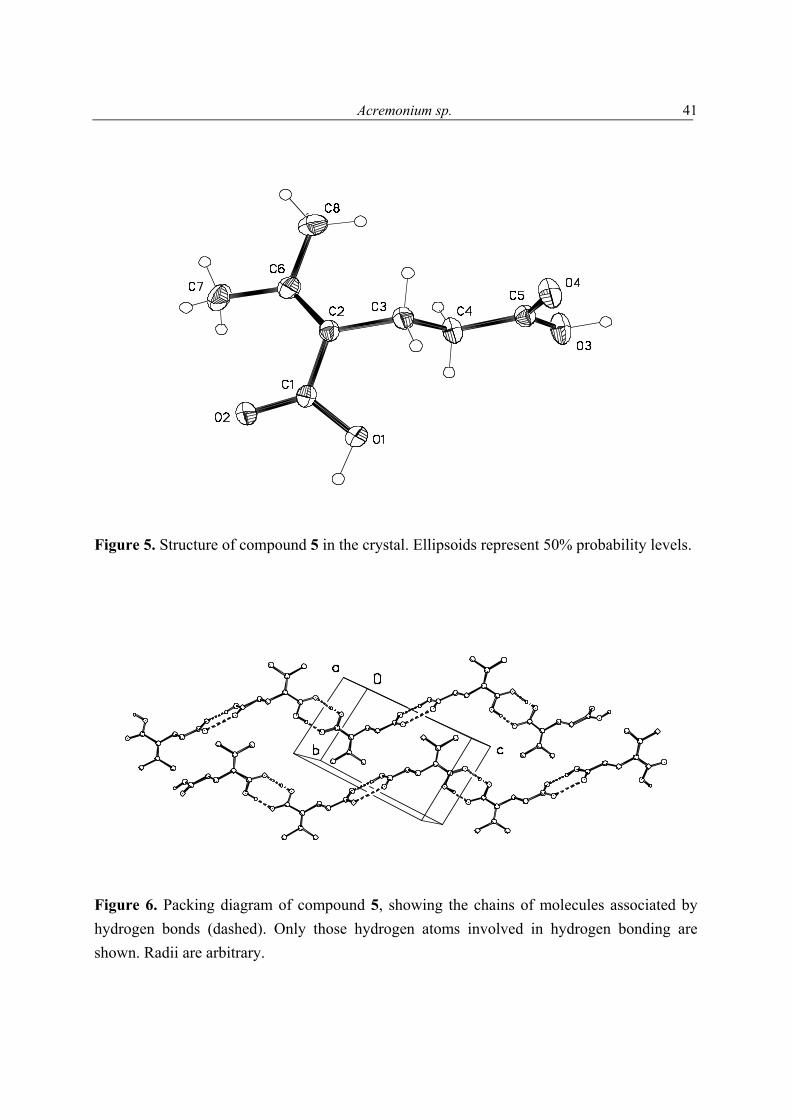
FABMS and NMR analysis of 5 showed it to have the molecular formula C8H12O4. Its 13C NMR spectrum contained 8 carbon resonances attributable to 4 x C, 2 x CH2, 2 x CH3 groups (Table 7). It was also evident from these data that the three degrees of unsaturation within 5 were due to a C═C double bond, and two carbonyl groups as parts of either ester or carboxyl functions, one of which was α, β-unsaturated; the molecule was acyclic. The 1H and 13C NMR data enable all but two of the hydrogen atoms within 5 to be assigned to directly bonded C atoms. The two remaining hydrogens were therefore present as parts of two carboxylic functions, a deduction that was supported by the δ 10.80 (2H) 1H NMR resonance, and the IR data (2922 cm-1), of 5. With all 1H and 13C NMR resonances assigned in the HMQC spectrum of 5, it was possible to deduce the structure of 5 by interpretation of its 1H-1H COSY and HMBC spectra. Compound 5 was crystalline X-ray
OH
O
OHO
4
1
7
8
5
3
25
6
Acremonium sp.
40
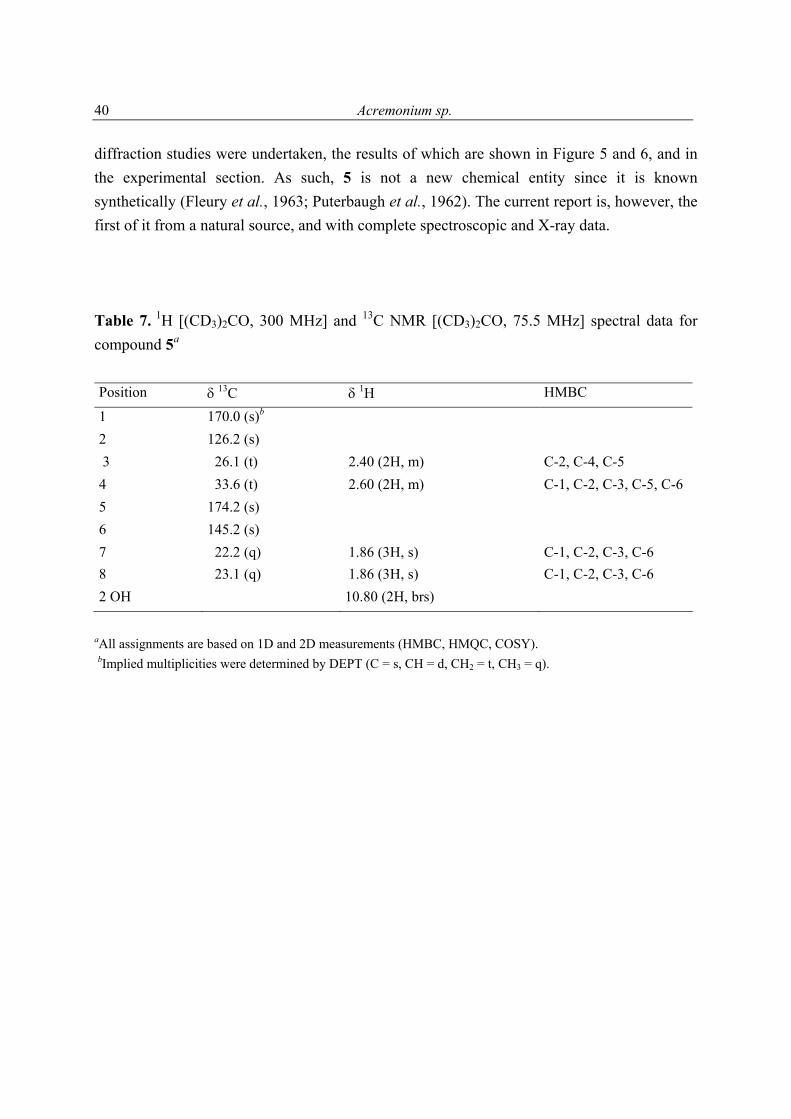
diffraction studies were undertaken, the results of which are shown in Figure 5 and 6, and in the experimental section. As such, 5 is not a new chemical entity since it is known synthetically (Fleury et al., 1963; Puterbaugh et al., 1962). The current report is, however, the first of it from a natural source, and with complete spectroscopic and X-ray data. Table 7. 1H [(CD3)2CO, 300 MHz] and 13C NMR [(CD3)2CO, 75.5 MHz] spectral data for compound 5a
Position δ 13C δ 1H HMBC
1 170.0 (s)b 2 126.2 (s) 3 26.1 (t) 2.40 (2H, m) C-2, C-4, C-5 4 33.6 (t) 2.60 (2H, m) C-1, C-2, C-3, C-5, C-6 5 174.2 (s) 6 145.2 (s) 7 22.2 (q) 1.86 (3H, s) C-1, C-2, C-3, C-6 8 23.1 (q) 1.86 (3H, s) C-1, C-2, C-3, C-6 2 OH 10.80 (2H, brs)
aAll assignments are based on 1D and 2D measurements (HMBC, HMQC, COSY). bImplied multiplicities were determined by DEPT (C = s, CH = d, CH2 = t, CH3 = q).
Acremonium sp.
41
Figure 5. Structure of compound 5 in the crystal. Ellipsoids represent 50% probability levels.
Figure 6. Packing diagram of compound 5, showing the chains of molecules associated by hydrogen bonds (dashed). Only those hydrogen atoms involved in hydrogen bonding are shown. Radii are arbitrary.
Acremonium sp.
42
Compounds 6-8 are structural isomers that proved to be inseparable by HPLC. GC-MS analysis and accurate mass measurement of the mixture 6/8 showed the three compounds present to have the identical molecular formula C9H14O4. A comparison of the MS and NMR spectral data of 6 and 7 with those of 5 (Tables 7 and 8), indicated 6 and 7 to be monomethoxyl derivatives of 5. In each case the position of the methoxyl group was established from HMBC data. For 6, an HMBC correlation between the resonance for H3-9 and that of C-5, clearly made the C-9 methyl group part of a methyl ester function and revealed the molecule to be pentanedioic acid, 2-(1-methylethylidene)-5-methyl ester. In the case of 7, the diagnostic HMBC correlation was between H3-9 and C-1,and showed the molecule to be pentanedioic acid, 2-(1-methyl- ethylidene)-1-methyl ester. Even though the molecular formula of 8 (C9H14O4) was identical to those of 6 and 7 the NMR data were notably different (Table 8). As for 6 and 7, the 13C NMR spectrum contained nine carbon resonances attributable to 1 x CH3, 1 x OCH3, 3 x CH2, 1 x CH, and 3 x C, groups. It was also evident from these data that one of the three degrees of unsaturation within 8 was present as an exomethylene group, in contrast to the endo-carbon-carbon double bond found in 6 and 7, and that the two carbonyl functions present in 5-7 were also to be found in 8. Interpretation of the HMQC, 1H-1H COSY and HMBC spectral data of 8 enabled its planar structure to be deduced. Thus, cross peaks in the 1H-1H COSY spectrum of 8 showed H3-7 to long-range couple with H2-8 and H-2, H-2 also coupled with H2-3, which further coupled with H2-4, clearly characterizing the C-8 to C-4 part of the molecule. The HMBC spectral data of 8, showed correlations between the resonances for H2-8 and those for C-1, C-2, C-6, and C-7; between that for H-2 and those for C-1, C-3, C-6, C-7, and C-8; and between those for H2-3 and C-2, C-4, C-5 and C-6, and between that for H3-9 and that for C-5. These data revealed C-1 to bond with C-2, C-4 with C-5, and the methoxyl group to be part of the methyl ester function at C-5. Accordingly, 8 is most appropriately named pentanedioic acid, 2-(1-methylethenyl)-5-methyl ester.
O
R2
6 R1 = OH, R2 = OCH37 R1 = OCH3, R2 = OH
R1O1
2
3
45
6
7
8
4
1
6
7
8
3
2 O
O
OHO
5
8
9
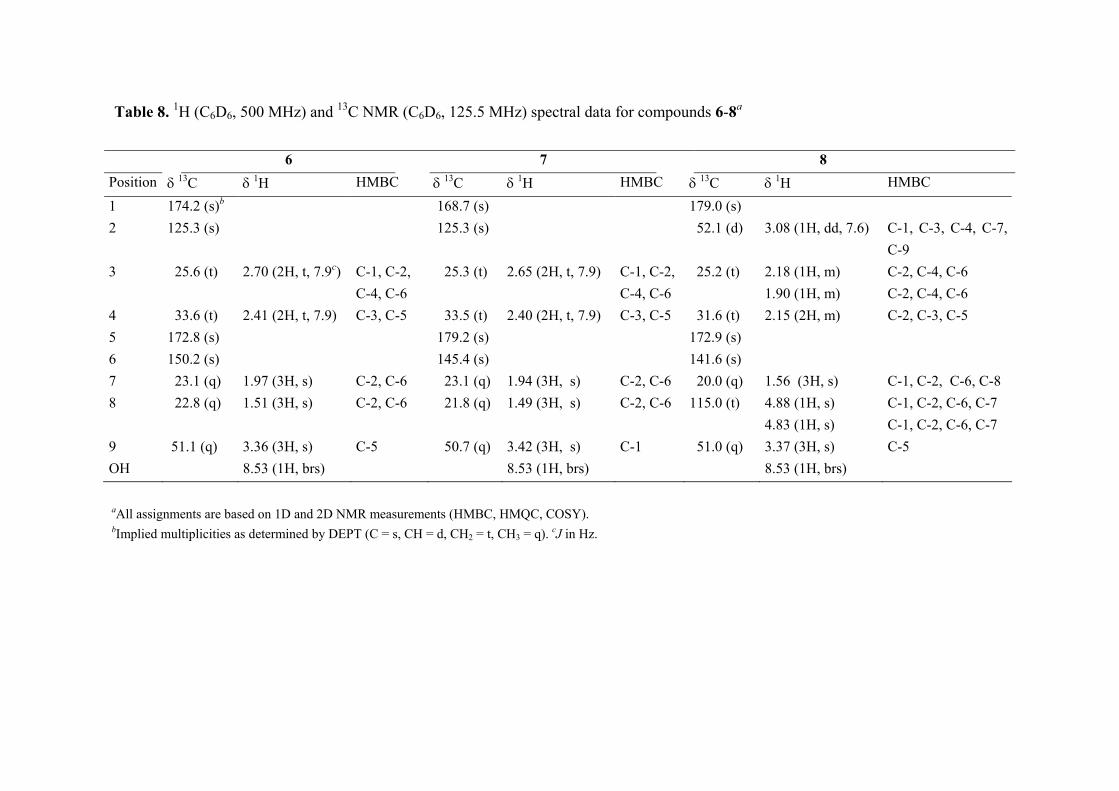
Table 8. 1H (C6D6, 500 MHz) and 13C NMR (C6D6, 125.5 MHz) spectral data for compounds 6-8a
6 7 8 Position δ 13C δ 1H HMBC δ 13C δ 1H HMBC δ 13C δ 1H HMBC 1 174.2 (s)b 168.7 (s) 179.0 (s) 2 125.3 (s) 125.3 (s) 52.1 (d) 3.08 (1H, dd, 7.6) C-1, C-3, C-4, C-7,
C-9 3 25.6 (t) 2.70 (2H, t, 7.9c) C-1, C-2,
C-4, C-6 25.3 (t) 2.65 (2H, t, 7.9) C-1, C-2,
C-4, C-6 25.2 (t) 2.18 (1H, m)
1.90 (1H, m) C-2, C-4, C-6 C-2, C-4, C-6
4 33.6 (t) 2.41 (2H, t, 7.9) C-3, C-5 33.5 (t) 2.40 (2H, t, 7.9) C-3, C-5 31.6 (t) 2.15 (2H, m) C-2, C-3, C-5 5 172.8 (s) 179.2 (s) 172.9 (s) 6 150.2 (s) 145.4 (s) 141.6 (s) 7 23.1 (q) 1.97 (3H, s) C-2, C-6 23.1 (q) 1.94 (3H, s) C-2, C-6 20.0 (q) 1.56 (3H, s) C-1, C-2, C-6, C-8 8 22.8 (q) 1.51 (3H, s) C-2, C-6 21.8 (q) 1.49 (3H, s) C-2, C-6 115.0 (t) 4.88 (1H, s)
4.83 (1H, s) C-1, C-2, C-6, C-7 C-1, C-2, C-6, C-7
9 51.1 (q) 3.36 (3H, s) C-5 50.7 (q) 3.42 (3H, s) C-1 51.0 (q) 3.37 (3H, s) C-5 OH 8.53 (1H, brs) 8.53 (1H, brs) 8.53 (1H, brs)
aAll assignments are based on 1D and 2D NMR measurements (HMBC, HMQC, COSY). bImplied multiplicities as determined by DEPT (C = s, CH = d, CH2 = t, CH3 = q). cJ in Hz.
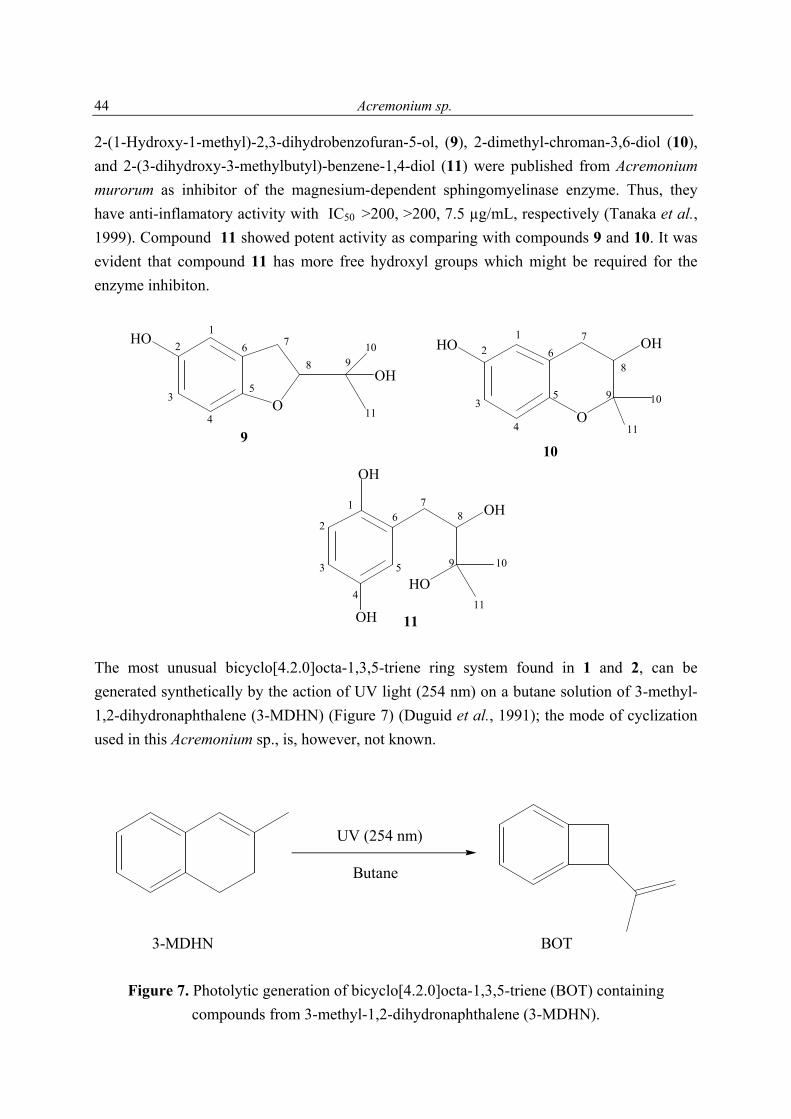
Acremonium sp.
44
2-(1-Hydroxy-1-methyl)-2,3-dihydrobenzofuran-5-ol, (9), 2-dimethyl-chroman-3,6-diol (10), and 2-(3-dihydroxy-3-methylbutyl)-benzene-1,4-diol (11) were published from Acremonium murorum as inhibitor of the magnesium-dependent sphingomyelinase enzyme. Thus, they have anti-inflamatory activity with IC50 >200, >200, 7.5 µg/mL, respectively (Tanaka et al., 1999). Compound 11 showed potent activity as comparing with compounds 9 and 10. It was evident that compound 11 has more free hydroxyl groups which might be required for the enzyme inhibiton.
HO
HO
OH
9
11
O
10
OH
OH
OH
O
OHHO
10
9
2
3
4
5
6
1 7
8
10
11
12
2
3
3
4
4
5
5
6
6
7
7
8
8
9
9 10
11
11
1
The most unusual bicyclo[4.2.0]octa-1,3,5-triene ring system found in 1 and 2, can be generated synthetically by the action of UV light (254 nm) on a butane solution of 3-methyl-1,2-dihydronaphthalene (3-MDHN) (Figure 7) (Duguid et al., 1991); the mode of cyclization used in this Acremonium sp., is, however, not known.
UV (254 nm)
Butane
3-MDHN BOT
Figure 7. Photolytic generation of bicyclo[4.2.0]octa-1,3,5-triene (BOT) containing compounds from 3-methyl-1,2-dihydronaphthalene (3-MDHN).
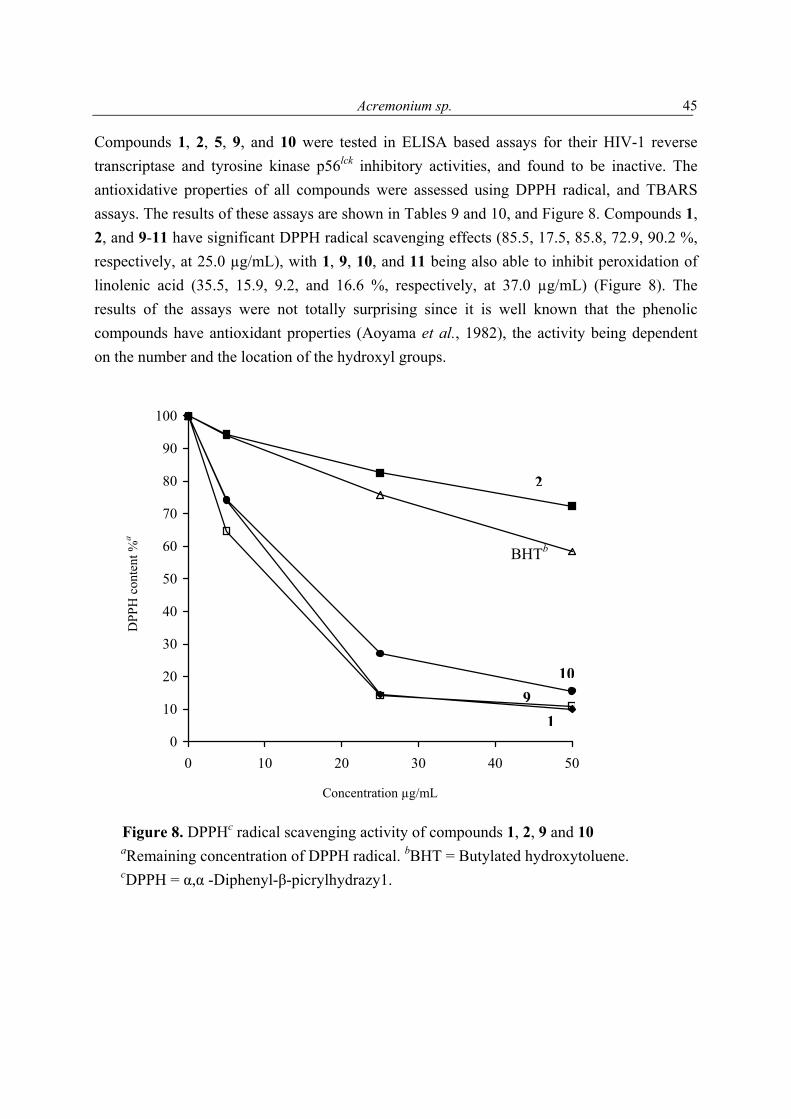
Acremonium sp.
45
Compounds 1, 2, 5, 9, and 10 were tested in ELISA based assays for their HIV-1 reverse transcriptase and tyrosine kinase p56lck inhibitory activities, and found to be inactive. The antioxidative properties of all compounds were assessed using DPPH radical, and TBARS assays. The results of these assays are shown in Tables 9 and 10, and Figure 8. Compounds 1, 2, and 9-11 have significant DPPH radical scavenging effects (85.5, 17.5, 85.8, 72.9, 90.2 %, respectively, at 25.0 µg/mL), with 1, 9, 10, and 11 being also able to inhibit peroxidation of linolenic acid (35.5, 15.9, 9.2, and 16.6 %, respectively, at 37.0 µg/mL) (Figure 8). The results of the assays were not totally surprising since it is well known that the phenolic compounds have antioxidant properties (Aoyama et al., 1982), the activity being dependent on the number and the location of the hydroxyl groups.
0
10
20
30
40
50
60
70
80
90
100
0 10 20 30 40 50
Concentration µg/mL
DPP
H c
onte
nt %
a
Figure 8. DPPHc radical scavenging activity of compounds 1, 2, 9 and 10 aRemaining concentration of DPPH radical. bBHT = Butylated hydroxytoluene. cDPPH = α,α -Diphenyl-β-picrylhydrazy1.
BHTb
2
10
91
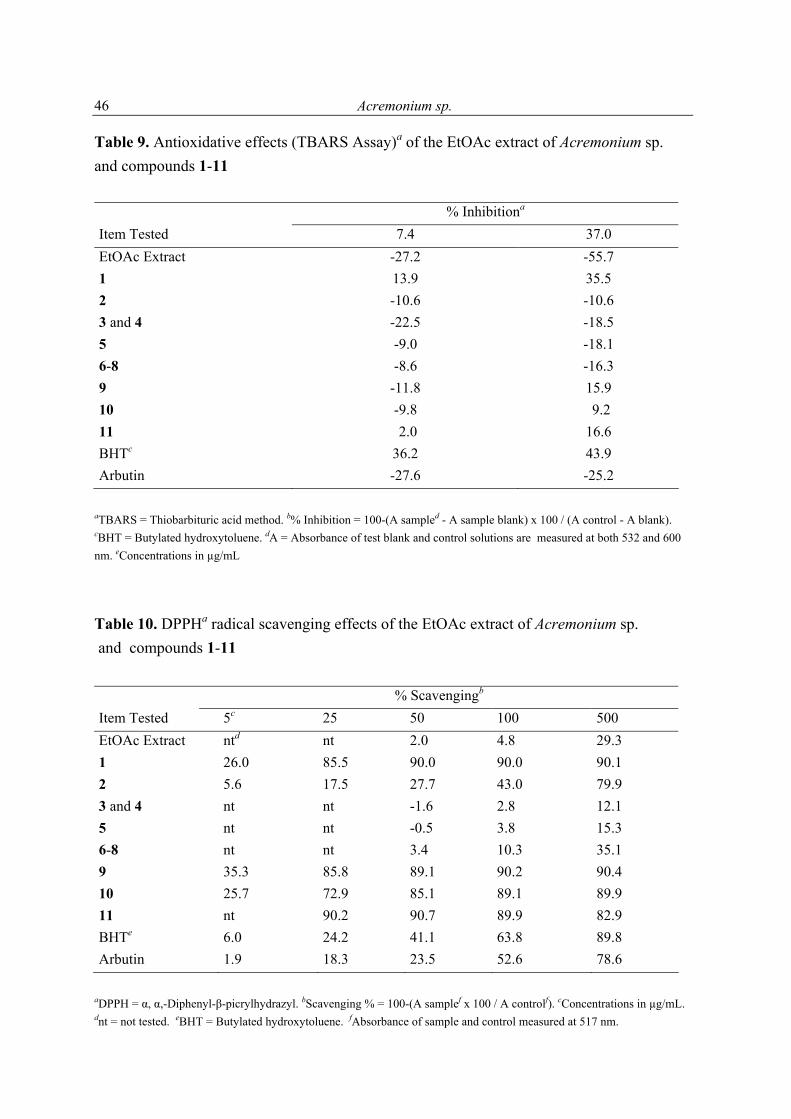
Acremonium sp.
46
Table 9. Antioxidative effects (TBARS Assay)a of the EtOAc extract of Acremonium sp. and compounds 1-11 % Inhibitiona
Item Tested 7.4 37.0 EtOAc Extract -27.2 -55.7 1 13.9 35.5 2 -10.6 -10.6 3 and 4 -22.5 -18.5 5 -9.0 -18.1 6-8 -8.6 -16.3 9 -11.8 15.9 10 -9.8 9.2 11 2.0 16.6 BHTc 36.2 43.9 Arbutin -27.6 -25.2
aTBARS = Thiobarbituric acid method. b% Inhibition = 100-(A sampled - A sample blank) x 100 / (A control - A blank). cBHT = Butylated hydroxytoluene. dA = Absorbance of test blank and control solutions are measured at both 532 and 600 nm. eConcentrations in µg/mL
Table 10. DPPHa radical scavenging effects of the EtOAc extract of Acremonium sp. and compounds 1-11 % Scavengingb
Item Tested 5c 25 50 100 500 EtOAc Extract ntd nt 2.0 4.8 29.3 1 26.0 85.5 90.0 90.0 90.1 2 5.6 17.5 27.7 43.0 79.9 3 and 4 nt nt -1.6 2.8 12.1 5 nt nt -0.5 3.8 15.3 6-8 nt nt 3.4 10.3 35.1 9 35.3 85.8 89.1 90.2 90.4 10 25.7 72.9 85.1 89.1 89.9 11 nt 90.2 90.7 89.9 82.9 BHTe 6.0 24.2 41.1 63.8 89.8 Arbutin 1.9 18.3 23.5 52.6 78.6
aDPPH = α, α,-Diphenyl-β-picrylhydrazyl. bScavenging % = 100-(A samplef x 100 / A controlf). cConcentrations in µg/mL. dnt = not tested. eBHT = Butylated hydroxytoluene. fAbsorbance of sample and control measured at 517 nm.
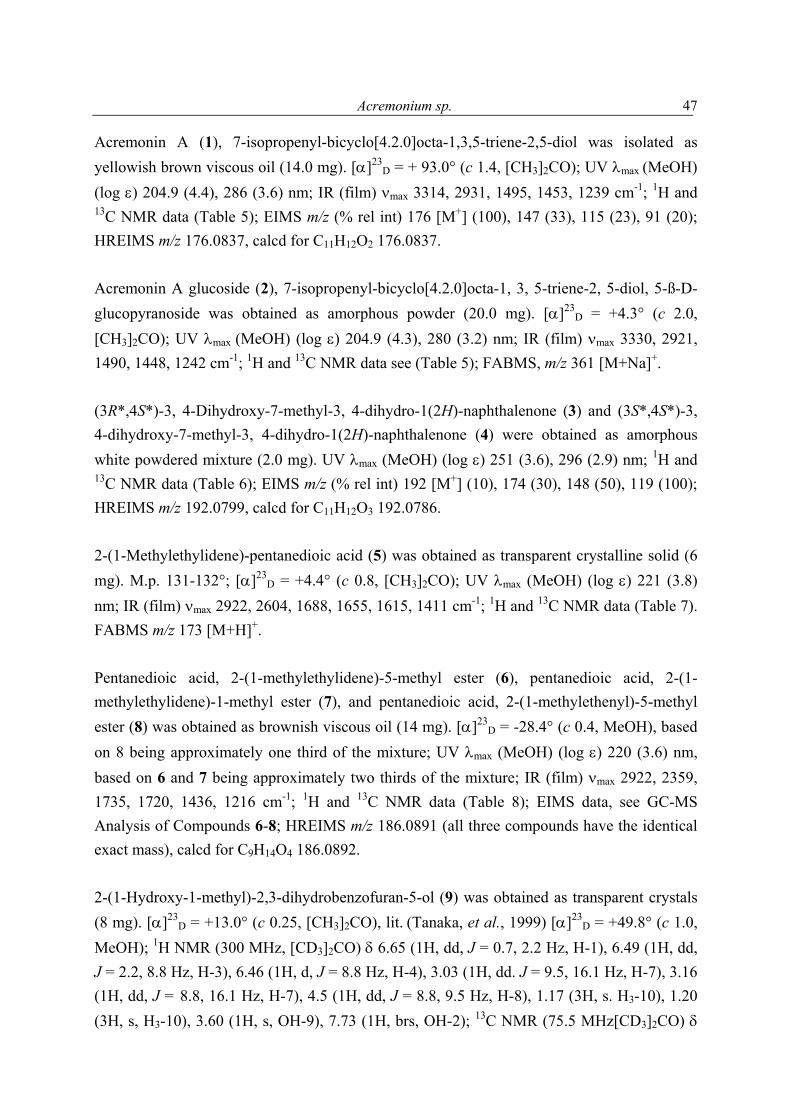
Acremonium sp.
47
Acremonin A (1), 7-isopropenyl-bicyclo[4.2.0]octa-1,3,5-triene-2,5-diol was isolated as yellowish brown viscous oil (14.0 mg). [α]23
D = + 93.0° (c 1.4, [CH3]2CO); UV λmax (MeOH) (log ε) 204.9 (4.4), 286 (3.6) nm; IR (film) νmax 3314, 2931, 1495, 1453, 1239 cm-1; 1H and 13C NMR data (Table 5); EIMS m/z (% rel int) 176 [M+] (100), 147 (33), 115 (23), 91 (20); HREIMS m/z 176.0837, calcd for C11H12O2 176.0837. Acremonin A glucoside (2), 7-isopropenyl-bicyclo[4.2.0]octa-1, 3, 5-triene-2, 5-diol, 5-ß-D-glucopyranoside was obtained as amorphous powder (20.0 mg). [α]23
D = +4.3° (c 2.0, [CH3]2CO); UV λmax (MeOH) (log ε) 204.9 (4.3), 280 (3.2) nm; IR (film) νmax 3330, 2921, 1490, 1448, 1242 cm-1; 1H and 13C NMR data see (Table 5); FABMS, m/z 361 [M+Na]+. (3R*,4S*)-3, 4-Dihydroxy-7-methyl-3, 4-dihydro-1(2H)-naphthalenone (3) and (3S*,4S*)-3, 4-dihydroxy-7-methyl-3, 4-dihydro-1(2H)-naphthalenone (4) were obtained as amorphous white powdered mixture (2.0 mg). UV λmax (MeOH) (log ε) 251 (3.6), 296 (2.9) nm; 1H and 13C NMR data (Table 6); EIMS m/z (% rel int) 192 [M+] (10), 174 (30), 148 (50), 119 (100); HREIMS m/z 192.0799, calcd for C11H12O3 192.0786. 2-(1-Methylethylidene)-pentanedioic acid (5) was obtained as transparent crystalline solid (6 mg). M.p. 131-132°; [α]23
D = +4.4° (c 0.8, [CH3]2CO); UV λmax (MeOH) (log ε) 221 (3.8) nm; IR (film) νmax 2922, 2604, 1688, 1655, 1615, 1411 cm-1; 1H and 13C NMR data (Table 7). FABMS m/z 173 [M+H]+. Pentanedioic acid, 2-(1-methylethylidene)-5-methyl ester (6), pentanedioic acid, 2-(1-methylethylidene)-1-methyl ester (7), and pentanedioic acid, 2-(1-methylethenyl)-5-methyl ester (8) was obtained as brownish viscous oil (14 mg). [α]23
D = -28.4° (c 0.4, MeOH), based on 8 being approximately one third of the mixture; UV λmax (MeOH) (log ε) 220 (3.6) nm, based on 6 and 7 being approximately two thirds of the mixture; IR (film) νmax 2922, 2359, 1735, 1720, 1436, 1216 cm-1; 1H and 13C NMR data (Table 8); EIMS data, see GC-MS Analysis of Compounds 6-8; HREIMS m/z 186.0891 (all three compounds have the identical exact mass), calcd for C9H14O4 186.0892. 2-(1-Hydroxy-1-methyl)-2,3-dihydrobenzofuran-5-ol (9) was obtained as transparent crystals (8 mg). [α]23
D = +13.0° (c 0.25, [CH3]2CO), lit. (Tanaka, et al., 1999) [α]23D = +49.8° (c 1.0,
MeOH); 1H NMR (300 MHz, [CD3]2CO) δ 6.65 (1H, dd, J = 0.7, 2.2 Hz, H-1), 6.49 (1H, dd, J = 2.2, 8.8 Hz, H-3), 6.46 (1H, d, J = 8.8 Hz, H-4), 3.03 (1H, dd. J = 9.5, 16.1 Hz, H-7), 3.16 (1H, dd, J = 8.8, 16.1 Hz, H-7), 4.5 (1H, dd, J = 8.8, 9.5 Hz, H-8), 1.17 (3H, s. H3-10), 1.20 (3H, s, H3-10), 3.60 (1H, s, OH-9), 7.73 (1H, brs, OH-2); 13C NMR (75.5 MHz[CD3]2CO) δ
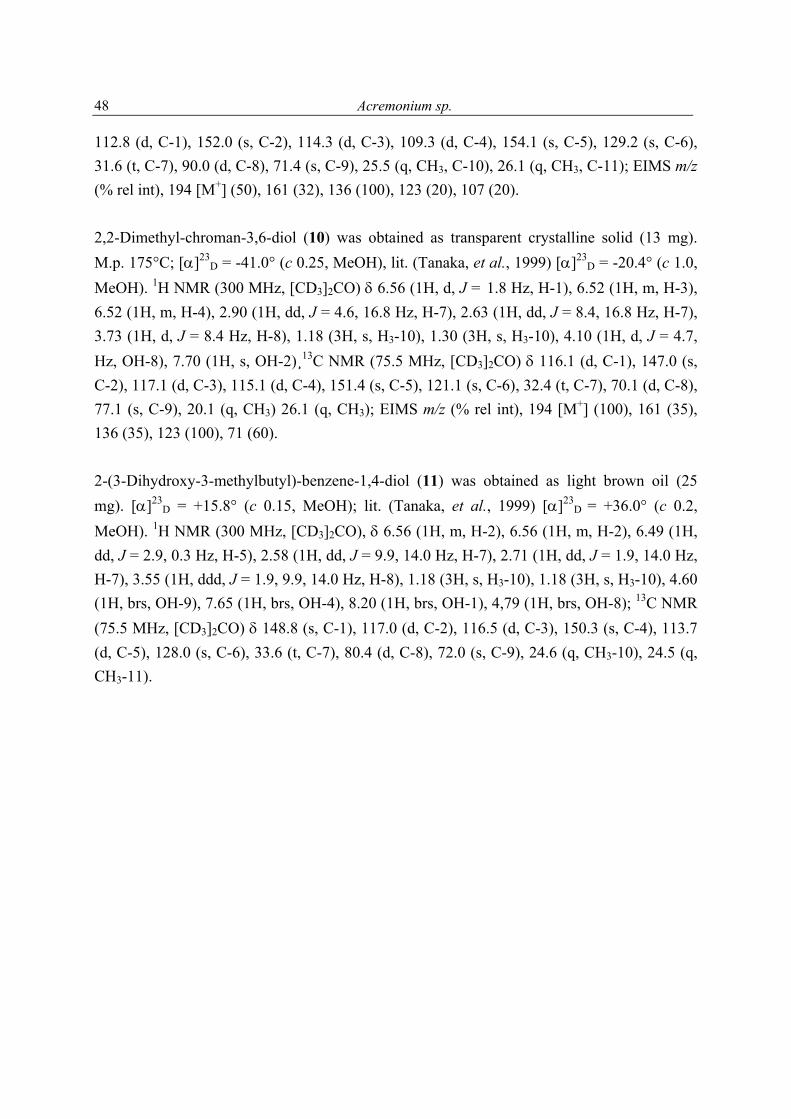
Acremonium sp.
48
112.8 (d, C-1), 152.0 (s, C-2), 114.3 (d, C-3), 109.3 (d, C-4), 154.1 (s, C-5), 129.2 (s, C-6), 31.6 (t, C-7), 90.0 (d, C-8), 71.4 (s, C-9), 25.5 (q, CH3, C-10), 26.1 (q, CH3, C-11); EIMS m/z (% rel int), 194 [M+] (50), 161 (32), 136 (100), 123 (20), 107 (20). 2,2-Dimethyl-chroman-3,6-diol (10) was obtained as transparent crystalline solid (13 mg). M.p. 175°C; [α]23
D = -41.0° (c 0.25, MeOH), lit. (Tanaka, et al., 1999) [α]23D = -20.4° (c 1.0,
MeOH). 1H NMR (300 MHz, [CD3]2CO) δ 6.56 (1H, d, J = 1.8 Hz, H-1), 6.52 (1H, m, H-3), 6.52 (1H, m, H-4), 2.90 (1H, dd, J = 4.6, 16.8 Hz, H-7), 2.63 (1H, dd, J = 8.4, 16.8 Hz, H-7), 3.73 (1H, d, J = 8.4 Hz, H-8), 1.18 (3H, s, H3-10), 1.30 (3H, s, H3-10), 4.10 (1H, d, J = 4.7, Hz, OH-8), 7.70 (1H, s, OH-2)¸13C NMR (75.5 MHz, [CD3]2CO) δ 116.1 (d, C-1), 147.0 (s, C-2), 117.1 (d, C-3), 115.1 (d, C-4), 151.4 (s, C-5), 121.1 (s, C-6), 32.4 (t, C-7), 70.1 (d, C-8), 77.1 (s, C-9), 20.1 (q, CH3) 26.1 (q, CH3); EIMS m/z (% rel int), 194 [M+] (100), 161 (35), 136 (35), 123 (100), 71 (60). 2-(3-Dihydroxy-3-methylbutyl)-benzene-1,4-diol (11) was obtained as light brown oil (25 mg). [α]23
D = +15.8° (c 0.15, MeOH); lit. (Tanaka, et al., 1999) [α]23D = +36.0° (c 0.2,
MeOH). 1H NMR (300 MHz, [CD3]2CO), δ 6.56 (1H, m, H-2), 6.56 (1H, m, H-2), 6.49 (1H, dd, J = 2.9, 0.3 Hz, H-5), 2.58 (1H, dd, J = 9.9, 14.0 Hz, H-7), 2.71 (1H, dd, J = 1.9, 14.0 Hz, H-7), 3.55 (1H, ddd, J = 1.9, 9.9, 14.0 Hz, H-8), 1.18 (3H, s, H3-10), 1.18 (3H, s, H3-10), 4.60 (1H, brs, OH-9), 7.65 (1H, brs, OH-4), 8.20 (1H, brs, OH-1), 4,79 (1H, brs, OH-8); 13C NMR (75.5 MHz, [CD3]2CO) δ 148.8 (s, C-1), 117.0 (d, C-2), 116.5 (d, C-3), 150.3 (s, C-4), 113.7 (d, C-5), 128.0 (s, C-6), 33.6 (t, C-7), 80.4 (d, C-8), 72.0 (s, C-9), 24.6 (q, CH3-10), 24.5 (q, CH3-11).
Wardomyces anomalus
49
4.3 Two new xanthone derivatives from the algicolous marine fungus Wardomyces anomalus Abstract A marine fungal isolate, identified as Wardomyces anomalus, was cultivated and found to produce two new xanthone derivatives, 2,3,6,8-tetrahydroxy-1-methylxanthone (12), and 2,3,4,6,8-pentahydroxy-1-methylxanthone (13), in addition to the known xanthone derivative 3,6,8-trihydroxy-1-methylxanthone (14), and the known fungal metabolite, 5-(hydroxyl- methyl)-2-furanocarboxylic acid (15). The structures of all compounds were determined based on extensive spectroscopic measurements (1D and 2D NMR, MS, UV, and IR). Compounds 12 and 14 showed significant antioxidant activities. The total extract and 12, 14 and 15 were shown to be inhibitors of p56lck tyrosine kinase.
Wardomyces anomalus
50
Introduction Xanthone derivatives are widespread in nature, commonly occurring in a number of higher plant families, and fungi (Peres et al., 2000; Morel et al., 2000). Some fungal species are well known as sources of xanthone derivatives e.g., Penicillium raistrickii (Belofsky et al., 1998), Phomopsis sp. (Isaka et al., 2001), Actinoplanes sp. (Chu et al., 1997), Ascodesmis sphaerospora (Hein et al., 1998), and Humicola sp. (Tabata et al., 1996). Xanthones are known to have a variety of biological activities e.g., antimicrobial, antitubercular, antitumor, and antiviral (Peres et al., 2000; Morel et al., 2000). In continuation of our projects aimed at finding new natural products with biological activity and/or novel chemical structures from marine-derived fungi (Abdel-Lateff et al., 2002),
Wardomyces anomalus Brooks & Hansford, isolated from the green alga Enteromorpha sp. collected around Fehmarn island in the Baltic Sea, was investigated. The crude extract showed antimicrobial effects towards Microbotryum violaceum and Eurotium repens, inhibition of HIV-1 reverse transcriptase (HIV-1-RT) (65.4 % at 66 µg/mL), and inhibition of p56lck tyrosine kinase (TK) (98 % at 200 µg/mL). Radical scavenging activity was observed using α,α-diphenyl-β-picrylhydrazyl (DPPH) as indicator (71.9 % at 500 µg/mL). An extensive computer survey indicated there to be no prior investigation of W. anomalus. On this basis, the fungus was further investigated in order to identify the natural products responsible for this activity. Materials and methods Isolation and taxonomy of the fungal strain After sterilization with 70 % ethanol, algal (Enteromorpha sp., Ulvaceae, OS4T) samples were rinsed with sterile water and pressed onto agar plates to detect any residual fungal spores on the surface of algae. Sterilized algae were then cut into pieces and placed on agar plates containing isolation medium: 15 g/L agar, and 1 L seawater from the sample collecting site, plus antibiotics benzyl penicillin and streptomycin sulfate (250 mg/L). Fungal colonies growing out of the algal tissue were transferred to medium for sporulation (1.0 g glucose, 0.1 g yeast extract, 0.5 g peptone from meat, enzymatic digest, 15 g of agar, and 1 L artificial sea water, pH 8) in order to enable taxonomy of the isolates.
Wardomyces anomalus
51
Cultivation The Fungus W. anomalus (Microascaceae, Ascomycetes, OS4T-3-2-1, 406), was cultivated on 100 mL of media, composed of 50 g biomalt, 15 g agar, and 1 L ASW. Biological activity, see chapter 3.4. Extraction and isolation Cultivated W. anomalus mycelia and medium were diluted with water (100 mL/L) and homogenized using an Ultra Turrax model T25 at 8000 min-1. The resulting mixture was exhaustively extracted with EtOAc (3 x 0.5 L) to yield 66 mg of highly viscous brownish black oil. The EtOAc extract was fractionated over a Bakerbond SPE column (octadecyl C-18, 40 µm, APD, 60 Å, J. T. Baker, USA), gradient elution H2O to MeOH, and three fractions were collected, 20 mL of each: Fraction 1 (16.4 mg, 160.4 mg/L) was identified as 15. Fraction 2 (20 mg) was subjected to HPLC (Eurospher-100 C-18, 5 µm, 250 x 8 mm ID, Knauer), eluted with H2O:MeOH 8:2, and yielded 13 (1 mg, 10 mg/L). Fraction 3 (26.6 mg) was subjected to reversed (RP-18) phase HPLC, eluted with H2O:MeOH 4:6, and yielded 12 (6 mg, 60 mg/L), and 14 (2 mg, 20 mg/L). Results and discussion Compound 12 has the molecular formula C14H10O6 as established by high resolution mass measurement. The 13C NMR spectrum of 12 contained 14 carbon resonances attributable to 10 x C, 3 x CH, and 1 x CH3 groups (Table 11). It was also evident from these data that seven of the ten elements of unsaturation within 12 were present as C=C double bonds, and a carbonyl group (this deduction being supported by an IR absorption at νmax 1646 cm-1), the molecule was thus tricyclic. As the 13C and 1H NMR spectral data enabled all but four of the hydrogen atoms within 12 to be accounted for, it was evident that the remaining four must be present as OH groups, a deduction that was supported by IR data (νmax 3275 cm-1). UV maxima at 234, 258, 311, 358 nm suggested a xanthone nucleus (Morel et al., 2000). The 1H NMR spectral data revealed the presence of three aromatic protons, two of them (H-5 and H-7) with a meta coupling, the third (H-4) one was a singlet, an aryl methyl group (11-CH3), and a hydrogen-bonded phenolic OH (8-OH). After association of all protons with directly bonded carbons via a 2D NMR (HMQC) spectral measurement, it was possible to deduce the substitution pattern of the xanthone nucleus from HMBC correlations. Thus, HMBC correlations were seen between H-5 and C-6, C-7, C-9 (weak), C-9a, and C-10a, between H-7 and C-5, C-6, C-9 (weak) and C-9a, between H-4 and C-1 (weak), C-1a, C-2, C-3, C-4a, and C-9 (weak), and also between H3-11, and C-1, C-1a, C-2, C-4a (weak), and C-9 (weak). The
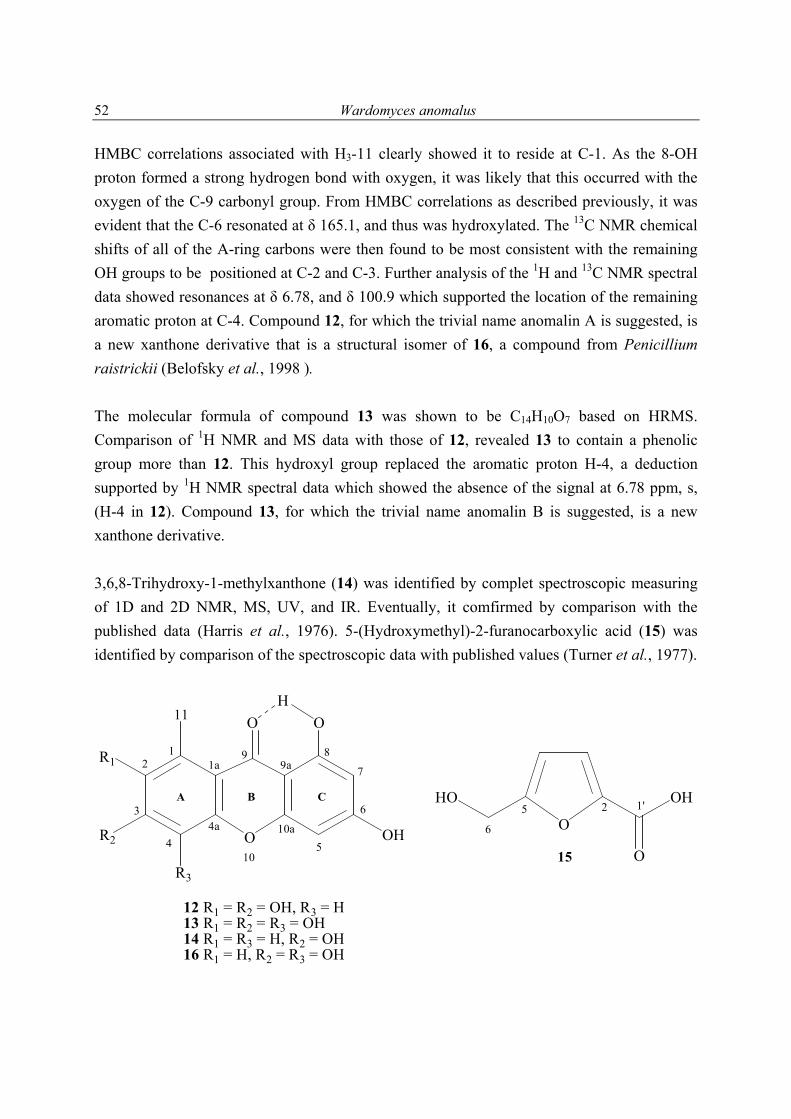
Wardomyces anomalus
52
HMBC correlations associated with H3-11 clearly showed it to reside at C-1. As the 8-OH proton formed a strong hydrogen bond with oxygen, it was likely that this occurred with the oxygen of the C-9 carbonyl group. From HMBC correlations as described previously, it was evident that the C-6 resonated at δ 165.1, and thus was hydroxylated. The 13C NMR chemical shifts of all of the A-ring carbons were then found to be most consistent with the remaining OH groups to be positioned at C-2 and C-3. Further analysis of the 1H and 13C NMR spectral data showed resonances at δ 6.78, and δ 100.9 which supported the location of the remaining aromatic proton at C-4. Compound 12, for which the trivial name anomalin A is suggested, is a new xanthone derivative that is a structural isomer of 16, a compound from Penicillium raistrickii (Belofsky et al., 1998 ). The molecular formula of compound 13 was shown to be C14H10O7 based on HRMS. Comparison of 1H NMR and MS data with those of 12, revealed 13 to contain a phenolic group more than 12. This hydroxyl group replaced the aromatic proton H-4, a deduction supported by 1H NMR spectral data which showed the absence of the signal at 6.78 ppm, s, (H-4 in 12). Compound 13, for which the trivial name anomalin B is suggested, is a new xanthone derivative. 3,6,8-Trihydroxy-1-methylxanthone (14) was identified by complet spectroscopic measuring of 1D and 2D NMR, MS, UV, and IR. Eventually, it comfirmed by comparison with the published data (Harris et al., 1976). 5-(Hydroxymethyl)-2-furanocarboxylic acid (15) was identified by comparison of the spectroscopic data with published values (Turner et al., 1977).
O
O OH
R3
A B C
O
OHHO
O
R1
R2 OH
12
5
3
4
6
7
89
10
9a
10a4a
1a
11
15
12 R1 = R2 = OH, R3 = H13 R1 = R2 = R3 = OH14 R1 = R3 = H, R2 = OH16 R1 = H, R2 = R3 = OH
25
6
1'
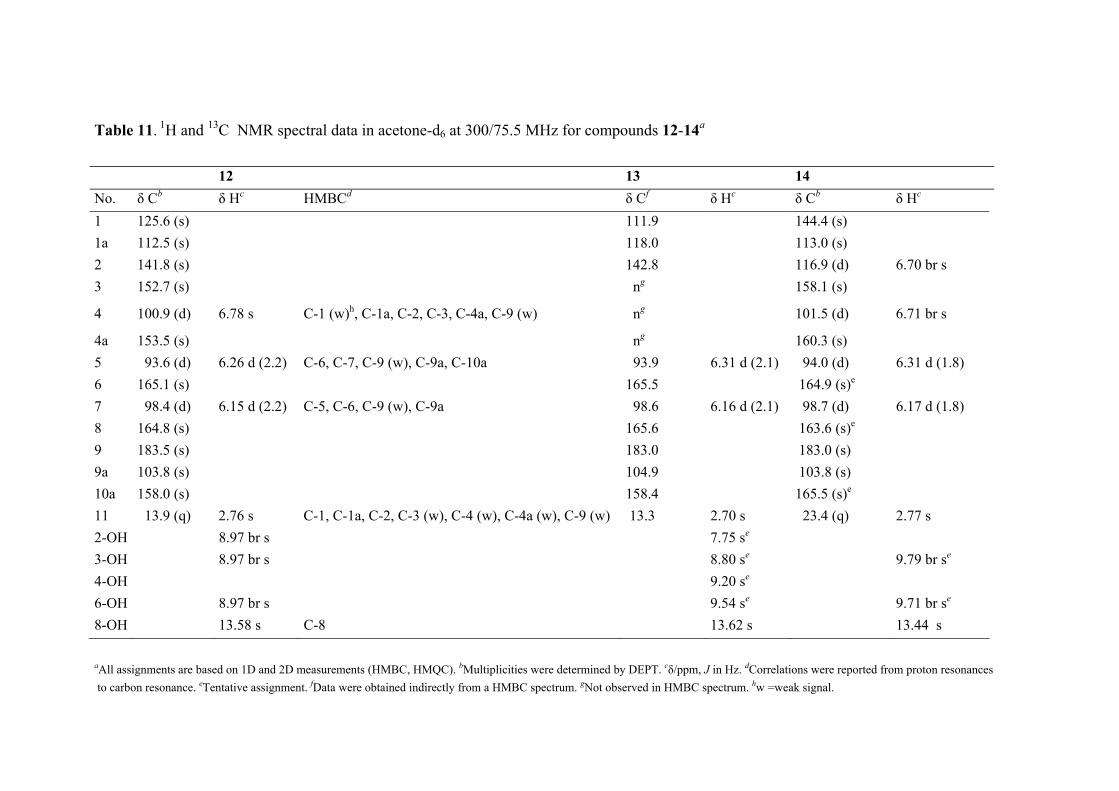
Table 11. 1H and 13C NMR spectral data in acetone-d6 at 300/75.5 MHz for compounds 12-14a
12 13 14 No. δ Cb δ Hc HMBCd δ Cf δ Hc δ Cb δ Hc 1 125.6 (s) 111.9 144.4 (s) 1a 112.5 (s) 118.0 113.0 (s) 2 141.8 (s) 142.8 116.9 (d) 6.70 br s 3 152.7 (s) ng 158.1 (s)
4 100.9 (d) 6.78 s C-1 (w)h, C-1a, C-2, C-3, C-4a, C-9 (w) ng 101.5 (d) 6.71 br s
4a 153.5 (s) ng 160.3 (s) 5 93.6 (d) 6.26 d (2.2) C-6, C-7, C-9 (w), C-9a, C-10a 93.9 6.31 d (2.1) 94.0 (d) 6.31 d (1.8) 6 165.1 (s) 165.5 164.9 (s)e 7 98.4 (d) 6.15 d (2.2) C-5, C-6, C-9 (w), C-9a 98.6 6.16 d (2.1) 98.7 (d) 6.17 d (1.8) 8 164.8 (s) 165.6 163.6 (s)e 9 183.5 (s) 183.0 183.0 (s) 9a 103.8 (s) 104.9 103.8 (s) 10a 158.0 (s) 158.4 165.5 (s)e 11 13.9 (q) 2.76 s C-1, C-1a, C-2, C-3 (w), C-4 (w), C-4a (w), C-9 (w) 13.3 2.70 s 23.4 (q) 2.77 s 2-OH 8.97 br s 7.75 se 3-OH 8.97 br s 8.80 se 9.79 br se 4-OH 9.20 se 6-OH 8.97 br s 9.54 se 9.71 br se 8-OH 13.58 s C-8 13.62 s 13.44 s
aAll assignments are based on 1D and 2D measurements (HMBC, HMQC). bMultiplicities were determined by DEPT. cδ/ppm, J in Hz. dCorrelations were reported from proton resonances to carbon resonance. eTentative assignment. fData were obtained indirectly from a HMBC spectrum. gNot observed in HMBC spectrum. hw =weak signal.
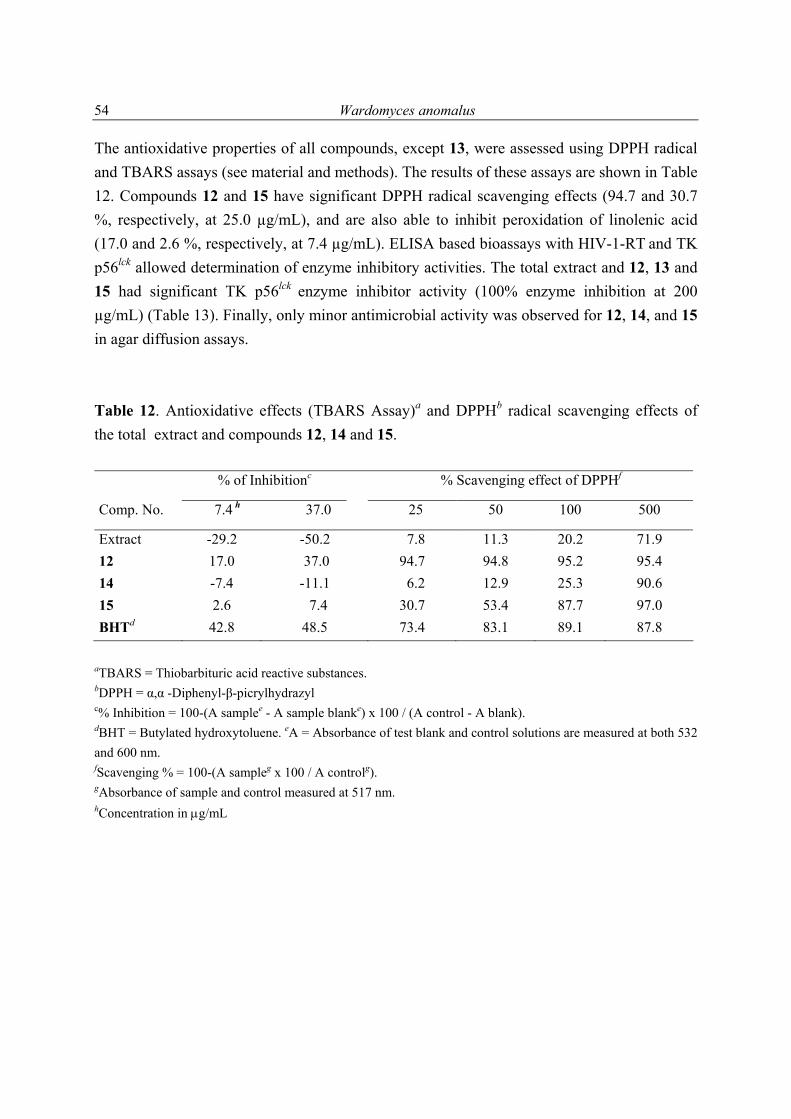
Wardomyces anomalus
54
The antioxidative properties of all compounds, except 13, were assessed using DPPH radical and TBARS assays (see material and methods). The results of these assays are shown in Table 12. Compounds 12 and 15 have significant DPPH radical scavenging effects (94.7 and 30.7 %, respectively, at 25.0 µg/mL), and are also able to inhibit peroxidation of linolenic acid (17.0 and 2.6 %, respectively, at 7.4 µg/mL). ELISA based bioassays with HIV-1-RT and TK p56lck allowed determination of enzyme inhibitory activities. The total extract and 12, 13 and 15 had significant TK p56lck enzyme inhibitor activity (100% enzyme inhibition at 200 µg/mL) (Table 13). Finally, only minor antimicrobial activity was observed for 12, 14, and 15 in agar diffusion assays. Table 12. Antioxidative effects (TBARS Assay)a and DPPHb radical scavenging effects of the total extract and compounds 12, 14 and 15. % of Inhibitionc % Scavenging effect of DPPHf
Comp. No. 7.4 h 37.0 25 50 100 500
Extract -29.2 -50.2 7.8 11.3 20.2 71.9 12 17.0 37.0 94.7 94.8 95.2 95.4 14 -7.4 -11.1 6.2 12.9 25.3 90.6 15 2.6 7.4 30.7 53.4 87.7 97.0 BHTd 42.8 48.5 73.4 83.1 89.1 87.8
aTBARS = Thiobarbituric acid reactive substances. bDPPH = α,α -Diphenyl-β-picrylhydrazyl
c% Inhibition = 100-(A samplee - A sample blanke) x 100 / (A control - A blank). dBHT = Butylated hydroxytoluene. eA = Absorbance of test blank and control solutions are measured at both 532 and 600 nm. fScavenging % = 100-(A sampleg x 100 / A controlg). gAbsorbance of sample and control measured at 517 nm. hConcentration in µg/mL
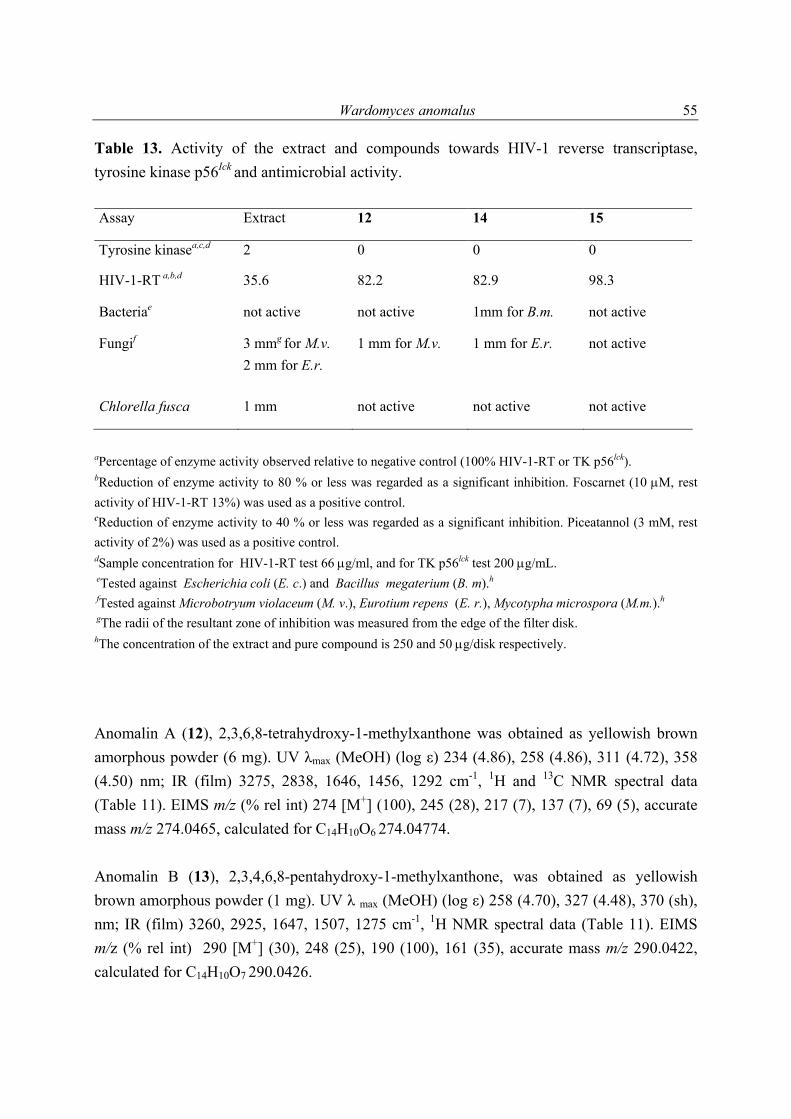
Wardomyces anomalus
55
Table 13. Activity of the extract and compounds towards HIV-1 reverse transcriptase, tyrosine kinase p56Ick and antimicrobial activity. Assay Extract 12 14 15
Tyrosine kinasea,c,d 2 0 0 0
HIV-1-RT a,b,d 35.6 82.2 82.9 98.3
Bacteriae not active not active 1mm for B.m. not active
Fungif 3 mmg for M.v. 2 mm for E.r.
1 mm for M.v. 1 mm for E.r. not active
Chlorella fusca 1 mm not active not active not active
aPercentage of enzyme activity observed relative to negative control (100% HIV-1-RT or TK p56lck). bReduction of enzyme activity to 80 % or less was regarded as a significant inhibition. Foscarnet (10 µM, rest activity of HIV-1-RT 13%) was used as a positive control. cReduction of enzyme activity to 40 % or less was regarded as a significant inhibition. Piceatannol (3 mM, rest activity of 2%) was used as a positive control. dSample concentration for HIV-1-RT test 66 µg/ml, and for TK p56lck test 200 µg/mL. eTested against Escherichia coli (E. c.) and Bacillus megaterium (B. m).h
fTested against Microbotryum violaceum (M. v.), Eurotium repens (E. r.), Mycotypha microspora (M.m.).h
gThe radii of the resultant zone of inhibition was measured from the edge of the filter disk. hThe concentration of the extract and pure compound is 250 and 50 µg/disk respectively.
Anomalin A (12), 2,3,6,8-tetrahydroxy-1-methylxanthone was obtained as yellowish brown amorphous powder (6 mg). UV λmax (MeOH) (log ε) 234 (4.86), 258 (4.86), 311 (4.72), 358 (4.50) nm; IR (film) 3275, 2838, 1646, 1456, 1292 cm-1, 1H and 13C NMR spectral data (Table 11). EIMS m/z (% rel int) 274 [M+] (100), 245 (28), 217 (7), 137 (7), 69 (5), accurate mass m/z 274.0465, calculated for C14H10O6 274.04774. Anomalin B (13), 2,3,4,6,8-pentahydroxy-1-methylxanthone, was obtained as yellowish brown amorphous powder (1 mg). UV λ max (MeOH) (log ε) 258 (4.70), 327 (4.48), 370 (sh), nm; IR (film) 3260, 2925, 1647, 1507, 1275 cm-1, 1H NMR spectral data (Table 11). EIMS m/z (% rel int) 290 [M+] (30), 248 (25), 190 (100), 161 (35), accurate mass m/z 290.0422, calculated for C14H10O7 290.0426.
Wardomyces anomalus
56
3,6,8-Trihydroxy-1-methylxanthone (14) was obtained as yellowish brown amorphous powder (2 mg). Lit. (Harris et al., 1976), UV λ max (MeOH) (log ε) 238 (4.72), 310 (4.60) nm; IR (film) 3260, 2925, 1647, 1507, 1275 cm-1; 1H NMR (300 MHz, [CD3]2CO), δ 6.71 (1H, br s, H-4), δ 6.70 (1H, br s, H-2), 6.31 (1H, d, J = 1.8, H-5), 6.171 (1H, d, J = 1.8, H-7), 2.77 (3H, s, H3-11), 13.44 (1H, s, OH-8); 9.79 (1H, br s, OH-3), 9.71 (1H, br s, OH-6), 9.79 (1H, d, J = 1.8, OH-3); 13C NMR (75.5 MHz, (CD3)2CO) δ 183.0 (s, C-9), 165.5 (s, C-10a), 164.9 (s, C-6), 163.6 (s, C-8), 160.3 (s, C-4a), 158.1 (s, C-3), 144.4 (s, C-1), 116.0 (d, C-2), 113.0 (s, C-1a), 103.8 (s, C-1a), 101.5 (d, C-4), 98.7 (d, C-7), 94.0 (d, C-5), 23.4 (q, C-11). EIMS m/z (% rel int) 258 [M+] (100), 229 (10), 69 (5), accurate mass m/z 258.0524, calculated for C14H10O5 258.0528. 5-(Hydroxymethyl)-2-furanocarboxylic acid (15) was obtained as brown oil (16.4 mg). Lit. (Turner, 1977), 1H NMR (300 MHz, [CD3]2CO), δ 7.12 (1H, d, J = 3.5, H-4), δ 6.44 (1H, d, J = 3.5, H-3), 4.52 (2H, s, H-6); 13C NMR (75.5 MHz, [CD3]2CO) δ 162.5 (s, C-1`), 160.6 (s, C-2), 145.9 (d, C-5), 119.5 (d, C-4), 110.2 (s, C-3), 57.8 (t, C-6). EIMS m/z 142, calculated for C6H6O4 142.0266.
Epicoccum sp.
57
4.4 A new antioxidant isobenzofuranone derivative from the algicolous marine fungus Epicoccum sp. Abstract The fungus Epicoccum sp., was isolated from the marine brown alga Fucus vesiculosus. After cultivation the fungus was investigated for its secondary metabolite content, and found to contain the new natural product 4,5,6-trihydroxy-7-methylphthalide (epicoccone, 17), together with 5-(acetoxymethyl)-2-furanocarboxylic acid (18), 2-furanocarboxylic acid (19), 5-(hydroxymethyl)-2-furanocarboxylic acid (15), (-)-(3R,4S)-4-hydroxymellein (20), and (-)-(3R)-5-hydroxymellein (21). The structures of all compounds were determined by interpretation of their spectroscopic data (1D and 2D NMR, MS, UV, optical rotation and IR). Each isolate was tested for its antioxidative properties, and compound 17 was found to be potently active.
Epicoccum sp.
58
Introduction Fungi of the genus Epicoccum are commonly associated with beach wrack material (Kohlmeyer et al., 1979). Only a few members of this genus of trestrial origin have been studied for their secondary metabolite content e.g. epicorazines A and B (Baute et al., 1976, 1978), triornicin (Frederick et al., 1981), orevactaene (Shu et al., 1997), all being produced by E. nigrum (= E. purpurascens) and the ability of Epicoccum sp. to produce biologically active secondary metabolites is not yet investigated. During our investigation dealing with isolation and structure elcidation of novel bioactive secondary metabolites of fungi associated with algae, the obligate marine fungus Epicoccum sp. was isolated from the brown alga Fucus vesiculosus L., collected at the German coast (Tönning, North Sea). After successive fractionation of the EtOAc extract yielded a new potent isobenzofuranone (phthalide) derivative. Isobenzofuranone (phthalide) derivatives like convolvulanic acid A and B (Tsantrizos et al., 1992), and 3-butyl-7-hydroxyphthalide (Makino et al., 1998), were formerly isolated from fungi. This group of natural products is, however also known from higher plants, e.g. 3-ethyl-7-hydroxy phthalide (Kameoka et al., 1975).
Materials and methods Isolation and taxonomy of the fungal strain Algal material was collected from the North Sea coast (Tönning, Germany), and identified as Fucus vesiculosus L. (Fucaceae, N 1). After sterilisation with 70 % ethanol, algal samples were rinsed with sterile water and pressed onto agar plates to detect any residual fungal spores on their surface. Sterilised algae were then cut into pieces and placed on agar plates containing isolation medium: 15 g/L agar, 1 L seawater from the sample collecting site, benzyl penicillin and streptomycin sulphate (250 mg/L). Fungal colonies growing out of the algal tissue were transferred onto medium for sporulation: 1.0 g/L glucose, 0.1 g/L yeast extract, 0.5 g/L peptone from meat, enzymatic digest, 15 g/L agar, 1 L artificial sea water, the pH was adjusted to 8 in order to enable taxonomy of the isolates. Cultivation The fungus Epicoccum sp. (Hyphomycetes, Tuberculaiaceae, N 1-12, 353) was cultivated at room temperature for two months in 5 L (20 Fernbach flasks) of solid biomalt agar containing
Epicoccum sp.
59
50 g/L biomalt, 15 g/L agar in ASW. Each Fernbach flask was inoculated with 10 mL of a 10-day-old culture (room temperature) grown in biomalt media without agar. Biological activity, see chapter 3.4. Extraction and isolation Mycelia and medium of the cultivated fungus were diluted with water (100 mL/L), homogenized using an Ika Ultra-turax model T25 at 8000 rpm for 2 min, the resulting mixture exhaustively extracted with EtOAc (3 x 8 L) and filtered. The filtrate was evaporated under reduced prssure to yield 1.7 g of a highly viscous dark redish gum. This extract was fractionated by VLC (2.5 x 20 cm, RP-18, 30 g) employing gradient elution from H2O to MeOH, to yield 6 fractions (H2O:MeOH, 1:0; 8:2; 6:4; 4:6; 2:8; 0:1, each 100 mL). 1H NMR identified fractions 1, 4 and 5 as promising for further fractionation. VLC fraction 1 (0.286 g) was fractionated on a Sep Pack column (RP-18) using gradient elution from H2O to MeOH, to yield 6 fractions (H2O:MeOH, 1:0; 8:2; 6:4; 4:6; 2:8; 0:1, each 20 mL). SPE fraction 1 was further fractionated by RP-18 HPLC (Eurospher-100, 5 µm, 250 x 8 mm, Knauer), employing gradient elution from H2O to H2O:MeOH (1:1) in 30 min, 2 mL/min, to yield 17 (semi-pure), 18, and a mixture of 19 and 15 (tR = 27 min, 2.0 mg/L; tR = 12 min, 0.8 mg/L; tR = 6 min, 1 mg/L, respectively). Compound 17 was finally purified by gradient elution with 4:1 H2O:MeOH to 3:7 H2O:MeOH in 25 min, 2 mL/min. VLC fraction 4 and 5 were pooled, based on similarities of 1H NMR spectral data, and further fractionated by SPE (RP-18), employing gradient elution from H2O to MeOH, to yield 8 fractions (H2O:MeOH, 1:0; 8.5:1.5; 7:3; 5.5:4.5; 4:6; 2.5:7.5; 1:9; 0:1, each 20 mL), which were combined, based on their 1H NMR spectral data, into 4 pools. Of these, pool 4 was purified using RP-18 (Eurospher-100, 5 µm, 250 x 8 mm, Knauer) HPLC, and gradient elution from 7:3 H2O:MeOH to 4:6 H2O:MeOH in 30 min, 2 mL/min, to yield 20 (tR = 23 min, 0.3 mg/L) and 21 (tR = 27 min, 0.3 mg/L). GC-MS analysis of 19 and 15 TMS derivatives were made by dissolving 1 mg of the compound mixture (19 and 15) in 100 µL of TFA. Then 0.9 mL of MSTFA (N-methyl-N-trimethylsilyl-trifluroacetamid; WGA GmbH 370520) was added dropwise, and the reaction mixture was left at room temperature for 1 hour. The GC-MS analysis was carried out on a A 30 m x 0.32 mm N931-6023 Pe-1 (film thickness of 0.25 µm) capillary column. The instrument was set to an initial temperature of 50 °C, and maintained at this temperature for 10 min. At the end of this period the oven was heated at 10°/min up to 250°C, and kept there for 10 min. Injection port temperature was
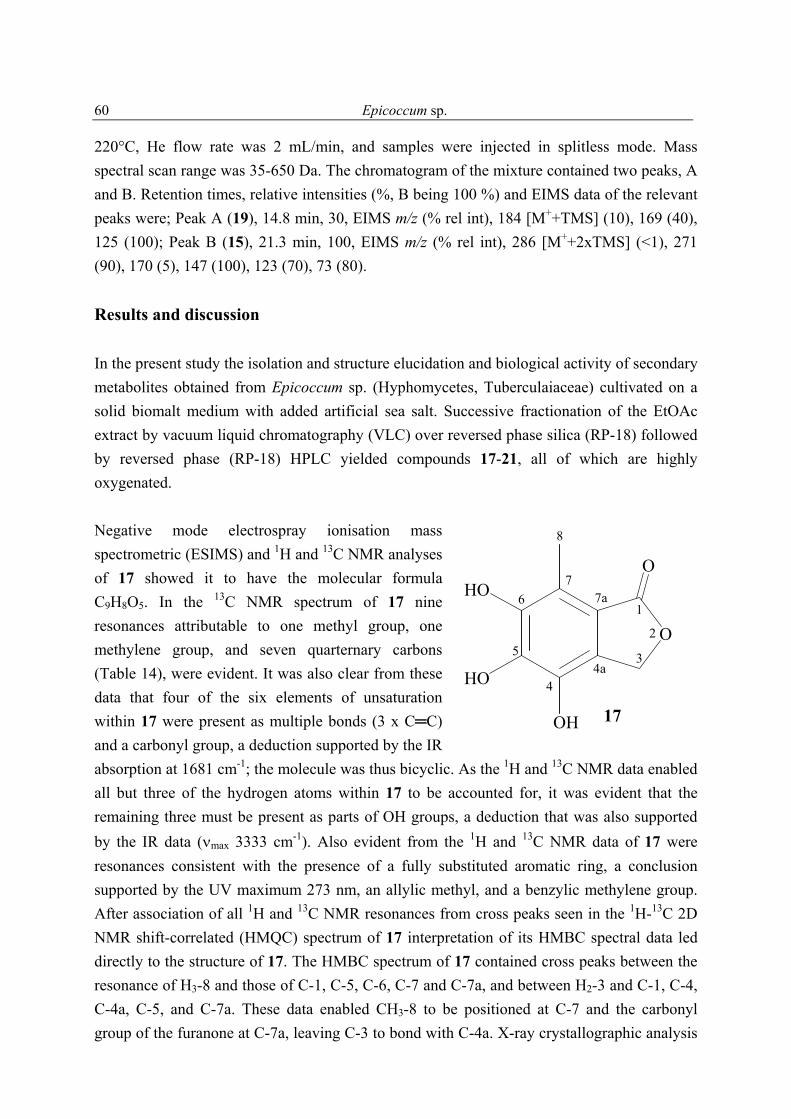
Epicoccum sp.
60
220°C, He flow rate was 2 mL/min, and samples were injected in splitless mode. Mass spectral scan range was 35-650 Da. The chromatogram of the mixture contained two peaks, A and B. Retention times, relative intensities (%, B being 100 %) and EIMS data of the relevant peaks were; Peak A (19), 14.8 min, 30, EIMS m/z (% rel int), 184 [M++TMS] (10), 169 (40), 125 (100); Peak B (15), 21.3 min, 100, EIMS m/z (% rel int), 286 [M++2xTMS] (<1), 271 (90), 170 (5), 147 (100), 123 (70), 73 (80). Results and discussion In the present study the isolation and structure elucidation and biological activity of secondary metabolites obtained from Epicoccum sp. (Hyphomycetes, Tuberculaiaceae) cultivated on a solid biomalt medium with added artificial sea salt. Successive fractionation of the EtOAc extract by vacuum liquid chromatography (VLC) over reversed phase silica (RP-18) followed by reversed phase (RP-18) HPLC yielded compounds 17-21, all of which are highly oxygenated. Negative mode electrospray ionisation mass spectrometric (ESIMS) and 1H and 13C NMR analyses of 17 showed it to have the molecular formula C9H8O5. In the 13C NMR spectrum of 17 nine resonances attributable to one methyl group, one methylene group, and seven quarternary carbons (Table 14), were evident. It was also clear from these data that four of the six elements of unsaturation within 17 were present as multiple bonds (3 x C═C) and a carbonyl group, a deduction supported by the IR absorption at 1681 cm-1; the molecule was thus bicyclic. As the 1H and 13C NMR data enabled all but three of the hydrogen atoms within 17 to be accounted for, it was evident that the remaining three must be present as parts of OH groups, a deduction that was also supported by the IR data (νmax 3333 cm-1). Also evident from the 1H and 13C NMR data of 17 were resonances consistent with the presence of a fully substituted aromatic ring, a conclusion supported by the UV maximum 273 nm, an allylic methyl, and a benzylic methylene group. After association of all 1H and 13C NMR resonances from cross peaks seen in the 1H-13C 2D NMR shift-correlated (HMQC) spectrum of 17 interpretation of its HMBC spectral data led directly to the structure of 17. The HMBC spectrum of 17 contained cross peaks between the resonance of H3-8 and those of C-1, C-5, C-6, C-7 and C-7a, and between H2-3 and C-1, C-4, C-4a, C-5, and C-7a. These data enabled CH3-8 to be positioned at C-7 and the carbonyl group of the furanone at C-7a, leaving C-3 to bond with C-4a. X-ray crystallographic analysis
O
OHO
HO
OH 17
1
2
3
4
5
67
8
7a
4a
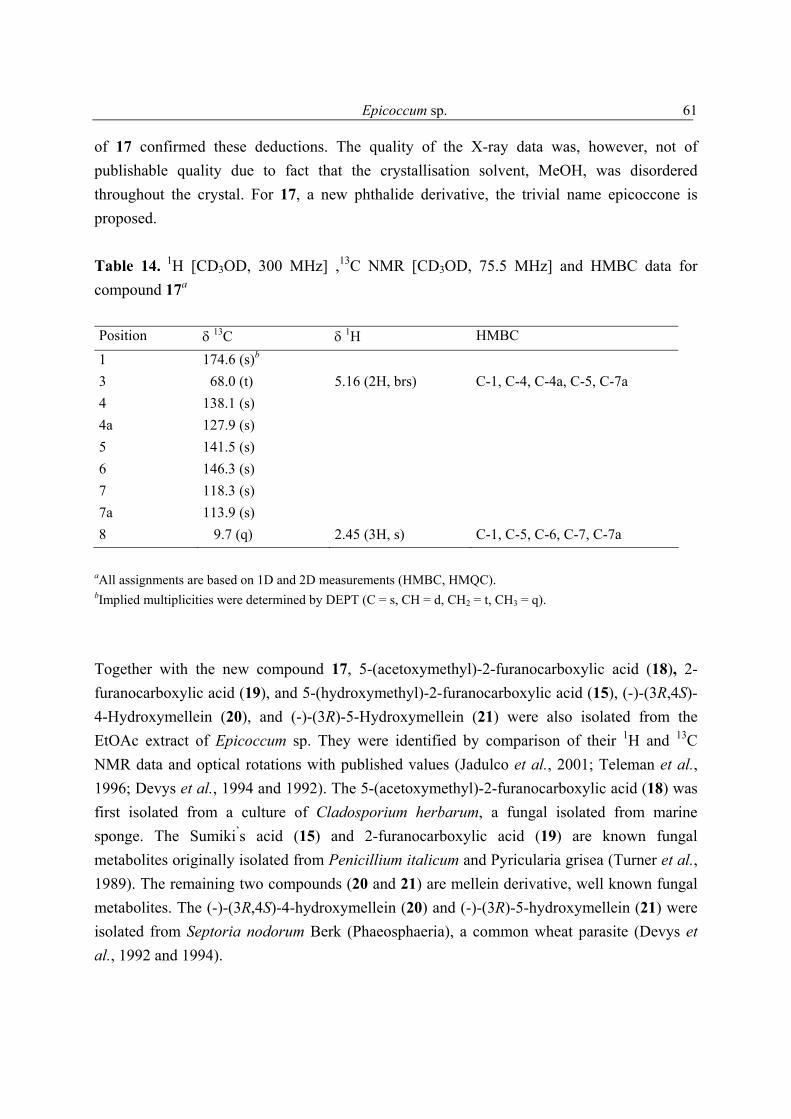
Epicoccum sp.
61
of 17 confirmed these deductions. The quality of the X-ray data was, however, not of publishable quality due to fact that the crystallisation solvent, MeOH, was disordered throughout the crystal. For 17, a new phthalide derivative, the trivial name epicoccone is proposed. Table 14. 1H [CD3OD, 300 MHz] ,13C NMR [CD3OD, 75.5 MHz] and HMBC data for compound 17a Position δ 13C δ 1H HMBC
1 174.6 (s)b 3 68.0 (t) 5.16 (2H, brs) C-1, C-4, C-4a, C-5, C-7a 4 138.1 (s) 4a 127.9 (s) 5 141.5 (s) 6 146.3 (s) 7 118.3 (s) 7a 113.9 (s) 8 9.7 (q) 2.45 (3H, s) C-1, C-5, C-6, C-7, C-7a
aAll assignments are based on 1D and 2D measurements (HMBC, HMQC). bImplied multiplicities were determined by DEPT (C = s, CH = d, CH2 = t, CH3 = q).
Together with the new compound 17, 5-(acetoxymethyl)-2-furanocarboxylic acid (18), 2-furanocarboxylic acid (19), and 5-(hydroxymethyl)-2-furanocarboxylic acid (15), (-)-(3R,4S)-4-Hydroxymellein (20), and (-)-(3R)-5-Hydroxymellein (21) were also isolated from the EtOAc extract of Epicoccum sp. They were identified by comparison of their 1H and 13C NMR data and optical rotations with published values (Jadulco et al., 2001; Teleman et al., 1996; Devys et al., 1994 and 1992). The 5-(acetoxymethyl)-2-furanocarboxylic acid (18) was first isolated from a culture of Cladosporium herbarum, a fungal isolated from marine sponge. The Sumiki’s acid (15) and 2-furanocarboxylic acid (19) are known fungal metabolites originally isolated from Penicillium italicum and Pyricularia grisea (Turner et al., 1989). The remaining two compounds (20 and 21) are mellein derivative, well known fungal metabolites. The (-)-(3R,4S)-4-hydroxymellein (20) and (-)-(3R)-5-hydroxymellein (21) were isolated from Septoria nodorum Berk (Phaeosphaeria), a common wheat parasite (Devys et al., 1992 and 1994).
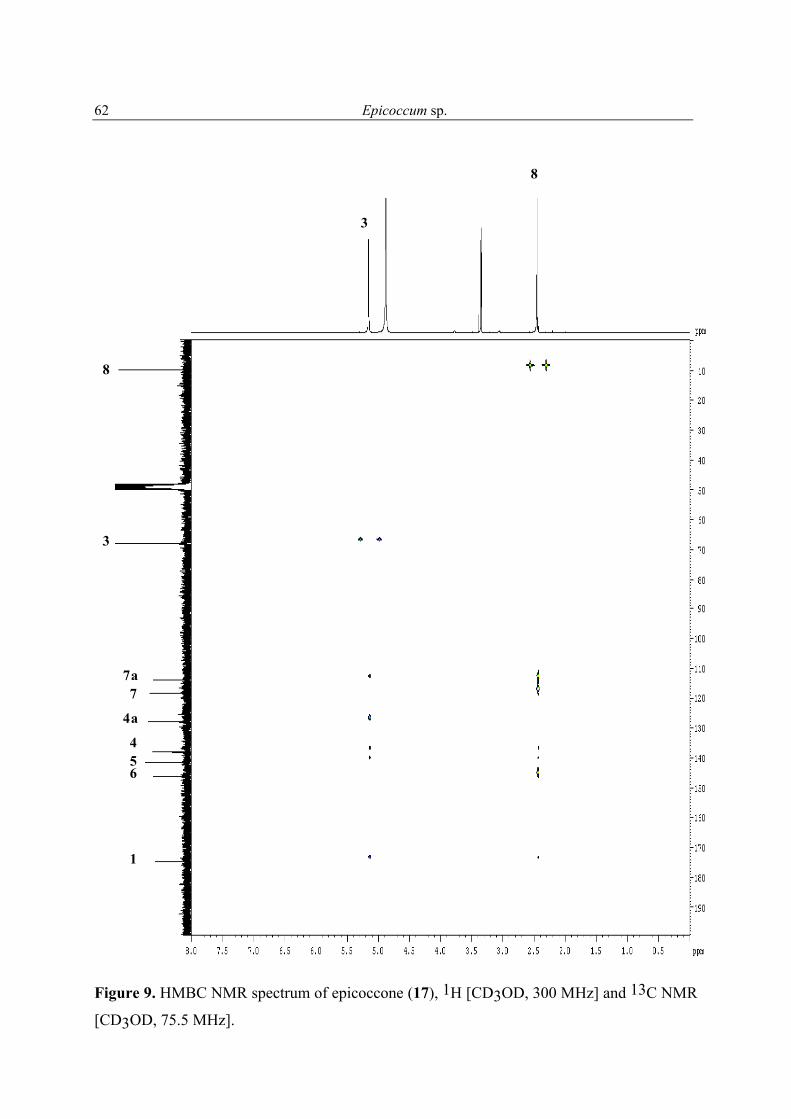
Epicoccum sp.
62
8
3
3
8
7a7
4a
456
1
Figure 9. HMBC NMR spectrum of epicoccone (17), 1H [CD3OD, 300 MHz] and 13C NMR
[CD3OD, 75.5 MHz].
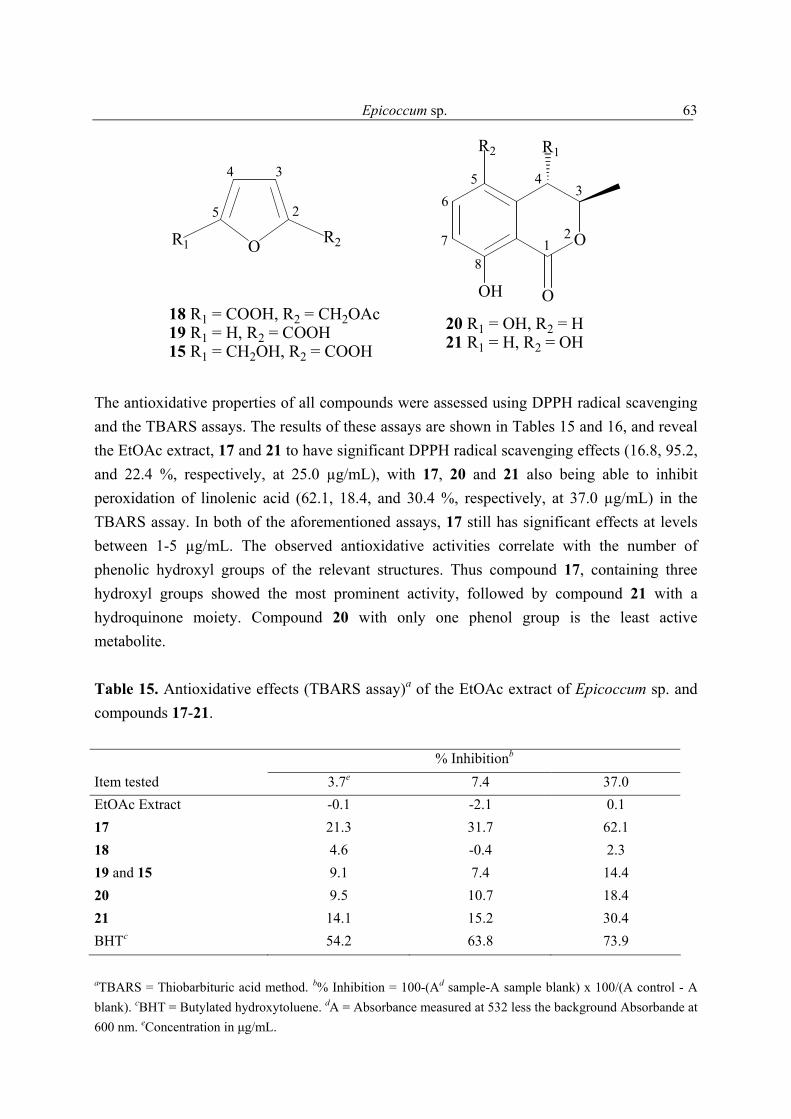
Epicoccum sp.
63
O O
OOH
R1
R2
18 R1 = COOH, R2 = CH2OAc19 R1 = H, R2 = COOH 15 R1 = CH2OH, R2 = COOH
20 R1 = OH, R2 = H21 R1 = H, R2 = OH
R2
R1 12
345
6
7
8
2
34
5
The antioxidative properties of all compounds were assessed using DPPH radical scavenging and the TBARS assays. The results of these assays are shown in Tables 15 and 16, and reveal the EtOAc extract, 17 and 21 to have significant DPPH radical scavenging effects (16.8, 95.2, and 22.4 %, respectively, at 25.0 µg/mL), with 17, 20 and 21 also being able to inhibit peroxidation of linolenic acid (62.1, 18.4, and 30.4 %, respectively, at 37.0 µg/mL) in the TBARS assay. In both of the aforementioned assays, 17 still has significant effects at levels between 1-5 µg/mL. The observed antioxidative activities correlate with the number of phenolic hydroxyl groups of the relevant structures. Thus compound 17, containing three hydroxyl groups showed the most prominent activity, followed by compound 21 with a hydroquinone moiety. Compound 20 with only one phenol group is the least active metabolite. Table 15. Antioxidative effects (TBARS assay)a of the EtOAc extract of Epicoccum sp. and compounds 17-21. % Inhibitionb Item tested 3.7e 7.4 37.0 EtOAc Extract -0.1 -2.1 0.1 17 21.3 31.7 62.1 18 4.6 -0.4 2.3 19 and 15 9.1 7.4 14.4 20 9.5 10.7 18.4 21 14.1 15.2 30.4 BHTc 54.2 63.8 73.9
aTBARS = Thiobarbituric acid method. b% Inhibition = 100-(Ad sample-A sample blank) x 100/(A control - A blank). cBHT = Butylated hydroxytoluene. dA = Absorbance measured at 532 less the background Absorbande at 600 nm. eConcentration in µg/mL.
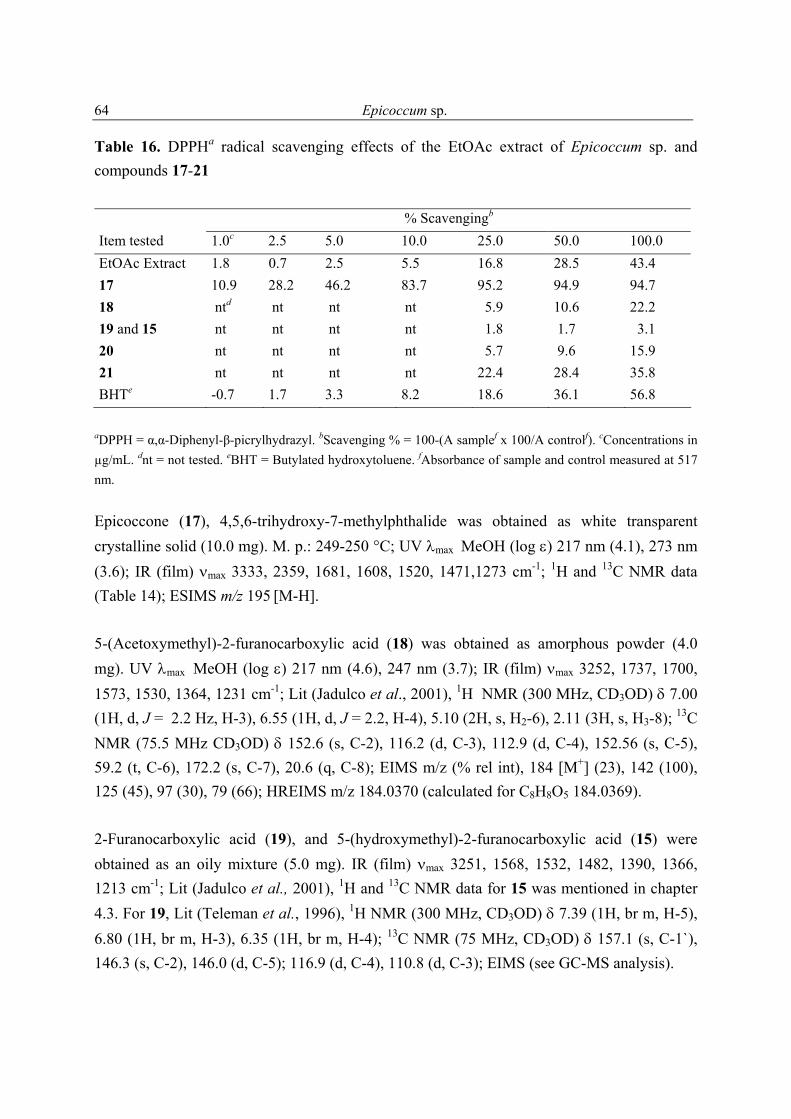
Epicoccum sp.
64
Table 16. DPPHa radical scavenging effects of the EtOAc extract of Epicoccum sp. and compounds 17-21 % Scavengingb Item tested 1.0c 2.5 5.0 10.0 25.0 50.0 100.0 EtOAc Extract 1.8 0.7 2.5 5.5 16.8 28.5 43.4 17 10.9 28.2 46.2 83.7 95.2 94.9 94.7 18 ntd nt nt nt 5.9 10.6 22.2 19 and 15 nt nt nt nt 1.8 1.7 3.1 20 nt nt nt nt 5.7 9.6 15.9 21 nt nt nt nt 22.4 28.4 35.8 BHTe -0.7 1.7 3.3 8.2 18.6 36.1 56.8
aDPPH = α,α-Diphenyl-β-picrylhydrazyl. bScavenging % = 100-(A samplef x 100/A controlf). cConcentrations in µg/mL. dnt = not tested. eBHT = Butylated hydroxytoluene. fAbsorbance of sample and control measured at 517 nm.
Epicoccone (17), 4,5,6-trihydroxy-7-methylphthalide was obtained as white transparent crystalline solid (10.0 mg). M. p.: 249-250 °C; UV λmax MeOH (log ε) 217 nm (4.1), 273 nm (3.6); IR (film) νmax 3333, 2359, 1681, 1608, 1520, 1471,1273 cm-1; 1H and 13C NMR data (Table 14); ESIMS m/z 195 [M-H]. 5-(Acetoxymethyl)-2-furanocarboxylic acid (18) was obtained as amorphous powder (4.0 mg). UV λmax MeOH (log ε) 217 nm (4.6), 247 nm (3.7); IR (film) νmax 3252, 1737, 1700, 1573, 1530, 1364, 1231 cm-1; Lit (Jadulco et al., 2001), 1H NMR (300 MHz, CD3OD) δ 7.00 (1H, d, J = 2.2 Hz, H-3), 6.55 (1H, d, J = 2.2, H-4), 5.10 (2H, s, H2-6), 2.11 (3H, s, H3-8); 13C NMR (75.5 MHz CD3OD) δ 152.6 (s, C-2), 116.2 (d, C-3), 112.9 (d, C-4), 152.56 (s, C-5), 59.2 (t, C-6), 172.2 (s, C-7), 20.6 (q, C-8); EIMS m/z (% rel int), 184 [M+] (23), 142 (100), 125 (45), 97 (30), 79 (66); HREIMS m/z 184.0370 (calculated for C8H8O5 184.0369).
2-Furanocarboxylic acid (19), and 5-(hydroxymethyl)-2-furanocarboxylic acid (15) were obtained as an oily mixture (5.0 mg). IR (film) νmax 3251, 1568, 1532, 1482, 1390, 1366, 1213 cm-1; Lit (Jadulco et al., 2001), 1H and 13C NMR data for 15 was mentioned in chapter 4.3. For 19, Lit (Teleman et al., 1996), 1H NMR (300 MHz, CD3OD) δ 7.39 (1H, br m, H-5), 6.80 (1H, br m, H-3), 6.35 (1H, br m, H-4); 13C NMR (75 MHz, CD3OD) δ 157.1 (s, C-1`), 146.3 (s, C-2), 146.0 (d, C-5); 116.9 (d, C-4), 110.8 (d, C-3); EIMS (see GC-MS analysis).
Epicoccum sp.
65
(-)-(3R,4S)-4-Hydroxymellein (20) was obtained as amorphous solid (1.5 mg). [α]23D = -26.3°
(c 0.05, CHCl3), lit. (Devys et al., 1992). 1H NMR (300 MHz, CDCl3) δ 4.60 (2H, brs, H-3 and 4), 6.99 (1H, d, J = 7.7, H-5), 7.53 (1H, dd, J = 7.7, 6.6 Hz, H-6), 7.02 (1H, d, J = 6.6 Hz, H-7); EIMS m/z (% rel int), 194 [M+] (50), 150 (95), 121 (100), 94 (18), 65 (23). HREIMS m/z 194.0578 (calculated for C10H10O4 194.0578). (-)-(3R)-5-Hydroxymellein (21) was obtained as amorphous powder (1.5 mg). [α]23
D = -19.8° (c 0.05, CH2Cl2), lit. (Devys, et al., 1994). [α]23
D = -72 (c 1650 mg %). 1H NMR (300 MHz, DMSO) δ 4.70 (1H, m, H-3), 3.07 (1H, dd, J = 17.2, 2.9 H-4), 2.65 (1H, m, H-4), 10.36 (1H, s, OH-5), 6.72 (1H, d, J = 9.15, H-6), 7.06(1H, d, J = 9.15, H-7); EIMS m/z (% rel int), 194 [M+] (50), 176 (35), 165 (20), 149 (50), 121 (20), 111 (4), 97 (50), 121 (20), 83 (70), 69(7), 57 (100). HREIMS m/z 194.0578 (calculated for C10H10O4 194.0576).
Trichoderma viride
66
4.5 Novel sorbicillinoid derivatives from the marine fungus Trichoderma viride associated with the Caribbean sponge Agelas dispar Abstract The fungus Trichoderma viride isolated from the Caribbean sponge Agelas dispar, collected on Dominica, was mass cultivated and found to produce four novel sorbicillinoid polyketide derivatives, trichodermanone A-D (22-25) and the new natural product 6-(4-hydroxy-1-pentenyl)-4-methoxy-3-methyl-2H-pyran-2-one (trichopyranone, 26). In addition to these compounds two known hexaketide derivatives, epoxysorbicillinol (27), vertinolide (28) and three known dodecaketides trichodimerol (29), bislongiquinolide (trichotetronine, 30), and bisvertinol (31), were isolated. Finally, a known fungal metabolite, 2-furancarboxylic acid (19) was obtained. The structures of all compounds were determined by interpretation of their spectroscopic data (1D and 2D NMR, MS, UV and IR). Total extract and compounds 27-30 have DPPH radical savenging effects (12.5, 43.8, 15.5, 37.2, and 23.8 % respectively at 230 µmol/L), with 27-29 being also able to inhibit peroxidation of linolenic acid (17.8, 5.2 and 19.9, respectively at 164 µmol/L). Compound 27 showed moderate HIV-1 reverse transcriptase inhibitory activity (63.8 % at 200 µg/mL). All compounds and the total extract except 19 were tested for their estrogenic, antitumor and antimicrobial effects and no significant activities were observed.
Trichoderma viride
67
Introduction The fungal genus Trichoderma (Persoon 1821) is known for its ubiquitous occurrence (Andrade et al., 1992). The taxonomical classification of these fungi, however is difficult. In the last decade considerable interest has been shown in the use of Trichoderma sp. as biological control (Cooney et al., 1999). Trichoderma sp. are noted for their secondary metabolite content, to date around 500 compounds have been reported from fungi belonging to this genus, including koniginin G (Culter et al., 1999), trichocaranes A-D (Macías et al., 2000), pentenocins A and B (Matsumoto et al., 1999).
Vertinoid (sorbicillinoid) polyketides are a growing and diverse class of structurally novel natural products, and are endowed with a broad range of biological activities. They are hexaketide-derived metabolites. Included within this class are more than fourteen compounds with a C14 skeleton, and also dimers with C28 (Sperry et al., 1998). For instance, sorbicillin was the first member belonging to the simple vertinoids (C14), and is considered as the hypothetical biosynthetic precursor of epoxysorbicillinol, a yellow pigment obtained from Trichoderma longibrachiatum (Sperry et al., 1998). The bisorbicillinoids are the dimeric form of sorbicillin-derived compounds such as bisorbibutenolide, trichodimerol, bisorbicillinolide and bisvertinol. This class of metabolites is restricted to a few genera including Trichoderma, Verticillium, Acremonium, and Penicillium (Abe et al., 1999; Andrade et al.,1996; Trifonov et al., 1982, 1983, and 1986). The unusual and complex molecular architecture of these compounds motivated researchers to study their biological activities. Some of them exhibit antioxidant properties e.g. bisorbicillinol, bisorbibutenolide and bisorbicillinolide (Abe et al., 2000). The oxidized form of bisvertinol represents the first inhibitor of β-6-glucan biosynthesis, thus, it is considered as a potential antifungal agent (Nicolaou et al., 2000). Trichodimerol, originally isolated from Trichoderma sp., showed significant inhibitory activity against lipopolysaccharide induced production of tumor necrosis factor alpha (TNF-α) in human monocytes and thus, represents a new lead for the treatment of septic shock (Abe et al., 1998 and 1999; Nicolaou et al., 2000).
On this basis, we continued our projects aimed at finding new natural products with biological activity and/or novel chemical structures from marine-derived fungi (Abdel-Lateff et al., 2002 and 2003a and b). The current secondary metabolite investigation was undertaken with the marine fungus Trichoderma viride (Hypocreaceae, Ascomycota), isolated from the Caribbean sponge Agelas dispar J. (order Agelasida, family Agelasidae), collected from waters around the Island of Dominica. The fungus was cultivated on a solid glucose biomalt medium with added
Trichoderma viride
68
artificial sea salt. Successive fractionation of the EtOAc extract by vacuum liquid chromatography (VLC) over normal phase silica followed by reversed phase (RP-18) HPLC yielded four novel sorbicillinoid polyketide derivatives trichodermanone A-D (22-25) and a new pyrone derivative (Trichopyranone, 26). In addition to these compounds two known hexaketide derivatives epoxysorbicillinol (27) (Sperry et al., 1998), vertinolide (28) (Trifonov et al., 1982), and three known dodecaketides trichodimerol (29) (Andrade et al., 1992; Abe et al., 1998) bislongiquinolide (Trichotetronine, 30) (Sperry et al., 1998), and bisvertinol (31) (Trifonov et al., 1986), were isolated. Finally, a known fungal metabolite, 2-furancarboxylic acid (19) (Corey et al., 1958), was also obtained. Materials and methods Isolation and taxonomy of the fungal strain The sponge Agelas dispa J. was collected using Scuba in 1993 from the waters around the Caribbean Island of Dominica. The sponge was identified by Dr. R. Desqueroux-Faundez, Musee d’Historie Naturelle, Geneve. The fungus was isolated by inoculating small pieces of its inner tissue on cellulose (10 g/L), yeast extract (1 g/L), benzylpenicillin (250 mg/L), streptomycin sulphate (250 mg/L), agar (15 g/L), and ASW (800 mL/L). Cultivation The fungus Trichoderma viride (Hypocreaceae, Ascomycota, 193E61, 54), was cultivated at room temperature for two months in 5 L (20 Fern Bach flasks) of solid glucose biomalt agar containing biomalt (50 g/L, Villa Natura Gesundheitsprodukte GmbH, Germany), glucose (10 g/L, J. T. Baker), agar (15 g/L, Fluka Chemie AG) in ASW. Biological activity, see chapter 3. 4. Extraction and isolation Mycelia and medium were diluted with water (100 mL/L), homogenized using an Ika Ultra-turax T25 at 8000 rpm for 2 min and the resulting mixture exhaustively was extracted with EtOAc (3 x 8 L) and filtered. The filtrate was evaporated under reduced pressure to yield 5 g of a highly viscous yellowish brown gum. The extract was fractionated by Vaccum Liquid Chromatography (VLC) (2.5 x 20 cm, Si gel 60, 120 g, Merck 7739), employing gradient elution from petroleum ether to acetone, to yield 5 fractions (petroleum ether:acetone, 1:0;7.5:
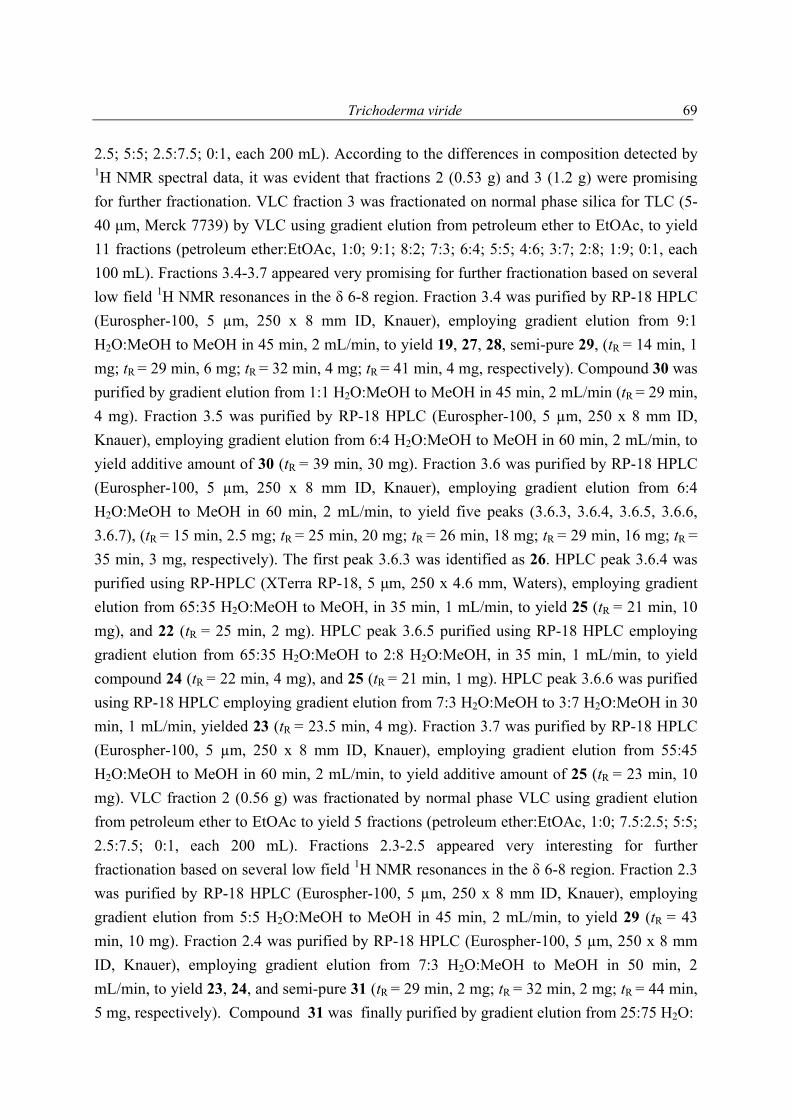
Trichoderma viride
69
2.5; 5:5; 2.5:7.5; 0:1, each 200 mL). According to the differences in composition detected by 1H NMR spectral data, it was evident that fractions 2 (0.53 g) and 3 (1.2 g) were promising for further fractionation. VLC fraction 3 was fractionated on normal phase silica for TLC (5-40 µm, Merck 7739) by VLC using gradient elution from petroleum ether to EtOAc, to yield 11 fractions (petroleum ether:EtOAc, 1:0; 9:1; 8:2; 7:3; 6:4; 5:5; 4:6; 3:7; 2:8; 1:9; 0:1, each 100 mL). Fractions 3.4-3.7 appeared very promising for further fractionation based on several low field 1H NMR resonances in the δ 6-8 region. Fraction 3.4 was purified by RP-18 HPLC (Eurospher-100, 5 µm, 250 x 8 mm ID, Knauer), employing gradient elution from 9:1 H2O:MeOH to MeOH in 45 min, 2 mL/min, to yield 19, 27, 28, semi-pure 29, (tR = 14 min, 1 mg; tR = 29 min, 6 mg; tR = 32 min, 4 mg; tR = 41 min, 4 mg, respectively). Compound 30 was purified by gradient elution from 1:1 H2O:MeOH to MeOH in 45 min, 2 mL/min (tR = 29 min, 4 mg). Fraction 3.5 was purified by RP-18 HPLC (Eurospher-100, 5 µm, 250 x 8 mm ID, Knauer), employing gradient elution from 6:4 H2O:MeOH to MeOH in 60 min, 2 mL/min, to yield additive amount of 30 (tR = 39 min, 30 mg). Fraction 3.6 was purified by RP-18 HPLC (Eurospher-100, 5 µm, 250 x 8 mm ID, Knauer), employing gradient elution from 6:4 H2O:MeOH to MeOH in 60 min, 2 mL/min, to yield five peaks (3.6.3, 3.6.4, 3.6.5, 3.6.6, 3.6.7), (tR = 15 min, 2.5 mg; tR = 25 min, 20 mg; tR = 26 min, 18 mg; tR = 29 min, 16 mg; tR = 35 min, 3 mg, respectively). The first peak 3.6.3 was identified as 26. HPLC peak 3.6.4 was purified using RP-HPLC (XTerra RP-18, 5 µm, 250 x 4.6 mm, Waters), employing gradient elution from 65:35 H2O:MeOH to MeOH, in 35 min, 1 mL/min, to yield 25 (tR = 21 min, 10 mg), and 22 (tR = 25 min, 2 mg). HPLC peak 3.6.5 purified using RP-18 HPLC employing gradient elution from 65:35 H2O:MeOH to 2:8 H2O:MeOH, in 35 min, 1 mL/min, to yield compound 24 (tR = 22 min, 4 mg), and 25 (tR = 21 min, 1 mg). HPLC peak 3.6.6 was purified using RP-18 HPLC employing gradient elution from 7:3 H2O:MeOH to 3:7 H2O:MeOH in 30 min, 1 mL/min, yielded 23 (tR = 23.5 min, 4 mg). Fraction 3.7 was purified by RP-18 HPLC (Eurospher-100, 5 µm, 250 x 8 mm ID, Knauer), employing gradient elution from 55:45 H2O:MeOH to MeOH in 60 min, 2 mL/min, to yield additive amount of 25 (tR = 23 min, 10 mg). VLC fraction 2 (0.56 g) was fractionated by normal phase VLC using gradient elution from petroleum ether to EtOAc to yield 5 fractions (petroleum ether:EtOAc, 1:0; 7.5:2.5; 5:5; 2.5:7.5; 0:1, each 200 mL). Fractions 2.3-2.5 appeared very interesting for further fractionation based on several low field 1H NMR resonances in the δ 6-8 region. Fraction 2.3 was purified by RP-18 HPLC (Eurospher-100, 5 µm, 250 x 8 mm ID, Knauer), employing gradient elution from 5:5 H2O:MeOH to MeOH in 45 min, 2 mL/min, to yield 29 (tR = 43 min, 10 mg). Fraction 2.4 was purified by RP-18 HPLC (Eurospher-100, 5 µm, 250 x 8 mm ID, Knauer), employing gradient elution from 7:3 H2O:MeOH to MeOH in 50 min, 2 mL/min, to yield 23, 24, and semi-pure 31 (tR = 29 min, 2 mg; tR = 32 min, 2 mg; tR = 44 min, 5 mg, respectively). Compound 31 was finally purified by gradient elution from 25:75 H2O:
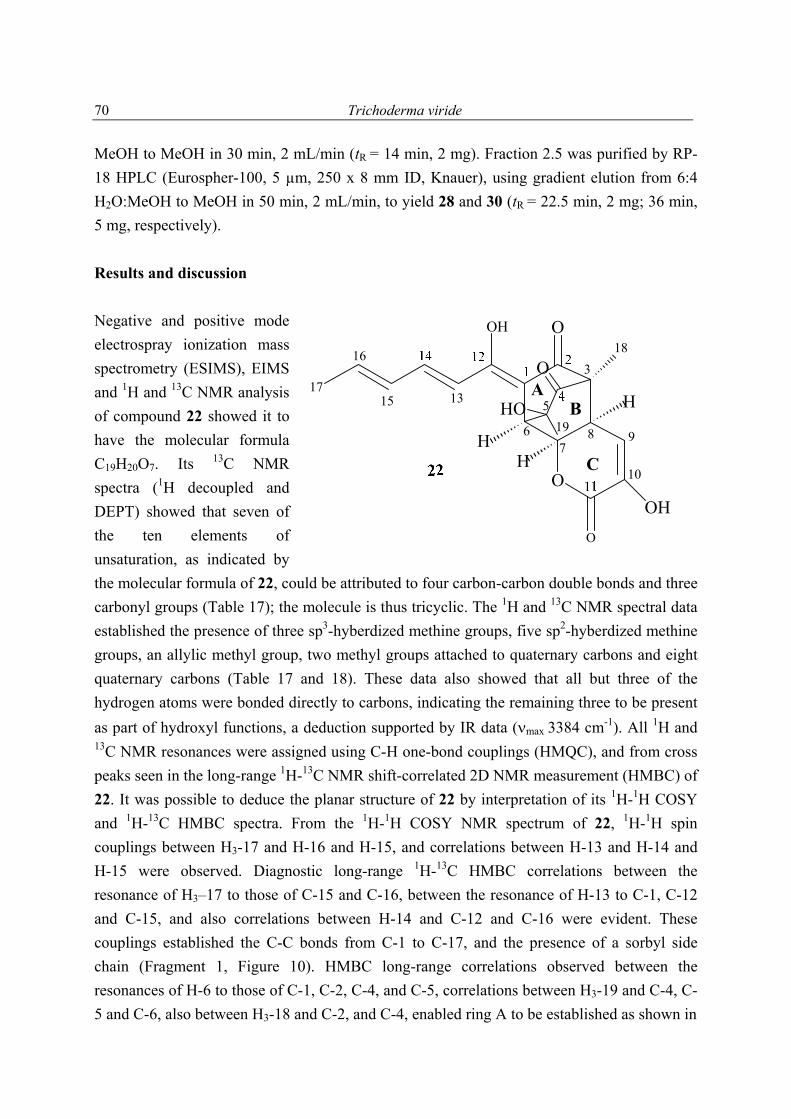
Trichoderma viride
70
MeOH to MeOH in 30 min, 2 mL/min (tR = 14 min, 2 mg). Fraction 2.5 was purified by RP-18 HPLC (Eurospher-100, 5 µm, 250 x 8 mm ID, Knauer), using gradient elution from 6:4 H2O:MeOH to MeOH in 50 min, 2 mL/min, to yield 28 and 30 (tR = 22.5 min, 2 mg; 36 min, 5 mg, respectively). Results and discussion Negative and positive mode electrospray ionization mass spectrometry (ESIMS), EIMS and 1H and 13C NMR analysis of compound 22 showed it to have the molecular formula C19H20O7. Its 13C NMR spectra (1H decoupled and DEPT) showed that seven of the ten elements of unsaturation, as indicated by the molecular formula of 22, could be attributed to four carbon-carbon double bonds and three carbonyl groups (Table 17); the molecule is thus tricyclic. The 1H and 13C NMR spectral data established the presence of three sp3-hyberdized methine groups, five sp2-hyberdized methine groups, an allylic methyl group, two methyl groups attached to quaternary carbons and eight quaternary carbons (Table 17 and 18). These data also showed that all but three of the hydrogen atoms were bonded directly to carbons, indicating the remaining three to be present as part of hydroxyl functions, a deduction supported by IR data (νmax 3384 cm-1). All 1H and 13C NMR resonances were assigned using C-H one-bond couplings (HMQC), and from cross peaks seen in the long-range 1H-13C NMR shift-correlated 2D NMR measurement (HMBC) of 22. It was possible to deduce the planar structure of 22 by interpretation of its 1H-1H COSY and 1H-13C HMBC spectra. From the 1H-1H COSY NMR spectrum of 22, 1H-1H spin couplings between H3-17 and H-16 and H-15, and correlations between H-13 and H-14 and H-15 were observed. Diagnostic long-range 1H-13C HMBC correlations between the resonance of H3–17 to those of C-15 and C-16, between the resonance of H-13 to C-1, C-12 and C-15, and also correlations between H-14 and C-12 and C-16 were evident. These couplings established the C-C bonds from C-1 to C-17, and the presence of a sorbyl side chain (Fragment 1, Figure 10). HMBC long-range correlations observed between the resonances of H-6 to those of C-1, C-2, C-4, and C-5, correlations between H3-19 and C-4, C-5 and C-6, also between H3-18 and C-2, and C-4, enabled ring A to be established as shown in
3
5
67
8 9
1315
16
19
AB
CO
OH O
O
O
OH
HO
HH
H17
18
10
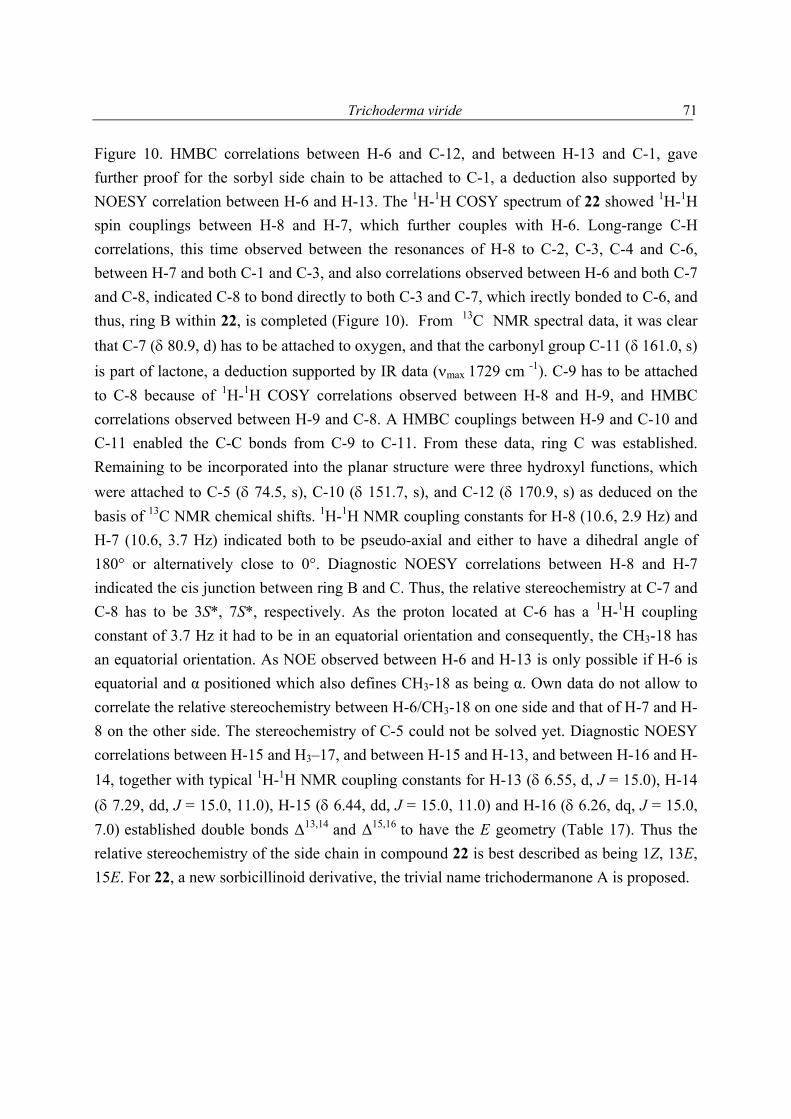
Trichoderma viride
71
Figure 10. HMBC correlations between H-6 and C-12, and between H-13 and C-1, gave further proof for the sorbyl side chain to be attached to C-1, a deduction also supported by NOESY correlation between H-6 and H-13. The 1H-1H COSY spectrum of 22 showed 1H-1H spin couplings between H-8 and H-7, which further couples with H-6. Long-range C-H correlations, this time observed between the resonances of H-8 to C-2, C-3, C-4 and C-6, between H-7 and both C-1 and C-3, and also correlations observed between H-6 and both C-7 and C-8, indicated C-8 to bond directly to both C-3 and C-7, which irectly bonded to C-6, and thus, ring B within 22, is completed (Figure 10). From 13C NMR spectral data, it was clear that C-7 (δ 80.9, d) has to be attached to oxygen, and that the carbonyl group C-11 (δ 161.0, s) is part of lactone, a deduction supported by IR data (νmax 1729 cm -1). C-9 has to be attached to C-8 because of 1H-1H COSY correlations observed between H-8 and H-9, and HMBC correlations observed between H-9 and C-8. A HMBC couplings between H-9 and C-10 and C-11 enabled the C-C bonds from C-9 to C-11. From these data, ring C was established. Remaining to be incorporated into the planar structure were three hydroxyl functions, which were attached to C-5 (δ 74.5, s), C-10 (δ 151.7, s), and C-12 (δ 170.9, s) as deduced on the basis of 13C NMR chemical shifts. 1H-1H NMR coupling constants for H-8 (10.6, 2.9 Hz) and H-7 (10.6, 3.7 Hz) indicated both to be pseudo-axial and either to have a dihedral angle of 180° or alternatively close to 0°. Diagnostic NOESY correlations between H-8 and H-7 indicated the cis junction between ring B and C. Thus, the relative stereochemistry at C-7 and C-8 has to be 3S*, 7S*, respectively. As the proton located at C-6 has a 1H-1H coupling constant of 3.7 Hz it had to be in an equatorial orientation and consequently, the CH3-18 has an equatorial orientation. As NOE observed between H-6 and H-13 is only possible if H-6 is equatorial and α positioned which also defines CH3-18 as being α. Own data do not allow to correlate the relative stereochemistry between H-6/CH3-18 on one side and that of H-7 and H-8 on the other side. The stereochemistry of C-5 could not be solved yet. Diagnostic NOESY correlations between H-15 and H3–17, and between H-15 and H-13, and between H-16 and H-14, together with typical 1H-1H NMR coupling constants for H-13 (δ 6.55, d, J = 15.0), H-14 (δ 7.29, dd, J = 15.0, 11.0), H-15 (δ 6.44, dd, J = 15.0, 11.0) and H-16 (δ 6.26, dq, J = 15.0, 7.0) established double bonds ∆13,14 and ∆15,16 to have the E geometry (Table 17). Thus the relative stereochemistry of the side chain in compound 22 is best described as being 1Z, 13E, 15E. For 22, a new sorbicillinoid derivative, the trivial name trichodermanone A is proposed.
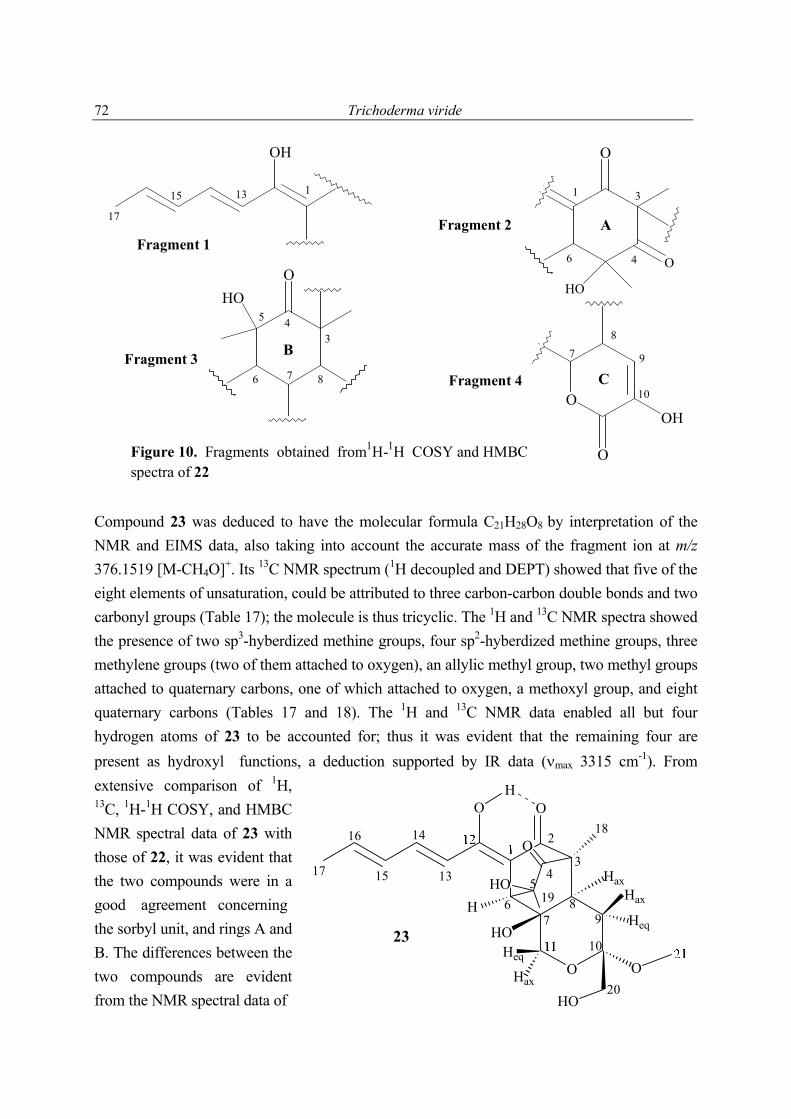
Trichoderma viride
72
O
O
HOO
OOH
HO
O
OH
Fragment 1A
B
C Fragment 3
1 3
6 7
83
6
7
8
4
5
11315
17
4
9
10Fragment 4
Fragment 2
Figure 10. Fragments obtained from1H-1H COSY and HMBC spectra of 22
Compound 23 was deduced to have the molecular formula C21H28O8 by interpretation of the NMR and EIMS data, also taking into account the accurate mass of the fragment ion at m/z 376.1519 [M-CH4O]+. Its 13C NMR spectrum (1H decoupled and DEPT) showed that five of the eight elements of unsaturation, could be attributed to three carbon-carbon double bonds and two carbonyl groups (Table 17); the molecule is thus tricyclic. The 1H and 13C NMR spectra showed the presence of two sp3-hyberdized methine groups, four sp2-hyberdized methine groups, three methylene groups (two of them attached to oxygen), an allylic methyl group, two methyl groups attached to quaternary carbons, one of which attached to oxygen, a methoxyl group, and eight quaternary carbons (Tables 17 and 18). The 1H and 13C NMR data enabled all but four hydrogen atoms of 23 to be accounted for; thus it was evident that the remaining four are present as hydroxyl functions, a deduction supported by IR data (νmax 3315 cm-1). From extensive comparison of 1H, 13C, 1H-1H COSY, and HMBC NMR spectral data of 23 with those of 22, it was evident that the two compounds were in a good agreement concerning the sorbyl unit, and rings A and B. The differences between the two compounds are evident from the NMR spectral data of
O
O
O
O
HO
O
HO
Hax
H
23
2
3413
14
15
16
19
17
20
HOHeq
Hax
Heq
Hax
H
56
7 9
10
18
8
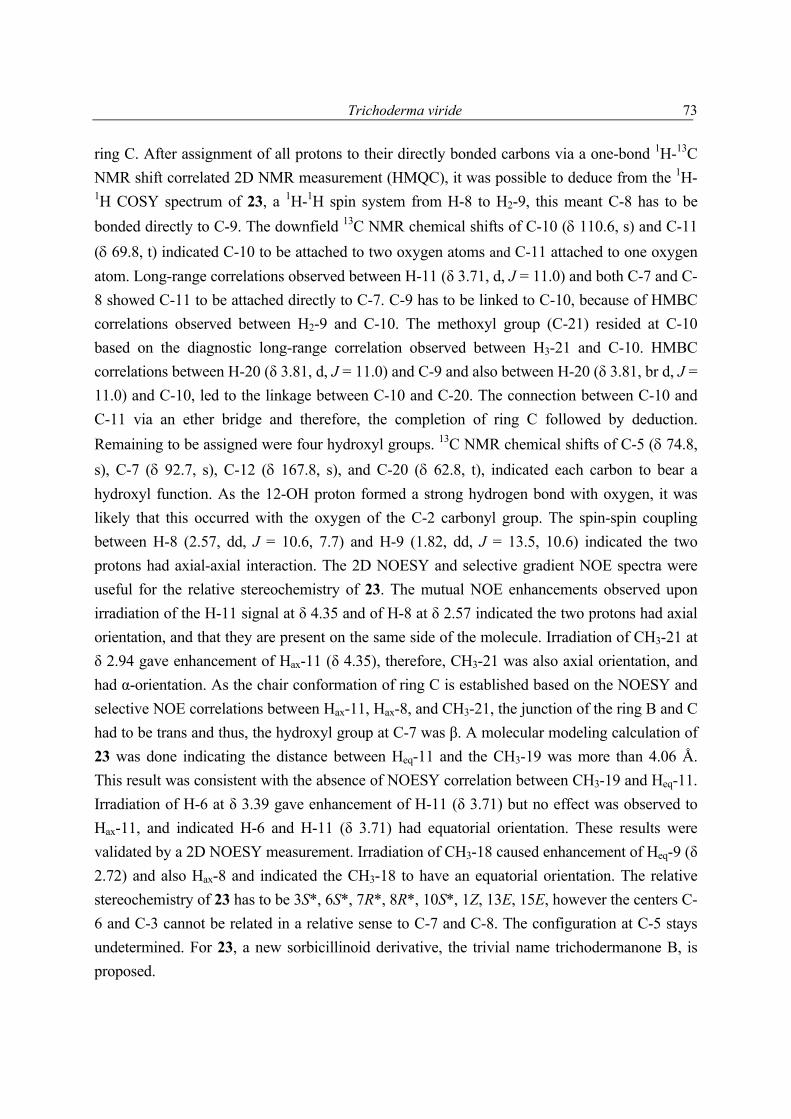
Trichoderma viride
73
ring C. After assignment of all protons to their directly bonded carbons via a one-bond 1H-13C NMR shift correlated 2D NMR measurement (HMQC), it was possible to deduce from the 1H-1H COSY spectrum of 23, a 1H-1H spin system from H-8 to H2-9, this meant C-8 has to be bonded directly to C-9. The downfield 13C NMR chemical shifts of C-10 (δ 110.6, s) and C-11 (δ 69.8, t) indicated C-10 to be attached to two oxygen atoms and C-11 attached to one oxygen atom. Long-range correlations observed between H-11 (δ 3.71, d, J = 11.0) and both C-7 and C-8 showed C-11 to be attached directly to C-7. C-9 has to be linked to C-10, because of HMBC correlations observed between H2-9 and C-10. The methoxyl group (C-21) resided at C-10 based on the diagnostic long-range correlation observed between H3-21 and C-10. HMBC correlations between H-20 (δ 3.81, d, J = 11.0) and C-9 and also between H-20 (δ 3.81, br d, J = 11.0) and C-10, led to the linkage between C-10 and C-20. The connection between C-10 and C-11 via an ether bridge and therefore, the completion of ring C followed by deduction. Remaining to be assigned were four hydroxyl groups. 13C NMR chemical shifts of C-5 (δ 74.8, s), C-7 (δ 92.7, s), C-12 (δ 167.8, s), and C-20 (δ 62.8, t), indicated each carbon to bear a hydroxyl function. As the 12-OH proton formed a strong hydrogen bond with oxygen, it was likely that this occurred with the oxygen of the C-2 carbonyl group. The spin-spin coupling between H-8 (2.57, dd, J = 10.6, 7.7) and H-9 (1.82, dd, J = 13.5, 10.6) indicated the two protons had axial-axial interaction. The 2D NOESY and selective gradient NOE spectra were useful for the relative stereochemistry of 23. The mutual NOE enhancements observed upon irradiation of the H-11 signal at δ 4.35 and of H-8 at δ 2.57 indicated the two protons had axial orientation, and that they are present on the same side of the molecule. Irradiation of CH3-21 at δ 2.94 gave enhancement of Hax-11 (δ 4.35), therefore, CH3-21 was also axial orientation, and had α-orientation. As the chair conformation of ring C is established based on the NOESY and selective NOE correlations between Hax-11, Hax-8, and CH3-21, the junction of the ring B and C had to be trans and thus, the hydroxyl group at C-7 was β. A molecular modeling calculation of 23 was done indicating the distance between Heq-11 and the CH3-19 was more than 4.06 Å. This result was consistent with the absence of NOESY correlation between CH3-19 and Heq-11.
Irradiation of H-6 at δ 3.39 gave enhancement of H-11 (δ 3.71) but no effect was observed to Hax-11, and indicated H-6 and H-11 (δ 3.71) had equatorial orientation. These results were validated by a 2D NOESY measurement. Irradiation of CH3-18 caused enhancement of Heq-9 (δ 2.72) and also Hax-8 and indicated the CH3-18 to have an equatorial orientation. The relative stereochemistry of 23 has to be 3S*, 6S*, 7R*, 8R*, 10S*, 1Z, 13E, 15E, however the centers C-6 and C-3 cannot be related in a relative sense to C-7 and C-8. The configuration at C-5 stays undetermined. For 23, a new sorbicillinoid derivative, the trivial name trichodermanone B, is proposed.
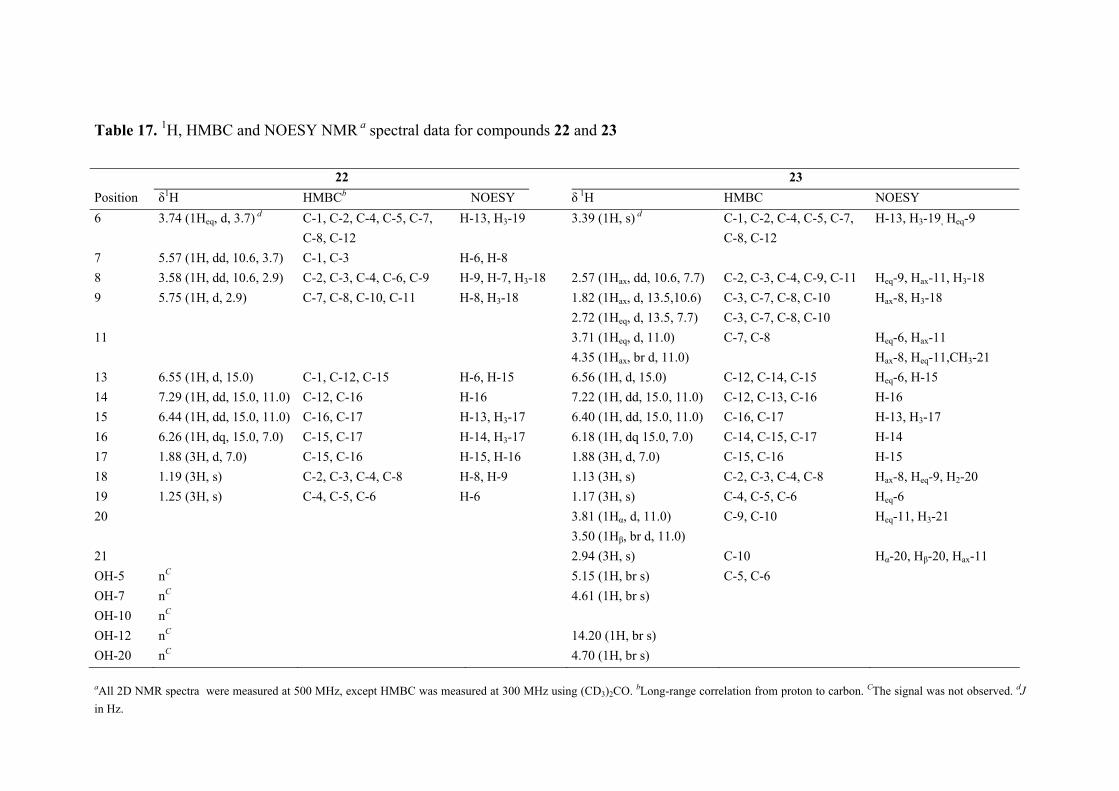
Table 17. 1H, HMBC and NOESY NMR a spectral data for compounds 22 and 23
22 23 Position δ1H HMBCb NOESY δ 1H HMBC NOESY 6 3.74 (1Heq, d, 3.7) d C-1, C-2, C-4, C-5, C-7,
C-8, C-12 H-13, H3-19 3.39 (1H, s) d C-1, C-2, C-4, C-5, C-7,
C-8, C-12 H-13, H3-19, Heq-9
7 5.57 (1H, dd, 10.6, 3.7) C-1, C-3 H-6, H-8 8 3.58 (1H, dd, 10.6, 2.9) C-2, C-3, C-4, C-6, C-9 H-9, H-7, H3-18 2.57 (1Hax, dd, 10.6, 7.7) C-2, C-3, C-4, C-9, C-11 Heq-9, Hax-11, H3-18 9 5.75 (1H, d, 2.9) C-7, C-8, C-10, C-11 H-8, H3-18 1.82 (1Hax, d, 13.5,10.6)
2.72 (1Heq, d, 13.5, 7.7) C-3, C-7, C-8, C-10 C-3, C-7, C-8, C-10
Hax-8, H3-18
11 3.71 (1Heq, d, 11.0) 4.35 (1Hax, br d, 11.0)
C-7, C-8
Heq-6, Hax-11 Hax-8, Heq-11,CH3-21
13 6.55 (1H, d, 15.0) C-1, C-12, C-15 H-6, H-15 6.56 (1H, d, 15.0) C-12, C-14, C-15 Heq-6, H-15 14 7.29 (1H, dd, 15.0, 11.0) C-12, C-16 H-16 7.22 (1H, dd, 15.0, 11.0) C-12, C-13, C-16 H-16 15 6.44 (1H, dd, 15.0, 11.0) C-16, C-17 H-13, H3-17 6.40 (1H, dd, 15.0, 11.0) C-16, C-17 H-13, H3-17 16 6.26 (1H, dq, 15.0, 7.0) C-15, C-17 H-14, H3-17 6.18 (1H, dq 15.0, 7.0) C-14, C-15, C-17 H-14 17 1.88 (3H, d, 7.0) C-15, C-16 H-15, H-16 1.88 (3H, d, 7.0) C-15, C-16 H-15 18 1.19 (3H, s) C-2, C-3, C-4, C-8 H-8, H-9 1.13 (3H, s) C-2, C-3, C-4, C-8 Hax-8, Heq-9, H2-20 19 1.25 (3H, s) C-4, C-5, C-6 H-6 1.17 (3H, s) C-4, C-5, C-6 Heq-6 20 3.81 (1Hα, d, 11.0)
3.50 (1Hβ, br d, 11.0) C-9, C-10 Heq-11, H3-21
21 2.94 (3H, s) C-10 Hα-20, Hβ-20, Hax-11 OH-5 nC 5.15 (1H, br s) C-5, C-6 OH-7 nC 4.61 (1H, br s) OH-10 nC OH-12 nC 14.20 (1H, br s) OH-20 nC 4.70 (1H, br s)
aAll 2D NMR spectra were measured at 500 MHz, except HMBC was measured at 300 MHz using (CD3)2CO. bLong-range correlation from proton to carbon. CThe signal was not observed. dJ in Hz.
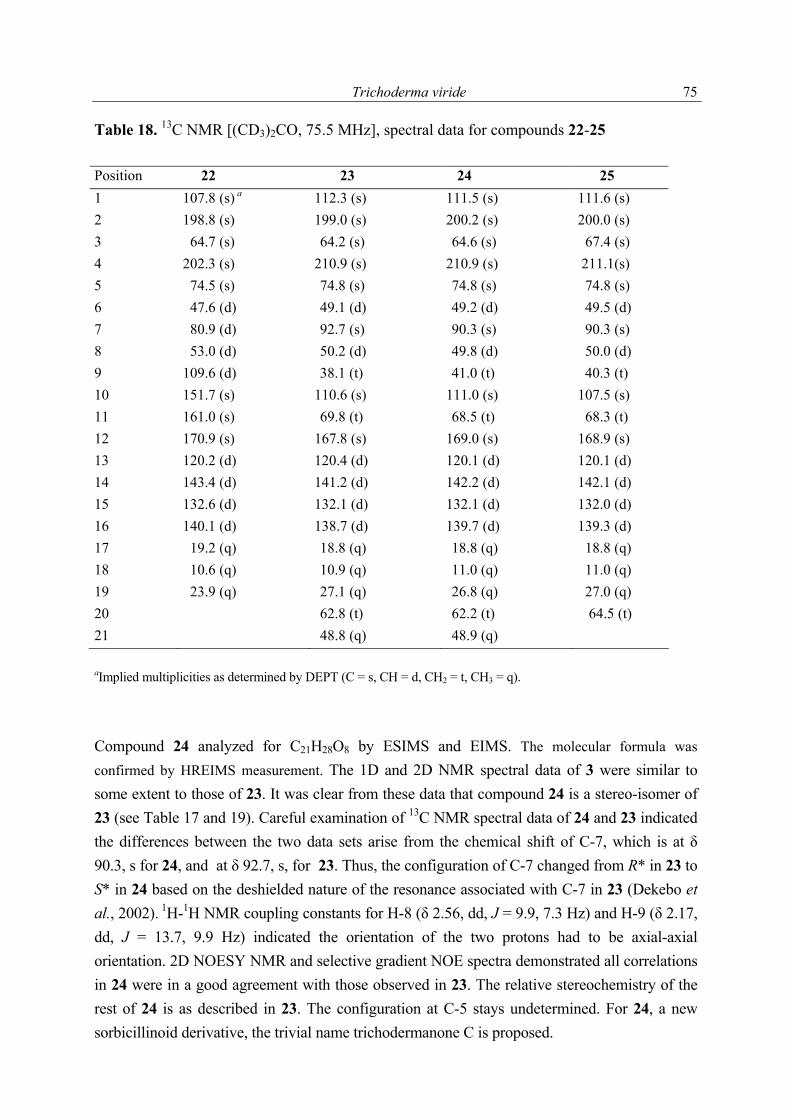
Trichoderma viride
75
Table 18. 13C NMR [(CD3)2CO, 75.5 MHz], spectral data for compounds 22-25 Position 22 23 24 25 1 107.8 (s) a 112.3 (s) 111.5 (s) 111.6 (s) 2 198.8 (s) 199.0 (s) 200.2 (s) 200.0 (s) 3 64.7 (s) 64.2 (s) 64.6 (s) 67.4 (s) 4 202.3 (s) 210.9 (s) 210.9 (s) 211.1(s) 5 74.5 (s) 74.8 (s) 74.8 (s) 74.8 (s) 6 47.6 (d) 49.1 (d) 49.2 (d) 49.5 (d) 7 80.9 (d) 92.7 (s) 90.3 (s) 90.3 (s) 8 53.0 (d) 50.2 (d) 49.8 (d) 50.0 (d) 9 109.6 (d) 38.1 (t) 41.0 (t) 40.3 (t) 10 151.7 (s) 110.6 (s) 111.0 (s) 107.5 (s) 11 161.0 (s) 69.8 (t) 68.5 (t) 68.3 (t) 12 170.9 (s) 167.8 (s) 169.0 (s) 168.9 (s) 13 120.2 (d) 120.4 (d) 120.1 (d) 120.1 (d) 14 143.4 (d) 141.2 (d) 142.2 (d) 142.1 (d) 15 132.6 (d) 132.1 (d) 132.1 (d) 132.0 (d) 16 140.1 (d) 138.7 (d) 139.7 (d) 139.3 (d) 17 19.2 (q) 18.8 (q) 18.8 (q) 18.8 (q) 18 10.6 (q) 10.9 (q) 11.0 (q) 11.0 (q) 19 23.9 (q) 27.1 (q) 26.8 (q) 27.0 (q) 20 62.8 (t) 62.2 (t) 64.5 (t) 21 48.8 (q) 48.9 (q)
aImplied multiplicities as determined by DEPT (C = s, CH = d, CH2 = t, CH3 = q). Compound 24 analyzed for C21H28O8 by ESIMS and EIMS. The molecular formula was confirmed by HREIMS measurement. The 1D and 2D NMR spectral data of 3 were similar to some extent to those of 23. It was clear from these data that compound 24 is a stereo-isomer of 23 (see Table 17 and 19). Careful examination of 13C NMR spectral data of 24 and 23 indicated the differences between the two data sets arise from the chemical shift of C-7, which is at δ 90.3, s for 24, and at δ 92.7, s, for 23. Thus, the configuration of C-7 changed from R* in 23 to S* in 24 based on the deshielded nature of the resonance associated with C-7 in 23 (Dekebo et al., 2002). 1H-1H NMR coupling constants for H-8 (δ 2.56, dd, J = 9.9, 7.3 Hz) and H-9 (δ 2.17, dd, J = 13.7, 9.9 Hz) indicated the orientation of the two protons had to be axial-axial orientation. 2D NOESY NMR and selective gradient NOE spectra demonstrated all correlations in 24 were in a good agreement with those observed in 23. The relative stereochemistry of the rest of 24 is as described in 23. The configuration at C-5 stays undetermined. For 24, a new sorbicillinoid derivative, the trivial name trichodermanone C is proposed.
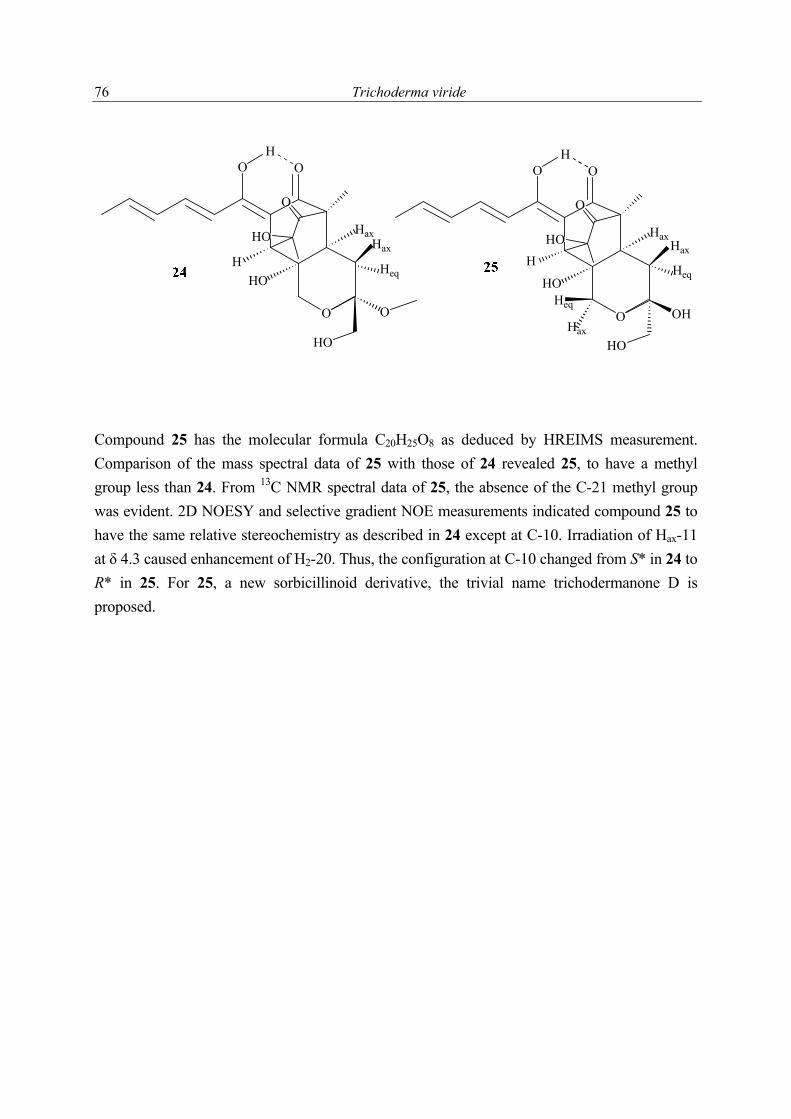
Trichoderma viride
76
O
O
O
O
HO
O
HO
HO
HO
O
O
O
HO
OH
HO
HO
Hax
HeqHH
Heq
Hax
Hax
Heq
Hax
Hax
H
Compound 25 has the molecular formula C20H25O8 as deduced by HREIMS measurement. Comparison of the mass spectral data of 25 with those of 24 revealed 25, to have a methyl group less than 24. From 13C NMR spectral data of 25, the absence of the C-21 methyl group was evident. 2D NOESY and selective gradient NOE measurements indicated compound 25 to have the same relative stereochemistry as described in 24 except at C-10. Irradiation of Hax-11 at δ 4.3 caused enhancement of H2-20. Thus, the configuration at C-10 changed from S* in 24 to R* in 25. For 25, a new sorbicillinoid derivative, the trivial name trichodermanone D is proposed.
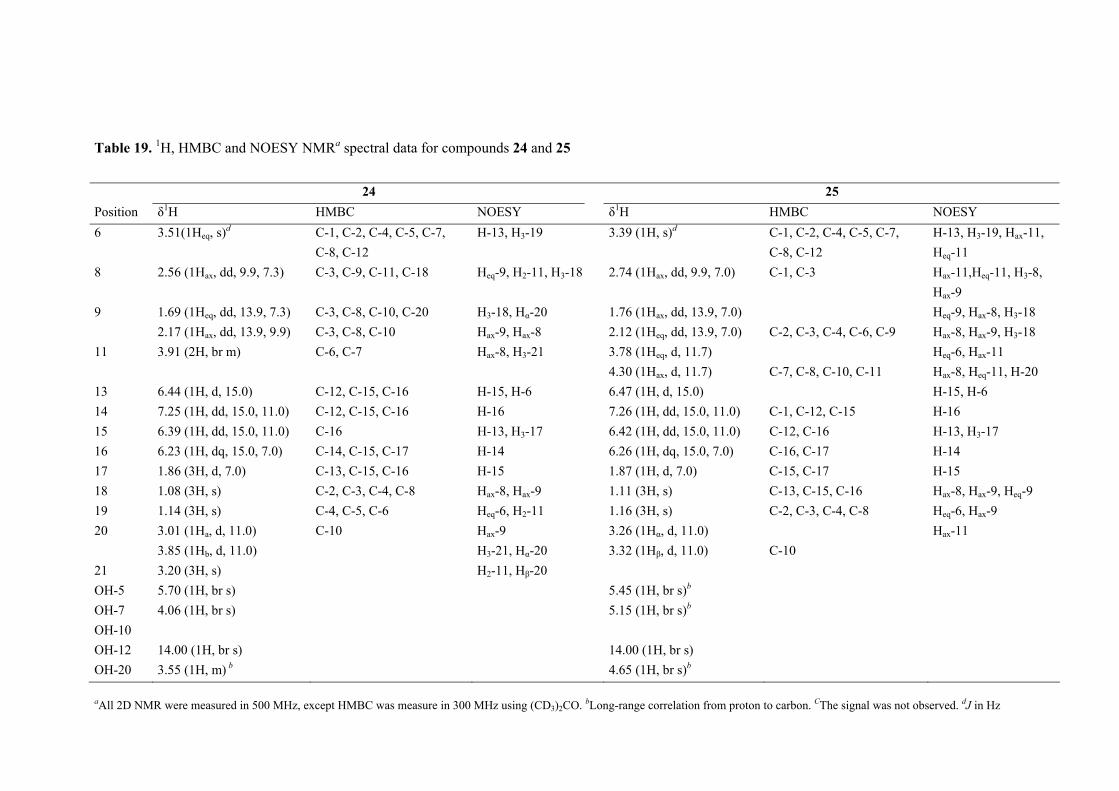
Table 19. 1H, HMBC and NOESY NMRa spectral data for compounds 24 and 25 24 25 Position δ1H HMBC NOESY δ1H HMBC NOESY 6 3.51(1Heq, s)d C-1, C-2, C-4, C-5, C-7,
C-8, C-12 H-13, H3-19 3.39 (1H, s)d C-1, C-2, C-4, C-5, C-7,
C-8, C-12 H-13, H3-19, Hax-11, Heq-11
8 2.56 (1Hax, dd, 9.9, 7.3) C-3, C-9, C-11, C-18 Heq-9, H2-11, H3-18 2.74 (1Hax, dd, 9.9, 7.0) C-1, C-3 Hax-11,Heq-11, H3-8, Hax-9
9 1.69 (1Heq, dd, 13.9, 7.3) 2.17 (1Hax, dd, 13.9, 9.9)
C-3, C-8, C-10, C-20 C-3, C-8, C-10
H3-18, Hα-20 Hax-9, Hax-8
1.76 (1Hax, dd, 13.9, 7.0) 2.12 (1Heq, dd, 13.9, 7.0)
C-2, C-3, C-4, C-6, C-9
Heq-9, Hax-8, H3-18 Hax-8, Hax-9, H3-18
11 3.91 (2H, br m) C-6, C-7 Hax-8, H3-21 3.78 (1Heq, d, 11.7) 4.30 (1Hax, d, 11.7)
C-7, C-8, C-10, C-11
Heq-6, Hax-11 Hax-8, Heq-11, H-20
13 6.44 (1H, d, 15.0) C-12, C-15, C-16 H-15, H-6 6.47 (1H, d, 15.0) H-15, H-6 14 7.25 (1H, dd, 15.0, 11.0) C-12, C-15, C-16 H-16 7.26 (1H, dd, 15.0, 11.0) C-1, C-12, C-15 H-16 15 6.39 (1H, dd, 15.0, 11.0) C-16 H-13, H3-17 6.42 (1H, dd, 15.0, 11.0) C-12, C-16 H-13, H3-17 16 6.23 (1H, dq, 15.0, 7.0) C-14, C-15, C-17 H-14 6.26 (1H, dq, 15.0, 7.0) C-16, C-17 H-14 17 1.86 (3H, d, 7.0) C-13, C-15, C-16 H-15 1.87 (1H, d, 7.0) C-15, C-17 H-15 18 1.08 (3H, s) C-2, C-3, C-4, C-8 Hax-8, Hax-9 1.11 (3H, s) C-13, C-15, C-16 Hax-8, Hax-9, Heq-9 19 1.14 (3H, s) C-4, C-5, C-6 Heq-6, H2-11 1.16 (3H, s) C-2, C-3, C-4, C-8 Heq-6, Hax-9 20 3.01 (1Ha, d, 11.0)
3.85 (1Hb, d, 11.0) C-10 Hax-9
H3-21, Hα-20 3.26 (1Hα, d, 11.0) 3.32 (1Hβ, d, 11.0)
C-10
Hax-11
21 3.20 (3H, s) H2-11, Hβ-20 OH-5 5.70 (1H, br s) 5.45 (1H, br s)b OH-7 4.06 (1H, br s) 5.15 (1H, br s)b OH-10 OH-12 14.00 (1H, br s) 14.00 (1H, br s) OH-20 3.55 (1H, m) b 4.65 (1H, br s)b
aAll 2D NMR were measured in 500 MHz, except HMBC was measure in 300 MHz using (CD3)2CO. bLong-range correlation from proton to carbon. CThe signal was not observed. dJ in Hz
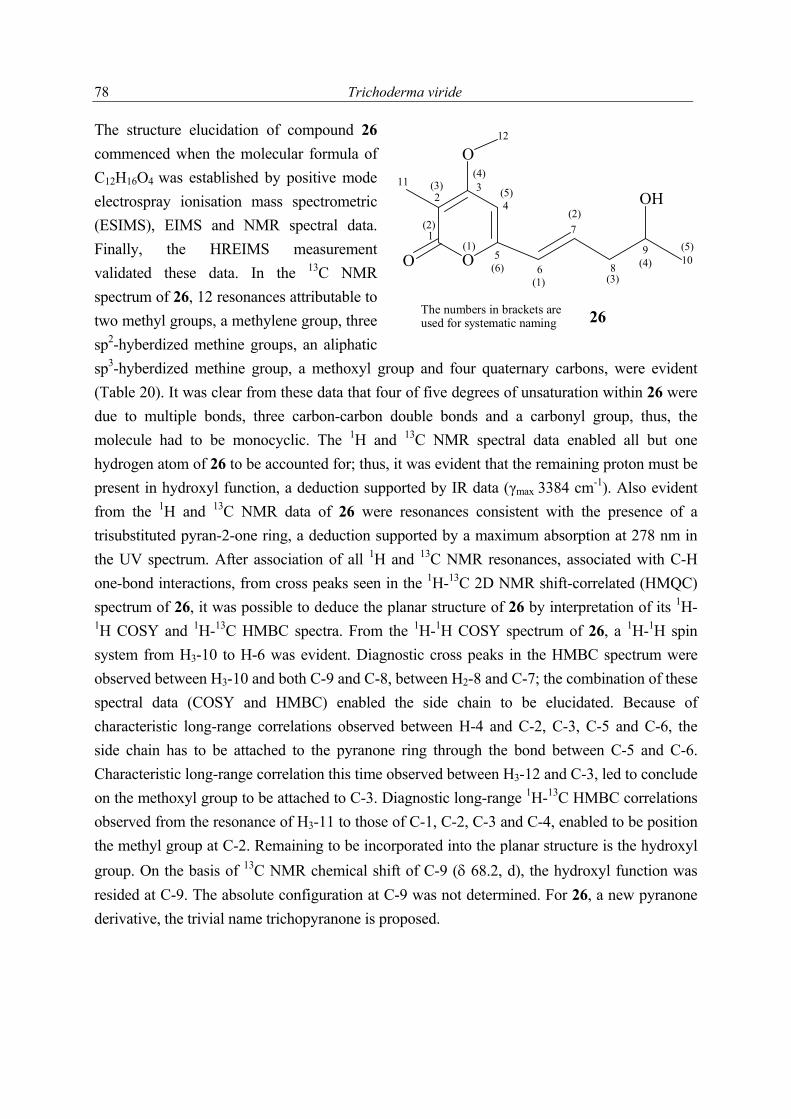
Trichoderma viride
78
The structure elucidation of compound 26 commenced when the molecular formula of C12H16O4 was established by positive mode electrospray ionisation mass spectrometric (ESIMS), EIMS and NMR spectral data. Finally, the HREIMS measurement validated these data. In the 13C NMR spectrum of 26, 12 resonances attributable to two methyl groups, a methylene group, three sp2-hyberdized methine groups, an aliphatic sp3-hyberdized methine group, a methoxyl group and four quaternary carbons, were evident (Table 20). It was clear from these data that four of five degrees of unsaturation within 26 were due to multiple bonds, three carbon-carbon double bonds and a carbonyl group, thus, the molecule had to be monocyclic. The 1H and 13C NMR spectral data enabled all but one hydrogen atom of 26 to be accounted for; thus, it was evident that the remaining proton must be present in hydroxyl function, a deduction supported by IR data (γmax 3384 cm-1). Also evident from the 1H and 13C NMR data of 26 were resonances consistent with the presence of a trisubstituted pyran-2-one ring, a deduction supported by a maximum absorption at 278 nm in the UV spectrum. After association of all 1H and 13C NMR resonances, associated with C-H one-bond interactions, from cross peaks seen in the 1H-13C 2D NMR shift-correlated (HMQC) spectrum of 26, it was possible to deduce the planar structure of 26 by interpretation of its 1H-1H COSY and 1H-13C HMBC spectra. From the 1H-1H COSY spectrum of 26, a 1H-1H spin system from H3-10 to H-6 was evident. Diagnostic cross peaks in the HMBC spectrum were observed between H3-10 and both C-9 and C-8, between H2-8 and C-7; the combination of these spectral data (COSY and HMBC) enabled the side chain to be elucidated. Because of characteristic long-range correlations observed between H-4 and C-2, C-3, C-5 and C-6, the side chain has to be attached to the pyranone ring through the bond between C-5 and C-6. Characteristic long-range correlation this time observed between H3-12 and C-3, led to conclude on the methoxyl group to be attached to C-3. Diagnostic long-range 1H-13C HMBC correlations observed from the resonance of H3-11 to those of C-1, C-2, C-3 and C-4, enabled to be position the methyl group at C-2. Remaining to be incorporated into the planar structure is the hydroxyl group. On the basis of 13C NMR chemical shift of C-9 (δ 68.2, d), the hydroxyl function was resided at C-9. The absolute configuration at C-9 was not determined. For 26, a new pyranone derivative, the trivial name trichopyranone is proposed.
OH
O
O
26
23
4
5
7
8
910
11
12
6O
The numbers in brackets are used for systematic naming
(1)
(4)(3)
(2)
(5)(1)
(2)
(3)(4)
(5)
(6)
1
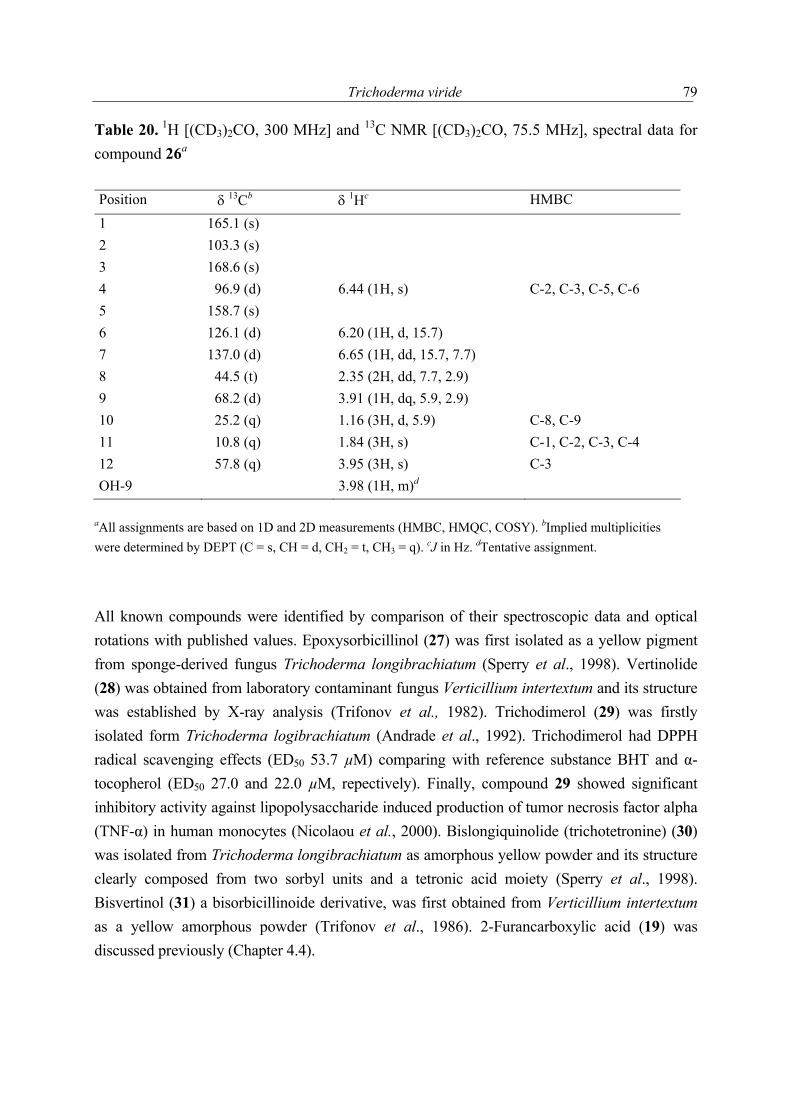
Trichoderma viride
79
Table 20. 1H [(CD3)2CO, 300 MHz] and 13C NMR [(CD3)2CO, 75.5 MHz], spectral data for compound 26a
Position δ 13Cb δ 1Hc HMBC 1 165.1 (s) 2 103.3 (s) 3 168.6 (s) 4 96.9 (d) 6.44 (1H, s) C-2, C-3, C-5, C-6 5 158.7 (s) 6 126.1 (d) 6.20 (1H, d, 15.7) 7 137.0 (d) 6.65 (1H, dd, 15.7, 7.7) 8 44.5 (t) 2.35 (2H, dd, 7.7, 2.9) 9 68.2 (d) 3.91 (1H, dq, 5.9, 2.9) 10 25.2 (q) 1.16 (3H, d, 5.9) C-8, C-9 11 10.8 (q) 1.84 (3H, s) C-1, C-2, C-3, C-4 12 57.8 (q) 3.95 (3H, s) C-3 OH-9 3.98 (1H, m)d
aAll assignments are based on 1D and 2D measurements (HMBC, HMQC, COSY). bImplied multiplicities were determined by DEPT (C = s, CH = d, CH2 = t, CH3 = q). cJ in Hz. dTentative assignment.
All known compounds were identified by comparison of their spectroscopic data and optical rotations with published values. Epoxysorbicillinol (27) was first isolated as a yellow pigment from sponge-derived fungus Trichoderma longibrachiatum (Sperry et al., 1998). Vertinolide (28) was obtained from laboratory contaminant fungus Verticillium intertextum and its structure was established by X-ray analysis (Trifonov et al., 1982). Trichodimerol (29) was firstly isolated form Trichoderma logibrachiatum (Andrade et al., 1992). Trichodimerol had DPPH radical scavenging effects (ED50 53.7 µM) comparing with reference substance BHT and α-tocopherol (ED50 27.0 and 22.0 µM, repectively). Finally, compound 29 showed significant inhibitory activity against lipopolysaccharide induced production of tumor necrosis factor alpha (TNF-α) in human monocytes (Nicolaou et al., 2000). Bislongiquinolide (trichotetronine) (30) was isolated from Trichoderma longibrachiatum as amorphous yellow powder and its structure clearly composed from two sorbyl units and a tetronic acid moiety (Sperry et al., 1998). Bisvertinol (31) a bisorbicillinoide derivative, was first obtained from Verticillium intertextum as a yellow amorphous powder (Trifonov et al., 1986). 2-Furancarboxylic acid (19) was discussed previously (Chapter 4.4).
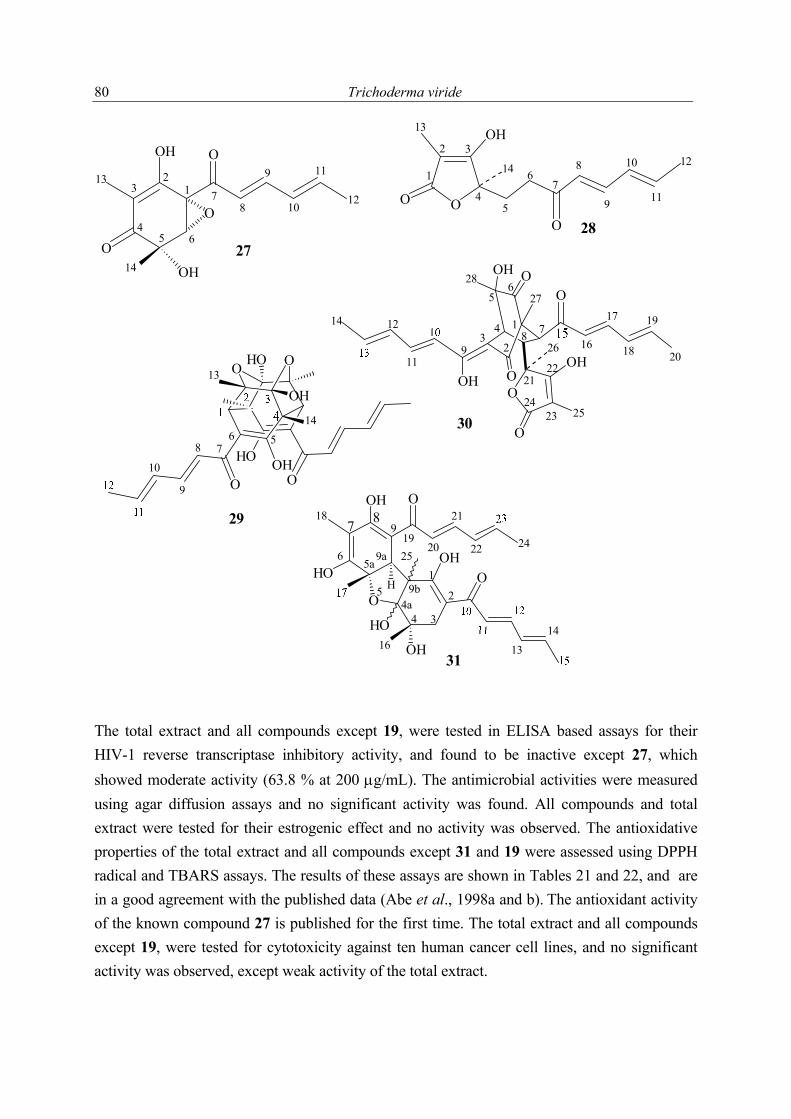
Trichoderma viride
80
OH
O
O
OH
O
27
12
3
45 6
78
9
10
11
12
HO
OOOH
O O
OH
HO
OO
OH
O 28
1
2 3
45
67
8
9
10
11
12
13
14
OOH
O
O
O25
OH
OH O
3024
23
2221
201816
1
23
4
56
712
11
14
O
HO
OOH
OOH
OH
HO
31
987
5
4
2
13
125
21
2019
18
24225a
9a
9b
16
34a
6
14
78
9
13
14
29
26
27
28
13
14
98
H
6
10
5
17 19
The total extract and all compounds except 19, were tested in ELISA based assays for their HIV-1 reverse transcriptase inhibitory activity, and found to be inactive except 27, which showed moderate activity (63.8 % at 200 µg/mL). The antimicrobial activities were measured using agar diffusion assays and no significant activity was found. All compounds and total extract were tested for their estrogenic effect and no activity was observed. The antioxidative properties of the total extract and all compounds except 31 and 19 were assessed using DPPH radical and TBARS assays. The results of these assays are shown in Tables 21 and 22, and are in a good agreement with the published data (Abe et al., 1998a and b). The antioxidant activity of the known compound 27 is published for the first time. The total extract and all compounds except 19, were tested for cytotoxicity against ten human cancer cell lines, and no significant activity was observed, except weak activity of the total extract.
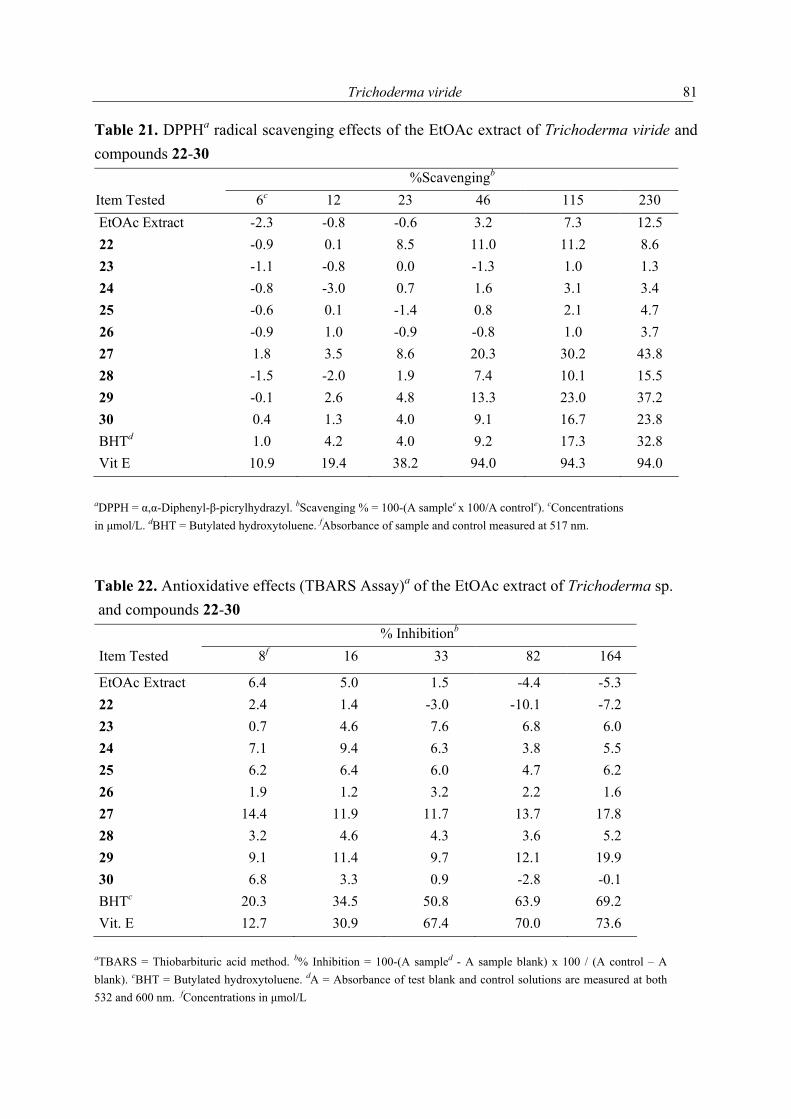
Trichoderma viride
81
Table 21. DPPHa radical scavenging effects of the EtOAc extract of Trichoderma viride and compounds 22-30 %Scavengingb Item Tested 6c 12 23 46 115 230 EtOAc Extract -2.3 -0.8 -0.6 3.2 7.3 12.5 22 -0.9 0.1 8.5 11.0 11.2 8.6 23 -1.1 -0.8 0.0 -1.3 1.0 1.3 24 -0.8 -3.0 0.7 1.6 3.1 3.4 25 -0.6 0.1 -1.4 0.8 2.1 4.7 26 -0.9 1.0 -0.9 -0.8 1.0 3.7 27 1.8 3.5 8.6 20.3 30.2 43.8 28 -1.5 -2.0 1.9 7.4 10.1 15.5 29 -0.1 2.6 4.8 13.3 23.0 37.2 30 0.4 1.3 4.0 9.1 16.7 23.8 BHTd 1.0 4.2 4.0 9.2 17.3 32.8 Vit E 10.9 19.4 38.2 94.0 94.3 94.0
aDPPH = α,α-Diphenyl-β-picrylhydrazyl. bScavenging % = 100-(A samplee x 100/A controle). cConcentrations in µmol/L. dBHT = Butylated hydroxytoluene. fAbsorbance of sample and control measured at 517 nm.
Table 22. Antioxidative effects (TBARS Assay)a of the EtOAc extract of Trichoderma sp. and compounds 22-30 % Inhibitionb
Item Tested 8f 16 33 82 164
EtOAc Extract 6.4 5.0 1.5 -4.4 -5.3 22 2.4 1.4 -3.0 -10.1 -7.2 23 0.7 4.6 7.6 6.8 6.0 24 7.1 9.4 6.3 3.8 5.5 25 6.2 6.4 6.0 4.7 6.2 26 1.9 1.2 3.2 2.2 1.6 27 14.4 11.9 11.7 13.7 17.8 28 3.2 4.6 4.3 3.6 5.2 29 9.1 11.4 9.7 12.1 19.9 30 6.8 3.3 0.9 -2.8 -0.1 BHTc 20.3 34.5 50.8 63.9 69.2 Vit. E 12.7 30.9 67.4 70.0 73.6
aTBARS = Thiobarbituric acid method. b% Inhibition = 100-(A sampled - A sample blank) x 100 / (A control – A blank). cBHT = Butylated hydroxytoluene. dA = Absorbance of test blank and control solutions are measured at both 532 and 600 nm. fConcentrations in µmol/L
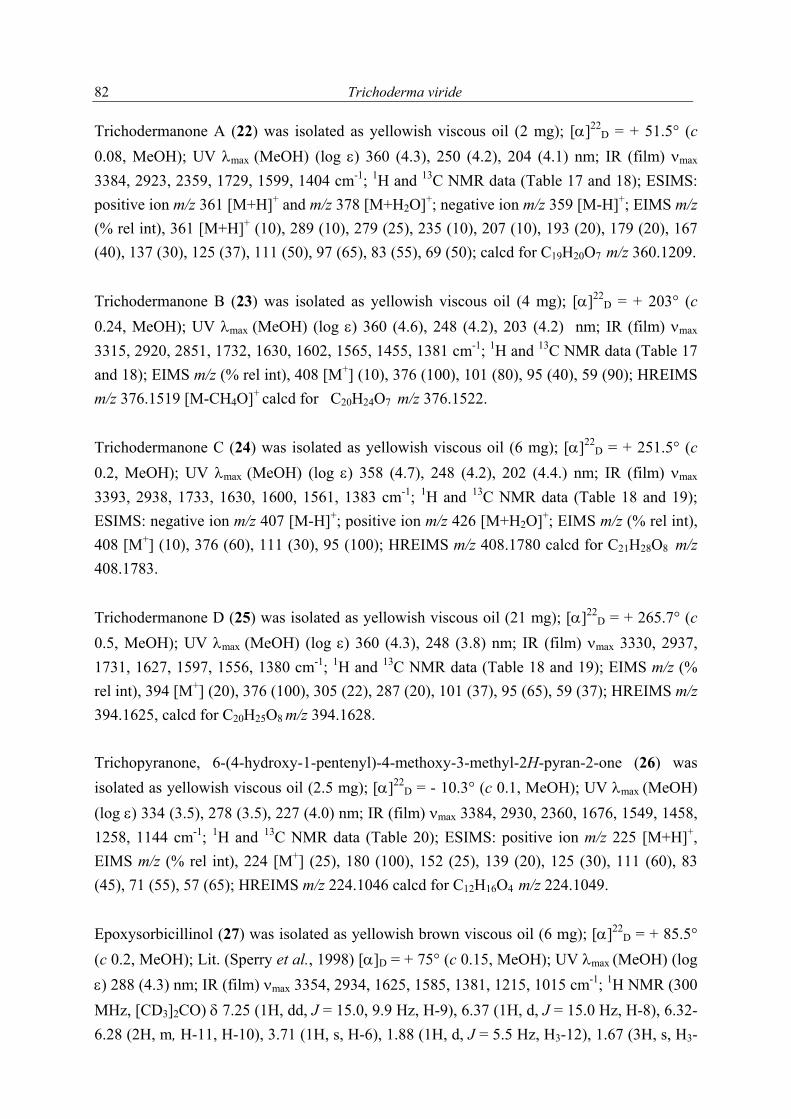
Trichoderma viride
82
Trichodermanone A (22) was isolated as yellowish viscous oil (2 mg); [α]22D = + 51.5° (c
0.08, MeOH); UV λmax (MeOH) (log ε) 360 (4.3), 250 (4.2), 204 (4.1) nm; IR (film) νmax 3384, 2923, 2359, 1729, 1599, 1404 cm-1; 1H and 13C NMR data (Table 17 and 18); ESIMS: positive ion m/z 361 [M+H]+ and m/z 378 [M+H2O]+; negative ion m/z 359 [M-H]+; EIMS m/z (% rel int), 361 [M+H]+ (10), 289 (10), 279 (25), 235 (10), 207 (10), 193 (20), 179 (20), 167 (40), 137 (30), 125 (37), 111 (50), 97 (65), 83 (55), 69 (50); calcd for C19H20O7 m/z 360.1209. Trichodermanone B (23) was isolated as yellowish viscous oil (4 mg); [α]22
D = + 203° (c 0.24, MeOH); UV λmax (MeOH) (log ε) 360 (4.6), 248 (4.2), 203 (4.2) nm; IR (film) νmax 3315, 2920, 2851, 1732, 1630, 1602, 1565, 1455, 1381 cm-1; 1H and 13C NMR data (Table 17 and 18); EIMS m/z (% rel int), 408 [M+] (10), 376 (100), 101 (80), 95 (40), 59 (90); HREIMS m/z 376.1519 [M-CH4O]+ calcd for C20H24O7 m/z 376.1522. Trichodermanone C (24) was isolated as yellowish viscous oil (6 mg); [α]22
D = + 251.5° (c 0.2, MeOH); UV λmax (MeOH) (log ε) 358 (4.7), 248 (4.2), 202 (4.4.) nm; IR (film) νmax 3393, 2938, 1733, 1630, 1600, 1561, 1383 cm-1; 1H and 13C NMR data (Table 18 and 19); ESIMS: negative ion m/z 407 [M-H]+; positive ion m/z 426 [M+H2O]+; EIMS m/z (% rel int), 408 [M+] (10), 376 (60), 111 (30), 95 (100); HREIMS m/z 408.1780 calcd for C21H28O8 m/z 408.1783. Trichodermanone D (25) was isolated as yellowish viscous oil (21 mg); [α]22
D = + 265.7° (c 0.5, MeOH); UV λmax (MeOH) (log ε) 360 (4.3), 248 (3.8) nm; IR (film) νmax 3330, 2937, 1731, 1627, 1597, 1556, 1380 cm-1; 1H and 13C NMR data (Table 18 and 19); EIMS m/z (% rel int), 394 [M+] (20), 376 (100), 305 (22), 287 (20), 101 (37), 95 (65), 59 (37); HREIMS m/z 394.1625, calcd for C20H25O8 m/z 394.1628. Trichopyranone, 6-(4-hydroxy-1-pentenyl)-4-methoxy-3-methyl-2H-pyran-2-one (26) was isolated as yellowish viscous oil (2.5 mg); [α]22
D = - 10.3° (c 0.1, MeOH); UV λmax (MeOH) (log ε) 334 (3.5), 278 (3.5), 227 (4.0) nm; IR (film) νmax 3384, 2930, 2360, 1676, 1549, 1458, 1258, 1144 cm-1; 1H and 13C NMR data (Table 20); ESIMS: positive ion m/z 225 [M+H]+, EIMS m/z (% rel int), 224 [M+] (25), 180 (100), 152 (25), 139 (20), 125 (30), 111 (60), 83 (45), 71 (55), 57 (65); HREIMS m/z 224.1046 calcd for C12H16O4 m/z 224.1049. Epoxysorbicillinol (27) was isolated as yellowish brown viscous oil (6 mg); [α]22
D = + 85.5° (c 0.2, MeOH); Lit. (Sperry et al., 1998) [α]D = + 75° (c 0.15, MeOH); UV λmax (MeOH) (log ε) 288 (4.3) nm; IR (film) νmax 3354, 2934, 1625, 1585, 1381, 1215, 1015 cm-1; 1H NMR (300 MHz, [CD3]2CO) δ 7.25 (1H, dd, J = 15.0, 9.9 Hz, H-9), 6.37 (1H, d, J = 15.0 Hz, H-8), 6.32-6.28 (2H, m, H-11, H-10), 3.71 (1H, s, H-6), 1.88 (1H, d, J = 5.5 Hz, H3-12), 1.67 (3H, s, H3-
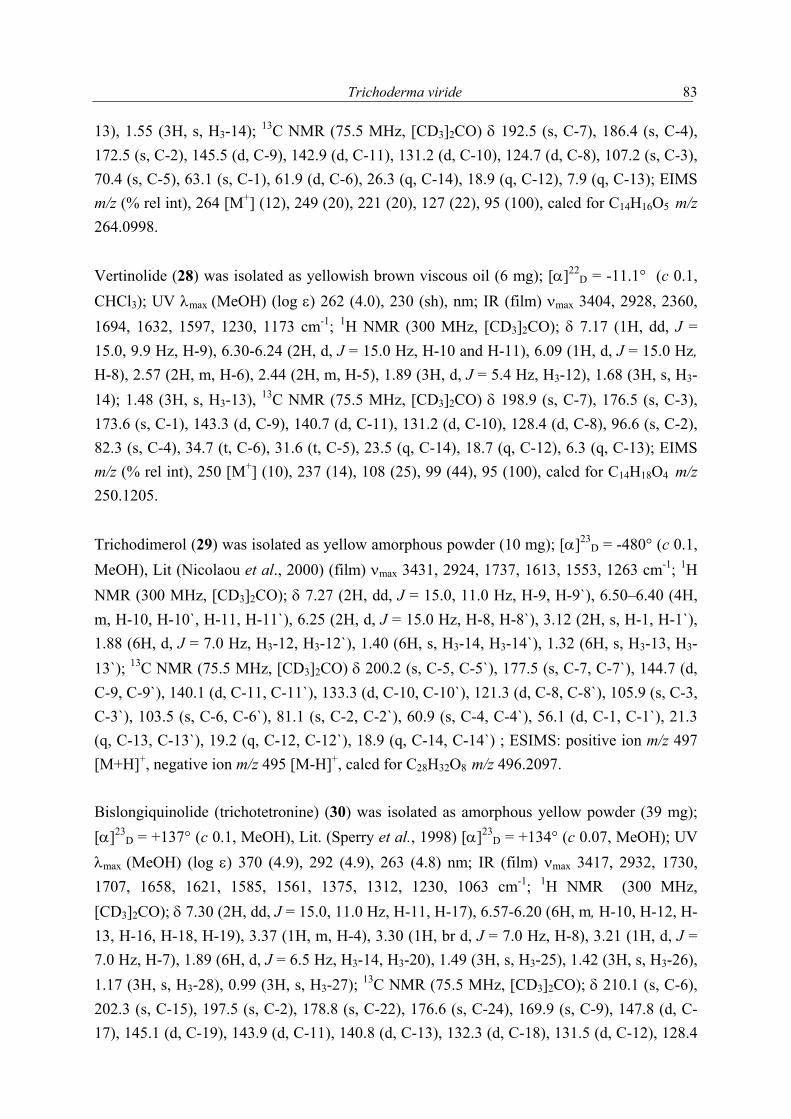
Trichoderma viride
83
13), 1.55 (3H, s, H3-14); 13C NMR (75.5 MHz, [CD3]2CO) δ 192.5 (s, C-7), 186.4 (s, C-4), 172.5 (s, C-2), 145.5 (d, C-9), 142.9 (d, C-11), 131.2 (d, C-10), 124.7 (d, C-8), 107.2 (s, C-3), 70.4 (s, C-5), 63.1 (s, C-1), 61.9 (d, C-6), 26.3 (q, C-14), 18.9 (q, C-12), 7.9 (q, C-13); EIMS m/z (% rel int), 264 [M+] (12), 249 (20), 221 (20), 127 (22), 95 (100), calcd for C14H16O5 m/z 264.0998. Vertinolide (28) was isolated as yellowish brown viscous oil (6 mg); [α]22
D = -11.1° (c 0.1, CHCl3); UV λmax (MeOH) (log ε) 262 (4.0), 230 (sh), nm; IR (film) νmax 3404, 2928, 2360, 1694, 1632, 1597, 1230, 1173 cm-1; 1H NMR (300 MHz, [CD3]2CO); δ 7.17 (1H, dd, J = 15.0, 9.9 Hz, H-9), 6.30-6.24 (2H, d, J = 15.0 Hz, H-10 and H-11), 6.09 (1H, d, J = 15.0 Hz, H-8), 2.57 (2H, m, H-6), 2.44 (2H, m, H-5), 1.89 (3H, d, J = 5.4 Hz, H3-12), 1.68 (3H, s, H3-14); 1.48 (3H, s, H3-13), 13C NMR (75.5 MHz, [CD3]2CO) δ 198.9 (s, C-7), 176.5 (s, C-3), 173.6 (s, C-1), 143.3 (d, C-9), 140.7 (d, C-11), 131.2 (d, C-10), 128.4 (d, C-8), 96.6 (s, C-2), 82.3 (s, C-4), 34.7 (t, C-6), 31.6 (t, C-5), 23.5 (q, C-14), 18.7 (q, C-12), 6.3 (q, C-13); EIMS m/z (% rel int), 250 [M+] (10), 237 (14), 108 (25), 99 (44), 95 (100), calcd for C14H18O4 m/z 250.1205. Trichodimerol (29) was isolated as yellow amorphous powder (10 mg); [α]23
D = -480° (c 0.1, MeOH), Lit (Nicolaou et al., 2000) (film) νmax 3431, 2924, 1737, 1613, 1553, 1263 cm-1; 1H NMR (300 MHz, [CD3]2CO); δ 7.27 (2H, dd, J = 15.0, 11.0 Hz, H-9, H-9`), 6.50–6.40 (4H, m, H-10, H-10`, H-11, H-11`), 6.25 (2H, d, J = 15.0 Hz, H-8, H-8`), 3.12 (2H, s, H-1, H-1`), 1.88 (6H, d, J = 7.0 Hz, H3-12, H3-12`), 1.40 (6H, s, H3-14, H3-14`), 1.32 (6H, s, H3-13, H3-13`); 13C NMR (75.5 MHz, [CD3]2CO) δ 200.2 (s, C-5, C-5`), 177.5 (s, C-7, C-7`), 144.7 (d, C-9, C-9`), 140.1 (d, C-11, C-11`), 133.3 (d, C-10, C-10`), 121.3 (d, C-8, C-8`), 105.9 (s, C-3, C-3`), 103.5 (s, C-6, C-6`), 81.1 (s, C-2, C-2`), 60.9 (s, C-4, C-4`), 56.1 (d, C-1, C-1`), 21.3 (q, C-13, C-13`), 19.2 (q, C-12, C-12`), 18.9 (q, C-14, C-14`) ; ESIMS: positive ion m/z 497 [M+H]+, negative ion m/z 495 [M-H]+, calcd for C28H32O8 m/z 496.2097. Bislongiquinolide (trichotetronine) (30) was isolated as amorphous yellow powder (39 mg); [α]23
D = +137° (c 0.1, MeOH), Lit. (Sperry et al., 1998) [α]23D = +134° (c 0.07, MeOH); UV
λmax (MeOH) (log ε) 370 (4.9), 292 (4.9), 263 (4.8) nm; IR (film) νmax 3417, 2932, 1730, 1707, 1658, 1621, 1585, 1561, 1375, 1312, 1230, 1063 cm-1; 1H NMR (300 MHz, [CD3]2CO); δ 7.30 (2H, dd, J = 15.0, 11.0 Hz, H-11, H-17), 6.57-6.20 (6H, m, H-10, H-12, H-13, H-16, H-18, H-19), 3.37 (1H, m, H-4), 3.30 (1H, br d, J = 7.0 Hz, H-8), 3.21 (1H, d, J = 7.0 Hz, H-7), 1.89 (6H, d, J = 6.5 Hz, H3-14, H3-20), 1.49 (3H, s, H3-25), 1.42 (3H, s, H3-26), 1.17 (3H, s, H3-28), 0.99 (3H, s, H3-27); 13C NMR (75.5 MHz, [CD3]2CO); δ 210.1 (s, C-6), 202.3 (s, C-15), 197.5 (s, C-2), 178.8 (s, C-22), 176.6 (s, C-24), 169.9 (s, C-9), 147.8 (d, C-17), 145.1 (d, C-19), 143.9 (d, C-11), 140.8 (d, C-13), 132.3 (d, C-18), 131.5 (d, C-12), 128.4
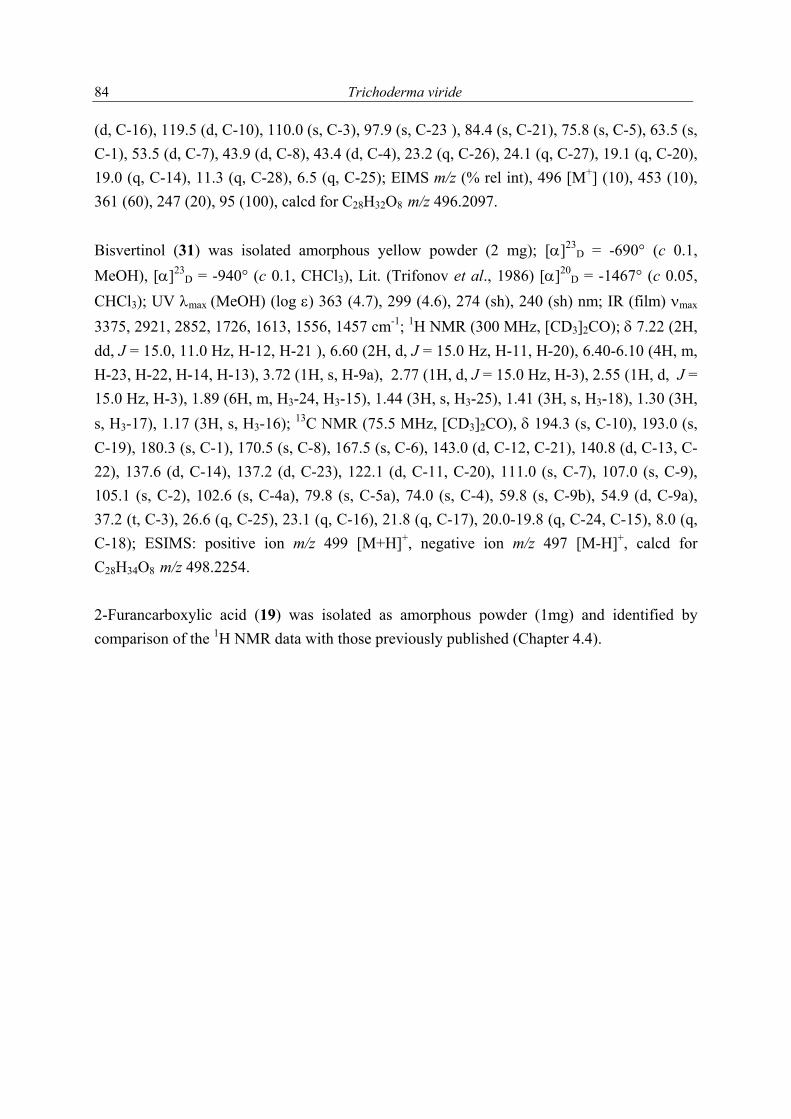
Trichoderma viride
84
(d, C-16), 119.5 (d, C-10), 110.0 (s, C-3), 97.9 (s, C-23 ), 84.4 (s, C-21), 75.8 (s, C-5), 63.5 (s, C-1), 53.5 (d, C-7), 43.9 (d, C-8), 43.4 (d, C-4), 23.2 (q, C-26), 24.1 (q, C-27), 19.1 (q, C-20), 19.0 (q, C-14), 11.3 (q, C-28), 6.5 (q, C-25); EIMS m/z (% rel int), 496 [M+] (10), 453 (10), 361 (60), 247 (20), 95 (100), calcd for C28H32O8 m/z 496.2097. Bisvertinol (31) was isolated amorphous yellow powder (2 mg); [α]23
D = -690° (c 0.1, MeOH), [α]23
D = -940° (c 0.1, CHCl3), Lit. (Trifonov et al., 1986) [α]20D = -1467° (c 0.05,
CHCl3); UV λmax (MeOH) (log ε) 363 (4.7), 299 (4.6), 274 (sh), 240 (sh) nm; IR (film) νmax 3375, 2921, 2852, 1726, 1613, 1556, 1457 cm-1; 1H NMR (300 MHz, [CD3]2CO); δ 7.22 (2H, dd, J = 15.0, 11.0 Hz, H-12, H-21 ), 6.60 (2H, d, J = 15.0 Hz, H-11, H-20), 6.40-6.10 (4H, m, H-23, H-22, H-14, H-13), 3.72 (1H, s, H-9a), 2.77 (1H, d, J = 15.0 Hz, H-3), 2.55 (1H, d, J = 15.0 Hz, H-3), 1.89 (6H, m, H3-24, H3-15), 1.44 (3H, s, H3-25), 1.41 (3H, s, H3-18), 1.30 (3H, s, H3-17), 1.17 (3H, s, H3-16); 13C NMR (75.5 MHz, [CD3]2CO), δ 194.3 (s, C-10), 193.0 (s, C-19), 180.3 (s, C-1), 170.5 (s, C-8), 167.5 (s, C-6), 143.0 (d, C-12, C-21), 140.8 (d, C-13, C-22), 137.6 (d, C-14), 137.2 (d, C-23), 122.1 (d, C-11, C-20), 111.0 (s, C-7), 107.0 (s, C-9), 105.1 (s, C-2), 102.6 (s, C-4a), 79.8 (s, C-5a), 74.0 (s, C-4), 59.8 (s, C-9b), 54.9 (d, C-9a), 37.2 (t, C-3), 26.6 (q, C-25), 23.1 (q, C-16), 21.8 (q, C-17), 20.0-19.8 (q, C-24, C-15), 8.0 (q, C-18); ESIMS: positive ion m/z 499 [M+H]+, negative ion m/z 497 [M-H]+, calcd for C28H34O8 m/z 498.2254. 2-Furancarboxylic acid (19) was isolated as amorphous powder (1mg) and identified by comparison of the 1H NMR data with those previously published (Chapter 4.4).
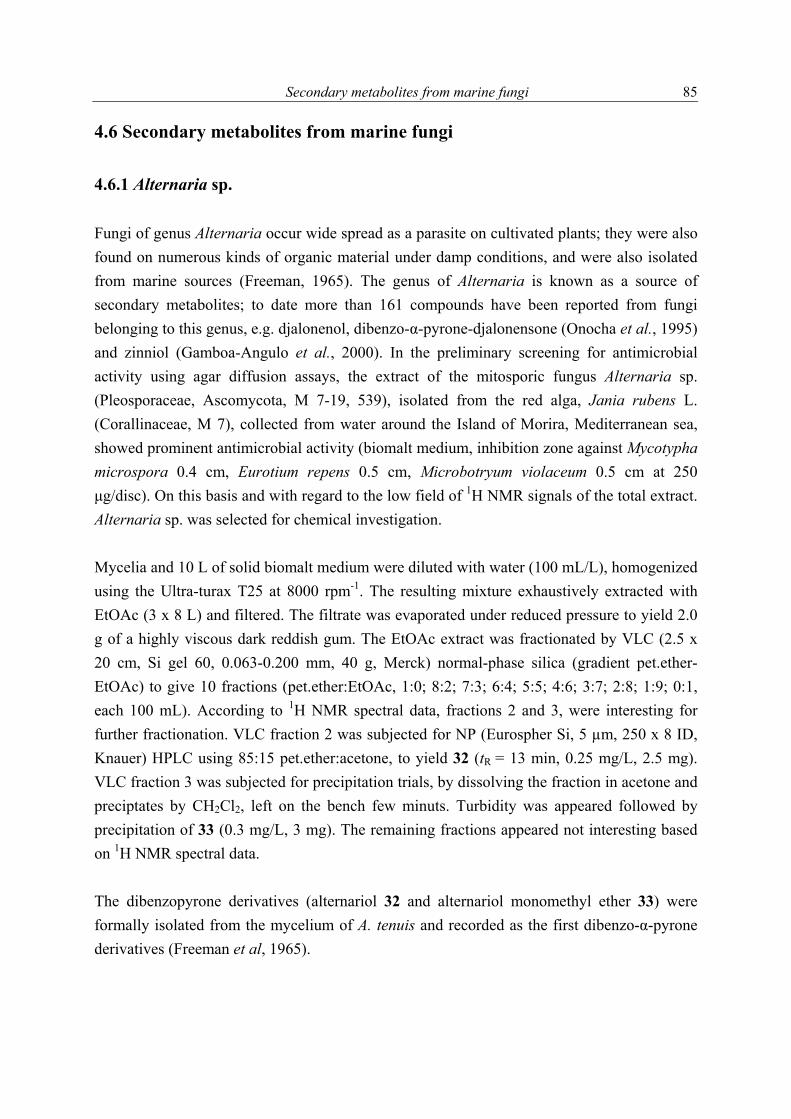
Secondary metabolites from marine fungi
85
4.6 Secondary metabolites from marine fungi 4.6.1 Alternaria sp. Fungi of genus Alternaria occur wide spread as a parasite on cultivated plants; they were also found on numerous kinds of organic material under damp conditions, and were also isolated from marine sources (Freeman, 1965). The genus of Alternaria is known as a source of secondary metabolites; to date more than 161 compounds have been reported from fungi belonging to this genus, e.g. djalonenol, dibenzo-α-pyrone-djalonensone (Onocha et al., 1995) and zinniol (Gamboa-Angulo et al., 2000). In the preliminary screening for antimicrobial activity using agar diffusion assays, the extract of the mitosporic fungus Alternaria sp. (Pleosporaceae, Ascomycota, M 7-19, 539), isolated from the red alga, Jania rubens L. (Corallinaceae, M 7), collected from water around the Island of Morira, Mediterranean sea, showed prominent antimicrobial activity (biomalt medium, inhibition zone against Mycotypha microspora 0.4 cm, Eurotium repens 0.5 cm, Microbotryum violaceum 0.5 cm at 250 µg/disc). On this basis and with regard to the low field of 1H NMR signals of the total extract. Alternaria sp. was selected for chemical investigation. Mycelia and 10 L of solid biomalt medium were diluted with water (100 mL/L), homogenized using the Ultra-turax T25 at 8000 rpm-1. The resulting mixture exhaustively extracted with EtOAc (3 x 8 L) and filtered. The filtrate was evaporated under reduced pressure to yield 2.0 g of a highly viscous dark reddish gum. The EtOAc extract was fractionated by VLC (2.5 x 20 cm, Si gel 60, 0.063-0.200 mm, 40 g, Merck) normal-phase silica (gradient pet.ether-EtOAc) to give 10 fractions (pet.ether:EtOAc, 1:0; 8:2; 7:3; 6:4; 5:5; 4:6; 3:7; 2:8; 1:9; 0:1, each 100 mL). According to 1H NMR spectral data, fractions 2 and 3, were interesting for further fractionation. VLC fraction 2 was subjected for NP (Eurospher Si, 5 µm, 250 x 8 ID, Knauer) HPLC using 85:15 pet.ether:acetone, to yield 32 (tR = 13 min, 0.25 mg/L, 2.5 mg). VLC fraction 3 was subjected for precipitation trials, by dissolving the fraction in acetone and preciptates by CH2Cl2, left on the bench few minuts. Turbidity was appeared followed by precipitation of 33 (0.3 mg/L, 3 mg). The remaining fractions appeared not interesting based on 1H NMR spectral data. The dibenzopyrone derivatives (alternariol 32 and alternariol monomethyl ether 33) were formally isolated from the mycelium of A. tenuis and recorded as the first dibenzo-α-pyrone derivatives (Freeman et al, 1965).
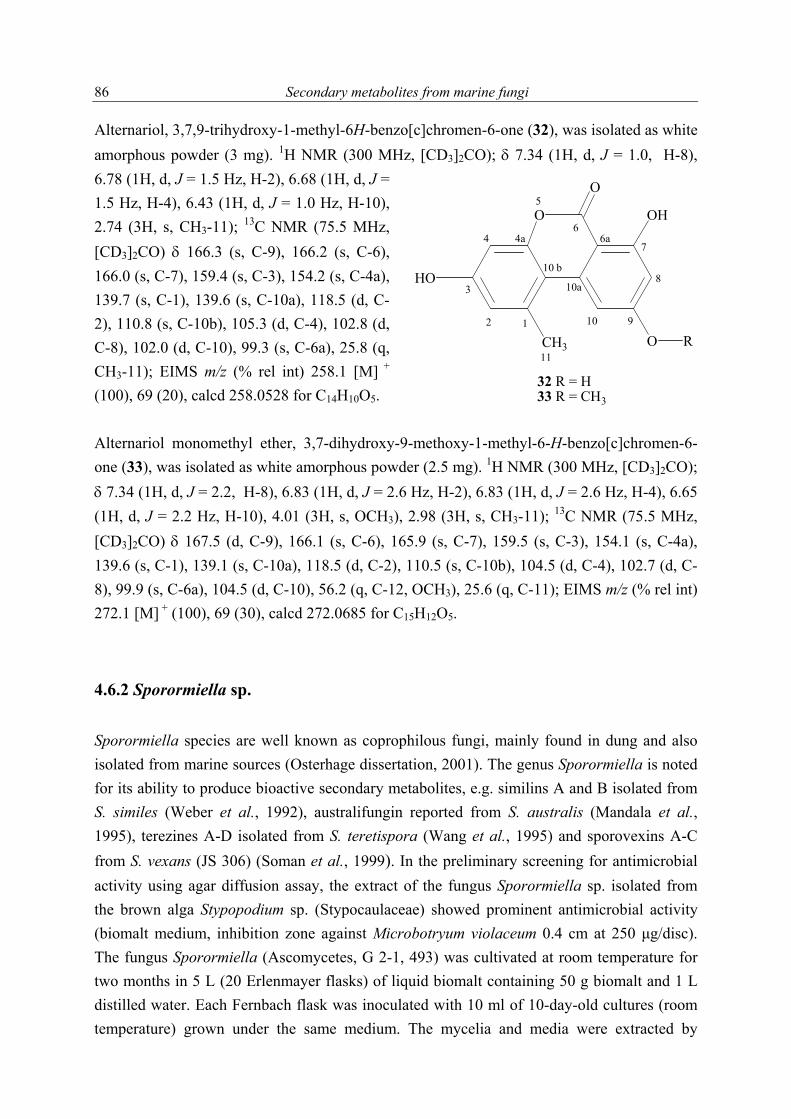
Secondary metabolites from marine fungi
86
Alternariol, 3,7,9-trihydroxy-1-methyl-6H-benzo[c]chromen-6-one (32), was isolated as white amorphous powder (3 mg). 1H NMR (300 MHz, [CD3]2CO); δ 7.34 (1H, d, J = 1.0, H-8), 6.78 (1H, d, J = 1.5 Hz, H-2), 6.68 (1H, d, J = 1.5 Hz, H-4), 6.43 (1H, d, J = 1.0 Hz, H-10), 2.74 (3H, s, CH3-11); 13C NMR (75.5 MHz, [CD3]2CO) δ 166.3 (s, C-9), 166.2 (s, C-6), 166.0 (s, C-7), 159.4 (s, C-3), 154.2 (s, C-4a), 139.7 (s, C-1), 139.6 (s, C-10a), 118.5 (d, C-2), 110.8 (s, C-10b), 105.3 (d, C-4), 102.8 (d, C-8), 102.0 (d, C-10), 99.3 (s, C-6a), 25.8 (q, CH3-11); EIMS m/z (% rel int) 258.1 [M] + (100), 69 (20), calcd 258.0528 for C14H10O5. Alternariol monomethyl ether, 3,7-dihydroxy-9-methoxy-1-methyl-6-H-benzo[c]chromen-6-one (33), was isolated as white amorphous powder (2.5 mg). 1H NMR (300 MHz, [CD3]2CO); δ 7.34 (1H, d, J = 2.2, H-8), 6.83 (1H, d, J = 2.6 Hz, H-2), 6.83 (1H, d, J = 2.6 Hz, H-4), 6.65 (1H, d, J = 2.2 Hz, H-10), 4.01 (3H, s, OCH3), 2.98 (3H, s, CH3-11); 13C NMR (75.5 MHz, [CD3]2CO) δ 167.5 (d, C-9), 166.1 (s, C-6), 165.9 (s, C-7), 159.5 (s, C-3), 154.1 (s, C-4a), 139.6 (s, C-1), 139.1 (s, C-10a), 118.5 (d, C-2), 110.5 (s, C-10b), 104.5 (d, C-4), 102.7 (d, C-8), 99.9 (s, C-6a), 104.5 (d, C-10), 56.2 (q, C-12, OCH3), 25.6 (q, C-11); EIMS m/z (% rel int) 272.1 [M] + (100), 69 (30), calcd 272.0685 for C15H12O5. 4.6.2 Sporormiella sp. Sporormiella species are well known as coprophilous fungi, mainly found in dung and also isolated from marine sources (Osterhage dissertation, 2001). The genus Sporormiella is noted for its ability to produce bioactive secondary metabolites, e.g. similins A and B isolated from S. similes (Weber et al., 1992), australifungin reported from S. australis (Mandala et al., 1995), terezines A-D isolated from S. teretispora (Wang et al., 1995) and sporovexins A-C from S. vexans (JS 306) (Soman et al., 1999). In the preliminary screening for antimicrobial activity using agar diffusion assay, the extract of the fungus Sporormiella sp. isolated from the brown alga Stypopodium sp. (Stypocaulaceae) showed prominent antimicrobial activity (biomalt medium, inhibition zone against Microbotryum violaceum 0.4 cm at 250 µg/disc). The fungus Sporormiella (Ascomycetes, G 2-1, 493) was cultivated at room temperature for two months in 5 L (20 Erlenmayer flasks) of liquid biomalt containing 50 g biomalt and 1 L distilled water. Each Fernbach flask was inoculated with 10 ml of 10-day-old cultures (room temperature) grown under the same medium. The mycelia and media were extracted by
O
O
CH3
HO
O
OH
32 R = H33 R = CH3
R2 1
3
4
5
6
7
8
910
11
10a
10 b
6a4a
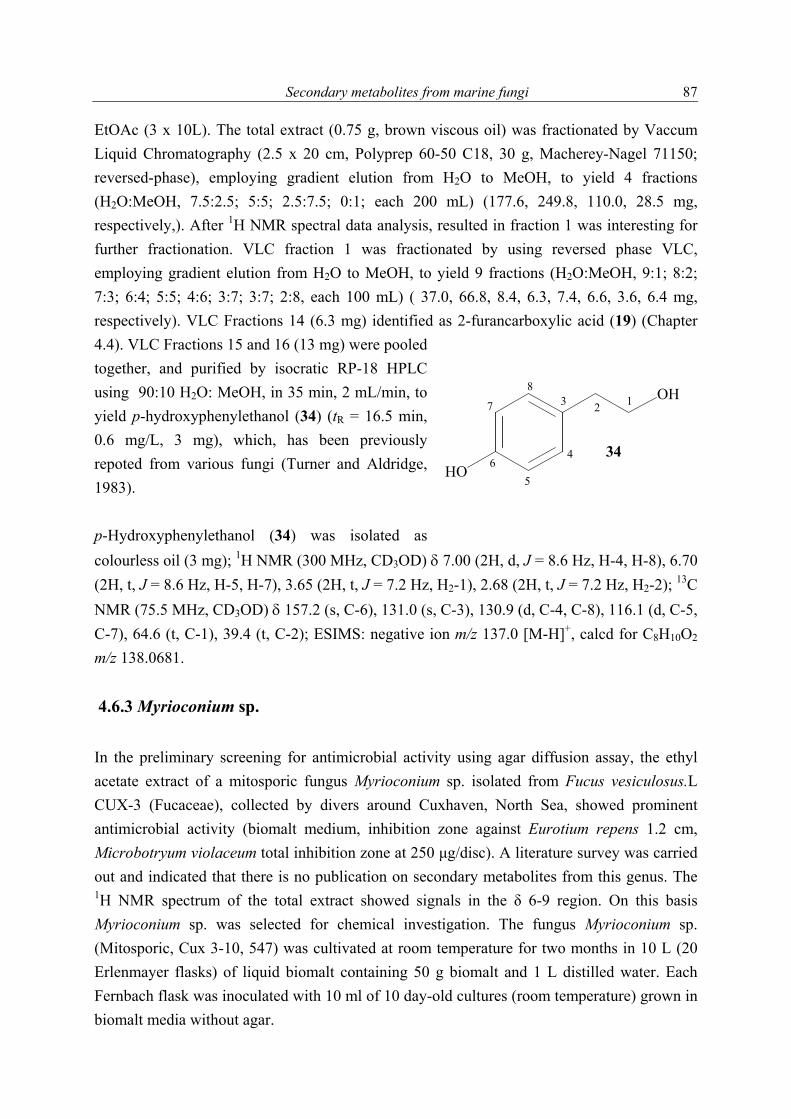
Secondary metabolites from marine fungi
87
EtOAc (3 x 10L). The total extract (0.75 g, brown viscous oil) was fractionated by Vaccum Liquid Chromatography (2.5 x 20 cm, Polyprep 60-50 C18, 30 g, Macherey-Nagel 71150; reversed-phase), employing gradient elution from H2O to MeOH, to yield 4 fractions (H2O:MeOH, 7.5:2.5; 5:5; 2.5:7.5; 0:1; each 200 mL) (177.6, 249.8, 110.0, 28.5 mg, respectively,). After 1H NMR spectral data analysis, resulted in fraction 1 was interesting for further fractionation. VLC fraction 1 was fractionated by using reversed phase VLC, employing gradient elution from H2O to MeOH, to yield 9 fractions (H2O:MeOH, 9:1; 8:2; 7:3; 6:4; 5:5; 4:6; 3:7; 3:7; 2:8, each 100 mL) ( 37.0, 66.8, 8.4, 6.3, 7.4, 6.6, 3.6, 6.4 mg, respectively). VLC Fractions 14 (6.3 mg) identified as 2-furancarboxylic acid (19) (Chapter 4.4). VLC Fractions 15 and 16 (13 mg) were pooled together, and purified by isocratic RP-18 HPLC using 90:10 H2O: MeOH, in 35 min, 2 mL/min, to yield p-hydroxyphenylethanol (34) (tR = 16.5 min, 0.6 mg/L, 3 mg), which, has been previously repoted from various fungi (Turner and Aldridge, 1983). p-Hydroxyphenylethanol (34) was isolated as colourless oil (3 mg); 1H NMR (300 MHz, CD3OD) δ 7.00 (2H, d, J = 8.6 Hz, H-4, H-8), 6.70 (2H, t, J = 8.6 Hz, H-5, H-7), 3.65 (2H, t, J = 7.2 Hz, H2-1), 2.68 (2H, t, J = 7.2 Hz, H2-2); 13C NMR (75.5 MHz, CD3OD) δ 157.2 (s, C-6), 131.0 (s, C-3), 130.9 (d, C-4, C-8), 116.1 (d, C-5, C-7), 64.6 (t, C-1), 39.4 (t, C-2); ESIMS: negative ion m/z 137.0 [M-H]+, calcd for C8H10O2 m/z 138.0681. 4.6.3 Myrioconium sp. In the preliminary screening for antimicrobial activity using agar diffusion assay, the ethyl acetate extract of a mitosporic fungus Myrioconium sp. isolated from Fucus vesiculosus.L CUX-3 (Fucaceae), collected by divers around Cuxhaven, North Sea, showed prominent antimicrobial activity (biomalt medium, inhibition zone against Eurotium repens 1.2 cm, Microbotryum violaceum total inhibition zone at 250 µg/disc). A literature survey was carried out and indicated that there is no publication on secondary metabolites from this genus. The 1H NMR spectrum of the total extract showed signals in the δ 6-9 region. On this basis Myrioconium sp. was selected for chemical investigation. The fungus Myrioconium sp. (Mitosporic, Cux 3-10, 547) was cultivated at room temperature for two months in 10 L (20 Erlenmayer flasks) of liquid biomalt containing 50 g biomalt and 1 L distilled water. Each Fernbach flask was inoculated with 10 ml of 10 day-old cultures (room temperature) grown in biomalt media without agar.
OH
HO
123
4
56
7
8
34
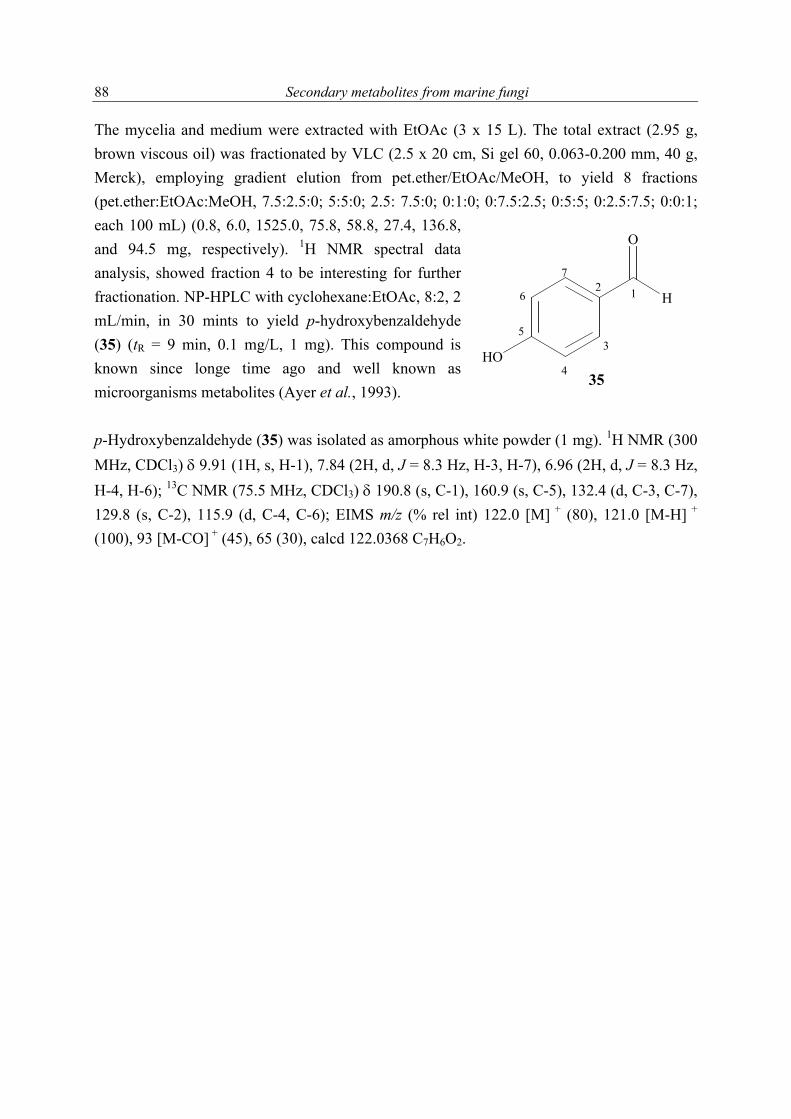
Secondary metabolites from marine fungi
88
The mycelia and medium were extracted with EtOAc (3 x 15 L). The total extract (2.95 g, brown viscous oil) was fractionated by VLC (2.5 x 20 cm, Si gel 60, 0.063-0.200 mm, 40 g, Merck), employing gradient elution from pet.ether/EtOAc/MeOH, to yield 8 fractions (pet.ether:EtOAc:MeOH, 7.5:2.5:0; 5:5:0; 2.5: 7.5:0; 0:1:0; 0:7.5:2.5; 0:5:5; 0:2.5:7.5; 0:0:1; each 100 mL) (0.8, 6.0, 1525.0, 75.8, 58.8, 27.4, 136.8, and 94.5 mg, respectively). 1H NMR spectral data analysis, showed fraction 4 to be interesting for further fractionation. NP-HPLC with cyclohexane:EtOAc, 8:2, 2 mL/min, in 30 mints to yield p-hydroxybenzaldehyde (35) (tR = 9 min, 0.1 mg/L, 1 mg). This compound is known since longe time ago and well known as microorganisms metabolites (Ayer et al., 1993). p-Hydroxybenzaldehyde (35) was isolated as amorphous white powder (1 mg). 1H NMR (300 MHz, CDCl3) δ 9.91 (1H, s, H-1), 7.84 (2H, d, J = 8.3 Hz, H-3, H-7), 6.96 (2H, d, J = 8.3 Hz, H-4, H-6); 13C NMR (75.5 MHz, CDCl3) δ 190.8 (s, C-1), 160.9 (s, C-5), 132.4 (d, C-3, C-7), 129.8 (s, C-2), 115.9 (d, C-4, C-6); EIMS m/z (% rel int) 122.0 [M] + (80), 121.0 [M-H] + (100), 93 [M-CO] + (45), 65 (30), calcd 122.0368 C7H6O2.
H
O
HO
12
3
4
5
6
7
35
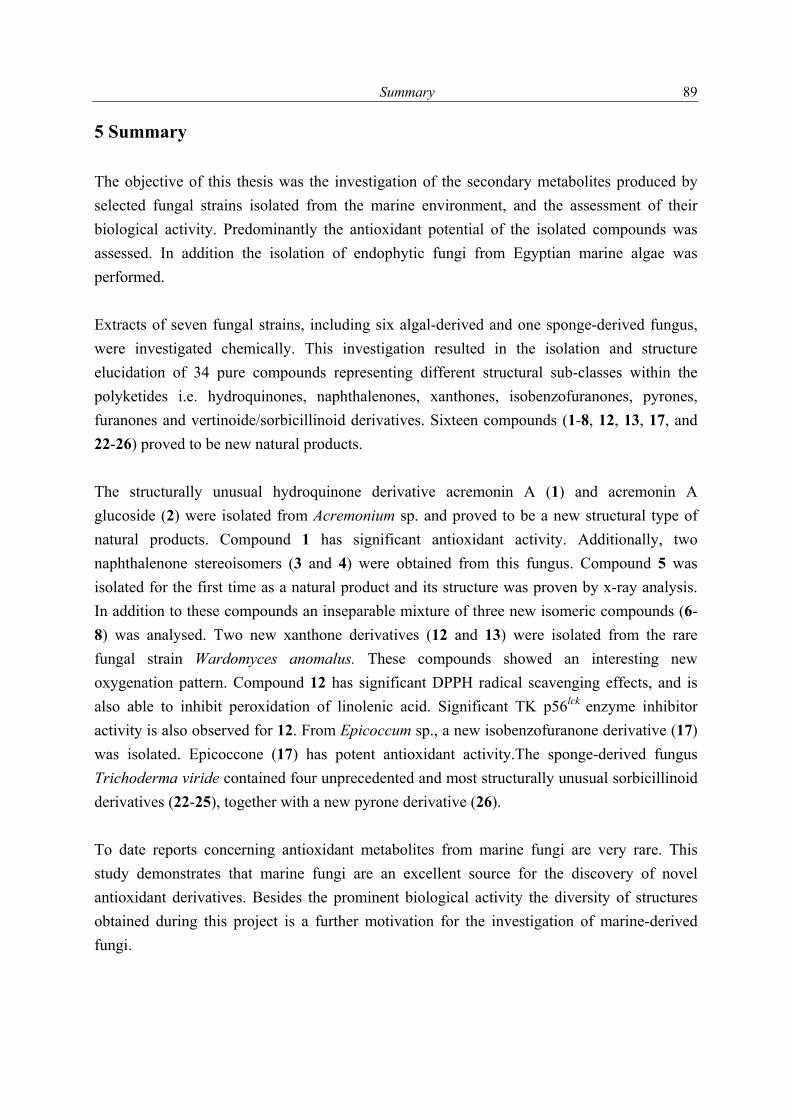
Summary
89
5 Summary The objective of this thesis was the investigation of the secondary metabolites produced by selected fungal strains isolated from the marine environment, and the assessment of their biological activity. Predominantly the antioxidant potential of the isolated compounds was assessed. In addition the isolation of endophytic fungi from Egyptian marine algae was performed. Extracts of seven fungal strains, including six algal-derived and one sponge-derived fungus, were investigated chemically. This investigation resulted in the isolation and structure elucidation of 34 pure compounds representing different structural sub-classes within the polyketides i.e. hydroquinones, naphthalenones, xanthones, isobenzofuranones, pyrones, furanones and vertinoide/sorbicillinoid derivatives. Sixteen compounds (1-8, 12, 13, 17, and 22-26) proved to be new natural products. The structurally unusual hydroquinone derivative acremonin A (1) and acremonin A glucoside (2) were isolated from Acremonium sp. and proved to be a new structural type of natural products. Compound 1 has significant antioxidant activity. Additionally, two naphthalenone stereoisomers (3 and 4) were obtained from this fungus. Compound 5 was isolated for the first time as a natural product and its structure was proven by x-ray analysis. In addition to these compounds an inseparable mixture of three new isomeric compounds (6-8) was analysed. Two new xanthone derivatives (12 and 13) were isolated from the rare fungal strain Wardomyces anomalus. These compounds showed an interesting new oxygenation pattern. Compound 12 has significant DPPH radical scavenging effects, and is also able to inhibit peroxidation of linolenic acid. Significant TK p56lck enzyme inhibitor activity is also observed for 12. From Epicoccum sp., a new isobenzofuranone derivative (17) was isolated. Epicoccone (17) has potent antioxidant activity.The sponge-derived fungus Trichoderma viride contained four unprecedented and most structurally unusual sorbicillinoid derivatives (22-25), together with a new pyrone derivative (26). To date reports concerning antioxidant metabolites from marine fungi are very rare. This study demonstrates that marine fungi are an excellent source for the discovery of novel antioxidant derivatives. Besides the prominent biological activity the diversity of structures obtained during this project is a further motivation for the investigation of marine-derived fungi.
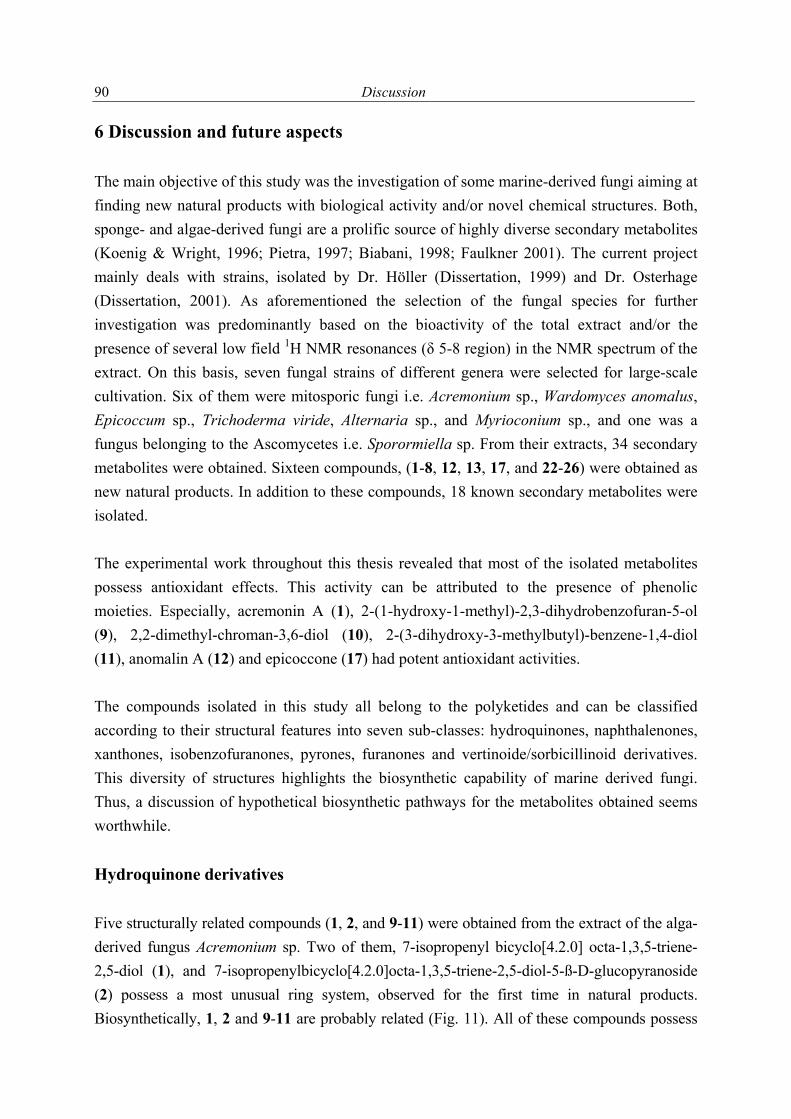
Discussion
90
6 Discussion and future aspects The main objective of this study was the investigation of some marine-derived fungi aiming at finding new natural products with biological activity and/or novel chemical structures. Both, sponge- and algae-derived fungi are a prolific source of highly diverse secondary metabolites (Koenig & Wright, 1996; Pietra, 1997; Biabani, 1998; Faulkner 2001). The current project mainly deals with strains, isolated by Dr. Höller (Dissertation, 1999) and Dr. Osterhage (Dissertation, 2001). As aforementioned the selection of the fungal species for further investigation was predominantly based on the bioactivity of the total extract and/or the presence of several low field 1H NMR resonances (δ 5-8 region) in the NMR spectrum of the extract. On this basis, seven fungal strains of different genera were selected for large-scale cultivation. Six of them were mitosporic fungi i.e. Acremonium sp., Wardomyces anomalus, Epicoccum sp., Trichoderma viride, Alternaria sp., and Myrioconium sp., and one was a fungus belonging to the Ascomycetes i.e. Sporormiella sp. From their extracts, 34 secondary metabolites were obtained. Sixteen compounds, (1-8, 12, 13, 17, and 22-26) were obtained as new natural products. In addition to these compounds, 18 known secondary metabolites were isolated. The experimental work throughout this thesis revealed that most of the isolated metabolites possess antioxidant effects. This activity can be attributed to the presence of phenolic moieties. Especially, acremonin A (1), 2-(1-hydroxy-1-methyl)-2,3-dihydrobenzofuran-5-ol (9), 2,2-dimethyl-chroman-3,6-diol (10), 2-(3-dihydroxy-3-methylbutyl)-benzene-1,4-diol (11), anomalin A (12) and epicoccone (17) had potent antioxidant activities. The compounds isolated in this study all belong to the polyketides and can be classified according to their structural features into seven sub-classes: hydroquinones, naphthalenones, xanthones, isobenzofuranones, pyrones, furanones and vertinoide/sorbicillinoid derivatives. This diversity of structures highlights the biosynthetic capability of marine derived fungi. Thus, a discussion of hypothetical biosynthetic pathways for the metabolites obtained seems worthwhile. Hydroquinone derivatives Five structurally related compounds (1, 2, and 9-11) were obtained from the extract of the alga-derived fungus Acremonium sp. Two of them, 7-isopropenyl bicyclo[4.2.0] octa-1,3,5-triene-2,5-diol (1), and 7-isopropenylbicyclo[4.2.0]octa-1,3,5-triene-2,5-diol-5-ß-D-glucopyranoside (2) possess a most unusual ring system, observed for the first time in natural products. Biosynthetically, 1, 2 and 9-11 are probably related (Fig. 11). All of these compounds possess
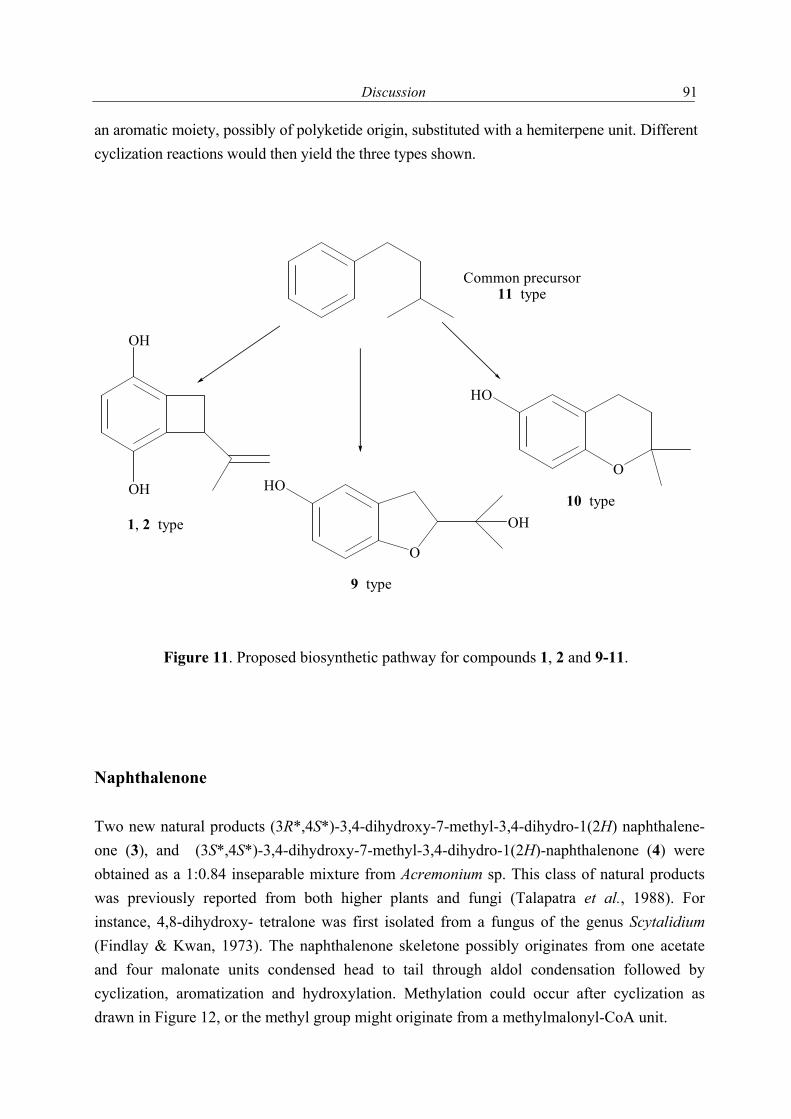
Discussion
91
an aromatic moiety, possibly of polyketide origin, substituted with a hemiterpene unit. Different cyclization reactions would then yield the three types shown.
O
O
OH
OH
OH HO
HO
Common precursor11 type
1, 2 type
9 type
10 type
Figure 11. Proposed biosynthetic pathway for compounds 1, 2 and 9-11. Naphthalenone Two new natural products (3R*,4S*)-3,4-dihydroxy-7-methyl-3,4-dihydro-1(2H) naphthalene- one (3), and (3S*,4S*)-3,4-dihydroxy-7-methyl-3,4-dihydro-1(2H)-naphthalenone (4) were obtained as a 1:0.84 inseparable mixture from Acremonium sp. This class of natural products was previously reported from both higher plants and fungi (Talapatra et al., 1988). For instance, 4,8-dihydroxy- tetralone was first isolated from a fungus of the genus Scytalidium (Findlay & Kwan, 1973). The naphthalenone skeletone possibly originates from one acetate and four malonate units condensed head to tail through aldol condensation followed by cyclization, aromatization and hydroxylation. Methylation could occur after cyclization as drawn in Figure 12, or the methyl group might originate from a methylmalonyl-CoA unit.
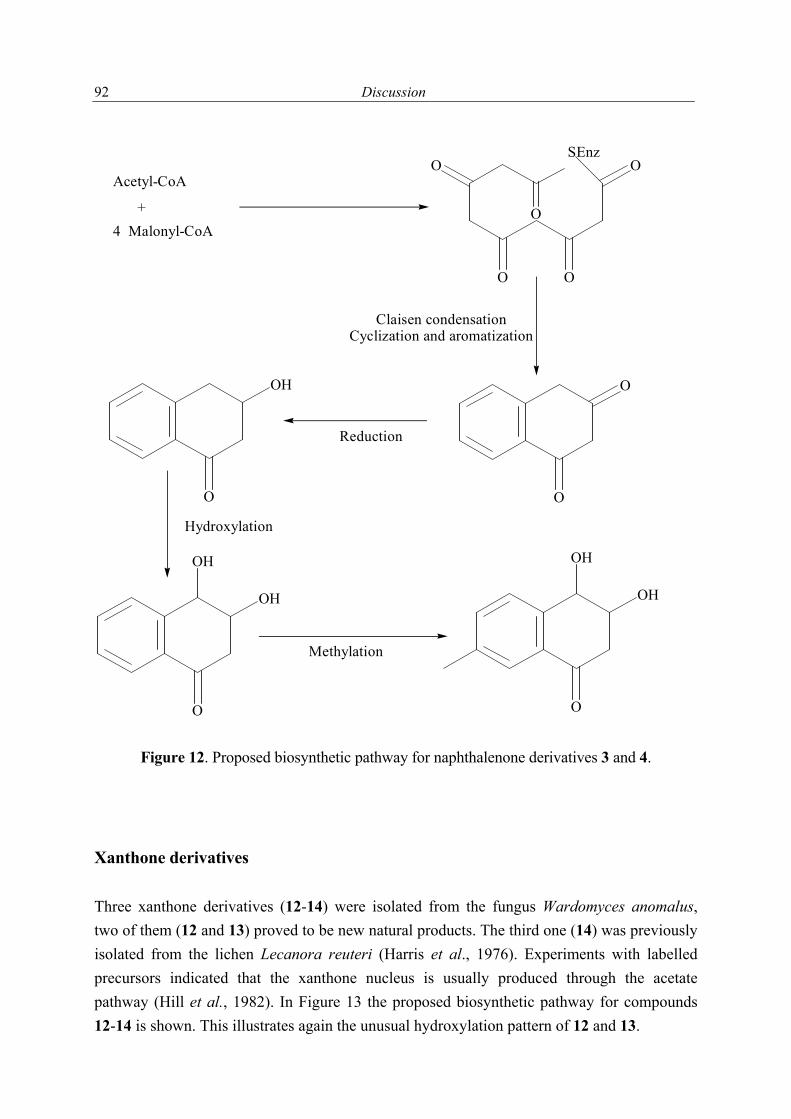
Discussion
92
Acetyl-CoAO
OO
O
O
SEnz
O
O
OH
O
OH
O
OH
OH
O
OH
Hydroxylation
Methylation
4 Malonyl-CoA+
Claisen condensationCyclization and aromatization
Reduction
Figure 12. Proposed biosynthetic pathway for naphthalenone derivatives 3 and 4. Xanthone derivatives Three xanthone derivatives (12-14) were isolated from the fungus Wardomyces anomalus, two of them (12 and 13) proved to be new natural products. The third one (14) was previously isolated from the lichen Lecanora reuteri (Harris et al., 1976). Experiments with labelled precursors indicated that the xanthone nucleus is usually produced through the acetate pathway (Hill et al., 1982). In Figure 13 the proposed biosynthetic pathway for compounds 12-14 is shown. This illustrates again the unusual hydroxylation pattern of 12 and 13.
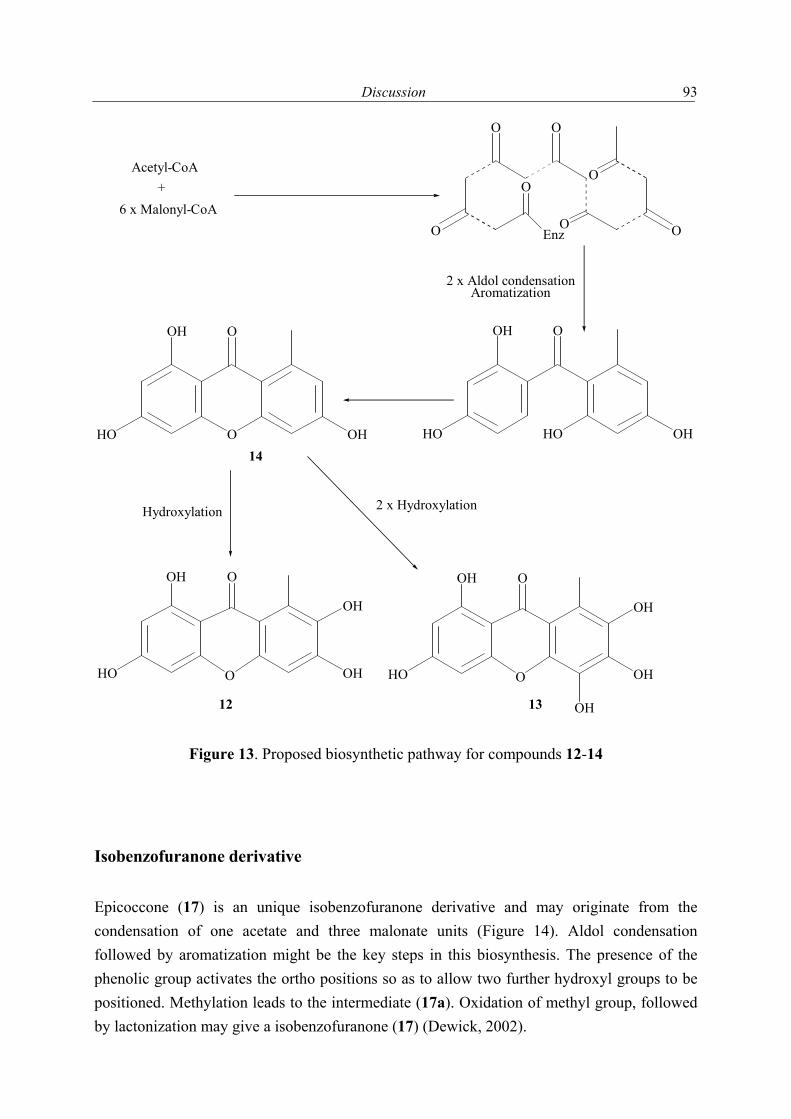
Discussion
93
Enz
O
HO
OH
OH
O
HO
OH
OHO
O
OOH
HO OH
12 13
14
Hydroxylation
Acetyl-CoA
6 x Malonyl-CoA+
OH
O
OOH
HO OH
OH
OH
OO
O OO
OO
2 x Aldol condensationAromatization
HO
2 x Hydroxylation
Figure 13. Proposed biosynthetic pathway for compounds 12-14 Isobenzofuranone derivative Epicoccone (17) is an unique isobenzofuranone derivative and may originate from the condensation of one acetate and three malonate units (Figure 14). Aldol condensation followed by aromatization might be the key steps in this biosynthesis. The presence of the phenolic group activates the ortho positions so as to allow two further hydroxyl groups to be positioned. Methylation leads to the intermediate (17a). Oxidation of methyl group, followed by lactonization may give a isobenzofuranone (17) (Dewick, 2002).
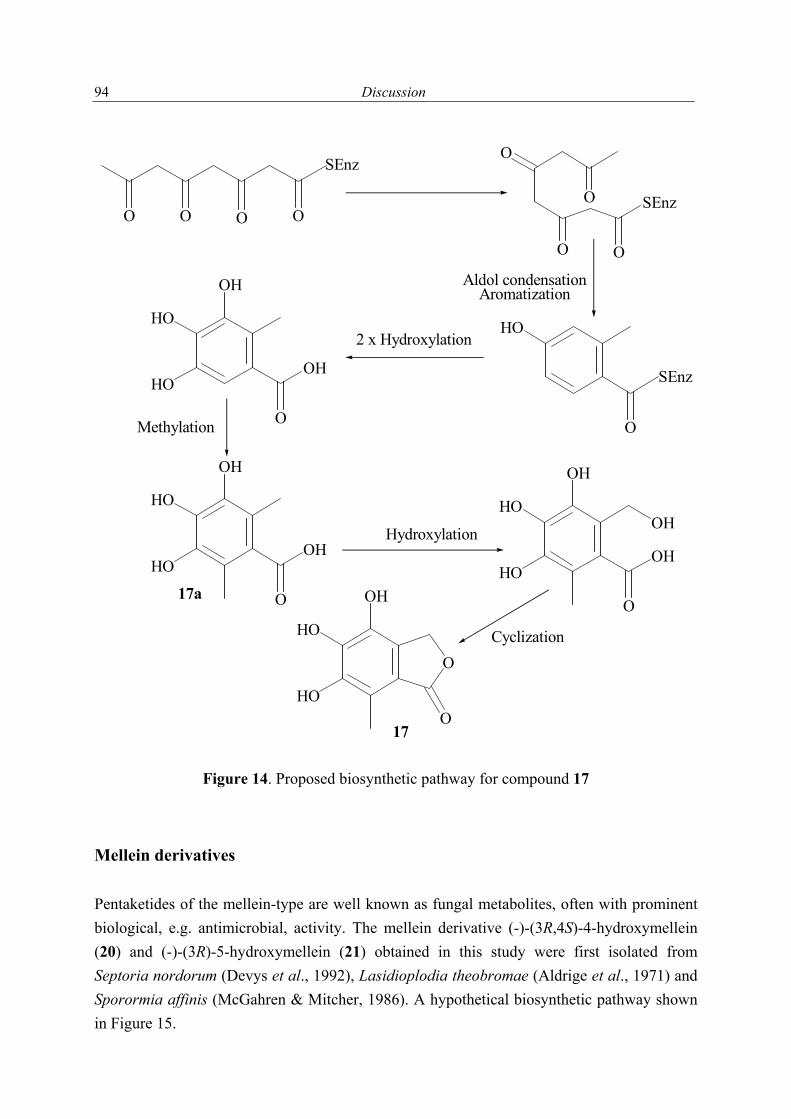
Discussion
94
O O O
HO
HO
OH
O
O
HO
O
SEnz
O
O
O
OH
HO
HO
OH
O
OH
HO
HO
OH
O
OH
HO
HO
OH
O
OH
SEnz
SEnz
O
O
Hydroxylation
Cyclization
Aldol condensationAromatization
17
17a
Methylation
2 x Hydroxylation
Figure 14. Proposed biosynthetic pathway for compound 17 Mellein derivatives Pentaketides of the mellein-type are well known as fungal metabolites, often with prominent biological, e.g. antimicrobial, activity. The mellein derivative (-)-(3R,4S)-4-hydroxymellein (20) and (-)-(3R)-5-hydroxymellein (21) obtained in this study were first isolated from Septoria nordorum (Devys et al., 1992), Lasidioplodia theobromae (Aldrige et al., 1971) and Sporormia affinis (McGahren & Mitcher, 1986). A hypothetical biosynthetic pathway shown in Figure 15.
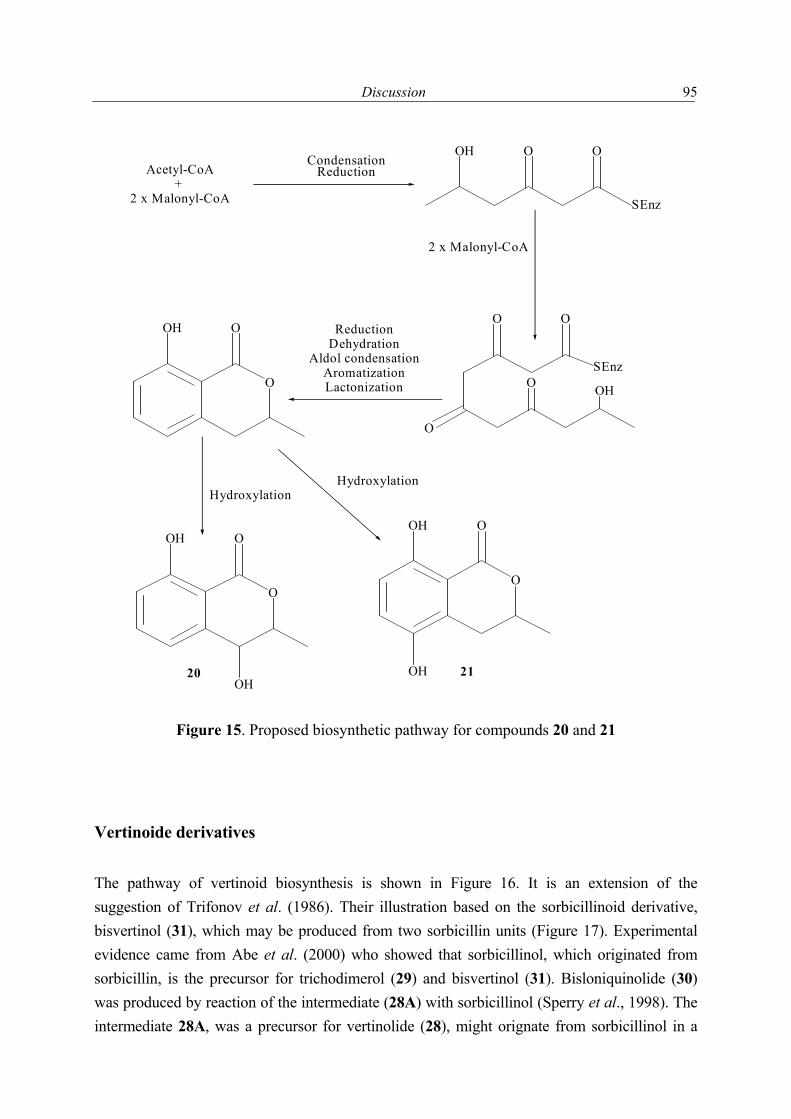
Discussion
95
O
OH
OH O
O
O
OH
OH
O O
SEnz
OH
O
20 21
Acetyl-CoA+
2 x Malonyl-CoA
OH
SEnz
O O
O
CondensationReduction
O
OH O ReductionDehydration
Aldol condensationAromatizationLactonization
2 x Malonyl-CoA
HydroxylationHydroxylation
Figure 15. Proposed biosynthetic pathway for compounds 20 and 21 Vertinoide derivatives The pathway of vertinoid biosynthesis is shown in Figure 16. It is an extension of the suggestion of Trifonov et al. (1986). Their illustration based on the sorbicillinoid derivative, bisvertinol (31), which may be produced from two sorbicillin units (Figure 17). Experimental evidence came from Abe et al. (2000) who showed that sorbicillinol, which originated from sorbicillin, is the precursor for trichodimerol (29) and bisvertinol (31). Bisloniquinolide (30) was produced by reaction of the intermediate (28A) with sorbicillinol (Sperry et al., 1998). The intermediate 28A, was a precursor for vertinolide (28), might orignate from sorbicillinol in a
Discussion
96
similar way as penicillic acid from orsellinic acid. Our suggestion for 28 is thus based on analogies to the biosynthesis of penicillic acid from orsellinic acid (Figure 17). Penicillic acid was reported as a fungal metabolite from Penicillium cyclopium, and biosynthetically produced via the ring fission of orsellinic acid as in Figure 17 (Dewick, 2002). It is possible that compounds 22-25 were produced through a Diels-Alder cycloaddition of A to B followed by oxidation and decarboxylation to yield 22, or by cyclization to give compounds 23-25 (Figure 18).
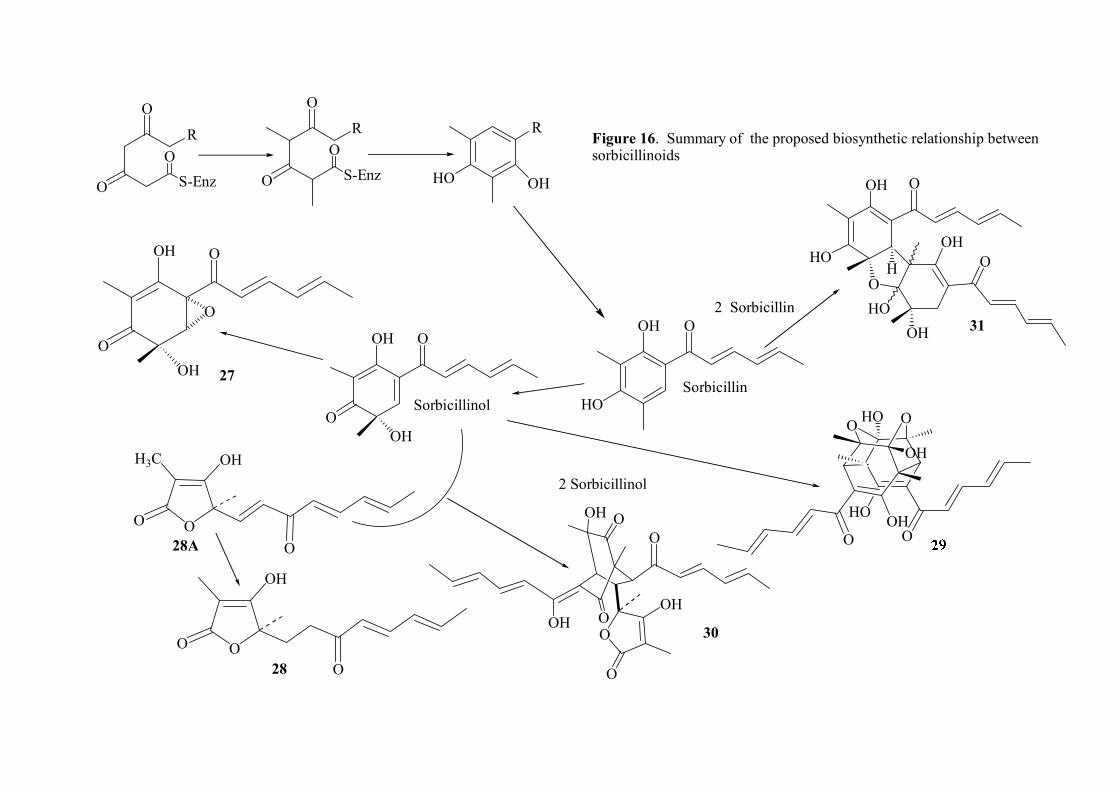
R
O
O
HO
R
OH
OS-Enz
R
O
O
OS-Enz
HOOO
OH
O O
OH
HO
OHO
OOH
OOH
OH
HO
31
H
O
OOH
OO
H3C OH
O
Sorbicillinol
OOH
O
O
O
OH
OH O
30
OH
O
OOH
O
27
OO
OH
O28
Figure 16. Summary of the proposed biosynthetic relationship between sorbicillinoids
OOH
HOSorbicillin
2 Sorbicillinol
28A
OH
2 Sorbicillin
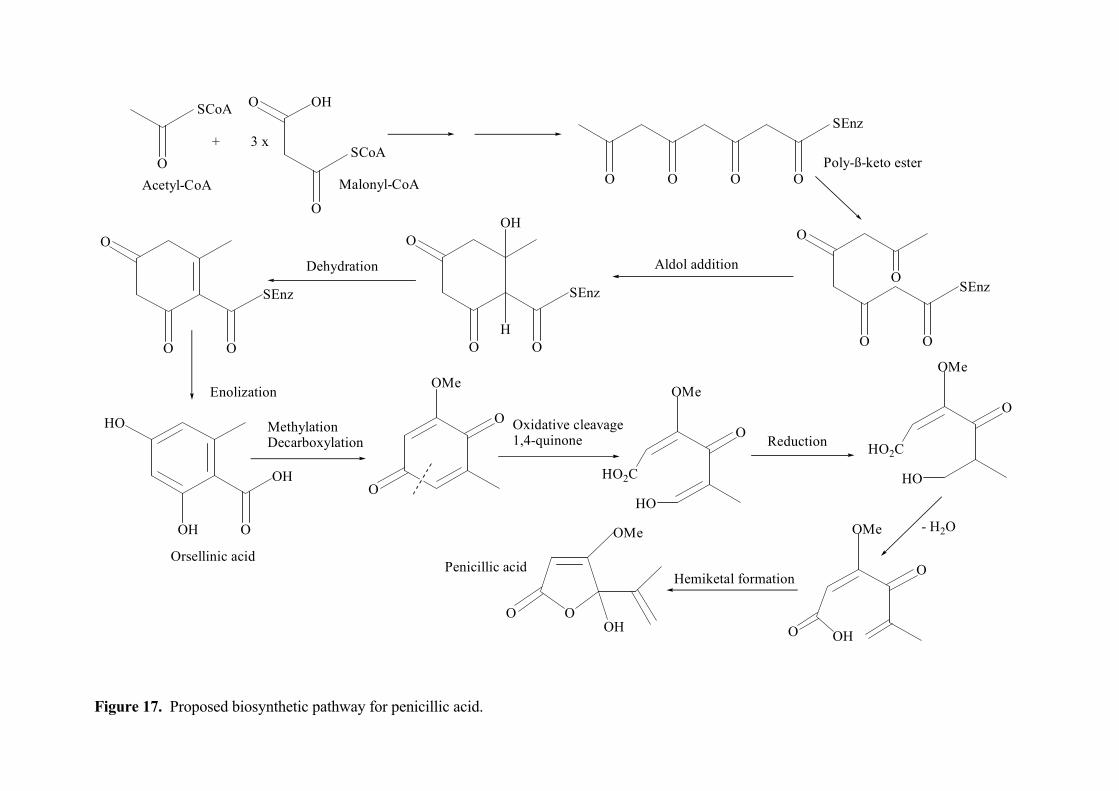
O
SCoA
+
O
SCoA
O OH
3 x
O O O O
SEnz
O
O O
OSEnz
OH
HOO
O
SEnz
O
OO
SEnz
HO
OH
OOH
OMe
O
OO
OMe
HO2C
HO
O
OMe
O OHOO
OH
OMe
Orsellinic acidPenicillic acid
Oxidative cleavage 1,4-quinone
O
OMe
HO2C
HO
- H2O
Hemiketal formation
Acetyl-CoA Malonyl-CoAPoly-ß-keto ester
Aldol addition
Enolization
MethylationDecarboxylation Reduction
Dehydration
Figure 17. Proposed biosynthetic pathway for penicillic acid.
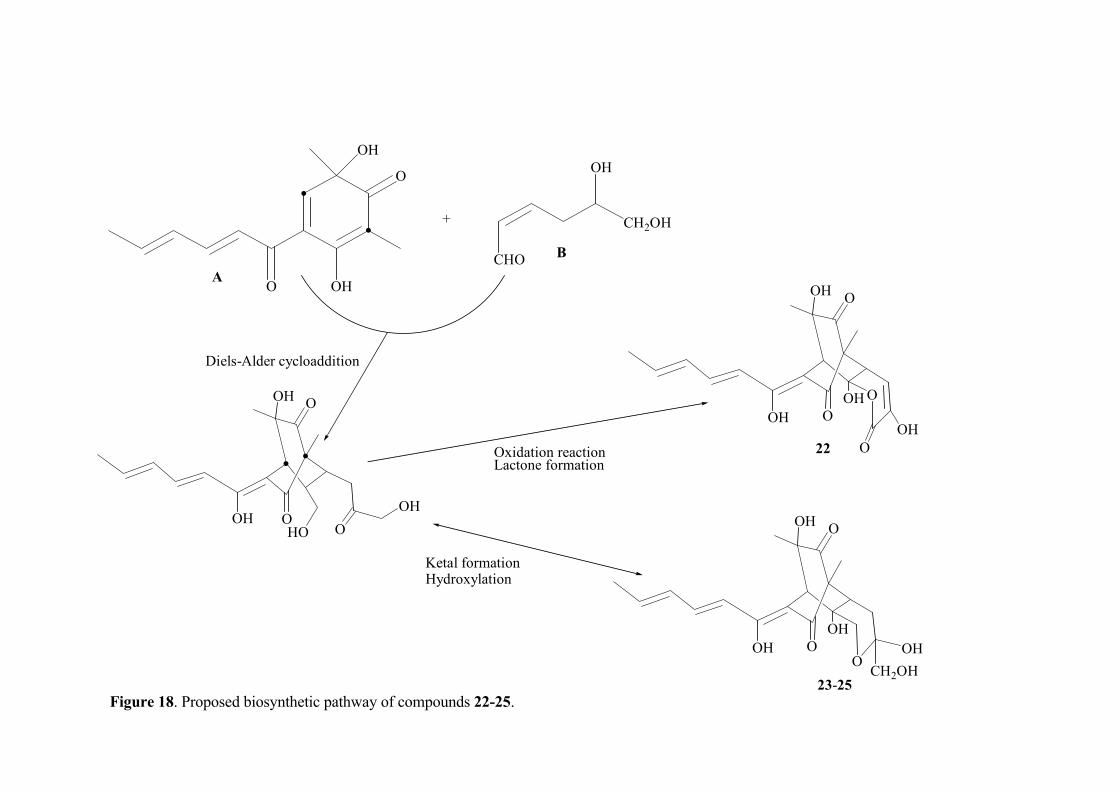
Figure 18. Proposed biosynthetic pathway of compounds 22-25.
O
OHO
OH
CH2OH
CHO
OH
OOH
OH O
OHO CH2OH
+
22
23-25
Oxidation reactionLactone formation
Diels-Alder cycloaddition
OH
Ketal formationHydroxylation
OOH
OH O
OOH
HO
A
B
OOH
OH O
O
OH
OH
O
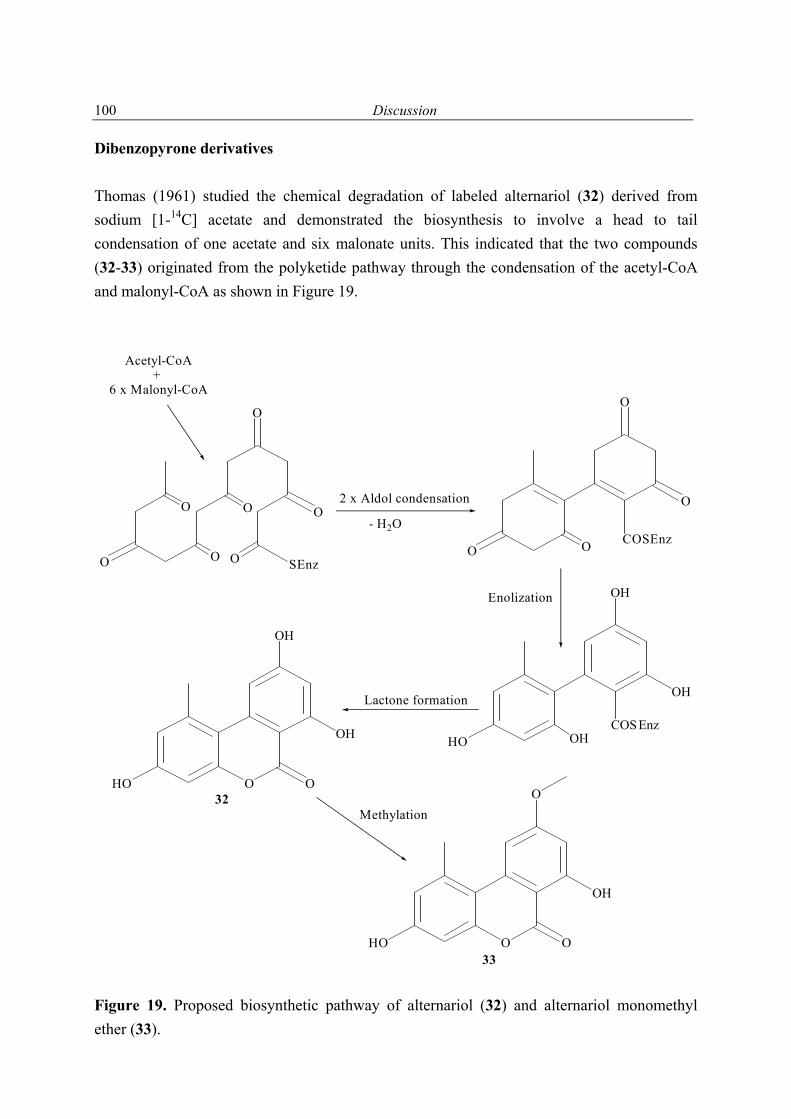
Discussion
100
Dibenzopyrone derivatives Thomas (1961) studied the chemical degradation of labeled alternariol (32) derived from sodium [1-14C] acetate and demonstrated the biosynthesis to involve a head to tail condensation of one acetate and six malonate units. This indicated that the two compounds (32-33) originated from the polyketide pathway through the condensation of the acetyl-CoA and malonyl-CoA as shown in Figure 19.
OO
O
O
O
O
O OO SEnz
O
OH
HO
OH
O
O
OCOSEnz
OHCOS Enz
OH
OH
HO
Acetyl-CoA+
6 x Malonyl-CoA
2 x Aldol condensation
- H2O
Enolization
Lactone formation
32
O O
O
HO
OH
33
Methylation
Figure 19. Proposed biosynthetic pathway of alternariol (32) and alternariol monomethyl ether (33).
Discussion
101
The next step of the current project would be the investigation of the biosynthetic pathways based on the hypothesis illustrated, using labelled (13C or 2H or 18O) precursors. The most interesting compounds would be the trichodermanones A-D (22-25), as well as the other polyketide compounds (26-31) produced by Trichoderma viride since they represent most unusual novel structures. Once the biosynthetic pathway is established, molecular biologic experiments might be worthwhile for the isolation and identification of the genclusters responsible for the polyketide production. Secondary metabolites isolated during this study represented different structural classes of natural product. This indicates that marine-derived fungi have a wide range of biosynthetic capabilities for the production of novel structures. Within this study the polyketides produced by Trichoderma viride possess the most unusual structural skeletons and these compounds might have still undiscovered biological activities. Thus, the application of OSMAC (One Strain-Many Compounds) concept may be worthy in this case (Bode et al., 2000, 2002). OSMAC is carried out by using different media and/or different cultivation parameters such as UV-light irradiation, pH, temperature, and oxygen. This could yield further new metabolites.
References
102
7 References and notes Abdel-Lateff, A.; König, G. M.; Fisch, K. M.; Höller, U.; Wright, A. D. J. Nat. Prod. 2002,
65, 1605-1611. Abdel-Lateff, A.; König, G. M.; Wright, A. D. J. Nat. Prod. 2003, 66, 706-708. Abdel-Lateff, A.; Fisch, K. M.; König, G. M.; Wright, A. D. Planta Med. 2003, 69, 831-834. Abe, N.; Murata, T.; Hirota, A. Biosci. Biotechnol. Biochem. 1998a, 62, 2120-2126. Abe, N.; Murata, T.; Hirota, A. Biosci. Biotechnol. Biochem. 1998b, 62, 661-666. Abe, N.; Murata, T.; Yamamoto, K.; Hirota, A. Tetrahedron Lett. 1999, 40, 5203-5206. Abe, N.; Sugimoto, O.; Tanji, K.-I.; Hirota, A. J. Am. Chem. Soc. 2000, 122, 12606-12607. Aldrige, D. C.; Giles, D.; Turner, W. B. J. Chem. Soc. 1971, 3888-3891. Amarowicz. R.; Naczk, M.; Shahidi, F. J. Agric. Food Chem. 2000, 48, 2755-2759. Andrade, R.; Ayer, W. A.; Mebe, P. P. Can. J. Chem. 1992, 70, 2526-2535. Andrade, R.; Ayer, W. A.; Trifonov, L. S. Can. J. Chem. 1996, 74, 371-379. Aoyama, T.; Nakakita, Y.; Nakagawa, M.; Sakai, H. Agric. Biol. Chem. 1982, 46, 2369-2371. Ayer, W. A.; Trifonov, L. S. J. Nat. Prod. 1993, 56, 85-90. Baute, M. A.; Deffieux, G.; Baute, R.; Neveu, A. J. Antibiot. 1978, 11, 1099-1101. Baute, R.; Deffieux, G.; Baute, M. A.; Filleau, M. A.; Neveu, A.; Tetrahedron Lett. 1976,
3943-3944. Belofsky, G. N.; Gloer, K. B.; Gloer, J. B.; Wicklow D. T.; Dowd, P. F. J. Nat. Prod. 1998,
61, 1115-1119. Belofsky, G. N.; Anguera, M.; Jensen, P. R.; Fenical, W.; Köck, M. Chem. Eur. J. 2000, 6,
1355-1360. Biabani, M. A. F.; Laatsch, H. J. Prakt. Chem. 1998, 340, 589-607. Blois, M. S. Nature 1958, 181, 1199-1200. Blunt, J. W.; Copp, B. R.; Munro, M. H. G.; Northcote, P. T.; Prinsep, M. R. Nat. Prod. Rep.
2003, 20, 1–48 Bode, H. B.; Bethe, B.; Höfs, R.; Zeeck, A. Eur. J. Biochem. 2002, 3, 619-627. Bode, H. B.; Walker, M.; Zeeck, A. Eur. J. Org. Chem. 2000, 1451-1456. Brauers, G.; Ebel, R.; Edrada, R. A; Wray, V.; Berg, A.; Gräfe, U.; Proksch, P. J. Nat. Prod.
2001, 64, 651-652. Brauers, G.; Edrada, R. A.; Ebel, R.; Proksch, P.; Wray, V.; Berg, A.; Gräfe, U.; Schächtele, C.;
Totzke, F.; Finkenzeller, G.; Marme, D.; Kraus, J.; Münchbach, M.; Michel, M.; Bringmann, G.; Schaumann, K. J. Nat. Prod. 2000, 63, 739-745.
Buckingham, J. D. (ed.) Chemical dictionaries on CD-ROM. Natural Products. Version 7.1 2001.
Chen, C.; Imamura, N.; Nishijima, M.; Adachi, K.; Sakai, M.; Sano, H. J. Antibiot. 1996, 49, 998-1005.
References
103
Chu, M.; Truumees, I.; Mierzwa, R.; Terracciano, J.; Patel, M.; Loebenberg, D.; Kaminski, J.
J.; Das, P.; Puar, M. S. J. Nat. Prod. 1997, 60, 525-528. Cooney, J. M.; Lauren, D. R. J. Nat. Prod. 1999, 62, 681-683. Corey, E. J.; Slomp, G.; Dev, S.; Tobinaga, S.; Glazier, E. R. J. Am. Chem. Soc. 1958, 80, 1204-
1206. Cueto, M.; Jensen, P. R.; Kauffman, C.; Fenicle, W.; Lobkovsky, E.; Clardy, J. J. Nat. Prod.
2001, 64, 1444-1446. Culter, H. G.; Culter, S. J.; Ross, S. A.; El Sayed, K.; Dugan, F. M.; Barlett, M. G.; Hill, A. A.;
Hill, R. A.; Parker, S R. J. Nat. Prod. 1999, 62, 137-139. Dekebo, A.; Lang, M.; Polborn, K.; Dagne, E.; Steglich, W. J. Nat. Prod. 2002, 65, 1252-
1257. Dewick P. M. Medicinal Natural Products, a biosynthetic approach. WILEY Press, London,
2002. Devys, M.; Barbier, M.; Bousquet, J.-F.; Kollmann, A. Phytochemistry 1994, 35, 825-826. Devys, M.; Barbier, M.; Bousquet, J.-F.; Kollmann, A. Z. Naturforsch. 1992, 47c, 779-781. Duguid, R. J.; Morrison, H . J. Am. Chem. Soci. 1991, 113, 1271-1281. Edrada, R. A.; Heubes, M.; Brauers, G.; Wray, V.; Berg, A.; Gräfe, U.; Wohlfarth, M.;
Mühlbacher, J.; Schumann, K.; Sudarsono; Bringmann, G.; Proksch, P. J. Nat. Prod. 2002, 65, 1598-1604.
Edrada, R. A.; Wray, V.; Berg, A.; Gräfe, U.; Sudarsono, Brauers, G.; Proksch, P. Z. Naturforsch. 2000, 55c, 218-221.
Eberle, J.; Seibl, R. J. Virolog. Meth. 1992, 40, 347-356. Faulkner, D. J. Nat. Prod. Rep. 2000a, 17, 1-6. Faulkner, D. J. Nat. Prod. Rep. 2000b, 17, 7-55. Faulkner, D. J. Nat. Prod. Rep. 2001, 18, 1-49. Feofilova, E. P. Appl. Biochem. Microbiol. 2001, 37, 124-137. Fleury, J. P.; Lichtenberger, A. L. J. Bull. Soc. Chim. France, 1963, 565-570. Frederick, C. B.; Szaniszlo, P. J.; Vickrey, P. E.; Bentley, M, D.; Shive, W. Biochem. J. 1981,
20, 2436-2436. Freeman, G. G. Phytochemistry 1965, 5, 719-725. Friedrich, A. B.; Merkert, H.; Fendert, T.; Hacker, J.; Proksch, P.; Hentschel, U. Marine
Biology 1999, 134, 461-470. Gamboa-Angulo, M. M.; Alejos-Gonzále, F.; Esculanta-Erose, F.; García-Sosa, k.; Delagado-
Lamas, G.; Peňa-Rodríguez, L. M. J. Nat. Prod. 2000, 63, 1117-1120. Grever, M. R.; Schepartz, S. A.; Chabner, B. A. Semin. Oncol. 1992, 19, 622-638. Harris, C. M.; Roberson, J. S.; Harris, T. M. J. Am. Chem. Soc. 1976, 98, 5380-5386. Hawksworth D. L. Mycol. Res. 1991, 95, 641-655.
References
104
Hawksworth D. L.; Rossman A. Y. Phytopathology 1997, 87, 888-891. Hayashi, K.; Suzuki, K.; Kawaguchi, M.; Nakajima, T.; Suzuki, T.; Numata, M.; Nakamura,
T. Biosci. Biotech. Biochem. 1995, 59, 319-320. Hein, S. M.; Gloer, J. B.; Koster, B.; Malloch, D. J. Nat. Prod. 1998, 61, 1566-1567. Hirota, A.; Morimitsu, Y.; Hojo, H. Biosci. Biotech. Biochem. 1997, 61, 647-650. Hill, J. G.; Nakashima, T. T.; Vederas, J. C. J. Am. Chem. Soc. 1982, 104,1745-1748. Höller, U.; König, G. M.; Wright A. D. J. Nat. Prod. 1999, 62, 114-118. Höller, U.; Wright A. D.; Matthée, G. F.; König, G. M.; Draeger, S.; Aust, H.-J.; Schulz, B.
Mycol. Res. 2000, 104, 1354-1365. Isaka, M.; Jaturapat, A.; Rukseree, K.; Danwisetkanjana, K.; Tanticharoen, M.; Thebtaranonth
, Y. J. Nat. Prod. 2001, 64, 1015-1018. Iwamoto, C.; Yamada, T.; Ito, Y.; Minoura, K.; Numata, A. Tetrahedron 2001, 57, 2997-
3004. Jadulco, R.; Brauers, G.; Edrad, R. A.; Ebel, R.; Wray, V.; Sudarsono; Proksch, P. J. Nat.
Prod. 2002, 65, 730-733. Jadulco, R.; Proksch, P.; Wray, V.; Sudarsono; Berg, A.; Gräfe, U. J Nat Prod, 2001, 64, 527-
530. Jiang, Z.; Barret, M.-O.; Boyd, K. G.; Adams, D. R.; Boyd, A. S. F.; Burgess, J. G.
Phytochemistry 2002, 60, 33-38. Kameoka, H.; Miyazawa, M.; Haze, K. Phytochemistry, 1975, 14, 1676-1677. Kirsch, G.; König, G. M.; Wright, A. D.; Kaminsky R. J. Nat. Prod. 2000, 63, 825-829. Kohlmeyer, J.; Kohlmeyer, E. In Marine Mycology, The higher fungi; Academic press; New
York, San Francisco, London, 1979; pp, 54-69. Kohlmeyer, J. Veröff. Inst. Meeresforsch. Bremerh. 1974, 5, 339-356. Kohlmeyer, J.; Volkmann-Kohlmeyer, B. Bot. Marina 1991, 34, 1-61. Komatsu, K.; Shigemori, H.; Kobayashi, J. J. Org. Chem. 2001, 66, 6189-6192. König, G. M.; Wright, A. D. Planta Med. 1996, 62, 193-211. König, G. M.; Wright, A. D. Trends in marine biotechnology. In: Drug Discovery from Nature.
Grabley, S.; Thiericke, R. editors, Springer Verlag. Berlin 1999. P. 180-187. Li, Y.; Li, X. F.; Kim, D. S.; Choi, H. D.; Son, B. W. Arch. Pharm. Res. 2003, 26, 21-23. Liberra, K.; Lindequist, U.; Pharmazie 1995, 50, 583-588. Lin, W.; Brauers, G.; Ebel, R.; Wray, V.; Berg, A.; Sudarsono; Proksch, P. J. Nat. Prod.
2003, 66, 57-61. Lorenz, P.; Jensen, P. R.; Fenical, W. Nat. Prod. Lett. 1998, 12, 55-60. Macías, F. A.; Varela, R. M.; Simonet, A. M.; Culter, H. G.; Culter, S. J.; Eden, M. A.; Hill, R.
A. J. Nat. Prod. 2000, 63, 1197-1200.
References
105
Makino, M.; Endoh, T.; Ogawa, Y.; Watanabe, K.; Fujimoto, Y. Heterocycles 1998, 48, 931-
1934. Malmstrøm, J.; Christophersen, C.; Barrero, A. F.; Oltra, J. E.; Justicia, J.; Rosales, A. J. Nat.
Prod. 2002, 65, 364-367. Mandala, S. M..; Thornton, R. A.; Frommer, B. R.; Curotto, J. E.; Rasidsky, W.; Kurtz, M. B.;
Giacobbe, R. A.; Bills, G. F.; Cabello, M. A.; Martin, I.; Pelaez, F.; Harris, G. H. J. Antibiot. 1995, 48, 349-356.
Matsumoto, T.; Ishiyama, A.; Yamaguchi, Y.; Masuma, R.; Ui, H.; Shiomi, K.; Yamada, H.; Ōmura, S. J. Antibiot. 1999, 52, 754-757.
McGahren, W. J. Am. Chem. Soc. 1969, 91, 157 Merck Index, www.ulb.uni-bonn.de/Cdroms/datenbanken.htm, monographs number 4467. Molecular Modeling of compounds 22-25 were calculated by conformation search (grid scan)
using a MMFF force field as implemented in the Cerius2 4.0 (MSI) molecular modeling software package. The models were further refined with 1500 iterations of minimisation. Calculations were performed using a Silicon Graphics O2 workstation (Irix 6.5.6).
Morel, C.; Séraphin, D.; Oger, J.- M.; Litaudon, M.; Sévenet, T.; Richomme, P.; Bruneton, J. J. Nat. Prod. 2000, 63, 1471-1474.
Meyer, B. N.; Ferrigni, N. R.; Putnam, J. E.; Jacobsen, L. B.; Nichols, D. E.; McLaughlin, J. L. Planta Med. 1982, 45, 31-34.
Matthée, G. F. Dissertation at Gemeinsame Naturwissenschaftlichen Fakultät, Technischen Universität Carolo-Wilhelmina, Braunschweig, Deutschland, 1999.
Nicolaou, K. C.; Vassilikogiannakis, G.; Simonsen, K. B.; Baran, P. S.; Zhong, Y.-L.; Vidali, V. P.; Pitsinos, E. N.; Couladouros, E. A. J. Am. Chem. Soc. 2000, 122, 3071-3079.
Osterhage, C.; Kaminsky, R.; König, G. M.; Wright, A. D. J. Org. Chem. 2000, 6412-6417. Osterhage, C.; König, G. M.; Höller, U.; Wright, A. D. J. Nat. Prod. 2002, 65, 306-313. Osterhage, C.; König, G. M.; Jones, P. G.; Wright, A. D. Planta med. 2002, 68, 1052-1054. Osterhage, C. Dissertation at Gemeinsame Naturwissenschaftlichen Fakultät, Technischen
Universität Carolo-Wilhelmina, Braunschweig, Deutschland, 2001. Onocha, P. A.; Okorie, D. A.; Connolly, J. D. Roycroft, D. D. Phytochemistry 1995, 40,
1183-1189. Peres, V.; Nagem, T. J.; Oliveira, F. F. Phytochemistry 2000, 55, 683-710. Pietra, F. Nat. Prod. Rep. 1997, 14, 453-464. Proksch, P.; Edrad, R. A.; Ebel, R. Appl. Microbiol, Biotechnol. 2002, 59, 125-134. Puterbaugh, W. H. J. Org. Chem. 1962, 27, 4010-4015. Routledge, E. J.; Sumpter, J. P. Environ. Toxicol. Chem. 1996, 15, 241-248.
References
106
Roy, K.; Chatterjee, S.; Deshmukh, S. K.; Vijayakumar, E. K. S.; Ganguli, B. N.; Fehlhaber,
H.-W. J. Antibiot. 1996, 49,1186-1187. Sassa, T.; Kinoshita, H.; Nukina, M.; Sugiyama, T. J. Antibiot. 1998, 51, 967-969. Schulz, B.; Suker, J.; Aust, H. J.; Krohn, K.; Ludewig, K.; Jones, P. G.; Döring, D. Mycol.
Res. 1995, 99, 1007-1015. Sheldrick, G. M. SHELX97 (SHELXS and SHELXL). Manual of Programs for the Refinement
of Crystal Structures; University of Göttingen, Germany, 1997. Shu, Y.-Z.;, Ye, Q.; Li, H.; Kadow, K. F.; Hussain, R. A.; Huang, S.; Gustavson, D. R.;
Lowe, S. E.; Chang, L.-P.; Pirnik, D. M.; Kodukula, K. Bioorg. Med. Chem. Lett. Bio 1997, 7, 2295-2298.
Soman, A. G.; Gloer, J. B.; Koster, B.; Malloch, D. J. Nat. Prod. 1999, 62, 659-661. Smith, C. J.; Abbanat, D.; Bernan, V. S.; Maiese, W. M.; Greenstein, M.; Jompa, J.; Tahir, A.;
Ireland, C. M. J. Nat. Prod. 2000, 63, 142-145. Son, B. W.; Choi, J. S.; Kim, J. C.; Nam, K. W.; Kim, D.-S.; Chung, H. Y.; Kang, J. S.; Choi,
H. D. J. Nat. Prod. 2002, 65, 794-795. Solis, P. N.; Wright, C. W.; Anderson, M. M.; Gupta, M. P., Phillipson, J. D. Planta Med.
1993, 59, 250-252. Sperry, S.; Samuels, G. J.; Crews, P. J. Org. Chem. 1998, 63, 10011-10014. Steinert, M.; Hentschel, U.; Hacker, J. Naturwissenschaften 2000, 87, 1-11. Tabata, N.; Tomoda, H.; Iwai, Y.; Ōmura, S. J. Antibiot. 1996, 49, 267-271. Talapatra, S. K.; Karmacharya, B.; De, S. C.; Talapatra, B. Phytochemistry, 1988, 27, 3929-
3932. Tan, R. X.; Zou, W. X.; Nat. Prod. Rep. 2001, 18, 448-459. Takahashi, N.; Tamagawa, K.; Kawai, K.; Fukui, T. Biol. Pharm. Bull. 2000, 23, 989-994. Tanaka, M.; Nara, F.; Yamasato, Y.; Ono, Y.; Ogita, T. J. Antibiot. 1999, 52, 827-830. Teleman, A.; Hausalo, T.; Tenkanen, M.; Vuorinen. T. Carbohydr. Res. 1996, 280, 197-208. Thomas, R. J. Biochem. 1961, 80, 234-240. Teshima, Y.; Shin-Ya, K.; Shimazu, A.; Furihata, K.; Chul, H. S.; Furihata, K.; Hayakawa,
Y.; Nagai, K.; Seto, H. J. Antibiot. 1991, 44, 685-687. Trifonov, L. S.; Bieri, J. H.; Prewo, R.; Dreiding, A. S.; Hoesch, L.; Rast, D. M. Tetrahedron
1983, 39, 4243-4256. Trifonov, L. S.; Hilpert, H.; Floersheim, P.; Dreiding, A. S.; Rast, D. M.; Skrivanova, R.;
Hoesch, L. Tetrahedron 1986, 42, 3157-3179. Trifonov, L.; Bieri, J. H.; Prewo, R.; Dreiding, A. S.; Rast, D. M.; Hoesch, L. Tetrahedron
1982, 38, 397-403. Tsantrizos, Y. S.; Ogilive, K. K.; Watson, A. K. Can. J. Chem. 1992, 70, 2276-2284. Turner, W. Fungal Metabolites 2; Academic Press: London, 1977; p 26.
References
107
Varoglu, M.; Crews, P. J. Nat. Prod. 2000, 63, 41-43. Wallin, B.; Rosengren, B.; Shertzer, H. G.; Camejo, G. Anal. Biochem. 1993, 208, 10-15. Wang, C.-Y.; Wang, B.-G..; Brauers, G.; Guan, H.-S.; Procksch, P.; Ebel, R. J. Nat. Prod.
2002, 65, 772-775. Wang, Y.; Gloer, J. B. J. Nat. Prod. 1995, 58, 93-99. Wegner, C.; Schwibbe, M.; König, G. M.; Wright A. D. Phytochem. Anal. 2000, 11, 1-7. Wessels, M.; König, G. M.; Wright A. D. J. Nat. Prod. 1999, 62, 927-930. Weber, H. A.; Swenson, D. C.; Gloer, J. B. Tetrahedron Lett. 1992, 33, 1157-1160. Westenburg, H. E.; Lee, K.-J.; Lee, S. K.; Fong, H. H. S.; Breemen, R. B.; Pezzuto, J. M.;
Kinghorn, A. D. J. Nat. Prod. 2000, 63, 1696-1698. Yamada, T.; Iwamoto, C.; Yamagaki, N.; Yamanouchi, T.; Minoura, K.; Yamori, T.; Uehara,
Y.; Andoh, T.; Umemura, K.; Numata, A. Tetrahedron 2002, 58, 479-487. Yan, X.; Chuda, Y.; Suzuki, M.; Nagata, T. Biosci, Biotechnol. Biochem. 1999, 63, 605-607. Yen, G.-C., Lee, C.-A. J. Food Prot. 1996, 59, 1327-1330. Yen, G.-C.; Chang, Y.-C. J. Food Prot. 1999, 62, 657-661. Yen, G. C.; Lee, C. E. J. Sci. Food Agric. 1997, 75, 326-332. Yen, G.-C.; Chang, Y.-C.; Sheu, F.; Chiang, H.-C. J. Agric. Food Chem. 2001, 49, 1426-
1431.
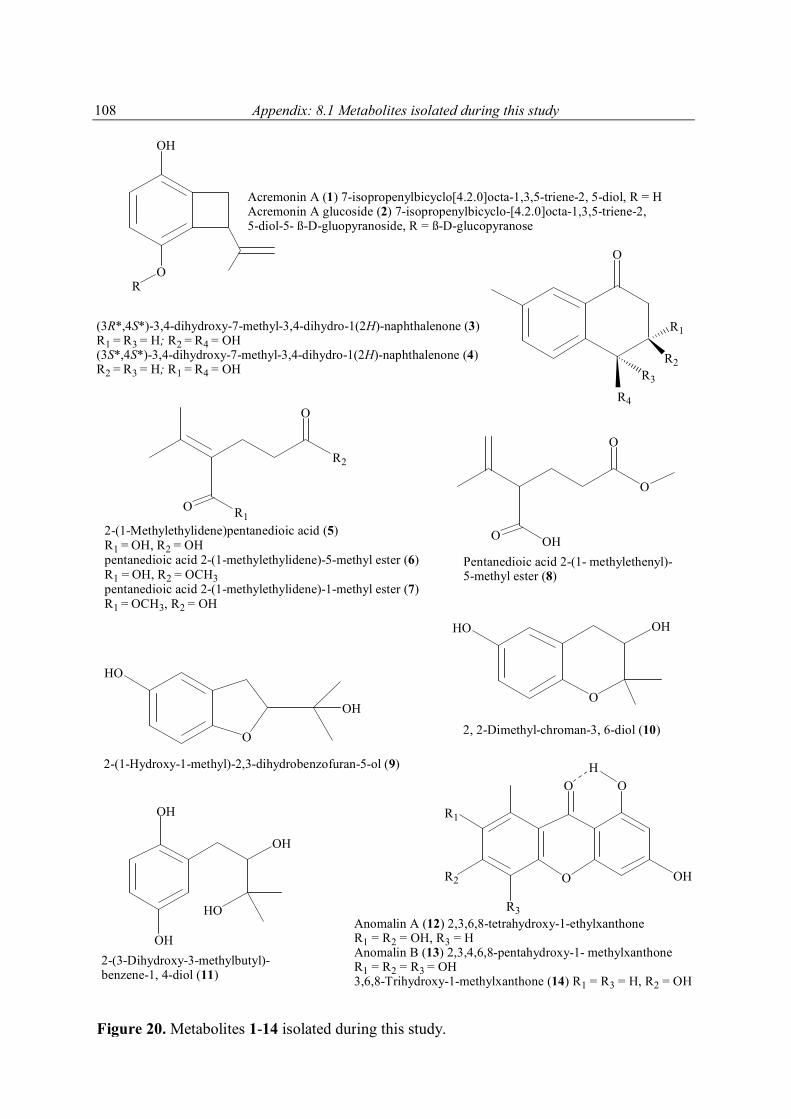
Appendix: 8.1 Metabolites isolated during this study
108
HO
HO
OH
Acremonin A (1) 7-isopropenylbicyclo[4.2.0]octa-1,3,5-triene-2, 5-diol, R = H Acremonin A glucoside (2) 7-isopropenylbicyclo-[4.2.0]octa-1,3,5-triene-2, 5-diol-5- ß-D-gluopyranoside, R = ß-D-glucopyranose
OH
OR
O
OH
OH
OH
O
OHHO
O
R2
(3R*,4S*)-3,4-dihydroxy-7-methyl-3,4-dihydro-1(2H)-naphthalenone (3) R1 = R3 = H; R2 = R4 = OH(3S*,4S*)-3,4-dihydroxy-7-methyl-3,4-dihydro-1(2H)-naphthalenone (4)R2 = R3 = H; R1 = R4 = OH
R2
O
R1O
O
O
OHO
R3
R1
R4
Pentanedioic acid 2-(1- methylethenyl)- 5-methyl ester (8)
2-(1-Methylethylidene)pentanedioic acid (5) R1 = OH, R2 = OH pentanedioic acid 2-(1-methylethylidene)-5-methyl ester (6)R1 = OH, R2 = OCH3 pentanedioic acid 2-(1-methylethylidene)-1-methyl ester (7)R1 = OCH3, R2 = OH
2-(1-Hydroxy-1-methyl)-2,3-dihydrobenzofuran-5-ol (9)
2, 2-Dimethyl-chroman-3, 6-diol (10)
O
O OH
R3
R1
R2 OH
Anomalin A (12) 2,3,6,8-tetrahydroxy-1-ethylxanthone R1 = R2 = OH, R3 = H Anomalin B (13) 2,3,4,6,8-pentahydroxy-1- methylxanthone R1 = R2 = R3 = OH3,6,8-Trihydroxy-1-methylxanthone (14) R1 = R3 = H, R2 = OH
2-(3-Dihydroxy-3-methylbutyl)-benzene-1, 4-diol (11)
Figure 20. Metabolites 1-14 isolated during this study.
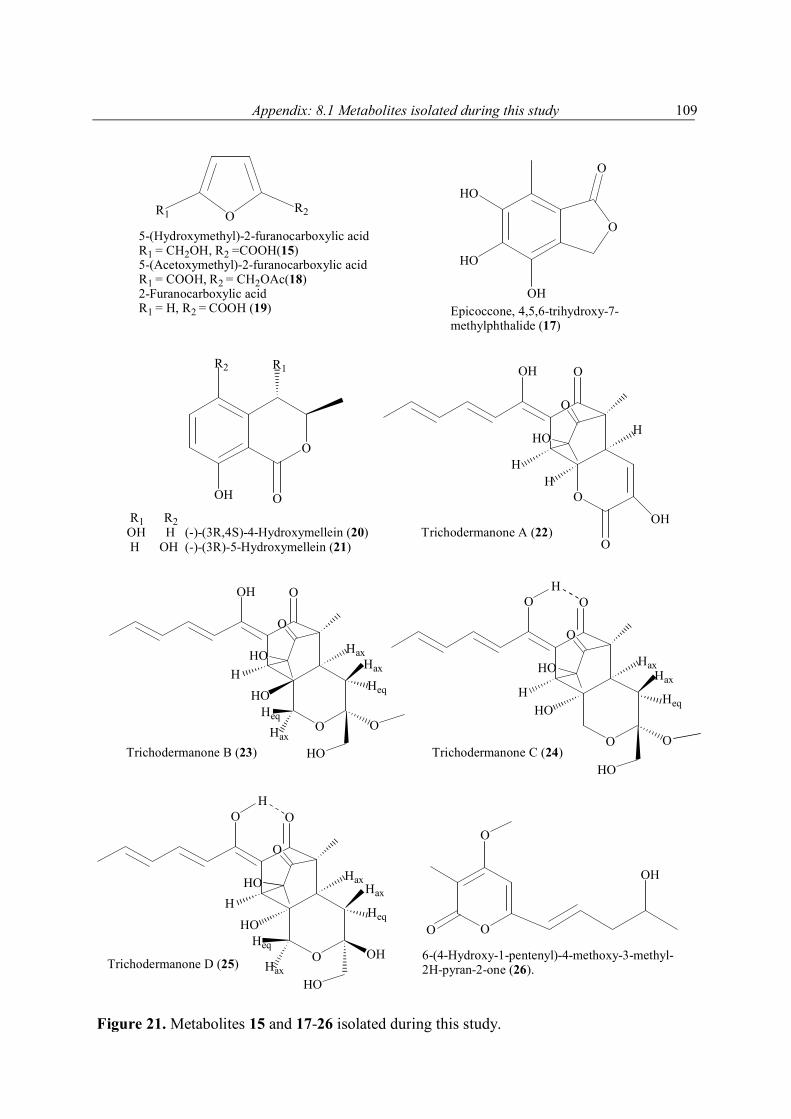
Appendix: 8.1 Metabolites isolated during this study
109
Figure 21. Metabolites 15 and 17-26 isolated during this study.
O
O
OH
HO
HO
O
OOH
R1R2
R1 R2OH H (-)-(3R,4S)-4-Hydroxymellein (20) Trichodermanone A (22) H OH (-)-(3R)-5-Hydroxymellein (21)
O
OH O
O
O
OH
HO
HH
H
OH
O
O
O
HO
O
HO
Hax
HHO
Heq
Hax
Heq
Hax
Epicoccone, 4,5,6-trihydroxy-7-methylphthalide (17)
O
O
O
O
HO
O
HO
HO
H
H Heq
Hax
Hax
Trichodermanone B (23) Trichodermanone C (24)
O R2R1
5-(Hydroxymethyl)-2-furanocarboxylic acid R1 = CH2OH, R2 =COOH(15)5-(Acetoxymethyl)-2-furanocarboxylic acid R1 = COOH, R2 = CH2OAc(18)2-Furanocarboxylic acid R1 = H, R2 = COOH (19)
OH
O
O
O
6-(4-Hydroxy-1-pentenyl)-4-methoxy-3-methyl-2H-pyran-2-one (26).
O
O
O
O
HO
OH
HO
HO
Hax
HeqH
Heq
Hax
Hax
H
Trichodermanone D (25)
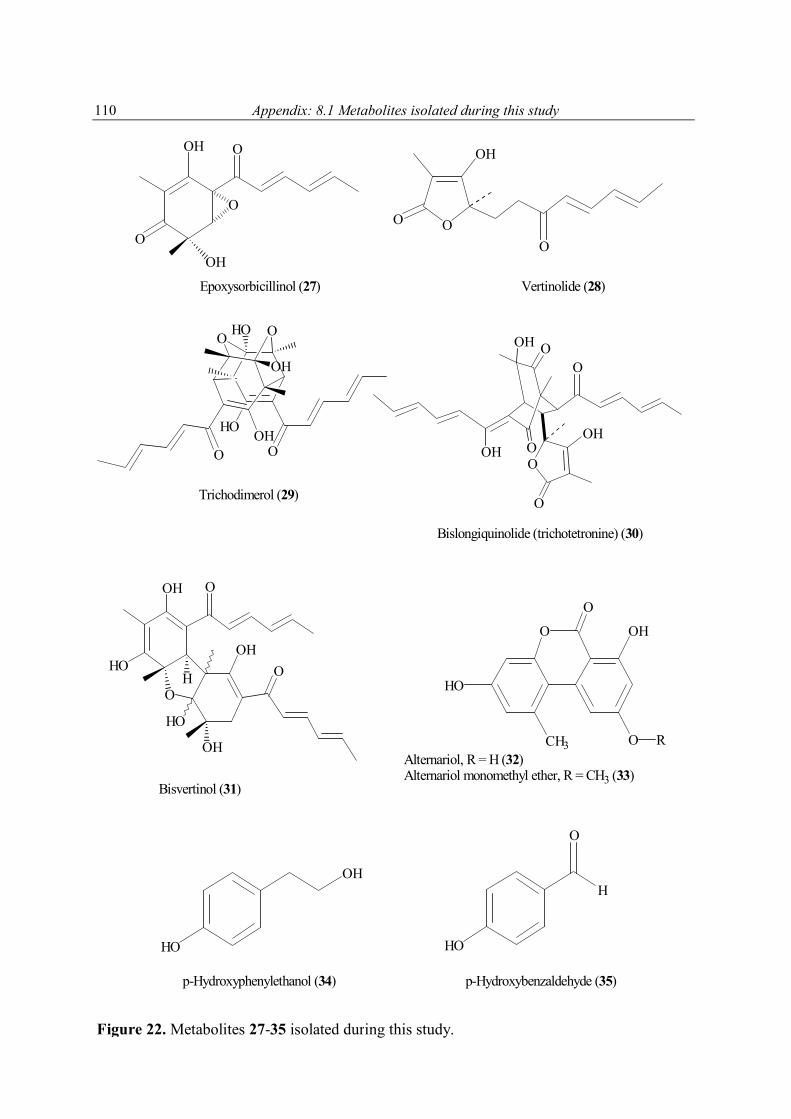
Appendix: 8.1 Metabolites isolated during this study
110
HO
OOOH
O O
OH
HO
OO
OH
O
OH
O
OOH
O
Epoxysorbicillinol (27) Vertinolide (28)
OOH
O
O
O
OH
OH O
O
HO
OOH
OOH
OH
HOH
Bisvertinol (31)
Bislongiquinolide (trichotetronine) (30)
Trichodimerol (29)
O
O
CH3
HO
O
OH
RAlternariol, R = H (32)Alternariol monomethyl ether, R = CH3 (33)
OH
HO
p-Hydroxyphenylethanol (34) p-Hydroxybenzaldehyde (35)
H
O
HO
Figure 22. Metabolites 27-35 isolated during this study.
Appendix: 8.2 1H NMR spectra of selected compounds
111
8.2 1H NMR spectra of selected compounds page Acremonin A (1) 112Acremonin A glucoside (2) 112(3R*,4S*)-3,4-Dihydroxy-7-methyl-3,4-dihydro-1(2H)-naphthalenone (3) 113(3S*,4S*)-3,4-Dihydroxy-7-methyl-3,4-dihydro-1(2H)-naphthalenone (4) 1132-(1-Methylethylidene)-pentanedioic acid (5) 113Pentanedioic acid, 2-(1-methylethylidene)-5-methyl ester (6) 114Pentanedioic acid, 2-(1-methylethylidene)-1-methyl ester (7) 114Pentanedioic acid, 2-(1-methyl ethenyl)-5-methyl ester (8) 1142-(1-Hydroxy-1-methyl)-2, 3-dihydrobenzofuran-5-ol (9) 1142,2-Dimethyl-chroman-3,6-diol (10) 1152-(3-Dihydroxy-3-methylbutyl)-benzene-1,4-diol (11) 115Anomalin A (12) 116Epicoccone, 4,5,6-trihydroxy-7-methylphthalide (17) 1165-(Acetoxymethyl)-2-furanocarboxylic acid (18) 117(-)-(3R,4S)-4-Hydroxymellein (20) 117(-)-(3R)-5-Hydroxymellein (21) 118Trichodermanone A (22) 118Trichodermanone B (23) 119Trichodermanone C (24) 119Trichodermanone D (25) 120Trichopyranone (26) 120Epoxysorbicillinol (27) 121Vertinolide (28) 121Trichodimerol (29) 122Bislongiquinolide (trichotetronine) (30) 122Bisvertinol (31) 123Alternariol monomethy ether (33) 123
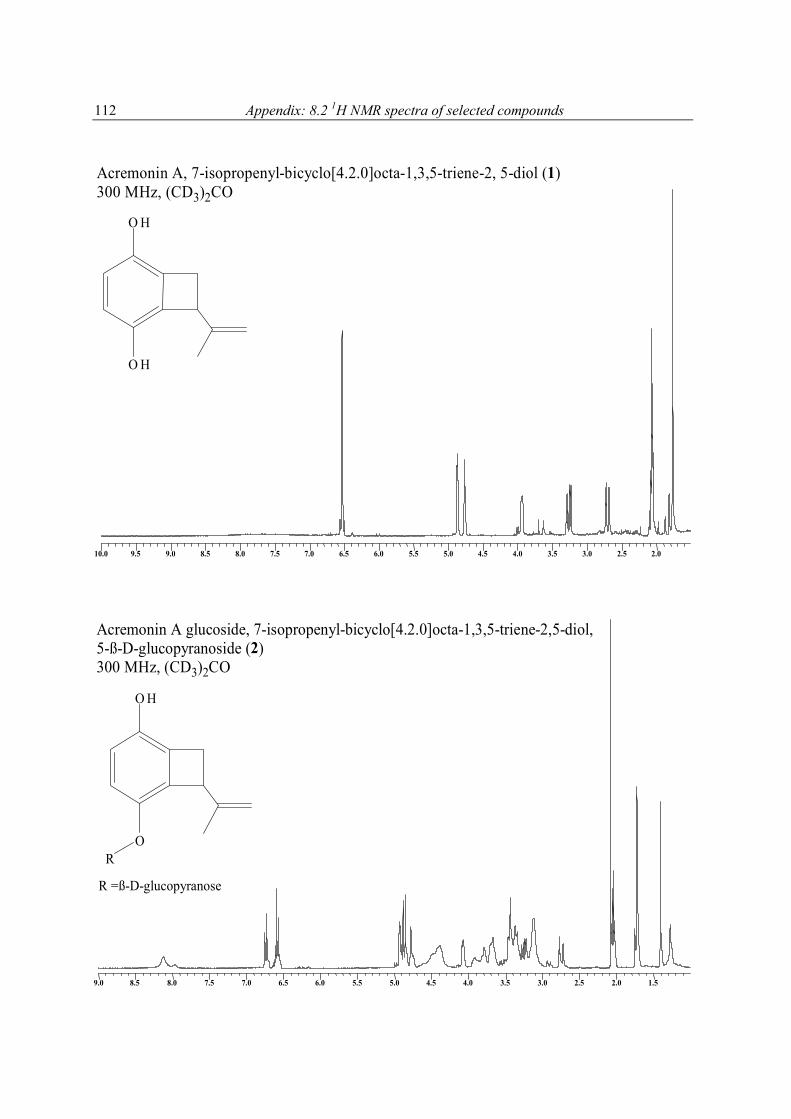
Appendix: 8.2 1H NMR spectra of selected compounds
112
2.02.02.52.53.03.03.53.54.04.04.54.55.05.05.55.56.06.06.56.57.07.07.57.58.08.08.58.59.09.09.59.510.010.0
1.51.52.02.02.52.53.03.03.53.54.04.04.54.55.05.05.55.56.06.06.56.57.07.07.57.58.08.08.58.59.09.0
O H
O H
Acremonin A, 7-isopropenyl-bicyclo[4.2.0]octa-1,3,5-triene-2, 5-diol (1)300 MHz, (CD3)2CO
Acremonin A glucoside, 7-isopropenyl-bicyclo[4.2.0]octa-1,3,5-triene-2,5-diol,5-ß-D-glucopyranoside (2)300 MHz, (CD3)2CO
R =ß-D-glucopyranose
O
O H
R
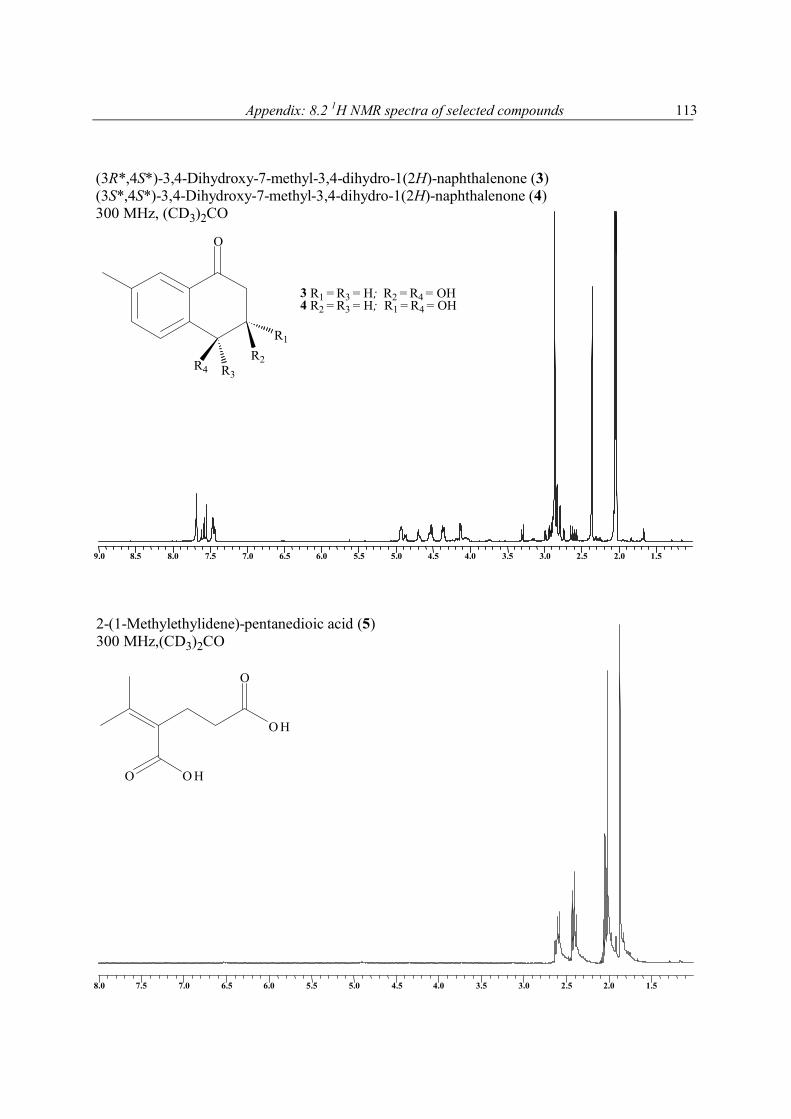
Appendix: 8.2 1H NMR spectra of selected compounds
113
1.51.52.02.02.52.53.03.03.53.54.04.04.54.55.05.05.55.56.06.06.56.57.07.07.57.58.08.08.58.59.09.0
1.52.02.53.03.54.04.55.05.56.06.57.07.58.0
O O H
O H
2-(1-Methylethylidene)-pentanedioic acid (5)300 MHz,(CD3)2CO
O
R3
R1
O
R2R4
(3R*,4S*)-3,4-Dihydroxy-7-methyl-3,4-dihydro-1(2H)-naphthalenone (3)(3S*,4S*)-3,4-Dihydroxy-7-methyl-3,4-dihydro-1(2H)-naphthalenone (4)300 MHz, (CD3)2CO
3 R1 = R3 = H; R2 = R4 = OH4 R2 = R3 = H; R1 = R4 = OH
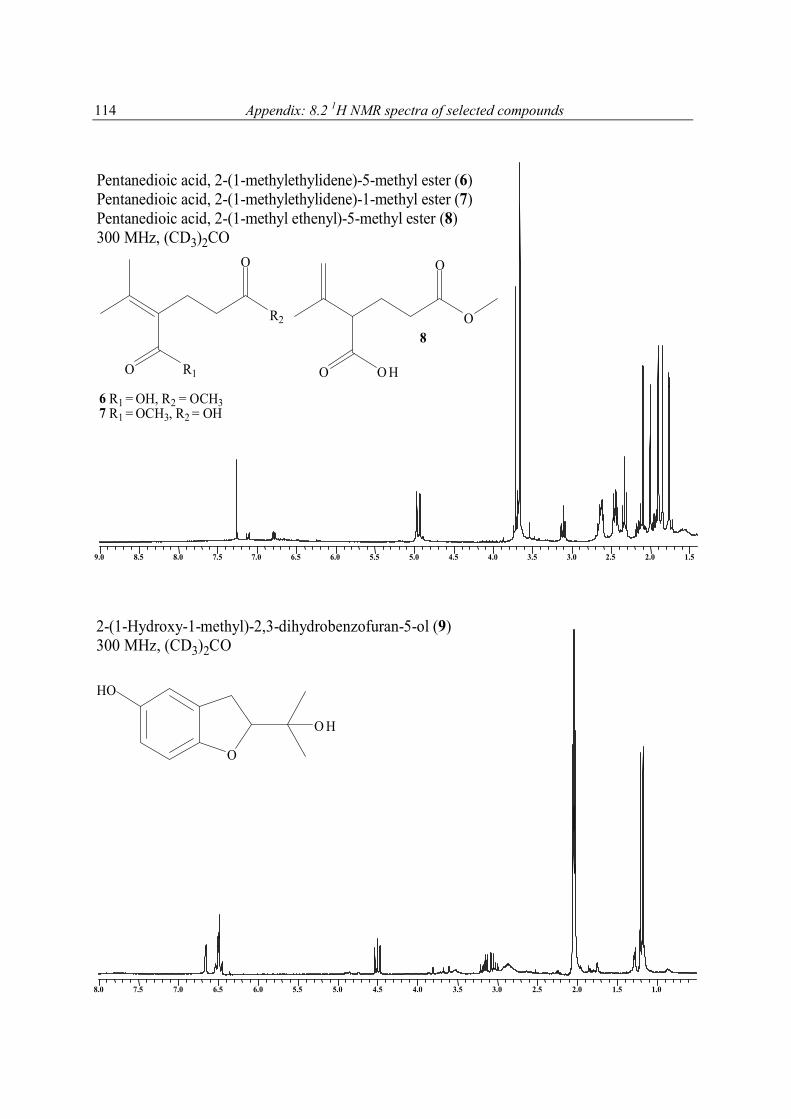
Appendix: 8.2 1H NMR spectra of selected compounds
114
1.01.01.51.52.02.02.52.53.03.03.53.54.04.04.54.55.05.05.55.56.06.06.56.57.07.07.57.58.08.0
1.51.52.02.02.52.53.03.03.53.54.04.04.54.55.05.05.55.56.06.06.56.57.07.07.57.58.08.08.58.59.09.0
O R1
R2
6 R1 = OH, R2 = OCH37 R1 = OCH3, R2 = OH
Pentanedioic acid, 2-(1-methylethylidene)-5-methyl ester (6)Pentanedioic acid, 2-(1-methylethylidene)-1-methyl ester (7)Pentanedioic acid, 2-(1-methyl ethenyl)-5-methyl ester (8)300 MHz, (CD3)2CO
O
O O H
O
O
8
O
O H
HO
2-(1-Hydroxy-1-methyl)-2,3-dihydrobenzofuran-5-ol (9)300 MHz, (CD3)2CO
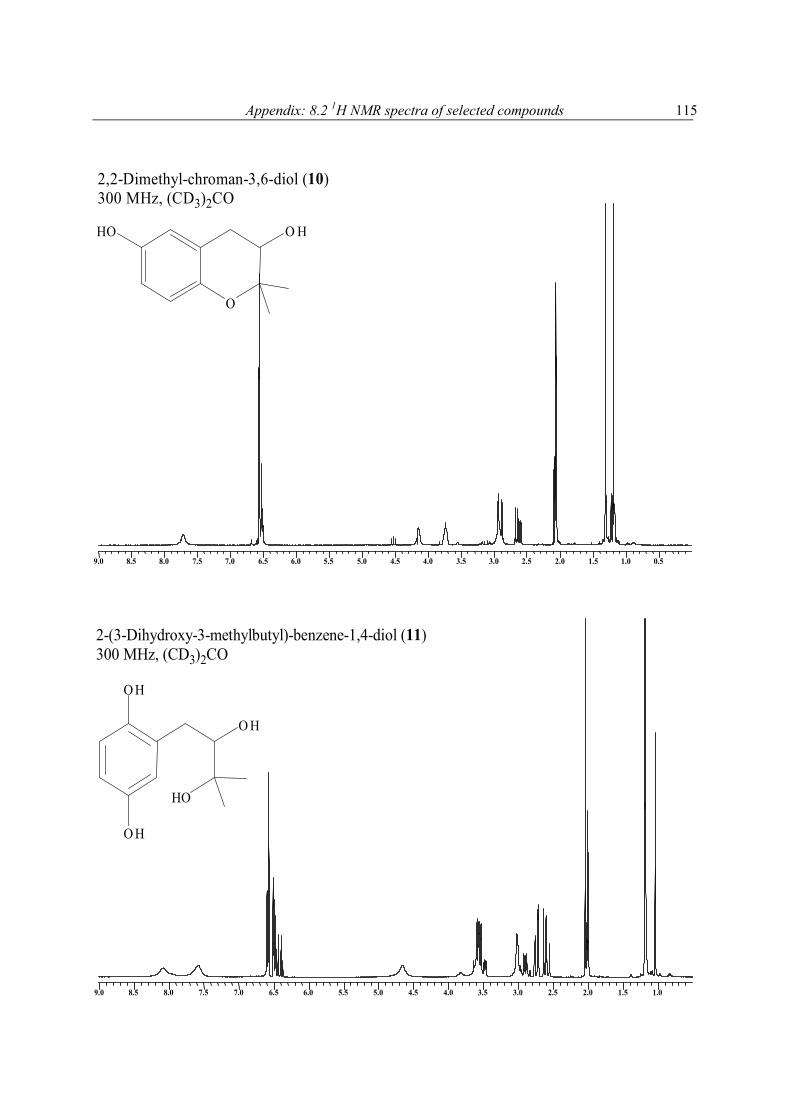
Appendix: 8.2 1H NMR spectra of selected compounds
115
0.50.51.01.01.51.52.02.02.52.53.03.03.53.54.04.04.54.55.05.05.55.56.06.06.56.57.07.07.57.58.08.08.58.59.09.0
1.01.01.51.52.02.02.52.53.03.03.53.54.04.04.54.55.05.05.55.56.06.06.56.57.07.07.57.58.08.08.58.59.09.0
O
O HHO
2,2-Dimethyl-chroman-3,6-diol (10)300 MHz, (CD3)2CO
HO
O H
O H
O H
2-(3-Dihydroxy-3-methylbutyl)-benzene-1,4-diol (11)300 MHz, (CD3)2CO
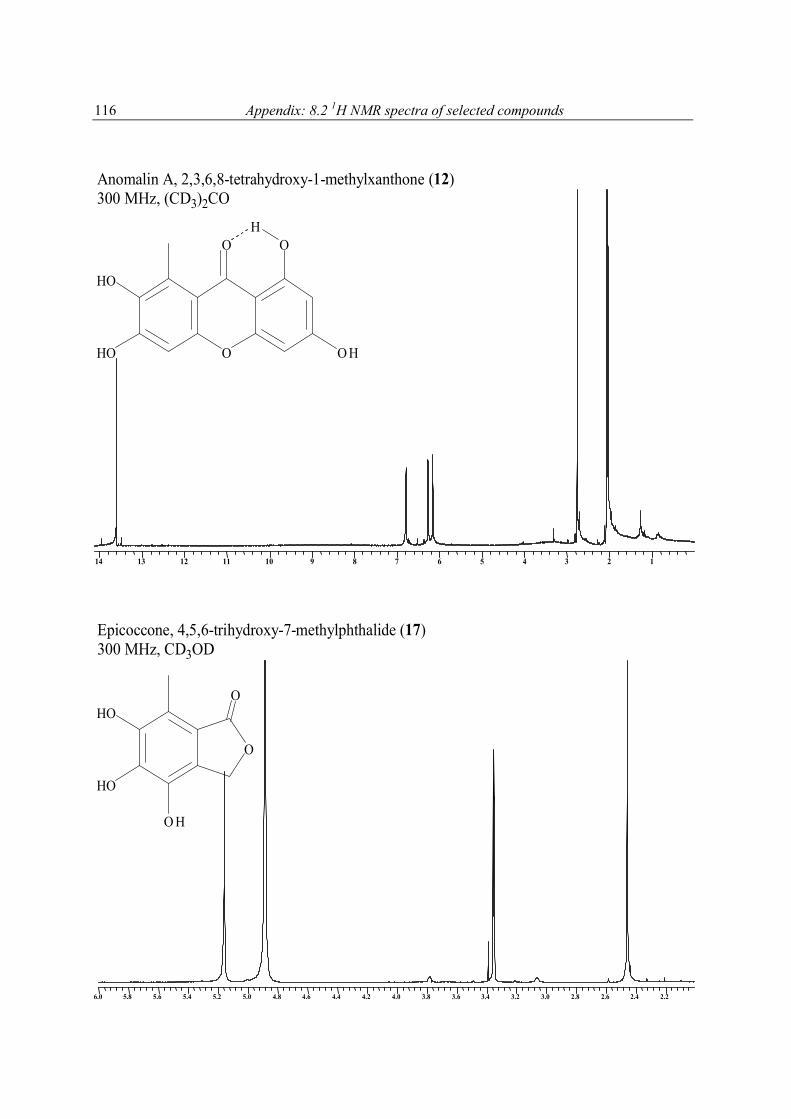
Appendix: 8.2 1H NMR spectra of selected compounds
116
11223344556677889910101111121213131414
2.22.22.42.42.62.62.82.83.03.03.23.23.43.43.63.63.83.84.04.04.24.24.44.44.64.64.84.85.05.05.25.25.45.45.65.65.85.86.06.0
O
O OH
HO
HO O H
Anomalin A, 2,3,6,8-tetrahydroxy-1-methylxanthone (12)300 MHz, (CD3)2CO
O
OHO
HO
O H
Epicoccone, 4,5,6-trihydroxy-7-methylphthalide (17)300 MHz, CD3OD
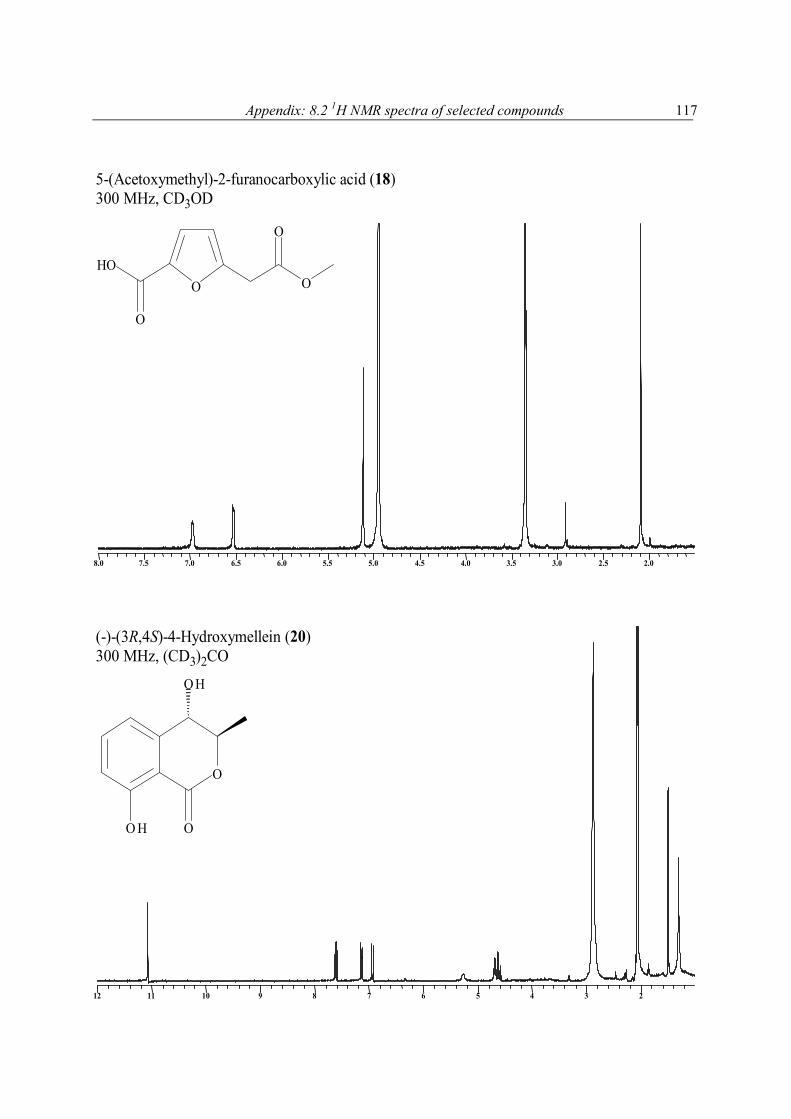
Appendix: 8.2 1H NMR spectra of selected compounds
117
2.02.02.52.53.03.03.53.54.04.04.54.55.05.05.55.56.06.06.56.57.07.07.57.58.08.0
2233445566778899101011111212
O
5-(Acetoxymethyl)-2-furanocarboxylic acid (18)300 MHz, CD3OD
OHO
O
O
O
OO H
(-)-(3R,4S)-4-Hydroxymellein (20)300 MHz, (CD3)2CO
O H
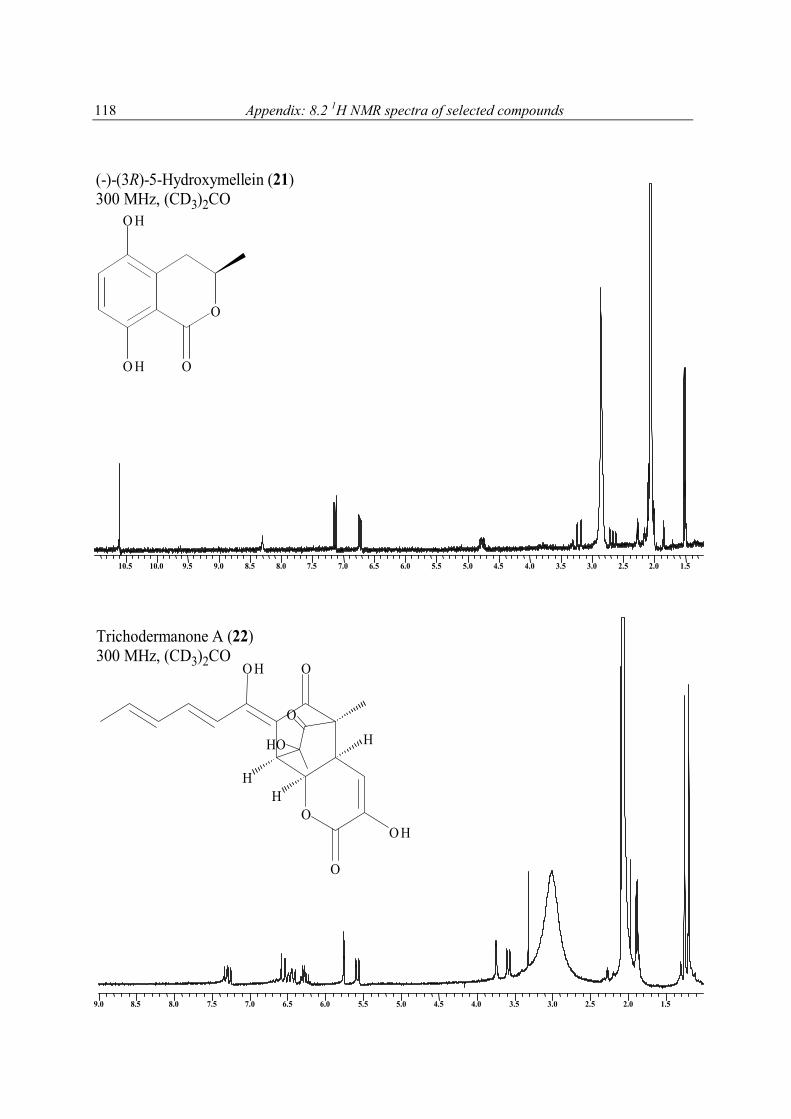
Appendix: 8.2 1H NMR spectra of selected compounds
118
1.51.52.02.02.52.53.03.03.53.54.04.04.54.55.05.05.55.56.06.06.56.57.07.07.57.58.08.08.58.59.09.09.59.510.010.010.510.5
1.51.52.02.02.52.53.03.03.53.54.04.04.54.55.05.05.55.56.06.06.56.57.07.07.57.58.08.08.58.59.09.0
O
H
O
H
H
O H
O
O H
O
HO
Trichodermanone A (22)300 MHz, (CD3)2CO
O
O H
O H
O
(-)-(3R)-5-Hydroxymellein (21)300 MHz, (CD3)2CO
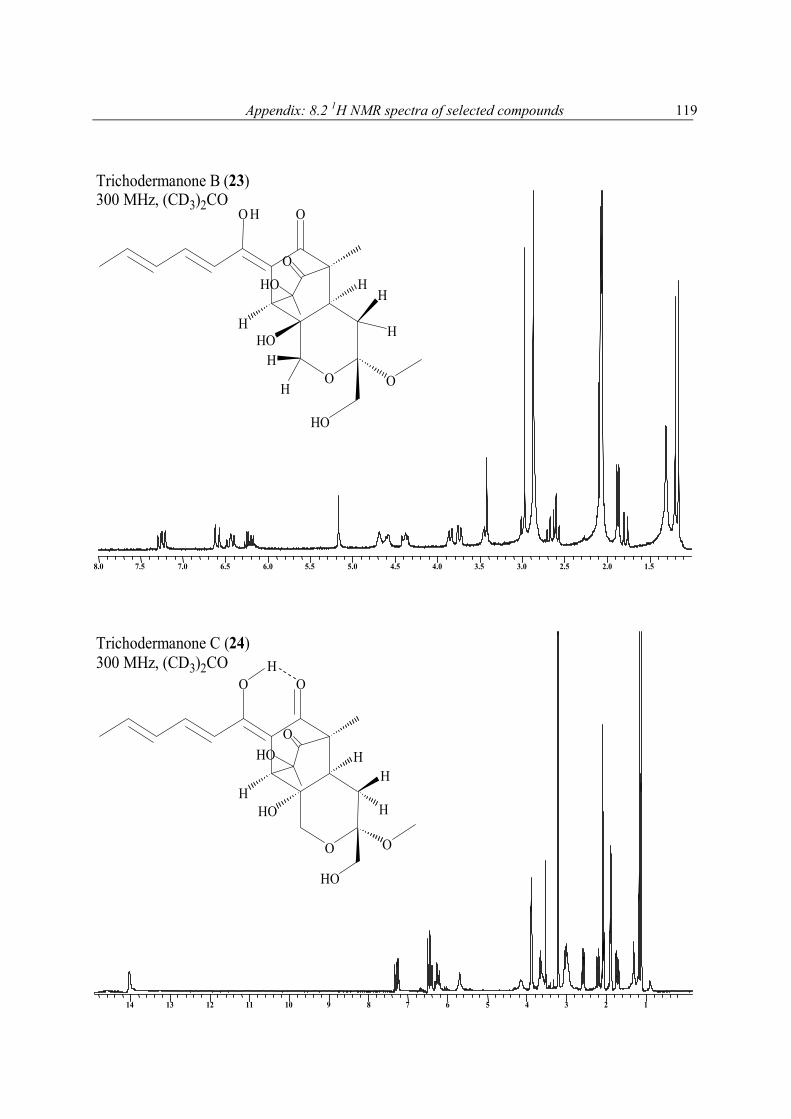
Appendix: 8.2 1H NMR spectra of selected compounds
119
1.51.52.02.02.52.53.03.03.53.54.04.04.54.55.05.05.55.56.06.06.56.57.07.07.57.58.08.0
11223344556677889910101111121213131414
H
O
OO H
HO
H
HO
O
H
H
H
H
HOO
Trichodermanone B (23)300 MHz, (CD3)2CO
H
O
OO
HO
HH
H
HO
O
OHO
Trichodermanone C (24)300 MHz, (CD3)2CO H
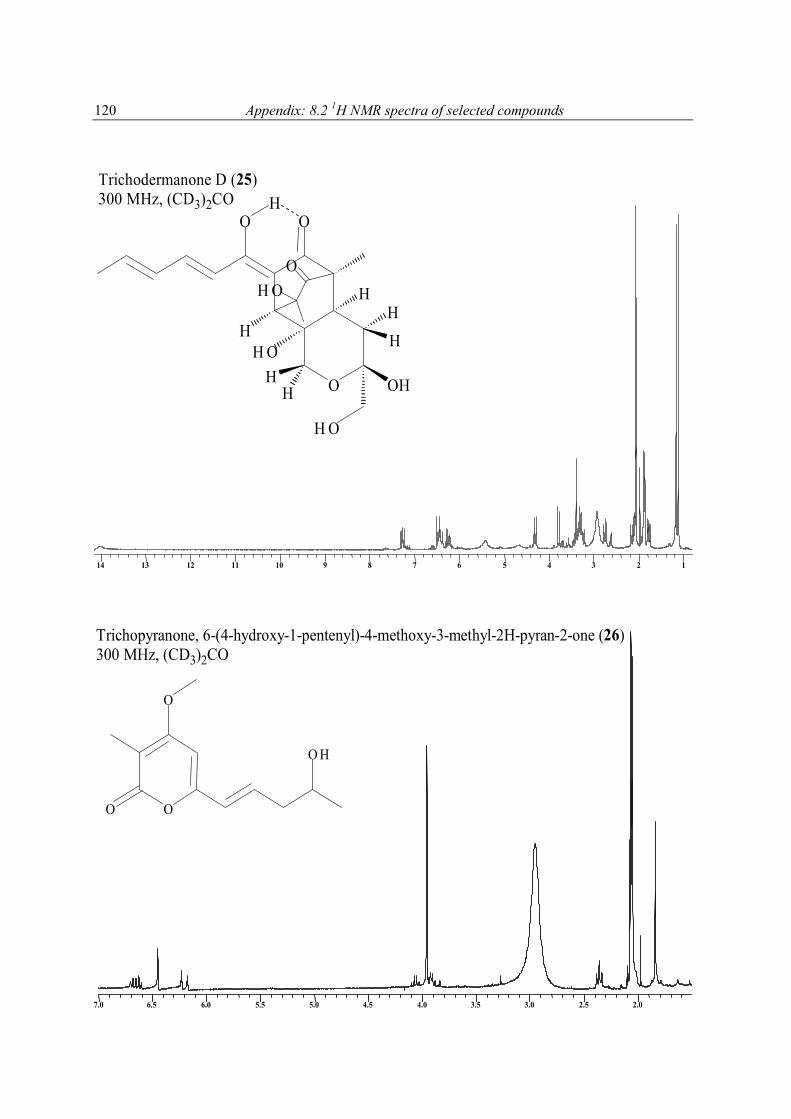
Appendix: 8.2 1H NMR spectra of selected compounds
120
11223344556677889910101111121213131414
2.02.02.52.53.03.03.53.54.04.04.54.55.05.05.55.56.06.06.56.57.07.0
O O
O H
O
Trichopyranone, 6-(4-hydroxy-1-pentenyl)-4-methoxy-3-methyl-2H-pyran-2-one (26)300 MHz, (CD3)2CO
HH
O
OO
OH O
H O
OH
H O
H
H
HH
Trichodermanone D (25)300 MHz, (CD3)2CO H
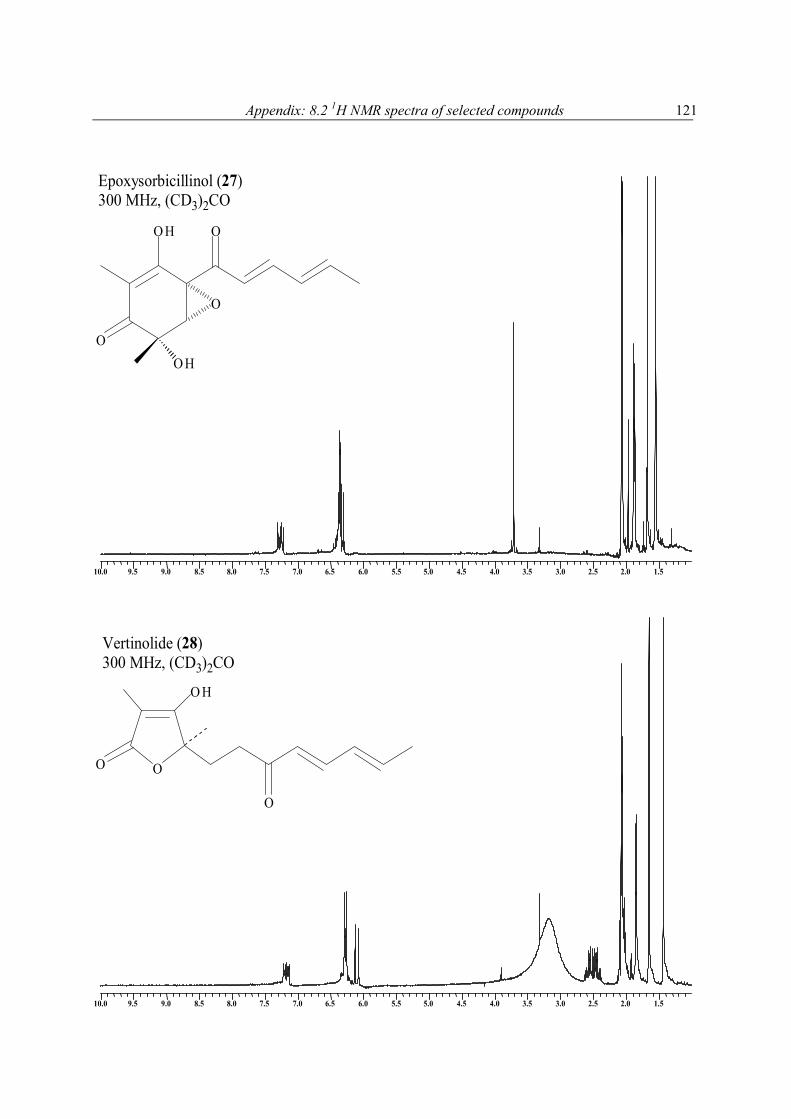
Appendix: 8.2 1H NMR spectra of selected compounds
121
1.51.52.02.02.52.53.03.03.53.54.04.04.54.55.05.05.55.56.06.06.56.57.07.07.57.58.08.08.58.59.09.09.59.510.010.0
1.51.52.02.02.52.53.03.03.53.54.04.04.54.55.05.05.55.56.06.06.56.57.07.07.57.58.08.08.58.59.09.09.59.510.010.0
O
O
O H
O
Vertinolide (28)300 MHz, (CD3)2CO
O
O H
OO H
O
Epoxysorbicillinol (27)300 MHz, (CD3)2CO
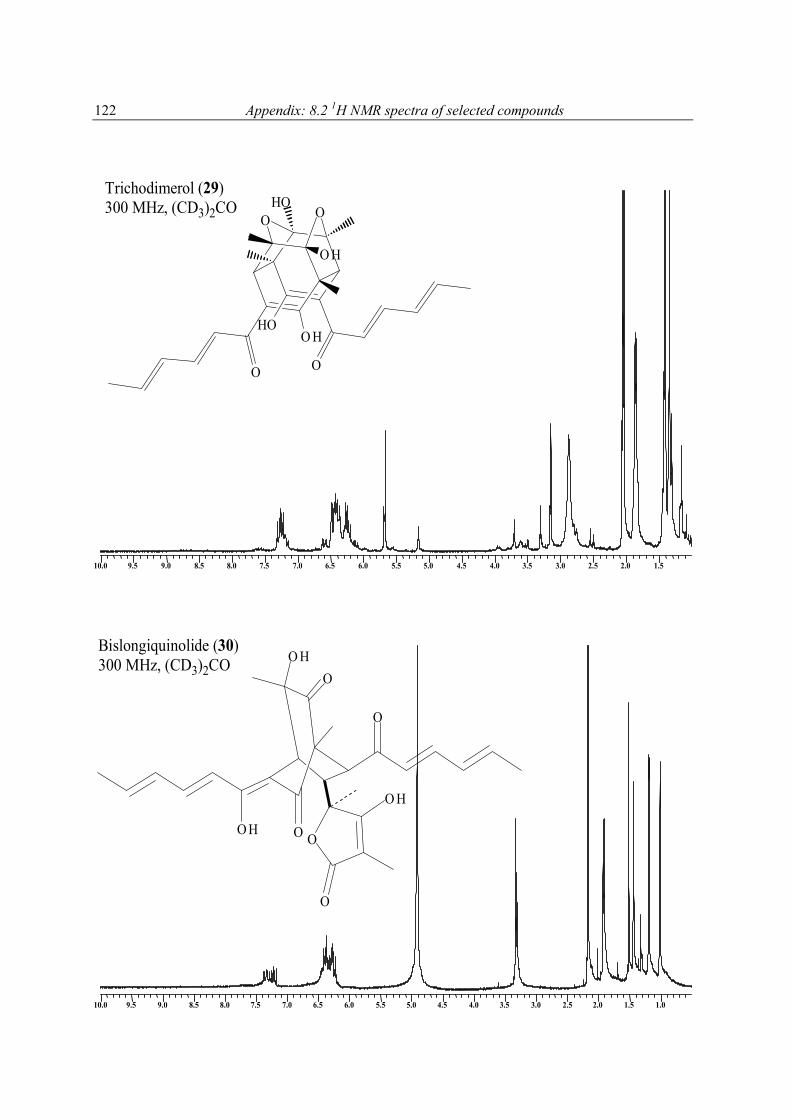
Appendix: 8.2 1H NMR spectra of selected compounds
122
1.51.52.02.02.52.53.03.03.53.54.04.04.54.55.05.05.55.56.06.06.56.57.07.07.57.58.08.08.58.59.09.09.59.510.010.0
1.01.01.51.52.02.02.52.53.03.03.53.54.04.04.54.55.05.05.55.56.06.06.56.57.07.07.57.58.08.08.58.59.09.09.59.510.010.0
OO
O H
HOO H
HO
OO
Trichodimerol (29)300 MHz, (CD3)2CO
O HO
OO H
O
O
O
O H
Bislongiquinolide (30)300 MHz, (CD3)2CO
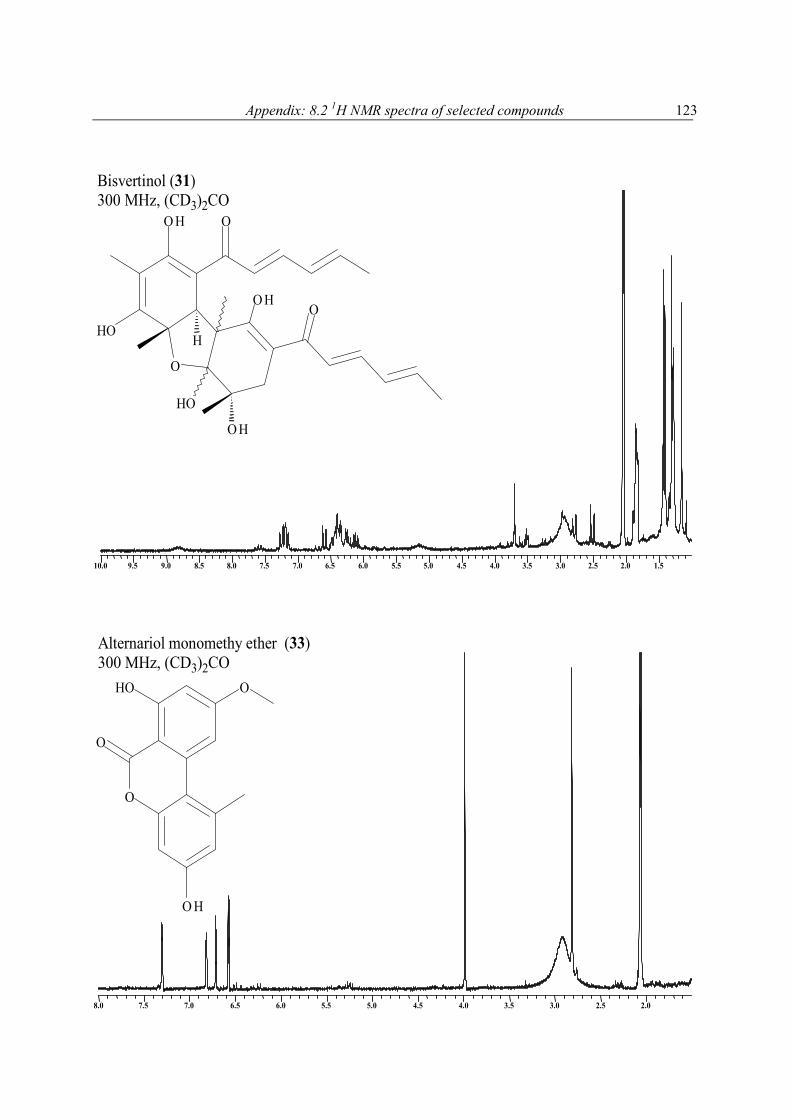
Appendix: 8.2 1H NMR spectra of selected compounds
123
1.51.52.02.02.52.53.03.03.53.54.04.04.54.55.05.05.55.56.06.06.56.57.07.07.57.58.08.08.58.59.09.09.59.510.010.0
2.02.02.52.53.03.03.53.54.04.04.54.55.05.05.55.56.06.06.56.57.07.07.57.58.08.0
HO
OO H
O
O H
O H
H
O
HO
Bisvertinol (31)300 MHz, (CD3)2CO
O
HO O
O H
O
Alternariol monomethy ether (33)300 MHz, (CD3)2CO


![Pränataldiagnostik der Trisomie 21 durch ...archiv.ub.uni-marburg.de/diss/z2001/0345/pdf/dre.pdf · 1Einleitung 1.1Down-Syndrom 1866 beschrieb Langdon Down [15] erstmalig ein Krankheitsbild,](https://img.pdfslide.org/doc/110x75/5d5806fd88c9934a778b6fa1/praenataldiagnostik-der-trisomie-21-durch-1einleitung-11down-syndrom-1866.jpg)