Embed Size (px)
Citation preview
Institut für Technische Chemie, Lehrstuhl II
Selective Hydrogenation of Butyronitrile over Raney-Metals
Adam Chojecki
Vollständiger Abdruck der von der Fakultät für Chemie der Technischen
Universität München zur Erlangung des akademischen Grades eines
Doktors der Naturwissenschaften (Dr. rer. nat.) genehmigten Dissertation.
Vorsitzender: Univ-Prof. Dr. K. Köhler Prüfer der Dissertation:
1. Univ. Prof. Dr. J. A. Lercher
2. Univ. Prof. Dr. Th. Bach
Die Dissertation wurde am 25.02.04 bei der Technischen Universität
München eingereicht und durch die Fakultät für Chemie am 17.03.04
angenommen.
Acknowledgment
The scientific work presented in the thesis is a result of the collaboration among
a good few people.
First of all, I do thank Prof. Dr. Johannes A. Lercher for inviting me to
the fellowship of Technische Chemie 2 and for his scientific guidance. I am also much
obliged to my mentor PD. Thomas E. Müller, PhD for taking care on daily bases of this
work and for helping in correcting the thesis. The scientific help of PD. Andreas Jentys,
PhD (DFT calculations), Dr. Hervé Jobic (Institut de Recherches sur la Catalyse, France;
INS spectroscopy) and Prof. Dr. Stan Veprek (Institut für Chemie Anorganischer
Materialien, TUM; XPS spectroscopy) is gratefully acknowledged.
Over those years I have met many people that in one or the other way have
supported me, especially the fellows of the TC2 group. I would like to let you know
at this place that I really appreciate the help I received from you.
Last but not least Air Products & Chemicals Inc. is gratefully thanked for
the financial support; Institut Laue-Langevin is thanked for access to the IN1-BeF
spectrometer.
Table of Contents - i -
1 General Introduction 2 1.1 Aliphatic Amines 2
1.1.1 Catalytic Routes to Lower Aliphatic Amines 2
1.2 Metals as Catalysts 4 1.2.1 Dispersed Metal Catalysts 4
1.2.2 Chemical Bonding at Metal Surfaces 6
1.2.2.1 Solid State Theory of Transition Metals 6
1.2.3 Surface Catalyzed Step-Wise Hydrogenation of Nitriles 7
1.3 The Scope of the Thesis 9 Acknowledgment 10 References 10
2 Experimental Methods and Setups 14 2.1 Preparation of Catalysts and Chemicals 14
2.1.1 Catalysts 14
2.1.2 Chemicals 14
2.1.2.1 Synthesis of N-butylidene-butylamine 15
2.2 Characterization of the Catalyst Samples 16 2.2.1 Elemental Analysis 16
2.2.2 Surface Area and Porosity 16
2.2.3 Particle Size and Dispersion Measurements 17
2.2.3.1 X-Ray Diffraction Line Broadening Analysis 18
2.2.3.2 Hydrogen Chemisorption 18
2.2.4 Temperature Programmed Desorption 20
2.2.5 Photoelectron Spectroscopy 21
2.2.6 Adsorption at Solid-Liquid Interface 22
2.2.7 Calorimetrically Measured Heat of Adsorption 23
2.3 Catalytic Tests 23 2.3.1 Catalytic Testing Procedure 24
2.4 Characterization of the Catalytic Process with Vibrational Spectroscopy
24
Table of Contents - ii -
2.4.1 In Situ Attenuated Total Internal Reflectance Infrared Spectroscopy (ATR-IR) 24
2.4.1.1 The Nature of ATR Spectra 25
2.4.1.2 ReactIR 1000 Setup 26
2.4.2 Inelastic Neutron Scattering (INS) 27
2.4.2.1 The INS Theory 27
2.4.2.2 The INS Spectrometer 29
2.5 Calculation Methods 29 2.5.1 Thermodynamic Equilibrium 29
2.5.1.1 Thermodynamic Equilibrium Calculated from the Experimental Data. 29
2.5.1.2 Thermodynamic Equilibrium Computed ab initio 30
2.5.2 DFT Search for a Transition State 31
Acknowledgment 32 References 32
3 Characterization of Raney-Ni and Raney-Co Catalysts and Their Use in the Selective Hydrogenation of Butyronitrile 35
3.1 Introduction 35 3.2 Experimental 36
3.2.1 Catalysts and Chemicals 36
3.2.2 Setups and Experimental Procedures 37
3.3 Results 40 3.3.1 Particle Size and Structure of Raney-Co 40
3.3.2 Specific Surface and Accessible Metal Surface Area 40
3.3.3 Temperature Programmed Desorption (TPD) 44
3.3.3.1 TPD of Residual Hydrogen and Water 44
3.3.3.2 Ammonia-TPD 46
3.3.4 X-ray Photoelectron Spectroscopy (XPS) 49
3.3.5 Adsorption of Butyronitrile and n-Butylamine from the Liquid Phase 53
3.3.5.1 Heat of Adsorption of Butyronitrile at 371.9 K 56
3.3.6 Catalytic Tests 57
3.3.6.1 Kinetics of the Hydrogenation of Butyronitrile 61
Table of Contents - iii -
3.4 Discussion 61 3.4.1 The Activity of the Raney-Catalysts in the Hydrogenation of
Butyronitrile. 61
3.4.2 The Selectivity to n-Butylamine over Raney-Catalysts in the Hydrogenation of Butyronitrile 62
3.5 Conclusions 63 Acknowledgment 64 References 64
4 Towards Understanding the Selectivity in the Hydrogenation of Butyronitrile over Raney-Co Catalysts - Formation and Cleavage of N-butylidene-butylamine 70
4.1 Introduction 70 4.2 Experimental 71
4.2.1 Calculations of thermodynamic parameters 71
4.2.2 Catalysts and Chemicals 71
4.2.3 Setup 73
4.3 Results 74 4.3.1 Formation of N-butylidene-butylamine in the Hydrogenation of
Butyronitrile 74
4.3.1.1 Control of the Condensation Reaction 78
4.3.2 Reactions of N-butylidene-butylamine 79
4.3.2.1 Cleavage of N-butylidene-butylamine to n-butylamine 80
4.3.2.2 Hydrogenation and Deuteration of N-butylidene-butylamine 84
4.3.2.3 Imine-Enamine Tautomerism of N-butylidene-butylamine 87
4.4 Discussion 89 4.4.1 Formation of N-butylidene-butylamine 90
4.4.2 Cleavage of N-butylidene-butylamine 91
4.5 Conclusions 91 Acknowledgment 92 References 92
5 Inelastic Neutron Scattering Study of Hydrogen and Butyronitrile Adsorbed on Raney-Co Catalysts 96
Table of Contents - iv -
5.1 Introduction 96 5.2 Experimental 97
5.2.1 Sample preparation 97
5.2.2 Measurement 97
5.2.3 Data treatment 98
5.3 Results and Discussion 99 5.4 Conclusions 108 Acknowledgment 108 References 108
6 Summary 112 6.1 Summary of the Research 112 6.2 Conclusions 113 References 116
- 1 -
Chapter 1 This chapter features a general introduction that highlights the importance of
lower aliphatic amines in the industry, presents catalytic routes to lower
aliphatic amines and discusses Raney-catalysts and the process of
hydrogenation of nitriles to amines in detail. The research problem encountered
during the selective hydrogenation of nitriles to primary amines is formulated.
Finally, the milestones of the research work presented in the subsequent
chapters are highlighted.
Chapter 1 - 2 -
1 General Introduction
1.1 Aliphatic Amines
Lower aliphatic amines are of considerable industrial importance. A large number of
drugs, plasticizers, agrochemicals (herbicides and pesticides), dyes and other chemicals
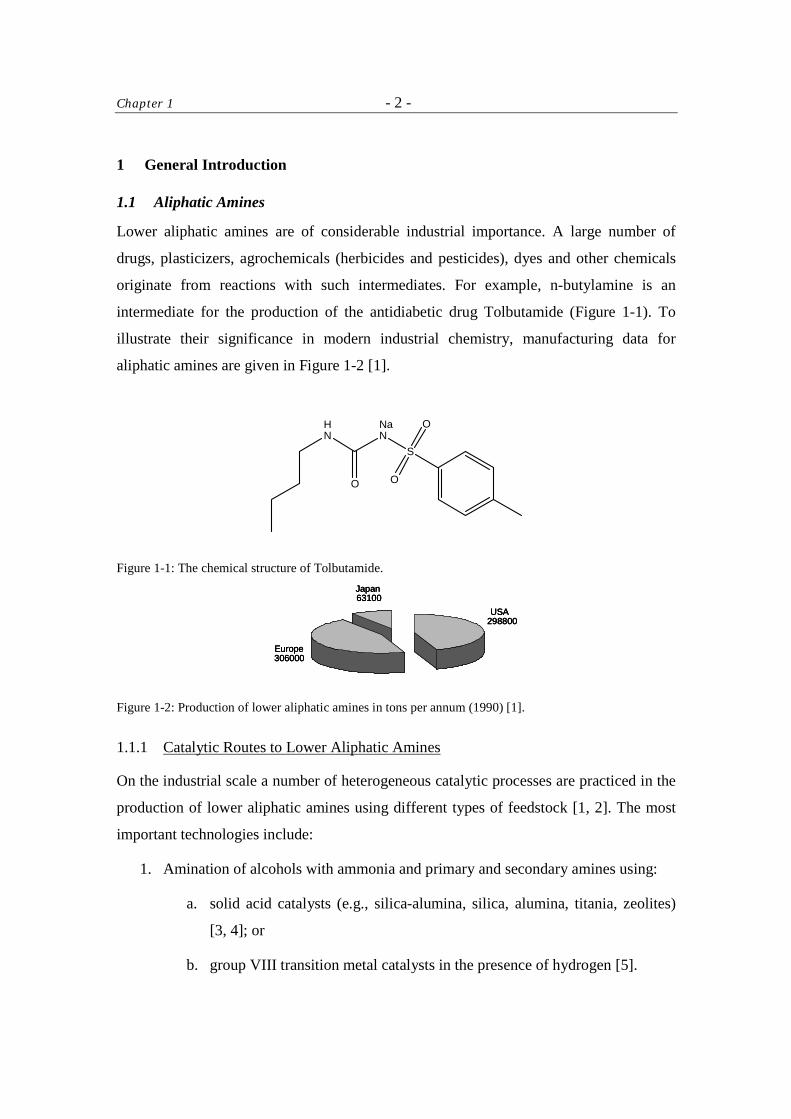
originate from reactions with such intermediates. For example, n-butylamine is an
intermediate for the production of the antidiabetic drug Tolbutamide (Figure 1-1). To
illustrate their significance in modern industrial chemistry, manufacturing data for
aliphatic amines are given in Figure 1-2 [1].
HN
O
NaN
S
O
O
Figure 1-1: The chemical structure of Tolbutamide.
298800
306000
63100USA
Europe
Japan
298800
306000
63100USA
Europe
Japan
298800
306000
63100USA
Europe
Japan
Figure 1-2: Production of lower aliphatic amines in tons per annum (1990) [1].
1.1.1 Catalytic Routes to Lower Aliphatic Amines
On the industrial scale a number of heterogeneous catalytic processes are practiced in the
production of lower aliphatic amines using different types of feedstock [1, 2]. The most
important technologies include:
1. Amination of alcohols with ammonia and primary and secondary amines using:
a. solid acid catalysts (e.g., silica-alumina, silica, alumina, titania, zeolites)
[3, 4]; or
b. group VIII transition metal catalysts in the presence of hydrogen [5].
Chapter 1 - 3 -
2. Amination of carbonyl compounds (reductive amination) with ammonia or
amines (primary and secondary) and hydrogen over group VIII transition metals
[6].
3. Catalytic reduction of nitriles with molecular hydrogen over Raney-Ni, Raney-
Co, or rhodium, palladium and platinum on various supports (e.g., Al2O3, carbon)
[7].
4. Amination of iso-butene over zeolites and other solid acids [8].
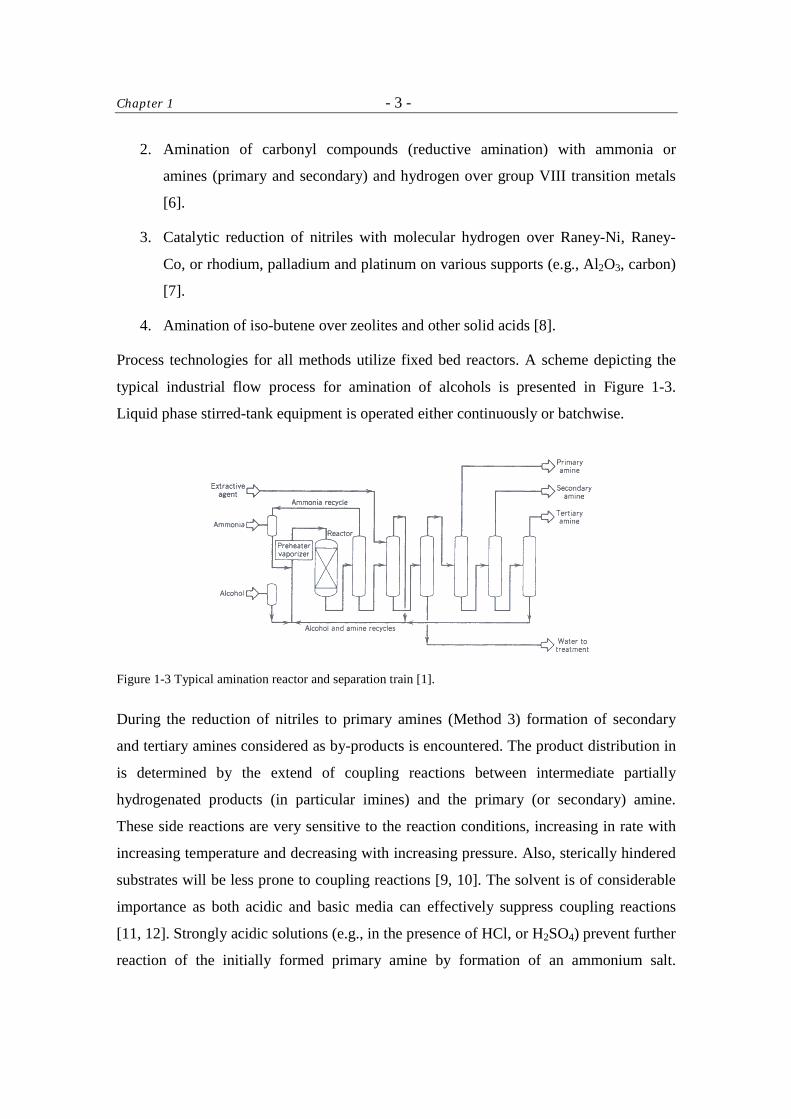
Process technologies for all methods utilize fixed bed reactors. A scheme depicting the
typical industrial flow process for amination of alcohols is presented in Figure 1-3.
Liquid phase stirred-tank equipment is operated either continuously or batchwise.
Figure 1-3 Typical amination reactor and separation train [1].
During the reduction of nitriles to primary amines (Method 3) formation of secondary
and tertiary amines considered as by-products is encountered. The product distribution in
is determined by the extend of coupling reactions between intermediate partially
hydrogenated products (in particular imines) and the primary (or secondary) amine.
These side reactions are very sensitive to the reaction conditions, increasing in rate with
increasing temperature and decreasing with increasing pressure. Also, sterically hindered
substrates will be less prone to coupling reactions [9, 10]. The solvent is of considerable
importance as both acidic and basic media can effectively suppress coupling reactions
[11, 12]. Strongly acidic solutions (e.g., in the presence of HCl, or H2SO4) prevent further
reaction of the initially formed primary amine by formation of an ammonium salt.
Chapter 1 - 4 -
Another effective way of preventing coupling reactions is to carry out the reduction in
acylating solvents such as acetic acid or acetic anhydride. A common technique in
industry for minimizing the formation of secondary amines is to perform the
hydrogenation in the presence of excess ammonia. Latter shifts the thermodynamic
equilibrium in favor of the primary amine. Ammonia may function in other ways as well,
for a variety of bases, such as tertiary amines, carbonates, and hydroxides, also lead to a
decrease in the formation of condensation products. Greenfield suggested that bases may
decrease the rate of the hydrogenolysis reaction leading to secondary and tertiary amines
[13].
1.2 Metals as Catalysts
1.2.1 Dispersed Metal Catalysts
One of the major functionalities of transition metals in catalysis is their ability to catalyze
hydrogenation reactions due to dissociative chemisorption of molecular hydrogen. Finely
dispersed metal is desired for practical catalysis because of the high surface area. In its
simplest form an unsupported metal powder can be used for these purposes. Typical
methods of preparation of such powders (metal ‘blacks’) [14, 15] include (i) reduction of
a metal salt in solution [e.g., 16, 17] (ii) reduction of metal oxides (prepared via
precipitation as hydroxides carbonatesetc.) in the gas phase with hydrogen [e.g., 18, 19]
(iii) thermal decomposition under vacuum of salts of organic acids as well as nitrates,
oxalates, carbonyls and organometallic compounds [e.g., 20].
Another class of commercially important metal powders generically called ‘skeletal’
metal catalysts was invented by Murray Raney [21]. These Raney-catalysts are prepared
by melting the active metal (e.g., Co, Ni, Cu) together with aluminum (usually 50+ wt.
%). Up to 10 wt. % of promoters (e.g., Fe, Cr, Mo) are added to the melt. The alloy is
then crushed and screened according to the particle size. Finally, the parent alloy is
activated by selective leaching of aluminium at elevated temperatures using NaOH(aq.).
The leaching reaction is given in Figure 1-4.
2 M – Al(s) + 2 OH –(aq.) + 6 H2O(l) � 2 M(s) + 2 Al(OH)4-(aq.) + 3 H2(g)
Figure 1-4: Leaching reaction during preparation of Raney-catalysts.
Chapter 1 - 5 -
The resulting powdered skeletal catalyst is subsequently washed and stored under slightly
alkaline conditions (pH 9 ~ 10) to avoid precipitation of aluminum hydroxide as bayerite.
The procedure leaves microcrystallites of the active metal joined randomly to create
sponge-like particles incorporating a large void volume within the intensive pore system
so formed. Typical particle diameters for these catalysts range from 20 to 100 µm which
is much higher than the crystallite size as measured by X-ray diffraction line broadening
(approximately 5 nm [22]). The typical surface area of Raney-Ni (50 – 100 m2·g-1) is
usually larger than that of Raney-Co (26 m2·g-1) [23].
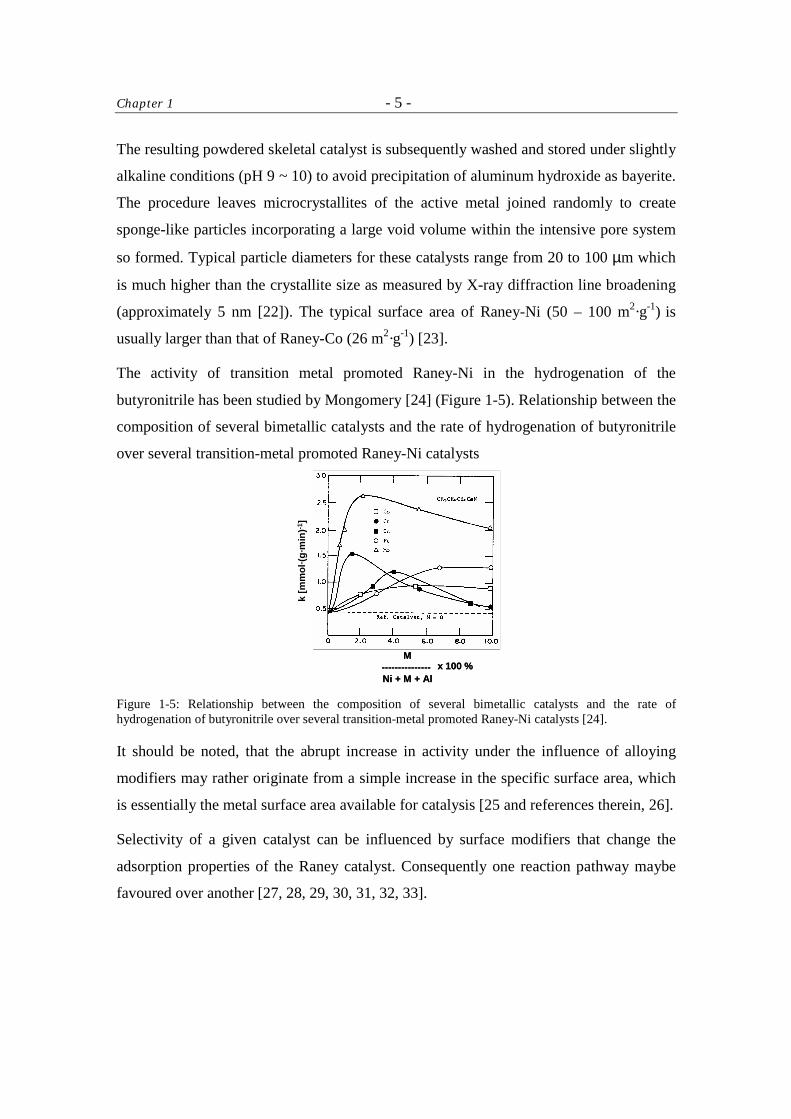
The activity of transition metal promoted Raney-Ni in the hydrogenation of the
butyronitrile has been studied by Mongomery [24] (Figure 1-5). Relationship between the
composition of several bimetallic catalysts and the rate of hydrogenation of butyronitrile
over several transition-metal promoted Raney-Ni catalysts
k [m
mol
·(g·m
in)-1
]
M ---------------Ni + M + Al
x 100 %M
---------------Ni + M + Al
x 100 %
Figure 1-5: Relationship between the composition of several bimetallic catalysts and the rate of hydrogenation of butyronitrile over several transition-metal promoted Raney-Ni catalysts [24].
It should be noted, that the abrupt increase in activity under the influence of alloying
modifiers may rather originate from a simple increase in the specific surface area, which
is essentially the metal surface area available for catalysis [25 and references therein, 26].
Selectivity of a given catalyst can be influenced by surface modifiers that change the
adsorption properties of the Raney catalyst. Consequently one reaction pathway maybe
favoured over another [27, 28, 29, 30, 31, 32, 33].
Chapter 1 - 6 -
One of the most important drawbacks of Raney-catalysts is their pyrophority in dry form.
This problem has been tackled by removing most of the adsorbed hydrogen and mild
oxidization applied at controlled circumstances [34 and references therein, 35].
1.2.2 Chemical Bonding at Metal Surfaces
As the catalyst itself participates in chemical reactions with adsorbed molecules, the
metal surface is the place for various reactions such as bond formation between the
adsorbate and surface atoms, reconstruction of the surface and penetration of erosive
adatoms into subsurfaces. It has been long realized that a good catalyst is characterized
by a low activation energy and weak binding of the intermediates (the Sabatier principle).
However, only over the last two decades a qualitative approach to catalysis by metals
could be applied thanks to the progress in computer modeling of the quantum chemical
molecule-surface interactions [36, 37, 38, 39].
1.2.2.1 Solid State Theory of Transition Metals [40, 41, 42].
Chemisorption properties of metals are in the first place correlated either with the number
of holes in the d-band or with the percentage of d-character of the metal (Table 1-1).
0.5546.0Pd
0.6044.0Pt
0.0036.0Cu
0.6040.0Ni
1.7039.5Co
2.2239.7Fe
Number of holes in d-band
Percentage dcharacter
Metal
0.5546.0Pd
0.6044.0Pt
0.0036.0Cu
0.6040.0Ni
1.7039.5Co
2.2239.7Fe
Number of holes in d-band
Percentage dcharacter
Metal
Table 1-1: Number of holes in the d-band and the percentage of d-character for some metals of interest [43].
In the quantum-mechanical theories the potential energy is taken as varying periodically
through the crystal structure of a metal, owing to the presence of the atomic nuclei. The
Schrödinger equation is set up and solved on that basis. A solution for a single atom
shows that an electron may occupy an s-, p-, d- or f-orbital, thus, the ground electronic
Chapter 1 - 7 -
state of the atom is uniquely defined. However, when a number of atoms are assembled
to form a crystal, each orbital is compelled by the Pauli principle and needs to be
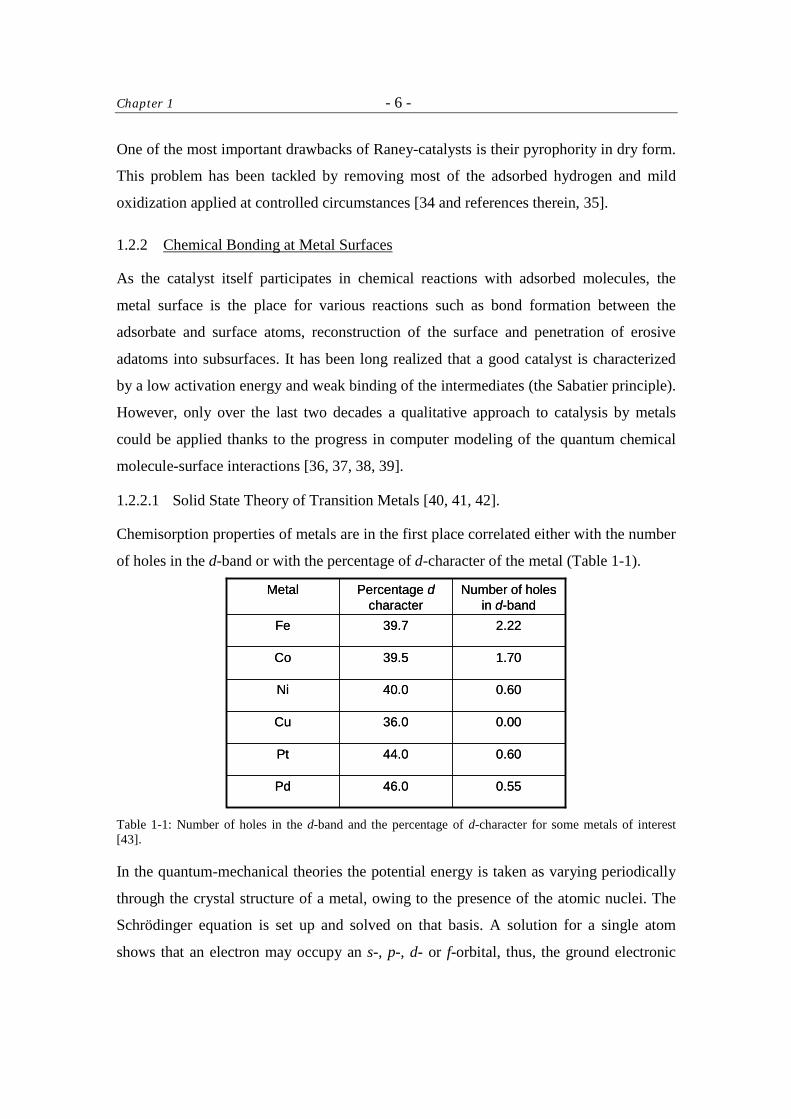
replaced by an energy level within the band. The bands of valence electrons in metals
overlap so that electrons may be exchanged between two or more bands (Figure 1-6).
Because of their great importance in catalysis, much interest has been devoted to the band
structure of the transition metals that have partly filled shells of d-electrons. For a number
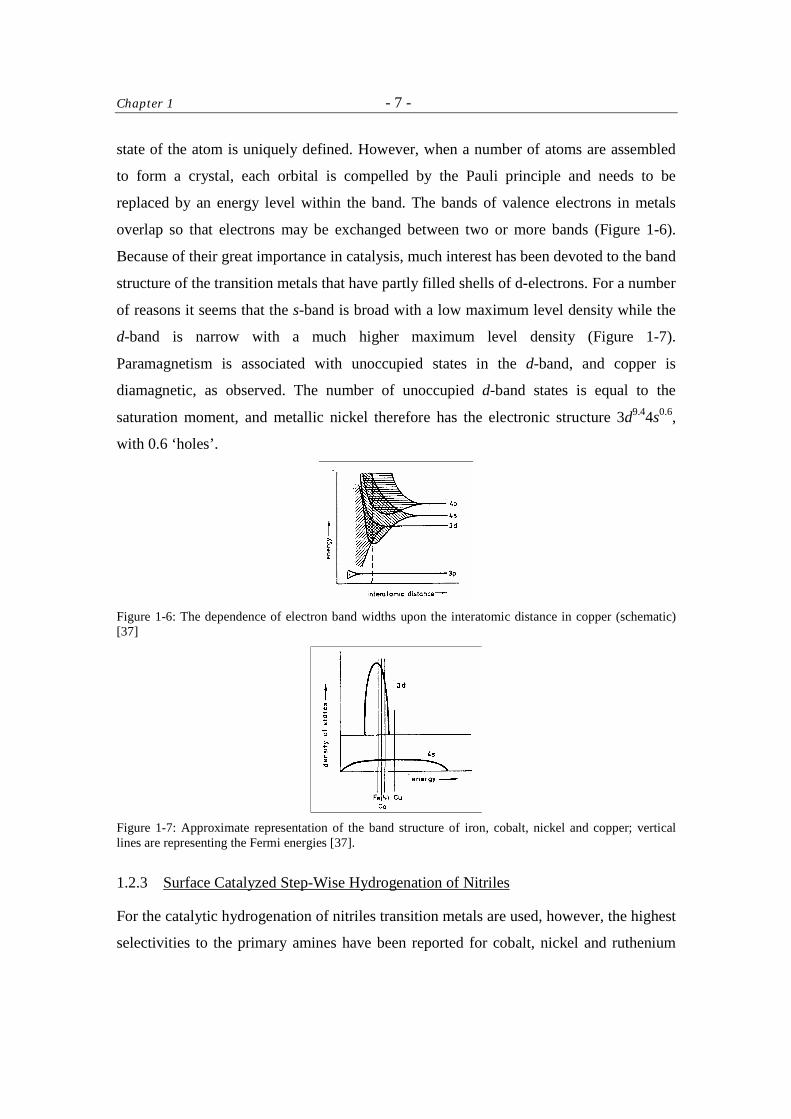
of reasons it seems that the s-band is broad with a low maximum level density while the
d-band is narrow with a much higher maximum level density (Figure 1-7).
Paramagnetism is associated with unoccupied states in the d-band, and copper is
diamagnetic, as observed. The number of unoccupied d-band states is equal to the
saturation moment, and metallic nickel therefore has the electronic structure 3d9.44s0.6,
with 0.6 ‘holes’.
Figure 1-6: The dependence of electron band widths upon the interatomic distance in copper (schematic) [37]
Figure 1-7: Approximate representation of the band structure of iron, cobalt, nickel and copper; vertical lines are representing the Fermi energies [37].
1.2.3 Surface Catalyzed Step-Wise Hydrogenation of Nitriles
For the catalytic hydrogenation of nitriles transition metals are used, however, the highest
selectivities to the primary amines have been reported for cobalt, nickel and ruthenium
Chapter 1 - 8 -
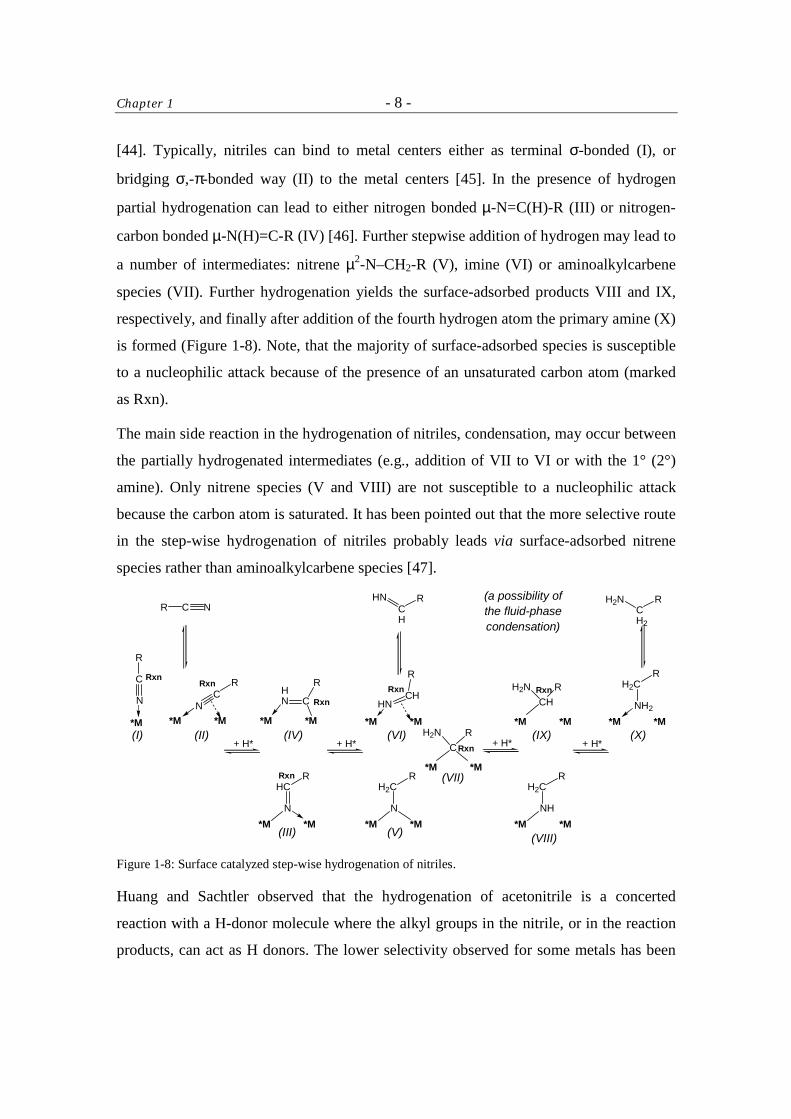
[44]. Typically, nitriles can bind to metal centers either as terminal σ-bonded (I), or
bridging σ,-π-bonded way (II) to the metal centers [45]. In the presence of hydrogen
partial hydrogenation can lead to either nitrogen bonded µ-N=C(H)-R (III) or nitrogen-
carbon bonded µ-N(H)=C-R (IV) [46]. Further stepwise addition of hydrogen may lead to
a number of intermediates: nitrene µ2-N–CH2-R (V), imine (VI) or aminoalkylcarbene
species (VII). Further hydrogenation yields the surface-adsorbed products VIII and IX,
respectively, and finally after addition of the fourth hydrogen atom the primary amine (X)
is formed (Figure 1-8). Note, that the majority of surface-adsorbed species is susceptible
to a nucleophilic attack because of the presence of an unsaturated carbon atom (marked
as Rxn).
The main side reaction in the hydrogenation of nitriles, condensation, may occur between
the partially hydrogenated intermediates (e.g., addition of VII to VI or with the 1° (2°)
amine). Only nitrene species (V and VIII) are not susceptible to a nucleophilic attack
because the carbon atom is saturated. It has been pointed out that the more selective route
in the step-wise hydrogenation of nitriles probably leads via surface-adsorbed nitrene
species rather than aminoalkylcarbene species [47].
C NR
HC
N
+ H* + H*
*M
C
N
R
CN
R
CHN
R
+ H*
CH
HN R
*M*M *M*M
R
*M*M
H2C
N
R
*M*M
CHHN
R
*M*M
CH2N R
*M*M
Rxn
Rxn
Rxn
Rxn
Rxn
+ H*
H2C
NH2
R
*M*M
CH2
H2N R
Rxn
CHH2N R
*M*M
Rxn
H2C
NH
R
*M*M
(I) (II)
(III)
(IV)
(V)
(VI)
(VII)
(X)(IX)
(VIII)
(a possibility ofthe fluid-phasecondensation)
Figure 1-8: Surface catalyzed step-wise hydrogenation of nitriles.
Huang and Sachtler observed that the hydrogenation of acetonitrile is a concerted
reaction with a H-donor molecule where the alkyl groups in the nitrile, or in the reaction
products, can act as H donors. The lower selectivity observed for some metals has been
Chapter 1 - 9 -
related to their low propensity for the formation of metal-nitrogen multiple bonds [48, 49,
50, 51, 52].
1.3 The Scope of the Thesis
The research work presented in this thesis has been initiated by an industry project in
collaboration with Air Products and Chemicals, Inc. The aim was to explore the role of
LiOH as promoter for Raney-catalysts. It was known that the co-catalyst LiOH leads to
an increased selectivity in the hydrogenation of nitriles to primary amines [53, 54].
In Chapter 2 the characterization and experimental methods used in this thesis are
reviewed.
In Chapter 3 the hydrogenation of butyronitrile was explored as a model reaction for the
catalytic reduction of nitriles over Raney-Co and Raney-Ni. The aim was to understand
the differences in the catalytic performance between the two metals. Furthermore, the
increase in selectivity towards primary amines which is observed after modifying Raney-
Co with LiOH was explored and discussed on the basis of a detailed characterization of
the catalysts. Changes in the mechanism that may lead to the higher selectivity were
examined.
In Chapter 4 the possible mechanism of side-reactions in the hydrogenation of
butyronitrile over parent and LiOH-modified Raney-Co was investigated. The questions
that were addressed concern the pathways which lead to the formation of the reaction
intermediate N-butylidene-butylamine and the factors, which lead to the significantly
lower amount of this intermediate over LiOH-modified Raney-Co. Further, reactions of
N-butylidene-butylamine with special interest in a possibility of cleaving the imine bond
to yield n-butylamine were explored.
In Chapter 5 an Inelastic Neutron Scattering study (INS) of co-adsorbed butyronitrile and
hydrogen on parent and LiOH-modified Raney-Co is presented. The study was aimed at
detecting partially hydrogenated cobalt-adsorbed species and in identifying surface bound
intermediates in the hydrogenation of butyronitrile to n-butylamine.
In Chapter 6 the main results and conclusions of this thesis are summarized.
Chapter 1 - 10 -
Acknowledgment
Air Products & Chemicals Inc. is gratefully thanked for the launch of the project and the
generous financial support.
References 1 M. G. Turcotte, T. A. Johnson in: J. I. Kroschwitz (Ed.), Kirk-Othmer Encyclopedia
of Chemical Technology Vol. 2 (4th Ed.), John Wiley & Sons, NY, 1992, p.369 - 386
2 G. Heilen in: W. Gerhartz (Ed.), Ullmann’s Encyclopedia of Industrial Chemistry
Vol. A2, VCH, Weinheim, 1985, p. 1 – 10
3 D.M. Roundhill, Chem. Rev. 92 (1992) 1
4 Y. Takita, Y. Nishida, T. Seiyama, Bull. Soc. Chem. Jpn. 49 (1976) 3699
5 A. Baker, J. Kijenski, Catal. Rev. Sci. Eng. 27(4) (1985) 653
6 T. Mallat, A. Baiker in: G. Ertl, H. Knözinger, J. Weitkamp (Eds.) Handbook of
Heterogeneous Catalysis Vol. 5, Wiley-VCH, Weinheim, 1997, p. 2334 – 2348
7 P. R. Rylander, Hydrogenation Methods, Academic Press, London, 1988 (2nd Ed.), p.
94 - 103
8 T. E. Müller, M. Beller, Chem. Rev. 98 (1998) 675
9 M. Hudlicky, Reductions in Organic Chemistry - ACS Monograph Vol. 188,
American Chemical Society, Washington DC, 1996, p. 239 - 241
10 A. G. M. Barrett in: B. M. Trost (Ed.-in-Chief), Comprehensive Organic Synthesis
Vol. 8 – Reduction, Pergamon Press, Oxford, 1991, p. 251 – 257
11 P. N. Rylander, Hydrogenation Methods, Academic Press, London, 1988 (2nd Ed.), p.
94 – 103
12 P. N. Rylander, Catalytic Hydrogenation over Platinum Metals, Academic Press, NY
and London, 1967, p. 203 – 226
13 H. Greenfield, Ind. Eng. Chem. Prod. Rev. Dev. 6 (1967) 142
14 J. R. Anderson, Structure of Metallic Catalysts, Academic Press, London, 1975, p.
218 – 236
15 G. C. Bond, Catalysis by Metals, Academic Press, London, 1962, p. 33 – 36
16 H. Wang, Z. Yu, H. Chen, J. Yang, J. Deng, Appl. Cat. A 129 (1995) L143
17 H. Li, X. Chen, M. Wang, Y. Xu, Appl. Cat. A 225 (2002) 117
Chapter 1 - 11 -
18 K. Schachter, P. Tetenyi, Acta Chim. Hung. 46 (1965) 229
19 D. W. McKee, J. Catal. 8 (1967) 240
20 J. van Wonterghem, S. Mørup, S. W. Charles, S. Villadeen Wells, J. Phys. Lett. 55
(1985) 410
21 M. Raney, US Patent 1 563 587 (1925)
22 J. P. Orchard, A. D. Tomsett, M. S. Wainwright and D. J. Young, J. Catal. 84 (1983)
189
23 M. S. Wainwright in: G. Ertl, H. Knözinger, J. Weitkamp (Eds.), Preparation of Solid
Catalysts, Wiley-VCH, Weinheim, 1999, p. 28 – 43
24 S. R. Montgomery in: W.R. Moser (Ed.) Catalysis of Organic Reactions - Chemical
Industries Series Vol. 5, Marcel Dekker, 1981, p. 383 – 409
25 A.B. Fasman in: F. Herkes (Ed.) Catalysis of Organic Reactions - Chemical Industries
Series Vol. 75, Marcel Dekker, 1998, p. 151 – 168
26 Y. Kiros , M. Majari and T.A. Nissinen, J. Alloys Compd. 360 (2003) 279
27 K. Hotta and T. Kubomatsu, Bull. Chem. Soc. Jpn. 46 (1973) 3566
28 G. V. Smith, M. Musoiu, J. Catal. 60 (1979) 184
29 B. Liu, L. Lu, B. Wang, T. Cai, K. Iwatani, Appl. Cat. A 171 (1998) 117
30 B. Liu, L. Lu, T. Cai, K. Iwatani, Appl. Cat. A 180 (1999) 105
31 P. Kukula and L. Cervený, Appl. Catal., A 223 (2002) 43
32 P. Kukula and L. Cervený, J. Mol. Catal. A: Chem. 185 (2002) 195
33 P. Tundo, A. Perosa and S. Zinovyev, J. Mol. Catal. A: Chem. 204-205 (2003) 747
34 S. D. Mikhailenko, T. A. Khodareva, E. V. Leongardt, A. I. Lyashenko, A. B.
Fasman, J. Catal. 141 (1993) 688
35 A. Bota, G. Goerigk, T. Drucker, H.-G. Haubold, and J. Petro, J. Catal. 205 (2002),
354
36 S. Yoshida, S. Sakaki and H. Kobayashi, Electronic Processes in Catalysis – A
Quantum Chemical Approach to Catalysis, Wiley-VCH, Weinheim, 1994, p. 213 –
240
37 J. K. Nørskov, P. Stoltze, Catal. Lett. 9 (1991) 173
38 G. D. Yadav, M. R. Kharkara, Appl. Cat. A 126 (1995) 115
Chapter 1 - 12 -
39 J. K. Nørskov, T. Bligaard, A. Logadottir, S. Bahn, L. B. Hansen, M. Bollinger, H.
Bengaard, B. Hammer, Z. Sljivancanin, M. Mavrikakis, Y. Xu, S. Dahl, C. J. H.
Jacobsen, J. Catal. 209 (2002) 275
40 G. V. Raynor, Rep. Prog. Phys. 15 (1952) 173
41 G. C. Bond, Catalysis by Metals, Academic Press, London, 1962, p. 17 – 28
42 J. R. Anderson, Structure of Metallic Catalysts, Academic Press, London, 1975, p. 1 –
28
43 K. J. Laidler, Chemical Kinetics, McGraw-Hill, London, 1965 (2nd Ed.), p. 309
44 J. Volf and J. Pasek, in: L. Cerveny (Ed.), Stud. Surf. Sci. Catal. 27, Elsevier,
Amsterdam, 1986, p.105
45 C. M. Friend, E. L. Muetterties and J. L. Gland, J. Phys. Chem. 85 (1981) 3256
46 F. J. G. Alonso, M. G. Sanz and V. Riera, Organometallics 11 (1992) 801
47 B. Coq, D. Tichit and S. Ribet, J. Catal. 189 (2000) 117 and references therein
48 Y. Huang and W. M. H. Sachtler, J.Phys. Chem. B 102 (1998) 102
49 Y. Huang and W. M. H. Sachtler, J. Catal. 184 (1999) 247
50 Y. Huang and W. M. H. Sachtler, J. Catal. 190 (2000) 69
51 Y. Huang and W. M. H. Sachtler, Appl. Catal., A 182 (1999) 365
52 Y. Huang and W. M. H. Sachtler, Appl. Catal., A 191 (2000) 35
53 T. A. Johnson, US Patent No. 5 869 653 (1999), to Air Products and Chemicals, Inc.
54 T. A. Johnson and D. P. Freyberger in: M. E. Ford (Ed.), Catalysis of Organic
Reactions - Chemical Industries Series Vol. 82, Marcel Dekker, 2000, p. 201 – 227
- 13 -
Chapter 2 This chapter introduces the reader to the experimental methods and presents
the experimental setups that were used during the research work.
Chapter 2 - 14 -
2 Experimental Methods and Setups
2.1 Preparation of Catalysts and Chemicals
2.1.1 Catalysts
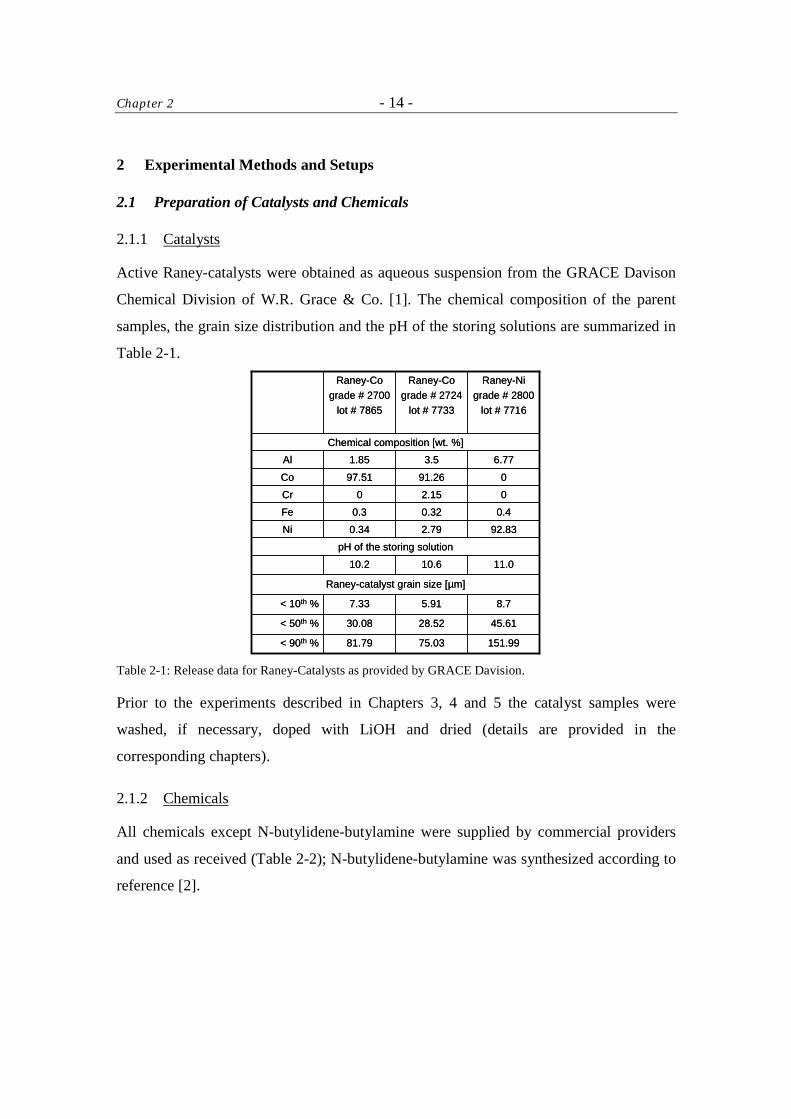
Active Raney-catalysts were obtained as aqueous suspension from the GRACE Davison
Chemical Division of W.R. Grace & Co. [1]. The chemical composition of the parent
samples, the grain size distribution and the pH of the storing solutions are summarized in
Table 2-1.
Chemical composition [wt. %]
92.832.790.34Ni
45.6128.5230.08< 50th %
11.010.610.2
Raney-catalyst grain size [µm]
8.75.917.33< 10th %
151.9975.0381.79< 90th %
pH of the storing solution
0.40.320.3Fe
02.150Cr
091.2697.51Co
6.773.51.85Al
Raney-Nigrade # 2800
lot # 7716
Raney-Cograde # 2724
lot # 7733
Raney-Cograde # 2700
lot # 7865
Table 2-1: Release data for Raney-Catalysts as provided by GRACE Davision.
Prior to the experiments described in Chapters 3, 4 and 5 the catalyst samples were
washed, if necessary, doped with LiOH and dried (details are provided in the
corresponding chapters).
2.1.2 Chemicals
All chemicals except N-butylidene-butylamine were supplied by commercial providers
and used as received (Table 2-2); N-butylidene-butylamine was synthesized according to
reference [2].
Chapter 2 - 15 -
Messer-GriesheimGmbH
99.999nitrogen
Alfa≥ 99n-pentaneM = 72.15, d = 0.626
Merck98(2 % Li2CO3)
lithium hydroxideM = 23.95
Aldrich99.5n-octaneM = 114.23, d = 0.703
Messer-GriesheimGmbH
99.999argonDeutero GmbH99.8deuterium
Aldrich99.5n-undecaneM = 156.31, d =0.740
Fluka≥ 99n-butyraldehydeM = 72.11, d = 0.800
Fluka86potassium hydroxideM = 56.11
Aldrich Chemie> 99tri-n-butylamineM =185.36, d = 0.778
Aldrich Chemie> 99di-n-butylamineM = 129.25, d = 0.760
Aldrich Chemie≥ 99n-butylamineM = 73.14, d = 0.740
Messer-GriesheimGmbH
99.98ammonia
Messer-GriesheimGmbH
99.999hydrogen
Fluka≥ 99butyronitrileM = 69.11, d = 0.794
Company Purity[%]
Compound [mol·g-1], [g·cm-3]
Messer-GriesheimGmbH
99.999nitrogen
Alfa≥ 99n-pentaneM = 72.15, d = 0.626
Merck98(2 % Li2CO3)
lithium hydroxideM = 23.95
Aldrich99.5n-octaneM = 114.23, d = 0.703
Messer-GriesheimGmbH
99.999argonDeutero GmbH99.8deuterium
Aldrich99.5n-undecaneM = 156.31, d =0.740
Fluka≥ 99n-butyraldehydeM = 72.11, d = 0.800
Fluka86potassium hydroxideM = 56.11
Aldrich Chemie> 99tri-n-butylamineM =185.36, d = 0.778
Aldrich Chemie> 99di-n-butylamineM = 129.25, d = 0.760
Aldrich Chemie≥ 99n-butylamineM = 73.14, d = 0.740
Messer-GriesheimGmbH
99.98ammonia
Messer-GriesheimGmbH
99.999hydrogen
Fluka≥ 99butyronitrileM = 69.11, d = 0.794
Company Purity[%]
Compound [mol·g-1], [g·cm-3]
Table 2-2: Chemicals used in this study.
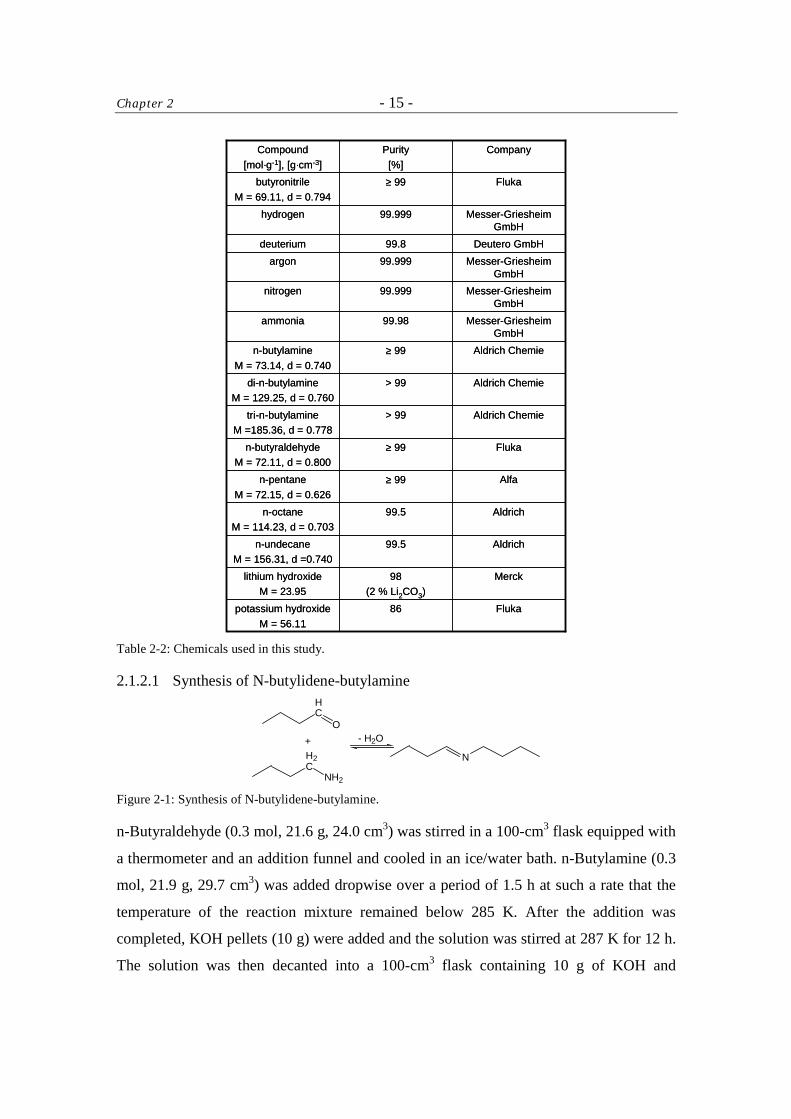
2.1.2.1 Synthesis of N-butylidene-butylamine HC
O
H2C
NH2
N
- H2O+
Figure 2-1: Synthesis of N-butylidene-butylamine.
n-Butyraldehyde (0.3 mol, 21.6 g, 24.0 cm3) was stirred in a 100-cm3 flask equipped with
a thermometer and an addition funnel and cooled in an ice/water bath. n-Butylamine (0.3
mol, 21.9 g, 29.7 cm3) was added dropwise over a period of 1.5 h at such a rate that the
temperature of the reaction mixture remained below 285 K. After the addition was
completed, KOH pellets (10 g) were added and the solution was stirred at 287 K for 12 h.
The solution was then decanted into a 100-cm3 flask containing 10 g of KOH and
Chapter 2 - 16 -
allowed to stand for 6 h in the freezer (271 K). Finally, the mixture was transferred into
another 100-cm3 flask and distilled through a 15-cm Vigreux column over a few KOH
pellets to give 5.99 g of N-butylidene-butylamine as a colorless liquid collected at 315 –
316 K (16 - 17 mbar) (16 % yield, purity ≥ 99 % according to the NMR spectrum). The
product was kept in the refrigerator (271 K) and used within of days.
2.2 Characterization of the Catalyst Samples
2.2.1 Elemental Analysis
Atomic absorption spectroscopy (AAS) is a technique for determining the concentration
of an element (usually metals and some metalloids) within a sample. AAS uses the
absorption of light to measure the concentration of gas-phase atoms. Ions or atoms in a
sample must undergo desolvation and vaporization in a high-temperature source such as a
flame or graphite furnace. Flame AA can only analyze solutions, while graphite furnace
AA can accept solutions, slurries, or solid samples. The amount of the LiOH deposited on
the surface of Raney-Co was measured by atomic adsorption spectroscopy on a
UNICAM 939 AA-Spectrometer. The concentration measurements were determined
from a working curve after calibrating the instrument with standards of known
concentration.
2.2.2 Surface Area and Porosity
The specific surface area (as) of a solid material is obtained by measuring the molecular
cross-sectional area occupied by adsorbate molecules in a complete monolayer [3]. The
monolayer capacity (nma) is defined as the amount of adsorbate required to form a
complete monolayer on the surface. Brunauer, Emmett and Teller derived an isothermal
equation describing the dynamic equilibrium of the multilayer adsorption [4]. Equation 2-
1 represents a linear form of that equation, where c is a constant. The intercept and the
tangent of α readily permit the calculation of nma.
( ) 00
0 11/1
/pp
cnc
cnppnpp
am
am
a ⋅⋅
−+⋅
=−
Equation 2-1
Chapter 2 - 17 -
Calculation methods for the pore volume use the Kelvin equation (Equation 2-2), where
rk, σ, vl are the Kelvin radius, surface tension of the liquid condensate and its molar
volume, respectively [5].
( )0/ln2
ppRTv
r lk
⋅⋅=
σ Equation 2-2
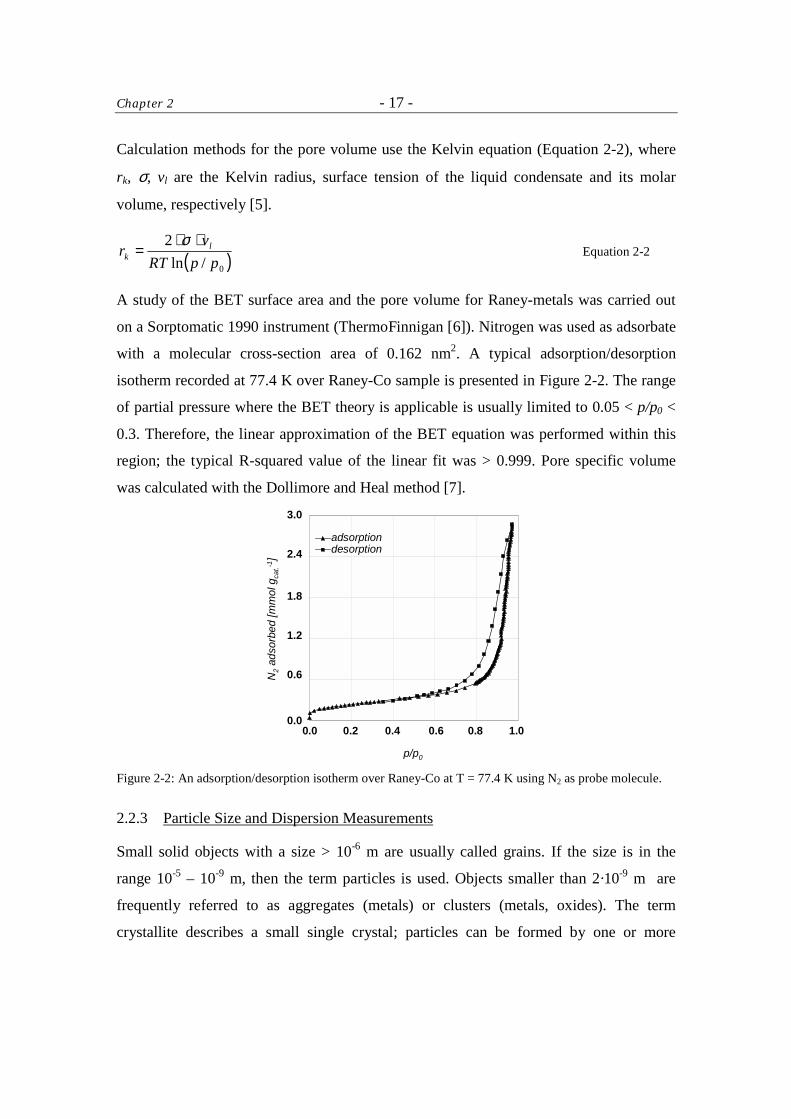
A study of the BET surface area and the pore volume for Raney-metals was carried out
on a Sorptomatic 1990 instrument (ThermoFinnigan [6]). Nitrogen was used as adsorbate
with a molecular cross-section area of 0.162 nm2. A typical adsorption/desorption
isotherm recorded at 77.4 K over Raney-Co sample is presented in Figure 2-2. The range
of partial pressure where the BET theory is applicable is usually limited to 0.05 < p/p0 <
0.3. Therefore, the linear approximation of the BET equation was performed within this
region; the typical R-squared value of the linear fit was > 0.999. Pore specific volume
was calculated with the Dollimore and Heal method [7].
p/p0
N2
adso
rbed
[mm
ol·g
cat.-1
]
0.0 0.80.2 0.4 0.6 1.0
3.0
2.4
1.8
1.2
0.6
0.0
adsorptiondesorption
Figure 2-2: An adsorption/desorption isotherm over Raney-Co at T = 77.4 K using N2 as probe molecule.
2.2.3 Particle Size and Dispersion Measurements
Small solid objects with a size > 10-6 m are usually called grains. If the size is in the
range 10-5 – 10-9 m, then the term particles is used. Objects smaller than 2·10-9 m are
frequently referred to as aggregates (metals) or clusters (metals, oxides). The term
crystallite describes a small single crystal; particles can be formed by one or more
Chapter 2 - 18 -
crystallites. The crystallite size of the Raney-cobalt was determined from the line
broadening in X-ray diffraction
2.2.3.1 X-Ray Diffraction Line Broadening Analysis (LBA) [8]
Considering an X-ray reflection on N lattice planes of spacing dhkl, Scherrer showed that
the thickness of a crystallite Lhkl = N·dhkl in the direction perpendicular to the diffracting
planes (hkl) can be obtained from the breadth β of the diffraction profile using the
relationship expressed in Equation 2-3:
0cosθβλ
⋅⋅= kLhkl Equation 2-3
where, k is a constant (shape factor), λ is the wavelength of the X-radiation employed,
and θ0 is the angular position of the peak maximum. The size of the crystallites is thus
inversely proportional to the breadth of the diffraction line.
Due to pyrophoric nature of the Raney-catalysts it was necessary to coat the powdered
catalyst with wax prior to examination. A sample of Raney-Co # 2700 (ca. 0.2 g) was
washed with ethanol (3 x 5 cm3) and decanted. The wet catalyst sample was then mixed
with molten wax (T ~ 373 K) and ethanol was allowed to evaporate. Finally, the
suspension was cooled down on a silicon wafer. The measurement was carried out on a
Semens D-5000 powder diffractometer. An estimate of the crystallite size was obtained
from X-ray LBA using the software package Diffract v.3.0. The true peak breadth was
found from the Warren formula (Equation 2-4) using cobalt foil (99.95 wt. % metal basis,
Alfa Aesar) as reference.
222referenceobserved βββ −= Equation 2-4
2.2.3.2 Hydrogen Chemisorption [9]
Formation of chemisorbed monolayer is the most frequently used method for
characterization of metallic catalysts. Generally, hydrogen adsorbs dissociatively on
metals according to Equation 2-5:
H2 + 2 M(s) � 2 M(s)-H
Equation 2-5: Hydrogen chemisorption on metal surfaces.
Chapter 2 - 19 -
From the volume of chemisorbed hydrogen required the formation of a monolayer vm
(cm3, STP) on a sample with mass m (g) containing metal M (g·mol-1) with loading wt.
(%), the metal dispersion D as a fraction of surface atoms is directly obtained from
Equation 2-6:
.100
224142
wtmMD m ⋅⋅⋅=ν Equation 2-6
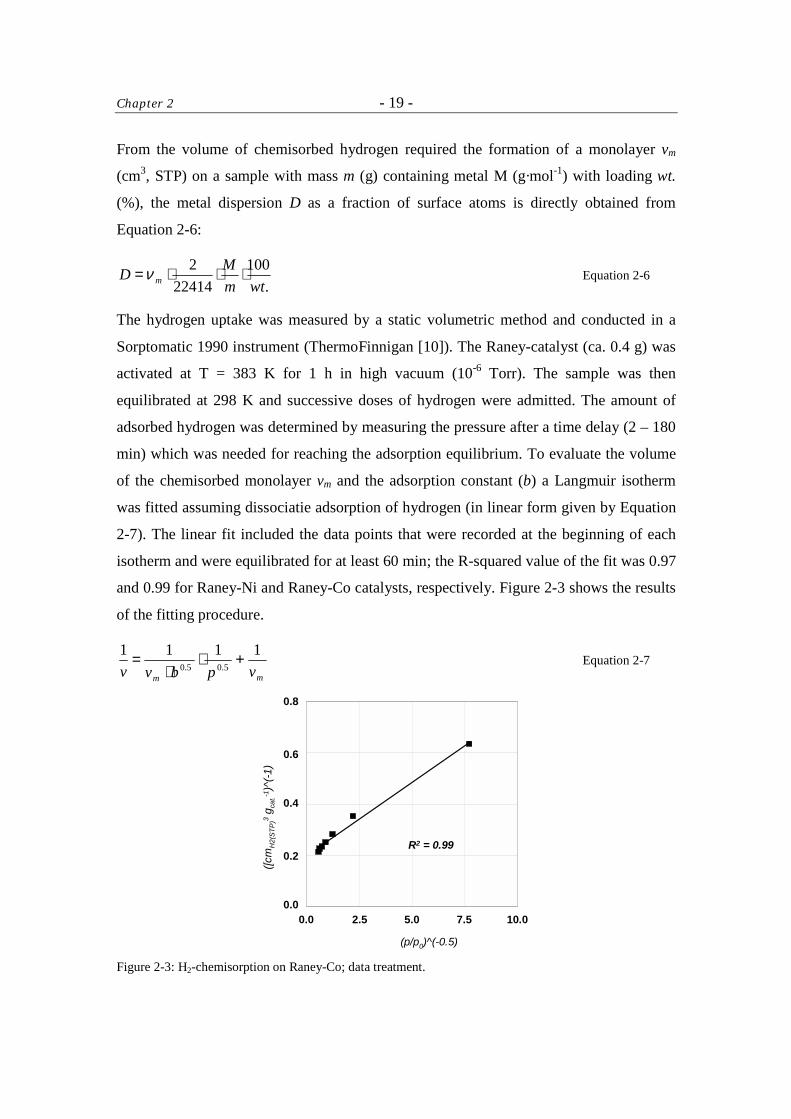
The hydrogen uptake was measured by a static volumetric method and conducted in a
Sorptomatic 1990 instrument (ThermoFinnigan [10]). The Raney-catalyst (ca. 0.4 g) was
activated at T = 383 K for 1 h in high vacuum (10-6 Torr). The sample was then
equilibrated at 298 K and successive doses of hydrogen were admitted. The amount of
adsorbed hydrogen was determined by measuring the pressure after a time delay (2 – 180
min) which was needed for reaching the adsorption equilibrium. To evaluate the volume
of the chemisorbed monolayer vm and the adsorption constant (b) a Langmuir isotherm
was fitted assuming dissociatie adsorption of hydrogen (in linear form given by Equation
2-7). The linear fit included the data points that were recorded at the beginning of each
isotherm and were equilibrated for at least 60 min; the R-squared value of the fit was 0.97
and 0.99 for Raney-Ni and Raney-Co catalysts, respectively. Figure 2-3 shows the results
of the fitting procedure.
mm vpbvv1111
5.05.0 +⋅⋅
= Equation 2-7
(p/p0)^(-0.5)
([cm
H2(
STP
)3 ·gca
t.-1)^
(-1)
0.0 10.02.5 5.0 7.5
0.8
0.6
0.4
0.2
0.0
R2 = 0.99
Figure 2-3: H2-chemisorption on Raney-Co; data treatment.
Chapter 2 - 20 -
The rate of rise of the Langmuir adsorption isotherm (b) in the region of low equilibrium
pressures is determined by the heat of adsorption (q) and the temperature (T) [11].
2.2.4 Temperature Programmed Desorption
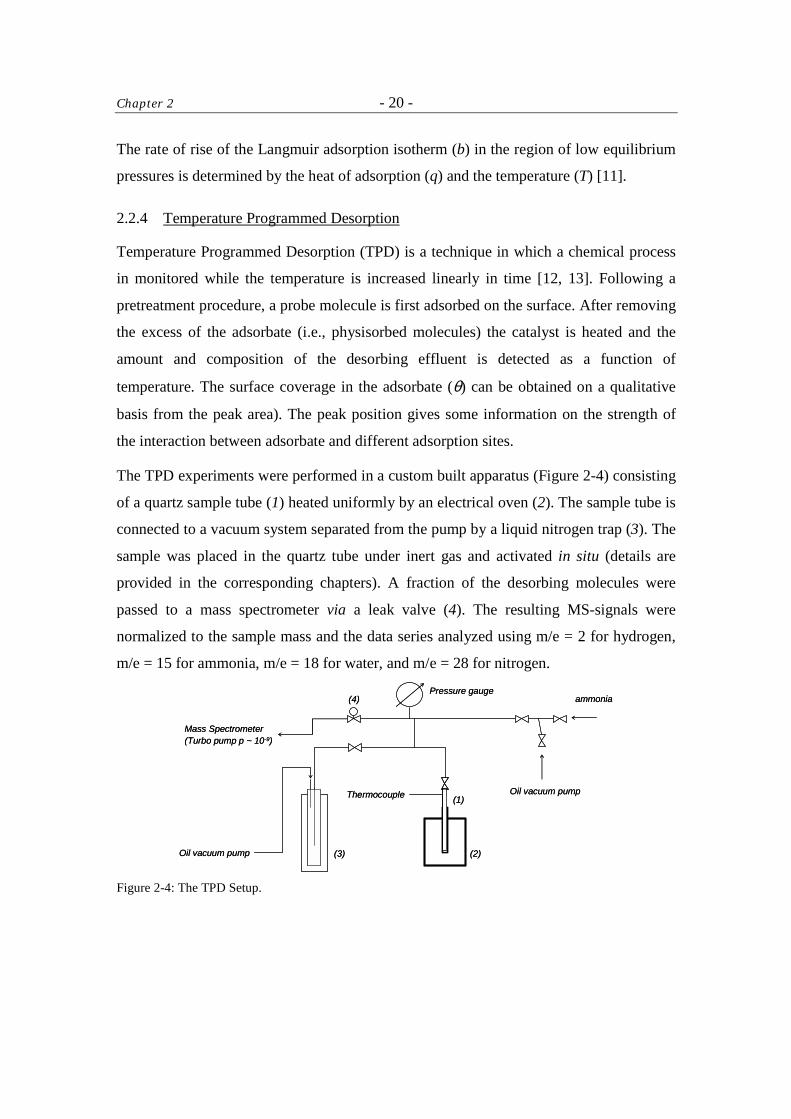
Temperature Programmed Desorption (TPD) is a technique in which a chemical process
in monitored while the temperature is increased linearly in time [12, 13]. Following a
pretreatment procedure, a probe molecule is first adsorbed on the surface. After removing
the excess of the adsorbate (i.e., physisorbed molecules) the catalyst is heated and the
amount and composition of the desorbing effluent is detected as a function of
temperature. The surface coverage in the adsorbate (θ) can be obtained on a qualitative
basis from the peak area). The peak position gives some information on the strength of
the interaction between adsorbate and different adsorption sites.
The TPD experiments were performed in a custom built apparatus (Figure 2-4) consisting
of a quartz sample tube (1) heated uniformly by an electrical oven (2). The sample tube is
connected to a vacuum system separated from the pump by a liquid nitrogen trap (3). The
sample was placed in the quartz tube under inert gas and activated in situ (details are
provided in the corresponding chapters). A fraction of the desorbing molecules were
passed to a mass spectrometer via a leak valve (4). The resulting MS-signals were
normalized to the sample mass and the data series analyzed using m/e = 2 for hydrogen,
m/e = 15 for ammonia, m/e = 18 for water, and m/e = 28 for nitrogen.
Oil vacuum pump
ammoniaPressure gauge
(4)
(1)
(3) (2)Oil vacuum pump
Mass Spectrometer(Turbo pump p ~ 10-9)
Thermocouple Oil vacuum pump
ammoniaPressure gauge
(4)
(1)
(3) (2)Oil vacuum pump
Mass Spectrometer(Turbo pump p ~ 10-9)
Thermocouple
Figure 2-4: The TPD Setup.
Chapter 2 - 21 -
2.2.5 Photoelectron Spectroscopy
With photoelectron spectroscopy, electrons are emitted by photoemmision, i.e., ionization
with photons. When X-rays are used as excitation source the information about the core
electrons of the sample is obtained. The kinetic energy of an emitted electron reflects the
immediate surroundings of the parent atom. The binding energy (BE) of the electron in
the parent atom is defined as equal to the difference between the initial photon energy
(hν, where ν is the frequency of the monochromatic radiation used) and the maximum
kinetic energy (KE) possessed by the electron when it is ejected (Equation 8) [14].
KEhBE −= ν Equation 2-8
In X-ray photoelectron spectroscopy (XPS), X-ray radiation (commonly Mg Kα (1254
eV, 0.98 nm) or Al Kα (1487 eV, 0.83 nm)) are used to eject inner electrons in the core
orbitals of atoms in the sample. The method is non-destructive and probes the material
surface. Sampling depth is typically 20 – 100 Å, however, it varies in dependence on
electron KE and material. Chemical shifts give information about oxidation states and
chemical environment. One of the drawbacks is that surface charging (for example that of
insulators) shifts BE scale. A simple method to remove the charging effect is the use of
the C 1s signal due to carbon contamination [15].
Leybold LH 10 surface analytic system was used for the measurement of the Raney-
catalyst surface composition by means of X-ray photoelectron spectroscopy (XPS). The
samples were deposited on an adhesive, conducting tape and transferred to the instrument
under protective atmosphere (Ar). Over each sample a survey spectra were collected. The
detail spectra were excited with the Al Kα source and recorded in ∆E = constant mode.
Repetitive scans of selected spectral regions and signal averaging were used in order to
obtain a sufficient signal-to-noise ratio. To compensate for the charging the C 1s signal at
285 eV due to carbon contamination was used as a reference. The spectra resolution was
0.5 eV.
Chapter 2 - 22 -
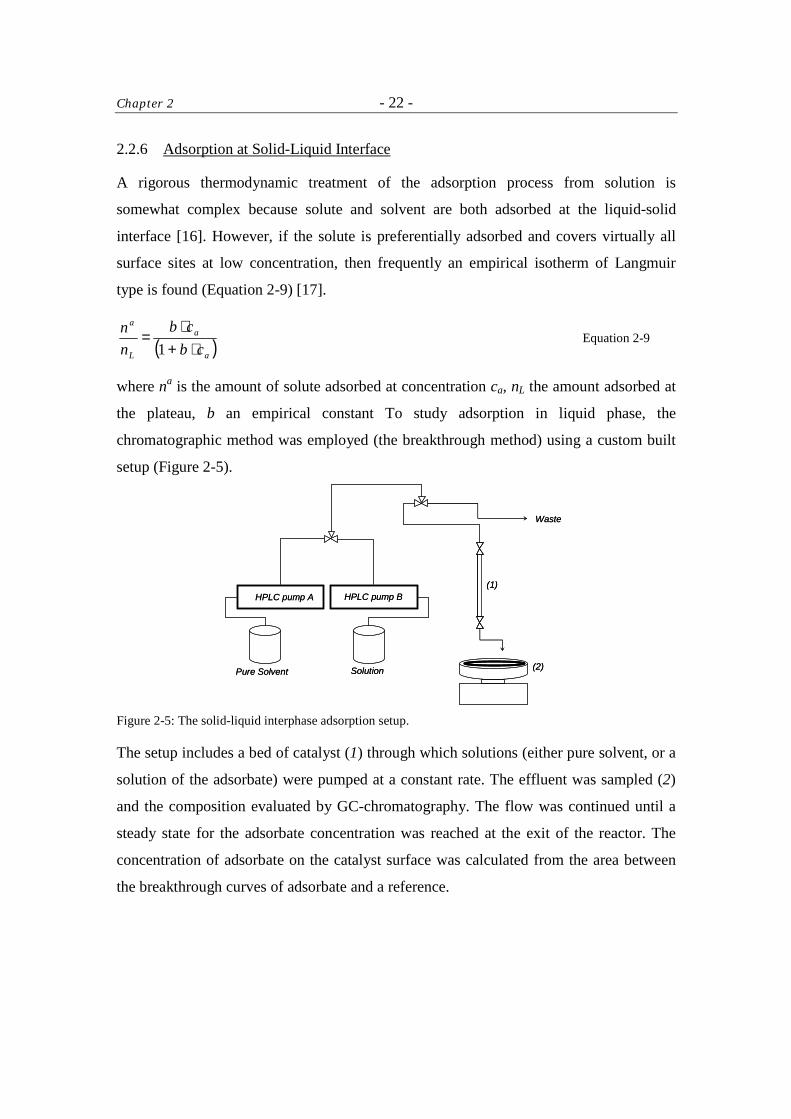
2.2.6 Adsorption at Solid-Liquid Interface
A rigorous thermodynamic treatment of the adsorption process from solution is
somewhat complex because solute and solvent are both adsorbed at the liquid-solid
interface [16]. However, if the solute is preferentially adsorbed and covers virtually all
surface sites at low concentration, then frequently an empirical isotherm of Langmuir
type is found (Equation 2-9) [17].
( )a
a
L
a
cbcb
nn
⋅+⋅
=1
Equation 2-9
where na is the amount of solute adsorbed at concentration ca, nL the amount adsorbed at
the plateau, b an empirical constant To study adsorption in liquid phase, the
chromatographic method was employed (the breakthrough method) using a custom built
setup (Figure 2-5).
(1)
(2)
Waste
HPLC pump A HPLC pump B
Pure Solvent Solution
(1)
(2)
Waste
HPLC pump A HPLC pump B
Pure Solvent Solution
Figure 2-5: The solid-liquid interphase adsorption setup.
The setup includes a bed of catalyst (1) through which solutions (either pure solvent, or a
solution of the adsorbate) were pumped at a constant rate. The effluent was sampled (2)
and the composition evaluated by GC-chromatography. The flow was continued until a
steady state for the adsorbate concentration was reached at the exit of the reactor. The
concentration of adsorbate on the catalyst surface was calculated from the area between
the breakthrough curves of adsorbate and a reference.
Chapter 2 - 23 -
2.2.7 Calorimetrically Measured Heat of Adsorption
Calorimetry is used to determine the heat released or absorbed in a chemical reaction. To
measure the heat of adsorption of butyronitrile over different catalyst sample a C80 II
Calvet Calorimeter was used (Setaram Scientific and Industrial Equipment
[18]).Calorimetric experiments were carried out in a C80 II Calvet Calorimeter (Setaram
Scientific and Industrial Equipment). For a typical calorimetric experiment catalyst
sample (0.5 g) was sealed under vacuum in a glass ampoule. The ampoule was placed in
a metal vessel and covered with butyronitrile (2.5 g). The vessel was closed and placed
inside the calorimeter together with a reference vessel of the same mass, and heated up to
371.85 K (ramp 1 K·min-1). The vessel was equilibrated at this temperature over 5 h. At
the end of the equilibration period the ampoule was broken and the heat flow was
recorded over next hours (2 - 3 h) until all the heat transfer effects ceased. An average of
2 - 3 results over each catalyst was taken as a measure of the heat of adsorption of
butyronitrile. The estimated error of the measurement was about 1 J·gcatalyst-1.
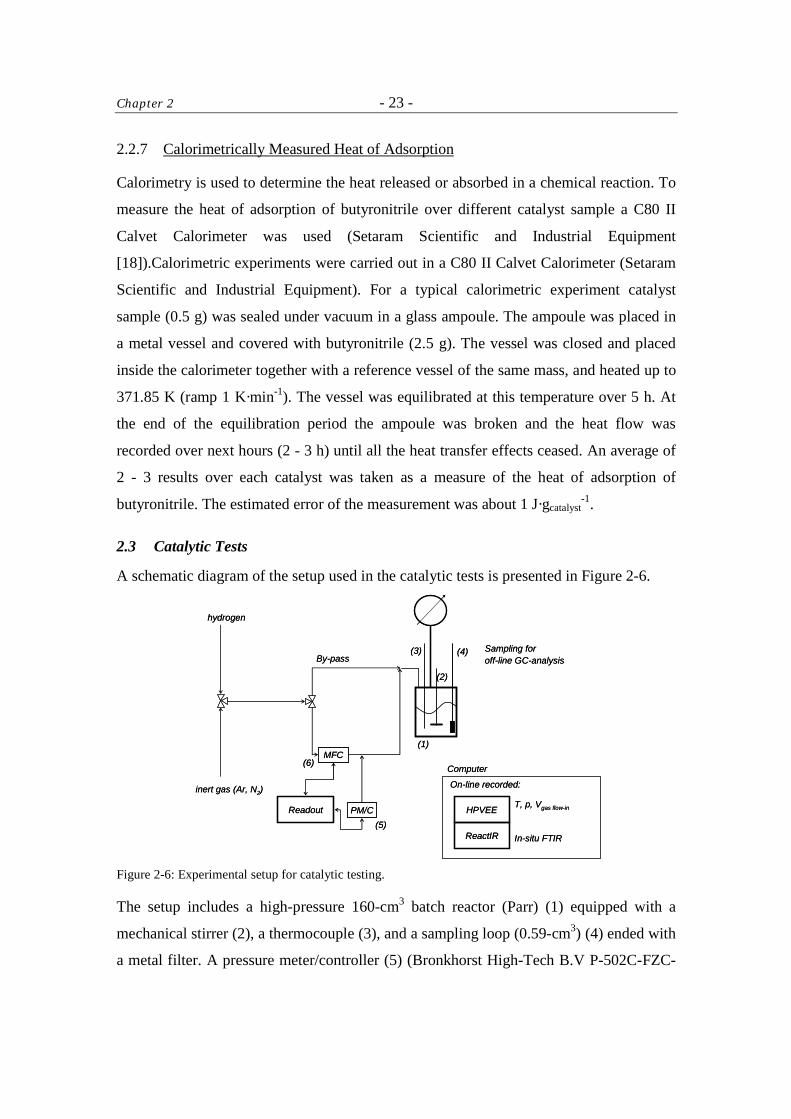
2.3 Catalytic Tests
A schematic diagram of the setup used in the catalytic tests is presented in Figure 2-6.
inert gas (Ar, N2)
MFC
PM/CReadout
hydrogen
(3)
(2)
(1)
(4)
(5)
(6)
HPVEE T, p, Vgas flow-in
Sampling foroff-line GC-analysis
In-situ FTIRReactIR
On-line recorded:
By-pass
Computer
inert gas (Ar, N2)
MFC
PM/CReadout
hydrogen
(3)
(2)
(1)
(4)
(5)
(6)
HPVEE T, p, Vgas flow-in
Sampling foroff-line GC-analysis
In-situ FTIRReactIR
On-line recorded:
By-pass
Computer
Figure 2-6: Experimental setup for catalytic testing.
The setup includes a high-pressure 160-cm3 batch reactor (Parr) (1) equipped with a
mechanical stirrer (2), a thermocouple (3), and a sampling loop (0.59-cm3) (4) ended with
a metal filter. A pressure meter/controller (5) (Bronkhorst High-Tech B.V P-502C-FZC-
Chapter 2 - 24 -
39-V) and a mass flow controller (6) (Bronkhorst High-Tech B.V. F-201C-FAC-33-V)
allowed to maintain a constant pressure during the experiments. The temperature,
pressure and hydrogen consumption were recorded on-line using a program written in
Hewlett-Packard Visual Engineering Environment (HP VEE 5.0). In conjunction with the
setup the composition of the reaction mixture was analyzed by in situ IR spectroscopy
using a diamond ATR crystal (ReactIR).
2.3.1 Catalytic Testing Procedure
The autoclave was charged at ambient conditions with catalyst suspended in the reaction
mixture. Then, the autoclave was pressurized several times with inert gas (up to 7.5 bar)
to expel air. If necessary, ammonia was then added from a loop with defined volume. The
reaction mixture was heated and allowed to equilibrate at the desired temperature. The
experiment was started by pressurizing the reactor with hydrogen: the reactor was filled
within several seconds to the desired hydrogen pressure via a by-pass. Subsequently the
hydrogen flow was switched to stream via the mass flow controller. The sampling
procedure for off-line GC-analysis was as follows: through a three-way valve a sample
was taken to the sample loop and released into a single use syringe. Then the loop was
cleaned with pentane (3 - 5 cm3) and flushed with dry air. The samples were sealed inside
1.5-cm3 vials. GC-analysis was performed on a HP Gas Chromatograph 5890 equipped
with Automatic Sampler and Injector HP 7673A using a 30-m RESTEK Rtx - 5 Amine
column. The GC temperature program was as follows: dwell 4 min at 313 K; ramp 15
K⋅min-1 up to 473 K, dwell 5.33 min at 473 K. The retention times for n-butylamine,
butyronitrile, N-butylidene-butylamine, di-n-butylamine and tri-n-butylamine were 5.9,
6.9, 11.75, 12.2, 15.4 minutes, respectively.
2.4 Characterization of the Catalytic Process with Vibrational Spectroscopy
Vibrational spectroscopy was used to provide both qualitative and quantitative
information on molecular species present during catalysis.
2.4.1 In Situ Attenuated Total Internal Reflectance Infrared Spectroscopy (ATR-IR)
Vibrations in a molecule can be excited by the absorption of photons of electromagnetic
radiation with wavelengths in the range: 500 to 1.1 µm (infrared region). A great
Chapter 2 - 25 -
advantage of IR spectroscopy is that the technique can be used to study a catalytic
process in situ. In particular, ATR-IR technique was employed to follow the
concentration of reactants in the liquid phase at high hydrogen pressure and temperature.
2.4.1.1 The Nature of ATR Spectra [19, 20]
Total internal reflection can occur on the interface of an IR-transparent crystal and a
sample. There are certain geometric requirements for this and importantly the refractive
index of the crystal must exceed that of the sample. Specifically, if the IR beam comes in
at incident angle αi , the condition for the total internal reflection is:
( )crystal
samplei n
n>αsin Equation 2-10
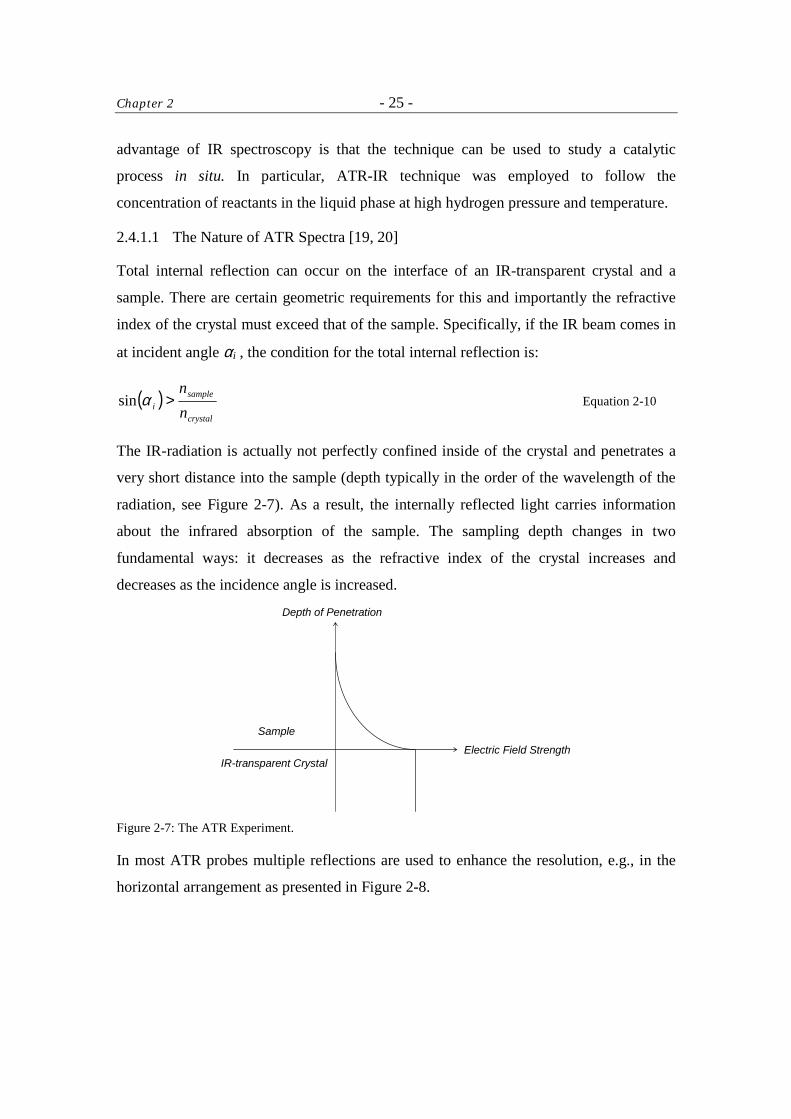
The IR-radiation is actually not perfectly confined inside of the crystal and penetrates a
very short distance into the sample (depth typically in the order of the wavelength of the
radiation, see Figure 2-7). As a result, the internally reflected light carries information
about the infrared absorption of the sample. The sampling depth changes in two
fundamental ways: it decreases as the refractive index of the crystal increases and
decreases as the incidence angle is increased.
IR-transparent Crystal
Sample
Electric Field Strength
Depth of Penetration
Figure 2-7: The ATR Experiment.
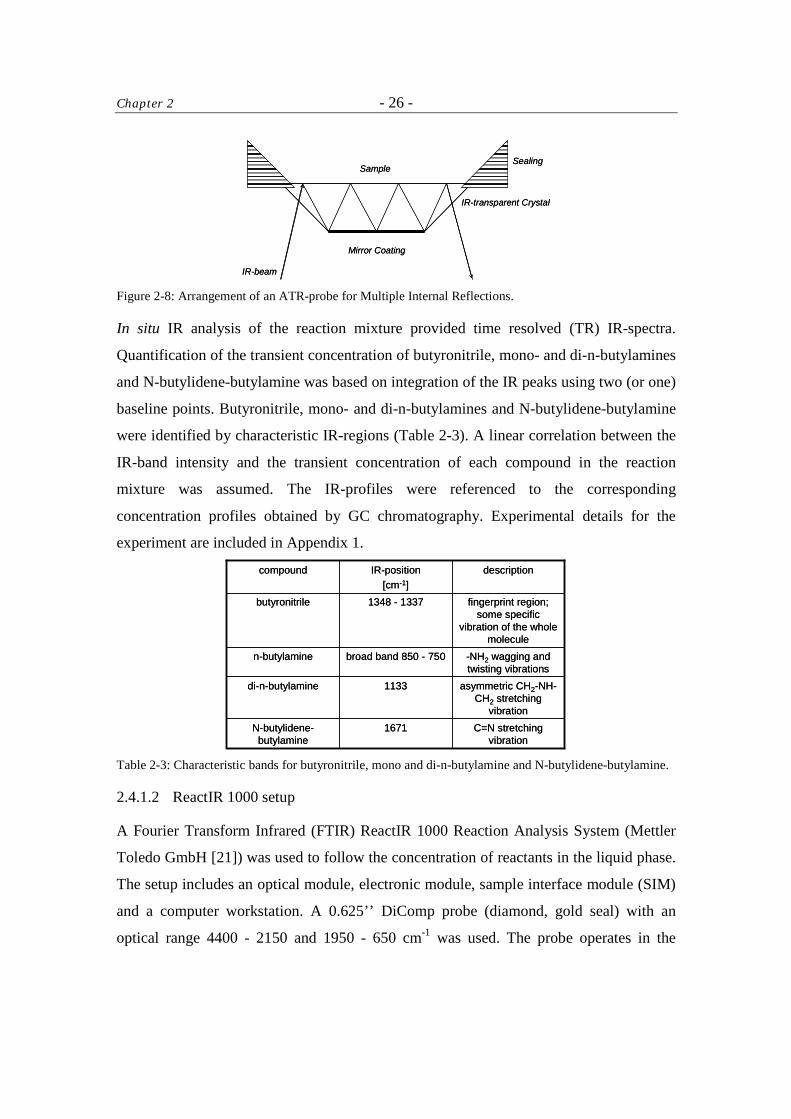
In most ATR probes multiple reflections are used to enhance the resolution, e.g., in the
horizontal arrangement as presented in Figure 2-8.
Chapter 2 - 26 -
IR-transparent Crystal
Sample
Mirror Coating
IR-beam
Sealing
IR-transparent Crystal
Sample
Mirror Coating
IR-beam
Sealing
Figure 2-8: Arrangement of an ATR-probe for Multiple Internal Reflections.
In situ IR analysis of the reaction mixture provided time resolved (TR) IR-spectra.
Quantification of the transient concentration of butyronitrile, mono- and di-n-butylamines
and N-butylidene-butylamine was based on integration of the IR peaks using two (or one)
baseline points. Butyronitrile, mono- and di-n-butylamines and N-butylidene-butylamine
were identified by characteristic IR-regions (Table 2-3). A linear correlation between the
IR-band intensity and the transient concentration of each compound in the reaction
mixture was assumed. The IR-profiles were referenced to the corresponding
concentration profiles obtained by GC chromatography. Experimental details for the
experiment are included in Appendix 1.
asymmetric CH2-NH-CH2 stretching
vibration
1133di-n-butylamine
C=N stretching vibration
1671N-butylidene-butylamine
-NH2 wagging and twisting vibrations
broad band 850 - 750n-butylamine
fingerprint region; some specific
vibration of the whole molecule
1348 - 1337butyronitrile
descriptionIR-position[cm-1]
compound
Table 2-3: Characteristic bands for butyronitrile, mono and di-n-butylamine and N-butylidene-butylamine.
2.4.1.2 ReactIR 1000 setup
A Fourier Transform Infrared (FTIR) ReactIR 1000 Reaction Analysis System (Mettler
Toledo GmbH [21]) was used to follow the concentration of reactants in the liquid phase.
The setup includes an optical module, electronic module, sample interface module (SIM)
and a computer workstation. A 0.625’’ DiComp probe (diamond, gold seal) with an
optical range 4400 - 2150 and 1950 - 650 cm-1 was used. The probe operates in the
Chapter 2 - 27 -
temperature range 193 – 523 K and pressure up to 100 bar. The software ReactIR v. 2.21
was used to analyze the infrared spectra collected.
2.4.2 Inelastic Neutron Scattering (INS)
Alternatively to absorption, an inelastic scattering can be used as a method for measuring
the vibrational spectrum. Here, the energy of incident and scattered quantum particles are
compared. The INS spectroscopy has no selection rules and is highly sensitive with
respect to hydrogen-involved motions.
2.4.2.1 The INS Theory [22]
James Chadwick was awarded the Nobel Price in Physics in 1935 for the discovery of the
neutron [23]. The most important feature of a neutron is that while passing through
matter, it loses energy in collisions with the atomic nuclei but not with the electrons as its
charge is zero. Neutrons possess a mass and a nuclear spin of ½. The collision of a
neutron with an atomic nucleus, although much more frequent than with an electron, is a
rare event, for the forces between a neutron and a nucleus are very small except at
distances of the order of 10-14 m. Thus, neutrons are highly penetrating and can be used as
nondestructive probes. Neutrons are quantum particles and their wavelengths (according
to the de Broglie relation) and energy at thermal equilibrium with the surrounding match
the typical interatomic spacing and excitation, respectively, in condensed matter. This is
in contrast to other probes which typically have either the appropriate wavelength range
(X-rays) or energy range (photons) but not both.
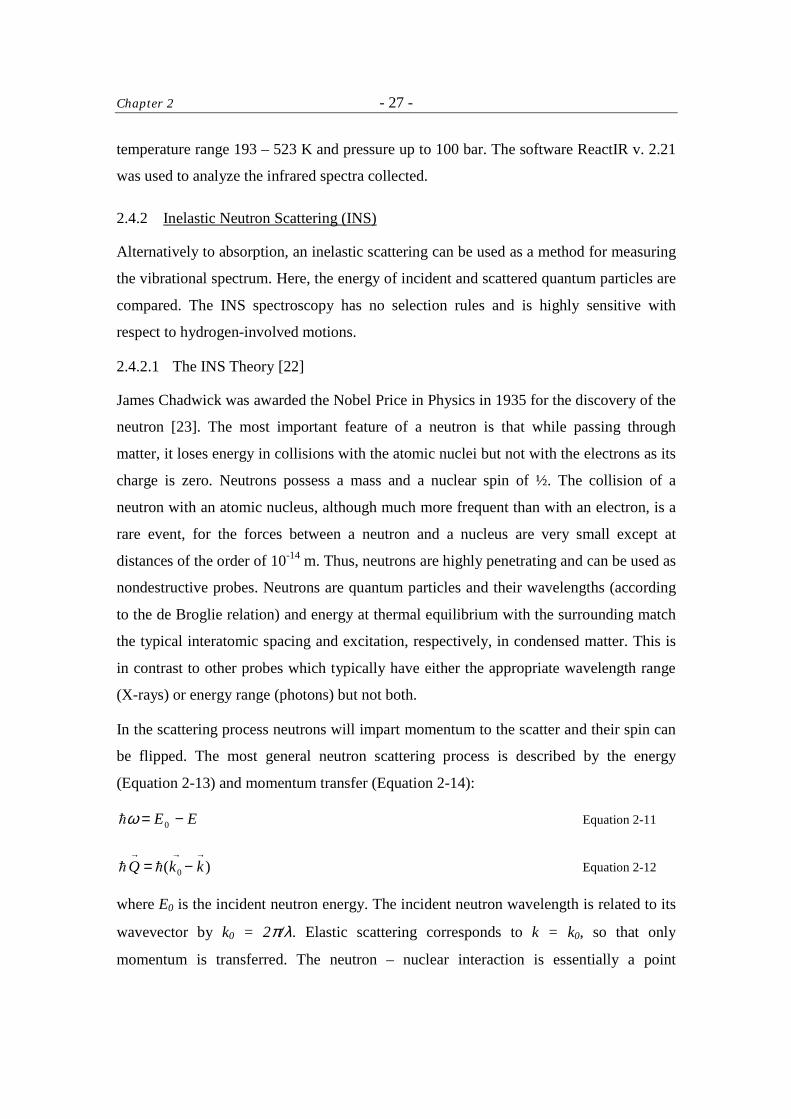
In the scattering process neutrons will impart momentum to the scatter and their spin can
be flipped. The most general neutron scattering process is described by the energy
(Equation 2-13) and momentum transfer (Equation 2-14):
EE −= 0ω� Equation 2-11
)( 0
→→→−= kkQ �� Equation 2-12
where E0 is the incident neutron energy. The incident neutron wavelength is related to its
wavevector by k0 = 2π/λ. Elastic scattering corresponds to k = k0, so that only
momentum is transferred. The neutron – nuclear interaction is essentially a point
Chapter 2 - 28 -
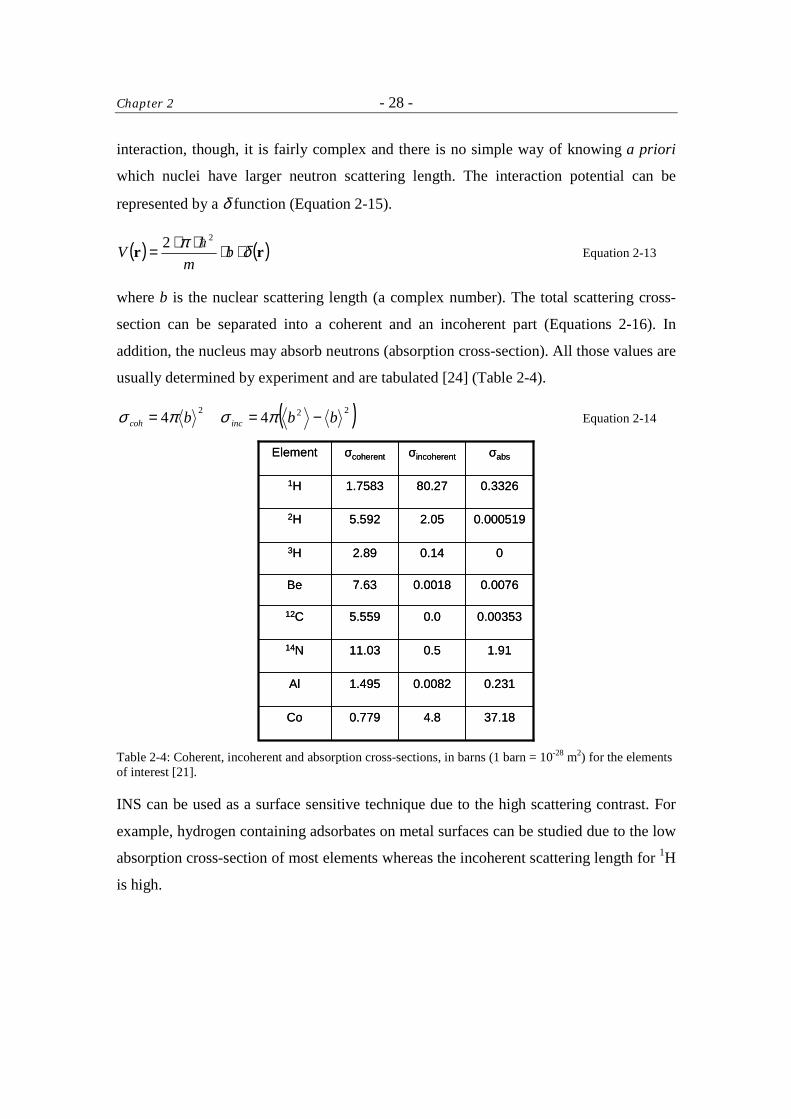
interaction, though, it is fairly complex and there is no simple way of knowing a priori
which nuclei have larger neutron scattering length. The interaction potential can be
represented by a δ function (Equation 2-15).
( ) ( )rr δπ ⋅⋅⋅⋅= bm
V22 �
Equation 2-13
where b is the nuclear scattering length (a complex number). The total scattering cross-
section can be separated into a coherent and an incoherent part (Equations 2-16). In
addition, the nucleus may absorb neutrons (absorption cross-section). All those values are
usually determined by experiment and are tabulated [24] (Table 2-4).
( )222 44 bbb inccoh −== πσπσ Equation 2-14
00.142.893H
37.184.80.779Co
0.2310.00821.495Al
1.910.511.0314N
0.003530.05.55912C
0.00760.00187.63Be
0.0005192.055.5922H
0.332680.271.75831H
σabsσincoherentσcoherentElement
00.142.893H
37.184.80.779Co
0.2310.00821.495Al
1.910.511.0314N
0.003530.05.55912C
0.00760.00187.63Be
0.0005192.055.5922H
0.332680.271.75831H
σabsσincoherentσcoherentElement
Table 2-4: Coherent, incoherent and absorption cross-sections, in barns (1 barn = 10-28 m2) for the elements of interest [21].
INS can be used as a surface sensitive technique due to the high scattering contrast. For
example, hydrogen containing adsorbates on metal surfaces can be studied due to the low
absorption cross-section of most elements whereas the incoherent scattering length for 1H
is high.
Chapter 2 - 29 -
2.4.2.2 The INS Spectrometer
The INS experiments were carried out at Institut Laue Langevin (ILL) (Grenoble/France).
Neutrons were provided by the high-flux reactor which operates at a thermal power of 58
MW using a single fuel-element with an operating cycle of 50 days [25, 26]. The INS
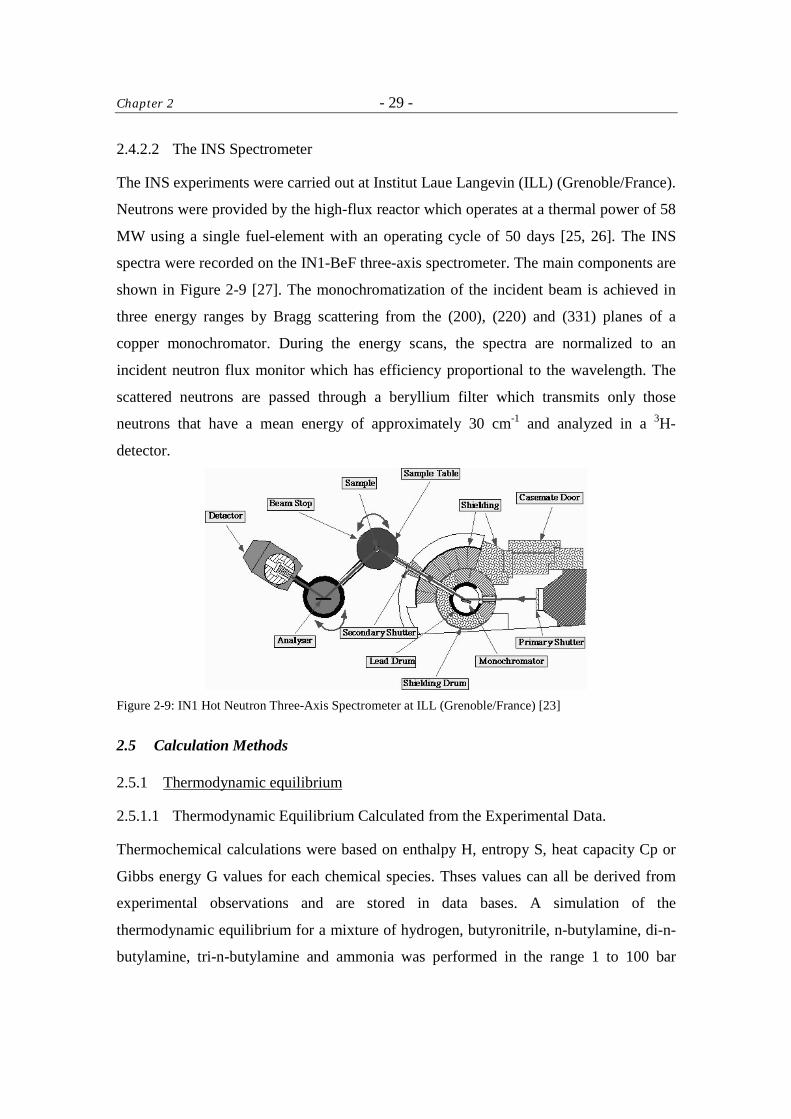
spectra were recorded on the IN1-BeF three-axis spectrometer. The main components are
shown in Figure 2-9 [27]. The monochromatization of the incident beam is achieved in
three energy ranges by Bragg scattering from the (200), (220) and (331) planes of a
copper monochromator. During the energy scans, the spectra are normalized to an
incident neutron flux monitor which has efficiency proportional to the wavelength. The
scattered neutrons are passed through a beryllium filter which transmits only those
neutrons that have a mean energy of approximately 30 cm-1 and analyzed in a 3H-
detector.
Figure 2-9: IN1 Hot Neutron Three-Axis Spectrometer at ILL (Grenoble/France) [23]
2.5 Calculation Methods
2.5.1 Thermodynamic equilibrium
2.5.1.1 Thermodynamic Equilibrium Calculated from the Experimental Data.
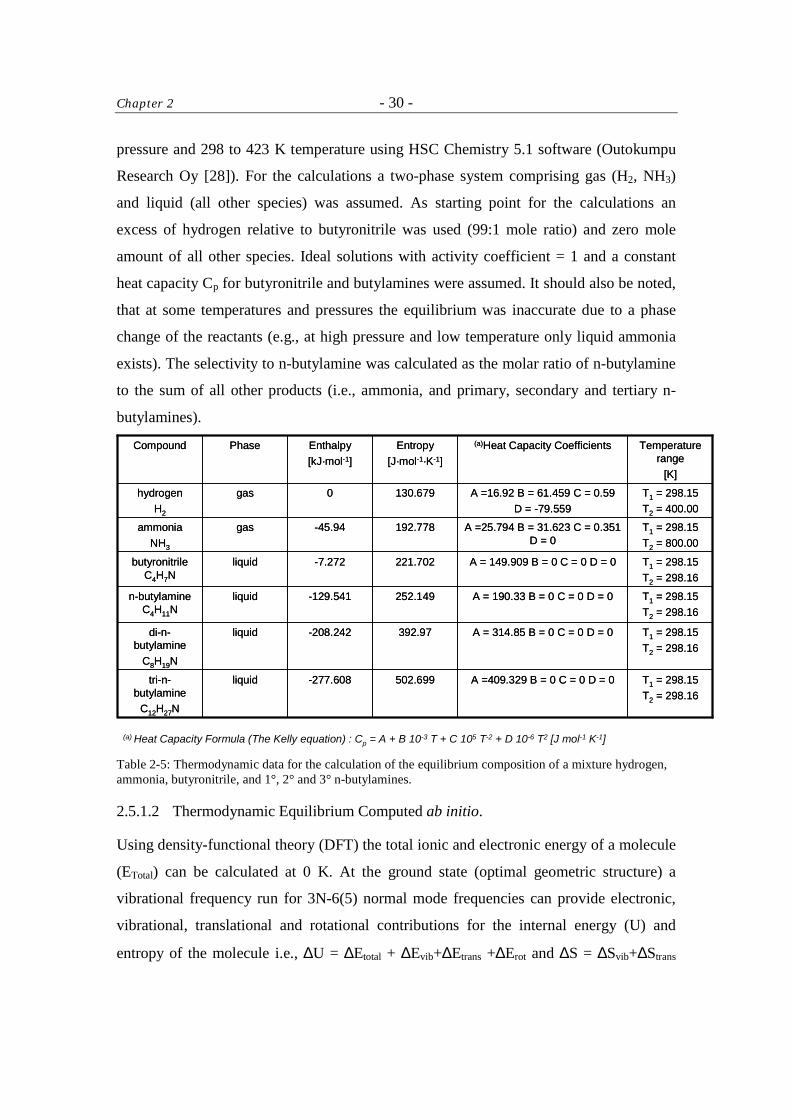
Thermochemical calculations were based on enthalpy H, entropy S, heat capacity Cp or
Gibbs energy G values for each chemical species. Thses values can all be derived from
experimental observations and are stored in data bases. A simulation of the
thermodynamic equilibrium for a mixture of hydrogen, butyronitrile, n-butylamine, di-n-
butylamine, tri-n-butylamine and ammonia was performed in the range 1 to 100 bar
Chapter 2 - 30 -
pressure and 298 to 423 K temperature using HSC Chemistry 5.1 software (Outokumpu
Research Oy [28]). For the calculations a two-phase system comprising gas (H2, NH3)
and liquid (all other species) was assumed. As starting point for the calculations an
excess of hydrogen relative to butyronitrile was used (99:1 mole ratio) and zero mole
amount of all other species. Ideal solutions with activity coefficient = 1 and a constant
heat capacity Cp for butyronitrile and butylamines were assumed. It should also be noted,
that at some temperatures and pressures the equilibrium was inaccurate due to a phase
change of the reactants (e.g., at high pressure and low temperature only liquid ammonia
exists). The selectivity to n-butylamine was calculated as the molar ratio of n-butylamine
to the sum of all other products (i.e., ammonia, and primary, secondary and tertiary n-
butylamines).
T1 = 298.15T2 = 298.16
A =409.329 B = 0 C = 0 D = 0502.699-277.608liquidtri-n-butylamine
C12H27N
T1 = 298.15T2 = 298.16
A = 314.85 B = 0 C = 0 D = 0392.97-208.242liquiddi-n-butylamine
C8H19N
T1 = 298.15T2 = 298.16
A = 190.33 B = 0 C = 0 D = 0252.149-129.541liquidn-butylamine C4H11N
T1 = 298.15T2 = 298.16
A = 149.909 B = 0 C = 0 D = 0221.702-7.272liquidbutyronitrile C4H7N
T1 = 298.15T2 = 800.00
A =25.794 B = 31.623 C = 0.351 D = 0
192.778-45.94gasammoniaNH3
T1 = 298.15T2 = 400.00
A =16.92 B = 61.459 C = 0.59D = -79.559
130.6790gashydrogenH2
Temperature range
[K]
(a)Heat Capacity CoefficientsEntropy[J·mol-1·K-1]
Enthalpy[kJ·mol-1]
Phase Compound
T1 = 298.15T2 = 298.16
A =409.329 B = 0 C = 0 D = 0502.699-277.608liquidtri-n-butylamine
C12H27N
T1 = 298.15T2 = 298.16
A = 314.85 B = 0 C = 0 D = 0392.97-208.242liquiddi-n-butylamine
C8H19N
T1 = 298.15T2 = 298.16
A = 190.33 B = 0 C = 0 D = 0252.149-129.541liquidn-butylamine C4H11N
T1 = 298.15T2 = 298.16
A = 149.909 B = 0 C = 0 D = 0221.702-7.272liquidbutyronitrile C4H7N
T1 = 298.15T2 = 800.00
A =25.794 B = 31.623 C = 0.351 D = 0
192.778-45.94gasammoniaNH3
T1 = 298.15T2 = 400.00
A =16.92 B = 61.459 C = 0.59D = -79.559
130.6790gashydrogenH2
Temperature range
[K]
(a)Heat Capacity CoefficientsEntropy[J·mol-1·K-1]
Enthalpy[kJ·mol-1]
Phase Compound
(a) Heat Capacity Formula (The Kelly equation) : Cp = A + B·10-3·T + C·105·T-2 + D·10-6·T2 [J·mol-1·K-1] Table 2-5: Thermodynamic data for the calculation of the equilibrium composition of a mixture hydrogen, ammonia, butyronitrile, and 1°, 2° and 3° n-butylamines.
2.5.1.2 Thermodynamic Equilibrium Computed ab initio.
Using density-functional theory (DFT) the total ionic and electronic energy of a molecule
(ETotal) can be calculated at 0 K. At the ground state (optimal geometric structure) a
vibrational frequency run for 3N-6(5) normal mode frequencies can provide electronic,
vibrational, translational and rotational contributions for the internal energy (U) and
entropy of the molecule i.e., ∆U = ∆Etotal + ∆Evib+∆Etrans +∆Erot and ∆S = ∆Svib+∆Strans
Chapter 2 - 31 -
+∆Srot, (at T = 0 K, S0 = 0), respectively. To determine ∆GT of a reaction from first
principles calculations one uses the relation: G = H - T⋅S and a thermodynamic cycle. In
the cycle ∆HT and ∆ST can be calculated knowing the reaction enthalpy and entropy at T0
and the heat capacities of the product and reactants between T0 and T.
In order to calculate thermodynamic properties of a molecule different Dmol3 software
from Cerius2 suite was used. Each run ‘Optimization & Frequency’ included (i.)
minimization of the energy for a molecule followed by (ii.) computation of the IR/Raman
frequencies of the system at the optimized geometry. Generalized gradient approximation
(gga) DFT method with Perdew-Wang 1991 (p91) Hamiltonian and double numeric
functions together with polarization functions atomic basis functions (DNP) in expansion
of molecular orbitals was used in the runs [29]. Finally, the equilibrium constant as a
function of temperature was calculated.
2.5.2 DFT Search for a Transition State
Feasibility and rate of a certain chemical reaction crucially depends on the transition state
energy and structure. A transition state (TS) is defined as the geometry at the energy peak
of a chemical reaction from reactant to product molecules. Halgren and Lipscomb [30]
introduced the linear synchronous transit (LST) and quadratic synchronous transit (QST)
methods for searching for the transition states. The LST method performs a linear
geometric interpolation between the reactant and product structures and a series of single
point energy calculations are performed to find the maximum energy along this path. The
energy of the system at this geometry gives an upper limit to the transition state energy.
For refining the LST transition state structure a single energy minimization is performed
in a direction perpendicular to the original LST path to yield a new intermediate
structure. A quadratic interpolation is then performed between the reactant, product and
this intermediate structure to define a QST path. Single point energy calculations are then
performed to obtain the maximum energy on the QST path. This procedure gives a
refined estimate for the transition state geometry and provides a good approximation of
the transition state energy.
A search for the TS of the tautomerization reaction from ethylideneamine to vinylamine
was done with Dmol3. Both reactants were optimized at the ground state (0 K) with DFT
Chapter 2 - 32 -
gga(p91) functional using double numeric (DN) atomic basis functions. Next, a run for
QST Transiton State search was performed. Finally, TS was optimized [31].
Acknowledgment
Xavier Hecht and Andreas Marx are thanked for the help during constructing of the
catalytic test setup and HPVEE programming. Martin Neukamm and Jan Prochazka
(Institut für Chemie Anorganischer Materialien, TUM) are thanked for the AAS and
XRD measurements, respectively. Alexander Guzman, Dr. Olaf Jaurich (Mettler Toledo)
and Carsten Minkley (Porotec) are thanked for the introduction to the TPD, ReactIR and
the Sorptomatic 1990 instruments, respectively. Dr. Maritza Veprek-Heijman (Institut für
Chemie Anorganischer Materialien, TUM) is thanked for the XPS measurement and help
with the data interpretation. Dr. Alexander Ivanov (Institut Laue-Langevin, France) is
thanked for supervising of the IN1-BeF spectrometer during the INS experiments.
References 1 http://www.gracedavison.com/
2 R.A. Benkeser and D.C. Snyder, J. Organomet. Chem. 225 (1982) 107
3 K.S.W. Sing and J. Rouquerol in: G. Ertl, H. Knözinger, J. Weitkamp (Eds.)
Handbook of Heterogeneous Catalysis Vol.2, VCH-Wiley, Weinheim, 1997, p. 429
4 S. Brunauer, P.H. Emmett and E. Teller, J. Am. Chem. Soc. 60 (1938) 309
5 K.S.W. Sing and J. Rouquerol in: G. Ertl, H. Knözinger, J. Weitkamp (Eds.)
Handbook of Heterogeneous Catalysis Vol.2, VCH-Wiley, Weinheim, 1997, p. 430
6 http://www.porotec.de/ and http://www.thermo.com/
7 D. Dollimore and G.R. Heal, J. Appl. Chem.14 (1964) 109
8 G. Bergeret and P. Gallezot in: G. Ertl, H. Knözinger, J. Weitkamp (Eds.) Handbook
of Heterogeneous Catalysis Vol.2, VCH-Wiley, Weinheim, 1997, p. 446 – 450
9 G. Bergeret and P. Gallezot in: G. Ertl, H. Knözinger, J. Weitkamp (Eds.) Handbook
of Heterogeneous Catalysis Vol.2, VCH-Wiley, Weinheim, 1997, p. 442 – 446
10 http://www.porotec.de/ and http://www.thermo.com/
11 G. Wedler, Chemisorption: An Experimental Approach, Butterworths, London, 1976,
22 – 32
Chapter 2 - 33 -
12 J.W. Niemantsverdriet, Spectroscopy in Catalysis – An Introduction, VCH-Wiley,
Weinheim, 1993, p. 11 – 35
13 J.L. Falconer and J.A. Schwarz, Catal. Rev. Sci. Eng. 25(2) (1983) 141
14 I.M. Campbell, Catalysis at Surfaces, Chapman and Hall Ltd., London and New
York, 1988, p. 115 - 116
15 G. Moretti, in: G. Ertl, H. Knözinger, J. Weitkamp (Eds.) Handbook of
Heterogeneous Catalysis Vol.2, VCH-Wiley, Weinheim, 1997, p. 632 – 641
16 A. Dabrowski and M. Jaroniec, Adv. Colloid Interface Sci. 31 (1990) 155
17 K.S.W. Sing and J. Rouquerol in: G. Ertl, H. Knözinger, J. Weitkamp (Eds.)
Handbook of Heterogeneous Catalysis Vol.2, VCH-Wiley, Weinheim, 1997, p. 435
18 http://www.setaram.fr
19 A. Shchegolikhin and O. Lazareva, Int. J. Vib. Spect. [www.ijvs.com] 1(4) (1997) 38
- 47
20 D. Coombs, Int. J. Vib. Spect. [www.ijvs.com] 2(2) (1998) 3 – 4
21 http://www.asirxn.com/
22 J. Eckert, Spectrochim. Acta 48 (1992) 271
23 J. Chadwick, Nobel Lecture entitled: ‘The neutron and its properties’ (1935)
24 http://www.ncnr.nist.gov/resources/n-lengths/list.html from Neutron News 3(3)
(1992) 29
25 Commissariat a l'Energie Atomique, Bulletin d'Informations Scientifiques et
Techniques (BIST), 165 (December 1971) and 166 (January 1971)
26 P. Ageron , Nucl. Instr. and Meth. A 284 (1989) 197199
27 The Yellow Book: Guide to Neutron Research Facilities at the ILL, Institut Max von
Laue-Paul Langevin, Grenoble-France, December 1997
28 http://www.outokumpu.com/
29 Accelrys Training Manual: Calculating free energies of chemical reactions, Catalysis
Consortium, Cambridge UK, February 2002
30 T.A. Halgren and W.N. Lipscomb, Chem. Phys. Lett. 49 (1977) 225
31 Accelrys Training Manual: Optimization and TS search using DMol3
- 34 -
Chapter 3 The performance of Raney-Ni, Raney-Co, Ni-Cr promoted Raney-Co and LiOH-
modified Raney-Co as catalysts in the hydrogenation of butyronitrile to n-
butylamine in a three-phase reactor was studied. Each catalyst was
characterized thoroughly to explain differences in the activity and the
selectivity.
The rate of the hydrogenation reaction depends on the fraction of the catalyst
BET area that is free from inactive multi-oxide deposits and is able to adsorb
the reactants. The adsorption of the reactants depends on the catalyst metal and
surface applied modifiers (i.e., LiOH). The selectivity of the reaction depends on
the rate of a bi-molecular side-reaction forming N-butylidene-butylamine. The
most important factor that controls the rate of the side-reaction is the surface
concentration in partially hydrogenated species. Later could be lowered by
doping cobalt catalysts with LiOH due to adsorption phenomena and an
increased ratio of reactive hydrogen to unsaturated surface-adsorbed species.
Chapter 3 - 35 -
3 Characterization of Raney-Ni and Raney-Co Catalysts and Their Use in the Selective Hydrogenation of Butyronitrile
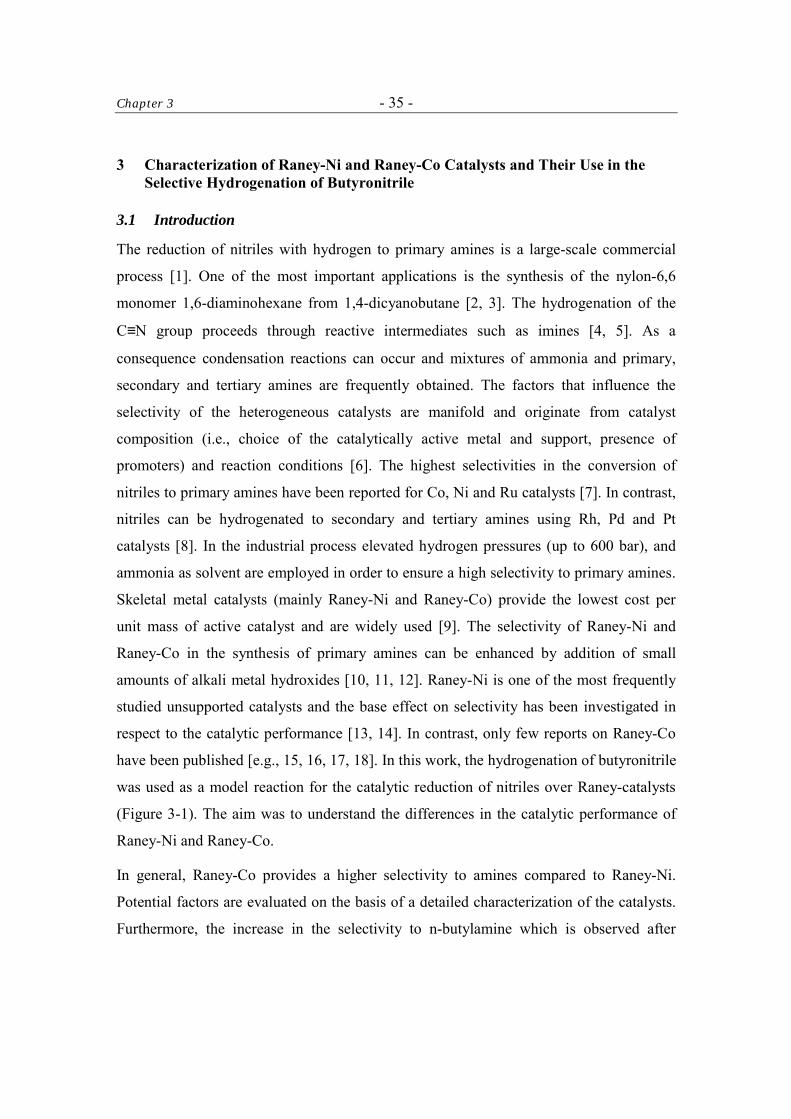
3.1 Introduction
The reduction of nitriles with hydrogen to primary amines is a large-scale commercial
process [1]. One of the most important applications is the synthesis of the nylon-6,6
monomer 1,6-diaminohexane from 1,4-dicyanobutane [2, 3]. The hydrogenation of the
C≡N group proceeds through reactive intermediates such as imines [4, 5]. As a
consequence condensation reactions can occur and mixtures of ammonia and primary,
secondary and tertiary amines are frequently obtained. The factors that influence the
selectivity of the heterogeneous catalysts are manifold and originate from catalyst
composition (i.e., choice of the catalytically active metal and support, presence of
promoters) and reaction conditions [6]. The highest selectivities in the conversion of
nitriles to primary amines have been reported for Co, Ni and Ru catalysts [7]. In contrast,
nitriles can be hydrogenated to secondary and tertiary amines using Rh, Pd and Pt
catalysts [8]. In the industrial process elevated hydrogen pressures (up to 600 bar), and
ammonia as solvent are employed in order to ensure a high selectivity to primary amines.
Skeletal metal catalysts (mainly Raney-Ni and Raney-Co) provide the lowest cost per
unit mass of active catalyst and are widely used [9]. The selectivity of Raney-Ni and
Raney-Co in the synthesis of primary amines can be enhanced by addition of small
amounts of alkali metal hydroxides [10, 11, 12]. Raney-Ni is one of the most frequently
studied unsupported catalysts and the base effect on selectivity has been investigated in
respect to the catalytic performance [13, 14]. In contrast, only few reports on Raney-Co
have been published [e.g., 15, 16, 17, 18]. In this work, the hydrogenation of butyronitrile
was used as a model reaction for the catalytic reduction of nitriles over Raney-catalysts
(Figure 3-1). The aim was to understand the differences in the catalytic performance of
Raney-Ni and Raney-Co.
In general, Raney-Co provides a higher selectivity to amines compared to Raney-Ni.
Potential factors are evaluated on the basis of a detailed characterization of the catalysts.
Furthermore, the increase in the selectivity to n-butylamine which is observed after
Chapter 3 - 36 -
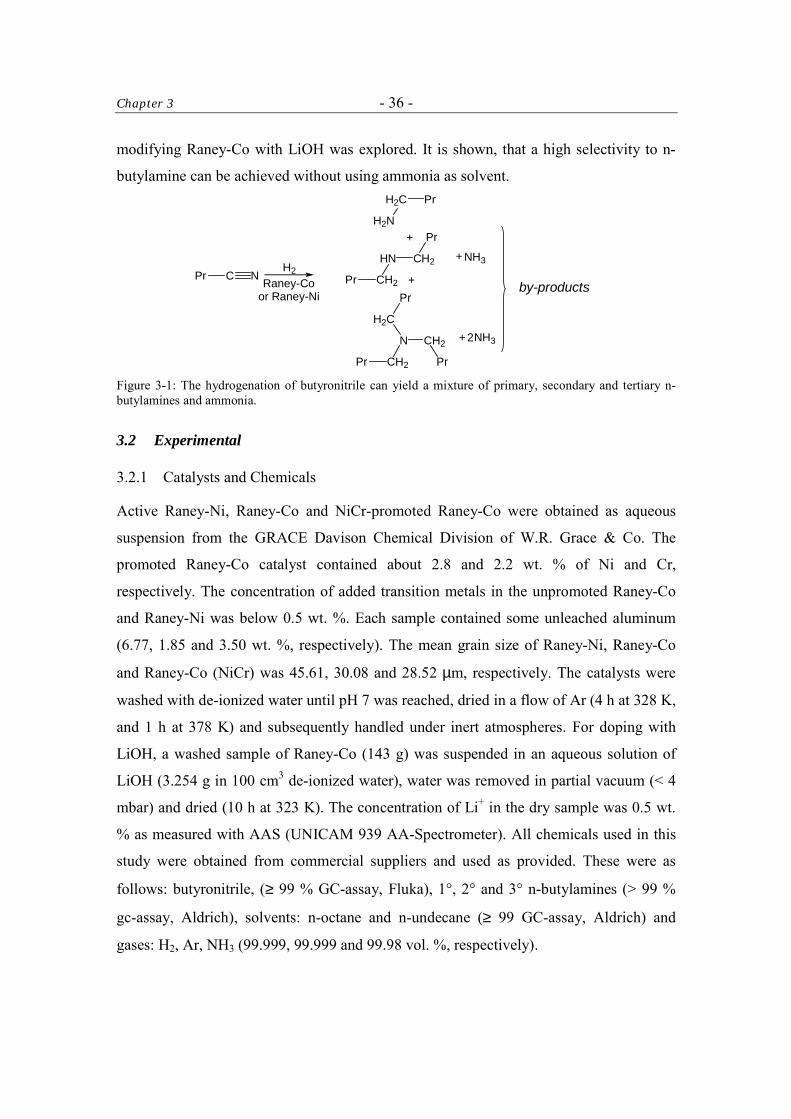
modifying Raney-Co with LiOH was explored. It is shown, that a high selectivity to n-
butylamine can be achieved without using ammonia as solvent.
by-productsC NPr
H2CH2
HN
Pr
CH2
Pr
CH2
N
Pr
CH2
H2C
Pr
Pr
H2C
H2N
Pr
NH3
NH3
+
+
+
+ 2
Raney-Coor Raney-Ni
Figure 3-1: The hydrogenation of butyronitrile can yield a mixture of primary, secondary and tertiary n-butylamines and ammonia.
3.2 Experimental
3.2.1 Catalysts and Chemicals
Active Raney-Ni, Raney-Co and NiCr-promoted Raney-Co were obtained as aqueous
suspension from the GRACE Davison Chemical Division of W.R. Grace & Co. The
promoted Raney-Co catalyst contained about 2.8 and 2.2 wt. % of Ni and Cr,
respectively. The concentration of added transition metals in the unpromoted Raney-Co
and Raney-Ni was below 0.5 wt. %. Each sample contained some unleached aluminum
(6.77, 1.85 and 3.50 wt. %, respectively). The mean grain size of Raney-Ni, Raney-Co
and Raney-Co (NiCr) was 45.61, 30.08 and 28.52 µm, respectively. The catalysts were
washed with de-ionized water until pH 7 was reached, dried in a flow of Ar (4 h at 328 K,
and 1 h at 378 K) and subsequently handled under inert atmospheres. For doping with
LiOH, a washed sample of Raney-Co (143 g) was suspended in an aqueous solution of
LiOH (3.254 g in 100 cm3 de-ionized water), water was removed in partial vacuum (< 4
mbar) and dried (10 h at 323 K). The concentration of Li+ in the dry sample was 0.5 wt.
% as measured with AAS (UNICAM 939 AA-Spectrometer). All chemicals used in this
study were obtained from commercial suppliers and used as provided. These were as
follows: butyronitrile, (≥ 99 % GC-assay, Fluka), 1°, 2° and 3° n-butylamines (> 99 %
gc-assay, Aldrich), solvents: n-octane and n-undecane (≥ 99 GC-assay, Aldrich) and
gases: H2, Ar, NH3 (99.999, 99.999 and 99.98 vol. %, respectively).
Chapter 3 - 37 -
3.2.2 Setups and Experimental Procedures
Powder X-ray diffraction using Siemens D-5000 powder diffractometer was done on a
wax-coated sample of Raney-Co.
The BET and H2-chemisorption measurements were carried out in a fully computerized
Sorptomatic 1990 instrument (ThermoFinnigan). The catalyst samples (ca. 1 and 0.4 g,
respectively) were outgassed in high vacuum using turbomolecular pump for 1 h at the
desired temperature of activation (298 – 633 K). The BET measurements were carried out
at T = 77 K using N2 as probe molecule. The H2-chemisorption isotherms were recorded
at T = 298 K, allowing to equilibrate between 2 and 180 min for each equilibration point.
Temperature programmed desorption measurements were carried out in a custom built
vacuum setup (Figure 2-4). For TPD of residual adsorbates (i.e., hydrogen and water), the
catalysts sample (ca. 50 mg) was outgassed for 8 h at 378(5) K. Then the temperature was
raised with an increment of 10 K·min-1 up to 973 K. The mass spectrometer (MS) signal
for m/z+ = 2 and 18 was used to monitor hydrogen and water, respectively. The relative
number of desorbing molecules was estimated from the area under the corresponding MS
trace. To determine the location of the desorption maxima each MS trace was fitted with
Gaussian curves. For NH3-TPD experiments, samples (ca. 100 mg) were outgassed and
heated at 5 K⋅min-1 up to 473 K. After maintaining this temperature for 5 min the sample
was cooled to 423(5) K at which temperature it was left in dynamic vacuum for ca. 12 h.
Subsequently, the sample was equilibrated with ammonia (T = 423 K, pNH3 = 1 ± 0.3
mbar, 1 h) and outgassed for another 3 h. Finally, the sample was heated (10 K⋅min-1) and
desorption of ammonia was followed with MS using m/z+ = 15.
For X-ray photoelectron spectroscopy (XPS) a Leybold LH 10 surface analytic system
was used. The samples were deposited on an adhesive, conducting tape and transferred to
the instrument under Argon. For each sample a survey spectrum was collected. The
detailed spectra were excited with an Al Kα (1486.6 eV, 0.83 nm) source and recorded
in ∆E = constant mode. Repetitive scans of selected spectral regions and signal averaging
were used in order to obtain a sufficient signal-to-noise ratio. To compensate for charging
the C 1s signal at 285 eV due to carbon contamination was used as a reference [19]. The
spectral resolution was 0.5 eV.
Chapter 3 - 38 -
Adsorption study at liquid-solid interphase was carried out in a custom built setup (Figure
2-5). For the adsorption isotherms (at T = 293 K) a chromatographic column of the
catalyst (ca. 2.5 g) was equilibrated with pure solvent. A solution of the adsorbate and
octane (both 12.5 mmol.dm-3) in pentane was passed at constant rate (2.2-2.3 cm3.min-1)
over the column. The effluent was sampled every 0.2 min and the composition evaluated
by gas chromatography. The concentration of the adsorbate was then increased step-wise
to 25, 50, 75 or 100 mmol.dm-3 and the flow continued until a steady state for the
adsorbate concentration was reached at the exit of the reactor. To follow the
characteristics of the setup, the concentration of a weakly adsorbing marker (octane) was
increased in parallel to the adsorbate. In order to estimate the competitive sorption of two
adsorbates, an equimolar solution of n-butylamine and butyronitrile was passed over the
catalyst column. The reversibility of the adsorption of n-butylamine and butyronitrile on
parent and LiOH-modified catalyst surface was also tested. First, a solution of the
adsorbate (either n-butylamine or butyronitrile) was pumped through the catalyst column.
Once the breakthrough of the reference and the adsorbate was observed and a steady state
was reached at the outlet of the column, the pure solvent was passed over the column.
The concentration of adsorbate on the catalyst surface in the adsorption experiment was
calculated from the area between the breakthrough curves of adsorbate and reference.
Calorimetric experiments were carried out in a C80 II Calvet Calorimeter (Setaram
Scientific and Industrial Equipment). The catalyst (0.5 g) was sealed under vacuum in a
glass ampoule. The ampoule was placed in the sample holder and covered with
butyronitrile (2.5 g). The vessel was closed and placed inside the calorimeter together
with a reference vessel of the same mass, and heated to 371.85 K (1 K·min-1). The vessel
was equilibrated at this temperature over 5 h. The ampoule was broken and the heat flow
was recorded over 2 - 3 h until all heat transfer effects had ceased. The average of 2 - 3
measurements is stated as the heat of adsorption of butyronitrile. The estimated error of
the measurement was about 1 J·gcatalyst-1.
The hydrogenation of butyronitrile was carried out in a high-pressure 160-cm3 semi-batch
reactor at constant hydrogen pressure. The reactor was equipped with a mechanical
stirrer, a thermocouple, and a sampling loop (Figure 2-6). A test on mass transfer
limitations showed that the reaction rate for the hydrogenation of butyronitrile over
Chapter 3 - 39 -
Raney-Co at 393 K did not depend on the stirring speed in the range 1000 – 1850 rpm.
Because of the lower rate of reaction at lower temperatures used in this study no mass
transfer limitations were projected. The reactor was charged with a suspension of the
catalyst (0.200 g) in octane. The mixture was outgassed and butyronitrile added under a
flow of argon. The mixture was stirred at 1500 rpm and equilibrated at the desired
reaction temperature for 45 - 60 min. Introduction of hydrogen was defined as the start of
the hydrogenation. During the experiment a number of samples were taken for off-line
GC-analysis. The GC-samples were analyzed with HP Gas Chromatograph 5890
equipped with a crosslinked 5% diphenyl-95% dimethyl-polysiloxane column 30 m,
Restek GmbH, Rtx-5 Amine. n-Undecane was used as an internal standard. The
hydrogenation of butyronitrile in dependence on the starting concentration of
butyronitrile (0.25, 0.50 and 0.75 mol·dm-3), the hydrogen pressure (15, 30 and 45 bar)
and the reaction temperature (353, 373 and 383 K) was tested.
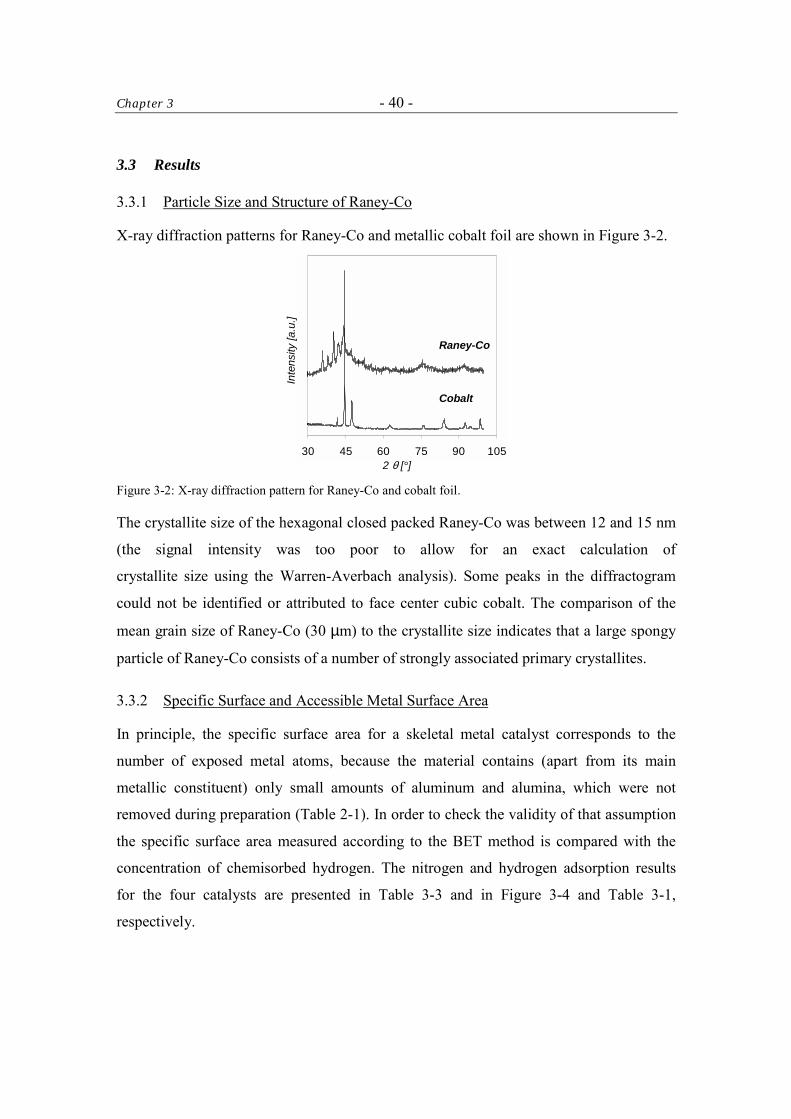
Chapter 3 - 40 -
3.3 Results
3.3.1 Particle Size and Structure of Raney-Co
X-ray diffraction patterns for Raney-Co and metallic cobalt foil are shown in Figure 3-2.
30 45 60 75 90 1052 θ [°]
Inte
nsity
[a.u
.]
Cobalt
Raney-Co
Figure 3-2: X-ray diffraction pattern for Raney-Co and cobalt foil.
The crystallite size of the hexagonal closed packed Raney-Co was between 12 and 15 nm
(the signal intensity was too poor to allow for an exact calculation of
crystallite size using the Warren-Averbach analysis). Some peaks in the diffractogram
could not be identified or attributed to face center cubic cobalt. The comparison of the
mean grain size of Raney-Co (30 µm) to the crystallite size indicates that a large spongy
particle of Raney-Co consists of a number of strongly associated primary crystallites.
3.3.2 Specific Surface and Accessible Metal Surface Area
In principle, the specific surface area for a skeletal metal catalyst corresponds to the
number of exposed metal atoms, because the material contains (apart from its main
metallic constituent) only small amounts of aluminum and alumina, which were not
removed during preparation (Table 2-1). In order to check the validity of that assumption
the specific surface area measured according to the BET method is compared with the
concentration of chemisorbed hydrogen. The nitrogen and hydrogen adsorption results
for the four catalysts are presented in Table 3-3 and in Figure 3-4 and Table 3-1,
respectively.
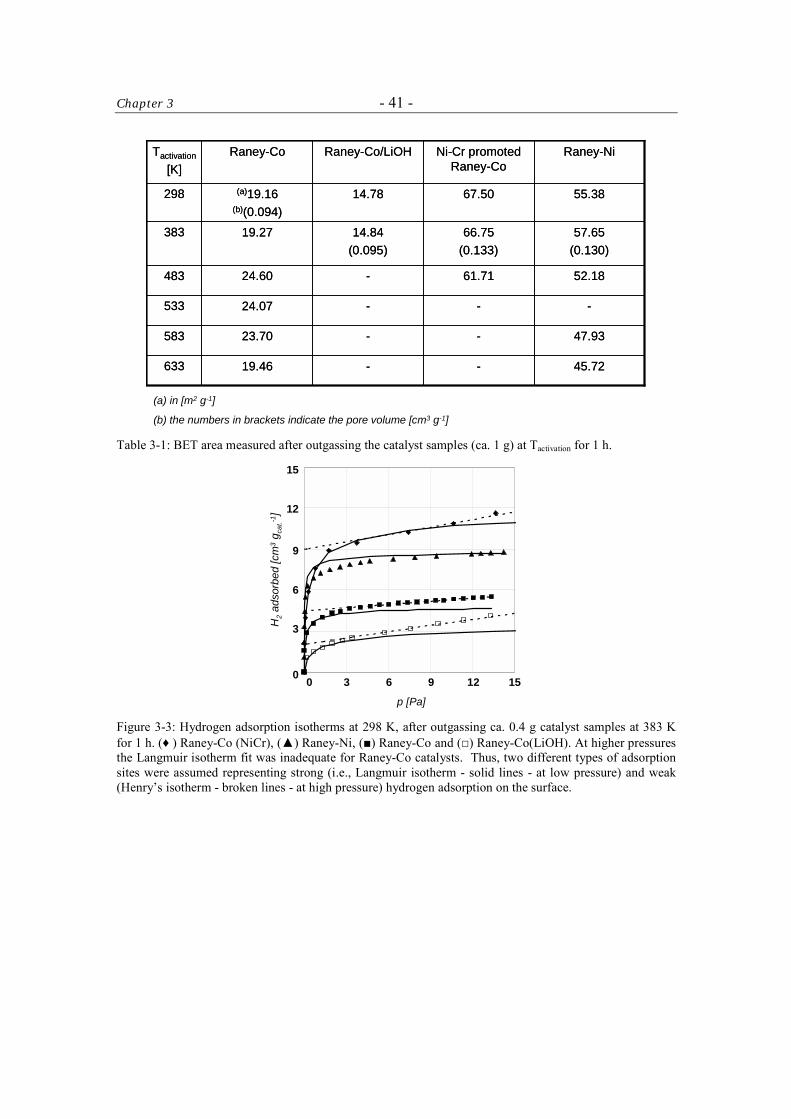
Chapter 3 - 41 -
---24.07533
47.93--23.70583
45.72--19.46633
52.1861.71-24.60483
57.65(0.130)
66.75(0.133)
14.84(0.095)
19.27383
55.3867.5014.78(a)19.16(b)(0.094)
298
Raney-NiNi-Cr promoted Raney-Co
Raney-Co/LiOHRaney-CoTactivation
[K]
---24.07533
47.93--23.70583
45.72--19.46633
52.1861.71-24.60483
57.65(0.130)
66.75(0.133)
14.84(0.095)
19.27383
55.3867.5014.78(a)19.16(b)(0.094)
298
Raney-NiNi-Cr promoted Raney-Co
Raney-Co/LiOHRaney-CoTactivation
[K]
(a) in [m2·g-1]
(b) the numbers in brackets indicate the pore volume [cm3·g-1] Table 3-1: BET area measured after outgassing the catalyst samples (ca. 1 g) at Tactivation for 1 h.
p [Pa]
H2
adso
rbed
[cm
3 ·gca
t.-1]
0 123 6 9 15
15
12
9
6
3
0
Figure 3-3: Hydrogen adsorption isotherms at 298 K, after outgassing ca. 0.4 g catalyst samples at 383 K for 1 h. (♦ ) Raney-Co (NiCr), (▲) Raney-Ni, (■) Raney-Co and (□) Raney-Co(LiOH). At higher pressures the Langmuir isotherm fit was inadequate for Raney-Co catalysts. Thus, two different types of adsorption sites were assumed representing strong (i.e., Langmuir isotherm - solid lines - at low pressure) and weak (Henry’s isotherm - broken lines - at high pressure) hydrogen adsorption on the surface.
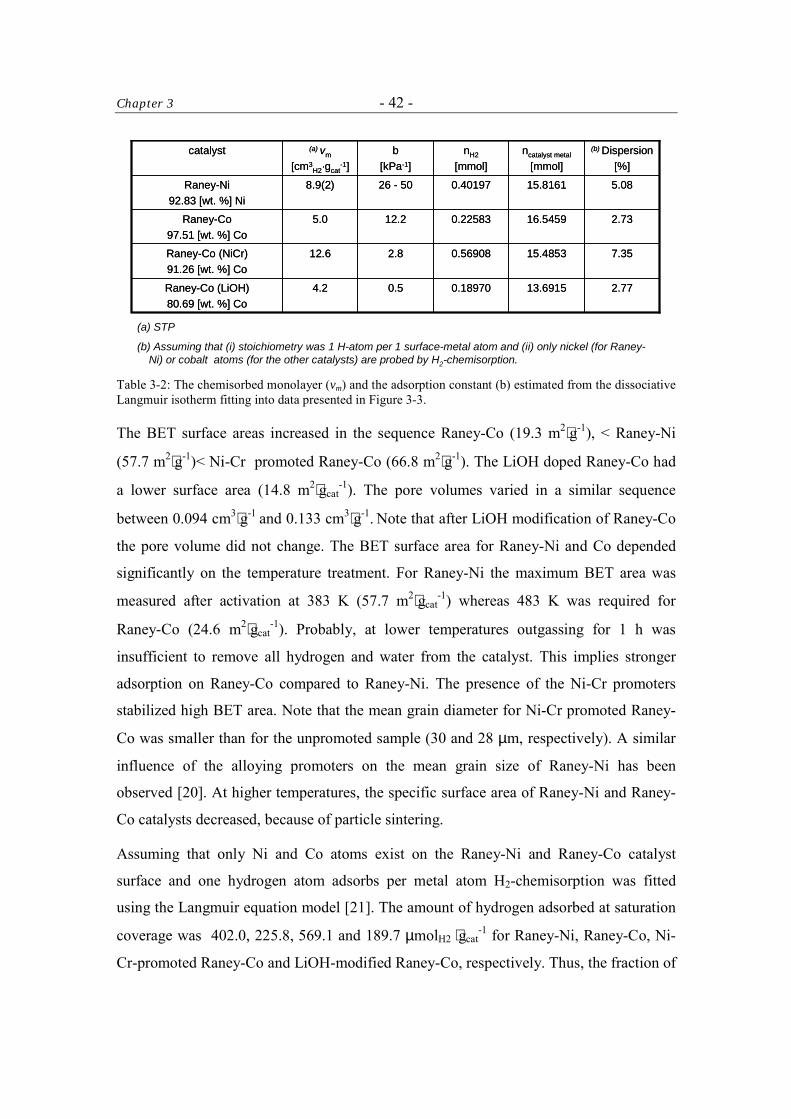
Chapter 3 - 42 -
(a) STP
(b) Assuming that (i) stoichiometry was 1 H-atom per 1 surface-metal atom and (ii) only nickel (for Raney-Ni) or cobalt atoms (for the other catalysts) are probed by H2-chemisorption.
7.3515.48530.569082.812.6Raney-Co (NiCr)91.26 [wt. %] Co
2.7713.69150.189700.54.2Raney-Co (LiOH)80.69 [wt. %] Co
16.5459
15.8161
ncatalyst metal
[mmol]
2.730.2258312.25.0Raney-Co97.51 [wt. %] Co
5.080.4019726 - 508.9(2)Raney-Ni92.83 [wt. %] Ni
(b) Dispersion[%]
nH2
[mmol]b
[kPa-1]
(a) vm
[cm3H2·gcat
-1]catalyst
Table 3-2: The chemisorbed monolayer (vm) and the adsorption constant (b) estimated from the dissociative Langmuir isotherm fitting into data presented in Figure 3-3.
The BET surface areas increased in the sequence Raney-Co (19.3 m2⋅g-1), < Raney-Ni
(57.7 m2⋅g-1)< Ni-Cr promoted Raney-Co (66.8 m2⋅g-1). The LiOH doped Raney-Co had
a lower surface area (14.8 m2⋅gcat-1). The pore volumes varied in a similar sequence
between 0.094 cm3⋅g-1 and 0.133 cm3⋅g-1. Note that after LiOH modification of Raney-Co
the pore volume did not change. The BET surface area for Raney-Ni and Co depended
significantly on the temperature treatment. For Raney-Ni the maximum BET area was
measured after activation at 383 K (57.7 m2⋅gcat-1) whereas 483 K was required for
Raney-Co (24.6 m2⋅gcat-1). Probably, at lower temperatures outgassing for 1 h was
insufficient to remove all hydrogen and water from the catalyst. This implies stronger
adsorption on Raney-Co compared to Raney-Ni. The presence of the Ni-Cr promoters
stabilized high BET area. Note that the mean grain diameter for Ni-Cr promoted Raney-
Co was smaller than for the unpromoted sample (30 and 28 µm, respectively). A similar
influence of the alloying promoters on the mean grain size of Raney-Ni has been
observed [20]. At higher temperatures, the specific surface area of Raney-Ni and Raney-
Co catalysts decreased, because of particle sintering.
Assuming that only Ni and Co atoms exist on the Raney-Ni and Raney-Co catalyst
surface and one hydrogen atom adsorbs per metal atom H2-chemisorption was fitted
using the Langmuir equation model [21]. The amount of hydrogen adsorbed at saturation
coverage was 402.0, 225.8, 569.1 and 189.7 µmolH2 ⋅gcat
-1 for Raney-Ni, Raney-Co, Ni-
Cr-promoted Raney-Co and LiOH-modified Raney-Co, respectively. Thus, the fraction of
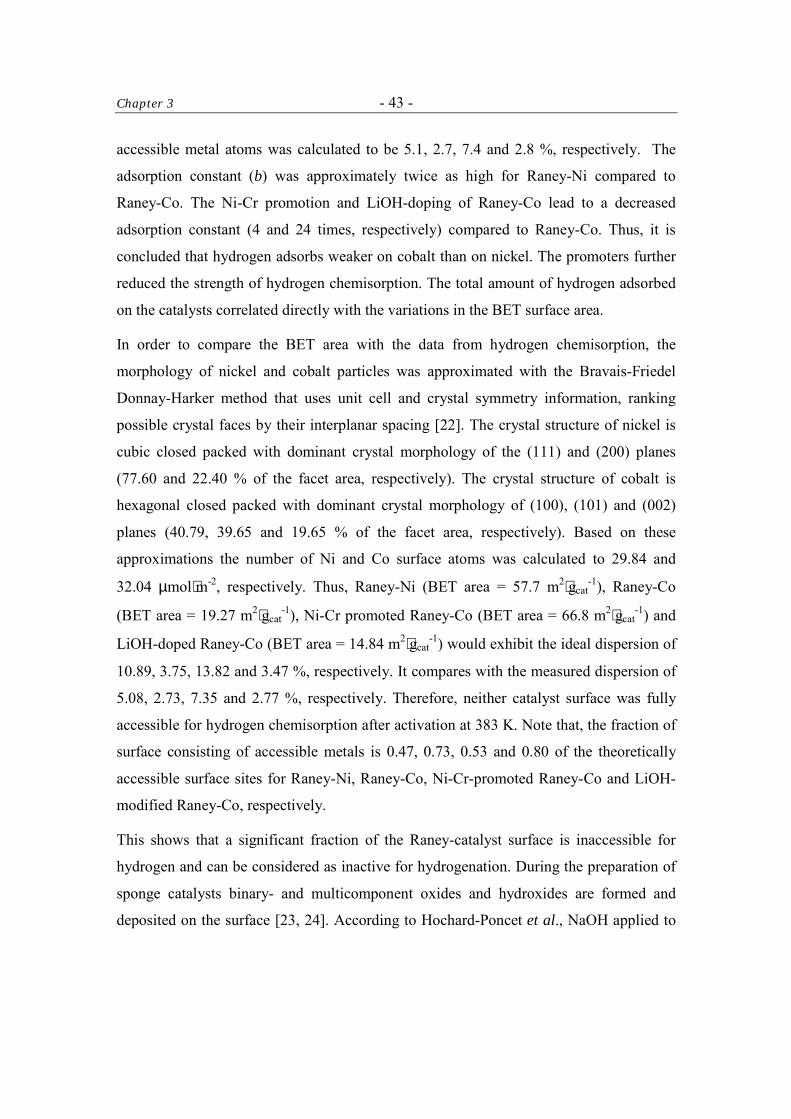
Chapter 3 - 43 -
accessible metal atoms was calculated to be 5.1, 2.7, 7.4 and 2.8 %, respectively. The
adsorption constant (b) was approximately twice as high for Raney-Ni compared to
Raney-Co. The Ni-Cr promotion and LiOH-doping of Raney-Co lead to a decreased
adsorption constant (4 and 24 times, respectively) compared to Raney-Co. Thus, it is
concluded that hydrogen adsorbs weaker on cobalt than on nickel. The promoters further
reduced the strength of hydrogen chemisorption. The total amount of hydrogen adsorbed
on the catalysts correlated directly with the variations in the BET surface area.
In order to compare the BET area with the data from hydrogen chemisorption, the
morphology of nickel and cobalt particles was approximated with the Bravais-Friedel
Donnay-Harker method that uses unit cell and crystal symmetry information, ranking
possible crystal faces by their interplanar spacing [22]. The crystal structure of nickel is
cubic closed packed with dominant crystal morphology of the (111) and (200) planes
(77.60 and 22.40 % of the facet area, respectively). The crystal structure of cobalt is
hexagonal closed packed with dominant crystal morphology of (100), (101) and (002)
planes (40.79, 39.65 and 19.65 % of the facet area, respectively). Based on these
approximations the number of Ni and Co surface atoms was calculated to 29.84 and
32.04 µmol⋅m-2, respectively. Thus, Raney-Ni (BET area = 57.7 m2⋅gcat-1), Raney-Co
(BET area = 19.27 m2⋅gcat-1), Ni-Cr promoted Raney-Co (BET area = 66.8 m2⋅gcat
-1) and
LiOH-doped Raney-Co (BET area = 14.84 m2⋅gcat-1) would exhibit the ideal dispersion of
10.89, 3.75, 13.82 and 3.47 %, respectively. It compares with the measured dispersion of
5.08, 2.73, 7.35 and 2.77 %, respectively. Therefore, neither catalyst surface was fully
accessible for hydrogen chemisorption after activation at 383 K. Note that, the fraction of
surface consisting of accessible metals is 0.47, 0.73, 0.53 and 0.80 of the theoretically
accessible surface sites for Raney-Ni, Raney-Co, Ni-Cr-promoted Raney-Co and LiOH-
modified Raney-Co, respectively.
This shows that a significant fraction of the Raney-catalyst surface is inaccessible for
hydrogen and can be considered as inactive for hydrogenation. During the preparation of
sponge catalysts binary- and multicomponent oxides and hydroxides are formed and
deposited on the surface [23, 24]. According to Hochard-Poncet et al., NaOH applied to
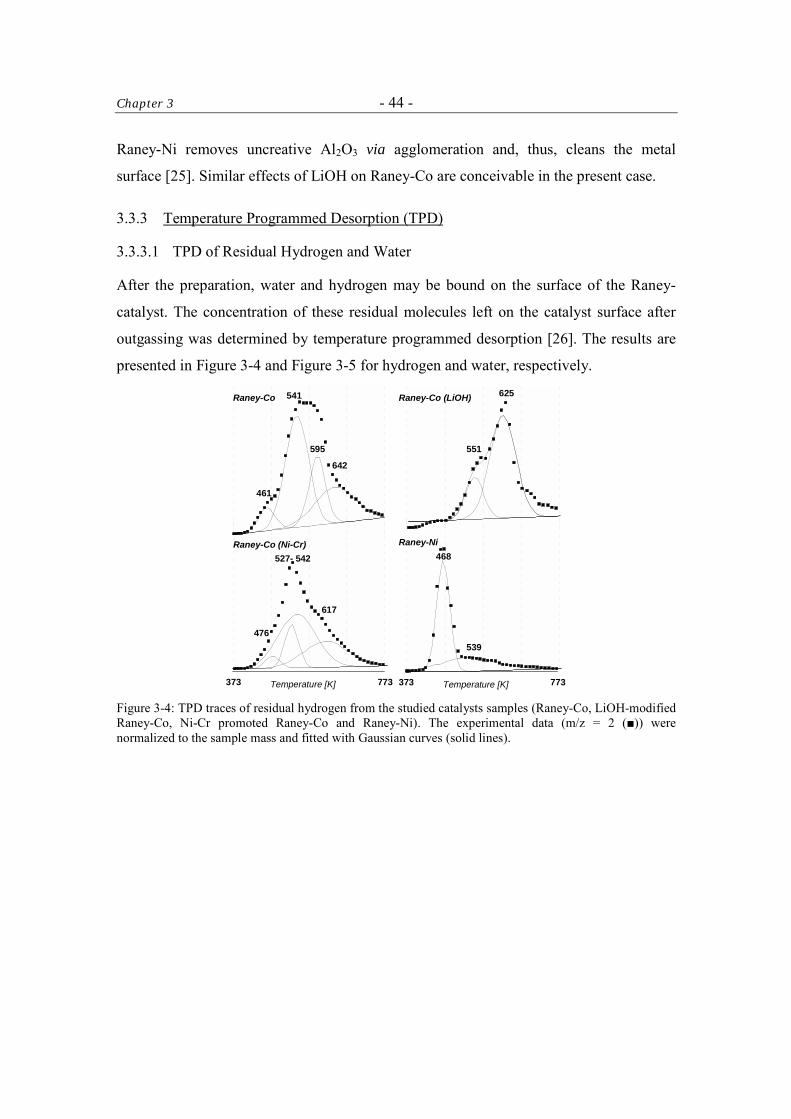
Chapter 3 - 44 -
Raney-Ni removes uncreative Al2O3 via agglomeration and, thus, cleans the metal
surface [25]. Similar effects of LiOH on Raney-Co are conceivable in the present case.
3.3.3 Temperature Programmed Desorption (TPD)
3.3.3.1 TPD of Residual Hydrogen and Water
After the preparation, water and hydrogen may be bound on the surface of the Raney-
catalyst. The concentration of these residual molecules left on the catalyst surface after
outgassing was determined by temperature programmed desorption [26]. The results are
presented in Figure 3-4 and Figure 3-5 for hydrogen and water, respectively.
Raney-Co
Raney-Co (Ni-Cr) Raney-Ni
461
541
595
642
476
527- 542
617
373 773Temperature [K]
468
373 773Temperature [K]
539
Raney-Co (LiOH)
551
625
Figure 3-4: TPD traces of residual hydrogen from the studied catalysts samples (Raney-Co, LiOH-modified Raney-Co, Ni-Cr promoted Raney-Co and Raney-Ni). The experimental data (m/z = 2 (■)) were normalized to the sample mass and fitted with Gaussian curves (solid lines).
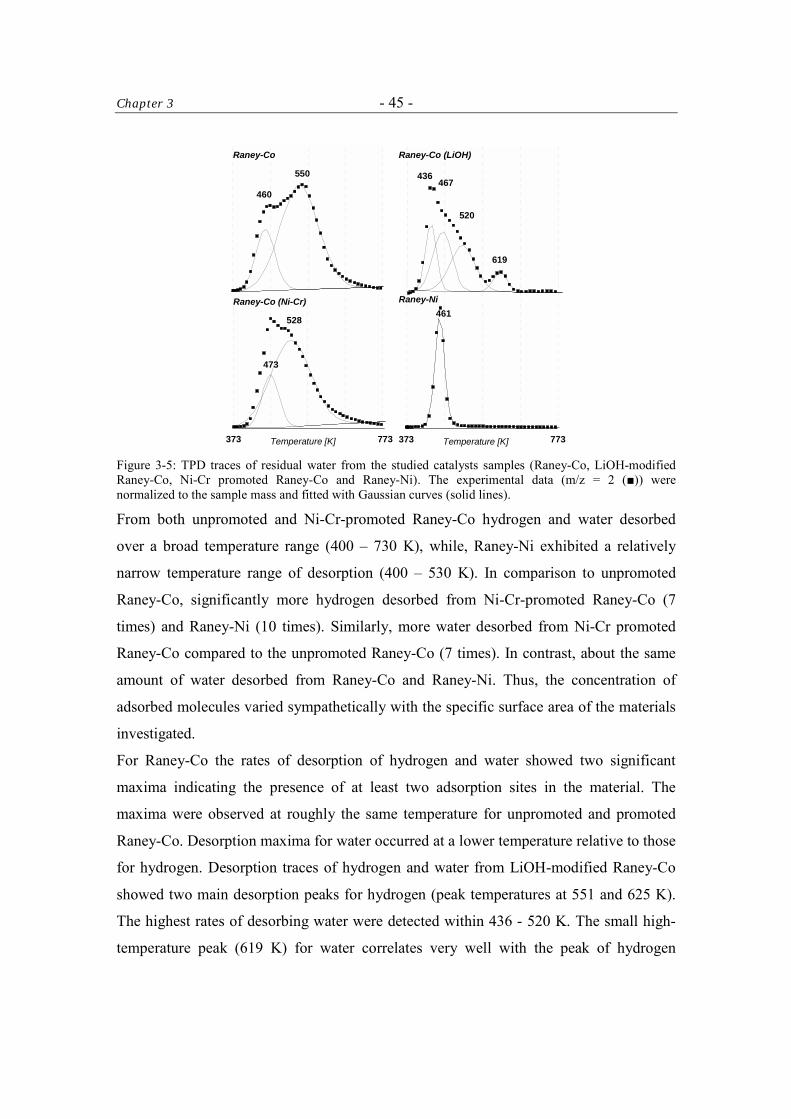
Chapter 3 - 45 -
Raney-Co
Raney-Co (Ni-Cr) Raney-Ni
460
550
473
528
373 773Temperature [K]
461
373 773Temperature [K]
Raney-Co (LiOH)
436
520
467
619
Figure 3-5: TPD traces of residual water from the studied catalysts samples (Raney-Co, LiOH-modified Raney-Co, Ni-Cr promoted Raney-Co and Raney-Ni). The experimental data (m/z = 2 (■)) were normalized to the sample mass and fitted with Gaussian curves (solid lines).
From both unpromoted and Ni-Cr-promoted Raney-Co hydrogen and water desorbed
over a broad temperature range (400 – 730 K), while, Raney-Ni exhibited a relatively
narrow temperature range of desorption (400 – 530 K). In comparison to unpromoted
Raney-Co, significantly more hydrogen desorbed from Ni-Cr-promoted Raney-Co (7
times) and Raney-Ni (10 times). Similarly, more water desorbed from Ni-Cr promoted
Raney-Co compared to the unpromoted Raney-Co (7 times). In contrast, about the same
amount of water desorbed from Raney-Co and Raney-Ni. Thus, the concentration of
adsorbed molecules varied sympathetically with the specific surface area of the materials
investigated.
For Raney-Co the rates of desorption of hydrogen and water showed two significant
maxima indicating the presence of at least two adsorption sites in the material. The
maxima were observed at roughly the same temperature for unpromoted and promoted
Raney-Co. Desorption maxima for water occurred at a lower temperature relative to those
for hydrogen. Desorption traces of hydrogen and water from LiOH-modified Raney-Co
showed two main desorption peaks for hydrogen (peak temperatures at 551 and 625 K).
The highest rates of desorbing water were detected within 436 - 520 K. The small high-
temperature peak (619 K) for water correlates very well with the peak of hydrogen
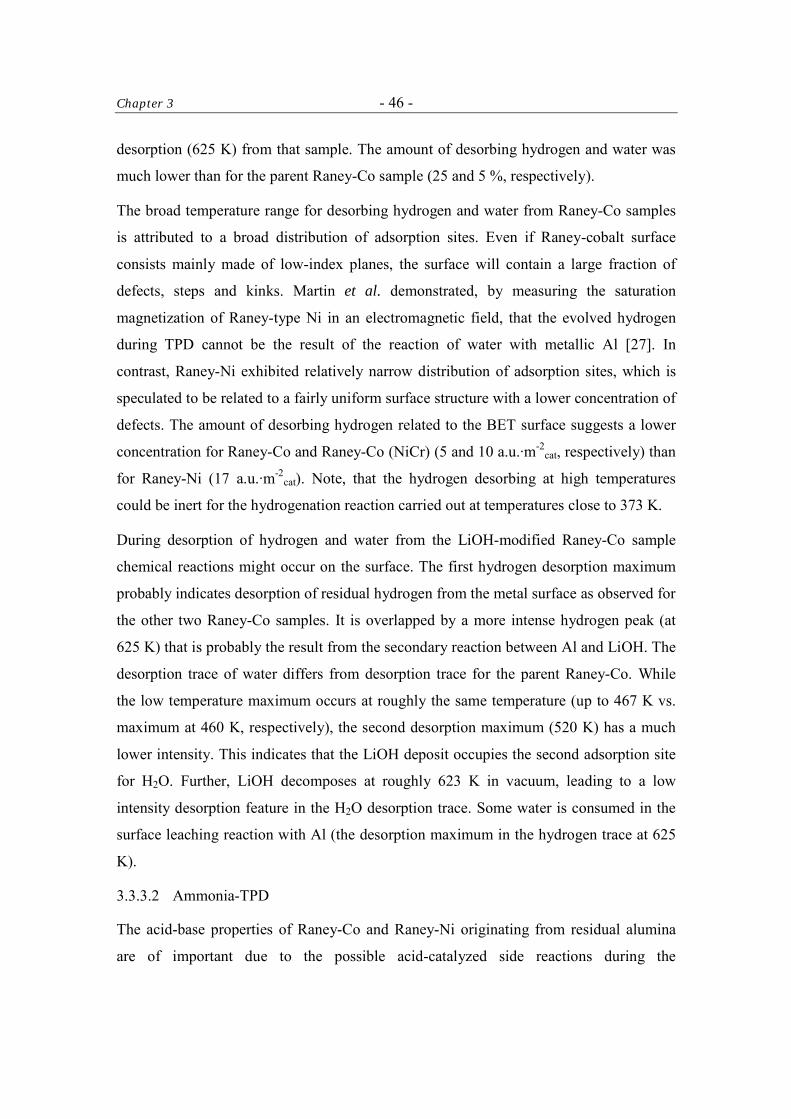
Chapter 3 - 46 -
desorption (625 K) from that sample. The amount of desorbing hydrogen and water was
much lower than for the parent Raney-Co sample (25 and 5 %, respectively).
The broad temperature range for desorbing hydrogen and water from Raney-Co samples
is attributed to a broad distribution of adsorption sites. Even if Raney-cobalt surface
consists mainly made of low-index planes, the surface will contain a large fraction of
defects, steps and kinks. Martin et al. demonstrated, by measuring the saturation
magnetization of Raney-type Ni in an electromagnetic field, that the evolved hydrogen
during TPD cannot be the result of the reaction of water with metallic Al [27]. In
contrast, Raney-Ni exhibited relatively narrow distribution of adsorption sites, which is
speculated to be related to a fairly uniform surface structure with a lower concentration of
defects. The amount of desorbing hydrogen related to the BET surface suggests a lower
concentration for Raney-Co and Raney-Co (NiCr) (5 and 10 a.u.·m-2cat, respectively) than
for Raney-Ni (17 a.u.·m-2cat). Note, that the hydrogen desorbing at high temperatures
could be inert for the hydrogenation reaction carried out at temperatures close to 373 K.
During desorption of hydrogen and water from the LiOH-modified Raney-Co sample
chemical reactions might occur on the surface. The first hydrogen desorption maximum
probably indicates desorption of residual hydrogen from the metal surface as observed for
the other two Raney-Co samples. It is overlapped by a more intense hydrogen peak (at
625 K) that is probably the result from the secondary reaction between Al and LiOH. The
desorption trace of water differs from desorption trace for the parent Raney-Co. While
the low temperature maximum occurs at roughly the same temperature (up to 467 K vs.
maximum at 460 K, respectively), the second desorption maximum (520 K) has a much
lower intensity. This indicates that the LiOH deposit occupies the second adsorption site
for H2O. Further, LiOH decomposes at roughly 623 K in vacuum, leading to a low
intensity desorption feature in the H2O desorption trace. Some water is consumed in the
surface leaching reaction with Al (the desorption maximum in the hydrogen trace at 625
K).
3.3.3.2 Ammonia-TPD
The acid-base properties of Raney-Co and Raney-Ni originating from residual alumina
are of important due to the possible acid-catalyzed side reactions during the
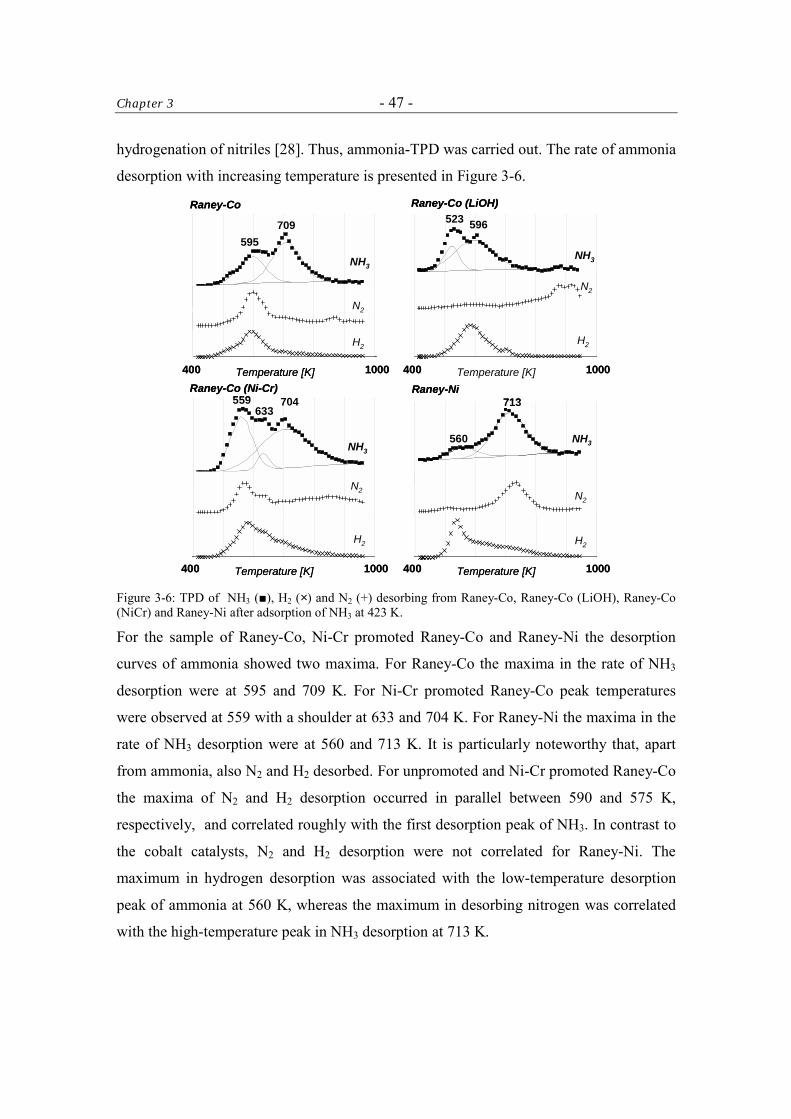
Chapter 3 - 47 -
hydrogenation of nitriles [28]. Thus, ammonia-TPD was carried out. The rate of ammonia
desorption with increasing temperature is presented in Figure 3-6.
400 1000Temperature [K]
Raney-Co
595709
NH3
H2
N2
400 1000Temperature [K]
Raney-Co
595709
NH3
H2
N2
Temperature [K]
Raney-Co (LiOH)
400 1000
NH3
H2
N2
523 596
Raney-Co (LiOH)
400 1000
NH3
H2
N2
523 596
400 1000Temperature [K]
559633
NH3
H2
N2
704Raney-Co (Ni-Cr)
400 1000Temperature [K]
559633
NH3
H2
N2
704Raney-Co (Ni-Cr) Raney-Ni
400 1000Temperature [K]
NH3
N2
H2
713
560
Raney-Ni
400 1000Temperature [K]
NH3
N2
H2
713
560
Figure 3-6: TPD of NH3 (■), H2 (×) and N2 (+) desorbing from Raney-Co, Raney-Co (LiOH), Raney-Co (NiCr) and Raney-Ni after adsorption of NH3 at 423 K.
For the sample of Raney-Co, Ni-Cr promoted Raney-Co and Raney-Ni the desorption
curves of ammonia showed two maxima. For Raney-Co the maxima in the rate of NH3
desorption were at 595 and 709 K. For Ni-Cr promoted Raney-Co peak temperatures
were observed at 559 with a shoulder at 633 and 704 K. For Raney-Ni the maxima in the
rate of NH3 desorption were at 560 and 713 K. It is particularly noteworthy that, apart
from ammonia, also N2 and H2 desorbed. For unpromoted and Ni-Cr promoted Raney-Co
the maxima of N2 and H2 desorption occurred in parallel between 590 and 575 K,
respectively, and correlated roughly with the first desorption peak of NH3. In contrast to
the cobalt catalysts, N2 and H2 desorption were not correlated for Raney-Ni. The
maximum in hydrogen desorption was associated with the low-temperature desorption
peak of ammonia at 560 K, whereas the maximum in desorbing nitrogen was correlated
with the high-temperature peak in NH3 desorption at 713 K.
Chapter 3 - 48 -
For the LiOH-modified Raney-Co the NH3 desorption trace showed two maxima at 523
and 596 K. The H2 desorption rate showed one desorption peak at 573 K, while hardly
any nitrogen desorbed from the sample.
The maxima in desorption rates suggest different (reactive) adsorption states of ammonia
on the studied samples. The low temperature NH3-desorption peak (595 and 559 K for
Raney-Co and Raney-Ni, respectively) is assigned to ammonia desorbing from the metal
surface. At the temperature of adsorption (423 K) the ammonia molecules are
dehydrogenated to give surface hydrogen atoms and nitrene species (NHn, n = 2, 1) [29].
During desorption, the surface species can either recombine to ammonia or form
molecular hydrogen and nitrogen. The ammonia trace for Raney-Co promoted with Ni-Cr
showed a peak at the same temperature as the nickel catalyst (559 K) with a shoulder at
633 K. Both could indicate that the promoting transition metals (Ni and Cr) are also
present on the surface. For all samples the second maximum occurred at roughly 710 K.
This is attributed to desorption of ammonia from Al3+ Lewis acid sites. The presence of
Al3+ on the surface of Raney-Ni, which had been washed thoroughly with distilled water,
has been reported [30]. Due to their high stability the Lewis adducts (H3N:→Al3+)
decompose only at high temperatures [31].
In comparison to the parent catalyst, the desorption of ammonia from LiOH-modified
Raney-Co showed an extra peak at 523 K, together with the peak that has been proposed
to indicate NH3 desorption from metallic cobalt (at 596 K). It is noteworthy that the latter
peak was accompanied only by H2-desorption (no N2). It is speculated that ammonia is
only partially dehydrogenated in the presence of LiOH. A fraction of ammonia molecules
could even be coordinated to the metal atoms without any dissociative chemisorption. Of
course, molecular-state ammonia would be desorbed easier (i.e., at lower temperature) in
line with the peak at 523 K. No desorption from the alumina sites was found (~ 710 [K]).
A surface reaction of lithium hydroxide (LiOH⋅H2O) with bayerite (the form of
aluminum hydroxide found in Raney-catalysts) will produce lithium dialuminate
(LiAl2(OH)7⋅2H2O) [32]. Note that the removal of structural water from
LiAl2(OH)7⋅2H2O occurs below 473 K [33]. Thus, LiOH quenches the sites which are
associated with the alumina Lewis acidity.
Chapter 3 - 49 -
The significant differences in the desorption of molecular nitrogen between cobalt and
nickel can be explained by considering the different temperatures of formation and
decomposition of cobalt and nickel nitrides [34, 35]. Baiker et al. described that the
interaction of nickel with ammonia at elevated temperatures leads to the formation of
nickel nitride Ni3N and hydrogen [36]. Nickel nitride is formed at temperatures above
395 K and is stable in inert atmospheres up to ∼ 683 K. Further increase in temperature
leads to decomposition of Ni3N to metallic nickel and nitrogen. In agreement with this
description ammonia, which is dissociated on the Ni-surface at the temperature of
adsorption (423 K), can react with the bulk nickel to form nickel nitride. As the catalyst is
heated to more than 563 K in vacuum all adsorbed species desorb except the nitrogen that
reacted with nickel. At higher temperatures Ni3N decomposes resulting in the maximum
rate of nitrogen evolution at ∼ 733 K. Dissociative adsorption of ammonia onto Raney-Co
can also be accompanied by formation of cobalt nitride. However, in contrast to nickel,
Co3N is less stable and decomposes when heated to 549 K [37]. Therefore, hardly any
cobalt nitride is formed.
3.3.4 X-ray Photoelectron Spectroscopy (XPS)
The occurrence and the nature of different phases at the catalyst surface was evaluated
from the position of XPS emission lines. In Figure 3-7 XPS spectra of Raney-Co, Raney-
Co(LiOH), Raney-Co(NiCr) and Raney-Ni are presented.
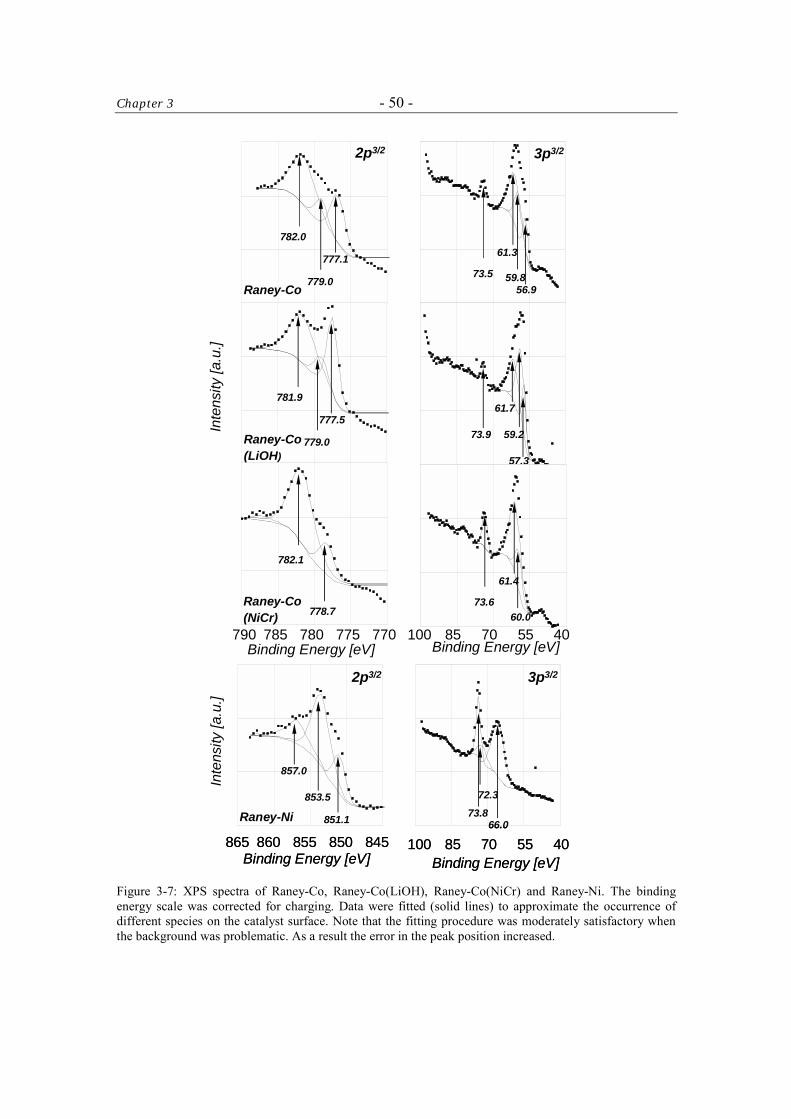
Chapter 3 - 50 -
61.3
59.856.9
3p3/2
73.5
61.3
59.856.9
3p3/2
73.5
Inte
nsity
[a.u
.]
2p3/2
782.0
779.0
777.1
Raney-Co
790Binding Energy [eV]
785 780 770775 100 85 70 4055Binding Energy [eV]
61.7
59.2
57.3
73.9
61.7
59.2
57.3
73.9
781.9
779.0
777.5
Raney-Co(LiOH)
61.4
60.073.6
61.4
60.073.6
782.1
778.7Raney-Co(NiCr)
865Binding Energy [eV]
860 855 845850865Binding Energy [eV]
860 855 845850
Inte
nsity
[a.u
.]
100 85 70 4055Binding Energy [eV]
100 85 70 4055Binding Energy [eV]
73.8
72.3
66.0
3p3/2
73.8
72.3
66.0
3p3/2
857.0
853.5
851.1
2p3/2
Raney-Ni
Figure 3-7: XPS spectra of Raney-Co, Raney-Co(LiOH), Raney-Co(NiCr) and Raney-Ni. The binding energy scale was corrected for charging. Data were fitted (solid lines) to approximate the occurrence of different species on the catalyst surface. Note that the fitting procedure was moderately satisfactory when the background was problematic. As a result the error in the peak position increased.
Chapter 3 - 51 -
The XPS spectra of cobalt samples in the high binding energy region between 790 and
770 eV (Co 2p3/2 region) exhibited at least two maxima at 782.0(5) and 779.0(5) eV.
Additionally, the spectra of Raney-Co and Raney-Co(LiOH) showed a peak at 777.5(5)
eV, which was absent in the spectrum of Raney-Co(NiCr). Note that the intensity of the
peak at 777.5(5) eV increased relative to the other peaks in the spectrum after LiOH-
modification of Raney-Co. Similarly, for Raney-Ni three peaks at 857.0(5), 853.5(5) and
851.1(5) eV were observed in the Ni 2p3/2 region (i.e., 865 – 845 eV).
In the region between 100 and 40 eV spectra all three cobalt samples featured a peak at
73.5(5) eV. Additionally, a broad peak between 70 and 55 eV was observed with a
contribution from peaks at roughly 61(1) and 60(1) eV. It was further speculated that the
spectra of Raney-Co and Raney-Co(LiOH) might include one further peak at 57(1) eV.
The spectrum of Raney-Ni, apart from the peak at 73.8(5) eV, revealed a small peak at
72.3(5) eV and an intense peak at 66.0(5) eV.
The XPS spectra of the cobalt catalysts (Co 2p3/2) showed the highest binding energy at
782.0(5) eV that was probably related to oxidized cobalt in a strongly ionic ligand field.
Probably Co-O-Al species give rise to this peak. The small peak at 770.0(5) eV also
observed for in each cobalt sample likely indicates the presence of Co2O3 (779.2 eV
[38]), although CoOOH could also be present (779.2 [39]). The photoelectron
contribution at 777.5(5) eV shows that metallic cobalt Co0 is present at the outermost
surface (777.8 [40]). Note that the latter (i) was not detected for Raney-Co(NiCr) and (ii)
its relative contribution increased after LiOH modification of the surface. In the XPS
spectrum of Raney-Ni (Ni 2p3/2) two peaks at 857.0(5) and 853.5(5) eV correspond to
oxidized nickel (Ni2+). This is probably NiAl2O4 (857.1 eV [41]) and NiO (853.5 eV
[42]), respectively. In literature, Ni2O3 [43], Ni(OH)2 and NiAl2O4 [44] have been
claimed to be present at the surface of Raney-type Ni catalysts. However, the peak at
853.5(5) eV could also be attributed to an alloy Al3Ni (853.6 eV [45]). Note that Al3Ni is
one of the components of the parent alloy used in the preparation of Raney-Ni. Metallic
nickel (Ni0) was observed at 851.1(5) eV, although the peak position was lower than
reported in the literature (852.1 eV [46]).
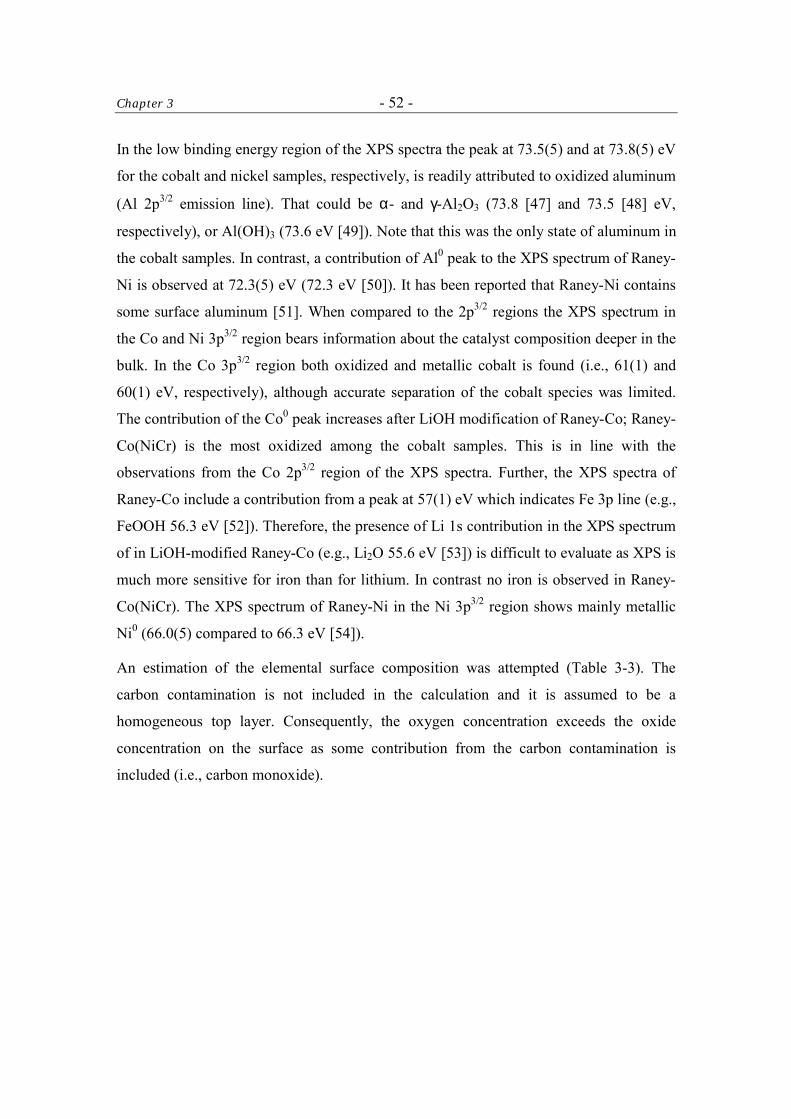
Chapter 3 - 52 -
In the low binding energy region of the XPS spectra the peak at 73.5(5) and at 73.8(5) eV
for the cobalt and nickel samples, respectively, is readily attributed to oxidized aluminum
(Al 2p3/2 emission line). That could be α- and γ-Al2O3 (73.8 [47] and 73.5 [48] eV,
respectively), or Al(OH)3 (73.6 eV [49]). Note that this was the only state of aluminum in
the cobalt samples. In contrast, a contribution of Al0 peak to the XPS spectrum of Raney-
Ni is observed at 72.3(5) eV (72.3 eV [50]). It has been reported that Raney-Ni contains
some surface aluminum [51]. When compared to the 2p3/2 regions the XPS spectrum in
the Co and Ni 3p3/2 region bears information about the catalyst composition deeper in the
bulk. In the Co 3p3/2 region both oxidized and metallic cobalt is found (i.e., 61(1) and
60(1) eV, respectively), although accurate separation of the cobalt species was limited.
The contribution of the Co0 peak increases after LiOH modification of Raney-Co; Raney-
Co(NiCr) is the most oxidized among the cobalt samples. This is in line with the
observations from the Co 2p3/2 region of the XPS spectra. Further, the XPS spectra of
Raney-Co include a contribution from a peak at 57(1) eV which indicates Fe 3p line (e.g.,
FeOOH 56.3 eV [52]). Therefore, the presence of Li 1s contribution in the XPS spectrum
of in LiOH-modified Raney-Co (e.g., Li2O 55.6 eV [53]) is difficult to evaluate as XPS is
much more sensitive for iron than for lithium. In contrast no iron is observed in Raney-
Co(NiCr). The XPS spectrum of Raney-Ni in the Ni 3p3/2 region shows mainly metallic
Ni0 (66.0(5) compared to 66.3 eV [54]).
An estimation of the elemental surface composition was attempted (Table 3-3). The
carbon contamination is not included in the calculation and it is assumed to be a
homogeneous top layer. Consequently, the oxygen concentration exceeds the oxide
concentration on the surface as some contribution from the carbon contamination is
included (i.e., carbon monoxide).
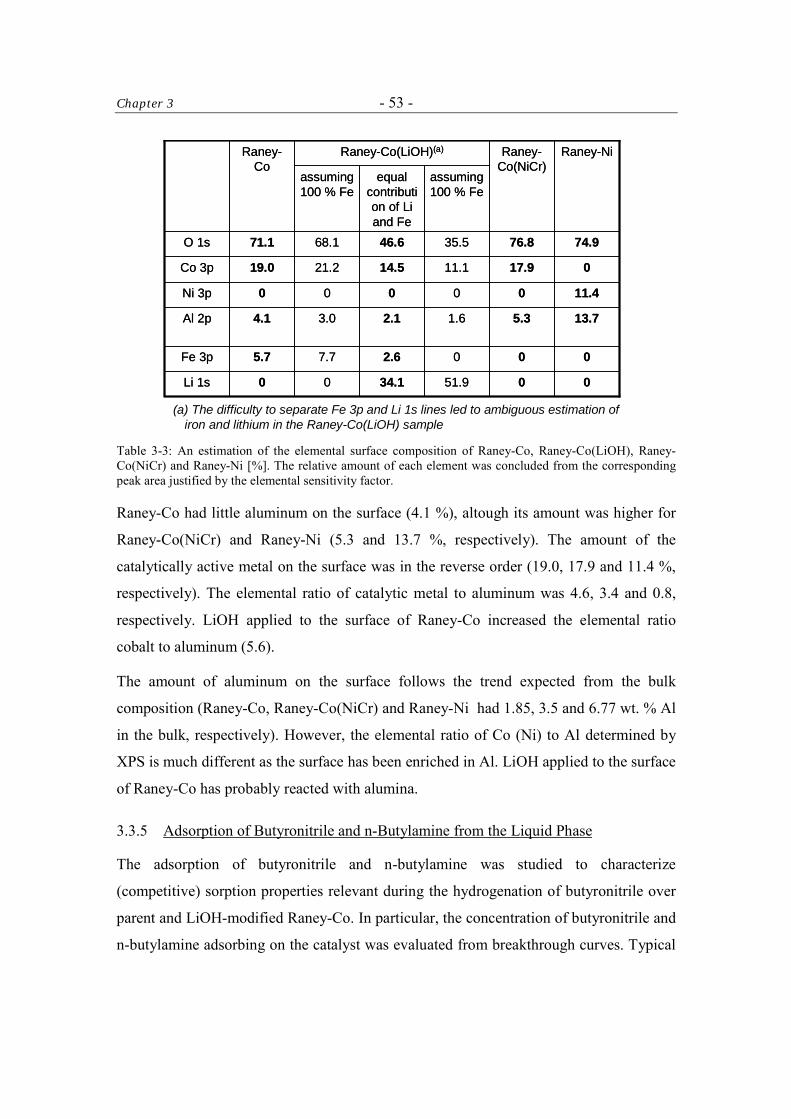
Chapter 3 - 53 -
assuming 100 % Fe
equal contribution of Li and Fe
assuming 100 % Fe
0
7.7
3.0
0
21.2
68.1
Raney-Co(LiOH)(a)
34.1
2.6
2.1
0
14.5
46.6
0051.90Li 1s
0005.7Fe 3p
13.75.31.64.1Al 2p
11.4000Ni 3p
017.911.119.0Co 3p
74.976.835.571.1O 1s
Raney-NiRaney-Co(NiCr)
Raney-Co
assuming 100 % Fe
equal contribution of Li and Fe
assuming 100 % Fe
0
7.7
3.0
0
21.2
68.1
Raney-Co(LiOH)(a)
34.1
2.6
2.1
0
14.5
46.6
0051.90Li 1s
0005.7Fe 3p
13.75.31.64.1Al 2p
11.4000Ni 3p
017.911.119.0Co 3p
74.976.835.571.1O 1s
Raney-NiRaney-Co(NiCr)
Raney-Co
(a) The difficulty to separate Fe 3p and Li 1s lines led to ambiguous estimation of iron and lithium in the Raney-Co(LiOH) sample
Table 3-3: An estimation of the elemental surface composition of Raney-Co, Raney-Co(LiOH), Raney-Co(NiCr) and Raney-Ni [%]. The relative amount of each element was concluded from the corresponding peak area justified by the elemental sensitivity factor.
Raney-Co had little aluminum on the surface (4.1 %), altough its amount was higher for
Raney-Co(NiCr) and Raney-Ni (5.3 and 13.7 %, respectively). The amount of the
catalytically active metal on the surface was in the reverse order (19.0, 17.9 and 11.4 %,
respectively). The elemental ratio of catalytic metal to aluminum was 4.6, 3.4 and 0.8,
respectively. LiOH applied to the surface of Raney-Co increased the elemental ratio
cobalt to aluminum (5.6).
The amount of aluminum on the surface follows the trend expected from the bulk
composition (Raney-Co, Raney-Co(NiCr) and Raney-Ni had 1.85, 3.5 and 6.77 wt. % Al
in the bulk, respectively). However, the elemental ratio of Co (Ni) to Al determined by
XPS is much different as the surface has been enriched in Al. LiOH applied to the surface
of Raney-Co has probably reacted with alumina.
3.3.5 Adsorption of Butyronitrile and n-Butylamine from the Liquid Phase
The adsorption of butyronitrile and n-butylamine was studied to characterize
(competitive) sorption properties relevant during the hydrogenation of butyronitrile over
parent and LiOH-modified Raney-Co. In particular, the concentration of butyronitrile and
n-butylamine adsorbing on the catalyst was evaluated from breakthrough curves. Typical
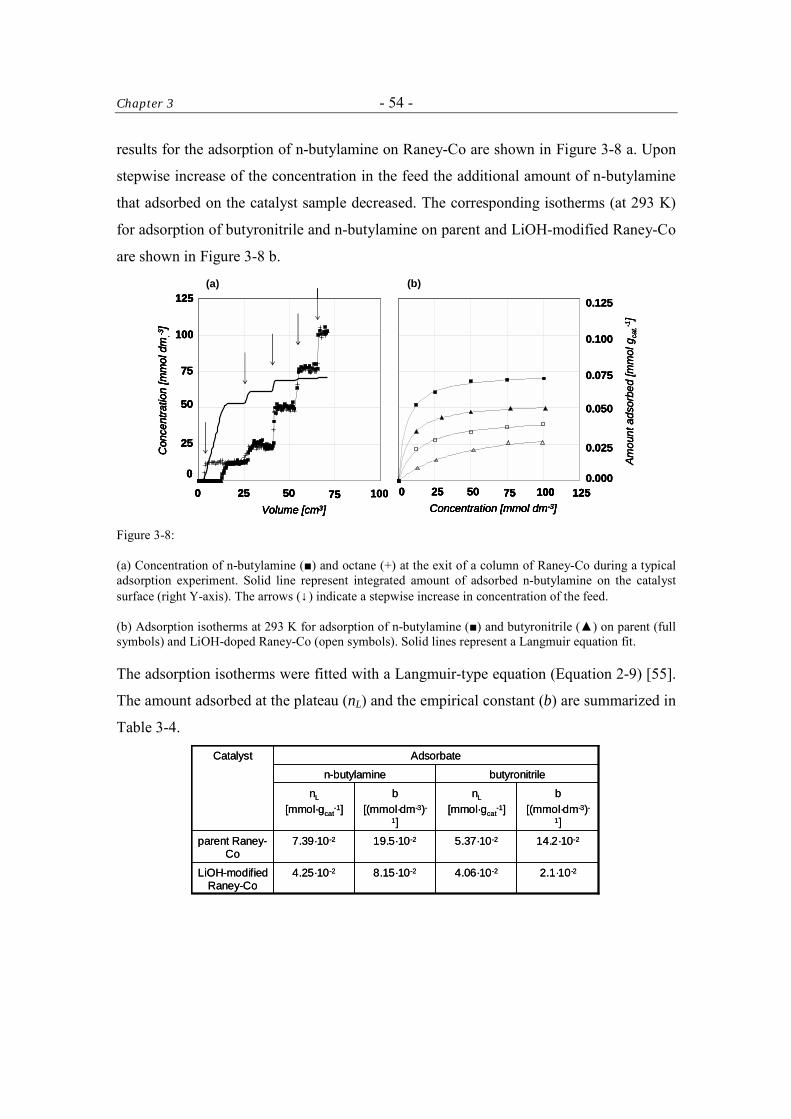
Chapter 3 - 54 -
results for the adsorption of n-butylamine on Raney-Co are shown in Figure 3-8 a. Upon
stepwise increase of the concentration in the feed the additional amount of n-butylamine
that adsorbed on the catalyst sample decreased. The corresponding isotherms (at 293 K)
for adsorption of butyronitrile and n-butylamine on parent and LiOH-modified Raney-Co
are shown in Figure 3-8 b.
1000Volume [cm3]
25 50 75
125
100
75
50
25
0
Con
cent
ratio
n [m
mol
·dm
.-3]
0.125
0.100
0.075
0.050
0.025
0.000
Amou
nt a
dsor
bed
[mm
ol·g
cat.-1
]
0 100Concentration [mmol·dm-3]25 50 75 1251000
Volume [cm3]25 50 75
125
100
75
50
25
0
Con
cent
ratio
n [m
mol
·dm
.-3]
1000Volume [cm3]
25 50 75
125
100
75
50
25
0
Con
cent
ratio
n [m
mol
·dm
.-3]
0Volume [cm3]
25 50 75
125
100
75
50
25
0
Con
cent
ratio
n [m
mol
·dm
.-3]
0.125
0.100
0.075
0.050
0.025
0.000
Amou
nt a
dsor
bed
[mm
ol·g
cat.-1
]
0 100Concentration [mmol·dm-3]25 50 75 125
0.125
0.100
0.075
0.050
0.025
0.000
Amou
nt a
dsor
bed
[mm
ol·g
cat.-1
]
0 100Concentration [mmol·dm-3]25 50 75 1250 100Concentration [mmol·dm-3]25 50 75 125
(a) (b)
Figure 3-8:
(a) Concentration of n-butylamine (■) and octane (+) at the exit of a column of Raney-Co during a typical adsorption experiment. Solid line represent integrated amount of adsorbed n-butylamine on the catalyst surface (right Y-axis). The arrows (↓) indicate a stepwise increase in concentration of the feed.
(b) Adsorption isotherms at 293 K for adsorption of n-butylamine (■) and butyronitrile (▲) on parent (full symbols) and LiOH-doped Raney-Co (open symbols). Solid lines represent a Langmuir equation fit.
The adsorption isotherms were fitted with a Langmuir-type equation (Equation 2-9) [55].
The amount adsorbed at the plateau (nL) and the empirical constant (b) are summarized in
Table 3-4.
2.1·10-24.06·10-28.15·10-24.25·10-2LiOH-modified Raney-Co
14.2·10-25.37·10-219.5·10-27.39·10-2parent Raney-Co
b[(mmol·dm-3)-
1]
nL
[mmol·gcat-1]
b[(mmol·dm-3)-
1]
nL
[mmol·gcat-1]
butyronitrilen-butylamine
AdsorbateCatalyst
2.1·10-24.06·10-28.15·10-24.25·10-2LiOH-modified Raney-Co
14.2·10-25.37·10-219.5·10-27.39·10-2parent Raney-Co
b[(mmol·dm-3)-
1]
nL
[mmol·gcat-1]
b[(mmol·dm-3)-
1]
nL
[mmol·gcat-1]
butyronitrilen-butylamine
AdsorbateCatalyst
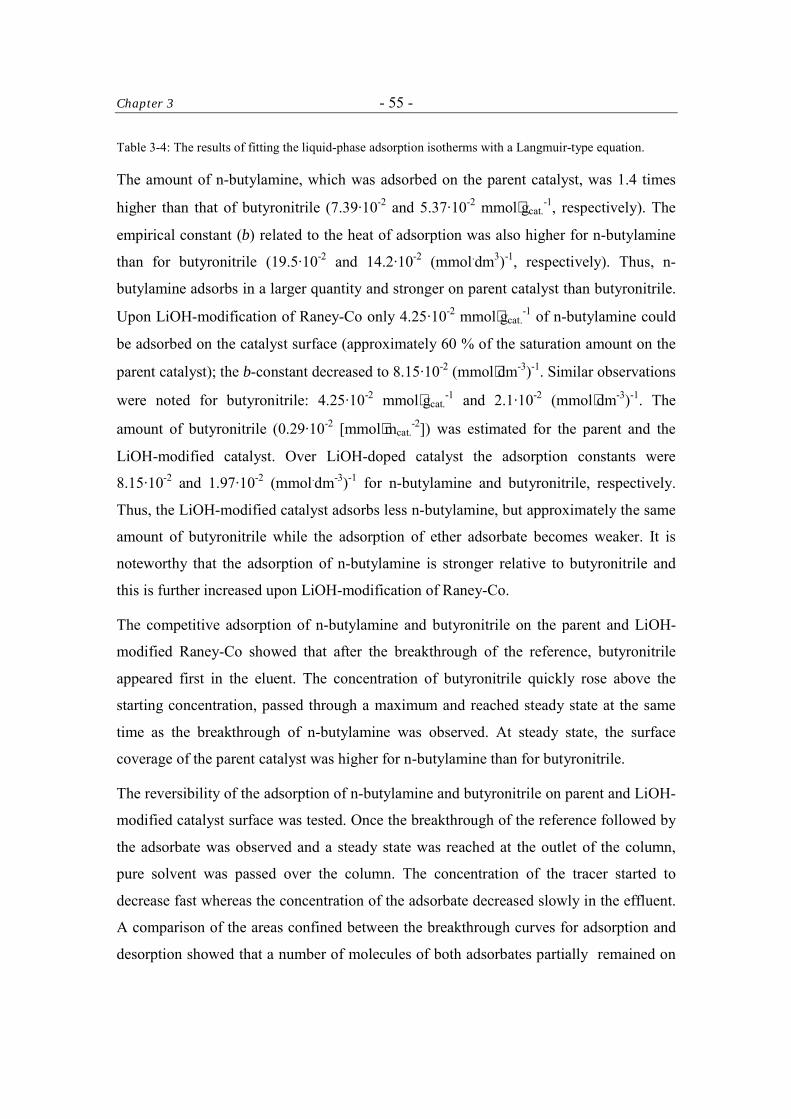
Chapter 3 - 55 -
Table 3-4: The results of fitting the liquid-phase adsorption isotherms with a Langmuir-type equation.
The amount of n-butylamine, which was adsorbed on the parent catalyst, was 1.4 times
higher than that of butyronitrile (7.39·10-2 and 5.37·10-2 mmol⋅gcat.-1, respectively). The
empirical constant (b) related to the heat of adsorption was also higher for n-butylamine
than for butyronitrile (19.5·10-2 and 14.2·10-2 (mmol.dm3)-1, respectively). Thus, n-
butylamine adsorbs in a larger quantity and stronger on parent catalyst than butyronitrile.
Upon LiOH-modification of Raney-Co only 4.25·10-2 mmol⋅gcat.-1 of n-butylamine could
be adsorbed on the catalyst surface (approximately 60 % of the saturation amount on the
parent catalyst); the b-constant decreased to 8.15·10-2 (mmol⋅dm-3)-1. Similar observations
were noted for butyronitrile: 4.25·10-2 mmol⋅gcat.-1 and 2.1·10-2 (mmol⋅dm-3)-1. The
amount of butyronitrile (0.29·10-2 [mmol⋅mcat.-2]) was estimated for the parent and the
LiOH-modified catalyst. Over LiOH-doped catalyst the adsorption constants were
8.15·10-2 and 1.97·10-2 (mmol.dm-3)-1 for n-butylamine and butyronitrile, respectively.
Thus, the LiOH-modified catalyst adsorbs less n-butylamine, but approximately the same
amount of butyronitrile while the adsorption of ether adsorbate becomes weaker. It is
noteworthy that the adsorption of n-butylamine is stronger relative to butyronitrile and
this is further increased upon LiOH-modification of Raney-Co.
The competitive adsorption of n-butylamine and butyronitrile on the parent and LiOH-
modified Raney-Co showed that after the breakthrough of the reference, butyronitrile
appeared first in the eluent. The concentration of butyronitrile quickly rose above the
starting concentration, passed through a maximum and reached steady state at the same
time as the breakthrough of n-butylamine was observed. At steady state, the surface
coverage of the parent catalyst was higher for n-butylamine than for butyronitrile.
The reversibility of the adsorption of n-butylamine and butyronitrile on parent and LiOH-
modified catalyst surface was tested. Once the breakthrough of the reference followed by
the adsorbate was observed and a steady state was reached at the outlet of the column,
pure solvent was passed over the column. The concentration of the tracer started to
decrease fast whereas the concentration of the adsorbate decreased slowly in the effluent.
A comparison of the areas confined between the breakthrough curves for adsorption and
desorption showed that a number of molecules of both adsorbates partially remained on
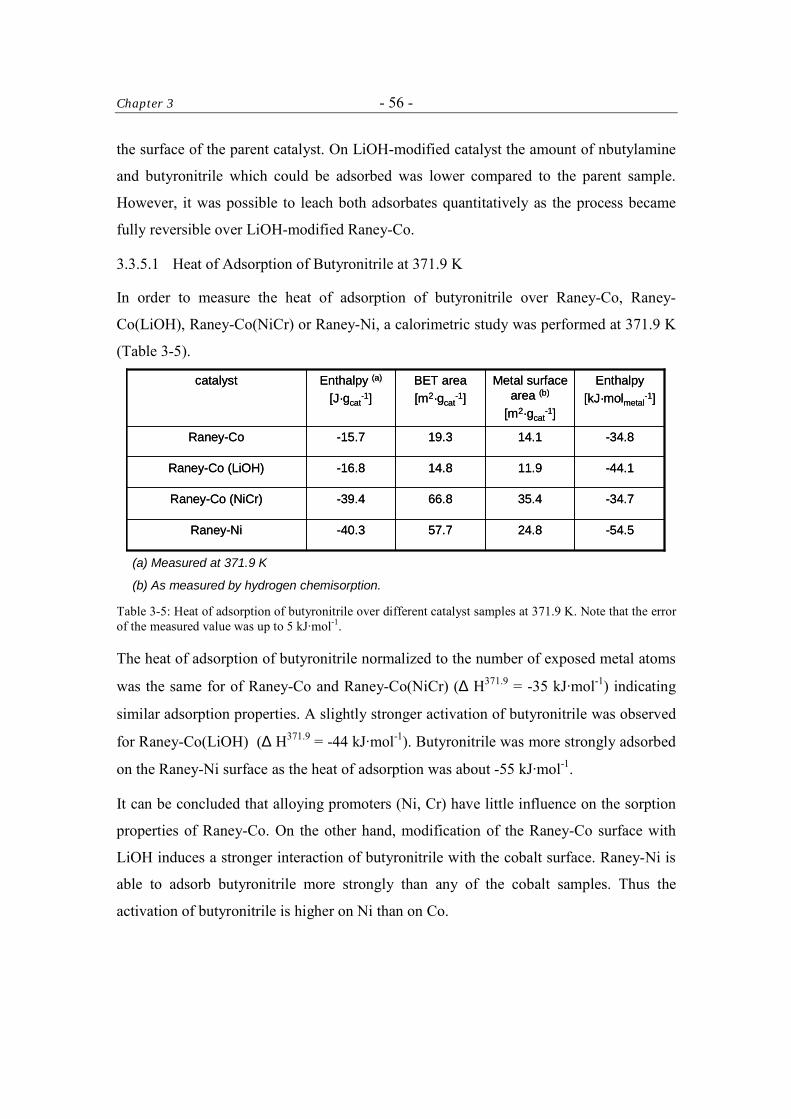
Chapter 3 - 56 -
the surface of the parent catalyst. On LiOH-modified catalyst the amount of nbutylamine
and butyronitrile which could be adsorbed was lower compared to the parent sample.
However, it was possible to leach both adsorbates quantitatively as the process became
fully reversible over LiOH-modified Raney-Co.
3.3.5.1 Heat of Adsorption of Butyronitrile at 371.9 K
In order to measure the heat of adsorption of butyronitrile over Raney-Co, Raney-
Co(LiOH), Raney-Co(NiCr) or Raney-Ni, a calorimetric study was performed at 371.9 K
(Table 3-5).
(a) Measured at 371.9 K
(b) As measured by hydrogen chemisorption.
-44.111.914.8-16.8Raney-Co (LiOH)
-54.524.857.7-40.3Raney-Ni
-34.735.466.8-39.4Raney-Co (NiCr)
-34.814.119.3-15.7Raney-Co
Enthalpy[kJ·molmetal
-1]Metal surface
area (b)
[m2·gcat-1]
BET area[m2·gcat
-1]Enthalpy (a)
[J·gcat-1]
catalyst
-44.111.914.8-16.8Raney-Co (LiOH)
-54.524.857.7-40.3Raney-Ni
-34.735.466.8-39.4Raney-Co (NiCr)
-34.814.119.3-15.7Raney-Co
Enthalpy[kJ·molmetal
-1]Metal surface
area (b)
[m2·gcat-1]
BET area[m2·gcat
-1]Enthalpy (a)
[J·gcat-1]
catalyst
Table 3-5: Heat of adsorption of butyronitrile over different catalyst samples at 371.9 K. Note that the error of the measured value was up to 5 kJ·mol-1.
The heat of adsorption of butyronitrile normalized to the number of exposed metal atoms
was the same for of Raney-Co and Raney-Co(NiCr) (∆ H371.9 = -35 kJ·mol-1) indicating
similar adsorption properties. A slightly stronger activation of butyronitrile was observed
for Raney-Co(LiOH) (∆ H371.9 = -44 kJ·mol-1). Butyronitrile was more strongly adsorbed
on the Raney-Ni surface as the heat of adsorption was about -55 kJ·mol-1.
It can be concluded that alloying promoters (Ni, Cr) have little influence on the sorption
properties of Raney-Co. On the other hand, modification of the Raney-Co surface with
LiOH induces a stronger interaction of butyronitrile with the cobalt surface. Raney-Ni is
able to adsorb butyronitrile more strongly than any of the cobalt samples. Thus the
activation of butyronitrile is higher on Ni than on Co.
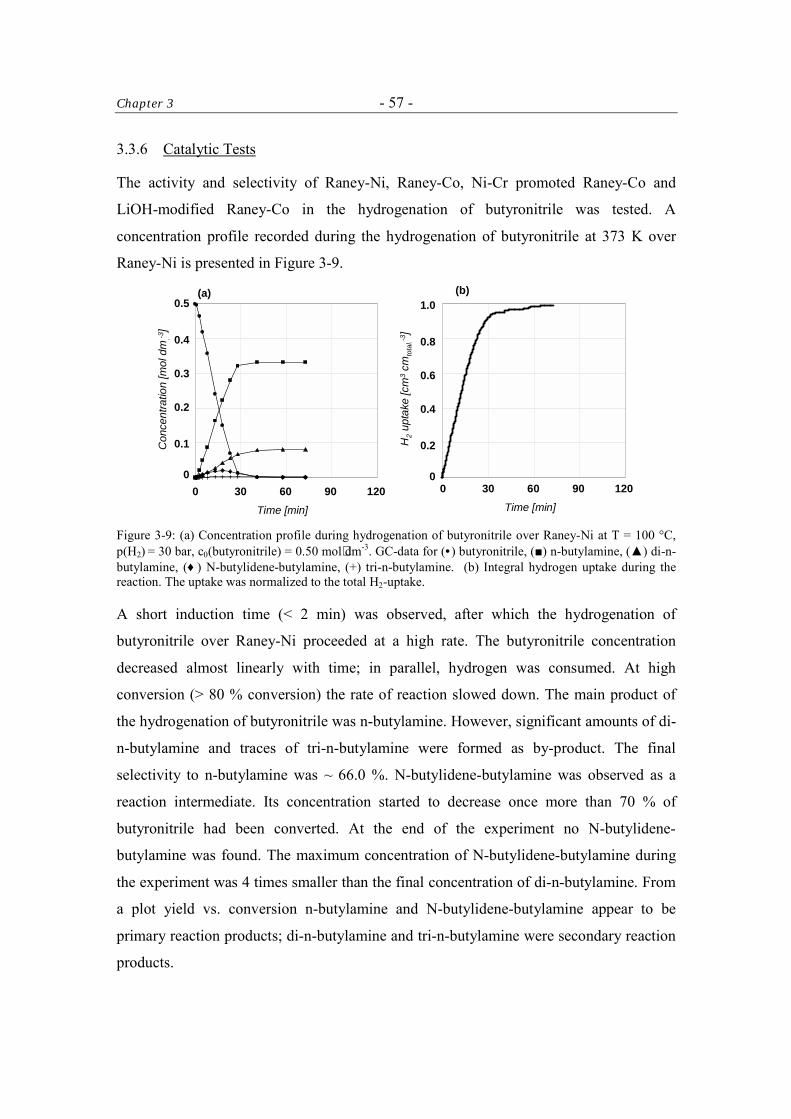
Chapter 3 - 57 -
3.3.6 Catalytic Tests
The activity and selectivity of Raney-Ni, Raney-Co, Ni-Cr promoted Raney-Co and
LiOH-modified Raney-Co in the hydrogenation of butyronitrile was tested. A
concentration profile recorded during the hydrogenation of butyronitrile at 373 K over
Raney-Ni is presented in Figure 3-9.
Con
cent
ratio
n [m
ol·d
m.-3
]
H2
upta
ke [c
m3 ·c
mto
tal.-3
]
Time [min]
0 12030 60 90
0.5
0.4
0.3
0.2
0.1
0
Time [min]
0 12030 60 90
1.0
0.8
0.6
0.4
0.2
0
(a) (b)
Figure 3-9: (a) Concentration profile during hydrogenation of butyronitrile over Raney-Ni at T = 100 °C, p(H2) = 30 bar, c0(butyronitrile) = 0.50 mol⋅dm-3. GC-data for (• ) butyronitrile, (■) n-butylamine, (▲) di-n-butylamine, (♦ ) N-butylidene-butylamine, (+) tri-n-butylamine. (b) Integral hydrogen uptake during the reaction. The uptake was normalized to the total H2-uptake.
A short induction time (< 2 min) was observed, after which the hydrogenation of
butyronitrile over Raney-Ni proceeded at a high rate. The butyronitrile concentration
decreased almost linearly with time; in parallel, hydrogen was consumed. At high
conversion (> 80 % conversion) the rate of reaction slowed down. The main product of
the hydrogenation of butyronitrile was n-butylamine. However, significant amounts of di-
n-butylamine and traces of tri-n-butylamine were formed as by-product. The final
selectivity to n-butylamine was ~ 66.0 %. N-butylidene-butylamine was observed as a
reaction intermediate. Its concentration started to decrease once more than 70 % of
butyronitrile had been converted. At the end of the experiment no N-butylidene-
butylamine was found. The maximum concentration of N-butylidene-butylamine during
the experiment was 4 times smaller than the final concentration of di-n-butylamine. From
a plot yield vs. conversion n-butylamine and N-butylidene-butylamine appear to be
primary reaction products; di-n-butylamine and tri-n-butylamine were secondary reaction
products.
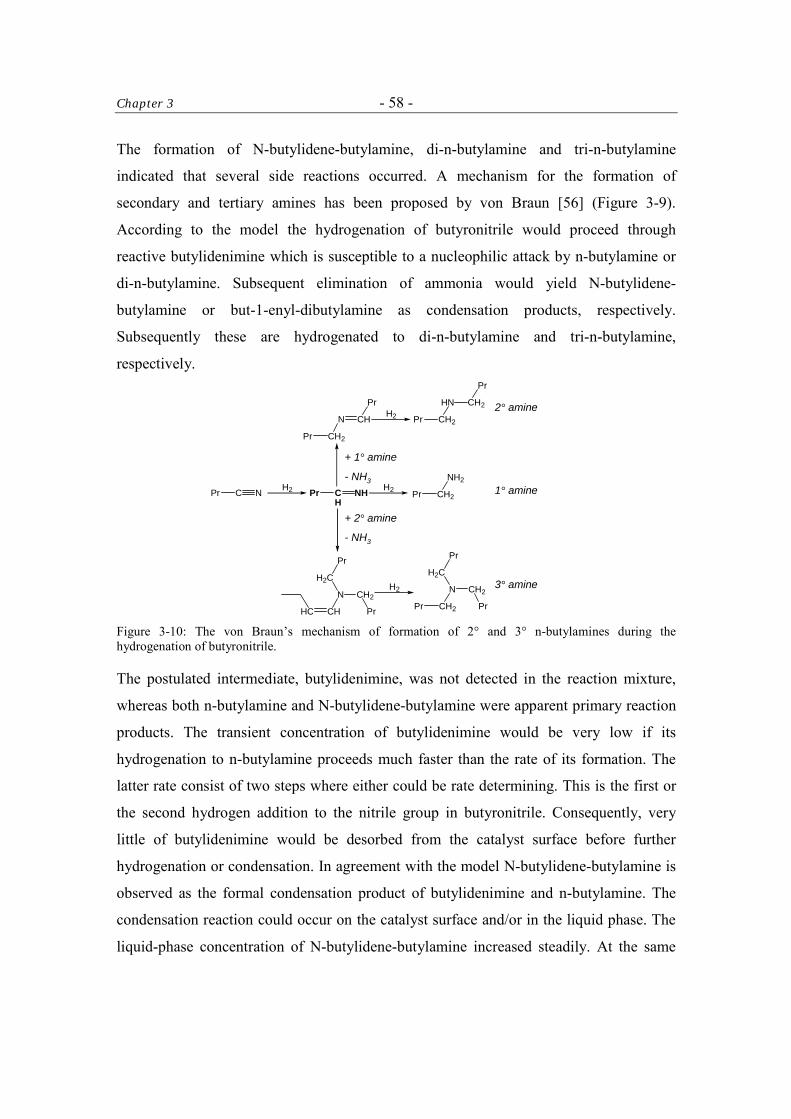
Chapter 3 - 58 -
The formation of N-butylidene-butylamine, di-n-butylamine and tri-n-butylamine
indicated that several side reactions occurred. A mechanism for the formation of
secondary and tertiary amines has been proposed by von Braun [56] (Figure 3-9).
According to the model the hydrogenation of butyronitrile would proceed through
reactive butylidenimine which is susceptible to a nucleophilic attack by n-butylamine or
di-n-butylamine. Subsequent elimination of ammonia would yield N-butylidene-
butylamine or but-1-enyl-dibutylamine as condensation products, respectively.
Subsequently these are hydrogenated to di-n-butylamine and tri-n-butylamine,
respectively.
3° amine
1° amine
2° amineCH2
HN
Pr
CH2
Pr
H2
CH2
N
Pr
CH
Pr
CH2
NH2
PrH2 H2C NPr C
HNHPr
CH2
N
Pr
CH2
H2C
Pr
Pr
CH
N CH2
H2C
Pr
Pr
HC
H2
+ 1° amine
- NH3
+ 2° amine
- NH3
Figure 3-10: The von Braun’s mechanism of formation of 2° and 3° n-butylamines during the hydrogenation of butyronitrile.
The postulated intermediate, butylidenimine, was not detected in the reaction mixture,
whereas both n-butylamine and N-butylidene-butylamine were apparent primary reaction
products. The transient concentration of butylidenimine would be very low if its
hydrogenation to n-butylamine proceeds much faster than the rate of its formation. The
latter rate consist of two steps where either could be rate determining. This is the first or
the second hydrogen addition to the nitrile group in butyronitrile. Consequently, very
little of butylidenimine would be desorbed from the catalyst surface before further
hydrogenation or condensation. In agreement with the model N-butylidene-butylamine is
observed as the formal condensation product of butylidenimine and n-butylamine. The
condensation reaction could occur on the catalyst surface and/or in the liquid phase. The
liquid-phase concentration of N-butylidene-butylamine increased steadily. At the same
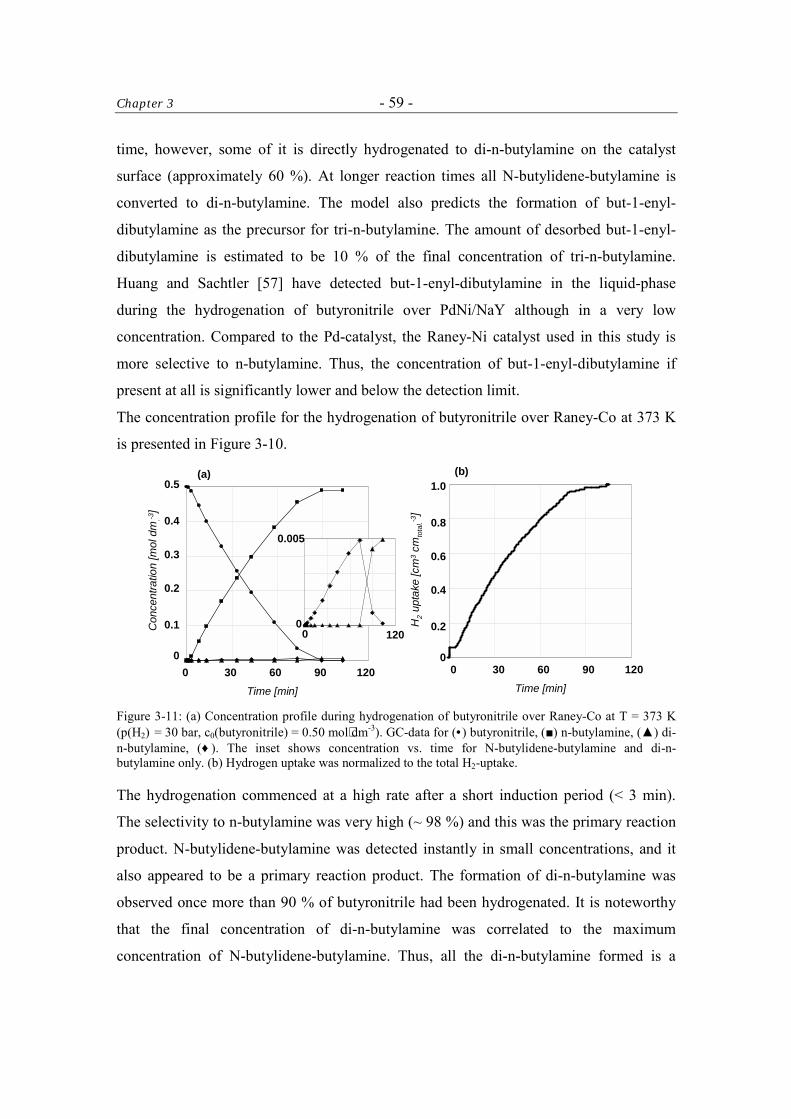
Chapter 3 - 59 -
time, however, some of it is directly hydrogenated to di-n-butylamine on the catalyst
surface (approximately 60 %). At longer reaction times all N-butylidene-butylamine is
converted to di-n-butylamine. The model also predicts the formation of but-1-enyl-
dibutylamine as the precursor for tri-n-butylamine. The amount of desorbed but-1-enyl-
dibutylamine is estimated to be 10 % of the final concentration of tri-n-butylamine.
Huang and Sachtler [57] have detected but-1-enyl-dibutylamine in the liquid-phase
during the hydrogenation of butyronitrile over PdNi/NaY although in a very low
concentration. Compared to the Pd-catalyst, the Raney-Ni catalyst used in this study is
more selective to n-butylamine. Thus, the concentration of but-1-enyl-dibutylamine if
present at all is significantly lower and below the detection limit.
The concentration profile for the hydrogenation of butyronitrile over Raney-Co at 373 K
is presented in Figure 3-10.
Con
cent
ratio
n [m
ol·d
m.-3
]
H2
upta
ke [c
m3 ·c
mto
tal.-3
]
Time [min]
0 12030 60 90
0.5
0.4
0.3
0.2
0.1
0
Time [min]
0 12030 60 90
1.0
0.8
0.6
0.4
0.2
0
0
0.005
1200
(a) (b)
Figure 3-11: (a) Concentration profile during hydrogenation of butyronitrile over Raney-Co at T = 373 K (p(H2) = 30 bar, c0(butyronitrile) = 0.50 mol⋅dm-3). GC-data for (• ) butyronitrile, (■) n-butylamine, (▲) di-n-butylamine, (♦ ). The inset shows concentration vs. time for N-butylidene-butylamine and di-n-butylamine only. (b) Hydrogen uptake was normalized to the total H2-uptake.
The hydrogenation commenced at a high rate after a short induction period (< 3 min).
The selectivity to n-butylamine was very high (~ 98 %) and this was the primary reaction
product. N-butylidene-butylamine was detected instantly in small concentrations, and it
also appeared to be a primary reaction product. The formation of di-n-butylamine was
observed once more than 90 % of butyronitrile had been hydrogenated. It is noteworthy
that the final concentration of di-n-butylamine was correlated to the maximum
concentration of N-butylidene-butylamine. Thus, all the di-n-butylamine formed is a
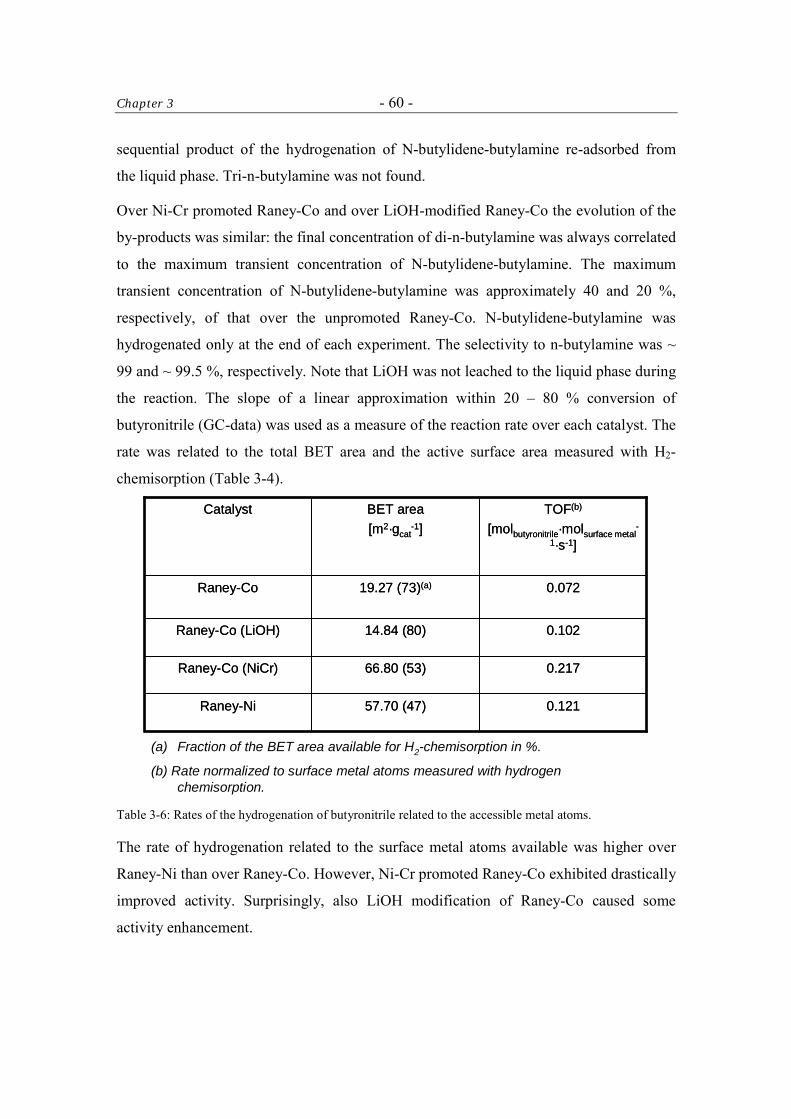
Chapter 3 - 60 -
sequential product of the hydrogenation of N-butylidene-butylamine re-adsorbed from
the liquid phase. Tri-n-butylamine was not found.
Over Ni-Cr promoted Raney-Co and over LiOH-modified Raney-Co the evolution of the
by-products was similar: the final concentration of di-n-butylamine was always correlated
to the maximum transient concentration of N-butylidene-butylamine. The maximum
transient concentration of N-butylidene-butylamine was approximately 40 and 20 %,
respectively, of that over the unpromoted Raney-Co. N-butylidene-butylamine was
hydrogenated only at the end of each experiment. The selectivity to n-butylamine was ~
99 and ~ 99.5 %, respectively. Note that LiOH was not leached to the liquid phase during
the reaction. The slope of a linear approximation within 20 – 80 % conversion of
butyronitrile (GC-data) was used as a measure of the reaction rate over each catalyst. The
rate was related to the total BET area and the active surface area measured with H2-
chemisorption (Table 3-4).
(a) Fraction of the BET area available for H2-chemisorption in %.
(b) Rate normalized to surface metal atoms measured with hydrogenchemisorption.
0.07219.27 (73)(a)Raney-Co
0.12157.70 (47)Raney-Ni
0.21766.80 (53)Raney-Co (NiCr)
0.10214.84 (80)Raney-Co (LiOH)
TOF(b)
[molbutyronitrile·molsurface metal-
1·s-1]
BET area[m2·gcat
-1]Catalyst
0.07219.27 (73)(a)Raney-Co
0.12157.70 (47)Raney-Ni
0.21766.80 (53)Raney-Co (NiCr)
0.10214.84 (80)Raney-Co (LiOH)
TOF(b)
[molbutyronitrile·molsurface metal-
1·s-1]
BET area[m2·gcat
-1]Catalyst
Table 3-6: Rates of the hydrogenation of butyronitrile related to the accessible metal atoms.
The rate of hydrogenation related to the surface metal atoms available was higher over
Raney-Ni than over Raney-Co. However, Ni-Cr promoted Raney-Co exhibited drastically
improved activity. Surprisingly, also LiOH modification of Raney-Co caused some
activity enhancement.
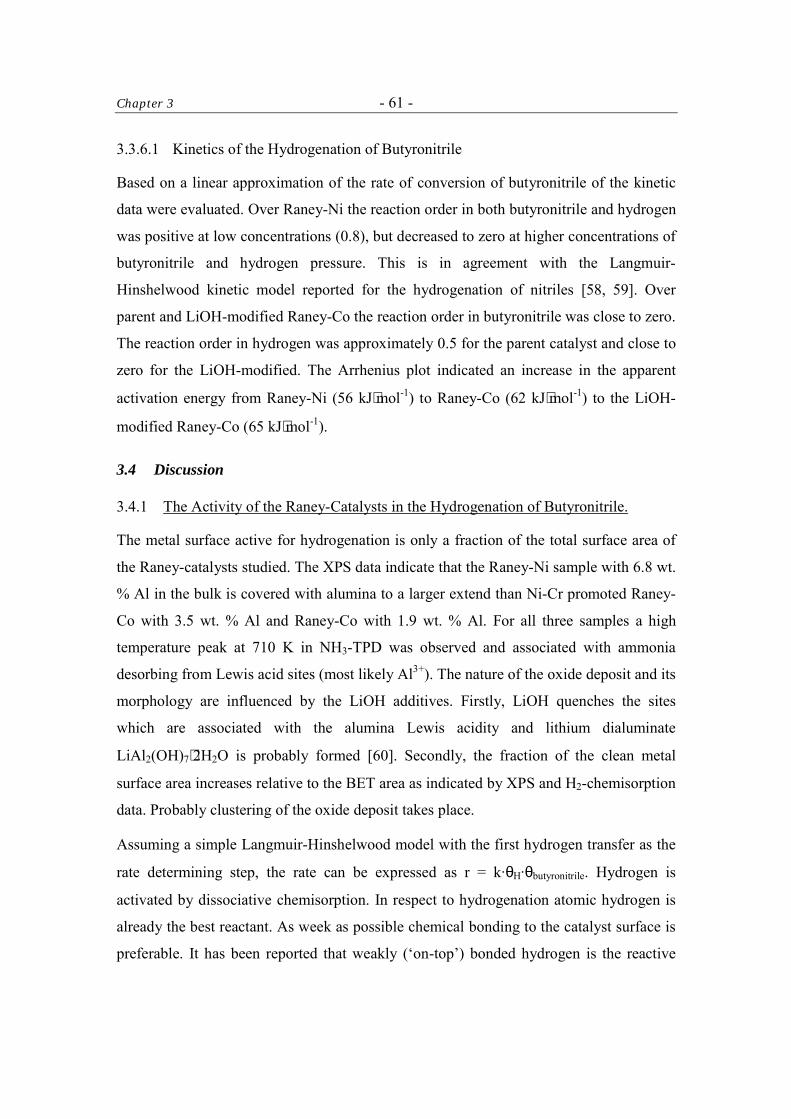
Chapter 3 - 61 -
3.3.6.1 Kinetics of the Hydrogenation of Butyronitrile
Based on a linear approximation of the rate of conversion of butyronitrile of the kinetic
data were evaluated. Over Raney-Ni the reaction order in both butyronitrile and hydrogen
was positive at low concentrations (0.8), but decreased to zero at higher concentrations of
butyronitrile and hydrogen pressure. This is in agreement with the Langmuir-
Hinshelwood kinetic model reported for the hydrogenation of nitriles [58, 59]. Over
parent and LiOH-modified Raney-Co the reaction order in butyronitrile was close to zero.
The reaction order in hydrogen was approximately 0.5 for the parent catalyst and close to
zero for the LiOH-modified. The Arrhenius plot indicated an increase in the apparent
activation energy from Raney-Ni (56 kJ⋅mol-1) to Raney-Co (62 kJ⋅mol-1) to the LiOH-
modified Raney-Co (65 kJ⋅mol-1).
3.4 Discussion
3.4.1 The Activity of the Raney-Catalysts in the Hydrogenation of Butyronitrile.
The metal surface active for hydrogenation is only a fraction of the total surface area of
the Raney-catalysts studied. The XPS data indicate that the Raney-Ni sample with 6.8 wt.
% Al in the bulk is covered with alumina to a larger extend than Ni-Cr promoted Raney-
Co with 3.5 wt. % Al and Raney-Co with 1.9 wt. % Al. For all three samples a high
temperature peak at 710 K in NH3-TPD was observed and associated with ammonia
desorbing from Lewis acid sites (most likely Al3+). The nature of the oxide deposit and its
morphology are influenced by the LiOH additives. Firstly, LiOH quenches the sites
which are associated with the alumina Lewis acidity and lithium dialuminate
LiAl2(OH)7⋅2H2O is probably formed [60]. Secondly, the fraction of the clean metal
surface area increases relative to the BET area as indicated by XPS and H2-chemisorption
data. Probably clustering of the oxide deposit takes place.
Assuming a simple Langmuir-Hinshelwood model with the first hydrogen transfer as the
rate determining step, the rate can be expressed as r = k·θH·θbutyronitrile. Hydrogen is
activated by dissociative chemisorption. In respect to hydrogenation atomic hydrogen is
already the best reactant. As week as possible chemical bonding to the catalyst surface is
preferable. It has been reported that weakly (‘on-top’) bonded hydrogen is the reactive
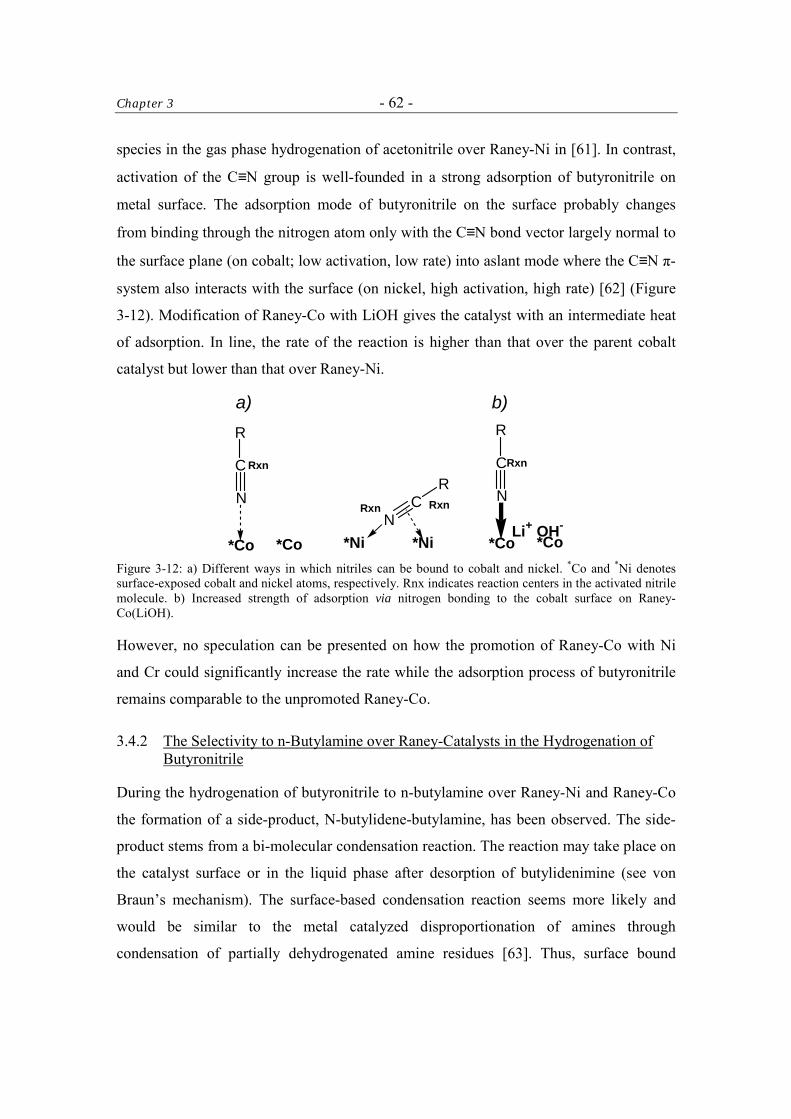
Chapter 3 - 62 -
species in the gas phase hydrogenation of acetonitrile over Raney-Ni in [61]. In contrast,
activation of the C≡N group is well-founded in a strong adsorption of butyronitrile on
metal surface. The adsorption mode of butyronitrile on the surface probably changes
from binding through the nitrogen atom only with the C≡N bond vector largely normal to
the surface plane (on cobalt; low activation, low rate) into aslant mode where the C≡N π-
system also interacts with the surface (on nickel, high activation, high rate) [62] (Figure
3-12). Modification of Raney-Co with LiOH gives the catalyst with an intermediate heat
of adsorption. In line, the rate of the reaction is higher than that over the parent cobalt
catalyst but lower than that over Raney-Ni.
C
N
R
Li+ OH-*Co*Co
RxnC
N
R
*Co*Co
Rxn
CN
R
*Ni *Ni
Rxn Rxn
a) b)
Figure 3-12: a) Different ways in which nitriles can be bound to cobalt and nickel. *Co and *Ni denotes surface-exposed cobalt and nickel atoms, respectively. Rnx indicates reaction centers in the activated nitrile molecule. b) Increased strength of adsorption via nitrogen bonding to the cobalt surface on Raney-Co(LiOH).
However, no speculation can be presented on how the promotion of Raney-Co with Ni
and Cr could significantly increase the rate while the adsorption process of butyronitrile
remains comparable to the unpromoted Raney-Co.
3.4.2 The Selectivity to n-Butylamine over Raney-Catalysts in the Hydrogenation of Butyronitrile
During the hydrogenation of butyronitrile to n-butylamine over Raney-Ni and Raney-Co
the formation of a side-product, N-butylidene-butylamine, has been observed. The side-
product stems from a bi-molecular condensation reaction. The reaction may take place on
the catalyst surface or in the liquid phase after desorption of butylidenimine (see von
Braun’s mechanism). The surface-based condensation reaction seems more likely and
would be similar to the metal catalyzed disproportionation of amines through
condensation of partially dehydrogenated amine residues [63]. Thus, surface bound

Chapter 3 - 63 -
carbene and nitrene species should be included in the mechanism [64]. In the very initial
step of the formation of the new C-N bond, a species with a free electron pair on nitrogen
will nucleophilic attack a reactive carbon atom. For example, the carbon atom of a
strongly activated nitrile group or the carbon atom present in a partially hydrogenated
derivative of the nitrile. This step of the condensation process is likely acid-catalyzed [65,
66]. Note that nitrene species where the carbon atom is fully hydrogenated (µ-N-CH2-R)
are protected from nucleophilic addition [67].
Based on the presented picture one can attempt to explain the higher selectivity over
cobalt relative to nickel and the beneficial effect of doping with LiOH. A direct control
over the rate of surface condensation reactions can be realized by decreasing the surface
coverage in the reacting molecules. These species will exist in a low steady-state surface
concentration if a high ratio of active hydrogen to butyronitrile is maintained. However,
atomic hydrogen should be reactive hence weakly adsorbed on the catalyst surface. Note
that our TPD data indicate a higher density of strongly adsorbing hydrogen sites on
Raney-Ni than on Raney-Co. On the other hand, stronger adsorption of butyronitrile on
nickel than on cobalt could also have implications for the selectivity. Firstly, if more
butyronitrile is adsorbed the concentration in the partially hydrogenated species is higher.
Thus, LiOH-modification is beneficial because it reduces the sorption capacity for
butyronitrile (as well as butylamine) and consequently diminishes the concentration of
surface substrates for bi-molecular condensation reactions. Secondly, upon strong
activation of the nitrile group the molecule is more susceptible to undesired reaction
pathways (Figure 3-12 a, reaction center simultaneously on carbon and nitrogen). Doping
of Raney-Co with LiOH brings about a slight increase in the heat of adsorption and
enhances the selectivity. It is speculated that this modification actually increases the
strength of the nitrogen binding to the cobalt surface) and the step-wise hydrogenation
process proceeds via nitrene species.
3.5 Conclusions
Properties of Raney-catalysts depend on the amount of aluminum, which precipitates as
alumina and mixed oxides on the catalyst surface. The nature and morphology of the
deposit can by modified by doping with LiOH. Most likely islands of lithium dialuminate
Chapter 3 - 64 -
and lithium hydroxide are formed on the catalyst surface exposing a higher fraction of
clean metal surface. The selectivity to primary amine depends on the rate of a bi-
molecular reaction forming N-butylidene-butylamine. The concentration of the reactive
species on the surface decreases after LiOH doping the selectivity increases. In particular,
LiOH modification of Raney-Co leads to enhanced selectivity by (i) reducing the catalyst
sorption capacity for butyronitrile and amines, (ii) increasing the probability of the step-
wise hydrogenation via nitrene species and (iii) poisoning of Al3+ Lewis acid sites that
catalyze the condensation reaction.
Acknowledgments
Air Products & Chemicals Inc. is gratefully thanked for the generous financial support.
Dr. Maritza Veprek-Heijman and Prof. Dr. Stan Veprek (Institut für Chemie
Anorganischer Materialien, TUM) are thanked for the XPS measurement, help with the
data interpretation and many discussions. Dr. Jeno Bodis is gratefully acknowledged for
many stimulating discussions.
References 1 M. G. Turcotte, T. A. Johnson in: J. I. Kroschwitz (Ed.), Kirk-Othmer Encyclopedia
of Chemical Technology Vol. 2 (4th Ed.), John Wiley & Sons, NY, 1992, p.369 - 386
2 M. Serra, P. Salagre, Y. Cesteros, F. Medina, and J. E. Sueiras, J. Catal. 209 (2002)
202
3 S. Alini, A. Bottino, G. Capannelli, R. Carbone, A. Comite and G. Vitulli, J. Mol.
Catal. A: Chem. 206 (2003) 363
4 A. G. M. Barrett in: B. M. Trost (Ed.-in-Chief), Comprehensive Organic Synthesis
Vol. 8 – Reduction, Pergamon Press, Oxford, 1991, p. 251 – 257
5 J. Barrault and Y. Pouilloux, Catal. Today 37 (1997) 137
6 P. Baumeister, M. Studer and F. Roessler in: G. Ertl, H. Knözinger, J. Weitkamp
(Eds.), Handbook of Heterogenious Catalysis Vol. 5, Wiley-VCH, Weinheim, 1997,
p. 2186 – 2195
7 F. Medina, P. Salagre and J.E. Sueiras, J. Mol. Catal. 81 (1993) 363
8 P. N. Rylander, Catalytic Hydrogenation over Platinum Metals, Academic Press, NY
and London, 1967, p. 203 – 226
Chapter 3 - 65 -
9 M. S. Wainwright in: G. Ertl, H. Knözinger, J. Weitkamp (Eds.), Preparation of Solid
Catalysts, Wiley-VCH, Weinheim, 1999, p. 28 – 43
10 G. Cordier, P. Fouilloux, N. Laurain and J.F. Spindler, US Patent No. 5,777,166
(1998), to Rhone-Poulene Chimie
11 T. A. Johnson, US Patent No. 5 869 653 (1999), to Air Products and Chemicals, Inc
12 A. F. Elsasser, US Patent No. 5,874,625 (1999), to Henkel Corporation
13 F. Hochard-Poncet, P. Delichere, B. Moraweck, J. Jobic and A. Renouprez, J. Chem.
Soc. Faraday Trans. 91 (1995) 2891
14 S. N. Thomas-Pryor, T. A. Manz, Z. Liu, T. A. Koch, S. K. Sengupta and W.N.
Delgass, Catalysis of Organic Reactions - Chemical Industries Series Vol. 75, Marcel
Dekker, 1998, p. 195
15 W. Reeve and J. Christian, J. Am. Chem. Soc. 78 (1956) 860
16 A. J. Chadwell Jr. and H. A. Smith, J. Phys. Chem. – US 60 (1956) 1339
17 J. P. Orchard, A. D. Tomsett, M. S. Wainwright and D. J. Young, J. Catal. 84 (1983)
189
18 S. Nishimura,M. Kawashuma, S. Inoue, S. Takeoka, M. Shimizu and Y. Takagai,
Appl. Catal. 76 (1991) 19
19 G. Moretti, in: G. Ertl, H. Knözinger, J. Weitkamp (Eds.) Handbook of
Heterogeneous Catalysis Vol.2, VCH-Wiley, Weinheim, 1997, p. 632 – 641
20 S. R. Montgomery in: W.R. Moser (Ed.) Catalysis of Organic Reactions - Chemical
Industries Series Vol. 5, Marcel Dekker, 1981, p. 383 – 409
21 The fit included the data points that were recorded at the beginning of the isotherm
and the equilibration time was at least 60 min; the R-squared value of the fit was 0.97
and 0.99 for Raney-Ni and Raney-Co catalysts, respectively.
22 J. D. Donnay and G. Harker, Am. Mineral. 22 (1937) 446; particles morphology was
computed in Cerius2 Modeling and Simulation Environment using Crystal Builder
and Surface Builder modules.
23 J. R. Anderson, Structure of Metallic Catalysts, AP, London, 1975, p. 228
24 A. B. Fasman in: F. Herkes (Ed.) Catalysis of Organic Reactions - Chemical
Industries Series Vol. 75, Marcel Dekker, 1998, p. 151 – 168
Chapter 3 - 66 -
25 F. Hochard-Poncet, P. Delichere, B. Moraweck, H. Jobic and A. J. Renouprez, J.
Chem. Soc. Faraday Trans. 91 (1995) 2891 and references therein
26 J. L. Falconer and J. A. Schwarz, Catal. Rev. – Sci. Eng., 25 (1983) 141
27 G. A. Martin and P- Fouilloux, J. Catal. 38 (1975) 231
28 M. J. F. M. Verhaak, A. J. van Dillen and J. W. Geus, Catal.Lett. 26 (1994) 37
29 A. Borgna, R. Frety, M. Primet and M. Guenin, Appl. Catal., 76 (1991) 233 and
references therein
30 S. N. Thomas-Pryor, T. A. Manz, Z. Liu, T. A. Koch, S. K. Sengupta and W.N.
Delgass, Catalysis of Organic Reactions - Chemical Industries Series Vol. 75, Marcel
Dekker, 1998, p. 195
31 Y. Okamoto, J. Cryst. Growth 191 (1998) 405
32 J. P. Thiel, C. K. Chiang, and K. R. Poeppelmeier, Chem. Mater. 5 (1993) 297
33 M. Nayak, T. R. N. Kutty, V. Jayaraman and G. Periaswamy, J. Mater. Chem. 7
(1997) 2131
34 M. J. F. M. Verhaak, A. J. van Dillen and J. W. Geus, Appl. Catal., A 105 (1993) 251
35 Gmelin, System-Nr. 58: Kobalt, Teil A, Erg’bd. P. 511 (1961)
36 A. Baiker and M. Maciejewski, J. Chem. Soc. Faraday Trans.1 80 (1984) 2331
37 Gmelin, System-Nr. 58: Kobalt, Teil A, Erg’bd. P. 511 (1961)
38 C. D. Wagner, W. M. Riggs, L. E. Davis, J. F. Moulder in: G. E. Muilenberg (Ed.):
Handbook of X-ray photoelectron spectroscopy, Perking-Elmer Corporation (Physical
Electronics Division), 1979 (1st Edition)
39 C. D. Wagner, W. M. Riggs, L. E. Davis, J. F. Moulder in: G. E. Muilenberg (Ed.):
Handbook of X-ray photoelectron spectroscopy, Perking-Elmer Corporation (Physical
Electronics Division), 1979 (1st Edition)
40 C. D. Wagner, W. M. Riggs, L. E. Davis, J. F. Moulder in: G. E. Muilenberg (Ed.):
Handbook of X-ray photoelectron spectroscopy, Perking-Elmer Corporation (Physical
Electronics Division), 1979 (1st Ed.)
41 C. D. Wagner, W. M. Riggs, L. E. Davis, J. F. Moulder in: G. E. Muilenberg (Ed.):
Handbook of X-ray photoelectron spectroscopy, Perking-Elmer Corporation (Physical
Electronics Division), 1979 (1st Ed.)
Chapter 3 - 67 -
42 C. D. Wagner, W. M. Riggs, L. E. Davis, J. F. Moulder in: G. E. Muilenberg (Ed.):
Handbook of X-ray photoelectron spectroscopy, Perking-Elmer Corporation (Physical
Electronics Division), 1979 (1st Ed.)
43 T. Yoshino, T. Abe and I. Nakabayashi, J. Catal. 118 (1989) 436
44 F. Hochard-Poncet, P. Delichere, B. Moraweck, J. Jobic and A. Renouprez, J. Chem.
Soc. Faraday Trans. 91 (1995) 2891
45 D. Briggs and M. P. Seah (Eds.) Pratical surface analysis, Vol. 1, John WILLEY &
SONS, 1993 (2nd Ed.)
46 C. D. Wagner, W. M. Riggs, L. E. Davis, J. F. Moulder in: G. E. Muilenberg (Ed.):
Handbook of X-ray photoelectron spectroscopy, Perking-Elmer Corporation (Physical
Electronics Division), 1979 (1st Ed.)
47 T. L. Barr, J. Vac. Sci. Technol A, 9, (1991) 1793
48 C. D. Wagner, W. M. Riggs, L. E. Davis, J. F. Moulder in: G. E. Muilenberg (Ed.):
Handbook of X-ray photoelectron spectroscopy, Perking-Elmer Corporation (Physical
Electronics Division), 1979 (1st Ed.)
49 T. L. Barr, J. Vac. Sci. Technol A, 9 (1991) 1793
50 C. D. Wagner, W. M. Riggs, L. E. Davis, J. F. Moulder in: G. E. Muilenberg (Ed.):
Handbook of X-ray photoelectron spectroscopy, Perking-Elmer Corporation (Physical
Electronics Division), 1979 (1st Ed.)
51 S. N. Thomas-Pryor, T. A. Manz, Z. Liu, T. A. Koch, S. K. Sengupta and W.N.
Delgass, Catalysis of Organic Reactions - Chemical Industries Series Vol. 75, Marcel
Dekker, 1998, p. 195
52 D. Brion, Appl. Surf. Sci., 5 (1980) 133
53 J. P. Contour, A. Salesse, M. Froment, M. Garreau, J. Thevenin and D. Warin, J.
Microsc. Spectrosc. Electron.. 4 (1979) 483
54 N.S. McIntyre, M. G. Cook, Anal. Chem, 47 (1975) 2208
55 K.S. W. Sing and J. Rouquerol in: G. Ertl, H. Knözinger, J. Weitkamp (Eds.)
Handbook of Heterogeneous Catalysis Vol.2, VCH-Wiley, Weinheim, 1997, p. 435
56 J. von Braun, G. Blessing and F. Zobel, Ber. 56B (1923) 1988
57 Y. Huang and W. M. H. Sachtler, Appl. Catal., A 182 (1999) 365
Chapter 3 - 68 -
58 Mathieu C., Dietrich E., Delmas H., Jenck J., Chem. Eng. Sci. 47(9-11) (1992) 2289
59 C. Joly-Vuillemin, D. Gavroy, G. Cordier, C. De Bellefon and H. Delmas, Chem. Eng.
Sci. 49 (1994) 4839
60 J. P. Thiel, C. K. Chiang, and K. R. Poeppelmeier, Chem. Mater. 5 (1993) 297
61 F. Hochard, H. Jobic, J. Massardier and A. Renouprez, J. Mol. Catal. A 95 (1995) 165
62 F. J. G. Alonso, M. G. Sanz and V. Riera, Organometallics 11 (1992) 801
63 A. Ozaki, Isotopic Studies of Heterogeneous Catalysis, Kodansha Ltd., Tokyo,
Academic Press, London, 1977, p.140 - 141
64 B. Coq, D. Tichit and S. Ribet, J. Catal. 189 (2000) 117
65 P. Sykes, A Guidebook to Mechanism in Organic Chemistry, London & Singapore,
Longman, 1986 (6th Ed.)
66 M. J. F. M. Verhaak, A.J. van Dillen, J.W. Geus, Catal. Lett. 26 (1994) 37
67 B. Coq, D. Tichit and S. Ribet, J. Catal. 189 (2000) 117
- 69 -
Chapter 4 The catalytic performance of Raney-Co and LiOH-modified Raney-Co was
tested in a three-phase high-pressure batch reactor where reactions were
followed in-situ by ATR-IR spectroscopy. Catalyst activity and selectivitywere
compared for a set of model reaction, in particular, (i) hydrogenation of
butyronitrile, (ii) disproportionate of n-butylamine, (iii) hydrogenation of N-
butylidene-butylamine in the presence of ammonia and (iv) hydrogenation
/deuteration of N-butylidene-butylamine.
N-butylidene-butylamine has been identified as the key species in respect to the
selectivity during the catalytic reduction of butyronitrile to n-butylamine over
Raney-Co. After hydrogenation di-n-butylamine, the final by-product, is
formed. N-butylidene-butylamine is formed on the catalyst surface, where
unsaturated species react with one another. In the presence of LiOH this
reaction is significantly retarded. It has been proposed, that improved
hydrogenation-dehydrogenation properties of the modified catalyst drastically
lower the transient concentration in reactive species on the catalyst surface.
Additionally, the nucleophilic condensation among products of partial
hydrogenation of butyronitrile is probably inhibited in the presence of a
stronger nucleophile (OH-).
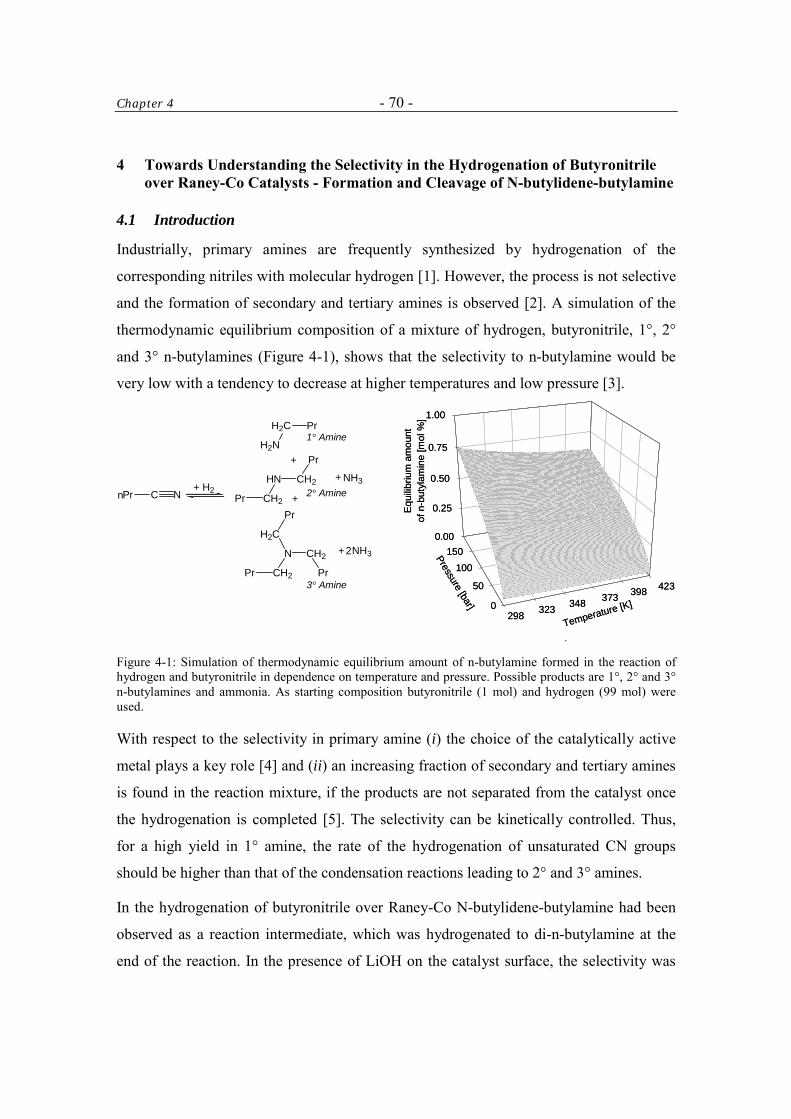
Chapter 4 - 70 -
4 Towards Understanding the Selectivity in the Hydrogenation of Butyronitrile over Raney-Co Catalysts - Formation and Cleavage of N-butylidene-butylamine
4.1 Introduction
Industrially, primary amines are frequently synthesized by hydrogenation of the
corresponding nitriles with molecular hydrogen [1]. However, the process is not selective
and the formation of secondary and tertiary amines is observed [2]. A simulation of the
thermodynamic equilibrium composition of a mixture of hydrogen, butyronitrile, 1°, 2°
and 3° n-butylamines (Figure 4-1), shows that the selectivity to n-butylamine would be
very low with a tendency to decrease at higher temperatures and low pressure [3].
0.00
0.25
0.50
0.75
1.00
298 323 348 373 398 423
0
50
100150
Temperature [K]
Pressure [bar]
Equi
libriu
m a
mou
ntof
n-b
utyl
amin
e [m
ol %
]
0.00
0.25
0.50
0.75
1.00
298 323 348 373 398 423
0
50
100150
Temperature [K]
Pressure [bar]
Equi
libriu
m a
mou
ntof
n-b
utyl
amin
e [m
ol %
]
.
C NPr+ H2
CH2
HN
Pr
CH2
Pr
CH2
N
Pr
CH2
H2C
Pr
Pr
H2C
H2N
Pr
NH3
NH3
+
+
+
+2
n
1° Amine
2° Amine
3° Amine
Figure 4-1: Simulation of thermodynamic equilibrium amount of n-butylamine formed in the reaction of hydrogen and butyronitrile in dependence on temperature and pressure. Possible products are 1°, 2° and 3° n-butylamines and ammonia. As starting composition butyronitrile (1 mol) and hydrogen (99 mol) were used.
With respect to the selectivity in primary amine (i) the choice of the catalytically active
metal plays a key role [4] and (ii) an increasing fraction of secondary and tertiary amines
is found in the reaction mixture, if the products are not separated from the catalyst once
the hydrogenation is completed [5]. The selectivity can be kinetically controlled. Thus,
for a high yield in 1° amine, the rate of the hydrogenation of unsaturated CN groups
should be higher than that of the condensation reactions leading to 2° and 3° amines.
In the hydrogenation of butyronitrile over Raney-Co N-butylidene-butylamine had been
observed as a reaction intermediate, which was hydrogenated to di-n-butylamine at the
end of the reaction. In the presence of LiOH on the catalyst surface, the selectivity was
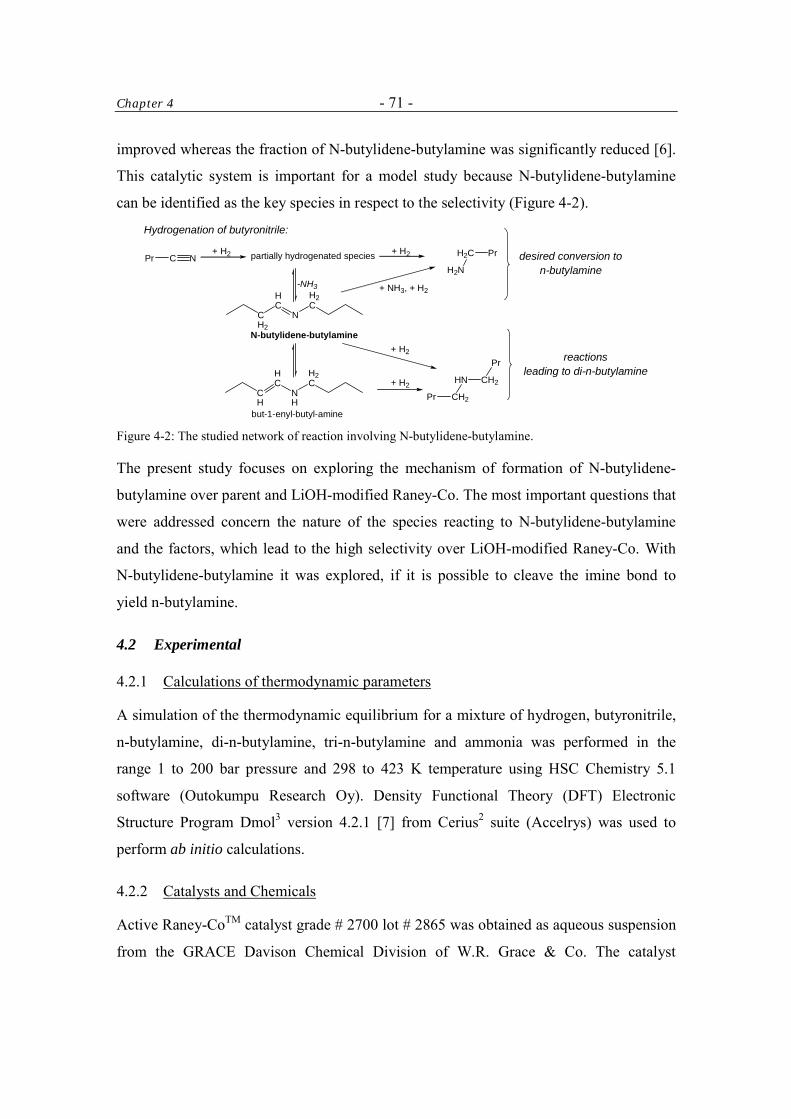
Chapter 4 - 71 -
improved whereas the fraction of N-butylidene-butylamine was significantly reduced [6].
This catalytic system is important for a model study because N-butylidene-butylamine
can be identified as the key species in respect to the selectivity (Figure 4-2).
+ H2 + H2
CH2
HC
N
H2C
CH
HC
NH
H2C
+ H2
+ H2
but-1-enyl-butyl-amine
N-butylidene-butylamine
+ NH3, + H2
C NPr H2C
H2N
Pr
CH2
HN
Pr
CH2
Pr
partially hydrogenated species
-NH3
desired conversion ton-butylamine
reactionsleading to di-n-butylamine
Hydrogenation of butyronitrile:
Figure 4-2: The studied network of reaction involving N-butylidene-butylamine.
The present study focuses on exploring the mechanism of formation of N-butylidene-
butylamine over parent and LiOH-modified Raney-Co. The most important questions that
were addressed concern the nature of the species reacting to N-butylidene-butylamine
and the factors, which lead to the high selectivity over LiOH-modified Raney-Co. With
N-butylidene-butylamine it was explored, if it is possible to cleave the imine bond to
yield n-butylamine.
4.2 Experimental
4.2.1 Calculations of thermodynamic parameters
A simulation of the thermodynamic equilibrium for a mixture of hydrogen, butyronitrile,
n-butylamine, di-n-butylamine, tri-n-butylamine and ammonia was performed in the
range 1 to 200 bar pressure and 298 to 423 K temperature using HSC Chemistry 5.1
software (Outokumpu Research Oy). Density Functional Theory (DFT) Electronic
Structure Program Dmol3 version 4.2.1 [7] from Cerius2 suite (Accelrys) was used to
perform ab initio calculations.
4.2.2 Catalysts and Chemicals
Active Raney-CoTM catalyst grade # 2700 lot # 2865 was obtained as aqueous suspension
from the GRACE Davison Chemical Division of W.R. Grace & Co. The catalyst
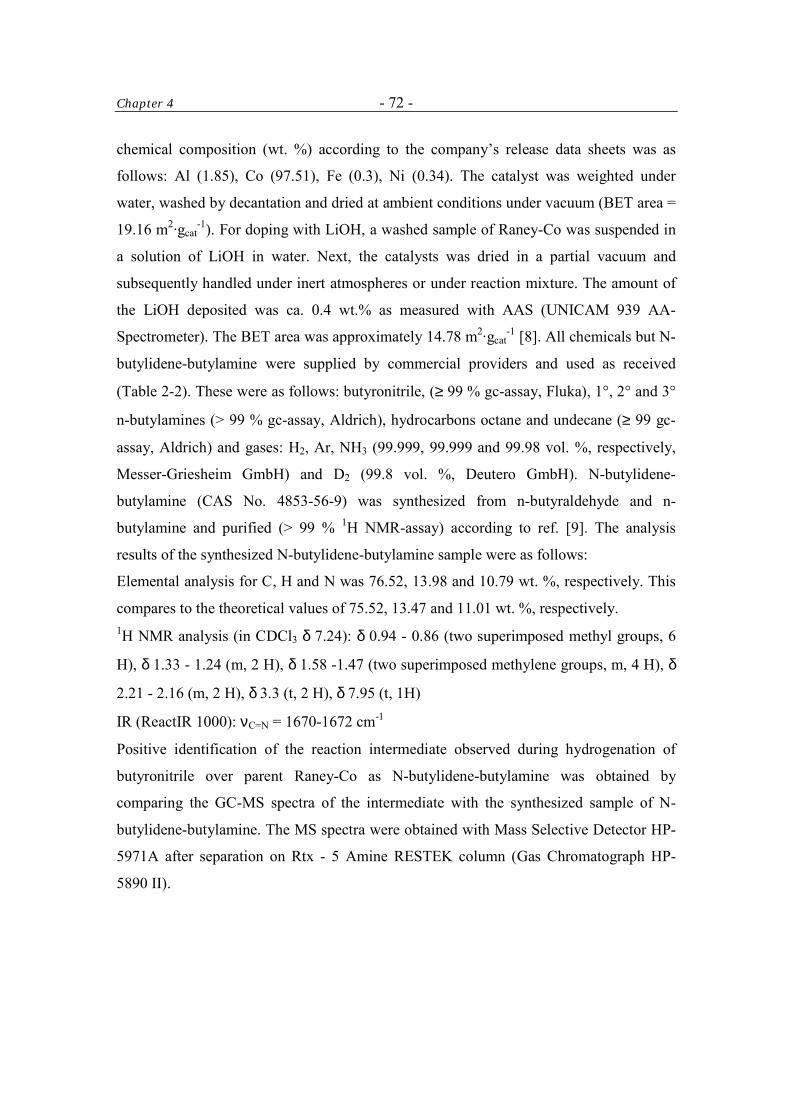
Chapter 4 - 72 -
chemical composition (wt. %) according to the company’s release data sheets was as
follows: Al (1.85), Co (97.51), Fe (0.3), Ni (0.34). The catalyst was weighted under
water, washed by decantation and dried at ambient conditions under vacuum (BET area =
19.16 m2·gcat-1). For doping with LiOH, a washed sample of Raney-Co was suspended in
a solution of LiOH in water. Next, the catalysts was dried in a partial vacuum and
subsequently handled under inert atmospheres or under reaction mixture. The amount of
the LiOH deposited was ca. 0.4 wt.% as measured with AAS (UNICAM 939 AA-
Spectrometer). The BET area was approximately 14.78 m2·gcat-1 [8]. All chemicals but N-
butylidene-butylamine were supplied by commercial providers and used as received
(Table 2-2). These were as follows: butyronitrile, (≥ 99 % gc-assay, Fluka), 1°, 2° and 3°
n-butylamines (> 99 % gc-assay, Aldrich), hydrocarbons octane and undecane (≥ 99 gc-
assay, Aldrich) and gases: H2, Ar, NH3 (99.999, 99.999 and 99.98 vol. %, respectively,
Messer-Griesheim GmbH) and D2 (99.8 vol. %, Deutero GmbH). N-butylidene-
butylamine (CAS No. 4853-56-9) was synthesized from n-butyraldehyde and n-
butylamine and purified (> 99 % 1H NMR-assay) according to ref. [9]. The analysis
results of the synthesized N-butylidene-butylamine sample were as follows:
Elemental analysis for C, H and N was 76.52, 13.98 and 10.79 wt. %, respectively. This
compares to the theoretical values of 75.52, 13.47 and 11.01 wt. %, respectively. 1H NMR analysis (in CDCl3 δ 7.24): δ 0.94 - 0.86 (two superimposed methyl groups, 6
H), δ 1.33 - 1.24 (m, 2 H), δ 1.58 -1.47 (two superimposed methylene groups, m, 4 H), δ
2.21 - 2.16 (m, 2 H), δ 3.3 (t, 2 H), δ 7.95 (t, 1H)
IR (ReactIR 1000): νC=N = 1670-1672 cm-1
Positive identification of the reaction intermediate observed during hydrogenation of
butyronitrile over parent Raney-Co as N-butylidene-butylamine was obtained by
comparing the GC-MS spectra of the intermediate with the synthesized sample of N-
butylidene-butylamine. The MS spectra were obtained with Mass Selective Detector HP-
5971A after separation on Rtx - 5 Amine RESTEK column (Gas Chromatograph HP-
5890 II).
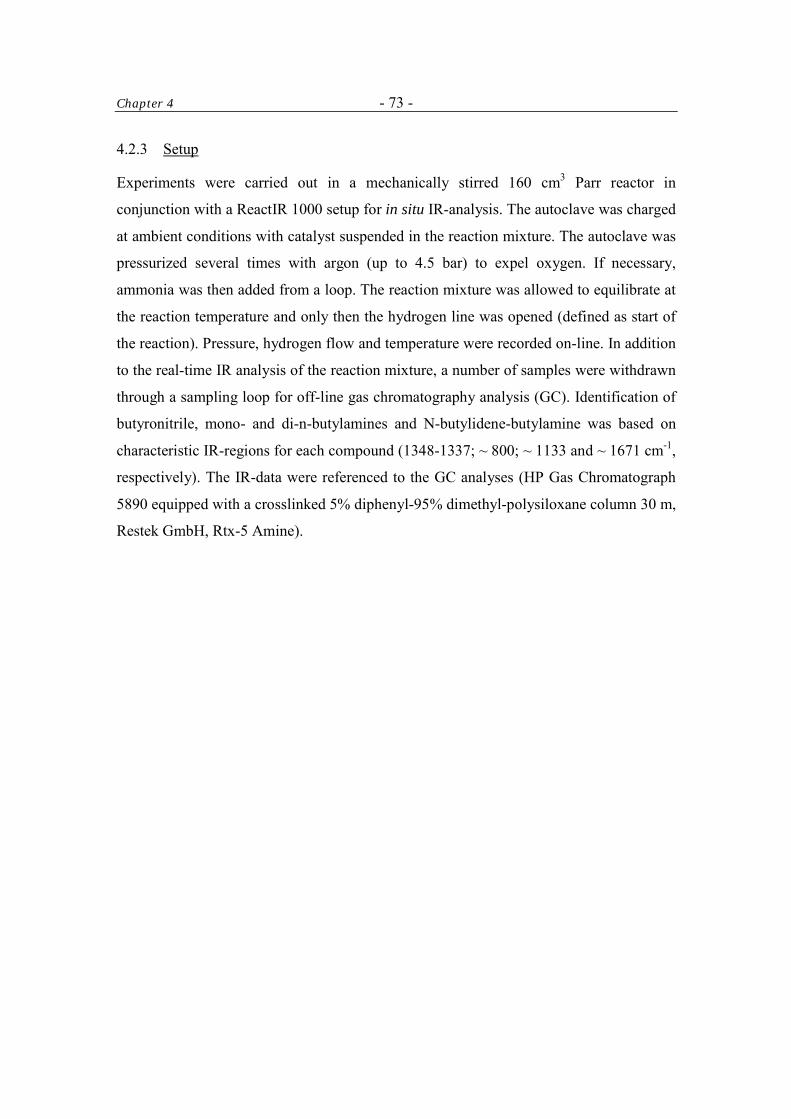
Chapter 4 - 73 -
4.2.3 Setup
Experiments were carried out in a mechanically stirred 160 cm3 Parr reactor in
conjunction with a ReactIR 1000 setup for in situ IR-analysis. The autoclave was charged
at ambient conditions with catalyst suspended in the reaction mixture. The autoclave was
pressurized several times with argon (up to 4.5 bar) to expel oxygen. If necessary,
ammonia was then added from a loop. The reaction mixture was allowed to equilibrate at
the reaction temperature and only then the hydrogen line was opened (defined as start of
the reaction). Pressure, hydrogen flow and temperature were recorded on-line. In addition
to the real-time IR analysis of the reaction mixture, a number of samples were withdrawn
through a sampling loop for off-line gas chromatography analysis (GC). Identification of
butyronitrile, mono- and di-n-butylamines and N-butylidene-butylamine was based on
characteristic IR-regions for each compound (1348-1337; ~ 800; ~ 1133 and ~ 1671 cm-1,
respectively). The IR-data were referenced to the GC analyses (HP Gas Chromatograph
5890 equipped with a crosslinked 5% diphenyl-95% dimethyl-polysiloxane column 30 m,
Restek GmbH, Rtx-5 Amine).
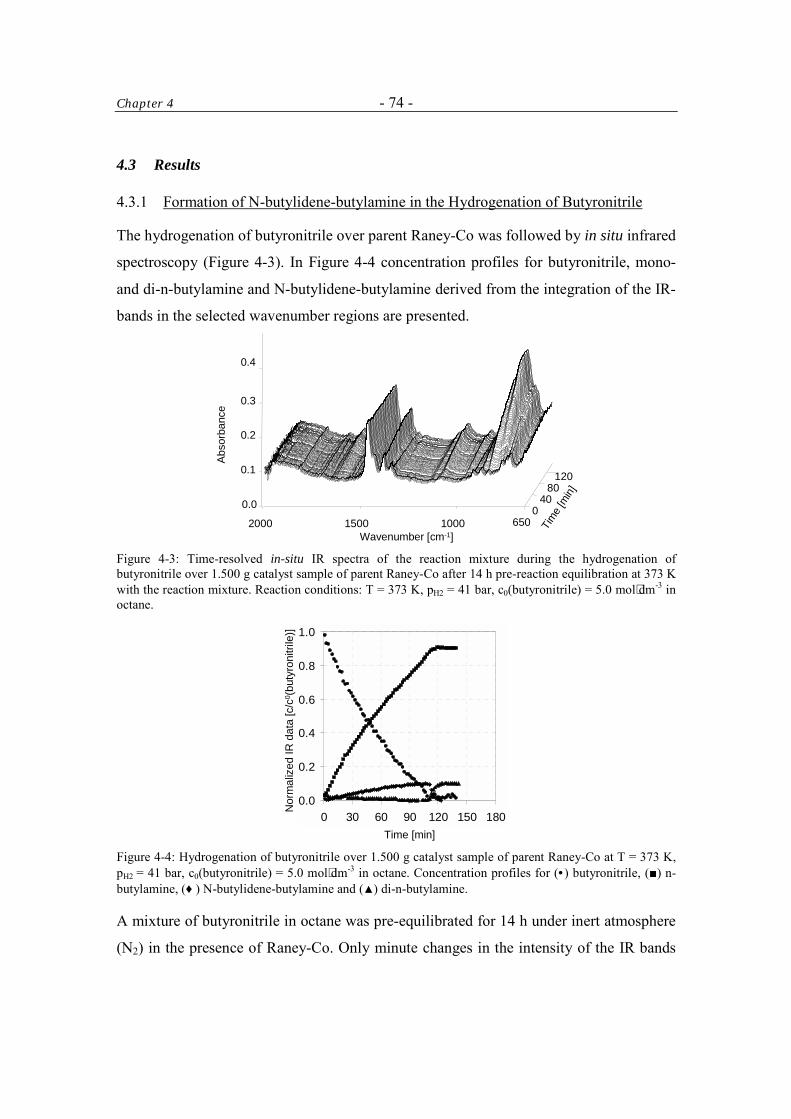
Chapter 4 - 74 -
4.3 Results
4.3.1 Formation of N-butylidene-butylamine in the Hydrogenation of Butyronitrile
The hydrogenation of butyronitrile over parent Raney-Co was followed by in situ infrared
spectroscopy (Figure 4-3). In Figure 4-4 concentration profiles for butyronitrile, mono-
and di-n-butylamine and N-butylidene-butylamine derived from the integration of the IR-
bands in the selected wavenumber regions are presented.
040
80120
Tim
e [m
in]
0.0
0.1
0.2
0.3
0.4
Abs
orba
nce
2000 1500 1000 Wavenumber [cm-1]
650
Figure 4-3: Time-resolved in-situ IR spectra of the reaction mixture during the hydrogenation of butyronitrile over 1.500 g catalyst sample of parent Raney-Co after 14 h pre-reaction equilibration at 373 K with the reaction mixture. Reaction conditions: T = 373 K, pH2 = 41 bar, c0(butyronitrile) = 5.0 mol⋅dm-3 in octane.
Time [min]
Nor
mal
ized
IR d
ata
[c/c
0 (bu
tyro
nitri
le)]
0.0
0.2
0.4
0.6
0.8
1.0
0 30 60 90 120 150 180
Figure 4-4: Hydrogenation of butyronitrile over 1.500 g catalyst sample of parent Raney-Co at T = 373 K, pH2 = 41 bar, c0(butyronitrile) = 5.0 mol⋅dm-3 in octane. Concentration profiles for (• ) butyronitrile, (■) n-butylamine, (♦ ) N-butylidene-butylamine and (▲) di-n-butylamine.
A mixture of butyronitrile in octane was pre-equilibrated for 14 h under inert atmosphere
(N2) in the presence of Raney-Co. Only minute changes in the intensity of the IR bands
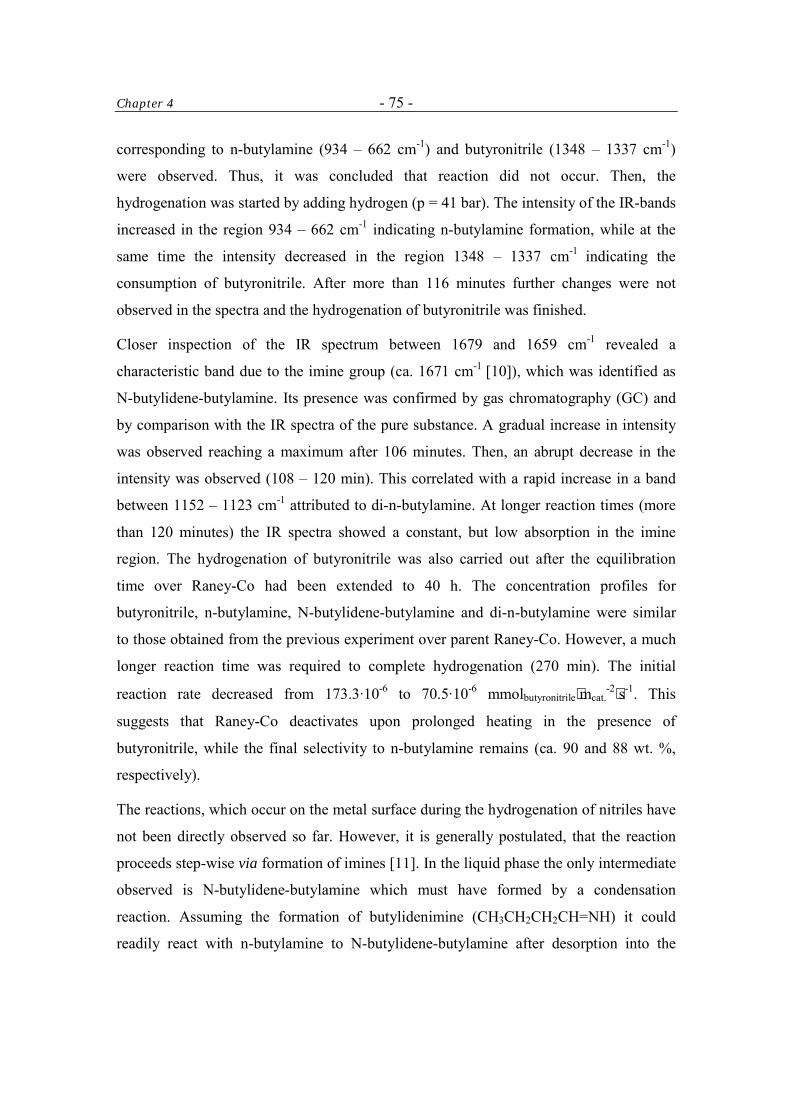
Chapter 4 - 75 -
corresponding to n-butylamine (934 – 662 cm-1) and butyronitrile (1348 – 1337 cm-1)
were observed. Thus, it was concluded that reaction did not occur. Then, the
hydrogenation was started by adding hydrogen (p = 41 bar). The intensity of the IR-bands
increased in the region 934 – 662 cm-1 indicating n-butylamine formation, while at the
same time the intensity decreased in the region 1348 – 1337 cm-1 indicating the
consumption of butyronitrile. After more than 116 minutes further changes were not
observed in the spectra and the hydrogenation of butyronitrile was finished.
Closer inspection of the IR spectrum between 1679 and 1659 cm-1 revealed a
characteristic band due to the imine group (ca. 1671 cm-1 [10]), which was identified as
N-butylidene-butylamine. Its presence was confirmed by gas chromatography (GC) and
by comparison with the IR spectra of the pure substance. A gradual increase in intensity
was observed reaching a maximum after 106 minutes. Then, an abrupt decrease in the
intensity was observed (108 – 120 min). This correlated with a rapid increase in a band
between 1152 – 1123 cm-1 attributed to di-n-butylamine. At longer reaction times (more
than 120 minutes) the IR spectra showed a constant, but low absorption in the imine
region. The hydrogenation of butyronitrile was also carried out after the equilibration
time over Raney-Co had been extended to 40 h. The concentration profiles for
butyronitrile, n-butylamine, N-butylidene-butylamine and di-n-butylamine were similar
to those obtained from the previous experiment over parent Raney-Co. However, a much
longer reaction time was required to complete hydrogenation (270 min). The initial
reaction rate decreased from 173.3·10-6 to 70.5·10-6 mmolbutyronitrile⋅mcat.-2⋅s-1. This
suggests that Raney-Co deactivates upon prolonged heating in the presence of
butyronitrile, while the final selectivity to n-butylamine remains (ca. 90 and 88 wt. %,
respectively).
The reactions, which occur on the metal surface during the hydrogenation of nitriles have
not been directly observed so far. However, it is generally postulated, that the reaction
proceeds step-wise via formation of imines [11]. In the liquid phase the only intermediate
observed is N-butylidene-butylamine which must have formed by a condensation
reaction. Assuming the formation of butylidenimine (CH3CH2CH2CH=NH) it could
readily react with n-butylamine to N-butylidene-butylamine after desorption into the
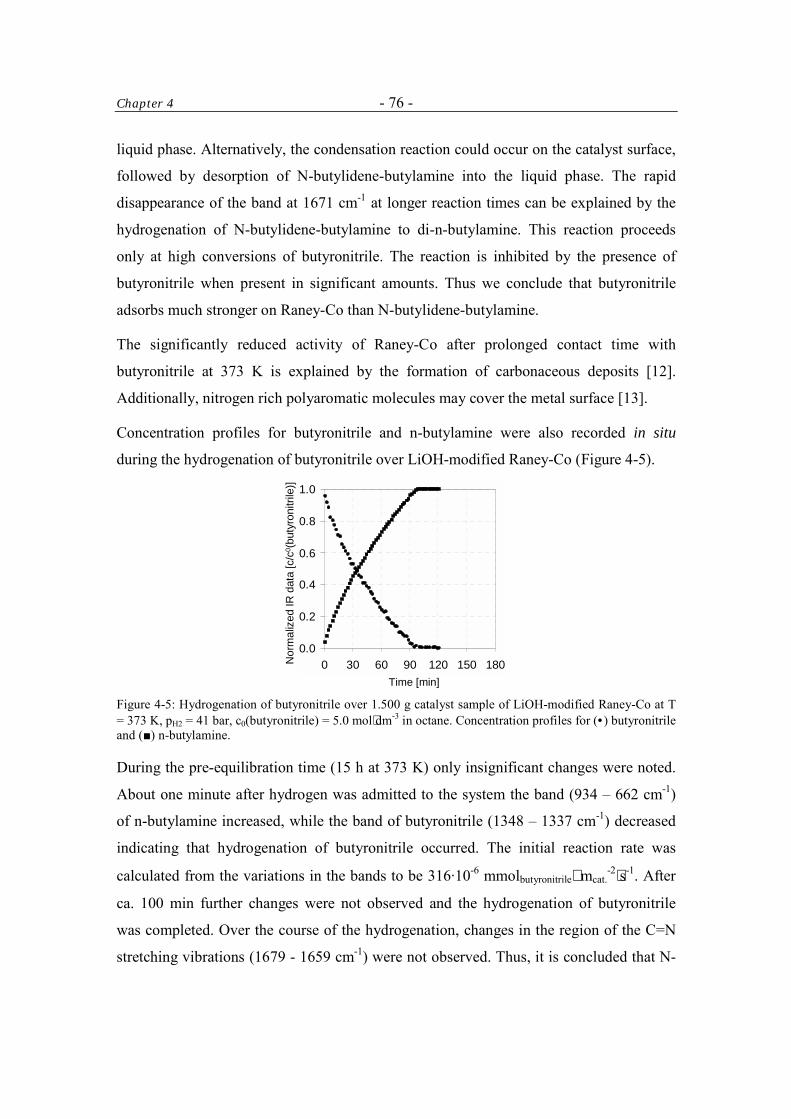
Chapter 4 - 76 -
liquid phase. Alternatively, the condensation reaction could occur on the catalyst surface,
followed by desorption of N-butylidene-butylamine into the liquid phase. The rapid
disappearance of the band at 1671 cm-1 at longer reaction times can be explained by the
hydrogenation of N-butylidene-butylamine to di-n-butylamine. This reaction proceeds
only at high conversions of butyronitrile. The reaction is inhibited by the presence of
butyronitrile when present in significant amounts. Thus we conclude that butyronitrile
adsorbs much stronger on Raney-Co than N-butylidene-butylamine.
The significantly reduced activity of Raney-Co after prolonged contact time with
butyronitrile at 373 K is explained by the formation of carbonaceous deposits [12].
Additionally, nitrogen rich polyaromatic molecules may cover the metal surface [13].
Concentration profiles for butyronitrile and n-butylamine were also recorded in situ
during the hydrogenation of butyronitrile over LiOH-modified Raney-Co (Figure 4-5).
Time [min]
Nor
mal
ized
IR d
ata
[c/c
0 (bu
tyro
nitri
le)]
0.0
0.2
0.4
0.6
0.8
1.0
0 30 60 90 120 150 180
Figure 4-5: Hydrogenation of butyronitrile over 1.500 g catalyst sample of LiOH-modified Raney-Co at T = 373 K, pH2 = 41 bar, c0(butyronitrile) = 5.0 mol⋅dm-3 in octane. Concentration profiles for (• ) butyronitrile and (■) n-butylamine.
During the pre-equilibration time (15 h at 373 K) only insignificant changes were noted.
About one minute after hydrogen was admitted to the system the band (934 – 662 cm-1)
of n-butylamine increased, while the band of butyronitrile (1348 – 1337 cm-1) decreased
indicating that hydrogenation of butyronitrile occurred. The initial reaction rate was
calculated from the variations in the bands to be 316·10-6 mmolbutyronitrile⋅ mcat.-2⋅s-1. After
ca. 100 min further changes were not observed and the hydrogenation of butyronitrile
was completed. Over the course of the hydrogenation, changes in the region of the C=N
stretching vibrations (1679 - 1659 cm-1) were not observed. Thus, it is concluded that N-
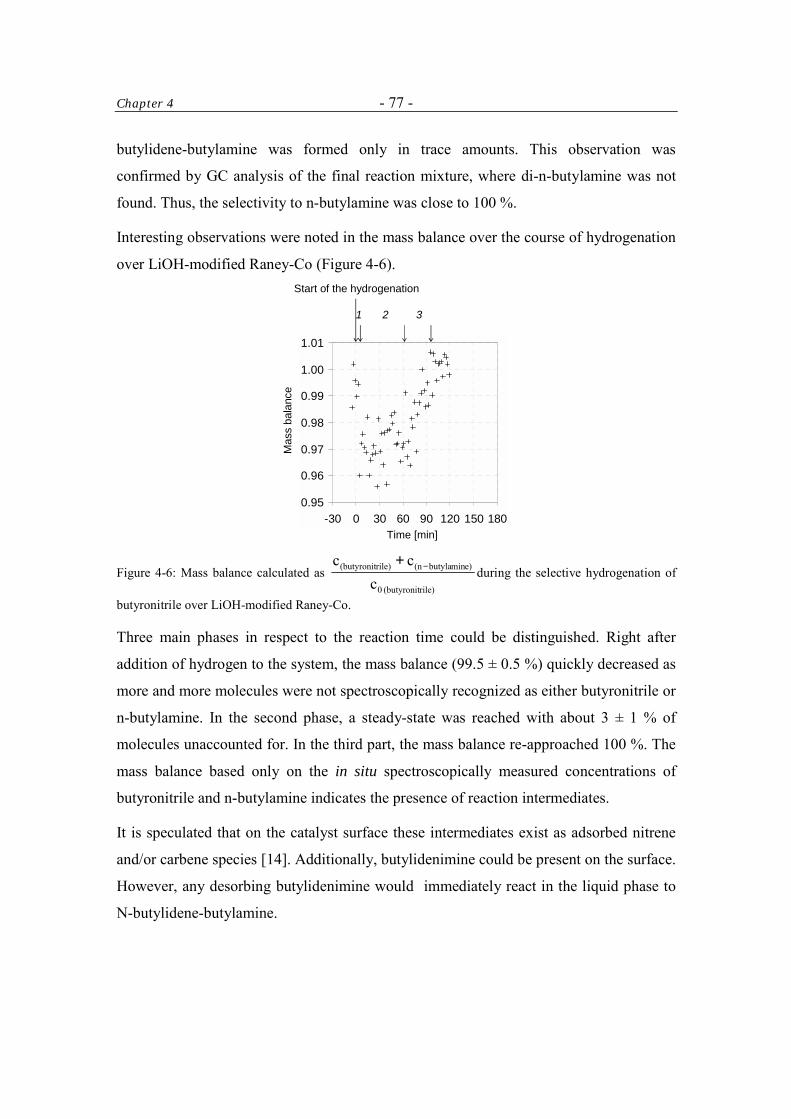
Chapter 4 - 77 -
butylidene-butylamine was formed only in trace amounts. This observation was
confirmed by GC analysis of the final reaction mixture, where di-n-butylamine was not
found. Thus, the selectivity to n-butylamine was close to 100 %.
Interesting observations were noted in the mass balance over the course of hydrogenation
over LiOH-modified Raney-Co (Figure 4-6).
0.95
0.96
0.97
0.98
0.99
1.00
1.01
-30 0 30 60 90 120 150 180
Start of the hydrogenation
Time [min]
Mas
s ba
lanc
e
1 2 3
Figure 4-6: Mass balance calculated as rile)(butyronit 0
e)minbutyla(nrile)(butyronit
ccc −+
during the selective hydrogenation of
butyronitrile over LiOH-modified Raney-Co.
Three main phases in respect to the reaction time could be distinguished. Right after
addition of hydrogen to the system, the mass balance (99.5 ± 0.5 %) quickly decreased as
more and more molecules were not spectroscopically recognized as either butyronitrile or
n-butylamine. In the second phase, a steady-state was reached with about 3 ± 1 % of
molecules unaccounted for. In the third part, the mass balance re-approached 100 %. The
mass balance based only on the in situ spectroscopically measured concentrations of
butyronitrile and n-butylamine indicates the presence of reaction intermediates.
It is speculated that on the catalyst surface these intermediates exist as adsorbed nitrene
and/or carbene species [14]. Additionally, butylidenimine could be present on the surface.
However, any desorbing butylidenimine would immediately react in the liquid phase to
N-butylidene-butylamine.
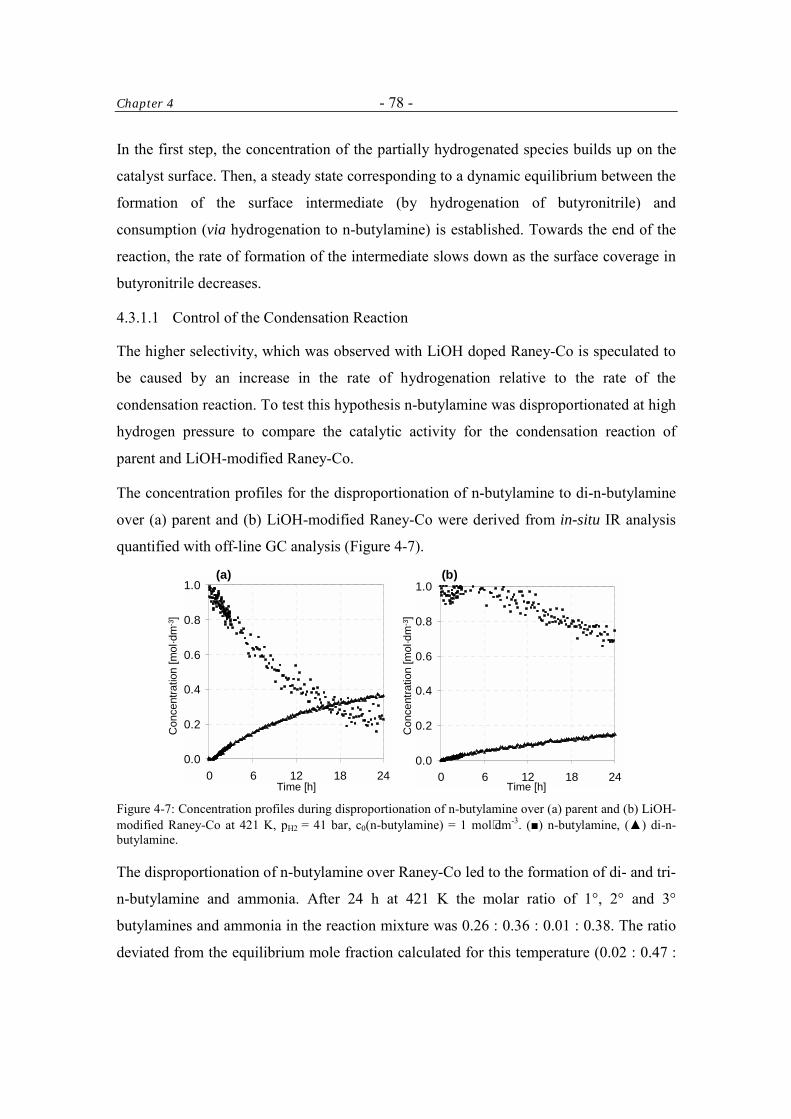
Chapter 4 - 78 -
In the first step, the concentration of the partially hydrogenated species builds up on the
catalyst surface. Then, a steady state corresponding to a dynamic equilibrium between the
formation of the surface intermediate (by hydrogenation of butyronitrile) and
consumption (via hydrogenation to n-butylamine) is established. Towards the end of the
reaction, the rate of formation of the intermediate slows down as the surface coverage in
butyronitrile decreases.
4.3.1.1 Control of the Condensation Reaction
The higher selectivity, which was observed with LiOH doped Raney-Co is speculated to
be caused by an increase in the rate of hydrogenation relative to the rate of the
condensation reaction. To test this hypothesis n-butylamine was disproportionated at high
hydrogen pressure to compare the catalytic activity for the condensation reaction of
parent and LiOH-modified Raney-Co.
The concentration profiles for the disproportionation of n-butylamine to di-n-butylamine
over (a) parent and (b) LiOH-modified Raney-Co were derived from in-situ IR analysis
quantified with off-line GC analysis (Figure 4-7).
0.0
0.2
0.4
0.6
0.8
1.0
0 6 12 18 240.0
0.2
0.4
0.6
0.8
1.0
0 6 12 18 24Time [h]
Con
cent
ratio
n [m
ol·d
m-3
]
Con
cent
ratio
n [m
ol·d
m-3
]
(a) (b)
Time [h] Figure 4-7: Concentration profiles during disproportionation of n-butylamine over (a) parent and (b) LiOH-modified Raney-Co at 421 K, pH2 = 41 bar, c0(n-butylamine) = 1 mol⋅dm-3. (■) n-butylamine, (▲) di-n-butylamine.
The disproportionation of n-butylamine over Raney-Co led to the formation of di- and tri-
n-butylamine and ammonia. After 24 h at 421 K the molar ratio of 1°, 2° and 3°
butylamines and ammonia in the reaction mixture was 0.26 : 0.36 : 0.01 : 0.38. The ratio
deviated from the equilibrium mole fraction calculated for this temperature (0.02 : 0.47 :
Chapter 4 - 79 -
0.02 : 0.50) [15]. Thus, full disproportionation was not accomplished. The rate was
approximated with a first order dependence and the reaction rate constant (kCo) was
calculated to be 16.8·10-6 s-1. LiOH doping retarded the rate of the disproportionation
reaction significantly. After 24 h the molar ratio of n-butylamine to di-n-butylamine and
ammonia was 0.70 : 0.15 : 0.15, respectively; tri-n-butylamine was not detected. Similar
to the parent Raney-Co the reaction was first order in n-butylamine. The rate constant
(kLiOH/Co) was 4.2 ·10-6 s-1. A control experiment in the absence of catalyst showed that
the reaction does not occur in the fluid phase.
The disproportionation of n-butylamine is catalyzed by cobalt. Under experimental
conditions (liquid phase, presence of hydrogen) the catalyst surface is likely saturated
with n-butylamine. However, the hydrogenation/dehydrogenation function of cobalt was
necessary for catalyzing the reaction. The strongly decreased rate of the condensation
reaction over the LiOH-modified catalyst (kCo(LiOH)/kCo = 0.25) could be related to a lower
number of catalytically active metal sites for dehydrogenation. The catalytic surface area
was 25 % lower than for the parent material. This shows the high sensitivity of the
reactivity with respect to a modest decrease in available Co on the surface. Further, the
results suggest that LiOH inhibits the condensation reaction on the catalyst surface. There
is no uniform kinetic description of the disproportionation of amines in the literature.
Some studies have been presented on a zero order and a higher-than-one order
disproportionation of ethylamine [16]. Based on isotopic studies of the disproportionation
of methylamine Anderson and Clark concluded that the most likely mechanism is a
surface bimolecular reaction between adsorbed amine residues [17].
4.3.2 Reactions of N-butylidene-butylamine
N-butylidene-butylamine has been identified as the key intermediate with respect to
selectivity in the hydrogenation of butyronitrile to n-butylamine over Raney-Co. One
strategy for improving the selectivity of the overall reaction is to convert N-butylidene-
butylamine which has formed to n-butylamine. Formally, this can be done by adding
ammonia to N-butylidene-butylamine and reductive C – N bond cleavage. This reaction
constitutes the reverse of the condensation reaction. However, it should be noted that
equilibrium thermodynamics suggests that the reaction will hardly proceed.
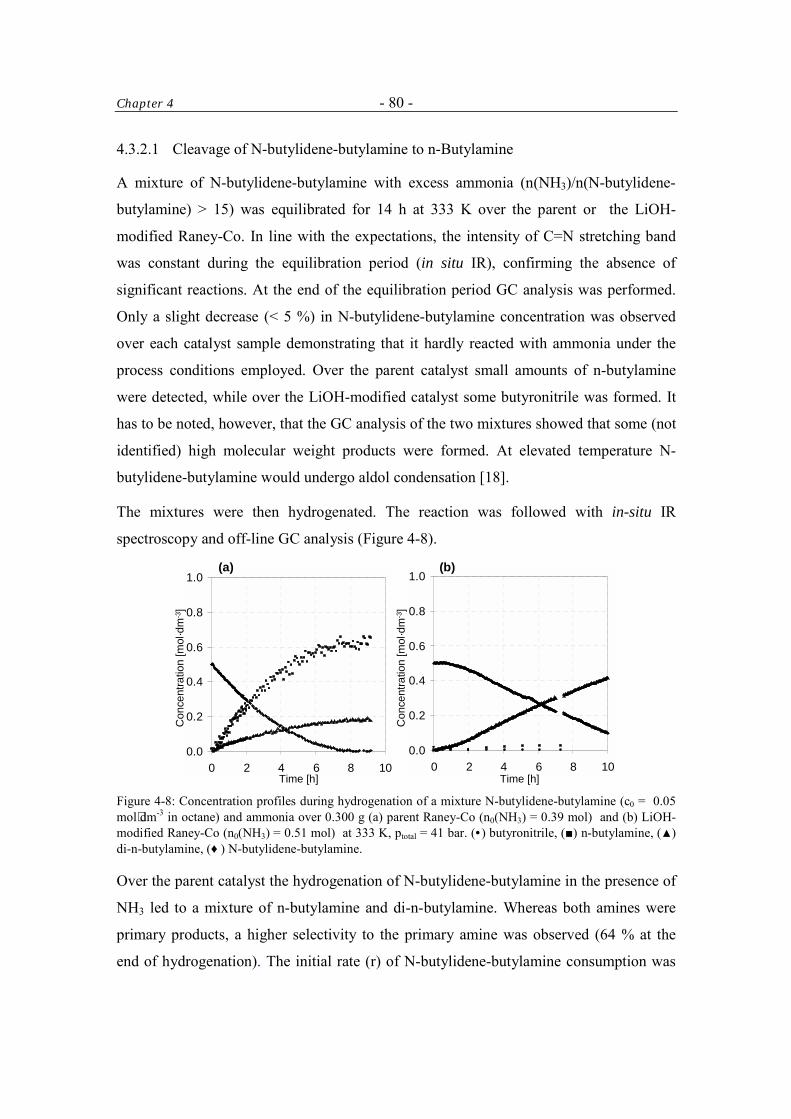
Chapter 4 - 80 -
4.3.2.1 Cleavage of N-butylidene-butylamine to n-Butylamine
A mixture of N-butylidene-butylamine with excess ammonia (n(NH3)/n(N-butylidene-
butylamine) > 15) was equilibrated for 14 h at 333 K over the parent or the LiOH-
modified Raney-Co. In line with the expectations, the intensity of C=N stretching band
was constant during the equilibration period (in situ IR), confirming the absence of
significant reactions. At the end of the equilibration period GC analysis was performed.
Only a slight decrease (< 5 %) in N-butylidene-butylamine concentration was observed
over each catalyst sample demonstrating that it hardly reacted with ammonia under the
process conditions employed. Over the parent catalyst small amounts of n-butylamine
were detected, while over the LiOH-modified catalyst some butyronitrile was formed. It
has to be noted, however, that the GC analysis of the two mixtures showed that some (not
identified) high molecular weight products were formed. At elevated temperature N-
butylidene-butylamine would undergo aldol condensation [18].
The mixtures were then hydrogenated. The reaction was followed with in-situ IR
spectroscopy and off-line GC analysis (Figure 4-8).
0.0
0.2
0.4
0.6
0.8
1.0
0 2 4 6 8 100.0
0.2
0.4
0.6
0.8
1.0
0 2 4 6 8 10Time [h]
Con
cent
ratio
n [m
ol·d
m-3
]
(a)
Time [h]
Con
cent
ratio
n [m
ol·d
m-3
]
(b)
Figure 4-8: Concentration profiles during hydrogenation of a mixture N-butylidene-butylamine (c0 = 0.05 mol⋅dm-3 in octane) and ammonia over 0.300 g (a) parent Raney-Co (n0(NH3) = 0.39 mol) and (b) LiOH-modified Raney-Co (n0(NH3) = 0.51 mol) at 333 K, ptotal = 41 bar. (• ) butyronitrile, (■) n-butylamine, (▲) di-n-butylamine, (♦ ) N-butylidene-butylamine.
Over the parent catalyst the hydrogenation of N-butylidene-butylamine in the presence of
NH3 led to a mixture of n-butylamine and di-n-butylamine. Whereas both amines were
primary products, a higher selectivity to the primary amine was observed (64 % at the
end of hydrogenation). The initial rate (r) of N-butylidene-butylamine consumption was
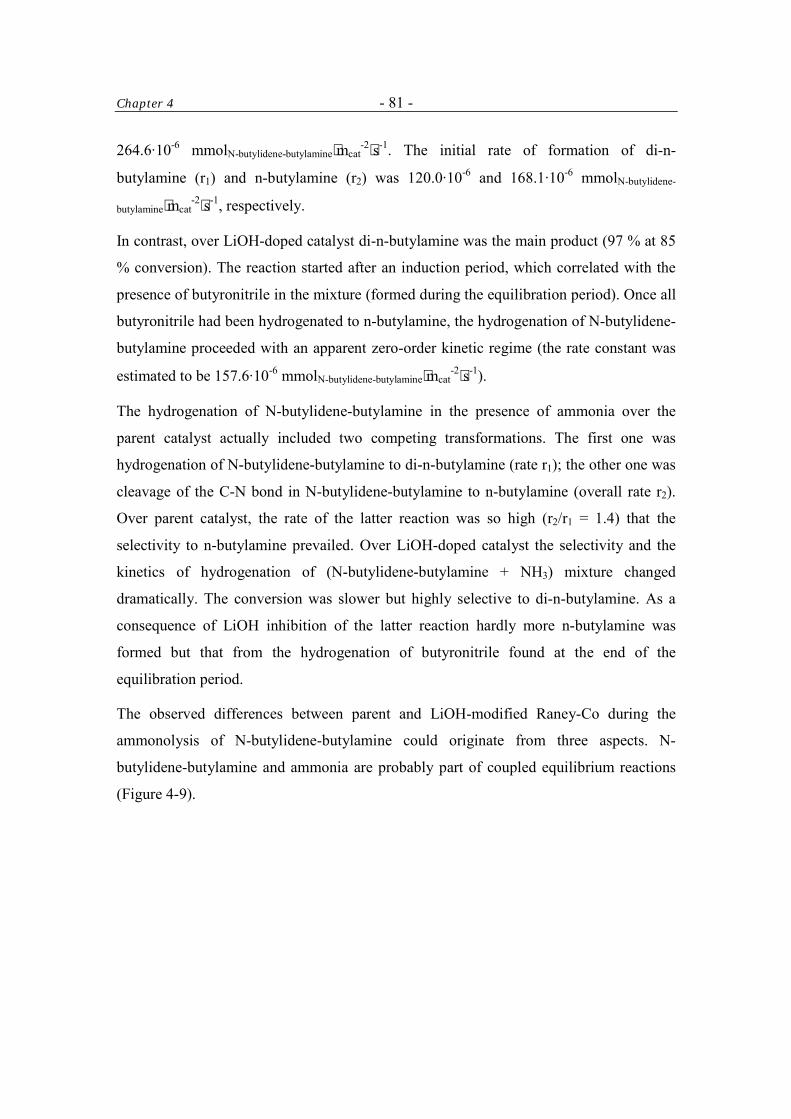
Chapter 4 - 81 -
264.6·10-6 mmolN-butylidene-butylamine⋅mcat-2⋅s-1. The initial rate of formation of di-n-
butylamine (r1) and n-butylamine (r2) was 120.0·10-6 and 168.1·10-6 mmolN-butylidene-
butylamine⋅mcat-2⋅s-1, respectively.
In contrast, over LiOH-doped catalyst di-n-butylamine was the main product (97 % at 85
% conversion). The reaction started after an induction period, which correlated with the
presence of butyronitrile in the mixture (formed during the equilibration period). Once all
butyronitrile had been hydrogenated to n-butylamine, the hydrogenation of N-butylidene-
butylamine proceeded with an apparent zero-order kinetic regime (the rate constant was
estimated to be 157.6·10-6 mmolN-butylidene-butylamine⋅mcat-2⋅s-1).
The hydrogenation of N-butylidene-butylamine in the presence of ammonia over the
parent catalyst actually included two competing transformations. The first one was
hydrogenation of N-butylidene-butylamine to di-n-butylamine (rate r1); the other one was
cleavage of the C-N bond in N-butylidene-butylamine to n-butylamine (overall rate r2).
Over parent catalyst, the rate of the latter reaction was so high (r2/r1 = 1.4) that the
selectivity to n-butylamine prevailed. Over LiOH-doped catalyst the selectivity and the
kinetics of hydrogenation of (N-butylidene-butylamine + NH3) mixture changed
dramatically. The conversion was slower but highly selective to di-n-butylamine. As a
consequence of LiOH inhibition of the latter reaction hardly more n-butylamine was
formed but that from the hydrogenation of butyronitrile found at the end of the
equilibration period.
The observed differences between parent and LiOH-modified Raney-Co during the
ammonolysis of N-butylidene-butylamine could originate from three aspects. N-
butylidene-butylamine and ammonia are probably part of coupled equilibrium reactions
(Figure 4-9).
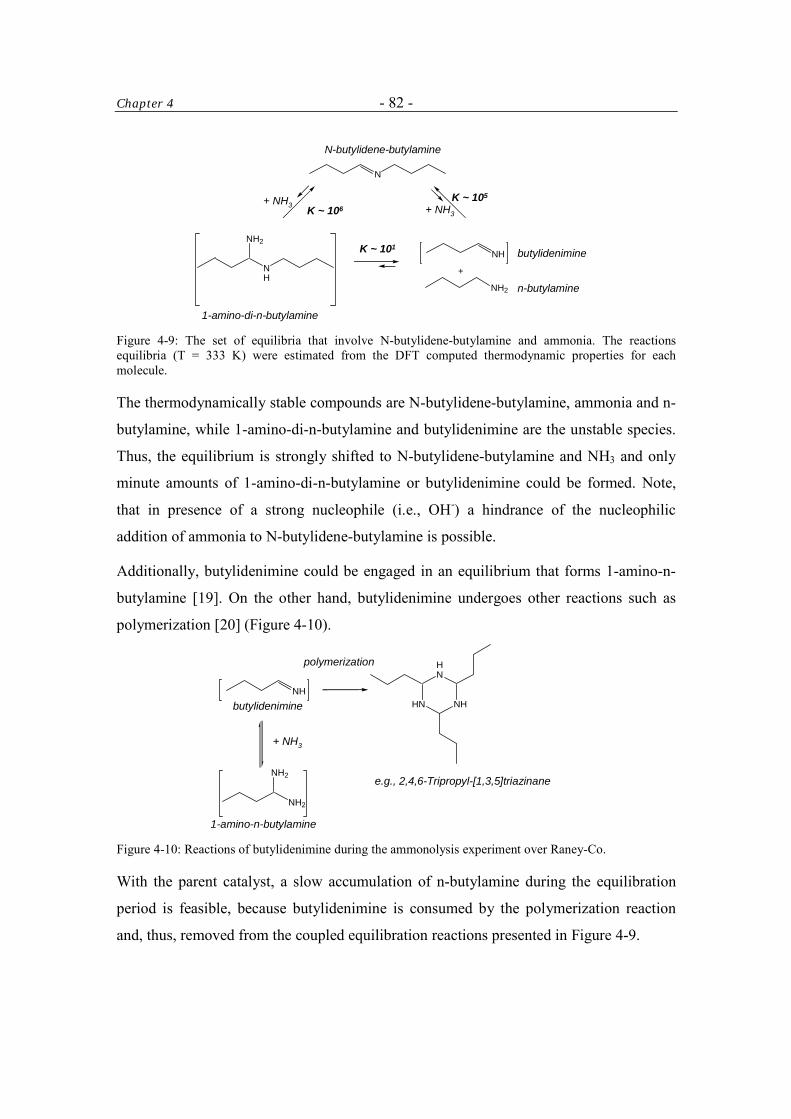
Chapter 4 - 82 -
N
NH2
NH
NH2
+
NH
N-butylidene-butylamine
1-amino-di-n-butylamine
butylidenimine
n-butylamine
K ~ 106K ~ 105
K ~ 101
+ NH3 + NH3
Figure 4-9: The set of equilibria that involve N-butylidene-butylamine and ammonia. The reactions equilibria (T = 333 K) were estimated from the DFT computed thermodynamic properties for each molecule.
The thermodynamically stable compounds are N-butylidene-butylamine, ammonia and n-
butylamine, while 1-amino-di-n-butylamine and butylidenimine are the unstable species.
Thus, the equilibrium is strongly shifted to N-butylidene-butylamine and NH3 and only
minute amounts of 1-amino-di-n-butylamine or butylidenimine could be formed. Note,
that in presence of a strong nucleophile (i.e., OH-) a hindrance of the nucleophilic
addition of ammonia to N-butylidene-butylamine is possible.
Additionally, butylidenimine could be engaged in an equilibrium that forms 1-amino-n-
butylamine [19]. On the other hand, butylidenimine undergoes other reactions such as
polymerization [20] (Figure 4-10).
NHHN NH
HN
NH2
NH2
polymerization
1-amino-n-butylamine
e.g., 2,4,6-Tripropyl-[1,3,5]triazinane
butylidenimine
+ NH3
Figure 4-10: Reactions of butylidenimine during the ammonolysis experiment over Raney-Co.
With the parent catalyst, a slow accumulation of n-butylamine during the equilibration
period is feasible, because butylidenimine is consumed by the polymerization reaction
and, thus, removed from the coupled equilibration reactions presented in Figure 4-9.
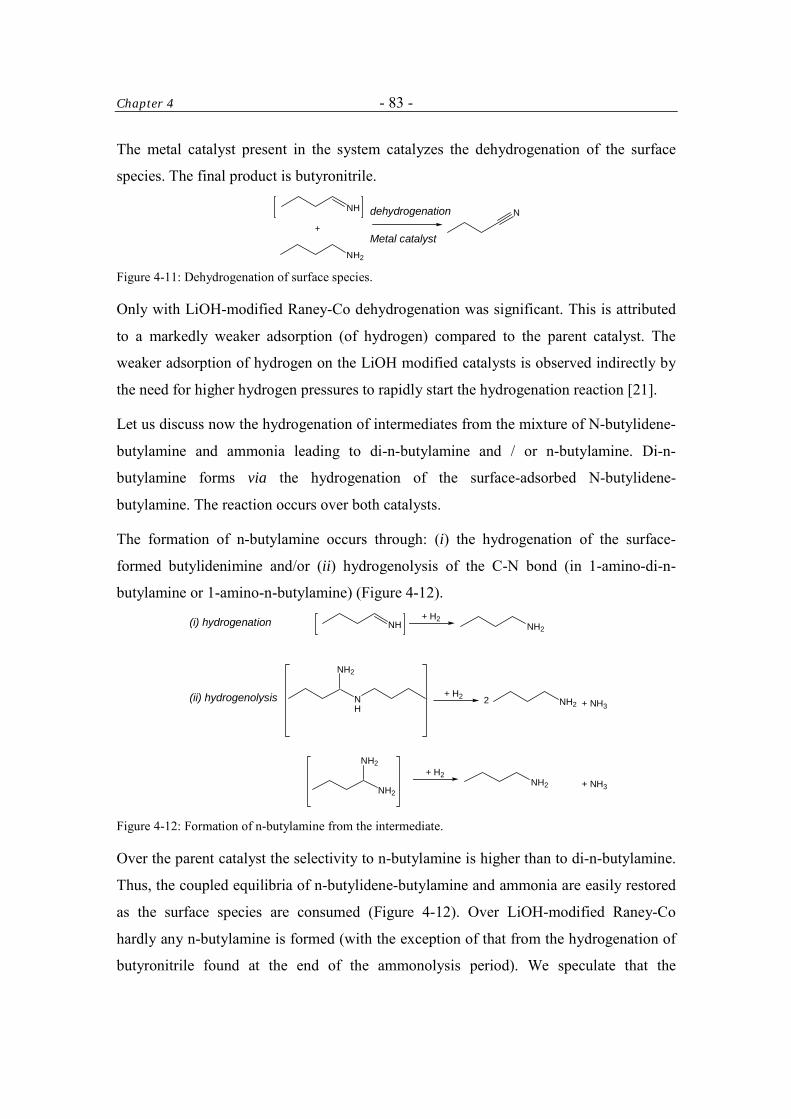
Chapter 4 - 83 -
The metal catalyst present in the system catalyzes the dehydrogenation of the surface
species. The final product is butyronitrile.
NH2
+
NH N
Metal catalyst
dehydrogenation
Figure 4-11: Dehydrogenation of surface species.
Only with LiOH-modified Raney-Co dehydrogenation was significant. This is attributed
to a markedly weaker adsorption (of hydrogen) compared to the parent catalyst. The
weaker adsorption of hydrogen on the LiOH modified catalysts is observed indirectly by
the need for higher hydrogen pressures to rapidly start the hydrogenation reaction [21].
Let us discuss now the hydrogenation of intermediates from the mixture of N-butylidene-
butylamine and ammonia leading to di-n-butylamine and / or n-butylamine. Di-n-
butylamine forms via the hydrogenation of the surface-adsorbed N-butylidene-
butylamine. The reaction occurs over both catalysts.
The formation of n-butylamine occurs through: (i) the hydrogenation of the surface-
formed butylidenimine and/or (ii) hydrogenolysis of the C-N bond (in 1-amino-di-n-
butylamine or 1-amino-n-butylamine) (Figure 4-12).
(ii) hydrogenolysis
(i) hydrogenation
NH
NH2
NH NH2
NH2
NH2
NH2
NH2
2 + NH3
+ NH3
+ H2
+ H2
+ H2
Figure 4-12: Formation of n-butylamine from the intermediate.
Over the parent catalyst the selectivity to n-butylamine is higher than to di-n-butylamine.
Thus, the coupled equilibria of n-butylidene-butylamine and ammonia are easily restored
as the surface species are consumed (Figure 4-12). Over LiOH-modified Raney-Co
hardly any n-butylamine is formed (with the exception of that from the hydrogenation of
butyronitrile found at the end of the ammonolysis period). We speculate that the
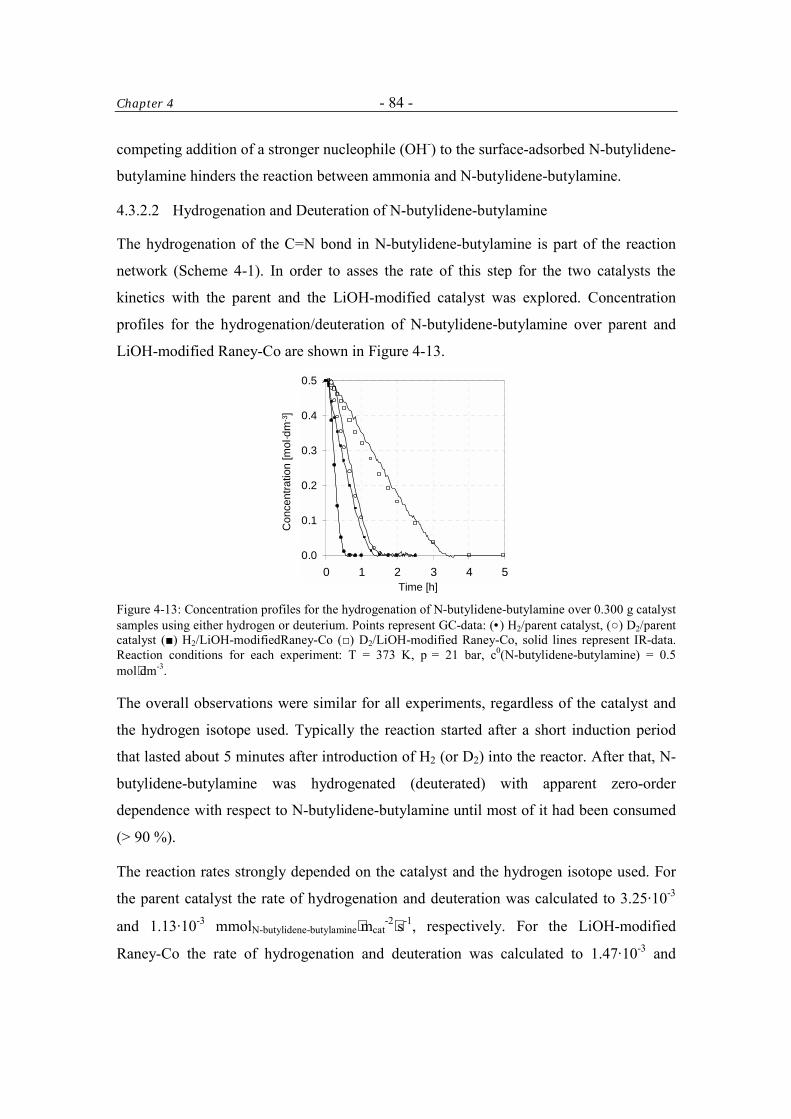
Chapter 4 - 84 -
competing addition of a stronger nucleophile (OH-) to the surface-adsorbed N-butylidene-
butylamine hinders the reaction between ammonia and N-butylidene-butylamine.
4.3.2.2 Hydrogenation and Deuteration of N-butylidene-butylamine
The hydrogenation of the C=N bond in N-butylidene-butylamine is part of the reaction
network (Scheme 4-1). In order to asses the rate of this step for the two catalysts the
kinetics with the parent and the LiOH-modified catalyst was explored. Concentration
profiles for the hydrogenation/deuteration of N-butylidene-butylamine over parent and
LiOH-modified Raney-Co are shown in Figure 4-13.
0.0
0.1
0.2
0.3
0.4
0.5
0 1 2 3 4 5Time [h]
Con
cent
ratio
n [m
ol·d
m-3]
Figure 4-13: Concentration profiles for the hydrogenation of N-butylidene-butylamine over 0.300 g catalyst samples using either hydrogen or deuterium. Points represent GC-data: (• ) H2/parent catalyst, (○) D2/parent catalyst (■) H2/LiOH-modifiedRaney-Co (□) D2/LiOH-modified Raney-Co, solid lines represent IR-data. Reaction conditions for each experiment: T = 373 K, p = 21 bar, c0(N-butylidene-butylamine) = 0.5 mol⋅dm-3.
The overall observations were similar for all experiments, regardless of the catalyst and
the hydrogen isotope used. Typically the reaction started after a short induction period
that lasted about 5 minutes after introduction of H2 (or D2) into the reactor. After that, N-
butylidene-butylamine was hydrogenated (deuterated) with apparent zero-order
dependence with respect to N-butylidene-butylamine until most of it had been consumed
(> 90 %).
The reaction rates strongly depended on the catalyst and the hydrogen isotope used. For
the parent catalyst the rate of hydrogenation and deuteration was calculated to 3.25·10-3
and 1.13·10-3 mmolN-butylidene-butylamine⋅mcat-2⋅s-1, respectively. For the LiOH-modified
Raney-Co the rate of hydrogenation and deuteration was calculated to 1.47·10-3 and
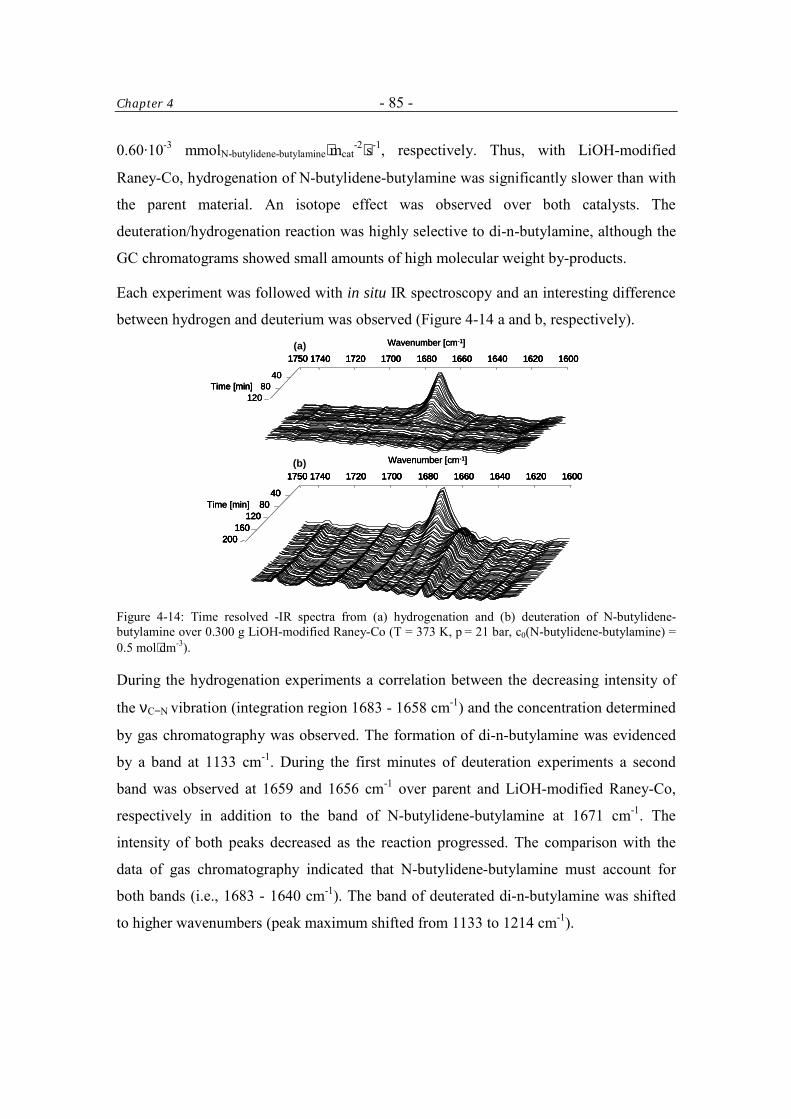
Chapter 4 - 85 -
0.60·10-3 mmolN-butylidene-butylamine⋅mcat-2⋅s-1, respectively. Thus, with LiOH-modified
Raney-Co, hydrogenation of N-butylidene-butylamine was significantly slower than with
the parent material. An isotope effect was observed over both catalysts. The
deuteration/hydrogenation reaction was highly selective to di-n-butylamine, although the
GC chromatograms showed small amounts of high molecular weight by-products.
Each experiment was followed with in situ IR spectroscopy and an interesting difference
between hydrogen and deuterium was observed (Figure 4-14 a and b, respectively).
4080
120
1740 1720 1700 1680 1660 1640 1620 1600 1750
Wavenumber [cm-1]
Time [min]40
80120
4080
120
1740 1720 1700 1680 1660 1640 1620 1600 1750
Wavenumber [cm-1]
Time [min]
1740 1720 1700 1680 1660 1640 1620 1600 1750 1740 1720 1700 1680 1660 1640 1620 1600 1750 1740 1720 1700 1680 1660 1640 1620 1600 1750
Wavenumber [cm-1]
Time [min]Time [min]
(a)
1740 1720 1700 1680 1660 1640 1620 1600 1750
4080
120160
200
Wavenumber [cm-1]
Time [min]
1740 1720 1700 1680 1660 1640 1620 1600 1750
4080
120160
200
Wavenumber [cm-1]
Time [min]
1740 1720 1700 1680 1660 1640 1620 1600 1750 1740 1720 1700 1680 1660 1640 1620 1600 1750 1740 1720 1700 1680 1660 1640 1620 1600 1750
4080
120160
200
4080
120160
200
4080
120160
200
Wavenumber [cm-1]
Time [min]
(b)
Figure 4-14: Time resolved -IR spectra from (a) hydrogenation and (b) deuteration of N-butylidene-butylamine over 0.300 g LiOH-modified Raney-Co (T = 373 K, p = 21 bar, c0(N-butylidene-butylamine) = 0.5 mol⋅dm-3).
During the hydrogenation experiments a correlation between the decreasing intensity of
the νC=N vibration (integration region 1683 - 1658 cm-1) and the concentration determined
by gas chromatography was observed. The formation of di-n-butylamine was evidenced
by a band at 1133 cm-1. During the first minutes of deuteration experiments a second
band was observed at 1659 and 1656 cm-1 over parent and LiOH-modified Raney-Co,
respectively in addition to the band of N-butylidene-butylamine at 1671 cm-1. The
intensity of both peaks decreased as the reaction progressed. The comparison with the
data of gas chromatography indicated that N-butylidene-butylamine must account for
both bands (i.e., 1683 - 1640 cm-1). The band of deuterated di-n-butylamine was shifted
to higher wavenumbers (peak maximum shifted from 1133 to 1214 cm-1).
Chapter 4 - 86 -
LiOH-modified Raney-Co has a lower activity for hydrogenation (2.2 times) and
deuteration (1.9 times) of the C=N double bonds compared to the parent catalyst. This is
in contrast to the improved activity observed in hydrogenation of butyronitrile. We
speculate that the significantly weaker adsorption of N-butylidene-butylamine on the
LiOH-doped catalyst causes the lower rate of the C=N bond hydrogenation in analogy to
other catalysts selectively catalyzing the hydrogenation of C≡C triple bonds [22].
Assuming a Langmuir - Hinshelwood model, the kinetics of the saturation of the C=N
bond is accomplished in two steps on the catalyst surface. The isotope effect on the
reaction rate (rH/rD = 2.9 and 2.5 over parent and LiOH-modified catalyst, respectively)
may arise either from the first or the second hydrogen transfer. Because rH/rD is largely
determined by the difference in zero-point energy associated with the dissociating bond
of surface adsorbed hydrogen and deuterium, the light hydrogen isotope reacts faster than
deuterium since E0(H) > E0(D) [23] (Equation 4-1; it is assumed that the dissociating or
forming bond is so weak that the zero-point energy is negligible for the activated state
marked “≠”)
( ) ( )( ) ( ) ( )( )
−−−=
≠≠
RTEEEE HDHD 0000
DH expk/k Equation 4-1
The zero-point energy difference between H2 and D2 (about 7.53 kJ·mol-1) and a kinetic
isotope effect during dissociative chemisorption of H2 / D2 on the catalyst surface does
not play a role as this step reaches equilibrium (i.e., the Langmuir -Hinshelwood model).
However, the thermodynamic isotope effect on the surface concentration of reactants
(hydrogen and deuterium) should be considered. It has been reported that D2 adsorbs
stronger on Ni having the larger heat of adsorption of about 4.2 kJ·mol-1 than H2 [24].
Similar effect on cobalt would lead to θD > θH under given experimental conditions.
Further, this would increase the saturation rate defined as r = k·θH(D)· θC=N. Modification
of the cobalt surface with LiOH changes the catalyst sorption properties. Therefore, rH/rD
for parent and LiOH-modified catalyst are expected to be different as it has been
observed.
Chapter 4 - 87 -
During deuteration, an unexpected shift in the stretching vibration of the C=N group to
lower wavenumbers was observed (∆ν = 12 - 15 cm-1). However, none of the atoms
directly contributing to the νC=N stretch vibration was isotopically exchanged. If isotopic
scrambling of deuterium and formation of CH3CH2CHDCD=N(CH2)3CH3 is postulated,
then the observed shift to lower wave numbers could be explained [25]. Note that the N-
butylidene-butylamine is in equilibrium with its tautomeric form but-1-enyl-butylamine.
If the second step is the slower, than the first step of the saturation reaction is in partially
reversible and an isotopic scrambling within N-butylidene-butylamine would occur.
Aliphatic secondary amines with primary α-carbons (CH2-NH-CH2) have a medium-
strong band at 1146 – 1132 cm-1 due to the asymmetric C-N-C stretch vibration [26].
After isotope exchange of hydrogen by deuterium at the nitrogen and α-carbon atoms a
shift of vibration to higher wave numbers (∆ν = 81 cm-1) is expected.
4.3.2.3 Imine-Enamine Tautomerism of N-butylidene-butylamine
For N-butylidene-butylamine four different isomers are possible: (E-) and (Z-) N-
butylidene-butylamine and (E-) and (Z-) but-1-enyl-butyl-amine. The isomerization
requires formal transfer of one hydrogen atom within the molecule (Figure 4-15). (E-)
and (Z-) N-butylidene-butylamine could be involved in the cleavage route to n-
butylamine via ammonolysis/hydrogenolysis of the C=N bond. Thus, it is of special
interest to characterize the N-butylidene-butylamine/but-1-enyl-butyl-amine tautomeric
mixture to obtain information about the thermodynamic and kinetic aspects of that
equilibrium [27, 28, 29].
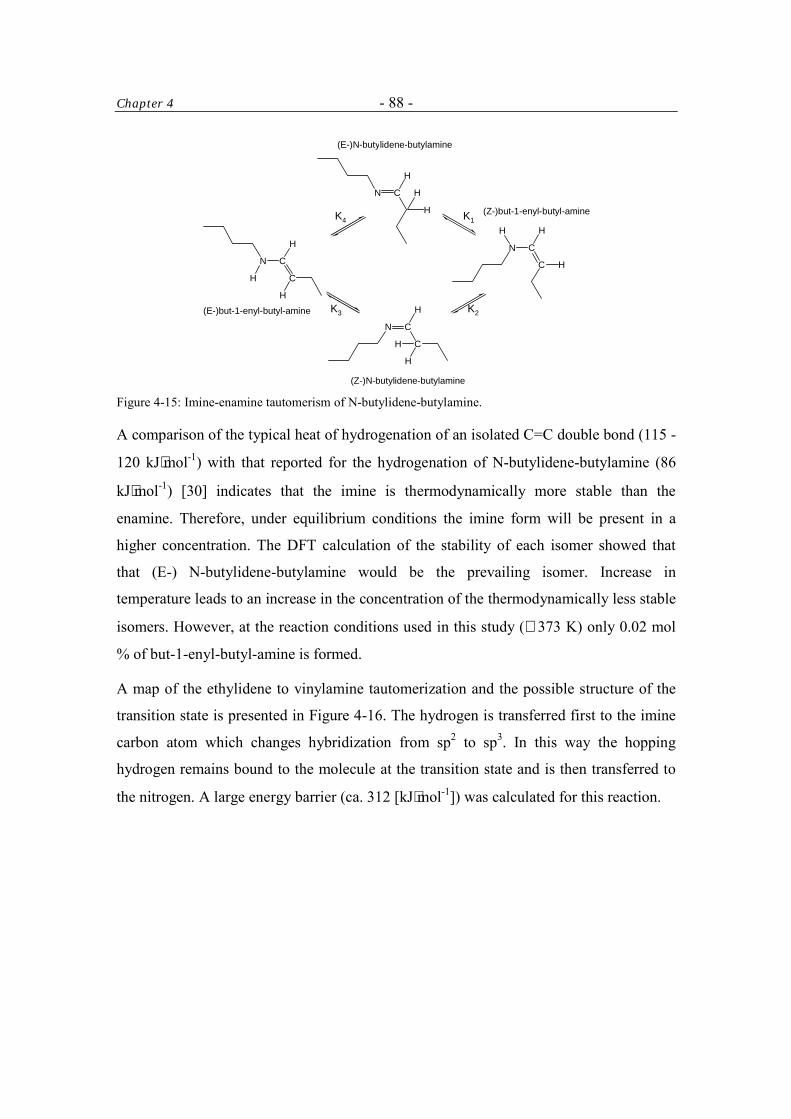
Chapter 4 - 88 -
C
CN
CN
C
H
H
HH
(E-)N-butylidene-butylamine
H
H
CN
H
H
H
CN
C
H
H
H
(Z-)N-butylidene-butylamine
(E-)but-1-enyl-butyl-amine
(Z-)but-1-enyl-butyl-amineK1
K2K3
K4
Figure 4-15: Imine-enamine tautomerism of N-butylidene-butylamine.
A comparison of the typical heat of hydrogenation of an isolated C=C double bond (115 -
120 kJ⋅mol-1) with that reported for the hydrogenation of N-butylidene-butylamine (86
kJ⋅mol-1) [30] indicates that the imine is thermodynamically more stable than the
enamine. Therefore, under equilibrium conditions the imine form will be present in a
higher concentration. The DFT calculation of the stability of each isomer showed that
that (E-) N-butylidene-butylamine would be the prevailing isomer. Increase in
temperature leads to an increase in the concentration of the thermodynamically less stable
isomers. However, at the reaction conditions used in this study (∼ 373 K) only 0.02 mol
% of but-1-enyl-butyl-amine is formed.
A map of the ethylidene to vinylamine tautomerization and the possible structure of the
transition state is presented in Figure 4-16. The hydrogen is transferred first to the imine
carbon atom which changes hybridization from sp2 to sp3. In this way the hopping
hydrogen remains bound to the molecule at the transition state and is then transferred to
the nitrogen. A large energy barrier (ca. 312 [kJ⋅mol-1]) was calculated for this reaction.
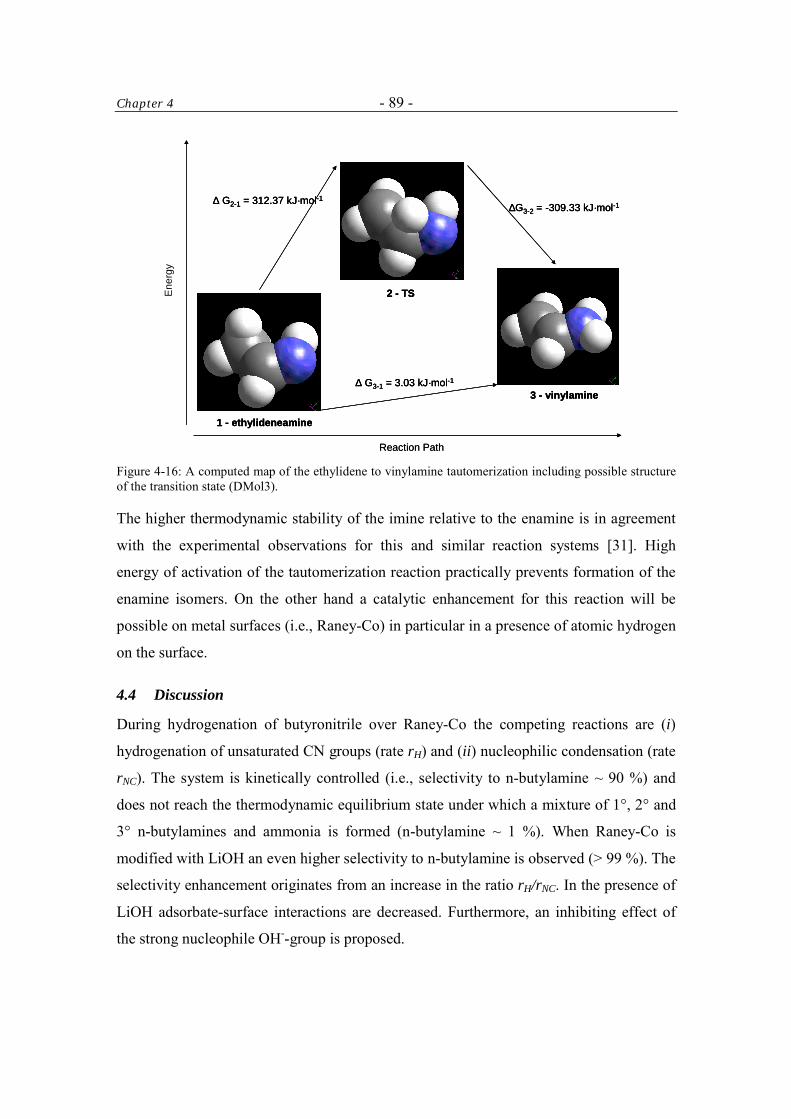
Chapter 4 - 89 -
Ene
rgy
1 - ethylideneamine
2 - TS
3 - vinylamine
∆ G2-1 = 312.37 kJ·mol-1∆G3-2 = -309.33 kJ·mol-1
∆ G3-1 = 3.03 kJ·mol-1
Reaction Path
1 - ethylideneamine
2 - TS
3 - vinylamine
∆ G2-1 = 312.37 kJ·mol-1∆G3-2 = -309.33 kJ·mol-1
∆ G3-1 = 3.03 kJ·mol-1
1 - ethylideneamine
2 - TS
3 - vinylamine
∆ G2-1 = 312.37 kJ·mol-1∆G3-2 = -309.33 kJ·mol-1
∆ G3-1 = 3.03 kJ·mol-1
Reaction Path Figure 4-16: A computed map of the ethylidene to vinylamine tautomerization including possible structure of the transition state (DMol3).
The higher thermodynamic stability of the imine relative to the enamine is in agreement
with the experimental observations for this and similar reaction systems [31]. High
energy of activation of the tautomerization reaction practically prevents formation of the
enamine isomers. On the other hand a catalytic enhancement for this reaction will be
possible on metal surfaces (i.e., Raney-Co) in particular in a presence of atomic hydrogen
on the surface.
4.4 Discussion
During hydrogenation of butyronitrile over Raney-Co the competing reactions are (i)
hydrogenation of unsaturated CN groups (rate rH) and (ii) nucleophilic condensation (rate
rNC). The system is kinetically controlled (i.e., selectivity to n-butylamine ~ 90 %) and
does not reach the thermodynamic equilibrium state under which a mixture of 1°, 2° and
3° n-butylamines and ammonia is formed (n-butylamine ~ 1 %). When Raney-Co is
modified with LiOH an even higher selectivity to n-butylamine is observed (> 99 %). The
selectivity enhancement originates from an increase in the ratio rH/rNC. In the presence of
LiOH adsorbate-surface interactions are decreased. Furthermore, an inhibiting effect of
the strong nucleophile OH--group is proposed.
Chapter 4 - 90 -
4.4.1 Formation of N-butylidene-butylamine
Over parent catalyst a side-reaction yields N-butylidene-butylamine. The reaction
involves two molecules originating from butyronitrile. The probable mechanism of N-
butylidene-butylamine formation is based on a nucleophilic condensation mechanism. A
reactive species with unsaturated carbon atom undergoes nucleophilic attack by a
nitrogen species to form a new C-N bond. The process is accompanied by the release of
NH3. It is generally assumed that the reactive intermediate is imine i.e., butylidenimine. It
should be noted that in situ spectroscopy has not provided direct evidence for this step.
However, the butylidenimine concentration in the liquid phase may be well below the
detection limit of the IR probe used in the study. Further, even if butylidenimine desorbs
in very minute amounts, it would undergo rapid condensation in the liquid phase [32].
The reaction between N-butylidene-butylamine and ammonia has been tested as a reverse
route to those species. Over the parent catalyst n-butylamine (the nucleophile) is found,
whereas short-living butylidenimine is not found. Instead, some high molecular weight
products are detected. Note that n-butylamine in reaction with butylidenimine would
directly yield N-butylidene-butylamine.
Over LiOH-modified Raney-Co the hydrogenation of butyronitrile is selective to n-
butylamine. Because LiOH remains on the catalyst surface during reaction, it is evident
that only surface species can be prevented from nucleophilic condensation. This has been
demonstrated by the surface-catalyzed disproportionation of n-butylamine to di-n-
butylamine. Thus, in the mechanism of butyronitrile hydrogenation a number of surface-
adsorbed species should be considered. The presence of carbene species could still lead to
the formation of N-butylidene-butylamine as the reactive center on the unsaturated
carbon atom is available. However, it is speculated that the strong nucleophile OH-
inhibits nucleophilic attack of other nucleophiles (nitrogen compounds) and thus hinders
the formation of the C-N bond.
Over LiOH-modified catalyst ammonolysis of N-butylidene-butylamine unexpectedly
yields only butyronitrile. This implies fast dehydrogenation of the products (i.e.,
butylidenimine and n-butylamine). Probably LiOH-modified Raney-Co exhibits better
dehydrogenation and hydrogenation activity than parent catalyst. It has been reported that
Chapter 4 - 91 -
over oxides (e.g., MgO) dehydrogenation of primary amines to nitriles easily proceeds
[33]. Consequently, the transient surface concentration in species reacting to N-
butylidene-butylamine (like butylidenimine) would be decreased and the rate of the bi-
molecular surface reactions would be retarded.
4.4.2 Cleavage of N-butylidene-butylamine
Over Raney-Co the amount of N-butylidene-butylamine produced is inversely correlated
with the selectivity to n-butylamine for the hydrogenation of butyronitrile. Thus, a
decrease in its concentration before full saturation to di-butylamine can be proposed as a
selectivity enhancement. The reaction of N-butylidene-butylamine with ammonia in
presence of hydrogen indeed yields n-butylamine. However, hydrogenation to di-n-
butylamine also occurs. It should be mentioned that it is not realistic to expect full
conversion of N-butylidene-butylamine to n-butylamine, because N-butylidene-
butylamine also exists in its tautomeric form as but-1-enyl-butyl-amine. The
tautomerization occurs via intramolecular hydrogen transfer and is likely catalyzed by the
metal. But-1-enyl-butyl-amine probably does not react with ammonia and its
hydrogenation contributes to the formation of di-n-butylamine.
In contrast, in the presence of LiOH, N-butylidene-butylamine hardly reacts with NH3
and practically only di-n-butylamine is obtained after hydrogenation. Most likely, the
much stronger nucleophile OH- (i.e., LiOH) forms a surface adsorbed amino-alcohol (or
its salt) and protects the C=N group from nucleophilic attack of ammonia. Further
hydrogenolysis produces di-n-butylamine. By analogy it could also be possible that LiOH
inhibits the nucleophilic condensation among partially hydrogenated intermediates during
the hydrogenation of butyronitrile.
4.5 Conclusions
In the hydrogenation of butyronitrile to n-butylamine over Raney-Co N-butylidene-
butylamine is the product of a side-reaction on the catalyst surface. Modification of
Raney-Co with LiOH (0.4 wt. % Li+) gives a more active and selective catalyst (> 99 %
selectivity). With the modified catalyst hardly any N-butylidene-butylamine is formed.
Probably the hydrogenation-dehydrogenation properties of the LiOH-modified catalyst
Chapter 4 - 92 -
are enhanced compared to the parent catalyst. This would lead to a drastically lower
transient concentration in reactive species on the catalyst surface. Additionally, the
nucleophilic condensation among products of partial hydrogenation of butyronitrile in the
presence of a much stronger nucleophile (OH-) is likely inhibited.
Acknowledgments
Dr. Jeno Bodis is gratefully acknowledged for many elucidating discussions.
References 1 M. G. Turcotte, T. A. Johnson in: J. I. Kroschwitz (Ed.), Kirk-Othmer Encyclopedia
of Chemical Technology Vol. 2 (4th Ed.), John Wiley & Sons, NY, 1992, p. 369 -
386
2 M. Hudlicky, Reductions in Organic Chemistry - ACS Monograph Vol. 188,
American Chemical Society, Washington DC, 1996, p. 239 - 241
3 HSC Chemistry 5.1 - Chemical Reaction and Equilibrium Software with extensive
Thermochemical Database, Outokumpu Research Oy.
4 F. Medina, P. Salagre and J.E. Sueiras, J. Mol. Cat. 81 (1993) 363
5 P. N. Rylander, Catalytic Hydrogenation over Platinum Metals, Academic Press, NY
and London, 1967, p. 203 – 226
6 A. Chojecki, T. E. Müller and J. A. Lercher, Characterization of Raney-Ni and
Raney-Co and Their Use in the Selective Hydrogenation of Butyronitrile to be
submitted
7 B. Delley, J. Chem. Phys. 92 (1990) 508
8 The BET area was not measured for that sample, however, another batch of LiOH-
doped Raney-Co (0.5 wt. % Li+) showed BET area of 14.78 m2·gcat-1.
9 R. A. Benkeser and D.C. Snyder, J. Organomet. Chem. 225 (1982) 107
10 N. B.Colthup, L. H. Daly and S.E. Wiberley, Introduction to Infrared and Raman
Spectroscopy, Academic Press, NY and London, 1990 (3rd Ed.), p. 344 - 345
11 P. N. Rylander, Hydrogenation Methods, Academic Press, London, 1988 (2nd Ed.), p.
94 – 103
12 A. Fási, J.T. Kiss, B. Török and I. Pálinkó, Appl. Catal., A 200 (2000) 189
13 Y. Huang and W.M.H. Sachtler, Appl. Catal., A 191 (2000) 35
Chapter 4 - 93 -
14 B. Coq, D. Tichit and S. Ribet, J. Catal. 189 (2000) 117
15 HSC Chemistry 5.1 - Chemical Reaction and Equilibrium Software with extensive
Thermochemical Database, Outokumpu Research Oy.
16 A. Baiker and J. Kijenski, Catal. Rev. – Sci. Eng., 27 (1985) 653 and references
therein
17 J.R. Anderson and N.J. Clark, J. Catal. 5 (1966) 250
18 R.W. Layer, Chem. Rev. 63 (1963) 489
19 P. N. Rylander, Hydrogenation Methods, Academic Press, London, 1988 (2nd Ed.), p.
94 – 103
20 M.R. Crampton, S.D. Lord and R. Millar, J. Chem. Soc., Perkin Trans. 2, (1997) 909
21 A. Chojecki, T. E. Müller and J. A. Lercher, Characterization of Raney-Ni and
Raney-Co and Their Use in the Selective Hydrogenation of Butyronitrile to be
submitted
22 M. Gruttadauria, R. Noto, G. Deganello and L.F. Liotta, Tetrahedron Lett., 40(14)
(1999) 2857
23 A. Ozaki, Isotopic Studies of Heterogeneous Catalysis, Kodansha Ltd., Tokyo,
Academic Press, London, 1977, p. 169 – 203.
24 G. Wedler, F.J. Bröker, G. Fisch and G. Schroll, Z. Phys. Chem. N. F. 76 (1971) 212
25 W. Fresenius, J. F. K. Huber, E. Pungor, W. Simon, Th. S. West, Tabellen zur
Strukturaufklärung organischer Verbindungen mit spektroskopischen Methoden,
Springer-Verlag, Berlin, 1986.
26 N.B.Colthup, L.H. Daly and S.E. Wiberley, Introduction to Infrared and Raman
Spectroscopy, Academic Press, NY and London, 1990 (3rd Ed.), p. 341
27 K. Lammertsma and B.V. Prasad, J. Am. Chem. Soc. 116 (1994) 642
28 P. Perez and A. Toro-Labbe, Theor. Chem. Acc. 105 (2001) 422
29 W. Koch and M.C. Holthausen, A Chemist’s Guide to Density Functional Theory (2nd
Ed), Wiley-VCH, Weinheim, 2001
30 G. Hafelinger and L. Steinmann, Angew. Chem. Int. Ed. Engl. 16 (1977) 47
31 S.P. Lu and A.H. Lewin, Tetrahedron, 54 (1998) 15097
32 M.R. Crampton, S.D. Lord and R. Millar, J. Chem. Soc., Perkin Trans. 2 (1997) 909

Chapter 4 - 94 -
33 H. Abe and A.T. Bell, J. Catal. 142 (1993) 430 and references therein
- 95 -
Chapter 5 In order to characterize the catalytic process during the hydrogenation of
butyronitrile on the surface of parent and LiOH-modified Raney-Co Incoherent
Inelastic Neutron Scattering (INS) spectroscopy was used in combination with
ab initio computational study of molecular vibrations. Because of the large
scattering contrast INS can be used as a surface technique to study the
adsorption of hydrogen and hydrogenation reactions on the transition metal
surfaces.
Sorption of hydrogen onto Raney-Co at low pressure is mainly related to the
three-fold sites. Wet deposition of LiOH onto Raney-Co and subsequent
temperature treatment at 473 K creates clustered rather than layered lithium
hydroxide which vibrational frequencies are well described by the factor group
analysis of crystalline LiOH. On Raney-Co butyronitrile and hydrogen
promptly react yielding a number of (partially-) hydrogenated derivatives that
are characterized by the presence of hydrogen atom(s) on the nitrogen atom. In
consequence the condensation reaction leading to condensation products (i.e.,
N-butylidene-butylamine) is feasible.
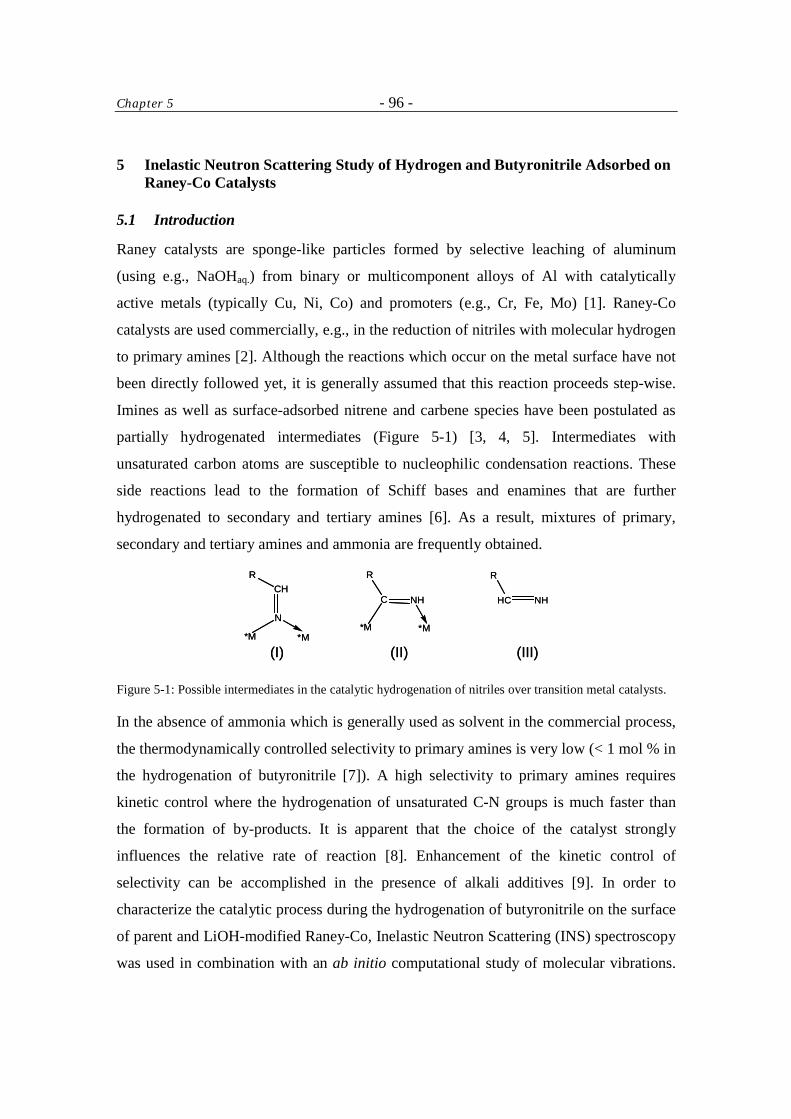
Chapter 5 - 96 -
5 Inelastic Neutron Scattering Study of Hydrogen and Butyronitrile Adsorbed on Raney-Co Catalysts
5.1 Introduction
Raney catalysts are sponge-like particles formed by selective leaching of aluminum
(using e.g., NaOHaq.) from binary or multicomponent alloys of Al with catalytically
active metals (typically Cu, Ni, Co) and promoters (e.g., Cr, Fe, Mo) [1]. Raney-Co
catalysts are used commercially, e.g., in the reduction of nitriles with molecular hydrogen
to primary amines [2]. Although the reactions which occur on the metal surface have not
been directly followed yet, it is generally assumed that this reaction proceeds step-wise.
Imines as well as surface-adsorbed nitrene and carbene species have been postulated as
partially hydrogenated intermediates (Figure 5-1) [3, 4, 5]. Intermediates with
unsaturated carbon atoms are susceptible to nucleophilic condensation reactions. These
side reactions lead to the formation of Schiff bases and enamines that are further
hydrogenated to secondary and tertiary amines [6]. As a result, mixtures of primary,
secondary and tertiary amines and ammonia are frequently obtained.
CH
N
*M *M
R
C NH
*M *M
R
(I) (II) (III)
HC NH
RCH
N
*M *M
R
C NH
*M *M
R
(I) (II) (III)
HC NH
R
Figure 5-1: Possible intermediates in the catalytic hydrogenation of nitriles over transition metal catalysts.
In the absence of ammonia which is generally used as solvent in the commercial process,
the thermodynamically controlled selectivity to primary amines is very low (< 1 mol % in
the hydrogenation of butyronitrile [7]). A high selectivity to primary amines requires
kinetic control where the hydrogenation of unsaturated C-N groups is much faster than
the formation of by-products. It is apparent that the choice of the catalyst strongly
influences the relative rate of reaction [8]. Enhancement of the kinetic control of
selectivity can be accomplished in the presence of alkali additives [9]. In order to
characterize the catalytic process during the hydrogenation of butyronitrile on the surface
of parent and LiOH-modified Raney-Co, Inelastic Neutron Scattering (INS) spectroscopy
was used in combination with an ab initio computational study of molecular vibrations.
Chapter 5 - 97 -
INS is particularly sensitive to vibrational modes that involve hydrogen motion in the
molecules because of a large incoherent scattering contrast between 1H and all other
elements and isotopes (including 2H) [10]. Due to virtual transparency of condensed
matter for neutrons (low absorption cross-section), INS becomes a surface
characterization technique for studying hydrogen adsorption and hydrogenation reaction
on the transition metal surfaces [11, 12, 13].
5.2 Experimental
5.2.1 Sample Preparation
Raney-Co (GRACE Davison Chemical Division of W.R. Grace & Co grade # 2700 lot #
7865) with the chemical composition: Al, 1.85; Co, 97.51; Fe, 0.3; Ni, 0.34 wt. % was
used. The catalyst (212 g) was washed with deionized water until the pH of the wash
water was ~ 7. The volatiles were removed in low vacuum (< 4 mbar) and the catalyst
was dried (at 323 K, 10 h). Doping with LiOH was carried out in an aqueous solution of
LiOH (3.254 g in 100 cm3 deionized water, room temperature, left for 1 h) followed by
drying in low vacuum (at 323 K, 10 h). The concentration of Li+ in Raney-Co(LiOH) was
0.5 wt. % as measured with AAS (UNICAM 939 AA-Spectrometer). Pre-dried Raney-Co
catalysts, both the parent and the LiOH-modified samples (mcat = 25 g) were placed
inside aluminum containers used for INS experiments under inert atmosphere. Note that
N2 adsorption for 0.5 g samples of the parent and the LiOH-modified Raney-Co activated
in high vacuum at 473 K for 1 h had shown a specific BET surface area of 24.5 and 14.8
m2·gcat.-1, respectively. For INS the catalysts were further activated at UHV (p ≤ 10-6
mbar) at 473 K for 6 h. For reference measurements, samples of such activated Raney-Co
and LiOH-Raney-Co were used. Another Raney-Co sample was equilibrated with H2 at
0.2 bar. Two other samples of parent and LiOH-doped Raney-Co were in contact with
butyronitrile (13.02 and 9.41 mmol of butyronitrile, respectively) and were subsequently
equilibrated with 0.2 bar H2.
5.2.2 Measurement
Experiments were carried out at 10 K. The beryllium-filter detector spectrometer IN1BeF
at ILL in Grenobxle with a Cu (220) monochromator plane was used. The instrument
Chapter 5 - 98 -
resolution was varying from 25 cm-1, at low energy transfers, to 50 cm-1 at large energy
transfers. Note that the spectra were recorded in meV, and are presented in wavenumber
units (1 meV = 8.065 cm-1) after subtracting the Be-filter energy shift of 40 cm-1. Apart
from the Raney-Co samples, reference spectra of solid butyronitrile (Aldrich) and an
empty aluminum container were recorded.
5.2.3 Data Treatment
Vibrational modes of hydrogen adsorbed on different cobalt clusters were computed in
Dmol3 version 4.2.1 from the Cerius2 program suite (2001), Accelrys Inc. [14]. Cobalt
clusters (4 – 5 atoms) were cut out from the bulk crystal of hcp Co. Each calculation
included minimization of a hydrogen atom over 1 to 4 cobalt atoms with fixed
coordinates, followed by computation of the vibrational frequencies of the system at the
optimized geometry. The generalized gradient approximation (gga) DFT method with
Perdew-Wang 1991 (p91) Hamiltonian and double numeric basis functions including
polarization functions (dnp) in expansion of molecular orbitals were used in the runs. In
order to meet the SCF convergence criteria electronic state was set on ‘thermal’ which
allows electrons to be smeared out among all orbitals within in the vicinity of the Fermi
level. Note, that the crystal structure of cobalt is hexagonal close-packed with dominant
crystal morphology of (100), (101) and (002) planes (40.79, 39.65 and 19.65 % of the
facet area, respectively) [15]. For butyronitrile, n-butylamine and butylideneimine ab
initio quantum mechanical calculations with the B3LYP hybrid functional (a 6-31G**
basis set) and Hartree-Fock approximation followed by a MØller-Plesset correlation
energy correction truncated at second-order (MP2) were done with GAUSSIAN 98 [16].
The a-CLIMAX software was used to calculate the INS spectra from the theoretical
frequency and amplitude results [17].
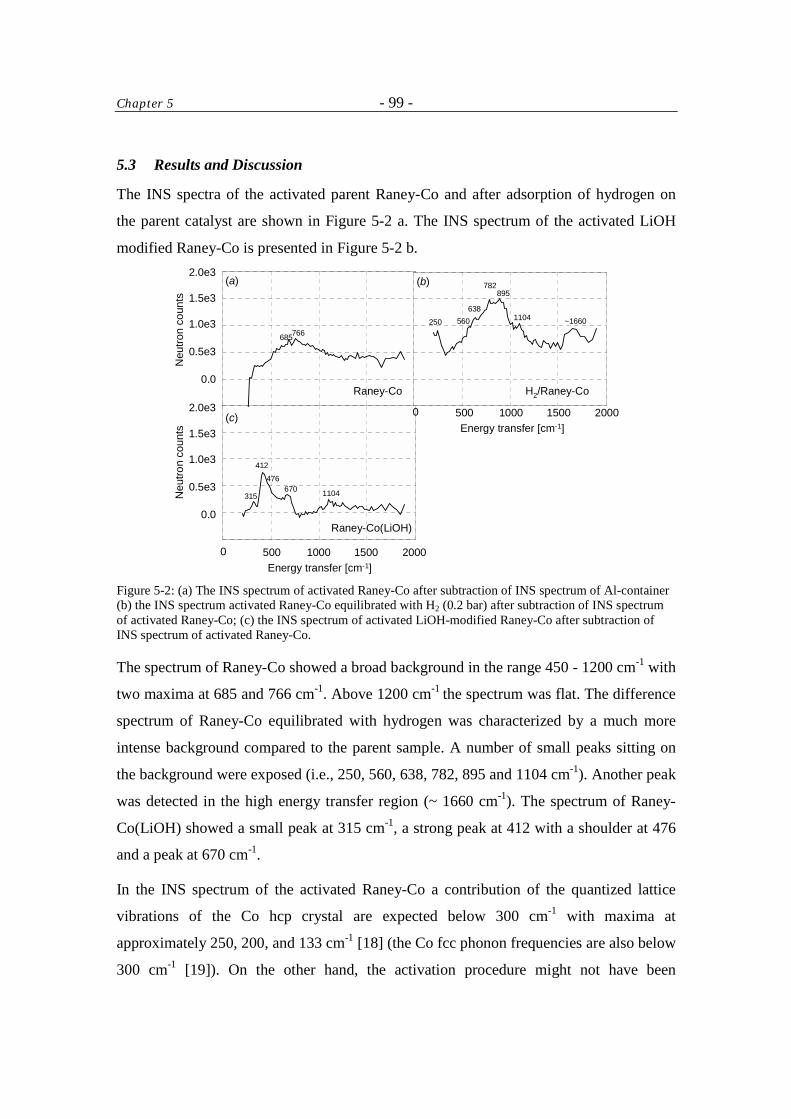
Chapter 5 - 99 -
5.3 Results and Discussion
The INS spectra of the activated parent Raney-Co and after adsorption of hydrogen on
the parent catalyst are shown in Figure 5-2 a. The INS spectrum of the activated LiOH
modified Raney-Co is presented in Figure 5-2 b.
0.0
0.5e3
1.0e3
1.5e3
2.0e3
0.0
0.5e3
1.0e3
1.5e3
2.0e3
0 500 1000 1500 2000Energy transfer [cm-1]
Raney-Co(LiOH)
315
412
670 1104
476
Neu
tron
coun
tsN
eutro
n co
unts
Raney-Co H2/Raney-Co
0 500 1000 1500 2000Energy transfer [cm-1]
685766
1104
895782
638560 ~1660250
(a)
(c)
(b)
Figure 5-2: (a) The INS spectrum of activated Raney-Co after subtraction of INS spectrum of Al-container (b) the INS spectrum activated Raney-Co equilibrated with H2 (0.2 bar) after subtraction of INS spectrum of activated Raney-Co; (c) the INS spectrum of activated LiOH-modified Raney-Co after subtraction of INS spectrum of activated Raney-Co.
The spectrum of Raney-Co showed a broad background in the range 450 - 1200 cm-1 with
two maxima at 685 and 766 cm-1. Above 1200 cm-1 the spectrum was flat. The difference
spectrum of Raney-Co equilibrated with hydrogen was characterized by a much more
intense background compared to the parent sample. A number of small peaks sitting on
the background were exposed (i.e., 250, 560, 638, 782, 895 and 1104 cm-1). Another peak
was detected in the high energy transfer region (~ 1660 cm-1). The spectrum of Raney-
Co(LiOH) showed a small peak at 315 cm-1, a strong peak at 412 with a shoulder at 476
and a peak at 670 cm-1.
In the INS spectrum of the activated Raney-Co a contribution of the quantized lattice
vibrations of the Co hcp crystal are expected below 300 cm-1 with maxima at
approximately 250, 200, and 133 cm-1 [18] (the Co fcc phonon frequencies are also below
300 cm-1 [19]). On the other hand, the activation procedure might not have been
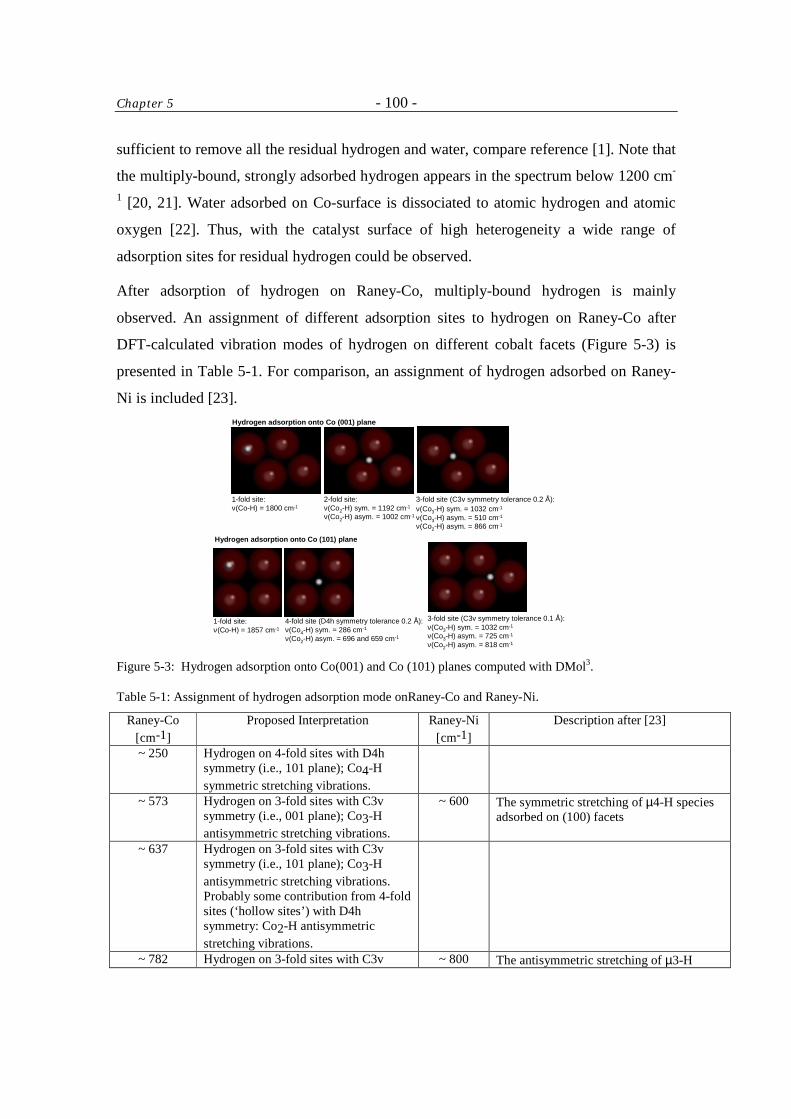
Chapter 5 - 100 -
sufficient to remove all the residual hydrogen and water, compare reference [1]. Note that
the multiply-bound, strongly adsorbed hydrogen appears in the spectrum below 1200 cm-
1 [20, 21]. Water adsorbed on Co-surface is dissociated to atomic hydrogen and atomic
oxygen [22]. Thus, with the catalyst surface of high heterogeneity a wide range of
adsorption sites for residual hydrogen could be observed.
After adsorption of hydrogen on Raney-Co, multiply-bound hydrogen is mainly
observed. An assignment of different adsorption sites to hydrogen on Raney-Co after
DFT-calculated vibration modes of hydrogen on different cobalt facets (Figure 5-3) is
presented in Table 5-1. For comparison, an assignment of hydrogen adsorbed on Raney-
Ni is included [23]. Hydrogen adsorption onto Co (001) plane
1-fold site:ν(Co-H) = 1800 cm-1
2-fold site:ν(Co2-H) sym. = 1192 cm-1
ν(Co2-H) asym. = 1002 cm-1
3-fold site (C3v symmetry tolerance 0.2 Å):ν(Co3-H) sym. = 1032 cm-1
ν(Co3-H) asym. = 510 cm-1
ν(Co2-H) asym. = 866 cm-1 Hydrogen adsorption onto Co (101) plane
4-fold site (D4h symmetry tolerance 0.2 Å):ν(Co4-H) sym. = 286 cm-1
ν(Co2-H) asym. = 696 and 659 cm-1
1-fold site:ν(Co-H) = 1857 cm-1
3-fold site (C3v symmetry tolerance 0.1 Å):ν(Co3-H) sym. = 1032 cm-1
ν(Co3-H) asym. = 725 cm-1
ν(Co2-H) asym. = 818 cm-1 Figure 5-3: Hydrogen adsorption onto Co(001) and Co (101) planes computed with DMol3.
Table 5-1: Assignment of hydrogen adsorption mode onRaney-Co and Raney-Ni.
Raney-Co [cm-1]
Proposed Interpretation Raney-Ni [cm-1]
Description after [23]
~ 250 Hydrogen on 4-fold sites with D4h symmetry (i.e., 101 plane); Co4-H symmetric stretching vibrations.
~ 573 Hydrogen on 3-fold sites with C3v symmetry (i.e., 001 plane); Co3-H antisymmetric stretching vibrations.
~ 600 The symmetric stretching of µ4-H species adsorbed on (100) facets
~ 637 Hydrogen on 3-fold sites with C3v symmetry (i.e., 101 plane); Co3-H antisymmetric stretching vibrations. Probably some contribution from 4-fold sites (‘hollow sites’) with D4h symmetry: Co2-H antisymmetric stretching vibrations.
~ 782 Hydrogen on 3-fold sites with C3v ~ 800 The antisymmetric stretching of µ3-H
Chapter 5 - 101 -
symmetry (i.e., 101 plane); Co2-H asymmetric stretching vibrations.
species adsorbed on (110) facets
~ 894 Hydrogen on 3-fold sites with C3v symmetry (i.e., 001 plane); Co2-H antisymmetric stretching vibrations.
~ 940 The antisymmetric stretching of µ3-H species adsorbed on (111) facets
~ 1100
Hydrogen on 3-fold sites with C3v symmetry (i.e., 001 and 101 planes); Co3-H symmetric stretching vibrations.
~ 1100
~ 1130
The symmetric stretching of µ3-H species adsorbed on (110) facets The symmetric stretching of µ3-H species adsorbed on (111) facets
~ 1660 Probably hydrogen on some 1-fold sites. However, the DFT calculations of single bound hydrogen on 101 and 001 planes yield a peak at 1800 – 1860 cm1.
~ 1800 The stretching vibrations of µ1-H species (on-top hydrogen); the bending mode is expected between 800 and 1130 cm-1, and is thus hidden by the more intense features due to multiply bound hydrogen
It is particularly noteworthy to mention that sorption of hydrogen onto Raney-Co at low
pressure is mainly related to the three-fold sites (corresponding to maxima at 782, 895
and 1100 cm-1). Relatively small contribution of ‘on-top’ hydrogen has been observed,
however, this binding mode can be prevailing at a high hydrogen pressure.
The wet deposition of LiOH onto Raney-Co surface and the subsequent activation
procedure at 473 K may lead to a number of lithium compounds. Most likely, a surface
reaction of lithium hydroxide monohydrate (LiOH·H2O) with bayerite (aluminum
hydroxide found on the surface of Raney catalysts) produce lithium dialuminate
(Li2Al2(OH)7·2H2O) [24]. Removal of structural water from Li2Al2(OH)7·2H2O occurs
below 473 K [25], whereas the crystal water of LiOH·H2O(s) is removed already at ~ 380
K [26]. Thus, dehydrated lithium hydroxide (mostly) and small amount of lithium
aluminates are expected. The former having hydrogen in the structure should
significantly contribute to the INS differential spectrum of LiOH deposited on Raney-Co.
The crystal structure of lithium hydroxide belongs to the tetragonal symmetry group D4h7
≡ P4/nmm and each Bravais cell contains two formula units of LiOH [27, 28]. The
internal and external fundamental vibrations are classified into five symmetry species of
the D4h7 group (i.e., a1g, eg, b1g, a2u, eu) [29]. The IR and Raman vibrational active modes
have been studied in detail [30, 31, 32, 33], and a high-temperature study of
polycrystalline LiOH by INS has been presented by Safford and LoSacco [34].
The observed bands in the INS differential spectrum of LiOH deposited on Raney-Co
mainly result from vibrations that involve motions of the OH- group. Consequently, it is
Chapter 5 - 102 -
proposed that the INS band at 315 cm-1 represents translational lattice vibrations (i.e.,
T'(OH-)) of the a1g species (329 and 332 cm-1 in Raman and INS spectra of
polycrystalline LiOH, respectively). The very strong INS vibration at 412 cm-1 can be
assigned to the rocking lattice mode of OH- (R'(OH-)) of the eu symmetry species (419
cm-1 in IR spectrum). The adjacent, less intense INS vibration (the shoulder at 476 cm-1)
reveals probably T'(OH-) of the a2u species. The literature data on this vibration are
conflicting. The IR data by Yoshida and Hase refer to a vibration at 595 cm-1 as the a2u
species’ coupled vibration of T'(OH-) and T'(Li+) [35, 36]. On the other hand, Buchanan
et. al. have reported a vibration at 495 cm-1 as the IR active vibration of the a2u symmetry
species [37]. Also Safford and LoSacco have presented the INS spectrum of LiOH with
an intense peak at 468 cm-1. The vibration at 670 cm-1 in the INS spectrum might be
assigned to the pure rotational vibration of OH- groups of the eg species. The R'(OH-)
with a contribution from the mechanical coupling with T'(Li+) is recorded at 620 cm-1 in
the Raman spectrum and corresponds to the INS peak at 625 cm-1 of LiOH. Note that the
acoustic lattice vibrations of LiOH and the internal stretching modes of OH- are expected
to appear outside the energy scale of the INS spectrum considered (i.e., below 200 and
above 3000 cm-1, respectively).
In Figure 5-4, the differential INS spectra of co-adsorbed butyronitrile and hydrogen on
parent (a) and LiOH-modified Raney-Co (c) are shown after subtraction of the reference
background. The INS spectrum of a solid sample of butyronitrile (b) is also included.
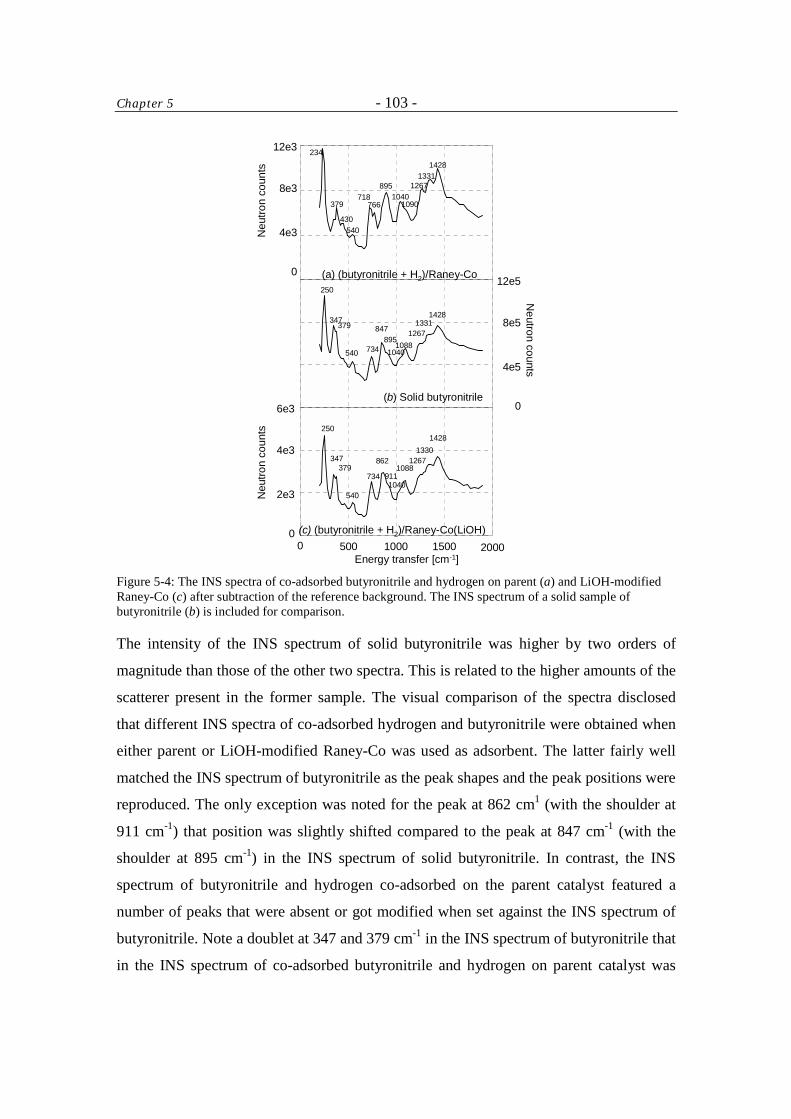
Chapter 5 - 103 -
0 500 1000 1500 2000Energy transfer [cm-1]
(c) (butyronitrile + H2)/Raney-Co(LiOH)
(a) (butyronitrile + H2)/Raney-Co
(b) Solid butyronitrile
Neu
tron
coun
ts
0
2e3
4e3
6e3
Neu
tron
coun
ts0
4e3
8e3
12e3
Neutron counts
0
4e5
8e5
12e5
234
379
430 540
718766
895
10901040
14281331
1267
13311428
12671088
1040
847895
734540
379347
250
13301428
12671088
1040
862
911734
540
379347
250
Figure 5-4: The INS spectra of co-adsorbed butyronitrile and hydrogen on parent (a) and LiOH-modified Raney-Co (c) after subtraction of the reference background. The INS spectrum of a solid sample of butyronitrile (b) is included for comparison.
The intensity of the INS spectrum of solid butyronitrile was higher by two orders of
magnitude than those of the other two spectra. This is related to the higher amounts of the
scatterer present in the former sample. The visual comparison of the spectra disclosed
that different INS spectra of co-adsorbed hydrogen and butyronitrile were obtained when
either parent or LiOH-modified Raney-Co was used as adsorbent. The latter fairly well
matched the INS spectrum of butyronitrile as the peak shapes and the peak positions were
reproduced. The only exception was noted for the peak at 862 cm1 (with the shoulder at
911 cm-1) that position was slightly shifted compared to the peak at 847 cm-1 (with the
shoulder at 895 cm-1) in the INS spectrum of solid butyronitrile. In contrast, the INS
spectrum of butyronitrile and hydrogen co-adsorbed on the parent catalyst featured a
number of peaks that were absent or got modified when set against the INS spectrum of
butyronitrile. Note a doublet at 347 and 379 cm-1 in the INS spectrum of butyronitrile that
in the INS spectrum of co-adsorbed butyronitrile and hydrogen on parent catalyst was
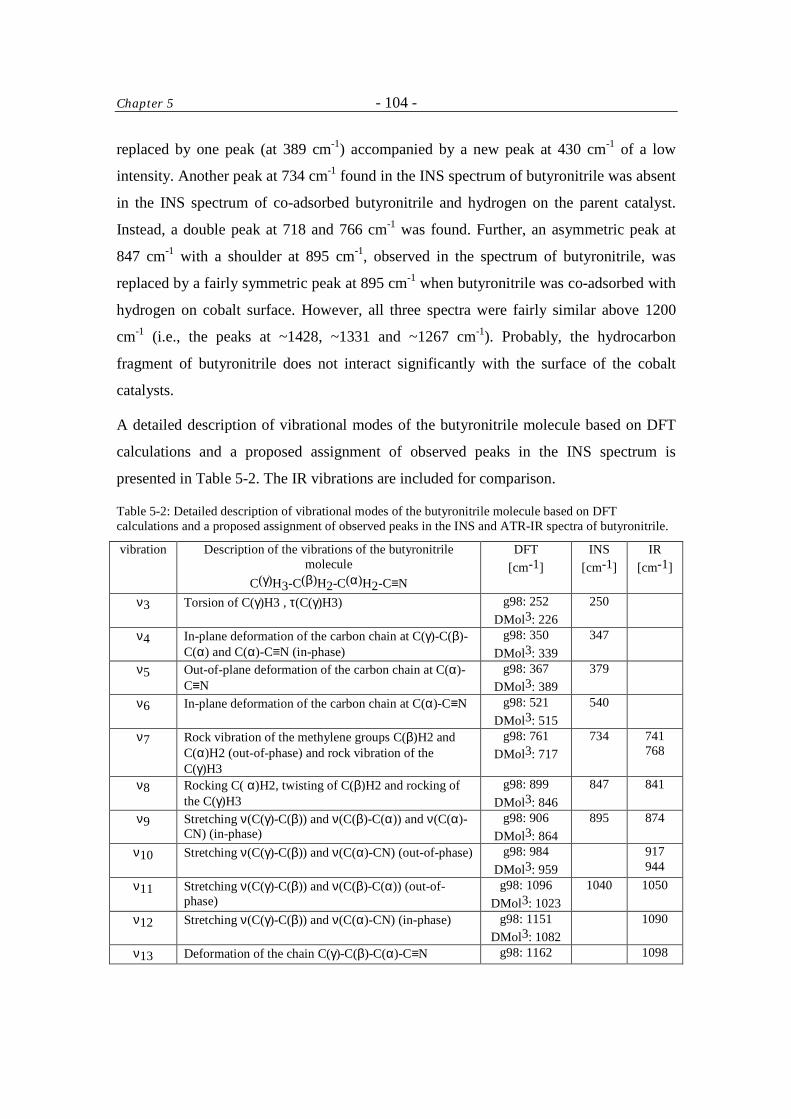
Chapter 5 - 104 -
replaced by one peak (at 389 cm-1) accompanied by a new peak at 430 cm-1 of a low
intensity. Another peak at 734 cm-1 found in the INS spectrum of butyronitrile was absent
in the INS spectrum of co-adsorbed butyronitrile and hydrogen on the parent catalyst.
Instead, a double peak at 718 and 766 cm-1 was found. Further, an asymmetric peak at
847 cm-1 with a shoulder at 895 cm-1, observed in the spectrum of butyronitrile, was
replaced by a fairly symmetric peak at 895 cm-1 when butyronitrile was co-adsorbed with
hydrogen on cobalt surface. However, all three spectra were fairly similar above 1200
cm-1 (i.e., the peaks at ~1428, ~1331 and ~1267 cm-1). Probably, the hydrocarbon
fragment of butyronitrile does not interact significantly with the surface of the cobalt
catalysts.
A detailed description of vibrational modes of the butyronitrile molecule based on DFT
calculations and a proposed assignment of observed peaks in the INS spectrum is
presented in Table 5-2. The IR vibrations are included for comparison.
Table 5-2: Detailed description of vibrational modes of the butyronitrile molecule based on DFT calculations and a proposed assignment of observed peaks in the INS and ATR-IR spectra of butyronitrile.
vibration Description of the vibrations of the butyronitrile molecule
C(γ)H3-C(β)H2-C(α)H2-C≡N
DFT [cm-1]
INS [cm-1]
IR [cm-1]
ν3 Torsion of C(γ)H3 , τ(C(γ)H3) g98: 252 DMol3: 226
250
ν4 In-plane deformation of the carbon chain at C(γ)-C(β)-C(α) and C(α)-C≡N (in-phase)
g98: 350 DMol3: 339
347
ν5 Out-of-plane deformation of the carbon chain at C(α)-C≡N
g98: 367 DMol3: 389
379
ν6 In-plane deformation of the carbon chain at C(α)-C≡N g98: 521 DMol3: 515
540
ν7 Rock vibration of the methylene groups C(β)H2 and C(α)H2 (out-of-phase) and rock vibration of the C(γ)H3
g98: 761 DMol3: 717
734 741 768
ν8 Rocking C( α)H2, twisting of C(β)H2 and rocking of the C(γ)H3
g98: 899 DMol3: 846
847 841
ν9 Stretching ν(C(γ)-C(β)) and ν(C(β)-C(α)) and ν(C(α)-CN) (in-phase)
g98: 906 DMol3: 864
895 874
ν10 Stretching ν(C(γ)-C(β)) and ν(C(α)-CN) (out-of-phase) g98: 984 DMol3: 959
917 944
ν11 Stretching ν(C(γ)-C(β)) and ν(C(β)-C(α)) (out-of-phase)
g98: 1096 DMol3: 1023
1040 1050
ν12 Stretching ν(C(γ)-C(β)) and ν(C(α)-CN) (in-phase) g98: 1151 DMol3: 1082
1090
ν13 Deformation of the chain C(γ)-C(β)-C(α)-C≡N g98: 1162 1098
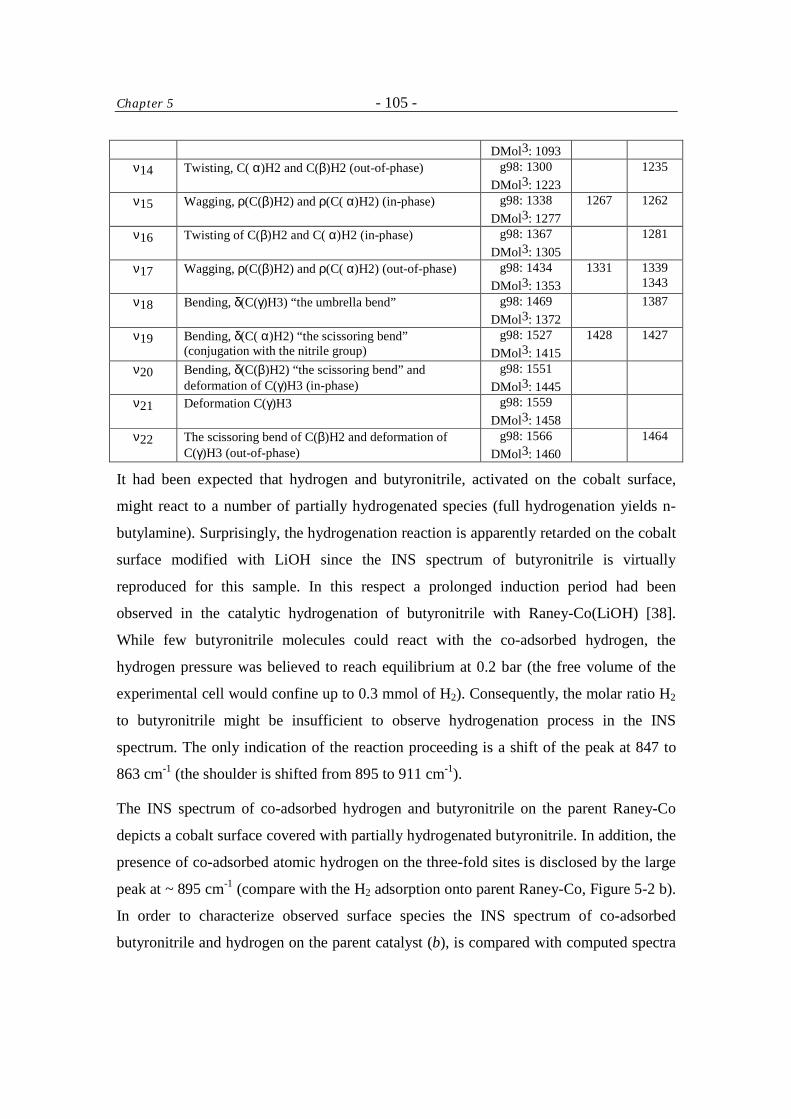
Chapter 5 - 105 -
DMol3: 1093 ν14 Twisting, C( α)H2 and C(β)H2 (out-of-phase) g98: 1300
DMol3: 1223 1235
ν15 Wagging, ρ(C(β)H2) and ρ(C( α)H2) (in-phase) g98: 1338 DMol3: 1277
1267 1262
ν16 Twisting of C(β)H2 and C( α)H2 (in-phase) g98: 1367 DMol3: 1305
1281
ν17 Wagging, ρ(C(β)H2) and ρ(C( α)H2) (out-of-phase) g98: 1434 DMol3: 1353
1331 1339 1343
ν18 Bending, δ(C(γ)H3) “the umbrella bend” g98: 1469 DMol3: 1372
1387
ν19 Bending, δ(C( α)H2) “the scissoring bend” (conjugation with the nitrile group)
g98: 1527 DMol3: 1415
1428 1427
ν20 Bending, δ(C(β)H2) “the scissoring bend” and deformation of C(γ)H3 (in-phase)
g98: 1551 DMol3: 1445
ν21 Deformation C(γ)H3 g98: 1559 DMol3: 1458
ν22 The scissoring bend of C(β)H2 and deformation of C(γ)H3 (out-of-phase)
g98: 1566 DMol3: 1460
1464
It had been expected that hydrogen and butyronitrile, activated on the cobalt surface,
might react to a number of partially hydrogenated species (full hydrogenation yields n-
butylamine). Surprisingly, the hydrogenation reaction is apparently retarded on the cobalt
surface modified with LiOH since the INS spectrum of butyronitrile is virtually
reproduced for this sample. In this respect a prolonged induction period had been
observed in the catalytic hydrogenation of butyronitrile with Raney-Co(LiOH) [38].
While few butyronitrile molecules could react with the co-adsorbed hydrogen, the
hydrogen pressure was believed to reach equilibrium at 0.2 bar (the free volume of the
experimental cell would confine up to 0.3 mmol of H2). Consequently, the molar ratio H2
to butyronitrile might be insufficient to observe hydrogenation process in the INS
spectrum. The only indication of the reaction proceeding is a shift of the peak at 847 to
863 cm-1 (the shoulder is shifted from 895 to 911 cm-1).
The INS spectrum of co-adsorbed hydrogen and butyronitrile on the parent Raney-Co
depicts a cobalt surface covered with partially hydrogenated butyronitrile. In addition, the
presence of co-adsorbed atomic hydrogen on the three-fold sites is disclosed by the large
peak at ~ 895 cm-1 (compare with the H2 adsorption onto parent Raney-Co, Figure 5-2 b).
In order to characterize observed surface species the INS spectrum of co-adsorbed
butyronitrile and hydrogen on the parent catalyst (b), is compared with computed spectra
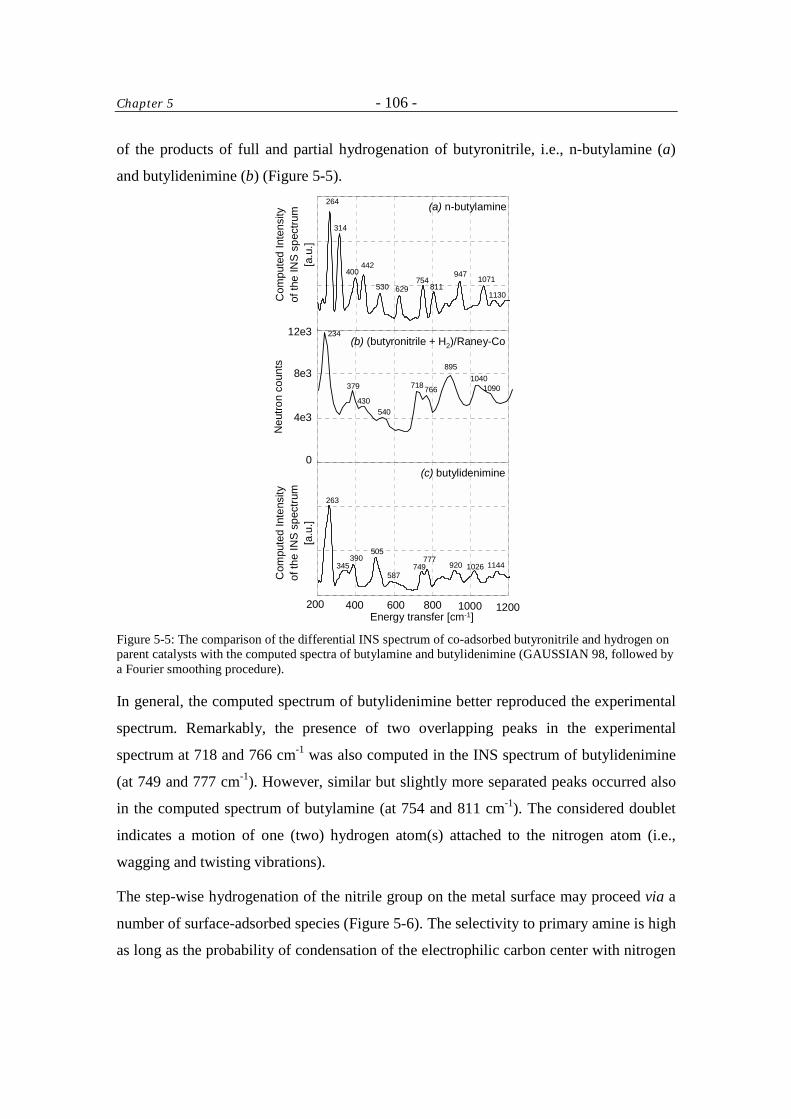
Chapter 5 - 106 -
of the products of full and partial hydrogenation of butyronitrile, i.e., n-butylamine (a)
and butylidenimine (b) (Figure 5-5).
(b) (butyronitrile + H2)/Raney-Co
(c) butylidenimine
(a) n-butylamine
Com
pute
d In
tens
ityof
the
INS
spe
ctru
m[a
.u.]
Com
pute
d In
tens
ityof
the
INS
spec
trum
[a.u
.]
234
379
430 540
718766
895
0
4e3
8e3
12e3
200 400 600 800 1000Energy transfer [cm-1]
Neu
tron
coun
ts
263
345390
505
587749
7771026
264
314
400442
530 629754
811947
1200
10401090
1071
1130
920 1144
Figure 5-5: The comparison of the differential INS spectrum of co-adsorbed butyronitrile and hydrogen on parent catalysts with the computed spectra of butylamine and butylidenimine (GAUSSIAN 98, followed by a Fourier smoothing procedure).
In general, the computed spectrum of butylidenimine better reproduced the experimental
spectrum. Remarkably, the presence of two overlapping peaks in the experimental
spectrum at 718 and 766 cm-1 was also computed in the INS spectrum of butylidenimine
(at 749 and 777 cm-1). However, similar but slightly more separated peaks occurred also
in the computed spectrum of butylamine (at 754 and 811 cm-1). The considered doublet
indicates a motion of one (two) hydrogen atom(s) attached to the nitrogen atom (i.e.,
wagging and twisting vibrations).
The step-wise hydrogenation of the nitrile group on the metal surface may proceed via a
number of surface-adsorbed species (Figure 5-6). The selectivity to primary amine is high
as long as the probability of condensation of the electrophilic carbon center with nitrogen
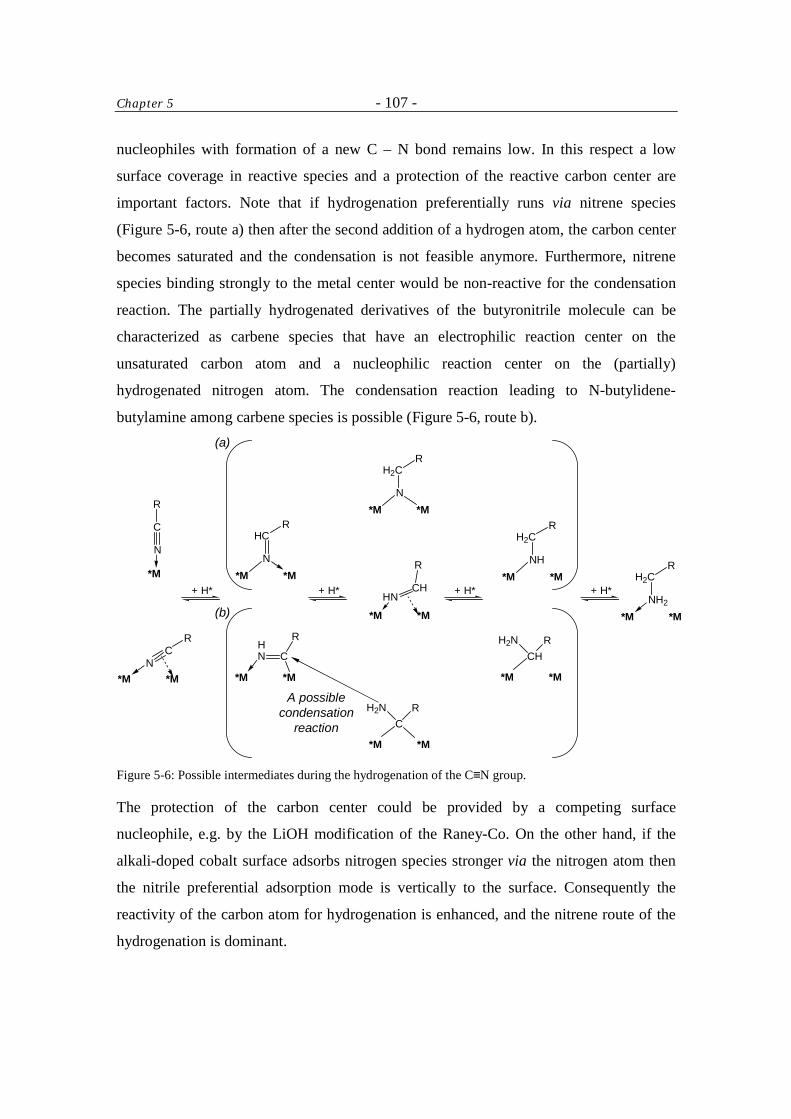
Chapter 5 - 107 -
nucleophiles with formation of a new C – N bond remains low. In this respect a low
surface coverage in reactive species and a protection of the reactive carbon center are
important factors. Note that if hydrogenation preferentially runs via nitrene species
(Figure 5-6, route a) then after the second addition of a hydrogen atom, the carbon center
becomes saturated and the condensation is not feasible anymore. Furthermore, nitrene
species binding strongly to the metal center would be non-reactive for the condensation
reaction. The partially hydrogenated derivatives of the butyronitrile molecule can be
characterized as carbene species that have an electrophilic reaction center on the
unsaturated carbon atom and a nucleophilic reaction center on the (partially)
hydrogenated nitrogen atom. The condensation reaction leading to N-butylidene-
butylamine among carbene species is possible (Figure 5-6, route b).
H2C
NH2
R
*M*M
+ H* + H*
CN
R
*M*M
*M
C
N
R
HC
N
R
*M*M
H2C
N
R
*M*M
H2C
NH
R
*M*MCH
HN
R
*M*M
CHN
R
*M*M
CH2N R
*M*M
CHH2N R
*M*M
+ H* + H*
(a)
(b)
A possible condensation
reaction
Figure 5-6: Possible intermediates during the hydrogenation of the C≡N group.
The protection of the carbon center could be provided by a competing surface
nucleophile, e.g. by the LiOH modification of the Raney-Co. On the other hand, if the
alkali-doped cobalt surface adsorbs nitrogen species stronger via the nitrogen atom then
the nitrile preferential adsorption mode is vertically to the surface. Consequently the
reactivity of the carbon atom for hydrogenation is enhanced, and the nitrene route of the
hydrogenation is dominant.
Chapter 5 - 108 -
5.4 Conclusions
Sorption of hydrogen onto Raney-Co at low pressure is mainly related to the three-fold
sites. Wet deposition of LiOH onto Raney-Co and subsequent temperature treatment at
473 K creates clusters of LiOH rather than a thin film on the cobalt surface. The factor
group analysis can be used to describe vibrational frequencies of LiOH crystallites on the
cobalt surface. On Raney-Co, butyronitrile and hydrogen react promptly to partially-
hydrogenated derivatives that are characterized by the presence of hydrogen atom(s) on
the nitrogen atom. The condensation reaction leading to N-butylidene-butylamine is
feasible. Treatment of Raney-Co with LiOH leads to modified sorption properties of the
catalyst surface. It is speculated that strong binding via the nitrogen atom may stimulate
swift hydrogenation of the carbon atom in the nitrile group. This preserves it from
secondary condensation reactions. However, further experimental evidence is necessary
to proof the presence of nitrene species populating the surface of Raney-Co(LiOH)
during the reaction.
Acknowledgment
Dr. Herve Jobic (Institut de Recherches sur la Catalyse, France), PD. Andreas Jentys,
PhD, and Prof. Dr. Winfried Petry (Lehrstuhl für Experimentalphysik IV, TUM) are
gratefully thanked for the introduction to INS spectroscopy, help with ab initio
calculations, and the discussion of the results. Institut Laue-Langevin is thanked for
access to the IN1-BeF spectrometer and, in particular, Alexander Ivanov for assistance
during the INS experiments. A sample of Active Raney-Co grade # 2700 lot # 7865 was
kindly donated by Unichema Chemie GmbH, Emmerich, Germany.
References 1 M.S. Wainwright in: G. Ertl, H. Knözinger, J. Weitkamp (Eds.), Preparation of Solid
Catalysts, Wiley-VCH, Weinheim, 1999, p. 28 – 43
2 M. G. Turcotte, T. A. Johnson in: J. I. Kroschwitz (Ed.), Kirk-Othmer Encyclopedia
of Chemical Technology Vol. 2 (4th Ed.), John Wiley & Sons, NY, 1992, p.369 - 386
3 P. R. Rylander, Hydrogenation Methods, Academic Press, London, 1988 (2nd Ed.), p.
94 - 103
Chapter 5 - 109 -
4 B. Coq, D. Tichit and S. Ribet, J. Catal. 189 (2000) 117
5 F.J.G. Alonso, M.G. Sanz, V. Riera, Organometallics 11 (1992) 801
6 Y. Huang, W.M.H. Sachtler, Appl. Catal. A 182(2) (1999) 365
7 Calculation performed in HSC Chemistry for Windows 5.1, Outokumpu Research
Oy, P.O. Box 60, FIN – 28101 Pori, Finland, Fax: +358 – 2 – 626 – 5310; Phone:
+358 – 2 – 626 – 6111
8 F. Medina, P. Salagre and J.E. Sueiras, J. Mol. Cat. 81 (1993) 363
9 H. Greenfield, Ind. Eng. Chem. Prod. Rev. Dev. 6 (1967) 142
10 B. S. Hudson, J. Phys. Chem. A 105 (2001) 3949
11 D. Graham, J. Howard and T. C. Waddington, J. Chem. Soc., Faraday Trans. 1, 79
(1983) 1281
12 H. Jobic and A. Renouprez, J. Chem. Soc., Faraday Trans. 1, 80 (1984) 1991
13 J.M. Nicol, Spectrochim. Acta 48A(3) (1992) 313
14 B. Delley, J. Chem. Phys. 92 (1990) 508
15 J. D. Donnay and G. Harker, Am. Mineral. 22 (1937) 446; particles morphology was
computed in Cerius2 program suite (2001, Accelrys Inc.) using Crystal Builder and
Surface Builder modules.
16 M.J. Frisch, G.W. Trucks, H.B. Schlegel, G.E. Scuseria, M.A. Robb, J.R. Cheeseman,
V.G. Zakrzewski, J.A. Montgomery, R.E. Stratmann, J.C. Burant, S. Dapprich, J.M.
Millam, A.D. Daniels, K.N. Kudin, M.C. Strain, O. Farkas, J. Tomasi, V. Barone, M.
Cossi, R. Cammi, B. Mennucci, C. Pomeli, C. Adamo, S. Clifford, J. Ochterski, G.A.
Petersson, P.Y. Ayala, Q. Cui, K. Morakuma, D.K. Malick, A.D. Rabuck, K.
Raghavachari, J.B. Foresman, J. Cioslowski, J.V. Ortiz, B.B. Stefanov, G. Lui, A.
Liashenko, P. Piskorz, I. Komaromi, R. Gomperts, R.L. Martin, D.J. Fox, T. Keith,
M.A. Al-Laham, C.Y. Peng, Nanayakkara, C. Gonzalez, M. Challacombe, P.M.W.
Gill, B.G. Johnson, W. Chen, M.W. Wong, J.L. Andreas, M. Head-Gordon, E.S.
Repolgle, J.A. Pople, GAUSSIAN 98 (Revision A.9), Gaussian, Pittsburg, PA, 1998.
17 aCLIMAX v. 4.0, the new software for analyzing and interpreting INS spectra; J.A.
Ramirez-Cuesta, to be published
18 N. Wakabayashi, R. H. Schrem and H. G. Smith, Phys. Rev. B 25 (1982) 5122
Chapter 5 - 110 -
19 B. Strauss, F. Frey, W. Petry, J. Trampenau, K. Nicolaus, S. M. Shapiro, J. Bossy,
Phys. Rev. B 54 (1996) 6035
20 M. Sayers and C. J. Wright, J. Chem. Soc., Faraday Trans. 1, 80 (1984) 1217
21 H. Jobic and A. Renouprez, J. Chem. Soc., Faraday Trans. 1, 80 (1984) 1991
22 F. Grellner, B. Klingenberg, D. Borgmann and G. Wedler, Surf. Sci. 312 (1994) 143
23 F. Hochard, H. Jobic, J. Massardier and A. Renouprez, J. Mol. Catal. A 95 (1995) 165
24 J. P. Thiel, C. K. Chiang, and K. R. Poeppelmeier, Chem. Mater. 5 (1993) 297
25 M. Nayak, T. R. N. Kutty, V. Jayaraman and G. Periaswamy, J. Mater. Chem. 7
(1997) 2131
26 J.M. Kiat, G. Boemare, B. Rieu and D. Aymes, Solid State Commun. 108 (1998) 24
27 T. Ernst, Z. Phys. Chem. B20 (1933) 65
28 H. Dachs, Z. Krystallogr. 112 (1959) 60
29 K. A. Wickersheim, J. Chem. Phys. 31 (1959) 863
30 Y. Hase and I. V. Pagotto-Yoshida, Chem. Phys. Lett. 65 (1979) 46
31 F. Harbach and F. Fisher, J. Phys. Chem. Solids, 36 (1975) 601
32 I. V. P. Yoshida and Y. Hase, Spectrosc. Lett. 12 (1979) 409
33 R. A. Buchanan, H. H. Caspers and H. R. Marlin, 40 (1964) 1125
34 G. J. Safford and F. J. LoSacco, J. Chem. Phys. 44 (1966) 345
35 I. V. P. Yoshida and Y. Hase, Spectrosc. Lett. 12 (1979) 409
36 Y. Hase and I. V. P. Yoshida, J. Mol. Struct., 56 (1979) 297
37 R. A. Buchanan, H. H. Caspers and H. R. Marlin, J. Phys. Chem. 40 (1964) 1125
38 ‘Characterization of Raney-Ni and Raney-Co Catalysts and Their Use in the Selective
Hydrogenation of Butyronitrile’ A. Chojecki, T.E. Müller, J.A. Lercher to be
submitted
- 111 -
Chapter 6 Summary of the research.
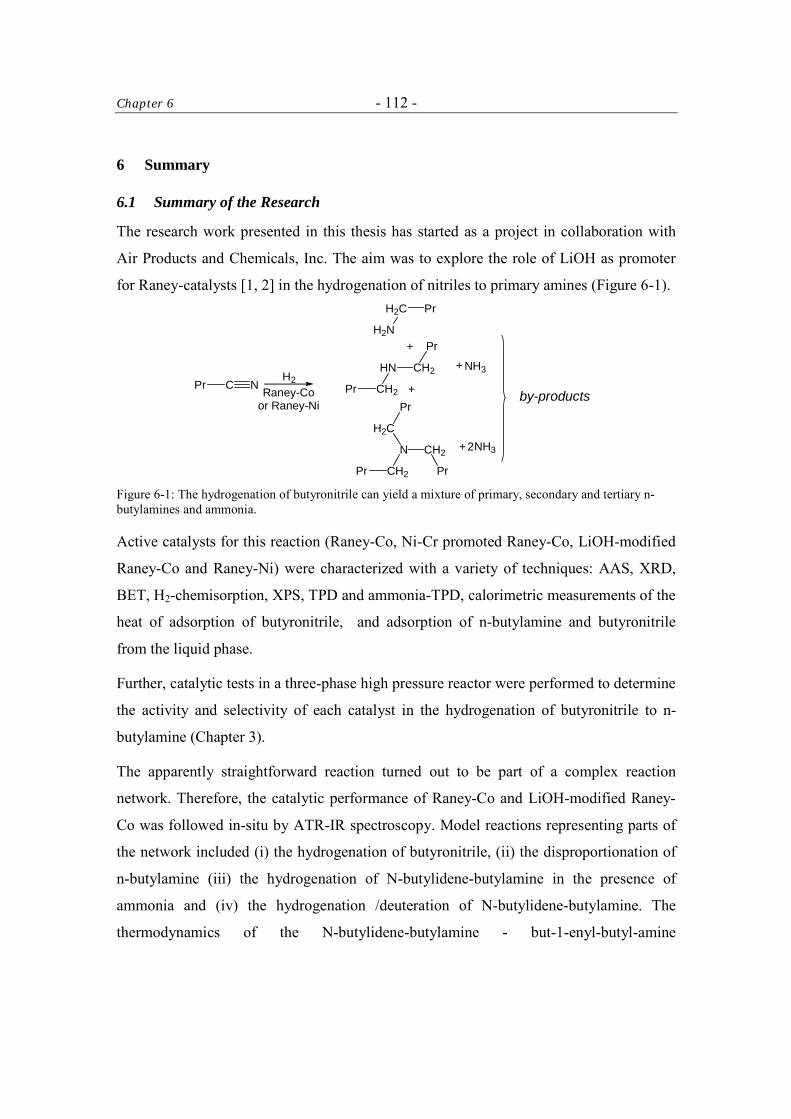
Chapter 6 - 112 -
6 Summary
6.1 Summary of the Research
The research work presented in this thesis has started as a project in collaboration with
Air Products and Chemicals, Inc. The aim was to explore the role of LiOH as promoter
for Raney-catalysts [1, 2] in the hydrogenation of nitriles to primary amines (Figure 6-1).
by-productsC NPr
H2CH2
HN
Pr
CH2
Pr
CH2
N
Pr
CH2
H2C
Pr
Pr
H2C
H2N
Pr
NH3
NH3
+
+
+
+2
Raney-Coor Raney-Ni
Figure 6-1: The hydrogenation of butyronitrile can yield a mixture of primary, secondary and tertiary n-butylamines and ammonia.
Active catalysts for this reaction (Raney-Co, Ni-Cr promoted Raney-Co, LiOH-modified
Raney-Co and Raney-Ni) were characterized with a variety of techniques: AAS, XRD,
BET, H2-chemisorption, XPS, TPD and ammonia-TPD, calorimetric measurements of the
heat of adsorption of butyronitrile, and adsorption of n-butylamine and butyronitrile
from the liquid phase.
Further, catalytic tests in a three-phase high pressure reactor were performed to determine
the activity and selectivity of each catalyst in the hydrogenation of butyronitrile to n-
butylamine (Chapter 3).
The apparently straightforward reaction turned out to be part of a complex reaction
network. Therefore, the catalytic performance of Raney-Co and LiOH-modified Raney-
Co was followed in-situ by ATR-IR spectroscopy. Model reactions representing parts of
the network included (i) the hydrogenation of butyronitrile, (ii) the disproportionation of
n-butylamine (iii) the hydrogenation of N-butylidene-butylamine in the presence of
ammonia and (iv) the hydrogenation /deuteration of N-butylidene-butylamine. The
thermodynamics of the N-butylidene-butylamine - but-1-enyl-butyl-amine
Chapter 6 - 113 -
tautomerisation reaction and a possible structure of the transition state structure were
studied using ab initio methods (Chapter 4).
Incoherent Inelastic Neutron Scattering (INS) spectroscopy was used in combination with
ab initio computational study of molecular vibrations to (i) study the hydrogen species
adsorbed on the surface of Raney-Co (ii) characterize the LiOH-modification of Raney-
Co and (iii) identify possible reaction intermediates during co-adsorption of hydrogen
and butyronitrile on the surface of parent and LiOH-modified Raney-Co (Chaper 5).
6.2 Conclusions
The metal surface active for hydrogenation is only a fraction of the total surface area of
the Raney-catalysts studied. Although the amount of alumina on the surface of Raney-
Ni, Raney-Co(NiCr) and Raney-Co follows the trend of the bulk composition Al seems to
be enriched at the surface. The nature of the oxide deposit and its morphology are
influenced by the LiOH additive. Firstly, LiOH quenches the sites which are associated
with the alumina Lewis acidity (Al2O3) and lithium dialuminate Li2Al2(OH)7⋅2H2O is
probably formed. Secondly, clustering of the oxide deposit takes place as the fraction of
the clean metal surface area increases relative to the total surface. On cobalt the
adsorption mode of butyronitrile on the surface probably is probably characterized by σ-
binding through the nitrogen atom with the C≡N bond vector largely normal to the
surface plane (low heat of adsorption). In contrast on nickel an aslant mode where the
C≡N π-system also interacts with the surface dominates (high heat of adsorption).
Modification of Raney-Co with LiOH gives a catalyst with an intermediate heat of
adsorption, although, it is speculated that this modification leads to an increase in the
strength of the nitrogen binding to the cobalt surface. In line, the rate of the
hydrogenation of butyronitrile is higher over nickel than over cobalt; also LiOH-
modification of Raney-Co leads to an enhanced catalytic activity (Figure 6-2).
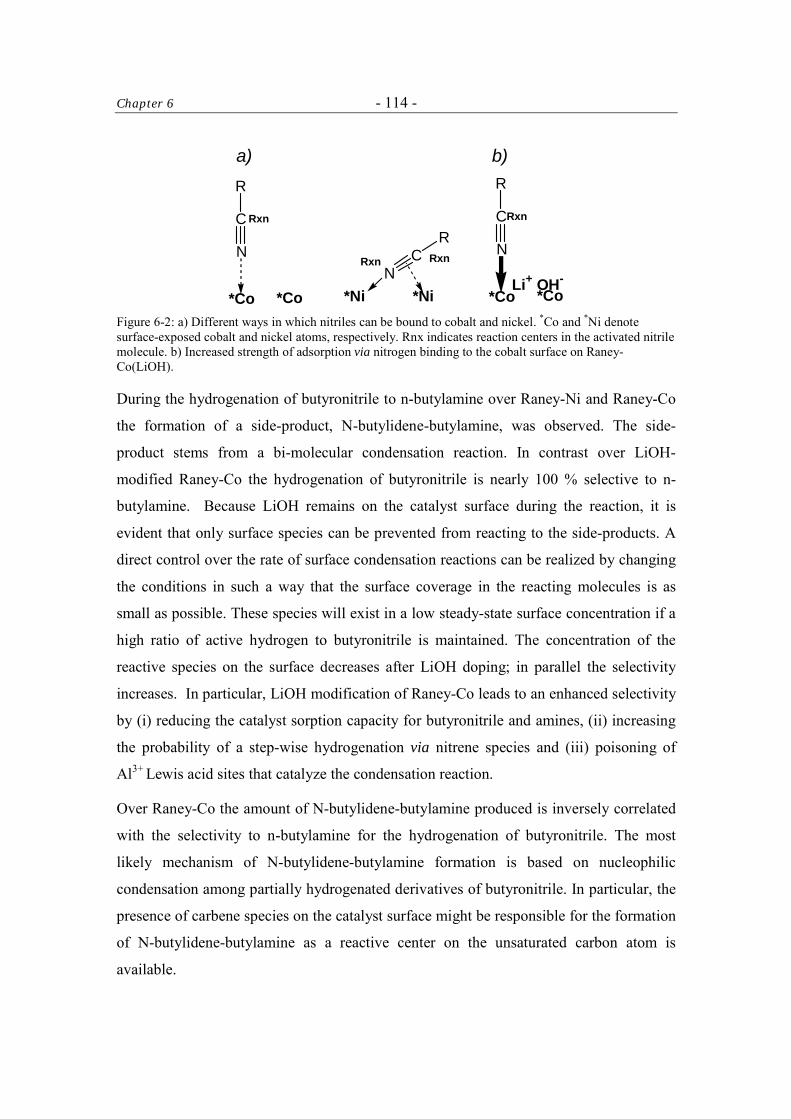
Chapter 6 - 114 -
C
N
R
Li+ OH-*Co*Co
RxnC
N
R
*Co*Co
Rxn
CN
R
*Ni *Ni
Rxn Rxn
a) b)
Figure 6-2: a) Different ways in which nitriles can be bound to cobalt and nickel. *Co and *Ni denote surface-exposed cobalt and nickel atoms, respectively. Rnx indicates reaction centers in the activated nitrile molecule. b) Increased strength of adsorption via nitrogen binding to the cobalt surface on Raney-Co(LiOH).
During the hydrogenation of butyronitrile to n-butylamine over Raney-Ni and Raney-Co
the formation of a side-product, N-butylidene-butylamine, was observed. The side-
product stems from a bi-molecular condensation reaction. In contrast over LiOH-
modified Raney-Co the hydrogenation of butyronitrile is nearly 100 % selective to n-
butylamine. Because LiOH remains on the catalyst surface during the reaction, it is
evident that only surface species can be prevented from reacting to the side-products. A
direct control over the rate of surface condensation reactions can be realized by changing
the conditions in such a way that the surface coverage in the reacting molecules is as
small as possible. These species will exist in a low steady-state surface concentration if a
high ratio of active hydrogen to butyronitrile is maintained. The concentration of the
reactive species on the surface decreases after LiOH doping; in parallel the selectivity
increases. In particular, LiOH modification of Raney-Co leads to an enhanced selectivity
by (i) reducing the catalyst sorption capacity for butyronitrile and amines, (ii) increasing
the probability of a step-wise hydrogenation via nitrene species and (iii) poisoning of
Al3+ Lewis acid sites that catalyze the condensation reaction.
Over Raney-Co the amount of N-butylidene-butylamine produced is inversely correlated
with the selectivity to n-butylamine for the hydrogenation of butyronitrile. The most
likely mechanism of N-butylidene-butylamine formation is based on nucleophilic
condensation among partially hydrogenated derivatives of butyronitrile. In particular, the
presence of carbene species on the catalyst surface might be responsible for the formation
of N-butylidene-butylamine as a reactive center on the unsaturated carbon atom is
available.
Chapter 6 - 115 -
). It should be noted that in situ spectroscopy has not provided evidence that any
butylidenimine, which was frequently postulated as reaction intermediate, was formed or
desorbed into the liquid phase.
The reaction between N-butylidene-butylamine and ammonia has been explored as the
reverse of the condensation reaction observed during the hydrogenation of butyronitrile.
However, the reaction hardly proceeded. Over the parent catalyst ammonolysis of N-
butylidene-butylamine produced traces of n-butylamine and some high molecular weight
products. Note that n-butylamine in reaction with butylidenimine would directly yield N-
butylidene-butylamine. Over LiOH-modified catalyst ammonolysis of N-butylidene-
butylamine unexpectedly yielded only butyronitrile. This implies fast dehydrogenation of
reactants or products (i.e., butylidenimine and n-butylamine). Probably the LiOH-
modified Raney-Co exhibits better dehydrogenation and hydrogenation activity than the
parent catalyst.
The reaction of N-butylidene-butylamine with ammonia in the presence of hydrogen will
lead to n-butylamine. Over parent catalyst the reaction yields n-butylamine, however, di-
n-butylamine is also obtained. In contrast, in the presence of LiOH on the catalyst
surface, N-butylidene-butylamine hardly reacts with NH3 and practically only di-n-
butylamine is formed after hydrogenation. Most likely, the much stronger nucleophile
OH-forms a surface adsorbed amino-alcohol (or its salt) and protects the C=N group from
nucleophilic attack of ammonia. By analogy it could also be possible that LiOH inhibits
the nucleophilic condensation among partially hydrogenated intermediates.
INS spectroscopy indicated that sorption of hydrogen onto Raney-Co at low pressure is
mainly related to the three-fold sites. Wet deposition of LiOH onto Raney-Co and
subsequent temperature treatment at 473 K creates clustered rather than layered lithium
hydroxide. On Raney-Co butyronitrile and hydrogen promptly react yielding a number of
(partially-) hydrogenated derivatives that are characterized by the presence of at least one
hydrogen atom on the nitrogen atom. In consequence the condensation reaction leading to
condensation products (i.e., N-butylidene-butylamine) is feasible. Modification of Raney-
Co with LiOH significantly changes the sorption properties of the catalyst surface. It is
speculated that strong binding via the nitrogen atom may in the first place stimulate
Chapter 6 - 116 -
hydrogenation of the carbon atom in the nitrile group. This preserves it from a
nucleophilic attack and subsequent condensation reactions. However, further
experimental evidence of the nitrene species populating the surface of Raney-Co(LiOH)
during the reaction is necessary.
References 1 T. A. Johnson, US Patent No. 5 869 653 (1999), to Air Products and Chemicals, Inc.
2 T. A. Johnson and D. P. Freyberger in: M. E. Ford (Ed.), Catalysis of Organic
Reactions - Chemical Industries Series Vol. 82, Marcel Dekker, 2000, p. 201 – 227