Embed Size (px)
Citation preview
Sewage sludge-based ac vated carbonProduc on and poten al in wastewater and stormwater treatment
Alexander Betsholtz
Stina Jacobsson
Salar Haghighatafshar
Karin Jönsson
Rapport Nr. 122018

ii
iii
Foreword The report was financed by Svenskt Vatten via VA-teknik Södra (https://va-tekniksodra.se/) - a cluster of companies and organizations represented within academia, industry and public sector in Sweden. The major part of the study was performed by Alexander Betsholtz during the fall of 2017 and early spring of 2018. The adsorption experiments were performed in laboratory by master student Stina Jacobsson as part of a project course at the department of Chemical Engineering at Lund University during the spring of 2018. Salar Haghighatafshar developed the idea of the project based on earlier lab experiments and Karin Jönsson has been supervising the project. The authors would like to thank several people at the department of Chemical Engineering. First of all, thanks to Herje Schagerlöf for helping with the porosity analysis and to Christian Hulteberg for sharing his advice and knowledge about porous materials and their characterization. Thanks to Maja Ekblad for helping out formulating and initiating the project. Also, thanks to Gertrud Persson and Per Falås for their help with design of the laboratory experiments.

iv
v
List of abbreviations SBAC – Sludge based activated carbon
CAC – Commercial activated carbon
GAC – Granular activated carbon
PAC – Powdered activated carbon
BET – Brunauer, Emmet and Teller. Multilayer adsorption theory for specific surface area determination.
BJH – Barrett-Joyner-Halenda. Theory for determination of mesopore size/volume distribution.
COD – Chemical oxygen demand
SCOD – Soluble chemical oxygen demand
TS – Total solids
CEC – Cation exchange capacity

vi
vii
Summary Sustainable sewage sludge management has been a heavily debated topic in Europe for more than a decade. Due to its content of pollutants such as heavy metals, pharmaceuticals and other organic micropollutants, the use of sewage sludge for farmland application is currently banned or restricted in most European countries. Therefore, alternative methods for sludge management are discussed. The production of sludge-based activated carbon (SBAC) from digested sewage sludge is an alternative that would make use of problematic waste — sewage sludge — to produce a potentially valuable adsorbent. In this study, SBAC has been reviewed based on its potential use as an adsorbent for pollutants in wastewater and stormwater. The study consists of a literature review targeting (i) different methods for SBAC production, (ii) the influence of the production methods on the physical and chemical properties of the activated carbons and (iii) the importance of physical and chemical carbon properties on the adsorption of various types of pollutants in aquatic solutions. In connection to the literature study, SBAC was produced in the laboratory using a one-step steam activation method in order to study how various production parameters, such as pyrolysis temperature and steam oxidation, affect the porosity development of SBAC. The porosity of the carbon was assessed using N2 adsorption and desorption isotherms at 77 K. Several combinations of the decisive parameters at various levels were tested and consequently the steam activated SBAC with highest volume of micropores (and highest specific surface area) was selected and tested for the adsorption of chemical oxygen demand (COD) and inorganic nutrients (NH4
+, NO3- and PO4
3-) in wastewater from Källby WWTP in Lund, Sweden. As a reference, the SBAC was compared with a commercial activated carbon (CAC), Norit Sae Super (from Cabot), with a BET surface area of 975 m2/g. The results from existing literature show that SBAC, due to their high inorganic content, in general exhibit low micropore volumes compared to CAC, and therefore also tend to have a lower adsorption potential for small organic substances. However, the larger pores of the SBAC might be advantageous for adsorption of large organic pollutants such as dyes. In addition, the inorganic content of SBAC may contribute to the adsorption of charged and/or hydrophilic substances that are adsorbed through chemical interactions with surface functional groups of the carbon, rather than by physical adsorption to the core carbon structure. With respect to SBAC production, both feedstock type (e.g. biological sludge vs. chemical sludge) and production method (chemical vs. physical activation) have large influence on the properties of the carbon. In general, chemical activation using strong acids or based tend to generate SBAC with higher micropore volumes and abundance of surface functional groups compared to physical activation methods (such as steam activation), although its applicability can be questioned due to the large required input of chemicals. The result from the laboratory studies show that steam activated SBAC with BET surface areas of up to 162 m2/g could be generated using one-step steam activation at 800 °C for 30 minutes,
viii
although activation parameters were not optimized with respect to maximum surface area generation. The adsorption experiments showed that CAC was much better at adsorbing COD in effluent wastewater compared to the steam activated SBAC produced in lab, especially at low carbon concentrations. The experiments further showed that neither CAC nor SBAC was successful in adsorbing large quantities of inorganic nutrients (NH4
+, NO3- and PO4
3-), probably due to lack of charged surface functional groups. Much work remains in order to demonstrate large scale production of SBAC in order to evaluate the economic feasibility of the process. In connection, more work is needed to understand how to maximize the potential of SBAC for the uptake of specific substances such as heavy metals or hydrophilic micropollutants.
ix
Sammanfattning (Swedish) Hållbar hantering av avloppsslam har vart ett mycket debatterat ämne de senaste åren. På grund av sitt relativt höga innehåll av problematiska ämnen såsom tungmetaller, läkemedel och andra organiska mikroföroreningar, är användningen av avloppsslam inom jordbruket för närvarande förbjuden eller begränsad i de flesta europeiska länder. Produktion av slambaserat aktivt kol (SBAC) från rötat avloppsslam är ett alternativ som skulle utnyttja problematiskt avfall - avloppsslam - för att producera en potentiellt värdefull adsorbent. I denna studie har SBAC utvärderats baserat på dess potential att användas för adsorption av föroreningar i avloppsvatten och dagvatten. Studien innehåller en litteraturgenomgång med fokus på (i) olika metoder för produktion av SBAC (ii) produktionsmetodernas påverkan på det aktiva kolets fysikaliska och kemiska egenskaper och (iii) vikten av de fysikaliska och kemiska egenskaperna för adsorption av olika typer av föroreningar. I samband med litteraturstudien producerades SBAC från rötat avloppsslam genom fysisk aktivering med vattenånga, detta för att studera hur olika produktionsparametrar, såsom pyrolystemperatur och närvaron av vattenånga vid pyrolysen, påverkar porositetsutvecklingen hos SBAC. De producerade kolens porositet utvärderades baserat på N2-adsorption vid 77 K. Det producerade SBAC med högst andel mikroporer (högst specifik area) jämfördes med ett kommersiellt aktivt kol för adsorption av kemisk syreförbrukning (COD) och inorganiska näringsämnen (NH4
+, NO3- and PO4
3-) i avloppsvatten från Källby avloppsreningsverk i Lund. Det kommersiella aktiva kolet (Norit Sae Super, Cabot ã) hade en specifik yta på 975 m2/g. Resultaten från befintlig litteratur visar att SBAC, på grund av dess höga oorganiska innehåll, i allmänhet har låg mikroporositet (och specifik yta) jämfört med CAC, och därför tenderar att ha en lägre adsorptionspotential för små organiska föreningar. Samtidigt kan de större porerna hos SBAC vara fördelaktiga för adsorption av stora organiska föroreningar såsom färgämnen. Dessutom kan det oorganiska innehållet i SBAC bidra till adsorption av laddade och/eller hydrofila ämnen som adsorberas genom kemiska interaktioner med funktionella grupper på det aktiva kolets yta, snarare än genom fysisk adsorption till kolets grundstruktur. Med avseende på SBAC-produktion har både valet av råmaterial (t ex bioslam eller kemiskt slam) och produktionsmetod (kemisk eller fysisk aktivering) stor inverkan på kolets egenskaper. Generellt tenderar kemisk aktivering med starka syror eller baser att generera SBAC med högre mikroporositet och närvaro av funktionella grupper, jämfört med fysiska aktiveringsmetoder (såsom aktivering med vattenånga). Kemisk aktivering kan dock ifrågasättas på grund av den stora mängden kemikalier som behöver användas. Resultatet från laboratorieförsöken visar att SBAC med specifika ytor på upp till 162 m2/g kunde genereras med en enstegs-aktivering med vattenånga vid 800 °C i 30 minuter (även om tillverkningen inte optimerats med avseende på att generera maximal specifik ytarea).
x
Adsorptionsexperiment visade att CAC var mycket bättre på att adsorbera COD i avloppsvatten jämfört med SBAC, speciellt vid låga koldoser. Experimenten visade också att varken CAC eller SBAC lyckades adsorbera någon större andel av de oorganiska näringsämnena (NH4
+, NO3- and
PO43-) även vid höga koldoser, vilket tyder på att kolen saknar laddade funktionella grupper på
ytan. Även om adsorptionskapaciteten hos SBAC generellt är lägre till CAC för adsorption av små organiska föroreningar kan detta övervinnas genom att öka SBAC-dosen samt genom att arbeta vidare med optimering av SBAC-egenskaper med lämpliga aktiveringsmetoder. Framför allt behövs det mer arbete kring att utvärdera ekonomin kring framställning av SBAC och huruvida det kan konkurrera med CAC i olika sammanhang.
xi
Contents 1. Introduction .................................................................................................................................... 1
1.1 Aim ............................................................................................................................................ 2 1.2 Method overview ....................................................................................................................... 2 1.3 Limitations ................................................................................................................................. 2
2. Background ..................................................................................................................................... 3 2.1 Introduction to activated carbon ................................................................................................ 3 2.2 Adsorption ................................................................................................................................. 3
2.2.1 Pore size and distribution .................................................................................................. 3 2.2.2 Specific surface area ........................................................................................................... 4 2.2.3 Surface functional groups and surface character ................................................................. 4 2.2.4 Isotherms .......................................................................................................................... 5 2.2.5 Adsorption Kinetics ........................................................................................................... 6 2.2.6 Carbon characterization ..................................................................................................... 7
2.3 Production of activated carbon ................................................................................................... 7 2.3.1 Physical activation ............................................................................................................. 8 2.3.2 Chemical activation ............................................................................................................ 8
2.4 Activated carbon design ............................................................................................................. 9 3. Sludge-based activated carbon (SBAC) .......................................................................................... 11
3.1 Sewage sludge .......................................................................................................................... 11 3.2 Activated carbon from sewage sludge ....................................................................................... 12
3.2.1 Acid washing ................................................................................................................... 13 3.2.2 Sewage sludge blends ....................................................................................................... 13
3.3 Physical activation .................................................................................................................... 14 3.4 Chemical activation .................................................................................................................. 14
3.4.1 Chemical impregnation and consumption ........................................................................ 16 3.5 Summary .................................................................................................................................. 17 3.6 Fate of heavy metals in SBACs ................................................................................................. 17 3.7 Adsorption of specific compounds by SBACs .......................................................................... 17 3.8 Economic considerations ......................................................................................................... 19
4. Production of activated carbon from sewage sludge using one-step activation with steam .............. 21 4.1 Background .............................................................................................................................. 21 4.2 Method .................................................................................................................................... 21
4.2.1 Experimental set-up ......................................................................................................... 21 4.2.2 Experimental procedure .................................................................................................. 23 4.2.3. Carbon characterization ....................................................................................................... 24
xii
4.3 Sample description ................................................................................................................... 24 4.4 Results and discussion .............................................................................................................. 25
5. Adsorption of COD and inorganic nutrients in municipal wastewater effluent using SBAC ........... 31 5.1 Method .................................................................................................................................... 31
5.1.1 Carbon characterization ................................................................................................... 31 5.1.2 Batch adsorption experiments .......................................................................................... 32
5.2 Results ..................................................................................................................................... 32 5.2.1 COD adsorption .............................................................................................................. 32 5.2.2 Adsorption of inorganic nutrients .................................................................................... 34
6. Conclusions ................................................................................................................................... 37 6.1 Literature study ........................................................................................................................ 37
6.1.1 General remarks .............................................................................................................. 37 6.1.2 SBAC potential ................................................................................................................ 37
6.2 Production of SBAC with one-step steam activation ................................................................. 38 6.2.1 Influence of production parameters on carbon characteristics .......................................... 38 6.2.2 Adsorption of COD and inorganic nutrients in wastewater .............................................. 38
7. Future studies ................................................................................................................................ 39 8. References ..................................................................................................................................... 41 9. Appendix ...................................................................................................................................... 45
9.1 Nitrogen gas adsorption and desorption isotherms (at 77 K) ..................................................... 45
1
1. Introduction Vast amounts of sewage sludge are being generated at sewage treatment plants over the world. Sewage sludge is rich in organic matter and nutrients such as phosphorous, nitrogen and potassium, making sludge attractive for use as a sustainable fertilizer. However, sewage sludge may also contain a number of undesired compounds such as heavy metals, pathogens, organic micropollutants, pharmaceutical residues and microplastics. As a result, the use of sewage sludge for farmland application is in many countries banned or restricted. Therefore, alternative methods are needed to utilize the organics and nutrients within the sludge without compromising our environment and health through soil contamination. In the EU, the most popular disposal route for sewage sludge after farmland application (42%) is incineration (27%) (Milieu Ltd et al., 2003). During incineration, the biomass is turned into heat, leaving an inorganic ash behind. Currently, a lot of research is targeting the extraction of phosphorous from sewage sludge ash (e.g. Guedes et al., 2014). However, the inorganic ash has the potential of heavy metal leaching and will require suitable storage (Samolada and Zabaniotou, 2014). A more promising alternative is perhaps sludge pyrolysis, a process where the sludge is heated under oxygen-free conditions, generating bio-oil, pyrolytic gases and a solid fraction — a char — consisting of a porous, carbon-rich skeleton, in which the inorganic material is incorporated. In contrast to sludge ash, sludge char stabilizes the heavy metals, reducing the risk of heavy metal leakage (Samolada and Zabaniotou, 2014). In addition, it has the potential to be used as biochar for soil amendment (Agrafioti et al., 2013) or as activated carbon for adsorption of pollutants in waste streams (Smith et al., 2009). Furthermore, pyrolysis will generate a very stable form of carbon which will lead to carbon sequestration (Samolada and Zabaniotou, 2014). While the use of biochar is an interesting alternative, potential long-term release of heavy metals cannot be excluded. In contrast, the production of adsorbents from sewage sludge has shown great promise for adsorption of certain pollutants, including heavy metals, dyes and other organic substances (Smith et al., 2009), although its use has mostly targeted adsorption of specific molecules from industrial waste streams. However, the use of activated carbon for adsorption in wastewater has recently gotten more attention, targeting the treatment of micropollutants such as pharmaceuticals, which are not sufficiently removed by conventional treatment techniques (Cimbritz et al., 2014). Adsorption using activated carbon is the most used process for removal of micropollutants in wastewater. However, there is a large amount of more environmental friendly and potentially cheaper alternatives (Gupta et al., 2009). Sludge-based activated carbon (SBAC) production is a possible solution that would make use of problematic waste — sewage sludge — to produce a potentially valuable adsorbent for treatment of wastewater and stormwater. Still, a lot of research is needed to understand which adsorbent properties that are most important for adsorption of specific substances, and how these properties are influenced by the choice of production method.

2
This report aims to give an overview of the different techniques currently used for production of SBACs and their potential use for adsorption of pollutants in wastewater and stormwater. In addition, the study includes an attempt to produce SBAC in the laboratory and compare it with a commonly used commercial activated carbon (CAC). 1.1 Aim The aim of the study is to:
1. Review the production of SBACs as well as their potential for adsorption of common pollutants in wastewater and stormwater.
2. Compare different activation methods and the quality/performance of their corresponding SBAC.
3. Produce SBAC in the laboratory and compare its properties and adsorption performance with that of a CAC.
1.2 Method overview A literature study was conducted to review different methods of producing activated carbon from sewage sludge as well as the properties and adsorption performance of the produced SBACs. In connection to the literature study, SBAC was produced in laboratory using pyrolysis and physical activation. Different production parameters (mainly temperature and with/without the presence of steam) were varied based on numbers in existing literature, and the resulting SBACs were characterized based on their specific surface areas and pore size distributions based on N2-adsorption/desorption at 77 K. The SBAC with the highest specific surface area was finally compared with CAC for the adsorption of ammonium, nitrate, phosphate and chemical oxygen demand (COD) in effluent water from Källby WWTP in Lund, Sweden. 1.3 Limitations The aim of this study is to investigate the potential use of sludge based activated carbon for adsorption in wastewater and stormwater systems. It does not include a larger comparison with other potential uses of activated sludge or thorough evaluation of the economic feasibility for SBAC production. Furthermore, the study does not go into the practical details of operating activated carbon systems or carbon characterization. Lastly, the production of SBAC in this study was not optimized for maximal BET surface area generation, or for maximal adsorption of various substances/contaminants.
3
2. Background In order to be able to understand the differences and potentials of activated carbon, one first needs to understand the basics of adsorption and activated carbon production. This chapter therefore aims to give the reader a brief introduction to the adsorption phenomena, activated carbon features and its production. 2.1 Introduction to activated carbon Activated carbon has a structure similar to graphite, the main component consisting of layers of fused hexagonal rings. In contrast to graphite, the layers in activated carbon are disorganized and incomplete, giving rise to a highly porous structure with varying pore sizes. Activated carbon can essentially be produced from organic material using the processes of pyrolysis and activation, which will be discussed in a later chapter. Activated carbon can be divided into two types: Powdered Activated Carbon (PAC) and Granular Activated Carbon (GAC). As the name suggests, the difference between the two types of carbon lies primarily in the size of the carbon particles. There are pros and cons of using the respective form of activated carbon as they enable different modes of operation (This is not a focus of the report). In general, the use of PAC enables a higher proportion of the adsorption potential to be used compared due to kinetic mass transfer restrictions in the larger particles of the GAC (more of this in section 2.2.5). On the other hand, the use of GAC will enable design of more easily operated systems. 2.2 Adsorption Adsorption is the accumulation of substrates (adsorbate) at a surface or interface (adsorbent) and occur at the interface between two different states of matter, either gas-liquid, liquid-liquid, liquid-solid or solid-gas. Most often, adsorption is referred to as the adsorption of substances from gas and liquid phases onto a solid surface. Solid surfaces contain sites of high energy where substances may adsorb exothermically (releasing energy) or desorb endothermically (through an uptake of energy). Within this report, focus lies on the use of activated carbon for adsorption in aqueous solutions, such as for the treatment of wastewater or stormwater. Adsorption is divided into physical adsorption (physisorption) and chemical adsorption (chemisorption). Physisorption occurs due to weak intermolecular forces (so called van der Waals forces) between the adsorbate and adsorbent. Here, the textural characteristics (pore size and structure) play an important role. Chemisorption on the other hand, occur due to chemical bonding (such as hydrogen bonding or ionic bonding) between the adsorbate and surface sites of the adsorbent. The bonding energy of chemisorption is higher than for physisorption, although the boundary between the two is somewhat fluid (Worch, 2012). Often, the adsorption onto activated carbon is a combination of physisorption and chemisorption. Their interaction will be further explained in the following subchapters. 2.2.1 Pore size and distribution Pore size and pore size distribution are important concepts as the size of the pores affect the mass transfer of substrate as well as the strength (and extent) of adsorption. Pore sizes are separated
4
into three types depending on their size: micropores, mesopores and macropores. Their respective sizes are shown in Table 1 based on (Marsh and Rodriguez-Reinoso, 2006). Although this classification is the most commonly used in the literature, it should be noted that several other classifications with slightly different size spans are also sometimes used. Table 1. Pore size definition according to (Marsh and Rodriguez-Reinoso, 2006).
Name Pore size (nm)* Pore size (Å)** Microporosity < 2.0 < 20 Narrow microporosity < 0.7 < 7 Mesoporosity 2-50 20-500 Macroporosity > 50 > 500
*1 nm=10-9 m **1 Å=10-10 m In general, macropores and mesopores are responsible for the mass transfer of substrate to the interior of the activated carbon, whereas the micropores are responsible for most of the adsorption (Worch, 2012). The size of the adsorbate in relation to the pore size is important for the strength of adsorption and for size exclusion. The larger the adsorbate, the more contact points (and van der Waal interactions) between the adsorbate and the pore walls and the stronger the adsorption (physisorption), up until the point where the adsorbate will no longer fit in the pores. This so called size exclusion of particles is important to consider for the adsorption of large molecules, such as large organic molecules (Li et al., 2002). In aqueous systems, size exclusion may occur when the pore width is less than 1.7 times the second largest dimension of the adsorbate (Kasaoka et al., 1987) or 1.3-1.8 times the kinetic diameter of the adsorbate (Li et al. 2002). 2.2.2 Specific surface area Since adsorption occurs onto surfaces, carbons with larger surface areas should be able to adsorb more substrate. Therefore, an estimation the surface areas of adsorbents can give an indication of the overall adsorption capacity. There is also a strong correlation between surface area and the micropore volume, since small pores have a larger area to volume ratio. Usually, there is a separation between the internal and external surface areas. The external surface area is important for the mass transfer of substrate between the bulk and the adsorbent whereas the internal surface area is where most of the adsorption occur (Worch, 2012). 2.2.3 Surface functional groups and surface character While textural characteristics of activated carbon are very important for the physisorption of substrate, the surface characteristics have large impact on the chemical interaction (chemisorption) between the adsorbent/adsorbate. Activated carbon surfaces differ from each other through the presence of various elements other than carbon (referred to as heteroatoms). These include for example H, O, N and S, in addition to a large variety of inorganic complexes (ash content). Heteroatoms may bind to the edges of the defective graphene layers of the carbon, or within the hexagon rings (except for H, which may only bind to edges) (Marsh and Rodriguez-Reinoso, 2006).
5
Heteroatoms, particularly edge bonded oxygen form so-called oxygen functional groups that have large impact on the surface characteristics of activated carbon by imposing changes in surface polarity, charge, hydrophobicity, acidity/basicity and its subsequent interaction with adsorbents (Aktaş and Çeçen, 2006; Marsh and Rodriguez-Reinoso, 2006). The most common oxygen surface functional groups include carboxyl, carboxyl anhydride, lactone, phenol, carbonyl, ether, pyrone and chromene (Marsh and Rodriguez-Reinoso, 2006). These are often separated depending on their contribution to the acidic or basic character of the carbon surface. Surface acidity is ascribed to acidic surface functional groups including carboxylic acid, carboxylic anhydride, lactone and phenolic hydroxyl. Surface basicity on the other hand is mainly related to the absence of acidic functional groups as well as the presence of delocalized p-electrons in the defective graphene layers of the activated carbon (Montes-Morán et al., 2004). Some basicity, however, has also been ascribed to the oxygen functional groups of chromene, ketones and pyrones (Montes-Morán et al., 2004; Shafeeyan et al., 2010), although this is still debated (Worch, 2012). The basic or acidic character of the surface strongly influence the adsorption of charged groups of molecules and atoms. Acidic functional groups will protolyze at normal pH values, forming negatively charged groups where positive groups of adsorbates can bind. Similarly, positive sites may be formed by basic functionality. Indeed, many studies have shown enhanced uptake of cations from aquatic solutions when increasing the amount of acidic surface functional groups at the carbon surface (Yin et al., 2007). The improved uptake of negative ions by activated carbons with increased basic character has also been shown (Iida et al., 2013), although this is less studied than the uptake of cations. In general, the literature shows that the presence of acidic functional groups facilitate uptake of cations (Marsh and Rodriguez-Reinoso, 2006), whereas their removal enhance the uptake of organics (Li et al., 2002). It is important to note that the increased organic removal is not ascribed to increased basicity but to the reduced polarity (and reduced hydrophilicity) when surface oxygen functional groups are removed. It is the general thought that polar surfaces will interact with water molecules that (i) compete with adsorbate for adsorption sites and (ii) form water clusters that may further block the access to micropores within the carbon (Çeçen and Aktaş, 2011; Li et al., 2002) 2.2.4 Isotherms Characterization of activated carbon porosity and surface is not enough to be able to predict the actual adsorption behavior (although it can provide hints). The actual adsorption depends on adsorbent/adsorbate interactions and is affected by a large number of factors, including the physical and chemical characteristics of the adsorbent and adsorbate, the adsorbate matrix, pH and temperature (Çeçen and Aktaş, 2011). This large complexity makes it necessary to evaluate the adsorption performance for the target substrate/substrates in its natural matrix. The adsorption potential of activated carbon is commonly evaluated with isotherms, describing the adsorbed amount of the target substance at adsorption equilibrium (when adsorption is equal
6
to desorption). Here, the adsorbed amount Qeq can be described as a function of the equilibrium adsorbate concentration Ceq and the temperature T (Çeçen and Aktaş, 2011):
!"# = %&'"#, )*(1) Keeping the temperature constant gives us the following expression known as the adsorption isotherm:
!"# = %&'"#*, ) = /0123413(2) Depending on the characteristics of the adsorbent - adsorbate and their interaction, the isotherm will appear different. Many attempts have been made to adapt mathematical expressions for the isotherms using a set of parameters. Two commonly used isotherms functions are described by Langmuir and Freundlich (Çeçen and Aktaş, 2011). Both expressions use two parameters that will determine the shape of the isotherm. These parameters can be used to compare the adsorption capacity of different activated carbons in standard or specific solutions. The Langmuir isotherm expression is described with the following equation:
!"# =!67'"#1 + 7'"#,
(3) where Qm and b are isotherm parameters. The Langmuir isotherm is based on assumption of monolayer coverage and energetically homogenous sites. Normally, this isotherm cannot describe adsorption in aqueous solutions (Worch, 2012). Instead, the Freundlich isotherm is more commonly used:
: = ;/"#</>(4) where K and n are adsorption parameters. The Freundlich isotherm cannot correctly describe the linear adsorption range at low concentrations or the saturation effect at high concentrations. Still, it is widely used to describe adsorption in aqueous solutions, also for multisolute conditions (in solutions with more than one substance) (Worch, 2012). Qualitatively, the K-parameter describes the strength of adsorption, whereas the n-parameter is related to the energetic heterogeneity of the adsorbent sites and affects the curvature of the isotherm. 2.2.5 Adsorption Kinetics In normal adsorption applications, the adsorption will rarely have time to reach the equilibrium expressed in the isotherms. This is because the system is limited by the mass transfer rate of substrate from the bulk solution to the adsorption sites of the adsorbent. The mass transfer processes can be divided into three steps (Aktaş and Çeçen, 2006):
7
1. Advection – The transport of substrate from the bulk solution to the boundary layer of liquid surrounding the adsorbent particle.
2. External diffusion – The transport of substrate through the stationary layer of water surrounding the carbon particle
3. Internal (intraparticle) diffusion – The transport of substrate within the carbon pores, either along the carbon surface (surface diffusion) or through the pores (pore diffusion). The rate of diffusion depends on pore size and structure.
Within this report, the focus lies on comparing the maximum adsorption capacities of activated carbon for various types of substrate using isotherms. In many real applications however, favored kinetics can be equally important as the maximum adsorption potential. This is especially the case when using GAC-filters, which should be evaluated based on substrate breakthrough rather than on equilibrium isotherms (Aktaş and Çeçen, 2006). 2.2.6 Carbon characterization A large number of methods can be used to assess activated carbon characteristics. However, a thorough and complete characterization of activated carbon would require extensive work and be economically unrealistic (Marsh and Rodriguez-Reinoso, 2006). Some of the most commonly used methods are mentioned below without describing the specific methodology of each method. Commonly, activated carbon porosity is assessed based on N2-gas adsorption and desorption at 77 K, although other gases, including argon and carbon dioxide are sometimes used. Based on the shape of the isotherms, various mathematical models have been developed in order to be able to estimate parameters such as the volume and distribution of micropores, mesopores and macropores as well as the specific surface area. In order to determine the micropore volume, the t-plot method (Harkins and Jura, 1944) is commonly applied, while mesopore and macropore volume is estimated using Barrett-Joyner-Halenda (BJH) theory (Barrett et al., 1951). The specific surface area is determined based on Brunauer-Emmet-Teller (BET) (Brunauer et al., 1938) and is often referred to as the BET surface area. Surface chemistry of activated carbon can be assessed with different techniques. For example, Boehm, (1966) developed a method of step-wise titration to quantify the amount of acidic and basic functional groups of different strength. Specific functional groups can be detected using for example diffusive reflectance spectroscopy, temperature programmed desorption, X-ray photoelectron spectroscopy or fourier transform infrared spectroscopy (Marsh and Rodriguez-Reinoso, 2006; Shafeeyan et al., 2010). 2.3 Production of activated carbon The production of activated carbon essentially consists of two steps: pyrolysis and activation. Pyrolysis involves the heating of the carbonaceous material to temperatures between about 300-1000°C under oxygen-free conditions, typically using a flow of nitrogen gas. During this treatment, non-carbon elements are released from the precursor as volatile gaseous products. In addition, free elementary carbon atoms are grouped together in irregular crystalline structures, consisting of defective, disoriented graphene layers (Marsh and Rodríguez-Reinoso, 2006).
8
During pyrolysis a porous carbon structure is formed. However, the pore structure is normally not ideal for adsorption; some pores might be unavailable for adsorption through size exclusion or pore blocking effects. Therefore, an activation method is commonly applied after pyrolysis, aiming to improve the porosity by opening up and widening existing pores to allow for better mass transfer and allowing larger molecules access to the interior of the carbon structure (Marsh and Rodriguez-Reinoso, 2006). Activation is separated into the two categories of physical and chemical activation. 2.3.1 Physical activation During physical activation, the pyrolyzed material (often referred to as char) is exposed to a mild oxidative gas, commonly water vapor, carbon dioxide (CO2) or a mixture of these at temperatures between 800-1000°C (Marsh and Rodriguez-Reinoso, 2006). Physical activation is thought to improve the porosity of the char through three main mechanisms (Marsh and Rodriguez-Reinoso, 2006); (i) opening of inaccessible pores (ii) creation of new pores by selective gasification of certain structural components and (iii) widening of existing pores. Physical activation not only leads to the production of gases, but also to the formation of surface functional groups by chemical binding of oxygen or hydrogen to carbon atoms (Marsh and Rodriguez-Reinoso, 2006). Porosity development As activation proceeds, carbon is successively removed from the char, decreasing the process yield. While this improves the porosity at first, excessive oxidation will destroy the carbon skeleton and ultimately leave only ash. There is therefore an optimum degree of oxidation (burn-off) for maximization of the porosity. This optimum is rarely above 40-50% (Marsh and Rodriguez-Reinoso, 2006). 2.3.2 Chemical activation Chemical activation is usually a single-step process where the precursor is exposed to chemicals (such as KOH, H2SO4, H3PO4 and ZnCl2) and then pyrolyzed at temperatures around 300-800°C. Essentially, carbonization and activation happen simultaneously. The mechanisms of activation using chemicals differ from that of physical activation, and also differ between chemicals. ZnCl2, H3PO4 and other acids have a dehydrating effect on the activation, removing oxygen and hydrogen from the carbon structure without removing carbon to the same extent. This dehydrating step reduces the amount of carbon volatilization and increases the carbonization yield compared to physical activation (Marsh and Rodriguez-Reinoso, 2006). For activation using alkali hydroxides such as NaOH and KOH, the main mechanisms include the formation of intercalation compounds consisting of carbon and K2O, which infiltrates to the inside of the carbon. During high temperatures, the potassium is reduced to metallic K-atoms with the formation steam and CO2, adding to the development of porosity as in physical activation. Furthermore, K-vapors are proposed to add to porosity development by widening the distance between adjacent carbon sheets (Marsh and Rodriguez-Reinoso, 2006)
9
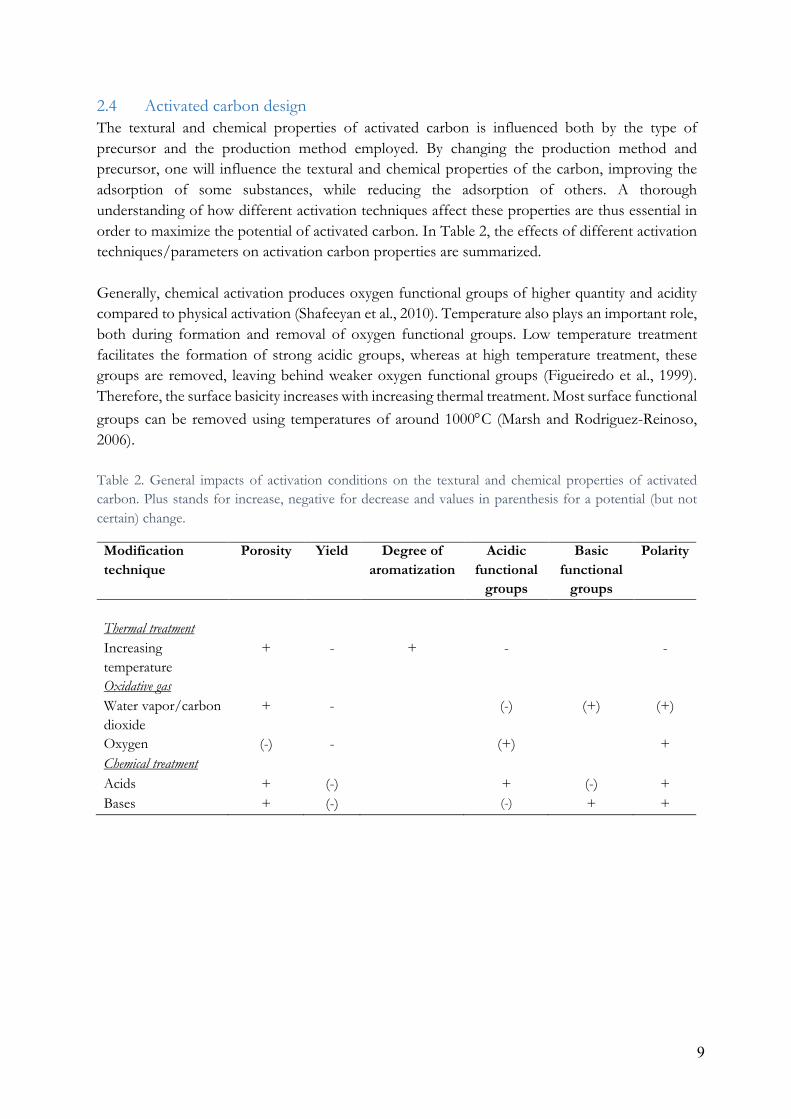
2.4 Activated carbon design The textural and chemical properties of activated carbon is influenced both by the type of precursor and the production method employed. By changing the production method and precursor, one will influence the textural and chemical properties of the carbon, improving the adsorption of some substances, while reducing the adsorption of others. A thorough understanding of how different activation techniques affect these properties are thus essential in order to maximize the potential of activated carbon. In Table 2, the effects of different activation techniques/parameters on activation carbon properties are summarized. Generally, chemical activation produces oxygen functional groups of higher quantity and acidity compared to physical activation (Shafeeyan et al., 2010). Temperature also plays an important role, both during formation and removal of oxygen functional groups. Low temperature treatment facilitates the formation of strong acidic groups, whereas at high temperature treatment, these groups are removed, leaving behind weaker oxygen functional groups (Figueiredo et al., 1999). Therefore, the surface basicity increases with increasing thermal treatment. Most surface functional groups can be removed using temperatures of around 1000°C (Marsh and Rodriguez-Reinoso, 2006). Table 2. General impacts of activation conditions on the textural and chemical properties of activated carbon. Plus stands for increase, negative for decrease and values in parenthesis for a potential (but not certain) change.
Modification technique
Porosity Yield Degree of aromatization
Acidic functional
groups
Basic functional
groups
Polarity
Thermal treatment Increasing temperature
+ - + -
-
Oxidative gas Water vapor/carbon dioxide
+ -
(-) (+) (+)
Oxygen (-) -
(+)
+ Chemical treatment Acids + (-)
+ (-) +
Bases + (-)
(-) + +

10
11
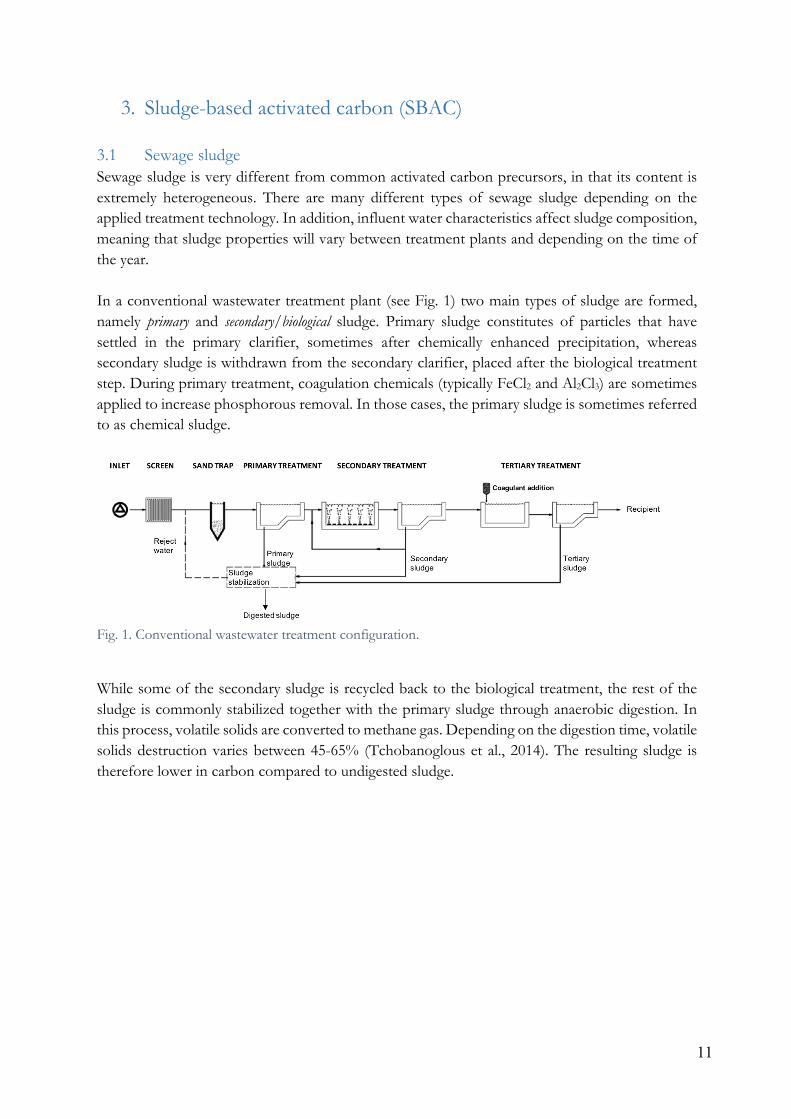
3. Sludge-based activated carbon (SBAC) 3.1 Sewage sludge Sewage sludge is very different from common activated carbon precursors, in that its content is extremely heterogeneous. There are many different types of sewage sludge depending on the applied treatment technology. In addition, influent water characteristics affect sludge composition, meaning that sludge properties will vary between treatment plants and depending on the time of the year. In a conventional wastewater treatment plant (see Fig. 1) two main types of sludge are formed, namely primary and secondary/biological sludge. Primary sludge constitutes of particles that have settled in the primary clarifier, sometimes after chemically enhanced precipitation, whereas secondary sludge is withdrawn from the secondary clarifier, placed after the biological treatment step. During primary treatment, coagulation chemicals (typically FeCl2 and Al2Cl3) are sometimes applied to increase phosphorous removal. In those cases, the primary sludge is sometimes referred to as chemical sludge.
Fig. 1. Conventional wastewater treatment configuration.
While some of the secondary sludge is recycled back to the biological treatment, the rest of the sludge is commonly stabilized together with the primary sludge through anaerobic digestion. In this process, volatile solids are converted to methane gas. Depending on the digestion time, volatile solids destruction varies between 45-65% (Tchobanoglous et al., 2014). The resulting sludge is therefore lower in carbon compared to undigested sludge.

12
In Table 3, carbon and ash content of typical activated carbon precursors are presented. The values can be compared with typical values for sewage sludge, see Table 4.
Table 3. Properties of common activated carbon precursors. Adapted from (Inglezakis and Poulopoulos, 2006).
Raw material Total Carbon (wt%)
Ash content (wt%)
Volatiles (wt%)
Wood 40-45 0.3-1.1 55-60 Nut shells 40-45 - 55-60 Lignite 55-70 5-6 25-40 Coal 65-95 2-15 5-30 Petroleum coke 70-85 0.5-0.7 15-20
Table 4. Carbon content and ash content generated by different studies and different sludge types. Volatile content was not given in in any of the cases.
Sludge type Total carbon (wt%)
Ash content (wt%)
Reference
Biological sludge 31.4 31.2 (Lillo-Ródenas et al., 2008)
Biological sludge 36.5 30.0 (Tay et al., 2001) Anaerobically digested biological sludge
32.0 34.6 (Tay et al., 2001)
Dewatered, raw 41.0 20.4 (Mohamed et al., 2011)
Viscous liquid sludge 39.4 22 (Rio et al., 2006) As can be seen, the carbon content is lower in sewage sludge compared to the common precursors while the ash content is much higher. As will be discussed further, this has large implications for the characteristics of the activated carbon. 3.2 Activated carbon from sewage sludge Due to the high inorganic content of sewage sludge, the total ash content of SBACs is usually very high. Furthermore, the porosity of the inorganic part is most often very low, causing SBACs to end up with BET surface areas and general adsorption capacity below corresponding values for CACs (Smith et al., 2009). With this being said, the unique content of the inorganic parts sometimes seem to contribute to the adsorption of certain compounds by changing the surface chemistry of the carbon (Smith et al., 2009). In addition, while the ash contribution to activated carbon porosity is generally considered non existing, Lillo-Ródenas et al. (2008) found that the inorganic part of SBAC activated with NaOH indeed has a positive contribution to porosity, with a BET surface area as
13
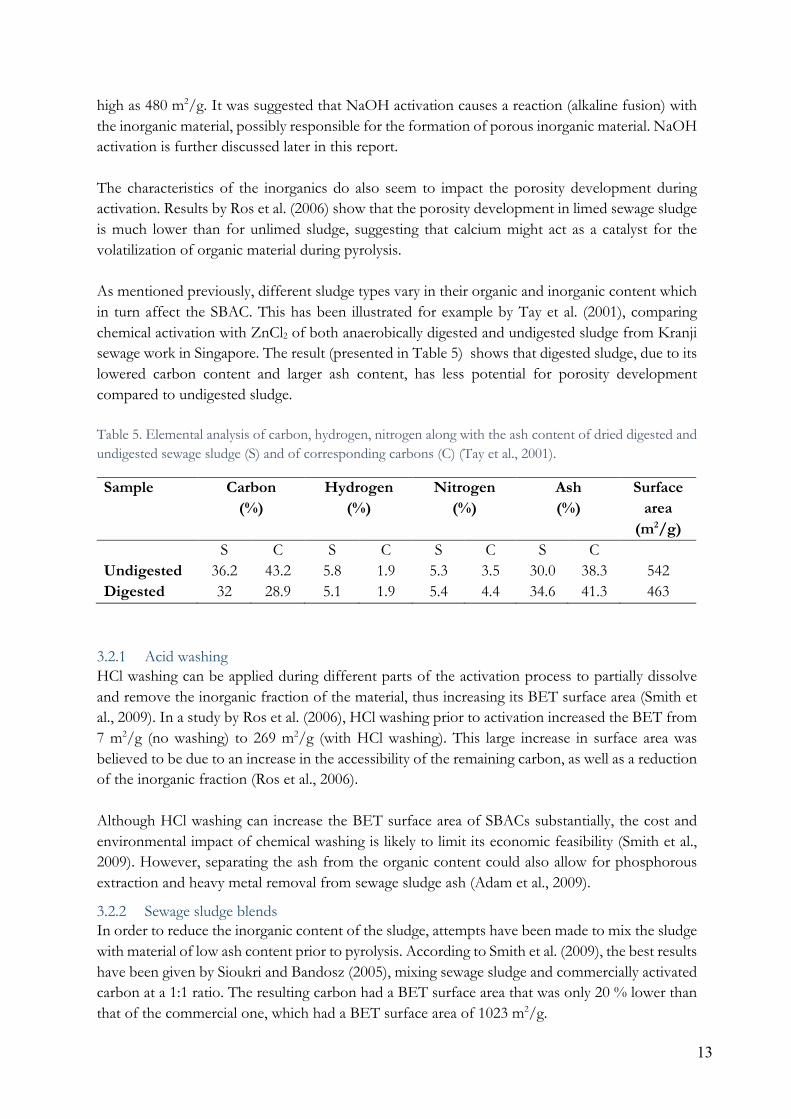
high as 480 m2/g. It was suggested that NaOH activation causes a reaction (alkaline fusion) with the inorganic material, possibly responsible for the formation of porous inorganic material. NaOH activation is further discussed later in this report. The characteristics of the inorganics do also seem to impact the porosity development during activation. Results by Ros et al. (2006) show that the porosity development in limed sewage sludge is much lower than for unlimed sludge, suggesting that calcium might act as a catalyst for the volatilization of organic material during pyrolysis. As mentioned previously, different sludge types vary in their organic and inorganic content which in turn affect the SBAC. This has been illustrated for example by Tay et al. (2001), comparing chemical activation with ZnCl2 of both anaerobically digested and undigested sludge from Kranji sewage work in Singapore. The result (presented in Table 5) shows that digested sludge, due to its lowered carbon content and larger ash content, has less potential for porosity development compared to undigested sludge. Table 5. Elemental analysis of carbon, hydrogen, nitrogen along with the ash content of dried digested and undigested sewage sludge (S) and of corresponding carbons (C) (Tay et al., 2001).
Sample Carbon (%)
Hydrogen (%)
Nitrogen (%)
Ash (%)
Surface area
(m2/g) S C S C S C S C Undigested 36.2 43.2 5.8 1.9 5.3 3.5 30.0 38.3 542 Digested 32 28.9 5.1 1.9 5.4 4.4 34.6 41.3 463
3.2.1 Acid washing HCl washing can be applied during different parts of the activation process to partially dissolve and remove the inorganic fraction of the material, thus increasing its BET surface area (Smith et al., 2009). In a study by Ros et al. (2006), HCl washing prior to activation increased the BET from 7 m2/g (no washing) to 269 m2/g (with HCl washing). This large increase in surface area was believed to be due to an increase in the accessibility of the remaining carbon, as well as a reduction of the inorganic fraction (Ros et al., 2006). Although HCl washing can increase the BET surface area of SBACs substantially, the cost and environmental impact of chemical washing is likely to limit its economic feasibility (Smith et al., 2009). However, separating the ash from the organic content could also allow for phosphorous extraction and heavy metal removal from sewage sludge ash (Adam et al., 2009).
3.2.2 Sewage sludge blends In order to reduce the inorganic content of the sludge, attempts have been made to mix the sludge with material of low ash content prior to pyrolysis. According to Smith et al. (2009), the best results have been given by Sioukri and Bandosz (2005), mixing sewage sludge and commercially activated carbon at a 1:1 ratio. The resulting carbon had a BET surface area that was only 20 % lower than that of the commercial one, which had a BET surface area of 1023 m2/g.
14
3.3 Physical activation Based on the review by Smith et al. (2009), SBACs with BET surface areas in the range of 7-269 m2/g have been generated with physical activation. The values are low compared to commercial activated carbons with areas usually exceeding 1000 m2/g and are believed to be caused by the large ash contents of the sludge (e.g. 39.1 % (Kojima et al., 2002) and 22 % (Rio et al., 2006). The large variations in surface area are probably not only to differences in activating conditions, but also due to variations in sludge characteristics (Smith et al., 2009). Overall, using steam as gasifying agent generated higher BET surface areas compared the use of air or CO2. The best results given by physical activation without chemical treatment were attained by (Rio et al., 2006) . Using response surface methodology, an optimization of parameters resulted in an SBAC with a BET surface area of 226 m2/g for a yield of 22%. The SBAC had 2-5 times lower adsorption of phenol than two commercial carbons with exhibiting BET surface areas ranging between 1180 and 1845 m2/g. Uptake of dyes was however better for the SBAC, the authors suggesting due to size exclusion of these large molecules from the very narrow micropores of the commercial carbons (Rio et al., 2006). 3.4 Chemical activation Chemical activation is the most popular method for SBAC production, generating carbons with BET surface areas ranging between 26-1686 m2/g. A wide range of chemicals have been used, including NaOH, KOH, K2S, H2SO4, H3PO4, HNO3 and ZnCl2. In general, higher BET surface areas and higher yields have been achieved with chemical activation compared to physical activation. One reason for this is that lower temperatures can be used, resulting in a higher yield (Hadi et al., 2015). In addition, the chemicals may have dehydrating effects, reducing the amount of carbon lost as volatiles during pyrolysis (Ahmadpour and Do, 1996). The activation mechanisms vary between different chemicals, resulting in different characteristics of the produced SBACs in terms of their porosity and surface functionality. In this chapter, the most commonly used chemicals will be discussed shortly in terms of their use and performance for SBAC production and the best results attained so far in terms of BET surface area will be presented. ZnCl2
Zink chloride (ZnCl2) is one of the most commonly used chemicals for SBAC production. It is believed to have a dehydrating effect, reducing tar formation and increasing aromatization of the carbon skeleton. In addition, ZnCl2 molecules that are entrapped within the precursor during activation are thought to act as templates for porosity, generating micropores as they are removed during activation or by the following acid-washing step (Marsh and Rodriguez-Reinoso, 2006). The best result was achieved by Chen et al. (2002), producing a SBAC with a BET surface area of 647 m2/g from anaerobically digested sludge. The use of ZnCl2 have been questioned due to its environmental impact (Smith et al., 2009), and Zn leaching from Zn-activated SBAC is a likely outcome in case the acid washing is insufficient (Chen et al., 2002).
15
H3PO4
Phosphoric acid (H3PO4) is a commonly used chemical for SBAC activation. The mechanism of activation is similar to that of ZnCl2: it has a dehydrating effect and acts as a template for porosity formation. However, H3PO4 forms a large variety of molecules of different size in water. The template molecules thus generate a larger variation of pore sizes in the microporous range compared to ZnCl2 (Marsh and Rodriguez-Reinoso, 2006). While H3PO4 is considered better than ZnCl2 in terms of the environmental impact (Smith et al., 2009), the maximum BET attained of 289 m2/g (Zhang et al., 2005) is slightly lower. H2SO4
Sulphuric acid has been used for activation in some studies. Although less popular compared to H3PO4 and ZnCl2, it is more environmental friendly than ZnCl2, and has generated higher BET surface areas (up to 408 m2/g (Zhang et al., 2005)) compared to activation with H3PO4. KOH and NaOH Activation using KOH and NaOH has, by far, generated the best SBACs with BET surface areas of 1686 m2/g and 1224 m2/g, respectively (Ros et al., 2006). In this study, the surface area was highly dependent on the impregnation methodology. For example, dry physical mixing gave better results than wet impregnation. As explained earlier, KOH and NaOH have different means of activation compared to acids, including reaction with the carbon atom and intercalation of metallic K and Na. However, this mechanism does not alone seem to be responsible for the large difference seen in the results. In a study by (Lillo-Ródenas et al., 2008), the inorganic part (ash) of the KOH-activated SBACs had a surface area of 408 m2/g. It thus seems that KOH activation, as opposed to other activation methods, can develop porosity also within the inorganic part of the sludge. The ash consisted mainly of porous silica and the mechanism proposed for the porosity development was alkaline fusion. While KOH- activation seems to be the most promising method for producing SBACs with high surface areas, it may also result in the formation of cyanide (Lillo-Ródenas et al., 2008; Fuente et al., 2010). It was first believed the cyanide originated from nitrous gas used during activation, but results by Fuente et al. (2010) suggest that it originates from nitrogen present in the precursor. Thus, it was suggested that KOH activation should be conducted on precursors with low nitrogen content only.
16
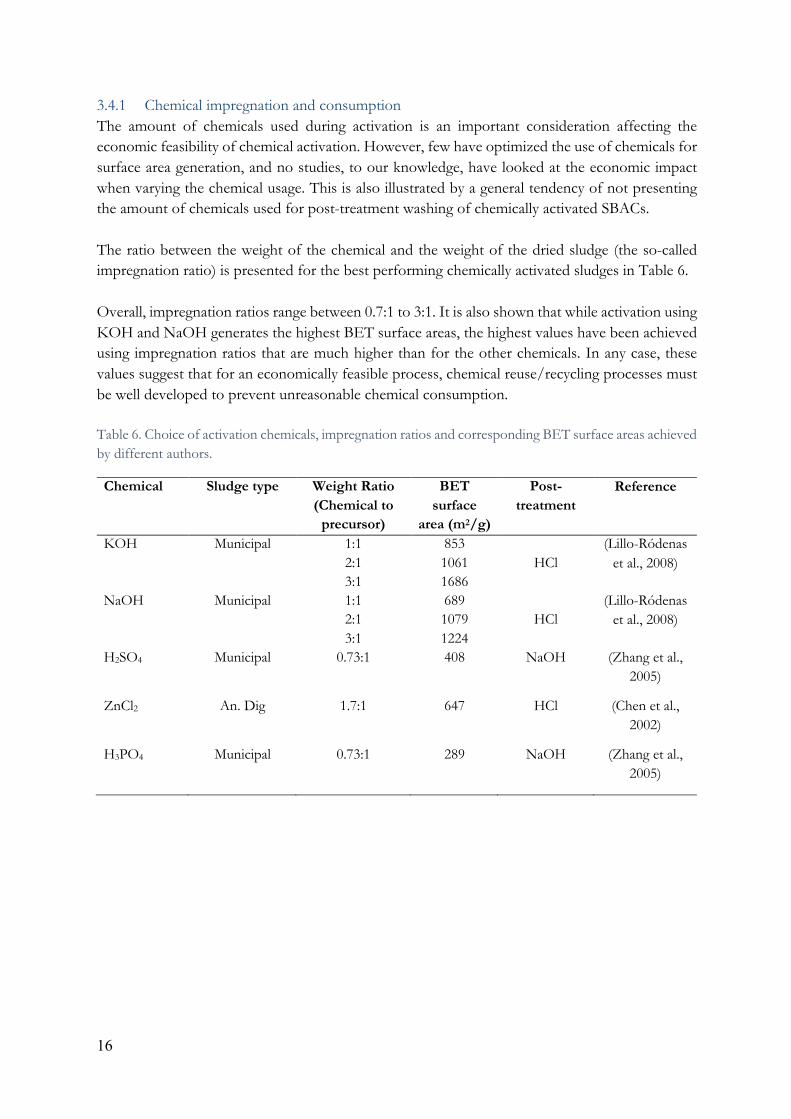
3.4.1 Chemical impregnation and consumption The amount of chemicals used during activation is an important consideration affecting the economic feasibility of chemical activation. However, few have optimized the use of chemicals for surface area generation, and no studies, to our knowledge, have looked at the economic impact when varying the chemical usage. This is also illustrated by a general tendency of not presenting the amount of chemicals used for post-treatment washing of chemically activated SBACs. The ratio between the weight of the chemical and the weight of the dried sludge (the so-called impregnation ratio) is presented for the best performing chemically activated sludges in Table 6. Overall, impregnation ratios range between 0.7:1 to 3:1. It is also shown that while activation using KOH and NaOH generates the highest BET surface areas, the highest values have been achieved using impregnation ratios that are much higher than for the other chemicals. In any case, these values suggest that for an economically feasible process, chemical reuse/recycling processes must be well developed to prevent unreasonable chemical consumption. Table 6. Choice of activation chemicals, impregnation ratios and corresponding BET surface areas achieved by different authors.
Chemical Sludge type Weight Ratio (Chemical to
precursor)
BET surface
area (m2/g)
Post-treatment
Reference
KOH Municipal 1:1 2:1 3:1
853 1061 1686
HCl
(Lillo-Ródenas et al., 2008)
NaOH Municipal 1:1 2:1 3:1
689 1079 1224
HCl
(Lillo-Ródenas et al., 2008)
H2SO4 Municipal 0.73:1 408 NaOH (Zhang et al., 2005)
ZnCl2 An. Dig 1.7:1 647 HCl (Chen et al., 2002)
H3PO4 Municipal 0.73:1 289 NaOH (Zhang et al., 2005)
17
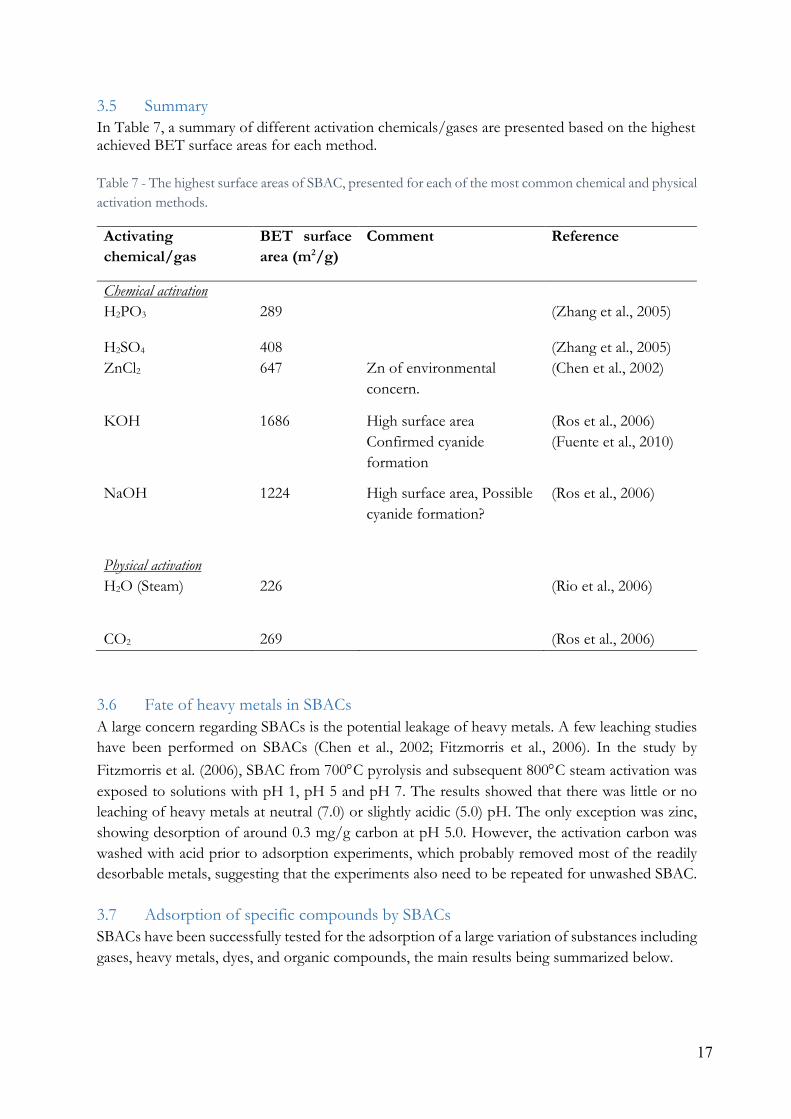
3.5 Summary In Table 7, a summary of different activation chemicals/gases are presented based on the highest achieved BET surface areas for each method. Table 7 - The highest surface areas of SBAC, presented for each of the most common chemical and physical activation methods.
Activating chemical/gas
BET surface area (m2/g)
Comment Reference
Chemical activation H2PO3 289 (Zhang et al., 2005)
H2SO4 408 (Zhang et al., 2005) ZnCl2 647 Zn of environmental
concern. (Chen et al., 2002)
KOH 1686 High surface area Confirmed cyanide formation
(Ros et al., 2006) (Fuente et al., 2010)
NaOH 1224 High surface area, Possible cyanide formation?
(Ros et al., 2006)
Physical activation H2O (Steam) 226 (Rio et al., 2006)
CO2 269 (Ros et al., 2006) 3.6 Fate of heavy metals in SBACs A large concern regarding SBACs is the potential leakage of heavy metals. A few leaching studies have been performed on SBACs (Chen et al., 2002; Fitzmorris et al., 2006). In the study by Fitzmorris et al. (2006), SBAC from 700°C pyrolysis and subsequent 800°C steam activation was exposed to solutions with pH 1, pH 5 and pH 7. The results showed that there was little or no leaching of heavy metals at neutral (7.0) or slightly acidic (5.0) pH. The only exception was zinc, showing desorption of around 0.3 mg/g carbon at pH 5.0. However, the activation carbon was washed with acid prior to adsorption experiments, which probably removed most of the readily desorbable metals, suggesting that the experiments also need to be repeated for unwashed SBAC.
3.7 Adsorption of specific compounds by SBACs SBACs have been successfully tested for the adsorption of a large variation of substances including gases, heavy metals, dyes, and organic compounds, the main results being summarized below.
18
Metal ion uptake The adsorption of metal ions onto SBACs have been tested in several studies, showing that chemically activated SBACs are good adsorbents for metal ions, with uptakes that sometimes largely exceed that of the commercial carbons used for comparison (Smith et al., 2009). The mechanism has been ascribed to the presence of acidic functional groups as well as the cationic exchange capacity (CEC) of the inorganic fraction, although the contribution of the latter is not fully understood (Smith et al., 2009). In any case, it seems that the surface chemistry and inorganic matter content is more important than surface area (and micropore volume) for metal ion adsorption. While chemically activated carbons are generally better at adsorption of metal ions due to their higher CEC, physically activated carbons might also be able to show substantial uptake of heavy metals. For example attained Cu2+ removal of 146.9 mg/g using steam activated SBAC. Here, the large uptake was ascribed to the fact that the sludge had been limed, so that the calcium content would allow for a high CEC in the SBAC. Dyes Due to their large molecular sizes, the adsorption of dyes is affected by effects of size exclusion. For example, Martin et al. (2003) compared adsorption of four different dyes onto a H2SO4-activated SBAC and a commercial activated carbon respectively. The results show that the three largest dyes were adsorbed to a higher extent by the SBAC (with the highest mesopore volume and widest pore size distribution), while the smallest one was better adsorbed onto the commercial carbon (with the highest volume of micropores). Organics Uptake of organics by SBACs is mainly confined to phenol adsorption (Smith et al., 2009). However, both Yu and Zhong (2006) and Pan et al. (2011) have looked at adsorption of natural organic matter in wastewater. The results from Yu and Zhong (2006) show that SBACs can perform better than CAC in both static (batch) and dynamic (breakthrough behavior of granular activated carbon columns) adsorption tests, even though the CAC exhibited a surface area around 10 times larger than for the SBACs. The higher uptake was ascribed to the larger mesopore and macropore volumes of the SBACs compared to the CAC. This was further supported in the study by Pan et al. (2011), investigating the uptake of organics of different sizes (as soluble chemical oxygen demand (SCOD)) onto SBACs prepared from biological sludge, chemical sludge and hybrid sludge (mixture of biological and chemical sludge). Their results show that the largest molecules of the SCOD (45 µm-30 kDalton) were better adsorbed by all the SBACs, probably due to their larger meso-and macroporosity. Surprisingly, also the smallest molecules (1 kDalton-30 kDalton) were better adsorbed by the chemical and hybrid sludge, which was ascribed to the high presence of aluminium and iron oxides (used as precipitation chemicals), potentially increasing uptake of hydrophilic organic substances through ion exchange.
19
Pharmaceuticals The removal of pharmaceuticals from wastewater has received large interest over the last couple of years as they have been showed to cause potential harm to receiving ecosystems (Larsson et al., 1999). To our knowledge, no published studies have looked closely into the adsorption of pharmaceuticals onto SBACs, although a few more general experiments have been made. In a report by Baresel et al. (2017), the adsorption of 25 different pharmaceuticals onto five different SBACs and a reference CAC was investigated through batch adsorption experiments. The results show that the best SBAC allowed around 10-20 % reduction of most pharmaceutical compared to around 90-95 % reduction for the reference CAC, using the same carbon concentrations. Since no activation (only pyrolysis) and no optimization of the SBAC production had been made targeting pharmaceutical removal, there is likely a large room for improvement of the carbon performance. The characteristics of the best performing SBAC was unfortunately not presented in the report. The adsorption of pharmaceuticals onto CAC has also been studied by for example Rakić et al. (2015), who looked at the adsorption of four different pharmaceuticals (Salicylic acid, Acetylsalicylic acid, Diclofenac-Na and Atenolol Salicylic acid) onto three different commercial AC of different textural and chemical characteristics. The carbons were analyzed with respect to textural characteristics as well as surface characteristics. The results showed that the AC with highest BET also had the best adsorption characteristics for all the pharmaceuticals. However, differences in surface chemistry was also believed to play an important role, although its relative influence was not discussed (Rakić et al., 2015). The study by Baresel et al. (2017) shows that the potential use of SBACs for pharmaceutical uptake merits further investigation.
3.8 Economic considerations The economic feasibility of SBAC production in an important question, especially since farmland application has become a less attractive route for sewage sludge. Sewage sludge pyrolysis has slowly stepped into full-scale applications, although incineration is the most popular route (Samolada and Zabaniotou, 2014). Still, many questions remain regarding the economic feasibility of SBAC production, especially in contrast to incineration or gasification. While the overall cost of pyrolysis has been discussed in several cases (e.g. by Samolada and Zabaniotou (2014), focus has not been on the production of SBAC, but rather on the overall energy considerations compared to sludge gasification and incineration. In general, since pyrolysis does not convert all of the carbon into CO2, or synthetic gases, the energy gain from the pyrolysis is less compared to incineration and gasification (Samolada and Zabaniotou, 2014). Looking at the PyregÓ process as an example, the sludge has to be pre-dried to a level where the calorific value is larger than 10 MJ/kg and the TS content > 80 %. The process promises to generate up to 150 kW of heat that may be used for drying of the sludge from around 20% TS (that may be achieved with mechanical thickening) to the required 80 %. Additional heat has to be added for the drying, although the amount is not specified (PYREG, 2018). According to Böjner (2018), the overall process of sludge pre-drying and pyrolysis provided by Torkapparater AB can be self-sufficient in energy, providing a sludge TS content of around 35 %.
20
In the end, the value of the end product, being activated carbon or char, will have to be compared to the extra amounts of energy that can be supplied when using incineration or gasification. The actual cost of SBAC production will vary depending on many factors, including the moisture content of the sludge, the cost of drying, operational temperatures, use of gasification gases for activation, investment and operation costs, choice of technique, etc. Comparing physical and chemical activation for common AC precursors, Stavropoulos and Zabaniotou (2009) concluded that chemical activation is the cheaper alternative, mainly due to the increased yield from the process. Rio et al. (2006b), to our knowledge, is the only author who looked at the cost of SBAC production. Their results suggest that SBAC production using steam activation cost 316 €/ton DM (dry matter). Assuming a yield of 30 %, this corresponds to a price of 1,05 €/kg. Rio et al. (2006b) further compared the cost of SBAC production to that of incineration (210-310 €/ton DM) and farmland application (100-150 €/ton DM). These values may give hints of how highly the SBAC must be valued in order to compensate for the higher production cost in comparison to the other technologies. For commercial activated carbon product, prices range between 1.37-20 $/kg (Gupta et al., 2009). According to Stavropoulos and Zabaniotou (2009), the cost of AC from waste products range down to 1.08 $/kg, which is similar to the value for SBAC production suggested by (Rio et al., 2006).
21
4. Production of activated carbon from sewage sludge using one-step activation with steam
4.1 Background Based on existing literature, one-step activation with steam is an easy method for producing SBAC, avoiding the use of strong acids/bases and the need for washing to remove residual chemicals after activation (Rio et al., 2006; Smith et al., 2009). Therefore, the laboratory experiments conducted within this study aimed at producing steam-activated SBAC in the laboratory and evaluating its textural properties (porosity) using N2-adsorption at 77 K. Varying production parameters such as pyrolysis temperature, time and steam addition was investigated, comparing their impact on the pore size distribution and surface area of the produced carbons. 4.2 Method The sludge used in the study was anaerobically digested hybrid sludge, generated from a mixture of sludge from chemically enhanced primary treatment and secondary biological treatment. The sludge was collected from Källby wastewater treatment plant in Lund, Sweden in 2015, when initial experiments on SBAC production were performed. The sludge was then dried at 105°C, separated into different size fractions using a sieve and then stored in plastic containers in a fridge until the time of this study during 2017/2018. Dried sludge granules of sizes 2-4 mm were picked out and used in this study. The volatile matter content and ash content of the sludge was determined by the following methodology:
1. A couple of hundred grams were picked out and dried overnight in 105°C and allowed to cool in a desiccator, making sure that any water adsorbed during storage was released.
2. Volatile matter content was determined as the mean loss of weight by exposing 3x10 g of the sludge to 575°C for 2 hours inside a muffle furnace (Thermolyne 6000).
3. The ash content was approximated as the remaining weight after loss of volatile matter.
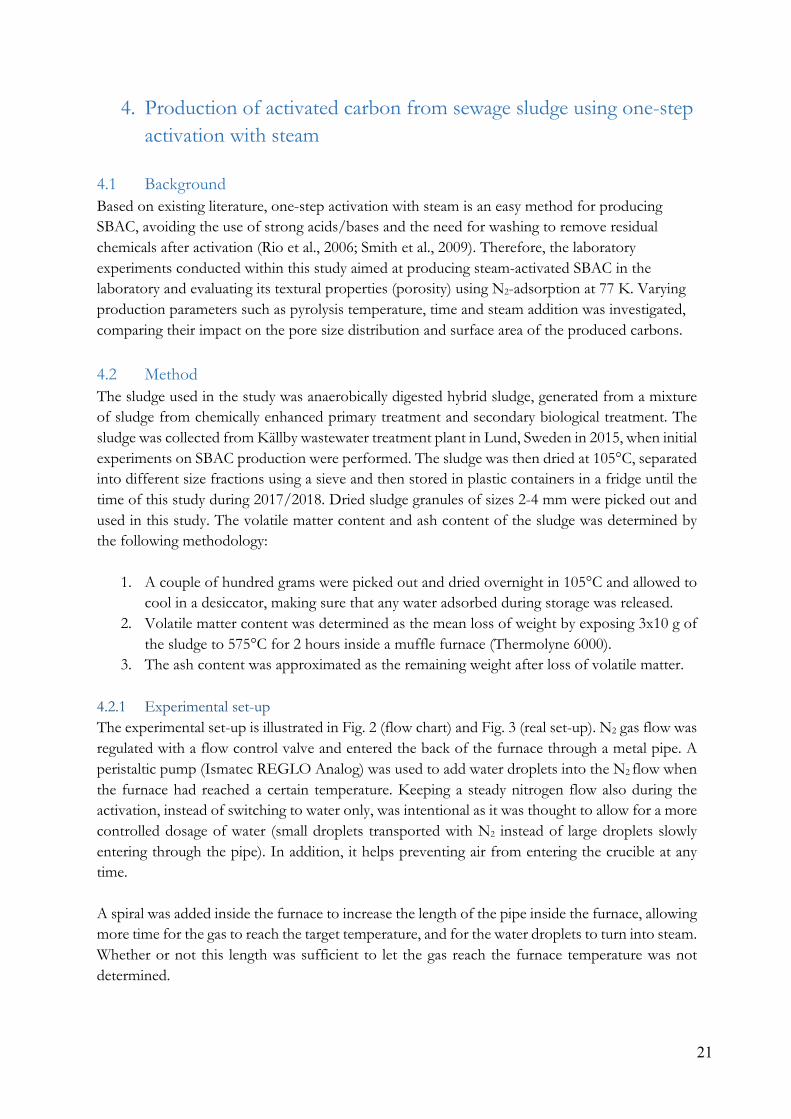
4.2.1 Experimental set-up The experimental set-up is illustrated in Fig. 2 (flow chart) and Fig. 3 (real set-up). N2 gas flow was regulated with a flow control valve and entered the back of the furnace through a metal pipe. A peristaltic pump (Ismatec REGLO Analog) was used to add water droplets into the N2 flow when the furnace had reached a certain temperature. Keeping a steady nitrogen flow also during the activation, instead of switching to water only, was intentional as it was thought to allow for a more controlled dosage of water (small droplets transported with N2 instead of large droplets slowly entering through the pipe). In addition, it helps preventing air from entering the crucible at any time. A spiral was added inside the furnace to increase the length of the pipe inside the furnace, allowing more time for the gas to reach the target temperature, and for the water droplets to turn into steam. Whether or not this length was sufficient to let the gas reach the furnace temperature was not determined.
22
Fig. 2. Experimental set-up.
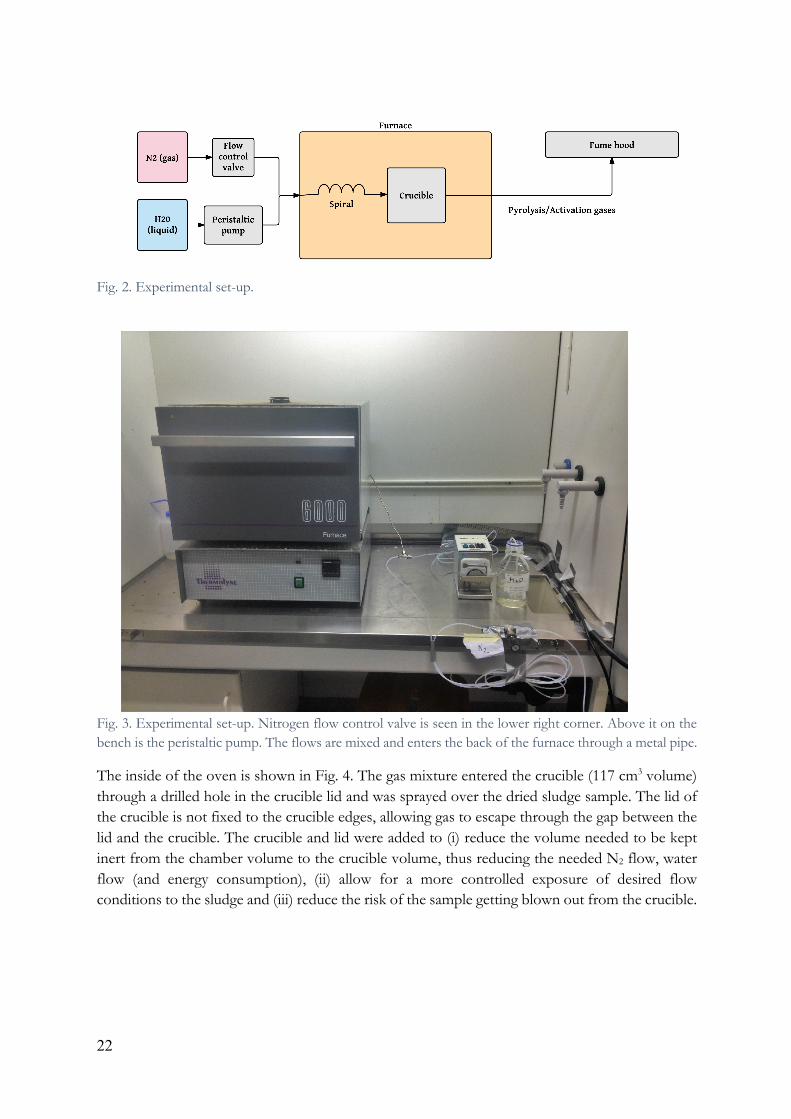
Fig. 3. Experimental set-up. Nitrogen flow control valve is seen in the lower right corner. Above it on the bench is the peristaltic pump. The flows are mixed and enters the back of the furnace through a metal pipe.
The inside of the oven is shown in Fig. 4. The gas mixture entered the crucible (117 cm3 volume) through a drilled hole in the crucible lid and was sprayed over the dried sludge sample. The lid of the crucible is not fixed to the crucible edges, allowing gas to escape through the gap between the lid and the crucible. The crucible and lid were added to (i) reduce the volume needed to be kept inert from the chamber volume to the crucible volume, thus reducing the needed N2 flow, water flow (and energy consumption), (ii) allow for a more controlled exposure of desired flow conditions to the sludge and (iii) reduce the risk of the sample getting blown out from the crucible.
23
The sample of dried sludge was put inside the crucible and exposed to the pyrolysis/activating conditions of choice. The pyrolysis/activation gases were released into the oven which further released gas into the fume hood. This is achieved by putting the whole furnace inside the fume hood. Thus, at this point, pyrolysis/activation gases were not collected for analysis. Flow control The nitrogen gas flow rate was estimated by noting the time needed to fill a submerged, water-filled container of known volume with gas (and remove the water). Steam flow was calculated from the water flow of the peristaltic pump, knowing the difference in density at the target temperature and room temperature. The connection between the water flow control valve and the actual flow was determined by finding the time needed to fill a small container of known volume. Temperature profile control Target temperature, dwell time and heating rate/heating time were set using the display on the muffle furnace. On this furnace, the heating time is specified, and from this the corresponding heating rate is calculated. Due to technical limitations the maximum heating rate was about 12°C/min. 4.2.2 Experimental procedure The experimental procedure was the following:
1. Approximately 10 grams of dried sludge was put in a crucible, the sample and crucible weights noted.
2. Nitrogen and water flows were checked. The water pump was run for a while during nitrogen flow to make sure it filled the plastic tube all the way to the connection. The pump was then set to the
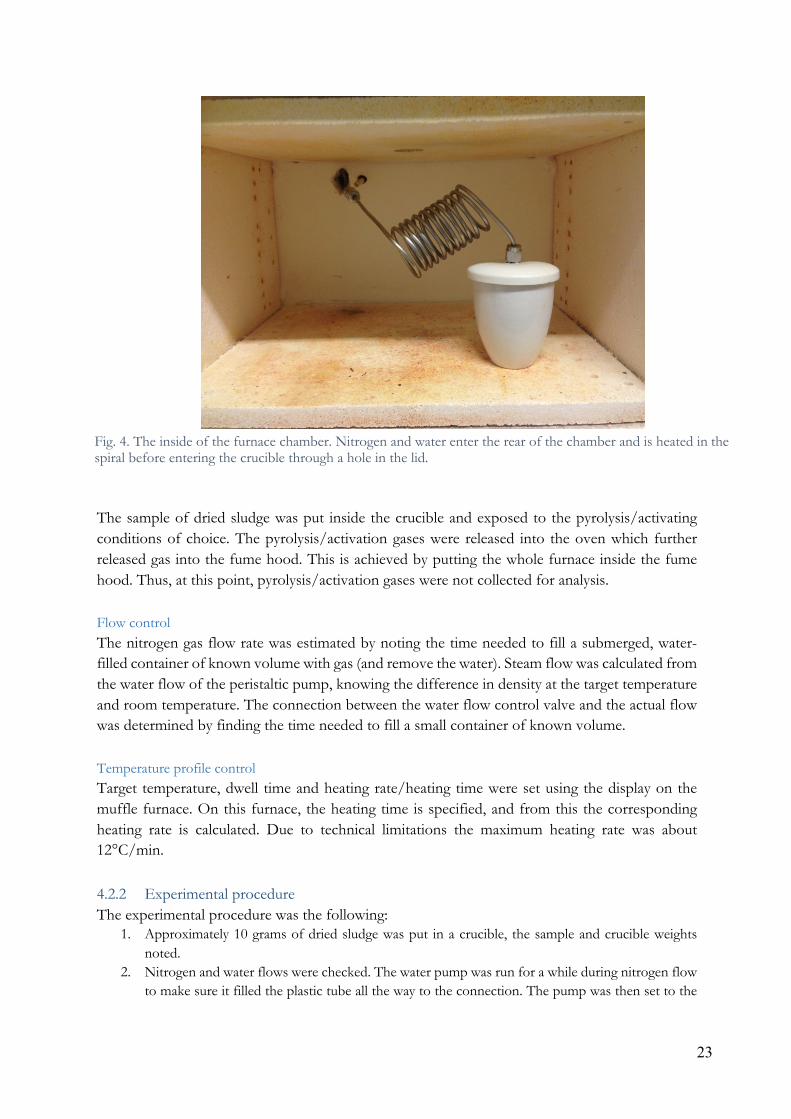
Fig. 4. The inside of the furnace chamber. Nitrogen and water enter the rear of the chamber and is heated in the spiral before entering the crucible through a hole in the lid.
24
design flow rate and turned off while nitrogen was flushed through the metal pipe to make sure it was free from water.
3. The crucible was put in place inside the oven, connecting the steel pipe and lid as seen in Fig. 3. 4. Temperature profile (target temperature, dwell time and heating rate) was set according to
experiment design. 5. Nitrogen flow was set to 3 L/min and the furnace turned on. 6. For steam activation experiments (not for pyrolysis only), water/steam was added at a certain point
in time (either directly when the temperature reached the target, or after letting pyrolysis go on for some time before starting activation), by turning on the peristaltic pump. For all experiments, water flow was set to about 0.6 ml/min (which was the lowest possible flow rate available with the pump). This flow corresponds to a steam flow rate of about 3 L/min at 800°C and about 2.3 L/min at 550°C. At this point, the nitrogen flow was reduced to about 2 L/min to reduce the total gas flow (nitrogen + steam).
7. At the end of the program (end of dwell time), water flow was turned off, nitrogen flow increased to 3L/min and the furnace door was opened slightly to allow for quicker cooling.
8. After around 3-4 hours of cooling during constant nitrogen flow, the temperature had reached below 200°C at which the crucible was removed from the furnace and put in a desiccator to cool.
9. The sample was finally weighted, determining the mass loss (and yields). All samples were subjected to N2 adsorption experiments at 77 K.
4.2.3. Carbon characterization The physical characteristics of the SBACs were determined based on the adsorption and desorption isotherms of N2-adsorption at 77 K using a 3Flex (Micromeritics). The specific surface areas were determined using BET methodology (Brunauer et al., 1938). The mesopore and macropore volumes (17-3000 Å), size distributions and mean pore diameter were determined using Barrett-Joyner-Halenda (BJH) theory (Barrett et al., 1951). The micropore volume was estimated using the t-plot method (Harkins and Jura, 1944). The pH of the carbons were measured by mixing them with de-ionized water by a mass ratio of 1:10 (Wang et al., 2015) and measuring the resulting pH of the solution using a pH-electrode (WTW pH 320). 4.3 Sample description A total of 7 experiments were performed using the experimental procedure. In Table 8, the pyrolysis/activation conditions used are summarized for each experiment. The heating rate/heating time was assumed to play a small role compared to temperature and dwell time (Smith et al., 2009) and was not largely varied during these experiments. It was set between 9 and 12°C/min depending on target temperature, aiming to keep a similar ramp time for all experiments. The generated samples of SBAC were all characterized using N2 adsorption at 77 K.
25
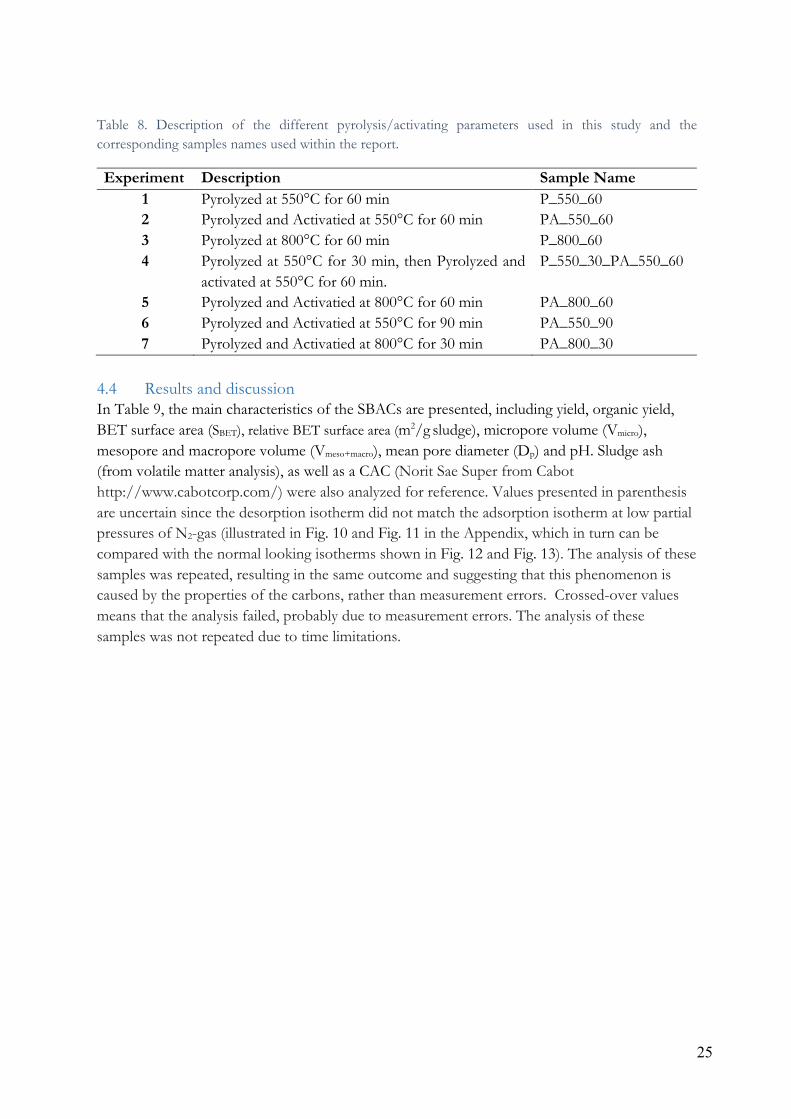
Table 8. Description of the different pyrolysis/activating parameters used in this study and the corresponding samples names used within the report.
Experiment Description Sample Name 1 Pyrolyzed at 550°C for 60 min P_550_60 2 Pyrolyzed and Activatied at 550°C for 60 min PA_550_60 3 Pyrolyzed at 800°C for 60 min P_800_60 4 Pyrolyzed at 550°C for 30 min, then Pyrolyzed and
activated at 550°C for 60 min. P_550_30_PA_550_60
5 Pyrolyzed and Activatied at 800°C for 60 min PA_800_60 6 Pyrolyzed and Activatied at 550°C for 90 min PA_550_90 7 Pyrolyzed and Activatied at 800°C for 30 min PA_800_30
4.4 Results and discussion In Table 9, the main characteristics of the SBACs are presented, including yield, organic yield, BET surface area (SBET), relative BET surface area (m2/g sludge), micropore volume (Vmicro), mesopore and macropore volume (Vmeso+macro), mean pore diameter (Dp) and pH. Sludge ash (from volatile matter analysis), as well as a CAC (Norit Sae Super from Cabot http://www.cabotcorp.com/) were also analyzed for reference. Values presented in parenthesis are uncertain since the desorption isotherm did not match the adsorption isotherm at low partial pressures of N2-gas (illustrated in Fig. 10 and Fig. 11 in the Appendix, which in turn can be compared with the normal looking isotherms shown in Fig. 12 and Fig. 13). The analysis of these samples was repeated, resulting in the same outcome and suggesting that this phenomenon is caused by the properties of the carbons, rather than measurement errors. Crossed-over values means that the analysis failed, probably due to measurement errors. The analysis of these samples was not repeated due to time limitations.
26
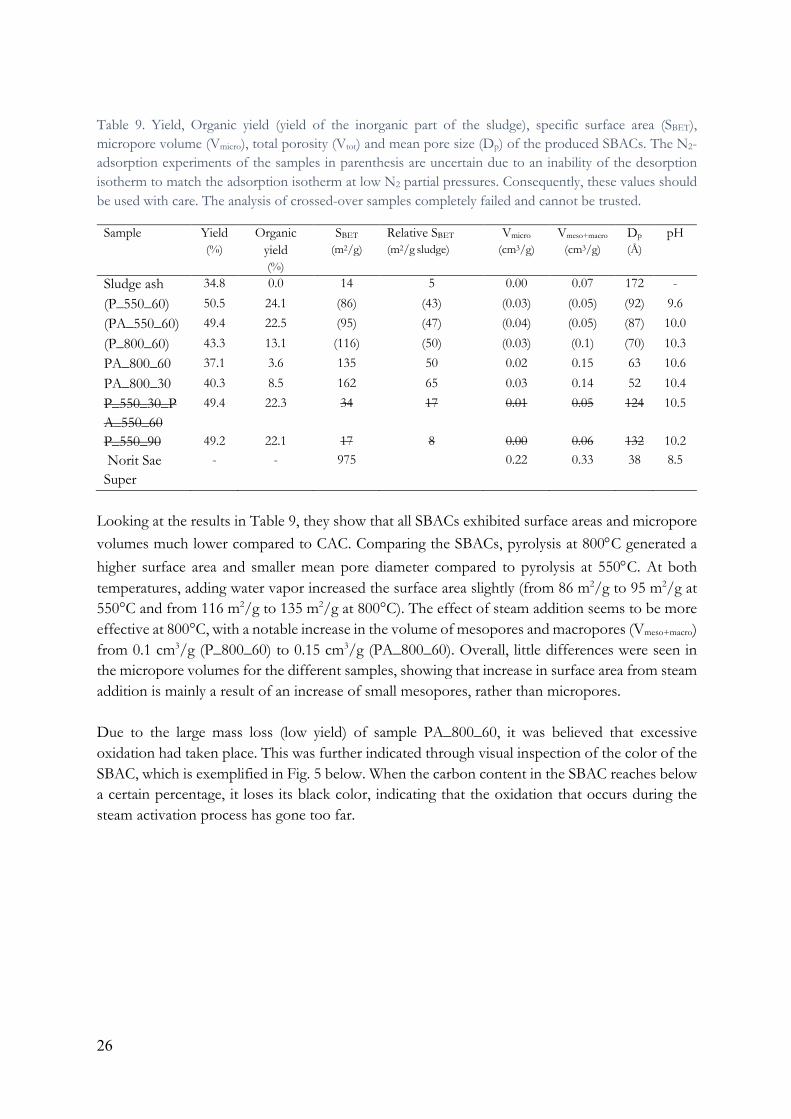
Table 9. Yield, Organic yield (yield of the inorganic part of the sludge), specific surface area (SBET), micropore volume (Vmicro), total porosity (Vtot) and mean pore size (Dp) of the produced SBACs. The N2-adsorption experiments of the samples in parenthesis are uncertain due to an inability of the desorption isotherm to match the adsorption isotherm at low N2 partial pressures. Consequently, these values should be used with care. The analysis of crossed-over samples completely failed and cannot be trusted.
Sample Yield (%)
Organic yield (%)
SBET (m2/g)
Relative SBET (m2/g sludge)
Vmicro (cm3/g)
Vmeso+macro
(cm3/g) Dp
(Å) pH
Sludge ash 34.8 0.0 14 5 0.00 0.07 172 - (P_550_60) 50.5 24.1 (86) (43) (0.03) (0.05) (92) 9.6 (PA_550_60) 49.4 22.5 (95) (47) (0.04) (0.05) (87) 10.0 (P_800_60) 43.3 13.1 (116) (50) (0.03) (0.1) (70) 10.3 PA_800_60 37.1 3.6 135 50 0.02 0.15 63 10.6 PA_800_30 40.3 8.5 162 65 0.03 0.14 52 10.4 P_550_30_PA_550_60
49.4 22.3 34 17 0.01 0.05 124 10.5
P_550_90 49.2 22.1 17 8 0.00 0.06 132 10.2 Norit Sae Super
- - 975 0.22 0.33 38 8.5
Looking at the results in Table 9, they show that all SBACs exhibited surface areas and micropore volumes much lower compared to CAC. Comparing the SBACs, pyrolysis at 800°C generated a higher surface area and smaller mean pore diameter compared to pyrolysis at 550°C. At both temperatures, adding water vapor increased the surface area slightly (from 86 m2/g to 95 m2/g at 550°C and from 116 m2/g to 135 m2/g at 800°C). The effect of steam addition seems to be more effective at 800°C, with a notable increase in the volume of mesopores and macropores (Vmeso+macro) from 0.1 cm3/g (P_800_60) to 0.15 cm3/g (PA_800_60). Overall, little differences were seen in the micropore volumes for the different samples, showing that increase in surface area from steam addition is mainly a result of an increase of small mesopores, rather than micropores. Due to the large mass loss (low yield) of sample PA_800_60, it was believed that excessive oxidation had taken place. This was further indicated through visual inspection of the color of the SBAC, which is exemplified in Fig. 5 below. When the carbon content in the SBAC reaches below a certain percentage, it loses its black color, indicating that the oxidation that occurs during the steam activation process has gone too far.
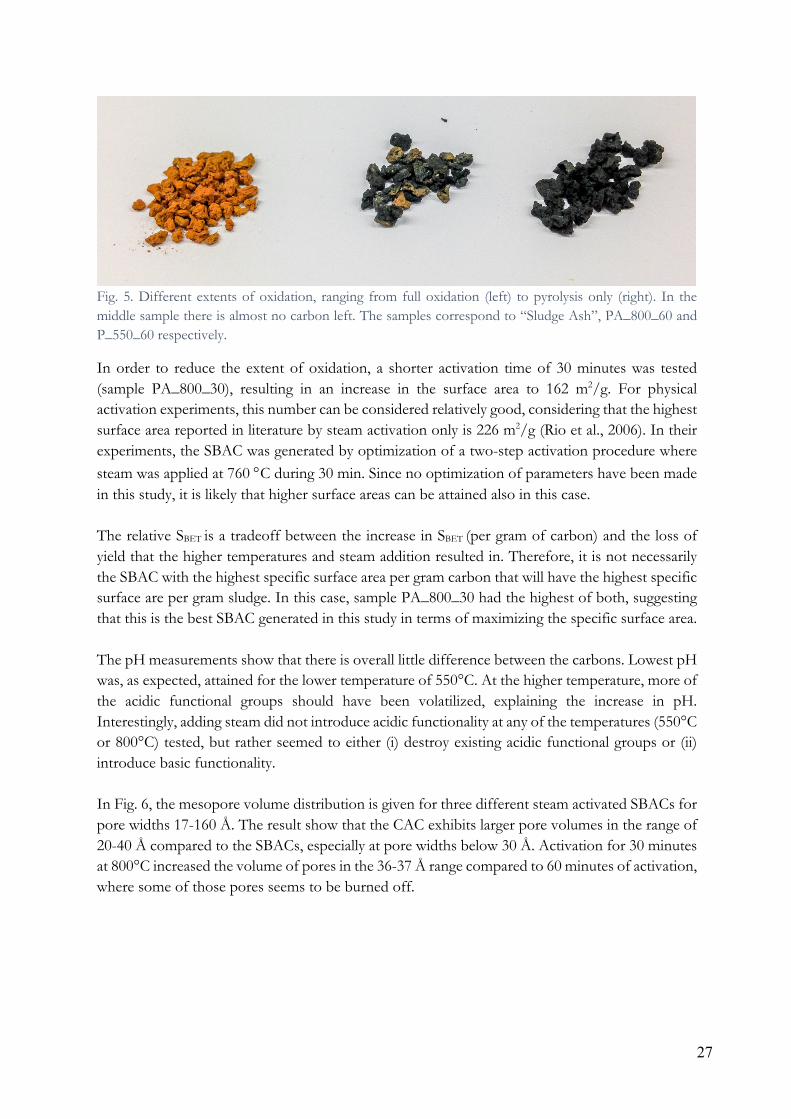
27
Fig. 5. Different extents of oxidation, ranging from full oxidation (left) to pyrolysis only (right). In the middle sample there is almost no carbon left. The samples correspond to “Sludge Ash”, PA_800_60 and P_550_60 respectively.
In order to reduce the extent of oxidation, a shorter activation time of 30 minutes was tested (sample PA_800_30), resulting in an increase in the surface area to 162 m2/g. For physical activation experiments, this number can be considered relatively good, considering that the highest surface area reported in literature by steam activation only is 226 m2/g (Rio et al., 2006). In their experiments, the SBAC was generated by optimization of a two-step activation procedure where steam was applied at 760 °C during 30 min. Since no optimization of parameters have been made in this study, it is likely that higher surface areas can be attained also in this case. The relative SBET is a tradeoff between the increase in SBET (per gram of carbon) and the loss of yield that the higher temperatures and steam addition resulted in. Therefore, it is not necessarily the SBAC with the highest specific surface area per gram carbon that will have the highest specific surface are per gram sludge. In this case, sample PA_800_30 had the highest of both, suggesting that this is the best SBAC generated in this study in terms of maximizing the specific surface area. The pH measurements show that there is overall little difference between the carbons. Lowest pH was, as expected, attained for the lower temperature of 550°C. At the higher temperature, more of the acidic functional groups should have been volatilized, explaining the increase in pH. Interestingly, adding steam did not introduce acidic functionality at any of the temperatures (550°C or 800°C) tested, but rather seemed to either (i) destroy existing acidic functional groups or (ii) introduce basic functionality. In Fig. 6, the mesopore volume distribution is given for three different steam activated SBACs for pore widths 17-160 Å. The result show that the CAC exhibits larger pore volumes in the range of 20-40 Å compared to the SBACs, especially at pore widths below 30 Å. Activation for 30 minutes at 800°C increased the volume of pores in the 36-37 Å range compared to 60 minutes of activation, where some of those pores seems to be burned off.
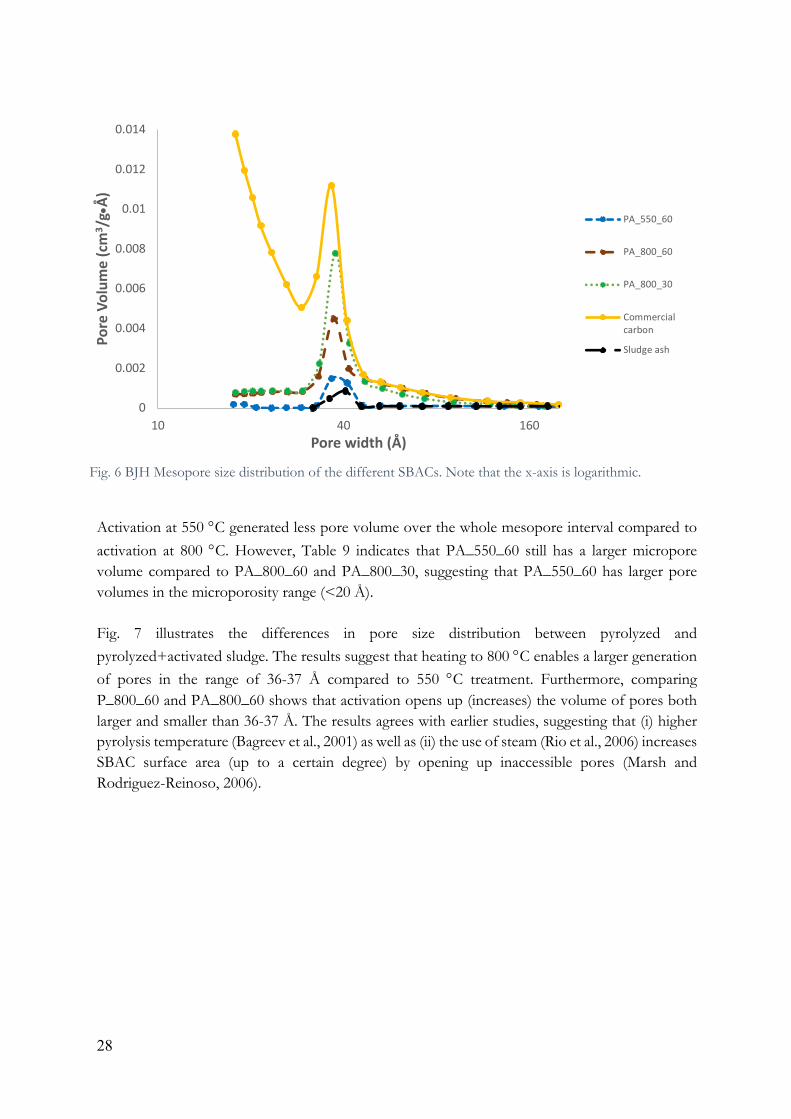
28
Activation at 550 °C generated less pore volume over the whole mesopore interval compared to activation at 800 °C. However, Table 9 indicates that PA_550_60 still has a larger micropore volume compared to PA_800_60 and PA_800_30, suggesting that PA_550_60 has larger pore volumes in the microporosity range (<20 Å). Fig. 7 illustrates the differences in pore size distribution between pyrolyzed and pyrolyzed+activated sludge. The results suggest that heating to 800 °C enables a larger generation of pores in the range of 36-37 Å compared to 550 °C treatment. Furthermore, comparing P_800_60 and PA_800_60 shows that activation opens up (increases) the volume of pores both larger and smaller than 36-37 Å. The results agrees with earlier studies, suggesting that (i) higher pyrolysis temperature (Bagreev et al., 2001) as well as (ii) the use of steam (Rio et al., 2006) increases SBAC surface area (up to a certain degree) by opening up inaccessible pores (Marsh and Rodriguez-Reinoso, 2006).
0
0.002
0.004
0.006
0.008
0.01
0.012
0.014
10 40 160
Pore
Vol
ume
(cm
3 /g•
Å)
Pore width (Å)
PA_550_60
PA_800_60
PA_800_30
Commercialcarbon
Sludge ash
Fig. 6 BJH Mesopore size distribution of the different SBACs. Note that the x-axis is logarithmic.
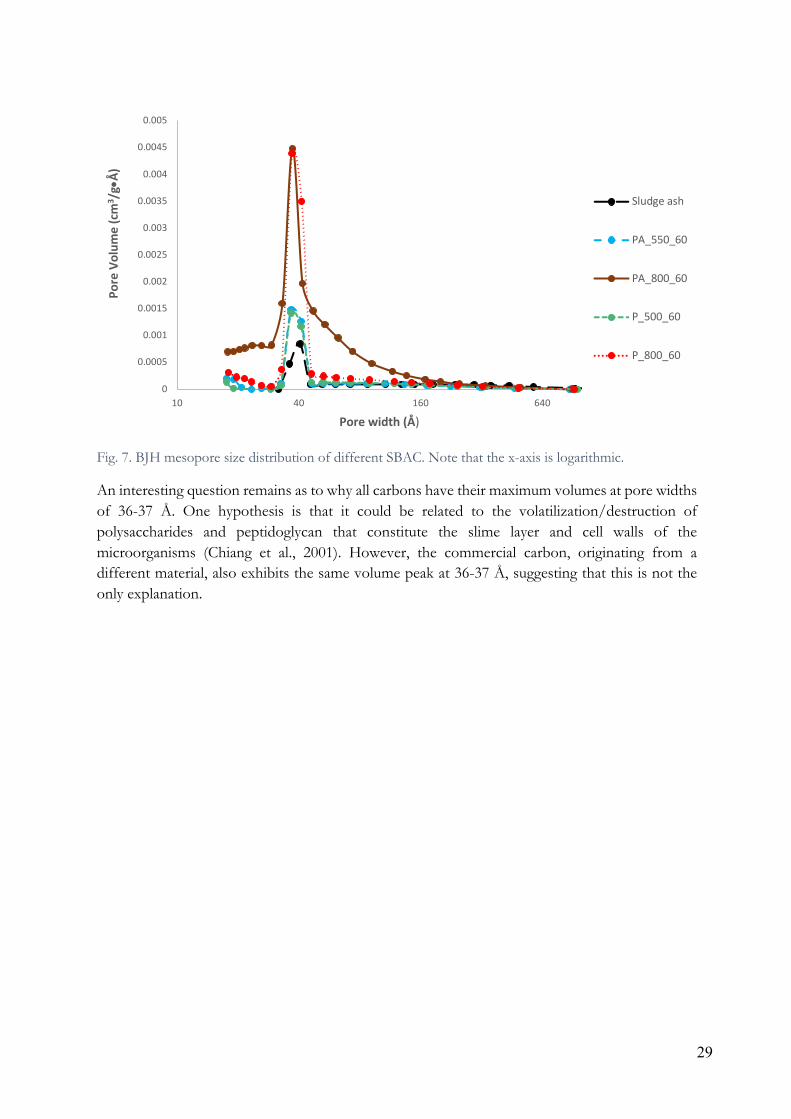
29
Fig. 7. BJH mesopore size distribution of different SBAC. Note that the x-axis is logarithmic.
An interesting question remains as to why all carbons have their maximum volumes at pore widths of 36-37 Å. One hypothesis is that it could be related to the volatilization/destruction of polysaccharides and peptidoglycan that constitute the slime layer and cell walls of the microorganisms (Chiang et al., 2001). However, the commercial carbon, originating from a different material, also exhibits the same volume peak at 36-37 Å, suggesting that this is not the only explanation.
0
0.0005
0.001
0.0015
0.002
0.0025
0.003
0.0035
0.004
0.0045
0.005
10 40 160 640
Pore
Vol
ume
(cm
3 /g•
Å)
Pore width (Å)
Sludge ash
PA_550_60
PA_800_60
P_500_60
P_800_60

30
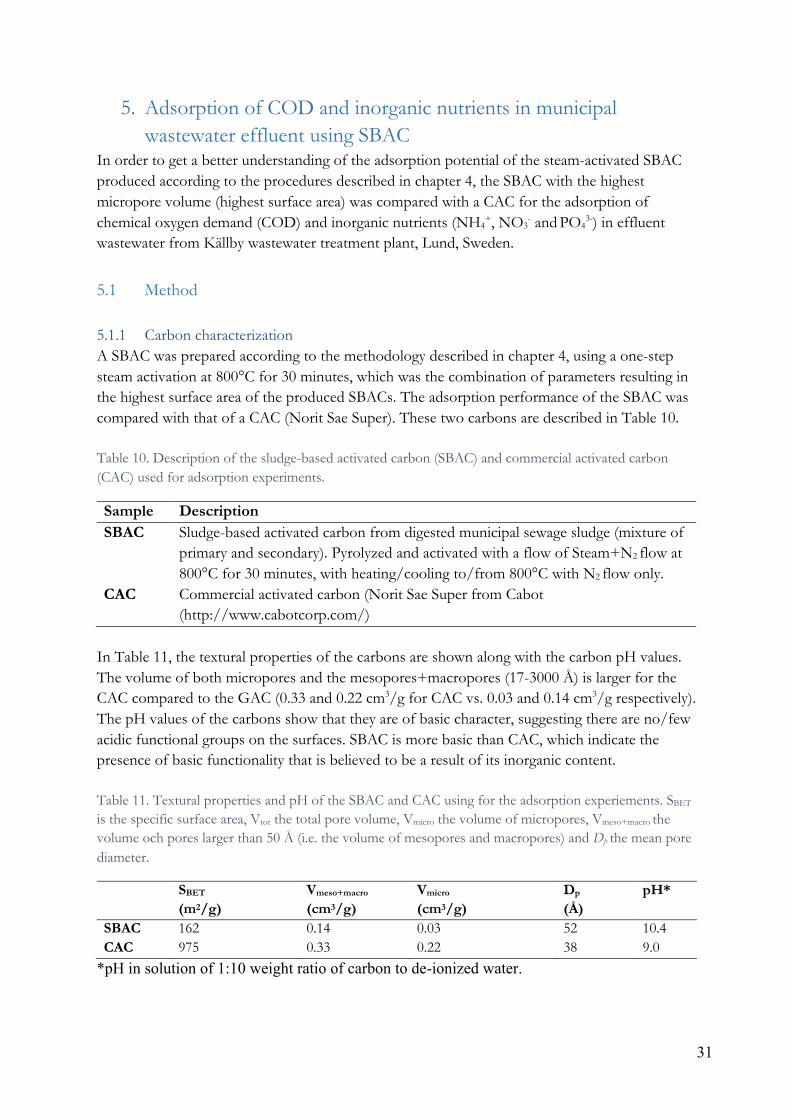
31
5. Adsorption of COD and inorganic nutrients in municipal wastewater effluent using SBAC
In order to get a better understanding of the adsorption potential of the steam-activated SBAC produced according to the procedures described in chapter 4, the SBAC with the highest micropore volume (highest surface area) was compared with a CAC for the adsorption of chemical oxygen demand (COD) and inorganic nutrients (NH4
+, NO3- and PO4
3-) in effluent wastewater from Källby wastewater treatment plant, Lund, Sweden. 5.1 Method 5.1.1 Carbon characterization A SBAC was prepared according to the methodology described in chapter 4, using a one-step steam activation at 800°C for 30 minutes, which was the combination of parameters resulting in the highest surface area of the produced SBACs. The adsorption performance of the SBAC was compared with that of a CAC (Norit Sae Super). These two carbons are described in Table 10. Table 10. Description of the sludge-based activated carbon (SBAC) and commercial activated carbon (CAC) used for adsorption experiments.
Sample Description SBAC Sludge-based activated carbon from digested municipal sewage sludge (mixture of
primary and secondary). Pyrolyzed and activated with a flow of Steam+N2 flow at 800°C for 30 minutes, with heating/cooling to/from 800°C with N2 flow only.
CAC Commercial activated carbon (Norit Sae Super from Cabot (http://www.cabotcorp.com/)
In Table 11, the textural properties of the carbons are shown along with the carbon pH values. The volume of both micropores and the mesopores+macropores (17-3000 Å) is larger for the CAC compared to the GAC (0.33 and 0.22 cm3/g for CAC vs. 0.03 and 0.14 cm3/g respectively). The pH values of the carbons show that they are of basic character, suggesting there are no/few acidic functional groups on the surfaces. SBAC is more basic than CAC, which indicate the presence of basic functionality that is believed to be a result of its inorganic content. Table 11. Textural properties and pH of the SBAC and CAC using for the adsorption experiements. SBET is the specific surface area, Vtot the total pore volume, Vmicro the volume of micropores, Vmeso+macro the volume och pores larger than 50 Å (i.e. the volume of mesopores and macropores) and Dp the mean pore diameter.
SBET (m2/g)
Vmeso+macro
(cm3/g) Vmicro (cm3/g)
Dp (Å)
pH*
SBAC 162 0.14 0.03 52 10.4 CAC 975 0.33 0.22 38 9.0
*pH in solution of 1:10 weight ratio of carbon to de-ionized water.
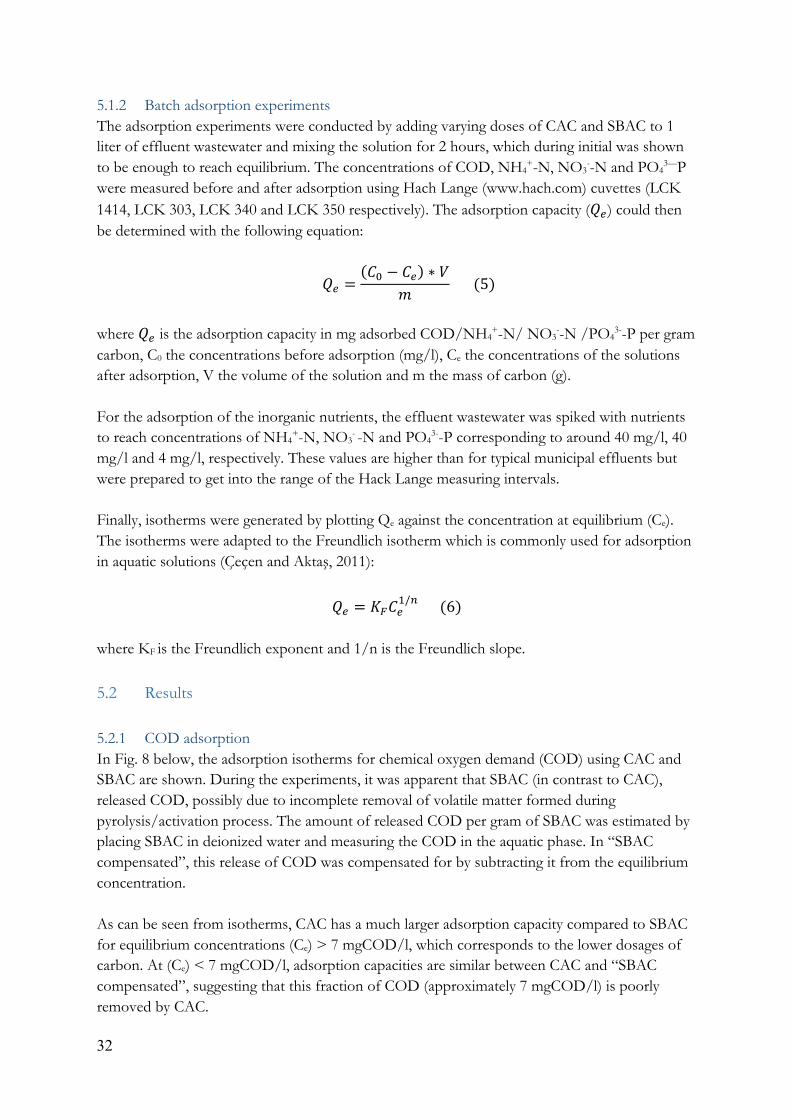
32
5.1.2 Batch adsorption experiments The adsorption experiments were conducted by adding varying doses of CAC and SBAC to 1 liter of effluent wastewater and mixing the solution for 2 hours, which during initial was shown to be enough to reach equilibrium. The concentrations of COD, NH4
+-N, NO3--N and PO4
3—P were measured before and after adsorption using Hach Lange (www.hach.com) cuvettes (LCK 1414, LCK 303, LCK 340 and LCK 350 respectively). The adsorption capacity (!") could then be determined with the following equation:
!" =('@ − '") ∗ C
D (5)
where !" is the adsorption capacity in mg adsorbed COD/NH4+-N/ NO3
--N /PO43--P per gram
carbon, C0 the concentrations before adsorption (mg/l), Ce the concentrations of the solutions after adsorption, V the volume of the solution and m the mass of carbon (g).
For the adsorption of the inorganic nutrients, the effluent wastewater was spiked with nutrients to reach concentrations of NH4
+-N, NO3- -N and PO4
3--P corresponding to around 40 mg/l, 40 mg/l and 4 mg/l, respectively. These values are higher than for typical municipal effluents but were prepared to get into the range of the Hack Lange measuring intervals. Finally, isotherms were generated by plotting Qe against the concentration at equilibrium (Ce). The isotherms were adapted to the Freundlich isotherm which is commonly used for adsorption in aquatic solutions (Çeçen and Aktaş, 2011):
!" = ;F'"</>(6) where KF is the Freundlich exponent and 1/n is the Freundlich slope. 5.2 Results 5.2.1 COD adsorption In Fig. 8 below, the adsorption isotherms for chemical oxygen demand (COD) using CAC and SBAC are shown. During the experiments, it was apparent that SBAC (in contrast to CAC), released COD, possibly due to incomplete removal of volatile matter formed during pyrolysis/activation process. The amount of released COD per gram of SBAC was estimated by placing SBAC in deionized water and measuring the COD in the aquatic phase. In “SBAC compensated”, this release of COD was compensated for by subtracting it from the equilibrium concentration. As can be seen from isotherms, CAC has a much larger adsorption capacity compared to SBAC for equilibrium concentrations (Ce) > 7 mgCOD/l, which corresponds to the lower dosages of carbon. At (Ce) < 7 mgCOD/l, adsorption capacities are similar between CAC and “SBAC compensated”, suggesting that this fraction of COD (approximately 7 mgCOD/l) is poorly removed by CAC.
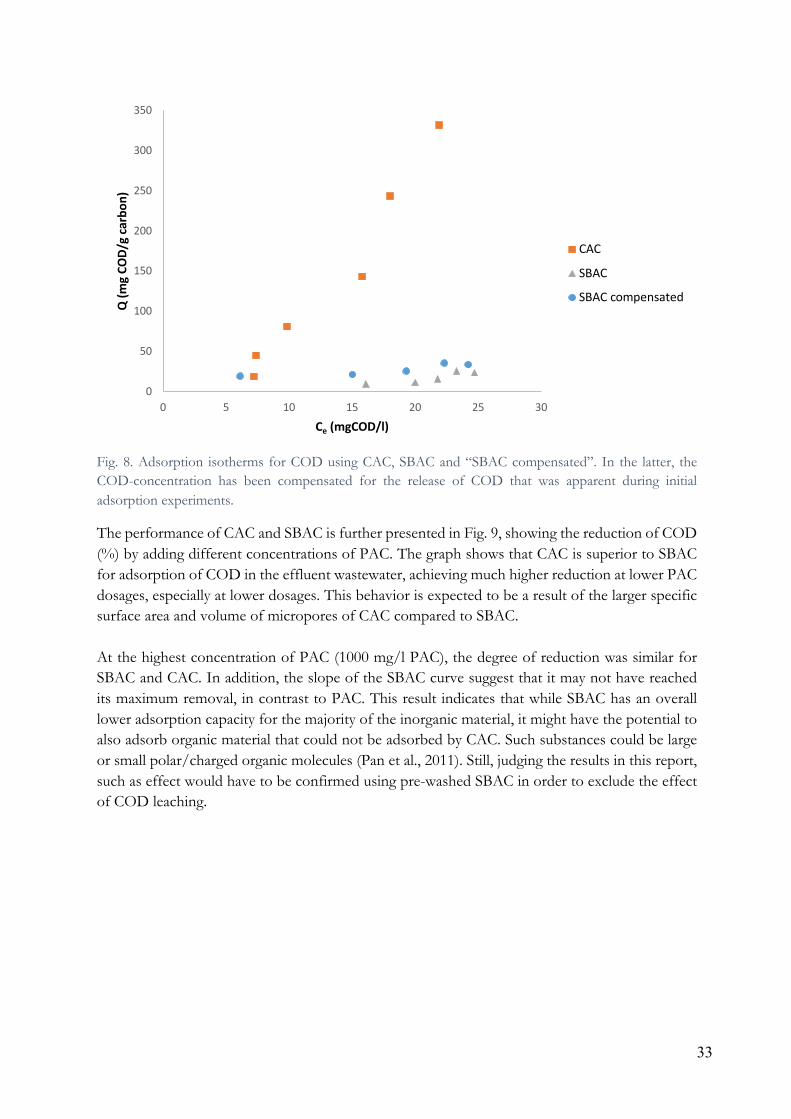
33
Fig. 8. Adsorption isotherms for COD using CAC, SBAC and “SBAC compensated”. In the latter, the COD-concentration has been compensated for the release of COD that was apparent during initial adsorption experiments.
The performance of CAC and SBAC is further presented in Fig. 9, showing the reduction of COD (%) by adding different concentrations of PAC. The graph shows that CAC is superior to SBAC for adsorption of COD in the effluent wastewater, achieving much higher reduction at lower PAC dosages, especially at lower dosages. This behavior is expected to be a result of the larger specific surface area and volume of micropores of CAC compared to SBAC. At the highest concentration of PAC (1000 mg/l PAC), the degree of reduction was similar for SBAC and CAC. In addition, the slope of the SBAC curve suggest that it may not have reached its maximum removal, in contrast to PAC. This result indicates that while SBAC has an overall lower adsorption capacity for the majority of the inorganic material, it might have the potential to also adsorb organic material that could not be adsorbed by CAC. Such substances could be large or small polar/charged organic molecules (Pan et al., 2011). Still, judging the results in this report, such as effect would have to be confirmed using pre-washed SBAC in order to exclude the effect of COD leaching.
0
50
100
150
200
250
300
350
0 5 10 15 20 25 30
Q (m
g CO
D/g
carb
on)
Ce (mgCOD/l)
CAC
SBAC
SBAC compensated
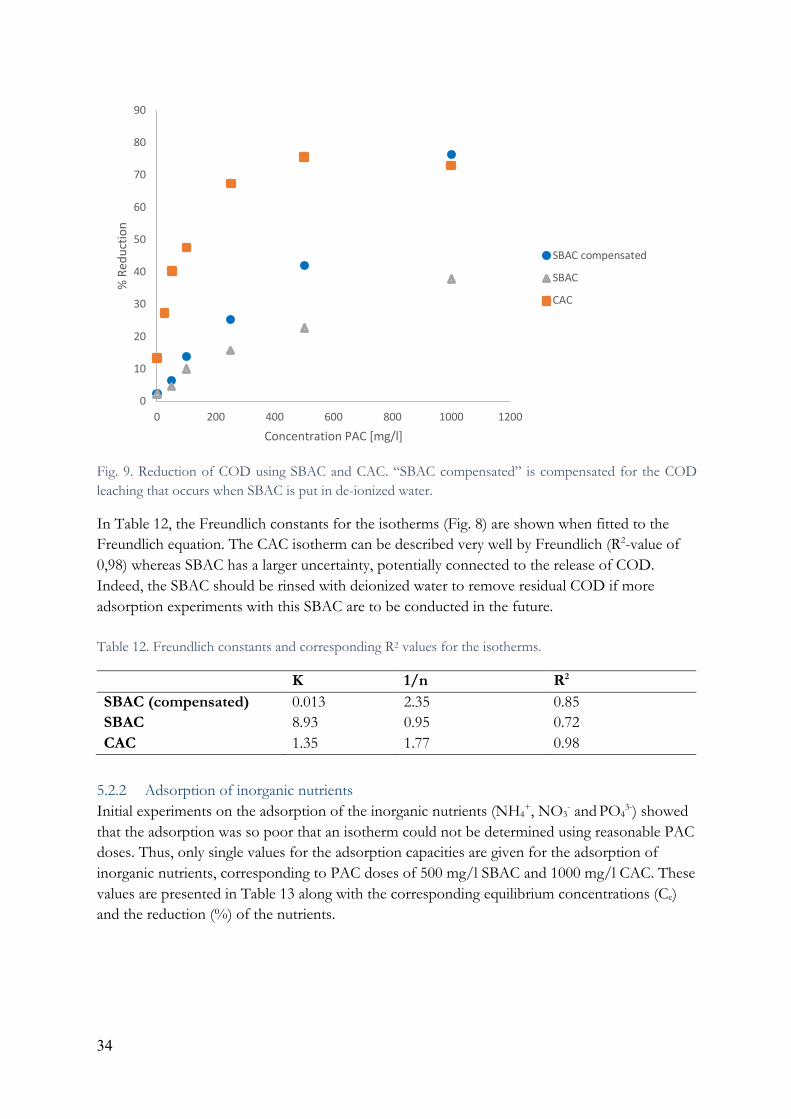
34
Fig. 9. Reduction of COD using SBAC and CAC. “SBAC compensated” is compensated for the COD leaching that occurs when SBAC is put in de-ionized water.
In Table 12, the Freundlich constants for the isotherms (Fig. 8) are shown when fitted to the Freundlich equation. The CAC isotherm can be described very well by Freundlich (R2-value of 0,98) whereas SBAC has a larger uncertainty, potentially connected to the release of COD. Indeed, the SBAC should be rinsed with deionized water to remove residual COD if more adsorption experiments with this SBAC are to be conducted in the future. Table 12. Freundlich constants and corresponding R2 values for the isotherms.
K 1/n R2 SBAC (compensated) 0.013 2.35 0.85 SBAC 8.93 0.95 0.72 CAC 1.35 1.77 0.98
5.2.2 Adsorption of inorganic nutrients Initial experiments on the adsorption of the inorganic nutrients (NH4
+, NO3- and PO4
3-) showed that the adsorption was so poor that an isotherm could not be determined using reasonable PAC doses. Thus, only single values for the adsorption capacities are given for the adsorption of inorganic nutrients, corresponding to PAC doses of 500 mg/l SBAC and 1000 mg/l CAC. These values are presented in Table 13 along with the corresponding equilibrium concentrations (Ce) and the reduction (%) of the nutrients.
0
10
20
30
40
50
60
70
80
90
0 200 400 600 800 1000 1200
% R
educ
tion
Concentration PAC [mg/l]
SBAC compensated
SBAC
CAC
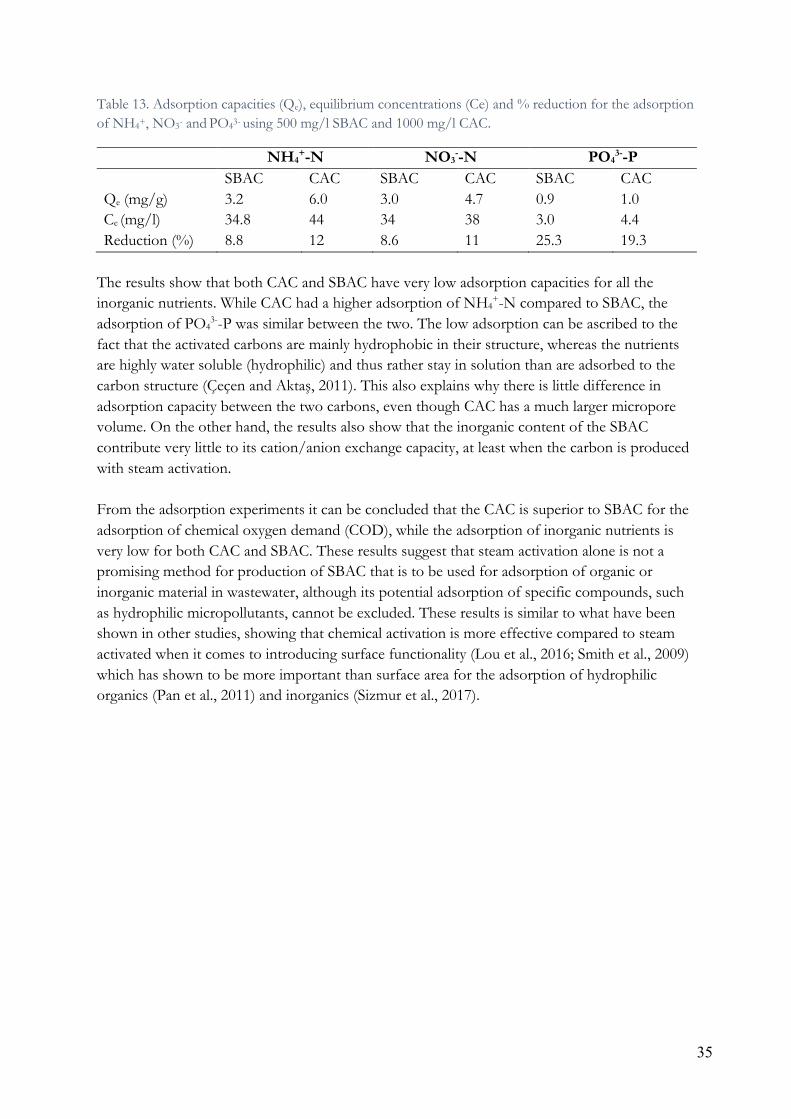
35
Table 13. Adsorption capacities (Qe), equilibrium concentrations (Ce) and % reduction for the adsorption of NH4+, NO3- and PO43- using 500 mg/l SBAC and 1000 mg/l CAC.
NH4+-N NO3
--N PO43--P
SBAC CAC SBAC CAC SBAC CAC Qe (mg/g) 3.2 6.0 3.0 4.7 0.9 1.0 Ce (mg/l) 34.8 44 34 38 3.0 4.4 Reduction (%) 8.8 12 8.6 11 25.3 19.3
The results show that both CAC and SBAC have very low adsorption capacities for all the inorganic nutrients. While CAC had a higher adsorption of NH4
+-N compared to SBAC, the adsorption of PO4
3--P was similar between the two. The low adsorption can be ascribed to the fact that the activated carbons are mainly hydrophobic in their structure, whereas the nutrients are highly water soluble (hydrophilic) and thus rather stay in solution than are adsorbed to the carbon structure (Çeçen and Aktaş, 2011). This also explains why there is little difference in adsorption capacity between the two carbons, even though CAC has a much larger micropore volume. On the other hand, the results also show that the inorganic content of the SBAC contribute very little to its cation/anion exchange capacity, at least when the carbon is produced with steam activation. From the adsorption experiments it can be concluded that the CAC is superior to SBAC for the adsorption of chemical oxygen demand (COD), while the adsorption of inorganic nutrients is very low for both CAC and SBAC. These results suggest that steam activation alone is not a promising method for production of SBAC that is to be used for adsorption of organic or inorganic material in wastewater, although its potential adsorption of specific compounds, such as hydrophilic micropollutants, cannot be excluded. These results is similar to what have been shown in other studies, showing that chemical activation is more effective compared to steam activated when it comes to introducing surface functionality (Lou et al., 2016; Smith et al., 2009) which has shown to be more important than surface area for the adsorption of hydrophilic organics (Pan et al., 2011) and inorganics (Sizmur et al., 2017).

36
37
6. Conclusions 6.1 Literature study Based on the literature study, the following conclusions can be drawn regarding the production and potential of SBAC: 6.1.1 General remarks
• SBACs produced in different studies are very difficult to compare since their properties depends on both feedstock (sludge) specifics, production method and pyrolysis/activation parameters (e.g. temperature).
• The most important properties of SBACs depends on the target adsorbent/adsorbents. SBAC is generally compared in terms of their micropore volume (surface area), while pore size distribution and surface functionality might be equally, or even more importantly, depending on the characteristics of the desired adsorbate.
6.1.2 SBAC potential • SBAC production is more expensive compared to incineration but leaves a potentially
valuable adsorbent behind. • Chemical activation results in a higher SBAC yield, requires lower temperature and
produce carbons with higher surface areas compared to physical activation. However, the production requires substantial chemical use and one or more washing steps to remove excess chemicals from the end product.
• Activation using NaOH and KOH can produce SBAC with surface areas comparable to or even exceeding that of commercial activated carbon but may lead to cyanide formation.
• SBAC does in general have lower adsorption potential compared to commercial activated carbons (due to their lower micropore volumes), but may perform better for adsorption in the following applications:
- Adsorption of large organic substances, such as dyes, which may not be adsorbed by commercial activated carbon due to their lack of meso- and macroporosity.
- Adsorption of heavy metal ions and other polar/charged compounds that are adsorbed chemically rather than physically, making cation exchange capacity and the presence of surface functional groups more important than surface area (and micropore volume).
• The economic feasibility of SBAC production remains to be investigated in relation to actual applications rather than to their surface areas. For example, the cost could be related to the amount of heavy metals adsorbed in stormwater, or the amount of pharmaceuticals adsorbed in effluent wastewater.
38
6.2 Production of SBAC with one-step steam activation From the lab experiments, the following conclusions can be drawn regarding SBAC production with one-step steam activation: 6.2.1 Influence of production parameters on carbon characteristics
• Temperature and steam presence were shown to be two important parameters influencing SBAC surface area and pore size distribution. By varying these parameters (no optimization), SBAC with surface functional areas of up to 162 m2/g were generated by using steam activation at 800°C for 30 min.
• Pyrolysis at 800°C resulted in generation of SBAC with higher surface areas compared to activation at 550°C, which was mainly a result of mesopore development.
• Adding steam to the pyrolysis increased the volume of mesopores both larger and smaller than 37 Å. Adding steam for 30 minutes at 800°C resulted in the highest surface area SBAC of the different combinations, while one-hour steam exposure led to pore volume losses.
6.2.2 Adsorption of COD and inorganic nutrients in wastewater • CAC (Norit Sea Super with surface area of 975 m2/g) was shown to be superior to a
steam activated SBAC (surface area 162 m2/g) for the adsorption of organic matter (measured as chemical oxygen demand) in municipal WWTP effluent, probably due to its higher surface area (and micropore volume).
• Both CAC and SBAC had very low adsorption capacities for ammonium, nitrate and phosphate, probably due to an absence of charged surface functional groups or functionality induced by the inorganic content.
39
7. Future studies A number of questions remain unanswered regarding SBAC production and their potential as adsorbents. While the potential of SBAC for heavy metal adsorption has been pointed out, its use in pilot scale/large scale operation remains to be proved. In addition, the adsorption of other specific compounds, for example organic micropollutants, remains to be investigated and related to a representative CAC. Overall, there is a lack of understanding how the inorganic content of sewage sludge affects the properties of the SBAC, and in which cases it may add to the chemical or physical adsorption. Many questions also remain regarding chemical activation. While it can generate SBAC with larger surface areas compared to physical activation, this improvement of SBAC properties has to be compared with the additional cost and environmental impact of the used chemicals (including production and transport). Here, life cycle assessment could be a powerful tool in combination with studies looking at the optimization of chemical usage (impregnation ratios) for maximum porosity development. An important issue to keep in mind is also the formation of potentially harmful substances during activation. For activation using alkali hydroxides, the potential formation of cyanide was pointed out. More of such potentially toxic byproducts should be kept in mind in future experiments, especially when using chemical activation. Lastly, the economy of SBAC production has to be thoroughly investigated in order to determine if and when SBAC can compete with commercial activated carbon or activated carbon made from other waste material. Important consideration also includes the managing of used SBAC: should it be incinerated, reactivated or perhaps be put in the soil to be used as biochar?

40
41
8. References Adam, C., Peplinski, B., Michaelis, M., Kley, G., Simon, F.G., 2009. Thermochemical treatment
of sewage sludge ashes for phosphorus recovery. Waste Manag. 29, 1122–1128. https://doi.org/10.1016/j.wasman.2008.09.011
Agrafioti, E., Bouras, G., Kalderis, D., Diamadopoulos, E., 2013. Biochar production by sewage sludge pyrolysis. J. Anal. Appl. Pyrolysis 101, 72–78. https://doi.org/10.1016/j.jaap.2013.02.010
Ahmadpour, A., Do, D.D., 1996. The preparation of active carbons from coal by chemical and physical activation. Carbon N. Y. 34, 471–479. https://doi.org/10.1016/0008-6223(95)00204-9
Aktaş, Ö., Çeçen, F., 2006. Effect of type of carbon activation on adsorption and its reversibility. J. Chem. Technol. Biotechnol. 81, 94–101. https://doi.org/10.1002/jctb.1363
Bagreev, A., Bashkova, S., Locke, D.G., Bandosz, T.J., 2001. Sewage sludge-derived materials as efficient adsorbents for removal of hydrogen sulfide. Environ. Sci. Technol. 35, 1537–1543. https://doi.org/10.1021/es001678h
Baresel, C., Ek, M., Harding, M., Magnér, J., Allard, A., Karlsson, J., 2017. Kompletterande tester för en resurseffektiv avancerad rening av avloppsvatten. IVL rapport nr B 2287. Stockholm.
Barrett, E.P., Joyner, L.G., Halenda, P.P., 1951. The Determination of Pore Volume and Area Distributions in Porous Substances. I. Computations from Nitrogen Isotherms. J. Am. Chem. Soc. https://doi.org/10.1021/ja01145a126
Boehm, H.P., 1966. Chemical Identification of Surface Groups. Adv. Catal. 16, 179–274. https://doi.org/10.1016/S0360-0564(08)60354-5
Brunauer, S., Emmett, P.H., Teller, E., 1938. Adsorption of Gases in Multimolecular Layers. J. Am. Chem. Soc. https://doi.org/10.1021/ja01269a023
Böjner, U., 2018. AB Torkapparater. Personal communication september 2018. Çeçen, F., Aktaş, Ö., 2011. Activated Carbon for Water and Wastewater Treatment: Integration
of Adsorption and Biological Treatment, 1st ed. WILEY-VCH Verlag GmbH & Co. KGaA, Weinheim. https://doi.org/10.1002/9783527639441
Chen, X., Jeyaseelan, S., Graham, N., 2002. Physical and chemical properties study of the activated carbon made from sewage sludge. Waste Manag. 22, 755–760. https://doi.org/10.1016/S0956-053X(02)00057-0
Chiang, H.L., Chao, C.G., Chang, C.Y., Wang, C.F., Chiang, P.C., 2001. Residue characteristics and pore development of petrochemical industry sludge pyrolysis. Water Res. 35, 4331–4338. https://doi.org/10.1016/S0043-1354(01)00159-2
Cimbritz, M., Tumlin, S., Hagman, M., Dimitrova, I., Hey, G., Mases, M., Astrand, N., Jansen, J. la C., 2014. Rening från läkemedelsrester och andra mikroföroreningar - En kunskapssammanställning. Svenskt Vatten Utveckling. Rapport Nr. 2016-04. Bromma.
Figueiredo, J.., Pereira, M.F.., Freitas, M.M.., Órfão, J.J.., 1999. Modification of the surface chemistry of activated carbons. Carbon N. Y. 37, 1379–1389. https://doi.org/10.1016/S0008-6223(98)00333-9
Fitzmorris, K.B., Lima, I.M., Marshall, W.E., Reimers, R.S., 2006. Anion and Cation Leaching or Desorption from Activated Carbons from Municipal Sludge and Poultry Manure as Affected by pH. Water Environ. Res. 78, 2324–2329. https://doi.org/10.2175/106143006X95375
Fuente, E., Gil, R.R., Girón, R.P., Lillo-Ródenas, M.A., Montes-Morán, M.A., Martin, M.J., Linares-Solano, A., 2010. Evidence for the presence of cyanide during carbon activation by KOH. Carbon N. Y. 48, 1032–1037. https://doi.org/10.1016/j.carbon.2009.11.022
Guedes, P., Couto, N., Ottosen, L.M., Ribeiro, A.B., 2014. Phosphorus recovery from sewage sludge ash through an electrodialytic process. Waste Manag. 34, 886–892. https://doi.org/10.1016/j.wasman.2014.02.021
42
Gupta, V.K., Carrott, P.J.M., Ribeiro Carrott, M.M.L., Suhas, 2009. Low-Cost Adsorbents: Growing Approach to Wastewater Treatment—a Review. Crit. Rev. Environ. Sci. Technol. 39, 783–842. https://doi.org/10.1080/10643380801977610
Hadi, P., Xu, M., Ning, C., Sze Ki Lin, C., McKay, G., 2015. A critical review on preparation, characterization and utilization of sludge-derived activated carbons for wastewater treatment. Chem. Eng. J. 260, 895–906. https://doi.org/10.1016/j.cej.2014.08.088
Harkins, W.D., Jura, G., 1944. Surfaces of Solids. XII. An Absolute Method for the Determination of the Area of a Finely Divided Crystalline Solid. J. Am. Chem. Soc. https://doi.org/10.1021/ja01236a047
Iida, T., Amano, Y., Machida, M., Imazeki, F., 2013. Effect of surface property of activated carbon on adsorption of nitrate ion. Chem. Pharm. Bull. 61, 1173–1177. https://doi.org/10.1248/cpb.c13-00422
Inglezakis, V.J., Poulopoulos, S.G., 2006. Adsorption, Ion Exchange and Catalysis, Adsorption, Ion Exchange and Catalysis. https://doi.org/10.1016/B978-0-444-52783-7.X5000-9
Kasaoka, S., Sakata, Y., Eiji, T., Naitoh, R., 1987. Preparation of activated fibrous carbon from phenolic fabric and its molecular sieving properties. Nippon Kagaku Kaishi 60, 990–1000. https://doi.org/10.1246/nikkashi.1987.990
Kojima, N., Mitomo, A., Itaya, Y., Mori, S., Yoshida, S., 2002. Adsorption removal of pollutants by active cokes produced from sludge in the energy recycle process of wastes. Waste Manag. 22, 399–404. https://doi.org/10.1016/S0956-053X(02)00022-3
Larsson, D.G.J., Adolfsson-Erici, M., Parkkonen, J., Pettersson, M., Berg, A.H., Olsson, P.E., Förlin, L., 1999. Ethinyloestradiol - An undesired fish contraceptive? Aquat. Toxicol. 45, 91–97. https://doi.org/10.1016/S0166-445X(98)00112-X
Li, L., Quinlivan, P.A., Knappe, D.R.U., 2002. Effects of activated carbon surface chemistry and pore structure on the adsorption of organic contaminants from aqueous solution. Carbon N. Y. 40, 2085–2100. https://doi.org/10.1016/S0008-6223(02)00069-6
Lillo-Ródenas, M.A., Ros, A., Fuente, E., Montes-Morán, M.A., Martin, M.J., Linares-Solano, A., 2008. Further insights into the activation process of sewage sludge-based precursors by alkaline hydroxides. Chem. Eng. J. 142, 168–174. https://doi.org/10.1016/j.cej.2007.11.021
Lou, K., Rajapaksha, A.U., Ok, Y.S., Chang, S.X., 2016. Pyrolysis temperature and steam activation effects on sorption of phosphate on pine sawdust biochars in aqueous solutions. Chem. Speciat. Bioavailab. 28, 42–50. https://doi.org/10.1080/09542299.2016.1165080
Marsh, H., Rodriguez-Reinoso, F., 2006. Activated Carbon, 1st ed. Elsevier Science, Oxford. Marsh, H., Rodríguez-Reinoso, F., 2006. Applicability of Activated Carbon. Act. Carbon 383–
453. https://doi.org/10.1016/B978-008044463-5/50022-4 Martin, M.J., Artola, A., Balaguer, M.D., Rigola, M., 2003. Activated carbons developed from
surplus sewage sludge for the removal of dyes from dilute aqueous solutions. Chem. Eng. J. 94, 231–239. https://doi.org/10.1016/S1385-8947(03)00054-8
Milieu Ltd, WRc, RPA, 2003. Environmental, economic and social impacts of the use of sewage sludge on land. Final Report. Part I: Overview Report. European Commission, DG Environment. Belgium.
Mohamed, E.F., Andriantsiferana, C., Wilhelm, a M., Delmas, H., 2011. Competitive adsorption of phenolic compounds from aqueous solution using sludge-based activated carbon. Environ. Technol. 32, 1325–36. https://doi.org/10.1080/09593330.2010.536783
Montes-Morán, M.A., Suárez, D., Menéndez, J.A., Fuente, E., 2004. On the nature of basic sites on carbon surfaces: An overview. Carbon N. Y. 42, 1219–1224. https://doi.org/10.1016/j.carbon.2004.01.023
Pan, Z. hui, Tian, J. yu, Xu, G. ren, Li, J. jing, Li, G. bai, 2011. Characteristics of adsorbents made from biological, chemical and hybrid sludges and their effect on organics removal in wastewater treatment. Water Res. 45, 819–827. https://doi.org/10.1016/j.watres.2010.09.008
43
Rakić, V., Rac, V., Krmar, M., Otman, O., Auroux, A., 2015. The adsorption of pharmaceutically
active compounds from aqueous solutions onto activated carbons. J. Hazard. Mater. 282, 141–149. https://doi.org/10.1016/j.jhazmat.2014.04.062
Rio, S., Le Coq, L., Faur, C., Lecomte, D., Le Cloirec, P., 2006. Preparation of Adsorbents from Sewage Sludge by Steam Activation for Industrial Emission Treatment. Process Saf. Environ. Prot. 84, 258–264. https://doi.org/10.1205/psep.05161
Ros, A., Lillo-Ródenas, M.A., Fuente, E., Montes-Morán, M.A., Martín, M.J., Linares-Solano, A., 2006. High surface area materials prepared from sewage sludge-based precursors. Chemosphere 65, 132–140. https://doi.org/10.1016/j.chemosphere.2006.02.017
Ros, A., Montes-Moran, M.A., Fuente, E., Nevskaia, D.M., Martin, M.J., 2006. Dried sludges and sludge-based chars for H2S removal at low temperature: Influence of sewage sludge characteristics. Environ. Sci. Technol. 40, 302–309. https://doi.org/10.1021/es050996j
Samolada, M.C., Zabaniotou, A.A., 2014. Comparative assessment of municipal sewage sludge incineration, gasification and pyrolysis for a sustainable sludge-to-energy management in Greece. Waste Manag. 34, 411–420. https://doi.org/10.1016/j.wasman.2013.11.003
Shafeeyan, M.S., Daud, W.M.A.W., Houshmand, A., Shamiri, A., 2010. A review on surface modification of activated carbon for carbon dioxide adsorption. J. Anal. Appl. Pyrolysis 89, 143–151. https://doi.org/10.1016/j.jaap.2010.07.006
Sioukri, E., Bandosz, T.J., 2005. Enhancement of the performance of activated carbons as municipal odor removal media by addition of a sewage-sludge-derived phase. Environ. Sci. Technol. 39, 6225–6230. https://doi.org/10.1021/es0503985
Sizmur, T., Fresno, T., Akgül, G., Frost, H., Moreno-Jiménez, E., 2017. Biochar modification to enhance sorption of inorganics from water. Bioresour. Technol. 246, 34–47. https://doi.org/10.1016/j.biortech.2017.07.082
Smith, K.M., Fowler, G.D., Pullket, S., Graham, N.J.D., 2009. Sewage sludge-based adsorbents: A review of their production, properties and use in water treatment applications. Water Res. 43, 2569–2594. https://doi.org/10.1016/j.watres.2009.02.038
Stavropoulos, G.G., Zabaniotou, A.A., 2009. Minimizing activated carbons production cost. Fuel Process. Technol. 90, 952–957. https://doi.org/10.1016/j.fuproc.2009.04.002
Tay, J.H., Chen, X.G., Jeyaseelan, S., Graham, N., 2001. Optimising the preparation of activated carbon from digested sewage sludge and coconut husk. Chemosphere 44, 45–51. https://doi.org/10.1016/S0045-6535(00)00383-0
Tchobanoglous, G., Burton, F.L., Stensel, H.D., 2014. Wastewater Engineering: Treatment and Reuse. Metcalf & Eddy, Inc., 5th ed, Engineering. McGraw-Hill Education, New York. https://doi.org/10.1016/0309-1708(80)90067-6
Wang, Z., Guo, H., Shen, F., Yang, G., Zhang, Y., Zeng, Y., Wang, L., Xiao, H., Deng, S., 2015. Biochar produced from oak sawdust by Lanthanum (La)-involved pyrolysis for adsorption of ammonium (NH4+), nitrate (NO3-), and phosphate (PO43-). Chemosphere 119, 646–653. https://doi.org/10.1016/j.chemosphere.2014.07.084
Worch, E., 2012. Adsorption Technology in Water Treatment: Fundamentals, Processes, and Modeling, 1st ed. de Gruyter GmbH, Walter, Berlin. https://doi.org/10.1515/9783110240238
Yin, C.Y., Aroua, M.K., Daud, W.M.A.W., 2007. Review of modifications of activated carbon for enhancing contaminant uptakes from aqueous solutions. Sep. Purif. Technol. 52, 403–415. https://doi.org/10.1016/j.seppur.2006.06.009
Yu, L., Zhong, Q., 2006. Preparation of adsorbents made from sewage sludges for adsorption of organic materials from wastewater. J. Hazard. Mater. 137, 359–366. https://doi.org/10.1016/j.jhazmat.2006.02.007
44
Zhang, F.-S., Nriagu, J.O., Itoh, H., 2005. Mercury removal from water using activated carbons derived from organic sewage sludge. Water Res. 39, 389–395.https://doi.org/10.1016/j.watres.2004.09.027
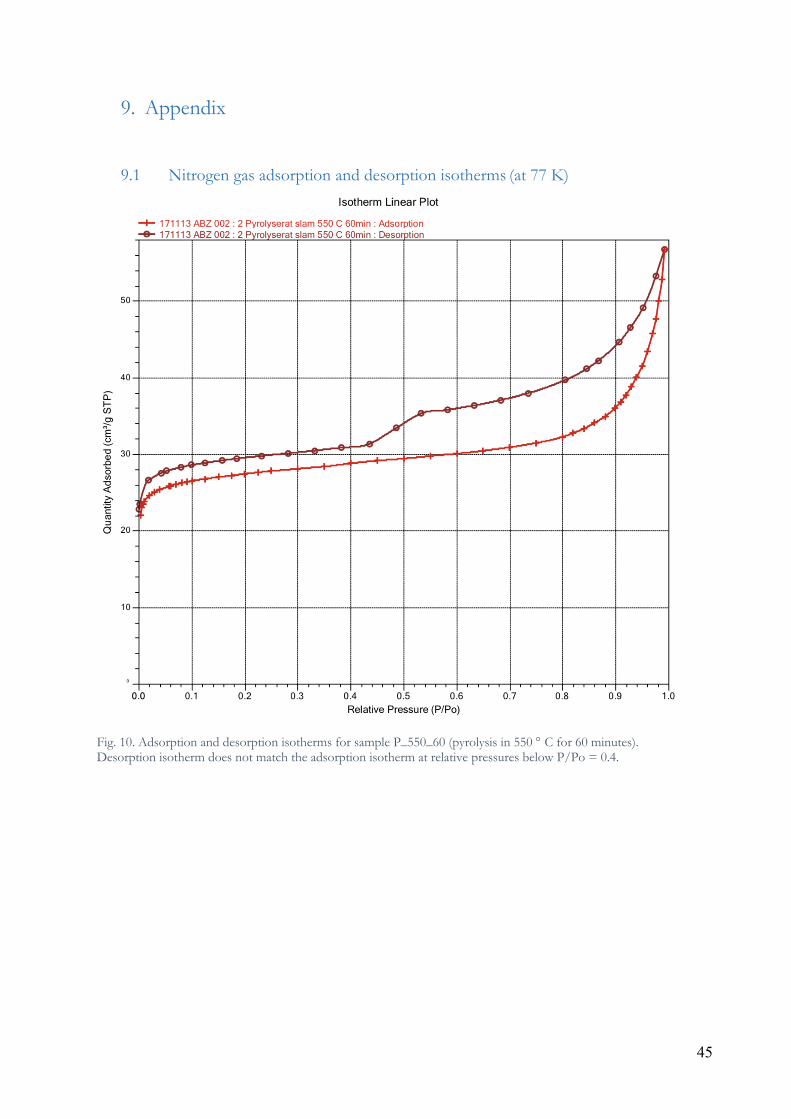
45
9. Appendix
9.1 Nitrogen gas adsorption and desorption isotherms (at 77 K)
Fig. 10. Adsorption and desorption isotherms for sample P_550_60 (pyrolysis in 550 ° C for 60 minutes). Desorption isotherm does not match the adsorption isotherm at relative pressures below P/Po = 0.4.
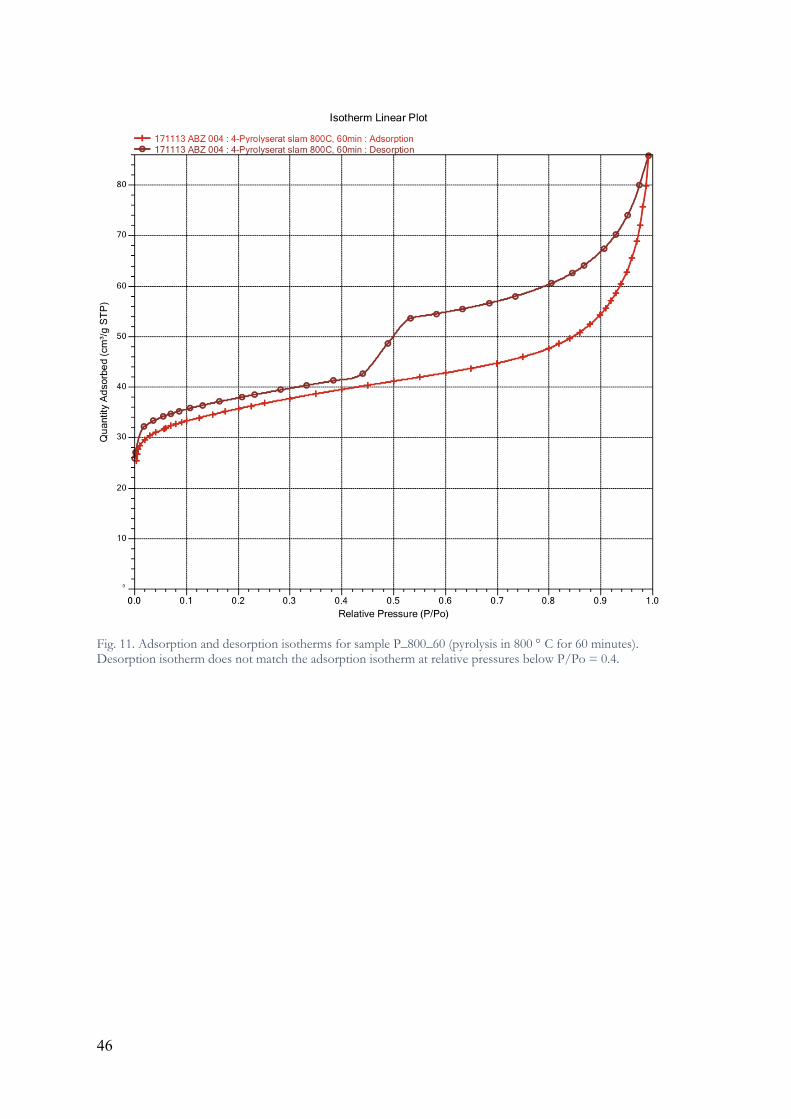
46
Fig. 11. Adsorption and desorption isotherms for sample P_800_60 (pyrolysis in 800 ° C for 60 minutes). Desorption isotherm does not match the adsorption isotherm at relative pressures below P/Po = 0.4.
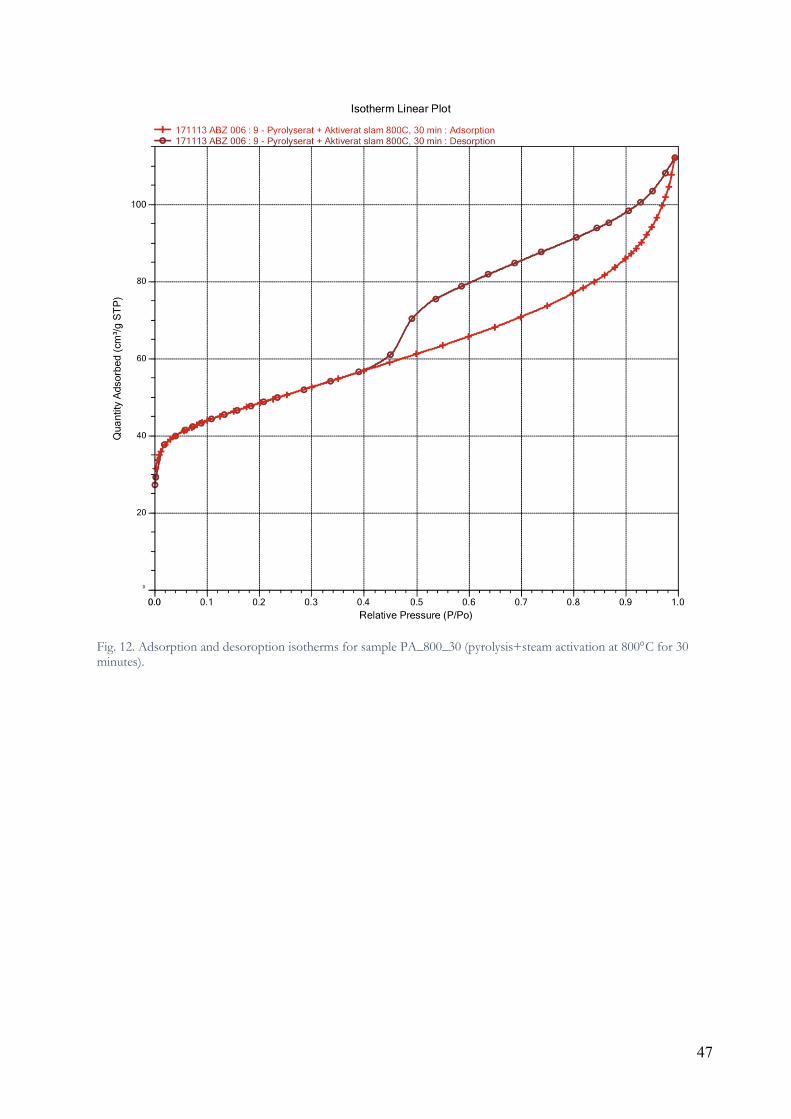
47
Fig. 12. Adsorption and desoroption isotherms for sample PA_800_30 (pyrolysis+steam activation at 800°C for 30 minutes).
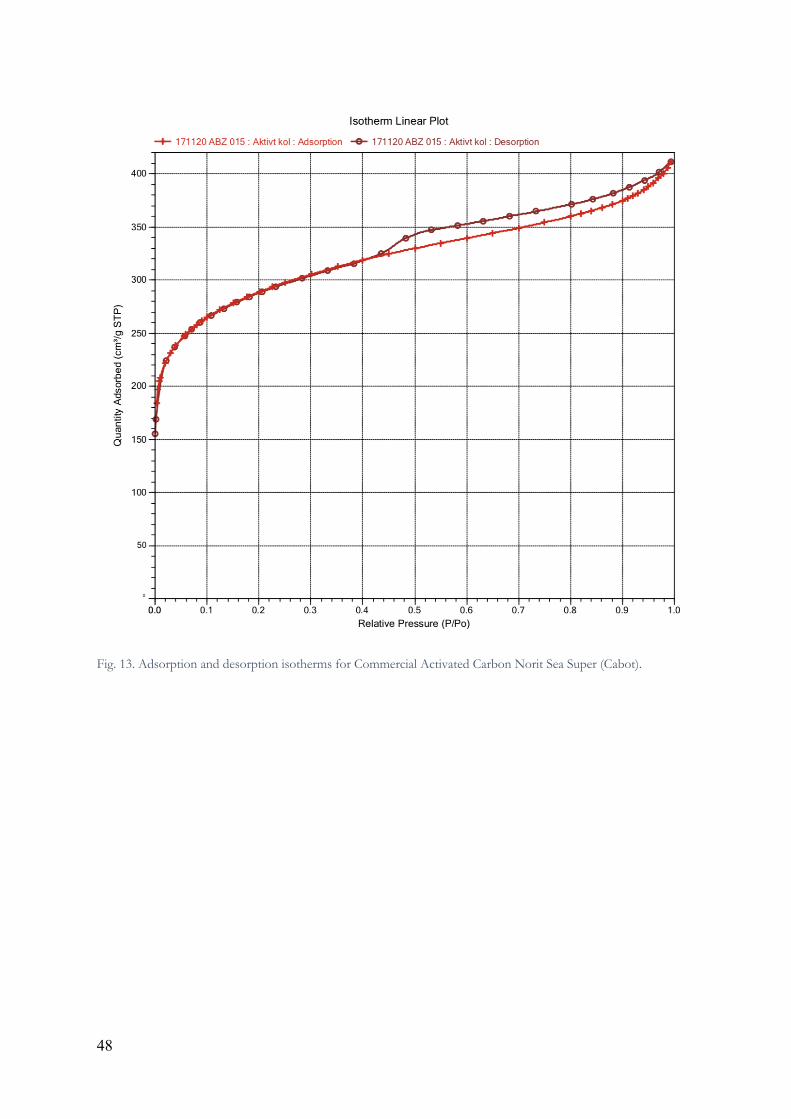
48
Fig. 13. Adsorption and desorption isotherms for Commercial Activated Carbon Norit Sea Super (Cabot).