Embed Size (px)
Citation preview
Sonderdruck aus:
Silvae Genetica
J. D. Sauerländer’s Verlag, Frankfurt a. M.
Silvae Genetica 48 (1999)

Silvae Geneticais e d i t e d b y t h e
Bundesforschungsanstalt fiir Fo&- undHolzwirtschaft Hamburg
in c o l l a b o r a t i o n w i t h
Silvae Geneticaherausgegeben v o n d e r
Bundesforschungsanstalt für Fo&- undHolzwirtschaft Hamburg
unter Mitwirkung von
Silvae Geneticakdite par
Bundesforschungsanstalt für Forst- undHolzwirtschaft Hamburg
avec l a c o o p é r a t i o n d e
AhujaI n s t i t u t e o f F o r e s t G e n e t i c sUSDA Forest Service2480 Carson RoadPlacedle, CA 95667USAFax: +530-622-2633e - m a i l : [email protected]
Dr. Ph. BaradatENSAM-INRA, Laboratoire d’ArboricultureFruitière2 , P l a c e P e r r a VialaF - 3 4 0 6 0 M o n t p e l l i e r Cedex 1FranceF a x : +33-04-9961-2616e - m a i l : baradatOensam.inra.fr
Dr. Richard BarnesU n i v e r s i t y o f O x f o r dD e p t . o f P l a n t S c i e n c e sO x f o r d F o r e s t r y I n s t i t u t eSouth Parks RoadOxford OX1 3RBUnited KingdomFax: +44-l-865-275-074
Dr: Nuno M. G. BorralhoRAIZ Forest and Paper Research InstituteH e r d a d e d a T o r r e BelaAp. 15P - 2 0 6 5 A l c o e n t r eP o r t u g a lF a x : +351-63-44490e - m a i l : [email protected]
Dr. Dietrich EwaldBFH - Institut fiir Forstgenetik undForstpflanzenzüchtungEberswalder Chaussee 3D-15377 WaldsieversdorfGermanyFax: +49-33433-66-199e - m a i l : [email protected]
Dr. Leonardo A. GalloINTAE.E.A. - BarilocheUnidad de Genética ForestalC a s i l l a d e C o r r e o 2 7 78400 Bariloche, PatagoniaArgentinaFax: +54-944-24991e - m a i l : [email protected]
Prof: D>: Maciej GiertychP o l i s h A c a d e m y o f S c i e n c e sI n s t i t u t e o f D e n d r o l o g yParkowa 5PL-62 035 KórnikPolandFax: +48-61-170166e-mail: [email protected]
Prof DI: Hans-H. HattemerAbt. für Forstgenetik undForstpflanzenzüchtungGeorg-August-Universität G ö t t i n g e nBüsgenweg 2D-37077 GöttingenGermanyF a x : +49-551-39-8367e-mail: [email protected]
brot: Dr. Martin HubbesFaculty o f F o r e s t r yU n i v e r s i t y o f T o r o n t oE a r t h S c i e n c e s C e n t r e3 3 W i l l c o c k s S t r e e tT o r o n t o , O n t a r i o M5S 3 8 3CanadaF a x : +l-416-978-3834
DI: Keith W. HutchisonU n i v e r s i t y o f M a i n eDepartment o f B i o c h e m i s t r y ,M i c r o b i o l o g y a n d M o l e c u l a r B i o l o g y5735 Hitchner HallOrono, Maine 044695735USAFax: +l-207-581-2801e - m a i l : [email protected]
DI: D. K. KhuranaDepartment of Tree ImprovementC o l l e g e o f F o r e s t r yDr. Y. S. Parmar University ofHorticulture and ForestryNauni, Solan (H. P) 173230IndiaF a x : +91-1792-20225/52242
Prof: Dr. Edward G. KirbyD e p a r t m e n t o f B i o l o g y S c i e n c e sRutgers UniversityUniversity HeightsNewark, New Jersey 07102USAFax: +l-201-648-1007e - m a i l : [email protected]
Dr. Veikko KoskiFinnish Forest Research InstituteF’. 0. Box 18FIN-01301 VantaaFinlandF a x : +358-g-8570-5711e - m a i l : veikko.koskiOmetla.6
Prof: DI: Dag LindgrenSLU
Dr. David B. NealeI n s t i t u t e o f F o r e s t G e n e t i c sU S D A F o r e s t S e r v i c ePacific Southwest Research StationF! 0. Box 245B e r k e l e y , C A 9 4 7 0 1USAF a x : +l-510-559-6499e - m a i l : [email protected]
DI: Olof OlssonDepartment o f M o l e c u l a r B i o l o g yGöteborg UniversityMedicinaregatan 9cS - 4 1 3 9 0 G ö t e b o r gS w e d e nFax: +46-31-773-3801e - m a i l : [email protected]
DI: Hans RoulundDen. Kgl. Veterinaer-o g LandbohejskoleI n s t i t u t f o r B o t a n i k , D e n d r o l o g i o gF o r s t g e n e t i kA r b o r e t e tKirkegårdsvej 3ADK-2970 HersholmDenmarkFax: +45-35-28-36-29e-mail: [email protected]
Dr: Outi SauolainenUniversity of OuluD e p a r t m e n t o f B i o l o g yLinnanmaa PL 400FIN-90571 OuluFinlandFax: +358-8-553-1061e - m a i l : [email protected]
Dr. Scott E. SchlarbaumD e p t . o f F o r e s t r y , W i l d l i f e a n d F i s h e r i e sThe Univers i ty o f TennesseeInstitute of AgricultureP . 0 . B o x 1 0 7 1Knoxville, TN 37901-1071USAFax: +l-423-974-4733e - m a i l : [email protected]
Dr. Dauid G. ThompsonC o i l l t e TeorantaThe Irish Forestry BoardResearch LaboratoryNewtownmountkennedyCo. WicklowIrelandFax: +353-1281-0465e - m a i l : btdetalOiol.ie
D e p t . o f F o r e s t G e n e t i c s & P l a n t PhysiologyS-901 83 UmeåSwedenFax: +46-90-165901e-mail: [email protected]
Prof: Dr. Csaba MátyásThe University of SopronD e p t . o f E n v i r o n m e n t a l S c i e n c eAdy Endre u. 5F’. 0. B. 132H-9401 SopronHungaryFax: +36-99-329840e - m a i l : [email protected]
Prof: Dr. Gerhard Miiller-StajkL e h r b e r e i c h F o r s t g e n e t i kForstwissenschaftliche FakultätLudwig-Maximilians-Universität MünchenAm Hochanger 13D-85354 FreisingGermanyFax: +49-8161-71-4861e - m a i l : [email protected].
uni-muenchen. de
Editorial Office: Hans-J. Muhs Schriftleitung: Han&. Muhs Maison d’Edition: Hans-J. Muhs
Address: Siekerlandstrasse 2D-22927 GrosshansdorfFederal Republic of GermanyTel.: 49/4102/696-OF a x : 49/4102/696-200
Rules for Publishing a manuscript in SilvaeGenetica can be requested from the Publishingh o u s e or f r o m t h e e d i t o r i a l Office.
Adresse: Siekerlandstrasse 2D-22927 GrosshansdorfBundesrepublik DeutschlandTel.: 0 4102/696-OFax: 0 4102/6 96-2 OO
Richtlinien sur Veröffentlichung cines Manu-skriptes in Silvae Genetica können von derR e d a k t i o n o d e r dem,Verlag a n g e f o r d e r t w e r d e n .
Adresse: Siekerlandstrasse 2D-22927 GrosshansdorfRépublique fédérale d’AllemagneT e l . : 49/4102/696-OFax: 49/4102/6 96-2 OO
Des instructions pour publier un manuscriptdans Silvae Genetica peuvent être demandées àla rédaction ou à la maison d’édition.
Allozyme Diversity of Selected and Natural LoblollyPine Populations
By R. C. SCHMIDTLING~)?, E. CARROLL~)~) and T. LAFARGE?~)
(Received 19th January 1999)
Summary
Loblolly pine (Pinus taeda L.) megagametophytes andembryos were examined electrophoretically to compare theextent and distribution of genetic variability in allozymes ofselected and wild populations. Range-wide collections of threedifferent types were investigated in this study. These consistedof seed sampled from, 1. a provenance test established in 1953,2. bulk seed sampled from collections obtained from naturalstands, and 3. seed harvested from clones used to produceimproved seed in a tree improvement program.
Al1 18 loci tested were found to be polymorphic. The averagenumber of alleles overa11 (N,) was 3.8. Expected heterozygosi-ties (H,) varied from 0.193 in the 70-year old orchard clones, to0.174 in the 40-year-old provenance test samples, to 0.163 inthe embryos of the bulk collections. The maximum F,, was0.066 for the provenance test populations, which indicates thatonly a small proportion (6.6 %) of the total variation in allozy-mes was attributed to population differences. In spite of this,the populations were well differentiated in multivariate analy-sis.
In controlled-pollinated progeny tests of the orchard selec-tions, there was a negative association between growth and thepresente of rare alleles in the parent. A rare allele at the IDHlocus was associated with slower growth, probably because itindicated hybridization with the slower-growing shortleaf pine(E) echinata MILL.).
Allozyme variation as well as variation in cortical monoter-penes and fusiform rust resistance suggests that loblolly pineresided in two refugia during the Pleistocene; one in SouthTexas / northeast Mexico and one in South Florida / Caribbean.The two populations migrated to the northern Gulf CoastalPlain at the beginning of the Holocene and merged just east ofthe Mississippi River.
Key LOO&: Pinus toedo, allozymes, geographic variation, Pleistocene,tree improvement, genetic variation, hybridization.
FDC: 165.52; 165.3; 165.71; 174.7 Pinus taeda.
Introduction
Forest tree populations in the southeastern United Stateshave undergone a great deal of change after the height of theWisconsin glaciation 13,000 years ago (WATTS, 1933). As popu-lations migrated northward in the wake of the retreatingglacier, following optimum environments for the species, theyevolved in response to their new environment. Adaptations inresponse to these environmental changes are probably still
‘1 Geneticists, USDA Forest Service2, Southern Institute of Forest Genetics, 23332 Hwy 67, Saucier, MS
39574, USA, tel: 228-832-2747, fax: 228-832-0130, e-mail:schmidtlQdatasync.com
3, National Forest Genetic Electrophoresis Lab., Camino, CA 95709,USA
4, Southern Region, Atlanta, GA 30367, USA5, Nursery records on file at the Ashe Nursery, USDA Forest Service,
Brooklyn, MS.
Silvae Genetica 48,1(1999)
taking place because forest trees are long lived, have a slowgeneration turnover, and exist in a constantly changingclimate.
Recently, man has greatly accelerated the rate of geneticchange. Starting before the turn of the century, clear-cuttingand high-grading, followed by sporadic natural regenerationleft many areas devoid of forest or sparsely populated by a fewgenotypes that were inferior to the harvested stands. In thereforestation carried out by the Civilian Conservation Corps inthe 193O’s, an effort was made to use native seed sources, butnursery records5) show that the source of seed was sometimesdisregarded; the result was a random mixing of foreign prov-enances with the native populations. During reforestation,species composition shifted significantly. Vast acreages of slashpine (Pinus elliottii ENGELM.) were planted within, as well asoutside its natural range. Longleaf pine (P palustris MILL.),once the predominant species on the Coastal Plain, was largelyreplaced by slash and loblolly pines (P taeda L.) because long-leaf pine was very difficult to plant and slow in early growth(CROKER, 1990). Shortleaf pine (P. echinata MILL.) was largelyreplaced by the faster growing loblolly pine in the southernpart of its range.
Beginning in the 195O’s, the mixing of populations becamemuch more widespread and systematic in loblolly, the most fre-quently planted southern pine. Tremendous quantities of seed-lings from Livingston Parish, Louisiana, and east Texas havebeen planted in Georgia, Alabama, and north Florida becausethey are resistant to fusiform rust (WELLS, 1985). In the otherdirection, great quantities of seedlings from the Coastal Plainof the Carolinas have been planted in Arkansas, because theygreatly surpass the local sources in growth, although there isincreased risk for crep failure (LAMBETH et al., 1984).
The plantations resulting from these moves are geneticallydifferent from the local sources (WELLS, 1985). Even if al1 ofthese plantations are clear-cut, their genes will persist asadvanced natural regeneration or as pollen contamination inseed produced in surrounding native populations.
Tree improvement programs also bring about geneticchange; this is their sole purpose. The widespread use ofgenetically improved material may also affect genetic diversity.
Studies of allozyme variation can be very useful in defíninggenetic variation in forest trees (HAMRICK et al., 1992). Therehave been few published studies of allozyme variation anddiversity for range-wide loblolly pine. FLORENCE and RINK
(1979) reported on variation that did not include samples fromthe northeastern par-t of the range. They noted differencesbetween populations east of the Mississippi River and thosewest of the river. In the present study, loblolly pine seed wereexamined electrophoretically to compare the extent, distribu-tion and magnitude of possible change in genetic variability forselected and wild populations of various origins. Progeny testdata were also examined to determine the relationship betweengenetic variability (as measured by allozymes) and heightgrowth.
3 5
IMaterials and Methods
Seed SourcesRange-wide collections of seed of four different types were
used in the study. Seed were collected from: 1. The SouthwidelSouthern Pine Seed Source Study (SSPSSS), 2. Bulk woods-runIcollections, and 3. and 4. Collections from orchard clones from a.tree improvement program.
1. The Southwide Southern Pine Seed Source StudyISSPSSS) is the most extensive set of provenance tests ever:mstalled in the United States (WELLS, 1969). The SSPSSS was;a very large undertaking involving many cooperators coordinat-ed by the Southern Forest Tree Improvement Committee. Seed:from numerous natural stands of slash, loblolly, longleaf, andzshortleaf pines was collected across the entire southern pine:range in the early 1950’s. The loblolly pine plantings were esta-lblished in 1954.
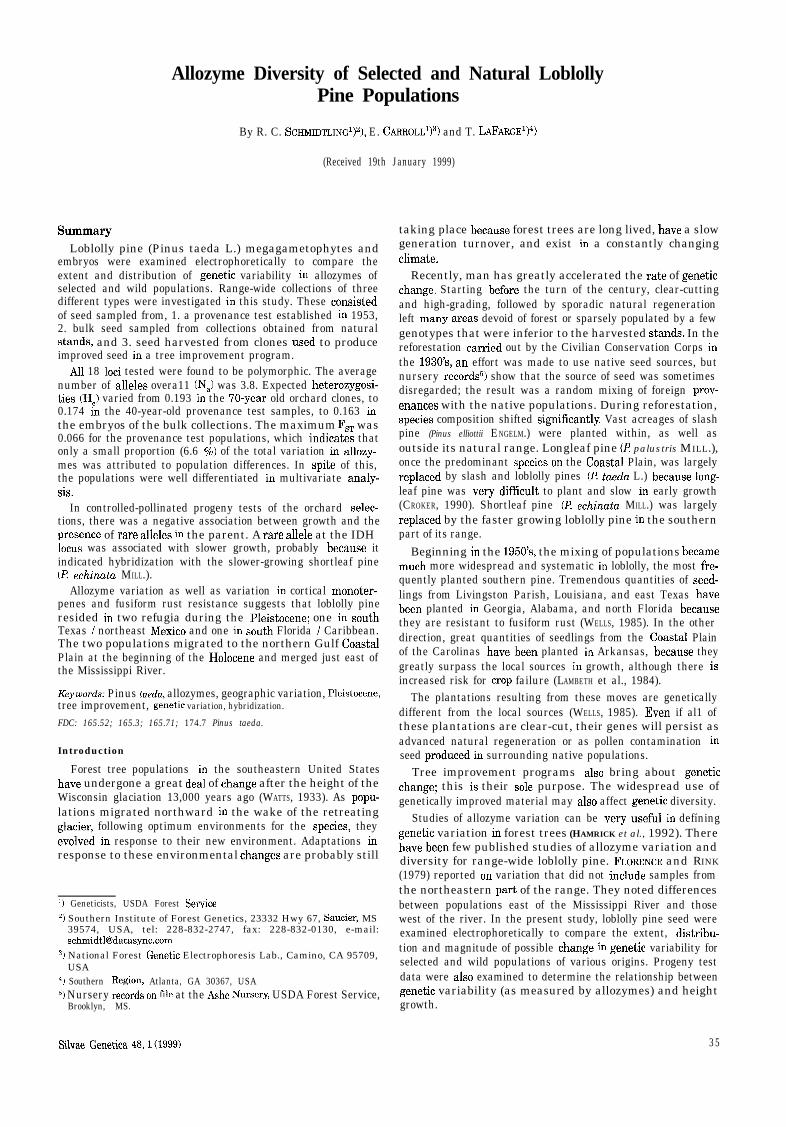
Seed for electrophoresis were collected from 9 to 17 trees per:source from 14 sources in two of the SSPSSS loblolly plantingslocated in South Mississippi (Fig. 1, Table 1). Only megagame-tophytes were used for analysis, since the provenance of theIpollen parent is indeterminate.
2. The wild, or bulk seed lots were from 10 locations acrossthe natural range (Fig. 1). These were obtained from variouscooperators and were collections from large numbers of trees innatural stands for general planting use. Embryos were analyz-ed.
3. The orchard clones are from the USDA Forest Service treejmprovement program in the Southern Region (R-8). The R-8I.oblolly pine program divides the southeastern US into 5 breed-ing zones, containing one or more 50-clone sources. Breeding
zone 1 contained interior sources ll, 12, and 13 from north AL,GA and MS, respectively (Fig. 1). Zone 2 consists of the westernsources 21 and 22 from west LA and TX. Zone 3 is number 32from southwest MS. Zone 4 consists of numbers 41 and 44 fromthe coastal Carolinas. Zone 5 consists of piedmont SC number53. A total of 329 clones from 9 sources were used in this analy-sis. Each clone was genotyped at 18 loci by analyzing 10megagametophytes from each clone.
4. A simulated ,,orchard output“ was constructed for each ofthe 9 sources by mixing equal numbers of seed from each clonewithin each source and analyzing embryos, to study the effectsof tree improvement on genetic diversity.
Enzyme ElectrophoresisIsozyme band patterns were investigated using megagame-
tophyte and embryo tissues. Intact seeds were sterilized forfive minutes in calcium hypochlorite solution and then spreadon petri plates lined with filter paper moistened with 1%hydrogen peroxide. Seeds were placed in a germinator at 20°Cto 21°C with a 8-hr photoperiod, until radicles were 5 mm to10 mm in length, which normally occurred within 5 to 7 days.
For the SSPSSS and orchard clonal material, extracts wereprepared by crushing an excised megagametophyte in twodrops of 0.20 M phosphate buffer (pH 7.51, absorbing it onto2 mm wide paper wicks and freezing the wicks at -70°C. Forthe bulk and orchard output samples, the excised embryoswere placed in two drops of 0.20 M phosphate buffer (pH 7.51,and frozen at -70 “C.
Prior to electrophoresis, the embryo samples were thawed,macerated and absorbed on 2.5 mm wicks for electrophoresis.
NATURAL DISTRIBUTION OFLOBLOLLY FINE (PínuS faeh L.1
R-8 ORCHARD SOURCES
SSPSSS SEED SOURCESBULK COLLECTIONS
R-8 ORCHARDS
OK AR
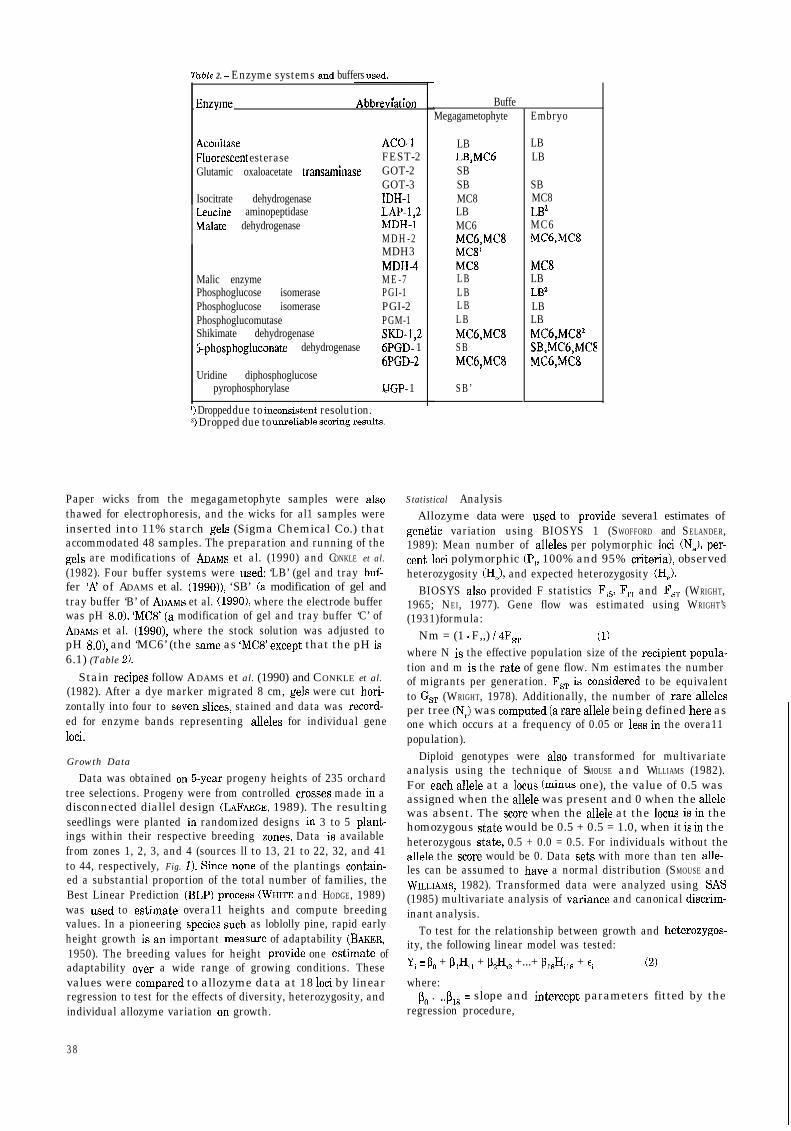
Figure 1. - Map of the southeastern United States showing the natural range of loblolly pine (Pinus tae& L.) and thelocations of the sampled populations.
3 6
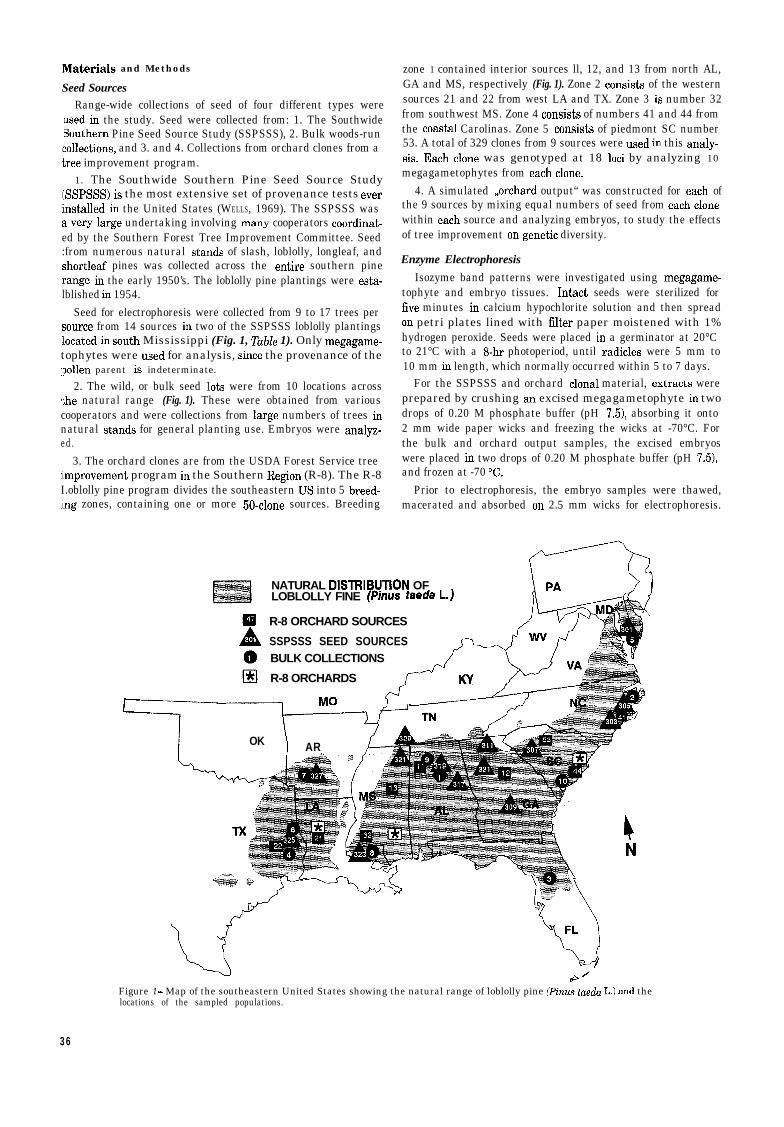
Tuble 1. - Population origins, number of trees sampled per population, mean number of alleles per polymorphic loci (NJ,percent loci polymorphic (Pr), observed heterozygosity (HJ, and expected heterozygosity (H,) at 12 loci.
1PopulalionSource County State
Samplesízc
5’Na 100% 95% I-4 He
By!.~...p!&g~m!~~....__._...... ,._ . .._e%! _.._. __.......... _... . . . . . . .._.. . . _~ .-..-..._ _ . . . . , . , . , . . .._ . . . . . . I,. . .,..,.,. l.. . . . . . . . . . . . .,.... . . . . . . . . . ../....... -.1 Jefferson AL 6 8 2.00(0.28)~ 66 .7 33 .3 0.142(0.0s~) 0.154(0.061)2 Beaufort NC 63 2.42(0.36) 75 .0 50 .0 0 . 1 7 l(O.060) 0.174(0*065)3 Marion FL 61 2.58(0.38) 83 .3 41 .7 0.158(0.065) 0.174(0.068)4 Polk TX 6 6 1.83(o.z) 66 .7 41 .7 o.i52(O,O6l) 0.14d(O.O56)5 Worchester MD 67 2.42@.~3) 83 .3 41 .7 0.157(0.057) 0,173(0.06q6 Angelina TX 64 2.08(0.19) 83 .3 41 .7 0.143(0.05I) 0.157(0.058)7 Howard AR 6 6 2.33(0.38) 83 .3 50 .0 0.160(0.063) 0.173(0.062)8 Livingston LA 6 9 2.17(0.32) 15 .0 33 .3 0.127(o.o~j) 0.137(0.061)9 Cullman AL 67 2.33(0.31) 83 .3 50 .0 0.175(O.OEo) 0.173(0.057)1 0 Charleston S C 6 6 2.25(0.41) 66 .7 50 .0 0.172(o.Oa) 0.171(0.065)
Mean 2.24 77 .5 43 .3 0.156 0.163
SSPSSS Sourccs301 Somerset MD303 Onslow NC305 Pamlico NC307 Newbctry SC309 Wilcox GA311 Clarke GA317 Clay kL319 Jefferson AL321 Premíss MS3 2 3 Lívingston L A325 Angelina TX327 Clark AR329 Hardeman TN33 1 Spalding GA
Mean
Trecs1 71 79
1 01 01 011111 01 710151 01 0
___.... ________.. _......_ __ ___._., ,,_____,,l_,,,_. _,_ .____..._._____.... ..,......._...__ ..______ ~ ,,_,.____._....__...2.17(0.39) 58 .3 58 .3 -3 0.203(0.066)2.33(0.31) 75 .0 50 .0 0.184(0.057)2.00(0.17) 83 .3 41 .7 0.149(O.O48)1.83(0.21) 66 .7 66 .7 0.169(0.053)1.67(o.zz) 50 .0 41 .7 O.l54(0,06o)2.00(0.25) 66 .7 66 .7 0.200(0,055)2.42(036) 75 .0 75 .0 0.238(0.060)2.33(0.28) 83 .3 66 .7 0.213(0.062)1.50(0,23) 33 .3 25 .0 0.119(0.064)1.83(0.30) 50 .0 50 .0 0.181(0.066)1.58(0.23) 41 .7 33 .3 0.1 10(0.055)2,08(0.19) 83 .3 58 .3 0.169(0.05l)2.08(0.23) 75‘0 6 6 . 7 0.218(0.056)1.83(o.zí) 66 .7 33 .3 0.135(0.055)1.98 64 .9 52 .4 0 .174
Seed Orchard Clones Trccs. . . . . . . . . . . . . . . . . . . . . . . . . _ . . . . ..-.-..-.... _ . . . . _ . . . . _ . . . . . . . . . . . . . ____..........,.... x . . . . . . . . . . . ___ . . . . . . . . . . . . _ . . . ..I. _ --.-......._.. _.._ . . . . . . _ . . ...” . . . . . . . . - . .._.--_ -..-...-.. - . .. . . .ll N--Central AL 53 2,67(0.31) 91 .7 75 .0 0,156(0.051) [email protected])12 N . - C e n t r a l G A 1 9 2.58(0.31) 83 .3 75 .0 0.228(o.our) 0.216(0.057)1 3 N--Central M S 30 2.42(0.29) 91 .7 66 .7 0.161(0.053) 0.176(0.062)21 Central LA 5 1 2.50(0.19) 100 50.0 0.196(0.06q 0.180(0.056)22 SrEiast TX 50 2.33(0.19) 91 .7 66 .7 0.202(0.054) 0.196(0.050)32 S.-W& MS 39 2.25(o.z) 83 .3 58 .3 0.182(0.058) 0.177(0.058)41 Coastal NC 33 2.58(0.38) 91 .7 58 .3 0.240(0.0~4) 0.235(0.060)44 coasra SC 2 6 2.50(0.42) 75 .0 58 .3 0.250(0.072) 0 . 2 3 l(o.066)53 Picdmont SC 4 8 2.58(0.35) 83 .3 58 .3 0.167(0.056) 0.166(0.055)
Mean 2.49 88 .0 60 .2 0.198 0.193
Seed Orchard Output Seed. ..._.....,.. I . . . . .._............ __ .-..-._._... _. . . ...” . . . . . . . . . . . . . . . . . . . . . . . . . . . . . . . . . . “” __ . . ..--........_ -____ . . . . . . . . .““.,..., . . . . __.” . . . . . . . _.~.._ ..-- __~-.__ . . . . . . . . . . . . . . . . . .I...”I I N;Central A L 46 1.83~0.34) 50 .0 16 .7 0 . 1 1 S(o.064) 0 . 1 1 O(O.059)12 N.-Central GA 54 2.08(0.26) 75 .0 41 .7 0.167(0,067) 0.164(0.062)1 3 N.-Central M S 39 1.92(o.q 66 .7 41 .7 0.132(0.056) 0.147(0.065)21 Central LA 43 2.25(0.30) 83 .3 41 .7 0.154(0.061) 0.154(0.058)22 s;East TX 4 7 1.92(0.19) 75 .0 50 .0 0.158(0.05q 0.160(0.053)32 S.-West MS 43 uww7) 83 .3 33 .3 0 . 1 SS(O.069) 0.158(0.064)41 Coastal NC 45 2.OstO.34) 66 .7 50 .0 0.165(0.063) 0.173(0.066)44 Coastal SC 4 0 2.33(Oo.31) 83 .3 50 .0 0.177(0.061) 0.178(0.057)53 Piedmont SC 4 4 [email protected]) 66 .7 41 .7 0.133(0.056) 0.148(0.059)
M e a n 2.07 72 .2 40 .8 0.151 0.155
r) At the 100 % criterion, a locus is considered polymorphic if more than one allele was deteeted. At the 95 % criterion, themost common allele must have a frequency of 0.95 or less for a locus to be considered polymorphic.
s) Standard errors of the estimates are in parenthesis.3, The seed were bulked and approximately 50 megagametophytes per source were genotyped. Since individual tree data
are not available, observed heterozygosities were not computable.
3 7
l
AconitaseFluorescent esteraseGlutamic oxaloacetate transaminase
Isocitrate dehydrogenaseLeucine aminopeptidaseMalate dehydrogenase
Table 2. - Enzyme systems and buffers used.
Malic enzymePhosphoglucose isomerasePhosphoglucose isomerasePhosphoglucomutaseShikimate dehydrogenase5phosphogluconate dehydrogenase
Uridine diphosphoglucosepyrophosphorylase
ACO-FEST-2GOT-2GOT-3IDH-1LAP-1,2MDH-1MDH-2MDH3MDH-4ME-7PGI-1PGI-2PGM-1SKD-1,2óPGD- 16PGD-2
.UGP- 1
l) Dropped due to inconsistent resolution.? Dropped due to unreliable scoring results.
Paper wicks from the megagametophyte samples were alsothawed for electrophoresis, and the wicks for al1 samples wereinserted into 11% starch gels (Sigma Chemical Co.) thataccommodated 48 samples. The preparation and running of thegels are modifications of ADAMS et al. (1990) and CONKLE et al.(1982). Four buffer systems were used: ‘LB’ (gel and tray buf-fer ‘AZ of ADAMS et al. (1990)), ‘SB’ (a modification of gel andtray buffer ‘B’ of ADAMs et al. (1990), where the electrode bufferwas pH KO), ‘MC8’ (a modification of gel and tray buffer ‘C’ ofADAMS et al. (1990), where the stock solution was adjusted topH 8.0), and ‘MC6’ (the same as ‘MC8’ except that the pH is6.1) (Table 2).
Stain recipes follow ADAMS et al. (1990) and CONKLE et al.(1982). After a dye marker migrated 8 cm, gels were cut hori-zontally into four to seven slices, stained and data was record-ed for enzyme bands representing alleles for individual geneloci.
Growth Data
Data was obtained on 5-year progeny heights of 235 orchardtree selections. Progeny were from controlled crosses made in adisconnected diallel design (LAFARGE, 1989). The resultingseedlings were planted in randomized designs in 3 to 5 plant-ings within their respective breeding zones. Data is availablefrom zones 1, 2, 3, and 4 (sources ll to 13, 21 to 22, 32, and 41to 44, respectively, Fig. 1). Since none of the plantings contain-ed a substantial proportion of the total number of families, theBest Linear Prediction (BLP) process (WHITE and HODGE, 1989)was used to estimate overa11 heights and compute breedingvalues. In a pioneering species such as loblolly pine, rapid earlyheight growth is an important measure of adaptability (BAKER,1950). The breeding values for height provide one estimate ofadaptability over a wide range of growing conditions. Thesevalues were compared to allozyme data at 18 loci by linearregression to test for the effects of diversity, heterozygosity, andindividual allozyme variation on growth.
3 8
BuffeMegagametophyte
LBLB,MCóSBSBMC8LBMC6MC6,MC8MCS’MC8LBLBLBLBMC6,MC8SBMC6,MC8
SB’
Embryo
LBLB
SBMC8LB2MC6MC6,MC8
MC8LBLB’LBLBMC6,MC8’SB,MC6,MCEMC6,MC8
Statistical AnalysisAllozyme data were used to provide severa1 estimates of
genetic variation using BIOSYS 1 (SWOFFORD and SELANDER,1989): Mean number of alleles per polymorphic loci (NJ, per-cent loci polymorphic (P,, 100% and 95% criteria), observedheterozygosity CH,,), and expected heterozygosity CH,).
BIOSYS also provided F statistics F,,, F, and F,, (WRIGHT,1965; NEI, 1977). Gene flow was estimated using WRIGHT’S(193 1) formula:
Nm = (1 - F,,) / 4F,, (1)where N is the effective population size of the recipient popula-tion and m is the rate of gene flow. Nm estimates the numberof migrants per generation. F, is considered to be equivalentto G,, (WRIGHT, 1978). Additionally, the number of rare allelesper tree (NJ was computed (a rare allele being defined here asone which occurs at a frequency of 0.05 or less in the overa11population).
Diploid genotypes were also transformed for multivariateanalysis using the technique of SMOUSE and WILLIAMS (1982).For each allele at a locus (minus one), the value of 0.5 wasassigned when the allele was present and 0 when the allelewas absent. The score when the allele at the locus is in thehomozygous state would be 0.5 + 0.5 = 1.0, when it is in theheterozygous state, 0.5 + 0.0 = 0.5. For individuals without theallele the score would be 0. Data sets with more than ten alle-les can be assumed to have a normal distribution (SMOUSE andWILLIAMS, 1982). Transformed data were analyzed using SAS(1985) multivariate analysis of variance and canonical discrim-inant analysis.
To test for the relationship between growth and heterozygos-ity, the following linear model was tested:Yi = Po + &Hi, + &H, +...+ p,,Hi,, + ei (2)
where:Po . ..& = slope and intercept parameters fitted by the
regression procedure,
.
Yi = BLP estimate of breeding value for height at age 5 for Results and Discussion
f progeny from clone i,Hi, . . Hi,s - for locus 1 through 18 for clone i, = 0 if the locus
is homozygous and =l if the locus is heterozygous, andei = residual.
As one approach to examining the hypothesis that allozymevariants are selectively neutral, it was first assumed that ifallozymes are not selectively neutral, than the ,,fitness“ of anallozyme may be related to its frequency in the population. Ateach locus for each allele, the allozyme codes were replacedwith the frequency of the subject allozyme in the population,and then tested in a linear model relating these frequencies tobreeding values for height:
or
where:Po . PS6 = slope and intercept parameters fitted by the regres-
sion procedure,Yi = BLP estimate of breeding value for height at age 5 for
progeny from clone i,Ai, . . . Ails - for locus 1 through 18, = the frequency of the
allele for the most common allele at the subject locus for clone1,
a,, aiI8 - for locus 1 through 18, = the frequency of the alle-le for the least common allele at the subject locus for clone i,and
ei = residual.Two models were tested, the ,,full“ or additive model that
included all the terms, ie, both the ,,A“ and ,,a“ terms (3a), andthe ,,dominance model“ (3b), which consisted only of the ,,A‘terms, or the frequency of only the most common allele at thelocus (this assumes that the most common allele is dominant tothe least common allele).
AllozymeLoclls
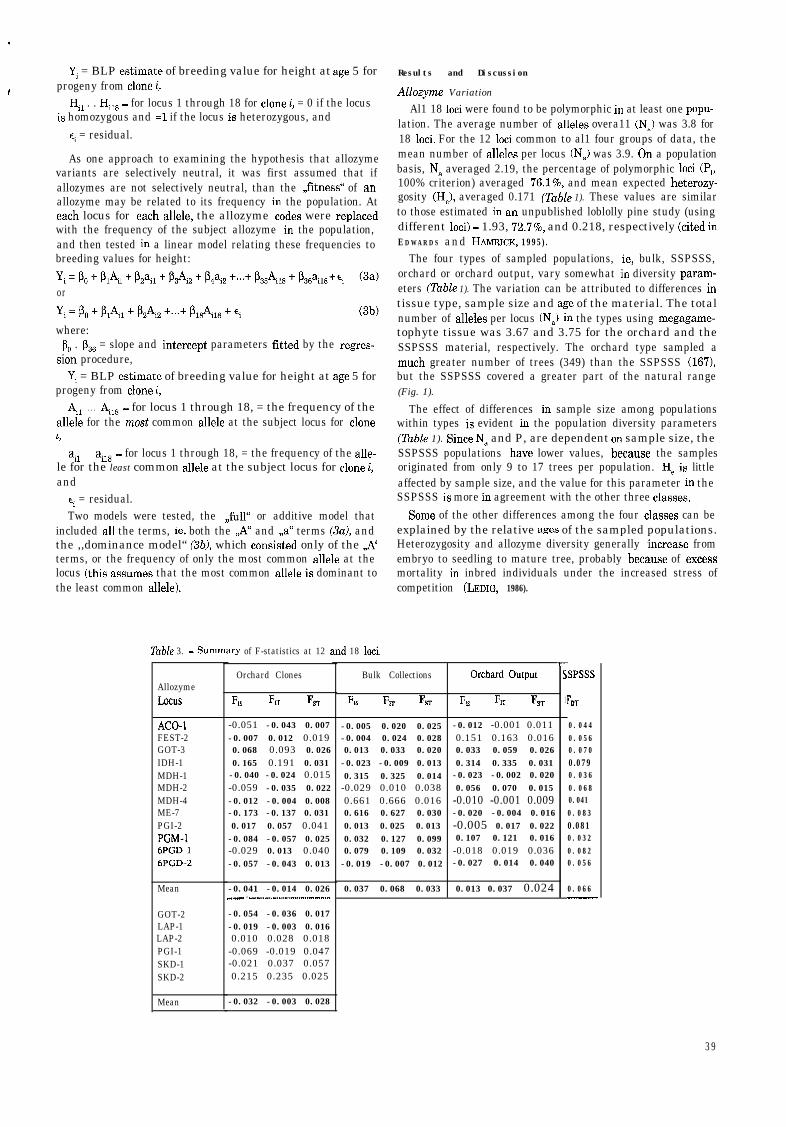
ACO- -0.051 -0.043 0.007 -0.005 0.020 0.025 -0.012 -0.001 0.011FEST-2 -0.007 0.012 0.019 -0.004 0.024 0.028 0.151 0.163 0.016GOT-3 0.068 0.093 0.026 0.013 0.033 0.020 0.033 0.059 0.026IDH-1 0.165 0.191 0.031 -0.023 -0.009 0.013 0.314 0.335 0.031MDH-1 -0.040 -0.024 0.015 0.315 0.325 0.014 -0.023 -0.002 0.020MDH-2 -0.059 -0.035 0.022 -0.029 0.010 0.038 0.056 0.070 0.015MDH-4 -0.012 -0.004 0.008 0.661 0.666 0.016 -0.010 -0.001 0.009ME-7 -0.173 -0.137 0.031 0.616 0.627 0.030 -0.020 -0.004 0.016PGI-2 0.017 0.057 0.041 0.013 0.025 0.013 -0.005 0.017 0.022PGM-1 -0.084 -0.057 0.025 0.032 0.127 0.099 0.107 0.121 0.0166PGD-1 -0.029 0.013 0.040 0.079 0.109 0.032 -0.018 0.019 0.0366PGD-2 -0.057 -0.043 0.013 -0.019 -0.007 0.012 -0.027 0.014 0.040
Mean
GOT-2LAP-1LAP-2PGI-1SKD-1SKD-2
Mean
Allozyme Variation
Al1 18 loci were found to be polymorphic in at least one popu-lation. The average number of alleles overa11 (NJ was 3.8 for18 loci. For the 12 loci common to al1 four groups of data, themean number of alleles per locus (NJ was 3.9. On a populationbasis, NB averaged 2.19, the percentage of polymorphic loci (P,,100% criterion) averaged 76.1%, and mean expected heterozy-gosity (H,), averaged 0.171 (Tuble 1). These values are similarto those estimated in an unpublished loblolly pine study (usingdifferent loci) - 1.93, 72.7%, and 0.218, respectively (cited inE D W A R D S and HAMRICK, 1995).
The four types of sampled populations, ie, bulk, SSPSSS,orchard or orchard output, vary somewhat in diversity param-eters (Table 1). The variation can be attributed to differences intissue type, sample size and age of the material. The totalnumber of alleles per locus (NJ in the types using megagame-tophyte tissue was 3.67 and 3.75 for the orchard and theSSPSSS material, respectively. The orchard type sampled amuch greater number of trees (349) than the SSPSSS (1671,but the SSPSSS covered a greater part of the natural range(Fig. 1).
The effect of differences in sample size among populationswithin types is evident in the population diversity parameters(Table 1). Since Na and P, are dependent on sample size, theSSPSSS populations have lower values, because the samplesoriginated from only 9 to 17 trees per population. He is littleaffected by sample size, and the value for this parameter in theSSPSSS is more in agreement with the other three classes.
Some of the other differences among the four classes can beexplained by the relative ages of the sampled populations.Heterozygosity and allozyme diversity generally increase fromembryo to seedling to mature tree, probably because of excessmortality in inbred individuals under the increased stress ofcompetition (LEDIG, 1986).
Bulk Collections
F,s 6, FsT
Table 3. - Summary of F-statistics at 12 and 18 loci.
Orchard Clones
h.s Frr FST
-0.041 -0.014 0.026_I_^I . .._...........................~.......... 0.037 0.068 0.033
-0.054 -0.036 0.017-0.019 -0.003 0.0160.010 0.028 0.018
-0.069 -0.019 0.047-0.021 0.037 0.0570.215 0.235 0.025
-0.032 -0.003 0.028
Orchard Output
6s F, FST
0.013 0.037 0.024
Ts
1
SPSSS
F DT
0.0440.0560.0700.0790.0360.0680.0410.0830.0810.0320.0820.056
0.066
3 9
In the bulk collections and the seed orchard output, embryosare genotyped; they have the lowest values for N,, P,, and He(Table 1). Since megagametophytes were genotyped for theorchard clones and the SSPSSS collections, these representgenotypes of the parent trees. The seed orchard clones, whichhave the highest values for these parameters, have been select-ed for their size and averaged around 70 years of age at thetime of selection. They are presumably well-adapted. TheSSPSSS samples, which are from trees 40 years old, are inter-mediate in He, the one parameter that is comparable to theother classes. He varies from 0.193 in the 70-year old orchardclones, to 0.174 in the 40-year-old SSPSSS samples, to 0.163and 0.155 in the bulk collections and embryos of the seedorchard output, respectively.
Although the seed orchard clones have the greatest geneticvariability of any of the four classes, the open-pollinated seedfrom these clones, the seed orchard output, has slightly lessgenetic variability than the comparable bulk collections (Table1). This may be a reflection of the size of the orchard sources,which is limited to 50 clones, and not al1 clones from a givensource were represented in some of our samples.
The observed heterozygosities (HJ are very close to theexpected heterozygosities CH,) indicating that the populationsare close to HARDY-WEINBERG equilibrium (Table 1). He isslightly higher than H0 in the bulk and seed orchard outputclasses indicating a slight degree of inbreeding; the opposite istrue in the orchard clones. The excess of homozygotes in the
Oe A. Natural Populationsa
0.4 -
’ tC. SSPSSS Populations
95% CI
bulk and seed orchard classes in verified by the slightly posi-tive values for F,, and F, (Table 3). These values are slightlynegative in the seed orchard clones, indicating an excess ofheterozygotes.
Geographic Variation
F,,, a quantification of population differentiation, was 0.033for the bulk populations, and 0.066 for the SSPSSS populations(the two types representing the broadest range of sampling)which indicates that only a small proportion (3.3% to 6.6%) ofthe total variation in allozymes was attributed to populationdifferences (Table 3). F,, values for the orchard clones andorchard output were lower (0.026 and 0.024, respectively),probably because the orchards did not include populations fromthe extremities of the range, Arkansas and Maryland (Fig. 1).
Estimates of gene flow using WRIGHT’S formula (1) rangesfrom Nm = 3.54 migrants per generation in the bulk collectionsto Nm = 9.37 in the orchard sources. These values bracket thenumber of 4 migrants per generation which WRIGHT (1931) con-sidered the minimum to prevent differentiation due to drift.This is not surprising considering the extensive long-distancepollen flow demonstrated in studies of pollen contamination inloblolly pine seed orchards (FRIEDMAN and ADAMS, 1985).
In spite of the low values for F,,, the multivariate analysis oftransformed diploid data of the orchard, bulk, and SSPSSSseed sources showed significant differences among populations(P < 0.001). Plots of the first two canonical functions showed
1en
8. Orchard Populations
6
I 1 I 1-0.4 0.2 Second°Canon~~al FunXion
-3Y7% 0.8 1
-0.8 -0.6 -0.4 -0.2 0 0.2 0.4 0.0 08 1 1.2Second Canonical Function - 18.6%
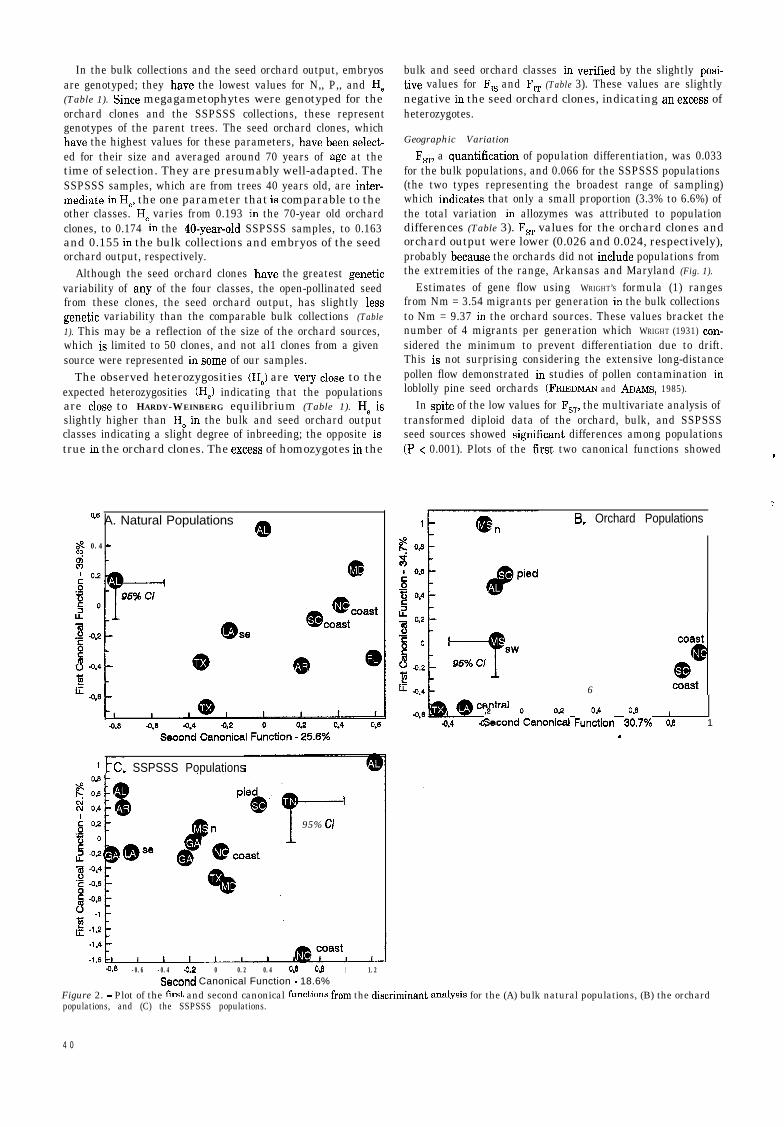
Figure 2. - Plot of the first and second canonical functions from the discriminant analysis for the (A) bulk natural populations, (B) the orchardpopulations, and (C) the SSPSSS populations.
4 0
reasonable distributions and groupings for the orchard andbulk samples (Fig. ZA and ZB). Sources from west of theMississippi River tend to group together in the lower leftcomer in both plots.
In the plot of the orchard populations (Fig. ZB), the Texasand central Louisiana sources group very close together in thelower left comer, the Atlantic coastal sources are arrayed to theright, and the inland sources are arrayed toward the upper left.The southwest Mississippi source, which is from just east ofthe Mississippi River, is in a transitional position relative tothe other three groupings.
The plot of the bulk natural populations is similar to the plotof the orchard populations (Fig. ZA). In this case the southeastLouisiana source, which originates from just South of thesouthwest Mississippi source (Fig. 1), is in a transitional posi-tion. The one anomaly in the plot of the natural sources is theposition of the Arkansas source, which plots closer to theAtlantic sources than the other western sources. This sourcewas collected around 1991, and the affinity for the coastalsources may be an indication of pollen contamination from non-local Atlantic Coastal Plain sources which have been planted ingreat numbers in Arkansas (LAMBETH et al., 1984).
The plot of the SSPSSS populations shows a more confusedpicture of geographic variation, perhaps because of the smallsample sizes (Fig. 2C, Table 1). The first two canonical func-tions account for only 41% of the variation in the SSPSSS,
i compared to 65% and 66% for the first two functions in theorchard and bulk samples, respectively. The two most distantsources geographically, Texas and Maryland, are adjacent to
6 one another in a plot of the first two functions, although theyare well separated in the third and fourth functions (notshown). The Texas source was derived from only ten trees(Table l), and appears out of place. There is a tendency for a
separation of eastern and western sources, as well as some dif-ferentiation between coastal and interior sources in the easternpopulations.
One interesting feature of figure 2C as well as figure 2B isthe wide separation of the two Alabama sources. Al1 of theAlabama sources originate from a relatively small part of thenatural range, in northern Alabama (Fig. 1). Although morethan 50 years separates the times of the original collections forthe SSPSSS and the bulk samples, they both seem to show agreat deal of variation on a relatively small geographic scale.
In spite of these differences, the populations do not differobviously in allelic frequencies at most loci. The average fre-quency of the most common allele is 0.87 for al1 loci over al1populations.
There did appear to be some differences in the occurrence ofrare alleles among populations. Twenty of the rare alleles weredetected only in the eastern populations, whereas only twowere found exclusively in the western populations. Nearly al1the alleles that are found in the western populations can befound in the eastern populations, but many of the alleles foundin the eastern populations were not found in the western popu-lations. Only one private allele was found, a third allele at theIDH-1 locus in the Florida bulk population.
Allele number 7 of enzyme GPGD-1 is relatively common inmany populations of loblolly pine east of the river, having a fre-quency as high as 0.29 in one population in Maryland (Fig. 3).This allele is very rare west of the river, and was not detectedin most populations. The presente of this allele in the Arkansasnatural bulk population is another indication of possible con-tamination with coastal Carolina sources. The allele was notdetected in the SSPSSS collection from a nearby county (Fig.3). The original SSPSSS collections were made in the early
I-1Natural dlstrlbutlon ofD loblollv olne (Plnus tseda L.)--------,m
wlth freq
0.3 -0.2 :
-0Frequency of GPDG-1
0.0 - allele number 7 1Locatlon of eteep
- - - - l of fuslform rust re %radlentIstance
KY
,
Figure 3. - Map of the southeastern United States showing the natural range of loblolly pine, thefrequency of trees with high limonene (adapted from SQUILLACE and WELLS, 19811, and the frequency oflocus number 7 of the enzyme BPGD-1 in the sampled populations.
41
1950’s before these mass transfers began (LAMBETH et al.,1984). The early results of the SSPSSS were, in fact, instru-mental in bringing about these transfers (WELLS and WAKELEY,1966). The Arkansas natural bulk collection was made frommature trees on the National Forest where such seed transfershave not occurred.
The distribution of GPGD-1 allele number 7, as well as thedistribution of the rare alleles suggests that gene flow in thewesterly direction across the Mississippi River is restricted.The six populations sampled from the western edge of theeastern populations, ie., western Tennessee, north Mississippi,southwest Mississippi and southeast Louisiana, al1 possess theseventh allele in appreciable proportions, with an averagefrequency around 0.10 to 0.15 (Fig. 3). In populations west ofthe river, the allele was found in only two of the seven popula-tions at a frequency of less than 0.02.
Although the east-west differences in allozyme frequenciestend to be subtle, there are well-defined differences betweeneastern and western populations of loblolly pine in adaptivecharacters. Western sources are slower growing, have bettersurvival, have greater resistance to fusiform rust (Cronartiumquercuum (BERK.) M IYABE ex SHIRAI f.sp. fusiforme), and havegreater concentrations of limonene in cortical gum thaneastern sources (SQUILLACE and WELLS, 1981, Fig. 3). Perhapsas a result of differences in monoterpenes, western sourcesappear to be less susceptible than eastern sources to southernpine beetle (Dendroctonus frontal& ZIMM., POWERS et al., 1992)and Nantucket pine tip moth (Rhyacionia frustrana COMSTOCK,SCHMIDTLING and NELSON, 1996). The area where SQUILLACE
and Wells (1981) found that 100% of loblolly pine had highlimonene concentrations in their cortical gum (central Louisi-ana - Fig. 31, corresponds closely to the only area in the south-eastern USA identified as a ,,hazard area“ for three insectpests; southern pine beetle, loblolly saw fly (Neodiprion taedaeZinearus ROSS), and Texas leaf-cutting ant (Attu texana BUCKL.)(USDA, 1969).
The isolating effect of the pineless Mississippi River Valleyhas been proposed as the reason for differences betweeneastern and western sources (WELLS and WAKELEY, 1966). Thewell-known resistance to fusiform rust of the western sources
op24 c A. Loblolly n �
E8 0.16E$j 0.165$ 0.14al0p 0.12l3
0.08
of loblolly pine is also present, however, in a seed source fromeast of the river, in Livingston Parish, Louisiana. The divisionbetween resistant western sources and susceptible easternsources is well east of the river (WELLS et al., 1991, Fig. 3).When geographic variation in limonene concentration and fusi-form rust resistance are considered (Fig. 3) the division be-tween western and eastern sources also appears to be east ofthe Mississippi River.
The continuous clinal variation in limonene content and fusi-form rust resistance across the Mississippi River (SQUILLACE
and WELLS, 1981; WELLS et al., 1991, Fig. 3) suggests thatthere is no barrier to gene flow in the eastern direction acrossthe valley. The allozyme data presented here, however, suggestthat gene flow in the western direction is restricted. Prevailingwinds since the beginning of the Holocene 14,000 years agomay be a factor in this predominately one-way gene flow.
Pleistocene Refugia
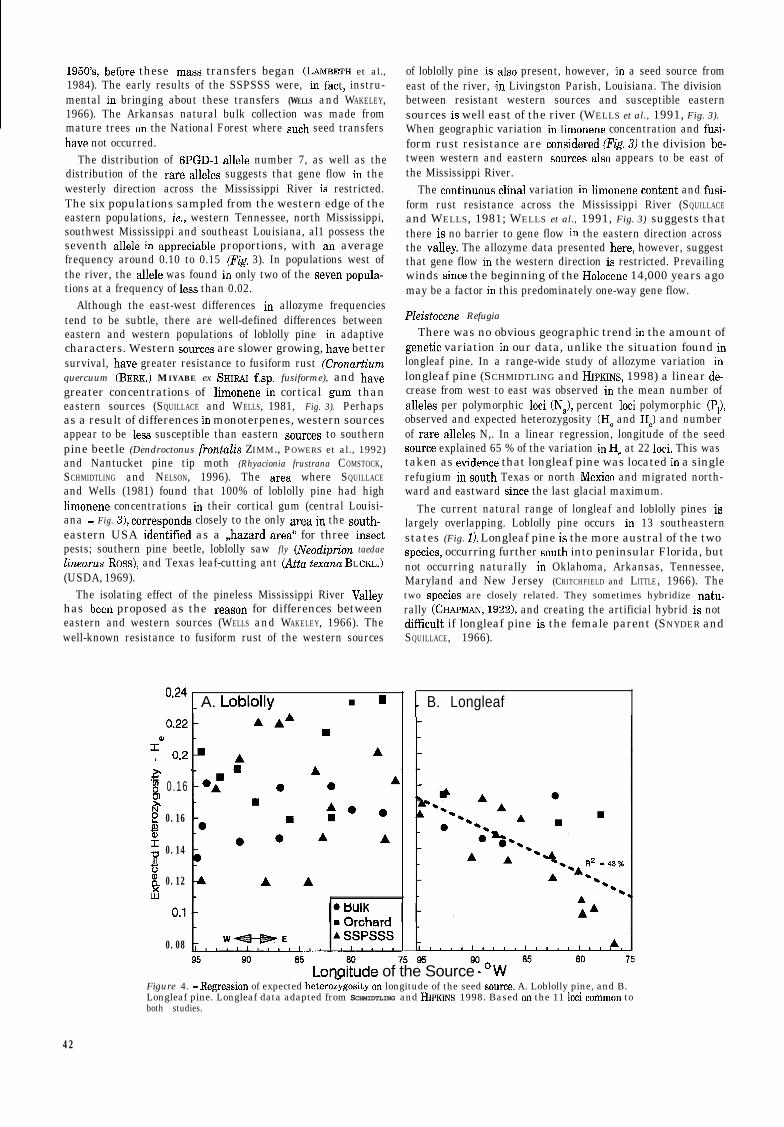
There was no obvious geographic trend in the amount ofgenetic variation in our data, unlike the situation found inlongleaf pine. In a range-wide study of allozyme variation inlongleaf pine (SCHMIDTLING and HIPKINS, 1998) a linear de-crease from west to east was observed in the mean number ofalleles per polymorphic loci (N,), percent loci polymorphic (P,),observed and expected heterozygosity (HO and He) and numberof rare alleles N,. In a linear regression, longitude of the seedsource explained 65 % of the variation in He at 22 loci. This wastaken as evidente that longleaf pine was located in a singlerefugium in South Texas or north Mexico and migrated north-ward and eastward since the last glacial maximum.
The current natural range of longleaf and loblolly pines islargely overlapping. Loblolly pine occurs in 13 southeasternstates (Fig. 1). Longleaf pine is the more austral of the twospecies, occurring further South into peninsular Florida, butnot occurring naturally in Oklahoma, Arkansas, Tennessee,Maryland and New Jersey (CRITCHFIELD and LITTLE, 1966). Thetwo species are closely related. They sometimes hybridize natu-rally (CHAPMAN, 1922), and creating the artificial hybrid is notdifficult if longleaf pine is the female parent (SNYDER andSQUILLACE, 1966).
tB. Longleaf
Lonqitude of the Source - ‘WFigure 4. - Regression of expected heteroz$gosity on longitude of the seed source. A. Loblolly pine, and B.Longleaf pine. Longleaf data adapted from SCHMIDTLING and HIPKINS 1998. Based on the 11 loci common toboth studies.
42
,
The pattern of east-west variation is different for the twospecies, however. A comparison of the east-west variation in Hefor the ll loci that are common to the current study and thelongleaf study (SCHMIDTLING and HIPKINS, 1998) shows clearlythe trend in variation with longitude in longleaf pine (Fig. 4B)but not in loblolly pine (Fig. 4A). This could be taken as nega-tive evidente for a single refugium for loblolly pine during thePleistocene, and positive evidente for two refugia, one in SouthTexas / northeast Mexico and the other in South Florida /Caribbean as proposed by WELLS et al. (1991). The dashed lineeast of the Mississippi, in southeast Louisiana and westMississippi (Fig. 3) shows the location of a very steep gradientin fusiform rust resistance (WELLS et al., 1991) in loblolly pinepopulations. There is no corresponding change in climate orsoils (USDA, 1969) or in abundance of the oak (Quercus sp.)species (SQUILLACE and WILHITE, 197’7) which are the alternatehosts of fusiform rust. The part of the natural range of loblollypine having the highest rust infection is in South Georgia,where very little resistance is found in the natural populations.The gradient in fusiform rust resistance just east of theMississippi River can best be explained by assuming theconfluente of two populations. This, as well as the previouslymentioned gradient in terpene concentration in the same loca-tion suggests the merging of two populations after the retreatof the Wisconsin glaciation.
There are some interesting similarities between longleafpine and western sources of loblolly pine. Like western sourcesof loblolly pine, longleaf pine is resistant to fusiform rust andmuch less susceptible to tip moth and southern pine beetle(SNYDER et al., 1977). This suggests that western loblolly popu-lations and al1 longleaf populations shared an environment atsome time in the past where selection for resistance to thesepests was important. The proposal that longleaf pine andwestern sources of loblolly pine both originated in a commonrefugia in South Texas / northeast Mexico bits the circumstan-tial evidente. The present climate in South Texas is too dry forpines, but was probably much wetter during the Pleistocene(WATTS, 1983). Other pines occur just South of the border inMexico, at high elevations (CRITCHFIELD and LITTLE, 1966).
Growth and Allozymes
Variation at allozyme loci is considered non-adaptive (END-LER, 1986), but such variation may reflect variation at otherloci. Therefore ít may be useful to compare allozyme variation,especially heterozygosity, with the adaptive trait of heightgrowth. The progeny test data for 5-year height from 235 of theorchard selections was compared to allozyme heterozygosity at18 loci. Heterozygosity of the parent was not related to heightgrowth of the progeny. The linear model (2) showed no rela-tionship between heterozygosity and height (p=O.43). Age 5may be too soon to show much effect, however, since the stressassociated with competition would be minimal. It may also beimportant that these progeny are al1 from controlled pollina-tions among unrelated select trees. Although the gains inheight growth are relatively modest in the R-8 tree improve-ment program, 5% to lo%, the select trees are higher inheterozygosity and are more diverse in general than theaverage tree (Table 1). Although the progeny were not genotyp-ed, it is safe to assume that controlled crosses among theunrelated select trees would result in much less inbreeding andgreater than average heterozygosity and diversity in theprogeny than in open-pollinated, woods r-un progeny. The popu-lations of progeny measured, therefore, would represent asomewhat truncated population, and might not give an accu-rate measure of the relationship between heterozygosity andgrowth.
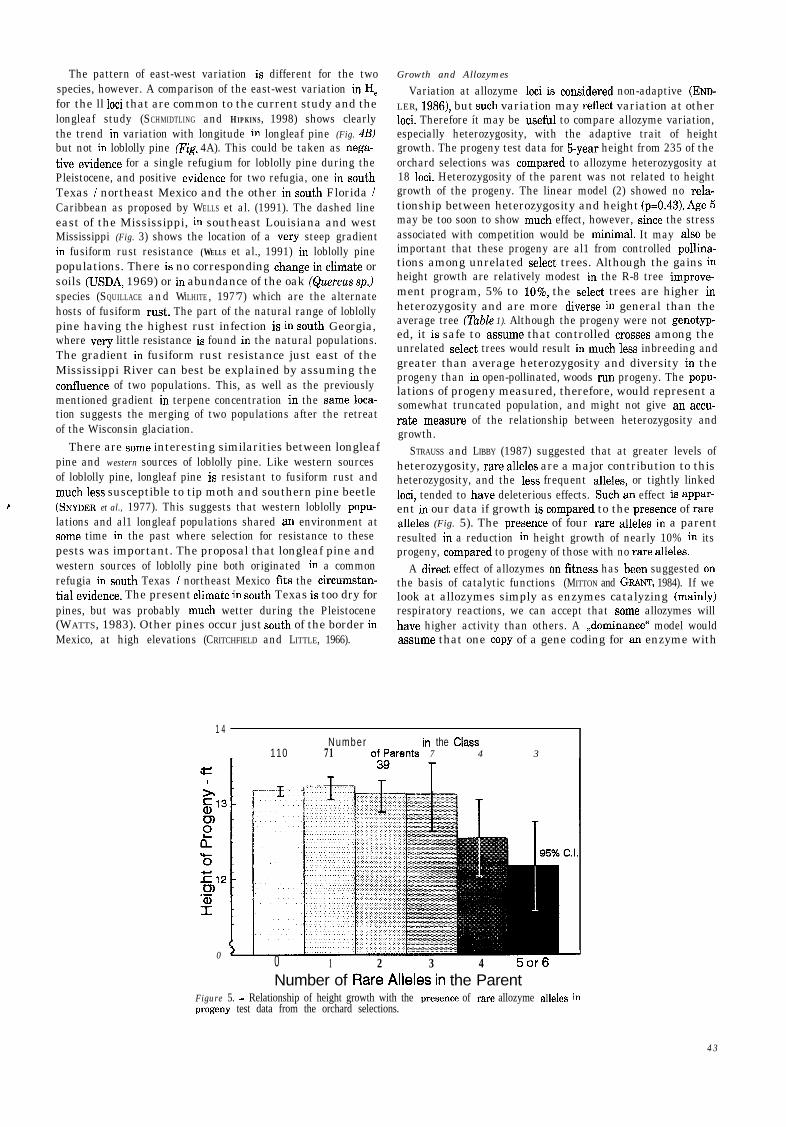
STRAUSS and LIBBY (1987) suggested that at greater levels ofheterozygosity, rare alleles are a major contribution to thisheterozygosity, and the less frequent alleles, or tightly linkedloci, tended to have deleterious effects. Such an effect is appar-ent in our data if growth is compared to the presente of rarealleles (Fig. 5). The presente of four rare alleles in a parentresulted in a reduction in height growth of nearly 10% in itsprogeny, compared to progeny of those with no rare alleles.
A direct effect of allozymes on fitness has been suggested onthe basis of catalytic functions (MITTON and GFWTT, 1984). If welook at allozymes simply as enzymes catalyzing (mainly)respiratory reactions, we can accept that some allozymes willhave higher activity than others. A ,,dominance“ model wouldassume that one copy of a gene coding for an enzyme with
1 4Number in the Class
110 71 o;Qarents 7 4 3
0 0 1 2 3 4 5or6Number of Rare Alleles in the Parent
Figure 5. - Relationship of height growth with the presente of rare allozyme alleles inprogeny test data from the orchard selections.
43
optimum activity would be suffcient for optimum catalysis.There is a possibility that ,more is better“, or there may also becompetitive effects between allozymes of differing effrciency.
Our linear models (3a and 3b) assumed that the ,,fitness“ ofan allozyme, measured here as height, is related to its frequen-cy in the population. The ,,dominance“ model (3b) did not showa significant relationship between height and allozyme fre-quency (p=O.34). The ,,additive“ model (3a), on the other hand,showed a highly significant relationship between allozymesand height (p=O.O06). A step-wise regression, however, revealedthat only one locus, IDH-1, was responsible for the statisticalsignificance. Polymorphisms at this locus have previously beenlinked to hybridization with shortleaf pine (HIJNEYCUTT andASKEW, 1989). A comparison between our loblolly data andshortleaf allozyme data from another study (SCHMIDTLING et al.,1996) confirmed that the probable origin of the rare allele atthis locus is from shortleaf pine.
Shortleaf pine grows slower than loblolly pine, and thehybrid is intermediate in growth (SCHMITT, 1968). We wouldexpect, therefore, that hybridization with shortleaf pine wouldresult in slower growth. Six of our orchard clones possess the,,shortleaf’ allele at the IDH-1 locus, three from Texas, onefrom Louisiana and two from north Mississippi. One of theTexas clones is homozygous for the shortleaf allele. Progenyfrom the clone homozygous for the shortleaf allele averaged3.56 m, progeny from clones heterozygous for the shortleaf alle-le averaged 3.68 m, and those from clones homozygous for theloblolly allele averaged 4.02 m in height after 5 years. The dif-ferences are statistically significant (p < 0.001).
If this locus is indeed an indicator of hybridization betweenshortleaf and loblolly pines, than the converse relationshipshould obtain. That is, shortleaf possessing the ,,loblolly“ alleleshould grow faster than those not possessing the allele. Allo-zyme data and growth data from studies involving controlledcrosses of 22 shortleaf clones from central Arkansas (SCHMIDT-LING, 1996; SCHMIDTLING et al., 1996) revealed just such a rela-tionship. Four of the 22 clones were heterozygous for the loblol-ly allele, their progeny averaged 2.90 m, progeny from theother 18 clones averaged 2.82 m. The difference, though small,was statistically significant (p = 0.023).
Conclusions
7. The usefulness of using the IDH locus to indicate hybrid-ization between loblolly and shortleaf pines is supported. í
Literature Cited
ADAMS, W.T., NEALE , D.B., DOERKSEN, A.H. and SMITH, D.B.: Inheritanceand linkage of isozyme variants from seed and vegetative bud tissue incoastal Douglas-fir-[Pseudotsugu menziesii var. mcnziesii (MIRB.) FRAN-col. Silvae Genet. 39: 153-167 (1990). - BAKER, F.S.: Principles of Silvi-culture. McGraw-Hill, New York (1950). - CHAPMAN, H.H.: A newhybrid pine (Pinas palustris x Pinus taeda). J. For. 20: 729-734 (1922).- CONKLE, M.T., HODGKISS, PD., NUNNALLY, L.B. and HUNTER, S.C.:Starch gel electrophoresis of conifer seeds: a laboratory manual. USDAFor. Serv., Pacific Southwest For. Range Exp. Sta., Berkeley, CA, 18 p.(1982). - CRITCHFIELD, W.B. and LITTLE Jr., E.L.: Geographic dis-tribution of the pines of the world. USDA For. Serv. Misc. Pub. 991.97 p. (1966). - CROKER Jr., T.C.: Longleaf pine - myths and facts. In:Proceedings of a symposium on the management of longleaf pine. USDAFor. Serv., South. For. Exp. Sta., Gen. Tech. Rep. SO-75. New Orleans,LA, p. 2-10 (1990). - EDWARDS, M.A. and HAMRICK, J.L.: Geneticvariation in shortleaf pine, Pinus echinata MILL. (Pinaceae). For. Genet.2: 21-28 (1995). - ENDLER, J.A.: Natural selection in the wild. Prince-ton Univ. Press, Princeton, NJ (1986). - FLORENCE, L.Z. and RINK, G.:Geographic patterns of allozymic variation in loblolly pine. In: Proc.15th South. For. Tree Improv. Conf., Mississippi State, MS. p. 3341(1979). - FRIEDMAN, S.T. and ADAMS, W.T.: Estimation of gene flow intotwo seed orchards of loblolly pine (Pinus toeda L.). Theor. Appl. Genet.69: 609-615 (1985). - HAMRICK, J.L., GODT, M.J.W. and SHERMAN-BROYLES, S.L.: Factors influencing levels of genetic diversity in woodyplant species. New Forests 6: 95-124 (19921. - HUNEYCUTT, M. andASKEW, G.R.: Electrophoretic identification of loblolly pine-shortleaf pinehybrids. Silvae Genet. 38: 95-96 (1989). - LAFARGE, T.: Applications ofbest linear prediction to the analysis of five full-sib loblolly pine progenytests. In: Proc. 20th South. For. Tree Improv. Conf., Charleston, SC.p. 315-322 (1989). - LAMBETH, C.C., DOUGHERTY, PM., GLADSTONE , W.T.,MCCULLOUGH, R.B. and WELLS, 0.0.: Large-scale planting of NorthCarolina loblolly pine in Arkansas and Oklahoma: A case of gain versusrisk. J. Forestry 82: 736-741 (1984). - LEDIG, F.T.: Heterozygosity,heterosis, and fitness in outbreeding plants. In: M.E. SOULE, ed.. Con-servation biology: The science of scarcity and diversity. Sinauer Associ-ates, Sunderland, MA. p. 77-104 (1986). - MITTON, J.B. and GRANT,M.C.: Associations among protein heterozygosity, growth rate, anddevelopmental homeostasis. Am-m. Rev. Ecol. Syst. 15: 479-499 (1984).- NEI, M.: F-statistics and analysis of gene diversity in subdividedpopulations. Ann. Human Genet. 41: 225-233 (1977). - POWERS Jr.,H.R., BELANGER, R.P., PEPPER, W.D. and HASTINGS, F.L.: Loblolly pineseed sources differ in susceptibility to the southern pine beetle in SouthCarolina. South. J. Appl. For. 16: 169-174 (1992). - SAS Institute, Inc.:SAS User’s Guide: Statistics. SAS Institute Inc., Cary, NC. 956 p.(1985). - SCHMIDTLING, R.C.: Reproductive enviromnent affects growthof shortleaf pine. Proc. Tree Improv. Sustainable Tropical Forestry -QFRI - IUFRO Conference, Caloundra, Queensland, Australia, Oct.
1. Genetic parameters measured by allozymes indicate that1996. p. 261-264 (1996). - SCJXMIDTLING, R.C. and HIPKINS, V.: Genetic
loblolly pine is slightly more diverse than longleaf pine butdiversity in longleaf pine (Pinza palustris MILL.): Influente of historicaland prehistorical events. Can. J. For. Res. 28: 1135-1145 (1998). -
comparable to other southern pines. SCH~IDTLING, R.C., HIPKINS, V and CARROLL, E.: After effects of repro-
with the alleles appear to be slightly less fit. Differences in
2. Selections from a loblolly pine tree improvement programs
fitness among the more common alleles, if they exist, were too
had greater average allozymic diversity and heterozygosity
subtile to be detected in our tests.
than natural populations, but the seed output from theorchards is very much like the natural populations in diversity.
3. The assumption that allozymes are selectively neutralmay not be correct. Rare alleles are rare for a reason; trees
4. It is suggested that loblolly pine was located in two ref-ugia during the Pleistocene, one in Texas / Mexico and one inFlorida / Caribbean as proposed by WELLS et al. (1991).
5. Using the Mississippi River Valley as the dividing line be-tween western and eastern populations is contraindicated bythis study. There appears to have been regular gene flow acrossthe southern end of the Valley, at least in the eastward direc-tion.
6. There was some evidente that seed movement by forestmanagers is affecting the genetic makeup of natural popula-tions.
associations. Biometrics 38: 757-768 (1982). - S&DER, E.B., DINUS,R.J. and DERR, H.J.: Genetics of longleaf pine. USDA For. Serv. Res.
ductive environment in shortleaf pine (Pinus echinata MILL). Proc.
Paper WO-33, 24 p. (1977). - SNYDER, E.B. and SQUILLACE, A.E.: Coneand seed yields from controlled breeding of southern pines.
IUFRO Diversity and adaptation in forest ecosystems in a changingworld. Aug. 1996. UBC, Vancouver, BC, Canada. p. 54 (1996). -
USDA For.Serv., South. For. Exp. Sta., Res. Paper SO-22. 7 p. (19661. - SQUILLACE,A.E. and WELLS, 0.0.: Geographic variation of monoterpenes in cortical
SCHMIDTLING, R.C. and NELSON, C.D.: Interprovenance crosses in
oleoresin of loblolly pine. Silvae Genet. 30: 127-135 (1981). - SQUILLA-CE, A.E. and WILHITE , LP: Influente of oak abundance and distribution
loblolly pine using selected parents. For. Genet. 3: 53-66 (1996). -
on fusiform rust. In: DINUS, R.J. and SCHMIDT, R.A.: Proc. Symp. Manag.Fusiform Rust in Southern Pines. Unix FL, Gainesville, p. 59-70
SCHMITT, D.: Performance of southern pine hybrids in South Mississippi.
(1977). - STRAUSS, S.H. and LIBBY, W.J.: Allozyme heterosis in radiatapine is poorly explained by overdominance. Amer. Nat. 130: 879-890
USDA For. Serv., South. For. Exp. Sta., Res. Paper SO-36. 15 p. (1968). -
(1987). - SWOFFORD, D.L. and SELANDER, R.B.: BIOSYS-1, a computer
SMOUSE, P.E. and WILLL~MS, R.C.: Multivariate analysis of HLA-disease
program for the analysis of allelic variation in nonulation genetics andbiochemical systematics. Release 1.7. IL Nat. Hist. Surv., Champa@,IL. (1989). - USDA: A Forest Atlas of the South. USDA For. Serv.,South. For. Exp. Stat., 27 p. (1969). - WA~<S, W.A.: A vegetationalhistory of the eastern United States 25,000 to 10,000 years ago. In: S.C.
4 4
PORTER (ed.). The late Pleistocene. p. 294-310. Vol. 1. Late-Quaternaryenvironments of the United States. University of Minnesota Press, Min-neapolis (1983). - WELLS, 0.0.: Results of the southwide pine seedsource study through 1968-69. In: Proc. 10th South. For. Tree Improv.Conf., Houston, TX. p. 117-129 (1969). - WELLS, 0.0.: Use of Living-ston Parish, Louisiana loblolly pine by forest products industries in theSoutheast. South. J. Appl. For. 9: 180-185 (1985). -WELLS, O.O., SWIT-ZER, G.L. and SCHMIDTLING, R.C.: Geographic variation in Mississippiloblolly pine and sweetgum. Silvae Genet. 40: 105-118 (1991). -WELLS,0.0. and WAKELEY, PC.: Geographic variation in survival, growth and
fusiform rust infection of planted loblolly pine. For. Sci. Monograph ll,40 p. (1966). - WHITE, T.L. and HODGE, G.R.: Predicting brsedingvalues with applications in forest tree improvement. Kluwer AcademicPublishers, Dordrecht, Netherlands. 367 p. (1989). -WRIGHT, S.: Evolu-tion in MENDELian populations. Genetics 16: 97-159 (1931). - WRIGHT,S.: The interpretation of population structure by F-statistics withspecial regard to systems of mating. Evolution 19: 395420 (1965). -WRIGHT, S.: Evolution and the Genetics of Populations. Vol. 4. Varia-bility Within and Among Natural Populations. Univ. Chicago Press,Chicago (1978).
Silvae Genetica 48,1(1999) 45

.
Silvae Genetica is an international journal,which continues Zeitschrift für Forstgenetikund Forstpflanzenzüchtung (Journal of ForestGenetics and Forest Tree Breeding) foundedby W. LANGNER in 1951. In Silvae Geneticaoriginal articles, short notes, reviews, announ-cements and reports on meetings and congres-ses on Forest Tree Breeding and Genetics andrelated tlelds are published in German,English or French.
Reproduction of contributions is not permitt-ed; reproduction of illustrations is permittedonly with the approval of the author and thepublisher.
Authors should send two copies df theirmanuscript to one of the regional co-editors,generally olose to the institute from which thearticle originates. Authors are however free toselect an appropriate co-editor who should bea native speaker of the language of the paperand familar with the subject matter.
Original articles, including tables, illustra-tions and literature must not exceed six print-ed pages (equivalent to 24 typed pages with30 lines at double spacing and- with a 5 cmborder). Longer papers can only be accepted inexceptional cases. The same applies to extracosts for special plates. - In preparing themanuscript authors are asked to conform tothe following arrangements. The title pageshould contain the following information: a)Title of the paper; b) Christian and surnamesof the authors; c) Institute where the articlehas been written; d) if neoessary, the presentaddress of the authors as footnote; e) up to 10key words to facilitate referencing of thepaper; and on a separate special page; D asummary in the original language of thepaper and one in English, if that is not theoriginal language of the paper.
For financia1 and technical reasons tables,figures and mathematical terms or formulaemust be submitted separately from the textand ready for photoprinting. This appliesespecially to mathematical formulae whichshould be numbered and brought together inthe finished state into ene or few groups.
Manuscripts ready for printing will be register-ed the month they reach the editorial oftice inGrosshansdorf. They will be published in theorder of their receipt. Their rearrangement fortechnical reasons is the prerogative of theeditorial manager.
S’hort notes may be up to one page in length(about 4 pages of typescript) and should alsobe classified by some key words. They will bepublished as soon as possible.
Galley proofs of original articles and shortnotes will be sent to authors for correction.They must be returned with the least possible
t delay. The only corrections permitted arethose arising during typesetting. No amend-ments of the manuscript are permitted. Cor-rections on announcements, reports, andreviews will be made in the editorial Office.
Reprints: Authors obtain, free of charge, up to30 reprints of their articles. Additionalreprints may be purchased if ordered inadvance from the publisher.
Publication schedule: 6 numbers each year.
Silvae Genetica ist eine internationale Zeit-sohrift; sie setzt die im Jahre 1951 vonW. LANGNER begriindete Zeitschrift für Forst-genetik und Forstpflanzenzüchtung fort.Silvae Genetica veroffentlioht Originalarbei-ten, Kurzmitteilungen, Besprechungen sowieHinweise und Berichte über’ Tagungen undKongresse über Genetik und Züchtung sowieverwandte Fachgebiete in deutscher, engli-scher oder französisoher Sprache, soweit siefür Forstgenetik und Forstpflanzenzüchtungvon Bedeutung sind.
Der Nachdruck der Beiträge ist nicht gestat-tet; der Nachdruck von Abbildungen nur mitGenehmigung des Verfassers und des Verla-ges.
Manuskripte werden in zweifacher Ausferti-gung im allgemeinen an einen der regionalenMitarbeiter in der Nähe der Institution erbe-ten, aus der der Artikel stammt. Autoren sindjedoch frei, einen entsprechenden Mitarbeiterzur Durchsicht ihrer Arbeit zu wählen. Ersollte die Sprache, in der der Artikel abgefaBtist, als Muttersprache beherrschen und mitdem bearbeiteten Problem vertraut sein.
Originalarbeiten einschlieBlich Tabellen,Abbildungen und Literaturhinweisen sollennicht über 6 Druckseiten hinausgehen. (Die-ser Umfang entspricht ungefähr 24 Schreib-maschinenseiten mit 30 Zeilen mit doppeltemAbstand und 5 cm Rand). Längere Arbeiten ,können nur in Ausnahmefallen angenommenwerden. Das gleiche gilt für spezielle Druck-verfahren. - Die Anordnung der Manuskriptesol1 in der fiir Silvae Genetica üblichen Formgeschehen. Die Titelseite sol1 die folgendenInformationen aufweisen: a) Titel der Arbeit,b) Vor- und Zunamen der Autoren, c) Institut,in dem die Arbeit entstanden ist, d) wenn not-wendig, die gegenwärtige Ansohrift der Ver-fasser als FuBnote, e) bis zu 10 Schlagwortezur Charakterisierung des Inhalts der Arbeitund zur leichteren bibliographischen Erfas-sung und auBerdem auf besonderem Blatt, Deine Zusammenfassung in der Originalspra-che der Arbeit und eine weitere in englisch,wenn dies nicht die Originalspraohe derArbeit ist.
Aus dnanziellen und technischen Griindensollen Tabellen, Abbildungen und mathemati-sche Ausdrücke oder Formeln getrennt vomText als druckfertige Klischee-Vorlagen fürden Photo-Druck eingereicht werden. Dies giltbesonders auch für im Text vorkommendemathematische Ausdriicke, die mit entspre-ohender Kennzeichnung (Numerierung) ineiner oder wenigen Klischee-Vorlagen zusam-mengefa6t werden sollen.
Druckfertige Manuskripte werden mit demMonat ihres Eingangs in die Schriftleitung inGrosshansdorf registriert und in der Reihen-folge ihres Eingangs veröffentlicht. Aus tech-nischen Griinden kann der Redakteur jedocheine andere Entscheidung treffen.
Kurzmitteilungen können bis zu einer Druck-seite (etwa 4 Schreibmaschinenseitn) langsein und sollten ebenfalls mit einigen Schlag-worten oharakterisiert werden. Sie erscheinenbaldmöglichst auBer der Reihe.
Druckfuhnen von Originalarbeiten und Kurz-mitteilungen werden den Autoren zur Korrek-tur zugesandt. Sie sollen unter Verwendungder international üblichen Symbole korrigiertund möglichst umgehend an den Verlagzurückgeschickt werden. Dabei sind nur sol-che Fehler zu korrigieren erlaubt, die auf feh-lerhaften Satz zurückzuftihren sind. Anderun-gen des Manuskripts sind nicht gestattet. DieKorrekturen von Ankündigungen, Berichten
Silvae Genetica est un Periodique internatio-nal aui est la suite de ZeitschriR f?ir Forstge-netik und Forstpflanzenzüchtu&CJournal¡ofForest Genetics and Forest Tree Breedinglfondé en 1951 par W., LANGNER et publie desarticles originaux, en allemand, anglais oufranca&, ainsi que des Notes et des mises aupoint annonces et des compterendus deRéunions et de Congrès sur 1’Amélioration desArbres Forestiers, la Génétique et les discipli-nes voisines. La reproduction des artides n’estpas autorisée, la reproduction des illustra-tions n’est autorisée qu’avee l’approbation del’auteur et de l’éditeur.
Les auteurs doivent envoyer deux exemplairesde leur manuscrit à l’un des co-éditeurs régio-naux, en général le plus proche de l’Institutdont l’auteur de l’article fait partie. Toutefois,les auteurs sont libre de choisier un co-éditeurde même langue que celle de l’article, et à quile sujet de l’article soit familier.
Les articles originalu: y compris les tableaux,les figures et la bibliographie, ne doit pasdépasser 6 pages imprimées (soit 24 pagesdactylographiées de 30 lignes, à double inter-ligne et avec une marge de 5 cm).
Les articles plus longs ne peuvent être accep-tés que dans des cas excèptionnels. Lesmêmes conditions s’appliquent aux fraissupplémentaires pour les clichés spéciaux.Pour la préparation du manuscrit, il estdemandé aux auteurs de se conformer auxindications suivantes: La page de titre doitcontenir les informations suivantes a) Titrede l’article; b) Nom et prénoms des auteurs; c)Institut auquel I’auteur appartient; d) sinécessaire, l’adresse actuelle des auteurs ennote infrapaginale; e) des mots clés permett-ant de faoiliter la classification de l’article - \dans le limite de 10; et, sur une page séparéeD un résumé dans la langue originale del’article - un résumé en anglais, si ce n’est pasla langue originale de l’article.
Pour des raisons financieres et techniques lestableaux, les figures et les termes ou formulesmathématiques doivent être présentés-séparés du texte et prêts à l’impression-photo.Ceci s’applique particulièrement aux formulesmathématiques qui doivent être numérotées,et rassemblées dans leur état définitif en unou plusieurs groupes.
Les manuscrits prêts à I’impression serontenregistres dans le mois de leur arrivée auBureau de Rédaction de Grosshansdorf. Ilssont publiés dans l’ordre chronologique deleur arrivée au Bureau de Rédaction. LeRédacteur peut toutefois modifier cet ordrepour des raisons techniques.
Les notes peuvent avoir jusqu’a 1 page (envi-ron 4 pages dactylographiées) et doivent êtreindexées par’quelques mots cl&. Elles serontpubliés aussi rapidement que possible.
Les épreu;es d’imprimerie des articles origin-aux et des notes seront envoyées aux auteurspour correction. Elles doivent être retournéesdans le délai le plus bref possible. Les seulescorrections permises sont celle qui ont rapportà la typographie. Auoune modification dumanuscrit n’est pas permise. Los correctionsdes annonces, ,compte-redus et misses aupoint sont fait dans le Bureau de Rédaction.
lIré à par-t: Les auteurs peuvent obtenir gra-tuitement jusqu’aux 30 tirés à part de leur
3
Subscription: Silvae Genetica may be orderedthrough book-sellers in Germany and othercountries, or directly from the publisher. Sub-scriptions are effective for a complete volumeand continue in forte unless terminatedfollowing delivery of the last number of a vol-ume.
und Besprechungen werden in der Schriftlei-tung durchgefiihrt.
Sonderdrucke: Die Verfasser erhalten vonihren Arbeiten bis zu 30 Sonderdrucke kosten-los. Bei rechtzeitiger Bestellung bestehen fiir
article. Les quantités supplementaires peu-vent être achetées par commonde 21 l’avance *auprès de l’éditeur. *
Périodicité de publication: 6 fasicules par an.
weitere Sonderdrucke Bezugsmöglichkeitengegen Berechnung.
Price of subscription for the 6 numbers of avolume, DM 485.-; for students DM 388.-;postal expenses are extra.
Erscheinungsweise: 6 Hefte im Jahr.
Bezugsmöglichkeiten: Silvae Genetica kannThis journal is covered by Biological Ab- durch den in- und ausländischen Buchhandelstracta, Biosciences Information Service of oder direkt vom Verlag bezogen werden. Das
Biological Abstracts (Series Agriculture, Biólo- Abonnement ‘läuft weiter, wenn nicht unmit-gy and Environmental Sciencies) of Institute telbar nach der Lieferung des SchluBheftesfor Scientific Information, Forestry Abstracts, eines Bandes eine Abbestellung erfolgt.Institute for Scientific Information of the Aca-demy of Sciences of the USSR, CambridgeScientific Abstracta
Bezugspreis für die 6 Hefte des Bandesbeträgt DM 485,- (fiir Studenten DM 388,-lzuzüglich Versandspesen.
Abonnement: On peut s’abonner à SilvaeGenetica auprès des libraires en Allemagne oudans les autres pays, ou bien directementauprès de l’sditeur. L’abonnement est valablepour un volume complet, et se poursuit auto-matiquement, à moins que l’abonné nedemande qu’il se termine après le derniernuméro du volume en cours.
Prix de l’abonnement: pourles 6 numéros d’unvolume: 485,- DM; pour les étudiants: 388,-DM. Les frais d’expédition sont en sus.
Aduertisements: Inquiries about the size andprice of advertisements should be addressed Anzeigen: Anfragen’ über Preise und GröBeto the publisher. von Anzeigen werden an den Verlag erbeten.
Index Vol. 47,199s
P u b l i c i t é : Les demandes d’informationsconcernant les prix et la dimension des annon-ces publicitaires doivent être adressées àl’éditeur.
Diesem Heft liegen Titelblatt, Inhaltsverzeichnis und Register des Bandez 47 (1998) der Silvae Genetica bei.
Neuerscheinung
Verkernung und weitere verwendungsrelevanteEigenschaften von Douglasi~n-Schwachholz aus
unterschiedlich behandelten Jungbeständen ’Folgerungen für die Sortierung und die industrielle Verwendung
von Douglasien-Schwachholz
Schriften aus der Forstlichen Fakultät der Universität Göttingenund der Niedersächsischen Forstlichen Verstichsanstalt, Band 127
Von F. HAPLA
205 Seiten mit 53 Abbildungen und 105 TabellenISBN 3-7939-5127-8 * Kartoniert DM 45,-
Den An aben der jüngsten Bundeswaldinventur zufolgebetry 8e
stungsmater ia ls von groBer Bedeutung. Deshalb wurde die
Bun esrepub ik Deutschland etwa 134000 Hektar. Etwa7esamte Anbaunäche der Douglasie in der ’ Projektkonzeption um holzchemische, holzanatomische,
80% dieser Bestände entfallen auf die erste und zweiteratio-densitometrische und holzphysikalische Unter-suchungsgänge erweitert .
Altersklasse. Damit befinden sich die höchsten Vorrats-anteile im Bereich des schwachen Stammholzes. Vor dem
Anhand der verfügbaren Daten der Douglasien-Durchfor-
Hintergrund der,allstun
holzmarkt bereitet Bemeinen Situation auf dem Schwach-
sstämme wurden unterschiedliche Sortierungsvarian-
ie Verwertung des schwachen Dougla-ten (Kurchgeführt. Dabei wurde die Anzahl der Profilspa-
sienholzes aus Durchforstungsbeständen Schwierigkeiten.ner- und Industrieholzabschnit te, sowie deren Volumina in
Informationen und Prognosen über die KernausdehnungAbhängigkeit von verschiedenen Längen- und Zopf-vor aben je Stichprobenstamm errechnet. Die effiziente
im Stamm sowie über kernfreie Stammabschnitte können %A u s almng von verwertungs- und verwendungsrelvantenin Verbindung mit der Stammdimension mal3geblich zurEntscheidung über eine qualitätsorientierte Verwendun
Sortimenten unter Beachtung der Verkernun
3anatomischen und physikafschen Holzeigenscfl
und deraften d e r
des Douglasienholzes beitragen, indem die Nutzung un Douglasien-Durchforstungsstämme werden beispielhaftAushahung sich gezielt an .verwendunybezogdene diskutieit. Darüber hinaus werden die Ergebnisse dererwünschten Kernanteilen onentiert. Daher estan dasLeitziel dieser Untersuchung darin, die Verkernun
Aushaltungsvarianten jeweils waldbaulich unterschied-
Douglasien-Schwachholz in Abhängigkei t von verse lede-l?v o n lsi&behandelten Untersuchungsbeständen gegenüberge-
. 3nen Einflullfaktoren an repräsentativen Durchforstungs-kollektiven aus Erstdurchforstungsbeständen in quantita-tiver Hinsicht zu untersuchen.Im Hinblick auf, eine o timaledes Douglasien-SchwachK olzes
industr iel le Verwendungist eine über die quantita-
tive Kernanalyse hinausführende Kenntnis weiterer ver-wendungsrelevanter Holzeigenschaften des Durchfor- Neuaufforstungen zu.
J. D. SAUERLANDER’S VERLAG - FRANKFURT AM MAIN


![1265 BR Schalterbroschuere 2017 HELLA DE print...Montageöffnung, mit Einbaurahmen [mm] 51,3 x 48,3 (für zwei Einheiten) 44,1 x 22,1 (für eine Einheit) 51,3 x 48,1 (für zwei Einheiten)](https://img.pdfslide.org/doc/110x75/5fc56f47f803960d4e7dc0bb/1265-br-schalterbroschuere-2017-hella-de-print-montageffnung-mit-einbaurahmen.jpg)