Embed Size (px)
Citation preview
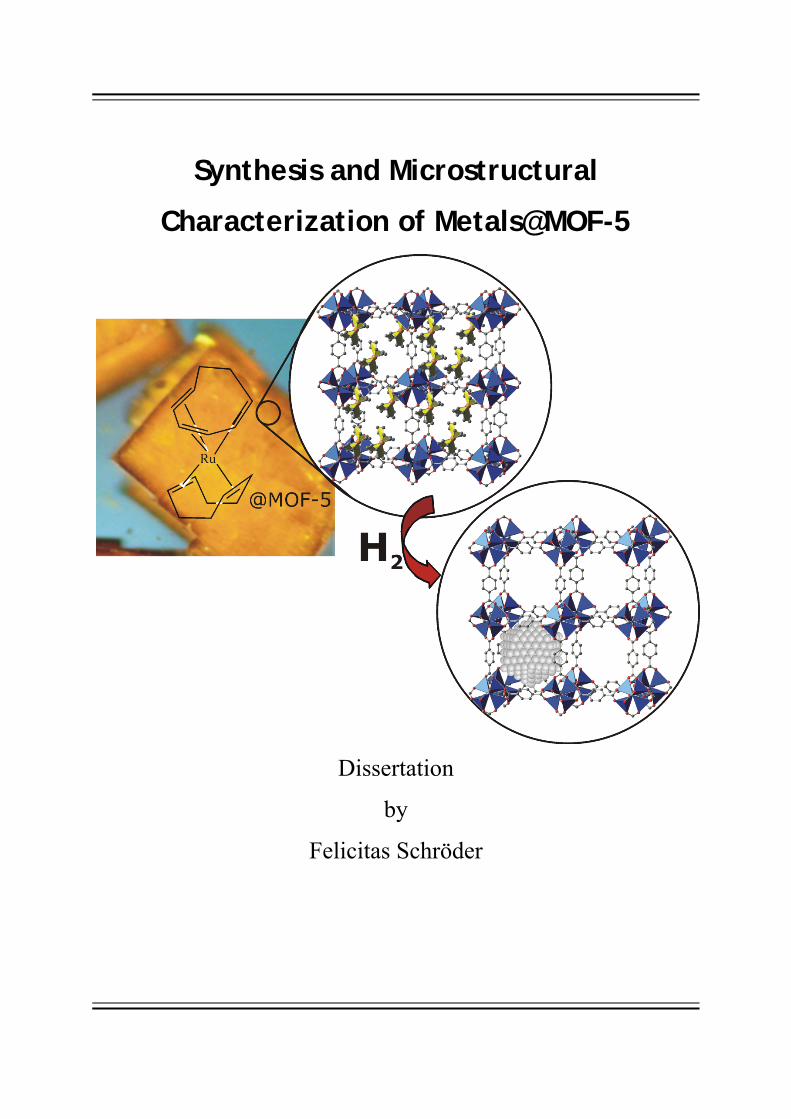
Synthesis and Microstructural
Characterization of Metals@MOF-5
Dissertation
by
Felicitas Schröder
Synthesis and Microstructural
Characterization of Metals@MOF-5
Dissertation
Zur Erlangung der Doktorwürde
der Fakultät für Chemie und Biochemie
an der Ruhr-Universität Bochum
Vorgelegt von
Dipl. Chem.
Felicitas Schröder
2008
III
This work has been performed in the time between January 2006 and August 2008 at the
Chair of Inorganic Chemistry II, Organometallics & Materials Chemistry of the Ruhr-
University Bochum.
Herein I declare that I have written this thesis independently and without unauthorised help.
Further, I assure that I have used no other sources, auxiliary means or quotes than those
stated.
I further declare that I have not submitted this thesis in this or in a similar form to any other
university or college.
Besides, I declare that I have not already undertaken an unsuccessful attempt to obtain a
doctorate from another college or university.
Felicitas Schröder, November 2008
Day of examination: 19.12.2008
1st referee: Prof. Dr. Roland A. Fischer
2nd referee: Prof. Dr. Christof Wöll

IV
I am grateful to my supervisor
Prof. Dr. Roland A. Fischer
for giving me great support and scientific freedom throughout the work on my thesis.
I always enjoyed being part of your group.
V
Acknowledgements
First I would like to thank all members of the MOF group for a great time and working
atmosphere: Maike Müller, Daniel Esken, Sebastian Henke, Denise Zacher, Xiaoning Zhang,
Saeed Amirjalayer, Mikhael Meilikhov and Dr. Kirill Yusenko.
I would also like to thank Prof. Dr. Bruno Chaudret from the Laboratoire de Chimie de
Coordination, CNRS, Toulouse for being my second supervisor in my thesis and very helpful
discussions.
I sincerely thank Prof. Dr. G. Buntkowsky from the Friedrich Schiller Universität, Jena, Dr.
Bernadeta Walaszek and Prof. Dr. H.-H. Limbach from the Freie Universität, Berlin for
readily accepting my request to measure my samples and useful discussions.
I would also like to thank Dr. Oleg I Lebedev and Stuart Turner from the EMAT institute in
Antwerp, Belgium for the detailed TEM measurements and evaluations of my metal@MOF-5
samples.
Of course I would also like to thank Hans-Jochen Hauswald from the Department of
Analytical Chemistry for teaching me how to work the MAS-NMR instrument and all his
patience during the sometimes time consuming measurements.
I sincerely thank Dr. Harish Parala for introducing me to the XRD and his help during
technical difficulties.
I would also like to thank Dr. Bernd Marler, Faculty of Geoscience, for help with the Rietveld
refinement and many helpful discussions.
Many thanks also go to Dr. Konstanze Schröck and Prof. Dr. Martina Havenith-Newen for an
interesting collaboration within the scope of the THz project.
I would like to give my warmest regards to Sabine Pankau for her help in organizing things of
everyday and scientific life.
VI
Also, I would like to thank all group members of AC II for a nice working atmosphere:
Saeed Amirjalayer, Daniela Bekermann, Timo Bollermann, Thomas Cadenbach, Jun. Prof.
Anjana Devi, Dr. Sandra Gonzalez Gallardo, Dr. Eliza Gemel, Dr. Christian Gemel, Vanessa
Gwildis, Markus Halbherr, Malte Hellwig, Ursula Herrmann, Todor Hikov, Dr. Ramasamy
Pothiraja, Dr. Ganesan Prabusankar, Heike Gronau-Schmid, Andrian Milanov, Dr. Rochus
Schmid, Dr. Maxim Tafipolski, Tobias Thiede, Manuela Winter, Ke Xu
Of course, warm regards also go to the former group members:
Dr. Arne Baunemann, Dr. Raghunandan Bhakta, Dr. Stephan Hermes, Dr. Andreas Kempter,
Dr. Jayaprakash Khanderi, Dr. Eva Maile, Dr. Daniel Rische, Dr. Marie-Kathrin Schröter, Dr.
Tobias Steinke, Dr. Urmila Patil
Further, I would like to thank the German National Academic Foundation (Studienstiftung des
Deutschen Volkes) for granting me a PhD fellowship over the last three years.
I would also like to thank the Research School of the Ruhr-University Bochum for granting
me a fellowship.
Financial support from the Deutsche Forschungsgemeinschaft (DFG) within the scope of the
Sonderforschungsbereich 558 – Metal-Support Interactions in Heterogeneous Catalysis is also
gratefully acknowledged.
Also I would like to thank, Dr. André van Veen, André Rittermeier and of course Angelika
Kruse-Fernkorn and Ruth Knödlseder-Mutschler for a nice but sadly too short time in the GK
of the SFB 558.
I sincerely thank Prof. Dr. Christof Wöll for accepting being co-referee within my PhD
defence and for the past years of collaborations.
Besides, I would also like to thank the following persons without whom it would not have
been possible to realise this work:
VII
- Prof. Dr. Wolfgang Grünert and Dr. Maurits van den Berg, Department of Technical
Chemistry at the Ruhr-University Bochum, for the XAS measurements at Hasylab,
Hamburg
- Dr. Andreas Trautwein (Südchemie AG, Heufeld) and Karin Bartholomäus
(Department of Analytical Chemistry, Ruhr-University Bochum) for elemental
analysis measurements.
- Susanne Buse for the N2 sorption measurements
- Jutta Schäfer and Sabine Bendix (Department of Analytical Chemistry, Ruhr-
University Bochum) for the GC-MS measurements
- The entire staff from the chemical lager, the glassblowing and the fine mechanics
factories of the Faculty of Chemistry and Biochemistry of the Ruhr-University
Bochum
- Dr. Alexander Birkner for help with TEM measurements at the Ruhr-University
Bochum
Finally I would like to thank Mirza Cokoja for being on my side always. Your love and
support always were and always will be everything I could have ever wished for in my life.

VIII
For my parents and Mirza
IX
Table of contents
1. Motivation and objectives ............................................................... 1
2. Introduction ................................................................................ 3
2.1. Metal-organic frameworks – an introduction .............................................................. 3
2.2. Loading of MOFs with functional molecules ............................................................. 8
2.2.1. Large organic molecules ....................................................................................... 9
2.3. Towards nanoparticles in metal-organic frameworks ............................................... 11
2.3.1. Loading with MOCVD precursors ...................................................................... 12
2.3.2. Reactions inside MOFs ....................................................................................... 16
2.4. Nanoparticle synthesis inside metal-organic frameworks ......................................... 18
2.4.1. General synthesis ................................................................................................. 18
2.4.2. Metal nanoparticles inside MOF-5 ...................................................................... 19
2.4.2.1. Pd@MOF-5 ................................................................................................ 20
2.4.2.2. Cu@MOF-5 and Au@MOF-5 ................................................................... 21
2.4.2.3. Metal nanoparticles in MOF-177 ............................................................... 22
2.4.3. Metaloxide@MOF-5 and metal/metaloxide@MOF-5 ........................................ 22
2.5. Other frameworks and other loading techniques ....................................................... 24
2.5.1. Noble metal particle formation at redox-active frameworks .............................. 24
2.5.2. Grafting of metal nanoparticles inside MOFs ..................................................... 26
2.6. Applications of nanoparticles loaded MOFs in catalysis .......................................... 28
3. Synthesis and characterisation of Ru nanoparticles in MOF-5 ................. 31
3.1. Loading of MOF-5 with [Ru(cod)(cot)] .................................................................... 33
3.1.1. Synthesis .............................................................................................................. 33
3.1.2. Characterization .................................................................................................. 33
3.1.2.1. Elemental/AAS analysis and packing density of
[Ru(cod)(cot)]3.5@MOF-5 .......................................................................... 33
3.1.2.2. 13C MAS-NMR spectroscopic measurements ............................................ 36
3.1.2.3. FT-IR spectroscopic measurements ........................................................... 39
3.1.2.4. X-ray diffraction studies of [Ru(cod)(cot)]3.5@MOF-5 ............................. 40
3.2. Attempts of the structural analysis of [Ru(cod)(cot)]3.5@MOF-5 by the
Rietveld method ........................................................................................................ 41
X
3.3. Hydrogenolysis of [Ru(cod)(cot)]3.5@MOF-5 at mild conditions ............................ 45
3.3.1. Synthesis .............................................................................................................. 45
3.3.2. Characterization .................................................................................................. 45
3.3.2.1. 13C MAS NMR spectroscopic investigations of
{[Ru(cod)]/Ru}@MOF-5 ........................................................................... 45
3.3.2.2. PXRD structural investigation of {[Ru(cod)]/Ru}@MOF-5 ..................... 48
3.3.2.3. TEM analysis of {[Ru(cod)]/Ru}@MOF-5 ............................................... 49
3.4. Quantitative hydrogenolysis of [Ru(cod)(cot)]3.5@MOF-5 to give Ru@MOF-5 ..... 50
3.4.1. Synthesis .............................................................................................................. 50
3.4.2. Characterization .................................................................................................. 50
3.4.2.1. 13C MAS-NMR investigations of Ru@MOF-5 .......................................... 50
3.4.2.2. PXRD structural investigations and calcination studies of Ru@MOF-5 ... 51
3.4.2.3. X-ray absorption spectroscopy (XAS) measurements of Ru@MOF-5 ...... 54
3.5. Microstructural investigation of Ru@MOF-5 by advanced TEM techniques .......... 56
3.6. Investigation of the host-guest interactions in Ru@MOF-5 ..................................... 62
3.6.1. CO-Adsorption on Ru@MOF-5 .......................................................................... 62
3.6.2. Hydride Mobility of Ru@MOF-5 in comparison to Ru Nanoparticles
stabilized by organic surfactants ......................................................................... 63
3.7. Catalytic Test Reactions of Ru@MOF-5 .................................................................. 66
3.7.1. Oxidation of benzyl alcohol ................................................................................ 66
3.7.2. Hydrogenation of benzene .................................................................................. 68
3.8. Conclusion ................................................................................................................. 69
4. Investigations of the loading of MOF-5 with two precursor components .... 71
4.1. Loading of MOF-5 with [Fe(η6-toluene)(η4-C4H6)] and [CpPtMe3] ........................ 73
4.1.1. Synthesis .............................................................................................................. 74
4.1.2. Characterization .................................................................................................. 74
4.1.2.1. Elemental analysis ...................................................................................... 74
4.1.2.2. MAS-NMR investigations .......................................................................... 75
4.1.2.3. PXRD structural investigations .................................................................. 76
4.2. Loading of MOF-5 with [CpPd(η3-C3H5)] and [CpPtMe3] ....................................... 78
4.2.1. Synthesis .............................................................................................................. 79
4.2.2. Characterization .................................................................................................. 79
4.2.2.1. Elemental analysis ...................................................................................... 79
XI
4.2.2.2. MAS-NMR investigations .......................................................................... 80
4.2.2.3. PXRD structural investigations .................................................................. 82
4.3. Loading of MOF-5 with [Ru(cod)(cot)]/[Pt(cod)Me2] .............................................. 84
4.3.1. Synthesis .............................................................................................................. 84
4.3.2. Characterization .................................................................................................. 85
4.3.2.1. 13C MAS NMR spectroscopic investigations ............................................. 85
4.3.2.2. PXRD structural investigations .................................................................. 86
4.4. Co-Hydrogenolysis of [Ru(cod)(cot)] and [Pt(cod)Me2] in MOF-5
at mild conditions ...................................................................................................... 88
4.4.1. Synthesis .............................................................................................................. 88
4.4.2. Characterization .................................................................................................. 88
4.4.2.1. MAS-NMR spectroscopic investigations ................................................... 88
4.4.2.2. PXRD structural investigations .................................................................. 89
4.5. Quantitative Co-Hydrogenolysis of [Ru(cod)(cot)] and [Pt(cod)Me2] in MOF-5 .... 91
4.5.1. Synthesis .............................................................................................................. 91
4.5.2. Characterization .................................................................................................. 91
4.5.2.1. 13C MAS-NMR spectroscopic investigations ............................................ 91
4.5.2.2. PXRD structural investigations .................................................................. 93
4.5.2.3. TEM investigations .................................................................................... 95
4.6. Conclusion ................................................................................................................. 97
5. Investigations of MOF-5-water interactions ..................................... 100
5.1. Loading of MOF-5 with 4wt.% and 8 wt.% of water ............................................. 104
5.1.1. Synthesis ............................................................................................................ 104
5.1.2. Characterization ................................................................................................ 104
5.1.2.1. PXRD structural investigations ................................................................ 104
5.1.2.2. THz-TDS spectroscopic investigations .................................................... 106
5.1.3. FT-IR investigation of MOF-5 + 8 wt.% H2O .................................................. 109
5.1.4. 13C MAS-NMR of MOF-5 + 8 wt.% H2O ........................................................ 110
5.2. Conclusions ............................................................................................................. 112
6. Summary and Outlook ................................................................ 114
XII
7. Experimental ........................................................................... 118
7.1. Analytical methods and instrumental details .......................................................... 118
7.1.1. Specific surface area determination from N2 adsorption measurements ........... 118
7.1.2. X-ray powder diffraction ................................................................................... 120
7.1.3. Transmission electron microscopy .................................................................... 121
7.1.4. X-ray absorption spectroscopy .......................................................................... 123
7.1.5. Solid State Nuclear Magnetic Resonance-general ............................................ 125
7.1.6. THz spectroscopy .............................................................................................. 127
7.1.7. IR spectroscopy ................................................................................................. 129
7.1.8. Elemental/Atom Absorption analysis ................................................................ 129
7.1.9. Gas chromatography-mass spectroscopy .......................................................... 129
7.2. Syntheses of the materials ....................................................................................... 130
7.2.1. Synthesis of MOF-5 ([Zn4O(bdc)3]) powder .................................................... 131
7.2.2. Synthesis of MOF-5 ([Zn4O(bdc)3]) crystals .................................................... 131
7.2.3. Synthesis of [Ru(cod)(cot)]3.5@MOF-5 ............................................................ 133
7.2.4. Hydrogenolysis of [Ru(cod)(cot)]3.5@MOF-5 at mild conditions .................... 134
7.2.5. Synthesis of Ru@MOF-5 by quantitative hydrogenolysis of
[Ru(cod)(cot)]3.5@MOF-5 ................................................................................. 135
7.2.6. Deuterium adsorption at Ru@MOF-5, sample preparation for solid state 2H-NMR measurements .................................................................................... 135
7.2.7. CO adsorption at Ru@MOF-5 for FT-IR measurements .................................. 136
7.2.8. Oxidation of benzyl alcohol using oxidized Ru@MOF-5 as catalyst ............... 136
7.2.9. Hydrogenation of benzene using Ru@MOF-5 as catalyst ................................ 137
7.2.10. Synthesis of [Fe(η6-toluene)(η4-C4H6)]/[CpPtMe3]@MOF-5 .......................... 138
7.2.11. Synthesis of [CpPd(η3-C3H5)]/[CpPtMe3]@MOF-5 ......................................... 139
7.2.12. Synthesis of [Ru(cod)(cot)]/[Pt(cod)Me2]@MOF-5 ......................................... 141
7.2.13. Removal of the precursor molecules from
[Ru(cod)(cot)]/[Pt(cod)Me2]@MOF-5 .............................................................. 142
7.2.14. Co-Hydrogenolysis of [Ru(cod)(cot)]/[Pt(cod)(CH3)2] in MOF-5 at mild
conditions .......................................................................................................... 143
7.2.15. Quantitative Co-Hydrogenolysis of [Ru(cod)(cot)]/[Pt(cod)Me2]@MOF-5 .... 144
7.2.16. Loading of MOF-5 with H2O ............................................................................ 145

XIII
8. References ............................................................................. 147
9. Appendix ................................................................................ 147
9.1. List of publications .................................................................................................. 147
9.2. Poster presentations ................................................................................................. 148
9.3. Curriculum Vitae ..................................................................................................... 150
XIV
Abbrevations
AAS Atom absorption spectroscopy
at.% Atomic percent
BTB 4,4′,4′′-Benzene-1,3,5-triyl-tribenzoate
BTC Benzene-1,3,5-carboxylate
bdc 1,4-Benzene-dicarboxylate
bpdc 4,4′,-Biphenyldicarboxylate
BPTC 1,1´-Biphenyl-2,2´,6,6´-tetracarboxylate
bpy 4,4′-Bipyridine
CNtBu Tertiary-butyl isonitrile
cod cis,cis-1,5-Cyclooctane
COF Covalent organic framework
cot cis,cis,cis-1,3,5-Cyclooctatriene
Cp Cyclopentadienyl-anion (C5H5)
cyclam 1,4,8,11-Tetraaza-cyclotetradecane
dmf Dimethylformamide
DEF Diethylformamide
DMA N,N-Dimethylacetamide
EDX Energy dispersive spectroscopy
EXAFS Extended X-ray absorption fine structure
FT-IR Fourier transform infrared spectroscopy
FWHM Full width at half maximum
fcc Face centered cubic
GC-MS Gas chromatography coupled with mass spectroscopy
HAADF High-angle annular dark field
hcp Hexagonal close packed
JCPDS Joint committee on powder diffraction standards
JUC Jilin University China
Me Methyl
MOCVD Metal-organic vapor deposition
MOF Metal-organic framework
MIL Matérial Institute Lavoisier
mtb methanetetra-benzoate
XV
OiPr Iso-propoxide
pzdc Pyrazine-2,3-dicarboxylate
pyz Pyrazine
SAED Selected area electron diffraction
STEM Scanning transmission electron microscopy
TATB triazine-1,3,5-tribenzoate
TEM Transmission electron microscopy
THz-TDS Terahertz time-domain spectroscopy
THF Tetrahydrofuran
wt.% Weight percent
XANES X-ray absorption near-edge structure
XAS X-ray absorption spectroscopy
XRD X-ray powder diffraction
ZIF Zeolite A imidazolate framework
1. Motivation and objectives
1
1. Motivation and objectives
Metal/support-interactions play an important role in heterogenous catalysis. In this
context, the Cu/ZnO based methanol catalyst represents a prototype of the so-called strong
metal support interactions in heterogeneous catalysis. This work was performed within the
scope of the research center SFB 558 ‘Metal support-interactions in heterogeneous catalysis’
at the Ruhr-University Bochum, which focuses on these interactions. Beside common porous
support materials such as silica or alumina, metal-organic frameworks arise as new support
matrices. MOFs exhibit large surface areas (up to 5900 m2/g) and temperature stability of up
to 500 °C with yet a rather different support-interaction than other common porous supports.
MOFs appear to behave rather like solid solvent cages with comparably low interaction with
embedded metal nanospecies. On the other hand, MOF-5 exhibits an unusual promotional
effect on embedded Cu nanoparticles in methanol catalysis. Zn-free Cu colloids were found to
be completely inactive in methanol catalysis, yet Cu@MOF-5 showed low catalytic activity in
methanol catalysis. Obviously MOFs exhibit unique novel properties as stabilization matrices
for metal nanospecies in heterogeneous catalysis.
Metals@MOF-5: Microstructural and Metal/Support-interaction
Although investigations of the synthesis of metal and metal oxide nanoparticles in
MOFs have already been performed, there has never been a direct proof as to where the
obtained nanoparticles are actually located inside the MOF cavities or at the outer surface of
the framework. A detailed investigation of the framework-guest (either nanoparticles or guest
molecules) interaction has also never been performed. The general objective of this work was
therefore to provide a deeper understanding of the nanoparticle-guest interaction and the
location of nanoparticles@MOF-5. Due to its easy accessibility, relatively large surface area
and pore opening/diameter (see discussion above), MOF-5 was chosen as model metal-
organic framework host material in this work. In order to investigate the framework-
nanoparticle interaction in more detail, especially investigation of the synthesis of ruthenium
nanoparticles in MOF-5 was selected as study case. The synthesis of ruthenium nanoparticles
on solid supports or ruthenium colloids in solution has already been extensively studied (see
next chapter), and an extended database of results from TEM, PXRD, XAS, MAS NMR and
FT-IR measurements is available in the literature. Therefore, the obtained corresponding
analytical data from Ru@MOF-5 can easily be compared to these data and new insights of the
properties of nanoparticles@MOF-5 appear possible. In addition, Ru nanoparticles are also of
1. Motivation and objectives
2
relevance in catalytic oxidation and hydrogenation reactions, studies of the catalytic
properties of the composite Ru@MOF-5 are hence interesting as well.
Bimetallics@MOF-5
With the perspective of synthesizing bimetallic nanoparticles in MOF, loading of
MOF-5 with two different metal precursor molecules was studied. Bimetallic nanoparticles
such as FePt, PdPt and PtRu have already been studies in the literature due to their superior
magnetic (FePt) or catalytic properties (PdPt, PtRu). For example, the catalytic properties of a
single metal catalyst can be greatly enhanced by adding an additional metal. Three binary
systems of Pd/Pt, Fe/Pt and Ru/Pt precursors were examined. Here the main objective was to
investigate whether the MOF material can be loaded with distinct precursor ratios, which is an
important prerequisite of the synthesis of distinct metallic alloys. Preliminary results on the
synthesis of PtRu nanoparticles were also obtained.
Water@MOF-5
Since many catalytic processes also demand the presence or production of water, the
interaction between MOF-5 and water guest molecules was another objective of this work.
For this, Terahertz spectroscopy, which is frequently used to investigate protein-water
interactions, was applied. The examined MOF-5 materials, loaded with 4 wt.% and 8 wt.%
water were investigated additionally by PXRD, FT-IR and MAS-NMR.
2. Nanoparticles synthesis in MOFs
3
2. Introduction
2.1. Metal-organic frameworks – an introduction
The phrase coordination polymer first appeared in the literature in the early 1960s
with the corresponding research area already being reviewed in 1964.[1] However, it was not
until the early 1990s that more detailed research on porous coordination polymers started to
increase considerably. Early papers on these new polymeric compounds already pointed out
the great possibilities for new material structures and properties offered by these materials.[2-6]
Ever since, this novel class of hybrid inorganic-organic soft solid state materials, largely
based on Werner-type coordination chemistry, has become a major field of research. Beyond
the scope of pure inorganic porous materials, i. e. zeolites, alumophosphates etc; metal-
organic frameworks (MOFs) are completely regular, have a high porosity and are highly
designable. Their synthesis usually occurs under mild conditions by using a choice of a
certain combinations of discrete molecular building units which, in the ideal case, leads to the
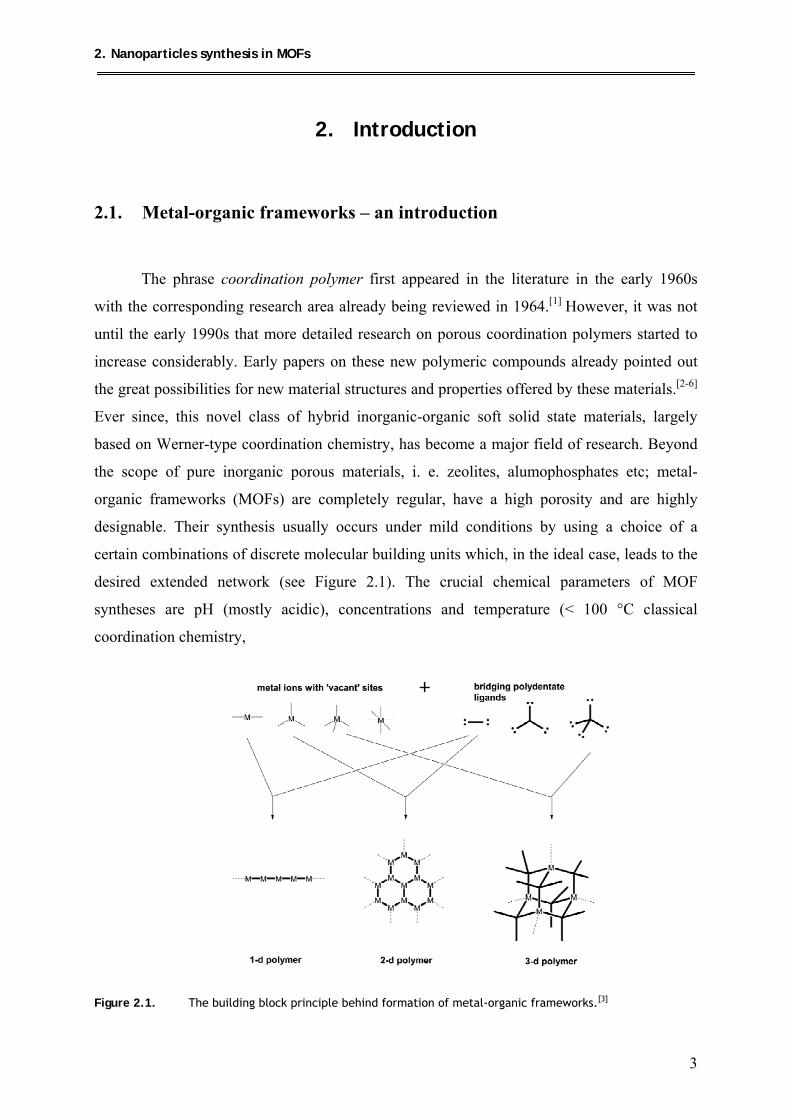
desired extended network (see Figure 2.1). The crucial chemical parameters of MOF
syntheses are pH (mostly acidic), concentrations and temperature (< 100 °C classical
coordination chemistry,
Figure 2.1. The building block principle behind formation of metal-organic frameworks.[3]
2. Nanoparticles synthesis in MOFs
4
>100 °C solvothermal conditions). These are directly linked to the overall possibility of
designing MOF structures. During MOF synthesis, the organic linkers remain invariant
whereas the nuclearity and dimensionality of the inorganic brick can change if the synthesis
parameters are not controlled; leading to possible undesired framework structures. Due to the
infinite number of possible combinations of organic and inorganic building parts, basic
principles of classification of the resulting MOF structures are clearly needed. O’Keeffe and
Férey were the first to develop two different approaches concerning the topology of
structures.[7,8] O’Keeffe’s concept of ‘augmented nets’ describes every solid as a geometric
figure (net) resulting from the connection of the entities of the structure. For instance, in an
[N,M] connected net, some vertices are connected to N and some vertices to M neighbors. An
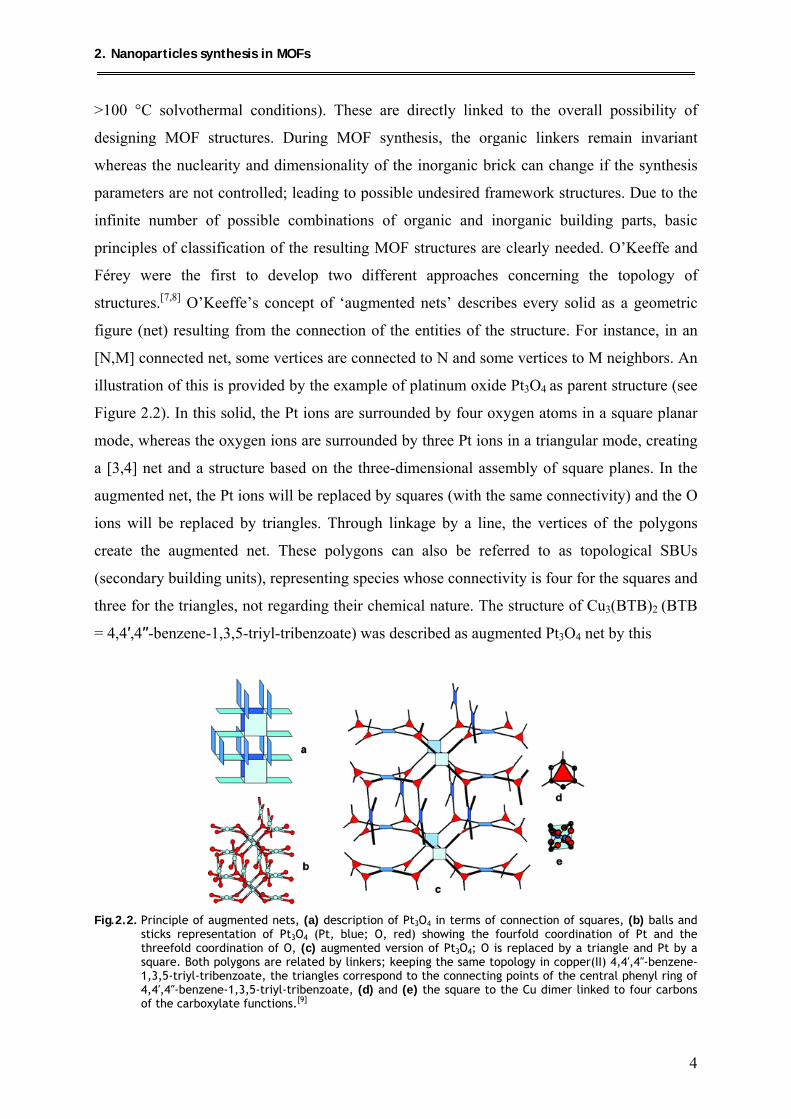
illustration of this is provided by the example of platinum oxide Pt3O4 as parent structure (see
Figure 2.2). In this solid, the Pt ions are surrounded by four oxygen atoms in a square planar
mode, whereas the oxygen ions are surrounded by three Pt ions in a triangular mode, creating
a [3,4] net and a structure based on the three-dimensional assembly of square planes. In the
augmented net, the Pt ions will be replaced by squares (with the same connectivity) and the O
ions will be replaced by triangles. Through linkage by a line, the vertices of the polygons
create the augmented net. These polygons can also be referred to as topological SBUs
(secondary building units), representing species whose connectivity is four for the squares and
three for the triangles, not regarding their chemical nature. The structure of Cu3(BTB)2 (BTB
= 4,4′,4′′-benzene-1,3,5-triyl-tribenzoate) was described as augmented Pt3O4 net by this
Fig.2.2. Principle of augmented nets, (a) description of Pt3O4 in terms of connection of squares, (b) balls and
sticks representation of Pt3O4 (Pt, blue; O, red) showing the fourfold coordination of Pt and the threefold coordination of O, (c) augmented version of Pt3O4; O is replaced by a triangle and Pt by a square. Both polygons are related by linkers; keeping the same topology in copper(II) 4,4′,4′′-benzene-1,3,5-triyl-tribenzoate, the triangles correspond to the connecting points of the central phenyl ring of 4,4′,4′′-benzene-1,3,5-triyl-tribenzoate, (d) and (e) the square to the Cu dimer linked to four carbons of the carboxylate functions.[9]
2. Nanoparticles synthesis in MOFs
5
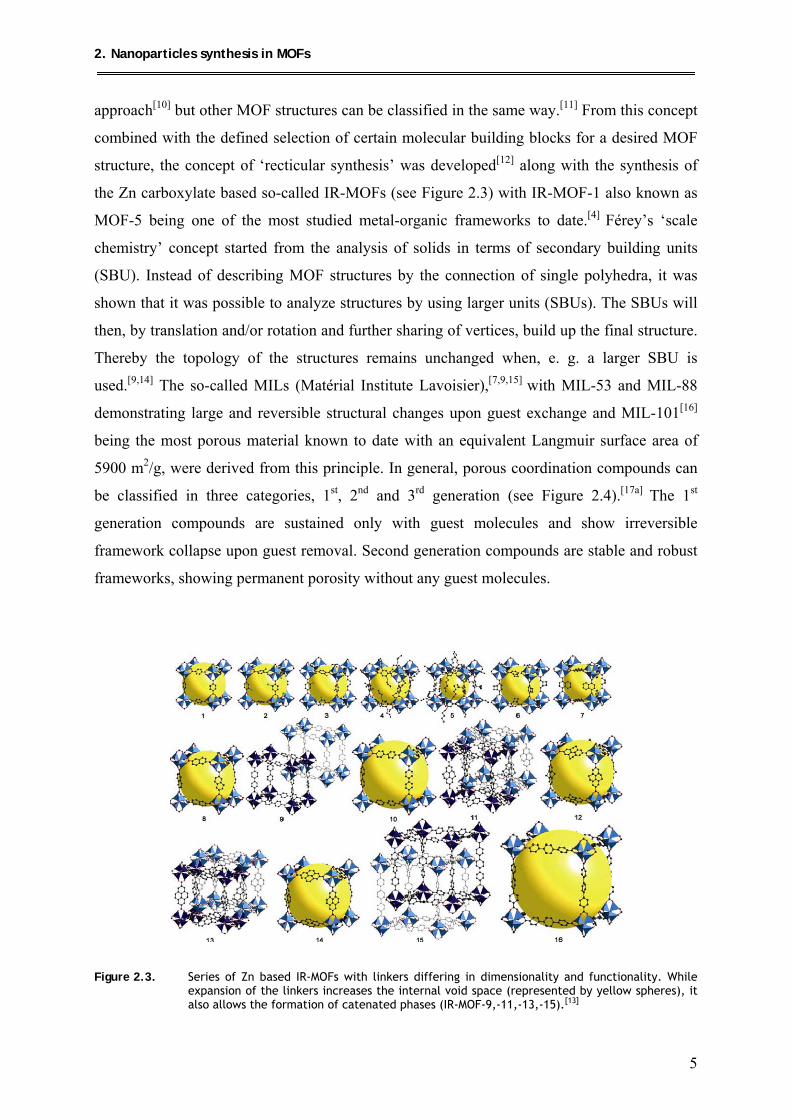
approach[10] but other MOF structures can be classified in the same way.[11] From this concept
combined with the defined selection of certain molecular building blocks for a desired MOF
structure, the concept of ‘recticular synthesis’ was developed[12] along with the synthesis of
the Zn carboxylate based so-called IR-MOFs (see Figure 2.3) with IR-MOF-1 also known as
MOF-5 being one of the most studied metal-organic frameworks to date.[4] Férey’s ‘scale
chemistry’ concept started from the analysis of solids in terms of secondary building units
(SBU). Instead of describing MOF structures by the connection of single polyhedra, it was
shown that it was possible to analyze structures by using larger units (SBUs). The SBUs will
then, by translation and/or rotation and further sharing of vertices, build up the final structure.
Thereby the topology of the structures remains unchanged when, e. g. a larger SBU is
used.[9,14] The so-called MILs (Matérial Institute Lavoisier),[7,9,15] with MIL-53 and MIL-88
demonstrating large and reversible structural changes upon guest exchange and MIL-101[16]
being the most porous material known to date with an equivalent Langmuir surface area of
5900 m2/g, were derived from this principle. In general, porous coordination compounds can
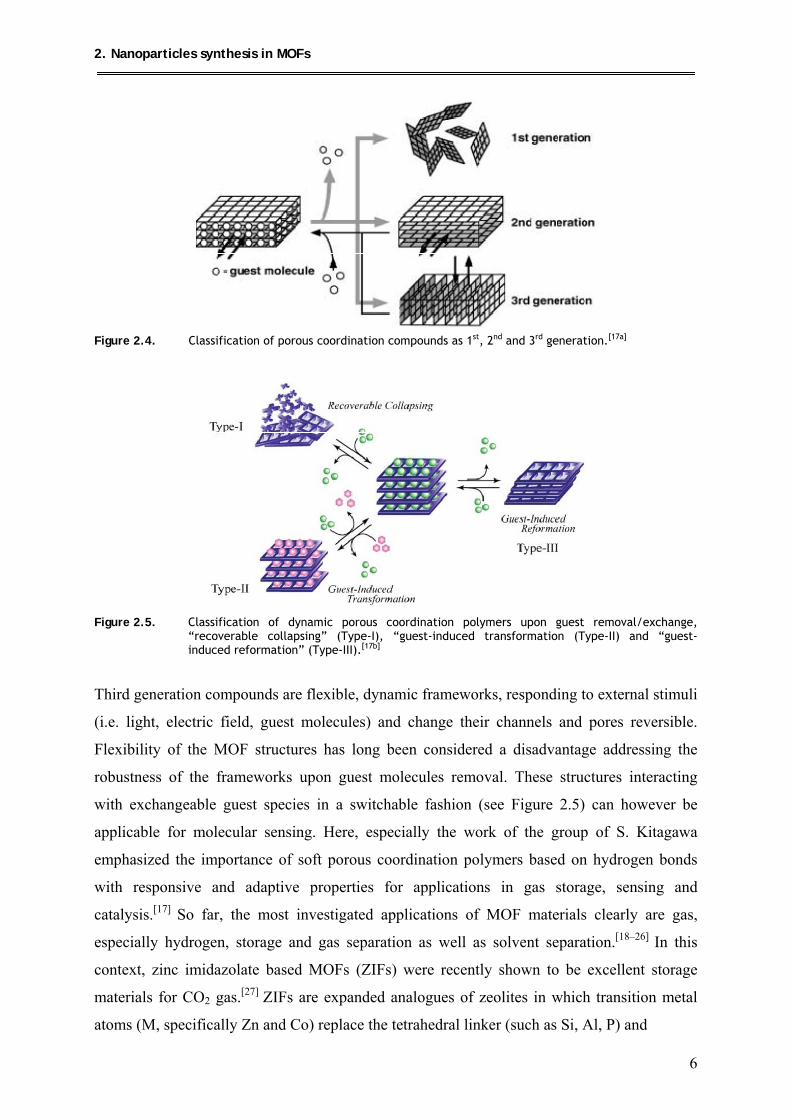
be classified in three categories, 1st, 2nd and 3rd generation (see Figure 2.4).[17a] The 1st
generation compounds are sustained only with guest molecules and show irreversible
framework collapse upon guest removal. Second generation compounds are stable and robust
frameworks, showing permanent porosity without any guest molecules.
Figure 2.3. Series of Zn based IR-MOFs with linkers differing in dimensionality and functionality. While expansion of the linkers increases the internal void space (represented by yellow spheres), it also allows the formation of catenated phases (IR-MOF-9,-11,-13,-15).[13]
2. Nanoparticles synthesis in MOFs
6
Figure 2.4. Classification of porous coordination compounds as 1st, 2nd and 3rd generation.[17a]
Figure 2.5. Classification of dynamic porous coordination polymers upon guest removal/exchange,
“recoverable collapsing” (Type-I), “guest-induced transformation (Type-II) and “guest-induced reformation” (Type-III).[17b]
Third generation compounds are flexible, dynamic frameworks, responding to external stimuli
(i.e. light, electric field, guest molecules) and change their channels and pores reversible.
Flexibility of the MOF structures has long been considered a disadvantage addressing the
robustness of the frameworks upon guest molecules removal. These structures interacting
with exchangeable guest species in a switchable fashion (see Figure 2.5) can however be
applicable for molecular sensing. Here, especially the work of the group of S. Kitagawa
emphasized the importance of soft porous coordination polymers based on hydrogen bonds
with responsive and adaptive properties for applications in gas storage, sensing and
catalysis.[17] So far, the most investigated applications of MOF materials clearly are gas,
especially hydrogen, storage and gas separation as well as solvent separation.[18–26] In this
context, zinc imidazolate based MOFs (ZIFs) were recently shown to be excellent storage
materials for CO2 gas.[27] ZIFs are expanded analogues of zeolites in which transition metal
atoms (M, specifically Zn and Co) replace the tetrahedral linker (such as Si, Al, P) and
2. Nanoparticles synthesis in MOFs
7
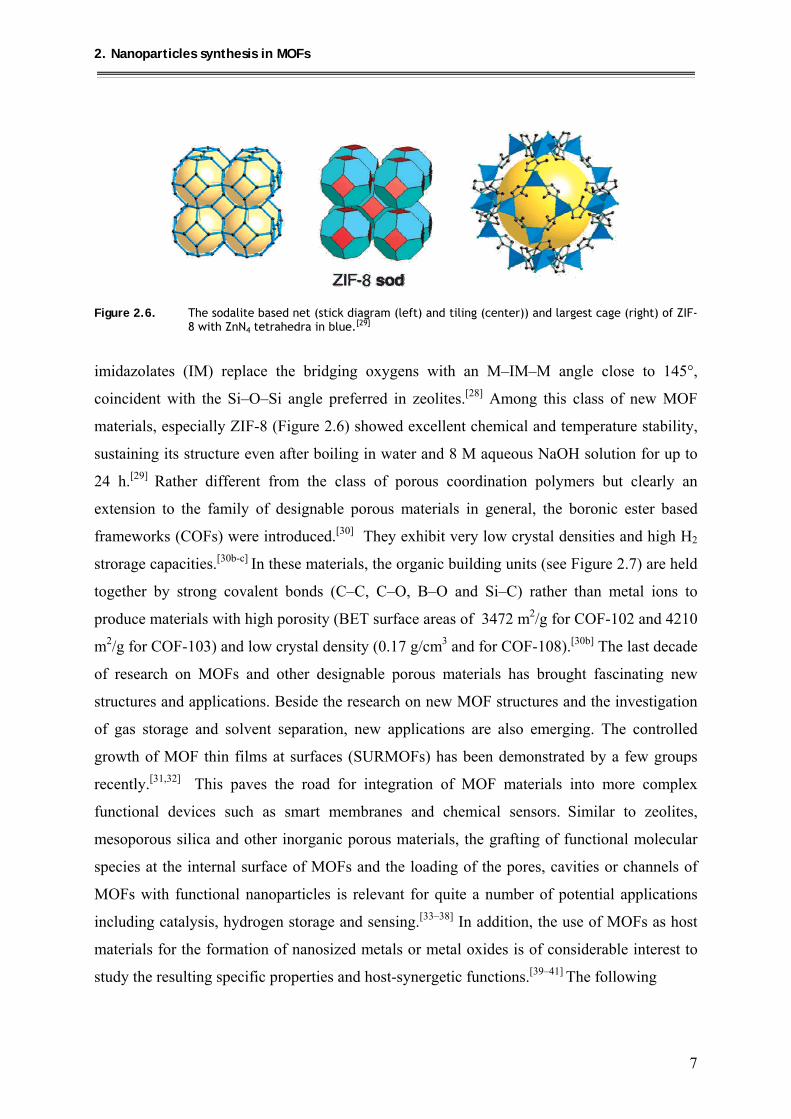
Figure 2.6. The sodalite based net (stick diagram (left) and tiling (center)) and largest cage (right) of ZIF-
8 with ZnN4 tetrahedra in blue.[29]
imidazolates (IM) replace the bridging oxygens with an M–IM–M angle close to 145°,
coincident with the Si–O–Si angle preferred in zeolites.[28] Among this class of new MOF
materials, especially ZIF-8 (Figure 2.6) showed excellent chemical and temperature stability,
sustaining its structure even after boiling in water and 8 M aqueous NaOH solution for up to
24 h.[29] Rather different from the class of porous coordination polymers but clearly an
extension to the family of designable porous materials in general, the boronic ester based
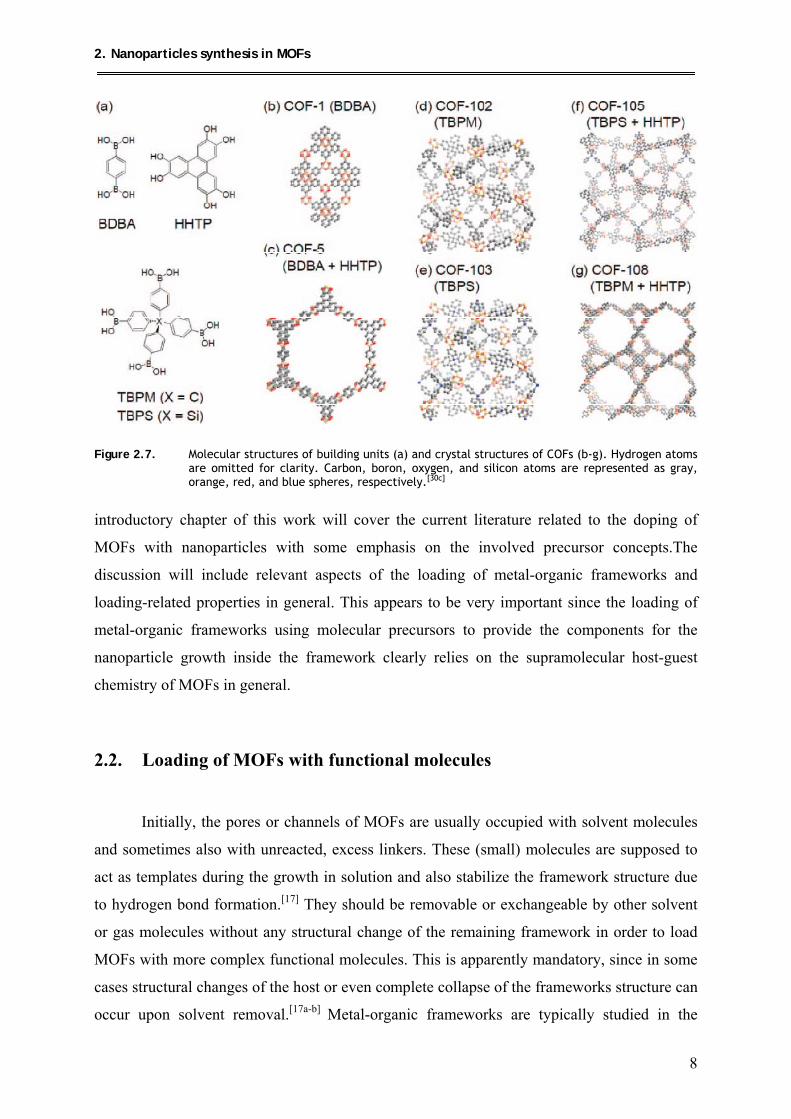
frameworks (COFs) were introduced.[30] They exhibit very low crystal densities and high H2
strorage capacities.[30b-c] In these materials, the organic building units (see Figure 2.7) are held
together by strong covalent bonds (C–C, C–O, B–O and Si–C) rather than metal ions to
produce materials with high porosity (BET surface areas of 3472 m2/g for COF-102 and 4210
m2/g for COF-103) and low crystal density (0.17 g/cm3 and for COF-108).[30b] The last decade
of research on MOFs and other designable porous materials has brought fascinating new
structures and applications. Beside the research on new MOF structures and the investigation
of gas storage and solvent separation, new applications are also emerging. The controlled
growth of MOF thin films at surfaces (SURMOFs) has been demonstrated by a few groups
recently.[31,32] This paves the road for integration of MOF materials into more complex
functional devices such as smart membranes and chemical sensors. Similar to zeolites,
mesoporous silica and other inorganic porous materials, the grafting of functional molecular
species at the internal surface of MOFs and the loading of the pores, cavities or channels of
MOFs with functional nanoparticles is relevant for quite a number of potential applications
including catalysis, hydrogen storage and sensing.[33–38] In addition, the use of MOFs as host
materials for the formation of nanosized metals or metal oxides is of considerable interest to
study the resulting specific properties and host-synergetic functions.[39–41] The following
2. Nanoparticles synthesis in MOFs
8
Figure 2.7. Molecular structures of building units (a) and crystal structures of COFs (b-g). Hydrogen atoms
are omitted for clarity. Carbon, boron, oxygen, and silicon atoms are represented as gray, orange, red, and blue spheres, respectively.[30c]
introductory chapter of this work will cover the current literature related to the doping of
MOFs with nanoparticles with some emphasis on the involved precursor concepts.The
discussion will include relevant aspects of the loading of metal-organic frameworks and
loading-related properties in general. This appears to be very important since the loading of
metal-organic frameworks using molecular precursors to provide the components for the
nanoparticle growth inside the framework clearly relies on the supramolecular host-guest
chemistry of MOFs in general.
2.2. Loading of MOFs with functional molecules
Initially, the pores or channels of MOFs are usually occupied with solvent molecules
and sometimes also with unreacted, excess linkers. These (small) molecules are supposed to
act as templates during the growth in solution and also stabilize the framework structure due
to hydrogen bond formation.[17] They should be removable or exchangeable by other solvent
or gas molecules without any structural change of the remaining framework in order to load
MOFs with more complex functional molecules. This is apparently mandatory, since in some
cases structural changes of the host or even complete collapse of the frameworks structure can
occur upon solvent removal.[17a-b] Metal-organic frameworks are typically studied in the
2. Nanoparticles synthesis in MOFs
9
context of their gas storage and/or separation properties mainly focusing on rather non-polar
hydrocarbons.[18-26] Most MOFs exhibit non polar, i.e. hydrophobic inner surfaces, and here
the discussion will be largely restricted to these types of MOFs. The general possibility to
adsorb non-trivial, large functional organic molecules inside the cavities of MOFs was
demonstrated, for example, by Yaghi et al. using dyes[42] and by Férey et al. applying
pharmaceutically relevant molecules.[43] Obviously, for larger guest molecules, the potential
host frameworks should exhibit pore diameters or window openings that allow the in-
diffusion of this compounds. This will be discussed later in this chapter.
2.2.1. Large organic molecules
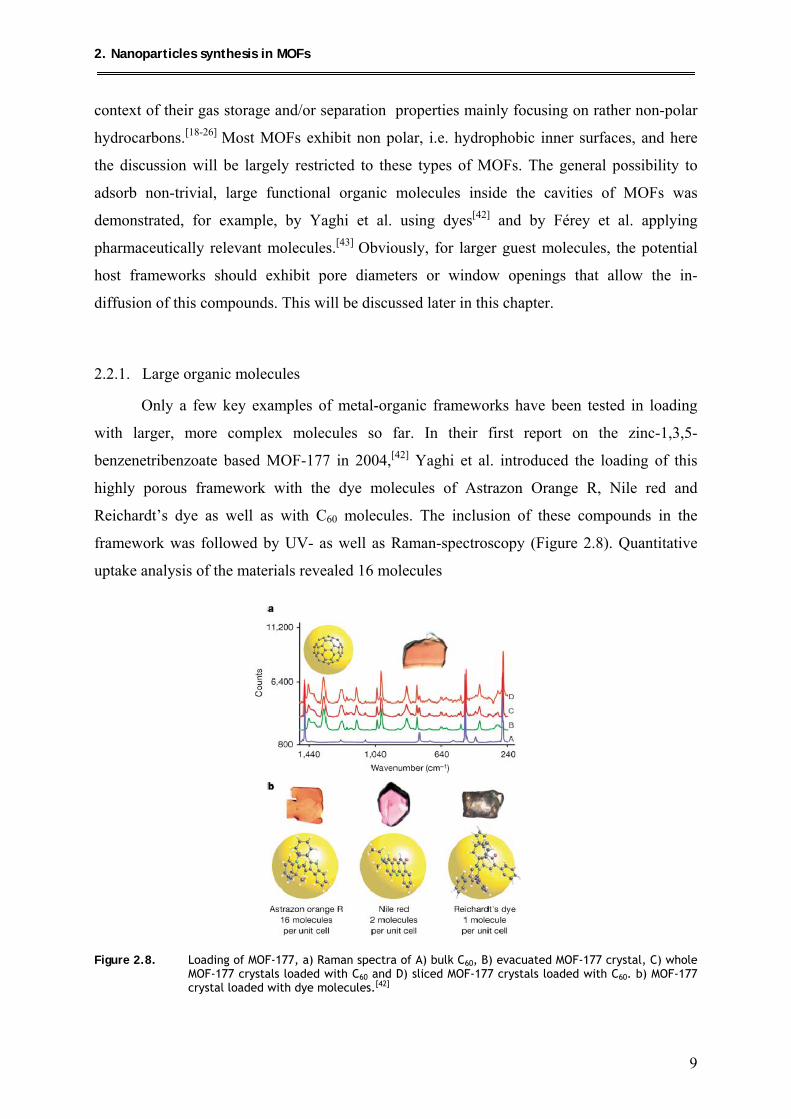
Only a few key examples of metal-organic frameworks have been tested in loading
with larger, more complex molecules so far. In their first report on the zinc-1,3,5-
benzenetribenzoate based MOF-177 in 2004,[42] Yaghi et al. introduced the loading of this
highly porous framework with the dye molecules of Astrazon Orange R, Nile red and
Reichardt’s dye as well as with C60 molecules. The inclusion of these compounds in the
framework was followed by UV- as well as Raman-spectroscopy (Figure 2.8). Quantitative
uptake analysis of the materials revealed 16 molecules
Figure 2.8. Loading of MOF-177, a) Raman spectra of A) bulk C60, B) evacuated MOF-177 crystal, C) whole
MOF-177 crystals loaded with C60 and D) sliced MOF-177 crystals loaded with C60. b) MOF-177 crystal loaded with dye molecules.[42]
2. Nanoparticles synthesis in MOFs
10
of Astrazon Orange R, two molecules of Nile red and one molecule of Reichardt’s dye per
MOF-177 unit cell, already demonstrating the size dependant sorption properties of MOF-
177. Quiu et al. presented the synthesis of the porous framework [Cd3(bpdc)3(dmf)]·5 dmf·18
H2O (bpdc = 4,4′,-biphenyldicarboxylate, dmf = dimethylformamide, JUC-48, JUC = Jilin
University China) and the assembly of Rh6G dye molecules in its pores.[44] Dye molecules
were infiltrated by either adding an ethanolic solution of the dye to the mother liquor of the
MOF or immersion of the framework in the dye solution. The dye@MOF composite showed
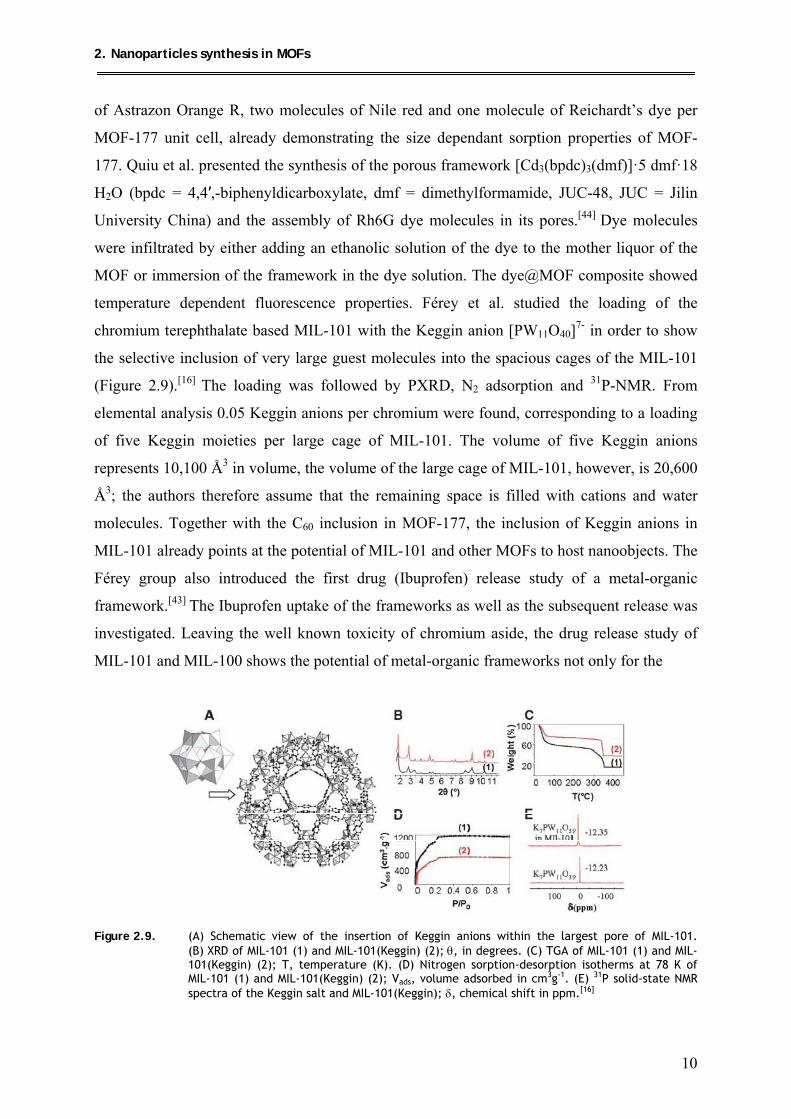
temperature dependent fluorescence properties. Férey et al. studied the loading of the
chromium terephthalate based MIL-101 with the Keggin anion [PW11O40]7- in order to show
the selective inclusion of very large guest molecules into the spacious cages of the MIL-101
(Figure 2.9).[16] The loading was followed by PXRD, N2 adsorption and 31P-NMR. From
elemental analysis 0.05 Keggin anions per chromium were found, corresponding to a loading
of five Keggin moieties per large cage of MIL-101. The volume of five Keggin anions
represents 10,100 Å3 in volume, the volume of the large cage of MIL-101, however, is 20,600
Å3; the authors therefore assume that the remaining space is filled with cations and water
molecules. Together with the C60 inclusion in MOF-177, the inclusion of Keggin anions in
MIL-101 already points at the potential of MIL-101 and other MOFs to host nanoobjects. The
Férey group also introduced the first drug (Ibuprofen) release study of a metal-organic
framework.[43] The Ibuprofen uptake of the frameworks as well as the subsequent release was
investigated. Leaving the well known toxicity of chromium aside, the drug release study of
MIL-101 and MIL-100 shows the potential of metal-organic frameworks not only for the
Figure 2.9. (A) Schematic view of the insertion of Keggin anions within the largest pore of MIL-101.
(B) XRD of MIL-101 (1) and MIL-101(Keggin) (2); θ, in degrees. (C) TGA of MIL-101 (1) and MIL-101(Keggin) (2); T, temperature (K). (D) Nitrogen sorption-desorption isotherms at 78 K of MIL-101 (1) and MIL-101(Keggin) (2); Vads, volume adsorbed in cm3g-1. (E) 31P solid-state NMR spectra of the Keggin salt and MIL-101(Keggin); δ, chemical shift in ppm.[16]
2. Nanoparticles synthesis in MOFs
11
loading but also the controlled release of an imbedded compound.[43a] MIL-101 is able to take
up four times as much Ibuprofen as MCM-41 which has comparable cage sizes. It also shows
a slower delivery rate which supposes advantages for larger pharmacological molecules. Very
recently, the ‘breathing’ chromium and iron based MIL-53 frameworks have also been used
as matrices for the delivery of Ibuprofen.[43b] Very slow, controlled and complete delivery was
achieved under physiological conditions which is due to the frameworks ability to adapt to the
dimensions of the drug.
These and similar studies employing more complex organic molecules as guests prove distinct
features of the corresponding frameworks, i.e. extraordinary cavity size or adsorption
properties. Thus, these studies focus on the function of the MOF itself as matrix for
adsorption. The loading of MOFs with organometallic precursor molecules is motivated by
combination of the functionality of the precursors to serve as source for nanoparticles with the
function of the MOF to restrict the growth and the aggregation of the particles by caging
effects. Interestingly, the characteristic sizes of cavities, channels and pores of MOFs cover a
size regime between that of classical zeolites ≤ 1 nm and that of mesoporous materials ≥ 2–3
nm. In contrast to these latter materials however, MOFs are expected to show a much weaker
particle/host interaction.
2.3. Towards nanoparticles in metal-organic frameworks
Metal doping of metal-organic frameworks seems to be a promising field of research
not only for catalytic applications but also for enhanced capacity in gas storage as compared
to the pure metal-organic framework.[45] In general, one could think of two different
approaches for the synthesis of metal nanoparticles inside MOFs, the infiltration of preformed
nanoparticles stabilized by organic molecules (surfactants) in solution or the stepwise
infiltration of suitable precursors and their conversion into nanoparticles inside the
framework’s cavities. For other porous host materials, such as silica and alumina, several
approaches for imbedding nanoparticles into their cavities via immersion in colloidal
solutions are literature known.[46] However, the typical cavity sizes of MOFs are too small to
match surfactant stabilized nanoparticles with hydrodynamic radii typically larger than 3 nm.
In order to utilize the metal-organic framework as stabilizing agent and host material at the
same time, stepwise precursor infiltration and subsequent decomposition appears to be the
most suitable approach. In this way, the size and shape of the nanoparticles, synthesized
2. Nanoparticles synthesis in MOFs
12
directly in the pores of the framework, should be controlled by the pore size, shape and
channel structure of the host material. Suitable precursor molecules for the synthesis of metal
nanoparticles in MOFs can in general be molecules that are also commonly used in the
synthesis of colloidal metal nanoparticles in solution or metal nanoparticles in the solid state.
These molecules are often also known from thin film formation processes such as MOCVD
(Metal-Organic Vapor Deposition) or ALD (Atomic Layer Deposition) and are basically
metal-organic coordination compounds or so-called organometallic, often all-hydrocarbon
ligand molecules featuring metal carbon bonds. Upon decomposition, the ligands of these
molecules are cleaved off the metal center, leaving ‘free’ metal atoms that will then fuse
together to form metal clusters.[47] Space confinement of the MOF cavities should ideally limit
the growth of the particles to the size of the corresponding pore diameter. Note that the host
framework should be inert towards the imbedded precursor itself as well as to decomposition
products or free ligands of the precursor molecules. Here, common approaches known from
colloid and nanoparticle chemistry in general, like the ‘polyol process’ for coinage and noble
metal colloids, seem to have a somewhat lower importance, due to the reactivity of many
metal-organic frameworks toward acidic conditions (protons) and halides, especially at
elevated temperatures. It should also not be neglected that typical metal-organic precursor
molecules often exhibit an intrinsic reactivity toward protic solvent residues, hydroxyl groups
or other reactive surface groups inside the host material. Hence, a careful choice of the metal-
organic framework and the precursor is mandatory for a controlled nanoparticle synthesis
inside MOFs.
2.3.1. Loading with MOCVD precursors
Loading of metal-organic frameworks with organometallic molecules can be seen as
an extension of the loading with larger non-trivial organic molecules mentioned above. Some
of these coordination compounds are highly volatile already at room temperature; others are
sublimable at elevated temperature and pressure. Loading of MOFs with these compounds
can, therefore, be compared to the loading with gases or volatile solvents and is usually
performed in vacuo. With respect to the subsequent controlled decomposition of the included
molecules to nanoparticles, MOCVD (Metal-Organic Vapor Deposition) precursors are a very
suitable class of compounds for the loading of MOFs. For a controlled loading, the
characterization of the primary inclusion compounds precursor@MOF is mandatory to
warrant the yield of a well defined metal@MOF composite in a second step. In addition,
2. Nanoparticles synthesis in MOFs
13
studying the loading process of the MOF with precursor molecules also gives interesting
insights into the host-guest interactions of this composite which may help to elucidate the
interactions between imbedded metal nanoparticles and the MOF. This is highly relevant
since, e.g., catalytic processes often demand well defined host guest interactions to enable
stabilization of free adsorption sites for molecules in the catalytic reaction. Depending on the
guest molecules, loading of the metal-organic frameworks can be generally performed via gas
phase in vacuo or via solution. In all studies discussed above, loading of MOFs with dye
molecules,[42,44] C60,[42,16] Keggin anions[16] and Ibuprofen[43] was performed via solution
impregnation of the MOF powders. The MOF materials were immersed in saturated solutions
of the compounds, letting the guest molecules slowly diffuse into the MOF cavities. When
loading via solution, the competition in diffusion between the guest and the solvent molecules
has to be taken into account. A uniform distribution of the guest molecules throughout the
framework is not easy to achieve due to the inclusion of solvent molecules at the same
time.[42] Kaskel et al. have used the incipient wetness technique to load MOF-5 with the Pd
precursor [Pd(acac)2] (acac = acetylacetonate).[45] The advantage of this technique is the rather
precise control of the loading just by choosing a certain concentration of the precursor in the
solution. With this technique, however, the loading with precursors is limited to the solubility
of the precursor molecule in the solvent used. Notably, Kaskel and co-workers introduced
only 1 wt.% Pd into the MOF, which is fine for many catalytic applications.
Due to its facile synthesis even in larger scales, temperature stability up to 400 °C in argon,
high Langmuir surface area of up to 4400 m2/g[48] and the relatively large pore opening of 7.8
Å,[4] MOF-5 is quite a nice test system for various types of loading studies. Of course, the
reactivity of MOF-5 towards water and humid air[49,50] limits its application in technical
processes to some extent. The first studies on the loading of MOFs with organometallic
molecules and the subsequent synthesis of metal nanoparticles in MOF (which will be
discussed later) have been performed by infiltration of [CpPd(η3-C3H5)], [CpCu(PMe3)] and
[Au(CH3)(PMe3)] in MOF-5 (Zn4O(bdc)3, bdc = benzene-1,4-dicarboxylate) via gas phase.[51]
Prior to that, the freshly prepared [Zn4O(bdc)3] was activated in vacuo and then exposed to
the vapor of the different metal-organic molecules. The loading was followed by 1H and 13C
MAS-NMR, FT-IR, powder X-ray diffraction and elemental analysis. It was shown that,
similar to the loading with the large organic molecules, the structure of the host framework
remains intact after inclusion of the organometallic compounds.
2. Nanoparticles synthesis in MOFs
14
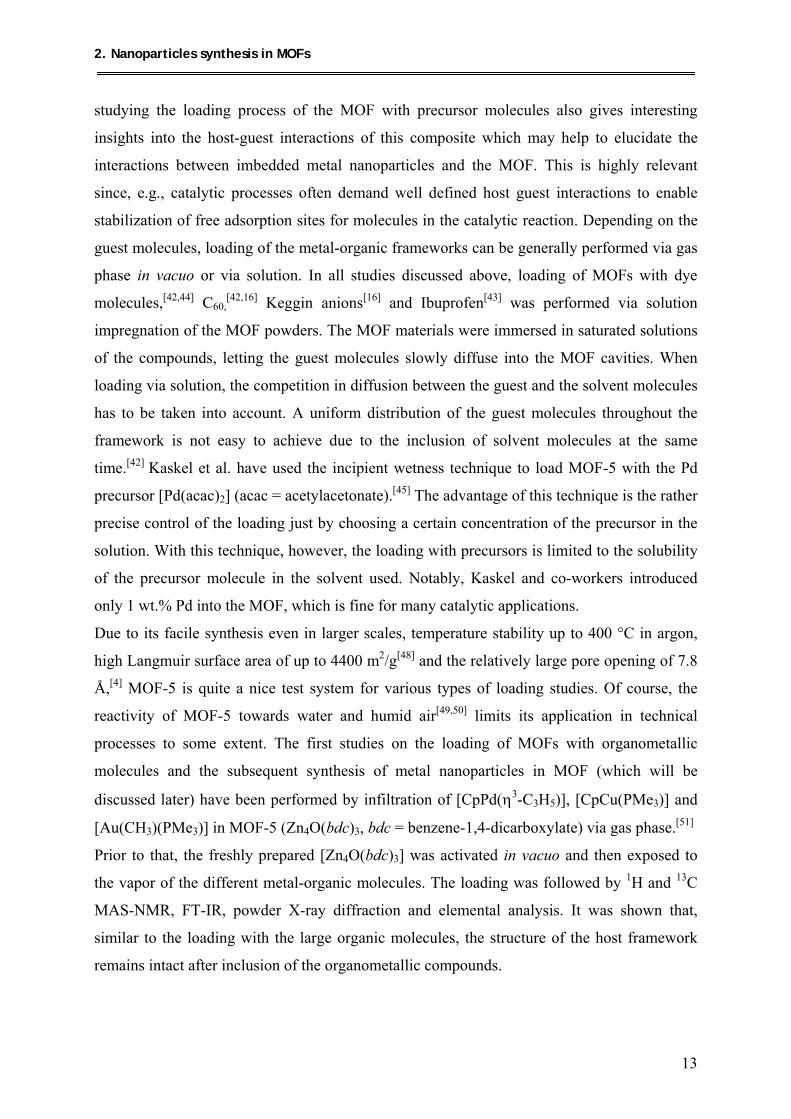
Figure 2.10. Cut-out of the crystal structure[52] of the inclusion compound ferrocene7@MOF-5.
The presence of the unchanged guest molecules inside the MOF cavities was detected by the
corresponding solid state 1H and 13C MAS-NMR signals and elemental analysis. In a second,
more detailed study, loading of MOF-5 was extended to a variety of metal and metal oxide
precursors; here different aspects of the loading were investigated.[53] The metal loading was
determined to be in a range of 10–40 wt.%. The reversible loading of MOF-5 was presented,
without changing the chemical properties of the precursors or the host framework. Ferrocene,
as representative example for many organometallic compounds of interest here, can first be
infiltrated into the MOF-5 cavities and then be removed without any change of the host
material. Also, the dependence of the size of the precursor molecules on the loading was
shown. MOF-5 cavities exhibit an opening diameter of 7.8 Å. Ideally, only one of the three
principal axes (x, y, z; see Table 2.1) of the enveloping ellipsoid representing the van der
Waals volume of the respective precursor molecule should exceed this diameter in order to
allow diffusion into the MOF cavities. For that reason, [Cu(OCHMeCH2NMe2)2] is not
adsorbed by the MOF-5 matrix since its characteristic dimensions exceed the pore opening in
all three dimensions (see Table 1.1). Not surprisingly, the loading is also dependent on the
vapor pressure of the precursor molecule. Rapid desorption was observed for small,
comparably volatile compounds like [Fe(CO)5] or [Zn(C2H5)2]. Cyclopentadienyl complexes
like [FeCp2] form more stable inclusion compounds with the MOF-5 matrix (see Figure 2.10).
More or less stoichiometric inclusion compounds of the formula precursorn@MOF-5 (where n
2. Nanoparticles synthesis in MOFs
15
is the average number of precursor molecules per MOF-5 cavity) are obtained in all cases
according to elemental analysis. In addition to this, also the loading of MOF-177, as another
member of the zinc carboxylate based MOFs, with organometallic precursor molecules has
already been studied.[54,55] The larger pore opening and pore volume of MOF-177 (10.8 Å and
1.59 m2/g[42]) in comparison to MOF-5 (7.8 Å and 1.04 m2/g[4]) allows the diffusion of larger
molecules like [Cu(OCHMeCH2NMe2)2] into the cavities and the overall absorption of more
molecules per cavity than in MOF-5.[54]
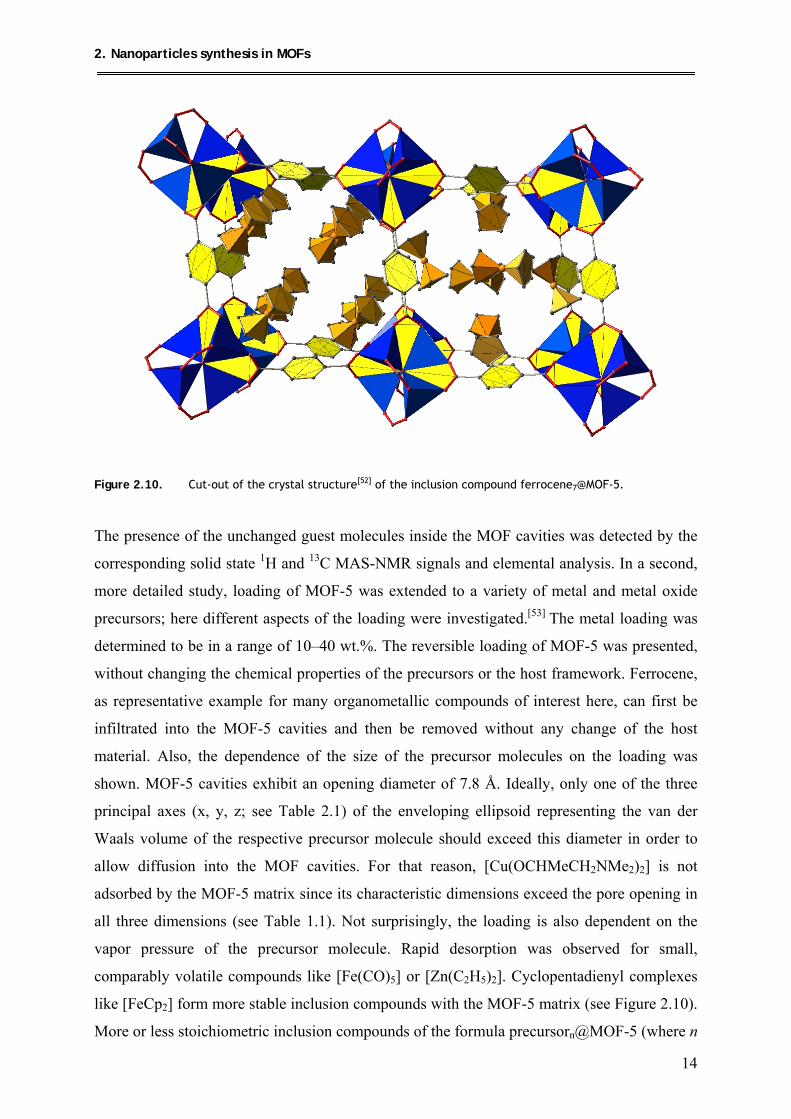
Table 2.1 Characteristic molecular dimensions of organometallic precursors absorbed by MOF-5.[53]
Precursor x y z Max.
[CpPd(η3-C3H5)] 4.5 4.5 4.5 5.5
[CpPtMe3] 4.3 4.7 4.7 6.5
[FeCp2] 3.5 4.5 4.5 5.2
[CpCu(P(CH3)3)] 5.0 5.0 7.5 7.5
[Au(CH3)(P(CH3)3)] 4.5 4.5 7.0 7.0
[Sn(C4H9)2(OOC2H3)2] 6.5 7.8 10.0 10.0
[Zn(C2H5)2] 1.8 3.0 8.0 8.0
[Fe(CO)5] 4.2 4.6 5.9 5.9
[Cu(OCHMeCH2NMe2)2] 6.5 7.9 8.7 8.7
x, y, z in Å
Besides following the loading of MOFs with precursor molecules by MAS-NMR
spectroscopy and elemental analysis, investigation of ordering of these compounds in the
MOF cavities is clearly an interesting aspect of loading MOFs in general. Only in a few cases
a crystal structure of the host-guest composite has been obtained so far. The first example for
such a substructure was investigated by Kim et al.[52] Similar to the first reports by Hermes et
al., MOF-5 was loaded with ferrocene via gas phase in vacuum. Interestingly, the authors
attempted loading of MOF-5 in DMF (dimethyl formamide) solution as well, however in this
case inclusion of the guest molecules was not successful as shown by UV/VIS spectroscopy
(see the above comments regarding solution impregnation). By applying synchrotron radiation
at 100 K, a single crystal structure of the compound [FeCp2]7@MOF-5 was obtained.
Shrinkage of the unit cell volume of 3.7 % is observed compared to the evacuated host. The
unit cell is defined by the space group Pa-3. The smaller pores of MOF-5 are filled with six,
the larger pores with eight ferrocene molecules (see Figure 2.10).[52] Depending on the tilting
of the bdc linkers, MOF-5 exhibits two kinds of pore diameters with 11.0 Å and 15.1 Å.[4] The
results of the crystal structure were confirmed by elemental analysis, giving seven ferrocene
molecules per formula unit of MOF-5, which corresponds to 56 ferrocene molecules per
2. Nanoparticles synthesis in MOFs
16
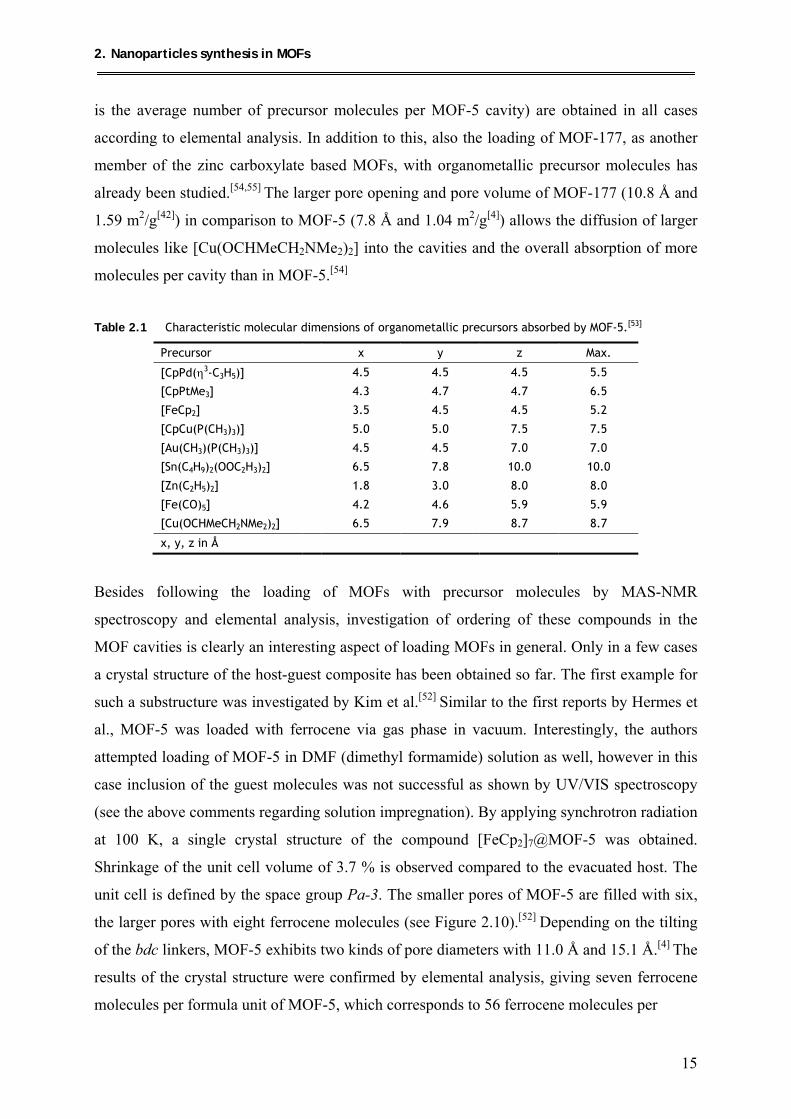
Figure 2.11. a) The orientation of the ferrocene molecules in the larger pore of MOF-5. b) The π-stacked
ferrocene molecules are 3.53 Å apart.[52]
elementary cell of the MOF-5 structure. The six ferrocene molecules in the smaller pore adopt
an octahedral arrangement with the ferrocene molecules close to the faces of the cube shaped
cavity; whereas the eight molecules in the larger pore are positioned near the corners of the
MOF-5 pores (see Figure 2.11). Here, extensive π−π interactions exist between the guest
molecules as well as between the guests and the framework itself. The packing of the
ferrocene molecules in the pores leaves only 1.6 % of the crystal volume accessible to other
guest molecules. In another study, Kim et al. have also shown the loading of porous
[Tb16(TATB)16(DMA)24](DMA)91(H2O)108 (TATB = triazine-1,3,5-tribenzoate, DMA = N,N-
dimethylacetamide) with ferrocene.[56] In this case, a crystal structure of the composite was
not obtained. Loading was followed by emission spectroscopy and 1H NMR spectroscopy.
Elemental analysis suggests 65 ferrocene molecules per formula unit. However, the crystal
structure of ferrocene@MOF-5 nicely shows the influence of the space limitation of the MOF
cavities on the ferrocene arrangement and vice versa the subtle effects of the loading on the
MOF-5 framework itself. This leads to another aspect of loading metal-organic frameworks.
The space confinement of the MOF cavities may as well support stabilization of reactive
species in order to observe reactive intermediates of organometallic or organic reactions.
2.3.2. Reactions inside MOFs
The interior of porous hosts may be very different from that of the exterior
surroundings, leading to a novel kind of reactive of species included in these pores. For
example, reactive intermediates from organometallic or organic reactions could possibly be
stabilized in the cavities of the host material. At this point, it is notable that detailed studies on
2. Nanoparticles synthesis in MOFs
17
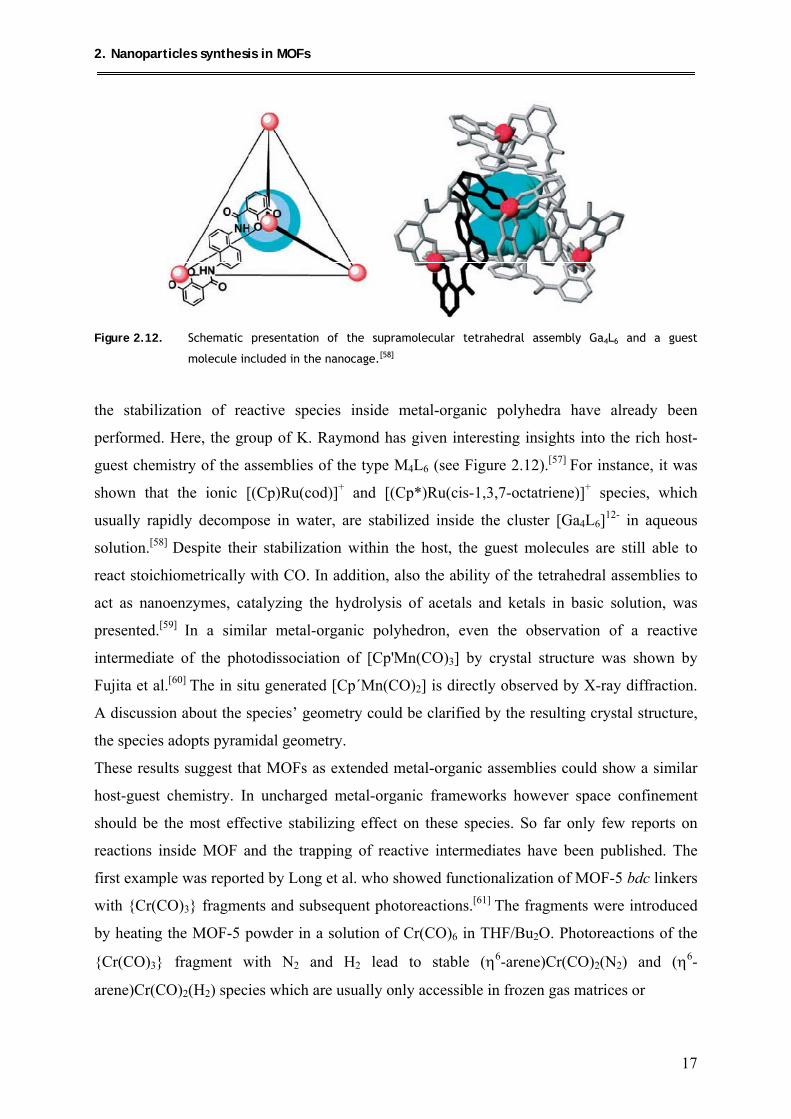
Figure 2.12. Schematic presentation of the supramolecular tetrahedral assembly Ga4L6 and a guest
molecule included in the nanocage.[58]
the stabilization of reactive species inside metal-organic polyhedra have already been
performed. Here, the group of K. Raymond has given interesting insights into the rich host-
guest chemistry of the assemblies of the type M4L6 (see Figure 2.12).[57] For instance, it was
shown that the ionic [(Cp)Ru(cod)]+ and [(Cp*)Ru(cis-1,3,7-octatriene)]+ species, which
usually rapidly decompose in water, are stabilized inside the cluster [Ga4L6]12- in aqueous
solution.[58] Despite their stabilization within the host, the guest molecules are still able to
react stoichiometrically with CO. In addition, also the ability of the tetrahedral assemblies to
act as nanoenzymes, catalyzing the hydrolysis of acetals and ketals in basic solution, was
presented.[59] In a similar metal-organic polyhedron, even the observation of a reactive
intermediate of the photodissociation of [Cp'Mn(CO)3] by crystal structure was shown by
Fujita et al.[60] The in situ generated [Cp´Mn(CO)2] is directly observed by X-ray diffraction.
A discussion about the species’ geometry could be clarified by the resulting crystal structure,
the species adopts pyramidal geometry.
These results suggest that MOFs as extended metal-organic assemblies could show a similar
host-guest chemistry. In uncharged metal-organic frameworks however space confinement
should be the most effective stabilizing effect on these species. So far only few reports on
reactions inside MOF and the trapping of reactive intermediates have been published. The
first example was reported by Long et al. who showed functionalization of MOF-5 bdc linkers
with {Cr(CO)3} fragments and subsequent photoreactions.[61] The fragments were introduced
by heating the MOF-5 powder in a solution of Cr(CO)6 in THF/Bu2O. Photoreactions of the
{Cr(CO)3} fragment with N2 and H2 lead to stable (η6-arene)Cr(CO)2(N2) and (η6-
arene)Cr(CO)2(H2) species which are usually only accessible in frozen gas matrices or
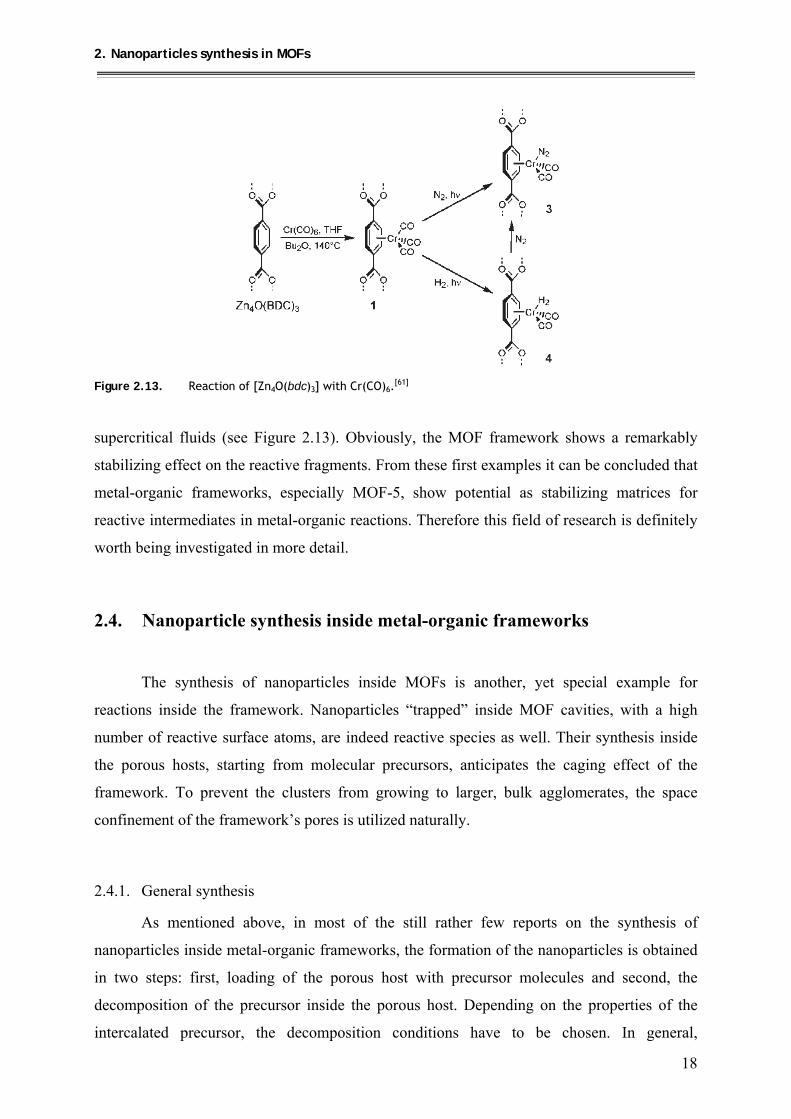
2. Nanoparticles synthesis in MOFs
18
Figure 2.13. Reaction of [Zn4O(bdc)3] with Cr(CO)6.
[61]
supercritical fluids (see Figure 2.13). Obviously, the MOF framework shows a remarkably
stabilizing effect on the reactive fragments. From these first examples it can be concluded that
metal-organic frameworks, especially MOF-5, show potential as stabilizing matrices for
reactive intermediates in metal-organic reactions. Therefore this field of research is definitely
worth being investigated in more detail.
2.4. Nanoparticle synthesis inside metal-organic frameworks
The synthesis of nanoparticles inside MOFs is another, yet special example for
reactions inside the framework. Nanoparticles “trapped” inside MOF cavities, with a high
number of reactive surface atoms, are indeed reactive species as well. Their synthesis inside
the porous hosts, starting from molecular precursors, anticipates the caging effect of the
framework. To prevent the clusters from growing to larger, bulk agglomerates, the space
confinement of the framework’s pores is utilized naturally.
2.4.1. General synthesis
As mentioned above, in most of the still rather few reports on the synthesis of
nanoparticles inside metal-organic frameworks, the formation of the nanoparticles is obtained
in two steps: first, loading of the porous host with precursor molecules and second, the
decomposition of the precursor inside the porous host. Depending on the properties of the
intercalated precursor, the decomposition conditions have to be chosen. In general,
2. Nanoparticles synthesis in MOFs
19
decomposition of MOCVD precursors can be obtained by treatment with reactive gases such
as H2 at a suitable temperature, treatment at elevated temperature or by photolysis. The
formation of nanoparticles from metal salts, i.e. loading the MOFs with metal cations or
inorganic metal complexes, e.g. [PdCl4]2- as precursors, will be addressed as a special case
later. It is mandatory to choose precursors with decomposition conditions that will be
tolerated by the host framework. Therefore, the temperature stability of the framework should
match the corresponding decomposition temperature of the precursor in order to obtain
nanoparticles in an unchanged host matrix. Also, the stability of the MOF toward possible
additional reactive gases or UV radiation has to be confirmed. For different precursors,
different decomposition protocols have to be applied. The obtained nanoparticle@MOF
composites can subsequently be investigated by standard analytical techniques such as
powder X-ray diffraction (PXRD), X-ray absorption spectroscopy (XAS), N2 sorption
measurements and transmission electron microscopy (TEM). Similar to the related research
on nanoparticles hosted by zeolites or mesoporous silica etc., the challenge here clearly is to
check whether the nanoparticles are located inside or outside the framework and to investigate
and control the distribution of the particles inside the matrix. Beside TEM, the routine
analytical methods give only indirect proof of the existence of embedded particles. The few
reports on the synthesis of either metallic or oxidic nanoparticles in MOFs so far have mostly
been performed with MOF-5, however some other metal-organic frameworks have been
studied as well. Therefore, this part of the introductory chapter will be divided into two sub
chapters. First, nanoparticles synthesis in MOF-5 will be discussed. Second, nanoparticles
synthesis in other MOFs will be addressed.
2.4.2. Metal nanoparticles inside MOF-5
In the first report on the synthesis of metal nanoparticles inside MOF-5, the formation
of Pd, Cu and Au nanoparticles inside this framework was presented.[51] After loading with the
corresponding precursors [CpPd(η3-C3H5)], [CpCu(PMe3)] and [Au(CH3)(PMe3)] (see
above), decomposition of the precursor to nanoparticles was achieved by either photolysis
(UV radiation) or hydrogenolysis. Both, UV radiation and H2 treatment, even at elevated
temperature, left MOF-5 unchanged, controlled decomposition of precursor molecules only is
therefore ensured. First, the synthesis and characterization of Pd nanoparticles inside MOFs
will be discussed in more detail, after that the synthesis of copper and gold nanoparticles will
be addressed.
2. Nanoparticles synthesis in MOFs
20
2.4.2.1. Pd@MOF-5
Palladium nanoparticles with a dimension of 1.4 nm were obtained by photolysis of
[CpPd(η3-C3H5)] in MOF-5 at room temperature or below (with cooling) in the absence of
additional hydrogen, leaving a perfectly intact MOF-5 matrix as confirmed by powder X-ray
analysis and N2 sorption measurements.[51] The powder XRD of the corresponding sample
shows an additional broad reflection (FWHM = 5.4°) at 2θ = 40.99°, typical for
nanocrystalline Pd particles. The size of the nanoparticles derived from TEM and PXRD data
(Scherrer equation) is in good agreement with the diameter of the MOF-5 cavities (see above)
hinting at nanoparticles embedded in the porous host. Treatment of the same
precursor@MOF-5 composite with H2 gas at -35 °C led to Pd nanoparticles in the same size
regime, here, however, the MOF-5 matrix appeared to have lost its 2D long range order,
indicated by the absence of some Bragg reflections of the host material. Elemental analysis in
both cases gave a metal loading of 35.6 wt.% Pd.
Another route of introducing Pd nanoparticles into MOF-5, was presented by Kaskel et al., as
already mentioned above.[45] Here, MOF-5 powder was loaded with a solution of [Pd(acac)2]
in CHCl3 following standard recipes of the incipient wetness technique. Decomposition of the
precursor was obtained by thermal treatment at 150–200 °C or hydrogenolysis at 150–200 °C.
From elemental analysis, the metal loading was determined to be 1 wt.%. In the PXRD of the
composite, no additional Bragg reflections for Pd were observed. Due to the low metal
loading, detection of the embedded Pd species and their chemical nature, whether it is fully
reduced to Pd0 nanoparticles or whether there are still some remaining PdII species, was
presumably rather difficult. These aspects were not reported and discussed in detail by the
authors. The BET surface area of the composite material was, however, reduced in
comparison to the starting material, from 2885 g/m2 to 958 g/m2 which is most probably due
to the embedding of Pd nanoparticles. In another approach, Kaskel and coworkers also
applied coprecipitation for the preparation of Pd in MOF-5.[62] In this case, Pd(NO3)2 was
directly added during the synthesis of the MOF, leading to Pd contents of 0.43–0.64 wt.%.
Again, no Pd reflections were observed in the corresponding PXRD data, however a slightly
reduced surface area was observed. Obviously the detection of the location and the nature of
imbedded metal species in MOF-5 remains a particular challenge, especially if the
corresponding metal content is rather low. Here the detection limit of most analytic
techniques obviously anticipates a detailed examination.
2. Nanoparticles synthesis in MOFs
21
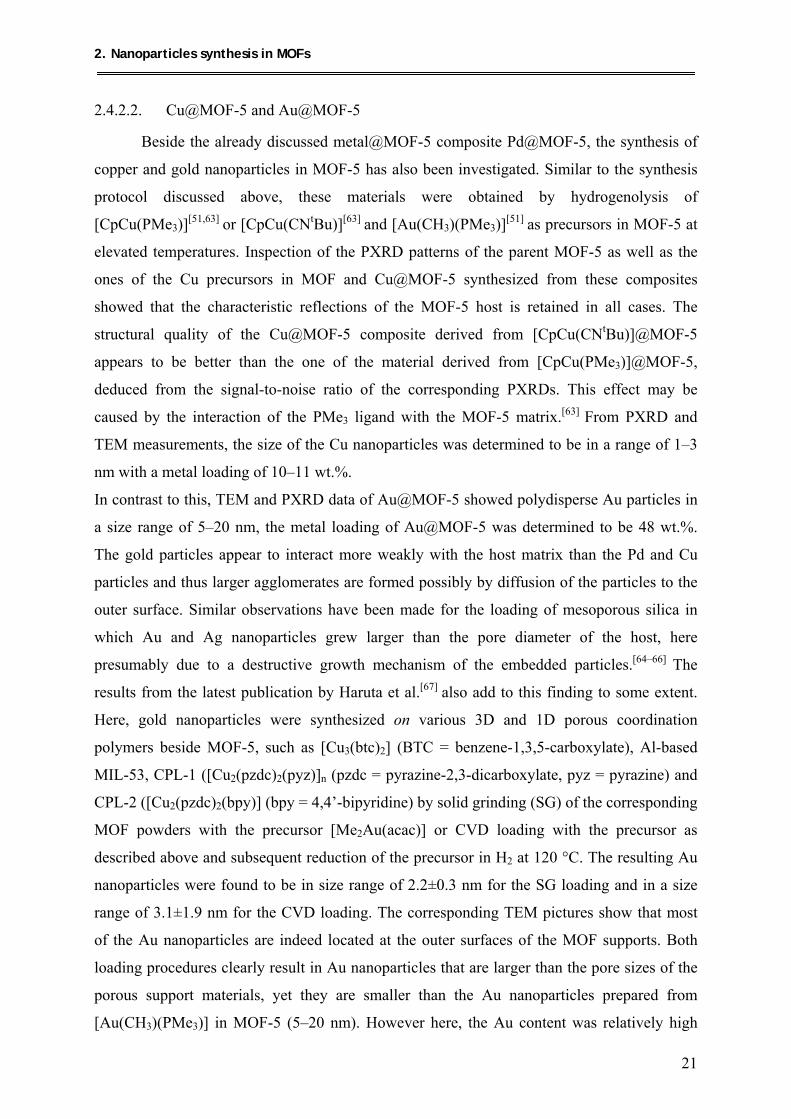
2.4.2.2. Cu@MOF-5 and Au@MOF-5
Beside the already discussed metal@MOF-5 composite Pd@MOF-5, the synthesis of
copper and gold nanoparticles in MOF-5 has also been investigated. Similar to the synthesis
protocol discussed above, these materials were obtained by hydrogenolysis of
[CpCu(PMe3)][51,63] or [CpCu(CNtBu)][63] and [Au(CH3)(PMe3)][51] as precursors in MOF-5 at
elevated temperatures. Inspection of the PXRD patterns of the parent MOF-5 as well as the
ones of the Cu precursors in MOF and Cu@MOF-5 synthesized from these composites
showed that the characteristic reflections of the MOF-5 host is retained in all cases. The
structural quality of the Cu@MOF-5 composite derived from [CpCu(CNtBu)]@MOF-5
appears to be better than the one of the material derived from [CpCu(PMe3)]@MOF-5,
deduced from the signal-to-noise ratio of the corresponding PXRDs. This effect may be
caused by the interaction of the PMe3 ligand with the MOF-5 matrix.[63] From PXRD and
TEM measurements, the size of the Cu nanoparticles was determined to be in a range of 1–3
nm with a metal loading of 10–11 wt.%.
In contrast to this, TEM and PXRD data of Au@MOF-5 showed polydisperse Au particles in
a size range of 5–20 nm, the metal loading of Au@MOF-5 was determined to be 48 wt.%.
The gold particles appear to interact more weakly with the host matrix than the Pd and Cu
particles and thus larger agglomerates are formed possibly by diffusion of the particles to the
outer surface. Similar observations have been made for the loading of mesoporous silica in
which Au and Ag nanoparticles grew larger than the pore diameter of the host, here
presumably due to a destructive growth mechanism of the embedded particles.[64–66] The
results from the latest publication by Haruta et al.[67] also add to this finding to some extent.
Here, gold nanoparticles were synthesized on various 3D and 1D porous coordination
polymers beside MOF-5, such as [Cu3(btc)2] (BTC = benzene-1,3,5-carboxylate), Al-based
MIL-53, CPL-1 ([Cu2(pzdc)2(pyz)]n (pzdc = pyrazine-2,3-dicarboxylate, pyz = pyrazine) and
CPL-2 ([Cu2(pzdc)2(bpy)] (bpy = 4,4’-bipyridine) by solid grinding (SG) of the corresponding
MOF powders with the precursor [Me2Au(acac)] or CVD loading with the precursor as
described above and subsequent reduction of the precursor in H2 at 120 °C. The resulting Au
nanoparticles were found to be in size range of 2.2±0.3 nm for the SG loading and in a size
range of 3.1±1.9 nm for the CVD loading. The corresponding TEM pictures show that most
of the Au nanoparticles are indeed located at the outer surfaces of the MOF supports. Both
loading procedures clearly result in Au nanoparticles that are larger than the pore sizes of the
porous support materials, yet they are smaller than the Au nanoparticles prepared from
[Au(CH3)(PMe3)] in MOF-5 (5–20 nm). However here, the Au content was relatively high
2. Nanoparticles synthesis in MOFs
22
(48 wt.%) in comparison to the Au content in the composites synthesized by Haruta et al.
(0.5–1 wt.%), which might be a reason for this finding.
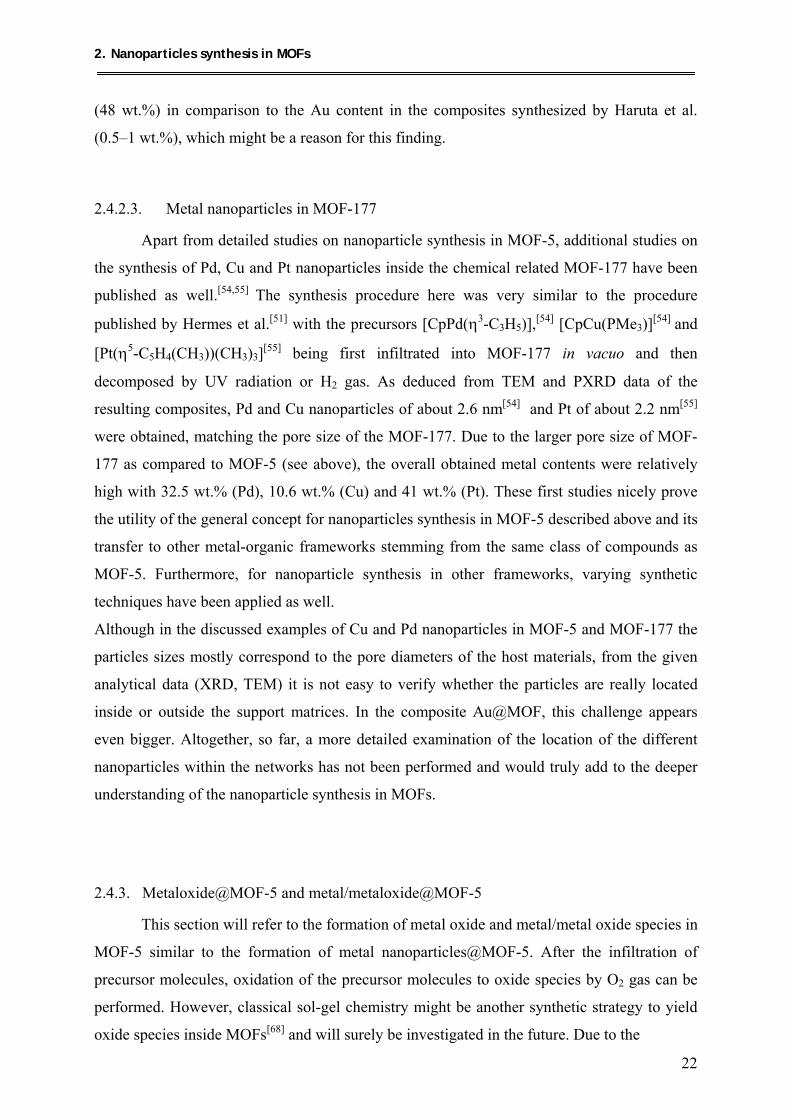
2.4.2.3. Metal nanoparticles in MOF-177
Apart from detailed studies on nanoparticle synthesis in MOF-5, additional studies on
the synthesis of Pd, Cu and Pt nanoparticles inside the chemical related MOF-177 have been
published as well.[54,55] The synthesis procedure here was very similar to the procedure
published by Hermes et al.[51] with the precursors [CpPd(η3-C3H5)],[54] [CpCu(PMe3)][54] and
[Pt(η5-C5H4(CH3))(CH3)3][55] being first infiltrated into MOF-177 in vacuo and then
decomposed by UV radiation or H2 gas. As deduced from TEM and PXRD data of the
resulting composites, Pd and Cu nanoparticles of about 2.6 nm[54] and Pt of about 2.2 nm[55]
were obtained, matching the pore size of the MOF-177. Due to the larger pore size of MOF-
177 as compared to MOF-5 (see above), the overall obtained metal contents were relatively
high with 32.5 wt.% (Pd), 10.6 wt.% (Cu) and 41 wt.% (Pt). These first studies nicely prove
the utility of the general concept for nanoparticles synthesis in MOF-5 described above and its
transfer to other metal-organic frameworks stemming from the same class of compounds as
MOF-5. Furthermore, for nanoparticle synthesis in other frameworks, varying synthetic
techniques have been applied as well.
Although in the discussed examples of Cu and Pd nanoparticles in MOF-5 and MOF-177 the
particles sizes mostly correspond to the pore diameters of the host materials, from the given
analytical data (XRD, TEM) it is not easy to verify whether the particles are really located
inside or outside the support matrices. In the composite Au@MOF, this challenge appears
even bigger. Altogether, so far, a more detailed examination of the location of the different
nanoparticles within the networks has not been performed and would truly add to the deeper
understanding of the nanoparticle synthesis in MOFs.
2.4.3. Metaloxide@MOF-5 and metal/metaloxide@MOF-5
This section will refer to the formation of metal oxide and metal/metal oxide species in
MOF-5 similar to the formation of metal nanoparticles@MOF-5. After the infiltration of
precursor molecules, oxidation of the precursor molecules to oxide species by O2 gas can be
performed. However, classical sol-gel chemistry might be another synthetic strategy to yield
oxide species inside MOFs[68] and will surely be investigated in the future. Due to the
2. Nanoparticles synthesis in MOFs
23
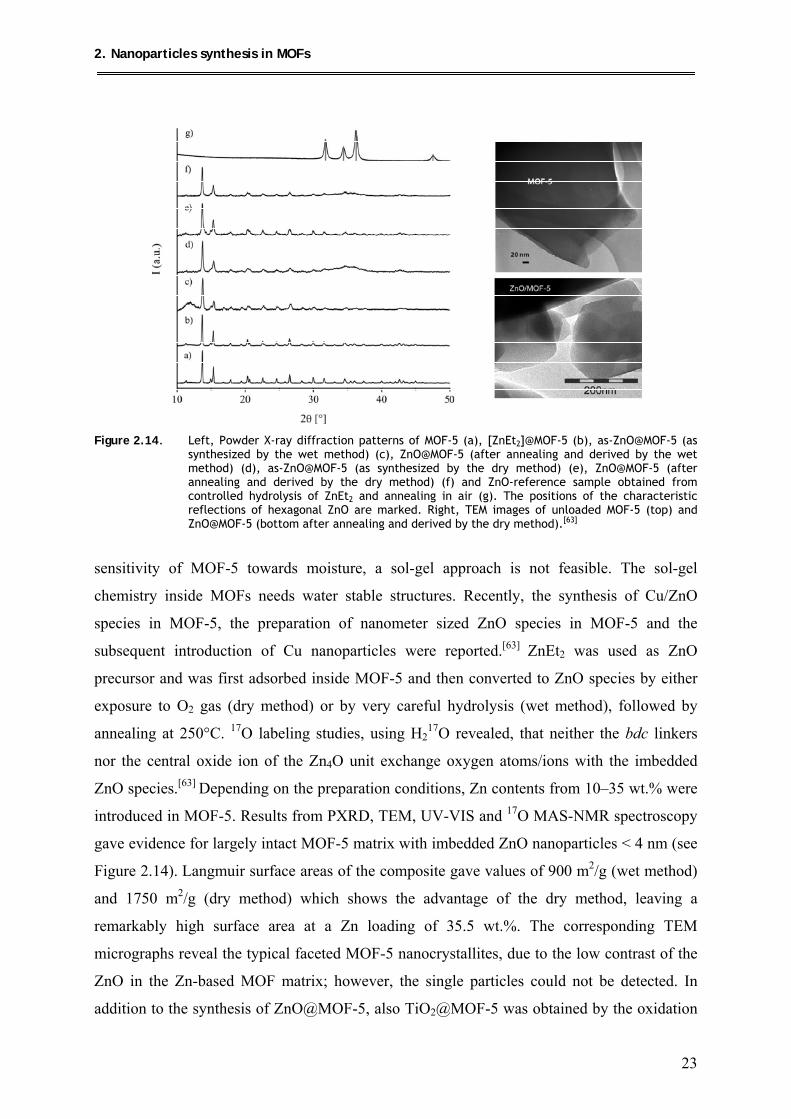
Figure 2.14. Left, Powder X-ray diffraction patterns of MOF-5 (a), [ZnEt2]@MOF-5 (b), as-ZnO@MOF-5 (as
synthesized by the wet method) (c), ZnO@MOF-5 (after annealing and derived by the wet method) (d), as-ZnO@MOF-5 (as synthesized by the dry method) (e), ZnO@MOF-5 (after annealing and derived by the dry method) (f) and ZnO-reference sample obtained from controlled hydrolysis of ZnEt2 and annealing in air (g). The positions of the characteristic reflections of hexagonal ZnO are marked. Right, TEM images of unloaded MOF-5 (top) and ZnO@MOF-5 (bottom after annealing and derived by the dry method).[63]
sensitivity of MOF-5 towards moisture, a sol-gel approach is not feasible. The sol-gel
chemistry inside MOFs needs water stable structures. Recently, the synthesis of Cu/ZnO
species in MOF-5, the preparation of nanometer sized ZnO species in MOF-5 and the
subsequent introduction of Cu nanoparticles were reported.[63] ZnEt2 was used as ZnO
precursor and was first adsorbed inside MOF-5 and then converted to ZnO species by either
exposure to O2 gas (dry method) or by very careful hydrolysis (wet method), followed by
annealing at 250°C. 17O labeling studies, using H217O revealed, that neither the bdc linkers
nor the central oxide ion of the Zn4O unit exchange oxygen atoms/ions with the imbedded
ZnO species.[63] Depending on the preparation conditions, Zn contents from 10–35 wt.% were
introduced in MOF-5. Results from PXRD, TEM, UV-VIS and 17O MAS-NMR spectroscopy
gave evidence for largely intact MOF-5 matrix with imbedded ZnO nanoparticles < 4 nm (see
Figure 2.14). Langmuir surface areas of the composite gave values of 900 m2/g (wet method)
and 1750 m2/g (dry method) which shows the advantage of the dry method, leaving a
remarkably high surface area at a Zn loading of 35.5 wt.%. The corresponding TEM
micrographs reveal the typical faceted MOF-5 nanocrystallites, due to the low contrast of the
ZnO in the Zn-based MOF matrix; however, the single particles could not be detected. In
addition to the synthesis of ZnO@MOF-5, also TiO2@MOF-5 was obtained by the oxidation
2. Nanoparticles synthesis in MOFs
24
of Ti(OiPr)4 inside the MOF cavities.[69] The resulting metal oxide aggregates are presumably
quite small and neither showed reflections in the PXRD nor in the SAED.
The attempt to synthesize CuO or Cu2O species in MOF-5 by oxidizing the composite
Cu@MOF-5 with O2 led to a complete collapse of the framework as indicated by powder X-
ray diffraction.[63] Yet, soft oxidation of the embedded Cu nanoparticles with N2O yields core-
shell Cu2O/Cu nanoparticles inside the framework with the host matrix remaining completely
unchanged. The oxidation is completely reversible, upon treatment with H2 gas
Cu2O/Cu@MOF-5 is fully re-reduced to Cu@MOF-5.[63] Cu/ZnO@MOF-5 was obtained by
gas phase loading of ZnO@MOF-5 with [CpCuL] (L = PMe3, CNtBu) followed by
hydrogenolysis of the precursor. Here, a Cu loading of 1.4 wt.% together with ZnO loading
of 9.9 wt.% was obtained. The composite exhibited a surface area of 920 m2/g, indicating an
intact host matrix. In this case, the order in introducing the different nano species is a crucial
point. Although both precursors of ZnO and Cu nanoparticles were infiltrated in the MOF
simultaneously as unchanged molecules, the simultaneous conversion by pyrolysis, photolysis
or hydrogenolysis of both to Cu/ZnO@MOF-5 failed and led to collapse of the host matrix.
Therefore, the Cu precursor had to be infiltrated after the formation the ZnO species in MOF-
5. Below, the catalytic properties of the obtained composite Cu/ZnO@MOF-5 will be
discussed as well.
2.5. Other frameworks and other loading techniques
Due to its easy accessibility and photochemical as well as thermal stability MOF-5 has
been the typical study case for nanoparticle@MOF synthesis and characterisation. However,
few studies of other frameworks are known as well and are summarized in the following.
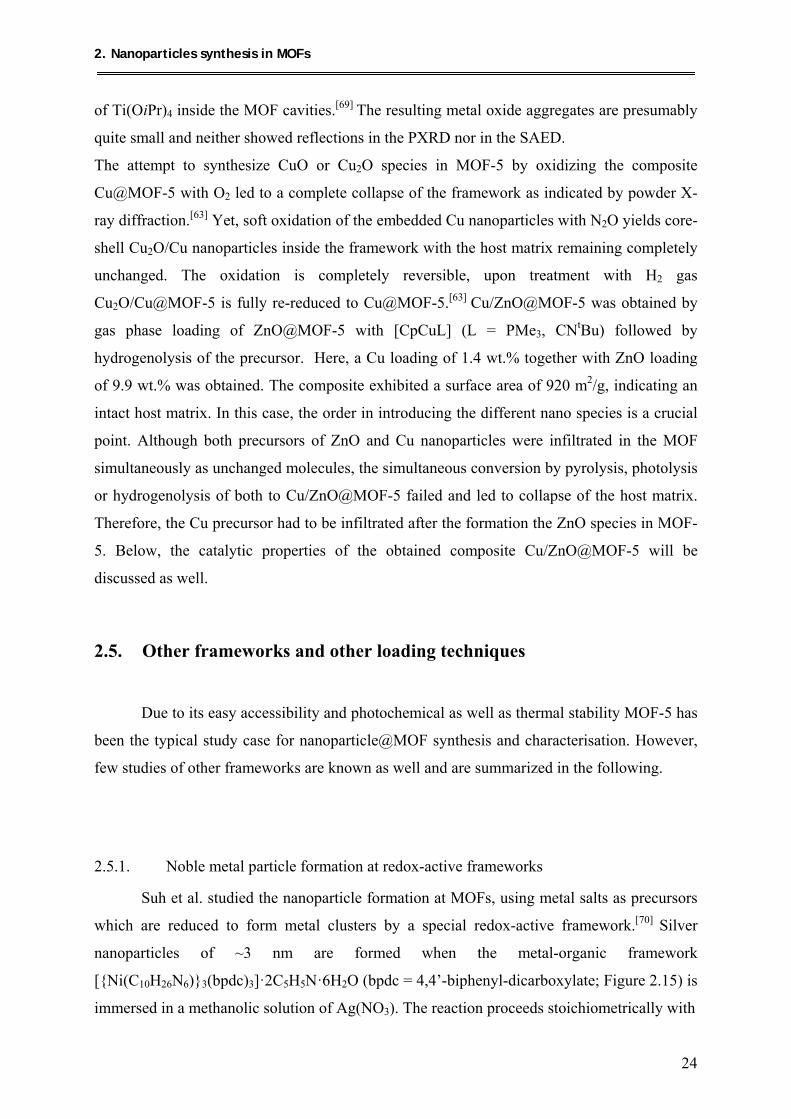
2.5.1. Noble metal particle formation at redox-active frameworks
Suh et al. studied the nanoparticle formation at MOFs, using metal salts as precursors
which are reduced to form metal clusters by a special redox-active framework.[70] Silver
nanoparticles of ~3 nm are formed when the metal-organic framework
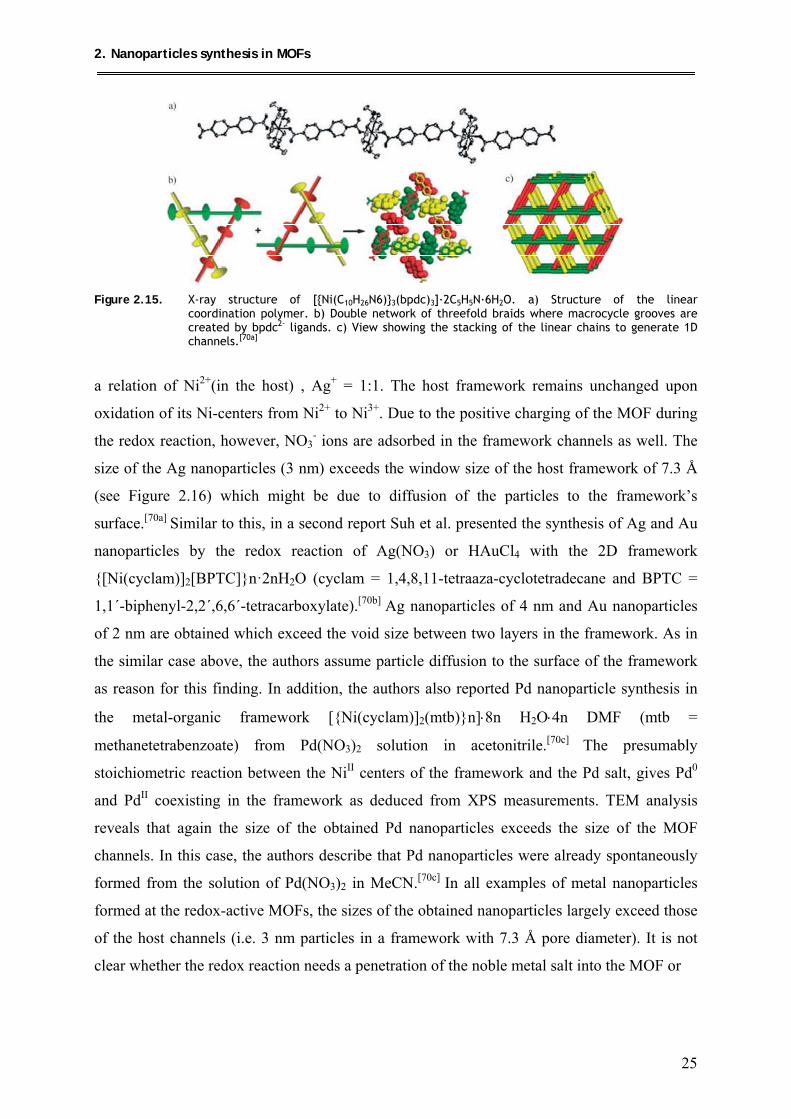
[{Ni(C10H26N6)}3(bpdc)3]·2C5H5N·6H2O (bpdc = 4,4’-biphenyl-dicarboxylate; Figure 2.15) is
immersed in a methanolic solution of Ag(NO3). The reaction proceeds stoichiometrically with
2. Nanoparticles synthesis in MOFs
25
Figure 2.15. X-ray structure of [{Ni(C10H26N6)}3(bpdc)3]·2C5H5N·6H2O. a) Structure of the linear
coordination polymer. b) Double network of threefold braids where macrocycle grooves are created by bpdc2- ligands. c) View showing the stacking of the linear chains to generate 1D channels.[70a]
a relation of Ni2+(in the host) , Ag+ = 1:1. The host framework remains unchanged upon
oxidation of its Ni-centers from Ni2+ to Ni3+. Due to the positive charging of the MOF during
the redox reaction, however, NO3- ions are adsorbed in the framework channels as well. The
size of the Ag nanoparticles (3 nm) exceeds the window size of the host framework of 7.3 Å
(see Figure 2.16) which might be due to diffusion of the particles to the framework’s
surface.[70a] Similar to this, in a second report Suh et al. presented the synthesis of Ag and Au
nanoparticles by the redox reaction of Ag(NO3) or HAuCl4 with the 2D framework
{[Ni(cyclam)]2[BPTC]}n·2nH2O (cyclam = 1,4,8,11-tetraaza-cyclotetradecane and BPTC =
1,1´-biphenyl-2,2´,6,6´-tetracarboxylate).[70b] Ag nanoparticles of 4 nm and Au nanoparticles
of 2 nm are obtained which exceed the void size between two layers in the framework. As in
the similar case above, the authors assume particle diffusion to the surface of the framework
as reason for this finding. In addition, the authors also reported Pd nanoparticle synthesis in
the metal-organic framework [{Ni(cyclam)]2(mtb)}n]⋅8n H2O⋅4n DMF (mtb =
methanetetrabenzoate) from Pd(NO3)2 solution in acetonitrile.[70c] The presumably
stoichiometric reaction between the NiII centers of the framework and the Pd salt, gives Pd0
and PdII coexisting in the framework as deduced from XPS measurements. TEM analysis
reveals that again the size of the obtained Pd nanoparticles exceeds the size of the MOF
channels. In this case, the authors describe that Pd nanoparticles were already spontaneously
formed from the solution of Pd(NO3)2 in MeCN.[70c] In all examples of metal nanoparticles
formed at the redox-active MOFs, the sizes of the obtained nanoparticles largely exceed those
of the host channels (i.e. 3 nm particles in a framework with 7.3 Å pore diameter). It is not
clear whether the redox reaction needs a penetration of the noble metal salt into the MOF or
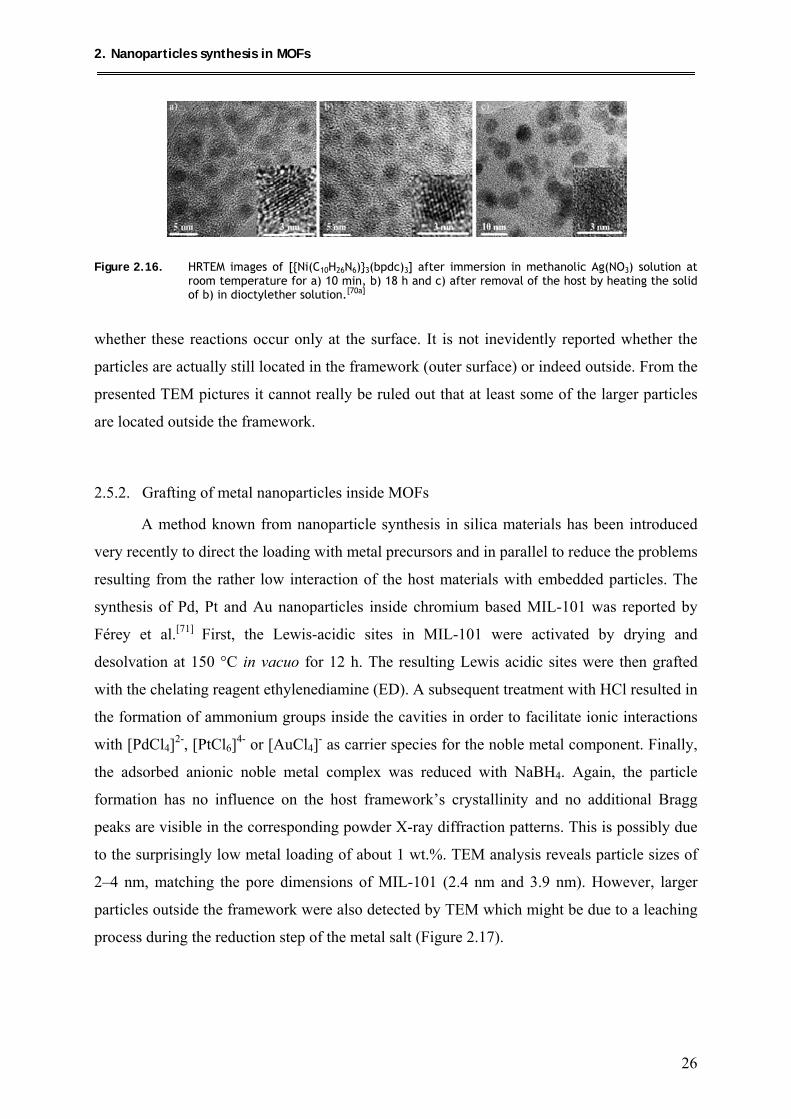
2. Nanoparticles synthesis in MOFs
26
Figure 2.16. HRTEM images of [{Ni(C10H26N6)}3(bpdc)3] after immersion in methanolic Ag(NO3) solution at
room temperature for a) 10 min, b) 18 h and c) after removal of the host by heating the solid of b) in dioctylether solution.[70a]
whether these reactions occur only at the surface. It is not inevidently reported whether the
particles are actually still located in the framework (outer surface) or indeed outside. From the
presented TEM pictures it cannot really be ruled out that at least some of the larger particles
are located outside the framework.
2.5.2. Grafting of metal nanoparticles inside MOFs
A method known from nanoparticle synthesis in silica materials has been introduced
very recently to direct the loading with metal precursors and in parallel to reduce the problems
resulting from the rather low interaction of the host materials with embedded particles. The
synthesis of Pd, Pt and Au nanoparticles inside chromium based MIL-101 was reported by
Férey et al.[71] First, the Lewis-acidic sites in MIL-101 were activated by drying and
desolvation at 150 °C in vacuo for 12 h. The resulting Lewis acidic sites were then grafted
with the chelating reagent ethylenediamine (ED). A subsequent treatment with HCl resulted in
the formation of ammonium groups inside the cavities in order to facilitate ionic interactions
with [PdCl4]2-, [PtCl6]4- or [AuCl4]- as carrier species for the noble metal component. Finally,
the adsorbed anionic noble metal complex was reduced with NaBH4. Again, the particle
formation has no influence on the host framework’s crystallinity and no additional Bragg
peaks are visible in the corresponding powder X-ray diffraction patterns. This is possibly due
to the surprisingly low metal loading of about 1 wt.%. TEM analysis reveals particle sizes of
2–4 nm, matching the pore dimensions of MIL-101 (2.4 nm and 3.9 nm). However, larger
particles outside the framework were also detected by TEM which might be due to a leaching
process during the reduction step of the metal salt (Figure 2.17).
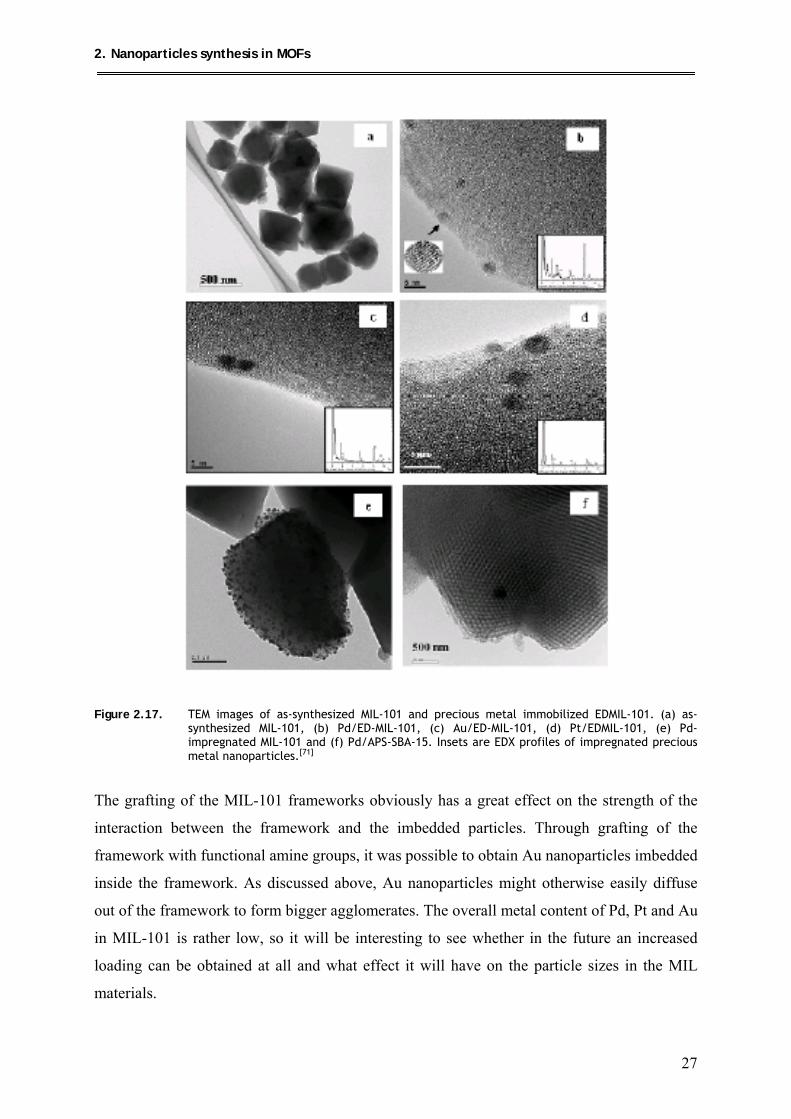
2. Nanoparticles synthesis in MOFs
27
Figure 2.17. TEM images of as-synthesized MIL-101 and precious metal immobilized EDMIL-101. (a) as-
synthesized MIL-101, (b) Pd/ED-MIL-101, (c) Au/ED-MIL-101, (d) Pt/EDMIL-101, (e) Pd- impregnated MIL-101 and (f) Pd/APS-SBA-15. Insets are EDX profiles of impregnated precious metal nanoparticles.[71]
The grafting of the MIL-101 frameworks obviously has a great effect on the strength of the
interaction between the framework and the imbedded particles. Through grafting of the
framework with functional amine groups, it was possible to obtain Au nanoparticles imbedded
inside the framework. As discussed above, Au nanoparticles might otherwise easily diffuse
out of the framework to form bigger agglomerates. The overall metal content of Pd, Pt and Au
in MIL-101 is rather low, so it will be interesting to see whether in the future an increased
loading can be obtained at all and what effect it will have on the particle sizes in the MIL
materials.
2. Nanoparticles synthesis in MOFs
28
In addition to this, synthesis of Pd@MIL-101 was also performed using the “incipient
wetness technique” by Kaskel et al.[72] Similar to the procedure published previously on
loading MOF-5 by the same technique,[45] Pd nanospecies in MIL-101 at rather low Pd
content (1 wt.%) were obtained. As in the previous work of the same group,[45] no additional
Bragg reflections for palladium in the corresponding PXRD of Pd@MIL-101 were observed.
The results from N2 and H2 sorption measurements however indicate the loading of the MIL-
101 pores.
2.6. Applications of nanoparticles loaded MOFs in catalysis
Most of the already discussed examples of metal@MOFs and metaloxides@MOFs
have been synthesized in order to obtain novel kinds of supported nanoparticles with
potentially advantageous properties for catalytical applications. The catalytic properties of the
composite materials Pd@MOF-5 and Cu@MOF-5 were among the first to be tested. Here, the
Pd@MOF-5 composite that was obtained by the gas-phase loading/photolysis synthetic
protocol (35.6 wt.% Pd) showed moderate activity in catalysis of hydrogenation of
cyclooctene.[51] The Pd@MOF-5 (1 wt.%) synthesized by the incipient wetness technique
from [Pd(acac)2] was tested as catalyst in hydrogenation of styrene, 1-octene and cis-
cyclooctene, exhibiting a slightly higher catalytic activity than Pd supported on activated
carbon (Pd/Norit A; see Figure 2.18).[45] Possibly, the observed enhanced catalytic
performance of Pd@MOF-5 (1 wt.%) in comparison to Pd/Norit A (1 wt.%) and Pd@MOF-5
(35.6 wt.%)[45] is due to the higher dispersion and accessibility of the active Pd sites in this
sample. Also, Pd@MOF-5 was tested in hydrogen adsorption, revealing a capacity of up to
1.86 wt.% (at 77 K, 1 bar), clearly exceeding the value of Pd-free MOF-5 (1.32 wt.% at 77 K,
1 bar) by about 40 %. The material Pd@MOF-5 material obtained from coprecipitation[62] was
also tested in hydrogenation catalysis of ethyl cinnamate, revealing an activity twice as high
as the one of Pd supported on activated carbon. Again, the higher performance was attributed
to the higher dispersion and better accessibility of palladium; however, the actual
microstructure of the catalyst is still unknown. From N2 measurements of the composite
material after subsequent catalytic test reactions, it was found that Pd is most probably bound
to the outer surface of the MOF-5 crystals. Therefore, the as-prepared composite might be less
stable in prolonged catalytic runs than a sample with Pd particles located in the MOF-5 pores.
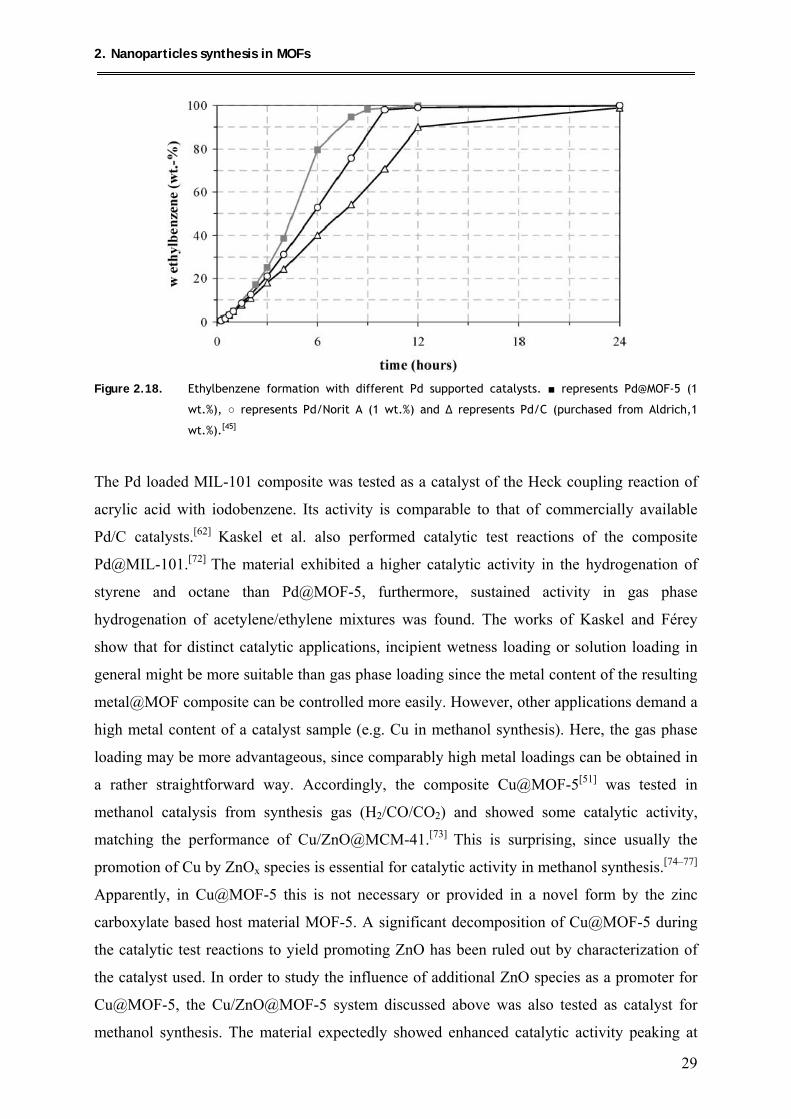
2. Nanoparticles synthesis in MOFs
29
Figure 2.18. Ethylbenzene formation with different Pd supported catalysts. ■ represents Pd@MOF-5 (1
wt.%), ○ represents Pd/Norit A (1 wt.%) and ∆ represents Pd/C (purchased from Aldrich,1
wt.%).[45]
The Pd loaded MIL-101 composite was tested as a catalyst of the Heck coupling reaction of
acrylic acid with iodobenzene. Its activity is comparable to that of commercially available
Pd/C catalysts.[62] Kaskel et al. also performed catalytic test reactions of the composite
Pd@MIL-101.[72] The material exhibited a higher catalytic activity in the hydrogenation of
styrene and octane than Pd@MOF-5, furthermore, sustained activity in gas phase
hydrogenation of acetylene/ethylene mixtures was found. The works of Kaskel and Férey
show that for distinct catalytic applications, incipient wetness loading or solution loading in
general might be more suitable than gas phase loading since the metal content of the resulting
metal@MOF composite can be controlled more easily. However, other applications demand a
high metal content of a catalyst sample (e.g. Cu in methanol synthesis). Here, the gas phase
loading may be more advantageous, since comparably high metal loadings can be obtained in
a rather straightforward way. Accordingly, the composite Cu@MOF-5[51] was tested in
methanol catalysis from synthesis gas (H2/CO/CO2) and showed some catalytic activity,
matching the performance of Cu/ZnO@MCM-41.[73] This is surprising, since usually the
promotion of Cu by ZnOx species is essential for catalytic activity in methanol synthesis.[74–77]
Apparently, in Cu@MOF-5 this is not necessary or provided in a novel form by the zinc
carboxylate based host material MOF-5. A significant decomposition of Cu@MOF-5 during
the catalytic test reactions to yield promoting ZnO has been ruled out by characterization of
the catalyst used. In order to study the influence of additional ZnO species as a promoter for
Cu@MOF-5, the Cu/ZnO@MOF-5 system discussed above was also tested as catalyst for
methanol synthesis. The material expectedly showed enhanced catalytic activity peaking at
2. Nanoparticles synthesis in MOFs
30
about 60 % of an industrial reference catalyst.[63] With a comparably very low Cu loading of
only 1.4 wt.%, obviously a superior interfacial contact between the Cu and ZnO nanospecies
must exist. However, the MOF-5 host material collapsed after several hours under catalytic
conditions, leading to poor final activities. These observations are attributed to the instability
of MOF-5 against water. Water is a by-product in many oxidation reactions. Due to its
sensitivity to water, MOF-5 appears to be less suitable as support material in catalytic
reactions that demand or release water. Still, the Au@MOF-5 composites synthesized by
Haruta et al.[67] showed noticeable high catalytic activity in benzyl alcohol oxidation in the
liquid phase as well as product selectivity depending on the porous support material.
Au/MOF-5 and Au/MIL-53 were selective to methyl benzoate, whereas the Au nanoparticles
on the copper-based frameworks were selective to benzaldehyde. Note that in this case the
composites structures were not investigated after the catalytic reactions. Therefore,
information about possible changes or deformations in the framework’s structures upon
exposure to a protic medium is clearly missing. Yet, all the presented results are encouraging
and show the general potential of MOFs as support matrices in catalytic reactions.
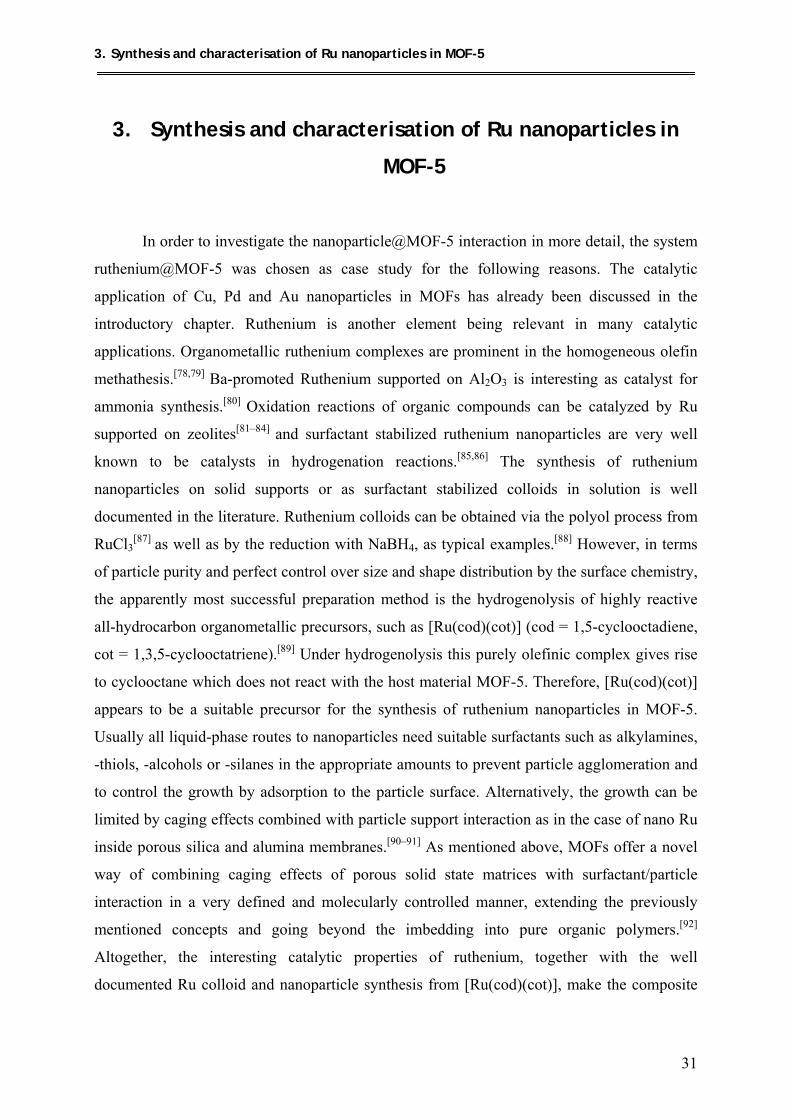
3. Synthesis and characterisation of Ru nanoparticles in MOF-5
31
3. Synthesis and characterisation of Ru nanoparticles in
MOF-5
In order to investigate the nanoparticle@MOF-5 interaction in more detail, the system
ruthenium@MOF-5 was chosen as case study for the following reasons. The catalytic
application of Cu, Pd and Au nanoparticles in MOFs has already been discussed in the
introductory chapter. Ruthenium is another element being relevant in many catalytic
applications. Organometallic ruthenium complexes are prominent in the homogeneous olefin
methathesis.[78,79] Ba-promoted Ruthenium supported on Al2O3 is interesting as catalyst for
ammonia synthesis.[80] Oxidation reactions of organic compounds can be catalyzed by Ru
supported on zeolites[81–84] and surfactant stabilized ruthenium nanoparticles are very well
known to be catalysts in hydrogenation reactions.[85,86] The synthesis of ruthenium
nanoparticles on solid supports or as surfactant stabilized colloids in solution is well
documented in the literature. Ruthenium colloids can be obtained via the polyol process from
RuCl3[87] as well as by the reduction with NaBH4, as typical examples.[88] However, in terms
of particle purity and perfect control over size and shape distribution by the surface chemistry,
the apparently most successful preparation method is the hydrogenolysis of highly reactive
all-hydrocarbon organometallic precursors, such as [Ru(cod)(cot)] (cod = 1,5-cyclooctadiene,
cot = 1,3,5-cyclooctatriene).[89] Under hydrogenolysis this purely olefinic complex gives rise
to cyclooctane which does not react with the host material MOF-5. Therefore, [Ru(cod)(cot)]
appears to be a suitable precursor for the synthesis of ruthenium nanoparticles in MOF-5.
Usually all liquid-phase routes to nanoparticles need suitable surfactants such as alkylamines,
-thiols, -alcohols or -silanes in the appropriate amounts to prevent particle agglomeration and
to control the growth by adsorption to the particle surface. Alternatively, the growth can be
limited by caging effects combined with particle support interaction as in the case of nano Ru
inside porous silica and alumina membranes.[90–91] As mentioned above, MOFs offer a novel
way of combining caging effects of porous solid state matrices with surfactant/particle
interaction in a very defined and molecularly controlled manner, extending the previously
mentioned concepts and going beyond the imbedding into pure organic polymers.[92]
Altogether, the interesting catalytic properties of ruthenium, together with the well
documented Ru colloid and nanoparticle synthesis from [Ru(cod)(cot)], make the composite

3. Synthesis and characterisation of Ru nanoparticles in MOF-5
32
Ru@MOF-5 a feasible target system for a detailed study of the general properties of
nanoparticles embedded in MOF-5 and MOFs in general.
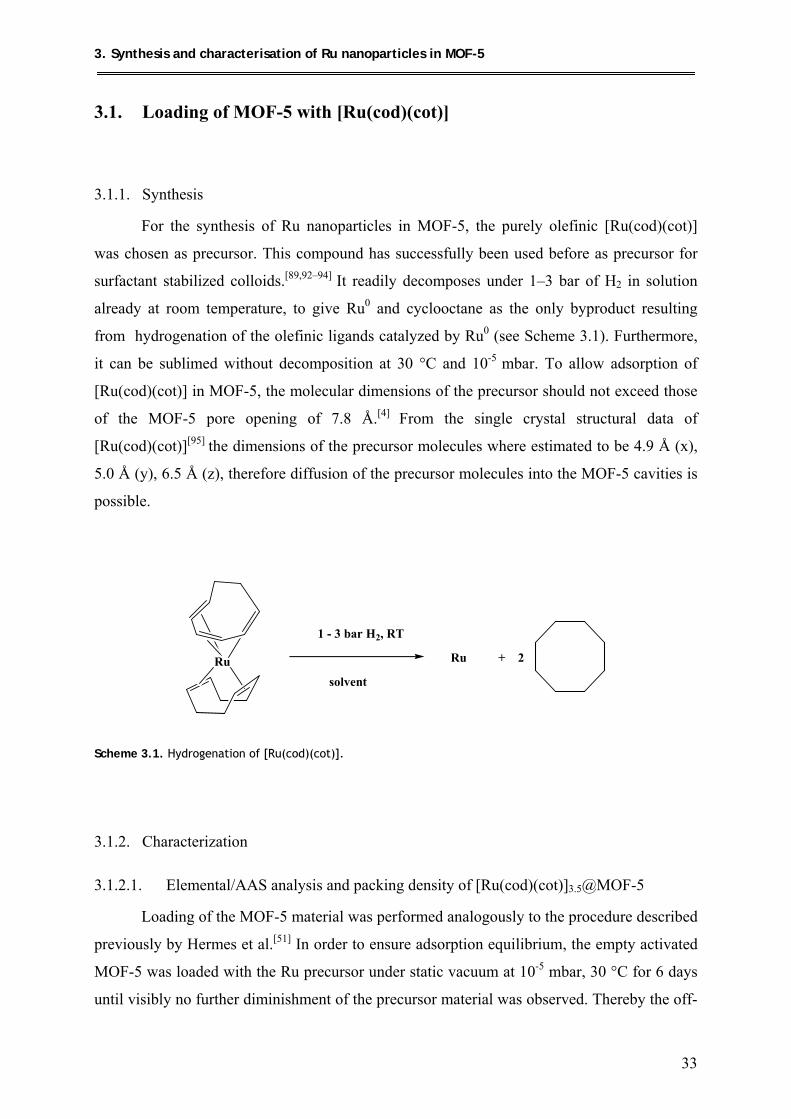
3. Synthesis and characterisation of Ru nanoparticles in MOF-5
33
3.1. Loading of MOF-5 with [Ru(cod)(cot)]
3.1.1. Synthesis
For the synthesis of Ru nanoparticles in MOF-5, the purely olefinic [Ru(cod)(cot)]
was chosen as precursor. This compound has successfully been used before as precursor for
surfactant stabilized colloids.[89,92–94] It readily decomposes under 1–3 bar of H2 in solution
already at room temperature, to give Ru0 and cyclooctane as the only byproduct resulting
from hydrogenation of the olefinic ligands catalyzed by Ru0 (see Scheme 3.1). Furthermore,
it can be sublimed without decomposition at 30 °C and 10-5 mbar. To allow adsorption of
[Ru(cod)(cot)] in MOF-5, the molecular dimensions of the precursor should not exceed those
of the MOF-5 pore opening of 7.8 Å.[4] From the single crystal structural data of
[Ru(cod)(cot)][95] the dimensions of the precursor molecules where estimated to be 4.9 Å (x),
5.0 Å (y), 6.5 Å (z), therefore diffusion of the precursor molecules into the MOF-5 cavities is
possible.
Ru
1 - 3 bar H2, RT
solvent
Ru + 2
Scheme 3.1. Hydrogenation of [Ru(cod)(cot)].
3.1.2. Characterization
3.1.2.1. Elemental/AAS analysis and packing density of [Ru(cod)(cot)]3.5@MOF-5
Loading of the MOF-5 material was performed analogously to the procedure described
previously by Hermes et al.[51] In order to ensure adsorption equilibrium, the empty activated
MOF-5 was loaded with the Ru precursor under static vacuum at 10-5 mbar, 30 °C for 6 days
until visibly no further diminishment of the precursor material was observed. Thereby the off-
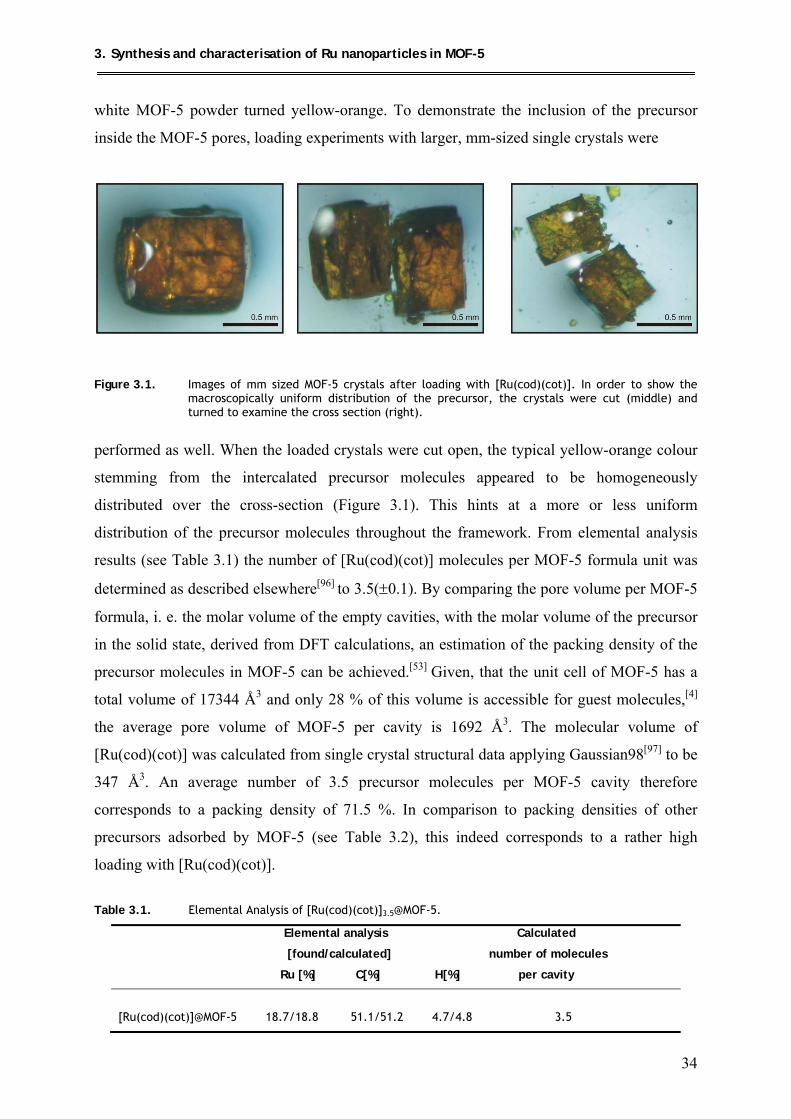
3. Synthesis and characterisation of Ru nanoparticles in MOF-5
34
white MOF-5 powder turned yellow-orange. To demonstrate the inclusion of the precursor
inside the MOF-5 pores, loading experiments with larger, mm-sized single crystals were
Figure 3.1. Images of mm sized MOF-5 crystals after loading with [Ru(cod)(cot)]. In order to show the
macroscopically uniform distribution of the precursor, the crystals were cut (middle) and turned to examine the cross section (right).
performed as well. When the loaded crystals were cut open, the typical yellow-orange colour
stemming from the intercalated precursor molecules appeared to be homogeneously
distributed over the cross-section (Figure 3.1). This hints at a more or less uniform
distribution of the precursor molecules throughout the framework. From elemental analysis
results (see Table 3.1) the number of [Ru(cod)(cot)] molecules per MOF-5 formula unit was
determined as described elsewhere[96] to 3.5(±0.1). By comparing the pore volume per MOF-5
formula, i. e. the molar volume of the empty cavities, with the molar volume of the precursor
in the solid state, derived from DFT calculations, an estimation of the packing density of the
precursor molecules in MOF-5 can be achieved.[53] Given, that the unit cell of MOF-5 has a
total volume of 17344 Å3 and only 28 % of this volume is accessible for guest molecules,[4]
the average pore volume of MOF-5 per cavity is 1692 Å3. The molecular volume of
[Ru(cod)(cot)] was calculated from single crystal structural data applying Gaussian98[97] to be
347 Å3. An average number of 3.5 precursor molecules per MOF-5 cavity therefore
corresponds to a packing density of 71.5 %. In comparison to packing densities of other
precursors adsorbed by MOF-5 (see Table 3.2), this indeed corresponds to a rather high
loading with [Ru(cod)(cot)].
Table 3.1. Elemental Analysis of [Ru(cod)(cot)]3.5@MOF-5.
Elemental analysis Calculated
[found/calculated] number of molecules
Ru [%] C[%] H[%] per cavity
[Ru(cod)(cot)]@MOF-5 18.7/18.8 51.1/51.2 4.7/4.8 3.5
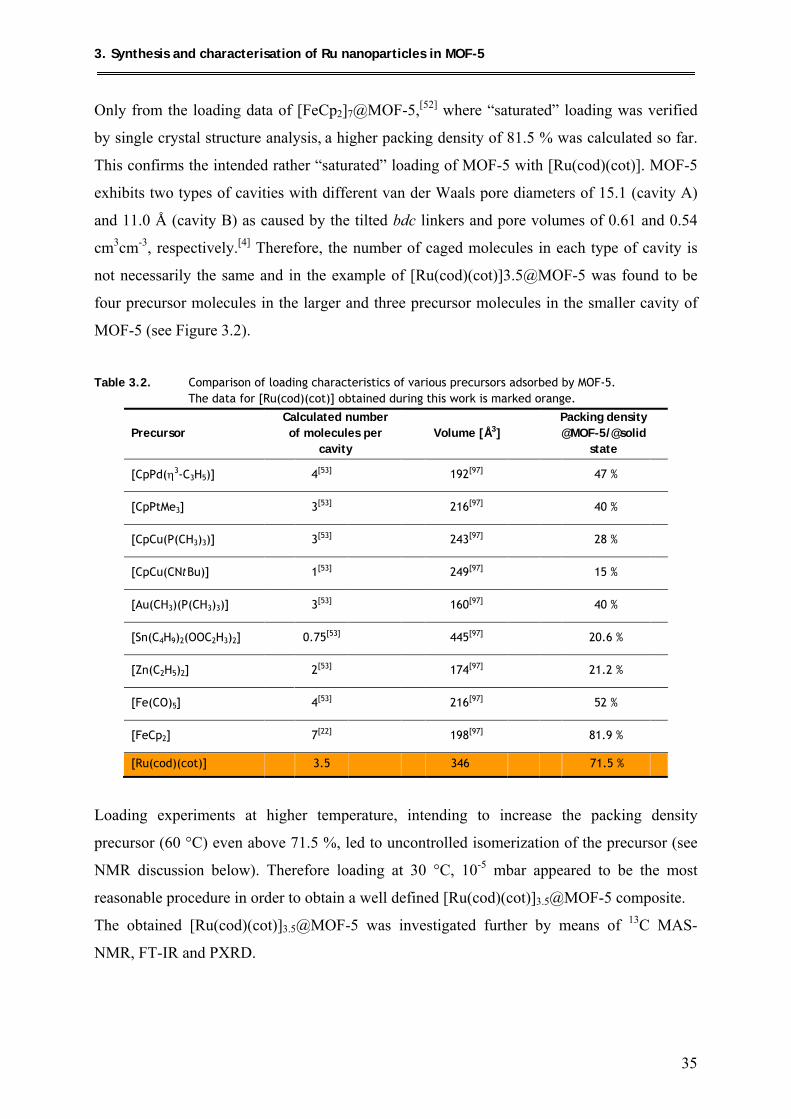
3. Synthesis and characterisation of Ru nanoparticles in MOF-5
35
Only from the loading data of [FeCp2]7@MOF-5,[52] where “saturated” loading was verified
by single crystal structure analysis, a higher packing density of 81.5 % was calculated so far.
This confirms the intended rather “saturated” loading of MOF-5 with [Ru(cod)(cot)]. MOF-5
exhibits two types of cavities with different van der Waals pore diameters of 15.1 (cavity A)
and 11.0 Å (cavity B) as caused by the tilted bdc linkers and pore volumes of 0.61 and 0.54
cm3cm-3, respectively.[4] Therefore, the number of caged molecules in each type of cavity is
not necessarily the same and in the example of [Ru(cod)(cot)]3.5@MOF-5 was found to be
four precursor molecules in the larger and three precursor molecules in the smaller cavity of
MOF-5 (see Figure 3.2).
Table 3.2. Comparison of loading characteristics of various precursors adsorbed by MOF-5.
The data for [Ru(cod)(cot)] obtained during this work is marked orange.
Precursor Calculated number of molecules per
cavity Volume [Å3]
Packing density @MOF-5/@solid
state
[CpPd(η3-C3H5)] 4[53]
192[97]
47 %
[CpPtMe3] 3[53]
216[97]
40 %
[CpCu(P(CH3)3)] 3[53]
243[97]
28 %
[CpCu(CNtBu)] 1[53]
249[97]
15 %
[Au(CH3)(P(CH3)3)] 3[53]
160[97]
40 %
[Sn(C4H9)2(OOC2H3)2] 0.75[53]
445[97]
20.6 %
[Zn(C2H5)2] 2[53]
174[97]
21.2 %
[Fe(CO)5]
4[53] 216[97] 52 %
[FeCp2] 7[22]
198[97]
81.9 %
[Ru(cod)(cot)] 3.5 346 71.5 %
Loading experiments at higher temperature, intending to increase the packing density
precursor (60 °C) even above 71.5 %, led to uncontrolled isomerization of the precursor (see
NMR discussion below). Therefore loading at 30 °C, 10-5 mbar appeared to be the most
reasonable procedure in order to obtain a well defined [Ru(cod)(cot)]3.5@MOF-5 composite.
The obtained [Ru(cod)(cot)]3.5@MOF-5 was investigated further by means of 13C MAS-
NMR, FT-IR and PXRD.
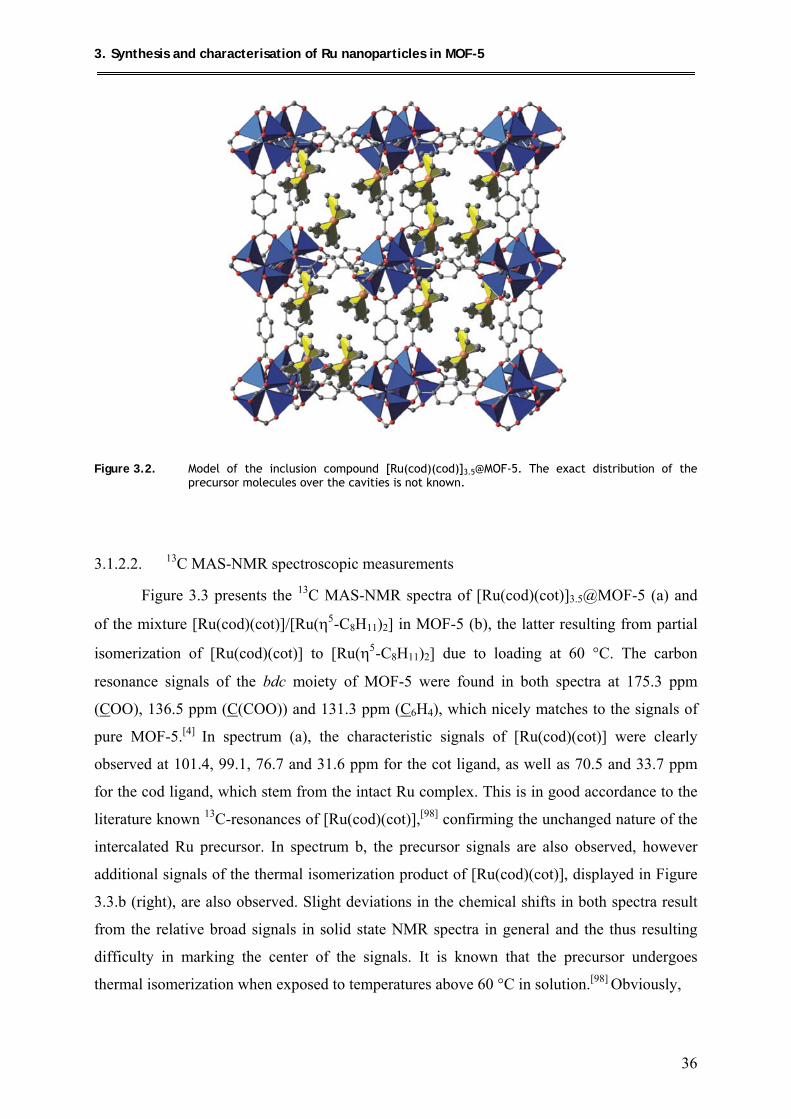
3. Synthesis and characterisation of Ru nanoparticles in MOF-5
36
Figure 3.2. Model of the inclusion compound [Ru(cod)(cod)]3.5@MOF-5. The exact distribution of the precursor molecules over the cavities is not known.
3.1.2.2. 13C MAS-NMR spectroscopic measurements
Figure 3.3 presents the 13C MAS-NMR spectra of [Ru(cod)(cot)]3.5@MOF-5 (a) and
of the mixture [Ru(cod)(cot)]/[Ru(η5-C8H11)2] in MOF-5 (b), the latter resulting from partial
isomerization of [Ru(cod)(cot)] to [Ru(η5-C8H11)2] due to loading at 60 °C. The carbon
resonance signals of the bdc moiety of MOF-5 were found in both spectra at 175.3 ppm
(COO), 136.5 ppm (C(COO)) and 131.3 ppm (C6H4), which nicely matches to the signals of
pure MOF-5.[4] In spectrum (a), the characteristic signals of [Ru(cod)(cot)] were clearly
observed at 101.4, 99.1, 76.7 and 31.6 ppm for the cot ligand, as well as 70.5 and 33.7 ppm
for the cod ligand, which stem from the intact Ru complex. This is in good accordance to the
literature known 13C-resonances of [Ru(cod)(cot)],[98] confirming the unchanged nature of the
intercalated Ru precursor. In spectrum b, the precursor signals are also observed, however
additional signals of the thermal isomerization product of [Ru(cod)(cot)], displayed in Figure
3.3.b (right), are also observed. Slight deviations in the chemical shifts in both spectra result
from the relative broad signals in solid state NMR spectra in general and the thus resulting
difficulty in marking the center of the signals. It is known that the precursor undergoes
thermal isomerization when exposed to temperatures above 60 °C in solution.[98] Obviously,
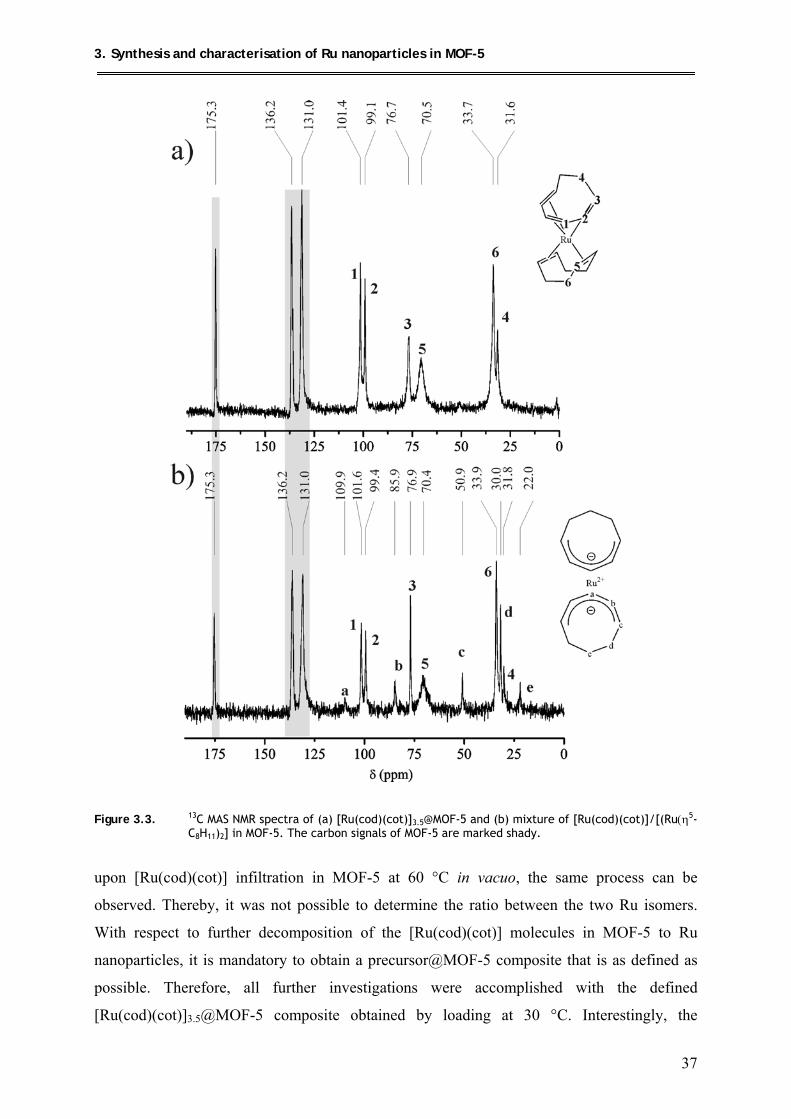
3. Synthesis and characterisation of Ru nanoparticles in MOF-5
37
Figure 3.3. 13C MAS NMR spectra of (a) [Ru(cod)(cot)]3.5@MOF-5 and (b) mixture of [Ru(cod)(cot)]/[(Ru(η5-C8H11)2] in MOF-5. The carbon signals of MOF-5 are marked shady.
upon [Ru(cod)(cot)] infiltration in MOF-5 at 60 °C in vacuo, the same process can be
observed. Thereby, it was not possible to determine the ratio between the two Ru isomers.
With respect to further decomposition of the [Ru(cod)(cot)] molecules in MOF-5 to Ru
nanoparticles, it is mandatory to obtain a precursor@MOF-5 composite that is as defined as
possible. Therefore, all further investigations were accomplished with the defined
[Ru(cod)(cot)]3.5@MOF-5 composite obtained by loading at 30 °C. Interestingly, the
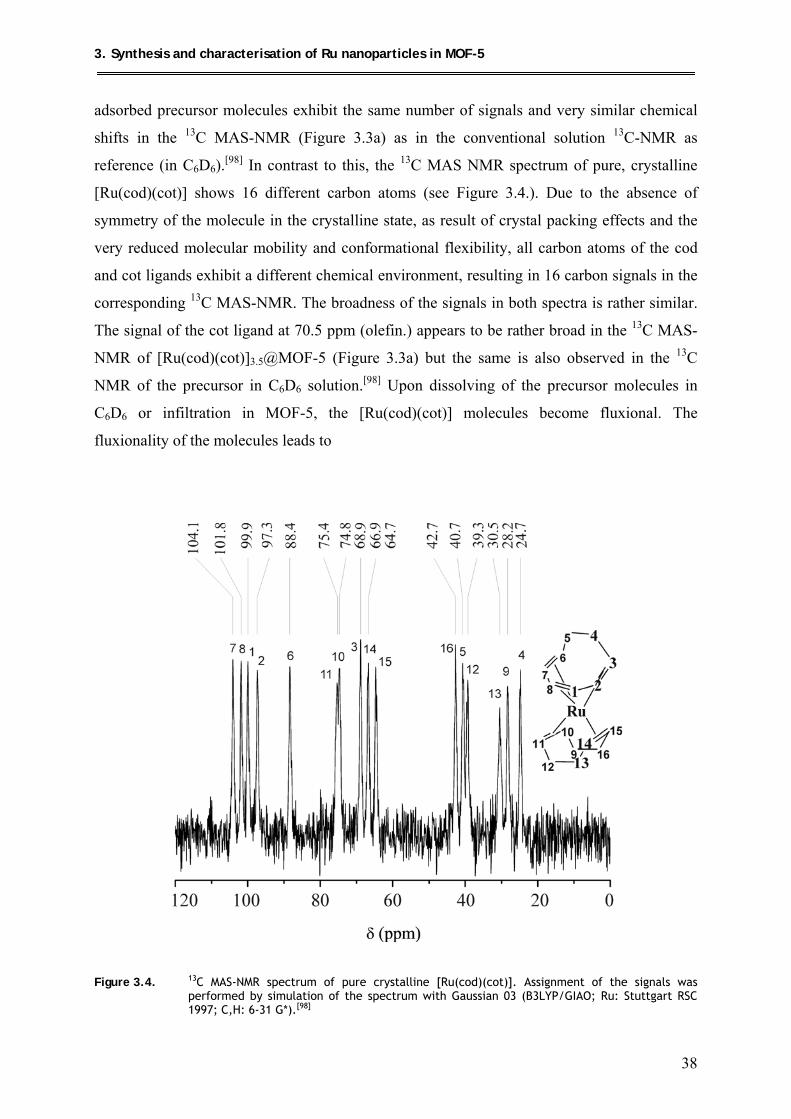
3. Synthesis and characterisation of Ru nanoparticles in MOF-5
38
adsorbed precursor molecules exhibit the same number of signals and very similar chemical
shifts in the 13C MAS-NMR (Figure 3.3a) as in the conventional solution 13C-NMR as
reference (in C6D6).[98] In contrast to this, the 13C MAS NMR spectrum of pure, crystalline
[Ru(cod)(cot)] shows 16 different carbon atoms (see Figure 3.4.). Due to the absence of
symmetry of the molecule in the crystalline state, as result of crystal packing effects and the
very reduced molecular mobility and conformational flexibility, all carbon atoms of the cod
and cot ligands exhibit a different chemical environment, resulting in 16 carbon signals in the
corresponding 13C MAS-NMR. The broadness of the signals in both spectra is rather similar.
The signal of the cot ligand at 70.5 ppm (olefin.) appears to be rather broad in the 13C MAS-
NMR of [Ru(cod)(cot)]3.5@MOF-5 (Figure 3.3a) but the same is also observed in the 13C
NMR of the precursor in C6D6 solution.[98] Upon dissolving of the precursor molecules in
C6D6 or infiltration in MOF-5, the [Ru(cod)(cot)] molecules become fluxional. The
fluxionality of the molecules leads to
Figure 3.4. 13C MAS-NMR spectrum of pure crystalline [Ru(cod)(cot)]. Assignment of the signals was performed by simulation of the spectrum with Gaussian 03 (B3LYP/GIAO; Ru: Stuttgart RSC 1997; C,H: 6-31 G*).[98]

3. Synthesis and characterisation of Ru nanoparticles in MOF-5
39
chemical equivalence of certain C atoms of the cod and cot ligands and only 6 different
signals can be observed in the corresponding 13C NMR spectra. However, the four olefinic C
atoms of the cot ligands appear to be less chemical equivalent (even in C6D6 solution),
probably due to limited fluxtionality of the Ru precursor molecules in certain dimensions,
which results in the detection of a comparably broad 13C NMR signal.
Obviously, when intercalated in MOF-5, the precursor molecules are more fluxional and
mobile and behave almost as in solution. The Ru precursor molecules behave as being
“dissolved” in the solid solvent MOF-5. Also, interaction with the host framework appears to
be rather weak as well, since no splitting of the carbon signals of the MOF-5 linkers, being a
hint for interaction with intercalated molecules is observed. The striking differences in the 13C
MAS-NMR spectra of [Ru(cod)(cot)]3.5@MOF-5 and the pure precursor, additionally show
that the loading of MOF-5 with the precursor does not lead to a simple physical mixture of the
two materials but indeed to a new composite material.
3.1.2.3. FT-IR spectroscopic measurements
The composite [Ru(cod)(cot)]3.5@MOF-5 was furthermore investigated by FT-IR
spectroscopy. Figure 3.5 shows the FT-IR spectra of pure empty MOF-5 (a) and
[Ru(cod)(cot)]3.5@MOF-5 (b). Both, the spectra of empty and loaded MOF-5 exhibit the
typical adsorption bands for C-O vibrations, with two very strong bands between 1400 and
1700 cm-1. The two bands at 1572 and 1507 cm-1 can be assigned to the asymmetric stretching
νas(COO), whereas the band at 1391 cm-1 can be assigned to the corresponding symmetric
stretching vibration νas(COO). These values are consistent with the presence of CO2- groups
coordinating to zinc. The vibrational bands in the range of 700–1200 cm-1 can be assigned to
the out-of-plane vibration of the MOF-5 terephthalates. In the FT-IR spectrum of the
composite [Ru(cod)(cot)]3.5@MOF-5, the vibrational bands of the host framework are still
dominating the spectrum without noticeable changes. However in the 1900–3100 cm-1 region,
where MOF-5 exhibits no adsorption bands, the vibrational bands of the precursor can be
observed. The observed bands at around 3000 cm-1 and 1970 cm-1 correspond well to the C-H
and C=C stretching vibrations of the olefinic cod and cot ligands of the precursor molecule.
Other bands of the precursor below 1500 cm-1 are more or less superimposed by the strong
MOF-5 vibrations.
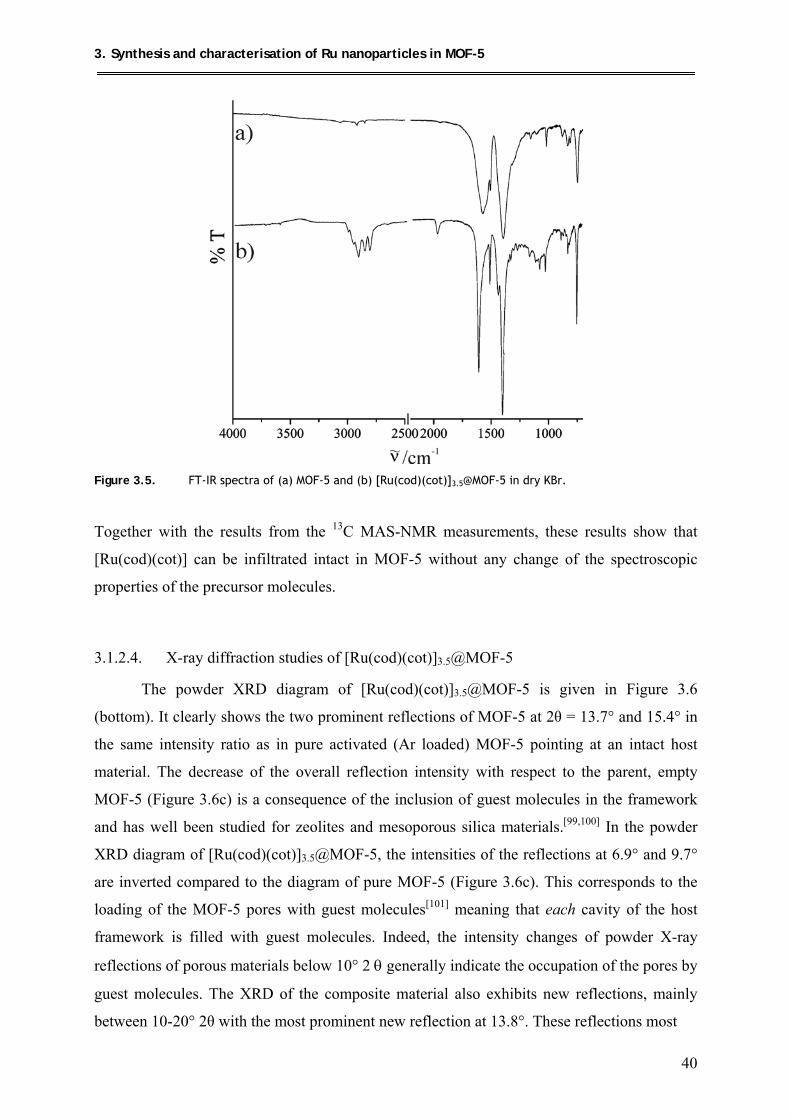
3. Synthesis and characterisation of Ru nanoparticles in MOF-5
40
Figure 3.5. FT-IR spectra of (a) MOF-5 and (b) [Ru(cod)(cot)]3.5@MOF-5 in dry KBr.
Together with the results from the 13C MAS-NMR measurements, these results show that
[Ru(cod)(cot)] can be infiltrated intact in MOF-5 without any change of the spectroscopic
properties of the precursor molecules.
3.1.2.4. X-ray diffraction studies of [Ru(cod)(cot)]3.5@MOF-5
The powder XRD diagram of [Ru(cod)(cot)]3.5@MOF-5 is given in Figure 3.6
(bottom). It clearly shows the two prominent reflections of MOF-5 at 2θ = 13.7° and 15.4° in
the same intensity ratio as in pure activated (Ar loaded) MOF-5 pointing at an intact host
material. The decrease of the overall reflection intensity with respect to the parent, empty
MOF-5 (Figure 3.6c) is a consequence of the inclusion of guest molecules in the framework
and has well been studied for zeolites and mesoporous silica materials.[99,100] In the powder
XRD diagram of [Ru(cod)(cot)]3.5@MOF-5, the intensities of the reflections at 6.9° and 9.7°
are inverted compared to the diagram of pure MOF-5 (Figure 3.6c). This corresponds to the
loading of the MOF-5 pores with guest molecules[101] meaning that each cavity of the host
framework is filled with guest molecules. Indeed, the intensity changes of powder X-ray
reflections of porous materials below 10° 2 θ generally indicate the occupation of the pores by
guest molecules. The XRD of the composite material also exhibits new reflections, mainly
between 10-20° 2θ with the most prominent new reflection at 13.8°. These reflections most
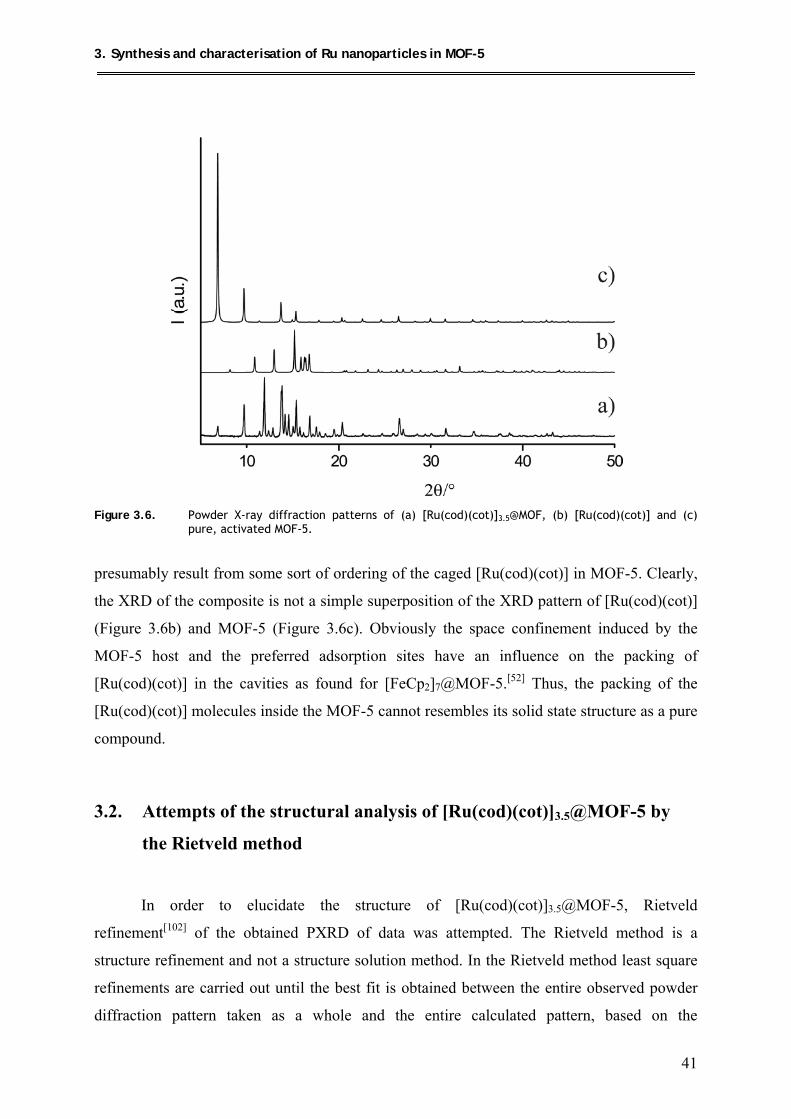
3. Synthesis and characterisation of Ru nanoparticles in MOF-5
41
Figure 3.6. Powder X-ray diffraction patterns of (a) [Ru(cod)(cot)]3.5@MOF, (b) [Ru(cod)(cot)] and (c)
pure, activated MOF-5.
presumably result from some sort of ordering of the caged [Ru(cod)(cot)] in MOF-5. Clearly,
the XRD of the composite is not a simple superposition of the XRD pattern of [Ru(cod)(cot)]
(Figure 3.6b) and MOF-5 (Figure 3.6c). Obviously the space confinement induced by the
MOF-5 host and the preferred adsorption sites have an influence on the packing of
[Ru(cod)(cot)] in the cavities as found for [FeCp2]7@MOF-5.[52] Thus, the packing of the
[Ru(cod)(cot)] molecules inside the MOF-5 cannot resembles its solid state structure as a pure
compound.
3.2. Attempts of the structural analysis of [Ru(cod)(cot)]3.5@MOF-5 by
the Rietveld method
In order to elucidate the structure of [Ru(cod)(cot)]3.5@MOF-5, Rietveld
refinement[102] of the obtained PXRD of data was attempted. The Rietveld method is a
structure refinement and not a structure solution method. In the Rietveld method least square
refinements are carried out until the best fit is obtained between the entire observed powder
diffraction pattern taken as a whole and the entire calculated pattern, based on the
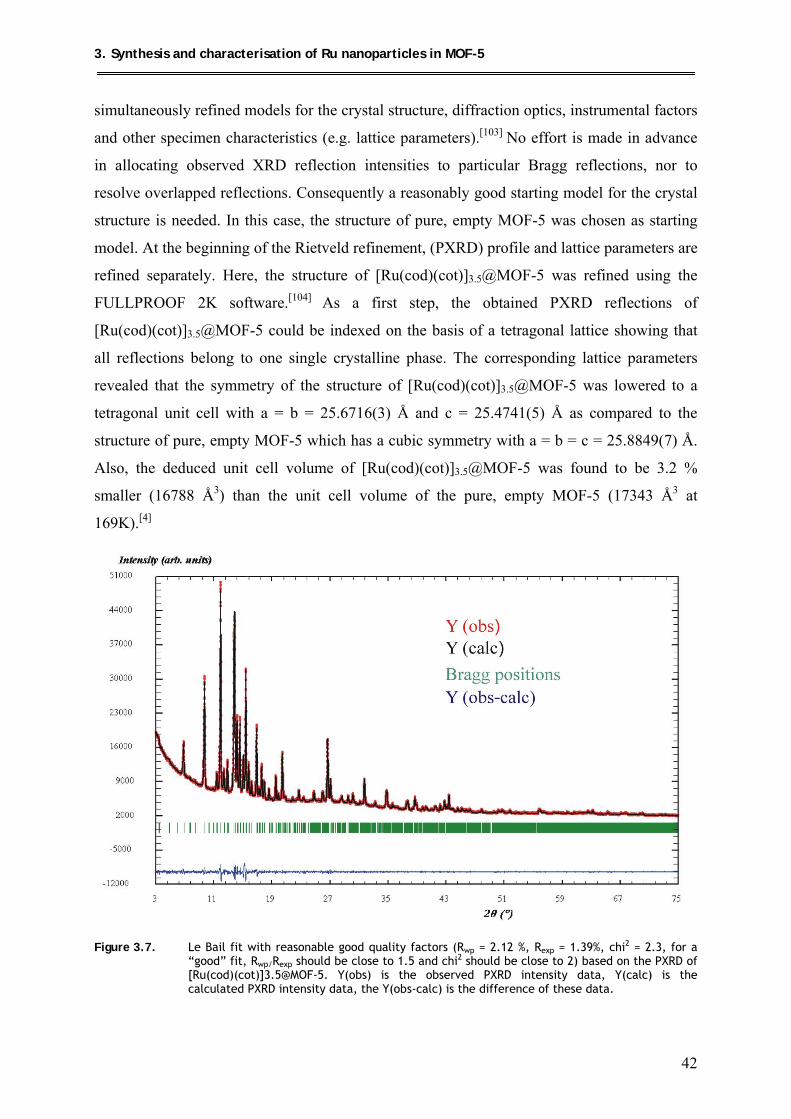
3. Synthesis and characterisation of Ru nanoparticles in MOF-5
42
simultaneously refined models for the crystal structure, diffraction optics, instrumental factors
and other specimen characteristics (e.g. lattice parameters).[103] No effort is made in advance
in allocating observed XRD reflection intensities to particular Bragg reflections, nor to
resolve overlapped reflections. Consequently a reasonably good starting model for the crystal
structure is needed. In this case, the structure of pure, empty MOF-5 was chosen as starting
model. At the beginning of the Rietveld refinement, (PXRD) profile and lattice parameters are
refined separately. Here, the structure of [Ru(cod)(cot)]3.5@MOF-5 was refined using the
FULLPROOF 2K software.[104] As a first step, the obtained PXRD reflections of
[Ru(cod)(cot)]3.5@MOF-5 could be indexed on the basis of a tetragonal lattice showing that
all reflections belong to one single crystalline phase. The corresponding lattice parameters
revealed that the symmetry of the structure of [Ru(cod)(cot)]3.5@MOF-5 was lowered to a
tetragonal unit cell with a = b = 25.6716(3) Å and c = 25.4741(5) Å as compared to the
structure of pure, empty MOF-5 which has a cubic symmetry with a = b = c = 25.8849(7) Å.
Also, the deduced unit cell volume of [Ru(cod)(cot)]3.5@MOF-5 was found to be 3.2 %
smaller (16788 Å3) than the unit cell volume of the pure, empty MOF-5 (17343 Å3 at
169K).[4]
Figure 3.7. Le Bail fit with reasonable good quality factors (Rwp = 2.12 %, Rexp = 1.39%, chi2 = 2.3, for a
“good” fit, Rwp/Rexp should be close to 1.5 and chi2 should be close to 2) based on the PXRD of [Ru(cod)(cot)]3.5@MOF-5. Y(obs) is the observed PXRD intensity data, Y(calc) is the calculated PXRD intensity data, the Y(obs-calc) is the difference of these data.
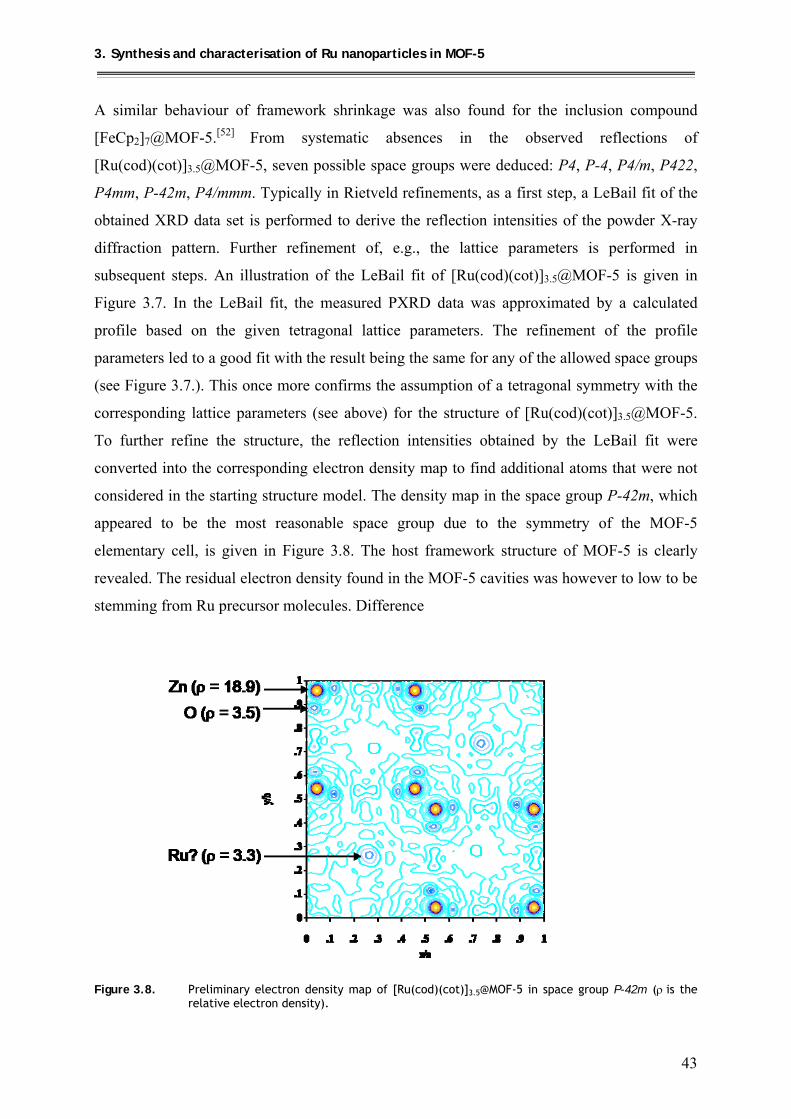
3. Synthesis and characterisation of Ru nanoparticles in MOF-5
43
A similar behaviour of framework shrinkage was also found for the inclusion compound
[FeCp2]7@MOF-5.[52] From systematic absences in the observed reflections of
[Ru(cod)(cot)]3.5@MOF-5, seven possible space groups were deduced: P4, P-4, P4/m, P422,
P4mm, P-42m, P4/mmm. Typically in Rietveld refinements, as a first step, a LeBail fit of the
obtained XRD data set is performed to derive the reflection intensities of the powder X-ray
diffraction pattern. Further refinement of, e.g., the lattice parameters is performed in
subsequent steps. An illustration of the LeBail fit of [Ru(cod)(cot)]3.5@MOF-5 is given in
Figure 3.7. In the LeBail fit, the measured PXRD data was approximated by a calculated
profile based on the given tetragonal lattice parameters. The refinement of the profile
parameters led to a good fit with the result being the same for any of the allowed space groups
(see Figure 3.7.). This once more confirms the assumption of a tetragonal symmetry with the
corresponding lattice parameters (see above) for the structure of [Ru(cod)(cot)]3.5@MOF-5.
To further refine the structure, the reflection intensities obtained by the LeBail fit were
converted into the corresponding electron density map to find additional atoms that were not
considered in the starting structure model. The density map in the space group P-42m, which
appeared to be the most reasonable space group due to the symmetry of the MOF-5
elementary cell, is given in Figure 3.8. The host framework structure of MOF-5 is clearly
revealed. The residual electron density found in the MOF-5 cavities was however to low to be
stemming from Ru precursor molecules. Difference
Figure 3.8. Preliminary electron density map of [Ru(cod)(cot)]3.5@MOF-5 in space group P-42m (ρ is the
relative electron density).
3. Synthesis and characterisation of Ru nanoparticles in MOF-5
44
electron density maps showed the electron density within the MOF-5 cavities to be highly
smeared out indicating highly disordered Ru precursor molecules since the presence of these
guest molecules was explicitly shown by the presented elemental analysis, 13C MAS-NMR
and FT-IR results. Therefore, it was not possible to obtain a satisfying crystal structure of the
inclusion compounds [Ru(cod)(cot)]n@MOF-5 (n ≤ 3.5). Noteworthy, in the case of
[FeCp2]7@MOF-5, the single crystal structure was determined only by using synchrotron
radiation at low temperature to measure a sufficient number of the (weak) superstructure
reflexes of the guest molecules.[52] In our case, one additional problem may be possible a non-
saturated loading of MOF-5 with the [Ru(cod)(cot)] throughout the micro crystals, which
leads to an increased disorder of the rather mobile guest molecules. A similar observation was
made for [FeCp2]n@MOF-5 with n < 7. However, the attempts to rigorously ensure
thermodynamic equilibrium and a maximum loading at higher temperatures led to the
discussed isomerization of the precursor. An even severer problem of disorder of the
intercalated molecules resulted. Nevertheless, all reflections observed in the X-ray powder
diffractogram of [Ru(cod)(cot)]3.5@MOF-5 could be indexed applying the same tetragonal
space group with preliminary values for the cell constants. Since pure MOF-5 crystallizes in a
cubic space group, this difference provides evidence for a significant distortion and symmetry
change of the MOF-5 framework itself, induced by intercalation of the guest molecules. In
fact, [Ru(cod)(cot)]3.5@MOF-5 can be described as one single new phase. So far this has not
been observed for MOF-5 but similar changes of the framework symmetry upon guest
inclusion are well known for MIL materials.[7] Although the elucidation of the ordering of
caged organometallic molecules inside the MOF matrices certainly warrants attention, the
system [Ru(cod)(cot)]n@MOF-5 is possibly not the best study object for that purpose because
of its chemical lability. Furthermore, 13C MAS-NMR investigation (see above) of the
composite at 25 °C showed that the precursor molecules inside MOF-5 behave almost as in
solution. Obviously, interactions between the [Ru(cod)(cot)] molecules and the host
framework are rather weak. This is possibly due to the lack of extended π − systems in the
ligands of [Ru(cod)(cot)] which could undergo more pronounced π − π interactions with the
aromatic MOF-5 linkers and hence help to increase the ordering of the precursor molecules as
in the case of [FeCp2]7@MOF-5. The refined PXRD data (Figure 3.7) was furthermore
measured at 25 °C due to the lack of a PXRD instrument with a cooling set-up. In order to
minimize molecular motions of the precursor molecules in MOF and the MOF-5 network
itself, PXRD data collection at lower temperature might help to solve the structure of the
composite.
3. Synthesis and characterisation of Ru nanoparticles in MOF-5
45
Nevertheless, 13C MAS-NMR and FT-IR spectroscopical measurements, as well as PXRD
data of the composite [Ru(cod)(cot)]3.5@MOF-5, prove the inclusion of intact precursor
molecules in an intact MOF-5 matrix. Therefore the mandatory prerequisite for further
investigations of a well defined hydrogenolysis of [Ru(cod)(cot)] in MOF-5 was achieved.
3.3. Hydrogenolysis of [Ru(cod)(cot)]3.5@MOF-5 at mild conditions
3.3.1. Synthesis
Studies of the hydrogenolysis of [Ru(cod)(cot)] in solution have shown that the
precursor decomposes already at 1 bar H2 at 25 °C.[89] The same gentle reactions conditions
were chosen for the hydrogenolysis of the precursor in MOF-5. When the composite
[Ru(cod)(cot)]3.5@MOF-5 was exposed to a stream of hydrogen (1 bar, 1 sccm) at 25 °C for
30 min, a colour change from yellow orange to brown was observed. The obtained brown
pyrophoric powder was identified as {[Ru(cod)]/Ru}@MOF-5 (see below) resulting from
incomplete hydrogenolysis of the Ru precursor and caging effects of the host framework. The
corresponding Langmuir surface area of the composite material was calculated to 1600 m2/g
from N2 sorption measurements (Type I Isotherms). This is a decrease of nearly 50% in
comparison to the “empty” MOF-5 powder which had a specific surface area of 3300 m2/g
prior to the loading with precursor and subsequent hydrogenation. The decrease of the surface
area can be attributed to the formation of Ru nanoparticles inside the framework and was also
observed upon loading of MOF-5 with Pd, Cu and Au.[51]
3.3.2. Characterization
3.3.2.1. 13C MAS NMR spectroscopic investigations of {[Ru(cod)]/Ru}@MOF-5
The 13C MAS-NMR spectrum of {[Ru(cod)]/Ru}@MOF-5 (Figure 3.9) shows the
characteristic signals for the MOF-5 matrix (marked shady), but five additional signals that
are not expected upon quantitative hydrogenolysis of the precursor molecules, are observed
too. When comparing the 13C MAS-NMR of the composite [Ru(cod)(cot)]3.5@MOF-5 before
(Figure 3.3a) and after hydrogenolysis (Figure 3.9) at room temperature, it is evident that
these additional signals are not derived from remaining, unchanged [Ru(cod)(cot)]. The
resonances of the cot ligand have completely disappeared. The three broad signals at 177.5
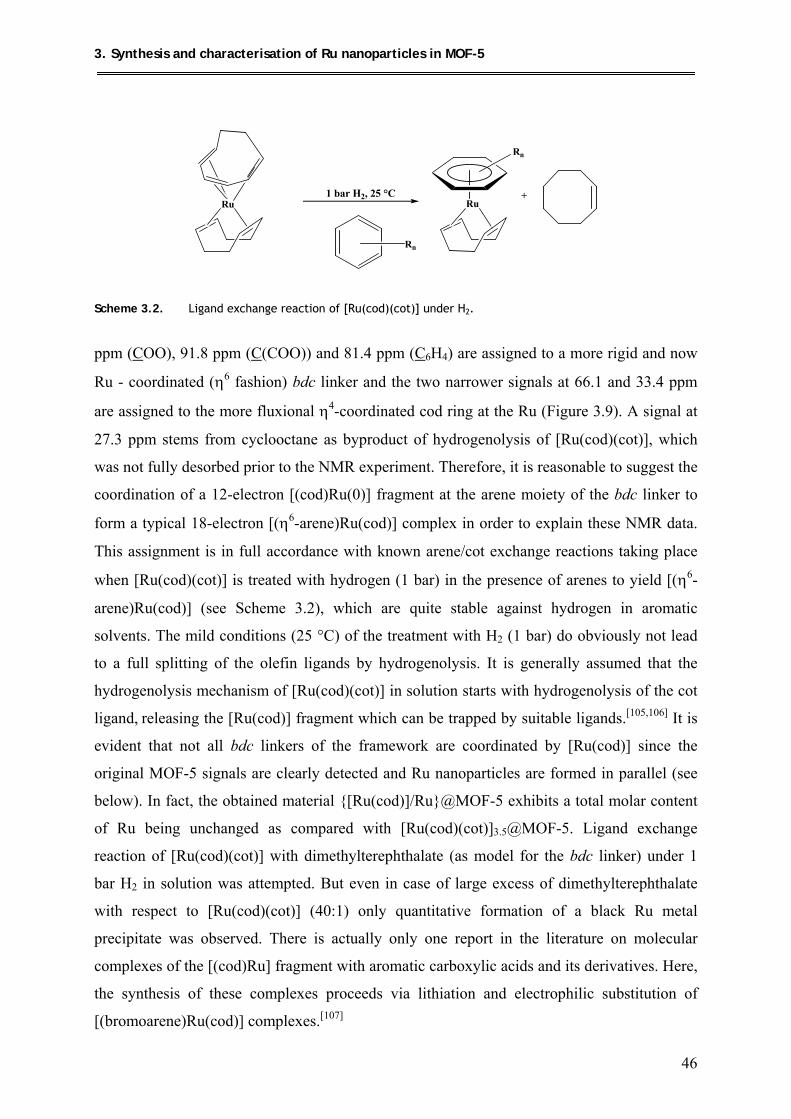
3. Synthesis and characterisation of Ru nanoparticles in MOF-5
46
Ru Ru
Rn
Rn
1 bar H2, 25 °C +
Scheme 3.2. Ligand exchange reaction of [Ru(cod)(cot)] under H2.
ppm (COO), 91.8 ppm (C(COO)) and 81.4 ppm (C6H4) are assigned to a more rigid and now
Ru - coordinated (η6 fashion) bdc linker and the two narrower signals at 66.1 and 33.4 ppm
are assigned to the more fluxional η4-coordinated cod ring at the Ru (Figure 3.9). A signal at
27.3 ppm stems from cyclooctane as byproduct of hydrogenolysis of [Ru(cod)(cot)], which
was not fully desorbed prior to the NMR experiment. Therefore, it is reasonable to suggest the
coordination of a 12-electron [(cod)Ru(0)] fragment at the arene moiety of the bdc linker to
form a typical 18-electron [(η6-arene)Ru(cod)] complex in order to explain these NMR data.
This assignment is in full accordance with known arene/cot exchange reactions taking place
when [Ru(cod)(cot)] is treated with hydrogen (1 bar) in the presence of arenes to yield [(η6-
arene)Ru(cod)] (see Scheme 3.2), which are quite stable against hydrogen in aromatic
solvents. The mild conditions (25 °C) of the treatment with H2 (1 bar) do obviously not lead
to a full splitting of the olefin ligands by hydrogenolysis. It is generally assumed that the
hydrogenolysis mechanism of [Ru(cod)(cot)] in solution starts with hydrogenolysis of the cot
ligand, releasing the [Ru(cod)] fragment which can be trapped by suitable ligands.[105,106] It is
evident that not all bdc linkers of the framework are coordinated by [Ru(cod)] since the
original MOF-5 signals are clearly detected and Ru nanoparticles are formed in parallel (see
below). In fact, the obtained material {[Ru(cod)]/Ru}@MOF-5 exhibits a total molar content
of Ru being unchanged as compared with [Ru(cod)(cot)]3.5@MOF-5. Ligand exchange
reaction of [Ru(cod)(cot)] with dimethylterephthalate (as model for the bdc linker) under 1
bar H2 in solution was attempted. But even in case of large excess of dimethylterephthalate
with respect to [Ru(cod)(cot)] (40:1) only quantitative formation of a black Ru metal
precipitate was observed. There is actually only one report in the literature on molecular
complexes of the [(cod)Ru] fragment with aromatic carboxylic acids and its derivatives. Here,
the synthesis of these complexes proceeds via lithiation and electrophilic substitution of
[(bromoarene)Ru(cod)] complexes.[107]
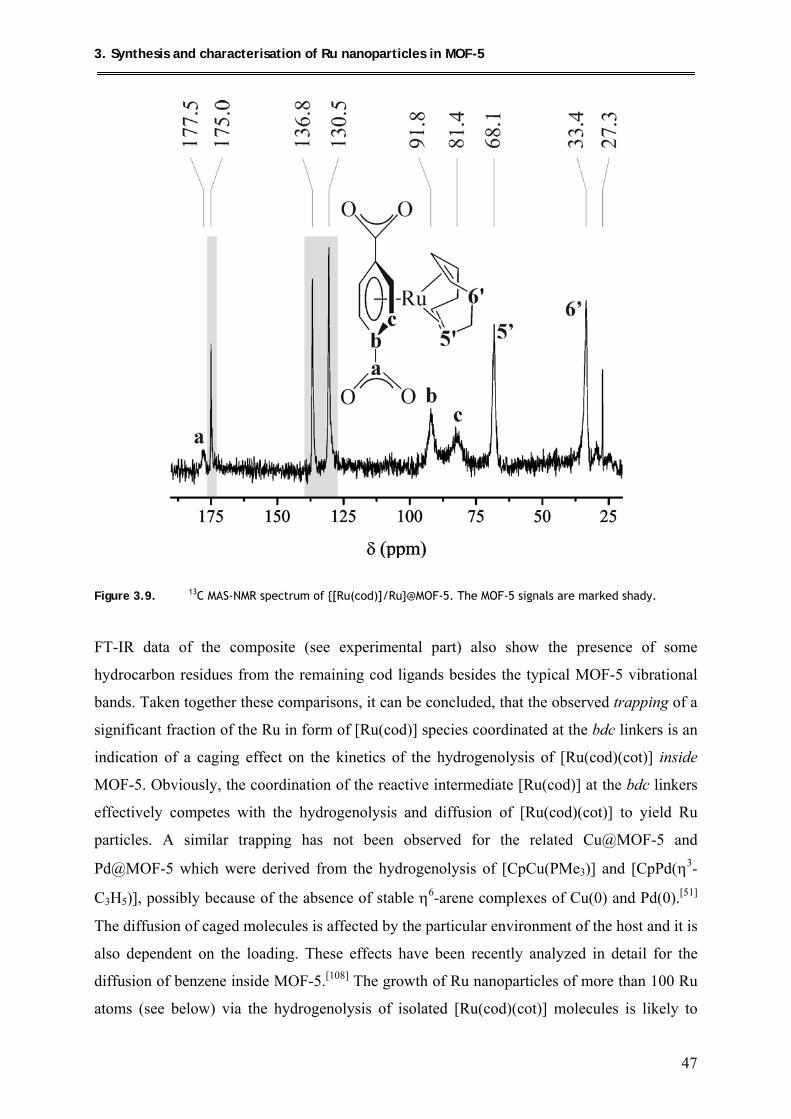
3. Synthesis and characterisation of Ru nanoparticles in MOF-5
47
Figure 3.9. 13C MAS-NMR spectrum of {[Ru(cod)]/Ru}@MOF-5. The MOF-5 signals are marked shady.
FT-IR data of the composite (see experimental part) also show the presence of some
hydrocarbon residues from the remaining cod ligands besides the typical MOF-5 vibrational
bands. Taken together these comparisons, it can be concluded, that the observed trapping of a
significant fraction of the Ru in form of [Ru(cod)] species coordinated at the bdc linkers is an
indication of a caging effect on the kinetics of the hydrogenolysis of [Ru(cod)(cot)] inside
MOF-5. Obviously, the coordination of the reactive intermediate [Ru(cod)] at the bdc linkers
effectively competes with the hydrogenolysis and diffusion of [Ru(cod)(cot)] to yield Ru
particles. A similar trapping has not been observed for the related Cu@MOF-5 and
Pd@MOF-5 which were derived from the hydrogenolysis of [CpCu(PMe3)] and [CpPd(η3-
C3H5)], possibly because of the absence of stable η6-arene complexes of Cu(0) and Pd(0).[51]
The diffusion of caged molecules is affected by the particular environment of the host and it is
also dependent on the loading. These effects have been recently analyzed in detail for the
diffusion of benzene inside MOF-5.[108] The growth of Ru nanoparticles of more than 100 Ru
atoms (see below) via the hydrogenolysis of isolated [Ru(cod)(cot)] molecules is likely to

3. Synthesis and characterisation of Ru nanoparticles in MOF-5
48
follow a diffusion limited kinetics which may be slowed down to some extent inside the solid
matrix MOF-5 as compared with conditions in solution. On the other hand, reactive
intermediates, such as [Ru(cod)], may be stabilized by caging effects in some way and
reaction paths may be altered as has been shown for a number of cases that have already been
discussed in the introductory chapter. Among these recent publications the formation of
{[Ru(cod)]/Ru}@MOF-5 can indeed be seen as another first examples.
3.3.2.2. PXRD structural investigation of {[Ru(cod)]/Ru}@MOF-5
The results of the powder X-ray diffraction measurements of {[Ru(cod)]/Ru}@MOF-5
compared to empty MOF-5 are presented in Figure 3.10. As already discussed above, the
overall decrease of the reflection intensities of the composite when compared to pure MOF-5
(Figure 3.10a) is due to the increased X-ray absorption caused by the embedded Ru
species.[63,64] Indeed, the PXRD of {[Ru(cod)]/Ru}@MOF-5 looks strikingly different from
the PXRD of the unchanged precursor in MOF-5 (see Figure 3.10a) and almost identical to
the one of the empty MOF-5 material (see discussion of the reflection intensities < 2 θ =10°
below) indicating an unchanged host matrix.
Figure 3.10. Powder X-ray diffraction patterns of (a) pure, activated MOF-5 and (b) {[Ru(cod)]/Ru}@MOF-5 (derived by treatment of [Ru(cod)(cot)]3.5@MOF-5 with 1 sccm H2, 25 °C, 30 min). (Lines: Ru JPDS reference No. 6-0663)
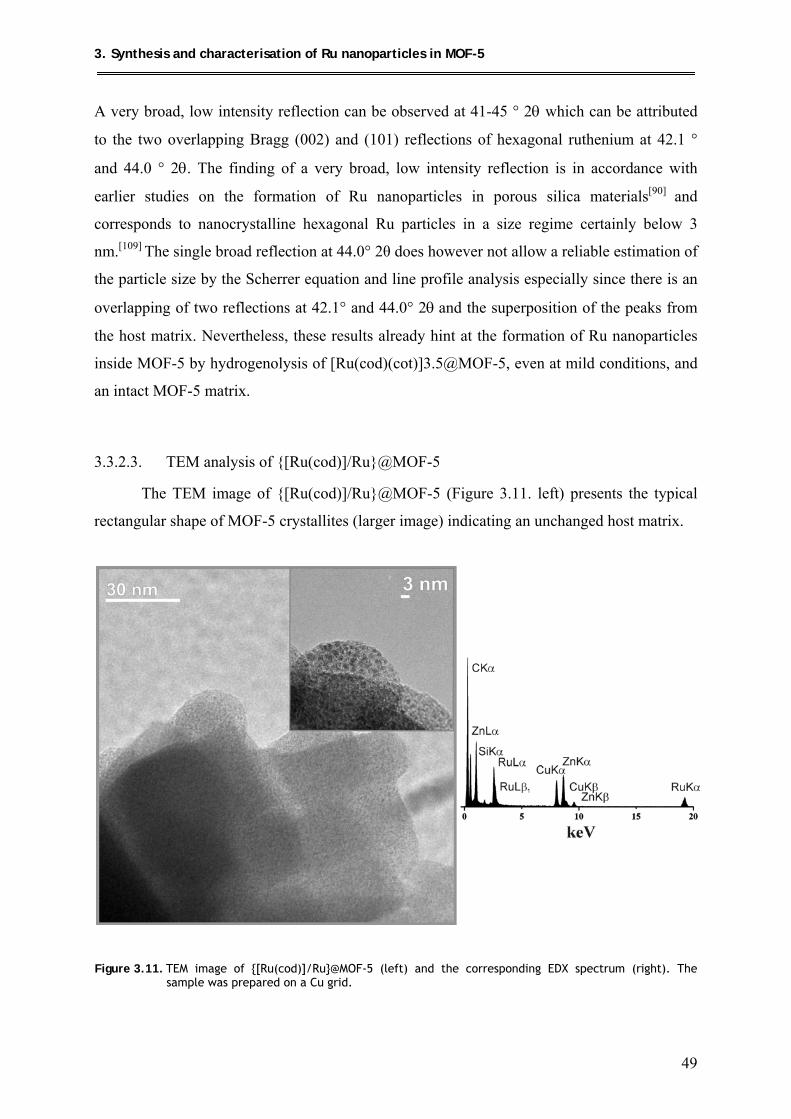
3. Synthesis and characterisation of Ru nanoparticles in MOF-5
49
A very broad, low intensity reflection can be observed at 41-45 ° 2θ which can be attributed
to the two overlapping Bragg (002) and (101) reflections of hexagonal ruthenium at 42.1 °
and 44.0 ° 2θ. The finding of a very broad, low intensity reflection is in accordance with
earlier studies on the formation of Ru nanoparticles in porous silica materials[90] and
corresponds to nanocrystalline hexagonal Ru particles in a size regime certainly below 3
nm.[109] The single broad reflection at 44.0° 2θ does however not allow a reliable estimation of
the particle size by the Scherrer equation and line profile analysis especially since there is an
overlapping of two reflections at 42.1° and 44.0° 2θ and the superposition of the peaks from
the host matrix. Nevertheless, these results already hint at the formation of Ru nanoparticles
inside MOF-5 by hydrogenolysis of [Ru(cod)(cot)]3.5@MOF-5, even at mild conditions, and
an intact MOF-5 matrix.
3.3.2.3. TEM analysis of {[Ru(cod)]/Ru}@MOF-5
The TEM image of {[Ru(cod)]/Ru}@MOF-5 (Figure 3.11. left) presents the typical
rectangular shape of MOF-5 crystallites (larger image) indicating an unchanged host matrix.
Figure 3.11. TEM image of {[Ru(cod)]/Ru}@MOF-5 (left) and the corresponding EDX spectrum (right). The
sample was prepared on a Cu grid.
3. Synthesis and characterisation of Ru nanoparticles in MOF-5
50
The Ru nanoparticles can be observed as regions of higher contrast, confirmed by EDX
analysis, due to the higher number of electrons in the metal compared to the metal oxide
based host material. The particles are in a size range of 1.6-1.8 nm which matches the pore
diameter of MOF-5[4] and also corresponds to the results from XRD analysis.
Taking together all analytical data from the analysis the composite {[Ru(cod)]/Ru}@MOF-5
it can be concluded, that the precursor cannot be fully hydrogenolyzed under 1 bar H2, 25 °C
when intercalated in MOF-5. An almost unchanged MOF-5 matrix was found as well as the
formation of small Ru nanoparticles matching the pore sizes of the host material. Side product
formation of (η6-arene)Ru(cod) complexes with the MOF-5 bdc linkers was observed, yet
most probably (see discussion of the XAS results below) most of the Ru precursor molecules
were decomposed to form Ru nanoparticles.
3.4. Quantitative hydrogenolysis of [Ru(cod)(cot)]3.5@MOF-5 to give
Ru@MOF-5
3.4.1. Synthesis
In order to obtain pure Ru nanoparticles in MOF-5, quantitative hydrogenolysis of
[Ru(cod)(cot)]3.5@MOF-5 was attempted. Finally, prolonged treatment (48 h) of the
composite under 3 bar H2, 150 °C gave Ru@MOF-5 with a total loading of 30.6 wt.% of Ru
metal. The Langmuir surface area, calculated from N2 sorption measurements was found to be
860 m2/g which again corresponds to the formation of Ru nanoparticles in the pore system of
MOF-5.[51] The composite {[Ru(cod)]/Ru}@MOF-5 could also be converted into Ru@MOF-
5 by the same procedure and appeared to be rather stable against H2 under more gentle
reaction conditions. The pure Ru@MOF-5 composite was subject to more thorough
investigations of the Ru nanoparticles, i.e. their chemical nature and especially location in
MOF-5 as well as their interactions with the host framework.
3.4.2. Characterization
3.4.2.1. 13C MAS-NMR investigations of Ru@MOF-5
The product of the hydrogenolysis of [Ru(cod)(cot)]3.5@MOF-5 at 3 bar H2, 150 °C
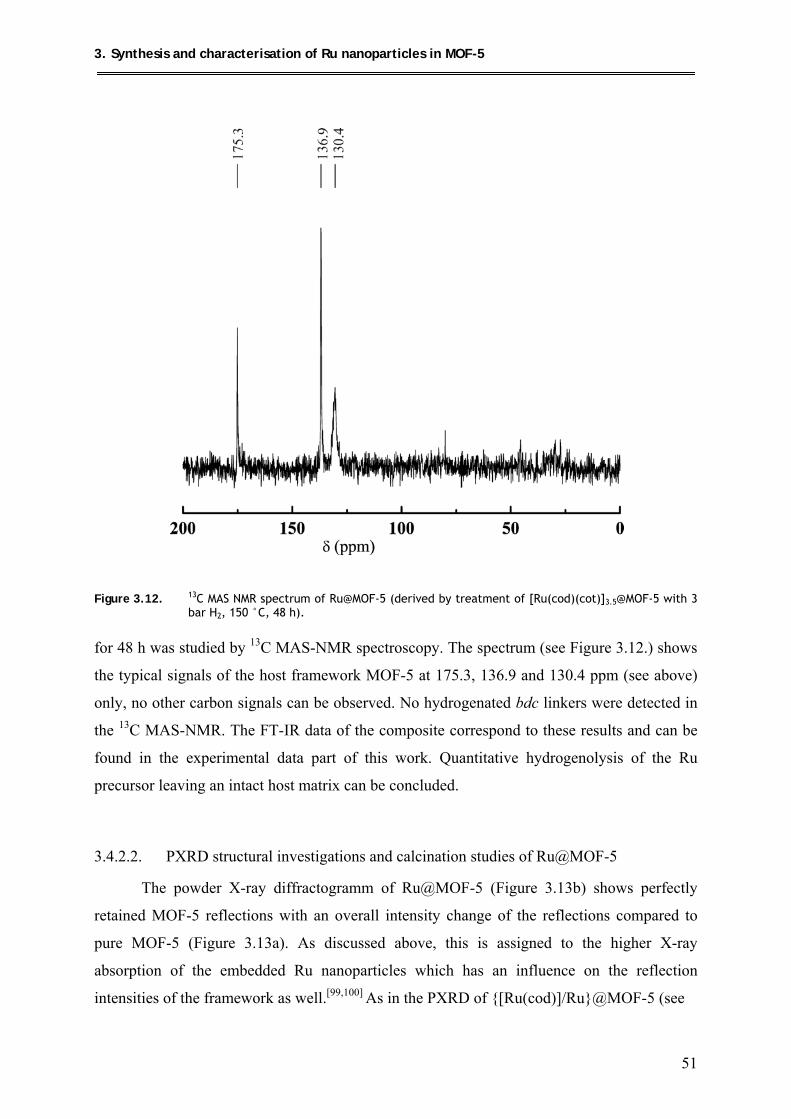
3. Synthesis and characterisation of Ru nanoparticles in MOF-5
51
Figure 3.12. 13C MAS NMR spectrum of Ru@MOF-5 (derived by treatment of [Ru(cod)(cot)]3.5@MOF-5 with 3 bar H2, 150 °C, 48 h).
for 48 h was studied by 13C MAS-NMR spectroscopy. The spectrum (see Figure 3.12.) shows
the typical signals of the host framework MOF-5 at 175.3, 136.9 and 130.4 ppm (see above)
only, no other carbon signals can be observed. No hydrogenated bdc linkers were detected in
the 13C MAS-NMR. The FT-IR data of the composite correspond to these results and can be
found in the experimental data part of this work. Quantitative hydrogenolysis of the Ru
precursor leaving an intact host matrix can be concluded.
3.4.2.2. PXRD structural investigations and calcination studies of Ru@MOF-5
The powder X-ray diffractogramm of Ru@MOF-5 (Figure 3.13b) shows perfectly
retained MOF-5 reflections with an overall intensity change of the reflections compared to
pure MOF-5 (Figure 3.13a). As discussed above, this is assigned to the higher X-ray
absorption of the embedded Ru nanoparticles which has an influence on the reflection
intensities of the framework as well.[99,100] As in the PXRD of {[Ru(cod)]/Ru}@MOF-5 (see
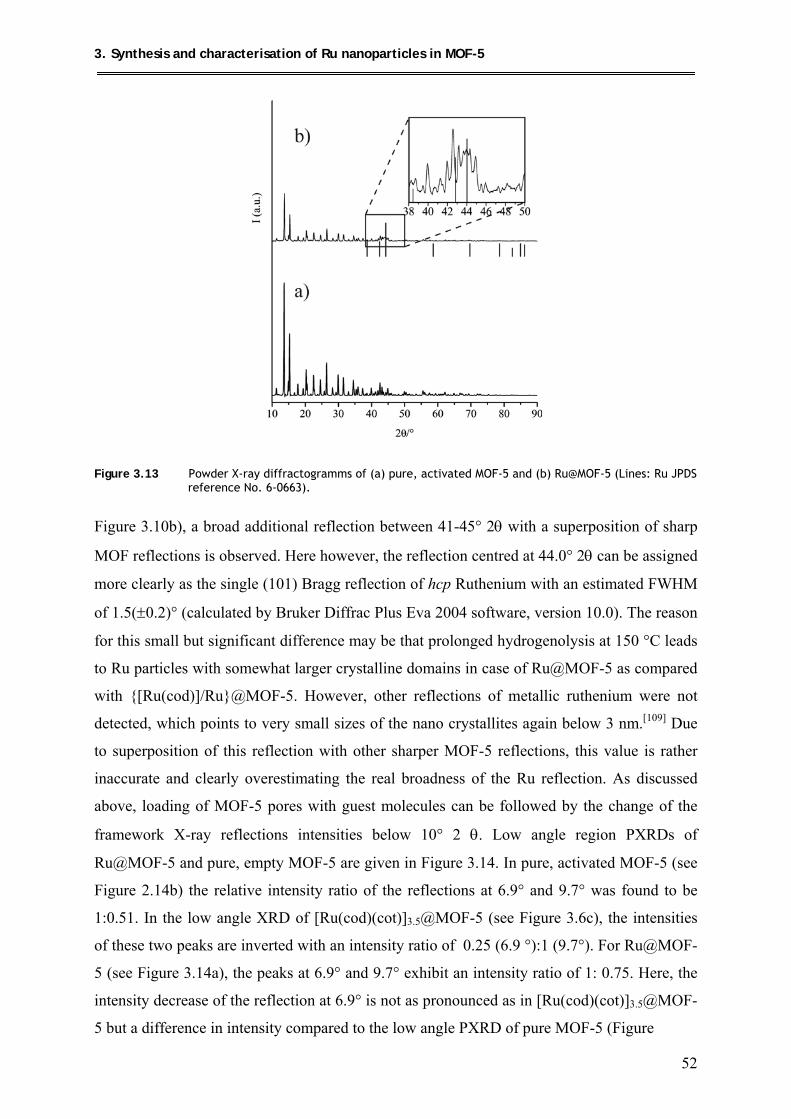
3. Synthesis and characterisation of Ru nanoparticles in MOF-5
52
Figure 3.13 Powder X-ray diffractogramms of (a) pure, activated MOF-5 and (b) Ru@MOF-5 (Lines: Ru JPDS reference No. 6-0663).
Figure 3.10b), a broad additional reflection between 41-45° 2θ with a superposition of sharp
MOF reflections is observed. Here however, the reflection centred at 44.0° 2θ can be assigned
more clearly as the single (101) Bragg reflection of hcp Ruthenium with an estimated FWHM
of 1.5(±0.2)° (calculated by Bruker Diffrac Plus Eva 2004 software, version 10.0). The reason
for this small but significant difference may be that prolonged hydrogenolysis at 150 °C leads
to Ru particles with somewhat larger crystalline domains in case of Ru@MOF-5 as compared
with {[Ru(cod)]/Ru}@MOF-5. However, other reflections of metallic ruthenium were not
detected, which points to very small sizes of the nano crystallites again below 3 nm.[109] Due
to superposition of this reflection with other sharper MOF-5 reflections, this value is rather
inaccurate and clearly overestimating the real broadness of the Ru reflection. As discussed
above, loading of MOF-5 pores with guest molecules can be followed by the change of the
framework X-ray reflections intensities below 10° 2 θ. Low angle region PXRDs of
Ru@MOF-5 and pure, empty MOF-5 are given in Figure 3.14. In pure, activated MOF-5 (see
Figure 2.14b) the relative intensity ratio of the reflections at 6.9° and 9.7° was found to be
1:0.51. In the low angle XRD of [Ru(cod)(cot)]3.5@MOF-5 (see Figure 3.6c), the intensities
of these two peaks are inverted with an intensity ratio of 0.25 (6.9 °):1 (9.7°). For Ru@MOF-
5 (see Figure 3.14a), the peaks at 6.9° and 9.7° exhibit an intensity ratio of 1: 0.75. Here, the
intensity decrease of the reflection at 6.9° is not as pronounced as in [Ru(cod)(cot)]3.5@MOF-
5 but a difference in intensity compared to the low angle PXRD of pure MOF-5 (Figure
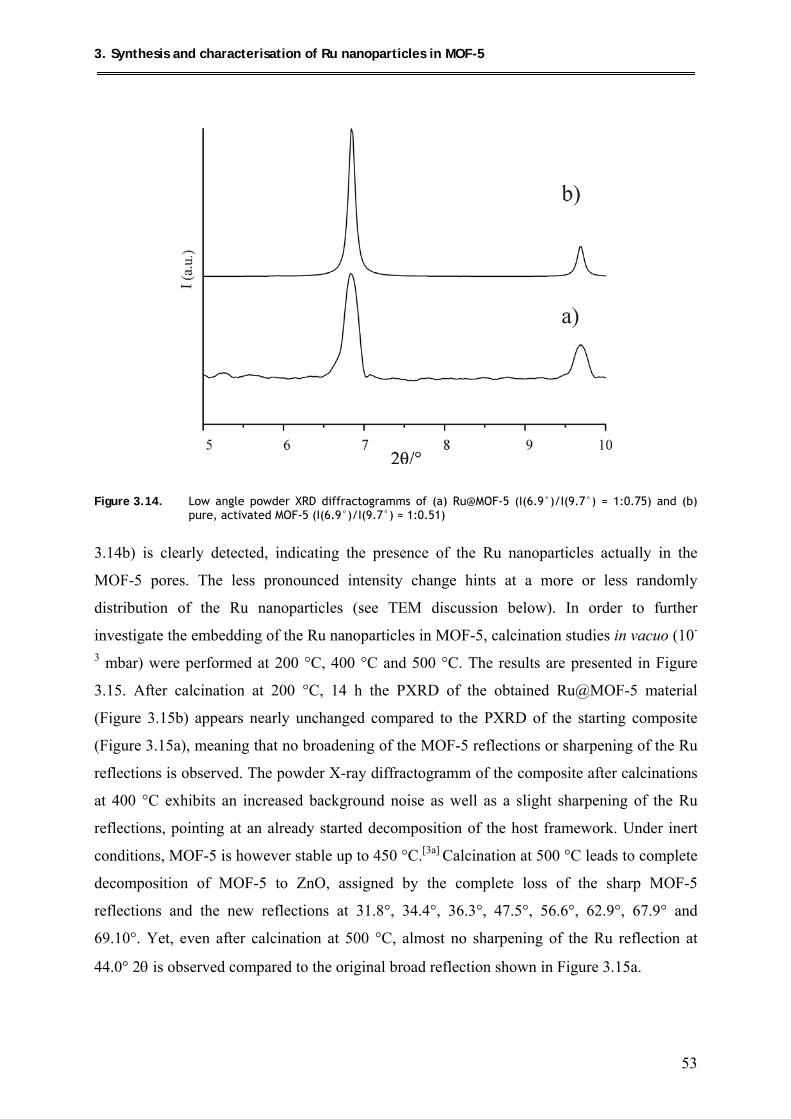
3. Synthesis and characterisation of Ru nanoparticles in MOF-5
53
Figure 3.14. Low angle powder XRD diffractogramms of (a) Ru@MOF-5 (I(6.9°)/I(9.7°) = 1:0.75) and (b) pure, activated MOF-5 (I(6.9°)/I(9.7°) = 1:0.51)
3.14b) is clearly detected, indicating the presence of the Ru nanoparticles actually in the
MOF-5 pores. The less pronounced intensity change hints at a more or less randomly
distribution of the Ru nanoparticles (see TEM discussion below). In order to further
investigate the embedding of the Ru nanoparticles in MOF-5, calcination studies in vacuo (10-
3 mbar) were performed at 200 °C, 400 °C and 500 °C. The results are presented in Figure
3.15. After calcination at 200 °C, 14 h the PXRD of the obtained Ru@MOF-5 material
(Figure 3.15b) appears nearly unchanged compared to the PXRD of the starting composite
(Figure 3.15a), meaning that no broadening of the MOF-5 reflections or sharpening of the Ru
reflections is observed. The powder X-ray diffractogramm of the composite after calcinations
at 400 °C exhibits an increased background noise as well as a slight sharpening of the Ru
reflections, pointing at an already started decomposition of the host framework. Under inert
conditions, MOF-5 is however stable up to 450 °C.[3a] Calcination at 500 °C leads to complete
decomposition of MOF-5 to ZnO, assigned by the complete loss of the sharp MOF-5
reflections and the new reflections at 31.8°, 34.4°, 36.3°, 47.5°, 56.6°, 62.9°, 67.9° and
69.10°. Yet, even after calcination at 500 °C, almost no sharpening of the Ru reflection at
44.0° 2θ is observed compared to the original broad reflection shown in Figure 3.15a.
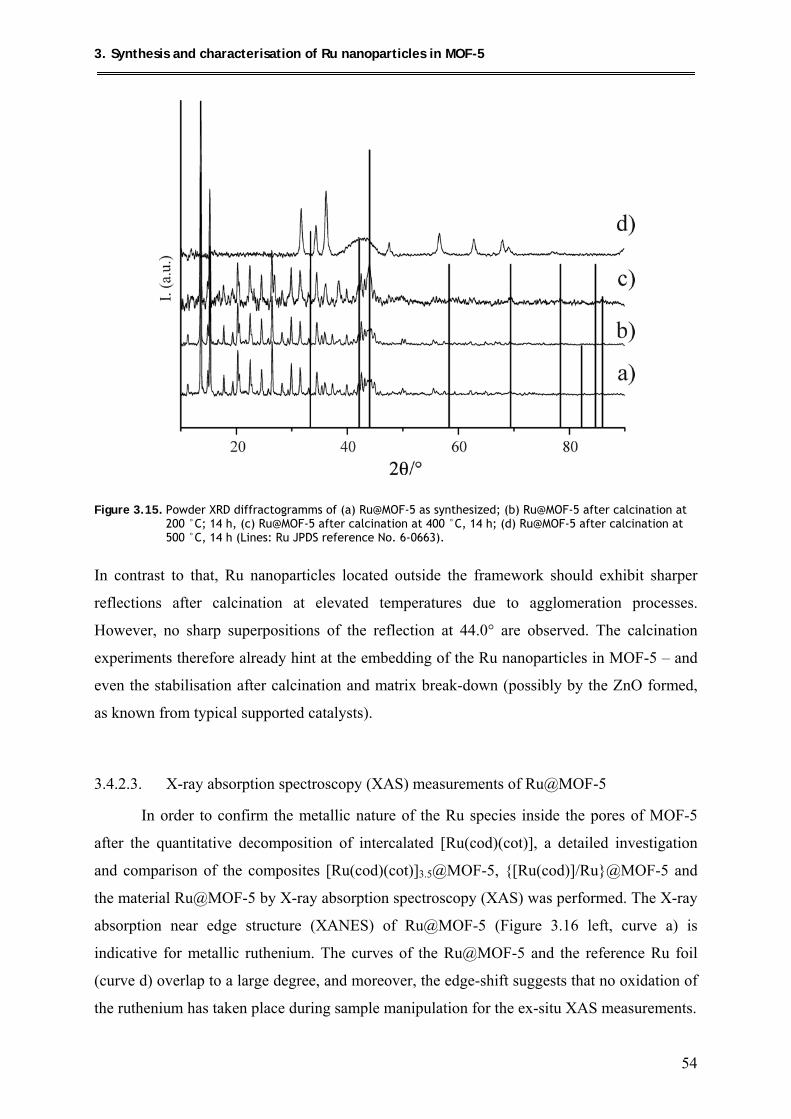
3. Synthesis and characterisation of Ru nanoparticles in MOF-5
54
Figure 3.15. Powder XRD diffractogramms of (a) Ru@MOF-5 as synthesized; (b) Ru@MOF-5 after calcination at 200 °C; 14 h, (c) Ru@MOF-5 after calcination at 400 °C, 14 h; (d) Ru@MOF-5 after calcination at 500 °C, 14 h (Lines: Ru JPDS reference No. 6-0663).
In contrast to that, Ru nanoparticles located outside the framework should exhibit sharper
reflections after calcination at elevated temperatures due to agglomeration processes.
However, no sharp superpositions of the reflection at 44.0° are observed. The calcination
experiments therefore already hint at the embedding of the Ru nanoparticles in MOF-5 – and
even the stabilisation after calcination and matrix break-down (possibly by the ZnO formed,
as known from typical supported catalysts).
3.4.2.3. X-ray absorption spectroscopy (XAS) measurements of Ru@MOF-5
In order to confirm the metallic nature of the Ru species inside the pores of MOF-5
after the quantitative decomposition of intercalated [Ru(cod)(cot)], a detailed investigation
and comparison of the composites [Ru(cod)(cot)]3.5@MOF-5, {[Ru(cod)]/Ru}@MOF-5 and
the material Ru@MOF-5 by X-ray absorption spectroscopy (XAS) was performed. The X-ray
absorption near edge structure (XANES) of Ru@MOF-5 (Figure 3.16 left, curve a) is
indicative for metallic ruthenium. The curves of the Ru@MOF-5 and the reference Ru foil
(curve d) overlap to a large degree, and moreover, the edge-shift suggests that no oxidation of
the ruthenium has taken place during sample manipulation for the ex-situ XAS measurements.
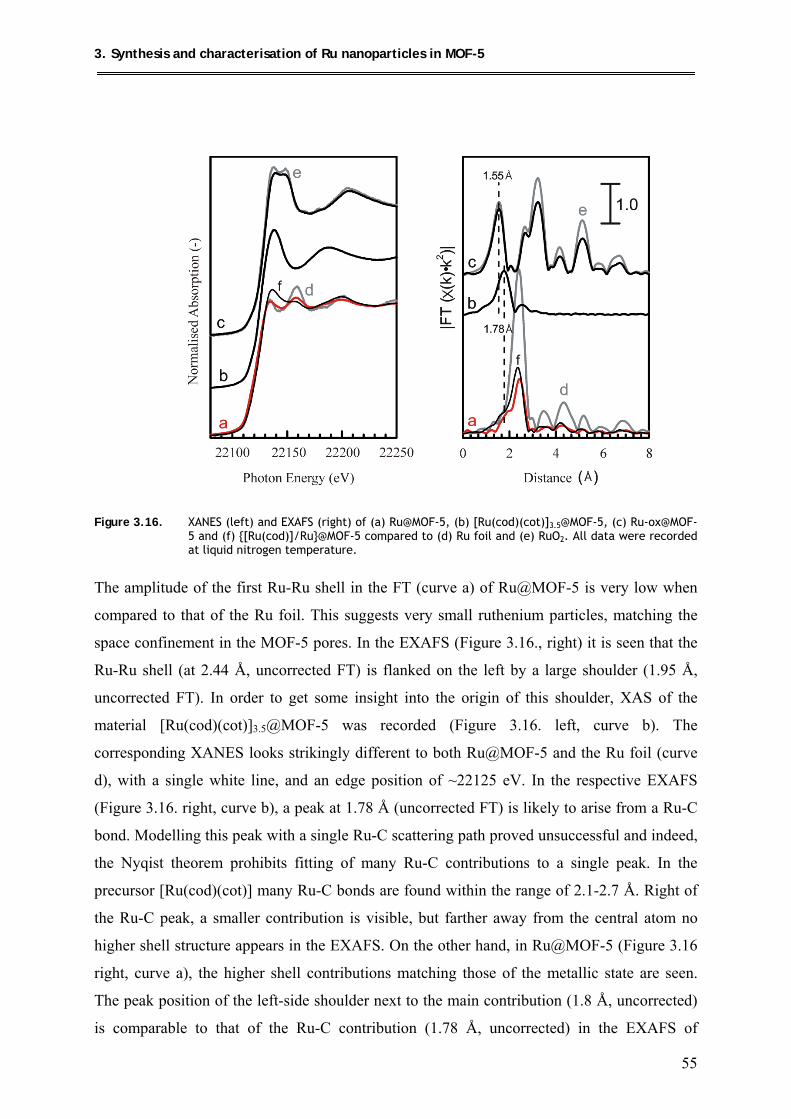
3. Synthesis and characterisation of Ru nanoparticles in MOF-5
55
Figure 3.16. XANES (left) and EXAFS (right) of (a) Ru@MOF-5, (b) [Ru(cod)(cot)]3.5@MOF-5, (c) Ru-ox@MOF-5 and (f) {[Ru(cod)]/Ru}@MOF-5 compared to (d) Ru foil and (e) RuO2. All data were recorded at liquid nitrogen temperature.
The amplitude of the first Ru-Ru shell in the FT (curve a) of Ru@MOF-5 is very low when
compared to that of the Ru foil. This suggests very small ruthenium particles, matching the
space confinement in the MOF-5 pores. In the EXAFS (Figure 3.16., right) it is seen that the
Ru-Ru shell (at 2.44 Å, uncorrected FT) is flanked on the left by a large shoulder (1.95 Å,
uncorrected FT). In order to get some insight into the origin of this shoulder, XAS of the
material [Ru(cod)(cot)]3.5@MOF-5 was recorded (Figure 3.16. left, curve b). The
corresponding XANES looks strikingly different to both Ru@MOF-5 and the Ru foil (curve
d), with a single white line, and an edge position of ~22125 eV. In the respective EXAFS
(Figure 3.16. right, curve b), a peak at 1.78 Å (uncorrected FT) is likely to arise from a Ru-C
bond. Modelling this peak with a single Ru-C scattering path proved unsuccessful and indeed,
the Nyqist theorem prohibits fitting of many Ru-C contributions to a single peak. In the
precursor [Ru(cod)(cot)] many Ru-C bonds are found within the range of 2.1-2.7 Å. Right of
the Ru-C peak, a smaller contribution is visible, but farther away from the central atom no
higher shell structure appears in the EXAFS. On the other hand, in Ru@MOF-5 (Figure 3.16
right, curve a), the higher shell contributions matching those of the metallic state are seen.
The peak position of the left-side shoulder next to the main contribution (1.8 Å, uncorrected)
is comparable to that of the Ru-C contribution (1.78 Å, uncorrected) in the EXAFS of
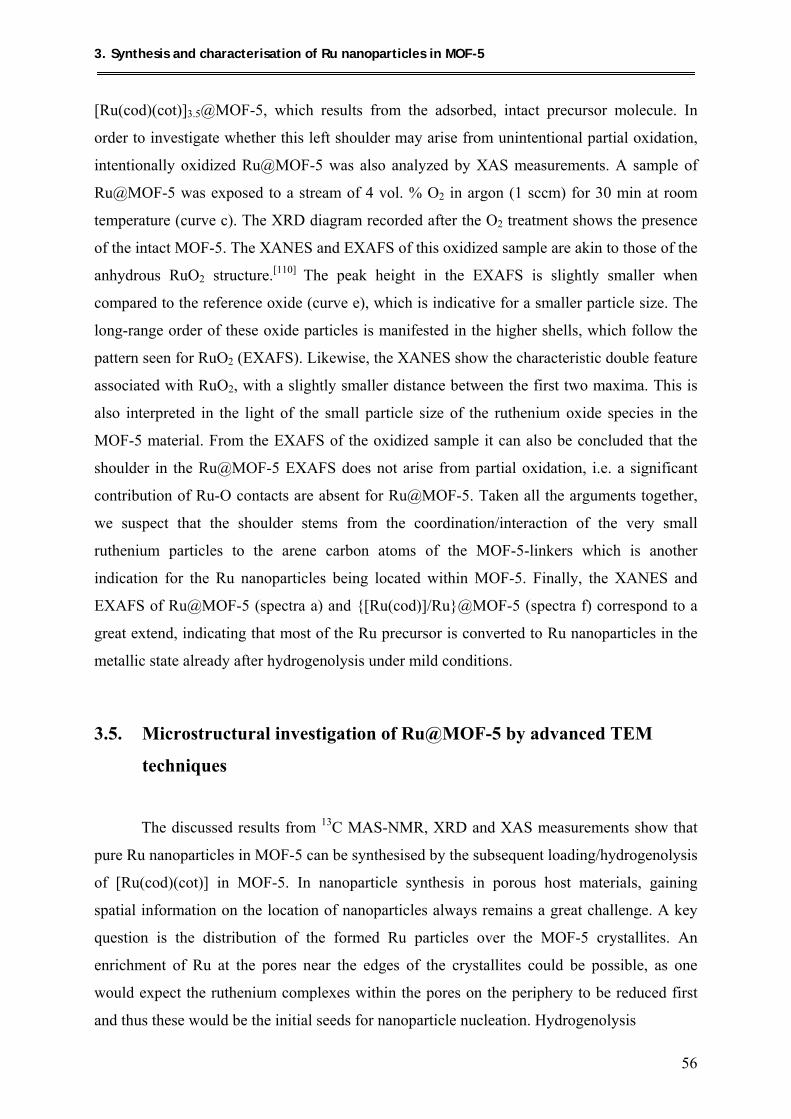
3. Synthesis and characterisation of Ru nanoparticles in MOF-5
56
[Ru(cod)(cot)]3.5@MOF-5, which results from the adsorbed, intact precursor molecule. In
order to investigate whether this left shoulder may arise from unintentional partial oxidation,
intentionally oxidized Ru@MOF-5 was also analyzed by XAS measurements. A sample of
Ru@MOF-5 was exposed to a stream of 4 vol. % O2 in argon (1 sccm) for 30 min at room
temperature (curve c). The XRD diagram recorded after the O2 treatment shows the presence
of the intact MOF-5. The XANES and EXAFS of this oxidized sample are akin to those of the
anhydrous RuO2 structure.[110] The peak height in the EXAFS is slightly smaller when
compared to the reference oxide (curve e), which is indicative for a smaller particle size. The
long-range order of these oxide particles is manifested in the higher shells, which follow the
pattern seen for RuO2 (EXAFS). Likewise, the XANES show the characteristic double feature
associated with RuO2, with a slightly smaller distance between the first two maxima. This is
also interpreted in the light of the small particle size of the ruthenium oxide species in the
MOF-5 material. From the EXAFS of the oxidized sample it can also be concluded that the
shoulder in the Ru@MOF-5 EXAFS does not arise from partial oxidation, i.e. a significant
contribution of Ru-O contacts are absent for Ru@MOF-5. Taken all the arguments together,
we suspect that the shoulder stems from the coordination/interaction of the very small
ruthenium particles to the arene carbon atoms of the MOF-5-linkers which is another
indication for the Ru nanoparticles being located within MOF-5. Finally, the XANES and
EXAFS of Ru@MOF-5 (spectra a) and {[Ru(cod)]/Ru}@MOF-5 (spectra f) correspond to a
great extend, indicating that most of the Ru precursor is converted to Ru nanoparticles in the
metallic state already after hydrogenolysis under mild conditions.
3.5. Microstructural investigation of Ru@MOF-5 by advanced TEM
techniques
The discussed results from 13C MAS-NMR, XRD and XAS measurements show that
pure Ru nanoparticles in MOF-5 can be synthesised by the subsequent loading/hydrogenolysis
of [Ru(cod)(cot)] in MOF-5. In nanoparticle synthesis in porous host materials, gaining
spatial information on the location of nanoparticles always remains a great challenge. A key
question is the distribution of the formed Ru particles over the MOF-5 crystallites. An
enrichment of Ru at the pores near the edges of the crystallites could be possible, as one
would expect the ruthenium complexes within the pores on the periphery to be reduced first
and thus these would be the initial seeds for nanoparticle nucleation. Hydrogenolysis
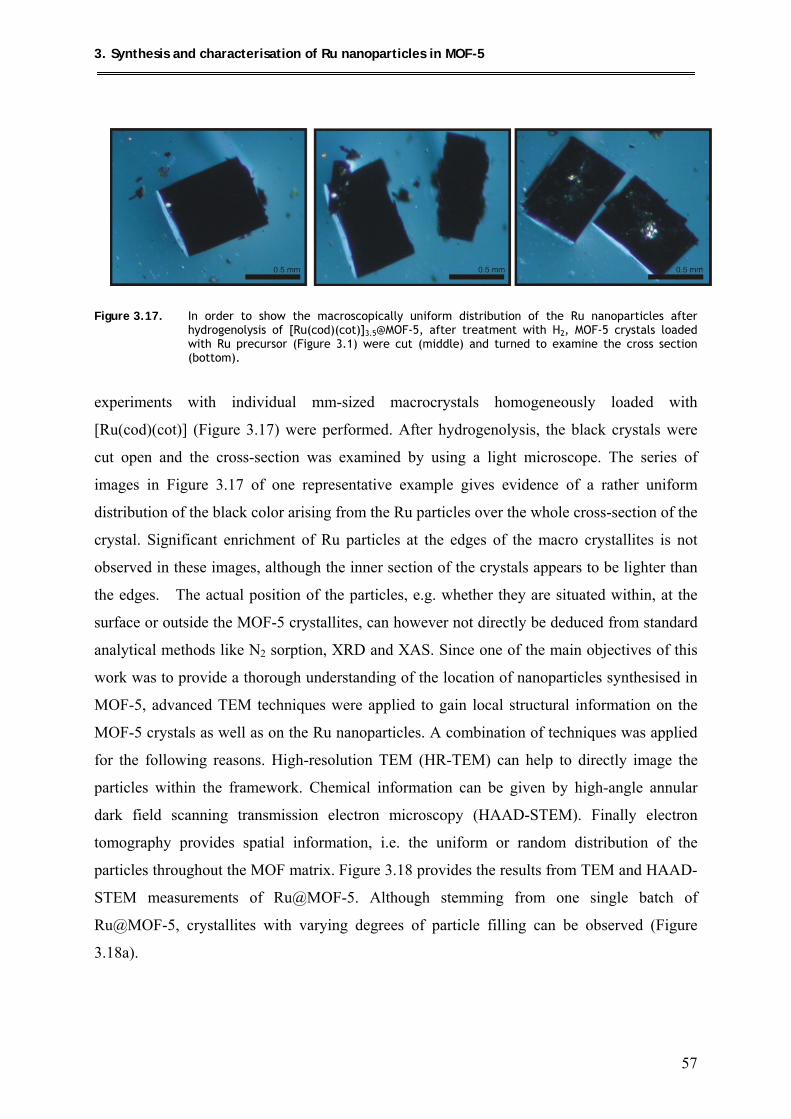
3. Synthesis and characterisation of Ru nanoparticles in MOF-5
57
Figure 3.17. In order to show the macroscopically uniform distribution of the Ru nanoparticles after
hydrogenolysis of [Ru(cod)(cot)]3.5@MOF-5, after treatment with H2, MOF-5 crystals loaded with Ru precursor (Figure 3.1) were cut (middle) and turned to examine the cross section (bottom).
experiments with individual mm-sized macrocrystals homogeneously loaded with
[Ru(cod)(cot)] (Figure 3.17) were performed. After hydrogenolysis, the black crystals were
cut open and the cross-section was examined by using a light microscope. The series of
images in Figure 3.17 of one representative example gives evidence of a rather uniform
distribution of the black color arising from the Ru particles over the whole cross-section of the
crystal. Significant enrichment of Ru particles at the edges of the macro crystallites is not
observed in these images, although the inner section of the crystals appears to be lighter than
the edges. The actual position of the particles, e.g. whether they are situated within, at the
surface or outside the MOF-5 crystallites, can however not directly be deduced from standard
analytical methods like N2 sorption, XRD and XAS. Since one of the main objectives of this
work was to provide a thorough understanding of the location of nanoparticles synthesised in
MOF-5, advanced TEM techniques were applied to gain local structural information on the
MOF-5 crystals as well as on the Ru nanoparticles. A combination of techniques was applied
for the following reasons. High-resolution TEM (HR-TEM) can help to directly image the
particles within the framework. Chemical information can be given by high-angle annular
dark field scanning transmission electron microscopy (HAAD-STEM). Finally electron
tomography provides spatial information, i.e. the uniform or random distribution of the
particles throughout the MOF matrix. Figure 3.18 provides the results from TEM and HAAD-
STEM measurements of Ru@MOF-5. Although stemming from one single batch of
Ru@MOF-5, crystallites with varying degrees of particle filling can be observed (Figure
3.18a).
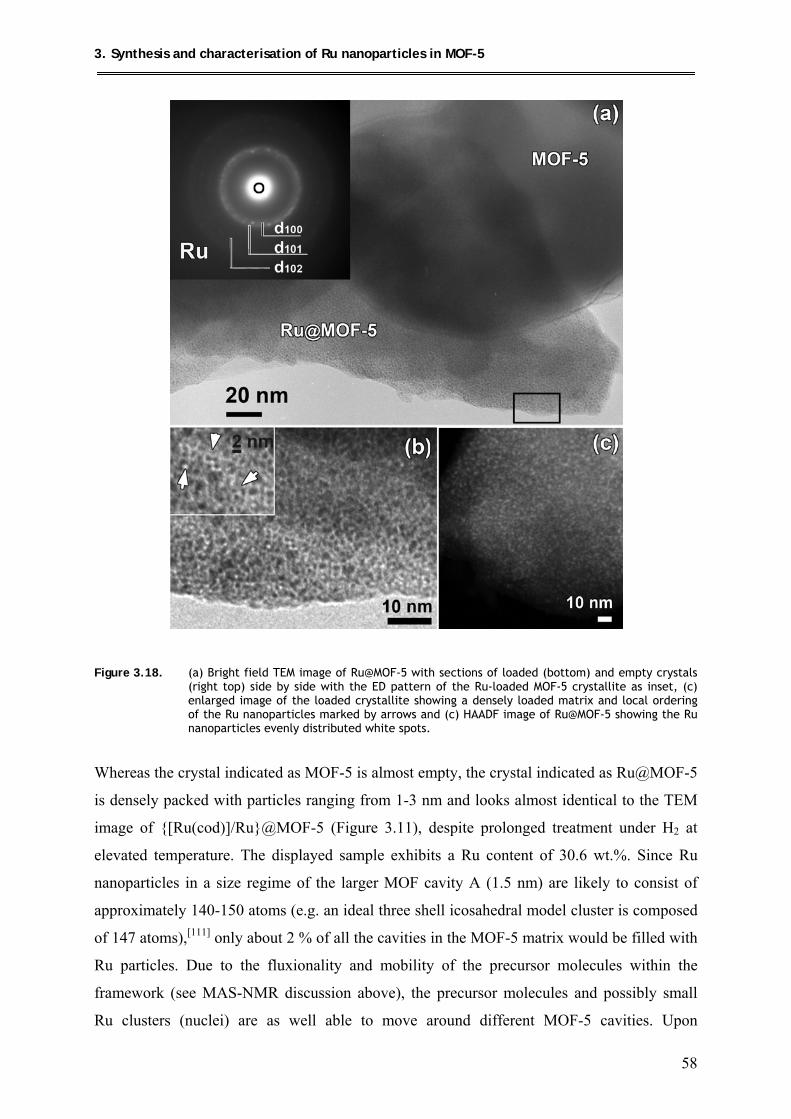
3. Synthesis and characterisation of Ru nanoparticles in MOF-5
58
Figure 3.18. (a) Bright field TEM image of Ru@MOF-5 with sections of loaded (bottom) and empty crystals (right top) side by side with the ED pattern of the Ru-loaded MOF-5 crystallite as inset, (c) enlarged image of the loaded crystallite showing a densely loaded matrix and local ordering of the Ru nanoparticles marked by arrows and (c) HAADF image of Ru@MOF-5 showing the Ru nanoparticles evenly distributed white spots.
Whereas the crystal indicated as MOF-5 is almost empty, the crystal indicated as Ru@MOF-5
is densely packed with particles ranging from 1-3 nm and looks almost identical to the TEM
image of {[Ru(cod)]/Ru}@MOF-5 (Figure 3.11), despite prolonged treatment under H2 at
elevated temperature. The displayed sample exhibits a Ru content of 30.6 wt.%. Since Ru
nanoparticles in a size regime of the larger MOF cavity A (1.5 nm) are likely to consist of
approximately 140-150 atoms (e.g. an ideal three shell icosahedral model cluster is composed
of 147 atoms),[111] only about 2 % of all the cavities in the MOF-5 matrix would be filled with
Ru particles. Due to the fluxionality and mobility of the precursor molecules within the
framework (see MAS-NMR discussion above), the precursor molecules and possibly small
Ru clusters (nuclei) are as well able to move around different MOF-5 cavities. Upon
3. Synthesis and characterisation of Ru nanoparticles in MOF-5
59
hydrogenolysis of [Ru(cod)(cot)] “liberated” Ru atoms from different molecules will fuse to
nanoparticles, leaving some MOF cavities empty. This was also verified by the low angle
PXRD of Ru@MOF-5 (see Figure 3.14). The inset electron diffraction pattern in Figure 3.18
was taken from the densely filled crystal and evidences crystalline Ru nanoparticles adopting
the hexagonal structure of bulk ruthenium (P63/mmc, space group 164, with lattice parameters
a = b = 2.7 Å and c = 4.3 Å). Figure 3.18b presents an enlargement of Figure 3.18a. The
closely packed particles appear in many cases to adopt some degree of cubic ordering
resulting from the cubically arranged pore structure of the host matrix MOF-5. This short-
range ordering, indicated by arrows (Figure 3.18b), stretches only 4-5 particles since not all
pores of the framework are filled. The local arrangement of the particles is however a strong
indication that the particles are located within the framework. The HAADF-STEM image of a
similar loaded MOF-5 crystallite is shown in Figure 3.18c. The contrast in this type of image
depends on both the thickness and the atomic number Z, and therefore contains chemical
information. The heavier Ru nanoparticles appear as bright white dots evenly distributed
within the darker MOF-5 framework. Although the TEM images were taken at low electron
beam dosage, the ordering of the metal organic framework is very difficult to record and
visualize. Reflections from electron diffraction of MOF-5 itself were not observed,
presumably due to degradation of the material in the electron beam.[112] So far, only for the
chromium terephthalate based porous framework MIL-101, the pore structure was directly
imaged and an electron diffraction pattern of the matrix could be measured.[112]
A set of HRTEM images of Ru@MOF-5 is given in Figure 3.19. In Figure 3.19a Ru
nanoparticles in a size range of 1-3 nm can be observed, whereas the MOF-5 matrix is mainly
by the electron beam of the high resolution measurement. The particles are monocrystalline
ruthenium, with lattice fringes in agreement with the hexagonal Ru structure. Figure 3.19b
displays a MOF-5 crystallite region with smaller particles (> 2 nm). Less lattice fringes are
visible as charging of the sample occurs due to the small size of the particles, distorting the
HRTEM image. For Ru nanoparticles embedded in MOF-5, a particle size of 1.1-1.5 nm
corresponding to the MOF-5 pore diameters[4] is expected. For metal nanoparticles embedded
in zeolites, it is known that the particle sizes can exceed the sizes of the zeolitic cages. It was
found, that the porous zeolitic structure is locally distorted by the imbedded particles but the
particles remain situated inside the porous structure.[113] It is reasonable to assume, that this is
also the case for larger Ru nanoparticles of about 3 nm inside MOF-5.
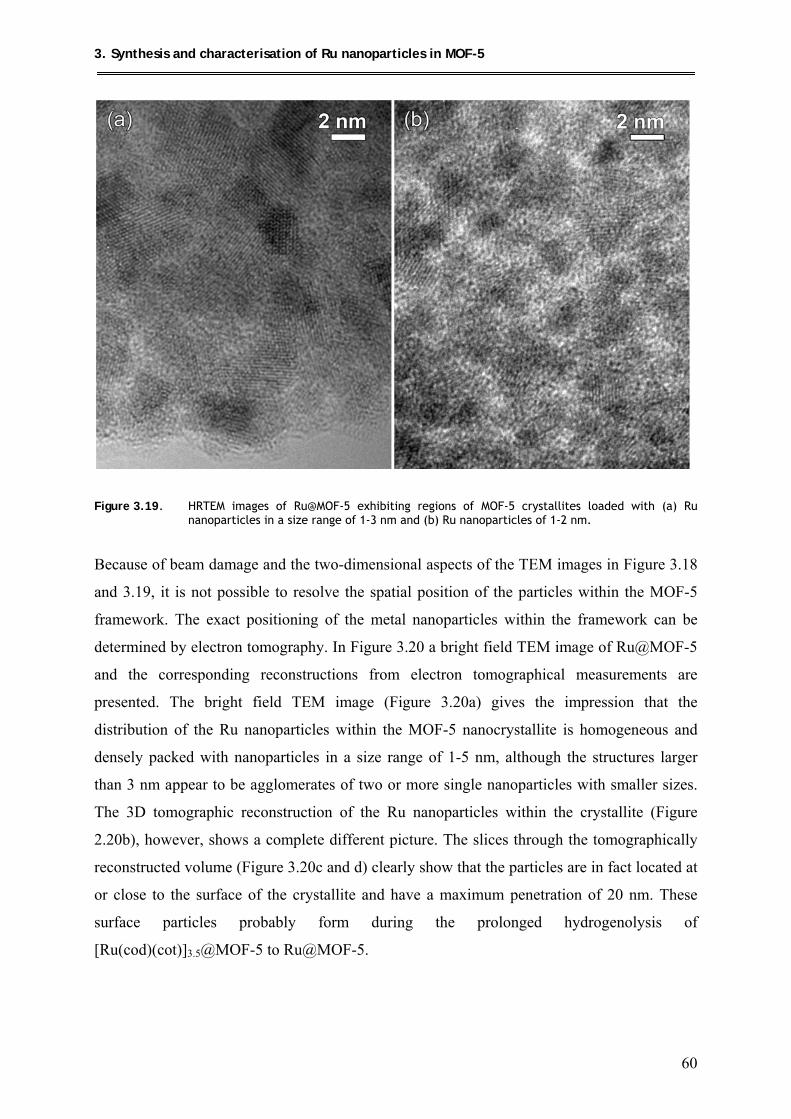
3. Synthesis and characterisation of Ru nanoparticles in MOF-5
60
Figure 3.19. HRTEM images of Ru@MOF-5 exhibiting regions of MOF-5 crystallites loaded with (a) Ru nanoparticles in a size range of 1-3 nm and (b) Ru nanoparticles of 1-2 nm.
Because of beam damage and the two-dimensional aspects of the TEM images in Figure 3.18
and 3.19, it is not possible to resolve the spatial position of the particles within the MOF-5
framework. The exact positioning of the metal nanoparticles within the framework can be
determined by electron tomography. In Figure 3.20 a bright field TEM image of Ru@MOF-5
and the corresponding reconstructions from electron tomographical measurements are
presented. The bright field TEM image (Figure 3.20a) gives the impression that the
distribution of the Ru nanoparticles within the MOF-5 nanocrystallite is homogeneous and
densely packed with nanoparticles in a size range of 1-5 nm, although the structures larger
than 3 nm appear to be agglomerates of two or more single nanoparticles with smaller sizes.
The 3D tomographic reconstruction of the Ru nanoparticles within the crystallite (Figure
2.20b), however, shows a complete different picture. The slices through the tomographically
reconstructed volume (Figure 3.20c and d) clearly show that the particles are in fact located at
or close to the surface of the crystallite and have a maximum penetration of 20 nm. These
surface particles probably form during the prolonged hydrogenolysis of
[Ru(cod)(cot)]3.5@MOF-5 to Ru@MOF-5.
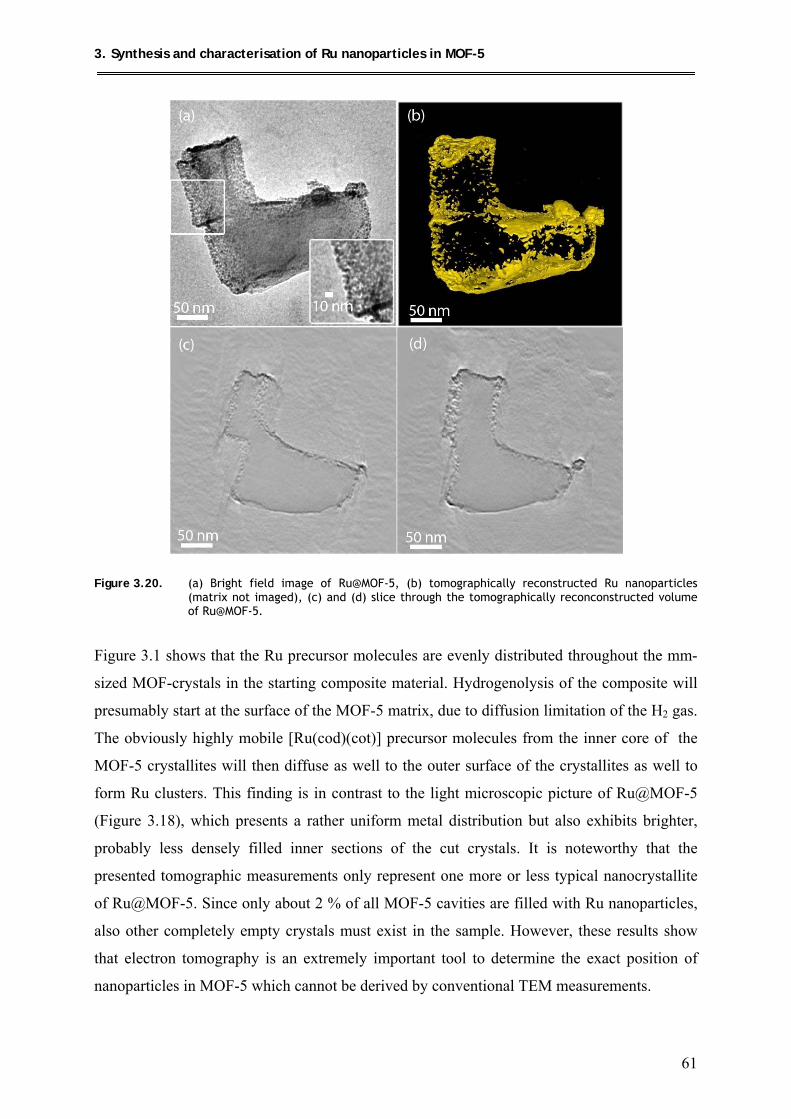
3. Synthesis and characterisation of Ru nanoparticles in MOF-5
61
Figure 3.20. (a) Bright field image of Ru@MOF-5, (b) tomographically reconstructed Ru nanoparticles
(matrix not imaged), (c) and (d) slice through the tomographically reconconstructed volume of Ru@MOF-5.
Figure 3.1 shows that the Ru precursor molecules are evenly distributed throughout the mm-
sized MOF-crystals in the starting composite material. Hydrogenolysis of the composite will
presumably start at the surface of the MOF-5 matrix, due to diffusion limitation of the H2 gas.
The obviously highly mobile [Ru(cod)(cot)] precursor molecules from the inner core of the
MOF-5 crystallites will then diffuse as well to the outer surface of the crystallites as well to
form Ru clusters. This finding is in contrast to the light microscopic picture of Ru@MOF-5
(Figure 3.18), which presents a rather uniform metal distribution but also exhibits brighter,
probably less densely filled inner sections of the cut crystals. It is noteworthy that the
presented tomographic measurements only represent one more or less typical nanocrystallite
of Ru@MOF-5. Since only about 2 % of all MOF-5 cavities are filled with Ru nanoparticles,
also other completely empty crystals must exist in the sample. However, these results show
that electron tomography is an extremely important tool to determine the exact position of
nanoparticles in MOF-5 which cannot be derived by conventional TEM measurements.
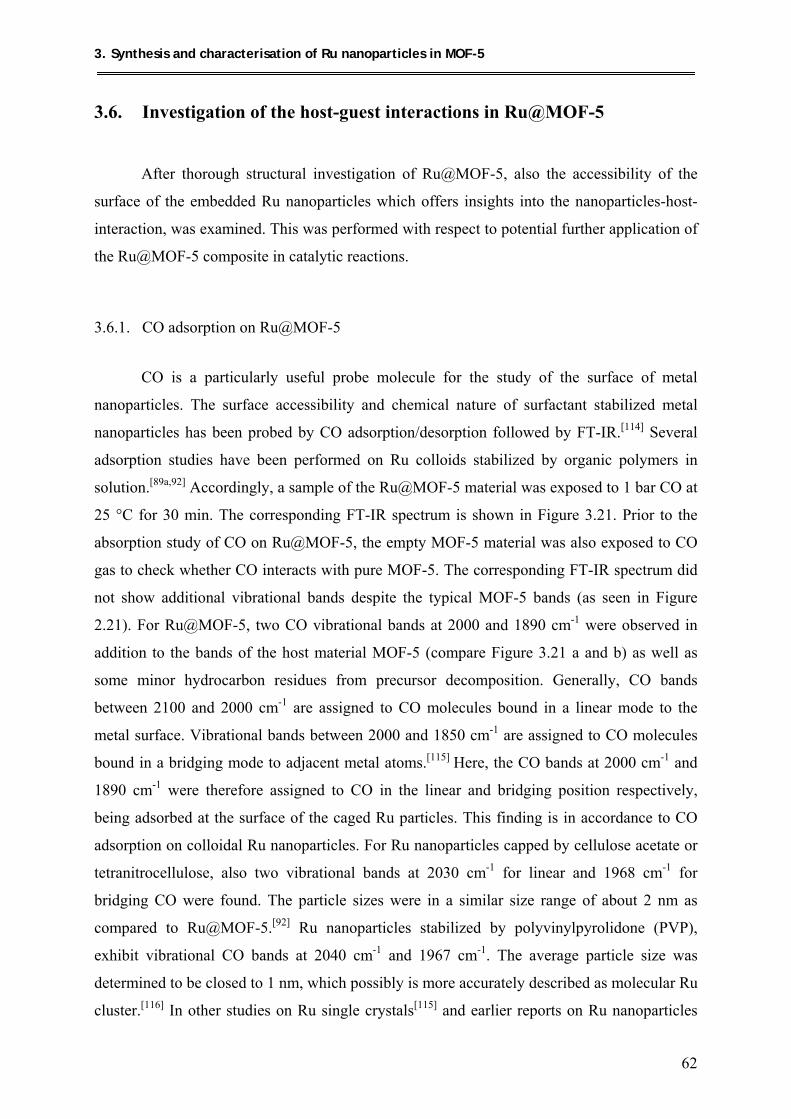
3. Synthesis and characterisation of Ru nanoparticles in MOF-5
62
3.6. Investigation of the host-guest interactions in Ru@MOF-5
After thorough structural investigation of Ru@MOF-5, also the accessibility of the
surface of the embedded Ru nanoparticles which offers insights into the nanoparticles-host-
interaction, was examined. This was performed with respect to potential further application of
the Ru@MOF-5 composite in catalytic reactions.
3.6.1. CO adsorption on Ru@MOF-5
CO is a particularly useful probe molecule for the study of the surface of metal
nanoparticles. The surface accessibility and chemical nature of surfactant stabilized metal
nanoparticles has been probed by CO adsorption/desorption followed by FT-IR.[114] Several
adsorption studies have been performed on Ru colloids stabilized by organic polymers in
solution.[89a,92] Accordingly, a sample of the Ru@MOF-5 material was exposed to 1 bar CO at
25 °C for 30 min. The corresponding FT-IR spectrum is shown in Figure 3.21. Prior to the
absorption study of CO on Ru@MOF-5, the empty MOF-5 material was also exposed to CO
gas to check whether CO interacts with pure MOF-5. The corresponding FT-IR spectrum did
not show additional vibrational bands despite the typical MOF-5 bands (as seen in Figure
2.21). For Ru@MOF-5, two CO vibrational bands at 2000 and 1890 cm-1 were observed in
addition to the bands of the host material MOF-5 (compare Figure 3.21 a and b) as well as
some minor hydrocarbon residues from precursor decomposition. Generally, CO bands
between 2100 and 2000 cm-1 are assigned to CO molecules bound in a linear mode to the
metal surface. Vibrational bands between 2000 and 1850 cm-1 are assigned to CO molecules
bound in a bridging mode to adjacent metal atoms.[115] Here, the CO bands at 2000 cm-1 and
1890 cm-1 were therefore assigned to CO in the linear and bridging position respectively,
being adsorbed at the surface of the caged Ru particles. This finding is in accordance to CO
adsorption on colloidal Ru nanoparticles. For Ru nanoparticles capped by cellulose acetate or
tetranitrocellulose, also two vibrational bands at 2030 cm-1 for linear and 1968 cm-1 for
bridging CO were found. The particle sizes were in a similar size range of about 2 nm as
compared to Ru@MOF-5.[92] Ru nanoparticles stabilized by polyvinylpyrolidone (PVP),
exhibit vibrational CO bands at 2040 cm-1 and 1967 cm-1. The average particle size was
determined to be closed to 1 nm, which possibly is more accurately described as molecular Ru
cluster.[116] In other studies on Ru single crystals[115] and earlier reports on Ru nanoparticles
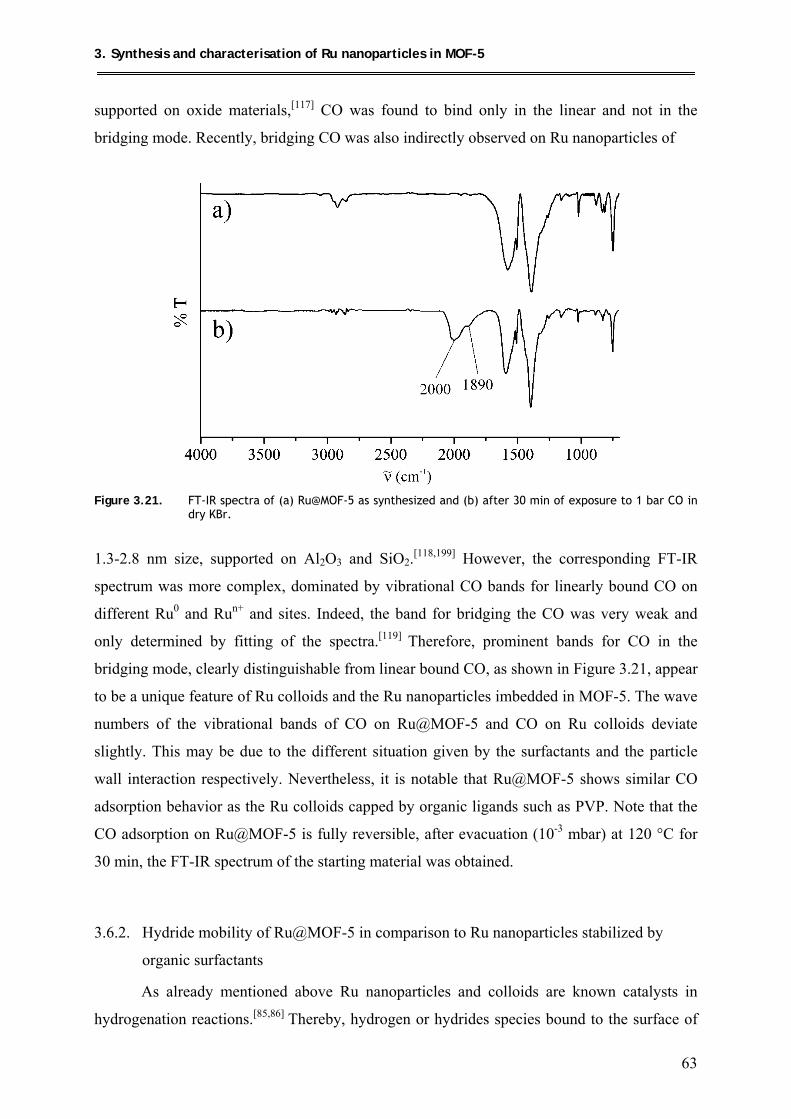
3. Synthesis and characterisation of Ru nanoparticles in MOF-5
63
supported on oxide materials,[117] CO was found to bind only in the linear and not in the
bridging mode. Recently, bridging CO was also indirectly observed on Ru nanoparticles of
Figure 3.21. FT-IR spectra of (a) Ru@MOF-5 as synthesized and (b) after 30 min of exposure to 1 bar CO in
dry KBr.
1.3-2.8 nm size, supported on Al2O3 and SiO2.[118,199] However, the corresponding FT-IR
spectrum was more complex, dominated by vibrational CO bands for linearly bound CO on
different Ru0 and Run+ and sites. Indeed, the band for bridging the CO was very weak and
only determined by fitting of the spectra.[119] Therefore, prominent bands for CO in the
bridging mode, clearly distinguishable from linear bound CO, as shown in Figure 3.21, appear
to be a unique feature of Ru colloids and the Ru nanoparticles imbedded in MOF-5. The wave
numbers of the vibrational bands of CO on Ru@MOF-5 and CO on Ru colloids deviate
slightly. This may be due to the different situation given by the surfactants and the particle
wall interaction respectively. Nevertheless, it is notable that Ru@MOF-5 shows similar CO
adsorption behavior as the Ru colloids capped by organic ligands such as PVP. Note that the
CO adsorption on Ru@MOF-5 is fully reversible, after evacuation (10-3 mbar) at 120 °C for
30 min, the FT-IR spectrum of the starting material was obtained.
3.6.2. Hydride mobility of Ru@MOF-5 in comparison to Ru nanoparticles stabilized by
organic surfactants
As already mentioned above Ru nanoparticles and colloids are known catalysts in
hydrogenation reactions.[85,86] Thereby, hydrogen or hydrides species bound to the surface of
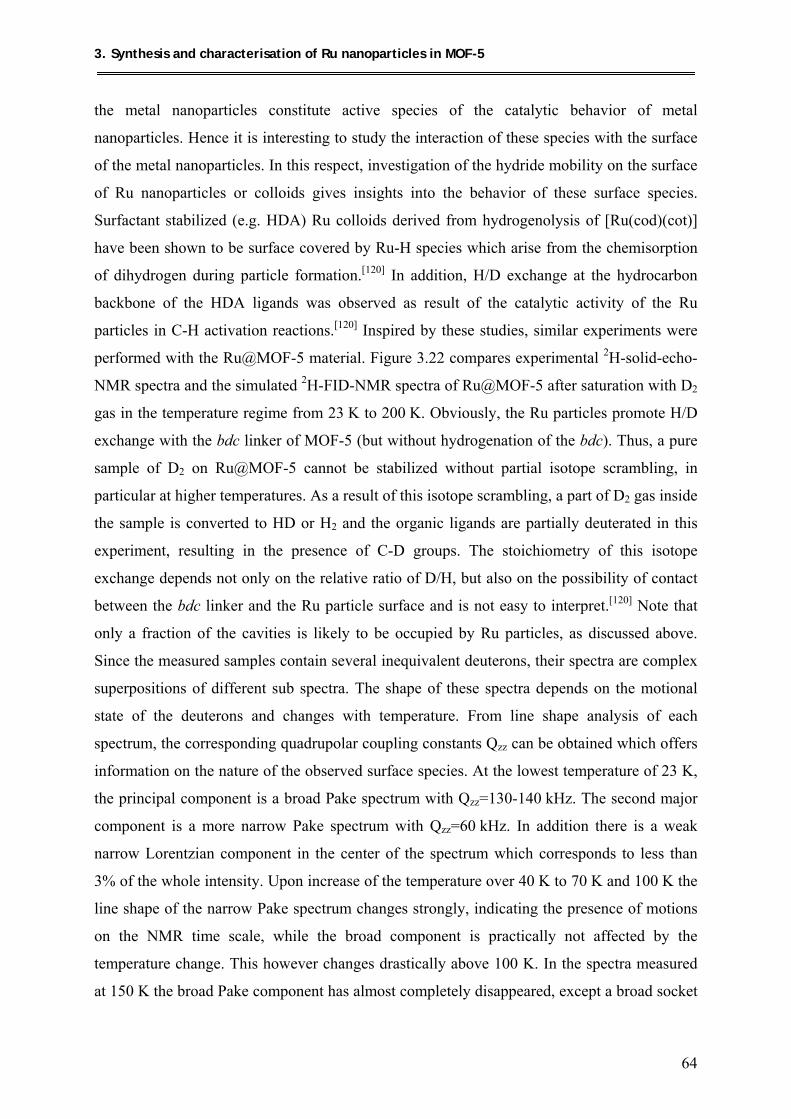
3. Synthesis and characterisation of Ru nanoparticles in MOF-5
64
the metal nanoparticles constitute active species of the catalytic behavior of metal
nanoparticles. Hence it is interesting to study the interaction of these species with the surface
of the metal nanoparticles. In this respect, investigation of the hydride mobility on the surface
of Ru nanoparticles or colloids gives insights into the behavior of these surface species.
Surfactant stabilized (e.g. HDA) Ru colloids derived from hydrogenolysis of [Ru(cod)(cot)]
have been shown to be surface covered by Ru-H species which arise from the chemisorption
of dihydrogen during particle formation.[120] In addition, H/D exchange at the hydrocarbon
backbone of the HDA ligands was observed as result of the catalytic activity of the Ru
particles in C-H activation reactions.[120] Inspired by these studies, similar experiments were
performed with the Ru@MOF-5 material. Figure 3.22 compares experimental 2H-solid-echo-
NMR spectra and the simulated 2H-FID-NMR spectra of Ru@MOF-5 after saturation with D2
gas in the temperature regime from 23 K to 200 K. Obviously, the Ru particles promote H/D
exchange with the bdc linker of MOF-5 (but without hydrogenation of the bdc). Thus, a pure
sample of D2 on Ru@MOF-5 cannot be stabilized without partial isotope scrambling, in
particular at higher temperatures. As a result of this isotope scrambling, a part of D2 gas inside
the sample is converted to HD or H2 and the organic ligands are partially deuterated in this
experiment, resulting in the presence of C-D groups. The stoichiometry of this isotope
exchange depends not only on the relative ratio of D/H, but also on the possibility of contact
between the bdc linker and the Ru particle surface and is not easy to interpret.[120] Note that
only a fraction of the cavities is likely to be occupied by Ru particles, as discussed above.
Since the measured samples contain several inequivalent deuterons, their spectra are complex
superpositions of different sub spectra. The shape of these spectra depends on the motional
state of the deuterons and changes with temperature. From line shape analysis of each
spectrum, the corresponding quadrupolar coupling constants Qzz can be obtained which offers
information on the nature of the observed surface species. At the lowest temperature of 23 K,
the principal component is a broad Pake spectrum with Qzz=130-140 kHz. The second major
component is a more narrow Pake spectrum with Qzz=60 kHz. In addition there is a weak
narrow Lorentzian component in the center of the spectrum which corresponds to less than
3% of the whole intensity. Upon increase of the temperature over 40 K to 70 K and 100 K the
line shape of the narrow Pake spectrum changes strongly, indicating the presence of motions
on the NMR time scale, while the broad component is practically not affected by the
temperature change. This however changes drastically above 100 K. In the spectra measured
at 150 K the broad Pake component has almost completely disappeared, except a broad socket
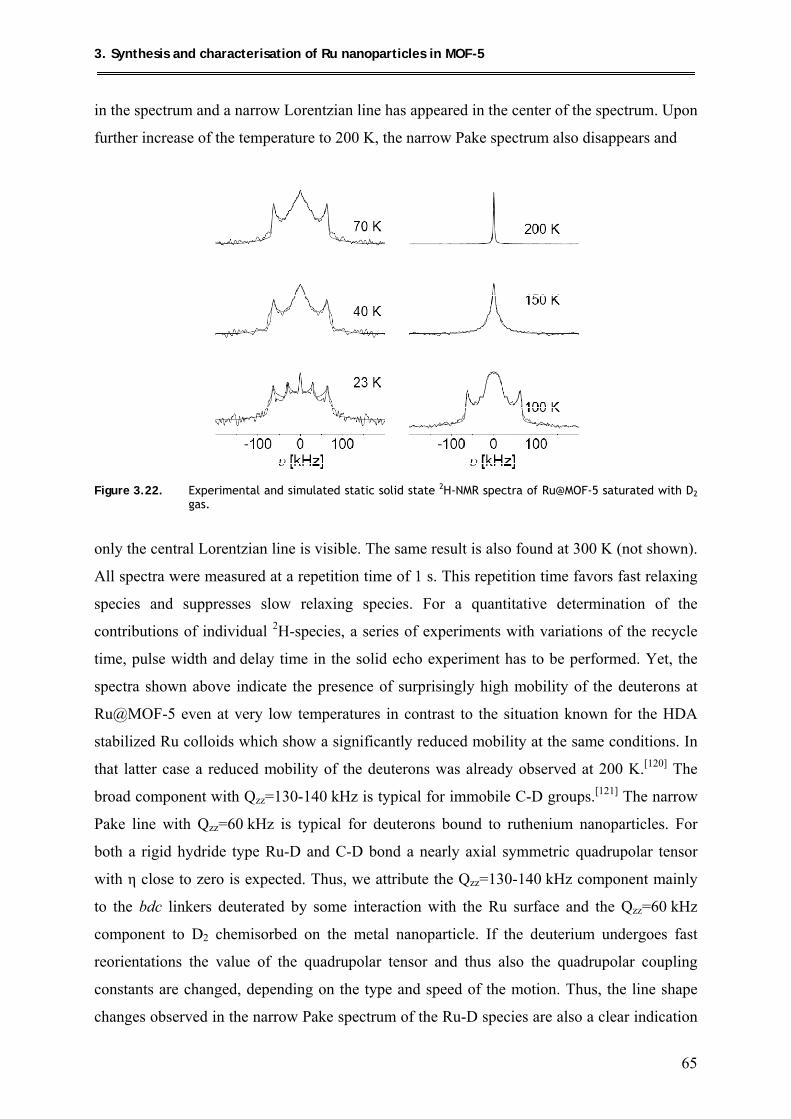
3. Synthesis and characterisation of Ru nanoparticles in MOF-5
65
in the spectrum and a narrow Lorentzian line has appeared in the center of the spectrum. Upon
further increase of the temperature to 200 K, the narrow Pake spectrum also disappears and
Figure 3.22. Experimental and simulated static solid state 2H-NMR spectra of Ru@MOF-5 saturated with D2
gas.
only the central Lorentzian line is visible. The same result is also found at 300 K (not shown).
All spectra were measured at a repetition time of 1 s. This repetition time favors fast relaxing
species and suppresses slow relaxing species. For a quantitative determination of the
contributions of individual 2H-species, a series of experiments with variations of the recycle
time, pulse width and delay time in the solid echo experiment has to be performed. Yet, the
spectra shown above indicate the presence of surprisingly high mobility of the deuterons at
Ru@MOF-5 even at very low temperatures in contrast to the situation known for the HDA
stabilized Ru colloids which show a significantly reduced mobility at the same conditions. In
that latter case a reduced mobility of the deuterons was already observed at 200 K.[120] The
broad component with Qzz=130-140 kHz is typical for immobile C-D groups.[121] The narrow
Pake line with Qzz=60 kHz is typical for deuterons bound to ruthenium nanoparticles. For
both a rigid hydride type Ru-D and C-D bond a nearly axial symmetric quadrupolar tensor
with η close to zero is expected. Thus, we attribute the Qzz=130-140 kHz component mainly
to the bdc linkers deuterated by some interaction with the Ru surface and the Qzz=60 kHz
component to D2 chemisorbed on the metal nanoparticle. If the deuterium undergoes fast
reorientations the value of the quadrupolar tensor and thus also the quadrupolar coupling
constants are changed, depending on the type and speed of the motion. Thus, the line shape
changes observed in the narrow Pake spectrum of the Ru-D species are also a clear indication
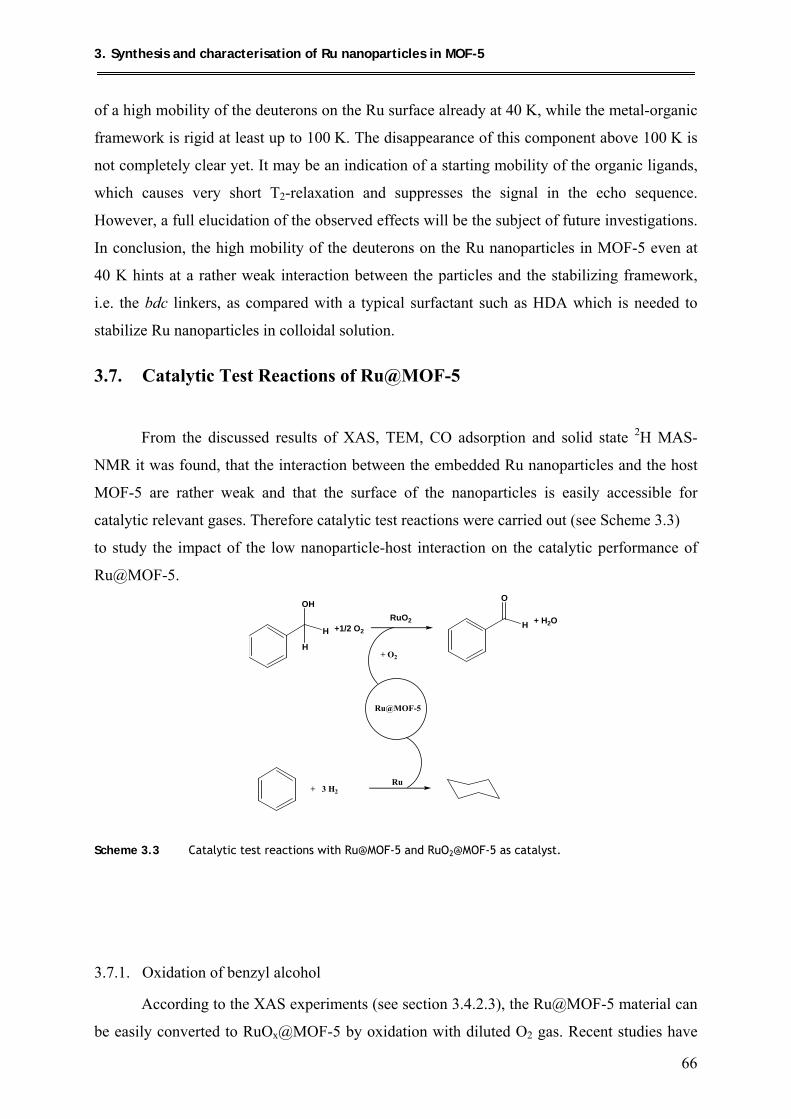
3. Synthesis and characterisation of Ru nanoparticles in MOF-5
66
of a high mobility of the deuterons on the Ru surface already at 40 K, while the metal-organic
framework is rigid at least up to 100 K. The disappearance of this component above 100 K is
not completely clear yet. It may be an indication of a starting mobility of the organic ligands,
which causes very short T2-relaxation and suppresses the signal in the echo sequence.
However, a full elucidation of the observed effects will be the subject of future investigations.
In conclusion, the high mobility of the deuterons on the Ru nanoparticles in MOF-5 even at
40 K hints at a rather weak interaction between the particles and the stabilizing framework,
i.e. the bdc linkers, as compared with a typical surfactant such as HDA which is needed to
stabilize Ru nanoparticles in colloidal solution.
3.7. Catalytic Test Reactions of Ru@MOF-5
From the discussed results of XAS, TEM, CO adsorption and solid state 2H MAS-
NMR it was found, that the interaction between the embedded Ru nanoparticles and the host
MOF-5 are rather weak and that the surface of the nanoparticles is easily accessible for
catalytic relevant gases. Therefore catalytic test reactions were carried out (see Scheme 3.3)
to study the impact of the low nanoparticle-host interaction on the catalytic performance of
Ru@MOF-5.
OH
H
H
O
HRuO2
+1/2 O2+ H2O
Ru@MOF-5
+ O2
+ 3 H2Ru
Scheme 3.3 Catalytic test reactions with Ru@MOF-5 and RuO2@MOF-5 as catalyst.
3.7.1. Oxidation of benzyl alcohol
According to the XAS experiments (see section 3.4.2.3), the Ru@MOF-5 material can
be easily converted to RuOx@MOF-5 by oxidation with diluted O2 gas. Recent studies have
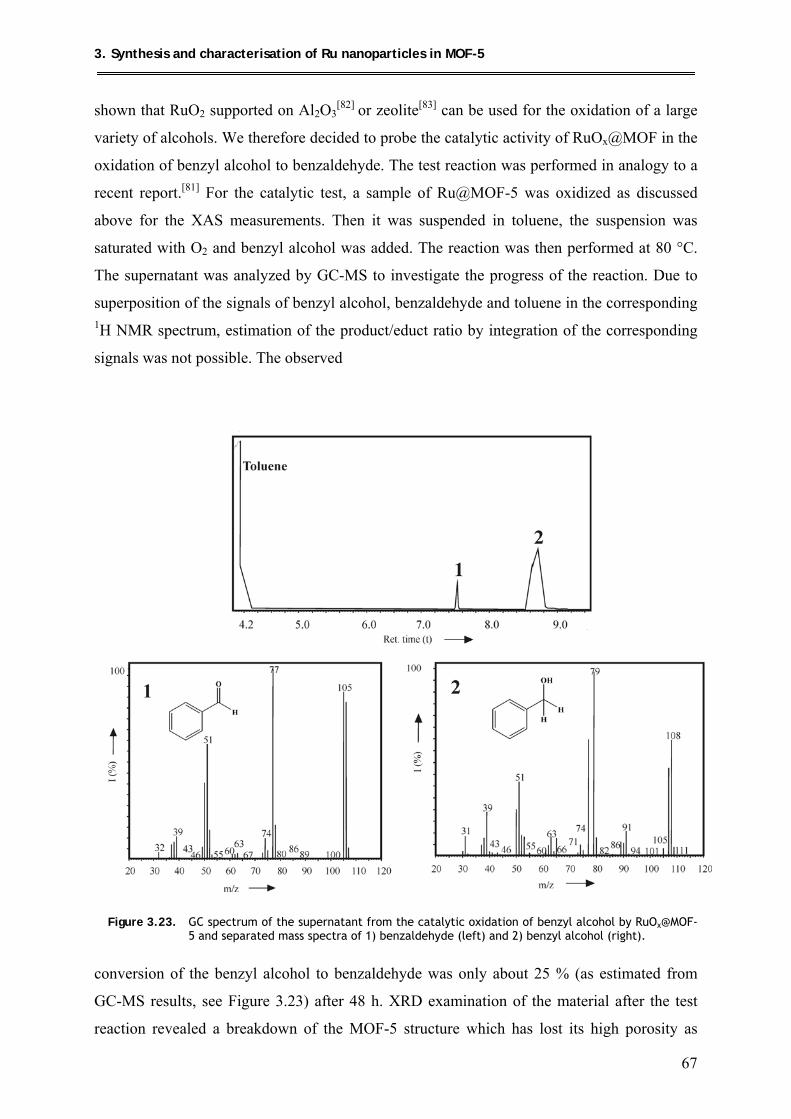
3. Synthesis and characterisation of Ru nanoparticles in MOF-5
67
shown that RuO2 supported on Al2O3[82] or zeolite[83] can be used for the oxidation of a large
variety of alcohols. We therefore decided to probe the catalytic activity of RuOx@MOF in the
oxidation of benzyl alcohol to benzaldehyde. The test reaction was performed in analogy to a
recent report.[81] For the catalytic test, a sample of Ru@MOF-5 was oxidized as discussed
above for the XAS measurements. Then it was suspended in toluene, the suspension was
saturated with O2 and benzyl alcohol was added. The reaction was then performed at 80 °C.
The supernatant was analyzed by GC-MS to investigate the progress of the reaction. Due to
superposition of the signals of benzyl alcohol, benzaldehyde and toluene in the corresponding 1H NMR spectrum, estimation of the product/educt ratio by integration of the corresponding
signals was not possible. The observed
Figure 3.23. GC spectrum of the supernatant from the catalytic oxidation of benzyl alcohol by RuOx@MOF-
5 and separated mass spectra of 1) benzaldehyde (left) and 2) benzyl alcohol (right).
conversion of the benzyl alcohol to benzaldehyde was only about 25 % (as estimated from
GC-MS results, see Figure 3.23) after 48 h. XRD examination of the material after the test
reaction revealed a breakdown of the MOF-5 structure which has lost its high porosity as
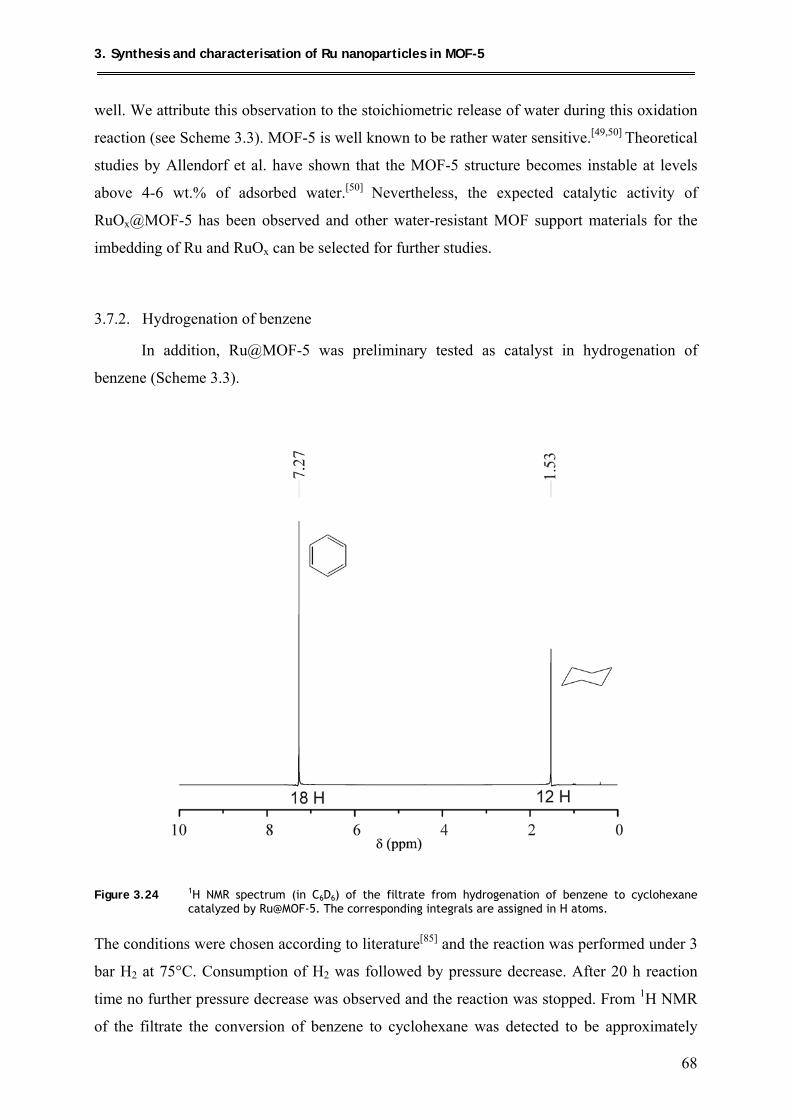
3. Synthesis and characterisation of Ru nanoparticles in MOF-5
68
well. We attribute this observation to the stoichiometric release of water during this oxidation
reaction (see Scheme 3.3). MOF-5 is well known to be rather water sensitive.[49,50] Theoretical
studies by Allendorf et al. have shown that the MOF-5 structure becomes instable at levels
above 4-6 wt.% of adsorbed water.[50] Nevertheless, the expected catalytic activity of
RuOx@MOF-5 has been observed and other water-resistant MOF support materials for the
imbedding of Ru and RuOx can be selected for further studies.
3.7.2. Hydrogenation of benzene
In addition, Ru@MOF-5 was preliminary tested as catalyst in hydrogenation of
benzene (Scheme 3.3).
Figure 3.24 1H NMR spectrum (in C6D6) of the filtrate from hydrogenation of benzene to cyclohexane
catalyzed by Ru@MOF-5. The corresponding integrals are assigned in H atoms. The conditions were chosen according to literature[85] and the reaction was performed under 3
bar H2 at 75°C. Consumption of H2 was followed by pressure decrease. After 20 h reaction
time no further pressure decrease was observed and the reaction was stopped. From 1H NMR
of the filtrate the conversion of benzene to cyclohexane was detected to be approximately
3. Synthesis and characterisation of Ru nanoparticles in MOF-5
69
25% (see Figure 3.24). The powder XRD diffractogramm of Ru@MOF-5 after catalysis
reveals perfectly intact MOF-5 structure as well as the typical broad Ru reflection at 44.0°.
All together, this shows the potential of Ru@MOF-5 as catalyst in hydrogenation of benzene.
For a complete conversion of benzene to cyclohexane however, the ideal reaction parameters
(p,T) have certainly to be adapted to the Ru@MOF-5 system in the future.
3.8. Conclusion
In summary, the synthesis of Ru nanoparticles in MOF-5 via hydrogenolysis of the
precursor [Ru(cod)(cot)] in MOF-5 was presented along with detailed studies on the
interaction between precursor molecules and finally Ru nanoparticles with the porous host
MOF-5. Loading of MOF-5 with the precursor molecules led to a completely changed PXRD
of the resulting composite [Ru(cod)(cot)]3.5@MOF-5. From the obtained PXRD data
measured at room temperature, the crystal structure of the composite could however not be
elucidated by Rietveld refinement. The Ru precursor molecules appear to be highly disordered
inside the MOF-5 cavities. 13C MAS-NMR spectroscopical investigations showed that the
precursor molecules behave almost as dissolved in MOF-5 which explains the finding of
highly disordered guest molecules. Further PXRD measurements at low temperature might
help to increase the degree of order of the [Ru(cod)(cot)] molecules and therefore to refine the
crystal structure by the Rietveld method.
Ru@MOF-5 was obtained from [Ru(cod)(cot)]3.5@MOF-5 by hydrogenolysis at 3 bar H2, 150
°C, 48 h, whereas hydrogenolysis at milder conditions led to a side reaction of {Ru(cod)}
fragments with MOF-5 bdc linkers alongside formation of Ru nanoparticles. XAS
measurements revealed the existence of small metallic Ru nanoparticles. Characterisation of
Ru@MOF-5 by TEM and electron tomography revealed the presence of Ru nanoparticles
below 3 nm, confirmed by PXRD measurements. The particles were however mostly located
at the surface or close to the surface of the investigated MOF-5 nanocrystallites which is most
probably due to the rather prolonged treatment under 3 bar H2 at 150 °C. Though a perfectly
even distribution of the precursor molecules was found prior to the hydrogenolysis, this rather
harsh treatment obviously caused diffusion of precursor molecules and smaller Ru clusters to
the outer regions of the MOF-5 crystallites. However the Ru nanoparticles still remain caged
by the MOF-5 host since temperature stability of up to 400 °C without pronounced particles
agglomeration was observed. CO adsorption studies and investigation of the hydride mobility
on the surface of Ru@MOF-5 showed that the Ru nanoparticles embedded in MOF-5 behave

3. Synthesis and characterisation of Ru nanoparticles in MOF-5
70
similar to Ru colloids stabilised by organic surfactants which presents MOF-5 as novel kind
of solid support matrix.
However the catalytic performance of Ru@MOF-5 was rather moderate in the oxidation of
benzyl alcohol. This was attributed to the sensitivity of MOF-5 towards water. Ru@MOF-5
showed catalytic activity in benzene hydrogenation as well, here however the catalytic
conditions (p,T) need to be adapted to this system in the future.
4. Investigations of the loading of MOF-5 with two precursor components
71
4. Investigations of the loading of MOF-5 with two
precursor componentS
Beside investigations of loading MOF materials with one metal or metal oxide
precursor compound, followed by decomposition to metal or metal oxide nanoparticles
embedded in MOFs, also simultaneous loading with two metal precursor components and
their co-decomposition appears to be a fruitful field of research. Among the plethora of
applications for bimetallic nanoparticles only a few will be addressed. For instance, the fully
ordered fct (face-centered tetragonal) structured FePt alloy exhibits an anisotropy constant K
that is among the highest of all known hard magnetic materials.[122] Therefore bimetallic
superparamagnetic FePt nanoparticles are expected to become the density limit for magnetic
memory devices.[123,124] In catalytical applications, the addition of a second metal can improve
the activity and/or selectivity of metallic catalysts.[125,126] The addition of Pd to Au catalysts
significantly enhances the catalytic performance for H2O2 and, at an optimum Pd-Au
composition, exceeds the H2O2 production rate of pure Pd catalysts which are significantly
more active than pure gold catalysts.[127] In the hydrogenation reaction of cinnamaldehyde to
cinnamyl alcohol, PtRu catalysts showed a notably improved selectivity which was up to 2
times higher than in the corresponding monometallic catalysts.[128] Furthermore PtRu
nanoparticles are the so far most promising anode catalysts in direct methanol fuel cells since
PtRu nanoparticles exhibit an excellent tolerance towards the poisoning CO formed during
methanol oxidation.[129] MOF-5 and MOFs in general as new kind of stabilization matrices
for nanoparticles might support these enhancement effect by the extraordinary low interaction
between the host matrix and embedded guests.
As discussed above, the hydrogenolysis of all-hydrocarbon precursors embedded in MOF-5
appears to be advantageous over other classical routes for the synthesis of metal nanoparticles
due to the formation of unreactive side products. For the synthesis of bimetallic nanoparticles
in MOF-5 materials, especially the co-hydrogenolysis of two all hydrocarbon metal
precursors under hydrogen pressure, analogously to strategy the developed by the group of B.
Chaudret for the synthesis of colloidal alloy nanoparticles in solution,[130] appears to be
feasible. The crucial point in bimetallic nanoparticle synthesis in MOF-5 and MOF materials
as solid support matrices in general, is the adjustment of defined metal (1)/metal(2) ratios.
4. Investigations of the loading of MOF-5 with two precursor components
72
Since so far no research on the simultaneous loading of MOFs with two precursor
components has been performed, the following chapter has a rather explorative character.
In contrast to bimetallic colloids in solution the stoichiometry of the intercalated precursor
compounds cannot be directly controlled by simply adding defined amounts of the two
precursor components. Since the loading with precursor molecules is usually performed via
gas phase in vaccum, a certain control over the precursor volatilities and diffusion properties
needs to be achieved when the MOF material is simultaneously loaded with two precursor
components. As in the previous chapter on Ru nanoparticle synthesis in the model metal-
organic framework compound MOF-5, the loading experiments were also carried out with
MOF-5. Different precursor ratios were applied for the simultaneous loading experiments,
followed by elemental/AAS analyses, spectroscopical and structural investigations of the
obtained composites. Finally, the co-decomposition of two precursors embedded in MOF-5
was also investigated in order to examine the nature of the obtained metal nanoparticles.
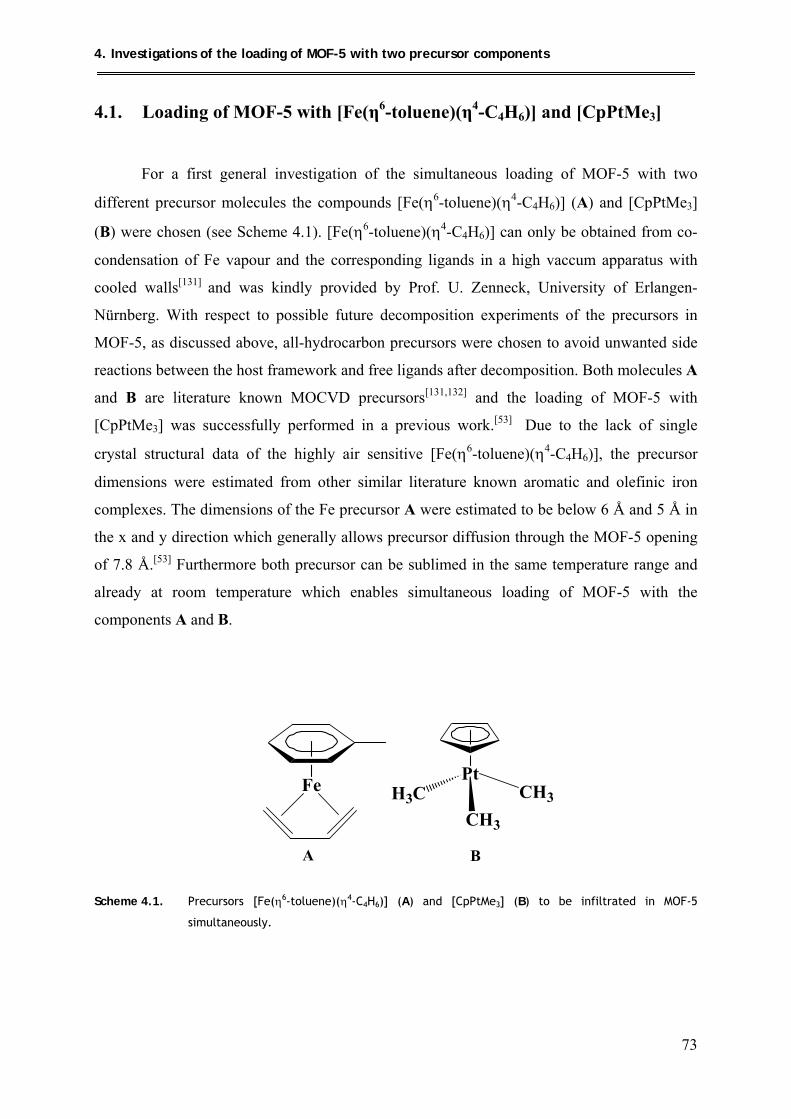
4. Investigations of the loading of MOF-5 with two precursor components
73
4.1. Loading of MOF-5 with [Fe(η6-toluene)(η4-C4H6)] and [CpPtMe3]
For a first general investigation of the simultaneous loading of MOF-5 with two
different precursor molecules the compounds [Fe(η6-toluene)(η4-C4H6)] (A) and [CpPtMe3]
(B) were chosen (see Scheme 4.1). [Fe(η6-toluene)(η4-C4H6)] can only be obtained from co-
condensation of Fe vapour and the corresponding ligands in a high vaccum apparatus with
cooled walls[131] and was kindly provided by Prof. U. Zenneck, University of Erlangen-
Nürnberg. With respect to possible future decomposition experiments of the precursors in
MOF-5, as discussed above, all-hydrocarbon precursors were chosen to avoid unwanted side
reactions between the host framework and free ligands after decomposition. Both molecules A
and B are literature known MOCVD precursors[131,132] and the loading of MOF-5 with
[CpPtMe3] was successfully performed in a previous work.[53] Due to the lack of single
crystal structural data of the highly air sensitive [Fe(η6-toluene)(η4-C4H6)], the precursor
dimensions were estimated from other similar literature known aromatic and olefinic iron
complexes. The dimensions of the Fe precursor A were estimated to be below 6 Å and 5 Å in
the x and y direction which generally allows precursor diffusion through the MOF-5 opening
of 7.8 Å.[53] Furthermore both precursor can be sublimed in the same temperature range and
already at room temperature which enables simultaneous loading of MOF-5 with the
components A and B.
Fe PtH3C CH3
CH3
A B
Scheme 4.1. Precursors [Fe(η6-toluene)(η4-C4H6)] (A) and [CpPtMe3] (B) to be infiltrated in MOF-5
simultaneously.
4. Investigations of the loading of MOF-5 with two precursor components
74
4.1.1. Synthesis
Especially FePt nanoparticles with a near equal atomic percentage of Fe and Pt are an
important class of magnetic nanomaterials.[122] Investigations of the loading of MOF-5 with
two different precursor molecules was performed to obtain possible composite materials
suitable for further decomposition studies yielding functional bimetallic nanoparticles
embedded in MOF-5. Therefore the molar ratio of the precursor materials [Fe(η6-toluene)(η4-
C4H6)] and [CpPtMe3] used for the loading of MOF-5 was set to 1:1.
The loading of MOF-5 with [Fe(η6-toluene)(η4-C4H6)] and [CpPtMe3] was performed at 25
°C, 10-3 mbar (static vaccum) for 12 h by placing pure, activated MOF-5 powder in a Schlenk
tube together with the two precursor components A (red-brown) and B (colorless) in separated
glass vials. The loading was perpetuated until no further uptake of the two precursor materials
was observed. Thereby a colour change of the MOF-5 material from off-white to red-brown
resulted. The obtained material was analyzed by elemental/AAS analysis, FT-IR and MAS-
NMR spectroscopy.
4.1.2. Characterization
4.1.2.1. Elemental analysis
Loading of MOF-5 with the precursors [Fe(η6-toluene)(η4-C4H6)] and [CpPtMe3] in a
molecular ratio of 1:1 was attempted. The results from the elemental/AAS analysis of the
obtained composite are combined in Table 4.1. Although the stochiometric ratio of the
precursors was set to Fe precursor:Pt precursor = 1:1 prior to the start of the loading
experiment, elemental and AAS analysis of composite gave an overall ratio of 1.37:1 of the
precursors embedded in MOF-5. Enrichment of the Fe precursor in composite is most
probably due to the higher vapour pressure of [Fe(η6-toluene)(η4-C4H6)] and lower molecular
mass (202.08 g/mol) in comparison to [CpPtMe3] (305.277 g/mol), enabling faster diffusion
of A over B into MOF. Although the vapour pressure of the Fe precursor is not literature
known, it should be higher than the vapour pressure of the Pt precursor (0.06 mbar at 23
°C)[132b] since it is a liquid at room temperature whereas [CpPtMe3] is a solid, crystalline
material under the same conditions.
4. Investigations of the loading of MOF-5 with two precursor components
75
Table 4.1. Comparison of the molar ratios of [Fe(η6-toluene)(η4-C4H6)] and [CpPtMe3] before and after absorption by MOF-5.
Precursor
used found
molar ratio molar ratio [Fe(η6-toluene)(η4-C4H6)]/ [CpPtMe3]
1:1 1.37:1
4.1.2.2. MAS-NMR investigations
Figure 4.1. presents the 13C (Figure 4.1b) and 195Pt MAS-NMR (Figure 4.1c) spectra
of [Fe(η6-toluene)(η4-C4H6)]/[CpPtMe3]@MOF-5. For comparison the 13C-MAS-NMR
spectrum of [Fe(η6-toluene)(η4-C4H6)]@MOF-5 (Figure 4.1a) is presented as well. The 13C-
MAS NMR spectra are comparably well resolved, once more pointing at MOF-5 behaving
almost as a solid solvent cage (see MAS-NMR discussion of [Ru(cod)(cot)]3.5@MOF-5).
Table 4.2. Assignment of the MAS-NMR data of [Fe(η6-toluene)(η4-C4H6)]/[CpPtMe3]@MOF-5
Precursor 13C MAS-NMR 195Pt MAS-NMR δ [ppm] δ [ppm] [Fe(η6-toluene)(η4-C4H6)](A) 93.8(η6-C6H5CH3), 84.5(η6-C6H5CH3), _______ 82.8(η6-C6H5CH3), 81.4(η6-C6H5CH3), 75.7(η4-C4H6), 33.8(η4-C4H6), 21.1(η6-C6H5CH3) [CpPtMe3](B) 96.3(η5-C5H5), -18.8(CH3, J(Pt,C) = 706 MHz) -5224.9
The observed 13C MAS-NMR signals of [Fe(η6-toluene)(η4-C4H6)]/[CpPtMe3] can be clearly
assigned to the carbons in the two different intercalated molecules (see Table 4.2) matching
the literature data of the precursor molecules in C6D6.[133] The MOF-5 carbon signals are
observed at 174.9 (COO), 137.0 (C(COO)) and 131 (C6H4) ppm. Furthermore, the Pt
precursor signal at -18.8 shows the typical splitting due to Pt-C coupling with a coupling
constant of 706 MHz.[132a] The 195Pt MAS-NMR of the composite exhibits one signal at -
5224.9 ppm also matching the literature data of [CpPtMe3].[132a]
The small deviations in the 13C MAS-NMR signals of the Fe precursor in MOF-5, when
loaded separately and together with the Pt precursor, arise from the relative broadness of the
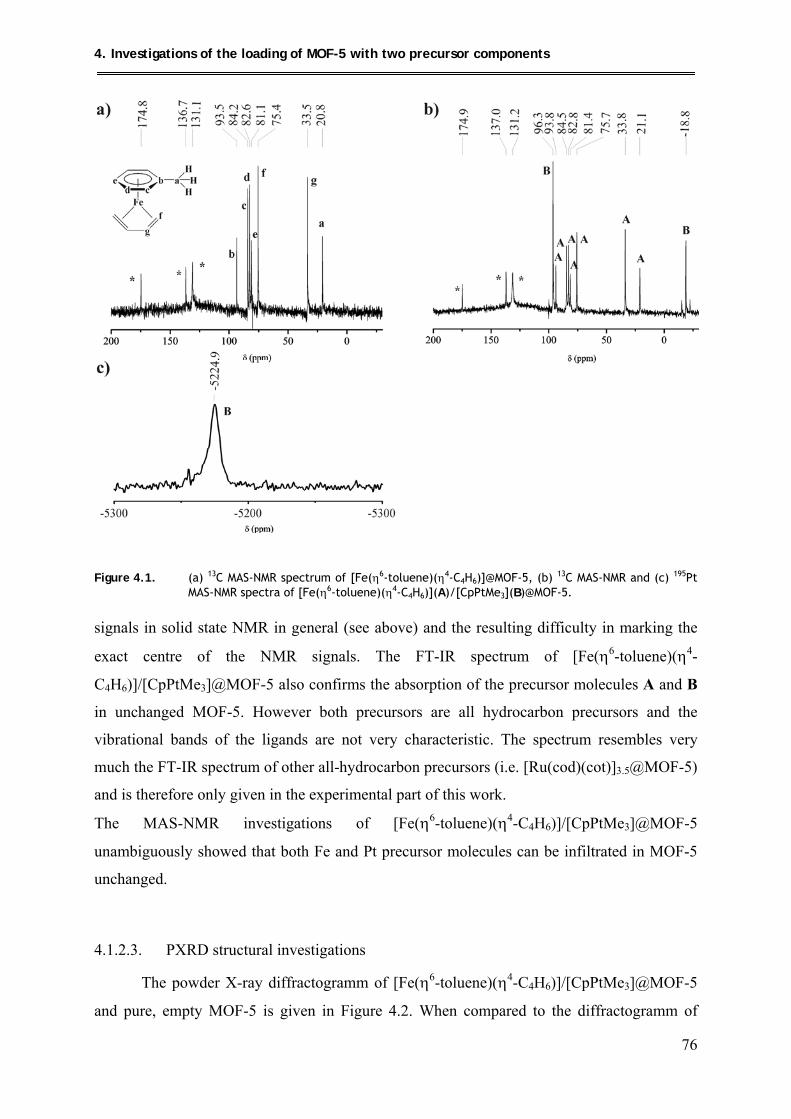
4. Investigations of the loading of MOF-5 with two precursor components
76
Figure 4.1. (a) 13C MAS-NMR spectrum of [Fe(η6-toluene)(η4-C4H6)]@MOF-5, (b) 13C MAS-NMR and (c) 195Pt
MAS-NMR spectra of [Fe(η6-toluene)(η4-C4H6)](A)/[CpPtMe3](B)@MOF-5. signals in solid state NMR in general (see above) and the resulting difficulty in marking the
exact centre of the NMR signals. The FT-IR spectrum of [Fe(η6-toluene)(η4-
C4H6)]/[CpPtMe3]@MOF-5 also confirms the absorption of the precursor molecules A and B
in unchanged MOF-5. However both precursors are all hydrocarbon precursors and the
vibrational bands of the ligands are not very characteristic. The spectrum resembles very
much the FT-IR spectrum of other all-hydrocarbon precursors (i.e. [Ru(cod)(cot)]3.5@MOF-5)
and is therefore only given in the experimental part of this work.
The MAS-NMR investigations of [Fe(η6-toluene)(η4-C4H6)]/[CpPtMe3]@MOF-5
unambiguously showed that both Fe and Pt precursor molecules can be infiltrated in MOF-5
unchanged.
4.1.2.3. PXRD structural investigations
The powder X-ray diffractogramm of [Fe(η6-toluene)(η4-C4H6)]/[CpPtMe3]@MOF-5
and pure, empty MOF-5 is given in Figure 4.2. When compared to the diffractogramm of
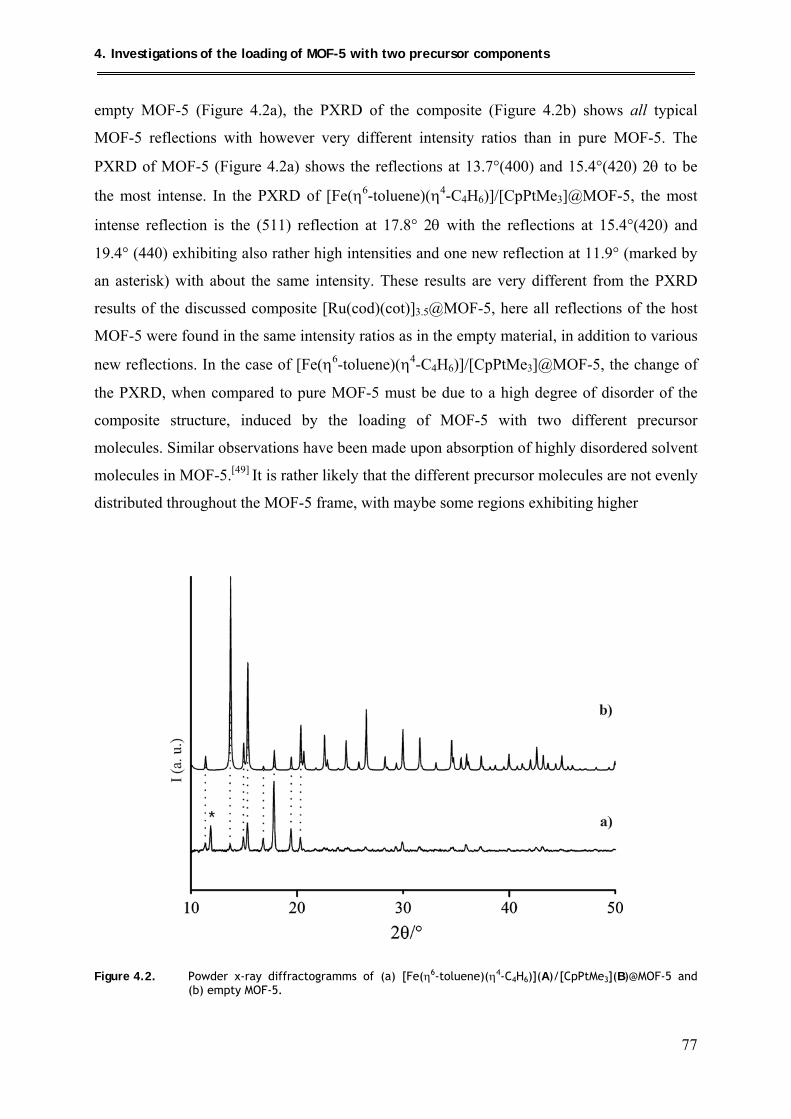
4. Investigations of the loading of MOF-5 with two precursor components
77
empty MOF-5 (Figure 4.2a), the PXRD of the composite (Figure 4.2b) shows all typical
MOF-5 reflections with however very different intensity ratios than in pure MOF-5. The
PXRD of MOF-5 (Figure 4.2a) shows the reflections at 13.7°(400) and 15.4°(420) 2θ to be
the most intense. In the PXRD of [Fe(η6-toluene)(η4-C4H6)]/[CpPtMe3]@MOF-5, the most
intense reflection is the (511) reflection at 17.8° 2θ with the reflections at 15.4°(420) and
19.4° (440) exhibiting also rather high intensities and one new reflection at 11.9° (marked by
an asterisk) with about the same intensity. These results are very different from the PXRD
results of the discussed composite [Ru(cod)(cot)]3.5@MOF-5, here all reflections of the host
MOF-5 were found in the same intensity ratios as in the empty material, in addition to various
new reflections. In the case of [Fe(η6-toluene)(η4-C4H6)]/[CpPtMe3]@MOF-5, the change of
the PXRD, when compared to pure MOF-5 must be due to a high degree of disorder of the
composite structure, induced by the loading of MOF-5 with two different precursor
molecules. Similar observations have been made upon absorption of highly disordered solvent
molecules in MOF-5.[49] It is rather likely that the different precursor molecules are not evenly
distributed throughout the MOF-5 frame, with maybe some regions exhibiting higher
Figure 4.2. Powder x-ray diffractogramms of (a) [Fe(η6-toluene)(η4-C4H6)](A)/[CpPtMe3](B)@MOF-5 and (b) empty MOF-5.
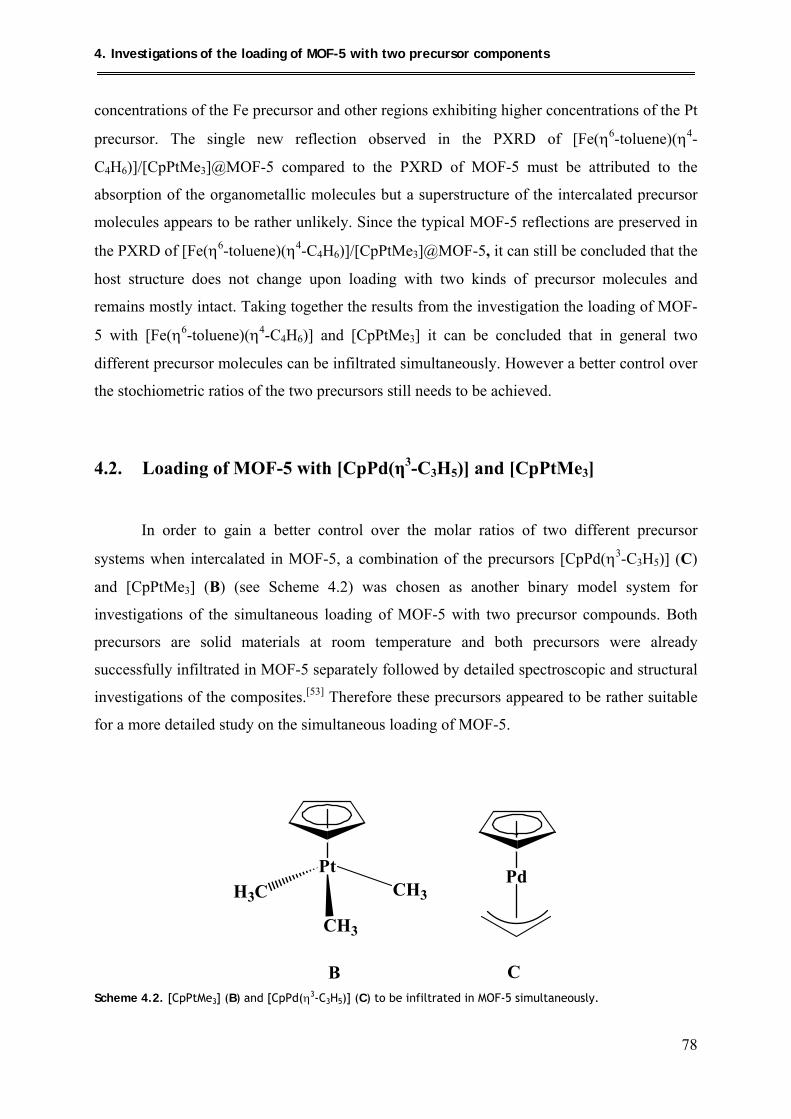
4. Investigations of the loading of MOF-5 with two precursor components
78
concentrations of the Fe precursor and other regions exhibiting higher concentrations of the Pt
precursor. The single new reflection observed in the PXRD of [Fe(η6-toluene)(η4-
C4H6)]/[CpPtMe3]@MOF-5 compared to the PXRD of MOF-5 must be attributed to the
absorption of the organometallic molecules but a superstructure of the intercalated precursor
molecules appears to be rather unlikely. Since the typical MOF-5 reflections are preserved in
the PXRD of [Fe(η6-toluene)(η4-C4H6)]/[CpPtMe3]@MOF-5, it can still be concluded that the
host structure does not change upon loading with two kinds of precursor molecules and
remains mostly intact. Taking together the results from the investigation the loading of MOF-
5 with [Fe(η6-toluene)(η4-C4H6)] and [CpPtMe3] it can be concluded that in general two
different precursor molecules can be infiltrated simultaneously. However a better control over
the stochiometric ratios of the two precursors still needs to be achieved.
4.2. Loading of MOF-5 with [CpPd(η3-C3H5)] and [CpPtMe3]
In order to gain a better control over the molar ratios of two different precursor
systems when intercalated in MOF-5, a combination of the precursors [CpPd(η3-C3H5)] (C)
and [CpPtMe3] (B) (see Scheme 4.2) was chosen as another binary model system for
investigations of the simultaneous loading of MOF-5 with two precursor compounds. Both
precursors are solid materials at room temperature and both precursors were already
successfully infiltrated in MOF-5 separately followed by detailed spectroscopic and structural
investigations of the composites.[53] Therefore these precursors appeared to be rather suitable
for a more detailed study on the simultaneous loading of MOF-5.
PdPtH3C CH3
CH3
B C Scheme 4.2. [CpPtMe3] (B) and [CpPd(η3-C3H5)] (C) to be infiltrated in MOF-5 simultaneously.
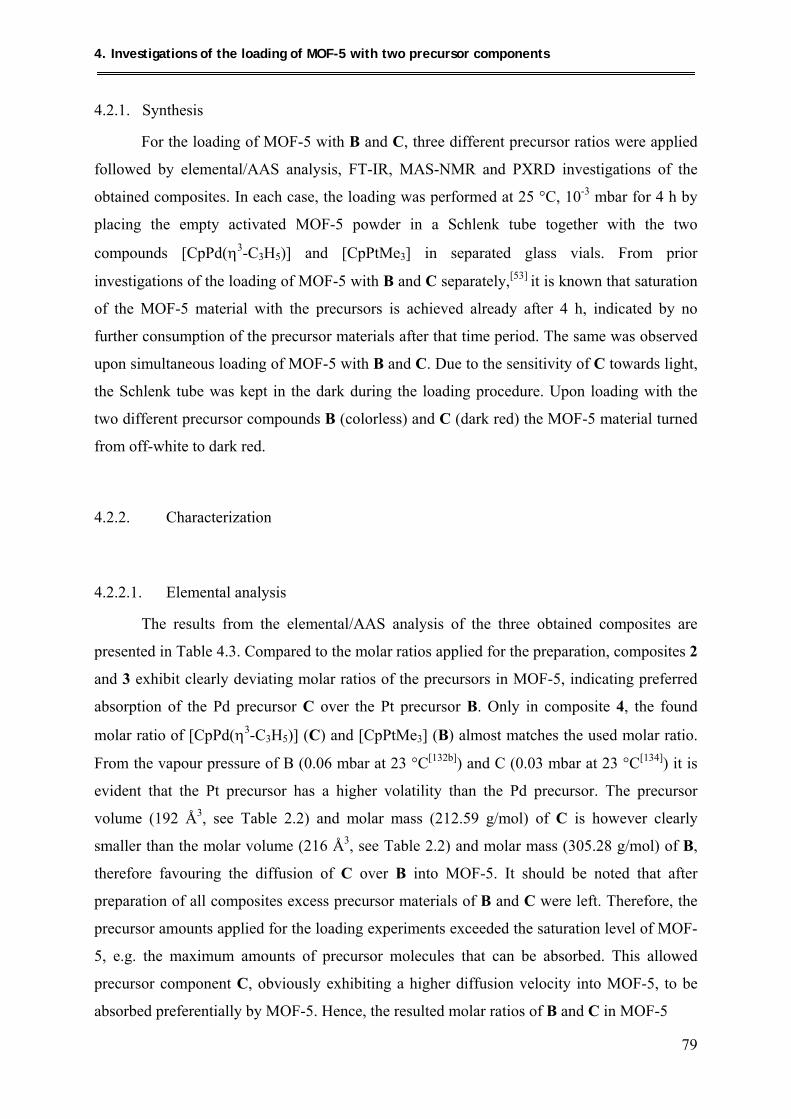
4. Investigations of the loading of MOF-5 with two precursor components
79
4.2.1. Synthesis
For the loading of MOF-5 with B and C, three different precursor ratios were applied
followed by elemental/AAS analysis, FT-IR, MAS-NMR and PXRD investigations of the
obtained composites. In each case, the loading was performed at 25 °C, 10-3 mbar for 4 h by
placing the empty activated MOF-5 powder in a Schlenk tube together with the two
compounds [CpPd(η3-C3H5)] and [CpPtMe3] in separated glass vials. From prior
investigations of the loading of MOF-5 with B and C separately,[53] it is known that saturation
of the MOF-5 material with the precursors is achieved already after 4 h, indicated by no
further consumption of the precursor materials after that time period. The same was observed
upon simultaneous loading of MOF-5 with B and C. Due to the sensitivity of C towards light,
the Schlenk tube was kept in the dark during the loading procedure. Upon loading with the
two different precursor compounds B (colorless) and C (dark red) the MOF-5 material turned
from off-white to dark red.
4.2.2. Characterization
4.2.2.1. Elemental analysis
The results from the elemental/AAS analysis of the three obtained composites are
presented in Table 4.3. Compared to the molar ratios applied for the preparation, composites 2
and 3 exhibit clearly deviating molar ratios of the precursors in MOF-5, indicating preferred
absorption of the Pd precursor C over the Pt precursor B. Only in composite 4, the found
molar ratio of [CpPd(η3-C3H5)] (C) and [CpPtMe3] (B) almost matches the used molar ratio.
From the vapour pressure of B (0.06 mbar at 23 °C[132b]) and C (0.03 mbar at 23 °C[134]) it is
evident that the Pt precursor has a higher volatility than the Pd precursor. The precursor
volume (192 Å3, see Table 2.2) and molar mass (212.59 g/mol) of C is however clearly
smaller than the molar volume (216 Å3, see Table 2.2) and molar mass (305.28 g/mol) of B,
therefore favouring the diffusion of C over B into MOF-5. It should be noted that after
preparation of all composites excess precursor materials of B and C were left. Therefore, the
precursor amounts applied for the loading experiments exceeded the saturation level of MOF-
5, e.g. the maximum amounts of precursor molecules that can be absorbed. This allowed
precursor component C, obviously exhibiting a higher diffusion velocity into MOF-5, to be
absorbed preferentially by MOF-5. Hence, the resulted molar ratios of B and C in MOF-5
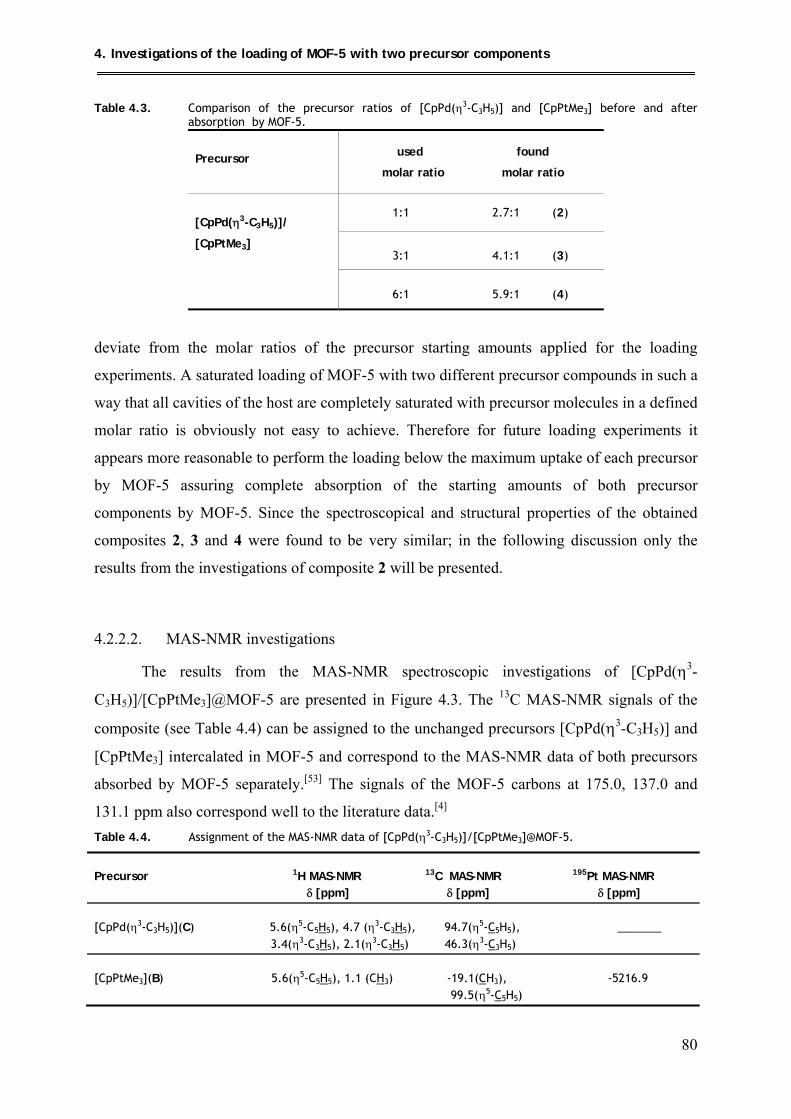
4. Investigations of the loading of MOF-5 with two precursor components
80
Table 4.3. Comparison of the precursor ratios of [CpPd(η3-C3H5)] and [CpPtMe3] before and after absorption by MOF-5.
Precursor
used found
molar ratio molar ratio
[CpPd(η3-C3H5)]/
[CpPtMe3]
1:1 2.7:1 (2)
3:1 4.1:1 (3)
6:1 5.9:1 (4)
deviate from the molar ratios of the precursor starting amounts applied for the loading
experiments. A saturated loading of MOF-5 with two different precursor compounds in such a
way that all cavities of the host are completely saturated with precursor molecules in a defined
molar ratio is obviously not easy to achieve. Therefore for future loading experiments it
appears more reasonable to perform the loading below the maximum uptake of each precursor
by MOF-5 assuring complete absorption of the starting amounts of both precursor
components by MOF-5. Since the spectroscopical and structural properties of the obtained
composites 2, 3 and 4 were found to be very similar; in the following discussion only the
results from the investigations of composite 2 will be presented.
4.2.2.2. MAS-NMR investigations
The results from the MAS-NMR spectroscopic investigations of [CpPd(η3-
C3H5)]/[CpPtMe3]@MOF-5 are presented in Figure 4.3. The 13C MAS-NMR signals of the
composite (see Table 4.4) can be assigned to the unchanged precursors [CpPd(η3-C3H5)] and
[CpPtMe3] intercalated in MOF-5 and correspond to the MAS-NMR data of both precursors
absorbed by MOF-5 separately.[53] The signals of the MOF-5 carbons at 175.0, 137.0 and
131.1 ppm also correspond well to the literature data.[4] Table 4.4. Assignment of the MAS-NMR data of [CpPd(η3-C3H5)]/[CpPtMe3]@MOF-5.
Precursor 1H MAS-NMR 13C MAS-NMR 195Pt MAS-NMR δ [ppm] δ [ppm] δ [ppm] [CpPd(η3-C3H5)](C) 5.6(η5-C5H5), 4.7 (η3-C3H5), 94.7(η5-C5H5), _______ 3.4(η3-C3H5), 2.1(η3-C3H5) 46.3(η3-C3H5) [CpPtMe3](B) 5.6(η5-C5H5), 1.1 (CH3) -19.1(CH3), -5216.9 99.5(η5-C5H5)
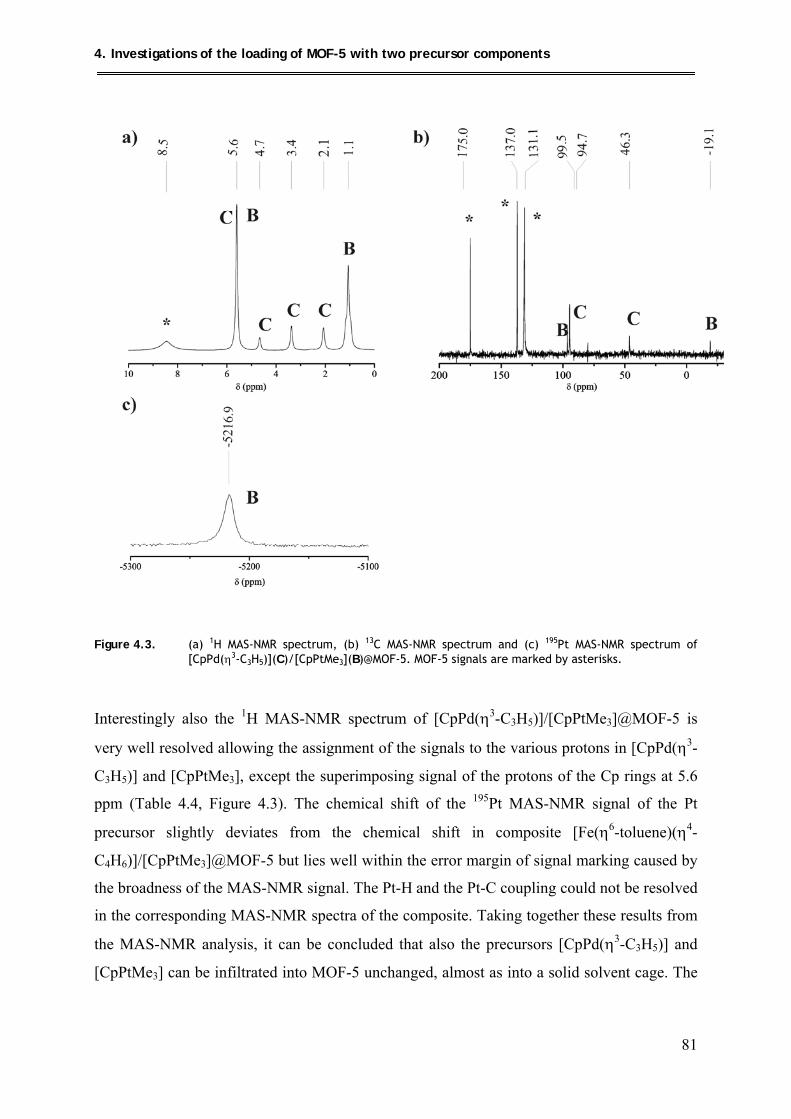
4. Investigations of the loading of MOF-5 with two precursor components
81
Figure 4.3. (a) 1H MAS-NMR spectrum, (b) 13C MAS-NMR spectrum and (c) 195Pt MAS-NMR spectrum of [CpPd(η3-C3H5)](C)/[CpPtMe3](B)@MOF-5. MOF-5 signals are marked by asterisks.
Interestingly also the 1H MAS-NMR spectrum of [CpPd(η3-C3H5)]/[CpPtMe3]@MOF-5 is
very well resolved allowing the assignment of the signals to the various protons in [CpPd(η3-
C3H5)] and [CpPtMe3], except the superimposing signal of the protons of the Cp rings at 5.6
ppm (Table 4.4, Figure 4.3). The chemical shift of the 195Pt MAS-NMR signal of the Pt
precursor slightly deviates from the chemical shift in composite [Fe(η6-toluene)(η4-
C4H6)]/[CpPtMe3]@MOF-5 but lies well within the error margin of signal marking caused by
the broadness of the MAS-NMR signal. The Pt-H and the Pt-C coupling could not be resolved
in the corresponding MAS-NMR spectra of the composite. Taking together these results from
the MAS-NMR analysis, it can be concluded that also the precursors [CpPd(η3-C3H5)] and
[CpPtMe3] can be infiltrated into MOF-5 unchanged, almost as into a solid solvent cage. The

4. Investigations of the loading of MOF-5 with two precursor components
82
corresponding FT-IR spectrum confirming this finding is given in the experimental part of
this work (see above).
4.2.2.3. PXRD structural investigations
The powder X-ray diffractogramm of [CpPd(η3-C3H5)]/[CpPtMe3]@MOF-5 is
presented in Figure 4.4b together with the PXRD of pure MOF-5 (Figure 4.4a). Very similar
to the PXRD of [Fe(η6-toluene)(η4-C4H6)]/[CpPtMe3]@MOF-5 (Figure 4.2), the PXRD of
[CpPd(η3-C3H5)]/[CpPtMe3]@MOF-5 exhibits all typical MOF-5 reflections with very
different intensity ratios from the reflections in the PXRD of the parent MOF-5. As in the case
of composite [Fe(η6-toluene)(η4-C4H6)]/[CpPtMe3]@MOF-5, in the PXRD of [CpPd(η3-
C3H5)]/[CpPtMe3]@MOF-5 (Figure 4.4b) also, the most prominent reflection has become the
(511) reflection at 17.8 ° 2θ with the two reflections at 15.4° (420) and 19.4° 2θ (440) being
rather prominent and one new reflection at 11.9° (marked by an asterisk). The similarity in the
PXRD results of the two different composites confirms that the simultaneous loading of
MOF-5 with two different molecules leads to a high degree of disorder in the composites’
structures indicated by the change in the corresponding PXRDs when compared to the PXRD
of empty MOF-5 or to composites with only one embedded precursor compound (see
discussion of [Ru(cod)(cot)]3.5@MOF-5). This also indicates that the distribution of the two
different precursors throughout the MOF-5 is very likely to be asymmetric. Most probably
some parts of the MOF-5 frame are enriched with the first precursor compound and other
parts are enriched with the second compound. A uniform mixture of both components
throughout the host framework’s cavities, as it is the case in a solvent is not obtained. This is
most likely caused by the different diffusion velocities of the two different compounds and
probably also by preferred intermolecular interactions between precursor molecules of the
same kind.
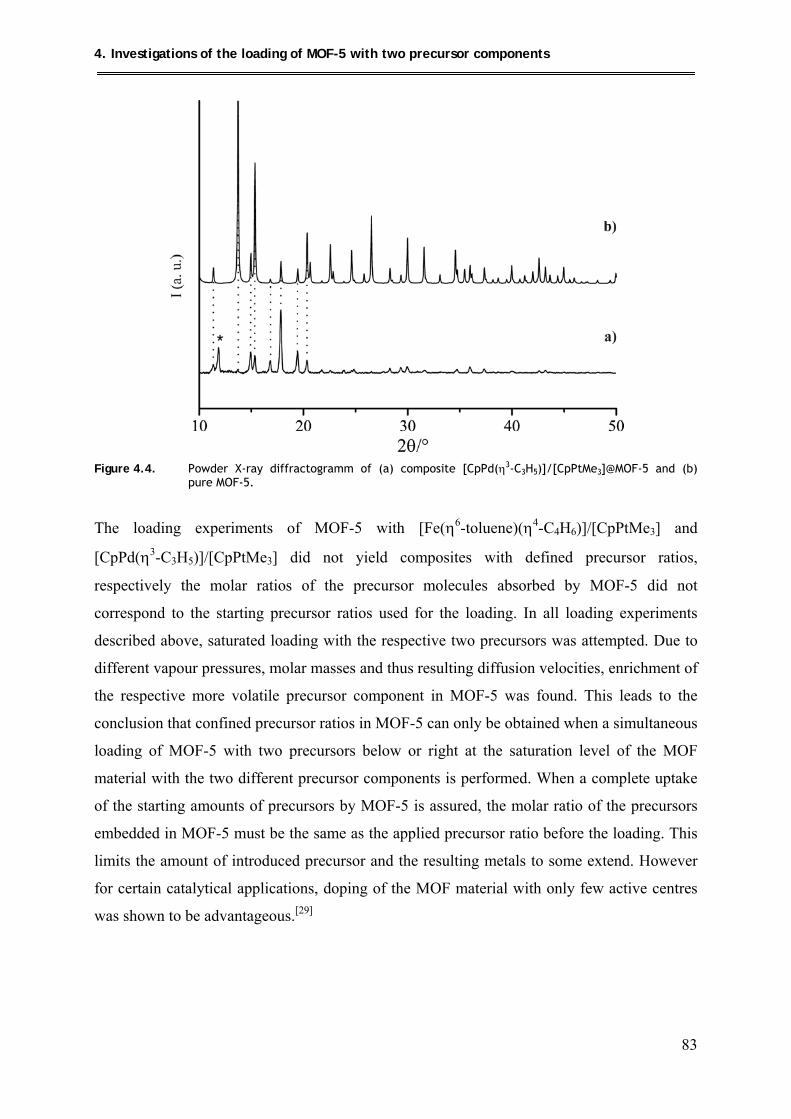
4. Investigations of the loading of MOF-5 with two precursor components
83
Figure 4.4. Powder X-ray diffractogramm of (a) composite [CpPd(η3-C3H5)]/[CpPtMe3]@MOF-5 and (b)
pure MOF-5.
The loading experiments of MOF-5 with [Fe(η6-toluene)(η4-C4H6)]/[CpPtMe3] and
[CpPd(η3-C3H5)]/[CpPtMe3] did not yield composites with defined precursor ratios,
respectively the molar ratios of the precursor molecules absorbed by MOF-5 did not
correspond to the starting precursor ratios used for the loading. In all loading experiments
described above, saturated loading with the respective two precursors was attempted. Due to
different vapour pressures, molar masses and thus resulting diffusion velocities, enrichment of
the respective more volatile precursor component in MOF-5 was found. This leads to the
conclusion that confined precursor ratios in MOF-5 can only be obtained when a simultaneous
loading of MOF-5 with two precursors below or right at the saturation level of the MOF
material with the two different precursor components is performed. When a complete uptake
of the starting amounts of precursors by MOF-5 is assured, the molar ratio of the precursors
embedded in MOF-5 must be the same as the applied precursor ratio before the loading. This
limits the amount of introduced precursor and the resulting metals to some extend. However
for certain catalytical applications, doping of the MOF material with only few active centres
was shown to be advantageous.[29]
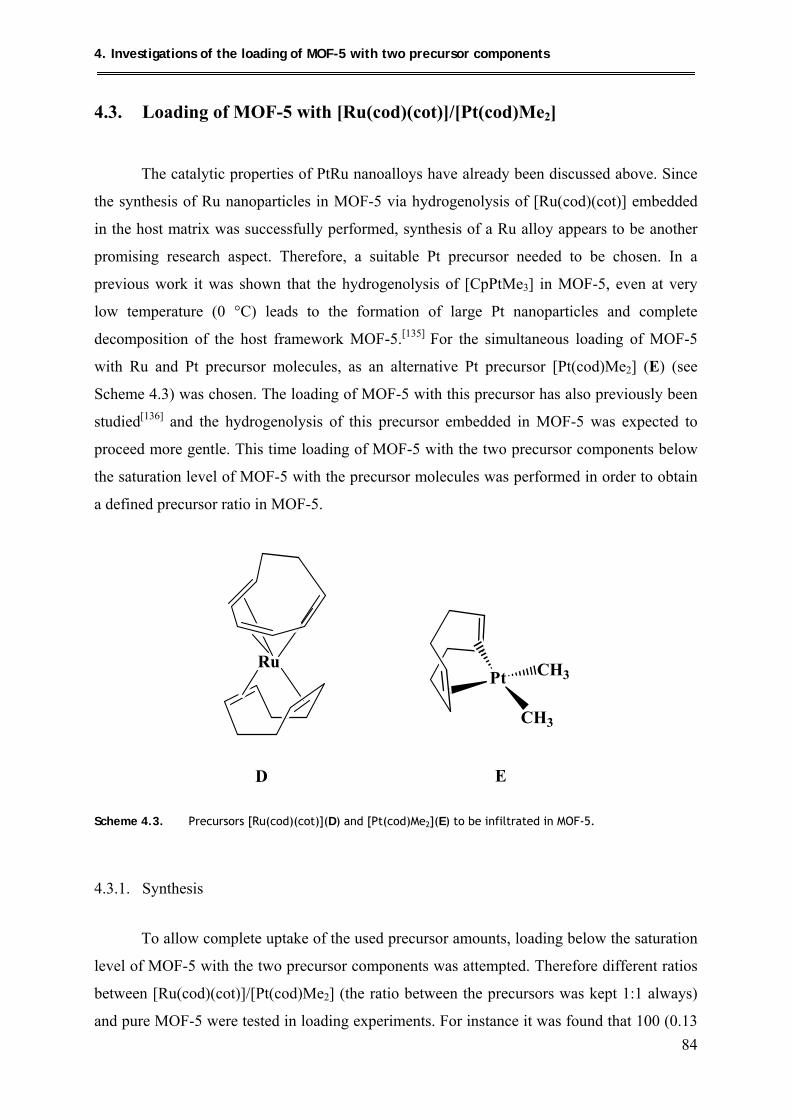
4. Investigations of the loading of MOF-5 with two precursor components
84
4.3. Loading of MOF-5 with [Ru(cod)(cot)]/[Pt(cod)Me2]
The catalytic properties of PtRu nanoalloys have already been discussed above. Since
the synthesis of Ru nanoparticles in MOF-5 via hydrogenolysis of [Ru(cod)(cot)] embedded
in the host matrix was successfully performed, synthesis of a Ru alloy appears to be another
promising research aspect. Therefore, a suitable Pt precursor needed to be chosen. In a
previous work it was shown that the hydrogenolysis of [CpPtMe3] in MOF-5, even at very
low temperature (0 °C) leads to the formation of large Pt nanoparticles and complete
decomposition of the host framework MOF-5.[135] For the simultaneous loading of MOF-5
with Ru and Pt precursor molecules, as an alternative Pt precursor [Pt(cod)Me2] (E) (see
Scheme 4.3) was chosen. The loading of MOF-5 with this precursor has also previously been
studied[136] and the hydrogenolysis of this precursor embedded in MOF-5 was expected to
proceed more gentle. This time loading of MOF-5 with the two precursor components below
the saturation level of MOF-5 with the precursor molecules was performed in order to obtain
a defined precursor ratio in MOF-5.
RuPt CH3
CH3
D E
Scheme 4.3. Precursors [Ru(cod)(cot)](D) and [Pt(cod)Me2](E) to be infiltrated in MOF-5.
4.3.1. Synthesis
To allow complete uptake of the used precursor amounts, loading below the saturation
level of MOF-5 with the two precursor components was attempted. Therefore different ratios
between [Ru(cod)(cot)]/[Pt(cod)Me2] (the ratio between the precursors was kept 1:1 always)
and pure MOF-5 were tested in loading experiments. For instance it was found that 100 (0.13
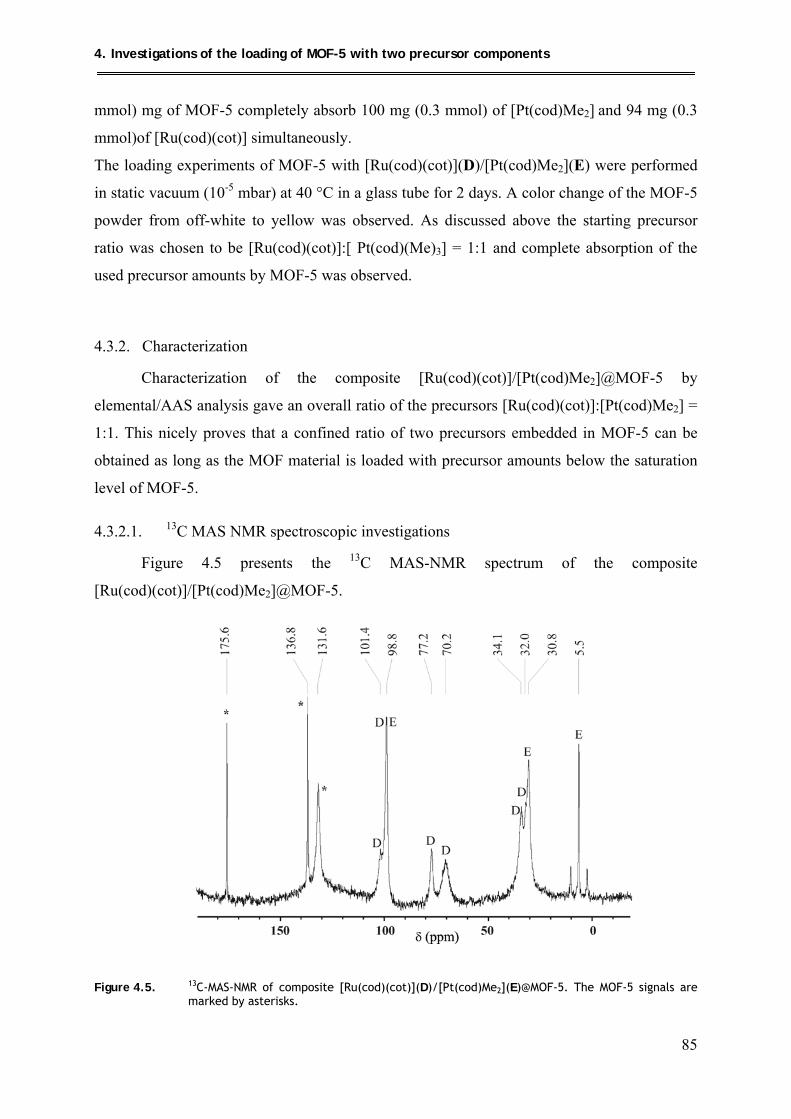
4. Investigations of the loading of MOF-5 with two precursor components
85
mmol) mg of MOF-5 completely absorb 100 mg (0.3 mmol) of [Pt(cod)Me2] and 94 mg (0.3
mmol)of [Ru(cod)(cot)] simultaneously.
The loading experiments of MOF-5 with [Ru(cod)(cot)](D)/[Pt(cod)Me2](E) were performed
in static vacuum (10-5 mbar) at 40 °C in a glass tube for 2 days. A color change of the MOF-5
powder from off-white to yellow was observed. As discussed above the starting precursor
ratio was chosen to be [Ru(cod)(cot)]:[ Pt(cod)(Me)3] = 1:1 and complete absorption of the
used precursor amounts by MOF-5 was observed.
4.3.2. Characterization
Characterization of the composite [Ru(cod)(cot)]/[Pt(cod)Me2]@MOF-5 by
elemental/AAS analysis gave an overall ratio of the precursors [Ru(cod)(cot)]:[Pt(cod)Me2] =
1:1. This nicely proves that a confined ratio of two precursors embedded in MOF-5 can be
obtained as long as the MOF material is loaded with precursor amounts below the saturation
level of MOF-5.
4.3.2.1. 13C MAS NMR spectroscopic investigations
Figure 4.5 presents the 13C MAS-NMR spectrum of the composite
[Ru(cod)(cot)]/[Pt(cod)Me2]@MOF-5.
Figure 4.5. 13C-MAS-NMR of composite [Ru(cod)(cot)](D)/[Pt(cod)Me2](E)@MOF-5. The MOF-5 signals are marked by asterisks.
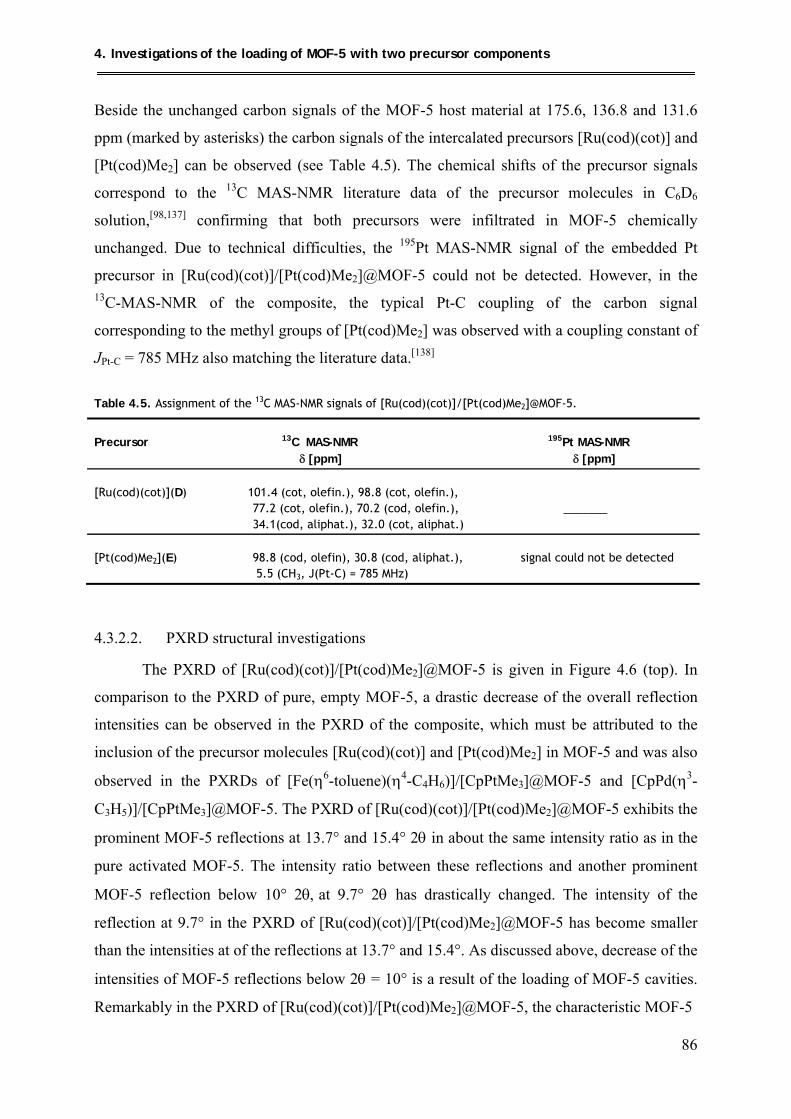
4. Investigations of the loading of MOF-5 with two precursor components
86
Beside the unchanged carbon signals of the MOF-5 host material at 175.6, 136.8 and 131.6
ppm (marked by asterisks) the carbon signals of the intercalated precursors [Ru(cod)(cot)] and
[Pt(cod)Me2] can be observed (see Table 4.5). The chemical shifts of the precursor signals
correspond to the 13C MAS-NMR literature data of the precursor molecules in C6D6
solution,[98,137] confirming that both precursors were infiltrated in MOF-5 chemically
unchanged. Due to technical difficulties, the 195Pt MAS-NMR signal of the embedded Pt
precursor in [Ru(cod)(cot)]/[Pt(cod)Me2]@MOF-5 could not be detected. However, in the 13C-MAS-NMR of the composite, the typical Pt-C coupling of the carbon signal
corresponding to the methyl groups of [Pt(cod)Me2] was observed with a coupling constant of
JPt-C = 785 MHz also matching the literature data.[138]
Table 4.5. Assignment of the 13C MAS-NMR signals of [Ru(cod)(cot)]/[Pt(cod)Me2]@MOF-5.
Precursor 13C MAS-NMR 195Pt MAS-NMR δ [ppm] δ [ppm] [Ru(cod)(cot)](D) 101.4 (cot, olefin.), 98.8 (cot, olefin.), 77.2 (cot, olefin.), 70.2 (cod, olefin.), _______ 34.1(cod, aliphat.), 32.0 (cot, aliphat.) [Pt(cod)Me2](E) 98.8 (cod, olefin), 30.8 (cod, aliphat.), signal could not be detected 5.5 (CH3, J(Pt-C) = 785 MHz)
4.3.2.2. PXRD structural investigations
The PXRD of [Ru(cod)(cot)]/[Pt(cod)Me2]@MOF-5 is given in Figure 4.6 (top). In
comparison to the PXRD of pure, empty MOF-5, a drastic decrease of the overall reflection
intensities can be observed in the PXRD of the composite, which must be attributed to the
inclusion of the precursor molecules [Ru(cod)(cot)] and [Pt(cod)Me2] in MOF-5 and was also
observed in the PXRDs of [Fe(η6-toluene)(η4-C4H6)]/[CpPtMe3]@MOF-5 and [CpPd(η3-
C3H5)]/[CpPtMe3]@MOF-5. The PXRD of [Ru(cod)(cot)]/[Pt(cod)Me2]@MOF-5 exhibits the
prominent MOF-5 reflections at 13.7° and 15.4° 2θ in about the same intensity ratio as in the
pure activated MOF-5. The intensity ratio between these reflections and another prominent
MOF-5 reflection below 10° 2θ, at 9.7° 2θ has drastically changed. The intensity of the
reflection at 9.7° in the PXRD of [Ru(cod)(cot)]/[Pt(cod)Me2]@MOF-5 has become smaller
than the intensities at of the reflections at 13.7° and 15.4°. As discussed above, decrease of the
intensities of MOF-5 reflections below 2θ = 10° is a result of the loading of MOF-5 cavities.
Remarkably in the PXRD of [Ru(cod)(cot)]/[Pt(cod)Me2]@MOF-5, the characteristic MOF-5
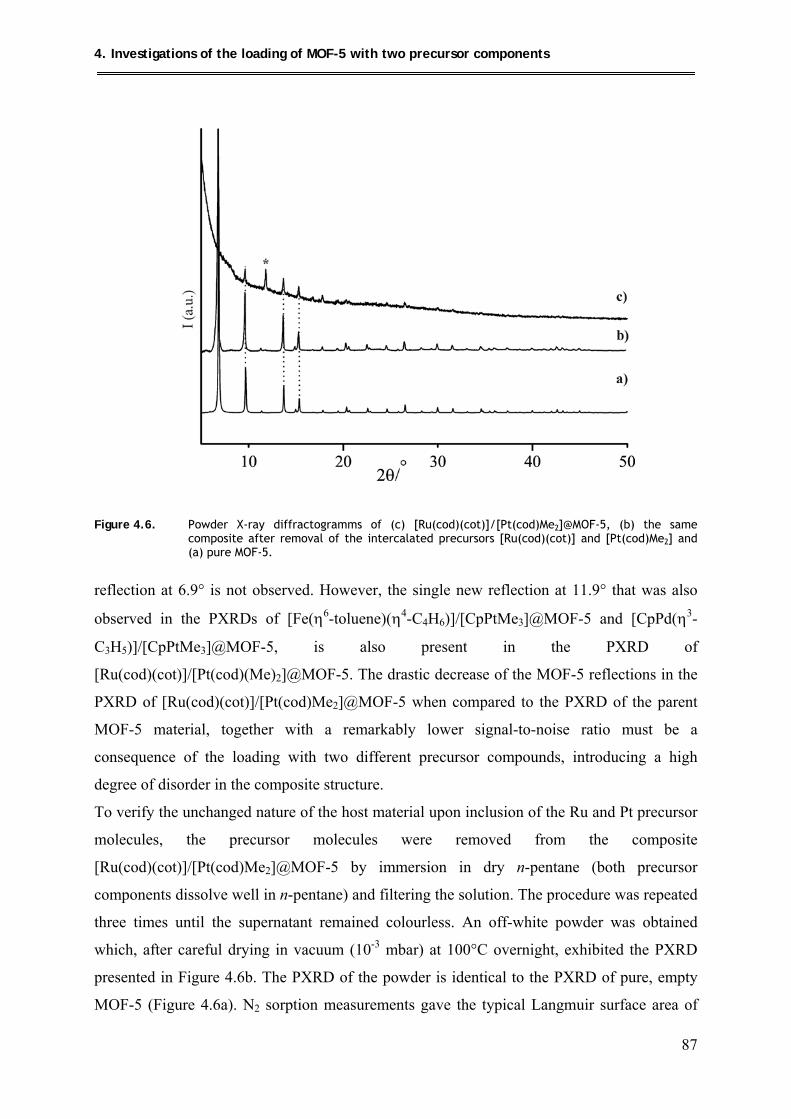
4. Investigations of the loading of MOF-5 with two precursor components
87
Figure 4.6. Powder X-ray diffractogramms of (c) [Ru(cod)(cot)]/[Pt(cod)Me2]@MOF-5, (b) the same
composite after removal of the intercalated precursors [Ru(cod)(cot)] and [Pt(cod)Me2] and (a) pure MOF-5.
reflection at 6.9° is not observed. However, the single new reflection at 11.9° that was also
observed in the PXRDs of [Fe(η6-toluene)(η4-C4H6)]/[CpPtMe3]@MOF-5 and [CpPd(η3-
C3H5)]/[CpPtMe3]@MOF-5, is also present in the PXRD of
[Ru(cod)(cot)]/[Pt(cod)(Me)2]@MOF-5. The drastic decrease of the MOF-5 reflections in the
PXRD of [Ru(cod)(cot)]/[Pt(cod)Me2]@MOF-5 when compared to the PXRD of the parent
MOF-5 material, together with a remarkably lower signal-to-noise ratio must be a
consequence of the loading with two different precursor compounds, introducing a high
degree of disorder in the composite structure.
To verify the unchanged nature of the host material upon inclusion of the Ru and Pt precursor
molecules, the precursor molecules were removed from the composite
[Ru(cod)(cot)]/[Pt(cod)Me2]@MOF-5 by immersion in dry n-pentane (both precursor
components dissolve well in n-pentane) and filtering the solution. The procedure was repeated
three times until the supernatant remained colourless. An off-white powder was obtained
which, after careful drying in vacuum (10-3 mbar) at 100°C overnight, exhibited the PXRD
presented in Figure 4.6b. The PXRD of the powder is identical to the PXRD of pure, empty
MOF-5 (Figure 4.6a). N2 sorption measurements gave the typical Langmuir surface area of
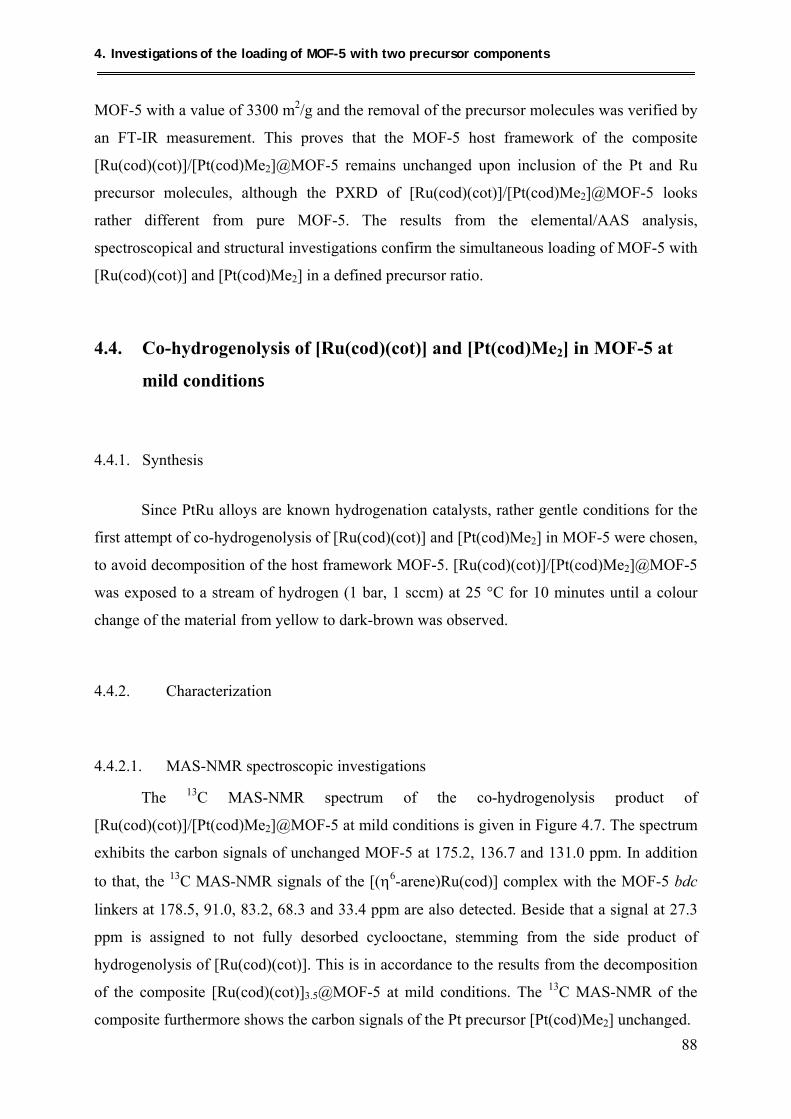
4. Investigations of the loading of MOF-5 with two precursor components
88
MOF-5 with a value of 3300 m2/g and the removal of the precursor molecules was verified by
an FT-IR measurement. This proves that the MOF-5 host framework of the composite
[Ru(cod)(cot)]/[Pt(cod)Me2]@MOF-5 remains unchanged upon inclusion of the Pt and Ru
precursor molecules, although the PXRD of [Ru(cod)(cot)]/[Pt(cod)Me2]@MOF-5 looks
rather different from pure MOF-5. The results from the elemental/AAS analysis,
spectroscopical and structural investigations confirm the simultaneous loading of MOF-5 with
[Ru(cod)(cot)] and [Pt(cod)Me2] in a defined precursor ratio.
4.4. Co-hydrogenolysis of [Ru(cod)(cot)] and [Pt(cod)Me2] in MOF-5 at
mild conditionS
4.4.1. Synthesis
Since PtRu alloys are known hydrogenation catalysts, rather gentle conditions for the
first attempt of co-hydrogenolysis of [Ru(cod)(cot)] and [Pt(cod)Me2] in MOF-5 were chosen,
to avoid decomposition of the host framework MOF-5. [Ru(cod)(cot)]/[Pt(cod)Me2]@MOF-5
was exposed to a stream of hydrogen (1 bar, 1 sccm) at 25 °C for 10 minutes until a colour
change of the material from yellow to dark-brown was observed.
4.4.2. Characterization
4.4.2.1. MAS-NMR spectroscopic investigations
The 13C MAS-NMR spectrum of the co-hydrogenolysis product of
[Ru(cod)(cot)]/[Pt(cod)Me2]@MOF-5 at mild conditions is given in Figure 4.7. The spectrum
exhibits the carbon signals of unchanged MOF-5 at 175.2, 136.7 and 131.0 ppm. In addition
to that, the 13C MAS-NMR signals of the [(η6-arene)Ru(cod)] complex with the MOF-5 bdc
linkers at 178.5, 91.0, 83.2, 68.3 and 33.4 ppm are also detected. Beside that a signal at 27.3
ppm is assigned to not fully desorbed cyclooctane, stemming from the side product of
hydrogenolysis of [Ru(cod)(cot)]. This is in accordance to the results from the decomposition
of the composite [Ru(cod)(cot)]3.5@MOF-5 at mild conditions. The 13C MAS-NMR of the
composite furthermore shows the carbon signals of the Pt precursor [Pt(cod)Me2] unchanged.
4. Investigations of the loading of MOF-5 with two precursor components
89
Figure 4.7. 13C-MAS-NMR spectrum of the co-hydrogenolysis product of [Ru(cod)(cot)]/[Pt(cod)Me2]@MOF-
5 at mild conditions. The MOF-5 signals are marked by asterisks.
These results show that co-hydrogenolysis of [Ru(cod)(cot)]/[Pt(cod)Me2]@MOF-5 at mild
conditions proceeds incomplete yielding only partly hydrogenolysed Ru precursor molecules
and most probably completely unchanged Pt precursor molecules. The 13C MAS-NMR
investigations of the hydrogenolysis of [Ru(cod)(cot)]3.5@MOF-5 have shown that
hydrogenolysis at mild conditions leads to incomplete conversion of the Ru precursor.
However particularly XAS investigations of the obtained composite {[Ru(cod)]/Ru}@MOF-5
showed that beside the formation of a [(η6-arene)Ru(cod)] complex with the MOF-5 bdc
linkers also metallic Ru nanoparticles were formed. This is most probably also the case in the
co-hydrogenolysis product of [Ru(cod)(cot)]/[Pt(cod)Me2]@MOF-5 at mild conditions
4.4.2.2. PXRD structural investigations
The powder X-ray diffractogramm of the composite (see Figure 4.8b) looks strikingly
different from the PXRD of the composite material before hydrogen treatment. It exhibits the
typical MOF-5 PXRD reflections in the same intensity ratios as in the parent MOF-5 material
(Figure 4.8a) hinting at an unchanged MOF-5 matrix.
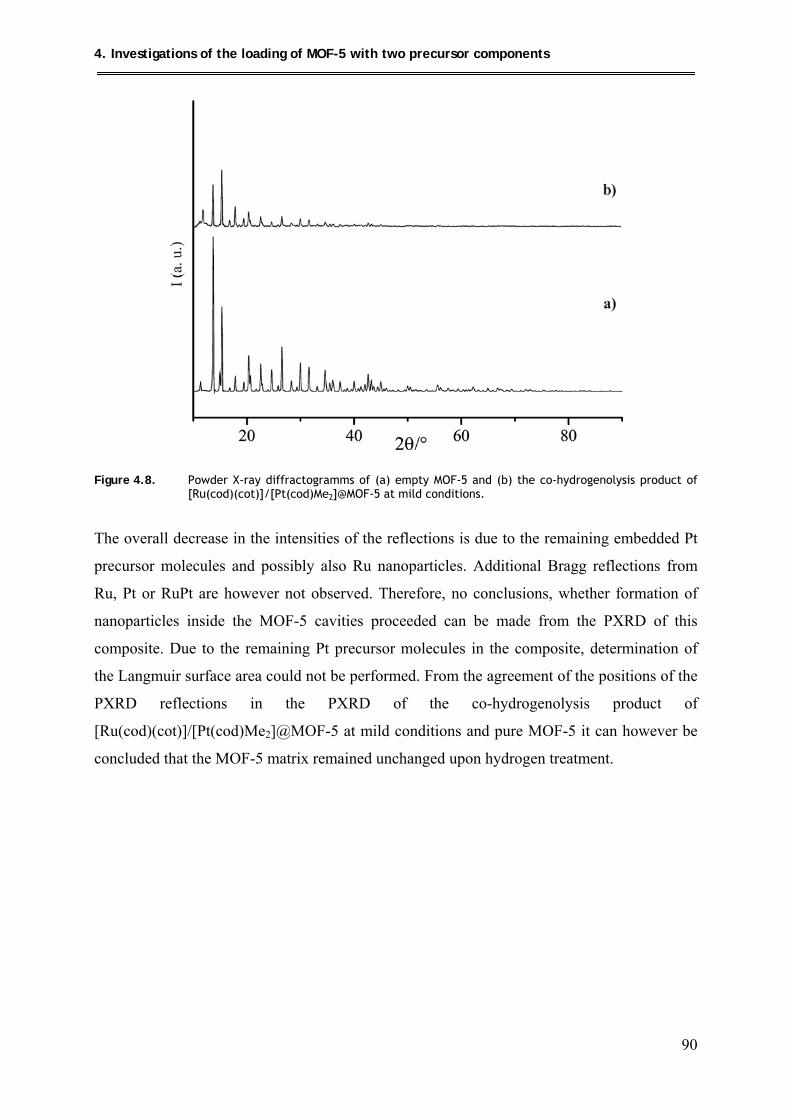
4. Investigations of the loading of MOF-5 with two precursor components
90
Figure 4.8. Powder X-ray diffractogramms of (a) empty MOF-5 and (b) the co-hydrogenolysis product of
[Ru(cod)(cot)]/[Pt(cod)Me2]@MOF-5 at mild conditions.
The overall decrease in the intensities of the reflections is due to the remaining embedded Pt
precursor molecules and possibly also Ru nanoparticles. Additional Bragg reflections from
Ru, Pt or RuPt are however not observed. Therefore, no conclusions, whether formation of
nanoparticles inside the MOF-5 cavities proceeded can be made from the PXRD of this
composite. Due to the remaining Pt precursor molecules in the composite, determination of
the Langmuir surface area could not be performed. From the agreement of the positions of the
PXRD reflections in the PXRD of the co-hydrogenolysis product of
[Ru(cod)(cot)]/[Pt(cod)Me2]@MOF-5 at mild conditions and pure MOF-5 it can however be
concluded that the MOF-5 matrix remained unchanged upon hydrogen treatment.
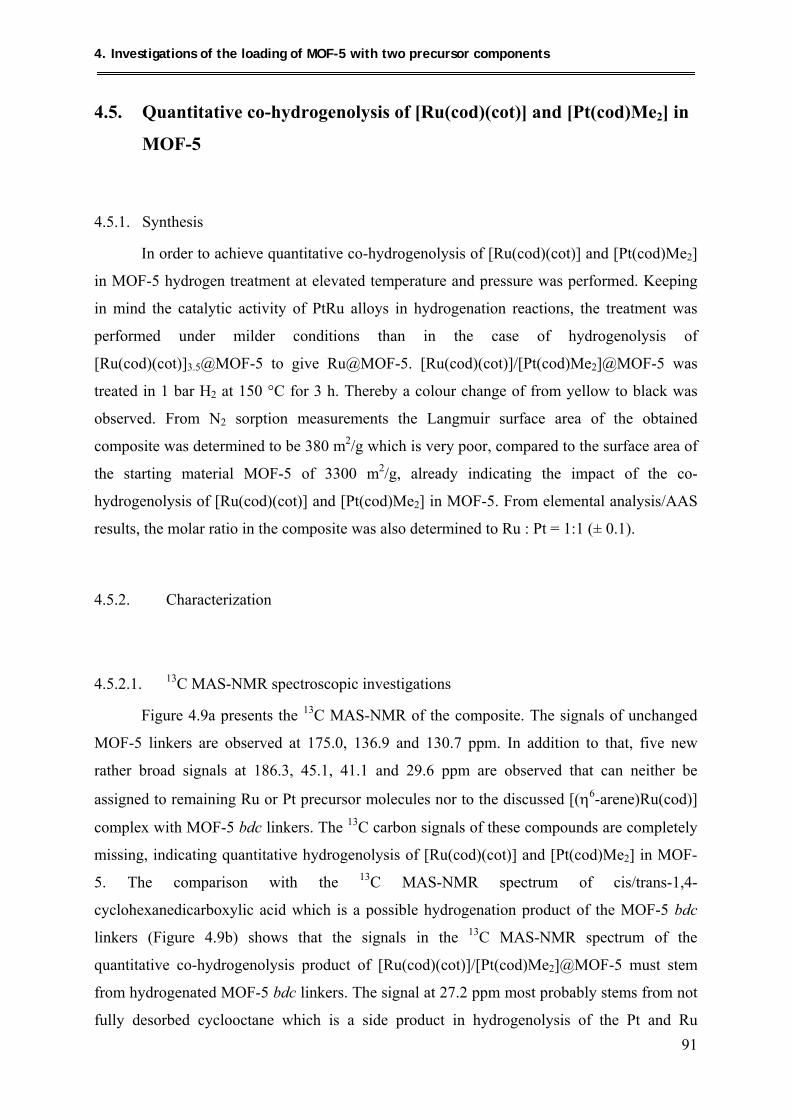
4. Investigations of the loading of MOF-5 with two precursor components
91
4.5. Quantitative co-hydrogenolysis of [Ru(cod)(cot)] and [Pt(cod)Me2] in
MOF-5
4.5.1. Synthesis
In order to achieve quantitative co-hydrogenolysis of [Ru(cod)(cot)] and [Pt(cod)Me2]
in MOF-5 hydrogen treatment at elevated temperature and pressure was performed. Keeping
in mind the catalytic activity of PtRu alloys in hydrogenation reactions, the treatment was
performed under milder conditions than in the case of hydrogenolysis of
[Ru(cod)(cot)]3.5@MOF-5 to give Ru@MOF-5. [Ru(cod)(cot)]/[Pt(cod)Me2]@MOF-5 was
treated in 1 bar H2 at 150 °C for 3 h. Thereby a colour change of from yellow to black was
observed. From N2 sorption measurements the Langmuir surface area of the obtained
composite was determined to be 380 m2/g which is very poor, compared to the surface area of
the starting material MOF-5 of 3300 m2/g, already indicating the impact of the co-
hydrogenolysis of [Ru(cod)(cot)] and [Pt(cod)Me2] in MOF-5. From elemental analysis/AAS
results, the molar ratio in the composite was also determined to Ru : Pt = 1:1 (± 0.1).
4.5.2. Characterization
4.5.2.1. 13C MAS-NMR spectroscopic investigations
Figure 4.9a presents the 13C MAS-NMR of the composite. The signals of unchanged
MOF-5 linkers are observed at 175.0, 136.9 and 130.7 ppm. In addition to that, five new
rather broad signals at 186.3, 45.1, 41.1 and 29.6 ppm are observed that can neither be
assigned to remaining Ru or Pt precursor molecules nor to the discussed [(η6-arene)Ru(cod)]
complex with MOF-5 bdc linkers. The 13C carbon signals of these compounds are completely
missing, indicating quantitative hydrogenolysis of [Ru(cod)(cot)] and [Pt(cod)Me2] in MOF-
5. The comparison with the 13C MAS-NMR spectrum of cis/trans-1,4-
cyclohexanedicarboxylic acid which is a possible hydrogenation product of the MOF-5 bdc
linkers (Figure 4.9b) shows that the signals in the 13C MAS-NMR spectrum of the
quantitative co-hydrogenolysis product of [Ru(cod)(cot)]/[Pt(cod)Me2]@MOF-5 must stem
from hydrogenated MOF-5 bdc linkers. The signal at 27.2 ppm most probably stems from not
fully desorbed cyclooctane which is a side product in hydrogenolysis of the Pt and Ru
4. Investigations of the loading of MOF-5 with two precursor components
92
precursor molecules. Obviously complete conversion of the embedded Ru and Pt precursor
molecules was achieved however partly hydrogenation of the MOF-5 linkers proceeded as
well. Compared to the carbon signals in the 13C MAS-NMR spectrum of the free acid
molecules (Figure 4.9b), the corresponding signals in the 13C MAS-NMR of the composite
material are rather broad. This indicates that the hydrogenated linkers remain bound to the
Zn4O units of the MOF-5 and are therefore more rigid than the free acid molecules. Recently
the synthesis of a metal-organic framework based on Zn4O tetrahedrons linked by
cyclohexanedicarboxylates was
Figure 4.9. 13C MAS-NMR spectra of (a) the quantitative co-hydrogenolysis product of
[Ru(cod)(cot)]/[Pt(cod)Me2]@MOF-5 and (b) cis/trans-1,4-cyclohexanedicarboxylic acid.
4. Investigations of the loading of MOF-5 with two precursor components
93
reported.[139] Therefore the remaining MOF-5 matrix might stay intact even though a fraction
of the bdc linkers was converted to cyclohexanedicarboxylates. Since unchanged MOF-5
signals can be also observed in the 13C MAS-NMR spectrum of the quantitative co-
hydrogenolysis product of [Ru(cod)(cot)]/[Pt(cod)Me2]@MOF-5 (Figure 4.9a) at least part of
the host matrix is most probably intact. Hydrogenation of the linkers possibly occurred in the
close environment of the PtRu species. Upon decomposition [Ru(cod)(cot)]3.5@MOF-5 no
hydrogenation of the MOF-5 linkers was observed in the corresponding 13C MAS-NMR
spectrum. Obviously, the presence of additional Pt species together with Ru nanoparticles
leads to partial hydrogenation of the MOF-5 linkers. The great superior catalytic activity of
RuPt catalysts in hydrogenation of benzene, in contrast to pure Ru or Pt catalyst is literature
known.[140] This effect might be also the reason for the partly hydrogenation of the MOF-5
linkers in the discussed case here. Contributing to that, the hydrogenolysis of [CpPtMe3] in
MOF-5[135] led to a complete break-down of the MOF lattice and large Pt nanoparticles which
hints at a partial hydrogenation of the MOF-5 linkers in that case also. The formation of Pt
nanoparticles in MOF-177 via hydrogenolysis of [Pt(η5-C5H4(CH3))(CH3)3] was shown as
well[55] The authors did not detect hydrogenated MOF-177 linkers in the corresponding 13C
MAS-NMR. The corresponding spectrum was however rather poorly resolved, with spinning
side bands possibly overlapping signals of partially hydrogenated linker molecules.
4.5.2.2. PXRD structural investigations
The powder X-ray diffractogramm of the composite material (top) in comparison to
the powder X-ray diffarctogramm of pure MOF-5 (bottom) is given in Figure 4.10. The
PXRD of the composite shows only very weak remaining reflections of the host matrix MOF-
5, indicating a great loss of crystallinity of the host matrix most probably due to
hydrogenation of a fraction of the MOF-5 bdc linkers. In addition also four broad Bragg
reflections are observed with the most prominent centered at 39.91° 2θ exhibiting a FWHM
(full width at half maximum) of 2.496°. The Bragg reflections stem from the metal
nanospecies formed upon quantitative hydrogenolysis of [Ru(cod)(cot)] and [Pt(cod)Me2] in
MOF-5. Comparison of these Bragg reflections with the simulated PXRD patterns of bulk
(hcp) Ru and (fcc) Pt metal (Figure 4.10b) shows that the reflections cannot be assigned to Ru
nanoparticles. The additional reflections rather exhibit a face centered cubic structure more
similar to platinum. However the enlargement in Figure 4.10b shows that the maximum of the
most prominent
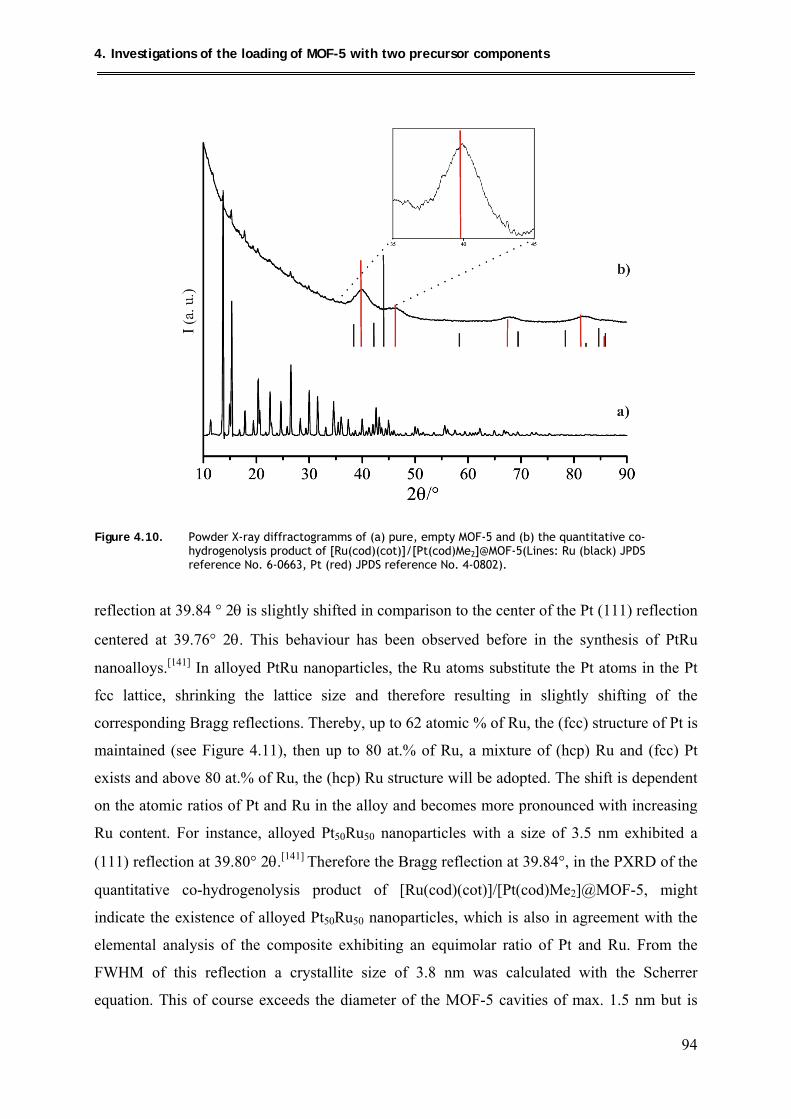
4. Investigations of the loading of MOF-5 with two precursor components
94
Figure 4.10. Powder X-ray diffractogramms of (a) pure, empty MOF-5 and (b) the quantitative co-hydrogenolysis product of [Ru(cod)(cot)]/[Pt(cod)Me2]@MOF-5(Lines: Ru (black) JPDS reference No. 6-0663, Pt (red) JPDS reference No. 4-0802).
reflection at 39.84 ° 2θ is slightly shifted in comparison to the center of the Pt (111) reflection
centered at 39.76° 2θ. This behaviour has been observed before in the synthesis of PtRu
nanoalloys.[141] In alloyed PtRu nanoparticles, the Ru atoms substitute the Pt atoms in the Pt
fcc lattice, shrinking the lattice size and therefore resulting in slightly shifting of the
corresponding Bragg reflections. Thereby, up to 62 atomic % of Ru, the (fcc) structure of Pt is
maintained (see Figure 4.11), then up to 80 at.% of Ru, a mixture of (hcp) Ru and (fcc) Pt
exists and above 80 at.% of Ru, the (hcp) Ru structure will be adopted. The shift is dependent
on the atomic ratios of Pt and Ru in the alloy and becomes more pronounced with increasing
Ru content. For instance, alloyed Pt50Ru50 nanoparticles with a size of 3.5 nm exhibited a
(111) reflection at 39.80° 2θ.[141] Therefore the Bragg reflection at 39.84°, in the PXRD of the
quantitative co-hydrogenolysis product of [Ru(cod)(cot)]/[Pt(cod)Me2]@MOF-5, might
indicate the existence of alloyed Pt50Ru50 nanoparticles, which is also in agreement with the
elemental analysis of the composite exhibiting an equimolar ratio of Pt and Ru. From the
FWHM of this reflection a crystallite size of 3.8 nm was calculated with the Scherrer
equation. This of course exceeds the diameter of the MOF-5 cavities of max. 1.5 nm but is
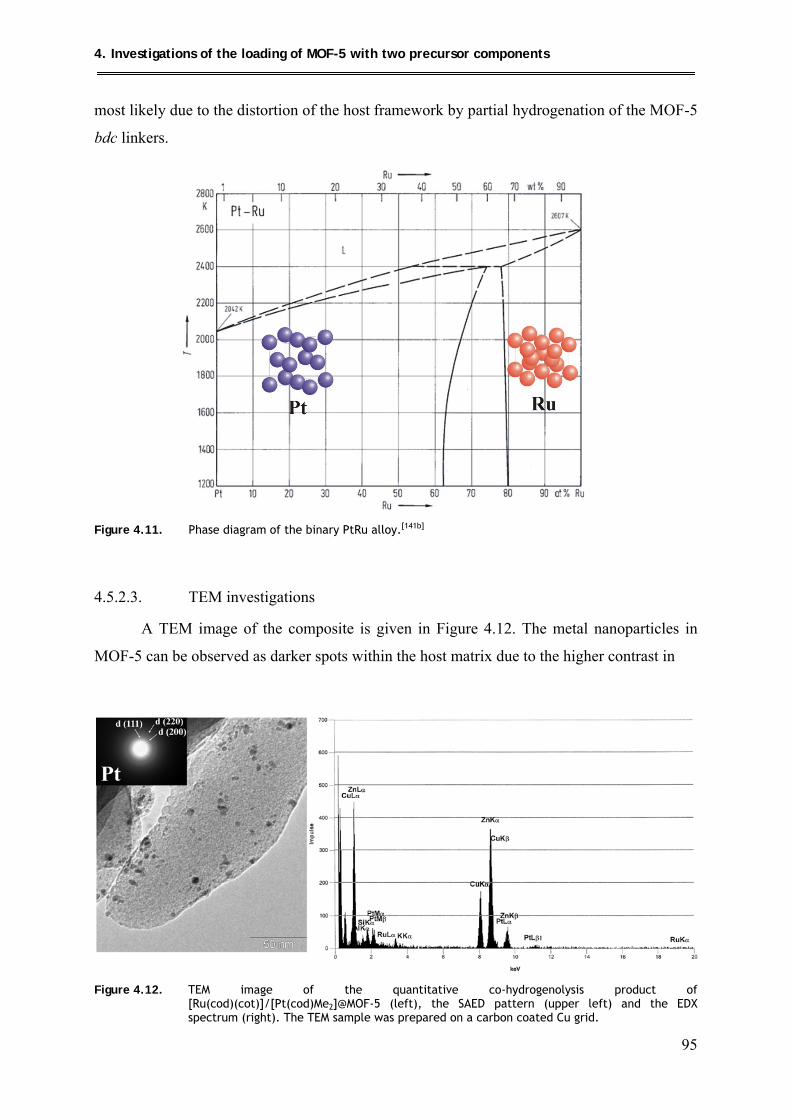
4. Investigations of the loading of MOF-5 with two precursor components
95
most likely due to the distortion of the host framework by partial hydrogenation of the MOF-5
bdc linkers.
Figure 4.11. Phase diagram of the binary PtRu alloy.[141b]
4.5.2.3. TEM investigations
A TEM image of the composite is given in Figure 4.12. The metal nanoparticles in
MOF-5 can be observed as darker spots within the host matrix due to the higher contrast in
Figure 4.12. TEM image of the quantitative co-hydrogenolysis product of
[Ru(cod)(cot)]/[Pt(cod)Me2]@MOF-5 (left), the SAED pattern (upper left) and the EDX spectrum (right). The TEM sample was prepared on a carbon coated Cu grid.
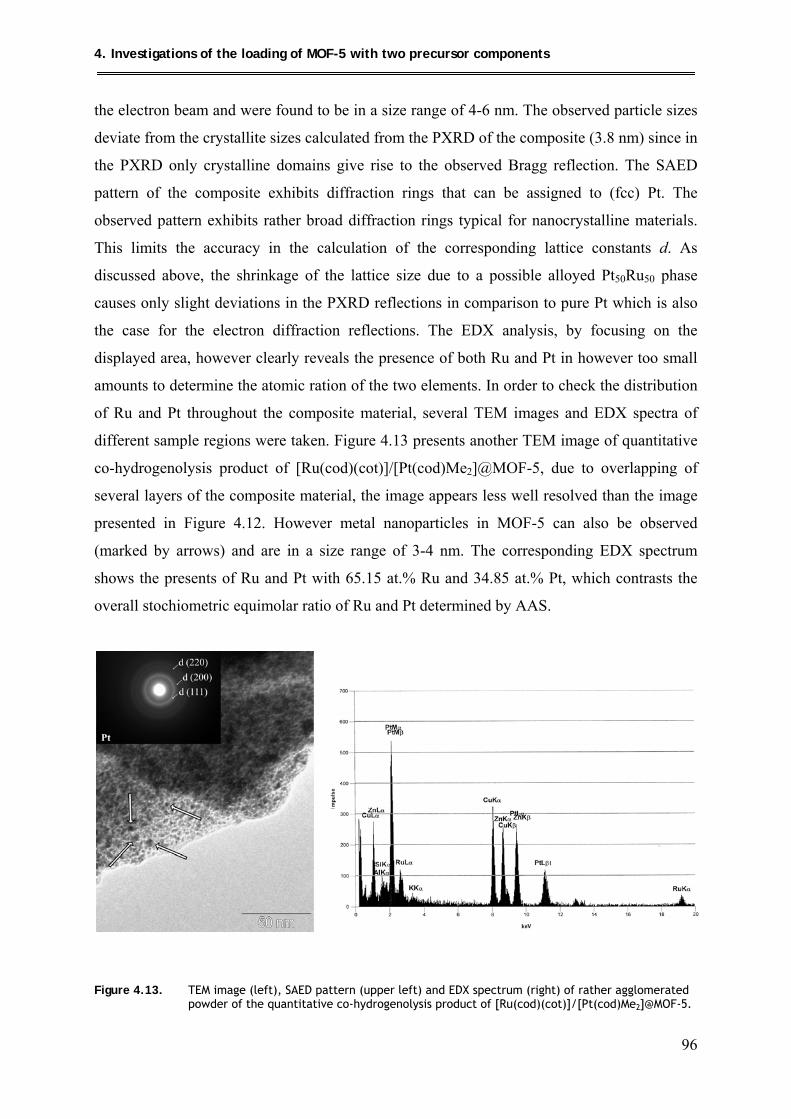
4. Investigations of the loading of MOF-5 with two precursor components
96
the electron beam and were found to be in a size range of 4-6 nm. The observed particle sizes
deviate from the crystallite sizes calculated from the PXRD of the composite (3.8 nm) since in
the PXRD only crystalline domains give rise to the observed Bragg reflection. The SAED
pattern of the composite exhibits diffraction rings that can be assigned to (fcc) Pt. The
observed pattern exhibits rather broad diffraction rings typical for nanocrystalline materials.
This limits the accuracy in the calculation of the corresponding lattice constants d. As
discussed above, the shrinkage of the lattice size due to a possible alloyed Pt50Ru50 phase
causes only slight deviations in the PXRD reflections in comparison to pure Pt which is also
the case for the electron diffraction reflections. The EDX analysis, by focusing on the
displayed area, however clearly reveals the presence of both Ru and Pt in however too small
amounts to determine the atomic ration of the two elements. In order to check the distribution
of Ru and Pt throughout the composite material, several TEM images and EDX spectra of
different sample regions were taken. Figure 4.13 presents another TEM image of quantitative
co-hydrogenolysis product of [Ru(cod)(cot)]/[Pt(cod)Me2]@MOF-5, due to overlapping of
several layers of the composite material, the image appears less well resolved than the image
presented in Figure 4.12. However metal nanoparticles in MOF-5 can also be observed
(marked by arrows) and are in a size range of 3-4 nm. The corresponding EDX spectrum
shows the presents of Ru and Pt with 65.15 at.% Ru and 34.85 at.% Pt, which contrasts the
overall stochiometric equimolar ratio of Ru and Pt determined by AAS.
Figure 4.13. TEM image (left), SAED pattern (upper left) and EDX spectrum (right) of rather agglomerated powder of the quantitative co-hydrogenolysis product of [Ru(cod)(cot)]/[Pt(cod)Me2]@MOF-5.
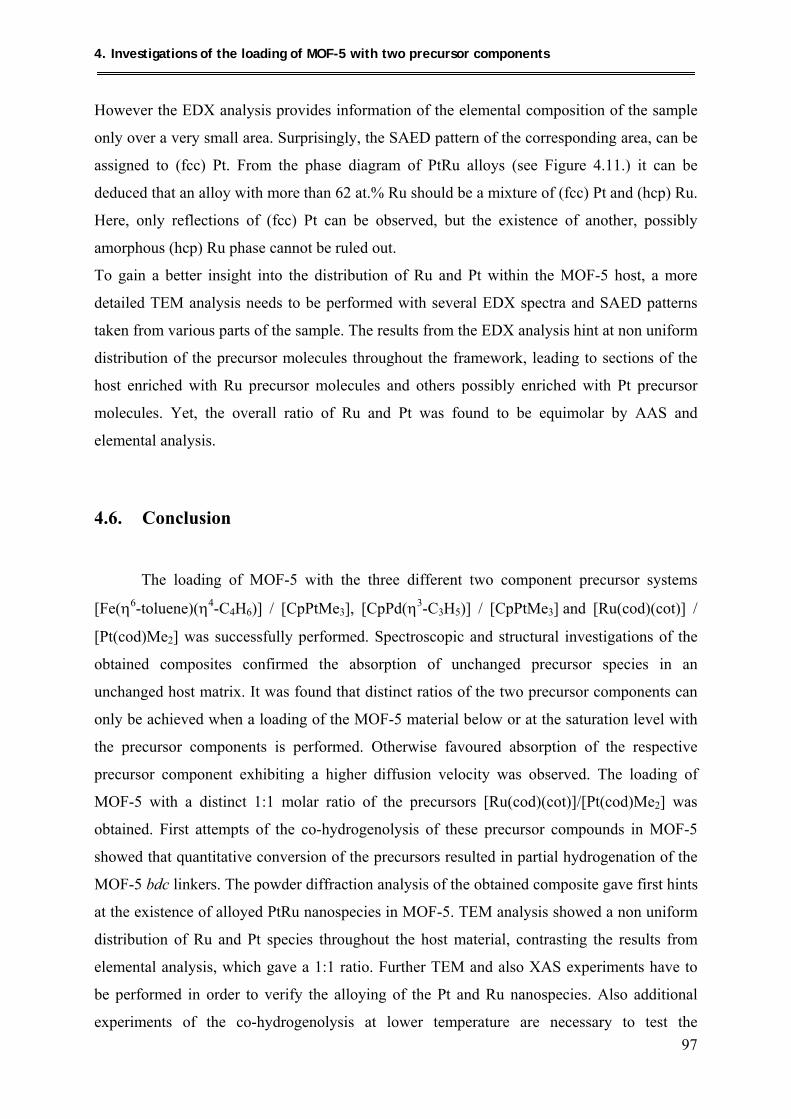
4. Investigations of the loading of MOF-5 with two precursor components
97
However the EDX analysis provides information of the elemental composition of the sample
only over a very small area. Surprisingly, the SAED pattern of the corresponding area, can be
assigned to (fcc) Pt. From the phase diagram of PtRu alloys (see Figure 4.11.) it can be
deduced that an alloy with more than 62 at.% Ru should be a mixture of (fcc) Pt and (hcp) Ru.
Here, only reflections of (fcc) Pt can be observed, but the existence of another, possibly
amorphous (hcp) Ru phase cannot be ruled out.
To gain a better insight into the distribution of Ru and Pt within the MOF-5 host, a more
detailed TEM analysis needs to be performed with several EDX spectra and SAED patterns
taken from various parts of the sample. The results from the EDX analysis hint at non uniform
distribution of the precursor molecules throughout the framework, leading to sections of the
host enriched with Ru precursor molecules and others possibly enriched with Pt precursor
molecules. Yet, the overall ratio of Ru and Pt was found to be equimolar by AAS and
elemental analysis.
4.6. Conclusion
The loading of MOF-5 with the three different two component precursor systems
[Fe(η6-toluene)(η4-C4H6)] / [CpPtMe3], [CpPd(η3-C3H5)] / [CpPtMe3] and [Ru(cod)(cot)] /
[Pt(cod)Me2] was successfully performed. Spectroscopic and structural investigations of the
obtained composites confirmed the absorption of unchanged precursor species in an
unchanged host matrix. It was found that distinct ratios of the two precursor components can
only be achieved when a loading of the MOF-5 material below or at the saturation level with
the precursor components is performed. Otherwise favoured absorption of the respective
precursor component exhibiting a higher diffusion velocity was observed. The loading of
MOF-5 with a distinct 1:1 molar ratio of the precursors [Ru(cod)(cot)]/[Pt(cod)Me2] was
obtained. First attempts of the co-hydrogenolysis of these precursor compounds in MOF-5
showed that quantitative conversion of the precursors resulted in partial hydrogenation of the
MOF-5 bdc linkers. The powder diffraction analysis of the obtained composite gave first hints
at the existence of alloyed PtRu nanospecies in MOF-5. TEM analysis showed a non uniform
distribution of Ru and Pt species throughout the host material, contrasting the results from
elemental analysis, which gave a 1:1 ratio. Further TEM and also XAS experiments have to
be performed in order to verify the alloying of the Pt and Ru nanospecies. Also additional
experiments of the co-hydrogenolysis at lower temperature are necessary to test the

4. Investigations of the loading of MOF-5 with two precursor components
98
quantitative conversion of the precursor molecules while maintaining the unchanged nature of
the host framework MOF-5.
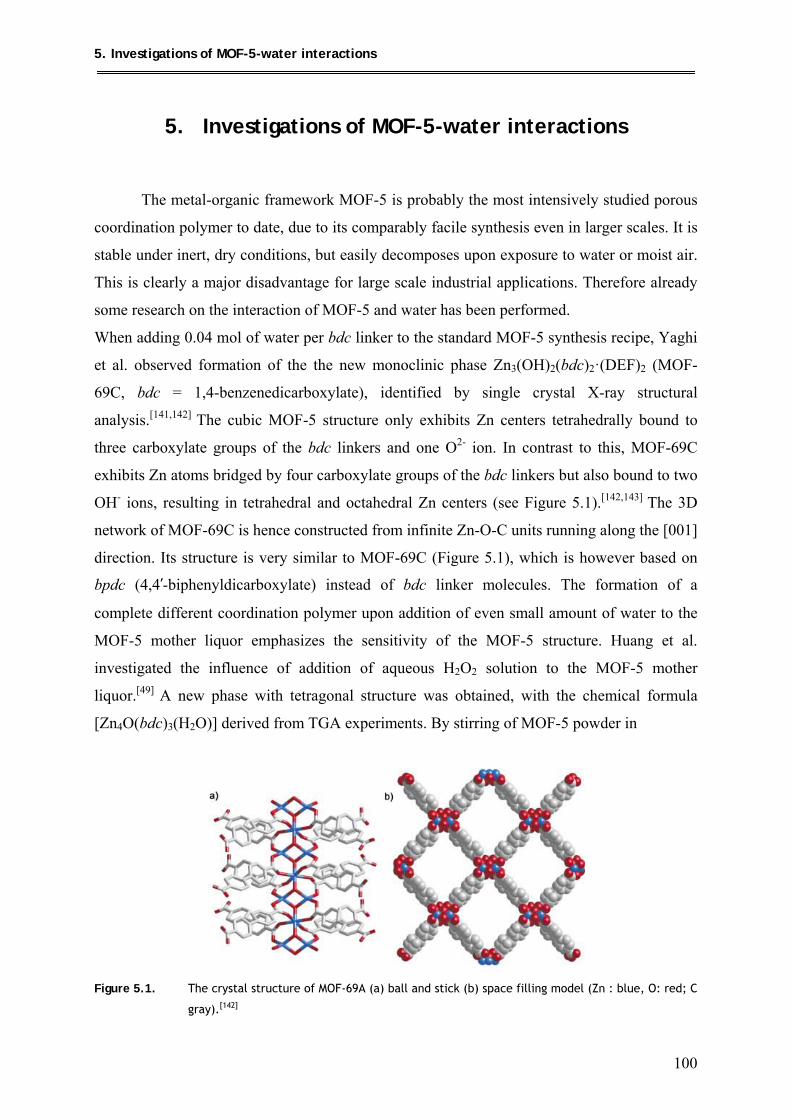
5. Investigations of MOF-5-water interactions
100
5. Investigations of MOF-5-water interactions
The metal-organic framework MOF-5 is probably the most intensively studied porous
coordination polymer to date, due to its comparably facile synthesis even in larger scales. It is
stable under inert, dry conditions, but easily decomposes upon exposure to water or moist air.
This is clearly a major disadvantage for large scale industrial applications. Therefore already
some research on the interaction of MOF-5 and water has been performed.
When adding 0.04 mol of water per bdc linker to the standard MOF-5 synthesis recipe, Yaghi
et al. observed formation of the the new monoclinic phase Zn3(OH)2(bdc)2·(DEF)2 (MOF-
69C, bdc = 1,4-benzenedicarboxylate), identified by single crystal X-ray structural
analysis.[141,142] The cubic MOF-5 structure only exhibits Zn centers tetrahedrally bound to
three carboxylate groups of the bdc linkers and one O2- ion. In contrast to this, MOF-69C
exhibits Zn atoms bridged by four carboxylate groups of the bdc linkers but also bound to two
OH- ions, resulting in tetrahedral and octahedral Zn centers (see Figure 5.1).[142,143] The 3D
network of MOF-69C is hence constructed from infinite Zn-O-C units running along the [001]
direction. Its structure is very similar to MOF-69C (Figure 5.1), which is however based on
bpdc (4,4′-biphenyldicarboxylate) instead of bdc linker molecules. The formation of a
complete different coordination polymer upon addition of even small amount of water to the
MOF-5 mother liquor emphasizes the sensitivity of the MOF-5 structure. Huang et al.
investigated the influence of addition of aqueous H2O2 solution to the MOF-5 mother
liquor.[49] A new phase with tetragonal structure was obtained, with the chemical formula
[Zn4O(bdc)3(H2O)] derived from TGA experiments. By stirring of MOF-5 powder in
Figure 5.1. The crystal structure of MOF-69A (a) ball and stick (b) space filling model (Zn : blue, O: red; C
gray).[142]
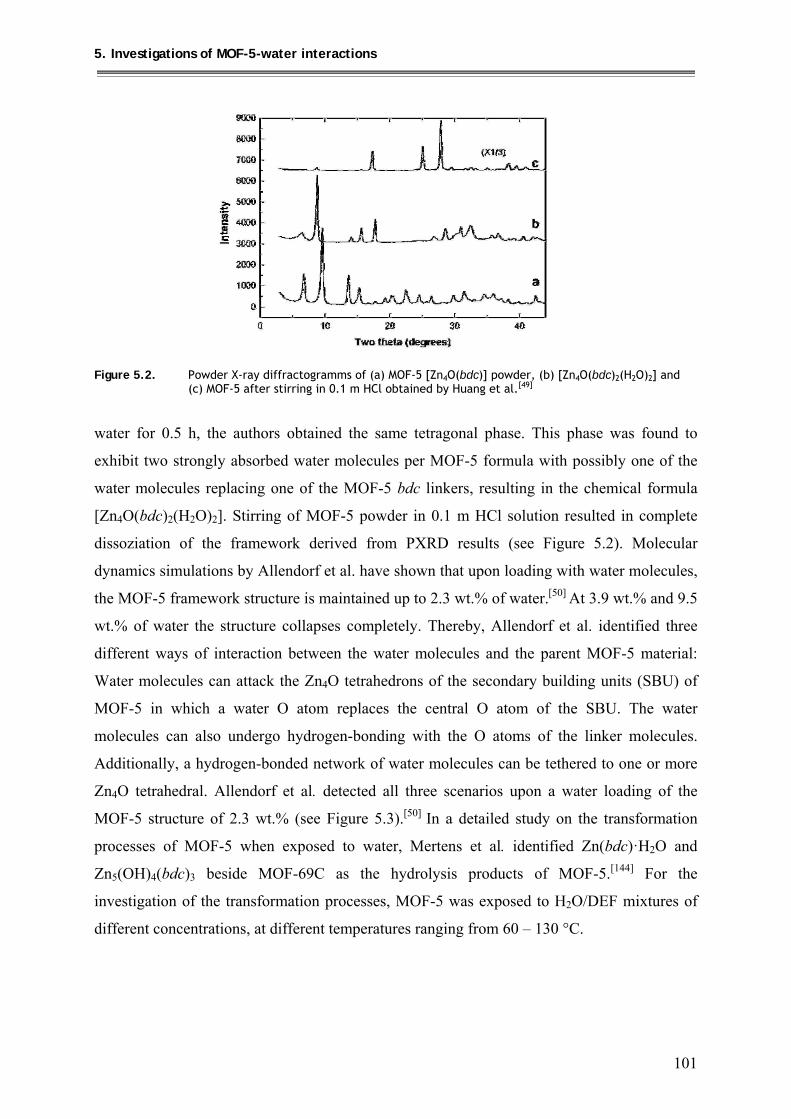
5. Investigations of MOF-5-water interactions
101
Figure 5.2. Powder X-ray diffractogramms of (a) MOF-5 [Zn4O(bdc)] powder, (b) [Zn4O(bdc)2(H2O)2] and
(c) MOF-5 after stirring in 0.1 m HCl obtained by Huang et al.[49]
water for 0.5 h, the authors obtained the same tetragonal phase. This phase was found to
exhibit two strongly absorbed water molecules per MOF-5 formula with possibly one of the
water molecules replacing one of the MOF-5 bdc linkers, resulting in the chemical formula
[Zn4O(bdc)2(H2O)2]. Stirring of MOF-5 powder in 0.1 m HCl solution resulted in complete
dissoziation of the framework derived from PXRD results (see Figure 5.2). Molecular
dynamics simulations by Allendorf et al. have shown that upon loading with water molecules,
the MOF-5 framework structure is maintained up to 2.3 wt.% of water.[50] At 3.9 wt.% and 9.5
wt.% of water the structure collapses completely. Thereby, Allendorf et al. identified three
different ways of interaction between the water molecules and the parent MOF-5 material:
Water molecules can attack the Zn4O tetrahedrons of the secondary building units (SBU) of
MOF-5 in which a water O atom replaces the central O atom of the SBU. The water
molecules can also undergo hydrogen-bonding with the O atoms of the linker molecules.
Additionally, a hydrogen-bonded network of water molecules can be tethered to one or more
Zn4O tetrahedral. Allendorf et al. detected all three scenarios upon a water loading of the
MOF-5 structure of 2.3 wt.% (see Figure 5.3).[50] In a detailed study on the transformation
processes of MOF-5 when exposed to water, Mertens et al. identified Zn(bdc)·H2O and
Zn5(OH)4(bdc)3 beside MOF-69C as the hydrolysis products of MOF-5.[144] For the
investigation of the transformation processes, MOF-5 was exposed to H2O/DEF mixtures of
different concentrations, at different temperatures ranging from 60 – 130 °C.
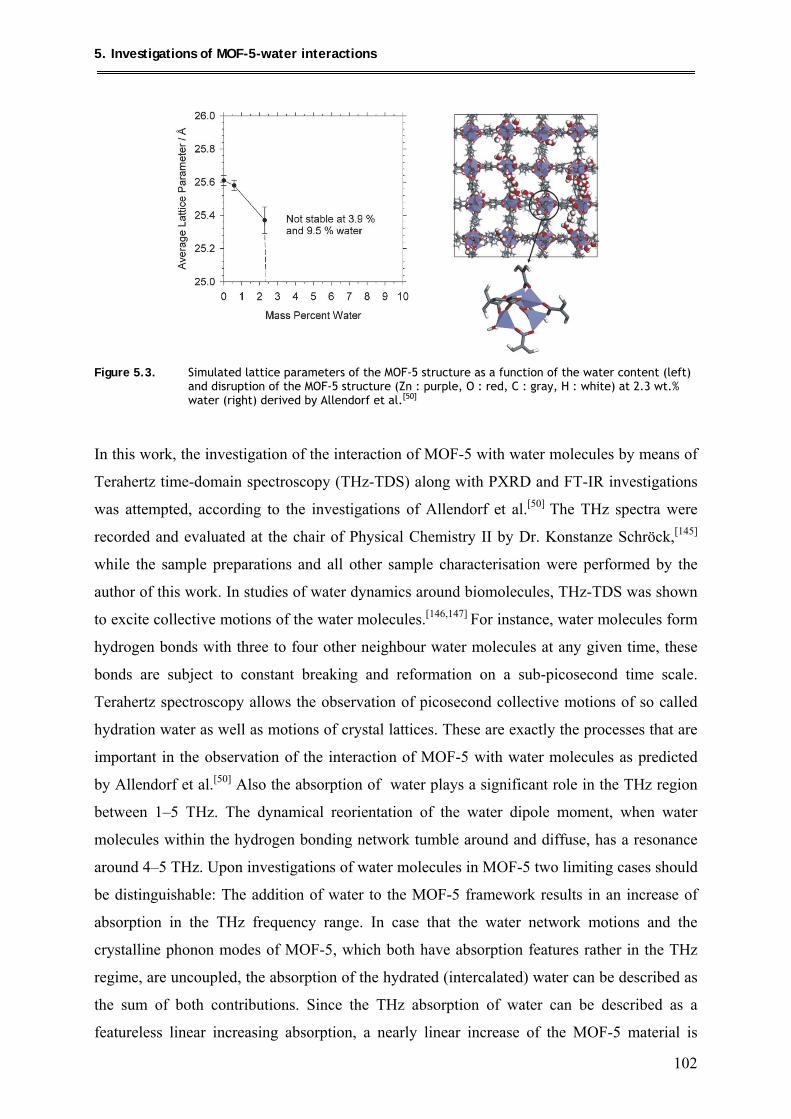
5. Investigations of MOF-5-water interactions
102
Figure 5.3. Simulated lattice parameters of the MOF-5 structure as a function of the water content (left)
and disruption of the MOF-5 structure (Zn : purple, O : red, C : gray, H : white) at 2.3 wt.% water (right) derived by Allendorf et al.[50]
In this work, the investigation of the interaction of MOF-5 with water molecules by means of
Terahertz time-domain spectroscopy (THz-TDS) along with PXRD and FT-IR investigations
was attempted, according to the investigations of Allendorf et al.[50] The THz spectra were
recorded and evaluated at the chair of Physical Chemistry II by Dr. Konstanze Schröck,[145]
while the sample preparations and all other sample characterisation were performed by the
author of this work. In studies of water dynamics around biomolecules, THz-TDS was shown
to excite collective motions of the water molecules.[146,147] For instance, water molecules form
hydrogen bonds with three to four other neighbour water molecules at any given time, these
bonds are subject to constant breaking and reformation on a sub-picosecond time scale.
Terahertz spectroscopy allows the observation of picosecond collective motions of so called
hydration water as well as motions of crystal lattices. These are exactly the processes that are
important in the observation of the interaction of MOF-5 with water molecules as predicted
by Allendorf et al.[50] Also the absorption of water plays a significant role in the THz region
between 1–5 THz. The dynamical reorientation of the water dipole moment, when water
molecules within the hydrogen bonding network tumble around and diffuse, has a resonance
around 4–5 THz. Upon investigations of water molecules in MOF-5 two limiting cases should
be distinguishable: The addition of water to the MOF-5 framework results in an increase of
absorption in the THz frequency range. In case that the water network motions and the
crystalline phonon modes of MOF-5, which both have absorption features rather in the THz
regime, are uncoupled, the absorption of the hydrated (intercalated) water can be described as
the sum of both contributions. Since the THz absorption of water can be described as a
featureless linear increasing absorption, a nearly linear increase of the MOF-5 material is
5. Investigations of MOF-5-water interactions
103
expected upon loading with water molecules. In case of coupling of the dynamics of the
intercalated water molecules and the MOF-5 crystal lattice, a rather different net absorption is
expected. As in the case of the hydrated tri-peptide Alanin,[148] a strong crystal-water
coupling, or a reformation of the crystal structure might be detectable in the THz region,
resulting in considerable frequency shift and appearance of new absorption features in the
corresponding THz spectrum. In addition to the THz measurements, also the structural
properties of the MOF-5 materials after exposure to water were investigated by PXRD
analysis. FT-IR measurements were performed as well to observe possible changes in the
vibrations of the MOF-5 bdc linkers.
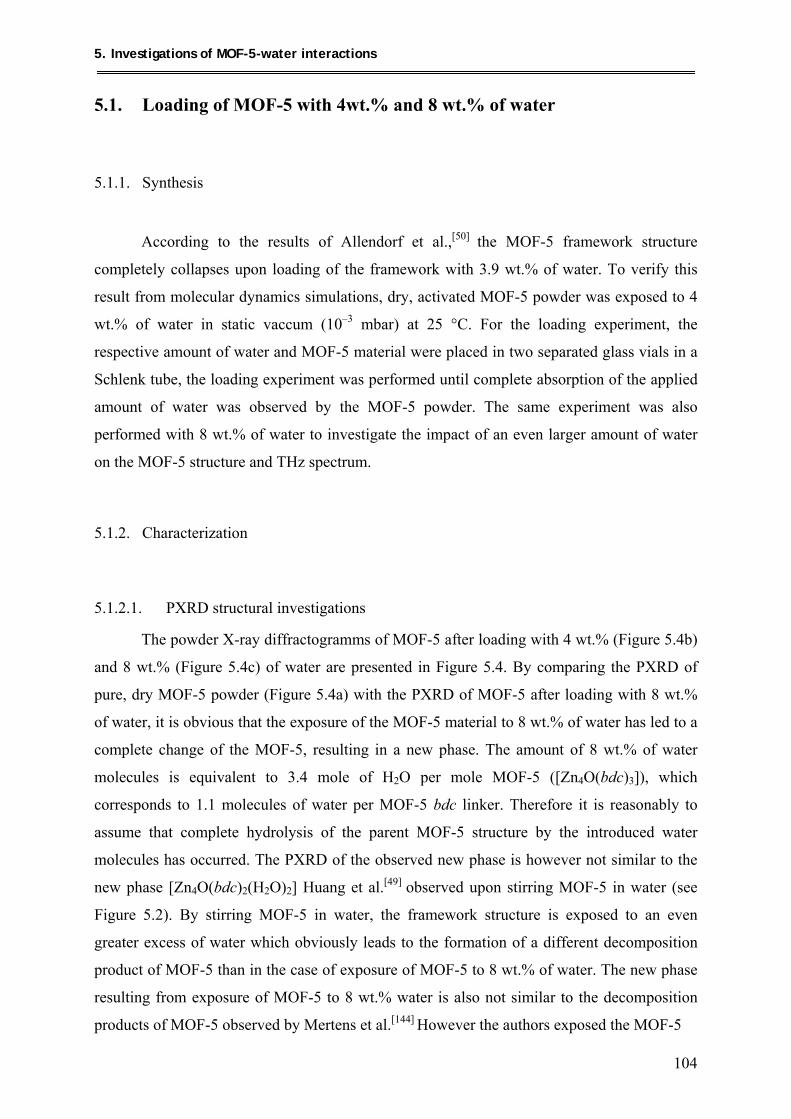
5. Investigations of MOF-5-water interactions
104
5.1. Loading of MOF-5 with 4wt.% and 8 wt.% of water
5.1.1. Synthesis
According to the results of Allendorf et al.,[50] the MOF-5 framework structure
completely collapses upon loading of the framework with 3.9 wt.% of water. To verify this
result from molecular dynamics simulations, dry, activated MOF-5 powder was exposed to 4
wt.% of water in static vaccum (10–3 mbar) at 25 °C. For the loading experiment, the
respective amount of water and MOF-5 material were placed in two separated glass vials in a
Schlenk tube, the loading experiment was performed until complete absorption of the applied
amount of water was observed by the MOF-5 powder. The same experiment was also
performed with 8 wt.% of water to investigate the impact of an even larger amount of water
on the MOF-5 structure and THz spectrum.
5.1.2. Characterization
5.1.2.1. PXRD structural investigations
The powder X-ray diffractogramms of MOF-5 after loading with 4 wt.% (Figure 5.4b)
and 8 wt.% (Figure 5.4c) of water are presented in Figure 5.4. By comparing the PXRD of
pure, dry MOF-5 powder (Figure 5.4a) with the PXRD of MOF-5 after loading with 8 wt.%
of water, it is obvious that the exposure of the MOF-5 material to 8 wt.% of water has led to a
complete change of the MOF-5, resulting in a new phase. The amount of 8 wt.% of water
molecules is equivalent to 3.4 mole of H2O per mole MOF-5 ([Zn4O(bdc)3]), which
corresponds to 1.1 molecules of water per MOF-5 bdc linker. Therefore it is reasonably to
assume that complete hydrolysis of the parent MOF-5 structure by the introduced water
molecules has occurred. The PXRD of the observed new phase is however not similar to the
new phase [Zn4O(bdc)2(H2O)2] Huang et al.[49] observed upon stirring MOF-5 in water (see
Figure 5.2). By stirring MOF-5 in water, the framework structure is exposed to an even
greater excess of water which obviously leads to the formation of a different decomposition
product of MOF-5 than in the case of exposure of MOF-5 to 8 wt.% of water. The new phase
resulting from exposure of MOF-5 to 8 wt.% water is also not similar to the decomposition
products of MOF-5 observed by Mertens et al.[144] However the authors exposed the MOF-5
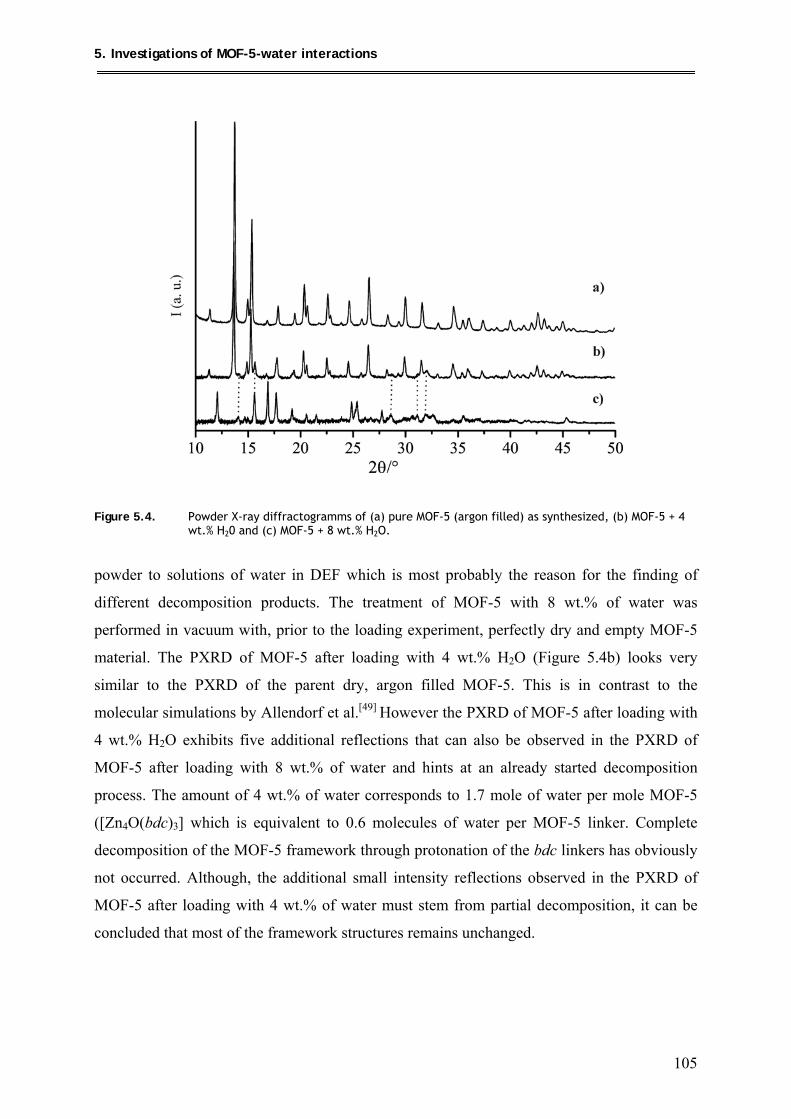
5. Investigations of MOF-5-water interactions
105
Figure 5.4. Powder X-ray diffractogramms of (a) pure MOF-5 (argon filled) as synthesized, (b) MOF-5 + 4
wt.% H20 and (c) MOF-5 + 8 wt.% H2O.
powder to solutions of water in DEF which is most probably the reason for the finding of
different decomposition products. The treatment of MOF-5 with 8 wt.% of water was
performed in vacuum with, prior to the loading experiment, perfectly dry and empty MOF-5
material. The PXRD of MOF-5 after loading with 4 wt.% H2O (Figure 5.4b) looks very
similar to the PXRD of the parent dry, argon filled MOF-5. This is in contrast to the
molecular simulations by Allendorf et al.[49] However the PXRD of MOF-5 after loading with
4 wt.% H2O exhibits five additional reflections that can also be observed in the PXRD of
MOF-5 after loading with 8 wt.% of water and hints at an already started decomposition
process. The amount of 4 wt.% of water corresponds to 1.7 mole of water per mole MOF-5
([Zn4O(bdc)3] which is equivalent to 0.6 molecules of water per MOF-5 linker. Complete
decomposition of the MOF-5 framework through protonation of the bdc linkers has obviously
not occurred. Although, the additional small intensity reflections observed in the PXRD of
MOF-5 after loading with 4 wt.% of water must stem from partial decomposition, it can be
concluded that most of the framework structures remains unchanged.
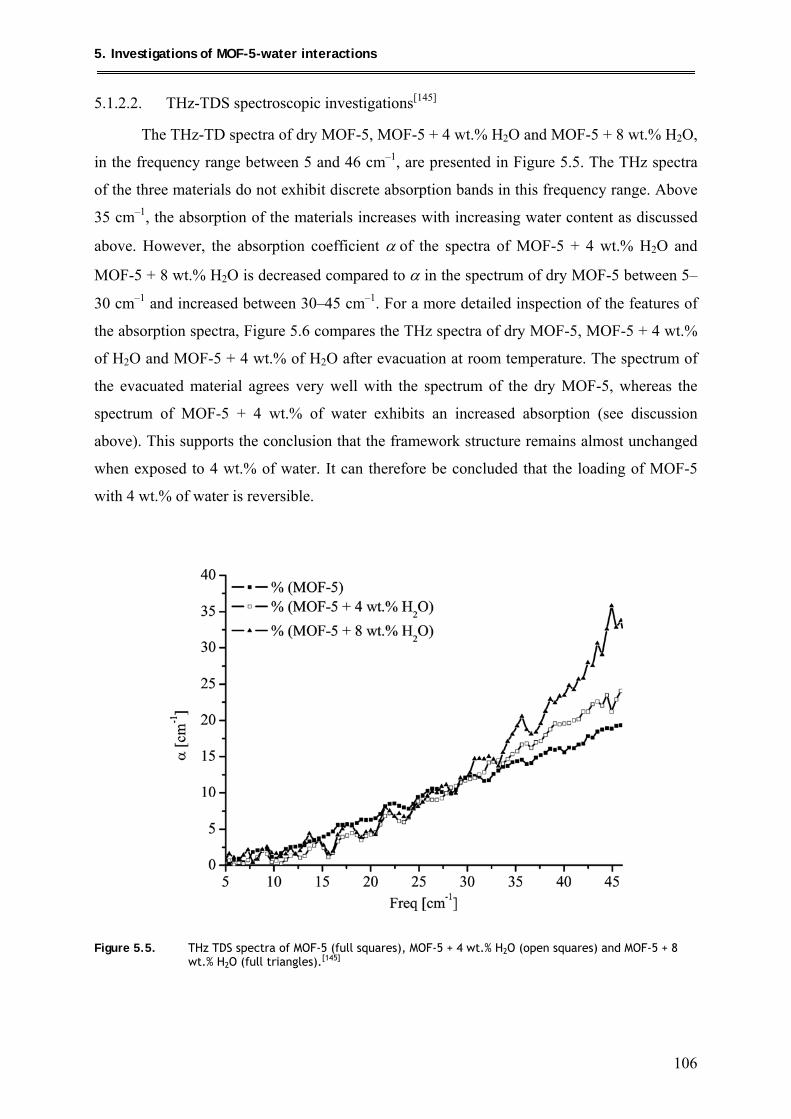
5. Investigations of MOF-5-water interactions
106
5.1.2.2. THz-TDS spectroscopic investigations[145]
The THz-TD spectra of dry MOF-5, MOF-5 + 4 wt.% H2O and MOF-5 + 8 wt.% H2O,
in the frequency range between 5 and 46 cm–1, are presented in Figure 5.5. The THz spectra
of the three materials do not exhibit discrete absorption bands in this frequency range. Above
35 cm–1, the absorption of the materials increases with increasing water content as discussed
above. However, the absorption coefficient α of the spectra of MOF-5 + 4 wt.% H2O and
MOF-5 + 8 wt.% H2O is decreased compared to α in the spectrum of dry MOF-5 between 5–
30 cm–1 and increased between 30–45 cm–1. For a more detailed inspection of the features of
the absorption spectra, Figure 5.6 compares the THz spectra of dry MOF-5, MOF-5 + 4 wt.%
of H2O and MOF-5 + 4 wt.% of H2O after evacuation at room temperature. The spectrum of
the evacuated material agrees very well with the spectrum of the dry MOF-5, whereas the
spectrum of MOF-5 + 4 wt.% of water exhibits an increased absorption (see discussion
above). This supports the conclusion that the framework structure remains almost unchanged
when exposed to 4 wt.% of water. It can therefore be concluded that the loading of MOF-5
with 4 wt.% of water is reversible.
Figure 5.5. THz TDS spectra of MOF-5 (full squares), MOF-5 + 4 wt.% H2O (open squares) and MOF-5 + 8 wt.% H2O (full triangles).[145]
5. Investigations of MOF-5-water interactions
107
Figure 5.6. Comparison of the THz spectra of dry MOF-5 (full squares), MOF-5 + 4 wt.% H2O (open squares) and MOF-5 + 4 wt.% H2O after evacuation (full triangles). [145]
The same comparison for MOF-5 + 8 wt.% H2O is given in Figure 5.7. The THz spectra of
dry MOF-5, MOF-5 + 8 wt.% H2O and MOF-5 + 8 wt.% of H2O after evacuation in dynamic
vacuum at 200 °C for 24 h are presented. Since the PXRD of MOF-5 + 8 wt.% H2O looked
strikingly different from the starting material MOF-5, evacuation at elevated temperature was
performed in order to reobtain the parent material. However, the PXRD of the evacuated
material looked akin to the loaded material MOF-5 + 8 wt.% H2O. Also, the THz spectrum of
the evacuated material looks rather different from the THz spectrum of dry MOF-5. Different
from MOF-5 + 4 wt.% H2O, evacuation of the material loaded with the higher water content
did not lead to a THz spectrum similar to dry MOF-5. Obviously hydration above 4 wt.% of
water has led to irreversible decomposition of the MOF-5 material. The changed crystal
structure gives rise to measurable changes in the collective network motions of the framework
as can be probed by the corresponding THz TD spectrum. This confirms the thesis of
Allendorf et al.,[49] that exposure of MOF-5 to water contents of or above 4 wt.% H2O leads to
complete decomposition of the MOF-5 structure to some extent. From the close similarity of
the THz spectra of MOF-5 + 4 wt.% H2O after prolonged evacuation and dry MOF-5 it was
concluded that the loading of MOF-5 with 4 wt.% H2O is reversible. This indicates that there
is no coupling between the vibrations of the water molecules and the MOF-5 lattice. In this
case, the both contributions of additional water absorptions due to the loading of MOF-5 with
water and the low frequency spectrum of the MOF-5 excitations in the THz should be simply
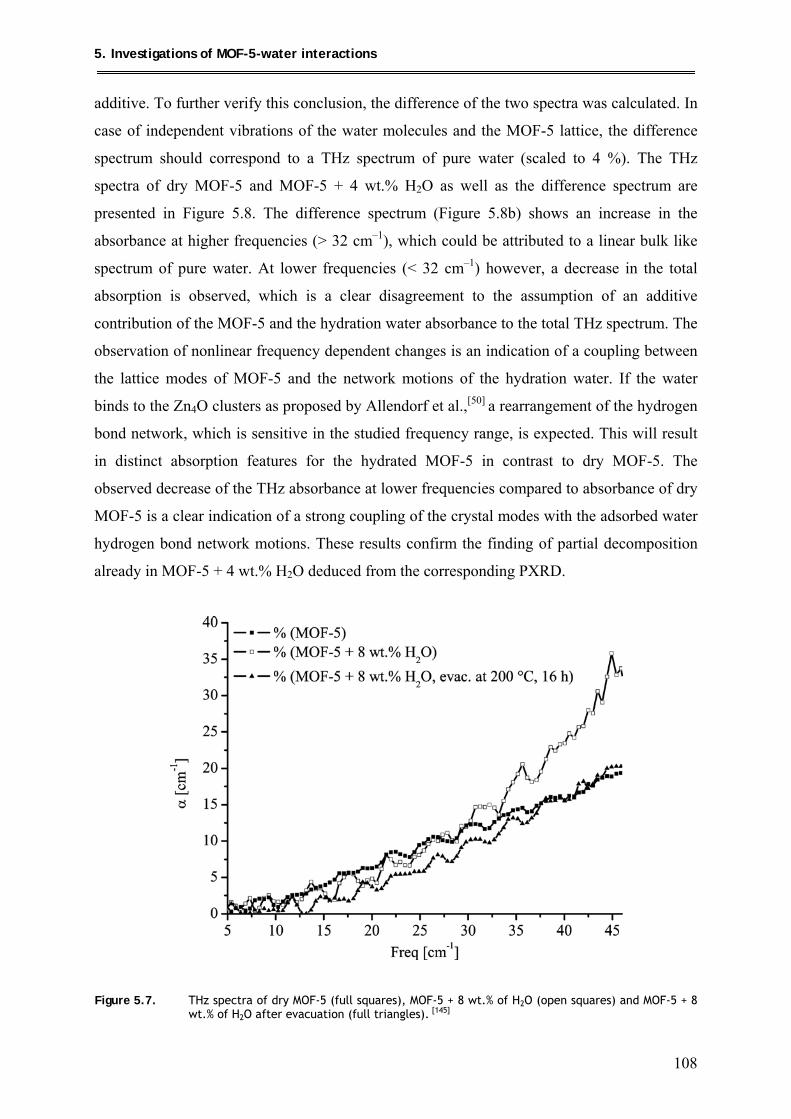
5. Investigations of MOF-5-water interactions
108
additive. To further verify this conclusion, the difference of the two spectra was calculated. In
case of independent vibrations of the water molecules and the MOF-5 lattice, the difference
spectrum should correspond to a THz spectrum of pure water (scaled to 4 %). The THz
spectra of dry MOF-5 and MOF-5 + 4 wt.% H2O as well as the difference spectrum are
presented in Figure 5.8. The difference spectrum (Figure 5.8b) shows an increase in the
absorbance at higher frequencies (> 32 cm–1), which could be attributed to a linear bulk like
spectrum of pure water. At lower frequencies (< 32 cm–1) however, a decrease in the total
absorption is observed, which is a clear disagreement to the assumption of an additive
contribution of the MOF-5 and the hydration water absorbance to the total THz spectrum. The
observation of nonlinear frequency dependent changes is an indication of a coupling between
the lattice modes of MOF-5 and the network motions of the hydration water. If the water
binds to the Zn4O clusters as proposed by Allendorf et al.,[50] a rearrangement of the hydrogen
bond network, which is sensitive in the studied frequency range, is expected. This will result
in distinct absorption features for the hydrated MOF-5 in contrast to dry MOF-5. The
observed decrease of the THz absorbance at lower frequencies compared to absorbance of dry
MOF-5 is a clear indication of a strong coupling of the crystal modes with the adsorbed water
hydrogen bond network motions. These results confirm the finding of partial decomposition
already in MOF-5 + 4 wt.% H2O deduced from the corresponding PXRD.
Figure 5.7. THz spectra of dry MOF-5 (full squares), MOF-5 + 8 wt.% of H2O (open squares) and MOF-5 + 8 wt.% of H2O after evacuation (full triangles). [145]
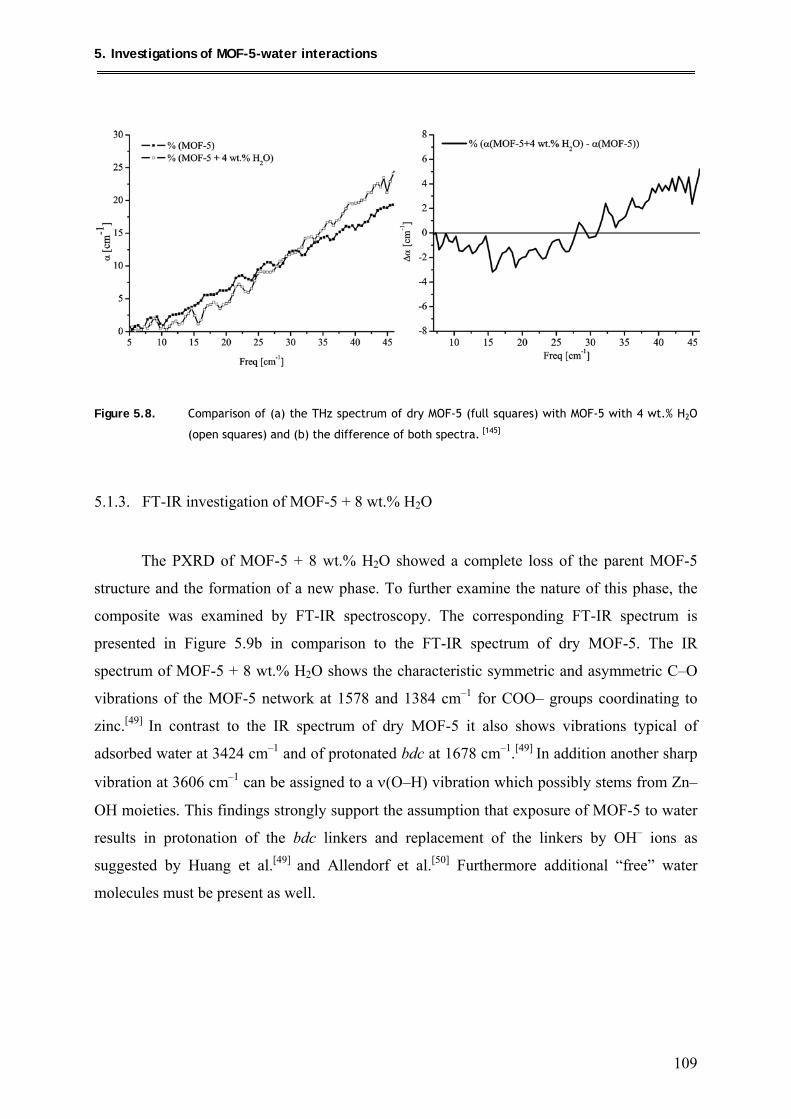
5. Investigations of MOF-5-water interactions
109
Figure 5.8. Comparison of (a) the THz spectrum of dry MOF-5 (full squares) with MOF-5 with 4 wt.% H2O
(open squares) and (b) the difference of both spectra. [145]
5.1.3. FT-IR investigation of MOF-5 + 8 wt.% H2O
The PXRD of MOF-5 + 8 wt.% H2O showed a complete loss of the parent MOF-5
structure and the formation of a new phase. To further examine the nature of this phase, the
composite was examined by FT-IR spectroscopy. The corresponding FT-IR spectrum is
presented in Figure 5.9b in comparison to the FT-IR spectrum of dry MOF-5. The IR
spectrum of MOF-5 + 8 wt.% H2O shows the characteristic symmetric and asymmetric C–O
vibrations of the MOF-5 network at 1578 and 1384 cm–1 for COO– groups coordinating to
zinc.[49] In contrast to the IR spectrum of dry MOF-5 it also shows vibrations typical of
adsorbed water at 3424 cm–1 and of protonated bdc at 1678 cm–1.[49] In addition another sharp
vibration at 3606 cm–1 can be assigned to a ν(O–H) vibration which possibly stems from Zn–
OH moieties. This findings strongly support the assumption that exposure of MOF-5 to water
results in protonation of the bdc linkers and replacement of the linkers by OH– ions as
suggested by Huang et al.[49] and Allendorf et al.[50] Furthermore additional “free” water
molecules must be present as well.
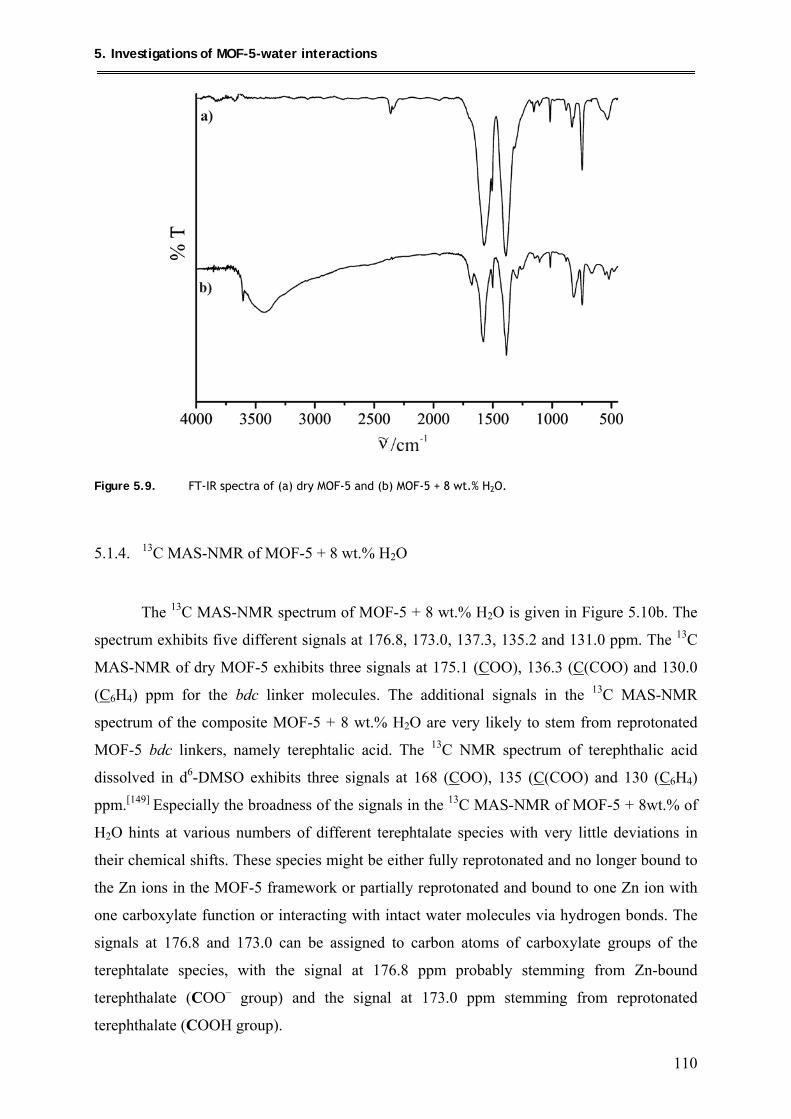
5. Investigations of MOF-5-water interactions
110
Figure 5.9. FT-IR spectra of (a) dry MOF-5 and (b) MOF-5 + 8 wt.% H2O.
5.1.4. 13C MAS-NMR of MOF-5 + 8 wt.% H2O
The 13C MAS-NMR spectrum of MOF-5 + 8 wt.% H2O is given in Figure 5.10b. The
spectrum exhibits five different signals at 176.8, 173.0, 137.3, 135.2 and 131.0 ppm. The 13C
MAS-NMR of dry MOF-5 exhibits three signals at 175.1 (COO), 136.3 (C(COO) and 130.0
(C6H4) ppm for the bdc linker molecules. The additional signals in the 13C MAS-NMR
spectrum of the composite MOF-5 + 8 wt.% H2O are very likely to stem from reprotonated
MOF-5 bdc linkers, namely terephtalic acid. The 13C NMR spectrum of terephthalic acid
dissolved in d6-DMSO exhibits three signals at 168 (COO), 135 (C(COO) and 130 (C6H4)
ppm.[149] Especially the broadness of the signals in the 13C MAS-NMR of MOF-5 + 8wt.% of
H2O hints at various numbers of different terephtalate species with very little deviations in
their chemical shifts. These species might be either fully reprotonated and no longer bound to
the Zn ions in the MOF-5 framework or partially reprotonated and bound to one Zn ion with
one carboxylate function or interacting with intact water molecules via hydrogen bonds. The
signals at 176.8 and 173.0 can be assigned to carbon atoms of carboxylate groups of the
terephtalate species, with the signal at 176.8 ppm probably stemming from Zn-bound
terephthalate (COO– group) and the signal at 173.0 ppm stemming from reprotonated
terephthalate (COOH group).
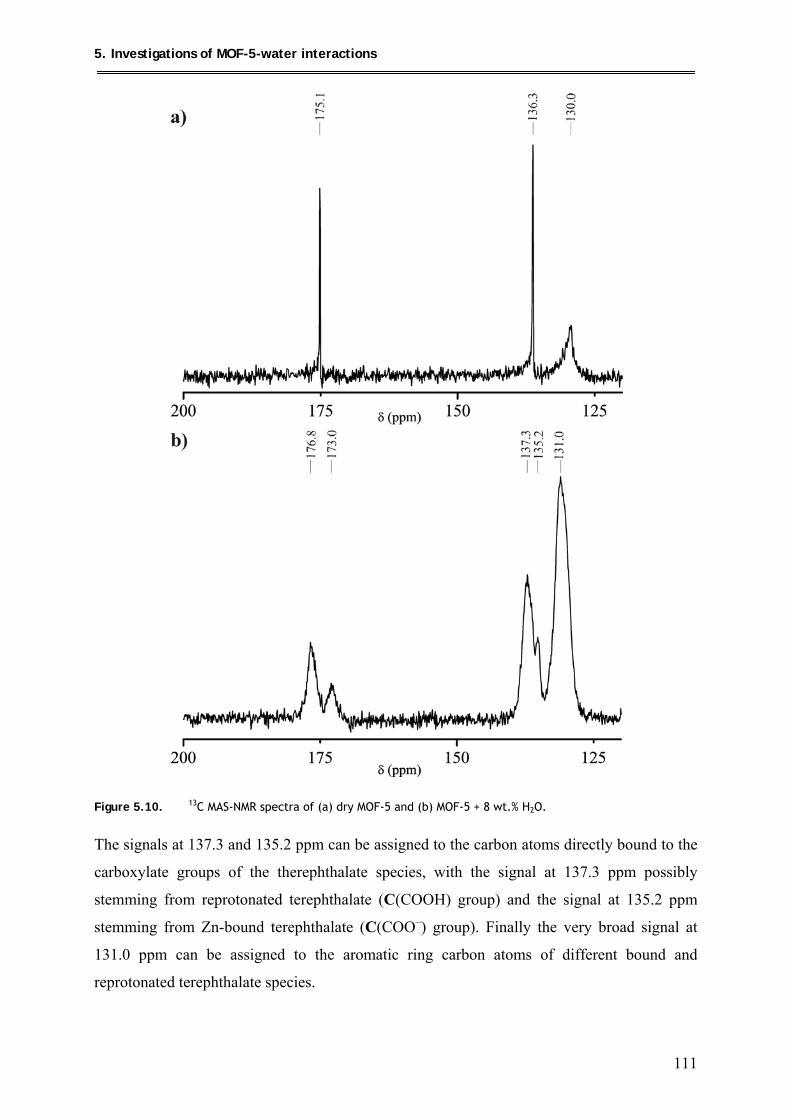
5. Investigations of MOF-5-water interactions
111
Figure 5.10. 13C MAS-NMR spectra of (a) dry MOF-5 and (b) MOF-5 + 8 wt.% H2O.
The signals at 137.3 and 135.2 ppm can be assigned to the carbon atoms directly bound to the
carboxylate groups of the therephthalate species, with the signal at 137.3 ppm possibly
stemming from reprotonated terephthalate (C(COOH) group) and the signal at 135.2 ppm
stemming from Zn-bound terephthalate (C(COO–) group). Finally the very broad signal at
131.0 ppm can be assigned to the aromatic ring carbon atoms of different bound and
reprotonated terephthalate species.
5. Investigations of MOF-5-water interactions
112
5.2. Conclusions
The interaction of MOF-5 and water was investigated by means of PXRD, THz, FT-IR
and 13C MAS-NMR spectroscopy. The loading experiments were performed in vacuum with
dry, empty MOF-5 powders. Complete decomposition of MOF-5 upon exposure to 8 wt.% of
water was found, whereas upon exposure to 4 wt.% H2O, the framework remained almost
unchanged. THz experiments confirmed the reaction of the intercalated water molecules and
the MOF-5 framework. Coupling of the crystal modes of the framework and the absorbed
water hydrogen bond network motions was observed already in MOF-5 + 4 wt.% of H2O.
This proves the sensitivity of MOF-5 towards even small amount of water. The PXRD of
MOF-5 + 8 wt.% of H2O confirmed the formation of a new phase that has not yet been
observed in the literature. However, in the reports on the reactivity of MOF-5 towards water,
the water was either added during the synthesis of MOF-5[49,141,142] or the MOF-5 materials are
stirred in pure water or water/DEF solutions.[49,143] Treatment of MOF-5 with water vapour in
vacuum led to a different kind of decomposition product. The examination of the
decomposition product by FT-IR and 13C MAS-NMR spectroscopy showed the existence of
partially reprotonated bdc linkers and additional water molecules in this material which is in
accordance to earlier reports on the reactivity of MOF-5 towards water.
6. Summary and Outlook
114
6. Summary and Outlook
Synthesis and characterisation of Ru@MOF-5
This work presents the synthesis of Ru@MOF-5, by hydrogenolysis of [Ru(cod)(cot)]
in MOF-5. Since Ru nanoparticle and colloid synthesis in other porous supports or in solution
is well documented in the literature, a classification of MOF-5 as support matrix by
comparing the properties of Ru@MOF-5 to the properties of other Ru nanospecies is possible.
The intercalated Ru precursor molecules were found to be highly fluxional and behaving
almost as in solution. This behavior clearly differentiates MOF-5 from other solid support
matrixes like zeolites, which undergo rather strong interactions with intercalated guest
molecules and nanoparticles, due to, e.g., reactive surface Si–OH groups. The hydrogenolysis
of [Ru(cod)(cot)] in MOF-5 at mild conditions resulted in a side reaction between precursor
{Ru(cod)} fragments and MOF-5 linkers, as it is known from hydrogenolysis of the precursor
in aromatic solvents. Quantitative hydrogenolysis could only be obtained by prolonged
treatment under elevated H2 pressure and temperature. The resulting Ru nanoparticles
exhibited a surprisingly high surface hydride mobility. Due to obviously rather weak
interactions between the MOF-5 host and the embedded particles, the surface hydrides adopt a
mobility that is even higher than the mobility on Ru colloids stabilized by organic surfactants,
which hints at a possibly superior activity of Ru@MOF-5 in hydrogenation catalysis.
However, a preliminary catalytic test revealed rather low activity of the composite, certainly
the reaction conditions need to be optimized for Ru@MOF-5. Tomographical TEM
measurements showed that most of the Ru nanoparticles are located at the surface of the
MOF-5 nanocrystallites. This might be due to the rather harsh conditions for the quantitative
hydrogenolysis of the Ru precursor molecules and possibly also due to the weak MOF-5-
nanoparticle interactions which might even allow small metal clusters to diffuse to the outer
regions of the nanocrystallites. Precursor molecules that can be decomposed to metal
nanoparticles at more gentle conditions may lead to a more uniform distribution.
Loading of MOF-5 with two precursor components
In this work, the simultaneous loading of MOF-5 with two metal precursor
components was investigated, using the precursor compounds: [Fe(η6-toluene)(η4-
6. Summary and Outlook
115
C4H6)]/[CpPtMe3], [CpPd(η3-C3H5)]/[CpPtMe3] and [Ru(cod)(cot)]/[Pt(cod)Me2]. The
synthesis of bimetallic nanoparticles in MOF-5 and MOFs in general is clearly a reasonable
continuation of the synthesis of metal or metal oxide nanoparticles in MOFs performed so far.
However, especially the adjustment of a certain molar ratio between the intercalated precursor
molecules in MOF-5, which is an important prerequisite for the synthesis of functional alloys,
proved to be rather difficult to achieve. When saturated loading, i.e. loading of MOF-5 with
two different precursor components in such a way, that all MOF-5 cavities are completely
filled with precursor molecules, was attempted, enrichment of the precursor component,
which is absorbed faster, was observed. However loading below the maximum loading level
of MOF-5 with the two precursor components [Ru(cod)(cot)] and [Pt(cod)Me2] was obtained
in a equimolar precursor ratio. In a similar way, it should be possible to load MOF-5 with
other two precursor components in a defined molar ratio.
Co-decomposition of two precursor components in MOF-5
In this work the co-hydrogenolysis of [Ru(cod)(cot)]/[Pt(cod)Me2]@MOF-5 was
attempted. Quantitative decomposition of the precursors was achieved, however partial
hydrogenation of the MOF-5 bdc linkers occurred at the same time. Analysis of the obtained
composite material by TEM, revealed a non uniform distribution of Ru and Pt throughout the
MOF-5 host. Although, elemental and AAS analysis of the composite revealed an Pt/Ru = 1/1
ratio, EDX analysis revealed enrichment of Ru in parts of the nanocrystallites of the
composite material. This hints at an also non uniform distribution of the Ru and Pt precursor
molecules in MOF-5, prior to the hydrogenolysis. In addition, the hydrogenolysis of the Ru
precursor obviously occurs faster than that of the Pt precursor. Hydrogenolysis of
[Ru(cod)(cot)]/[Pt(cod)Me2]@MOF-5 at mild conditions led to partial decomposition of the
Ru precursor molecules, whereas the Pt precursor molecules remained unchanged. The
formation of Ru nanoparticles prior to the start of formation of Pt clusters can also lead to Ru
enriched parts of the host framework and furthermore also complicates the formation of a
nanoalloy. The PXRD (and SAED) of the obtained Pt/Ru@MOF-5 composite revealed
reflections assignable to (fcc) Pt, with the reflection maxima however slightly shifted to
higher 2θ values. This finding is a hint at possibly alloyed Pt/Ru species, since PtRu alloys
adopt the (fcc) Pt structure up to 62 at.% of Ru. However, further TEM and also XAS
6. Summary and Outlook
116
measurements need to be performed to examine the nature of the obtained species in more
detail.
Investigations of the MOF-5-water interactions
The interactions of 4 and 8wt.% water with MOF-5 were investigated by THz
spectroscopy in combination with PXRD, FT-IR and MAS-NMR spectroscopy. The loading
of MOF-5 with 8 wt.% H2O led to a complete conversion of the parent MOF-5 structure and
to the formation of a new phase. Upon loading with 4 wt.% of H2O, the MOF-5 structure was
remained, however, in the corresponding PXRD, additional reflections from the
decomposition product were detected. The analysis of the composites by THz spectroscopy
showed that loading of MOF-5 with 4 wt.% H2O is reversible, the water can be removed in
vacuum and the resulting material exhibited a THz spectrum akin to dry MOF-5. However,
coupling of the crystal modes of the framework and the absorbed water hydrogen bond
network motions was observed already in MOF-5 + 4 wt.% of H2O and was found to be even
more distinct in the case of MOF-5 + 8wt.%. This proves the sensitivity of MOF-5 towards
even small amount of water.
Future perspectives for the synthesis of metals@MOF-5
The obtained results on the properties of Ru@MOF-5 classify MOF-5 as a novel
stabilization matrix with properties beyond conventional porous support matrices. Especially
the weak interactions with the embedded nanoparticles, which still allow stabilization of very
small nanoparticles (< 3 nm) at the same time, assign MOF-5 to be a very fascinating support
matrix for nanoparticles, especially in catalytic reactions. However, the sensitivity of MOF-5
towards even small amount of water clearly limits the application of metal@MOF-5 to a
certain extent. For future investigations of Ru nanoparticles embedded in metal-organic
frameworks other suitable MOFs need to be investigated. Especially the ZIF materials appear
to be very promising stabilization matrices due to their extremely high chemical stability.
Also, unwanted side reactions with the imidazolate linkers during precursor hydrogenolysis
are rather unlikely. The rather small pore diameters of these materials (comparable to those of
zeolites) might be the only limitation in loading with MOCVD precursor molecules. Also
MIL-53 (Al based) and MIL-101 (Cr based) immerge as suitable support matrices for
nanoparticles.
6. Summary and Outlook
117
The first results from co-hydrogenolysis of two precursor components in MOF-5 show the
general possibility of synthesizing bimetallic nanoparticles in MOFs. Different from co-
hydrogenolysis in solution which usually occurs under rapid stirring of the solution, the
reaction in MOFs is clearly limited by the distribution of the precursor molecules within the
host matrix. However, additional experiments need to be performed to investigate the
obtained already synthesized Pt/Ru species. Certainly, co-hydrogenolysis experiments at
various temperatures and pressures, followed by detailed TEM and XAS analysis have to be
performed in order to find the optimum reaction conditions for the formation of PtRu species
in an intact host matrix. The use of a more labile Pt precursor that undergoes hydrogenolysis
more readily might also be examined. Also the investigation of the synthesis of other
functional bimetallic nanoparticles in MOF, whose synthesis in solution is very well studied,
e.g. CuZn, AuPd, AuPt, appears feasible.
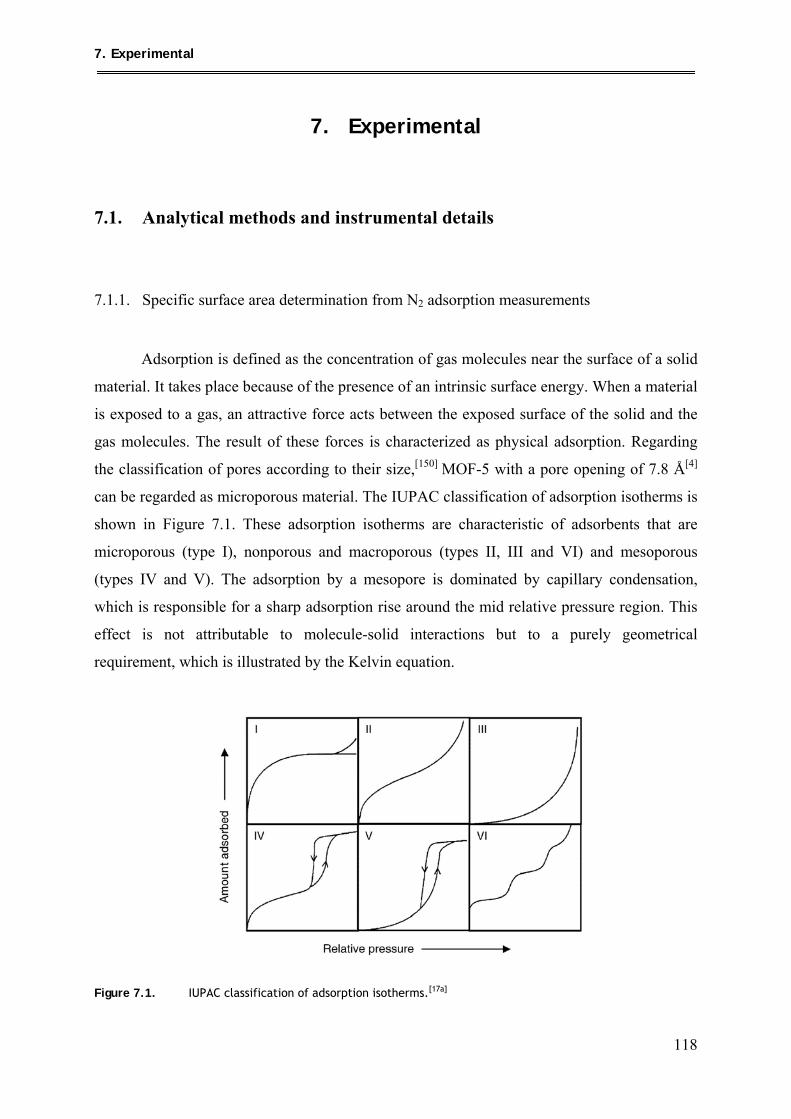
7. Experimental
118
7. Experimental
7.1. Analytical methods and instrumental details
7.1.1. Specific surface area determination from N2 adsorption measurements
Adsorption is defined as the concentration of gas molecules near the surface of a solid
material. It takes place because of the presence of an intrinsic surface energy. When a material
is exposed to a gas, an attractive force acts between the exposed surface of the solid and the
gas molecules. The result of these forces is characterized as physical adsorption. Regarding
the classification of pores according to their size,[150] MOF-5 with a pore opening of 7.8 Å[4]
can be regarded as microporous material. The IUPAC classification of adsorption isotherms is
shown in Figure 7.1. These adsorption isotherms are characteristic of adsorbents that are
microporous (type I), nonporous and macroporous (types II, III and VI) and mesoporous
(types IV and V). The adsorption by a mesopore is dominated by capillary condensation,
which is responsible for a sharp adsorption rise around the mid relative pressure region. This
effect is not attributable to molecule-solid interactions but to a purely geometrical
requirement, which is illustrated by the Kelvin equation.
Figure 7.1. IUPAC classification of adsorption isotherms.[17a]
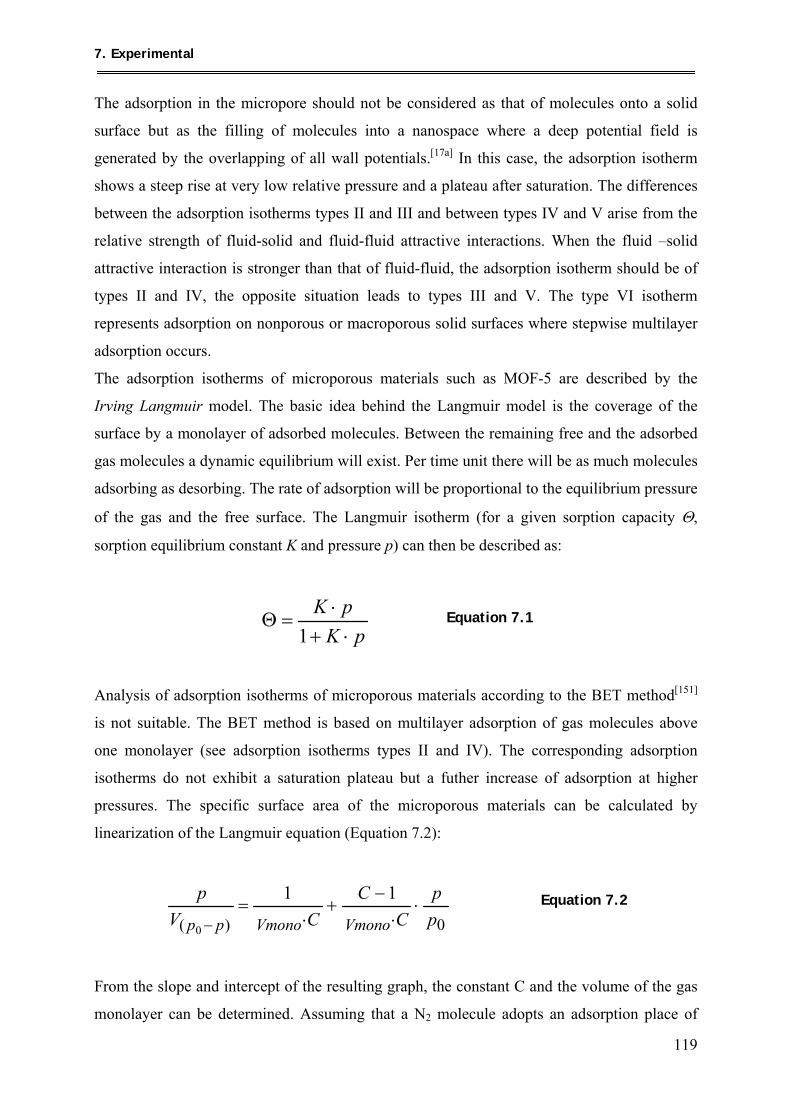
7. Experimental
119
The adsorption in the micropore should not be considered as that of molecules onto a solid
surface but as the filling of molecules into a nanospace where a deep potential field is
generated by the overlapping of all wall potentials.[17a] In this case, the adsorption isotherm
shows a steep rise at very low relative pressure and a plateau after saturation. The differences
between the adsorption isotherms types II and III and between types IV and V arise from the
relative strength of fluid-solid and fluid-fluid attractive interactions. When the fluid –solid
attractive interaction is stronger than that of fluid-fluid, the adsorption isotherm should be of
types II and IV, the opposite situation leads to types III and V. The type VI isotherm
represents adsorption on nonporous or macroporous solid surfaces where stepwise multilayer
adsorption occurs.
The adsorption isotherms of microporous materials such as MOF-5 are described by the
Irving Langmuir model. The basic idea behind the Langmuir model is the coverage of the
surface by a monolayer of adsorbed molecules. Between the remaining free and the adsorbed
gas molecules a dynamic equilibrium will exist. Per time unit there will be as much molecules
adsorbing as desorbing. The rate of adsorption will be proportional to the equilibrium pressure
of the gas and the free surface. The Langmuir isotherm (for a given sorption capacity Θ,
sorption equilibrium constant K and pressure p) can then be described as:
pKpK⋅+
⋅=Θ
1 Equation 7.1
Analysis of adsorption isotherms of microporous materials according to the BET method[151]
is not suitable. The BET method is based on multilayer adsorption of gas molecules above
one monolayer (see adsorption isotherms types II and IV). The corresponding adsorption
isotherms do not exhibit a saturation plateau but a futher increase of adsorption at higher
pressures. The specific surface area of the microporous materials can be calculated by
linearization of the Langmuir equation (Equation 7.2):
0)(
11
0pp
CC
CVp
VmonoVmonopp⋅
⋅−
+⋅
=−
Equation 7.2
From the slope and intercept of the resulting graph, the constant C and the volume of the gas
monolayer can be determined. Assuming that a N2 molecule adopts an adsorption place of
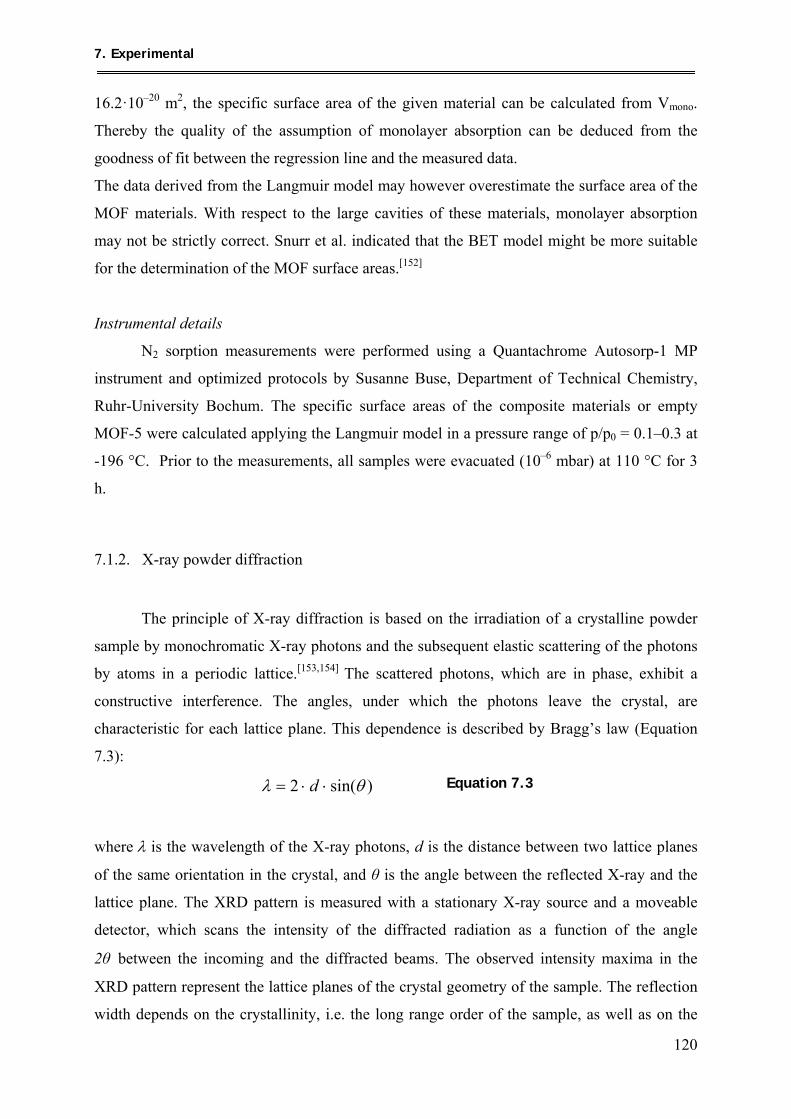
7. Experimental
120
16.2·10–20 m2, the specific surface area of the given material can be calculated from Vmono.
Thereby the quality of the assumption of monolayer absorption can be deduced from the
goodness of fit between the regression line and the measured data.
The data derived from the Langmuir model may however overestimate the surface area of the
MOF materials. With respect to the large cavities of these materials, monolayer absorption
may not be strictly correct. Snurr et al. indicated that the BET model might be more suitable
for the determination of the MOF surface areas.[152]
Instrumental details
N2 sorption measurements were performed using a Quantachrome Autosorp-1 MP
instrument and optimized protocols by Susanne Buse, Department of Technical Chemistry,
Ruhr-University Bochum. The specific surface areas of the composite materials or empty
MOF-5 were calculated applying the Langmuir model in a pressure range of p/p0 = 0.1–0.3 at
-196 °C. Prior to the measurements, all samples were evacuated (10–6 mbar) at 110 °C for 3
h.
7.1.2. X-ray powder diffraction
The principle of X-ray diffraction is based on the irradiation of a crystalline powder
sample by monochromatic X-ray photons and the subsequent elastic scattering of the photons
by atoms in a periodic lattice.[153,154] The scattered photons, which are in phase, exhibit a
constructive interference. The angles, under which the photons leave the crystal, are
characteristic for each lattice plane. This dependence is described by Bragg’s law (Equation
7.3):
)sin(2 θλ ⋅⋅= d Equation 7.3
where λ is the wavelength of the X-ray photons, d is the distance between two lattice planes
of the same orientation in the crystal, and θ is the angle between the reflected X-ray and the
lattice plane. The XRD pattern is measured with a stationary X-ray source and a moveable
detector, which scans the intensity of the diffracted radiation as a function of the angle
2θ between the incoming and the diffracted beams. The observed intensity maxima in the
XRD pattern represent the lattice planes of the crystal geometry of the sample. The reflection
width depends on the crystallinity, i.e. the long range order of the sample, as well as on the
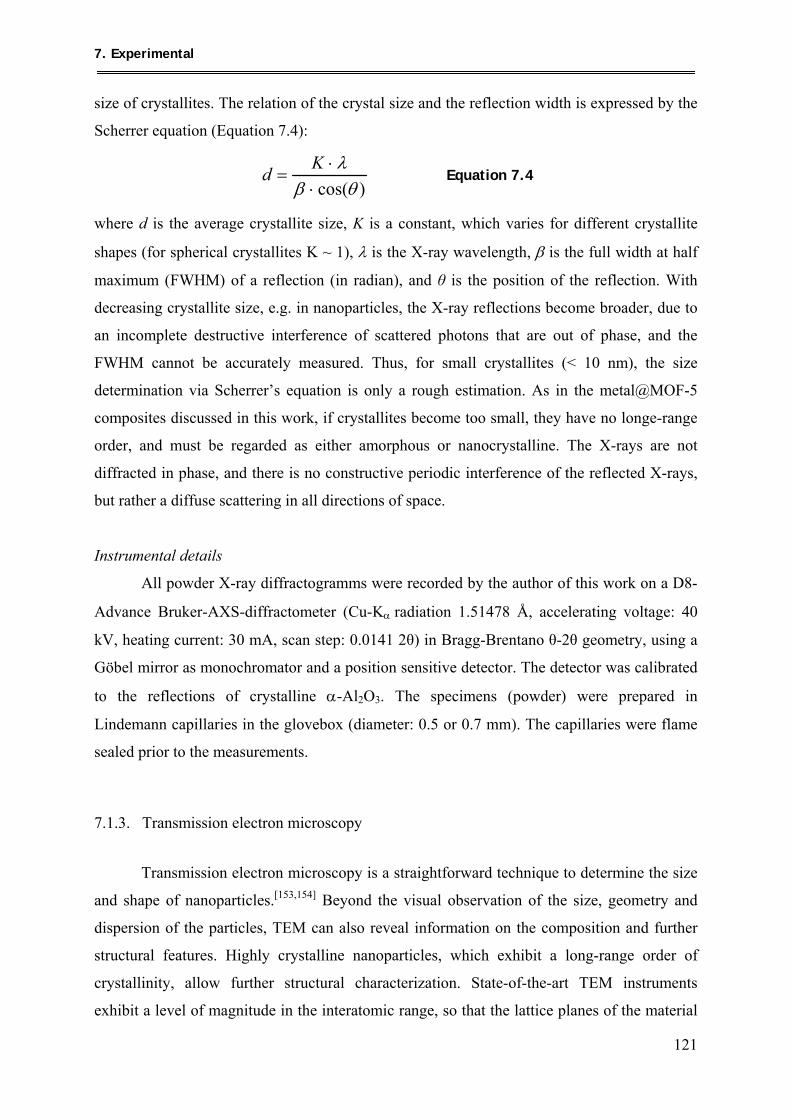
7. Experimental
121
size of crystallites. The relation of the crystal size and the reflection width is expressed by the
Scherrer equation (Equation 7.4):
)cos(θβλ
⋅⋅
=Kd
Equation 7.4
where d is the average crystallite size, K is a constant, which varies for different crystallite
shapes (for spherical crystallites K ~ 1), λ is the X-ray wavelength, β is the full width at half
maximum (FWHM) of a reflection (in radian), and θ is the position of the reflection. With
decreasing crystallite size, e.g. in nanoparticles, the X-ray reflections become broader, due to
an incomplete destructive interference of scattered photons that are out of phase, and the
FWHM cannot be accurately measured. Thus, for small crystallites (< 10 nm), the size
determination via Scherrer’s equation is only a rough estimation. As in the metal@MOF-5
composites discussed in this work, if crystallites become too small, they have no longe-range
order, and must be regarded as either amorphous or nanocrystalline. The X-rays are not
diffracted in phase, and there is no constructive periodic interference of the reflected X-rays,
but rather a diffuse scattering in all directions of space.
Instrumental details
All powder X-ray diffractogramms were recorded by the author of this work on a D8-
Advance Bruker-AXS-diffractometer (Cu-Kα radiation 1.51478 Å, accelerating voltage: 40
kV, heating current: 30 mA, scan step: 0.0141 2θ) in Bragg-Brentano θ-2θ geometry, using a
Göbel mirror as monochromator and a position sensitive detector. The detector was calibrated
to the reflections of crystalline α-Al2O3. The specimens (powder) were prepared in
Lindemann capillaries in the glovebox (diameter: 0.5 or 0.7 mm). The capillaries were flame
sealed prior to the measurements.
7.1.3. Transmission electron microscopy
Transmission electron microscopy is a straightforward technique to determine the size
and shape of nanoparticles.[153,154] Beyond the visual observation of the size, geometry and
dispersion of the particles, TEM can also reveal information on the composition and further
structural features. Highly crystalline nanoparticles, which exhibit a long-range order of
crystallinity, allow further structural characterization. State-of-the-art TEM instruments
exhibit a level of magnitude in the interatomic range, so that the lattice planes of the material
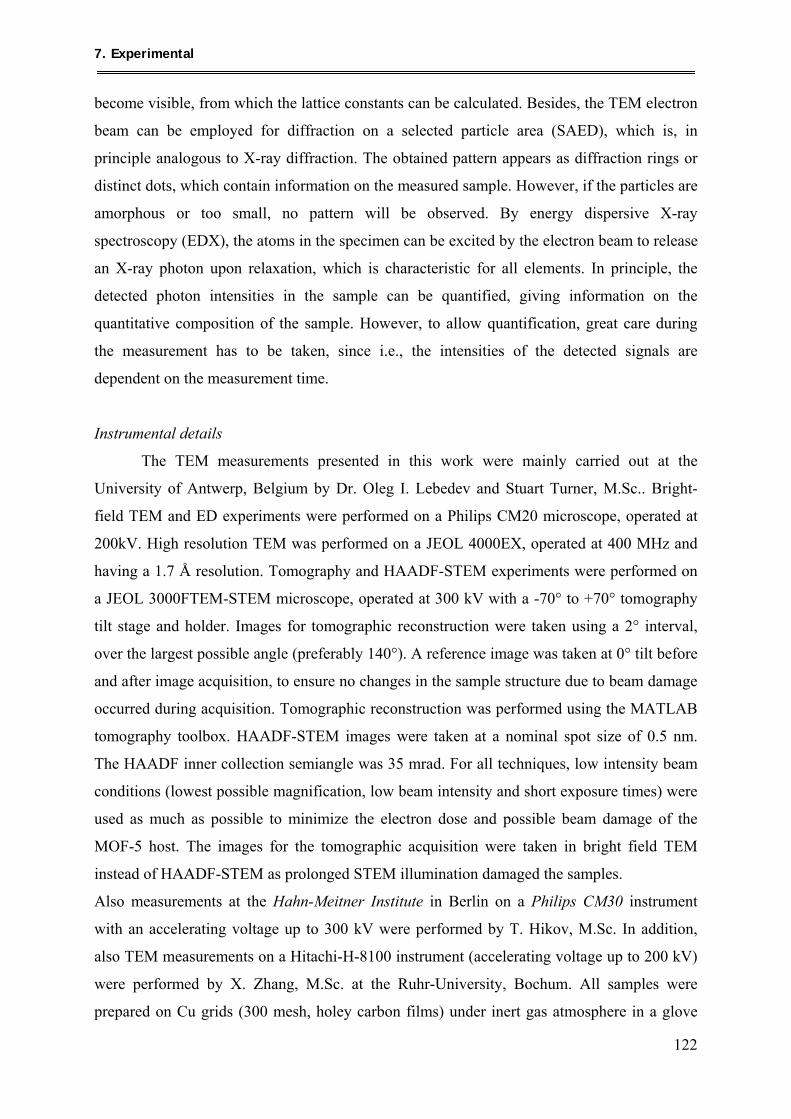
7. Experimental
122
become visible, from which the lattice constants can be calculated. Besides, the TEM electron
beam can be employed for diffraction on a selected particle area (SAED), which is, in
principle analogous to X-ray diffraction. The obtained pattern appears as diffraction rings or
distinct dots, which contain information on the measured sample. However, if the particles are
amorphous or too small, no pattern will be observed. By energy dispersive X-ray
spectroscopy (EDX), the atoms in the specimen can be excited by the electron beam to release
an X-ray photon upon relaxation, which is characteristic for all elements. In principle, the
detected photon intensities in the sample can be quantified, giving information on the
quantitative composition of the sample. However, to allow quantification, great care during
the measurement has to be taken, since i.e., the intensities of the detected signals are
dependent on the measurement time.
Instrumental details
The TEM measurements presented in this work were mainly carried out at the
University of Antwerp, Belgium by Dr. Oleg I. Lebedev and Stuart Turner, M.Sc.. Bright-
field TEM and ED experiments were performed on a Philips CM20 microscope, operated at
200kV. High resolution TEM was performed on a JEOL 4000EX, operated at 400 MHz and
having a 1.7 Å resolution. Tomography and HAADF-STEM experiments were performed on
a JEOL 3000FTEM-STEM microscope, operated at 300 kV with a -70° to +70° tomography
tilt stage and holder. Images for tomographic reconstruction were taken using a 2° interval,
over the largest possible angle (preferably 140°). A reference image was taken at 0° tilt before
and after image acquisition, to ensure no changes in the sample structure due to beam damage
occurred during acquisition. Tomographic reconstruction was performed using the MATLAB
tomography toolbox. HAADF-STEM images were taken at a nominal spot size of 0.5 nm.
The HAADF inner collection semiangle was 35 mrad. For all techniques, low intensity beam
conditions (lowest possible magnification, low beam intensity and short exposure times) were
used as much as possible to minimize the electron dose and possible beam damage of the
MOF-5 host. The images for the tomographic acquisition were taken in bright field TEM
instead of HAADF-STEM as prolonged STEM illumination damaged the samples.
Also measurements at the Hahn-Meitner Institute in Berlin on a Philips CM30 instrument
with an accelerating voltage up to 300 kV were performed by T. Hikov, M.Sc. In addition,
also TEM measurements on a Hitachi-H-8100 instrument (accelerating voltage up to 200 kV)
were performed by X. Zhang, M.Sc. at the Ruhr-University, Bochum. All samples were
prepared on Cu grids (300 mesh, holey carbon films) under inert gas atmosphere in a glove
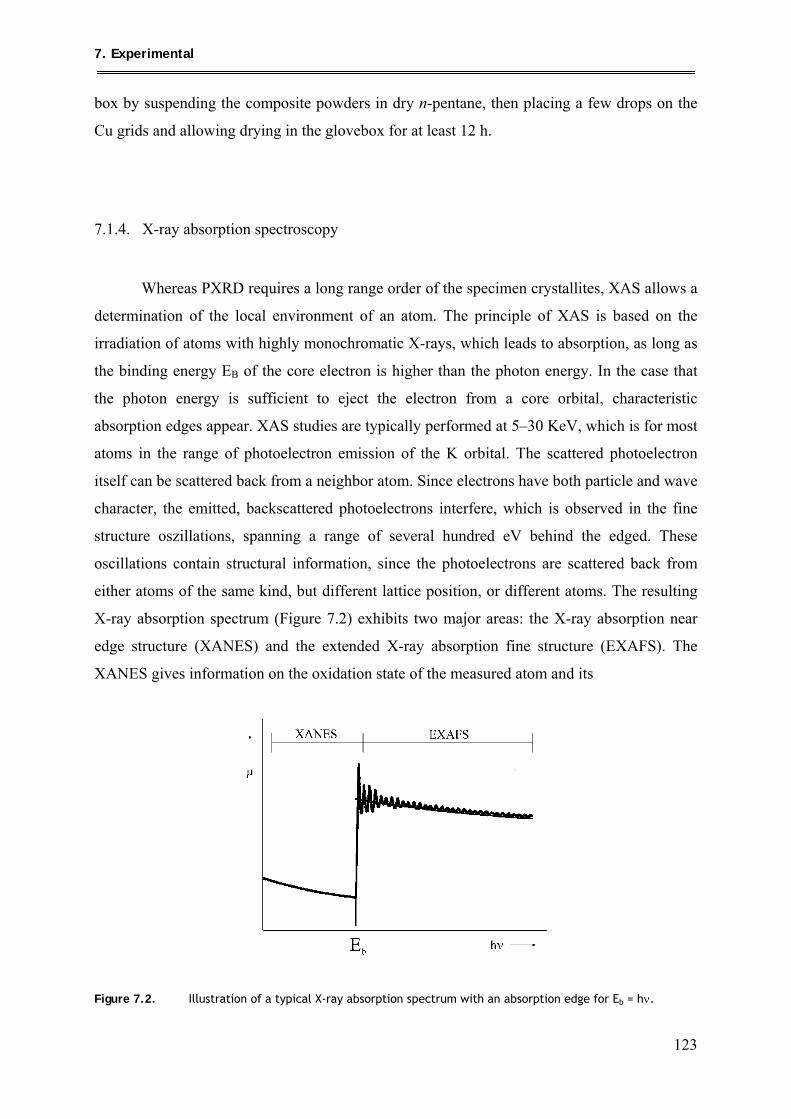
7. Experimental
123
box by suspending the composite powders in dry n-pentane, then placing a few drops on the
Cu grids and allowing drying in the glovebox for at least 12 h.
7.1.4. X-ray absorption spectroscopy
Whereas PXRD requires a long range order of the specimen crystallites, XAS allows a
determination of the local environment of an atom. The principle of XAS is based on the
irradiation of atoms with highly monochromatic X-rays, which leads to absorption, as long as
the binding energy EB of the core electron is higher than the photon energy. In the case that
the photon energy is sufficient to eject the electron from a core orbital, characteristic
absorption edges appear. XAS studies are typically performed at 5–30 KeV, which is for most
atoms in the range of photoelectron emission of the K orbital. The scattered photoelectron
itself can be scattered back from a neighbor atom. Since electrons have both particle and wave
character, the emitted, backscattered photoelectrons interfere, which is observed in the fine
structure oszillations, spanning a range of several hundred eV behind the edged. These
oscillations contain structural information, since the photoelectrons are scattered back from
either atoms of the same kind, but different lattice position, or different atoms. The resulting
X-ray absorption spectrum (Figure 7.2) exhibits two major areas: the X-ray absorption near
edge structure (XANES) and the extended X-ray absorption fine structure (EXAFS). The
XANES gives information on the oxidation state of the measured atom and its
Figure 7.2. Illustration of a typical X-ray absorption spectrum with an absorption edge for Eb = hν.
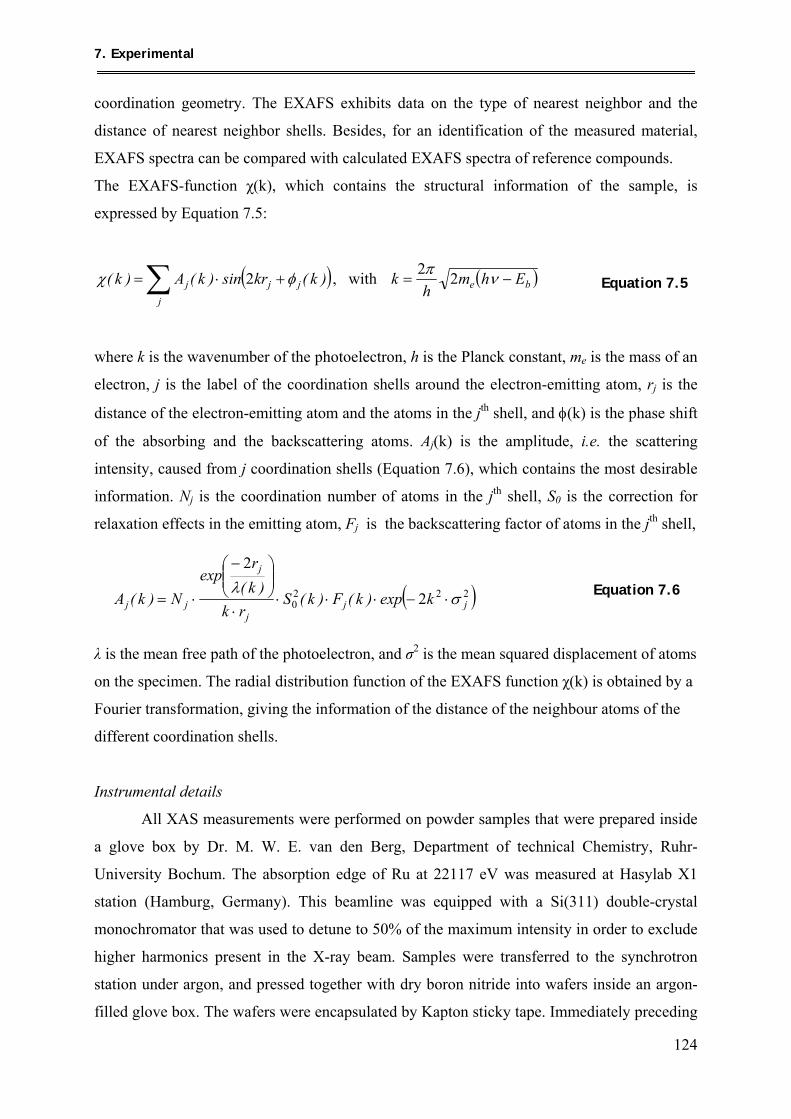
7. Experimental
124
coordination geometry. The EXAFS exhibits data on the type of nearest neighbor and the
distance of nearest neighbor shells. Besides, for an identification of the measured material,
EXAFS spectra can be compared with calculated EXAFS spectra of reference compounds.
The EXAFS-function χ(k), which contains the structural information of the sample, is
expressed by Equation 7.5:
( )∑ +⋅=j
jjj )k(krsin)k(A)k( φχ 2 , with ( )be Ehmh
k −= νπ 22 Equation 7.5
where k is the wavenumber of the photoelectron, h is the Planck constant, me is the mass of an
electron, j is the label of the coordination shells around the electron-emitting atom, rj is the
distance of the electron-emitting atom and the atoms in the jth shell, and φ(k) is the phase shift
of the absorbing and the backscattering atoms. Aj(k) is the amplitude, i.e. the scattering
intensity, caused from j coordination shells (Equation 7.6), which contains the most desirable
information. Nj is the coordination number of atoms in the jth shell, S0 is the correction for
relaxation effects in the emitting atom, Fj is the backscattering factor of atoms in the jth shell,
( )2220 2
2
jjj
j
jj kexp)k(F)k(Srk
)k(r
expN)k(A σ
λ⋅−⋅⋅⋅
⋅
⎟⎟⎠
⎞⎜⎜⎝
⎛ −
⋅= Equation 7.6
λ is the mean free path of the photoelectron, and σ2 is the mean squared displacement of atoms
on the specimen. The radial distribution function of the EXAFS function χ(k) is obtained by a
Fourier transformation, giving the information of the distance of the neighbour atoms of the
different coordination shells.
Instrumental details
All XAS measurements were performed on powder samples that were prepared inside
a glove box by Dr. M. W. E. van den Berg, Department of technical Chemistry, Ruhr-
University Bochum. The absorption edge of Ru at 22117 eV was measured at Hasylab X1
station (Hamburg, Germany). This beamline was equipped with a Si(311) double-crystal
monochromator that was used to detune to 50% of the maximum intensity in order to exclude
higher harmonics present in the X-ray beam. Samples were transferred to the synchrotron
station under argon, and pressed together with dry boron nitride into wafers inside an argon-
filled glove box. The wafers were encapsulated by Kapton sticky tape. Immediately preceding
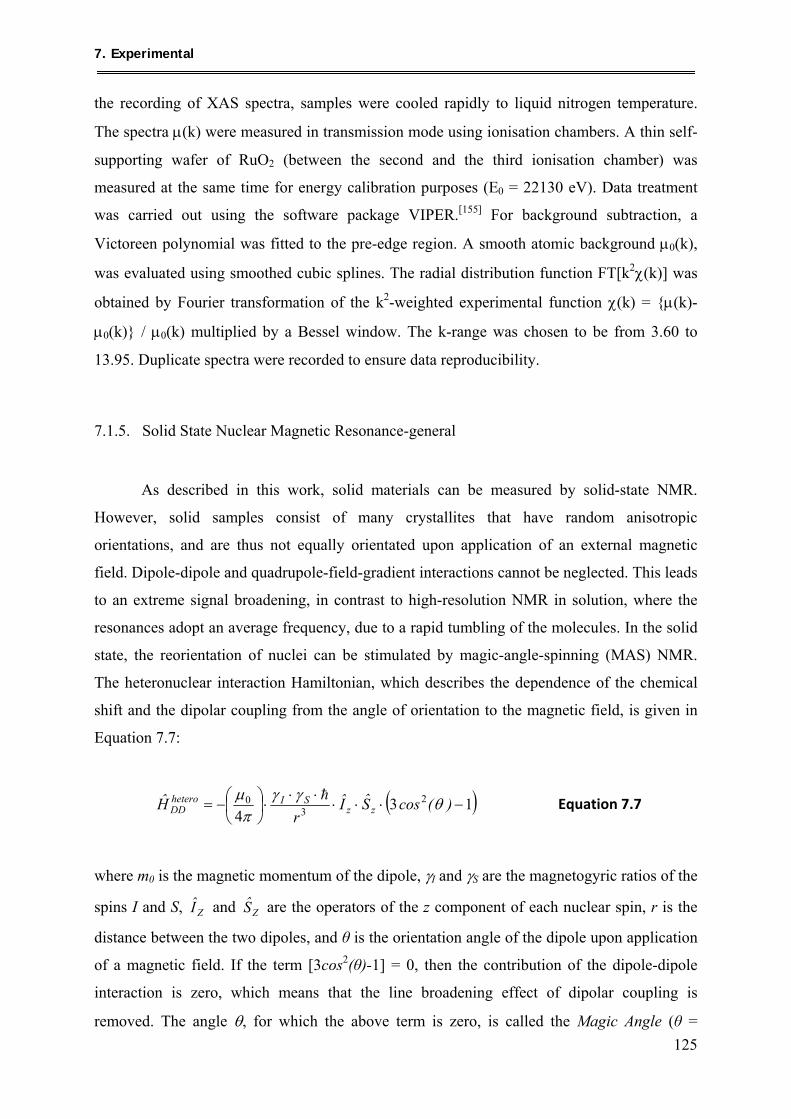
7. Experimental
125
the recording of XAS spectra, samples were cooled rapidly to liquid nitrogen temperature.
The spectra μ(k) were measured in transmission mode using ionisation chambers. A thin self-
supporting wafer of RuO2 (between the second and the third ionisation chamber) was
measured at the same time for energy calibration purposes (E0 = 22130 eV). Data treatment
was carried out using the software package VIPER.[155] For background subtraction, a
Victoreen polynomial was fitted to the pre-edge region. A smooth atomic background μ0(k),
was evaluated using smoothed cubic splines. The radial distribution function FT[k2χ(k)] was
obtained by Fourier transformation of the k2-weighted experimental function χ(k) = {μ(k)-
μ0(k)} / μ0(k) multiplied by a Bessel window. The k-range was chosen to be from 3.60 to
13.95. Duplicate spectra were recorded to ensure data reproducibility.
7.1.5. Solid State Nuclear Magnetic Resonance-general
As described in this work, solid materials can be measured by solid-state NMR.
However, solid samples consist of many crystallites that have random anisotropic
orientations, and are thus not equally orientated upon application of an external magnetic
field. Dipole-dipole and quadrupole-field-gradient interactions cannot be neglected. This leads
to an extreme signal broadening, in contrast to high-resolution NMR in solution, where the
resonances adopt an average frequency, due to a rapid tumbling of the molecules. In the solid
state, the reorientation of nuclei can be stimulated by magic-angle-spinning (MAS) NMR.
The heteronuclear interaction Hamiltonian, which describes the dependence of the chemical
shift and the dipolar coupling from the angle of orientation to the magnetic field, is given in
Equation 7.7:
( )134
23
0 −⋅⋅⋅⋅⋅
⋅⎟⎠⎞
⎜⎝⎛−= )(cosSI
rH zz
SIheteroDD θγγ
πμ h Equation 7.7
where m0 is the magnetic momentum of the dipole, γI and γS are the magnetogyric ratios of the
spins I and S, ZI and ZS are the operators of the z component of each nuclear spin, r is the
distance between the two dipoles, and θ is the orientation angle of the dipole upon application
of a magnetic field. If the term [3cos2(θ)-1] = 0, then the contribution of the dipole-dipole
interaction is zero, which means that the line broadening effect of dipolar coupling is
removed. The angle θ, for which the above term is zero, is called the Magic Angle (θ =
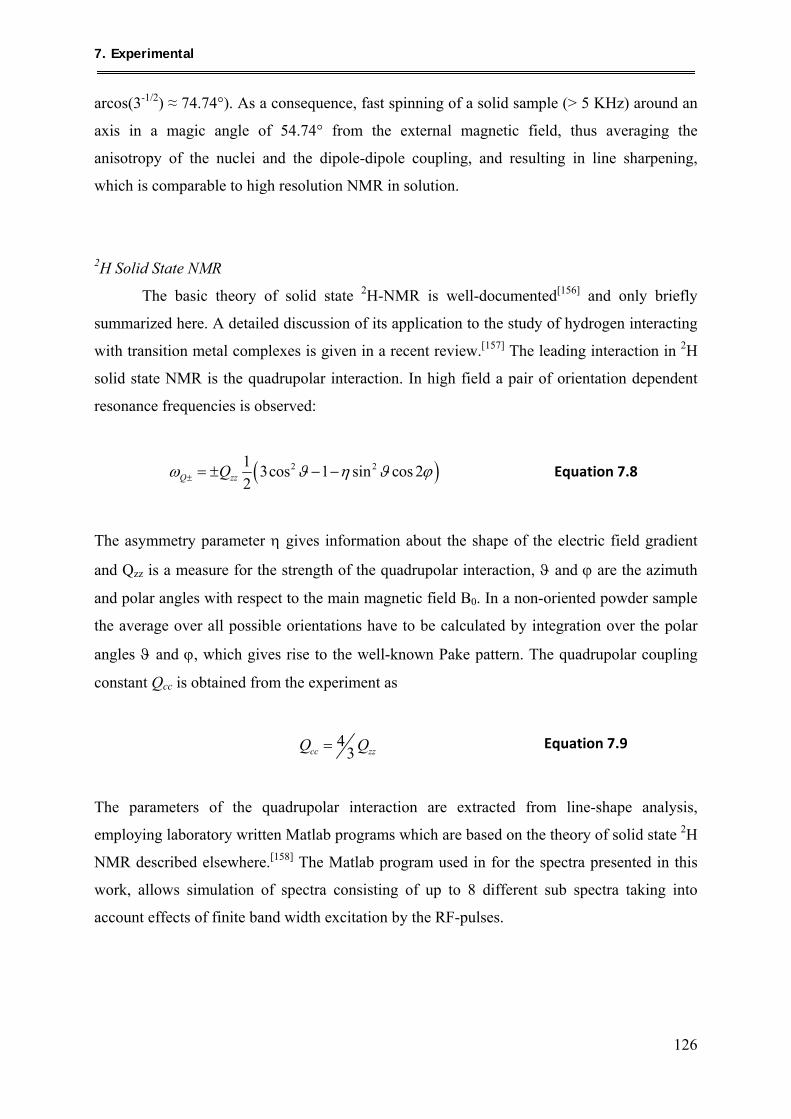
7. Experimental
126
arcos(3-1/2) ≈ 74.74°). As a consequence, fast spinning of a solid sample (> 5 KHz) around an
axis in a magic angle of 54.74° from the external magnetic field, thus averaging the
anisotropy of the nuclei and the dipole-dipole coupling, and resulting in line sharpening,
which is comparable to high resolution NMR in solution.
2H Solid State NMR
The basic theory of solid state 2H-NMR is well-documented[156] and only briefly
summarized here. A detailed discussion of its application to the study of hydrogen interacting
with transition metal complexes is given in a recent review.[157] The leading interaction in 2H
solid state NMR is the quadrupolar interaction. In high field a pair of orientation dependent
resonance frequencies is observed:
( )2 21 3cos 1 sin cos 22Q zzQω ϑ η ϑ ϕ± = ± − − Equation 7.8
The asymmetry parameter η gives information about the shape of the electric field gradient
and Qzz is a measure for the strength of the quadrupolar interaction, ϑ and ϕ are the azimuth
and polar angles with respect to the main magnetic field B0. In a non-oriented powder sample
the average over all possible orientations have to be calculated by integration over the polar
angles ϑ and ϕ, which gives rise to the well-known Pake pattern. The quadrupolar coupling
constant Qcc is obtained from the experiment as
4
3cc zzQ Q= Equation 7.9
The parameters of the quadrupolar interaction are extracted from line-shape analysis,
employing laboratory written Matlab programs which are based on the theory of solid state 2H
NMR described elsewhere.[158] The Matlab program used in for the spectra presented in this
work, allows simulation of spectra consisting of up to 8 different sub spectra taking into
account effects of finite band width excitation by the RF-pulses.
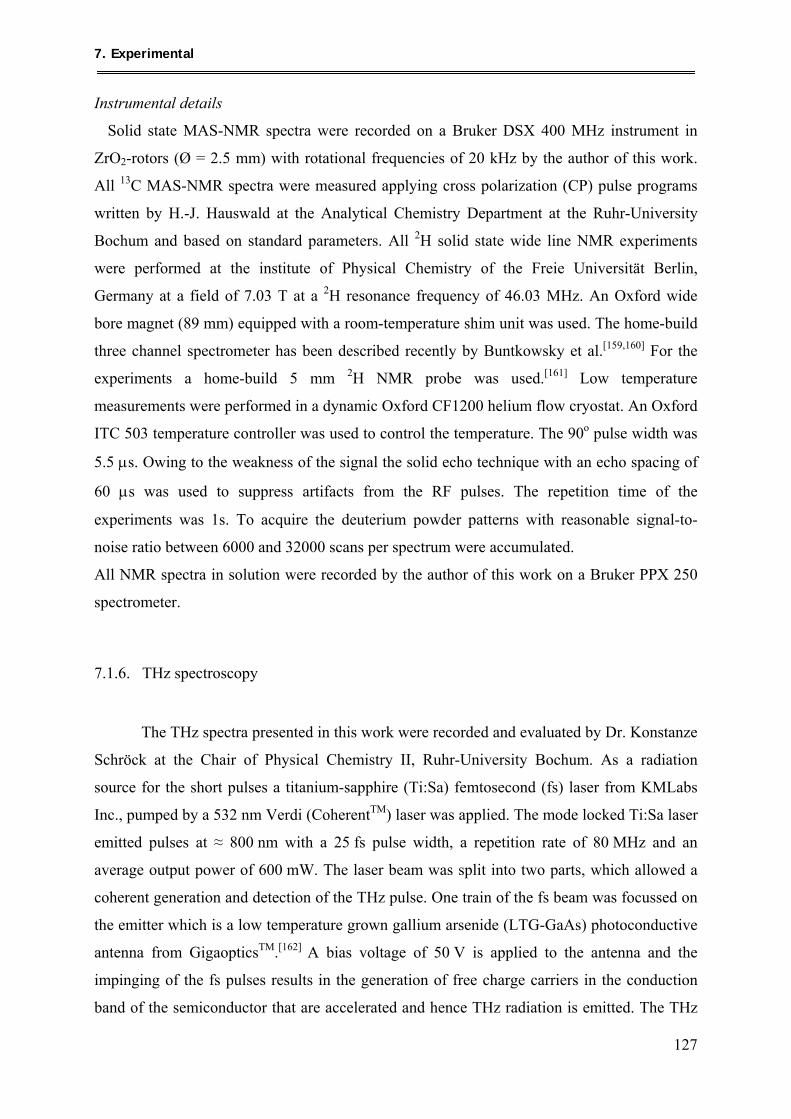
7. Experimental
127
Instrumental details
Solid state MAS-NMR spectra were recorded on a Bruker DSX 400 MHz instrument in
ZrO2-rotors (Ø = 2.5 mm) with rotational frequencies of 20 kHz by the author of this work.
All 13C MAS-NMR spectra were measured applying cross polarization (CP) pulse programs
written by H.-J. Hauswald at the Analytical Chemistry Department at the Ruhr-University
Bochum and based on standard parameters. All 2H solid state wide line NMR experiments
were performed at the institute of Physical Chemistry of the Freie Universität Berlin,
Germany at a field of 7.03 T at a 2H resonance frequency of 46.03 MHz. An Oxford wide
bore magnet (89 mm) equipped with a room-temperature shim unit was used. The home-build
three channel spectrometer has been described recently by Buntkowsky et al.[159,160] For the
experiments a home-build 5 mm 2H NMR probe was used.[161] Low temperature
measurements were performed in a dynamic Oxford CF1200 helium flow cryostat. An Oxford
ITC 503 temperature controller was used to control the temperature. The 90o pulse width was
5.5 μs. Owing to the weakness of the signal the solid echo technique with an echo spacing of
60 μs was used to suppress artifacts from the RF pulses. The repetition time of the
experiments was 1s. To acquire the deuterium powder patterns with reasonable signal-to-
noise ratio between 6000 and 32000 scans per spectrum were accumulated.
All NMR spectra in solution were recorded by the author of this work on a Bruker PPX 250
spectrometer.
7.1.6. THz spectroscopy
The THz spectra presented in this work were recorded and evaluated by Dr. Konstanze
Schröck at the Chair of Physical Chemistry II, Ruhr-University Bochum. As a radiation
source for the short pulses a titanium-sapphire (Ti:Sa) femtosecond (fs) laser from KMLabs
Inc., pumped by a 532 nm Verdi (CoherentTM) laser was applied. The mode locked Ti:Sa laser
emitted pulses at ≈ 800 nm with a 25 fs pulse width, a repetition rate of 80 MHz and an
average output power of 600 mW. The laser beam was split into two parts, which allowed a
coherent generation and detection of the THz pulse. One train of the fs beam was focussed on
the emitter which is a low temperature grown gallium arsenide (LTG-GaAs) photoconductive
antenna from GigaopticsTM.[162] A bias voltage of 50 V is applied to the antenna and the
impinging of the fs pulses results in the generation of free charge carriers in the conduction
band of the semiconductor that are accelerated and hence THz radiation is emitted. The THz
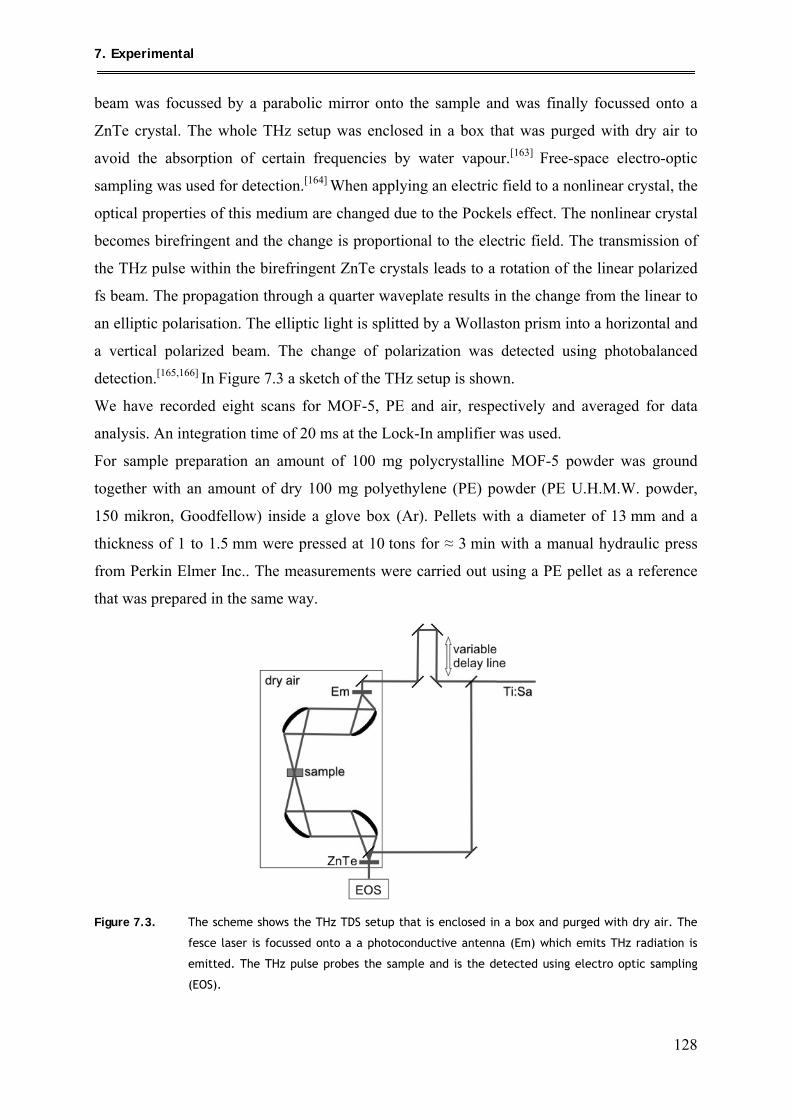
7. Experimental
128
beam was focussed by a parabolic mirror onto the sample and was finally focussed onto a
ZnTe crystal. The whole THz setup was enclosed in a box that was purged with dry air to
avoid the absorption of certain frequencies by water vapour.[163] Free-space electro-optic
sampling was used for detection.[164] When applying an electric field to a nonlinear crystal, the
optical properties of this medium are changed due to the Pockels effect. The nonlinear crystal
becomes birefringent and the change is proportional to the electric field. The transmission of
the THz pulse within the birefringent ZnTe crystals leads to a rotation of the linear polarized
fs beam. The propagation through a quarter waveplate results in the change from the linear to
an elliptic polarisation. The elliptic light is splitted by a Wollaston prism into a horizontal and
a vertical polarized beam. The change of polarization was detected using photobalanced
detection.[165,166] In Figure 7.3 a sketch of the THz setup is shown.
We have recorded eight scans for MOF-5, PE and air, respectively and averaged for data
analysis. An integration time of 20 ms at the Lock-In amplifier was used.
For sample preparation an amount of 100 mg polycrystalline MOF-5 powder was ground
together with an amount of dry 100 mg polyethylene (PE) powder (PE U.H.M.W. powder,
150 mikron, Goodfellow) inside a glove box (Ar). Pellets with a diameter of 13 mm and a
thickness of 1 to 1.5 mm were pressed at 10 tons for ≈ 3 min with a manual hydraulic press
from Perkin Elmer Inc.. The measurements were carried out using a PE pellet as a reference
that was prepared in the same way.
Figure 7.3. The scheme shows the THz TDS setup that is enclosed in a box and purged with dry air. The
fesce laser is focussed onto a a photoconductive antenna (Em) which emits THz radiation is
emitted. The THz pulse probes the sample and is the detected using electro optic sampling
(EOS).
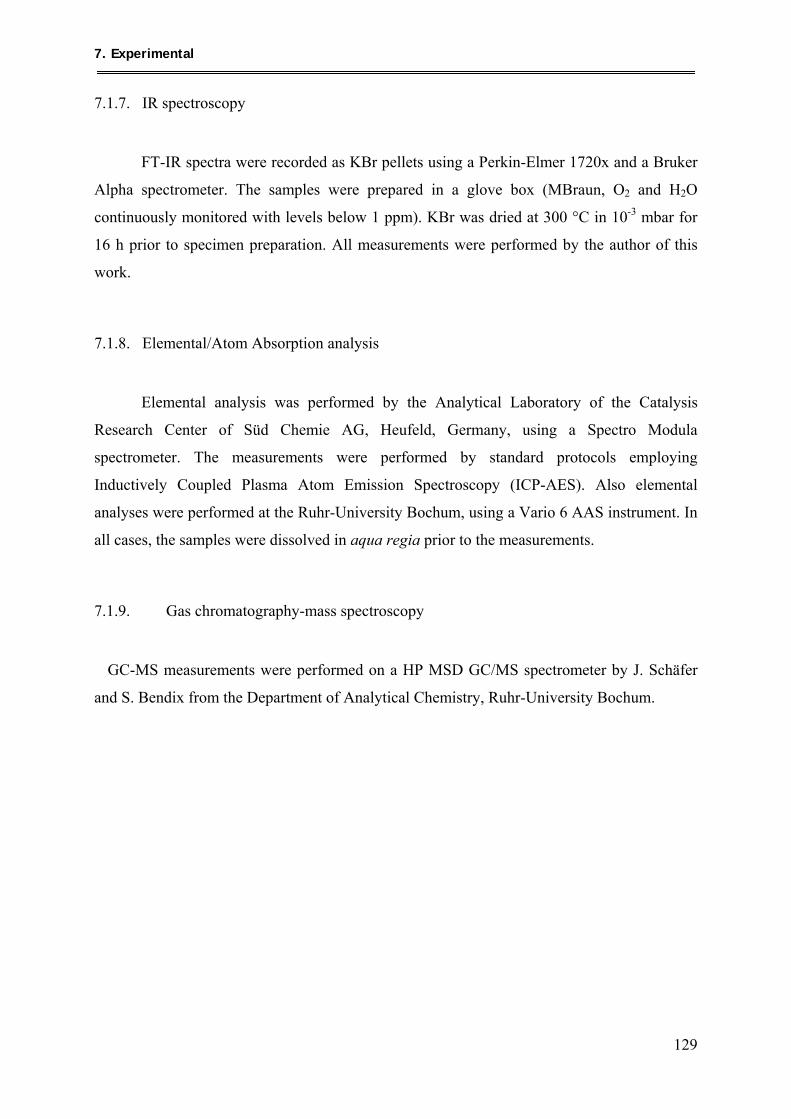
7. Experimental
129
7.1.7. IR spectroscopy
FT-IR spectra were recorded as KBr pellets using a Perkin-Elmer 1720x and a Bruker
Alpha spectrometer. The samples were prepared in a glove box (MBraun, O2 and H2O
continuously monitored with levels below 1 ppm). KBr was dried at 300 °C in 10-3 mbar for
16 h prior to specimen preparation. All measurements were performed by the author of this
work.
7.1.8. Elemental/Atom Absorption analysis
Elemental analysis was performed by the Analytical Laboratory of the Catalysis
Research Center of Süd Chemie AG, Heufeld, Germany, using a Spectro Modula
spectrometer. The measurements were performed by standard protocols employing
Inductively Coupled Plasma Atom Emission Spectroscopy (ICP-AES). Also elemental
analyses were performed at the Ruhr-University Bochum, using a Vario 6 AAS instrument. In
all cases, the samples were dissolved in aqua regia prior to the measurements.
7.1.9. Gas chromatography-mass spectroscopy
GC-MS measurements were performed on a HP MSD GC/MS spectrometer by J. Schäfer
and S. Bendix from the Department of Analytical Chemistry, Ruhr-University Bochum.
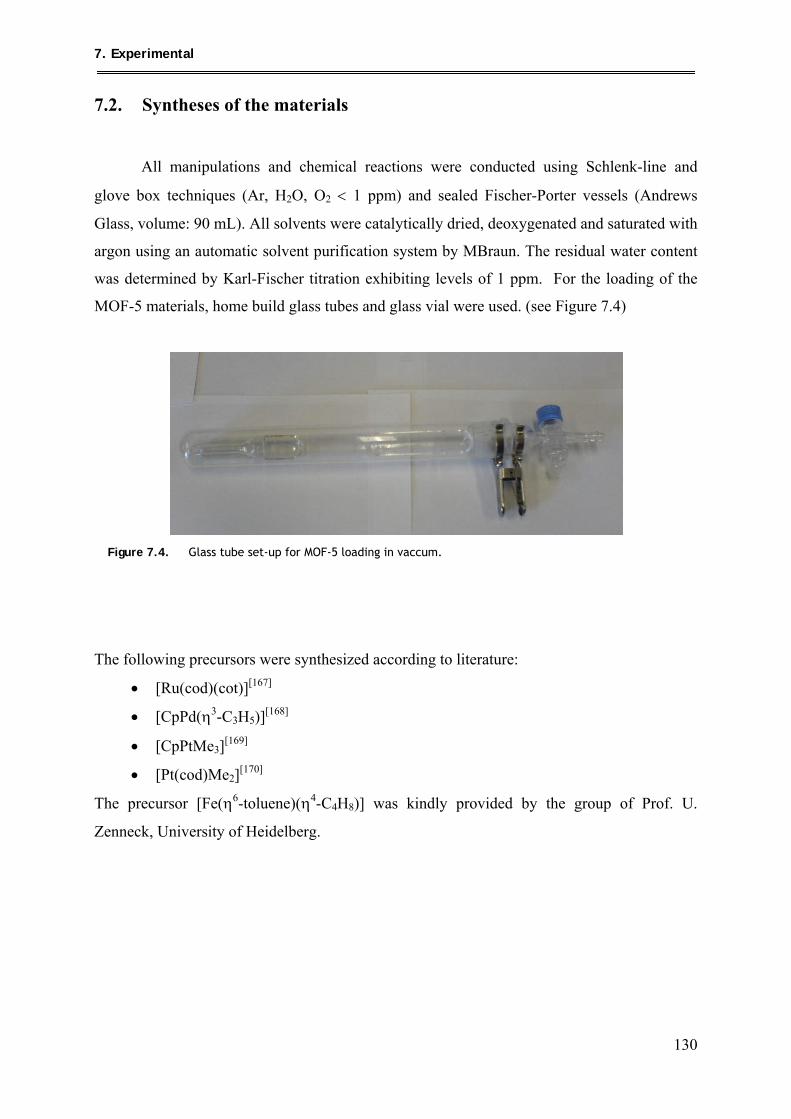
7. Experimental
130
7.2. Syntheses of the materials
All manipulations and chemical reactions were conducted using Schlenk-line and
glove box techniques (Ar, H2O, O2 < 1 ppm) and sealed Fischer-Porter vessels (Andrews
Glass, volume: 90 mL). All solvents were catalytically dried, deoxygenated and saturated with
argon using an automatic solvent purification system by MBraun. The residual water content
was determined by Karl-Fischer titration exhibiting levels of 1 ppm. For the loading of the
MOF-5 materials, home build glass tubes and glass vial were used. (see Figure 7.4)
Figure 7.4. Glass tube set-up for MOF-5 loading in vaccum.
The following precursors were synthesized according to literature:
• [Ru(cod)(cot)][167]
• [CpPd(η3-C3H5)][168]
• [CpPtMe3][169]
• [Pt(cod)Me2][170]
The precursor [Fe(η6-toluene)(η4-C4H8)] was kindly provided by the group of Prof. U.
Zenneck, University of Heidelberg.
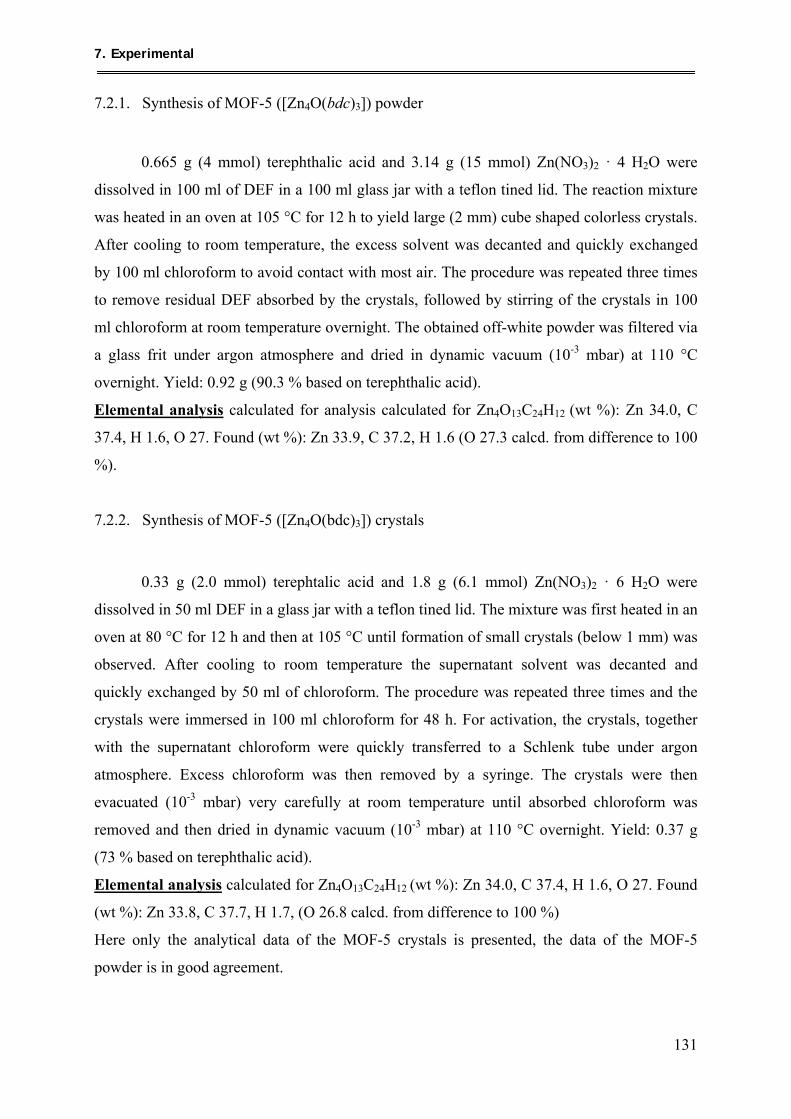
7. Experimental
131
7.2.1. Synthesis of MOF-5 ([Zn4O(bdc)3]) powder
0.665 g (4 mmol) terephthalic acid and 3.14 g (15 mmol) Zn(NO3)2 · 4 H2O were
dissolved in 100 ml of DEF in a 100 ml glass jar with a teflon tined lid. The reaction mixture
was heated in an oven at 105 °C for 12 h to yield large (2 mm) cube shaped colorless crystals.
After cooling to room temperature, the excess solvent was decanted and quickly exchanged
by 100 ml chloroform to avoid contact with most air. The procedure was repeated three times
to remove residual DEF absorbed by the crystals, followed by stirring of the crystals in 100
ml chloroform at room temperature overnight. The obtained off-white powder was filtered via
a glass frit under argon atmosphere and dried in dynamic vacuum (10-3 mbar) at 110 °C
overnight. Yield: 0.92 g (90.3 % based on terephthalic acid).
Elemental analysis calculated for analysis calculated for Zn4O13C24H12 (wt %): Zn 34.0, C
37.4, H 1.6, O 27. Found (wt %): Zn 33.9, C 37.2, H 1.6 (O 27.3 calcd. from difference to 100
%).
7.2.2. Synthesis of MOF-5 ([Zn4O(bdc)3]) crystals
0.33 g (2.0 mmol) terephtalic acid and 1.8 g (6.1 mmol) Zn(NO3)2 · 6 H2O were
dissolved in 50 ml DEF in a glass jar with a teflon tined lid. The mixture was first heated in an
oven at 80 °C for 12 h and then at 105 °C until formation of small crystals (below 1 mm) was
observed. After cooling to room temperature the supernatant solvent was decanted and
quickly exchanged by 50 ml of chloroform. The procedure was repeated three times and the
crystals were immersed in 100 ml chloroform for 48 h. For activation, the crystals, together
with the supernatant chloroform were quickly transferred to a Schlenk tube under argon
atmosphere. Excess chloroform was then removed by a syringe. The crystals were then
evacuated (10-3 mbar) very carefully at room temperature until absorbed chloroform was
removed and then dried in dynamic vacuum (10-3 mbar) at 110 °C overnight. Yield: 0.37 g
(73 % based on terephthalic acid).
Elemental analysis calculated for Zn4O13C24H12 (wt %): Zn 34.0, C 37.4, H 1.6, O 27. Found
(wt %): Zn 33.8, C 37.7, H 1.7, (O 26.8 calcd. from difference to 100 %)
Here only the analytical data of the MOF-5 crystals is presented, the data of the MOF-5
powder is in good agreement.
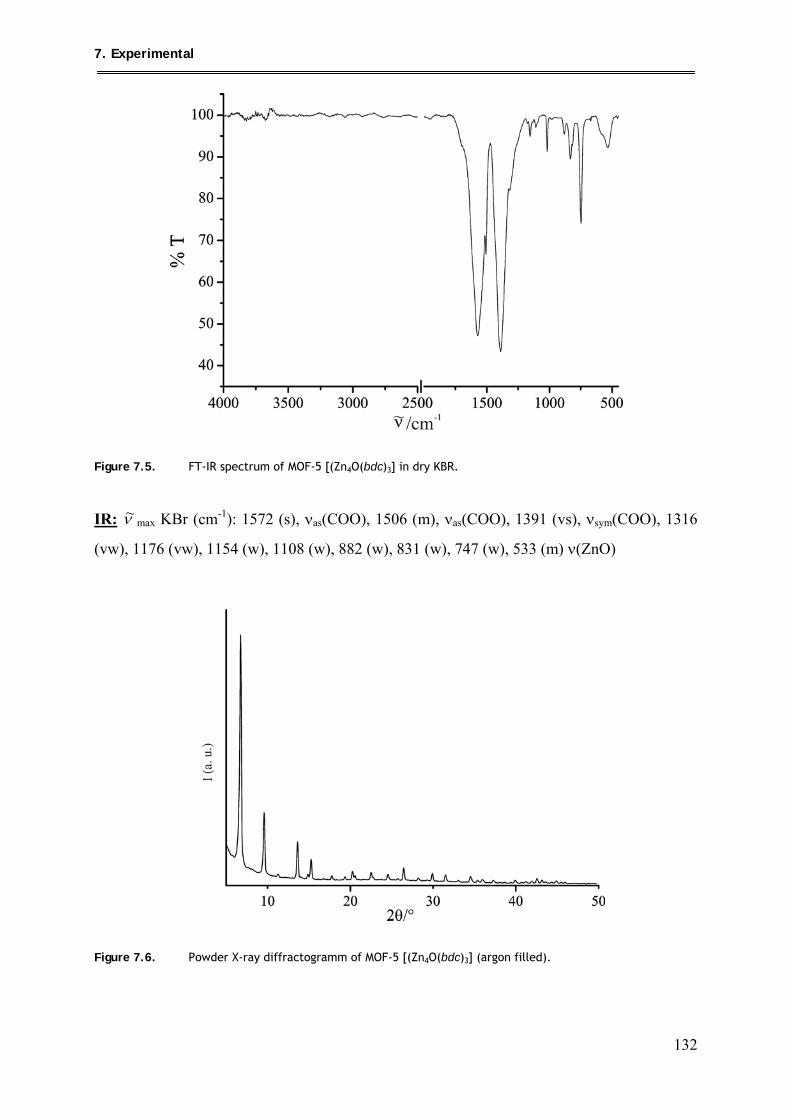
7. Experimental
132
Figure 7.5. FT-IR spectrum of MOF-5 [(Zn4O(bdc)3] in dry KBR.
IR: ν~ max KBr (cm-1): 1572 (s), νas(COO), 1506 (m), νas(COO), 1391 (vs), νsym(COO), 1316
(vw), 1176 (vw), 1154 (w), 1108 (w), 882 (w), 831 (w), 747 (w), 533 (m) ν(ZnO)
Figure 7.6. Powder X-ray diffractogramm of MOF-5 [(Zn4O(bdc)3] (argon filled).
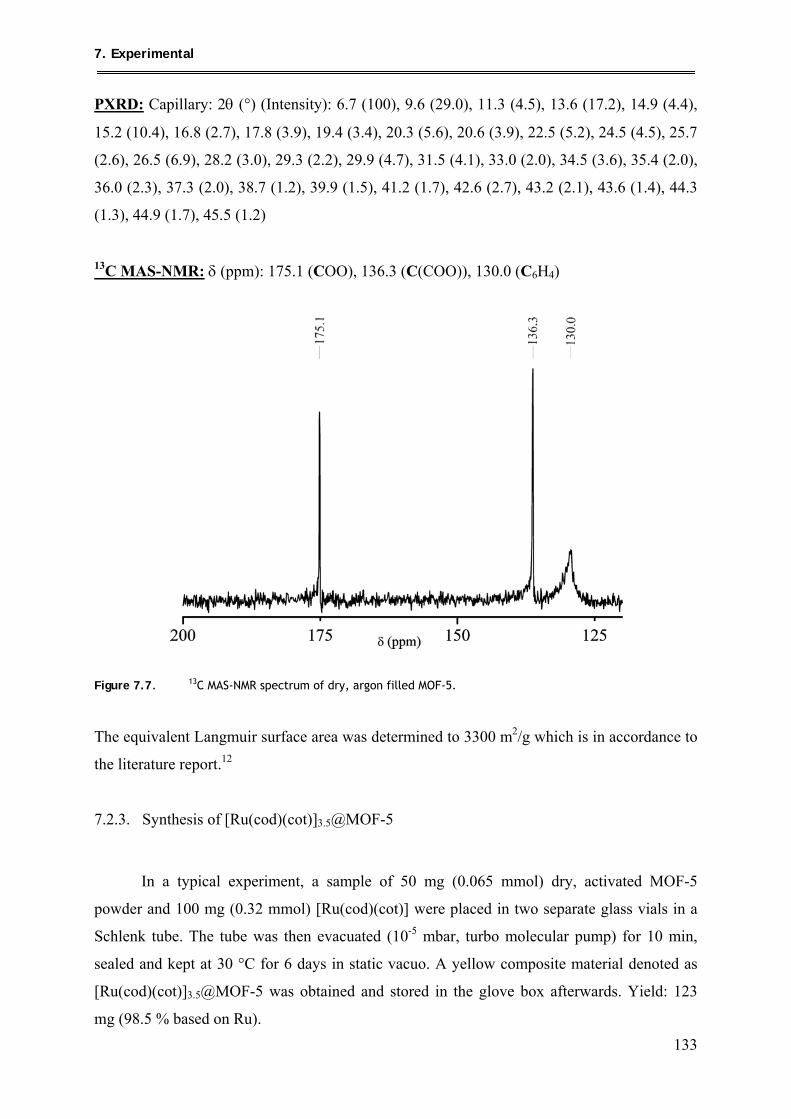
7. Experimental
133
PXRD: Capillary: 2θ (°) (Intensity): 6.7 (100), 9.6 (29.0), 11.3 (4.5), 13.6 (17.2), 14.9 (4.4),
15.2 (10.4), 16.8 (2.7), 17.8 (3.9), 19.4 (3.4), 20.3 (5.6), 20.6 (3.9), 22.5 (5.2), 24.5 (4.5), 25.7
(2.6), 26.5 (6.9), 28.2 (3.0), 29.3 (2.2), 29.9 (4.7), 31.5 (4.1), 33.0 (2.0), 34.5 (3.6), 35.4 (2.0),
36.0 (2.3), 37.3 (2.0), 38.7 (1.2), 39.9 (1.5), 41.2 (1.7), 42.6 (2.7), 43.2 (2.1), 43.6 (1.4), 44.3
(1.3), 44.9 (1.7), 45.5 (1.2)
13C MAS-NMR: δ (ppm): 175.1 (COO), 136.3 (C(COO)), 130.0 (C6H4)
Figure 7.7. 13C MAS-NMR spectrum of dry, argon filled MOF-5.
The equivalent Langmuir surface area was determined to 3300 m2/g which is in accordance to
the literature report.12
7.2.3. Synthesis of [Ru(cod)(cot)]3.5@MOF-5
In a typical experiment, a sample of 50 mg (0.065 mmol) dry, activated MOF-5
powder and 100 mg (0.32 mmol) [Ru(cod)(cot)] were placed in two separate glass vials in a
Schlenk tube. The tube was then evacuated (10-5 mbar, turbo molecular pump) for 10 min,
sealed and kept at 30 °C for 6 days in static vacuo. A yellow composite material denoted as
[Ru(cod)(cot)]3.5@MOF-5 was obtained and stored in the glove box afterwards. Yield: 123
mg (98.5 % based on Ru).
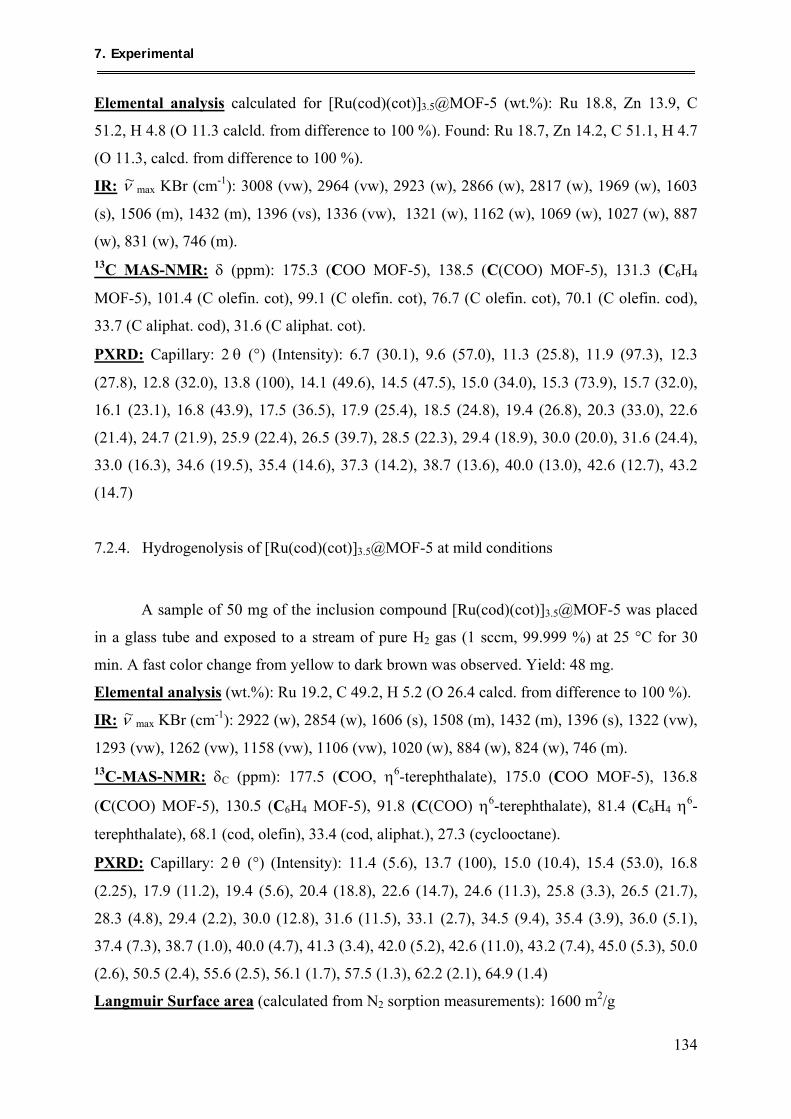
7. Experimental
134
Elemental analysis calculated for [Ru(cod)(cot)]3.5@MOF-5 (wt.%): Ru 18.8, Zn 13.9, C
51.2, H 4.8 (O 11.3 calcld. from difference to 100 %). Found: Ru 18.7, Zn 14.2, C 51.1, H 4.7
(O 11.3, calcd. from difference to 100 %).
IR: ν~ max KBr (cm-1): 3008 (vw), 2964 (vw), 2923 (w), 2866 (w), 2817 (w), 1969 (w), 1603
(s), 1506 (m), 1432 (m), 1396 (vs), 1336 (vw), 1321 (w), 1162 (w), 1069 (w), 1027 (w), 887
(w), 831 (w), 746 (m). 13C MAS-NMR: δ (ppm): 175.3 (COO MOF-5), 138.5 (C(COO) MOF-5), 131.3 (C6H4
MOF-5), 101.4 (C olefin. cot), 99.1 (C olefin. cot), 76.7 (C olefin. cot), 70.1 (C olefin. cod),
33.7 (C aliphat. cod), 31.6 (C aliphat. cot).
PXRD: Capillary: 2 θ (°) (Intensity): 6.7 (30.1), 9.6 (57.0), 11.3 (25.8), 11.9 (97.3), 12.3
(27.8), 12.8 (32.0), 13.8 (100), 14.1 (49.6), 14.5 (47.5), 15.0 (34.0), 15.3 (73.9), 15.7 (32.0),
16.1 (23.1), 16.8 (43.9), 17.5 (36.5), 17.9 (25.4), 18.5 (24.8), 19.4 (26.8), 20.3 (33.0), 22.6
(21.4), 24.7 (21.9), 25.9 (22.4), 26.5 (39.7), 28.5 (22.3), 29.4 (18.9), 30.0 (20.0), 31.6 (24.4),
33.0 (16.3), 34.6 (19.5), 35.4 (14.6), 37.3 (14.2), 38.7 (13.6), 40.0 (13.0), 42.6 (12.7), 43.2
(14.7)
7.2.4. Hydrogenolysis of [Ru(cod)(cot)]3.5@MOF-5 at mild conditions
A sample of 50 mg of the inclusion compound [Ru(cod)(cot)]3.5@MOF-5 was placed
in a glass tube and exposed to a stream of pure H2 gas (1 sccm, 99.999 %) at 25 °C for 30
min. A fast color change from yellow to dark brown was observed. Yield: 48 mg.
Elemental analysis (wt.%): Ru 19.2, C 49.2, H 5.2 (O 26.4 calcd. from difference to 100 %).
IR: ν~ max KBr (cm-1): 2922 (w), 2854 (w), 1606 (s), 1508 (m), 1432 (m), 1396 (s), 1322 (vw),
1293 (vw), 1262 (vw), 1158 (vw), 1106 (vw), 1020 (w), 884 (w), 824 (w), 746 (m). 13C-MAS-NMR: δC (ppm): 177.5 (COO, η6-terephthalate), 175.0 (COO MOF-5), 136.8
(C(COO) MOF-5), 130.5 (C6H4 MOF-5), 91.8 (C(COO) η6-terephthalate), 81.4 (C6H4 η6-
terephthalate), 68.1 (cod, olefin), 33.4 (cod, aliphat.), 27.3 (cyclooctane).
PXRD: Capillary: 2 θ (°) (Intensity): 11.4 (5.6), 13.7 (100), 15.0 (10.4), 15.4 (53.0), 16.8
(2.25), 17.9 (11.2), 19.4 (5.6), 20.4 (18.8), 22.6 (14.7), 24.6 (11.3), 25.8 (3.3), 26.5 (21.7),
28.3 (4.8), 29.4 (2.2), 30.0 (12.8), 31.6 (11.5), 33.1 (2.7), 34.5 (9.4), 35.4 (3.9), 36.0 (5.1),
37.4 (7.3), 38.7 (1.0), 40.0 (4.7), 41.3 (3.4), 42.0 (5.2), 42.6 (11.0), 43.2 (7.4), 45.0 (5.3), 50.0
(2.6), 50.5 (2.4), 55.6 (2.5), 56.1 (1.7), 57.5 (1.3), 62.2 (2.1), 64.9 (1.4)
Langmuir Surface area (calculated from N2 sorption measurements): 1600 m2/g
7. Experimental
135
7.2.5. Synthesis of Ru@MOF-5 by quantitative hydrogenolysis of [Ru(cod)(cot)]3.5@MOF-5
A sample of 100 mg (0.054 mmol) of the inclusion compound
[Ru(cod)(cot)]3.5@MOF-5 was placed in a Fischer-Porter-Bottle and evacuated for 5 min
(dynamic vacuo, 10-3 mbar). The bottle was then filled with 3 bar of H2 gas (99.999 %) at 25
°C and heated to 150 °C for 48 h. A color change from yellow to brown was observed within
the first 15 minutes. Some slight further darkening was visible during the treatment. After
cooling to room temperature, H2 was removed in dynamic vacuo (10-3 mbar, 15 min) and
thereafter the bottle was refilled with Ar (1 mbar). Yield, 61 mg (0.054 mmol, 100 %),
Elemental analysis (wt.%) calculated for Ru3.5@MOF-5.: Ru 31.5, Zn 23.3, C 25.7, H 1.08
(O 18.4, calcd. from difference to 100 %). Found: Ru 30.6, Zn 23.1, C 25.5, H 1.06 (O, 19.7,
calcd. from difference to 100 %).
IR: ν~ max KBr (cm-1): 1576 (s), 1505 (m), 1390 (s), 1259 (w), 1176 (w), 1153 (w), 1095 (w),
1017 (w), 878 (w), 829 (w), 810 (w), 745 (m). 13C MAS-NMR: δ (ppm): 175.1 (COO MOF-5), 136.9 (C(COO) MOF-5), 130.6 (C6H4
MOF-5).
PXRD: Capillary: 2 θ (°) (Intensity): 11.3 (3.9), 11.8 (15.8), 13.7 (77.4), 15.3 (100), 16.8
(6.6), 17.8 (27.8), 19.4 (36.9), 20.3 (51.2), 20.6 (24.9), 22.6 (31.5), 22.8 (14.2), 24.6 (30.9),
25.8 (6.6), 26.5 (44.2), 27.0 (7.8), 28.3 (11.3), 29.3 (3.8), 30.0 (22.7), 31.6 (21.7), 33.1 (5.2),
34.6 (17.9), 40.0 (11.3), 41.3 (11.4), 42.0 (18.3), 42.6 (28.9), 43.2 (26.0), 43.7 (25.6), 44.0
Ru[101] (23.3), 44.4 (23.0), 44.9 (18.6), 50.0 (4.5), 50.5 (4.3), 55.6 (5.5), 56.1 (2.9), 57.6
(2.9), 62.3 (3.45), 65.0 (2.9)
Langmuir surface area (calculated from N2 sorption measurements): 860 m2/g
For the calcinations experiments 40 mg of Ru@MOF-5 were filled into a glass ampoule in the
glove box. The ampoule was evacuated(10-3 mbar) and then sealed. The calcinations were
performed at 200 °C, 400 °C and 500 °C for 14 h by placing the ampoules in an oven.
7.2.6. Deuterium adsorption at Ru@MOF-5, sample preparation for solid state 2H-NMR
measurements
A sample of 200 mg Ru@MOF-5 was placed in a NMR tube and evacuated for 15 min
(10-7 mbar, turbomolecular pump). Subsequently, 1 bar of D2 gas was added at 25 °C for 1 h.

7. Experimental
136
Then, the D2 gas was removed in vacuo (10-7 mbar, 25 °C) and the sample was evacuated for
5 more minutes before the NMR tube was flame sealed.
7.2.7. CO adsorption at Ru@MOF-5 for FT-IR measurements
A sample of 50 mg of Ru@MOF-5 was filled in a Fischer-Porter-Bottle and evacuated
for 5 min (at 10-3 mbar, oil pump). Then, the material was treated with 1 bar of CO for 30 min
at 25 °C in the sealed bottle. Afterwards, the non absorbed gas was removed in vacuo (10-3
mbar, 25 °C), the sample was introduced to a glove box immediately and a KBr pellet for FT-
IR measurements was prepared inside the box.
IR: ν~ max KBr (cm-1): 2922 (vw), 2854 (vw), 2000 (m), 1890 (m), 1590 (s), 1506 (m), 1390
(s), 1310 (m), 1250 (vw), 1153 (vw), 1018 (vw), 882 (vw), 824 (vw), 811 (vw), 781 (vw), 745
(m)
7.2.8. Oxidation of benzyl alcohol using oxidized Ru@MOF-5 as catalyst
A sample of 20 mg (0.011 mmol) of Ru@MOF-5 was exposed to a stream of 4 vol.%
O2 diluted in argon (1 sccm) at room temperature for 30 min.
Figure 7.8. Powder X-ray diffractogramm of Ru@MOF-5 after oxidation in 4 vol.% O2 diluted in argon at
25 °C, 30 min.
7. Experimental
137
PXRD: Capillary: 2 θ (°) (Intensity): 13.6 (100), 14.9 (11.9), 15.3 (69.2), 16.7 (3.58), 17.8
(13.7), 19.4 (14.4), 20.3 (31.8), 20.6 (14.7), 22.5 (22.0), 22.8 (7.2), 24.6 (18.5), 25.8 (6.1),
26.5 (35.7), 28.3 (8.9), 29.3 (3.6), 30.0 (22.8), 31.5 (18.0), 33.0 (3.7), 34.5 (14.4), 35.4 (5.9),
36.0 (8.0), 37.4 (7.6), 40.0 (6.4), 41.2 (3.5), 42.0 (5.32), 42.6 (12.7), 43.2 (8.0), 45.0 (7.1),
50.0 (4.0), 55.6 (5.64)
The obtained powder was then introduced into a Schlenk tube, suspended in 5 ml of toluene
and 0.1 mL of benzyl alcohol were added. The solution was saturated with O2 and stirred for
48 h at 80 °C. Then the suspension was filtered and the filtrate was analyzed by GC-MS.
PXRD analysis of the remaining catalyst powder after the catalytic reaction showed complete
decomposition of the MOF-5 matrix.
7.2.9. Hydrogenation of benzene using Ru@MOF-5 as catalyst
A sample of 50 mg Ru@MOF-5 (0.011 mmol) of Ru@MOF-5 were placed in a
Fisher-Porter bottle and 0.7 ml of benzene (7.8 mmol) were added. After short evacuation, 3
bar of H2 gas (99.999 %) were added and the mixture was heated to 75°C for 20 h. 1.43 bar of
H2 were consumed after 20 h, prolonged heating did not lead to additional gas consumption.
The reaction mixture was investigated by 1H NMR.
Figure 7.9. Powder X-ray diffractogramm of Ru@MOF-5 after hydrogenation catalysis (Lines: Ru JPDS
reference No. 6-0663).
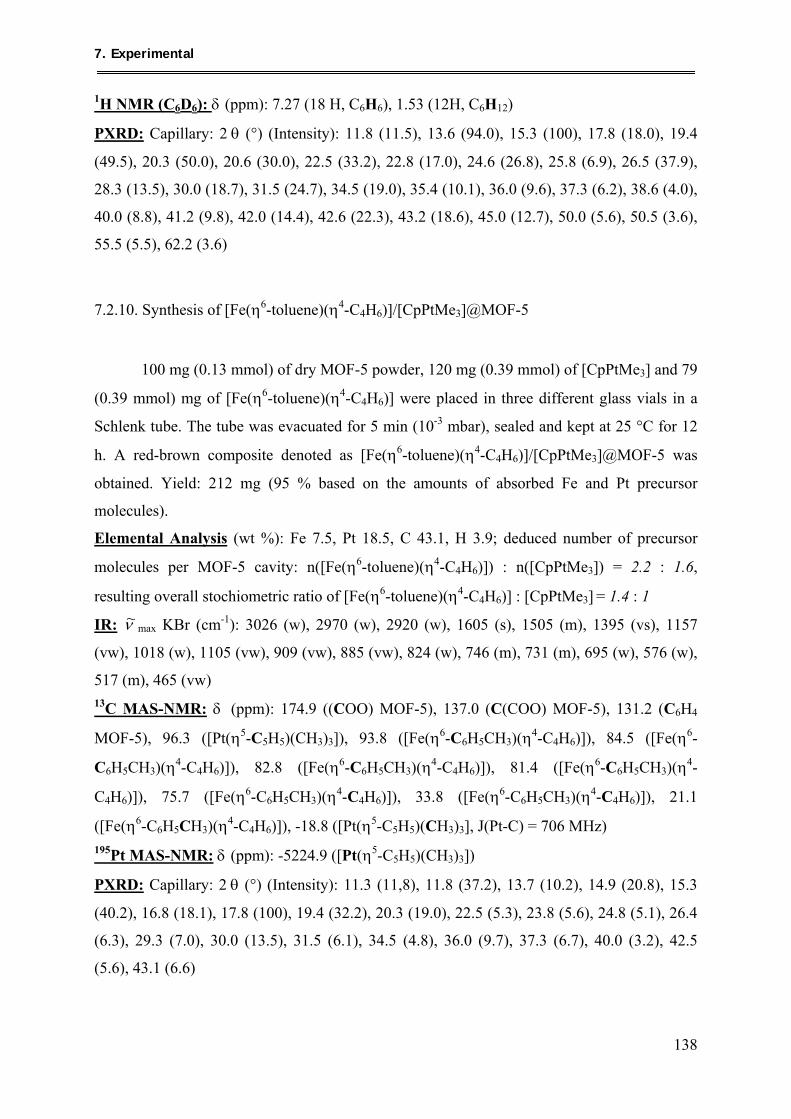
7. Experimental
138
1H NMR (C6D6): δ (ppm): 7.27 (18 H, C6H6), 1.53 (12H, C6H12)
PXRD: Capillary: 2 θ (°) (Intensity): 11.8 (11.5), 13.6 (94.0), 15.3 (100), 17.8 (18.0), 19.4
(49.5), 20.3 (50.0), 20.6 (30.0), 22.5 (33.2), 22.8 (17.0), 24.6 (26.8), 25.8 (6.9), 26.5 (37.9),
28.3 (13.5), 30.0 (18.7), 31.5 (24.7), 34.5 (19.0), 35.4 (10.1), 36.0 (9.6), 37.3 (6.2), 38.6 (4.0),
40.0 (8.8), 41.2 (9.8), 42.0 (14.4), 42.6 (22.3), 43.2 (18.6), 45.0 (12.7), 50.0 (5.6), 50.5 (3.6),
55.5 (5.5), 62.2 (3.6)
7.2.10. Synthesis of [Fe(η6-toluene)(η4-C4H6)]/[CpPtMe3]@MOF-5
100 mg (0.13 mmol) of dry MOF-5 powder, 120 mg (0.39 mmol) of [CpPtMe3] and 79
(0.39 mmol) mg of [Fe(η6-toluene)(η4-C4H6)] were placed in three different glass vials in a
Schlenk tube. The tube was evacuated for 5 min (10-3 mbar), sealed and kept at 25 °C for 12
h. A red-brown composite denoted as [Fe(η6-toluene)(η4-C4H6)]/[CpPtMe3]@MOF-5 was
obtained. Yield: 212 mg (95 % based on the amounts of absorbed Fe and Pt precursor
molecules).
Elemental Analysis (wt %): Fe 7.5, Pt 18.5, C 43.1, H 3.9; deduced number of precursor
molecules per MOF-5 cavity: n([Fe(η6-toluene)(η4-C4H6)]) : n([CpPtMe3]) = 2.2 : 1.6,
resulting overall stochiometric ratio of [Fe(η6-toluene)(η4-C4H6)] : [CpPtMe3] = 1.4 : 1
IR: ν~ max KBr (cm-1): 3026 (w), 2970 (w), 2920 (w), 1605 (s), 1505 (m), 1395 (vs), 1157
(vw), 1018 (w), 1105 (vw), 909 (vw), 885 (vw), 824 (w), 746 (m), 731 (m), 695 (w), 576 (w),
517 (m), 465 (vw) 13C MAS-NMR: δ (ppm): 174.9 ((COO) MOF-5), 137.0 (C(COO) MOF-5), 131.2 (C6H4
MOF-5), 96.3 ([Pt(η5-C5H5)(CH3)3]), 93.8 ([Fe(η6-C6H5CH3)(η4-C4H6)]), 84.5 ([Fe(η6-
C6H5CH3)(η4-C4H6)]), 82.8 ([Fe(η6-C6H5CH3)(η4-C4H6)]), 81.4 ([Fe(η6-C6H5CH3)(η4-
C4H6)]), 75.7 ([Fe(η6-C6H5CH3)(η4-C4H6)]), 33.8 ([Fe(η6-C6H5CH3)(η4-C4H6)]), 21.1
([Fe(η6-C6H5CH3)(η4-C4H6)]), -18.8 ([Pt(η5-C5H5)(CH3)3], J(Pt-C) = 706 MHz) 195Pt MAS-NMR: δ (ppm): -5224.9 ([Pt(η5-C5H5)(CH3)3])
PXRD: Capillary: 2 θ (°) (Intensity): 11.3 (11,8), 11.8 (37.2), 13.7 (10.2), 14.9 (20.8), 15.3
(40.2), 16.8 (18.1), 17.8 (100), 19.4 (32.2), 20.3 (19.0), 22.5 (5.3), 23.8 (5.6), 24.8 (5.1), 26.4
(6.3), 29.3 (7.0), 30.0 (13.5), 31.5 (6.1), 34.5 (4.8), 36.0 (9.7), 37.3 (6.7), 40.0 (3.2), 42.5
(5.6), 43.1 (6.6)
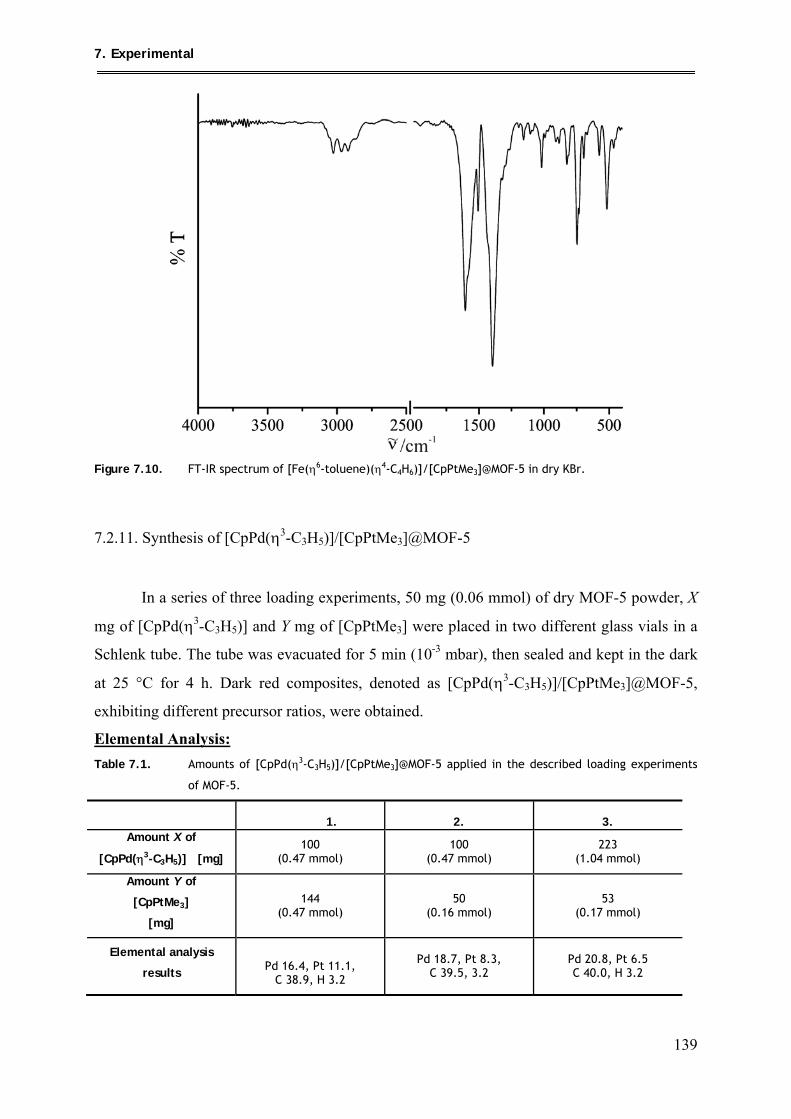
7. Experimental
139
Figure 7.10. FT-IR spectrum of [Fe(η6-toluene)(η4-C4H6)]/[CpPtMe3]@MOF-5 in dry KBr.
7.2.11. Synthesis of [CpPd(η3-C3H5)]/[CpPtMe3]@MOF-5
In a series of three loading experiments, 50 mg (0.06 mmol) of dry MOF-5 powder, X
mg of [CpPd(η3-C3H5)] and Y mg of [CpPtMe3] were placed in two different glass vials in a
Schlenk tube. The tube was evacuated for 5 min (10-3 mbar), then sealed and kept in the dark
at 25 °C for 4 h. Dark red composites, denoted as [CpPd(η3-C3H5)]/[CpPtMe3]@MOF-5,
exhibiting different precursor ratios, were obtained.
Elemental Analysis: Table 7.1. Amounts of [CpPd(η3-C3H5)]/[CpPtMe3]@MOF-5 applied in the described loading experiments
of MOF-5.
1. 2. 3.
Amount X of
[CpPd(η3-C3H5)] [mg] 100
(0.47 mmol) 100
(0.47 mmol) 223
(1.04 mmol)
Amount Y of
[CpPtMe3]
[mg]
144 (0.47 mmol)
50 (0.16 mmol)
53 (0.17 mmol)
Elemental analysis
results
Pd 16.4, Pt 11.1,
C 38.9, H 3.2
Pd 18.7, Pt 8.3,
C 39.5, 3.2
Pd 20.8, Pt 6.5 C 40.0, H 3.2
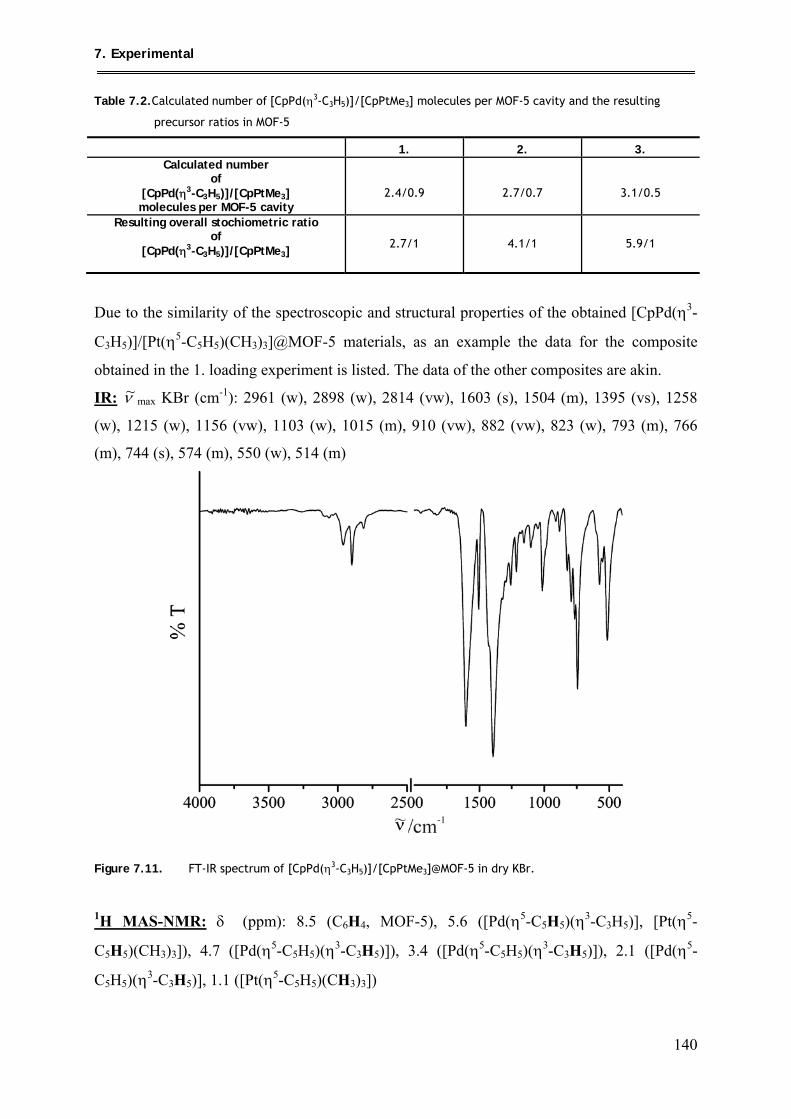
7. Experimental
140
Table 7.2.Calculated number of [CpPd(η3-C3H5)]/[CpPtMe3] molecules per MOF-5 cavity and the resulting
precursor ratios in MOF-5
1. 2. 3. Calculated number
of [CpPd(η3-C3H5)]/[CpPtMe3] molecules per MOF-5 cavity
2.4/0.9
2.7/0.7
3.1/0.5
Resulting overall stochiometric ratio of
[CpPd(η3-C3H5)]/[CpPtMe3]
2.7/1 4.1/1 5.9/1
Due to the similarity of the spectroscopic and structural properties of the obtained [CpPd(η3-
C3H5)]/[Pt(η5-C5H5)(CH3)3]@MOF-5 materials, as an example the data for the composite
obtained in the 1. loading experiment is listed. The data of the other composites are akin.
IR: ν~ max KBr (cm-1): 2961 (w), 2898 (w), 2814 (vw), 1603 (s), 1504 (m), 1395 (vs), 1258
(w), 1215 (w), 1156 (vw), 1103 (w), 1015 (m), 910 (vw), 882 (vw), 823 (w), 793 (m), 766
(m), 744 (s), 574 (m), 550 (w), 514 (m)
Figure 7.11. FT-IR spectrum of [CpPd(η3-C3H5)]/[CpPtMe3]@MOF-5 in dry KBr.
1H MAS-NMR: δ (ppm): 8.5 (C6H4, MOF-5), 5.6 ([Pd(η5-C5H5)(η3-C3H5)], [Pt(η5-
C5H5)(CH3)3]), 4.7 ([Pd(η5-C5H5)(η3-C3H5)]), 3.4 ([Pd(η5-C5H5)(η3-C3H5)]), 2.1 ([Pd(η5-
C5H5)(η3-C3H5)], 1.1 ([Pt(η5-C5H5)(CH3)3])
7. Experimental
141
13C MAS-NMR: δ (ppm): 175.0 (COO MOF-5), 137.0 (C(COO) MOF-5), 131.1 (C6H4
MOF-5), 99.5 ([Pt(η5-C5H5)(CH3)3]), 94.7 ([Pd(η5-C5H5)(η3-C3H5)]), 46.3 ([Pd(η5-C5H5)(η3-
C3H5)]), -19.1 ([Pt(η5-C5H5)(CH3)3]) 195Pt MAS-NMR: δ (ppm): -5216.9 ([Pt(η5-C5H5)(CH3)3])
PXRD: Capillary: 2 θ (°) (Intensity): 11.3 (12.5), 11.9 (40.1), 13.7 (5.6), 14.9 (32.8), 15.3
(27.8), 16.8 (20.3), 17.8 (100), 19.4 (35.1), 20.3 (19.8), 21.7 (5.0), 22.6 (4.0), 23.9 (4.9), 24.9
(5.9), 28.3 (7.6), 29.3 (8.8), 30.0 (10.4), 31.6 (4.7), 34.7 (5.8), 36.0 (9.6), 37.3 (6.4), 40.0
(2.8), 42.6 (3.7), 43.2 (4.6)
7.2.12. Synthesis of [Ru(cod)(cot)]/[Pt(cod)Me2]@MOF-5
In a typical experiment 50 mg (0.06 mmol) dry MOF-5 powder, 53 mg (0.16 mmol)
[Pt(cod)Me2] and 50 mg (0.16 mmol) [Ru(cod)(cot)] were placed in a Schlenk tube in two
different glass vials. The tube was evacuated for 10 min, sealed (10-5 mbar) and then kept at
30 °C until complete absorption of both precursors was observed (duration: 48 h). A yellow
powder, denoted as [Ru(cod)(cot)]/[Pt(cod)Me2]@MOF-5 was obtained. Yield: 151 mg (99 %
based on complete absorption of both precursor materials)
Elemental Analysis (wt %): Ru 9.8, Pt 17.0, Zn 13.5, C 41.3, H 4.39 (O 14.0 calcd. From
difference to 100 %); deduced number of precursor molecules per MOF-5 cavity:
n([Ru(cod)(cot)]):n([Pt(cod)Me2]) = 1.9:1.7, resulting overall stochiometric ratio of
[Ru(cod)(cot)] : [Pt(cod)Me2]): 1:1 (± 0.1).
IR: ν~ max KBr (cm-1): 3057 (vw), 2994 (vw), 2920 (w), 2869 (w), 2833 (vw), 2792 (vw), 1953
(w), 1603 (s), 1504 (m), 1393 (vs), 1265 (w), 1156 (w), 1092 (w), 1017 (w), 977 (w), 883
(vw), 858 (vw), 821 (w), 745 (m), 574 (w), 514 (w) 13C MAS-NMR: δ (ppm): 175.6 (COO MOF-5), 136.8 (C(COO) MOF-5), 131.6 (C6H4
MOF-5), 101.4 ([Ru(cod)(cot)], cot, olefin.), 98.8 ([Ru(cod)(cot)], cot, olefin. &
[Pt(cod)(CH3)2], cot olefin.), 77.2 ([Ru(cod)(cot)], cot, olefin.), 70.2 ([Ru(cod)(cot)], cod,
olefin), 34.1 ([Ru(cod)(cot)], cod, aliphat.), 32.0 ([Ru(cod)(cot)], cot, aliphat.), 30.8
([Pt(cod)(CH3)2], cod, aliphat.), 5.5 ([Pt(cod)(CH3)2], J(Pt-C) = 785 MHz)
PXRD: Capillary: 2 θ (°) (Intensity): 9.6 (100), 11.8 (99.5), 13.7 (83.5), 15.3 (68.7), 16.7
(48.2), 17.8 (52.4), 19.3 (43.3), 20.3 (44.5), 26.5 (40.0)
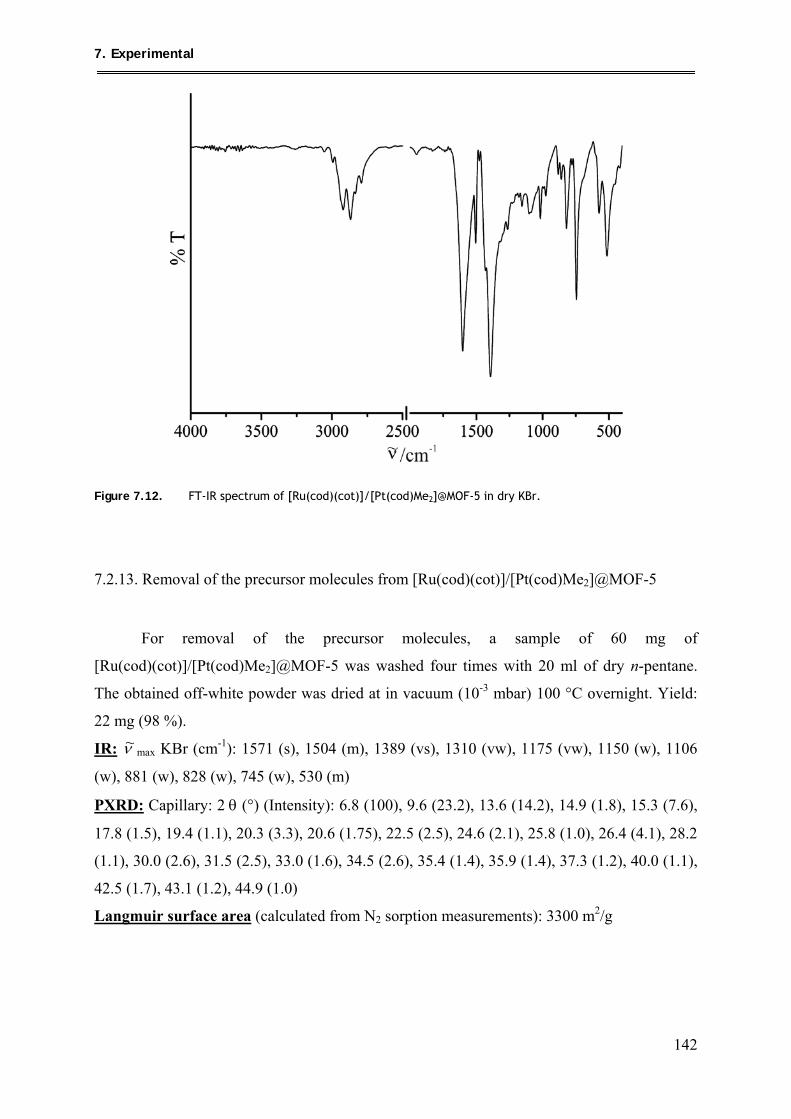
7. Experimental
142
Figure 7.12. FT-IR spectrum of [Ru(cod)(cot)]/[Pt(cod)Me2]@MOF-5 in dry KBr.
7.2.13. Removal of the precursor molecules from [Ru(cod)(cot)]/[Pt(cod)Me2]@MOF-5
For removal of the precursor molecules, a sample of 60 mg of
[Ru(cod)(cot)]/[Pt(cod)Me2]@MOF-5 was washed four times with 20 ml of dry n-pentane.
The obtained off-white powder was dried at in vacuum (10-3 mbar) 100 °C overnight. Yield:
22 mg (98 %).
IR: ν~ max KBr (cm-1): 1571 (s), 1504 (m), 1389 (vs), 1310 (vw), 1175 (vw), 1150 (w), 1106
(w), 881 (w), 828 (w), 745 (w), 530 (m)
PXRD: Capillary: 2 θ (°) (Intensity): 6.8 (100), 9.6 (23.2), 13.6 (14.2), 14.9 (1.8), 15.3 (7.6),
17.8 (1.5), 19.4 (1.1), 20.3 (3.3), 20.6 (1.75), 22.5 (2.5), 24.6 (2.1), 25.8 (1.0), 26.4 (4.1), 28.2
(1.1), 30.0 (2.6), 31.5 (2.5), 33.0 (1.6), 34.5 (2.6), 35.4 (1.4), 35.9 (1.4), 37.3 (1.2), 40.0 (1.1),
42.5 (1.7), 43.1 (1.2), 44.9 (1.0)
Langmuir surface area (calculated from N2 sorption measurements): 3300 m2/g
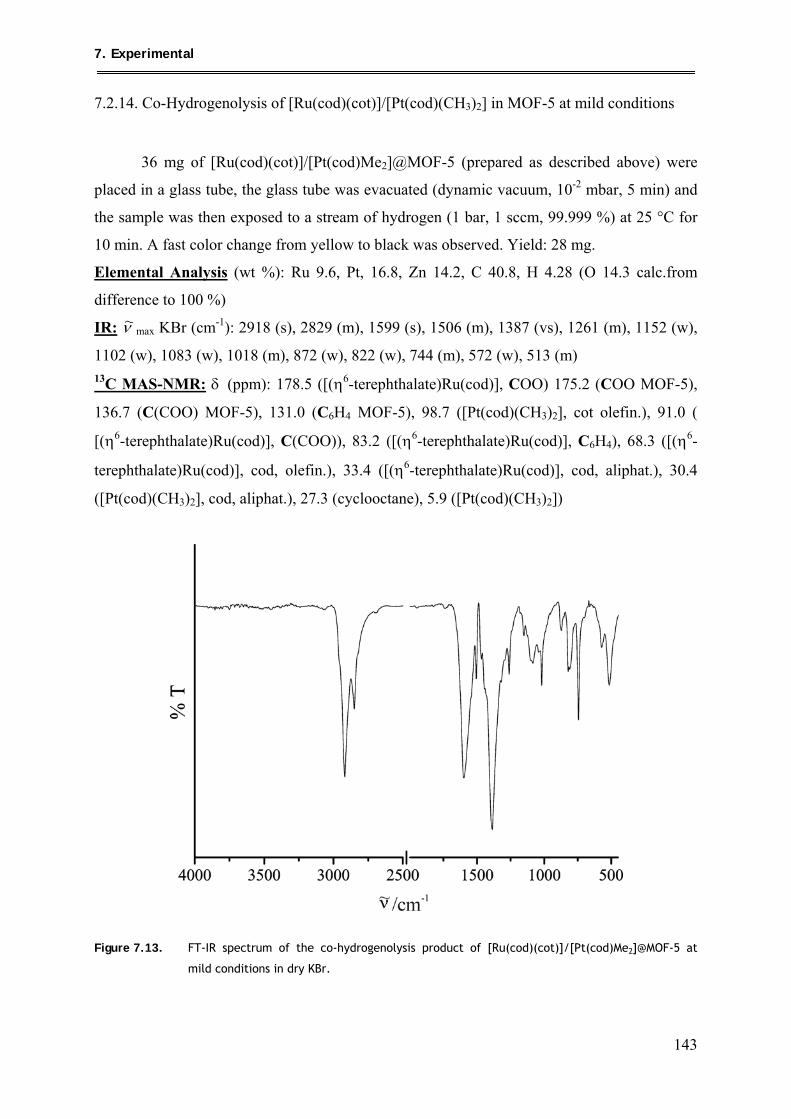
7. Experimental
143
7.2.14. Co-Hydrogenolysis of [Ru(cod)(cot)]/[Pt(cod)(CH3)2] in MOF-5 at mild conditions
36 mg of [Ru(cod)(cot)]/[Pt(cod)Me2]@MOF-5 (prepared as described above) were
placed in a glass tube, the glass tube was evacuated (dynamic vacuum, 10-2 mbar, 5 min) and
the sample was then exposed to a stream of hydrogen (1 bar, 1 sccm, 99.999 %) at 25 °C for
10 min. A fast color change from yellow to black was observed. Yield: 28 mg.
Elemental Analysis (wt %): Ru 9.6, Pt, 16.8, Zn 14.2, C 40.8, H 4.28 (O 14.3 calc.from
difference to 100 %)
IR: ν~ max KBr (cm-1): 2918 (s), 2829 (m), 1599 (s), 1506 (m), 1387 (vs), 1261 (m), 1152 (w),
1102 (w), 1083 (w), 1018 (m), 872 (w), 822 (w), 744 (m), 572 (w), 513 (m) 13C MAS-NMR: δ (ppm): 178.5 ([(η6-terephthalate)Ru(cod)], COO) 175.2 (COO MOF-5),
136.7 (C(COO) MOF-5), 131.0 (C6H4 MOF-5), 98.7 ([Pt(cod)(CH3)2], cot olefin.), 91.0 (
[(η6-terephthalate)Ru(cod)], C(COO)), 83.2 ([(η6-terephthalate)Ru(cod)], C6H4), 68.3 ([(η6-
terephthalate)Ru(cod)], cod, olefin.), 33.4 ([(η6-terephthalate)Ru(cod)], cod, aliphat.), 30.4
([Pt(cod)(CH3)2], cod, aliphat.), 27.3 (cyclooctane), 5.9 ([Pt(cod)(CH3)2])
Figure 7.13. FT-IR spectrum of the co-hydrogenolysis product of [Ru(cod)(cot)]/[Pt(cod)Me2]@MOF-5 at
mild conditions in dry KBr.
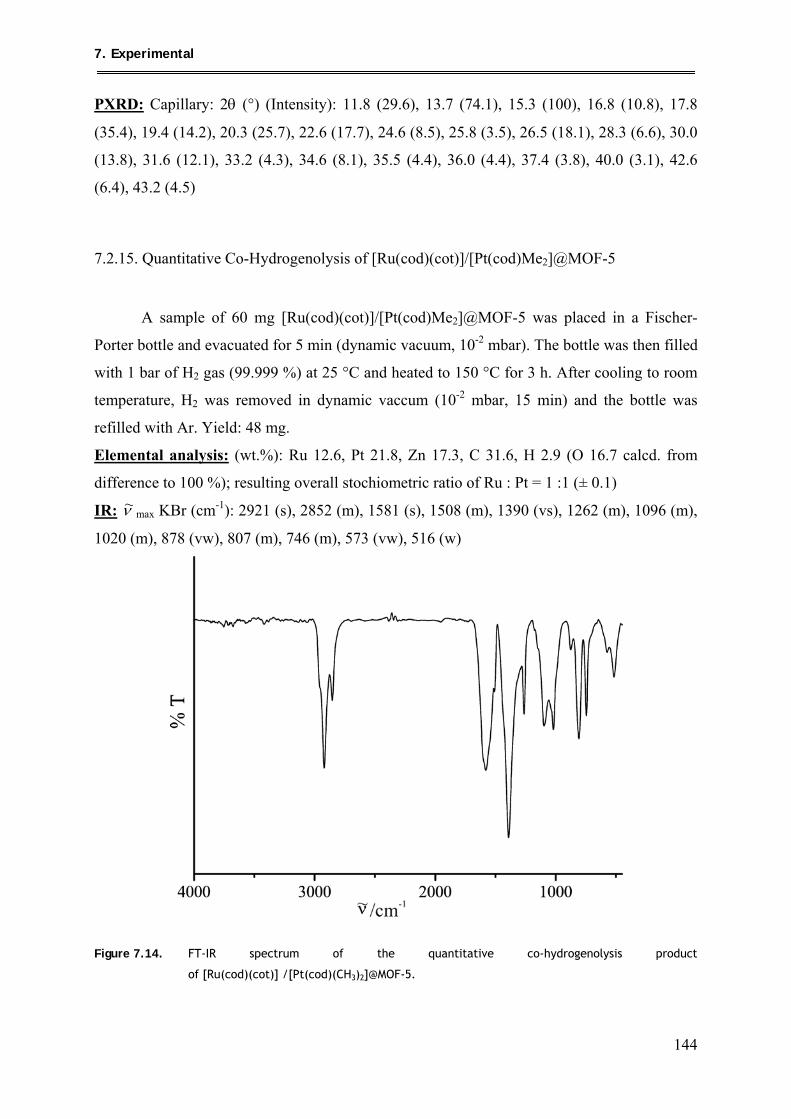
7. Experimental
144
PXRD: Capillary: 2θ (°) (Intensity): 11.8 (29.6), 13.7 (74.1), 15.3 (100), 16.8 (10.8), 17.8
(35.4), 19.4 (14.2), 20.3 (25.7), 22.6 (17.7), 24.6 (8.5), 25.8 (3.5), 26.5 (18.1), 28.3 (6.6), 30.0
(13.8), 31.6 (12.1), 33.2 (4.3), 34.6 (8.1), 35.5 (4.4), 36.0 (4.4), 37.4 (3.8), 40.0 (3.1), 42.6
(6.4), 43.2 (4.5)
7.2.15. Quantitative Co-Hydrogenolysis of [Ru(cod)(cot)]/[Pt(cod)Me2]@MOF-5
A sample of 60 mg [Ru(cod)(cot)]/[Pt(cod)Me2]@MOF-5 was placed in a Fischer-
Porter bottle and evacuated for 5 min (dynamic vacuum, 10-2 mbar). The bottle was then filled
with 1 bar of H2 gas (99.999 %) at 25 °C and heated to 150 °C for 3 h. After cooling to room
temperature, H2 was removed in dynamic vaccum (10-2 mbar, 15 min) and the bottle was
refilled with Ar. Yield: 48 mg.
Elemental analysis: (wt.%): Ru 12.6, Pt 21.8, Zn 17.3, C 31.6, H 2.9 (O 16.7 calcd. from
difference to 100 %); resulting overall stochiometric ratio of Ru : Pt = 1 :1 (± 0.1)
IR: ν~ max KBr (cm-1): 2921 (s), 2852 (m), 1581 (s), 1508 (m), 1390 (vs), 1262 (m), 1096 (m),
1020 (m), 878 (vw), 807 (m), 746 (m), 573 (vw), 516 (w)
Figure 7.14. FT-IR spectrum of the quantitative co-hydrogenolysis product
of [Ru(cod)(cot)] /[Pt(cod)(CH3)2]@MOF-5.
7. Experimental
145
13C MAS-NMR: δ (ppm): 186.3 (COO, cis-/trans-1,4-cyclohexanedicarboxylate), 175.0
(COO MOF-5), 136.9 (C(COO MOF-5), 130.7 (C6H4 MOF-5), 45.1 (C(COO) cis-1,4-
cyclohexanedicarboxylate), 41.1 (C(COO) trans-1,4-cyclohexanedicarboxylate), 29.6 (ring C
atoms cis-/trans-1,4-cyclohexanedicarboxylate), 27.2 (cyclooctane)
PXRD: Capillary: 2θ (°) (Intensity): 11.8 (34.4), 13.6 (48.8), 15.3 (65.5), 17.8 (56.5), 19.4
(23.4), 20.3 (27.7), 22.6 (15.8), 24.6 (17.0), 26.5 (36.7), 30.0 (20.4), 39.8 Pt [111] (100), 46.6
Pt [200] (31.5), 67.5 Pt [220] (27.7), 81.6 Pt [311] (38.6)
Langmuir surface area (calculated from N2 sorption measurements): 380 m2/g
7.2.16. Loading of MOF-5 with H2O
8 wt.%:
200 mg (0.26 mmol) of dry MOF-5 powder and 16 μl H2O (8 wt.%, 0.89 mmol) were
placed in a Schlenk tube in two different glass vials. The tube was evacuated (10-3 mbar, 25
°C) until boiling of the water was observed (2 min) and then sealed. The loading was
perpetuated until complete absorption of the water by MOF-5 was observed (max. duration 3
h). Yield: 214 mg (99 %).
IR: ν~ max KBr (cm-1): 3606 (m), 3432 (m), 1678 (m), 1580 (s), 1500 (m), 1386 (vs), 1296 (w),
1254 (w), 1148 (vw), 1106 (vw), 1016 (w), 884 (vw), 818 (m), 748 (m), 666 (w), 554 (vw),
522 (vw) 13C MAS-NMR: δ (ppm): 176.8 (COO MOF-5), 173.0 (COOH re-protonated terephthalate),
137.3 (C(COOH re-protonated terephthalate), 135.2 (C(COO) MOF-5, 131.0 (C6H4 MOF-5)
PXRD: Capillary: 2θ (°) (Intensity): 12.1 (75.3), 14.1 (12.4), 14.7 (9.5), 15.0 (6.3), 15.6
(77.7), 16.9 (100), 17.7 (80.8), 18.5 (3.7), 19.2 (31.4), 20.6 (18.4), 21.5 (17.6), 23.0 (4.0),
23.9 (8.5), 24.9 (52.4), 25.4 (58.5), 26.1 (10.0), 26.7 (9.8), 27.2 (6.8), 27.8 (27.9), 29.9 (9.5),
30.6 (16.7), 31.1 (18.3), 31.9 (23.0), 32.6 (20.9), 34.5 (3.3), 35.5 (16.8), 36.7 (7.0), 40.0 (3.9),
40.5 (8.8), 41.4 (9.6), 41.7 (10.6), 42.3 (4.8), 42.9 (5.9), 43.5 (5.5), 45.3 (22.9), 45.9 (3.1)
4 wt.%: 200 mg of dry MOF-5 powder (0.26 mmol) and 8 μl H2O (4 wt.%, 0.44 mmol) were
placed placed in a Schlenk tube in two different glass vials. The tube was evacuated (10-3
mbar, 25 °C) until boiling of the water was observed (30 s) and then sealed. The loading was
perpetuated until complete absorption of the water by MOF-5 was observed (max. duration 1
h). Yield: 206 mg (99 %)

7. Experimental
146
PXRD: Capillary: 2θ (°) (Intensity): 11.3 (6.1), 13.6 (100), 14.9 (11.5), 15.3 (50.6), 15.6
(11.8), 16.7 (2.4), 17.8 (14.6), 19.4 (5.8), 20.3 (20.4), 20.6 (9.5), 22.5 (14.9), 22.8 (5.0), 24.6
(12.2), 25.8 (3.6), 26.5 (24.9), 28.2 (5.4), 28.7 (2.6), 29.3 (3.0), 30.0 (14.7), 31.5 (13.0), 32.1
(5.3), 33.0 (2.6), 34.5 (10.5), 35.4 (3.7), 35.9 (6.6), 37.3 (4.8), 39.9 (5.2), 40.7 82.3), 41.2
(2.3), 41.9 (3.8), 42.5 (9.2), 43.1 (5.8), 43.6 (2.4), 44.4 (2.0), 44.9 (4.8), 45.4 (2.4)
8. References
147
8. References [1] Bailar; J. C. Jr. Prep. Inorg. React. 1964, 1.
[2] a) Hoskins, B. F.; Robson, R.; J. Am. Chem. Soc. 1989, 111, 5962-64. b) Hoskins, B.
F.; Robson, R.; J. Am. Chem. Soc. 1990, 112, 1546-1554. c) Abrahams, B. F.;
Hoskins, B. F.; Michail, D. M.; Robson, R., Nature 1994, 369, 727-729.
[3] a) Venkataraman, D.; Gardner, G. B.; Lee, S.; Moore, J. S., J. Am. Chem. Soc., 1995,
117, 11600-11601. b) Gardner, G. B.; Venkataraman, D.; Moore, J. S.; Lee, S., Nature
1995, 374, 792-795.
[4] Li, H.; Eddaoudi, M.; O’Keeffe, M.; Yaghi, O. M., Nature 1999, 402, 276-279.
[5] Subramanian S.; Zaworotko, M. J.; Angew. Chem., Int. Ed. 1995, 34, 2127-2129
[6] James, S. L., Chem. Soc. Rev. 2003, 32, 276-288.
[7] O’Keeffe, M.; Eddaoudi, M.; Li, H.; Reineke, T.; Yaghi, O. M., J. Solid State Chem.
2000, 152, 3-20.
[8] Férey, G., J. Solid State Chem. 2000, 152, 37-53.
[9] Férey, G., Chem. Soc. Rev. 2008, 37, 191-214 and references therein.
[10] Chen, B.; Eddaoudi, M.; Hydes, S. T.; O’Keeffe, M.; Yaghi, O. M., Science 2001, 291,
1021-123.
[11] a) Ockwig, N. W.; Delgado-Friedrichs; O., O’Keeffe, M.; Yaghi, O. M., Acc. Chem.
Res. 2005, 38, 176-182. b) Delgado-Friedrichs, O.; O’Keeffe, M.; Yaghi, O. M., Phys.
Chem. Chem. Phys. 2007, 9, 1035-1043.
[12] Yaghi, O. M.; O’Keeffe, M.; Ockwig, N. W.; Chae, H. K.; Eddaoudi, M.; Kim, J.;
Nature 2003, 423, 705-714.
[13] Rowsell, J. C. R.; Yaghi, O. M., Microporous Mesoporous Mater. 2004, 73, 3-14.
[14] Serre, C.; Millange, F.; Surblé, S.; Férey, G., Angew. Chem., Int. Ed. 2004, 43, 6286-
6289.
[15] Férey, G.; Mellot-Draznieks, C.; Serre, C.; Millange, F., Acc. Chem. Res. 2005, 38,
217-225 and references therein.
[16] Férey, G.; Mellot-Draznieks, C.; Serre, C.; Millange, F.; Dutour, J.; Surble, S.;
Margiolaki, I., Science 2005, 309, 2040-2042.
[17] a) Kitagawa, S.; Kitaura, R.; Noro, S.; Angew. Chem., Int. Ed. 2004, 43, 2334-2375
and references therein. b) Kitagawa, S.; Uemura, K., Chem. Soc. Rev. 2005, 34, 109-
8. References
148
119 and references therein. d) Tanaka, D.; Kitagawa, S., Chem. Mater. 2008, 20, 922-
931 and references therein.
[18] Eddaoudi, M.; Kim, J.; Rosi, N.; Vodak, D.; Wachter, J.; O’Keeffe, M.; Yaghi, O. M.,
Science 2002, 295, 469-472.
[19] Serre, C.; Millange, F.; Thouvenot, C.; Noguès, M.; Marsolier, G.; Louër, D.; Férey,
G., J. Am. Chem. Soc. 2002, 124, 13519-13526.
[20] Rowsell, J. L.; Millward, C. A. R.; Park, K. S.; Yaghi, O. M, J. Am. Chem. Soc. 2004,
126, 5666-5667.
[21] Millward, A. R.; Yaghi, O. M, J. Am. Chem. Soc. 2005, 127, 17998-17999.
[22] Matsuda, R.; Kitaura, R.; Kitagawa, S.; Kubota, Y., Belosludov, R. V.; Kobayashi, T.
C.; Sakamoto, H.; Chiba, T.; Takata, M.; Kawazoe, Y.; Mita, Y., Nature 2005, 436,
238-241.
[23] Rowsell, J. L. C.; Yaghi, O. M., Angew. Chem., Int. Ed. 2005, 44, 4670-4679.
[24] Surblé, S.; Millange, F.; Serre, C.; Düren, T.; Latroche, M.; Bourrelly, S.; Llewellyn,
P. L.; Férey, G., J. Am. Chem. Soc. 2006, 128, 14889-14896.
[25] Maji, T. K.; Matsuda, R.; Kitagawa, S., Nat. Mater. 2007, 6, 142-148.
[26] Alaerts, L.; Kirschhock, C. E. A.; Maes, M.; van der Veen, M. A.; Finsy, V.; Depla,
A.; Martens, J. A.; Baron, G. V.; Jacobs, P. A.; Denayer, J. F. M.; De Vos, D. E.,
Angew. Chem., Int. Ed. 2007, 119, 1-6.
[27] Banerjee, R.; Phan, A.; Wang, B.; Knobler, C.; Furukawa, H.; O’Keeffe, M.; Yaghi,
O. M., Science 2008, 319, 939-943.
[28] a) Hayashi, H.; Côté, A. P.; Furukawa, H.; O’Keeffe, M.; Yaghi, O. M., Nature 2007,
6, 501-506. b) Wang, B.; Côté, A. P; Furukawa, H; O’Keeffe, M.; Yaghi, O. M,
Nature 2008, 453, 207-212.
[29] Park, K. S.; Ni, Z.; Côté, A. P.; Choi, J. Y.; Huang, R.; Uribe-Romo, F. J.; Chae, H.
K.; O’Keeffe, M.; Yaghi, O. M., Proc. Natl. Acad. Sci. U. S. A. 2006, 103, 10186-
10191.
[30] a) Côté, A. P.; Benin, A. L.; Ockwig, N. W.; O’Keeffe, M.; Matzger, A. J.; Yaghi, O.
M., Science 2005, 310, 1166-1170. b) El-Kaderi, H. M.; Hunt, J. R.; Medosa-Cortés, J.
L.; Côté, A. P.; Taylor, R. E.; O’Keeffe, M.; Yaghi, O. M., Science 2007, 316, 268-
272. c) Han, S. S.; Furukawa, H.; Yaghi, O. M.; Goddard, W. A. III, J. Am. Chem.
Soc. 2008, 130, 11580-11581.
[31] a) Hermes, S.; Schröder, F.; Chelmowski, R.; Wöll, C.; Fischer. R. A, J. Am. Chem.
Soc. 2005, 127, 13744-1375. b) Hermes, S.; Zacher, D.; Baunemann, A.; Wöll, C.,
8. References
149
Fischer, R. A., Chem. Mater. 2007, 19, 2168-2173. c) Shekhah, O.; Wang, H.;
Kowarik, S.; Schreiber, F.; Paulus, M.; Tolan, M.; Sternemann, C.; Evers, F.; Zacher,
D.; Fischer, R. A.; Wöll, C., J. Am. Chem. Soc. 2007, 129, 15118-15119. d) Zacher,
D.; Baunemann, A.; Hermes, S.; Fischer, R. A., J. Mater. Chem. 2007, 17, 2785-2792.
[32] a) Biemmi, E.; Scherb, C.; Bein, T, J. Am. Chem. Soc. 2007, 129, 8054-8055.
b) Scherb, C.; Schödel, A.; Bein, T., Angew. Chem., Int. Ed. 2008, 47, 5777-5779.
[33] Wu, C.-D.; Hu, A.; Zhang, L.; Lin, W., J. Am. Chem. Soc. 2005, 127, 8940-8941.
[34] Cho, S.-H.; Ma, B.; Nguyen, S. T.; Hupp, J. T.; Albrecht-Schmitt, T. E, Chem.
Commun. 2006, 24, 2563-2565.
[35] Bauer, C. A.; Timofeeva, T. V.; Settersten, T. B.; Patterson, B. D.; Liu, V. H.;
Simmons, B. A.; Allendorf, M. D., J. Am. Chem. Soc. 2007, 129, 7136-7144.
[36] Chen, B.; Yang, Y.; Zapata, F.; Lin, G.; Qian, G.; Lobkovsky, E. B., Adv. Mater.
2007, 19, 1693-1696.
[37] Llabres i Xamena, F. X.; Corma, A.; Garcia, H, J. Phys. Chem. C 2007, 111, 80-85.
[38] Alvaro, M.; Carbonell, E.; Ferrer, B.; Llabres i Xamena, F. X.; Garcia, H., Chem.-Eur.
J. 2007, 13, 5106-5112.
[39] Hulteen, J. C.; Martin, C. R., J. Mater. Chem. 1997, 7, 1075-1087.
[40] Joo, S. H.; Choi, S. J.; Oh, I.; Kwak, J.; Liu, Z.; Terasaki, O.; Ryoo, R, Nature 2001,
412, 169-173.
[41] Gray, D. H.; Hu, S.; Juang, E.; Gin, D. L., Adv. Mater. 1997, 9, 731-736.
[42] Chae, H. K.; Siberio-Pérez; D. Y.; Kim, J.; Go, Y.; Eddaoudi, M.; Matzger, A.;
O’Keeffe, M.; Yaghi, O. M., Nature 2004, 427, 523-527.
[43] a) Horcajada, P.; Serre, C.; Vallet-Regí, M.; Sebban, M.; Taulelle, F.; Férey, G.,
Angew. Chem., Int. Ed. 2006, 118, 6120-6124. b) Horcajada, P.; Serre, C.; Maurin, G.;
Ramsahye, N. A.; Balas, F.; Vallet-Regí, M.; Sebban, M.; Taulelle, F.; Férey, G, J.
Am. Chem. Soc. 2008, 130, 6774-6780.
[44] Fang, Q.-R.; Zhu, G.-S.; Jin, Z.; Ji, Y.-Y.; Ye, J.-W.; Xue, M.; Yang, H.; Wang, Y.;
Qiu, S.-L., Angew. Chem., Int. Ed. 2007, 46, 6638-6642.
[45] Sabo, M.; Henschel, A.; Fröde, H.; Klemm, E.; Kaskel, S., J. Mater. Chem. 2007, 17,
3827-3832.
[46] a) Schmid, G., Chem. Rev. 1992, 92, 1709-1727. b) Bradley, J. S. in The Chemistry of
Transition Metal Colloids, in Clusters and Colloids, From Theory to Applications (Ed.
Schmid, G.), 459-544, VCH, Weinheim, 1994.
8. References
150
[47] a) Chemical Vapor Deposition, Principles and Applications (Eds. Hitchman, M. L.,
Jensen, K. F.), Academic Press Limited, London, 1993. b) Sherman, A., Chemical
Vapor Deposition for Microelectronics. Principles, Technology and Applications (Eds.
R. F. Bunshah, G. E. McGuire), Noyes Publications, Park Ridge, 1987.
[48] Kaye, S. S.; Dailly, A.; Yaghi, O. M.; Long, J. R, J. Am. Chem. Soc. 2007, 129,
14176-14177.
[49] Huang, L.; Wang, H.; Chen, J.; Wang, Z.; Sun, J.; Zhao, D.; Yan, Y., Microporous
Mesoporous Mater. 2003, 58, 105-114.
[50] Greathouse, J. A., Allendorf, M. D., J. Am. Chem. Soc. 2006, 128, 10678-10679.
[51] Hermes, S.; Schröter, M.-K.; Schmid, R.; Khodeir, L.; Muhler, M.; Tissler, A.;
Fischer, R. W.; Fischer, R. A., Angew. Chem., Int. Ed. 2005, 44, 6237-6241.
[52] Kim, H.; Chun, H.; Kim, G.-H.; Leeb, H.-S; Kim, K., Chem. Commun. 2005, 2759-
2761.
[53] Hermes, S.; Schröder, F.; Amirjalayer, S.; Schmid, R.; Fischer, R. A., J. Mater. Chem.
2006, 16, 2464-2472.
[54] Müller, M.; Lebedev, O. I.; Fischer, R. A., J. Mater. Chem. 2008,
DOI,10.1039/b810989c.
[55] Proch, S.; Hermannsdörfer, J.; Kempe, R.; Kern, C.; Jess, A.; Seyfahrt, L.; Senker, J.;
Chem. Eur. J. 2008, 14, 8204-8212.
[56] Park, Y. K.; Choi, S. B.; Kim, H.; Kim, K.; Won, B.-H.; Choi, K.; Choi, J.-S.; Ahn,
W.-S.; Won, N.; Kim, S.; Jung, D. H.; Choi, S.-H.; Kim, G.-H.; Cha, S.-S.; Jhon, Y.
H.; Yang, J. K.; Kim, J., Angew. Chem., Int. Ed. 2007, 46, 8230-8233.
[57] a) Caulder, D. L.; Brückner, C.; Powers, R. E.; König, S.; Parac, T. N.; Leary, J. A.;
Raymond, K. N., J. Am. Chem. Soc. 2001, 123, 8923-8938, b) Pluth, M. D.; Raymond,
K. N., Chem. Soc. Rev. 2006, 36, 161-171.
[58] Fiedler, D.; Bergman, R. G.; Raymond, K. N., Angew. Chem., Int. Ed. 2006, 45, 745-
748.
[59] Pluth, M. D.; Bergman, R. G.; Raymond, K. N., Angew. Chem., Int. Ed. 2007, 46,
8587-8589.
[60] Kawano, M.; Kobayashi, Y.; Ozeki, T.; Fujita, M., J. Am. Chem. Soc. 2006, 128,
6558-6559.
[61] Kaye, S. S.; Long, J. R., J. Am. Chem. Soc. 2008,130, 806-807.
[62] Opelt, S.; Türk, S.; Dietzsch, E.; Henschel, A.; Kaskel, S.; Klemm, E., Catalysis
Communications 2008, 9, 1286-1290.
8. References
151
[63] Müller, M.; Hermes, S.; Kähler, K.; van den Berg, M. W. E.; Muhler, M.; Fischer, R.
A., Chem. Mater. 2008, 20, 4576-4587.
[64] Sung, C.-K.; Hong, W.; Shi, Q.; Kou, X.; Yeung, M. H.; Wang, J.; Stucky, G. D.,
Adv. Funct. Mater. 2006, 16, 2225-2230.
[65] Besson, S.; Gacoin, T.; Ricolleau, Boilot, J.-P., Chem. Commun. 2003, 3, 360-361.
[66] Plyuto, Y.; Berquier, J.-M.; Jacquiod, C.; Ricolleau, C., Chem. Commun. 1999, 17,
1653-1654.
[67] Ishida, T.; Nagaoka, M.; Akita, T.; Haruta, M., Chem. Eur. J. 2008, 14, 8456-8460.
[68] Uemura, T.; Hiramatsu, D.; Yoshida, K.; Isoda, S.; Kitagawa, S., J. Am. Chem. Soc.
2008, 130, 9216-9217.
[69] Müller, M.; Zhang, X.; Wang, Y.; Fischer, Chem. Commun. 2008, DOI:
10.1039/b814214f.
[70] a) RiMoon, H.; Kim, J. H.; Suh, M. P., Angew. Chem., Int. Ed. 44, 2005, 1261-1265,
b) Suh, M. P.; Moon, H. R.; Lee, E. Y.; Jang S. J., J Am. Chem. Soc. 2006, 128, 4710-
4718. c) Cheon, Y. E.; Suh, M. P., Chem. Eur. J. 2008, 14, 3961-3967.
[71] Hwang, Y. K.; Hong, D.-Y.; Chang, J.-S.; Jhung, S. H.; Seo, Y.-K.; Kim, J.; Vimont,
A.; Daturi, M.; Serre, C.; Férey, G., Angew. Chem., Int. Ed. 2008, 47, 4144-4148.
[72] Henschel, A.; Gedrich, K.; Kraehnert, R.; Kaskel, S., Chem. Commun. 2008, 4192-
4194.
[73] Becker, R.; Parala, H.; Hipler, F.; Tkachenko, O. P.; Klementiev, K. V.; Grünert, W.;
Wilmer, H.; Hinrichsen, O.; Muhler, M.; Birkner, A.; Wöll, C.; Schäfer, S.; Fischer, R.
A., Angew. Chem., Int. Ed. 2004, 43, 2839-2842.
[74] Hansen, P. L.; Wagner, J. B.; Helveg, S.; Rostrup-Nielsen, J. R.; Clausen, B. S.;
Topsøe, H., Science 2002, 295, 2053–2055.
[75] Günter, M. M.; Ressler, T.; Bems, B.; Büscher, C.; Genger, T.; Hinrichsen, O.,
Muhler; M.; Schlögl R., Catal. Lett. 2001, 71, 37 – 44.
[76] Fujitani, T.; Nakamura, J. Appl. Catal. A 2000, 191, 111–129.
[77] Kurtz, M.; Bauer, N.; Buscher, C.; Wilmer, H.; Hinrichsen, O.; Becker, R.; Rabe, S.;
Merz, K.; Driess, M.; Fischer, R. A.; Muhler, M., Catal. Lett. 2004, 92, 49 – 52.
[78] Grubbs, R. H.; Tumas, W., Science 1989, 243, 907-915.
[79] Grubbs, R. H.; Chang, S., Tetrahedron 1998, 54, 4413-4450.
[80] Bielawa, H.; Hinrichsen, O.; Birkner, A.; Muhler, M., Angew. Chem., Int. Ed. 2001,
40, 1061-1063.
[81] Yamaguchi, K.; Mizuno, N., Angew. Chem., Int. Ed. 2002, 41, 4538-4542.
8. References
152
[82] Zhan, B.-Z.; White, M. A.; Sham, T.-K.; Pincock, J. A.; Doucet, R. J.; Rao, K. V. R.;
Robertson, K. N.; Cameron, T. S., J. Am. Chem. Soc. 2003, 125, 2195-2199.
[83] Ho, C.-M.; Yu, W.-Y.; Che, C.-M., Angew. Chem., Int. Ed. 2004, 43, 3303-3307.
[84] Kim, W.-H.; Park, I. S.; Park, J., Org. Lett. 2006, 8, 2543-2545.
[85] Miao, S.; Liu, Z.; Han, B.; Huang, J.; Sun, Z.; Zhang, J.; Jiang, T.; Angew. Chem., Int.
Ed. 2005, 45, 266-269.
[86] a) Kormann, H.-P.; Schmid, G.; Pelzer, K.; Philippot, K.; Chaudret, B., Z. Anorg.
Allgem. Chem. 2004, 630, 1913-1918. b) Jansat, S.; Picurelli, D.; Pelzer, K.; Philippot,
K.; Gomez, M.; Muller, G.; Lecante, P.; Chaudret, B., New J. Chem. 2006, 30, 115-
122. c) Garcia Anton, J.; Axet, M. R.; Jansat, S., Philippot, K.; Chaudret, B.; Pery, T.;
Buntkowsky, G,; Limbach H.-H., Angew. Chem., Int. Ed. 2008, 47, 2074-2078.
[87] Bönnemann, H.; Brijoux, W.; Brinkmann, R.; Dinjus, E.; Joussen, T.; Korall, B.,
Angew. Chem., Int. Ed. 1991, 10, 1312-1314.
[88] Viau, G.; Brayner, R.; Poul, L.; Chakroune, N.; Lacaze, E.; Fievet-Vincent, F.; Fievet,
F., Chem. Mater. 2003, 15, 486-494.
[89] a) Pan, C.; Pelzer, K.; Philippot, K.; Chaudret, B.; Dassenoy, F.; Lecante, P.;
Casanove, M.-J., J. Am. Chem. Soc. 2001, 123, 7584-7593. b) Pelzer, K.; Laleu, B.;
Lefebvre, F.; Philippot, K.; Chaudret, B.; Candy, J. P.; Basset, J. M., Chem. Mater.
2004, 16, 4937-4941. c) Pelzer, K.; Vidoni, O.; Philippot, K.; Chaudret, B.; Colliere,
V., Adv. Funct. Mater. 2003, 13, 118-126.
[90] Hulea, V.; Brunel, D.; Galarneau, A.; Philippot, K.; Chaudret, B.; Kooyman, P. J.;
Fajula, F., Microporous Mesoporous Mater. 2005, 79, 185-194.
[91] Pelzer, K.; Philippot, K.; Chaudret, B.; Meyer-Zaika, W.; Schmid, G., Z. Anorg. Allg.
Chem. 2003, 629, 1217-1222.
[92] Duteil, A.; Queau, R.; Chaudret, B.; Mazel, R.; Roucau, C.; Bradley, J. S., Chem.
Mater. 1993, 5, 341-347.
[93] Tristany, M.; Chaudret, B.; Dieudonne, P.; Guari, Y.; Lecante, P.; Matsura, V.;
Moreno-Manas, M.; Philippot, K.; Pleixats, R., Adv. Funct. Mater. 2006, 16, 2008-
2015.
[94] Vidoni, O.; Philippot, K.; Amiens, C.; Chaudret, B.; Balmes, O.; Malm, J.-O.; Bovin,
J.-O.; Senocq, F.; Casanove, M.-J., Angew. Chem., Int. Ed. 1999, 38, 3736-3738.
[95] Frosin, K. M.; Dahlenburg, L., Inorg. Chim. Acta 1990, 167, 83-89
[96] Hermes, S., Dissertation, Ruhr-Universität Bochum 2006.
[97] Gaussian 98, Revision A.11.1, Frisch, M. J.; Trucks, G. W.; Schlegel, H. B.;
8. References
153
Scuseria, G. E.; Robb, M. A.; Cheeseman, J. R.; Zakrzewski, V. G.; Montgomery, J.
A. Jr.; Stratmann, R.E.; Burant, J. C.; Dapprich, S.; Millam, J. M.; Daniels, A. D.;
Kudin, K. N.; Strain, M. C.; Farkas, O.; Tomasi, J.; Barone, V.; Cossi, M.; Cammi, R.;
Mennucci, B.; Pomelli, C.; Adamo, C.; Clifford, S.; Ochterski, J.; Petersson, G. A.;
Ayala, P. Y.; Cui, Q.; Morokuma, K.; Salvador, P.; Dannenberg, J. J.; Malick, D. K;
Rabuck, A. D.; Raghavachari, K.; Foresman, J. B.; Cioslowski, J.; Ortiz, J. V.; Baboul,
A. G.; Stefanov, B. B.; Liu, G.; Liashenko, A.; Piskorz, P.; Komaromi, I.; Gomperts,
R.; Martin, R. L.; Fox, D. J.; Keith, T.; Al-Laham, M. A.; Peng, C. Y.; Nanayakkara,
A.; Challacombe, M.; Gill, P. M. W.; Johnson, B.; Chen, W.; Wong, M. W.; Andres, J.
L.; Gonzalez, C.; Head-Gordon, M.; Replogle, E. S.; Pople, J. A.; Gaussian, Inc.,
Pittsburgh PA, 2001.
[98] Pertici, P.; Vitulli, G.; Paci, M.; Porri, L., J. Chem. Soc., Dalton Trans. 1980, 10,
1961-1964.
[99] Sauer, J.; Marlow, F.; Spliethoff, B.; Schuth, F., Chem. Mater. 2002, 14, 217-224.
[100] Marler, B.; Oberhagemann, U.; Vortmann, S.; Gies, H., Microporous Mesoporous
Mater. 1996, 6, 375-383.
[101] Hafizovic, J.; Bjorgen, M.; Olsbye, U.; Dietzel, P. D. C.; Bordiga, S.; Prestipino, C.;
Lamberti, C.; Lillerud, K. P., J. Am. Chem. Soc. 2007, 129, 3612-3620.
[102] Rietveld, H. M., J. Appl. Cryst. 1969, 2, 65-71.
[103] The Rietveld Method (Ed. Young, R.A.), Oxford University Press, Oxford, 1993.
[104] Rodriguez-Carval, J., FULLPROF: A Programm for Rietveld Refinement and Pattern
Matching Analysis. http://www-llb.cea.fr/fullweb/powder.htm.
[105] Pertici, P.; Vitulli, G.; Lazzaroni, R.; Salvadori, P.; Barili, P. L., J. Chem. Soc., Dalton
Trans. 1982, 6, 1019-1022.
[106] Pertici, P.; Simonelli, G.; Vitulli, G.; Deganello, G.; Sandrini, P.; Mantovani, A., J.
Chem. Soc., Chem. Commun. 1977, 4, 132-133.
[107] Bodes, G.; Heinemann, F. W.; Jobi, G.; Klodwig, J.; Neumann, S.; Zenneck, U., Eur.
J. Inorg. Chem. 2003, 281-292.
[108] Amirjalayer, S.; Tafipolski, M.; Schmid, R., Angew. Chem., Int. Ed. 2007, 46, 463-
466.
[109] Philippot, K.; Chaudret, B., C. R. Chim. 2003, 6, 1019-1034.
[110] Altwasser, S.; Sulaiman Lo, R. G. A.; Liu, P.; Chao, K.; Weitkamp, J., Microporous
Mesoporous Mater. 2006, 89, 109-122.
[111] Schmid, G., Chem. Rev. 1992, 92, 1709-1727.
8. References
154
[112] Lebedev, O. I.; Millange, F.; Serre, C.; Van Tendeloo, G.; Férey, G., Chem. Mater.
2005, 17, 6525-6527.
[113] Kampers, F. W. H., Engelein, C. W. R., van Hoff, J. H. C., Koningsberger, D. C., J.
Phys. Chem. 1990, 94, 8574-8578.
[114] Schroeter, M. K.; Khodeir, L.; Hambrock, J.; Loeffler, E.; Muhler, M.; Fischer, R. A.,
Langmuir 2004, 20, 9453-9455.
[115] Sheppard, N.; Nguyen, T. T., Advances in Infrared and Raman Spectroscopy 1978, 5,
67-148.
[116] Bradley, J. S.; Millar, J. M.; Hill, E. W.; Behal, S.; Chaudret, B.; Duteil, A., Faraday
Discuss. 1992, 92, 255-268.
[117] Dalla Betta, R. A., J. Phys. Chem. 1975, 79, 2519-2525.
[118] Chin, S. Y.; Williams, C. T.; Amiridis, M. D., J. Phys. Chem. B 2006, 110, 871-882.
[119] Chin, S. Y.; Alexeev, O. S.; Amiridis, M. D., Appl. Catal., A 2005, 286, 157-166.
[120] Pery, T.; Pelzer, K.; Buntkowsky, G.; Philippot, K.; Limbach, H.-H.; Chaudret, B.,
ChemPhysChem 2005, 6, 605-607.
[121] Masierak, W.; Emmler, T.; Gedat, E.; Schreiber, A.; Findenegg, G. H.; Buntkowsky,
G., J. Phys. Chem. B 2004, 108, 18890-18896.
[122] Sun, S., Adv. Mater. 2006, 18, 393-403.
[123] Weller, D.; Doerner, M. E.; Annu. Rev. Mater. Sci. 2000, 30, 611-644.
[124] Moser, A.; Takano, K.; Margulies, D. T.; Albrecht, M.; Sonobe, Y.; Ikeda, Y.; Sun, S.;
Fullerton, E. E., J. Phys. D: Appl. Phys. 2002, 35, R157-R167.
[125] Giroir-Fendler, A.; Richard, D.; Gallezot, P.; Faraday Discuss. 1991, 69, 92-78.
[126] a) Harada, M.; Asakura, K.; Toshima, N., J. Phys. Chem. 1994, 98, 2653-2662. b)
Toshima, N.; Hirakawa, K. Apll. Surf. Sci. 1997, 121-122, 534-537, c) Toshima, N.;
Yonezawa, T., New J. Chem. 1998, 22, 1179-1202.
[127] Hutchings, G. J., Chem. Commun. 2008, 1148-1164.
[128] Vu, H.; Goncales, V.; Philippe, R.; Lamouroux, E.; Corrias, M.; Kihn, Y.; Plee, D.;
Kalck, P.; Serp, P., J. Catal. 2006, 240, 19-22.
[129] a) Schmidt, T. J.; Noeske, M.; Gasteiger, H. A.; Behm, R. J.; Britz, P.; Brijoux, W.;
Bönnemann, H., Langmuir 1997, 13, 2591-2595. b) Vogel, W.; Britz, P.; Bönnemann,
H.; Rothe, J.; Horms, J., J. Phys Chem B. 1997, 101, 11029-1036.
[130] a) Dassenoy, F.; Casanove, M.-J.; Lecante, P.; Pan, C.; Philippot, K.; Chaudret, B.;
Phys. Rev. B: Condens. Matter Mater. Phys. 2001, 63, 235407 1-7. b) Dumestre, F.;
Martinez, S.; Zitoun, D.; Fromen, M.-C.; Casanove, M.-J.; Lecante, P.; Respaud, M.;
8. References
155
Serres, A.; Benfield, E.; Amiens, C.; Chaudret, B.; Farady Discuss. 2004, 125, 265-
278. c) Devaux, C.; Amiens, C.; Fejes, P.; Renaud, P.; Respaud, M.; Lecante, P.;
Snoeck, E.; Chaudret, B., Nat. Mater. 2005, 4, 750-753.
[131] Popovska, N.; Schneider, A.; Emig, G.; Zenneck, U.; Topf, C., Electrochemical
Society Proceedings, 2003-08, 931-937.
[132] a) Dryden, N. H.; Kumar, R. K.; Ou, E.; Rashidi, M.; Roy, S.; Norton, P. R.;
Puddephatt, R. J., Chem. Mater. 1991, 3, 677-685. b) Xue, Z.; Strouse, M. J.; Shuh, D.
K.; Knobler, C. B.; Kaesz, H.; Hicks, R. F.; Williams, R. S., J. Am. Chem. Soc. 1989,
111, 8779-8784.
[133] a) Boardman, L. D.; Newmark, R. A., Magnet. Res. Chem. 1992, 30, 481-489. The 13C
NMR spectrum of [Fe(η6-C6H5CH3)(η4-C4H6)] is not literature known. Comparison
with 13C MAS-NMR shifts of similar Fe complexes was performed: b) Schneider, J.
J.; Specht, U.; Goddard, R.; Krüger, C.; Ensling, J.; Gütlich, P., Chem. Ber. 1995, 128,
941-945. c) Kreiter, C. G.; Stüber, S.; Wackerle, L.; J. Organomet. Chem. 1974, 66,
C49-C52.
[134] Thomas, R. R., Park, J. M., J. Electrochem. Soc. 1989, 136, 1661-1666.
[135] Sebastian Henke, Bachelor Thesis 2006, Ruhr-Universität Bochum.
[136] Daniel Esken, Master Thesis 2007, Ruhr-Universität Bochum.
[137] Wan, F.; Bönnemann, H., Appl. Organometal. Chem. 2005, 19, 94-97.
[138] Kennedy, J. D.; McFarlane, W.; Puddephatt, R. J.; Thompson, P. J., J. Chem. Soc.,
Dalton Trans. 1976, 10, 874-879.
[139] Bailey, A. J.; Lee, C.; Feller, R. K.; Orton, J. B.; Mellot-Draznieks, C.; Slater, B.;
Harrison, W. T. A.; Simoncic, P.; Navrotsky, A.; Grossel, M. C.; Cheetham, A. K.,
Angew. Chem. Int. Ed. 2008, 47, 8634-8637.
[140] Blanchard, G.; Charcosset, H.; Guenin, M.; Tournayan, L, New J. Chem. 1981, 5, 85-
89.
[141] a) Liu, Z.,; Ada, E. T.; Shamsuzzoha, M.; Thompson, G. B.; Nikles, D. E.; Chem.
Mater. 2006, 18, 4946-4951. b) Hutchinson jr., J. M., Platinum Met. Rev. 1972, 16, 88.
c) Massalski, T. B. (editor-in chief), Materials Information Soc., Materials Park, Ohio,
1990
[142] Rosi, N. L.; Eddaoudi, M.; Kim, J.; O’Keeffe, M.; Yaghi, O. M., Angew. Chem. Int.
Ed. 2002, 41, 284-287.
[143] Rosi, N. L.; Kim, J.; Eddaoudi, M.; Chen, B.; O’Keeffe, M.; Yaghi, O. M., J. Am.
Chem. Soc. 2005, 127, 1504-1518.
8. References
156
[144] Hausdorf, S.; Wagler, J.; Moßig, R.; Mertens, F. O. R. L., J. Phys. Chem. A. 2008,
112, 7567-7576.
[145] K. Schröck, Dissertation 2008, Ruhr-Universität Bochum.
[146] Ebbinghaus, S.; Kim, S. J.; Heyden, M.; Yu, X.; Gruebele, M.; Leitner, D. M.;
Havenith, M., J. Am. Chem. Soc. 2007, 130, 2374-2375.
[147] Heyden, M.; Bründermann, E.; Heugen, U.; Niehues, G.; Leitner, D. M.; Havenith,
M.; J. Am. Chem. Soc. 2008, 130, 5773-5779.
[148] Siegrist, K.; Bucher, C. R.; Mandelbaum, I.; Hight Walker, A. R.; Balu, R.; Gregurick,
S. K.; Pusquellic, D., J. Am. Chem. Soc. 2006, 128, 5764-5775.
[149] www.sigmaaldrich.com
[150] IUPAC Manual of Symbols and Terminology, Appendix 2, Pt. 1, Colloid and Surface
Chemistry [Pure Appl. Chem. 1972, 31, 578].
[151] Brunauer, S.; Emmet, P. H.; Teller, E., J. Am. Chem. Soc. 1938, 60, 309-319.
[152] Walton, K. S.; Snurr, R. Q., J. Am. Chem. Soc. 2007, 129, 8552-8556.
[153] Nietmantsverdriet, J. W., Spectroscopy in Catalysis, 2nd Ed., Wiley-VCH, New York,
2000.
[154] Lifshin, E., in Characterisation of Materials-Materials Science and Technology, Vol.
2a/2b (Eds.: Cahn, R. W.; Haasen, P.; Kramer, E. J.), Wiley-VCH, New York, 2005.
[155] Klementiev, K. V., VIPER for Windows (Visual Processing in EXAFS Researches),
freeware, www.desy.de/~klmm/viper.html
[156] Schmidt-Rohr, K.; Spiess, H. W., Multidimensional Solid State NMR and Polymers,
Academic Press, London, 1994 and references therein .
[157] Buntkowsky, G.; Limbach, H.-H., J. Low Temp. Phys. 2006, 143, 55-114.
[158] Masierak, W.; Emmler, T.; Gedat, E.; Schreiber, A.; Findenegg, G. H.; Buntkowsky,
G., J. Phys. Chem. B 2004, 108, 18890-18896.
[159] Buntkowsky, G.; Roessler, E,; Taupitz, M.; Vieth, M. H., J. Phys. Chem. A 1997, 67-
75.
[160] Gedat, E.; Schreiber, A.; Albrecht, J.; Shenderovich, I; Findenegg, G. H.; Limbach,
H.-H., Buntkowsky, G.; J. Phys. Chem. B 2002, 106, 1977-1984.
[161] Wehrmann, F.; Albrecht, J.; Gedat, E.; Kubas, G. J.; Eckert, J.; Limbach, H.-H.;
Buntkowsky, G., J. Phys. Chem. A 2002, 106, 1977-1984.
[162] Dreyhaupt, A.; Winnerl, S.; Dekorsy, T.; Helm, M., Appl. Phys. Lett. 2005,
86, 121114-12115.
8. References
157
[163] Matsushima, F.; Odashima, H.; Iwasaki, T.; Tsunekawa, S.; Takagi, K., J. Molec.
Struc. 1995, 352/353,371-378.
[164] Zhang, C.; Lee, K.-S.; Zhang, X.-C.; Wei, X.; Shen, Y. R., Appl. Phys. Lett. 2001, 79,
491-493.
[165] Wu, Q.; Zhang, X.-C., Appl. Phys. Lett. 1995, 67, 3523-3525.
[166] Wu, Q.; Litz, M.; Zhang, X.-C., Appl. Phys. Lett. 1996, 68, 2924-2926.
[167] Itoh, K.; Nagashima, H.; Ohshima, T.; Oshima, N.; Nishiyama, H., J. Organomet.
Chem. 1984, 272, 179-88.
[168] Tatsuno, Y.; Yoshida, T.; Otsuka, S., Inorg. Synth. 1979, 19, 220-223.
[169] Meiere S.; Hoover, C. A.; Coon, G. L., PCT Int. Appl. 2003, WO 03/106011 A2.
[170] Clark, H. C.; Manzer, L. E., J. Organomet. Chem. 1973, 59, 411-428.
9. Appendix
147
9. Appendix
9.1. List of publications
The results of this work are partly comprised in the following publications:
[1] Ruthenium nanoparticles inside porous [Zn4O(bdc)3] by hydrogenolysis of adsorbed
[Ru(cod)(cot)]: a solid state reference system for surfactant-stabilized ruthenium
colloids.
Schröder, F.; Esken, D.; Cokoja, M.; van den Berg, M.W. E.; Lebedev; O. I.; Van
Tendeloo, G.; Walaszek, B.; Buntkowsky, G.; Limbach, H.-H.; Chaudret, B.; Fischer,
R.A., J. Am. Chem. Soc. 2008, 130, 6119-6130.
[2] Direct imaging of loaded metal−organic framework materials (Metal@MOF-5).
Turner, S.; Lebedev, O. I.; Schröder, F.; Esken, D.; Fischer, R. A.; Van Tendeloo, G.,
Chem. Mater. 2008, 20, 5622-5627.
[3] Characterization of interfacial water in MOF-5 (Zn4(O)(BDC)3) - a combined
spectroscopic and theoretical study.
Schröck, K.; Schröder, F.; Heyden, M.; Fischer, R. A.; Havenith, M., Phys. Chem.
Chem. Phys. 2008, 10, 4732-4739.
Patents:
[1] Highly porous layers made of MOF materials and methode for producing such layers.
Fischer, R. W.; Fischer, R, A.; Wöll, Ch.; Schröder, F.; Hermes S.,
WO/2007/014678; DE 10 2005 035 762.8 2007.
Book contributions:
[1] Metal doping of metal-organic frameworks.
Schröder, F; Fischer, R. A., in Topics in Current Chemistry 2009(Ed. M. Schroeder),
Springer, Heidelberg.
9. Appendix
148
Contributions to other projects:
[1] Chemistry in Confined Geometries: Reactions at an Organic Surface.
K. Rajalingam, A. Bashir, M. Badin, F. Schröder, N. Hardman, T. Strunskus, R. A.
Fischer, C. Wöll, ChemPhysChem 2007, 8, 657-660.
[2] Synthesis of Periodic Mesoporous Organosilicas with Chemically Active Bridging
Groups and High Loadings of Thiol Groups.
W.-H. Zhang, X. Zhang, L. Zhang, F. Schröder, H. Parala, S. Hermes, J. Shi, R. A.
Fischer, J. Mater. Chem. 2007, 17, 4320-4326.
[3] Synthesis, Bifunctionalization and Application of Isocyanurate-Based Periodic
Mesoporous Organosilicas.
W.-H. Zhang, X. Zhang, Z. Hua, H. Parala, F. Schröder, S. Hermes, T. Cadenbach, J. Shi,
R. A. Fischer, Chem. Mater. 2007, 19, 2663-2670.
[4] Loading of Porous Metal-Organic Open Frameworks with Organometallic CVD-
Precursors: Inclusion Compounds of the Type [LnM]a@MOF-5.
S. Hermes, F. Schröder, S. Amirjalayer, R. Schmid, R. A. Fischer, J. Mater. Chem. 2006,
16, 2464-2470.
[5] Selective Nucleation and Growth of Metal-Organic Open Framework Thin Films on
Patterned COOH/CF3-Terminated Self-Assembled Monolayers on Au (111).
S. Hermes, F. Schröder, R. Chelmowski, C. Wöll, R. A. Fischer, J. Am. Chem. Soc. 2005,
127, 13744-13745.
[6] Insertion Reactions of GaCp*, InCp* and In[C(SiMe3)3] into the Ru-Cl bonds of [(p-
cymene)RuIICl2]2 and [Cp*RuIICl]4.
M. Cokoja, C. Gemel, T. Steinke, F. Schröder, R. A. Fischer, Dalton Trans. 2005, 44-55.
9.2. Poster presentations
[1] Thin Films of Metal Organic Framework Compounds: Design and Characterization of
New Functional Surfaces.
F. Schröder, S. Hermes, C. A. Bauer, A. J. Skulan, B. A. Simmons, M. D. Allendorf,
C. Wöll, R. A. Fischer, 231st ACS National Spring Meeting, March 26-30, 2006,
Atlanta, USA.

9. Appendix
149
[2] Ru@MOF-5: A Solid State Reference System for Surfactant Stabilized Ru Colloids.
F. Schröder, D. Esken, M. W. E. van den Berg, O. I. Lebedev, G. Buntkowsky, R. A.
Fischer, 3rd International Symposium on Chemistry of Coordination Space, December
9-12, 2007, Awaji Island, Japan.
9. Appendix
150
9.3. Curriculum Vitae
Name: Felicitas Schröder Nationality: German Birthday: 15.02.1981 Place of birth: Bochum Marital status: single
EDUCATION
06/2005-12/2008 PhD at the Chair of Inorganic Chemistry II, Ruhr-University Bochum Topic: Synthesis and Microstructural
Characterization of Metals@MOF-5
09/2005-12/2005 Internship at the Sandia National Laboratories, Livermore, California, USA: MOF Thin Films
10/2000-05/2005 Study of Chemistry at the Ruhr-University
Bochum
10/2004-05/2005 Diploma Thesis at the Chair of Inorganic Chemistry II, Ruhr-University Bochum: Topic: Metal-Organic Preparation of
Cu/ZnO@MCM-48 Catalysts: Comparison of Liquid and Gas Phase Impregnation
08/1991-06/2000 High School Education at the Graf-Engelbert
Gymnasium, Bochum
FELLOWSHIPS AND AWARDS
01/2006-12/2008 Doctoral Fellowship of the German National Academic Foundation (Studienstiftung des Deutschen Volkes)
Since 02/2007 Fellowship of the Research School of the Ruhr-
University Bochum 09/2005-12/2005 Foreign Exchange Fellowship of the German
National Academic Foundation 06/2005 Award of the Ruth and Gerd Massenberg
Foundation for the Diploma 06/2005 Wilke-Award of the Faculty of Chemistry and
Biochemistry for the Diploma Thesis 03/2003-05/2005 Undergraduate Fellowship of the German
National Academic Foundation


![Kapitel WT:III (Fortsetzung) - uni- · PDF fileXML-Schema Einordnung [Jeckle 2004] XML-Schema Unicode MOF UML XMI XML Namespaces RDF XHTML XLink XPath Extensible Markup Language, XML](https://img.pdfslide.org/doc/110x75/5a79113d7f8b9a523d8c9e9f/kapitel-wtiii-fortsetzung-uni-einordnung-jeckle-2004-xml-schema-unicode.jpg)