Embed Size (px)
Citation preview
The potential scarcity of rare elements for the Energiewende
Alex M. Bradshaw1, *, Benjamin Reuter2 and Thomas Hamacher3
1Max-Planck-Institut für Plasmaphysik, (Garching/Greifswald), Boltzmannstr. 2, 85748 Garching and Fritz-Haber-Institut der Max-Planck-Gesellschaft,
Faradayweg 4-6, 14195 Berlin, Germany 2Lehrstuhl für Fahrzeugtechnik, Technische Universität München, Boltzmanstr. 15,
85748 Garching, Germany 3Institut für Energiewirtschaft und Anwendungstechnik, Technische Universität München,
Arcisstrasse 21, 80333 München, Germany Abstract: In the next few decades there is expected to be a global shift in power generation from fossil fuels and nuclear fission to various forms of renewable energy. This process will be accompanied, however, by a strong demand for non-fuel raw materials required for the generation, storage, transmission and utilisation of these energy forms. Some of the raw materials are potentially exhaustible; some are already regarded, rightly or wrongly, as geochemically “scarce”. Many of them have been characterised by steep price increases in recent years. Examples are neodymium, praseodymium and dysprosium for rare earth-based permanent magnets in wind turbines; indium, gallium, selenium and tellurium for thin film solar cells; helium. The supply situation with regard to such elements is often described as “critical”. A possible geochemical scarcity is, however, not the only factor contributing to this designation; the supply situation is influenced by various other parameters. We discuss the use of the terms “critical” and “criticality” in this context, pointing out the confusion which arises because of a different meaning of the terms in the physical sciences. In examining the elements mentioned above – both with respect to the supply situation and to their specific energy-oriented applications – we look at the issues of potential geochemical scarcity, substitutability and extraction as by-product. Together with the recycling potential these are three important indicators, or constraint parameters, in so-called criticality analyses. Geochemical scarcity already seems to play a role in the case of helium and could also soon become apparent for tellurium, indium and possibly dysprosium. We conclude that geochemical scarcity pertains as a consequence of mineral depletion when average grades of ore are falling, but at the same time inflation-corrected mineral prices are rising. The use of rare metals for the production of renewable energy – like nearly all resource-consuming systems in our society – does not satisfy “strong” sustainability criteria. Keywords. Energiewende, geochemical scarcity, mineral depletion, sustainability, wind power, photovoltaic cells, fusion, rare elements, helium PACS®(2010).
2
1 Introduction In a recent commentary in Nature the financier and former oil analyst, Jeremy Grantham, pointed out that the prices of global raw materials are rising fast [1]. This, he claims, is not due to a bubble, but is, rather, “a genuine paradigm shift, perhaps the most important economic change since the Industrial Revolution. Simply, we are running out.” The GMO inflation-adjusted price index [2] of 33 important commodities, including the metals aluminium, copper, gold, iron, lead, nickel, palladium, platinum, tin and uranium, declined by 70% in the 100 years up to 2002. In the years following, prices rose by a factor of three. Other commodity indices, e.g. that of The Economist [3], tell the same story. According to Grantham the surge is not only due to world population growth and an explosion of capital spending in China, but also to resource depletion. He cites phosphorous and potassium, important constituent elements in fertilisers as examples, pointing out that the reserves are limited and that the richest deposits occur only in a small number of countries. Grantham’s article immediately provoked a response from a columnist at Forbes [4], who claimed that Grantham was “horribly, horribly wrong” and had not understood the meaning of the word “reserves”1. Indeed, it is extremely important in this context to take into account not the reserves, but rather the identified resources and, as far as possible, the still undiscovered resources. These may be orders of magnitude higher than the reserves. In the case of potassium and phosphorous the relatively high crustal abundances (by weight) of 1.84 and 0.11 %, respectively, probably suggest that this is also true for these two metals. (Scholz and Wellmer have recently looked at the case of phosphorous in more detail [5].) This debate reminds us of the exchanges between the economist Julian Simon and various “conservationists” in the early 1980’s. Simon pointed out that the fall in the inflation-adjusted prices of nearly all raw materials during most of the 20th century was due to improved prospecting and production methods in mining [6]. Moreover, he wrote in his Science article “the term ‘finite’ is not only inappropriate but is downright misleading in the context of natural resources, both from the practical and the philosophical points of view. … A definition of resource quantity must be operational to be useful. It must tell us how the quantity of the resource that might be available in the future could be calculated. But the future quantities of natural resources such as copper cannot be calculated even in principle, because of new lodes, new methods of mining copper, and variations in grades of copper lodes; because copper can be made from other metals (sic); and because of the vagueness of the boundaries within which copper might be found – including the sea, and other planets.” It is the purpose of this article to look at potential geochemical scarcity and at other factors contributing to the supply risks associated with non-fuel raw materials that may be of decisive importance for the Energiewende. We use the German word Energiewende intentionally. The weekly newspaper DIE ZEIT recently reported that it is now being used in the Anglo-Saxon media for want of a good English translation, although in our view “energy transformation” comes quite near [7]. But what does it mean exactly? Very specifically, it refers to the decision in 2011 of the German government, and subsequently of the German parliament, in the aftermath of the Fukushima disaster to shut down immediately 8 nuclear reactors and the remaining 9 by 2022. This corresponds to about 25% of generating capacity, which has to be compensated as far as possible by renewable energy forms and increases in energy efficiency. See, for example, the discussion by Schlögl recently in this journal [8]. The term Energiewende is, however, broader in its extent and is taken by many in Germany to mean the achievement of a 60 % 1 “Reserves” are deposits in or on the Earth’s crust which can be exploited economically at the present time. “Resources” are defined as deposits in such a condition that economic extraction is potentially feasible. Resources can be further divided into “identified” and “undiscovered”.
3
penetration of renewables into the total primary energy market by 2050, as foreseen in the Energiekonzept of the German government in 2010 [9]. Some would even go further and define the word as meaning the achievement of such ambitious targets on a global scale! In the next Section we discuss the terms “critical” and “criticality” which have recently been used in connection with several rare elements that are of decisive importance for many modern (energy) technologies, and in the present case, for the Energiewende. We summarise the procedures and methodologies applied in judging which materials should be deemed “critical” and also discuss (critically!) the terminology itself. In Section 3, some examples are given of the use of the indicators, or constraint parameters, used in such analyses. In Section 4 we return to the topic of scarcity and to the question as to whether mineral depletion is already a contributory factor. 2 What does “critical” mean? Several recent publications – either reports or papers in academic journals – have drawn attention to potential global supply risks associated with specific mineral resources, the consumption of which has increased enormously in recent years [10 - 17]. Moreover, at least five studies have been concerned specifically with energy-related materials [18 - 23]. As the APS/MRS report [21] notes, many of the elements concerned were once laboratory curiosities but have now acquired considerable commercial and “security of supply” significance. Probably most influential was the study [10] in 2008 of the National Research Council (NRC) of the US National Academies, with the title “Minerals, critical minerals, and the US economy”. The adjective “critical” has been used for some years in the context of mineral resources. “Critical” minerals are - according to current usage in the study of resources - economically important raw materials, for which there is a strong possibility of supply interruption. Strictly speaking, minerals cannot be “critical” in themselves, at least not according to the several definitions of the word given in the Oxford English Dictionary [24]. Rather, it is the situation, or state of a system, brought about by some attribute or property, which is said to become critical. The particular property, or variable, can usually be expressed in terms of an “indicator”, or sometimes more appropriate, “constraint parameter”. In the case of minerals, the availability of the ore (supply risk), and the consequences of supply restriction (vulnerability), are obvious candidates. In the physical sciences, on the other hand, the word “critical” is used almost exclusively in connection with a point at which the state of a system converts into a second state described by new parameters, as in a phase transition; hence, for example, “critical point”, “critical angle” or “critical mass” (The latter concept is well known from nuclear physics and corresponds to the minimum mass of fissile material required to produce a self-sustaining chain reaction.) By analogy, “critical” in the minerals context should therefore perhaps only be used to describe the situation that pertains when one or more indicators corresponding to particular attributes or properties cross a (previously determined) threshold value. In several of the studies cited above this procedure is actually used – necessarily in a qualitative or semi-quantitative way – to arrive at the designation “critical” for a particular metal or mineral. Unfortunately, however, the NRC study also introduces the notion of “criticality” and the use of a so-called criticality matrix. The concept derives from the field of risk analysis; the criticality matrix is also known as the risk assessment matrix. The approach has been further developed by Graedel et al [25, 26], who, in addition to the (composite) indicators “supply risk” and “vulnerability”, also use one for “environmental aspects”, giving a third dimension to the matrix. By expressing the three indicators in the form of numbers (even if the process of arriving at those numbers may only be qualitative), the procedure gives rise to a point in three-dimensional “criticality space”. The
4
“overall criticality” is then given by the distance from that point to the origin. This approach is fundamentally different from that of the threshold-based definition of “critical”. Criticality is here a matter of degree, which, it is suggested, is necessary in order to compare one element with another and to account for variations over time, thus reflecting changes in demand and technological development as well as new extraction techniques. The term, and the corresponding matrix method, have been used in several of the studies cited above. In the physical sciences the noun “criticality” is only used (i) to describe the occurrence of critical phenomena generally, e.g. [27], or (ii) the achievement of the critical state in a nuclear reactor. Thus, similar to the situation with the corresponding adjective, there is a contradiction – confusing for the non-specialist – between the concept of criticality in physics and the use of the term in some of the resources literature. In the following, we describe some of the more important results from several of these studies. In the influential NRC report 11 elements and element groups are examined, of which the platinum group metals (PGMs), the rare earth elements (REEs), indium, manganese and niobium were determined to be critical because of their position in the risk assessment, or criticality matrix [10]. The composite indicator “supply risk” on one axis covers, for example, import dependence, the ratio of reserves and/or reserve base to annual consumption, the relative importance of by-product production and the relative proportion of production from old scrap. The indicator “impact of supply restriction” on the other axis includes percentage consumption for uses where substitution is difficult or impossible as well as the importance of growth of large-scale use in emerging areas. The assessment is based on a national, not global perspective for a short to medium timescale of up to ten years. A similar procedure is used in the Oakdene-Hollins report [11] to derive a Material Insecurity Index, equivalent to the “criticality” variable of the NRC report [10] and of Erdmann and Graedel [25]. The authors examine 69 different materials, mostly metallic elements, and draw up a list of the eight most “insecure materials” (equivalent to “critical materials”): gold, rhodium, mercury, platinum, strontium, silver, antimony and tin, which deserve attention. The approach is more global than the title of the report suggests! Similarly, the report of the EU Commission uses a risk assessment matrix, based on the two composite indicators supply risk und economic importance, but sets thresholds values for each. Materials exceeding both of these values are designated “critical” (clearly the threshold interpretation!). 41 non-fuel materials were investigated. The 14 materials, which thus “achieve criticality” are antimony, beryllium, cobalt, fluorspar, gallium, germanium, graphite, indium, magnesium, niobium, PGMs, REEs, tantalum and tungsten. Using a different approach and with a single, but well-researched indicator, Angerer et al [13] have carried a technology-based analysis of continued and possible further technical innovations up to the year 2030. The study covered the following sectors: transport, IT, energy, chemistry, medical technology and advanced materials. They first identify 19 elements which will be essential to these areas and estimate the global demand for each in 2006 and 2030 on the basis of the technology analysis. The ratio of this estimate to present global production then not only demonstrates the shaping power of new technologies, but also gives an indication of the drastic changes to be expected in production and on the commodity markets. Demand for gallium, neodymium, indium, germanium, scandium and platinum, is expected to exceed substantially present day production by 2030. This report was published in 2009; it is to be hoped that its very useful quantitative estimates will be updated soon. At least five studies have concentrated on non-fuel, energy-related materials [18 - 23], in particular those required for “clean” energy. At the focus of attention is thus a number of rare metals, which may be characterised by supply problems and which are used mostly in the generation, storage, transmission and utilisation of CO2-free electrical energy. In the two
5
reports of the US Department of Energy (DOE) 16 elements are identified as being in this category. They are dysprosium, neodymium, terbium, europium, yttrium, lithium, tellurium, cerium, cobalt, gallium, indium, lanthanum, manganese, praseodymium, nickel and samarium. In an analysis similar to those of the NRC and EU reports (see above) the first five rare earth elements in this list are characterised as “critical” in the medium term (five to fifteen years). The next two – lithium and tellurium – are regarded as “near-critical” and the remaining nine as “not critical”. The corresponding list of the American Physical Society and the Materials Research Society (APS/MRS) [19] – identified without a specific risk analysis – consists of helium, lithium, most of the REEs, cobalt, gallium, germanium, selenium, PGMs, silver, indium, tellurium and rhenium. The report recommends, amongst other things, setting up a statistical agency in the US to gather, analyse and disseminate statistical information on “energy critical elements” with the aim of identifying critical applications and potential shortfalls. Further, it suggests that the federal government establish a research and develop-ment effort in resource efficiency, recycling and substitution. For one element, namely, helium the report recommends that specific (“interventionist”) measures be taken to conserve and enhance the current US reserves. We return to the topic of helium below. The report from the EU Joint Research Centre by Moss et al [20] produces a similar, but certainly not identical list. Their starting point is the EU Strategic Energy Technology Plan which foresees the accelerated deployment of the six low-CO2 technologies nuclear, solar, wind, bio-energy, carbon capture and storage (CCS), and electricity grids. They first identify 14 elements, the use of which in the application of these technologies in Europe in the period 2020 to 2030 will probably require more than 1% of the current global annual supply. On the basis of a risk analysis involving several indicators they conclude that from this list the two rare earth elements dysprosium and neodymium as well as tellurium, gallium and indium, which are by-products in the extraction of other metals, are at a high risk with respect to future supply-chain bottlenecks. The group makes a series of recommendations as to how the EU should cope with this problem. Bradshaw and Hamacher [21] also look at several elements important for the transformation of the energy economy into CO2-free energy systems, but not on the basis of a formal risk analysis. They concentrate more on the long-term, emphasising the ethical, environmental and economic aspects that today are usually subsumed under the heading of “sustainability”. Achzet et al [22], in a report sponsored by two large companies, compile a list, which is similar, but not identical with the APS/MRS list, of elements deemed important for the energy industry. It consists of cadmium, chromium, cobalt, copper, gallium, germanium, indium, lithium, molybdenum, phosphorous, potassium, rhodium, silver, tellurium, tungsten, uranium and vanadium, as well as the REE’s. The elements are all designated as “critical” and subsequently a risk factor (high, medium, low) is determined for various indicators (constraints) that include ecological impact and recyclability. They define criticality as the degree to which a particular material is necessary as a contributor to an energy pathway, which is equivalent to the vulnerability indicator in Refs. [10] and [25]. Much information is available in this report, most of it in useful, tabular form. Finally, we mention the most recent contribution in this area made by two engineering consultancies on behalf of the International Energy Agency (IEA) [23]. This group, in a painstakingly detailed study, examines the bottlenecks along the supply chain for the deployment of wind and photovoltaic devices on both the medium-term (present to 2025) and long-term (2025 - 2050) time scales. The supply chain does not just cover materials supply, but treats constraints (“bottlenecks”) due to manufacturing and operations, human resources and regulatory issues. Each indicator or potential bottleneck is plotted individually in the form of a two-dimensional criticality matrix of “severity of impact” against “likelihood”. Insufficient availability of silver, tellurium and indium for photovoltaic modules and of dysprosium, neodymium and carbon fibre for wind turbines are seen as major risks.
6
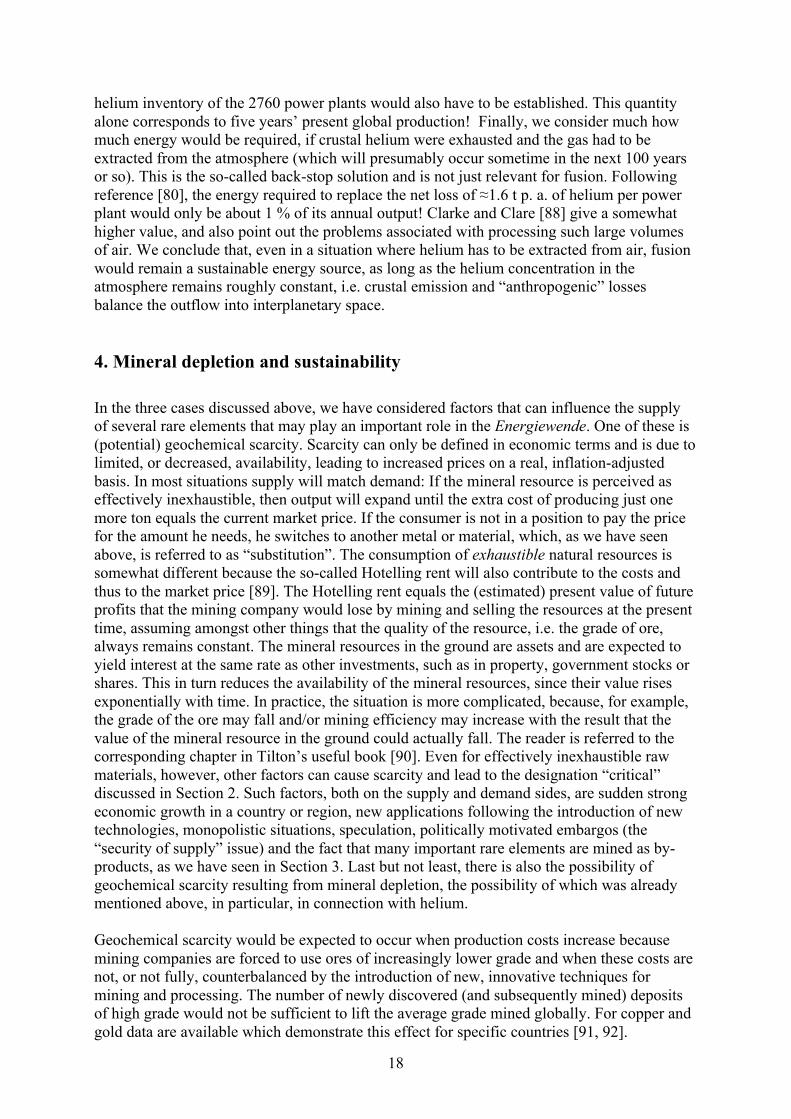
Apart from the fact that the word criticality is used in most cases differently from that in the physical sciences, there is also disagreement in the field of resource studies as to its exact definition and as to how a criticality matrix should be constructed. We have encountered three different versions of the latter above. However, the various studies mostly come to the same, or a similar list as to which elements are “critical”, or where the degree of “criticality” is high, even in cases where a more intuitive approach was used instead of such an analysis. Un-fortunately, the indicators are qualitative by nature, at the most semi-quantitative. If it were possible to describe the indicators quantitatively, more sophisticated methods, such as sensitivity analyses could perhaps be used. We should at this point, therefore, ask the question as to whether such an instrument is actually necessary. Nassar et al [26] write optimistically “the additional knowledge provided by criticality assessments is likely to enable better decisions to be made in the interest of corporations, countries, and the planet”. It would seem to the present authors that the different “customers”, be they corporations, countries or global society as a whole, may find in depth assessments for a particular element in terms of the individual perceived risks associated with each indicator just as useful as a multi-dimensional, but still qualitative overall criticality index. The technical indicators “substitutability”, “supply as by-product” and “production/resources ratio” play important roles in such an assessment. The latter is a potential measure of impending geochemical scarcity. In the following we look at three cases in which these aspects are emphasised. Because the importance of “recycling” for resource efficiency, and thus for sustainability, is well known and because it has been treated well elsewhere, e.g. [28-30], we omit this topic in the present paper. 3. Three case studies 3.1 Strong permanent magnets for wind turbines and automotive applications: the rare earth elements neodymium, praseodymium and dysprosium 3.1.1 General In the last few years there has been a spectacular rise in the use of certain rare earth elements (REE) in the manufacture of high field permanent magnets, in particular for the transport and energy sectors. The REE consist of lanthanum and the subsequent 14 elements of successively higher atomic number, known as the lanthanides. Yttrium and scandium, occurring in the same vertical group of the Periodic Table as lanthanum, are normally included because they have similar properties. In the lanthanide series the 4f shell is successively filled, which gives rise to interesting spectroscopic and magnetic properties, but the chemical properties are very similar, which makes separation difficult. This turns out to be a particular problem for extraction because the rare earth elements never occur singly in the various ores. They are mined and traded as oxides, often referred to as rare earth oxides (REO), which is actually a misnomer, since “earth” already means “oxide”. Until 1950 annual global REO production was on average 2,000 t. There has been a phenomenal increase in the last 60 years as shown in Figure 1, based on data from the United States Geological Survey (USGS) [31]. For several years, China was virtually the only producer of REE. The Chinese share of global production rose from an average of 60 % in the 1990’s to 95-98 % in the last decade [32], in particular from a large deposit in Bayan Obo, Inner Mongolia [33-37]. Largely because of environmental concerns, which apply not only to extraction but to a lesser extent also to separation, mining activities effectively came to an end in the US and Australia. Due to the
7
recent re-opening of the Mountain Pass mine in California in 2012, the dominance of China is now beginning to decrease and its share of global production fell to 86 % in 2012 [32]. The Mount Weld mine in Australia is also due to re-open this year. Moreover, other mine re-openings are planned and many new mining projects have been proposed worldwide, spurred by the price increases 2010 – 2012. Beginning in the early 2000’s the Chinese government imposed restrictions on the export of REE in order to regulate their industry more stringently, in particular from the environmental point of view, and also to conserve supplies for their own manufacturers [38]. The political connotations of this move have, as might be expected, also given rise to comment. The restrictions have received considerable attention not only in the general media and trade magazines, but also in scientific journals, e.g. [39, 40]. They were reinforced, and even intensified, in a new White Paper in 2012. Subsequently, Japan, the US and the EU jointly filed a World Trade Organisation (WTO) dispute settlement case. Japan, in particular - probably because of other, political disputes with China - is urgently looking for alternative sources of REE [38, 40]. The so-called rare earth supply problem has led to an increase in research funding in the US for new materials for permanent magnets [41]. Hardly surprisingly, the crisis led to a classic speculative price bubble, which peaked in the middle of 2011. In the last decade the price of neodymium oxide (FOB China) was under 20 $/kg; it doubled in 2010, reached almost 300 $/kg in 2011, but had fallen to about 75 $/kg by the time of writing (early 2013). The same trend was observed for other REO: praseodymium oxide followed exactly this pattern at the same price level. Dysprosium oxide followed the same trend except that in this case the kg prices were a factor ten higher! Note that this sudden price development (see also [31]) is quite unrelated to the supply curve shown in Figure 1, which shows a steady increase in mine production over the last 60 years, corresponding to the many newly found uses of the REE in this period: lighting, permanent magnets, catalysis, alloying, glass polishing, etc. The consultants Oakdene-Hollins summarised the rare earth element supply problem in 2010 [42]. A somewhat more detailed review of the geological availability, extraction and recycling of rare earths has been published by the German Öko-Institut [33], but, since it was published at the beginning of 2011, it was unable to take into account some recent developments. The report by Hatch [34] is slightly more up to date and likewise extremely useful. Gambogi and Cordier in their USGS Yearbook contribution [35] provide a useful overview of the rare earth composition of the major mines. Surprisingly perhaps, such details are important for present considerations. Rare earths are produced mainly from monazite (CeYPO4), as in Mount Weld, and bastnäsite (CeFCO3), as in Bayan Obo and Mountain Pass. (All the rare earth atoms can substitute for the cerium atom.) Both minerals consist almost exclusively of the light rare earth elements (LREE), yttrium to europium, in particular lanthanum, cerium and neodymium. The corresponding heavy REE, gadolinium to lutetium, are obtained from other minerals, in particular xenotime and the clay deposits in Southern China. The percentage of the much-coveted HREE dysprosium (see below) in xenotime can be as high as 9 %. We note in passing that most of the rare earth deposits also contain uranium and thorium and that this can constitute a serious hazard for personnel and for the environment, for example, because of radioactive contamination of the “tailings”. Neodymium forms an intermetallic compound from which strong permanent magnets can be produced. On account of its high remanence and high coercivity neodymium iron boride (Nd2Fe14B), developed by Sagawa in 1983 [43], is at present the material of choice for synchronous motors in a wide variety of applications, particularly in the automobile industry, including the main motor in all-electric and hybrid vehicles, and for wind turbines. The material also contains normally praseodymium and dysprosium (and perhaps a little terbium). Dysprosium is very important, as it increases the coercivity and extends the temperature
8
range. Hatch [44] gives the composition for various grades of magnet material: whereas, for example, a composition (by weight) of 23 % Nd, 8 % Pr and 1 % Dy gives a maximum working temperature of 80 °C, 14 % Nd, 5 % Pr and 12 % Dy extends the maximum working temperature to 240 °C and trebles the coercivity. Current R&D on this material focuses on the improvement of production techniques such that smaller quantities of dysprosium can be used (“Dy-saving technology”). Global mine production of rare earths was 0.13 Mt (as REO) in 2012 [32]. The crustal abundance of cerium, the most plentiful REE, is 83 ppm, that of lutetium, the rarest 0.8 ppm [37]. Reserves are currently estimated by the USGS to be 110 Mt, half of which are thought to be in China. Whether the recent assessments that led to the many project proposals at the height of the bubble have been taken into account, is not clear. The reserves of neodymium and praseodymium would probably be about 20 % of this figure. A very rough guess for the reserves of dysprosium would give about 1 % (1 Mt), since this REE is essentially only a trace element in most bastnäsite and monazite minerals. The extent of the resources is unknown. The USGS states: “Rare earths are relatively abundant in the Earth’s crust, but discovered minable concentrations are less common than for most ores. US and world resources are contained primarily in bastnäsite and monazite….Undiscovered resources are thought to be very large relative to expected demand” [32]. What can be said about possible future demand for REE in the energy sector? In order to arrive at an estimate we focus on the year 2050, for which a penetration of 60 % by renewables into the total energy market – at least in Germany – is the stated aim of the Energiewende (see Section 1). We assume that this target could also be reached globally. Total global primary energy supply in 2010 was 12 717 Mtoe, or 147 900 TWh, according to the International Energy Agency (IEA) statistics [45]. We assume that this will double by the year 2050, as was roughly the case between 1973 and 2010 [45], to give 300 000 TWh. Furthermore, if renewables provide 60%, we arrive at a contribution of 150 000 TWh, after taking into account a 10 % share of renewables in the form of bio-mass which is used for heating etc. After this point the assumptions become rather arbitrary, but it should be remembered that we are only attempting an “order of magnitude” estimation! Assuming that wind, solar thermal and PV will have equal shares and that hydro and various other renewable energy forms will only contribute 10 %, we obtain a figure of 45 000 TWh for wind energy. Converting to power and assuming a capacity factor of 50%, we obtain for the “global wind park” 10 TWp. A figure of 100 – 200 kg REE per MWp is normally quoted as the requirement for neodymium-based permanent magnets [34, 42, 46]. This gives a figure of 1-2 Mt for the required in-use stock in the year 2050. Assuming the transport sector also requires the same amount (a very arbitrary assumption!), we can make an order of magnitude guess of 3 Mt. This is only a small fraction of the reserves summed over all seventeen REE as currently estimated. However, the requirement is for specific rare earths: anything up to 40 % dysprosium is required for the highest coercivity [44], corresponding perhaps to the total amount of this metal in the reserves (as designated by the USGS). In connection with permanent magnets Alonso et al [46] have modelled demand for wind energy using various scenarios, but assume generally a much lower market penetration than in the “order of magnitude” estimation above. As noted above, there has been a large number of new REE projects initiated in the last three years, not only in government-assisted schemes but also by so-called junior mining companies. Admittedly, some observers feel that the chances of many being realised are small. These activities suggest, however, as do other factors, that in addition to the reserves, there are also large resources - both discovered and undiscovered and that the long term
9
supply situation is not a serious constraint. Recycling is also expected to eventually play an important role, although the small amount of present in-use stock implies that this would probably not start in earnest for several years. A pressing problem is, however, the Chinese monopoly, which despite attempts by developed countries to diversify supply is expected by observers to last for at least two decades! Moreover, in the case of dysprosium, geochemical scarcity may play a possible role. In this situation it is important to examine possible substitutes for permanent magnet electric motors and generators. In the next three sections we consider alternative concepts and their suitability for electromotive systems and wind turbines. As might be expected, aspects such as efficiency, weight, volume, price and maintenance play a role. 3.1.2 Types of electric motor Modern vehicle concepts with an electric propulsion system are expected to extend the use of renewable energies in the transport sector and to improve the efficiency of use of conventional fossil fuels. Such vehicles consist of an electric motor and an internal combustion engine and have varying degrees of hybrid character (i.e. mild hybrid, full hybrid, or plug-in hybrid), or they are battery electric vehicles (BEVs) which are equipped only with an electric power train. Although these vehicles can reduce the dependence on oil and cut CO2 emissions, the change of technology is obviously accompanied by an increase in the demand for electric motors, batteries and other components. These, in turn, also require raw materials. Here we concentrate on the electric motor, in particular on the possibilities offered by devices which do not contain REE-based permanent magnets, i.e. on the possibilities of substitution. The development of electric motors began in the 19th century and since then various technologies have been introduced and improved over the years. Generally speaking, all types of motor can be used in electric vehicles, although each has specific advantages and disadvantages. The major drawback of motors using direct current (DC motors) is the requirement of a commutator which consists of carbon brushes in order to change the direction of the current. This component has however, various problems with respect to maintenance, wear, carbon dust formation, etc. Since DC motors play a minor role for electric vehicles, only motors using alternating current (AC motors) are discussed in the following [47-49]. The two main categories of AC motor are the synchronous motor and the asynchronous motors; the latter is also termed induction motor. Synchronous motors have a rotor which contains either permanent magnets, or electromagnets constructed from copper windings. Induction motors have no windings on the rotor, which consists of iron, but contains a so-called squirrel cage which is usually made from aluminium, or sometimes copper. (The function of a squirrel cage is to enable the induction of current within the rotor. This current produces its own magnetic field which – together with the magnetic field in the stator – causes the rotor to turn.) The stator is the same for synchronous and asynchronous motors and contains copper windings which generate a rotating magnetic field. These two motor types are compared in the schematic diagrams of Figures 2a and 2b. An inverter is used for converting the direct current from the battery into alternating current of varying frequency, resulting in a magnetic field with variable rotational velocity. As the name suggests, the rotor of the synchronous motor follows this magnetic field synchronously, whereas the rotor of the asynchronous motor turns at a lower rotational velocity, resulting in the so-called slip [47-51]. Another electromagnetic phenomenon which can be used for electric motors is the so-called reluctance. This is the property of a ferromagnetic material to align itself along magnetic field lines, similar to the magnetic needle of a compass. It is used in a motor with a so-called
10
salient-pole rotor (see Figure 2c). In the stator a rotating magnetic field is created with which the poles of the rotor align. The rotation of the magnetic field in the stator is generated by successively activating and deactivating the copper windings; the rotor then follows. As in the case of the induction motor, no permanent magnets are needed for this type of motor; the rotor just consists of ferromagnetic material such as iron or steel [44, 41-53]. 3.1.3 Assessing the properties of electric motors for use in electric vehicles Weight is one of the most important parameters in the design of an automobile, since additional weight leads directly to an increase in energy consumption. Further, the free space in a vehicle is very limited, particularly since the number of comfort, safety and so-called infotainment systems has increased substantially in the last few years. Since the battery of an electric vehicle is a large, heavy device, the requirement that other components be small and light is even more important than for conventional vehicles. Additionally, since battery prices are still very high, the battery energy content must be used as effectively as possible, in order to allow a long kilometre range. Strict requirements of high efficiency (low energy losses) as well as low weight and volume apply to all components in electric vehicles. Electric motors – as key components – are especially subject to these constraints. Induction motors represent the most mature motor technology, since they have been used in industrial applications for decades. Hence, they are very robust (low maintenance) and, since they do not require special materials such as permanent magnets, are also quite cheap. They also have a high efficiency, but the main disadvantage is their volume and weight which make this type of motor an unfavourable option for electric vehicles [54]. In contrast, permanent magnet synchronous motors show highest power-to-weight and power-to-volume ratios. Also, they work most efficiently and are quite robust making them an ideal solution for electric vehicles. However, as they require permanent magnets, their price is higher than that of alternative motor technologies (about + 20% [55]). The permanent magnets for a synchronous motor can be substituted by copper windings in the rotor which act as electromagnets. This results in a lower price for the motor, but is accompanied by additional weight and volume. Furthermore, since additional current-induced losses occur in the rotor, the efficiency of the motor is lowered. The switched reluctance motor is relatively cheap, very robust and fairly efficient, thus appearing to be an alternative solution for electric vehicles. Unfortunately, its volume and weight are not as beneficial, as those of a permanent magnet synchronous motor. The crucial drawback of the switched reluctance motor, that has impeded its application in electric cars until now is, however, its acoustic noise emission resulting from the torque ripple (fluctuating variations of the motor torque). It has to be mentioned that a significant potential for improvement might be found in future, since this type of motor is not yet at its full technological maturity. A compromise which is applied to many electric cars nowadays is the so-called hybrid synchronous motor which combines - to a certain extent - the permanent magnet synchronous motor with the reluctance effect. This leads to very good results with respect to volume, weight and efficiency. Costs are also reduced since the amount of magnet material required is lower than for pure permanent magnet synchronous motors [56]. Although the permanent magnet synchronous motor has been the preferred motor for today’s first-generation electric vehicles, it is widely thought that the induction motor might become more important in future for a variety of reasons. If the prices for REE rise too high, it is to be expected that engineers will find ways of coping with the drawbacks of weight and volume.
11
3.1.4 Assessment of modern wind turbine technologies Wind turbines are among the most economic producers of electricity from renewable sources. The annual installation of new wind turbines is significant in all parts of the world, especially in China with an added capacity of 17.6 GWp in 2011, in the US 6.8 GWp, in India 3.0 GWp and in Germany 2.1 GWp [57]. Wind generators have been traditionally located on land, but offshore wind generation, i.e. wind turbines located in the sea up to 40 km from the coast, has great potential, since average wind speed is higher and electricity is generated more continuously than at onshore sites. However, the current cost for offshore wind generators remains quite high (because of the additional expenses of installation, servicing and grid connection) which has resulted in an initially slow exploitation of off-shore possibilities [58]. (We note at this point, that for the production of electricity, electric generators are used which do not differ principally from the electric motors described earlier. The main difference obviously is the reversal of the energy flow. For each type of motor a corresponding type of generator exists; a DC-motor results in a dynamo, the induction motor in an induction generator, and so forth. For this reason, electric motors and electric generators are often both termed “electric machines”.) Just like the situation for any producer of electricity connected to the grid, the AC current from a wind turbine has to be synchronized with the grid. This means that the rotational speed of the generator must be compatible with the frequency of the grid. Traditionally, gearboxes have been used in wind turbines to connect the slowly turning rotor blades with the electric generator in the so-called nacelle. However, these gearboxes can be quite susceptible to faults, and even to complete failure, giving rise to considerable maintenance needs. Wind turbines without a gearbox have therefore been on the market since the mid 1990s. Here, the generator and the utility grid are connected via an AC-DC-AC converter, which allows the rotational velocity of the generator to be completely independent of the grid frequency. The alternating current (AC) produced in the generator is rectified to direct current (DC) in a first step and then converted into alternating current in accordance with the requirements of the grid in a second step. As the use of such power electronics makes the gearbox unnecessary, this technology is particularly advantageous for off-shore wind generators where the cost of maintenance is particularly high. Earlier types of wind generator were designed for only one rotational speed in accordance with the frequency of the grid. Generally speaking, all types of electric machines can be used in wind turbines. The gearless technology, however, was first implemented using synchronous generators with electromagnetic windings on the rotor. Since the size of wind generators has increased in order to raise the power output, this technology has led to a considerable demand for copper and a significant increase in the weight of the nacelle. This was the reason for substituting the electrically excited rotor by a rotor with permanent magnets, which allows substantial weight reductions and an improvement in the efficiency of the generator. However, the price of a generator using permanent magnets is higher (about 25%) than the alternative with an electromagnet [58]. In summary, turbines without a gearbox are the preferred technology for off-shore wind parks. For this purpose, permanent magnets can be used, but do not necessarily have to be used. Thus, the development of the relative prices of REE and copper might well decide which of the alternative gearless wind turbine technologies will be utilized in the long run. 3.2 Elements for thin film solar modules: cadmium, gallium, indium, selenium and tellurium
12
3.2.1 General The elements cadmium, gallium, indium, selenium and tellurium have recently become very important for thin film photovoltaic cells. Globally, 27.7 GW of new photovoltaic capacity was installed in 2011. According to the US Department of Energy [59] and other sources the thin film materials cadmium telluride, amorphous silicon and copper indium gallium diselenide {Cu(InxGa1-x)Se2}, or CIGS, had PV market shares in that year of 7%, 3% and 2.5%, respectively. (The production figures from First Solar, the largest CdTe module supplier globally, suggest that the estimate for CdTe is actually too low.) Schematic diagrams of the three cells are shown in Figure 3. Note that the thin film of transparent conducting oxide (TCO) in all three cases is usually indium tin oxide (ITO), the latter being a ubiquitous material in many display and conductive coating applications. In general, thin film modules have lower efficiencies than those based on single crystal silicon technology, but are cheaper to manufacture. Current module efficiencies are given as 10 – 12 %, 12 – 14 % and 6 – 9 % for CdTe, CIGS and a-Si, respectively, compared with a value of up to 20% for crystalline silicon. (The figures for research-cell efficiency and for module efficiency should be carefully distinguished. Clearly, under laboratory conditions, considerably higher efficiencies can be reached. These are documented, and frequently updated, by the US National Renewable Energy Laboratory in a useful chart [60]. The “records” for research-cell efficiency are 18.3 %, 20.3 % and 13.4 %, respectively, compared to 25.0 % for crystalline silicon.) Of the thin film modules CIGS has the highest manufacturing costs, but these can in principle – other factors being equal – be offset by the higher efficiency. We conclude this paragraph by noting that at the time of writing (early 2013) the photovoltaic market is still in turmoil, due to the recent spectacular rise in Chinese exports, the reduction of subsidies, particularly in Germany and the closure of production facilities in Europe. Production figures and market shares for 2012 are not yet available. All five elements are by-products in the production process of a primary resource, which for cadmium and indium is zinc, for gallium is mainly aluminium and for selenium and tellurium is copper or lead. In fact, they are extracted exclusively on this basis; there are no cadmium mines, for example, because there are few or no minable deposits of this element. By-products can be very important for the profitability of a mine. Mining operations result in “tailings” containing several elements in very low concentration, the extraction of which may or may not be economically viable. In general, however, once the ore has been mined and the mineral concentrated, the additional expense of extracting low concentration by-products is relatively low. For example, the kg price of cadmium (see next paragraph) is only about 2 – 3 higher than that of zinc. The reader is also referred to the USGS circular by Bleiwas on this topic [61]. Table 1 gives an overview of some of the by-products which can be obtained from aluminium, copper, lead, nickel, platinum, tin and zinc [29, 37, 62]. 3.2.2 Cadmium telluride The rare metal cadmium with a crustal abundance of 0.2 ppm is mainly used for nickel-cadmium batteries. Note, however, that inside the EU the manufacture of new NiCd batteries is forbidden because of the toxicity of cadmium. Li-ion batteries are in any case replacing NiCd batteries in many consumer applications, because of the greater energy density, although the price is approximately double. World primary production of cadmium, which is roughly static, or even in decline, was about 23 kt in 2011; additionally, a further ≈ 5 kt was obtained from recycling (so-called secondary production), particularly of batteries [32]. As noted above, cadmium is a by-product in zinc mining, where it substitutes atomically to the extent of about 0.3% for zinc in sphalerite (ZnS). Other rare elements similarly present in
13
sphalerite in concentrations up to a few tenths of a percent include gallium, germanium and sometimes indium (Table 1). First Solar has just instituted “the industry’s first comprehensive, prefunded module collection and recycling program”, presumably in response to concerns about the toxicity of cadmium. On the assumption of about 2.5 GWp freshly installed CdTe capacity in 2011, the amount of Cd required (see Table of Bleiwas [61]) was 165 t, or about 0.6 % of annual production. Although it is perhaps not meaningful to talk about cadmium reserves, because of their dependence on the mining of zinc, the USGS [32] gives a figure of 640 kt corresponding to a reserves-to-primary production ratio (also known as the “static lifetime”) of 28 years. The same source gives a figure of 1.9 Gt for Zn resources, which could imply that the Cd resources are at least 5 Mt. Tolcin [63] notes that if the applications and markets for cadmium continue to decline, excess by-product cadmium may need to be stockpiled and managed, similar to the situation that the US Government faces with mercury. On the other hand, the possible future use of NiCd batteries as large-scale storage devices for intermittent renewable energy sources (outside the EU!) could increase the demand for cadmium in coming years. The situation with regard to the very rare metalloid tellurium, which has an abundance of 0.001 ppm in the Earth’s crust, can fairly be described as critical. Annual global production is not accurately known, but is thought to be about 500 t [64]. The source of 90 % of tellurium is copper ore, in which the element may be present in a concentration of up to 1 x 10⁻⁶ relative to the copper. (Other by-products of copper mining may include gold, selenium, antimony and the platinum group metals.) A small amount of tellurium is also obtained as by-product in the mining of zinc, lead, gold, nickel and platinum. Potential primary ore sources have also been identified [65, 66]. Tellurium and the other by-products are extracted from the anode slime produced in electrolytic copper refining. The USGS [32] remarks that increased use of the leach/solvent extraction/electro-winning process [67], which does not capture tellurium, will limit the future supply of tellurium from some copper ores. (This is not the whole story, since some ores for which the L-SE-EW process is used, such as carbonates{malachite}, do not contain Te and Se as by-products anyway [68].) If, as in the case of cadmium, we assume 2.5 GWp freshly installed CdTe capacity in 2011, the amount of Te required was 189 t, or 38 % of total production. George [64] gives 40 %; other uses include thermoelectrics (30 %), alloying (15 %) and vulcanisation (5 %). Of all five rare metals considered in this Section it is only tellurium for which solar cell manufacture consumes a very significant part of annual production! Reserves are given by the USGS as 24 kt, assuming that copper remains essentially the only source. (Note the proviso above concerning the meaning of reserves in the case of a by-product!) This corresponds to a reserves-to-primary production ratio of 50 years. The same agency gives a figure of 3 x 10⁹ t for global copper resources (excluding the seabed), which might imply that the tellurium resources are as high as 105 t, although we must remember that the concentration of tellurium in copper ores varies strongly. What can we say about the future consumption of these two elements in the photovoltaic sector? As in Section 3.1.1 we focus on the year 2050, for which a penetration of 60 % by renewables into the total global energy market has been stated as the main aim of the Energiewende. Total global primary energy supply in 2010 was 12 717 Mtoe, or 147 900 TWh, according to the International Energy Agency (IEA) statistics [45]. We assume that this will double by the year 2050, as was roughly the case between 1973 and 2010 [45]. Furthermore, if renewables provide 60%, we arrive at a contribution of 150 000 TWh, after taking into account a 10 % share of renewables for other purposes, mainly heating. Assuming further that wind, solar thermal and PV will have equal shares and that hydro and various other renewable energy forms will only contribute 10 %, we obtain a figure of 45 000 TWh for PV. (The very high share of 60 % for solar energy assumes of course that considerable
14
progress will have been made in energy storage.) Very arbitrarily, we give CdTe a one third share of the PV market. Converting to power and assuming a 25 % capacity factor, gives 6 TWp. Using literature values for the amounts of cadmium and tellurium required per TWp, as above [61, 65], the resulting material requirements for the “in-use stock” in 2050 would be 5 x 10⁵ t and 6 x 10⁵ t, respectively. These are enormous quantities: the figure of 6 x 10⁵ t of tellurium is comparable to, if not higher than the putative resources! The situation with regard to cadmium is perhaps not critical. It may be possible to reduce the amounts of Cd and Te relative to the power rating by increasing the module efficiency. More promising, however, would be to manufacture modules with substantially reduced film thicknesses, which is thought to be technically possible [61]. 3.2.3 Copper indium gallium diselenide (CIGS) Copper is unlikely to present an availability problem, at least not on account of its use in solar modules. We therefore begin with indium, which is a rare metal with a crustal abundance of ≈ 0.1 ppm. Like cadmium, it is mainly obtained from zinc deposits, where it substitutes for zinc in sphalerite (ZnS), but at the most to the extent of 0.01 %. Global primary production of indium was 640 t in 2011 [32]. The largest producer of primary indium is China, which maintains an export quota. Substantially more indium derives, however, from recycling the material which is left over from the rather inefficient process of sputtering ITO (indium tin oxide) layers [69]. Thus, global consumption of both primary and secondary indium was thought to be more than 1800 t in 2011 [32]. Recycling from end-user electronics applications (displays) is still only of minor significance, although processes are available [70]. Substantially more than 50 % of indium production is used for the thin layers of ITO required for liquid crystal displays (LCDs), plasma displays, touch panels, organic light-emitting diodes (LEDs) and solar cells. Other uses include solders and alloys, as well as III-V semiconductors for LEDs and laser diodes. On the basis of the figures in Section 3.1 above, we obtain a value of 0.7 GWp for the freshly installed CIGS capacity in 2011. This corresponds to an indium requirement of 16 t. We note, however, that all of the three thin film solar cells also have TCO, usually ITO, layers. These are typically an order of magnitude thinner than the active layers, but a simple estimation gives the result that a further 6 t of indium were used for this purpose. Thus, solar cell applications were responsible for only 22 t, or ca. 1 %, of the 1800 t indium consumed in 2011. Presumably because of the difficulty of obtaining reliable data, the USGS currently does not quote the global reserves; in 2008 a figure of 11 kt was given. Gallium is a non-metal present in the Earth’s crust in an average concentration of 15 ppm. It is extracted almost exclusively from the aluminium ore bauxite, but with a very small amount coming from sphalerite. Global refined gallium production was 310 t in 2011, considerably more than the 216 t given as the primary gallium production. Interestingly, the latter value already represents an increase of 19% compared to 2010. Since the majority of gallium is used for the manufacture of GaAs, and to a lesser extent, GaN devices, this reflects the currently expanding market for “smart” phones [71]. In an analogous way to indium we estimate the amount of gallium required for the manufacture of CIGS solar modules in 2011 as 5 t, corresponding to 1 – 2 % of annual production. The USGS [32] makes no attempt to estimate the gallium reserves, pointing out that only a certain proportion of the gallium in bauxite and sphalerite are extractable, but the details are proprietary. The world resources of gallium in bauxite are estimated to be 1 Mt. The situation with regard to selenium, a non-metal, is very similar to that of tellurium: not only does it come between sulphur and tellurium in the same group of the periodic table, but it
15
is also an important by-product in copper mining and extraction. With a crustal abundance of 0.05 ppm it is, however, not quite so rare. Surprisingly, selenium is a necessary nutrient for humans in trace quantities. In higher concentrations it is toxic and its presence in drinking water has led to public health problems [37]. Annual global production in 2011 was probably 3000-3500 t [64]. Note that the concentration of by-product - selenium, tellurium, gold and antimony, etc. - depends on the copper ore. George [64] records that in 2006 data from 56 electro-refiners selenium and tellurium were reported as by-product in 52 and 45 plants, respectively. Selenium-containing slimes averaged 7 % Se, with some going as high as 25 %, and tellurium-containing slimes averaged 2 %. Its main uses are alloying (40 %), glass (25 %) and agriculture (10 %); we estimate that solar cell manufacture required only 32 t, or about 1 %. Reserves are given as 92 kt [32], assuming that copper remains virtually the only source, which corresponds to a reserves-to-production ratio of about 30 years. As in the case of tellurium, the USGS gives no figure for the selenium resources, but it is possible to make a rough guess. On the assumption that copper ores remain the main source of selenium, and that the global copper resources amount to 109 t, we arrive at an estimate of ≈ 4 x 10⁵ t for the Se resources, i.e. about five times higher than the reserves. Note, however, that nickel also contains selenium, as does coal (between 0.5 and 12 ppm). The latter is probably a potentially large-scale, if at present uneconomical, source [32]. In an analogous way to Section 3.2.2 for CdTe we now make an order of magnitude estimate of the material requirements for a possible substantial future penetration of the renewables market by CIGS technology. Giving CIGS a 30 % share of the PV market (itself assumed to have a size of 45 000 TWh in 2050), we arrive, as above, at a value of 6 TWp, assuming a 25 % capacity factor. Such a scenario gives figures for the in-use stock of 1 x 10⁵ t, 5 x 10⁴ t and 3 x 10⁵ t for indium (including ITO), gallium and selenium, respectively. Again, these figures are higher than the reserves (USGS data), and comparable to the putative resources. 3.3 Helium: is there geological scarcity in this case? 3. 3. 1 General Surprisingly perhaps, there has long been concern expressed about the availability and the long-term supply situation for the element helium [72-74], which, with an atomic number of two, heads the group of noble gases in the periodic table. Although helium is the second most abundant element in the universe, the average concentration in the Earth’s crust is probably not even in the ppb range, and in the Earth’s atmosphere it is only 5.2 ppm per volume. Fortunately, helium has concentrated in certain regions of the crust, in particular in natural gas deposits, and can be readily extracted. At the time of writing, however, the world is plagued by a shortage of helium, with concomitant rising prices [75]. Does this mean that helium resources are already being depleted at such a rate that exhaustion is looming? What is the origin of terrestrial helium? And why is the element important in the context of the Energiewende? To answer the latter question first, we note that helium as a cryogenic gas has unique properties that allow temperatures near absolute zero to be reached in a routine way, not just in a physics laboratory! Arguably, most important of all is the use of liquid helium to cool the superconducting electromagnetic coils – usually made of a niobium-based alloy – to produce the very high magnetic fields that are required, for example, for magnetic resonance imaging. 30 - 35 % of the total helium produced worldwide is used for cryogenics. Unless there are substantial advances in the manufacture of “high temperature” superconductor wire in the
16
next few years, which would allow liquid nitrogen-cooled coils to be used, it can be assumed that helium-based cryogenic systems will also be required for the first nuclear fusion power plants. Fusion, as recently discussed by Romanelli and Laxåback in this journal [76], is a potential source of sustainable [77], safe and environmentally responsible energy for the second half of the 21st century. Moreover, because of its high thermal conductivity, high specific heat and inertness, helium at high pressure is also an ideal coolant, or energy transfer medium, in the power conversion system of the plant. Global helium resources are finite. The high demand for helium for fusion purposes, both as a cryogenic gas and as a coolant, could exacerbate an already difficult supply situation. Conversely, the restricted availability of helium could also affect the development of fusion power in a negative way. These problems have been recently helium looked at by Clarke and Cai [78] as a chapter in an extremely useful book entitled “The future of helium as a natural resource” edited by Nuttal et al [79], as well as by Bradshaw and Hamacher [80]. 3. 3. 2 Origin, occurrence and reserves The majority (probably about 95%) of terrestrial helium derives from the nuclear decay of uranium and thorium in the Earth’s crust; the rest is of stellar origin. The main contributors are the isotopes 238U and 232Th, which decay in chain reactions via α and β emission to produce stable isotopes of lead. Most of the helium thus created has diffused to the surface and escaped into the atmosphere over the last 4 billion years, but a small fraction thereof has been trapped by impermeable layers of rock. Natural gas, consisting mainly of methane, also collects in such geological constellations, so that helium for commercial use is normally produced from natural gas, where it is a minor component with a concentration up to, but very rarely exceeding, about one per cent. Although it was already clear in the 1920’s that the helium was of radiogenic origin, a problem later became apparent. Several authors pointed out that, based on the amount of uranium and thorium in the Earth’s crust (≈ 1 x 10¹⁴ t and 5 x 10¹⁴ t, respectively) and the half-lives of the two parent nuclei, the rate of generation of helium is about 3 x 10³ t per year, which also corresponds to the rate of degassing, i.e. the rate of emission into the atmosphere [81]. Moreover, about 1 x 10¹⁴ t helium has passed into the Earth’s atmosphere since the formation of the planet. Yet the concentration of helium in the Earth’s atmosphere is only 5.2 ppm (by volume) at sea level, corresponding to a total of 3.5 x 10⁹ t, and is presumed to have remained more or less constant on the geological time scale! This means that about 1014 t must also have been lost from the upper atmosphere during this period. The high altitude ionosphere consists of an almost collisionless plasma containing H+, He+ and O+ ions. The latter move along the Earth’s magnetic field lines, which normally remain closed. However, the interaction with the solar wind above the poles causes magnetic reconnection to take place, so that the field lines open and the plasma flows into the magnetosphere and eventually into interplanetary space. The effect was predicted by Axford [82], who termed it the “polar wind”. We should perhaps emphasise at this point that, despite the huge amount of helium that has passed through the Earth’s atmosphere in the last 4 billion years, the actual rate of production in the crust is only about 3 x 10³ t per year. There is no possibility of tapping this supply at source, because of the high degree of dispersion of the uranium and thorium radionuclei. The total helium resources in the United States – as of the year 2006 – are given by the United States Geological Survey (USGS) [32] in metric tons as 3.6 x 10⁶ t and the total resources outside the US as 5.2 x 10⁶ t, thus giving a global value of 8.8 x 10⁶ t. (Note that this is a factor of several hundred less than the amount of helium in the atmosphere.) The US, Qatar, Algeria and Russia have the largest resources at their disposal. Nineteen plants are currently
17
in operation in the US, as well as 7 elsewhere. New plants for helium in conjunction with liquid natural gas (LNG) production will come online in the next few years in Algeria, Qatar, Australia and probably Russia. Helium supply in the last few years has been characterised by shortages and price rises [75]. The price is essentially determined by the price at which the US Bureau of Land Management sells off the helium from the federal reserve in Cliffside Field, Texas. In the next few years, the supply situation will undoubtedly change due to the new helium production facilities outside the US mentioned above, but also – in the opposite sense - by the more recent recommendation of the NAS not to run down the federal reserve as originally envisaged by the US Congress in 1996. 3. 3. 3 Helium requirements for fusion power plants On the assumption that helium will be used both as cryogenic medium and as coolant in the power conversion system (although other solutions have been discussed), future fusion power plants will be major consumers of helium. Future helium power plants will also produce helium, both in the fusion reaction itself and through the action of the neutron multiplier, which we assume will be beryllium. In order to estimate helium inventories (loadings), loss rates and the helium production rate, we follow reference [80] and use design data from ITER [83], from the European DEMO power plant design project [84] and from the European test blanket project [85]. With assistance from Serio [83] we obtain for a DEMO-like power plant a total helium inventory of about 34 t for the cryogenic system. According to Boccaccini and Franza [86] the power conversion system (PCS) will contain about 23 t helium. How high are the unavoidable losses, i.e. the amount of helium, which for a variety of reasons might not be recovered and therefore might be vented yearly into the atmosphere? On the basis of experience a figure of 10% would be reachable after several years of operation, although Serio is of the opinion that 1 % per annum would be possible in principle, if there were corresponding advances in cryo-technology specifically aimed at reducing losses and, in particular, if provision were made for collection and storage in the case of shutdowns [83]. The same applies, of course, to end-of-life decommissioning. In view of the present uncertainty attached to these figures, it is probably best to use a worst-case scenario of a 5 % annual loss for the cryosystem, i.e. for the power plant considered here 1.7 t. We can assume a lower value for the coolant, since the PCS is a closed, high-pressure system. Berton [87] gives a figure of 310 kg p.a., corresponding to 1.4 %. We take a worst case of 2 %, or 0.5 t. In total we then have 2.2 t p.a. helium losses per power plant, emphasising again that the helium is recovered when end-of-life decommissioning takes place. Finally, using data from our previous paper [77], we can calculate the quantity of helium produced by the fusion reaction and by the beryllium multiplier, the sum of which turns out to be 0.6 t. Note that the latter value is considerably more accurate than the estimate of the losses! Despite this inaccuracy we may conclude that fusion reactors, at least the first generation thereof, will be net consumers of helium, The ratio of the identified global resources (8.5 x 10⁶ t) to annual production (3.1 x 10⁴ t) gives a “static lifetime” of 270 years. What difference would fusion make? We use the scenario of reference [77]: 2,760 power plants (similar to DEMO) which would account globally for a 30 % base-load (24,000 TWh). Using the data in this section, the total helium inventory of all power plants is 1.7 x 10⁵ t, which is 2 % of identified global resources. Annual losses would be about 4 x 10³ t, when the helium produced by the power plants is taken into account; this would decrease the static reserve index to 245 years. Fusion as a non-sustainable net consumer of helium would therefore not play an overriding role in helium consumption, but its requirements could make a difficult situation worse. Note, too, that the
18
helium inventory of the 2760 power plants would also have to be established. This quantity alone corresponds to five years’ present global production! Finally, we consider much how much energy would be required, if crustal helium were exhausted and the gas had to be extracted from the atmosphere (which will presumably occur sometime in the next 100 years or so). This is the so-called back-stop solution and is not just relevant for fusion. Following reference [80], the energy required to replace the net loss of ≈1.6 t p. a. of helium per power plant would only be about 1 % of its annual output! Clarke and Clare [88] give a somewhat higher value, and also point out the problems associated with processing such large volumes of air. We conclude that, even in a situation where helium has to be extracted from air, fusion would remain a sustainable energy source, as long as the helium concentration in the atmosphere remains roughly constant, i.e. crustal emission and “anthropogenic” losses balance the outflow into interplanetary space. 4. Mineral depletion and sustainability
In the three cases discussed above, we have considered factors that can influence the supply of several rare elements that may play an important role in the Energiewende. One of these is (potential) geochemical scarcity. Scarcity can only be defined in economic terms and is due to limited, or decreased, availability, leading to increased prices on a real, inflation-adjusted basis. In most situations supply will match demand: If the mineral resource is perceived as effectively inexhaustible, then output will expand until the extra cost of producing just one more ton equals the current market price. If the consumer is not in a position to pay the price for the amount he needs, he switches to another metal or material, which, as we have seen above, is referred to as “substitution”. The consumption of exhaustible natural resources is somewhat different because the so-called Hotelling rent will also contribute to the costs and thus to the market price [89]. The Hotelling rent equals the (estimated) present value of future profits that the mining company would lose by mining and selling the resources at the present time, assuming amongst other things that the quality of the resource, i.e. the grade of ore, always remains constant. The mineral resources in the ground are assets and are expected to yield interest at the same rate as other investments, such as in property, government stocks or shares. This in turn reduces the availability of the mineral resources, since their value rises exponentially with time. In practice, the situation is more complicated, because, for example, the grade of the ore may fall and/or mining efficiency may increase with the result that the value of the mineral resource in the ground could actually fall. The reader is referred to the corresponding chapter in Tilton’s useful book [90]. Even for effectively inexhaustible raw materials, however, other factors can cause scarcity and lead to the designation “critical” discussed in Section 2. Such factors, both on the supply and demand sides, are sudden strong economic growth in a country or region, new applications following the introduction of new technologies, monopolistic situations, speculation, politically motivated embargos (the “security of supply” issue) and the fact that many important rare elements are mined as by-products, as we have seen in Section 3. Last but not least, there is also the possibility of geochemical scarcity resulting from mineral depletion, the possibility of which was already mentioned above, in particular, in connection with helium. Geochemical scarcity would be expected to occur when production costs increase because mining companies are forced to use ores of increasingly lower grade and when these costs are not, or not fully, counterbalanced by the introduction of new, innovative techniques for mining and processing. The number of newly discovered (and subsequently mined) deposits of high grade would not be sufficient to lift the average grade mined globally. For copper and gold data are available which demonstrate this effect for specific countries [91, 92].
19
Unfortunately, there are little or no geological data available on a global level, although we can look at the prices of raw materials in recent decades. Various commentators, e.g. [1] have drawn attention to the fact that real (inflation-adjusted) prices of nearly all raw materials fell steadily for most of the 20th century due mainly to the use of improved prospecting and production methods. The GMO commodity index for 33 commodities, 12 of which are metals, fell by 70% between 1900 and 2000 despite blips for both world wars and the oil crises of the 70’s [2]. The same development can also be seen in the non-oil commodity price index of The Economist [3]. However, Grantham – amongst others – has pointed out that the trend has recently reversed, in fact quite sharply [2]. This turn-around in the last ten years is also clearly visible in other commodity indices. The price of copper, for example, has – despite a recent downturn – risen by a factor of five since 2002. A massive increase in demand, mainly in China, is certainly a contributory factor, but the question is whether geochemical scarcity, as defined above, also plays a role. For example, the Financial Times has reported that money is “pouring into” copper exploration, but without there being many new discoveries [93]. The Economist cites the Gold Field Mineral Services (GFMS) Ltd in noting that the average grades of gold have fallen by 30 % since 1999 and comments that “all the easy gold has been mined already” [94]. Despite record exploration budgets fewer gold is being discovered. Production costs are rising accordingly: In 2000 the average cost of extracting an ounce of gold was just over $200; by 2010 it had risen to $850 [95]. The three case studies in Section 3 were chosen to illustrate the possibilities of substitution (rare earth elements {REE} in electric machines), extraction as a by-product (rare metals for thin film photovoltaics) and depletion (in all three, but particularly for helium). These factors typically belong to the indicators in the determination of potentially critical supply situations (see the discussion on “criticality” in Section 2). In the case of synchronous machines it was established that employing copper coils rather than REE-based permanent magnets is a viable alternative for synchronous motors and still allows gearless operation, for example, in the case of wind turbines. In the second example it was shown how the supply of Cd, Te, In, Ga and Se is dependent on the extraction of the parent ore. For helium (case 3) the availability of the gas generally, the needs of fusion and the finite nature of the reserves and resources were discussed. However, not just for helium, but in all three cases, geochemical scarcity may soon play a role. The amount of the REE dysprosium needed to fulfil possible global requirements for wind energy and electromobility might not be covered by the available reserves, as quoted by the USGS. In the case of tellurium in photovoltaics, and possibly indium too, the demand could be higher than the putative resources.
Do these observations mean that mineral depletion is already contributing to scarcity and influencing the market? At first sight the values above are alarming, but one should recall that the comparison of these data with possible future demand is not a straightforward matter and that the data on reserves and resources are dynamic in nature. For minerals in general, advanced prospecting methods and improvements in extraction technology allow - in the course of time - resources to be re-classified as reserves and undiscovered resources to be re-classified as identified resources. The USGS Mineral Commodity Summaries cite as an example the case of copper [32]: In 1970, identified and undiscovered world copper resources were estimated to consist of 1.6 x 10⁹ t; the reserves were 2.8 x 10⁸ t. Since then, the world has produced 4.0 x 10⁸ t of copper and the reserves are now estimated to be 6.9 x 10⁸ t and the global resources possibly 3 x 10⁹ t! Thus the figures for dysprosium, tellurium, indium do not necessarily indicate that there will be exhaustion of all the resources in the next few decades, or even in the next one to two centuries.
Helium is for two main reasons not a normal mineral commodity. Firstly, there is no substitute for what is its most important application, namely, in cryogenics. Secondly, it is a
20
by-product of a fossil fuel energy carrier, namely, natural gas, the demand for which is expected to rise drastically in the years to come, as a result of its more favourable greenhouse gas emission characteristics compared to coal. The danger exists that mankind’s thirst for cheap fossil fuel energy will result in the effective, possibly complete, exhaustion of natural gas deposits in the medium term (≈ 1 century), without the helium being extracted and preserved for future generations. Moreover, for the helium which is extracted and used, most of the gas is not recovered, although this is feasible in many applications. The backstop technology – extracting helium from air – not only requires large amounts of energy, but in the words Clarke and Clare [88] “it would be a gargantuan task to supply the approximately 75 tonnes per day of helium the world now uses. At 5.2 ppm (volume), over 100 cubic kilometres of air would have to be processed every day”.
Clearly, the consumption of mineral resources, and in particular of those required for producing “regenerative” energy, must be part of the wider debate on sustainability, or, to use a term which “sustainability” seems partially to have replaced in recent years, “intergenerational equity”. In the case of the mineral resources of the planet in general, complete exhaustion of a particular mineral will never occur. If, however, uninhibited usage continues, a situation will be reached, which could be termed “effective” exhaustion, where the cost of producing a further ton in terms of energy, water and environmental damage will be so great, that mining activities will cease. Our society, or world economy, will switch to a cheaper, more readily available, but for the purpose, less appropriate substitute. This non-sustainable process of “unlimited substitutability” [96, 97] could in principle go on in-definitely, but with disastrous consequences for future generations. Due to the development of world population and concomitant increases in average standards of living, demand for raw materials will presumably continue to increase in coming decades until a maximum in the level of in-use stock is reached. Under such conditions, improved recycling can in principle supply the majority of global materials needs [98]. However, although elements are never destroyed (except in the case of nuclear reactions) and thus remain potentially available, recycling can never be 100 % efficient. Due to the loss of material at very high dilution in the environment (dispersion) and in the recycling processes themselves, fresh ore will always be necessary. For this reason, mineral depletion and even effective exhaustion are inevitable. Since the activities of extracting and processing ores from the Earth’s crust are inherently non-sustainable, the term “sustainable mining” is indeed an oxymoron [99]. We are forced to conclude that “strong” sustainability [100, 101] is simply not achievable.
Acknowledgements We thank R. Clarke, J. Leissner, A. Lossin and M. Wanner for useful discussions and the Fonds der chemischen Industrie for financial support.
21
Figure 1: The large increase in the annual world production of rare earth oxides since 1960. Data from USGS tables [31].
0
20000
40000
60000
80000
100000
120000
140000
1950 1960 1970 1980 1990 2000 2010
Wor
ld P
rodu
ctio
n of
REO
(met
ric to
ns)
World production of REO (1950 - today)
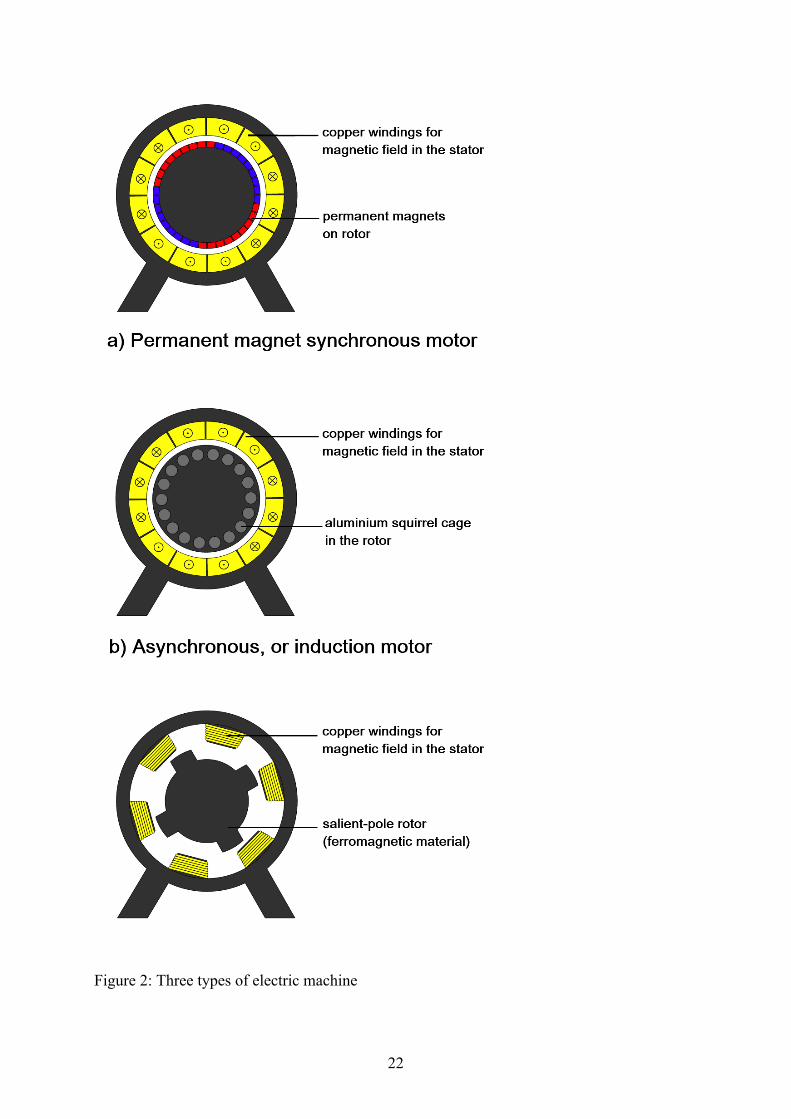
22
Figure 2: Three types of electric machine
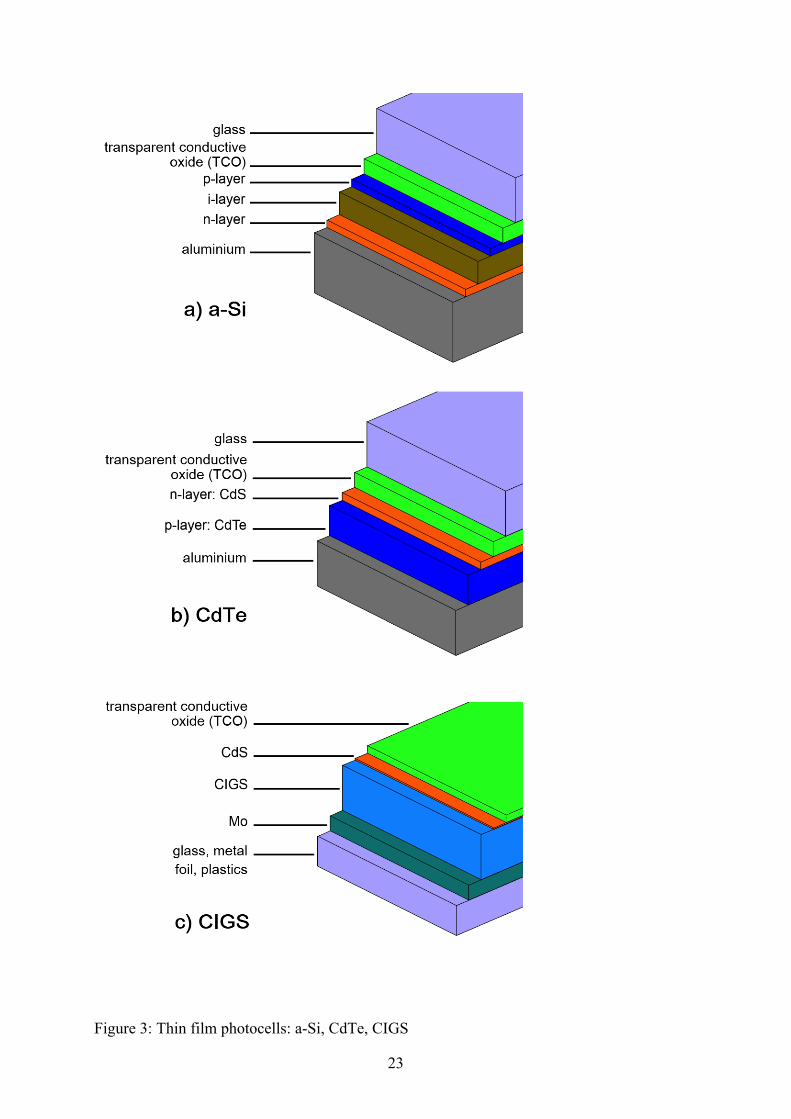
23
Figure 3: Thin film photocells: a-Si, CdTe, CIGS
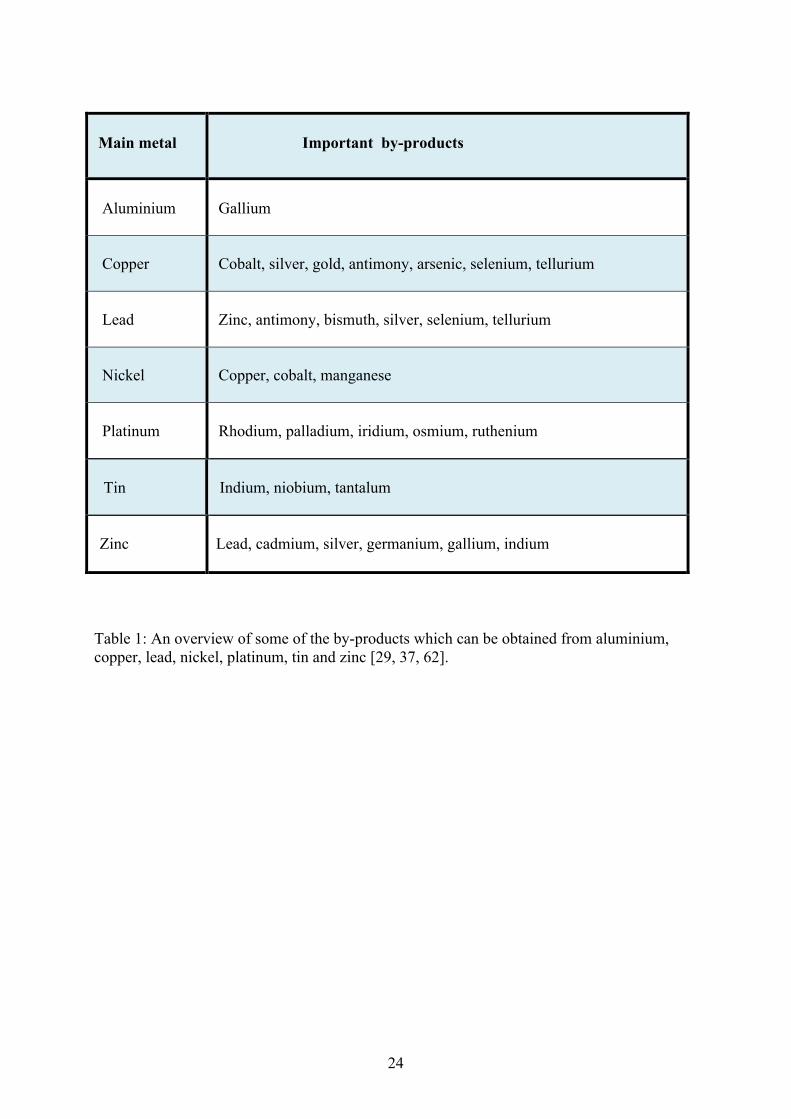
24
Main metal
Important by-products
Aluminium
Gallium
Copper
Cobalt, silver, gold, antimony, arsenic, selenium, tellurium
Lead
Zinc, antimony, bismuth, silver, selenium, tellurium
Nickel
Copper, cobalt, manganese
Platinum
Rhodium, palladium, iridium, osmium, ruthenium
Tin
Indium, niobium, tantalum
Zinc
Lead, cadmium, silver, germanium, gallium, indium
Table 1: An overview of some of the by-products which can be obtained from aluminium, copper, lead, nickel, platinum, tin and zinc [29, 37, 62].
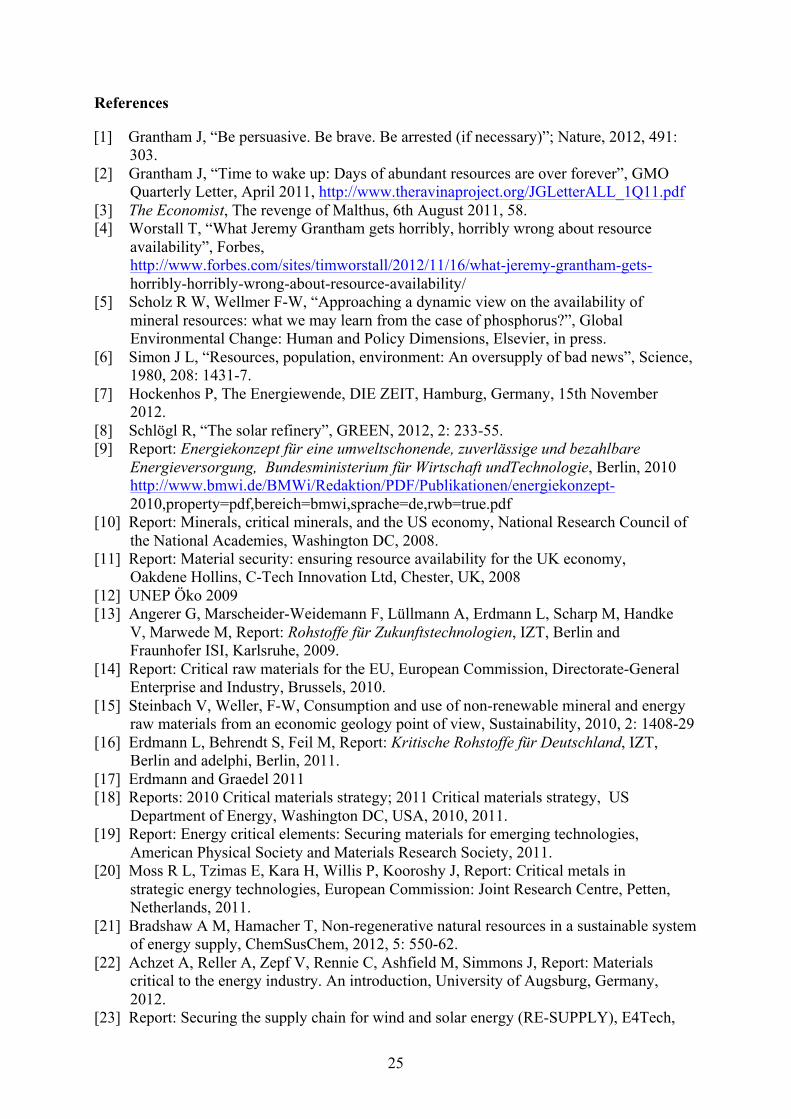
25
References
[1] Grantham J, “Be persuasive. Be brave. Be arrested (if necessary)”; Nature, 2012, 491: 303.
[2] Grantham J, “Time to wake up: Days of abundant resources are over forever”, GMO Quarterly Letter, April 2011, http://www.theravinaproject.org/JGLetterALL_1Q11.pdf [3] The Economist, The revenge of Malthus, 6th August 2011, 58. [4] Worstall T, “What Jeremy Grantham gets horribly, horribly wrong about resource availability”, Forbes, http://www.forbes.com/sites/timworstall/2012/11/16/what-jeremy-grantham-gets- horribly-horribly-wrong-about-resource-availability/ [5] Scholz R W, Wellmer F-W, “Approaching a dynamic view on the availability of mineral resources: what we may learn from the case of phosphorus?”, Global Environmental Change: Human and Policy Dimensions, Elsevier, in press. [6] Simon J L, “Resources, population, environment: An oversupply of bad news”, Science, 1980, 208: 1431-7. [7] Hockenhos P, The Energiewende, DIE ZEIT, Hamburg, Germany, 15th November 2012. [8] Schlögl R, “The solar refinery”, GREEN, 2012, 2: 233-55. [9] Report: Energiekonzept für eine umweltschonende, zuverlässige und bezahlbare Energieversorgung, Bundesministerium für Wirtschaft undTechnologie, Berlin, 2010 http://www.bmwi.de/BMWi/Redaktion/PDF/Publikationen/energiekonzept- 2010,property=pdf,bereich=bmwi,sprache=de,rwb=true.pdf [10] Report: Minerals, critical minerals, and the US economy, National Research Council of the National Academies, Washington DC, 2008. [11] Report: Material security: ensuring resource availability for the UK economy, Oakdene Hollins, C-Tech Innovation Ltd, Chester, UK, 2008 [12] UNEP Öko 2009 [13] Angerer G, Marscheider-Weidemann F, Lüllmann A, Erdmann L, Scharp M, Handke V, Marwede M, Report: Rohstoffe für Zukunftstechnologien, IZT, Berlin and Fraunhofer ISI, Karlsruhe, 2009. [14] Report: Critical raw materials for the EU, European Commission, Directorate-General Enterprise and Industry, Brussels, 2010. [15] Steinbach V, Weller, F-W, Consumption and use of non-renewable mineral and energy raw materials from an economic geology point of view, Sustainability, 2010, 2: 1408-29 [16] Erdmann L, Behrendt S, Feil M, Report: Kritische Rohstoffe für Deutschland, IZT, Berlin and adelphi, Berlin, 2011. [17] Erdmann and Graedel 2011 [18] Reports: 2010 Critical materials strategy; 2011 Critical materials strategy, US Department of Energy, Washington DC, USA, 2010, 2011. [19] Report: Energy critical elements: Securing materials for emerging technologies, American Physical Society and Materials Research Society, 2011. [20] Moss R L, Tzimas E, Kara H, Willis P, Kooroshy J, Report: Critical metals in strategic energy technologies, European Commission: Joint Research Centre, Petten, Netherlands, 2011. [21] Bradshaw A M, Hamacher T, Non-regenerative natural resources in a sustainable system of energy supply, ChemSusChem, 2012, 5: 550-62. [22] Achzet A, Reller A, Zepf V, Rennie C, Ashfield M, Simmons J, Report: Materials critical to the energy industry. An introduction, University of Augsburg, Germany, 2012. [23] Report: Securing the supply chain for wind and solar energy (RE-SUPPLY), E4Tech,
26
London/Lausanne and Avalon Consulting, Mumbai, India, 2012. [24] Oxford English Dictionary http://www.oed.com/ [25] Graedel T E, Barr R, Chandler C, Chase T, Choi J, Christoffersen L, Friedlander E, Henly C, Jun C, Nassar N T, Schechner D, Warren S, Yang M, Zhu C, Methodology of metal criticality determination, Environ. Sci. Technol., 2012, 46: 1063-70. [26] Nassar N T, Barr R, Browning M, Diao Z, Friedlander E, Harper E M, Henly C, Kavlak G, Kwatra S, Jun C, Warren S, Yang M-Y, Graedel T E, Criticality of the geological copper family, Environ. Sci. Technol., 2012, 46: 1071-78 [27] Holovatch Y (ed.), Order, disorder and criticality: Advanced problems of phase transition theory, 2012, Imperial College Press, London. [28] International Panel for Sustainable Resource Management, Recycling rates of metals: A status report, 2011, United Nations Environment Programme, Paris. [29] Hagelüken C, Meskers C E M, Complex life cycles of precious and special metals, in Linkages of Sustainability (eds. Graedel T E, van der Voet E), 2010, MIT Press, Cambridge, Mass. [30] Reck B R, Graedel T, Challenges in metal recycling, Science, 2012, 337: 690-95. [31] United States Geological Survey (USGS), Historical statistics for mineral and material commodities in the Unites States. http://minerals.usgs.gov/ds/2005/140 [32] USGS, Mineral Commodity Summaries, 1997-2012 http://minerals.usgs.gov/ [33] Schüler D, Buchert M, Liu R, Dittrich S, Merz C, Report: Study on rare earths and their recycling, 2011, Öko-Institut, Darmstadt, Germany. [34] Hatch G P, Critical rare earths: Global supply and demand projections and the leading contenders for new sources of supply, Technology Metals research (TMR), 2011 http://www.weee-forum.org/system/files/documents/201108_critical_rare_earths.pdf [35] Gambogi J, Cordier D J, Rare Earths, Minerals Year Book, USGS, 2010 http://minerals.usgs.gov/ [36] Goonan T, Rare earth elements – End use and recyclability, USGS, Scientific Investigations Report 2011-5094. [37] Craig, J R, Vaughan D J, Skinner B J, Earth Resources and the Environment, 4th Edition, Prentice Hall, Boston, 2011. [38] Yu K-h, Japan challenging China’s rare earth hegemony? J. Energy Security, 2012 xxx [39] Kramer D, Concern grows over China’s dominance of rare earth metals, Physics Today, 2010, May: 22-24. [40] Fuyuno I, Japan and Vietnam join forces to exploit rare-earth elements, Nature, 13 July 2012 [41] US Department of Energy (DOE), ARPA-E: Rare earth alternatives in critical technologies, 2011, http://arpa-e.energy.gov/?q=arpa-e-programs/react [42] Oakdene-Hollins (London, UK), Lanthanide resources and alternatives, 2010 http://www.oakdenehollins.co.uk/pdf/lanthanide_resources_and_alternatives_may_ 2010.pdf [43] Sagawa M, Fujimura S, Togawa N, Yamamoto H, Matsura Y, New material for permanent magnets on a base of Nd and Fe, J. Appl. Phys., 1984, 55: 2083-7. [44] Hatch G P, A brief overview of recent rare earth supply and pricing dynamics, Technology Metals Research (TMR), 2012 [45] Key World Energy Statistics 2012, International Energy Agency, Paris. http://www.iea.org/publications/freepublications/publication/name,31287,en.html [46] Alonso E, Sherman A M, Wallington T J, Everson M P, Field F R, Roth R, Kirchain
27
R E, Evaluating rare earth element availability: A case with revolutionary demand from clean technologies, Environ. Sci. Technol., 2012, 46: 3406-14. [47] Larminie J, Lowry J, Electric vehicle technology explained, 2nd Edition, Wiley, Chichester, 2012. [48] Hughes A, Electric motors and drives: Fundamentals, types and applications, 3rd
Edition, Elsevier/Newnes, Oxford, 2006. [49] Wallentowitz H, Freialdenhoven A, Strategien zur Elektrifizierung des Antriebs- stranges, 2nd Edition, Vieweg + Teubner, Wiesbaden, 2011. [50] Laskaris K, Kladas A, Internal permanent magnet motor design for Electric vehicle drive, IEEE Transactions on Industrial Electronics, 2010, 57: xxx. [51] Zhu Z, Howe D, Electrical machines and drives for electric, hybrid, and fuel cell vehicles, Proceedings of the IEEE, 2007, 95: 746-65. [52] Risse S, Entwicklung einer geschalteten Reluktanzmaschine als Elektrofahrzeug- antrieb, Shaker, Aachen, 2002. [53] Lawrenson P J, Stephenson J M, Fulton N N, Blenkinsop P T, Corda J, Variable-speed switched reluctance motors, Electric Power Applications, IEE Proceedings B, 1980, 127: 253-65. [54] Felden M, Butterling P, Jeck P, Eckstein L, Hameyer K, Electric vehicle drive trains: From the specification sheet to the drive-train concept, 14th International Power Electronics and Motion Control Conference (EPE/PEMC), 2010, S11-9-S11-16. [55] Naunin D, Hybrid-, Batterie- und Brennstoffzellen-Elektrofahrzeuge, 4th Edition, expert verlag, Renningen, 2007 [56] Mathoy A, Grundlagen für die Spezifikation von E-Antrieben, MTZ- Motorentechnische Zeitschrift, 2010, 71: 556-63. [57] Global wind energy council – global statistics, http://www.gwec.net/global-figures/graphs/ [58] Hau E, Wind turbines, Springer, Berlin, 2006 [59] US Department of Energy (DOE): SunShot Initiative http://www1.eere.energy.gov/solar/sunshot/index.html [60] US National Renewable energy Laboratory (NREL): Best Research-Cell Efficiencies, http://www.nrel.gov/ncpv/images/efficiency_chart.jpg [61] Bleiwas D I, By-product mineral commodities used for the production of photovoltaic cells, USGS Circular 1365, 2010. http://minerals.usgs.gov/ [62] Rankin W J, Minerals, metals and sustainability – Meeting future material needs, CSIRO Publishing, Collingwood, Australia, 2011. [63] Tolcin A C, Cadmium, Minerals Year Book, USGS, 2011. http://minerals.usgs.gov/ [64] George M W, Selenium and tellurium, Minerals Year Book, USGS, 2011. http://minerals.usgs.gov/ [65] Zweibel K, The impact of tellurium supply on cadmium telluride photovoltaics, Science, 2010, 328: 699-701. [66] Fthenakis V, Anctil A, Direct Te mining: Resource availability and impact on CdTe PV lifetime assessments, IEEE J Photovoltaics, 2013, 3: 1-3. [67] Kordosky G A, Copper recovery using leach/solvent extraction/electrowinning technology: Forty years of innovation, 2.2 million tonnes of copper annually, J. South African Inst. Min. Metall., 2002, Nov./Dec., 445-50. [68] Lossin A, personal communication. [69] Goonan T G, Materials flow of indium in the United States in 2008 and 2009, USGS Circular 1377, 2012. [70] Tolcin A C, Indium, Minerals Year Book, USGS, 2011.
28
http://minerals.usgs.gov/ [71] Jaskula B W, Gallium, Minerals Year Book, USGS, 2011. http://minerals.usgs.gov/ [72] Cook E, The helium question, Science, 1979 206: 1141-7. [73] Report of the Committee on the Impact of Selling the Helium Reserve, National Re4] Nuttall W J, Clarke R H, Glowacki, B A, Stop squandering helium, Nature, 2012, 485: 573-5 [77] Garvey M D, Tight supply reins in the worldwide helium market, CryoGas
International, October 2011, 30-1. [76] Romanelli F, Fusion energy research for ITE and beyond, GREEN, 2011, 1: 249-61. [77] Bradshaw A M, Hamacher T, Is nuclear fusion a sustainable energy form? Fusion
Engineering and Design, 2011, 86: 2770-73. [78] Clarke R H, Cai Z, Helium and fusion energy, in Ref. [8], 235-64. [79] Nuttall W J, Clarke R H, Glowacki B A (eds.), The future of helium as a natural resource, Routledge, Abingdon and New York, 2012. [80]: Bradshaw A M, Hamacher T, Nuclear fusion and the helium supply problem, Fusion Engineering and Design, in press. [81] E. g. Cook M A, Where is the Earth’s radiogenic helium? Nature, 1957, 179: 213. [82] Axford, W I, The polar wind and the terrestrial helium budget, J. Geophys. Res., Space
Phys., 1968, 73: 6855-59. [83] Serio L, personal communication. [84] Maisonnier D, European DEMO design and maintenance strategy, Fusion Engineering
and Design, 2008, 83: 858-64. [85] Boccaccini L V et al, Present status of the conceptual design of the EU test blanket
systems, Fusion Engineering and Design, 2011, 86: 478-83. [86] Boccaccini L V, Franza F, personal communication. [87] Berton L, Helium and tritium leaks in the PPCS BKT & DV cooling circuits, CEA Technical Document DTN/STP/LTCG/2004/032 (2004) [88] Clarke R H, Clare R, Helium from the air, in Ref. [8], 118-33. [89] Hotelling H, The Economics of Exhaustible Resources, J. Pol. Econ., 1931, 39: 137-175. [90] Tilton J E, On Borrowed Time? Assessing the Threat of Mineral Depletion, Resources
for the Future, Washington DC, 2002. [91] Norgate T E, Deteriorating ore resources: Energy and water impacts, in Linkages of
Sustainability (eds. Graedel T E, van der Voet E), 2010, MIT Press, Cambridge, Mass. 131-48.
[92] Mudd G M, Gold mining in Australia: Linking historical trends and environmental and resource sustainability, Environm. Sci. Policy, 2007, 10: 629-44.
[93] MacNamara W, The copper exploration conundrum, Financial Times, 14th March 2011. [94] The Economist, The wacky world of gold, 4th June 2011, 75-6. [95] Owens B, Extreme prospects: High gold prices are making it worthwhile to look for gold
in some unusual places, Nature, 2013, 495: S4-6. [96] Solow R M, Intergenerational equity and exhaustible resources, Rev. Econ. Studies,
1974, 41(5): 29-45. [97] Goeller H E, Weinberg A M, The age of substitutability, Science, 1976, 191: 683-9. [98] Steinbach V, Wellmer F-W, Consumption and use of non-renewable mineral and energy
raw materials from an economic geology point of view, Sustainability, 2010, 2: 1408-30.
[99] Tilton J E, Is mineral depletion a threat to sustainable mining?, Paper presented at the International Conference on Sustainable Mining, Santiago de Compostela, Spain, 2009. [100] Dobson A, Environmental sustainabilities: An analysis and a typology, Environmental
Politics, 1996, 5: 401-28.

29
[101] Ayres R U, On the practical limits to substitution, Ecological Economics, 2007, 61:
115-28.