Embed Size (px)
Citation preview
econstor www.econstor.eu
Der Open-Access-Publikationsserver der ZBW – Leibniz-Informationszentrum WirtschaftThe Open Access Publication Server of the ZBW – Leibniz Information Centre for Economics
Standard-Nutzungsbedingungen:
Die Dokumente auf EconStor dürfen zu eigenen wissenschaftlichenZwecken und zum Privatgebrauch gespeichert und kopiert werden.
Sie dürfen die Dokumente nicht für öffentliche oder kommerzielleZwecke vervielfältigen, öffentlich ausstellen, öffentlich zugänglichmachen, vertreiben oder anderweitig nutzen.
Sofern die Verfasser die Dokumente unter Open-Content-Lizenzen(insbesondere CC-Lizenzen) zur Verfügung gestellt haben sollten,gelten abweichend von diesen Nutzungsbedingungen die in der dortgenannten Lizenz gewährten Nutzungsrechte.
Terms of use:
Documents in EconStor may be saved and copied for yourpersonal and scholarly purposes.
You are not to copy documents for public or commercialpurposes, to exhibit the documents publicly, to make thempublicly available on the internet, or to distribute or otherwiseuse the documents in public.
If the documents have been made available under an OpenContent Licence (especially Creative Commons Licences), youmay exercise further usage rights as specified in the indicatedlicence.
zbw Leibniz-Informationszentrum WirtschaftLeibniz Information Centre for Economics
Raff, Horst; Trofimenko, Natalia
Working Paper
World Market Access of Emerging-Market Firms: TheRole of Foreign Ownership and Access to ExternalFinance
CESifo Working Paper, No. 4346
Provided in Cooperation with:Ifo Institute – Leibniz Institute for Economic Research at the University ofMunich
Suggested Citation: Raff, Horst; Trofimenko, Natalia (2013) : World Market Access of Emerging-Market Firms: The Role of Foreign Ownership and Access to External Finance, CESifo WorkingPaper, No. 4346
This Version is available at:http://hdl.handle.net/10419/79657
World Market Access of Emerging-Market Firms: The Role of Foreign Ownership and
Access to External Finance
Horst Raff Natalia Trofimenko
CESIFO WORKING PAPER NO. 4346 CATEGORY 8: TRADE POLICY
JULY 2013
An electronic version of the paper may be downloaded • from the SSRN website: www.SSRN.com • from the RePEc website: www.RePEc.org
• from the CESifo website: Twww.CESifo-group.org/wp T
CESifo Working Paper No. 4346 World Market Access of Emerging-Market Firms:
The Role of Foreign Ownership and Access to External Finance
Abstract This paper uses micro-data from the World Bank Investment Climate Surveys 2002-2006 to investigate how foreign ownership and access to external finance affect the likelihood of manufacturers in emerging markets to export and/or import. Applying propensity score matching to control for differences across firms in terms of labor productivity, size, etc., we find that foreign ownership and access to external finance are statistically significant determinants of the likelihood that a firm will export or import. Foreign ownership has a large positive impact on the likelihood to engage in direct trade but a negative effect on the likelihood to trade through intermediaries; the effects vary across upper and lower middle income countries. Access to external finance has a modest but positive effect on the likelihood to engage in any of the modes of connecting with foreign customers or suppliers.
JEL-Code: F120, F140, F230, O190.
Keywords: international trade, foreign ownership, financing, developing countries, intermediation, multinational enterprise.
Horst Raff* Department of Economics
University of Kiel Kiel Institute for the World Economy
Kiel / Germany [email protected]
Natalia Trofimenko Kiel Institute for the World Economy
Kiel / Germany [email protected]
*corresponding author June 2013
1 Introduction
Access to world markets for imports and exports is generally considered to be
one of the necessary conditions for sustained economic growth and poverty
reduction in developing countries (see WTO (2001)). Much has been written
on the nexus between international trade and growth at the aggregate level
and on export-led growth strategies, for instance, of China or the Asian Tiger
countries.1 By contrast, we have little systematic evidence on how firms
in emerging markets actually connect with foreign customers and suppliers,
and on the factors that may help them do so. The purpose of the current
paper therefore is to investigate the role of two potentially important factors,
namely foreign ownership and access to external finance, and to investigate
how their impact changes with the level of economic development.
We use micro-data from the World Bank Investment Climate Surveys
2002-2006 to establish a causal effect of foreign ownership and access to
external finance on the propensity of manufacturing firms to engage in ex-
porting and importing by matching each firm exhibiting one of these factors
with a control group of firms from the same industry and country that, in
terms of their labor productivity, size and other characteristics, are equally
likely to exhibit that factor. We then compare the average export and im-
port propensities of firms exhibiting this factor with the average respective
propensities of firms in the control group. In this way we can isolate the
effect of foreign ownership and access to external finance over and beyond
the effect stemming from firm productivity and size that are already well
known to be highly correlated with export and import activities of firms.2
1See, for instance, Edwards (1993), Frankel and Romer (1999), United Nations (2008),Winters et al. (2004), or Rodrik (2007)). The large literature on the role of trade inalleviating poverty in developing countries is surveyed by Bhagwati and Srinivasan (2002),Goldberg and Pavcnik (2004) and Winters et al. (2004). McCaig (2011) finds a strongcausal effect of trade on reducing poverty in Vietnam. See also Topalova (2010) for evidencefrom India.
2See, for instance, Bernard and Jensen (2004) on the firm-specific determinants of trade.The large literature on firm heterogeneity and selection into exporting and importing is
1
It is a well established stylized fact that firms generally face substantial
"fixed costs" when accessing export and import markets (Roberts and Ty-
bout (1997)). In the case of developing countries there is reason to believe
that these "fixed costs" are especially large relative to firms’ own capacity to
bear them, so that firms depend on the external support that they may draw
from, among other things, foreign ownership and external finance. First,
firms in less developed countries are less likely to have the technological and
marketing know-how and the foreign contacts to identify potential customers
and to produce according to these customers’ needs. Moreover, they are less
likely to be able to link up with overseas suppliers and to make use of for-
eign intermediate goods. As suggested by a good deal of research conducted
by the World Bank and summarized by Keesing (1983), developing country
firms have been surprisingly successful in exporting certain types of consumer
goods because they received help from overseas buyers that provided contacts
and, more precisely, technical, logistical and management capabilities. Simi-
larly, Gereffi (1999) sees the role of ‘buyer-driven global commodity chains’ as
critical to understand why, despite formidable spatial and cultural distances,
countries like Japan, South Korea, Taiwan, Hong Kong, Singapore, and now
China have been so successful in exporting to Western countries.3 Foreign
ownership is only one way to organize this outside support, but it is likely
to be an important one (see also Markusen and Trofimenko (2009)). Second,
developing countries tend to have poorly developed financial markets, pro-
viding limited financing opportunities for firms. Access to external finance
therefore is all the more important if firms in these countries are to engage
in exporting or importing (see, for instance, Kletzer and Bardhan (1987) or
Beck (2002)).
We view foreign ownership and external financing in a wider sense as
forms of intermediation of international trade. We also observe in our dataset
surveyed by Greenaway and Kneller (2007) and Wagner (2012).3Feenstra and Hamilton (2006) provide a detailed discussion of the trade strategies of
firms in South Korea and Taiwan.
2
firms that rely on intermediation in a narrow sense, namely by exporting
and importing through independent distributors. The use of this indirect as
opposed to direct trade is of course correlated with foreign ownership and
external financing. First, in foreign-owned firms the distribution of exports
and imports is likely to be internalized, i.e., carried out within the firm
and therefore not directly observable. We would hence expect foreign-owned
firms to rely less on independent distributors. Second, access to external
finance may also make it easier for firms to internalize certain functions
for which they otherwise would use independent distributors. Hence it is
all the more important to be very precise about the way foreign ownership
and external finance interact with firms’ own capabilities and the use of
independent distributors.
We therefore proceed in two steps, namely by building a simple theoretical
model to guide our empirical analysis, and then using propensity score match-
ing to control for firms’ own capabilities (measured as productivity or size)
when quantifying the effects of foreign ownership and external finance. In
the theoretical model heterogeneous firms draw on external support (foreign
ownership or external finance) when engaging in direct or indirect trade. Se-
lection into direct and indirect modes of trade are thus functions of the firms’
own capability and external support. In the empirical analysis we investigate
the effect of foreign ownership and external finance on the propensity to ex-
port and import both directly and indirectly. And as a robustness check we
examine how firms’ ability to do business with multinational enterprises or
large domestic firms affects their propensity to engage in the various trade
modes.
We find that foreign ownership significantly increases the propensity of
firms to engage in international trade, namely by approximately 12 per-
centage points. This is true for both exporting and importing. All of this
increase is attributable to direct engagement in foreign trade: as anticipated,
foreign-owned firms are significantly less likely to rely on independent dis-
3
tributors than domestically owned firms. The effect of foreign ownership on
the propensity to engage in trade, and especially on exporting, is particu-
larly important for firms in lower middle income countries. In upper middle
income countries, the differences between foreign-owned and domestic firms
are minimal and not statistically significant, except for imports. We find
the impact of access to external finance to be relatively smaller in magni-
tude but also statistically significant: financially constrained firms are about
6 percentage points less likely to engage in international trade. Access to
external finance appears to be equally important in both lower and upper
middle income countries.
The paper is related to four strands of literature. First, while there is
a large literature that explores trade activities at the firm level, few papers
focus on the role of foreign ownership, and if they do they study firms in
developed countries.4 An interesting exception is a paper by Manova and
Zhang (2009) on exports and imports by Chinese firms. That paper shows
that foreign-owned firms trade more on average than local privately owned
firms and that their trading relationships tend to be more stable. However,
it does not attempt to measure the effect of foreign ownership or, for that
matter, of external financing on the propensity to engage in trade. Girma
et al. (2008) study the role of foreign ownership and financial constraints on
Chinese firms, but the emphasis is on innovation activity not trade. Second,
there is a quickly growing literature on the role of intermediaries in interna-
tional trade. The most closely related part of this literature examines the
selection of firms into direct and indirect modes of exporting or importing.5
4See, for instance, Raff and Wagner (2013) on the effect of foreign ownership on theextensive margins of exports of German manufacturing firms.
5Among the papers are Abel-Koch (2011), Ahn et al. (2011), Akerman (2010), Blum etal. (2009), Crozet et al. (2013), Felbermayr and Jung (2009), McCann (2010), Petropoulou(2007). Imbruno (2012) discusses direct and indirect modes of importing. Basker and Van(2010), Bernard et al. (2010) and Blum et al. (2010) present empirical evidence on therole of retailers and wholesalers in intermediating trade with developed and developingcountries.
4
But none of these papers considers the role of foreign ownership or access
to external finance. Third, our paper contributes to the literature on the
role of financial frictions in trade by examining firms from emerging markets
and examining the effects on different modes of engaging in trade.6 Fourth,
there is a large literature on how domestic firms in developing countries may
benefit from the presence of multinationals, in particular when it comes to ex-
porting.7 However, the emphasis of this literature is on measuring spillovers
across firms, rather than on comparing the trade performance of matched
domestically controlled and foreign owned firms.
The rest of the paper is organized as follows. In the next section, we
present a simple theoretical model to make precise the interaction between
firms’ internal capabilities and external support from foreign ownership and
external finance. In Section 3 we discuss the empirical methodology and how
it helps control for the interaction between own capabilities and external
support spelled out in the theoretical model. Section 4 presents the data,
and Section 5 contains the empirical results. Conclusions follow in Section
6.
2 Theoretical Framework
In this section we develop a simple theoretical framework with heterogeneous
firms, based on Chaney (2005), to set the stage for our empirical analysis.
The model allows us to identify how foreign ownership and access to external
finance interact with the more standard firm-level determinants of foreign-
market participation like productivity or size. We focus on foreign market
6Prominent papers in this literature are Amiti and Weinstein (2011) who study theeffect of the Japanese financial crisis on exports by Japanese firms, and Manova (2012)and Muûls (2008) who study the effect of credit constraints on exports at the aggregatelevel and on Belgian firms, respectively. Greenaway et al. (2007) examine the link betweenfinancial factors and export performance of UK firms.
7Görg and Greenaway (2004) provide a survey of the literature. For more trade-relatedaspects see Swenson (2008), and Mayneris and Poncet (2013).
5
access for exports, noting that models of firm heterogeneity can be easily
adapted to study imports of intermediates (see, e.g., Debaere et al. (2013))
or both imports of intermediates and exports (as in Kasahara and Lapham
(2013)).
Consider two symmetric countries, home and foreign. Each country has
two industries that use labor as the only input. One industry produces a
homogeneous, freely tradable good with a constant unit labor requirement of
1. This is the numeraire good and, since its price is set to 1, we also obtain
a wage rate of 1. The other industry produces a continuum of differentiated
goods under increasing returns to scale and monopolistic competition.
2.1 Households
Home has L consumers/workers, each endowed with one unit of labor. Indi-
vidual preferences are given by the utility function
U = q0 + ρ lnQc, ρ < 1, (1)
where q0 denotes the consumption of the numeraire, and Qc is the aggre-
gate individual consumption of differentiated goods. Letting qc(i) denote the
quantity consumed of variety i, we assume that Qc takes the following CES
form:
Qc =
i∈∆
qc(i)σ−1
σ di
σ
σ−1
, (2)
where σ > 1 is the constant elasticity of substitution between varieties and
∆ is the endogenous set of varieties.
Maximizing utility subject to the consumer’s budget constraint and ag-
gregating individual demands over the L consumers yields the following total
demand for variety i:
q(i) =ρL
P 1−σp(i)−σ, (3)
6
where p(i) is the consumer price of variety i, and
P =
i∈∆
p(i)1−σdi
1
1−σ
(4)
is the CES price index.
2.2 Firms
Firms in each country have access to the same technology. In the differ-
entiated good industry each firm draws a random unit labor productivity
z ≥ 0. When entering the domestic market a firm incurs a fixed cost Fd. To
enter the export market a firm has to choose between two strategies: strat-
egy x is to export directly, strategy w is to export indirectly with the help
of a domestic wholesaler/intermediary. Strategy x involves a fixed cost of
exporting Fx. Going through an intermediary requires a smaller fixed cost,
Fw < Fx, for instance, because the intermediary is able to spread market
access costs across a number of exporters that it represents. The trade-off
is that the intermediary has to be paid in kind for each unit that it ships
abroad. This iceberg-like cost of intermediation is denoted by ω > 1. Both
exporting strategies also involve an iceberg transport cost τ ≥ 1. We may
hence summarize the cost of producing quantities qd for the domestic market
and qw or qx for sale in the foreign market via indirect, respectively direct
trade as follows:
Cd(qd) =qdz+ Fd, (5)
Cw(qw) =ωτqwz
+ Fw, (6)
Cx(qx) =τqxz+ Fx. (7)
Profit maximization in the case of CES demand functions requires a firm with
labor productivity z to set a price at a constant mark-up over its marginal
7
cost, c, so that p(c) = σc/(σ − 1). The marginal cost c of supplying output
is equal to 1/z in the domestic market, ωτ/z and τ/z, respectively, in the
foreign market. The corresponding profits that such a firm can earn in the
respective markets and using the respective modes of delivery are then given
by:
πd(z) =ρL
σ
σ
(σ − 1)zP
1−σ− Fd, (8)
πw(z) =ρL
σ
σωτ
(σ − 1)zP
1−σ− Fw, (9)
πx(z) =ρL
σ
στ
(σ − 1)zP
1−σ− Fx. (10)
2.3 Foreign Ownership and Access to External Finance
We are interested in determining how foreign ownership and access to exter-
nal finance affect the export market participation of firms and the choice of
export mode, w or x; and we want to separate the impact of these two factors
from that of labor productivity. A simple and very useful way to model the
effect of foreign ownership or access to external finance is to assume that they
allow each firm to draw a random endowment of an asset or ability, A, that
may help it to overcome barriers to foreign-market entry. In particular, let A
and z be drawn from the joint cumulative distribution G(A, z), and let the
marginal distribution of z be given by Gz(z) ≡ limA→∞G(A, z).8 Modelling
foreign ownership and access to external finance as a random draw of ability
is useful, precisely because in our data we do not directly observe how much,
if at all, an individual firm benefits from these factors.
We formally treat A as an asset that a firm can combine with the profit
it earns in the domestic market to pay the fixed cost of exporting directly or
8In his model Chaney (2005) interprets A as a liquidity shock and examines how drawsof z and A affect the propensity of a firm to export. Our model extends Chaney’s byallowing for both direct trade and indirect trade through an intermediary.
8
through intermediaries:
πd(z) +A ≥ Fi for i = w, x. (11)
We thus implicitly assume that the firm cannot leverage potential export
proceeds to overcome this fixed cost. This market failure can be overcome if
the firms has enough A. More precisely, since πd(z) is strictly increasing in z,
only a very productive firm may be able to pay Fi without a large endowment
of A, whereas a firm with a very low labor productivity may not be able to
export indirectly even if A is large.
2.4 Equilibrium
To simplify the characterization of equilibrium we assume that import prices
have a negligible effect on the domestic price index. That is, we approximate
the price index in (4) by:
P ≈
z∈∆
pd(z)1−σdGz(z)
1
1−σ
. (12)
We can then derive the equilibrium in three steps. The first step is to con-
sider firms that do not face any "ability" constraint. For such firms we can
use equations (8) to (10) to implicitly define three cut-off levels of labor
productivity, zd, zw and zx, at which they would earn exactly zero profit
in the domestic market and in the export market using strategies w and x,
respectively:
πi(zi) = 0 for i = d,w, x. (13)
Assuming, reasonably, that the trade costs and intermediation costs are such
that zd < zw < zx, we obtain four types of firms.9 The most efficient firms,
i.e., those with z > zx, sell both on the domestic market and export directly
to the foreign market. Firms with labor productivity in the range zw < z ≤ zx
9Note that a sufficient condition for zd < zw is simply Fd ≤ Fw. For zw < zx we requireFx to be sufficiently greater than Fw.
9
sell at home and export through intermediaries. Firms in the productivity
range zd < z ≤ zw sell only on the domestic market; and firms with labor
productivity z < zd do not sell on either market.
Using (12) in (13) we can derive implicit expressions for these cutoffs.
From πd(zd) = 0 we obtain
zd =
σFdρL
z≥zd
zσ−1dGz(z)
1
σ−1
. (14)
For what follows it turns out to be convenient to define a function h(·) with
h′ > 0 such that
zd = h(Fd). (15)
Proceeding in the same fashion with the other two cutoffs we have
zw = ωτ
FwFd
1
σ−1
h(Fd), (16)
zx = τ
FxFd
1
σ−1
h(Fd). (17)
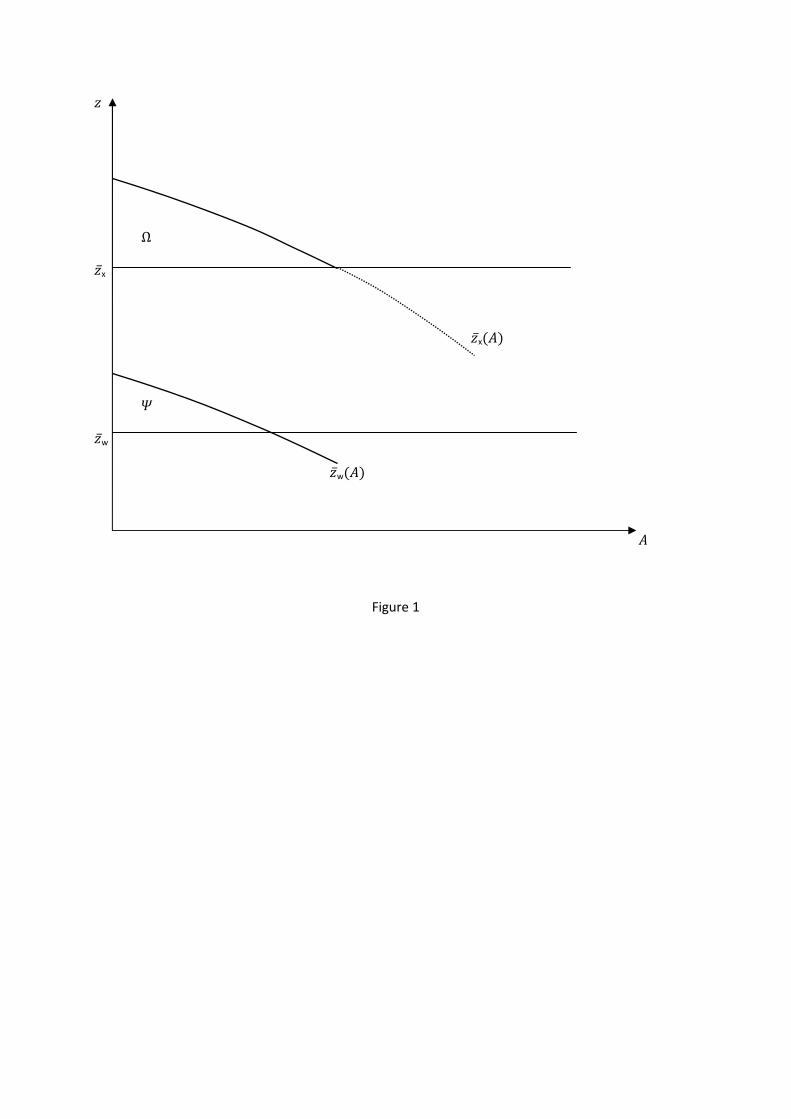
Figure 1 shows cutoffs zw and zx as horizontal lines.
The second step is to consider the cut-off levels of labor productivity in
the presence of an "ability" constraint, specifically to use (11) to implicitly
define zw(A) and zx(A) such that a firm below the respective cut-off cannot
export through intermediaries, respectively directly:
πd(z(A)) +A = Fi for i = w, x. (18)
Using (18) we obtain
zw(A) =
Fd + Fw −A
Fd
1
σ−1
h(Fd), (19)
zx(A) =
Fd + Fx − A
Fd
1
σ−1
h(Fd). (20)
10
Notice that zw(A) and zx(A) are both decreasing in A with zw(A) < zx(A).
These two curves are also shown in Figure 1.
The third step is to combine the "unconstrained" cut-off lines from step
1 that are relevant when firms have sufficient ability with the "constrained"
cutoffs from step 2 that are appropriate when firms have little ability. This
is also illustrated in Figure 1. First consider the two curves zx(A) and zx,
where we have assumed that (Fd + Fx) > Fxτσ−1 so that zx(0) > zx and
the two curves intersect at a positive level of A. Firms in the set Ω in
Figure 1 thus do not have enough ability to export directly despite the fact
that their productivity exceeds zx. However, these firms would be able to
export directly, if they had a large enough endowment of A (to the right of
zx(A)). Put differently, for these firms having more A raises the probability
of exporting directly.
Next, consider the two curves zw(A) and zw. In Figure 1 they are drawn
assuming that (Fd+Fw) > Fw(ωτ)σ−1 so that zw(0) > zw and the intersection
is again at a positive level of A. Firms with a productivity between zw and
zx are productive enough to export through an intermediary provided they
have a sufficient endowment of A; those in the set Ψ have insufficient A to
export. Hence for firms in this productivity range having more A increases
the probability of exporting through an intermediary.
Finally notice that in drawing Figure 1 we assumed that Fxτσ−1 > (Fd+
Fw) so that zx > zw(0), meaning that while they do not have enough A to
export directly, all firms in Ω are sufficiently productive to export through
intermediaries. For these firms raising A implies that they would switch
from indirect exporting through an intermediary to direct exporting as A
rises. Hence the more A they have, the less likely they are to export through
an intermediary.10
10It is straightforward to extend this result to the case where zx<zw(0) so that somefirms in Ω cannot export directly for lack of A. However, for the remaining firms in Ω theconclusion that they are less likely to export indirectly when A rises still holds.
11
2.5 Testable Predictions
The model indicates that, if we are to correctly measure the impact of A
on a firm’s likelihood to export directly, we have to control for the firm’s
labor productivity z. First, there are two reasons why a firm may fail to
export directly: it may be in the set Ω and hence lack ability; or its labor
productivity may be below zx, in which case the firm would be unable to
export directly even if it had enough A. Hence if we fail to control for the
firm’s labor productivity we would wrongly attribute too much of its inability
to export directly to its lack of A. In other words, we would overestimate the
impact of foreign ownership and access to external financing, because firms
with too low a labor productivity would not export directly even if they were
foreign owned or had access to external financing. Hence the need to account
for heterogeneity across firms in labor productivity.
Second, in order to measure the effect of A on the probability that a firm
will export through an intermediary we also have to control for the firm’s
productivity. To see this notice that the firms in Ω are able to export, but
do so through intermediaries. However, these firms when given additional
A would switch to exporting directly and therefore would be less likely to
export through intermediaries. Hence it might seem that foreign ownership
or access to external finance may reduce the probability that a firm will be
able to export indirectly. But this should not be construed as meaning that
these factors are unimportant for the overall ability to export.
Finally, we turn to the model’s testable predictions. First, consider how A
affects the overall likelihood of exporting. Firms with productivity exceeding
zx are more likely to export directly the more A they have, those in the
interval zw to zx are more likely to export indirectly the more A they have,
whereas firms with productivity below zw do not export. Hence we may state:
Hypothesis 1: Controlling for productivity, a firm is more likely to export
(directly or indirectly) the more A it has.
12
Second, consider the effect of A on the probability that a firm exports
directly. Only for firms with productivity greater than zx does an increase
in A raise their likelihood of exporting directly. For the other firms A has no
effect. Hence we obtain:
Hypothesis 2 Controlling for productivity, a firm is more likely to export
directly the more A it has.
Third, consider the relationship between A and the probability that a
firm exports through an intermediary. Here we observe that for firms with
productivity in the interval zw to zx an increase in A unambiguously raises
their likelihood of exporting through an intermediary. However, for firms
with productivity exceeding zx having more A may reduce the likelihood of
exporting through an intermediary. We summarize this as follows:
Hypothesis 3 For firms with a sufficiently moderate productivity, the like-
lihood of exporting through an intermediary is increasing in A. But for
firms with sufficiently high productivity, an increase in A may reduce
the likelihood of exporting through an intermediary.
3 Empirical Methodology
Our model allows us to explain why empiricists observe a large overlap in
the productivity distributions of exporters and non-exporters in the data.
Specifically, depending on the endowment of “ability”, seemingly equally
productive plants may export directly, access foreign markets through inter-
mediaries, or serve only the domestic market. In this study we would like to
evaluate the effect of “ability” on accessing foreign markets and we proxy for
“ability” with foreign ownership and access to external finance.
Apart from the fact that foreigners may target more productive plants
that already meet the threshold requirements for entering foreign markets,
foreign ownership can have a further impact on access to foreign markets to
13
the extent that foreign owners may bring along a wide and well-established
distribution network, access to internal financing opportunities, or otherwise
contribute to the plant’s endowment of “ability”. Access to external sources
of financing is an indicator of financial liquidity, which complements the firm’s
productivity draw in determining whether it will be able to access foreign
markets. Similar to foreign ownership, financial liquidity is also likely to be
tightly interwoven with the firm’s overall performance, with “better” firms
having an easier time acquiring bank loans.
This intermingled nature of the relationship between “ability” variables
and productivity clarifies why the interaction of “ability” and productivity
cannot be studied in a simple regression framework by simply introducing an
interaction term into an OLS framework. We use propensity score matching
and propensity score reweighting to take into account this imbalance on the
covariates, especially productivity, between firms of different “ability” and
to reduce the confounding effects of productivity and other covariates.
3.1 Standard Propensity Score Matching
Although other statistical procedures are available to evaluate treatment ef-
fects (see, for instance, the propensity score reweighting below), we choose
standard propensity score matching as our baseline specification. This choice
is motivated by that fact that this method does not rely on the correct speci-
fication of the functional form between our treatment and outcome variables;
our data set does not provide us with the wealth of information that is gen-
erally available in the studies arguing that controlling for more variables is
a better alternative to matching estimators; most of the covariates that are
available to us are well balanced; and the findings are strongly supported
by the propensity score reweighting estimator and provide conservative esti-
mates of the effects.
In our basic setup we pair each firm with “ability” with three otherwise
very similar firms but without “ability” based on a number of background
14
characteristics, the most important being labor productivity. Specifically,
we use propensity scores to match each foreign owned firm to 3 domestic
firms within the same industry and country that have a similar predicted
probability of being foreign owned based on the size of labor force, labor
productivity relative to the industry median, existence of plants abroad and
location of headquarters. We opt for this 3-to-1 matching due to this esti-
mator’s lower variability at the cost of higher bias in comparison to 1-to-1
matching, since our balancing tests (see the Results section) indicate that
bias is not a concern in our sample.
The specification for the matching on access to financing is somewhat
different in that we match each firm with access to external sources of fi-
nancing to 3 firms financing working capital from internal sources within the
same industry and country that have a similar predicted probability of hav-
ing access to external sources of financing based on size of the labor force,
labor productivity relative to the industry median, and reporting of cost of
financing and lack of access to financing as an obstacle to running a business.
To reduce the dimensionality problem when considering the differences
on so many observable characteristics, these characteristics are summarized
into a single scalar (propensity score) reflecting the probability of a firm to
possess “ability”. In a 3-to-1 matching, three firms without “ability” but
with a similar propensity score as a firm with ability will then be used as the
missing counterfactuals and will help us to answer the question: “Would a
firm with ‘ability’ and with a given set of characteristics engage in exporting
and/or importing had it not been endowed with ‘ability’, and–if so–would
it trade directly or indirectly through intermediaries?”
3.2 Propensity Score Reweighing
Recent empirical studies indicate that Nearest Neighbor Matching techniques
may be less efficient than the use of larger samples of untreated observations
15
with different weights assigned to each plant.11 We therefore also use the
propensity score reweighting estimator due to Hirano et al. (2003) which has
been shown to generate an efficient estimate of the average treatment effects
on the basis of reweighting by the inverse of the propensity score. Intuitively,
this method adjusts for differences between firms with “ability” and without
“ability” by assigning higher weights to firms that are more similar to the
firms in the treatment group. Rather than completely dismissing firms that
are not very similar, this method simply assigns a lower weight to such obser-
vations. In what follows, we demonstrate the use of the method for our first
indicator of “ability”: foreign ownership. We proceed in exactly the same
manner for access to external finance.
In the first step we estimate a probit model of foreign ownership of a firm
in country i and industry j:
Fij = α+ βXij + di + dj + εij,
where Fij = 0 if the foreign ownership share equals zero, and Fij = 1 other-
wise, and where Xij is a vector of covariates that we believe to be correlated
with the ownership form of the firm. Xij includes first of all the variables
from the standard propensity score estimation: size of the labor force, labor
productivity relative to the industry median, existence of plants abroad, lo-
cation of headquarters, reporting of cost of financing and lack of access to
financing as an obstacle to running a business. In addition, we include plant
age, percentage of college educated labor force, R&D expenditure, the use of
external auditing for financial statements and the existence of ISO certifica-
tion. We also include dummy variables di and dj to control for country and
industry, respectively.
Having obtained marginal probabilities of being foreign owned, pf , we
weigh each foreign owned firm by 1 and each domestically owned firm by
pf/(1− pf) to obtain the average treatment effects on the (treated) foreign
11See, for instance, Black and Smith (2004), and Lechner and Wunsch (2013).
16
owned firms and by 1/pf and by 1/(1− pf) to obtain the population average
treatment effects. In the tables, we report the average treatment effects on
the treated; population average treatment effects are available upon request.
3.3 Extensions
We anticipate that the endowment of “ability” will have different effects
across countries depending on their level of development and explore this hy-
pothesis by conducting the analysis separately for lower- and upper- middle
income countries.12 We also explore other proxies for a firm’s endowment
of “ability”. Specifically, we consider firms’ sales to multinational compa-
nies (MNCs) operating in the home market (and independent of the firm in
question) as a proxy for the firms’ networking ability and access to better,
more sophisticated and demanding clients that may be indicative of a firm’s
ability to meet higher product quality standards and more stringent delivery
or other rules. Networking with MNCs can also provide the firm with access
to these firms’ distribution channels and thus affect a firm’s ability to engage
in international trade. To test whether by looking at trade with MNCs we
are not simply capturing “large client” effects, we also conduct the analysis
using “trade with large domestic partners” as a proxy for “ability”.
4 Data and Summary Statistics
We use firm-level data collected by the World Bank as part of the Invest-
ment Climate Surveys project (for more information about the surveys visit
http://www.enterprisesurveys.org). The sample for each country is represen-
tative of the population of firms according to their industry and location.
Our final sample contains 9,244 plants from 13 countries and 11 indus-
12We also investigated whether there are differences in the magnitudes of the effectsacross industries by considering light and heavy industries separately, but could not findany consistent differences.
17
tries.13 Although the data base collects information on a wide variety of
countries, including both low- (as most African economies) and high-income
(such as Poland or Hungary) economies, we limit our sample to middle-
income countries: Egypt, El Salvador, Guatemala, Honduras, India, Mo-
rocco, Nicaragua, Philippines, and Vietnam (lower middle income) ; Brazil,
Chile, Ecuador, and South Africa (upper middle income). The reason for
this restriction is data-driven: only these countries provide enough observa-
tions with complete information across all variables of interest after we clean
the data for missing values, obvious errors and outliers.14 The data cover
light industries (textiles, leather, garments, and food) and heavy industries
(auto and auto components, chemicals, electronics, metals and machinery,
non-metallic and plastic materials, paper, wood and furniture). The data
cover the period 2002 to 2006, but the plants are not followed up in later
years, so the data do not constitute a panel.
The survey records information on a number of plant characteristics, such
as the plant’s location, industry, ownership structure, employment, etc. The
survey also records detailed information on the distribution of sales between
domestic and foreign markets, where foreign sales are broken down into di-
rect and indirect exports (exports through a distributor). On average 37%
of plants are exporters, ranging from 23-24% in industries like “auto and
auto components” to 50% in “garments”. About three quarters of exporters
do so directly, and around 15% indirectly. The share of plants that export
only through distributors is as low as 10% in industries “metals and machin-
ery”, “electronics” and “chemicals and pharmaceuticals” and as high as 20%
in industries like “food”, “textiles”, “furniture” and “other manufacturing
13The data are provided at the establishment (plant) level and we use “firm,” “plant”and “establishment” interchangeably.
14We defined outliers based on the values of studentized residuals from regressions withdependent variables defined as shares of direct and indirect exports and imports, andindependent variables given by relative productivity and other firm characteristics, suchas size, age, foreign ownership, etc. Observations with studentized residuals falling outsideof the (-2.5; +2.5) interval are defined as outliers.
18
goods”. The remaining 10% of exporters engage in both modes of export-
ing. On average 40% of plants are importers, ranging from 14% in “auto
and auto components” to over 50% in “paper”. About 55% of importers
import directly and about 30% import only through distributors, with the
remaining 15% engaging in both modes of importing. Whereas only 4% of
importers in “auto and auto components” engage in both modes of import-
ing, in other industries the numbers are closer to 10% (20% in “chemicals
and pharmaceuticals”). About one fifth of firms engage in exporting and
importing simultaneously, especially in industries like textiles, leather, and
garments (26, 29 and 34 percent respectively).
Export intensity varies between industries, from the median of about 10%
of output in “paper” to nearly 100% in “garments” and “leather”. In general,
plants that export only directly export a higher share of their production
than the indirect exporters do, although there is a large variation in the size
of the gap between industries: from a couple of percent in “beverages” to
20-30% in “electronics”. The gaps between direct and indirect traders are
even more conspicuous when we look at importers, although there are large
cross-industry differences, just as in the case of exporters.
We define a firm as foreign owned if it reports a positive share of owner-
ship by foreigners. Based on this definition, about 7 % of plants in the sample
are foreign owned. Most foreign owned plants are in garments, foods, metals
& machinery and chemicals (these four industries accounting for nearly 35%
of all foreign owned plants). Access to external sources of financing is based
on the share of loans from local commercial banks, foreign owned commer-
cial banks and leasing arrangements in financing working capital. About 38
percent of plants report non-zero values for these types of funding for their
working capital. Exporters and importers are about 12 percent more likely
to be financing their working capital from external sources.
Approximately 10% of plants engage in trade with multinational compa-
nies located in the plant’s home country. It is important to emphasize that
19
sales to MNCs cannot reflect intra-firm trade, because if a firm were part of
a multinational company intra-firm trade would be captured by the variable
“sales to the parent company or subsidiaries”. The proportion of plants trad-
ing with MNCs is particularly high in “auto and auto-components” (24% of
firms in the industry) and in “metals and machinery” (20%). In fact, of all
984 plants that report trading with MNCs a third are plants from “metals
and machinery”. Exporters are somewhat more likely to engage in trade
with MNCs than non-exporters: being an exporter increases the probability
of a plant also engaging in trade with MNCs by about 30%. The extent
to which a plant engages in trade with MNCs also seems to depend on the
foreign ownership status: 20 percent of foreign owned plants and 10 percent
of domestic plants sell to MNCs.
Slightly over a quarter of the plants in our sample report non-zero trade
with large domestic enterprises. This trade is somewhat more common among
foreign owned plants and exporters (approximately 30 percent versus 26 per-
cent, respectively).
5 Results
5.1 Estimates from Standard Propensity Score Match-
ing
As Table 1 indicates, foreign owned and domestic firms widely differ in their
propensity to engage in international trade, especially directly. In an un-
matched sample, the difference can be as large as 50 percentage points. A
lot of this difference does disappear once we take into account the differences
in productivity, size of the labor force and other relevant firm characteristics.
When we look at the entire pool of domestically owned firms, we see that
the propensity to engage in trade among them is fairly low. It is only after
we focus on the subgroup of domestically owned firms that are very similar
to the foreign owned ones that we see a higher propensity to trade. But the
20
outcome of the matching procedure reported in the last column of the table
shows that an economically sizeable and statistically significant difference
in terms of engagement in international trade still exists for the two groups
of firms. Consistent with Hypothesis 1, foreign owned firms are about 11
percentage points more likely to engage in trade than domestic firms (the
differences are nearly identical for exporting and importing). This is true
particularly for the engagement in direct trade (in line with our Hypothesis
2): the propensity to engage in direct trade is about 82 percent for foreign
owned firms and only 67 percent for domestic firms. Foreign owned firms are
also about 12 percentage points more likely to engage in both exporting and
importing than domestic firms.
In Table 2 we investigate the role that access to external sources of fi-
nancing plays in allowing firms to engage in trade. Financially constrained
firms are less likely to engage in trade across all categories. Similar to the
earlier case, the differences in the propensity to trade between financially
constrained and unconstrained firms are larger in the unmatched sample,
suggesting that firms with access to external sources of financing are inher-
ently different from financially constrained firms in terms of size, productivity
and their views on the cost of financing and access to finance as obstacles to
doing business. These inherent differences, however, are not nearly as large
as those between foreign owned and domestic firms, as evidenced by much
smaller changes in pre- and post-matching propensities for the “untreated”
group (i.e. financially constrained firms) in the current analysis as compared
to the previous one on foreign ownership. The magnitudes of the effects
in the matched sample are moderate but highly significant, i.e., there is a
small–never exceeding 6 percentage points–but persistent effect of access
to financing on engagement in international trade.
One notable difference between Tables 1 and 2 is the switch in how
our measure of “ability” affects engagement in trade through intermediaries:
whereas the impact is positive in the case of access to external financing, it
21
is negative in the case of foreign ownership. This suggests that multination-
als internalize at least some of the roles intermediaries play in international
trade. But notice from Table 3 that in terms of relative productivity and
firm size (usually a good proxy for efficiency), matched samples in the two
cases are different: the sample of foreign-owned and matched domestic firms
consists of larger and more productive firms than the firms in the matched
access to financing sample. Hence, our finding that the coefficient switches
sign is also in line with our Hypothesis 3, which states that for firms with
a sufficiently moderate productivity, the likelihood of exporting through an
intermediary is increasing in “ability”; but for firms with sufficiently high
productivity, an increase in “ability” may reduce the likelihood of exporting
through an intermediary.
Of course, validity of our findings is dependent on the quality of the
matching. As Table 3 indicates, the samples we want to compare are in-
deed very different in terms of observables. However, the reduction in bias
after matching for both treatment variables (foreign ownership and access to
external financing) was successful, since most of the covariates are well bal-
anced. The general requirement for the bias after the matching is to be less
than 5%, and we find that with the exception of “plants abroad” in the first
panel of Table 3, where the bias slightly exceeds this limit, this requirement
has been met. The matching in case of the access to external financing has
been even more successful with the values of the bias on all covariates well
under the acceptable limit.
5.2 Estimates from the Propensity Score Reweighting
Estimator
One of the disadvantages of the standard propensity score method is the
fact that it discards a lot of the potentially useful information in the sample.
For example, in our case of 3-to-1 matching for a set of 605 foreign owned
firms in a sample of 9,244 firms, only 1815 (3*605) domestic firms would
22
be included in the analysis, and this is only if a good match is found for
each foreign owned firm. So, only about a quarter of the surveyed firms will
be used in the analysis. In Tables 4 and 5 we repeat our analysis of the
impact of foreign ownership and access to external financing on engagement
in trade for a significantly larger sample of 6967 firms (some observations
drop out due to non-reporting of the additional controls that we include in
the analysis). Including additional control variables does affect the results of
the balancing tests: the bias on ISO certification, and educated labor force
and especially on plant age goes beyond the 5% cut off, which justifies the
use of the propensity score reweighting estimator.
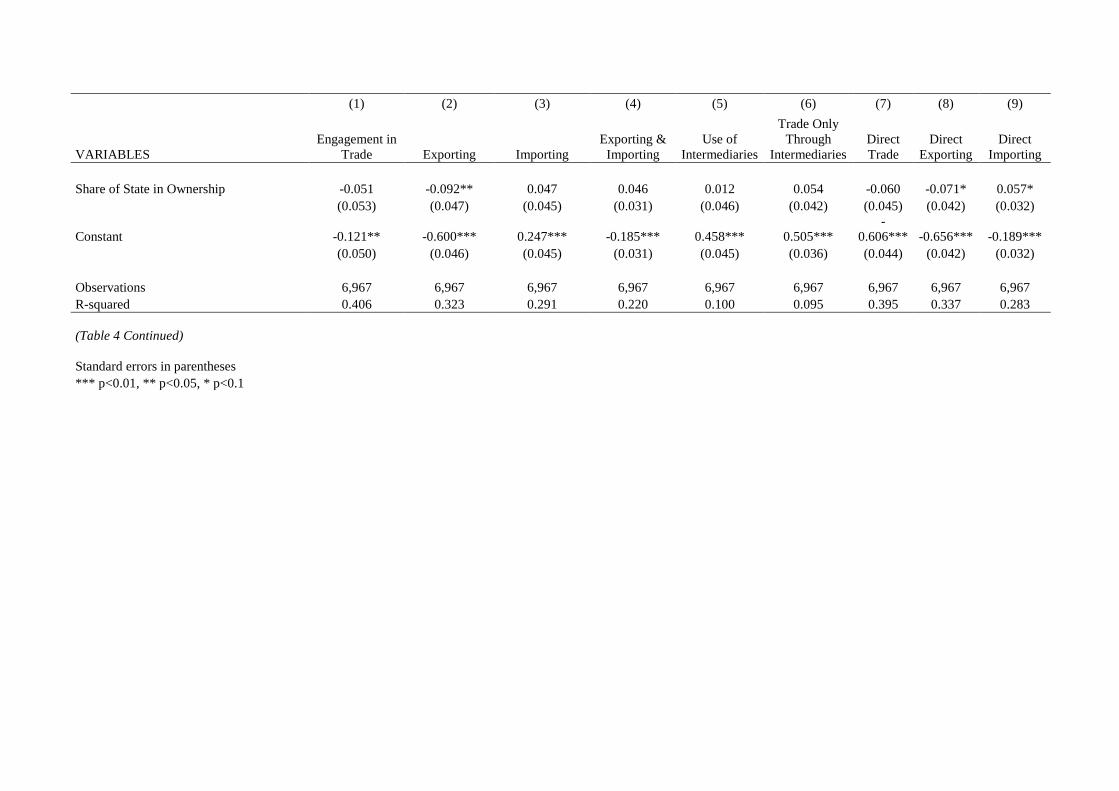
The first thing to note about the results in Tables 4 and 5 is the remark-
able similarity to the effects found in our standard propensity score analysis.
Foreign ownership and access to external sources of financing unambiguously
boost engagement in direct international trade, with the effect of foreign
ownership at least triple the size of the effect of access to external financ-
ing. Unlike moderately significant findings in the standard propensity score
analysis, all propensity score reweighting estimates are significant at the 1%
significance level.
Tables 4 and 5 also show other factors to be strongly correlated with
engagement in international trade. In line with expectations, larger and
more productive firms are more likely to engage in exporting and importing,
especially directly. The effects of R&D expenditure and the use of educated
labor are moderate, contrary to expectation. New to the literature on firm-
level determinants of trade are the use of ISO certification (as a proxy for
product quality) and the indicator of whether a firm uses external audit
(as a proxy for reputation). Both variables have a moderate positive effect
on direct engagement in international trade. Existence of plants abroad
and location of headquarters in other countries have statistically strong and
economically large effects; like foreign ownership these are indicators that
the plant is part of an MNC.
23
5.3 Extensions
In Tables 6-8 we break down the analysis for lower and upper middle income
countries and consider alternative factors that could be related to the firm’s
endowment of “ability”. Given the similarity between the standard propen-
sity score and reweighting estimates, we choose to report the findings from
the former one, because they provide conservative estimates of the effects.
In Table 6 we investigate whether the impact of foreign ownership on the
propensity to engage in trade is similar across different country groupings.
Specifically, we investigate the differences between lower and upper middle
income countries. Foreign owned firms are more likely to engage in interna-
tional trade only in lower middle income countries (by 17 percentage points
in the matched sample). The difference between foreign owned and domes-
tic firms is much smaller in upper middle income countries–primarily due
to much higher engagement in international trade by domestic firms–and
its size shrinks and the statistical significance disappears once we employ
matching. When we break down trade by type, we see that this finding is
driven primarily by similar propensity of foreign owned and domestic firms
to export. Whereas in lower middle income countries foreign firms are more
likely to engage in all types of international trade, in upper middle income
countries foreign owned firms are only significantly more likely to import
and, when they import, they are more likely than domestic firms to do so
directly. Propensity to both export and import is higher for foreign owned
firms, irrespective of the country’s development level.
In Table 7 we look at the effect of access to external sources of financing
across different country groupings. The first thing to notice is that whereas
in upper middle income countries about half of the firms are financially con-
strained, their proportion in lower middle income is much higher (about 70
percent). Overall, the differences in the magnitude of the effects between
upper and lower middle income countries are minor; nonetheless the effects
are much more statistically significant for lower middle income countries. In
24
particular, engagement in importing depends on access to external finance
only in lower middle income countries.
In Table 8 we conduct a robustness check and look at two more indica-
tors of “outside/external support” or “ability”: doing business with MNCs
operating in the local market and with large domestic partners, respectively.
Comparing the second column of the top and the bottom panels of Table 6
(the analyses before matching), we see that the firms who do not have MNCs
or large domestic firms as clients are remarkably similar in the propensities
to engage in international trade. Similar comparison of the first column sug-
gests that the firms who do business with MNCs are somewhat more likely to
engage in international trade than those with large domestic partners. After
restricting the sample through the matching procedure, the differences be-
tween firms with “external support” and without–be it in the form of large
domestic partners or MNCs–decrease dramatically and are driven primar-
ily by importing behavior, with no differences in exporting. Firms without
“external support” also seem to rely less on independent distributors and to
trade through intermediaries. What this suggests is that contrary to the ex-
pectation that having MNCs as clients could be another source of “ability”,
it seems to be that there is no particular benefit to having them as clients
and that it is rather the size of the trading partner that matters. It is pos-
sible that large trading partners–be they domestic or multinational–may
have some specific product quality requirements and that firms meet those
by using imported intermediate goods.
6 Conclusions
The paper used micro-data from the World Bank Investment Climate Surveys
to study how manufacturing firms in emerging markets connect with foreign
customers and suppliers. In particular, we examined the role of two factors
in this process, namely foreign ownership and access to external finance. We
25
discovered that both factors have a statistically significant and in many cases
economically large impact on the world market access of emerging market
firms.
Foreign owned firms are 11 percentage points more likely to engage in
trade than domestically owned firms. This premium of foreign owned firms
in the propensity to trade is especially big when it comes to direct trade,
namely 15 percentage points. The impact of access to external finance is
smaller but persistent, with firms reporting access to external sources of
financing being up to 6 percentage points more likely to engage in foreign
trade.
While foreign owned firms are significantly more likely to trade than
matched domestic firms, they are around 4 percentage points less likely to
export or import through intermediaries. Apparently MNCs internalize at
least some of the intermediation functions that are important to international
trade. This role of MNCs in matching buyers and sellers in international mar-
kets is especially important for lower middle income countries, with foreign
owned firms being 17 percentage points more likely to engage in direct in-
ternational trade in the matched sample than domestic firms. By contrast,
foreign ownership conveys no such advantage in upper middle income coun-
tries, at least when it comes to exporting, which suggests that the export
support foreign owners can bring is especially important for countries with a
low level of economic development but vanishes as countries become devel-
oped. Foreign ownership remains an important factor in the propensity to
import even in upper middle income countries.
The effect of access to external finance has a similar magnitude in both
upper and lower middle income countries. Nonetheless the effects are much
more statistically significant for lower middle income countries. In particular,
engagement in importing depends on access to finance only in lower middle
income countries.
Overall the evidence presented in the current paper suggests that world
26
market access of emerging-market firms benefits significantly from external
support, specifically from the intermediation provided by foreign owners.
This is also supported by the finding that simply doing business with in-
dependent MNCs operating in the country provides no advantage to firms
when it comes to trade: there is no effect on the propensity to export, and
the propensity to import is boosted to the same extent as having a large
domestic client. These results have obvious implications for economic policy,
suggesting in particular that foreign ownership plays an important role in
facilitating international trade.
This role, however, has recently been put under strain by the financial
crisis. According to UNCTAD (2011, Table I.1), world outflows of foreign
direct investment (FDI) were 46% lower in 2009 compared to 2007, with the
drop in outflows from developed countries exceeding 50%. The direct acqui-
sition of ownership in foreign companies through cross-border mergers and
acquisitions fell even more during this period, namely by over 75% measured
in net purchases (UNCTAD, 2011, Table I.3). Moreover, FDI flows have so
far been very slow to recover. Given the importance of foreign owners in
intermediating exports especially from lower middle income countries, the
financial crisis may have long-term negative effects on developing country
trade over and above the effects stemming from the obvious difficulties of
firms to gain access to external sources of finance.
References
[1] Abel-Koch, Jennifer (2011), “Who Uses Intermediaries in International
Trade? Evidence from Firm-Level Survey Data,” Mimeo, University of
Mainz.
[2] Ahn, JaeBin, Amit K. Khandelwal, and Shang-Jin Wei (2011), “The
Role of Intermediaries in Facilitating Trade,” Journal of International
Economics 84, 73—85.
27
[3] Akerman, Anders (2010), “A Theory on the Role of Wholesalers in In-
ternational Trade based on Economies of Scope,” Research Papers in
Economics 2010:1, Stockholm University, Department of Economics.
[4] Amiti, Mary and David E. Weinstein (2011), "Exports and Financial
Shocks," Quarterly Journal of Economics 126, 1841—1877.
[5] Basker, Emek and Pham Hoang Van (2010), Imports "R" Us: Retail
Chains as Platforms for Developing-Country Imports, American Eco-
nomic Review 100, 414-418.
[6] Beck, T. (2002), “Financial Development and International Trade. Is
There a Link?” Journal of International Economics 57, 107—31.
[7] Bernard, Andrew B. and J. Bradford Jensen (2004), “Why Some Firms
Export,” Review of Economics and Statistics 86, 561—569.
[8] Bernard, Andrew B., J. Bradford Jensen, Stephen J. Redding and Peter
K. Schott (2010a),“Wholesalers and Retailers in US Trade,” American
Economic Review 100, 408—13.
[9] Bernard, Andrew B., Marco Grazzi, and Chiara Tomasi (2010b), “In-
termediaries in International Trade : Direct versus Indirect Modes of
Export,” Working Paper Research 199, National Bank of Belgium.
[10] Bhagwati, Jagdish and T.N. Srinivasan (2002), “Trade and Poverty in
the Poor Countries,” American Economic Review 92 (2002), 180—183.
[11] Black, D., and J. Smith (2004), “How Robust is the Evidence on the
Effects of College Quality? Evidence from Matching,” Journal of Econo-
metrics 121(1-2), 99—124.
[12] Blum, Bernardo S., Sebastian Claro and Ignatius Horstmann (2009),
“Intermediation and the Nature of Trade Costs: Theory and Evidence,”
Mimeo, University of Toronto.
28
[13] Blum, Bernardo S., Sebastian Claro and Ignatius Horstmann (2010),
“Facts and Figures on Intermediated Trade,” American Economic Re-
view 100, 419—23.
[14] Chaney, Thomas, (2005), “Liquidity Constrained Exporters,” mimeo,
University of Chicago.
[15] Crozet, Matthieu, Guy Lalanne and Sandra Poncet (2013), “Wholesalers
in International Trade,” European Economic Review 58, 1—17.
[16] Debaere, Peter, Holger Görg and Horst Raff (2013), “Greasing the
Wheels of International Commerce: How Services Facilitate Firms’ In-
ternational Sourcing,” Canadian Journal of Economics 46, 78—102.
[17] European Bank for Reconstruction and Development and World Bank
(2010), “The Business Environment and Enterprise Performance Sur-
vey (BEEPS) 2008-2009: A Report on methodology and observations,”
European Bank for Reconstruction and Development and World Bank.
[18] Edwards, Sebastian (1993), “Openness, Trade Liberalization, and
Growth in Developing Countries,” Journal of Economic Literature 31,
1358—1393.
[19] Feenstra, Robert C. and Gary G. Hamilton (2006), Emergent
Economies, Divergent Paths: Economic Organization and International
Trade in South Korea and Taiwan. Cambridge University Press, Cam-
bridge.
[20] Felbermayr, Gabriel J. and Benjamin Jung (2009), “Trade Intermedia-
tion and the Organization of Exporters,” Discussion Papers 309/2009,
Department of Economics, University of Hohenheim.
[21] Frankel, Jeffrey A. and David H. Romer (1999), “Does Trade Cause
Growth?” American Economic Review 89, 379—399.
29
[22] Gereffi, Gary (1999), “International Trade and Industrial Upgrading in
the Apparel Commodity Chain,” Journal of International Economics 48,
37—70.
[23] Girma, Sourafel, Yundan Gong and Holger Görg (2008), “Foreign Di-
rect Investment, Access to Finance, and Innovation Activity in Chinese
Enterprises,” World Bank Economic Review 22, 367—382.
[24] Goldberg, Pinelopi K. and Nina Pavcnik (2004), “Trade, inequality, and
poverty: what do we know? Evidence from recent trade liberalization
episodes in developing countries,” Brookings Trade Forum 2004, 223—
269.
[25] Görg, Holger and David Greenaway (2004), “Much Ado About Nothing?
Do Domestic Firms Really Benefit from Foreign Direct Investment?”
World Bank Research Observer 19, 171—197.
[26] Greenaway, David and Richard Kneller (2007), “Firm heterogeneity, ex-
porting and foreign direct investment,” Economic Journal 117, F134—
161.
[27] Greenaway, D., Guariglia, A. and R. Kneller (2007), “Financial Factors
and Exporting Decisions,” Journal of International Economics 73, 377—
95.
[28] Hirano K., G.W. Imbens and G.Ridder (2003), “Efficient Estimation
of Average Treatment Effects Using the Estimated Propensity Score”,
Econometrica 71, 1161-1189.
[29] Imbruno, Michele (2012), “Trade Liberalization, Intermediate Inputs
and Firm Competitiveness: Direct Versus Indirect Modes of Import,”
University of Nottingham, mimeo.
30
[30] Kasahara, Hiroyuki and Beverly Lapham (2013), “Productivity and the
Decision to Import and Export: Theory and Evidence,” Journal of In-
ternational Economics 89, 272—282.
[31] Keesing, Donald B. (1983), “Linking Up to Distant Markets: South to
North Exports of Manufactured Consumer Goods,” American Economic
Review 73, 338—342.
[32] Kletzer, K. and P. Bardhan (1987), “Credit Markets and Patterns of
International Trade,” Journal of Development Economics 27, 57—70.
[33] Lechner, M. and Wunsch C. (2013) “Sensitivity of matching-based pro-
gram evaluations to the availability of control variables,” Labor Eco-
nomics 21, 111—121.
[34] Manova, Kalina and Zhiwei Zhang (2009), “China’s Exporters and Im-
porters: Firms, Products and Trade Partners,” NBER Working Paper
15249.
[35] Manova, Kalina (2012), “Credit Constraints, Heterogeneous Firms, and
International Trade,” Stanford University, mimeo.
[36] Markusen, James R. and Natalia Trofimenko (2009), “Teaching Locals
New Tricks: Foreign Experts as a Channel of Knowledge Transfers,”
Journal of Development Economics, 88 (1), 120—131.
[37] Mayneris, Florian and Sandra Poncet (2013), “Chinese Firms’ Entry to
Export Markets: The Role of Foreign Export Spillovers,” World Bank
Economic Review, forthcoming.
[38] McCann, Fergal (2010), “Indirect Exporters,” CEPII Working Paper
2010-22.
31
[39] McCaig, Brian (2011), “Exporting out of Poverty: Provincial Poverty in
Vietnam and U.S. Market Access,” Journal of International Economics
85, 102—113.
[40] Muûls, Mirabelle, (2008), “Exporters and Credit Constraints. A Firm
Level Approach,” London School of Economics mimeo.
[41] Petropoulou, Dimitra (2007), “Information Costs, Networks and Inter-
mediation in International Trade,” Economics Series Working Papers
370, University of Oxford, Department of Economics.
[42] Raff, Horst and Joachim Wagner (2013), “Foreign Ownership and the
Extensive Margins of Exports: Theory and Evidence for Manufacturing
Enterprises in Germany,” Kiel Working Paper 1845.
[43] Roberts, Mark J. and James R. Tybout (1997), “The Decision to Export
in Colombia: An Empirical Model of Entry with Sunk Cost,” American
Economic Review 87, 545—564.
[44] Rodrik, Dani (2007), One Economics, Many Recipes, Princeton, NJ:
Princeton University Press.
[45] Swenson, Deborah (2008), “Multinationals and the Creation of Chinese
Trade Linkages,” Canadian Journal of Economics 41, 596—618.
[46] Topalova, P., (2010), “Factor Immobility and Regional Impacts of Trade
Liberalization: Evidence on Poverty from India.” American Economic
Journal: Applied Economics 2, 1—41.
[47] United Nations (2008), World Development Report 2009: Reshaping
Economic Geography, Washington, DC: The World Bank.
[48] United Nations Conference on Trade and Development (2011), World
Investment Report 2011, United Nations, New York.
32
[49] Wagner, Joachim (2012), “International Trade and Firm Performance:
A Survey of Empirical Studies since 2006,” Review of World Economics
148, 235—267.
[50] Winters, A.L., McCulloch, N., McKay, A., (2004), “Trade Liberalization
and Poverty: The Evidence so far,” Journal of Economic Literature 42,
72—115.
[51] World Trade Organization (2001), Doha Minister-
ial Declaration. Ministerial Conference, Fourth Ses-
sion. Washington DC: World Trade Organization,
www.wto.org/english/thewto_e/minist_e/min01_e/mindecl_e.pdf.
33
Ω
x
x()
w
w()
Figure 1
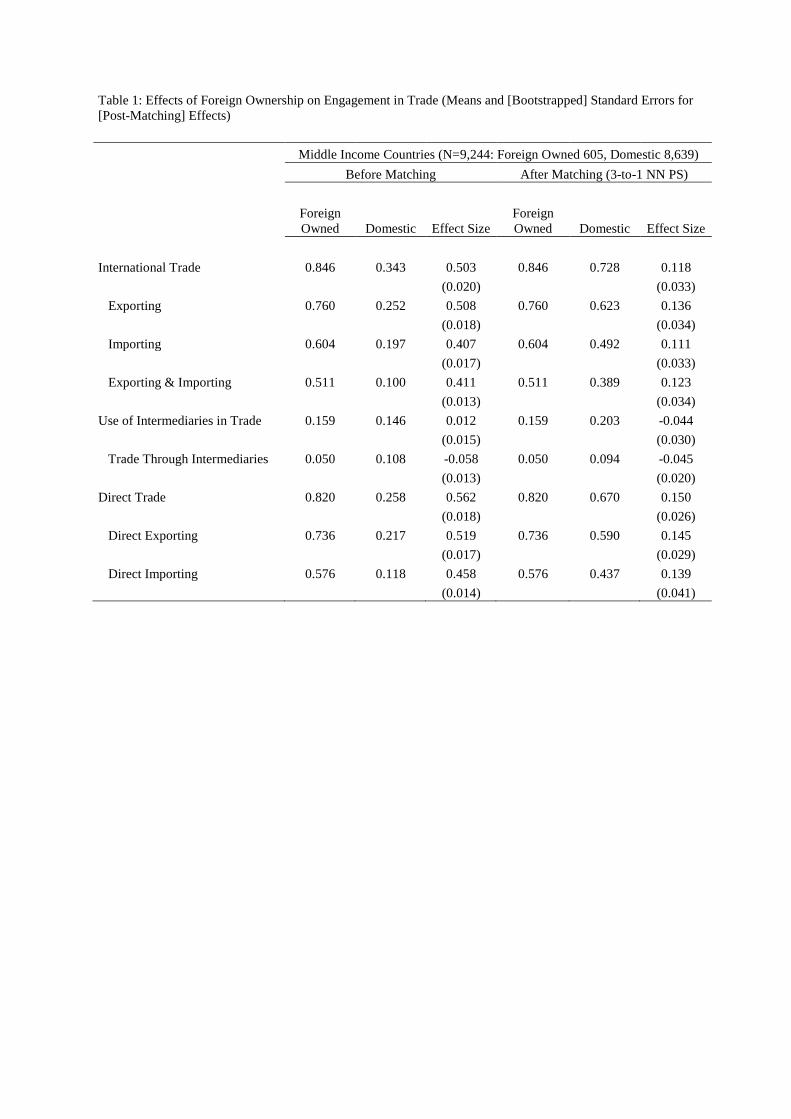
Table 1: Effects of Foreign Ownership on Engagement in Trade (Means and [Bootstrapped] Standard Errors for [Post-Matching] Effects)
Middle Income Countries (N=9,244: Foreign Owned 605, Domestic 8,639)
Before Matching After Matching (3-to-1 NN PS)
Foreign Owned Domestic Effect Size
Foreign Owned Domestic Effect Size
International Trade 0.846 0.343 0.503 0.846 0.728 0.118
(0.020)
(0.033)
Exporting 0.760 0.252 0.508 0.760 0.623 0.136
(0.018)
(0.034)
Importing 0.604 0.197 0.407 0.604 0.492 0.111
(0.017)
(0.033)
Exporting & Importing 0.511 0.100 0.411 0.511 0.389 0.123
(0.013)
(0.034)
Use of Intermediaries in Trade 0.159 0.146 0.012 0.159 0.203 -0.044
(0.015)
(0.030)
Trade Through Intermediaries 0.050 0.108 -0.058 0.050 0.094 -0.045
(0.013)
(0.020)
Direct Trade 0.820 0.258 0.562 0.820 0.670 0.150
(0.018)
(0.026)
Direct Exporting 0.736 0.217 0.519 0.736 0.590 0.145
(0.017)
(0.029)
Direct Importing 0.576 0.118 0.458 0.576 0.437 0.139
(0.014)
(0.041)
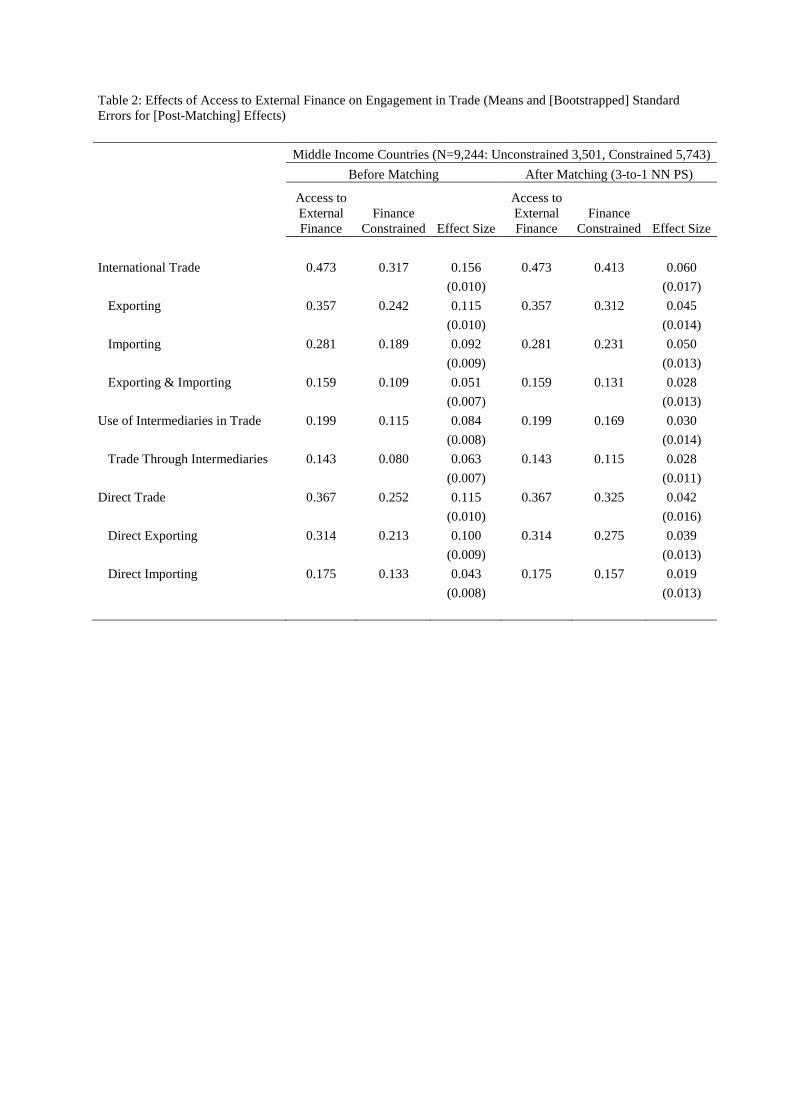
Table 2: Effects of Access to External Finance on Engagement in Trade (Means and [Bootstrapped] Standard Errors for [Post-Matching] Effects)
Middle Income Countries (N=9,244: Unconstrained 3,501, Constrained 5,743)
Before Matching After Matching (3-to-1 NN PS)
Access to External Finance
Finance Constrained Effect Size
Access to External Finance
Finance Constrained Effect Size
International Trade 0.473 0.317 0.156 0.473 0.413 0.060
(0.010)
(0.017)
Exporting 0.357 0.242 0.115 0.357 0.312 0.045
(0.010)
(0.014)
Importing 0.281 0.189 0.092 0.281 0.231 0.050
(0.009)
(0.013)
Exporting & Importing 0.159 0.109 0.051 0.159 0.131 0.028
(0.007)
(0.013)
Use of Intermediaries in Trade 0.199 0.115 0.084 0.199 0.169 0.030
(0.008)
(0.014)
Trade Through Intermediaries 0.143 0.080 0.063 0.143 0.115 0.028
(0.007)
(0.011)
Direct Trade 0.367 0.252 0.115 0.367 0.325 0.042
(0.010)
(0.016)
Direct Exporting 0.314 0.213 0.100 0.314 0.275 0.039
(0.009)
(0.013)
Direct Importing 0.175 0.133 0.043 0.175 0.157 0.019
(0.008)
(0.013)
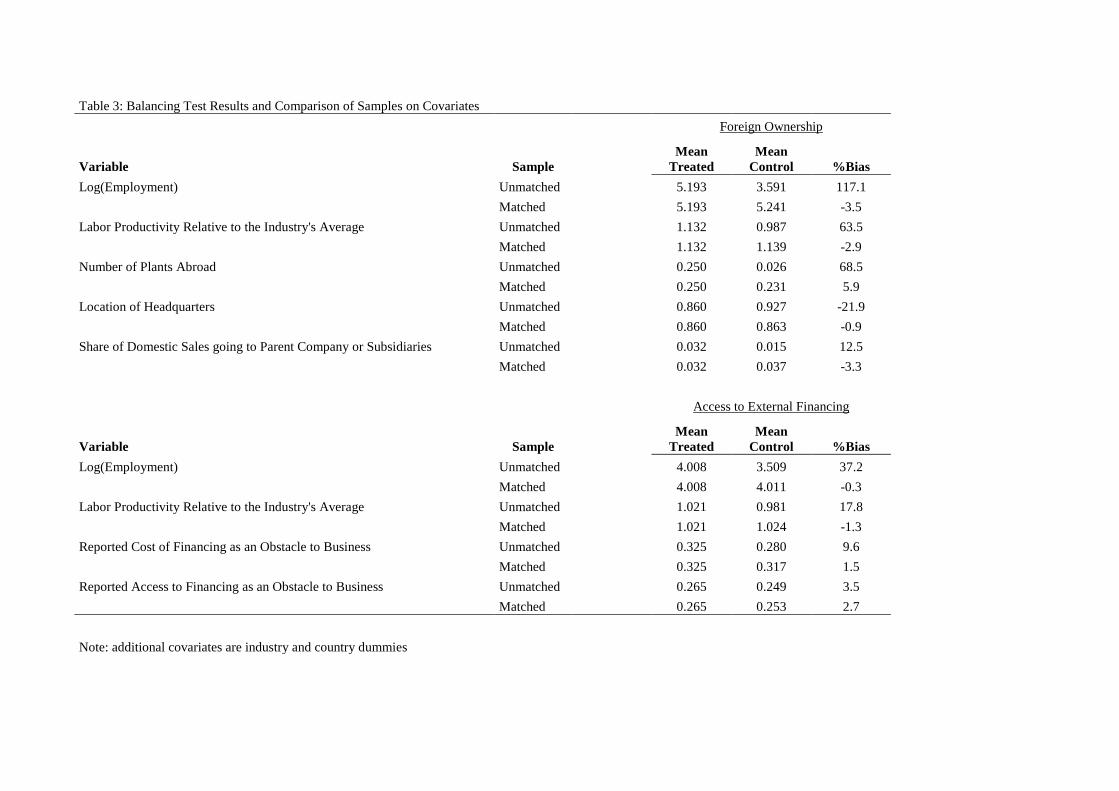
Table 3: Balancing Test Results and Comparison of Samples on Covariates
Foreign Ownership
Variable Sample
Mean Treated
Mean Control %Bias
Log(Employment) Unmatched
5.193 3.591 117.1
Matched
5.193 5.241 -3.5
Labor Productivity Relative to the Industry's Average Unmatched
1.132 0.987 63.5
Matched
1.132 1.139 -2.9
Number of Plants Abroad Unmatched
0.250 0.026 68.5
Matched
0.250 0.231 5.9
Location of Headquarters Unmatched
0.860 0.927 -21.9
Matched
0.860 0.863 -0.9
Share of Domestic Sales going to Parent Company or Subsidiaries Unmatched
0.032 0.015 12.5
Matched
0.032 0.037 -3.3
Access to External Financing
Variable Sample
Mean Treated
Mean Control %Bias
Log(Employment) Unmatched
4.008 3.509 37.2
Matched
4.008 4.011 -0.3
Labor Productivity Relative to the Industry's Average Unmatched
1.021 0.981 17.8
Matched
1.021 1.024 -1.3
Reported Cost of Financing as an Obstacle to Business Unmatched
0.325 0.280 9.6
Matched
0.325 0.317 1.5
Reported Access to Financing as an Obstacle to Business Unmatched
0.265 0.249 3.5 Matched 0.265 0.253 2.7
Note: additional covariates are industry and country dummies
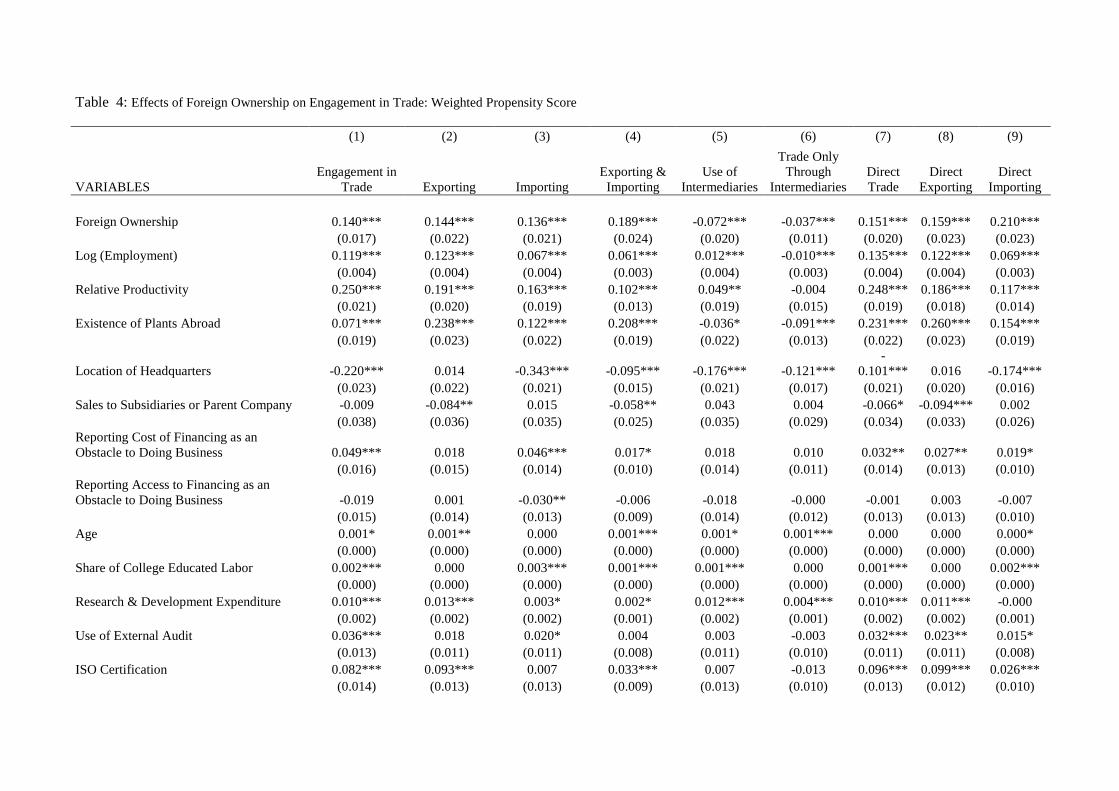
Table 4: Effects of Foreign Ownership on Engagement in Trade: Weighted Propensity Score
(1) (2) (3) (4) (5) (6) (7) (8) (9)
VARIABLES Engagement in
Trade Exporting Importing Exporting &
Importing Use of
Intermediaries
Trade Only Through
Intermediaries Direct Trade
Direct Exporting
Direct Importing
Foreign Ownership 0.140*** 0.144*** 0.136*** 0.189*** -0.072*** -0.037*** 0.151*** 0.159*** 0.210***
(0.017) (0.022) (0.021) (0.024) (0.020) (0.011) (0.020) (0.023) (0.023)
Log (Employment) 0.119*** 0.123*** 0.067*** 0.061*** 0.012*** -0.010*** 0.135*** 0.122*** 0.069***
(0.004) (0.004) (0.004) (0.003) (0.004) (0.003) (0.004) (0.004) (0.003)
Relative Productivity 0.250*** 0.191*** 0.163*** 0.102*** 0.049** -0.004 0.248*** 0.186*** 0.117***
(0.021) (0.020) (0.019) (0.013) (0.019) (0.015) (0.019) (0.018) (0.014)
Existence of Plants Abroad 0.071*** 0.238*** 0.122*** 0.208*** -0.036* -0.091*** 0.231*** 0.260*** 0.154***
(0.019) (0.023) (0.022) (0.019) (0.022) (0.013) (0.022) (0.023) (0.019)
Location of Headquarters -0.220*** 0.014 -0.343*** -0.095*** -0.176*** -0.121*** -
0.101*** 0.016 -0.174***
(0.023) (0.022) (0.021) (0.015) (0.021) (0.017) (0.021) (0.020) (0.016)
Sales to Subsidiaries or Parent Company -0.009 -0.084** 0.015 -0.058** 0.043 0.004 -0.066* -0.094*** 0.002
(0.038) (0.036) (0.035) (0.025) (0.035) (0.029) (0.034) (0.033) (0.026)
Reporting Cost of Financing as an Obstacle to Doing Business 0.049*** 0.018 0.046*** 0.017* 0.018 0.010 0.032** 0.027** 0.019*
(0.016) (0.015) (0.014) (0.010) (0.014) (0.011) (0.014) (0.013) (0.010)
Reporting Access to Financing as an Obstacle to Doing Business -0.019 0.001 -0.030** -0.006 -0.018 -0.000 -0.001 0.003 -0.007
(0.015) (0.014) (0.013) (0.009) (0.014) (0.012) (0.013) (0.013) (0.010)
Age 0.001* 0.001** 0.000 0.001*** 0.001* 0.001*** 0.000 0.000 0.000*
(0.000) (0.000) (0.000) (0.000) (0.000) (0.000) (0.000) (0.000) (0.000)
Share of College Educated Labor 0.002*** 0.000 0.003*** 0.001*** 0.001*** 0.000 0.001*** 0.000 0.002***
(0.000) (0.000) (0.000) (0.000) (0.000) (0.000) (0.000) (0.000) (0.000)
Research & Development Expenditure 0.010*** 0.013*** 0.003* 0.002* 0.012*** 0.004*** 0.010*** 0.011*** -0.000
(0.002) (0.002) (0.002) (0.001) (0.002) (0.001) (0.002) (0.002) (0.001)
Use of External Audit 0.036*** 0.018 0.020* 0.004 0.003 -0.003 0.032*** 0.023** 0.015*
(0.013) (0.011) (0.011) (0.008) (0.011) (0.010) (0.011) (0.011) (0.008)
ISO Certification 0.082*** 0.093*** 0.007 0.033*** 0.007 -0.013 0.096*** 0.099*** 0.026***
(0.014) (0.013) (0.013) (0.009) (0.013) (0.010) (0.013) (0.012) (0.010)
(1) (2) (3) (4) (5) (6) (7) (8) (9)
VARIABLES Engagement in
Trade Exporting Importing Exporting &
Importing Use of
Intermediaries
Trade Only Through
Intermediaries Direct Trade
Direct Exporting
Direct Importing
Share of State in Ownership -0.051 -0.092** 0.047 0.046 0.012 0.054 -0.060 -0.071* 0.057*
(0.053) (0.047) (0.045) (0.031) (0.046) (0.042) (0.045) (0.042) (0.032)
Constant -0.121** -0.600*** 0.247*** -0.185*** 0.458*** 0.505*** -
0.606*** -0.656*** -0.189***
(0.050) (0.046) (0.045) (0.031) (0.045) (0.036) (0.044) (0.042) (0.032)
Observations 6,967 6,967 6,967 6,967 6,967 6,967 6,967 6,967 6,967 R-squared 0.406 0.323 0.291 0.220 0.100 0.095 0.395 0.337 0.283 (Table 4 Continued) Standard errors in parentheses
*** p<0.01, ** p<0.05, * p<0.1
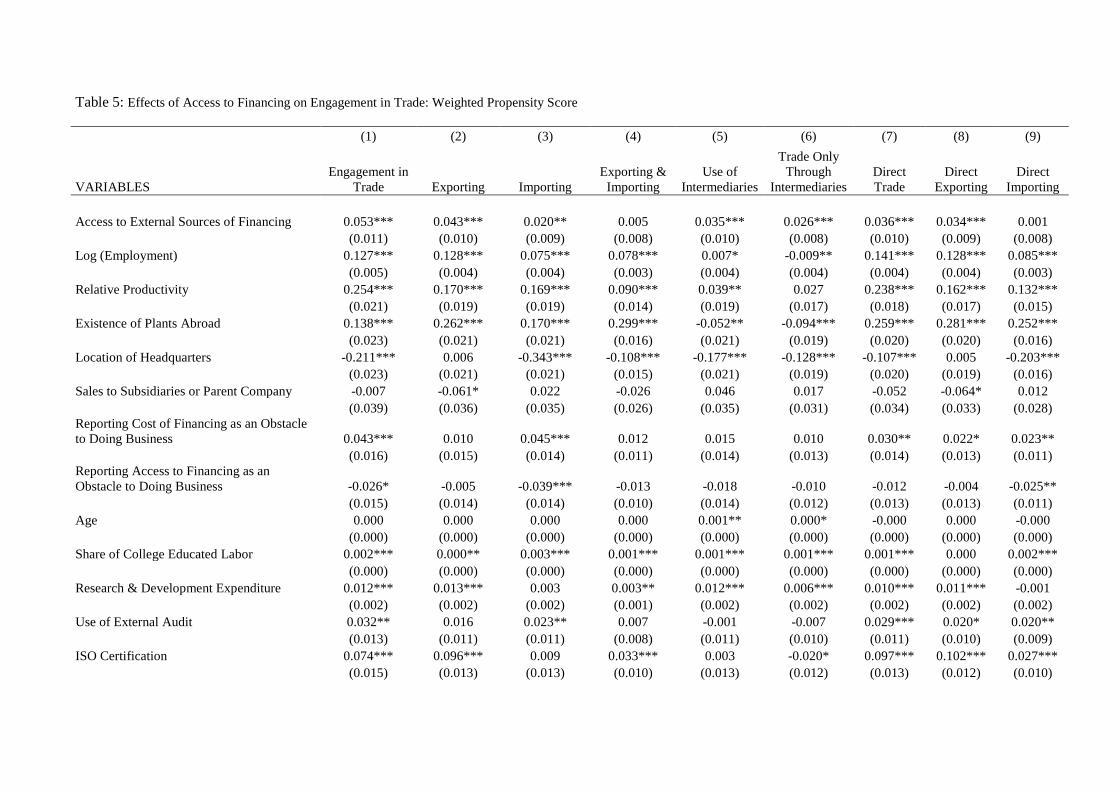
Table 5: Effects of Access to Financing on Engagement in Trade: Weighted Propensity Score
(1) (2) (3) (4) (5) (6) (7) (8) (9)
VARIABLES Engagement in
Trade Exporting Importing Exporting &
Importing Use of
Intermediaries
Trade Only Through
Intermediaries Direct Trade
Direct Exporting
Direct Importing
Access to External Sources of Financing 0.053*** 0.043*** 0.020** 0.005 0.035*** 0.026*** 0.036*** 0.034*** 0.001
(0.011) (0.010) (0.009) (0.008) (0.010) (0.008) (0.010) (0.009) (0.008)
Log (Employment) 0.127*** 0.128*** 0.075*** 0.078*** 0.007* -0.009** 0.141*** 0.128*** 0.085***
(0.005) (0.004) (0.004) (0.003) (0.004) (0.004) (0.004) (0.004) (0.003)
Relative Productivity 0.254*** 0.170*** 0.169*** 0.090*** 0.039** 0.027 0.238*** 0.162*** 0.132***
(0.021) (0.019) (0.019) (0.014) (0.019) (0.017) (0.018) (0.017) (0.015)
Existence of Plants Abroad 0.138*** 0.262*** 0.170*** 0.299*** -0.052** -0.094*** 0.259*** 0.281*** 0.252***
(0.023) (0.021) (0.021) (0.016) (0.021) (0.019) (0.020) (0.020) (0.016)
Location of Headquarters -0.211*** 0.006 -0.343*** -0.108*** -0.177*** -0.128*** -0.107*** 0.005 -0.203***
(0.023) (0.021) (0.021) (0.015) (0.021) (0.019) (0.020) (0.019) (0.016)
Sales to Subsidiaries or Parent Company -0.007 -0.061* 0.022 -0.026 0.046 0.017 -0.052 -0.064* 0.012
(0.039) (0.036) (0.035) (0.026) (0.035) (0.031) (0.034) (0.033) (0.028)
Reporting Cost of Financing as an Obstacle to Doing Business 0.043*** 0.010 0.045*** 0.012 0.015 0.010 0.030** 0.022* 0.023**
(0.016) (0.015) (0.014) (0.011) (0.014) (0.013) (0.014) (0.013) (0.011)
Reporting Access to Financing as an Obstacle to Doing Business -0.026* -0.005 -0.039*** -0.013 -0.018 -0.010 -0.012 -0.004 -0.025**
(0.015) (0.014) (0.014) (0.010) (0.014) (0.012) (0.013) (0.013) (0.011)
Age 0.000 0.000 0.000 0.000 0.001** 0.000* -0.000 0.000 -0.000
(0.000) (0.000) (0.000) (0.000) (0.000) (0.000) (0.000) (0.000) (0.000)
Share of College Educated Labor 0.002*** 0.000** 0.003*** 0.001*** 0.001*** 0.001*** 0.001*** 0.000 0.002***
(0.000) (0.000) (0.000) (0.000) (0.000) (0.000) (0.000) (0.000) (0.000)
Research & Development Expenditure 0.012*** 0.013*** 0.003 0.003** 0.012*** 0.006*** 0.010*** 0.011*** -0.001
(0.002) (0.002) (0.002) (0.001) (0.002) (0.002) (0.002) (0.002) (0.002)
Use of External Audit 0.032** 0.016 0.023** 0.007 -0.001 -0.007 0.029*** 0.020* 0.020**
(0.013) (0.011) (0.011) (0.008) (0.011) (0.010) (0.011) (0.010) (0.009)
ISO Certification 0.074*** 0.096*** 0.009 0.033*** 0.003 -0.020* 0.097*** 0.102*** 0.027***
(0.015) (0.013) (0.013) (0.010) (0.013) (0.012) (0.013) (0.012) (0.010)
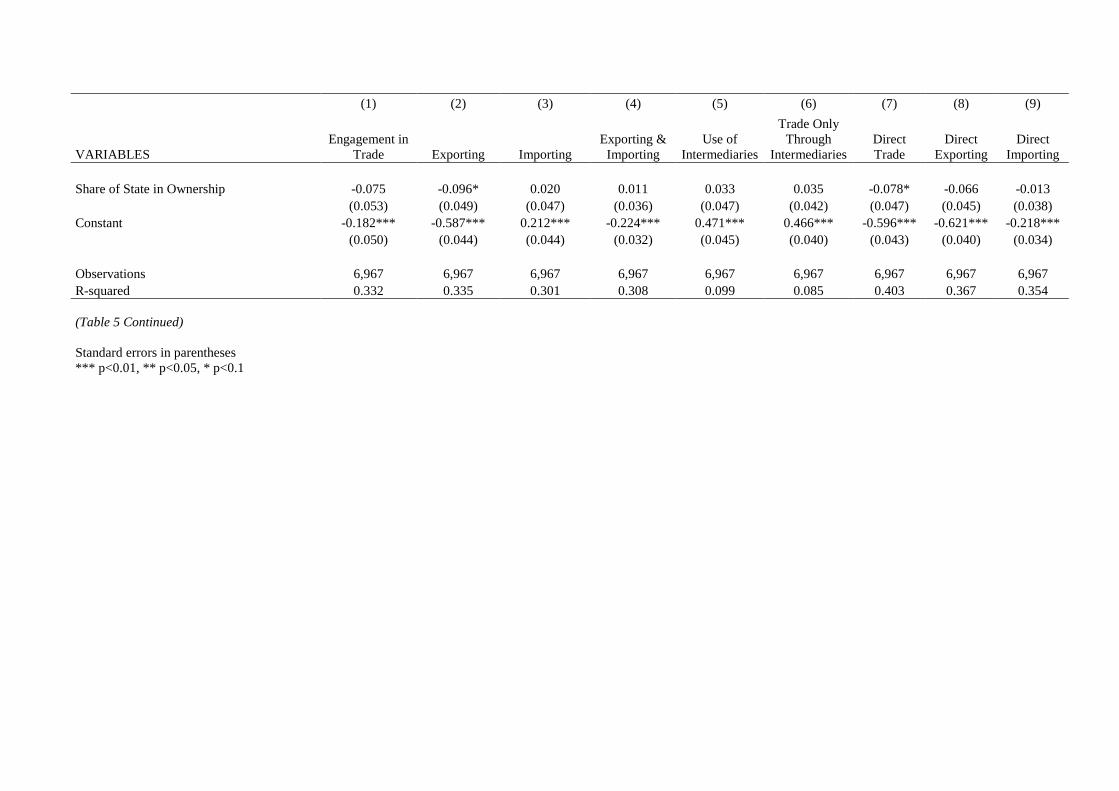
(1) (2) (3) (4) (5) (6) (7) (8) (9)
VARIABLES Engagement in
Trade Exporting Importing Exporting &
Importing Use of
Intermediaries
Trade Only Through
Intermediaries Direct Trade
Direct Exporting
Direct Importing
Share of State in Ownership -0.075 -0.096* 0.020 0.011 0.033 0.035 -0.078* -0.066 -0.013
(0.053) (0.049) (0.047) (0.036) (0.047) (0.042) (0.047) (0.045) (0.038)
Constant -0.182*** -0.587*** 0.212*** -0.224*** 0.471*** 0.466*** -0.596*** -0.621*** -0.218***
(0.050) (0.044) (0.044) (0.032) (0.045) (0.040) (0.043) (0.040) (0.034)
Observations 6,967 6,967 6,967 6,967 6,967 6,967 6,967 6,967 6,967 R-squared 0.332 0.335 0.301 0.308 0.099 0.085 0.403 0.367 0.354 (Table 5 Continued) Standard errors in parentheses
*** p<0.01, ** p<0.05, * p<0.1
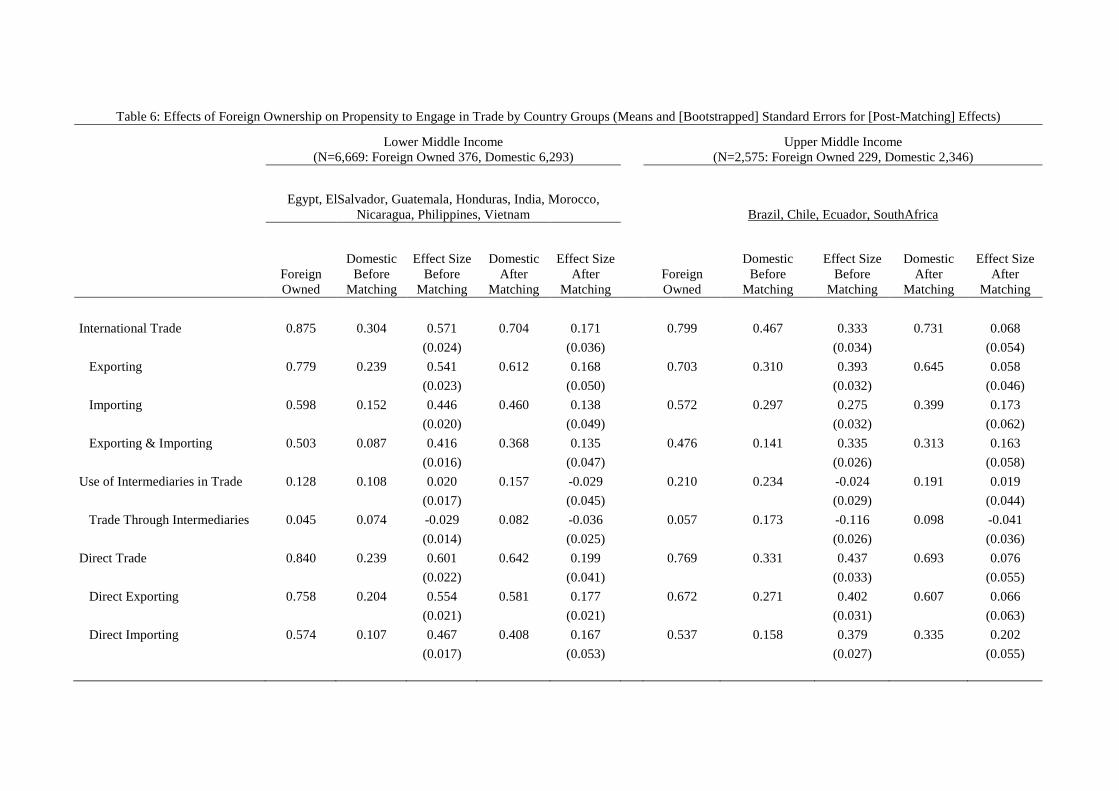
Table 6: Effects of Foreign Ownership on Propensity to Engage in Trade by Country Groups (Means and [Bootstrapped] Standard Errors for [Post-Matching] Effects)
Lower Middle Income (N=6,669: Foreign Owned 376, Domestic 6,293)
Upper Middle Income (N=2,575: Foreign Owned 229, Domestic 2,346)
Egypt, ElSalvador, Guatemala, Honduras, India, Morocco, Nicaragua, Philippines, Vietnam
Brazil, Chile, Ecuador, SouthAfrica
Foreign Owned
Domestic Before
Matching
Effect Size Before
Matching
Domestic After
Matching
Effect Size After
Matching Foreign Owned
Domestic Before
Matching
Effect Size Before
Matching
Domestic After
Matching
Effect Size After
Matching
International Trade 0.875 0.304 0.571 0.704 0.171
0.799 0.467 0.333 0.731 0.068
(0.024)
(0.036)
(0.034)
(0.054)
Exporting 0.779 0.239 0.541 0.612 0.168
0.703 0.310 0.393 0.645 0.058
(0.023)
(0.050)
(0.032)
(0.046)
Importing 0.598 0.152 0.446 0.460 0.138
0.572 0.297 0.275 0.399 0.173
(0.020)
(0.049)
(0.032)
(0.062)
Exporting & Importing 0.503 0.087 0.416 0.368 0.135
0.476 0.141 0.335 0.313 0.163
(0.016)
(0.047)
(0.026)
(0.058)
Use of Intermediaries in Trade 0.128 0.108 0.020 0.157 -0.029
0.210 0.234 -0.024 0.191 0.019
(0.017)
(0.045)
(0.029)
(0.044)
Trade Through Intermediaries 0.045 0.074 -0.029 0.082 -0.036
0.057 0.173 -0.116 0.098 -0.041
(0.014)
(0.025)
(0.026)
(0.036)
Direct Trade 0.840 0.239 0.601 0.642 0.199
0.769 0.331 0.437 0.693 0.076
(0.022)
(0.041)
(0.033)
(0.055)
Direct Exporting 0.758 0.204 0.554 0.581 0.177
0.672 0.271 0.402 0.607 0.066
(0.021)
(0.021)
(0.031)
(0.063)
Direct Importing 0.574 0.107 0.467 0.408 0.167
0.537 0.158 0.379 0.335 0.202
(0.017)
(0.053)
(0.027)
(0.055)
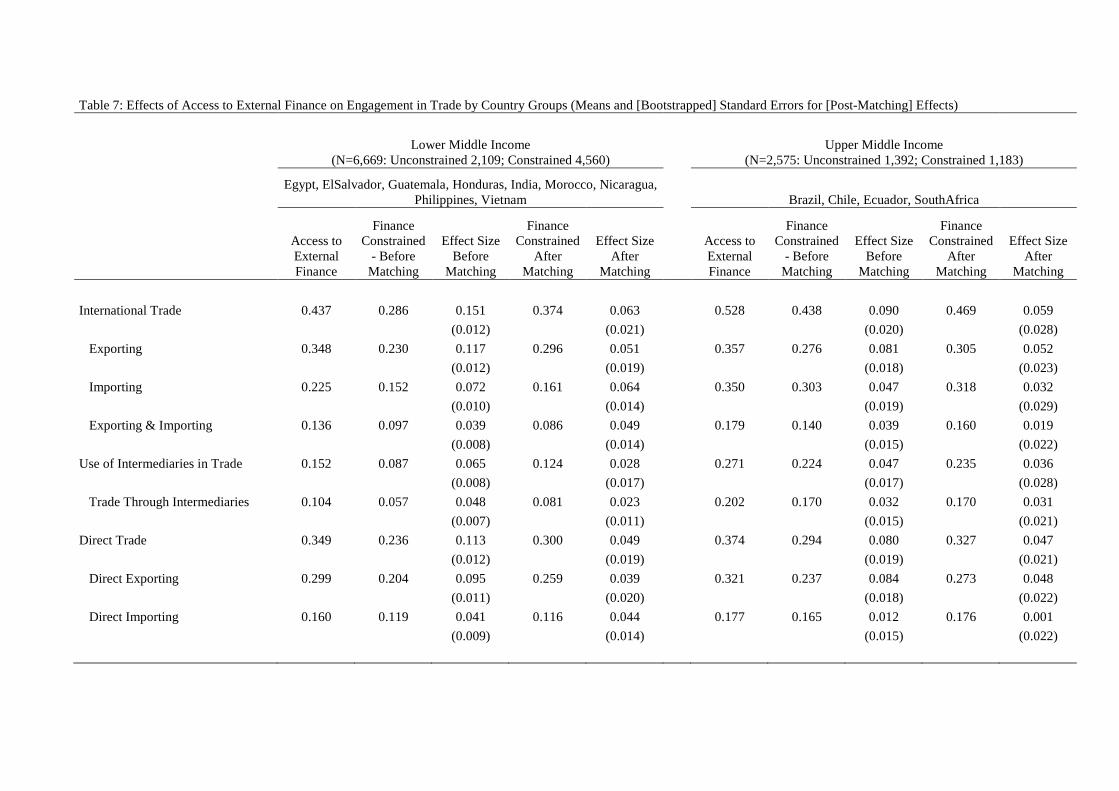
Table 7: Effects of Access to External Finance on Engagement in Trade by Country Groups (Means and [Bootstrapped] Standard Errors for [Post-Matching] Effects)
Lower Middle Income (N=6,669: Unconstrained 2,109; Constrained 4,560)
Upper Middle Income (N=2,575: Unconstrained 1,392; Constrained 1,183)
Egypt, ElSalvador, Guatemala, Honduras, India, Morocco, Nicaragua, Philippines, Vietnam
Brazil, Chile, Ecuador, SouthAfrica
Access to External Finance
Finance Constrained
- Before Matching
Effect Size Before
Matching
Finance Constrained
After Matching
Effect Size After
Matching
Access to External Finance
Finance Constrained
- Before Matching
Effect Size Before
Matching
Finance Constrained
After Matching
Effect Size After
Matching
International Trade 0.437 0.286 0.151 0.374 0.063
0.528 0.438 0.090 0.469 0.059
(0.012)
(0.021)
(0.020)
(0.028)
Exporting 0.348 0.230 0.117 0.296 0.051
0.357 0.276 0.081 0.305 0.052
(0.012)
(0.019)
(0.018)
(0.023)
Importing 0.225 0.152 0.072 0.161 0.064
0.350 0.303 0.047 0.318 0.032
(0.010)
(0.014)
(0.019)
(0.029)
Exporting & Importing 0.136 0.097 0.039 0.086 0.049
0.179 0.140 0.039 0.160 0.019
(0.008)
(0.014)
(0.015)
(0.022)
Use of Intermediaries in Trade 0.152 0.087 0.065 0.124 0.028
0.271 0.224 0.047 0.235 0.036
(0.008)
(0.017)
(0.017)
(0.028)
Trade Through Intermediaries 0.104 0.057 0.048 0.081 0.023
0.202 0.170 0.032 0.170 0.031
(0.007)
(0.011)
(0.015)
(0.021)
Direct Trade 0.349 0.236 0.113 0.300 0.049
0.374 0.294 0.080 0.327 0.047
(0.012)
(0.019)
(0.019)
(0.021)
Direct Exporting 0.299 0.204 0.095 0.259 0.039
0.321 0.237 0.084 0.273 0.048
(0.011)
(0.020)
(0.018)
(0.022)
Direct Importing 0.160 0.119 0.041 0.116 0.044
0.177 0.165 0.012 0.176 0.001
(0.009)
(0.014)
(0.015)
(0.022)
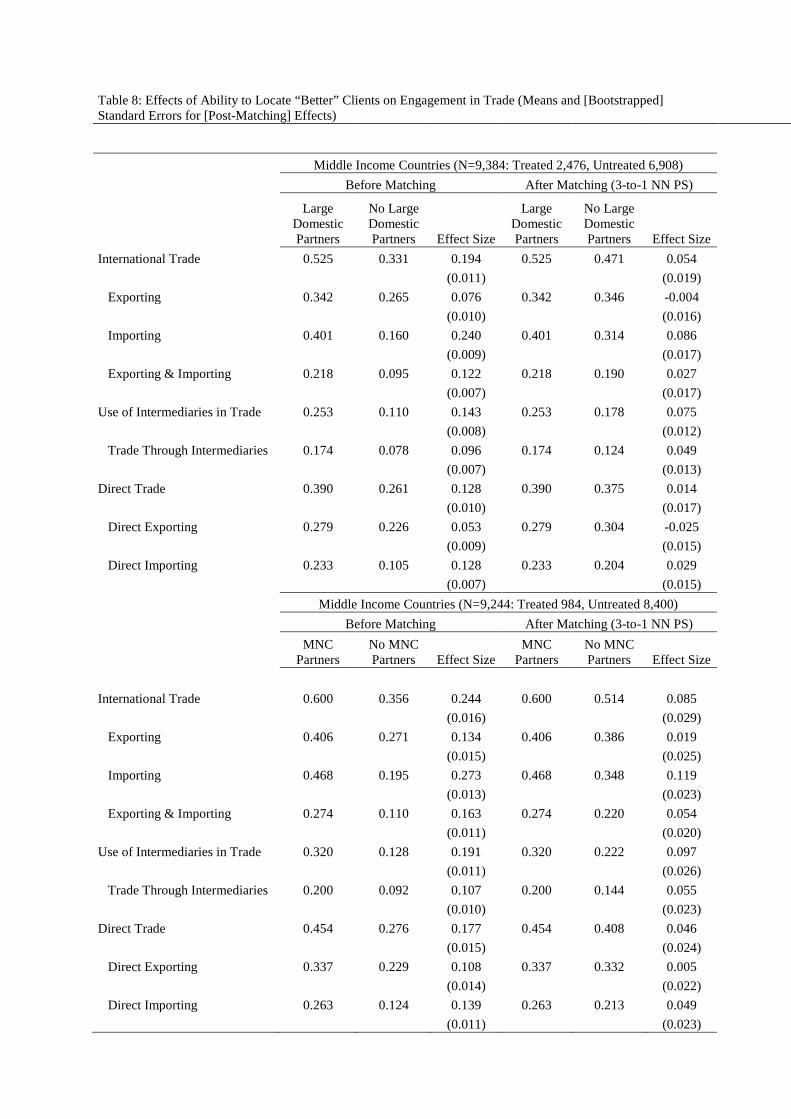
Table 8: Effects of Ability to Locate “Better” Clients on Engagement in Trade (Means and [Bootstrapped] Standard Errors for [Post-Matching] Effects)
Middle Income Countries (N=9,384: Treated 2,476, Untreated 6,908)
Before Matching After Matching (3-to-1 NN PS)
Large Domestic Partners
No Large Domestic Partners Effect Size
Large Domestic Partners
No Large Domestic Partners Effect Size
International Trade 0.525 0.331 0.194 0.525 0.471 0.054
(0.011) (0.019)
Exporting 0.342 0.265 0.076 0.342 0.346 -0.004
(0.010) (0.016)
Importing 0.401 0.160 0.240 0.401 0.314 0.086
(0.009) (0.017)
Exporting & Importing 0.218 0.095 0.122 0.218 0.190 0.027
(0.007) (0.017)
Use of Intermediaries in Trade 0.253 0.110 0.143 0.253 0.178 0.075
(0.008) (0.012)
Trade Through Intermediaries 0.174 0.078 0.096 0.174 0.124 0.049
(0.007) (0.013)
Direct Trade 0.390 0.261 0.128 0.390 0.375 0.014
(0.010) (0.017)
Direct Exporting 0.279 0.226 0.053 0.279 0.304 -0.025
(0.009) (0.015)
Direct Importing 0.233 0.105 0.128 0.233 0.204 0.029
(0.007) (0.015)
Middle Income Countries (N=9,244: Treated 984, Untreated 8,400)
Before Matching After Matching (3-to-1 NN PS)
MNC Partners
No MNC Partners Effect Size
MNC Partners
No MNC Partners Effect Size
International Trade 0.600 0.356 0.244 0.600 0.514 0.085
(0.016) (0.029)
Exporting 0.406 0.271 0.134 0.406 0.386 0.019
(0.015) (0.025)
Importing 0.468 0.195 0.273 0.468 0.348 0.119
(0.013) (0.023)
Exporting & Importing 0.274 0.110 0.163 0.274 0.220 0.054
(0.011) (0.020)
Use of Intermediaries in Trade 0.320 0.128 0.191 0.320 0.222 0.097
(0.011) (0.026)
Trade Through Intermediaries 0.200 0.092 0.107 0.200 0.144 0.055
(0.010) (0.023)
Direct Trade 0.454 0.276 0.177 0.454 0.408 0.046
(0.015) (0.024)
Direct Exporting 0.337 0.229 0.108 0.337 0.332 0.005
(0.014) (0.022)
Direct Importing 0.263 0.124 0.139 0.263 0.213 0.049 (0.011) (0.023)
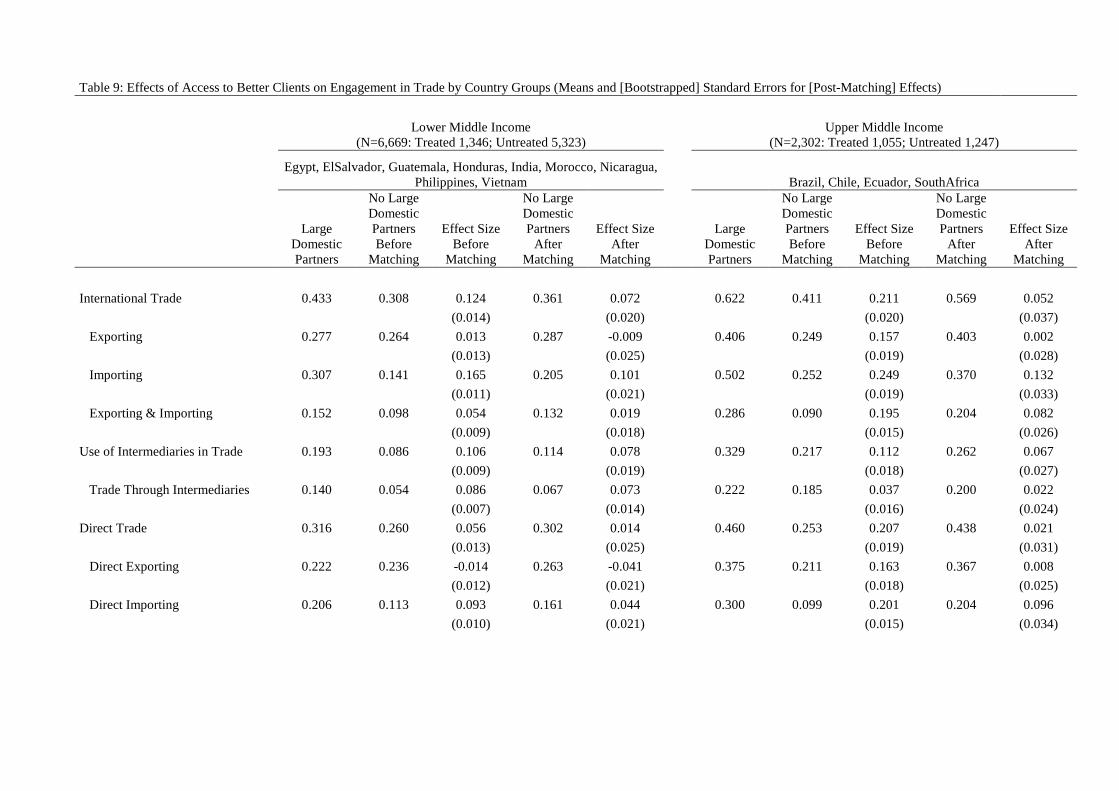
Table 9: Effects of Access to Better Clients on Engagement in Trade by Country Groups (Means and [Bootstrapped] Standard Errors for [Post-Matching] Effects)
Lower Middle Income (N=6,669: Treated 1,346; Untreated 5,323)
Upper Middle Income (N=2,302: Treated 1,055; Untreated 1,247)
Egypt, ElSalvador, Guatemala, Honduras, India, Morocco, Nicaragua, Philippines, Vietnam
Brazil, Chile, Ecuador, SouthAfrica
Large Domestic Partners
No Large Domestic Partners Before
Matching
Effect Size Before
Matching
No Large Domestic Partners
After Matching
Effect Size After
Matching
Large Domestic Partners
No Large Domestic Partners Before
Matching
Effect Size Before
Matching
No Large Domestic Partners
After Matching
Effect Size After
Matching
International Trade 0.433 0.308 0.124 0.361 0.072 0.622 0.411 0.211 0.569 0.052
(0.014) (0.020) (0.020) (0.037)
Exporting 0.277 0.264 0.013 0.287 -0.009 0.406 0.249 0.157 0.403 0.002 (0.013) (0.025) (0.019) (0.028) Importing 0.307 0.141 0.165 0.205 0.101 0.502 0.252 0.249 0.370 0.132
(0.011) (0.021) (0.019) (0.033)
Exporting & Importing 0.152 0.098 0.054 0.132 0.019 0.286 0.090 0.195 0.204 0.082
(0.009) (0.018) (0.015) (0.026)
Use of Intermediaries in Trade 0.193 0.086 0.106 0.114 0.078 0.329 0.217 0.112 0.262 0.067
(0.009) (0.019) (0.018) (0.027)
Trade Through Intermediaries 0.140 0.054 0.086 0.067 0.073 0.222 0.185 0.037 0.200 0.022
(0.007) (0.014) (0.016) (0.024)
Direct Trade 0.316 0.260 0.056 0.302 0.014 0.460 0.253 0.207 0.438 0.021
(0.013) (0.025) (0.019) (0.031)
Direct Exporting 0.222 0.236 -0.014 0.263 -0.041 0.375 0.211 0.163 0.367 0.008
(0.012) (0.021) (0.018) (0.025)
Direct Importing 0.206 0.113 0.093 0.161 0.044 0.300 0.099 0.201 0.204 0.096
(0.010) (0.021) (0.015) (0.034)
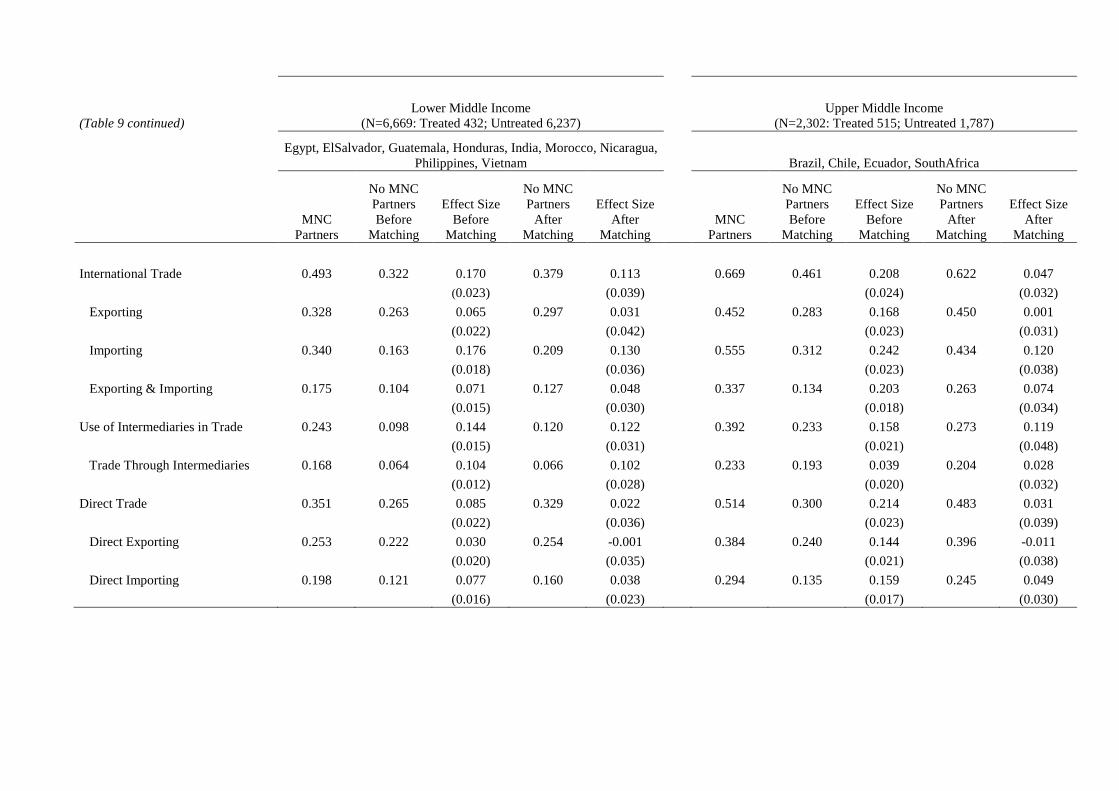
(Table 9 continued) Lower Middle Income
(N=6,669: Treated 432; Untreated 6,237)
Upper Middle Income (N=2,302: Treated 515; Untreated 1,787)
Egypt, ElSalvador, Guatemala, Honduras, India, Morocco, Nicaragua, Philippines, Vietnam
Brazil, Chile, Ecuador, SouthAfrica
MNC
Partners
No MNC Partners Before
Matching
Effect Size Before
Matching
No MNC Partners
After Matching
Effect Size After
Matching MNC
Partners
No MNC Partners Before
Matching
Effect Size Before
Matching
No MNC Partners
After Matching
Effect Size After
Matching International Trade 0.493 0.322 0.170 0.379 0.113 0.669 0.461 0.208 0.622 0.047 (0.023) (0.039) (0.024) (0.032) Exporting 0.328 0.263 0.065 0.297 0.031 0.452 0.283 0.168 0.450 0.001 (0.022) (0.042) (0.023) (0.031) Importing 0.340 0.163 0.176 0.209 0.130 0.555 0.312 0.242 0.434 0.120 (0.018) (0.036) (0.023) (0.038) Exporting & Importing 0.175 0.104 0.071 0.127 0.048 0.337 0.134 0.203 0.263 0.074 (0.015) (0.030) (0.018) (0.034) Use of Intermediaries in Trade 0.243 0.098 0.144 0.120 0.122 0.392 0.233 0.158 0.273 0.119 (0.015) (0.031) (0.021) (0.048) Trade Through Intermediaries 0.168 0.064 0.104 0.066 0.102 0.233 0.193 0.039 0.204 0.028 (0.012) (0.028) (0.020) (0.032) Direct Trade 0.351 0.265 0.085 0.329 0.022 0.514 0.300 0.214 0.483 0.031 (0.022) (0.036) (0.023) (0.039) Direct Exporting 0.253 0.222 0.030 0.254 -0.001 0.384 0.240 0.144 0.396 -0.011 (0.020) (0.035) (0.021) (0.038) Direct Importing 0.198 0.121 0.077 0.160 0.038 0.294 0.135 0.159 0.245 0.049 (0.016) (0.023) (0.017) (0.030)