Embed Size (px)
Citation preview
GRS - A - 3162
Validierung des ge-koppelten Codes ATHLET – QUABOX/CUBBOX durch Nachrechnung des OECD/CSNI SWR Turbinenschnell-schluss-Benchmarks mit Messdaten
Abschlussbericht
Gesellschaft für Anlagen-und Reaktorsicherheit (GRS) mbH
Abschlussbericht/ Final Report Reaktorsicherheitsforschung-Vorhabens Nr.:/ Reactor Safety Research-Project No.: RS 1130 Vorhabenstitel / Project Title: Validierung des gekoppelten Codes ATHLET – QUABOX/CUBBOX durch Nachrechnung des OECD/ CSNI SWR Turbinenschnell-schluss-Benchmarks mit Messdaten Validation of the coupled code ATHLET – QUABOX/CUBBOX by the OECD/CSNI-BWR Turbine Trip Benchmark Autor / Authors: S. Langenbuch K.-D. Schmidt K. Velkov
Berichtszeitraum / Publication Date:
August 2005
Anmerkung: Das diesem Bericht zugrunde lie-gende F&E-Vorhaben wurde im Auftrag des Bundesministeriums für Wirtschaft und Arbeit (BMWA) unter dem Kennzeichen RS 1130durchgeführt. Die Verantwortung für den Inhalt dieser Veröffentlichung liegt beim Auftragnehmer.
GRS - A - 3162
Kurzfassung
Die Weiterentwicklung der Rechenmethodik für Störfallanalysen der Reaktoranlagen
führte zur Entwicklung der gekoppelten Rechenprogramme, wobei in den thermo-
fluiddynamischen Systemcodes 3D-Kernmodelle voll integriert wurden. In der GRS
wurde für LWR der Systemcode ATHLET mit dem 3D-Kernmodell QUABOX/CUBBOX
gekoppelt. Diese neue Rechenmethodik muss für den zukünftigen Einsatz in Störfall-
analysen validiert werden. Als erster Schritt wurde in einem internationalen OECD
Benchmark ein DWR Frischdampfleitungsbruch in TMI-1 berechnet, und die Ergebnis-
se von mehreren international verfügbaren gekoppelten Codes verglichen. Als Fortset-
zung der OECD Benchmark Aktivitäten erfolgt im Rahmen des Vorhabens RS1130 die
Nachrechnung einer SWR Turbinenschnellschlußtransiente in Peach Bottom 2, wofür
auch Messdaten von der Anlage vorliegen. Dieser Bericht beschreibt die Aufgabenstel-
lung und die Durchführung des Benchmarks, die erzielten Ergebnisse mit dem gekop-
pelten Code ATHLET-QUABOX/CUBBOX sowie die Erfahrungen bei der Durchführung
der Berechnungen.

Abstract
The improvement of computational tools for accident analysis of nuclear power plants
led to the development of coupled codes, which integrate 3D reactor core models into
fluiddynamic system codes. In GRS the system code ATHLET was coupled with the 3D
reactor core model QUABOX/CUBBOX for LWR conditions. These new computational
tools must be validated for the future application in safety analysis. A first step was per-
formed within the international OECD benchmark activities by analyzing a PWR main
steam line break (MSLB) transient in TMI-1 which allowed to compare the results of
several coupled codes internationally available. As a continuation of the OECD bench-
mark activities, the analysis of a BWR turbine trip (TT) transient in Peach Bottom 2 is
performed, for which also measured data are available. This analysis is performed
within the project RS1130. This report describes the benchmark specifications and the
approach performing the benchmark evaluations. It presents the results obtained by
the coupled code ATHLET-QUABOX/CUBBOX together with the experiences gained
during the analysis.

Inhaltsverzeichnis
1 Einleitung................................................................................................... 1
2 Aufgabenstellung des SWR Turbinenschnellschluss-Benchmarks .... 2
2.1 Beschreibung der Aufgabenstellung ........................................................... 2
3 Durchführung des Benchmarks............................................................... 6
4 Berechnung der SWR Turbinenschnellschlusstransiente für Peach Bottom 2 ......................................................................................... 8
4.1 Berechnung der Anlagentransiente mit ATHLET, Teilschritt 1.................... 8
4.1.1 Erstellung des ATHLET-Modells ................................................................. 8
4.1.2 Ergebnisse der ATHLET-Berechnung für die Turbinenschnellschluss-
Transiente ................................................................................................... 9
4.2 Berechnung der Kerntransiente mit ATHLET-QUABOX/CUBBOX,
Teilschritt 2................................................................................................ 11
4.2.1 Erstellung des Datensatzes für das 3D Kernmodell
QUABOX/CUBBOX................................................................................... 11
4.2.2 Berechnung der Kerntransiente mit vorgegebenen Randbedingungen,
Teilschritt 2................................................................................................ 12
4.3 Berechnung der Turbinenschnellschlusstransiente mit dem
gekoppelten Rechenprogramm, Teilschritt 3 ............................................ 13
4.3.1 Eingabedaten für das gekoppelte Rechenprogramm................................ 13
4.3.2 Ergebnisse zur gekoppelten Berechnung der
Turbinenschnellschlußtransiente .............................................................. 13
4.4 Berechnung der extremen Fälle................................................................ 14
4.4.1 Eingabedatensatz für die extremen Fälle.................................................. 14
4.4.2 Ergebnisse für die extremen Fälle ............................................................ 14
5 Zusammenfassung ................................................................................. 16
6 Literaturverzeichnis ................................................................................ 18
I

7 Bilder ........................................................................................................ 20
Anhang 1
Anhang 2
Anhang 3
Anhang 4
II
Abbildungsverzeichnis
Bild 4.1.1 ATHLET-Nodalisierung des Primärkreises
Bild 4.1.2 ATHLET-Nodalisierung des Frischdampfsystems
Bild 4.1.3 Gesamte Reaktorleistung wie für den Teilschritt 1 spezifiziert
Bild 4.1.4 Teilschritt 1, Vergleich des mit ATHLET berechneten Druckverlaufes mit
den Ergebnissen der RETRAN Rechnung und der Messung
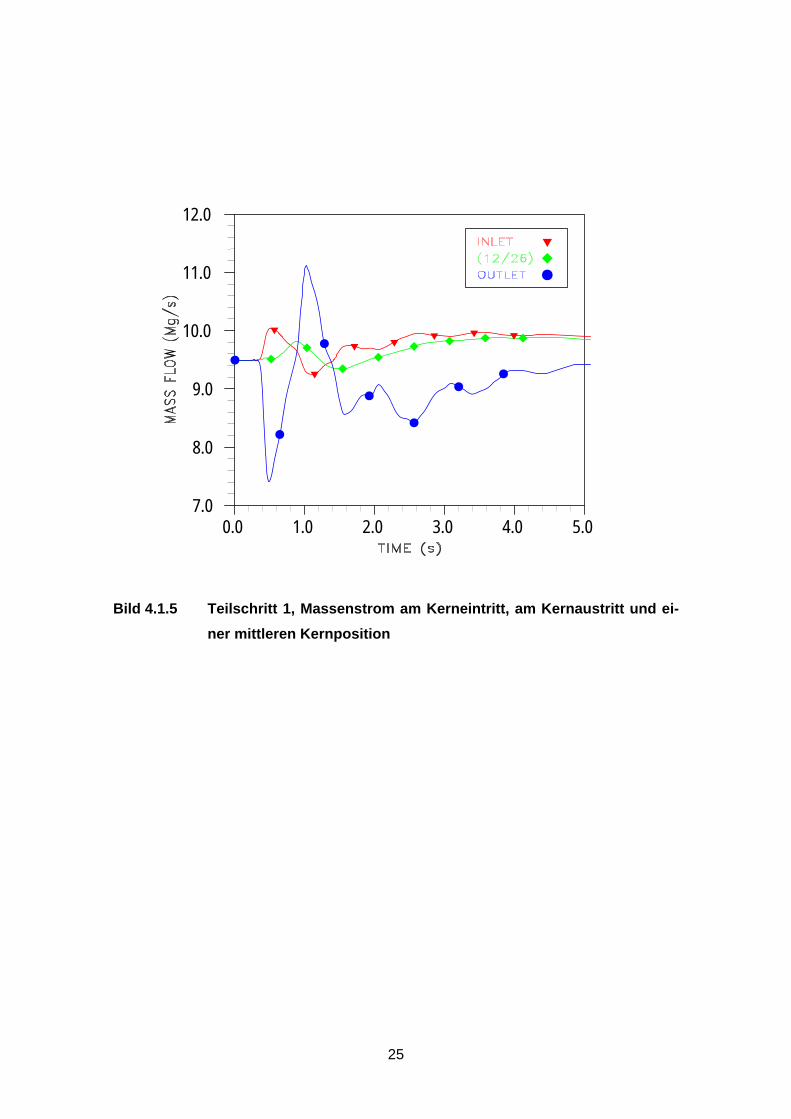
Bild 4.1.5 Teilschritt 1, Massenstrom am Kerneintritt, am Kernaustritt und einer
mittleren Kernposition
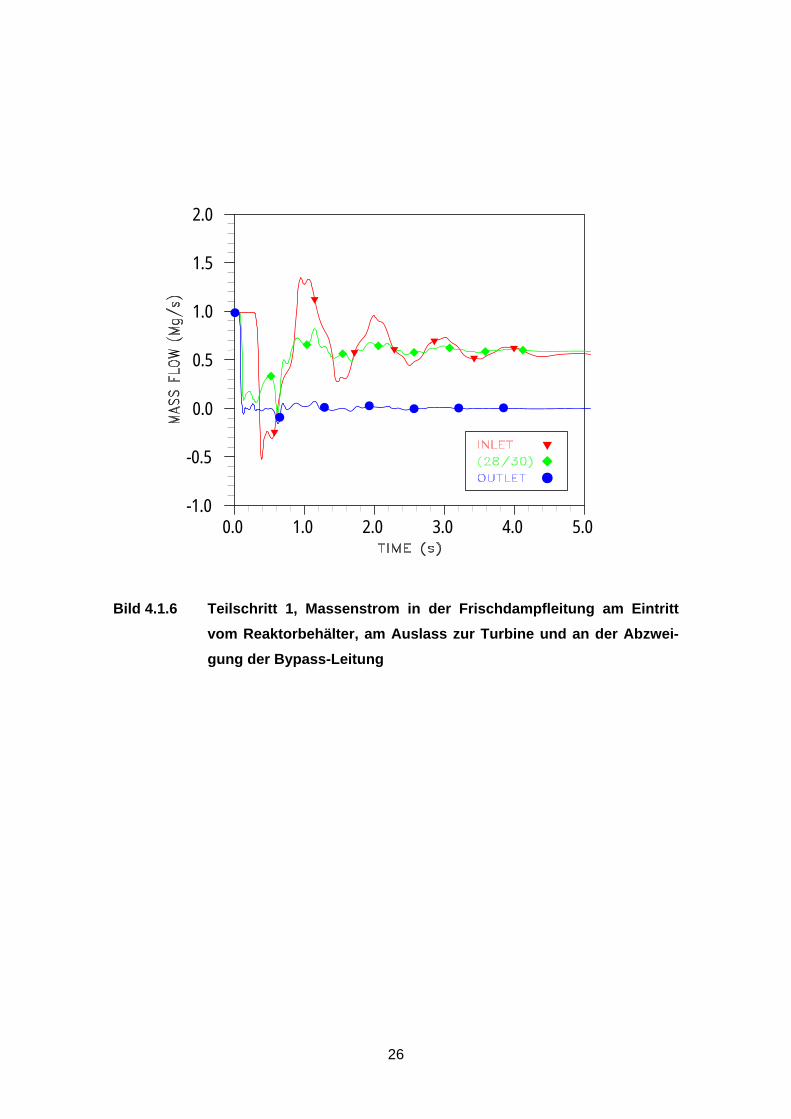
Bild 4.1.6 Teilschritt 1, Massenstrom in der Frischdampfleitung am Eintritt vom
Reaktorbehälter, am Auslass zur Turbine und an der Abzweigung der
Bypassleitung
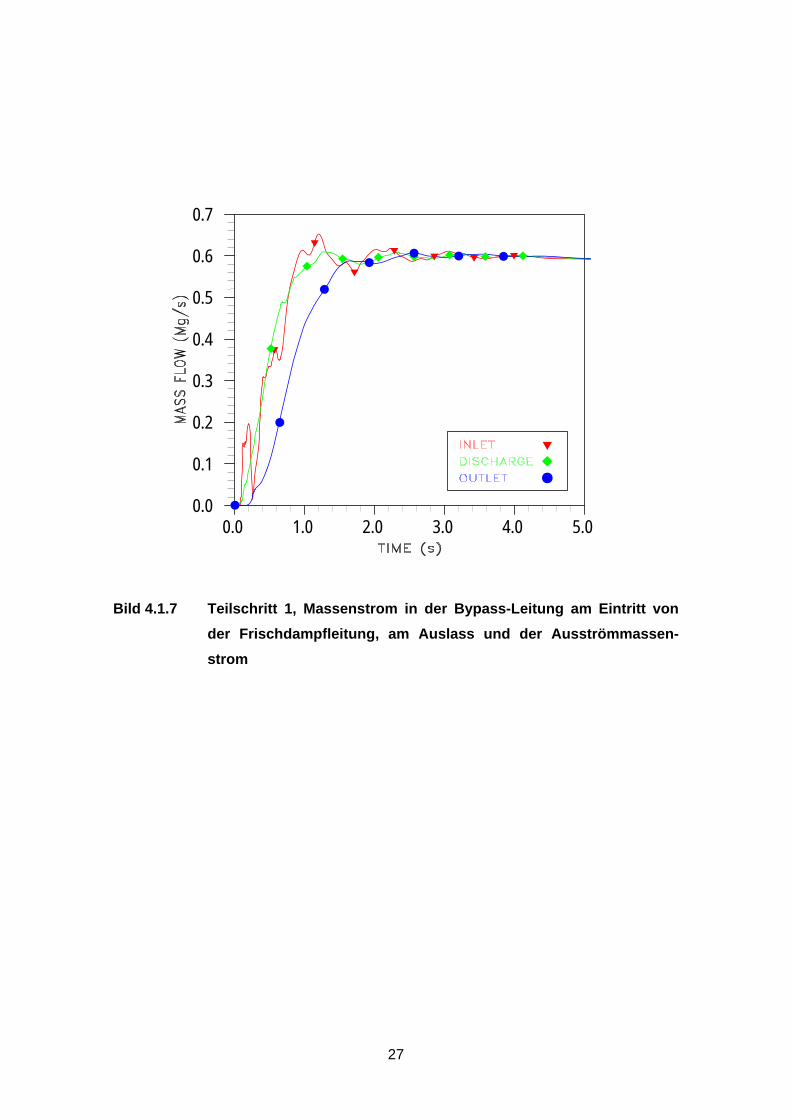
Bild 4.1.7 Teilschritt 1, Massenstrom in der Bypassleitung am Eintritt von der
Frischdampfleitung, am Auslass und der Ausströmmassenstrom
Bild 4.2.1 Sensitivitätsuntersuchung zum Einfluss von Randbedingungen und Mo-
dellparametern auf den Leistungspeak
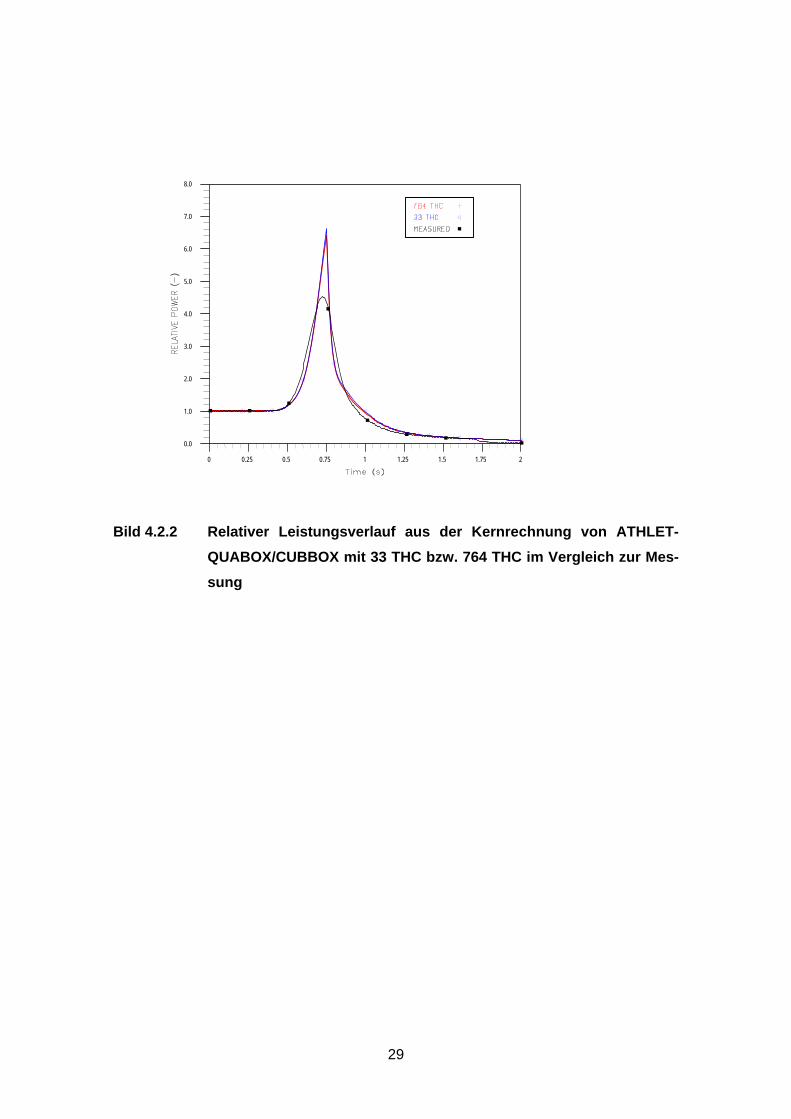
Bild 4.2.2 Relativer Leistungsverlauf aus der Kernrechnung von ATHLET-
QUABOX/CUBBOX mit 33 THC bzw. 764 THC im Vergleich zur Mes-
sung
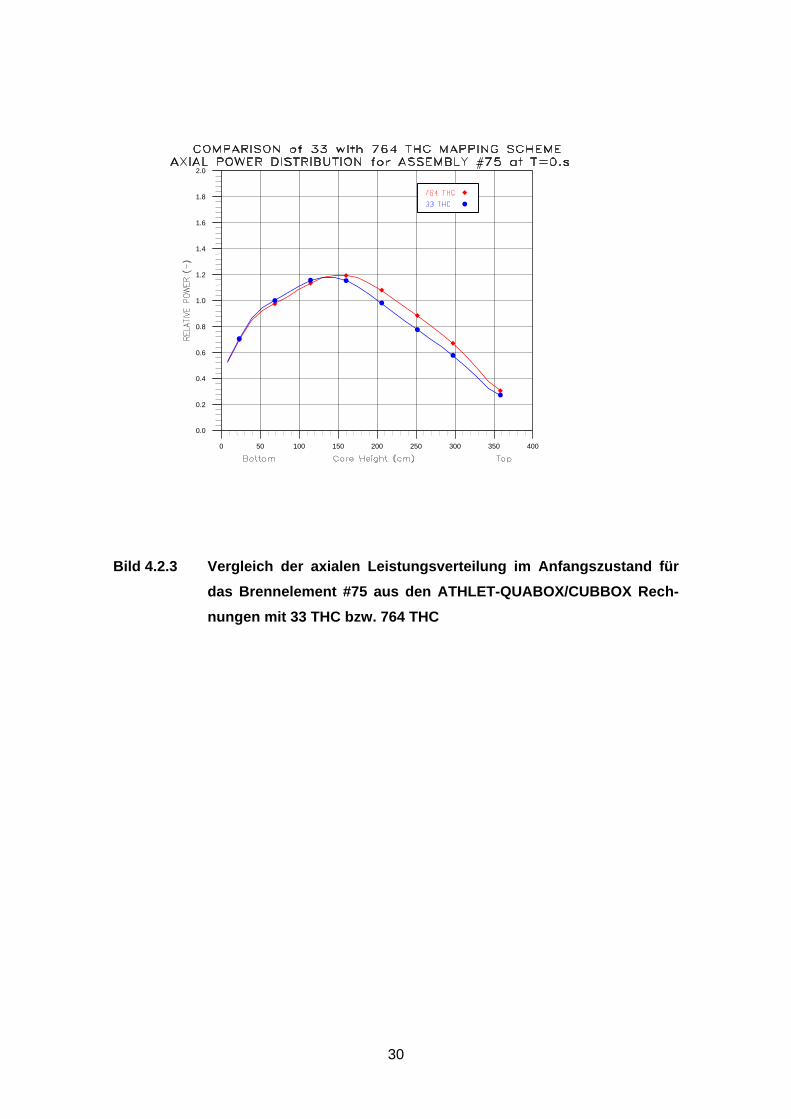
Bild 4.2.3 Vergleich der axialen Leistungsverteilung im Anfangszustand für das
Brennelement #75 aus den ATHLET-QUABOX/CUBBOX Rechnungen
mit 33 THC bzw. 764 THC
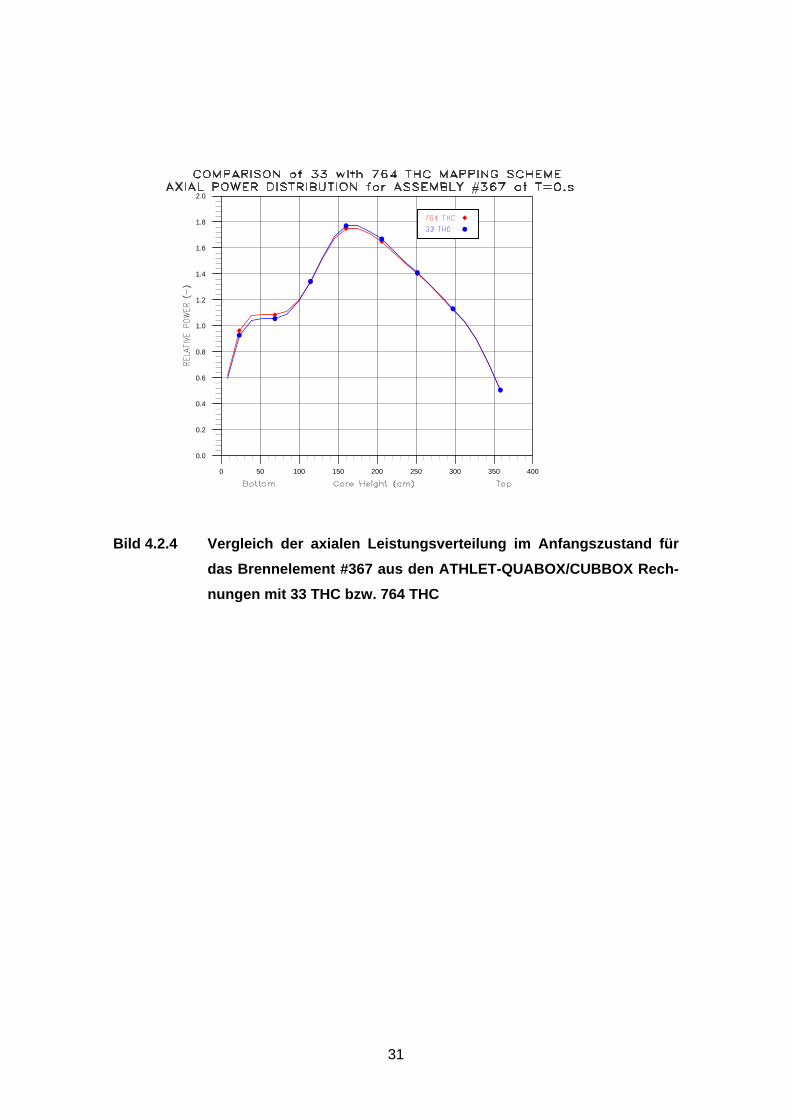
Bild 4.2.4 Vergleich der axialen Leistungsverteilung im Anfangszustand für das
Brennelement #367 aus den ATHLET-QUABOX/CUBBOX Rechnungen
mit 33 THC bzw. 764 THC
Bild 4.3.1 Zuordnung der Brennelemente zu den thermohydraulischen Kanälen für
33 THC
Bild 4.3.2 Vergleich des mittleren axialen Leistungsprofils aus Berechnung und
Messung
Bild 4.3.3 Axiales Leistungsprofil in Brennelementposition 75
Bild 4.3.4 Axiales Leistungsprofil in der Brennelementposition 367
Bild 4.3.5 Gesamtleistung für den SWR Turbinenschnellschluss, Vergleich von be-
rechneten und gemessenen Werten
Bild 4.3.6 Gesamtleistung (wie vorher mit größerer Auflösung)
Bild 4.3.7 Vergleich des Druckverlaufs an unterschiedlichen Ortspunkten
III
Bild 4.2.8 Massenstrom durch das Turbinenbypassventil und am Einlass und Aus-
lass der Frischdampfleitung
Bild 4.3.9 Berechnete LPRM Anzeigen in den spezifizierten vier Ebenen
Bild 4.4.1 Anordnung des Frischdampfsystems mit Ventilen
Bild 4.4.2 Leistungsverlauf für die extremen Fälle 1, 2 und 3
Bild 4.4.3 Massenstrom am Abblase- und Sicherheitsventil für den extremen Fall 1
Bild 4.4.4 Massenstrom am Abblaseventil für den extremen Fall 2
Bild 4.4.5 Massenstrom am Abblaseventil für den extremen Fall 3
Bild 4.4.6 Leistungsverlauf im extremen Fall 4 ohne Dampfabgabe
Bild 4.4.7 Verlauf der Reaktivitätsbeiträge für den extremen Fall 4
Bild 4.4.8 Verlauf der maximalen und mittleren Brennstofftemperaturen für den ex-
tremen Fall 4
IV

Tabellenverzeichnis
Tabelle 3-1 Workshops und eigene Beiträge zum SWR-TT Benchmarks............... 7 Tabelle 4-1 Anfangszustand der Transiente............................................................ 9 Tabelle 4-2 Öffnungs- und Schließzeiten der Ventile ............................................ 10
V

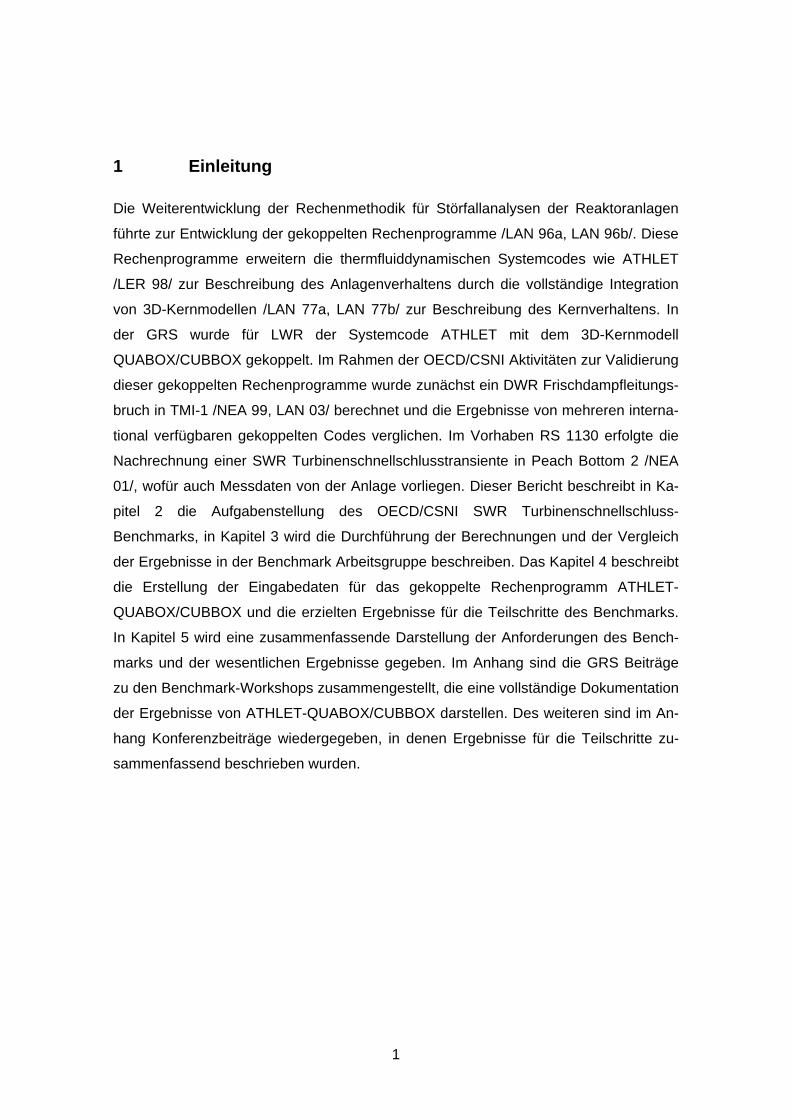
1 Einleitung
Die Weiterentwicklung der Rechenmethodik für Störfallanalysen der Reaktoranlagen
führte zur Entwicklung der gekoppelten Rechenprogramme /LAN 96a, LAN 96b/. Diese
Rechenprogramme erweitern die thermfluiddynamischen Systemcodes wie ATHLET
/LER 98/ zur Beschreibung des Anlagenverhaltens durch die vollständige Integration
von 3D-Kernmodellen /LAN 77a, LAN 77b/ zur Beschreibung des Kernverhaltens. In
der GRS wurde für LWR der Systemcode ATHLET mit dem 3D-Kernmodell
QUABOX/CUBBOX gekoppelt. Im Rahmen der OECD/CSNI Aktivitäten zur Validierung
dieser gekoppelten Rechenprogramme wurde zunächst ein DWR Frischdampfleitungs-
bruch in TMI-1 /NEA 99, LAN 03/ berechnet und die Ergebnisse von mehreren interna-
tional verfügbaren gekoppelten Codes verglichen. Im Vorhaben RS 1130 erfolgte die
Nachrechnung einer SWR Turbinenschnellschlusstransiente in Peach Bottom 2 /NEA
01/, wofür auch Messdaten von der Anlage vorliegen. Dieser Bericht beschreibt in Ka-
pitel 2 die Aufgabenstellung des OECD/CSNI SWR Turbinenschnellschluss-
Benchmarks, in Kapitel 3 wird die Durchführung der Berechnungen und der Vergleich
der Ergebnisse in der Benchmark Arbeitsgruppe beschreiben. Das Kapitel 4 beschreibt
die Erstellung der Eingabedaten für das gekoppelte Rechenprogramm ATHLET-
QUABOX/CUBBOX und die erzielten Ergebnisse für die Teilschritte des Benchmarks.
In Kapitel 5 wird eine zusammenfassende Darstellung der Anforderungen des Bench-
marks und der wesentlichen Ergebnisse gegeben. Im Anhang sind die GRS Beiträge
zu den Benchmark-Workshops zusammengestellt, die eine vollständige Dokumentation
der Ergebnisse von ATHLET-QUABOX/CUBBOX darstellen. Des weiteren sind im An-
hang Konferenzbeiträge wiedergegeben, in denen Ergebnisse für die Teilschritte zu-
sammenfassend beschrieben wurden.
1
2 Aufgabenstellung des SWR Turbinenschnellschluss-Benchmarks
2.1 Beschreibung der Aufgabenstellung
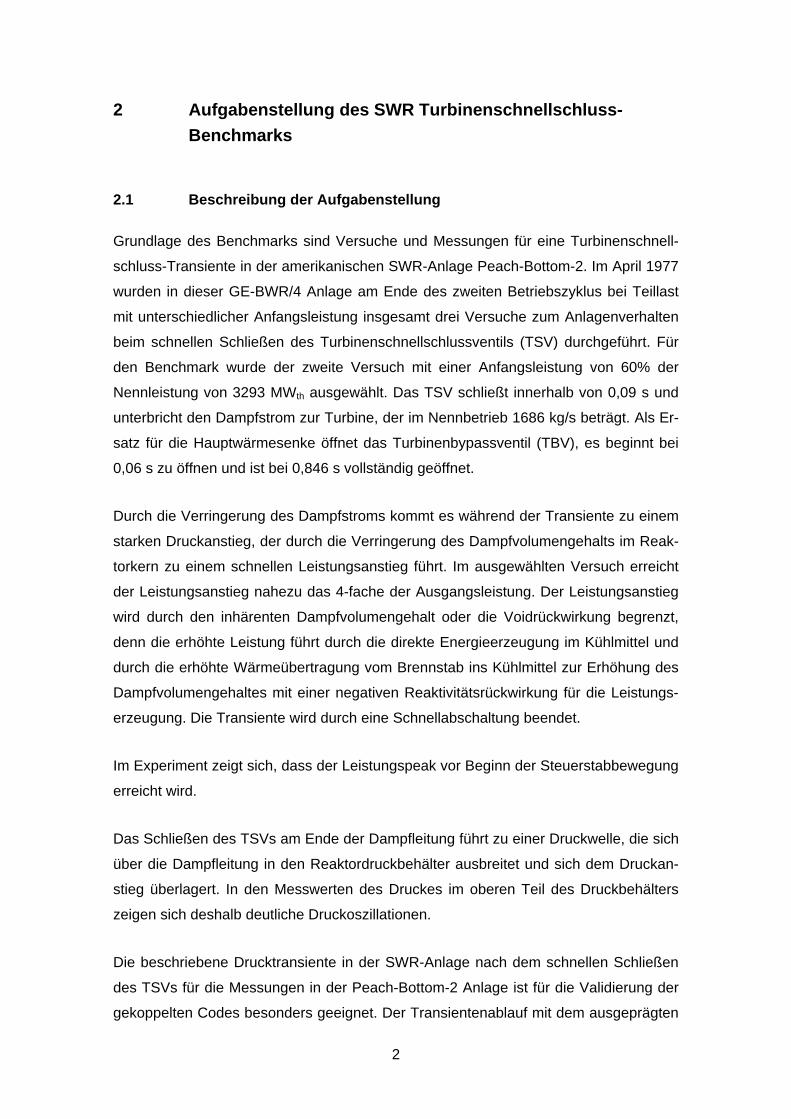
Grundlage des Benchmarks sind Versuche und Messungen für eine Turbinenschnell-
schluss-Transiente in der amerikanischen SWR-Anlage Peach-Bottom-2. Im April 1977
wurden in dieser GE-BWR/4 Anlage am Ende des zweiten Betriebszyklus bei Teillast
mit unterschiedlicher Anfangsleistung insgesamt drei Versuche zum Anlagenverhalten
beim schnellen Schließen des Turbinenschnellschlussventils (TSV) durchgeführt. Für
den Benchmark wurde der zweite Versuch mit einer Anfangsleistung von 60% der
Nennleistung von 3293 MWth ausgewählt. Das TSV schließt innerhalb von 0,09 s und
unterbricht den Dampfstrom zur Turbine, der im Nennbetrieb 1686 kg/s beträgt. Als Er-
satz für die Hauptwärmesenke öffnet das Turbinenbypassventil (TBV), es beginnt bei
0,06 s zu öffnen und ist bei 0,846 s vollständig geöffnet.
Durch die Verringerung des Dampfstroms kommt es während der Transiente zu einem
starken Druckanstieg, der durch die Verringerung des Dampfvolumengehalts im Reak-
torkern zu einem schnellen Leistungsanstieg führt. Im ausgewählten Versuch erreicht
der Leistungsanstieg nahezu das 4-fache der Ausgangsleistung. Der Leistungsanstieg
wird durch den inhärenten Dampfvolumengehalt oder die Voidrückwirkung begrenzt,
denn die erhöhte Leistung führt durch die direkte Energieerzeugung im Kühlmittel und
durch die erhöhte Wärmeübertragung vom Brennstab ins Kühlmittel zur Erhöhung des
Dampfvolumengehaltes mit einer negativen Reaktivitätsrückwirkung für die Leistungs-
erzeugung. Die Transiente wird durch eine Schnellabschaltung beendet.
Im Experiment zeigt sich, dass der Leistungspeak vor Beginn der Steuerstabbewegung
erreicht wird.
Das Schließen des TSVs am Ende der Dampfleitung führt zu einer Druckwelle, die sich
über die Dampfleitung in den Reaktordruckbehälter ausbreitet und sich dem Druckan-
stieg überlagert. In den Messwerten des Druckes im oberen Teil des Druckbehälters
zeigen sich deshalb deutliche Druckoszillationen.
Die beschriebene Drucktransiente in der SWR-Anlage nach dem schnellen Schließen
des TSVs für die Messungen in der Peach-Bottom-2 Anlage ist für die Validierung der
gekoppelten Codes besonders geeignet. Der Transientenablauf mit dem ausgeprägten
2
Leistungspeak wird durch die enge Reaktivitätskopplung zwischen Kühlmittel-
dichteänderung infolge des Druckanstiegs und der Leistungserzeugung bestimmt.
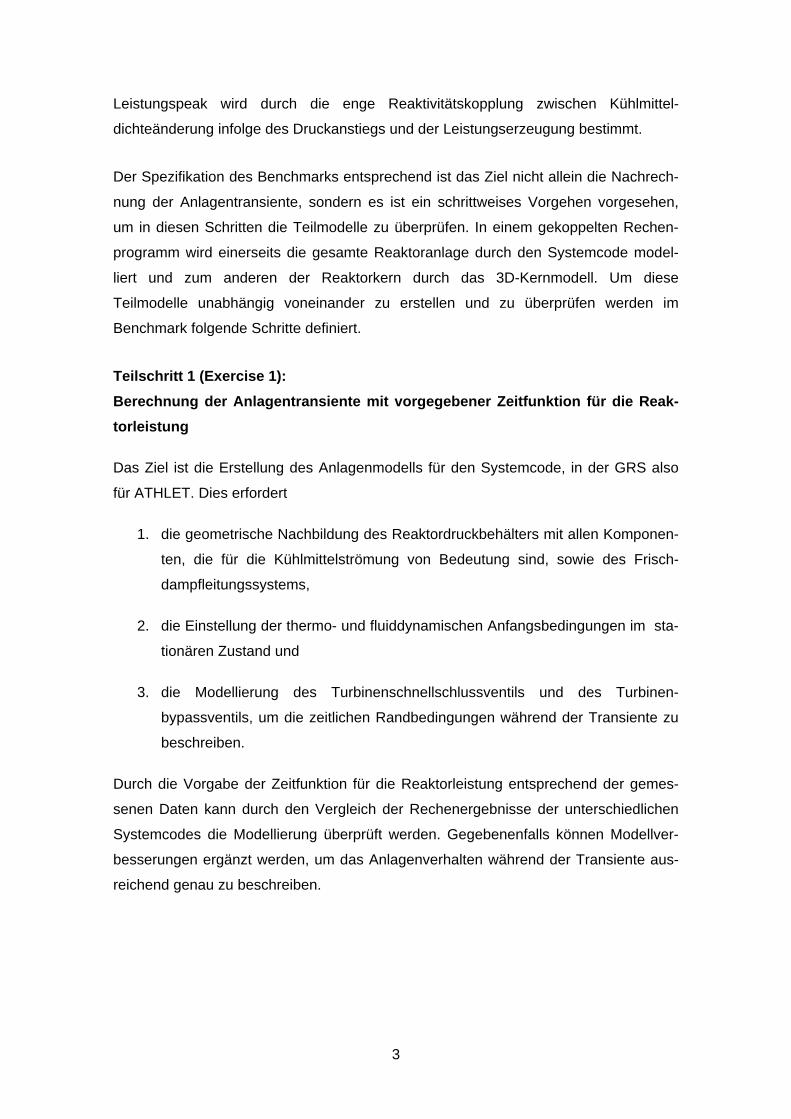
Der Spezifikation des Benchmarks entsprechend ist das Ziel nicht allein die Nachrech-
nung der Anlagentransiente, sondern es ist ein schrittweises Vorgehen vorgesehen,
um in diesen Schritten die Teilmodelle zu überprüfen. In einem gekoppelten Rechen-
programm wird einerseits die gesamte Reaktoranlage durch den Systemcode model-
liert und zum anderen der Reaktorkern durch das 3D-Kernmodell. Um diese
Teilmodelle unabhängig voneinander zu erstellen und zu überprüfen werden im
Benchmark folgende Schritte definiert.
Teilschritt 1 (Exercise 1): Berechnung der Anlagentransiente mit vorgegebener Zeitfunktion für die Reak-torleistung
Das Ziel ist die Erstellung des Anlagenmodells für den Systemcode, in der GRS also
für ATHLET. Dies erfordert
1. die geometrische Nachbildung des Reaktordruckbehälters mit allen Komponen-
ten, die für die Kühlmittelströmung von Bedeutung sind, sowie des Frisch-
dampfleitungssystems,
2. die Einstellung der thermo- und fluiddynamischen Anfangsbedingungen im sta-
tionären Zustand und
3. die Modellierung des Turbinenschnellschlussventils und des Turbinen-
bypassventils, um die zeitlichen Randbedingungen während der Transiente zu
beschreiben.
Durch die Vorgabe der Zeitfunktion für die Reaktorleistung entsprechend der gemes-
senen Daten kann durch den Vergleich der Rechenergebnisse der unterschiedlichen
Systemcodes die Modellierung überprüft werden. Gegebenenfalls können Modellver-
besserungen ergänzt werden, um das Anlagenverhalten während der Transiente aus-
reichend genau zu beschreiben.
3
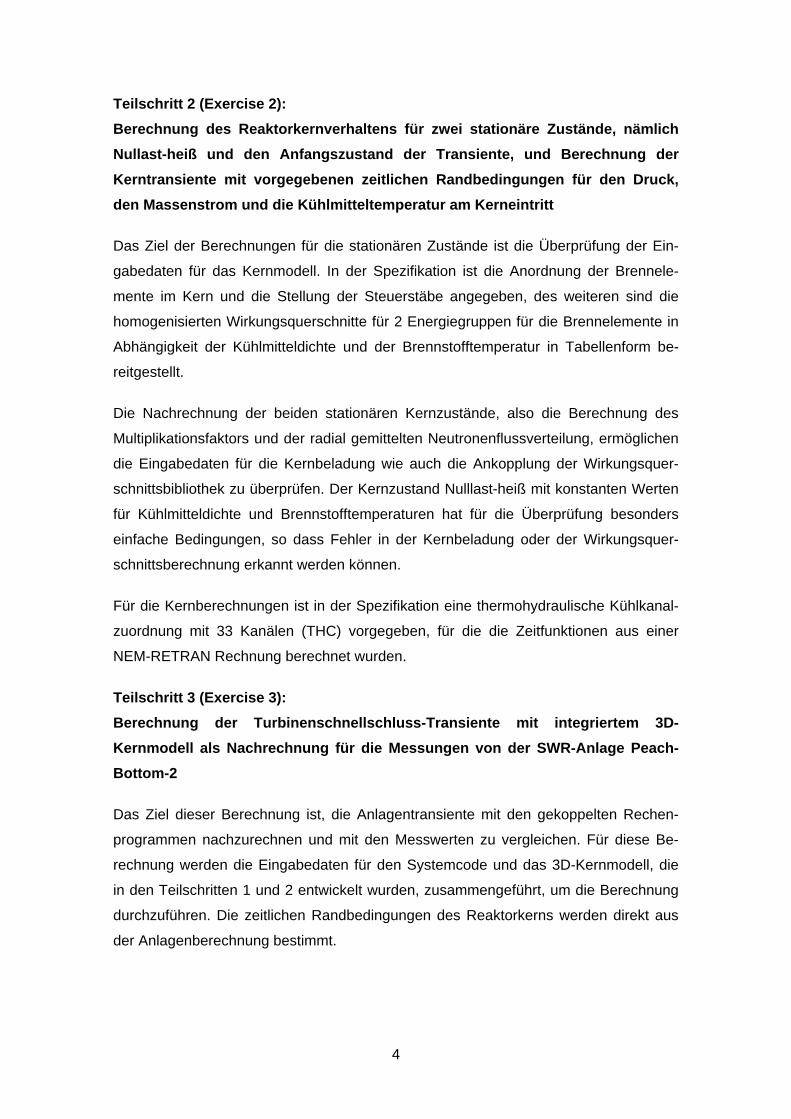
Teilschritt 2 (Exercise 2): Berechnung des Reaktorkernverhaltens für zwei stationäre Zustände, nämlich Nullast-heiß und den Anfangszustand der Transiente, und Berechnung der Kerntransiente mit vorgegebenen zeitlichen Randbedingungen für den Druck, den Massenstrom und die Kühlmitteltemperatur am Kerneintritt
Das Ziel der Berechnungen für die stationären Zustände ist die Überprüfung der Ein-
gabedaten für das Kernmodell. In der Spezifikation ist die Anordnung der Brennele-
mente im Kern und die Stellung der Steuerstäbe angegeben, des weiteren sind die
homogenisierten Wirkungsquerschnitte für 2 Energiegruppen für die Brennelemente in
Abhängigkeit der Kühlmitteldichte und der Brennstofftemperatur in Tabellenform be-
reitgestellt.
Die Nachrechnung der beiden stationären Kernzustände, also die Berechnung des
Multiplikationsfaktors und der radial gemittelten Neutronenflussverteilung, ermöglichen
die Eingabedaten für die Kernbeladung wie auch die Ankopplung der Wirkungsquer-
schnittsbibliothek zu überprüfen. Der Kernzustand Nulllast-heiß mit konstanten Werten
für Kühlmitteldichte und Brennstofftemperaturen hat für die Überprüfung besonders
einfache Bedingungen, so dass Fehler in der Kernbeladung oder der Wirkungsquer-
schnittsberechnung erkannt werden können.
Für die Kernberechnungen ist in der Spezifikation eine thermohydraulische Kühlkanal-
zuordnung mit 33 Kanälen (THC) vorgegeben, für die die Zeitfunktionen aus einer
NEM-RETRAN Rechnung berechnet wurden.
Teilschritt 3 (Exercise 3): Berechnung der Turbinenschnellschluss-Transiente mit integriertem 3D-Kernmodell als Nachrechnung für die Messungen von der SWR-Anlage Peach-Bottom-2
Das Ziel dieser Berechnung ist, die Anlagentransiente mit den gekoppelten Rechen-
programmen nachzurechnen und mit den Messwerten zu vergleichen. Für diese Be-
rechnung werden die Eingabedaten für den Systemcode und das 3D-Kernmodell, die
in den Teilschritten 1 und 2 entwickelt wurden, zusammengeführt, um die Berechnung
durchzuführen. Die zeitlichen Randbedingungen des Reaktorkerns werden direkt aus
der Anlagenberechnung bestimmt.
4
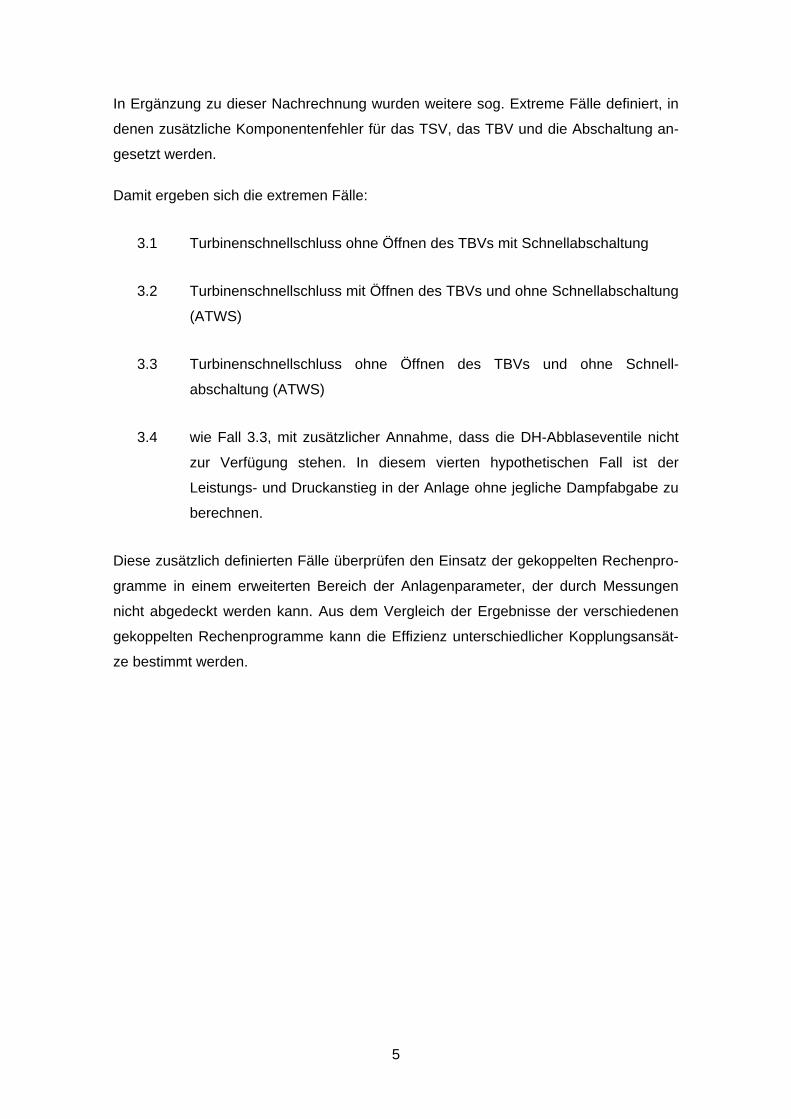
In Ergänzung zu dieser Nachrechnung wurden weitere sog. Extreme Fälle definiert, in
denen zusätzliche Komponentenfehler für das TSV, das TBV und die Abschaltung an-
gesetzt werden.
Damit ergeben sich die extremen Fälle:
3.1 Turbinenschnellschluss ohne Öffnen des TBVs mit Schnellabschaltung
3.2 Turbinenschnellschluss mit Öffnen des TBVs und ohne Schnellabschaltung
(ATWS)
3.3 Turbinenschnellschluss ohne Öffnen des TBVs und ohne Schnell-
abschaltung (ATWS)
3.4 wie Fall 3.3, mit zusätzlicher Annahme, dass die DH-Abblaseventile nicht
zur Verfügung stehen. In diesem vierten hypothetischen Fall ist der
Leistungs- und Druckanstieg in der Anlage ohne jegliche Dampfabgabe zu
berechnen.
Diese zusätzlich definierten Fälle überprüfen den Einsatz der gekoppelten Rechenpro-
gramme in einem erweiterten Bereich der Anlagenparameter, der durch Messungen
nicht abgedeckt werden kann. Aus dem Vergleich der Ergebnisse der verschiedenen
gekoppelten Rechenprogramme kann die Effizienz unterschiedlicher Kopplungsansät-
ze bestimmt werden.
5
3 Durchführung des Benchmarks
Die Aufgabenstellung des Benchmarks ist in der Spezifikation beschrieben. Die inter-
nationale Beteiligung war groß, insgesamt 14 Institutionen aus 8 Ländern beteiligten
sich an der Berechnung der SWR-Turbinenschnellschluss-Transiente. Die Berechnun-
gen zu den drei Teilschritten wurden nacheinander durchgeführt und die Ergebnisse zu
den Teilschritten wurden auf Workshops diskutiert. Für die erzielten Ergebnisse dieses
Benchmarks ist dieses schrittweise Vorgehen von besonderer Bedeutung, denn es er-
möglichte eine ständige Diskussion der Modellierung und der sich daraus ergebenden
Berechnungsergebnisse. Der Koordinator des Informationsaustausches war die
PennState University. Auf Nachfragen der Teilnehmer zur Modellierung der SWR-
Anlage Peach-Bottom-2 oder zur Modellierung des Reaktorkerns wurden vom Koordi-
nator die Spezifikation erläutert oder in einigen Fällen präzisiert. Der Informationsaus-
tausch zwischen den Teilnehmern wurde durch einen Mail-Server unterstützt. Während
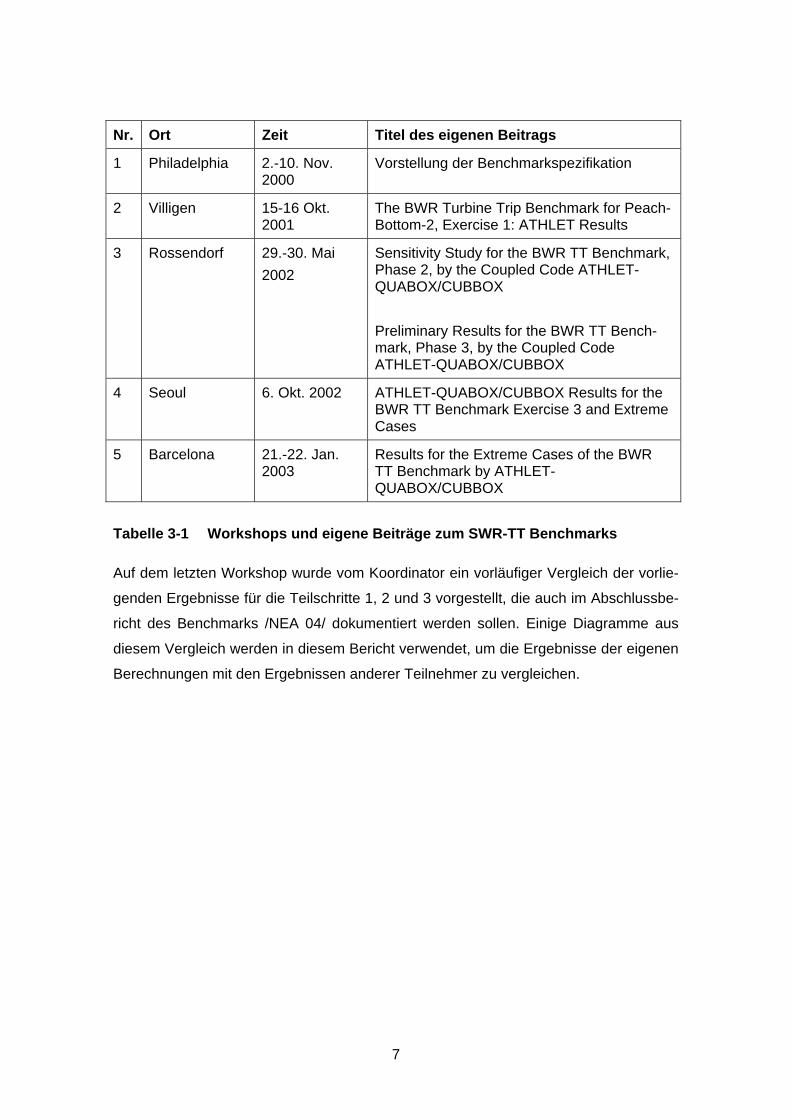
der Bearbeitung des Benchmarks wurden insgesamt fünf Workshops abgehalten. Eine
Übersicht zu diesen Workshops ist in Tabelle 3.1 gegeben.
Auf diesem Workshop wurden Zwischenergebnisse von den Teilnehmern vorgestellt
und Fragen zur Modellierung oder zu den vorläufigen Ergebnissen ausführlich disku-
tiert. Die Protokolle dieser Workshops liegen als NEA/NSC/DOC-Dokumente vor, die
Beiträge der Teilnehmer sind auf CD’s verfügbar. Die Beträge der GRS sind ebenfalls
in der Tabelle 3.1 zusammengestellt. Aus dieser Tabelle ergibt sich auch der Zeitplan,
in dem die Berechnungen zu den drei Teilschritten 1 bis 3 durchgeführt wurden.
6
Nr. Ort Zeit Titel des eigenen Beitrags
1 Philadelphia 2.-10. Nov. 2000
Vorstellung der Benchmarkspezifikation
2 Villigen 15-16 Okt. 2001
The BWR Turbine Trip Benchmark for Peach-Bottom-2, Exercise 1: ATHLET Results
3 Rossendorf 29.-30. Mai 2002
Sensitivity Study for the BWR TT Benchmark, Phase 2, by the Coupled Code ATHLET-QUABOX/CUBBOX Preliminary Results for the BWR TT Bench-mark, Phase 3, by the Coupled Code ATHLET-QUABOX/CUBBOX
4 Seoul 6. Okt. 2002 ATHLET-QUABOX/CUBBOX Results for the BWR TT Benchmark Exercise 3 and Extreme Cases
5 Barcelona 21.-22. Jan. 2003
Results for the Extreme Cases of the BWR TT Benchmark by ATHLET-QUABOX/CUBBOX
Tabelle 3-1 Workshops und eigene Beiträge zum SWR-TT Benchmarks
Auf dem letzten Workshop wurde vom Koordinator ein vorläufiger Vergleich der vorlie-
genden Ergebnisse für die Teilschritte 1, 2 und 3 vorgestellt, die auch im Abschlussbe-
richt des Benchmarks /NEA 04/ dokumentiert werden sollen. Einige Diagramme aus
diesem Vergleich werden in diesem Bericht verwendet, um die Ergebnisse der eigenen
Berechnungen mit den Ergebnissen anderer Teilnehmer zu vergleichen.
7
4 Berechnung der SWR Turbinenschnellschlusstransiente für Peach Bottom 2
4.1 Berechnung der Anlagentransiente mit ATHLET, Teilschritt 1
4.1.1 Erstellung des ATHLET-Modells
Die amerikanische SWR-Anlage Peach-Bottom-2 unterscheidet sich von deutschen
SWR-Anlagen durch die zwei äußeren Umwälzschleifen oder Rezirkulationsschleifen,
für die internen Jetpumpen. Deshalb konnte für die Berechnungen kein ATHLET-
Standardeingabedatensatz für eine SWR-Anlage deutscher Bauart als Ausgangspunkt
gewählt werden. In der Spezifikation sind Eingabedaten für eine RETRAN Nodalisie-
rung des Reaktordruckbehälters (RDB) und des Frischdampfsystems angegeben. Dies
umfasst eine Darstellung durch Volumenelemente (VE) sowie die Angaben zum Volu-
men und der Länge der VE, der Strömungsfläche und des hydraulischen Durchmes-
sers sowie der geometrischen Höhen für den Reaktordruckbehälter, die
Rezirkulationsschleifen und die Frischdampfleitung einschließlich der Bypassleitung.
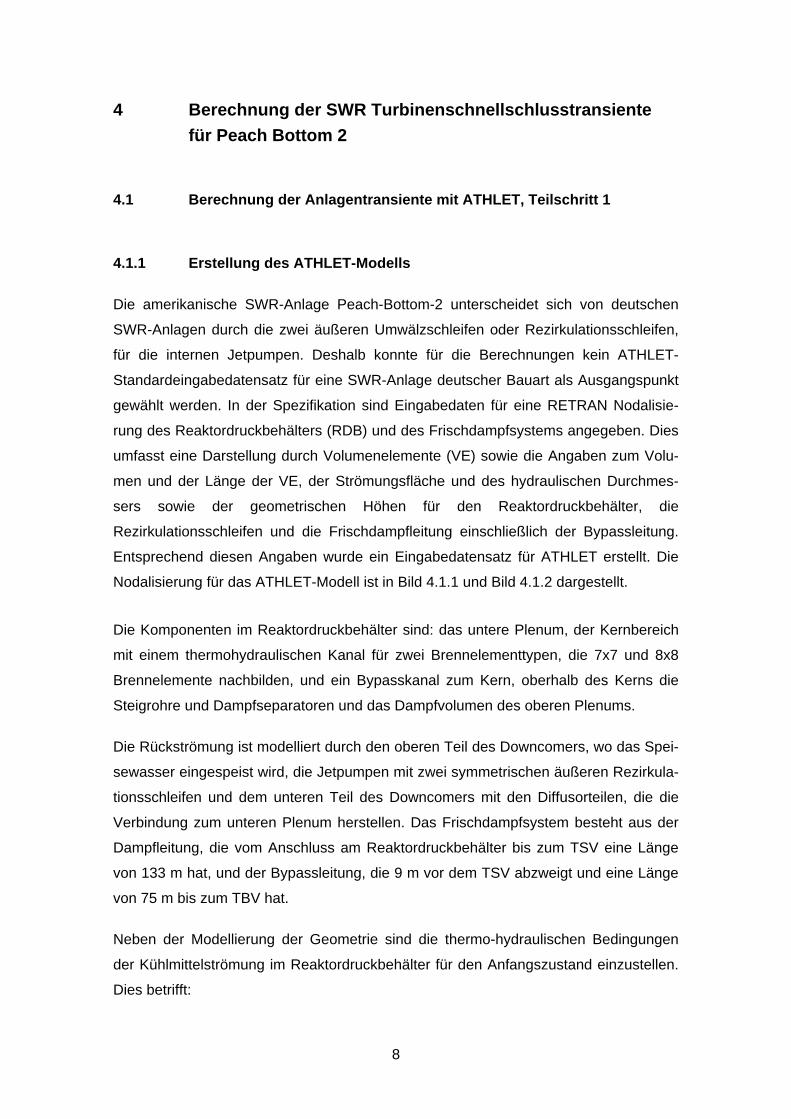
Entsprechend diesen Angaben wurde ein Eingabedatensatz für ATHLET erstellt. Die
Nodalisierung für das ATHLET-Modell ist in Bild 4.1.1 und Bild 4.1.2 dargestellt.
Die Komponenten im Reaktordruckbehälter sind: das untere Plenum, der Kernbereich
mit einem thermohydraulischen Kanal für zwei Brennelementtypen, die 7x7 und 8x8
Brennelemente nachbilden, und ein Bypasskanal zum Kern, oberhalb des Kerns die
Steigrohre und Dampfseparatoren und das Dampfvolumen des oberen Plenums.
Die Rückströmung ist modelliert durch den oberen Teil des Downcomers, wo das Spei-
sewasser eingespeist wird, die Jetpumpen mit zwei symmetrischen äußeren Rezirkula-
tionsschleifen und dem unteren Teil des Downcomers mit den Diffusorteilen, die die
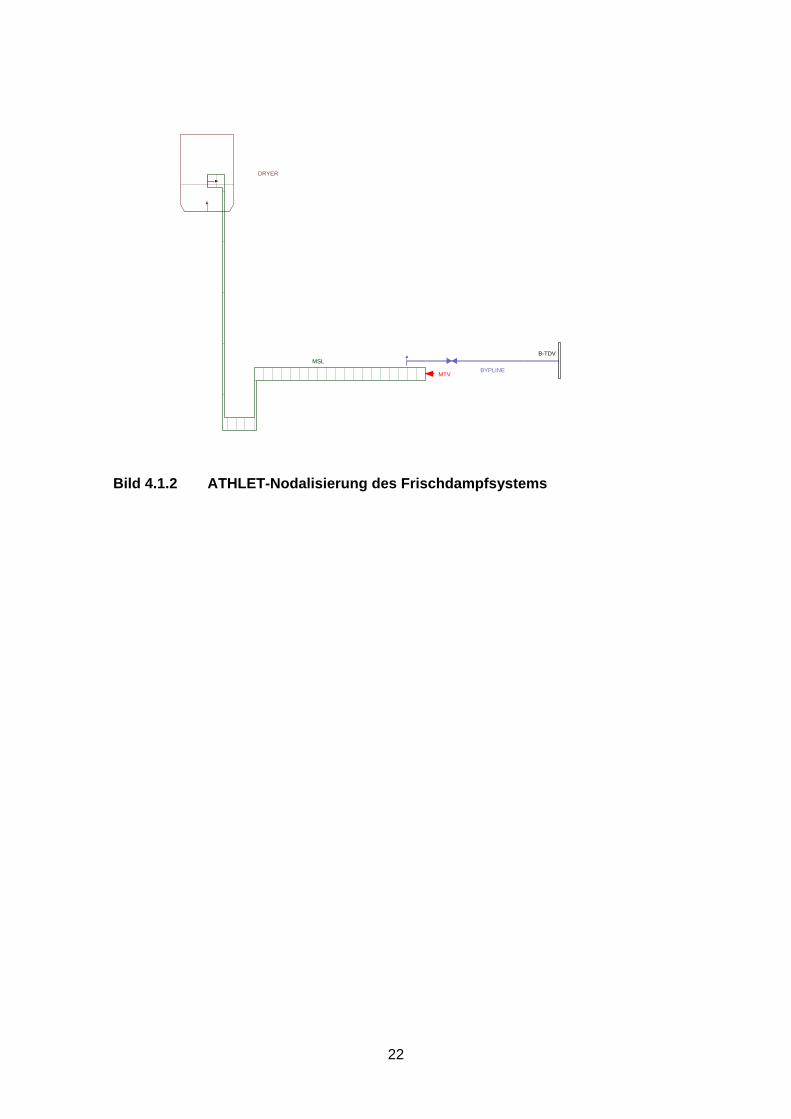
Verbindung zum unteren Plenum herstellen. Das Frischdampfsystem besteht aus der
Dampfleitung, die vom Anschluss am Reaktordruckbehälter bis zum TSV eine Länge
von 133 m hat, und der Bypassleitung, die 9 m vor dem TSV abzweigt und eine Länge
von 75 m bis zum TBV hat.
Neben der Modellierung der Geometrie sind die thermo-hydraulischen Bedingungen
der Kühlmittelströmung im Reaktordruckbehälter für den Anfangszustand einzustellen.
Dies betrifft:
8
• die Druckverteilung im System, wobei der Druck im Dampfvolumen des oberen
Plenums als vorgegebener Bezugswert vorgegeben wird und die Wider-
standswerte und Reibungskoeffizienten benutzt werden, um die Druckvertei-
lung im System anzupassen, insbesondere den Druckabfall über dem Kern,
• die Eintrittsbedingungen am Reaktorkern, also Massenstrom und Kühl-
mitteltemperatur am Kerneintritt.
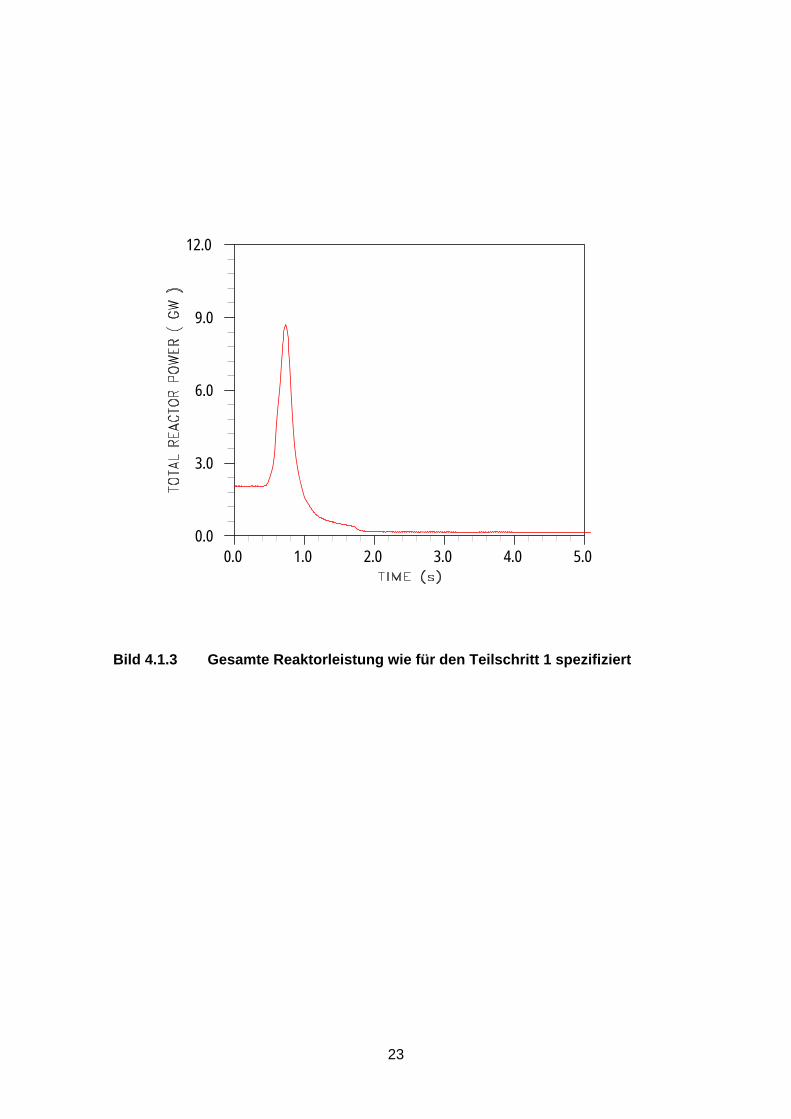
Die Reaktorleistung wird als Zeitfunktion vorgegeben. Für die Berechnung der Turbi-
nenschnellschluss-Transiente wird ein lineares Verhalten der Ventilöffnungsflächen
von TSV und TBV angesetzt. Die Charakteristik des TBV wird so angesetzt, dass stets
kritische Ausströmbedingungen während des Öffnens erreicht werden und der Dampf-
strom bei voll geöffnetem Ventil 600 kg/s beträgt.
4.1.2 Ergebnisse der ATHLET-Berechnung für die Turbinenschnellschluss-
Transiente
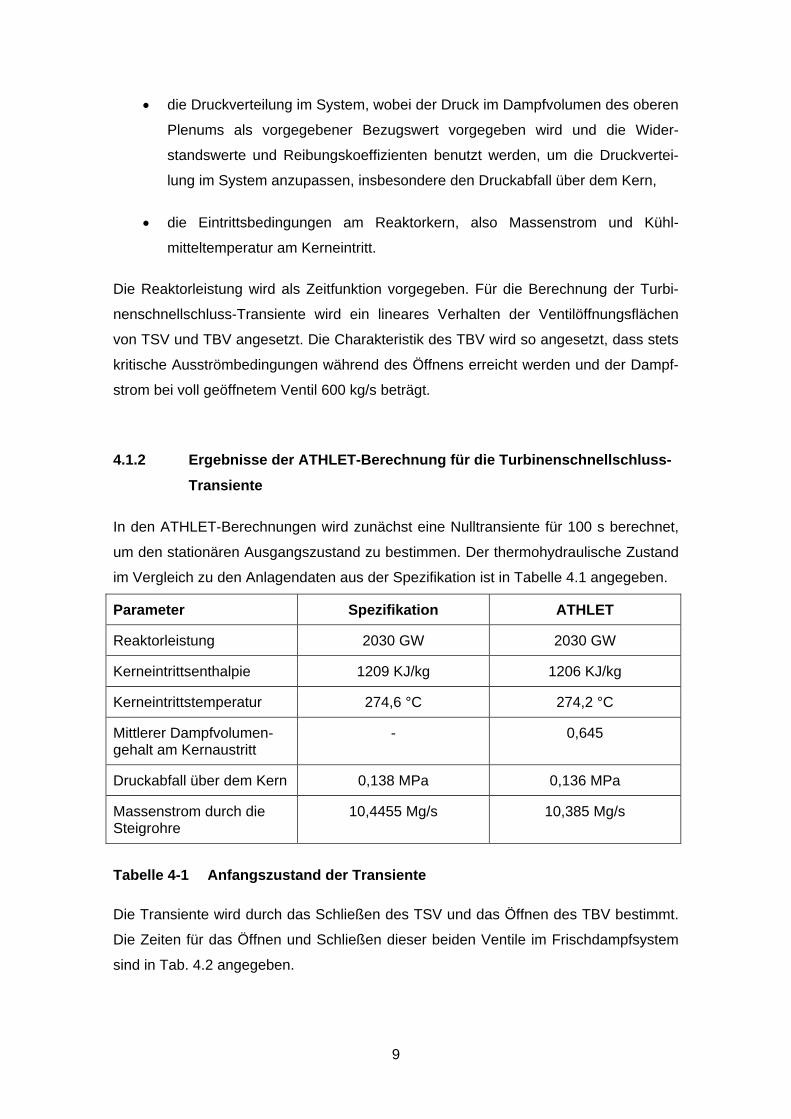
In den ATHLET-Berechnungen wird zunächst eine Nulltransiente für 100 s berechnet,
um den stationären Ausgangszustand zu bestimmen. Der thermohydraulische Zustand
im Vergleich zu den Anlagendaten aus der Spezifikation ist in Tabelle 4.1 angegeben.
Parameter Spezifikation ATHLET
Reaktorleistung 2030 GW 2030 GW
Kerneintrittsenthalpie 1209 KJ/kg 1206 KJ/kg
Kerneintrittstemperatur 274,6 °C 274,2 °C
Mittlerer Dampfvolumen-gehalt am Kernaustritt
- 0,645
Druckabfall über dem Kern 0,138 MPa 0,136 MPa
Massenstrom durch die Steigrohre
10,4455 Mg/s 10,385 Mg/s
Tabelle 4-1 Anfangszustand der Transiente
Die Transiente wird durch das Schließen des TSV und das Öffnen des TBV bestimmt.
Die Zeiten für das Öffnen und Schließen dieser beiden Ventile im Frischdampfsystem
sind in Tab. 4.2 angegeben.
9
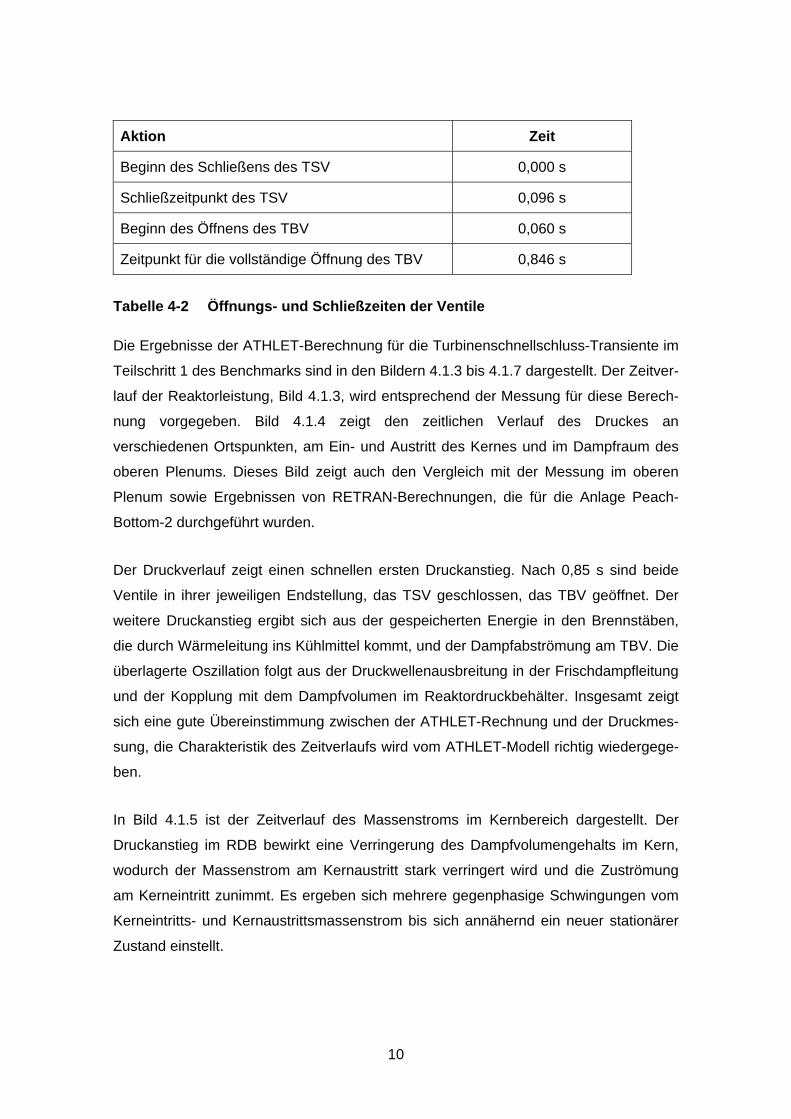
Aktion Zeit
Beginn des Schließens des TSV 0,000 s
Schließzeitpunkt des TSV 0,096 s
Beginn des Öffnens des TBV 0,060 s
Zeitpunkt für die vollständige Öffnung des TBV 0,846 s
Tabelle 4-2 Öffnungs- und Schließzeiten der Ventile
Die Ergebnisse der ATHLET-Berechnung für die Turbinenschnellschluss-Transiente im
Teilschritt 1 des Benchmarks sind in den Bildern 4.1.3 bis 4.1.7 dargestellt. Der Zeitver-
lauf der Reaktorleistung, Bild 4.1.3, wird entsprechend der Messung für diese Berech-
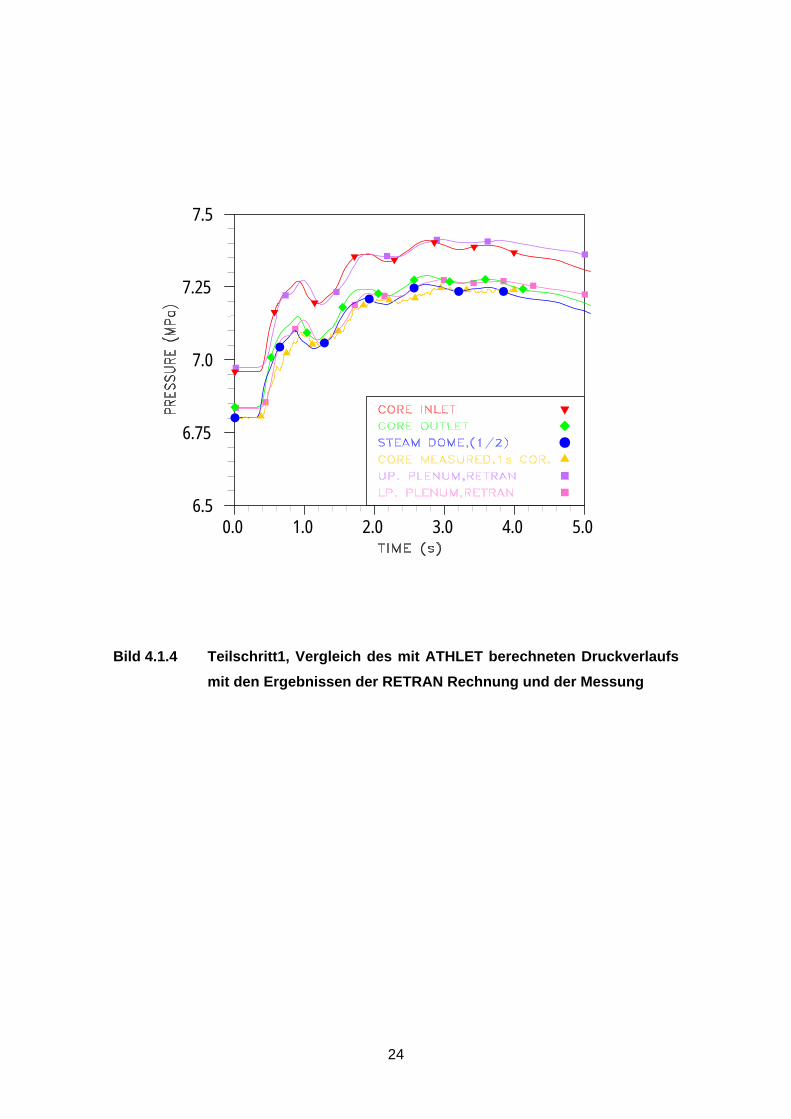
nung vorgegeben. Bild 4.1.4 zeigt den zeitlichen Verlauf des Druckes an
verschiedenen Ortspunkten, am Ein- und Austritt des Kernes und im Dampfraum des
oberen Plenums. Dieses Bild zeigt auch den Vergleich mit der Messung im oberen
Plenum sowie Ergebnissen von RETRAN-Berechnungen, die für die Anlage Peach-
Bottom-2 durchgeführt wurden.
Der Druckverlauf zeigt einen schnellen ersten Druckanstieg. Nach 0,85 s sind beide
Ventile in ihrer jeweiligen Endstellung, das TSV geschlossen, das TBV geöffnet. Der
weitere Druckanstieg ergibt sich aus der gespeicherten Energie in den Brennstäben,
die durch Wärmeleitung ins Kühlmittel kommt, und der Dampfabströmung am TBV. Die
überlagerte Oszillation folgt aus der Druckwellenausbreitung in der Frischdampfleitung
und der Kopplung mit dem Dampfvolumen im Reaktordruckbehälter. Insgesamt zeigt
sich eine gute Übereinstimmung zwischen der ATHLET-Rechnung und der Druckmes-
sung, die Charakteristik des Zeitverlaufs wird vom ATHLET-Modell richtig wiedergege-
ben.
In Bild 4.1.5 ist der Zeitverlauf des Massenstroms im Kernbereich dargestellt. Der
Druckanstieg im RDB bewirkt eine Verringerung des Dampfvolumengehalts im Kern,
wodurch der Massenstrom am Kernaustritt stark verringert wird und die Zuströmung
am Kerneintritt zunimmt. Es ergeben sich mehrere gegenphasige Schwingungen vom
Kerneintritts- und Kernaustrittsmassenstrom bis sich annähernd ein neuer stationärer
Zustand einstellt.
10
Das Bild 4.1.6 zeigt die Massenströme im Frischdampfsystem. Die Ortspunkte sind:
Beginn der Dampfleitung am RDB, das TSV und die Abzweigung der Bypassleitung
von der Frischdampfleitung. Nach dem Schließen des TSV innerhalb von 0,096 s geht
der Dampfmassenstrom auf Null. Am Ausgang des RDB’s zeigt sich eine Schwingung
des Dampfmassenstroms, deren Amplitude über den Ausgangswert im Anfangszu-
stand hinausgeht. Die Massenstromschwingung ist gedämpft und passt sich dem Mas-
senstrom an der Abzweigung der Bypassleitung an. Dieser Massenstrom entspricht der
Abströmung von 600 kg/s am TBV. Die Dampfmassenströme in der Bypassleitung sind
in Bild 4.1.7 dargestellt.
In Parameterstudien zur Transiente wurde festgestellt, dass die Dämpfung der Mas-
senstromschwingung in der Frischdampfleitung stark von dem Widerstandswert am
Übergang vom RDB zur Frischdampfleitung abhängt. Eine Erhöhung des Wider-
standswertes bewirkt eine stärkere Dämpfung. Die Charakteristik des TBV wurde so
angepasst, dass der Dampfstrom des geöffneten Ventils 600 kg/s beträgt. Eine Erhö-
hung oder Verringerung dieses Massenstromwerts beeinflusst den Druckverlauf im
System. Mit dem für die Rechnung gewählten Wert ergibt sich die beste Übereinstim-
mung mit dem gemessenen Druckverlauf.
4.2 Berechnung der Kerntransiente mit ATHLET-QUABOX/CUBBOX, Teil-
schritt 2
4.2.1 Erstellung des Datensatzes für das 3D Kernmodell QUABOX/CUBBOX
Für das 3D Kernmodell ist die Kernbeladung zu beschreiben, die in der Spezifikation
beschrieben ist. Die Ortsdiskretisierung wurde so gewählt, dass jedem Brennelement
im XY-Querschnitt ein Node entspricht. In axialer Richtung wird die aktive Kernzone in
24 Nodes unterteilt mit je einem zusätzlichen Node für den unteren und oberen Reflek-
tor. Die Kernbeladung besteht aus 7x7 und 8x8 Brennelementen, wobei die 8x8
Brennelemente mit und ohne Drosselung am Eintritt eingesetzt werden. Die Wirkungs-
querschnitte und ihre Abhängigkeit von Abbrand, Kühlmitteldichte und Brennstofftem-
peratur sind in der Spezifikation vorgegeben. Die Funktionstabellen wurden in eine
QUABOX/CUBBOX Wirkungsquerschnittsbibliothek umgesetzt, wobei die vorgegebene
Interpolationsroutine verwendet wurde.
11
Für das Rückwirkungsmodell wurde ein Parallelkanalmodell aus ATHLET-
Komponenten erstellt. Dies besteht pro Kanal aus einer Fill-Komponente, einem Pipe-
Element und am oberen Austritt aus einer ‚time-dependent volume’-Komponente. Die
Kernrandbedingungen werden im ATHLET-Parallelkanalmodell durch die vorgegebe-
nen Zeitfunktionen für den Druck am Kernaustritt sowie den Massenstrom und die
Kühlmitteltemperaturen am Kerneintritt beschrieben. Die in der Spezifikation ebenfalls
angegebene Zeitfunktion für den Druck am Kerneintritt wird in diesem Modell nur für
die Initialisierung des Kerndruckabfalls im stationären Zustand verwendet. Im Stan-
dardmodell werden 33 THC modelliert, zum Vergleich wurde ein Kernmodell mit einer
1:1 Zuordnung der Brennelemente zu den Kühlkanälen erstellt, was zu 764 THC führt.
4.2.2 Berechnung der Kerntransiente mit vorgegebenen Randbedingungen,
Teilschritt 2
In einer Sensitivitätsstudie zu einigen Modellparametern und den Randbedingungen
des Kerns wurde der Einfluss auf wesentliche Ergebnisparameter untersucht, Die Ab-
hängigkeiten sind in Bild 4.2.1 zusammengefaßt, wobei die Pfeile auf der linken Seite
die Richtung der Parameteränderung bezeichnen und die Pfeile auf der rechten Seite
die Antwort in den Ergebnisparametern beschreibt. Als wesentliche Ergebnisparameter
werden betrachtet: der Eigenwert, der mittlere Dampfvolumenanteil im Kern, der axiale
Leistungspeakfaktor sowie die Höhe und der Zeitpunkt des Leistungspeaks.
Die Berechnungen wurden einerseits mit einem Kernmodell mit 33 THC wie in der
Benchmarkspezifikation vorgeschlagen durchgeführt, andererseits zum Vergleich mit
einem Kernmodell mit einer 1:1 Kühlkanalzuordnung zu den Brennelementen, was zu
insgesamt 764 THC führt. Das Bild 4.2.2 zeigt den Vergleich der beiden Berechnungen
für den Leistungspeak im Vergleich zu der Messung. Die axialen Leistungsprofile in
zwei ausgewählten Brennelementpositionen für die beiden Berechnungen werden in
den Bildern 4.2.3 und 4.2.4 verglichen. Grundsätzlich ist die Übereinstimmung recht
gut, die Leistungsverteilung wird in der Berechnung mit 764 THC etwas in die obere
Kernhälfte verschoben.
12
4.3 Berechnung der Turbinenschnellschlusstransiente mit dem gekoppel-
ten Rechenprogramm, Teilschritt 3
4.3.1 Eingabedaten für das gekoppelte Rechenprogramm
Der Eingabedatensatz für das gekoppelte Rechenprogramm entsteht durch Zusam-
menführung des ATHLET-Eingabedatensatzes für Teilschritt 1 und des
QUABOX/CUBBOX-Eingabedatensatzes für Teilschritt 2. Die wesentliche Ergänzung
ist die Zuordnung der Brennelemente der Kernbeladung zu den thermofluiddynami-
schen Kanälen (THC) zur Beschreibung der Kühlmittelströmung, die in Bild 4.3.1 dar-
gestellt ist. Die gekoppelte Berechnung wird mit 34 THC durchgeführt. Die zeitlichen
Änderungen am Kerneintritt werden jetzt direkt aus der Berechnung bestimmt. Der
Transientenablauf wird wie in Teilschritt 1 für die Anlagentransiente durch das Schlie-
ßen des TSVs und das Öffnen des TBVs bestimmt.
4.3.2 Ergebnisse zur gekoppelten Berechnung der Turbi-
nenschnellschlußtransiente
Das Ergebnis der Berechnung sind der zeitliche Verlauf des Druckes im Reaktordruck-
behälter, der zeitliche Verlauf des Leistungspeaks, wobei sich Zeitpunkt und Höhe des
Peaks direkt aus der Berechnung ergeben. Zur Auswertung und zum Vergleich werden
das radial gemittelte axiale Dampfblasenprofil und die radial gemittelte axiale Leis-
tungsdichteverteilung bestimmt. Die axiale Leistungsdichteverteilung wird in zwei
Brennelementpositionen bestimmt um auch lokale Leistungsdichten zu vergleichen.
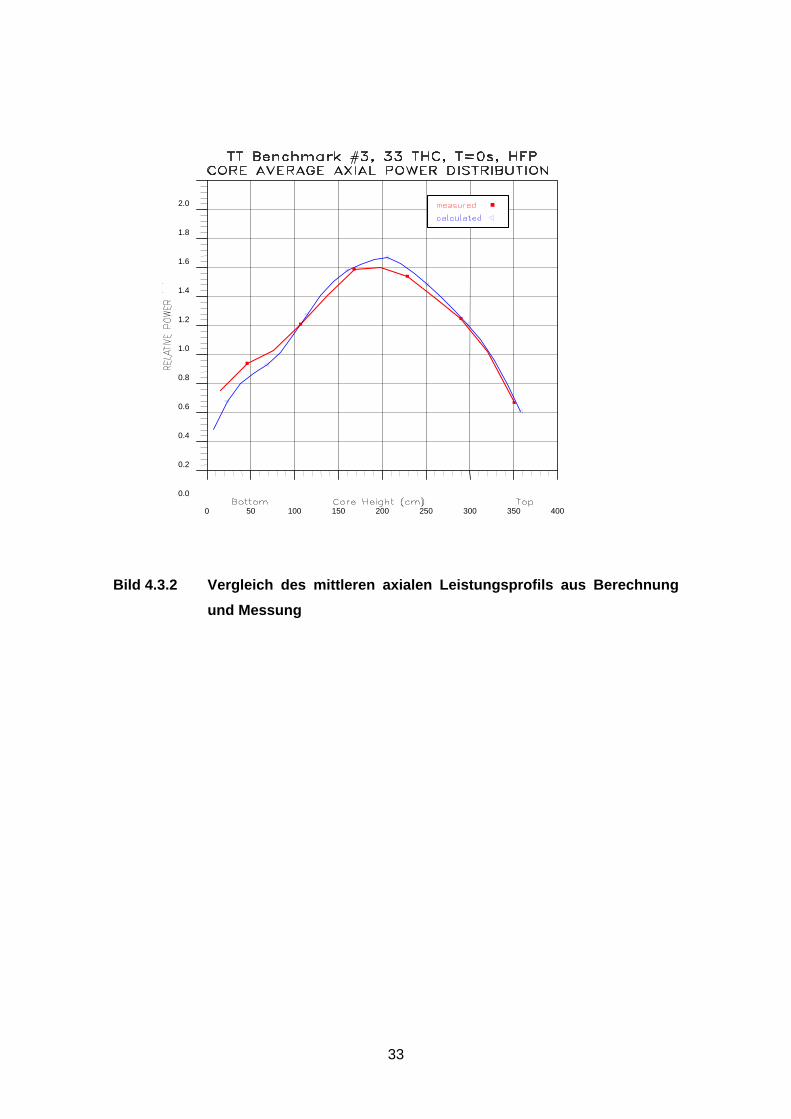
Der Vergleich der axialen Leistungsprofile im stationären Zustand für die Berechnung
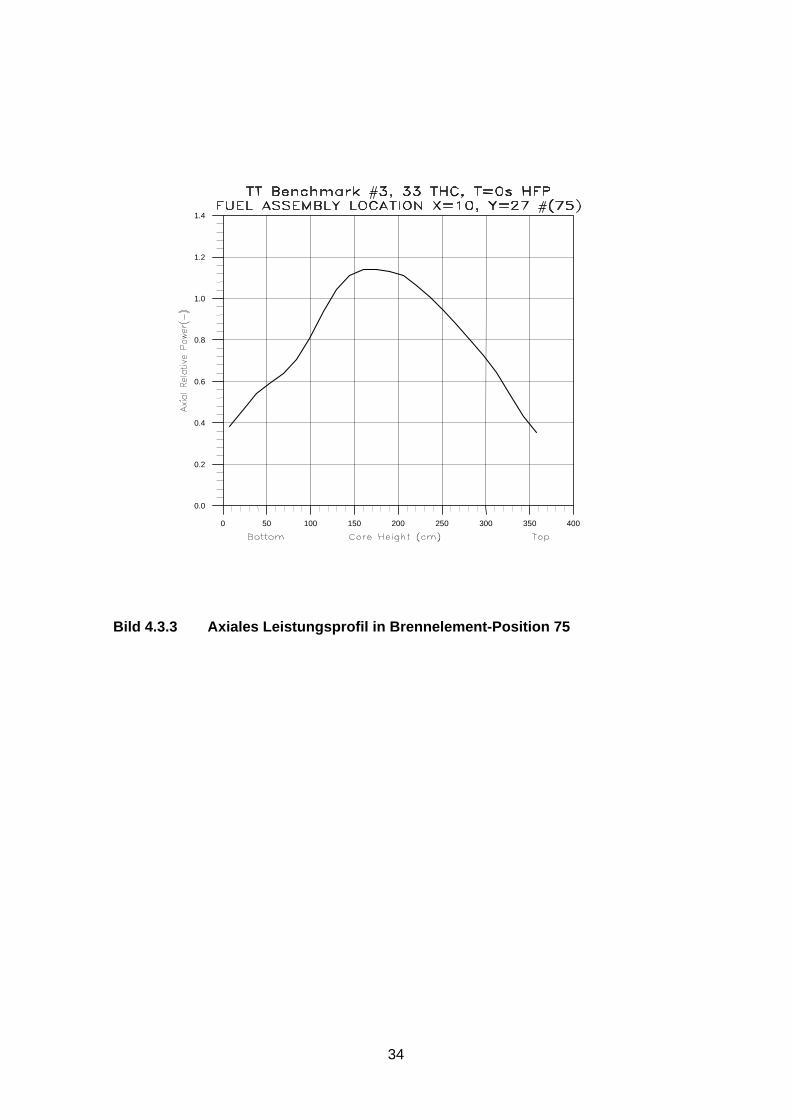
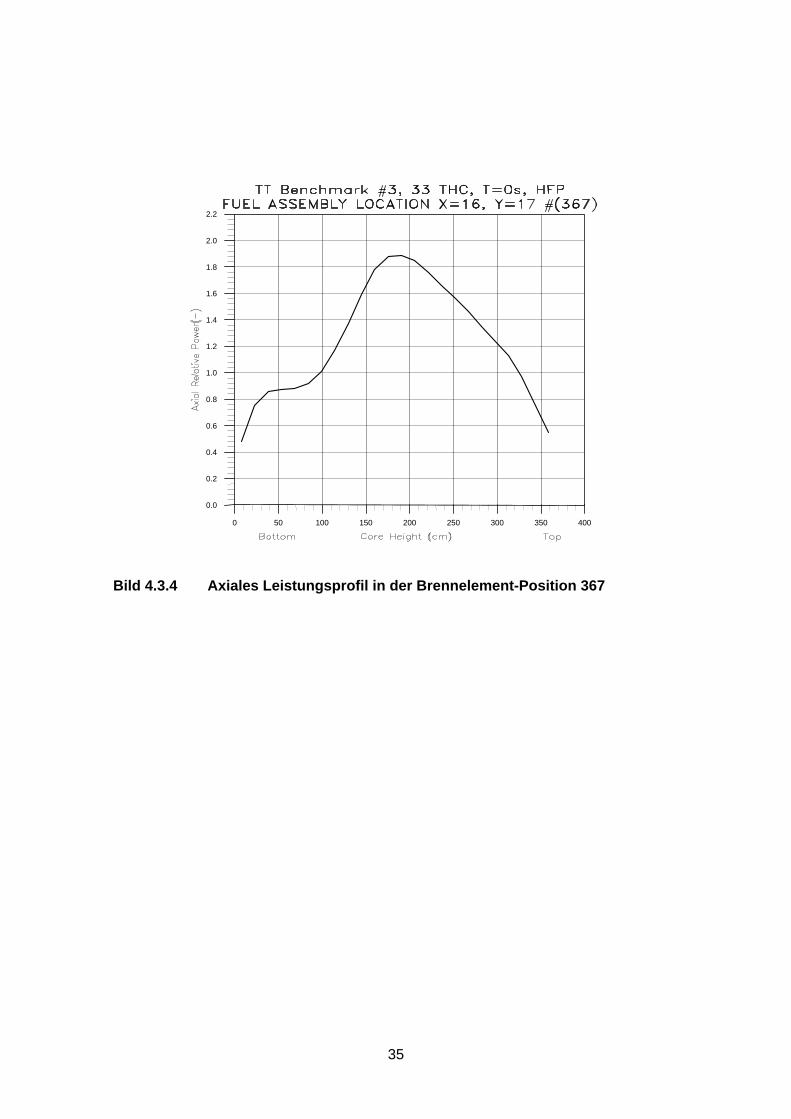
mit 33 THC und 764 THC ist in Bild 4.3.2 dargestellt. Die Bilder 4.3.3 und 4.3.4 zeigen
das axiale Leistungsprofil in den ausgewählten Brennelementpositionen.
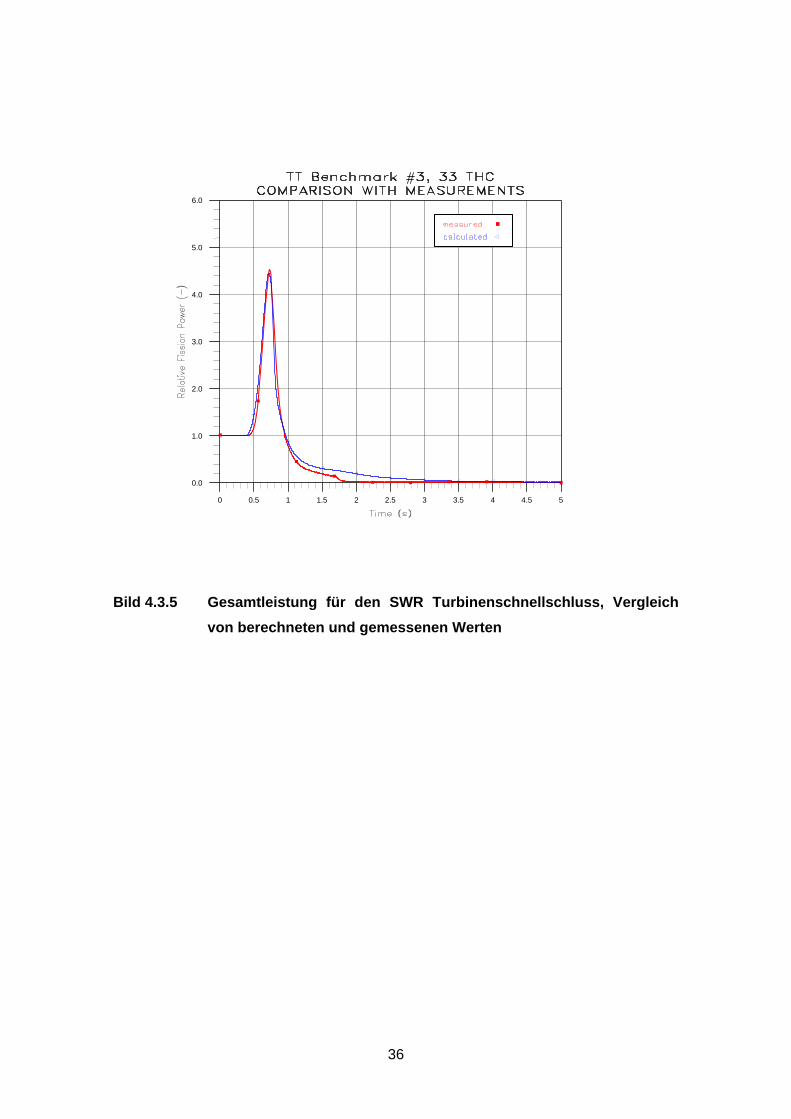
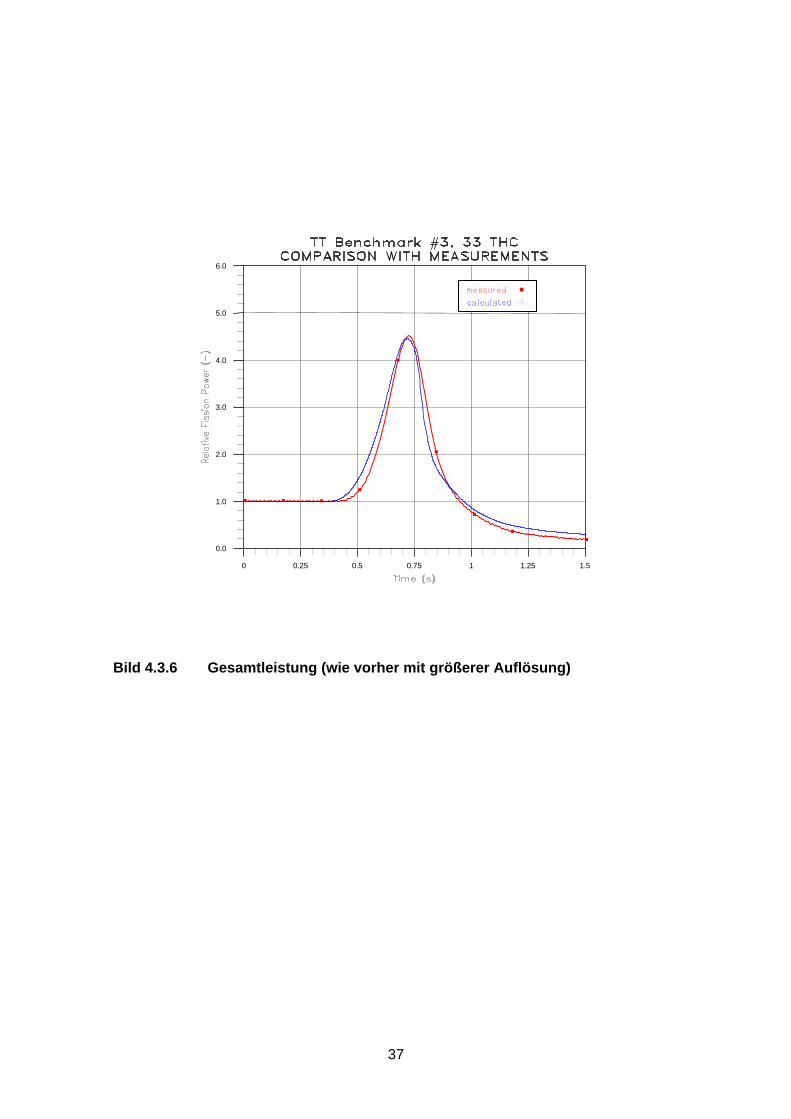
Der Vergleich für den Leistungspeak während der Turbinenschnellschlusstransiente
zwischen Berechnung und Messung ist in Bild 4.3.5 dargestellt, tatsächlich ergibt sich
eine sehr gute Übereinstimmung. Der Vergleich ist im Bild 4.3.6 in vergrößertem Maß-
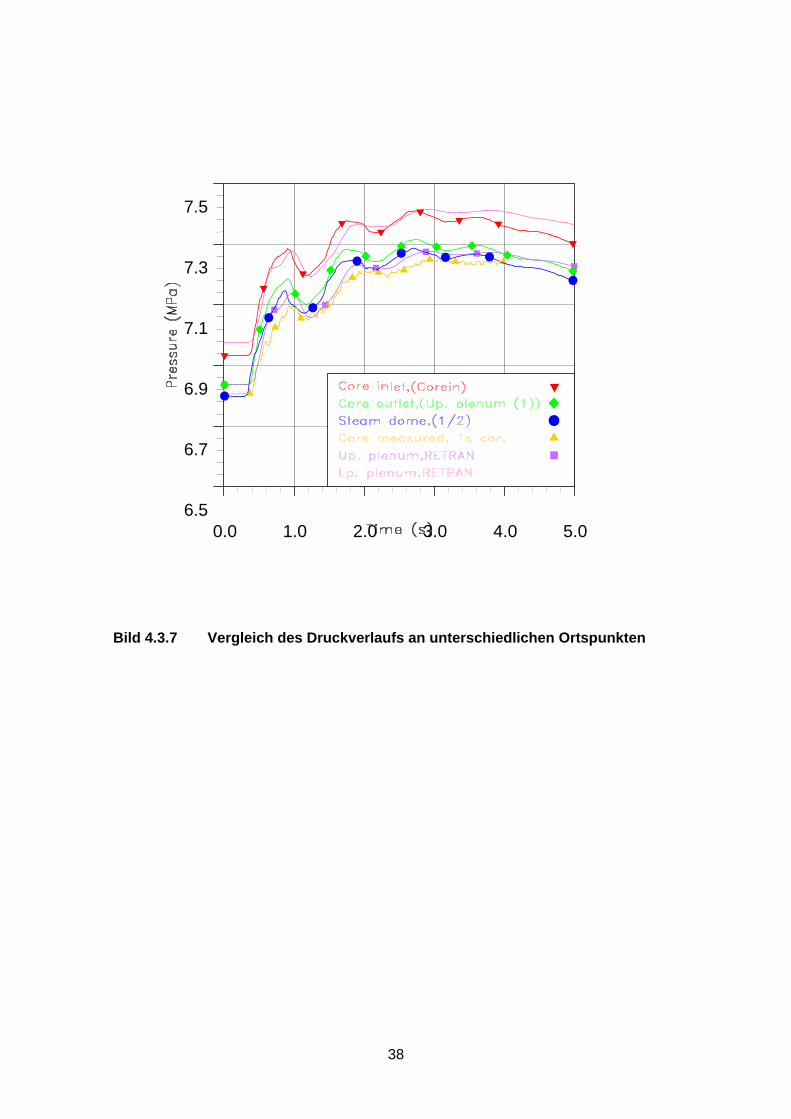
stab dargestellt. Der zeitliche Verlauf für den Druck an verschiedenen Ortspunkten ist
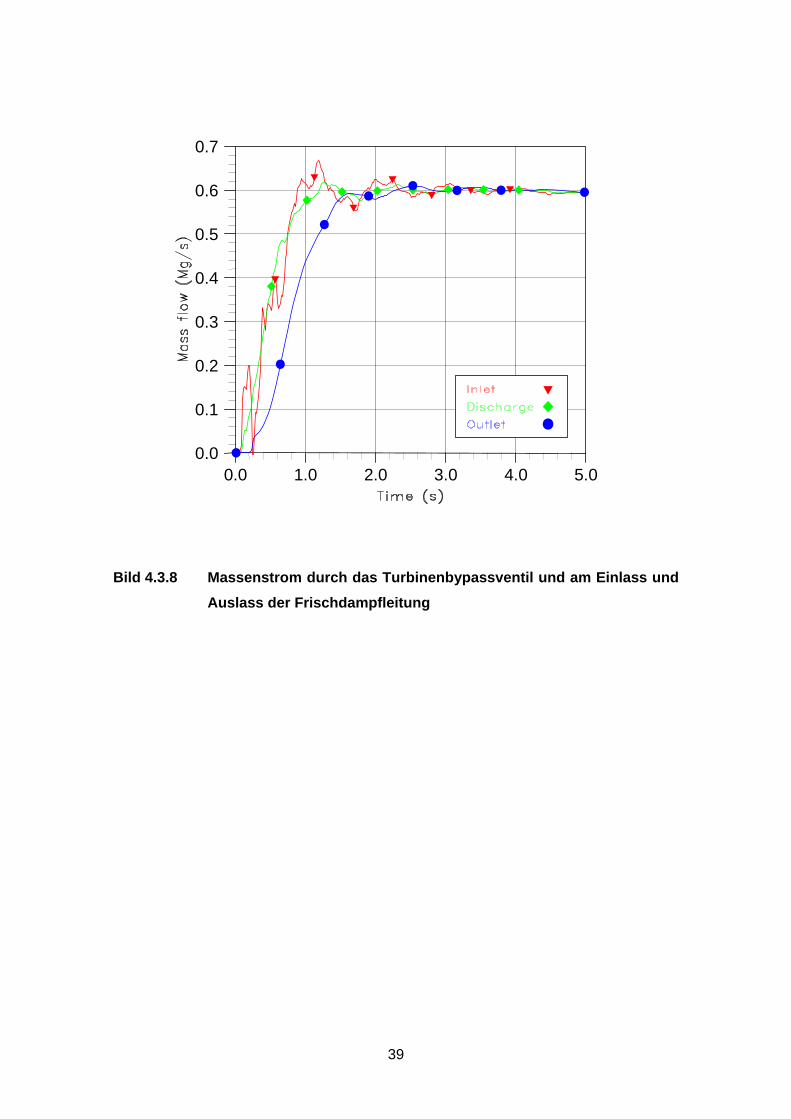
in Bild 4.3.7 dargestellt und die Massenströme in der Frischdampfleitung und im TBV in
Bild 4.3.8. Ein Vergleich mit den Ergebnissen aus Teilschritt 1 ergibt eine gute Über-
einstimmung in den Zeitverläufen. Zu beachten ist jedoch, dass in der gekoppelten Be-
13
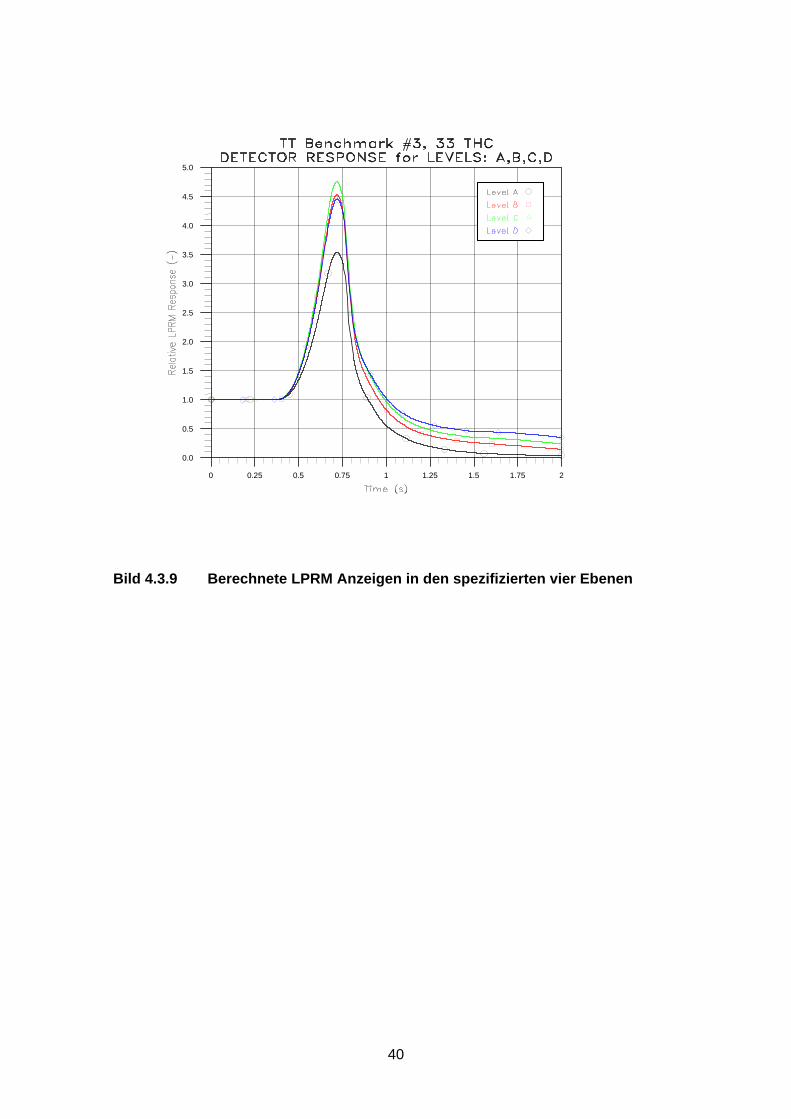
rechnung der Leistungspeak ein direktes Ergebnis der Berechnung ist. In Ergänzung
sind in Bild 4.3.9 zusätzlich die LPRM-Anzeigen aus der Berechnung angegeben.
4.4 Berechnung der extremen Fälle
4.4.1 Eingabedatensatz für die extremen Fälle
Für die Berechnung der sog. extremen Fälle mit zusätzlich postulierten Ausfällen wird
der Eingabedatensatz für die Nachrechnung der Turbinenschnellschlusstransiente mit
dem gekoppelten Rechenprogramm herangezogen. Die postulierten Ausfälle werden
im Datensatz entsprechend umgesetzt. Die Anordnung der Ventile im Frischdampfsys-
tem ist in Bild 4.4.1 dargestellt. Es werden folgende Fälle betrachtet:
3.1 Turbinenschnellschluss ohne Öffnen des TBVs mit Schnellabschaltung
3.2 Turbinenschnellschluss mit Öffnen des TBVs und ohne Schnellab-
schaltung (ATWS)
3.3 Die Überlagerung der beiden Ausfälle, also Turbinenschnellschluss
ohne Öffnen der TBVs und ohne Schnellabschaltung (ATWS), die DH-
Abblaseventile sind zur Druckbegrenzung wirksam
3.4 Der hypothetische Fall, wobei im Fall 3.3 zusätzlich unterstellt wird,
dass die DH-Abblaseventile nicht zur Verfügung stehen. Damit ist das
Anlagenverhalten ohne jegliche Dampfabgabe zu berechnen
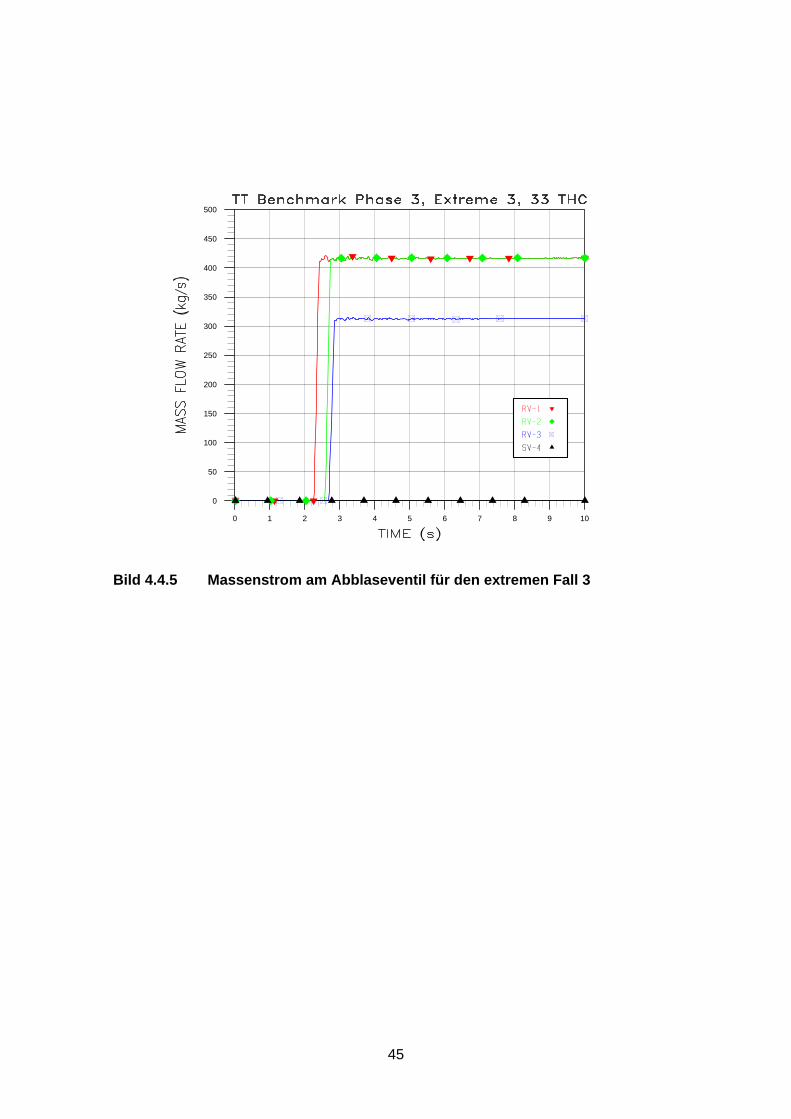
4.4.2 Ergebnisse für die extremen Fälle
Die wesentlichen Unterschiede in den extremen Fällen ergeben sich daraus, ob der
Reaktor abgeschaltet wird oder nicht. Nach der Abschaltung wird die Leistung stark
verringert, ohne Abschaltung stellt sich ein neuer Gleichgewichtszustand bei erhöhter
Leistung ein. Je nach den Bedingungen der Dampfentnahme zur Druckbegrenzung
von dem TBV oder den Abblase- und Sicherheitsventilen überlagern sich unterschied-
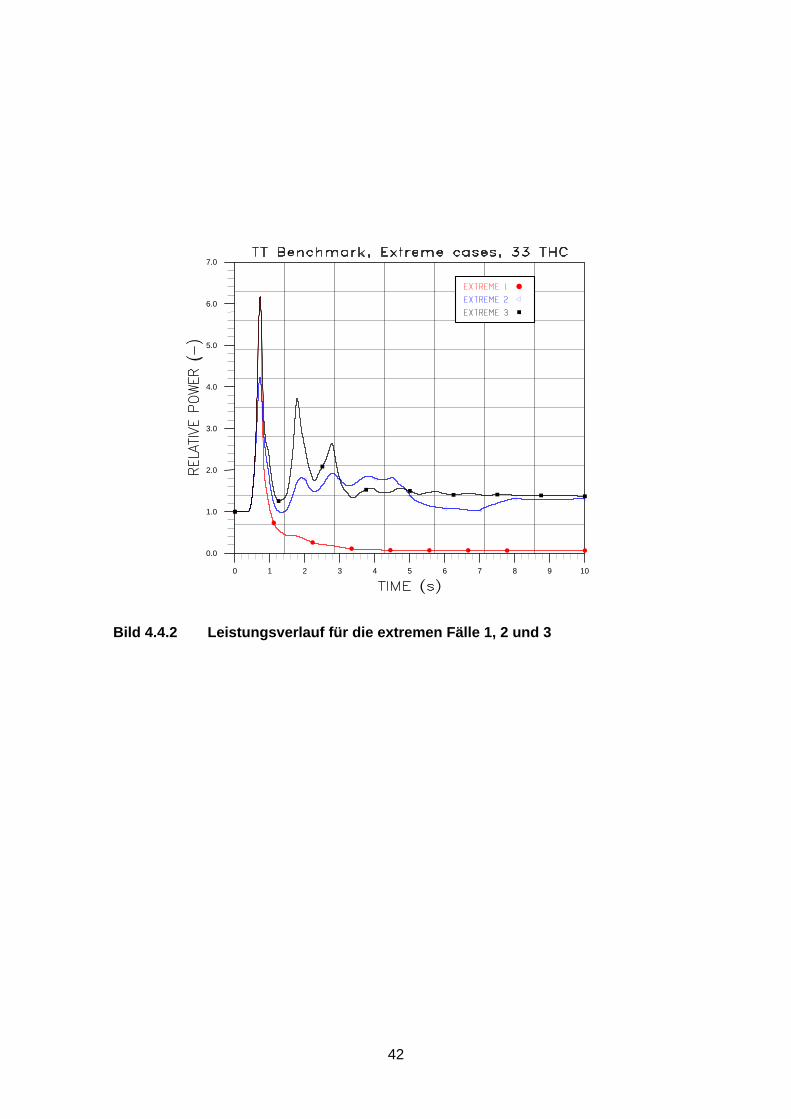
lich starke Leistungsoszillationen. Die Zeitverläufe der Leistung für die extremen Fälle
1 bis 3 sind in Bild 4.4.2 gemeinsam dargestellt. Die den Fällen 1 bis 3 zugeordneten
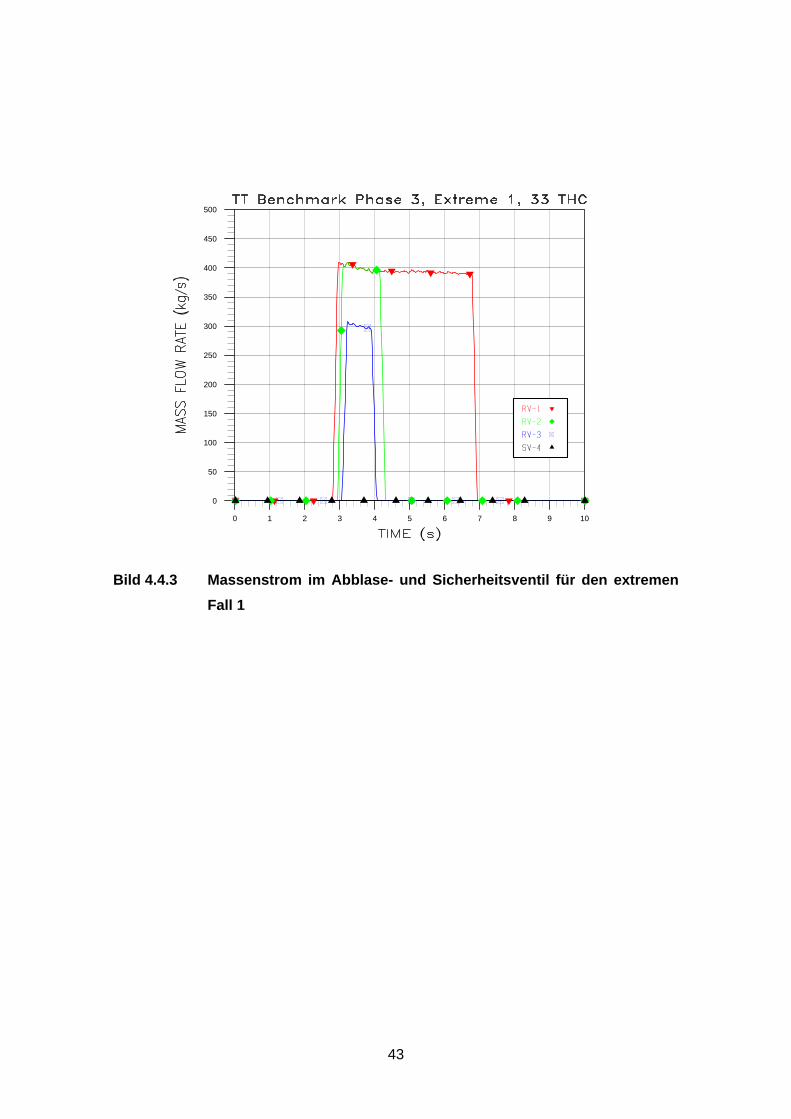
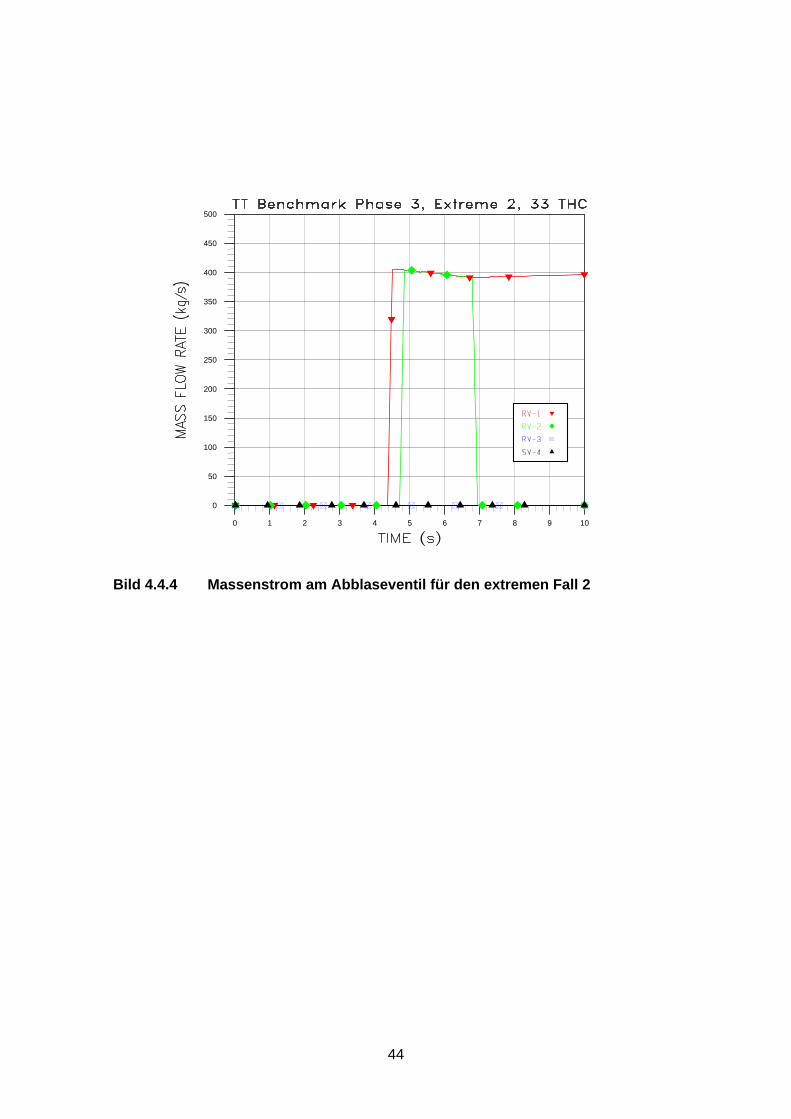
Massenströme an den Abblase- und Sicherheitsventilen sind in den Bildern 4.4.3 bis
4.4.5 dargestellt. Es ist offensichtlich, dass die Zeitpunkte des Ventilöffnens und der
14

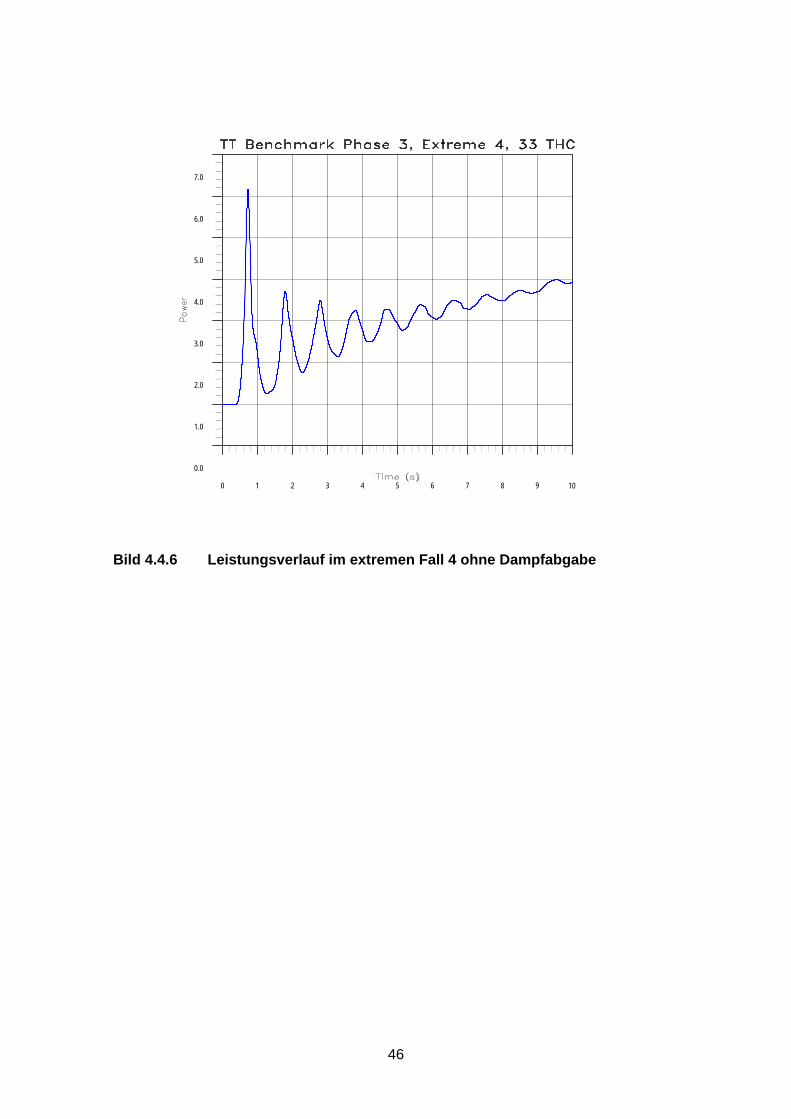
jeweilige Abblasemassenstrom den Leistungsverlauf beeinflussen. Aus diesem Grund
wurde für den besseren Vergleich der verschiedenen Rechenprogramme ein hypothe-
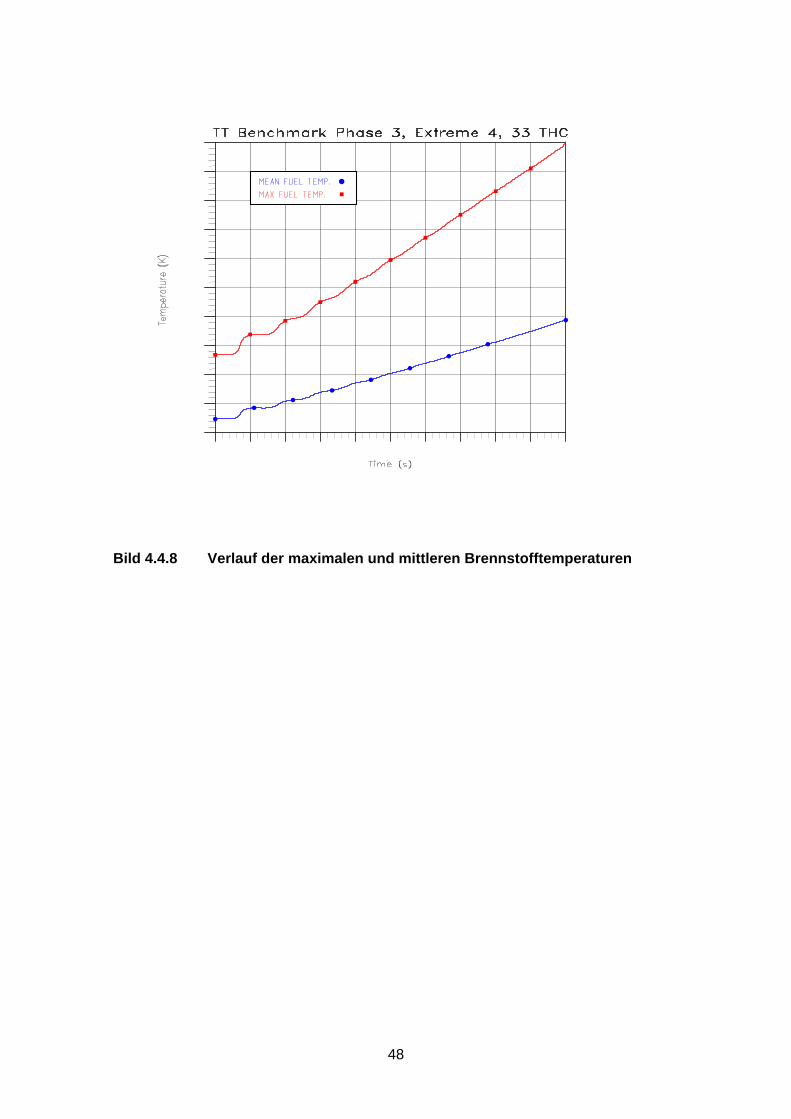
tischer Fall 4 definiert, in dem die Nichtverfügbarkeit der Ventile postuliert wird. Die we-
sentlichen Ergebnisparameter dieser Berechnung sind die Leistung in Bild 4.4.6, die
relativen Reaktivitätsbeiträge in Bild 4.4.7 und die maximale und mittlere Brennstoff-
temperatur in Bild 4.4.8. Die Berechnung dieses hypothetischen Falles ohne Dampfab-
gabe bestätigt, dass das gekoppelte Rechenprogramm ATHLET-QUABOX/CUBBOX
durchaus geeignet ist solche Leistungsoszillationen über einen längeren Zeitbereich zu
berechnen.
15
5 Zusammenfassung
Im Rahmen der OECD Aktivitäten zur Validierung gekoppelter Rechenprogramme für
LWR wurden nunmehr zwei Benchmarks durchgeführt. Nach der Berechnung eines
DWR Frischdampfleitungsbruches, bei dem nur die Ergebnisse verschiedener Re-
chenprogramme verglichen wurden, jetzt die Berechnung einer SWR Turbi-
nenschnellschlusstransiente, für die auch gemessene Daten von der Anlage Peach
Bottom-2 vorliegen. Die Methodik, die Benchmarks in mehreren Teilschritten durchzu-
führen, hat sich bewährt. Es ist äußerst nützlich, die Datenerstellung für das Anlagen-
modell, also den Eingabedatensatz für ATHLET, und das 3D-Kernmodell, also den
Eingabedatensatz für QUABOX/CUBBOX, getrennt durchzuführen und die Ergebnisse
der Teilmodelle in den gekoppelten Rechenprogrammen auf Plausibilität und Konsis-
tenz zu testen. Im Übrigen entspricht dies auch dem Ablauf in der Praxis. Die Auswer-
tung der Anlagentransiente mit Punktkinetik oder für die SWR Turbinenschnell-
schlusstransiente mit vorgegebener Zeitfunktion für die Leistung macht Unterschiede in
der Modellierung in den verschiedenen Systemcodes deutlich, die dann noch aufein-
ander abgestimmt werden können. Die Durchführung der 3D-Kernrechnung mit vorge-
gebenen Zeitfunktionen dient im Wesentlichen zur Überprüfung der Umsetzung der
Kernbeladung und der Wirkungsquerschnittsbibliotheken für die Kernberechnung.
Der Vergleich der Berechnungen für die DWR- und die SWR-Transiente zeigt, dass die
Berechnungen für eine SWR-Anlagentransiente in mehreren Punkten anspruchsvoller
sind. Das ATHLET-Modell für die zweiphasige Kühlmittelströmung enthält einige Mo-
dellparameter, wie z. B. die Dampfproduktionsrate oder das thermodynamische Nicht-
gleichgewicht zwischen Dampf- und Wasserphasen, die sich direkt auf das axiale
Dampfblasenprofil auswirken, und in Verbindung mit der starken Rückwirkung auf die
Leistungserzeugung das axiale Leistungsdichteprofil beeinflussen. Für die Dynamik der
Dampfbildung in den Kühlkanälen ist der Anteil der direkten Energieerzeugung im
Kühlmittel von großer Bedeutung, dies gilt insbesondere für die Beschreibung der
Drucktransiente mit dem sehr schnellen Leistungsanstieg nach dem Schließen des
Turbinenstellventils. Des Weiteren ist die Anpassung der Eintrittsmassenströme in den
Brennelementen in Abhängigkeit des Druckabfalls über den Kern wichtig, um die axiale
Dampfblasenverteilung in den Kühlkanälen und damit die axiale Leistungsdichtevertei-
lung zu beschreiben.
Insgesamt ist die Übereinstimmung der berechneten Leistungspeaks und des zeitli-
chen Druckverlaufs im Reaktordruckbehälter durch das gekoppelte Rechenprogramm
16
mit den gemessenen Werten von der Reaktoranlage sehr gut. Der schnelle Druckan-
stieg nach dem Turbinenschnellschluss und die überlagerten Schwingungen durch die
Druckwelle längs der Dampfleitung werden von der Rechnung richtig wiedergegeben.
Ebenso werden der Zeitpunkt und die Höhe des Leistungspeaks vom Rechenmodell
erfasst.
Die Berechnung der extremen Fälle mit zusätzlichen Ausfällen bestätigen, dass das
gekoppelte Rechenprogramm auch Transienten mit großen Leistungsschwingungen
berechnen kann, ohne dass numerische Schwierigkeiten auftreten. Die berechneten
Ergebnisse von ATHLET-QUABOX/CUBBOX sind plausibel und es zeigt sich Überein-
stimmung mit den Ergebnissen der anderen Rechenprogramme.
Zusammenfassend ist festzustellen, dass das gekoppelte Rechenprogramm ATHLET-
QUABOX/CUBBOX die SWR Turbinenschnellschlusstransiente in Peach Bottom-2 er-
folgreich berechnen konnte. Diese Nachrechnung einer Drucktransiente mit komplexen
physikalischen Prozessen in der Reaktoranlage und der engen Rückwirkung zwischen
Leistungserzeugung im Reaktorkern und der Kühlmittelströmung liefert einen wichtigen
Beitrag zur Validierung des Rechenprogramms für SWR Bedingungen.
17
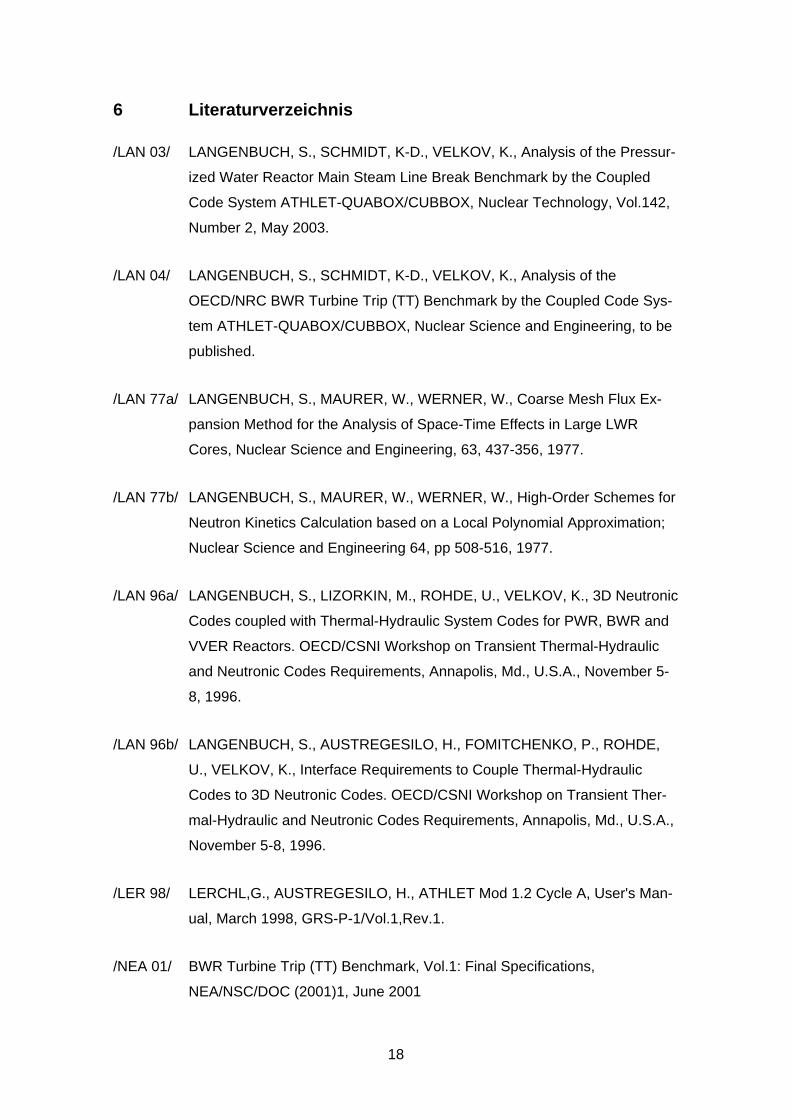
6 Literaturverzeichnis
/LAN 03/ LANGENBUCH, S., SCHMIDT, K-D., VELKOV, K., Analysis of the Pressur-
ized Water Reactor Main Steam Line Break Benchmark by the Coupled
Code System ATHLET-QUABOX/CUBBOX, Nuclear Technology, Vol.142,
Number 2, May 2003.
/LAN 04/ LANGENBUCH, S., SCHMIDT, K-D., VELKOV, K., Analysis of the OECD/NRC BWR Turbine Trip (TT) Benchmark by the Coupled Code Sys-
tem ATHLET-QUABOX/CUBBOX, Nuclear Science and Engineering, to be
published.
/LAN 77a/ LANGENBUCH, S., MAURER, W., WERNER, W., Coarse Mesh Flux Ex-
pansion Method for the Analysis of Space-Time Effects in Large LWR
Cores, Nuclear Science and Engineering, 63, 437-356, 1977.
/LAN 77b/ LANGENBUCH, S., MAURER, W., WERNER, W., High-Order Schemes for
Neutron Kinetics Calculation based on a Local Polynomial Approximation;
Nuclear Science and Engineering 64, pp 508-516, 1977.
/LAN 96a/ LANGENBUCH, S., LIZORKIN, M., ROHDE, U., VELKOV, K., 3D Neutronic
Codes coupled with Thermal-Hydraulic System Codes for PWR, BWR and
VVER Reactors. OECD/CSNI Workshop on Transient Thermal-Hydraulic
and Neutronic Codes Requirements, Annapolis, Md., U.S.A., November 5-
8, 1996.
/LAN 96b/ LANGENBUCH, S., AUSTREGESILO, H., FOMITCHENKO, P., ROHDE,
U., VELKOV, K., Interface Requirements to Couple Thermal-Hydraulic
Codes to 3D Neutronic Codes. OECD/CSNI Workshop on Transient Ther-
mal-Hydraulic and Neutronic Codes Requirements, Annapolis, Md., U.S.A.,
November 5-8, 1996.
/LER 98/ LERCHL,G., AUSTREGESILO, H., ATHLET Mod 1.2 Cycle A, User's Man-
ual, March 1998, GRS-P-1/Vol.1,Rev.1.
/NEA 01/ BWR Turbine Trip (TT) Benchmark, Vol.1: Final Specifications,
NEA/NSC/DOC (2001)1, June 2001
18

/NEA 99/ NEA/NSC/DOC(99) 8, PWR Main Steam Line Break (MSLB) Benchmark,
Volume 1: Final Specification.
/NEA 04/ Akdeniz B., Ivanov K., Olson A.,
Boiling Water Reactor Turbine Trip (TT) Benchmark, Volume II: Summary
Results of Exercise 1
NEA/NSC/DOC(2004)21, June 2005
19

7 Bilder
20
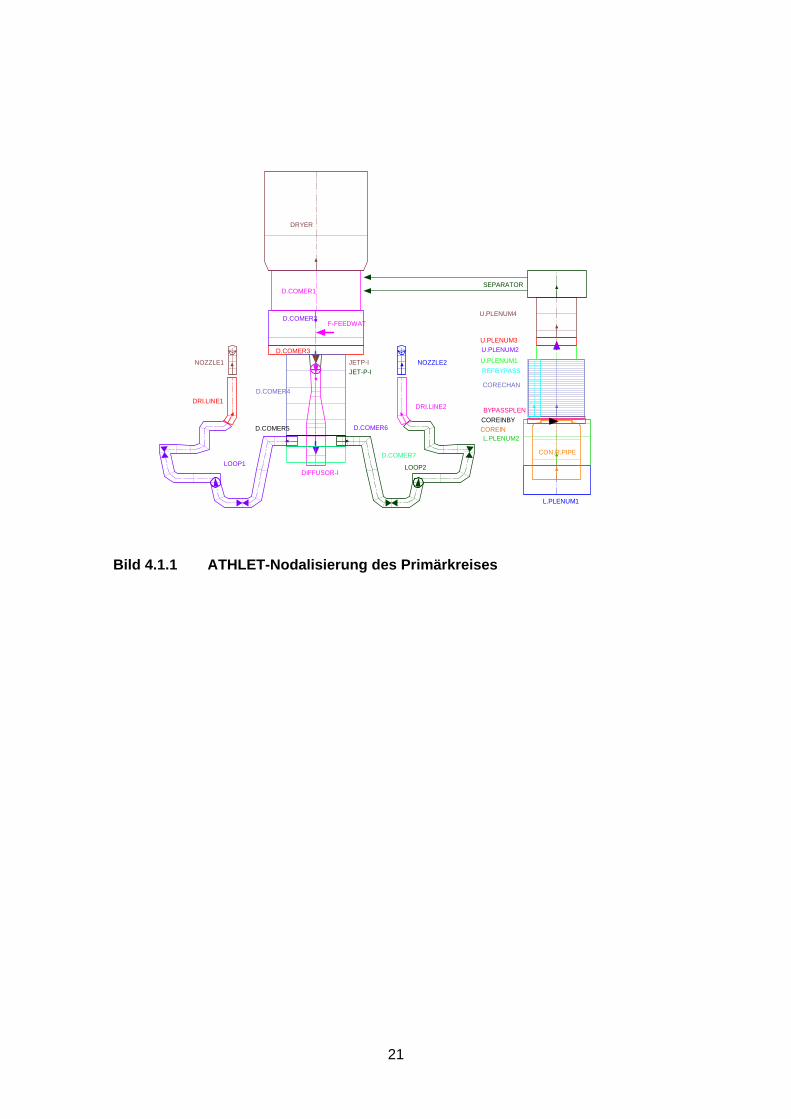
Bild 4.1.1 ATHLET-Nodalisierung des Primärkreises
D.COMER2
D.COMER3
JETP-IJET-P-I
DIFFUSOR-I
L.PLENUM1
L.PLENUM2COREIN
CORECHAN
U.PLENUM1U.PLENUM2U.PLENUM3
U.PLENUM4
SEPARATORD.COMER1
D.COMER4
D.COMER5
LOOP1
DRI.LINE1
NOZZLE1
LOOP2
DRI.LINE2
NOZZLE2
CON.R.PIPE
BYPASSPLEN
REFBYPASS
COREINBYD.COMER6
DRYER
F-FEEDWAT
D.COMER7
21
DRYER
MSLBYPLINE
B-TDV
MTV
Bild 4.1.2 ATHLET-Nodalisierung des Frischdampfsystems
22
5.04.03.02.01.00.0
12.0
9.0
6.0
3.0
0.0
Bild 4.1.3 Gesamte Reaktorleistung wie für den Teilschritt 1 spezifiziert
23
5.04.03.02.01.00.0
7.5
7.25
7.0
6.75
6.5
Bild 4.1.4 Teilschritt1, Vergleich des mit ATHLET berechneten Druckverlaufs mit den Ergebnissen der RETRAN Rechnung und der Messung
24
5.04.03.02.01.00.0
12.0
11.0
10.0
9.0
8.0
7.0
Bild 4.1.5 Teilschritt 1, Massenstrom am Kerneintritt, am Kernaustritt und ei-ner mittleren Kernposition
25
5.04.03.02.01.00.0
2.0
1.5
1.0
0.5
0.0
-0.5
-1.0
Bild 4.1.6 Teilschritt 1, Massenstrom in der Frischdampfleitung am Eintritt vom Reaktorbehälter, am Auslass zur Turbine und an der Abzwei-gung der Bypass-Leitung
26
5.04.03.02.01.00.0
0.7
0.6
0.5
0.4
0.3
0.2
0.1
0.0
Bild 4.1.7 Teilschritt 1, Massenstrom in der Bypass-Leitung am Eintritt von der Frischdampfleitung, am Auslass und der Ausströmmassen-strom
27
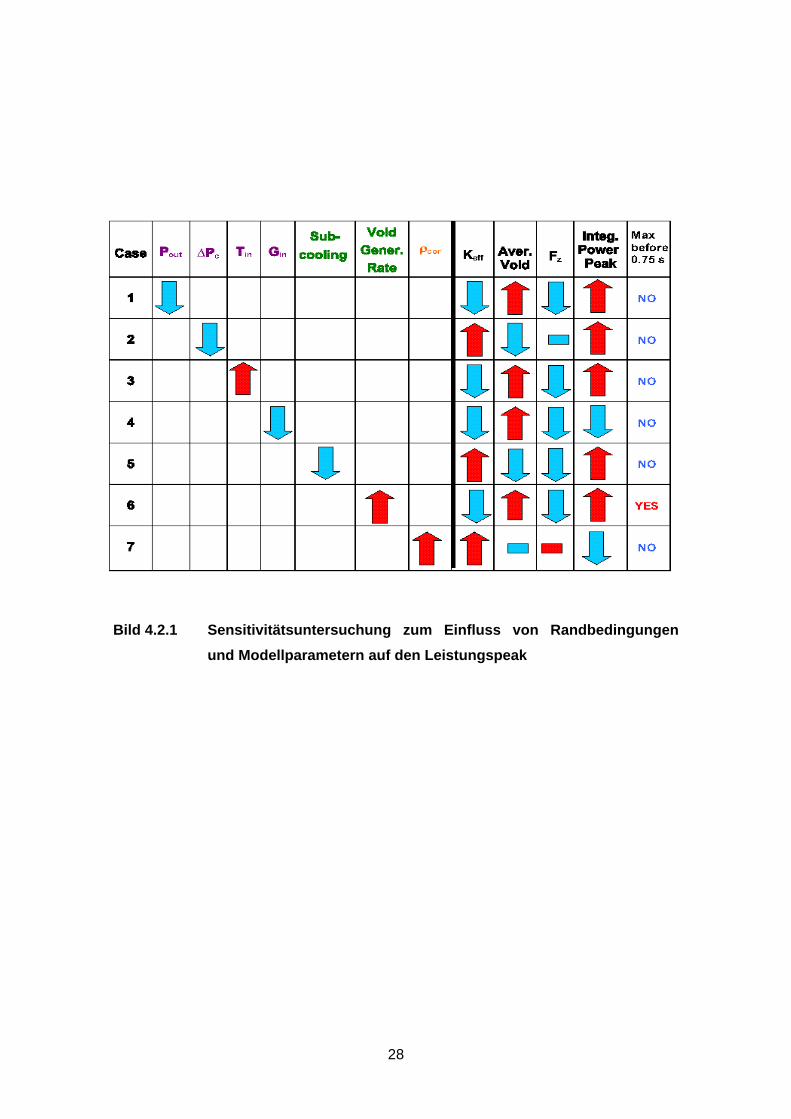
Bild 4.2.1 Sensitivitätsuntersuchung zum Einfluss von Randbedingungen und Modellparametern auf den Leistungspeak
28
21.751.51.2510.750.50.250
8.0
7.0
6.0
5.0
4.0
3.0
2.0
1.0
0.0
Bild 4.2.2 Relativer Leistungsverlauf aus der Kernrechnung von ATHLET-QUABOX/CUBBOX mit 33 THC bzw. 764 THC im Vergleich zur Mes-sung
29
400350300250200150100500
2.0
1.8
1.6
1.4
1.2
1.0
0.8
0.6
0.4
0.2
0.0
Bild 4.2.3 Vergleich der axialen Leistungsverteilung im Anfangszustand für das Brennelement #75 aus den ATHLET-QUABOX/CUBBOX Rech-nungen mit 33 THC bzw. 764 THC
30
400350300250200150100500
2.0
1.8
1.6
1.4
1.2
1.0
0.8
0.6
0.4
0.2
0.0
Bild 4.2.4 Vergleich der axialen Leistungsverteilung im Anfangszustand für das Brennelement #367 aus den ATHLET-QUABOX/CUBBOX Rech-nungen mit 33 THC bzw. 764 THC
31
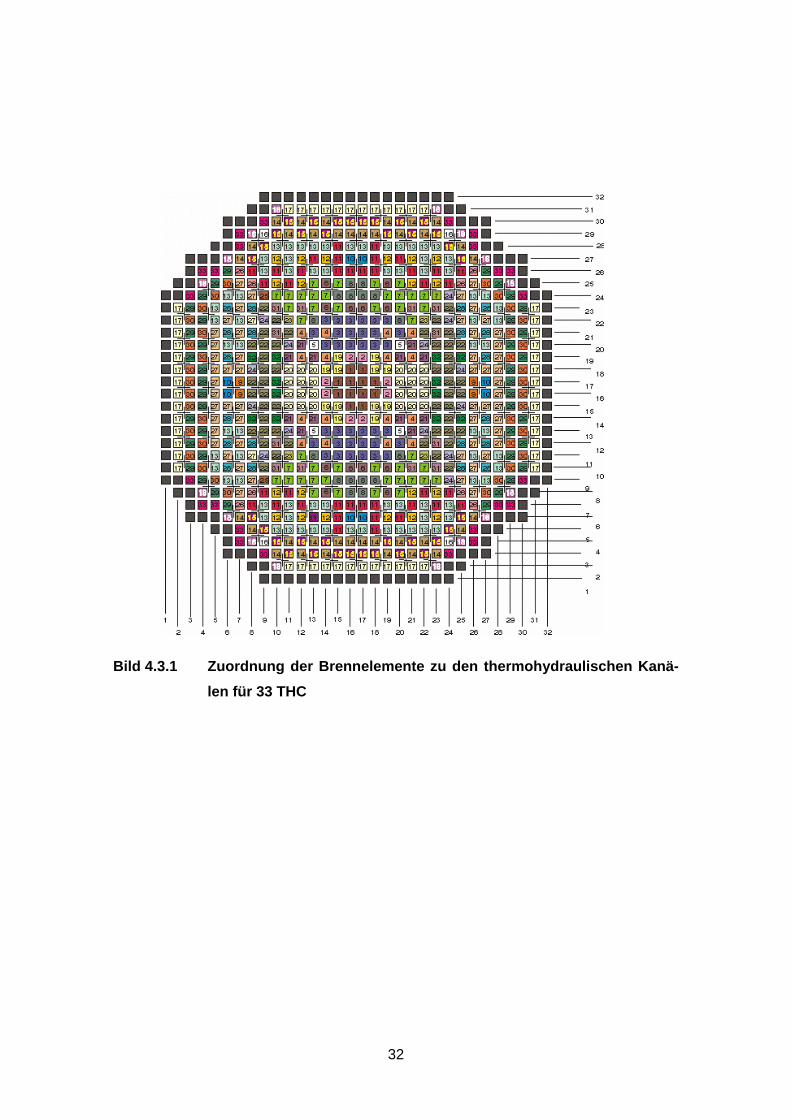
Bild 4.3.1 Zuordnung der Brennelemente zu den thermohydraulischen Kanä-len für 33 THC
32
400350300250200150100500
2.0
1.8
1.6
1.4
1.2
1.0
0.8
0.6
0.4
0.2
0.0
Bild 4.3.2 Vergleich des mittleren axialen Leistungsprofils aus Berechnung
und Messung
33
400350300250200150100500
1.4
1.2
1.0
0.8
0.6
0.4
0.2
0.0
Bild 4.3.3 Axiales Leistungsprofil in Brennelement-Position 75
34
400350300250200150100500
2.2
2.0
1.8
1.6
1.4
1.2
1.0
0.8
0.6
0.4
0.2
0.0
Bild 4.3.4 Axiales Leistungsprofil in der Brennelement-Position 367
35
54.543.532.521.510.50
6.0
5.0
4.0
3.0
2.0
1.0
0.0
Bild 4.3.5 Gesamtleistung für den SWR Turbinenschnellschluss, Vergleich von berechneten und gemessenen Werten
36
1.51.2510.750.50.250
6.0
5.0
4.0
3.0
2.0
1.0
0.0
Bild 4.3.6 Gesamtleistung (wie vorher mit größerer Auflösung)
37
38
5.04.03.02.01.00.0
7.5
7.3
7.1
6.9
6.7
6.5
Bild 4.3.7 Vergleich des Druckverlaufs an unterschiedlichen Ortspunkten
39
5.04.03.02.01.00.0
0.7
0.6
0.5
0.4
0.3
0.2
0.1
0.0
Bild 4.3.8 Massenstrom durch das Turbinenbypassventil und am Einlass und Auslass der Frischdampfleitung
40
21.751.51.2510.750.50.250
5.0
4.5
4.0
3.5
3.0
2.5
2.0
1.5
1.0
0.5
0.0
Bild 4.3.9 Berechnete LPRM Anzeigen in den spezifizierten vier Ebenen
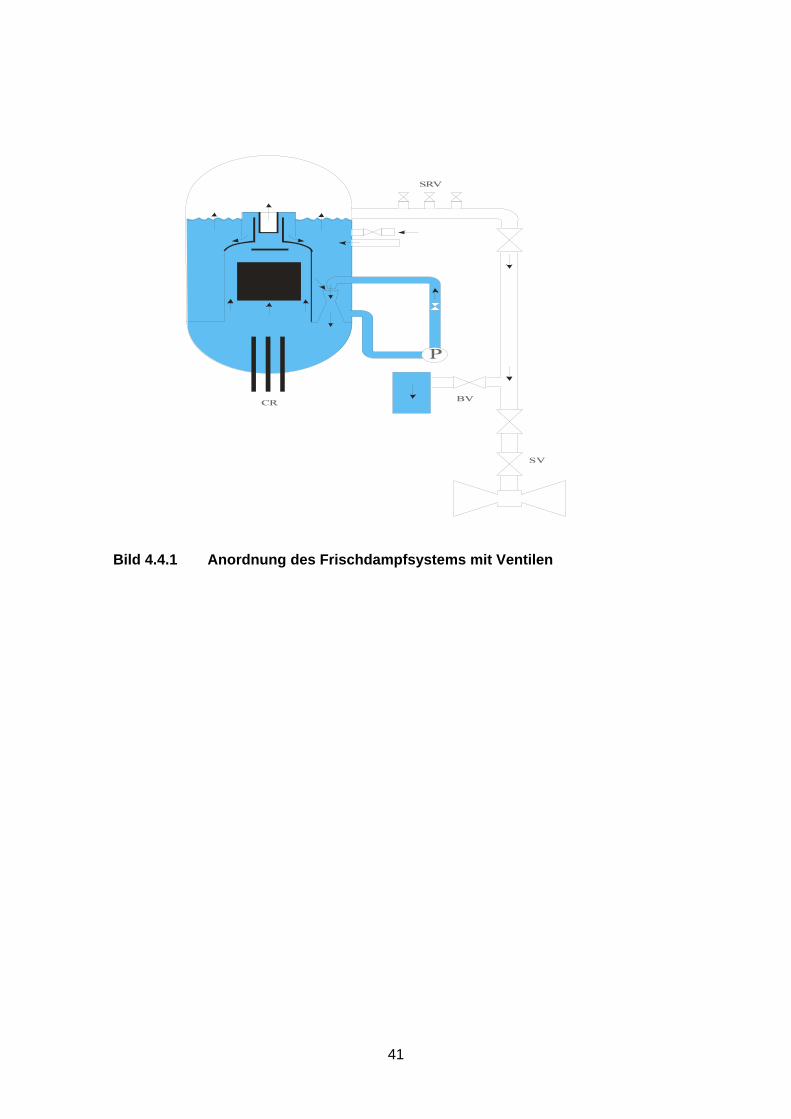
Bild 4.4.1 Anordnung des Frischdampfsystems mit Ventilen
41
109876543210
7.0
6.0
5.0
4.0
3.0
2.0
1.0
0.0
Bild 4.4.2 Leistungsverlauf für die extremen Fälle 1, 2 und 3
42
109876543210
500
450
400
350
300
250
200
150
100
50
0
Bild 4.4.3 Massenstrom im Abblase- und Sicherheitsventil für den extremen Fall 1
43
109876543210
500
450
400
350
300
250
200
150
100
50
0
Bild 4.4.4 Massenstrom am Abblaseventil für den extremen Fall 2
44
109876543210
500
450
400
350
300
250
200
150
100
50
0
Bild 4.4.5 Massenstrom am Abblaseventil für den extremen Fall 3
45
109876543210
7.0
6.0
5.0
4.0
3.0
2.0
1.0
0.0
Bild 4.4.6 Leistungsverlauf im extremen Fall 4 ohne Dampfabgabe
46
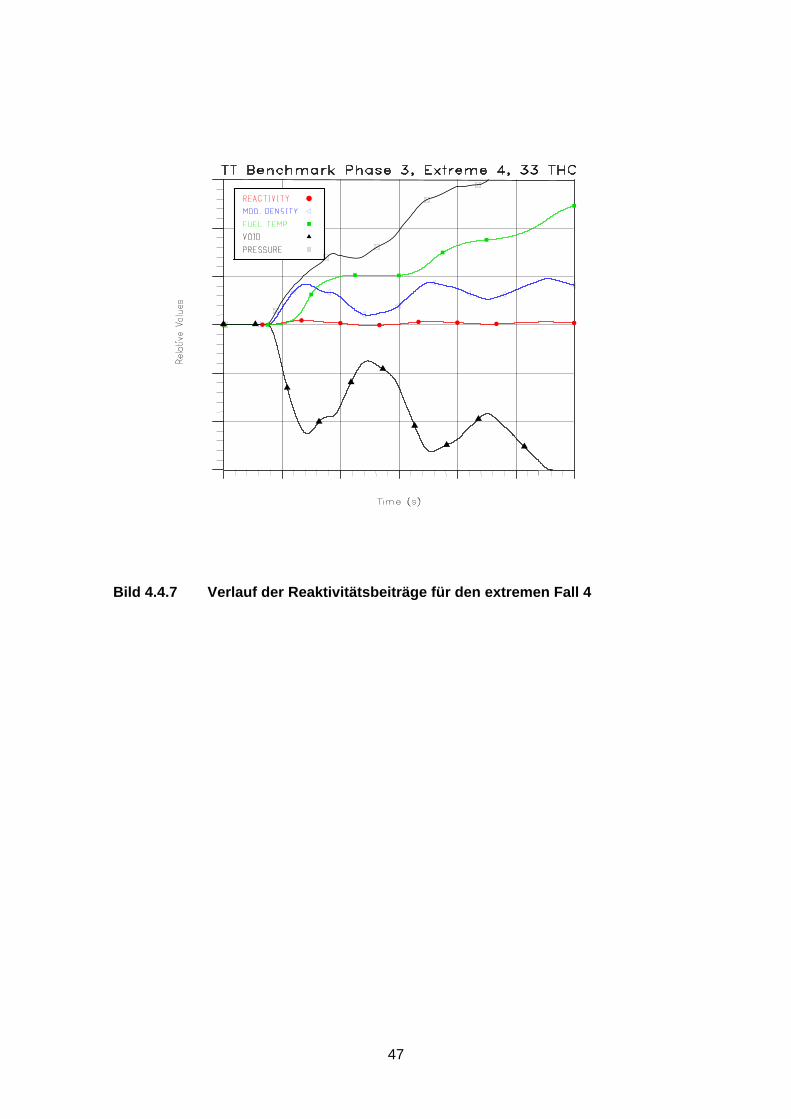
Bild 4.4.7 Verlauf der Reaktivitätsbeiträge für den extremen Fall 4
47
48
Bild 4.4.8 Verlauf der maximalen und mittleren Brennstofftemperaturen
Anhang 1
Liste der Beiträge zu den Workshops und Veröffentlichungen
Dieser Anhang enthält eine Liste der Vorträge zu den Benchmark Workshops, die eine
vollständige Beschreibung der Ergebnisse zu den Teilschritten des Benchmarks ent-
halten, und die Beiträge zu internationalen Konferenzen, die jeweils eine Zusammen-
fassung der Ergebnisse zu den Teilschritten darstellen. Die Konferenzbeiträge sind in
den nachfolgenden Anhängen 2 bis 4 wiedergegeben. Die Workshop-Beiträge sind:
1. The BWR Turbine Trip Benchmark for Peach Bottom 2, Exercise 1: ATHLET
Results, Villigen, 15.-16.Oktober 2001
2. Sensitivity Study for BWR-TT Benchmark, Phase 2, by the Coupled Codes
ATHLET-QUABOX/CUBBOX, Rossendorf, 28.-30.Mai 2002
3. Preliminary Results for BWR-TT Benchmark, Phase 3, by the Coupled Code
ATHLET-QUABOX/CUBBOX, Rossendorf, 28.-30.Mai 2002
4. ATHLET-QUABOX/CUBBOX Results for the BWR TT Benchmark – Exercise 3
and Extreme Cases, Seoul, 6.Oktober 2002
5. Results for the Extreme Cases of BWR TT Benchmark by ATHLET-
QUABOX/CUBBOX, Barcelona, 21.-22.Januar 2003
Die Konferenzbeiträge sind
1. Analysis of Exercise 1 and 2 of the OECD/NRC BWR Turbine Trip (TT) Bench-
mark by the coupled Code System ATHLET-QUABOX/CUBBOX, S. Langen-
buch, K.-D. Schmidt, K. Velkov, Physor2002, Seoul, Oct. 7-10,2002, (Anhang 2)
2. Analysis of Exercise 3 of the OECD/NRC BWR Turbine Trip Benchmark by the
Coupled Code System ATHLET-QUABOX/CUBBOX, S. Langenbuch, K.-D.
Schmidt, K. Velkov, M&C 2003, Gatlinburg, Tenn. April 6-11,2003 (Anhang 3)
3. Application of the Coupled Code ATHLET-QUABOX/CUBBOX for the Extreme
Scenario of the OECD/NRC BWR Turbine Trip Benchmark and its Performance
49

on Multi-Processor Computers, S. Langenbuch, K.-D. Schmidt, K. Velkov,
SNA2003, Paris, September 22.-24. 2003
4. Analysis of the OECD/NRC BWR Turbine Trip (TT) Benchmark by the Coupled
Code System ATHLET-QUABOX/CUBBOX, S. Langenbuch, K.-D. Schmidt, K.
Velkov, Nuclear Science and Engineering 148, 270 – 280, (2004)
50
PHYSOR 2002, Seoul, Korea, October 7-10, 2002
Anhang 2
ANALYSIS OF EXERCISES 1 AND 2 OF THE OECD/NRC BWR
TURBINE TRIP (TT) BENCHMARK BY THE COUPLED CODE
SYSTEM ATHLET-QUABOX/CUBBOX
S. Langenbuch, K.-D. Schmidt, K. Velkov
Gesellschaft für Anlagen- und Reaktorsicherheit (GRS) mbH
85748 Garching, GERMANY
[email protected]; [email protected]; [email protected]
ABSTRACT
The OECD/NRC BWR turbine trip (TT) benchmark [1] has been calculated by the cou-pled thermal-hydraulic neutronics system code ATHLET - QUABOX/CUBBOX [2,3] developed by GRS. The results obtained for the plant transient of Exercise 1 with speci-fied integral power time history are presented. In addition, the core boundary problem of Exercise 2 with specified initial and time-dependent core boundary conditions is in-vestigated. The results are presented, and the physical phenomena determining the BWR pressure transient are discussed. The sensitivity of results on variations of the ini-tial steady state conditions and of parameters of the two-phase flow model is studied. A comparison is also performed between the reactor core model with 33 thermal-hydraulic channels (THC) as specified and a reactor core model with 764 THC using a 1:1 map-ping scheme.
51
PHYSOR 2002, Seoul, Korea, October 7-10, 2002
INTRODUCTION 1
2
The BWR turbine trip (TT) transient has been defined within the OECD Benchmark ac-tivities to validate the coupled thermal-hydraulic system codes with integrated 3D reac-tor core models for BWR conditions. The reference plant is Peach Bottom 2, where experiments were performed to study such transients at reduced initial power. Thus, the benchmark problem is intended to compare results from different coupled codes with measured plant data. Coupled codes have been developed to perform realistic analysis of accident conditions, which are determined by a strong coupling between neutronics of the core and the thermal-hydraulics of the primary circuit. The BWR TT transient is determined by a fast pressure increase leading to the reduction of average void content in the reactor core, which causes a very fast power transient due to the positive reactiv-ity insertion. Therefore this transient is of particular interest for code validation. The Benchmark specification proposes three steps for the plant transient analysis and for the detailed code comparison. Exercise 1 addresses the overall plant response during the turbine trip transient using a specified time-function of integral power for all codes. The purpose of this step is to initialise the system models eliminating all neutronics and reactivity feedback effects. In Exercise 2, the reactor core behaviour is separately ana-lysed by applying specified initial conditions and time-functions as boundary conditions for the 3D reactor core models. These specified boundary conditions are: the pressure at core inlet and outlet, and the coolant temperature and mass flow rate for 33 thermal-hydraulic channels (THC) at the core inlet. In the final step, the full simulation capabil-ity with integrated 3D reactor core model in the thermal-hydraulic system code will be applied for the analysis to compare calculated results with measured plant transient data. This paper presents the available results for Exercises 1 and 2 obtained by the coupled code ATHLET-QUABOX/CUBBOX [2,3,4] together with the experiences gained dur-ing the model development.
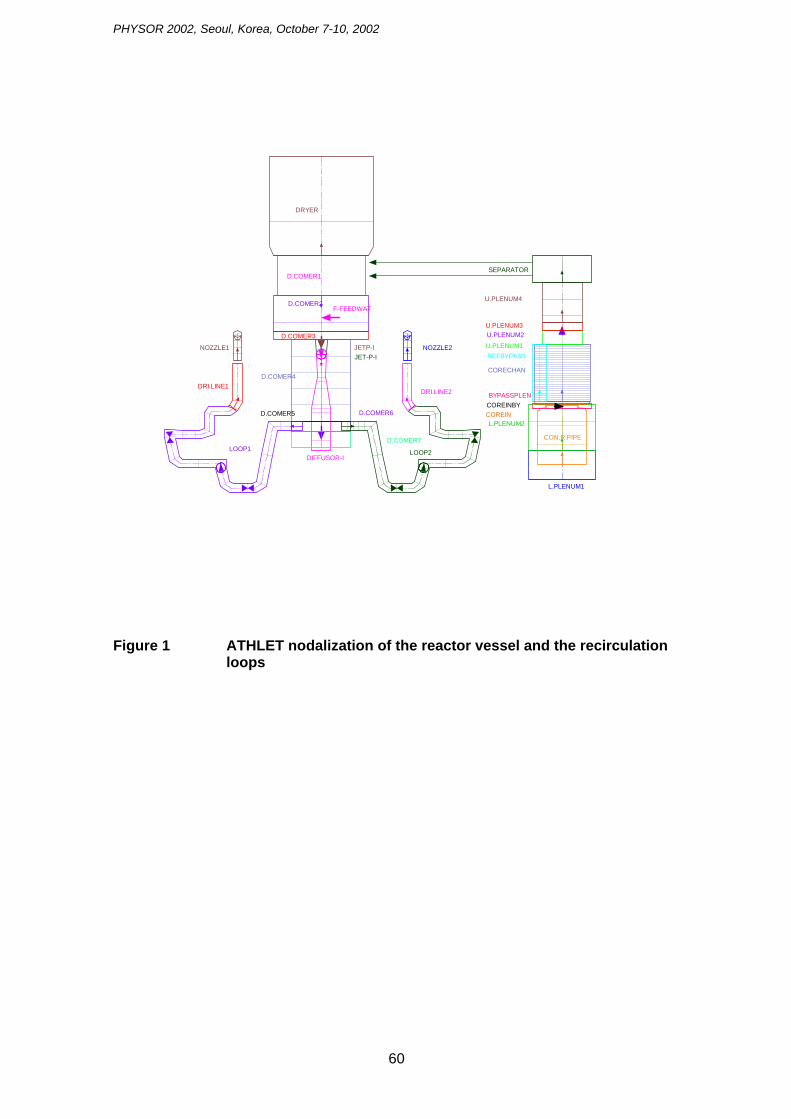
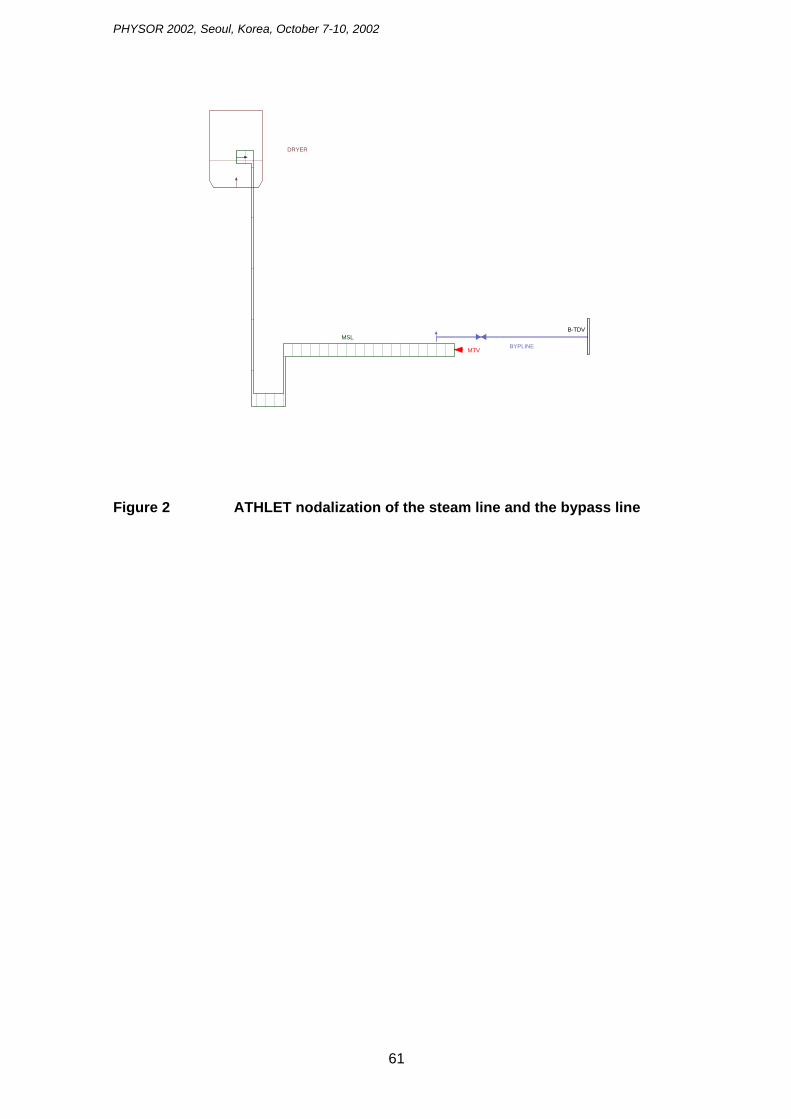
DESCRIPTION OF THE ATHLET PLANT MODEL The specification of the BWR TT Benchmark refers to the Peach Bottom 2 nuclear po-wer plant, a BWR with jet pumps and two external recirculation loops. The ATHLET model of the coolant flow in the reactor vessel consists of a lower plenum, a core region with a single thermal-hydraulic channel with two fuel rod types corresponding to 7x7 and 8x8 fuel assemblies and a bypass channel, an upper plenum, stand pipes, a separator and a steam dome. The downward flow path is modelled by an upper down comer sec-tion, where the feed water is supplied, the jet pumps and a lower down comer section with the diffusors. Two symmetric recirculation loops are described. The model con-figuration of ATHLET for the reactor vessel is shown in Fig.1. The flow path of the generated steam to the turbine is modelled by the main steam line pipes with the turbine stop valve (TSV) and the connected bypass line with the turbine bypass valve (TBV). As the transient is initiated by a sudden closure of the turbine stop valve leading to pres-
52
PHYSOR 2002, Seoul, Korea, October 7-10, 2002
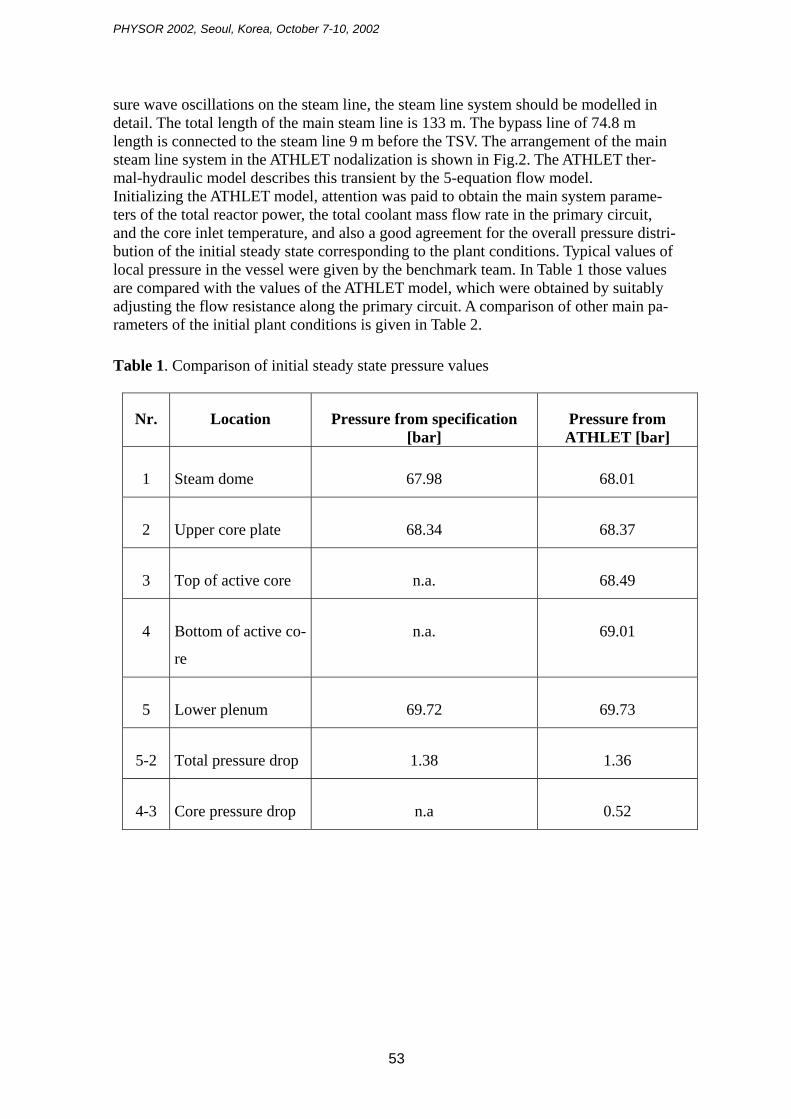
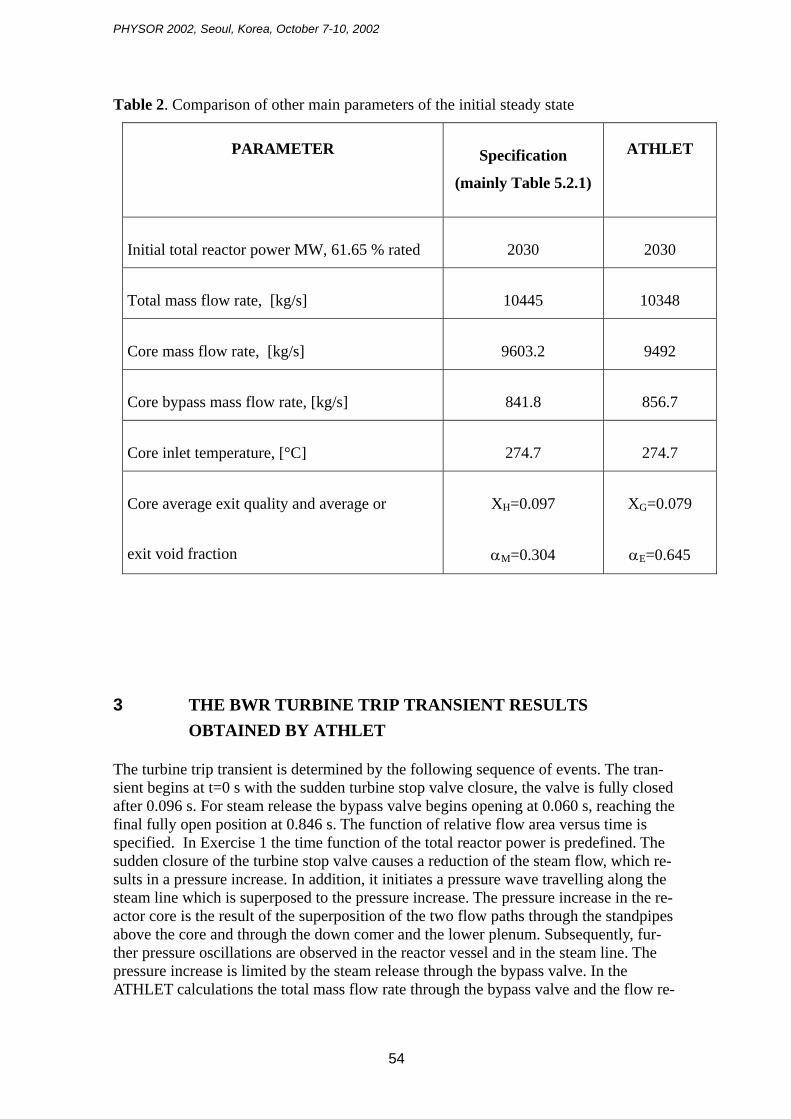
sure wave oscillations on the steam line, the steam line system should be modelled in detail. The total length of the main steam line is 133 m. The bypass line of 74.8 m length is connected to the steam line 9 m before the TSV. The arrangement of the main steam line system in the ATHLET nodalization is shown in Fig.2. The ATHLET ther-mal-hydraulic model describes this transient by the 5-equation flow model. Initializing the ATHLET model, attention was paid to obtain the main system parame-ters of the total reactor power, the total coolant mass flow rate in the primary circuit, and the core inlet temperature, and also a good agreement for the overall pressure distri-bution of the initial steady state corresponding to the plant conditions. Typical values of local pressure in the vessel were given by the benchmark team. In Table 1 those values are compared with the values of the ATHLET model, which were obtained by suitably adjusting the flow resistance along the primary circuit. A comparison of other main pa-rameters of the initial plant conditions is given in Table 2.
Table 1. Comparison of initial steady state pressure values
Nr. Location Pressure from specification [bar]
Pressure from ATHLET [bar]
1 Steam dome 67.98 68.01
2 Upper core plate 68.34 68.37
3 Top of active core n.a. 68.49
4 Bottom of active co-
re
n.a. 69.01
5 Lower plenum 69.72 69.73
5-2 Total pressure drop 1.38 1.36
4-3 Core pressure drop n.a 0.52
53
PHYSOR 2002, Seoul, Korea, October 7-10, 2002
Table 2. Comparison of other main parameters of the initial steady state
PARAMETER Specification
(mainly Table 5.2.1)
ATHLET
Initial total reactor power MW, 61.65 % rated 2030 2030
Total mass flow rate, [kg/s] 10445 10348
Core mass flow rate, [kg/s] 9603.2 9492
Core bypass mass flow rate, [kg/s] 841.8 856.7
Core inlet temperature, [°C] 274.7 274.7
Core average exit quality and average or
exit void fraction
XH=0.097
αM=0.304
XG=0.079
αE=0.645
THE BWR TURBINE TRIP TRANSIENT RESULTS OBTAINED BY ATHLET
3
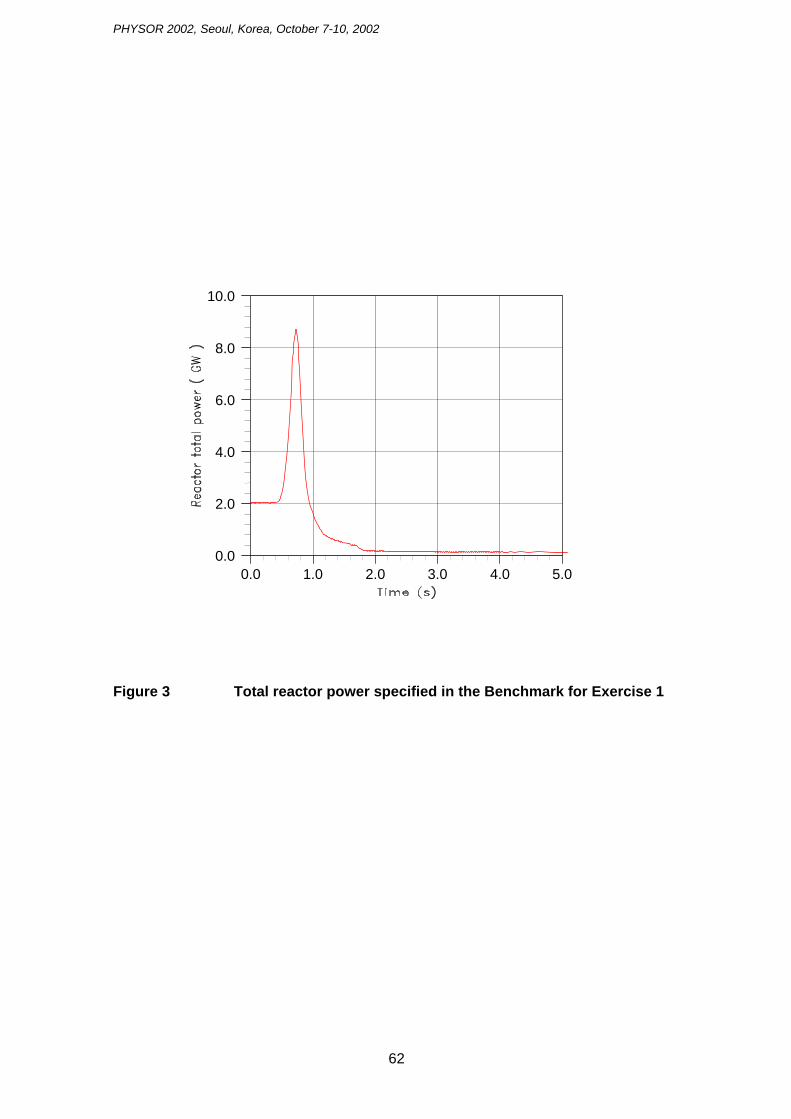
The turbine trip transient is determined by the following sequence of events. The tran-sient begins at t=0 s with the sudden turbine stop valve closure, the valve is fully closed after 0.096 s. For steam release the bypass valve begins opening at 0.060 s, reaching the final fully open position at 0.846 s. The function of relative flow area versus time is specified. In Exercise 1 the time function of the total reactor power is predefined. The sudden closure of the turbine stop valve causes a reduction of the steam flow, which re-sults in a pressure increase. In addition, it initiates a pressure wave travelling along the steam line which is superposed to the pressure increase. The pressure increase in the re-actor core is the result of the superposition of the two flow paths through the standpipes above the core and through the down comer and the lower plenum. Subsequently, fur-ther pressure oscillations are observed in the reactor vessel and in the steam line. The pressure increase is limited by the steam release through the bypass valve. In the ATHLET calculations the total mass flow rate through the bypass valve and the flow re-
54
PHYSOR 2002, Seoul, Korea, October 7-10, 2002
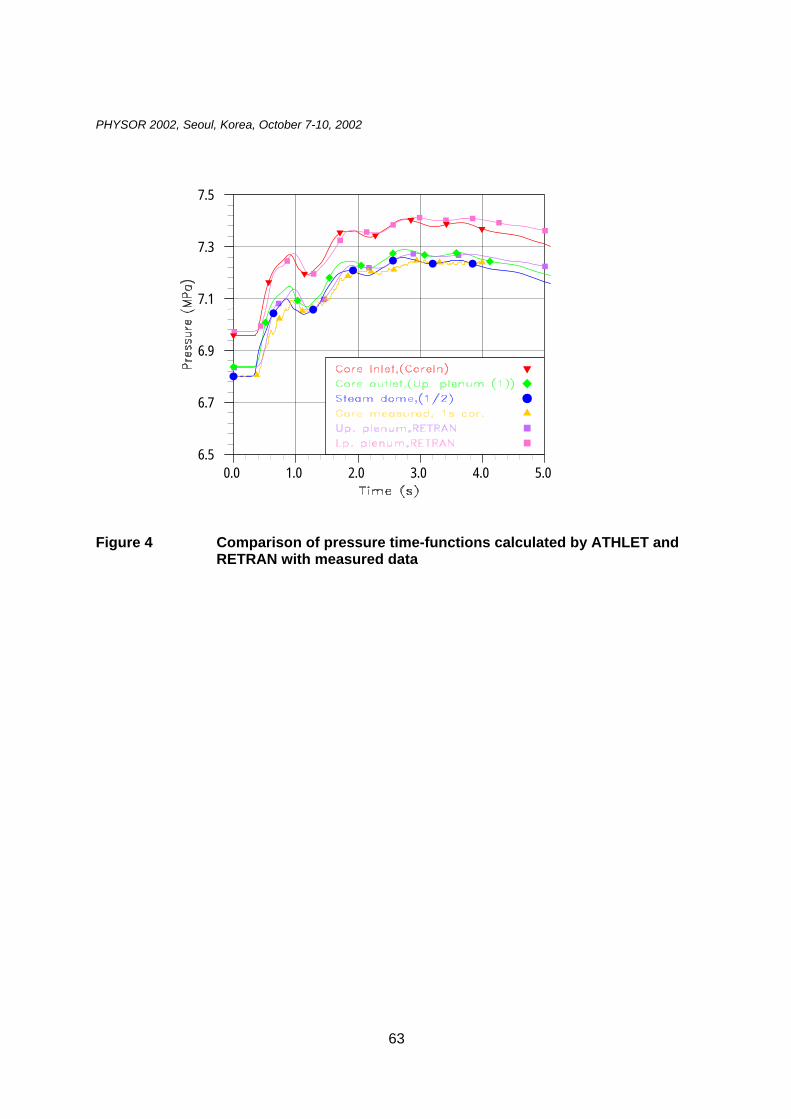
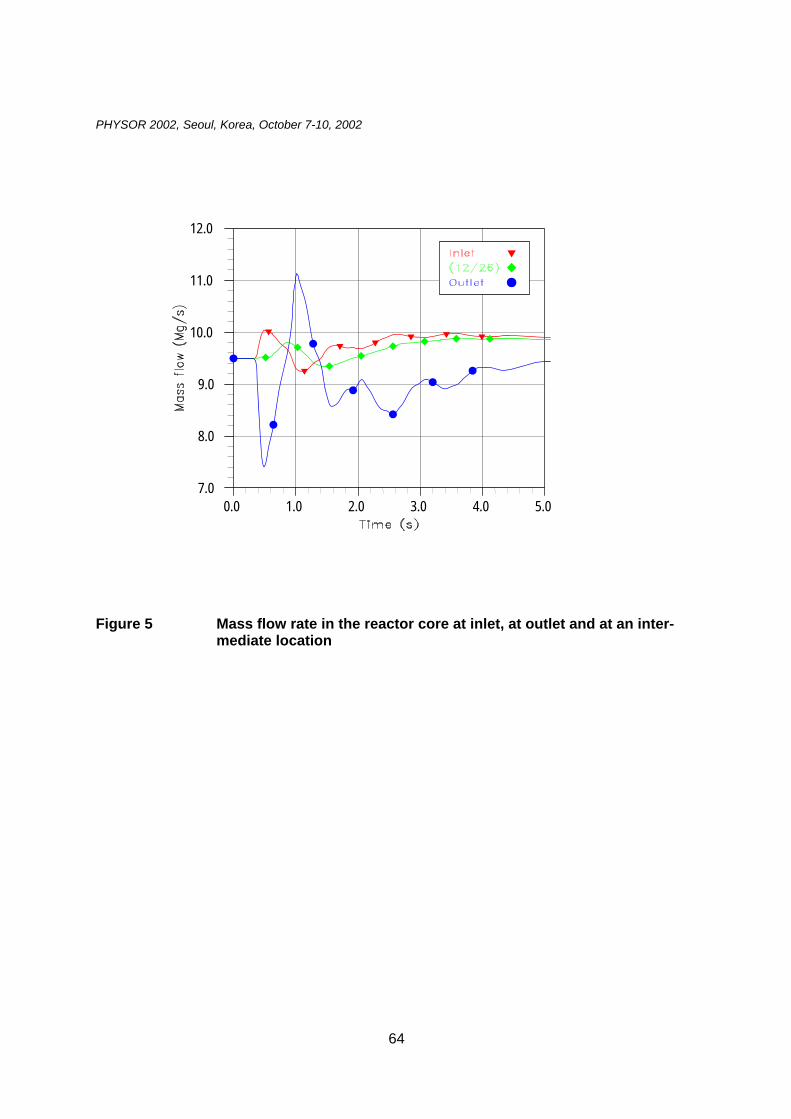
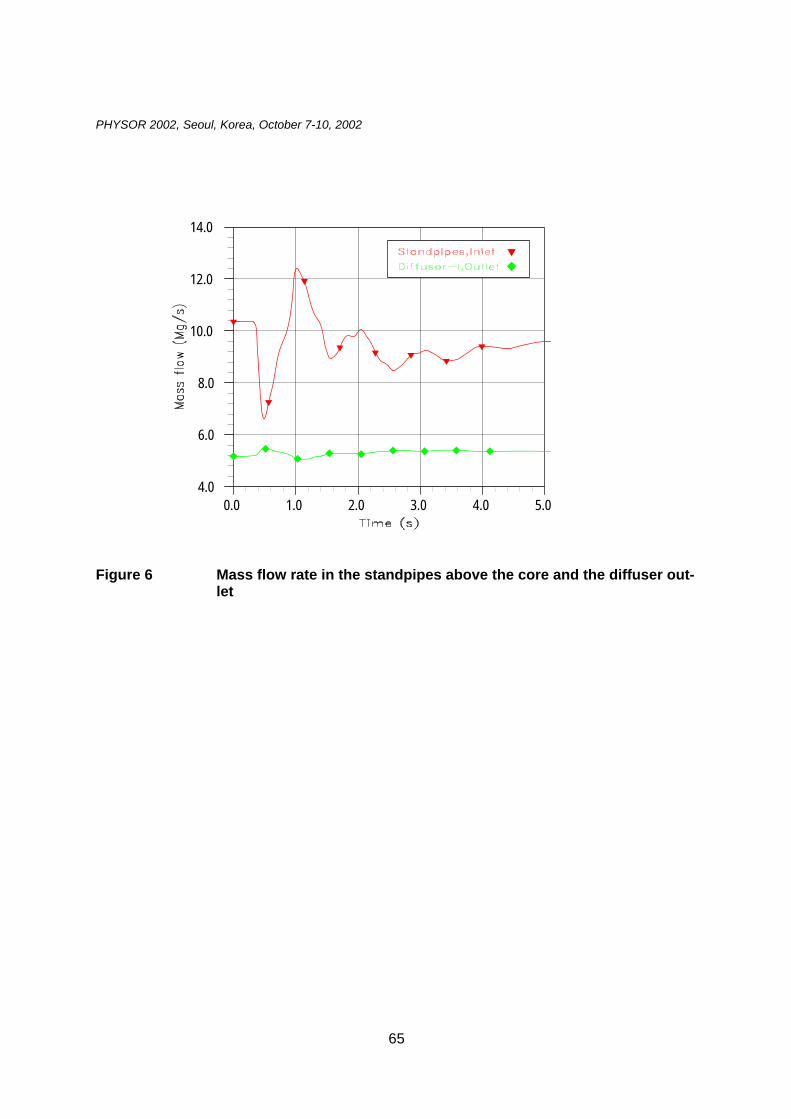
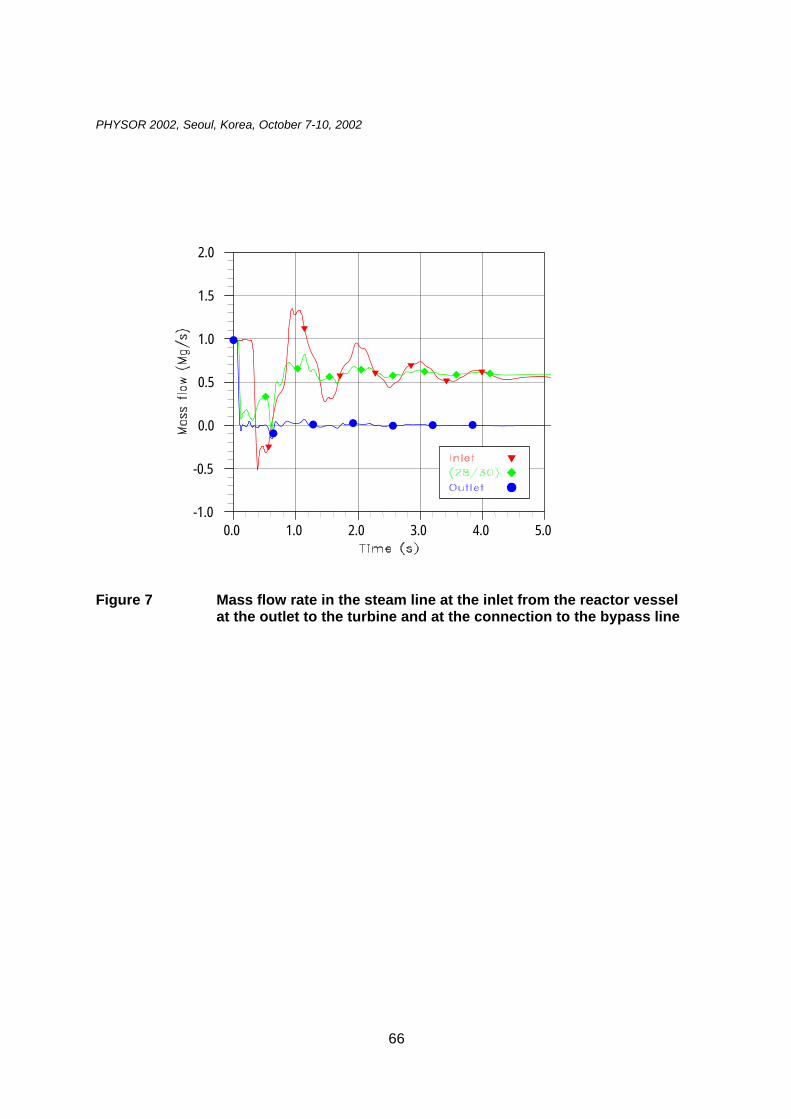
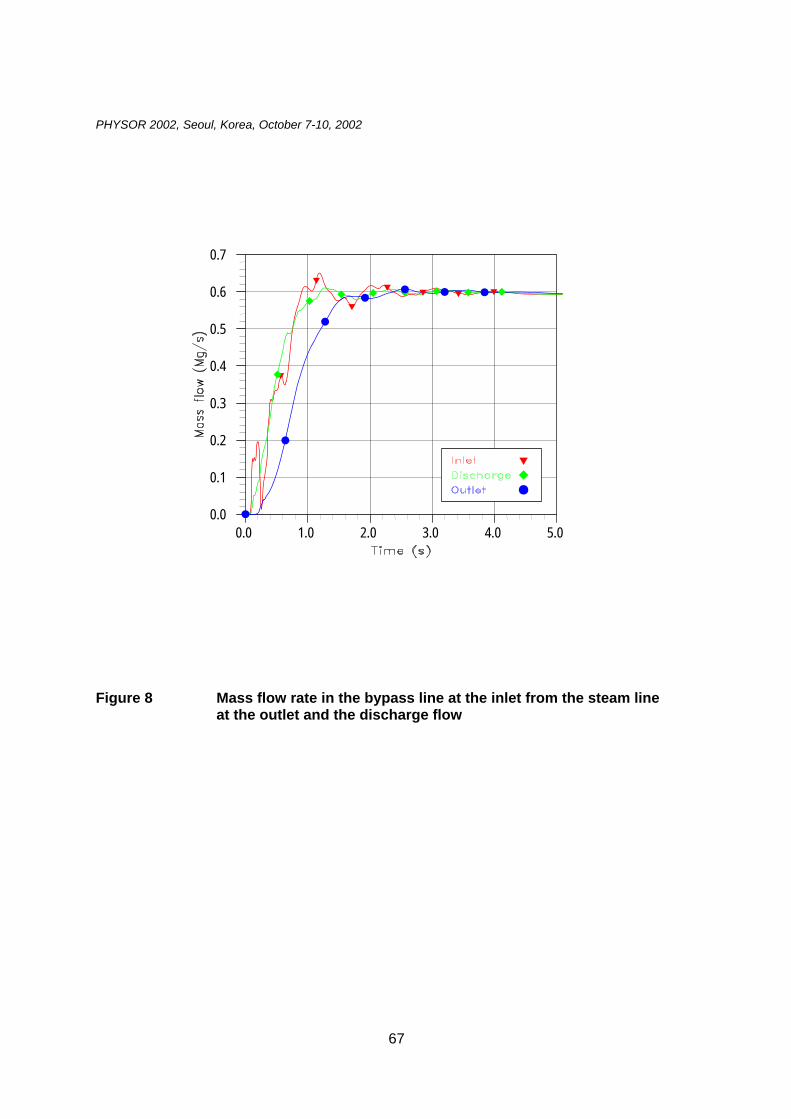
sistance at the inlet of the main steam line from the reactor vessel were identified as im-portant parameters for the overall plant behaviour. The flow characteristic of the bypass valve is determined by the time-function of the open flow area, which is defined by the specification, and in addition by the relation of the flow resistance to the flow area. The ATHLET model for the bypass valve was cho-sen such that during the valve opening critical flow conditions are always established. The flow area of the fully open valve was defined to yield an asymptotic steam mass flow rate of 600 kg/s. This value gives good agreement for the time-function of the pressure in the steam dome or reactor core outlet, for which measured data are available. In studies of different variants for modelling the steam line, it was observed that the flow resistance at the inlet of the main steam line from the reactor vessel strongly af-fects the amplitude of the pressure oscillations. If a very high resistance value is chosen, the oscillations are strongly damped; on the other hand, if a low value is chosen, the os-cillations are nearly without damping. Finally, an intermediate value of the flow resis-tance approximately corresponding to geometrical data was chosen for the ATHLET benchmark results, which show oscillations as seen in the measurements. The results obtained by the ATHLET model are shown in the following figures. Fig. 3 shows the time-function which is specified for Exercise 1 of the benchmark for the total reactor power. The pressure increase in the core and the steam dome obtained by the ATHLET calculation is shown in Fig. 4. This figure includes the time-functions of the available RETRAN results and the measurement. The comparison confirms an overall good agreement of the time evolution. The following figures present the time-functions of mass flow at different locations of the plant. Fig. 5 shows the mass flow at core inlet and core outlet and an intermediate location. At the beginning of the transient, the mass flow increases at core inlet and decreases at core outlet leading to an increased total mass in the core corresponding to the decrease of the average void content. Fig. 6 shows the mass flow through the stand pipes to the steam dome above the core and the mass flow at the diffuser outlet to the lower plenum and the core inlet. Fig. 7 presents the mass flow in the steam line at different locations. At the outlet the mass flow is reduced rapidly due to the closure of the TSV. The mass flow at the inlet shows strong oscilla-tions. The amplitude of the mass flow oscillation is getting smaller along the steam line to the TSV. Fig. 8 shows the mass flow in the bypass line at different locations. During valve opening always critical flow is reached. The fully open flow area is adjusted to get an asymptotic mass flow of about 600 kg/s. These figures give an overview on the ATHLET results by presenting the main parameters of the BWR TT transient.
ANALYSIS OF EXERCISE 2, THE CORE BOUNDARY PROBLEM
4
The objective of Exercise 2 of the BWR TT benchmark is to analyse separately the reac-tor core behaviour for specified initial and time-dependent boundary conditions. The specification defines the core loading and a model of the reactor core coolant flow with 33 thermal-hydraulic coolant channels. For the reactor core initial values and time-dependent function tables for the pressure at core inlet and outlet as well as for each channel the coolant temperature and coolant mass flow rate at core inlet are given.
55
PHYSOR 2002, Seoul, Korea, October 7-10, 2002
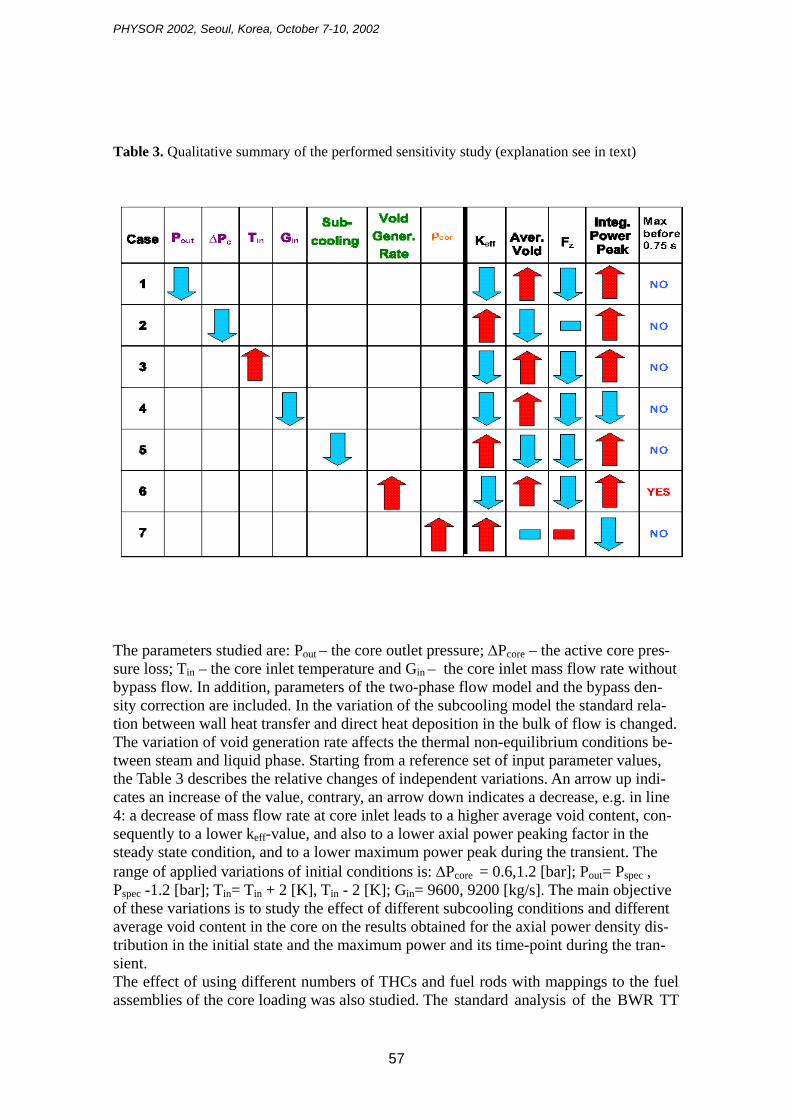
The reactor core problem is solved by the 3D neutron kinetics code QUABOX/CUBBOX including a feedback model describing coolant flow and fuel rods by ATHLET components. According to the specification, the thermal-hydraulic model consists of 33 pipe components, each with a fill component modelling inlet conditions and with a time-dependent volume modelling the upper plenum. The model represents the coolant flow by parallel flow channels without cross-flow. A fuel rod model, solving the heat-conduction equations with 5 radial zones for the fuel pellet, a gap heat resis-tance and a single zone for the cladding, is attached to each THC. Three types of THCs are defined corresponding to 7x7 respectively 8x8 fuel assemblies with and without flow restriction. The values of flow area, fuel rod diameter and flow resistances are de-termined according to the specification. Each THC and the corresponding fuel rod is mapped to a group of fuel assemblies of the core loading as specified. The ATHLET model uses the time-function tables for the boundary conditions of the pressure at the core outlet and the coolant temperature and the mass flow rate at the core inlet. As the pressure cannot be independently specified at the core outlet and inlet together with the mass flow rate at the core inlet, the pressure time-function at core inlet is substituted by meeting the total pressure difference in the steady state initialisation. The 3D neutron kinetics code QUABOX/CUBBOX [5] solves the neutron diffusion e-quations with two prompt neutron energy groups and six precursor groups of delayed neutrons by a coarse mesh method based on flux expansion using high-order local poly-nomials. Each fuel assembly of the BWR core, totally 764, is represented by a single node in the XY-plane. The core loading of the fuel assemblies and the position of con-trol rods correspond to the specification. In axial direction, the active core region is de-scribed by 24 nodes with one additional node for each of the top and bottom reflector. The nuclear cross-sections are calculated from the specified tables dependent on fuel temperature and coolant density. The effect of the fuel assembly bypass flow is consid-ered using an effective coolant density correction when calculating nuclear data. The ef-fect of the Xenon concentration on the cross-sections is taken into account as specified. No ADF corrections are considered, in consistency with the solution method based on local neutron flux expansion. In screening calculations for the BWR pressure transient, it was observed that variations of the core initial boundary conditions and also of some parameters of the two-phase flow model strongly affected the results. This applies to the initial steady state of the re-actor core, like the keff-value, the averaged axial core power distribution and the axial power peaking factor, as well as the transient evolution, like the maximum value of power and the corresponding time-point. The phenomena of the induced pressure tran-sient are the following: The pressure increase causes a collapse of steam bubbles, lead-ing to a reduction of the average void content in the reactor core, and consequently to a fast power increase due to the positive reactivity insertion. The power increase is limited by the generation of void in the coolant during the power transient and/or by the scram activation which initiates control rod insertion movement at 0.75 s. Thus, the fast power transient caused by the positive reactivity insertion is sensitive to the average void con-tent as well as the axial void distribution in the reactor core, and their relative changes during the pressure increase after the sudden closure of the turbine stop valve. In fact, the change of average void content and its axial distribution determine the effective positive reactivity insertion during the transient. Therefore, it is expedient to study the sensitivity in detail. The results of this study are summarised in Table 3, which describes the relations between variations of input and model parameters on the left side and their consequences on the main characteristics of the result on the right side.
56
PHYSOR 2002, Seoul, Korea, October 7-10, 2002
Table 3. Qualitative summary of the performed sensitivity study (explanation see in text)
The parameters studied are: Pout – the core outlet pressure; ΔPcore – the active core pres-sure loss; Tin – the core inlet temperature and Gin – the core inlet mass flow rate without bypass flow. In addition, parameters of the two-phase flow model and the bypass den-sity correction are included. In the variation of the subcooling model the standard rela-tion between wall heat transfer and direct heat deposition in the bulk of flow is changed. The variation of void generation rate affects the thermal non-equilibrium conditions be-tween steam and liquid phase. Starting from a reference set of input parameter values, the Table 3 describes the relative changes of independent variations. An arrow up indi-cates an increase of the value, contrary, an arrow down indicates a decrease, e.g. in line 4: a decrease of mass flow rate at core inlet leads to a higher average void content, con-sequently to a lower keff-value, and also to a lower axial power peaking factor in the steady state condition, and to a lower maximum power peak during the transient. The range of applied variations of initial conditions is: ΔPcore = 0.6,1.2 [bar]; Pout= Pspec , Pspec -1.2 [bar]; Tin= Tin + 2 [K], Tin - 2 [K]; Gin= 9600, 9200 [kg/s]. The main objective of these variations is to study the effect of different subcooling conditions and different average void content in the core on the results obtained for the axial power density dis-tribution in the initial state and the maximum power and its time-point during the tran-sient. The effect of using different numbers of THCs and fuel rods with mappings to the fuel assemblies of the core loading was also studied. The standard analysis of the BWR TT
57
PHYSOR 2002, Seoul, Korea, October 7-10, 2002
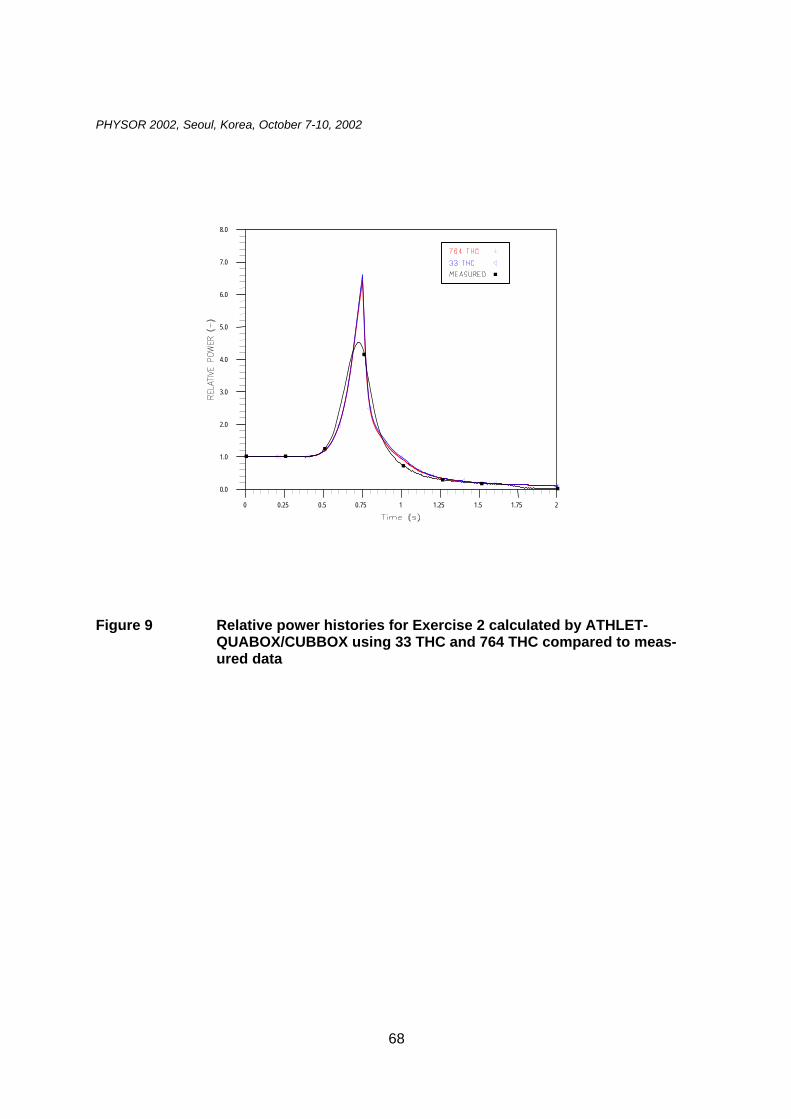
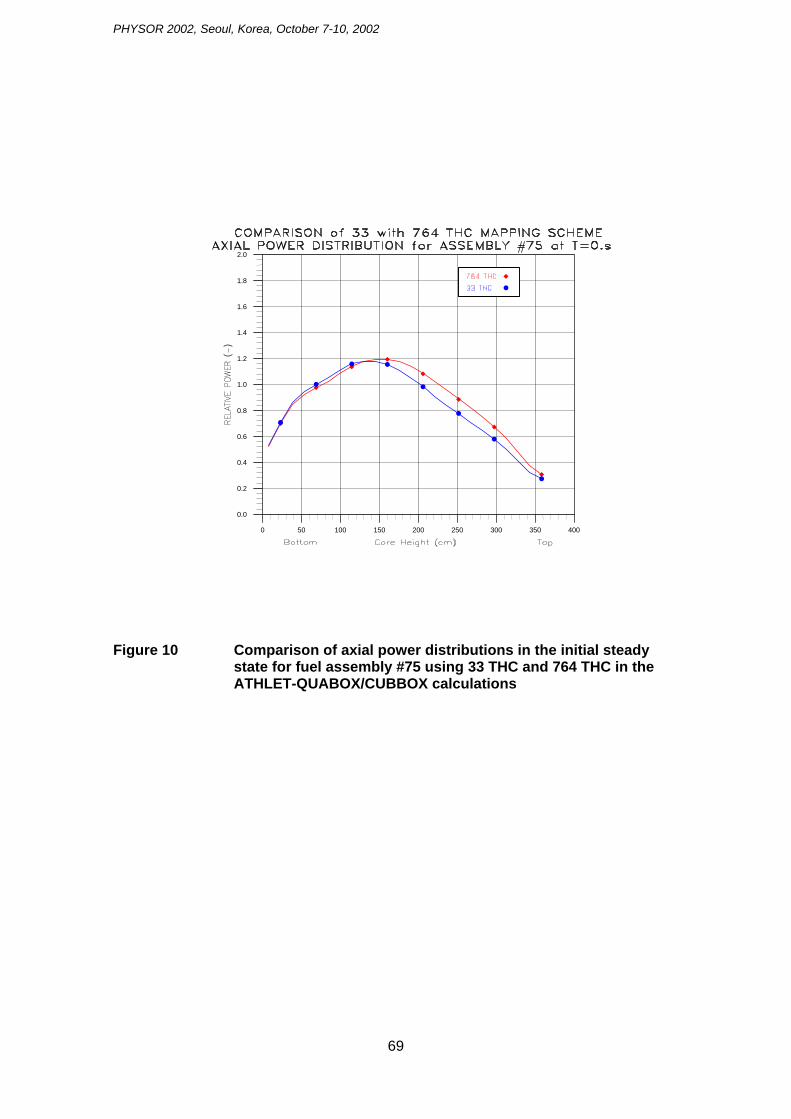
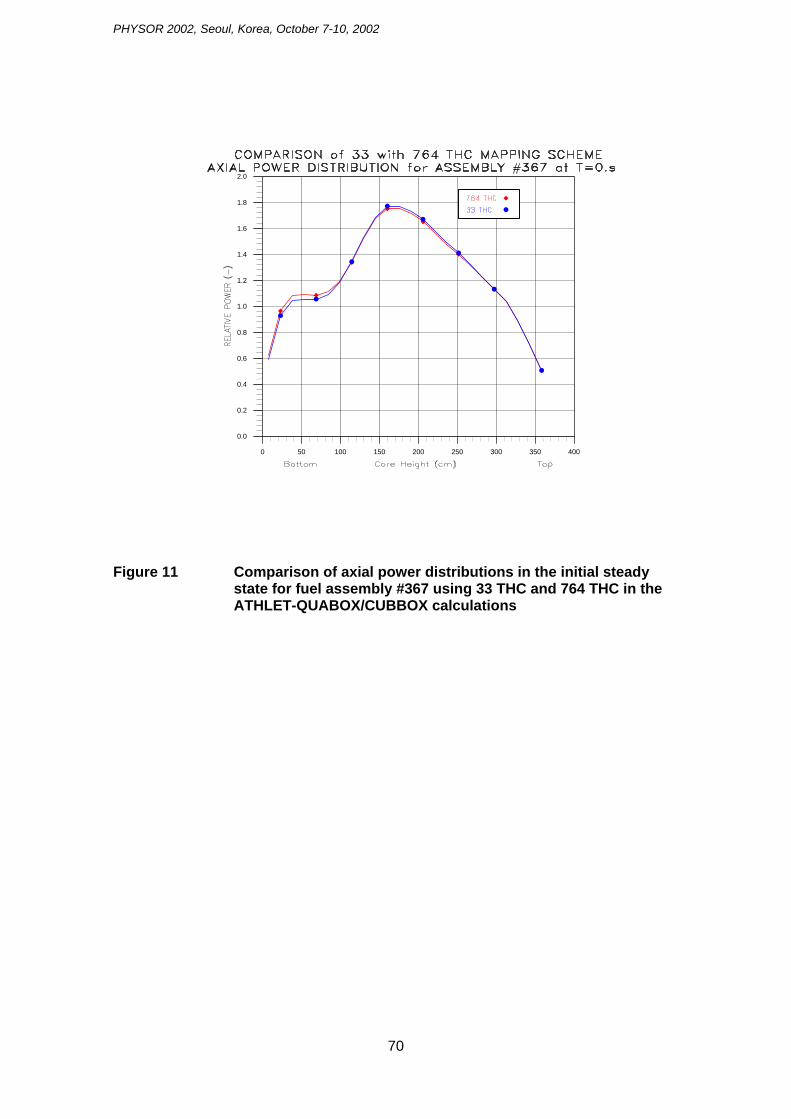
transient was performed using the 33 THC mapping scheme of the specification. For a comparison a detailed 1:1 modelling is applied, representing each fuel assembly by a THC, totally a number of 764 THC is used. The result of the keff-value for the initial steady state is 1.00188 with 33 THC and 0.99982 with 764 THC. Fig. 9 shows the tran-sient relative fission power history for both cases compared to the measurement. The maximum of fission power reached by both calculations agrees very well, but the maximum is higher than in the measurement. The benchmark defines particular fuel as-sembly locations for a detailed comparison. In Fig. 10 and Fig. 11 is shown the axial power distribution of the initial steady state condition in fuel assembly #75, fully con-trolled, and in fuel assembly #367, uncontrolled, but with partially inserted control rods in the neighbourhood. The power shape in fuel assembly #75 is shifted to the upper core region when the 1:1 mapping scheme is used. In general, the overall power shapes for both calculations agree quite well.
SUMMARY 5
6
The presentation describes the results of the coupled system code ATHLET - QUABOX/CUBBOX for Exercises 1 and 2 of the BWR TT benchmark. The ATHLET model developed for the Peach Bottom 2 NPP with jet pumps and two external recircu-lation loops is able to represent the overall plant behaviour. The calculated pressure transient in the steam line and the reactor vessel caused by the sudden closure of the turbine stop valve agrees quite well with the available experimental data. The analysis of the reactor core boundary problem with specified initial and time-dependent bound-ary conditions revealed a strong sensitivity of the initial core characteristics and the po-wer peak during the transient on the core initial boundary conditions and parameters of the two-phase flow model. A study was performed to determine the sensitivity of the main characteristic parameters of the results. In addition, a refined core model was ap-plied using a 1:1 mapping of fuel assemblies to the THC. The comparison of results confirms good agreement for the integral power of the transient, but it shows relevant changes for the average axial and local power shapes and other local parameters. The experience gained will be applied for the calculation of the full plant transient problem as defined for Exercise 3 of the benchmark.
ACKNOWLEDGMENT The work presented was performed within projects funded by the German Federal Min-istry of Economics and Technology (BMWI).
58
PHYSOR 2002, Seoul, Korea, October 7-10, 2002
REFERENCES 7
1. J. Solis, K. Ivanov, B. Sarikaya, A. Olson, K. Hunt, Boiling Water Reactor Turbine Trip (TT) Benchmark, Volume 1: Final Specifications, NEA/NSC/DOC(2001) 1.
2. G. Lerchl, H. Austregesilo, ATHLET Mod 1.2 Cycle A, User’s Manual, March 1998, GRS-P-1/VOL.1, Rev.1.
3. S. Langenbuch, H. Austregesilo, P. Fomitchenko, U. Rohde, K. Velkov, Interface Require-ments to Couple Thermal-Hydraulics Codes to 3D Neutronic Codes. OECD/CSNI Work-shop on Transient Thermal-Hydraulic and Neutronic Codes Requirements, Annapolis, Md., U.S.A., November 5-8, 1996.
4. S.Langenbuch, K.-D.Schmidt, K.Velkov, The Coupled Code System ATHLET-QUABOX/CUBBOX – Model Features and Results for the Core Transients of the OECD PWR MSLB-Benchmark, M&C, September 1999, Madrid, Spain.
5. S. Langenbuch, W. Maurer, W. Werner, Coarse Mesh Flux Expansion Method for the Analysis of Space-Time Effects in Large LWR Cores, Nuclear Science and En-gineering, 63, 437-456, 1977.
59
PHYSOR 2002, Seoul, Korea, October 7-10, 2002
Figure 1 ATHLET nodalization of the reactor vessel and the recirculation loops
D.COMER2
D.COMER3
JETP-IJET-P-I
DIFFUSOR-I
L.PLENUM1
L.PLENUM2COREIN
CORECHAN
U.PLENUM1U.PLENUM2U.PLENUM3
U.PLENUM4
SEPARATORD.COMER1
D.COMER4
D.COMER5
LOOP1
DRI.LINE1
NOZZLE1
LOOP2
DRI.LINE2
NOZZLE2
CON.R.PIPE
BYPASSPLEN
REFBYPASS
COREINBYD.COMER6
DRYER
F-FEEDWAT
D.COMER7
60
PHYSOR 2002, Seoul, Korea, October 7-10, 2002
DRYER
MSLBYPLINE
B-TDV
MTV
Figure 2 ATHLET nodalization of the steam line and the bypass line
61
PHYSOR 2002, Seoul, Korea, October 7-10, 2002
5.04.03.02.01.00.0
10.0
8.0
6.0
4.0
2.0
0.0
Figure 3 Total reactor power specified in the Benchmark for Exercise 1
62
PHYSOR 2002, Seoul, Korea, October 7-10, 2002
63
5.04.03.02.01.00.0
7.5
7.3
7.1
6.9
6.7
6.5
Figure 4 Comparison of pressure time-functions calculated by ATHLET and RETRAN with measured data
PHYSOR 2002, Seoul, Korea, October 7-10, 2002
5.04.03.02.01.00.0
12.0
11.0
10.0
9.0
8.0
7.0
Figure 5 Mass flow rate in the reactor core at inlet, at outlet and at an inter-mediate location
64
PHYSOR 2002, Seoul, Korea, October 7-10, 2002
5.04.03.02.01.00.0
14.0
12.0
10.0
8.0
6.0
4.0
Figure 6 Mass flow rate in the standpipes above the core and the diffuser out-let
65
PHYSOR 2002, Seoul, Korea, October 7-10, 2002
5.04.03.02.01.00.0
2.0
1.5
1.0
0.5
0.0
-0.5
-1.0
Figure 7 Mass flow rate in the steam line at the inlet from the reactor vessel at the outlet to the turbine and at the connection to the bypass line
66
PHYSOR 2002, Seoul, Korea, October 7-10, 2002
5.04.03.02.01.00.0
0.7
0.6
0.5
0.4
0.3
0.2
0.1
0.0
Figure 8 Mass flow rate in the bypass line at the inlet from the steam line at the outlet and the discharge flow
67
PHYSOR 2002, Seoul, Korea, October 7-10, 2002
68
21.751.51.2510.750.50.250
8.0
7.0
6.0
5.0
4.0
3.0
2.0
1.0
0.0
Figure 9 Relative power histories for Exercise 2 calculated by ATHLET-QUABOX/CUBBOX using 33 THC and 764 THC compared to meas-ured data
PHYSOR 2002, Seoul, Korea, October 7-10, 2002
400350300250200150100500
2.0
1.8
1.6
1.4
1.2
1.0
0.8
0.6
0.4
0.2
0.0
Figure 10 Comparison of axial power distributions in the initial steady state for fuel assembly #75 using 33 THC and 764 THC in the ATHLET-QUABOX/CUBBOX calculations
69
PHYSOR 2002, Seoul, Korea, October 7-10, 2002
400350300250200150100500
2.0
1.8
1.6
1.4
1.2
1.0
0.8
0.6
0.4
0.2
0.0
Figure 11 Comparison of axial power distributions in the initial steady state for fuel assembly #367 using 33 THC and 764 THC in the ATHLET-QUABOX/CUBBOX calculations
70
Analysis of Exercise 3 of the OECD/NRC BWR Turbine Trip Benchmark by the Coupled Code System ATHLET-
QUABOX/CUBBOX
America Nuclear Society Topical Meeting in Mathematics & Computations, Gatlinburg, TN, 2003
ANHANG 3
ANALYSIS OF EXERCISE 3 OF THE OECD/NRC BWR TURBINE TRIP
BENCHMARK BY THE COUPLED CODE SYSTEM ATHLET-
QUABOX/CUBBOX
S. Langenbuch, K.-D. Schmidt, K. Velkov
Gesellschaft für Anlagen- und Reaktorsicherheit (GRS) mbH 85748 Garching, GERMANY
[email protected]; [email protected]; [email protected]
ABSTRACT
The OECD/NRC BWR Turbine Trip (TT) Benchmark [1] has been calculated for all three exercises by the coupled thermal-hydraulic neutronics system code ATHLET - QUABOX/CUBBOX [2] developed by GRS. The results obtained for the best estimate case of Exercise 3 are presented and discussed in this paper. The availability of meas-urements for this transient makes the analysis valuable for validation of the coupled code system ATHLET - QUABOX/CUBBOX. Exercise 3 includes also three hypotheti-cal extreme cases initiated by malfunctions of the main steam line bypass valve and/or overlapping with no activation of reactor scram (ATWS condition). A new extreme sce-nario is introduced for code comparison under severe conditions; an extreme case 4 where in addition no credit is taken of the safety relieve valves (SRV) activation after the turbine trip. As a consequence, oscillations appear which are typical for a closed two phase thermal-hydraulic system with an internal heat generation source. The result of this extreme case is also discussed in the paper. Thus, the experiences with the coupled code system ATHLET - QUABOX/CUBBOX for the Exercise 3 of the BWR TT benchmark activity are summarised.
Key Words: BWR, Turbine Trip Benchmark, coupled codes, ATHLET - QUABOX/CUBBOX
71
Analysis of Exercise 3 of the OECD/NRC BWR Turbine Trip Benchmark by the Coupled Code System ATHLET-
QUABOX/CUBBOX
America Nuclear Society Topical Meeting in Mathematics & Computations, Gatlinburg, TN, 2003
1
2
INTRODUCTION The realistic simulation of nuclear power plant accident conditions requires 3D model-ling of the reactor core to describe coupled neutronic and thermal-hydraulic phenomena. For this purpose coupled code systems are developed and many activities are going on to develop further and to validate such code systems. The OECD/NRC BWR TT Benchmark has been defined to validate best estimate coupled code systems with 3D neutronics by comparing solutions with measured data and also code-to-code compari-son for some hypothetical extreme scenarios as an extension of the performed BWR turbine trip transient. The specification of the BWR TT Benchmark [1] refers to the Peach Bottom 2 nuclear power plant (PB-2 NPP). The benchmark specification provides the geometric data and the operational conditions of the plant. Three benchmark exercises are defined. Exercise 1: simulation of TT transient with fixed axial core power distribution and defined inte-gral power history supplied from experimental data. The purpose of this exercise is to test the thermal-hydraulic system response and to adjust the participants’ system models to the PB-2 NPP. Exercise 2: analysis of 3D neutronics and core thermal-hydraulics with given boundary conditions at core inlet and/or core outlet. The aim of this exercise is to initialize the 3D core neutronics on the basis of specified core loading and cross section libraries. Exercise 3: best estimate coupled 3D reactor core/thermal-hydraulic system modelling. The results can be compared with measured data from the Peach Bot-tom TT experiment. For testing of code coupling and feedback modelling under extreme conditions three additional hypothetical cases are defined: turbine trip without bypass system relief opening; turbine trip without scram and the combined scenario – turbine trip with bypass system relief failure without reactor scram. This paper presents the re-sults of the best estimate case of exercise 3 and the results of an additional simplified hypothetical scenario which can be considered as an extension to the extreme scenarios by imposing the non-opening of the safety relief valves.
COUPLED CODE SYSTEM ATHLET-QUABOX/CUBBOX The BWR TT benchmark has been analyzed with the GRS coupled code system ATHLET-QUABOX/CUBBOX. The code features and the coupling approach have been described in proceeding papers [3,4]. The coupling is based on a general interface, which separates data structures from neutronics and thermo-fluid dynamic codes and performs the exchange of data between the system code ATHLET and the 3D neutronic code QUABOX/CUBBOX. The fluid dynamic equations for the primary circuit and the flow channels in the reactor core region are completely modelled and numerically solved by ATHLET methods. The time-integration in the neutronics code QUABOX/CUBBOX is performed separately. Therefore, both codes keep their capa-bilities. The time-step size is adaptively synchronised during the transient. The coupling allows a flexible mapping defined by input between fuel assemblies of the core loading
72
Analysis of Exercise 3 of the OECD/NRC BWR Turbine Trip Benchmark by the Coupled Code System ATHLET-
QUABOX/CUBBOX
America Nuclear Society Topical Meeting in Mathematics & Computations, Gatlinburg, TN, 2003
3
and the thermo-fluid dynamic channels. Also the axial meshes for neutronics and fluid dynamics can be defined independently for both codes. The 3D kinetic core model QUABOX/CUBBOX is a nodal neutron diffusion code in Cartesian geometry developed in GRS with two prompt neutron groups and six groups of delayed neutron precursors. The coarse mesh method is based on a polynomial ex-pansion of neutron flux in each energy group. The time-integration is performed by a matrix-splitting method which decomposes the solution into implicit one dimensional steps for each spatial direction. The reactivity feedback is taken into account by depend-ence of homogenised cross-section on feedback parameters, the functional dependence can be defined in a very general and flexible manner. The system code ATHLET is also developed in GRS and is applied for the analysis of the whole plant behaviour under accident conditions. It is a thermal fluid dynamic sys-tem code based on 1D pipe components with a wide range of applications comprising anticipated and abnormal plant transients, small and intermediate leaks as well as large breaks in PWRs and BWRs. The possibility to implement connections among parallel channels in the reactor core allows to model cross-flow.
PLANT CONFIGURATION AND SCENARIO FOR THE BWR TT TRANSIENT
Peach Bottom 2 NPP is a boiling water reactor with jet pumps and two external recircu-lation loops. The ATHLET model of the coolant flow in the reactor vessel consists of a lower plenum, a core region with the specified 33 thermal-hydraulic channels, one core bypass channel, an upper plenum, stand pipes, a separator and a steam dome. The downward flow path is modelled by an upper down comer section, where the feed water is supplied, the jet pumps and a lower down comer section with the diffusors. Two symmetric recirculation loops are described. The model configuration of ATHLET for the reactor vessel is shown in Fig.1. The flow path of the generated steam to the turbine is modelled by the main steam line pipes with the turbine stop valve (TSV) and the con-nected bypass line with the turbine bypass valve (TBV). As the transient is initiated by a sudden closure of the turbine stop valve leading to pressure wave oscillations on the steam line, the steam line system should be modelled in detail. The total length of the main steam line is 133 m. The bypass line of 74.8 m length is connected to the steam line 9 m before the TSV. The arrangement and nodalization of the main steam line sys-tem in the ATHLET model is shown in Fig.2. The core model represents the coolant flow by parallel flow channels without cross-flow. A fuel rod model, solving the heat-conduction equations with 5 radial zones for the fuel pellet, a gap heat resistance and a single zone for the cladding, is attached to each THC. Three types of thermal-hydraulic channels (THC) are defined corresponding to 7x7 and 8x8 fuel assemblies with and without flow restriction. The values of flow area, fuel rod diameter and flow resistances are determined according to the specification. The 5-equation flow model is used in the ATHLET code. The 3D neutron kinetics code QUABOX/CUBBOX solves the neutron diffusion equations. Each fuel assembly of the BWR core is represented by a single node in the X-Y plane, in total 764 fuel assemblies. The core loading of the fuel assem-
73
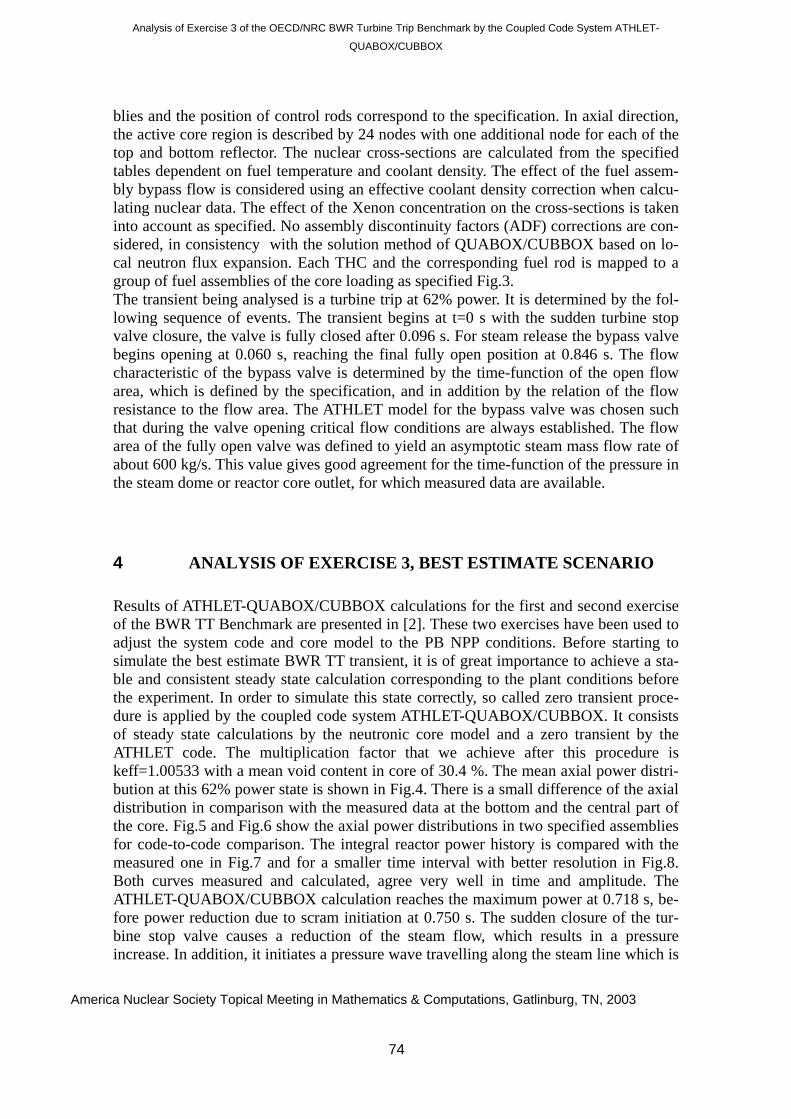
Analysis of Exercise 3 of the OECD/NRC BWR Turbine Trip Benchmark by the Coupled Code System ATHLET-
QUABOX/CUBBOX
America Nuclear Society Topical Meeting in Mathematics & Computations, Gatlinburg, TN, 2003
4
blies and the position of control rods correspond to the specification. In axial direction, the active core region is described by 24 nodes with one additional node for each of the top and bottom reflector. The nuclear cross-sections are calculated from the specified tables dependent on fuel temperature and coolant density. The effect of the fuel assem-bly bypass flow is considered using an effective coolant density correction when calcu-lating nuclear data. The effect of the Xenon concentration on the cross-sections is taken into account as specified. No assembly discontinuity factors (ADF) corrections are con-sidered, in consistency with the solution method of QUABOX/CUBBOX based on lo-cal neutron flux expansion. Each THC and the corresponding fuel rod is mapped to a group of fuel assemblies of the core loading as specified Fig.3. The transient being analysed is a turbine trip at 62% power. It is determined by the fol-lowing sequence of events. The transient begins at t=0 s with the sudden turbine stop valve closure, the valve is fully closed after 0.096 s. For steam release the bypass valve begins opening at 0.060 s, reaching the final fully open position at 0.846 s. The flow characteristic of the bypass valve is determined by the time-function of the open flow area, which is defined by the specification, and in addition by the relation of the flow resistance to the flow area. The ATHLET model for the bypass valve was chosen such that during the valve opening critical flow conditions are always established. The flow area of the fully open valve was defined to yield an asymptotic steam mass flow rate of about 600 kg/s. This value gives good agreement for the time-function of the pressure in the steam dome or reactor core outlet, for which measured data are available.
ANALYSIS OF EXERCISE 3, BEST ESTIMATE SCENARIO
Results of ATHLET-QUABOX/CUBBOX calculations for the first and second exercise of the BWR TT Benchmark are presented in [2]. These two exercises have been used to adjust the system code and core model to the PB NPP conditions. Before starting to simulate the best estimate BWR TT transient, it is of great importance to achieve a sta-ble and consistent steady state calculation corresponding to the plant conditions before the experiment. In order to simulate this state correctly, so called zero transient proce-dure is applied by the coupled code system ATHLET-QUABOX/CUBBOX. It consists of steady state calculations by the neutronic core model and a zero transient by the ATHLET code. The multiplication factor that we achieve after this procedure is keff=1.00533 with a mean void content in core of 30.4 %. The mean axial power distri-bution at this 62% power state is shown in Fig.4. There is a small difference of the axial distribution in comparison with the measured data at the bottom and the central part of the core. Fig.5 and Fig.6 show the axial power distributions in two specified assemblies for code-to-code comparison. The integral reactor power history is compared with the measured one in Fig.7 and for a smaller time interval with better resolution in Fig.8. Both curves measured and calculated, agree very well in time and amplitude. The ATHLET-QUABOX/CUBBOX calculation reaches the maximum power at 0.718 s, be-fore power reduction due to scram initiation at 0.750 s. The sudden closure of the tur-bine stop valve causes a reduction of the steam flow, which results in a pressure increase. In addition, it initiates a pressure wave travelling along the steam line which is
74
Analysis of Exercise 3 of the OECD/NRC BWR Turbine Trip Benchmark by the Coupled Code System ATHLET-
QUABOX/CUBBOX
America Nuclear Society Topical Meeting in Mathematics & Computations, Gatlinburg, TN, 2003
5
superposed to the pressure increase. Subsequently, further pressure oscillations are ob-served in the reactor vessel and in the steam line. The pressure increase is limited by the steam release through the bypass valve. This pressure history is to be seen in Fig.9 where it is compared with the measured one and with the results generated with the RETRAN code adjusted for the PB reactor by the utility. The deviation from the meas-urement is small. The total mass flow rate through the bypass valve and the flow resis-tance at the inlet of the main steam line from the reactor vessel which were identified as important parameters for the overall plant behaviour can be seen in Fig.10. Fig.11 shows the simulated local power range monitor (LPRM) response for the specified four reactor layers which will be compared in future with the available measured data.
ANALYSIS OF THE EXTREME SCENARIO 4
The specified extreme scenarios 1, 2 and 3 require an exact modelling of the SRVs. Dif-ferences in the participants’ modelling could affect the comparison, because only the discharge mass flow capacities at 103% of the set pressure are being specified for each one of the four relief and safety valves, but not the full characteristic of the valves’ opening. To avoid that, it was proposed an extreme case 4 which overcomes the uncer-tainties in safety/relief valve (SRV) modelling and which can be applied better for code-to-code comparisons. The basis for the hypothetical case 4 is the specified extreme case 3 (no activation of bypass line, no scram) with no opening of valves.
The reactor power history is shown in Fig.12. This case represents a closed system without heat sink and mass discharge and thereby a continuous increase of reactor mean power is observed. The reactor is critical and reaches maximum excess criticality of 1.00180. After the first power and reactivity excursion subsequent oscillations take place around the critical state (Fig.13). At the beginning of the transient the void reac-tivity is the determining parameter but afterwards due to the rising fuel temperature more negative reactivity is inserted and so the integral reactivity is stabilized later at about 0.18% dk/k. The relative changes of all important parameters can be seen in Fig.13. The oscillation of the power is due to the pressure wave propagation through the whole system which influences the void content and consequently the void reactivity. The oscillations are damped due to the constant increase of the fuel temperature making Doppler reactivity the prevailing phenomena. The eigen-frequency of the simulated close reactor system without any external or internal perturbation is approximately 1 Hz. The maximum local nodal temperature and the core mean temperature are presented in Fig.14. Ten seconds after the beginning of the transient the maximum fuel tempera-ture is still below the melting temperature.
75
Analysis of Exercise 3 of the OECD/NRC BWR Turbine Trip Benchmark by the Coupled Code System ATHLET-
QUABOX/CUBBOX
America Nuclear Society Topical Meeting in Mathematics & Computations, Gatlinburg, TN, 2003
76
6 CONCLUSIONS
The presentation describes the results of the coupled system code ATHLET - QUABOX/CUBBOX for the best estimate case of the BWR TT benchmark – Exercise 3. The detailed analysis of the physical processes and the comparison with the available measured data shows very good agreement. The proposed hypothetical extreme case 4 allows a consistent comparison of codes in view of physical effects and modelling fea-tures under severe conditions. The 3D neutronics in coupled codes allow the possibility to calculate accurately the reactivity changes and the local parameters relevant for safety evaluations. Therefore, the BWR TT benchmark is an important contribution to the validation of coupled code systems.
7 ACKNOWLEDGMENTS
The work presented was performed within projects funded by the German Federal Min-istry of Economics and Technology (BMWI).
8 REFERENCES
6. J. Solis, K. Ivanov, B. Sarikaya, A. Olson, K. Hunt, Boiling Water Reactor Turbine Trip
(TT) Benchmark, Volume 1: Final Specifications, NEA/NSC/DOC(2001) 1.
7. S.Langenbuch, K.-D.Schmidt, K.Velkov, Analysis of Exercises 1 and 2 of the OECD/NRC BWR Turbine Trip (TT) Benchmark by the Coupled Code System ATHLET-QUABOX/CUBBOX, PHYSOR 2002, October 7-10, 2002, Seoul, Korea.
8. S.Langenbuch, K.-D.Schmidt, K.Velkov, The Coupled Code System ATHLET-QUABOX/CUBBOX – Model Features and Results for the Core Transients of the OECD PWR MSLB-Benchmark, M&C, September 1999, Madrid, Spain.
9. S. Langenbuch, H. Austregesilo, P. Fomitchenko, U. Rohde, K. Velkov, Interface Require-ments to Couple Thermal-Hydraulics Codes to 3D Neutronic Codes. OECD/CSNI Work-shop on Transient Thermal-Hydraulic and Neutronic Codes Requirements, Annapolis, Md., U.S.A., November 5-8, 1996.
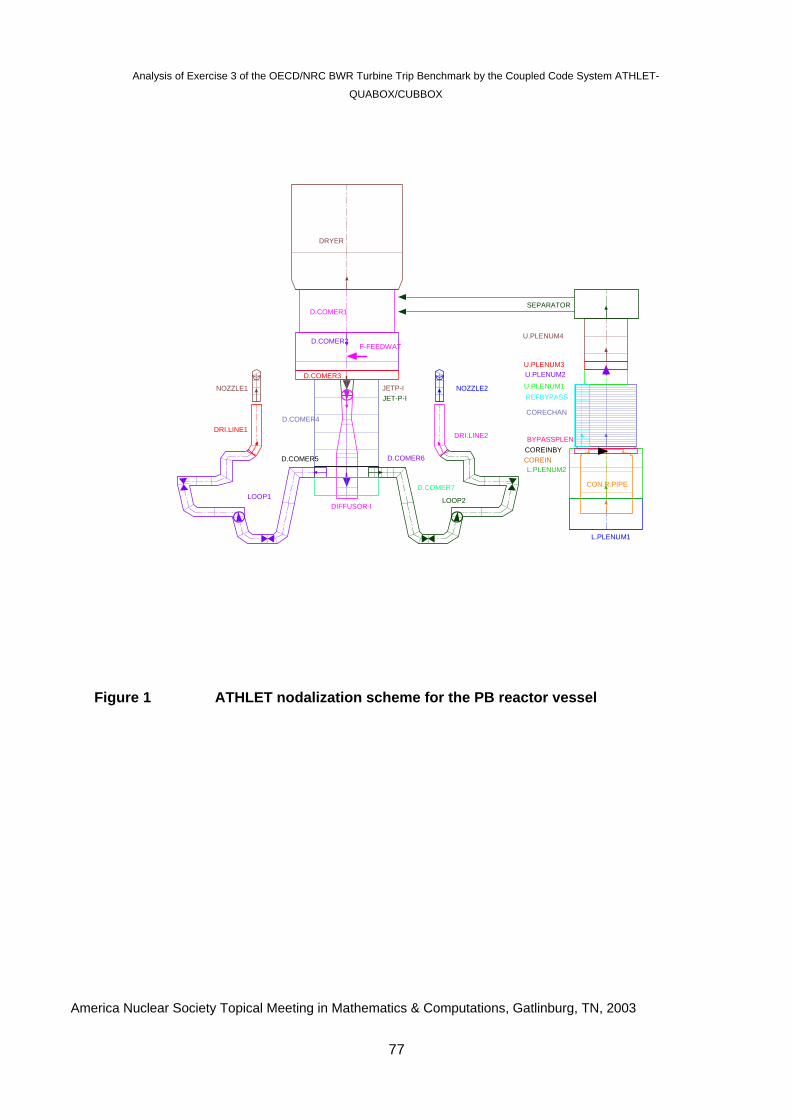
Analysis of Exercise 3 of the OECD/NRC BWR Turbine Trip Benchmark by the Coupled Code System ATHLET-
QUABOX/CUBBOX
America Nuclear Society Topical Meeting in Mathematics & Computations, Gatlinburg, TN, 2003
77
Figure 1 ATHLET nodalization scheme for the PB reactor vessel
D.COMER2
D.COMER3
JETP-IJET-P-I
DIFFUSOR-I
L.PLENUM1
L.PLENUM2COREIN
CORECHAN
U.PLENUM1U.PLENUM2U.PLENUM3
U.PLENUM4
SEPARATORD.COMER1
D.COMER4
D.COMER5
LOOP1
DRI.LINE1
NOZZLE1
LOOP2
DRI.LINE2
NOZZLE2
CON.R.PIPE
BYPASSPLEN
REFBYPASS
COREINBYD.COMER6
DRYER
F-FEEDWAT
D.COMER7
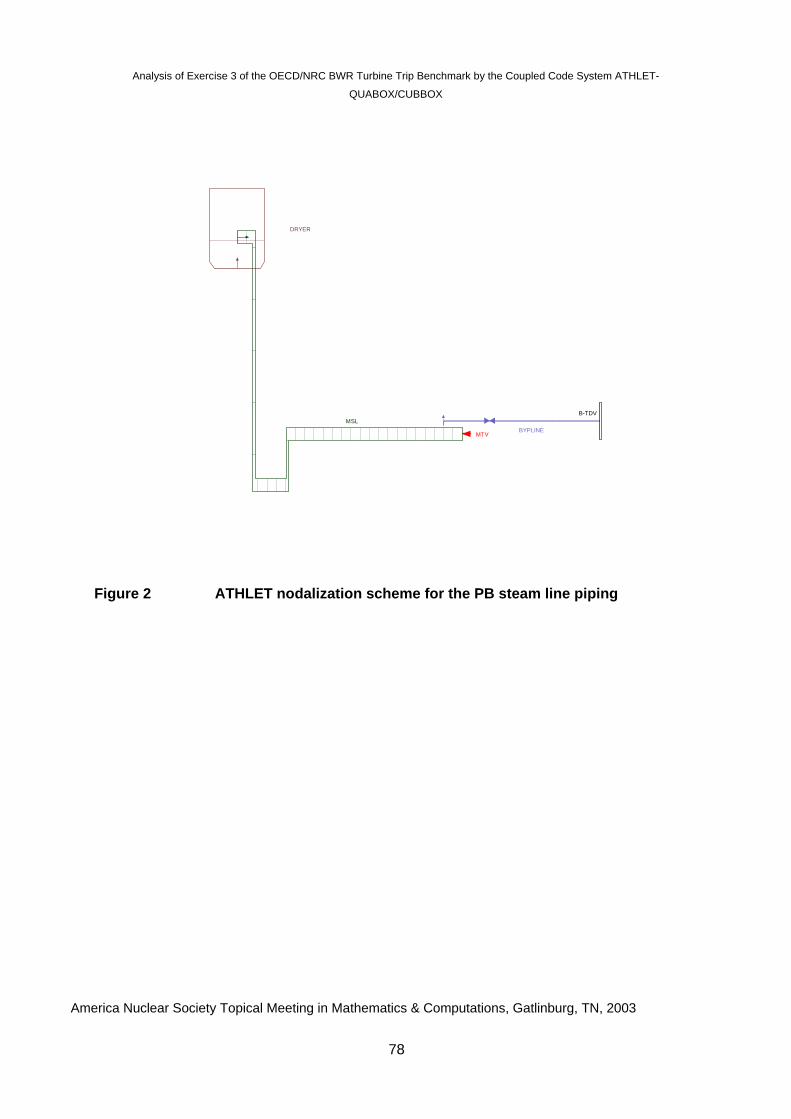
Analysis of Exercise 3 of the OECD/NRC BWR Turbine Trip Benchmark by the Coupled Code System ATHLET-
QUABOX/CUBBOX
America Nuclear Society Topical Meeting in Mathematics & Computations, Gatlinburg, TN, 2003
78
DRYER
MSLBYPLINE
B-TDV
MTV
Figure 2 ATHLET nodalization scheme for the PB steam line piping
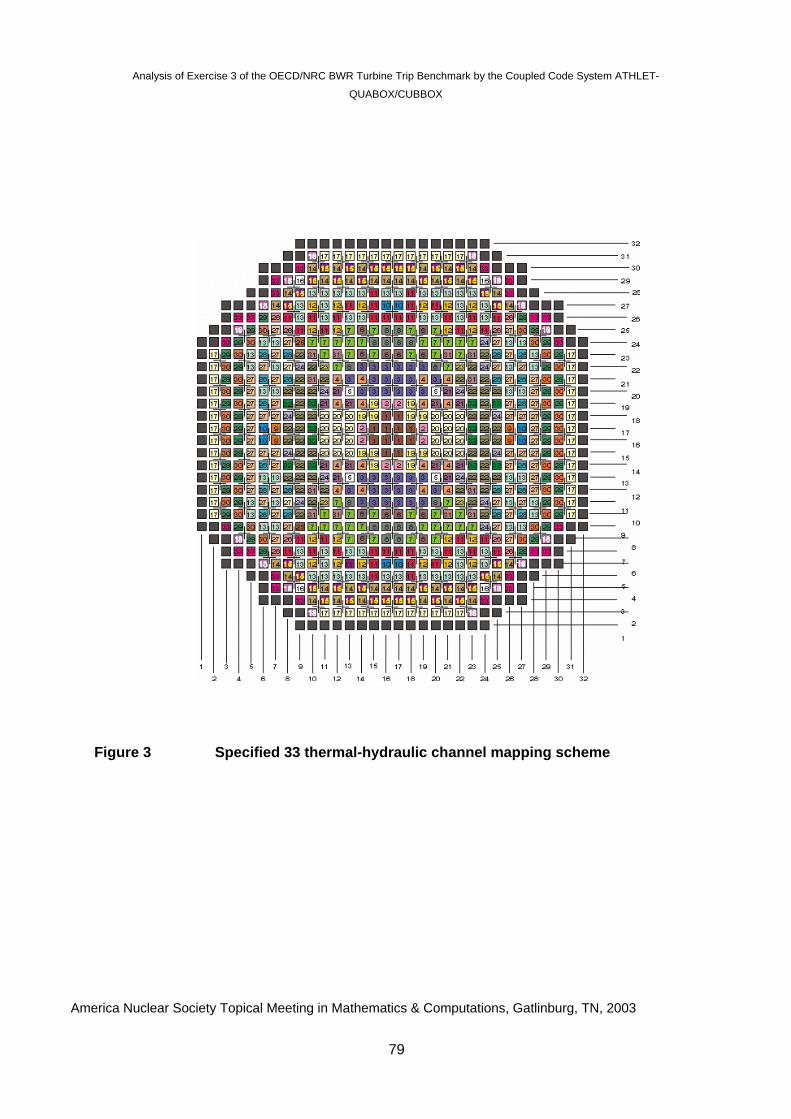
Analysis of Exercise 3 of the OECD/NRC BWR Turbine Trip Benchmark by the Coupled Code System ATHLET-
QUABOX/CUBBOX
America Nuclear Society Topical Meeting in Mathematics & Computations, Gatlinburg, TN, 2003
79
Figure 3 Specified 33 thermal-hydraulic channel mapping scheme
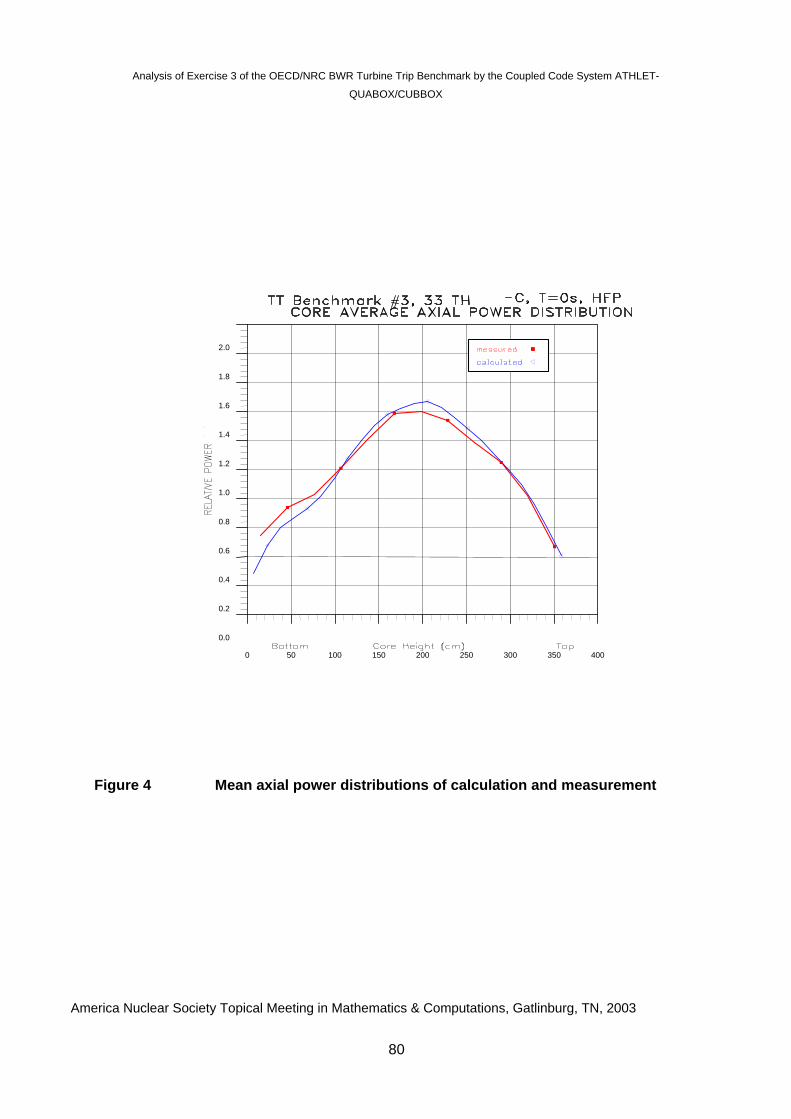
Analysis of Exercise 3 of the OECD/NRC BWR Turbine Trip Benchmark by the Coupled Code System ATHLET-
QUABOX/CUBBOX
America Nuclear Society Topical Meeting in Mathematics & Computations, Gatlinburg, TN, 2003
80
400350300250200150100500
2.0
1.8
1.6
1.4
1.2
1.0
0.8
0.6
0.4
0.2
0.0
Figure 4 Mean axial power distributions of calculation and measurement
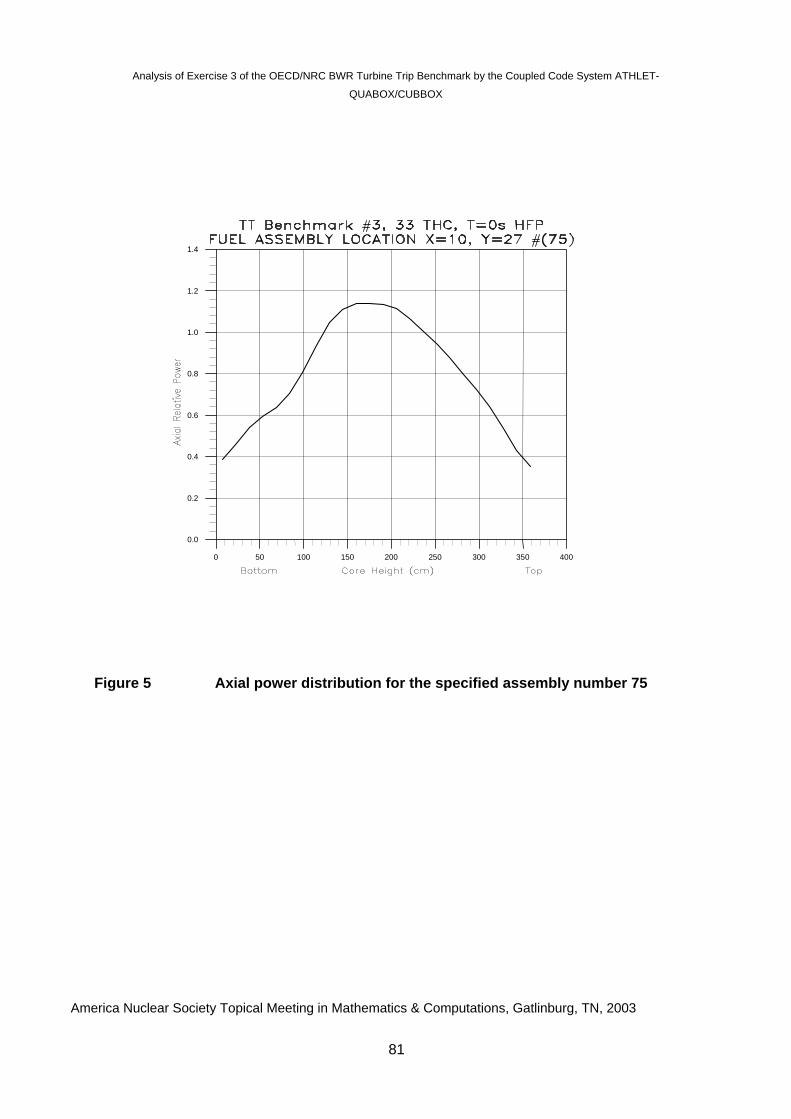
Analysis of Exercise 3 of the OECD/NRC BWR Turbine Trip Benchmark by the Coupled Code System ATHLET-
QUABOX/CUBBOX
America Nuclear Society Topical Meeting in Mathematics & Computations, Gatlinburg, TN, 2003
81
400350300250200150100500
1.4
1.2
1.0
0.8
0.6
0.4
0.2
0.0
Figure 5 Axial power distribution for the specified assembly number 75
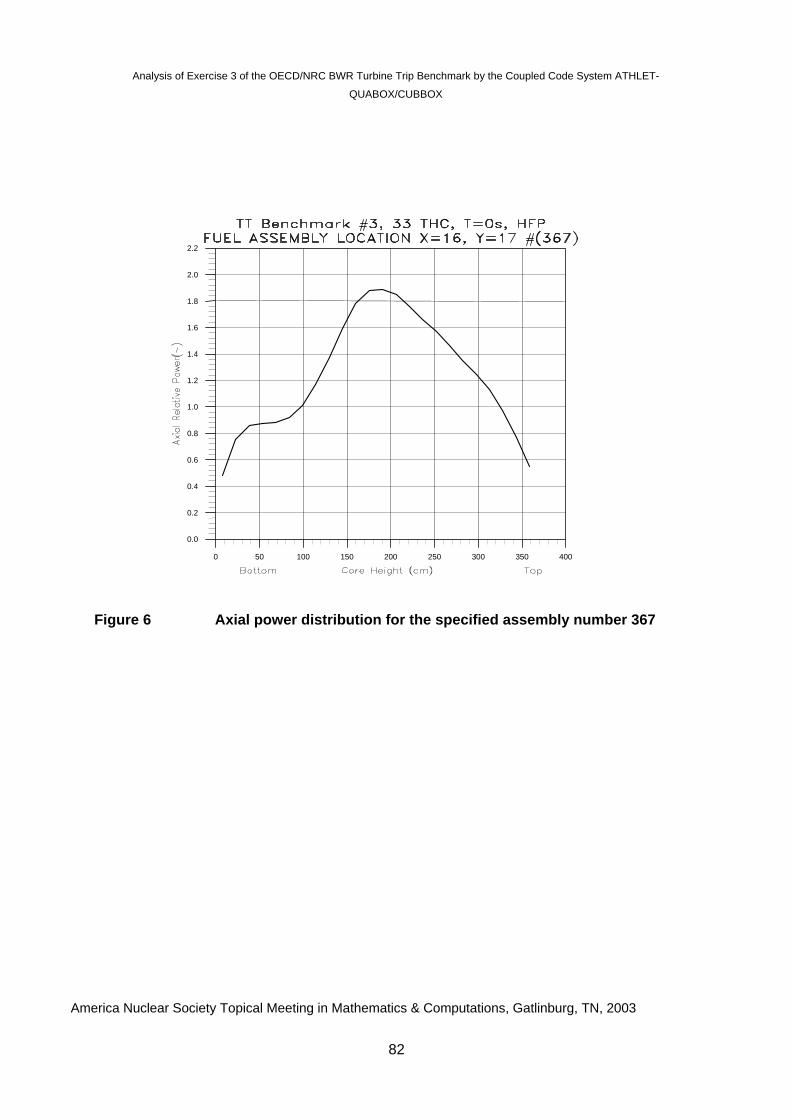
Analysis of Exercise 3 of the OECD/NRC BWR Turbine Trip Benchmark by the Coupled Code System ATHLET-
QUABOX/CUBBOX
America Nuclear Society Topical Meeting in Mathematics & Computations, Gatlinburg, TN, 2003
82
400350300250200150100500
2.2
2.0
1.8
1.6
1.4
1.2
1.0
0.8
0.6
0.4
0.2
0.0
Figure 6 Axial power distribution for the specified assembly number 367
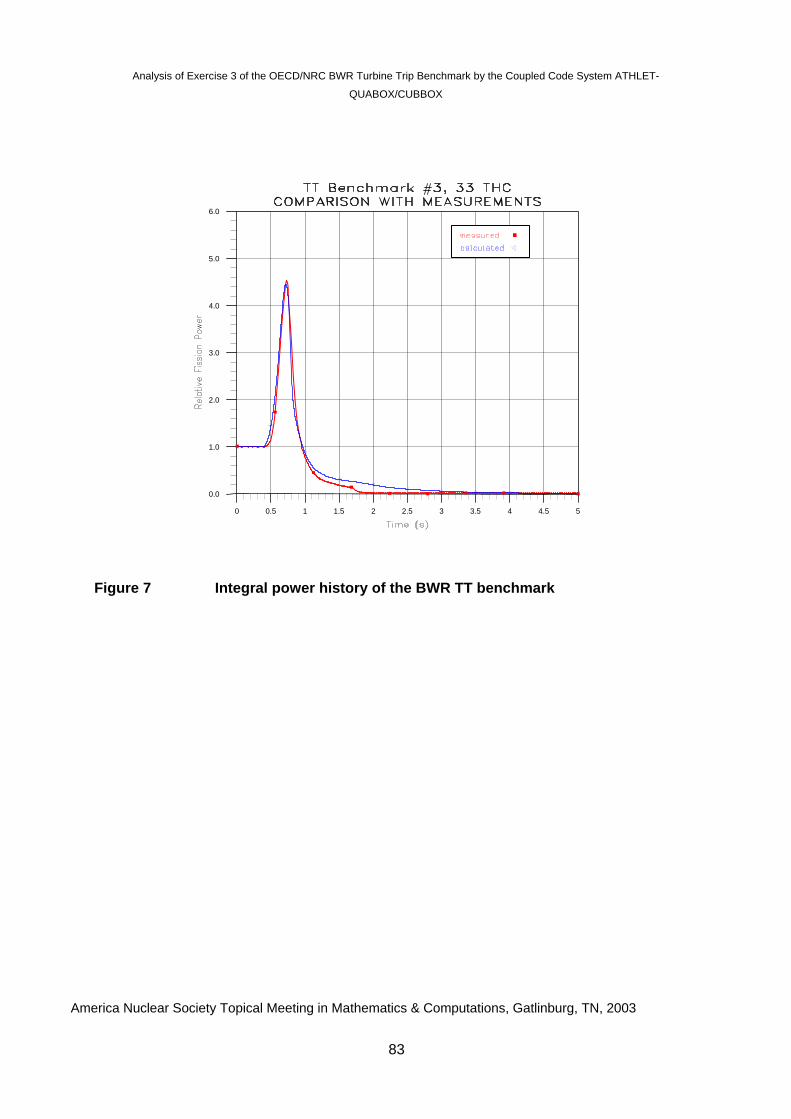
Analysis of Exercise 3 of the OECD/NRC BWR Turbine Trip Benchmark by the Coupled Code System ATHLET-
QUABOX/CUBBOX
America Nuclear Society Topical Meeting in Mathematics & Computations, Gatlinburg, TN, 2003
83
54.543.532.521.510.50
6.0
5.0
4.0
3.0
2.0
1.0
0.0
Figure 7 Integral power history of the BWR TT benchmark
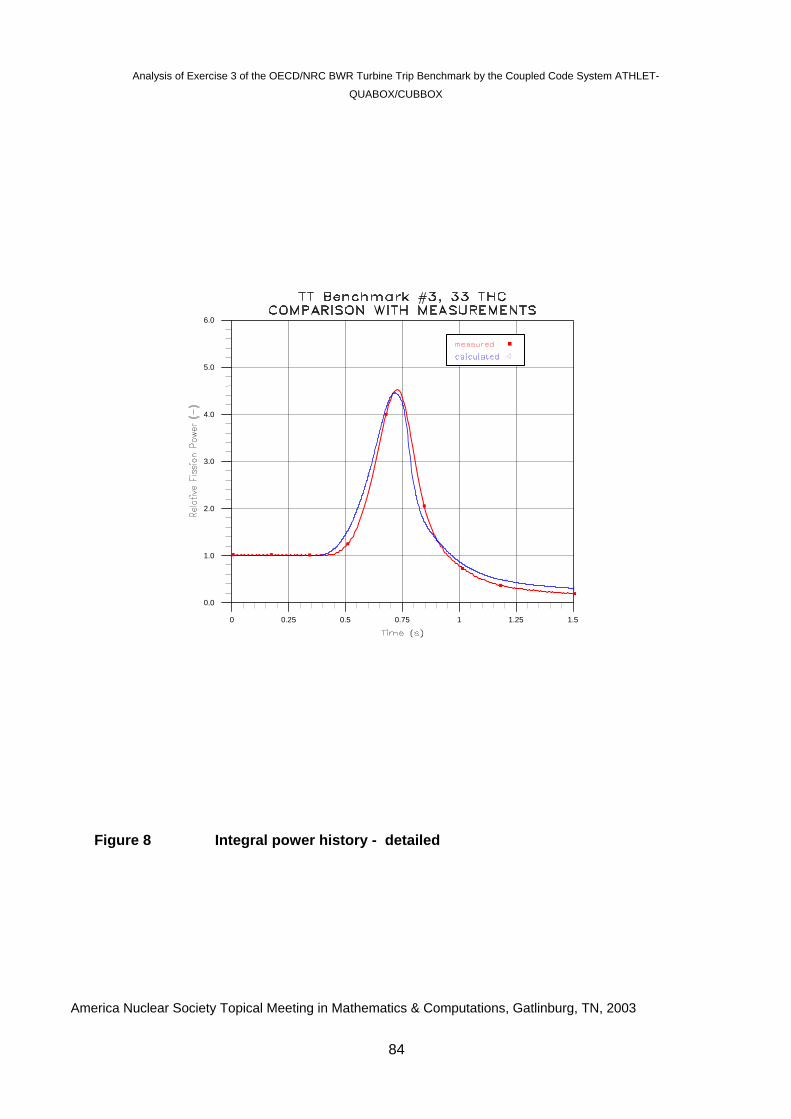
Analysis of Exercise 3 of the OECD/NRC BWR Turbine Trip Benchmark by the Coupled Code System ATHLET-
QUABOX/CUBBOX
America Nuclear Society Topical Meeting in Mathematics & Computations, Gatlinburg, TN, 2003
84
1.51.2510.750.50.250
6.0
5.0
4.0
3.0
2.0
1.0
0.0
Figure 8 Integral power history - detailed
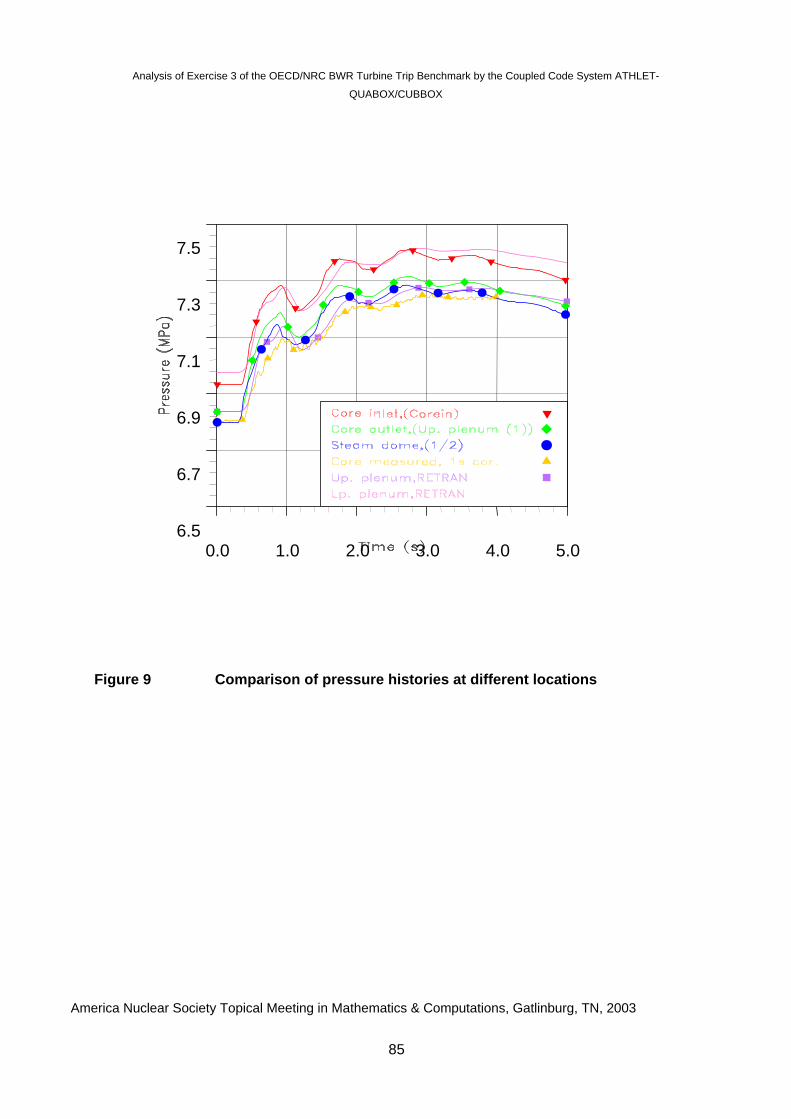
Analysis of Exercise 3 of the OECD/NRC BWR Turbine Trip Benchmark by the Coupled Code System ATHLET-
QUABOX/CUBBOX
America Nuclear Society Topical Meeting in Mathematics & Computations, Gatlinburg, TN, 2003
85
5.04.03.02.01.00.0
7.5
7.3
7.1
6.9
6.7
6.5
Figure 9 Comparison of pressure histories at different locations
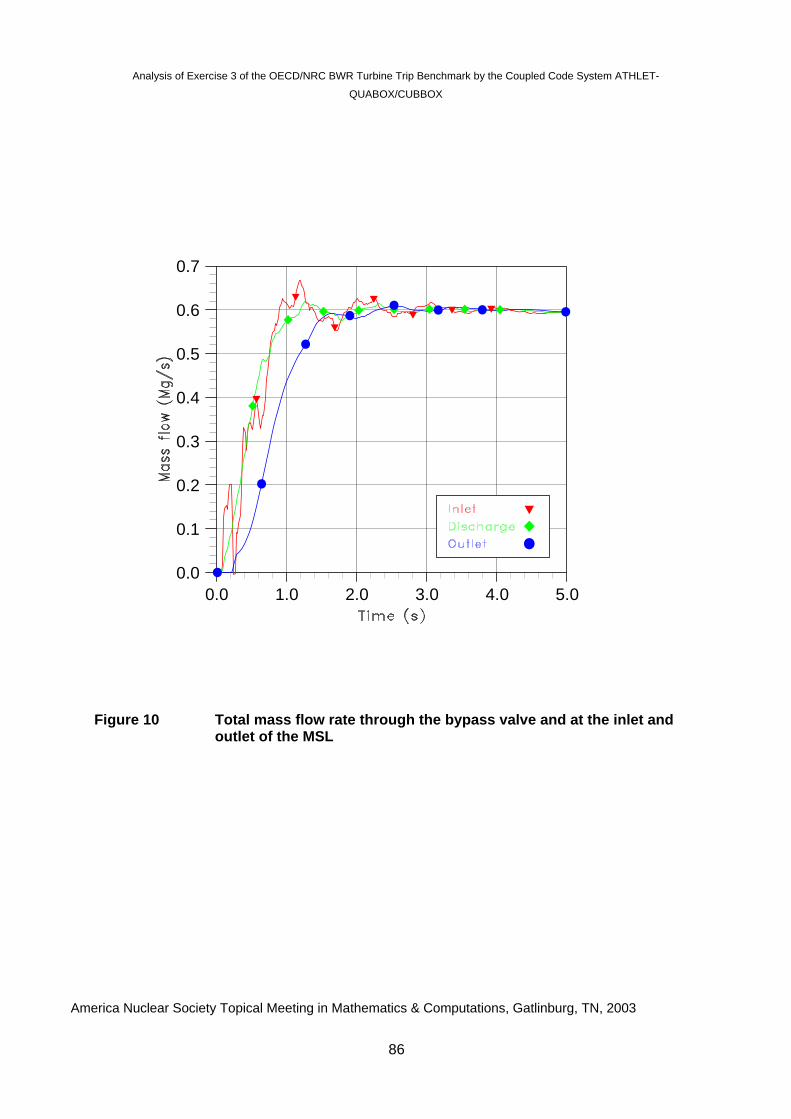
Analysis of Exercise 3 of the OECD/NRC BWR Turbine Trip Benchmark by the Coupled Code System ATHLET-
QUABOX/CUBBOX
America Nuclear Society Topical Meeting in Mathematics & Computations, Gatlinburg, TN, 2003
86
5.04.03.02.01.00.0
0.7
0.6
0.5
0.4
0.3
0.2
0.1
0.0
Figure 10 Total mass flow rate through the bypass valve and at the inlet and outlet of the MSL
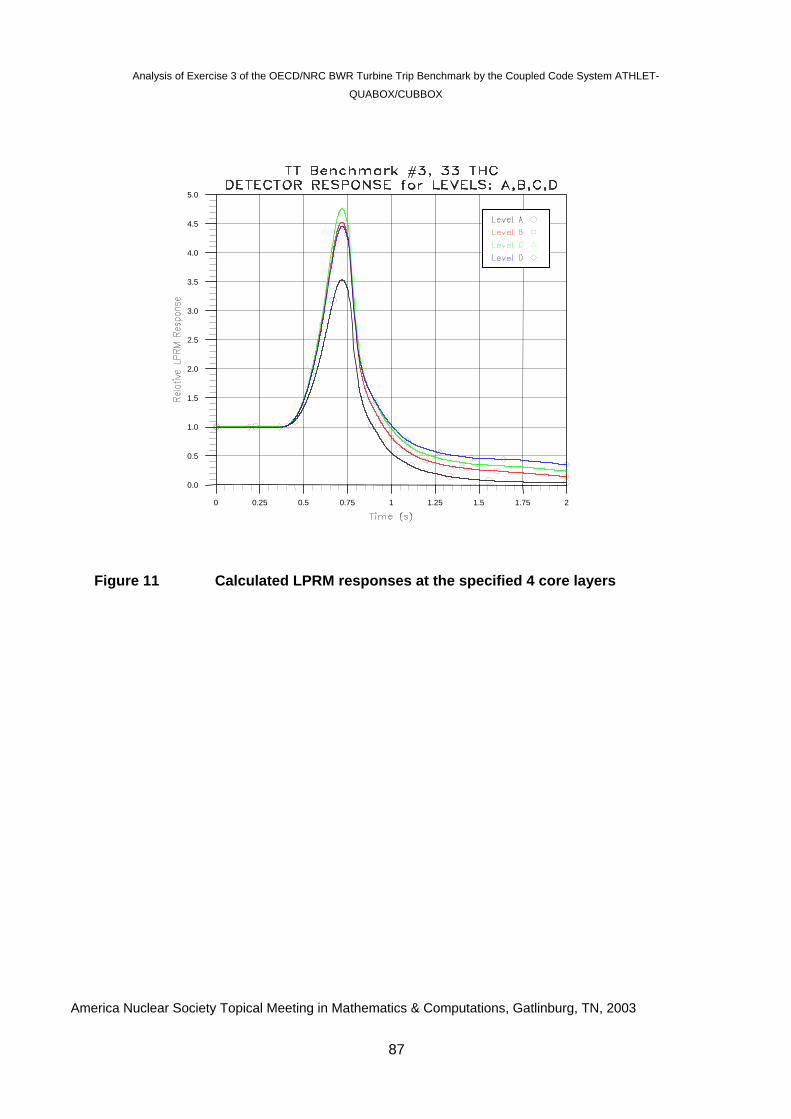
Analysis of Exercise 3 of the OECD/NRC BWR Turbine Trip Benchmark by the Coupled Code System ATHLET-
QUABOX/CUBBOX
America Nuclear Society Topical Meeting in Mathematics & Computations, Gatlinburg, TN, 2003
87
5.0
4.5
4.0
3.5
3.0
2.5
2.0
1.5
1.0
0.5
0.0
21.751.51.2510.750.50.250
Figure 11 Calculated LPRM responses at the specified 4 core layers
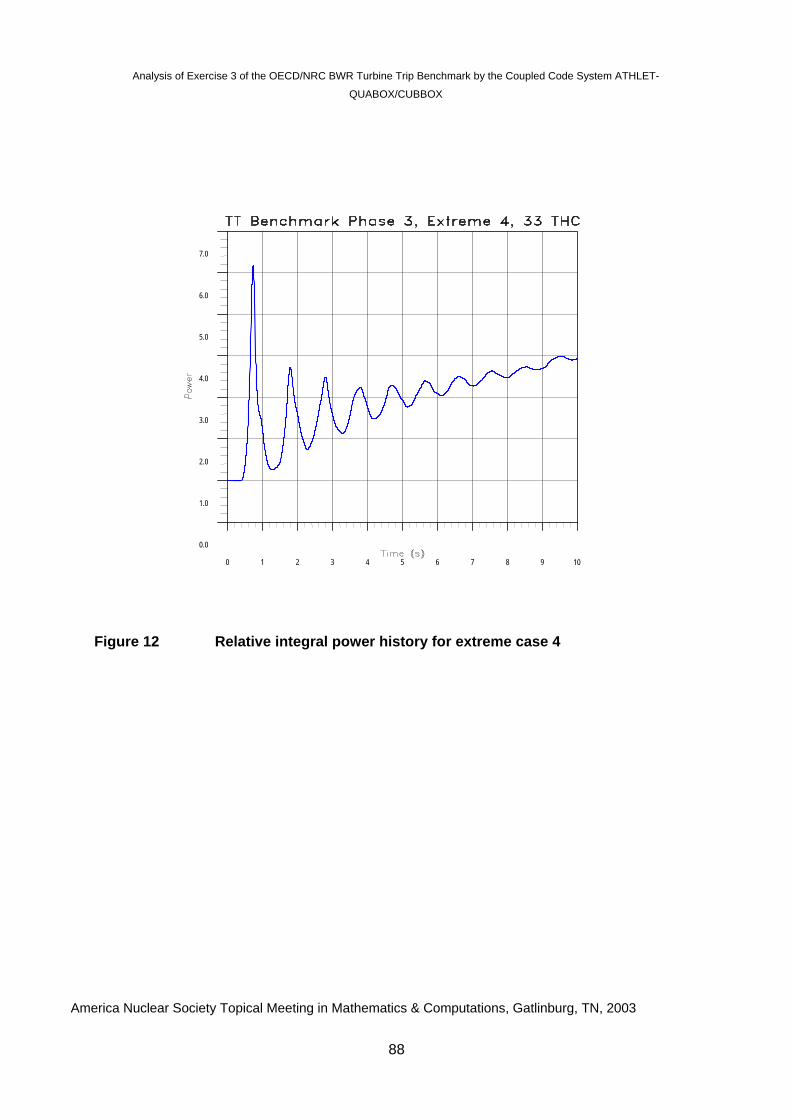
Analysis of Exercise 3 of the OECD/NRC BWR Turbine Trip Benchmark by the Coupled Code System ATHLET-
QUABOX/CUBBOX
America Nuclear Society Topical Meeting in Mathematics & Computations, Gatlinburg, TN, 2003
109876543210
7.0
6.0
5.0
4.0
3.0
2.0
1.0
0.0
Figure 12 Relative integral power history for extreme case 4
88
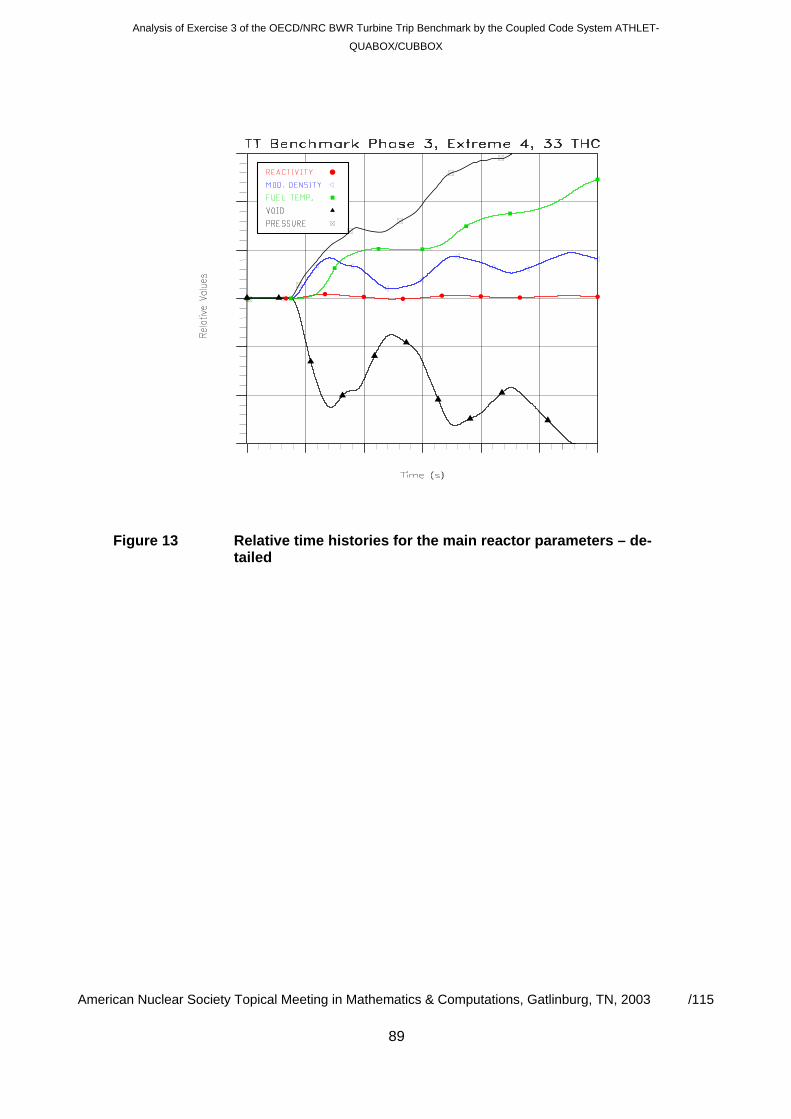
Analysis of Exercise 3 of the OECD/NRC BWR Turbine Trip Benchmark by the Coupled Code System ATHLET-
QUABOX/CUBBOX
American Nuclear Society Topical Meeting in Mathematics & Computations, Gatlinburg, TN, 2003 /115
Figure 13 Relative time histories for the main reactor parameters – de-tailed
89
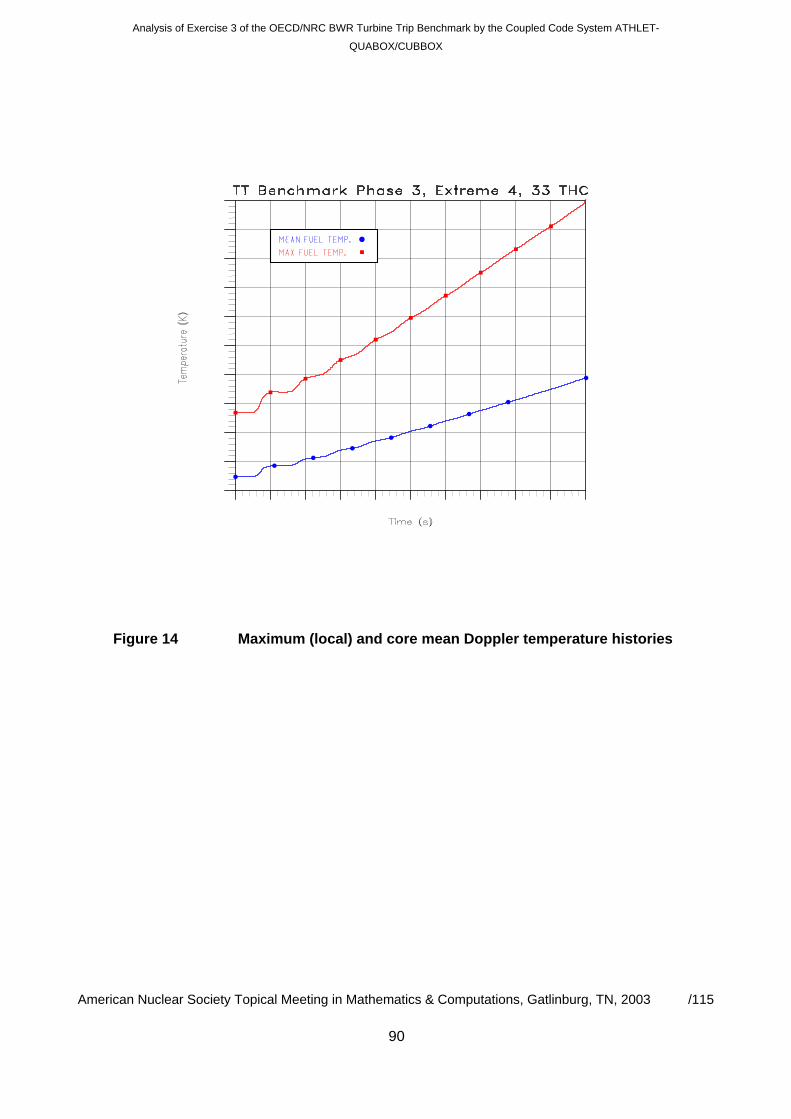
Analysis of Exercise 3 of the OECD/NRC BWR Turbine Trip Benchmark by the Coupled Code System ATHLET-
QUABOX/CUBBOX
American Nuclear Society Topical Meeting in Mathematics & Computations, Gatlinburg, TN, 2003 /115
Figure 14 Maximum (local) and core mean Doppler temperature histories
90
SNA 2003, Paris, September 22 – 24, 2003
Anhang 4
APPLICATION OF THE COUPLED CODE ATHLET-QUABOX/CUBBOX FOR THE
EXTREME SCENARIOS OF THE OECD/NRC BWR TURBINE TRIP BENCHMARK AND
ITS PERFORMANCE ON MULTI-PROCESSOR COMPUTERS
S. Langenbuch, K.-D. Schmidt and K. Velkov
Gesellschaft für Anlagen- und Reaktorsicherheit (GRS) mbH, Germany
[email protected]; [email protected]; [email protected]
Abstract
The OECD/NRC BWR Turbine Trip (TT) Benchmark [1] is investigated to perform code-to-code comparison of coupled codes including a comparison to measured data which are available from tur-bine trip experiments at Peach Bottom 2. This Benchmark problem for a BWR over-pressure transient represents a challenging application of coupled codes which integrate 3D neutron kinetics into ther-mal-hydraulic system codes for best-estimate simulation of plant transients. This transient represents a typical application of coupled codes which are usually performed on powerful workstations using a single CPU. Nowadays, the availability of multi-CPUs is much easier. Indeed, powerful workstations already provide 4 to 8 CPU, computer centers give access to multi-processor systems with numbers of CPUs in the order of 16 up to several 100. Therefore, the performance of the coupled code ATHLET-QUABOX/CUBBOX on multi-processor systems is studied. Different cases of application lead to changing requirements of the code efficiency, because the amount of computer time spent in different parts of the code is varying. This paper presents main results of the coupled code ATHLET-QUABOX/CUBBOX for the extreme scenarios of the BWR TT Benchmark together with evaluations of the code performance on multi-processor computers.
91
Introduction
The main goal of the OECD/NRC BWR Turbine Trip (TT) Benchmark [1] is to validate best esti-mate coupled code systems with integrated 3D neutron kinetics by comparing solutions with measured plant data. As an extension of the BWR turbine trip transient additional hypothetical extreme scenarios were defined for the purpose of code-to-code comparison. GRS results for the BWR TT Benchmark obtained with the coupled code system ATHLET-QUABOX/CUBBOX [2,3] of the Exercises 1 and 2 are presented in [4] and the results for Exercise 3 in [5]. The specification of the BWR TT Benchmark provides the geometric data and the operational con-ditions of the Peach Bottom 2 nuclear power plant. Complementary to the Exercises of the BWR TT Benchmark analyzing in three steps the reactor core and the plant behaviour, a set of hypothetical ex-treme cases is formulated. The first extreme case is the postulated TT transient without bypass system relief opening; the second one is TT without reactor scram initiation (ATWS) and the third is the com-bined scenario – turbine trip with bypass system relief failure and without reactor scram. The extreme case 4 with postulated failure of relief valves was already presented in [5]. All the extreme cases are calculated by coupled code systems with integrated 3D neutron kinetics for testing the code coupling and feedback modelling under extreme conditions. These extreme scenarios of Exercise 3 and for comparison two calculations for Exercise 2 of the BWR TT Benchmark are used to discuss the performance of the coupled code ATHLET-QUABOX/CUBBOX on multi-CPU computers and to evaluate the capability of code paral-lelization. For this purpose the software standards of parallel programming are briefly re-viewed. As starting point for the stepwise code parallelization a detailed analysis of code performance of ATHLET-QUABOX/CUBBOX is performed for the Benchmark calculations to identify those sections of code which are most effectively executed in parallel mode.
Plant configuration and scenarios for the extreme cases
The ATHLET model of Peach Bottom 2 NPP (Fig.1) consists of a nodalisation describing the primary circuit with two external symmetrical recirculation loops, the reactor vessel with a lower plenum, a core region with the specified 33 thermal-hydraulic channels (THC), one core bypass channel, an upper plenum, stand pipes, a separator and a steam dome. The downward flow path in the reactor vessel is modelled by an upper down comer section, where the feed water is supplied, the jet pumps and a lower down comer section with the diffusors. The flow path of the steam to the turbine is modelled by the main steam line pipe with the turbine stop valve (TSV) at the end and the connected bypass line with the turbine bypass valve (TBV). As the transient is initiated by a sudden closure of the turbine stop valve pressure wave oscilla-tions appear on the steam line that requires a detailed description. The total length of the main steam line is 133 m. The bypass line of 74.8 m length is connected to the steam line 9 m be-fore the TSV. The location of the three groups of relief valves (RV) and the safety relief valve (SRV) is chosen to be 10 m downstream from the reactor vessel on the main steam line. A lin-ear discharge characteristic of the RV and SRV has been defined, for example for RV number 1 at P=7.95 MPa (103% of set pressure) a mass flow rate of G=103.19 kg/s is assumed. The core model represents the coolant flow by parallel flow channels without cross-flow. A fuel
92
rod model, solving the heat-conduction equations with 5 radial zones for the fuel pellet, a gap heat resistance and a single zone for the cladding, is attached to each THC. Three types of THCs are defined corresponding to 7x7 fuel assemblies and 8x8 fuel assemblies with and without flow restriction. The values of flow area, fuel rod diameter and flow resistances are determined according to the specification. In the ATHLET code the 5-equation model is used solving the fluid dynamic conservation equations. The 3D neutron kinetics code QUABOX/CUBBOX solves the neutron diffusion equations for two energy groups by a coarse mesh method based on neutron flux expansion by local polynomials. Each fuel assem-bly of the BWR core is represented by a single node in the X-Y plane, totally 764. The core loading of the fuel assemblies and the position of control rods correspond to the specification. In axial direction, the active core region is described by 24 nodes with one additional node for each of the top and bottom reflector. The nuclear cross-sections are calculated from the speci-fied tables dependent on fuel temperature and coolant density. The effect of the fuel assembly bypass flow is considered using an effective coolant density correction when calculating nu-clear data. The effect of the Xenon concentration on the cross-sections is taken into account as specified. No ADF corrections are considered, in consistency with the solution method of QUABOX/CUBBOX based on local neutron flux expansion. Each THC and the correspond-ing fuel rod is mapped to a group of fuel assemblies of the core loading as specified (Fig.2). The hypothetical transients being analyzed is a turbine trip at 62% power with additionally postulated failures. The transient is determined by the following sequence of events. It begins at t=0 s with the sudden closure of the turbine stop valve, which is fully closed after 0.096 s. In extreme cases 1 and 3 the steam bypass valve remains closed, for case 2 it begins to open at 0.060 s reaching the final fully open position at 0.846 s. Reactor scram is considered only for case 1, and it takes place at the specified time of 0.75 s.
Results of the three extreme scenarios
For the extreme case 1 the ATHLET-QUABOX/CUBBOX calculation reaches the power maximum of 620 % at 0.722 s (Fig.3) before power reduction due to the scram initiation at 0.750 s. The sudden closure of the turbine stop valve causes a reduction of the steam flow, which results in a pressure increase. In addition, it initiates a pressure wave travelling along the steam line which is superposed to the pressure increase. The pressure increase is limited by the steam release through the RVs (Fig.4). The RV 1 opens at 2.8 s and remains open till 6.98 s while RV 2 and 3 open with 1 s delay after the RV 1 and stay open less than 1.4 s. After the scram the reactor remains sub-critical. For the second extreme case (Fig.3) the power maximum (420 %) is reached at 0.718 s (like by the best estimate scenario [5]) and due to the strong negative void reactivity the power is reduced to the initial level. Due to the absence of a scram and due to the pressure increase, the power continues to oscillate at a level of 180% and decreases after depressurization at 4.5 s because of reaching the opening pressure set point of relief valves. Like in the first case, the RV 1 opens first and afterwards RV 2 opens for about 2.3 s (Fig.5). RV 3 remains closed. After
93
7 s the reactor power stabilises at a power level of 140 % and the reactor has still an excess re-activity of 0.0003 dk/k. For the extreme case 3 the amplitude of the first power peak is the same as for case 1, but the absence of a scram and also the failure of opening of the bypass valves cause higher sec-ond and third power peaks compared to case 2 (Fig.3). Within a shorter time the opening pres-sure set points for all three relief valves are reached. RV 1, 2 and 3 remain open during the 10 s transient (Fig.6) and the power is stabilized again at a level of about 140 %.
Status of parallel programming
The approach to make simulation codes more efficient by using multi-CPU computers or parallel programming has a long history. It is accompanied by a continuous speed-up of single CPU efficiency, which made workstations and also PCs from year to year faster, contributing in this way to the speed-up of simulation codes without any programming effort. In the initial or pioneering phase of parallel programming, it was obligatory to apply dedicated software libraries to organize the initialization, the data exchange and the synchronization of multi-CPUs. In addition, the software was related to particu-lar hardware configurations excluding the portability of codes. These conditions constituted a strong disadvantage for efficient software development. Nowadays, the situation has changed, because the software tools for parallel programming are much mature. New standards like OpenMP and MPI have been established which support parallel pro-gramming for languages like FORTRAN90 and C, C++. The support of FORTRAN is important, be-cause main simulation codes in the nuclear field as in other fields have been developed using this language. Both codes, the system code ATHLET as well as the 3D neutron kinetics model QUABOX/CUBBOX are written in FORTAN. Due to regular up-dates they can be compiled by cur-rent FORTRAN90 compiler versions. The new parallel programming model is using directives in the source code which give the compiler the necessary information about the code structure and the code sections where the compiler can generate parallel processes or threads to distribute the calculation tasks on multi-CPUs. These directives support the fork and join of the program control flow as well as the definition of the private and the global data variables. It is well known that the greatest success of parallel programming can be achieved for simulation codes fulfilling particular requirements. In general, most of the computing time should be spent in a few subroutines of the numerical solution algorithms. If these subroutines or the corresponding task is well suited for parallel execution, the computing time can be strongly reduced and a high gain factor of computing time is achieved. An example of paral-lelization of a discrete ordinate method is presented in [6]. The structure of coupled codes doesn’t fulfil this requirement. Nevertheless, it is worth to study carefully the performance of such type of codes on multi-CPU computers, because their use will be made easier and more practical if the computing time can be further reduced.
94
Profiling of the coupled code system ATHLET-QUABOX/CUBBOX
Before analyzing the code performance, the approach of the code coupling is briefly de-scribed. Detailed information about coupling considerations and the definition of the interface between both codes is documented in [2]. The coupling of the fluid dynamic system code ATHLET and the 3D neutron kinetics code QUABOX/CUBBOX is based on the principle that the coolant flow in the primary circuit including the core region as well as all components like main coolant pumps and valves are modelled by ATHLET objects, and the power generation in the reactor core is calculated by QUABOX/CUBBOX solving the time-dependent neutron diffusion equations. Generally, the time-dependent solution is generated by solving the fluid dynamic conservation equations, the heat-conduction equations and the equations of ATHLET components for a time-step using the power density distribution from the begin of the time-step. After terminating the integration of ATHLET model equations, the new power density distribution for the end of the time-step is determined by solving neutron diffusion equations taking into account the coolant conditions, i.e. coolant temperature, coolant density and boron concentration, and the fuel rod temperatures as calculated by ATHLET. So both codes are coupled in a serial manner. The size of the time-step is controlled such, that the delay between thermo fluid dynamic parameters and neutron kinetics parameters is acceptable. In this cou-pling approach both codes remain independent as far as possible, the necessary data exchange is performed by specific interface subroutines. The analysis of the coupled code ATHLET-QUABOX/CUBBOX in view of the computing times is performed for three examples which represent typical cases of coupled code applica-tions. The example 1 and 2 are models of the BWR-TT core calculations of Exercise 2, mod-elling the thermal hydraulic feedback with 33 THCs as proposed in the specification and for comparison with 764 THCs using a 1:1 mapping between fuel assemblies of the core loading and the THCs describing the feedback. The example 3 corresponds to example 1 with 33 THCs in the core region including the whole plant model as it was applied for the extreme cases. For these examples the relative fraction of total computing time of each subroutine is de-termined by profiling options of the compiler and tools evaluating the simulation run. The main results of this analysis are summarized in Table 1.
95
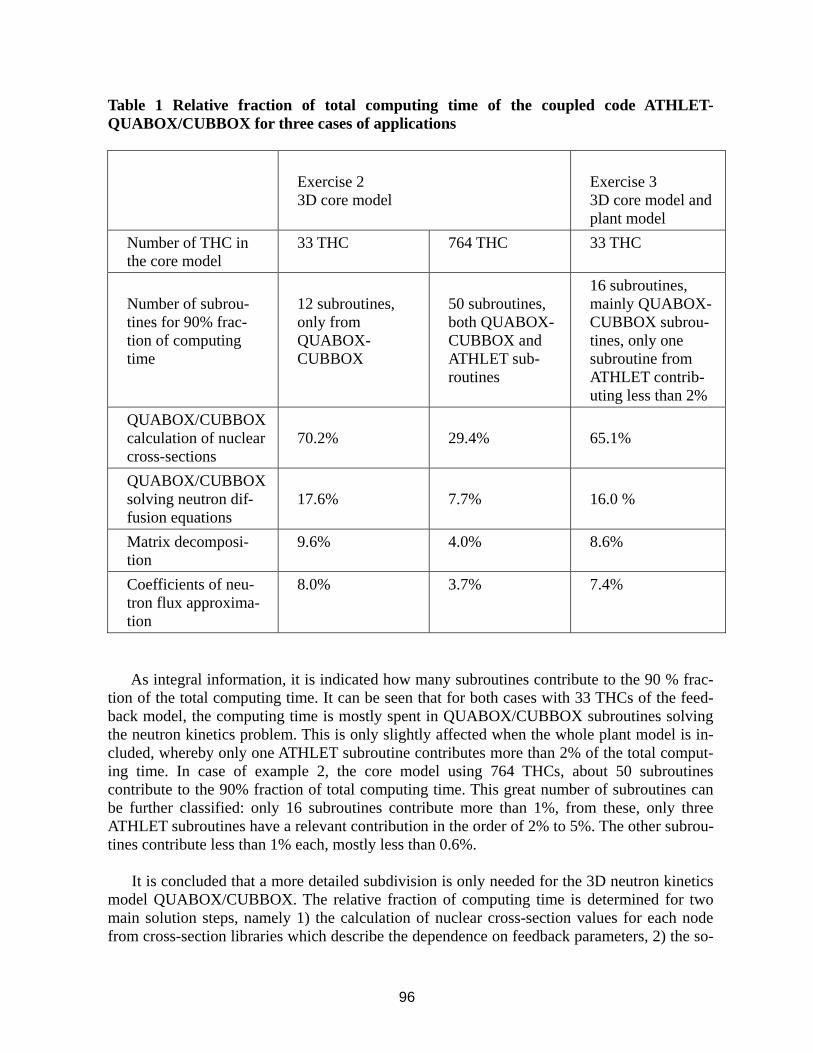
Table 1 Relative fraction of total computing time of the coupled code ATHLET-QUABOX/CUBBOX for three cases of applications
Exercise 2 3D core model
Exercise 3 3D core model and plant model
Number of THC in the core model
33 THC 764 THC 33 THC
Number of subrou-tines for 90% frac-tion of computing time
12 subroutines, only from QUABOX- CUBBOX
50 subroutines, both QUABOX- CUBBOX and ATHLET sub-routines
16 subroutines, mainly QUABOX- CUBBOX subrou-tines, only one subroutine from ATHLET contrib-uting less than 2%
QUABOX/CUBBOX calculation of nuclear cross-sections
70.2%
29.4%
65.1%
QUABOX/CUBBOX solving neutron dif-fusion equations
17.6%
7.7%
16.0 %
Matrix decomposi-tion
9.6% 4.0% 8.6%
Coefficients of neu-tron flux approxima-tion
8.0% 3.7% 7.4%
As integral information, it is indicated how many subroutines contribute to the 90 % frac-tion of the total computing time. It can be seen that for both cases with 33 THCs of the feed-back model, the computing time is mostly spent in QUABOX/CUBBOX subroutines solving the neutron kinetics problem. This is only slightly affected when the whole plant model is in-cluded, whereby only one ATHLET subroutine contributes more than 2% of the total comput-ing time. In case of example 2, the core model using 764 THCs, about 50 subroutines contribute to the 90% fraction of total computing time. This great number of subroutines can be further classified: only 16 subroutines contribute more than 1%, from these, only three ATHLET subroutines have a relevant contribution in the order of 2% to 5%. The other subrou-tines contribute less than 1% each, mostly less than 0.6%. It is concluded that a more detailed subdivision is only needed for the 3D neutron kinetics model QUABOX/CUBBOX. The relative fraction of computing time is determined for two main solution steps, namely 1) the calculation of nuclear cross-section values for each node from cross-section libraries which describe the dependence on feedback parameters, 2) the so-
96
lution of neutron diffusion equations. This second task is further divided into steps solving neutron diffusion equations by matrix decomposition and calculating coefficients of neutron flux approximation for each node. The evaluation shows: The relative fraction of time for cross-section calculation is in the order of 70% to 65% for the core models using 33 THCs, this relative fraction is reduced to about 30% for the core model using 764 THCs. The effort for solving neutron diffusion equations corresponds to 17.6% and 16% for the core model us-ing 33 THCs, but only about 8% for the core model using 764 THCs. The analysis of comput-ing times shows that the relative fraction of various tasks strongly varies with the application. A clearly identified task with a high contribution under all conditions is found only in the task calculating the nuclear cross-section values. The corresponding two subroutines calculating the nuclear cross-section values in QUABOX/CUBBOX were adjusted by OpenMP directives for parallel execution. A speed-up for this part of the code by a factor of 2.5 was achieved using 4 CPUs. The advantage of the available software standards for using multi-CPUs is seen that they can be applied in a step by step approach. On the other side, the analysis performed shows the restriction by the code structure, which limit the gain of efficiency to relatively low values.
Conclusions
The presentation describes the results of the coupled code system ATHLET - QUABOX/CUBBOX for three hypothetical extreme cases of the BWR TT Benchmark. The results allow a consistent comparison of codes in view of physical effects and modelling fea-tures under severe conditions. The 3D neutron kinetics integrated in coupled codes give the possibility to calculate precisely the reactivity changes and the local parameters relevant for safety evaluations. The BWR TT Benchmark is an important contribution to the validation of coupled code systems. These typical applications were used to evaluate the code performance of ATHLET-QUABOX/CUBBOX on multi-CPU computers. The analysis demonstrated that the code performance is strongly dependent on the application problem, because the ratio of computing time for the fluid dynamic part and neutron kinetics part is varying. In most cases, the solution of neutron diffusion equations needs up to 90% of total computing time. A reduc-tion for this neutron kinetics part is observed only for cases using a very high number of ther-mal hydraulic channels modelling the feedback effects in the reactor core. Therefore, the parallel programming is most effective for the neutron kinetics part. The solution steps for this part were evaluated in detail. The task of calculating the nuclear cross-sections was identified as the task requiring the highest fraction of total computing time for all examples studied. The gain factor of computing time by parallising the cross section calculation is estimated in the order of 2 to 3. Generally, the analysis shows that coupled codes like ATHLET-QUABOX/CUBBOX are not very well suited for parallel programming. Nevertheless, the new software standards allow the use of multi-CPU computers for these simulation codes with a minimum effort of programming and the gain in computing time makes the use of such cou-pled codes easier and more practical for safety analysis.
97
Acknowledgements
The work presented was performed within projects funded by the German Federal Ministry of Economics and Technology (BMWI).
References
1. J. Solis, K. Ivanov, B. Sarikaya, A. Olson, K. Hunt, Boiling Water Reactor Turbine Trip (TT)
Benchmark, Volume 1: Final Specifications, NEA/NSC/DOC(2001) 1.
2. S. Langenbuch, H. Austregesilo, P. Fomitchenko, U. Rohde, K. Velkov, Interface Requirements to Couple Thermal-Hydraulics Codes to 3D Neutronic Codes. OECD/CSNI Workshop on Transient Thermal-Hydraulic and Neutronic Codes Requirements, Annapolis, U.S.A., November 5-8, 1996.
3. S.Langenbuch, K.-D.Schmidt, K.Velkov, The Coupled Code System ATHLET-QUABOX/CUBBOX – Model Features and Results for the Core Transients of the OECD PWR MSLB-Benchmark, M&C, September 1999, Madrid, Spain.
4. S.Langenbuch, K.-D.Schmidt, K.Velkov, Analysis of Exercises 1 and 2 of the OECD/NRC BWR Turbine Trip (TT) Benchmark by the Coupled Code System ATHLET-QUABOX/CUBBOX, PHYSOR 2002, October 7-10, 2002, Seoul, Korea
5. S.Langenbuch, K.-D.Schmidt, K.Velkov, Analysis of Exercises of the OECD/NRC BWR Turbine Trip (TT) Benchmark by the Coupled Code System ATHLET-QUABOX/CUBBOX, M&C, Gat-linburg, April 6-11, 2003, Tennessee, USA
6. A.Pautz, S.Langenbuch, Experiences in Parallelization of the Discrete Ordinates Method Using OpenMP and MPI, A contribution to this conference.
98
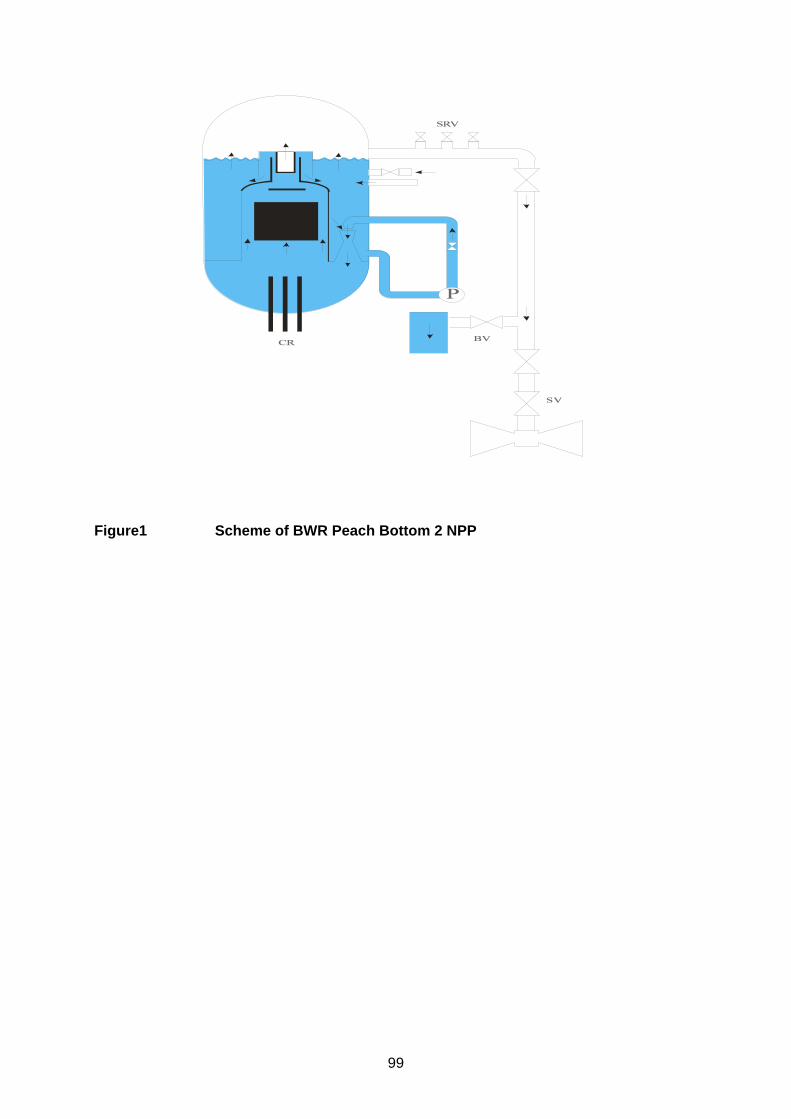
Figure1 Scheme of BWR Peach Bottom 2 NPP
99
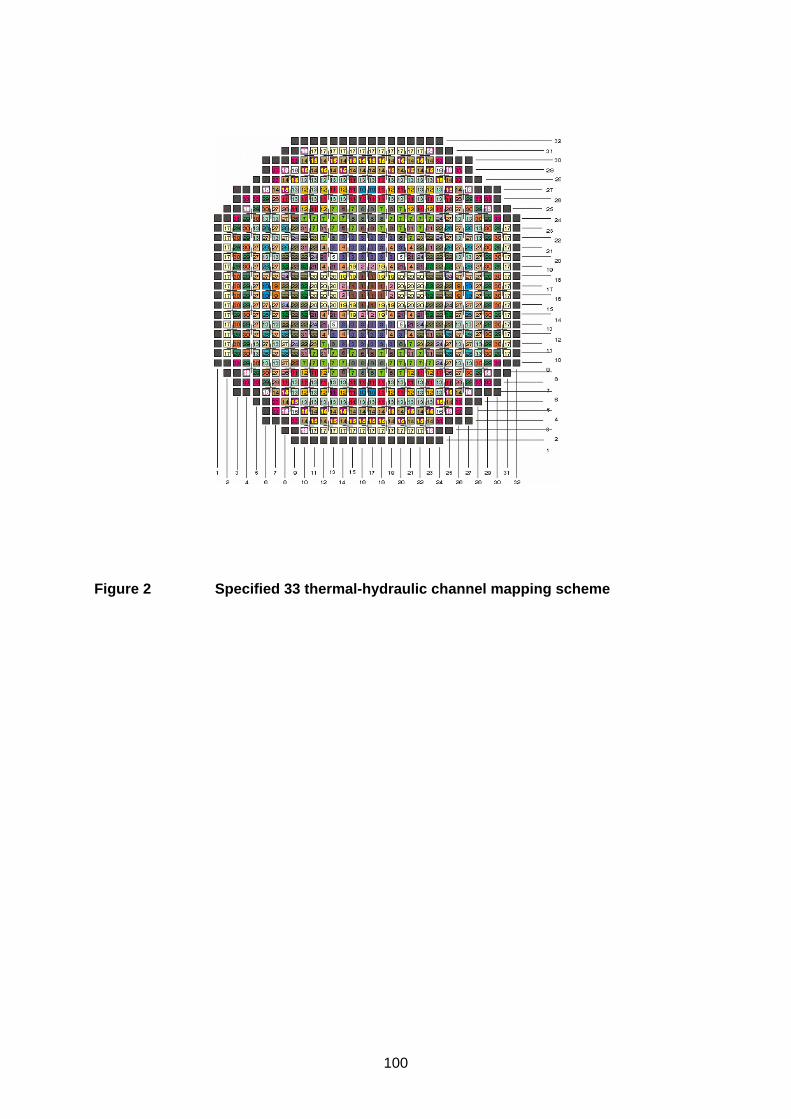
Figure 2 Specified 33 thermal-hydraulic channel mapping scheme
100
109876543210
7.0
6.0
5.0
4.0
3.0
2.0
1.0
0.0
Figure 3 Power history for extreme cases 1, 2 and 3
101
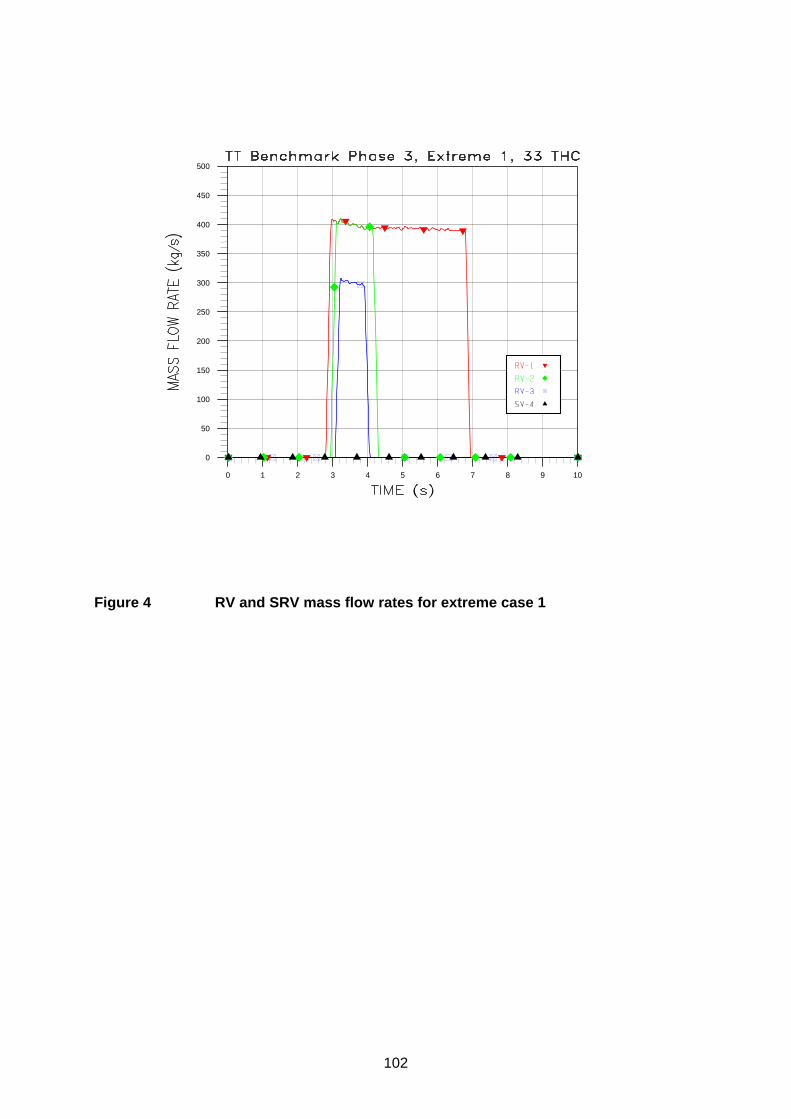
109876543210
500
450
400
350
300
250
200
150
100
50
0
Figure 4 RV and SRV mass flow rates for extreme case 1
102
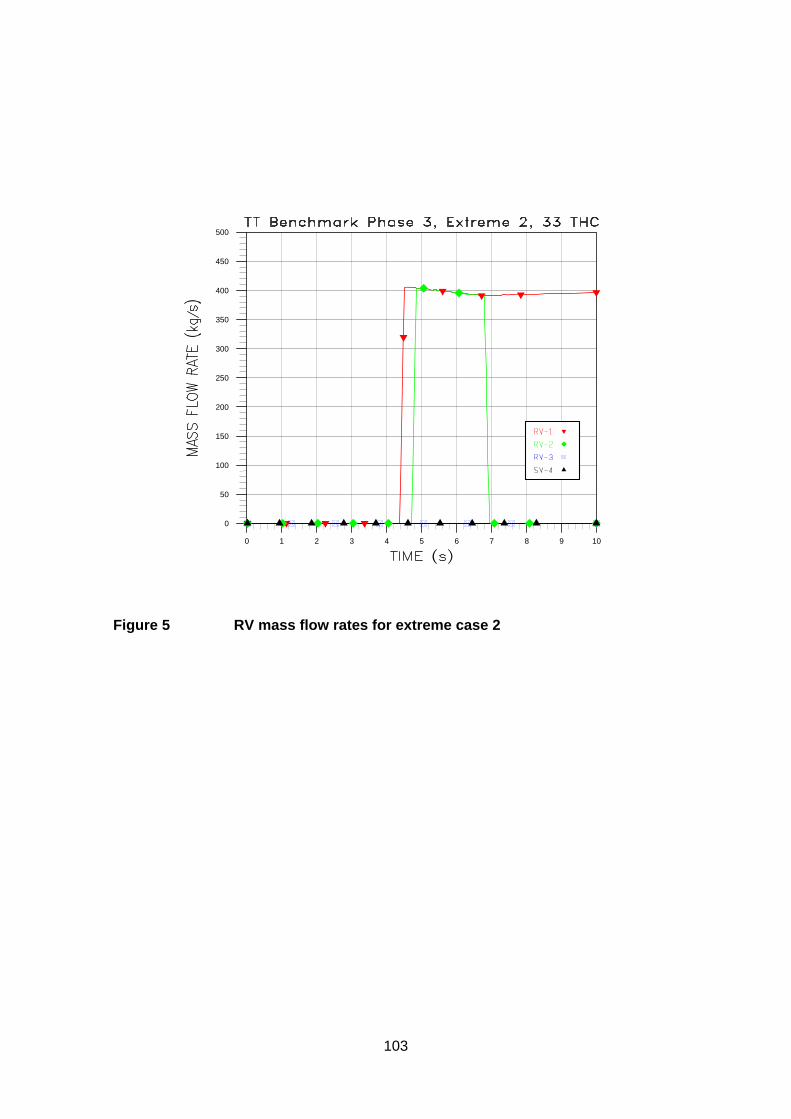
109876543210
500
450
400
350
300
250
200
150
100
50
0
Figure 5 RV mass flow rates for extreme case 2
103
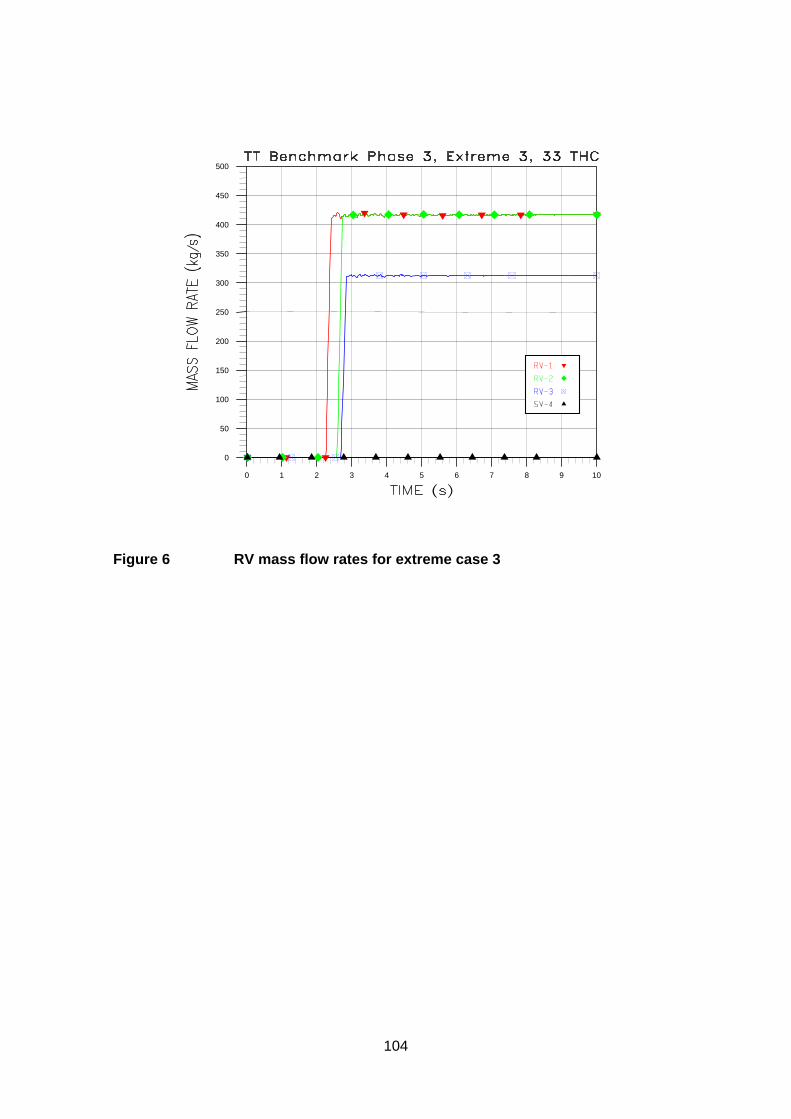
109876543210
500
450
400
350
300
250
200
150
100
50
0
Figure 6 RV mass flow rates for extreme case 3
104