Embed Size (px)
Citation preview
econstor www.econstor.eu
Der Open-Access-Publikationsserver der ZBW – Leibniz-Informationszentrum WirtschaftThe Open Access Publication Server of the ZBW – Leibniz Information Centre for Economics
Standard-Nutzungsbedingungen:
Die Dokumente auf EconStor dürfen zu eigenen wissenschaftlichenZwecken und zum Privatgebrauch gespeichert und kopiert werden.
Sie dürfen die Dokumente nicht für öffentliche oder kommerzielleZwecke vervielfältigen, öffentlich ausstellen, öffentlich zugänglichmachen, vertreiben oder anderweitig nutzen.
Sofern die Verfasser die Dokumente unter Open-Content-Lizenzen(insbesondere CC-Lizenzen) zur Verfügung gestellt haben sollten,gelten abweichend von diesen Nutzungsbedingungen die in der dortgenannten Lizenz gewährten Nutzungsrechte.
Terms of use:
Documents in EconStor may be saved and copied for yourpersonal and scholarly purposes.
You are not to copy documents for public or commercialpurposes, to exhibit the documents publicly, to make thempublicly available on the internet, or to distribute or otherwiseuse the documents in public.
If the documents have been made available under an OpenContent Licence (especially Creative Commons Licences), youmay exercise further usage rights as specified in the indicatedlicence.
zbw Leibniz-Informationszentrum WirtschaftLeibniz Information Centre for Economics
Dhillon, Amrita; Iversen, Vegard; Torsvik, Gaute
Working Paper
Employee Referral, Social Proximity and WorkerDiscipline: Theory and Evidence from India
CESifo Working Paper, No. 4309
Provided in Cooperation with:Ifo Institute – Leibniz Institute for Economic Research at the University ofMunich
Suggested Citation: Dhillon, Amrita; Iversen, Vegard; Torsvik, Gaute (2013) : EmployeeReferral, Social Proximity and Worker Discipline: Theory and Evidence from India, CESifoWorking Paper, No. 4309
This Version is available at:http://hdl.handle.net/10419/77682
Employee Referral, Social Proximity and Worker Discipline: Theory and Evidence from India
Amrita Dhillon Vegard Iversen Gaute Torsvik
CESIFO WORKING PAPER NO. 4309 CATEGORY 4: LABOUR MARKETS
JUNE 2013
An electronic version of the paper may be downloaded • from the SSRN website: www.SSRN.com • from the RePEc website: www.RePEc.org
• from the CESifo website: Twww.CESifo-group.org/wp T
CESifo Working Paper No. 4309 Employee Referral, Social Proximity and Worker
Discipline: Theory and Evidence from India
Abstract We study an important mechanism underlying employee referrals into informal low skilled jobs in developing countries. Employers can exploit social preferences between employee referees and potential workers to improve discipline. The profitability of using referrals increases with referee stakes in the firm, and, in most cases, with the strength of the social tie between the referee and the new recruit. We provide an empirical counterpart to these results using primary data covering low- and unskilled migrants in India. Consistent with the theoretical predictions, we find a high prevalence of workplace referral and strong kinship ties between referees and new recruits. Finally, workplace intermediaries are different from and typically in more ‘prestigious’ jobs than those recruited.
JEL-Code: J410, J310, D820, D860, O120, O170.
Keywords: networks, low- and unskilled jobs, India, moral hazard, employee referrals, efficiency wages, referee incentives, strength of ties.
Amrita Dhillon Warwick University
Coventry / United Kingdom [email protected]
Vegard Iversen Jindal School of Government and Public
Policy / New Delhi / India [email protected]
Gaute Torsvik
University of Bergen Bergen / Norway
We would like to thank Wiji Arulampalam, Paul Beaudry, Andres Carvajal, Markus Eberhardt, Mukesh Eswaran, Parikshit Ghosh, Magnus Hatlebakk, Matt Jackson, Amartya Lahiri, Rocco Machiavello, Jeremy Magruder, Francois Maniquet, Eric Maskin, Stelios Michalopoulos, Halvor Mehlum, Abhiroop Mukhopadhyay, Kaivan Munshi, Imran Rasul, Daniel Sgroi, E. Somanathan, Rohini Somanathan, Peter Vida, Chris Woodruff and participants at the ESOP Workshop on ’Social networks and urban labour markets in developing countries’, the ISI-IGC Conference, the IAS Economics Workshop and the PET development workshop for comments.Special thanks to the Indian Statistical Institute, Delhi for hosting Dhillon and Iversen and the IAS Princeton for hosting Dhillon. We are also indebted to Sushil Kumar and Jyoti Tripathi for their commitment and very competent data collection.
1 Introduction
In developing economies poor workers often rely on their social networks to ac-quire low and unskilled jobs.1 In spite of the high prevalence of network basedlabour market entry, little is known about why social networks are preferred, orwhat the underlying motivations for using referrals on the part of workers andemployers are. The question is important because networks give rise to inequal-ities especially when close family and kin benefit at the expense of others withsimilar qualifications. Using social connections to obtain jobs has also been inter-preted as favouritism that may lower productivity (Kramarz and Thesmar (2007),Fafchamps and Moradi (2009)).
This paper develops a theory of demand (employer) driven network recruit-ment. In our paper, employers use their own social network, or the network ofexisting employees, to fill job vacancies and mitigate discipline or motivationalproblems among sta�. In contrast to the negative e�ects of networks, our paperemphasises an important positive driving force for referrals in low and unskilledlabour markets.2
In settings where worker discipline poses a serious challenge and legal andinformational enforcement infrastructure is absent, informal institutions, such asemployee referrals may mitigate moral hazard problems in the workplace. Toinvestigate this possibility we consider employers who can recruit workers eitheranonymously in the spot market or via an employee referee. If referrals are used,the employee referee recommends a member of his social network which mayinclude close or more distant family, friends and acquaintances. The social prox-
1Munshi and Rosenzweig (2006) report that 70 % of blue collar jobs in Mumbai were foundthrough referral (with a corresponding figure for white collar jobs of around 44 %) and with ahigher referral prevalence for men than women. According to the World Bank’s MicroenterpriseSurvey for India, covering about 1,500 small enterprises (see below), between 40 and 65 % ofnew hires were recruited through a workplace insider.
2In spite of historical parallels, labour management challenges during rural-urban transitionshave received limited attention (e.g. Morris (1955), Kerr et al. (1966)). During the earlydays of the industrial revolution, workers were unaccustomed to the discipline requirements ofthe factory floor. Workers were ‘transient’, ‘deviant’ or ‘volatile’ (Pollard (1963)) and workattendance highly irregular: 50 per cent absenteeism on a given day was not uncommon. Itwas therefore not the better (in the sense of more productive) but the stable worker who wascoveted by employers (ibid). Such appreciations of workforce stability echo Holmstrom’s (1984)observations among Mumbai employers about two centuries later.
2
imity to the referee makes it more costly for a recruit to misbehave because ofthe negative consequences of his own conduct on the referee. The employer cantherefore reduce the wage premium (the e�ciency wage) to the worker necessaryto induce desirable behaviour. Of course, if the referee will be punished for workermisbehaviour, it is not clear why he would want to refer a worker in the first place.
Our main theoretical contribution is to show the conditions under which theemployer prefers referrals to anonymous hiring, taking account of a variety ofreferee utility functions. Indeed, one of the important conditions for employersto opt for referrals is that referees are employees who stand to lose a lot if theirrecommended worker misbehaves: i.e. referee stakes in good performance arehigh. Secondly, we endogenise the strength of ties and show that under plausibleconditions employers prefer strong ties. Thus, our paper provides an explanationfor why favouritism or the use of strong ties mitigates informational problems.Finally we show that, although when referee incentives are accounted for, referralsneed not always be advantageous to the employer, when referee stakes are highand the costs of opportunism are su�ciently high, referrals are the optimal modeof recruitment. 3
We complement our theoretical work with empirical analysis using a uniqueprimary data set that contains information on low and unskilled migrants from apoor area of rural North-India. Consistent with the 2006 World Bank microenter-prise survey for India, our data show that job entry through a workplace insideris widespread. Contrary to recent suggestions (e.g. Karlan et al (2009)), suchentry typically occurs through a strong social tie. Another important patternis that while entry is into bottom tier jobs, workplace intermediaries are usuallypersons in more prestigious jobs. Successful entry, therefore, may not only requirea strong social tie to a workplace insider but also that such insiders enjoy somestature within the recruiting firm.
Much of the literature focuses on how social networks match workers to firmsthrough supply side mechanisms, e.g. individuals searching for jobs obtain ex-clusive vacancy information through family and friends (Granovetter (1973) &
3For parallels to the idea of favouritism and family labour as e�ciency-improving, see theeconomic literature on agricultural organisation (e.g. Singh et al. (1986), Chowdhury (2010))and on family firms (e.g. Banerji et al. (2011)).
3
(1995), Wahba and Zenou (2005), Calvo-Armengol and Jackson (2004) & (2007),Topa (2011)). Network selection can also improve the match for both employersand employees (Saloner (1985), Simon and Warner (1992), Mortenson and Vish-wanath (1994)). Among the demand driven mechanisms, screening for higherability workers has been studied by Montgomery (1991), Kono (2006), Iversenet al. (2009) and more recently, and experimentally, by Beaman and Magruder(2012). Our paper fits into the strand of the literature that investigates expla-nations for referrals based on informational asymmetries but we focus on moralhazard rather than adverse selection. We believe, and anthropological evidencesuggests, that our moral hazard explanation for workplace referrals is particularlyplausible for the lower end unskilled labour markets in developing countries thatwe study.4
Referrals as a mechanism to curb worker moral hazard has also been studiedby Kugler (2003) and Heath (2010). We reinforce the empirical and theoreticalresults of these papers, that moral hazard is an important driver of workplacereferrals. Kugler (2003) and Heath (2010) both assume that referee incentiveswill always be satisfied. We endogenise referee incentives and derive the extraprediction that referrals will be used only when employers can access workplaceinsiders with su�ciently high stakes in referral success. Finally, we contribute tothe scarce empirical literature seeking to shed light on the mechanisms underlyingthe use of social networks and referrals in developing and industrial country labourmarkets.5
4Holmstrom (1984) provides a series of relevant examples from lower end Indian labourmarkets, including on p. 202, a cite from Van der Veen (1979; 64-65): ’It is a generally acceptedpolicy among managers to accept labourers on recommendation and as groups. The managersof the above-mentioned factories could tell me how everyone of their workers (from 12 to 35)had been introduced. They really prefer to utilize these personal relationships, because it givesthem a much stronger grip on their labourers. ’When one man misbehaves, I hold the onewho introduced him responsible, and that man will keep the mischief-maker in check’, said onemanager.’ See also Sheth (1968) and the appeal to kinship morality among employers in thedyeing industry in Tamil Nadu in De Neve (2008). Other social mechanisms are highlighted inthe nascent literature on social incentives in the workplace (e.g. Bandiera et al. (2009)).
5Using rainfall at the source end as an instrument, Munshi (2003) is among the few andseminal papers able to identify network e�ects using data on Mexico-US migration. Yet, conjec-tures about the precise network mechanisms remain proximate guesswork. That more seasonedmigrants are particularly useful for newcomers is interpreted as senior migrants providing re-ferrals on behalf of new arrivals: it might as well reflect the superior labour market knowledgeof these seniors. Munshi’s (2003) work underscores the challenge associated with convincingly
4
The rest of the paper is structured as follows. Section 2 presents our theoreti-cal model. Following the description of our study area and data sets in sections 3and 4, section 5 presents descriptive statistics on migration flows, network-basedand other modes of labour market entry, the prevalence of workplace referralsand the social ties between referees and new recruits. In order to obtain cluesabout referee stakes, this section also makes comparisons of the traits of work-place intermediaries and those recruited. Section 6 presents regression results androbustness tests while section 7 concludes.
2 Theoretical backdrop
Consider a firm that needs to fill a vacancy. No specific skills are required in thejobs of interest, but worker misconduct is costly for the firm. The firm can hirethe worker either in the spot market or through employee referral. A key featureof hiring through an employee referral is that the employer can sanction both thereferee and the recruit if the latter misbehaves. In what follows we develop a simpleframework to study e�ciency wages with spot and network based recruitment.
There are two periods. In the first period, the firm decides whether to hirea worker through the spot market or by using an employee referral. In eachcase, the firm o�ers a contract to the worker which can be of two types: (1) ane�ciency wage contract in which case the worker gets a higher wage but is firedif he is caught behaving opportunistically (shirks) or (2) a contract o�ering thereservation wage of the worker which is normalized to 0. There is an infinitesupply of labour for such unskilled jobs, so that the chances of a single workerfinding a job that pays e�ciency wages through anonymous search are zero, whilethe probability of an employer finding a worker in the spot market is 1. Of course,the worker can always find a job at the reservation wage of 0. If a referral is usedthe employer can make (request) referral specific transfers to (from) the employeewho gets the opportunity to o�er a vacancy to someone in his network.
In the second period workers choose behaviour, the employer checks for shirk-
pinning down specific network mechanisms. We approach this challenge from a di�erent, morepragmatic and more direct angle. Our advantage is the access to primary data with relevantdepth.
5
ing and pays the corresponding wages.
2.1 E�ciency wages with and without referrals
The worker to be hired produces a profit e ≠ w if he behaves well (does notshirk) and 1≠w if he behaves opportunistically (shirks), where e > 1 and w is theworker‘s wage. The costs of opportunism to the firm are given by c = (e≠1). Theworker gains –c if he behaves opportunistically, with – < 1. The firm monitorsit’s labour force and will detect a worker shirking with an exogenous probabilityq œ (0, 1). A worker caught shirking will lose his job and gets a reservation utilityequal to 0.
E�ciency wage in the spot market
If the worker behaves well (does not shirk) his payo� is the (e�ciency) wage ws
while his expected payo� if he shirks is (1≠ q)ws +–c. The spot market e�ciencywage is the minimum wage that ensures no shirking by the worker:
ws = –c
q
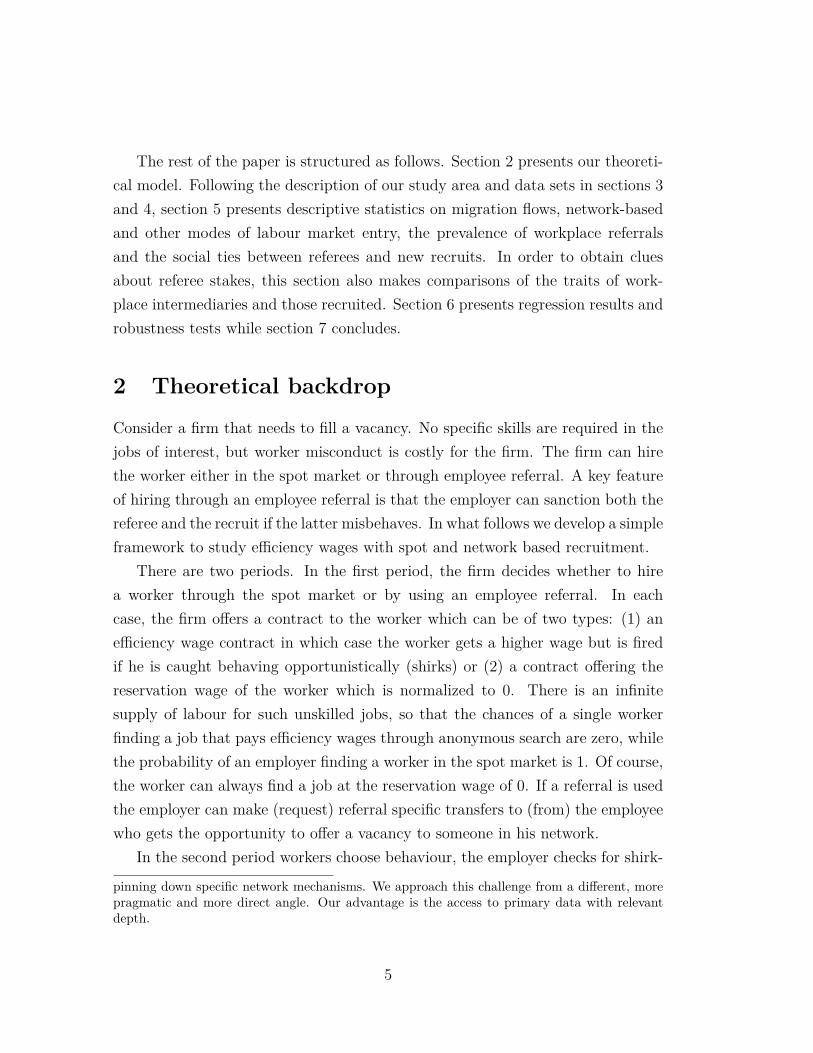
(1)
As in the standard e�ciency wage model, the e�ciency wage is increasing inthe opportunity cost of behaving well and decreasing in the probability of beingdetected when shirking.
E�ciency wages with employee referrals
If employee referral is used to fill the vacancy, a parameter fl signifies the relation-ship between the referee and the worker; a higher fl indicates a stronger social tie.We assume that the loss inflicted upon the referee if the recommended worker mis-behaves is proportional to the referee‘s stakes, or rents, in the firm. The stakes ofthe referee variable includes explicit punishments to the referee and also capturesthe promotional or reputational losses the referee might su�er if his recommendedworker misbehaves.
While we are agnostic about their origins, one possible source of referee rentsis the same as for the potential recruit: e�ciency wages to prevent opportunistic
6
behavior. Denote the rents at stake as R. These are exogenous to the problem athand but will vary across employees within the firm. The key assumption is thatthe recommended worker will take the referee loss into account when deciding howto behave. The weight assigned to this loss depends on the social proximity to thereferee. There are a variety of reasons for why this would be true. If the referee andthe worker belong to the same household or extended family the worker is morelikely to care about any pain inflicted on the referee through own misbehaviour,and the closer they are the stronger the internalization of this loss. Alternately,suppose the worker and referee are not directly related but have many friends incommon, then any information about the worker’s misbehaviour will percolatethrough the network more e�ciently the closer they are connected, resulting ina loss of future referral opportunities through the network. Formally, both thesee�ects are captured in the weight the worker assigns to the referee’s loss.
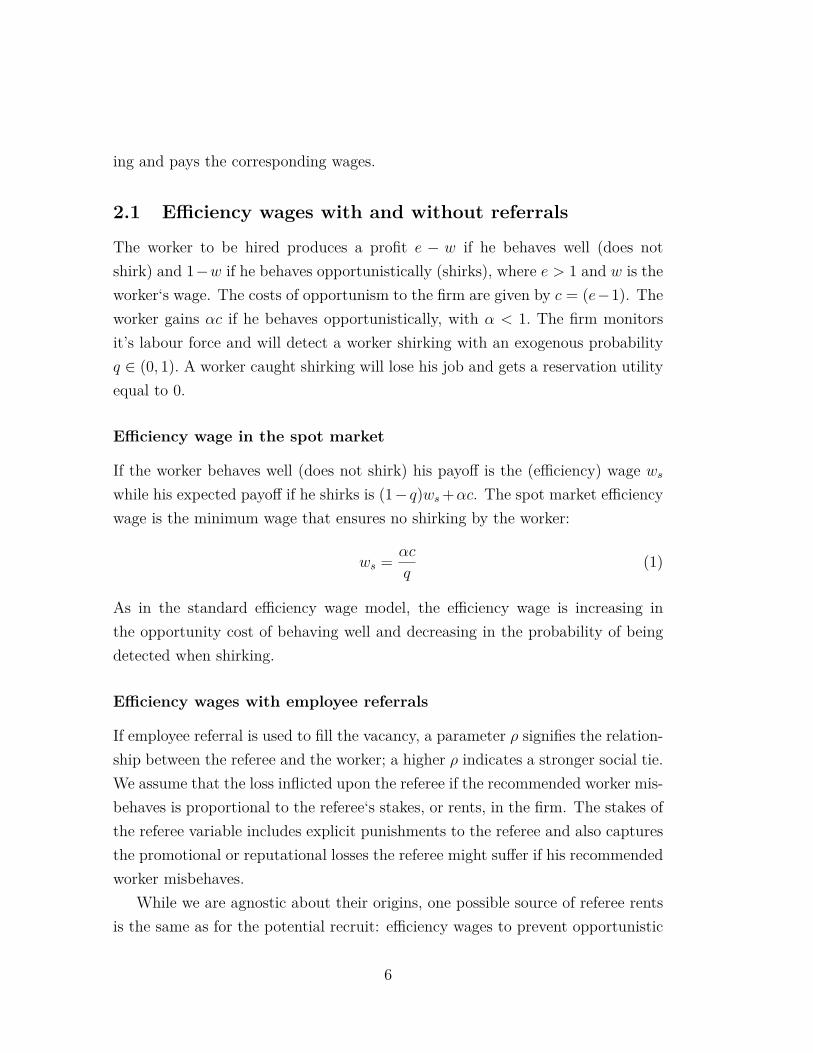
A refereed worker who does not shirk gets the wage wr, while the expectedwage if the worker shirks is given by (1 ≠ q)wr + –c + q (≠flR). The referrale�ciency wage is the minimum wage that ensures non-shirking behaviour and isgiven by
wr(fl) = ws ≠ flR. (2)
Equation (2) shows that the employer can o�er a lower wage premium to pre-vent shirking if the worker is hired through an in-house referral. This conclusionis similar to Kugler (2003), but the mechanism is di�erent. In Kugler (2003) peerpressure makes it costly for the new recruit to exert lower e�ort than the referee,and by selecting a referee who exerts peer pressure through his own high e�ort,the employer can induce higher e�ort at a lower cost. In contrast, in our set-up,the strength of the social tie between the referee and the new recruit a�ects theintensity of the social pressure. This social pressure intensifies further with thestakes of the referee.
In Heath (2010), as in our model, referees recruit new workers on the un-derstanding that they can be punished if their recommended worker misbehaves.However, there is no role for referee incentives or for the strength of ties. Moreovernone of the two papers considers referee incentives explicitly, which we analyze inthe next section.
7
2.2 Referee incentives
As we saw above, absent any problems of referee incentives, the employer wantsas close ties between the referee and the worker as possible in order to minimizethe wage required to prevent shirking. It is, however, not obvious that the refereeand the employer have aligned interests, and if not we need to examine how theemployer can induce strong tie referrals and whether it is still profitable to do so.
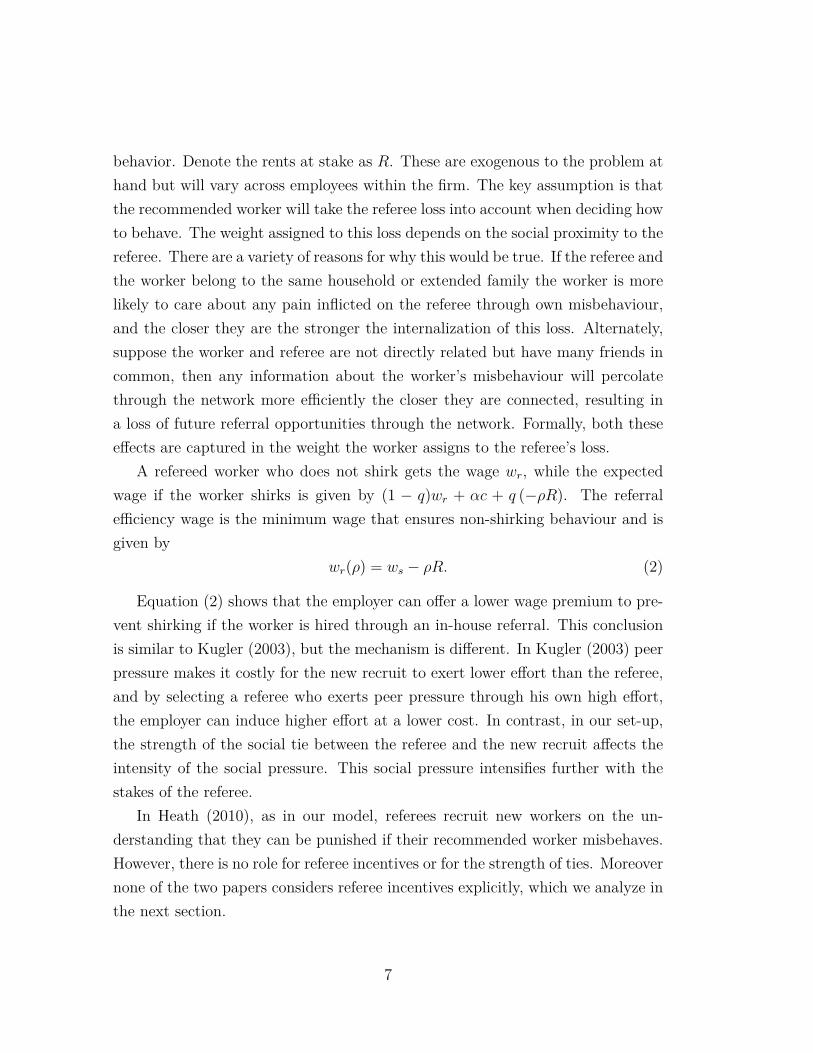
We will assume that two types of referral related transfers a�ect the utilityof the referee. In addition to workplace rents the referee may receive transfersfrom the referred worker and his family and network. We denote these transfersB(fl) = v(fl) + b(fl) where v captures the social utility a referee gets by helpingsomeone in his network to find a job. Social benefits such as status, prestige andreciprocal aid, are captured by this term. In addition, helping someone get a highpaying job may provide the referee with intrinsic utility (“warm glow” altruism).With these interpretations it is reasonable to assume that v(fl) is increasing in fl.The second term, b, captures the monetary transfers (bribes) the worker may paythe referee. It is reasonable to assume that the referee can claim a fraction of thewage premium that a worker obtains by being refereed into a job6. For the restof the paper, we will assume that b(fl) = “
flwr(fl), with “
fl< 1.
Finally, the employer may also make some referral related transfers. Let T (fl)be the monetary equivalent of the transfer the employer o�ers (demands) fromthe referee if the recommended worker is employed.
The referee’s utility (the part a�ected by the referral decision) is given byU(fl) = R + B(fl) + T (fl) and the referral related profit for the employer is givenby � (fl) = e ≠ wr(fl) ≠ T (fl). In the analysis below we assume there are only twostrengths of the social ties, fl =
1fl
H, fl
L2, with fl
H> fl
L. Our results extend tocases with more fine grained social connections.
6In an adverse selection model of worker referral Karlan et al (2009) assumes, similarly, thatthe low skill/productivity worker can bribe the referee to portray him as a high skilled worker.The bribe is a fraction of the wage premium that high skilled workers earn.
8
2.3 Complete information
Solving for the subgame perfect equilibrium of this two stage game, notice that inthe last period fl has already been chosen, so wr(fl) is the minimum e�ciency wagefor a given fl. In the first stage the employer must choose fl to maximize � (fl).For a fixed fl, maximizing profits implies that the referee is paid the minimum toinduce him to participate: Let U(0) = R, denote referee utility if he decides notto refer a worker. Hence, participation requires U(fl) = U(0) ∆T (fl) = ≠B(fl).Hence, the employer chooses fl to maximize � (fl) = e ≠ wr(fl) + B (fl). Thus,wehave �
1fl
H2
≠ �1fl
L2
=Ëwr(flL) ≠ wr(flH)
È+
ËB
1fl
H2
≠ B
1fl
L2È
We know from (2) that the first bracket term is positive, the second termcan be negative or positive depending on whether it is the social utility or themonetary transfer from the worker that dominates. If B(flH) > B(flL) then theemployer prefers strong ties as he saves wage costs both for the worker and thereferee. If, however, B(flH) < B(flL), the employer may want the referee to choosea worker he is weakly tied to. When could this happen? Recall that we assumedb(fl) = “
flwr(fl), with “
fl< 1. If the fraction of wages that the referee receives
is independent of the strength of the social tie, then it is always optimal for theemployer to have a strong tie referee-recruit relationship. But if “
H is su�cientlylower than “
L the employer will prefer a weak social tie since he can extractthe larger “bribe” the referee is paid by the worker. A weak tie is preferred ifwr(flL) ≠ wr(flH) Æ B(flL) ≠ B(flH), i.e. if:
ws(“L ≠ “
H) ≠ (v(flH) ≠ v(flL))fl
H(1 ≠ “
H) ≠ fl
L(1 ≠ “
L) > R. (3)
The employer prefers a worker with weak ties to the referee if the referee stakesare su�ciently low.
Recall that with the spot market e�ciency wage contract, employer profits are�(0) = e≠ws. Hence �(fl)≠�(0) = flR≠T (fl) = flR+B(fl) > 0, regardless of thestrength of ties chosen in equilibrium. To summarize, the employer always prefersreferrals to the spot market, conditional on the use of e�ciency wage contracts.However, the choice of strong or weak ties depends on whether the referee utilityis increasing or decreasing in fl. If referee utility is increasing in fl,then strongties are preferred while if referee utility is decreasing in fl, then strong ties are
9
preferred only if R is su�ciently large.
2.4 Incomplete information
It is unlikely that employers have complete information about the social networkof the existing employee. It might be common knowledge that everyone has a weaktie person they can suggest for the job, but not everyone has a suitable personthey are strongly tied to: Put di�erently, everyone has a fl
L in their network butnot all have a fl
H in their network, and whether there is a fl
H in the network isonly known by the referee.
Assume first that it is possible for the employer to verify the connection be-tween the referee and the worker once the worker is presented to the employer.We are then back to the complete information case since the contract that theemployer o�ers the referee can be made contingent on the strength of the tie.
Whichever tie the employer prefers between the referee and the recruit he givesthe selected employee the opportunity to recommend a worker and o�ers him acontract � =
ÓT (flL) = ≠B(flL), T (flH) = ≠B(flH)
Ô. This contract guarantees
the referee his reservation utility R whether he refers a worker he is strongly orweakly tied to and he is willing to bring the tie preferred by the employer.
A more interesting situation arises if the employer is unable to verify the socialties between the worker and the referee. Assume that B(flH) Ø B(flL) so that theemployer prefers strong ties with complete information. In this case a referee whois o�ered the above contract will recommend a fl
H person but misrepresent the tieas fl
L. The employer must provide the referee with incentives to disclose strongsocial ties. To examine the optimal contract in this case, let U(fl, fl̂) represent theutility of the referee if he refers a worker with social tie fl but presents the socialtie as fl̂.
We have U(flH, fl
L) = v(flH)+b(flH)+T (flL) and U(flH, fl
H) = v(flH)+b(flH)+T (flH). In order to induce truthful reporting U(flH
, fl
H) Ø U(flH, fl
L), hence theemployer must choose T (flH) Ø T (flL). Exploiting the fact that the participationconstraint requires T (flL) = ≠(v(flL) + b(flL)) implies T (flH) Ø ≠(v(flL) + b(flL)).This (incentive) constraint binds i� B(flH) Ø B(flL).
The cost minimizing contract disclosing strong social ties is given by �̃ =
10
ÓT (flL) = ≠B(flL), T (flH) = ≠B(flL)
Ô. It is straightforward to check that this
contract does not give a referee with weak ties to the worker an incentive tomisrepresent the tie (even if he could do so). Given B(flH) Ø B(flL) and wr(flH) <
wr(flL), the employer will o�er a contract that induces a referee with strong socialties to reveal this information.
Given the separating contract �̃, we have �1fl
H2
≠ �1fl
L2
= wr(flL) ≠wr(flH) > 0. In the complete information case this di�erence is given by
Ëwr(flL) ≠ wr(flH)
È+
ËB(flH) ≠ B(flL)
È> 0 which is higher than in the incomplete information case,
since the employer needs to leave a “referral” rent equal to the di�erence B(flH)≠B(flL) to the referee (a rent above R) to induce him to reveal that the worker isfl
H .On the other hand, suppose that B(flL) > B(flH), and R is su�ciently small,
then, as we saw above in the complete information case, the employer prefers aweak tie referral. In this case, the optimal contract leaves a rent with a weak-ties type referee. �̃ =
ÓT (flL) = ≠B(flH), T (flH) = ≠B(flH)
Ô, and analogous to
the case above, the gains to the employer due to referral are lower than in thecomplete information case.
To summarize, even with asymmetric information, the employer’s choice ofstrong or weak ties depends on the same conditions as in the complete informationcase: strong ties are preferred when referee utility is increasing in fl, and weakties are preferred when referee utility is decreasing in fl, and R is su�ciently low.Moreover, as before, in both cases, the minimum gain from referrals relative to thespot market, �(fl) ≠ �(0) = flR > 0, so, conditional on e�ciency wage contractsbeing used, referrals are always preferred by the employer.
2.5 Robustness
We started o� asking why referees should agree to refer given the risk of losingrents or goodwill vis-a-vis the employer. Informal interviews and discussions withindividuals who agreed and turned down the o�er to recruit on behalf of theirfirm suggest that this is a real concern. This risk is not captured in the model,since on the equilibrium path the worker never misbehaves. In this section, wemodel the possibility that there could be mistakes or accidents even if the worker
11

never misbehaves, so that the referee, more realistically, runs a risk by referring aworker.
Suppose the inspection technology is faulty and there is a chance ‘ conditionalon inspection that the worker is caught even when he did not misbehave. Thenspot market payo� if the worker does not misbehave is ((1 ≠ q) + q (1 ≠ ‘)) ws. Ifhe misbehaves he gets ws(1 ≠ q) + ac. The spot market e�ciency wage is givenby:
ws = –c
(1 ≠ ‘)qReferral e�ciency wages must now satisfy wr ((1 ≠ q) + q(1 ≠ ‘)) Ø wr(1 ≠ q) +–c + (1 ≠ q)flR, which gives a referral e�ciency wage:
w(fl) = wS ≠ flR
as before.The referee’s participation constraint changes since he must be compensated
for the risk that is involved when he acts as a referee. Participation requiresU(fl)(1 ≠ q + q(1 ≠ ‘)) Ø U(0), ie. U(fl) Ø U(0)
1≠‘> U(0). Thus the firm must pay
T (fl) = U(0)1≠‘q
≠U(0)≠B(fl) to ensure referee participation. Substituting for U(0) =R, the transfer that guarantees participation is given by T (fl) = ‘qR
1≠‘q≠ B(fl). Let
fl
ú œÓfl
L, fl
HÔ
denote the employer’s optimal choice of fl. Assuming completeinformation (results easily extends to incomplete information) referrals are nowpreferred by the employer if�(fl) ≠ �(0) = (e ≠ wr(flú) ≠ T (flú)) ≠ (e ≠ wS) > 0
Using the expression for T (flú) we derived from the participation constraintwe find that a su�cient condition for preferring a workplace referral, conditionalon e�ciency wage contracts being used, is that
fl
ú Ø ‘q
(1 ≠ ‘q) (1 ≠ “) © ‚fl.
Referee rewards for referral increase by ‘qR1≠‘q
compared to the benchmark, theno-risk, case. The relationship between the referral e�ciency wage and the spotmarket e�ciency wage is, however, unchanged. Hence the employers choice be-tween a strong or weak tie referral is not a�ected by the kind of risk we areexamining here.
12
We conclude that when the referee encounters a positive risk of losing work-place rents by referring a worker, referrals remain cheaper than the spot marketwhen the kinship network is su�ciently close, ie. when fl > fl̂.
2.6 Non-e�ciency wage contracts
So far we assumed that the firm used only e�ciency wage contracts, and showedthat conditional on e�ciency wages, referrals are preferred to anoymous hiring. Itis straightforward to show that when the costs of opportunism to the employer aresu�ciently low, the employer would prefer to pay the reservation wage for workers.If the employer pays reservation wages, then �S = 1 and if he uses e�ciency wagesand referral then profits are �(fl) = e ≠ wr(flú) ≠ T (flú) . Thus e�ciency wagesare preferred when �(fl) Ø 1. Consider first what happens when there are nomistakes in the detection of shirking. Then, �(fl) ≠ �S = c ≠ ac
q+ fl
úR+B(flú).
This is clearly positive as long as aq
< 1, i.e. as long as the detection probability ishigher than a. With a positive probability of mistakes, this changes to a
(1≠‘)q < 1,
In general, when the worker’s opportunity cost of shirking is given by wS thene�ciency wages are optimal whenever c Ø wS ≠ fl
úR≠B(flú)© c̄. It is clear that
c̄ is decreasing in R. Moreover, when referee utility is increasing in fl, then c̄ isdecreasing in fl as well.
We conclude that e�ciency wage contracts will used in jobs which have costs ofopportunism greater than a threshold, and this threshold is lower, if the employerhas access to referees with high stakes in the firm. We also predict a “referralpremium”: in equilibrium the worker is either hired through referral and thenhe is o�ered an e�ciency wage contract or he is hired anonymously and paidthe reservation wage. This referral premium however, decreases in referee stakesas well as with the strength of ties, if we assume that the referee has alignedincentives.
2.7 Summary and Predictions
We obtain the following robust predictions that we can use to explore whetheremployee referrals are used to mitigate discipline problems in the workplace:
13
• H1: We should observe referral based entry into low and unskilled jobs withhigh costs to firms from worker shirking (c Ø c̄(flú
, R)).
• H2: From H1 , we expect variation in the use of workplace referral acrosssectors and job types.
• H3: A higher prevalence of workplace referrals in jobs where strong tienetworks have the capacity to supply (fl > fl̂) candidates. In contrast toKarlan (2009), we expect more referral in low and unskilled jobs which arejobs ’everyone can do’.
• H4: There should be strong social ties between the worker and the refereewhen referee incentives are aligned with the firm or when referee stakes arehigh.
• H5: We should observe referrals when the employer has access to refereeswith high stakes (good positions, a lot to lose) in the firm.
• H6: We should observe a negative relationship between referee stakes andthe entrant’s wage and between the strength of ties and the entrant’s wage.
• H7: We should observe a referral wage premium for jobs that have a high costof opportunism relative to jobs with low costs of opportunism. Controllingfor the job however, this premium will disappear.
Although H6 and H7 are both interesting and testable with the right type ofinformation, our data will only allow us to address the first five hypotheses.
3 The context and data
Our primary data set is from two study villages in Nagina tehsil in Bijnor dis-trict in western Uttar Pradesh, India’s most populous state. A consistent under-performer, UP is part of India’s poverty belt and has the highest prevalence ofstunting (47 %) among children below the age of three of any Indian state. UPis also shared 16th (among 20 states) on the percentage of underweight children
14
in the same age group (46 %) (Shiva Kumar (2007)). The quality shortfall ingovernment schools (e.g. Dreze and Gazdar (1998)) has spurred private schoolinitiatives starting from the primary level. The 2001 Census rates for above age 7rural literacy are 69.3 % for males and 43.3 % for females.7 Sugarcane, wheat andpaddy remain the most important local crops. For low and unskilled workers, agri-cultural labour demand exhibits seasonal fluctuations that have compelled ruralhouseholds to actively remedy lean season employment opportunity shortfalls.8
As elsewhere in rural India, migration for agricultural or allied work has beencommon, and often to ‘nearby’ locations for sugarcane processing (crushing) work.Unlike the adjacent district headquarters of Muza�arnagar and Moradabad (a cen-tre for North-India’s brass industry), Bijnor’s industrial base and local non-farmemployment opportunities have been slow to evolve. Coupled with a post 1991decline in the availability of government jobs (Je�rey et al (2007)), frustrationsover limited local job opportunities run deep also among those responding to neweducational opportunities in the post-reform era. This failure of education to ful-fill the expectations of educated young local men transcends caste and religiousboundaries and is a recurring theme in the rich sociological literature on Bijnor(ibid.).
At 41 % Bijnor ranks third on the percentage of Muslims in the populationin Uttar Pradesh.9 The Muslim population comprises high status Sekhs as wellas menial groups like washermen (Dhobis) and barbers (Salmanis). The largestMuslim group in our study villages are the Ansaris (Julahas), traditionally aweaving community. Jats, the main local landowners, and Chamars, who areScheduled Castes and traditional leatherworkers, are among the most conspicuousand numerous Hindu communities. While the social and religious heterogeneity ofthe study area has been a seed of some conflict, the Ravidas Jayanti, a major andpolitically significant Chamar festival, was attended and celebrated by members ofall communities in Kasba Kotra in February 2009. In the latest Gram Panchayat
7The 2001 census figures for literacy among males and females above the age of 7 in our twostudy villages were 73.4 % and 48.3 % in Kasba Kotra and 52.3 % and 19.6 % in Jagannathpur,respectively.
8e.g. de Haan and Rogaly (2002); Rogaly et al (2003).9From the 2001 Census. The two other districts in UP with more than 40 % Muslims are
Moradabad (45.5%) and Rampur (49%). We are grateful to Roger Je�ery for sharing thesestatistics.
15
(village council) election in the same village, a political alliance of Ansari Muslimsand Chamars defeated and replaced an ine�cient male (in a seat reserved forwomen) Jat incumbent with a new Chamar village council head.
Our study of un- and low-skilled labour markets is thus located in an im-poverished rural setting where the quality of public services has been absymal,where private school penetration reflects growing parental aspirations and with aninteresting social and religious blend. Consistent with observations from other dis-tricts in Uttar Pradesh (Kapur et al (2010)), there is also discernible occupationalchange among the Chamars at the bottom of the caste hierarchy.
4 Data
Our data are from a random sample of households in Kasba Kotra and Jagan-nathpur villages in Nagina tehsil. The two villages were purposely selected andare located about 3 kms from Nagina town (30 kms to the east of Bijnor town)and the large village of Kotwali, respectively. Initial screening of neighbouringareas and villages suggest that the patterns reported below are quite typical ofrural Nagina. Having rejected as inadequate the Panchayat o�ce house list inKasba Kotra and the voter list in Jagannathpur, village censi were conducted andused to construct a proper sampling frame for each village. From each village andfollowing a PPS principle, households were randomly selected for interviews. Theevidence presented below draws on interviews with household members with alabour migration history who were identified during our initial household surveywhich covered 236 households in Kasba Kotra and Jagannathpur.10
Among the 316 individuals with a labour migration history only two werewomen. Through repeated village visits and the tracing of migrants in Chandi-garh and Delhi, in distant Mumbai and Pune as well as in nearby Haridwar andsurrounding areas with known factory clusters, we were able to pin down 278 or88 % of these migrants. The first round of migrant interviews were conducted in
10An individual is understood to have a labour migration history if he has spent a minimumof one month continuously living away from the village for employment purposes. FollowingWinters et al (2001), we define a household as (i) people living under the same roof and who eatfrom the same kitchen and (ii) o�spring or other family members who would otherwise residewith the unit in (i) but who have migrated for work.
16
May 2009, the last in February 2010. Through subsequent tracing we have beenable to increase the number of migrants interviewed to 287 (90.8 % of the sample).
In our retrospective migrant sample the timing of the first labour migrationstretches from 1950 and upto 2009. The bulk of these first migrations are re-cent with 64% occurring after 1990 and 39.3 % after 2000. Each migrant wasinterviewed in depth to collect as complete accounts of individual employmentand educational histories as possible. Special emphasis was placed on accuraterecording of the process of entering the first migrant job and on selected subse-quent job changes.11 To illustrate, we asked whether the first migrant job waspre-arranged and if so whether the migrant had received a job o�er. If he did, weasked if the person who made the o�er was working for the migrant’s first desti-nation employer. If yes, we defined these as cases of workplace-referral, of whichemployee referral forms a subset. For the person making the job o�er on behalfof an employer, information was collected from the migrant on the relationship tothe migrant and on the referee’s job (job title) within the recruiting firm.
As explained in the theory section, the latter intended to capture the referee’sstake vis-a-vis the employer (e.g. Fafchamps and Moradi (2009), Iversen andTorsvik (2010)). Similar information was collected for what we describe as maincontacts below. Apart from education, information on work experience and skillswere collected along with proxies for individual unobservables expected to beimportant in these employment relations, including a short Raven-type ability testor whether others considered the migrant to be a person with ‘jugar’.12 We alsoasked about individual aspirations, general knowledge and whether the migrantcast a vote in the most recent election.
11Given the spread in timings of first migrant jobs, recall poses a methodological hazard.Testing recall in relation to migration, Smith and Thomas (2003) find that subjects are able torecall salient moves with greater accuracy: the first migrations we study are typically salient.
12A local term that is widely used, well understood and resembles being ’street-smart’. Ittranslates more accurately as ‘capacity to improvise shrewdly with available resources (Je�reyet al 2007: 4).’
17
5 Descriptive statistics
Table 1 presents broad descriptive statistics disaggregated by social group for thefirst migrant job and destination. Ansaris and Chamars are both strongly repre-sented. Simple comparisons highlight startling contrasts – Ansaris were youngerand less educated at the time of departure and their sectoral concentration muchstronger. Although Delhi is the main first destination for all three groups, themain first destination state was nearby Uttarakhand for Chamars and ‘Others’and Maharasthtra, specifically Mumbai and Pune, for Ansaris. Notice also thatmore Ansaris move to large cities compared to the other groups. Ansari migrantsare also spread across more destinations with first migrations primarily for bakerywork to destinations stretching from Orissa and West-Bengal in the east, via Bi-har and now Jharkhand and Punjab, to Gujarat in the west. In contrast, Chamarmigrants typically cluster in nearby destinations.
18
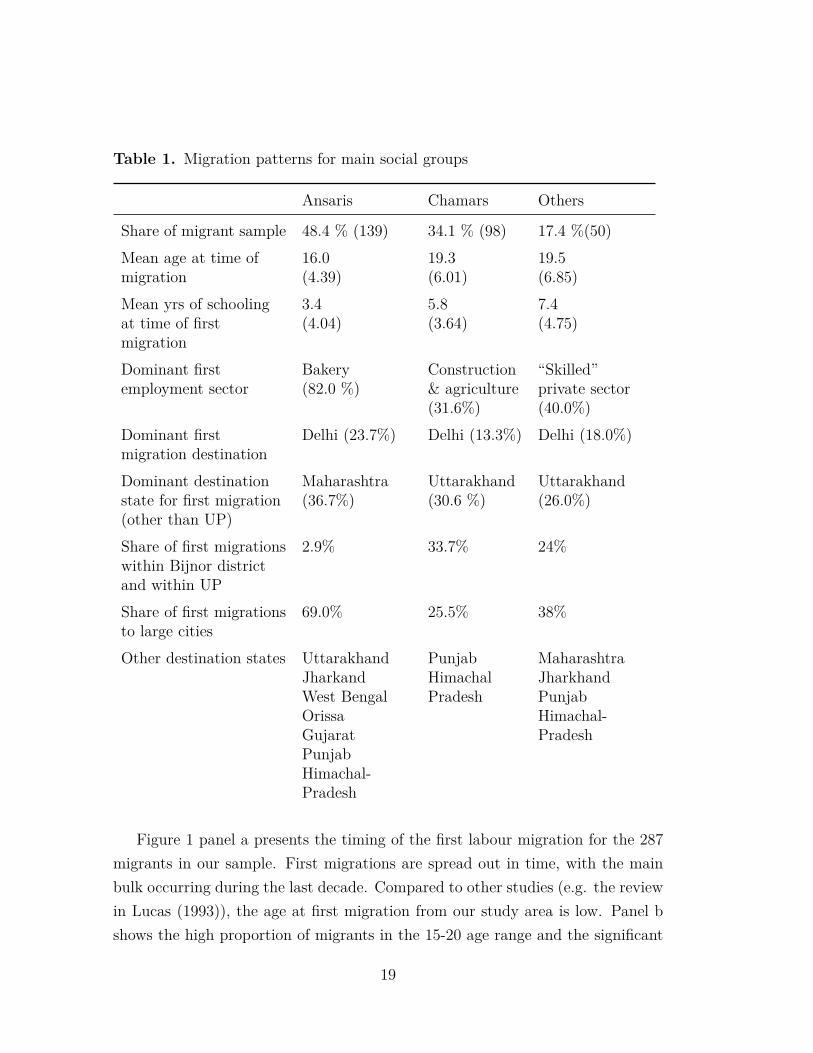
Table 1. Migration patterns for main social groups
Ansaris Chamars Others
Share of migrant sample 48.4 % (139) 34.1 % (98) 17.4 %(50)Mean age at time ofmigration
16.0(4.39)
19.3(6.01)
19.5(6.85)
Mean yrs of schoolingat time of firstmigration
3.4(4.04)
5.8(3.64)
7.4(4.75)
Dominant firstemployment sector
Bakery(82.0 %)
Construction& agriculture(31.6%)
“Skilled”private sector(40.0%)
Dominant firstmigration destination
Delhi (23.7%) Delhi (13.3%) Delhi (18.0%)
Dominant destinationstate for first migration(other than UP)
Maharashtra(36.7%)
Uttarakhand(30.6 %)
Uttarakhand(26.0%)
Share of first migrationswithin Bijnor districtand within UP
2.9% 33.7% 24%
Share of first migrationsto large cities
69.0% 25.5% 38%
Other destination states UttarakhandJharkandWest BengalOrissaGujaratPunjabHimachal-Pradesh
PunjabHimachalPradesh
MaharashtraJharkhandPunjabHimachal-Pradesh
Figure 1 panel a presents the timing of the first labour migration for the 287migrants in our sample. First migrations are spread out in time, with the mainbulk occurring during the last decade. Compared to other studies (e.g. the reviewin Lucas (1993)), the age at first migration from our study area is low. Panel bshows the high proportion of migrants in the 15-20 age range and the significant
19
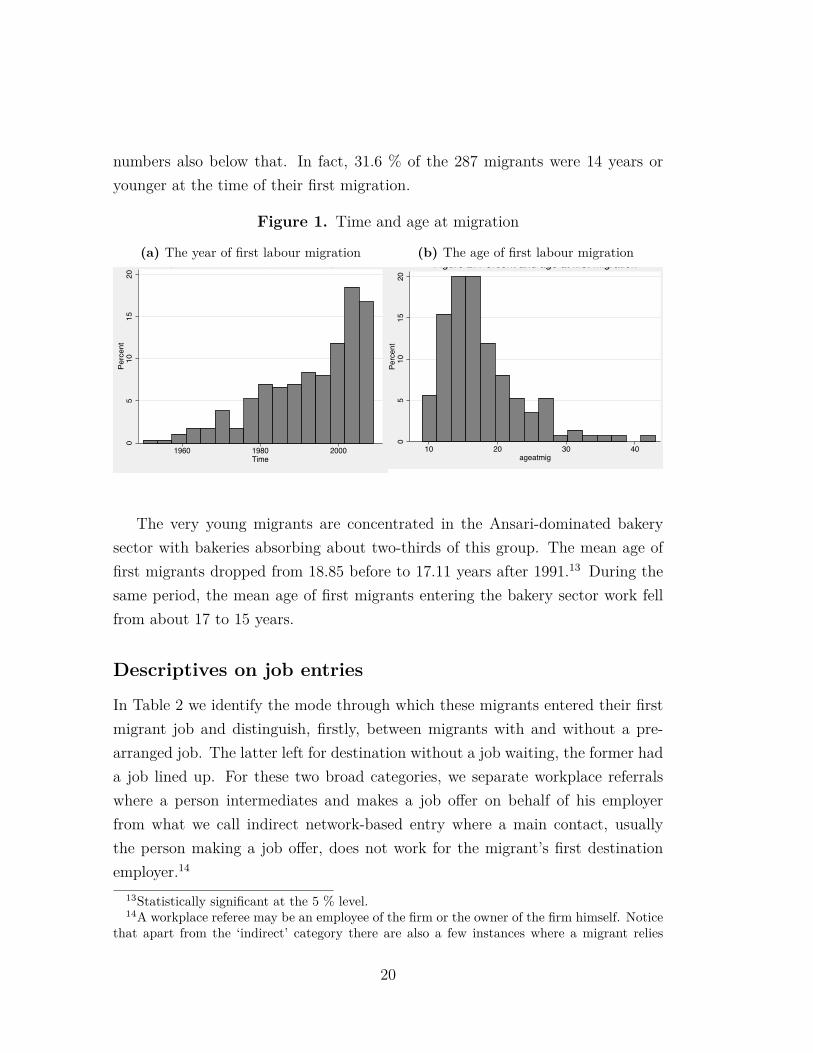
numbers also below that. In fact, 31.6 % of the 287 migrants were 14 years oryounger at the time of their first migration.
Figure 1. Time and age at migration
(a) The year of first labour migration
05
1015
20Pe
rcen
t
1940 1960 1980 2000 2020Time
Figure 1: Percent and year of first migration(b) The age of first labour migration
05
1015
20Pe
rcen
t
10 20 30 40ageatmig
Figure 2: Percent and age at first migration
The very young migrants are concentrated in the Ansari-dominated bakerysector with bakeries absorbing about two-thirds of this group. The mean age offirst migrants dropped from 18.85 before to 17.11 years after 1991.13 During thesame period, the mean age of first migrants entering the bakery sector work fellfrom about 17 to 15 years.
Descriptives on job entries
In Table 2 we identify the mode through which these migrants entered their firstmigrant job and distinguish, firstly, between migrants with and without a pre-arranged job. The latter left for destination without a job waiting, the former hada job lined up. For these two broad categories, we separate workplace referralswhere a person intermediates and makes a job o�er on behalf of his employerfrom what we call indirect network-based entry where a main contact, usuallythe person making a job o�er, does not work for the migrant’s first destinationemployer.14
13Statistically significant at the 5 % level.14A workplace referee may be an employee of the firm or the owner of the firm himself. Notice
that apart from the ‘indirect’ category there are also a few instances where a migrant relies
20
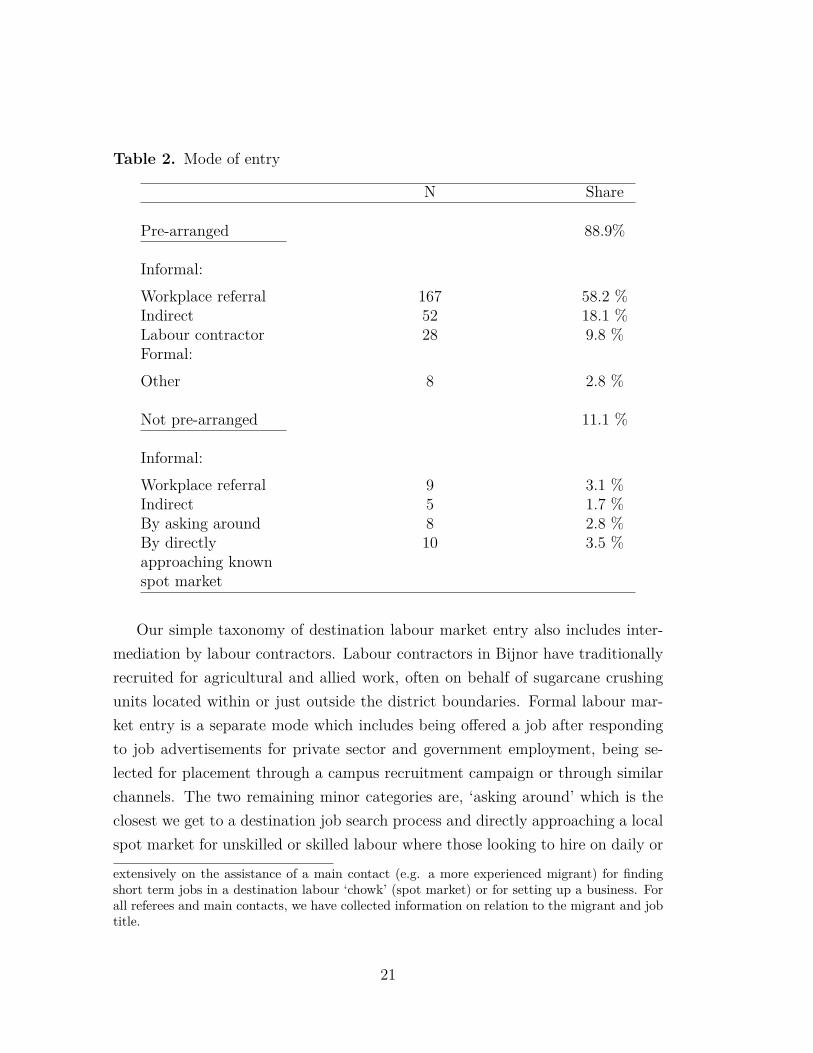
Table 2. Mode of entry
N Share
Pre-arranged 88.9%
Informal:Workplace referral 167 58.2 %Indirect 52 18.1 %Labour contractor 28 9.8 %Formal:Other 8 2.8 %
Not pre-arranged 11.1 %
Informal:Workplace referral 9 3.1 %Indirect 5 1.7 %By asking around 8 2.8 %By directlyapproaching knownspot market
10 3.5 %
Our simple taxonomy of destination labour market entry also includes inter-mediation by labour contractors. Labour contractors in Bijnor have traditionallyrecruited for agricultural and allied work, often on behalf of sugarcane crushingunits located within or just outside the district boundaries. Formal labour mar-ket entry is a separate mode which includes being o�ered a job after respondingto job advertisements for private sector and government employment, being se-lected for placement through a campus recruitment campaign or through similarchannels. The two remaining minor categories are, ‘asking around’ which is theclosest we get to a destination job search process and directly approaching a localspot market for unskilled or skilled labour where those looking to hire on daily or
extensively on the assistance of a main contact (e.g. a more experienced migrant) for findingshort term jobs in a destination labour ‘chowk’ (spot market) or for setting up a business. Forall referees and main contacts, we have collected information on relation to the migrant and jobtitle.
21
short term basis are matched with job seekers.15 Haridwar in Uttarakhand is onenearby destination with a local labour ‘chowk’ that Bijnori migrants are familiarwith while Delhi, the nearest big city, has many such spot markets. As expected,a substantial majority of the first migrant jobs were allocated informally.
Combining pre- and non-pre arranged jobs, workplace referral is observed for61.3 % of first migrant jobs. This is somewhat lower than Munshi and Rosen-zweig’s (2006) estimate of ‘referral’ in male blue collar jobs in Mumbai, but ourdefinition of workplace referral is more precise and narrow than the one used byMunshi and Rosenzweig. Our figure tallies with the estimates reported in the2006 WB Microenterprise survey. Table 3 reports mean values of employee re-ferral for the last recruited employee in the cross-section of firms covered by theWB survey. As far as we know, this is the first ’large’ sample of small enterprisesin a developing country setting to provide estimates of the incidence of employeereferral across sectors. The incidence is high, across the board, but particularlyhigh in garments and textiles. Standard errors are reported in parenthesis.
15See Bryan, Chowdhury and Mubarak (2011) for an innovative experiment illustrating why,in a context of widespread poverty, job search in the city (or at destination) may be prohibitivelycostly for most households thus helping to explain why, in such settings, jobs should be expectedto be arranged up front and prior to migration.
22
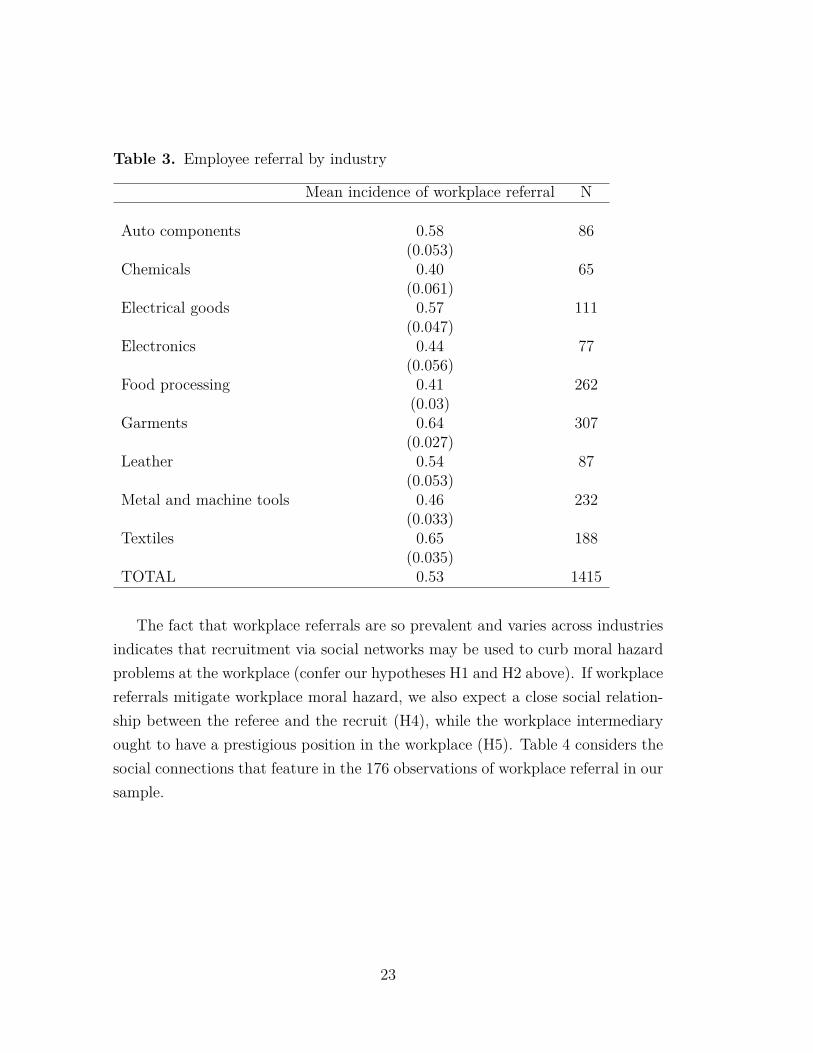
Table 3. Employee referral by industry
Mean incidence of workplace referral N
Auto components 0.58 86(0.053)
Chemicals 0.40 65(0.061)
Electrical goods 0.57 111(0.047)
Electronics 0.44 77(0.056)
Food processing 0.41 262(0.03)
Garments 0.64 307(0.027)
Leather 0.54 87(0.053)
Metal and machine tools 0.46 232(0.033)
Textiles 0.65 188(0.035)
TOTAL 0.53 1415
The fact that workplace referrals are so prevalent and varies across industriesindicates that recruitment via social networks may be used to curb moral hazardproblems at the workplace (confer our hypotheses H1 and H2 above). If workplacereferrals mitigate workplace moral hazard, we also expect a close social relation-ship between the referee and the recruit (H4), while the workplace intermediaryought to have a prestigious position in the workplace (H5). Table 4 considers thesocial connections that feature in the 176 observations of workplace referral in oursample.
23
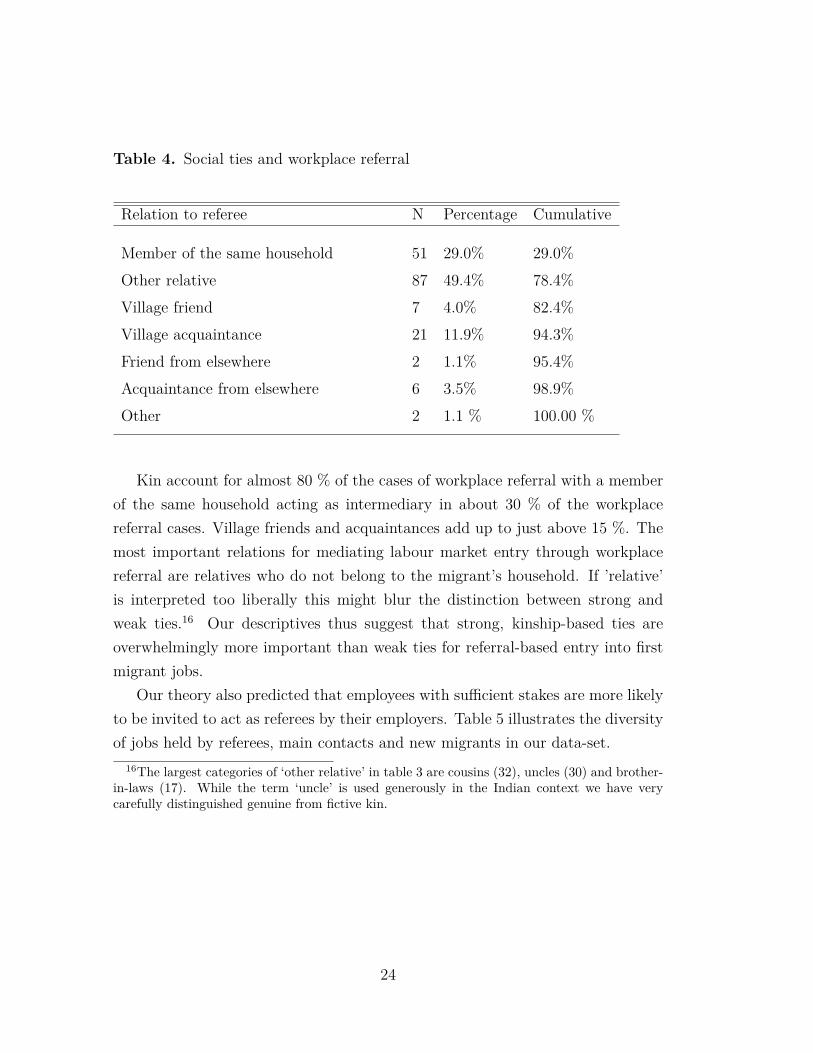
Table 4. Social ties and workplace referral
Relation to referee N Percentage Cumulative
Member of the same household 51 29.0% 29.0%Other relative 87 49.4% 78.4%Village friend 7 4.0% 82.4%Village acquaintance 21 11.9% 94.3%Friend from elsewhere 2 1.1% 95.4%Acquaintance from elsewhere 6 3.5% 98.9%Other 2 1.1 % 100.00 %
Kin account for almost 80 % of the cases of workplace referral with a memberof the same household acting as intermediary in about 30 % of the workplacereferral cases. Village friends and acquaintances add up to just above 15 %. Themost important relations for mediating labour market entry through workplacereferral are relatives who do not belong to the migrant’s household. If ’relative’is interpreted too liberally this might blur the distinction between strong andweak ties.16 Our descriptives thus suggest that strong, kinship-based ties areoverwhelmingly more important than weak ties for referral-based entry into firstmigrant jobs.
Our theory also predicted that employees with su�cient stakes are more likelyto be invited to act as referees by their employers. Table 5 illustrates the diversityof jobs held by referees, main contacts and new migrants in our data-set.
16The largest categories of ‘other relative’ in table 3 are cousins (32), uncles (30) and brother-in-laws (17). While the term ‘uncle’ is used generously in the Indian context we have verycarefully distinguished genuine from fictive kin.
24
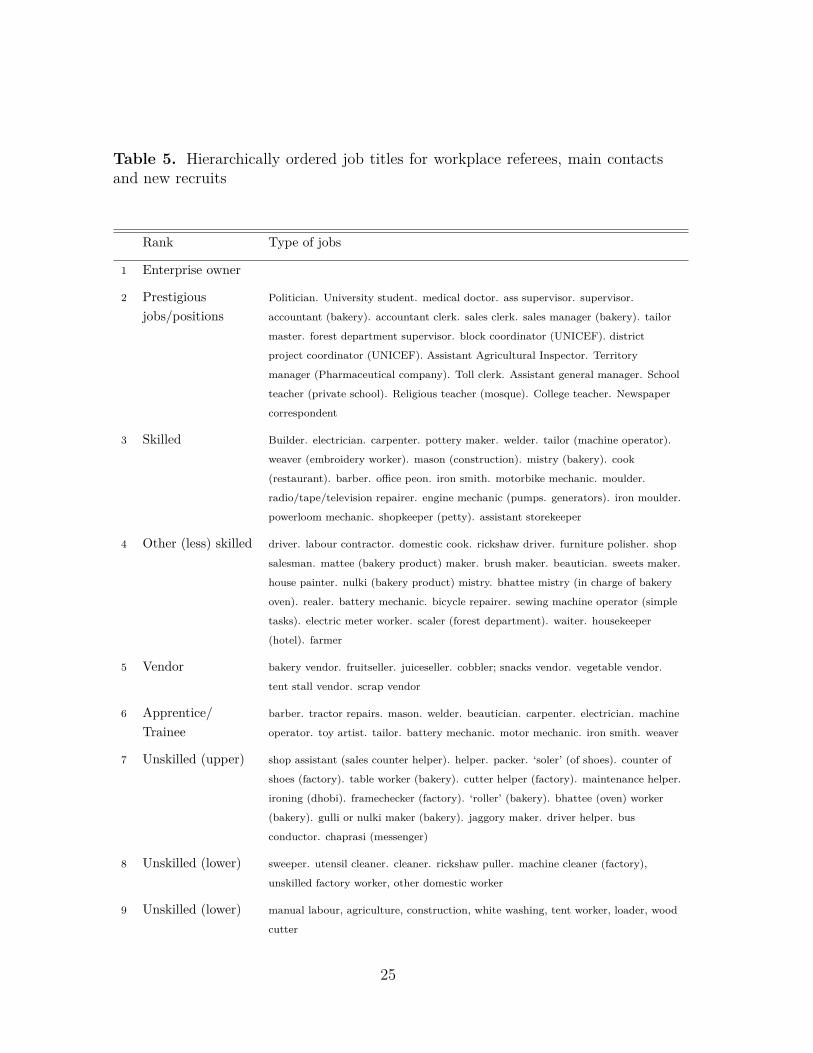
Table 5. Hierarchically ordered job titles for workplace referees, main contactsand new recruits
Rank Type of jobs
1 Enterprise owner
2 Prestigiousjobs/positions
Politician. University student. medical doctor. ass supervisor. supervisor.
accountant (bakery). accountant clerk. sales clerk. sales manager (bakery). tailor
master. forest department supervisor. block coordinator (UNICEF). district
project coordinator (UNICEF). Assistant Agricultural Inspector. Territory
manager (Pharmaceutical company). Toll clerk. Assistant general manager. School
teacher (private school). Religious teacher (mosque). College teacher. Newspaper
correspondent
3 Skilled Builder. electrician. carpenter. pottery maker. welder. tailor (machine operator).
weaver (embroidery worker). mason (construction). mistry (bakery). cook
(restaurant). barber. o�ce peon. iron smith. motorbike mechanic. moulder.
radio/tape/television repairer. engine mechanic (pumps. generators). iron moulder.
powerloom mechanic. shopkeeper (petty). assistant storekeeper
4 Other (less) skilled driver. labour contractor. domestic cook. rickshaw driver. furniture polisher. shop
salesman. mattee (bakery product) maker. brush maker. beautician. sweets maker.
house painter. nulki (bakery product) mistry. bhattee mistry (in charge of bakery
oven). realer. battery mechanic. bicycle repairer. sewing machine operator (simple
tasks). electric meter worker. scaler (forest department). waiter. housekeeper
(hotel). farmer
5 Vendor bakery vendor. fruitseller. juiceseller. cobbler; snacks vendor. vegetable vendor.
tent stall vendor. scrap vendor
6 Apprentice/Trainee
barber. tractor repairs. mason. welder. beautician. carpenter. electrician. machine
operator. toy artist. tailor. battery mechanic. motor mechanic. iron smith. weaver
7 Unskilled (upper) shop assistant (sales counter helper). helper. packer. ‘soler’ (of shoes). counter of
shoes (factory). table worker (bakery). cutter helper (factory). maintenance helper.
ironing (dhobi). framechecker (factory). ‘roller’ (bakery). bhattee (oven) worker
(bakery). gulli or nulki maker (bakery). jaggory maker. driver helper. bus
conductor. chaprasi (messenger)
8 Unskilled (lower) sweeper. utensil cleaner. cleaner. rickshaw puller. machine cleaner (factory),
unskilled factory worker, other domestic worker
9 Unskilled (lower) manual labour, agriculture, construction, white washing, tent worker, loader, wood
cutter
25
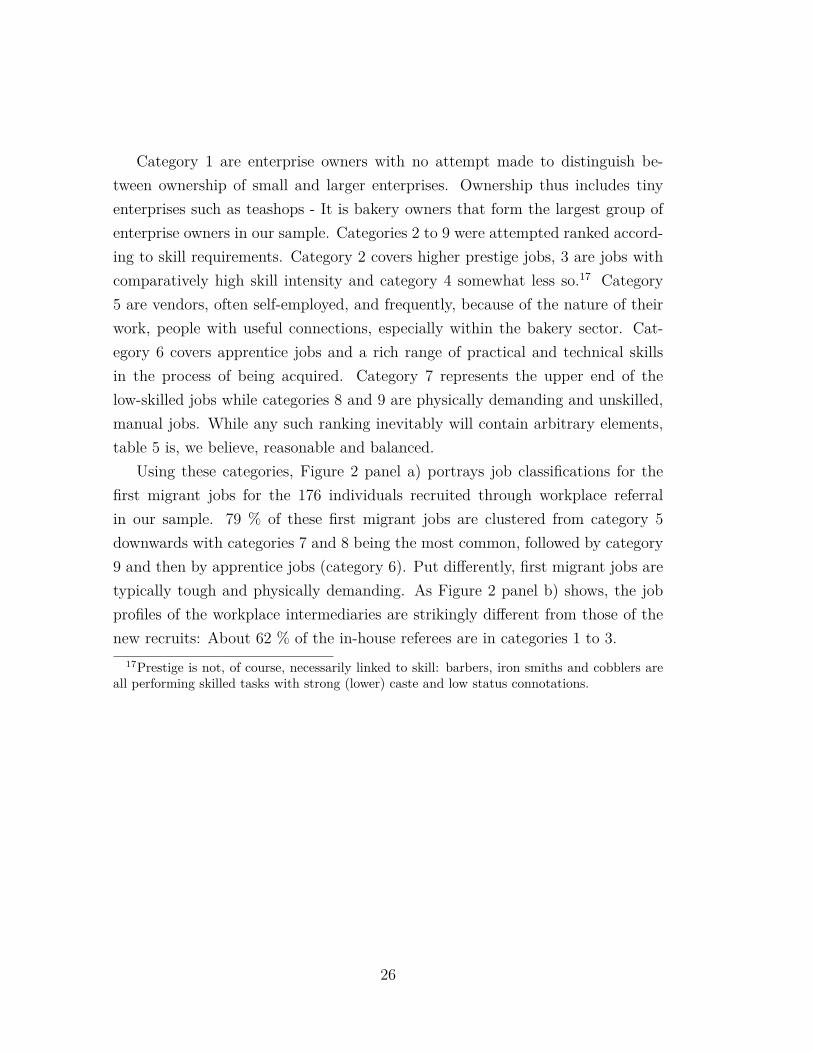
Category 1 are enterprise owners with no attempt made to distinguish be-tween ownership of small and larger enterprises. Ownership thus includes tinyenterprises such as teashops - It is bakery owners that form the largest group ofenterprise owners in our sample. Categories 2 to 9 were attempted ranked accord-ing to skill requirements. Category 2 covers higher prestige jobs, 3 are jobs withcomparatively high skill intensity and category 4 somewhat less so.17 Category5 are vendors, often self-employed, and frequently, because of the nature of theirwork, people with useful connections, especially within the bakery sector. Cat-egory 6 covers apprentice jobs and a rich range of practical and technical skillsin the process of being acquired. Category 7 represents the upper end of thelow-skilled jobs while categories 8 and 9 are physically demanding and unskilled,manual jobs. While any such ranking inevitably will contain arbitrary elements,table 5 is, we believe, reasonable and balanced.
Using these categories, Figure 2 panel a) portrays job classifications for thefirst migrant jobs for the 176 individuals recruited through workplace referralin our sample. 79 % of these first migrant jobs are clustered from category 5downwards with categories 7 and 8 being the most common, followed by category9 and then by apprentice jobs (category 6). Put di�erently, first migrant jobs aretypically tough and physically demanding. As Figure 2 panel b) shows, the jobprofiles of the workplace intermediaries are strikingly di�erent from those of thenew recruits: About 62 % of the in-house referees are in categories 1 to 3.
17Prestige is not, of course, necessarily linked to skill: barbers, iron smiths and cobblers areall performing skilled tasks with strong (lower) caste and low status connotations.
26
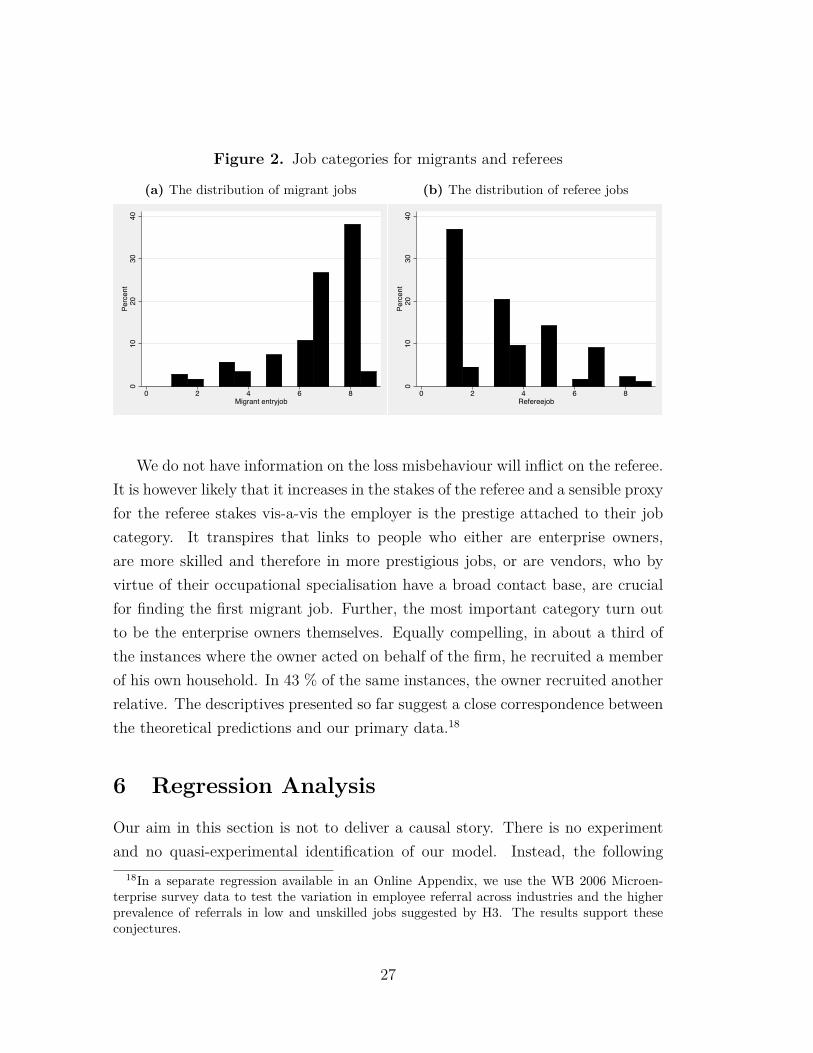
Figure 2. Job categories for migrants and referees
(a) The distribution of migrant jobs
010
2030
40Pe
rcen
t
0 2 4 6 8Migrant entryjob
(b) The distribution of referee jobs
010
2030
40Percent
0 2 4 6 8Refereejob
We do not have information on the loss misbehaviour will inflict on the referee.It is however likely that it increases in the stakes of the referee and a sensible proxyfor the referee stakes vis-a-vis the employer is the prestige attached to their jobcategory. It transpires that links to people who either are enterprise owners,are more skilled and therefore in more prestigious jobs, or are vendors, who byvirtue of their occupational specialisation have a broad contact base, are crucialfor finding the first migrant job. Further, the most important category turn outto be the enterprise owners themselves. Equally compelling, in about a third ofthe instances where the owner acted on behalf of the firm, he recruited a memberof his own household. In 43 % of the same instances, the owner recruited anotherrelative. The descriptives presented so far suggest a close correspondence betweenthe theoretical predictions and our primary data.18
6 Regression Analysis
Our aim in this section is not to deliver a causal story. There is no experimentand no quasi-experimental identification of our model. Instead, the following
18In a separate regression available in an Online Appendix, we use the WB 2006 Microen-terprise survey data to test the variation in employee referral across industries and the higherprevalence of referrals in low and unskilled jobs suggested by H3. The results support theseconjectures.
27
discussion centers on the more modest, pragmatic and important aim of delivering’robust’ correlations. Above we only considered migrants who entered their jobsthrough workplace referral. A better way to ’test’ the moral hazard hypothesis isto compare workplace referrals with migrants who found their jobs through othercontacts. If alleviation of moral hazard explains the use of workplace referralswe expect those who enter via a workplace referral to have stronger kinship tiesto their referee while the referees themselves should have more prestigious jobswhen compared to migrants in the reference group (comprising those entering ajob without a workplace intermediary).
In our baseline specification, we use a binary dependent variable that takes thevalue 1 if individual i entered his first workplace through workplace referral and 0otherwise. We relate this indicator to dummies capturing the social connectionsto the referee (or the main contact) and the status of the job held by the referee(or main contact). We think of our first regression as a ‘raw’or unconditionalcheck of the robustness of our descriptives and of the main patterns in the data.We estimate the following equation:
workplrefi = —0 + —1highjob + —1vendor + —1househ + —1rel + —1covill + Ái
highjob is a dummy that takes the value 1 if the referee (or main contact) hasa job in category 1-3 in Table 5 and vendor is a dummy taking the value 1 if thereferee (or main contact) was a (bakery) vendor. The following three dummiescapture the social relationship between the new recruit and the in-house referee(or main contact), specifically whether the workplace referee (or main contact) (i)was a member of the same household (househ), (ii) was another relative (rel), or(iii) was a co-villager not related through kin (covill).19 The results reported asmarginal probabilities in table 6 confirm the impressions from section 6: strongkinship ties and contacts in prestigious jobs appear crucial for acquiring the firstmigrant job through workplace referral.
19The benchmark category comprises 90 observations where strong social ties feature in 70 %of these observations. The corresponding figure for work-place referrals is 78.5 %.
28
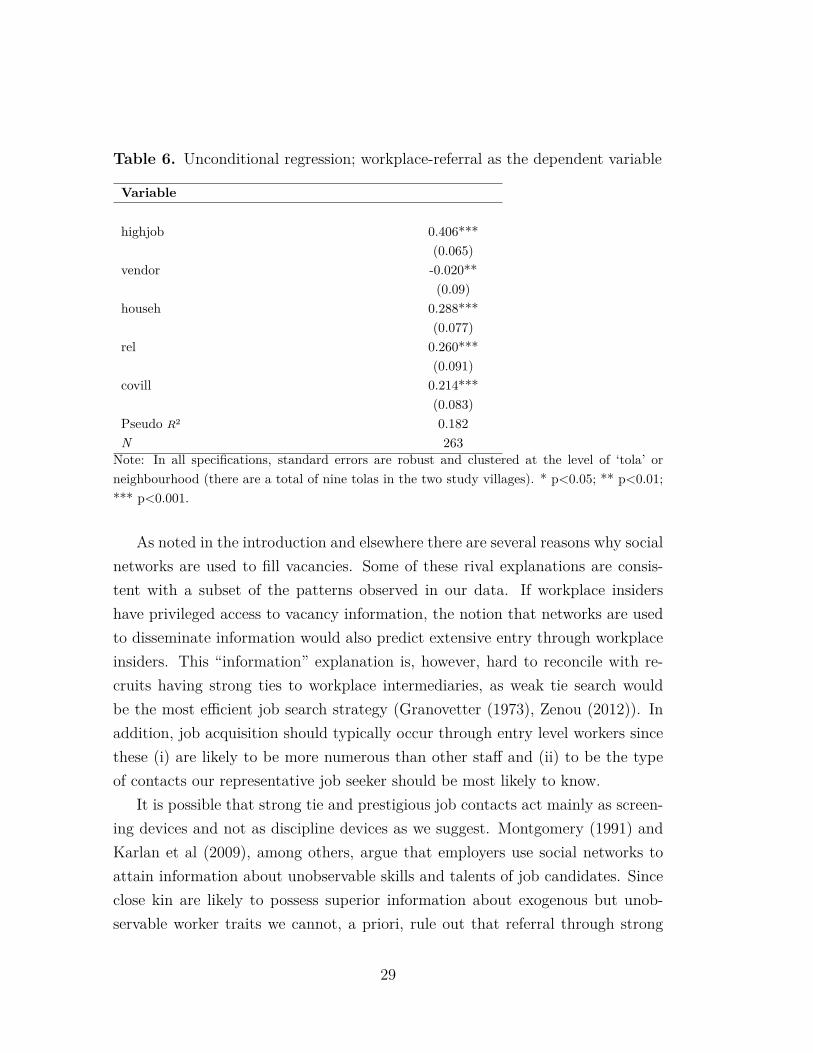
Table 6. Unconditional regression; workplace-referral as the dependent variable
Variable
highjob 0.406***(0.065)
vendor -0.020**(0.09)
househ 0.288***(0.077)
rel 0.260***(0.091)
covill 0.214***(0.083)
Pseudo R2 0.182N 263
Note: In all specifications, standard errors are robust and clustered at the level of ‘tola’ orneighbourhood (there are a total of nine tolas in the two study villages). * p<0.05; ** p<0.01;*** p<0.001.
As noted in the introduction and elsewhere there are several reasons why socialnetworks are used to fill vacancies. Some of these rival explanations are consis-tent with a subset of the patterns observed in our data. If workplace insidershave privileged access to vacancy information, the notion that networks are usedto disseminate information would also predict extensive entry through workplaceinsiders. This “information” explanation is, however, hard to reconcile with re-cruits having strong ties to workplace intermediaries, as weak tie search wouldbe the most e�cient job search strategy (Granovetter (1973), Zenou (2012)). Inaddition, job acquisition should typically occur through entry level workers sincethese (i) are likely to be more numerous than other sta� and (ii) to be the typeof contacts our representative job seeker should be most likely to know.
It is possible that strong tie and prestigious job contacts act mainly as screen-ing devices and not as discipline devices as we suggest. Montgomery (1991) andKarlan et al (2009), among others, argue that employers use social networks toattain information about unobservable skills and talents of job candidates. Sinceclose kin are likely to possess superior information about exogenous but unob-servable worker traits we cannot, a priori, rule out that referral through strong
29
tie connections benefit employers by screening for such traits. One fact that addsweight to our moral hazard interpretation is that most of the jobs in our sam-ple are low - or unskilled - jobs where screening for skills does not appear veryrelevant. To examine the possibility that workplace referral is mainly a screen-ing device more rigorously, and to rule out other confounding factors, we expandour benchmark specification by adding two proxies for unobservable individualmigrant attributes expected to matter in these employment relations: a generalability test score based on a Raven proxy and a dummy of whether the worker isconsidered a person with ‘jugar’.20
We also add controls for observable individual attributes, i.e. age at the timeof migration and years of schooling. For the former we use a dummy which takesthe value 1 for migrants aged 12 and below and 0 otherwise alongside a gen-eral variable for age at migration. If the advantages to employers of recruitmentthrough strong tie networks or through sta� in more prestigious jobs mainly aremanifested through screening for migrant unobservables, the strong tie and presti-gious job coe�cients should weaken once these unobservables are introduced. Asseen in column 1 in Table 7, the impacts of controlling for these unobservable andobservable worker traits on the highjob and social tie coe�cients are negligible.
It appears, therefore, that strong social ties and recruitment through sta�in more prestigious jobs do not provide employers with a screening advantage.Another possibility is that referrals through a strong tie to a person in a prestigiousjob may act as an insurance mechanism for very young migrants. The stronglypositive age 12 dummy is consistent with and adds support to this explanation.21
The kind of social clustering in the workplace that we observe could also reflectpreferences for working together. We are able to control for such preferences atthe level of the jati (sub-caste and its equivalent for Muslim workers) and at thelevel of the village (e.g. Banerjee (1983), Munshi (2003)). Specifically, we adddummies for belonging to the most numerous group within our migrant sample,the Ansaris, along with a village dummy to control for village level variation in
20The score on the Raven proxy test was obtained from the completion of six progressivematrices with an introductory comprehension test: see Online Appendix for further details.
21This impression is reinforced by the descriptives. The incidence of referral for migrants aged12 and below is 85.3 %. For the 13-16 age group, the corresponding incidence is 70.9 % and forthose aged 17 and above, the incidence is 49.3 %.
30
unobservable social cohesion and family relations. If the strong social tie coe�-cients simply reflect that members of the largest social group have more intensepreferences for working together, controlling for their identity should turn thestrong tie coe�cient insignificant. Similar reasoning applies to such preferencesat the village level. The results from introducing these two controls are reportedin column 2 in table 7.
Note that excepting the covill probability, other probabilities of interest nowshrink in size. The coe�cient on rel and covill also become statistically weaker.Closer scrutiny reveals that these are mainly Ansari e�ects: the village dummyhas no e�ect, whatsoever. Beyond the e�ects operating through the highjob andsocial tie coe�cients, there appears to be a large and separate e�ect of Ansariidentity on the probability of being recruited through referral.
In light of the descriptive statistics, which suggested a particularly high preva-lence of referral within the bakery sector, it is quite possible that the strong socialtie and high job coe�cients are driven by unobservable characteristics of the smallenterprises that dominate this sector. Column 3 in table 7 reports the results of in-troducing, firstly, a bakery sector dummy and secondly a dummy for first migrantjobs in agriculture and construction sector jobs: the latter are typically short-termand seasonal jobs. These two sectoral dummies are both statistically significant,the bakery dummy is positive and significant at the 1 % level. The coe�cientsof interest now all shrink in size. While the highjob coe�cient remains stronglysignificant, the social tie coe�cients become statistically weaker and borderline(in-) significant .
31
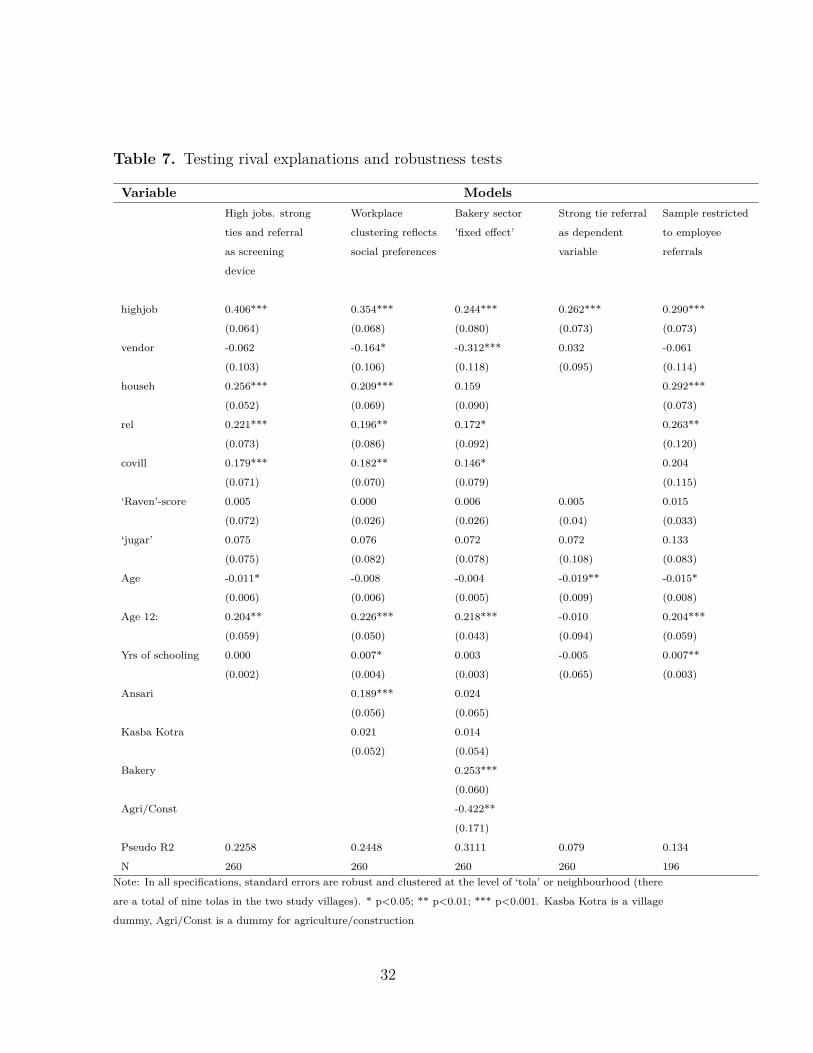
Table 7. Testing rival explanations and robustness tests
Variable ModelsHigh jobs. strong
ties and referral
as screening
device
Workplace
clustering reflects
social preferences
Bakery sector
’fixed e�ect’
Strong tie referral
as dependent
variable
Sample restricted
to employee
referrals
highjob 0.406***
(0.064)
0.354***
(0.068)
0.244***
(0.080)
0.262***
(0.073)
0.290***
(0.073)
vendor -0.062
(0.103)
-0.164*
(0.106)
-0.312***
(0.118)
0.032
(0.095)
-0.061
(0.114)
househ 0.256***
(0.052)
0.209***
(0.069)
0.159
(0.090)
0.292***
(0.073)
rel 0.221***
(0.073)
0.196**
(0.086)
0.172*
(0.092)
0.263**
(0.120)
covill 0.179***
(0.071)
0.182**
(0.070)
0.146*
(0.079)
0.204
(0.115)
‘Raven’-score 0.005
(0.072)
0.000
(0.026)
0.006
(0.026)
0.005
(0.04)
0.015
(0.033)
‘jugar’ 0.075
(0.075)
0.076
(0.082)
0.072
(0.078)
0.072
(0.108)
0.133
(0.083)
Age -0.011*
(0.006)
-0.008
(0.006)
-0.004
(0.005)
-0.019**
(0.009)
-0.015*
(0.008)
Age 12: 0.204**
(0.059)
0.226***
(0.050)
0.218***
(0.043)
-0.010
(0.094)
0.204***
(0.059)
Yrs of schooling 0.000
(0.002)
0.007*
(0.004)
0.003
(0.003)
-0.005
(0.065)
0.007**
(0.003)
Ansari 0.189***
(0.056)
0.024
(0.065)
Kasba Kotra 0.021
(0.052)
0.014
(0.054)
Bakery 0.253***
(0.060)
Agri/Const -0.422**
(0.171)
Pseudo R2 0.2258 0.2448 0.3111 0.079 0.134
N 260 260 260 260 196Note: In all specifications, standard errors are robust and clustered at the level of ‘tola’ or neighbourhood (there
are a total of nine tolas in the two study villages). * p<0.05; ** p<0.01; *** p<0.001. Kasba Kotra is a village
dummy, Agri/Const is a dummy for agriculture/construction
32
Put di�erently, while our results suggest that the high job and in particular thestrong tie e�ects are more pronounced in the bakery sector, they are also significantbut statistically weaker for other sectors. Such sectoral variation is consistent withour theoretical predictions (H1 & H2) and the descriptive statistics reported intable 3 and lends support to our moral hazard hypothesis.
The standard approach to addressing endogeneity concerns in regressions con-taining network variables is to make use of an IV technique. In Table 7, column4, we have instead and as a robustness check introduced an alternative dependentvariable, strongtie referral, that includes the most vulnerable regressors in ourearlier specifications, namely househ and rel.22 In this alternative specification,therefore, the social tie dummies are no longer relevant right hand side variables.Given the redefinition of the dependent variable, this enables us to check the as-socation between highjob and strongtie referral. Note that the highjob coe�cientremains positive and statistically significant.
Could the highjob coe�cient not also be biased? Suppose that unobserveddiligence is correlated with career progress and thus with having a ’high’ or ’pres-tigious’ job of the type that our workplace referees have been observed to have.For this to represent a genuine concern such unobserved diligence would have tobe associated with a higher (or lower) propensity to recruit relatives and familymembers into a given job. We find such an association implausible.
As a further robustness check, with results reported in table 7, column 5,we estimate our original model with workplacereferral as dependent variable andrestricting the sample to the subset of cases of ’employee referral’. The samplesize is now down to 196 observations. Even so the main equivalent results prevailand the key coe�cients, namely the highjob and strong tie dummies, continue tobe strongly significant.
7 Conclusion
In this paper we present a model where firms use employee referral to curb moralhazard problems in low and unskilled labour markets. We showed that the firm
22The strongtie referral dependent variable dummy is equal to 1 if referral=1 & referraloccurred through a strong social tie.
33
can exploit social preferences between the recruit and the referee to leverage de-sirable behaviour at a lower cost. This strategy only works if the referee has theright incentives and relevant, strong tie networks, have the capacity to supplycandidates. The latter is more likely for the type of jobs that we focus on, namelylow and unskilled jobs that anyone, in principle, can do. In general we expect toobserve referrals in jobs with high costs of opportunism and when referees withhigh stakes in the firm are available. We predict strong tie connections in thiscase.
We confront these predictions with an in-depth primary data set covering low-and unskilled migrants from Western Uttar Pradesh (India). Our descriptivessquare well with our predictions and show a very high prevalence of referral basedlabour market entry. The evidence we have presented should not be interpreted asdecisive; other concerns may explain the prevalence of job entry through workplaceinsiders. We do, however, address the main rival explanations and although theymay contribute to explain the high prevalence of entry through workplace insiders ,they do not alter our conclusion: For migration into low- and unskilled jobs, moralhazard is a relevant problem that employers appear to use workplace referrals tomitigate. Our paper thus support results in Kugler (2003) and Heath (2010)that moral hazard is an important driver of workplace referrals, but adds to theliterature the interesting themes of the role of social ties and how referee incentivescan shape referral prevalence and outcomes.
References
[1] Bandiera, O., I. Barankay and I. Rasul (2009): ‘Social connections and incen-tives in the workplace: Evidence from personnel data’, Econometrica, 77(4):1047-94
[2] Banerjee, B. (1983): ’Social networks in the migration process: empiricalevidence on chain migration in India’, The Journal of Developing Areas, 17(January): 185-96.
[3] Banerjee, B. (1991): ‘The determinants of migrating with a pre-arrangedjob and of the initial duration of urban unemployment: An analysis based on
34
Indian data on rural-to-urban migrants’, Journal of Development Economics,36(2): 337-51.
[4] Banerji, S., R. Natarajan and K. Sen (2011): ‘Monitoring Costs, CreditConstraints and Entrepreneurship’, mimeo, IDPM, University of Manchester.
[5] Beaman, L. and J. Magruder (2012): ‘Who gets the job referral? Ev-idence from a social networks experiment’, American Economic Review,vol.102(7):3574-93.
[6] Bryan, G., S. Chowdhury and A. M. Mobarak (2011): ‘Underinvestment inprofitable technologies when experimenting is costly: evidence from a migra-tion experiment in Bangladesh’, Paper presented at the Growth and Devel-opment Conference, Indian Statistical Institute, New Delhi, December 2011.
[7] Calvo-Armegnol, A. and M. O. Jackson (2004): ‘The Impacts of Social Net-works on Employment and Inequality’, American Economic Review, 94(3):426-54.
[8] Calvo-Armengol, A. and M. O. Jackson (2007): ‘Networks in Labour Mar-kets: Wage and Employment Dynamics and Inequality’, Journal of EconomicTheory, 132(1): 27-46.
[9] Chowdhury, N. T. (2010): The Relative E�ciency of Hired and Fam-ily Labour in Bangladesh Agriculture, mimeo, Department of Economics,Gothenburg University.
[10] de Haan, A. and B. Rogaly (2002): ‘Migrant Workers and their Role in RuralChange’, Journal of Development Studies, 38(5): 1-14.
[11] De Neve, G. (2008): ‘We are all Sondukarar (Relatives)! Kinship and itsmorality in an urban industry of Tamilnadu, India,’ Modern Asian Studies,42(1): 211-46.
[12] Dhillon, A. and V. Iversen (2011): Referrals, social proximity and workforcediscipline, mimeo, Department of Economics, University of Warwick.
35
[13] Dreze, J. and H. Gazdar (1998): Uttar Pradesh: The burden of inertia, inDreze, J. and A. Sen (eds): Indian Development – Selected Regional Per-spectives, New Delhi: Oxford University Press.
[14] Fafchamps, M. and Moradi (2009): Referral and job performance: evidencefrom the Ghana Colonial Army, mimeo, Department of Economics, Universityof Oxford.
[15] Fernandez, R., E.J. Castilla and P. Moore (2000): ‘Social Capital at Work:Networks and Employment at a Call Center,’ American Journal of Sociology,105(5): 1288-1356.
[16] Gore, M. S. (1970): Immigrants and neighbourhoods: Two aspects of life ina metropolitan city, Tata Institute of Social Sciences, Bombay.
[17] Granovetter, M (1973): The strength of weak ties, American Journal ofSociology, 78, 1360-80.
[18] Granovetter (1995): Getting a Job: A Study of Contacts and Careers, 2ndedition, Chicago University Press
[19] Heath, R. (2010): ‘Why do firms hire using referrals? Evidence fromBangladeshi Garment Factories,’ Unpublished manuscript.
[20] Holmstrom, M. (1984): Industry and Inequality: The social anthropology ofIndian labour, Cambridge University Press.
[21] Iversen, V., K. Sen, A. Verschoor and A. Dubey (2009): ‘Job recruitmentnetworks and migration to cities in India’, Journal of Development Studies,45(4): 522-43.
[22] Iversen, V. and G. Torsvik (2010): ‘Networks, middlemen and other (urban)labour market mysteries’, Indian Growth and Development Review, 3(1): 62-80.
[23] Je�rey, C., P. Je�ery and R. Je�ery (2007): Degrees without Freedom: Ed-ucation, Masculinities and Unemployment in North-India. Palo Alto, CA:Stanford University Press.
36
[24] Kajisa, K (2007): ‘Personal networks and agricultural employment: the caseof a farming village in the Philippines,’ Economic Development and CulturalChange, 55(4), pp. 669-708.
[25] Kapur, D., C. B. Prasad, L. Pritchett and D. S. Babu (2010): ‘RethinkingInequality: Dalits in Uttar Pradesh in the Market Reform Era’, Economicand Political Weekly 45(35): 39-49.
[26] Karlan, D., M. Mobius, T. Rosenblat and A. Szeidl (2009) ’Trust and SocialCollateral,’ Quarterly Journal of Economics, 124(3): 1307-1361.
[27] Kerr, C., J. T. Dunlop, F. H. Harbison and C. A. Myers (1966): ‘Industrialismand Industrial Man. The Problem of Labor and Management in EconomicGrowth’, Oxford University Press.
[28] Kono, H. (2006): ‘Employment with connections: negative network e�ects,’Journal of Development Economics, 81: 244-258
[29] Kugler, A. (2003): ‘Employee referrals and e�ciency wages’, Labour Eco-nomics, 10: 531-56.
[30] Kramarz, F. and Thesmar (2007): ’Social networks in the boardroom’,mimeo, CREST
[31] Lucas, R. E. B. (1993): Internal migration in developing countries, in M. R.Rosenzweig and O. Stark (eds): Handbook of Population and Family Eco-nomics, Vol 1, Part B: 721-98, Amsterdam: Elsevier.
[32] Manski, C. F. (2000): Economic analysis of social interactions, Journal ofEconomic Perspectives, 14(3): 115-36.
[33] Montgomery, J. D. (1991): ‘Social networks and labour market outcomes:toward an economic analysis’, American Economic Review, 81(5): 1408-18.
[34] Morris, M. D. (1955): ‘Labor Discipline, Trade Unions and the State inIndia’, Journal of Political Economy, 63(4): 293-308.
[35] Mortensen, D.T. and T.Vishwanath (1994): ’Personal contacts and earnings:It is who you know’, Labour Economics, 1: 187-201.
37
[36] Munshi, K. (2003): Networks in the Modern Economy: Mexican migrants inthe US labour market, Quarterly Journal of Economics, 118(2): 549-99.
[37] Munshi, K. and M. R. Rosenzweig (2006): ‘Traditional institutions meetthe modern world: Caste, Gender and Schooling Choice in a GlobalizingEconomy’, American Economic Review, 96(4): 1225-52.
[38] Pollard, S. (1963): ‘Factory Discipline in the Industrial Revolution,’ TheEconomic History Review, 16(2): 254-71.
[39] Rogaly, B, D. Coppard K. Rana, A. Rafique, A. Sengupta and J. Biswas(2003): ‘Seasonal Migration, Employer-Worker Interactions, and ShiftingEthnic Identities in Contemporary West Bengal, Contributions to IndianSociology, 37 (1-2): 281-310.
[40] Saloner, G, (1985): ’Old boy networks as screening mechanisms’, Journal ofLabour Economics, Vol.3(3): 255-267.
[41] Sheth, N. R. (1968): The social framework of an Indian factory, ManchesterUniversity Press.
[42] Shiva Kumar, A. K. (2007): ‘Why are levels of child malnutrition not im-proving?’, Economic and Political Weekly, 42(15): 1337-45.
[43] Simon, C. J. and S. Warner (1992): ‘Matchmaker, matchmaker: the e�ectof old boys networks on job-match quality, earnings and tenure’, Journal ofLabor Economics, 10(3): 306-30.
[44] Singh, I., L Squire and J. Strauss (1986): Agricultural Household Models:Extensions, Applications and Policy, John Hopkins University Press.
[45] Smith, J. P. and D. Thomas (2003): ‘Remembrance of Things Past: Test-Retest Reliability of Retrospective Migration Histories’, Journal of RoyalStatistical Society, 166(1): 23-49.
[46] Spence, Michael (1973): ‘Job Market Signalling’,Quarterly Journal of Eco-nomics 87:355-374.
38
[47] Topa, G. (2011):’Labour Markets and Referrals’, chapter 22 in Handbook ofSocial Economics, Vol.1:1193-122, J. Benhabib, A. Bisin and M.O.Jackson(eds).
[48] Wahba, J. and Zenou, Y. (2005): ‘Density, social networks and job searchmethods: Theory and application to Egypt,’ Journal of Development Eco-nomics, 78(2), 443-473.
[49] Winters, P., A. de Janvry and E. Sadoulet (2001): ‘Family and communitynetworks in Mexico-US migration’, Journal of Human Resources, 36(1): 159-84.
39


![Der Stoffwindelratgeber - Hug & Grow · 2019. 4. 18. · [Ver4] Fotonachweise: Herzog Foto, Hug & Grow, TotsBots, Xkko, Bambino Mio, Disana, Rasul Hasanov. Entdecke bei Hug & Grow](https://img.pdfslide.org/doc/110x75/60dd6d0f85ebd50a365c49d4/der-stoffwindelratgeber-hug-grow-2019-4-18-ver4-fotonachweise-herzog.jpg)


![SUMMARY OF FINANCIAL STATEMENTS [IFRS] (CONSOLIDATED ... · Underlying revenue growth* increased by 2.8% compared to the previous year. * Underlying revenue growth: Constant currency](https://img.pdfslide.org/doc/110x75/5f07da127e708231d41f129c/summary-of-financial-statements-ifrs-consolidated-underlying-revenue-growth.jpg)